Embed Size (px)
Citation preview
energies
Article
Simulation and Injector Bench Test Validation of DifferentNozzle Hole Effect on Pyrolysis Oil-Diesel Oil Mixtures
Máté Zöldy 1,* and István Péter Kondor 2
�����������������
Citation: Zöldy, M.; Kondor, I.P.
Simulation and Injector Bench Test
Validation of Different Nozzle Hole
Effect on Pyrolysis Oil-Diesel Oil
Mixtures. Energies 2021, 14, 2396.
https://doi.org/10.3390/en14092396
Academic Editor: Attilio Converti
Received: 25 March 2021
Accepted: 18 April 2021
Published: 23 April 2021
Publisher’s Note: MDPI stays neutral
with regard to jurisdictional claims in
published maps and institutional affil-
iations.
Copyright: © 2021 by the authors.
Licensee MDPI, Basel, Switzerland.
This article is an open access article
distributed under the terms and
conditions of the Creative Commons
Attribution (CC BY) license (https://
creativecommons.org/licenses/by/
4.0/).
1 Department of Automotive Technologies, Budapest University of Technology and Economics, P.O. Box 91,H-1521 Budapest, Hungary
2 Department of Vehicle Technologies, John von Neumann University, Izsáki út 10., H-6000 Kecskemét, Hungary;[email protected]
* Correspondence: [email protected]
Abstract: The tire pyrolysis oil is a waste-derived fuel with a lower cetane number and higher den-sity than diesel fuel, but this is a promising waste-based fuel for compression ignition en-gines. In theEuropean Union, it is necessary to increase the bio-share of fuels, and the second-generation waste-derived blend components are essential for achieving the 2030 goals. The injection characteristics oftire pyrolysis oil and diesel oil were investigated on a Bosch solenoid type common rail (CR) injector.Six different premixed ratios were investi-gated, including in a low volume percentage 250 ppmand higher 10%, 20%, and 100% pyrolysis oil and 100% diesel oil. The simulation investigation wasdone in the AVL Fire software, the experimental investigations were done on a LDX CR injection testbench, and the videos were taken on an Olympus Ispeed 3 camera. The scope of the research was torecord the flow pattern of the fuel mixture, flowing out of the high-pressure injector, from which themixing with air and the quality of the resulting combustion can be deduced, which has a significanteffect on the emissions.
Keywords: waste-based fuel; tire pyrolysis oil; dual-fuel injection; CR injector
1. Introduction
One of the greatest challenges that we face is the increasing amount of power thathumankind uses. To maintain the supply of energy on a market where the demand isgrowing day by day, we need to look for alternative fuels to power our powerplants andmachines. Making fuel out of waste is not only a solution for making alternative fuels,but it is also an excellent way to clean the environment from our dangerous byproducts.Over a billion tires are produced each year for the transportation industry. That neededto be recycled after use to protect the environment. The pyrolysis process is a seeminglypromising way to recycle waste tires. There are several types of pyrolysis processes and themost used process is vacuum pyrolysis [1]. The pyrolysis oil used for the measurementscomes from a pyrolyzer with a vertical structure, inside which a rotating vane mixes therubber waste [2]. Tire pyrolysis oil has a high gross calorific value (41–44 MJ/kg), andtherefore can be used well in internal combustion engines with a suitable mixing ratio [3].Literature review shows that the tyre pyrolysis oil (TPO) fuel is highly flammable andhas a calorific value equivalent to that of commercial diesel fuel [4]. TPO fuel, testedon a modern turbocharged diesel engine without changing its injection strategy, hasresulted in higher NOx and CO emissions, according to the literature search [5]. Thefuel injection quality (pressure, jet image, and time course) determines the amount ofpollutants in the exhaust gas to the greatest extent [6]. According to research, by slightlymixing TPO fuel with commercially available diesel fuel, the emission values do not changeor only to a negligible extent. Although it is advisable to use it primarily in industrialengines, road NOx measurements on light-duty modern diesel commercial vehicles didnot significantly differ compared to pure diesel fuel [7]. Internal combustion compression
Energies 2021, 14, 2396. https://doi.org/10.3390/en14092396 https://www.mdpi.com/journal/energies
Energies 2021, 14, 2396 2 of 14
ignition engines are now widely used in both the transportation and energy industries. Inmodern compression ignition (CI) engines, high-pressure injectors used in research arewidely used today. As the quality of the tested fuel blend differs from that of standarddiesel fuel, it is necessary to test the blend from several aspects. These include the injectionjet image, which significantly affects the mixing of the fuel with oxygen and, consequently,the combustion quality and pollutants’ concentration [8]. The research does not coverthe service life of injector components as it requires longer-term tests. The scope of theresearch was thus to investigate the effects of waste-based TPO on injectors, from which theexpected service life of the injection system and the expected emissions can be deduced.
Pyrolysis Properties
The pyrolysis reactor has a temperature of about 450 degrees Celsius and no catalystsor other accelerators are used during the process. During the pyrolysis process, the polymerstructure of the tire collapses and gases and vapors are released from the solid material (thepolymer chains break into smaller ones). These vapors and gases are captured and storedafter physical and chemical treatment. Materials formed during the process: gas fraction,gasoline fraction, oil fraction, and water. The resulting gas fraction can heat the pyrolyzerfirebox, which is located separately from the reactor. The firebox has a high temperature(950–1050 ◦C) which provides heating for the reactor. The reactor has a dual-layer wall.Into the outer wall, the hot flue gas is introduced. Within the inner wall, in an isolatedenvironment, pyrolysis takes place so that the structure of the rubber polymer collapsesunder the influence of external heat transfer without oxygen. [9] The quality of the TPO isgreatly influenced by the type of tire waste used. As the processed tire base material comesfrom several manufacturers, their material composition is also different. Samples takenduring processing show different laboratory tests values, so tire-based pyrolysis oil will nothave a standard composition like commercially available fuels. The properties of TPO fuelused in this study were analyzed in laboratory with standard methods and presented inTable 1. The diesel fuel used in the tests is a commercially available fuel that meets EN-590standard [10]. The main parameters of the two fuels are shown in Table 1. The purpose ofthis study was to test pyrolysis oil using a commercially available diesel–biogas blend.
Table 1. Main dimensions of nozzles [11].
D1 [µm] Dint [µm] D0 [µm] L [mm] L1 [mm] R [µm] θ [o] NL [µm]
Cylindricalnozzle 152 - 152 1 - 20 72.5 250
Ks nozzle 165 - 152 1 - 40 72.5 250Ksd nozzle 165 152 165 1 0.66 40 72.5 250
2. Experimental2.1. The Examined Nozzle Geometries
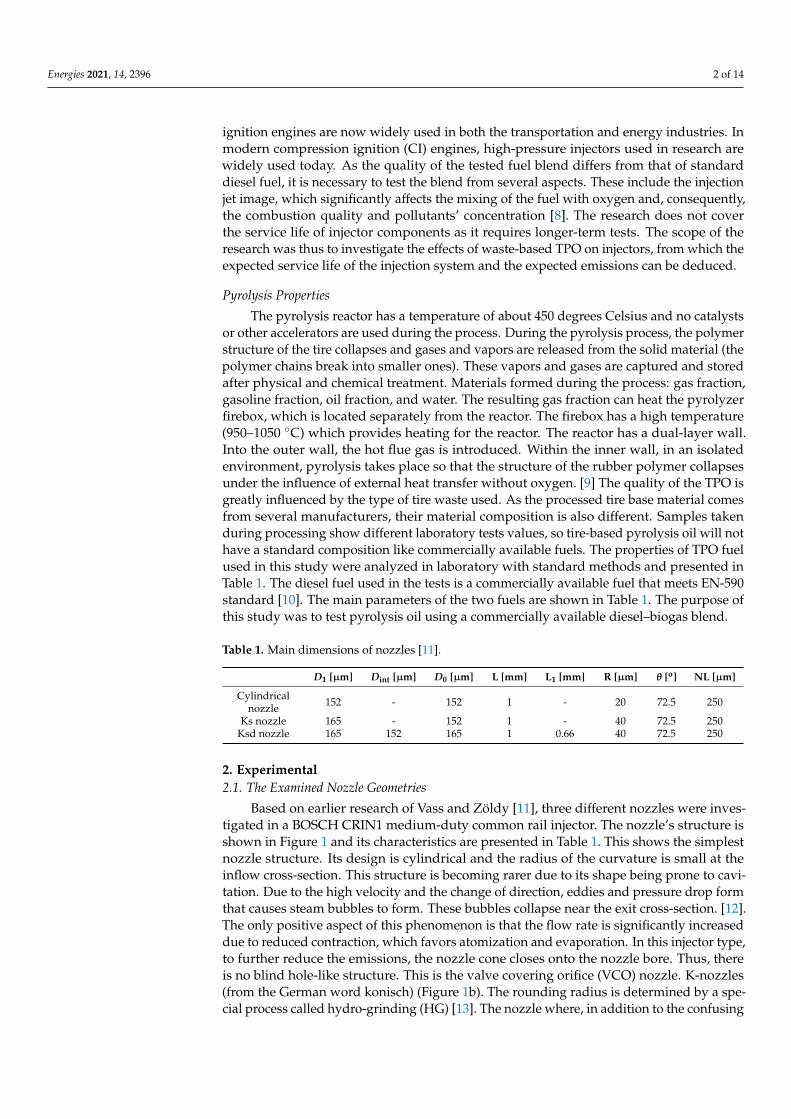
Based on earlier research of Vass and Zöldy [11], three different nozzles were inves-tigated in a BOSCH CRIN1 medium-duty common rail injector. The nozzle’s structure isshown in Figure 1 and its characteristics are presented in Table 1. This shows the simplestnozzle structure. Its design is cylindrical and the radius of the curvature is small at theinflow cross-section. This structure is becoming rarer due to its shape being prone to cavi-tation. Due to the high velocity and the change of direction, eddies and pressure drop formthat causes steam bubbles to form. These bubbles collapse near the exit cross-section. [12].The only positive aspect of this phenomenon is that the flow rate is significantly increaseddue to reduced contraction, which favors atomization and evaporation. In this injector type,to further reduce the emissions, the nozzle cone closes onto the nozzle bore. Thus, thereis no blind hole-like structure. This is the valve covering orifice (VCO) nozzle. K-nozzles(from the German word konisch) (Figure 1b). The rounding radius is determined by a spe-cial process called hydro-grinding (HG) [13]. The nozzle where, in addition to the confusing
Energies 2021, 14, 2396 3 of 14
hole, the HG process is also used called the nozzle (German konisch strömungsoptimiertwords) and forms such a type of the second simulation geometry (Figure 1c).
Energies 2021, 14, x FOR PEER REVIEW 3 of 15
K-nozzles (from the German word konisch) (Figure 1b). The rounding radius is deter-mined by a special process called hydro-grinding (HG) [13]. The nozzle where, in addition to the confusing hole, the HG process is also used called the nozzle (German konisch strömungsoptimiert words) and forms such a type of the second simulation geometry (Figure 1c).
Figure 1. The types of nozzles.
The taper of the nozzles at the injectors, which are not marked in the usual way in machine design, is called k-factor. The factor k can be determined from the inlet and outlet diameters: = [ ] − [ ]10 (1)
where Di is the inflow’s diameter and D0 is the outflow cross section’s diameter, and k is the k-factor. The geometrical dimensions of the three nozzles tested are shown in Table 1. The properties of the fuel used in the tests are shown in Table 2.
The injector used in the tests has a VCO nozzle design. The advantage of the VCO nozzle chamber is that the fuel remaining in the blind hole under the nozzle needle does not enter the combustion chamber, it does not participate in the combustion. If the fuel remained in the blind hole, it would enter the combustion chamber, further increasing hydrocarbon emissions. By reducing emission values, these nozzles are already in use to-day [14].
Table 2. Main parameters of TPO and Diesel fuels.
TPO Diesel Standard Cetane <30 ≥51.0 MSZ EN ISO 5165
Sulfur [mg/kg] 8348 ≤10 MSZ EN ISO 20846 Water (ppm) [mg/kg] 1804 ≤200 MSZ EN ISO 12937
Pensky-Martens Flashpoint <24 >55 MSZ EN 2719 Caloric Value [MJ/kg] 40.8 42.7
Ash [%/m/m] 0.005 ≤0.01 MSZ EN ISO 6245 Viscosity [mm2/s] 4.443 2.00–4.50 MSZ EN ISO 3104
Mechanical inpurities [mg/kg] 0.027–0.16 ≤24 MSZ EN 12662 Density [kg/m3] 926.1 0.83
Coke residue [%/m/m] 0.6 ≤0.30 EN ISO 10370 Cold Filter Plugging Point (CFPP) ≤5 MSZ EN 116
Policyclic carbohidrates 22–35 <8.0 MSZ EN 12916
2.2. Initial and Boundary Conditions The simulation was defined as a multiphase process with three phases. The first
phase is the diesel liquid phase or pyrolysis oil liquid phase, the second phase is the diesel
Figure 1. The types of nozzles.
The taper of the nozzles at the injectors, which are not marked in the usual wayin machine design, is called k-factor. The factor k can be determined from the inlet andoutlet diameters:
k =Di[µm]− D0[µm]
10(1)
where Di is the inflow’s diameter and D0 is the outflow cross section’s diameter, and k isthe k-factor. The geometrical dimensions of the three nozzles tested are shown in Table 1.
The properties of the fuel used in the tests are shown in Table 2.
Table 2. Main parameters of TPO and Diesel fuels.
TPO Diesel Standard
Cetane <30 ≥51.0 MSZ EN ISO 5165Sulfur [mg/kg] 8348 ≤10 MSZ EN ISO 20846
Water (ppm) [mg/kg] 1804 ≤200 MSZ EN ISO 12937Pensky-Martens Flashpoint <24 >55 MSZ EN 2719
Caloric Value [MJ/kg] 40.8 42.7Ash [%/m/m] 0.005 ≤0.01 MSZ EN ISO 6245
Viscosity [mm2/s] 4.443 2.00–4.50 MSZ EN ISO 3104Mechanical inpurities [mg/kg] 0.027–0.16 ≤24 MSZ EN 12662
Density [kg/m3] 926.1 0.83Coke residue [%/m/m] 0.6 ≤0.30 EN ISO 10370
Cold Filter Plugging Point (CFPP) ≤5 MSZ EN 116Policyclic carbohidrates 22–35 <8.0 MSZ EN 12916
The injector used in the tests has a VCO nozzle design. The advantage of the VCOnozzle chamber is that the fuel remaining in the blind hole under the nozzle needle doesnot enter the combustion chamber, it does not participate in the combustion. If the fuelremained in the blind hole, it would enter the combustion chamber, further increasinghydrocarbon emissions. By reducing emission values, these nozzles are already in usetoday [14].
2.2. Initial and Boundary Conditions
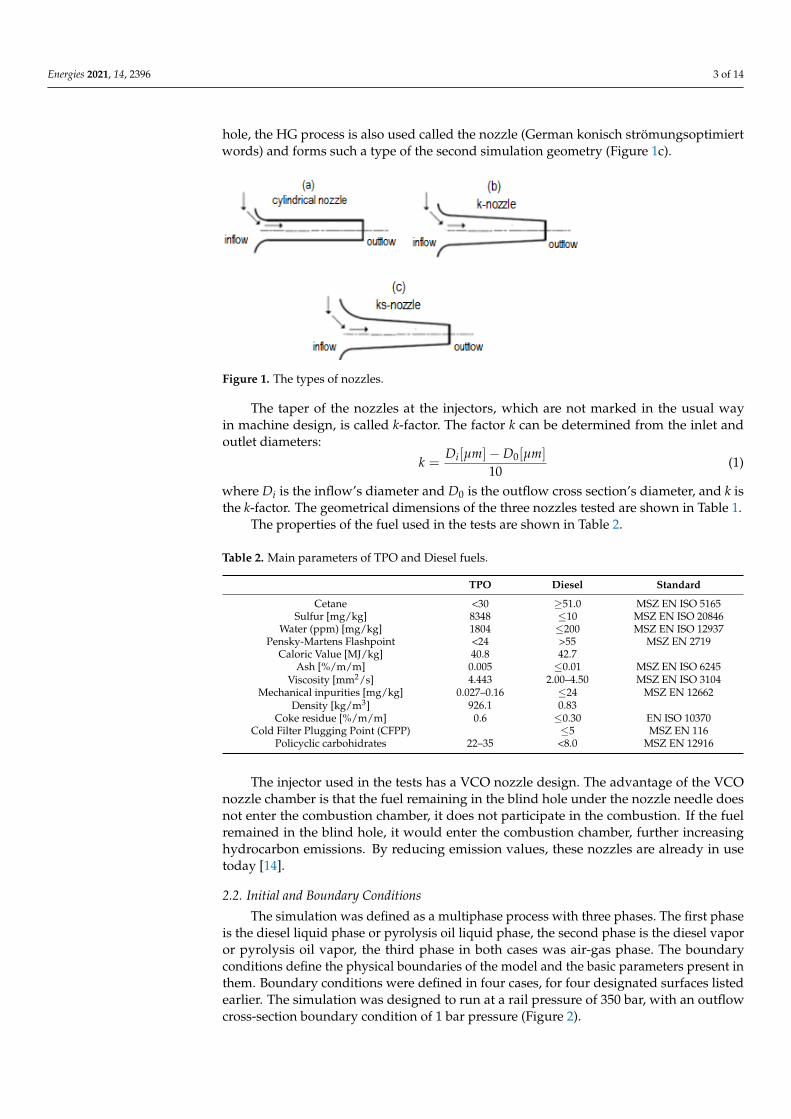
The simulation was defined as a multiphase process with three phases. The first phaseis the diesel liquid phase or pyrolysis oil liquid phase, the second phase is the diesel vaporor pyrolysis oil vapor, the third phase in both cases was air-gas phase. The boundaryconditions define the physical boundaries of the model and the basic parameters present inthem. Boundary conditions were defined in four cases, for four designated surfaces listedearlier. The simulation was designed to run at a rail pressure of 350 bar, with an outflowcross-section boundary condition of 1 bar pressure (Figure 2).
Energies 2021, 14, 2396 4 of 14
Energies 2021, 14, x FOR PEER REVIEW 4 of 15
vapor or pyrolysis oil vapor, the third phase in both cases was air-gas phase. The bound-ary conditions define the physical boundaries of the model and the basic parameters pre-sent in them. Boundary conditions were defined in four cases, for four designated surfaces listed earlier. The simulation was designed to run at a rail pressure of 350 bar, with an outflow cross-section boundary condition of 1 bar pressure (Figure 2).
Figure 2. Initial and boundary conditions.
The k-ε turbulence model was used at the simulations, which is a well-functioning, configurable turbulence model. Basic equations of the k-ε turbulence model:
Turbulent kinetic energy for k: ( ) + ( ) = + + + − ε − + (2)
The relations also have constants: C1ε, C2ε, Cµ, k, ε. ( ε) + ( ε ) = + є ε + ε ( + ) − ε + (3)
Formula for turbulent viscosity: = ε (4)
Linear cavitation model set with three phases: The relationships of the linear cavita-tion model are described in Equations (5) and (6). The mass exchange of the interface was done by introducing Equation (5), this is the mass transfer rate of the interface. = ( ) ∙ 4 = − (5)
The following relation (6) is the density of the bubbles formed by the cavitation, which represents the number of bubbles per unit volume:
,,, = ,,, ≤ 0.52( ,,, − 1)(1 − ) + 1 > 0.5 (6)
When writing the 3D graphical results, the following parameters were selected: den-sity, pressure, turbulent kinetic energy, velocity, volume ratio. These parameters were ex-amined in all three phases.
2.3. Experimental Setup The tests were performed on an LDX CR injector test bench, the parameters of the
test bench are shown in Table 3 [15]. A special test oil had to be drained and refilled with commercially available diesel fuel, and then with the tested TPO blends. The fuels were heated to 40 degrees Celsius. For the test, an injector was placed in the test tube of the test
Figure 2. Initial and boundary conditions.
The k-ε turbulence model was used at the simulations, which is a well-functioning,configurable turbulence model. Basic equations of the k-ε turbulence model:
Turbulent kinetic energy for k:
∂
∂t(ρk) +
∂
∂χi(ρkui) =
∂
∂χj
[(µ +
µ1
σk
)∂k∂χj
]+ Pk + Pb − ρε− YM + Sk (2)
The relations also have constants: C1ε, C2ε, Cµ, ∂k, ∂ε.
∂
∂t(ρε) +
∂
∂χi(ρεui) =
∂
∂χj
[(µ +
µ1
σie
)∂ε
∂χj
]+ C1ε
ε
k(Pk + C3εPb)− C2ερ
ε2
k+ Sε (3)
Formula for turbulent viscosity:
µt = ρCµk2
ε(4)
Linear cavitation model set with three phases: The relationships of the linear cavitationmodel are described in Equations (5) and (6). The mass exchange of the interface was doneby introducing Equation (5), this is the mass transfer rate of the interface.
ΓC =∫ ∞
0f (r) • 4πr2ρd
.rdr = −Γd (5)
The following relation (6) is the density of the bubbles formed by the cavitation, whichrepresents the number of bubbles per unit volume:
N,,, =
{N,,,
0 αd ≤ 0.5
2(
N,,,0 − 1
)(1 − αd) + 1 αd > 0.5
}(6)
When writing the 3D graphical results, the following parameters were selected: den-sity, pressure, turbulent kinetic energy, velocity, volume ratio. These parameters wereexamined in all three phases.
2.3. Experimental Setup
The tests were performed on an LDX CR injector test bench, the parameters of thetest bench are shown in Table 3 [15]. A special test oil had to be drained and refilled withcommercially available diesel fuel, and then with the tested TPO blends. The fuels wereheated to 40 degrees Celsius. For the test, an injector was placed in the test tube of thetest bench, illuminated by the camera’s frequency-free light source. The test chamber wascontinuously ventilated with compressed air to prevent fuel-spray fog. Measurementswere performed at 350 and 1000 bar rail pressures with pure diesel and pure TPO as well as10% TPO with 90% diesel, and 20% TPO with 80% diesel fuel. A Bosch CP3 pump providedfuel pressure. For the jet-images pictures, an Olympus Ispeed 3 high-speed camera was
Energies 2021, 14, 2396 5 of 14
used, which was placed in front of the test bench. The parameters of the camera are shownin Table 4.
Table 3. Main parameters of LDX CR injector test bench.
Technical Parameters
Power of electric motor 5.5 kW 3 phaseNumber of injectors to be tested 4
Speed of fuel pump 100–3000/minRail pressure (high pressure) HP 100–1800 bar
Feed pump pressure (low pressure) LP 0–7 barInjector operating time 0.1–3 ms
Test time 0–99 min
Table 4. Main parameters of the Olympus Ispeed 3.
Technical Parameters
Maximum resolution 1280 × 1024Maximum framerate 150,000 FPS
Pixel Size 21 umSensor Size 21.5 mm × 26 mm
Image depth 10 bitOn-Board Memory 4 GB RAM
3. Results and Evaluation3.1. Simulation Results 350 Bar Rail Pressure
Columns 1 and 2 in Figure 8 show the oil nozzle diagrams of the three nozzle typeswith pure diesel (left) and pure TPO (right). The figure shows the vapor phase diagramsof the fuels. The nozzle geometries in a row: cylindrical, confusional (ks), confusing-diffusing (ksd). For the diesel test, the literature results show similar results, confirming thefunctionality of the model. In the case of a cylindrical nozzle, cavitation forms at the inletedge of the nozzle, the cavitation phenomenon can be seen in the entire extent of the hole.In the case of pyrolysis oil, the rate of cavitation increases. It is clear that its surface is moreextensive than in diesel’s case, and this extends completely beyond the nozzle. The designof the ks-nozzle type was guided by the reduction of the amount of cavitation in the nozzle,and this is fully justified; and in contrast to the cylindrical nozzle, the minimum cavitationshown in the figure did not increase in the case of pyrolysis oil simulation. In the vaporphase, there is no change detected at the ks-nozzle. In the ksd nozzle case, cavitation in thediesel oil vapor phase is a bit higher, thanks to the confuser-diffuser design. However, thisis a negligible amount of cavitation compared to the cylindrical. Unfortunately, this trendis not the case for the pyrolysis oil’s vapor phase, as it continues to form a much largercavitation spot here compared to diesel.
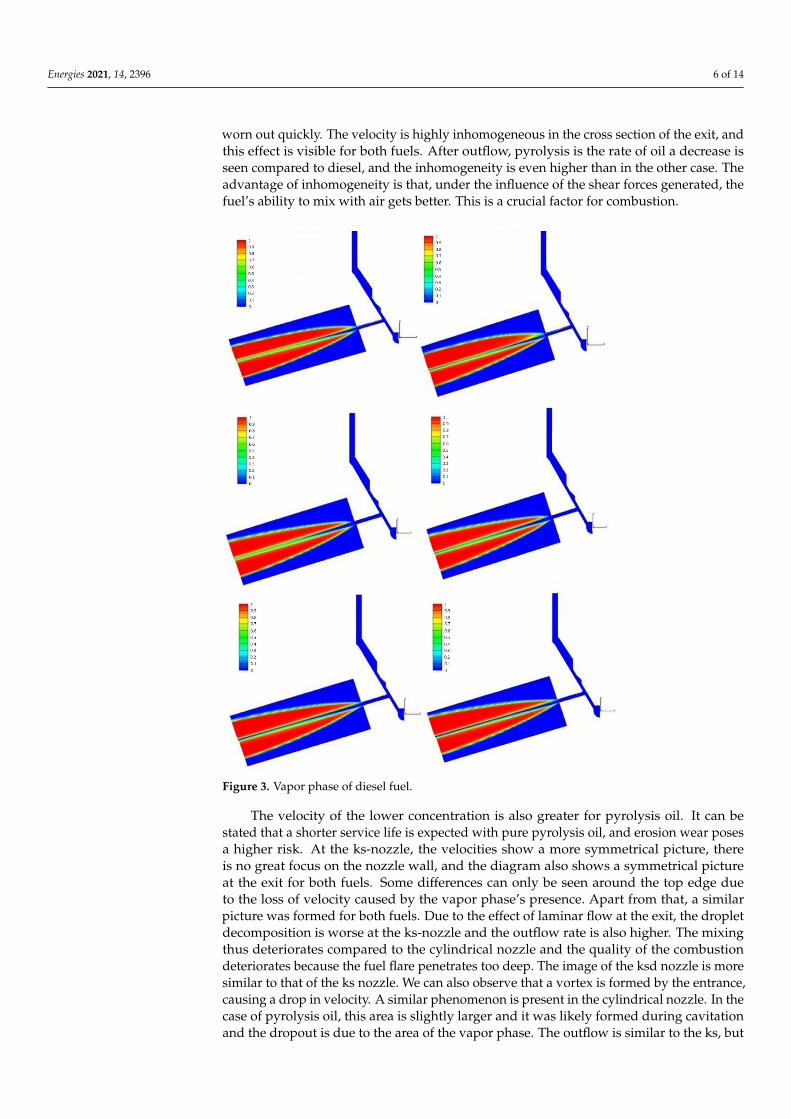
Figure 3 shows the overall vapor phases. In the case of a cylindrical nozzle, the vaporphases’ distribution is not symmetrical in the outflow volume, especially in the case of thepyrolysis oil vapor phase, where the distortion is visible at the lower parts, which is mainlydue to cavitation. In the case of the ks nozzle a complete symmetry is observed, while inthe case of the ksd nozzle, the difference is minor in-between the diesel vapor phase andthe pyrolysis oil vapor phase.
Columns 1 and 2 in Figure 9 present the velocity values in the liquid phases of thefuels. The location of the figures follows the arrangements of the previous figures. For bothfuels, it can be observed that the velocity concentrates in the lower range of the cylindricalnozzle due to the small inlet rounding radius. The blue range at the top does not mean thatthere is no fuel velocity, but that only the vapor phase is present there due to cavitationand in this case, only the velocities of the liquid phase are visible. High velocity valuesfalling further into the nozzle’s bottom region further increase the risk of erosion wear.Based on these observations, we can state that if we use cylindrical nozzles, they will get
Energies 2021, 14, 2396 6 of 14
worn out quickly. The velocity is highly inhomogeneous in the cross section of the exit, andthis effect is visible for both fuels. After outflow, pyrolysis is the rate of oil a decrease isseen compared to diesel, and the inhomogeneity is even higher than in the other case. Theadvantage of inhomogeneity is that, under the influence of the shear forces generated, thefuel’s ability to mix with air gets better. This is a crucial factor for combustion.
Energies 2021, 14, x FOR PEER REVIEW 6 of 15
Figure 3. Vapor phase of diesel fuel.
Columns 1 and 2 in Figure 9 present the velocity values in the liquid phases of the fuels. The location of the figures follows the arrangements of the previous figures. For both fuels, it can be observed that the velocity concentrates in the lower range of the cy-lindrical nozzle due to the small inlet rounding radius. The blue range at the top does not mean that there is no fuel velocity, but that only the vapor phase is present there due to cavitation and in this case, only the velocities of the liquid phase are visible. High velocity values falling further into the nozzle’s bottom region further increase the risk of erosion wear. Based on these observations, we can state that if we use cylindrical nozzles, they will get worn out quickly. The velocity is highly inhomogeneous in the cross section of the exit, and this effect is visible for both fuels. After outflow, pyrolysis is the rate of oil a decrease is seen compared to diesel, and the inhomogeneity is even higher than in the other case. The advantage of inhomogeneity is that, under the influence of the shear forces generated, the fuel’s ability to mix with air gets better. This is a crucial factor for combus-tion.
The velocity of the lower concentration is also greater for pyrolysis oil. It can be stated that a shorter service life is expected with pure pyrolysis oil, and erosion wear poses a higher risk. At the ks-nozzle, the velocities show a more symmetrical picture, there is no great focus on the nozzle wall, and the diagram also shows a symmetrical picture at the exit for both fuels. Some differences can only be seen around the top edge due to the loss of velocity caused by the vapor phase’s presence. Apart from that, a similar picture was formed for both fuels. Due to the effect of laminar flow at the exit, the droplet decompo-
Figure 3. Vapor phase of diesel fuel.
The velocity of the lower concentration is also greater for pyrolysis oil. It can bestated that a shorter service life is expected with pure pyrolysis oil, and erosion wear posesa higher risk. At the ks-nozzle, the velocities show a more symmetrical picture, thereis no great focus on the nozzle wall, and the diagram also shows a symmetrical pictureat the exit for both fuels. Some differences can only be seen around the top edge dueto the loss of velocity caused by the vapor phase’s presence. Apart from that, a similarpicture was formed for both fuels. Due to the effect of laminar flow at the exit, the dropletdecomposition is worse at the ks-nozzle and the outflow rate is also higher. The mixingthus deteriorates compared to the cylindrical nozzle and the quality of the combustiondeteriorates because the fuel flare penetrates too deep. The image of the ksd nozzle is moresimilar to that of the ks nozzle. We can also observe that a vortex is formed by the entrance,causing a drop in velocity. A similar phenomenon is present in the cylindrical nozzle. In thecase of pyrolysis oil, this area is slightly larger and it was likely formed during cavitationand the dropout is due to the area of the vapor phase. The outflow is similar to the ks, but
Energies 2021, 14, 2396 7 of 14
the outflow rate is lower, thus ensuring better mixing with the air and less penetration ofthe fuel flare.
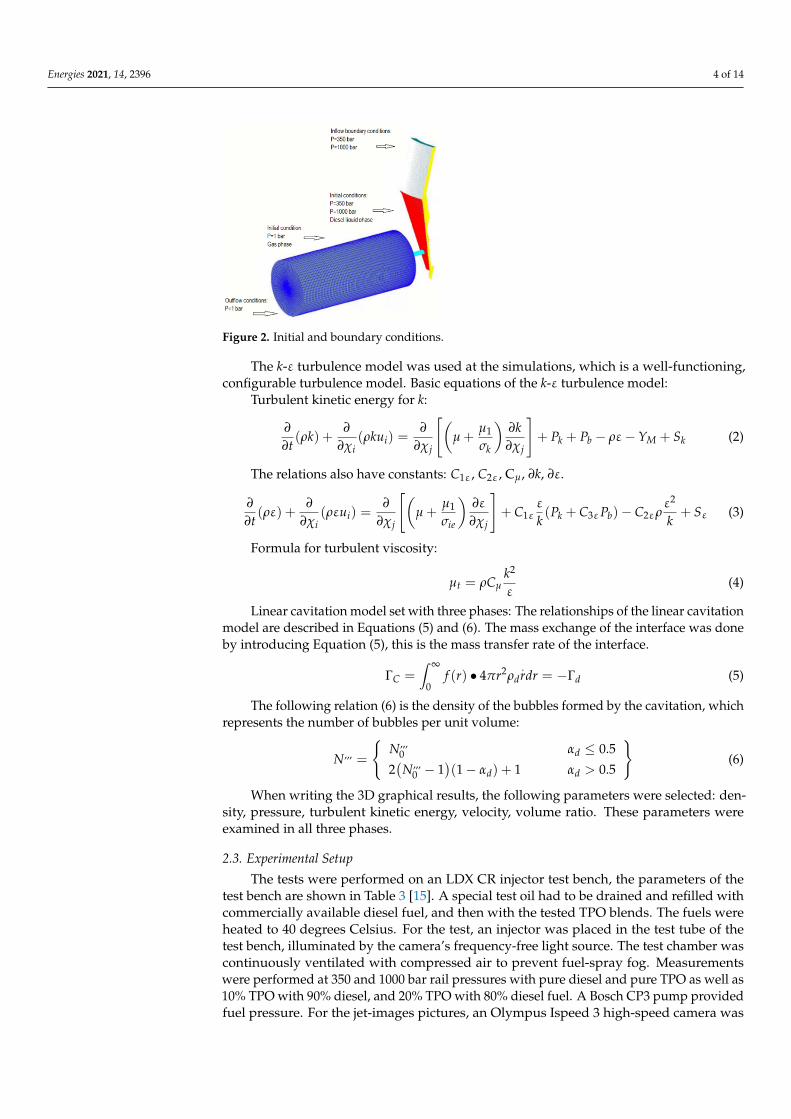
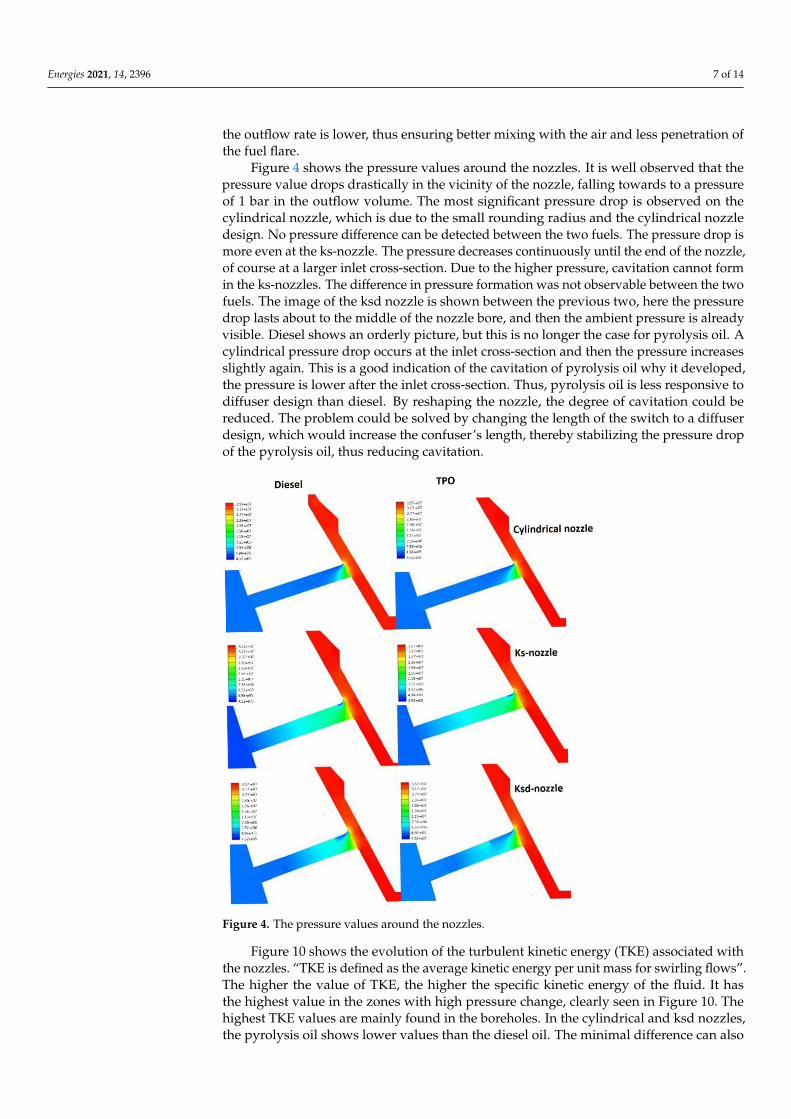
Figure 4 shows the pressure values around the nozzles. It is well observed that thepressure value drops drastically in the vicinity of the nozzle, falling towards to a pressureof 1 bar in the outflow volume. The most significant pressure drop is observed on thecylindrical nozzle, which is due to the small rounding radius and the cylindrical nozzledesign. No pressure difference can be detected between the two fuels. The pressure drop ismore even at the ks-nozzle. The pressure decreases continuously until the end of the nozzle,of course at a larger inlet cross-section. Due to the higher pressure, cavitation cannot formin the ks-nozzles. The difference in pressure formation was not observable between the twofuels. The image of the ksd nozzle is shown between the previous two, here the pressuredrop lasts about to the middle of the nozzle bore, and then the ambient pressure is alreadyvisible. Diesel shows an orderly picture, but this is no longer the case for pyrolysis oil. Acylindrical pressure drop occurs at the inlet cross-section and then the pressure increasesslightly again. This is a good indication of the cavitation of pyrolysis oil why it developed,the pressure is lower after the inlet cross-section. Thus, pyrolysis oil is less responsive todiffuser design than diesel. By reshaping the nozzle, the degree of cavitation could bereduced. The problem could be solved by changing the length of the switch to a diffuserdesign, which would increase the confuser’s length, thereby stabilizing the pressure dropof the pyrolysis oil, thus reducing cavitation.
Energies 2021, 14, x FOR PEER REVIEW 7 of 15
sition is worse at the ks-nozzle and the outflow rate is also higher. The mixing thus dete-
riorates compared to the cylindrical nozzle and the quality of the combustion deteriorates
because the fuel flare penetrates too deep. The image of the ksd nozzle is more similar to
that of the ks nozzle. We can also observe that a vortex is formed by the entrance, causing
a drop in velocity. A similar phenomenon is present in the cylindrical nozzle. In the case
of pyrolysis oil, this area is slightly larger and it was likely formed during cavitation and
the dropout is due to the area of the vapor phase. The outflow is similar to the ks, but the
outflow rate is lower, thus ensuring better mixing with the air and less penetration of the
fuel flare.
Figure 4 shows the pressure values around the nozzles. It is well observed that the
pressure value drops drastically in the vicinity of the nozzle, falling towards to a pressure
of 1 bar in the outflow volume. The most significant pressure drop is observed on the
cylindrical nozzle, which is due to the small rounding radius and the cylindrical nozzle
design. No pressure difference can be detected between the two fuels. The pressure drop
is more even at the ks-nozzle. The pressure decreases continuously until the end of the
nozzle, of course at a larger inlet cross-section. Due to the higher pressure, cavitation can-
not form in the ks-nozzles. The difference in pressure formation was not observable be-
tween the two fuels. The image of the ksd nozzle is shown between the previous two, here
the pressure drop lasts about to the middle of the nozzle bore, and then the ambient pres-
sure is already visible. Diesel shows an orderly picture, but this is no longer the case for
pyrolysis oil. A cylindrical pressure drop occurs at the inlet cross-section and then the
pressure increases slightly again. This is a good indication of the cavitation of pyrolysis
oil why it developed, the pressure is lower after the inlet cross-section. Thus, pyrolysis oil
is less responsive to diffuser design than diesel. By reshaping the nozzle, the degree of
cavitation could be reduced. The problem could be solved by changing the length of the
switch to a diffuser design, which would increase the confuser’s length, thereby stabiliz-
ing the pressure drop of the pyrolysis oil, thus reducing cavitation.
Figure 4. The pressure values around the nozzles. Figure 4. The pressure values around the nozzles.
Figure 10 shows the evolution of the turbulent kinetic energy (TKE) associated withthe nozzles. “TKE is defined as the average kinetic energy per unit mass for swirling flows”.The higher the value of TKE, the higher the specific kinetic energy of the fluid. It hasthe highest value in the zones with high pressure change, clearly seen in Figure 10. Thehighest TKE values are mainly found in the boreholes. In the cylindrical and ksd nozzles,the pyrolysis oil shows lower values than the diesel oil. The minimal difference can also
Energies 2021, 14, 2396 8 of 14
be observed at the ks nozzle. The lower specific kinetic energy caused by pyrolysis oilsuggests that more imperfect mixing with air occurs, with a lower shear force in the jet,which impairs droplet decomposition processes and combustion.
3.2. Simulation Results at 1000 Bar Rail Pressure
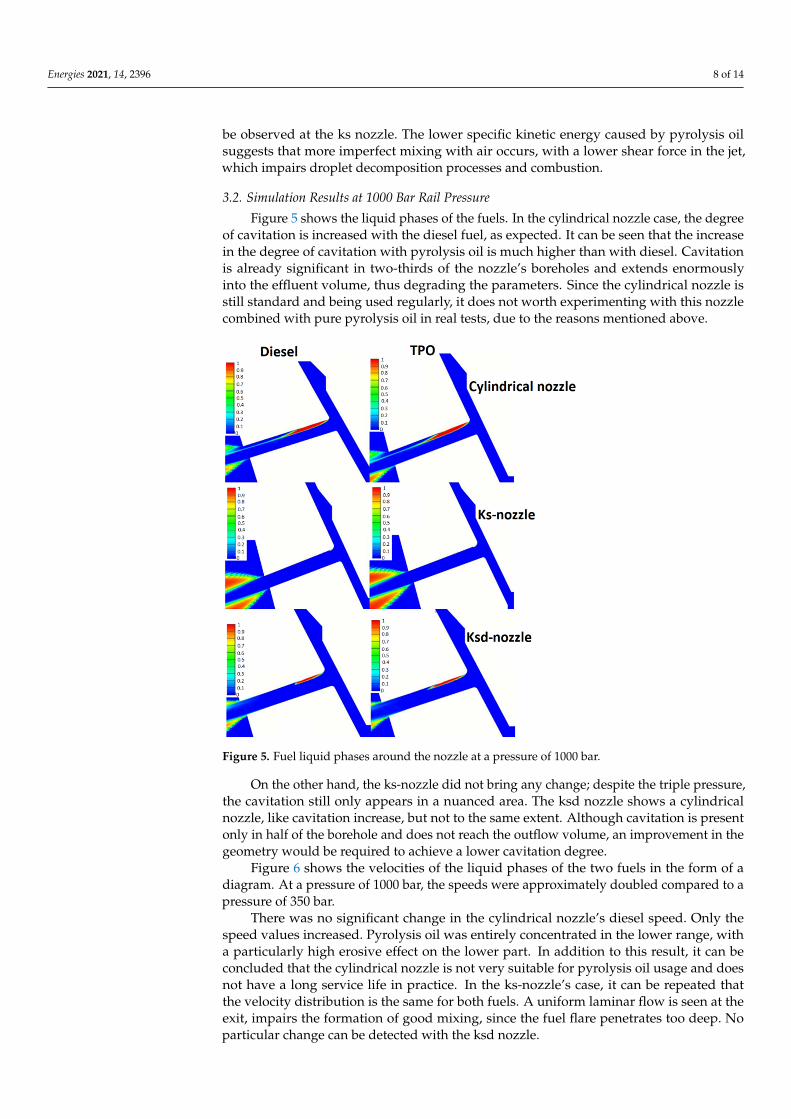
Figure 5 shows the liquid phases of the fuels. In the cylindrical nozzle case, the degreeof cavitation is increased with the diesel fuel, as expected. It can be seen that the increasein the degree of cavitation with pyrolysis oil is much higher than with diesel. Cavitationis already significant in two-thirds of the nozzle’s boreholes and extends enormouslyinto the effluent volume, thus degrading the parameters. Since the cylindrical nozzle isstill standard and being used regularly, it does not worth experimenting with this nozzlecombined with pure pyrolysis oil in real tests, due to the reasons mentioned above.
Energies 2021, 14, x FOR PEER REVIEW 8 of 15
Figure 10 shows the evolution of the turbulent kinetic energy (TKE) associated with the nozzles. “TKE is defined as the average kinetic energy per unit mass for swirling flows”. The higher the value of TKE, the higher the specific kinetic energy of the fluid. It has the highest value in the zones with high pressure change, clearly seen in Figure 10. The highest TKE values are mainly found in the boreholes. In the cylindrical and ksd noz-zles, the pyrolysis oil shows lower values than the diesel oil. The minimal difference can also be observed at the ks nozzle. The lower specific kinetic energy caused by pyrolysis oil suggests that more imperfect mixing with air occurs, with a lower shear force in the jet, which impairs droplet decomposition processes and combustion.
3.2. Simulation Results at 1000 Bar Rail Pressure Figure 5 shows the liquid phases of the fuels. In the cylindrical nozzle case, the degree
of cavitation is increased with the diesel fuel, as expected. It can be seen that the increase in the degree of cavitation with pyrolysis oil is much higher than with diesel. Cavitation is already significant in two-thirds of the nozzle’s boreholes and extends enormously into the effluent volume, thus degrading the parameters. Since the cylindrical nozzle is still standard and being used regularly, it does not worth experimenting with this nozzle com-bined with pure pyrolysis oil in real tests, due to the reasons mentioned above.
On the other hand, the ks-nozzle did not bring any change; despite the triple pres-sure, the cavitation still only appears in a nuanced area. The ksd nozzle shows a cylindri-cal nozzle, like cavitation increase, but not to the same extent. Although cavitation is pre-sent only in half of the borehole and does not reach the outflow volume, an improvement in the geometry would be required to achieve a lower cavitation degree.
Figure 5. Fuel liquid phases around the nozzle at a pressure of 1000 bar.
Figure 6 shows the velocities of the liquid phases of the two fuels in the form of a diagram. At a pressure of 1000 bar, the speeds were approximately doubled compared to a pressure of 350 bar.
There was no significant change in the cylindrical nozzle’s diesel speed. Only the speed values increased. Pyrolysis oil was entirely concentrated in the lower range, with a particularly high erosive effect on the lower part. In addition to this result, it can be con-cluded that the cylindrical nozzle is not very suitable for pyrolysis oil usage and does not
Figure 5. Fuel liquid phases around the nozzle at a pressure of 1000 bar.
On the other hand, the ks-nozzle did not bring any change; despite the triple pressure,the cavitation still only appears in a nuanced area. The ksd nozzle shows a cylindricalnozzle, like cavitation increase, but not to the same extent. Although cavitation is presentonly in half of the borehole and does not reach the outflow volume, an improvement in thegeometry would be required to achieve a lower cavitation degree.
Figure 6 shows the velocities of the liquid phases of the two fuels in the form of adiagram. At a pressure of 1000 bar, the speeds were approximately doubled compared to apressure of 350 bar.
There was no significant change in the cylindrical nozzle’s diesel speed. Only thespeed values increased. Pyrolysis oil was entirely concentrated in the lower range, witha particularly high erosive effect on the lower part. In addition to this result, it can beconcluded that the cylindrical nozzle is not very suitable for pyrolysis oil usage and doesnot have a long service life in practice. In the ks-nozzle’s case, it can be repeated thatthe velocity distribution is the same for both fuels. A uniform laminar flow is seen at theexit, impairs the formation of good mixing, since the fuel flare penetrates too deep. Noparticular change can be detected with the ksd nozzle.
Energies 2021, 14, 2396 9 of 14
Energies 2021, 14, x FOR PEER REVIEW 9 of 15
have a long service life in practice. In the ks-nozzle’s case, it can be repeated that the ve-locity distribution is the same for both fuels. A uniform laminar flow is seen at the exit, impairs the formation of good mixing, since the fuel flare penetrates too deep. No partic-ular change can be detected with the ksd nozzle.
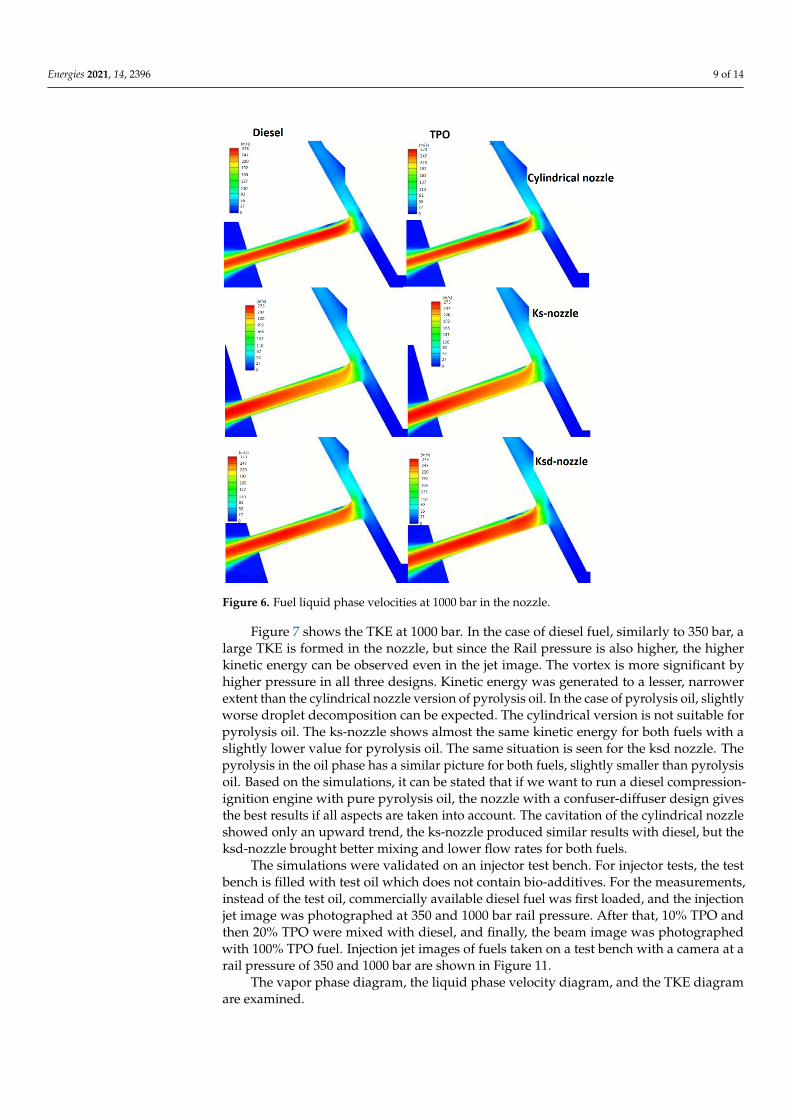
Figure 6. Fuel liquid phase velocities at 1000 bar in the nozzle.
Figure 7 shows the TKE at 1000 bar. In the case of diesel fuel, similarly to 350 bar, a large TKE is formed in the nozzle, but since the Rail pressure is also higher, the higher kinetic energy can be observed even in the jet image. The vortex is more significant by higher pressure in all three designs. Kinetic energy was generated to a lesser, narrower extent than the cylindrical nozzle version of pyrolysis oil. In the case of pyrolysis oil, slightly worse droplet decomposition can be expected. The cylindrical version is not suit-able for pyrolysis oil. The ks-nozzle shows almost the same kinetic energy for both fuels with a slightly lower value for pyrolysis oil. The same situation is seen for the ksd nozzle. The pyrolysis in the oil phase has a similar picture for both fuels, slightly smaller than pyrolysis oil. Based on the simulations, it can be stated that if we want to run a diesel compression-ignition engine with pure pyrolysis oil, the nozzle with a confuser-diffuser design gives the best results if all aspects are taken into account. The cavitation of the cylindrical nozzle showed only an upward trend, the ks-nozzle produced similar results with diesel, but the ksd-nozzle brought better mixing and lower flow rates for both fuels.
Figure 6. Fuel liquid phase velocities at 1000 bar in the nozzle.
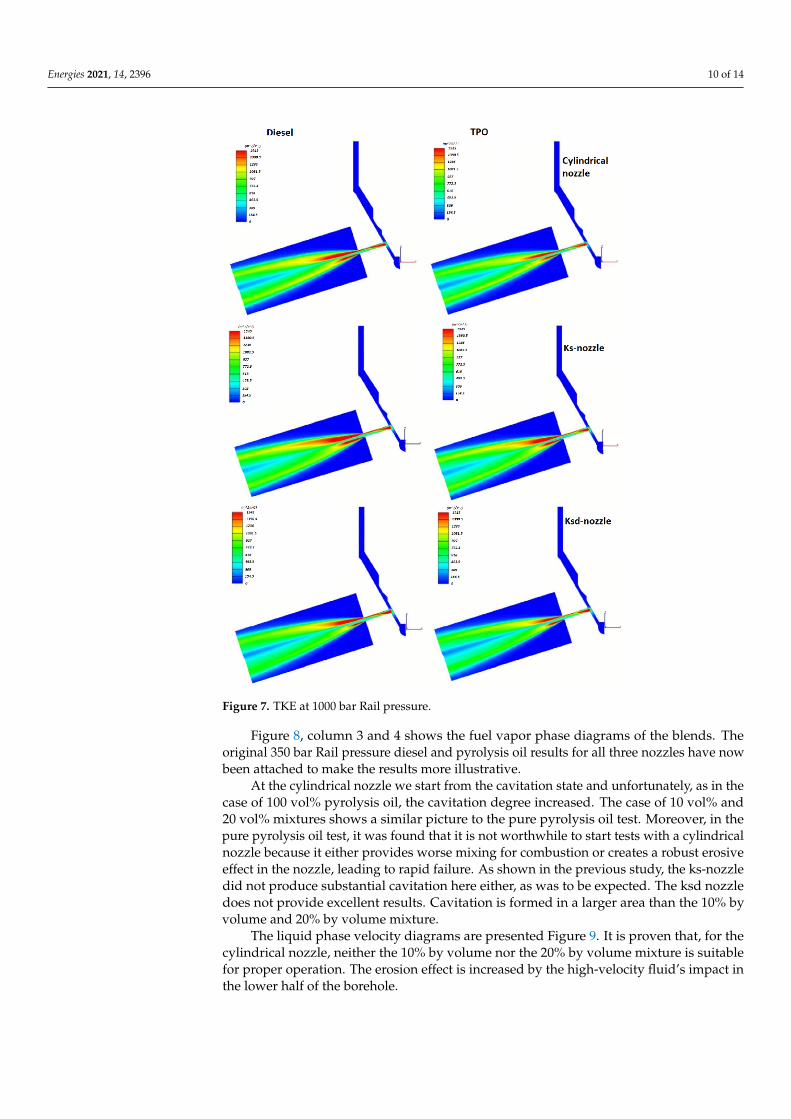
Figure 7 shows the TKE at 1000 bar. In the case of diesel fuel, similarly to 350 bar, alarge TKE is formed in the nozzle, but since the Rail pressure is also higher, the higherkinetic energy can be observed even in the jet image. The vortex is more significant byhigher pressure in all three designs. Kinetic energy was generated to a lesser, narrowerextent than the cylindrical nozzle version of pyrolysis oil. In the case of pyrolysis oil, slightlyworse droplet decomposition can be expected. The cylindrical version is not suitable forpyrolysis oil. The ks-nozzle shows almost the same kinetic energy for both fuels with aslightly lower value for pyrolysis oil. The same situation is seen for the ksd nozzle. Thepyrolysis in the oil phase has a similar picture for both fuels, slightly smaller than pyrolysisoil. Based on the simulations, it can be stated that if we want to run a diesel compression-ignition engine with pure pyrolysis oil, the nozzle with a confuser-diffuser design givesthe best results if all aspects are taken into account. The cavitation of the cylindrical nozzleshowed only an upward trend, the ks-nozzle produced similar results with diesel, but theksd-nozzle brought better mixing and lower flow rates for both fuels.
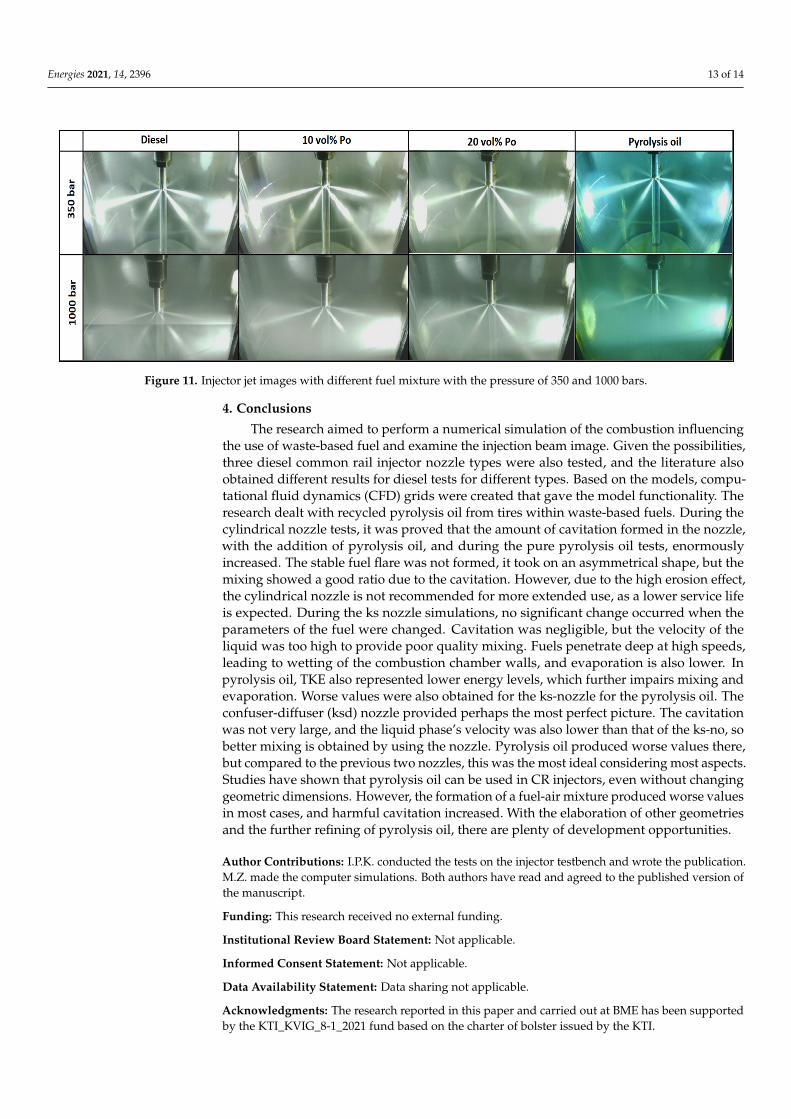
The simulations were validated on an injector test bench. For injector tests, the testbench is filled with test oil which does not contain bio-additives. For the measurements,instead of the test oil, commercially available diesel fuel was first loaded, and the injectionjet image was photographed at 350 and 1000 bar rail pressure. After that, 10% TPO andthen 20% TPO were mixed with diesel, and finally, the beam image was photographedwith 100% TPO fuel. Injection jet images of fuels taken on a test bench with a camera at arail pressure of 350 and 1000 bar are shown in Figure 11.
The vapor phase diagram, the liquid phase velocity diagram, and the TKE diagramare examined.
Energies 2021, 14, 2396 10 of 14Energies 2021, 14, x FOR PEER REVIEW 10 of 15
Figure 7. TKE at 1000 bar Rail pressure.
The simulations were validated on an injector test bench. For injector tests, the test bench is filled with test oil which does not contain bio-additives. For the measurements, instead of the test oil, commercially available diesel fuel was first loaded, and the injection jet image was photographed at 350 and 1000 bar rail pressure. After that, 10% TPO and then 20% TPO were mixed with diesel, and finally, the beam image was photographed with 100% TPO fuel. Injection jet images of fuels taken on a test bench with a camera at a rail pressure of 350 and 1000 bar are shown in Figure 11.
The vapor phase diagram, the liquid phase velocity diagram, and the TKE diagram are examined.
Figure 8, column 3 and 4 shows the fuel vapor phase diagrams of the blends. The original 350 bar Rail pressure diesel and pyrolysis oil results for all three nozzles have now been attached to make the results more illustrative.
At the cylindrical nozzle we start from the cavitation state and unfortunately, as in the case of 100 vol% pyrolysis oil, the cavitation degree increased. The case of 10 vol% and 20 vol% mixtures shows a similar picture to the pure pyrolysis oil test. Moreover, in the pure pyrolysis oil test, it was found that it is not worthwhile to start tests with a cylindrical nozzle because it either provides worse mixing for combustion or creates a robust erosive effect in the nozzle, leading to rapid failure. As shown in the previous study, the ks-nozzle did not produce substantial cavitation here either, as was to be expected. The ksd nozzle does not provide excellent results. Cavitation is formed in a larger area than the 10% by volume and 20% by volume mixture.
Figure 7. TKE at 1000 bar Rail pressure.
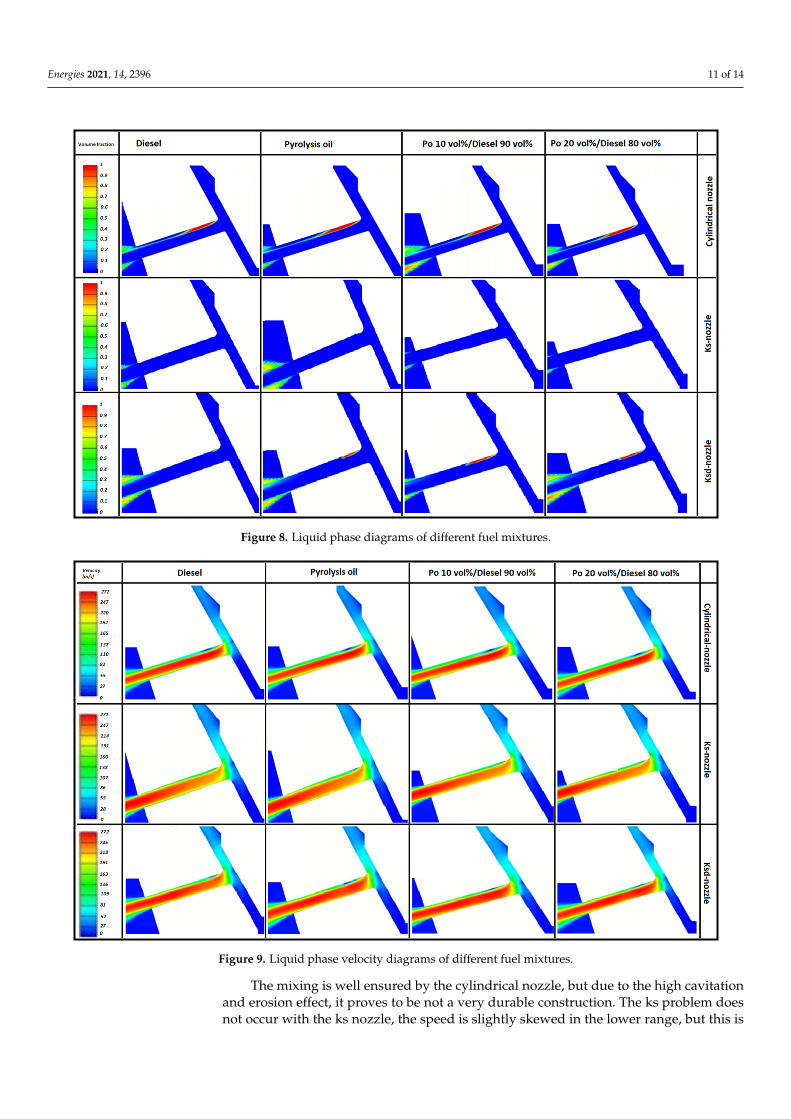
Figure 8, column 3 and 4 shows the fuel vapor phase diagrams of the blends. Theoriginal 350 bar Rail pressure diesel and pyrolysis oil results for all three nozzles have nowbeen attached to make the results more illustrative.
At the cylindrical nozzle we start from the cavitation state and unfortunately, as in thecase of 100 vol% pyrolysis oil, the cavitation degree increased. The case of 10 vol% and20 vol% mixtures shows a similar picture to the pure pyrolysis oil test. Moreover, in thepure pyrolysis oil test, it was found that it is not worthwhile to start tests with a cylindricalnozzle because it either provides worse mixing for combustion or creates a robust erosiveeffect in the nozzle, leading to rapid failure. As shown in the previous study, the ks-nozzledid not produce substantial cavitation here either, as was to be expected. The ksd nozzledoes not provide excellent results. Cavitation is formed in a larger area than the 10% byvolume and 20% by volume mixture.
The liquid phase velocity diagrams are presented Figure 9. It is proven that, for thecylindrical nozzle, neither the 10% by volume nor the 20% by volume mixture is suitablefor proper operation. The erosion effect is increased by the high-velocity fluid’s impact inthe lower half of the borehole.
Energies 2021, 14, 2396 11 of 14Energies 2021, 14, x FOR PEER REVIEW 11 of 15
Figure 8. liquid phase diagrams of different fuel mixtures.
The liquid phase velocity diagrams are presented Figure 9. It is proven that, for the cylindrical nozzle, neither the 10% by volume nor the 20% by volume mixture is suitable for proper operation. The erosion effect is increased by the high-velocity fluid’s impact in the lower half of the borehole.
The mixing is well ensured by the cylindrical nozzle, but due to the high cavitation and erosion effect, it proves to be not a very durable construction. The ks problem does not occur with the ks nozzle, the speed is slightly skewed in the lower range, but this is still acceptable. The problem lies in the high-velocity outflow mentioned several times, in accordance with the confusing design. The trend continues at the ksd nozzle. The presence of pyrolysis oil determines the velocity diagrams, the velocity is decreasing shifts, which should have an erosive effect for the hole, but not to the same extent as for the cylindrical one. In terms of combustion, as shown in previous studies, the ksd nozzle is the most suitable type. The degree of cavitation is still adequate and the velocity is sufficient, the fuel flare penetration is reduced compared to the ks-nozzle and the mixing with air is adequate, but this is also backed up by the TKE values shown in Figure 10.
Figure 8. Liquid phase diagrams of different fuel mixtures.
Energies 2021, 14, x FOR PEER REVIEW 12 of 15
Figure 9. liquid phase velocity diagrams of different fuel mixtures.
Figure 10. TKE values in different nozzles with different fuel mixtures.
The development of the kinetic energy in the jet image of the cylindrical nozzle shows an exciting result. The jet is asymmetric, but pyrolysis oil concentrates develop a higher TKE in the lower half of the jet than pure pyrolysis oil.
A higher value indicates that higher shear forces are generated in the jet when the fuel and air are mixed, and droplet decomposition dictates a good value, which is essential
Figure 9. Liquid phase velocity diagrams of different fuel mixtures.
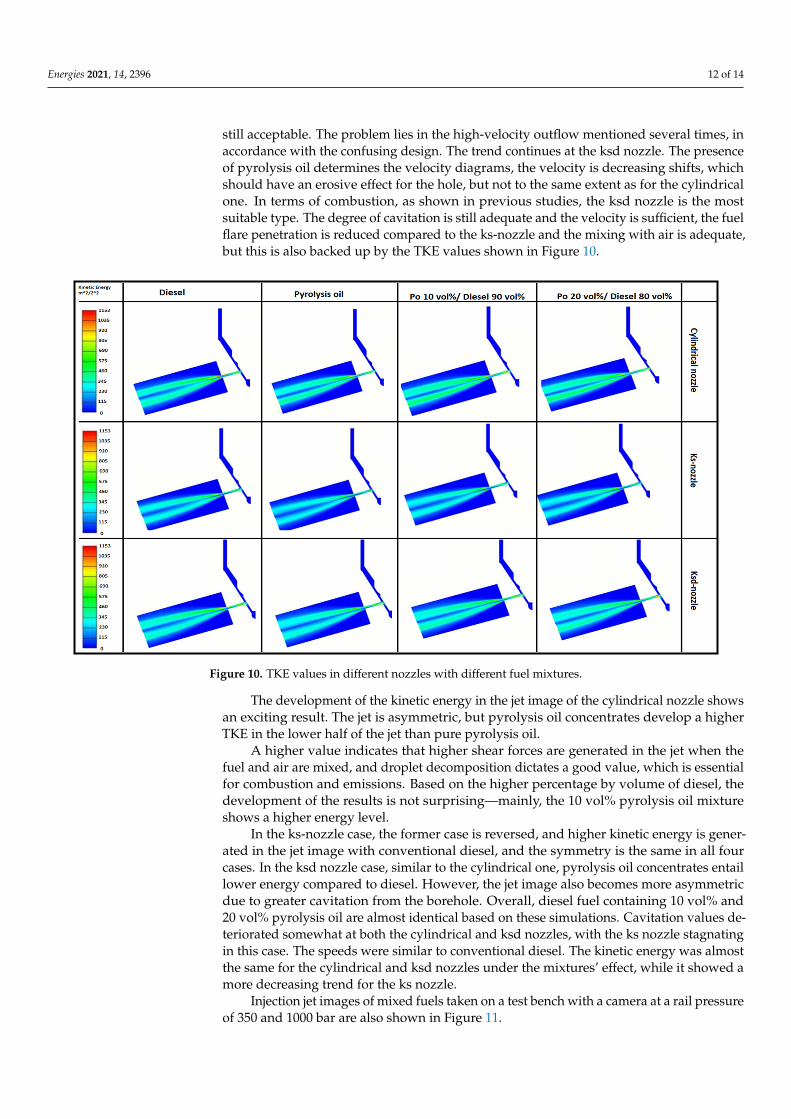
The mixing is well ensured by the cylindrical nozzle, but due to the high cavitationand erosion effect, it proves to be not a very durable construction. The ks problem doesnot occur with the ks nozzle, the speed is slightly skewed in the lower range, but this is
Energies 2021, 14, 2396 12 of 14
still acceptable. The problem lies in the high-velocity outflow mentioned several times, inaccordance with the confusing design. The trend continues at the ksd nozzle. The presenceof pyrolysis oil determines the velocity diagrams, the velocity is decreasing shifts, whichshould have an erosive effect for the hole, but not to the same extent as for the cylindricalone. In terms of combustion, as shown in previous studies, the ksd nozzle is the mostsuitable type. The degree of cavitation is still adequate and the velocity is sufficient, the fuelflare penetration is reduced compared to the ks-nozzle and the mixing with air is adequate,but this is also backed up by the TKE values shown in Figure 10.
Energies 2021, 14, x FOR PEER REVIEW 12 of 15
Figure 9. liquid phase velocity diagrams of different fuel mixtures.
Figure 10. TKE values in different nozzles with different fuel mixtures.
The development of the kinetic energy in the jet image of the cylindrical nozzle shows an exciting result. The jet is asymmetric, but pyrolysis oil concentrates develop a higher TKE in the lower half of the jet than pure pyrolysis oil.
A higher value indicates that higher shear forces are generated in the jet when the fuel and air are mixed, and droplet decomposition dictates a good value, which is essential
Figure 10. TKE values in different nozzles with different fuel mixtures.
The development of the kinetic energy in the jet image of the cylindrical nozzle showsan exciting result. The jet is asymmetric, but pyrolysis oil concentrates develop a higherTKE in the lower half of the jet than pure pyrolysis oil.
A higher value indicates that higher shear forces are generated in the jet when thefuel and air are mixed, and droplet decomposition dictates a good value, which is essentialfor combustion and emissions. Based on the higher percentage by volume of diesel, thedevelopment of the results is not surprising—mainly, the 10 vol% pyrolysis oil mixtureshows a higher energy level.
In the ks-nozzle case, the former case is reversed, and higher kinetic energy is gener-ated in the jet image with conventional diesel, and the symmetry is the same in all fourcases. In the ksd nozzle case, similar to the cylindrical one, pyrolysis oil concentrates entaillower energy compared to diesel. However, the jet image also becomes more asymmetricdue to greater cavitation from the borehole. Overall, diesel fuel containing 10 vol% and20 vol% pyrolysis oil are almost identical based on these simulations. Cavitation values de-teriorated somewhat at both the cylindrical and ksd nozzles, with the ks nozzle stagnatingin this case. The speeds were similar to conventional diesel. The kinetic energy was almostthe same for the cylindrical and ksd nozzles under the mixtures’ effect, while it showed amore decreasing trend for the ks nozzle.
Injection jet images of mixed fuels taken on a test bench with a camera at a rail pressureof 350 and 1000 bar are also shown in Figure 11.
Energies 2021, 14, 2396 13 of 14
Energies 2021, 14, x FOR PEER REVIEW 13 of 15
for combustion and emissions. Based on the higher percentage by volume of diesel, the development of the results is not surprising—mainly, the 10 vol% pyrolysis oil mixture shows a higher energy level.
In the ks-nozzle case, the former case is reversed, and higher kinetic energy is gener-ated in the jet image with conventional diesel, and the symmetry is the same in all four cases. In the ksd nozzle case, similar to the cylindrical one, pyrolysis oil concentrates entail lower energy compared to diesel. However, the jet image also becomes more asymmetric due to greater cavitation from the borehole. Overall, diesel fuel containing 10 vol% and 20 vol% pyrolysis oil are almost identical based on these simulations. Cavitation values de-teriorated somewhat at both the cylindrical and ksd nozzles, with the ks nozzle stagnating in this case. The speeds were similar to conventional diesel. The kinetic energy was almost the same for the cylindrical and ksd nozzles under the mixtures’ effect, while it showed a more decreasing trend for the ks nozzle.
Injection jet images of mixed fuels taken on a test bench with a camera at a rail pres-sure of 350 and 1000 bar are also shown in Figure 11.
Figure 11. Injector jet images with different fuel mixture with the pressure of 350 and 1000 bars.
4. Conclusions The research aimed to perform a numerical simulation of the combustion influencing
the use of waste-based fuel and examine the injection beam image. Given the possibilities, three diesel common rail injector nozzle types were also tested, and the literature also obtained different results for diesel tests for different types. Based on the models, compu-tational fluid dynamics (CFD) grids were created that gave the model functionality. The research dealt with recycled pyrolysis oil from tires within waste-based fuels. During the cylindrical nozzle tests, it was proved that the amount of cavitation formed in the nozzle, with the addition of pyrolysis oil, and during the pure pyrolysis oil tests, enormously increased. The stable fuel flare was not formed, it took on an asymmetrical shape, but the mixing showed a good ratio due to the cavitation. However, due to the high erosion effect, the cylindrical nozzle is not recommended for more extended use, as a lower service life is expected. During the ks nozzle simulations, no significant change occurred when the parameters of the fuel were changed. Cavitation was negligible, but the velocity of the liquid was too high to provide poor quality mixing. Fuels penetrate deep at high speeds, leading to wetting of the combustion chamber walls, and evaporation is also lower. In pyrolysis oil, TKE also represented lower energy levels, which further impairs mixing and evaporation. Worse values were also obtained for the ks-nozzle for the pyrolysis oil. The confuser-diffuser (ksd) nozzle provided perhaps the most perfect picture. The cavitation was not very large, and the liquid phase’s velocity was also lower than that of the ks-no, so better mixing is obtained by using the nozzle. Pyrolysis oil produced worse values there, but compared to the previous two nozzles, this was the most ideal considering most
Figure 11. Injector jet images with different fuel mixture with the pressure of 350 and 1000 bars.
4. Conclusions
The research aimed to perform a numerical simulation of the combustion influencingthe use of waste-based fuel and examine the injection beam image. Given the possibilities,three diesel common rail injector nozzle types were also tested, and the literature alsoobtained different results for diesel tests for different types. Based on the models, compu-tational fluid dynamics (CFD) grids were created that gave the model functionality. Theresearch dealt with recycled pyrolysis oil from tires within waste-based fuels. During thecylindrical nozzle tests, it was proved that the amount of cavitation formed in the nozzle,with the addition of pyrolysis oil, and during the pure pyrolysis oil tests, enormouslyincreased. The stable fuel flare was not formed, it took on an asymmetrical shape, but themixing showed a good ratio due to the cavitation. However, due to the high erosion effect,the cylindrical nozzle is not recommended for more extended use, as a lower service lifeis expected. During the ks nozzle simulations, no significant change occurred when theparameters of the fuel were changed. Cavitation was negligible, but the velocity of theliquid was too high to provide poor quality mixing. Fuels penetrate deep at high speeds,leading to wetting of the combustion chamber walls, and evaporation is also lower. Inpyrolysis oil, TKE also represented lower energy levels, which further impairs mixing andevaporation. Worse values were also obtained for the ks-nozzle for the pyrolysis oil. Theconfuser-diffuser (ksd) nozzle provided perhaps the most perfect picture. The cavitationwas not very large, and the liquid phase’s velocity was also lower than that of the ks-no, sobetter mixing is obtained by using the nozzle. Pyrolysis oil produced worse values there,but compared to the previous two nozzles, this was the most ideal considering most aspects.Studies have shown that pyrolysis oil can be used in CR injectors, even without changinggeometric dimensions. However, the formation of a fuel-air mixture produced worse valuesin most cases, and harmful cavitation increased. With the elaboration of other geometriesand the further refining of pyrolysis oil, there are plenty of development opportunities.
Author Contributions: I.P.K. conducted the tests on the injector testbench and wrote the publication.M.Z. made the computer simulations. Both authors have read and agreed to the published version ofthe manuscript.
Funding: This research received no external funding.
Institutional Review Board Statement: Not applicable.
Informed Consent Statement: Not applicable.
Data Availability Statement: Data sharing not applicable.
Acknowledgments: The research reported in this paper and carried out at BME has been supportedby the KTI_KVIG_8-1_2021 fund based on the charter of bolster issued by the KTI.
Energies 2021, 14, 2396 14 of 14
Conflicts of Interest: The authors declare no conflict of interest.
NomenclatureCAD Computer Aided DesignCI Compression IgnitionCFD Computational Fluid DynamicsCFPP Cold Filter Plugging PointCR Common RailHG Hydro GrindingHP High pressureLP Low pressureMSZ Hungarian StandardTKE Turbulent Kinetic EnergyTPO Tyre Pyrolysis OilVCO Valve Covering Orifice
References1. Zöldy, M. Investigation of Correlation Between Diesel Fuel Cold Operability and Standardised Cold Flow Properties. Period.
Polytech. Transp. Eng. 2021, 49, 120–125. [CrossRef]2. Zöldy, M. Improving heavy duty vehicles fuel consumption with density and friction modifier. Int. J. Automot. Technol. 2019, 20,
971–978. [CrossRef]3. Martínez, J.D.; Puy, N.; Murillo, R.; García, T.; Navarro, M.V.; Mastral, A.M. Waste tyre pyrolysis—A review. Renew. Sustain.
Energy Rev. 2013, 23, 179–213. [CrossRef]4. Shahir, V.K.; Jawahar, C.P.; Vinod, V.; Suresh, P.R. Experimental investigations on the performance and emissions characteristics
of a common rail direct injection engine using tyre pyrolitic biofuel. J. King Saud Univ. Eng. Sci. 2020, 32, 78–84. [CrossRef]5. Baškovic, U.Ž.; Seljak, T.; Katrašnik, T. Feasibility analysis of 100% tire pyrolysis oil in a common rail Diesel engine. Energy 2017,
137, 980–990. [CrossRef]6. Wongkhorsub, C.; Chindaprasert, N. A Comparison of the Use of Pyro lysis Oils in Diesel Engine. Energy Power Eng. 2013, 5,
350–355. [CrossRef]7. Bodisco, T.A.; Rahman, S.A.; Hossain, F.M.; Brown, R.J. On-road NOx emissions of a modern commercial light-duty diesel vehicle
using a blend of tyre oil and Diesel. Energy Rep. 2019, 5, 349–356. [CrossRef]8. Barabás, I. Liquid densities and excess molar volumes of ethanol + biodiesel binary system between the temperatures 273.15 K
and 333.15 K. J. Mol. Liq. 2015, 204, 95–99. [CrossRef]9. Lewandowski, W.M.; Januszewicz, K.; Kosakowski, W. Efficiency and proportions of waste tyre pyrolysis products depending on
the reactor type—A review. J. Anal. Appl. Pyrolysis 2019, 140, 25–53. [CrossRef]10. Available online: https://mol.hu/hu/autozzon-velunk/uzemanyagok/evo-diesel-garantalt-teljesitmeny/mol_dizel_termeklap.
pdf (accessed on 8 June 2020).11. Vass, S.; Zöldy, M. A model based new method for injection rate determination. Therm. Sci. 2020, 159. Available online:
http://thermalscience.vinca.rs/pdfs/papers-2020/TSCI190417159V.pdf (accessed on 8 June 2020). [CrossRef]12. Payri, F.; Payri, R.; Salvador, F.J.; Martínez-López, J. A contribution to the understanding of cavitation effects in Diesel injector
nozzles through a combined experimental and computational investigation. Comput. Fluids 2012, 58, 88–101. [CrossRef]13. He, Z.; Zhong, W.; Wang, Q.; Jiang, Z.; Shao, Z. Effect of nozzle geometrical and dynamic factors on cavitating and turbulent
flowin a diesel multi-hole injector nozzle. Int. J. Therm. Sci. 2013, 70, 132–143. [CrossRef]14. Vass, S.; Zöldy, M. Detailed Model of a Common Rail Injector. Acta Univ. Sapientiae Electr. Mech. Eng. 2019, 11, 22–33. [CrossRef]15. Available online: http://www.lito-technik.hu/en/ldx-4_cr_injector_and_pump_test_bench.html (accessed on 8 June 2020).


