Embed Size (px)
Citation preview

Gordon McFiggans, Atmospheric Science Group, University of Manchester,
PO Box 88, Sackville Street, Manchester, M60 1QD, UK
Simplification of the representation of the organic
component of atmospheric particulates
Gordon McFiggans, M. Rami Alfarra, James Allan, Keith Bower, Hugh
Coe, Mike Cubison, Dave Topping, Paul Williams
Stefano Decesari, Cristina Facchini
_____________________________________________________________
Abstract
We present an analysis of recent field data to investigate the variation in the
organic component of atmospheric aerosol and its behaviour in the moist
environment. In all locations the degree of oxygenation of the organic
material increases with photochemical age, as does the particulate
hygroscopicity. These changes will generally occur in spatial scales
comparable to a single cell in global models at representative boundary
layer wind speeds. Using ADDEM, a new model of the equilibrium state of
multicomponent aerosol, we show that inorganic component changes must

be responsible for the increase in particulate hygroscopicity with
photochemical age. It is suggested that a common representation of
nearfield and background organic aerosol composition is sufficient to
describe the behaviour of organic components in a variety of field
experiments; nearfield small mode organics being dominated by a
combustion-derived unoxidised signature, whilst the background
accumulation mode is more oxygenated and dominates in air masses with a
photochemical age of more than a couple of days. This representation may
be used within the sub-saturated regime to predict the behaviour of ambient
particulates in the moist atmosphere. Whether a similar common
representation can be used for cloud activation prediction in supersaturated
environments, or for investigation of gas-to-particle partitioning, should be
investigated.
_____________________________________________________________
Background
Tropospheric particulates contain a significant and variable fraction of
organic material, ranging from 10 to 70% of the fine particulate mass1-6. The
importance of this component in climate forcing7, on human health8 and in
bio-geochemical cycling9 is poorly understood; hence concerted recent
effort has recently been made to investigate and quantify the role of
organics in the tropospheric aerosol. Directly related to the poor knowledge
of the identity of the organic components, major uncertainties exist in
understanding the detailed roles of atmospheric processes on the aerosol
composition, of multicomponent aerosol property and behaviour
modification and in predicting the effects of the particulates on climatically
important processes.
In contrast to the inorganic component of atmospheric aerosol, the organic
fraction comprises hundreds of individual compounds of both natural and
anthropogenic origin covering a wide range of molecular forms, solubility,
reactivity and physical properties10. Field studies indicate that 20-70% of
condensed phase organic carbon is water soluble11,12 and includes low
molecular weight carboxylic acids, dicarboxylic acids, alcohols, aldehydes,
ketones, nitrates and multifunctional compounds13. Analysing the water
solubility, condensability and atmospheric abundance, Saxena and
Hildemann11 proposed that this fraction could also include C2-C7 polyols,
amino acids and other oxygenated multifunctional compounds. Significant
quantities of organic nitrates, nitrophenols and polynuclear aromatic
compounds have also been isolated. Major difficulties remain in performing
a comprehensive characterisation of the large number of individual
compounds and only 10-15% of the total organic aerosol mass has ever been
identified at a molecular level3,14. Besides problems associated with
conventional impactor sampling (including inevitable coarse temporal and
size averaging and problems associated with post-sampling transformation
of the bulk material), the sheer number of isolated, but as yet unattributed,
compounds leads to current insurmountable difficulties in interpretation and
prediction of aerosol properties using such approaches in isolation. It is
questionable whether such approaches employed in sampling and offline
analyses will ever yield a useful representation for ready interpretation of
the contribution of organics to atmospheric aerosol behaviour. Much of the
difficulty of isolating and identifying the vast array of individual organic
aerosol components may be attributed to the fact that high-molecular weight
organic (i.e. > C40) and highly polar compounds cannot be analysed with
standard GC/MS methods. In addition, some organic compounds are not
easily extracted or their GC/MS signatures cannot be confirmed by
standards3,11. However, water-soluble macromolecular substances with
spectroscopic signature and functional composition similar to “humic-like
substances” (HULIS) have recently been found to contribute 20 – 50% to
the water-soluble fraction of organic aerosol at urban and rural sites in
Europe15-19. These substances are composed of hundreds of different
molecules, which cannot be separated, and therefore cannot be individually
identified and quantified19. Limbeck et al.20 stated that primary sources such
as biomass burning, cannot explain their observed levels in Europe, and
demonstrated condensed phase macromolecule formation by heterogeneous
reaction of isoprene or α-pinene in the presence of a sulphuric acid aerosol
catalyst. In addition, recent chamber studies have reported the formation of
macromolecules in organic aerosol produced from the photooxidation of
anthropogenic and biogenic precursors21,22. The presence and
characterisation of HULIS in aerosol samples have been investigated using
a number of methods. Krivacsy et al.19 reported that in alkaline solutions,
these compounds are ionic and capillary electrophoresis can indicate their
presence in samples. Infrared spectroscopy (IR) has been widely used for
their characterisation in atmospheric samples15,20,23 and indicate that
carboxylic (COOH), hydroxyl (OH) and carbonyl groups (C=O) are the
main functional groups of these macromolecular organic aerosol
components. The macromolecular contribution to particulate mass is not
only from HULIS; proteins and their free amino-compound derivatives have
been found to contribute up to around 10 % fog water and PM2.5 WSOC
mass24. These compounds cannot be formed from in situ production and
indicate that particulate macromolecular material is at least in part of
primary origin.
A specific key property of particulates, important to all major potential
aerosol impacts, is their behaviour in the moist ambient atmosphere and
organic compounds have the potential to influence this behaviour. Direct
radiative forcing is critically dependent on the precise sizes of subsaturated
ambient aerosol particles, and cloud activation is determined solely by the
ability of a particle to take on water in a supersaturated environment.

Human health effects of particulates are largely dependent on their
respiribility, which in turn depends on the penetration depth in lung. Those
particles which take up less water in the moist environment may penetrate
deeper and become deposited in the alveolar region. An aerosol particle’s
affinity for water may be expressed as its growth factor (GFD) in changing
its environment from dry to a fixed relative humidity. The GFD can be
measured in the real atmosphere using a hygroscopicity tandem differential
mobility analyser (HTDMA)25,26. Observations of particle hygroscopicity,
coupled with chemical analyses, suggest a range of effects of organic
components in both sub- and supersaturated environments. It is seldom
possible to explain observed hygroscopicity through the consideration of
inorganic components alone and organic compounds may significantly
influence particle hygroscopicity. HTDMA field studies have indicated that
organics can hinder or enhance water uptake27,28. Laboratory studies have
mostly focused on carboxylic acids, di-carboxylic acids and multifunctional
organic acids13,29-31 and their combinations with inorganic salts29,32-34.,
though limited HTDMA laboratory studies of macromolecular compounds
have been carried out on humic acid35 and protein36 standards in isolation
and combined with inorganic compounds. There is no general consensus on
the effect of the wide range of organic compounds on hygroscopicity and
the effects depends not only on the specific organic components but also on
particle morphology and chemistry33.

This paper describes the application of the recently developed Aerosol
Diameter Dependent Equilibrium Model, ADDEM37,38 to interpret data from
the first experiment of the UK NERC-funded Tropospheric ORganic
CHemistry (TORCH) project. ADDEM requires temperature, relative
humidity and aerosol size and composition input and may be used to predict
the activities and equilibrium vapour pressures of all components. By use of
the water activity prediction under a given set of conditions, ADDEM can
predict the equilibrium size of the aerosol particle at any given humidity.
We briefly introduce the measurement strategy employed during TORCH 1
and discuss the relevant data collected. We then describe use of these data to
initialise ADDEM and compare the result with HTDMA GFD measured
during the project. The results are discussed in terms of the relative
importance of inorganic and organic aerosol components and in terms of the
simplification of the composition of the aerosol organic fraction.
Despite the overwhelming variety of organic aerosol species and the range
of their individual properties, evidence from tropospheric field observations
indicate that atmospheric situations may be grouped into a relatively small
number of representative scenarios reflecting emission patterns, chemistry
and meteorology. We describe the use of an Aerodyne Aerosol Mass
Spectrometer (AMS) (Aerodyne Research Inc., Billerica, MA, USA) to
provide insights into such behaviour with respect to organic particulate
matter. This suggests that aerosol complexity reduction by abstraction from

detailed speciation (analogous to that possible in gas phase mechanism
reduction) should be possible, depending on the criterion for simplification.
To enable reasonable description in detailed process models and ultimately
larger scale atmospheric models, the abstraction from known detailed
composition must be such that the accuracy and predictive capability of
such models will be preserved, particularly with respect to important aerosol
properties such as hygroscopicity. The organic aerosol characterisation from
the TORCH experiment is examined in the context of the findings from
other field projects and interpreted in terms of the proposed simplified
description of aerosol organics with respect to hygroscopicity.
Methodology & Results
Aerosol sampling and analysis during the first TORCH Experiment
The aims of the experimental part of the TORCH project were to
characterise the gaseous and particulate organic components in a variety of
air masses and to investigate processes determining organic partitioning.
Two experiments were conducted; the first relatively close to a strong urban
source region and the second at a more remote rural location. We focus on
the first experiment, conducted in the grounds of Writtle Agricultural
College, a semi-rural but urban-influenced location approximately 30km

North East of London (see Figure 1), between 30th July and 1st September
2003. A wide range of instrumentation was employed to characterise the
trace gas and aerosol composition in a range of air masses. Gas phase
measurements will not be discussed here.
The instrumentation for sub-micron aerosol measurement was located in a
shipping container at the foot of a 10 m scaffold tower. Air was drawn down
a 150 mm bore, 12m high sampling stack at a flow rate of 150 litres min-1.
The flow rate was such that diffusional losses for sub-micron particles were
minimal above 5 nm diameter. Air was sub-sampled isokinetically from the
main stack through a 40 mm bore stainless steel line, bending with a 1 m
radius of curvature then running the full length of the container. A variety of
instrumentation further sub-sampled isokinetically from the 40 mm tube.
A differential mobility particle sizer (DMPS) system comprising two
Vienna type differential mobility analysers (DMAs)39, one TSI model 3025
condensation particle counter (CPC) and one TSI model 3010 CPC, using
volumetric flow control with sheath to aerosol flow ratio of 10:1 occupied
the first sub-sampling location and was used to measure aerosol number
distributions from 3 nm to 700 nm diameter.
An HTDMA comprising a humidifier (using a controlled counterflow of
sample air and humidified sheath air across a series of Goretex membrane
tubes) situated between two identical Vienna type DMAs sub-sampled
immediately downstream of the DMPS. The instrument, described in

Cubison et al.26, was operated in two modes: i) the first DMA cycled hourly
through six dry diameters (27 nm, 40 nm, 60 nm, 89 nm, 137nm, 217 nm &
360 nm), with the second DMA stepping from 20 nm to around 750 nm at a
fixed degree of humidification (nominally 90%) and ii) a smaller number of
these dry sizes were selected for sizing with various stepped humidities to
build up humidograms, plotting GFD variation with humidity. The second
mode is time consuming so was performed only at each air mass change to
maintain an almost continuous time series for the first mode. Cubison et
al.26 present a new inversion algorithm for obtaining GFD distributions from
HTDMAs that takes account of the inherent measurement uncertainties and
instrument functions and delivers optimally separated GFD estimates.
An AMS was used to provide on-line quantitative measurements of the
chemical composition and size distributions of the non-refractory fraction of
submicron aerosol particles (approximately PM1.0) and occupied the third
sub-sampling location. Little detail of the AMS and principle of operation is
given here, a full general description can be found in the literature40-43, as
can specific detail concerning its capability of measuring organic material44.
Briefly, the sub-micron particles in the sampled atmospheric air are
focussed into a beam using an aerodynamic lens. The beam is aligned to
pass through a skimmer, a chopper, the particle-sizing chamber (39.5 cm
length) and an aperture, before finally impacting on a heated surface
(normally to 550˚C). After flash vaporisation of the non-refractory (volatile

and semi-volatile) particle components, the vapour is ionised using 70 eV
electron impaction. The resulting positive ions are analysed using a
quadrupole mass spectrometer (QMA 410, Balzers, Liechtenstein) and
detected with a calibrated electron multiplier. In typical field operation, the
AMS alternates between two modes: i) using the time-of-flight (ToF) mode
the mass of key chemical components can be resolved as a function of the
vacuum aerodynamic diameter of the particles (dM/dlogDva), ii) in the mass-
spectrum (MS) mode the averaged chemical composition of the non-
refractory aerosol ensemble is determined by scanning the mass spectrum
with the quadrupole mass spectrometer, without size resolved information.
Finally, a scanning mobility particle sizing (SMPS) system provided with a
controllable heated inlet cycling from ambient to 1300C and 3000C was used
to determine the volatile fraction of the aerosol population as a function of
size.
Particle distributions from 0.3 micron to 47 micron diameter were measured
at the top of the scaffold tower using two commercial optical instruments.
The Grimm model 1.109 optical particle counter (OPC) retrieved
distributions from 0.3 to 20 micron diameter using backscatter and a Droplet
Measurement Technologies-modified Particle Measurement Systems
Forward Scattering Spectrometer Probe (FSSP-100) with a rotating base to
maintain alignment with the prevailing wind was used to retrieve
distributions from 0.5 to 47 microns in 16 channels.

A pair of 4-stage Berner type aerosol impactors45 were located at the top of
the west-face of the tower. At a flow rate of 82 L min-1, the aerosol size cut-
offs for each stage were 0.2 µm (Backup filter), 0.2–0.5 µm (stage 1); 0.5–
1.5 µm (stage 2); 1.5–5.5 µm (stage 3); 5.5–10 µm (stage 4). Stages 1 to 4
were equipped with Tedlar substrates extensively pre-washed with milliQ
water. The same cleaning procedure was adopted for the Teflon back-up
filters. Based upon forecast back-trajectories, prevailing synoptic conditions
and local wind speed and direction, it was attempted to ensure that each
series of samples was collected in a single air mass classification. This
frequently entailed rotation of impactor cartridges and discontinuous
sampling. Six sets of samples of varying duration (based on loading
predicted by appropriate integration of size bins from the Grimm OPC) were
collected throughout the campaign. The samples were refrigerated and sent
for analysis. Each sample was extracted in deionised water in an ultrasonic
bath and divided for a variety of determinations: ion chromatography, total
organic compound (TOC) analysis and organic speciation by ion-exchange
chromatography. This final analysis using a HPLC system (Hitachi L-7100)
equipped with a DEAE-TSK gel column (7.5mm i.d. and 7.5 cm long) and a
UV detector provides fractionation of the WSOC into three groupings:
neutral compounds (NC), mono- and di-acids (MDA) and polyacidic
compounds (PA).

In addition to the Berner impactors, two Graseby Andersen Hi-Vol 6-stage
impactors with glass, or a mixture of quartz and glass, filters were deployed
on the top of the tower for aerosol analyses requiring a greater mass. At a
flow rate of 1.12 m3 / min, the size cut-offs for each stage were 4.49 µm
(stage 1); 1.87 µm (stage 2); 0.91 µm (stage 3); 0.6 µm (stage 4) ; 0.32 µm
(stage 5) ; 0.18 µm (stage 6). Samples from the quartz filters were extracted
similarly and, using ion-exchange chromatography and proton nuclear
magnetic resonance (1H NMR), a functional group analysis of the groupings
of WSOC was performed. The glass filters were extracted in deionised
water, separated by size-exclusion chromatography with a molecular cut-off
of 5000 Da and analysed for nitrogen, total, organic and inorganic carbon
and protein; the analytical techniques have been described elsewhere.
Aerosol composition distributions during the first TORCH Experiment
Impactor sampling has been combined with the online AMS analysis in four
field projects to-date. There is no reason to expect that the non-refractory
AMS organic mass loading should exactly correspond to the organic loading
from the impactor, operationally-defined by the analysis as WSOC. Topping
et al.46 and Decesari et al.47 present a characterisation of aerosol
composition from the ACE Asia field project on Jeju Island in the South
China Sea off the coast of South Korea. It was shown in Topping et al.46 that

the WSOC mass loading from the first two impactor stages (corresponding
to particles between 200 nm and 1 µm in diameter) agreed very well with
the total AMS organic mass loading time series. Figure 2 shows a
comparison between the non-refractory sub-micron aerosol particulate
loading measured by the AMS and the Berner impactor WSOC loading
during the first TORCH experiment. The smallest two stages of the
impactor (the darkest horizontal bars and those with the highest loadings),
collecting particles between 200 nm and 1 µm in diameter, roughly
correspond to the fraction of the aerosol particles passing through the AMS
aerodynamic lens inlet with unity efficiency.
Summing the WSOC loadings on these two impactor stages, it can be seen
that there is good general agreement between the offline and online
analyses. It can also be seen that the 4th, 5th and 6th impactor samples were
discontinuous to allow sampling during similar conditions for each discrete
sample. It was found that the loading on the 6th sample was too low for
organic analysis. The top panels in Figure 3 shows the total fine fraction
major ion plus WSOC contributions to mass loading from analyses of
aerosol sampled on the first two stages of the Berner impactors. At these
sizes it can be seen that, with the exception of the 6th period with low total
loading, inorganic compounds contribute between around half and three
quarters of particulate mass in all bulk samples and that there is a significant
contribution of organic compounds to the total loading. The most heavily

loaded sample (period 3) has the greatest contribution from organic
material. The bottom panels show relative group contributions to the total
WSOC mass from the same periods. In all samples, the bulk of the WSOC
mass is contributed by acidic compounds with a significant proportion of
polyfunctional acidic compounds.
Attribution of model compounds to three operational groupings of WSOC
(NC, MDA and PA) has been used to provide a representation of fine
aerosol organic material generally capable of reproducing the 1H NMR
measured aerosol functionality. The relative molar loadings of model
compounds satisfying the organic functionality are shown in Table 1. It
should be noted that it is not suggested that these are the compounds
actually present in atmospheric particulates, but that their choice closely
balances the mass of the functional groups identified in the analyses. Due to
the labour intensive nature of the impactor analyses and the consequent
insufficiency of highly time-resolved data it is not possible to state that, at
any one location, the representative compound combinations are invariant.
For the rest of the current analysis we will assume this to be the case;
however there are known differences between these combinations from
location to location, presumably dependent on the prevailing source
contributions and histories of the air masses from each source. For
comparison, Table 1 also shows the model compounds satisfying the 1H

NMR functional analysis from a project conducted in the Po Valley in
Italy6.
Detailed thermodynamic model use of functional representation of
organics to predict hygroscopicity:
There have been a number of recent attempts to explicitly treat the
thermodynamics of multicomponent inorganic / organic aerosols48,49. The
Aerosol Diameter Dependent Equilibrium Model (ADDEM)37,38 was
recently developed to describe the water content of a particle based the
contribution from all inorganic and organic components. The model uses a
constrained minimisation of the total Gibbs free energy of all solute, solvent
and solid components in a mixed aerosol particle to calculate its equilibrium
state. The Gibbs free energy is calculated as the summation of the chemical
potential of each component; each chemical potential being expressed in
terms of the component activity. The inorganic activities are calculated
using the Pitzer-Simonsen-Clegg mole fraction based ionic interaction
model50,51, whilst the organic activities are calculated using UNIFAC52 with
modified polar group contribution parameters53. The formation of solids is
suppressed when organic components are considered due to the lack of
available fundamental data for appropriate solid formation. Likewise, the
lack of organic – inorganic solute interaction data would limit the

applicability of the model to non-atmospheric mixtures if their inclusion
was attempted (organic – inorganic interactions may be “solvent” or “anti-
solvent” in tendency and estimation of the direction and magnitude of the
tendency is unreliable). Thus the water contributions of the organic and
inorganic fraction are additive, preserving the essence of the Zdanowski-
Stokes-Robinson relationship54. Nevertheless, the model can reproduce the
available laboratory data for mixed systems accurately to low RH37. To
capture the varying behaviour with curvature, and hence particle size, and
realistically represent the Kelvin effect, the whole minimisation is
embedded within an iterative scheme evaluating multicomponent density
and surface tension. The composition from the coarsely resolved impactor
composition measured during TORCH with its derived model compounds
(detailed in Table 2) was mapped onto the fine size resolution of the AMS
aerosol time-of-flight mass distribution averaged over the same time period
and used to initialise ADDEM, making it possible to predict the GFD of the
particles as a function of size. The detail of this procedure and model
application to predict GFD as a function of humidity to reproduce HTDMA
humidograms is the subject of another publication, but an example of the
prediction is shown in Figure 4. It can be seen that for the particular
impactor period, the HTDMA measured GFD to 90 % RH is reproduced
within the measurement uncertainty using the measured composition for all
but the largest 360 nm dry diameter particles (for these larger particles, it is

possible that the equilibration timescale is longer than the residence time in
the HTDMA humidifier). This initially appears encouraging. However,
further investigation of the contribution of the organic material to the
hygroscopicity reveals an interesting result. Figure 5 shows the prediction of
the wet to dry mass ratio (related to the cube of the GFD and the
multicomponent mixture density) for four organic bulk solutions in
equilibrium with varying RH (equal to the water activity for large particles
where the contribution from the Kelvin effect is negligible). The first three
cases are i) the model compounds from the Po Valley in their relative mass
fractions, ii) similarly the TORCH model compounds and iii) Suwannee
River Fulvic Acid, a compound frequently used as a proxy for HULIS in
atmospheric particulates and a compound closely representing the
functionality found in the PA fraction in both the Po Valley and TORCH
analyses. At 90% RH the predicted mass ratio corresponds to GFD values of
1.1081, 1.1098 and 1.08 respectively. For particles smaller than 100 nm or
so where the Kelvin term must be accounted for, this will be further
reduced. Referring back to Figure 4, it can be seen that the growth factor for
the particles greater than 137 nm, the GFD is greater than 1.4. For an organic
mass contribution of around 1/3 (and a significantly lower mole fraction),
the contribution from even the most oxidised organic fraction (as
represented by the model compounds for the WSOC sampled in the 200 nm
plus impactor stages) to the hygroscopicity will be negligible. Further, it is

shown below that even the low hygroscopicity (LH) mode has a GFD greater
than that which even an oxidised organic component can impart (and it
might reasonably be expected that organic material near to source is largely
insoluble with a GFD approximately equal to unity). The changes resulting
in the more hygroscopic (MH) mode must be due to changing inorganic
composition. This indicates that, so far as water affinity in the sub-saturated
regime is concerned, an atmospherically realistic amount of oxidised
organic material will only make a minor contribution to water content.
Two further considerations need to be made interpreting this analysis. The
first is that there is indication from emerging analyses of the glass Hi-Vol
filters that there may be a significant fraction of WSOC (of the order of 30%
in many cases, increasing with increasing particle size) contributed by
macromolecular nitrogen-containing compounds, probably proteins, of
greater than 5000 Da. Whilst no explicit calculation of the water affinity of
these compounds has been made, the number of molecules per unit mass
will be significantly lower than the largest model compounds currently
considered and hence will be associated with even less water (i.e. even
lower GFD). In attributing the model compounds to the 1H NMR analysed
impactor samples, no account is taken of information about molecular size.
To explore the potential effect of the presence of macromolecules, the
fourth curve in Figure 5 shows the predicted mass ratio variation with
relative humidity of a hypothetical macromolecular organic compound

comprising the functional groups of ten fulvic acid molecules. For the same
mass (i.e. ten times fewer molecules) it can be seen that there is a marginal
decrease in the water activity. Hence the calculation of hygroscopicity when
the organic component is macromolecular is even less dependent on organic
compounds present, only on the relative abundance of organic and inorganic
components in the particle. The second consideration is that the volatility
SMPS indicated that there was only a small contribution to the aerosol
distribution from refractory material at any size. This indicates that the
AMS loading will be reasonably accurate, and that elemental carbon (EC)
mass contribution will be low throughout the distribution.
It should be noted that only a single GFD value can be predicted using the
assumption of full internal mixing in contrast to the observed finite breadth
of the HTDMA-measured GFD distribution. An inversion of the composition
distribution using HTDMA-derived mixing state would allow prediction of
a GFD distribution for comparison with that measured. This is the subject of
ongoing investigation.
AMS characterisation of organic particulate material at several mid-
latitude Northern hemisphere locations
Detailed composition analyses using the AMS have been performed at a
variety of locations. The data used and summarised here were collected in

urban locations in Manchester (summer and winter) and Edinburgh in the
UK, in Vancouver and rural and semi-rural locations in Canada, on the
Jungfraujoch, a high alpine site in central Europe and on a remote marine
site on Jeju Island, South Korea. No detailed analysis of the individual field
studies will be presented here (the data have been published for the two
U.K. cities41, for the Korean experiment46 and the Canadian study44,55).
Figure 6 shows the mass size distributions of the sulphate, nitrate,
ammonium and organic fractions of the aerosol particles averaged over the
whole sampling period at each location. A significant accumulation mode,
principally composed of sulphate, nitrate, ammonium and organic material
with vacuum aerodynamic diameters between 300 – 800 nm, peaking
around 400 – 500 nm, was observed at all sites. A significant mass mode
composed of organic material with very small concentrations of inorganic
species at a diameter of about 100 – 200 nm was constantly observed at all
urban sites and when fresh or urban air masses affected the other sites55.
This is consistent with previous observations made in other urban sites in
the US42,43. This smaller-sized organic mode is characteristic of urban sites
and fresh emissions. At non-urban sites, the measurements were made away
from local sources, the small mode became less significant and the
distribution was dominated by the accumulation mode. Observed mass size
distributions at all urban sites (panels A – D, Figure 6) reveal consistently
similar bimodal organic and monomodal inorganic distributions (though

there is an observed difference in the lower size cut-off of the measured
organic distributions due to the difference in the particle transmission
efficiency of the aerodynamic lens that was upgraded before the Pacific
2001 experiment56). The temporal variations of the accumulation mode
component size distributions contributing to these averages at all locations
suggest that they are internally mixed and are indicative of a regional
background mode41,55. Further evidence for internal mixing is provided by
the similar modal diameters and mode shapes of the component mass
distributions, as the vacuum aerodynamic diameter is density dependent
these would be expected to be different if the particles were externally
mixed.
The results reveal that the organic fraction is the most significant contributor
to the total mass measured by the AMS at all of the sampling locations,
accounting for 38 – 70% of the total mass. Organic material has been found
to account for 70% of the total mass measured at the Slocan Park urban site
in Vancouver, which represent an emissions-dominated regime. However,
organics accounted for 53% of the total mass measured at the Jungfraujoch
high alpine research station, which is a remote site away from local sources.
These results illustrate the ubiquity of organic material in Northern
Hemisphere mid-latitudes, whilst highlighting a difference in behaviour as a
function of the distance from source regions that warrants further
investigation.

The small mode organic mass loading during the Vancouver urban study
was strongly correlated with gas phase CO, benzene, 1,3-butadiene and
toluene44 – all good markers for transport-related emissions, with Pearson’s
r values of 0.76, 0.79, 0.71 and 0.69, respectively. An even stronger
correlation between the small mode organic loading and NOx (r = 0.86) was
found for Manchester. The characteristic fragmentation of organic
compounds in the AMS was used to investigate organic aerosol behaviour
during the Canadian studies. It was been found that the fragments at m/z =
44, 43 and 57 may be used to explore the degree of oxygenation of the
contributions to the organic material. The m/z 44 (CO2+) fragment has been
found in the laboratory to be reproducibly produced by the thermal
decarboxylation of oxo-, di- and poly-carboxylic acids and humic-like
substances on the vapouriser, for which it is a main ion fragment, other
compounds show little or no ion signals at this mass peak. m/z 43 is a
characteristic fragment of both saturated hydrocarbon compounds (C3H7+)
and oxidised organic compounds such as aldehydes and ketones (CH3CO+
or its isomers) and m/z 57 is a typical fragment of saturated hydrocarbon
compounds (C4H9+) and generally receives a negligible contribution from
atmospheric oxidised organic compounds. A correlation of the mass
concentration of m/z 57 with the concentration of the CO at the urban site in
Vancouver had a Pearson’s r value of 0.74, while a similar correlation using
m/z 44 at the same location had a Pearson’s r value of 0.42. Similar

correlations have been performed with the Manchester winter data using
NOx as the primary marker and resulted in Pearson’s r values of 0.85 and
0.24 for m/z 57 and m/z 44, respectively. These correlations support the
selection of m/z 57 as a marker for freshly emitted organic combustion
aerosol in the AMS data and may rule out any significant contribution of
primary emissions to m/z 44. Figure 7 shows the mass size distributions of
these three key organic mass fragments averaged over the whole sampling
period at each of the sampling locations. The m/z 44 shows a pronounced
monomodal distribution, with a modal diameter of about 400 - 450 nm in all
but Manchester summer data, where a larger modal diameter of about 700
nm has been observed. This is strong evidence for internal mixing between
oxygenated organics and sulphate in the Manchester summer data, as the
latter also shows a similar increase in the modal diameter at this location.
The distribution for m/z 44 is not available for the Edinburgh data, because
this mass fragment was not scanned in the TOF mode. The domination of a
monomodal distribution of m/z 44 in the urban sites implies that there is
little contribution from highly oxygenated organic compounds in the small
organic mode. In addition, the relative magnitudes of m/z 44 to the other
two fragments indicate the presence of more oxidised organic compounds in
the Manchester summer and Vancouver data relative to that of Manchester
winter. In the rural locations dominance of mass fragments 44 and 43 in the
accumulation mode and the lack of significant contributions from mass

fragments 57 and 43 in the small mode (compared to the urban sites in the
left hand panels) suggest that organic particulate at these sites has a large
contribution from oxygenated compounds, and that they are more
significant than primary unoxidised organic material at these locations
during the sampling periods. Each of the mass fragments seems to have
similar size distributions in all non-urban locations. However the m/z 44
appears to be more pronounced relative to m/z 43 at the Jungfraujoch and
Jeju Island remote sites, possibly suggesting more atmospheric processing at
those locations relative to Langley and Sumas sites. At the urban locations,
the mass fragments at m/z 43 and 57 show bimodal mass size distributions
similar to that observed for the total organic aerosol fraction shown in
Figure 6.
The mass spectral signatures may be used to provide more information on
the organic composition. Panel C in the left column of Figure 8 shows a
mass spectrum of New York diesel bus exhaust aerosol 57. This spectrum
was compared to laboratory generated diesel fuel (left panel A) and
lubricating oil (left panel B) spectra leading to the conclusion that under
most operating conditions the organic carbon fraction of in-use diesel
vehicle exhaust aerosol is dominated by the recondensed vapour from the
evaporated (and / or partially combusted) engine lubricating oil. All spectra
were dominated by the ion series CnH2n+1+ (m/z 29, 43, 57, 71, 85…), which
is typical of saturated normal and branched alkanes. Other important ion

series were also observed including CnH2n-1+ (m/z 27, 41, 55, 69,83…)
typical of alkenes, CnH2n-3+ (m/z 67, 79, 81, 95, 107, 109…) typical of
cycloalkanes and C6H5CnH2n+ (m/z 77, 91, 105, 119…) typical of aromatic
hydrocarbons58. Left panel D shows a mass spectrum of the organic fraction
measured at the Vancouver urban site during periods dominated by traffic
emissions. A similar mass spectrum is shown in panel E for the Manchester
winter sampling period (the spectra are averaged over all periods where CO
concentrations were higher than the local averages (403 ppbv in Vancouver
and 289 ppbv in Manchester winter)). A comparison of the spectra in panels
D and E with that in panel C suggests significant similarity in the
composition of traffic-dominated ambient organic particulate in Manchester
and Vancouver and that of diesel exhaust organic in New York City. The
similarity of the ambient spectra and the laboratory generated lubricating oil
spectrum indicates that recondensed vapour from engine lubricating oil
dominated the organic fraction in Manchester and Vancouver during the
sampling periods. A closer inspection of the spectra in the left panels shows
that the ambient spectra have an extra fragment at m/z 44, a more enhanced
m/z 43 relative to its adjacent fragments and a more abundant m/z 55 relative
to m/z 57. Oxygenated organic compounds from the separate accumulation
mode are likely to contribute to each of these differences (and partial
combustion of the lubricating oil vapour may contribute to the variation in
m/z 55 to 57 ratio).

The right hand panels in Figure 8 show mass spectra of the organic aerosol
fraction averaged over the sampling duration at each of non-urban sites. The
mass spectral signatures are similar at all sites and the most significant
contributions to these spectra arise from mass fragments characteristic of
oxygenated organic compounds such as m/z 44 in addition to mass
fragments 43 and 55. The rural and semi rural spectra (right panels A and B,
receptively) show some contribution from fragments typical of aromatic and
cyclic compounds such as 67, 79, 91, 95 and 105. However, the spectra in
panels C and D show that these mass fragments are much less observed at
the Jungfraujoch and Jeju Island remote sites, supporting an argument that
organic particulates may have been exposed to more processing at those two
locations. It may be expected that, since an air parcel represents the
integrated history of all its emissions and chemical transformations, a
representation of the organic aerosol component by a generic species meant
to capture the behaviour of oxygenated particulate organics in a remote
environment will not capture the behaviour of air parcels significantly
influenced by recent emissions. However, the explanation of almost all the
variance in background organic particulates by a single, m/z = 44
dominated, fraction allows a simple intuitive separation of organic aerosol
material. Following the conclusion that the m/z = 57 dominated organic
fraction is derived from source driven primary emission, it is possible to
state that condensed organics may be represented by two components within

the lifetimes of particulate sampled during all these Northern Hemisphere
mid-latitude field studies. These two components are the, generally
unoxidised, HOA (Hydrocarbon-like) and OOA (oxygenated organic
aerosol)59. It would be useful to identify a generic representation for the
oxygenated organic material, using a single compound or known mixture
capturing the features of the background remote organic in the same way
that lubricating oil appears to capture the urban organic aerosol components.
It may be expected that such a representation would have a mass
fragmentation pattern similar to that at the more processed locations.
Therefore we now attempt to derive a representative EI mass fragmentation
pattern for the oxygenated fraction.
Attribution of representative AMS mass fragmentation pattern to the
oxygenated organic fraction
To conduct a preliminary investigation of the AMS response to model
compounds retrieved from the impactor analysis (and based on the
demonstrated importance of compounds with properties similar to HULIS),
an AMS spectrum of the standard fulvic acid reference (Suwannee River
Fulvic Acid) was obtained using particles generated in the laboratory. The
AMS mass spectrum of fulvic acid (panel A, Figure 9) is dominated by m/z
44 (CO2+) identified as the AMS signature of highly oxidised compounds

such as hydroxy- and di-carboxylic acids. There is also predicted to be
significant contributions from m/z 18 and m/z 28 due to the associated H2O
and CO formed in the decarboxylation process and subsequently ionised.
The contribution of mass fragment 18 to the fulvic acid mass spectrum has
been calculated by subtracting the air beam contribution to m/z 18 assuming
the particles are dry. This is not possible to retrieve from ambient data due
to interferences from ammonium, sulphate and gas phase and particulate
water, and as a result m/z 18 is set to equal m/z 44 as an estimation of the
minimum contribution of m/z 18 to the organic mass. Figure 9 compares the
fulvic acid mass spectrum signature with ambient organic mass spectra
obtained from the urban, rural and remote locations described here. The
comparison reveals that the mass spectral signatures of organic particulate
in the remote, rural and oxidised urban sites are highly similar to that of
humic-like compounds and were all dominated by m/z 44. On the other
hand, the traffic dominated organic spectrum measured in Vancouver
showed a different signature to that of fulvic acid, where m/z 43 and other
aliphatic fragments were far more dominant than m/z 44.
We now have a strong indication that, at least for continentally influenced
northern mid-latitude locations where these data were obtained, it may be
appropriate to use just two components to represent the organic component
of atmospheric aerosols; the primary organic contribution playing a
significant role near source, but reducing in importance moving towards the

background atmosphere. The similarity among the ambient spectra in Figure
9 and the fulvic acid spectrum was quantified by scattering the values of
each of the averaged atmospheric mass spectra against those of fulvic acid
and lubricating oil respectively, calculating the Pearson’s r values
summarised in Table 2. It can be seen that the fragmentation pattern of
lubricating oil can explain almost all the urban atmospheric organic material
and that of fulvic acid can explain the fragmentation of the organic
background. The gradual change in the organic mass spectral signature from
urban to remote sites shown in Figure 2, and the decreasing similarity with
the lubricating oil spectra and increasing similarity with the fulvic acid
spectra, as quantified in Table 2, provide clear evidence that atmospheric
organic material gradually becomes more highly oxygenated moving away
from source regions.
This is strong evidence that a generic prepresentation of the background
organic composition may not be unreasonable. Fulvic acid, one of the major
model compounds derived from 1H NMR analyses of the ambient impactor
samples gives a consistent and characteristic fragmentation pattern in the
AMS which is close to that representing a very large part of the mass
loading in background air. It must be stressed that the analysis does not
suggest that fulvic acid is a major component of background atmospheric
aerosol, but that the organic ions formed through volatilisation and
ionisation of ambient aerosol in the AMS are similar to those observed

when sampling fulvic acid. Together with the functional group analyses
suggesting that, in all locations there are significant similarities in the
relative proportion of oxidised functional groups, the AMS analysis
suggests that a single representation capturing the functionality and
behaviour of this mixture may be possible.
Use of TORCH data to investigate the relationship between particulate
organic behaviour and the oxidising environment:
If there is significant processing of the organic aerosol component or
significant addition of organic condensable material moving away from
urban source regions, it might be expected that the composition and
behaviour will depend on the exposure of the aerosols to an oxidising
environment. The linear covariance of the ratio of m/z 44 / total measured
aerosol organic with gas phase organic species concentration has been found
to be greatest for compounds such as carbonyls whose major sources are gas
phase oxidation56, reducing in magnitude for compounds with both primary
emission and oxidation sources and showing significant anticorrelation with
gas phase hydrocarbons with only direct emission as a source. Moreover,
the opposite trend was observed for the covariances of the ratio of m/z 57 /
total measured aerosol organic with the same species. This directly supports
the representation of the organic aerosol as one emission-driven and one

oxidation-driven component. In addition, it has been found that44, whereas
the small organic mode, where present, correlated significantly with CO and
NOx, the large mode was much more strongly correlated with PAN and O3.
Furthermore, the shift to larger modal size corresponding to periods of
higher ozone and lower CO was accompanied by the change in
fragmentation spectrum to more closely resemble the representative
background distribution.
We will now use data from the TORCH experiment to investigate in detail
the changes in the aerosol behaviour with oxidising environment. During the
experiment, three dominant categories of air mass were experienced.
Ambient aerosol, when arriving at the site across London from a south-
westerly direction, had less exposure to an oxidising environment since the
major injection of emissions was more recent than when the stagnant air of
European origin arrived at the site in the strong anticyclonic periods. Air
arriving in trajectories originating from the Arctic had even greater potential
exposure to atmospheric oxidation, but approached the measurement site
with variable local wind direction with potential for local contributions to
aerosol emissions. It is possible to obtain a measure of the integrated
oxidation history of an air parcel by use of ratios of gaseous hydrocarbons
of known common source profiles60. Such hydrocarbon ratio data have been
used to classify the air masses and segregate the measured data. Panel b) in
Figure 10 shows the benzene / toluene ratio (BTR) of each air mass

classification with the range of expected photochemical age dependent on
initial ratio and oxidant concentration in panel a).
Figure 11 shows the difference in the average HTDMA hygroscopic
diameter growth factor (GFD) of the aerosols to 90% RH between the south
westerly and anticyclonic periods. It can be seen that the south westerly
aerosols are lower in GFD at all sizes than those arriving in anticyclonic air
and that bimodality in the distributions from 60 nm to 137 nm showing the
transition between a “less hygroscopic” (LH) and “more hygroscopic” (MH)
mode is present only in the south westerly classification. At the smaller
sizes, one might expect a greater contribution from combustion-derived
organic components in air masses more recently influenced by direct
emissions. Such aerosols will be low in hygroscopicity and will fall into the
LH mode. There will be a smaller contribution with increasing size due to
the falloff in the size distribution of these directly emitted aerosols. In the
more aged anticyclonic air, there are no LH particles. This is consistent with
the picture of a background aerosol composition distribution appearing less
influenced by recent emissions.
Using a recently developed59 analysis to attribute the relative contributions
of the hydrocarbon-like to the oxygenated organic aerosol mass (that
represented by the AMS fragmentation pattern described above), the
contribution variation from a period of the TORCH 1 experiment is shown
in Figure 12. It can be seen that there is a large contribution of HOA during

the south westerly period only and very little during the anticyclonic period.
This is consistent with the expectation that the south westerly aerosols will
have a signature similar to that found elsewhere (as detailed above) for
recently emitted aerosols and that the anticyclonic organic component has a
signature in a large part comparable to that attributed to the background
oxygenated fraction identified previously.
To investigate how the aerosol population responds to the change in the
oxidising history of the air parcel, the variability of the composition and
hygroscopicity has been analysed in terms of the BTR. Figure 13 shows the
HOA fraction of the total organic aerosol mass plotted as a function of the
BTR for each classification. As expected, the aerosol with the greatest
contribution from HOA are in south westerly air masses with recent input of
emissions from the London area. All measurements in this classification are
at relatively young photochemical ages corresponding to BTR less than
around 0.5 with the HOA contribution to the total organic aerosol loading
reducing with increasing photochemical age. The stagnant air during the
anticyclone carried aerosol of moderate fractional HOA loading, reducing to
a base value of around 0.1 at BTR of around 0.5. With increasing
photochemical age there was little change in the HOA contribution. The
Arctic trajectories with local influence exhibited the greatest age and
generally low contribution from HOA. It can be seen that the general trend
is for the fractional contribution to the organic aerosol from HOA to reduce

to a threshold value of around 0.1 at a BTR value of around 0.5. This
indicates that the HOA is largely lost from the aerosol in a timescale of
between 12 and 36 hours (typically 20 hours, see Figure 10).
Averaging the HTDMA measurements over 5 ranges of BTR, it is possible
to establish whether the photochemical age effect on growth factor
behaviour corresponds to the effect on the changing HOA contribution to
the organic aerosol fraction. Figure 14 shows how the ambient aerosols in
air masses of varying photochemical age respond to the moist atmosphere.
The 27 nm dry diameter particles exhibit a single GFD mode increasing with
increasing age from 1.1 to 1.35 with no further change above BTR of 0.8.
The 89 nm particles appear to have a LH mode at all photochemical ages,
with a second MH mode increasing in GFD from 1.1 to 1.55 with increasing
age; a plateau again reached at BTR of 0.8. The largest dry sized particles,
at 360 nm, have little or no LH mode and a MH mode which remains
broadly constant at GFD around 1.55 to 1.6. In all cases the development of
the MH mode has been complete by between 18 to 60 hours (typically 30
hours, see Figure 10).
The data suggest that the reduction of the HOA contribution to the aerosol
organic fraction occurs on a similar timescale to, but probably slightly more
rapidly than, the changes effecting the removal of the LH mode and
development of the MH mode. We have already shown that the
hygroscopicity of the particulates is dominated by the inorganic

components. This is further evidence that, though the hygroscopicity and the
nature of the organic fraction both change with photochemical age of the air
mass, the change in the organic fraction is unlikely to directly cause of the
change in the aerosol behaviour in the moist atmosphere.
Conclusions
We have shown that inorganic component changes must be responsible for
any increase in hygroscopicity with photochemical ageing – the water
affinity of even the most oxidised organic components is insufficient to
contribute greatly to hygroscopicity of aged aerosols. It is therefore likely
that the changes in hygroscopicity as a function of photochemical age arise
from the gaseous photochemical production of condensable inorganic acids
or from the aqueous production of such compounds, either in- or out-of-
cloud. The accumulation and of condensed organic material with age will
increase the dry mass of the particle, but will not add significantly to the
water uptake. This will lead to an apparent reduction in hygroscopicity of
the particle, but evidence suggests that this is more than offset by the
increase in inorganic material.
If the photochemical transformation lifetimes measured during the TORCH
experiment are representative, the change in organic characteristics and in

particulate hygroscopicity, though not necessarily related, will happen in
around one day. This is generally within a single cell in global models at
representative boundary layer wind speeds.
A single representation of nearfield and background organic aerosol
composition is sufficient to describe the AMS fragmentation pattern
observed in a variety of field experiments including the TORCH
experiment. The nearfield small mode organics are dominated by a
combustion-derived unoxidised signature, whilst the background
accumulation mode is more oxygenated and dominates in air masses with a
photochemical age of more than a couple of days. It must be established to
what extent this representation is the result of oxidative production of
condensable precursors, condensed phase organic oxidation or simply the
associated dilution of urban-derived particles into the background
population.
This representation may be used within the sub-saturated regime to predict
the behaviour of ambient particulates in the moist atmosphere due to the
insensitivity of hygroscopicity to the contribution from organic material.
For the northern mid-latitude continentally influenced environment for
which we currently have measurements the organic fraction contributes little
to water uptake by the aerosol, which is dictated almost entirely by the

inorganic components. The organic fraction has been shown to have a
growth factor of only 1.11 for two different sets of model compounds; the
growth is dictated by the fractional mass loading of the inorganic and
organic components and this is the parameter which must be captured
accurately in large-scale models. At present, there is insufficient data to
ascertain whether this simplification can be more widely interpreted.
Further measurements and analyses are required to determine if the
conclusions are valid across all environments of this type or whether they
can be carried forward to simplify the interpretation of the hygroscopic
behaviour of mixed organic-inorganic aerosol systems in other or all
ambient atmospheric environments.
This approach also needs to be extended to explore whether there is a
significant effect of the change in organic character on other important
aspects of aerosol behaviour such as changes in optical properties or cloud
activation under supersaturation. It may be expected that the contribution of
organic compounds will increase on approaching saturation due to their
effect on surface tension suppression. In addition, the simple representation
of a vast range of organic compounds does not facilitate linkage to gaseous
precursors. However, if complex behaviour can be simplified using these
techniques or similar ones and parameterised in efficient ways, such as
linking to photochemical age, then global representation of complex aerosol
composition and prediction of subsequent behaviour may be possible.
References
1. M. R. Alfarra, H. Coe, J. D. Allan, K. N. Bower, H. Boudries, M. R.
Canagaratna, J. L. Jimenez, J. T. Jayne, A. Garforth, S. Li, and D. R.
Worsnop, Atmos. Environ., 2004, 38, 5745.
2. H. A. Gray, G. R. Cass, J. J. Huntzicker, E. K. Heyerdahl and J. A.
Rau., Environ. Sci. Technol., 1986, 20, 580.
3. W. F. Rogge, M. A. Mazurek, L. M. Hildemann, G. R. Cass, and B.
R. T. Simoneit, Atmos. Environ.,1993, 27, 1309.
4. A. M. Middlebrook, D. M. Murphy and D. S. Thomson, J. Geophys.
Res., 1998, 103, 16475.
5. J. C. Chow, J.G. Watson, E.M. Fujita, Z.Q. Lu, D.R. Lawson, and
L.L. Ashbaugh, Atmos. Environ., 1994, 28, 2061.
6. S. Decesari, M.C. Facchini, S. Fuzzi, and E. Tagliavini, J. Geophys.
Res., 2000, 105, 1481.
7. J. T. Houghton, Y. Ding, D. J. Griggs, M. Noguer, P. J. van der
Linden and D. Xiaosu (Eds.), Climate Change 2001: The Scientific
Basis, Cambridge, 2001.
8. C. A. Pope III, Aerosol Sci Technol., 2000, 32, 4

9. M. O. Andreae and P. J. Crutzen, Science, 1997, 276, 1052.
10. M. C. Jacobson, H.C. Hansson, K.J. Noone, and R.J. Charlson,
Rev. Geophys., 2000, 38, 267.
11. P. Saxena and L.M. Hildemann, Environ. Sci. Technol., 1997, 31,
3318.
12. M. C. Facchini, S. Decesari, M. Mircea, S. Fuzzi, and G. Loglio,
Atmos. Environ., 2000, 34, 4853.
13. C. G. Peng and C. K. Chan, Atmos. Environ., 2001, 35, 1183.
14. Puxbaum, H., J. Rendl, R. Allabashi, L. Otter and M. Scholes, J.
Geophys. Res., 2000, 105, 697.
15. Havers, N., P. Burba, J. Lambert and D. Klockow, J. Atmos. Chem.,
1998, 29, 45.
16. M. C. Facchini, S. Fuzzi, S. Zappoli, A. Andracchio, A. Gelencser,
G. Kiss, Z. Krivacsy, E. Meszaros, H.-C. Hansson, T. Alsberg and
Y. Zebuhr, J. Geophys. Res., 1999, 104, 26821.
17. Zappoli, S., A. Andracchio, S. Fuzzi, M. C. Facchini, A. Gelencser,
G. Kiss, Z. Krivacsy, A. Molnar, E. Meszaros and H.-C. Hansson,
Atmos. Environ., 1999, 33, 2733.
18. Z. Krivacsy, Z., G. Kiss, B. Varga, I. Galambos, Z. Sarvari, A.
Gelencser, A. Molnar, S. Fuzzi, M. C. Facchini and S. Zappoli.,
Atmos. Environ., 2000, 34, 4273.

19. Z. Krivacsy, Z., A. Hoffer, Z. Sarvari, D. Temesi, U. Baltensperger,
S. Nyeki, E. Weingartner, S. Kleefeld and S. G. Jennings, Atmos.
Environ., 2001, 35, 6231.
20. A. Limbeck, M. Kulmala and H. Puxbaum, Geophys. Res. Lett.,
2003, 30, doi:10.1029/2003GL107738.
21. M. Kalberer, D. Paulsen, M. Sax, M. Steinbacher, J. Dommen, A. S.
H. Prevot, R. Fisseha, E. Weingartner, V. Frankevich, R. Zenobi and
U. Baltensperger, Science, 2004, 303, 1659.
22. M. P. Tolocka, M. Jang, J. M. Ginter, F. J. Cox, R. M. Kamens and
M. V. Johnston, Environ. Sci. Tech., 2004, 38, 1428.
23. Mukai, H. and Y. Ambe, Atmos. Env., 1986, 20, 813.
24. Q. Zhang and C. Anastasio, Atmos. Environ., 2003, 37, 2247.
25. D. J. Rader and P. H. McMurry, J. Aerosol Sci., 1986, 17, 771
26. M. Cubison and H. Coe, J. Aerosol. Sci., 2004, 35,
27. M. L. Pitchford and P.H. McMurry, Atmos. Environ., 1994, 28, 827.
28. P. Saxena, L.M. Hildemann, P.H. Mcmurry, and J.H. Seinfeld, J
Geophys. Res., 1995, 100, 18755.
29. M. Y. Choi, and C.K. Chan, J. Phys Chem. A, 2002a 106, 4566.
30. Na, H. S., S. Arnold, and A. S. Myerson, J. Cryst. Growth, 1995,
149, 229.
31. A. J. Prenni, P.J. DeMott, S. M. Kreidenweis, D. E. Sherman, L. M.
Russell, and Y. Ming, J. Phys. Chem. A, 2001, 105, 11240.

32. M. Y. Choi and C.K. Chan, Environ. Sci. Technol., 2002b, 36, 2422.
33. C. N. Cruz and S. N. Pandis, Environ. Sci. Technol., 2000, 34, 4313.
34. J. M. Lightstone, T. B. Onasch, D. Imre, and S. Oatis, J. Phys.
Chem. A, 2000, 104, 9337.
35. S. D. Brooks, P. J. DeMott, S. M. Kreidenweis, Atmos. Environ.,
2004, 38, 1859.
36. E. Mikhailov, S. Vlasenko, R. Niessner and U. Poeschl, Atmos.
Chem. Phys., 2004, 4, 323.
37. D. O. Topping, G. McFiggans and H. Coe, submitted to Atmos.
Chem. Phys. Disc., 2004a
38. D. O. Topping, G. McFiggans and H. Coe, submitted to Atmos.
Chem. Phys. Disc., 2004b
39. W. Winklmayr, G. P. Reischl, A. O. Lindner and A. Berner, J.
Aerosol. Sci., 1991, 22, 289
40. J. T. Jayne, D. C. Leard, X. F. Zhang, P. Davidovits, K. A. Smith, C.
E. Kolb and D. R. Worsnop, Aerosol Sci. Technol., 2000, 33, 49.
41. J. D. Allan, M. R. Alfarra, K. N. Bower, P. I. Williams, M. W.
Gallagher, J. L. Jimenez, A. G. McDonald, E. Nemitz, M. R.
Canagaratna, J. T. Jayne, H. Coe and D. R. Worsnop, J. Geophys.
Res., 2003, 108, 4091.

42. J. L. Jimenez, J. T. Jayne, Q. Shi, C. E. Kolb, D. R. Worsnop, I.
Yourshaw, J. H. Seinfeld, R. C. Flagan, X. Zhang, K. A. Smith, J.
W. Morris and P. Davidovits, J. Geophys. Res., 2003, 108, 8425.
43. F. Drewnick, J. T. Jayne, M. R. Canagaratna, D. R. Worsnop and K.
L. Demerjian, Aerosol Sci. Technol., 2004, 38, 104..
44. M. R. Alfarra, H. Coe, J. D. Allan, K. N. Bower, H. Boudries, M. R.
Canagaratna, J. L. Jimenez, J. T. Jayne, A. Garforth, S. Li, and D. R.
Worsnop, Atmos. Environ., 2004, 38, 5745.
45. A. Berner and C. Lurzer, J. Phys. Chem., 1980, 84, 2079.
46. D. O. Topping, D. O., H. Coe, G. McFiggans, R. A. Burgess, J. D.
Allan, M. R. Alfarra, K. N. Bower, T. W. Choularton, S. Decesari
and M- C. Facchini, Atmos. Environ. , 2004, 38, 2111.
47. S. Decesari, M. C. Facchini, S. Fuzzi, G. McFiggans, H. Coe and K.
N. Bower, Atmos. Environ., 2005, 39, 211.
48. S. L. Clegg, J.H. Seinfeld, and P. Brimblecombe, J. Aerosol Sci.,
2001, 32, 713.,
49. Y. Ming and L.M. Russell, Aiche Journal, 2002, 48, 1331.
50. S. L. Clegg and K.S. Pitzer, J. Phys. Chem., 1992 96, 3513.
51. S. L. Clegg, K.S. Pitzer, and P. Brimblecombe, J. Phys. Chem., 1992
96, 9470.
52. A. Fredenslund, R.L. Jones, and J.M. Prausnitz, Aiche Journal,
1975, 21, 1086.

53. C. Peng, M.N. Chan, and C.K. Chan, Environ. Sci. Technol., 1998,
35, 4495.
54. Stokes, R.H., and R.A. Robinson, J. Phys. Chem., 1966, 70, 2126.
55. H. Boudries, M. R. Canagaratna, J. T. Jayne, M. R. Alfarra, J. D.
Allan, K. N. Bower, H. Coe, S. C. Pryor, J. L. Jimenez, J. R. Brook,
S. Li and D. R. Worsnop, Atmos. Environ., 2004, 38, 5759.
56. J. D. Allan, K. N. Bower, H. Coe, H. Boudries, J. T. Jayne and D. R.
Worsnop, J. Geophys. Res., 2004, 109, doi, 10.1029/2003JD004208.
57. M. R. Canagaratna, J. T. Jayne, D. A. Ghertner, S. Herndon, Q. Shi,
J. L. Jimenez, P. J. Silva, P. Williams, T. Lanni, F. Drewnick, K. L.
Demerjian, C. E. Kolb and D. R. Worsnop, Aerosol Sci. Technol.,
2004, 38, 555.
58. McLafferty, F. W. and F. Turecek, Interpretation of Mass Spectra,
Fourth Edition, University Science Books, 1993.
59. Zhang, Q., M. R. Alfarra, D. R. Worsnop, J. D. Allan, H. Coe, M. R.
Canagaratna and J. L. Jimenez, submitted to Environ. Sci. Technol.,
2004.
60. D. D. Parrish, C. J. Hahn, E. J. Williams, E. B. Norton, F. C.
Fehsenfeld, H. B. Singh, J. D. Shetter, B. W. Gandrud, and B. A.
Ridley, J. Geophys. Res., 1992, 103, 22339.

Table 1: Relative molar contributions to the representative model organic compounds based
on HPLC & 1H NMR analyses
*2-[(3,4,8-trimethyl-2-oxo-2H-chromen-7-yl)oxo]propanoic acid
TORCH Mole % Po Valley Mole %
D-galactal 9 Levoglucosan 11.9
Andrographolide 4 Pinonaldehyde 20.4 NC
Catechol 3.9
Acetic acid 7 Nonanedioic acid 16.0
Oxalic acid 9 3-hydroxybutanoic acid 31.2
Methane sulphonic acid 7 3-hydroxybenzoic acid 4.7
2-methyl-7-oxononanoic acid 28
4-oxoheptanedioic acid 16
MDA
aromatic mid MW acid* 5
PA Suwannee River Fulvic Acid 15 Suwannee River Fulvic Acid 11.9

Table 2: The variation in the primary and background contribution to
measured particulate organic loading is illustated by correlating the average
fragmentation pattern with the representative spectra for lubricating oil and
fulvic acid. The table is ordered from the most remote sampling location
through to the closest to source showing that most of the variance in the
pattern in the remote locations can be explained by the contribution from the
fulvic acid spectrum and that from urban locations by the lubricating oil
spectrum.
Pearson’s r value
Location Fulvic Acid Lubricating Oil
Jeju Island, remote Marine 0.96 0.26
Jungfraujoch, high alpine 0.95 0.31
Langley, rural 0.87 0.47
Vancouver, oxidised urban 0.87 0.50
Vancouver, traffic urban 0.50 0.87
Manchester, traffic urban 0.46 0.90
New York, diesel exhaust 0.14 0.97

Figure 1: Location of the first field experiment in the Tropospheric Organic
Chemistry project (TORCH 1) at Writtle agricultural college 30 km North
East of London.

Figure 2: Total sub-micron particle non-refractory organic mass loading
measured by the AMS during TORCH 1 plotted with WSOC loadings from
each impactor stage. The loadings from the stage with the lowest size cut
are the darkest horizontal bars, the masses of larger particles represented by
progressively lighter bars (see text for size cuts). The sum of the loading
from the two smallest stages should correspond roughly to the mass of
particles entering the AMS. It can be seen that there is generally good
agreement between the impactor and AMS measurements.

Figure 3: Top panels: Major ion and WSOC contributions to mass loading
from the two Berner impactor stages with the finest size cuts. Inorganic
compounds contribute between around half and three quarters of the mass in
all samples and there is a significant WSOC contribution to the total
loading. The bottom panels show broad group contributions to the total
WSOC mass from the same periods. Most of the WSOC mass is contributed
by acidic compounds with a significant proportion of polyfunctional acidic
compounds.
Period 1 Period 2
Impactor Mass Loadings
Period 3
Period 4 Period 5 Period 6
NO3-
SO42-
NH4+
Na+
Cl-
Other
WSOC
Period 1 Period 2
Impactor WSOC Groupings
Period 3
Period 4 Period 5NC
MDA
PAUnaccounted
NC Neutral Compounds
MDA Mono- & Diacidic
Compounds
PA Polyacidic Compounds

Figure 4. GFD to 90 % RH predicted by the ADDEM model compared with
that measured by the HTDMA during TORCH 1 impactor period 2. The
right hand panels show initialisation composition for TORCH impactor
period 2 used as input. The absolute loadings from the impactor were used
to normalise the AMS loadings across the distribution (the directly-
measured absolute AMS loadings are not yet available).

Figure 5: Wet to dry mass ratio predictions for four aqueous solutions of
organic compounds i) the model compounds representing the TORCH 1H
NMR functional group analysis, ii) the corresponding Po Valley
compounds, iii) Suwannee River Fulvic Acid and iv) a compound
comprising 10 times the number of functional groups of Fulvic Acid.

Figure 6: Mass size distributions of the organic, sulphate, nitrate and
ammonium fractions of the aerosol particles measured by the AMS at
various urban, rural and remote locations. Data are averaged over the entire
sampling period at each of the locations. Note the varying ranges of the y-
axes.

Figure 7: The mass size distributions of three key organic mass fragments
averaged over the whole sampling period at each of the sampling locations.

Figure 8: Averaged AMS mass spectra from a variety of locations compared
with spectra measured from nebulised lubricating oil and diesel fuel.
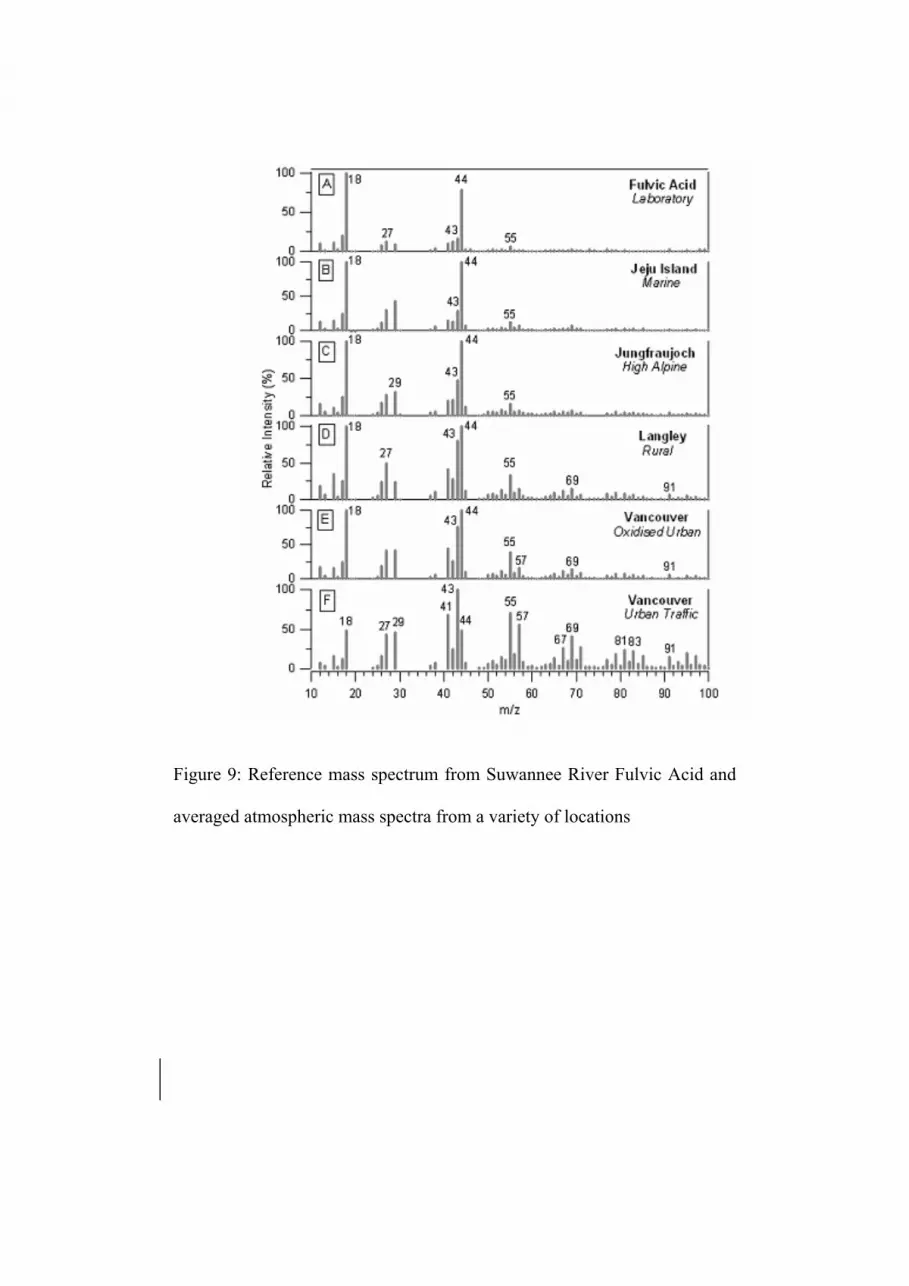
Figure 9: Reference mass spectrum from Suwannee River Fulvic Acid and
averaged atmospheric mass spectra from a variety of locations

Figure 10 a) The photochemical age expressed as a function of the benzene /
toluene ratio (BTR) for a range of hydroxyl radical concentrations and
initial hydrocarbon ratios. b) the range of BTR in each air mass
classification during the TORCH 1 experiment.

Figure 11: Average HTDMA hygroscopic diameter growth factor (GFD) of
the aerosols to 90% RH for the south westerly and anticyclonic periods.

Figure 12: The fraction of the total organic aerosol loading contributed by
HOA over an airmass change during TORCH 1
South-Westerly ==> <== Anticyclonic

Figure 13: HOA fraction of the total organic aerosol mass as a function of
the BTR for each air mass classification during TORCH 1.

Figure 14: Growth factor variation with varying photochemical age