Embed Size (px)
Citation preview
Relazione di TirocinioRoma, 12 Gennaio 20111
SILICA-ALUMINA FOR HYDROCARBON BULK REMOVAL FROM CONTAMINATED WATER
Moreno Maretto ,Roberto Bagatin, Alessandra De Folly D’Auris, Angela Carati, Massimiliano Baric, Rita Iazzoni,
Rodolfo Vignola, Marco Petrangeli Papini.
1st International Porous Powder Material Symposium and
Exhibition
Cesme 3rd – 6th September
2013
Relazione di TirocinioRoma, 12 Gennaio 20112
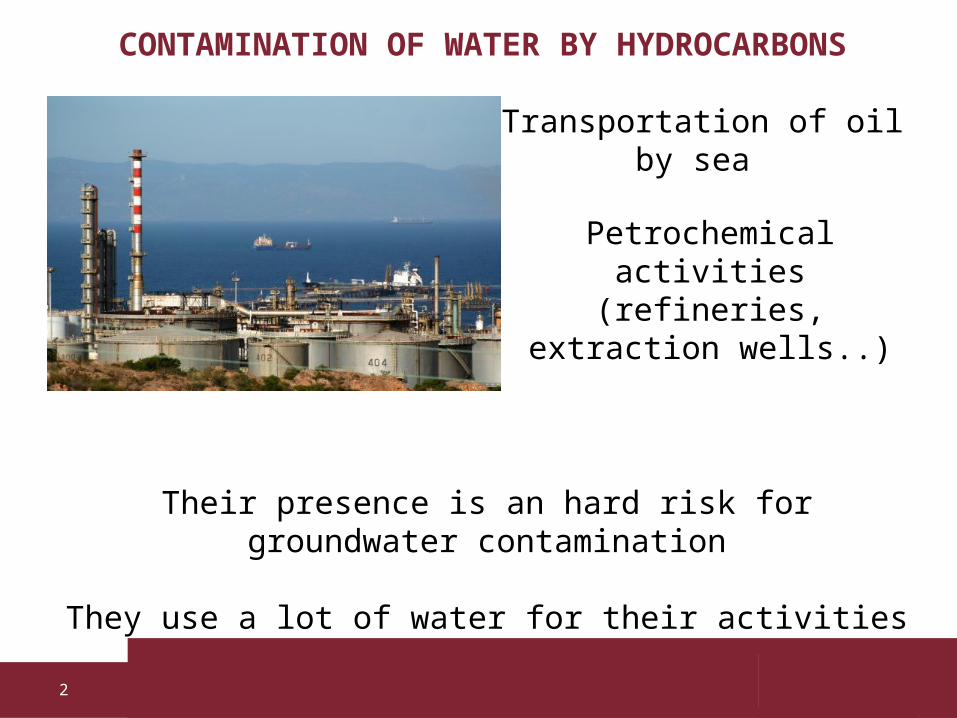
CONTAMINATION OF WATER BY HYDROCARBONS
Their presence is an hard risk for groundwater contamination
They use a lot of water for their activities
Petrochemical activities (refineries,
extraction wells..)
Transportation of oil by sea
Relazione di TirocinioRoma, 12 Gennaio 20113
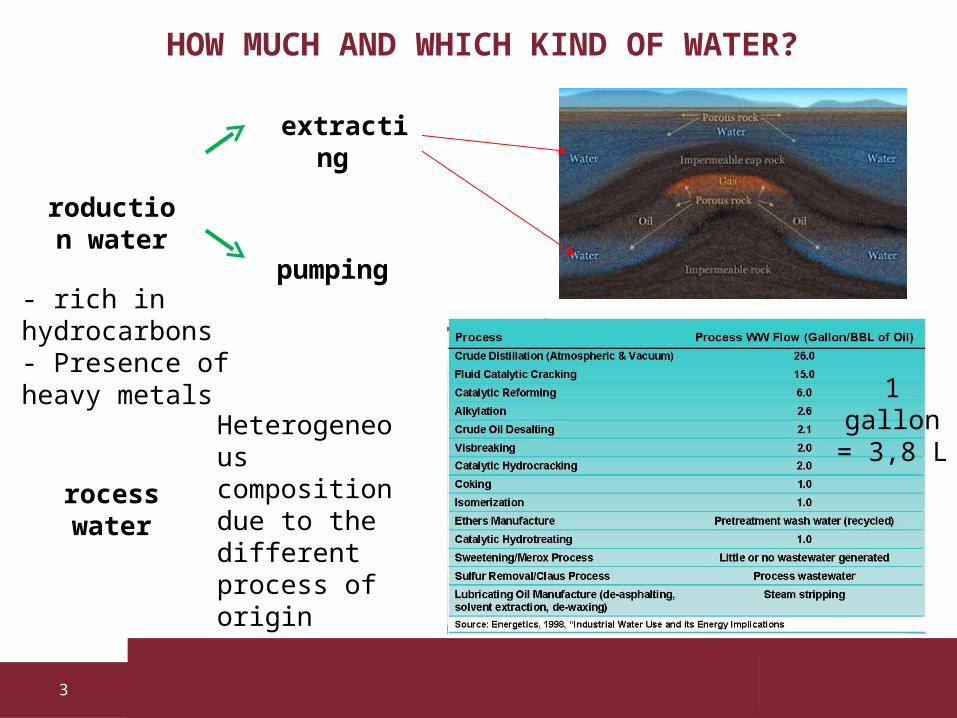
HOW MUCH AND WHICH KIND OF WATER?
Production water
extracting
pumping
Process water
1 gallon = 3,8 L
- rich in hydrocarbons- Presence of heavy metals
Heterogeneous composition due to the different process of origin
Relazione di TirocinioRoma, 12 Gennaio 20114
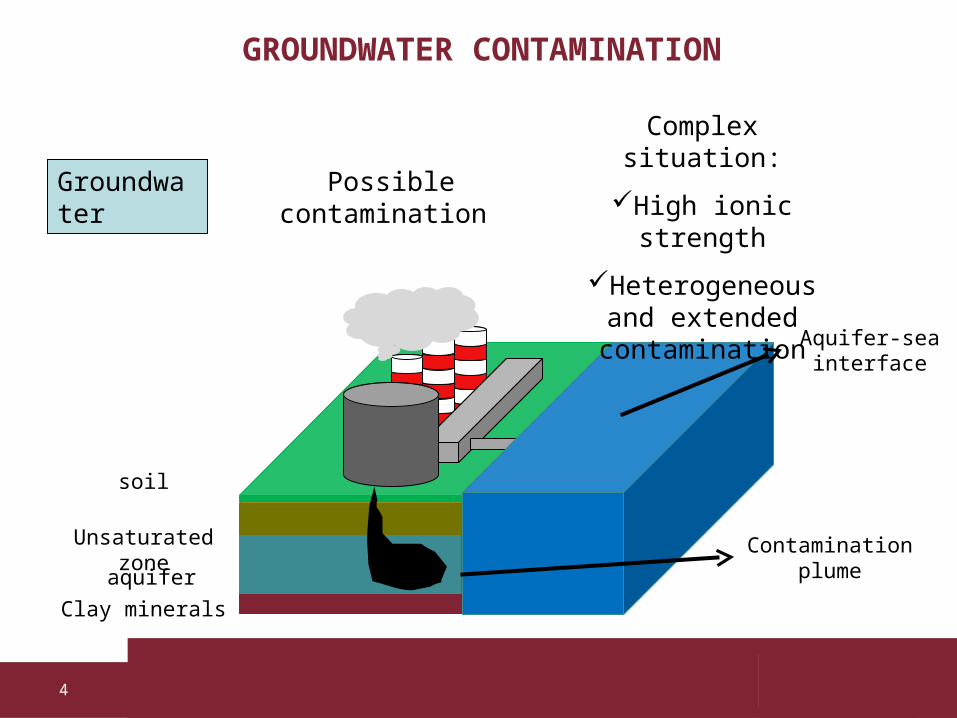
Groundwater
Possible contamination
soil
Unsaturated zoneaquifer
Clay minerals
Aquifer-sea interface
Contamination plume
Complex situation:
High ionic strength
Heterogeneous and extended contamination
GROUNDWATER CONTAMINATION

Relazione di TirocinioRoma, 12 Gennaio 20115
THE MOST USED WATER TREATMENT SYSTEMS
Production water
Reinjection in exhausted wells
Process water
physical treatments:Chemical treatments
groundwaterBiological treatmentsMembranes treatments
Adsorption/chelation
Development of economic versatile
and efficent process
enhancement waste into a resource
Relazione di TirocinioRoma, 12 Gennaio 20116
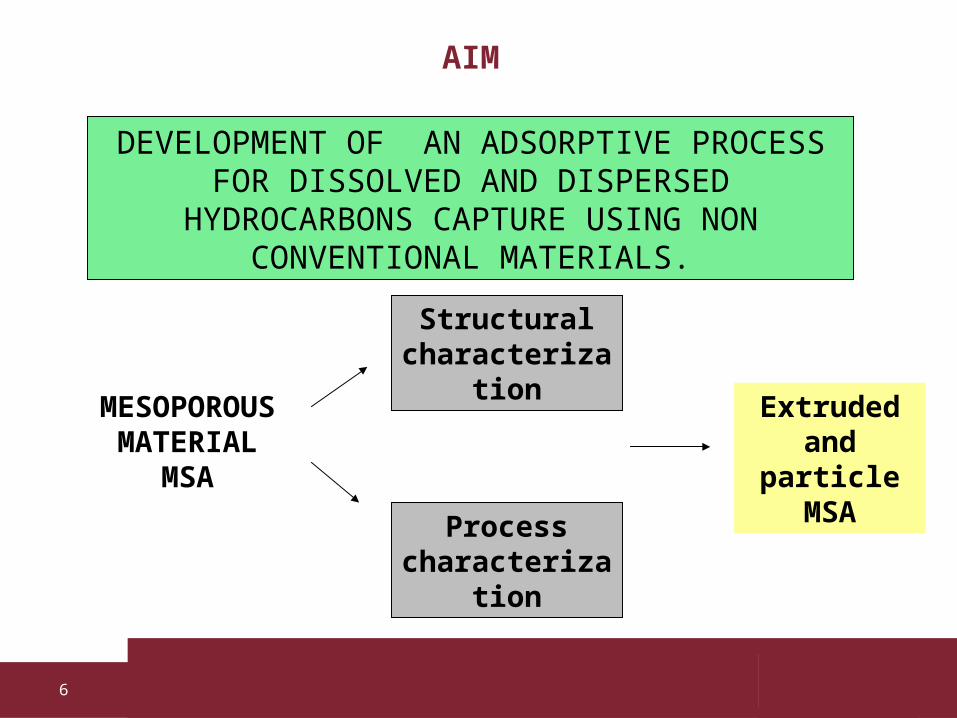
AIM
MESOPOROUS MATERIAL
MSAProcess
characterization
DEVELOPMENT OF AN ADSORPTIVE PROCESS FOR DISSOLVED AND DISPERSED
HYDROCARBONS CAPTURE USING NON CONVENTIONAL MATERIALS.
Structural characteriza
tion Extruded and
particle MSA
Relazione di TirocinioRoma, 12 Gennaio 20117
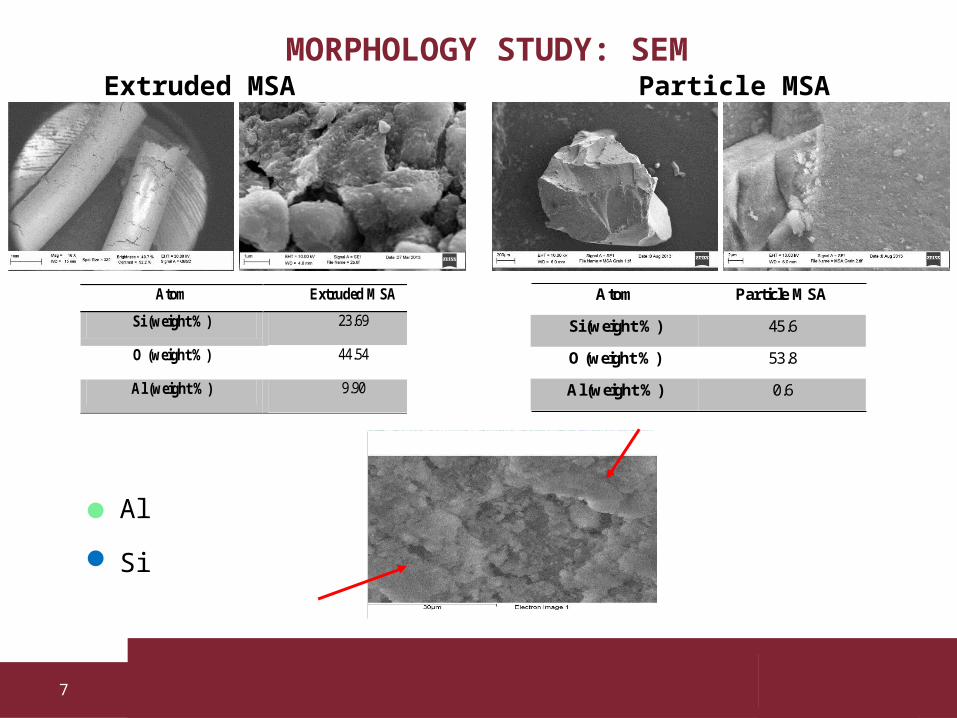
MORPHOLOGY STUDY: SEM
Atom Extruded M SA Si (weight % ) 23.69
O (weight % ) 44.54
Al (weight % ) 9.90
Table 1. EDX analyses of extruded and particle M SA
Atom Particle M SASi (weight% ) 45.6O (weight% ) 53.8Al (weight% ) 0.6
Extruded MSA Particle MSA
Al
Si
Relazione di TirocinioRoma, 12 Gennaio 20118
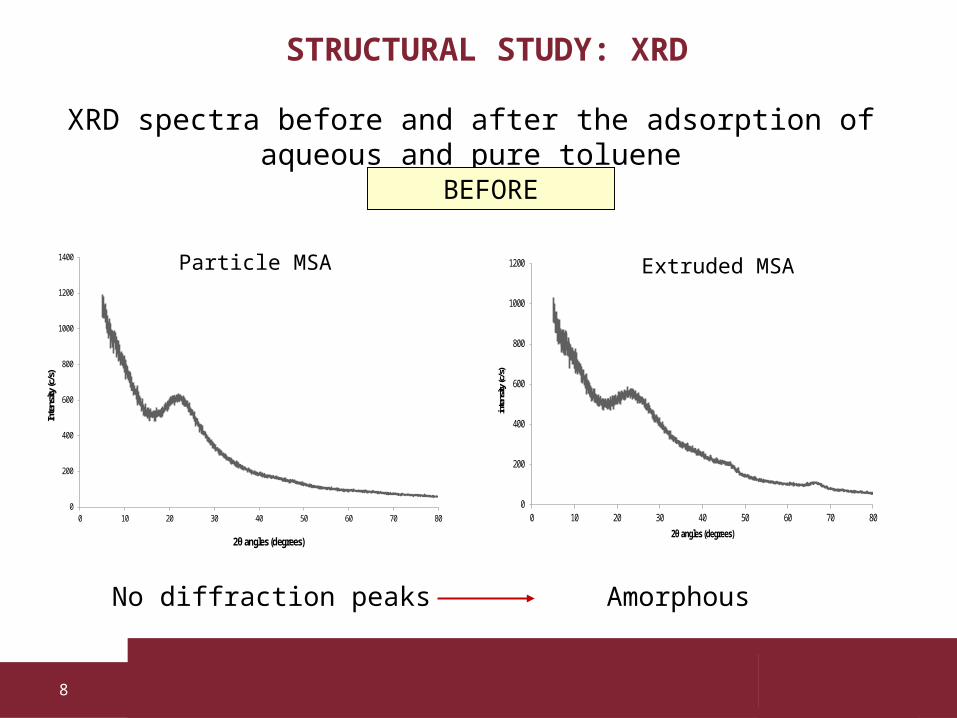
STRUCTURAL STUDY: XRD
XRD spectra before and after the adsorption of aqueous and pure toluene
0
200
400
600
800
1000
1200
0 10 20 30 40 50 60 70 80intensity (c/s)
2θ angles (degrees)
Extruded MSA
0
200
400
600
800
1000
1200
1400
0 10 20 30 40 50 60 70 80
Intensity (c/s)
2θ angles (degrees)
Particle MSA
No diffraction peaks Amorphous
BEFORE

Relazione di TirocinioRoma, 12 Gennaio 20119
STRUCTURAL STUDY: XRD
0
200
400
600
800
1000
1200
1400
0 10 20 30 40 50 60 70 80
intensity (c/s)
2θ angles (degrees)
Extruded MSA pure toluene
0
200
400
600
800
1000
1200
1400
0 10 20 30 40 50 60 70 80
Intensity (c/s)
2θ angles (degrees)
Particle MSA pure toluene
0
200
400
600
800
1000
1200
0 10 20 30 40 50 60 70 80
intensity (c/s)
2θ angles (degrees)
Extruded MSA aqueous toluene
0
200
400
600
800
1000
1200
1400
0 10 20 30 40 50 60 70 80
Intensity (c/s)
2θ angles (degrees)
Particle MSA aqueous toluene
AFTER
Relazione di TirocinioRoma, 12 Gennaio 201110
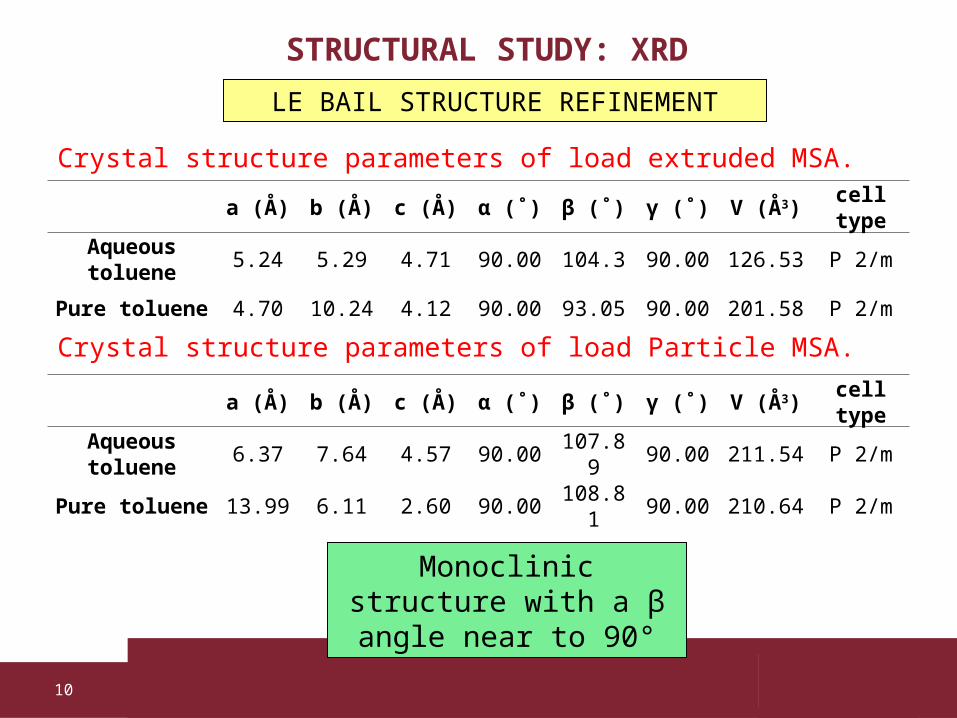
STRUCTURAL STUDY: XRD
a (Å) b (Å) c (Å) α (˚) β (˚) γ (˚) V (Å3) cell type
Aqueous toluene 5.24 5.29 4.71 90.00 104.3 90.00 126.53 P 2/m
Pure toluene 4.70 10.24 4.12 90.00 93.05 90.00 201.58 P 2/m
a (Å) b (Å) c (Å) α (˚) β (˚) γ (˚) V (Å3) cell type
Aqueous toluene 6.37 7.64 4.57 90.00 107.8
9 90.00 211.54 P 2/m
Pure toluene 13.99 6.11 2.60 90.00 108.81 90.00 210.64 P 2/m
LE BAIL STRUCTURE REFINEMENT
Monoclinic structure with a β angle near to 90°
Crystal structure parameters of load extruded MSA.
Crystal structure parameters of load Particle MSA.

Relazione di TirocinioRoma, 12 Gennaio 201111
STRUCTURAL STUDY: XRDLE BAIL STRUCTURE REFINEMENT
“Light monoclinic” structure of confined toluene into MSA pores
Orthorombic structure of bulk crystal toluene
Relazione di TirocinioRoma, 12 Gennaio 201112
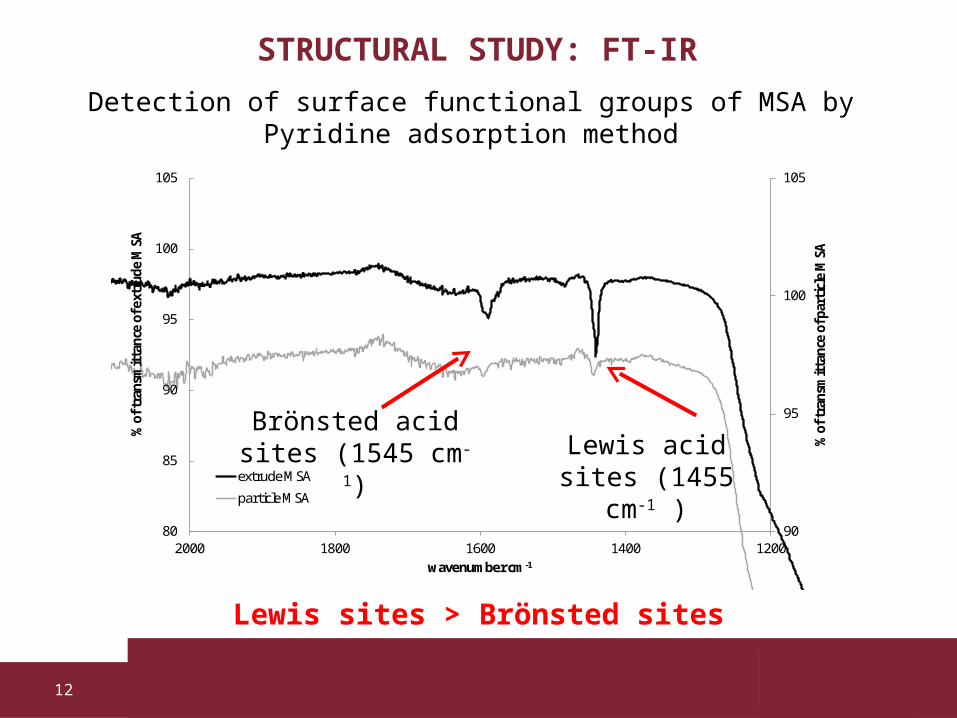
STRUCTURAL STUDY: FT-IR
Lewis sites > Brönsted sites
Detection of surface functional groups of MSA by Pyridine adsorption method
90
95
100
105
80
85
90
95
100
105
12001400160018002000
% of transm
ittance of pa
rticle
MSA
% of transm
ittance of ex
trude MSA
wavenumber cm -1
extrude M SAparticle M SA
Brönsted acid sites (1545 cm-
1)Lewis acid sites (1455
cm-1 )
Relazione di TirocinioRoma, 12 Gennaio 201113
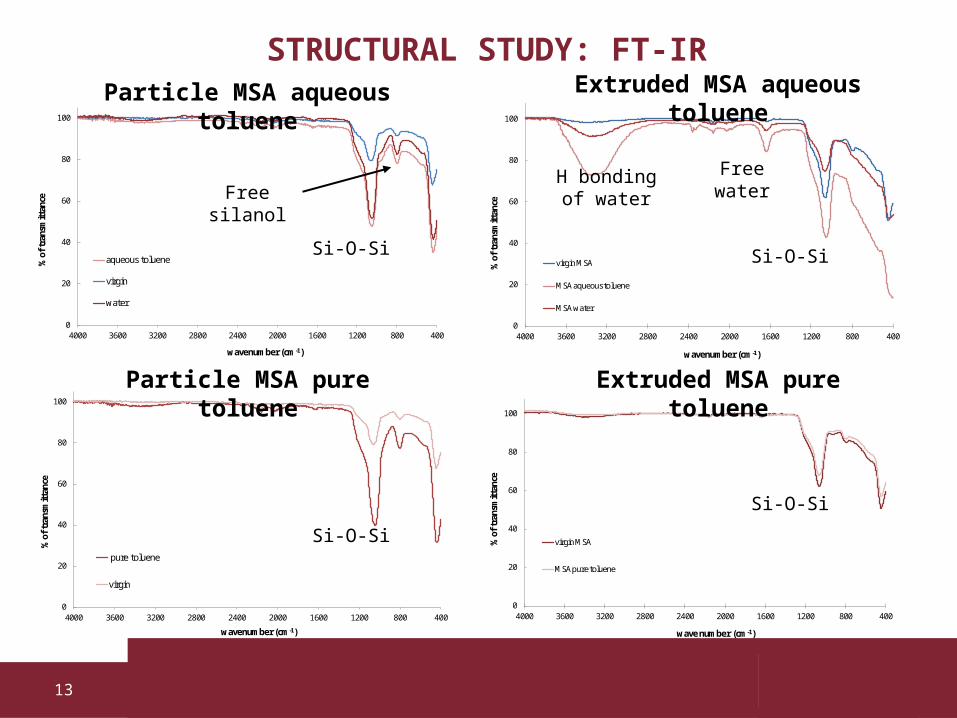
STRUCTURAL STUDY: FT-IR
0
20
40
60
80
100
40080012001600200024002800320036004000
% of transmittance
w avenum ber (cm -1)
virgin M SA
M SA aqueous toluene
M SA water
0
20
40
60
80
100
40080012001600200024002800320036004000
% of transmittance
w ave num ber (cm -1)
virgin M SA
M SA pure toluene
0
20
40
60
80
100
40080012001600200024002800320036004000
% of transmittance
w avenum ber (cm -1)
aqueous toluene
virgin
water
0
20
40
60
80
100
40080012001600200024002800320036004000
% of transmittance
w avenum ber (cm -1)
pure toluene
virgin
Si-O-Si
Si-O-Si
Si-O-Si
Si-O-Si
H bonding of water
Free waterFree
silanol
Extruded MSA aqueous toluene
Particle MSA aqueous toluene
Extruded MSA pure toluene
Particle MSA pure toluene
Relazione di TirocinioRoma, 12 Gennaio 201114
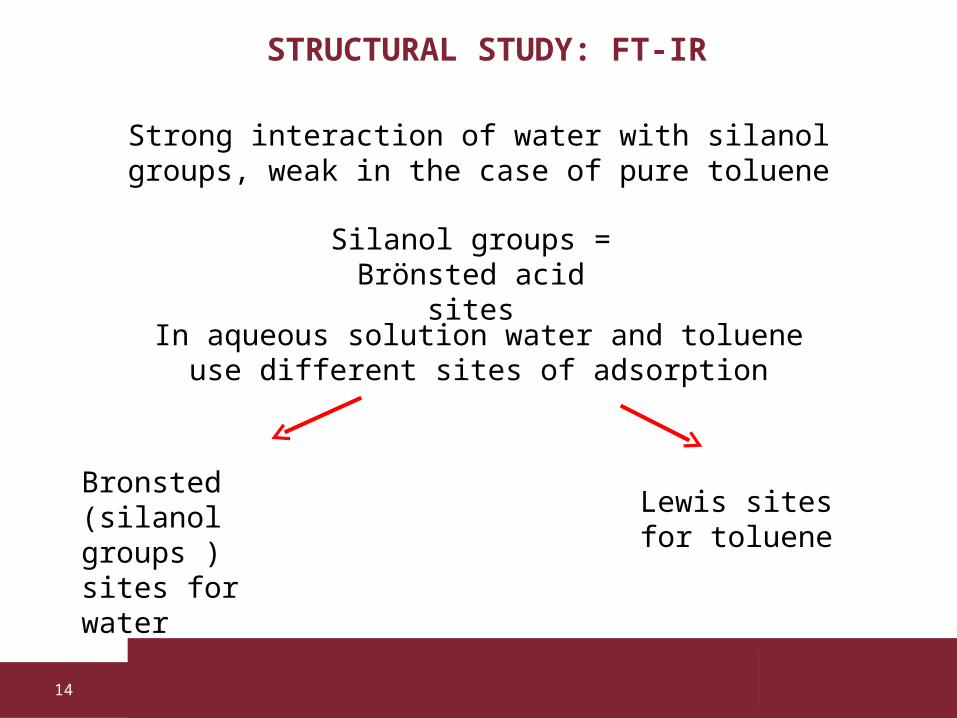
STRUCTURAL STUDY: FT-IR
Strong interaction of water with silanol groups, weak in the case of pure toluene
In aqueous solution water and toluene use different sites of adsorption
Lewis sites for toluene
Bronsted (silanol groups ) sites for water
Silanol groups = Brönsted acid
sites
Relazione di TirocinioRoma, 12 Gennaio 201115
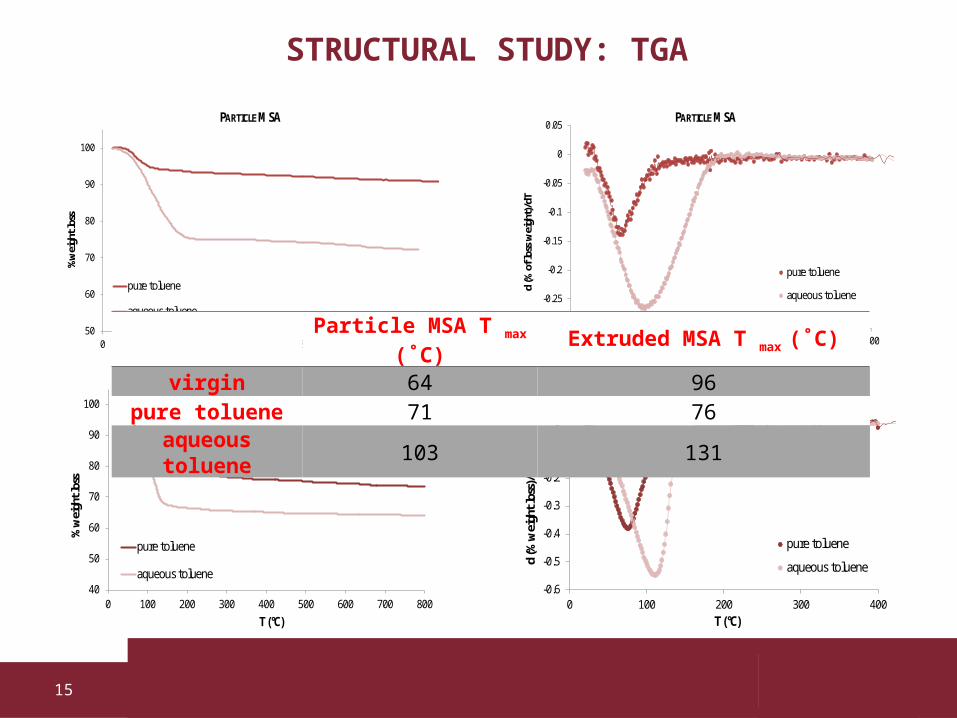
STRUCTURAL STUDY: TGA
50
60
70
80
90
100
0 100 200 300 400 500 600
%weight loss
T (°C)
PARTICLEM SA
pure toluene
aqueous toluene-0.3
-0.25
-0.2
-0.15
-0.1
-0.05
0
0.05
0 50 100 150 200 250 300 350 400
d (% of loss weight)/dT
T (°C)
PARTICLEM SA
pure tolueneaqueous toluene
40
50
60
70
80
90
100
0 100 200 300 400 500 600 700 800
% weight loss
T (°C)
EXTRUDED M SA
pure toluene
aqueous toluene-0.6
-0.5
-0.4
-0.3
-0.2
-0.1
0
0.1
0 100 200 300 400
d (% weight loss)/(dT)
T (°C)
EXTRUDED M SA
pure tolueneaqueous toluene
Particle MSA T max (˚C) Extruded MSA T max (˚C)
virgin 64 96pure toluene 71 76
aqueous toluene 103 131
Relazione di TirocinioRoma, 12 Gennaio 201116
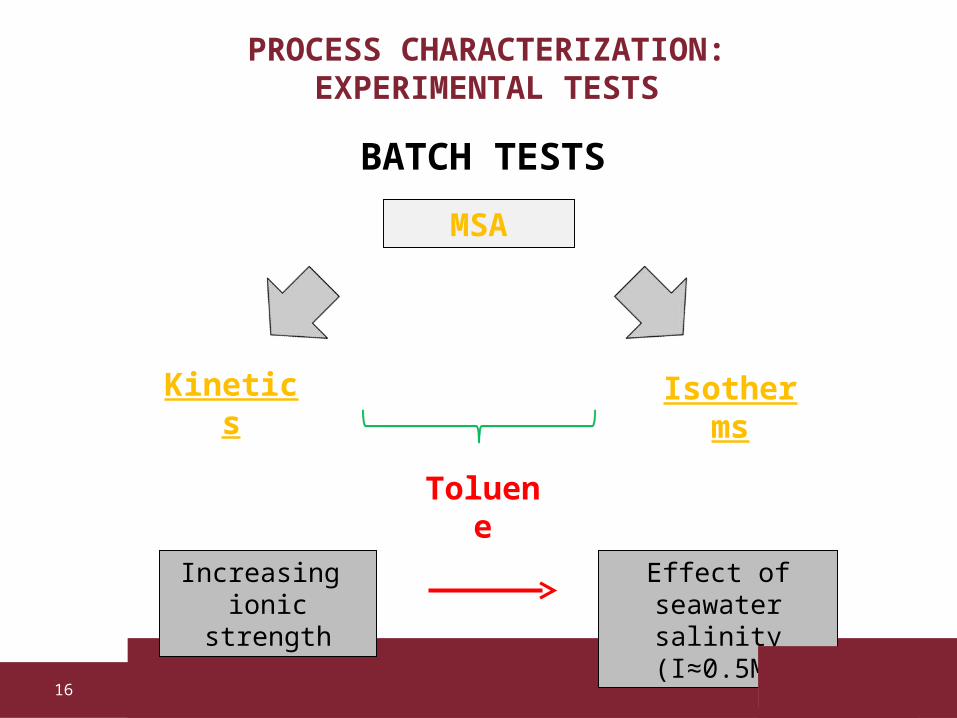
BATCH TESTS
Kinetics
Isotherms
MSA
Toluene
PROCESS CHARACTERIZATION: EXPERIMENTAL TESTS
Increasing ionic
strength
Effect of seawater salinity (I≈0.5M)
Relazione di TirocinioRoma, 12 Gennaio 201117
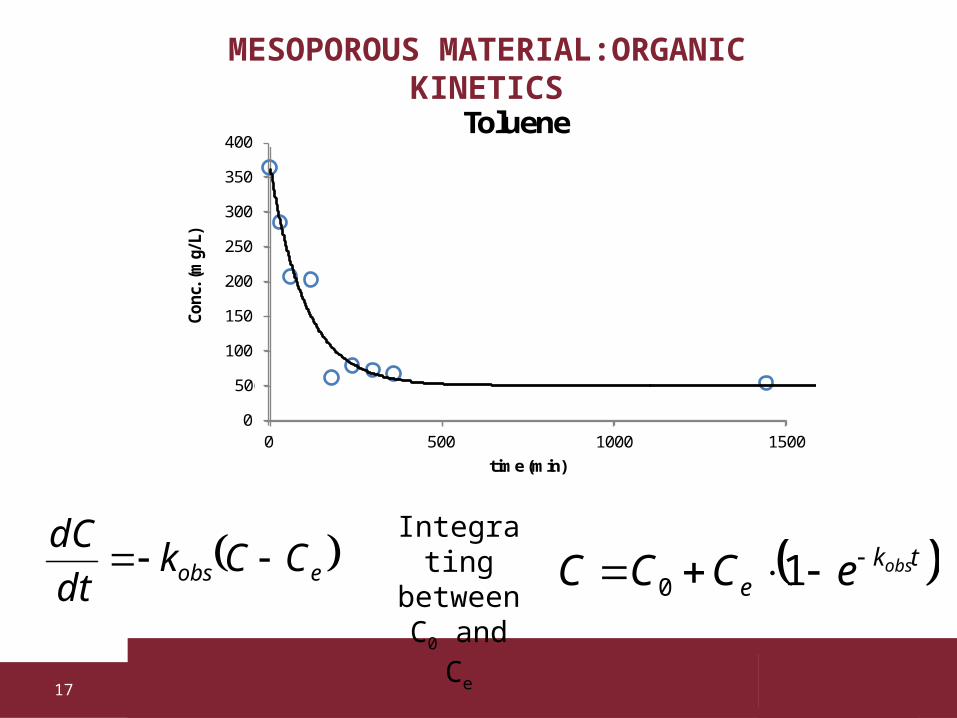
MESOPOROUS MATERIAL:ORGANIC KINETICS
0
50
100
150
200
250
300
350
400
0 500 1000 1500
Conc. (mg/L)
tim e (m in)
Toluene
0
50
100
150
200
250
300
350
400
0 500 1000 1500
Conc. (mg/L)
tim e (m in)
Toluene
eobs CCkdtdC
tke
obseCCC 10
Integrating
between C0 and Ce
Relazione di TirocinioRoma, 12 Gennaio 201118
0
50
100
150
200
250
300
350
400
0 500 1000 1500
C (mg
/L)
tim e (m in)
H2O deio
0.001M
0.01M
0.5 M
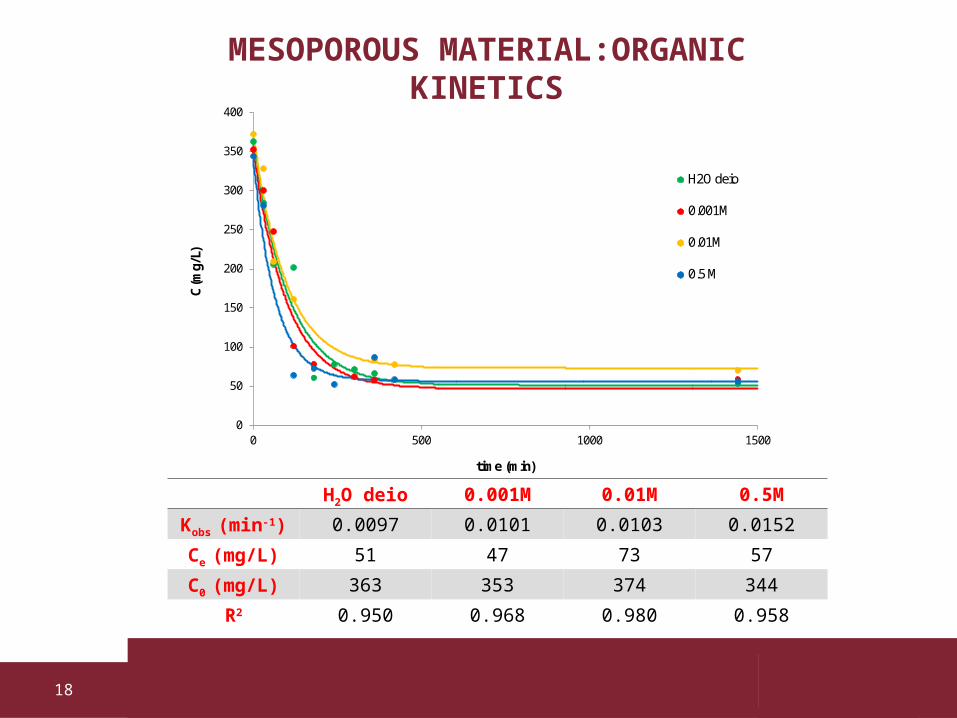
MESOPOROUS MATERIAL:ORGANIC KINETICS
H2O deio 0.001M 0.01M 0.5MKobs (min-1) 0.0097 0.0101 0.0103 0.0152Ce (mg/L) 51 47 73 57C0 (mg/L) 363 353 374 344
R2 0.950 0.968 0.980 0.958
Relazione di TirocinioRoma, 12 Gennaio 201119
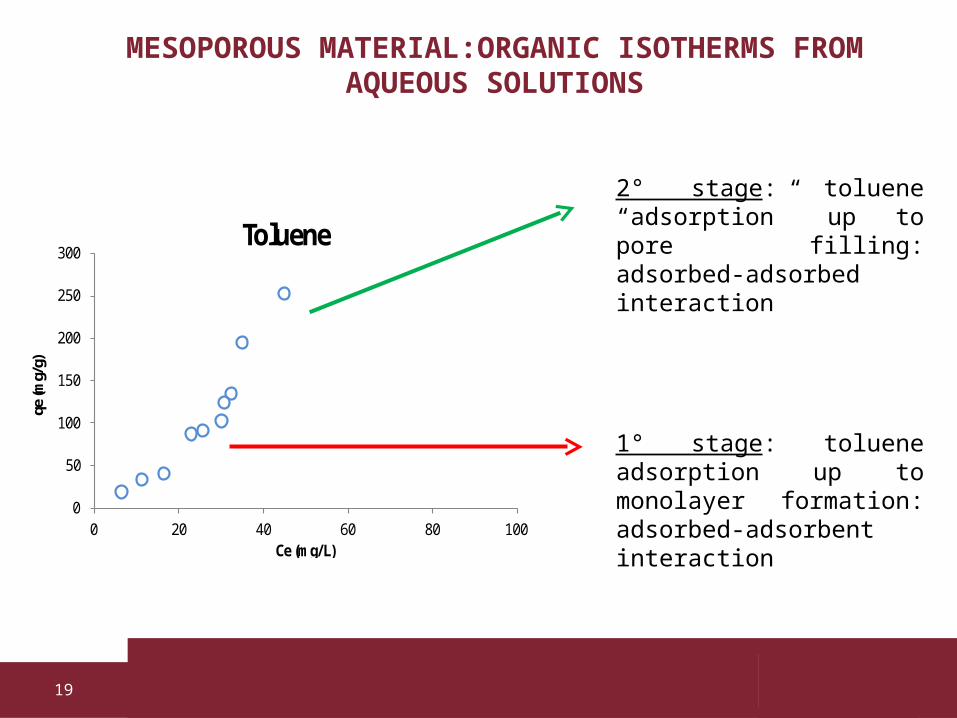
MESOPOROUS MATERIAL:ORGANIC ISOTHERMS FROM AQUEOUS SOLUTIONS
0
50
100
150
200
250
300
0 20 40 60 80 100
qe (mg/g)
Ce (m g/L)
Toluene
1° stage: toluene adsorption up to monolayer formation: adsorbed-adsorbent interaction
2° stage: toluene “adsorption” up to pore filling: adsorbed-adsorbed interaction

Relazione di TirocinioRoma, 12 Gennaio 201120
0
50
100
150
200
250
300
0 20 40 60 80 100
qe (m
g/g)
Ce (m g/L)
Toluene
0
50
100
150
200
250
300
0 20 40 60 80 100
qe (m
g/g)
Ce (m g/L)
Toluene
MESOPOROUS MATERIAL: ORGANIC ISOTHERMS FROM AQUEOUS SOLUTIONS
n
es
nes
el
ele CK
CKCK
CKqq11max
(J.W. Lee et al., 2004)
Relazione di TirocinioRoma, 12 Gennaio 201121
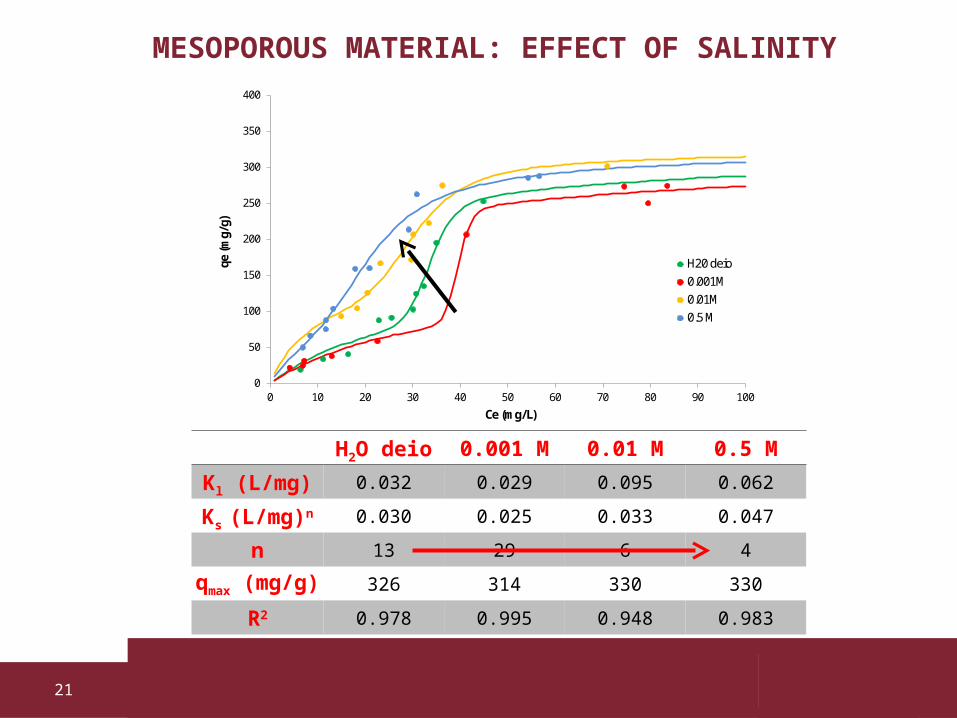
MESOPOROUS MATERIAL: EFFECT OF SALINITY
H2O deio 0.001 M 0.01 M 0.5 MKl (L/mg) 0.032 0.029 0.095 0.062Ks (L/mg)n 0.030 0.025 0.033 0.047
n 13 29 6 4qmax (mg/g) 326 314 330 330
R2 0.978 0.995 0.948 0.983
0
50
100
150
200
250
300
350
400
0 10 20 30 40 50 60 70 80 90 100
qe (m
g/g)
Ce (m g/L)
H20 deio0.001M0.01M0.5 M
Relazione di TirocinioRoma, 12 Gennaio 201122
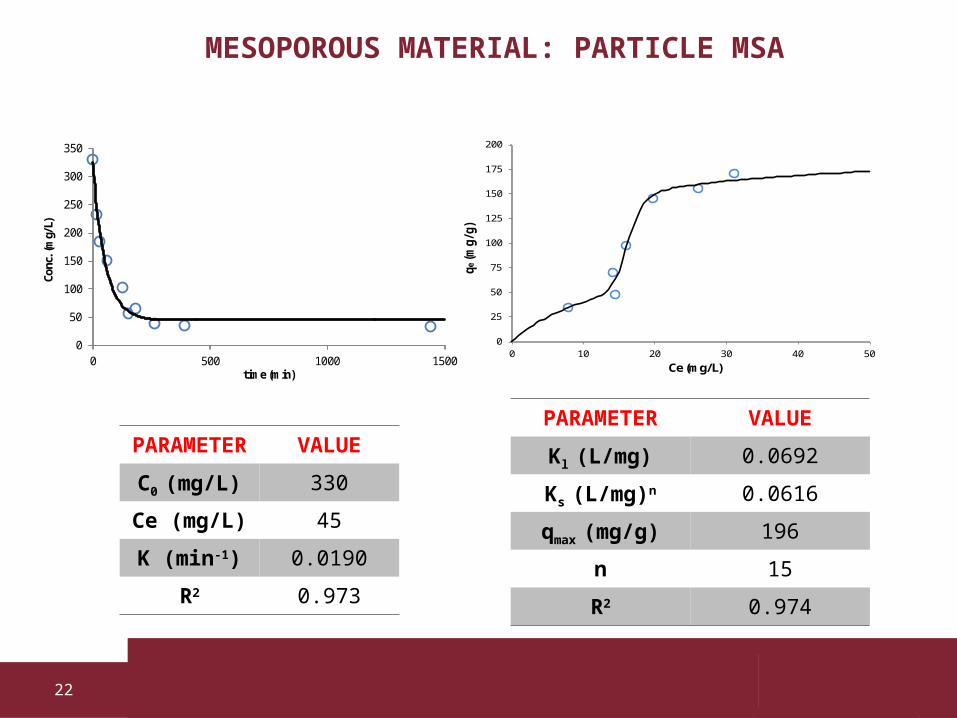
MESOPOROUS MATERIAL: PARTICLE MSA
0
50
100
150
200
250
300
350
0 500 1000 1500
Conc. (mg/L)
tim e (m in)
0
25
50
75
100
125
150
175
200
0 10 20 30 40 50
qe(m
g/g)
Ce (m g/L)
0
25
50
75
100
125
150
175
200
0 10 20 30 40 50
qe(m
g/g)
Ce (m g/L)0
50
100
150
200
250
300
350
0 500 1000 1500
Conc. (mg/L)
tim e (m in)
PARAMETER VALUEC0 (mg/L) 330Ce (mg/L) 45K (min-1) 0.0190
R2 0.973
PARAMETER VALUEKl (L/mg) 0.0692Ks (L/mg)n 0.0616qmax (mg/g) 196
n 15R2 0.974
Relazione di TirocinioRoma, 12 Gennaio 201123
CONCLUSION

Relazione di TirocinioRoma, 12 Gennaio 201124
THANKS FOR THE ATTENTION


