Embed Size (px)
Citation preview
National Park Service U.S. Department of the Interior Natural Resource Stewardship and Science
Sierra Nevada Network Lake Monitoring Protocol Standard Operating Procedures Natural Resource Report NPS/SIEN/NRR—2012/551.1

ON THE COVER Lake in the Upper Kern Watershed, Sequoia National Park. Photograph by: Bob Meadows
Sierra Nevada Network Lake Monitoring Protocol Standard Operating Procedures Natural Resource Report NPS/SIEN/NRR—2012/551.1
Andrea M. Heard1, Leigh Ann Harrod Starcevich2, James O. Sickman3, Rosamonde Cook4, Donald W. Schweizer1, Dena Paolilli1, and Catherine Fong1 1National Park Service, Sierra Nevada Network Sequoia and Kings Canyon National Parks 47050 Generals Highway Three Rivers, CA 93271 2Oregon State University Corvallis, OR 97331 3University of California, Riverside Department of Environmental Sciences Room 2324 Geology Riverside, CA 92521 4Western Riverside County MSHCP/Database Consultant 4500 Glenwood Drive, Bldg. C Riverside, CA 92501
July 2012
U.S. Department of the Interior National Park Service Natural Resource Stewardship and Science Fort Collins, Colorado
ii
The National Park Service, Natural Resource Stewardship and Science office in Fort Collins, Colorado publishes a range of reports that address natural resource topics of interest and applicability to a broad audience in the National Park Service and others in natural resource management, including scientists, conservation and environmental constituencies, and the public.
The Natural Resource Report Series is used to disseminate high-priority, current natural resource management information with managerial application. The series targets a general, diverse audience, and may contain NPS policy considerations or address sensitive issues of management applicability.
All manuscripts in the series receive the appropriate level of peer review to ensure that the information is scientifically credible, technically accurate, appropriately written for the intended audience, and designed and published in a professional manner. This report received formal, high-level peer review based on the importance of its content, or its potentially controversial or precedent-setting nature. Peer review was conducted by highly qualified individuals with subject area technical expertise and was overseen by a peer review manager.
Views, statements, findings, conclusions, recommendations, and data in this report do not necessarily reflect views and policies of the National Park Service, U.S. Department of the Interior. Mention of trade names or commercial products does not constitute endorsement or recommendation for use by the U.S. Government.
This report is available from the Sierra Nevada Network website (http://science.nature.nps.gov/im/units/sien/), and the Natural Resource Publications Management website (http://www.nature.nps.gov/publications/nrpm).
Please cite this publication as:
Heard, A. M., L. A. H. Starcevich, J. O. Sickman, R. Cook , D. W. Schweizer, D. Paolilli, and C. Fong. 2012. Sierra Nevada Network lake monitoring protocol: Standard operating procedures. Natural Resource Report NPS/SIEN/NRR—2012/551.1. National Park Service, Fort Collins, Colorado.
NPS 963/115668, July 2012
iii
Revision History Log Previous Version
#
Revision Date Author Changes Made Reason for
Change New
Version #

v
Table of Contents Page
SOP 1. Lake Monitoring Sites ............................................................................................. SOP 1.1
SOP 2. Safety ....................................................................................................................... SOP 2.1
SOP 3. Training ................................................................................................................... SOP 3.1
SOP 4. Quality Assurance Project Plan (QAPP) ................................................................. SOP 4.1
SOP 5. Field Season Preparations ........................................................................................ SOP 5.1
SOP 6. Chain of Custody ..................................................................................................... SOP 6.7
SOP 7. Equipment Disinfection ........................................................................................... SOP 7.1
SOP 8. Water Sampling Methods ........................................................................................ SOP 8.1
SOP 9. Sample Handling, Storage, and Shipping ................................................................ SOP 9.1
SOP 10. Water-level and Continuous Temperature Sampling .......................................... SOP 10.1
SOP 11. Post-season Procedures........................................................................................ SOP 11.1
SOP 12. Data Management ................................................................................................ SOP 12.1
SOP 13. Water Quality and Streamflow Monitoring Database User’s Manual ................ SOP 13.1
SOP 14. Data Analysis ....................................................................................................... SOP 14.1
SOP 15. Protocol Revision ................................................................................................ SOP 15.1


SIEN Lakes Monitoring Protocol
SOP 1.1
Sierra Nevada Network Lake Monitoring Protocol
SOP 1. Lake Monitoring Sites Version 1.00, May 2012 Prepared by Andrea M. Heard
Revision History Log Previous Version #
Revision Date Author Changes Made Reason for
Change New
Version #

SIEN Lakes Monitoring Protocol
SOP 1.3
Figures Page
Figure SOP 1.1. Cost surface model for Yosemite. .................................................... SOP 1.6
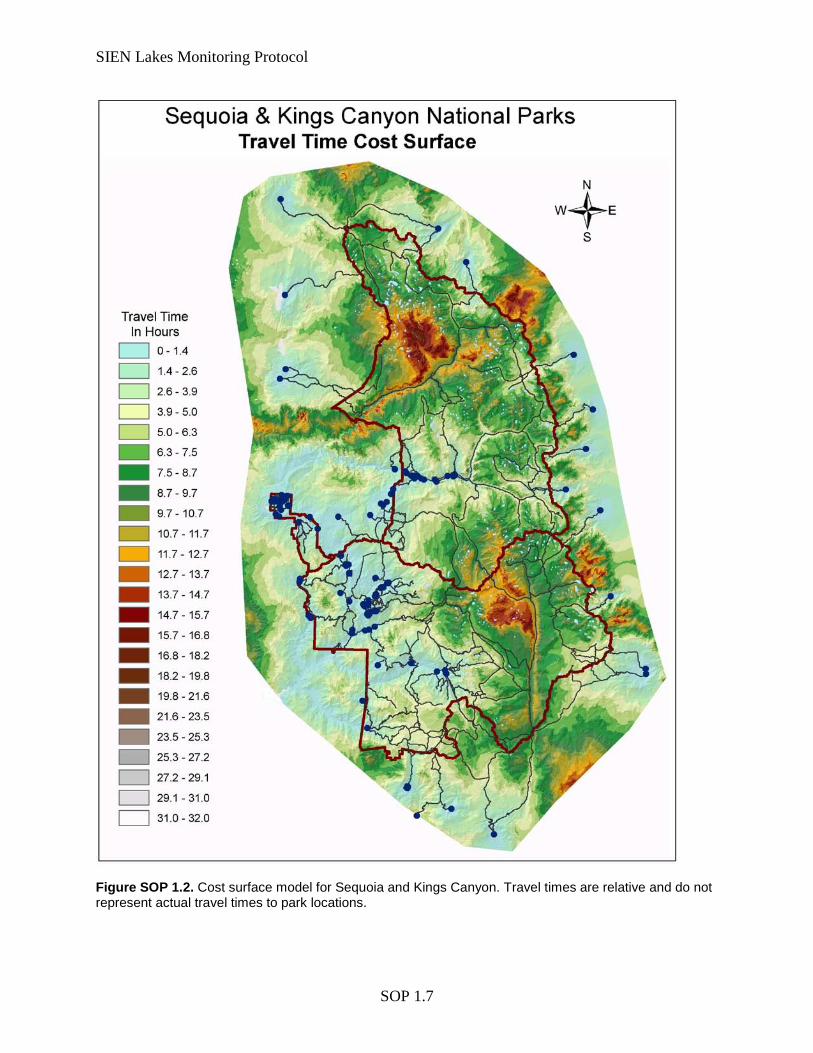
Figure SOP 1.2. Cost surface model for Sequoia and Kings Canyon. .................... SOP 1.7
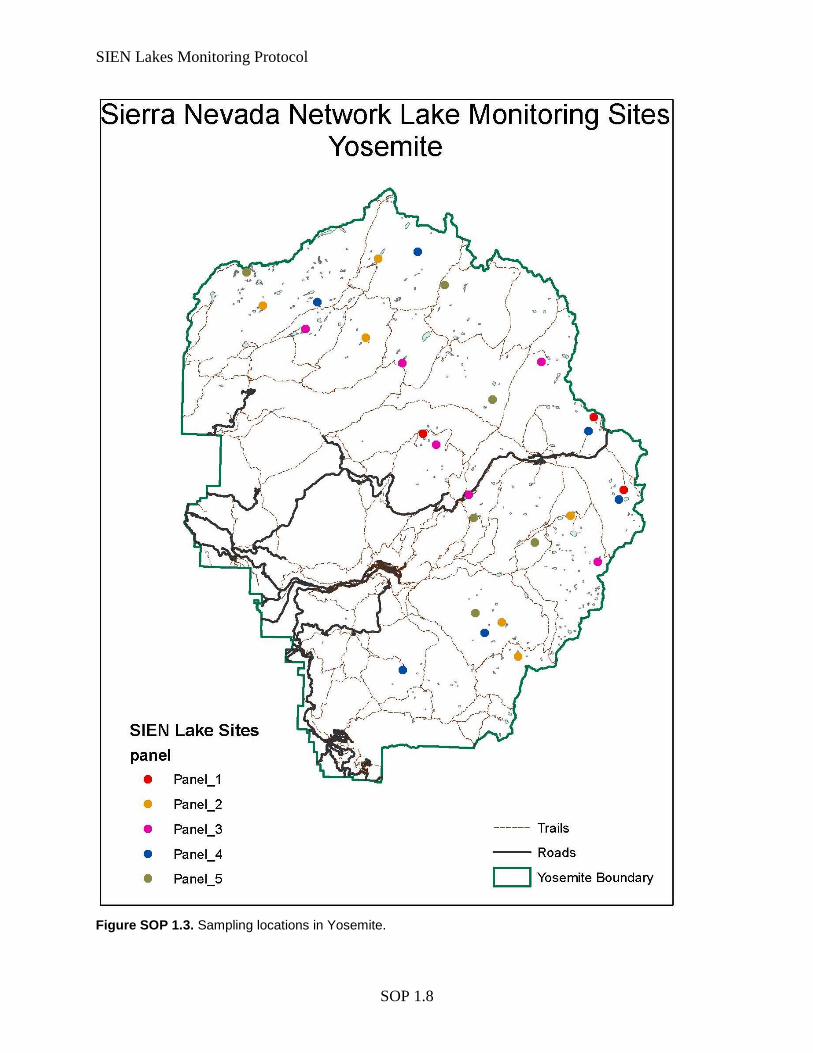
Figure SOP 1.3. Sampling locations in Yosemite. ...................................................... SOP 1.8
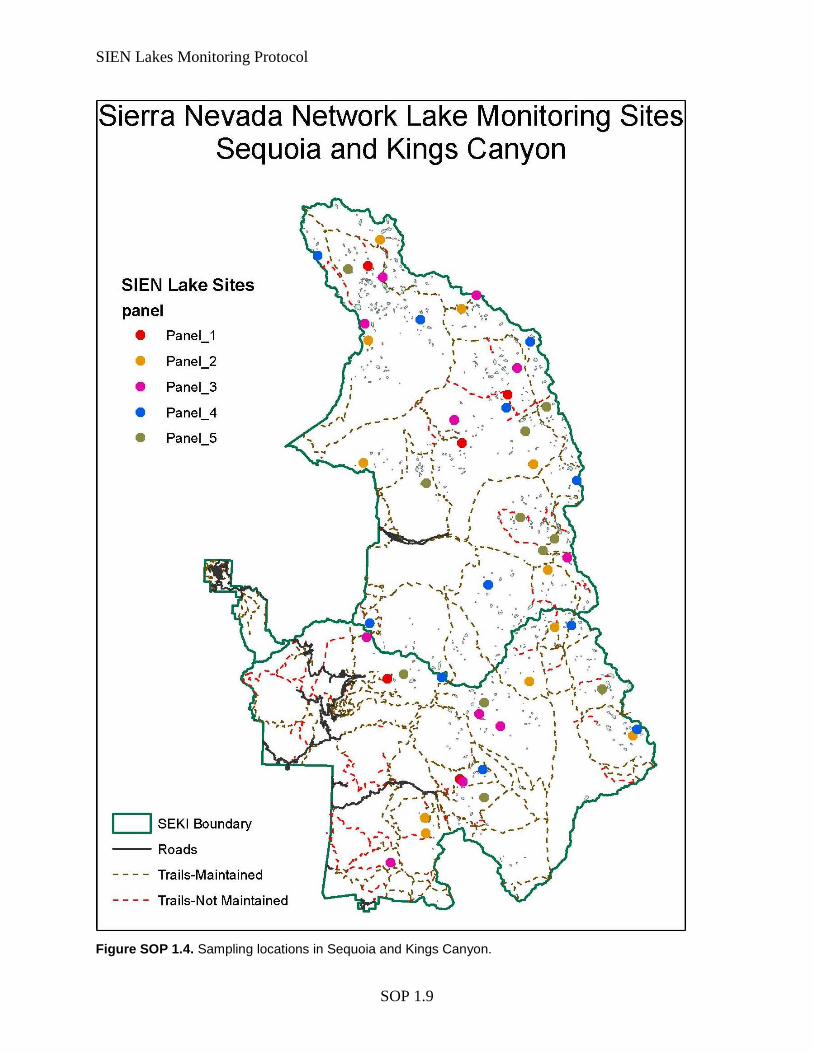
Figure SOP 1.4. Sampling locations in Sequoia and Kings Canyon. ...................... SOP 1.9
Tables Page
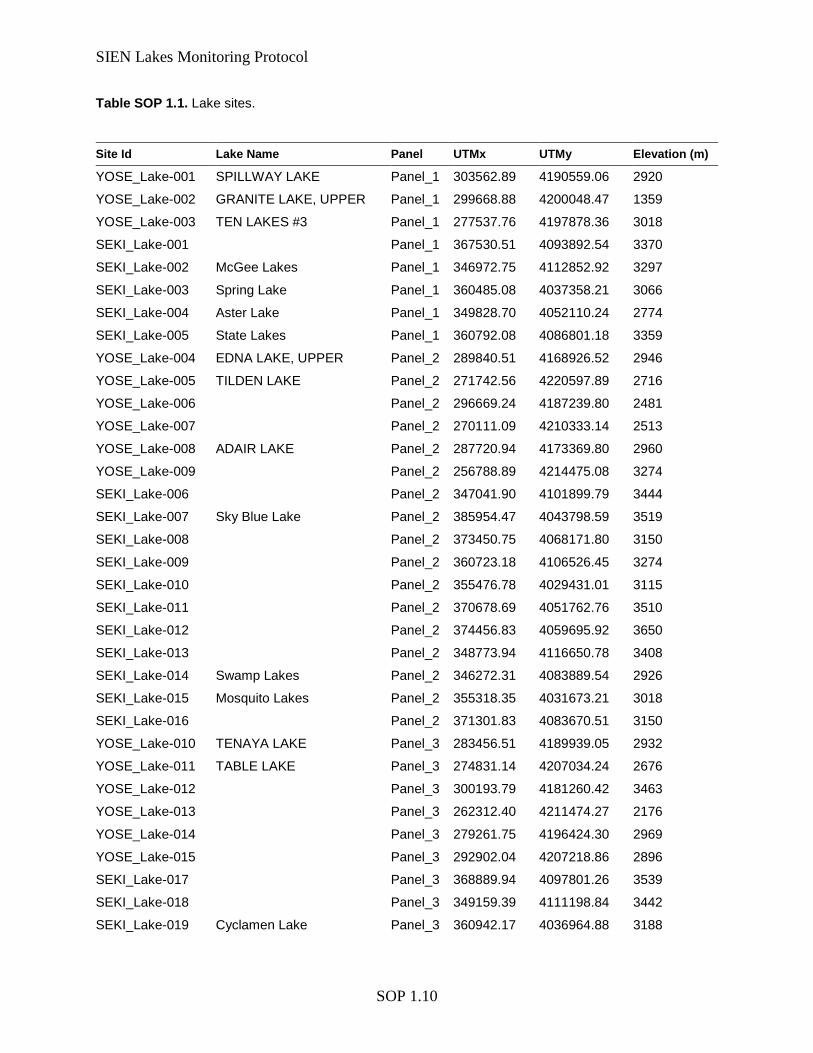
Table SOP 1.1. Lake sites. ............................................................................................ SOP 1.10

SIEN Lakes Monitoring Protocol
SOP 1.5
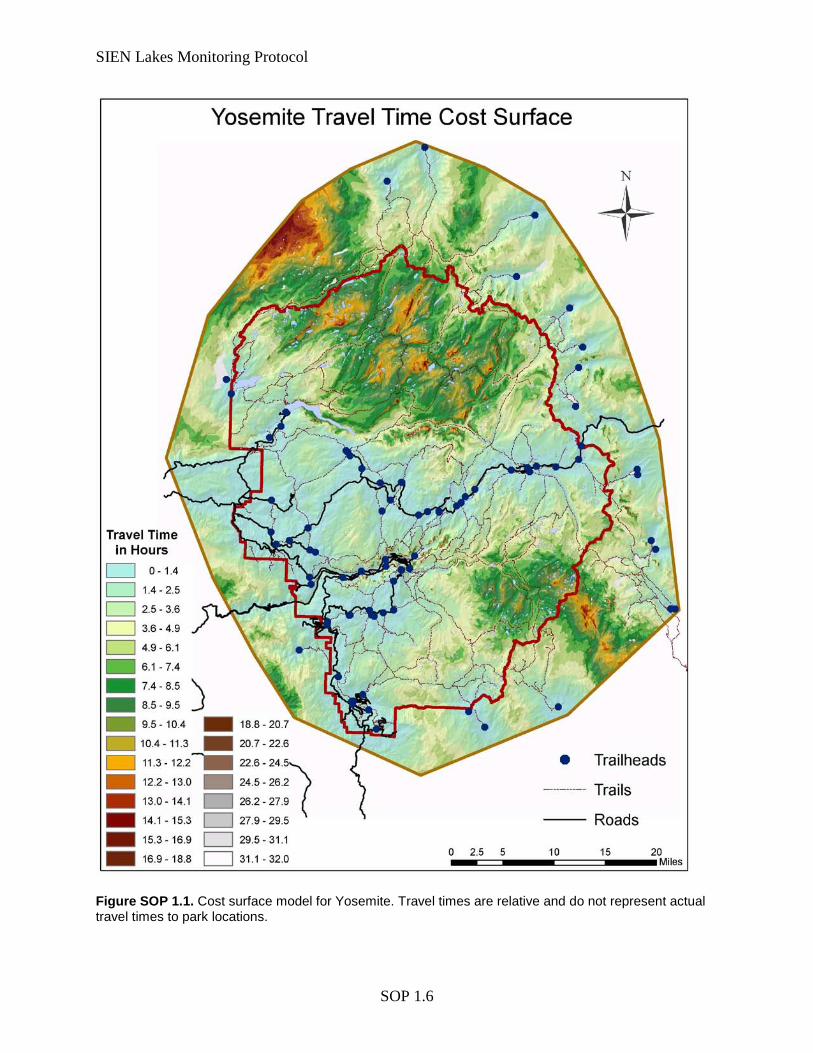
1 Lake Monitoring Sites This SOP documents the extensive lakes selected for monitoring. Extensive sites were probabilistically selected using a generalized random tessellation stratified (GRTS) design that incorporated unequal inclusion probabilities. Inclusion probabilities were based on a cost-surface model that computes relative travel times to sites based on factors such as the presence of trails, vegetation type, and slope angle (Frakes et al. 2007). Data from GIS layers were used to compute the travel time across the park landscapes and for each site in the target population; the inclusion probability for each site is inversely proportional to this time. Lakes that are quicker to access (i.e. closer to trails and trailheads or accessed via ‘easier’ cross country terrain) had a higher probability of being selected. The revisit design is: a [(1-0), (1-3)] revisit design; sampling 25 lakes per year with 8 visited annually and 17 visited per year in the alternating panels. Please refer to the Protocol Narrative for a complete description of the sampling design.
We created a cost-surface model for each park following methods in Frakes et al. (2007). We drew the GRTS sample using the R workspace ‘spsurvey’ (Kincaid 2006). Original files, including the R code, sample frame data, input files, model output, GRTS output, etc., along with metadata are stored in the appropriate folders under the I&M directory structure.
Access routes will vary by year and depend on current backcountry conditions, suite of sites selected for the year, crews abilities, and the many logistical considerations (e.g., housing locations, crew schedules). Over the first four years as we visit the sites, we will create a file for each site that documents previous routes and provides helpful location information for future crews.
This SOP includes park cost surface maps (Figure SOP 1.1 and Figure SOP 1.2), site maps (Figure SOP 1.3 and Figure SOP 1.4), and a list of sites in table format (Table SOP 1.1). A large oversample was drawn. These sites are not listed in this SOP, but are available in the shapefiles. For detailed information and planning purposes refer to the GIS shapefiles and electronic maps.
2 Literature Cited Frakes, B., C. Hurst, D. Pillmore, B. Schweiger, and C. Talbert. 2007. Travel time cost surface
model. Rocky Mountain Network, National Park Service, Fort Collins, CO. Kincaid, T. 2006. User guide for spsurvey, Version 1.4 - Probability survey design and analysis
function. http://cran.r-project.org/.
SIEN Lakes Monitoring Protocol
SOP 1.6
Figure SOP 1.1. Cost surface model for Yosemite. Travel times are relative and do not represent actual travel times to park locations.
SIEN Lakes Monitoring Protocol
SOP 1.7
Figure SOP 1.2. Cost surface model for Sequoia and Kings Canyon. Travel times are relative and do not represent actual travel times to park locations.
SIEN Lakes Monitoring Protocol
SOP 1.8
Figure SOP 1.3. Sampling locations in Yosemite.
SIEN Lakes Monitoring Protocol
SOP 1.9
Figure SOP 1.4. Sampling locations in Sequoia and Kings Canyon.
SIEN Lakes Monitoring Protocol
SOP 1.10
Table SOP 1.1. Lake sites.
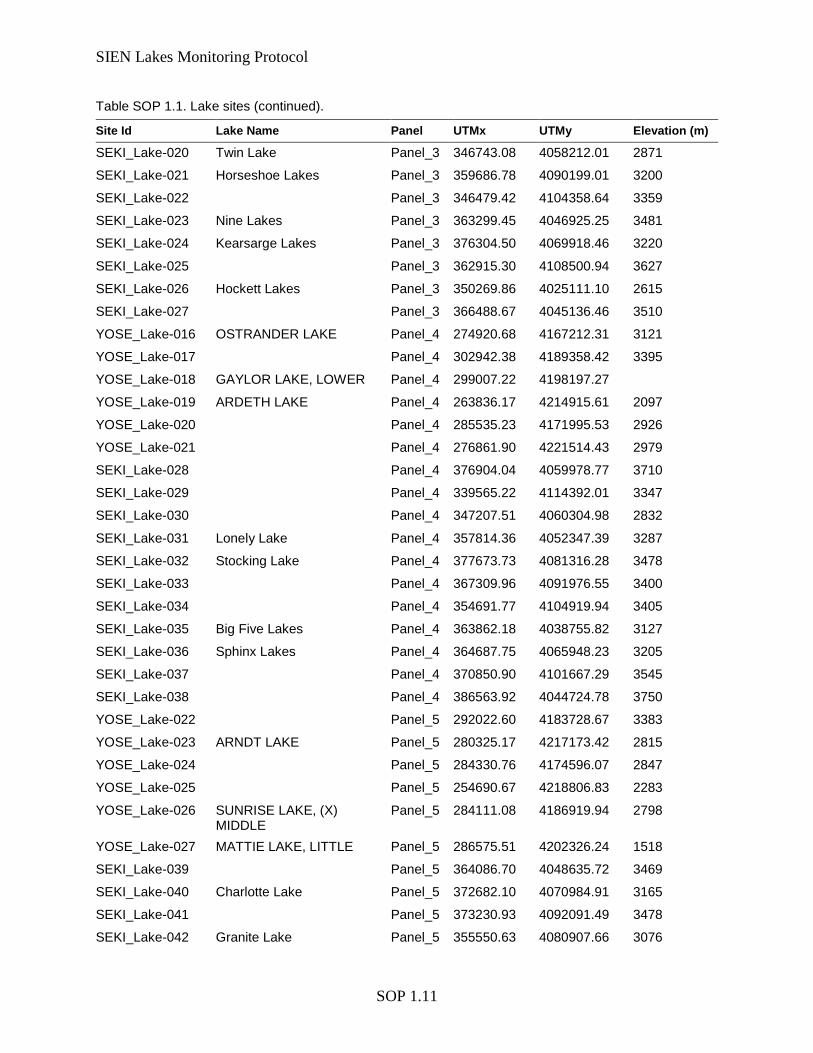
Table SOP 1.1. Lake sites (continued).
Site Id Lake Name Panel UTMx UTMy Elevation (m)
YOSE_Lake-001 SPILLWAY LAKE Panel_1 303562.89 4190559.06 2920
YOSE_Lake-002 GRANITE LAKE, UPPER Panel_1 299668.88 4200048.47 1359
YOSE_Lake-003 TEN LAKES #3 Panel_1 277537.76 4197878.36 3018
SEKI_Lake-001 Panel_1 367530.51 4093892.54 3370
SEKI_Lake-002 McGee Lakes Panel_1 346972.75 4112852.92 3297
SEKI_Lake-003 Spring Lake Panel_1 360485.08 4037358.21 3066
SEKI_Lake-004 Aster Lake Panel_1 349828.70 4052110.24 2774
SEKI_Lake-005 State Lakes Panel_1 360792.08 4086801.18 3359
YOSE_Lake-004 EDNA LAKE, UPPER Panel_2 289840.51 4168926.52 2946
YOSE_Lake-005 TILDEN LAKE Panel_2 271742.56 4220597.89 2716
YOSE_Lake-006 Panel_2 296669.24 4187239.80 2481
YOSE_Lake-007 Panel_2 270111.09 4210333.14 2513
YOSE_Lake-008 ADAIR LAKE Panel_2 287720.94 4173369.80 2960
YOSE_Lake-009 Panel_2 256788.89 4214475.08 3274
SEKI_Lake-006 Panel_2 347041.90 4101899.79 3444
SEKI_Lake-007 Sky Blue Lake Panel_2 385954.47 4043798.59 3519
SEKI_Lake-008 Panel_2 373450.75 4068171.80 3150
SEKI_Lake-009 Panel_2 360723.18 4106526.45 3274
SEKI_Lake-010 Panel_2 355476.78 4029431.01 3115
SEKI_Lake-011 Panel_2 370678.69 4051762.76 3510
SEKI_Lake-012 Panel_2 374456.83 4059695.92 3650
SEKI_Lake-013 Panel_2 348773.94 4116650.78 3408
SEKI_Lake-014 Swamp Lakes Panel_2 346272.31 4083889.54 2926
SEKI_Lake-015 Mosquito Lakes Panel_2 355318.35 4031673.21 3018
SEKI_Lake-016 Panel_2 371301.83 4083670.51 3150
YOSE_Lake-010 TENAYA LAKE Panel_3 283456.51 4189939.05 2932
YOSE_Lake-011 TABLE LAKE Panel_3 274831.14 4207034.24 2676
YOSE_Lake-012 Panel_3 300193.79 4181260.42 3463
YOSE_Lake-013 Panel_3 262312.40 4211474.27 2176
YOSE_Lake-014 Panel_3 279261.75 4196424.30 2969
YOSE_Lake-015 Panel_3 292902.04 4207218.86 2896
SEKI_Lake-017 Panel_3 368889.94 4097801.26 3539
SEKI_Lake-018 Panel_3 349159.39 4111198.84 3442
SEKI_Lake-019 Cyclamen Lake Panel_3 360942.17 4036964.88 3188
SIEN Lakes Monitoring Protocol
SOP 1.11
Table SOP 1.1. Lake sites (continued).
Site Id Lake Name Panel UTMx UTMy Elevation (m)
SEKI_Lake-020 Twin Lake Panel_3 346743.08 4058212.01 2871
SEKI_Lake-021 Horseshoe Lakes Panel_3 359686.78 4090199.01 3200
SEKI_Lake-022 Panel_3 346479.42 4104358.64 3359
SEKI_Lake-023 Nine Lakes Panel_3 363299.45 4046925.25 3481
SEKI_Lake-024 Kearsarge Lakes Panel_3 376304.50 4069918.46 3220
SEKI_Lake-025 Panel_3 362915.30 4108500.94 3627
SEKI_Lake-026 Hockett Lakes Panel_3 350269.86 4025111.10 2615
SEKI_Lake-027 Panel_3 366488.67 4045136.46 3510
YOSE_Lake-016 OSTRANDER LAKE Panel_4 274920.68 4167212.31 3121
YOSE_Lake-017 Panel_4 302942.38 4189358.42 3395
YOSE_Lake-018 GAYLOR LAKE, LOWER Panel_4 299007.22 4198197.27
YOSE_Lake-019 ARDETH LAKE Panel_4 263836.17 4214915.61 2097
YOSE_Lake-020 Panel_4 285535.23 4171995.53 2926
YOSE_Lake-021 Panel_4 276861.90 4221514.43 2979
SEKI_Lake-028 Panel_4 376904.04 4059978.77 3710
SEKI_Lake-029 Panel_4 339565.22 4114392.01 3347
SEKI_Lake-030 Panel_4 347207.51 4060304.98 2832
SEKI_Lake-031 Lonely Lake Panel_4 357814.36 4052347.39 3287
SEKI_Lake-032 Stocking Lake Panel_4 377673.73 4081316.28 3478
SEKI_Lake-033 Panel_4 367309.96 4091976.55 3400
SEKI_Lake-034 Panel_4 354691.77 4104919.94 3405
SEKI_Lake-035 Big Five Lakes Panel_4 363862.18 4038755.82 3127
SEKI_Lake-036 Sphinx Lakes Panel_4 364687.75 4065948.23 3205
SEKI_Lake-037 Panel_4 370850.90 4101667.29 3545
SEKI_Lake-038 Panel_4 386563.92 4044724.78 3750
YOSE_Lake-022 Panel_5 292022.60 4183728.67 3383
YOSE_Lake-023 ARNDT LAKE Panel_5 280325.17 4217173.42 2815
YOSE_Lake-024 Panel_5 284330.76 4174596.07 2847
YOSE_Lake-025 Panel_5 254690.67 4218806.83 2283
YOSE_Lake-026 SUNRISE LAKE, (X) MIDDLE
Panel_5 284111.08 4186919.94 2798
YOSE_Lake-027 MATTIE LAKE, LITTLE Panel_5 286575.51 4202326.24 1518
SEKI_Lake-039 Panel_5 364086.70 4048635.72 3469
SEKI_Lake-040 Charlotte Lake Panel_5 372682.10 4070984.91 3165
SEKI_Lake-041 Panel_5 373230.93 4092091.49 3478
SEKI_Lake-042 Granite Lake Panel_5 355550.63 4080907.66 3076
SIEN Lakes Monitoring Protocol
SOP 1.12
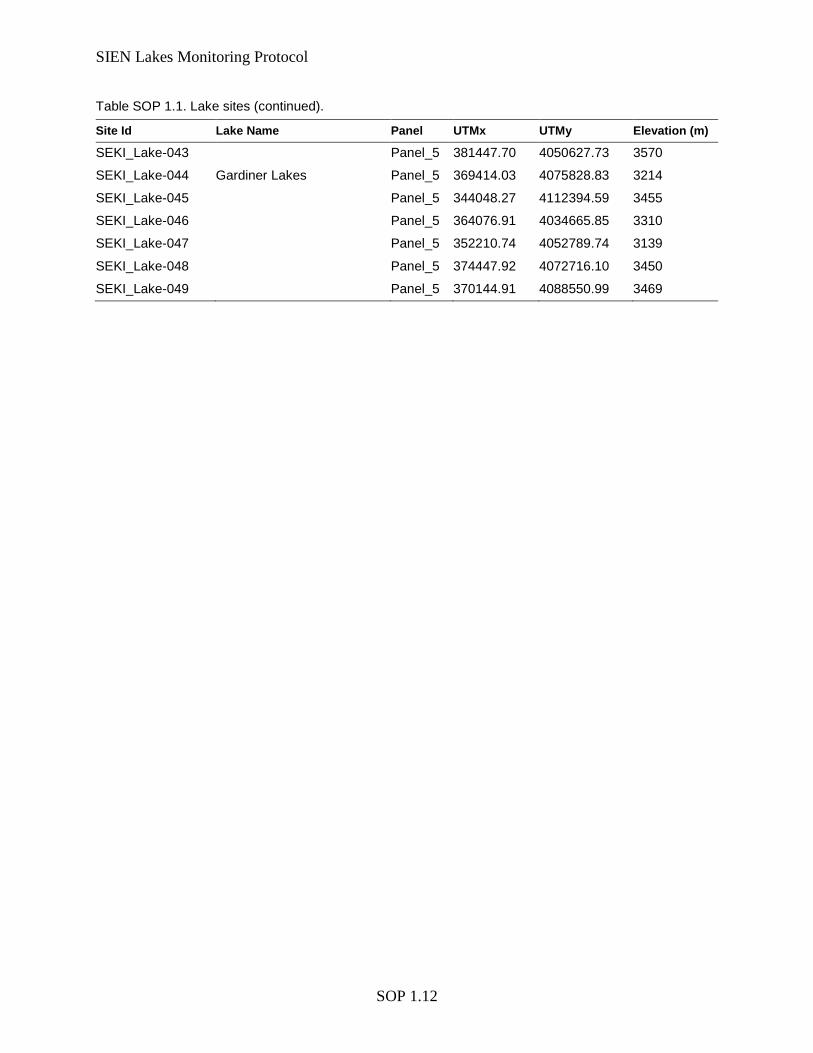
Table SOP 1.1. Lake sites (continued).
Site Id Lake Name Panel UTMx UTMy Elevation (m)
SEKI_Lake-043 Panel_5 381447.70 4050627.73 3570
SEKI_Lake-044 Gardiner Lakes Panel_5 369414.03 4075828.83 3214
SEKI_Lake-045 Panel_5 344048.27 4112394.59 3455
SEKI_Lake-046 Panel_5 364076.91 4034665.85 3310
SEKI_Lake-047 Panel_5 352210.74 4052789.74 3139
SEKI_Lake-048 Panel_5 374447.92 4072716.10 3450
SEKI_Lake-049 Panel_5 370144.91 4088550.99 3469
SIEN Lake Monitoring Protocol
SOP 2.1
Sierra Nevada Network Lake Monitoring Protocol
SOP 2. Safety Version 1.00, November 2012 Prepared by Don Schweizer
Revision History Log Previous Version #
Revision Date Author Changes Made Reason for
Change New
Version #
SIEN Lake Monitoring Protocol
SOP 2.2
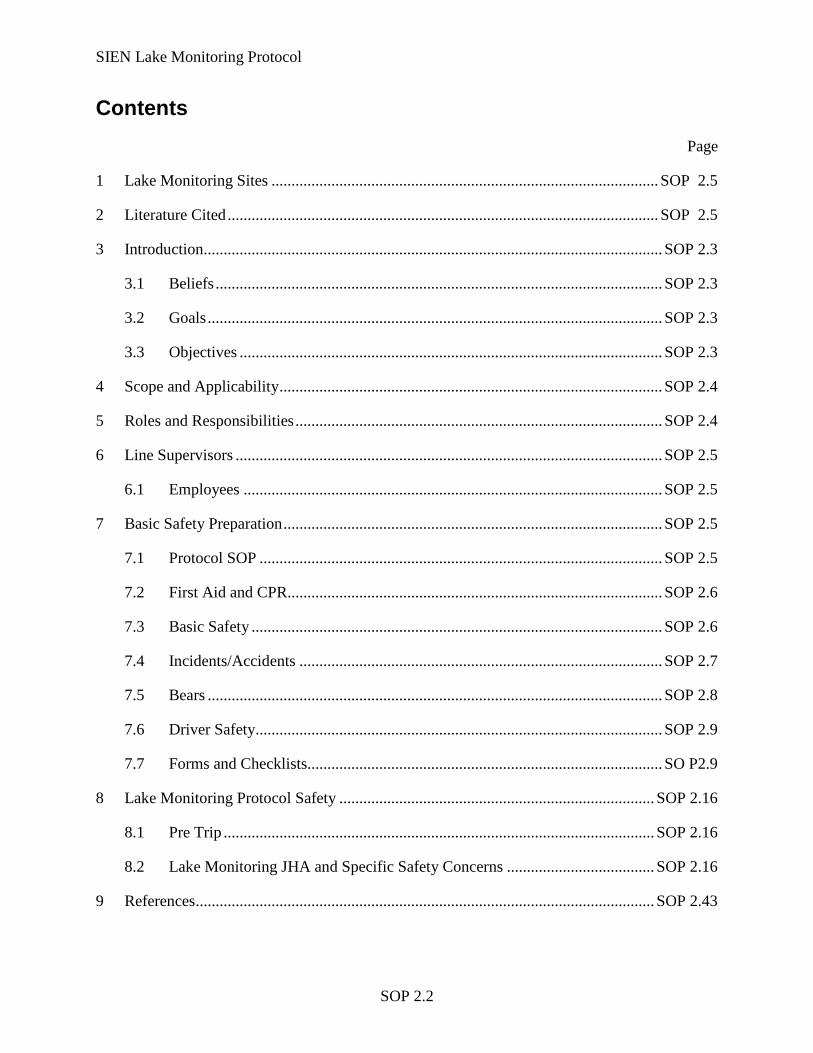
Contents Page
1 Lake Monitoring Sites ................................................................................................. SOP 2.5
2 Literature Cited ............................................................................................................ SOP 2.5
3 Introduction ................................................................................................................... SOP 2.3
3.1 Beliefs ................................................................................................................ SOP 2.3
3.2 Goals .................................................................................................................. SOP 2.3
3.3 Objectives .......................................................................................................... SOP 2.3
4 Scope and Applicability ................................................................................................ SOP 2.4
5 Roles and Responsibilities ............................................................................................ SOP 2.4
6 Line Supervisors ........................................................................................................... SOP 2.5
6.1 Employees ......................................................................................................... SOP 2.5
7 Basic Safety Preparation ............................................................................................... SOP 2.5
7.1 Protocol SOP ..................................................................................................... SOP 2.5
7.2 First Aid and CPR.............................................................................................. SOP 2.6
7.3 Basic Safety ....................................................................................................... SOP 2.6
7.4 Incidents/Accidents ........................................................................................... SOP 2.7
7.5 Bears .................................................................................................................. SOP 2.8
7.6 Driver Safety ...................................................................................................... SOP 2.9
7.7 Forms and Checklists......................................................................................... SO P2.9
8 Lake Monitoring Protocol Safety ............................................................................... SOP 2.16
8.1 Pre Trip ............................................................................................................ SOP 2.16
8.2 Lake Monitoring JHA and Specific Safety Concerns ..................................... SOP 2.16
9 References ................................................................................................................... SOP 2.43

SIEN Lake Monitoring Protocol
SOP 2.3
3 Introduction The “Safety SOP” provides safety information, checklists and forms for the Sierra Nevada Network and contract personnel who are involved with field activities. This SOP is meant to be used in conjunction with more comprehensive manuals, and regulations and recommendations that apply to specific locales and field conditions. In an attempt to make this a readable document with practical field application, this document does not attempt to comprehensively cover every safety issue. This document is intended to engage all personnel and initiate a synergistic creative environment to address field safety. The Sierra Nevada Network complies with the NPSafe program and with local park safety programs. NPSafe is a National Park Service employee safety and health implementation plan (NPS 2004). NPSafe outlines the following beliefs, goals and objectives:
3.1 Beliefs • Healthy productive employees are our most important resource, and employee safety is
our most important value.
• Injuries and occupational illnesses are unacceptable.
• At risk behaviors can be eliminated.
• Operating hazards and risks can be controlled.
• Safety is everyone’s responsibility.
• Managing for safety excellence can enhance employee productivity, save millions of dollars in workers compensation costs, and improve overall management effectiveness.
3.2 Goals • The NPS becomes the safest place to work in the Department of the Interior.
• Safety is integrated into all NPS activities.
• The NPS organizational culture values employee safety as much as it values protecting resources and serving visitors.
• Employees, supervisors, and managers demonstrate unwavering commitment to continuous improvement in employee health and safety.
3.3 Objectives • Managerial decisions and actions demonstrate a commitment and dedication to the health
and safety of the employees of the Service.
• Employees, supervisors, and managers are knowledgeable of the NPS safety vision, are involved in the safety program, and demonstrate the competencies to get the job done safely.
• Every park and program unit has consistent and timely access to Safety and Industrial Hygiene resources/services.
SIEN Lake Monitoring Protocol
SOP 2.4
• Every park and program unit implements a comprehensive and effective safety program per Director’s Order 50-B.
• All non-NPS organizations performing work in parks must operate safety programs that meet all applicable standards and guidelines.
• NPS has no fatalities and its “lost time accident rate” and “total incident rate” are below all other DOI agencies.
4 Scope and Applicability Safety of field personnel should always be the first concern in conducting a sampling program and in the selection of sampling sites. Numerous safety issues and concerns are associated with implementing a long-term, service-wide monitoring program that includes extensive fieldwork and sampling by network staff or other cooperators/contractors. Field work requires an awareness of potential hazards and knowledge of basic safety procedures. Field personnel routinely come in direct and indirect contact with waterborne pathogens, chemicals and potentially hazardous plants and animals. Advanced planning can reduce or eliminate many safety hazards. Field sampling requires planning that anticipates the risks and dangers that field personnel may be exposed to so precautions may be taken to limit threats to human safety as much as possible. 5 Roles and Responsibilities Division Chiefs or Network Coordinator
• Communicate vision clearly and continually.
• Monitor employee/unit performance, recognize successes, and take corrective actions when needed.
• Incorporate safety as a critical result in all supervisors’ and employees’ performance plans.
• Incorporate safety into all decision-making processes.
• Ensure requests are submitted for adequate funding of required safety programs and safety training.
• Integrate audit findings into existing performance management and training processes.
• Ensure all employees understand their roles and responsibilities in implementing a safety program.
• Ensure all employees are aware of their job hazards.

SIEN Lake Monitoring Protocol
SOP 2.5
6 Line Supervisors • Monitor employee/unit performance, recognize successes, and take corrective actions
when needed.
• Incorporate safety into all decision-making processes.
• Incorporate safety as a critical result in all employees’ performance plans.
• Develop and use employee safety and health orientation checklist identifying job specific hazards and safety concerns.
• Develop and continuously improve Job Hazard Analyses or Guidelines for all tasks and jobs.
• Integrate audit findings into existing performance management and training processes.
• Ensure all employees understand their roles and responsibilities in implementing a safety program.
• Ensure all employees are aware of and control their job hazards.
• Investigate all accidents and near misses, and implement corrective actions for identified hazards.
6.1 Employees • Collaborate with supervisor on Job Hazard Analyses development and use employee
safety and health orientation checklist.
• Integrate audit findings into existing performance management and training processes.
• Incorporate safety into all decision-making processes and job tasks.
• Ensure all employees understand their roles and responsibilities in implementing a safety program.
• Ensure all employees are aware of and control their job hazards.
• Identify and report hazards to immediate supervisor or park management.
7 Basic Safety Preparation It is desirable to begin training well before the field season begins to allow adequate time for thorough understanding of field and laboratory procedures and to obtain required certifications. Field crews must be familiar with the general safety protocol in the following sections and complete any required training that is protocol specific. 7.1 Protocol SOP A basic understanding of the system being studied is necessary for collecting good data. Recognition of bad or illogical data in the field can improve safety and efficiency by eliminating unnecessary sampling trips. Recognition of the problem at the time it occurs allows for immediate adjustment in the field. Individual protocol SOP’s will establish the training necessary to understand the system of study.
SIEN Lake Monitoring Protocol
SOP 2.6
Reading and understanding the entire protocol and all SOPs are crucial prior to initiating field work. The protocol lead will allow adequate time for all field crew members to complete this step to ensure success of the project. Field and laboratory related SOPs will also be covered as part of the hands-on training. Hands-on training and practice prior to the first sampling period will help ensure high quality data collection. Familiarity with the use and maintenance of equipment, procedures for collecting and processing water samples, techniques for cleaning field and laboratory equipment, and lake and stream safety are essential to the success of the lake and stream monitoring project. Field crew leaders are required to complete all of the following training. Field crew members should also complete the training, if possible, although it is not required. 7.2 First Aid and CPR Training in the basic first aid and CPR is required for all crew members and will be paid for by the Network. Certification is valid for two years. Training and certification should be acquired prior to the field season. Protocol lead is responsible for providing all crew members with the necessary training. 7.3 Basic Safety This SOP is meant to be used in conjunction with other safety manuals such as Chapter A9 of the USGS National Field Manual (Lane and Fay 1997), and national, regional, and individual park safety standards. National standards from the Risk Management Division of WASO are at http://inside.nps.gov/waso/waso.cfm?lv=2&prg=46. The Pacific West Region Safety and Health Website at http://inside.nps.gov/regions/region.cfm?rgn=70&lv=2 provides links to many safety tools including national, regional, and local safety protocol and online sites. The protocol and crew lead are responsible for updating SIEN safety protocol to keep it current with all standards. Park safety offices should be consulted to ensure SIEN crews are consistent with all park specific safety policies. The crew lead will contact individual park safety officers or resource managers for information on reporting injuries and safety concerns, park radio safety procedures, wilderness travel protocols, local problems and issues, such as dangerous or nuisance animals (e.g., black bears), insect-and tick-borne diseases (e.g., Lyme disease, encephalitis, West Nile disease), and other issues specific to each park. The crew lead is responsible for disseminating this information to the crew. Sequoia and Kings Canyon safety information can be found on the intranet safety site at http://165.83.72.79/risk_management/rm.htm. This site provides links to SEKI Accident/Incident Reporting Requirements, Job Hazard Analysis (JHA), and general safety policies, guidelines, and management directives. Yosemite safety information can be found in the Yosemite Safety Web page at http://www.yose.nps.gov/yosenet/safety/default.htm. This site provides links to the current Wilderness Travel Policy, a JHA Page, the YOSE Incident/Accident Reporting and Investigation policy, and many other safety links.
SIEN Lake Monitoring Protocol
SOP 2.7
Safety of field personnel is always the first concern in selection of sampling sites, and in conducting a sampling program. No sample or sampling site is worth the risk of injury or death. Every sampling trip, at any time, if there is a perceived risk, the task should be stopped and the risk mitigated. This includes any travel to and from sites, and with any of the protocol steps. Numerous safety issues and concerns are associated with implementing a monitoring project that includes extensive field work and sampling. Field personnel routinely come into direct and indirect contact with waterborne pathogens, chemicals, and potentially hazardous plants and animals. Field work requires an awareness of potential hazards and knowledge of basic safety procedures. Advanced planning can reduce or eliminate many safety hazards. An integral part of informed awareness and successful mitigation of potential hazards is a process that helps to reveal hazards. SIEN is using the Job Hazard Analysis (JHA) to critically examine tasks, identify specific hazards, and reduce or eliminate these risks. A JHA is created for each protocol, or distinctly different process in the protocol, prior to field implementation, and evolves with the input of subsequent employees to remain a current and effective safety tool. All employees are expected to know, understand, and contribute to the JHA. Field work should be done in pairs. Always carry a park radio and if possible, a cellular telephone. Carry basic safety equipment, including first aid kit, flashlight, boots, rain gear, antibacterial soap or hand cleaner, matches or lighter, etc. Be aware of changing weather conditions and the potential for storms. Be aware of potential hazards at a monitoring site. Carry general safety items in each vehicle (see checklist). At a minimum, a trip plan for each field trip must be completed and left it at a designated location in the office. The trip plan should include the following information:
• Field trip participants, including guests and observers, with emergency contact information
• Departure and expected return time(s) and date(s)
• Hotel and campground contact information (for overnight trips)
• Basic itinerary, including where and when sampling will occur
• Phone numbers for cellular phones or radio frequencies 7.4 Incidents/Accidents In the event of an accident or incident, get immediate medical attention if required. To report an accident or incident, local park policy should be followed (see YOSE Incident/Accident Reporting and Investigation). At a minimum, the employee will report any injury to their immediate supervisor as soon as possible. The supervisor needs to report the incident/accident to appropriate personnel, and complete any park specific reporting forms (SEKI-134B the Sequoia and Kings Canyon NP Incident/Accident Report, or the Yosemite National Park Supervisor Incident/Accident or Close-Call Reporting Form (2-1a)). Supervisors and employees are required to complete a Department of Labor Form CA-1 (Federal Employee’s Notice of Traumatic Injury and Claim for Continuation of Pay/Compensation) or CA-2 (Notice of Occupational Disease and Claim for Compensation) when work related injuries or diseases require medical treatment. The
SIEN Lake Monitoring Protocol
SOP 2.8
Safety Management Information System (SMIS) is the automated system for reporting Form CA-1 or CA-2 for the Department of the Interior (https://www.smis.doi.gov). Employees complete a CA-1/2 electronically at https://www.smis.doi.gov before the end of the next work shift after an accident. After the employee completes the CA-1/2, the supervisor logs onto SMIS and completes the supervisor portion of the electronic CA-1/2. The supervisor takes any corrective action necessary to prevent similar incidents. 7.5 Bears Most of the information in this section is from the Sierra Interagency Black Bear Group website: http://www.sierrawildbear.gov/. This website should be checked for the most up to date information on approved food storage containers. It is critical that I&M employees use proper food storage and maintain safe distances from bears. While black bears are wonderful to observe in the wild, it is important to keep a safe distance from bears and other wild animals. Bears will change their behavior if they become habituated to humans, which will happen if we crowd them or observe them too closely. Bears also change their behavior if they obtain human food—even just one time. They begin to break into cars, tents, and cabins and may become aggressive. If a bear becomes a safety hazard, it sometimes has to be destroyed. Other habituated and food-conditioned bears are killed by cars because they spend more time along roads and in campgrounds. Encountering bears in natural areas can be a great experience. The following rules will help to ensure a safe encounter with Sierra Nevada bears:
• Stay together (especially if children are present).
• Give the bear(s) lots of room (300 feet or more).
• Don’t get between a sow and her cubs.
• Don’t linger too long.
• Use a telephoto lens or binoculars instead of approaching too closely.
Bears need to be “hazed” out of developed areas so they don’t feel welcome and don’t get habituated or get food. Please help keep bears wild by following the suggestions below—these are especially important if a bear enters your campsite or picnic area.
• Check to make sure all your food and food related items are stored properly.
• Get everyone together, look big, and make lots of noise (yelling, banging pots, clapping, etc.).
• Never surround a bear; they need an escape route.
• Never separate a sow from her cubs (sometimes cubs are up a nearby tree).
• If a bear huffs at you and shows its profile, it may be ready to bluff charge. Stand your ground or back away slowly. Do not run.
• Never try to take food back from a bear.
SIEN Lake Monitoring Protocol
SOP 2.9
It is not uncommon for a black bear to show its dominance by bluff charging. If this happens, look big, raise your arms, and stand your ground. As soon as the bear backs away, you should back away as well. The bear may be guarding food or cubs and view you as a threat. While it is extremely unusual for black bears to harm humans, injuries are reported every year in the Sierra Nevada. In the unlikely event that a bear does make contact with you, roll into a ball, face down with your hands over your neck. If the bear continues its aggression, bear experts advise that you fight back. While some backcountry sites have metal food storage boxes available, many areas do not, and approved food storage containers are required when you are in these areas. The most up-to-date information on approved food storage containers can be found at: http://www.sierrawildbear.gov/foodstorage/index.htm. Conditional approval is given to any container that has passed visual inspection, an impact test, and a zoo test. Full approval is given to any container that has done the above and has been successful during three months of field-trials in the summer. Either type of approval may be revoked due to unexpected problems in the field that either lead to failures, injuries, or resource damage. If a bear enters your camp, make noise and try to scare it away. However, if a bear does take possession of your food storage container, DO NOT try to take the container back from the bear, and advise Wildlife Managers in the park you are working in of the outcome. 7.6 Driver Safety Driving in Sierra Nevada parks presents the typical hazards inherent to driving anywhere, in addition to hazards that are characteristic of driving in the mountains. Some hazards specific to driving in mountainous areas and popular national parks are:
• Wildlife in road
• Visitors not accustomed to driving mountainous roads
• Cars parked in road to view scenery or wildlife
• Winding, steep-gradient roads
• Fallen trees or rock slides in roads
• Ice and snow on roads
• Poor visibility from storms or smoke When driving on park roads for work purposes, a park radio should be carried to report any accidents, broken down vehicles, inappropriate behavior around wildlife (such as feeding) or other road-related problems to Park Dispatch. 7.7 Forms and Checklists The following pages contain medical forms, safety tailgaite forms, and equipment checklists for field personnel (adapted from Lane and Fay 1997). Prior to the field season, complete the

SIEN Lake Monitoring Protocol
SOP 2.10
medical information as thoroughly as possible. Confirm all contact information annually. Medical information sheets should be completed for each individual venturing into the field. Checklists are helpful for ensuring that personnel have the appropriate safety equipment available during field trips. Field crew members should consider their specific needs and should customize the checklists as necessary. The field crew and project manager will discuss the checklists and determine which items are necessary.
SIEN Lake Monitoring Protocol
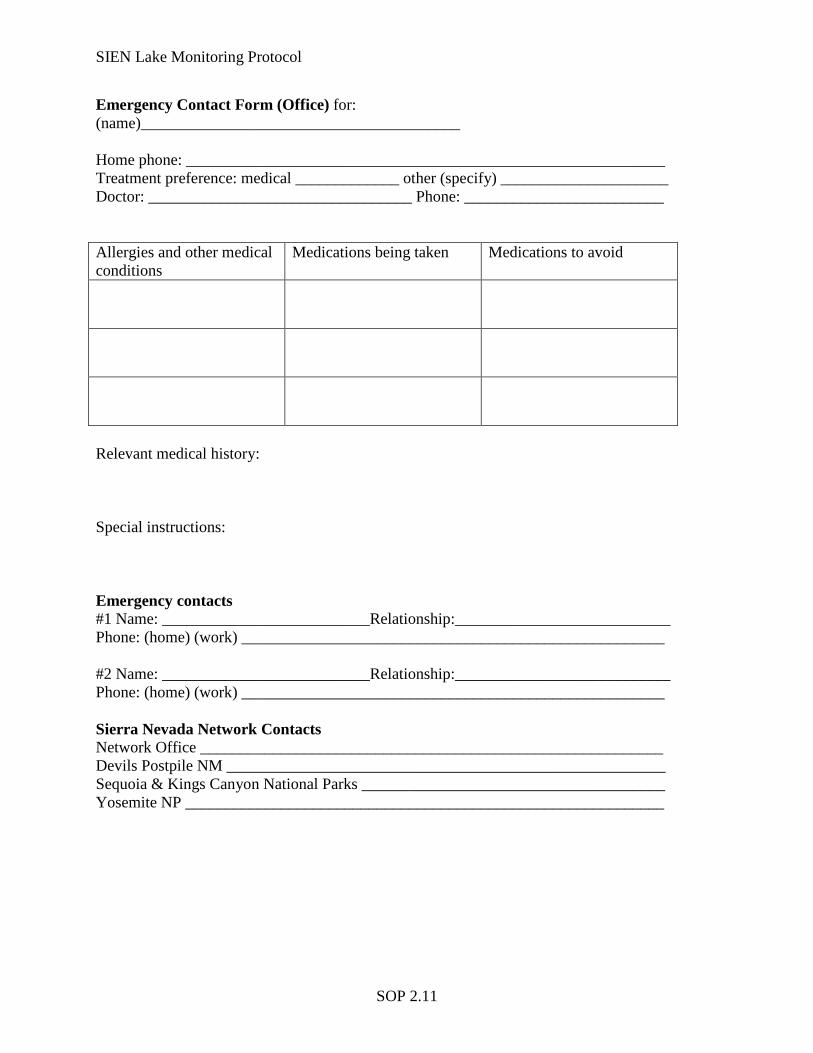
SOP 2.11
Emergency Contact Form (Office) for: (name)________________________________________ Home phone: ____________________________________________________________ Treatment preference: medical _____________ other (specify) _____________________ Doctor: _________________________________ Phone: _________________________ Allergies and other medical conditions
Medications being taken Medications to avoid
Relevant medical history: Special instructions: Emergency contacts #1 Name: __________________________Relationship:___________________________ Phone: (home) (work) _____________________________________________________ #2 Name: __________________________Relationship:___________________________ Phone: (home) (work) _____________________________________________________ Sierra Nevada Network Contacts Network Office __________________________________________________________ Devils Postpile NM _______________________________________________________ Sequoia & Kings Canyon National Parks ______________________________________ Yosemite NP ____________________________________________________________
SIEN Lake Monitoring Protocol
SOP 2.12
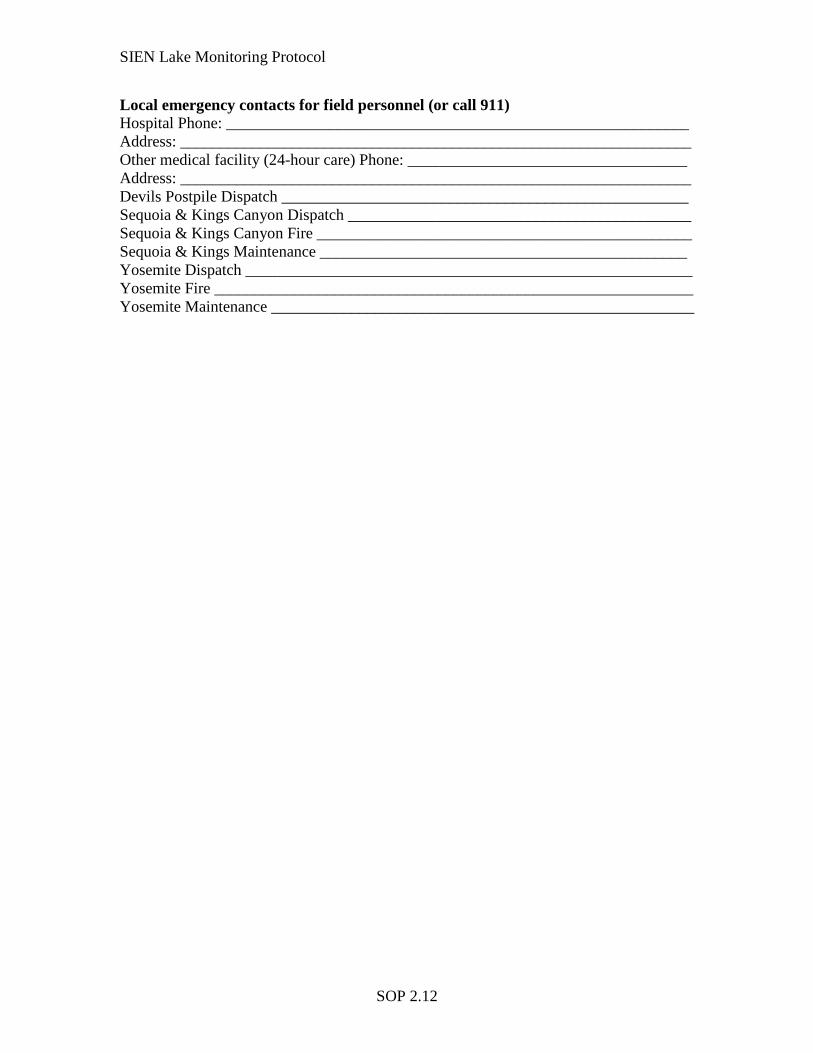
Local emergency contacts for field personnel (or call 911) Hospital Phone: __________________________________________________________ Address: ________________________________________________________________ Other medical facility (24-hour care) Phone: ___________________________________ Address: ________________________________________________________________ Devils Postpile Dispatch ___________________________________________________ Sequoia & Kings Canyon Dispatch ___________________________________________ Sequoia & Kings Canyon Fire _______________________________________________ Sequoia & Kings Maintenance ______________________________________________ Yosemite Dispatch ________________________________________________________ Yosemite Fire ____________________________________________________________ Yosemite Maintenance _____________________________________________________
SIEN Lake Monitoring Protocol
SOP 2.13
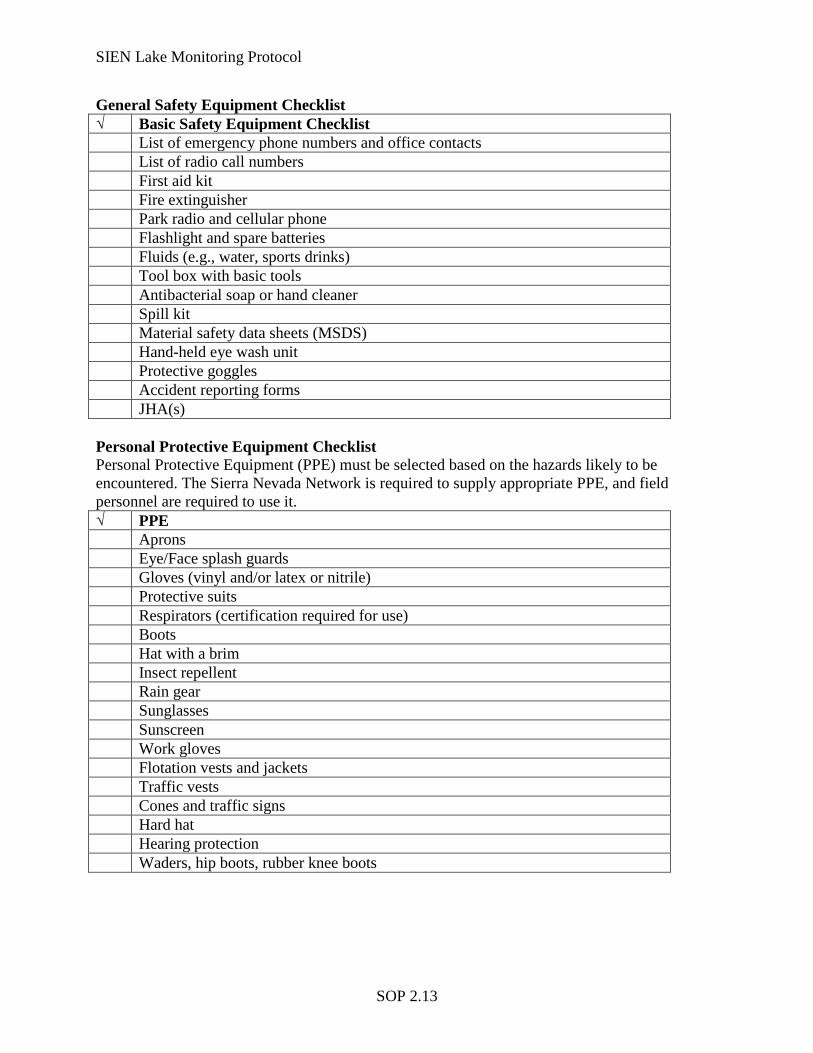
General Safety Equipment Checklist √ Basic Safety Equipment Checklist List of emergency phone numbers and office contacts List of radio call numbers First aid kit Fire extinguisher Park radio and cellular phone Flashlight and spare batteries Fluids (e.g., water, sports drinks) Tool box with basic tools Antibacterial soap or hand cleaner Spill kit Material safety data sheets (MSDS) Hand-held eye wash unit Protective goggles Accident reporting forms JHA(s) Personal Protective Equipment Checklist Personal Protective Equipment (PPE) must be selected based on the hazards likely to be encountered. The Sierra Nevada Network is required to supply appropriate PPE, and field personnel are required to use it. √ PPE Aprons Eye/Face splash guards Gloves (vinyl and/or latex or nitrile) Protective suits Respirators (certification required for use) Boots Hat with a brim Insect repellent Rain gear Sunglasses Sunscreen Work gloves Flotation vests and jackets Traffic vests Cones and traffic signs Hard hat Hearing protection Waders, hip boots, rubber knee boots
SIEN Lake Monitoring Protocol
SOP 2.14
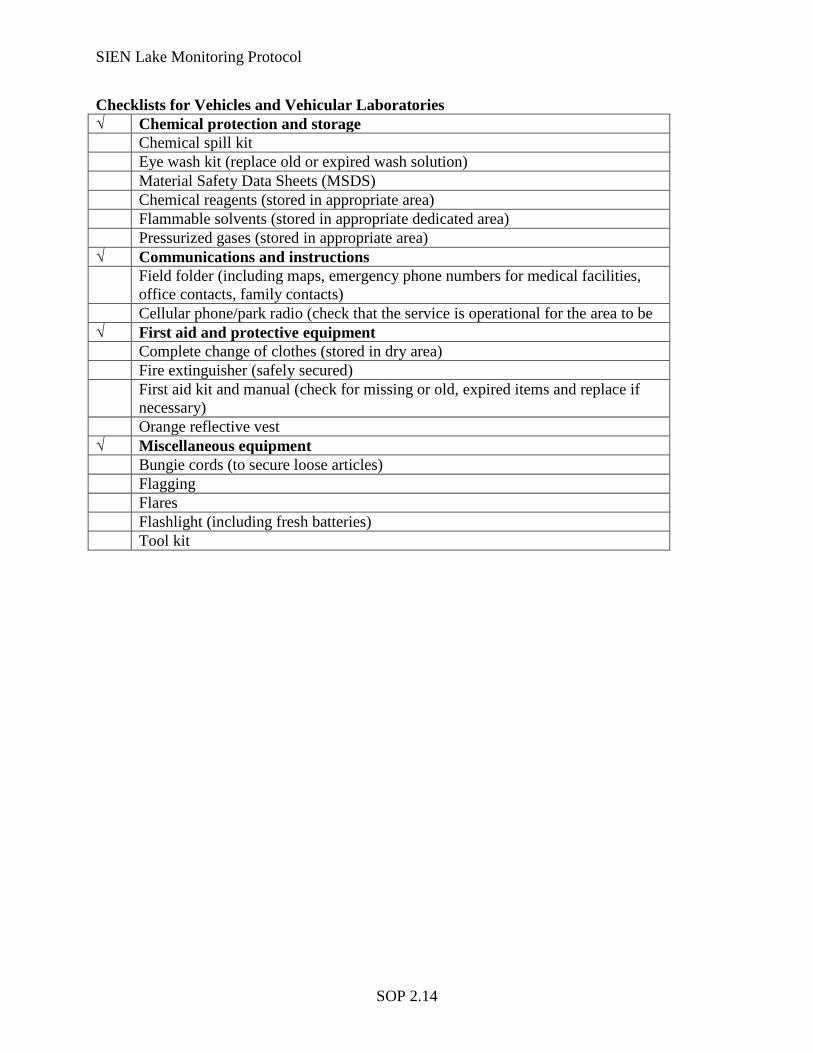
Checklists for Vehicles and Vehicular Laboratories √ Chemical protection and storage Chemical spill kit Eye wash kit (replace old or expired wash solution) Material Safety Data Sheets (MSDS) Chemical reagents (stored in appropriate area) Flammable solvents (stored in appropriate dedicated area) Pressurized gases (stored in appropriate area) √ Communications and instructions Field folder (including maps, emergency phone numbers for medical facilities,
office contacts, family contacts) Cellular phone/park radio (check that the service is operational for the area to be √ First aid and protective equipment Complete change of clothes (stored in dry area) Fire extinguisher (safely secured) First aid kit and manual (check for missing or old, expired items and replace if
necessary) Orange reflective vest √ Miscellaneous equipment Bungie cords (to secure loose articles) Flagging Flares Flashlight (including fresh batteries) Tool kit
SOP 2.15
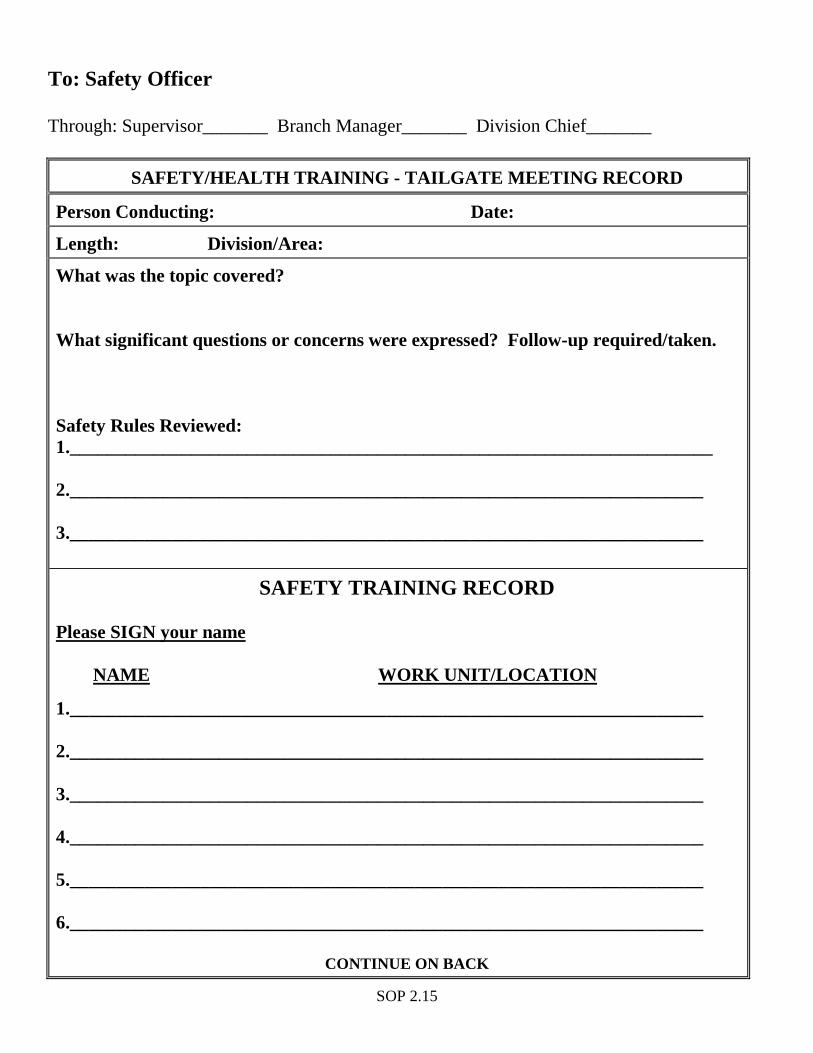
To: Safety Officer Through: Supervisor_______ Branch Manager_______ Division Chief_______ SAFETY/HEALTH TRAINING - TAILGATE MEETING RECORD
Person Conducting: Date:
Length: Division/Area:
What was the topic covered? What significant questions or concerns were expressed? Follow-up required/taken. Safety Rules Reviewed: 1._____________________________________________________________________ 2.____________________________________________________________________ 3.____________________________________________________________________
SAFETY TRAINING RECORD
Please SIGN your name
NAME
WORK UNIT/LOCATION
1.____________________________________________________________________ 2.____________________________________________________________________ 3.____________________________________________________________________ 4.____________________________________________________________________ 5.____________________________________________________________________ 6.____________________________________________________________________ CONTINUE ON BACK
SIEN Lake Monitoring Protocol
SOP 2.16
8 Lake Monitoring Protocol Safety An understanding of basic hydrologic concepts is needed for the Lake Monitoring Protocol. The crew lead, and if possible, other crew members, will study modules of the Water on the Web (2004) curricula (http://waterontheweb.org/curricula). The modules will be selected by the protocol lead and will include those on lake surveys (e.g., field profiles, sample collection, laboratory methods). Individual study will be followed with group discussion and/or individual discussion with the protocol lead or a hydrologist. Prior to the field season, the field crew will be trained in the correct use and maintenance of all equipment to be used in the field (e.g. DO meter, current meter). The protocol lead will ensure all crew members understand, and can safely complete all aspects of the monitoring protocol safely and efficiently. The Safety SOP will be reviewed by all crew members. Protocol specific safety concerns will be addressed by the protocol lead. 8.1 Pre Trip Before leaving for the field site, the field lead will ensure all required safety and work equipment (including vehicles) are available, maintained, and in good working condition. The field lead will notify all appropriate personnel about the location and time required for the sampling trip. All emergency contact information will be given to the protocol lead. The field lead will make sure all park specific wilderness protocol requirements are fulfilled. 8.2 Lake Monitoring JHA and Specific Safety Concerns All the staff is required to participate in the production and evolution of a job hazard analysis (JHA) specific to the field implementation of the lake monitoring protocol. The field lead is responsible for documentation of improvements to the JHA during field implementation. The protocol lead incorporates changes into the protocol. Principle steps in the implementation of the lake monitoring protocol include travel to and from the site, site monitoring from a boat, and site monitoring from the shore. Potential safety and health concerns include dehydration, heat stress, hypothermia, lightning, falls, sunburn, animal encounters, stream crossings, and drowning (see JHA adapted from Yosemite Wilderness Restoration). The JHA should be used as a catalyst for crew discussion and understanding of all safety concerns for the lake monitoring protocol. Discussions should address safety concerns including all aspects of safe wilderness travel to and from the site (such as traveling over rough terrain, high water crossings with and without a backpack, trip planning and notification, lightning and other weather events, heat and cold exposure, high elevation, snow travel, map and compass, GPS) with emphasis on the specific area being accessed and current local conditions. Working at lakes carries the inherent risk of drowning. When sampling at the outlet and along the water edge, extra care should be used around rocks and logs which can be unstable and slippery. When wading a stream, watch for and be prepared for cold water, slippery footing, strong current, holes, and strainers. A stream should not be waded that has a value of the depth multiplied by the velocity greater than or equal to 10 ft2/s (Lane and Fey 1997). Waders should be worn for foot protection, and when needed for protection from cold water. Wear extra layers of clothing to keep warm such as long underwear with waders. Avoid waders with tight ankles,
SIEN Lake Monitoring Protocol
SOP 2.17
and chest waders that are tight fitting at the top (hard to remove in an emergency). Watch for floating debris such as logs. When sampling from a boat a personal floatation device (PFD) is required. Do not wear waders or other items that could become a safety hazard if the boat flips or sinks. Special attention should be given to footing particularly when getting into and out of a boat. While working in the boat, be conscious of limitations in stability and awkward working conditions particularly when lifting heavy items such as the anchor. There should always be at least one crew member on shore, keeping an eye crew member(s) who are working on the lake. Dress appropriately for weather conditions. Weather can change quickly in the Sierra Nevada. Be prepared for sunny and hot conditions by drinking plenty of water and protecting yourself from exposure to sun with the use of sunscreen, a hat, and sunglasses. Anticipate bad weather by bringing raingear, extra layers, and extra food. Be alert to changing weather by watching for developing clouds, wind shifts, and the sound of thunder. If the weather begins to change get to shore. Lightning can strike even when there are no clouds overhead. If there is lightning in the area, get inside a building or car. If this is not possible, go to lower areas such as valleys and canyons. Do not remain near large solitary trees or in the middle of open areas. This safety protocol is not designed to attempt to comprehensively cover all safety issues that may be encountered. It is to be used as a starting point for field work where everyone is involved in creatively enhancing and bringing personal additions to the process. Safety is a responsibility of everyone. The JHA and all safety protocol should be constantly assessed to remove redundant and less useful items, and improved with the addition of new ideas and concepts. The field lead documents changes and new ideas gained from the crew and works with the protocol lead to keep the JHA and safety protocol current and pertinent .
SOP 2.18
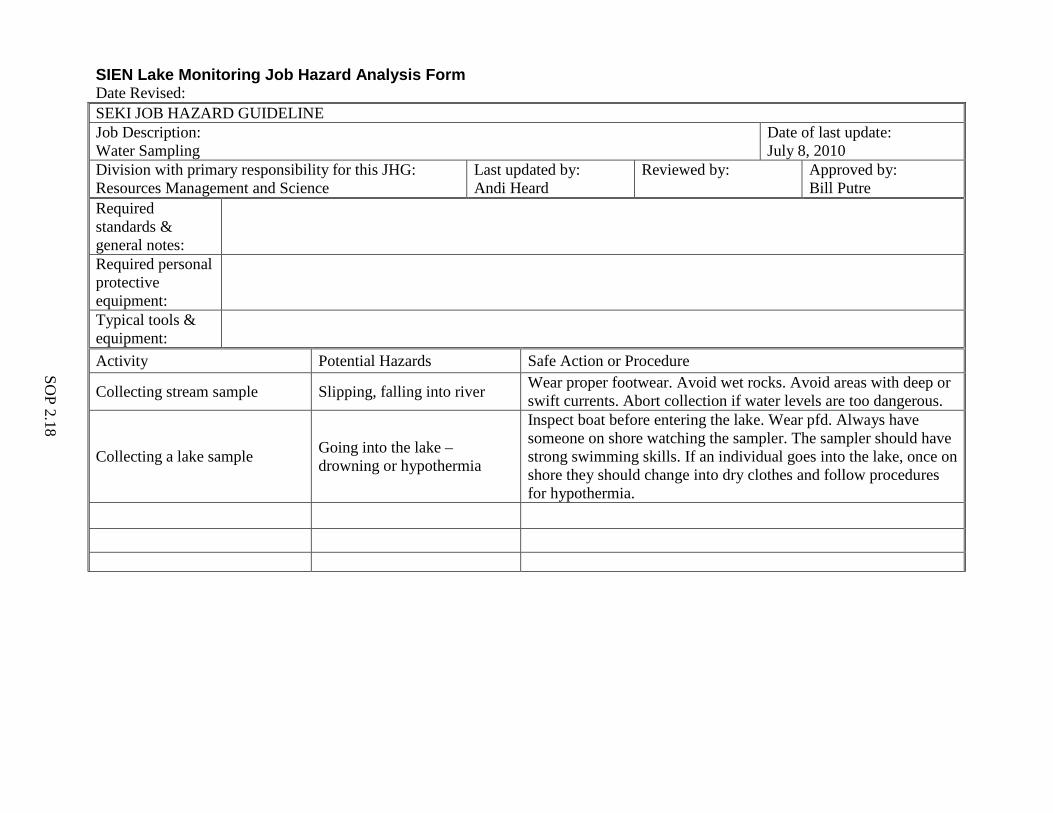
SIEN Lake Monitoring Job Hazard Analysis Form Date Revised: SEKI JOB HAZARD GUIDELINE Job Description: Water Sampling
Date of last update: July 8, 2010
Division with primary responsibility for this JHG: Resources Management and Science
Last updated by: Andi Heard
Reviewed by: Approved by: Bill Putre
Required standards & general notes:
Required personal protective equipment:
Typical tools & equipment:
Activity Potential Hazards Safe Action or Procedure
Collecting stream sample Slipping, falling into river Wear proper footwear. Avoid wet rocks. Avoid areas with deep or swift currents. Abort collection if water levels are too dangerous.
Collecting a lake sample Going into the lake – drowning or hypothermia
Inspect boat before entering the lake. Wear pfd. Always have someone on shore watching the sampler. The sampler should have strong swimming skills. If an individual goes into the lake, once on shore they should change into dry clothes and follow procedures for hypothermia.
SOP 2.19
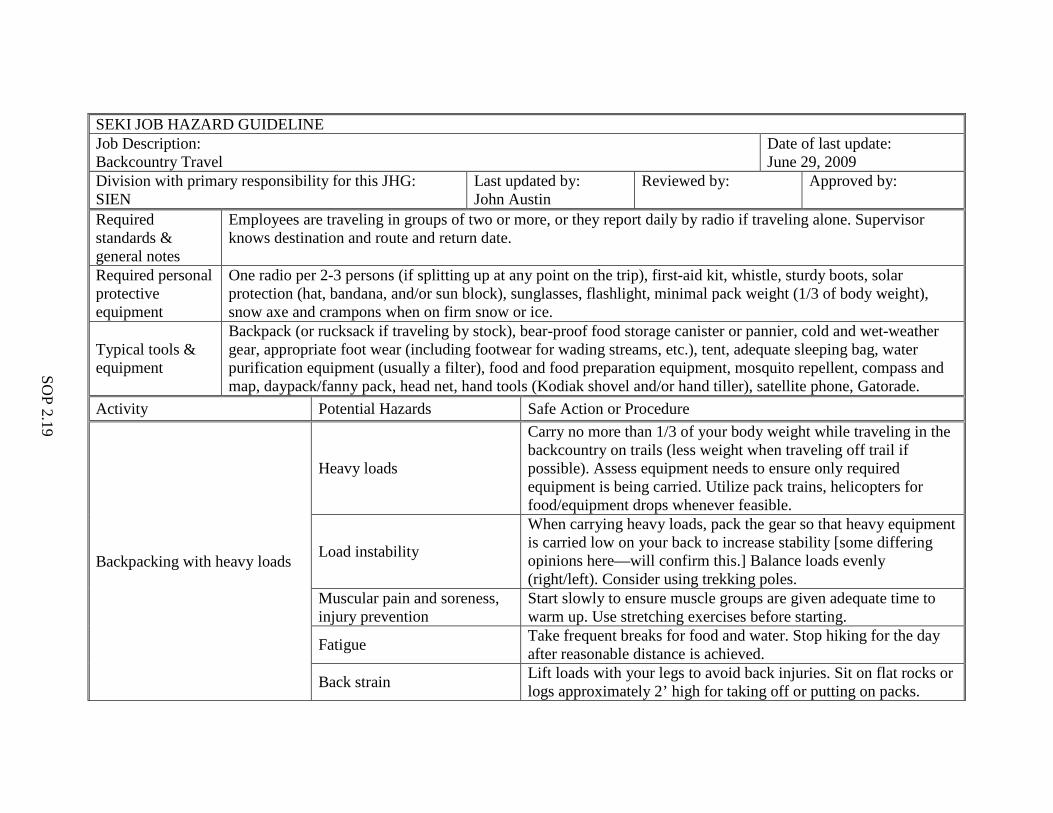
SEKI JOB HAZARD GUIDELINE Job Description: Backcountry Travel
Date of last update: June 29, 2009
Division with primary responsibility for this JHG: SIEN
Last updated by: John Austin
Reviewed by: Approved by:
Required standards & general notes
Employees are traveling in groups of two or more, or they report daily by radio if traveling alone. Supervisor knows destination and route and return date.
Required personal protective equipment
One radio per 2-3 persons (if splitting up at any point on the trip), first-aid kit, whistle, sturdy boots, solar protection (hat, bandana, and/or sun block), sunglasses, flashlight, minimal pack weight (1/3 of body weight), snow axe and crampons when on firm snow or ice.
Typical tools & equipment
Backpack (or rucksack if traveling by stock), bear-proof food storage canister or pannier, cold and wet-weather gear, appropriate foot wear (including footwear for wading streams, etc.), tent, adequate sleeping bag, water purification equipment (usually a filter), food and food preparation equipment, mosquito repellent, compass and map, daypack/fanny pack, head net, hand tools (Kodiak shovel and/or hand tiller), satellite phone, Gatorade.
Activity Potential Hazards Safe Action or Procedure
Backpacking with heavy loads
Heavy loads
Carry no more than 1/3 of your body weight while traveling in the backcountry on trails (less weight when traveling off trail if possible). Assess equipment needs to ensure only required equipment is being carried. Utilize pack trains, helicopters for food/equipment drops whenever feasible.
Load instability
When carrying heavy loads, pack the gear so that heavy equipment is carried low on your back to increase stability [some differing opinions here—will confirm this.] Balance loads evenly (right/left). Consider using trekking poles.
Muscular pain and soreness, injury prevention
Start slowly to ensure muscle groups are given adequate time to warm up. Use stretching exercises before starting.
Fatigue Take frequent breaks for food and water. Stop hiking for the day after reasonable distance is achieved.
Back strain Lift loads with your legs to avoid back injuries. Sit on flat rocks or logs approximately 2’ high for taking off or putting on packs.
SOP 2.20
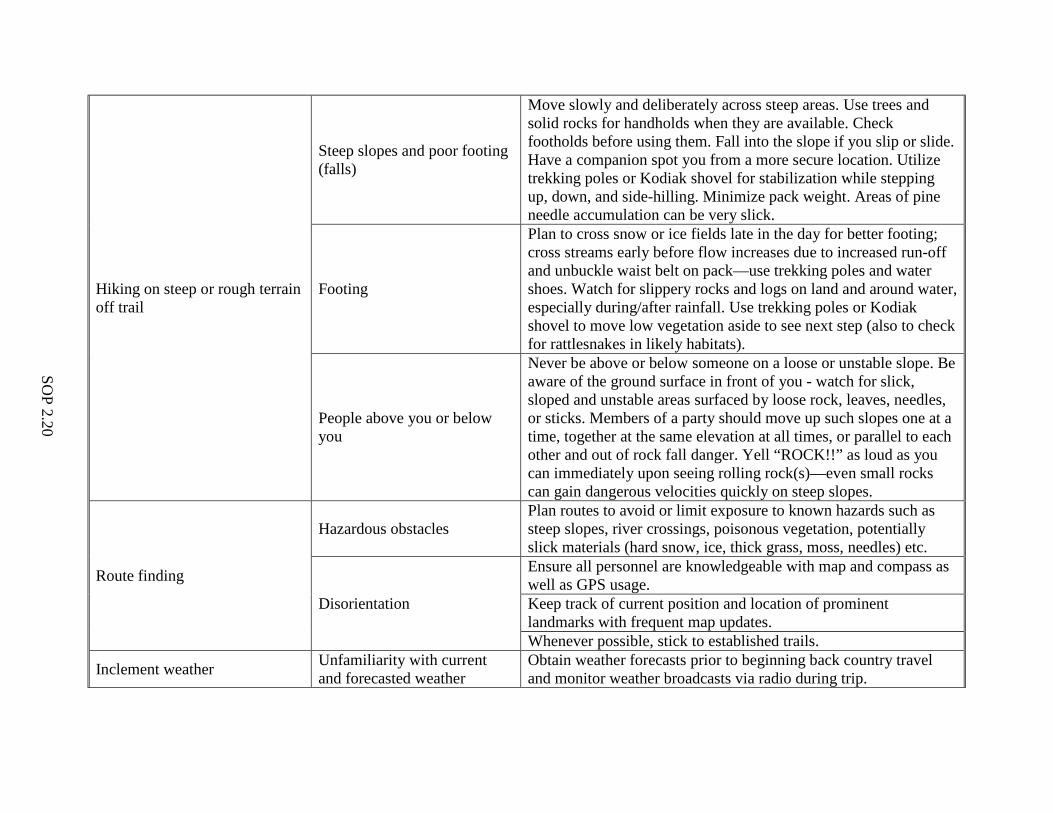
Hiking on steep or rough terrain off trail
Steep slopes and poor footing (falls)
Move slowly and deliberately across steep areas. Use trees and solid rocks for handholds when they are available. Check footholds before using them. Fall into the slope if you slip or slide. Have a companion spot you from a more secure location. Utilize trekking poles or Kodiak shovel for stabilization while stepping up, down, and side-hilling. Minimize pack weight. Areas of pine needle accumulation can be very slick.
Footing
Plan to cross snow or ice fields late in the day for better footing; cross streams early before flow increases due to increased run-off and unbuckle waist belt on pack—use trekking poles and water shoes. Watch for slippery rocks and logs on land and around water, especially during/after rainfall. Use trekking poles or Kodiak shovel to move low vegetation aside to see next step (also to check for rattlesnakes in likely habitats).
People above you or below you
Never be above or below someone on a loose or unstable slope. Be aware of the ground surface in front of you - watch for slick, sloped and unstable areas surfaced by loose rock, leaves, needles, or sticks. Members of a party should move up such slopes one at a time, together at the same elevation at all times, or parallel to each other and out of rock fall danger. Yell “ROCK!!” as loud as you can immediately upon seeing rolling rock(s)—even small rocks can gain dangerous velocities quickly on steep slopes.
Route finding
Hazardous obstacles Plan routes to avoid or limit exposure to known hazards such as steep slopes, river crossings, poisonous vegetation, potentially slick materials (hard snow, ice, thick grass, moss, needles) etc.
Disorientation
Ensure all personnel are knowledgeable with map and compass as well as GPS usage. Keep track of current position and location of prominent landmarks with frequent map updates. Whenever possible, stick to established trails.
Inclement weather Unfamiliarity with current and forecasted weather
Obtain weather forecasts prior to beginning back country travel and monitor weather broadcasts via radio during trip.
SOP 2.21
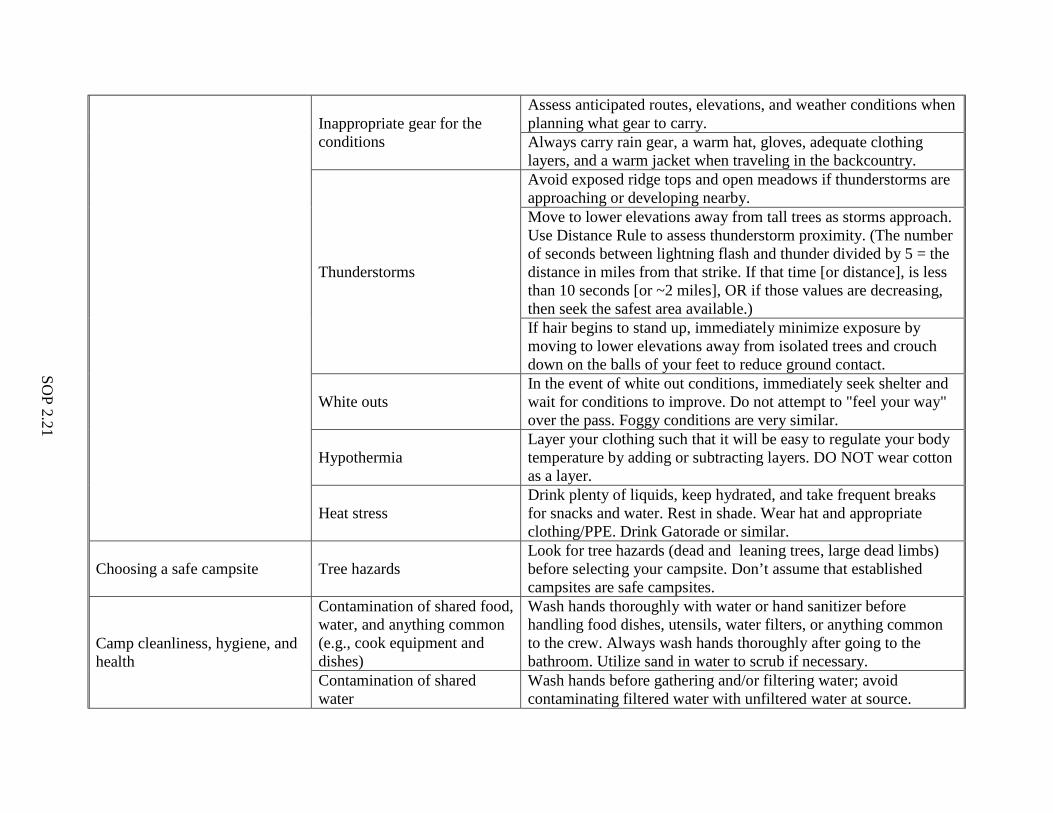
Inappropriate gear for the conditions
Assess anticipated routes, elevations, and weather conditions when planning what gear to carry. Always carry rain gear, a warm hat, gloves, adequate clothing layers, and a warm jacket when traveling in the backcountry.
Thunderstorms
Avoid exposed ridge tops and open meadows if thunderstorms are approaching or developing nearby. Move to lower elevations away from tall trees as storms approach. Use Distance Rule to assess thunderstorm proximity. (The number of seconds between lightning flash and thunder divided by 5 = the distance in miles from that strike. If that time [or distance], is less than 10 seconds [or ~2 miles], OR if those values are decreasing, then seek the safest area available.) If hair begins to stand up, immediately minimize exposure by moving to lower elevations away from isolated trees and crouch down on the balls of your feet to reduce ground contact.
White outs In the event of white out conditions, immediately seek shelter and wait for conditions to improve. Do not attempt to "feel your way" over the pass. Foggy conditions are very similar.
Hypothermia Layer your clothing such that it will be easy to regulate your body temperature by adding or subtracting layers. DO NOT wear cotton as a layer.
Heat stress Drink plenty of liquids, keep hydrated, and take frequent breaks for snacks and water. Rest in shade. Wear hat and appropriate clothing/PPE. Drink Gatorade or similar.
Choosing a safe campsite Tree hazards Look for tree hazards (dead and leaning trees, large dead limbs) before selecting your campsite. Don’t assume that established campsites are safe campsites.
Camp cleanliness, hygiene, and health
Contamination of shared food, water, and anything common (e.g., cook equipment and dishes)
Wash hands thoroughly with water or hand sanitizer before handling food dishes, utensils, water filters, or anything common to the crew. Always wash hands thoroughly after going to the bathroom. Utilize sand in water to scrub if necessary.
Contamination of shared water
Wash hands before gathering and/or filtering water; avoid contaminating filtered water with unfiltered water at source.
SOP 2.22
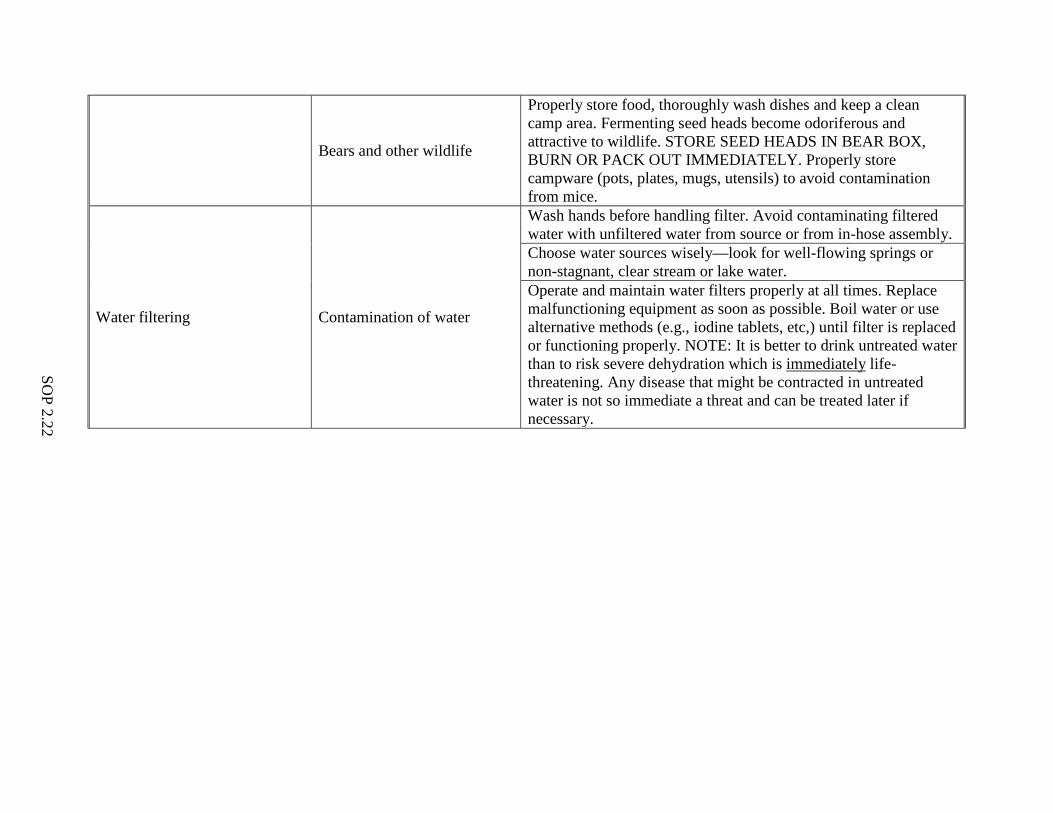
Bears and other wildlife
Properly store food, thoroughly wash dishes and keep a clean camp area. Fermenting seed heads become odoriferous and attractive to wildlife. STORE SEED HEADS IN BEAR BOX, BURN OR PACK OUT IMMEDIATELY. Properly store campware (pots, plates, mugs, utensils) to avoid contamination from mice.
Water filtering Contamination of water
Wash hands before handling filter. Avoid contaminating filtered water with unfiltered water from source or from in-hose assembly. Choose water sources wisely—look for well-flowing springs or non-stagnant, clear stream or lake water. Operate and maintain water filters properly at all times. Replace malfunctioning equipment as soon as possible. Boil water or use alternative methods (e.g., iodine tablets, etc,) until filter is replaced or functioning properly. NOTE: It is better to drink untreated water than to risk severe dehydration which is immediately
life-threatening. Any disease that might be contracted in untreated water is not so immediate a threat and can be treated later if necessary.
SOP 2.23
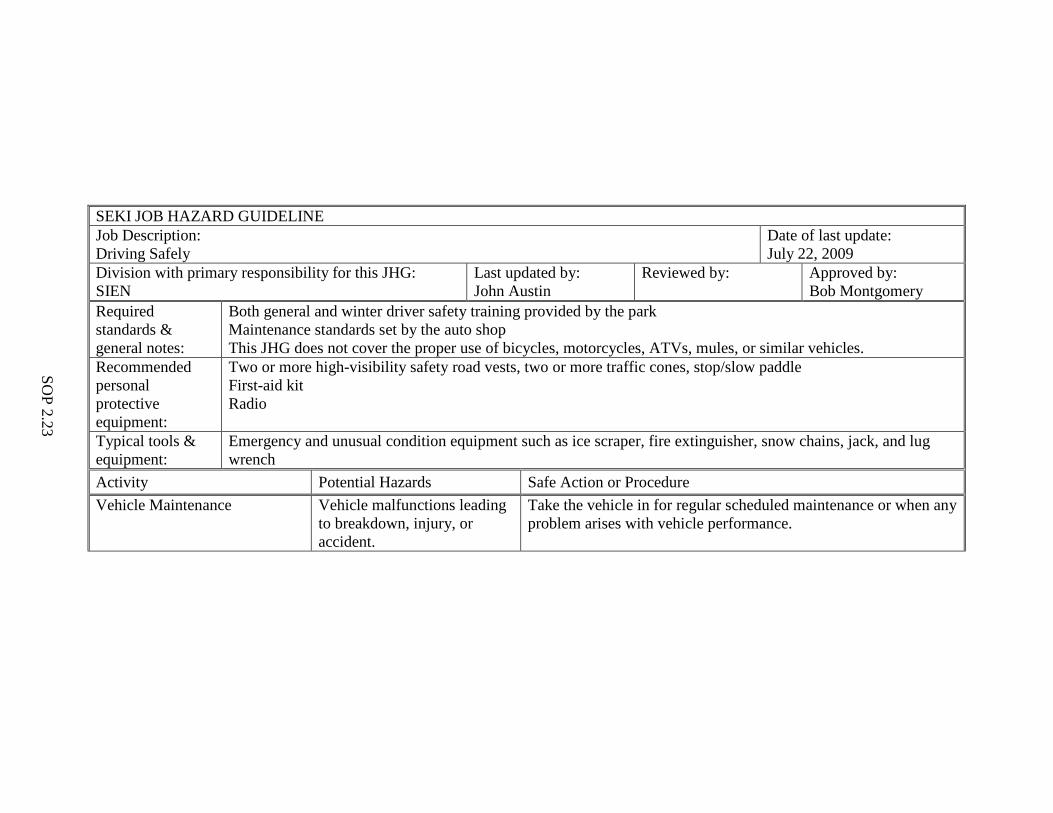
SEKI JOB HAZARD GUIDELINE Job Description: Driving Safely
Date of last update: July 22, 2009
Division with primary responsibility for this JHG: SIEN
Last updated by: John Austin
Reviewed by: Approved by: Bob Montgomery
Required standards & general notes:
Both general and winter driver safety training provided by the park Maintenance standards set by the auto shop This JHG does not cover the proper use of bicycles, motorcycles, ATVs, mules, or similar vehicles.
Recommended personal protective equipment:
Two or more high-visibility safety road vests, two or more traffic cones, stop/slow paddle First-aid kit Radio
Typical tools & equipment:
Emergency and unusual condition equipment such as ice scraper, fire extinguisher, snow chains, jack, and lug wrench
Activity Potential Hazards Safe Action or Procedure Vehicle Maintenance Vehicle malfunctions leading
to breakdown, injury, or accident.
Take the vehicle in for regular scheduled maintenance or when any problem arises with vehicle performance.
SOP 2.24
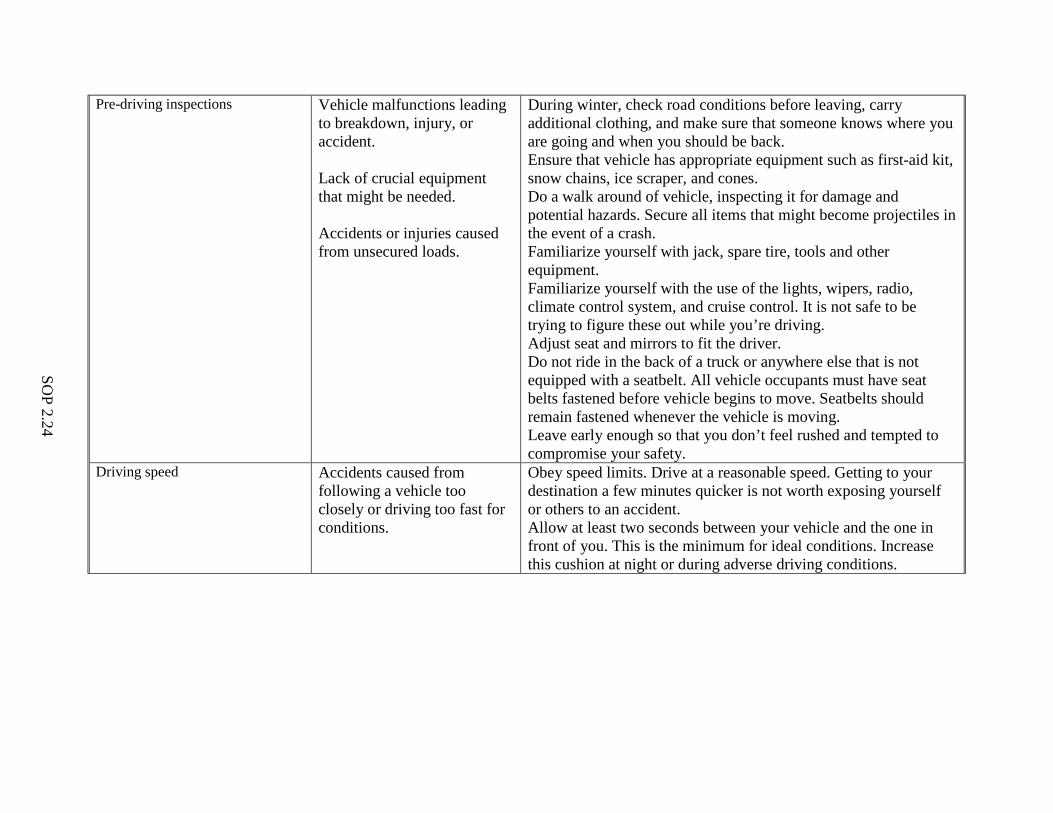
Pre-driving inspections Vehicle malfunctions leading to breakdown, injury, or accident. Lack of crucial equipment that might be needed. Accidents or injuries caused from unsecured loads.
During winter, check road conditions before leaving, carry additional clothing, and make sure that someone knows where you are going and when you should be back. Ensure that vehicle has appropriate equipment such as first-aid kit, snow chains, ice scraper, and cones. Do a walk around of vehicle, inspecting it for damage and potential hazards. Secure all items that might become projectiles in the event of a crash. Familiarize yourself with jack, spare tire, tools and other equipment. Familiarize yourself with the use of the lights, wipers, radio, climate control system, and cruise control. It is not safe to be trying to figure these out while you’re driving. Adjust seat and mirrors to fit the driver. Do not ride in the back of a truck or anywhere else that is not equipped with a seatbelt. All vehicle occupants must have seat belts fastened before vehicle begins to move. Seatbelts should remain fastened whenever the vehicle is moving. Leave early enough so that you don’t feel rushed and tempted to compromise your safety.
Driving speed Accidents caused from following a vehicle too closely or driving too fast for conditions.
Obey speed limits. Drive at a reasonable speed. Getting to your destination a few minutes quicker is not worth exposing yourself or others to an accident. Allow at least two seconds between your vehicle and the one in front of you. This is the minimum for ideal conditions. Increase this cushion at night or during adverse driving conditions.
SOP 2.25
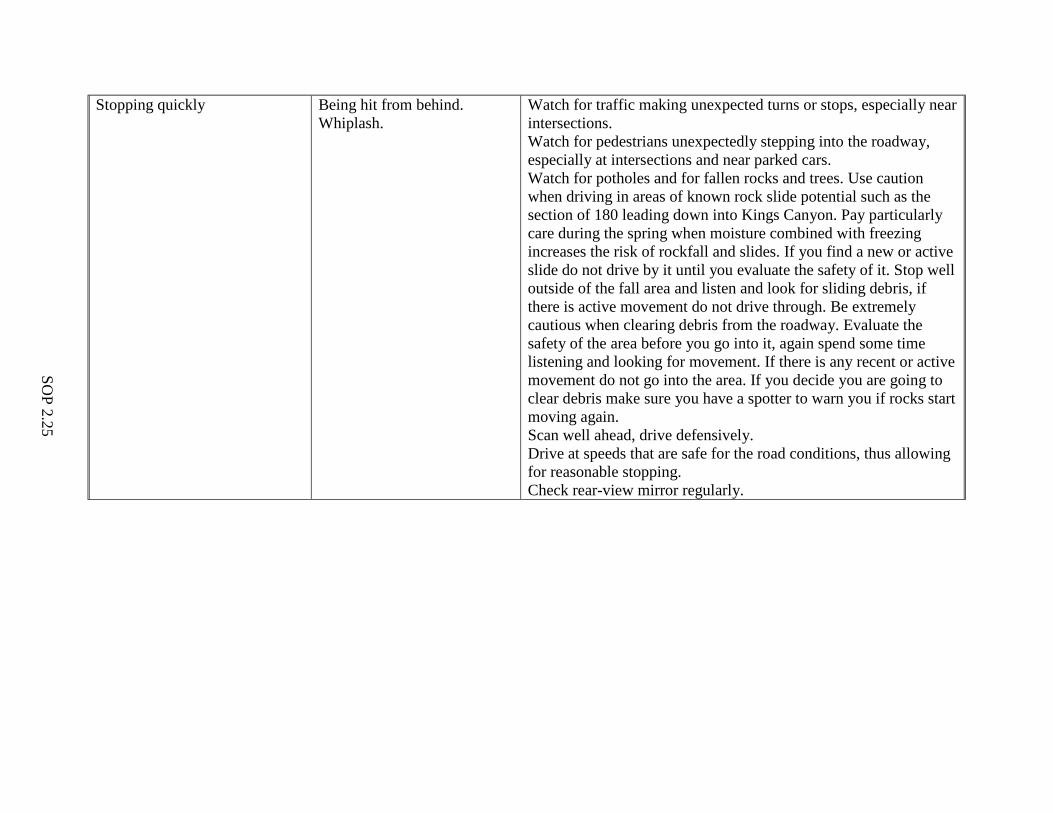
Stopping quickly Being hit from behind. Whiplash.
Watch for traffic making unexpected turns or stops, especially near intersections. Watch for pedestrians unexpectedly stepping into the roadway, especially at intersections and near parked cars. Watch for potholes and for fallen rocks and trees. Use caution when driving in areas of known rock slide potential such as the section of 180 leading down into Kings Canyon. Pay particularly care during the spring when moisture combined with freezing increases the risk of rockfall and slides. If you find a new or active slide do not drive by it until you evaluate the safety of it. Stop well outside of the fall area and listen and look for sliding debris, if there is active movement do not drive through. Be extremely cautious when clearing debris from the roadway. Evaluate the safety of the area before you go into it, again spend some time listening and looking for movement. If there is any recent or active movement do not go into the area. If you decide you are going to clear debris make sure you have a spotter to warn you if rocks start moving again. Scan well ahead, drive defensively. Drive at speeds that are safe for the road conditions, thus allowing for reasonable stopping. Check rear-view mirror regularly.
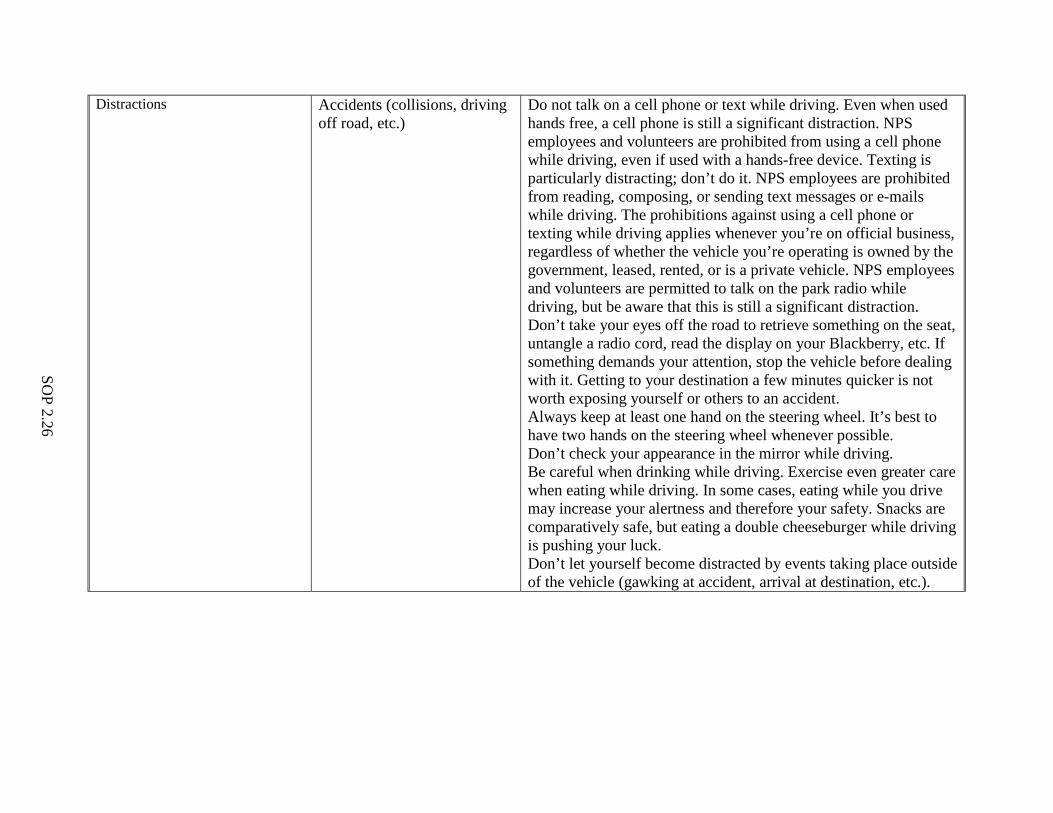
SOP 2.26
Distractions Accidents (collisions, driving off road, etc.)
Do not talk on a cell phone or text while driving. Even when used hands free, a cell phone is still a significant distraction. NPS employees and volunteers are prohibited from using a cell phone while driving, even if used with a hands-free device. Texting is particularly distracting; don’t do it. NPS employees are prohibited from reading, composing, or sending text messages or e-mails while driving. The prohibitions against using a cell phone or texting while driving applies whenever you’re on official business, regardless of whether the vehicle you’re operating is owned by the government, leased, rented, or is a private vehicle. NPS employees and volunteers are permitted to talk on the park radio while driving, but be aware that this is still a significant distraction. Don’t take your eyes off the road to retrieve something on the seat, untangle a radio cord, read the display on your Blackberry, etc. If something demands your attention, stop the vehicle before dealing with it. Getting to your destination a few minutes quicker is not worth exposing yourself or others to an accident. Always keep at least one hand on the steering wheel. It’s best to have two hands on the steering wheel whenever possible. Don’t check your appearance in the mirror while driving. Be careful when drinking while driving. Exercise even greater care when eating while driving. In some cases, eating while you drive may increase your alertness and therefore your safety. Snacks are comparatively safe, but eating a double cheeseburger while driving is pushing your luck. Don’t let yourself become distracted by events taking place outside of the vehicle (gawking at accident, arrival at destination, etc.).
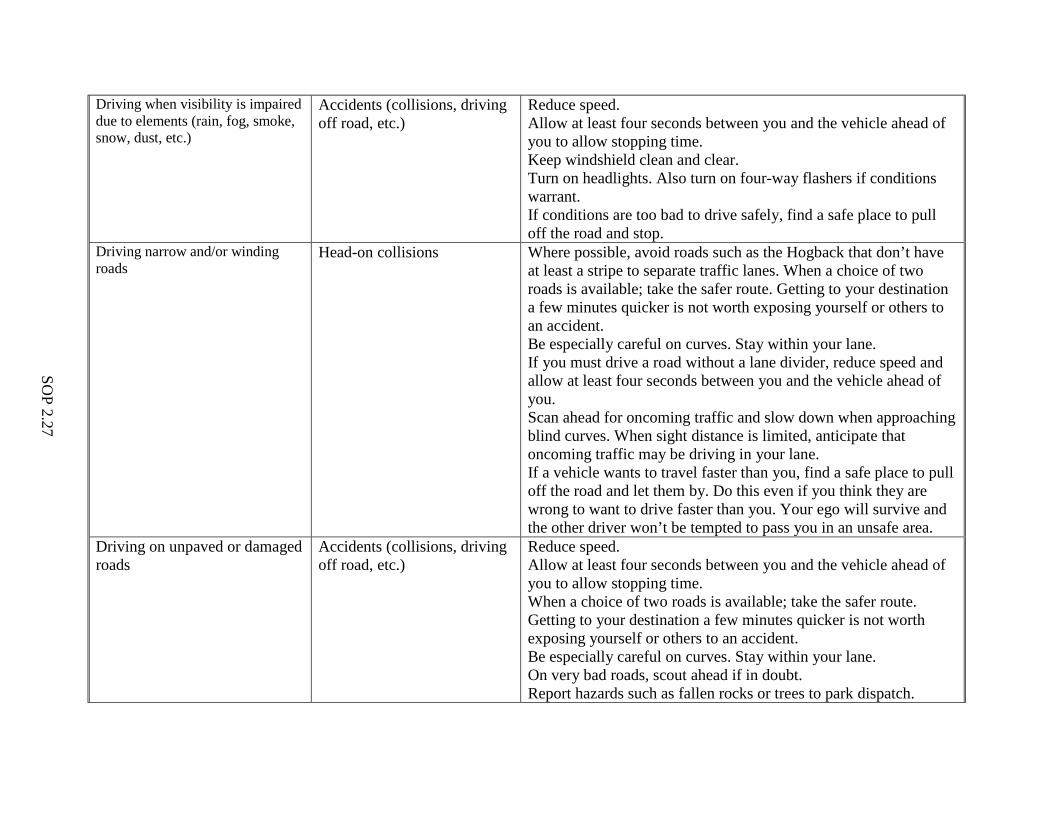
SOP 2.27
Driving when visibility is impaired due to elements (rain, fog, smoke, snow, dust, etc.)
Accidents (collisions, driving off road, etc.)
Reduce speed. Allow at least four seconds between you and the vehicle ahead of you to allow stopping time. Keep windshield clean and clear. Turn on headlights. Also turn on four-way flashers if conditions warrant. If conditions are too bad to drive safely, find a safe place to pull off the road and stop.
Driving narrow and/or winding roads
Head-on collisions Where possible, avoid roads such as the Hogback that don’t have at least a stripe to separate traffic lanes. When a choice of two roads is available; take the safer route. Getting to your destination a few minutes quicker is not worth exposing yourself or others to an accident. Be especially careful on curves. Stay within your lane. If you must drive a road without a lane divider, reduce speed and allow at least four seconds between you and the vehicle ahead of you. Scan ahead for oncoming traffic and slow down when approaching blind curves. When sight distance is limited, anticipate that oncoming traffic may be driving in your lane. If a vehicle wants to travel faster than you, find a safe place to pull off the road and let them by. Do this even if you think they are wrong to want to drive faster than you. Your ego will survive and the other driver won’t be tempted to pass you in an unsafe area.
Driving on unpaved or damaged roads
Accidents (collisions, driving off road, etc.)
Reduce speed. Allow at least four seconds between you and the vehicle ahead of you to allow stopping time. When a choice of two roads is available; take the safer route. Getting to your destination a few minutes quicker is not worth exposing yourself or others to an accident. Be especially careful on curves. Stay within your lane. On very bad roads, scout ahead if in doubt. Report hazards such as fallen rocks or trees to park dispatch.
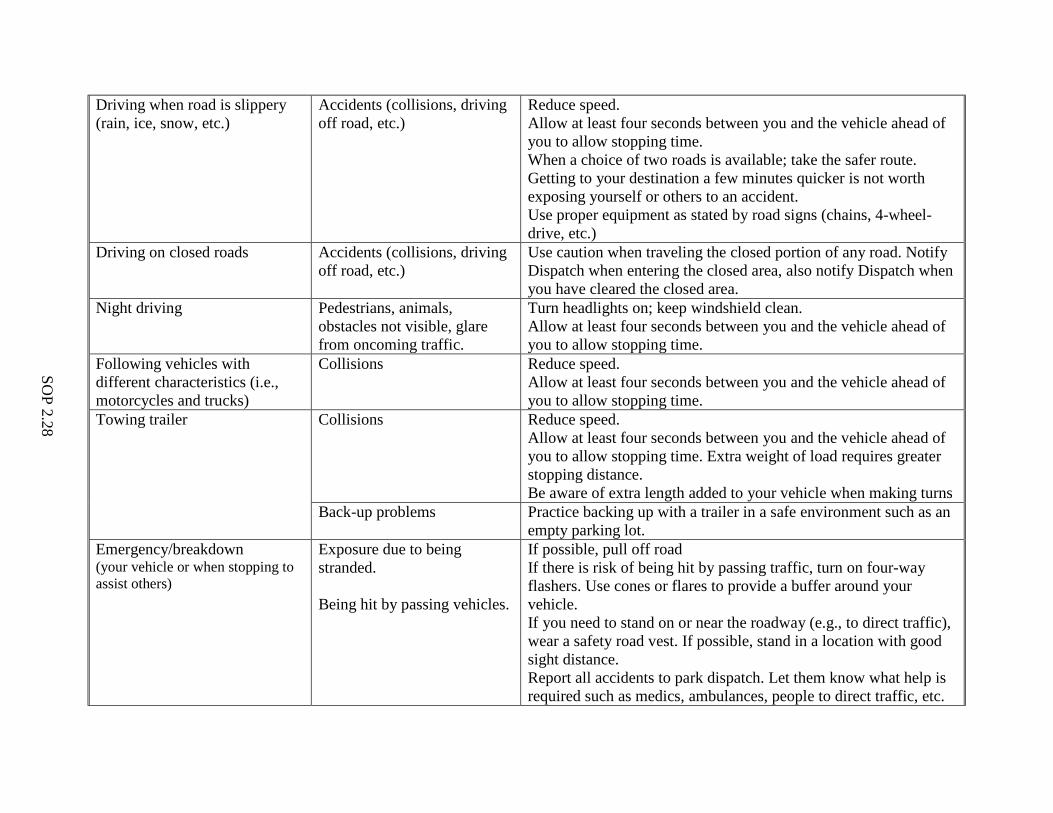
SOP 2.28
Driving when road is slippery (rain, ice, snow, etc.)
Accidents (collisions, driving off road, etc.)
Reduce speed. Allow at least four seconds between you and the vehicle ahead of you to allow stopping time. When a choice of two roads is available; take the safer route. Getting to your destination a few minutes quicker is not worth exposing yourself or others to an accident. Use proper equipment as stated by road signs (chains, 4-wheel-drive, etc.)
Driving on closed roads Accidents (collisions, driving off road, etc.)
Use caution when traveling the closed portion of any road. Notify Dispatch when entering the closed area, also notify Dispatch when you have cleared the closed area.
Night driving Pedestrians, animals, obstacles not visible, glare from oncoming traffic.
Turn headlights on; keep windshield clean. Allow at least four seconds between you and the vehicle ahead of you to allow stopping time.
Following vehicles with different characteristics (i.e., motorcycles and trucks)
Collisions Reduce speed. Allow at least four seconds between you and the vehicle ahead of you to allow stopping time.
Towing trailer Collisions Reduce speed. Allow at least four seconds between you and the vehicle ahead of you to allow stopping time. Extra weight of load requires greater stopping distance. Be aware of extra length added to your vehicle when making turns
Back-up problems Practice backing up with a trailer in a safe environment such as an empty parking lot.
Emergency/breakdown (your vehicle or when stopping to assist others)
Exposure due to being stranded. Being hit by passing vehicles.
If possible, pull off road If there is risk of being hit by passing traffic, turn on four-way flashers. Use cones or flares to provide a buffer around your vehicle. If you need to stand on or near the roadway (e.g., to direct traffic), wear a safety road vest. If possible, stand in a location with good sight distance. Report all accidents to park dispatch. Let them know what help is required such as medics, ambulances, people to direct traffic, etc.
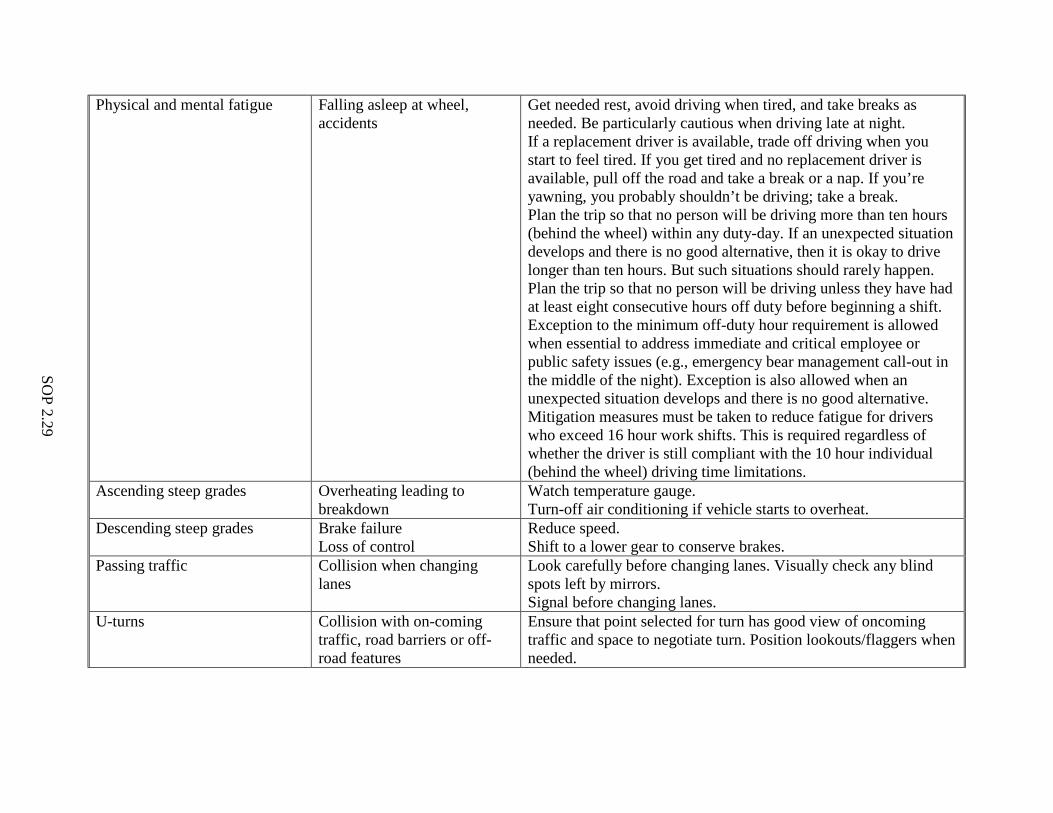
SOP 2.29
Physical and mental fatigue Falling asleep at wheel, accidents
Get needed rest, avoid driving when tired, and take breaks as needed. Be particularly cautious when driving late at night. If a replacement driver is available, trade off driving when you start to feel tired. If you get tired and no replacement driver is available, pull off the road and take a break or a nap. If you’re yawning, you probably shouldn’t be driving; take a break. Plan the trip so that no person will be driving more than ten hours (behind the wheel) within any duty-day. If an unexpected situation develops and there is no good alternative, then it is okay to drive longer than ten hours. But such situations should rarely happen. Plan the trip so that no person will be driving unless they have had at least eight consecutive hours off duty before beginning a shift. Exception to the minimum off-duty hour requirement is allowed when essential to address immediate and critical employee or public safety issues (e.g., emergency bear management call-out in the middle of the night). Exception is also allowed when an unexpected situation develops and there is no good alternative. Mitigation measures must be taken to reduce fatigue for drivers who exceed 16 hour work shifts. This is required regardless of whether the driver is still compliant with the 10 hour individual (behind the wheel) driving time limitations.
Ascending steep grades Overheating leading to breakdown
Watch temperature gauge. Turn-off air conditioning if vehicle starts to overheat.
Descending steep grades Brake failure Loss of control
Reduce speed. Shift to a lower gear to conserve brakes.
Passing traffic Collision when changing lanes
Look carefully before changing lanes. Visually check any blind spots left by mirrors. Signal before changing lanes.
U-turns Collision with on-coming traffic, road barriers or off-road features
Ensure that point selected for turn has good view of oncoming traffic and space to negotiate turn. Position lookouts/flaggers when needed.
SOP 2.30
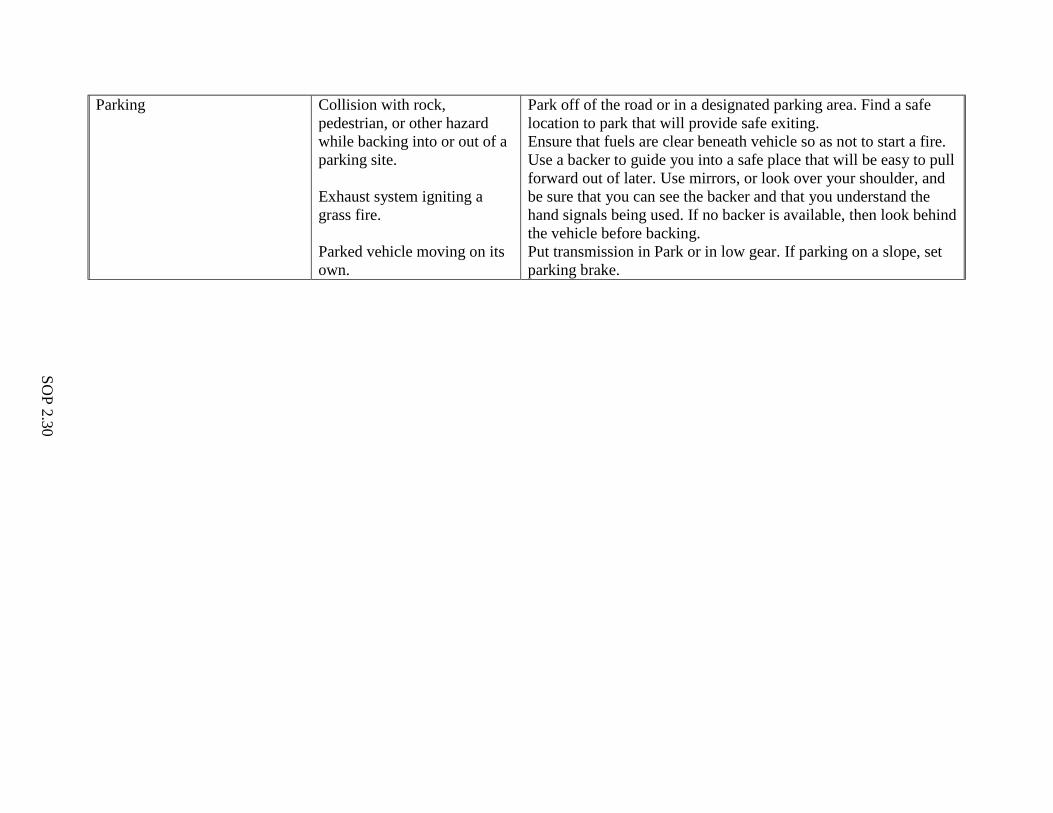
Parking Collision with rock, pedestrian, or other hazard while backing into or out of a parking site. Exhaust system igniting a grass fire. Parked vehicle moving on its own.
Park off of the road or in a designated parking area. Find a safe location to park that will provide safe exiting. Ensure that fuels are clear beneath vehicle so as not to start a fire. Use a backer to guide you into a safe place that will be easy to pull forward out of later. Use mirrors, or look over your shoulder, and be sure that you can see the backer and that you understand the hand signals being used. If no backer is available, then look behind the vehicle before backing. Put transmission in Park or in low gear. If parking on a slope, set parking brake.
SOP 2.31
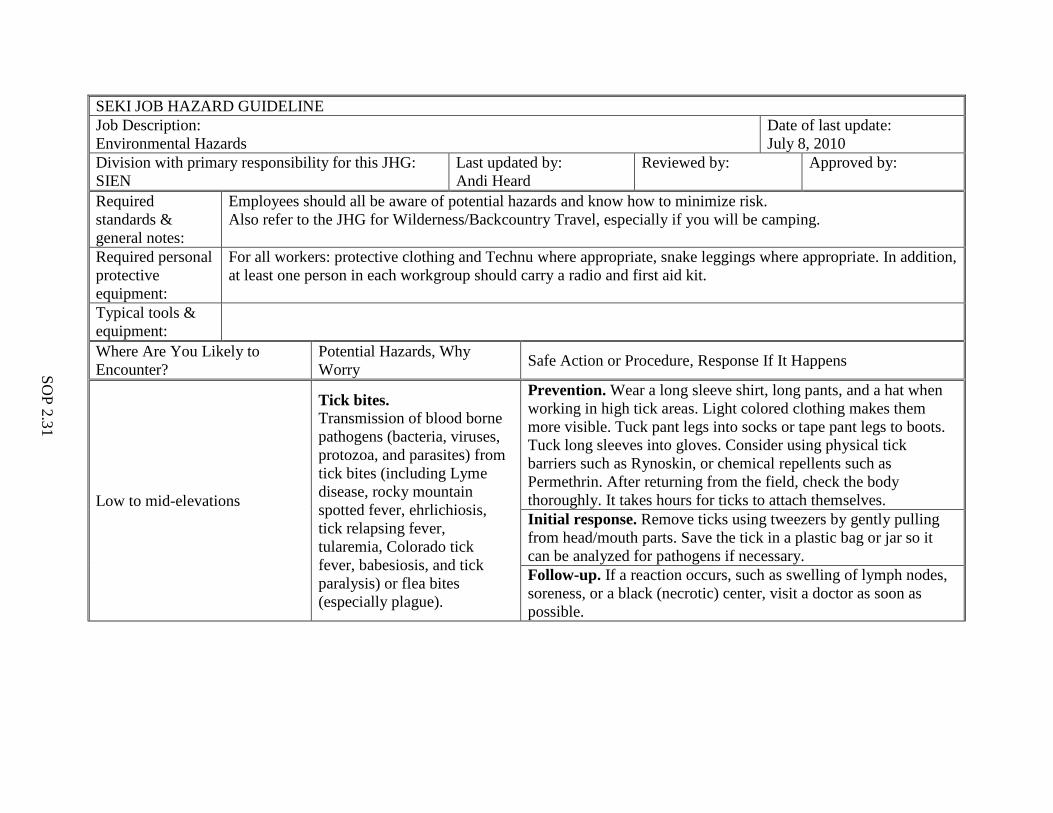
SEKI JOB HAZARD GUIDELINE Job Description: Environmental Hazards
Date of last update: July 8, 2010
Division with primary responsibility for this JHG: SIEN
Last updated by: Andi Heard
Reviewed by: Approved by:
Required standards & general notes:
Employees should all be aware of potential hazards and know how to minimize risk. Also refer to the JHG for Wilderness/Backcountry Travel, especially if you will be camping.
Required personal protective equipment:
For all workers: protective clothing and Technu where appropriate, snake leggings where appropriate. In addition, at least one person in each workgroup should carry a radio and first aid kit.
Typical tools & equipment:
Where Are You Likely to Encounter?
Potential Hazards, Why Worry Safe Action or Procedure, Response If It Happens
Low to mid-elevations
Tick bites. Transmission of blood borne pathogens (bacteria, viruses, protozoa, and parasites) from tick bites (including Lyme disease, rocky mountain spotted fever, ehrlichiosis, tick relapsing fever, tularemia, Colorado tick fever, babesiosis, and tick paralysis) or flea bites (especially plague).
Prevention. Wear a long sleeve shirt, long pants, and a hat when working in high tick areas. Light colored clothing makes them more visible. Tuck pant legs into socks or tape pant legs to boots. Tuck long sleeves into gloves. Consider using physical tick barriers such as Rynoskin, or chemical repellents such as Permethrin. After returning from the field, check the body thoroughly. It takes hours for ticks to attach themselves. Initial response. Remove ticks using tweezers by gently pulling from head/mouth parts. Save the tick in a plastic bag or jar so it can be analyzed for pathogens if necessary. Follow-up. If a reaction occurs, such as swelling of lymph nodes, soreness, or a black (necrotic) center, visit a doctor as soon as possible.
SOP 2.32
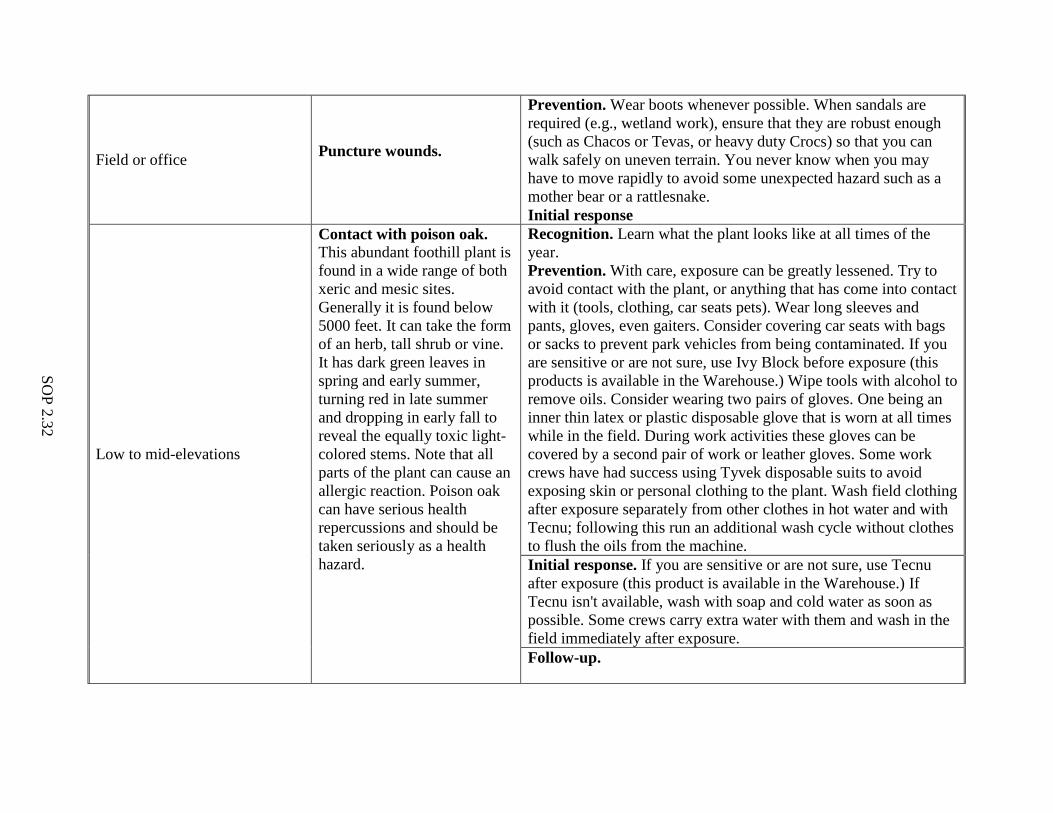
Field or office Puncture wounds.
Prevention. Wear boots whenever possible. When sandals are required (e.g., wetland work), ensure that they are robust enough (such as Chacos or Tevas, or heavy duty Crocs) so that you can walk safely on uneven terrain. You never know when you may have to move rapidly to avoid some unexpected hazard such as a mother bear or a rattlesnake. Initial response
Low to mid-elevations
Contact with poison oak. This abundant foothill plant is found in a wide range of both xeric and mesic sites. Generally it is found below 5000 feet. It can take the form of an herb, tall shrub or vine. It has dark green leaves in spring and early summer, turning red in late summer and dropping in early fall to reveal the equally toxic light-colored stems. Note that all parts of the plant can cause an allergic reaction. Poison oak can have serious health repercussions and should be taken seriously as a health hazard.
Recognition. Learn what the plant looks like at all times of the year. Prevention. With care, exposure can be greatly lessened. Try to avoid contact with the plant, or anything that has come into contact with it (tools, clothing, car seats pets). Wear long sleeves and pants, gloves, even gaiters. Consider covering car seats with bags or sacks to prevent park vehicles from being contaminated. If you are sensitive or are not sure, use Ivy Block before exposure (this products is available in the Warehouse.) Wipe tools with alcohol to remove oils. Consider wearing two pairs of gloves. One being an inner thin latex or plastic disposable glove that is worn at all times while in the field. During work activities these gloves can be covered by a second pair of work or leather gloves. Some work crews have had success using Tyvek disposable suits to avoid exposing skin or personal clothing to the plant. Wash field clothing after exposure separately from other clothes in hot water and with Tecnu; following this run an additional wash cycle without clothes to flush the oils from the machine. Initial response. If you are sensitive or are not sure, use Tecnu after exposure (this product is available in the Warehouse.) If Tecnu isn't available, wash with soap and cold water as soon as possible. Some crews carry extra water with them and wash in the field immediately after exposure. Follow-up.
SOP 2.33
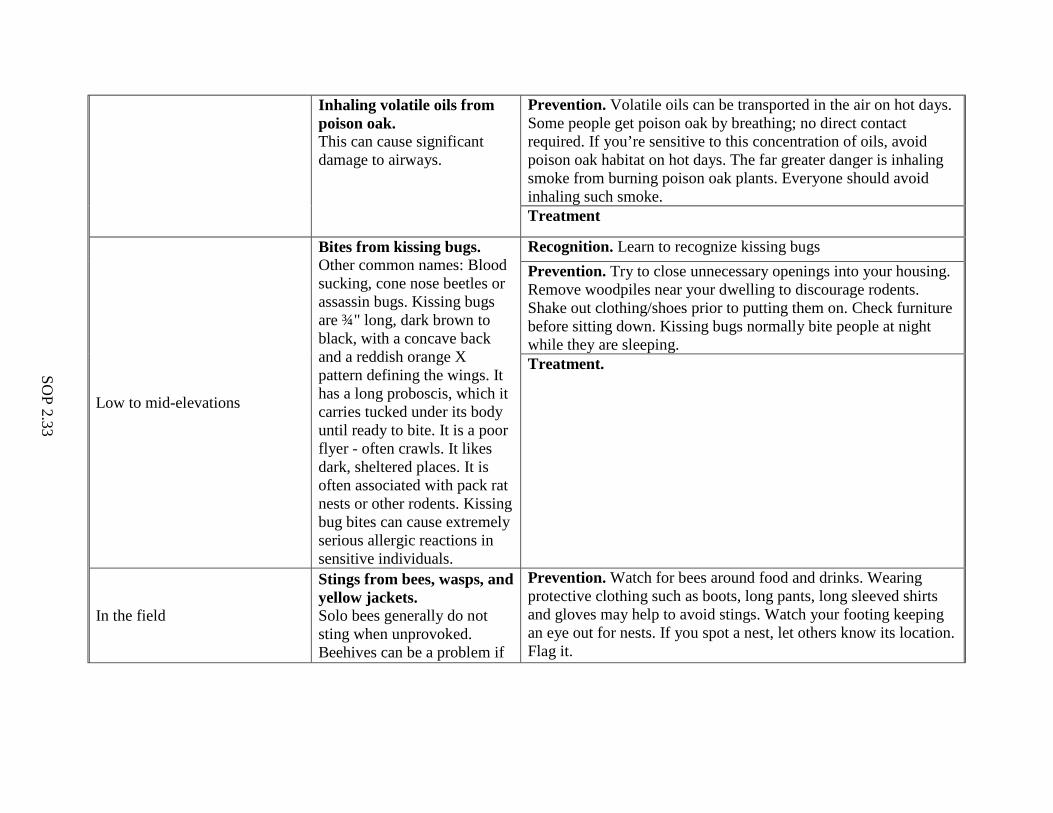
Inhaling volatile oils from poison oak. This can cause significant damage to airways.
Prevention. Volatile oils can be transported in the air on hot days. Some people get poison oak by breathing; no direct contact required. If you’re sensitive to this concentration of oils, avoid poison oak habitat on hot days. The far greater danger is inhaling smoke from burning poison oak plants. Everyone should avoid inhaling such smoke. Treatment
Low to mid-elevations
Bites from kissing bugs. Other common names: Blood sucking, cone nose beetles or assassin bugs. Kissing bugs are ¾" long, dark brown to black, with a concave back and a reddish orange X pattern defining the wings. It has a long proboscis, which it carries tucked under its body until ready to bite. It is a poor flyer - often crawls. It likes dark, sheltered places. It is often associated with pack rat nests or other rodents. Kissing bug bites can cause extremely serious allergic reactions in sensitive individuals.
Recognition. Learn to recognize kissing bugs Prevention. Try to close unnecessary openings into your housing. Remove woodpiles near your dwelling to discourage rodents. Shake out clothing/shoes prior to putting them on. Check furniture before sitting down. Kissing bugs normally bite people at night while they are sleeping. Treatment.
In the field
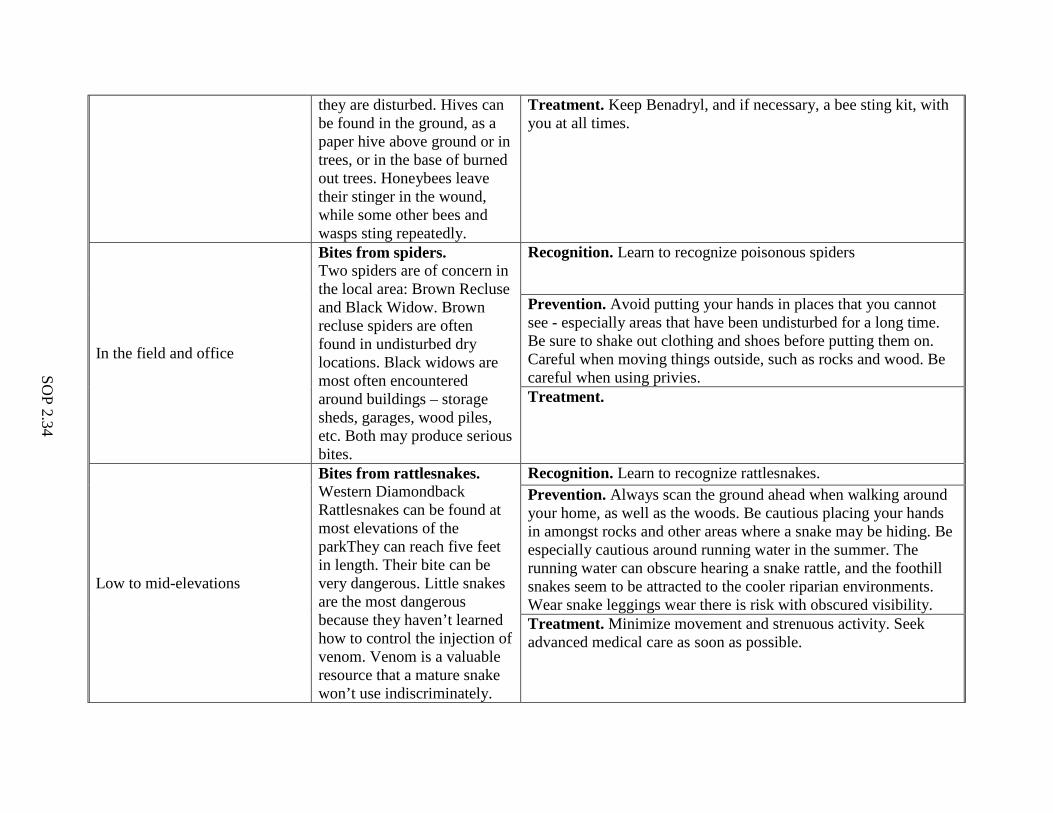
Stings from bees, wasps, and yellow jackets. Solo bees generally do not sting when unprovoked. Beehives can be a problem if
Prevention. Watch for bees around food and drinks. Wearing protective clothing such as boots, long pants, long sleeved shirts and gloves may help to avoid stings. Watch your footing keeping an eye out for nests. If you spot a nest, let others know its location. Flag it.
SOP 2.34
they are disturbed. Hives can be found in the ground, as a paper hive above ground or in trees, or in the base of burned out trees. Honeybees leave their stinger in the wound, while some other bees and wasps sting repeatedly.
Treatment. Keep Benadryl, and if necessary, a bee sting kit, with you at all times.
In the field and office
Bites from spiders. Two spiders are of concern in the local area: Brown Recluse and Black Widow. Brown recluse spiders are often found in undisturbed dry locations. Black widows are most often encountered around buildings – storage sheds, garages, wood piles, etc. Both may produce serious bites.
Recognition. Learn to recognize poisonous spiders
Prevention. Avoid putting your hands in places that you cannot see - especially areas that have been undisturbed for a long time. Be sure to shake out clothing and shoes before putting them on. Careful when moving things outside, such as rocks and wood. Be careful when using privies. Treatment.
Low to mid-elevations
Bites from rattlesnakes. Western Diamondback Rattlesnakes can be found at most elevations of the parkThey can reach five feet in length. Their bite can be very dangerous. Little snakes are the most dangerous because they haven’t learned how to control the injection of venom. Venom is a valuable resource that a mature snake won’t use indiscriminately.
Recognition. Learn to recognize rattlesnakes. Prevention. Always scan the ground ahead when walking around your home, as well as the woods. Be cautious placing your hands in amongst rocks and other areas where a snake may be hiding. Be especially cautious around running water in the summer. The running water can obscure hearing a snake rattle, and the foothill snakes seem to be attracted to the cooler riparian environments. Wear snake leggings wear there is risk with obscured visibility. Treatment. Minimize movement and strenuous activity. Seek advanced medical care as soon as possible.
SOP 2.35
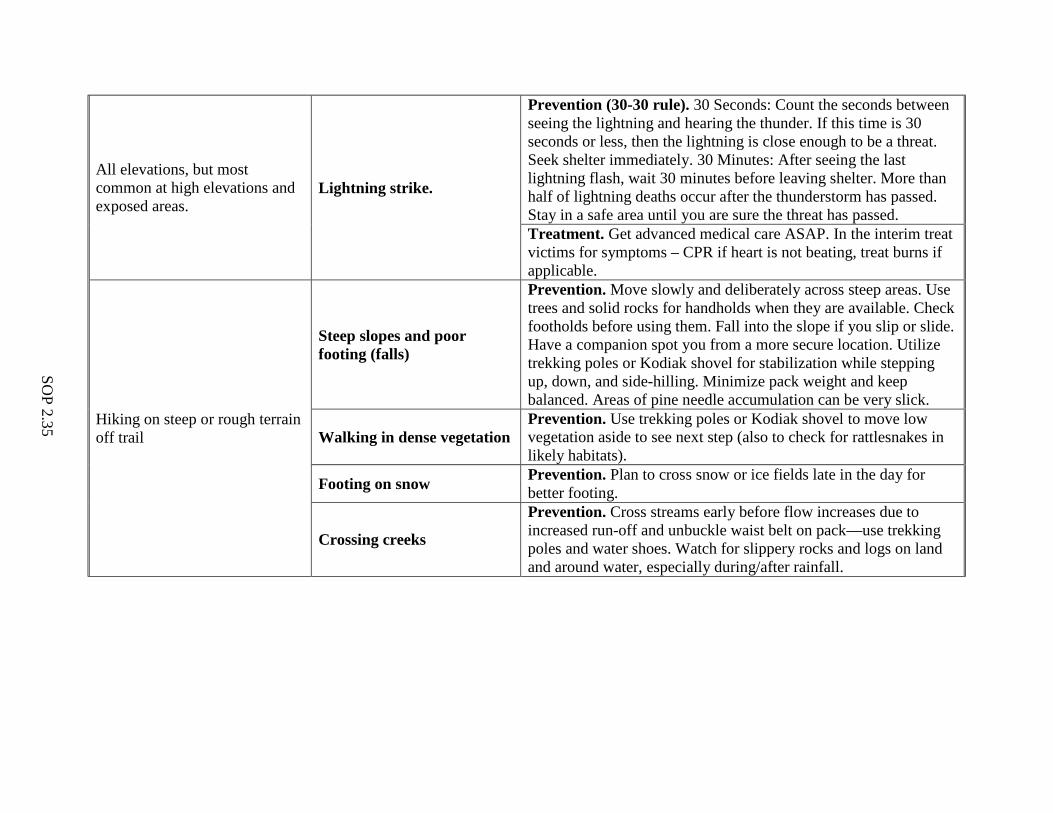
All elevations, but most common at high elevations and exposed areas.
Lightning strike.
Prevention (30-30 rule). 30 Seconds: Count the seconds between seeing the lightning and hearing the thunder. If this time is 30 seconds or less, then the lightning is close enough to be a threat. Seek shelter immediately. 30 Minutes: After seeing the last lightning flash, wait 30 minutes before leaving shelter. More than half of lightning deaths occur after the thunderstorm has passed. Stay in a safe area until you are sure the threat has passed. Treatment. Get advanced medical care ASAP. In the interim treat victims for symptoms – CPR if heart is not beating, treat burns if applicable.
Hiking on steep or rough terrain off trail
Steep slopes and poor footing (falls)
Prevention. Move slowly and deliberately across steep areas. Use trees and solid rocks for handholds when they are available. Check footholds before using them. Fall into the slope if you slip or slide. Have a companion spot you from a more secure location. Utilize trekking poles or Kodiak shovel for stabilization while stepping up, down, and side-hilling. Minimize pack weight and keep balanced. Areas of pine needle accumulation can be very slick.
Walking in dense vegetation Prevention. Use trekking poles or Kodiak shovel to move low vegetation aside to see next step (also to check for rattlesnakes in likely habitats).
Footing on snow Prevention. Plan to cross snow or ice fields late in the day for better footing.
Crossing creeks
Prevention. Cross streams early before flow increases due to increased run-off and unbuckle waist belt on pack—use trekking poles and water shoes. Watch for slippery rocks and logs on land and around water, especially during/after rainfall.
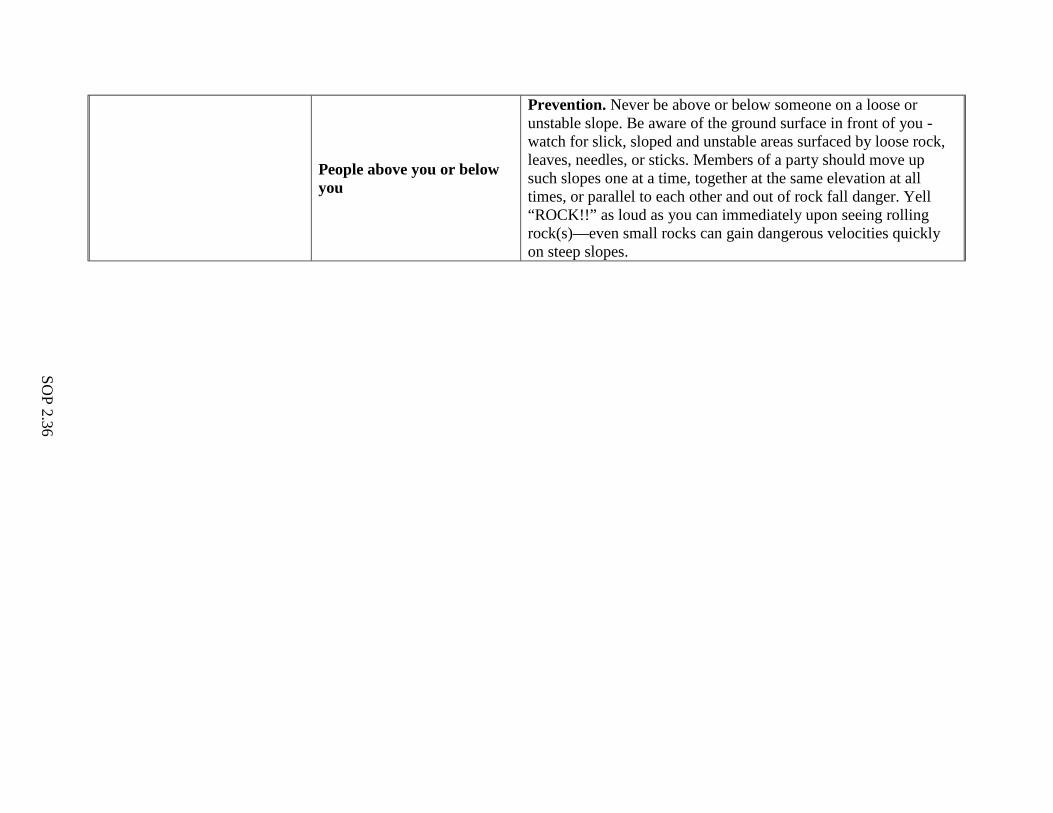
SOP 2.36
People above you or below you
Prevention. Never be above or below someone on a loose or unstable slope. Be aware of the ground surface in front of you - watch for slick, sloped and unstable areas surfaced by loose rock, leaves, needles, or sticks. Members of a party should move up such slopes one at a time, together at the same elevation at all times, or parallel to each other and out of rock fall danger. Yell “ROCK!!” as loud as you can immediately upon seeing rolling rock(s)—even small rocks can gain dangerous velocities quickly on steep slopes.
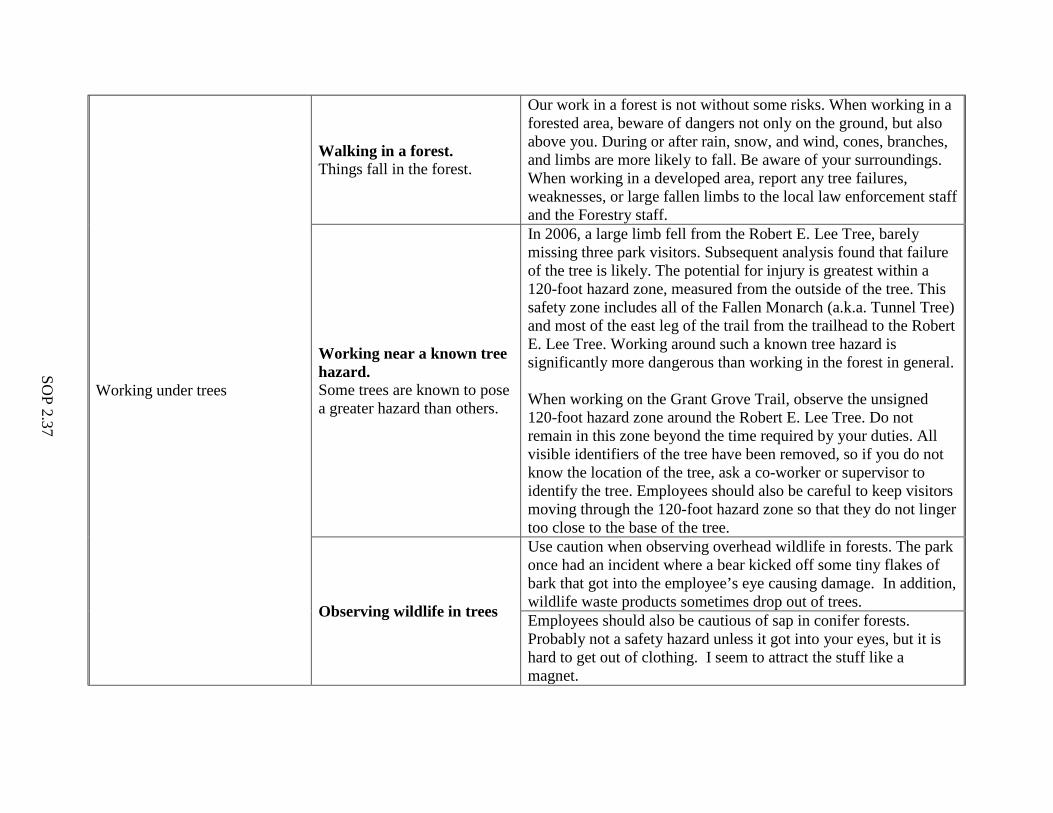
SOP 2.37
Working under trees
Walking in a forest. Things fall in the forest.
Our work in a forest is not without some risks. When working in a forested area, beware of dangers not only on the ground, but also above you. During or after rain, snow, and wind, cones, branches, and limbs are more likely to fall. Be aware of your surroundings. When working in a developed area, report any tree failures, weaknesses, or large fallen limbs to the local law enforcement staff and the Forestry staff.
Working near a known tree hazard. Some trees are known to pose a greater hazard than others.
In 2006, a large limb fell from the Robert E. Lee Tree, barely missing three park visitors. Subsequent analysis found that failure of the tree is likely. The potential for injury is greatest within a 120-foot hazard zone, measured from the outside of the tree. This safety zone includes all of the Fallen Monarch (a.k.a. Tunnel Tree) and most of the east leg of the trail from the trailhead to the Robert E. Lee Tree. Working around such a known tree hazard is significantly more dangerous than working in the forest in general. When working on the Grant Grove Trail, observe the unsigned 120-foot hazard zone around the Robert E. Lee Tree. Do not remain in this zone beyond the time required by your duties. All visible identifiers of the tree have been removed, so if you do not know the location of the tree, ask a co-worker or supervisor to identify the tree. Employees should also be careful to keep visitors moving through the 120-foot hazard zone so that they do not linger too close to the base of the tree.
Observing wildlife in trees
Use caution when observing overhead wildlife in forests. The park once had an incident where a bear kicked off some tiny flakes of bark that got into the employee’s eye causing damage. In addition, wildlife waste products sometimes drop out of trees. Employees should also be cautious of sap in conifer forests. Probably not a safety hazard unless it got into your eyes, but it is hard to get out of clothing. I seem to attract the stuff like a magnet.
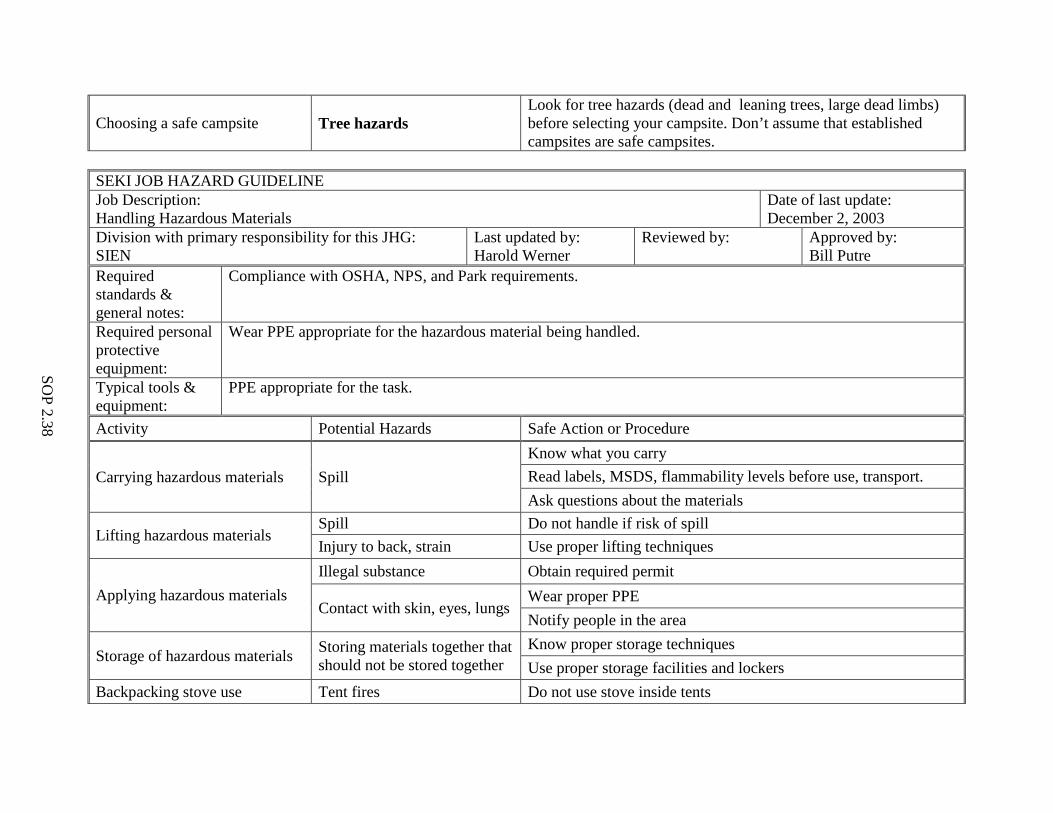
SOP 2.38
Choosing a safe campsite Tree hazards Look for tree hazards (dead and leaning trees, large dead limbs) before selecting your campsite. Don’t assume that established campsites are safe campsites.
SEKI JOB HAZARD GUIDELINE Job Description: Handling Hazardous Materials
Date of last update: December 2, 2003
Division with primary responsibility for this JHG: SIEN
Last updated by: Harold Werner
Reviewed by: Approved by: Bill Putre
Required standards & general notes:
Compliance with OSHA, NPS, and Park requirements.
Required personal protective equipment:
Wear PPE appropriate for the hazardous material being handled.
Typical tools & equipment:
PPE appropriate for the task.
Activity Potential Hazards Safe Action or Procedure
Carrying hazardous materials Spill Know what you carry Read labels, MSDS, flammability levels before use, transport. Ask questions about the materials
Lifting hazardous materials Spill Do not handle if risk of spill Injury to back, strain Use proper lifting techniques
Applying hazardous materials Illegal substance Obtain required permit
Contact with skin, eyes, lungs Wear proper PPE Notify people in the area
Storage of hazardous materials Storing materials together that should not be stored together
Know proper storage techniques Use proper storage facilities and lockers
Backpacking stove use Tent fires Do not use stove inside tents
SOP 2.39
Burns Be aware of spilled fuel and hot surfaces
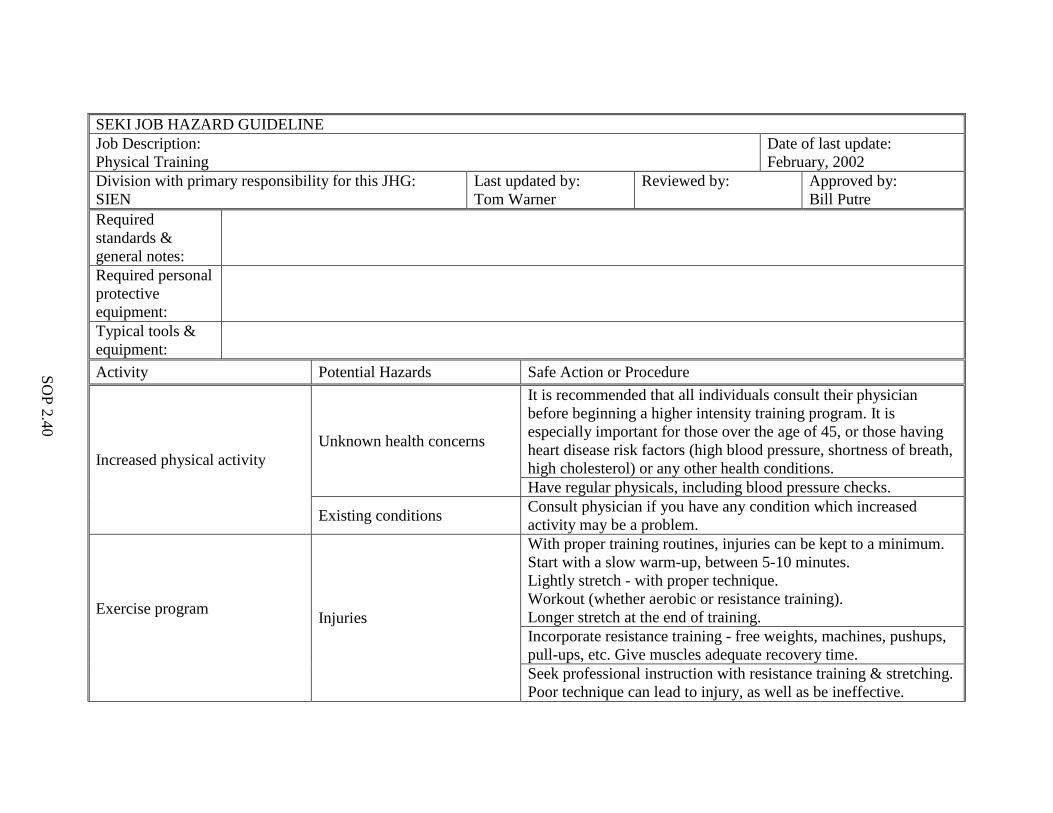
SOP 2.40
SEKI JOB HAZARD GUIDELINE Job Description: Physical Training
Date of last update: February, 2002
Division with primary responsibility for this JHG: SIEN
Last updated by: Tom Warner
Reviewed by: Approved by: Bill Putre
Required standards & general notes:
Required personal protective equipment:
Typical tools & equipment:
Activity Potential Hazards Safe Action or Procedure
Increased physical activity Unknown health concerns
It is recommended that all individuals consult their physician before beginning a higher intensity training program. It is especially important for those over the age of 45, or those having heart disease risk factors (high blood pressure, shortness of breath, high cholesterol) or any other health conditions. Have regular physicals, including blood pressure checks.
Existing conditions Consult physician if you have any condition which increased activity may be a problem.
Exercise program Injuries
With proper training routines, injuries can be kept to a minimum. Start with a slow warm-up, between 5-10 minutes. Lightly stretch - with proper technique. Workout (whether aerobic or resistance training). Longer stretch at the end of training. Incorporate resistance training - free weights, machines, pushups, pull-ups, etc. Give muscles adequate recovery time. Seek professional instruction with resistance training & stretching. Poor technique can lead to injury, as well as be ineffective.
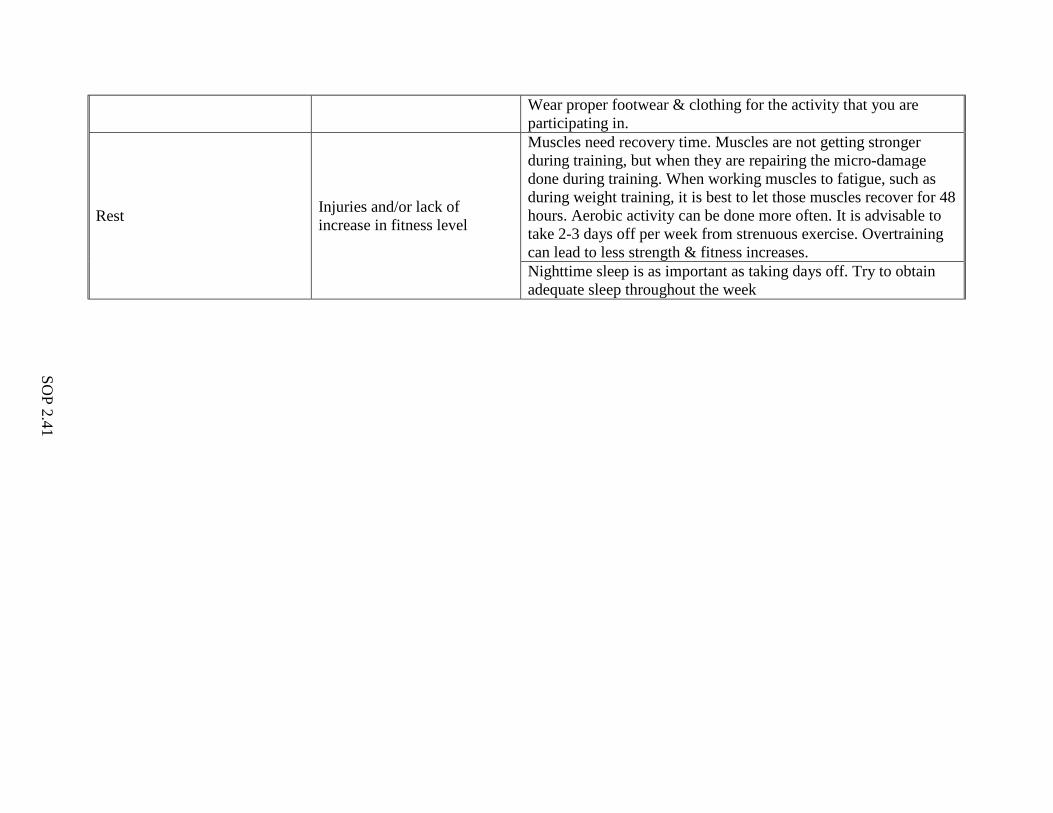
SOP 2.41
Wear proper footwear & clothing for the activity that you are participating in.
Rest Injuries and/or lack of increase in fitness level
Muscles need recovery time. Muscles are not getting stronger during training, but when they are repairing the micro-damage done during training. When working muscles to fatigue, such as during weight training, it is best to let those muscles recover for 48 hours. Aerobic activity can be done more often. It is advisable to take 2-3 days off per week from strenuous exercise. Overtraining can lead to less strength & fitness increases. Nighttime sleep is as important as taking days off. Try to obtain adequate sleep throughout the week
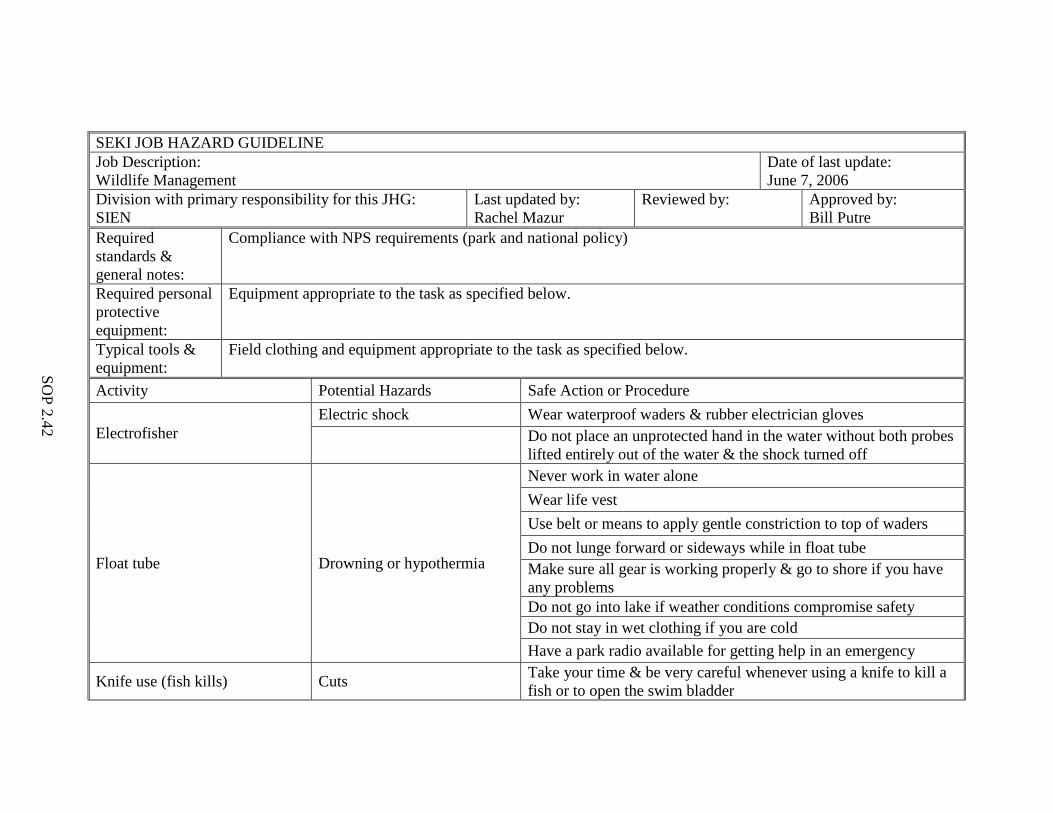
SOP 2.42
SEKI JOB HAZARD GUIDELINE Job Description: Wildlife Management
Date of last update: June 7, 2006
Division with primary responsibility for this JHG: SIEN
Last updated by: Rachel Mazur
Reviewed by: Approved by: Bill Putre
Required standards & general notes:
Compliance with NPS requirements (park and national policy)
Required personal protective equipment:
Equipment appropriate to the task as specified below.
Typical tools & equipment:
Field clothing and equipment appropriate to the task as specified below.
Activity Potential Hazards Safe Action or Procedure
Electrofisher Electric shock Wear waterproof waders & rubber electrician gloves
Do not place an unprotected hand in the water without both probes lifted entirely out of the water & the shock turned off
Float tube Drowning or hypothermia
Never work in water alone Wear life vest Use belt or means to apply gentle constriction to top of waders Do not lunge forward or sideways while in float tube Make sure all gear is working properly & go to shore if you have any problems Do not go into lake if weather conditions compromise safety Do not stay in wet clothing if you are cold Have a park radio available for getting help in an emergency
Knife use (fish kills) Cuts Take your time & be very careful whenever using a knife to kill a fish or to open the swim bladder
SIEN Lakes Monitoring Protocol
SOP 2.43
9 References Lane S. L., Fay, R. G. October 1997. Safety in field activities. Chapter A9 in U. S. Geologic
Survey techniques of water-resources investigations. http://pubs.water.usgs.gov/twri9A9/ (accessed August 28, 2007).
National Park Service (NPS). 2004. National Park Service safety and health implementation plan. http://inside.nps.gov/waso/custommenu.cfm?lv=3&prg=646&id=2341 (accessed August 28, 2007).
SIEN Lake Monitoring Protocol
SOP 3.1
Sierra Nevada Network Lake Monitoring Protocol
SOP 3. Training Version 1.00, July 2012 Prepared by Andrea M. Heard
Revision History Log Previous Version #
Revision Date Author Changes Made Reason for
Change New
Version #
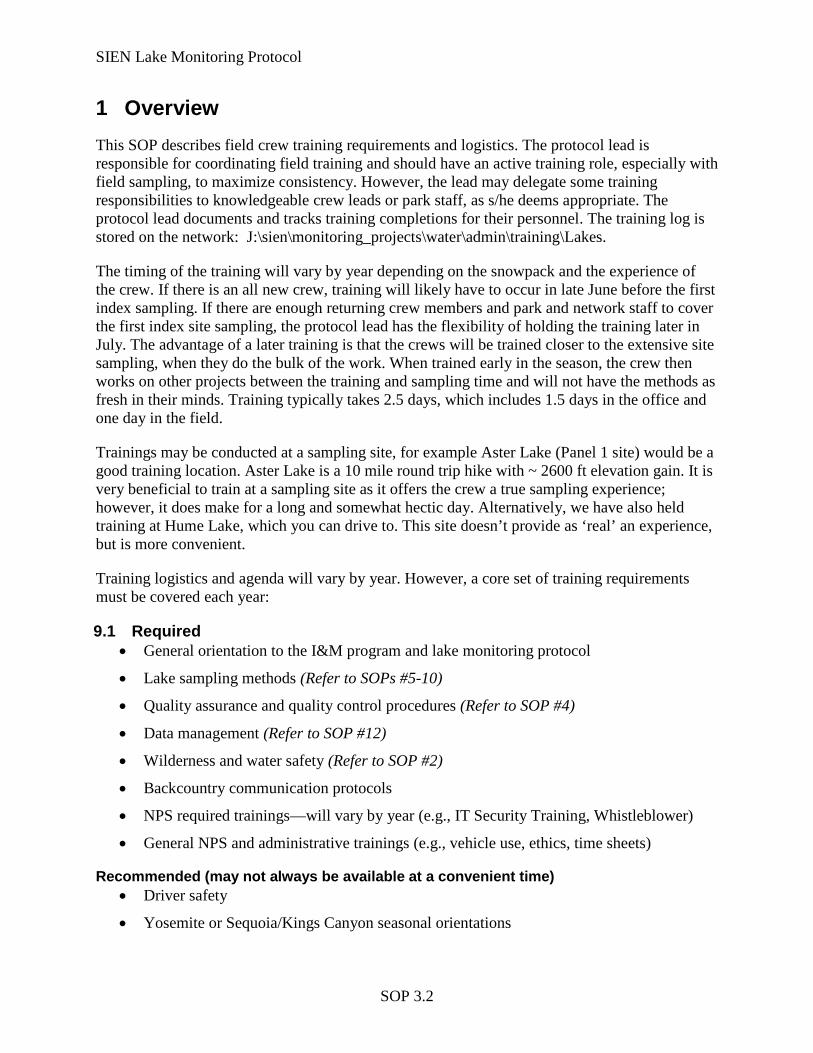
SIEN Lake Monitoring Protocol
SOP 3.2
1 Overview This SOP describes field crew training requirements and logistics. The protocol lead is responsible for coordinating field training and should have an active training role, especially with field sampling, to maximize consistency. However, the lead may delegate some training responsibilities to knowledgeable crew leads or park staff, as s/he deems appropriate. The protocol lead documents and tracks training completions for their personnel. The training log is stored on the network: J:\sien\monitoring_projects\water\admin\training\Lakes.
The timing of the training will vary by year depending on the snowpack and the experience of the crew. If there is an all new crew, training will likely have to occur in late June before the first index sampling. If there are enough returning crew members and park and network staff to cover the first index site sampling, the protocol lead has the flexibility of holding the training later in July. The advantage of a later training is that the crews will be trained closer to the extensive site sampling, when they do the bulk of the work. When trained early in the season, the crew then works on other projects between the training and sampling time and will not have the methods as fresh in their minds. Training typically takes 2.5 days, which includes 1.5 days in the office and one day in the field.
Trainings may be conducted at a sampling site, for example Aster Lake (Panel 1 site) would be a good training location. Aster Lake is a 10 mile round trip hike with ~ 2600 ft elevation gain. It is very beneficial to train at a sampling site as it offers the crew a true sampling experience; however, it does make for a long and somewhat hectic day. Alternatively, we have also held training at Hume Lake, which you can drive to. This site doesn’t provide as ‘real’ an experience, but is more convenient.
Training logistics and agenda will vary by year. However, a core set of training requirements must be covered each year:
9.1 Required • General orientation to the I&M program and lake monitoring protocol
• Lake sampling methods (Refer to SOPs #5-10)
• Quality assurance and quality control procedures (Refer to SOP #4)
• Data management (Refer to SOP #12)
• Wilderness and water safety (Refer to SOP #2)
• Backcountry communication protocols
• NPS required trainings—will vary by year (e.g., IT Security Training, Whistleblower)
• General NPS and administrative trainings (e.g., vehicle use, ethics, time sheets)
Recommended (may not always be available at a convenient time) • Driver safety
• Yosemite or Sequoia/Kings Canyon seasonal orientations

SIEN Lake Monitoring Protocol
SOP 3.3
• CPR
This SOP includes several resources to assist the protocol lead in planning the training. The following pages include an example agenda, a list of the handouts to provide, Power Point presentations to prepare, and the locations where these resources can be found on the network or in the protocol.
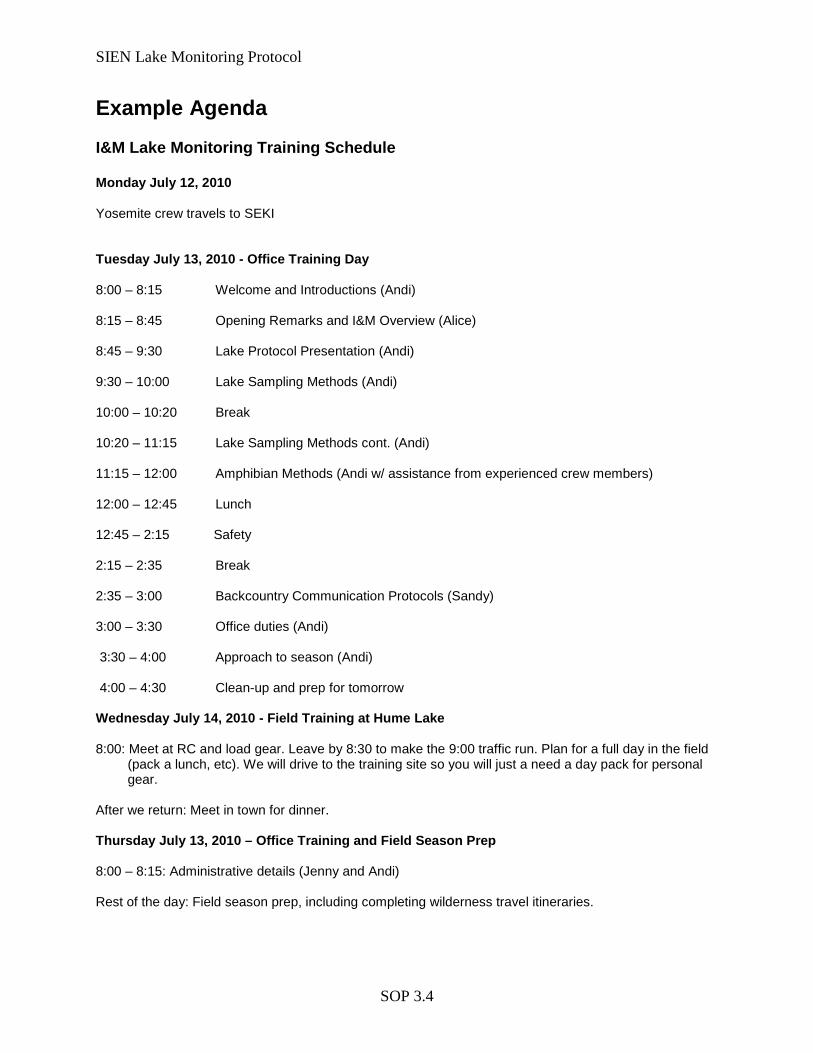
SIEN Lake Monitoring Protocol
SOP 3.4
Example Agenda I&M Lake Monitoring Training Schedule Monday July 12, 2010 Yosemite crew travels to SEKI Tuesday July 13, 2010 - Office Training Day 8:00 – 8:15 Welcome and Introductions (Andi) 8:15 – 8:45 Opening Remarks and I&M Overview (Alice) 8:45 – 9:30 Lake Protocol Presentation (Andi) 9:30 – 10:00 Lake Sampling Methods (Andi) 10:00 – 10:20 Break 10:20 – 11:15 Lake Sampling Methods cont. (Andi) 11:15 – 12:00 Amphibian Methods (Andi w/ assistance from experienced crew members) 12:00 – 12:45 Lunch 12:45 – 2:15 Safety 2:15 – 2:35 Break 2:35 – 3:00 Backcountry Communication Protocols (Sandy) 3:00 – 3:30 Office duties (Andi) 3:30 – 4:00 Approach to season (Andi) 4:00 – 4:30 Clean-up and prep for tomorrow Wednesday July 14, 2010 - Field Training at Hume Lake 8:00: Meet at RC and load gear. Leave by 8:30 to make the 9:00 traffic run. Plan for a full day in the field
(pack a lunch, etc). We will drive to the training site so you will just a need a day pack for personal gear.
After we return: Meet in town for dinner. Thursday July 13, 2010 – Office Training and Field Season Prep 8:00 – 8:15: Administrative details (Jenny and Andi) Rest of the day: Field season prep, including completing wilderness travel itineraries.
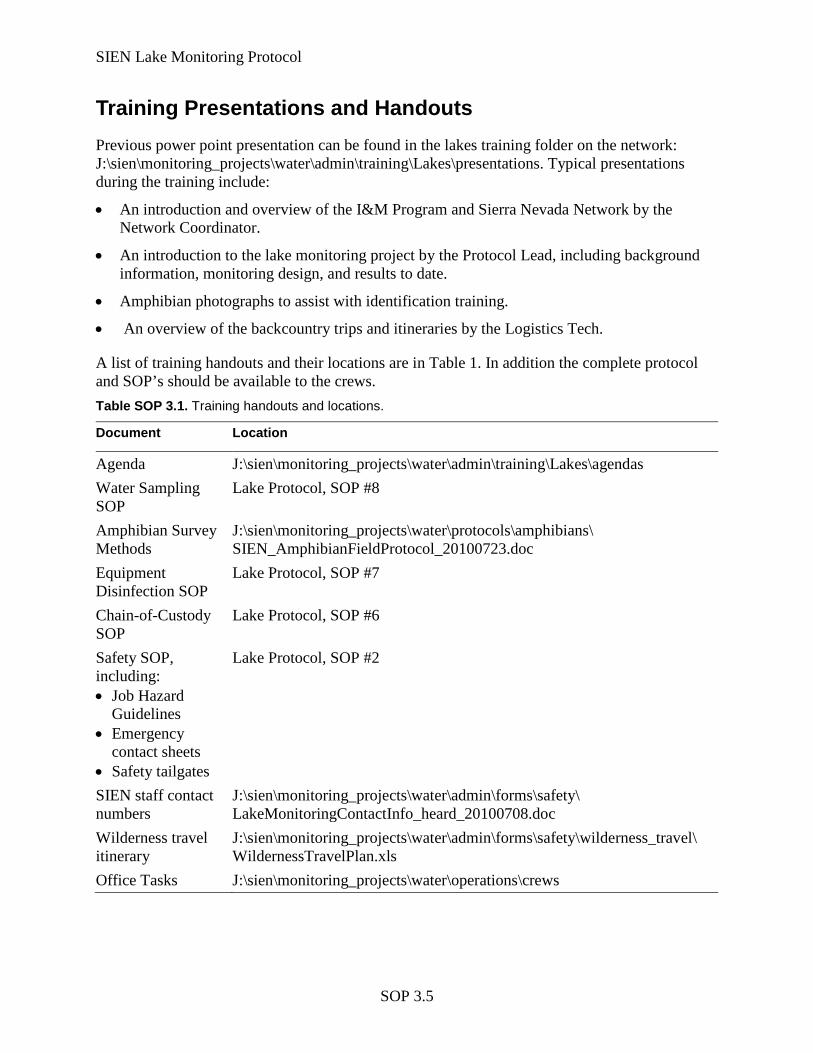
SIEN Lake Monitoring Protocol
SOP 3.5
Training Presentations and Handouts Previous power point presentation can be found in the lakes training folder on the network: J:\sien\monitoring_projects\water\admin\training\Lakes\presentations. Typical presentations during the training include:
• An introduction and overview of the I&M Program and Sierra Nevada Network by the Network Coordinator.
• An introduction to the lake monitoring project by the Protocol Lead, including background information, monitoring design, and results to date.
• Amphibian photographs to assist with identification training.
• An overview of the backcountry trips and itineraries by the Logistics Tech.
A list of training handouts and their locations are in Table 1. In addition the complete protocol and SOP’s should be available to the crews. Table SOP 3.1. Training handouts and locations.
Document Location
Agenda J:\sien\monitoring_projects\water\admin\training\Lakes\agendas Water Sampling SOP
Lake Protocol, SOP #8
Amphibian Survey Methods
J:\sien\monitoring_projects\water\protocols\amphibians\ SIEN_AmphibianFieldProtocol_20100723.doc
Equipment Disinfection SOP
Lake Protocol, SOP #7
Chain-of-Custody SOP
Lake Protocol, SOP #6
Safety SOP, including: • Job Hazard
Guidelines • Emergency
contact sheets • Safety tailgates
Lake Protocol, SOP #2
SIEN staff contact numbers
J:\sien\monitoring_projects\water\admin\forms\safety\ LakeMonitoringContactInfo_heard_20100708.doc
Wilderness travel itinerary
J:\sien\monitoring_projects\water\admin\forms\safety\wilderness_travel\ WildernessTravelPlan.xls
Office Tasks J:\sien\monitoring_projects\water\operations\crews
SIEN Lake Monitoring Protocol
SOP 4.1
Sierra Nevada Network Lake Monitoring Protocol
SOP 4. Quality Assurance Project Plan (QAPP) Version 1.00, November 2012 Prepared by Andrea M. Heard and James O. Sickman
Revision History Log Previous Version #
Revision Date Author Changes Made Reason for
Change New
Version #
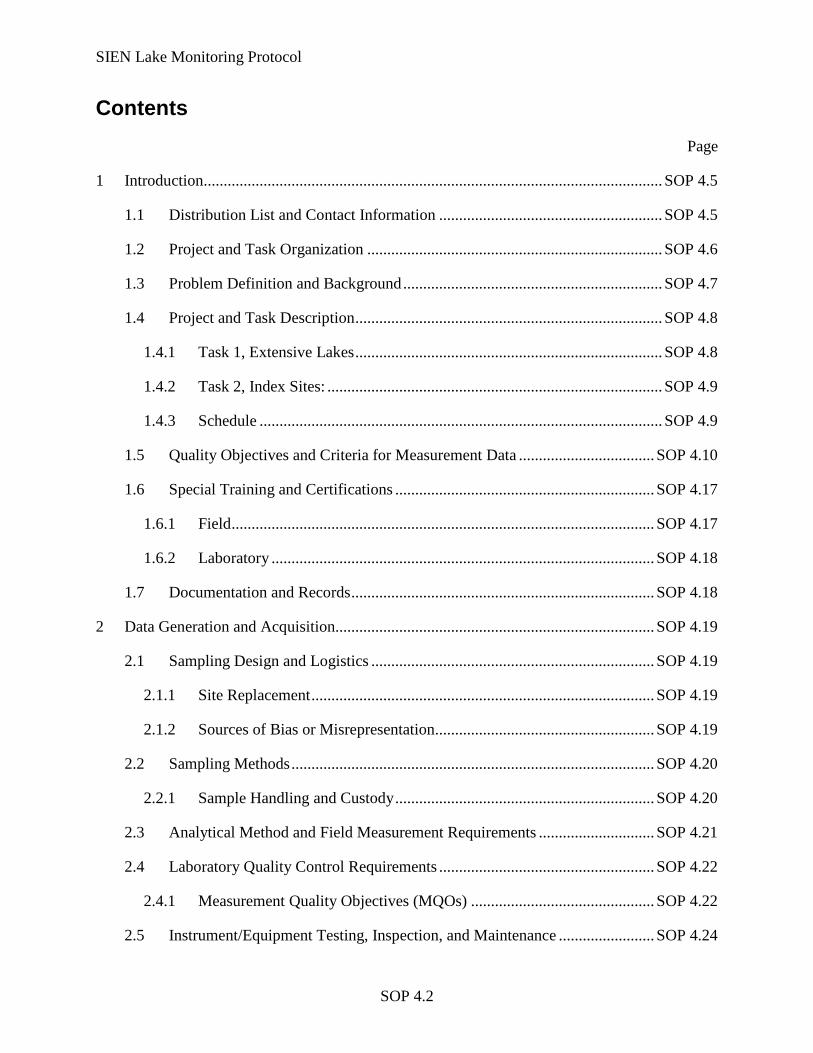
SIEN Lake Monitoring Protocol
SOP 4.2
Contents Page
1 Introduction ................................................................................................................... SOP 4.5
1.1 Distribution List and Contact Information ........................................................ SOP 4.5
1.2 Project and Task Organization .......................................................................... SOP 4.6
1.3 Problem Definition and Background ................................................................. SOP 4.7
1.4 Project and Task Description ............................................................................. SOP 4.8
1.4.1 Task 1, Extensive Lakes ............................................................................. SOP 4.8
1.4.2 Task 2, Index Sites: .................................................................................... SOP 4.9
1.4.3 Schedule ..................................................................................................... SOP 4.9
1.5 Quality Objectives and Criteria for Measurement Data .................................. SOP 4.10
1.6 Special Training and Certifications ................................................................. SOP 4.17
1.6.1 Field .......................................................................................................... SOP 4.17
1.6.2 Laboratory ................................................................................................ SOP 4.18
1.7 Documentation and Records ............................................................................ SOP 4.18
2 Data Generation and Acquisition ................................................................................ SOP 4.19
2.1 Sampling Design and Logistics ....................................................................... SOP 4.19
2.1.1 Site Replacement ...................................................................................... SOP 4.19
2.1.2 Sources of Bias or Misrepresentation....................................................... SOP 4.19
2.2 Sampling Methods ........................................................................................... SOP 4.20
2.2.1 Sample Handling and Custody ................................................................. SOP 4.20
2.3 Analytical Method and Field Measurement Requirements ............................. SOP 4.21
2.4 Laboratory Quality Control Requirements ...................................................... SOP 4.22
2.4.1 Measurement Quality Objectives (MQOs) .............................................. SOP 4.22
2.5 Instrument/Equipment Testing, Inspection, and Maintenance ........................ SOP 4.24
SIEN Lake Monitoring Protocol
SOP 4.3
Contents (continued) Page
2.6 Field Instrument/Equipment Calibration and Frequency ................................ SOP 4.24
2.7 Inspection/Acceptance for Supplies and Consumables ................................... SOP 4.25
2.8 Data Acquisition Requirements (Non-direct Measurements) ......................... SOP 4.25
2.9 Data Management ............................................................................................ SOP 4.26
3 Assessment and Oversight .......................................................................................... SOP 4.26
3.1 Assessments and Response Actions ................................................................ SOP 4.26
3.2 Reports to Management ................................................................................... SOP 4.26
4 Data Validation and Usability .................................................................................... SOP 4.26
4.1 Data Review, Verification, and Validation ..................................................... SOP 4.26
4.2 Verification and Validation Methods .............................................................. SOP 4.27
4.2.1 Verification............................................................................................... SOP 4.27
4.2.2 Validation ................................................................................................. SOP 4.27
4.2.3 Roles and Responsibilities ....................................................................... SOP 4.29
4.2.4 Resolution Process ................................................................................... SOP 4.29
4.3 Reconciliation and User Requirements ........................................................... SOP 4.30
5 Literature Cited ........................................................................................................... SOP 4.30
SIEN Lake Monitoring Protocol
SOP 4.4
Figures Page
Figure SOP 4.1. Organizational chart showing lines of project management and reporting responsibilities under the QAPP. ......................................................................... SOP 4.7
Figure SOP 4.2. Holding time tests for Emerald Lake. .................................................... SOP 4.14
Tables Page
Table SOP 4.1. QAPP distribution list. .............................................................................. SOP 4.5
Table SOP 4.2. Project roles and responsibilities. .............................................................. SOP 4.6
Table SOP 4.3. Long-term monitoring timetable. .............................................................. SOP 4.9
Table SOP 4.4. Monitoring—monthly schedule. ............................................................. SOP 4.10
Table SOP 4.5. Measurement quality objectives. ............................................................. SOP 4.12
SOP Table 4.6. Summary of analytical methods used in previous surveys and monitoring programs in the Sierra Nevada. ....................................................................... SOP 4.16
Table SOP 4.7. Summary of sample handling requirements. ........................................... SOP 4.21
Table SOP 4.8. Routine instrument inspections and calibrations. .................................... SOP 4.25
Table SOP 4.9. Verification and validation responsibilities and frequencies. ................. SOP 4.29
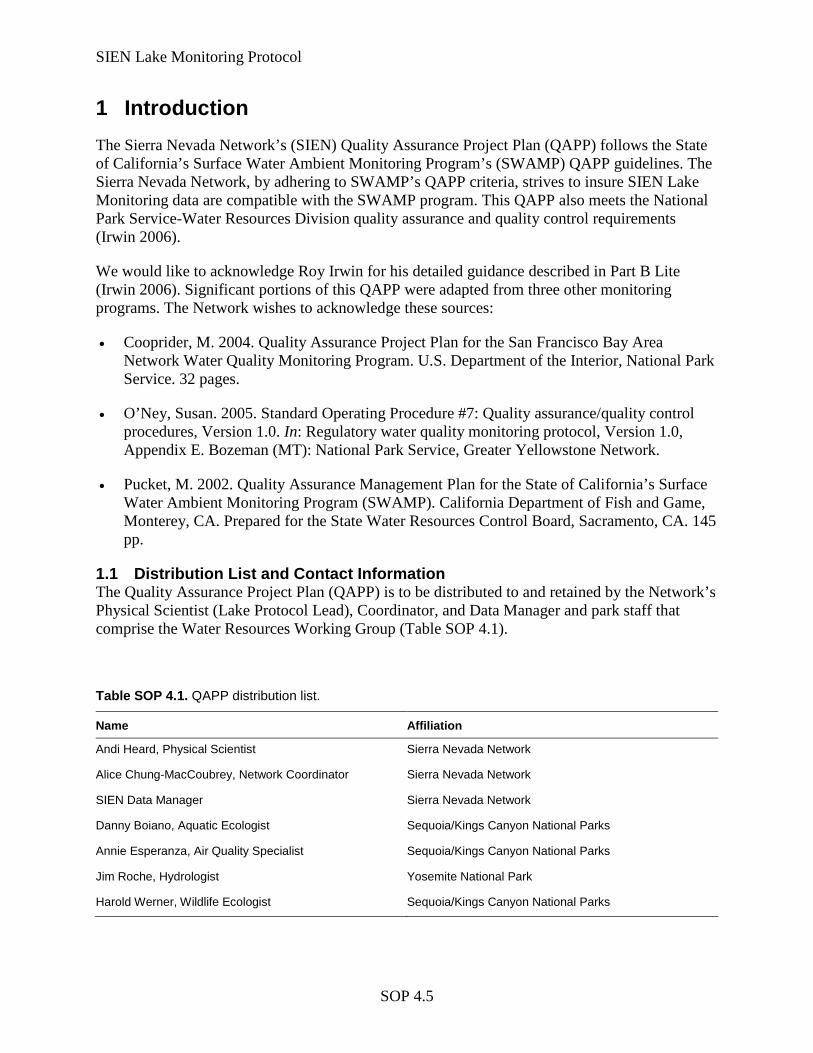
SIEN Lake Monitoring Protocol
SOP 4.5
1 Introduction The Sierra Nevada Network’s (SIEN) Quality Assurance Project Plan (QAPP) follows the State of California’s Surface Water Ambient Monitoring Program’s (SWAMP) QAPP guidelines. The Sierra Nevada Network, by adhering to SWAMP’s QAPP criteria, strives to insure SIEN Lake Monitoring data are compatible with the SWAMP program. This QAPP also meets the National Park Service-Water Resources Division quality assurance and quality control requirements (Irwin 2006).
We would like to acknowledge Roy Irwin for his detailed guidance described in Part B Lite (Irwin 2006). Significant portions of this QAPP were adapted from three other monitoring programs. The Network wishes to acknowledge these sources:
• Cooprider, M. 2004. Quality Assurance Project Plan for the San Francisco Bay Area Network Water Quality Monitoring Program. U.S. Department of the Interior, National Park Service. 32 pages.
• O’Ney, Susan. 2005. Standard Operating Procedure #7: Quality assurance/quality control procedures, Version 1.0. In: Regulatory water quality monitoring protocol, Version 1.0, Appendix E. Bozeman (MT): National Park Service, Greater Yellowstone Network.
• Pucket, M. 2002. Quality Assurance Management Plan for the State of California’s Surface Water Ambient Monitoring Program (SWAMP). California Department of Fish and Game, Monterey, CA. Prepared for the State Water Resources Control Board, Sacramento, CA. 145 pp.
1.1 Distribution List and Contact Information The Quality Assurance Project Plan (QAPP) is to be distributed to and retained by the Network’s Physical Scientist (Lake Protocol Lead), Coordinator, and Data Manager and park staff that comprise the Water Resources Working Group (Table SOP 4.1).
Table SOP 4.1. QAPP distribution list.
Name Affiliation
Andi Heard, Physical Scientist Sierra Nevada Network
Alice Chung-MacCoubrey, Network Coordinator Sierra Nevada Network
SIEN Data Manager Sierra Nevada Network
Danny Boiano, Aquatic Ecologist Sequoia/Kings Canyon National Parks
Annie Esperanza, Air Quality Specialist Sequoia/Kings Canyon National Parks
Jim Roche, Hydrologist Yosemite National Park
Harold Werner, Wildlife Ecologist Sequoia/Kings Canyon National Parks
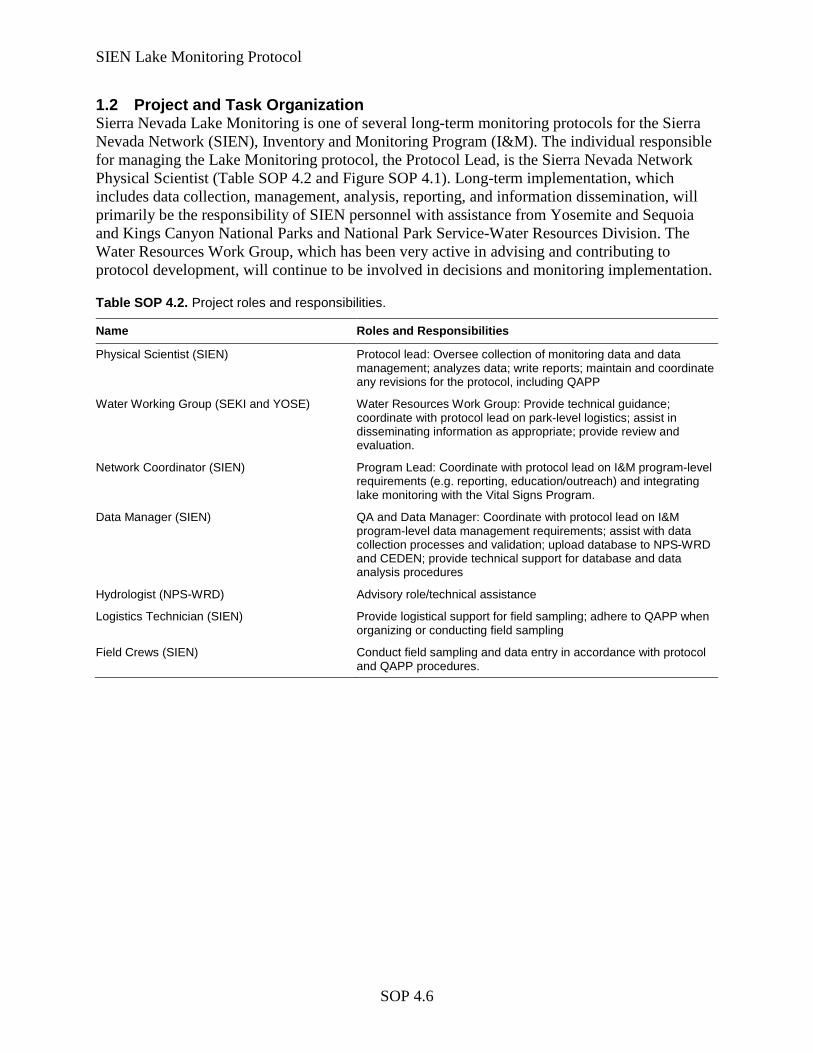
SIEN Lake Monitoring Protocol
SOP 4.6
1.2 Project and Task Organization Sierra Nevada Lake Monitoring is one of several long-term monitoring protocols for the Sierra Nevada Network (SIEN), Inventory and Monitoring Program (I&M). The individual responsible for managing the Lake Monitoring protocol, the Protocol Lead, is the Sierra Nevada Network Physical Scientist (Table SOP 4.2 and Figure SOP 4.1). Long-term implementation, which includes data collection, management, analysis, reporting, and information dissemination, will primarily be the responsibility of SIEN personnel with assistance from Yosemite and Sequoia and Kings Canyon National Parks and National Park Service-Water Resources Division. The Water Resources Work Group, which has been very active in advising and contributing to protocol development, will continue to be involved in decisions and monitoring implementation.
Table SOP 4.2. Project roles and responsibilities.
Name Roles and Responsibilities
Physical Scientist (SIEN) Protocol lead: Oversee collection of monitoring data and data management; analyzes data; write reports; maintain and coordinate any revisions for the protocol, including QAPP
Water Working Group (SEKI and YOSE) Water Resources Work Group: Provide technical guidance; coordinate with protocol lead on park-level logistics; assist in disseminating information as appropriate; provide review and evaluation.
Network Coordinator (SIEN) Program Lead: Coordinate with protocol lead on I&M program-level requirements (e.g. reporting, education/outreach) and integrating lake monitoring with the Vital Signs Program.
Data Manager (SIEN) QA and Data Manager: Coordinate with protocol lead on I&M program-level data management requirements; assist with data collection processes and validation; upload database to NPS-WRD and CEDEN; provide technical support for database and data analysis procedures
Hydrologist (NPS-WRD) Advisory role/technical assistance
Logistics Technician (SIEN) Provide logistical support for field sampling; adhere to QAPP when organizing or conducting field sampling
Field Crews (SIEN) Conduct field sampling and data entry in accordance with protocol and QAPP procedures.
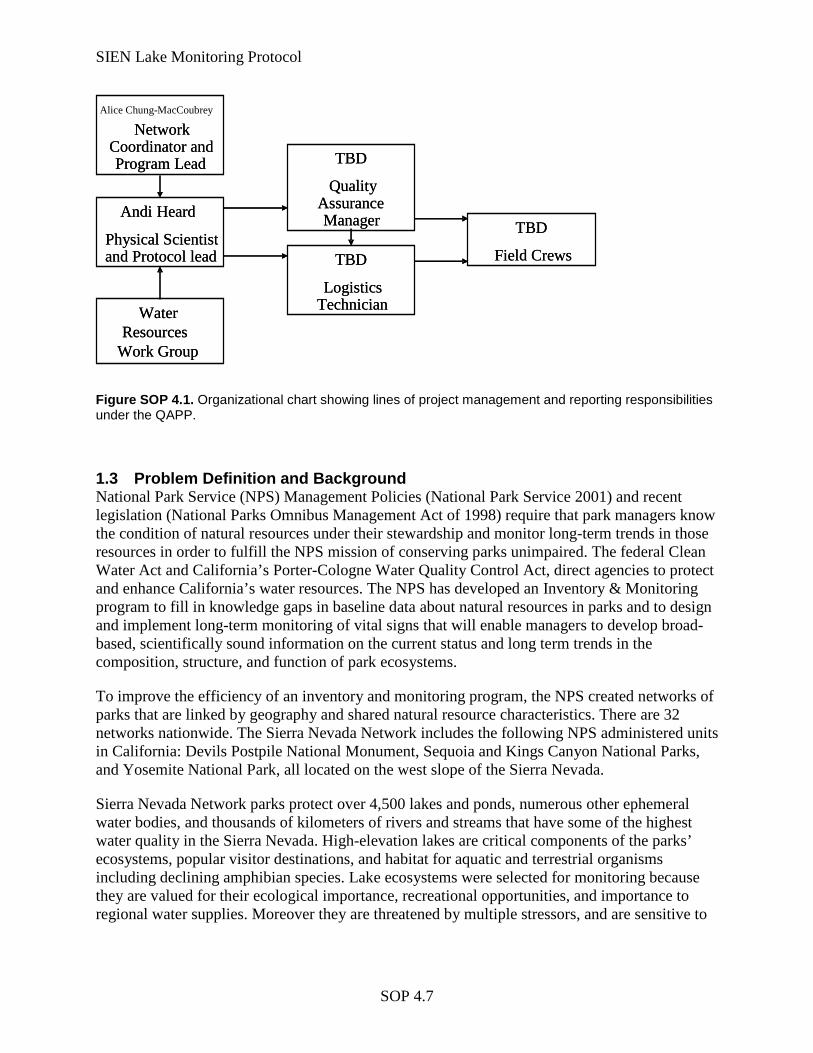
SIEN Lake Monitoring Protocol
SOP 4.7
Figure SOP 4.1. Organizational chart showing lines of project management and reporting responsibilities under the QAPP.
1.3 Problem Definition and Background National Park Service (NPS) Management Policies (National Park Service 2001) and recent legislation (National Parks Omnibus Management Act of 1998) require that park managers know the condition of natural resources under their stewardship and monitor long-term trends in those resources in order to fulfill the NPS mission of conserving parks unimpaired. The federal Clean Water Act and California’s Porter-Cologne Water Quality Control Act, direct agencies to protect and enhance California’s water resources. The NPS has developed an Inventory & Monitoring program to fill in knowledge gaps in baseline data about natural resources in parks and to design and implement long-term monitoring of vital signs that will enable managers to develop broad-based, scientifically sound information on the current status and long term trends in the composition, structure, and function of park ecosystems.
To improve the efficiency of an inventory and monitoring program, the NPS created networks of parks that are linked by geography and shared natural resource characteristics. There are 32 networks nationwide. The Sierra Nevada Network includes the following NPS administered units in California: Devils Postpile National Monument, Sequoia and Kings Canyon National Parks, and Yosemite National Park, all located on the west slope of the Sierra Nevada.
Sierra Nevada Network parks protect over 4,500 lakes and ponds, numerous other ephemeral water bodies, and thousands of kilometers of rivers and streams that have some of the highest water quality in the Sierra Nevada. High-elevation lakes are critical components of the parks’ ecosystems, popular visitor destinations, and habitat for aquatic and terrestrial organisms including declining amphibian species. Lake ecosystems were selected for monitoring because they are valued for their ecological importance, recreational opportunities, and importance to regional water supplies. Moreover they are threatened by multiple stressors, and are sensitive to
Andi Heard
Physical Scientist and Protocol lead
Alice Chung-MacCoubrey
Network Coordinator and Program Lead
Water Resources
Work Group
TBD
Quality Assurance Manager
TBD
Logistics Technician
TBD
Field Crews
Andi Heard
Physical Scientist and Protocol lead
Network Coordinator and Program Lead
Water Resources
Work Group
TBD
Quality Assurance Manager
TBD
Logistics Technician
TBD
Field Crews
SIEN Lake Monitoring Protocol
SOP 4.8
change. Lakes are habitat for two amphibian species that are candidates for listing as endangered under the federal Endangered Species Act––Sierran yellow-legged frog and Yosemite toad.
The Sierra Nevada Network Lake Monitoring protocol monitors status and trends in lake water chemistry, hydrology, and amphibians in Sequoia, Kings Canyon, and Yosemite National Parks. The I&M program strongly emphasizes data management and dissemination of information. Park managers and scientists are the primary users of these data. Information will be used to manage park natural resources, educate the public about the ecological condition of the parks, and meet government reporting requirements. Data and information are made available to researchers, state and federal agencies, and the public.
1.4 Project and Task Description Monitoring objectives are broken into two Tasks: 1) monitoring of “Extensive Lakes”, which are set of 76 low intensity monitoring sites sampled at a broad spatial scale and 2) monitoring of “Index Lakes”, which are a set of four lakes sampled more intensively. The target population from which our sample lakes are randomly selected includes all Sierra Nevada Network lakes. Lakes are defined as water bodies greater than or equal to 1 ha in surface area and greater than or equal to 2 m at maximum depth. Four index sites were judgmentally selected from the target population and include: Emerald Lake (Sequoia), an un-named lake in Dusy Basin (Kings Canyon), Maclure Lake (Yosemite), and an unnamed lake below Kuna Peak (Yosemite). Please refer to the protocol narrative for a map of the target population and index sites.
The Sierra Nevada Network’s monitoring objectives are:
1.4.1 Task 1, Extensive Lakes • Detect long-term trends in lake water chemistry for Sierra Nevada Network lakes by
measuring: − Temperature, pH, specific conductance, dissolved oxygen, acid neutralizing
capacity (ANC) − Major ions: Ca, Na, Mg, K, Cl, SO4 − Dissolved inorganic nitrogen (DIN), dissolved organic nitrogen (DON), total
dissolved nitrogen (TDN), particulate nitrogen (PN), total nitrogen (TN) − Total dissolved phosphorus (TDP), particulate phosphorus (PP), total phosphorus
(TP) − Particulate carbon (PC)
• Detect long-term trends in trophic condition of SIEN lakes, using the following nutrient ratios as chemical indicators of trophic status: PN:PP, DIN:TP, and TN:TP.
• Characterize Sierra Nevada Network lakes.
• Determine the proportion of Sierra Nevada Network lakes with chemical characteristics above/below threshold values for selected constituents.
• Detect long-term trends in lake level for Sierra Nevada lakes.
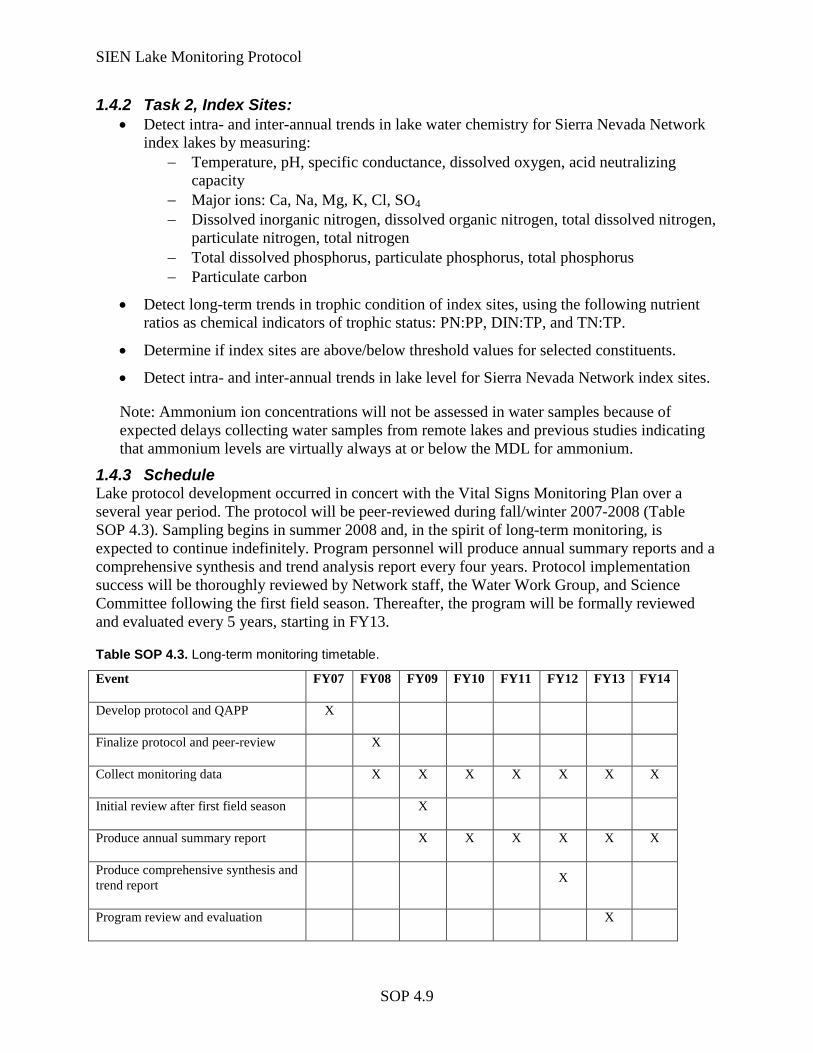
SIEN Lake Monitoring Protocol
SOP 4.9
1.4.2 Task 2, Index Sites: • Detect intra- and inter-annual trends in lake water chemistry for Sierra Nevada Network
index lakes by measuring: − Temperature, pH, specific conductance, dissolved oxygen, acid neutralizing
capacity − Major ions: Ca, Na, Mg, K, Cl, SO4 − Dissolved inorganic nitrogen, dissolved organic nitrogen, total dissolved nitrogen,
particulate nitrogen, total nitrogen − Total dissolved phosphorus, particulate phosphorus, total phosphorus − Particulate carbon
• Detect long-term trends in trophic condition of index sites, using the following nutrient ratios as chemical indicators of trophic status: PN:PP, DIN:TP, and TN:TP.
• Determine if index sites are above/below threshold values for selected constituents.
• Detect intra- and inter-annual trends in lake level for Sierra Nevada Network index sites.
Note: Ammonium ion concentrations will not be assessed in water samples because of expected delays collecting water samples from remote lakes and previous studies indicating that ammonium levels are virtually always at or below the MDL for ammonium.
1.4.3 Schedule Lake protocol development occurred in concert with the Vital Signs Monitoring Plan over a several year period. The protocol will be peer-reviewed during fall/winter 2007-2008 (Table SOP 4.3). Sampling begins in summer 2008 and, in the spirit of long-term monitoring, is expected to continue indefinitely. Program personnel will produce annual summary reports and a comprehensive synthesis and trend analysis report every four years. Protocol implementation success will be thoroughly reviewed by Network staff, the Water Work Group, and Science Committee following the first field season. Thereafter, the program will be formally reviewed and evaluated every 5 years, starting in FY13.
Table SOP 4.3. Long-term monitoring timetable.
Event FY07 FY08 FY09 FY10 FY11 FY12 FY13 FY14
Develop protocol and QAPP X
Finalize protocol and peer-review X
Collect monitoring data X X X X X X X
Initial review after first field season X
Produce annual summary report X X X X X X
Produce comprehensive synthesis and trend report X
Program review and evaluation X
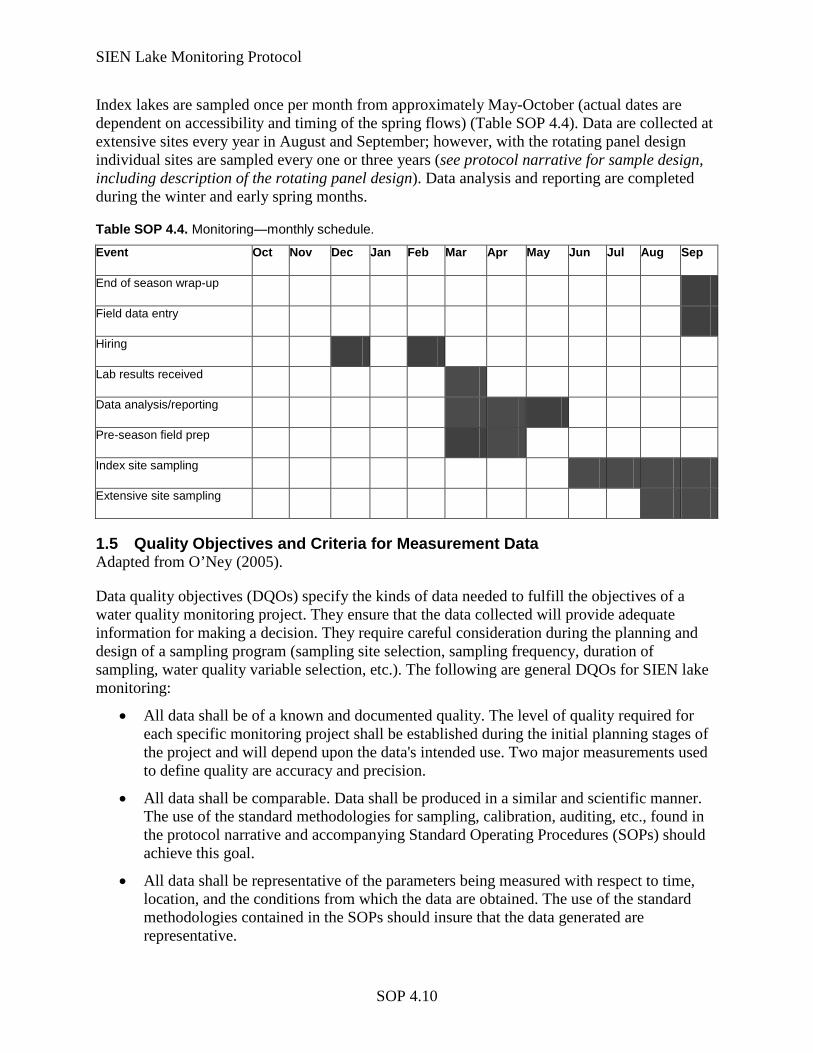
SIEN Lake Monitoring Protocol
SOP 4.10
Index lakes are sampled once per month from approximately May-October (actual dates are dependent on accessibility and timing of the spring flows) (Table SOP 4.4). Data are collected at extensive sites every year in August and September; however, with the rotating panel design individual sites are sampled every one or three years (see protocol narrative for sample design, including description of the rotating panel design). Data analysis and reporting are completed during the winter and early spring months.
Table SOP 4.4. Monitoring—monthly schedule.
Event Oct Nov Dec Jan Feb Mar Apr May Jun Jul Aug Sep
End of season wrap-up
Field data entry
Hiring
Lab results received
Data analysis/reporting
Pre-season field prep
Index site sampling
Extensive site sampling
1.5 Quality Objectives and Criteria for Measurement Data Adapted from O’Ney (2005).
Data quality objectives (DQOs) specify the kinds of data needed to fulfill the objectives of a water quality monitoring project. They ensure that the data collected will provide adequate information for making a decision. They require careful consideration during the planning and design of a sampling program (sampling site selection, sampling frequency, duration of sampling, water quality variable selection, etc.). The following are general DQOs for SIEN lake monitoring:
• All data shall be of a known and documented quality. The level of quality required for each specific monitoring project shall be established during the initial planning stages of the project and will depend upon the data's intended use. Two major measurements used to define quality are accuracy and precision.
• All data shall be comparable. Data shall be produced in a similar and scientific manner. The use of the standard methodologies for sampling, calibration, auditing, etc., found in the protocol narrative and accompanying Standard Operating Procedures (SOPs) should achieve this goal.
• All data shall be representative of the parameters being measured with respect to time, location, and the conditions from which the data are obtained. The use of the standard methodologies contained in the SOPs should insure that the data generated are representative.
SIEN Lake Monitoring Protocol
SOP 4.11
• The protocol narrative and the SOPs must be dynamic to continue to achieve their stated goals as techniques, systems, concepts, and project goals change.
Specific measurement quality objectives (MQOs) were identified a priori and revised in the first years of implementation. These include target method detection limits (MDL), minimum level of quantitation (ML), method quantitation limits (MQL), and alternative measurement sensitivity (AMS). Precision, bias, completeness and representativeness objectives were also identified. These objectives were considered when selecting field measurement equipment and contract laboratories for chemical analyses. Detection condition definitions are:
Method detection limit is the minimum level of analyte that can be detected with 99% confidence that the analytical response is greater than zero. Defined as 2 SD above minimum quantifiable signal. The MDL is calculated using EPA methods.
Minimum level of quantitation is the level of analyte that can be routinely detected and quantified in a real matrix without qualification. Defined as 8 SD above minimum quantifiable signal or as 3.18x the MDL.
Method quantitation limit is the lowest non-zero point included in the initial calibration.
Alternative measurement sensitivity is the range of measurement precision uncertainty based on a sample size of seven samples (non-blanks) and 99% confidence.
Values for MDL, ML, MQL and AMS for all chemical analyses are summarized in Table SOP 4.5 along with the specified analytical procedures to be used for each constituent.
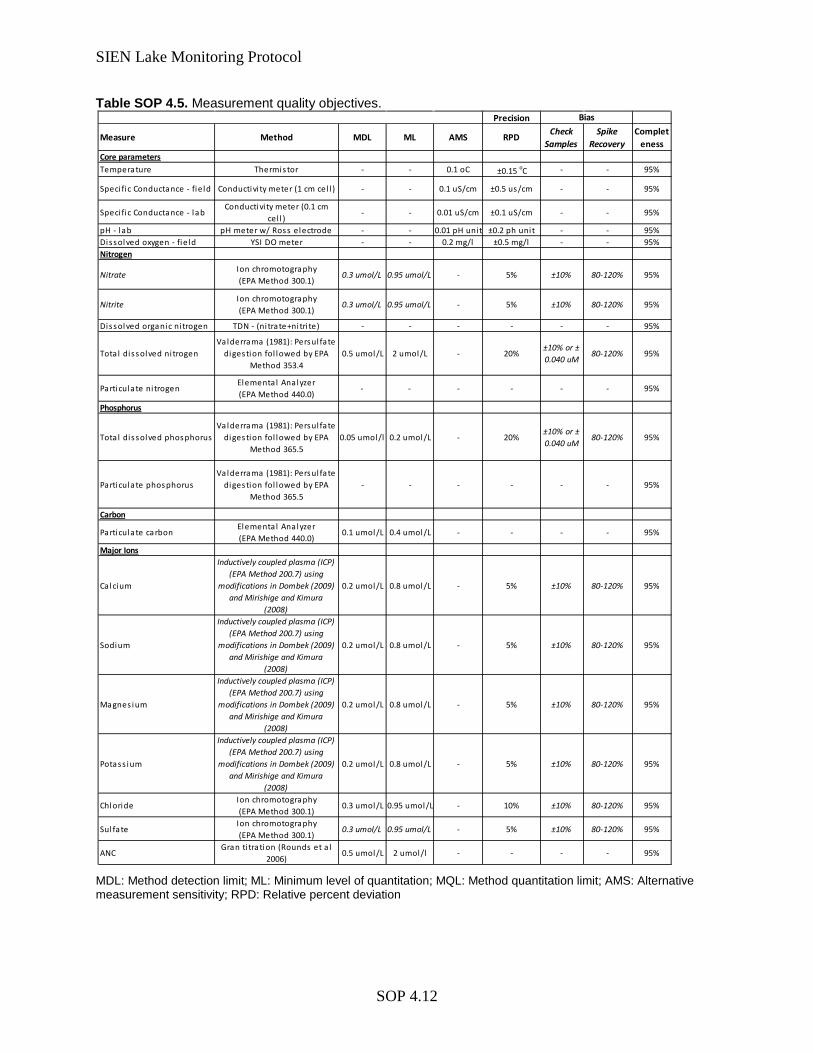
SIEN Lake Monitoring Protocol
SOP 4.12
Table SOP 4.5. Measurement quality objectives.
MDL: Method detection limit; ML: Minimum level of quantitation; MQL: Method quantitation limit; AMS: Alternative measurement sensitivity; RPD: Relative percent deviation
Precision
Measure Method MDL ML AMS RPD Check Samples
Spike Recovery
Completeness
Core parametersTemperature Thermistor - - 0.1 oC ±0.15 oC - - 95%
Speci fic Conductance - field Conductivi ty meter (1 cm cel l ) - - 0.1 uS/cm ±0.5 us/cm - - 95%
Speci fic Conductance - labConductivi ty meter (0.1 cm
cel l )- - 0.01 uS/cm ±0.1 uS/cm - - 95%
pH - lab pH meter w/ Ross electrode - - 0.01 pH unit ±0.2 ph uni t - - 95%Dissolved oxygen - field YSI DO meter - - 0.2 mg/l ±0.5 mg/l - - 95%Nitrogen
NitrateIon chromotography (EPA Method 300.1)
0.3 umol/L 0.95 umol/L - 5% ±10% 80-120% 95%
NitriteIon chromotography (EPA Method 300.1)
0.3 umol/L 0.95 umol/L - 5% ±10% 80-120% 95%
Dissolved organic ni trogen TDN - (ni trate+nitri te) - - - - - - 95%
Tota l dissolved ni trogenValderrama (1981): Persul fate
digestion fol lowed by EPA Method 353.4
0.5 umol/L 2 umol/L - 20%±10% or ± 0.040 uM
80-120% 95%
Particulate ni trogenElementa l Analyzer (EPA Method 440.0)
- - - - - - 95%
Phosphorus
Tota l dissolved phosphorusValderrama (1981): Persul fate
digestion fol lowed by EPA Method 365.5
0.05 umol/l 0.2 umol/L - 20%±10% or ± 0.040 uM
80-120% 95%
Particulate phosphorusValderrama (1981): Persul fate
digestion fol lowed by EPA Method 365.5
- - - - - - 95%
Carbon
Particulate carbonElementa l Analyzer (EPA Method 440.0)
0.1 umol/L 0.4 umol/L - - - - 95%
Major Ions
Calcium
Inductively coupled plasma (ICP) (EPA Method 200.7) using
modifications in Dombek (2009) and Mirishige and Kimura
(2008)
0.2 umol/L 0.8 umol/L - 5% ±10% 80-120% 95%
Sodium
Inductively coupled plasma (ICP) (EPA Method 200.7) using
modifications in Dombek (2009) and Mirishige and Kimura
(2008)
0.2 umol/L 0.8 umol/L - 5% ±10% 80-120% 95%
Magnes ium
Inductively coupled plasma (ICP) (EPA Method 200.7) using
modifications in Dombek (2009) and Mirishige and Kimura
(2008)
0.2 umol/L 0.8 umol/L - 5% ±10% 80-120% 95%
Potass ium
Inductively coupled plasma (ICP) (EPA Method 200.7) using
modifications in Dombek (2009) and Mirishige and Kimura
(2008)
0.2 umol/L 0.8 umol/L - 5% ±10% 80-120% 95%
ChlorideIon chromotography (EPA Method 300.1)
0.3 umol/L 0.95 umol/L - 10% ±10% 80-120% 95%
Sul fateIon chromotography (EPA Method 300.1)
0.3 umol/L 0.95 umol/L - 5% ±10% 80-120% 95%
ANCGran ti tration (Rounds et a l
2006)0.5 umol/L 2 umol/l - - - - 95%
Bias
SIEN Lake Monitoring Protocol
SOP 4.13
Representativeness expresses the degree to which data accurately and precisely represent a characteristic of a population, parameter variations at a sampling point, a process condition, or an environmental condition. Representativeness of the data is dependent on the sampling locations, sample timing, sample design, and the sampling procedures adequately representing the true condition of the sample site or target population. Sampling locations, sampling of relevant media (water, sediment, or biota), use of only approved/documented analytical methods, and a statistically sound sample design will determine if the measurement data does represent the conditions at a single investigation site or for the larger target population to the extent possible. Sampling schedules will be designed with respect to frequency, locations, and methodology in order to maximize representativeness, where possible and applicable.
SIEN’s sites are selected using two methods: 1) judgmental selection for index sites and 2) probabilistic selection for extensive sites. Sampling methods at the index sites will maximize representativeness for each site. The probabilistic sample design and methods for extensive sites will maximize representativeness to the target population (i.e. SIEN lakes). Samples are collected at different ‘sampling stations’—lake outlet and mid-lake (epilimnion and hypolimnion) locations. Samples are representative of these individual sampling locations. The more ‘mixed’ a lake is the more representative an individual sample will be of the larger water body.
An important aspect of representativeness for SIEN lakes is the verification of holding times for samples. Owing to the remote locations of the target lakes, samples must spend several days, un-refrigerated while in transit back to the laboratory. In addition, since much of the chemistry will be performed by laboratories outside of the Network Parks, additional delays are expected during sample shipping. Sample holding times, specific to waters from Sierra Nevada lakes, have been developed by Sickman and Melack (1989) (Figure SOP 4.2). The SEIN Lake Monitoring Protocol specifies routine holding times for all water quality constituents that are consistent with those developed for Emerald Lake.
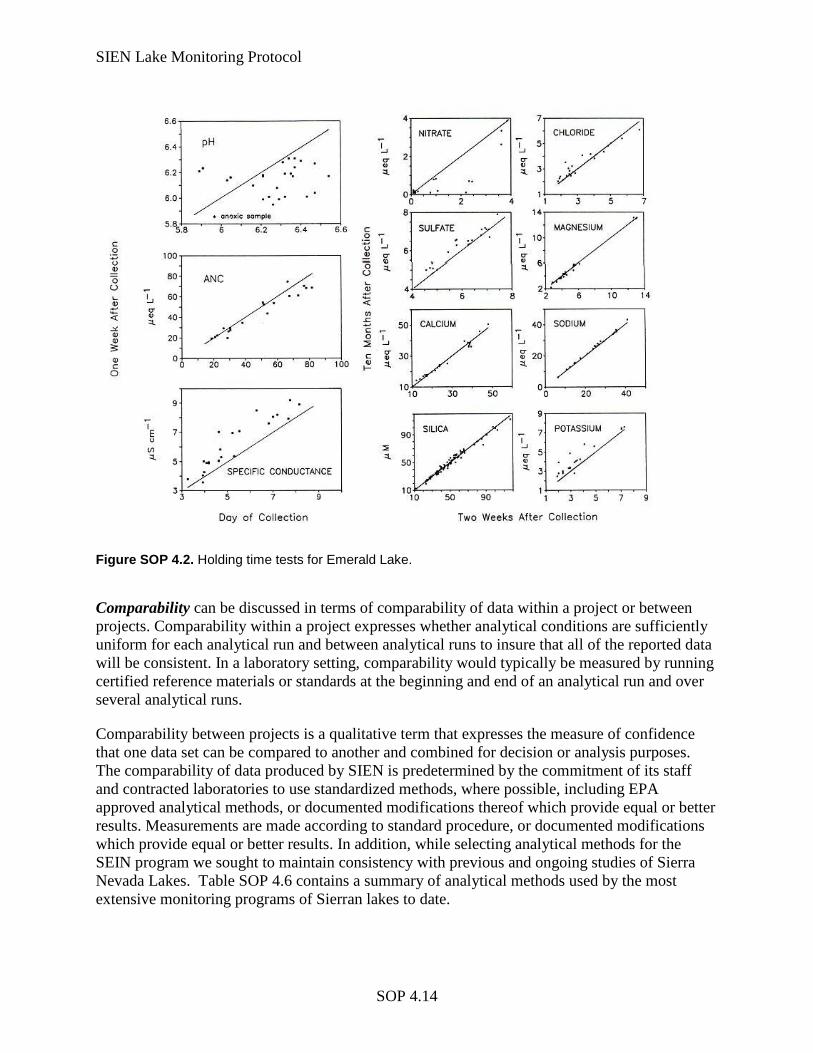
SIEN Lake Monitoring Protocol
SOP 4.14
Figure SOP 4.2. Holding time tests for Emerald Lake.
Comparability can be discussed in terms of comparability of data within a project or between projects. Comparability within a project expresses whether analytical conditions are sufficiently uniform for each analytical run and between analytical runs to insure that all of the reported data will be consistent. In a laboratory setting, comparability would typically be measured by running certified reference materials or standards at the beginning and end of an analytical run and over several analytical runs.
Comparability between projects is a qualitative term that expresses the measure of confidence that one data set can be compared to another and combined for decision or analysis purposes. The comparability of data produced by SIEN is predetermined by the commitment of its staff and contracted laboratories to use standardized methods, where possible, including EPA approved analytical methods, or documented modifications thereof which provide equal or better results. Measurements are made according to standard procedure, or documented modifications which provide equal or better results. In addition, while selecting analytical methods for the SEIN program we sought to maintain consistency with previous and ongoing studies of Sierra Nevada Lakes. Table SOP 4.6 contains a summary of analytical methods used by the most extensive monitoring programs of Sierran lakes to date.
SIEN Lake Monitoring Protocol
SOP 4.15
Overall, the projects listed in Table SOP 4.6 used identical or very similar methodologies. For example, dissolved inorganic nitrogen, chloride and sulfate were all measured by EPA Method 300.1 – ion chromatography (IC), with slight differences in instrumentation. The major exception to consistency, was the use of IC for base cation analyses by the US Forest Service. Unpublished inter-laboratory comparisons of cations in Sierra Nevada lakes measured by IC, atomic absorption spectrophotometry (AA) and inductively coupled plasma (ICP) have demonstrated that AA and ICP produce similar divalent cation concentrations on duplicate samples. In contrast, divalent cation concentrations measured by IC are not consistent with AA and ICP values (J. Sickman, UC Riverside and D. Clow, US Geological Survey, unpublished data). Thus for the SEIN protocol, only AA or ICP methods will be used for base cation analyses.
Completeness. The completeness of data is the percentage of data that are valid and available for use compared to the total potential data. Ideally, 100% of the data would be available. However, in reality, data become unavailable due to unexpected field conditions, contamination, insufficient sample volume, or samples broken in shipping. Therefore, 95% data completeness is required by SIEN for data usage in most cases.
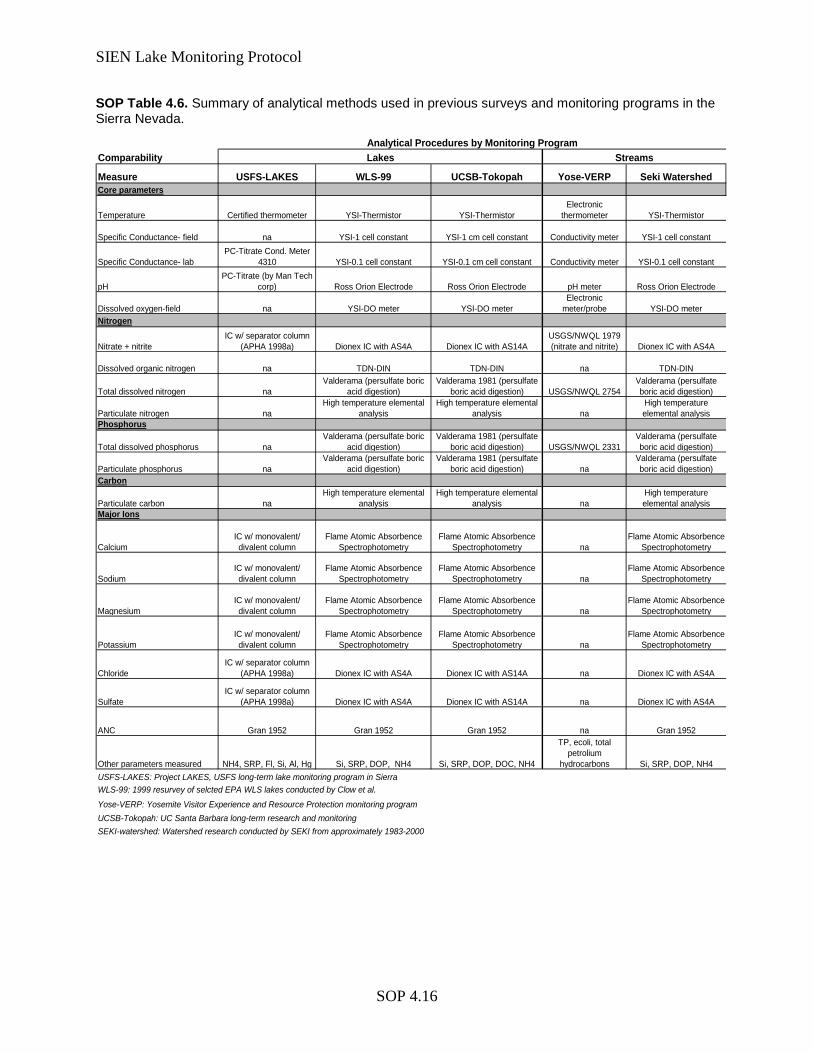
SIEN Lake Monitoring Protocol
SOP 4.16
SOP Table 4.6. Summary of analytical methods used in previous surveys and monitoring programs in the Sierra Nevada.
Comparability
Measure USFS-LAKES WLS-99 UCSB-Tokopah Yose-VERP Seki WatershedCore parameters
Temperature Certified thermometer YSI-Thermistor YSI-ThermistorElectronic
thermometer YSI-Thermistor
Specific Conductance- field na YSI-1 cell constant YSI-1 cm cell constant Conductivity meter YSI-1 cell constant
Specific Conductance- labPC-Titrate Cond. Meter
4310 YSI-0.1 cell constant YSI-0.1 cm cell constant Conductivity meter YSI-0.1 cell constant
pHPC-Titrate (by Man Tech
corp) Ross Orion Electrode Ross Orion Electrode pH meter Ross Orion Electrode
Dissolved oxygen-field na YSI-DO meter YSI-DO meterElectronic
meter/probe YSI-DO meterNitrogen
Nitrate + nitriteIC w/ separator column
(APHA 1998a) Dionex IC with AS4A Dionex IC with AS14AUSGS/NWQL 1979 (nitrate and nitrite) Dionex IC with AS4A
Dissolved organic nitrogen na TDN-DIN TDN-DIN na TDN-DIN
Total dissolved nitrogen naValderama (persulfate boric
acid digestion)Valderama 1981 (persulfate
boric acid digestion) USGS/NWQL 2754Valderama (persulfate boric acid digestion)
Particulate nitrogen naHigh temperature elemental
analysisHigh temperature elemental
analysis naHigh temperature elemental analysis
Phosphorus
Total dissolved phosphorus naValderama (persulfate boric
acid digestion)Valderama 1981 (persulfate
boric acid digestion) USGS/NWQL 2331Valderama (persulfate boric acid digestion)
Particulate phosphorus naValderama (persulfate boric
acid digestion)Valderama 1981 (persulfate
boric acid digestion) naValderama (persulfate boric acid digestion)
Carbon
Particulate carbon naHigh temperature elemental
analysisHigh temperature elemental
analysis naHigh temperature elemental analysis
Major Ions
CalciumIC w/ monovalent/ divalent column
Flame Atomic Absorbence Spectrophotometry
Flame Atomic Absorbence Spectrophotometry na
Flame Atomic Absorbence Spectrophotometry
SodiumIC w/ monovalent/ divalent column
Flame Atomic Absorbence Spectrophotometry
Flame Atomic Absorbence Spectrophotometry na
Flame Atomic Absorbence Spectrophotometry
MagnesiumIC w/ monovalent/ divalent column
Flame Atomic Absorbence Spectrophotometry
Flame Atomic Absorbence Spectrophotometry na
Flame Atomic Absorbence Spectrophotometry
PotassiumIC w/ monovalent/ divalent column
Flame Atomic Absorbence Spectrophotometry
Flame Atomic Absorbence Spectrophotometry na
Flame Atomic Absorbence Spectrophotometry
ChlorideIC w/ separator column
(APHA 1998a) Dionex IC with AS4A Dionex IC with AS14A na Dionex IC with AS4A
SulfateIC w/ separator column
(APHA 1998a) Dionex IC with AS4A Dionex IC with AS14A na Dionex IC with AS4A
ANC Gran 1952 Gran 1952 Gran 1952 na Gran 1952
Other parameters measured NH4, SRP, Fl, Si, Al, Hg Si, SRP, DOP, NH4 Si, SRP, DOP, DOC, NH4
TP, ecoli, total petrolium
hydrocarbons Si, SRP, DOP, NH4USFS-LAKES: Project LAKES, USFS long-term lake monitoring program in SierraWLS-99: 1999 resurvey of selcted EPA WLS lakes conducted by Clow et al.
Yose-VERP: Yosemite Visitor Experience and Resource Protection monitoring programUCSB-Tokopah: UC Santa Barbara long-term research and monitoring SEKI-watershed: Watershed research conducted by SEKI from approximately 1983-2000
Lakes StreamsAnalytical Procedures by Monitoring Program
SIEN Lake Monitoring Protocol
SOP 4.17
Precision, Bias, and Accuracy The precision, bias, and accuracy of data are determined by particular actions of the analytical laboratory and field staff.
Precision is a measure of the reproducibility of a measurement when an analysis is repeated. It is reported in Relative Percent Difference (RPD) or Relative Standard Deviation (RSD).
Two types of precision are evaluated during the project: analytical precision and process precision. Analytical precision refers to measurements of replicate samples during an analytical procedure at a 5% frequency. Process precision refers to duplicate samples collected in the field and run through the entire sample handling and analytical procedure (i.e., Field Duplicates). Field Duplicate samples are collected at a 5% frequency during both Task 1 and 2. Target values for analytical precision are summarized in Table SOP 4.5.
Accuracy of an analysis is a measure of how much of the constituent actually present is determined. An assessment of accuracy has to factor in both precision and bias. EPA has clarified that accuracy is “a measure of the overall agreement of a measurement to a known value”. Accuracy includes a combination of random error (precision) and systematic error (bias) components that are due to sampling and analytical operations. EPA recommends using the terms “precision” and “bias,” rather than “accuracy,” to convey the information usually associated with accuracy. Therefore, what is estimated for each sample batch or each QC sample is systematic error (bias) rather than accuracy.
Systematic error/bias will be measured in each analytical run at a 5% frequency, by adding a known amount of the constituent to a portion of the sample and determining how much of this spike is then measured, and, running a certified reference material at a 5% frequency. Bias will be reported as percent recovery and percent agreement with the certified value. The acceptable percent deviations and the acceptable percent recoveries are dependent on many factors including: analytical method used, laboratory used, media of sample, and constituent being measured. Target values for analytical bias are summarized in Table SOP 4.5.
It is the responsibility of the program manager to verify that the data are representative while the analytical data's precision, accuracy, and comparability are mainly the responsibility of the laboratory supervisor. The program manager also has prime responsibility for determining that the 95% data completeness criteria are met or for justifying acceptance of a lesser percentage.
1.6 Special Training and Certifications 1.6.1 Field Proper and consistent training for personnel is a critical aspect of quality assurance. Detailed training requirements are outlined in SOP 2 (Safety) and SOP 3 (Staff Training).
The Protocol Lead/Network Physical Scientist will have an educational background in biological, chemical, and/or physical sciences and specialized experience in water quality or closely related aquatic sciences. Field crews will have at least one individual with an educational background and/or field experience in biological, chemical, and/or physical sciences. Extensive site field crews will also have at least one individual with strong wilderness and backpacking skills.
SIEN Lake Monitoring Protocol
SOP 4.18
All personnel will be trained in the lake sampling protocol at the level appropriate for their position. The Protocol Lead is ultimately responsible for training field crews and ensuring consistency, to the extent possible, between crews and years. He/she may delegate portions of the training to experienced technicians or park professional staff that are well-versed and have hands-on experience with the Lake Monitoring protocol. Safety will be emphasized throughout the training. The Protocol Lead and employee supervisors (if not the Protocol Lead) are responsible for ensuring adequate safety training (see SOP #2: Safety).
1.6.2 Laboratory The contract laboratories used for chemical analyses will have in place, training procedures for all analysts to insure data meet our targets for completeness, precision, and bias. Documentation for these training procedures is mandatory for each contract laboratory and will be submitted in writing to the Protocol Lead. Both the QA Manager and the Protocol Lead will evaluate these procedures.
1.7 Documentation and Records The following documents, records, and electronic files are expected to be produced:
• Lake Monitoring Protocol, Standard Operating Procedures (includes QAPP), and supporting documents
• Field forms and notebooks • Chain-of-custody forms • GPS sampling location electronic files • Digital photographs • Laboratory chemical analysis results-electronic spreadsheet or database • Datalogger output files • Water quality and streamflow database • Annual summary reports • Synthesis and trend analysis reports • Publications • Contracts and agreements • Personnel records
The primary depository for paper records will be in the Inventory and Monitoring office at Ash Mountain, Sequoia National Park. The primary depository for electronic files will be on the Sequoia and Kings Canyon National Parks network in the Inventory and Monitoring file directory structure. Electronic copies of documents, records, etc. will be made available to staff stationed in other parks via the SIEN I&M Internet and Intranet sites and local park networks. Copies of paper documents will also be stored as needed in satellite offices. Electronic records will be backed-up in accordance with procedures outlined in the SIEN Data Management Plan (Cook and Lineback 2007).
The Protocol Lead is responsible for disseminating the QAPP, including revisions as they occur to those listed in Table SOP 4.2. Electronic copies are e-mailed or mailed on a CD to recipients
SIEN Lake Monitoring Protocol
SOP 4.19
identified in section A3. Hardcopies are sent on request. In addition, the current copy will be posted to SIEN web pages.
2 Data Generation and Acquisition 2.1 Sampling Design and Logistics Our network, along with others working in large mountainous landscapes, struggled with the trade-offs between in-depth temporal sampling and an ability to make inferences across the landscape. SIEN lakes, for the most part, are located in the remote Wilderness areas of Yosemite, Sequoia, and Kings Canyon. Access, logistics, and safety were prominent considerations throughout the development process. An additional and equally important requirement, was a sampling design that would address both trend and status objectives. Balancing these trade-offs, we settled on a design that is comprised of two site types: 1) extensive sites, which are probabilistically selected and sampled once every 1-3 years and, 2) index sites, which are judgmentally selected and sampled multiple times each year. To address the extensive site objectives, the type of design we are implementing is a spatially-balanced, probabilistic, split-panel design. Extensive sites are sampled once in August or September. Index sites, which are sampled 1/month from May-October, were selected using criteria such as accessibility, existing monitoring or research, and specific management concerns. Sampling will be conducted at the lake outlet and at mid-lake (this varies by site type and panel). Please refer to the Lake Protocol Narrative for a detailed description of the sample design and sampling schedule.
2.1.1 Site Replacement If a site is inaccessible or determined to be unsafe to access in anyway, the field crew will not sample the site.
In the case of index sites, if the barrier is temporary (e.g. from high streamflows, weather) crews will resume sampling once the site is safe to access again. If inaccessibility is deemed to be long-term, the Water Resources Work Group will meet and select a replacement index site.
In the case of extensive sites, if the barrier is temporary (e.g. weather), that site will not be sampled for that year, but sampling will continue the next time the site is scheduled for sampling. There will be a gap in the dataset for that year. If inaccessibility is deemed to be long-term (e.g. a route to a site is determined to be unsafe), the site will be replaced with the next site from the list of selected sites. Sites are selected using a general randomized tessellation stratified (GRTS) sample (Stevens Jr. and Olsen 2004). GRTS samples assure spatial balance by recursively subdividing the parks, drawing the sample, and then reversing the ordering. The final result is a list of lakes such that any contiguous set achieve a high degree of spatial balance. Because the design is spatially-balanced a site may be replaced without compromising statistical integrity.
2.1.2 Sources of Bias or Misrepresentation The Lake Monitoring protocol clearly defines the areas of inference for each site type and sampling station. Misrepresentation should be minimized as long as assumptions and areas of inference continue to be clearly stated.
There are sources of bias in the sample design. We are selecting lakes using a cost-surface model to apply unequal probability inclusions. Trend analyses in the context of panel designs cannot
SIEN Lake Monitoring Protocol
SOP 4.20
incorporate variable probability sampling. When testing trend it must be assumed that sites had equal chance of being selected. The results are trend estimates that are biased towards lakes that are quicker to access.
Sources of bias during data acquisition include bias from field instrumentation (e.g., DO and temperature meter) and bias in laboratory instrumentation.
2.2 Sampling Methods All measurements and sampling techniques associated with monitoring activities will be conducted according to the SOPs outlined in the SEIN Lake Monitoring Protocol narrative.
2.2.1 Sample Handling and Custody Proper sample handling procedures for water, sediment, and biological samples are provided in Table SOP 4.7. This table provides a summary of the size and composition of required sample containers, laboratory storage conditions, and maximum storage times for water and filter samples. In the field, all samples will be kept as cool as possible and in the shade since transporting frozen ice packs and coolers into remote field sites is impractical. During shipment to contract laboratories, samples will be shipped with refrigerant packs in insulated containers. All samples will be handled, prepared, transported and stored in a manner so as to minimize bulk loss, analyte loss, contamination or biological degradation. Sample containers will have computer generated labels printed on water-proof paper.
Lakes in the Sierra Nevada are extremely dilute, thus extraordinary care must be taken to not contaminate the samples with sweat or oils from finger tips. SOP #8 describes a series of precautions that will be used during field collection. Similarly, the filters and sample containers themselves can introduce significant levels of contaminants into samples if not properly prepared.
Only brand new, Nalgene, high density polypropylene (HDPE) bottles will be used for water sampling. The bottles will be rinsed once with 18 megaohm deionized water (DIW) and then filled to the brim with DIW. Bottles will be soaked for seven days and re-rinsed three times with DIW. They will then be air dried and capped. Clean bottles will be stored in clearly marked containers to avoid confusion with unclean bottles.
Two types of filters will be used to collect water and seston samples from the lakes and were chosen on the basis of their cleanliness and prior use in other Sierra Nevada lake studies. Polycarbonate filters from Nuclepore have been shown to have the lowest leachable solutes of any commercially available water filter and have been used with success by many of the research studies listed in Table SOP 4.6. For seston samples, we will use 47 mm Pall (Gelman) A/E filters. These filters are used around the world for collection of lake seston samples and the vast majority of seston data from Sierra Nevada lakes are based upon their use. The filters will be pre-combusted in a high-temperature furnace for 3-hours at 500 °C to reduce background levels of C,N and P. These glass fiber filters have a nominal pore size of one micron (1 µm).
In deciding on a pore size for the polycarbonate filters used for water sampling we considered both the standard 0.45 µm and 1.0 µm porosities. Dissolved constituents in water are most commonly defined as those that can pass through a 0.45 µm filter, although smaller sizes, e.g.,
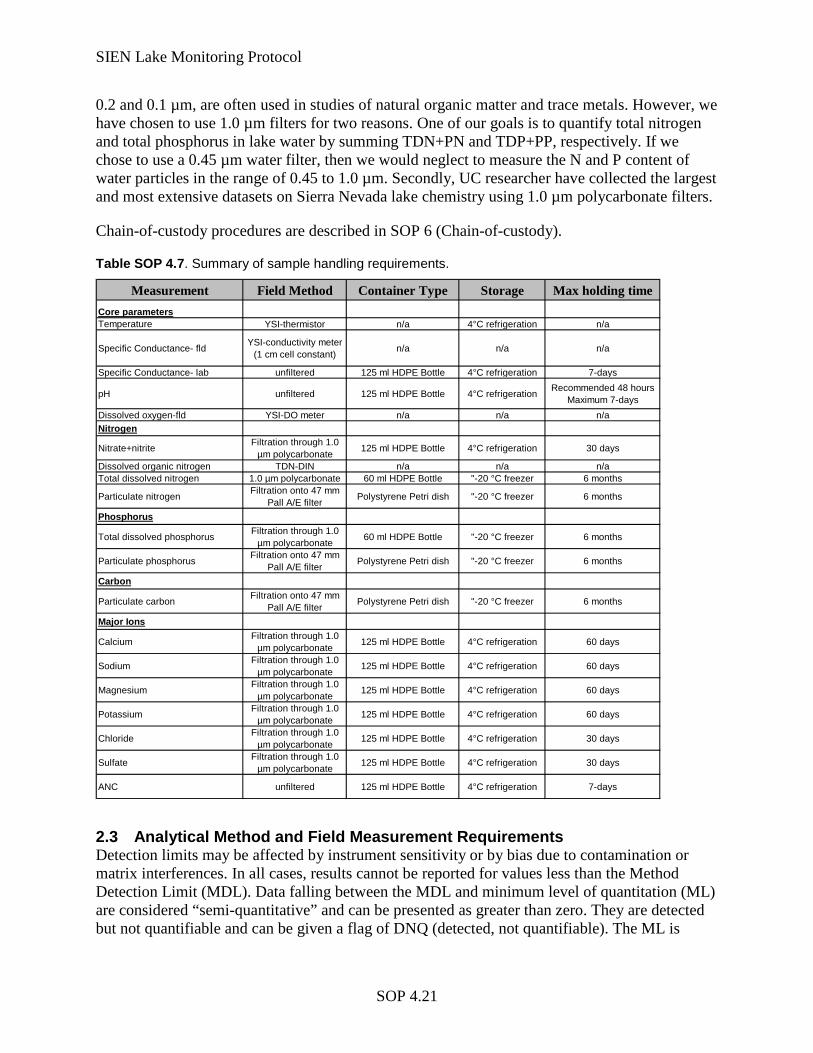
SIEN Lake Monitoring Protocol
SOP 4.21
0.2 and 0.1 µm, are often used in studies of natural organic matter and trace metals. However, we have chosen to use 1.0 µm filters for two reasons. One of our goals is to quantify total nitrogen and total phosphorus in lake water by summing TDN+PN and TDP+PP, respectively. If we chose to use a 0.45 µm water filter, then we would neglect to measure the N and P content of water particles in the range of 0.45 to 1.0 µm. Secondly, UC researcher have collected the largest and most extensive datasets on Sierra Nevada lake chemistry using 1.0 µm polycarbonate filters.
Chain-of-custody procedures are described in SOP 6 (Chain-of-custody).
Table SOP 4.7. Summary of sample handling requirements.
Measurement Field Method Container Type Storage Max holding timeCore parametersTemperature YSI-thermistor n/a 4°C refrigeration n/a
Specific Conductance- fld YSI-conductivity meter (1 cm cell constant) n/a n/a n/a
Specific Conductance- lab unfiltered 125 ml HDPE Bottle 4°C refrigeration 7-days
pH unfiltered 125 ml HDPE Bottle 4°C refrigeration Recommended 48 hoursMaximum 7-days
Dissolved oxygen-fld YSI-DO meter n/a n/a n/aNitrogen
Nitrate+nitrite Filtration through 1.0 µm polycarbonate 125 ml HDPE Bottle 4°C refrigeration 30 days
Dissolved organic nitrogen TDN-DIN n/a n/a n/aTotal dissolved nitrogen 1.0 µm polycarbonate 60 ml HDPE Bottle "-20 °C freezer 6 months
Particulate nitrogen Filtration onto 47 mm Pall A/E filter Polystyrene Petri dish "-20 °C freezer 6 months
Phosphorus
Total dissolved phosphorus Filtration through 1.0 µm polycarbonate 60 ml HDPE Bottle "-20 °C freezer 6 months
Particulate phosphorus Filtration onto 47 mm Pall A/E filter Polystyrene Petri dish "-20 °C freezer 6 months
Carbon
Particulate carbon Filtration onto 47 mm Pall A/E filter Polystyrene Petri dish "-20 °C freezer 6 months
Major Ions
Calcium Filtration through 1.0 µm polycarbonate 125 ml HDPE Bottle 4°C refrigeration 60 days
Sodium Filtration through 1.0 µm polycarbonate 125 ml HDPE Bottle 4°C refrigeration 60 days
Magnesium Filtration through 1.0 µm polycarbonate 125 ml HDPE Bottle 4°C refrigeration 60 days
Potassium Filtration through 1.0 µm polycarbonate 125 ml HDPE Bottle 4°C refrigeration 60 days
Chloride Filtration through 1.0 µm polycarbonate 125 ml HDPE Bottle 4°C refrigeration 30 days
Sulfate Filtration through 1.0 µm polycarbonate 125 ml HDPE Bottle 4°C refrigeration 30 days
ANC unfiltered 125 ml HDPE Bottle 4°C refrigeration 7-days
2.3 Analytical Method and Field Measurement Requirements Detection limits may be affected by instrument sensitivity or by bias due to contamination or matrix interferences. In all cases, results cannot be reported for values less than the Method Detection Limit (MDL). Data falling between the MDL and minimum level of quantitation (ML) are considered “semi-quantitative” and can be presented as greater than zero. They are detected but not quantifiable and can be given a flag of DNQ (detected, not quantifiable). The ML is
SIEN Lake Monitoring Protocol
SOP 4.22
equal to some multiple of the MDL. Censored data will be presented as less than or greater than the ML in order to compare it to water quality criteria (Irwin 2006).
The SIEN Lake Program will follow the same guidelines as the SWAMP program and STORET for recommended use of detection and quantification limits. Result quality codes for CEDEN and STORET are assigned to individual results in the database. The following are CEDEN result quality codes (Refer to Sierra Nevada Network Database User’s Manual for corresponding STORET codes): Values below the Method Detection Limit (MDL) are to be reported as ND = not detected and the actual MDL value is recorded. Values between the MDL and the ML (or quantification limit) will be reported as the actual measured value, with a flag that is carried all the way through data storage, handling, and reporting. The flag is DNQ = detected, not quantifiable. Values above the ML (or quantification limit) are deemed as acceptable values without reservation, and are shown as the actual measured value, and assigned a result quality code of ‘Detected and Quantified’. In general, laboratories should strive to meet target reporting limit recommendations for undetected analytes (Table SOP 4.5).
In most water quality investigations, MDLs are considerably lower than water quality objectives, however analyte levels in Sierra Nevada lakes are often at or below the MDL. The MDL levels specified in Table SOP 4.5 are in many cases below those typically reached in commercial analytical laboratories and to be attained, special analytical techniques must be followed. For example, to attain a detection limit below <1 µmol L-1 for chloride, nitrite, nitrate and sulfate, sample injection loops of 250 µl are required; most commercial laboratories use a 50 µl sample loop. Thus, a primary criterion for selecting contract laboratories for the SIEN Program will demonstrated experience in analyzing dilute water samples from areas such as the Sierra Nevada and Rocky Mountains.
2.4 Laboratory Quality Control Requirements The approaches required to meet data quality objectives will include laboratory matrix spikes, laboratory method blanks, calibration standards, laboratory- and field-duplicated samples, and sample holding time tests. The definition and use of each of these types of quality control samples are explained further below. Laboratories providing analytical support for chemical analyses will have the appropriate facilities to store, prepare, and process samples and appropriate instrumentation and staff to provide data of the required quality within the time period dictated by the project. Laboratories will be able to provide information documenting their ability to conduct the analyses with the required level of data quality. Such information will include results from inter-laboratory calibration studies, and summary data of internal QA/QC checks, and results from certified reference material analyses. Laboratories will also provide a laboratory QA plan and Analytical Methods Manual,
2.4.1 Measurement Quality Objectives (MQOs) Completeness: Completeness is the amount of data collected compared against the expected amount. For the SIEN Program we have established a data completeness level of 95%.
Precision: Precision is the reproducibility of an analytical method. Each laboratory is expected to maintain records for use by analysts in monitoring the overall precision of certified reference materials and natural samples. Within each analytical run, measurements of precision will be performed at a 5% frequency (i.e., one duplicate for every 20 samples) or at least once if the run
SIEN Lake Monitoring Protocol
SOP 4.23
contains less than 20 samples. Both certified reference material and natural samples will be used in measurements of precision. The relative percent difference (RPD) will be calculated for each analyte of interest and recorded and compared to values shown in Table SOP 4.5. Use of both synthetic and natural samples for precision measurements will help identify matrix interferences.
Laboratory Method Blank: Laboratory method blanks (also called extraction blanks, procedural blanks, or preparation blanks) are used to assess laboratory contamination and instrument background during all stages of sample preparation and analysis. An appropriate number of laboratory blanks will be done at the beginning and throughout each analytical run.
Matrix Spike Recovery: A laboratory fortified sample matrix (commonly called a matrix spike, or MS) will be used both to evaluate the effect of the sample matrix on the recovery of the compound(s) of interest and to provide an estimate of analytical precision. Recovery is the accuracy of an analytical test measured against a known analyte addition to a sample. These QA samples will be done in duplicate. Sample matrices will include both certified reference materials and natural water samples. Comparison of recoveries in synthetic and natural samples will allow identification of matrix interferences. These QA samples will be done at least once or at a 5% frequency in each analytical run.
Travel Blanks: The purpose of the travel blank is to determine if there is any cross-contamination of volatile constituents between sample containers. Travel blanks are not required for other analytes, but are encouraged to be utilized for other analytes as possible and appropriate.
Holding Time Tests: During each field season, duplicate samples will be collected at three lakes during performance of Task 2. The lakes chosen will be sampled on the final day of a field trip so that they can be rushed back to the laboratory. One set of replicates will be held for the standard holding times under standard storage conditions that are specified in Table SOP 4.7. The other set of duplicates will be stored at room temperature for 7 days then held for the standard holding times under standard storage conditions before analysis. All chemical analyses will be conducted on the duplicate samples and the results will be compared statistically to determine if 7 days of storage results in significantly different analyte concentrations.
Equipment Blanks (done in lab prior to field work): To insure that equipment used during sampling does not contaminate samples, the device is filled with DI water or DI water is pumped through the device, transferred to sample bottle(s), preserved (if appropriate) and analyzed by the lab.
Field Duplicates: Duplicate samples will be collected for all parameters at an annual rate of 5% of total samples to be collected within a given year's monitoring plan. These duplicate samples will be done in addition to the duplicate used for the holding time tests. The duplicate sample will be collected in the same manner and as close in time as possible to the original sample.
Field Blanks: A field blank is designed to assess potential sample contamination levels that could occur during field sampling and sample processing. Field Blanks (DI water) are taken to the field, transferred to the appropriate container, preserved (if appropriate), and otherwise treated the same as the corresponding sample type during the course of a sampling event. Field
SIEN Lake Monitoring Protocol
SOP 4.24
blanks for water quality constituents should be conducted upon initiation of sampling, and if field blank performance is acceptable, further collection and analysis of field blanks for these other media and analytes need only be performed on an as-needed basis, or during field performance audits.
2.5 Instrument/Equipment Testing, Inspection, and Maintenance To minimize downtime of measurement systems, all field sampling and laboratory equipment must be maintained in working condition. Also, backup equipment or common spare parts will be available, when possible, so that if any piece of equipment fails during use, repairs or replacement can be made as quickly as possible and the measurement tasks resumed. Refer to SOPs and Users Manuals for specific instructions.
Field Equipment - All field equipment that has manufacturer-recommended schedules of maintenance will receive preventive maintenance according to that schedule. Other equipment used only occasionally will be inspected for availability of spare parts, cleanliness, battery strength, etc. at least monthly and especially prior to being taken into the field. Common spare parts which should be available include, but are not limited to: batteries; DO membranes; tubing; replacement probes. After use in the field, all equipment will be re-checked for needed maintenance. The Crew Lead is responsible for testing, inspecting, and maintaining equipment.
Laboratory Equipment - Electronic laboratory equipment usually has recommended maintenance prescribed by the manufacturer. These instructions will be followed as a minimum requirement. Due to the cost of some laboratory equipment, back up capability may not be possible. But all commonly replaced parts will have spares available for rapid maintenance of failed equipment.
A separate log book will be maintained for each type of field and laboratory equipment. All preventive or corrective maintenance will be recorded. The total history of maintenance performed will be available for inspection during a systems audit.
2.6 Field Instrument/Equipment Calibration and Frequency An instrument or device used in obtaining an environmental measurement must be calibrated by the measurement of a standard. Every instrument or device has a specialized procedure for calibration and a special type of standard used to verify calibration. See instrument manuals for further details. A log book will be kept to record dates of calibration and any equipment errors or failures, battery changes, changes of calibration solutions, and repair notes. The log book will also contain calibration methods, this schedule of inspections and calibrations, and a list of needed supplies and equipment. When a change in equipment occurs, overlapping measurements will be made using both the old and new equipment in order to document precision in reproducibility. Calibration frequency, acceptance criteria, and corrective actions for field meters are outlined in Table SOP 4.8.
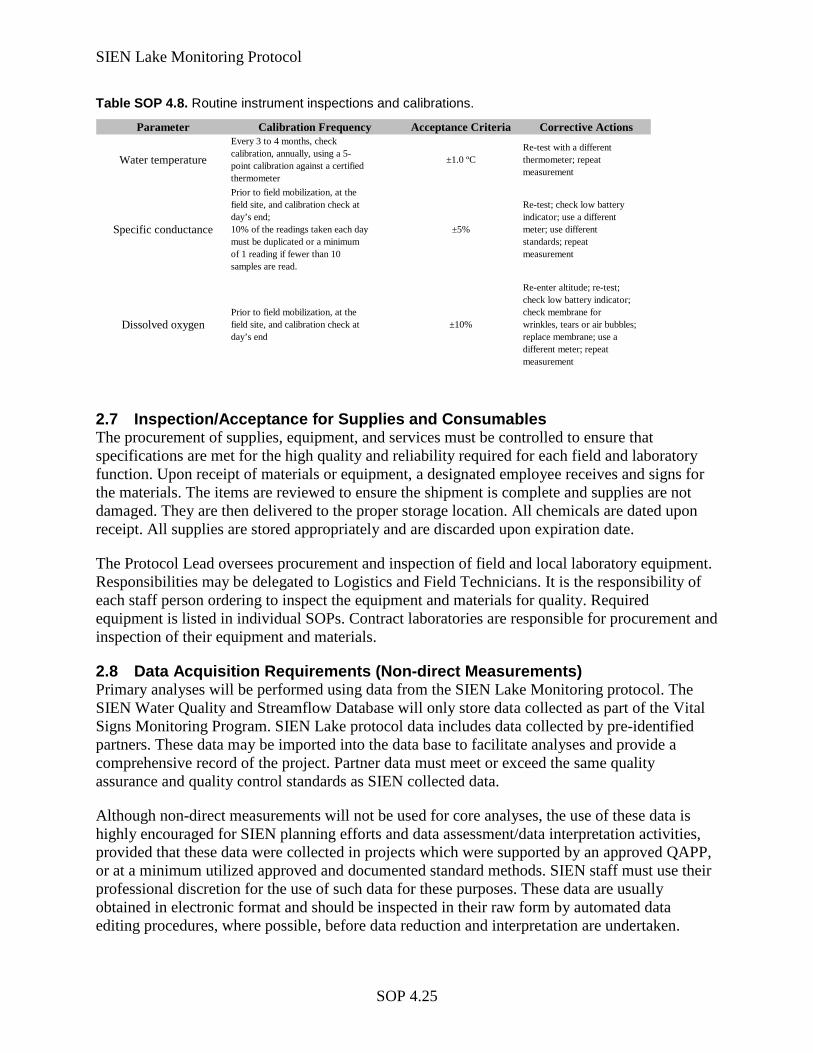
SIEN Lake Monitoring Protocol
SOP 4.25
Table SOP 4.8. Routine instrument inspections and calibrations.
Parameter Calibration Frequency Acceptance Criteria Corrective Actions
Water temperature
Every 3 to 4 months, checkcalibration, annually, using a 5-point calibration against a certified thermometer
±1.0 ºCRe-test with a differentthermometer; repeatmeasurement
Specific conductance
Prior to field mobilization, at thefield site, and calibration check atday’s end;10% of the readings taken each daymust be duplicated or a minimumof 1 reading if fewer than 10samples are read.
±5%
Re-test; check low batteryindicator; use a differentmeter; use differentstandards; repeatmeasurement
Dissolved oxygenPrior to field mobilization, at thefield site, and calibration check atday’s end
±10%
Re-enter altitude; re-test;check low battery indicator;check membrane forwrinkles, tears or air bubbles;replace membrane; use adifferent meter; repeatmeasurement
2.7 Inspection/Acceptance for Supplies and Consumables The procurement of supplies, equipment, and services must be controlled to ensure that specifications are met for the high quality and reliability required for each field and laboratory function. Upon receipt of materials or equipment, a designated employee receives and signs for the materials. The items are reviewed to ensure the shipment is complete and supplies are not damaged. They are then delivered to the proper storage location. All chemicals are dated upon receipt. All supplies are stored appropriately and are discarded upon expiration date.
The Protocol Lead oversees procurement and inspection of field and local laboratory equipment. Responsibilities may be delegated to Logistics and Field Technicians. It is the responsibility of each staff person ordering to inspect the equipment and materials for quality. Required equipment is listed in individual SOPs. Contract laboratories are responsible for procurement and inspection of their equipment and materials.
2.8 Data Acquisition Requirements (Non-direct Measurements) Primary analyses will be performed using data from the SIEN Lake Monitoring protocol. The SIEN Water Quality and Streamflow Database will only store data collected as part of the Vital Signs Monitoring Program. SIEN Lake protocol data includes data collected by pre-identified partners. These data may be imported into the data base to facilitate analyses and provide a comprehensive record of the project. Partner data must meet or exceed the same quality assurance and quality control standards as SIEN collected data.
Although non-direct measurements will not be used for core analyses, the use of these data is highly encouraged for SIEN planning efforts and data assessment/data interpretation activities, provided that these data were collected in projects which were supported by an approved QAPP, or at a minimum utilized approved and documented standard methods. SIEN staff must use their professional discretion for the use of such data for these purposes. These data are usually obtained in electronic format and should be inspected in their raw form by automated data editing procedures, where possible, before data reduction and interpretation are undertaken.
SIEN Lake Monitoring Protocol
SOP 4.26
2.9 Data Management The Sierra Nevada Network Data Management Plan provides the framework for lake monitoring data management procedures (Cook and Lineback 2007). Detailed procedures are described in the Lake Monitoring Protocol Narrative, SOPs, QAPP, SIEN Water Quality and Streamflow Database User’s Manual, and database documentation.
3 Assessment and Oversight 3.1 Assessments and Response Actions Proper and consistent use of equipment and methods is critical to maintaining the integrity of long-term monitoring data sets. The commitment to use approved equipment and approved methods when obtaining environmental samples and when producing field or laboratory measurements must have periodic verification that the equipment and methods are, in fact, being employed and being employed properly. Verification is accomplished by conducting periodic audits. The Protocol Lead is responsible for auditing field crews. Audits will be conducted at least once during the field season. If problems arise, the Protocol Lead should take one or more of the following actions, as appropriate:
• If sample integrity is compromised: Document issues in field forms and database. • Re-train field technician(s) in deficient areas • Modify sampling equipment or methods. Update protocol. Quality control issues and response actions will be documented.
3.2 Reports to Management Quality assurance is reported on annually as part of the annual summary reports. The Lake Protocol Lead is responsible for completing these summaries and reports. Reports will be distributed to NPS-WRD, Network staff, Resource Chiefs, and Water Resources Work Group. Reports will also be made available to interested spark staff and the public via the SIEN I&M web pages.
4 Data Validation and Usability 4.1 Data Review, Verification, and Validation This section was excerpted from the Sierra Nevada Network Data Management Plan (Cook and Lineback 2007).
Data quality is appraised by applying verification and validation procedures as part of the quality control process. These procedures are more successful when preceded by effective quality assurance practices (i.e., planning). Data verification checks that the digitized data match the source data, while data validation checks that the data make sense. Although data entry and verification can be handled by personnel who are less familiar with the data, validation requires in-depth knowledge about the data.
Validation is the process of reviewing computerized data for range and logic errors and may accompany data verification only if the operator has comprehensive knowledge of the data and subject. More often, validation is a separate operation carried out after verification by a project
SIEN Lake Monitoring Protocol
SOP 4.27
specialist who can identify generic and specific errors in particular data types. It is essential that we validate all data as truthful and do not misrepresent the circumstances and limitations of collection. Invalid data commonly consist of misspelled species names or site codes, wrong dates, or out-of-range errors in parameters with well defined limits (e.g., pH). More interesting and often puzzling errors are detected as unreasonable metrics (e.g., stream temperature of 70°C) or impossible associations (e.g., a tree 2 feet in diameter and only 3 feet high). These types of erroneous data are called logic errors because they produce illogical (and incorrect) results. The discovery of logic errors has direct, positive consequences for data quality and provides important feedback to the methods and data forms used in the field. Histograms, line plots, and basic statistics can reveal possible logic and range errors.
4.2 Verification and Validation Methods 4.2.1 Verification The Lake Protocol will follow guidelines for data verification outlined in the Sierra Nevada Network Data Management Plan (Cook and Lineback 2007):
• Project leaders are responsible for specifying in the project protocol one or more of the data verification methods available and ensuring proper execution. At the discretion of the project leader, additional verification methods may be applied.
• Data verification is carried out by staff thoroughly familiar with data collection and entry. • All records (100%) will be verified against original source data. • A subset of randomly selected records (10%) will be reviewed after initial verification by
the project leader. If errors are found, the entire data set will be verified again. • A record of the verification process for each dataset, including number of iterations and
results, will be prepared by the project leader as part of formal metadata generation. • Spatial data collected as part of the project will be viewed in a GIS and visually inspected
for accuracy (e.g., points located outside park boundaries, upland locations occurring in water).
The method we are using to verify the lake chemistry and streamflow data is visual review after data entry. Upon completion of data entry, all records are printed and compared with the original values from the hard copy. Errors are clearly marked and corrected in the database as soon after data entry as possible. The review is performed by someone other than the person keying the data or by two technicians---one reading from the original data and one checking the entered data.
Additional data verification methods include calculating summary statistics and identifying duplicate or omitted records. For example, the number of known constant elements, such as the number of sampling sites or dates per sample can be evaluated. The SIEN Water Quality Databases has built in controls to prevent duplicate records. Specific queries must be performed to identify missing records.
4.2.2 Validation The Lake Protocol will follow guidelines for data validation outlined in the Sierra Nevada Network Data Management Plan (Cook and Lineback 2007):
SIEN Lake Monitoring Protocol
SOP 4.28
• Project protocols will address a process for data validation that includes at least one of the available methods.
• Corrections or deletions as a result of data validation require notations in the original paper field records about how and why the data were changed, with the editor’s initials.
• Modifications of the field data will be clear and concise while preserving the original data entries or notes (i.e., no erasing).
• Validation efforts will also include a check for the completeness of a data set since field sheets or other sources of data could easily be overlooked.
• Use of automated routines and/or data summary and visualization (e.g., histograms, line plots, and basic statistics) will be maximized to identify possible logic and range errors.
• Use of database programming will be maximized to control data entry. This will be achieved via the use of lookup tables and/or field-type design in a database (e.g., yes/no field-types).
We use the following three validation methods:
1) Data entry application programming. Certain components of data validation are built into data entry forms. This method is essentially part of the database design. Not all fields, however, have appropriate ranges known in advance. Caution must be exercised when using lookup tables to constrain variable values. Values occurring outside the range set by a lookup table (established during database design) may not always be invalid. As part of data validation procedures, the project leader is responsible for correct use of lookup tables or other automated value range control.
2) Outlier Detection. According to Edwards (2000), “the term outlier is not (and should not be) formally defined. An outlier is simply an unusually extreme value for a variable, given the statistical model in use.” Any data set will undoubtedly contain some extreme values, so the meaning of ‘unusually extreme’ is subjective. The challenge in detecting outliers is in deciding how unusual a value must be before it can (with confidence) be considered ‘unusually’ extreme.
Data quality assurance procedures should not try to eliminate outliers. Extreme values naturally occur in many ecological phenomena; eliminating these values simply because they are extreme is equivalent to pretending the phenomenon is ‘well-behaved’ when it is not. Eliminating data contamination is perhaps a better way to explain this quality assurance goal. When an outlier is detected (via GIS, database, graphic, and statistical tools for ad-hoc queries and displays), the possibility of contamination will be evaluated and noted.
3) Other exploratory data analyses. Palmer and Landis (2002) suggest calculations for assessments of precision, bias, representativeness, completeness, and comparability may be applicable and, for certain types of measurements, evaluation of detection limits may also be warranted. Normal probability plots, Grubb’s test, and simple and multiple linear regression techniques may also be used (Edwards 2000).
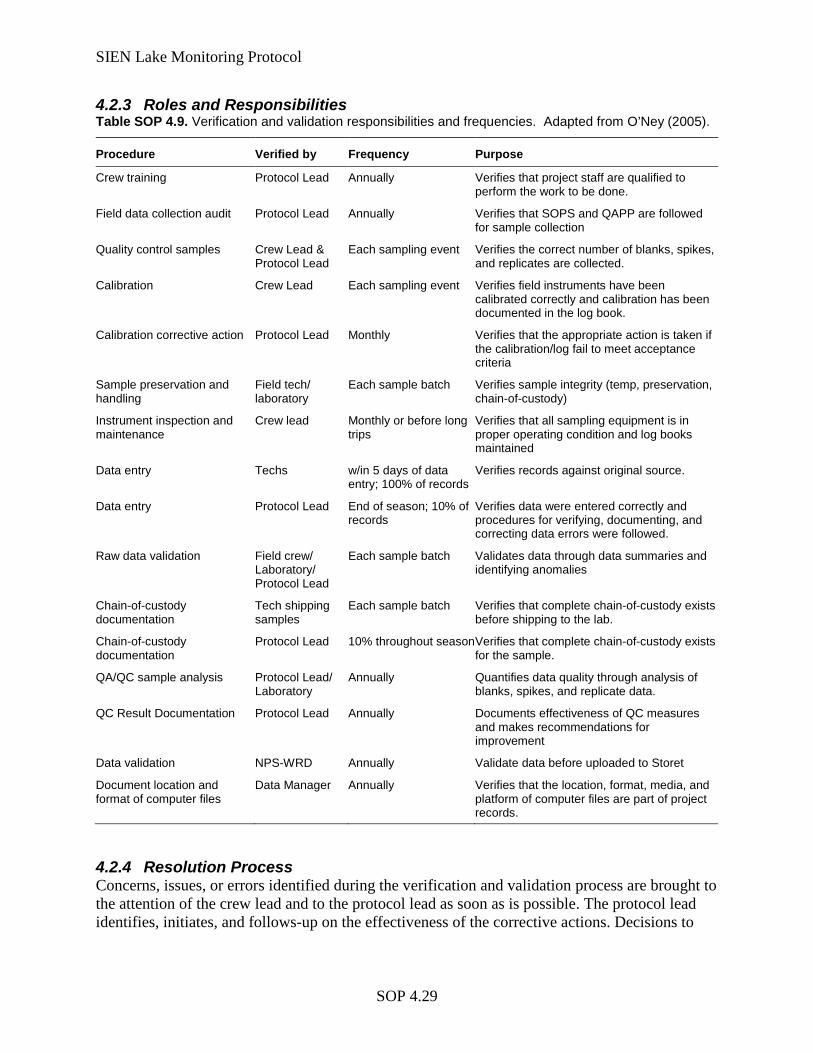
SIEN Lake Monitoring Protocol
SOP 4.29
4.2.3 Roles and Responsibilities Table SOP 4.9. Verification and validation responsibilities and frequencies. Adapted from O’Ney (2005).
Procedure Verified by Frequency Purpose
Crew training Protocol Lead Annually Verifies that project staff are qualified to perform the work to be done.
Field data collection audit Protocol Lead Annually Verifies that SOPS and QAPP are followed for sample collection
Quality control samples Crew Lead & Protocol Lead
Each sampling event Verifies the correct number of blanks, spikes, and replicates are collected.
Calibration Crew Lead Each sampling event Verifies field instruments have been calibrated correctly and calibration has been documented in the log book.
Calibration corrective action Protocol Lead Monthly Verifies that the appropriate action is taken if the calibration/log fail to meet acceptance criteria
Sample preservation and handling
Field tech/ laboratory
Each sample batch Verifies sample integrity (temp, preservation, chain-of-custody)
Instrument inspection and maintenance
Crew lead Monthly or before long trips
Verifies that all sampling equipment is in proper operating condition and log books maintained
Data entry Techs w/in 5 days of data entry; 100% of records
Verifies records against original source.
Data entry Protocol Lead End of season; 10% of records
Verifies data were entered correctly and procedures for verifying, documenting, and correcting data errors were followed.
Raw data validation Field crew/ Laboratory/ Protocol Lead
Each sample batch Validates data through data summaries and identifying anomalies
Chain-of-custody documentation
Tech shipping samples
Each sample batch Verifies that complete chain-of-custody exists before shipping to the lab.
Chain-of-custody documentation
Protocol Lead 10% throughout season Verifies that complete chain-of-custody exists for the sample.
QA/QC sample analysis Protocol Lead/ Laboratory
Annually Quantifies data quality through analysis of blanks, spikes, and replicate data.
QC Result Documentation Protocol Lead Annually Documents effectiveness of QC measures and makes recommendations for improvement
Data validation NPS-WRD Annually Validate data before uploaded to Storet
Document location and format of computer files
Data Manager Annually Verifies that the location, format, media, and platform of computer files are part of project records.
4.2.4 Resolution Process Concerns, issues, or errors identified during the verification and validation process are brought to the attention of the crew lead and to the protocol lead as soon as is possible. The protocol lead identifies, initiates, and follows-up on the effectiveness of the corrective actions. Decisions to
SIEN Lake Monitoring Protocol
SOP 4.30
discard or flag data are the responsibility of the protocol lead. Examples, of error correction procedures are:
• If identified immediately, take a second measurement or sample
• Correct data entry errors on field forms by putting a line through the error, documenting, and initialing the change.
• Correct data entry errors in the database and document in the database log book.
• Flag data in the database with qualifying codes.
• Evaluate if any changes in the protocol would decrease errors.
4.3 Reconciliation and User Requirements Any data that do not meet DQO will not be used. If data quality issues arise, a determination will be made on whether the error was caused by equipment failure or operator error. If additional staff training, equipment repair, or minor revisions to the protocol or SOPs do not correct the problem, then the DQOs will be re-evaluated for feasibility of attainment. If they are determined to be unattainable, then they will be modified or the use of the parameter(s) in question will be evaluated. In some cases, a parameter may be eliminated if no reasonable/acceptable DQOs can be attained.
Limitations on data are conveyed to users through thorough metadata documentation, most of which is contained in the database and therefore, will travel with the data. Users can also access the protocol, which describes the sample design and methods, via the SIEN websites or by contacting the network directly.
5 Literature Cited Cook, R. R., and P. Lineback. 2007. Sierra Nevada Network data management plan. In Natural
Resource Report NPS/PWR/SIEN/NRR—2007/XX. National Park Service, Three Rivers, CA.
Edwards, D. 2000. Data quality assurance. Pages 70–91 in W. K. Michener and J. W. Brunt,
editors. Ecological data: Design, management and processing. Methods in Ecology series. Blackwell Science Ltd., Malden, Massachusetts.
Irwin, R. 2006. Part B lite (Just the Basics) QA/QC review checklist for aquatic vital signs
monitoring protocols for SOPs. National Park Service, Water Resources Division, Fort Collins, CO.
National Park Service. 2000. Management policies 2001. Department of the Interior, National
Park Service. NPS D1416. www.nps.gov/refdesk/mp. O'Ney, S. E. 2005. Regulatory water quality monitoring protocol, Standard Operating
Procedure 7: Quality assurance/quality control procedures. National Park Service, Greater Yellowstone Network, Bozeman, MT.
SIEN Lake Monitoring Protocol
SOP 4.31
Palmer, C. J., and E. B. Landis. 2002. Draft. Lake Mead National Recreational Area Resource Management Division: Quality system management plan for environmental data collection projects.
Puckett, M. 2002. Quality Assurance management plan for the State of California's Surface
Water Ambient Monitoring Program. California Department of Fish and Game, Monterey, CA.
Sickman, J. O., and J. M. Melack. 1989. Characterization of year-round sensitivity of California's
montane lakes to acidic deposition. Final Report to California Air Resources Board. Contract A5-203-32. California Air Resources Board., Sacramento, CA.
Stevens Jr., D. L., and A. R. Olsen. 2004. Spatially balanced sampling of natural resources.
Journal of American Statistical Association 99:262–278.

SIEN Lake Monitoring Protocol
SOP 5.1
Sierra Nevada Network Lake Monitoring Protocol
SOP 5. Field Season Preparations Version 1.00, November 2012 Prepared by Andrea M. Heard
Revision History Log Previous Version #
Revision Date Author Changes Made Reason for
Change New
Version #
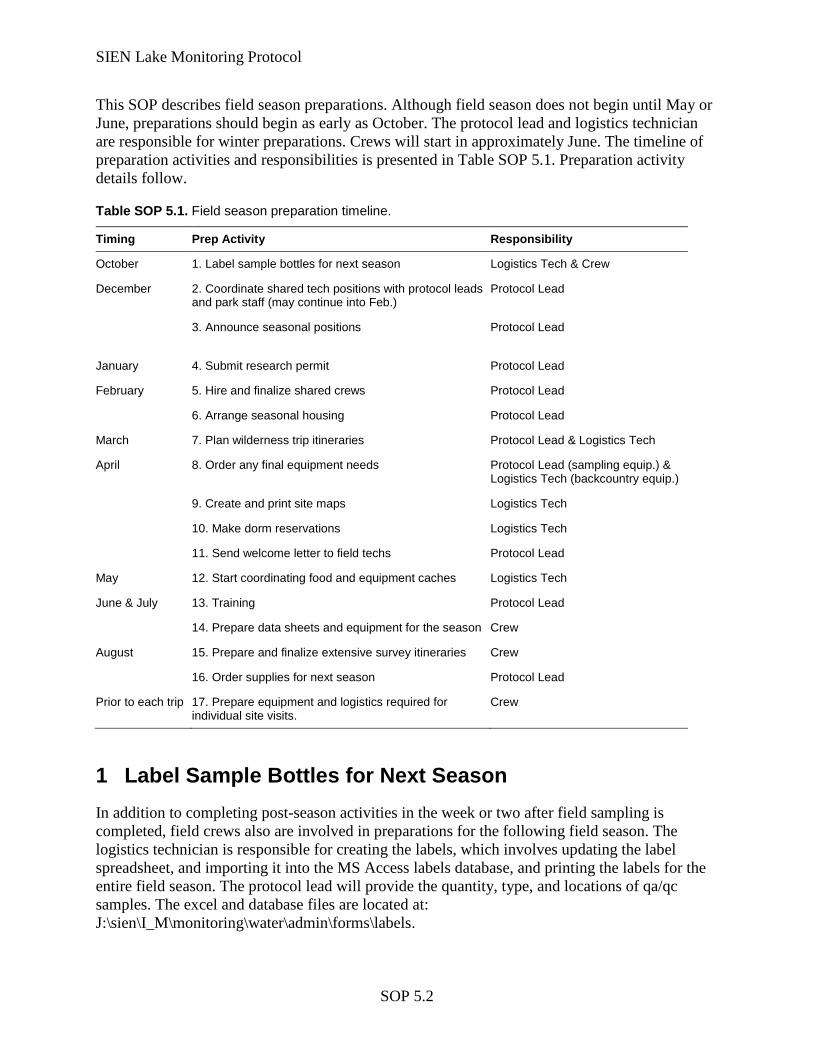
SIEN Lake Monitoring Protocol
SOP 5.2
This SOP describes field season preparations. Although field season does not begin until May or June, preparations should begin as early as October. The protocol lead and logistics technician are responsible for winter preparations. Crews will start in approximately June. The timeline of preparation activities and responsibilities is presented in Table SOP 5.1. Preparation activity details follow.
Table SOP 5.1. Field season preparation timeline.
Timing Prep Activity Responsibility
October 1. Label sample bottles for next season Logistics Tech & Crew
December 2. Coordinate shared tech positions with protocol leads and park staff (may continue into Feb.)
Protocol Lead
3. Announce seasonal positions Protocol Lead
January 4. Submit research permit Protocol Lead
February 5. Hire and finalize shared crews Protocol Lead
6. Arrange seasonal housing Protocol Lead
March 7. Plan wilderness trip itineraries Protocol Lead & Logistics Tech
April 8. Order any final equipment needs Protocol Lead (sampling equip.) & Logistics Tech (backcountry equip.)
9. Create and print site maps Logistics Tech
10. Make dorm reservations Logistics Tech
11. Send welcome letter to field techs Protocol Lead
May 12. Start coordinating food and equipment caches Logistics Tech
June & July 13. Training Protocol Lead
14. Prepare data sheets and equipment for the season Crew
August 15. Prepare and finalize extensive survey itineraries Crew
16. Order supplies for next season Protocol Lead
Prior to each trip 17. Prepare equipment and logistics required for individual site visits.
Crew
1 Label Sample Bottles for Next Season In addition to completing post-season activities in the week or two after field sampling is completed, field crews also are involved in preparations for the following field season. The logistics technician is responsible for creating the labels, which involves updating the label spreadsheet, and importing it into the MS Access labels database, and printing the labels for the entire field season. The protocol lead will provide the quantity, type, and locations of qa/qc samples. The excel and database files are located at: J:\sien\I_M\monitoring\water\admin\forms\labels.
SIEN Lake Monitoring Protocol
SOP 5.3
The field crews then label the sample bottles and organize them in ziplock bags, by site, for the following season. 2 Coordinate Shared Technician Positions Field technicians’ time are shared with other protocols and/or park projects. The protocol lead must coordinate time and workloads with other protocol leads and park staff well in advance. Additional shared opportunities include the Wetlands Ecological Integrity protocol and park air and water resources projects. Division of workload, schedule, and budget should be well-documented, approved by, and distributed to involved supervisors and network coordinator. Refer to the Protocol Narrative, Section 6: Personnel Requirements and Training for details on technician requirements (e.g., number and type). Coordination should be initiated by December, but might take until February to finalize when projects and budgets fall into place.
3 Announce Seasonal Positions Seasonal positions should be announced in December. The Sequoia and Kings Canyon Human Resources office provides hiring and administration functions for the network. The network may also hire off of park applicant lists; this may often be the case when sharing field crews with park projects. Applicants are required to meet the general qualifications for these roles (Table SOP 5.2). Field technicians should be comfortable traveling and working in remote wilderness areas for extended periods of time. They must have a high level of physical fitness and be proficient swimmers.
Table SOP 5.2. Qualifications for lake protocol positions.
Role Qualifications
Crew Member Meets basic requirements for a GS-5 bio/phys/hydro tech. Backpacking and field sampling (ideally water sampling) experience desirable. High level of physical fitness. Proficient swimmer.
4 Submit Research Permits In Yosemite, all NPS employees must apply for and carry a research permit. The protocol lead should submit the permitting paper work in January. The process may be completed over the internet at: http://science.nature.nps.gov/research/ac/ResearchIndex. Sequoia and Kings Canyon does not require NPS employees to apply for and carry research permits. However, a Wilderness minimum requirement analysis must be completed. Previous seasons permits can be found on the SEKI network at: J:\sien\monitoring_projects\water\admin\permits\.
5 Hire and Finalize Shared Crews A detailed plan for sharing crews should be completed by February and seasonal cert lists should be available by now. Crews should be hired by late February, early March at the latest. Consider qualifications in Table 2 when selecting technicians.
SIEN Lake Monitoring Protocol
SOP 5.4
6 Arrange Seasonal Housing The protocol lead, working with park staff, should start securing seasonal housing as early as February. The exact timing will be dependent on the park housing office’s schedule; however, since housing is always tight, we should be prepared when they are. Housing needs will vary by year and crew. Ideally, the Yosemite crew will be housed at Tuolumne Bug Camp. The Sequoia/Kings crew has the option of staying in the dorm and White Mt. Research Center when they are in the frontcountry. If they prefer a seasonal house at Ash Mt., one can be requested.
7 Plan Wilderness Trip Itineraries Trip itineraries must be planned early in the year to allow plenty of time to coordinate logistics. It is recommended the protocol lead and logistics technician consult with park staff who have extensive experience and knowledge of wilderness travel routes. For the first four years, staff need to determine if a site is safe to access. If a site is identified as unsafe, it is replaced with the next oversample. Once itineraries are developed, any housing, camping, food cash, or other logistics that require advanced planning should be coordinated. Crew schedules from previous years can be found on the SEKI network at: J:\sien\I_M\monitoring\water\operations\crews\schedules\. Route maps from prior trips can also be found on the network: J:\sien\I_M\monitoring\water\operations\backcountry_trips\route_maps
8 Order any Final Equipment Needs The majority of the equipment will have been ordered the prior summer. However, the protocol lead and logistics technician should make sure any final equipment needs are taken care of in April.
9 Create and Print Site Maps Site maps are printed in color on water proof paper for each site visit. If a site has not been visited than the logistics technician will create a new map. Existing maps are located on the SEKI network at: J:\sien\I_M\monitoring\water\admin\forms\data_sheets\SiteMaps. Completed maps for SEKI are stored in the file cabinet in the Research Center conference room and for YOSE in the Lake file folders at the Bug Camp Lab.
10 Make Dorm Reservations Reservations at the Ash Mt. dorm should be made as soon as possible, particularly for the month of June. Space will likely be needed for the Yosemite crew during the lake training week and for SEKI throughout the season (assuming they opt for dorm housing). The SEKI crew may also be staying at the White Mt. Research Station (WMRS) in Bishop. Space is less of an issue at the WMRS; however, reserving in timely manner is still suggested.
SIEN Lake Monitoring Protocol
SOP 5.5
11 Send Welcome Letters Welcome letters are emailed to new and returning field technicians. These include a general welcome, a schedule and ‘what to expect’ for the first pay period, an equipment checklist describing what they are responsible for bringing and what NPS provides, backcountry food recommendations, and driving directions to their initial park destination (i.e. El Portal Resources offices, Ash Mt. Research Center). Templates can found on the SEKI network: J:\sien\I_M\monitoring\water\operations\crews\pre-season.
12 Food and Equipment Caches Food cache options should have been originally identified when the wilderness itineraries were drafted in February. However, actually coordinating may begin as early as May and continue through September. Typically, food caches are piggy-backed onto existing backcountry stock and helicopter flights. For example, backcountry ranger station mobilizations and trail crew re-supplies.
Sampling equipment is cached at Dusy Basin in a box that is stored with the USFS amphibian research crew camp.
13 Training A multi-day training is conducted prior to the first index sampling trip. Training is coordinated by the protocol lead. I&M and park staff are key participants in the training. Refer to SOP #3: Staff Training for training requirements and details.
14 Prepare Data Sheets and Field Equipment The crew is responsible for preparing all equipment at the beginning of the season. This includes:
1. Photocopy blank field data sheets and chain-of-custody forms.
2. Unpack and inventory field gear.
3. Clean and test that all sampling equipment is working properly. Put new batteries in electronic equipment.
4. Calibrate meters (refer to corresponding SOPs and Users Manuals for instructions).
15 Prepare and Finalize Itineraries for Extensive Surveys The crew inventories and prepares backpacking and sampling equipment for the extensive surveys. Gear is organized ahead of time for all August and September trips to the extent possible.Wilderness itineraries were planned during the winter season. Crews should finalize these plans including making changes based on individual crew abilities and current wilderness conditions. Wilderness travel itineraries are completed and submitted to the protocol lead (note: this may also be completed earlier in the season, for example, in conjunction with the training).
SIEN Lake Monitoring Protocol
SOP 5.6
Wilderness travel forms are located at: J:\sien\I_M\monitoring\water\admin\forms\safety\wilderness travel
16 Order Supplies for Next Season The protocol lead is responsible for ensuring sampling equipment is ordered. The equipment is ordered in August for the following field season. Often SIEN’s administrative technician can assist in making these purchases. Equipment lists are included in the SOP #8: Water Sampling Methods. There is a spreadsheet on the SEKI network that contains information for ordering, including the vendor, catalog number, contact information, and approximate prices. Refer to J:\sien\I_M\monitoring\water\admin\fiscal\Equip_ordering\EquipLakes_heard_date.xls. Once the glass fiber filters arrive, they need to be sent to the lab where they will be pre-combusted and returned.
The logistics technician is responsible for ordering additional backpacking equipment as needed.
17 Prior to Each Sampling Trip Crew members complete the following preparation tasks prior to a site visit:
1. Test equipment and calibrate instruments. Refer to SOP 4 (QAPP) for calibration frequency and acceptance criteria.
2. Make sure equipment is disinfected before going into the field. 3. Pack sampling equipment. Refer to SOP 8 for the equipment checklist.
4. Pack day hiking or overnight backpacking equipment.
5. If traveling overnight, make sure a backcountry travel itinerary has been submitted to the protocol lead and supervisor (if different).
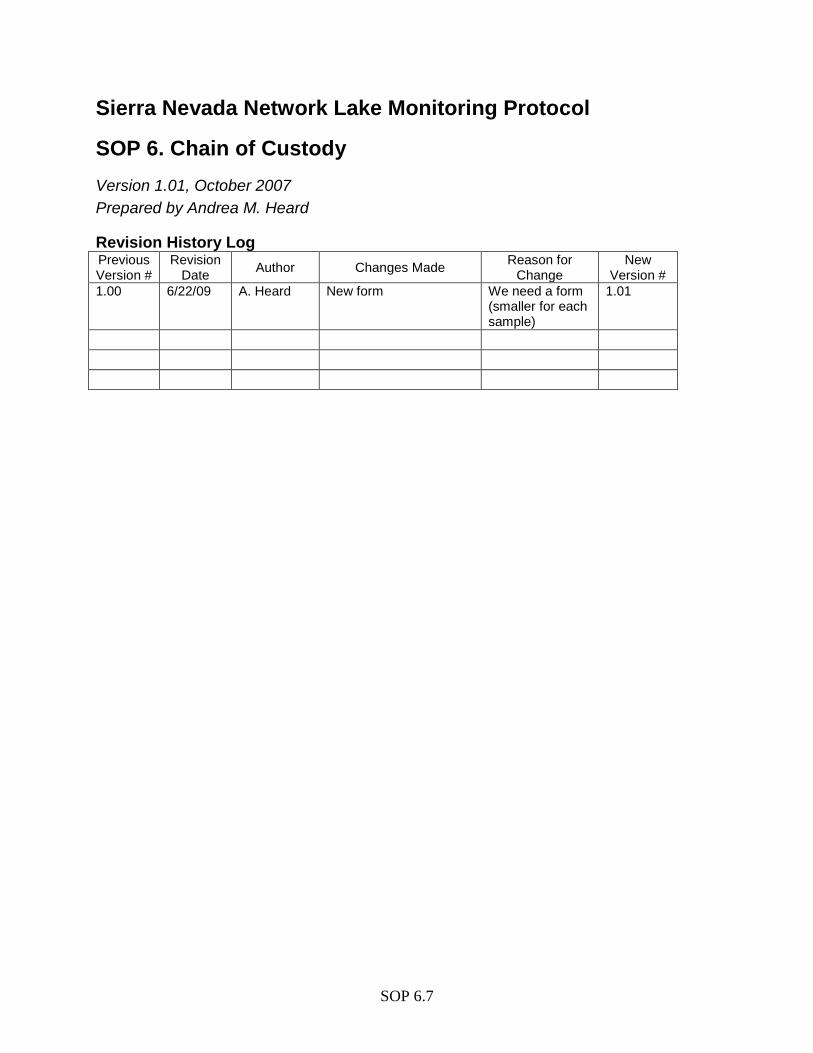
SIEN Lake Monitoring Protocol
SOP 6.7
Sierra Nevada Network Lake Monitoring Protocol
SOP 6. Chain of Custody Version 1.01, October 2007 Prepared by Andrea M. Heard
Revision History Log Previous Version #
Revision Date Author Changes Made Reason for
Change New
Version # 1.00 6/22/09 A. Heard New form We need a form
(smaller for each sample)
1.01
SIEN Lake Monitoring Protocol
SOP6.1
1 Overview Adapted from the Greater Yellowstone Network (O'Ney 2005).
A chain-of-custody includes the form and all references to the sample in any form, document or log book, which will enable the sample to be traced back to its collection. The chain-of-custody form documents the possession of the samples from the time they were collected until the sample analytical results are received. Lab technicians, field crew members, and the field crew leader are responsible for maintaining chain-of-custody conditions during the time that samples are in their possession.
Submitting a completed and signed chain-of-custody form with samples is mandatory. Each sample has its own chain-of-custody form. The purpose of this procedure is to assure that an accurate written record is created by the field technicians that will be accepted as valid evidence to trace a sample or samples from the moment of collection through laboratory testing and reporting of test results. Chain-of-custody forms are filed with the monitoring site records.
When shipping samples, the chain of custody form must be completed and placed in a water-tight plastic bag inside the sample cooler. The bag can be taped to the inside of the lid. If a common carrier is used to deliver the samples to the analytical laboratory, the technician retains the shipping receipt as proof of transfer of custody. Laboratory personnel indicate date and time received and sign the form. The original forms are retained for seven years and are filed in chronological order.
2 Literature Cited O'Ney, S. E. 2005. Regulatory water quality monitoring protocol, Standard Operating Procedure
#7: Quality assurance/quality control procedures. National Park Service, Greater Yellowstone Network, Bozeman, MT.
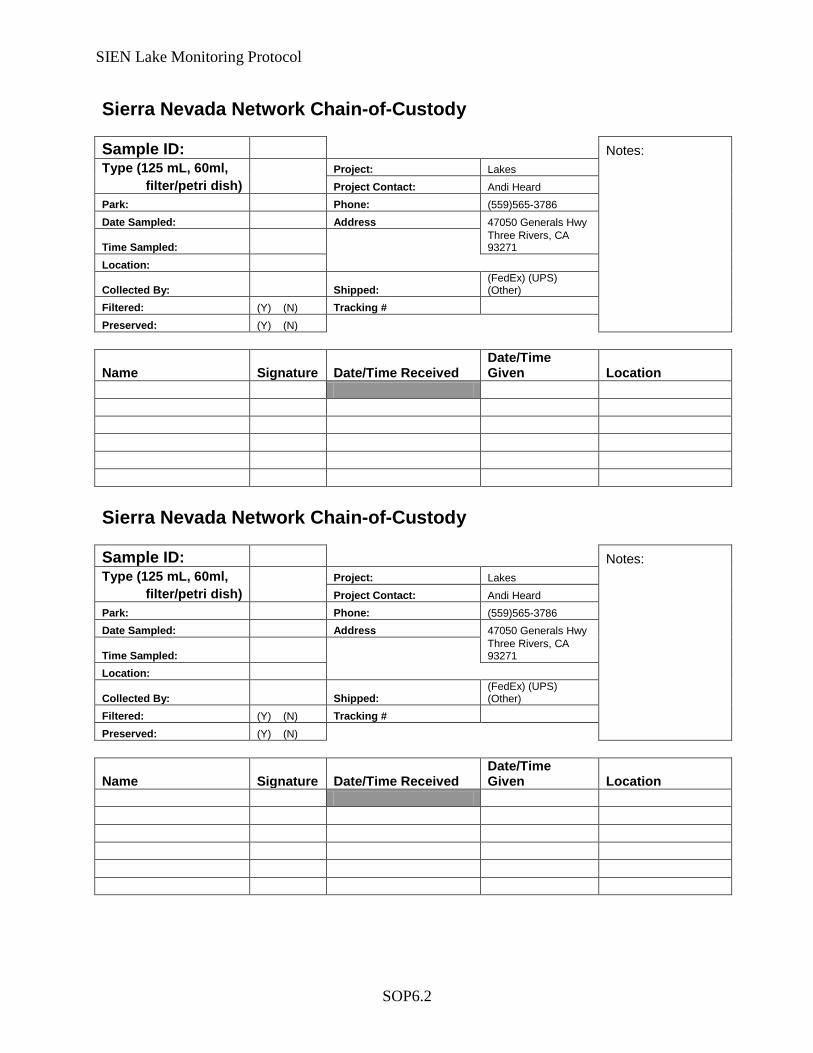
SIEN Lake Monitoring Protocol
SOP6.2
Sierra Nevada Network Chain-of-Custody Sample ID: Notes: Type (125 mL, 60ml, Project: Lakes
filter/petri dish) Project Contact: Andi Heard Park: Phone: (559)565-3786 Date Sampled: Address 47050 Generals Hwy
Time Sampled: Three Rivers, CA 93271
Location:
Collected By: Shipped: (FedEx) (UPS) (Other)
Filtered: (Y) (N) Tracking # Preserved: (Y) (N)
Name Signature Date/Time Received Date/Time Given Location


SIEN Lake Monitoring Protocol
SOP7.1
Sierra Nevada Network Lake Monitoring Protocol
SOP 7. Equipment Disinfection Version 1.00, November 2012 Prepared by Donald W. Schweizer
Revision History Log Previous Version #
Revision Date Author Changes Made Reason for
Change New
Version #
SIEN Lake Monitoring Protocol
SOP7.2
1 Introduction Field personnel have the potential to introduce and spread parasites and non-native organisms. These include the introduction and spread of the New Zealand mudsnail (Potamopyrgus antipodarum), quagga mussels (Dreissena rostriformis bugensis), and chytrid fungus (Batrachochytrium dendrobatidis), which are of particular regional concern. Sierra Nevada Network (SIEN) recognizes the need to minimize introduction and transport as part of the lake monitoring protocol. The Sierran yellow-legged frog is a species we are particularly focused on protecting as it is a candidate for listing as ‘endangered’ under the Federal Endangered Species Act. Recently, extremely rapid declines have been documented: for example, field research in Yosemite during 2005 revealed that 50% of revisited sites––previously extant during surveys conducted 2000–2002––are now extirpated. Recent research has shown that chytridiomycosis (Batrachochytrium dendrobatidis) is a proximate cause of yellow-legged frog mass mortality (Rachowicz et al. 2006). Aquatic species can be transported on clothing and sampling equipment. To minimize this risk, SIEN requires the following general policies to be followed if logistically possible:
• Start fieldwork with sterilized equipment.
• If the information is known, start field work from the cleanest site and work toward the dirtiest or contaminated site.
• Start from the highest point in the drainage and work down. We elected to use a chlorine bleach disinfection procedure. The alternative disinfectant is Quat-128®. Quat-128® is not used in this protocol because it is a source of nitrogen contamination. We recognize that chlorine bleach is a source of sodium and chloride ion contamination. However, disinfecting is a necessary step and, given our objectives, potential sodium and chloride contamination was the better of the two options.
2 Disinfection Procedure To avoid moving diseases from site to site, you must disinfect your gear that has been in contact with water or animals before sampling the next waterbody. The only exception to this rule is when your next survey site is in the same area: directly connected or within 100 meters downstream of the site you just surveyed and connected to it by a stream. Between sites in the same area, all equipment should be rinsed of organic debris. Equipment should be disinfected at the ‘new’ site. Do not disinfect after sampling a lake and then store the equipment with bleach on it in the packs. Long exposure to the bleach is hard on the equipment, not to mention it will get bleach on everything in your pack. When you arrive at the new site take cautions to not allow the ‘contaminated’ equipment to contact water until it has been disinfected.
SIEN Lake Monitoring Protocol
SOP7.3
Use the following equipment to disinfect between sampling locations: • Stiff scrub brush (if needed) • Latex gloves • Spray bottle • 3 gallon collapsible bucket or dry bag • Dry bleach (this should be in pre-measured, labeled packages for each sample site)
The following equipment should be cleaned and disinfected:
• Boots, shoes, waders, and sandals • Float tubes/ boats • Ropes, buoy • Fins • Dip nets • Net poles • Tarp • Water sampling pump • Cubie containers • Any other equipment that contacts the water or frogs.
Chlorine bleach is used to disinfect. Granulated chlorine bleach is preferred because it is lighter and easier to transport than liquid bleach and unlike liquid bleach it does not lose its effectiveness within 2 weeks. Granulated chlorine bleach can be purchased at swimming supply stores. Prior to going into the field, package and label the disinfectant.
1. Get labels and containers to package the dry bleach. Containers can be plastic storage bags, plastic bottles, etc. If using plastic storage bags, put all bags for the trip into one dry bag, stuff sack, or hard sided container that can protect the plastic storage bags from being punctured.
2. Measure 1 cup of 56% available dry chlorine bleach (to get a 2% bleach solution when added to a 60% full 3 gallon bucket of water in the field).
3. Place dry bleach in plastic storage bag.
4. Label plastic storage bag.
5. Label the puncture resistant bag (stuff sack, dry bag, or hard sided container).
6. Repeat to have individual pre-measured containers for each lake.
The first step in the field is to thoroughly clean equipment.
1. Remove all organic matter (mud, plants, algae, etc.). Particular attention should be given to the treads of boots, sandals, and waders. A stiff brush should be used if needed.
2. Ensure no water remains in any equipment by removing any residual water from all pumps, hoses, etc.
3. Dry as thoroughly as possible. When practical and appropriate, wipe dry.
SIEN Lake Monitoring Protocol
SOP7.4
4. Let all equipment air-dry as long as possible.
After the equipment is thoroughly cleaned, use the following steps to disinfect. 1. For small equipment, such as dip nets and ropes:
a. Use a 2% solution of bleach.
b. Fill the 3 gallon collapsible bucket a little over half (60% full) with water at the new survey site.
c. Mix the pre-measured quantity of dry bleach into the water in the bucket.
d. Soak all items (that have been cleaned of mud, etc.) for 2 minutes.
e. If the solution becomes noticeably dirty, dispose of it and mix up a new batch.
f. After disinfecting your gear, rinse with water from the new survey site.
2. For large equipment that cannot be soaked, such as float tube, boat, and waders:
a. Use the 2% solution of bleach.
b. Fill spray bottle with solution.
c. Spray cleaned surfaces. If needed, use a sponge to make sure all surfaces get covered with the spray solution.
d. Let air dry.
e. Rinse thoroughly with water from the new survey site to remove all disinfectant to avoid sample contamination, and getting bleach on clothing, etc.
3. Dispose of bleach solution at least 100 meters from water.
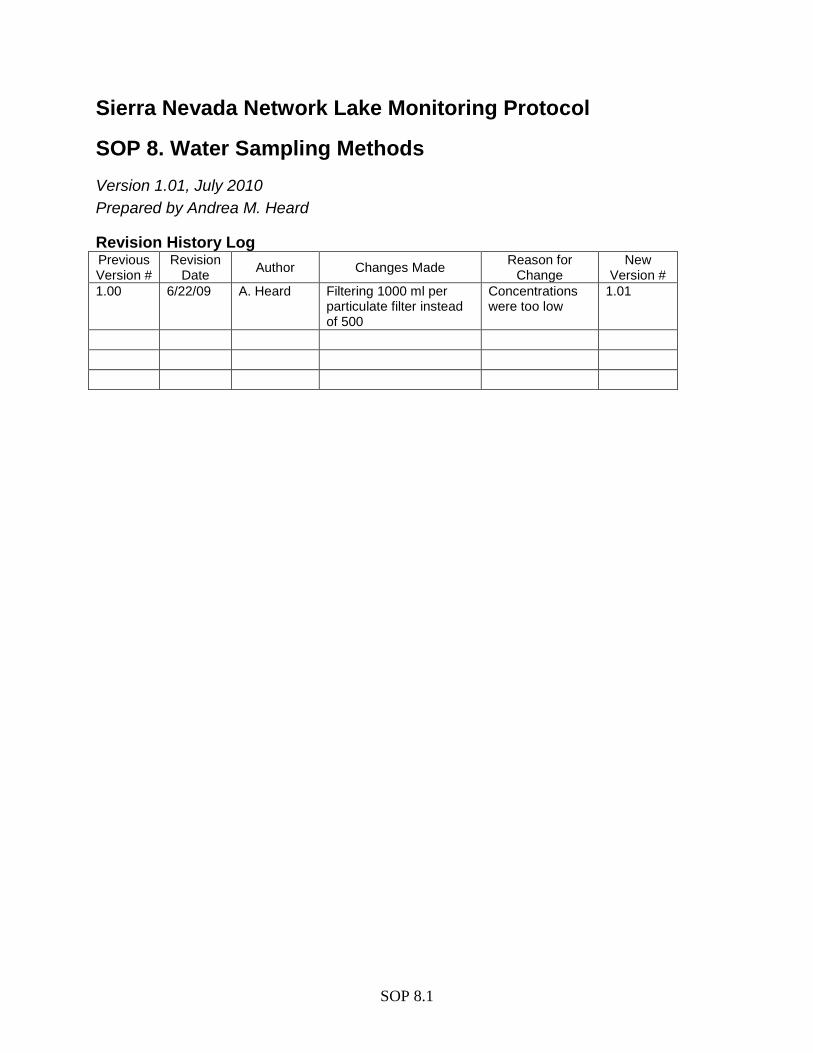
SIEN Lake Monitoring Protocol
SOP 8.1
Sierra Nevada Network Lake Monitoring Protocol
SOP 8. Water Sampling Methods Version 1.01, July 2010 Prepared by Andrea M. Heard
Revision History Log Previous Version #
Revision Date Author Changes Made Reason for
Change New
Version # 1.00 6/22/09 A. Heard Filtering 1000 ml per
particulate filter instead of 500
Concentrations were too low
1.01
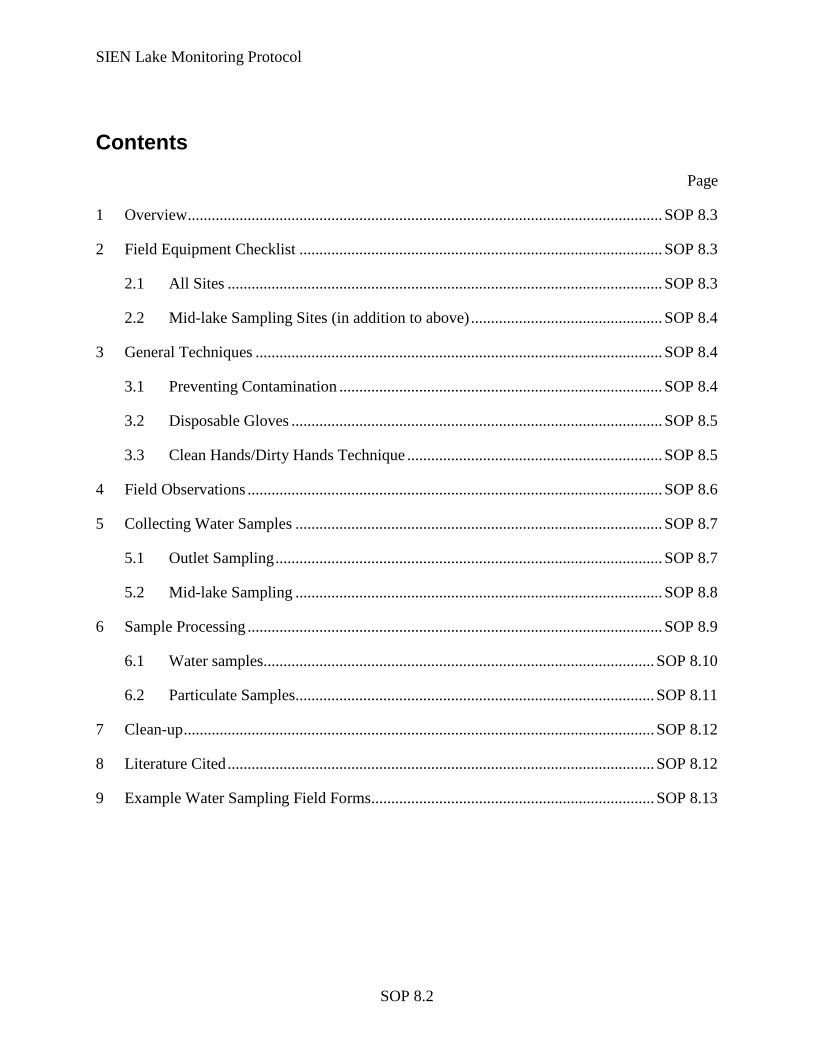
SIEN Lake Monitoring Protocol
SOP 8.2
Contents Page
1 Overview ....................................................................................................................... SOP 8.3
2 Field Equipment Checklist ........................................................................................... SOP 8.3
2.1 All Sites ............................................................................................................. SOP 8.3
2.2 Mid-lake Sampling Sites (in addition to above) ................................................ SOP 8.4
3 General Techniques ...................................................................................................... SOP 8.4
3.1 Preventing Contamination ................................................................................. SOP 8.4
3.2 Disposable Gloves ............................................................................................. SOP 8.5
3.3 Clean Hands/Dirty Hands Technique ................................................................ SOP 8.5
4 Field Observations ........................................................................................................ SOP 8.6
5 Collecting Water Samples ............................................................................................ SOP 8.7
5.1 Outlet Sampling ................................................................................................. SOP 8.7
5.2 Mid-lake Sampling ............................................................................................ SOP 8.8
6 Sample Processing ........................................................................................................ SOP 8.9
6.1 Water samples .................................................................................................. SOP 8.10
6.2 Particulate Samples.......................................................................................... SOP 8.11
7 Clean-up ...................................................................................................................... SOP 8.12
8 Literature Cited ........................................................................................................... SOP 8.12
9 Example Water Sampling Field Forms ....................................................................... SOP 8.13
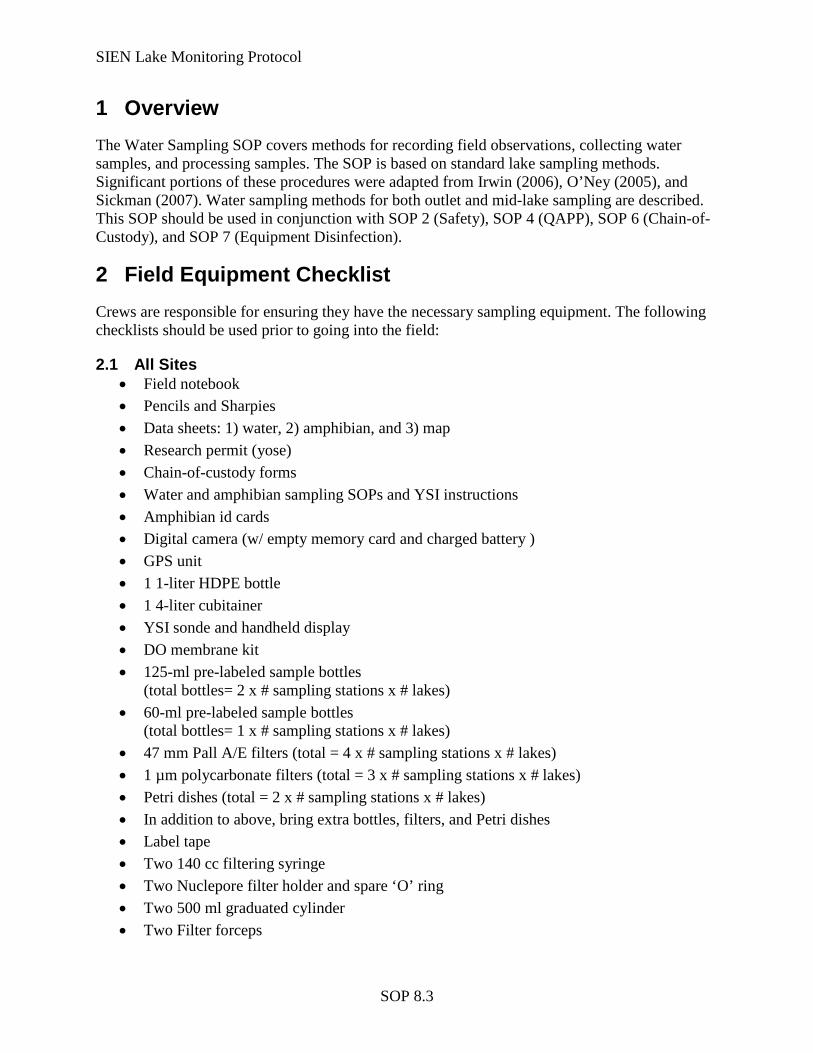
SIEN Lake Monitoring Protocol
SOP 8.3
1 Overview The Water Sampling SOP covers methods for recording field observations, collecting water samples, and processing samples. The SOP is based on standard lake sampling methods. Significant portions of these procedures were adapted from Irwin (2006), O’Ney (2005), and Sickman (2007). Water sampling methods for both outlet and mid-lake sampling are described. This SOP should be used in conjunction with SOP 2 (Safety), SOP 4 (QAPP), SOP 6 (Chain-of-Custody), and SOP 7 (Equipment Disinfection).
2 Field Equipment Checklist Crews are responsible for ensuring they have the necessary sampling equipment. The following checklists should be used prior to going into the field:
2.1 All Sites • Field notebook • Pencils and Sharpies • Data sheets: 1) water, 2) amphibian, and 3) map • Research permit (yose) • Chain-of-custody forms • Water and amphibian sampling SOPs and YSI instructions • Amphibian id cards • Digital camera (w/ empty memory card and charged battery ) • GPS unit • 1 1-liter HDPE bottle • 1 4-liter cubitainer • YSI sonde and handheld display • DO membrane kit • 125-ml pre-labeled sample bottles
(total bottles= 2 x # sampling stations x # lakes) • 60-ml pre-labeled sample bottles
(total bottles= 1 x # sampling stations x # lakes) • 47 mm Pall A/E filters (total = 4 x # sampling stations x # lakes) • 1 µm polycarbonate filters (total = 3 x # sampling stations x # lakes) • Petri dishes (total = 2 x # sampling stations x # lakes) • In addition to above, bring extra bottles, filters, and Petri dishes • Label tape • Two 140 cc filtering syringe • Two Nuclepore filter holder and spare ‘O’ ring • Two 500 ml graduated cylinder • Two Filter forceps
SIEN Lake Monitoring Protocol
SOP 8.4
• Ziploc bags • Powder-free gloves—various sizes • Spray bottle • Bleach
2.2 Mid-lake Sampling Sites (in addition to above) • Boat and oars • Pump or inflation bag • Personal flotation device • Mesh anchor bag • Anchor rope (braided polypropylene) • Sonar depth finder • Hand pump with inlet tubing (10 m) and outlet tubing (~.3 m) • 5 4-liter cubitainers • 3 gallon collapsible bucket or dry bag
3 General Techniques The following are general procedures and approaches that should be followed when conducting water sampling.
3.1 Preventing Contamination Adapted from O’Ney (2005)
Field technicians should be aware of and record potential sources of contamination at each field site.
• Wear appropriate disposable, powderless gloves (see section 3.2):
o Change gloves before each new step during sample collection (and processing).
o Avoid hand contact with contaminating surfaces (such as equipment, coins, food).
• Use only equipment that has been cleaned according to prescribed procedures.
• Field rinse equipment, as directed.
• Use correct sample-handling procedures: o Minimize the number of sample-handling steps.
o Use Clean Hands/Dirty Hands techniques when two technicians are available
• Obtain training for and practice field techniques under supervision before collecting water samples.
• Collect a sufficient number of appropriate types of quality-control samples.
SIEN Lake Monitoring Protocol
SOP 8.5
3.2 Disposable Gloves Adapted from O’Ney (2005) and Wilde (2004). Use of disposable, powderless gloves is required when handling equipment for collecting and processing water-quality samples. Wearing gloves serves to protect field personnel from contact with contaminants and chemical preservatives, and protects the sample from contamination transmitted by sample handling. Although common glove types include those made of vinyl, latex and nitrile, nitrile is in standard use for USGS sampling work because of its resistance to most of the chemicals to which it typically will be exposed for the length of exposure (usually under 15 minutes). Field personnel are cautioned that direct contact with materials such as latex or nitrile can cause severe allergic reactions in some individuals and should be monitored.
• Wear powderless nitrile gloves when handling equipment and chemical solutions. Do not allow the water that enters the sample bottle to contact gloved (or bare) hands.
• Check the manufacturer’s chemical resistance chart for any compound, such as acid, base or organic solvent, to which the glove might be exposed.
Physical properties to consider when selecting disposable gloves are glove length, slip protection, puncture resistance, heat and flame resistance, cold protection and comfort. These factors can vary between manufacturers. Gloves should be inspected visually for defects. Check for tears, punctures and other flaws that can prevent the glove from being an effective shield. After putting the gloves on, rinse them with water while gently rubbing hands together to remove any surface residue before handling sampling equipment.
3.3 Clean Hands/Dirty Hands Technique Adapted from O’Ney (2005) and Wilde (2004).
Clean Hands/Dirty Hands techniques require two or more people working together. At the field site, one person is designated as Clean Hands (CH) and a second person as Dirty Hands (DH). Although specific tasks are assigned at the start to CH or DH , some tasks overlap and can be handled by either, as long as the prescribed care is taken to prevent contaminating the sample. Both CH and DH wear appropriate disposable, powderless gloves during the entire sampling operation and change gloves frequently, usually with each change in task. (Wearing multiple layers of gloves allows rapid glove changes.)
CH takes care of all operations involving equipment that contacts the sample; for example, CH:
• Handles the surface-water sampler bottle.
• Handles the discharge end of the surface-water sample tubing.
• Prepares a clean work space.
• Sets up field-cleaning equipment and cleans equipment.
DH takes care of all operations involving contact with potential sources of contamination; for example, DH:
• Works exclusively exterior to processing area.
SIEN Lake Monitoring Protocol
SOP 8.6
• Prepares and operates sampling equipment.
• Handles instruments for field measurements.
• Handles stream-gaging or water-level equipment.
• Sets up and calibrates field-measurement instruments.
• Measures and records water levels and field measurements. Often two people are not available; in this case samples may be collected by an individual. This may be achieved by changing gloves when switching between clean-hands and dirty-hands tasks.
4 Field Observations Upon reaching a site fill out the general information (Lake Name, date/time, crews etc.) on the field data sheets.
Record the following field observations on the field data sheet:
• Identify sampling locations on the pre-printed lake maps. (Refer to Rose 2010.)
• Take 3 photographs: 1) of the lake from the outlet, 2) of the outlet sampling location, capturing the streamflow, and 3) a landscape view of the lake. Record the photo numbers. Note any additional photos taken during the visit.
• Weather observations
• Fish presence—check box if any fish are observed
• Qualitative outlet flow: Take a photo of the outlet and, on the data sheet, circle the most accurate flow description using one of the choices in Table SOP 8.1.
• Comments regarding site access.
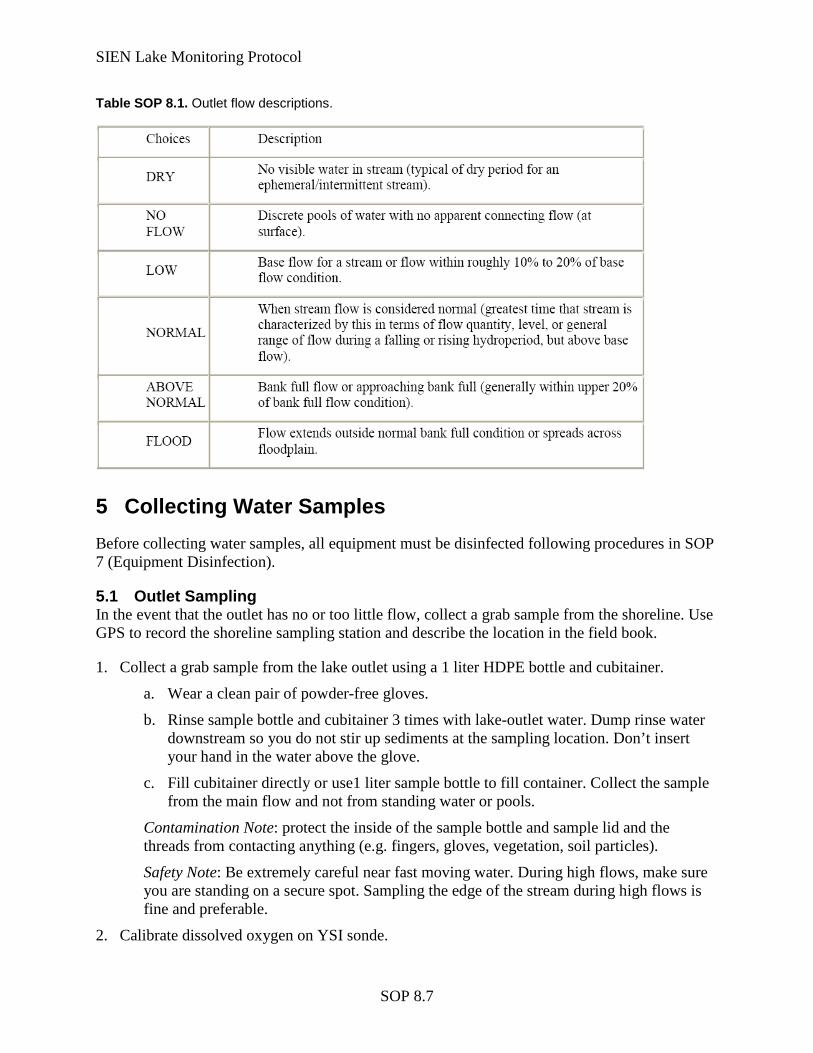
SIEN Lake Monitoring Protocol
SOP 8.7
Table SOP 8.1. Outlet flow descriptions.
5 Collecting Water Samples Before collecting water samples, all equipment must be disinfected following procedures in SOP 7 (Equipment Disinfection).
5.1 Outlet Sampling In the event that the outlet has no or too little flow, collect a grab sample from the shoreline. Use GPS to record the shoreline sampling station and describe the location in the field book.
1. Collect a grab sample from the lake outlet using a 1 liter HDPE bottle and cubitainer.
a. Wear a clean pair of powder-free gloves.
b. Rinse sample bottle and cubitainer 3 times with lake-outlet water. Dump rinse water downstream so you do not stir up sediments at the sampling location. Don’t insert your hand in the water above the glove.
c. Fill cubitainer directly or use1 liter sample bottle to fill container. Collect the sample from the main flow and not from standing water or pools.
Contamination Note: protect the inside of the sample bottle and sample lid and the threads from contacting anything (e.g. fingers, gloves, vegetation, soil particles).
Safety Note: Be extremely careful near fast moving water. During high flows, make sure you are standing on a secure spot. Sampling the edge of the stream during high flows is fine and preferable.
2. Calibrate dissolved oxygen on YSI sonde.
SIEN Lake Monitoring Protocol
SOP 8.8
3. Measure temperature, specific conductance, DO and pH in situ using the YSI sonde. Record results and meter id no. on the field data sheet.
4. Use GPS to record sampling location.
5.2 Mid-lake Sampling Adapted from Sickman (2007).
1. Calibrate DO meter.
2. Fill mesh anchor bag with rocks.
3. Inflate boat. Put on PFD.
4. Carefully, carry boat to lake shore. Boats can easily be punctured. It’s best to wade into the lake and climb into the boat where it’s at least 1–2 feet deep to avoid scraping the bottom.
5. Paddle to lake center and drop anchor. Take the following equipment with you:
• Anchor bag with rocks
• Anchor rope
• Field notebook or datasheets
• Pencil
• Depth probe
• GPS
• YSI meter
• Hand pump and tubing
• 4 cubitainers
6. Use GPS to record sampling location.
7. Technician on shore should photograph the sampling location and the outflow sampling site.
8. Record lake depth using the depth probe.
9. Record temperature/DO profile and specific conductance. a. Take first readings at the surface.
b. Take subsequent readings at 1 meter intervals (cable is marked every meter). The meter cable is ~17 m long. If the lake depth is less than 17 m than the last measure should between 1–2 feet above the lake bottom. Avoid putting probe directly into lake sediments. If the lake depth is greater than 17 m, take measurements until you reach the end of the cable. Temperature data for the top 15 m will generally be enough to determine if these lakes are stratified (Sickman 2007, personal communication).
c. Record depth (m), temp (C), DO (mg/l) in field notebook or data sheets.
10. Determine if lake is stratified or mixed. In a mixed lake temperature readings will be similar at all depths; stratified lakes will exhibit a temperature gradient, especially at the
SIEN Lake Monitoring Protocol
SOP 8.9
thermocline, where water temperatures change rapidly. In deeper Sierra Nevada lakes, the thermocline usually occurs between depths of 12–15 meters. If the lake is well-mixed, sample once at the epilimnion. If the lake is stratified collect sample from the epilimnion (sample from 1 m below lake surface) and the hypolimnion (sample below the thermocline).
11. Collect epilimnion sample (at 1 m below surface):
a. Lower hand pump inlet tubing to 1 m below the lake surface.
b. Pump water through tubing and pump to rinse (~100 revolutions).
c. Insert outlet tubing into cubitainer.
d. Pump about 200 ml of water into cubitainer. Repeat.
e. Rinse both cubitainers, labeled epilimnion, 3 times.
f. Fill 2 cubitainers and cap.
g. Record sampling depth.
12. Collect hypolimnion sample
a. Lower hand pump inlet tubing to desired depth (tubing is marked in 1 m intervals).
b. Pump water through tubing and pump to rinse (~100 revolutions).
c. Insert outlet tubing into cubitainer.
d. Pump about 200 ml of water into cubitainer. Repeat.
e. Rinse both cubitainers, labeled hypolimnion, 3 times.
f. Fill 2 cubitainers and cap.
g. Record sampling depth.
13. Return to shore.
14. Transfer measurements from field book to field data sheet, if applicable.
6 Sample Processing Adapted from Sickman (2007).
You will be processing unfiltered water samples, filtered water samples, and particulate filter samples. Processing will be identical for each sampling station. The sample stations include the outlet, epilimnion, and hypolimnion. Note that not every station will be sampled at each lake. For each station you will return with a total of 2 125 ml bottles, 1 60 ml bottle, and 4 filters (Table SOP 8.2). Periodically, qa/qc samples will also be collected. These will be coordinated by the Protocol Lead and Crew Lead before going into the field.
SIEN Lake Monitoring Protocol
SOP 8.10
Table SOP 8.2. Sample types with corresponding bottle and filter types.
Sampling Station Sample Type Bottle Filter Outlet Dissolved constituents (1) 125 ml HDPE
(1) 60 ml HDPE 1 µm polycarbonate
Sp. Cond., pH, ANC (1) 125 ml HDPE ─ ─ Particulate N and C ─ ─ (2) 47mm Pall A/E filter Particulate P ─ ─ (2) 47mm Pall A/E filter
Epilimnion Dissolved constituents (1) 125 ml HDPE (1) 60 ml HDPE
1 µm polycarbonate
Sp. Cond., pH, ANC (1) 125 ml HDPE ─ ─ Particulate N and C ─ ─ (2) 47mm Pall A/E filter Particulate P ─ ─ (2) 47mm Pall A/E filter
Hypolimnion Dissolved constituents (1) 125 ml HDPE (1) 60 ml HDPE
1 µm polycarbonate
Sp. Cond., pH, ANC (1) 125 ml HDPE ─ ─ Particulate N and C ─ ─ (2) 47mm Pall A/E filter Particulate P ─ ─ (2) 47mm Pall A/E filter
6.1 Water samples Sample bottles should be pre-labeled (before going into the field) with Sampling Station Code, Date, and Filtered or Unfiltered. You will need to fill in the date. 1. Wear a clean pair of gloves.
2. Unscrew the filter holder and, using forceps, place a 1 µm polycarbonate filter inside the holder. Screw filter holder back together.
3. Pull the plunger out the large syringe and attach the filter hold to the syringe barrel.
4. Pour water out of the cubitainers into the syringe barrel and insert the plunger.
5. Test that the apparatus is correctly assembled by applying moderate pressure to the syringe plunger.
6. Rinse all water bottles three times with 15–20 mls filtered sample.
7. Fill all filtered sample bottles and securely cap. The 125 ml bottles should be filled to the top—minimize the air bubble as much as possible. For the 60 ml bottles, do not fill to the top—these samples will be stored frozen and therefore, some space must be left for the ice to expand. While filtering, do not push too hard on the plunger—this may cause the filter to tear. If filtering becomes difficult:
a. Check if the filter is ‘vapor-locked’, by detaching the syringe and filter holder. This will release air/pressure.
SIEN Lake Monitoring Protocol
SOP 8.11
b. If ‘a’ does not work, the filter is clogged. Replace filter and continue filtering. Be sure to run about 50 mls of sample through the new filter to rinse it before collecting any water.
8. Triple rinse and fill unfiltered sample bottles directly from the cubitainer or 1-liter bottle.
9. Record samples collected and sample id numbers on the datasheet.
10. Create chain-of-custody forms for each sample bottle.
6.2 Particulate Samples We are sampling for particulate nitrogen (PN), phosphorus (PP), and carbon (PC). Particulate samples are collected on 47 mm Pall A/E filters. PN and PC are analyzed from the same filter. Duplicate filters are collected for each analysis (PN + PC, PP); therefore, there will be a total of 4 filters for each sampling station.
1. Unscrew the filter holder and, using forceps, place a 47 mm Pall A/E filter inside the holder. Screw filter holder back together.
2. Attach syringe to the filter holder, with the plunger out.
3. Pour water out of the cubitainers or 1 liter bottle into the syringe barrel and insert the plunger.
4. Filter 1000 ml through one filter.
a. Apply moderate and even pressure to the syringe. Filter the water into the graduated cylinder.
b. Filter 1000 ml through one filter into the graduated cylinder. Since you are using a 500 ml graduated cylinders, you will need to fill it twice. Keep track using rocks or a tally sheet in the field book.
c. If filtering becomes difficult, check if the filter is ‘vapor-locked’, by detaching the syringe and filter holder. This will release air/pressure.
d. If filtering 1000 is impossible, stop, record the amount of water that has passed through the filter and place the filter into the Petri dish as described below.
5. Remove filter from the filter holder, using forceps.
6. Fold filter in half (with sample on inside) and place in one side of the Petri dish.
7. Once two filters have been placed in a Petri dish, tape closed with lab tape. Label with Sampling Station Id, Sample Id, Date, Volume Filtered.
Contamination Note: Do not directly touch or let debris/vegetation touch the inside of the sample bottles, sample lids, filters, inside of syringe, inside filter holder, filter holder outlet, and any surface the water sample touches.
8. Record samples collected and sample id numbers on the datasheet.
9. Create chain-of-custody forms.
Place all water and filter samples in the Ziploc bag and seal. Try and keep samples as cool as possible by storing in the shade.
SIEN Lake Monitoring Protocol
SOP 8.12
7 Clean-up 1. Allow equipment to dry in the sun, as time permits.
2. Deflate boat or float tube. Make sure it is free of rocks or other particles that could cause a puncture.
3. Pack-up all gear.
4. Check that the field and chain-of-custody forms are completely filled out.
5. Double check that sampling area is clean before leaving.
8 Literature Cited Irwin, R. 2006. Part B lite (Just the Basics) QA/QC review checklist for aquatic vital signs
monitoring protocols for SOPs. National Park Service, Water Resources Division, Fort Collins, CO.
O'Ney, S. E. 2005. Standard Operating Procedure 6: Procedures for collection of regulatory
parameters, version 1.0. In Regulatory water quality monitoring protocol, version 1.0, Appendix E. National Park Service, Greater Yellowstone Network, Bozeman, MT.
Sickman, J. O. 2007. Sierra Nevada diatom study protocol. Pages 12. Univeristy of California,
Riverside, Riverside, CA. Wilde, F. D., D. B. Radtke, J. Gibs, and R. T. Iwatsubo, editors. 2004 with updates through
2009. Processing of water samples, Version 2.2. Chapter A5 in National field manual for the collection of water-quality data: U.S. Geological Survey Techniques of Water-Resources Investigations. USGS, Washington, D.C. Available at http://water.usgs.gov/owq/FieldManual/chapter5/html/Ch5_contents.html.
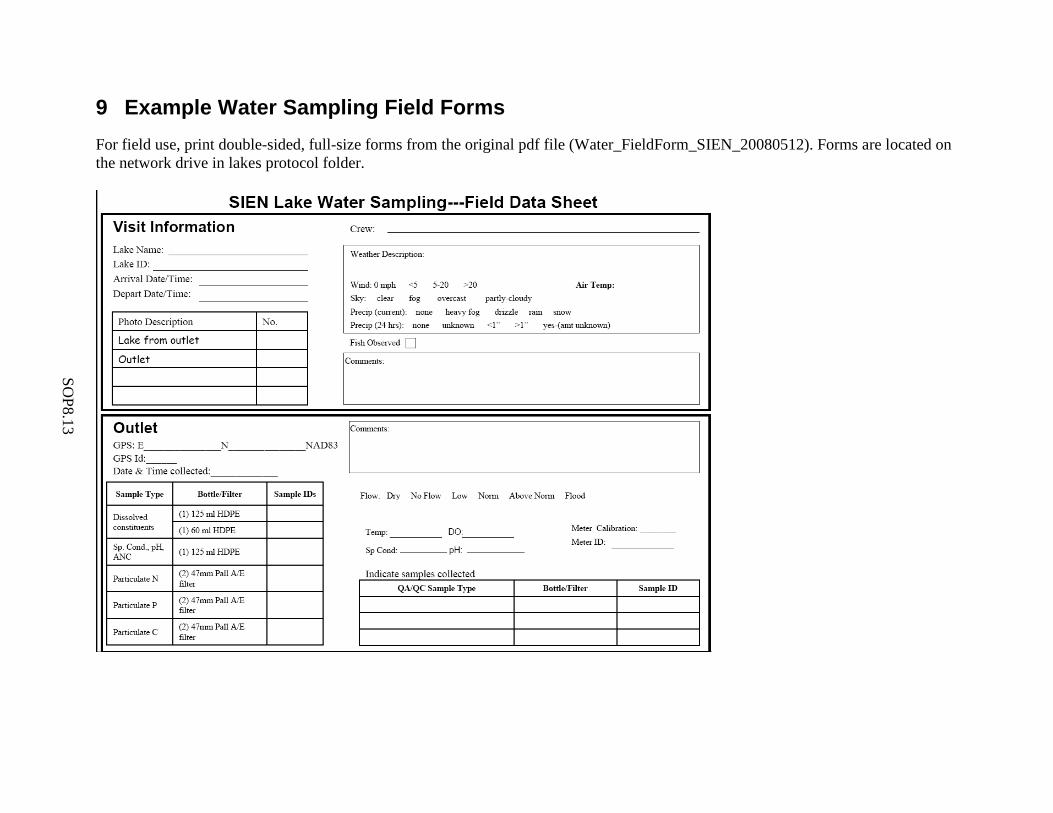
SOP8.13
9 Example Water Sampling Field Forms For field use, print double-sided, full-size forms from the original pdf file (Water_FieldForm_SIEN_20080512). Forms are located on the network drive in lakes protocol folder.
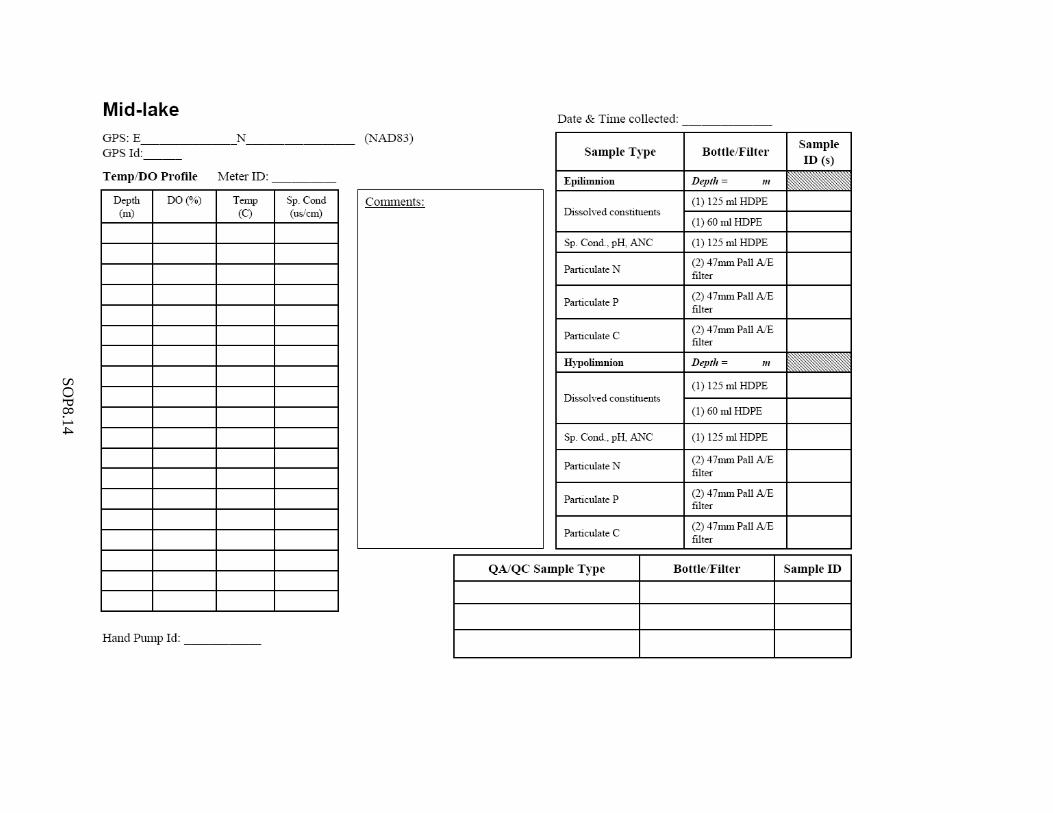
SOP8.14
SIEN Lake Monitoring Protocol
SOP 9.1
Sierra Nevada Network Lake Monitoring Protocol
SOP 9. Sample Handling, Storage, and Shipping Version 1.00, November 2012 Prepared by Andrea M. Heard and Donald W. Schweizer
Revision History Log Previous Version #
Revision Date Author Changes Made Reason for
Change New
Version #
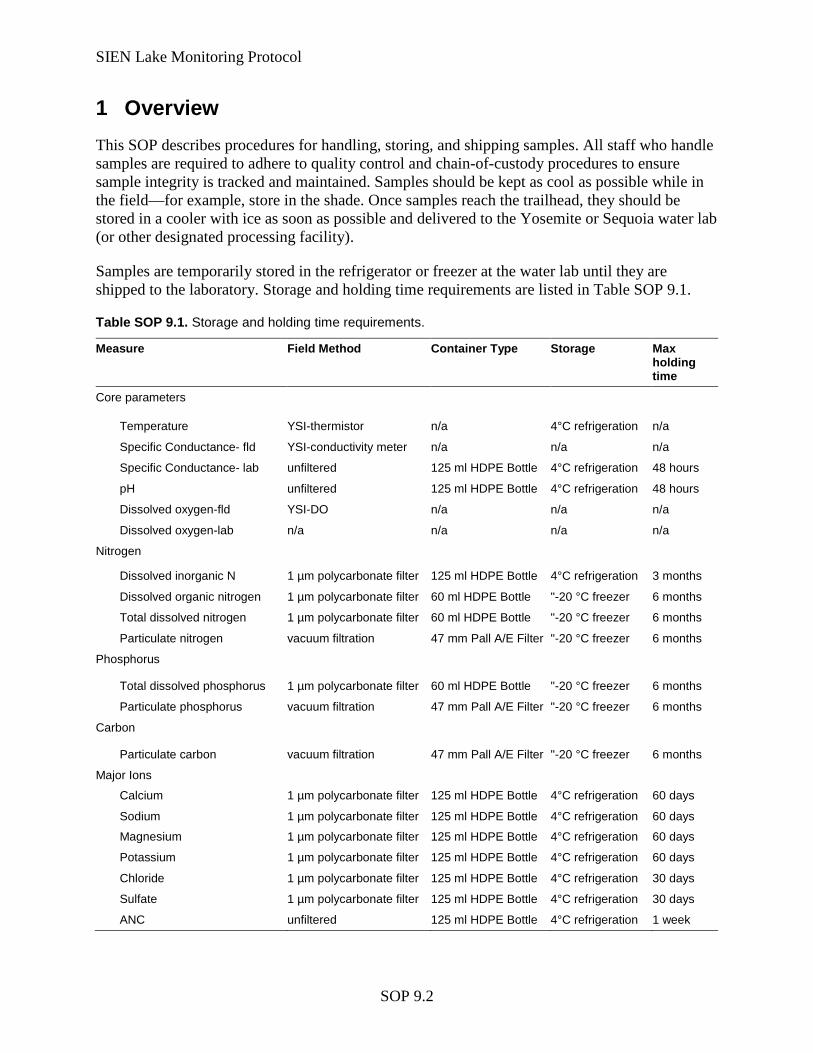
SIEN Lake Monitoring Protocol
SOP 9.2
1 Overview This SOP describes procedures for handling, storing, and shipping samples. All staff who handle samples are required to adhere to quality control and chain-of-custody procedures to ensure sample integrity is tracked and maintained. Samples should be kept as cool as possible while in the field—for example, store in the shade. Once samples reach the trailhead, they should be stored in a cooler with ice as soon as possible and delivered to the Yosemite or Sequoia water lab (or other designated processing facility).
Samples are temporarily stored in the refrigerator or freezer at the water lab until they are shipped to the laboratory. Storage and holding time requirements are listed in Table SOP 9.1.
Table SOP 9.1. Storage and holding time requirements.
Measure Field Method Container Type Storage Max holding time
Core parameters
Temperature YSI-thermistor n/a 4°C refrigeration n/a
Specific Conductance- fld YSI-conductivity meter n/a n/a n/a
Specific Conductance- lab unfiltered 125 ml HDPE Bottle 4°C refrigeration 48 hours
pH unfiltered 125 ml HDPE Bottle 4°C refrigeration 48 hours
Dissolved oxygen-fld YSI-DO n/a n/a n/a
Dissolved oxygen-lab n/a n/a n/a n/a
Nitrogen
Dissolved inorganic N 1 µm polycarbonate filter 125 ml HDPE Bottle 4°C refrigeration 3 months
Dissolved organic nitrogen 1 µm polycarbonate filter 60 ml HDPE Bottle "-20 °C freezer 6 months
Total dissolved nitrogen 1 µm polycarbonate filter 60 ml HDPE Bottle "-20 °C freezer 6 months
Particulate nitrogen vacuum filtration 47 mm Pall A/E Filter "-20 °C freezer 6 months
Phosphorus
Total dissolved phosphorus 1 µm polycarbonate filter 60 ml HDPE Bottle "-20 °C freezer 6 months
Particulate phosphorus vacuum filtration 47 mm Pall A/E Filter "-20 °C freezer 6 months
Carbon
Particulate carbon vacuum filtration 47 mm Pall A/E Filter "-20 °C freezer 6 months
Major Ions
Calcium 1 µm polycarbonate filter 125 ml HDPE Bottle 4°C refrigeration 60 days
Sodium 1 µm polycarbonate filter 125 ml HDPE Bottle 4°C refrigeration 60 days
Magnesium 1 µm polycarbonate filter 125 ml HDPE Bottle 4°C refrigeration 60 days
Potassium 1 µm polycarbonate filter 125 ml HDPE Bottle 4°C refrigeration 60 days
Chloride 1 µm polycarbonate filter 125 ml HDPE Bottle 4°C refrigeration 30 days
Sulfate 1 µm polycarbonate filter 125 ml HDPE Bottle 4°C refrigeration 30 days
ANC unfiltered 125 ml HDPE Bottle 4°C refrigeration 1 week
SIEN Lake Monitoring Protocol
SOP 9.3
2 Shipping Procedures 1. Contact laboratory and let them know you will be sending samples this week.
2. Pack sample bottles in Ziploc bags and place in cooler.
3. Put the original chain-of-custody form in a Ziploc bag and place in the cooler.
4. Pack cooler liberally with blue ice.
5. Seal and wrap cooler with strapping tape.
6. Ship the sample coolers to the lab overnight via Federal Express. They should be shipped early in the week (Mon-Wed) to ensure they arrive at the lab before the weekend. Samples should be packed the same day they are picked up by Fed-Ex (i.e. they should not sit overnight at the park warehouse).
7. Document which samples were shipped in the Sample Tracking log book.

SIEN Lake Monitoring Protocol
SOP 10.1
Sierra Nevada Network Lake Monitoring Protocol
SOP 10. Water-level and Continuous Temperature Sampling Version 1.00, August 2012 Prepared by Donald W. Schweizer and Andrea M. Heard
Revision History Log Previous Version #
Revision Date Author Changes Made Reason for
Change New
Version #
SIEN Lake Monitoring Protocol
SOP 10.2
Contents Page
Figures................................................................................................................................ SOP 10.2
1 Introduction ................................................................................................................. SOP 10.3
2 Equipment Checklists ................................................................................................. SOP 10.3
2.1 Routine Annual Visit ....................................................................................... SOP 10.3
2.2 Data logger installation (per site) .................................................................... SOP 10.3
2.3 Barologger installation (per site) ..................................................................... SOP 10.3
3 Data logger Setup ....................................................................................................... SOP 10.3
4 Routine Visit ............................................................................................................... SOP 10.5
5 References ................................................................................................................... SOP 10.6
Figures Page
Figure SOP 10.1. PVC housing for levelogger ................................................................ SOP 10.3
Figure SOP 10.2. Survey point ......................................................................................... SOP 10.4
Figure SOP 10.3. Measuring the water-level from survey point. ..................................... SOP 10.5
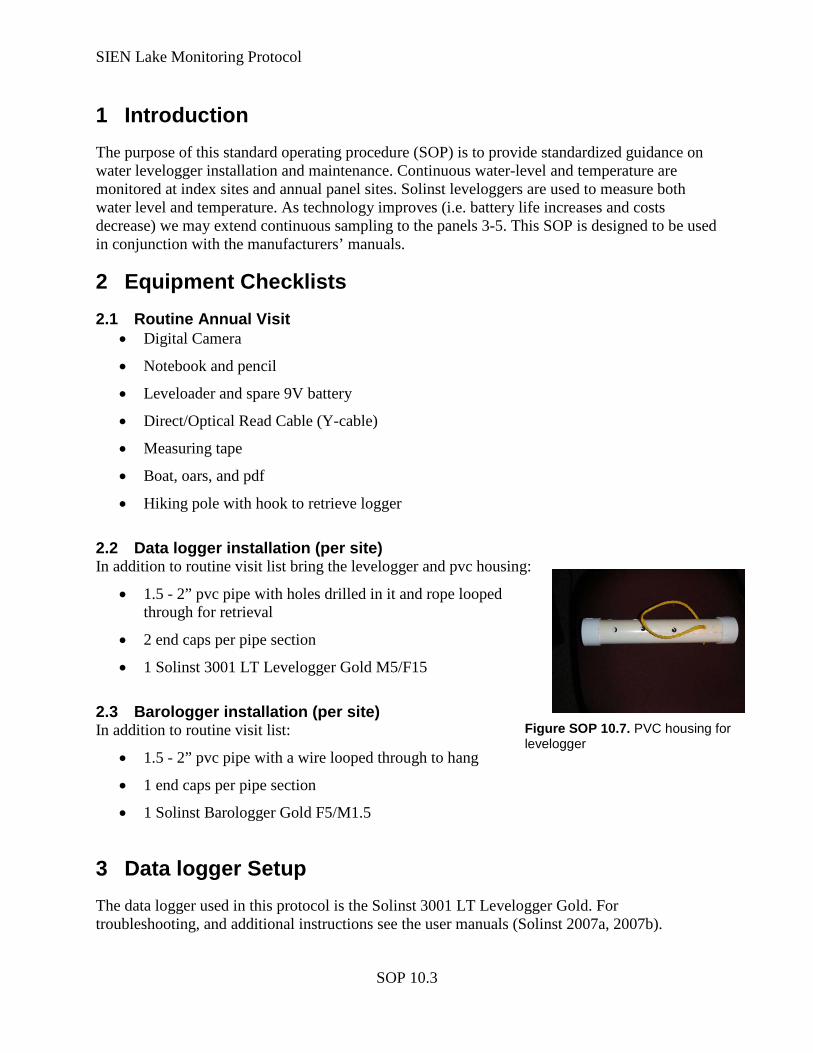
SIEN Lake Monitoring Protocol
SOP 10.3
1 Introduction The purpose of this standard operating procedure (SOP) is to provide standardized guidance on water levelogger installation and maintenance. Continuous water-level and temperature are monitored at index sites and annual panel sites. Solinst leveloggers are used to measure both water level and temperature. As technology improves (i.e. battery life increases and costs decrease) we may extend continuous sampling to the panels 3-5. This SOP is designed to be used in conjunction with the manufacturers’ manuals.
2 Equipment Checklists 2.1 Routine Annual Visit
• Digital Camera
• Notebook and pencil
• Leveloader and spare 9V battery
• Direct/Optical Read Cable (Y-cable)
• Measuring tape
• Boat, oars, and pdf
• Hiking pole with hook to retrieve logger
2.2 Data logger installation (per site) In addition to routine visit list bring the levelogger and pvc housing:
• 1.5 - 2” pvc pipe with holes drilled in it and rope looped through for retrieval
• 2 end caps per pipe section
• 1 Solinst 3001 LT Levelogger Gold M5/F15
2.3 Barologger installation (per site) In addition to routine visit list:
• 1.5 - 2” pvc pipe with a wire looped through to hang
• 1 end caps per pipe section
• 1 Solinst Barologger Gold F5/M1.5
3 Data logger Setup The data logger used in this protocol is the Solinst 3001 LT Levelogger Gold. For troubleshooting, and additional instructions see the user manuals (Solinst 2007a, 2007b).
Figure SOP 10.7. PVC housing for levelogger
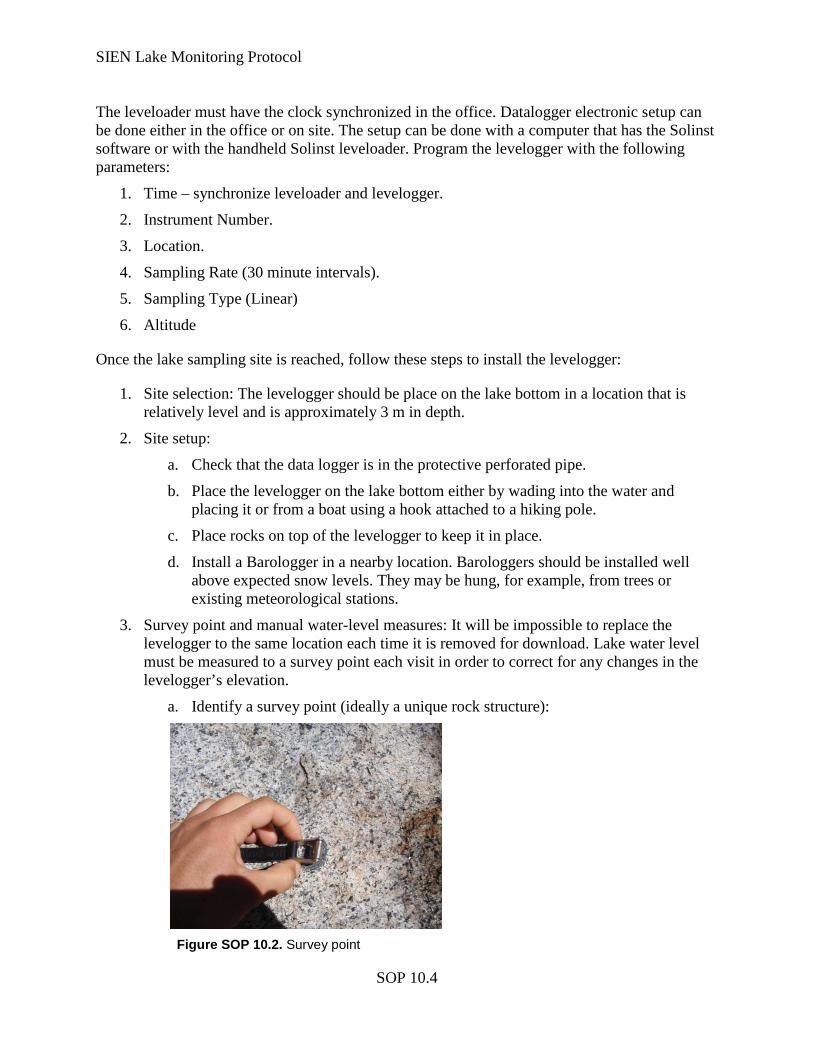
SIEN Lake Monitoring Protocol
SOP 10.4
The leveloader must have the clock synchronized in the office. Datalogger electronic setup can be done either in the office or on site. The setup can be done with a computer that has the Solinst software or with the handheld Solinst leveloader. Program the levelogger with the following parameters:
1. Time – synchronize leveloader and levelogger.
2. Instrument Number.
3. Location.
4. Sampling Rate (30 minute intervals).
5. Sampling Type (Linear)
6. Altitude
Once the lake sampling site is reached, follow these steps to install the levelogger:
1. Site selection: The levelogger should be place on the lake bottom in a location that is relatively level and is approximately 3 m in depth.
2. Site setup:
a. Check that the data logger is in the protective perforated pipe.
b. Place the levelogger on the lake bottom either by wading into the water and placing it or from a boat using a hook attached to a hiking pole.
c. Place rocks on top of the levelogger to keep it in place.
d. Install a Barologger in a nearby location. Barologgers should be installed well above expected snow levels. They may be hung, for example, from trees or existing meteorological stations.
3. Survey point and manual water-level measures: It will be impossible to replace the levelogger to the same location each time it is removed for download. Lake water level must be measured to a survey point each visit in order to correct for any changes in the levelogger’s elevation.
a. Identify a survey point (ideally a unique rock structure):
Figure SOP 10.2. Survey point
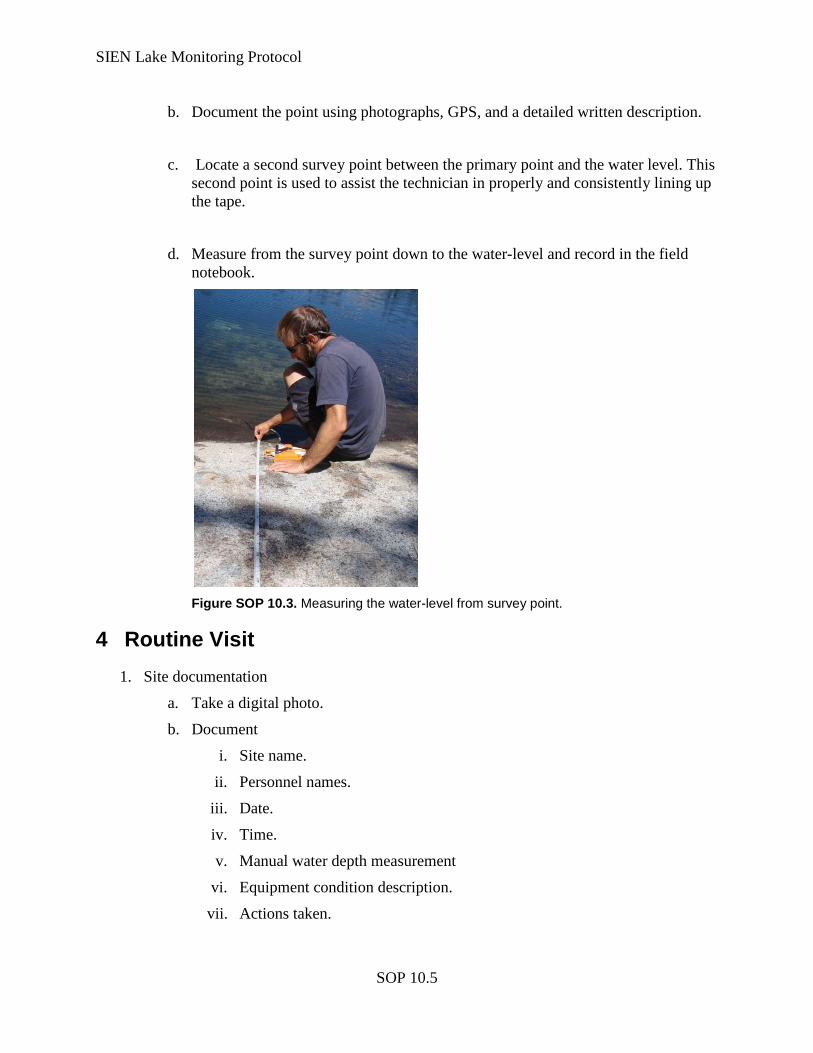
SIEN Lake Monitoring Protocol
SOP 10.5
b. Document the point using photographs, GPS, and a detailed written description.
c. Locate a second survey point between the primary point and the water level. This second point is used to assist the technician in properly and consistently lining up the tape.
d. Measure from the survey point down to the water-level and record in the field notebook.
Figure SOP 10.3. Measuring the water-level from survey point.
4 Routine Visit 1. Site documentation
a. Take a digital photo.
b. Document
i. Site name.
ii. Personnel names.
iii. Date.
iv. Time.
v. Manual water depth measurement
vi. Equipment condition description.
vii. Actions taken.
SIEN Lake Monitoring Protocol
SOP 10.6
2. Download data refer to the Solinst user manuals at: http://www.solinst.com/Downloads/downmain.html.
a. Remove the data logger from the lake.
b. Remove the data logger from the protective pipe.
c. Turn leveloader on.
d. Attach the direct read cable to the leveloader and the levelogger.
e. Highlight “Connect to Logger” press the button for OK.
f. Highlight “Data from Levelogger” press the button for OK.
g. Press the button for Save Log.
h. To erase the data just saved from the levelogger, highlight “Restart Levelogger” press the button for OK.
i. Highlight “Start Logging” press the button for Select.
j. The next screen will say “All Data will be erased and cannot recover!! Continue?” press the button for OK.
3. Check data and function of datalogger.
a. Highlight “Info from Levelogger” and press the button for OK.
b. Scroll down to “Logger Status” it should say “Started”.
4. Put levelogger back in protective pipe.
5. Return levelogger to lake.
Refer to SOP 14 for data processing and analysis guidance.
5 References Solinst 2007a. Leveloader Gold User Guide. Available at:
http://www.solinst.com/Downloads/downmain.html (Accessed 2007).
Solinst 2007b. Levelogger Gold Software Version 3.1.1 User Guide. Available at: http://www.solinst.com/Downloads/downmain.html (Accessed 2007).

SIEN Lake Monitoring Protocol
SOP 11.1
Sierra Nevada Network Lake Monitoring Protocol
SOP 11. Post-season Procedures Version 1.00, November 2010 Prepared by Andrea M. Heard, Dena Paolilli, and Catherine Fong
Revision History Log Previous Version #
Revision Date Author Changes Made Reason for
Change New
Version #
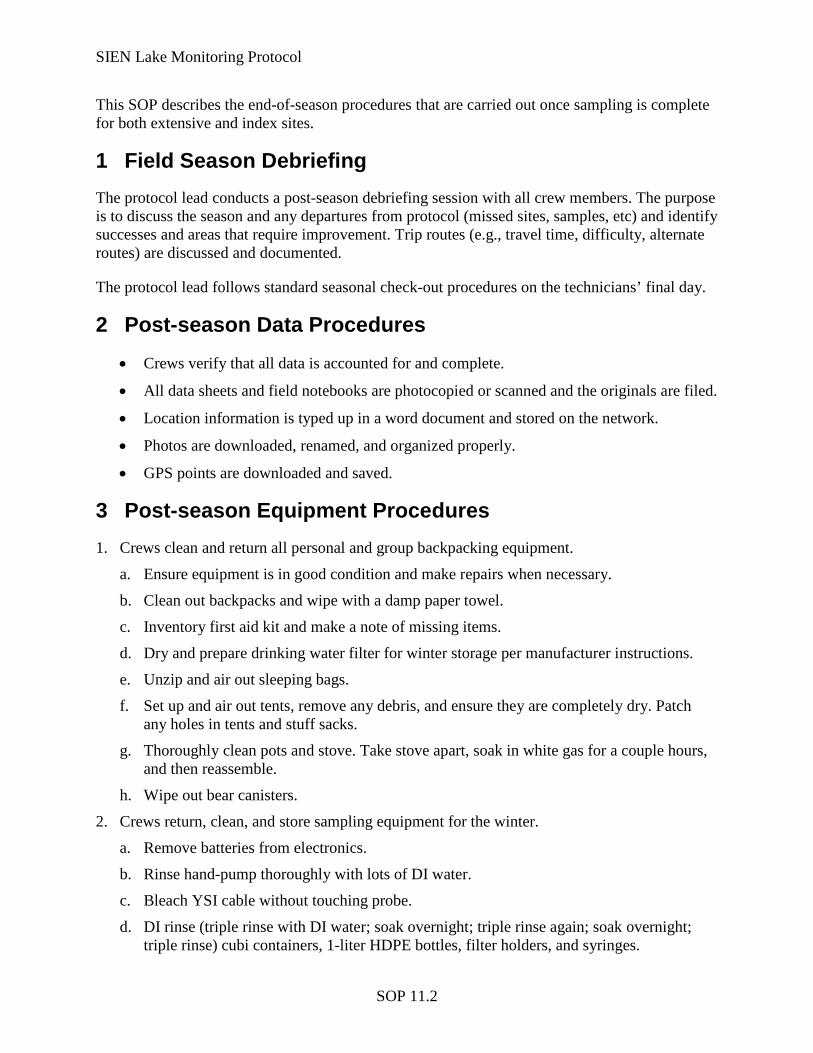
SIEN Lake Monitoring Protocol
SOP 11.2
This SOP describes the end-of-season procedures that are carried out once sampling is complete for both extensive and index sites.
1 Field Season Debriefing The protocol lead conducts a post-season debriefing session with all crew members. The purpose is to discuss the season and any departures from protocol (missed sites, samples, etc) and identify successes and areas that require improvement. Trip routes (e.g., travel time, difficulty, alternate routes) are discussed and documented.
The protocol lead follows standard seasonal check-out procedures on the technicians’ final day.
2 Post-season Data Procedures • Crews verify that all data is accounted for and complete.
• All data sheets and field notebooks are photocopied or scanned and the originals are filed.
• Location information is typed up in a word document and stored on the network.
• Photos are downloaded, renamed, and organized properly.
• GPS points are downloaded and saved.
3 Post-season Equipment Procedures 1. Crews clean and return all personal and group backpacking equipment.
a. Ensure equipment is in good condition and make repairs when necessary.
b. Clean out backpacks and wipe with a damp paper towel.
c. Inventory first aid kit and make a note of missing items.
d. Dry and prepare drinking water filter for winter storage per manufacturer instructions.
e. Unzip and air out sleeping bags.
f. Set up and air out tents, remove any debris, and ensure they are completely dry. Patch any holes in tents and stuff sacks.
g. Thoroughly clean pots and stove. Take stove apart, soak in white gas for a couple hours, and then reassemble.
h. Wipe out bear canisters.
2. Crews return, clean, and store sampling equipment for the winter.
a. Remove batteries from electronics.
b. Rinse hand-pump thoroughly with lots of DI water.
c. Bleach YSI cable without touching probe.
d. DI rinse (triple rinse with DI water; soak overnight; triple rinse again; soak overnight; triple rinse) cubi containers, 1-liter HDPE bottles, filter holders, and syringes.
SIEN Lake Monitoring Protocol
SOP 11.3
e. Set equipment in a clean and protected location and allow to air dry completely. To protect from dust loosely cover with paper towels.
f. Pack equipment into labeled Rubbermaid containers stored at the Sequoia and Kings Canyon I&M office.
3. Crews inventory all sampling equipment. Broken equipment is fixed or replaced. The crews submits a list of equipment to the protocol lead that requires replacing.
4. Crews prep new sample bottles for next season. Triple rinse, soak for several days, triple rinse, and then allow to air dry thoroughly.
4 Post-field Season Data Entry and Documentation Field observations and results are entered into the SIEN Water Database. Refer to SOPs 12–13 for data entry procedures.
The protocol lead documents logistics and strategies from the season that may be used as a reference for future field season planning (routes, mileages, approximate time taken, etc.).

SIEN Lake Monitoring Protocol
SOP 12.1
Sierra Nevada Network Lake Monitoring Protocol
SOP 12. Data Management Version 1.00, October 2012 Prepared by Andrea M. Heard
Revision History Log Previous Version #
Revision Date Author Changes Made Reason for
Change New
Version #
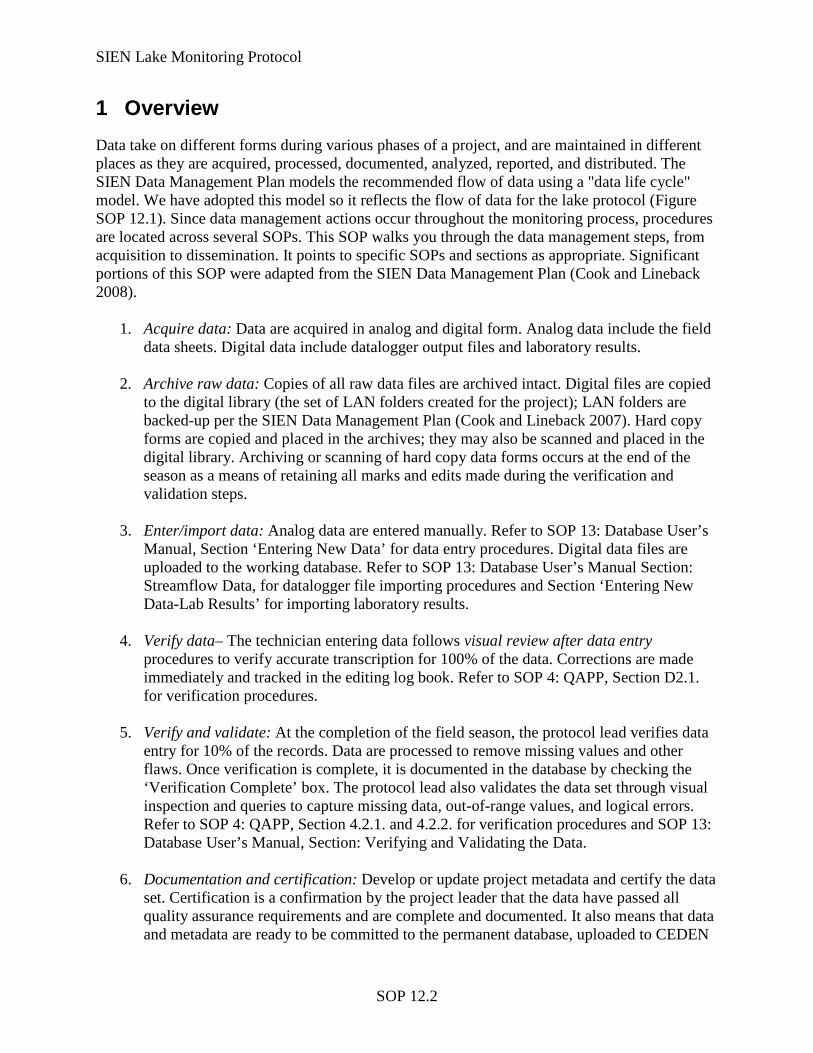
SIEN Lake Monitoring Protocol
SOP 12.2
1 Overview Data take on different forms during various phases of a project, and are maintained in different places as they are acquired, processed, documented, analyzed, reported, and distributed. The SIEN Data Management Plan models the recommended flow of data using a "data life cycle" model. We have adopted this model so it reflects the flow of data for the lake protocol (Figure SOP 12.1). Since data management actions occur throughout the monitoring process, procedures are located across several SOPs. This SOP walks you through the data management steps, from acquisition to dissemination. It points to specific SOPs and sections as appropriate. Significant portions of this SOP were adapted from the SIEN Data Management Plan (Cook and Lineback 2008).
1. Acquire data: Data are acquired in analog and digital form. Analog data include the field data sheets. Digital data include datalogger output files and laboratory results.
2. Archive raw data: Copies of all raw data files are archived intact. Digital files are copied
to the digital library (the set of LAN folders created for the project); LAN folders are backed-up per the SIEN Data Management Plan (Cook and Lineback 2007). Hard copy forms are copied and placed in the archives; they may also be scanned and placed in the digital library. Archiving or scanning of hard copy data forms occurs at the end of the season as a means of retaining all marks and edits made during the verification and validation steps.
3. Enter/import data: Analog data are entered manually. Refer to SOP 13: Database User’s
Manual, Section ‘Entering New Data’ for data entry procedures. Digital data files are uploaded to the working database. Refer to SOP 13: Database User’s Manual Section: Streamflow Data, for datalogger file importing procedures and Section ‘Entering New Data-Lab Results’ for importing laboratory results.
4. Verify data– The technician entering data follows visual review after data entry
procedures to verify accurate transcription for 100% of the data. Corrections are made immediately and tracked in the editing log book. Refer to SOP 4: QAPP, Section D2.1. for verification procedures.
5. Verify and validate: At the completion of the field season, the protocol lead verifies data entry for 10% of the records. Data are processed to remove missing values and other flaws. Once verification is complete, it is documented in the database by checking the ‘Verification Complete’ box. The protocol lead also validates the data set through visual inspection and queries to capture missing data, out-of-range values, and logical errors. Refer to SOP 4: QAPP, Section 4.2.1. and 4.2.2. for verification procedures and SOP 13: Database User’s Manual, Section: Verifying and Validating the Data.
6. Documentation and certification: Develop or update project metadata and certify the data
set. Certification is a confirmation by the project leader that the data have passed all quality assurance requirements and are complete and documented. It also means that data and metadata are ready to be committed to the permanent database, uploaded to CEDEN
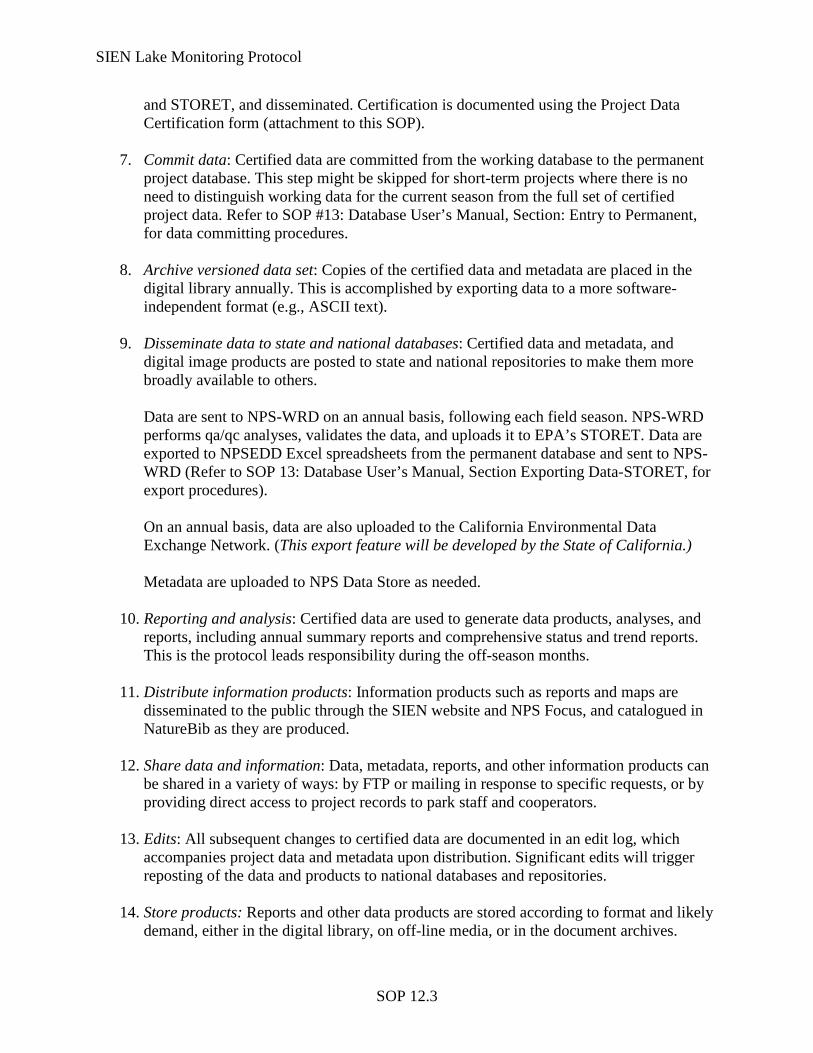
SIEN Lake Monitoring Protocol
SOP 12.3
and STORET, and disseminated. Certification is documented using the Project Data Certification form (attachment to this SOP).
7. Commit data: Certified data are committed from the working database to the permanent project database. This step might be skipped for short-term projects where there is no need to distinguish working data for the current season from the full set of certified project data. Refer to SOP #13: Database User’s Manual, Section: Entry to Permanent, for data committing procedures.
8. Archive versioned data set: Copies of the certified data and metadata are placed in the
digital library annually. This is accomplished by exporting data to a more software-independent format (e.g., ASCII text).
9. Disseminate data to state and national databases: Certified data and metadata, and
digital image products are posted to state and national repositories to make them more broadly available to others. Data are sent to NPS-WRD on an annual basis, following each field season. NPS-WRD performs qa/qc analyses, validates the data, and uploads it to EPA’s STORET. Data are exported to NPSEDD Excel spreadsheets from the permanent database and sent to NPS-WRD (Refer to SOP 13: Database User’s Manual, Section Exporting Data-STORET, for export procedures). On an annual basis, data are also uploaded to the California Environmental Data Exchange Network. (This export feature will be developed by the State of California.) Metadata are uploaded to NPS Data Store as needed.
10. Reporting and analysis: Certified data are used to generate data products, analyses, and
reports, including annual summary reports and comprehensive status and trend reports. This is the protocol leads responsibility during the off-season months.
11. Distribute information products: Information products such as reports and maps are
disseminated to the public through the SIEN website and NPS Focus, and catalogued in NatureBib as they are produced.
12. Share data and information: Data, metadata, reports, and other information products can
be shared in a variety of ways: by FTP or mailing in response to specific requests, or by providing direct access to project records to park staff and cooperators.
13. Edits: All subsequent changes to certified data are documented in an edit log, which
accompanies project data and metadata upon distribution. Significant edits will trigger reposting of the data and products to national databases and repositories.
14. Store products: Reports and other data products are stored according to format and likely
demand, either in the digital library, on off-line media, or in the document archives.
SIEN Lake Monitoring Protocol
SOP 12.4
15. Catalog project products: Catalog products and all information associated with a project,
including results of analyses and paths of dissemination, in SIEN’s project tracking database.
2 Literature Cited Cook, R.R. and P. Lineback. 2008. Sierra Nevada Network data management plan. Natural
Resource Report NPS/NRPC/NRR--2008/070. National Park Service, Fort Collins, Colorado. http://science.nature.nps.gov/im/units/sien/.
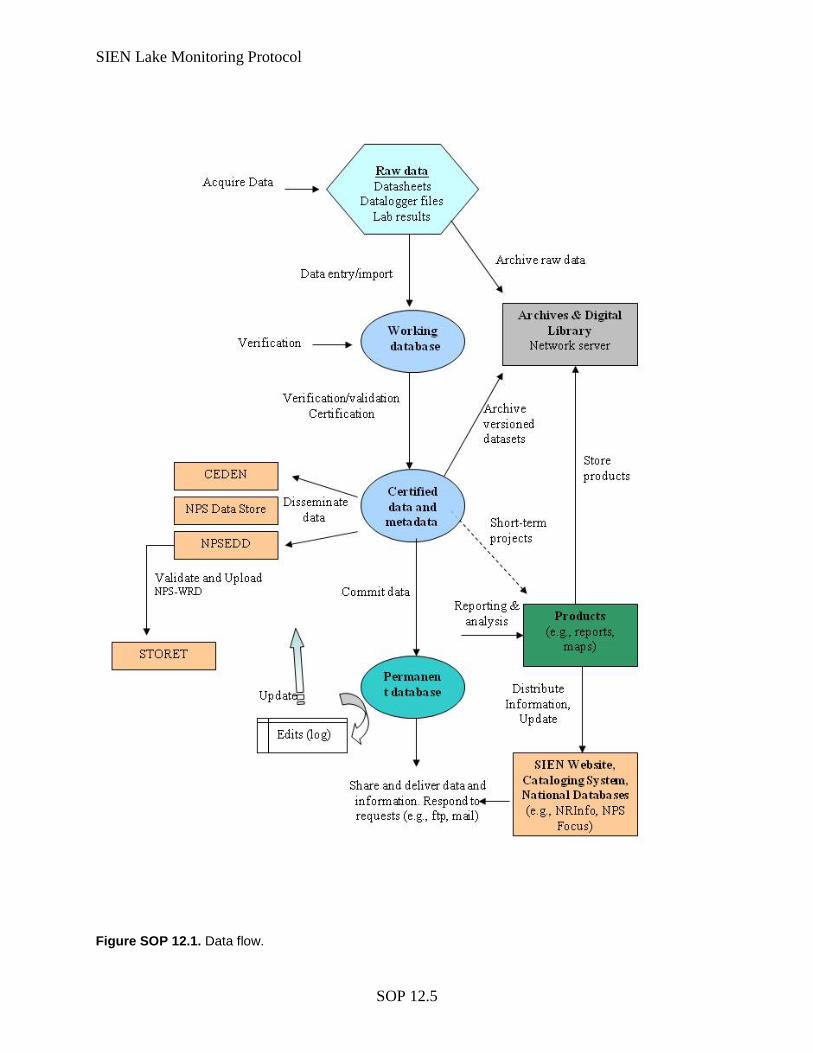
SIEN Lake Monitoring Protocol
SOP 12.5
Figure SOP 12.1. Data flow.
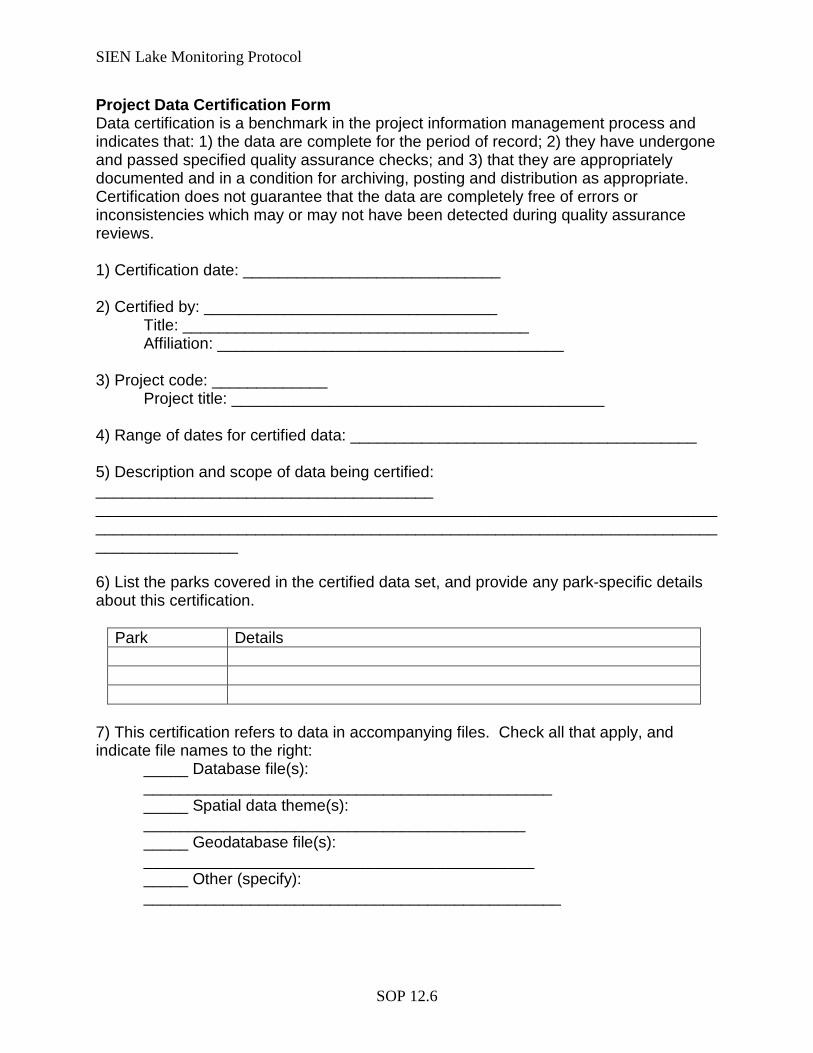
SIEN Lake Monitoring Protocol
SOP 12.6
Project Data Certification Form Data certification is a benchmark in the project information management process and indicates that: 1) the data are complete for the period of record; 2) they have undergone and passed specified quality assurance checks; and 3) that they are appropriately documented and in a condition for archiving, posting and distribution as appropriate. Certification does not guarantee that the data are completely free of errors or inconsistencies which may or may not have been detected during quality assurance reviews. 1) Certification date: _____________________________ 2) Certified by: _________________________________
Title: _______________________________________ Affiliation: _______________________________________
3) Project code: _____________
Project title: __________________________________________ 4) Range of dates for certified data: _______________________________________ 5) Description and scope of data being certified: ______________________________________ ____________________________________________________________________________________________________________________________________________________________ 6) List the parks covered in the certified data set, and provide any park-specific details about this certification.
Park Details
7) This certification refers to data in accompanying files. Check all that apply, and indicate file names to the right:
_____ Database file(s): ______________________________________________ _____ Spatial data theme(s): ___________________________________________ _____ Geodatabase file(s): ____________________________________________ _____ Other (specify): _______________________________________________
SIEN Lake Monitoring Protocol
SOP 12.7
_____ Certified data are already in the master version of a park, Network or NPS database. Please indicate the database system(s): ___________________________________
8) Is there any sensitive information in the certified data which may put resources at greater risk if released to the public (e.g., spotted owl nest sites, cave locations, rare plant locations)? _____ No _____ Yes Details: _______________________________________________________________________ ___________________________________________________________________________ 9) Description of data processing and quality assurance measures. (Note: These can be cut and pasted from appropriate sections of the protocol.) 10) Results and summary of quality assurance reviews, including details on steps taken to rectify problems encountered during data processing and quality reviews.

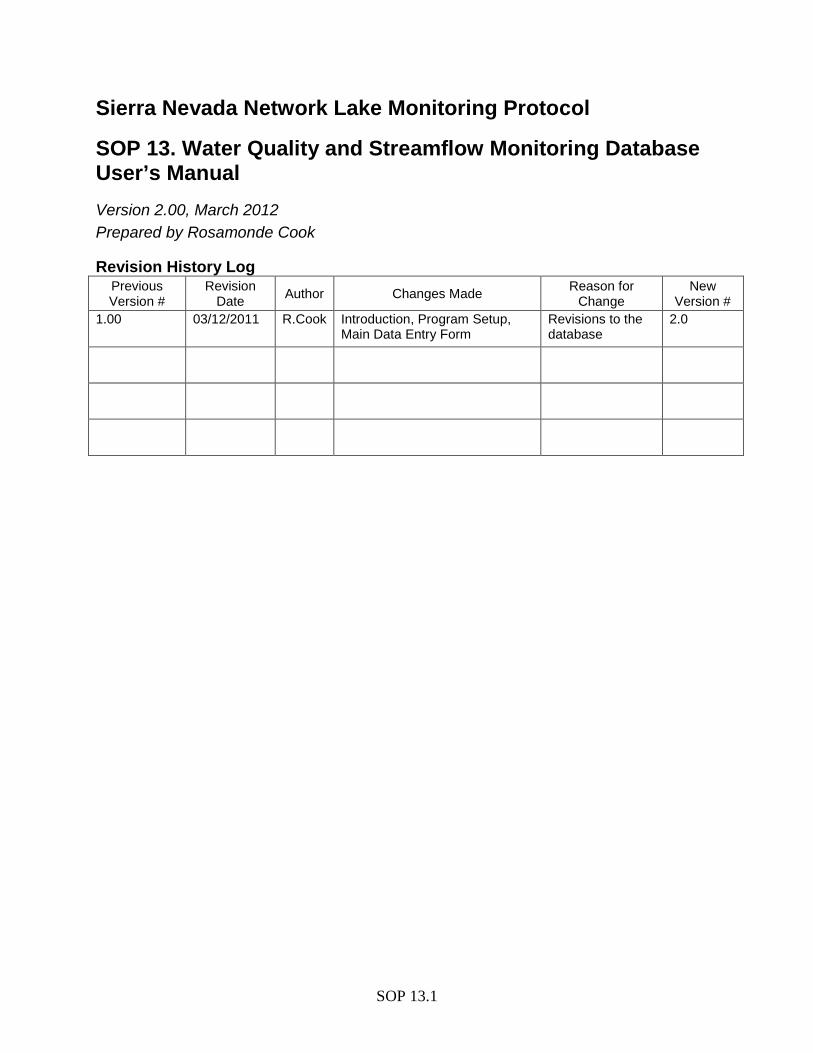
SIEN Lake Monitoring Protocol
SOP 13.1
Sierra Nevada Network Lake Monitoring Protocol
SOP 13. Water Quality and Streamflow Monitoring Database User’s Manual Version 2.00, March 2012 Prepared by Rosamonde Cook
Revision History Log Previous Version #
Revision Date Author Changes Made Reason for
Change New
Version # 1.00 03/12/2011 R.Cook Introduction, Program Setup,
Main Data Entry Form Revisions to the database
2.0
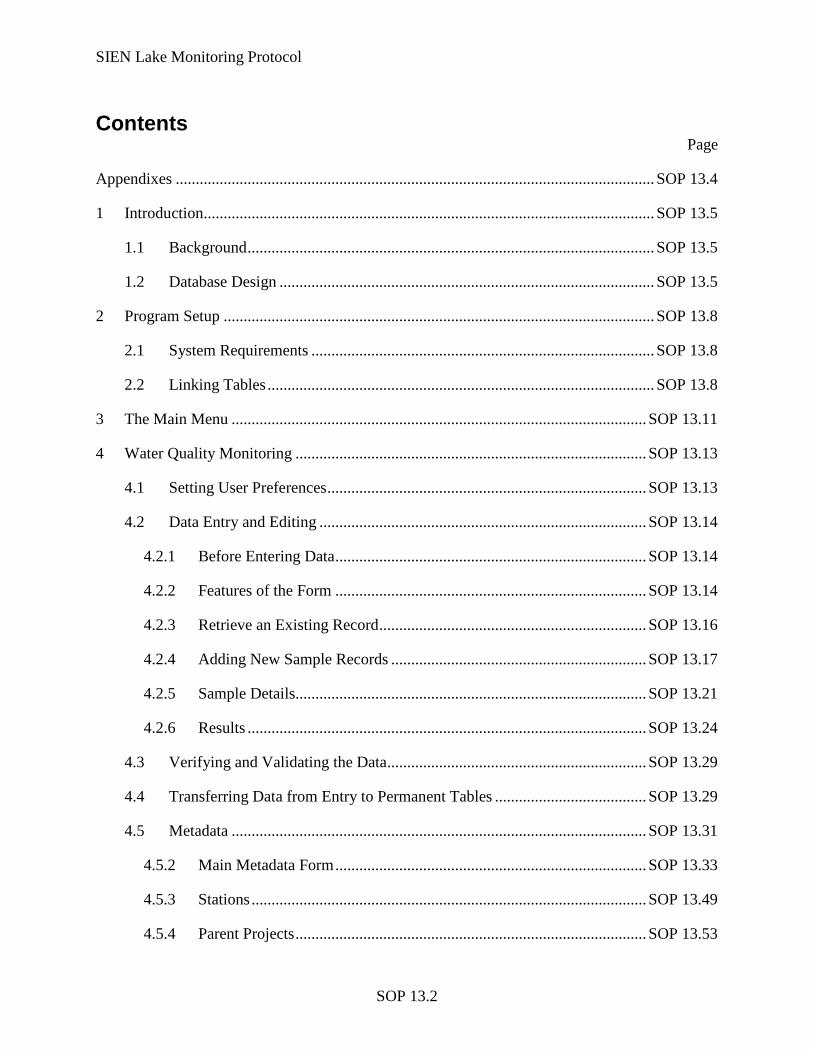
SIEN Lake Monitoring Protocol
SOP 13.2
Contents Page
Appendixes ........................................................................................................................ SOP 13.4
1 Introduction ................................................................................................................. SOP 13.5
1.1 Background ...................................................................................................... SOP 13.5
1.2 Database Design .............................................................................................. SOP 13.5
2 Program Setup ............................................................................................................ SOP 13.8
2.1 System Requirements ...................................................................................... SOP 13.8
2.2 Linking Tables ................................................................................................. SOP 13.8
3 The Main Menu ........................................................................................................ SOP 13.11
4 Water Quality Monitoring ........................................................................................ SOP 13.13
4.1 Setting User Preferences ................................................................................ SOP 13.13
4.2 Data Entry and Editing .................................................................................. SOP 13.14
4.2.1 Before Entering Data .............................................................................. SOP 13.14
4.2.2 Features of the Form .............................................................................. SOP 13.14
4.2.3 Retrieve an Existing Record ................................................................... SOP 13.16
4.2.4 Adding New Sample Records ................................................................ SOP 13.17
4.2.5 Sample Details........................................................................................ SOP 13.21
4.2.6 Results .................................................................................................... SOP 13.24
4.3 Verifying and Validating the Data ................................................................. SOP 13.29
4.4 Transferring Data from Entry to Permanent Tables ...................................... SOP 13.29
4.5 Metadata ........................................................................................................ SOP 13.31
4.5.2 Main Metadata Form .............................................................................. SOP 13.33
4.5.3 Stations ................................................................................................... SOP 13.49
4.5.4 Parent Projects ........................................................................................ SOP 13.53
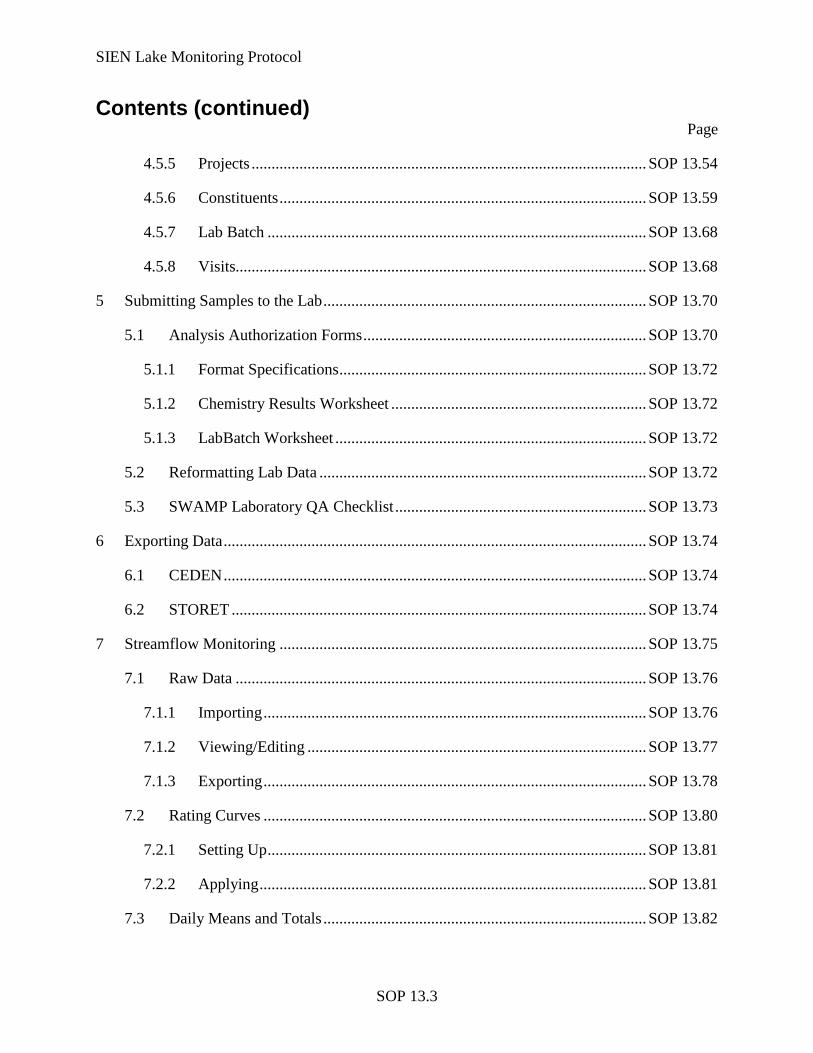
SIEN Lake Monitoring Protocol
SOP 13.3
Contents (continued) Page
4.5.5 Projects ................................................................................................... SOP 13.54
4.5.6 Constituents ............................................................................................ SOP 13.59
4.5.7 Lab Batch ............................................................................................... SOP 13.68
4.5.8 Visits....................................................................................................... SOP 13.68
5 Submitting Samples to the Lab ................................................................................. SOP 13.70
5.1 Analysis Authorization Forms ....................................................................... SOP 13.70
5.1.1 Format Specifications ............................................................................. SOP 13.72
5.1.2 Chemistry Results Worksheet ................................................................ SOP 13.72
5.1.3 LabBatch Worksheet .............................................................................. SOP 13.72
5.2 Reformatting Lab Data .................................................................................. SOP 13.72
5.3 SWAMP Laboratory QA Checklist ............................................................... SOP 13.73
6 Exporting Data .......................................................................................................... SOP 13.74
6.1 CEDEN .......................................................................................................... SOP 13.74
6.2 STORET ........................................................................................................ SOP 13.74
7 Streamflow Monitoring ............................................................................................ SOP 13.75
7.1 Raw Data ....................................................................................................... SOP 13.76
7.1.1 Importing ................................................................................................ SOP 13.76
7.1.2 Viewing/Editing ..................................................................................... SOP 13.77
7.1.3 Exporting ................................................................................................ SOP 13.78
7.2 Rating Curves ................................................................................................ SOP 13.80
7.2.1 Setting Up ............................................................................................... SOP 13.81
7.2.2 Applying ................................................................................................. SOP 13.81
7.3 Daily Means and Totals ................................................................................. SOP 13.82
SIEN Lake Monitoring Protocol
SOP 13.4
Contents (continued) Page
7.3.1 Calculating ............................................................................................. SOP 13.82
7.3.2 Viewing/Editing ..................................................................................... SOP 13.83
7.3.3 Exporting ................................................................................................ SOP 13.84
Appendixes
Page
Appendix SOP 13.A. SWAMP Laboratory File and Batch Naming Conventions .......... SOP 13.85
Appendix SOP 13.B. Example Acronym List (from database lookup tables)................. SOP 13.87
SIEN Lake Monitoring Protocol
SOP 13.5
1 Introduction 1.1 Background The National Park Service Water Resources Division (NPS-WRD) has created an MS Access desktop database (NPStoret) suitable for collection and delivery of water quality data to a central corporate repository (the NPS’ STORET Oracle database) through which it is managed and delivered to the Environmental Protection Agency’s (EPA) STORET national data warehouse. The Water Resources Division requires all water quality data collected by the NPS Inventory and Monitoring Program to be delivered to their central repository. Extensive water quality monitoring is also conducted by state agencies and other parties within California. The California State Water Quality Control Board coordinates and oversees all ambient surface water quality monitoring conducted by agencies of the state through its Surface Water Ambient Monitoring Program (SWAMP). Local and federal agencies, resource conservation districts, and non-profit organizations participate on a voluntary and welcome basis. The California Department of Water Resources (DWR) manages a corporate database and Internet data delivery system called the California Environmental Data Exchange Network (CEDEN) through which all water quality data collected through SWAMP and other monitoring programs in the state are integrated and made available to the public. The DWR has developed a desktop relational database in MS Access that is used by the SWAMP program and its clients to store and deliver data to CEDEN. The SWAMP Information Management System (SIMS), or simply the SWAMP Database, has several purposes, the most important of which is to provide a mechanism for sharing statewide water quality monitoring data among project participants. Data sharing is required for the SWAMP goal of producing an integrated hydrologic unit assessment of the State’s surface waters. While this is the primary focus, the SIMS has been developed as an initial effort toward data standardization among regions, agencies and laboratories and it is the intention that protocols adopted here may be later used for other data sharing purposes. While the system was constructed primarily to serve the State of California Regional Board Staff and technical committees, it has also been designed to supply data to non-project scientists and the interested public. 1.2 Database Design The Sierra Nevada Network (SIEN) Water Quality and Streamflow Monitoring Database is an extension of the SWAMP database for both water quality and stream flow monitoring projects. Stream flow monitoring data are stored in a separate set of data tables and managed through an application launched from the database’s Main Menu. Principal modifications to the water quality side of the database include the addition of metadata elements required by the NPS-WRD to database lookup tables, and development of the forms used for entering these data. The Main Menu has been modified to include a Metadata section that groups all lookup tables used by the database. Some modifications have also been made to the Data Entry/Edit form to customize data entry for SIEN water quality monitoring. None of these modifications affect the structure or
SIEN Lake Monitoring Protocol
SOP 13.6
content of the original SWAMP database, while incorporating the additional elements required for compatibility with NPStoret. The database is designed with parallel sets of tables, one for data entry and one for permanent data storage. All new data should be entered in the data entry tables. Once these data have been reviewed and certified as accurate and complete, they should be transferred to the permanent tables. The database includes a procedure for performing this transfer. Entry tables for water quality include: Sample_Entry SampleDetail_Entry FieldObsResult_Entry FieldResult_Entry LabResult_Entry LabBatch VisitPictures Visits StationPictures UserPreferences Entry tables for stream flow include: RatingCurves RawFlowData Permanent tables for water quality include: Sample SampleDetail FieldObsResult FieldResult LabResult LabBatch_Permanent VisitPictures_Permanent Visits_Permanent Permanent tables for stream flow include: DailyFlowTotals RawFlowDataPermanent There are two sets of lookup tables (tables that provide lists of options for data entry). One set follows SWAMP specifications and the other follows NPStoret. SWAMP lookup tables have a name that ends with “Lookup”, e.g., AnalyteLookup. NPStoret lookup tables all begin with “tblDef, e.g., tblDef_TSMFHU.
SIEN Lake Monitoring Protocol
SOP 13.7
Another group of tables join two tables together in many to many relationships, and have names that end with “Assignment”, e.g., CitationsProjectsAssignment which joins one or more citations to one or more projects. The database has been split into front-end and back-end components with two main sets of tables. Tables for data entry are stored in the back-end file, (NPSWQDatabase_Entry) and permanent tables in (NPSWQDatabase_Permanent). All SWAMP lookup tables are stored in NPSWQDatabase_Entry. All NPStoret lookup tables are stored in NPSTORET_DefTab. One table, ReportsAndQueries, in both Managers and Users front-ends is not linked to an external database files. A manager’s front-end file (NPSWQDatabase_Managers) is linked to all data entry and permanent tables. A user’s front-end (NPSWQDatabase_Users) is linked only to the data entry tables. Thus, access to permanent, certified data is restricted to individuals who have access to NPSWQDatabase_Managers or to NPSWQDatabase_Permanent directly. It is recommended that both of these files be placed in a separate folder on a park network drive and access limited through folder permissions. Two conventions are followed throughout. Form objects, including textboxes and comboboxes, receiving required data elements have a yellow background. Non-required data are represented by a white background. All fields incorporated from the NPStoret database are identified with blue labels.
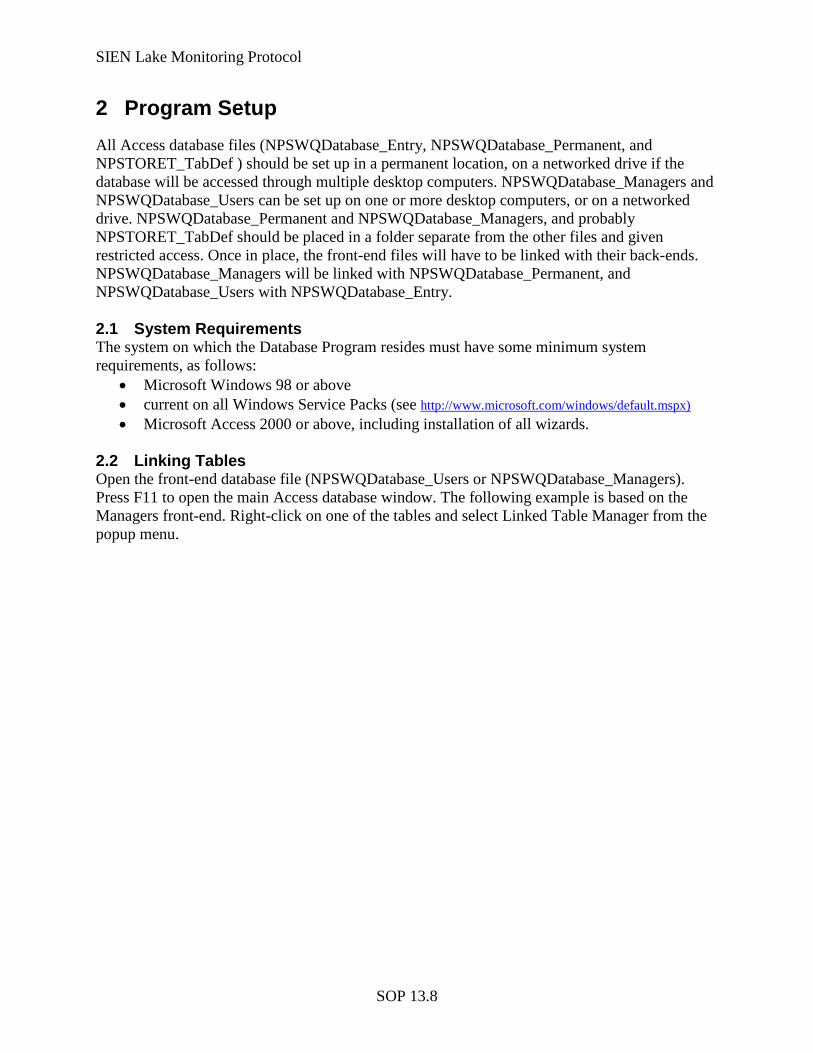
SIEN Lake Monitoring Protocol
SOP 13.8
2 Program Setup All Access database files (NPSWQDatabase_Entry, NPSWQDatabase_Permanent, and NPSTORET_TabDef ) should be set up in a permanent location, on a networked drive if the database will be accessed through multiple desktop computers. NPSWQDatabase_Managers and NPSWQDatabase_Users can be set up on one or more desktop computers, or on a networked drive. NPSWQDatabase_Permanent and NPSWQDatabase_Managers, and probably NPSTORET_TabDef should be placed in a folder separate from the other files and given restricted access. Once in place, the front-end files will have to be linked with their back-ends. NPSWQDatabase_Managers will be linked with NPSWQDatabase_Permanent, and NPSWQDatabase_Users with NPSWQDatabase_Entry. 2.1 System Requirements The system on which the Database Program resides must have some minimum system requirements, as follows:
• Microsoft Windows 98 or above • current on all Windows Service Packs (see • Microsoft Access 2000 or above, including installation of all wizards.
http://www.microsoft.com/windows/default.mspx)
2.2 Linking Tables Open the front-end database file (NPSWQDatabase_Users or NPSWQDatabase_Managers). Press F11 to open the main Access database window. The following example is based on the Managers front-end. Right-click on one of the tables and select Linked Table Manager from the popup menu.
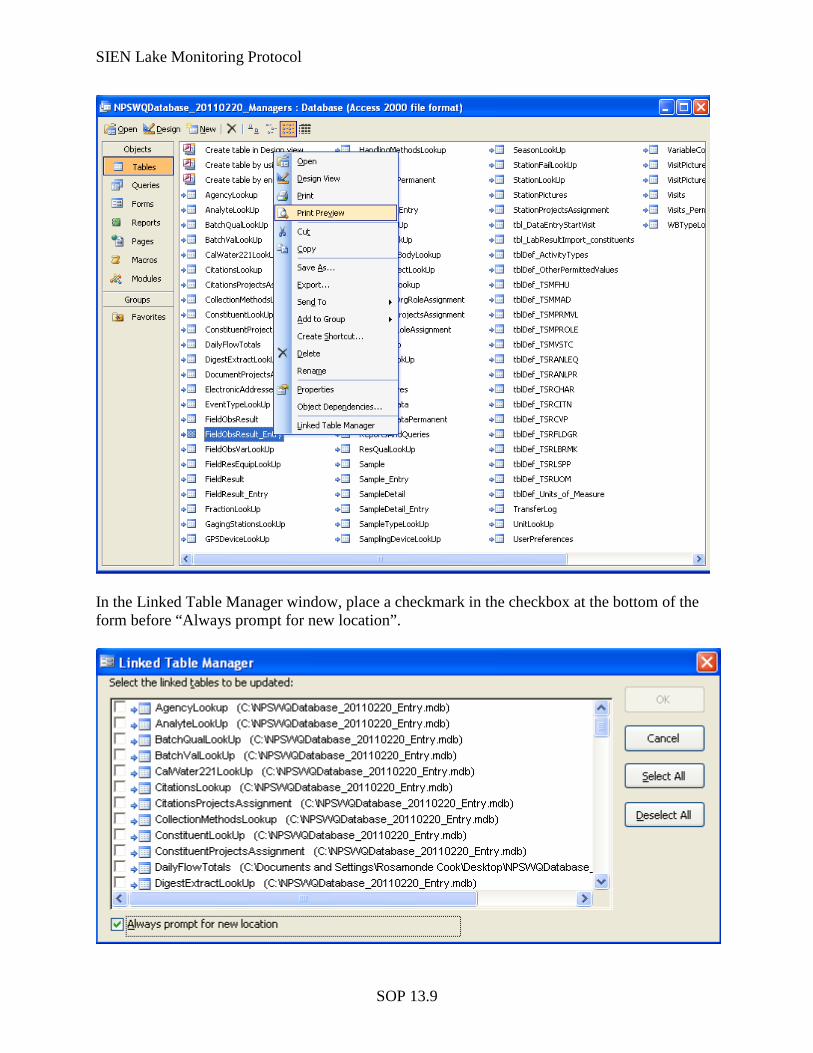
SIEN Lake Monitoring Protocol
SOP 13.9
In the Linked Table Manager window, place a checkmark in the checkbox at the bottom of the form before “Always prompt for new location”.
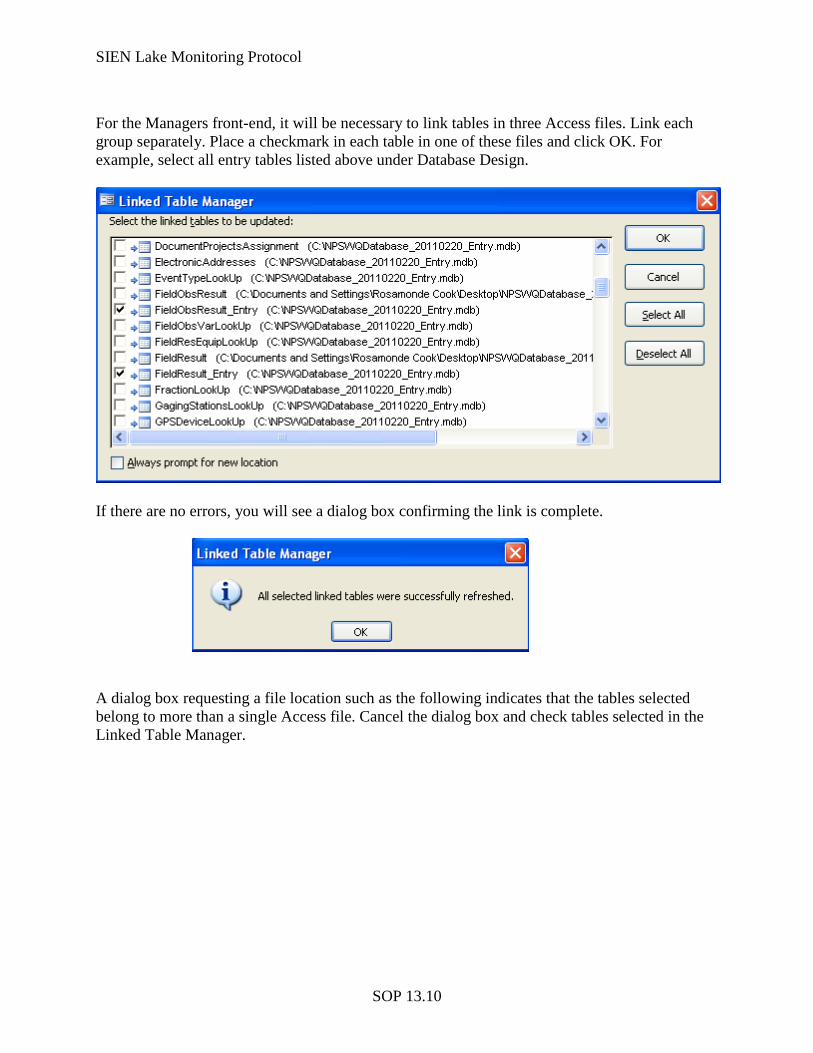
SIEN Lake Monitoring Protocol
SOP 13.10
For the Managers front-end, it will be necessary to link tables in three Access files. Link each group separately. Place a checkmark in each table in one of these files and click OK. For example, select all entry tables listed above under Database Design.
If there are no errors, you will see a dialog box confirming the link is complete.
A dialog box requesting a file location such as the following indicates that the tables selected belong to more than a single Access file. Cancel the dialog box and check tables selected in the Linked Table Manager.
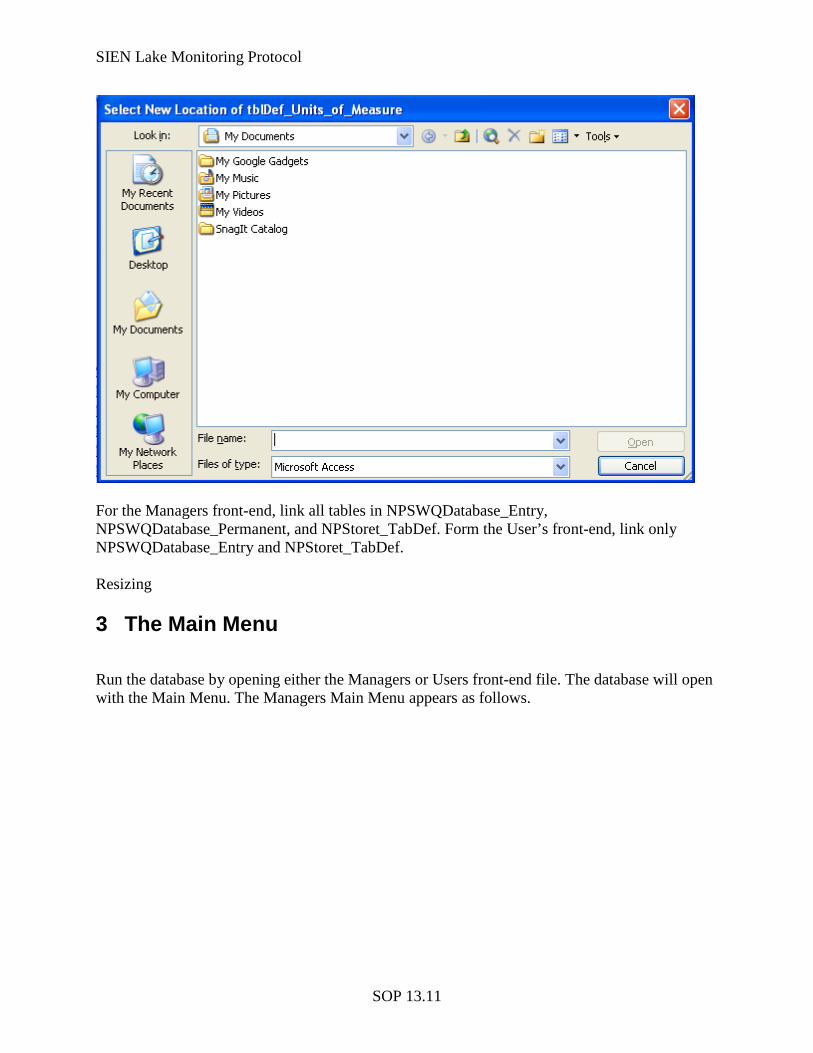
SIEN Lake Monitoring Protocol
SOP 13.11
For the Managers front-end, link all tables in NPSWQDatabase_Entry, NPSWQDatabase_Permanent, and NPStoret_TabDef. Form the User’s front-end, link only NPSWQDatabase_Entry and NPStoret_TabDef. Resizing 3 The Main Menu Run the database by opening either the Managers or Users front-end file. The database will open with the Main Menu. The Managers Main Menu appears as follows.
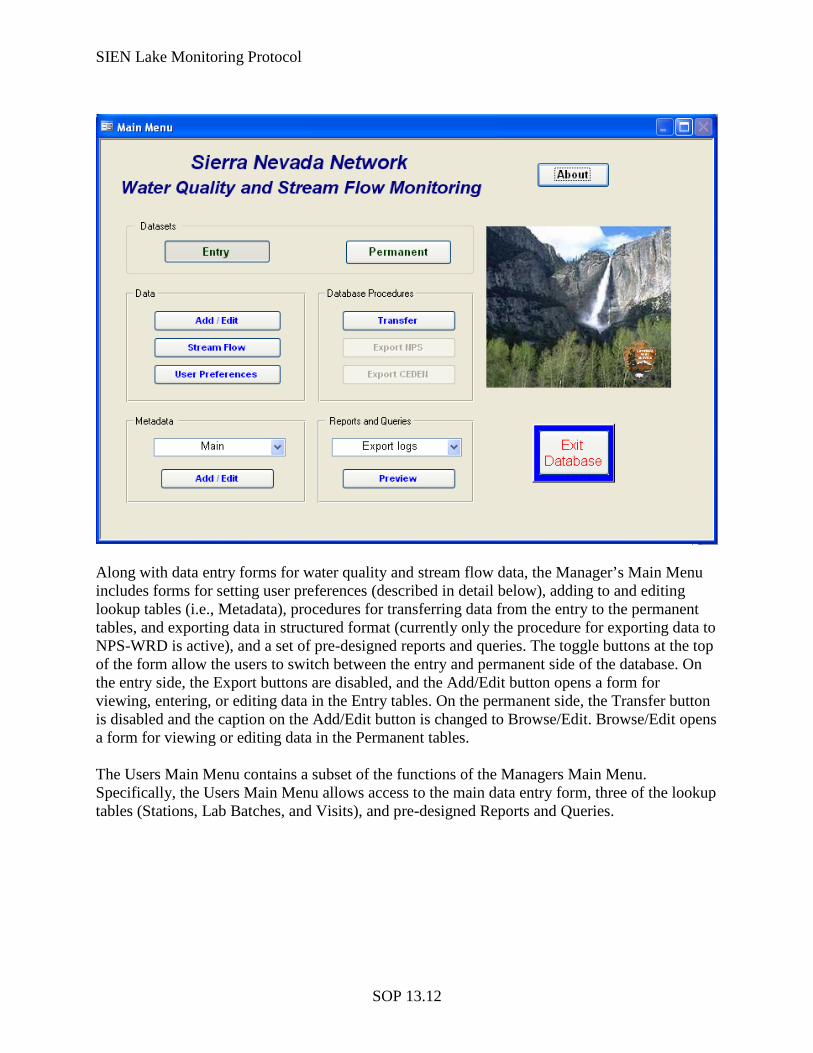
SIEN Lake Monitoring Protocol
SOP 13.12
Along with data entry forms for water quality and stream flow data, the Manager’s Main Menu includes forms for setting user preferences (described in detail below), adding to and editing lookup tables (i.e., Metadata), procedures for transferring data from the entry to the permanent tables, and exporting data in structured format (currently only the procedure for exporting data to NPS-WRD is active), and a set of pre-designed reports and queries. The toggle buttons at the top of the form allow the users to switch between the entry and permanent side of the database. On the entry side, the Export buttons are disabled, and the Add/Edit button opens a form for viewing, entering, or editing data in the Entry tables. On the permanent side, the Transfer button is disabled and the caption on the Add/Edit button is changed to Browse/Edit. Browse/Edit opens a form for viewing or editing data in the Permanent tables. The Users Main Menu contains a subset of the functions of the Managers Main Menu. Specifically, the Users Main Menu allows access to the main data entry form, three of the lookup tables (Stations, Lab Batches, and Visits), and pre-designed Reports and Queries.
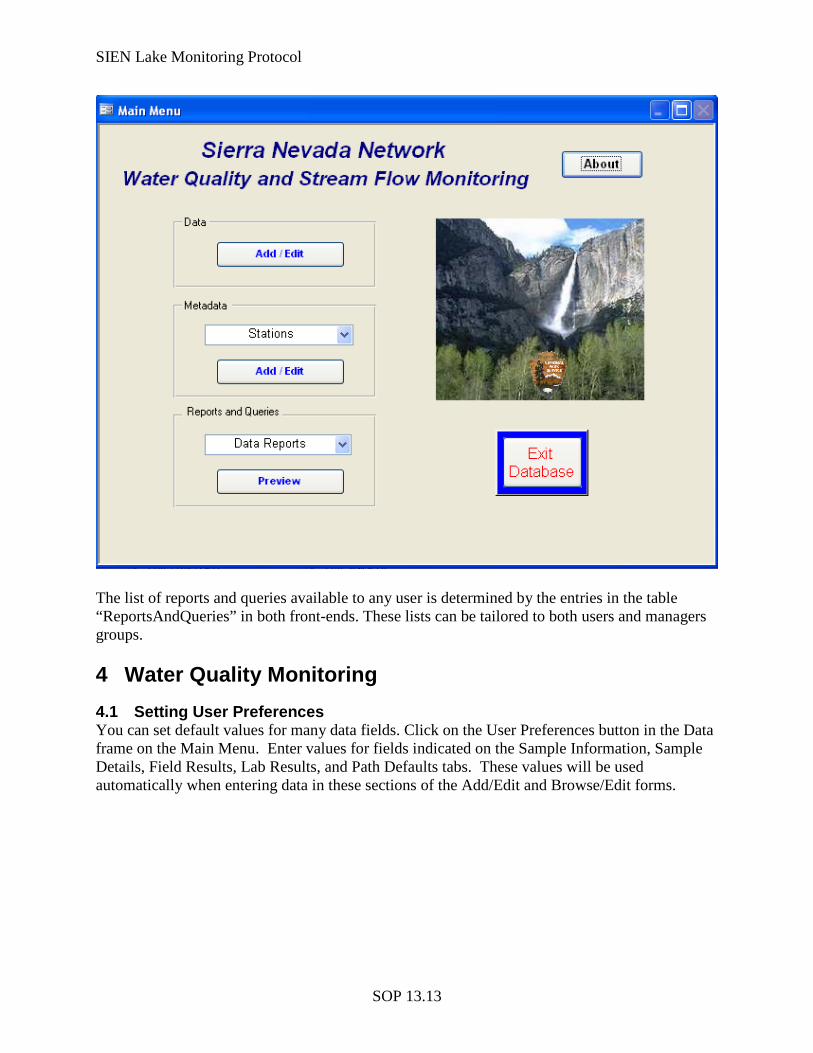
SIEN Lake Monitoring Protocol
SOP 13.13
The list of reports and queries available to any user is determined by the entries in the table “ReportsAndQueries” in both front-ends. These lists can be tailored to both users and managers groups. 4 Water Quality Monitoring 4.1 Setting User Preferences You can set default values for many data fields. Click on the User Preferences button in the Data frame on the Main Menu. Enter values for fields indicated on the Sample Information, Sample Details, Field Results, Lab Results, and Path Defaults tabs. These values will be used automatically when entering data in these sections of the Add/Edit and Browse/Edit forms.
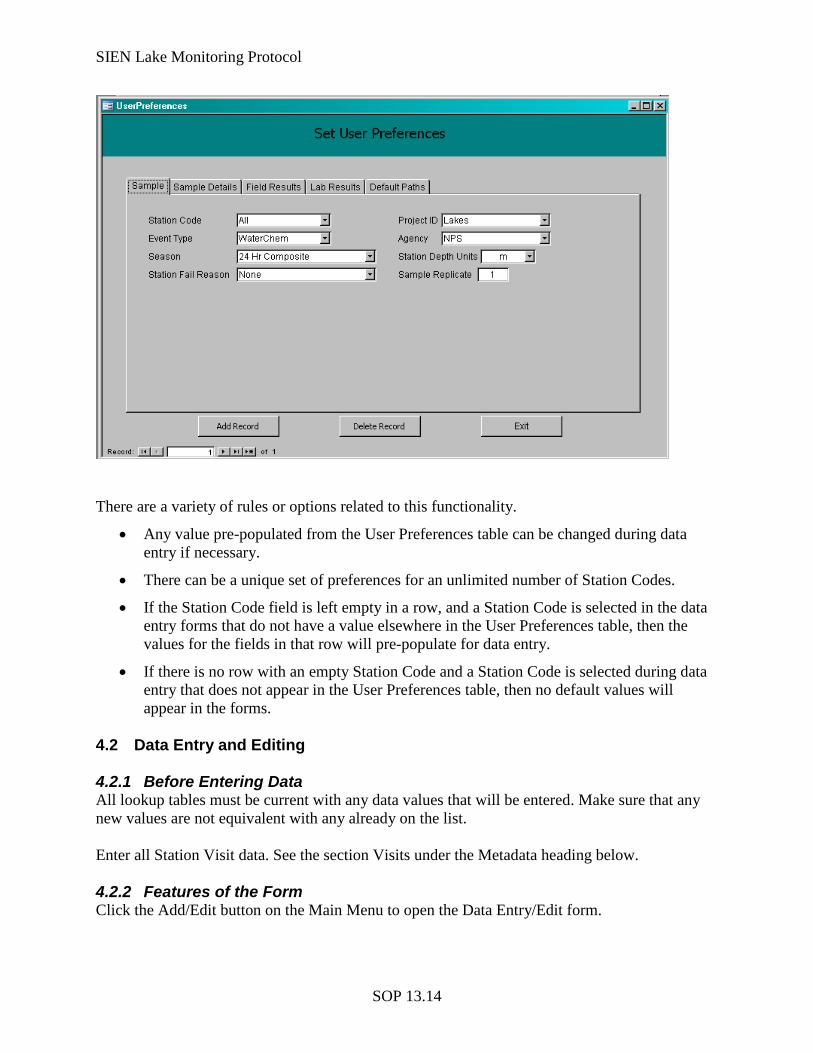
SIEN Lake Monitoring Protocol
SOP 13.14
There are a variety of rules or options related to this functionality.
• Any value pre-populated from the User Preferences table can be changed during data entry if necessary.
• There can be a unique set of preferences for an unlimited number of Station Codes.
• If the Station Code field is left empty in a row, and a Station Code is selected in the data entry forms that do not have a value elsewhere in the User Preferences table, then the values for the fields in that row will pre-populate for data entry.
• If there is no row with an empty Station Code and a Station Code is selected during data entry that does not appear in the User Preferences table, then no default values will appear in the forms.
4.2 Data Entry and Editing 4.2.1 Before Entering Data All lookup tables must be current with any data values that will be entered. Make sure that any new values are not equivalent with any already on the list. Enter all Station Visit data. See the section Visits under the Metadata heading below. 4.2.2 Features of the Form Click the Add/Edit button on the Main Menu to open the Data Entry/Edit form.
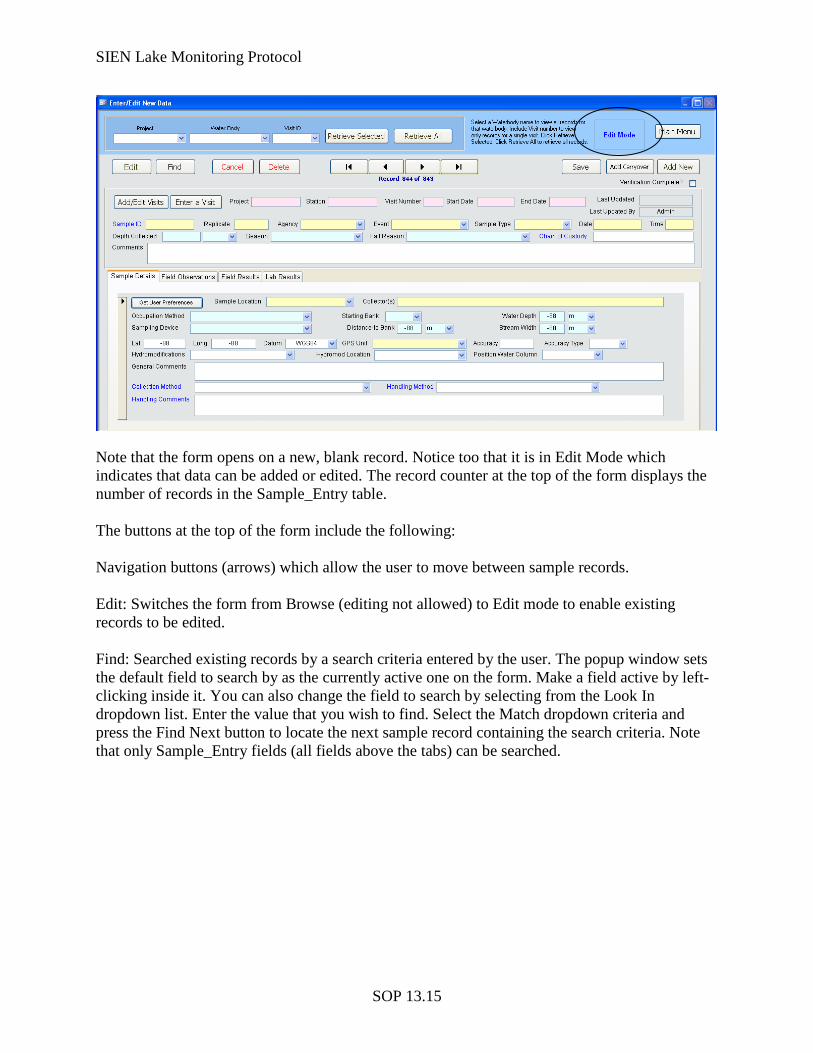
SIEN Lake Monitoring Protocol
SOP 13.15
Note that the form opens on a new, blank record. Notice too that it is in Edit Mode which indicates that data can be added or edited. The record counter at the top of the form displays the number of records in the Sample_Entry table. The buttons at the top of the form include the following: Navigation buttons (arrows) which allow the user to move between sample records. Edit: Switches the form from Browse (editing not allowed) to Edit mode to enable existing records to be edited. Find: Searched existing records by a search criteria entered by the user. The popup window sets the default field to search by as the currently active one on the form. Make a field active by left-clicking inside it. You can also change the field to search by selecting from the Look In dropdown list. Enter the value that you wish to find. Select the Match dropdown criteria and press the Find Next button to locate the next sample record containing the search criteria. Note that only Sample_Entry fields (all fields above the tabs) can be searched.
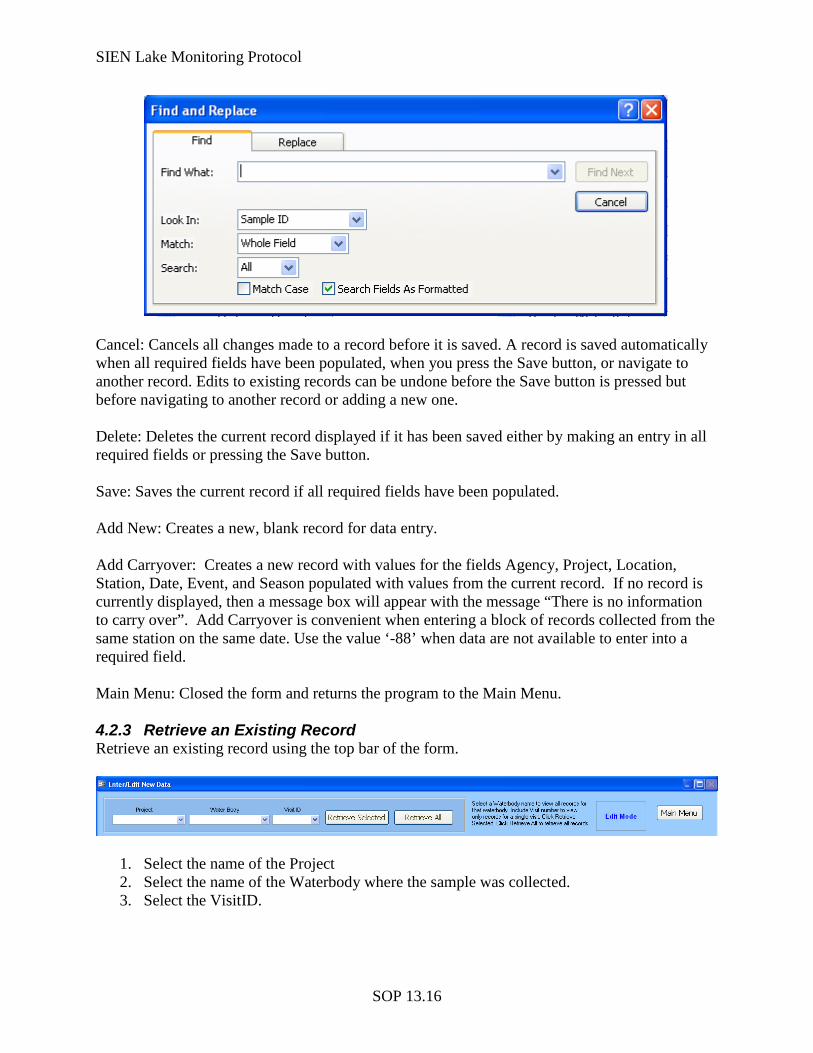
SIEN Lake Monitoring Protocol
SOP 13.16
Cancel: Cancels all changes made to a record before it is saved. A record is saved automatically when all required fields have been populated, when you press the Save button, or navigate to another record. Edits to existing records can be undone before the Save button is pressed but before navigating to another record or adding a new one. Delete: Deletes the current record displayed if it has been saved either by making an entry in all required fields or pressing the Save button. Save: Saves the current record if all required fields have been populated. Add New: Creates a new, blank record for data entry. Add Carryover: Creates a new record with values for the fields Agency, Project, Location, Station, Date, Event, and Season populated with values from the current record. If no record is currently displayed, then a message box will appear with the message “There is no information to carry over”. Add Carryover is convenient when entering a block of records collected from the same station on the same date. Use the value ‘-88’ when data are not available to enter into a required field. Main Menu: Closed the form and returns the program to the Main Menu. 4.2.3 Retrieve an Existing Record Retrieve an existing record using the top bar of the form.
1. Select the name of the Project 2. Select the name of the Waterbody where the sample was collected. 3. Select the VisitID.
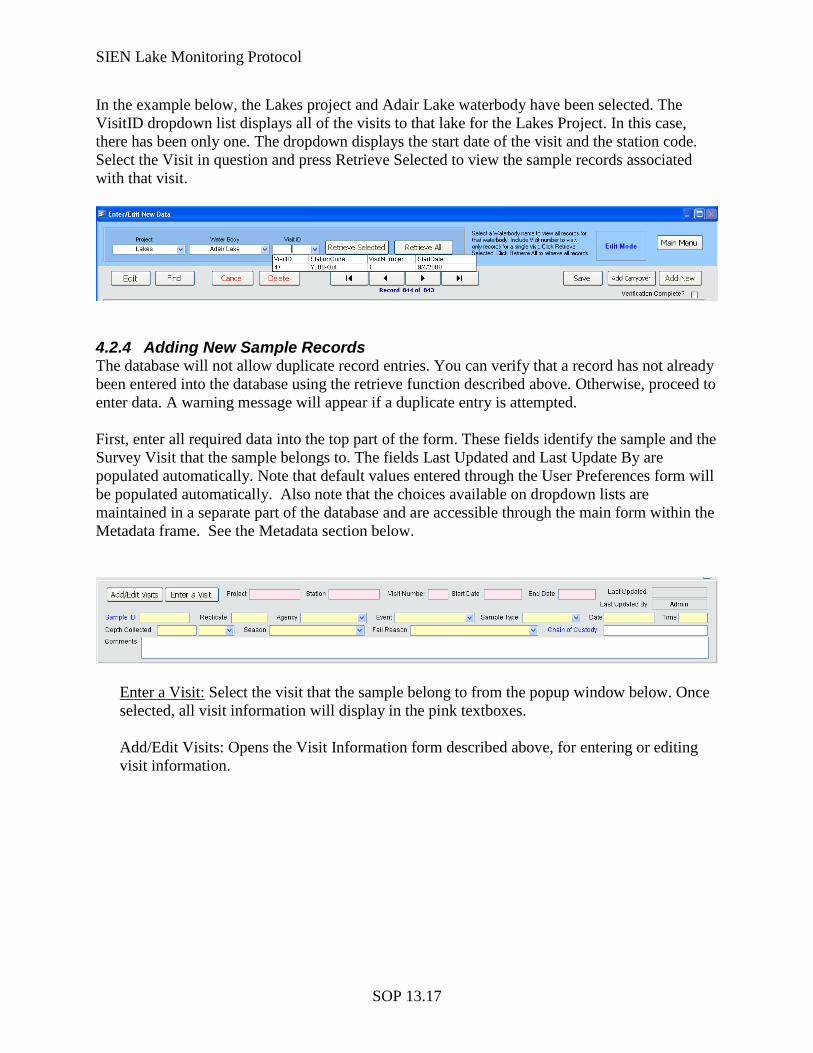
SIEN Lake Monitoring Protocol
SOP 13.17
In the example below, the Lakes project and Adair Lake waterbody have been selected. The VisitID dropdown list displays all of the visits to that lake for the Lakes Project. In this case, there has been only one. The dropdown displays the start date of the visit and the station code. Select the Visit in question and press Retrieve Selected to view the sample records associated with that visit.
4.2.4 Adding New Sample Records The database will not allow duplicate record entries. You can verify that a record has not already been entered into the database using the retrieve function described above. Otherwise, proceed to enter data. A warning message will appear if a duplicate entry is attempted. First, enter all required data into the top part of the form. These fields identify the sample and the Survey Visit that the sample belongs to. The fields Last Updated and Last Update By are populated automatically. Note that default values entered through the User Preferences form will be populated automatically. Also note that the choices available on dropdown lists are maintained in a separate part of the database and are accessible through the main form within the Metadata frame. See the Metadata section below.
Enter a Visit:
Select the visit that the sample belong to from the popup window below. Once selected, all visit information will display in the pink textboxes.
Add/Edit Visits: Opens the Visit Information form described above, for entering or editing visit information.
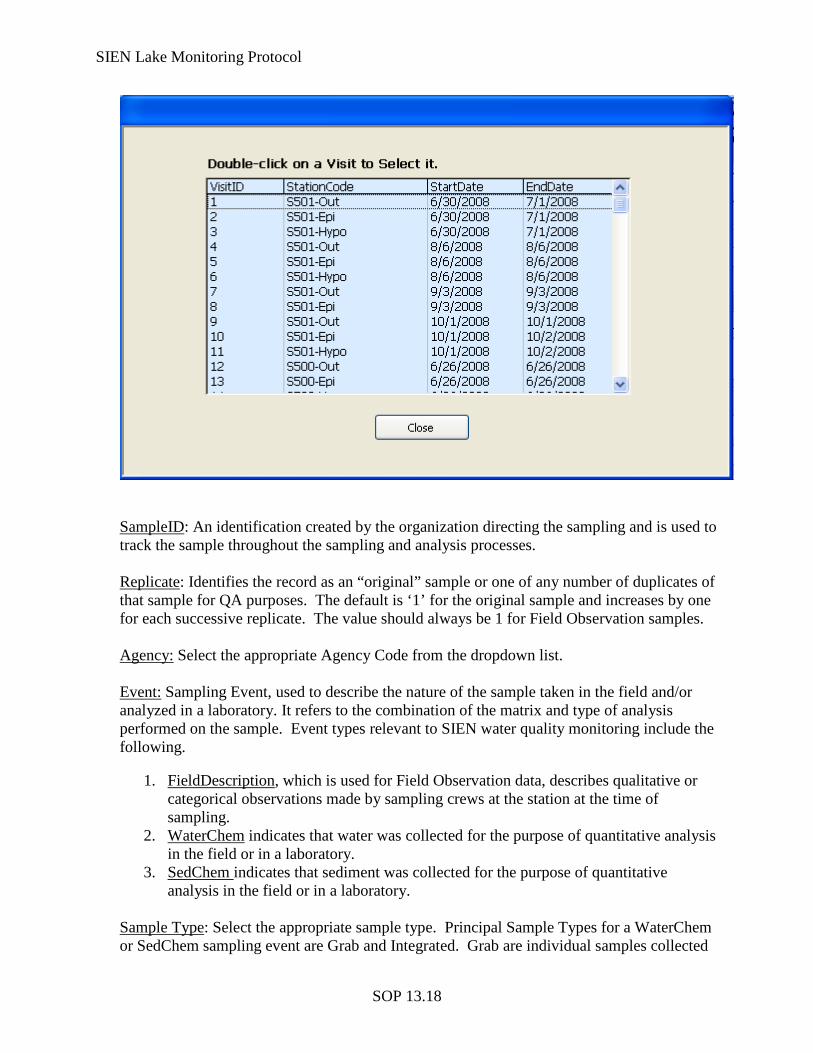
SIEN Lake Monitoring Protocol
SOP 13.18
SampleID
: An identification created by the organization directing the sampling and is used to track the sample throughout the sampling and analysis processes.
Replicate
: Identifies the record as an “original” sample or one of any number of duplicates of that sample for QA purposes. The default is ‘1’ for the original sample and increases by one for each successive replicate. The value should always be 1 for Field Observation samples.
Agency:
Select the appropriate Agency Code from the dropdown list.
Event:
Sampling Event, used to describe the nature of the sample taken in the field and/or analyzed in a laboratory. It refers to the combination of the matrix and type of analysis performed on the sample. Event types relevant to SIEN water quality monitoring include the following.
1. FieldDescription
2.
, which is used for Field Observation data, describes qualitative or categorical observations made by sampling crews at the station at the time of sampling. WaterChem
3.
indicates that water was collected for the purpose of quantitative analysis in the field or in a laboratory. SedChem
indicates that sediment was collected for the purpose of quantitative analysis in the field or in a laboratory.
Sample Type: Select the appropriate sample type. Principal Sample Types for a WaterChem or SedChem sampling event are Grab and Integrated. Grab are individual samples collected
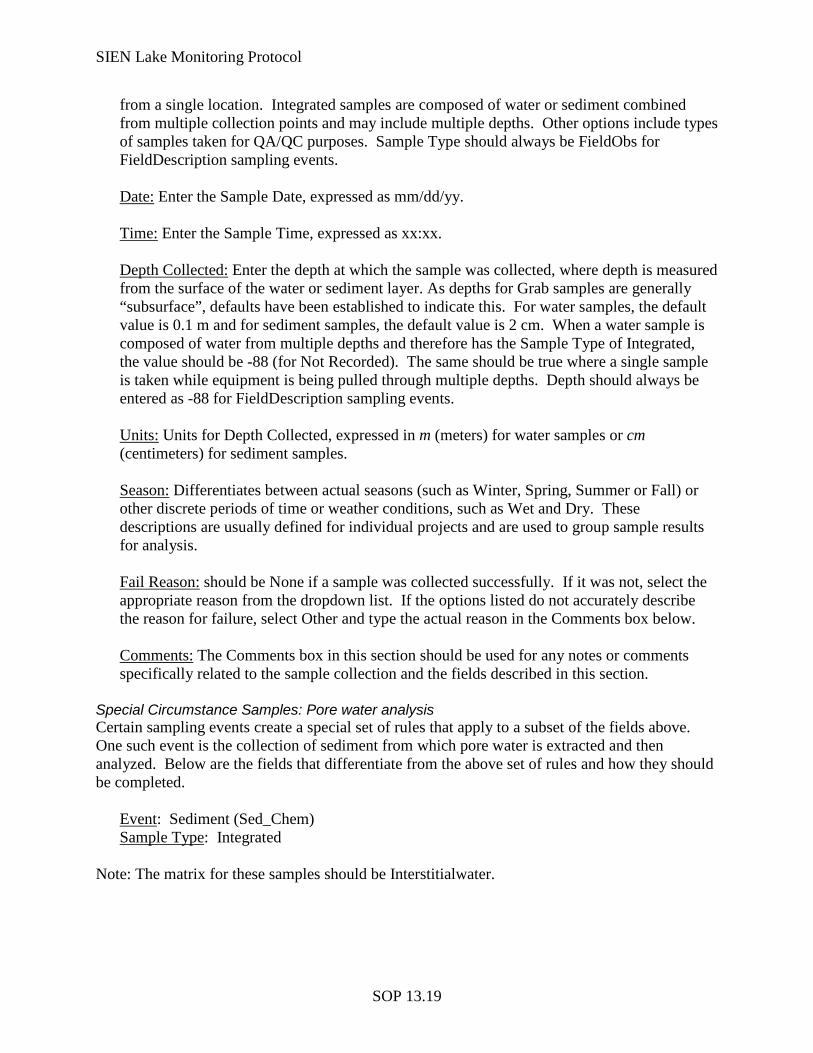
SIEN Lake Monitoring Protocol
SOP 13.19
from a single location. Integrated samples are composed of water or sediment combined from multiple collection points and may include multiple depths. Other options include types of samples taken for QA/QC purposes. Sample Type should always be FieldObs for FieldDescription sampling events. Date:
Enter the Sample Date, expressed as mm/dd/yy.
Time:
Enter the Sample Time, expressed as xx:xx.
Depth Collected:
Enter the depth at which the sample was collected, where depth is measured from the surface of the water or sediment layer. As depths for Grab samples are generally “subsurface”, defaults have been established to indicate this. For water samples, the default value is 0.1 m and for sediment samples, the default value is 2 cm. When a water sample is composed of water from multiple depths and therefore has the Sample Type of Integrated, the value should be -88 (for Not Recorded). The same should be true where a single sample is taken while equipment is being pulled through multiple depths. Depth should always be entered as -88 for FieldDescription sampling events.
Units:
Units for Depth Collected, expressed in m (meters) for water samples or cm (centimeters) for sediment samples.
Season:
Differentiates between actual seasons (such as Winter, Spring, Summer or Fall) or other discrete periods of time or weather conditions, such as Wet and Dry. These descriptions are usually defined for individual projects and are used to group sample results for analysis.
Fail Reason:
should be None if a sample was collected successfully. If it was not, select the appropriate reason from the dropdown list. If the options listed do not accurately describe the reason for failure, select Other and type the actual reason in the Comments box below.
Comments:
The Comments box in this section should be used for any notes or comments specifically related to the sample collection and the fields described in this section.
Special Circumstance Samples: Pore water analysis Certain sampling events create a special set of rules that apply to a subset of the fields above. One such event is the collection of sediment from which pore water is extracted and then analyzed. Below are the fields that differentiate from the above set of rules and how they should be completed.
Event: Sediment (Sed_Chem) Sample Type
: Integrated
Note: The matrix for these samples should be Interstitialwater.
SIEN Lake Monitoring Protocol
SOP 13.20
Special Circumstance Samples: Travel Blank For those types of analyses that require a Travel Blank to accompany a sampling event, the data is entered with the same set of business rules as the regular samples in the same group, with the following exceptions.
Agency: Agency that created the Travel Blank Date: should be entered as the date the Travel Blank becomes part of the sample group (i.e., leaves the lab for the sampling event). The date the sample returns to the lab should be noted in the Comments box. Depth Collected: -88 Units:
m
Laboratory-generated (QA) Samples There are two types of samples discussed in this section that are generated or modified within the laboratory. The first is a Matrix Spike (MS), which is a modified field sample. For these samples, all fields describing the sample (i.e. Station, Project ID, Agency, Season, Event, Date, and Time) remain the same as the original sample. The only thing to change is the Sample Type, which should be MS. For a list of QA sample types required for each type of chemical analysis, see the Section: SWAMP Laboratory QA Checklist below. All samples generated from within the laboratory, such as LabBlank, LCS, CRM, etc. have specific alternative business rules as follows:
Replicate: 1 for single samples, incrementing by one for each replicate split within a batch. There are situations within a batch when 2 identical sample types are used for QA reasons and the only way to differentiate between them is to give them each a different sample replicate number. In such situations, include an explanation in Comments.
Agency: Analyzing agency, as selected from the dropdown list.
Date: Date sample was analyzed on instrument, expressed as dd/mm/yyyy (same as Digest/Extract Date or Analysis Date when no digestion/extraction is performed).
Time: 0:0 0
Event: WaterChem or SedChem, as appropriate to the sample Matrix
Sample Type: Select the appropriate QA Sample Type from the dropdown list.
Depth Collected: -88.
Units: m for water or cm for sediment. Season: Not Applicable.
Fail Reason
: None.
The Associated Visit record should include:
ProjectID: Use a conventional id code to indicate a lab sample. For example, SWAMP uses yySWLAB, where yy refers to last 2 digits of the fiscal year used in the ProjectID for the
SIEN Lake Monitoring Protocol
SOP 13.21
field-generated samples. When ProjectIDs for related samples span multiple years, use the later year.
Station: LABQA
VisitNumber
: 1
Note: The matrix for constituent codes of these samples should be labwater or blankwater if the sample is water. Non-Project MS and Duplicate Samples At times, laboratories use samples not generated through a project in order to satisfy batch QA requirements. These samples have different business rules, as follows:
Agency: Lab Agency Code
Date: Analysis Date
Time: 0:00
Season: Not Applicable
Depth Collected:
-88
The Associated Visit record should include:
ProjectID: Use a conventional id code to indicate a lab sample. For example, SWAMP uses yySWLAB, where yy refers to last 2 digits of the fiscal year used in the ProjectID for the field-generated samples. When ProjectIDs for related samples span multiple years, use the later year.
Station: Use a conventional station id to indicate a lab sample. For example, SWAMP uses 000NONPJ.
VisitNumber
: 1
4.2.5 Sample Details The purpose of the Sample Details section is to document conditions under which samples were collected. Each of the fields includes an option for Not Recorded and/or Not Applicable for those situations in which there is no applicable response. Many of the fields have Other as a choice. If Other is the selection made, specific information can be entered in the Comments field in this section of the form. Note: Click Get User Preferences to instantly populate one or more fields with the default values entered in the User Preferences form. Sample Details are not entered for Field Observations.
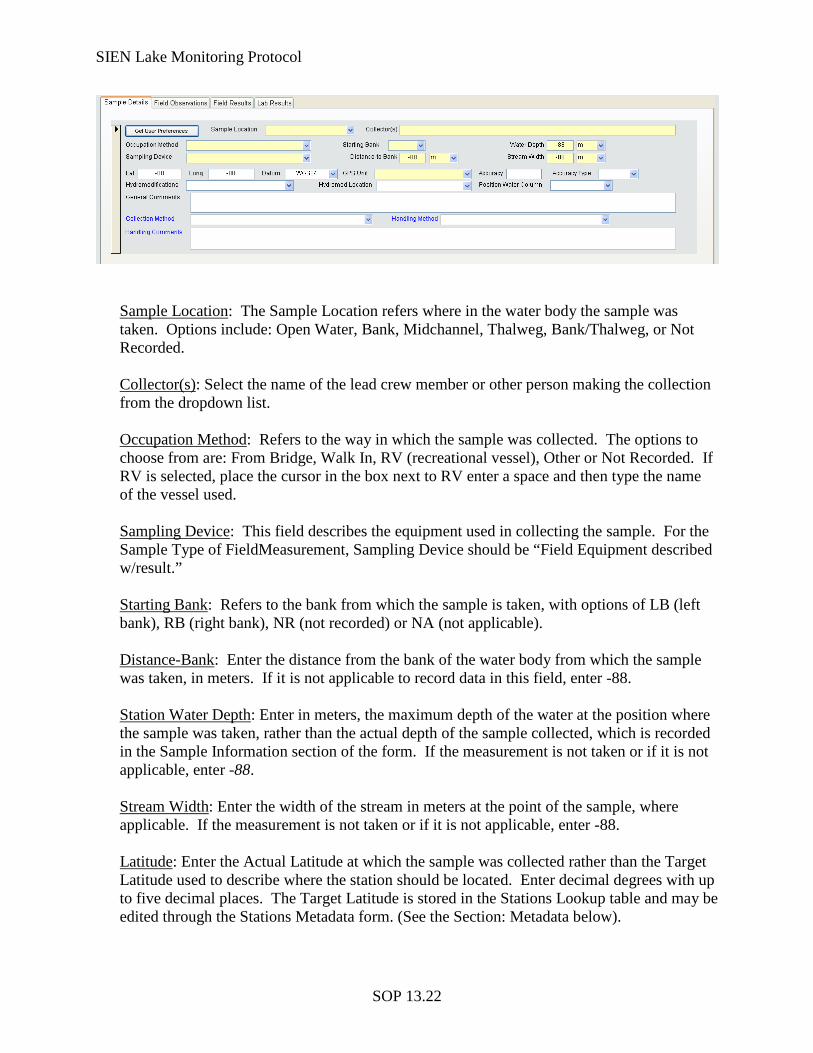
SIEN Lake Monitoring Protocol
SOP 13.22
Sample Location
: The Sample Location refers where in the water body the sample was taken. Options include: Open Water, Bank, Midchannel, Thalweg, Bank/Thalweg, or Not Recorded.
Collector(s)
: Select the name of the lead crew member or other person making the collection from the dropdown list.
Occupation Method
: Refers to the way in which the sample was collected. The options to choose from are: From Bridge, Walk In, RV (recreational vessel), Other or Not Recorded. If RV is selected, place the cursor in the box next to RV enter a space and then type the name of the vessel used.
Sampling Device
: This field describes the equipment used in collecting the sample. For the Sample Type of FieldMeasurement, Sampling Device should be “Field Equipment described w/result.”
Starting Bank
: Refers to the bank from which the sample is taken, with options of LB (left bank), RB (right bank), NR (not recorded) or NA (not applicable).
Distance-Bank
: Enter the distance from the bank of the water body from which the sample was taken, in meters. If it is not applicable to record data in this field, enter -88.
Station Water Depth
: Enter in meters, the maximum depth of the water at the position where the sample was taken, rather than the actual depth of the sample collected, which is recorded in the Sample Information section of the form. If the measurement is not taken or if it is not applicable, enter -88.
Stream Width
: Enter the width of the stream in meters at the point of the sample, where applicable. If the measurement is not taken or if it is not applicable, enter -88.
Latitude
Metadata
: Enter the Actual Latitude at which the sample was collected rather than the Target Latitude used to describe where the station should be located. Enter decimal degrees with up to five decimal places. The Target Latitude is stored in the Stations Lookup table and may be edited through the Stations Metadata form. (See the Section: below).
SIEN Lake Monitoring Protocol
SOP 13.23
Longitude
Metadata
: Enter the Actual Longitude at which the sample was collected rather than the Target Longitude used to describe where the station should be located and is recorded as negative (-) decimal degrees with up to five decimal places. The Target Longitude is stored in the Stations Lookup table and may be edited through the Stations Metadata form. (See the Section: below). Datum
: Datum used when latitude and longitude are recorded.
GPS Unit
: The type of GPS equipment used to record the latitude and longitude for the sample.
Accuracy
: GPS Accuracy.
Acc Type
: Units used to define Accuracy.
Hydromodifications: Refers to any man-made structure that appears at the station that could have an effect on the condition of the water body. Options include: drop, grade control, bridge or other (such as drain pipe). If the chosen option is other, details about the hydromodification can be recorded in the Comments field. Hydromod Location
: The location of the hydromodification refers to its location in relation to that from which the sample was collected. Options include US (upstream), DS (downstream), NR (not recorded) or NA (not applicable) are available.
Position Water Column
: The position in the water column from which the sample was collected. This field is particularly important for samples taken at multiple depths. Options are nearbotton, subsurface, midcolumn or Not Applicable.
Comments
: Record any notes or additional information related specifically to the conditions under which the sample was collected.
Collection Method:
Method of collection. Select from the dropdown list.
Handling Method
: Method of sample handling. Select from the dropdown list.
Handling Method Comments
: Any relevant comments about the method of sample handling.
Once this section has been completed, click the Save button to save the record. Note: Since some or all of the information recorded in Sample Details may be repeated for a different Sample Type, it may be helpful to copy data once entered and paste it into the next Sample. Follow these steps:
1. Access the Sample Details section to be copied. 2. On the left side of the form, click the arrow box which will cause it to darken in color.
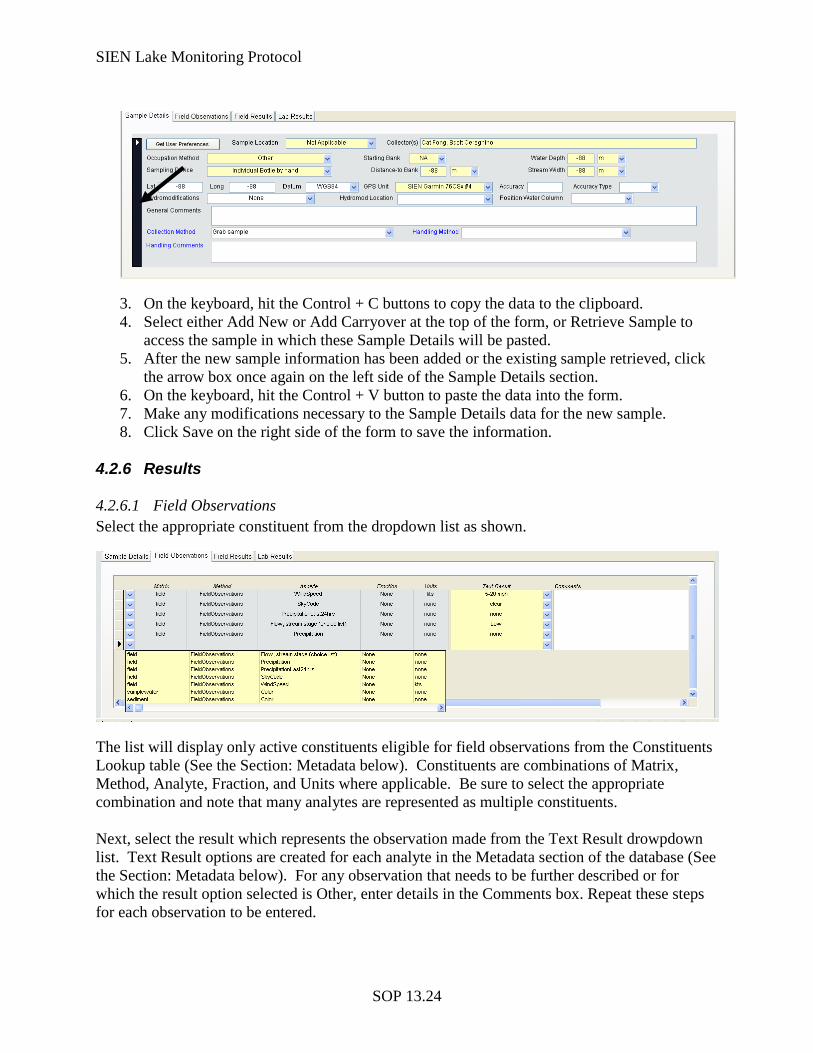
SIEN Lake Monitoring Protocol
SOP 13.24
3. On the keyboard, hit the Control + C buttons to copy the data to the clipboard. 4. Select either Add New or Add Carryover at the top of the form, or Retrieve Sample to
access the sample in which these Sample Details will be pasted. 5. After the new sample information has been added or the existing sample retrieved, click
the arrow box once again on the left side of the Sample Details section. 6. On the keyboard, hit the Control + V button to paste the data into the form. 7. Make any modifications necessary to the Sample Details data for the new sample. 8. Click Save on the right side of the form to save the information.
4.2.6 Results 4.2.6.1 Field Observations Select the appropriate constituent from the dropdown list as shown.
The list will display only active constituents eligible for field observations from the Constituents Lookup table (See the Section: Metadata below). Constituents are combinations of Matrix, Method, Analyte, Fraction, and Units where applicable. Be sure to select the appropriate combination and note that many analytes are represented as multiple constituents. Next, select the result which represents the observation made from the Text Result drowpdown list. Text Result options are created for each analyte in the Metadata section of the database (See the Section: Metadata below). For any observation that needs to be further described or for which the result option selected is Other, enter details in the Comments box. Repeat these steps for each observation to be entered.
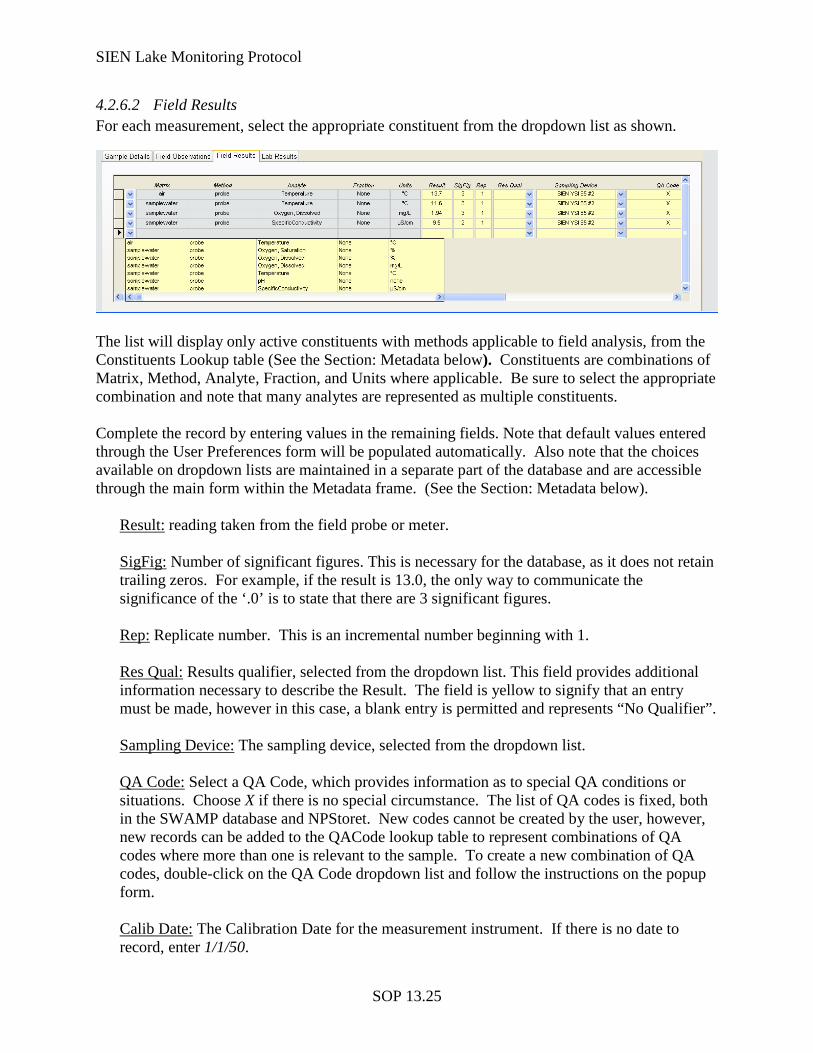
SIEN Lake Monitoring Protocol
SOP 13.25
4.2.6.2 Field Results For each measurement, select the appropriate constituent from the dropdown list as shown.
The list will display only active constituents with methods applicable to field analysis, from the Constituents Lookup table (See the Section: Metadata below). Constituents are combinations of Matrix, Method, Analyte, Fraction, and Units where applicable. Be sure to select the appropriate combination and note that many analytes are represented as multiple constituents. Complete the record by entering values in the remaining fields. Note that default values entered through the User Preferences form will be populated automatically. Also note that the choices available on dropdown lists are maintained in a separate part of the database and are accessible through the main form within the Metadata frame. (See the Section: Metadata below).
Result:
reading taken from the field probe or meter.
SigFig:
Number of significant figures. This is necessary for the database, as it does not retain trailing zeros. For example, if the result is 13.0, the only way to communicate the significance of the ‘.0’ is to state that there are 3 significant figures.
Rep:
Replicate number. This is an incremental number beginning with 1.
Res Qual:
Results qualifier, selected from the dropdown list. This field provides additional information necessary to describe the Result. The field is yellow to signify that an entry must be made, however in this case, a blank entry is permitted and represents “No Qualifier”.
Sampling Device:
The sampling device, selected from the dropdown list.
QA Code:
Select a QA Code, which provides information as to special QA conditions or situations. Choose X if there is no special circumstance. The list of QA codes is fixed, both in the SWAMP database and NPStoret. New codes cannot be created by the user, however, new records can be added to the QACode lookup table to represent combinations of QA codes where more than one is relevant to the sample. To create a new combination of QA codes, double-click on the QA Code dropdown list and follow the instructions on the popup form.
Calib Date: The Calibration Date for the measurement instrument. If there is no date to record, enter 1/1/50.
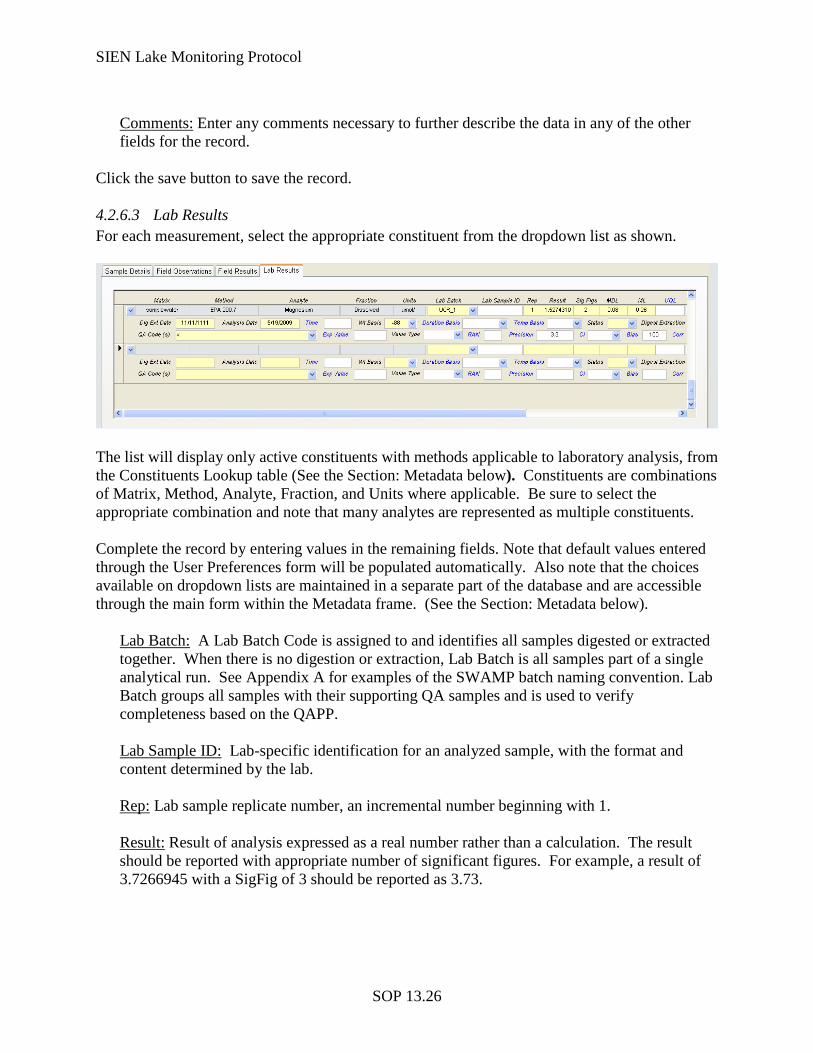
SIEN Lake Monitoring Protocol
SOP 13.26
Comments:
Enter any comments necessary to further describe the data in any of the other fields for the record.
Click the save button to save the record. 4.2.6.3 Lab Results For each measurement, select the appropriate constituent from the dropdown list as shown.
The list will display only active constituents with methods applicable to laboratory analysis, from the Constituents Lookup table (See the Section: Metadata below). Constituents are combinations of Matrix, Method, Analyte, Fraction, and Units where applicable. Be sure to select the appropriate combination and note that many analytes are represented as multiple constituents. Complete the record by entering values in the remaining fields. Note that default values entered through the User Preferences form will be populated automatically. Also note that the choices available on dropdown lists are maintained in a separate part of the database and are accessible through the main form within the Metadata frame. (See the Section: Metadata below).
Lab Batch:
A Lab Batch Code is assigned to and identifies all samples digested or extracted together. When there is no digestion or extraction, Lab Batch is all samples part of a single analytical run. See Appendix A for examples of the SWAMP batch naming convention. Lab Batch groups all samples with their supporting QA samples and is used to verify completeness based on the QAPP.
Lab Sample ID:
Lab-specific identification for an analyzed sample, with the format and content determined by the lab.
Rep:
Lab sample replicate number, an incremental number beginning with 1.
Result:
Result of analysis expressed as a real number rather than a calculation. The result should be reported with appropriate number of significant figures. For example, a result of 3.7266945 with a SigFig of 3 should be reported as 3.73.
SIEN Lake Monitoring Protocol
SOP 13.27
SigFig:
Number of significant figures. This is necessary for the database, as it does not retain trailing zeros. For example, if the result is 13.0, the only way to communicate the significance of the ‘.0’ is to state that there are 3 significant figures.
DL:
Detection Limit, or Method Detection Limit. The amount of an analyte that must be present in order to be detectable by the analytical equipment used.
LRL:
Lower Reporting Limit. The lowest concentration of an analyte at which the result can be reported with confidence. Established by the reporting laboratory.
URL:
Upper Reporting Limit. The highest concentration of an analyte at which the result can be reported with confidence. Established by the reporting laboratory.
Res Qual:
Results qualifier, selected from the dropdown list. This field provides additional information necessary to describe the Result. The field is yellow to signify that an entry must be made, however in this case, a blank entry is permitted and represents “No Qualifier”. NOTE: if the value in this field is NR (Not Reported), then an explanation must be entered into Comments.
Preparation:
Describes any preparation or preservation done on the samples prior to analysis. Select the appropriate preparation method from the drowpdown list.
Prep Date:
Date the preparation or preservation is performed and must be formatted as dd/mmm/yyyy. If there is no preparation (None) then PrepDate should be entered as 01/Jan/1950 (to indicate none).
Digest Extraction:
Describes any digestion or extraction performed on the sample prior to analysis.Select the digestion extraction method from the dropdown list.
Dig Ext Date:
Date of digestion extraction. Should be entered as dd/mmm/yyyy. If there is no digestion or extraction (None) then the DigestExtractDate should be entered as 01/Jan/1950 (to indicate none).
Anal Date:
Date the sample was analyzed. Should be expressed as dd/mmm/yyyy.
Basis:
Basis of analysis (e.g., dry weight, wet weight).
QA Code:
The QA Code describes any special conditions or situation occurring during or prior to the analysis to achieve the result. The default code, indicating no special conditions, is X. If more than one code should be applied to a record, the convention is to list them in alphabetical order separated by commas and no spaces. Each unique combination of codes must be represented by a record in the QA Lookup Table. To create a new combination of QA codes, double-click on the QA Code dropdown list and follow the instructions on the popup form. NOTE: If the code is not X, then a comment is required in Lab Results Comments.
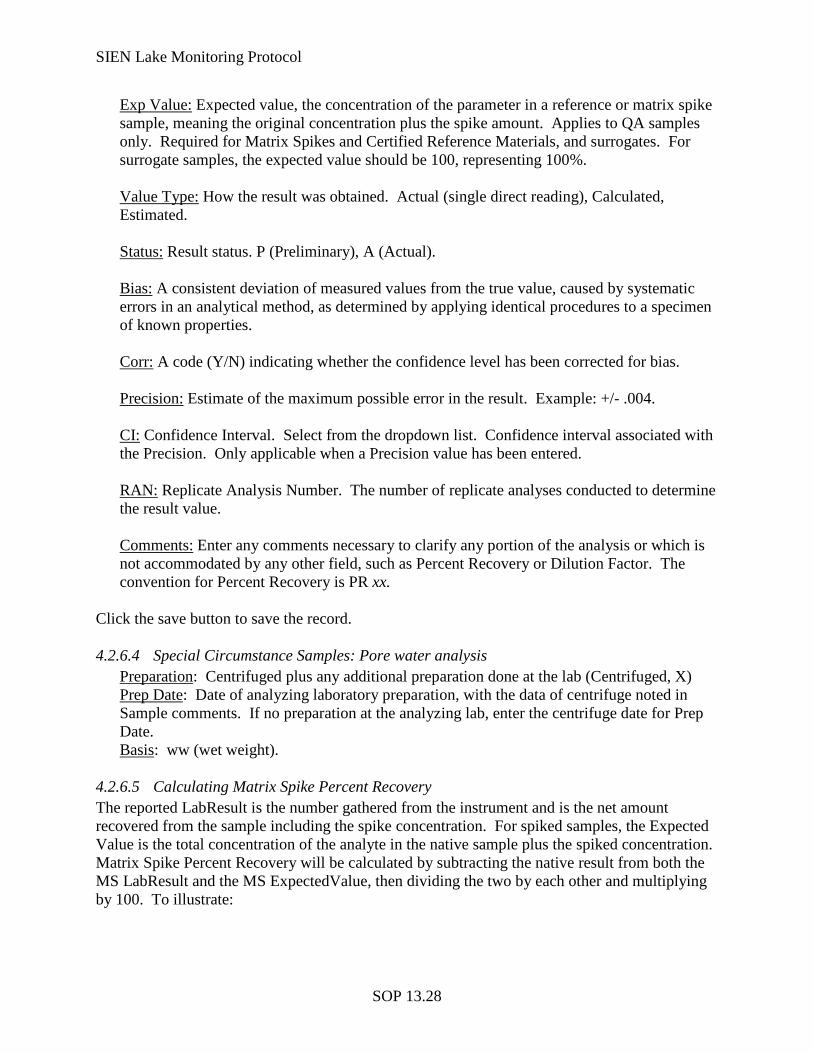
SIEN Lake Monitoring Protocol
SOP 13.28
Exp Value:
Expected value, the concentration of the parameter in a reference or matrix spike sample, meaning the original concentration plus the spike amount. Applies to QA samples only. Required for Matrix Spikes and Certified Reference Materials, and surrogates. For surrogate samples, the expected value should be 100, representing 100%.
Value Type:
How the result was obtained. Actual (single direct reading), Calculated, Estimated.
Status:
Result status. P (Preliminary), A (Actual).
Bias:
A consistent deviation of measured values from the true value, caused by systematic errors in an analytical method, as determined by applying identical procedures to a specimen of known properties.
Corr:
A code (Y/N) indicating whether the confidence level has been corrected for bias.
Precision:
Estimate of the maximum possible error in the result. Example: +/- .004.
CI:
Confidence Interval. Select from the dropdown list. Confidence interval associated with the Precision. Only applicable when a Precision value has been entered.
RAN:
Replicate Analysis Number. The number of replicate analyses conducted to determine the result value.
Comments:
Enter any comments necessary to clarify any portion of the analysis or which is not accommodated by any other field, such as Percent Recovery or Dilution Factor. The convention for Percent Recovery is PR xx.
Click the save button to save the record. 4.2.6.4 Special Circumstance Samples: Pore water analysis
Preparation: Centrifuged plus any additional preparation done at the lab (Centrifuged, X) Prep Date: Date of analyzing laboratory preparation, with the data of centrifuge noted in Sample comments. If no preparation at the analyzing lab, enter the centrifuge date for Prep Date. Basis
: ww (wet weight).
4.2.6.5 Calculating Matrix Spike Percent Recovery The reported LabResult is the number gathered from the instrument and is the net amount recovered from the sample including the spike concentration. For spiked samples, the Expected Value is the total concentration of the analyte in the native sample plus the spiked concentration. Matrix Spike Percent Recovery will be calculated by subtracting the native result from both the MS LabResult and the MS ExpectedValue, then dividing the two by each other and multiplying by 100. To illustrate:
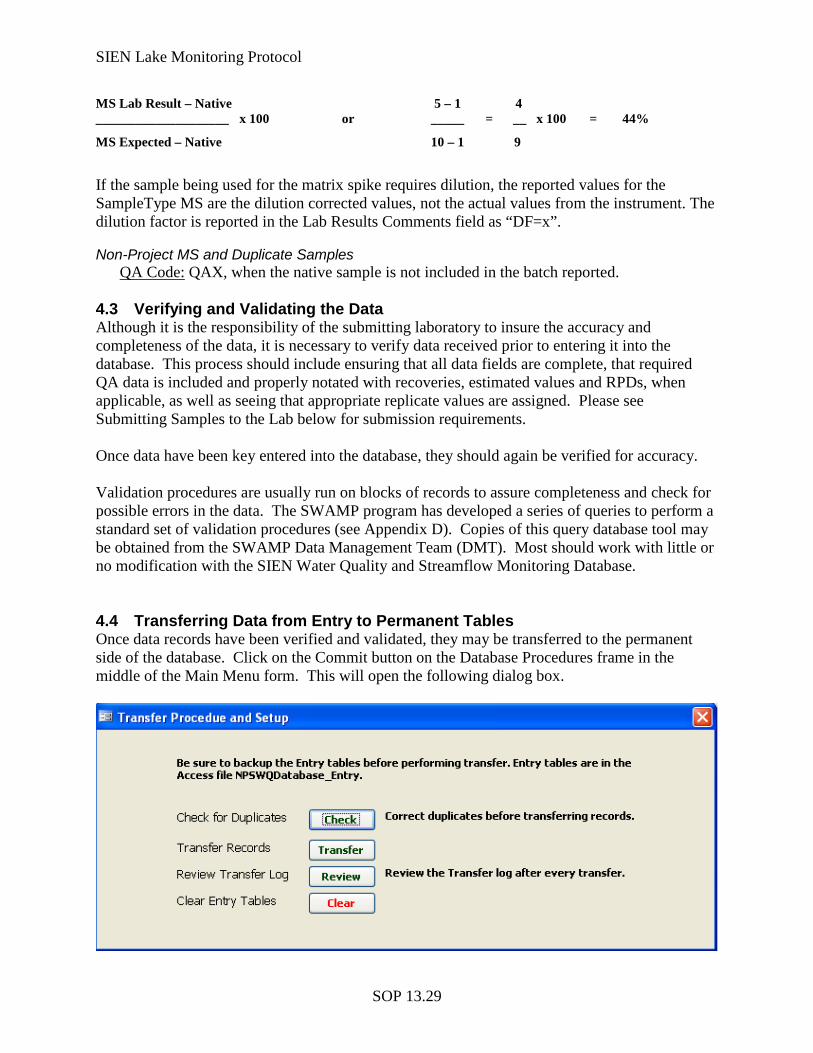
SIEN Lake Monitoring Protocol
SOP 13.29
MS Lab Result – Native 5 – 1 4 ____________________ x 100 or _____ = __ x 100 = 44%
MS Expected – Native 10 – 1 9
If the sample being used for the matrix spike requires dilution, the reported values for the SampleType MS are the dilution corrected values, not the actual values from the instrument. The dilution factor is reported in the Lab Results Comments field as “DF=x”. Non-Project MS and Duplicate Samples
QA Code:
QAX, when the native sample is not included in the batch reported.
4.3 Verifying and Validating the Data Although it is the responsibility of the submitting laboratory to insure the accuracy and completeness of the data, it is necessary to verify data received prior to entering it into the database. This process should include ensuring that all data fields are complete, that required QA data is included and properly notated with recoveries, estimated values and RPDs, when applicable, as well as seeing that appropriate replicate values are assigned. Please see Submitting Samples to the Lab below for submission requirements. Once data have been key entered into the database, they should again be verified for accuracy. Validation procedures are usually run on blocks of records to assure completeness and check for possible errors in the data. The SWAMP program has developed a series of queries to perform a standard set of validation procedures (see Appendix D). Copies of this query database tool may be obtained from the SWAMP Data Management Team (DMT). Most should work with little or no modification with the SIEN Water Quality and Streamflow Monitoring Database. 4.4 Transferring Data from Entry to Permanent Tables Once data records have been verified and validated, they may be transferred to the permanent side of the database. Click on the Commit button on the Database Procedures frame in the middle of the Main Menu form. This will open the following dialog box.
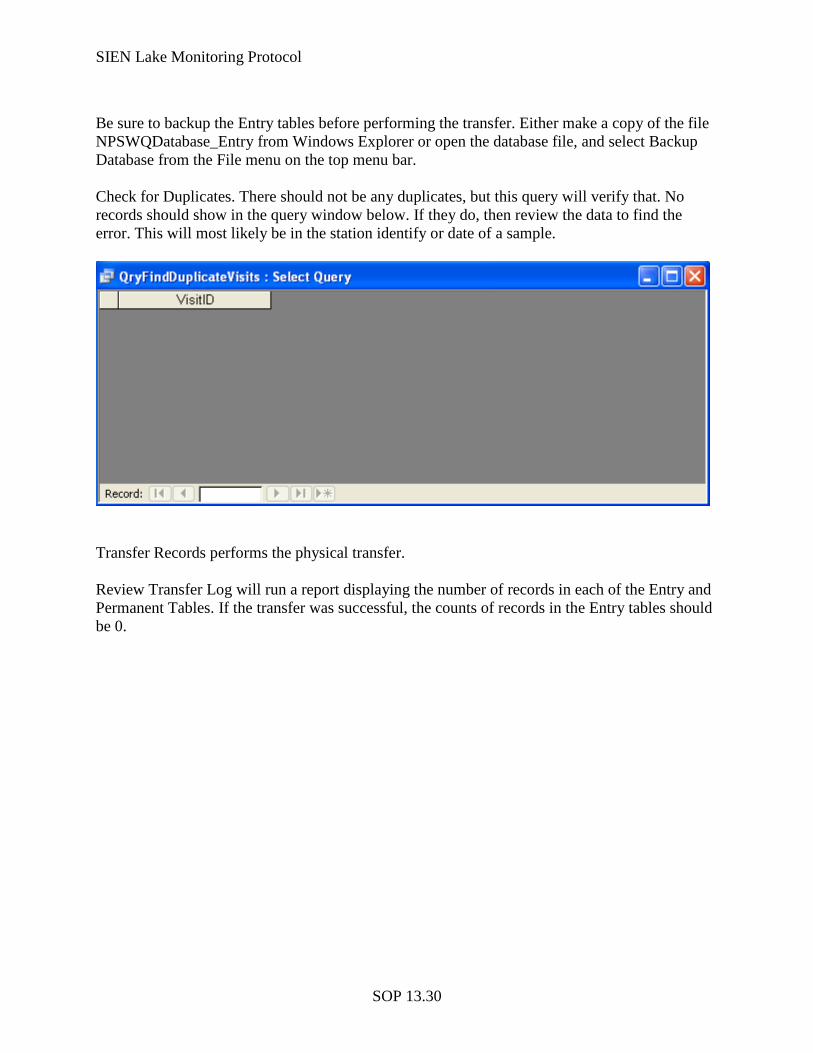
SIEN Lake Monitoring Protocol
SOP 13.30
Be sure to backup the Entry tables before performing the transfer. Either make a copy of the file NPSWQDatabase_Entry from Windows Explorer or open the database file, and select Backup Database from the File menu on the top menu bar. Check for Duplicates. There should not be any duplicates, but this query will verify that. No records should show in the query window below. If they do, then review the data to find the error. This will most likely be in the station identify or date of a sample.
Transfer Records performs the physical transfer. Review Transfer Log will run a report displaying the number of records in each of the Entry and Permanent Tables. If the transfer was successful, the counts of records in the Entry tables should be 0.
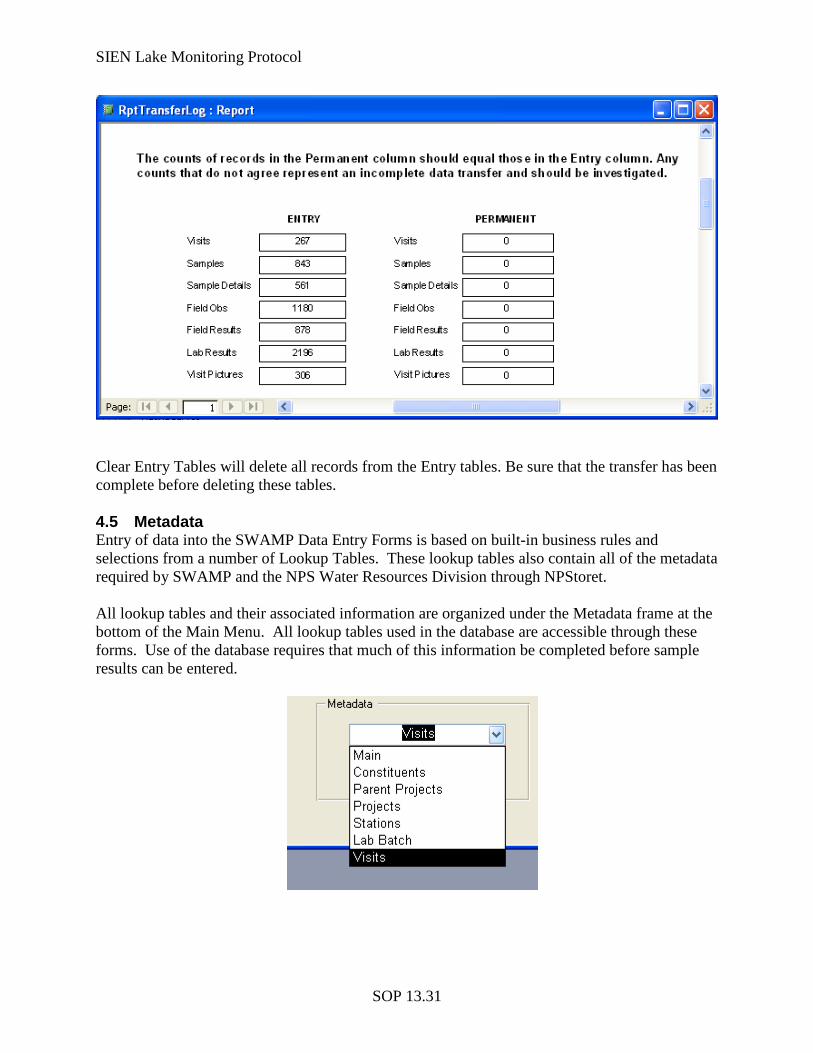
SIEN Lake Monitoring Protocol
SOP 13.31
Clear Entry Tables will delete all records from the Entry tables. Be sure that the transfer has been complete before deleting these tables. 4.5 Metadata Entry of data into the SWAMP Data Entry Forms is based on built-in business rules and selections from a number of Lookup Tables. These lookup tables also contain all of the metadata required by SWAMP and the NPS Water Resources Division through NPStoret. All lookup tables and their associated information are organized under the Metadata frame at the bottom of the Main Menu. All lookup tables used in the database are accessible through these forms. Use of the database requires that much of this information be completed before sample results can be entered.
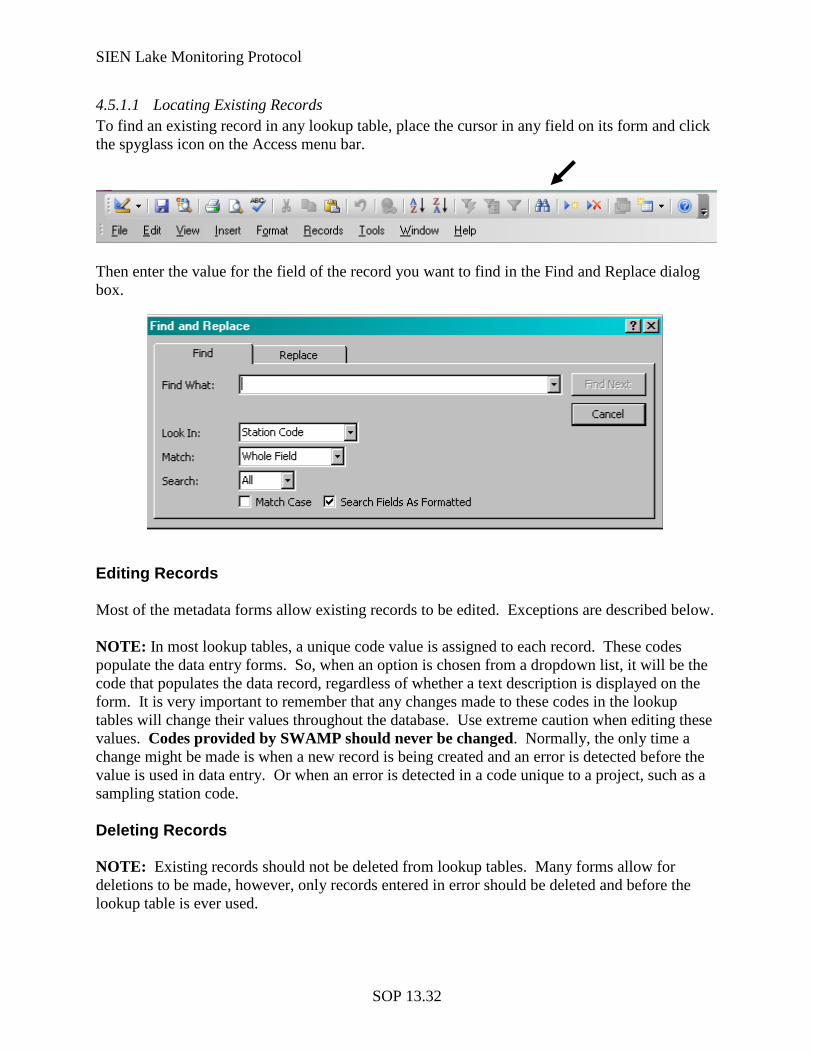
SIEN Lake Monitoring Protocol
SOP 13.32
4.5.1.1 Locating Existing Records To find an existing record in any lookup table, place the cursor in any field on its form and click the spyglass icon on the Access menu bar.
Then enter the value for the field of the record you want to find in the Find and Replace dialog box.
Editing Records Most of the metadata forms allow existing records to be edited. Exceptions are described below. NOTE: In most lookup tables, a unique code value is assigned to each record. These codes populate the data entry forms. So, when an option is chosen from a dropdown list, it will be the code that populates the data record, regardless of whether a text description is displayed on the form. It is very important to remember that any changes made to these codes in the lookup tables will change their values throughout the database. Use extreme caution when editing these values. Codes provided by SWAMP should never be changed. Normally, the only time a change might be made is when a new record is being created and an error is detected before the value is used in data entry. Or when an error is detected in a code unique to a project, such as a sampling station code. Deleting Records NOTE: Existing records should not be deleted from lookup tables. Many forms allow for deletions to be made, however, only records entered in error should be deleted and before the lookup table is ever used.
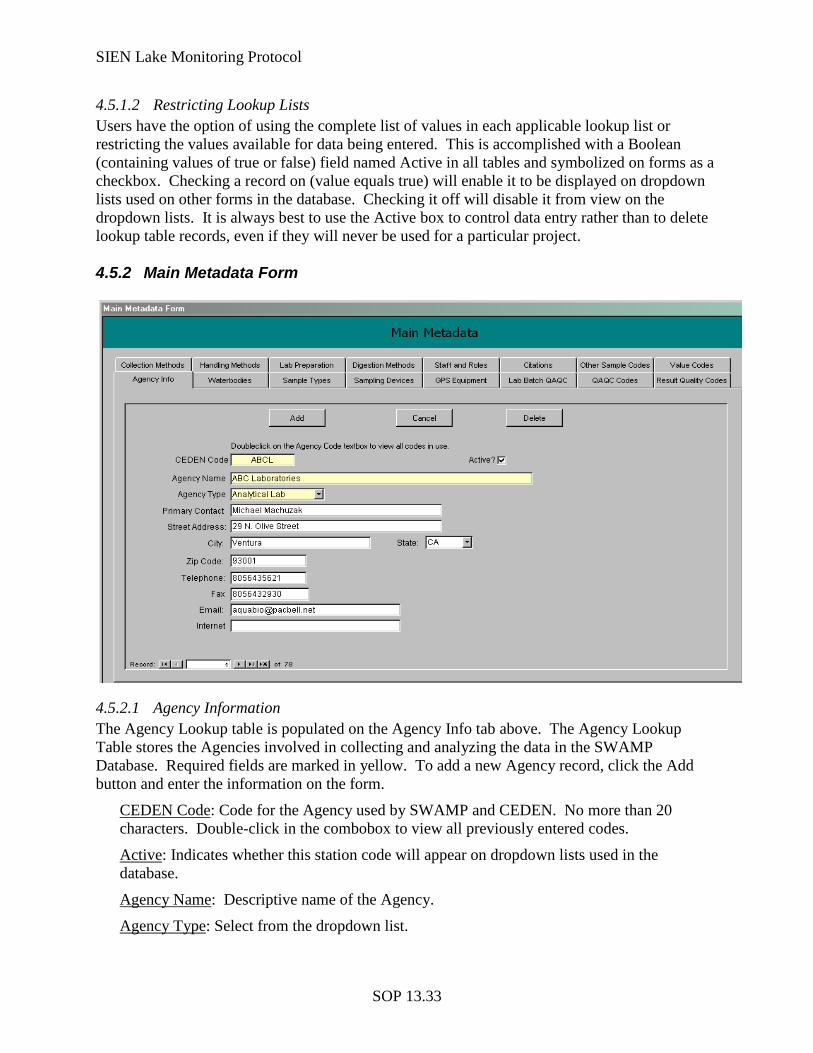
SIEN Lake Monitoring Protocol
SOP 13.33
4.5.1.2 Restricting Lookup Lists Users have the option of using the complete list of values in each applicable lookup list or restricting the values available for data being entered. This is accomplished with a Boolean (containing values of true or false) field named Active in all tables and symbolized on forms as a checkbox. Checking a record on (value equals true) will enable it to be displayed on dropdown lists used on other forms in the database. Checking it off will disable it from view on the dropdown lists. It is always best to use the Active box to control data entry rather than to delete lookup table records, even if they will never be used for a particular project. 4.5.2 Main Metadata Form
4.5.2.1 Agency Information The Agency Lookup table is populated on the Agency Info tab above. The Agency Lookup Table stores the Agencies involved in collecting and analyzing the data in the SWAMP Database. Required fields are marked in yellow. To add a new Agency record, click the Add button and enter the information on the form.
CEDEN Code: Code for the Agency used by SWAMP and CEDEN. No more than 20 characters. Double-click in the combobox to view all previously entered codes.
Active: Indicates whether this station code will appear on dropdown lists used in the database.
Agency Name: Descriptive name of the Agency.
Agency Type
: Select from the dropdown list.
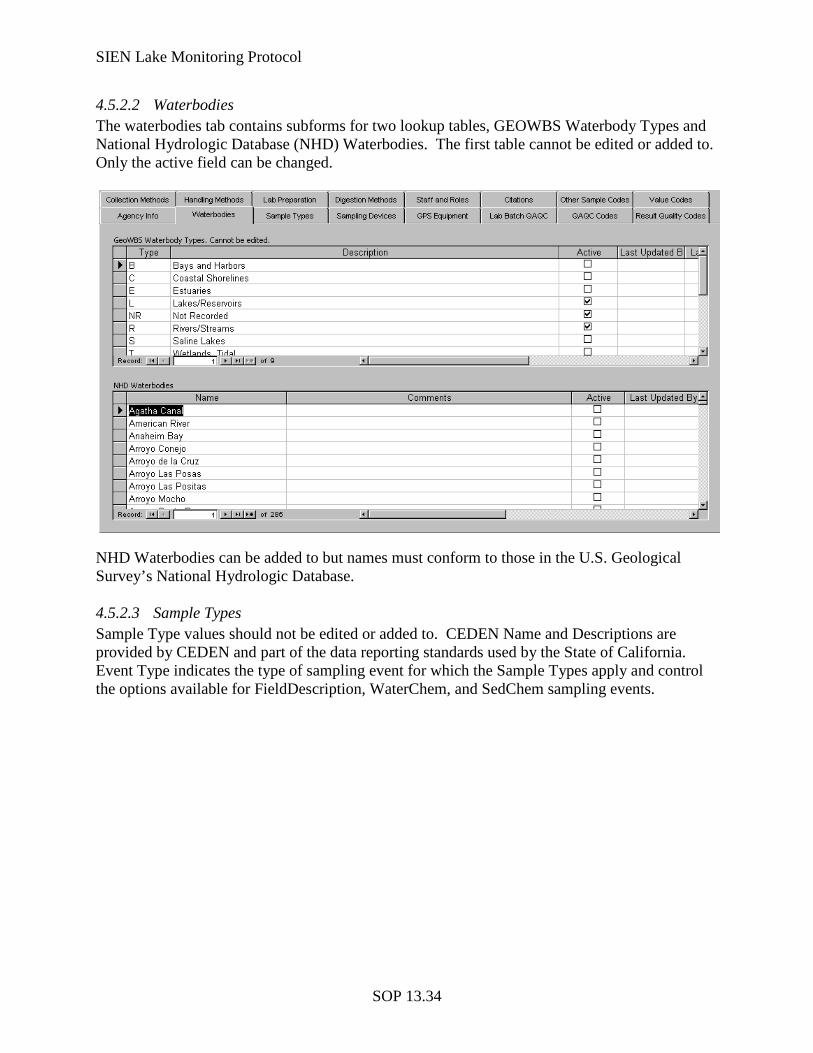
SIEN Lake Monitoring Protocol
SOP 13.34
4.5.2.2 Waterbodies The waterbodies tab contains subforms for two lookup tables, GEOWBS Waterbody Types and National Hydrologic Database (NHD) Waterbodies. The first table cannot be edited or added to. Only the active field can be changed.
NHD Waterbodies can be added to but names must conform to those in the U.S. Geological Survey’s National Hydrologic Database. 4.5.2.3 Sample Types Sample Type values should not be edited or added to. CEDEN Name and Descriptions are provided by CEDEN and part of the data reporting standards used by the State of California. Event Type indicates the type of sampling event for which the Sample Types apply and control the options available for FieldDescription, WaterChem, and SedChem sampling events.
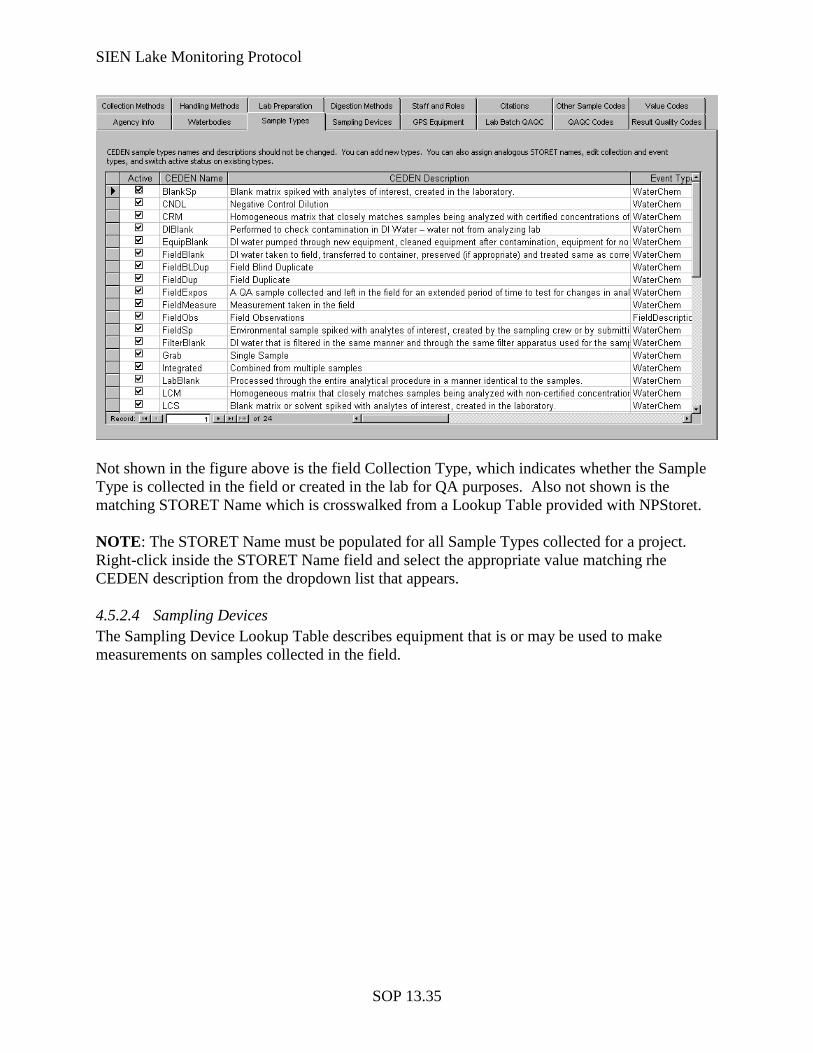
SIEN Lake Monitoring Protocol
SOP 13.35
Not shown in the figure above is the field Collection Type, which indicates whether the Sample Type is collected in the field or created in the lab for QA purposes. Also not shown is the matching STORET Name which is crosswalked from a Lookup Table provided with NPStoret. NOTE: The STORET Name must be populated for all Sample Types collected for a project. Right-click inside the STORET Name field and select the appropriate value matching rhe CEDEN description from the dropdown list that appears. 4.5.2.4 Sampling Devices The Sampling Device Lookup Table describes equipment that is or may be used to make measurements on samples collected in the field.
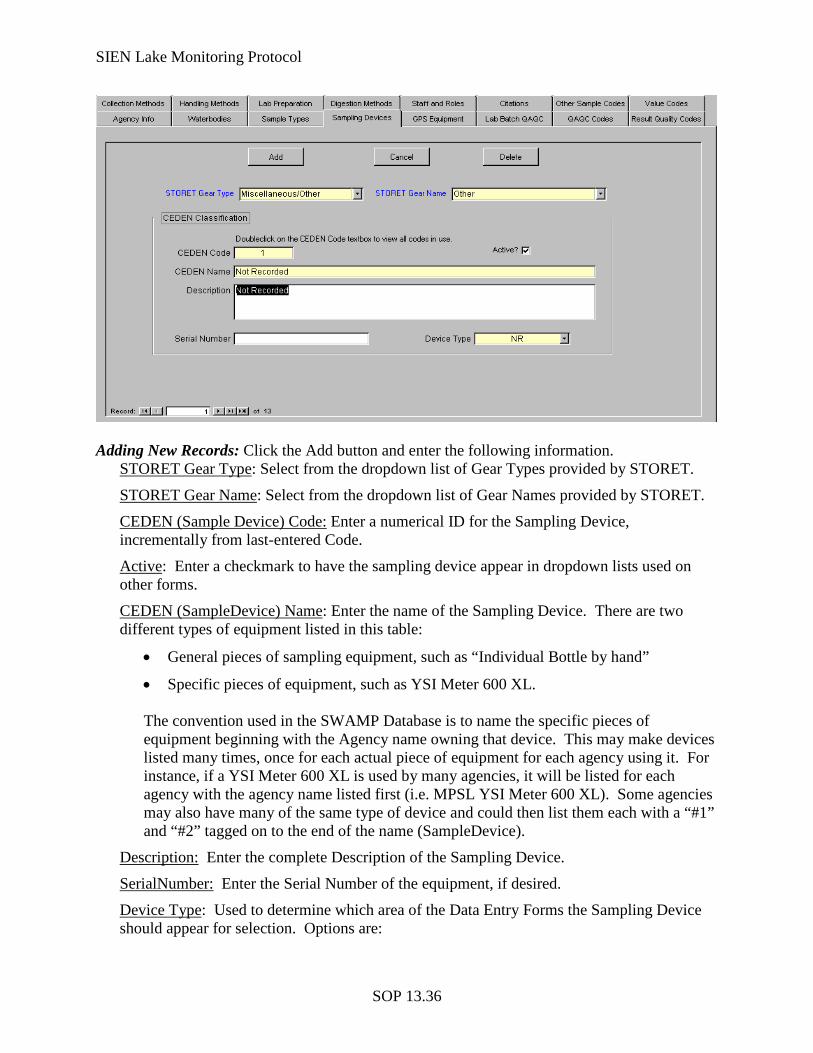
SIEN Lake Monitoring Protocol
SOP 13.36
Adding New Records: Click the Add button and enter the following information.
STORET Gear Type: Select from the dropdown list of Gear Types provided by STORET.
STORET Gear Name: Select from the dropdown list of Gear Names provided by STORET.
CEDEN (Sample Device) Code: Enter a numerical ID for the Sampling Device, incrementally from last-entered Code.
Active: Enter a checkmark to have the sampling device appear in dropdown lists used on other forms.
CEDEN (SampleDevice) Name
• General pieces of sampling equipment, such as “Individual Bottle by hand”
: Enter the name of the Sampling Device. There are two different types of equipment listed in this table:
• Specific pieces of equipment, such as YSI Meter 600 XL.
The convention used in the SWAMP Database is to name the specific pieces of equipment beginning with the Agency name owning that device. This may make devices listed many times, once for each actual piece of equipment for each agency using it. For instance, if a YSI Meter 600 XL is used by many agencies, it will be listed for each agency with the agency name listed first (i.e. MPSL YSI Meter 600 XL). Some agencies may also have many of the same type of device and could then list them each with a “#1” and “#2” tagged on to the end of the name (SampleDevice).
Description: Enter the complete Description of the Sampling Device.
SerialNumber: Enter the Serial Number of the equipment, if desired.
Device Type: Used to determine which area of the Data Entry Forms the Sampling Device should appear for selection. Options are:
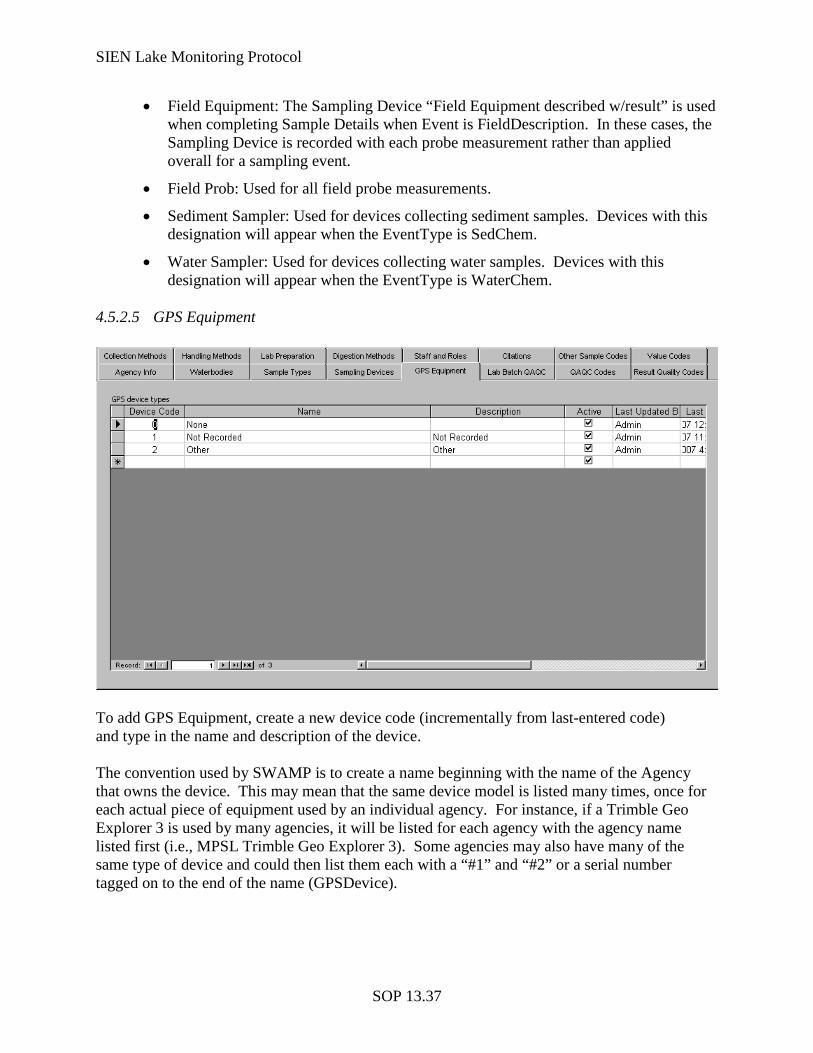
SIEN Lake Monitoring Protocol
SOP 13.37
• Field Equipment: The Sampling Device “Field Equipment described w/result” is used when completing Sample Details when Event is FieldDescription. In these cases, the Sampling Device is recorded with each probe measurement rather than applied overall for a sampling event.
• Field Prob: Used for all field probe measurements.
• Sediment Sampler: Used for devices collecting sediment samples. Devices with this designation will appear when the EventType is SedChem.
• Water Sampler: Used for devices collecting water samples. Devices with this designation will appear when the EventType is WaterChem.
4.5.2.5 GPS Equipment
To add GPS Equipment, create a new device code (incrementally from last-entered code) and type in the name and description of the device. The convention used by SWAMP is to create a name beginning with the name of the Agency that owns the device. This may mean that the same device model is listed many times, once for each actual piece of equipment used by an individual agency. For instance, if a Trimble Geo Explorer 3 is used by many agencies, it will be listed for each agency with the agency name listed first (i.e., MPSL Trimble Geo Explorer 3). Some agencies may also have many of the same type of device and could then list them each with a “#1” and “#2” or a serial number tagged on to the end of the name (GPSDevice).
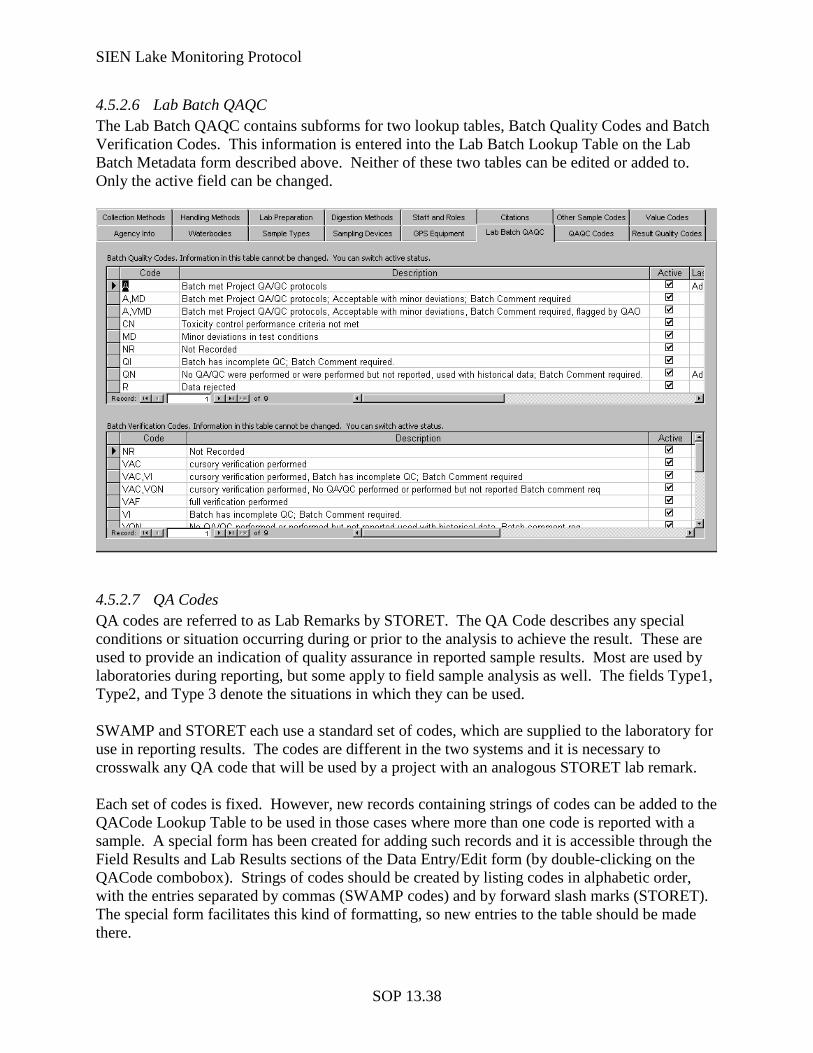
SIEN Lake Monitoring Protocol
SOP 13.38
4.5.2.6 Lab Batch QAQC The Lab Batch QAQC contains subforms for two lookup tables, Batch Quality Codes and Batch Verification Codes. This information is entered into the Lab Batch Lookup Table on the Lab Batch Metadata form described above. Neither of these two tables can be edited or added to. Only the active field can be changed.
4.5.2.7 QA Codes QA codes are referred to as Lab Remarks by STORET. The QA Code describes any special conditions or situation occurring during or prior to the analysis to achieve the result. These are used to provide an indication of quality assurance in reported sample results. Most are used by laboratories during reporting, but some apply to field sample analysis as well. The fields Type1, Type2, and Type 3 denote the situations in which they can be used. SWAMP and STORET each use a standard set of codes, which are supplied to the laboratory for use in reporting results. The codes are different in the two systems and it is necessary to crosswalk any QA code that will be used by a project with an analogous STORET lab remark. Each set of codes is fixed. However, new records containing strings of codes can be added to the QACode Lookup Table to be used in those cases where more than one code is reported with a sample. A special form has been created for adding such records and it is accessible through the Field Results and Lab Results sections of the Data Entry/Edit form (by double-clicking on the QACode combobox). Strings of codes should be created by listing codes in alphabetic order, with the entries separated by commas (SWAMP codes) and by forward slash marks (STORET). The special form facilitates this kind of formatting, so new entries to the table should be made there.
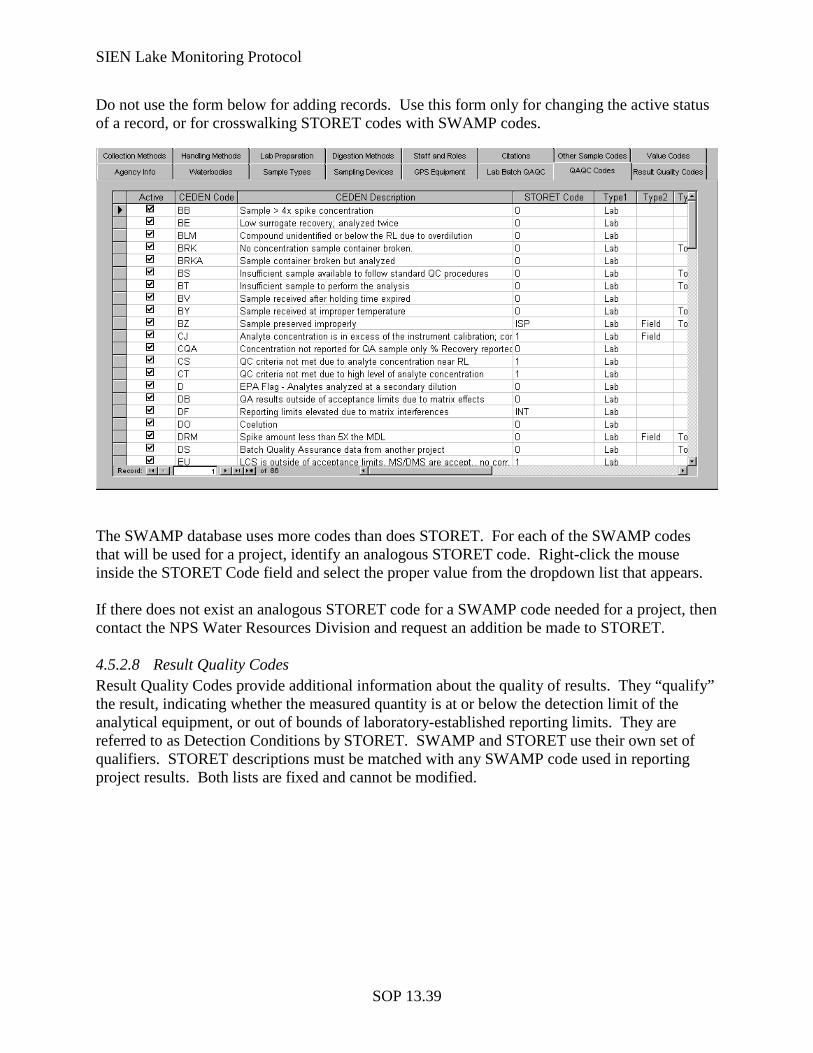
SIEN Lake Monitoring Protocol
SOP 13.39
Do not use the form below for adding records. Use this form only for changing the active status of a record, or for crosswalking STORET codes with SWAMP codes.
The SWAMP database uses more codes than does STORET. For each of the SWAMP codes that will be used for a project, identify an analogous STORET code. Right-click the mouse inside the STORET Code field and select the proper value from the dropdown list that appears. If there does not exist an analogous STORET code for a SWAMP code needed for a project, then contact the NPS Water Resources Division and request an addition be made to STORET. 4.5.2.8 Result Quality Codes Result Quality Codes provide additional information about the quality of results. They “qualify” the result, indicating whether the measured quantity is at or below the detection limit of the analytical equipment, or out of bounds of laboratory-established reporting limits. They are referred to as Detection Conditions by STORET. SWAMP and STORET use their own set of qualifiers. STORET descriptions must be matched with any SWAMP code used in reporting project results. Both lists are fixed and cannot be modified.
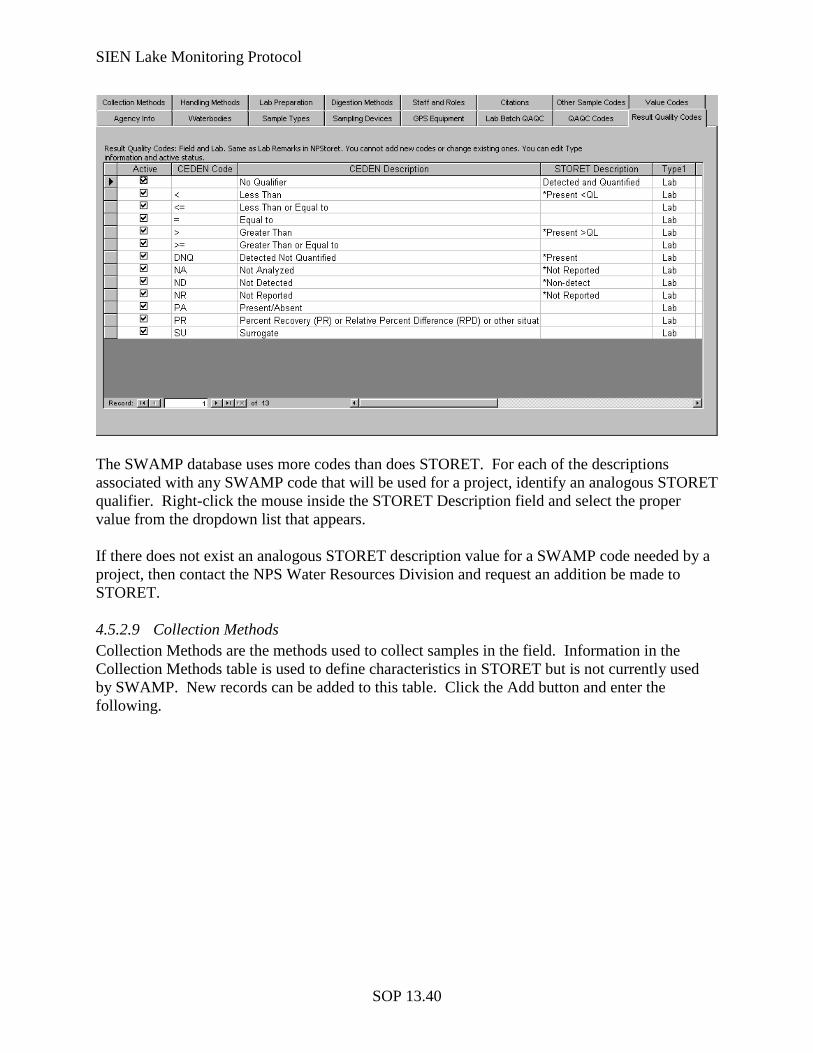
SIEN Lake Monitoring Protocol
SOP 13.40
The SWAMP database uses more codes than does STORET. For each of the descriptions associated with any SWAMP code that will be used for a project, identify an analogous STORET qualifier. Right-click the mouse inside the STORET Description field and select the proper value from the dropdown list that appears. If there does not exist an analogous STORET description value for a SWAMP code needed by a project, then contact the NPS Water Resources Division and request an addition be made to STORET. 4.5.2.9 Collection Methods Collection Methods are the methods used to collect samples in the field. Information in the Collection Methods table is used to define characteristics in STORET but is not currently used by SWAMP. New records can be added to this table. Click the Add button and enter the following.
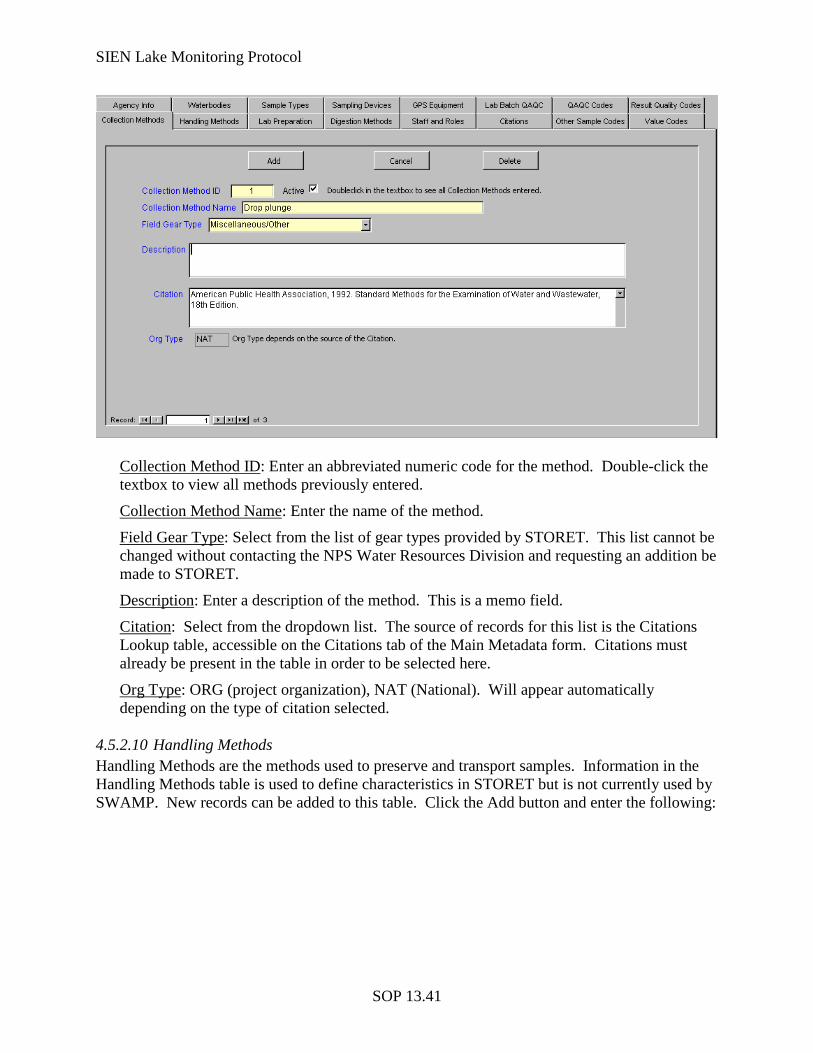
SIEN Lake Monitoring Protocol
SOP 13.41
Collection Method ID: Enter an abbreviated numeric code for the method. Double-click the textbox to view all methods previously entered.
Collection Method Name: Enter the name of the method.
Field Gear Type: Select from the list of gear types provided by STORET. This list cannot be changed without contacting the NPS Water Resources Division and requesting an addition be made to STORET.
Description: Enter a description of the method. This is a memo field.
Citation: Select from the dropdown list. The source of records for this list is the Citations Lookup table, accessible on the Citations tab of the Main Metadata form. Citations must already be present in the table in order to be selected here.
Org Type
: ORG (project organization), NAT (National). Will appear automatically depending on the type of citation selected.
4.5.2.10 Handling Methods Handling Methods are the methods used to preserve and transport samples. Information in the Handling Methods table is used to define characteristics in STORET but is not currently used by SWAMP. New records can be added to this table. Click the Add button and enter the following:
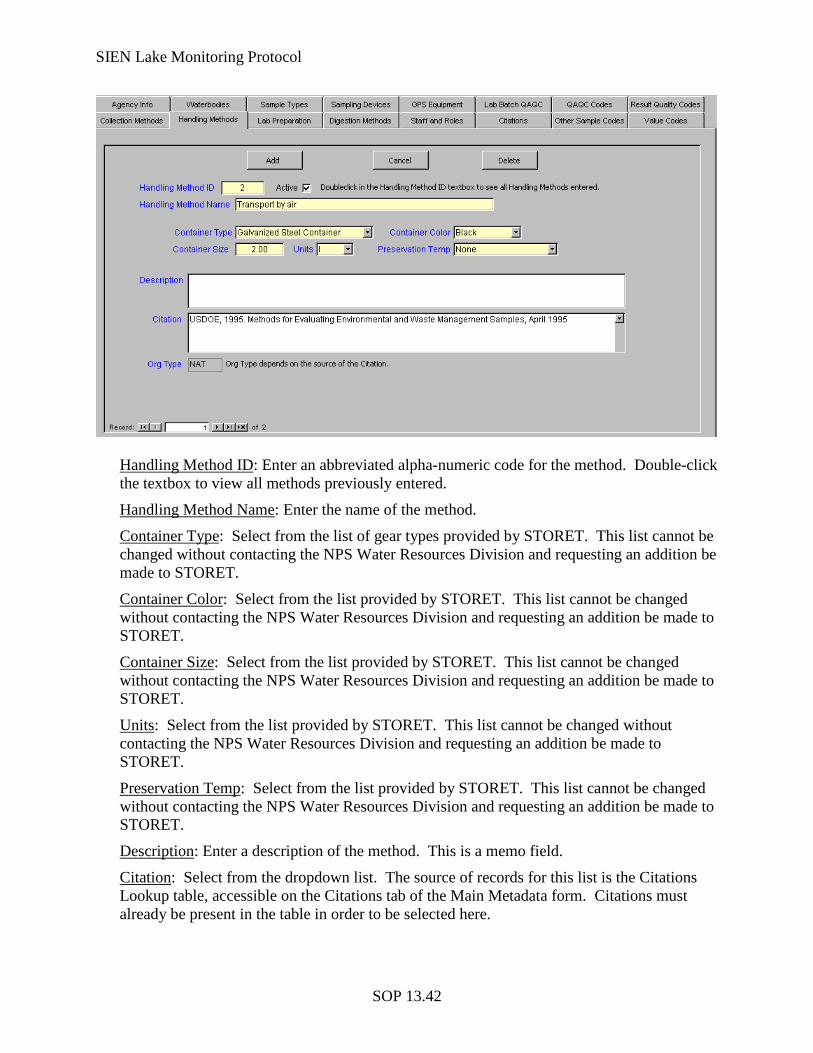
SIEN Lake Monitoring Protocol
SOP 13.42
Handling Method ID: Enter an abbreviated alpha-numeric code for the method. Double-click the textbox to view all methods previously entered.
Handling Method Name: Enter the name of the method.
Container Type: Select from the list of gear types provided by STORET. This list cannot be changed without contacting the NPS Water Resources Division and requesting an addition be made to STORET.
Container Color: Select from the list provided by STORET. This list cannot be changed without contacting the NPS Water Resources Division and requesting an addition be made to STORET.
Container Size: Select from the list provided by STORET. This list cannot be changed without contacting the NPS Water Resources Division and requesting an addition be made to STORET.
Units: Select from the list provided by STORET. This list cannot be changed without contacting the NPS Water Resources Division and requesting an addition be made to STORET.
Preservation Temp: Select from the list provided by STORET. This list cannot be changed without contacting the NPS Water Resources Division and requesting an addition be made to STORET.
Description: Enter a description of the method. This is a memo field.
Citation: Select from the dropdown list. The source of records for this list is the Citations Lookup table, accessible on the Citations tab of the Main Metadata form. Citations must already be present in the table in order to be selected here.
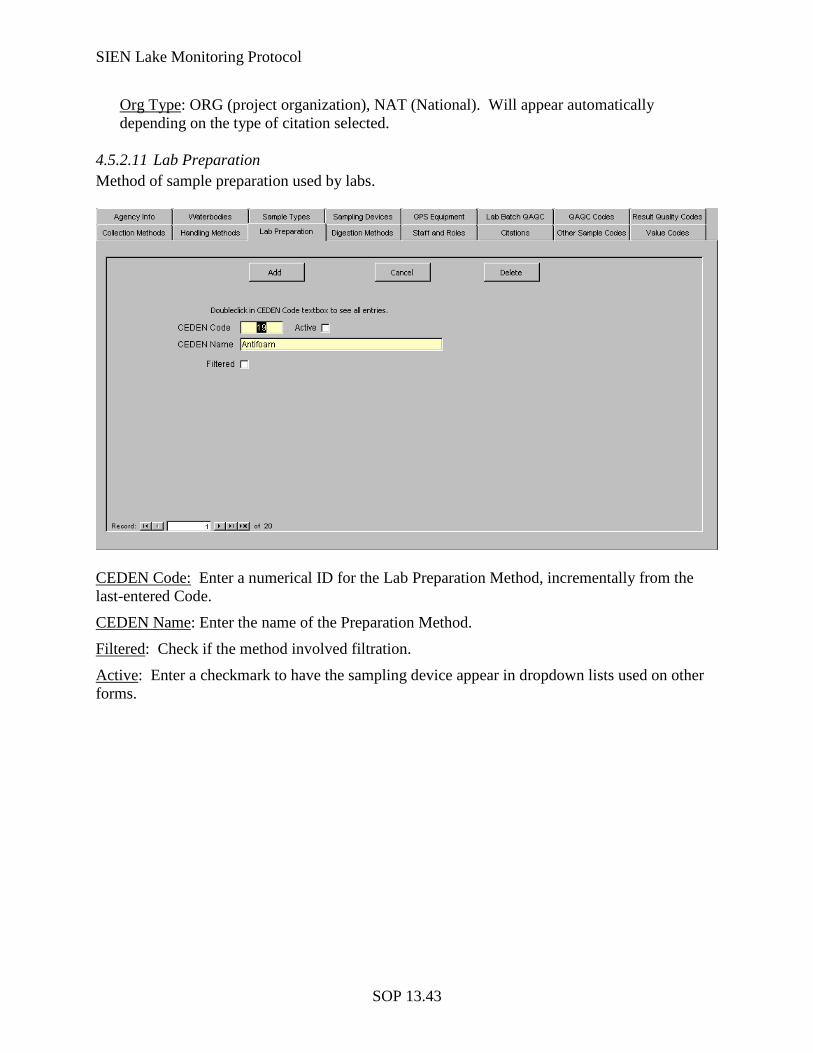
SIEN Lake Monitoring Protocol
SOP 13.43
Org Type
: ORG (project organization), NAT (National). Will appear automatically depending on the type of citation selected.
4.5.2.11 Lab Preparation Method of sample preparation used by labs.
CEDEN Code: Enter a numerical ID for the Lab Preparation Method, incrementally from the last-entered Code.
CEDEN Name: Enter the name of the Preparation Method.
Filtered: Check if the method involved filtration.
Active
: Enter a checkmark to have the sampling device appear in dropdown lists used on other forms.
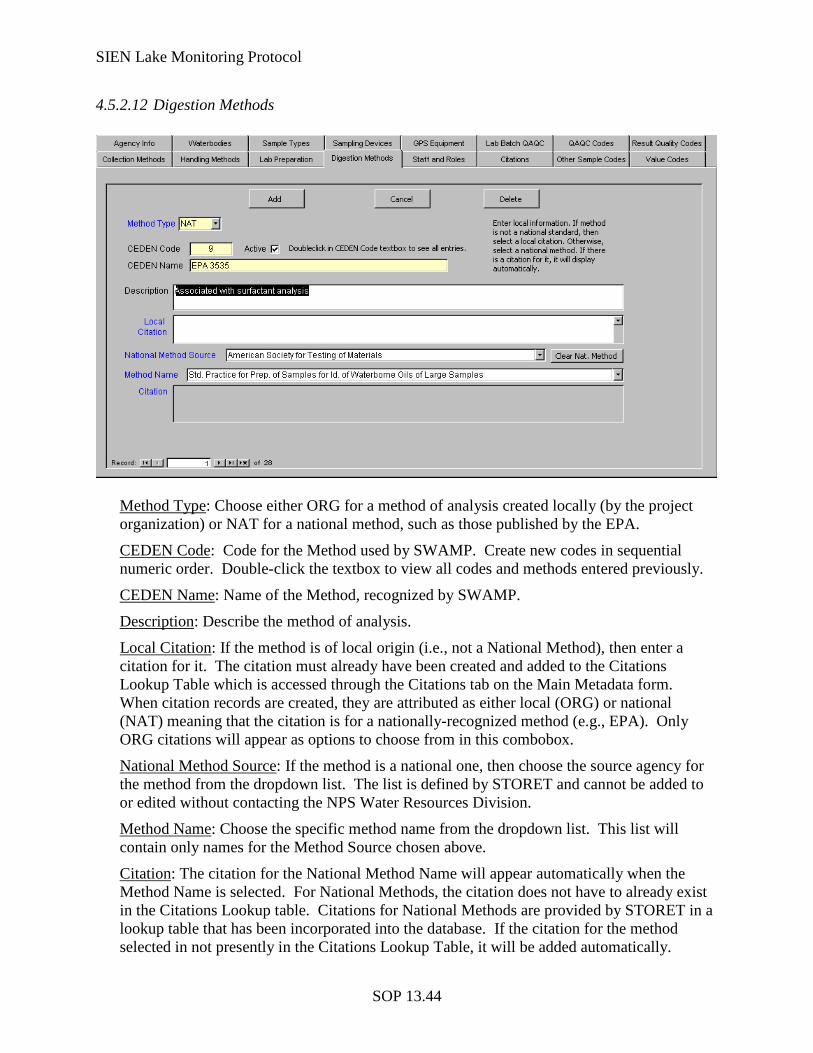
SIEN Lake Monitoring Protocol
SOP 13.44
4.5.2.12 Digestion Methods
Method Type: Choose either ORG for a method of analysis created locally (by the project organization) or NAT for a national method, such as those published by the EPA.
CEDEN Code: Code for the Method used by SWAMP. Create new codes in sequential numeric order. Double-click the textbox to view all codes and methods entered previously.
CEDEN Name: Name of the Method, recognized by SWAMP.
Description: Describe the method of analysis.
Local Citation: If the method is of local origin (i.e., not a National Method), then enter a citation for it. The citation must already have been created and added to the Citations Lookup Table which is accessed through the Citations tab on the Main Metadata form. When citation records are created, they are attributed as either local (ORG) or national (NAT) meaning that the citation is for a nationally-recognized method (e.g., EPA). Only ORG citations will appear as options to choose from in this combobox.
National Method Source: If the method is a national one, then choose the source agency for the method from the dropdown list. The list is defined by STORET and cannot be added to or edited without contacting the NPS Water Resources Division.
Method Name: Choose the specific method name from the dropdown list. This list will contain only names for the Method Source chosen above.
Citation: The citation for the National Method Name will appear automatically when the Method Name is selected. For National Methods, the citation does not have to already exist in the Citations Lookup table. Citations for National Methods are provided by STORET in a lookup table that has been incorporated into the database. If the citation for the method selected in not presently in the Citations Lookup Table, it will be added automatically.
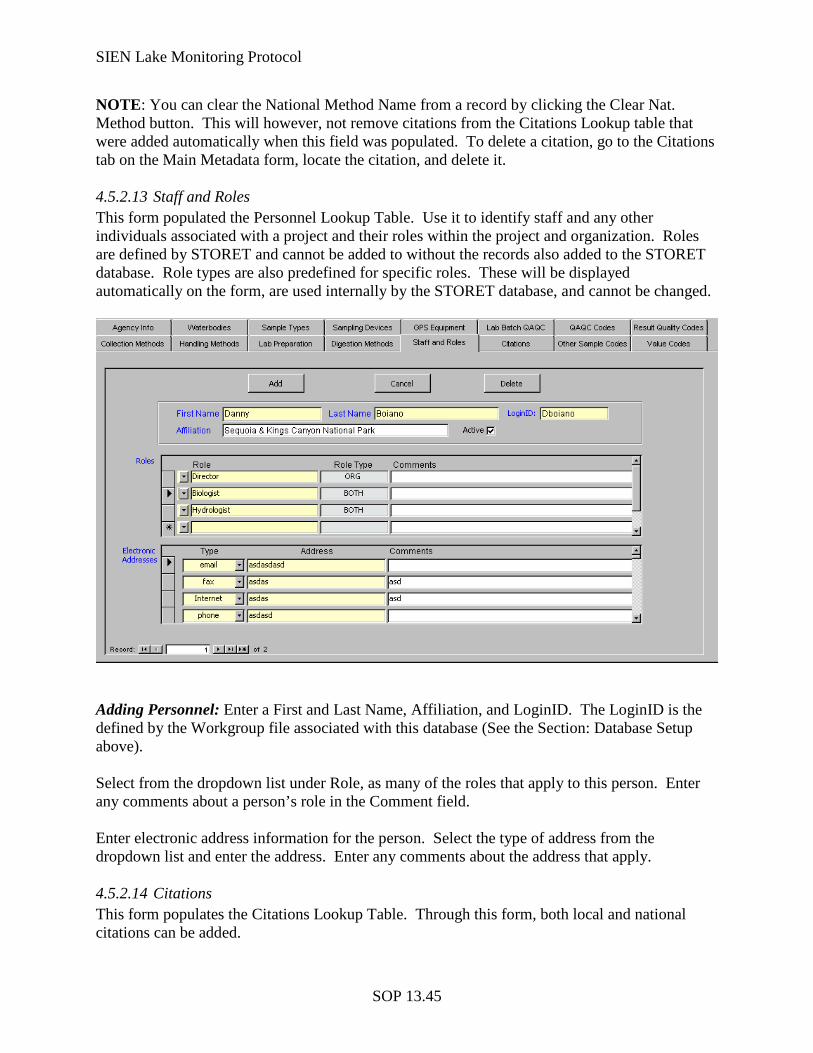
SIEN Lake Monitoring Protocol
SOP 13.45
NOTE: You can clear the National Method Name from a record by clicking the Clear Nat. Method button. This will however, not remove citations from the Citations Lookup table that were added automatically when this field was populated. To delete a citation, go to the Citations tab on the Main Metadata form, locate the citation, and delete it. 4.5.2.13 Staff and Roles This form populated the Personnel Lookup Table. Use it to identify staff and any other individuals associated with a project and their roles within the project and organization. Roles are defined by STORET and cannot be added to without the records also added to the STORET database. Role types are also predefined for specific roles. These will be displayed automatically on the form, are used internally by the STORET database, and cannot be changed.
Adding Personnel: Enter a First and Last Name, Affiliation, and LoginID. The LoginID is the defined by the Workgroup file associated with this database (See the Section: Database Setup above). Select from the dropdown list under Role, as many of the roles that apply to this person. Enter any comments about a person’s role in the Comment field. Enter electronic address information for the person. Select the type of address from the dropdown list and enter the address. Enter any comments about the address that apply. 4.5.2.14 Citations This form populates the Citations Lookup Table. Through this form, both local and national citations can be added.
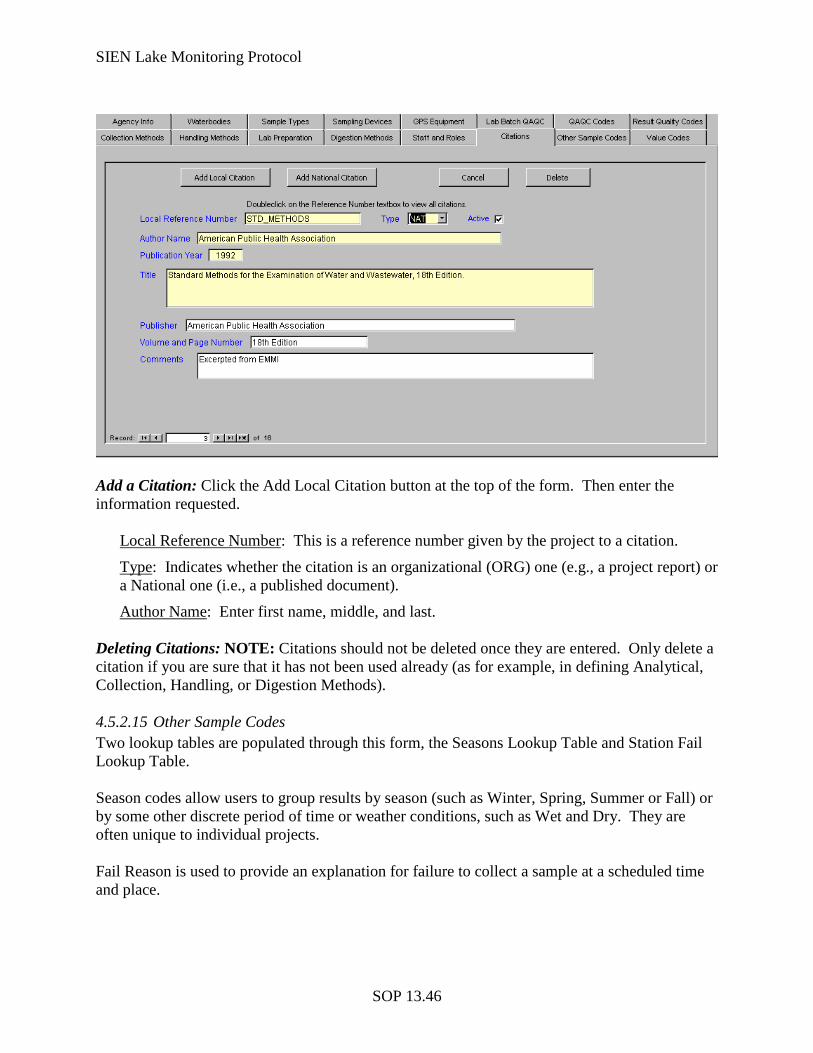
SIEN Lake Monitoring Protocol
SOP 13.46
Add a Citation: Click the Add Local Citation button at the top of the form. Then enter the information requested.
Local Reference Number: This is a reference number given by the project to a citation.
Type: Indicates whether the citation is an organizational (ORG) one (e.g., a project report) or a National one (i.e., a published document).
Author Name
: Enter first name, middle, and last.
Deleting Citations: NOTE: Citations should not be deleted once they are entered. Only delete a citation if you are sure that it has not been used already (as for example, in defining Analytical, Collection, Handling, or Digestion Methods). 4.5.2.15 Other Sample Codes Two lookup tables are populated through this form, the Seasons Lookup Table and Station Fail Lookup Table. Season codes allow users to group results by season (such as Winter, Spring, Summer or Fall) or by some other discrete period of time or weather conditions, such as Wet and Dry. They are often unique to individual projects. Fail Reason is used to provide an explanation for failure to collect a sample at a scheduled time and place.
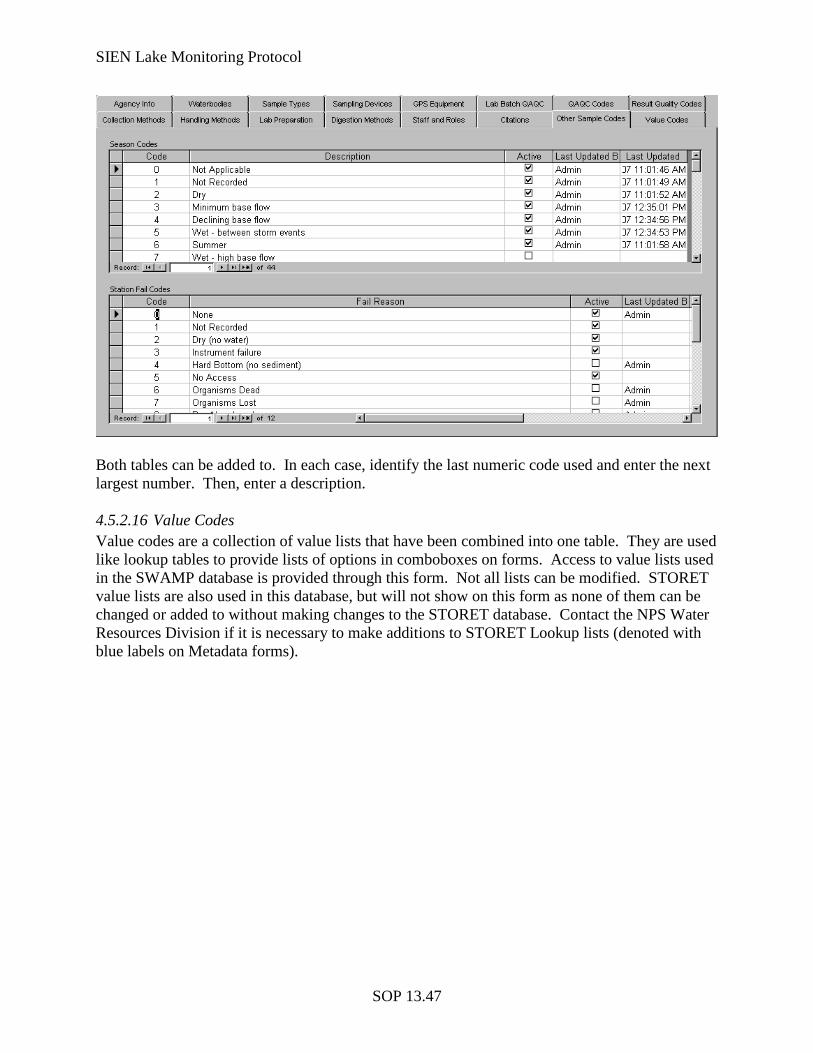
SIEN Lake Monitoring Protocol
SOP 13.47
Both tables can be added to. In each case, identify the last numeric code used and enter the next largest number. Then, enter a description. 4.5.2.16 Value Codes Value codes are a collection of value lists that have been combined into one table. They are used like lookup tables to provide lists of options in comboboxes on forms. Access to value lists used in the SWAMP database is provided through this form. Not all lists can be modified. STORET value lists are also used in this database, but will not show on this form as none of them can be changed or added to without making changes to the STORET database. Contact the NPS Water Resources Division if it is necessary to make additions to STORET Lookup lists (denoted with blue labels on Metadata forms).
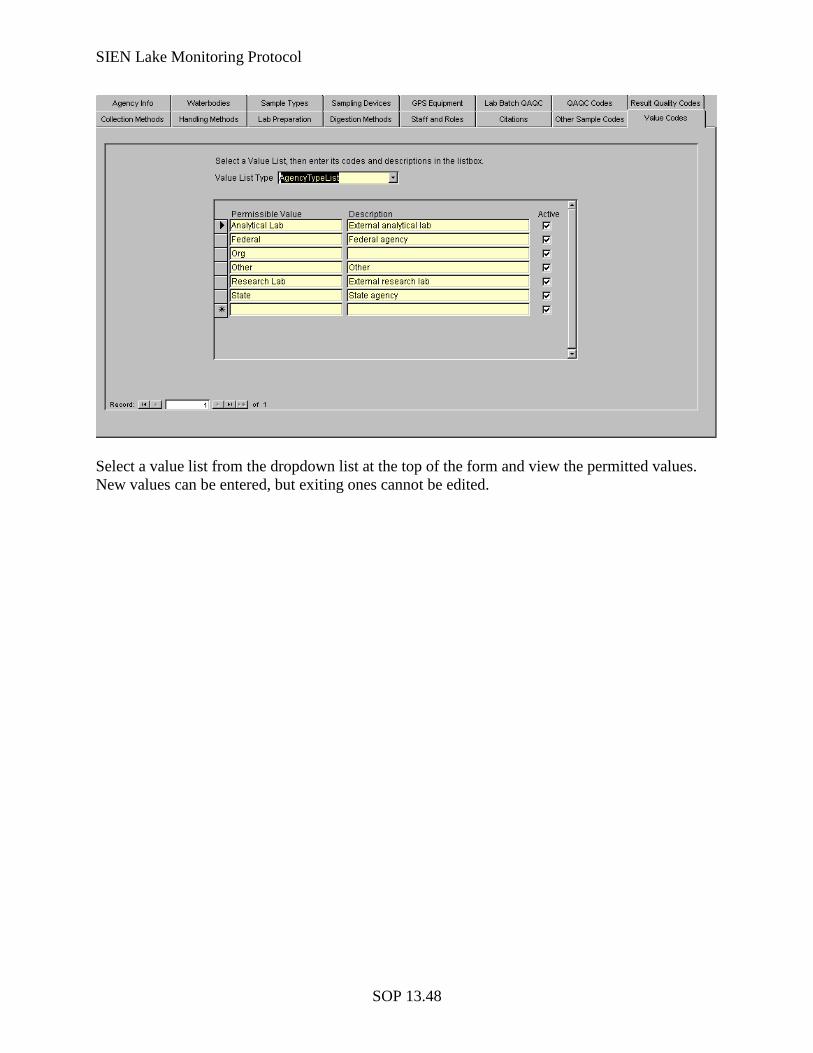
SIEN Lake Monitoring Protocol
SOP 13.48
Select a value list from the dropdown list at the top of the form and view the permitted values. New values can be entered, but exiting ones cannot be edited.
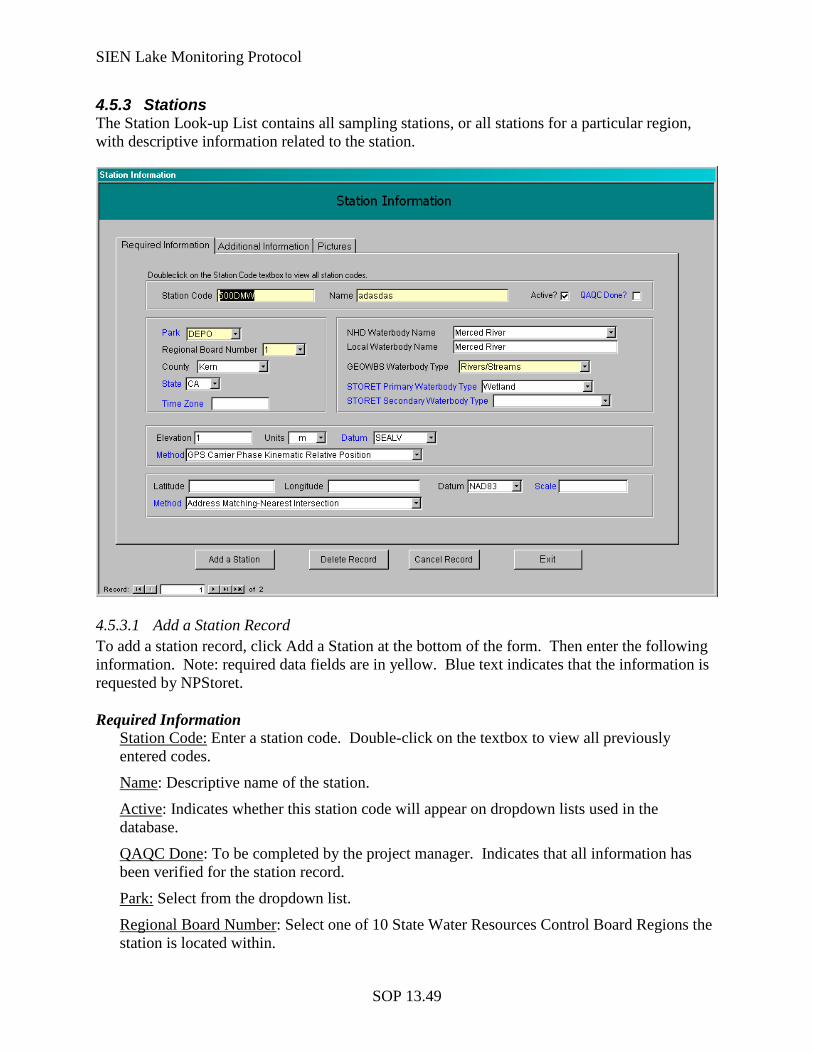
SIEN Lake Monitoring Protocol
SOP 13.49
4.5.3 Stations The Station Look-up List contains all sampling stations, or all stations for a particular region, with descriptive information related to the station.
4.5.3.1 Add a Station Record To add a station record, click Add a Station at the bottom of the form. Then enter the following information. Note: required data fields are in yellow. Blue text indicates that the information is requested by NPStoret. Required Information
Station Code: Enter a station code. Double-click on the textbox to view all previously entered codes.
Name: Descriptive name of the station.
Active: Indicates whether this station code will appear on dropdown lists used in the database.
QAQC Done: To be completed by the project manager. Indicates that all information has been verified for the station record.
Park: Select from the dropdown list.
Regional Board Number: Select one of 10 State Water Resources Control Board Regions the station is located within.
SIEN Lake Monitoring Protocol
SOP 13.50
County: The county where the station is located. Select from dropdown.
State: Select from the dropdown.
Time Zone: Enter time zone where the station is located. For SIEN parks, the time zone is always PST.
NHD Waterbody Name: Name of the waterbody where the station is located. From the U.S.G.S. National Hydraulogy Database. Many waterbodies in California are not yet named in the database. Leave blank if no name is available.
Local Waterbody Name: Defaults to NHD Waterbody Name if available. Otherwise, enter the name of the waterbody as it is used in the park.
GEOWBS Waterbody Type: A California classification system for types of waterbodies. Select from the dropdown list.
STORET Primary Waterbody Type: Defined by STORET. Select from the dropdown list.
STORET Secondary Waterbody Type: Defined by STORET. Select from the dropdown list.
Elevation: Elevation of the sampling station.
Units: Units of elevation.
Datum: Datum used in deriving elevation.
Method: Method used to derive the elevation.
Latitude: Expressed in decimal degrees.
Longitude: Expressed in decimal degrees. Negative (-) for SIEN parks.
Datum: Datum used in deriving the geographic coordinates.
Scale: Scale used to derive the geographic coordinates.
Method
: Method used to derive the geographic coordinates.
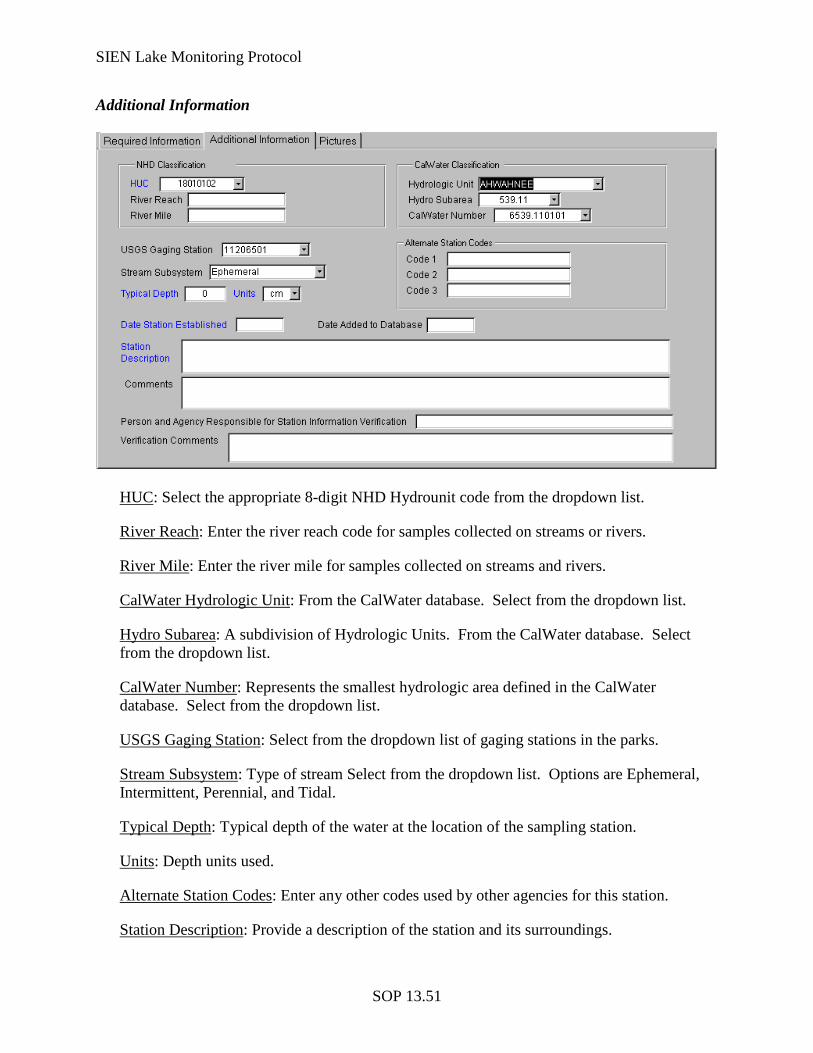
SIEN Lake Monitoring Protocol
SOP 13.51
Additional Information
HUC: Select the appropriate 8-digit NHD Hydrounit code from the dropdown list.
River Reach: Enter the river reach code for samples collected on streams or rivers.
River Mile: Enter the river mile for samples collected on streams and rivers.
CalWater Hydrologic Unit: From the CalWater database. Select from the dropdown list.
Hydro Subarea: A subdivision of Hydrologic Units. From the CalWater database. Select from the dropdown list.
CalWater Number: Represents the smallest hydrologic area defined in the CalWater database. Select from the dropdown list.
USGS Gaging Station: Select from the dropdown list of gaging stations in the parks.
Stream Subsystem: Type of stream Select from the dropdown list. Options are Ephemeral, Intermittent, Perennial, and Tidal.
Typical Depth: Typical depth of the water at the location of the sampling station.
Units: Depth units used.
Alternate Station Codes: Enter any other codes used by other agencies for this station.
Station Description: Provide a description of the station and its surroundings.
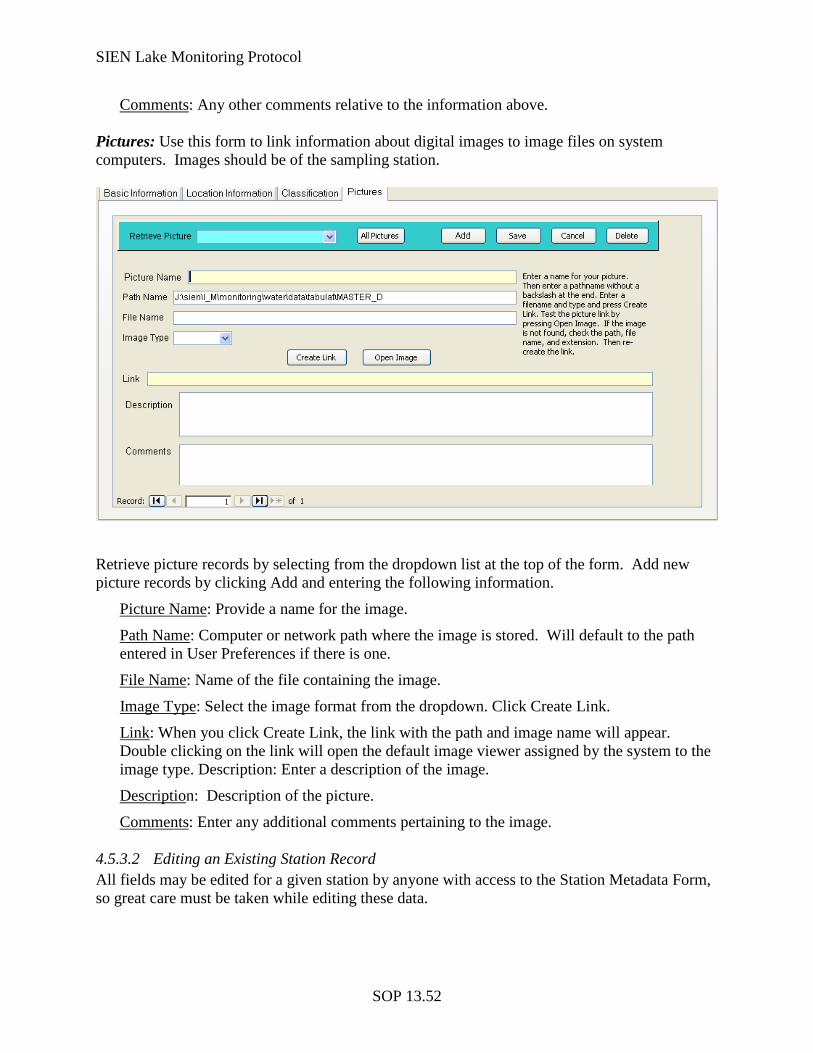
SIEN Lake Monitoring Protocol
SOP 13.52
Comments
: Any other comments relative to the information above.
Pictures: Use this form to link information about digital images to image files on system computers. Images should be of the sampling station.
Retrieve picture records by selecting from the dropdown list at the top of the form. Add new picture records by clicking Add and entering the following information.
Picture Name: Provide a name for the image.
Path Name: Computer or network path where the image is stored. Will default to the path entered in User Preferences if there is one.
File Name: Name of the file containing the image.
Image Type: Select the image format from the dropdown. Click Create Link.
Link: When you click Create Link, the link with the path and image name will appear. Double clicking on the link will open the default image viewer assigned by the system to the image type. Description: Enter a description of the image.
Description: Description of the picture.
Comments
: Enter any additional comments pertaining to the image.
4.5.3.2 Editing an Existing Station Record All fields may be edited for a given station by anyone with access to the Station Metadata Form, so great care must be taken while editing these data.
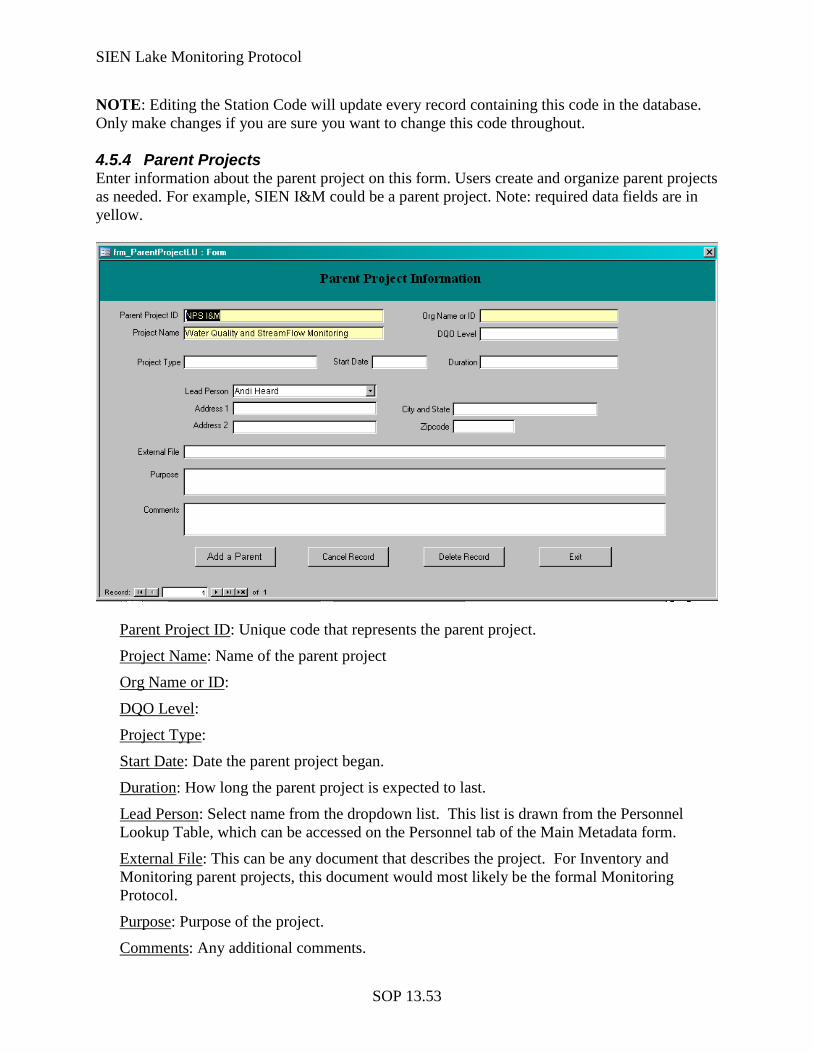
SIEN Lake Monitoring Protocol
SOP 13.53
NOTE: Editing the Station Code will update every record containing this code in the database. Only make changes if you are sure you want to change this code throughout. 4.5.4 Parent Projects Enter information about the parent project on this form. Users create and organize parent projects as needed. For example, SIEN I&M could be a parent project. Note: required data fields are in yellow.
Parent Project ID: Unique code that represents the parent project.
Project Name: Name of the parent project
Org Name or ID:
DQO Level:
Project Type:
Start Date: Date the parent project began.
Duration: How long the parent project is expected to last.
Lead Person: Select name from the dropdown list. This list is drawn from the Personnel Lookup Table, which can be accessed on the Personnel tab of the Main Metadata form.
External File: This can be any document that describes the project. For Inventory and Monitoring parent projects, this document would most likely be the formal Monitoring Protocol.
Purpose: Purpose of the project.
Comments: Any additional comments.
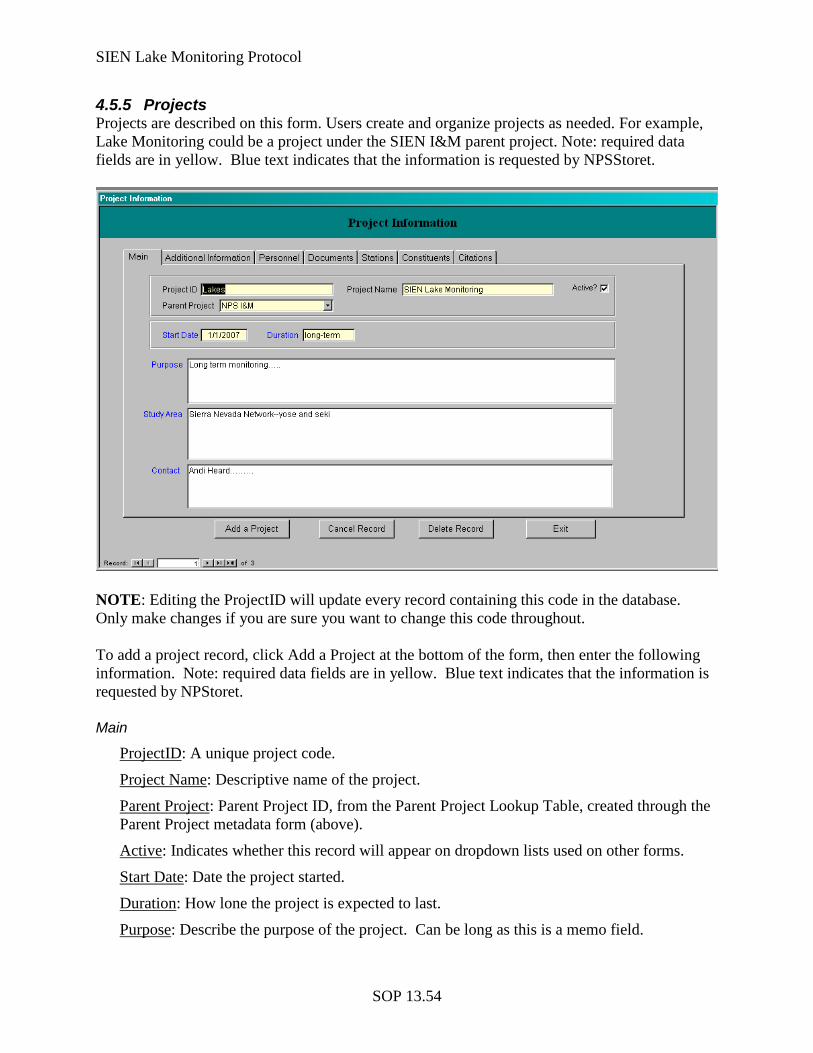
SIEN Lake Monitoring Protocol
SOP 13.54
4.5.5 Projects Projects are described on this form. Users create and organize projects as needed. For example, Lake Monitoring could be a project under the SIEN I&M parent project. Note: required data fields are in yellow. Blue text indicates that the information is requested by NPSStoret.
NOTE: Editing the ProjectID will update every record containing this code in the database. Only make changes if you are sure you want to change this code throughout. To add a project record, click Add a Project at the bottom of the form, then enter the following information. Note: required data fields are in yellow. Blue text indicates that the information is requested by NPStoret. Main
ProjectID: A unique project code.
Project Name: Descriptive name of the project.
Parent Project: Parent Project ID, from the Parent Project Lookup Table, created through the Parent Project metadata form (above).
Active: Indicates whether this record will appear on dropdown lists used on other forms.
Start Date: Date the project started.
Duration: How lone the project is expected to last.
Purpose: Describe the purpose of the project. Can be long as this is a memo field.
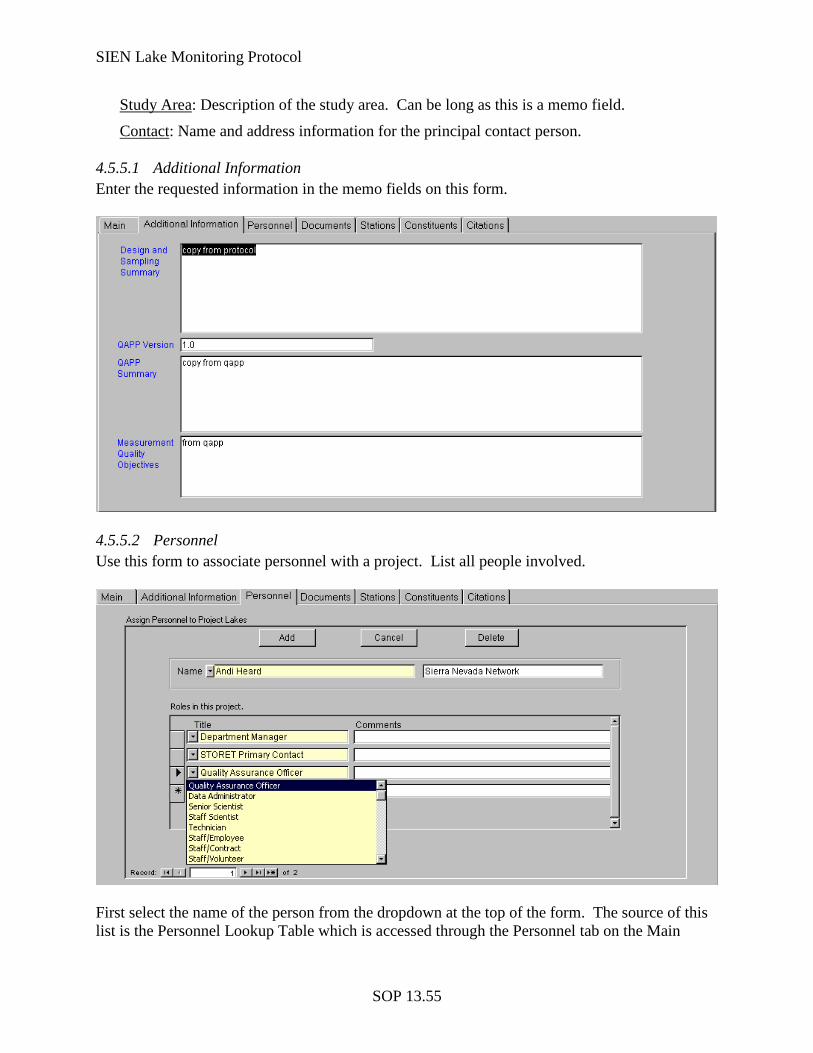
SIEN Lake Monitoring Protocol
SOP 13.55
Study Area: Description of the study area. Can be long as this is a memo field.
Contact
: Name and address information for the principal contact person.
4.5.5.1 Additional Information Enter the requested information in the memo fields on this form.
4.5.5.2 Personnel Use this form to associate personnel with a project. List all people involved.
First select the name of the person from the dropdown at the top of the form. The source of this list is the Personnel Lookup Table which is accessed through the Personnel tab on the Main
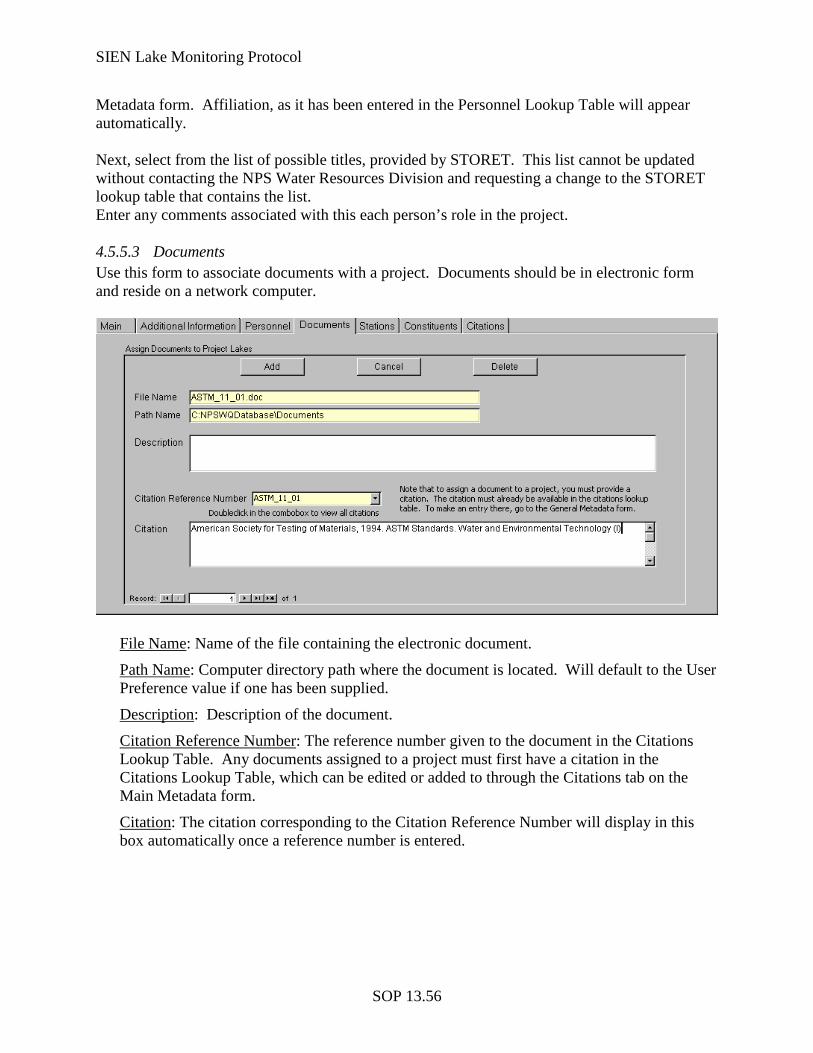
SIEN Lake Monitoring Protocol
SOP 13.56
Metadata form. Affiliation, as it has been entered in the Personnel Lookup Table will appear automatically. Next, select from the list of possible titles, provided by STORET. This list cannot be updated without contacting the NPS Water Resources Division and requesting a change to the STORET lookup table that contains the list. Enter any comments associated with this each person’s role in the project. 4.5.5.3 Documents Use this form to associate documents with a project. Documents should be in electronic form and reside on a network computer.
File Name: Name of the file containing the electronic document.
Path Name: Computer directory path where the document is located. Will default to the User Preference value if one has been supplied.
Description: Description of the document.
Citation Reference Number: The reference number given to the document in the Citations Lookup Table. Any documents assigned to a project must first have a citation in the Citations Lookup Table, which can be edited or added to through the Citations tab on the Main Metadata form.
Citation
: The citation corresponding to the Citation Reference Number will display in this box automatically once a reference number is entered.
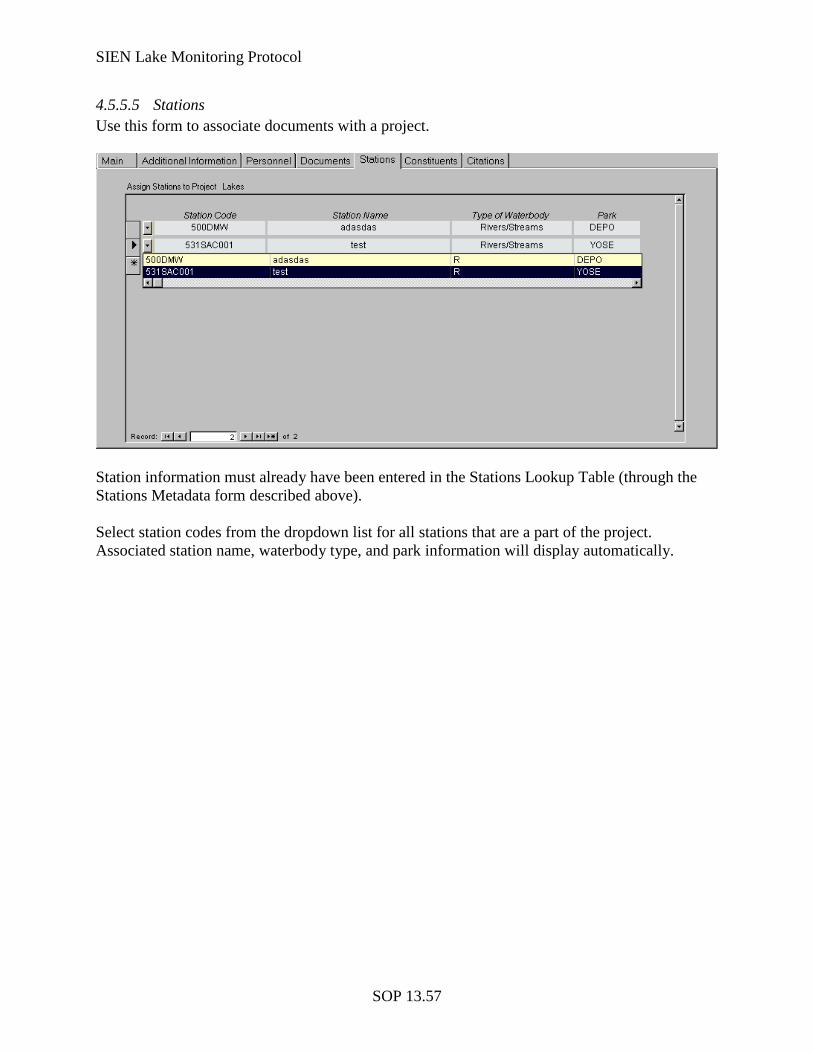
SIEN Lake Monitoring Protocol
SOP 13.57
4.5.5.5 Stations Use this form to associate documents with a project.
Station information must already have been entered in the Stations Lookup Table (through the Stations Metadata form described above). Select station codes from the dropdown list for all stations that are a part of the project. Associated station name, waterbody type, and park information will display automatically.
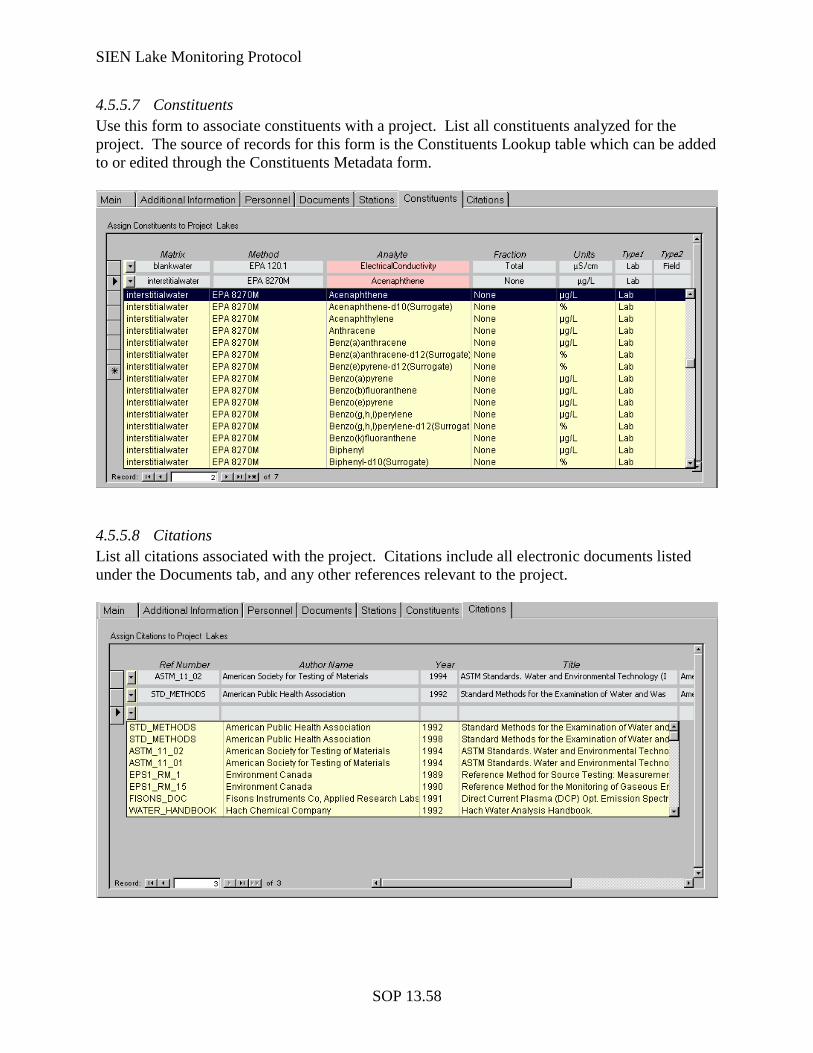
SIEN Lake Monitoring Protocol
SOP 13.58
4.5.5.7 Constituents Use this form to associate constituents with a project. List all constituents analyzed for the project. The source of records for this form is the Constituents Lookup table which can be added to or edited through the Constituents Metadata form.
4.5.5.8 Citations List all citations associated with the project. Citations include all electronic documents listed under the Documents tab, and any other references relevant to the project.
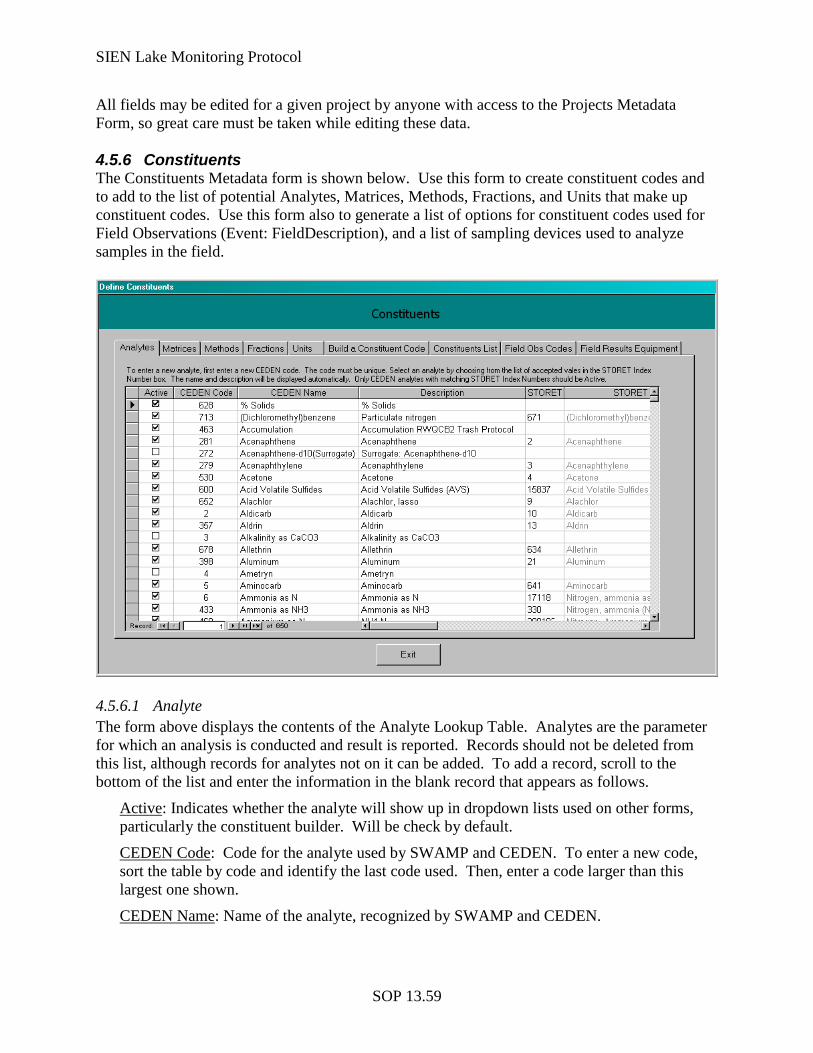
SIEN Lake Monitoring Protocol
SOP 13.59
All fields may be edited for a given project by anyone with access to the Projects Metadata Form, so great care must be taken while editing these data. 4.5.6 Constituents The Constituents Metadata form is shown below. Use this form to create constituent codes and to add to the list of potential Analytes, Matrices, Methods, Fractions, and Units that make up constituent codes. Use this form also to generate a list of options for constituent codes used for Field Observations (Event: FieldDescription), and a list of sampling devices used to analyze samples in the field.
4.5.6.1 Analyte The form above displays the contents of the Analyte Lookup Table. Analytes are the parameter for which an analysis is conducted and result is reported. Records should not be deleted from this list, although records for analytes not on it can be added. To add a record, scroll to the bottom of the list and enter the information in the blank record that appears as follows.
Active: Indicates whether the analyte will show up in dropdown lists used on other forms, particularly the constituent builder. Will be check by default.
CEDEN Code: Code for the analyte used by SWAMP and CEDEN. To enter a new code, sort the table by code and identify the last code used. Then, enter a code larger than this largest one shown.
CEDEN Name: Name of the analyte, recognized by SWAMP and CEDEN.
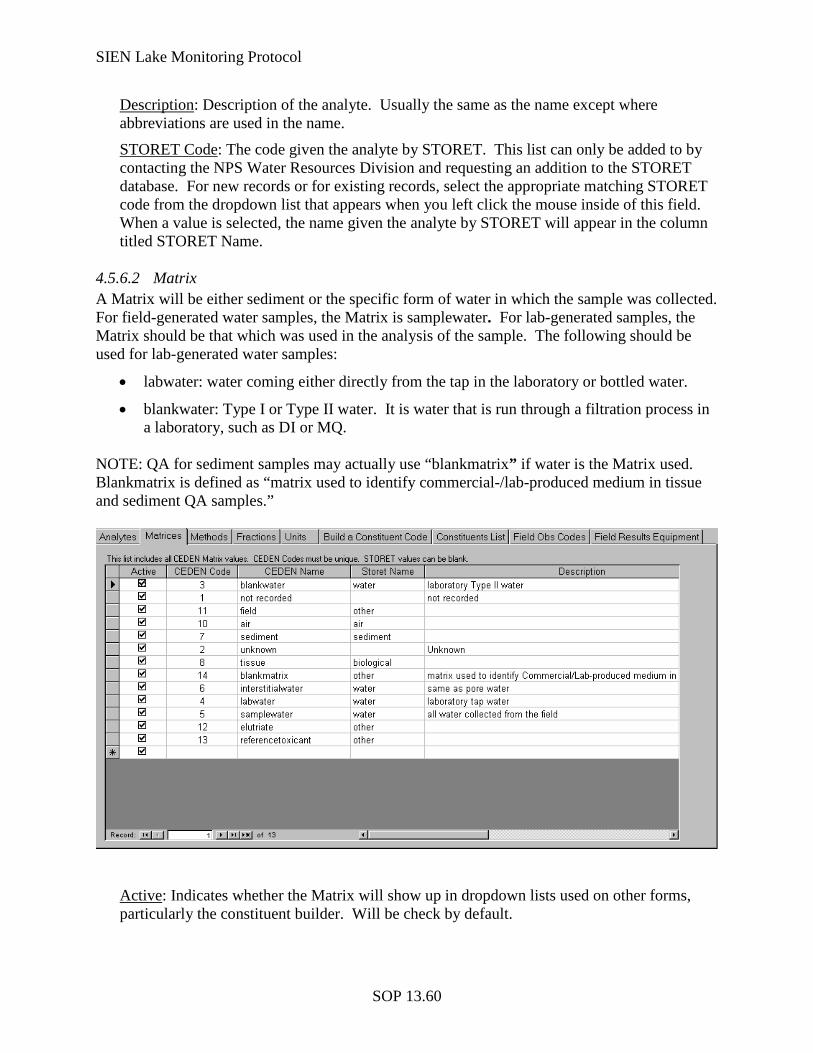
SIEN Lake Monitoring Protocol
SOP 13.60
Description: Description of the analyte. Usually the same as the name except where abbreviations are used in the name.
STORET Code
: The code given the analyte by STORET. This list can only be added to by contacting the NPS Water Resources Division and requesting an addition to the STORET database. For new records or for existing records, select the appropriate matching STORET code from the dropdown list that appears when you left click the mouse inside of this field. When a value is selected, the name given the analyte by STORET will appear in the column titled STORET Name.
4.5.6.2 Matrix A Matrix will be either sediment or the specific form of water in which the sample was collected. For field-generated water samples, the Matrix is samplewater. For lab-generated samples, the Matrix should be that which was used in the analysis of the sample. The following should be used for lab-generated water samples:
• labwater: water coming either directly from the tap in the laboratory or bottled water.
• blankwater: Type I or Type II water. It is water that is run through a filtration process in a laboratory, such as DI or MQ.
NOTE: QA for sediment samples may actually use “blankmatrix” if water is the Matrix used. Blankmatrix is defined as “matrix used to identify commercial-/lab-produced medium in tissue and sediment QA samples.”
Active: Indicates whether the Matrix will show up in dropdown lists used on other forms, particularly the constituent builder. Will be check by default.
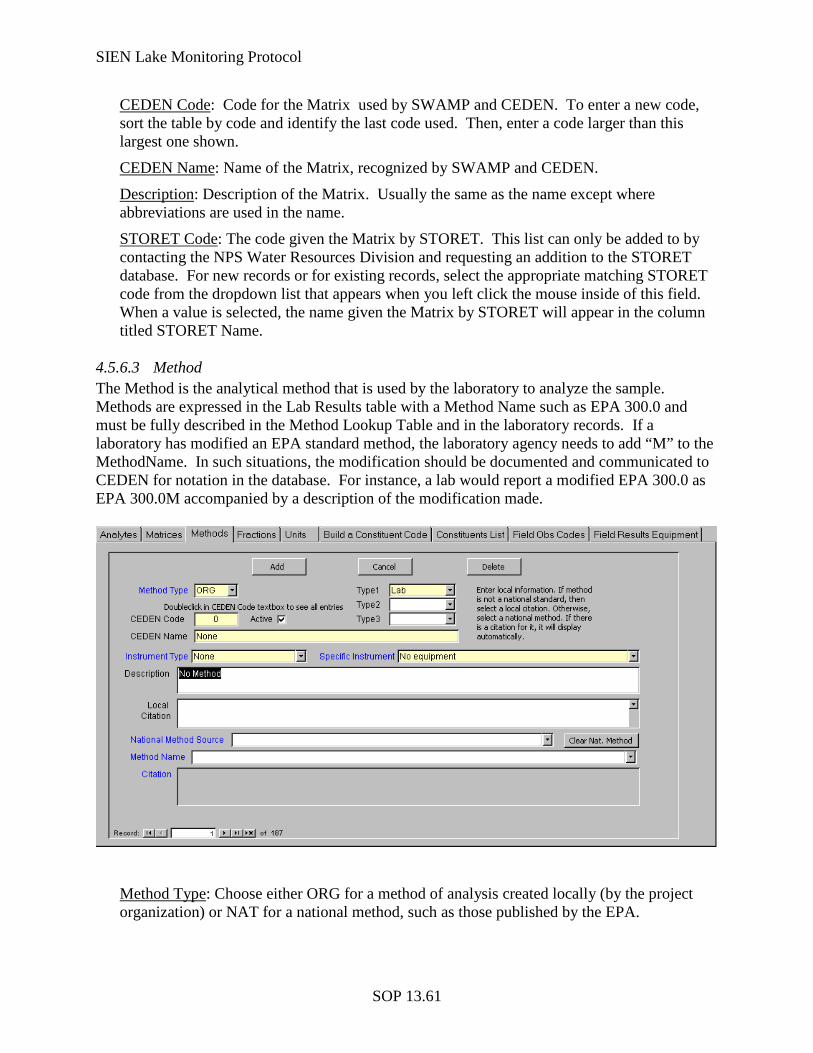
SIEN Lake Monitoring Protocol
SOP 13.61
CEDEN Code: Code for the Matrix used by SWAMP and CEDEN. To enter a new code, sort the table by code and identify the last code used. Then, enter a code larger than this largest one shown.
CEDEN Name: Name of the Matrix, recognized by SWAMP and CEDEN.
Description: Description of the Matrix. Usually the same as the name except where abbreviations are used in the name.
STORET Code
: The code given the Matrix by STORET. This list can only be added to by contacting the NPS Water Resources Division and requesting an addition to the STORET database. For new records or for existing records, select the appropriate matching STORET code from the dropdown list that appears when you left click the mouse inside of this field. When a value is selected, the name given the Matrix by STORET will appear in the column titled STORET Name.
4.5.6.3 Method The Method is the analytical method that is used by the laboratory to analyze the sample. Methods are expressed in the Lab Results table with a Method Name such as EPA 300.0 and must be fully described in the Method Lookup Table and in the laboratory records. If a laboratory has modified an EPA standard method, the laboratory agency needs to add “M” to the MethodName. In such situations, the modification should be documented and communicated to CEDEN for notation in the database. For instance, a lab would report a modified EPA 300.0 as EPA 300.0M accompanied by a description of the modification made.
Method Type: Choose either ORG for a method of analysis created locally (by the project organization) or NAT for a national method, such as those published by the EPA.
SIEN Lake Monitoring Protocol
SOP 13.62
Type 1, 2, 3: The situation in which an analysis using this method can be performed. Options include lab, field, and FieldObs (Field Observation). The three comboboxes allow for one or more of these values to be entered. At least one is required.
CEDEN Code: Code for the Method used by SWAMP and CEDEN. To enter a new code, sort the table by code and identify the last code used. Then, enter a code larger than this largest one shown.
CEDEN Name: Name of the Method, recognized by SWAMP and CEDEN.
Instrument Type: Classes of instruments used for analysis. The list is defined by STORET and cannot be added to or edited without contacting the NPS Water Resources Division. Select from the dropdown list.
Specific Instrument Type: The specific instrument of the Instrument Type class selected. The list is defined by STORET and cannot be added to or edited without contacting the NPS Water Resources Division. Select from the dropdown list.
Description: Describe the method of analysis.
Local Citation: If the method is of local origin (i.e., not a National Method), then enter a citation for it. The citation must already have been created and added to the Citations Lookup Table which is accessed through the Citations tab on the Main Metadata form. When citation records are created, they are attributed as either local (ORG) or national (NAT) meaning that the citation is for a nationally-recognized method (e.g., EPA). Only citations attributed ORG will show up as option to choose in this combobox.
National Method Source: If the method is a national one, then choose the source agency for the method from the dropdown list. The list is defined by STORET and cannot be added to or edited without contacting the NPS Water Resources Division.
Method Name: Choose the specific method name from the dropdown list. This list will contain only names for the Method Source chosen above.
Citation
: The citation for the National Method Name will appear automatically when the Method Name is selected. For National Methods, the citation does not have to already exist in the Citations Lookup table. Citations for National Methods are provided by STORET in a lookup table that has been incorporated into the database. If the citation for the method selected in not presently in the Citations Lookup Table, it will be added automatically.
NOTE: You can clear the National Method Name from a record by clicking the Clear Nat. Method button. This will however, not remove citations from the Citations Lookup table that were added automatically when this field was populated. To delete a citation, go to the Citations tab on the Main Metadata form, locate the citation, and delete it. 4.5.6.4 Fraction The Fraction is a more specific descriptor of the Analyte. For instance, metals are often expressed as Total or Dissolved, each of which would be expressed as the Fraction, distinguishing the appropriate Analyte.
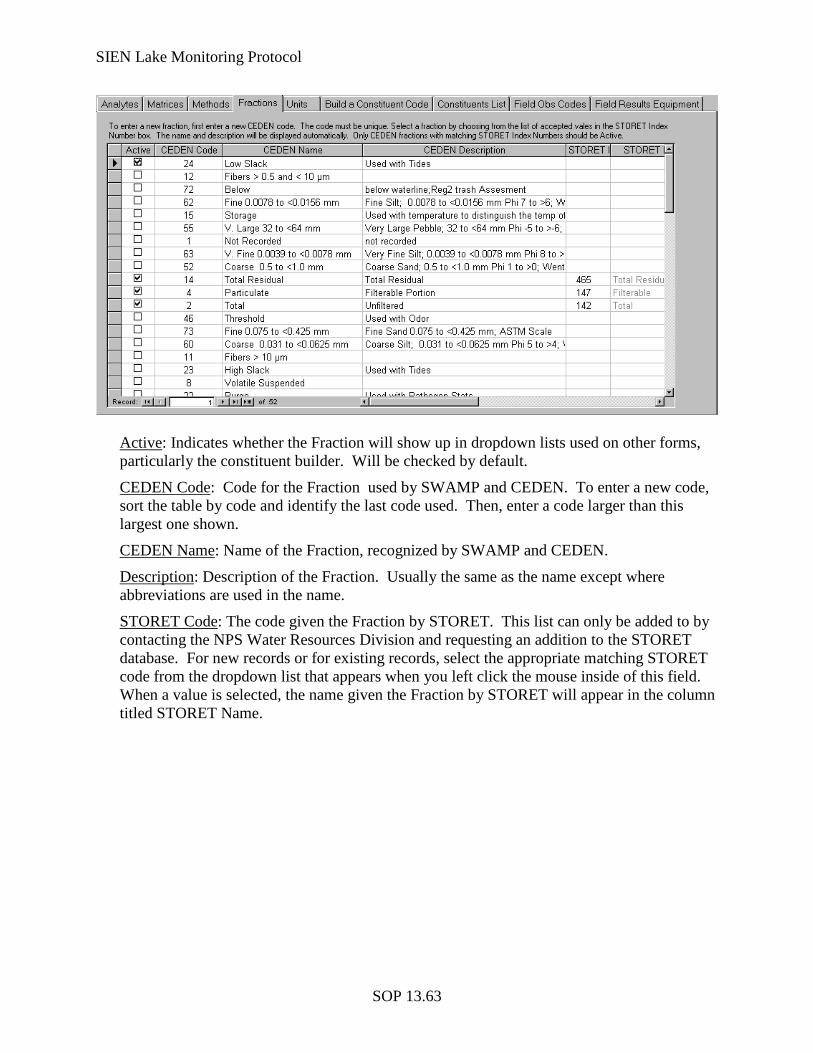
SIEN Lake Monitoring Protocol
SOP 13.63
Active: Indicates whether the Fraction will show up in dropdown lists used on other forms, particularly the constituent builder. Will be checked by default.
CEDEN Code: Code for the Fraction used by SWAMP and CEDEN. To enter a new code, sort the table by code and identify the last code used. Then, enter a code larger than this largest one shown.
CEDEN Name: Name of the Fraction, recognized by SWAMP and CEDEN.
Description: Description of the Fraction. Usually the same as the name except where abbreviations are used in the name.
STORET Code
: The code given the Fraction by STORET. This list can only be added to by contacting the NPS Water Resources Division and requesting an addition to the STORET database. For new records or for existing records, select the appropriate matching STORET code from the dropdown list that appears when you left click the mouse inside of this field. When a value is selected, the name given the Fraction by STORET will appear in the column titled STORET Name.
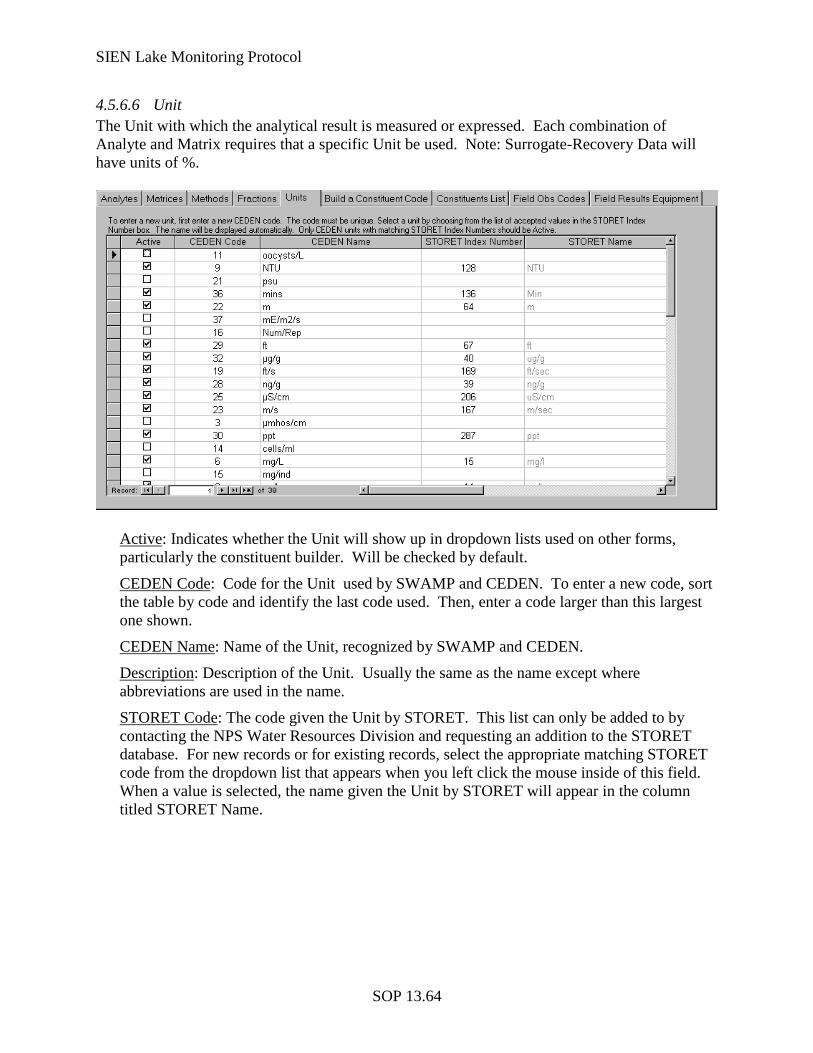
SIEN Lake Monitoring Protocol
SOP 13.64
4.5.6.6 Unit The Unit with which the analytical result is measured or expressed. Each combination of Analyte and Matrix requires that a specific Unit be used. Note: Surrogate-Recovery Data will have units of %.
Active: Indicates whether the Unit will show up in dropdown lists used on other forms, particularly the constituent builder. Will be checked by default.
CEDEN Code: Code for the Unit used by SWAMP and CEDEN. To enter a new code, sort the table by code and identify the last code used. Then, enter a code larger than this largest one shown.
CEDEN Name: Name of the Unit, recognized by SWAMP and CEDEN.
Description: Description of the Unit. Usually the same as the name except where abbreviations are used in the name.
STORET Code
: The code given the Unit by STORET. This list can only be added to by contacting the NPS Water Resources Division and requesting an addition to the STORET database. For new records or for existing records, select the appropriate matching STORET code from the dropdown list that appears when you left click the mouse inside of this field. When a value is selected, the name given the Unit by STORET will appear in the column titled STORET Name.
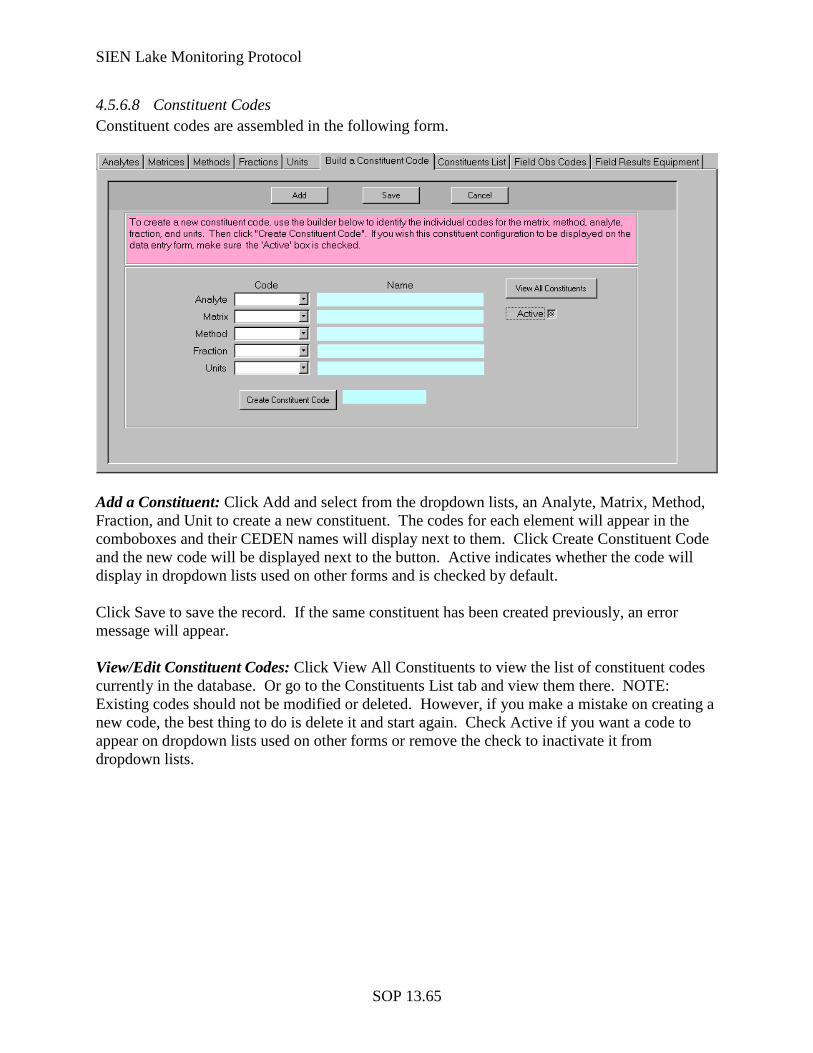
SIEN Lake Monitoring Protocol
SOP 13.65
4.5.6.8 Constituent Codes Constituent codes are assembled in the following form.
Add a Constituent: Click Add and select from the dropdown lists, an Analyte, Matrix, Method, Fraction, and Unit to create a new constituent. The codes for each element will appear in the comboboxes and their CEDEN names will display next to them. Click Create Constituent Code and the new code will be displayed next to the button. Active indicates whether the code will display in dropdown lists used on other forms and is checked by default. Click Save to save the record. If the same constituent has been created previously, an error message will appear. View/Edit Constituent Codes: Click View All Constituents to view the list of constituent codes currently in the database. Or go to the Constituents List tab and view them there. NOTE: Existing codes should not be modified or deleted. However, if you make a mistake on creating a new code, the best thing to do is delete it and start again. Check Active if you want a code to appear on dropdown lists used on other forms or remove the check to inactivate it from dropdown lists.
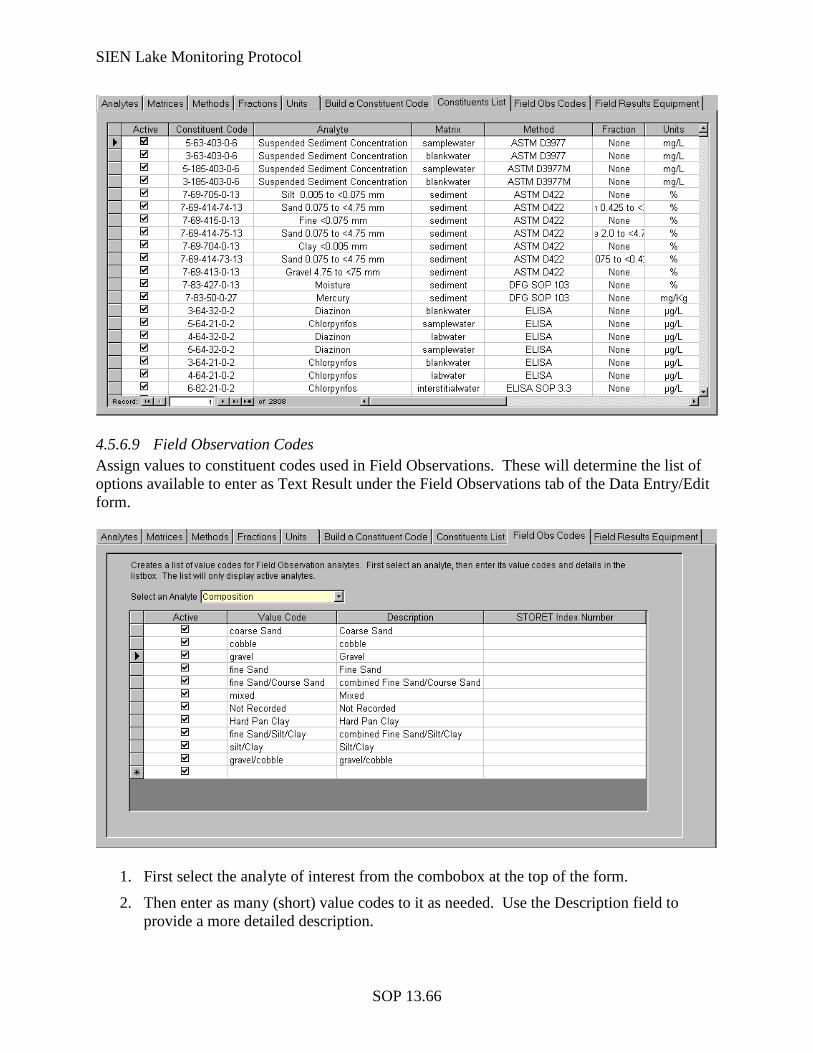
SIEN Lake Monitoring Protocol
SOP 13.66
4.5.6.9 Field Observation Codes Assign values to constituent codes used in Field Observations. These will determine the list of options available to enter as Text Result under the Field Observations tab of the Data Entry/Edit form.
1. First select the analyte of interest from the combobox at the top of the form.
2. Then enter as many (short) value codes to it as needed. Use the Description field to provide a more detailed description.
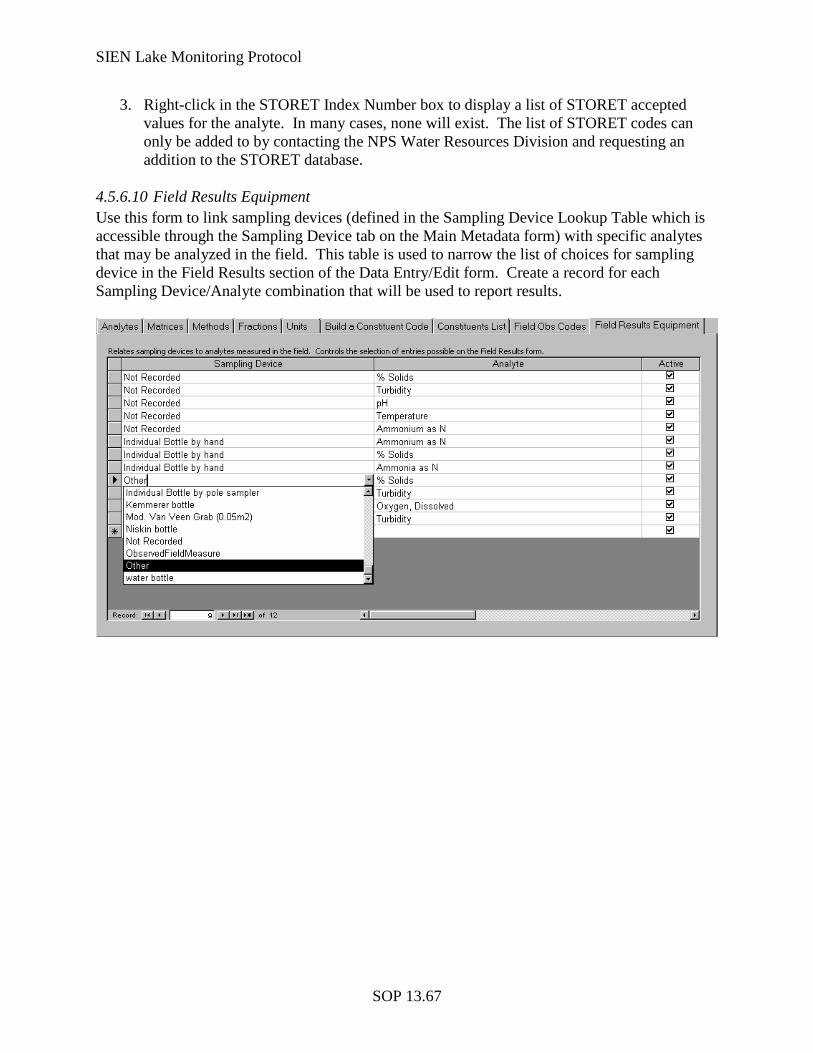
SIEN Lake Monitoring Protocol
SOP 13.67
3. Right-click in the STORET Index Number box to display a list of STORET accepted values for the analyte. In many cases, none will exist. The list of STORET codes can only be added to by contacting the NPS Water Resources Division and requesting an addition to the STORET database.
4.5.6.10 Field Results Equipment Use this form to link sampling devices (defined in the Sampling Device Lookup Table which is accessible through the Sampling Device tab on the Main Metadata form) with specific analytes that may be analyzed in the field. This table is used to narrow the list of choices for sampling device in the Field Results section of the Data Entry/Edit form. Create a record for each Sampling Device/Analyte combination that will be used to report results.
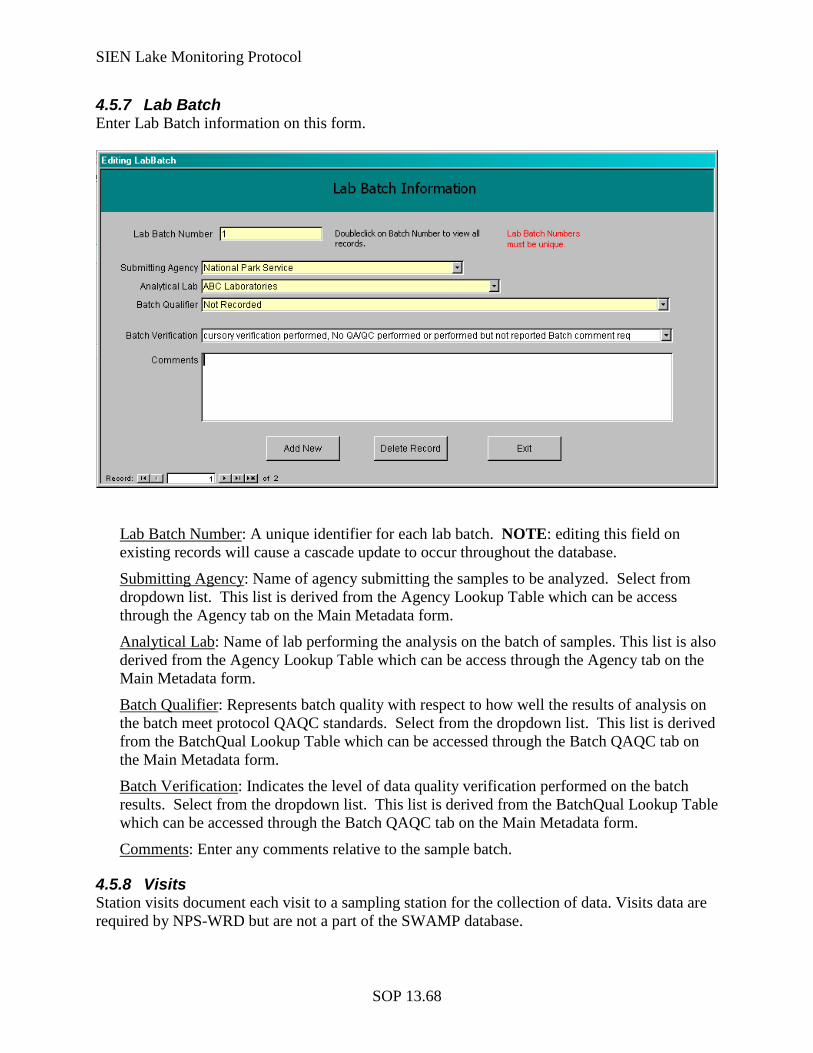
SIEN Lake Monitoring Protocol
SOP 13.68
4.5.7 Lab Batch Enter Lab Batch information on this form.
Lab Batch Number: A unique identifier for each lab batch. NOTE: editing this field on existing records will cause a cascade update to occur throughout the database.
Submitting Agency: Name of agency submitting the samples to be analyzed. Select from dropdown list. This list is derived from the Agency Lookup Table which can be access through the Agency tab on the Main Metadata form.
Analytical Lab: Name of lab performing the analysis on the batch of samples. This list is also derived from the Agency Lookup Table which can be access through the Agency tab on the Main Metadata form.
Batch Qualifier: Represents batch quality with respect to how well the results of analysis on the batch meet protocol QAQC standards. Select from the dropdown list. This list is derived from the BatchQual Lookup Table which can be accessed through the Batch QAQC tab on the Main Metadata form.
Batch Verification: Indicates the level of data quality verification performed on the batch results. Select from the dropdown list. This list is derived from the BatchQual Lookup Table which can be accessed through the Batch QAQC tab on the Main Metadata form.
Comments
: Enter any comments relative to the sample batch.
4.5.8 Visits Station visits document each visit to a sampling station for the collection of data. Visits data are required by NPS-WRD but are not a part of the SWAMP database.
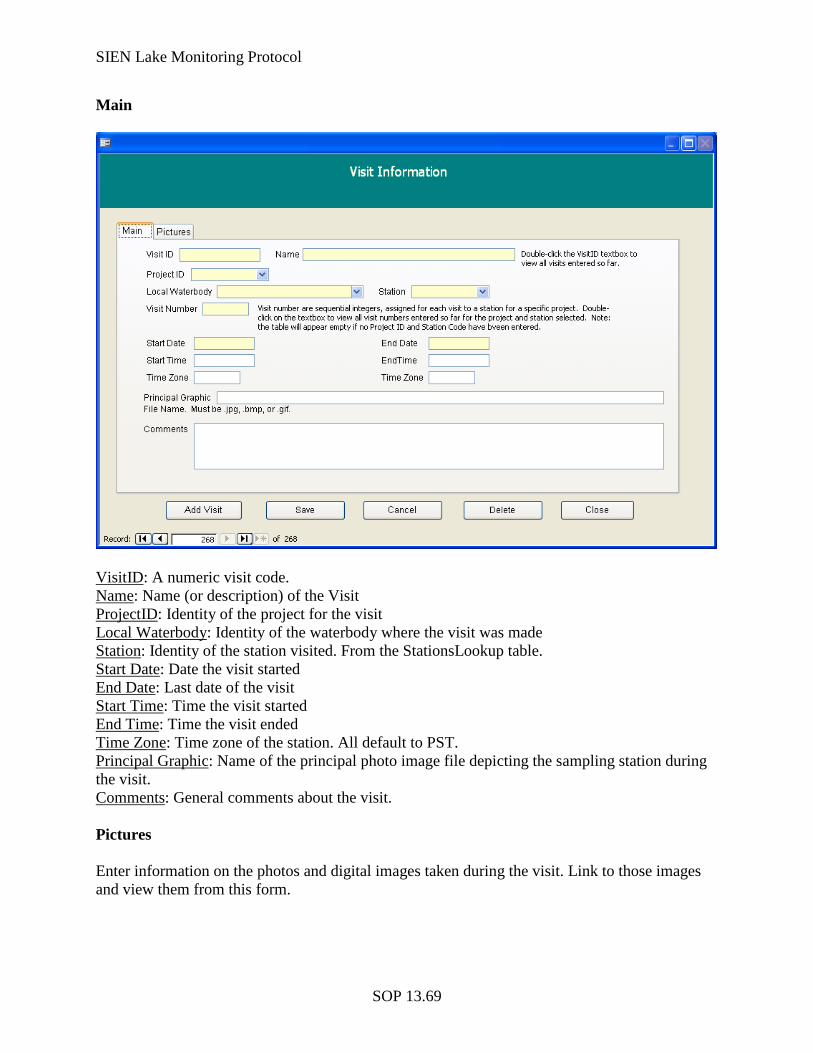
SIEN Lake Monitoring Protocol
SOP 13.69
Main
VisitID: A numeric visit code. Name: Name (or description) of the Visit ProjectID: Identity of the project for the visit Local Waterbody: Identity of the waterbody where the visit was made Station: Identity of the station visited. From the StationsLookup table. Start Date: Date the visit started End Date: Last date of the visit Start Time: Time the visit started End Time: Time the visit ended Time Zone: Time zone of the station. All default to PST. Principal Graphic: Name of the principal photo image file depicting the sampling station during the visit. Comments
: General comments about the visit.
Pictures Enter information on the photos and digital images taken during the visit. Link to those images and view them from this form.
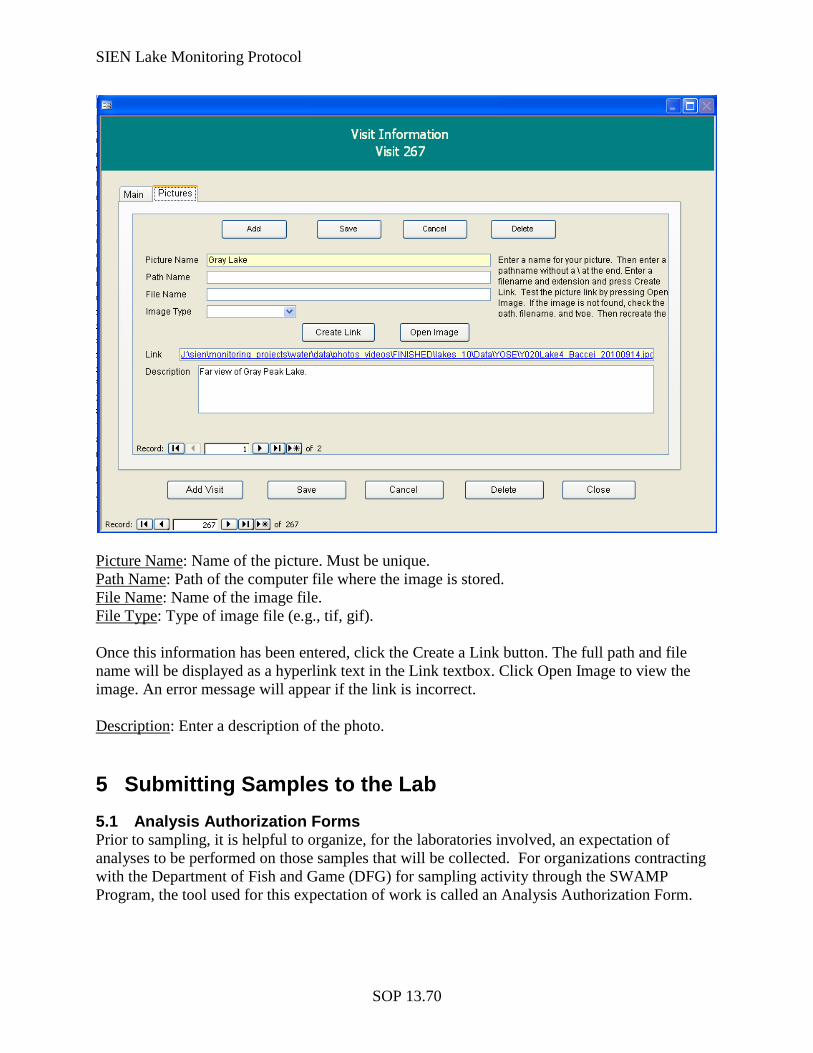
SIEN Lake Monitoring Protocol
SOP 13.70
Picture Name: Name of the picture. Must be unique. Path Name: Path of the computer file where the image is stored. File Name: Name of the image file. File Type
: Type of image file (e.g., tif, gif).
Once this information has been entered, click the Create a Link button. The full path and file name will be displayed as a hyperlink text in the Link textbox. Click Open Image to view the image. An error message will appear if the link is incorrect. Description
: Enter a description of the photo.
5 Submitting Samples to the Lab 5.1 Analysis Authorization Forms Prior to sampling, it is helpful to organize, for the laboratories involved, an expectation of analyses to be performed on those samples that will be collected. For organizations contracting with the Department of Fish and Game (DFG) for sampling activity through the SWAMP Program, the tool used for this expectation of work is called an Analysis Authorization Form.
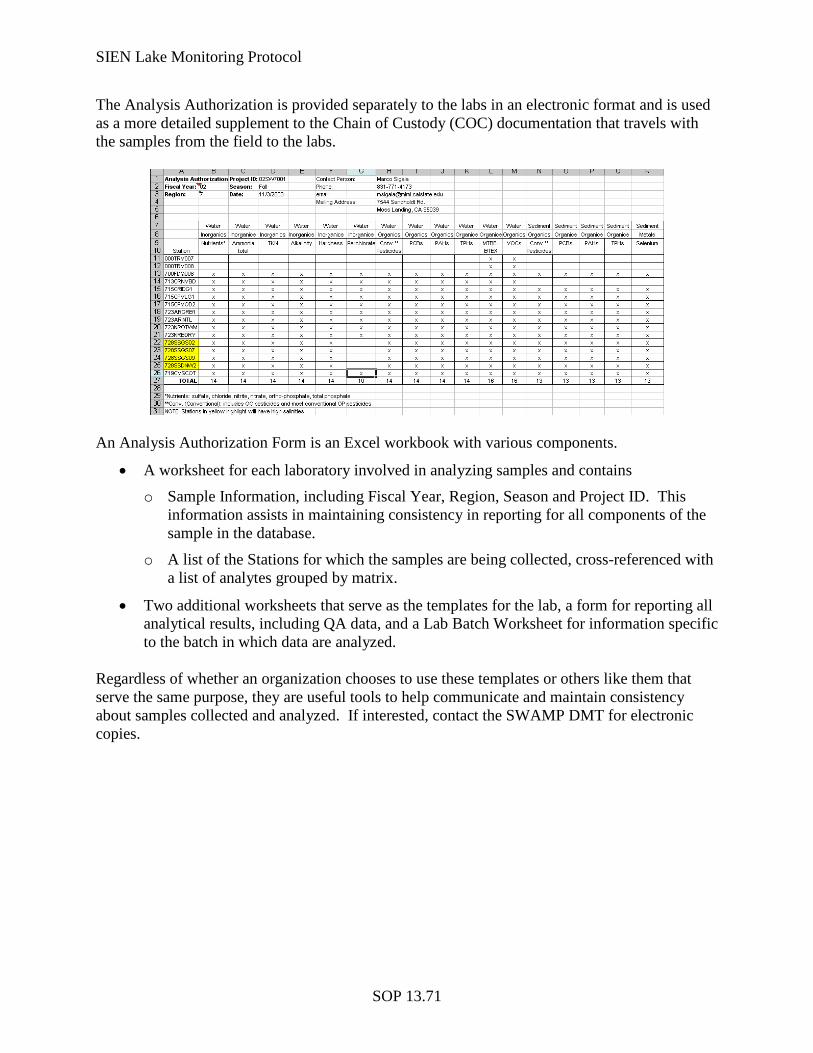
SIEN Lake Monitoring Protocol
SOP 13.71
The Analysis Authorization is provided separately to the labs in an electronic format and is used as a more detailed supplement to the Chain of Custody (COC) documentation that travels with the samples from the field to the labs.
An Analysis Authorization Form is an Excel workbook with various components.
• A worksheet for each laboratory involved in analyzing samples and contains o Sample Information, including Fiscal Year, Region, Season and Project ID. This
information assists in maintaining consistency in reporting for all components of the sample in the database.
o A list of the Stations for which the samples are being collected, cross-referenced with a list of analytes grouped by matrix.
• Two additional worksheets that serve as the templates for the lab, a form for reporting all analytical results, including QA data, and a Lab Batch Worksheet for information specific to the batch in which data are analyzed.
Regardless of whether an organization chooses to use these templates or others like them that serve the same purpose, they are useful tools to help communicate and maintain consistency about samples collected and analyzed. If interested, contact the SWAMP DMT for electronic copies.
SIEN Lake Monitoring Protocol
SOP 13.72
5.1.1 Format Specifications The SWAMP program has developed an Excel spreadsheet template for laboratories to use for formatting results data in a manner that can easily be loaded into the SWAMP Database. Copies may be obtained from the SWAMP DMT and modified to suit the SIEN Water Quality Monitoring and Streamflow Database. Or, similar templates may be developed from scratch. The template travels with the samples and Chain of Custody and should contain two worksheets. The first holds all chemistry results, including QA data and should be named Results in its worksheet tab. The second holds information specific to the laboratory batch in which data is analyzed. 5.1.2 Chemistry Results Worksheet Each record in this sheet represents a result from a specific analysis for a particular constituent at a single station or for a single QA sample. All results, including all supporting QA analyses will be reported on this worksheet. See the Section: Lab Results, under Entering New Data above for a list of fields and formatting specifications for this worksheet. This worksheet should also contain the basic Sample Information recorded in the field: Station Code, Event, Sample Type, Project ID, Season and Agency Code. These may be pre-populated before sending to the lab. 5.1.3 LabBatch Worksheet This worksheet should be named LabBatch (with no spaces) in its worksheet tab. The fields in this sheet are and should be completed as follows:
LabBatch: There should be one record (and only one record) for each unique Lab Batch ID found in the Results spreadsheet in the field LabBatch.
AgencyCode: This is the Agency Code of the agency or lab performing the analysis. See Agency Lookup in the Chem Analysis Data Template for specific codes.
BatchQualifierCode: Qualifies the batch as a whole. Applicable codes can be found in the Batch Qualifier lookup table in the Chem Analysis Data Template. Please note that if the qualifier is ‘A’, meaning Acceptable, the lab is ensuring that all SWAMP QAQC protocols were met for the batch.
LabBatchComm
: Use this field for any comments relating to the batch as a whole. (Not required).
5.2 Reformatting Lab Data In many laboratories, analytical results are produced in a format that does not easily fit into the one used by SWAMP. For example, many labs’ instruments provide reports in a vertical rather than horizontal format. The SWAMP DMT has developed a program to assist in the conversion of data from the instrument-provided format to that required by the SWAMP Database for uploading lab results data electronically. While this conversion program does not complete all of the work for the lab personnel, it greatly reduces the effort involved. Contact the SWAMP DMT for a copy of it.
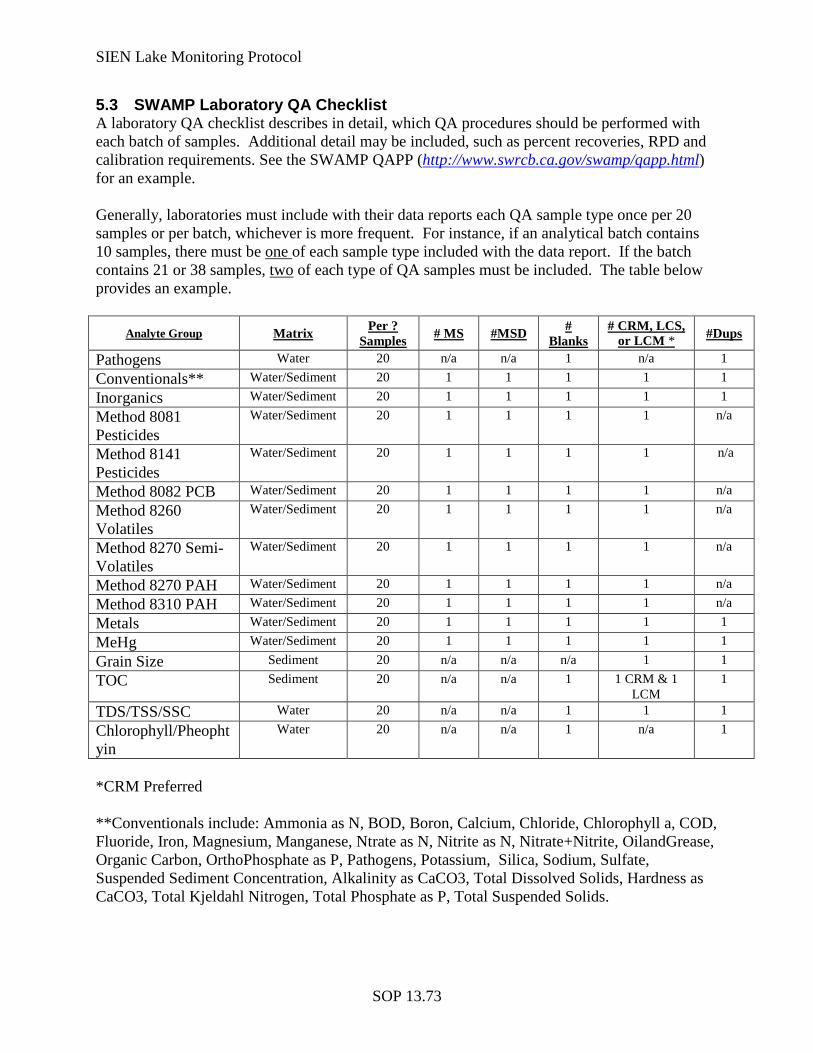
SIEN Lake Monitoring Protocol
SOP 13.73
5.3 SWAMP Laboratory QA Checklist A laboratory QA checklist describes in detail, which QA procedures should be performed with each batch of samples. Additional detail may be included, such as percent recoveries, RPD and calibration requirements. See the SWAMP QAPP (http://www.swrcb.ca.gov/swamp/qapp.html) for an example. Generally, laboratories must include with their data reports each QA sample type once per 20 samples or per batch, whichever is more frequent. For instance, if an analytical batch contains 10 samples, there must be one of each sample type included with the data report. If the batch contains 21 or 38 samples, two
of each type of QA samples must be included. The table below provides an example.
Analyte Group Matrix Per ? Samples # MS #MSD #
Blanks # CRM, LCS,
or LCM * Pathogens
#Dups
Water 20 n/a n/a 1 n/a 1 Conventionals** Water/Sediment 20 1 1 1 1 1 Inorganics Water/Sediment 20 1 1 1 1 1 Method 8081 Pesticides
Water/Sediment 20 1 1 1 1 n/a
Method 8141 Pesticides
Water/Sediment 20 1 1 1 1 n/a
Method 8082 PCB Water/Sediment 20 1 1 1 1 n/a Method 8260 Volatiles
Water/Sediment 20 1 1 1 1 n/a
Method 8270 Semi-Volatiles
Water/Sediment 20 1 1 1 1 n/a
Method 8270 PAH Water/Sediment 20 1 1 1 1 n/a Method 8310 PAH Water/Sediment 20 1 1 1 1 n/a Metals Water/Sediment 20 1 1 1 1 1 MeHg Water/Sediment 20 1 1 1 1 1 Grain Size Sediment 20 n/a n/a n/a 1 1 TOC Sediment 20 n/a n/a 1 1 CRM & 1
LCM 1
TDS/TSS/SSC Water 20 n/a n/a 1 1 1 Chlorophyll/Pheophtyin
Water 20 n/a n/a 1 n/a 1
*CRM Preferred **Conventionals include: Ammonia as N, BOD, Boron, Calcium, Chloride, Chlorophyll a, COD, Fluoride, Iron, Magnesium, Manganese, Ntrate as N, Nitrite as N, Nitrate+Nitrite, OilandGrease, Organic Carbon, OrthoPhosphate as P, Pathogens, Potassium, Silica, Sodium, Sulfate, Suspended Sediment Concentration, Alkalinity as CaCO3, Total Dissolved Solids, Hardness as CaCO3, Total Kjeldahl Nitrogen, Total Phosphate as P, Total Suspended Solids.
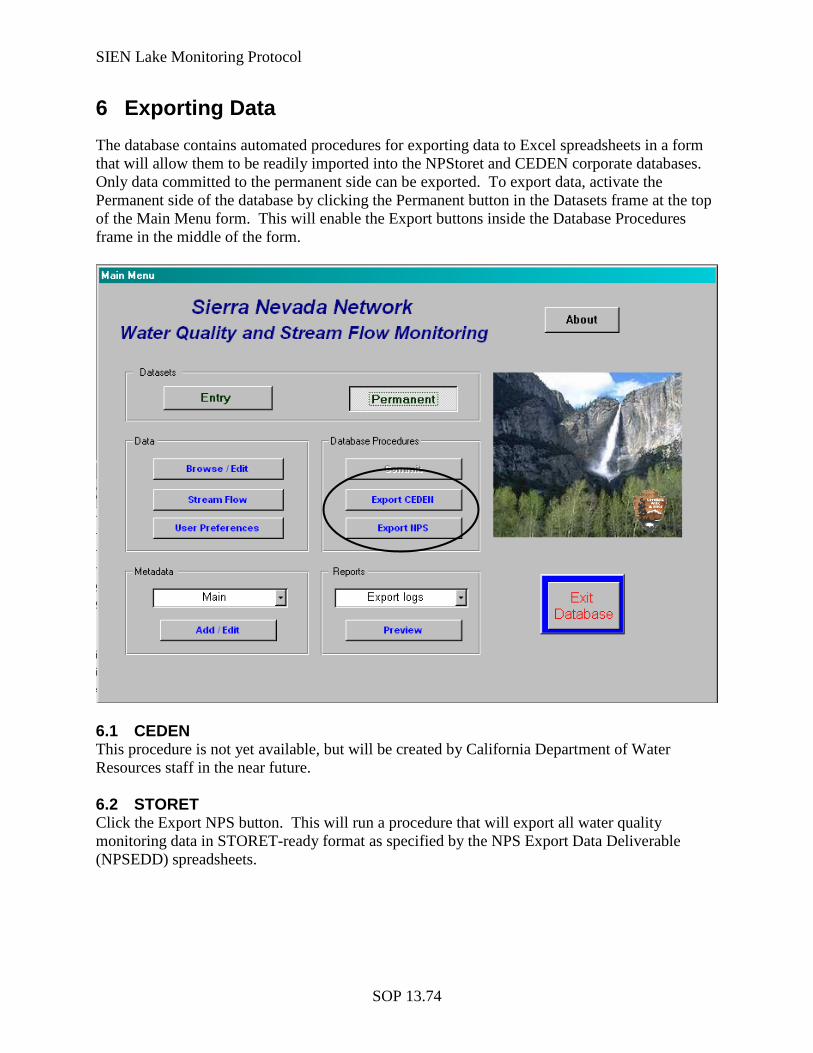
SIEN Lake Monitoring Protocol
SOP 13.74
6 Exporting Data The database contains automated procedures for exporting data to Excel spreadsheets in a form that will allow them to be readily imported into the NPStoret and CEDEN corporate databases. Only data committed to the permanent side can be exported. To export data, activate the Permanent side of the database by clicking the Permanent button in the Datasets frame at the top of the Main Menu form. This will enable the Export buttons inside the Database Procedures frame in the middle of the form.
6.1 CEDEN This procedure is not yet available, but will be created by California Department of Water Resources staff in the near future. 6.2 STORET Click the Export NPS button. This will run a procedure that will export all water quality monitoring data in STORET-ready format as specified by the NPS Export Data Deliverable (NPSEDD) spreadsheets.
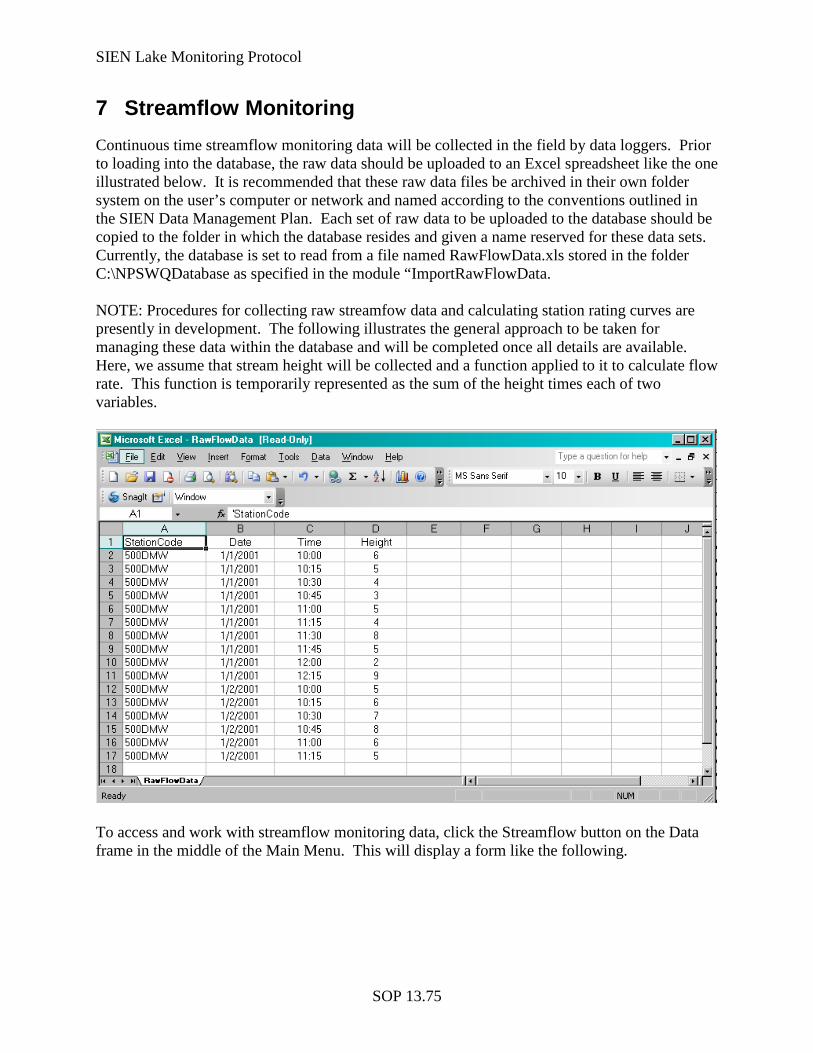
SIEN Lake Monitoring Protocol
SOP 13.75
7 Streamflow Monitoring Continuous time streamflow monitoring data will be collected in the field by data loggers. Prior to loading into the database, the raw data should be uploaded to an Excel spreadsheet like the one illustrated below. It is recommended that these raw data files be archived in their own folder system on the user’s computer or network and named according to the conventions outlined in the SIEN Data Management Plan. Each set of raw data to be uploaded to the database should be copied to the folder in which the database resides and given a name reserved for these data sets. Currently, the database is set to read from a file named RawFlowData.xls stored in the folder C:\NPSWQDatabase as specified in the module “ImportRawFlowData. NOTE: Procedures for collecting raw streamfow data and calculating station rating curves are presently in development. The following illustrates the general approach to be taken for managing these data within the database and will be completed once all details are available. Here, we assume that stream height will be collected and a function applied to it to calculate flow rate. This function is temporarily represented as the sum of the height times each of two variables.
To access and work with streamflow monitoring data, click the Streamflow button on the Data frame in the middle of the Main Menu. This will display a form like the following.
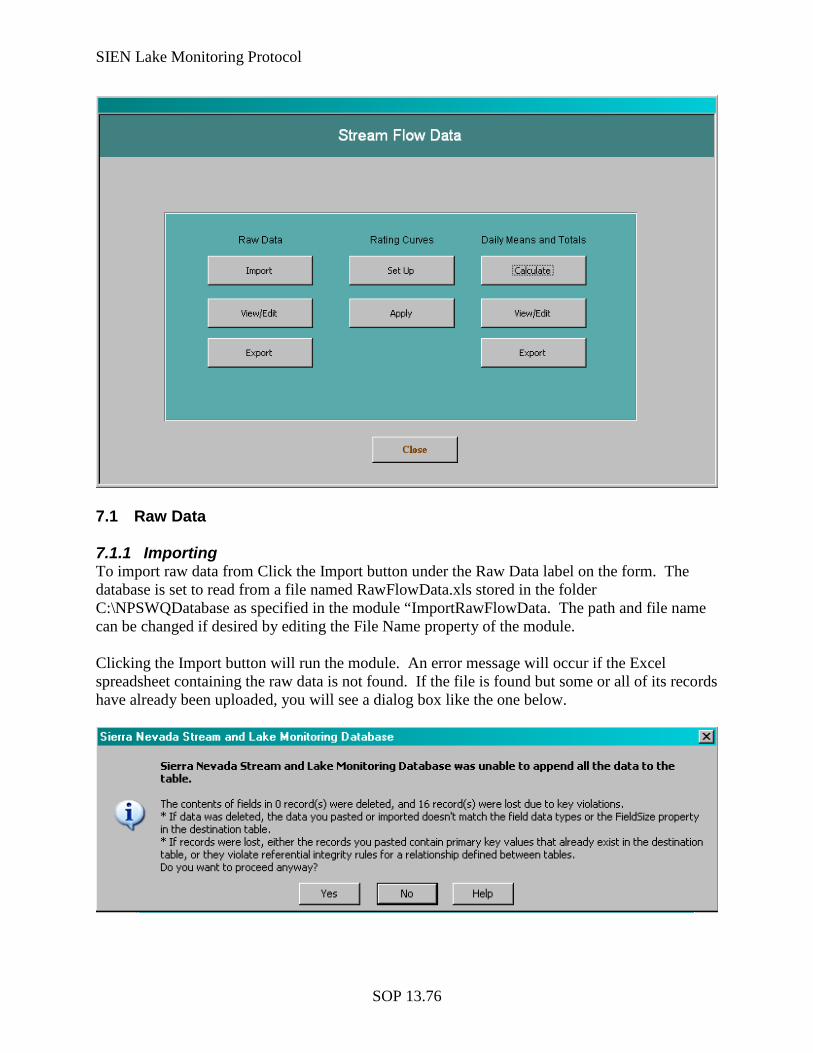
SIEN Lake Monitoring Protocol
SOP 13.76
7.1 Raw Data 7.1.1 Importing To import raw data from Click the Import button under the Raw Data label on the form. The database is set to read from a file named RawFlowData.xls stored in the folder C:\NPSWQDatabase as specified in the module “ImportRawFlowData. The path and file name can be changed if desired by editing the File Name property of the module. Clicking the Import button will run the module. An error message will occur if the Excel spreadsheet containing the raw data is not found. If the file is found but some or all of its records have already been uploaded, you will see a dialog box like the one below.
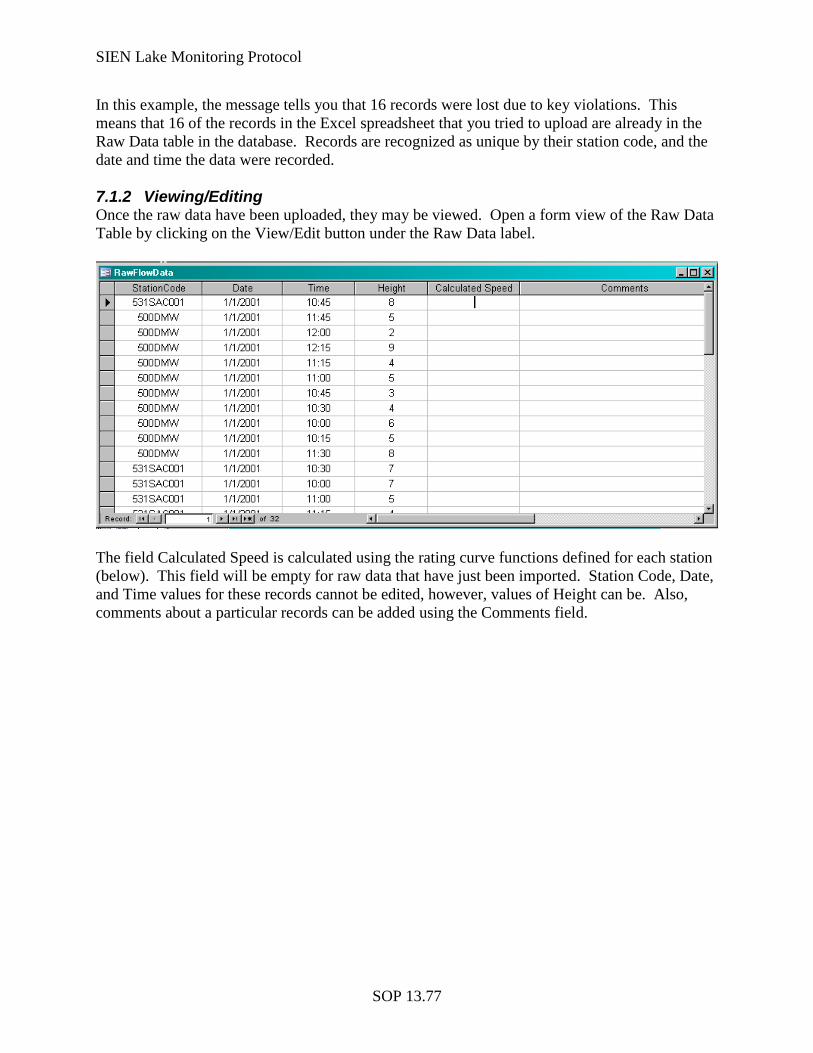
SIEN Lake Monitoring Protocol
SOP 13.77
In this example, the message tells you that 16 records were lost due to key violations. This means that 16 of the records in the Excel spreadsheet that you tried to upload are already in the Raw Data table in the database. Records are recognized as unique by their station code, and the date and time the data were recorded. 7.1.2 Viewing/Editing Once the raw data have been uploaded, they may be viewed. Open a form view of the Raw Data Table by clicking on the View/Edit button under the Raw Data label.
The field Calculated Speed is calculated using the rating curve functions defined for each station (below). This field will be empty for raw data that have just been imported. Station Code, Date, and Time values for these records cannot be edited, however, values of Height can be. Also, comments about a particular records can be added using the Comments field.
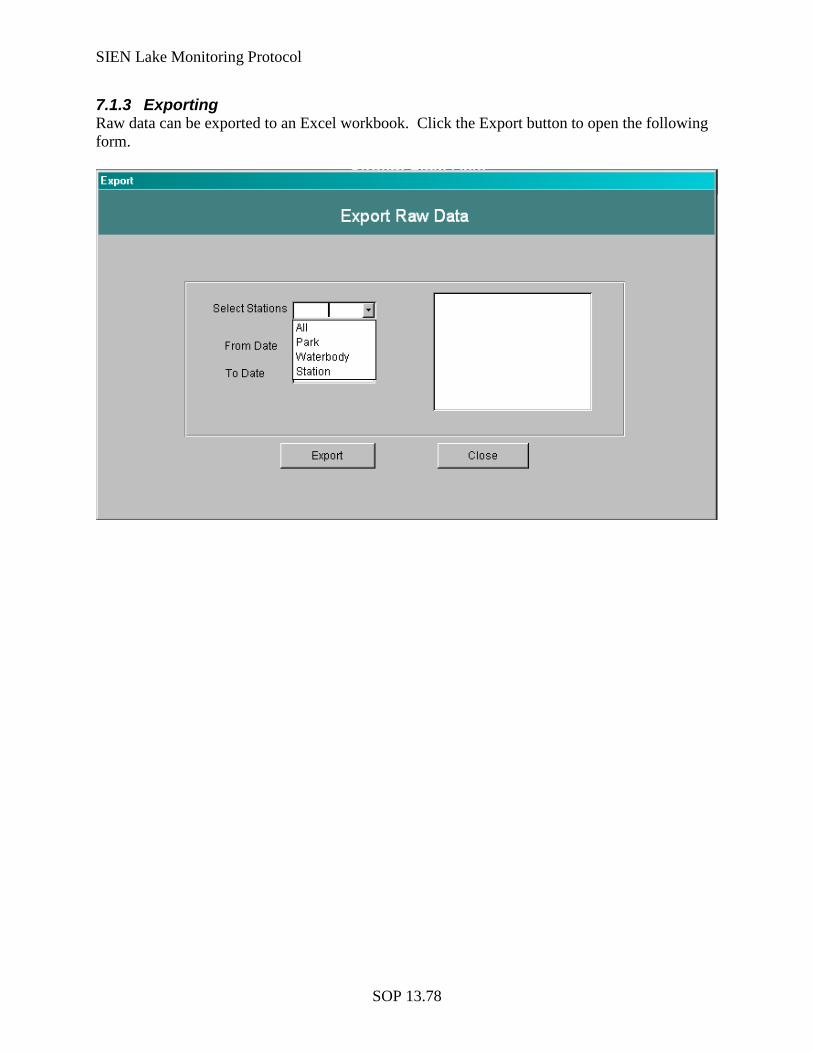
SIEN Lake Monitoring Protocol
SOP 13.78
7.1.3 Exporting Raw data can be exported to an Excel workbook. Click the Export button to open the following form.
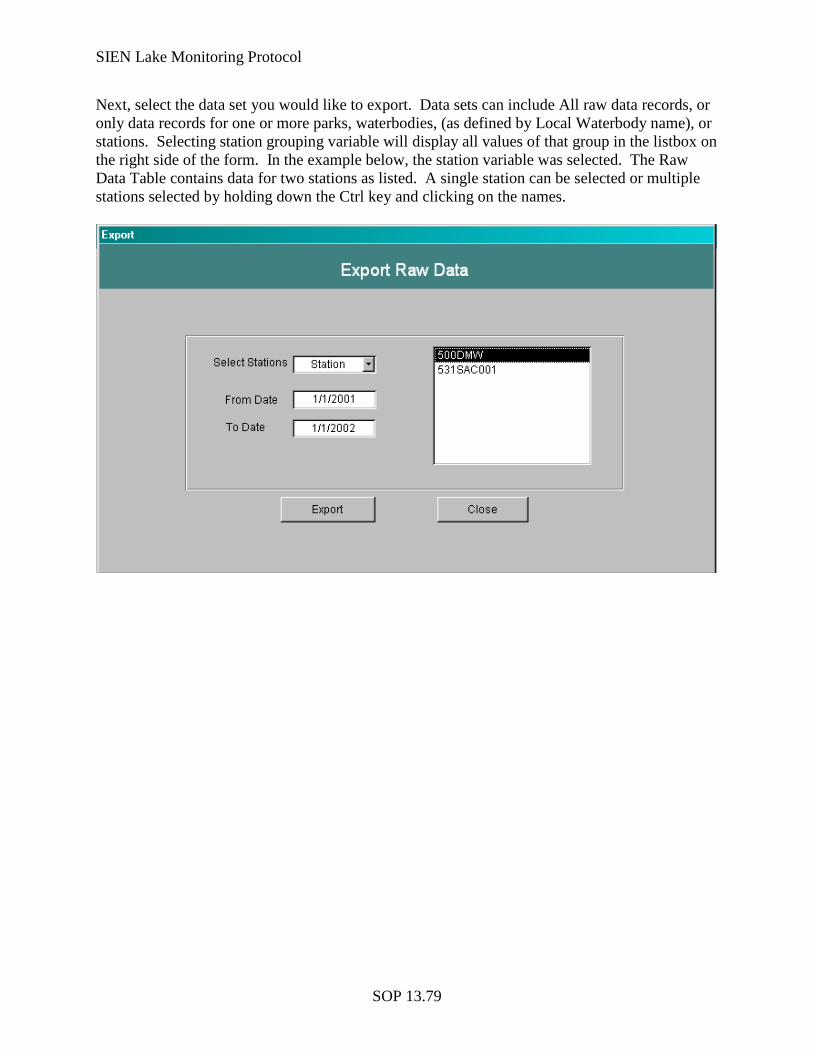
SIEN Lake Monitoring Protocol
SOP 13.79
Next, select the data set you would like to export. Data sets can include All raw data records, or only data records for one or more parks, waterbodies, (as defined by Local Waterbody name), or stations. Selecting station grouping variable will display all values of that group in the listbox on the right side of the form. In the example below, the station variable was selected. The Raw Data Table contains data for two stations as listed. A single station can be selected or multiple stations selected by holding down the Ctrl key and clicking on the names.
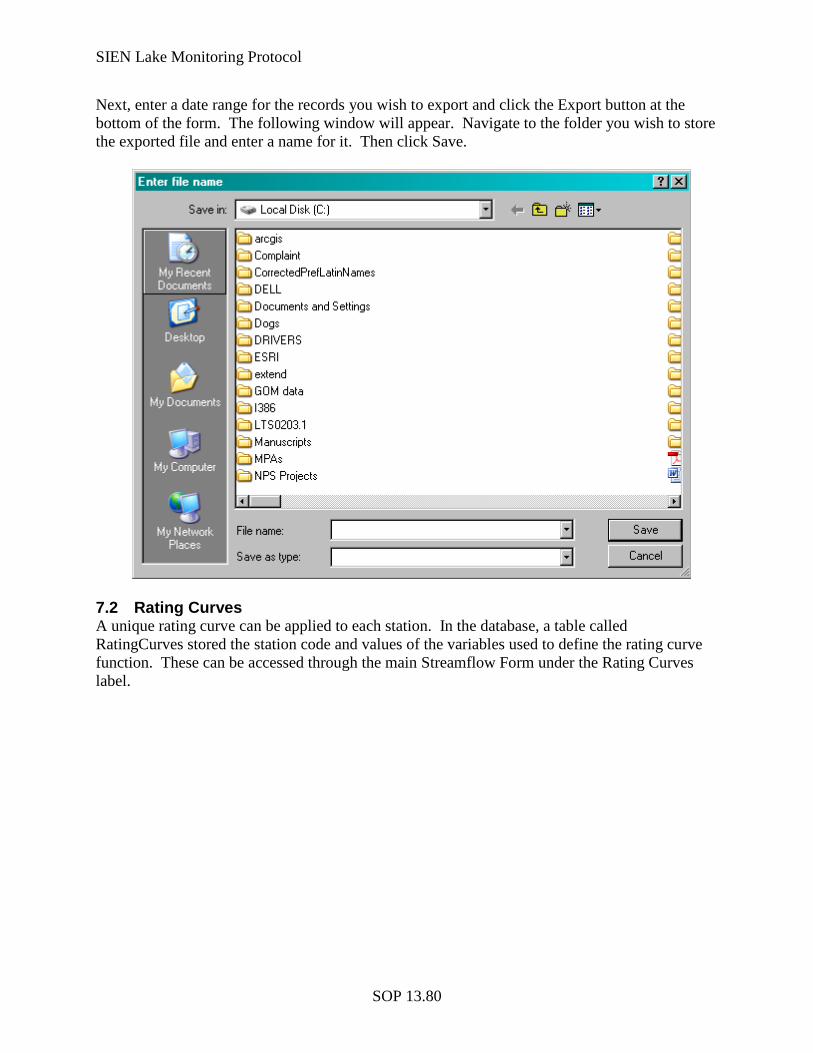
SIEN Lake Monitoring Protocol
SOP 13.80
Next, enter a date range for the records you wish to export and click the Export button at the bottom of the form. The following window will appear. Navigate to the folder you wish to store the exported file and enter a name for it. Then click Save.
7.2 Rating Curves A unique rating curve can be applied to each station. In the database, a table called RatingCurves stored the station code and values of the variables used to define the rating curve function. These can be accessed through the main Streamflow Form under the Rating Curves label.
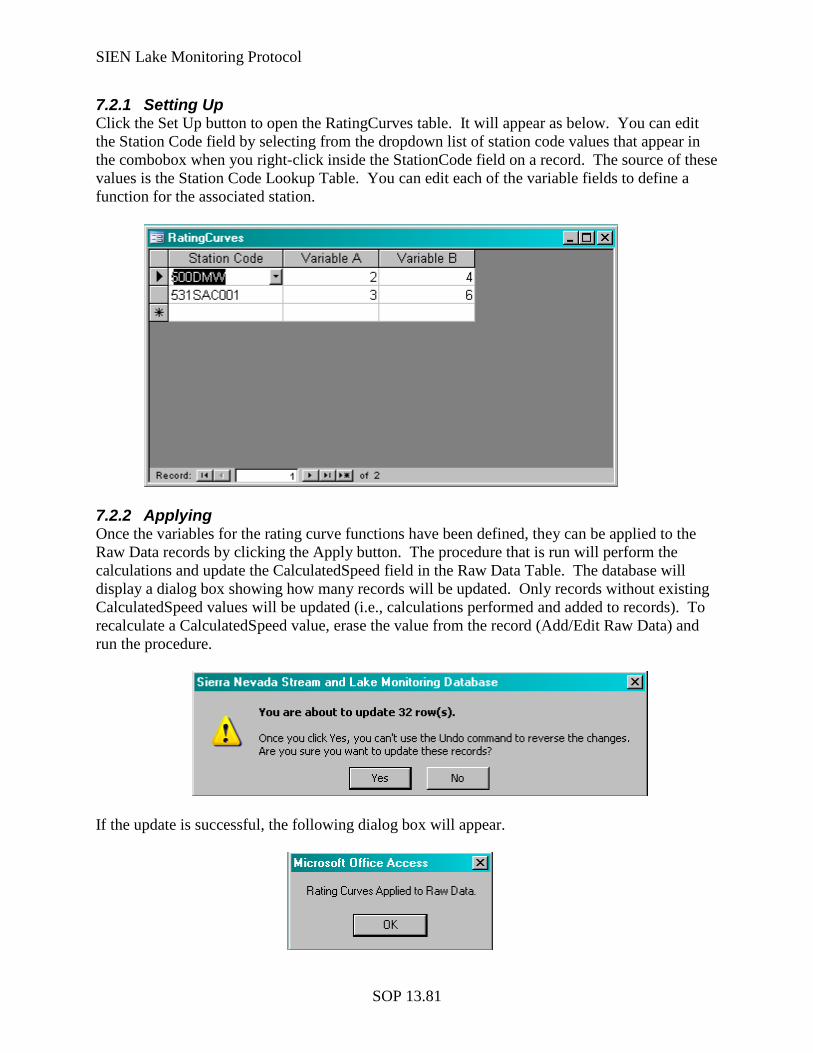
SIEN Lake Monitoring Protocol
SOP 13.81
7.2.1 Setting Up Click the Set Up button to open the RatingCurves table. It will appear as below. You can edit the Station Code field by selecting from the dropdown list of station code values that appear in the combobox when you right-click inside the StationCode field on a record. The source of these values is the Station Code Lookup Table. You can edit each of the variable fields to define a function for the associated station.
7.2.2 Applying Once the variables for the rating curve functions have been defined, they can be applied to the Raw Data records by clicking the Apply button. The procedure that is run will perform the calculations and update the CalculatedSpeed field in the Raw Data Table. The database will display a dialog box showing how many records will be updated. Only records without existing CalculatedSpeed values will be updated (i.e., calculations performed and added to records). To recalculate a CalculatedSpeed value, erase the value from the record (Add/Edit Raw Data) and run the procedure.
If the update is successful, the following dialog box will appear.
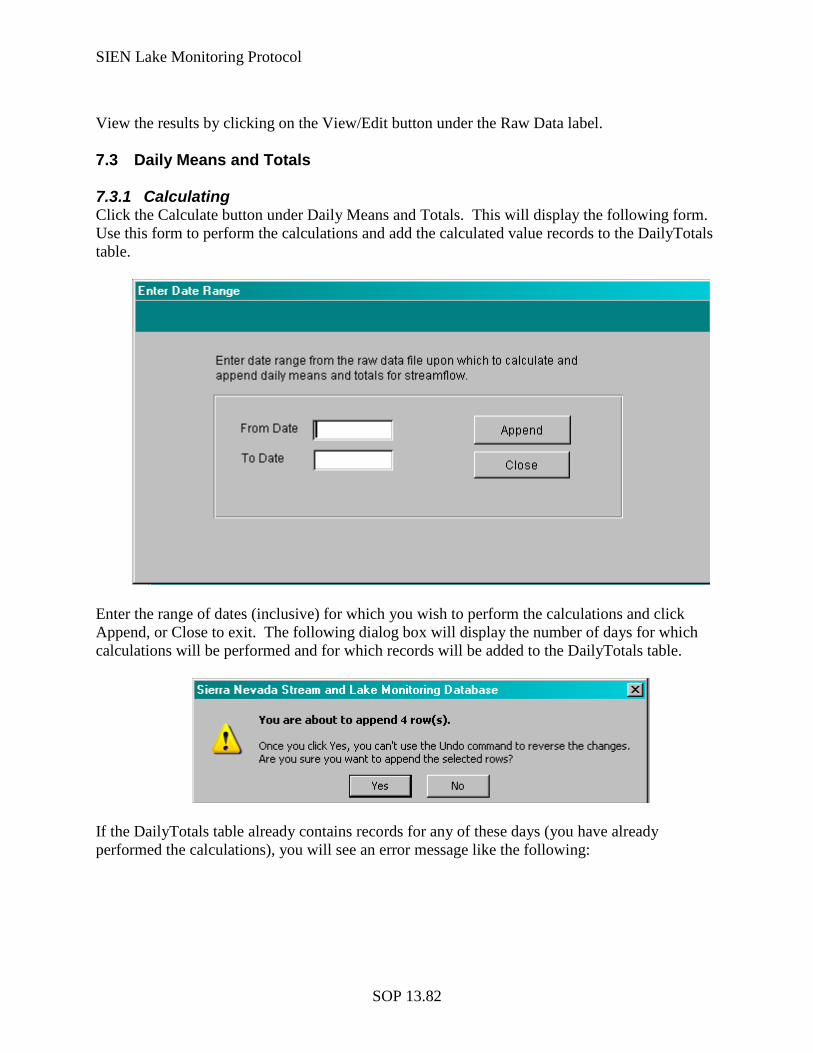
SIEN Lake Monitoring Protocol
SOP 13.82
View the results by clicking on the View/Edit button under the Raw Data label. 7.3 Daily Means and Totals 7.3.1 Calculating Click the Calculate button under Daily Means and Totals. This will display the following form. Use this form to perform the calculations and add the calculated value records to the DailyTotals table.
Enter the range of dates (inclusive) for which you wish to perform the calculations and click Append, or Close to exit. The following dialog box will display the number of days for which calculations will be performed and for which records will be added to the DailyTotals table.
If the DailyTotals table already contains records for any of these days (you have already performed the calculations), you will see an error message like the following:
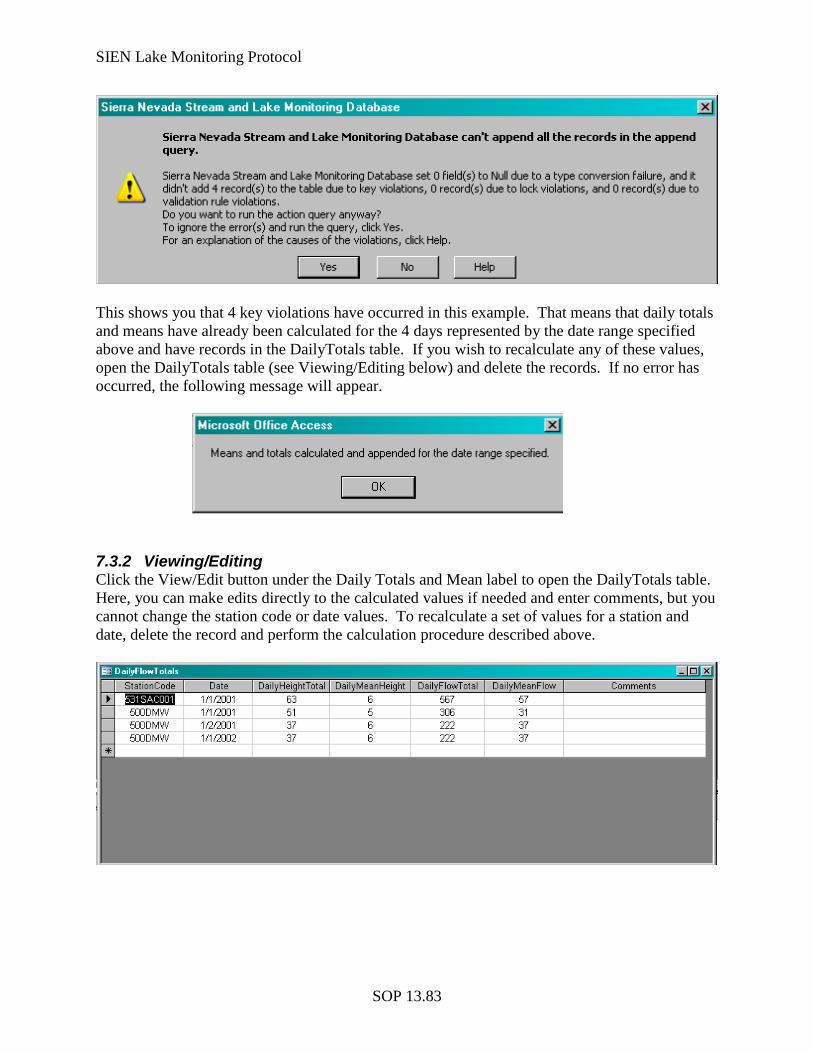
SIEN Lake Monitoring Protocol
SOP 13.83
This shows you that 4 key violations have occurred in this example. That means that daily totals and means have already been calculated for the 4 days represented by the date range specified above and have records in the DailyTotals table. If you wish to recalculate any of these values, open the DailyTotals table (see Viewing/Editing below) and delete the records. If no error has occurred, the following message will appear.
7.3.2 Viewing/Editing Click the View/Edit button under the Daily Totals and Mean label to open the DailyTotals table. Here, you can make edits directly to the calculated values if needed and enter comments, but you cannot change the station code or date values. To recalculate a set of values for a station and date, delete the record and perform the calculation procedure described above.
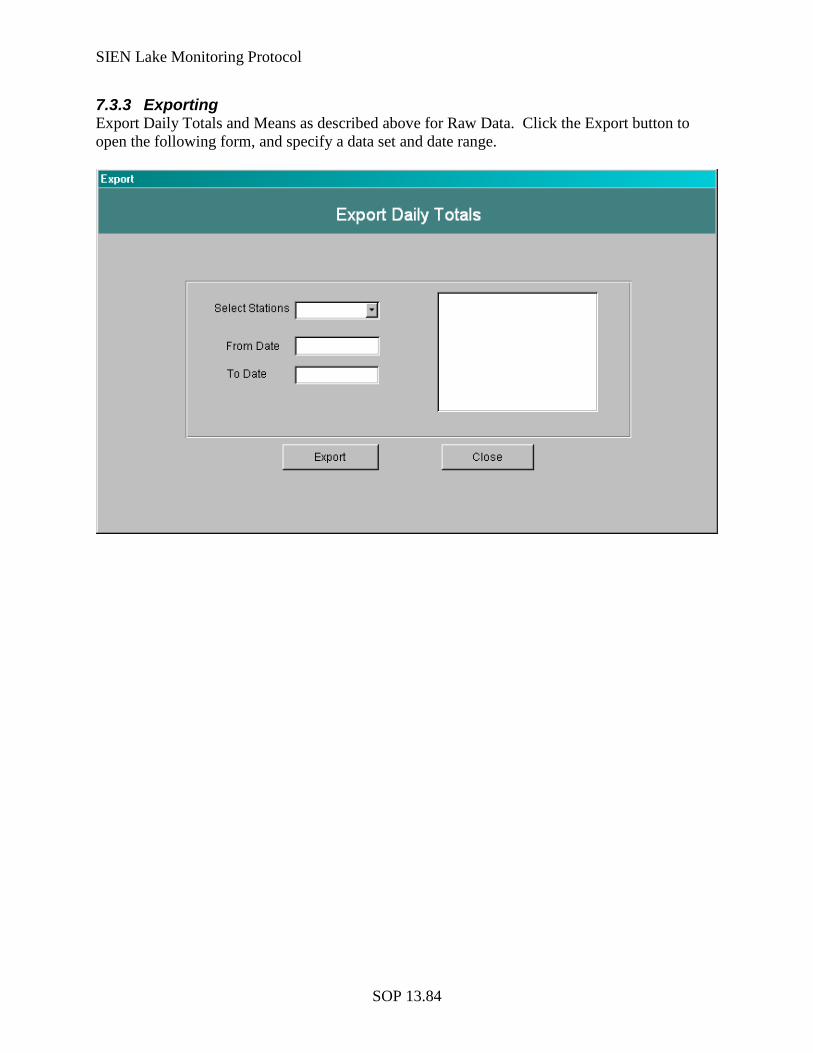
SIEN Lake Monitoring Protocol
SOP 13.84
7.3.3 Exporting Export Daily Totals and Means as described above for Raw Data. Click the Export button to open the following form, and specify a data set and date range.
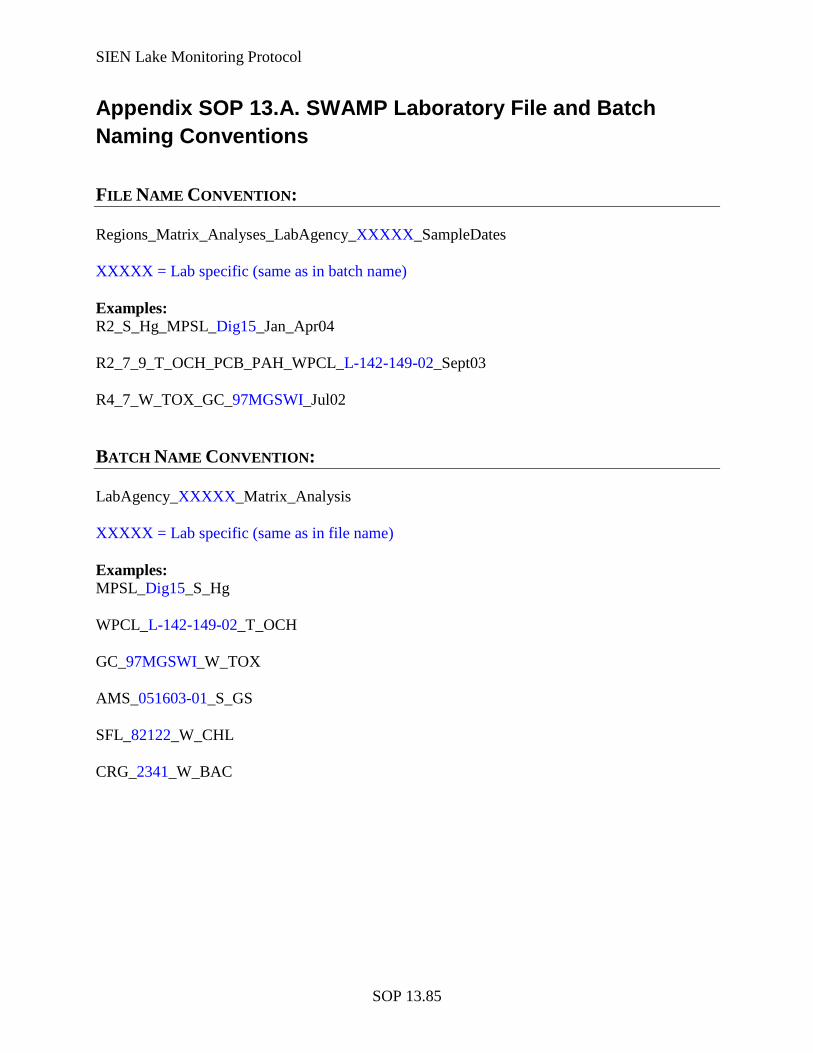
SIEN Lake Monitoring Protocol
SOP 13.85
Appendix SOP 13.A. SWAMP Laboratory File and Batch Naming Conventions FILE NAME CONVENTION: Regions_Matrix_Analyses_LabAgency_XXXXX_SampleDates XXXXX = Lab specific (same as in batch name) Examples: R2_S_Hg_MPSL_Dig15_Jan_Apr04 R2_7_9_T_OCH_PCB_PAH_WPCL_L-142-149-02_Sept03 R4_7_W_TOX_GC_97MGSWI_Jul02 BATCH NAME CONVENTION: LabAgency_XXXXX_Matrix_Analysis XXXXX = Lab specific (same as in file name) Examples: MPSL_Dig15_S_Hg WPCL_L-142-149-02_T_OCH GC_97MGSWI_W_TOX AMS_051603-01_S_GS SFL_82122_W_CHL CRG_2341_W_BAC

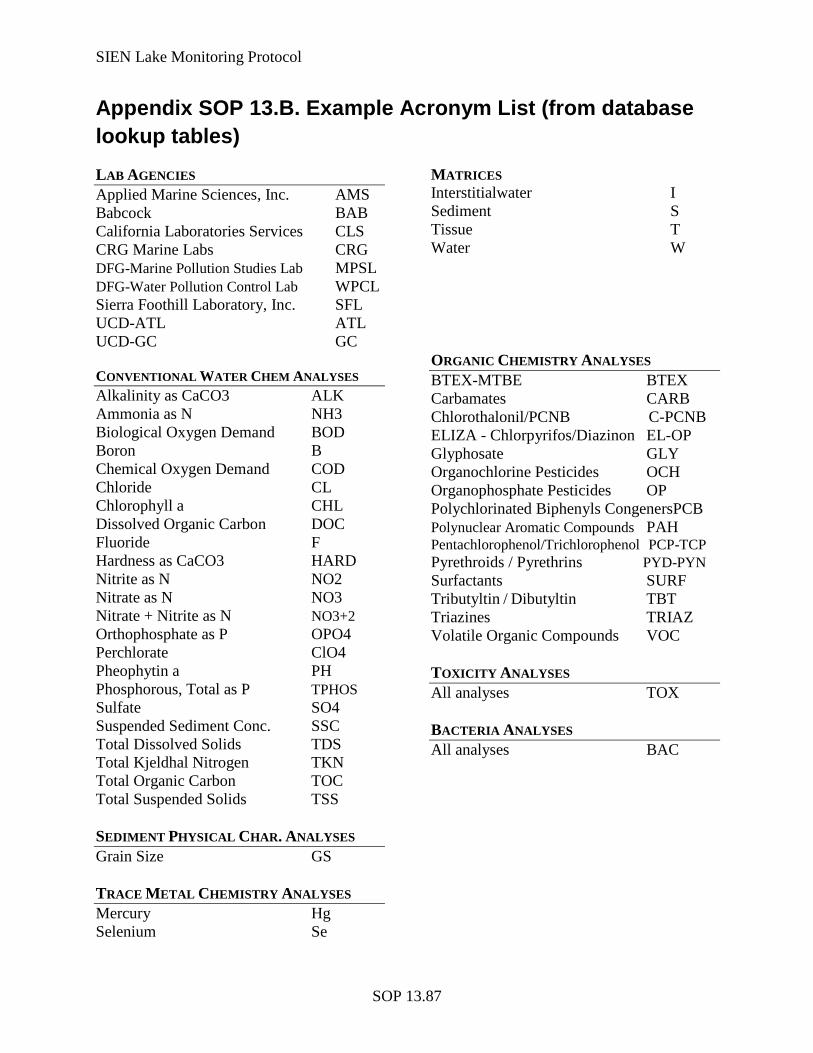
SIEN Lake Monitoring Protocol
SOP 13.87
Appendix SOP 13.B. Example Acronym List (from database lookup tables) LAB AGENCIES Applied Marine Sciences, Inc. AMS Babcock BAB California Laboratories Services CLS CRG Marine Labs CRG DFG-Marine Pollution Studies Lab MPSL DFG-Water Pollution Control Lab WPCL Sierra Foothill Laboratory, Inc. SFL UCD-ATL ATL UCD-GC GC
MATRICES Interstitialwater I Sediment S Tissue T Water W
CONVENTIONAL WATER CHEM ANALYSES Alkalinity as CaCO3 ALK Ammonia as N NH3 Biological Oxygen Demand BOD Boron B Chemical Oxygen Demand COD Chloride CL Chlorophyll a CHL Dissolved Organic Carbon DOC Fluoride F Hardness as CaCO3 HARD Nitrite as N NO2 Nitrate as N NO3 Nitrate + Nitrite as N NO3+2 Orthophosphate as P OPO4 Perchlorate ClO4 Pheophytin a PH Phosphorous, Total as P TPHOS Sulfate SO4 Suspended Sediment Conc. SSC Total Dissolved Solids TDS Total Kjeldhal Nitrogen TKN Total Organic Carbon TOC Total Suspended Solids TSS SEDIMENT PHYSICAL CHAR. ANALYSES Grain Size GS TRACE METAL CHEMISTRY ANALYSES Mercury Hg Selenium Se
ORGANIC CHEMISTRY ANALYSES BTEX-MTBE BTEX Carbamates CARB Chlorothalonil/PCNB C-PCNB ELIZA - Chlorpyrifos/Diazinon EL-OP Glyphosate GLY Organochlorine Pesticides OCH Organophosphate Pesticides OP Polychlorinated Biphenyls CongenersPCB Polynuclear Aromatic Compounds PAH Pentachlorophenol/Trichlorophenol PCP-TCP Pyrethroids / Pyrethrins PYD-PYN Surfactants SURF Tributyltin / Dibutyltin TBT Triazines TRIAZ Volatile Organic Compounds VOC TOXICITY ANALYSES All analyses TOX BACTERIA ANALYSES All analyses BAC

SIEN Lake Monitoring Protocol
SOP 14.1
Sierra Nevada Network Lake Monitoring Protocol
SOP 14. Data Analysis Version 1.00, October 2012 Prepared by Leigh Ann Harrod Starcevich and Andrea M. Heard
Revision History Log Previous Version #
Revision Date Author Changes Made Reason for
Change New
Version #
SIEN Lake Monitoring Protocol
SOP 14.2
Contents Page
1 Introduction ................................................................................................................. SOP 14.4
1.1 Suggested Reading .......................................................................................... SOP 14.4
2 Status: Water Chemistry ............................................................................................. SOP 14.6
2.1 Descriptive Statistics ....................................................................................... SOP 14.6
2.1.1 Status (Descriptive Statistics) Estimation in R ........................................ SOP 14.8
2.2 Threshold Conditions .................................................................................... SOP 14.11
3 Trend: Water Chemistry ........................................................................................... SOP 14.13
3.1 Time Series Plots ........................................................................................... SOP 14.13
3.2 Linear Mixed-Model ...................................................................................... SOP 14.13
3.2.1 Degrees of Freedom ............................................................................... SOP 14.16
3.2.2 Trend Tests ............................................................................................. SOP 14.17
3.2.3 Trend Estimates ...................................................................................... SOP 14.17
3.3 Seasonal Kendall Test ................................................................................... SOP 14.21
4 Continuous Water-level and Temperature ................................................................ SOP 14.28
4.1.2 Correcting Water Stage Data.................................................................. SOP 14.32
4.2 Routine Data Summaries for Annual Report ................................................. SOP 14.36
4.2.1 Summary Data ........................................................................................ SOP 14.36
4.2.2 Trend Analyses ....................................................................................... SOP 14.36
4.2.3 Photographs ............................................................................................ SOP 14.36
5 Literature Cited ......................................................................................................... SOP 14.37
SIEN Lake Monitoring Protocol
SOP 14.3
Figures Page
Figure SOP 14.1. Lognormal quantile plot of Y. ........................................................... SOP 14.10
Figure SOP 14.2. Example of a concentration-discharge graph for calcium. ................ SOP 14.25
Figure SOP 14.3. Flow chart of data processing procedures for water-level and temperature. ..................................................................................................................... SOP 14.29
Figure SOP 14.4. Correcting stage data for barometric pressure and elevation. ............ SOP 14.30
Figure SOP 14.5. Combining date and time fields into a single date:time field. ........... SOP 14.31
Figure SOP 14.6. Counting stage records in Excel. ....................................................... SOP 14.33
Figure SOP 14.7. Example of drift correction through linear interpolation using Microsoft Excel. ............................................................................................................... SOP 14.35
Tables Page
Table SOP 14.1. Data analysis procedures with corresponding objectives. ..................... SOP 14.4
Table SOP 14.2. Data format for lake chemistry analysis. ............................................... SOP 14.8
Table SOP 14.3. Status codes corresponding to steps in the S-ESTREND process. ...... SOP 14.23
Table SOP 14.A.1. Simulation results for two methods of estimating panel inclusion probabilities. ..................................................................................................................... SOP 14.42
Appendixes Page
Appendix SOP 14A: Adjusting Sample Inclusion Probabilities for Panel Surveys ..................... 39
Appendix SOP 14B: Example Excel File Used to Create a Tab-delimited Text File for the Mixed Linear Model. .............................................................................................................. 43
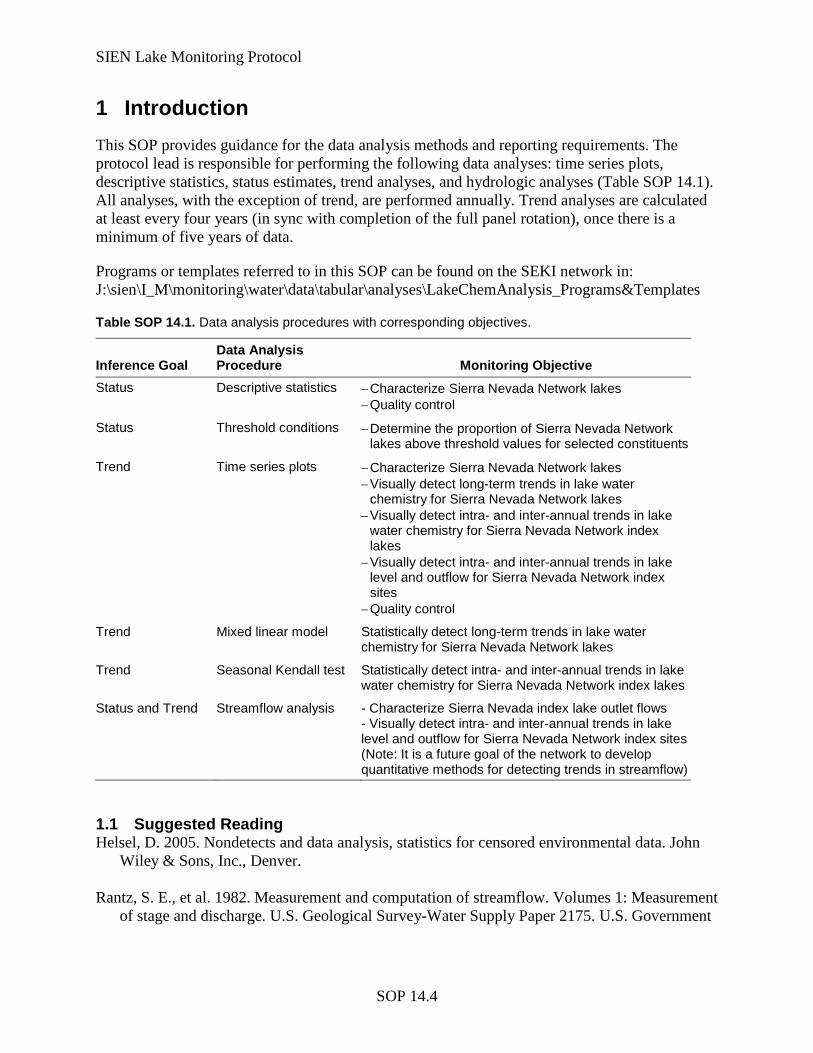
SIEN Lake Monitoring Protocol
SOP 14.4
1 Introduction This SOP provides guidance for the data analysis methods and reporting requirements. The protocol lead is responsible for performing the following data analyses: time series plots, descriptive statistics, status estimates, trend analyses, and hydrologic analyses (Table SOP 14.1). All analyses, with the exception of trend, are performed annually. Trend analyses are calculated at least every four years (in sync with completion of the full panel rotation), once there is a minimum of five years of data.
Programs or templates referred to in this SOP can be found on the SEKI network in: J:\sien\I_M\monitoring\water\data\tabular\analyses\LakeChemAnalysis_Programs&Templates
Table SOP 14.1. Data analysis procedures with corresponding objectives.
Inference Goal Data Analysis Procedure Monitoring Objective
Status Descriptive statistics − Characterize Sierra Nevada Network lakes − Quality control
Status Threshold conditions − Determine the proportion of Sierra Nevada Network lakes above threshold values for selected constituents
Trend Time series plots − Characterize Sierra Nevada Network lakes − Visually detect long-term trends in lake water
chemistry for Sierra Nevada Network lakes − Visually detect intra- and inter-annual trends in lake
water chemistry for Sierra Nevada Network index lakes
− Visually detect intra- and inter-annual trends in lake level and outflow for Sierra Nevada Network index sites
− Quality control
Trend Mixed linear model Statistically detect long-term trends in lake water chemistry for Sierra Nevada Network lakes
Trend Seasonal Kendall test Statistically detect intra- and inter-annual trends in lake water chemistry for Sierra Nevada Network index lakes
Status and Trend Streamflow analysis - Characterize Sierra Nevada index lake outlet flows - Visually detect intra- and inter-annual trends in lake level and outflow for Sierra Nevada Network index sites (Note: It is a future goal of the network to develop quantitative methods for detecting trends in streamflow)
1.1 Suggested Reading Helsel, D. 2005. Nondetects and data analysis, statistics for censored environmental data. John
Wiley & Sons, Inc., Denver. Rantz, S. E., et al. 1982. Measurement and computation of streamflow. Volumes 1: Measurement
of stage and discharge. U.S. Geological Survey-Water Supply Paper 2175. U.S. Government

SIEN Lake Monitoring Protocol
SOP 14.5
Printing Office, Washington DC. Available at http://pubs.usgs.gov/wsp/wsp2175/#table (accessed 2007).
Rantz, S. E., et al. 1982. Measurement and computation of streamflow. Volumes 2: Computation
of discharge. U.S. Geological Survey-Water Supply Paper 2175. U.S. Government Printing Office, Washington DC. Available at http://pubs.usgs.gov/wsp/wsp2175/#table (accessed XXXX).
SIEN Lake Monitoring Protocol
SOP 14.6
2 Status: Water Chemistry 2.1 Descriptive Statistics Water chemistry descriptive statistics are calculated with preliminary data as a quality check on the data and exploratory data analysis. Follow procedures outlined in Section 3.1 for identifying and documenting any atypical data points. In addition to the descriptive statistic calculations, we recommend presenting the data graphically using graphs such as boxplots and histograms.
Once data are certified, the protocol lead calculates ‘final’ summary statistics for the annual or comprehensive reports. For annual reports, data are calculated for the current field season. For comprehensive reports, which are completed at least once every four years following one full rotation of the panel, statistics are also computed for the most recent full panel rotation. Descriptive statistics may also be calculated for the larger data set or subsets as deemed applicable. The protocol lead may use any reputable statistical program that s/he is comfortable working in. R and S-Plus applications are currently (2007) available to NPS staff.
Descriptive statistics should include the following calculations for the water quality measures—mean, median, variance, standard deviation, standard error, minimum, maximum, sample size, and range. When computing the mean and variance, both censored data approaches and the Generalized Random Tessellation Stratified (GRTS) neighborhood variance estimator (Stevens Jr. and Olsen 2003, Stevens Jr. and Olsen 2004) are incorporated when possible. Software to compute GRTS estimators can be obtained for R and S-Plus applications at the following web site: http://www.epa.gov/nheerl/arm/analysispages/software.htm.
The mean is calculated as a Horvitz-Thompson estimate (Horvitz and Thompson 1952). The variance of the mean is calculated using the GRTS neighborhood variance estimator (Stevens Jr. and Olsen 2003, Stevens Jr. and Olsen 2004). The neighborhood variance estimator [VNBH(ZM)] for a mean is:
,
where:
µ̂ is the estimator of the population mean, μ,
si,j, or k are sample points,
R is the domain of the sampled population defined as a set of points occupied by the population elements,
D (si) is the local neighborhood for site i,
wij are weights chosen to reflect the behavior of the pairwise inclusion function for GRTS, and are constrained so that Σi wij = Σj wij = 1,
( ) ( )( )( )
( )( )( )( )
2 2
1ˆ ˆj j k ii j
j kNBH ij ik
s R s R s D ss D s kj j
z s z sV w w
ss sµ
ππ π∈ ∈ ∈∈
= − ∑ ∑ ∑ ∑
SIEN Lake Monitoring Protocol
SOP 14.7
( )iz s is the real-valued outcome measured at the ith point, and
( )isπ is the inclusion density for site i.
Methods to account for censored data are also needed to obtain summary statistics. Sample size and percent of censored data need to be considered when selecting a method. Details on the analysis methods are found in Helsel’s book, Nondetects and Data Analysis, Statistics for Censored Environmental Data Helsel 2005 ( ).
The robust maximum likelihood estimation (MLE) approach (Helsel 2005) is used to estimate missing values so that a complete data set may be used to obtain status estimates. The robust MLE approach by Kroll and Stedinger (1996) avoids transformation bias found in small and/or skewed samples. By regressing the logged response on the expected quantiles from a lognormal distribution, a model is obtained which can be used to impute censored values that are less than known thresholds. This technique can also accommodate multiple thresholds and is not reliant on correlated covariates for modeling. The authors suggest using a single imputation of values to obtain a complete data set from which to calculate moment estimates. However, multiple imputation techniques (Little and Rubin 2002) may increase the robustness of this procedure by examining a range of possible imputed values and by incorporating the uncertainty from substituting values for missing data. Therefore, the robust MLE approach is used to create several complete data sets, and each data set is used to obtain estimates of status based on the GRTS design. These status estimates are combined into a single status estimator that accounts for the spatially balanced sample, the detection limits, and the substitution of values to create complete data sets. This approach is discussed in more detail in Appendix B of the Protocol Narrative.
The robust MLE approach is implemented in the R workspace LakeChem.RData. This workspace contains all of the functions needed to obtain single-year status estimates for lake chemistry outcomes. Please note that some of these functions can take several minutes to run. The data must be formatted precisely; data columns are defined in Table SOP 14.2. The censoring format is similar to Helsel’s (2005) Table 6.3.
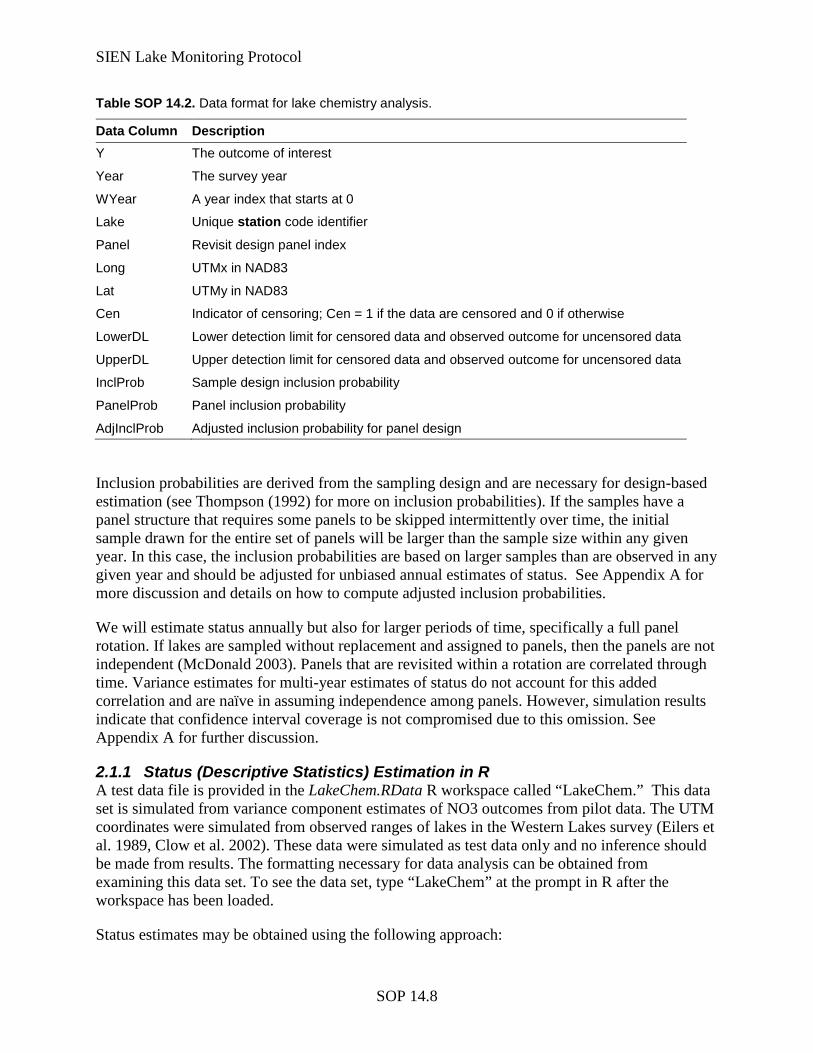
SIEN Lake Monitoring Protocol
SOP 14.8
Table SOP 14.2. Data format for lake chemistry analysis.
Data Column Description Y The outcome of interest
Year The survey year
WYear A year index that starts at 0
Lake Unique station code identifier
Panel Revisit design panel index
Long UTMx in NAD83
Lat UTMy in NAD83
Cen Indicator of censoring; Cen = 1 if the data are censored and 0 if otherwise
LowerDL Lower detection limit for censored data and observed outcome for uncensored data
UpperDL Upper detection limit for censored data and observed outcome for uncensored data
InclProb Sample design inclusion probability
PanelProb Panel inclusion probability
AdjInclProb Adjusted inclusion probability for panel design
Inclusion probabilities are derived from the sampling design and are necessary for design-based estimation (see Thompson (1992) for more on inclusion probabilities). If the samples have a panel structure that requires some panels to be skipped intermittently over time, the initial sample drawn for the entire set of panels will be larger than the sample size within any given year. In this case, the inclusion probabilities are based on larger samples than are observed in any given year and should be adjusted for unbiased annual estimates of status. See Appendix A for more discussion and details on how to compute adjusted inclusion probabilities.
We will estimate status annually but also for larger periods of time, specifically a full panel rotation. If lakes are sampled without replacement and assigned to panels, then the panels are not independent (McDonald 2003). Panels that are revisited within a rotation are correlated through time. Variance estimates for multi-year estimates of status do not account for this added correlation and are naïve in assuming independence among panels. However, simulation results indicate that confidence interval coverage is not compromised due to this omission. See Appendix A for further discussion.
2.1.1 Status (Descriptive Statistics) Estimation in R A test data file is provided in the LakeChem.RData R workspace called “LakeChem.” This data set is simulated from variance component estimates of NO3 outcomes from pilot data. The UTM coordinates were simulated from observed ranges of lakes in the Western Lakes survey (Eilers et al. 1989, Clow et al. 2002). These data were simulated as test data only and no inference should be made from results. The formatting necessary for data analysis can be obtained from examining this data set. To see the data set, type “LakeChem” at the prompt in R after the workspace has been loaded.
Status estimates may be obtained using the following approach:
SIEN Lake Monitoring Protocol
SOP 14.9
1. Import data:
LakeChem<-read.table("LakeChem.txt", header=T, sep=",")
attach(LakeChem)
If the data are separated by tabs, use sep="\t".
2. Load libraries for R (download from http://www.r-project.org/):
library(lme4) library(NADA) library(mitools) library(spsurvey) NOTE: These libraries must be loaded at the beginning of every R session for these analyses. Libraries are not saved within R workspaces.
3. Check that the lognormal assumption is met for all uncensored data: Compare uncensored outcomes against lognormal quantiles. Here, the uncensored data from 2010 (WYear=2) will be used and the plot is given in Figure SOP 14.1.
LakeChem2010<- LakeChem[LakeChem$Year==2010,] Obs2010<-LakeChem2010[LakeChem2010$Cen==0,] qqnorm(log(Obs2010$Y), main="") qqline(log(Obs2010$Y), col = 2) # Adds red line for lognormal expected values
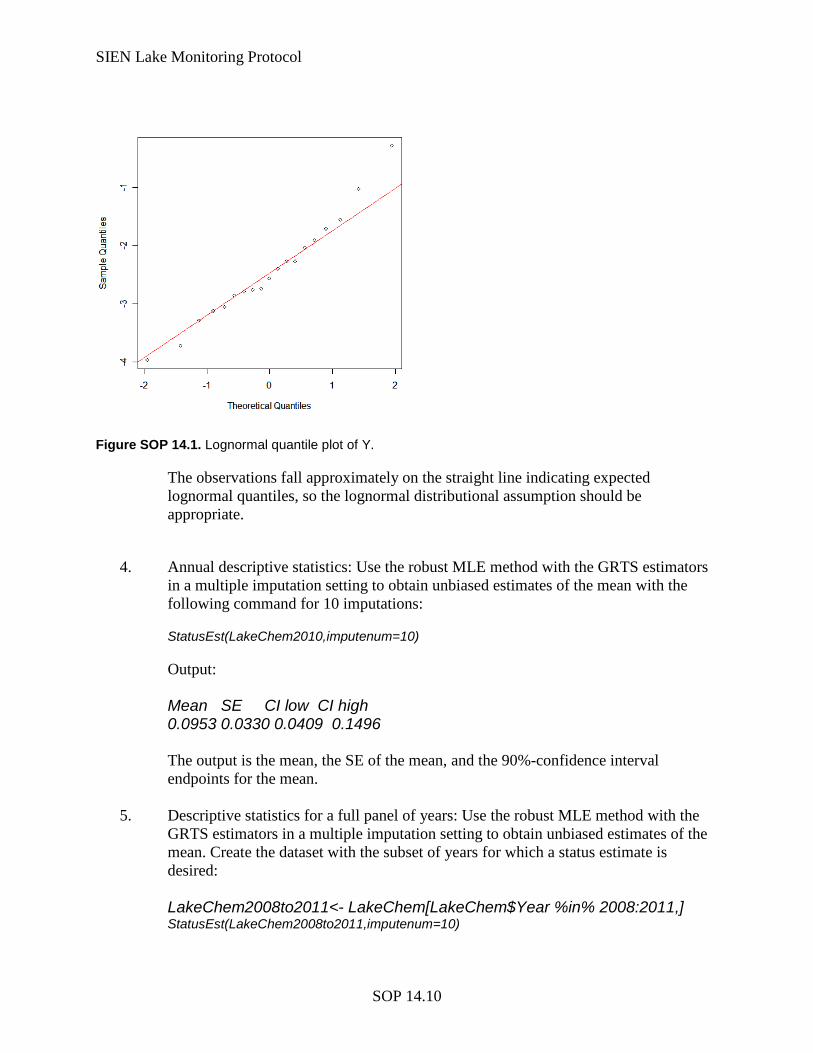
SIEN Lake Monitoring Protocol
SOP 14.10
Figure SOP 14.1. Lognormal quantile plot of Y.
The observations fall approximately on the straight line indicating expected lognormal quantiles, so the lognormal distributional assumption should be appropriate.
4. Annual descriptive statistics: Use the robust MLE method with the GRTS estimators
in a multiple imputation setting to obtain unbiased estimates of the mean with the following command for 10 imputations:
StatusEst(LakeChem2010,imputenum=10)
Output: Mean SE CI low CI high 0.0953 0.0330 0.0409 0.1496 The output is the mean, the SE of the mean, and the 90%-confidence interval endpoints for the mean.
5. Descriptive statistics for a full panel of years: Use the robust MLE method with the GRTS estimators in a multiple imputation setting to obtain unbiased estimates of the mean. Create the dataset with the subset of years for which a status estimate is desired: LakeChem2008to2011<- LakeChem[LakeChem$Year %in% 2008:2011,] StatusEst(LakeChem2008to2011,imputenum=10)
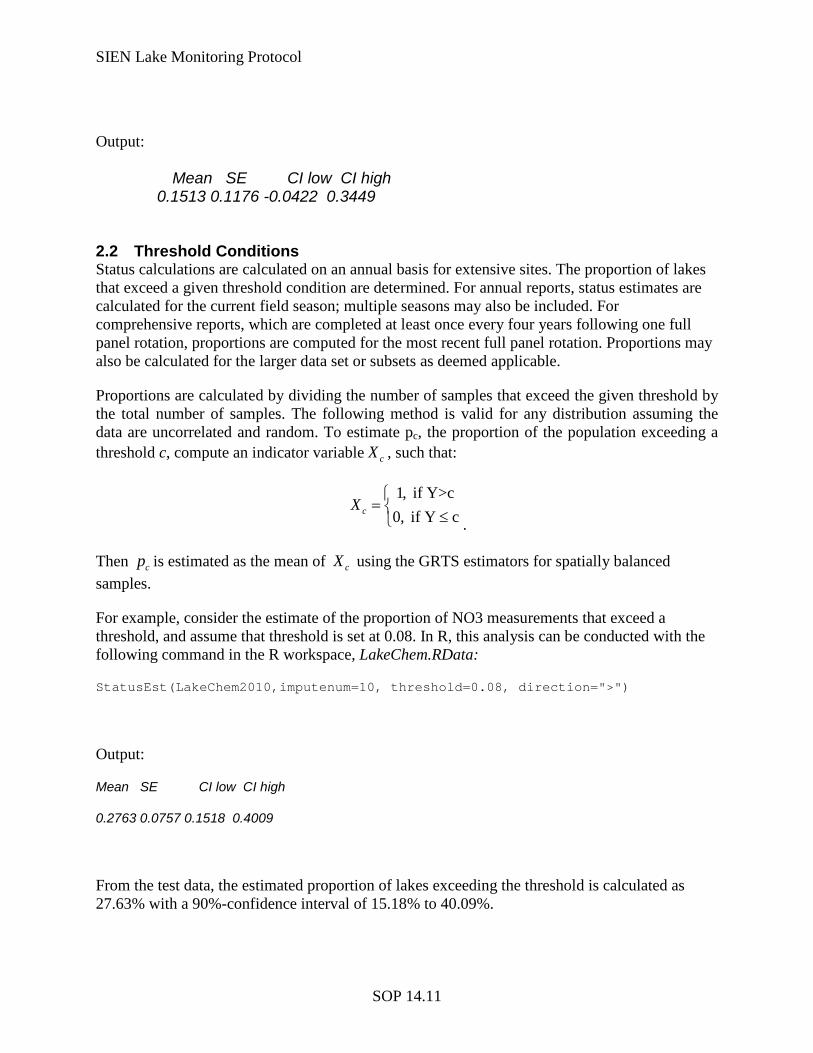
SIEN Lake Monitoring Protocol
SOP 14.11
Output:
Mean SE CI low CI high 0.1513 0.1176 -0.0422 0.3449
2.2 Threshold Conditions Status calculations are calculated on an annual basis for extensive sites. The proportion of lakes that exceed a given threshold condition are determined. For annual reports, status estimates are calculated for the current field season; multiple seasons may also be included. For comprehensive reports, which are completed at least once every four years following one full panel rotation, proportions are computed for the most recent full panel rotation. Proportions may also be calculated for the larger data set or subsets as deemed applicable.
Proportions are calculated by dividing the number of samples that exceed the given threshold by the total number of samples. The following method is valid for any distribution assuming the data are uncorrelated and random. To estimate pc, the proportion of the population exceeding a threshold c, compute an indicator variable cX , such that:
.
Then cp is estimated as the mean of cX using the GRTS estimators for spatially balanced samples.
For example, consider the estimate of the proportion of NO3 measurements that exceed a threshold, and assume that threshold is set at 0.08. In R, this analysis can be conducted with the following command in the R workspace, LakeChem.RData:
StatusEst(LakeChem2010,imputenum=10, threshold=0.08, direction=">")
Output:
Mean SE CI low CI high
0.2763 0.0757 0.1518 0.4009
From the test data, the estimated proportion of lakes exceeding the threshold is calculated as 27.63% with a 90%-confidence interval of 15.18% to 40.09%.
1, if Y>c0, if Y ccX
= ≤
SIEN Lake Monitoring Protocol
SOP 14.12
A multi-year estimate can be computed using a similar command and the naïve variance estimator for multiple years (as outlined in Appendix A):
StatusEst(LakeChem2008to2011,imputenum=10, threshold=0.08, direction=">")
Output:
Mean SE CI low CI high
0.4178 0.0799 0.2863 0.5493
To estimate the proportion of outcomes that lie below a threshold, use the input direction="<".
SIEN plans to identify threshold conditions after three years of monitoring data are available. Water quality standards can be used as a management trigger; however, due to the dilute nature of the Sierra Nevada lakes, ecological thresholds unique to these systems will be far more successful in protecting SIEN lakes. Establishing ecological thresholds is not a trivial task. It will involve input from park staff and outside area experts and likely will require additional research.
SIEN Lake Monitoring Protocol
SOP 14.13
3 Trend: Water Chemistry 3.1 Time Series Plots One of the first steps in evaluating water chemistry, stage, and discharge data are to plot them versus time (i.e. scatter plot). The protocol lead creates and evaluates preliminary plots shortly after data are obtained. This is an important step in the data verification and validation process (Refer to SOP 4. QAPP, Section 4). Preliminary plots are graphed using water chemistry data from the ‘entry side’ of the database. The protocol lead identifies any atypical data points. If a cause can be determined (e.g., analytical error, storm event), it should be documented in the database by flagging the result with an appropriate result code, if applicable, and/or documenting in comment fields (Refer to SOP 13. Database User’s Manual for detailed database procedures). For example, a laboratory or handling error is documented with a result quality code and possibly also in a comment field---if it has not already been done by the lab. A known naturally occurring event, such as an unusual storm, should be documented in the comments field—if it has not already been documented during data entry. If it is determined to be a data entry error, the error is corrected in the database and the correction documented. If it is suspected that there is an analytical error, the laboratory should be contacted immediately for clarification. If determined appropriate and possible, the sample may be re-analyzed.
Once data are certified, the protocol lead creates final time series plots that are used, in conjunction with the trend analyses results, to visually evaluate the data for temporal trends at extensive and index sites in water chemistry and lake outlet flow. Time series plots are presented and discussed in annual and comprehensive reports. Refer to Section 4 for streamflow analyses.
Censored data are presented following guidelines in Helsel’s book: Nondetects and Data Analysis, Statistics for Censored Environmental Data (Helsel 2005). Helsel recommends using intervals such as dashed, grayed-out, line segments that span from zero to the detection limit. The use of an interval, instead of a single point at a subjectively selected number (e.g., zero or the detection limit), conveys the uncertainty present in censored data.
The protocol lead may use any reputable graphing software s/he is comfortable working in. We suggest SigmaPlot, S-Plus, MS Excel, R---these programs are currently (2007) available to I&M staff.
3.2 Linear Mixed-Model A linear mixed-model is used to test for trend at extensive sites (α = 0.10). VanLeeuwen et al. and Piepho and Ogutu (1996, 2002) used this model to address trend estimation for correlated data. A mixed model allows some effects to be considered fixed and some to be considered random. Fixed effects contribute to the mean of the outcome and random effects contribute to the variance. Random effects are used to estimate variation of linear trends among subjects (lakes) and over time (years). Restricted maximum likelihood (REML) is used to obtain the estimates for fixed and random effects. The linear mixed model is a parametric model, requiring the assumptions of independent and normally distributed errors with equal variance. These assumptions will be verified using histograms and Q-Q plots of the residuals.
Piepho and Ogutu (2002) improve the estimator proposed by VanLeeuwen et al. (1996) by modeling the random site effect as correlated with the random slope. This modification allows an
SIEN Lake Monitoring Protocol
SOP 14.14
invariant t-test or F-test of trend from standard analysis output in statistical programs such as SAS and R. In addition, Piepho and Ogutu (2002) suggest that the site effect may be modeled as either fixed or random. The site intercept is modeled as random if the sample of lakes has been chosen using a probability sample and modeled as a fixed effect otherwise. However, Piepho and Ogutu (2002) recommend modeling the site intercept as fixed so that convergence problems are avoided and to optimize test power when residual variance is large. Because REML provides similar results for tests of trend regardless of how the lake intercept is modeled, we will adopt the recommended approach of Piepho and Ogutu (2002) and model the intercept as fixed. For more discussion of the linear mixed modeling approach for trend estimation and testing, see Appendix B of the Protocol Narrative.
The mixed model proposed in both articles is:
Because we are interested in measuring net trend over time as a percent change, the response must be logged so that exponential change may be estimated. In the model given above, the response ijky is actually the natural log of the response being modeled, i.e. ( )ijklog y . Therefore, inference on the original scale is actually made on median trend rather than mean trend.
The null and alternative hypotheses you are testing are no trend (β=0) versus trend (β≠0):
As defined above, β is the coefficient of the WYear variable and represents annual trend of the outcome on the log scale. This test is analogous to the test of:
ijkyμ β ,j j i j i ij ijkw b a w t c e= + + + + + +
a b
a
b
where i=1,.., ; j=1,.., ; k=1,.., and= the number of sites in the sample;= the number of consective years in the sample;
= the number of measurements taken within a site and year; constant j
m m mmmmw = threpresenting the j year (covariate);
μ and β = fixed intercept and slope of the linear time trend;
( )( )
th
th 2a
th 2t
= random effect of the j year;
= random intercept of i site, independent and identically distributed as N 0,σ ;
= random slope of i site, independent and identically distributed as N 0,σ
j
i
i
b
a
t
( )( )
2c
2e
;
= random effect of site by year, independent and identically distributed as N 0,σ ; and
= unexplained error, independent and identically distributed as N 0,σ .
ij
ijk
c
e
: 0 vs : 0o AH Hβ β= ≠
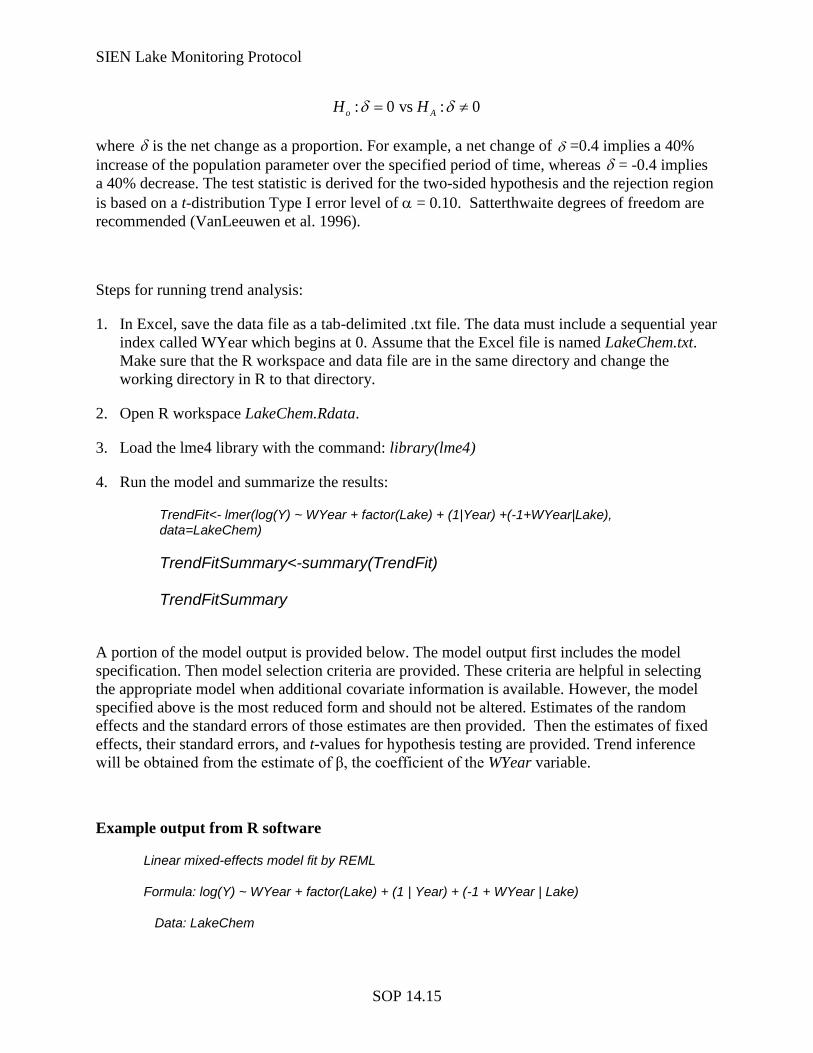
SIEN Lake Monitoring Protocol
SOP 14.15
where δ is the net change as a proportion. For example, a net change of δ =0.4 implies a 40% increase of the population parameter over the specified period of time, whereas δ = -0.4 implies a 40% decrease. The test statistic is derived for the two-sided hypothesis and the rejection region is based on a t-distribution Type I error level of α = 0.10. Satterthwaite degrees of freedom are recommended (VanLeeuwen et al. 1996).
Steps for running trend analysis:
1. In Excel, save the data file as a tab-delimited .txt file. The data must include a sequential year index called WYear which begins at 0. Assume that the Excel file is named LakeChem.txt. Make sure that the R workspace and data file are in the same directory and change the working directory in R to that directory.
2. Open R workspace LakeChem.Rdata.
3. Load the lme4 library with the command: library(lme4)
4. Run the model and summarize the results:
TrendFit<- lmer(log(Y) ~ WYear + factor(Lake) + (1|Year) +(-1+WYear|Lake), data=LakeChem)
TrendFitSummary<-summary(TrendFit) TrendFitSummary
A portion of the model output is provided below. The model output first includes the model specification. Then model selection criteria are provided. These criteria are helpful in selecting the appropriate model when additional covariate information is available. However, the model specified above is the most reduced form and should not be altered. Estimates of the random effects and the standard errors of those estimates are then provided. Then the estimates of fixed effects, their standard errors, and t-values for hypothesis testing are provided. Trend inference will be obtained from the estimate of β, the coefficient of the WYear variable.
Example output from R software
Linear mixed-effects model fit by REML
Formula: log(Y) ~ WYear + factor(Lake) + (1 | Year) + (-1 + WYear | Lake)
Data: LakeChem
: 0 vs : 0o AH Hδ δ= ≠
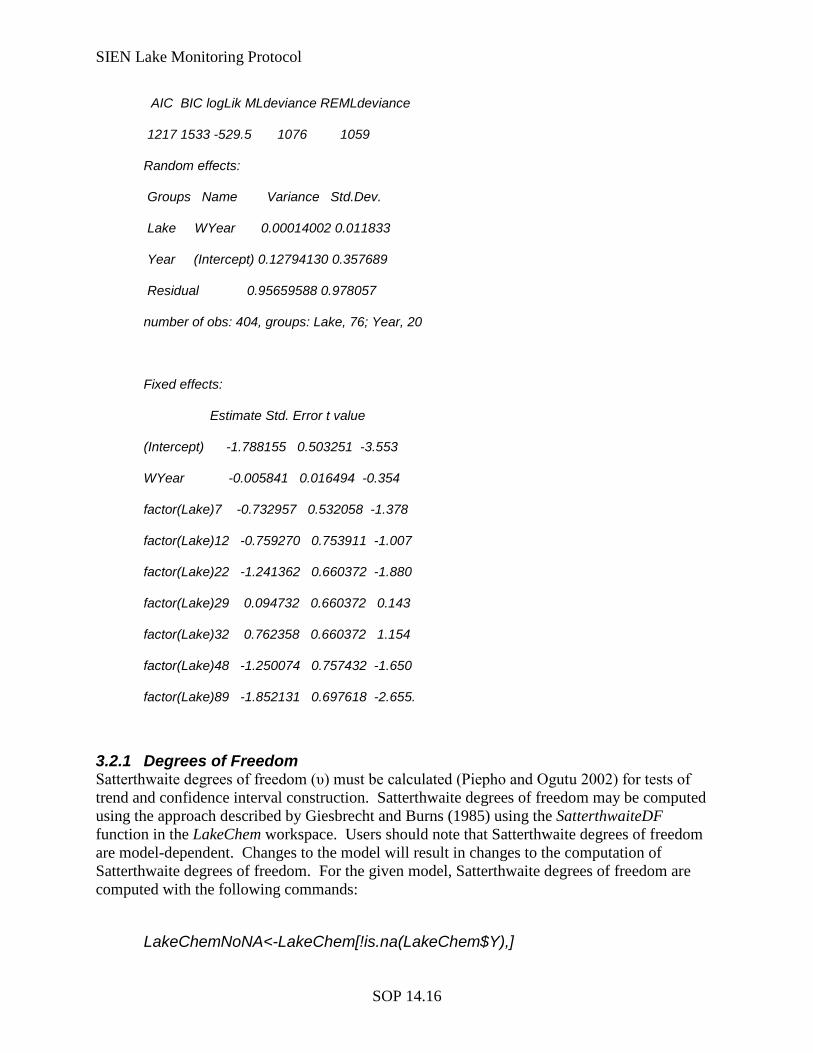
SIEN Lake Monitoring Protocol
SOP 14.16
AIC BIC logLik MLdeviance REMLdeviance
1217 1533 -529.5 1076 1059
Random effects:
Groups Name Variance Std.Dev.
Lake WYear 0.00014002 0.011833
Year (Intercept) 0.12794130 0.357689
Residual 0.95659588 0.978057
number of obs: 404, groups: Lake, 76; Year, 20
Fixed effects:
Estimate Std. Error t value
(Intercept) -1.788155 0.503251 -3.553
WYear -0.005841 0.016494 -0.354
factor(Lake)7 -0.732957 0.532058 -1.378
factor(Lake)12 -0.759270 0.753911 -1.007
factor(Lake)22 -1.241362 0.660372 -1.880
factor(Lake)29 0.094732 0.660372 0.143
factor(Lake)32 0.762358 0.660372 1.154
factor(Lake)48 -1.250074 0.757432 -1.650
factor(Lake)89 -1.852131 0.697618 -2.655.
3.2.1 Degrees of Freedom Satterthwaite degrees of freedom (υ) must be calculated (Piepho and Ogutu 2002) for tests of trend and confidence interval construction. Satterthwaite degrees of freedom may be computed using the approach described by Giesbrecht and Burns (1985) using the SatterthwaiteDF function in the LakeChem workspace. Users should note that Satterthwaite degrees of freedom are model-dependent. Changes to the model will result in changes to the computation of Satterthwaite degrees of freedom. For the given model, Satterthwaite degrees of freedom are computed with the following commands:
LakeChemNoNA<-LakeChem[!is.na(LakeChem$Y),]
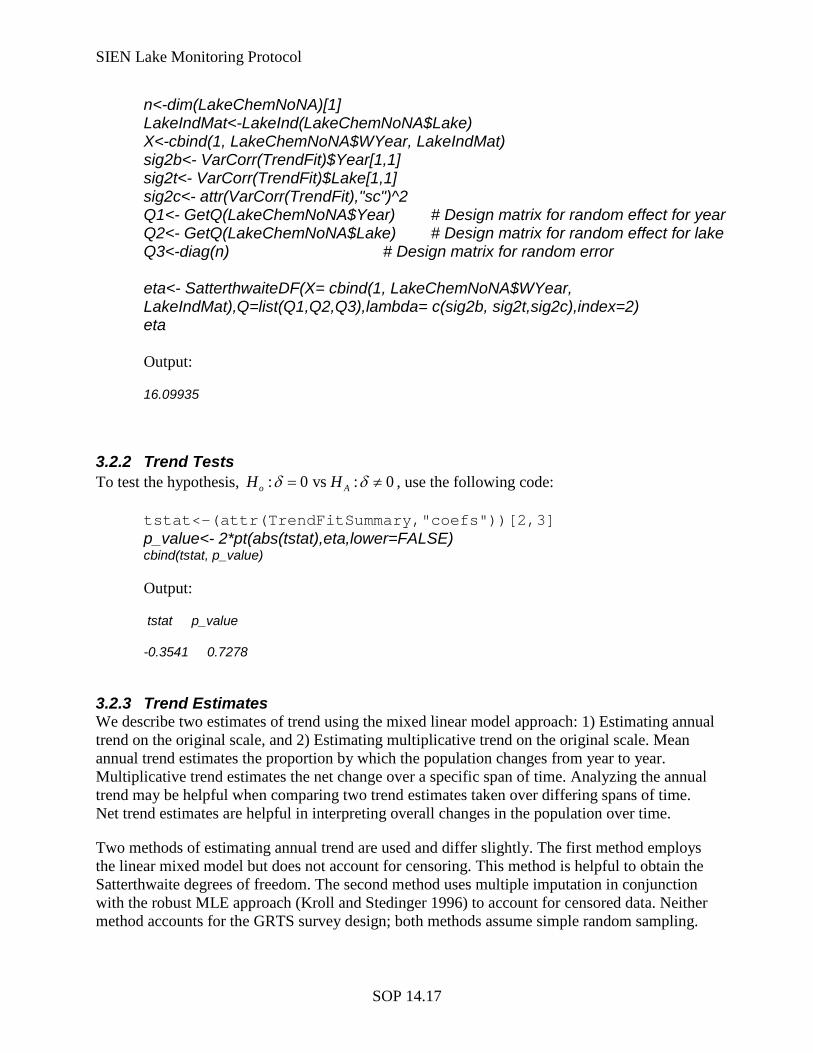
SIEN Lake Monitoring Protocol
SOP 14.17
n<-dim(LakeChemNoNA)[1] LakeIndMat<-LakeInd(LakeChemNoNA$Lake) X<-cbind(1, LakeChemNoNA$WYear, LakeIndMat) sig2b<- VarCorr(TrendFit)$Year[1,1] sig2t<- VarCorr(TrendFit)$Lake[1,1] sig2c<- attr(VarCorr(TrendFit),"sc")^2 Q1<- GetQ(LakeChemNoNA$Year) # Design matrix for random effect for year Q2<- GetQ(LakeChemNoNA$Lake) # Design matrix for random effect for lake Q3<-diag(n) # Design matrix for random error eta<- SatterthwaiteDF(X= cbind(1, LakeChemNoNA$WYear, LakeIndMat),Q=list(Q1,Q2,Q3),lambda= c(sig2b, sig2t,sig2c),index=2) eta Output:
16.09935
3.2.2 Trend Tests To test the hypothesis, : 0 vs : 0o AH Hδ δ= ≠ , use the following code:
tstat<-(attr(TrendFitSummary,"coefs"))[2,3] p_value<- 2*pt(abs(tstat),eta,lower=FALSE) cbind(tstat, p_value)
Output:
tstat p_value
-0.3541 0.7278
3.2.3 Trend Estimates We describe two estimates of trend using the mixed linear model approach: 1) Estimating annual trend on the original scale, and 2) Estimating multiplicative trend on the original scale. Mean annual trend estimates the proportion by which the population changes from year to year. Multiplicative trend estimates the net change over a specific span of time. Analyzing the annual trend may be helpful when comparing two trend estimates taken over differing spans of time. Net trend estimates are helpful in interpreting overall changes in the population over time.
Two methods of estimating annual trend are used and differ slightly. The first method employs the linear mixed model but does not account for censoring. This method is helpful to obtain the Satterthwaite degrees of freedom. The second method uses multiple imputation in conjunction with the robust MLE approach (Kroll and Stedinger 1996) to account for censored data. Neither method accounts for the GRTS survey design; both methods assume simple random sampling.
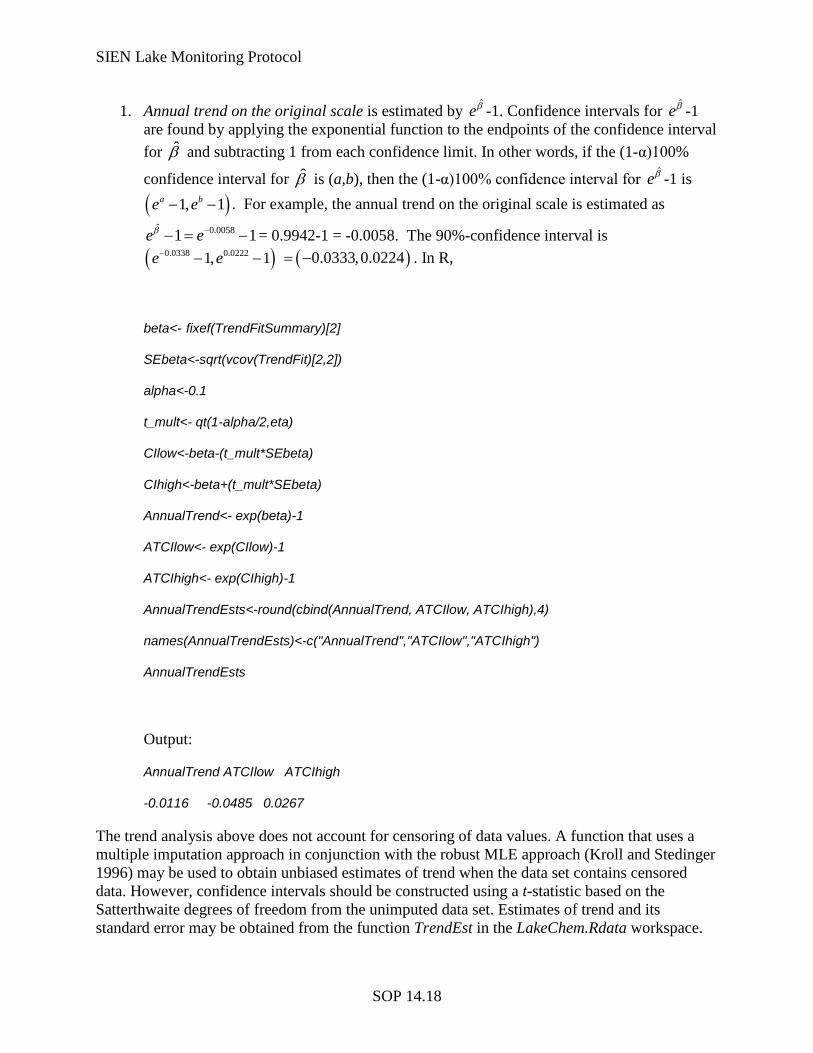
SIEN Lake Monitoring Protocol
SOP 14.18
1. Annual trend on the original scale is estimated by ˆeβ -1. Confidence intervals for ˆeβ -1 are found by applying the exponential function to the endpoints of the confidence interval for β̂ and subtracting 1 from each confidence limit. In other words, if the (1-α)100%
confidence interval for β̂ is (a,b), then the (1-α)100% confidence interval for ˆeβ -1 is
( )1, 1a be e− − . For example, the annual trend on the original scale is estimated as ˆ 0.00581 1e eβ −− = − = 0.9942-1 = -0.0058. The 90%-confidence interval is
( )0.0338 0.02221, 1e e− − − ( )0.0333,0.0224= − . In R,
beta<- fixef(TrendFitSummary)[2]
SEbeta<-sqrt(vcov(TrendFit)[2,2])
alpha<-0.1
t_mult<- qt(1-alpha/2,eta)
CIlow<-beta-(t_mult*SEbeta)
CIhigh<-beta+(t_mult*SEbeta)
AnnualTrend<- exp(beta)-1
ATCIlow<- exp(CIlow)-1
ATCIhigh<- exp(CIhigh)-1
AnnualTrendEsts<-round(cbind(AnnualTrend, ATCIlow, ATCIhigh),4)
names(AnnualTrendEsts)<-c("AnnualTrend","ATCIlow","ATCIhigh")
AnnualTrendEsts
Output:
AnnualTrend ATCIlow ATCIhigh
-0.0116 -0.0485 0.0267
The trend analysis above does not account for censoring of data values. A function that uses a multiple imputation approach in conjunction with the robust MLE approach (Kroll and Stedinger 1996) may be used to obtain unbiased estimates of trend when the data set contains censored data. However, confidence intervals should be constructed using a t-statistic based on the Satterthwaite degrees of freedom from the unimputed data set. Estimates of trend and its standard error may be obtained from the function TrendEst in the LakeChem.Rdata workspace.
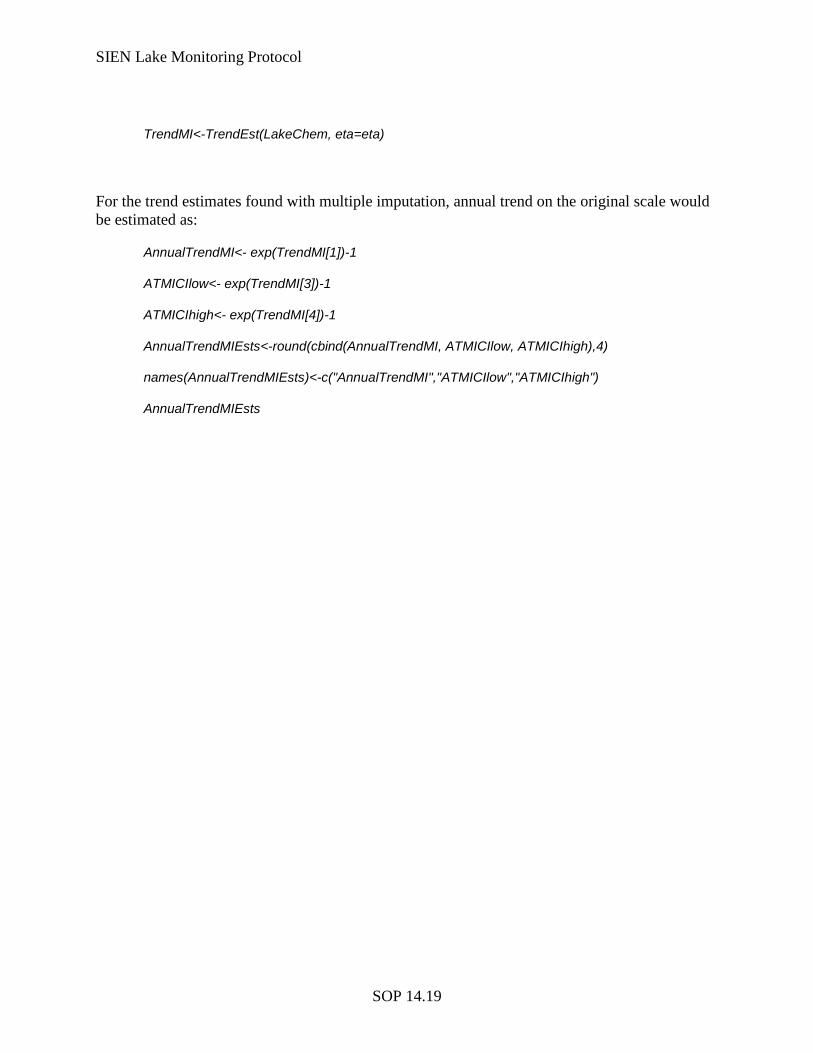
SIEN Lake Monitoring Protocol
SOP 14.19
TrendMI<-TrendEst(LakeChem, eta=eta)
For the trend estimates found with multiple imputation, annual trend on the original scale would be estimated as:
AnnualTrendMI<- exp(TrendMI[1])-1
ATMICIlow<- exp(TrendMI[3])-1
ATMICIhigh<- exp(TrendMI[4])-1
AnnualTrendMIEsts<-round(cbind(AnnualTrendMI, ATMICIlow, ATMICIhigh),4)
names(AnnualTrendMIEsts)<-c("AnnualTrendMI","ATMICIlow","ATMICIhigh")
AnnualTrendMIEsts
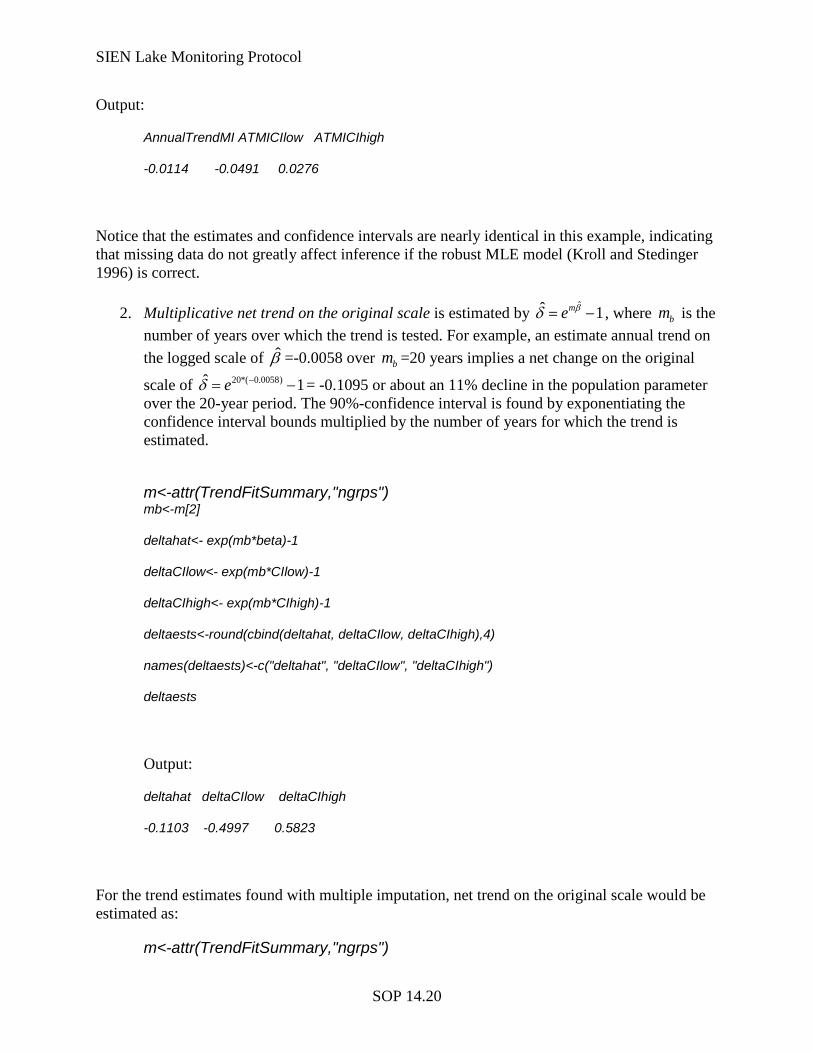
SIEN Lake Monitoring Protocol
SOP 14.20
Output:
AnnualTrendMI ATMICIlow ATMICIhigh
-0.0114 -0.0491 0.0276
Notice that the estimates and confidence intervals are nearly identical in this example, indicating that missing data do not greatly affect inference if the robust MLE model (Kroll and Stedinger 1996) is correct.
2. Multiplicative net trend on the original scale is estimated by ˆˆ 1me βδ = − , where bm is the number of years over which the trend is tested. For example, an estimate annual trend on the logged scale of β̂ =-0.0058 over bm =20 years implies a net change on the original
scale of 20*( 0.0058)ˆ 1eδ −= − = -0.1095 or about an 11% decline in the population parameter over the 20-year period. The 90%-confidence interval is found by exponentiating the confidence interval bounds multiplied by the number of years for which the trend is estimated.
m<-attr(TrendFitSummary,"ngrps") mb<-m[2]
deltahat<- exp(mb*beta)-1
deltaCIlow<- exp(mb*CIlow)-1
deltaCIhigh<- exp(mb*CIhigh)-1
deltaests<-round(cbind(deltahat, deltaCIlow, deltaCIhigh),4)
names(deltaests)<-c("deltahat", "deltaCIlow", "deltaCIhigh")
deltaests
Output:
deltahat deltaCIlow deltaCIhigh
-0.1103 -0.4997 0.5823
For the trend estimates found with multiple imputation, net trend on the original scale would be estimated as:
m<-attr(TrendFitSummary,"ngrps")
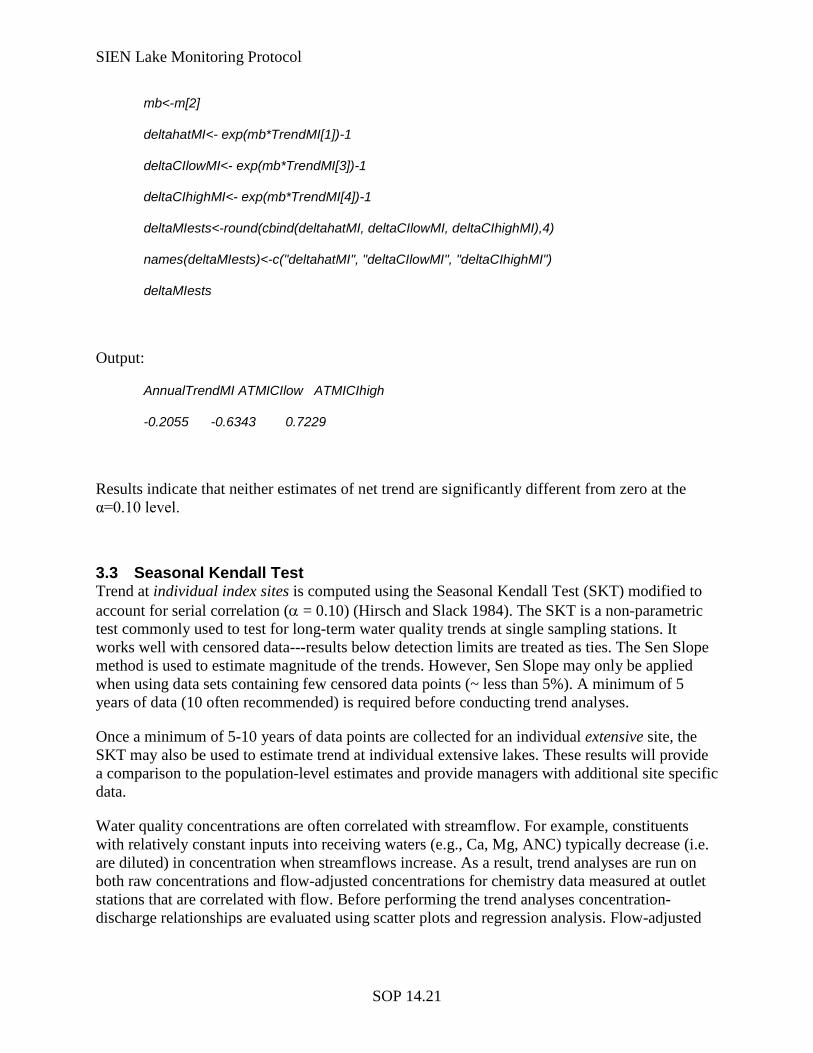
SIEN Lake Monitoring Protocol
SOP 14.21
mb<-m[2]
deltahatMI<- exp(mb*TrendMI[1])-1
deltaCIlowMI<- exp(mb*TrendMI[3])-1
deltaCIhighMI<- exp(mb*TrendMI[4])-1
deltaMIests<-round(cbind(deltahatMI, deltaCIlowMI, deltaCIhighMI),4)
names(deltaMIests)<-c("deltahatMI", "deltaCIlowMI", "deltaCIhighMI")
deltaMIests
Output:
AnnualTrendMI ATMICIlow ATMICIhigh
-0.2055 -0.6343 0.7229
Results indicate that neither estimates of net trend are significantly different from zero at the α=0.10 level.
3.3 Seasonal Kendall Test Trend at individual index sites is computed using the Seasonal Kendall Test (SKT) modified to account for serial correlation (α = 0.10) (Hirsch and Slack 1984). The SKT is a non-parametric test commonly used to test for long-term water quality trends at single sampling stations. It works well with censored data---results below detection limits are treated as ties. The Sen Slope method is used to estimate magnitude of the trends. However, Sen Slope may only be applied when using data sets containing few censored data points (~ less than 5%). A minimum of 5 years of data (10 often recommended) is required before conducting trend analyses.
Once a minimum of 5-10 years of data points are collected for an individual extensive site, the SKT may also be used to estimate trend at individual extensive lakes. These results will provide a comparison to the population-level estimates and provide managers with additional site specific data.
Water quality concentrations are often correlated with streamflow. For example, constituents with relatively constant inputs into receiving waters (e.g., Ca, Mg, ANC) typically decrease (i.e. are diluted) in concentration when streamflows increase. As a result, trend analyses are run on both raw concentrations and flow-adjusted concentrations for chemistry data measured at outlet stations that are correlated with flow. Before performing the trend analyses concentration-discharge relationships are evaluated using scatter plots and regression analysis. Flow-adjusted

SIEN Lake Monitoring Protocol
SOP 14.22
concentrations are then tested by modeling the variation due to discharge using a loess routine and conducting trend analyses on the residuals.
The SKT is computed using S-Plus with the USGS S-ESTREND library (Slack et al. 2003). (The program is currently installed on the Physical Scientist’s computer or it may be downloaded at http://water.usgs.gov/software/S-PLUS/). Once installed, the USGS library is accessed from the S-Plus main menu bar—labeled ‘USGS’. ESTREND is a subdirectory of USGS. There are multiple options under ESTREND---selecting each option, in order, steps you through the trend analysis process. Step-by-step S-ESTREND procedures, accompanied by examples, are well described by Lorenz (2003) in the S-ESTREND documentation. We outline the steps below and provide additional guidance specific to the lake protocol trend analyses. Follow these steps in conjunction with the detailed procedures in Lorenz (2003).
1. Create a new S-Plus chapter
Create a new subdirectory and separate S-Plus chapter for each new project. All files associated with the trend analysis project are stored in the new subdirectory.
2. Create a data frame in S-Plus S-ESTREND assumes data are in an S-Plus data frame and follow a specific format. Once data are queried and exported from the database, follow the instructions and examples in Lorenz (2003) carefully to ensure your data frame is correct.
3. Select Data Select the name of the data frame containing the water-quality data to be analyzed for trends and click OK
4. Create Data Structure Verify the name of the data frame containing the water-quality data to be analyzed for trends and click OK
5. Review Status You may refer back to and select review status throughout the procedure. Status should be checked after each of the steps. To print the status of all stations, make sure that the 'Print Status' is checked and click OK or Apply. To view the status of any constituent and station, simply select those desired and the status will be displayed. Do not click OK or Apply. To change the status of any constituent and station, simply select those desired and the status will be displayed. Make sure that 'Print Status' is not checked and check 'Update Status.' Then select the correct status and click OK or Apply.
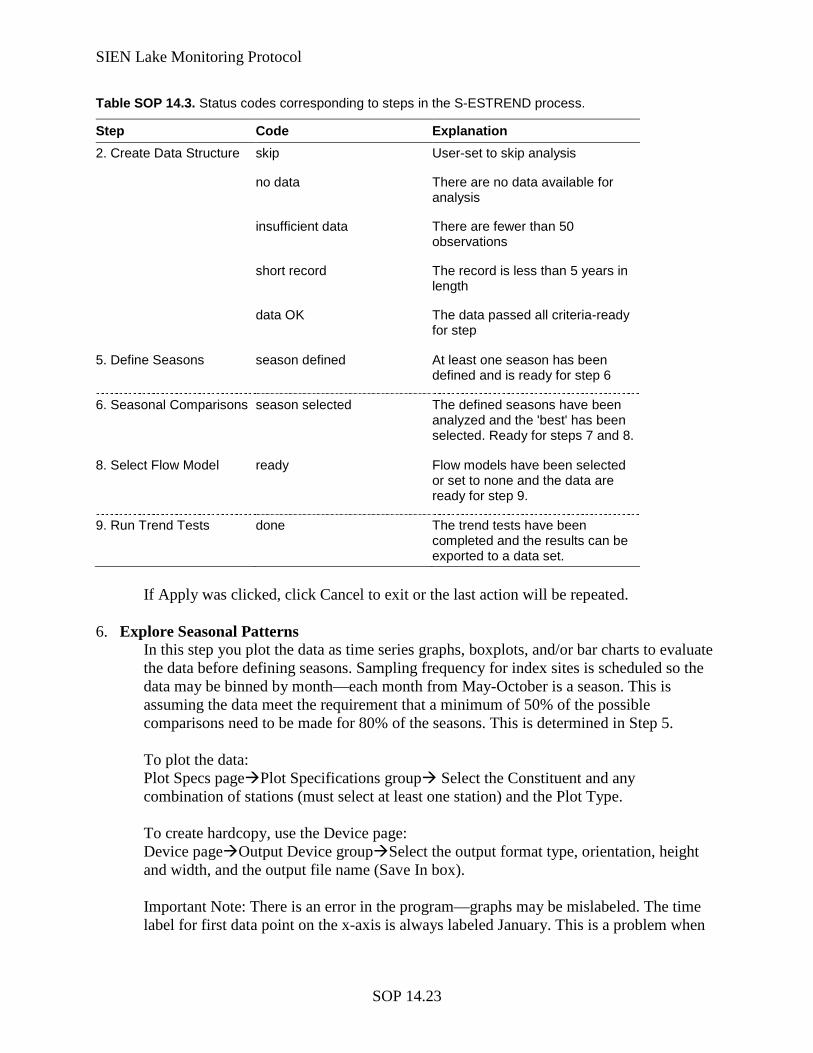
SIEN Lake Monitoring Protocol
SOP 14.23
Table SOP 14.3. Status codes corresponding to steps in the S-ESTREND process.
Step Code Explanation 2. Create Data Structure
skip User-set to skip analysis
no data There are no data available for analysis
insufficient data There are fewer than 50 observations
short record The record is less than 5 years in length
data OK The data passed all criteria-ready for step
5. Define Seasons season defined At least one season has been defined and is ready for step 6
6. Seasonal Comparisons season selected The defined seasons have been analyzed and the 'best' has been selected. Ready for steps 7 and 8.
8. Select Flow Model ready Flow models have been selected or set to none and the data are ready for step 9.
9. Run Trend Tests done The trend tests have been completed and the results can be exported to a data set.
If Apply was clicked, click Cancel to exit or the last action will be repeated.
6. Explore Seasonal Patterns In this step you plot the data as time series graphs, boxplots, and/or bar charts to evaluate the data before defining seasons. Sampling frequency for index sites is scheduled so the data may be binned by month—each month from May-October is a season. This is assuming the data meet the requirement that a minimum of 50% of the possible comparisons need to be made for 80% of the seasons. This is determined in Step 5. To plot the data: Plot Specs pagePlot Specifications group Select the Constituent and any combination of stations (must select at least one station) and the Plot Type. To create hardcopy, use the Device page: Device pageOutput Device groupSelect the output format type, orientation, height and width, and the output file name (Save In box). Important Note: There is an error in the program—graphs may be mislabeled. The time label for first data point on the x-axis is always labeled January. This is a problem when
SIEN Lake Monitoring Protocol
SOP 14.24
you graph by water year and the first month is October. The data are plotted in the correct order—just mislabeled. Click Apply or OK when ready; if Apply was clicked, click Cancel to exit.
7. Define Seasons Sampling frequency for index sites is scheduled so the data may be binned by month—each month from May-October is a season. To define the seasons:
a. Select page b. Initial group c. Check Initial Definition if seasons have not been previously defined. d. Check Print only and click OK or Apply if a summary printout is desired. e. Update group. If Initial Definition is unchecked, Constituents and Stations boxes
become active, select what ever constituents and stations will be modified, (must select at least one of each).
f. The remaining pages indicate which groups are on which page. The groups are identified by the number of season per year. To select a seasonal definition, check the Number of Seasons box and enter the ending month and day for each of the periods in that seasonal definition. Any seasonal definition that is not checked will not be used, so to make a change, all seasons must be defined, not just the one to be changed.
g. When everything is ready, click OK or Apply, click Cancel to exit or the last action will be repeated.
8. Compare Seasons No changes can be made after Compare Seasons has been run. The ‘Percent of Possible Comparisons’ is the criterion for trend tests within each season, for the beginning-ending and middle periods. Enter the value, or use the spinner to change it. 50 is recommened. The ‘Minimum Percent of Seasons to Qualify’ is the criterion for comparisons between each season, for the beginning-ending and middle periods. 80 is recommended. The 'best' season definition is the one with the most seasons that meet these criteria. Click OK when ready.
9. Select Best Season If only a summary of the results of the Compare Seasons analysis is desired, make sure that Print Summary is checked and click OK or Apply. If a 'selected' season is to be changed, make sure the Print Summary is not checked, select the constituent and station, then check Update Seasonal Selection and change Selected.
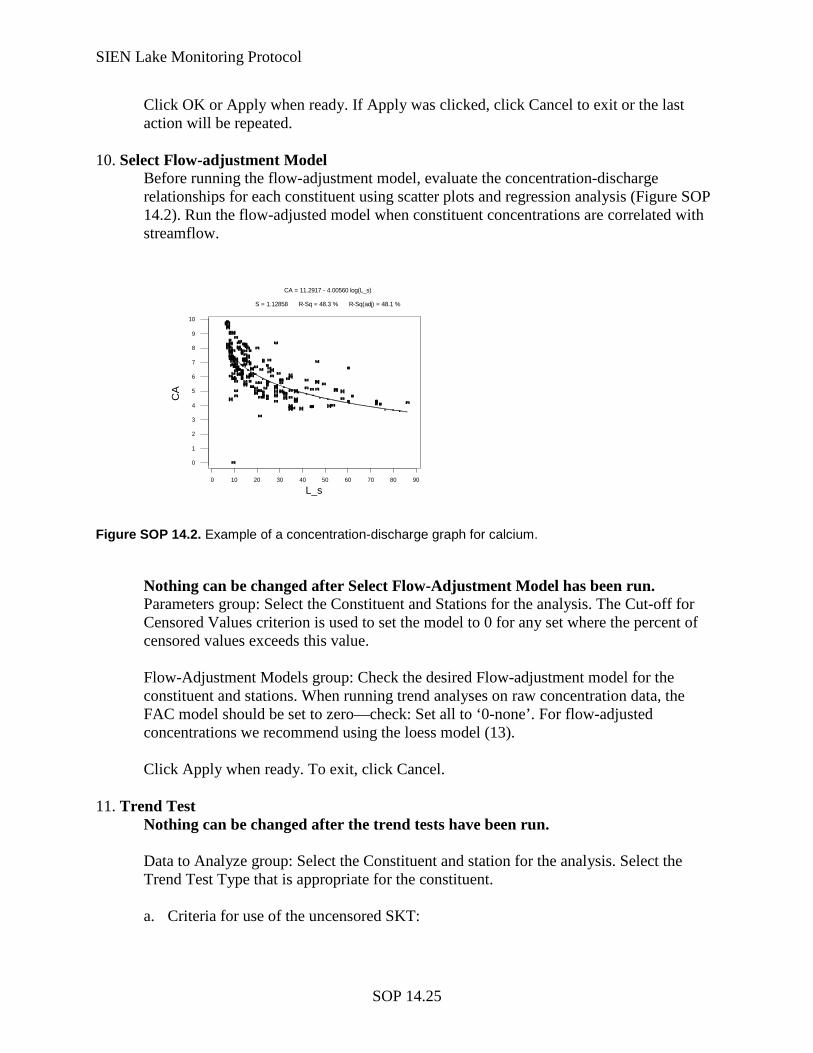
SIEN Lake Monitoring Protocol
SOP 14.25
Click OK or Apply when ready. If Apply was clicked, click Cancel to exit or the last action will be repeated.
10. Select Flow-adjustment Model Before running the flow-adjustment model, evaluate the concentration-discharge relationships for each constituent using scatter plots and regression analysis (Figure SOP 14.2). Run the flow-adjusted model when constituent concentrations are correlated with streamflow.
Figure SOP 14.2. Example of a concentration-discharge graph for calcium.
Nothing can be changed after Select Flow-Adjustment Model has been run. Parameters group: Select the Constituent and Stations for the analysis. The Cut-off for Censored Values criterion is used to set the model to 0 for any set where the percent of censored values exceeds this value. Flow-Adjustment Models group: Check the desired Flow-adjustment model for the constituent and stations. When running trend analyses on raw concentration data, the FAC model should be set to zero—check: Set all to ‘0-none’. For flow-adjusted concentrations we recommend using the loess model (13). Click Apply when ready. To exit, click Cancel.
11. Trend Test Nothing can be changed after the trend tests have been run. Data to Analyze group: Select the Constituent and station for the analysis. Select the Trend Test Type that is appropriate for the constituent. a. Criteria for use of the uncensored SKT:
0 10 20 30 40 50 60 70 80 90
0
1
2
3
4
5
6
7
8
9
10
L_s
CA
CA = 11.2917 - 4.00560 log(L_s)
S = 1.12858 R-Sq = 48.3 % R-Sq(adj) = 48.1 %
Calcium: Pre- burn
SIEN Lake Monitoring Protocol
SOP 14.26
i. Less than 5% of the data must be uncensored ii. The record must span a minimum of 5 years as determined by the difference in years between the beginning and ending observations. iii. The minimum number of observations in the record must be at least three times the number of designated annual seasons, and must be greater than or equal to 10. iv. A minimum percentage (50 and 80) of the total possible number of seasonal water-quality values in the beginning and ending fifths of the record must be present in the record. The beginning and ending fifths of the record are determined as described in section 4.2 of Schertz (1991).
b. Criteria for the censored SKT: i. May be used when greater than 5% of the data are censored ii. The record must span a minimum of fiver years as determined by the difference in years between the beginning and ending observations. iii. The minimum number of detected observations in the record must be at least three times the number of designated annual seasons, and must be greater than or equal to 10. iv. A minimum of one observation per year must be present in the beginning and ending fifths of the record.
Beginning and Ending Dates group: Enter the Calendar Year to Start and the Number of Years to Analyze. The Seasonal Kendal test requires at least 5 years. Seaken Parameters group: For the Uncensored Seasonal Kendall test, enter the Minimum Percent Values, which is the minimum acceptable percentage of values that are tested that must be non-missing. For the Censored Seasonal Kendall test, Enter the value to be used for all censored values. Click Apply when ready and Cancel to exit.
12. Extract Data by constituent Select the Constituent for extracting the results of the trend tests. Enter the Value to Use for the Significance Level. Click Apply when ready or Cancel to exit.
SIEN Lake Monitoring Protocol
SOP 14.27
The data are printed to the report window and stored in a data frame of the name trend.CONSTITUENT, where CONSTITUENT is the name specified in the Constituent box.
13. Extract Data by station Select the Station id for extracting the results of the trend tests. Enter the Value to Use for the Significance Level. Click Apply when ready or Cancel to exit. The data are printed to the report window and stored in a data frame of the name trend.STATION, where STATION is the name of the station specified in that box.
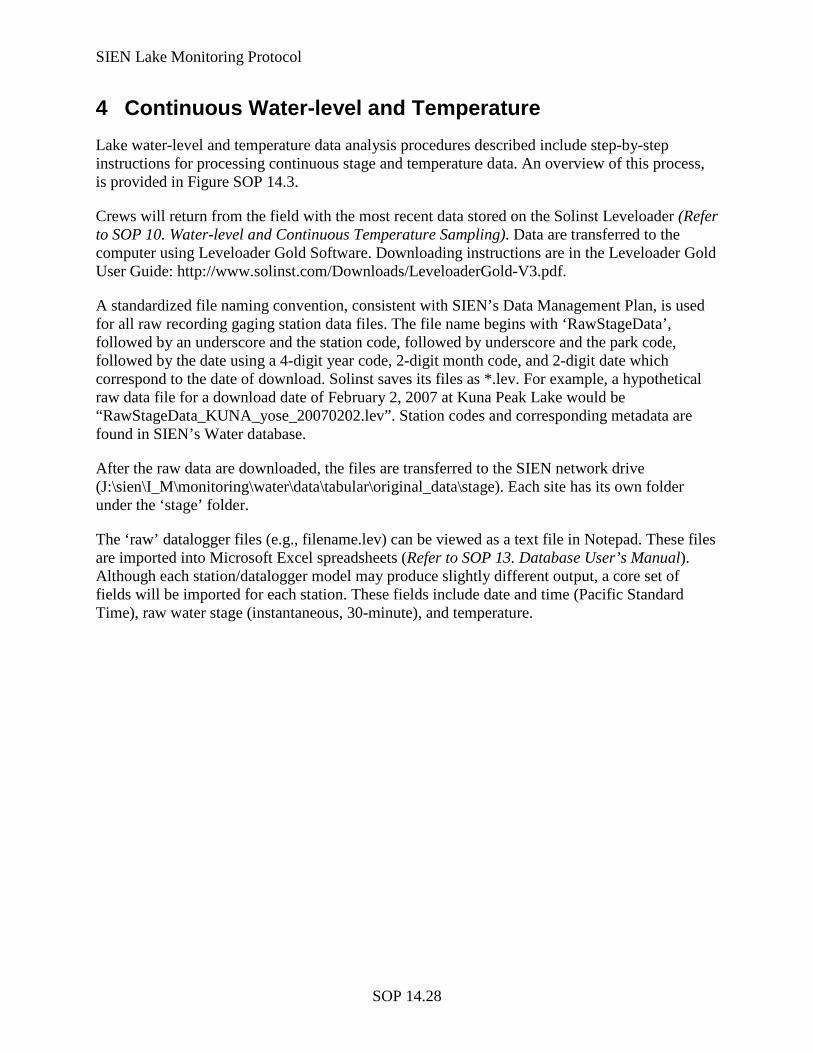
SIEN Lake Monitoring Protocol
SOP 14.28
4 Continuous Water-level and Temperature Lake water-level and temperature data analysis procedures described include step-by-step instructions for processing continuous stage and temperature data. An overview of this process, is provided in Figure SOP 14.3.
Crews will return from the field with the most recent data stored on the Solinst Leveloader (Refer to SOP 10. Water-level and Continuous Temperature Sampling). Data are transferred to the computer using Leveloader Gold Software. Downloading instructions are in the Leveloader Gold User Guide: http://www.solinst.com/Downloads/LeveloaderGold-V3.pdf.
A standardized file naming convention, consistent with SIEN’s Data Management Plan, is used for all raw recording gaging station data files. The file name begins with ‘RawStageData’, followed by an underscore and the station code, followed by underscore and the park code, followed by the date using a 4-digit year code, 2-digit month code, and 2-digit date which correspond to the date of download. Solinst saves its files as *.lev. For example, a hypothetical raw data file for a download date of February 2, 2007 at Kuna Peak Lake would be “RawStageData_KUNA_yose_20070202.lev”. Station codes and corresponding metadata are found in SIEN’s Water database.
After the raw data are downloaded, the files are transferred to the SIEN network drive (J:\sien\I_M\monitoring\water\data\tabular\original_data\stage). Each site has its own folder under the ‘stage’ folder.
The ‘raw’ datalogger files (e.g., filename.lev) can be viewed as a text file in Notepad. These files are imported into Microsoft Excel spreadsheets (Refer to SOP 13. Database User’s Manual). Although each station/datalogger model may produce slightly different output, a core set of fields will be imported for each station. These fields include date and time (Pacific Standard Time), raw water stage (instantaneous, 30-minute), and temperature.
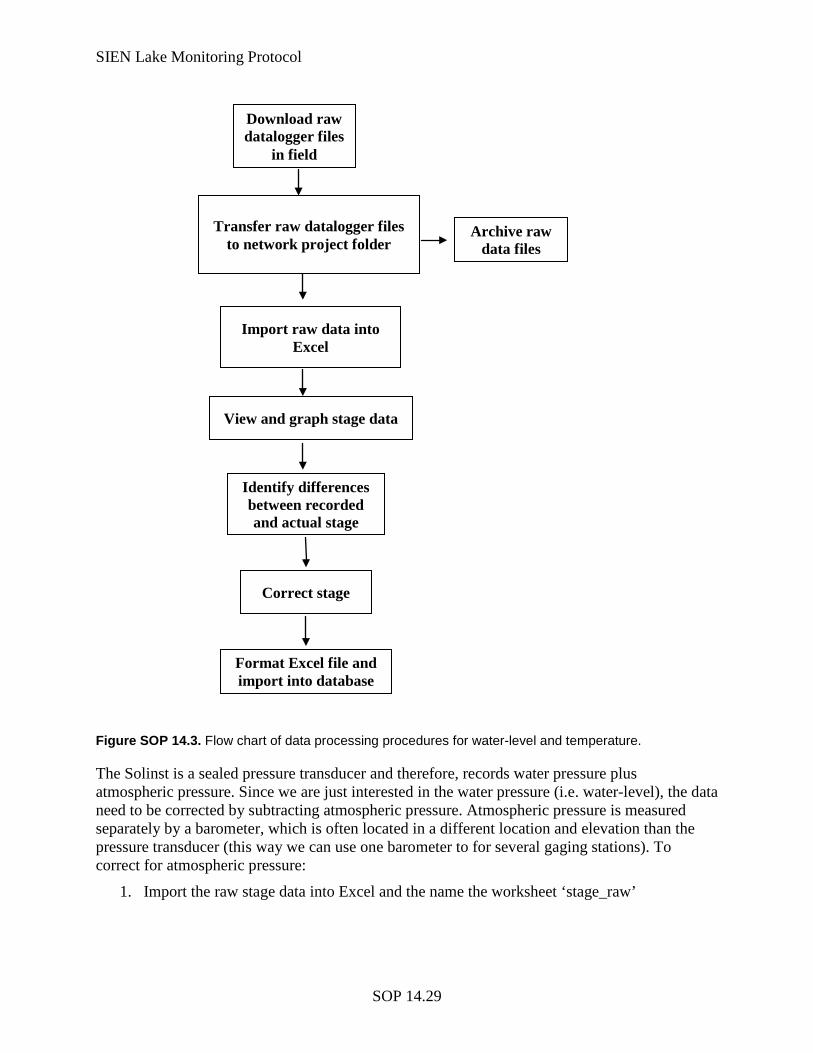
SIEN Lake Monitoring Protocol
SOP 14.29
Figure SOP 14.3. Flow chart of data processing procedures for water-level and temperature.
The Solinst is a sealed pressure transducer and therefore, records water pressure plus atmospheric pressure. Since we are just interested in the water pressure (i.e. water-level), the data need to be corrected by subtracting atmospheric pressure. Atmospheric pressure is measured separately by a barometer, which is often located in a different location and elevation than the pressure transducer (this way we can use one barometer to for several gaging stations). To correct for atmospheric pressure:
1. Import the raw stage data into Excel and the name the worksheet ‘stage_raw’
Download raw datalogger files
in field
Transfer raw datalogger files to network project folder
Import raw data into Excel
View and graph stage data
Archive raw data files
Identify differences between recorded and actual stage
Correct stage
Format Excel file and import into database
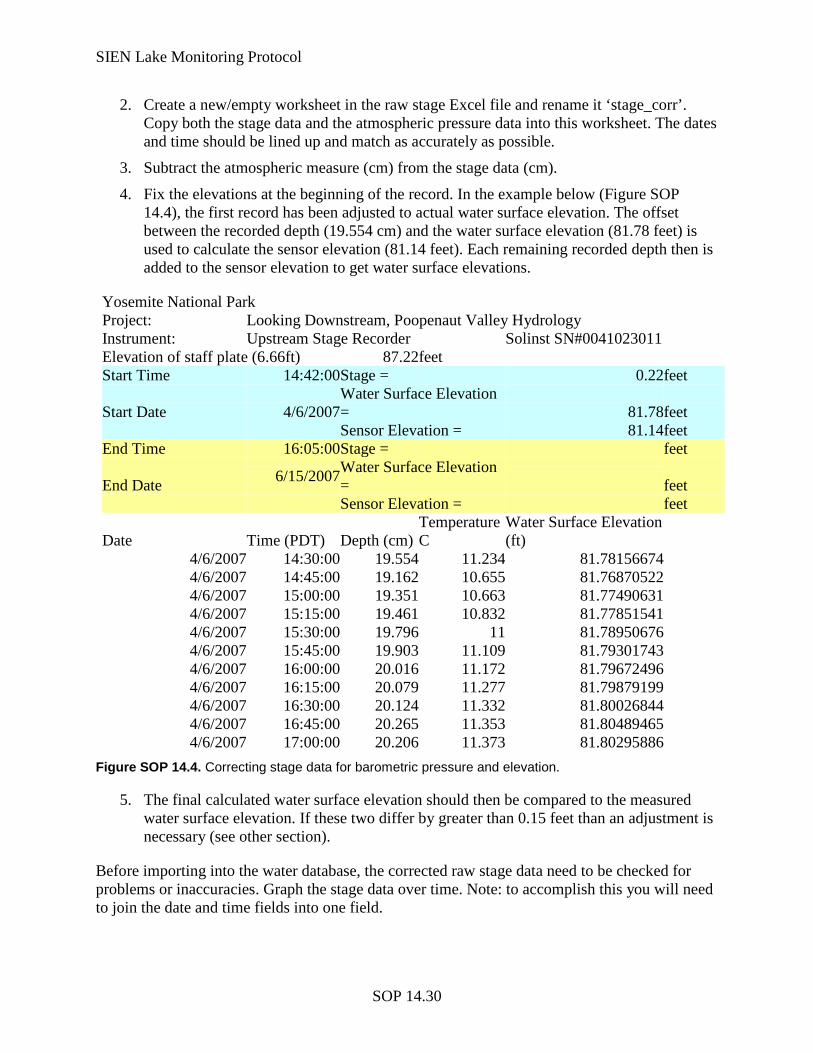
SIEN Lake Monitoring Protocol
SOP 14.30
2. Create a new/empty worksheet in the raw stage Excel file and rename it ‘stage_corr’. Copy both the stage data and the atmospheric pressure data into this worksheet. The dates and time should be lined up and match as accurately as possible.
3. Subtract the atmospheric measure (cm) from the stage data (cm).
4. Fix the elevations at the beginning of the record. In the example below (Figure SOP 14.4), the first record has been adjusted to actual water surface elevation. The offset between the recorded depth (19.554 cm) and the water surface elevation (81.78 feet) is used to calculate the sensor elevation (81.14 feet). Each remaining recorded depth then is added to the sensor elevation to get water surface elevations.
Yosemite National Park Project: Looking Downstream, Poopenaut Valley Hydrology Instrument: Upstream Stage Recorder Solinst SN#0041023011 Elevation of staff plate (6.66ft) 87.22 feet Start Time 14:42:00 Stage = 0.22 feet
Start Date 4/6/2007 Water Surface Elevation = 81.78 feet
Sensor Elevation = 81.14 feet End Time 16:05:00 Stage = feet
End Date 6/15/2007 Water Surface Elevation = feet
Sensor Elevation = feet
Date Time (PDT) Depth (cm) Temperature C
Water Surface Elevation (ft)
4/6/2007 14:30:00 19.554 11.234 81.78156674 4/6/2007 14:45:00 19.162 10.655 81.76870522 4/6/2007 15:00:00 19.351 10.663 81.77490631 4/6/2007 15:15:00 19.461 10.832 81.77851541 4/6/2007 15:30:00 19.796 11 81.78950676 4/6/2007 15:45:00 19.903 11.109 81.79301743 4/6/2007 16:00:00 20.016 11.172 81.79672496 4/6/2007 16:15:00 20.079 11.277 81.79879199 4/6/2007 16:30:00 20.124 11.332 81.80026844 4/6/2007 16:45:00 20.265 11.353 81.80489465 4/6/2007 17:00:00 20.206 11.373 81.80295886
Figure SOP 14.4. Correcting stage data for barometric pressure and elevation.
5. The final calculated water surface elevation should then be compared to the measured water surface elevation. If these two differ by greater than 0.15 feet than an adjustment is necessary (see other section).
Before importing into the water database, the corrected raw stage data need to be checked for problems or inaccuracies. Graph the stage data over time. Note: to accomplish this you will need to join the date and time fields into one field.
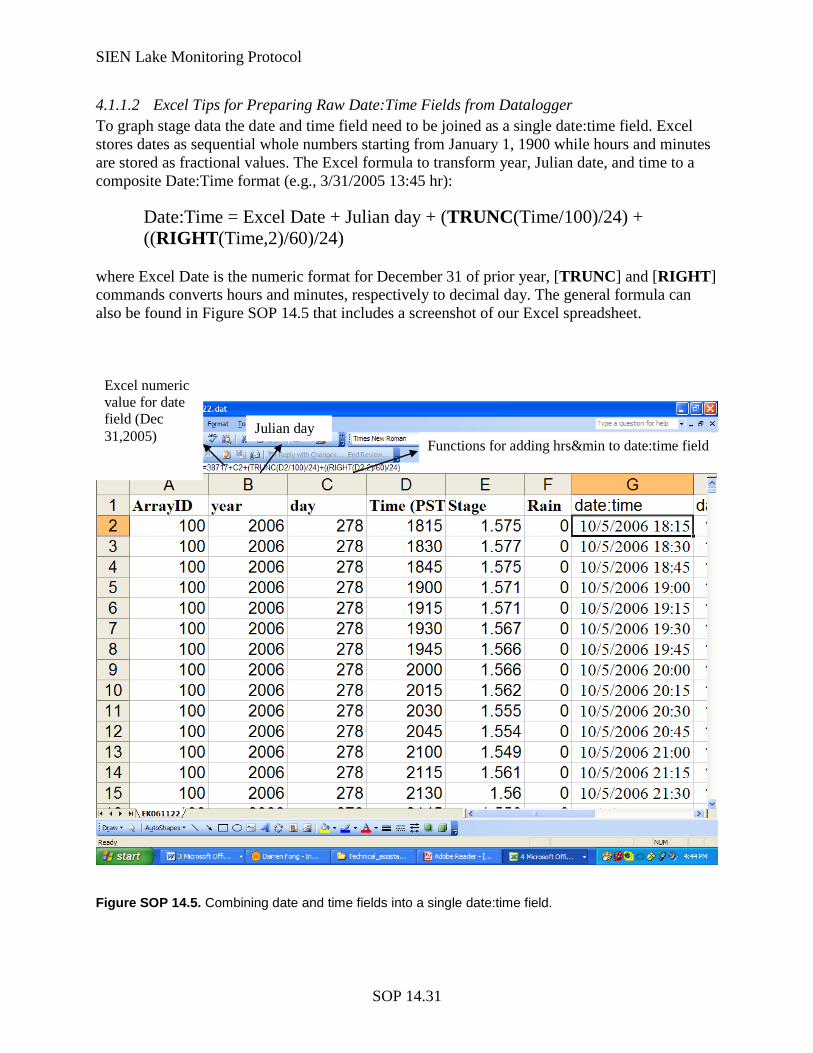
SIEN Lake Monitoring Protocol
SOP 14.31
4.1.1.2 Excel Tips for Preparing Raw Date:Time Fields from Datalogger To graph stage data the date and time field need to be joined as a single date:time field. Excel stores dates as sequential whole numbers starting from January 1, 1900 while hours and minutes are stored as fractional values. The Excel formula to transform year, Julian date, and time to a composite Date:Time format (e.g., 3/31/2005 13:45 hr):
Date:Time = Excel Date + Julian day + (TRUNC(Time/100)/24) + ((RIGHT(Time,2)/60)/24)
where Excel Date is the numeric format for December 31 of prior year, [TRUNC] and [RIGHT] commands converts hours and minutes, respectively to decimal day. The general formula can also be found in Figure SOP 14.5 that includes a screenshot of our Excel spreadsheet.
Figure SOP 14.5. Combining date and time fields into a single date:time field.
Excel numeric value for date field (Dec 31,2005) Julian day
Functions for adding hrs&min to date:time field
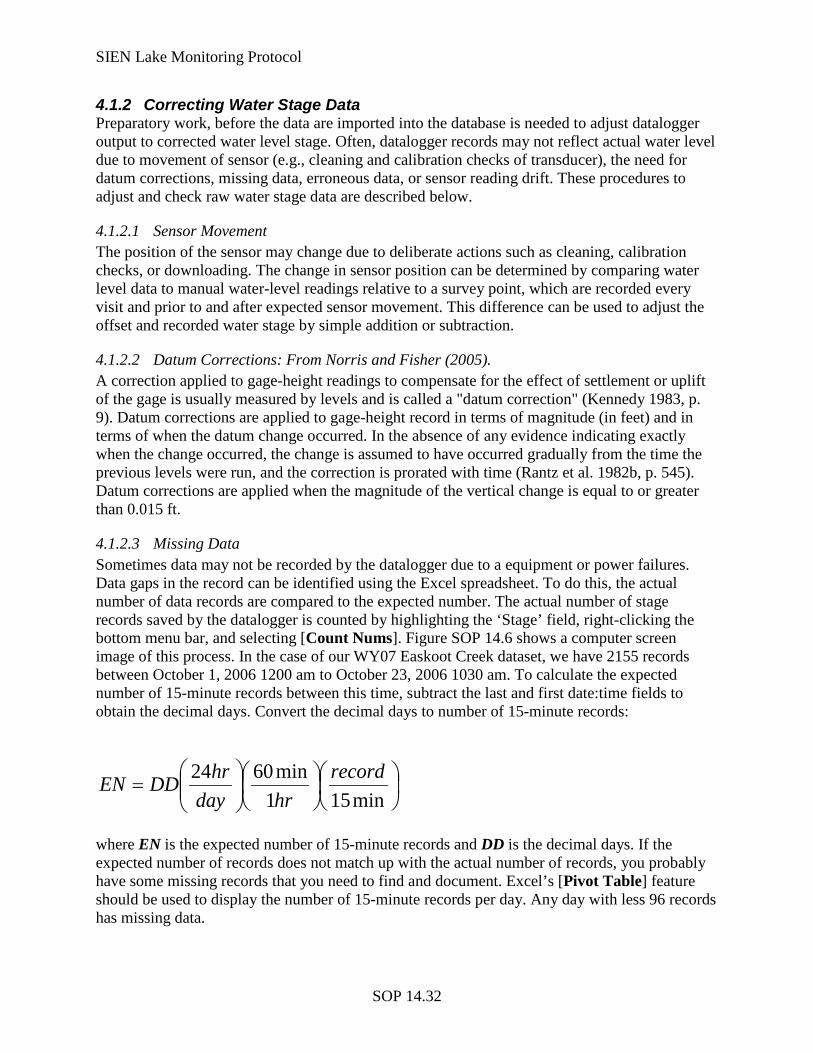
SIEN Lake Monitoring Protocol
SOP 14.32
4.1.2 Correcting Water Stage Data Preparatory work, before the data are imported into the database is needed to adjust datalogger output to corrected water level stage. Often, datalogger records may not reflect actual water level due to movement of sensor (e.g., cleaning and calibration checks of transducer), the need for datum corrections, missing data, erroneous data, or sensor reading drift. These procedures to adjust and check raw water stage data are described below.
4.1.2.1 Sensor Movement The position of the sensor may change due to deliberate actions such as cleaning, calibration checks, or downloading. The change in sensor position can be determined by comparing water level data to manual water-level readings relative to a survey point, which are recorded every visit and prior to and after expected sensor movement. This difference can be used to adjust the offset and recorded water stage by simple addition or subtraction.
4.1.2.2 Datum Corrections: From Norris and Fisher (2005). A correction applied to gage-height readings to compensate for the effect of settlement or uplift of the gage is usually measured by levels and is called a "datum correction" (Kennedy 1983, p. 9). Datum corrections are applied to gage-height record in terms of magnitude (in feet) and in terms of when the datum change occurred. In the absence of any evidence indicating exactly when the change occurred, the change is assumed to have occurred gradually from the time the previous levels were run, and the correction is prorated with time (Rantz et al. 1982b, p. 545). Datum corrections are applied when the magnitude of the vertical change is equal to or greater than 0.015 ft.
4.1.2.3 Missing Data Sometimes data may not be recorded by the datalogger due to a equipment or power failures. Data gaps in the record can be identified using the Excel spreadsheet. To do this, the actual number of data records are compared to the expected number. The actual number of stage records saved by the datalogger is counted by highlighting the ‘Stage’ field, right-clicking the bottom menu bar, and selecting [Count Nums]. Figure SOP 14.6 shows a computer screen image of this process. In the case of our WY07 Easkoot Creek dataset, we have 2155 records between October 1, 2006 1200 am to October 23, 2006 1030 am. To calculate the expected number of 15-minute records between this time, subtract the last and first date:time fields to obtain the decimal days. Convert the decimal days to number of 15-minute records:
where EN is the expected number of 15-minute records and DD is the decimal days. If the expected number of records does not match up with the actual number of records, you probably have some missing records that you need to find and document. Excel’s [Pivot Table] feature should be used to display the number of 15-minute records per day. Any day with less 96 records has missing data.
=
min151min6024 recordhrday
hrDDEN
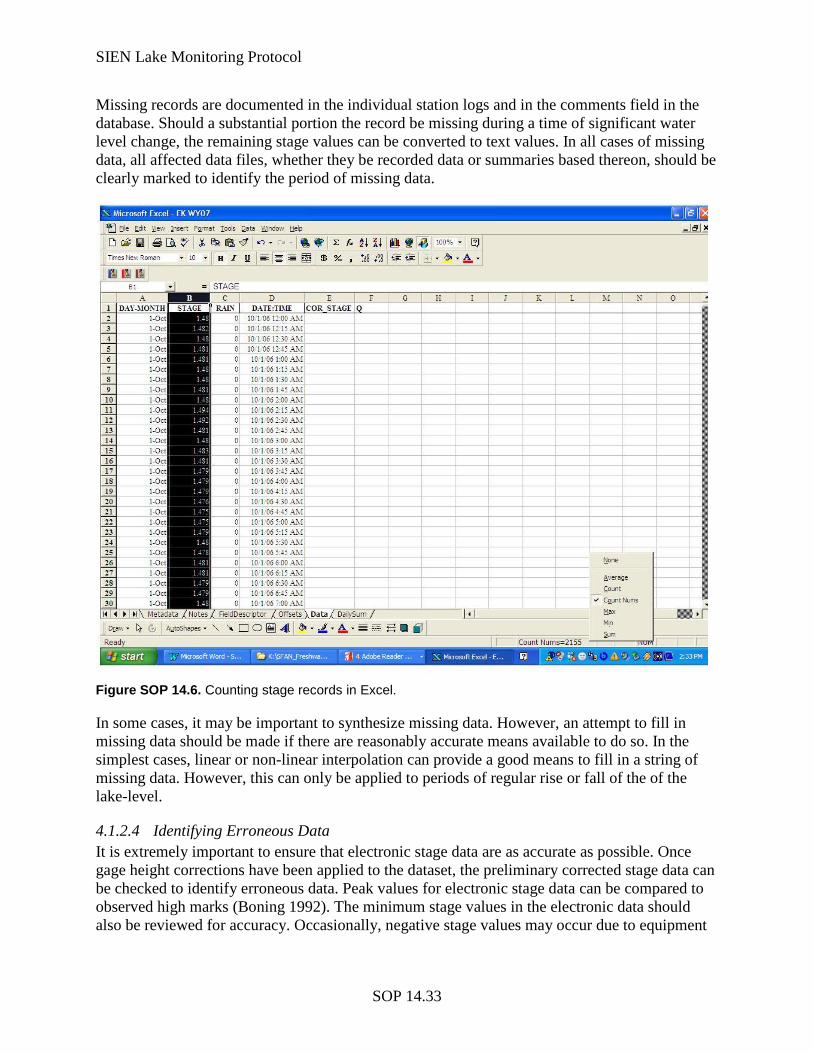
SIEN Lake Monitoring Protocol
SOP 14.33
Missing records are documented in the individual station logs and in the comments field in the database. Should a substantial portion the record be missing during a time of significant water level change, the remaining stage values can be converted to text values. In all cases of missing data, all affected data files, whether they be recorded data or summaries based thereon, should be clearly marked to identify the period of missing data.
Figure SOP 14.6. Counting stage records in Excel.
In some cases, it may be important to synthesize missing data. However, an attempt to fill in missing data should be made if there are reasonably accurate means available to do so. In the simplest cases, linear or non-linear interpolation can provide a good means to fill in a string of missing data. However, this can only be applied to periods of regular rise or fall of the of the lake-level.
4.1.2.4 Identifying Erroneous Data It is extremely important to ensure that electronic stage data are as accurate as possible. Once gage height corrections have been applied to the dataset, the preliminary corrected stage data can be checked to identify erroneous data. Peak values for electronic stage data can be compared to observed high marks (Boning 1992). The minimum stage values in the electronic data should also be reviewed for accuracy. Occasionally, negative stage values may occur due to equipment
SIEN Lake Monitoring Protocol
SOP 14.34
error or user error (e.g., pulling transducer from a stilling well for cleaning and forgetting to accurately document time of actions).
If after initial review, the suspect data still appear to be erroneous, the suspected data fields should be deleted and action noted in recorded data files and summary reports. If the data for this period are essential (e.g., occurring during peak storm event), new data can be synthesized using the approach described for missing data. In all cases of corrected data, all affected data files, whether they be recorded data or summaries based thereon, should be clearly marked with notations on the period of corrected data and how that period was dealt with (e.g., the method of correction used and data sources used for to assist corrections, who did the corrections and when, and so forth).
4.1.2.5 Gage-height/Stage Corrections A correction applied to gage-height readings to compensate for differences between the recording gage and the base gage is called a “gage-height correction” (Rantz and others 1982) (page 563). Gage height corrections are applied so that the recorded data agree with the base-gage data. These corrections are applied when the gage-height difference between the recording gage and the base gage is equal to or greater than 0.02 ft, or for as small a difference as 0.01 ft when warranted due to low-water conditions when the percent difference from the rating is excessive. The typical gage height correction is associated with sensor drift. Between data downloads the readings from the pressure transducers may “drift,” so that it will no longer be in agreement with the base gage (our staff plates). A drift correction—usually a linear proration with time—is applied to compensate for drift in the transducer’s offset calibration (Rantz and others 1982) (p. 563).
To rectify the difference, calculate the difference between the staff plate and recorded water stage at the beginning and the end of the logging period. If the difference is less than 0.01 ft, there is no need for correction because of the accuracy of staff plate reading is no better than 0.01 ft. The more frequently the staff plate is recorded the better the chance of knowing when the drift began. To correct for drift, the amount of drift must be distributed over the applicable time period by linear interpolation.
Microsoft Excel is used for drift correction. The linear interpolation is calculated for each 15-minute data record and used to correct the raw stage height. An example of how this is calculated is found in Figure SOP 14.7.
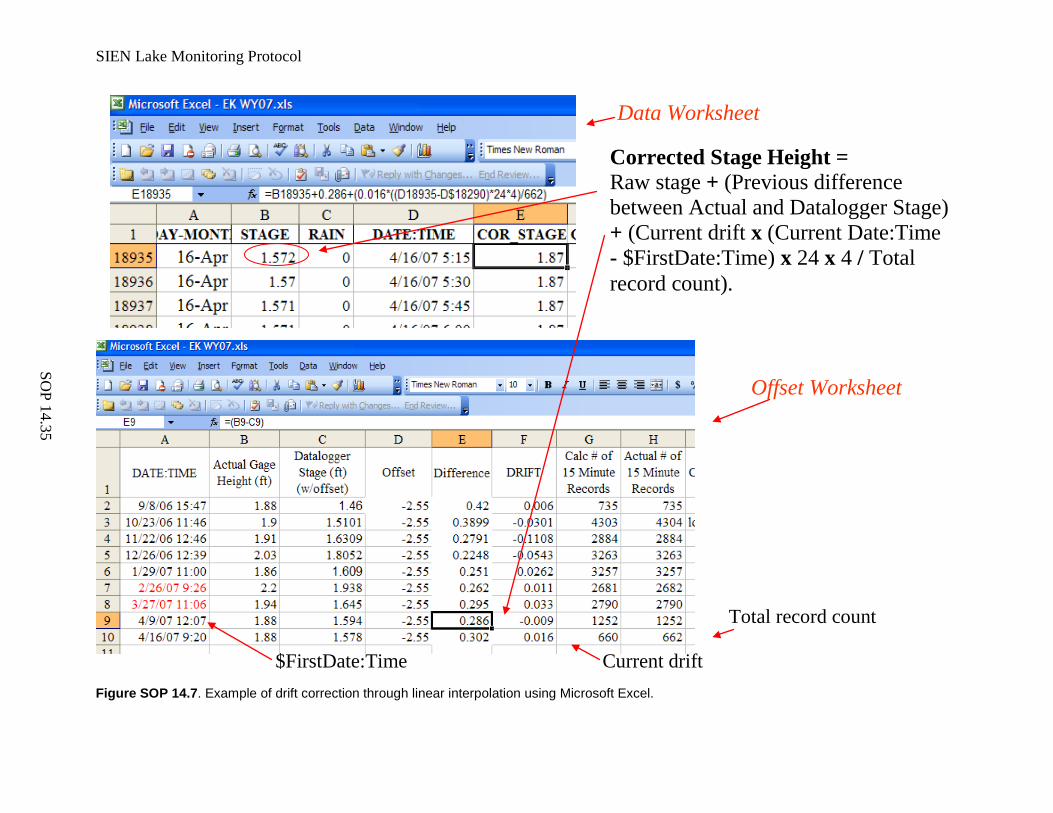
SIEN Lake Monitoring Protocol
SOP 14.35
Figure SOP 14.7. Example of drift correction through linear interpolation using Microsoft Excel.
Corrected Stage Height = Raw stage + (Previous difference between Actual and Datalogger Stage) + (Current drift x (Current Date:Time - $FirstDate:Time) x 24 x 4 / Total record count).
Current drift
Total record count
$FirstDate:Time
Offset Worksheet
Data Worksheet
SIEN Lake Monitoring Protocol
SOP 14.36
4.2 Routine Data Summaries for Annual Report Once the site data have been processed, several routine analyses are performed in order to summarize water-level and temperature date for each site by water year. The data are compiled in annual reports. The hydrologic information specific to each gaging station (station analysis, daily values table, hydrograph, rating curves, and key photographs) will be placed in the appendices and organized by gaging station.
4.2.1 Summary Data For all sites, a monthly mean water-level and temperature table is prepared for each Water Year. The table has basic data about the station (e.g., station name and coordinates). Time series graphs are created showing water-level and temperature data for each site.
4.2.2 Trend Analyses Trend analyses are performed on water-level and temperature using the Seasonal-Kendall Test for trend. Refer to Section 3.3 for analysis procedures. 4.2.3 Photographs Photographs are taken by field personnel for the purpose of documenting water-level and important conditions at the site. Photographs should be taken in the field using digital cameras with the highest possible quality setting and saved as TIFF files. The photographs should be archived on the SEKI network drive in the water folder (J:\sien\I_M\monitoring\water\data\photos_videos) and sorted by year and site name.
SIEN Lake Monitoring Protocol
SOP 14.37
5 Literature Cited Boning, C. W. 1992. Policy statement on stage accuracy. December 4, 1992. Clow, D. W., R. G. Striegl, M. Nanus, M. A. Mast, D. H. Campbell, and D. P. Krabbenhoft.
2002. Chemistry of selected high-elevation lakes in seven national parks in the western United States. Water Air and Soil Pollution 2:139-164.
Eilers, J. M., D. F. Brakke, D. H. Landers, and W. S. Overton. 1989. Chemistry of wilderness
lakes in the Western United States. Environmental Monitoring and Assessment 12. Giesbrecht, F. G., and J. C. Burns. 1985. Two-stagee analysis based on a mixed model: Large
Sample Asymptotic Theory and Small-Sample Simulation Results. Biometrics 41:477-486.
Helsel, D. 2005. Nondetects and Data Analysis, Statistics for Censored Environmental Data.
John Wiley & Sons, Inc., Denver. Hirsch, R. A., and J. R. Slack. 1984. A nonparametric trend test for seasonal data with serial
dependence. Water Resources Research 20:727-732. Horvitz, D. G., and D. T. Thompson. 1952. A generalization of sampling without replacement
from a finite universe. Journal of the Amernican Statistical Association 47:663-685. Kroll, C. N., and J. R. Stedinger. 1996. Estimation of moments and quantiles using censored
data. Water Resources Research 32. Little, R. J. A., and D. B. Rubin. 2002. Statistical Analysis with Missing Data. John Wiley and
Sons, Inc., New Jersey. Lorenz, D. 2003. Documentation for S-ESTREND, Version 1.2. Developed for the U.S.
Geological Survey, Mounds View, Minnesota. Norris, M., and G. Fisher. 2005. National Capitol Region Network surface water dynamics
protocol. National Park Service. Piepho, H. P., and J. O. Ogutu. 2002. A simple mixed model for trend analysis in wildlife
populations. Journal of Agriculture, Biological, and Environmental Statistics 7:350-360. Rantz, S. E., and others. 1982. Measurement and computation of streamflow. Volume 2,
Computation of discharge. US Geological Survey Water-Supply Paper 2175, US Governement Printing Office, Washington DC.
SIEN Lake Monitoring Protocol
SOP 14.38
Schertz, T. L., R. B. Alexander, and D. J. Ohe. 1991. The computer program Estimate Trend (ESTREND), a system for the detection of trends in water quality data. Water-Resources Investigations Report 91-4040, U. S. Geological Survey, Reston, Virginia.
Slack, J. R., D. L. Lorenz, and and others. 2003. USGS library for S-Plus for Windows --
Release 2.1. Open-File Report 03-357, U.S. Geological Survey. Stevens Jr., D. L., and A. R. Olsen. 2003. Variance estimation for spatially balanced samples of
environmental resources. Environmetrics 14:593-610. Stevens Jr., D. L., and A. R. Olsen. 2004. Spatially Balanced Sampling of Natural Resources.
Journal of American Statistical Association 99:262-278. Thompson, S. K. 1992. Sampling. John Wiley and Sons, Inc, New York. VanLeeuwen, D. M., L. W. Murray, and N. S. Urquart. 1996. A mixed model with both fixed
and random trend components across time. Journal of Agriculture, Biological, and Environmental Statistics 1:435-453.
SIEN Lake Monitoring Protocol
SOP 14.39
Appendix SOP 14A: Adjusting Sample Inclusion Probabilities for Panel Surveys When estimating status using a panel survey, the sample for a single year is part of a larger random sample. The inclusion probabilities for the overall random sample do not apply directly to a single year. Therefore, the inclusion probabilities that would be obtained from the survey design and in GRTS sample output would give an inclusion probability that is too large for an estimate of annual status. We recommend adjusting the sample inclusion probability with a panel inclusion probability to obtain unbiased estimates of status. Methods Two methods of weighting the inclusion probability were examined. Define a panel grouping as a set of panels that have the same revisit schedule. Let
g
= population size = original sample size for all panels combined= sample size of panel grouping , where =1,..,G
= sample size of panel within grouping , where =1,..,J
= sample size su
g
gj
t
Nnn g gn j g jn rveyed in year , where = 1,...,Tt t
Assume that a simple random sample of n is drawn from the population of N units for a sample
inclusion probability of nN
. The panel inclusion probability is calculated conditionally on
inclusion in the sample and may be estimated in two ways. Let
The panel inclusion probability gjp represents the proportion of each panel grouping surveyed in any given year and tp is the proportion of sampling units included in the sample in any given year (note that indexing for year is suppressed). The principal difference between the two weights is that gjp weights within a panel grouping and tp weights across groupings. Note that, when sample sizes are equal across panels within a grouping, the panel inclusion
probability can be easily calculated for panels within that grouping as ggj
g g
ap
a b=
+ for all j=1,..,
gJ where ( )g ga b− indexes the revisit pattern within panel grouping g. For example, a [1-0] design has one grouping and a [(1-0),[1-3)] design has two groupings. The panel inclusion
probability for grouping 1 would be calculated as 11
1 0jp =+
=1. The panel inclusion
gjgj
g
np
n= and t
tnpn
= .
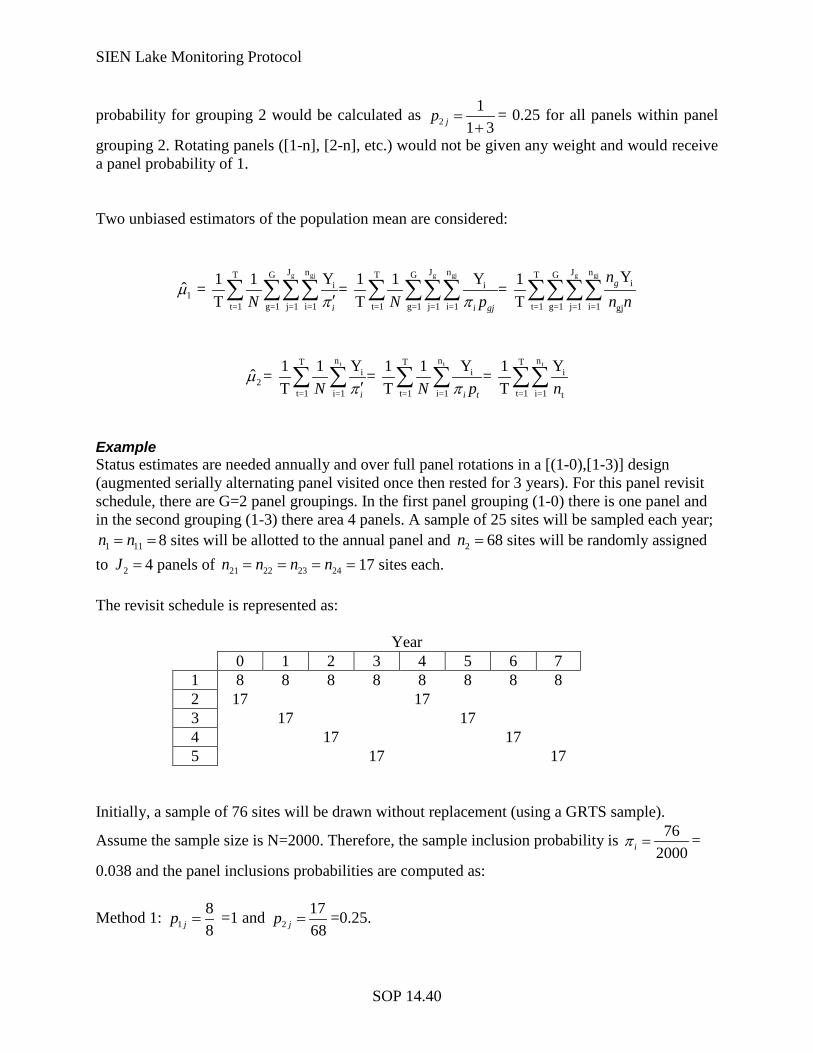
SIEN Lake Monitoring Protocol
SOP 14.40
probability for grouping 2 would be calculated as 21
1 3jp =+
= 0.25 for all panels within panel
grouping 2. Rotating panels ([1-n], [2-n], etc.) would not be given any weight and would receive a panel probability of 1. Two unbiased estimators of the population mean are considered:
Example Status estimates are needed annually and over full panel rotations in a [(1-0),[1-3)] design (augmented serially alternating panel visited once then rested for 3 years). For this panel revisit schedule, there are G=2 panel groupings. In the first panel grouping (1-0) there is one panel and in the second grouping (1-3) there area 4 panels. A sample of 25 sites will be sampled each year;
1 11n n= = 8 sites will be allotted to the annual panel and 2n = 68 sites will be randomly assigned to 2J = 4 panels of 21 22 23 24n n n n= = = = 17 sites each. The revisit schedule is represented as:
Year 0 1 2 3 4 5 6 7 1 8 8 8 8 8 8 8 8 2 17 17 3 17 17 4 17 17 5 17 17
Initially, a sample of 76 sites will be drawn without replacement (using a GRTS sample).
Assume the sample size is N=2000. Therefore, the sample inclusion probability is 762000iπ = =
0.038 and the panel inclusions probabilities are computed as:
Method 1: 188jp = =1 and 2
1768jp = =0.25.
g gj g gj g gjJ n J n J nT G T G T Gii i
1t=1 g=1 j=1 i=1 t=1 g=1 j=1 i=1 t=1 g=1 j=1 i=1 gj
YY Y1 1 1 1 1ˆ = = = T T T
g
i i gj
nN N p n n
µπ π′∑ ∑∑∑ ∑ ∑∑∑ ∑∑∑∑
t t tn n nT T Ti i i
2t=1 i=1 t=1 i=1 t=1 i=1 t
Y Y Y1 1 1 1 1ˆ = = = T T Ti i tN N p n
µπ π′∑ ∑ ∑ ∑ ∑∑
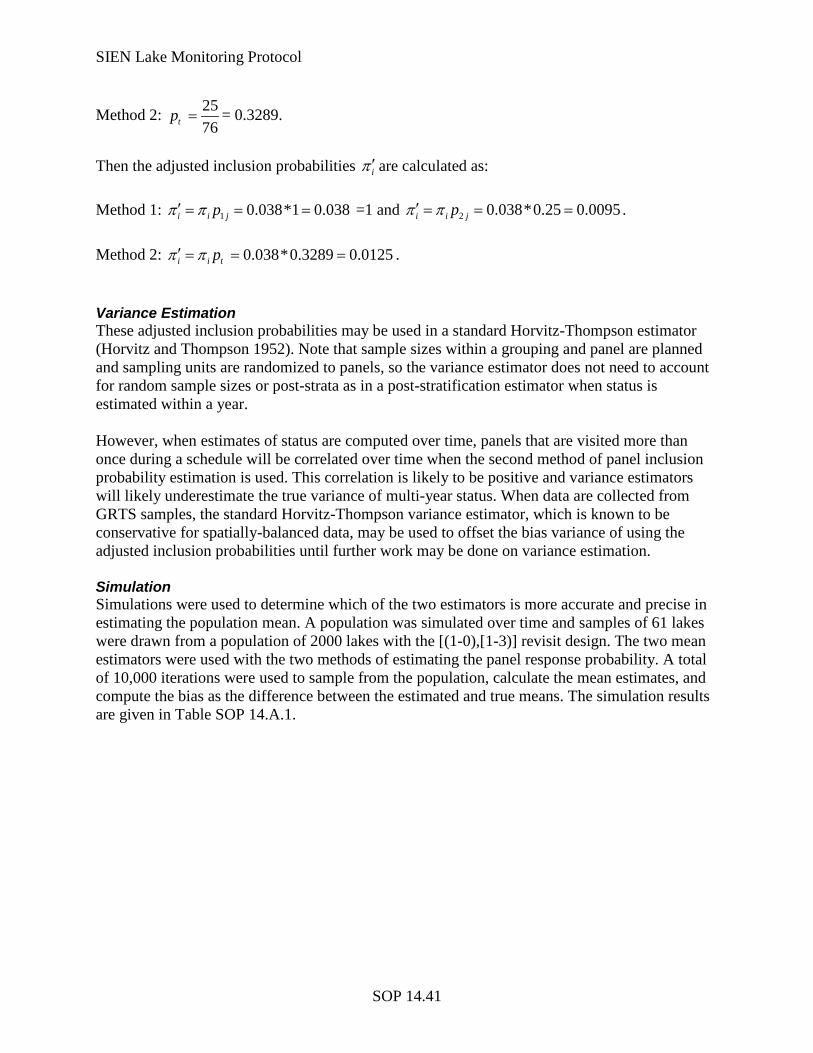
SIEN Lake Monitoring Protocol
SOP 14.41
Method 2: 2576tp = = 0.3289.
Then the adjusted inclusion probabilities iπ ′ are calculated as: Method 1: 1 0.038*1 0.038i i jpπ π′ = = = =1 and 2 0.038*0.25 0.0095i i jpπ π′ = = = . Method 2: 0.038*0.3289 0.0125i i tpπ π′ = = = . Variance Estimation These adjusted inclusion probabilities may be used in a standard Horvitz-Thompson estimator (Horvitz and Thompson 1952). Note that sample sizes within a grouping and panel are planned and sampling units are randomized to panels, so the variance estimator does not need to account for random sample sizes or post-strata as in a post-stratification estimator when status is estimated within a year. However, when estimates of status are computed over time, panels that are visited more than once during a schedule will be correlated over time when the second method of panel inclusion probability estimation is used. This correlation is likely to be positive and variance estimators will likely underestimate the true variance of multi-year status. When data are collected from GRTS samples, the standard Horvitz-Thompson variance estimator, which is known to be conservative for spatially-balanced data, may be used to offset the bias variance of using the adjusted inclusion probabilities until further work may be done on variance estimation. Simulation Simulations were used to determine which of the two estimators is more accurate and precise in estimating the population mean. A population was simulated over time and samples of 61 lakes were drawn from a population of 2000 lakes with the [(1-0),[1-3)] revisit design. The two mean estimators were used with the two methods of estimating the panel response probability. A total of 10,000 iterations were used to sample from the population, calculate the mean estimates, and compute the bias as the difference between the estimated and true means. The simulation results are given in Table SOP 14.A.1.
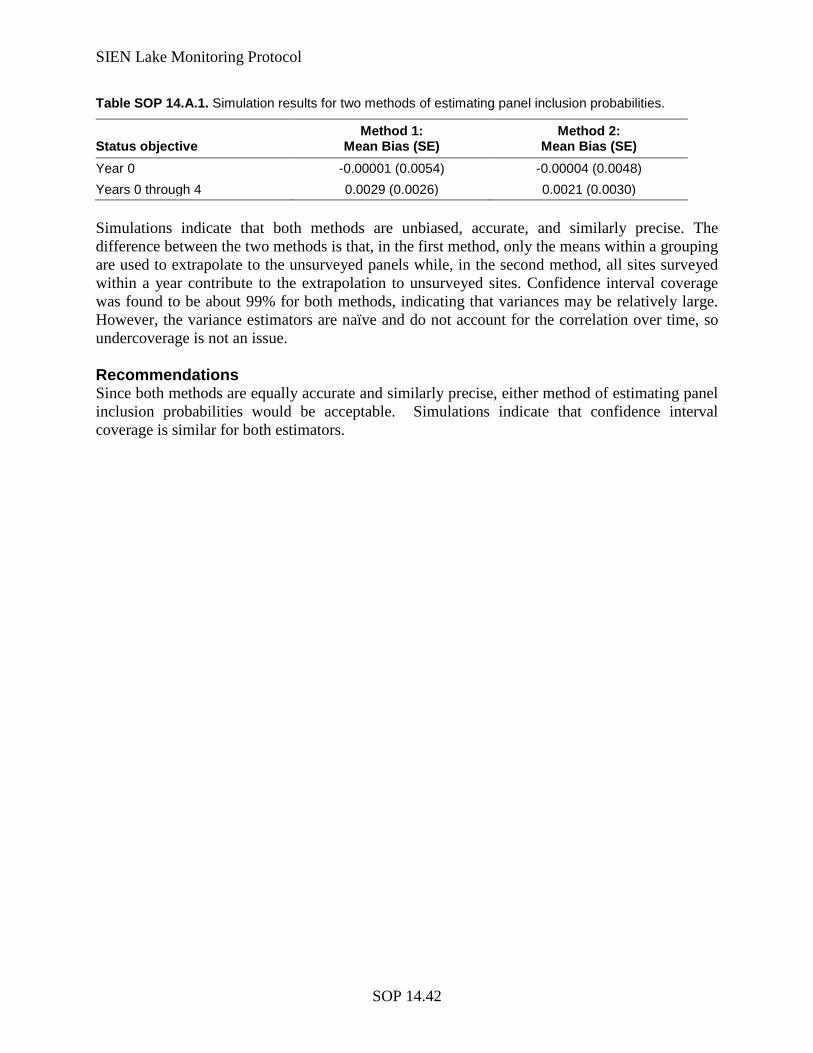
SIEN Lake Monitoring Protocol
SOP 14.42
Table SOP 14.A.1. Simulation results for two methods of estimating panel inclusion probabilities.
Status objective Method 1:
Mean Bias (SE) Method 2:
Mean Bias (SE) Year 0 -0.00001 (0.0054) -0.00004 (0.0048) Years 0 through 4 0.0029 (0.0026) 0.0021 (0.0030) Simulations indicate that both methods are unbiased, accurate, and similarly precise. The difference between the two methods is that, in the first method, only the means within a grouping are used to extrapolate to the unsurveyed panels while, in the second method, all sites surveyed within a year contribute to the extrapolation to unsurveyed sites. Confidence interval coverage was found to be about 99% for both methods, indicating that variances may be relatively large. However, the variance estimators are naïve and do not account for the correlation over time, so undercoverage is not an issue. Recommendations Since both methods are equally accurate and similarly precise, either method of estimating panel inclusion probabilities would be acceptable. Simulations indicate that confidence interval coverage is similar for both estimators.
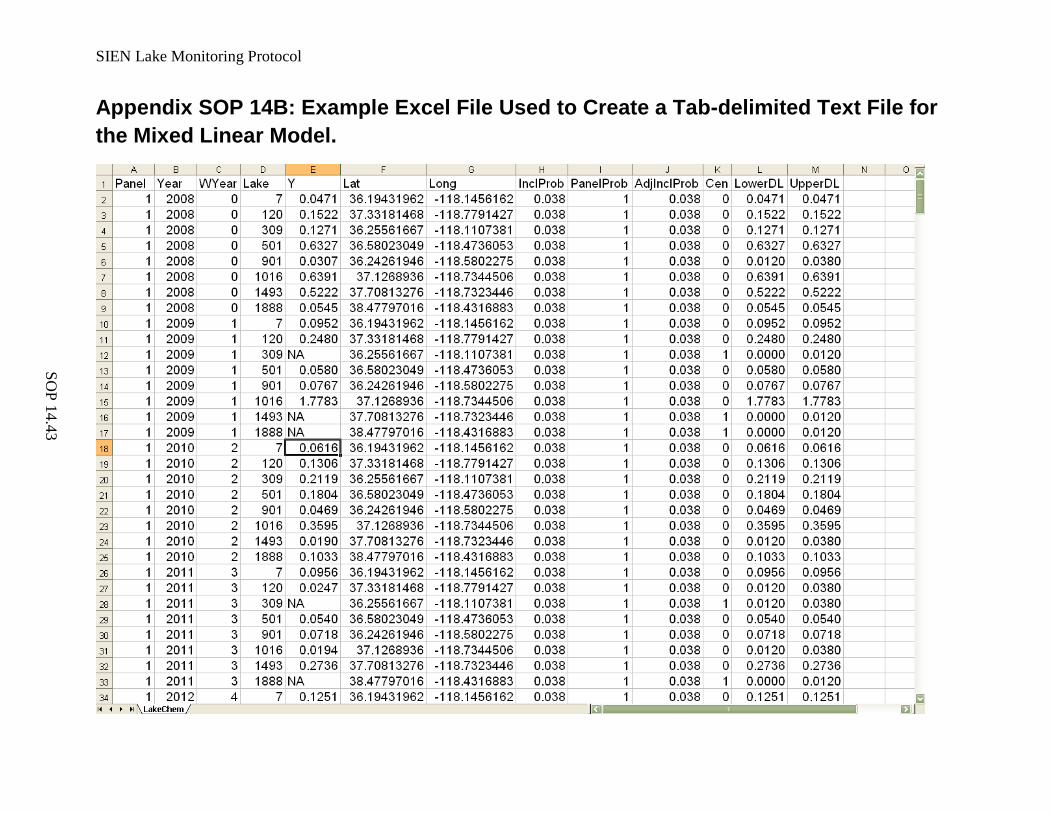
SIEN Lake Monitoring Protocol
SOP 14.43
Appendix SOP 14B: Example Excel File Used to Create a Tab-delimited Text File for the Mixed Linear Model.

SIEN Lake Monitoring Protocol
SOP 15.1
Sierra Nevada Network Lake Monitoring Protocol
SOP 15. Protocol Revision Version 1.00, October 2012 Prepared by Andrea M. Heard
Revision History Log Previous Version #
Revision Date Author Changes Made Reason for
Change New
Version #
SIEN Lake Monitoring Protocol
SOP 15.2
1 Overview Adapted from the NCCN Landbird Monitoring Protocol (Siegel et al. 2007)).
This SOP explains how to make and track changes to the Sierra Nevada Network Lake Monitoring Protocol, including the accompanying SOPs. Personnel should refer to this SOP whenever edits are necessary, and should be familiar with the protocol versioning system in order to identify and use the most current version of the protocol documents. Required revisions should e made in a timely manner to minimize disruptions to planning and operations for the following year.
Procedures:
1. Document edits and protocol versioning in the Revision History Log embedded in the narrative and each SOP document. Log changes only in the document being edited. Version numbers increase incrementally by the hundredths (e.g., version 1.01, version 1.02, etc) for minor changes. Major revisions should be designated with the next whole number (e.g., 2.00, 3.00, 4.00, etc.). Record the prevision version number, date of revision, author of the revision, identify paragraphs and pages where changes are made, and the reason for making the changes along with the new version number.
2. Inform the data manager about all protocol changes so the new version number(s) can be incorporated into project metadata. The data manager should be consulted prior to revision so the integrity of the data set is fully considered and ample time is allowed if changes to the database are necessary.
3. All edits require review for clarity and technical soundness. Small changes in response design (e.g., adding or modifying a variable), logistics planning, project budget, reporting schedules, or database implementation may be reviewed in house by the protocol lead and water work group and approved by the network coordinator. More drastic changes—for example, modifications to the sample design or analytical methods for trend detection—will trigger an outside review to be coordinated by the National Park Service, Water Resources Division and Pacific West Regional office.
4. Upon approval, new versions of documents should be posted to SIEN’s web pages and forwarded to all pertinent individuals.
2 Literature Cited Siegel, R. B., R. L. Wilerson, K. Jenkins, R. C. Kuntz II, J. Boetsch, J. Schaberl, and P. Happe.
2007. Landbird monitoring protocol for the National Parks in the North Coast and Cascades Monitoring Network (NCCN). U.S. Geological Survey Techniques and Methods 2–A6. U.S. Geological Survey, Reston, Virginia. Available from http://pubs.usgs.gov/tm/tm2a6/ (Accessed 17 February 2012).

The Department of the Interior protects and manages the nation’s natural resources and cultural heritage; provides scientific and other information about those resources; and honors its special responsibilities to American Indians, Alaska Natives, and affiliated Island Communities. NPS 963/115668, July 2012
National Park Service U.S. Department of the Interior
Natural Resource Stewardship and Science 1201 Oakridge Drive, Suite 150 Fort Collins, CO 80525 www.nature.nps.gov
EXPERIENCE YOUR AMERICA TM