Embed Size (px)
Citation preview

EASTERN JOURNAL OF EUROPEAN STUDIES Volume 2, Issue 2, December 2011 133
Should the EU climate policy framework
be reformed?
David ELLISON*
Abstract
Though to-date the European Union (EU) has played the most significant
leadership role in international negotiations to reduce greenhouse gas (GHG)
emissions, the emission-reducing performance of individual EU Member states
has for many been less than stellar. Several EU15 Member states continue to
raise rather than lower emissions. Analysing the most successful policy
instruments, this paper argues EU policy efforts could benefit from three
important innovations. The following strategies – the adoption of an EU-wide
FIT (feed-in tariff), an EU-wide carbon tax and more flexibility in the trading of
carbon credits – could significantly improve emission reductions, their relative
cost-efficiency and spread burden-sharing more evenly across technologies and
Member states. This raises important questions, both about the effectiveness of
EU and Kyoto-style commitments, as well as the EU Emission Trading Scheme
(ETS). The commitment strategy, and in particular the EU ETS mechanism, have
had the smallest impact on emission reductions. The proposed set of strategies
could make a far greater contribution to future EU efforts and potentially lock in
the impressive progress already made. Such a policy shift, if successful, would
also greatly enhance the EU’s already significant credibility and bargaining
power in international climate negotiations.
Keywords: EU climate policy, Climate change mitigation, Renewable Energy,
Energy Efficiency, Carbon Taxes
JEL Classification: Q48, Q58, Q54, Q56, Q43, H21
1. Introduction
The EU Climate (and Energy) policy framework84
is in need of urgent
reform. Though EU policy contains important commitments to the UNFCCC
* David Ellison is senior researcher at the Institute for World Economics, Hungarian
Academy of Sciences, Budapest, Hungary; e-mail: [email protected].
Acknowledgements: The author would like to thank anonymous reviewers for helpful
comments. The usual disclaimers apply. 84
For an excellent overview of the EU strategy and current status, see Morgera et al.
(2011).

134 David ELLISON
and Kyoto processes and further traps emissions in the vice of a complex
emission trading scheme (the EU ETS), to-date these two factors have ultimately
had little to do with actual progress on emission reductions. And though progress
for the EU27 as a whole has been stellar—in 2009, greenhouse gas (GHG)
emissions were approximately 17.3% below 1990 levels (EEA, 2010)—the two
most powerful explanatory factors are the economic and energy transformation
in Central and Eastern Europe and the more recent economic recession. Most,
though not all, of the EU15 Member states have made little or no progress on
emission reductions. Since signing the Kyoto Protocol in 1997 and despite a EU-
wide commitment to reduce emissions by 8% as of 2012 and 20% as of 2020,
quite a number of Member states have failed to make any progress and several
continue to raise emissions.
International bargaining on emissions is tremendously important and the
EU role highly important. For one, the EU has played an exceedingly important
international role in promoting commitments to emission reductions and in
pursuing the path of climate change mitigation and adaptation. For another,
without the current international and EU policy framework, things could clearly
be much worse. As a result, Member states have introduced national-level policy
frameworks leading to avoided emissions and reduced energy intensity. Yet,
movement toward the increased use of renewable energy sources is unevenly
distributed across the EU Member states. And much of this progress is largely
the result of national level policies that are relatively disconnected from the EU
policy framework. In fact, the failure to promote or delegate more responsibility
and authority to the EU level may mean that individual Member state efforts are
at best uneven and at worst likely to lead to significant distortions in the EU
marketplace.
A few simple (though politically complicated) tweaks of the EU climate
policy framework could potentially go a long way to resolving and improving
overall EU policy efforts. Rather than relying so heavily on the KP commitment
mechanism and in particular the EU ETS system, this article recommends the
EU amend the principal focus of policy efforts to a power-switch type model
focused broadly on the rapid adoption of renewable energy sources and
technologies (RES) and the more intense inclusion of end user-based energy
efficiency strategies that raise the cost of fossil fuel use and provide stronger
incentives for rapid new technology adoption in building-related energy use.
Finally, the progress made in reducing emissions in particular in the New
Member states of Central and Eastern Europe should be locked in by policies
promoting even more extensive improvements—potentially through the use of
EU Structural and Cohesion funds. Without this, economic growth and the slow
but progressive enrichment of Central and East European citizens will lead to
progressive increases in fossil fuel consumption.
Failure to adopt these changes may result in the limited efficacy of the EU
policy strategy. The reasons for this are quite simple. The strategy places its

SHOULD THE EU CLIMATE POLICY FRAMEWORK BE REFORMED? 135
principal emphasis on emissions in the power sector and high-emitting firms and
requires these firms to purchase the right to emit GHG’s at a price determined by
the carbon market. It thus raises the price of fossil fuel-based energy
consumption, effectively introducing a carbon price. While intended to
encourage a shift in the use of fossil fuels, this assumption is based on the logic
that users have the ability to raise their efficiency or choose other fuel types. For
coal-based electricity generation, for example, such choices are limited. While
firms can elect to build new RES-based facilities and abandon older facilities,
they frequently cannot simply switch fuels or update existing technology.
Similar problems arise for production in high-emitting firms. While new
production technologies may be around the corner, most industries have little
playroom for promoting more efficient production.85
Given this limited room for
manoeuvre, the EU ETS system may target the wrong actors. Alternatively, the
rapid adoption of new RES technologies or building-related energy use shows
significant potential. Thus a policy strategy focused on encouraging such
approaches may provide far greater potential margins for success.
In this sense, the EU commitment and EU ETS strategy should perhaps be
downplayed vis-à-vis alternative strategies. As this article demonstrates, there is
considerable potential for making rapid progress on the basis of a power-shift
type model, the more rapid adoption of RES technologies and a decisive end-
user strategy focused on the adoption of new technologies in building-related
energy use. The EU ETS model may ultimately hamstring rapid action, since it
places too much emphasis on the role of traditional industries (likely to favour
slower depreciation of fixed capital and physical infrastructure and thus slower
replacement rates)86
and not enough emphasis on complementary strategies
geared toward rewarding the rapid adoption of new technologies, in particular by
new and more flexible actors.
Without reform, progress toward emission reductions in the EU is likely
to remain at best uneven. Moreover, the ability of some countries to make
decisive progress in overall emission reductions, in the rapid adoption of low
carbon and energy efficient technologies and in the promotion of rapid
85
An International Energy Agency (IEA, 2007a) study estimated the adoption of best
practice technologies in the global manufacturing industry (excluding the power
generating sector) could lead to emission reductions of between 7 and 12%. On average,
from 2005-2008, ETS industries were responsible for 27.8% of emissions while
combustion installations were responsible for 72.2% (see the online European
Environment Agency data). On the other hand, some surprises are of course possible,
such as recent developments in the brick industry that may make possible efficiency
improvements of over 90%. See, “Silicon Valley Reinvents the Lowly Brick” (Reuters,
Sept. 21st, 2009).
86 The World Business Council for Sustainable Development (WBCSD) has, in various
publications, emphasized the importance of accelerating capital turnover rates. See for
e.g. WBCSD (2004, 2007).

136 David ELLISON
technology innovation and development, means an excessive share of the
emission reduction burden is borne by an uneven share of EU Member states.
This raises the potential for extensive market distortions and ultimately
introduces a disruptive element in the European single market space.
2. Current EU performance
The EU’s current efforts at greenhouse gas (GHG) emission reductions
are primarily focused on the power sector and other high-emitting industrial
installations. This project essentially has three components. One is the
requirement that the power sector and high-emitting industrial firms reduce their
carbon output or purchase carbon allowances on the EU emission trading
scheme (EU ETS) market. The second is that countries make an effort to
increase their use of renewable energy sources (RES) to a negotiated share of
total energy use by 2020. Finally, the EU also requires Members states to reduce
energy use by 20% by 2020 and to increase energy efficiency. The Energy
Efficiency Directive, a revised version of which is currently under negotiation,
encourages Member states to raise their energy efficiency by approximately 20%
by the year 2020. Thus, although EU MS are not moving rapidly on this front,
much of the 20% reduction in energy use could potentially be made through
raising energy efficiency.
In many ways, the EU is already well positioned to meet its 2020 target of
reducing GHG emissions by 20% from 1990 levels. In 2009, one year into the
first commitment period (2008-2012) specified in the Kyoto Protocol (KP) and
still far from the second commitment period (2013-2020) specified by the EU’s
2020 Energy and Climate Package, EU-27 emission reductions were 17.3%
below 1990 levels (EEA, 2010, p.6, 30). Partly in order to maintain this
momentum, discussions in fact revolved around whether the EU emission target
should be unilaterally raised to 30%,87
as previously discussed in the context of
an international Kyoto-II-type agreement. In this discussion, however, the two
principal explanations for successful EU-level emission reductions – 1) the role
of economic change and concerted action in the former communist countries,
now the New EU Member states, and 2) the economic crisis – are quickly
forgotten. In fact, and though a few select states have achieved significant
progress, little progress can be attributed to the positive actions of the EU and its
Old Member states.
As illustrated in Table 1, the Central and East European New Member
states have made the principal contribution to EU27 emission reductions.
Moreover, this is true whether one considers 1990 the effective base year, or
87
See e.g.: “30% greenhouse gas emissions cut 'still on the table'”, (Euractiv.com, Feb.
14th
, 2011), or “How to bring 30% back into the emissions debate”, (Euractiv.com, May
24th
, 2011).

SHOULD THE EU CLIMATE POLICY FRAMEWORK BE REFORMED? 137
1997, the year in which the Kyoto Protocol was finally signed (at which point
countries were aware what their “effective” targets would be). Though a large
share of the total EU27 emission reductions occurred in the Central and East
European Member states prior to the signing of the Protocol (in 1997), emission
reductions continue to be made well after that date. In fact, post-1997 the largest
share of emission reductions is still contributed by the NMSs. The positive
performance of the Central and East European states is marred only by the
negative performance of Slovenia. In this last country, emissions have grown by
a significant amount, both before and after 1997.
Finally, though the relative performance of the Central and East European
states is in part explained by the adoption of low emission reduction targets
(lower targets translate into higher performance), the New Member states
adopted remarkably strict targets compared to some of the former “cohesion”
Member states (those Western EU15 Member states previously the principal
recipients of EU Structural and Cohesion funding—in particular Spain, Portugal,
Greece and Ireland) and countries like Cyprus and Malta (who recently adopted
formal targets similar to those of the cohesion countries). While the former
cohesion countries were permitted to raise emissions under the KP framework,
the Central and East European Member states—despite considerably lower
levels of economic development—were all required to adopt emission reduction
targets between 6% and 8%.88
Though the performance illustrated in Table 1 the standard approach for
representing progress on emission reductions, little about how individual
Member states have performed relative to each other and to economic and
financial constraints is revealed. This analysis adopts two strategies for
standardizing and comparing individual Member state performance based on two
key factors: population- and income-weighted measures of individual Member
state contributions to emission reductions. These weights are chosen because
they represent the most relevant determinants of “equitably” based burden-
sharing – emission reduction shares based on per capita emissions and relative
wealth.
The EEA is responsible for collecting the EU GHG emission data used for
UNFCCC reporting. In order to assess the relative contribution of EU Members
states to GHG emission reductions, this data is analyzed comparing 2008 levels
to 1990. For the analysis herein, 2008 GHG emissions are subtracted from 1990
levels and this number is divided by the total EU27 contribution to emission
reductions. This relative share of emission reductions is then divided by the
individual Member state’s relative share in EU27 population and income (GDP).
88
Some have argued that the targets adopted by the New Member states were in fact
well above what one might have expected under ordinary circumstances (see Bhatti et
al., 2010). Moreover, this is a common theme in the EU climate policy framework (see
Ellison, 2008; Ellison and Hugyecz, 2008).
138 David ELLISON
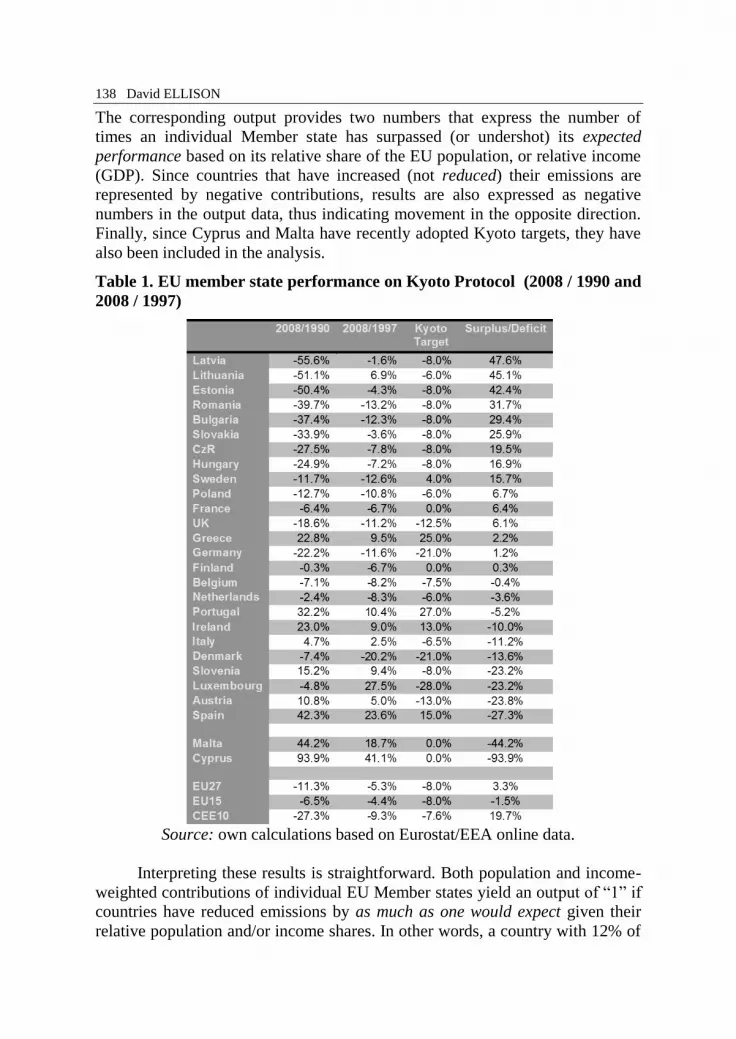
The corresponding output provides two numbers that express the number of
times an individual Member state has surpassed (or undershot) its expected
performance based on its relative share of the EU population, or relative income
(GDP). Since countries that have increased (not reduced) their emissions are
represented by negative contributions, results are also expressed as negative
numbers in the output data, thus indicating movement in the opposite direction.
Finally, since Cyprus and Malta have recently adopted Kyoto targets, they have
also been included in the analysis.
Table 1. EU member state performance on Kyoto Protocol (2008 / 1990 and
2008 / 1997)
Source: own calculations based on Eurostat/EEA online data.
Interpreting these results is straightforward. Both population and income-
weighted contributions of individual EU Member states yield an output of “1” if
countries have reduced emissions by as much as one would expect given their
relative population and/or income shares. In other words, a country with 12% of

SHOULD THE EU CLIMATE POLICY FRAMEWORK BE REFORMED? 139
the EU population might be expected to contribute 12% to the total GHG
emission reductions, yielding a value of “1”. Between 0 and 1, countries are
making progress but have thus far not managed to reduce their emissions by as
much as one would expect given their relative population/income share.
Numbers greater than “1” suggest that individual Member states have surpassed
what one would expect. Negative numbers indicate that Member states are
increasing emissions rather than reducing them. Further, there should be no
expectation that countries will perform the same on both population and income-
weighted measures. In fact, significantly less developed countries may perform
poorly with respect to population shares, but significantly better based on
relative income.
Countries not achieving what one would expect based on their relative
population or income shares still have the opportunity to do this given that the
first Commitment Period (CP1) runs from 2008-2012. In addition, these
numbers do not encompass emission reductions for 2009, the year most strongly
affected by the recent economic crisis, or the remaining years in CP1. Further
drops in emissions have likely resulted in some countries, in particular those
hardest hit by the recession. However, including 2009 data could be misleading
since it is unlikely the levels recently achieved will be maintained.
Weighted on the basis of population shares, the Central and East European
New Member states all represent the forerunners in the EU effort to reduce GHG
emissions (Figure 1). Estonia, for example has delivered an effort 12 times what
it should have contributed based on its relative share in EU population. Cyprus,
on the other hand, lies at the opposite end of the circle. To-date, Cyprus has
raised GHG emissions fully 5.1 times the amount it should have reduced them
based on its relative population shares. Similarly, Ireland has raised emissions
approximately 2.3 times the amount it should have reduced them. Similar results
are found for Greece (1.7 times), Portugal (1.4 times), Slovenia (1.1 times),
Austria (0.8 times) and Italy (0.3 times). Only a select set of old EU Member
states have managed to reduce emissions beyond what one would expect based
on their EU population shares (Germany,89
the UK, and Luxembourg). Several
other countries have at least made progress in reducing emissions, though for the
most part they remain below what one would expect based on their relative
population shares (Belgium, Sweden, Denmark, the Netherlands, France and
Finland). Among the Central and East European states, Slovenia stands out as
the only country to move in the wrong direction, away from its Kyoto target.
89
Because of German Unification in 1990 and the role of East Germany, Germany
represents something of an anomaly and exhibits some traits similar to those in the
Central and East European NMS.

140 David ELLISON
Figure 1. Population - weighted contribution (total emission reductions,
2008/1990)
Sources: own calculations based on data from EEA (2010) and Eurostat online
population data.
Analysis based on each Member state’s relative share of EU income
(GDP) yields similar results (Figure 2). Though the ordering of countries
changes, the basic principle remains the same. Based on their relative wealth in
the EU, the New Member states have again contributed far more to Kyoto
emission reductions than one would expect. Bulgaria tops this list, having
contributed 29.1 times what it should have contributed based on relative wealth.
This time the contrast in relative effort is starker than before, suggesting an
effort that is even (29.1/4.5 = 6.5) 6.5 times greater than what one would expect
based on relative EU population shares.
On the other end, Cyprus again remains near the top of the list of poor
performers, having increased its emissions by 5.9 times more than it should have
reduced them based on its relative share of EU wealth. And this time both Malta
and Cyprus remain at the bottom of the pack. Further, many EU15 Member
states are in a similar position (Spain, Portugal, Greece, Ireland, Austria and the
Netherlands). This time, only two EU15 Member states have contributed more to
emission reductions than one would expect based on relative wealth (Germany
and the UK). Since first commitment period ends only in 2012, several countries
have at least made progress in the right direction (Belgium, Sweden, Denmark,
France, and Finland). Slovenia again remains the lone exception among the
Central and East European New Member states, having raised emissions
approximately 1.6 times more than it should have reduced them based on
relative wealth.
Est, 12.0
Ltu, 5.8
Ltv, 5.1
Bulg, 4.5
CzR, 4.1 Slvk, 3.6
Rom, 3.5
Ger, 2.6
Hu, 1.9 UK, 1.9
Pol, 1.2
Lux, 1.1
Bel, 0.8
Swe, 0.7
Den, 0.7
Fr, 0.5
Net, 0.2
Fin, 0.0 It, -0.3
Aus, -0.8
Slve, -1.1
Por, -1.4 Gr, -1.7
Mlt, -1.7 Sp, -2.2
Ire, -2.3
Cyp, -5.1
Fig. I: Population-weighted Contribution
(Total Emission Reductions, 2008/1990)

SHOULD THE EU CLIMATE POLICY FRAMEWORK BE REFORMED? 141
Figure 2. Income - weighted contribution (total emission reductions, 2008 /
1990)
Sources: own calculations based on data from EEA (2010) and Eurostat online
GDP data.
This second set of findings is particularly important in the context of
arguments that wealthier states should bear a larger share of the burden of
reducing emissions. This basic principle is well integrated and enshrined into
thinking under the UNFCCC and IPCC frameworks, as well as the EU policy
context. In all three of these contexts, less wealthy states are generally granted a
framework that allows them to continue to grow economically without
significantly challenging them on emission reductions (as reflected, for example,
in the emission reduction targets of the former EU cohesion countries, Malta and
Cyprus).
The EEA has illustrated that the second largest contributor to EU27
emission reductions is the economic recession (EAA, 2010, Figure 4.1., p. 31).
Moreover, given the fact that the Central and East European states were typically
more immediately and dramatically affected by the recession, one should expect
emission reductions to again be significantly greater in the New Member states.
This point is substantiated by the most recent EEA GHG inventory submission
to the UNFCCC. Based on this data, the NMS reduced emissions by 10.3% in
2009, while the EU15 only witnessed emission reductions of 6.2%90
. As
suggested by the EEA projections for future emissions, the EEA does not expect
this decline in emissions to last. In February 2011, there were in fact already
signs EU27 emissions were again on the rise.91
And, a joint report from the PBL
90
These numbers are calculated on the basis of data in Table ES.3 (EEA, 2011, vii). 91
See for example: “Europe's CO2 emissions growing with the economy”
(EurActiv.com, Feb. 28th
, 2011).
Bulg, 29.1
Est, 29.1
Ltu, 18.9
Rom, 17.4
Ltv, 16.6
Slvk, 9.5
CzR, 8.5
Hu, 4.8
Pol, 3.7
Ger, 2.2 UK, 1.4
Bel,
0.6
Swe, 0.5
Den, 0.4
Fr, 0.4 Lux, 0.3 Net, 0.2
Fin, 0.0
It, -0.3
Aus, -0.6
Ire, -1.4
Slve, -1.6
Gr, -2.0
Por, -2.2
Sp, -2.3
Mlt, -3.2
Cyp, -5.9
Fig. II: Income-weighted Contribution
(Total Emission Reductions, 2008/1990)

142 David ELLISON
Netherlands Environmental Assessment Agency and the European
Commission’s JRC noted that EU27 emissions rose 3% in 2010 (PBL-JRC,
2011, p.11).
These findings raise important questions about the future. A very large
share of emission reductions in the EU27 results from the role played by the
Eastern Enlargement. Without this, the EU would not easily illustrate that
emission reductions can be achieved and pursued in a collective framework
(such as the EU or the UNFCCC’s Kyoto Protocol). In fact, few EU15 Member
states are able to demonstrate emission reductions are possible while at the same
time pursuing economic growth. Despite exceptions—the UK, Sweden, (perhaps
Germany), and France (based on relative income shares)—most of the EU15
Member states have been unable to make significant progress on reducing
emissions without significant reductions in economic growth (the economic
recession) or the opportunity to make use of the various UNFCCC flexible
mechanisms (i.e. the Clean Development Mechanism and Joint Implementation)
(EEA, 2010). Despite the declared goal of achieving an 8% reduction in
emissions by 2012 and 20% by 2020, many individual MS remain quite far from
achieving even the first of their EU-level burden-sharing commitments. Actual
performance is worse in some cases.
3. EU vs. national-level policy effectiveness?
As suggested above, the most efficient and effective emission reducing
tools to-date have been the Eastern Enlargement and economic change in the
Central and East European Member states and the economic recession.
However, other factors also contribute to important progress toward emission
reductions in individual Member states. In what follows, the rate of adoption of
new renewable technologies in individual EU Member states is analyzed based
on the same basic logic as above. The relative “effort” or performance of
individual member states is measured against what one might expect based on
relative EU population shares and/or wealth, using data for the period 1990-
2009.
Population-weighted analyses of the rapid adoption of renewable energy
technologies across the various EU27 Member states suggest two important
observations. First, a number of individual EU15 Member states are frequently
the most important contributors to the rapid adoption of certain types of
renewable energy technologies. Thus, when looking at wind power, Denmark,
Spain, Portugal, Germany, Ireland and Sweden are far and away the most
successful promoters adopting significantly larger shares of wind power relative
to their share of the EU population. Denmark in particular has adopted 4 times

SHOULD THE EU CLIMATE POLICY FRAMEWORK BE REFORMED? 143
what one might expect given its relative EU population share. Sweden on the
other hand, at 1.4 times, is close to what one might expect.
[See Figures 3 - 8 from the annex]
Second, the rapid adoption of renewable energy sources frequently occurs
in countries one might not expect given natural endowments of wind, solar
radiation and/or the availability of biomass. Thus for example, while Spain is far
and away the most prominent adopter of solar photovoltaic (PV) power cells on
the basis of population share, Germany and Luxembourg are in second and third
place, well ahead of Italy, Greece, Portugal and other southern countries with
significantly larger natural endowments of solar radiation. Thus, national level
strategies for the rapid adoption of renewable technologies presumably play a
significant role in explaining at least some of the cross-country variation in EU
Member state RES adoption.
Similar claims can be made about the adoption of other RES technologies.
For example, while the availability of wind power is significantly greater in
countries like the UK, performance on the adoption of wind power pales in
comparison to other countries like Germany. With regard to solar thermal energy
generation, while some of the countries at the top of the scale like Cyprus and
Greece may not surprise, other countries like Austria (in second place) is entirely
unexpected. Here again, national-level strategies plays an important role.
Analyzing the data in the context of relative income likewise provides
some interesting observations, particularly with regard to more conventional
claims that the high cost of renewable energy represents a barrier for the less
advanced economies or that incentives are not likely to be useful in countries
where there is little available capital. Taking wind power as the first example
(Figures 3 a, b), Portugal now tops the scale of rapid adoption based on its
relative share of EU income. And Bulgaria now takes 4th place (at 1.9 times),
Estonia 6th place (at 1.6 times), and Lithuania 9
th place at 0.9 times what one
would expect based on relative income. For Solar PV (see Figures 5 a, b),
though no NMS has adopted more than one might expect based on relative
income, the Czech Republic places surprisingly high, especially relative to the
quite large number of other EU15 Member states with significantly higher
amounts of solar radiation that place considerably lower on the scale (e.g.
Portugal and Italy). Similar claims can likewise be made regarding solar thermal
adoption (Figures 6 a, b) and Malta, Slovenia, the Czech Republic, Bulgaria and
Slovakia.
Thus national level policies play an important role in contexts where the
natural advantages of individual technologies alone (as in the case of solar
thermal in countries like Cyprus and Greece, and countless other examples) do
not immediately encourage rapid adoption. This basic analysis further
underscores the observation that although relative income represents an

144 David ELLISON
important barrier to the rapid adoption of renewable energy technologies, this
obstacle can be overcome with inventive strategies. Moreover, the selective
redistribution of resources to less advanced countries would presumably have
further beneficial impacts on the rapid adoption of renewable energy
technologies.
The adoption of biomass-based renewable energy technologies (district-
heating, electricity generation, combined heat and power as well as individual
household use) provides an additional important example (Figures 4 a, b). Based
on population-weighted measures, the use of biomass in primary energy
production is far and away the highest in Finland, Sweden, Estonia and Austria.
Finland hosts 8 times and Sweden 6.2 times more biomass-based energy
production than expected based on their share of EU population and Estonia
hosts 3.4 times more.
Based on income-weighted measures, however, the positions of individual
countries change significantly: Latvia jumps to first place (at 11.8 times what
one would expect) and Estonia, Romania, Lithuania and Bulgaria to 2nd
, 4th, 5
th
and 6th respectively. Only Finland remains in the top 5, in third place (at 6
times). This significant change in the relative positions of individual countries is
presumably related to two factors: the relative cost of biomass-based energy
resources (more competitive than other available RES technologies) and the
relative availability of biomass material in some (though not all) of these
countries. A varied mix of relative cost and resource abundance also presumably
explains the relative positions of Malta, Slovenia, the Czech Republic and
Slovakia with regard to solar thermal adoption.
Looking at the share of total renewable energy sources in primary energy
production (Figures 7 a, b) across the EU27 (because of limitations with regard
to new capacity, hydropower is excluded from these numbers), a number of the
EU15 Member states rank quite high based on relative population shares (in
particular Sweden, Finland and Austria). Only a few New Member states
produce more primary energy than one would expect based on relative
population shares (Latvia, Slovenia and Estonia). However, based on relative
income shares, a significantly large share of NMS comes out on top (in
particular Latvia and Estonia, followed by Finland, Romania, Sweden, Bulgaria
and Lithuania). The same analysis can be performed on the basis of the RES
share in gross inland consumption (Fig. VIII, a, b). The basic findings do not
really change. In particular, based on relative income shares, the same set of
NMS comes out on top. Moreover, and more importantly perhaps, not a single
NMS (including Slovenia) produces or consumes less RES energy than one
would expect based on relative income shares. However, the same cannot be
said for the majority of old EU Member states. Fully 9 out of 15 old EU Member
states both produce and consume less RES energy than one would expect based
on relative income shares.

SHOULD THE EU CLIMATE POLICY FRAMEWORK BE REFORMED? 145
These numbers are surprising given the conventional impression of
lagging performance in the New Member states. To raise the level of irony a
notch, back in 2008, it was once recommended that the Central and East
European New Member states postpone investment in renewable energy
resources until the technologies had become more mature and prices had
declined. However, as clearly illustrated in Table 2, the Central and East
European New Member states have witnessed the highest rate of growth of
renewable energy technologies. Though of course these countries have started
from a somewhat lower level of renewable energy development, the use of
renewable energy technologies rose 185% between 1990 and 2009, compared to
only 126% in the Old EU member states (see Table 2).
Table 2. Change in renewable and bio-energy use, 2009 / 1990
Source: own calculations based on Eurostat online data.

146 David ELLISON
At the same time, in the NMS, a relatively large share of this gross inland
consumption is from biomass resources, 95% for Estonia, 86% for Lithuania,
80% for Latvia, 77% for Hungary and 71% for Romania. While Latvia, Estonia
and, to a lesser extent, Lithuania have a relatively extensive forest cover,
Romania has significantly fewer available forest resources (MCPFE 2007: pp. 6,
8). Moreover, the use of biomass resources in Central and Eastern Europe has
experienced quite rapid rates of growth. As a share of primary energy production
(figures for Gross Inland Consumption are also included in Table 2), between
1990 and 2008 the use of biomass has grown some 174% in the ten New
Member states compared to only 68% in the EU15. Though these numbers
disguise some important outliers—e.g. biomass use in the UK has grown by
447%, in Italy by 376% and in Germany by 281% between 1990 and 2009—
over the same period biomass use has grown most significantly in Romania
(522%), Bulgaria (329%), Slovakia (272%), Estonia (270%), Poland (258%),
Lithuania (167%) and Hungary (128%). Whether this represents a threat to
available resources and the imperative of sustainable forest management remains
to be seen.
The above data overwhelmingly illustrate two important points. First, the
adoption of RES technologies is extremely uneven across EU Member states.
Moreover, as noted above, variation in the rate of adoption of renewable
technologies is not solely influenced by relative national endowments. This in
turn suggests that national level strategies for promoting the rapid adoption of
renewable technologies vary significantly in relative effectiveness across
Member states. Second, relative income appears to play a strong role in
determining what kind of renewable technologies are adopted. The New
Member states favour less costly renewable energy technologies, in particular
woody biomass. However, as illustrated above, some of the NMS have begun
adopting significant amounts of wind or solar PV. Thus, apart from some natural
locational advantages, national-level incentive systems presumably play an
important role.
Thus strategies that encourage the adoption of a broader range of
renewable energy technologies across the broad range of EU Member states
seem desirable. Moreover, the relative advantages arising from the promotion of
technology innovation and development across a broad set of technologies
should be self-evident.
4. A more effective Toolkit? Refining EU climate change mitigation tools
Much could be done to speed up progress on the climate mitigation
agenda and simultaneously to speed greater innovation and dissemination of
renewable energy technologies in the EU. Though the EU and the MS have
committed to significant emission and energy use reduction goals, the tools put
into place to achieve those goals have the unintended consequence of reducing
the overall efficiency of emission reduction efforts.

SHOULD THE EU CLIMATE POLICY FRAMEWORK BE REFORMED? 147
The reasons for this are straightforward. First, as illustrated above, beyond
the Eastern Enlargement and the economic recession, most of the major progress
is related to policy strategies that are not the direct result of EU policy efforts
but instead are primarily related to national-level policy strategies and efforts.
Second, the emission reduction potential in sectors outside the EU ETS is
substantial, in particular in the areas of reducing building-related energy use,
transport and LULUCF. Yet these sectors are typically not well mobilized in the
EU Energy and Climate Package. Third, the EU climate strategy remains heavily
compartmentalized. Countries have obligations in each of several categories: the
EU ETS, the adoption of RES technologies, increasing energy efficiency and the
reduction of energy use. The consequence is that individual Member states can
ostensibly exceed their RES targets and reduce their emissions to well over the
current 20% goal required by the EU Energy and Climate package for 2020, but
still be required to meet EU ETS targets. Such a model is both awkward and
inefficient.
A more successful EU strategy should first find ways of building upon the
more successful RES technology adoption strategies introduced in individual
Member states, second find ways of mobilizing the potential both in other non-
ETS sector activities and across ETS and non-ETS sectors, and third develop
mechanisms for linking each of these different areas in a more flexible carbon
trading framework in order to mobilize trade in particular across ETS and non-
ETS sectors. The current EU climate policy framework, the EU ETS, RES
technology adoption targets and EU energy efficiency guidelines may encourage
continued efforts on the part of individual MS, the power sector and high-
emitting firms. However, the introduction of more effective tools could
potentially push MS to go much further.
While the economic recession has affected all MS, its transient nature
means its effects will not be long-lived and significant reversals will result.
Further, though much of the experience of the NMS cannot be repeated, locking-
in some of this progress as quickly as possible and building upon it would be
advantageous. FIT systems, as well as the carbon tax model treated in more
detail below, though unevenly applied across MS, can in fact be transferred to
other EU MS and to the EU-level as whole. Strategies to link trading
mechanisms across the different emission reduction systems would likewise
permit greater flexibility in the strategies chosen by individual Member states
and presumably raise the overall efficiency and effectiveness of emission
reductions. Thus, to improve overall cost-efficiency, rapidity and relative
burden-sharing in emission reductions, these three modifications of current EU
strategy should be given greater consideration.

148 David ELLISON
4.1. FIT systems
Considerable variation in both the strategies adopted at the national-level,
as well as performance across the EU MS, speaks in favour of the promotion of
revised tools for the rapid adoption of renewable energy technologies. Typically,
feed-in tariff (FIT) systems that pay producers higher fixed tariffs for energy
produced with RES technologies have most efficiently encouraged rapid
adoption. Germany and now Spain and Portugal provide representative
examples. In general, countries that have introduced “differentiated” FIT
systems have been able to promote high rates of RES technology adoption at a
relatively reduced cost (Altmann et al., 2010a). Moreover, such strategies appear
to have knock-on effects on the rate of technological innovation. The rate of
RES technology adoption has triggered considerable growth in the RES
technology market, widespread competition across a large number of producers,
lower prices and improved technological potential.
To-date, the EU has done little to intervene in national-level MS RES
promotion strategies other than to set very broad targets on the adoption of
renewable energy and to promote what is called the Green guarantee of origin
system. The new Green guarantee of origin system was introduced at the EU
level along with the second Renewable Energy Directive (2009/28/EC)92
and is
essentially intended to promote trade in renewable energy credits across Member
states. However, it is not likely to have a significantly advantageous impact on
RES technology adoption. The principal reason is its failure to provide a
framework for the differentiated promotion of renewable energy sources. The
Green guarantee of origin strategy (Art. 15) grants one green certificate for one
MWh of RES energy produced, irrespective of technology type. This approach,
closely modeled on the Renewable Obligation strategy employed in some
Member states (e.g. the UK) has done little to promote the rapid adoption of
renewable energy and has typically proven to be more expensive as a strategy.
Moreover, like the Green guarantee of origin model, it is insensitive to
differences in technology. FIT systems, on the other hand, can offer different
tariff rates for different technologies, thus making it possible to adjust for the
varied cost of different renewable energy technologies. Since the EU level
strategy rewards one MWh of effort with one MWh of credit, it is likely to
encourage the large-scale use of wind energy technologies and biomass at the
expense of other renewable energy sources.
This has several disadvantages. Not all EU Member states enjoy large
wind energy or biomass potential. And it remains exceedingly difficult to
determine which renewable energy technologies will ultimately provide the best
and cheapest future alternatives. Though some technologies remain expensive
92
http://eur-lex.europa.eu/LexUriServ/LexUriServ.do?uri=OJ:L:2009:140:0016:0062:
en:PDF.

SHOULD THE EU CLIMATE POLICY FRAMEWORK BE REFORMED? 149
(e.g. Solar PV), different renewable technologies have different advantages.
Solar PV is perhaps one of the best potential strategies for reducing distances
between points of production and consumption. On the other hand, it is not
necessarily suitable in all locations (southern locations have better solar
radiation than northern locations) and to-date it remains one of the more costly
sources of renewable energy generation (though prices are falling fast). Wind
power may thus represent a more favourable option for many locations, in
particular where the amount of solar radiation is lower and where other
renewable energy sources are not readily available. On the other hand, wind
power typically requires large turbines that cannot easily be placed in densely
populated residential areas. And the sheer number of wind turbines required to
adequately meet all energy needs tends to make them unsightly.
An additional problem is related to the intermittency of many renewable
energy sources (in particular the fluctuation of solar and wind power over time),
the challenge of maintaining a continuous and secure supply of energy on the
grid and the technological problems related to building adequate storage
potential. Though more suitable storage technologies as well as more highly
developed Smart Grid networks are now the cutting edge of technology
development, non-differentiated strategies for the promotion of RES
technologies fail to address this specific problem. In contrast to the intermittent
character of wind and solar power, biomass combined heat and power,
geothermal energy resources, ocean-based power sources and hydropower all
provide constant base load power. Moreover, given favourable locational
variables (adequate biomass resources or favourable geological resources), both
geothermal and biomass-based energy resources are increasingly competitive
(UCS, 2009, Ch.5). In the Scandinavian countries, biomass has become the
energy source of choice for smaller scale combined heat and power generation.
FIT systems can be more effectively tailored to suit varying needs and even to
drive the introduction of new alternatives, such as storage technologies.
The current EU strategy is further unlikely to adequately adjust for the
tremendously uneven character of support for renewable energy sources across
the individual Member states. As suggested by the graphical representations
presented above, a select set of individual Member states bear an unusually high
share of the research and development costs associated with the promotion of
renewable energy resources. Countries like Germany, Denmark, Spain, Portugal
and even Bulgaria ultimately (though sometimes indirectly) fund R&D costs for
Wind or Solar PV to the benefit of the remaining EU Member states. For the
reasons discussed above, the non-differentiated character of the EU green
guarantee of origin strategy will do little to resolve this problem. This general
strategy of national-level promotion is not only inefficient. It is unlikely to bring
the adequate critical mass to bear in order to bring about a successful and rapid
shift in energy orientation across the EU as a whole.

150 David ELLISON
An EU-wide FIT system, on the other hand, would go a long way to
resolving these issues. It would enable a technology sensitive system for
promoting both the development and the adoption of renewable energy resources
across the EU as a whole. And in doing so, it would allow for the more rapid
diffusion of renewable energy resources across a wider geographic space.
Finally, such a system would be likely to promote more rapid technology
innovation and thus successfully integrate the low carbon economy in European
space.
Finally, much can be said about the benefits of FIT programs for
reinforcing market mechanisms and driving technological innovation and
development. FIT programs play a fundamental role in driving both the
commercialization of new renewable technologies as well as their rate of
adoption. Moreover, because of the way such programs are structured, they are
likely to have a remarkably favorable impact on market forces. FIT tariffs are
essentially paid to investor-generators, individuals all the way from small-scale
households up to large-scale wind and solar farms who invest in these
technologies for the purposes of power generation. Such investor-generators face
strong market incentives to favor the most cost-efficient and potentially reliable
renewable technologies available on the market, since these are likely to bring
the best returns from FIT systems. Renewable technology producers, on the
other hand, face strong market pressures to come up with the most cost-efficient
technologies so that investor-generators will purchase them.
Though the pricing of FIT systems has occasionally caused headaches for
individual countries (witness e.g. the recent case of Spain), their effective
implementation provides powerful incentives for the rapid adoption of new
technologies, as well as for rapid innovation, development and the
commercialization of new technologies. Moreover, the hidden costs of auction-
based strategies such as the UK model larger initial investments in order to file
appropriate bids and waste significant resources when these fail. Such strategies
not only artificially raise costs, they likewise inefficiently push most small-scale
(e.g. household or even SME) producers out of the market.93
Thus FIT systems,
if appropriately structured, can encourage the development of highly competitive
technology innovation markets. The withdrawal of support mechanisms, on the
other hand, not only stymies adoption rates, it drastically slows rates of
investment, innovation and market development.
4.2. Carbon taxes
The EU ETS system, with its focus on the power sector and high-emitting
industry, almost entirely misses the potential contribution to emission reductions
93
Though some argue such bidding systems will generate energy prices that are closer to
real costs, it is generally not recognized that bidding systems have the impact of raising
investment costs.

SHOULD THE EU CLIMATE POLICY FRAMEWORK BE REFORMED? 151
stemming from improvements in building-related energy use and/or reductions
in natural gas use. At best curious in the current framework of energy security
discussions (like oil, the adequate provisioning of natural gas is a highly
sensitive energy security concern), strategies should be found to broaden the
scope and application of the EU Energy and Climate Package to a much broader
segment of emission sources and fuel types. A carbon tax is presumably the
ideal tool with which to achieve this goal since it can easily be made to apply to
a broad range of fossil fuels—including natural gas—and it can easily be applied
to a far wider range of emission sources (not just the power sector and high-
emitting firms).
Oddly, carbon taxes have been significantly less well researched than most
of the other tools currently used in the EU toolkit. The reasons for this are a bit
obscure. Many of the major organizations (mostly research institutes and
NGO’s) that track and collect data on country-level strategies for reducing
emissions do not consistently keep or collect data on the use of carbon taxes.
Thus, for example, the European Renewable Energy Council (EREC) lists a
considerable amount of information on its website about the national policies
pursued by individual EU Member states.94
However, this information is for the
most part less explicitly focused on the use of carbon taxes (or tax exemption
strategies) than it is on the full range of other national-level strategies. However,
EREC ultimately does a more consistent job of addressing carbon taxes than
some of the other publicly available resources.95
None of these resources,
however, include an independent section comparing and discussing how carbon
taxes are put to use across the EU 27 or provide tables with comparative data on
carbon tax level or tax exemption amounts.
What is less clearly recognized in a broad range of studies is the relative
advantage carbon taxes have offered to some countries. In particular, countries
like Sweden and Finland have employed carbon taxes (or tax exemptions for the
consumption of renewable fuels) to great effect, using them as a tool to
progressively move individuals away from fuel oil and toward more carbon
neutral energy sources such as heat from primarily small scale combined heat
and power bio-energy plants and increasingly geothermal heat pumps as well.
Though countries like Finland and Sweden, in particular, have made only limited
progress in the adoption of renewable energy technologies like wind or solar
power, in population-weighted terms they are at the top of the scale regarding
the adoption of renewable energy technologies and the use of biomass resources
in both energy production and consumption.
94
See: http://www.erec.org/policy/national-policies.html. 95
Other agencies that closely track the adoption of renewable technologies and national
level strategies are: the EurObserv'ER barometer, REN21 and also the German Ministry
for the Environment, Nature Conservation and Nuclear Safety.

152 David ELLISON
The introduction of a carbon tax could significantly help re-distribute the
burden of reducing emissions across a much broader segment of industry and
society. If we accept the analysis that most of the emphasis of the EU climate
strategy is placed on the emission trading scheme (ETS), then it behooves us to
find strategies for redistributing this burden more evenly, especially when many
of the strategies for reducing energy use and thereby reducing emissions are also
among the most cost-efficient. Building-related energy use contributes
approximately 40% to global emissions. Further, natural gas use, despite the fact
that it is approximately 60% as carbon-intensive as coal, is only marginally
influenced by the EU ETS and its use gives rise to significant energy
dependencies—especially in countries who are large importers of Russian
natural gas. In this context, a strategy that has only a relatively weak impact on
natural gas use makes little sense. Strategies could and presumably should be
devised to promote both reduced natural gas use as well as reduced electricity
use.
A carbon tax is meaningful in particular because of its potential broad
application across a wider range and broader use of carbon-based fuels. Such a
policy strategy could ultimately even the burden of pursuing carbon-reducing
strategies by spreading them more broadly across the full range of carbon-based
fuel uses and by targeting a much broader segment of industry and also building-
related energy use (commercial, public, residential). Households in particular
face few changing incentives to reduce overall energy use and, in particular,
natural gas use under the current EU strategy.96
Yet with a carbon tax imposed
on all fossil fuels based on their carbon content, price signals could be more
effectively used as an incentive to discourage fossil fuel use and thus favor
carbon-reducing strategies on a broader scale.
Carbon taxes are deservedly controversial as a strategy. This is true for
several reasons, not the least of which is the political problems associated with
their introduction, nor the neo-liberal position that government already
intervenes too frequently in the lives of individuals without promoting adequate
added value. In the EU, the introduction of an EU-based taxation framework has
likewise proven difficult due to MS resistance.
Perhaps the most important reason why carbon taxes are controversial,
however, is perhaps the least frequently mentioned. The justification for carbon
taxes is usually explained in terms of an overly simplistic behavioural paradigm:
a simple change in price is assumed to => (lead to) behaviour modification. The
conventional logic argues that if prices are raised via the means of a tax on
96
Since electricity producers face changing carbon prices, to the extent possible, price
changes will be passed on to consumers. Thus price signals may drive changing behavior
with respect to household electricity use. The same relationship, however, is not true for
building-related natural gas use. In this regard, households (and other users of buildings)
face no or fewer significant incentives to alter their energy consuming behavior where
natural gas is concerned.

SHOULD THE EU CLIMATE POLICY FRAMEWORK BE REFORMED? 153
fossil fuels, consumers will immediately alter their behaviour and stop
consuming fossil fuels. The real world however is never so simple. For one, most
energy prices (electricity, engine fuels, natural gas and even coal) are more and
more erratic. Other factors such as world demand, economic crises and relative
supply (OPEC or peak oil) have equally or significantly larger price impacts.
The ability of the average individual to sift through multiple factors and single
out the relative impact of carbon taxes from among many potentially larger
causes of price fluctuations is limited. And frequently carbon taxes, if present,
exercise only a marginal influence on relative prices.
The second most neglected problem is inelastic demand. Thus even when
prices rise as a result of carbon taxes, consumers may not change their behaviour
due to the lack of reasonable alternatives. A classic example is the imposition of
fuel taxes in an attempt to motivate consumers to drive cars less frequently, find
alternative means of transportation or purchase more fuel-efficient vehicles.
Unless alternatives are available, many or even most consumers will not alter
their behaviour but will simply absorb the higher prices. Moreover, the rate of
change in fuel efficiency over the years has been quite small. The average
automobile consumer faces a complex set of variables (size, functionality,
convenience, comfort, etc.). Fuel efficiency of course is only one of many
variables driving consumer decisions. And many individuals likewise frequently
have few alternatives to the daily commute.
The point is that unless meaningful alternatives or complementary carbon
neutral alternatives (or products) are available, consumers are not likely to
significantly alter their consumption habits and carbon taxes will not have any
meaningful impact on behaviour. Energy price increases going into the 2008
economic recession and the economic crisis itself have done far more to change
both consumer behaviour as well as to provide adequate incentives for car
producers to change the range of vehicles and technologies they offer to
consumers. Of course significant changes in price—whether driven by taxes or
some other phenomenon such as increasing scarcity—are likely to have a
significant impact on consumer behavior. But significant price increases initiated
by carbon taxes are politically quite difficult to introduce and politicians face
diminishing incentives to impose taxes the greater the required change in price.
On the other hand, there are at least two very meaningful justifications for
carbon taxes. First, carbon taxes can easily be imposed on a wide variety of
fossil fuels and thus potentially impact a far broader range of consumption
patterns than, for example, the EU’s ETS. In this sense, carbon taxes can be both
more evenly distributed across a broad range of consumers, thus sharing the
burden more equally, and they can more effectively and meaningfully target a
wider range of fossil fuels. This last point is particularly important with regard to
the Achilles’ heel in the EU’s Energy and Climate Strategy, natural gas. Though
building-related energy use (of which a significant part is natural gas use)

154 David ELLISON
represents some 40% of EU emissions, the EU policy structure only weakly
targets this element, if at all.
Second, carbon taxes can be used in the same way the current EU ETS
system is used. Carbon taxes can essentially impose a carbon price on fossil fuel
consumption and thus affect relative price differentials between goods that are
dependent on fossil fuels for their production and those that are carbon neutral.
The advantage of this model, however, is its ability to target consumer behavior
over targeting and directly penalizing individual firms. And in important ways, a
carbon tax is a much simpler and far more bureaucratically streamlined tool for
achieving the same goal across a much broader range of sectors and fossil fuels.
However, as suggested above, two additional features seem to be
important with regard to the potential success of carbon tax strategies. The first
of these is the presence of complementary alternatives. Without significant
changes in fuel efficiency and thus the availability of real alternatives,
individuals are likely to make their consumption choices based on other
variables. Second, given the occasionally high cost of initial investments (e.g. re-
insulating a building or installing a new geothermal heat pump), and/or the low
impact of increased efficiency on consumer budgets (savings of $10-20/month
on energy bills may not be persuasive enough to drive significant changes in
consumer behaviour), the imposition of a carbon tax alone may not be adequate
to motivate significant behavioural changes. In this regard, additional
complementary government-driven strategies (rebates, additional tax
exemptions, one-time offers, etc.) are presumably a requirement.
4.3. Linking mechanisms
The trading of carbon credits is for the most part restricted to the power
sector and high-emitting firms, i.e. to the EU ETS system. As such, powerful
incentives to encourage emission-reducing activities are unevenly applied across
different emission sources. Moreover, the cost of making emission reductions in
individual compartments or sectors of national economies varies considerably
both from sector to sector and from country to country. Though reductions in
building-related energy use are thought to be the most cost-effective, the EU
strategy for the non-ETS sector only promotes a small amount of effort, and that
primarily in countries that presumably have the least to gain (i.e. have already
made the greatest progress in energy efficiency relative to other EU Member
states).
Many have attempted to place an increased emphasis on energy efficiency
goals. The 3C initiative in particular points to the high potential return
(economic reward) from heavily investing in energy efficiency and building-

SHOULD THE EU CLIMATE POLICY FRAMEWORK BE REFORMED? 155
related energy use.97
Tindale from the Centre for European Reform argues that
energy efficiency represents “the most pain-free way for European governments
to fight climate change”.98
The European Environment Agency likewise suggests
that energy efficiency efforts should be strengthened. Only a very small share of
current emission reductions can be attributed to sectors outside the EU ETS and
thus to energy efficiency (EEA, 2010, p.9). And the European Climate
Foundation (2010) recently published a report detailing the need for more
concerted energy efficiency efforts, noting that the EU MS would need to triple
their efforts in order to reach 2020 climate goals for reducing energy use by
20%.
Despite the great potential for efforts related to increasing energy
efficiency, policy efforts have to-date typically not succeeded in achieving their
goal. Certainly one reason for this is the fact that no binding targets have so far
been set on energy efficiency (Altmann et al., 2010b). The EU strategy so far
only provides guidelines for relevant energy efficiency efforts. Thus, to-date, at
least three separate tools for promoting significant advances in energy efficiency
have not been adequately explored. The first of these—binding targets—could
potentially go a long way to encouraging MS to get serious about energy
savings. Though several attempts have already been made to make gains in
energy efficiency binding on MS, these have so far failed. As suggested above,
the second, a carbon tax, could likewise have a significant impact on a broad
segment of energy users and could be applied to a broad range of fuel types (not
only those that are electricity generation related, but also to natural gas and/or
fuels). Attempts to pass a carbon tax at the EU level have likewise failed.
The third and potentially the most effective tool, however, for raising
energy efficiency—making it possible to trade improvements in energy
efficiency in carbon trading schemes—has been less widely explored. The
reasons for this are at best obscure. Some certainly fear that including too many
options into an emission-trading scheme is likely to reduce carbon prices and
thus weaken the effectiveness of the system and strategy. Such argumentation,
for example, is frequently used to restrict the augmentation of the EU ETS
system to other sectors such as the non-ETS sector or to land use, land use
change and forestry, LULUCF. In this regard, insistence on maintaining high
carbon prices in the EU ETS may represent one of the principal barriers to
creating more flexibility in the EU climate strategy.
Such concerns however seem misplaced. To-date, carbon prices have
played perhaps the weakest role in moving emission reductions forward. As
suggested by the data presented above, national level strategies for reducing
emissions—and in particular for encouraging the rapid adoption of renewable
97
The work of the 3C Initiative is based on 3C (2009) and the previous work of
affiliated organizations McKinsey (2008) and Vattenfall (2006). 98
See “The EU Should be Much Bolder on Energy Efficiency” (CER, Oct. 12th
, 2010).

156 David ELLISON
energy technologies—have ultimately been far more successful. These, what one
might call “positivist”, approaches may ultimately provide a more solid
groundwork for rapid progress than the EU ETS system and its imposition of
carbon prices.
At the same time, creating more linkages across the multiple Kyoto (KP)
and in particular EU trading mechanisms would appear to represent an
invaluable strategy for propelling movement forward based on the principles of
cost-efficiency and the ease of achieving emission reduction goals. Much of the
potential field for achieving emission reductions is currently poorly mobilized in
the EU framework. This could, presumably, be dramatically improved.
In important respects, the degree of inflexibility in the EU carbon trading
and emission reduction scheme(s) is frequently underestimated. This inflexibility
however is evident at many levels. For one, emission reductions and/or avoided
emissions promoted across the different elements of the EU climate policy
structure are not tradable across the same space. Thus, for example, even if
individual countries manage to meet their Kyoto targets specified in the EU
burden-sharing agreement, they can still remain behind on targets related to the
introduction of renewable energy or emission reductions in the non-ETS sector.
Without flexibility across the system, EU Member states remain subject to
multiple targets, not all of which can easily be met.
In a similar fashion, some Member states will be forced to pursue costly
emission reductions in the EU ETS sector, while neglecting emission reductions
that can frequently lead to positive returns in the non-ETS sector (in particular
with regard to building-related energy use). This particular problem is perhaps
most pronounced in countries with more limited resources to invest in new
production technologies. While the NMS have great potential to reduce GHG
emissions from building-related energy use—in particular due to years of
subsidized energy prices and far more limited use of energy efficiency
technologies—the EU policy package, and in particular the EU ETS system,
forces them to invest the larger share of their resources in one place.
Likewise, the EU climate policy framework continues to restrict countries
from taking advantage of the opportunities afforded by increased efforts at
supporting European forest growth. This last restriction on individual Member
states efforts is particularly difficult to understand, in particular in the context of
the advantages forests can provide on both the climate change mitigation and
adaptation fronts (see e.g. Ellison et al., 2011). Despite these potential
advantages, EU climate policy still prohibits trade in emission reductions
produced in the LULUCF sector.
A more flexible EU climate policy framework should permit the complete
fungibility of avoided and reduced emission credits across all potential segments
or sectors of the climate change mitigation framework. Only in this way can
emission reductions be achieved at the lowest possible cost and with the highest
rate of return. Moreover, absolute flexibility in the pursuit of both targets and

SHOULD THE EU CLIMATE POLICY FRAMEWORK BE REFORMED? 157
emission reductions would significantly help to encourage rapid emission
reductions and the rapid promotion of renewable energy technologies.
5. Discussion
These findings cast doubt on the effectiveness of EU tools for achieving
grand scale emission reductions over long periods of time. The EU commitment
strategy and the EU ETS do not appear to be the most effective strategies for
promoting emission reductions and technological change. At least one NGO
predicts the EU ETS will deliver only a 0.3% reduction in emissions (Sandbag,
2010) compared to the total 8% reduction to which the EU has committed for
2012. This is a very small contribution for an institutional and administrative
structure that requires a considerable measurement, monitoring and certificate
trading bureaucracy. Moreover, the quite massive financial sums redistributed
through the ETS trading mechanism – annually approx. 30-35 billion €
(Zachmann, 2011: p.2) – suggest the “expense” may far outweigh the usefulness
of the strategy. To be fair, the EU ETS system is not likely to begin to have a
real impact on emissions until the beginning of Phase 3 in 2013. Only after this
date will the transition from grandfathering to the required auctioning of
emission credits begin to give the EU ETS real teeth.
In contrast, the adoption of renewable energy technologies in the
individual EU Member states has already played a decisive role in the avoidance
of GHG emissions. Depending on how “avoided” emissions are calculated (the
baseline can be considered against coal-based energy production, any of the
other fossil fuels (brown coal, oil, natural gas), or an average across all of these.
Thus avoided emissions vary significantly depending on which of these fossil
fuels is chosen as the baseline. Thus, for the EU 27 and depending on the
baseline fossil fuel type, avoided emissions represent anywhere from 8-14% of
total 2008 GHG emissions (natural gas use and coal provide the lowest and the
highest estimates, respectively). An average across all of the fossil fuel types
listed above yields an estimate of approximately 11% avoided emissions in the
EU 27. Moreover, it is important to note that the relative share of renewable
resources in EU27 energy generation has been growing steadily between 1990
and the present.
Conventional predictions have repeatedly suggested the adoption of RES
technologies would be slow and painful. Most of the large organizations
conventionally engaged in predicting future energy generation needs and
technologies (the IEA, Capgemini and the European Commission) have argued
the predominant share of energy will be fossil fuel-based for many years to
come. Capgemini (2007), the European Commission (2007) and the
International Energy Agency (IEA, 2007b, Ch.1) have all suggested the role of
fossil fuels will make up some 80% of new capacity through 2020 or 2030. Early
in fall 2010, however, the European Commission was compelled to recognize
that actual progress in the adoption of RES technologies is rapidly outpacing

158 David ELLISON
predicted progress. With the reportedly quiet publication of its Energy Trends
update for 2009, the Commission finally acknowledged a significant shift toward
renewable energy sources was underway.99
This recognition is especially
important, since it may open a pathway for the adoption of an improved strategy.
6. Conclusions
Without the introduction of reformed strategies at the more centralized EU
level, current EU policy is likely to lead to important imbalances and distortions
across the EU Member state economies. Though the EU as a whole has good
chances of meeting and keeping its KP commitments, this is not necessarily the
result of the good performance of the older EU15 Member states that initially
signed the Kyoto Protocol in 1997, but is instead primarily the result of the
performance of the Central and East European New Member states. Moreover,
not only have these countries radically reduced emissions, they have also made
significant progress—in particular based on their relative EU income—in the
adoption of renewable energy technologies. The NMS are not alone in this
regard, a select number of Western EU Member states have also made
significant progress, both with emission reductions as well as with the rapid
adoption of renewable energy technologies. However, this performance is at best
uneven and could (some might say “must”) be significantly improved.
Reform of the EU climate strategy is important for several reasons. First,
much could be done to spread the positive performance of the NMS’s and the
select group of Western states more evenly across the wider range of EU
Member states. Failure to transfer more successful policy tools to the EU level
means that a select group of more successful countries are over-subsidizing both
the adoption of and innovation in RES technologies in the EU. Such market
distorting outcomes are neither in the EU’s interest, nor in that of the subsidizing
countries.
A EU-wide strategy could achieve several important goals at once. It
could: accelerate the rate of emission reductions and RES technology adoption,
accelerate the rate of innovation and create a more level playing field across EU
Member states in terms of the adoption and spread of RES technologies. Finally,
the adoption of an EU-wide carbon tax would help re-distribute the emission
reduction burden across a far broader segment of the economy as well as across
different fossil fuel types, thereby reducing the potential economic distortions
likely to arise from uneven performance. This would further have the benefit of
including and incorporating a significantly broader range of Western MS states
into the Kyoto mission.
Second, significant reform could help spread the adoption of a wide
variety of renewable energy technologies across a broader set of countries.
99
See in particular; “64% of new power to be renewable over next decade”,
(EurActiv.com, Sept. 16th
, 2010).

SHOULD THE EU CLIMATE POLICY FRAMEWORK BE REFORMED? 159
Currently there is a relatively clear trend toward supporting the adoption of the
cheaper RES technologies in the NMS. This trend cannot be easily explained on
the basis of national comparative advantage in specific technologies and appears
to be the direct outcome of a mix of both national level strategies and relative
income. This trend could be reversed with a RES technology promotion strategy
such as an EU-wide FIT that is firmly supported at the EU rather than only at the
national level.
Third, significant reform of the EU climate strategy could help lock in the
successful performance demonstrated by a broad range of countries. Renewed
economic growth, though slow to materialize, will pose a significant threat to the
quite significant emission reductions that have already been achieved across the
EU as a whole.
The structure and shape of national level policy instruments in particular
go a long way to explaining the successful comparative performance of a
number of individual EU countries. These successful strategies—and EU-wide
FIT system and broadly based Carbon Taxes—along with the introduction of a
more broadly based trading mechanism that allows for the complete flexibility
and fungibility of carbon reduction efforts are likely to significantly propel the
further reduction of EU emissions along a desirable path.
The current author does not wish to downplay the role of international
commitments and target-setting, nor the quite significant role the EU has played
in these negotiations. In the context of the rapidly increasing threats posed by
global warming and climate change, these efforts are increasingly important. At
the same time however, the commitment strategy is not able to explain the
relative success in emission reductions across the individual EU Member states.
Rather, the success of individual Member state policy packages and perhaps
individual Member state commitment to emission reductions appear to do a
much better job of explaining relative progress on the Kyoto goals.
Finally, it may be meaningful to consider that efforts to negotiate a Kyoto-
II style agreement in future Conference of the Party meetings will fail. In this
context, the fact that the policy framework proposed herein does not really
depend on a commitment style framework may be an advantage. The policy
framework proposed herein suggests that countries can make considerable
progress toward emission reductions without a Kyoto style commitment
framework. This does not mean the loss of the Kyoto framework would not have
significant negative consequences for the global project of reducing emissions.
Nor does it mean the climate policy framework proposed herein could be
seamlessly integrated into the EU policy framework. Difficult negotiations
across EU Member states would still be required. But progress is in some senses
less dependent on a commitment style framework than is frequently believed.
The EU can clearly learn from this success and improve upon the overall
climate policy package. Elevating the successful elements of individual Member
state policy to the EU level and increasing the degree of flexibility across the

160 David ELLISON
different components of the EU climate strategy could help to achieve the goal
of reducing GHG emissions and mitigating the climate challenge.
References:
3C Initiative (2009). A Roadmap to Combating Climate Change: The 3C Initiative’s
Recommendations to Political Leaders, 3C Initiative.
Altmann, M., Brenninkmeijer, A., Lanoix, J.C., Ellison, D., Crisan, A., Hugyecz, A.,
Koreneff, G., Hänninen, S. (2010a). Decentralized Energy Systems, Report
commissioned by the European Parliament.
Altmann M., Michalski, J., Brenninkmeijer, A., Lanoix, J.C., Tisserand, P., Egenhofer,
C., Behrens, A., Fujiwara, N., Ellison, D. (2010b). EU Energy Efficiency Policy –
Achievements and Outlook, Report commissioned by the European Parliament.
Bhatti Y., Lindskow K., Pedersen L.H. (2010). Burden-sharing and global climate
negotiations: the case of the Kyoto Protocol, Climate Policy, Vol. 10, pp. 131-147.
Capgemini (2007). European Energy Markets Observatory: 2006 and Winter 2006-2007
Data Set (9th
Edition), Capgemini.
EEA (2011). Annual European Union greenhouse gas inventory 1990–2009 and
inventory report 2011: Submission to the UNFCCC Secretariat, Copenhagen: European
Environment Agency.
EEA (2010). Tracking progress towards Kyoto and 2020 targets in Europe, EEA Report
No. 7/2010, Copenhagen: European Environment Agency.
Ellison, D., Futter, M., Bishop, K. (2011). Forest – Water Interactions: From Demand to
Supply-Side Thinking, Global Change Biology.
Ellison, D., Hugyecz A. (2008). An Initial investigation of the EU's 2020 Climate Change
Package and its Potential Domestic Impact, manuscript (revised and updated English
version), HAS (MTA) Institute for World Economics (study commissioned by the
Hungarian Ministry of the Economy and Transport).
Ellison, D. (2008). On Politics and Climate Change: Is EU 2020 Climate Change Policy
Tilted Toward Western Interests?, Development and Finance – Fejlesztés és
Finanszírozás No. 2, pp. 14-25.
Ellison, D. (2006). Hungary: From ‘Policy Taker’ to Policymaker?, in Zeff, Eleanor E.
and Ellen B. Pirro (eds.), European Union and the Member States, Boulder: Lynne
Rienner, pp. 315-342.
European Climate Foundation (2010). ENERGY SAVINGS 2020: How to triple the
impact of energy saving policies in Europe, European Climate Foundation.
European Commission (2007). European Energy and Transport, Trends to 2030, Update
2007, Directorate-General for Energy and Transport, Office for Official Publications of
the European Communities.
EWEA (2011, 2010, 2009). Wind in Power: European Statistics, European Wind
Energy Association.

SHOULD THE EU CLIMATE POLICY FRAMEWORK BE REFORMED? 161
IEA (2007a). Tracking Industrial Energy Use and CO2 Emissions, Paris: IEA/OECD.
http://www.iea.org/w/bookshop/add.aspx?id=298.
IEA (2007b). World Energy Outlook 2007: China and India Insights, Paris: International
Energy Agency.
McKinsey (2008). The Carbon Productivity Challenge: Curbing Climate Change and
Sustaining Economic Growth, McKinsey Global Institute.
MCPFE (2007). State of Europe’s Forests 2007: The MCPFE Report on Sustainable
Forest Management in Europe, Warsaw: Ministerial Conference on the Protection of
Forests in Europe.
Morgera E., Kulovesi K., Muñoz M., (2011). Environmental integration and multi-
faceted international dimensions of EU law: Unpacking the EU’s 2009 climate and
energy package, Common Market Law Review, 48(3), 829-891.
PBL-JRC (2011). Long-Term Trend in Global CO2 Emissions, 2011 Report, Olivier,
J.G.J., Janssens-Maenhout, G., Peters, J.A.H.W., Wilson, J., The Hague, PBL/JRC.
Sandbag (2011). Cap or Trap: How the EU Risks Locking-in Carbon Emissions,
London: Sandbag.
UCS (2009). Climate 2030: A National Blueprint for a Clean Energy Economy, Union
of Concerned Scientists, Cambridge, UCS Publications.
Vattenfall (2006). Curbing Climate Change: An Outline of a Framework Leading to a
Low Carbon Emitting Society, Vattenfall, Stockholm.
WBCSD (2004). Energy and Climate Change: Facts and Trends to 2050, World
Business Council for Sustainable Development, Conches-Geneva.
WBCSD (2007). Policy Directions to 2050: A business contribution to the dialogues on
cooperative action, World Business Council for Sustainable Development, Conches-
Geneva.
Zachmann, G. (2010). Is European Climate Policy the New Cap?, Breugel Policy Brief
(January).

162 David ELLISON
ANNEX
Figures 3 - 8. Share of renewable energy resource adoption by
technology and country (weighted by population and income)
Figures 3 a, b
Den, 4.0
Sp, 2.8
Por, 2.1
Ire, 2.0Ger, 1.9
Swe, 1.4Net, 0.8
Aus, 0.7
Est, 0.6
Gr, 0.6
Cyp, 0.6
It, 0.6
Fr, 0.5
Lux, 0.5
Bel, 0.5
UK, 0.5
Bulg, 0.3Ltu, 0.3
Fin, 0.2
Hu,
0.2
Pol, 0.2Rom, 0.1
CzR, 0.1
Ltv, 0.1
Slvk, 0.0
Slve, 0.0
Mlt, 0.0
Wind Power, 2010
Population-weighted
Por, 3.4
Sp, 2.9
Den, 2.4
Bulg, 1.9
Ger, 1.6Est, 1.6
Ire, 1.1
Swe, 0.9
Ltu, 0.9
Gr, 0.8
Cyp, 0.7
Rom, 0.6
Net, 0.6
It, 0.5
Aus, 0.5
Pol, 0.5
Hu, 0.4Fr, 0.4
UK, 0.4Bel, 0.4
Ltv, 0.3
CzR, 0.3 Lux, 0.2
Fin, 0.2
Slvk, 0.0
Slve, 0.0
Mlt, 0.0
Wind Power, 2010
Income-weighted

SHOULD THE EU CLIMATE POLICY FRAMEWORK BE REFORMED? 163
Figures 4 a, b
Fin, 8.0
Swe, 6.2
Ltv, 3.6
Est, 3.4Aus, 3.3
Den, 2.4
Por, 1.7
Ltu, 1.5
Slve, 1.4
CzR, 1.2
Rom,
1.1
Fr, 1.1
Hu, 0.9
Pol, 0.9
Ger, 0.9
Bel, 0.8
Slvk, 0.8 Sp, 0.6 Bulg, 0.6
Net, 0.5 Lux, 0.5
Gr, 0.5
It, 0.4
Ire, 0.3
UK, 0.2
Cyp, 0.1
Mlt, 0.0
Wood and Wood waste
in Gross Inland
Consumption, 2009
Population-weighted
Ltv, 11.8
Est, 8.2
Fin, 6.0
Rom, 5.7
Ltu, 4.8
Swe, 4.2
Bulg, 4.1
Pol, 2.8
Por, 2.7
Aus, 2.5
Hu, 2.4
CzR, 2.4
Slve, 2.1
Slvk, 2.0
Den, 1.4
Fr, 0.8
Ger, 0.7
Sp, 0.7
Bel, 0.6
Gr, 0.6
It, 0.4
Net, 0.4
Ire,
0.2
Cyp, 0.2
Lux, 0.2
UK, 0.1
Mlt, 0.0
Income-weighted
Wood and Wood waste
in Gross Inland
Consumption, 2009

164 David ELLISON
Figures 5 a, b
Sp, 3.7
Ger, 3.4
Lux, 2.5
It, 0.4
Bel, 0.3
Por, 0.3CzR, 0.3
Aus, 0.2
Net, 0.2
Cyp, 0.1
Fr, 0.1
Gr,
0.1
Fin,
0.1
Slve, 0.0
Swe,
0.0
Den, 0.0
Mlt, 0.0 UK, 0.0
Bulg, 0.0
Ire, 0.0Hu, 0.0
Pol, 0.0
Rom, 0.0
Ltu, 0.0
Slvk, 0.0Est, 0.0
Ltv, 0.0
Solar PV, 2008
Population-weighted
Sp, 3.9
Ger, 2.9
Lux, 0.8
CzR, 0.557
Por, 0.5
It, 0.4
Bel, 0.2
Cyp, 0.2
Aus, 0.1
Net, 0.1
Gr, 0.1
Fr, 0.1Slve,
0.1
Bulg, 0.1
Mlt,
0.1
Fin,
0.0
Swe, 0.0 Den, 0.0
UK, 0.0
Hu, 0.0
Rom, 0.0
Pol, 0.0
Ire, 0.0
Ltu, 0.0
Slvk, 0.0
Est, 0.0
Ltv, 0.0
Solar PV, 2008
Income-weighted

SHOULD THE EU CLIMATE POLICY FRAMEWORK BE REFORMED? 165
Figures 6 a, b
Cyp, 13.8
Aus, 7.9
Gr, 5.5
Ger, 2.4
Mlt, 1.7
Den, 1.3
Slve, 1.2
CzR, 0.8
Net, 0.7
Swe, 0.7Lux, 0.7
Sp, 0.6Por, 0.6
It, 0.5
Fr, 0.5
Bel, 0.5
Ire, 0.4
Slvk,
0.3
Pol,
0.2
UK, 0.1
Hu, 0.1Fin, 0.1
Rom, 0.1 Bulg, 0.1
Ltv, 0.1
Est, 0.0
Ltu, 0.0
Solar Thermal, 2009
Population-weighted
Cyp, 16.2
Gr, 6.8Aus, 6.0
Mlt, 3.1
Ger, 2.0
Slve, 1.8
CzR, 1.5
Por, 1.0Den, 0.8
Slvk, 0.8Sp, 0.7
Pol, 0.6
Net, 0.5
It, 0.5
Swe, 0.5
Bulg, 0.5
Rom, 0.4
Fr,
0.4
Bel, 0.4
Hu,
0.3
Ire, 0.3
Lux, 0.2Ltv, 0.2
UK, 0.1
Ltu, 0.1
Fin, 0.1
Est, 0.1
Solar Thermal, 2009
Income-weighted

166 David ELLISON
Figures 7 a, b
Swe, 5.4
Fin, 4.6
Aus, 3.1
Ltv, 2.8
Est, 2.0Den, 1.9
Por, 1.6
Slve, 1.3
Ger, 1.2
Sp, 1.1
Fr, 1.0
Ltu, 0.9
It, 0.8
CzR, 0.8
Rom, 0.7
Slvk, 0.7
Ire, 0.6
Net, 0.6
Lux, 0.6Hu, 0.6
Gr, 0.6
Bel, 0.5
Pol, 0.5
Bulg,
0.5
Cyp, 0.3
UK, 0.3
Mlt, 0.0
RES in Primary Energy
Production, 2009
Population-weighted
Ltv, 9.1
Est, 4.8
Rom, 3.7
Swe, 3.7
Fin, 3.4Bulg, 3.0
Ltu, 2.9
Por, 2.4
Aus, 2.4
Slve, 1.9
Slvk, 1.8
CzR, 1.6
Pol, 1.5
Hu, 1.5
Sp, 1.2
Den, 1.1
Ger, 1.0 Fr, 0.8 It, 0.8 Gr, 0.7
Net, 0.4
Bel, 0.4Ire, 0.4
Cyp,
0.3
UK, 0.2
Lux, 0.2
Mlt, 0.0
RES in Primary Energy
Production, 2009
Income-weighted

SHOULD THE EU CLIMATE POLICY FRAMEWORK BE REFORMED? 167
Figures 8 a, b
Swe, 5.3
Fin, 4.5
Aus, 3.2
Den, 2.1
Ltv, 2.0Est, 1.6
Por, 1.5
Slve, 1.3
Ger, 1.1
Sp, 1.1
Fr, 1.0
It, 0.8
Lux, 0.8
Ltu, 0.8
Rom, 0.7
CzR, 0.7
Slvk, 0.7
Bel, 0.7Net, 0.6
Ire, 0.6 Gr, 0.6
Hu, 0.6
Pol, 0.5
Bulg, 0.4 Cyp, 0.4
UK, 0.3
Mlt, 0.0
RES in Gross Inland
Consumption, 2009
Population-weighted
Ltv, 6.7
Est, 3.9
Fin, 3.3
Rom, 3.6
Swe, 3.6
Bulg, 2.8Ltu, 2.5
Aus, 2.4
Por, 2.4
Slve, 1.9
Slvk, 1.7
CzR, 1.5
Pol, 1.5
Hu, 1.4
Den, 1.2
Ger, 1.0
Sp, 1.1Fr, 0.8
It, 0.8
Gr, 0.7
Net, 0.5 Bel,
0.5
Cyp, 0.4 Ire, 0.4
UK, 0.3Lux, 0.3
Mlt, 0.0
RES in Gross Inland
Consumption, 2009
Income-weighted


