Embed Size (px)
Citation preview
DOINo. 10.20968/rpm/2018/vl6/il/l 29207 1
Shopping Convenience: A Case of Online Retailing Vikas Gautam'A^
Abstract This study examined the relative effects of dimensions of shopping convenience on customer satisfaction in Indian online retail context. First order Structural Equation Modeling (SEM) was used in order to test the relationships among study constructs with the help of 227 sample elements. The study results confirmed the access convenience (P = 0.441, p = 0.002) as most important shopping convenience dimension to ascertain customer satisfaction followed by search (P = 0.424, p <0.000), transaction (P = 0.379, p = 0.007 and possession (P = 0.279, p = 0.023). Whereas evaluation convenience (P = 0.217, p = 0.034) proved to be least important shopping convenience dimension in order to ascertain customer satisfaction. The findings of the study would help managers in better understanding of shopping convenience as perceived by customers and subsequently designing customized marketing mix for better return on efforts. In addition, it will also help marketing researchers in developing the better understanding of shopping convenience concept in online retail context.
Keywords: Electronic-Commerce, Customer Satisfaction, Confirmatory Factor Analysis, Structural Equation Modeling.
Introduction
The consumer in their busy lifestyle, rising income along with technological empowerment, have been looking for convenient and less time taking option of shopping activities. This attitudinal change in the mindset of the consumer has been influencing their choice of online shopping mode as an alternative to brick and mortar shopping and Indian consumers are welcoming online retail in a big way.
As per the recent estimates (www. indiaretailing. com), the Indian online retail market is expected to grow to $ 60 billion by 2020 with CAGR (Compound annual Growth Rate) of over 30 %. In addition, organized retail penetration is expected to rise by 10 % by 2020. In 2025, India will become 3rd largest consumer economy with $4000 billion size.
In the literature, there are several evidences about shopping convenience as a key driver of online
* Dr. Vikas Gautam, Assistant Professor, New Delhi Institute of Management, Tughlakabad, New Delhi
shopping adoption (Beauchamp and Ponder, 2010; Moeller et al., 2009; Reimers and Clulow, 2009; Colwell et al., 2008). Online retailers want to leverage on this move of shoppers for which they want to understand thoroughly that, how virtual shopping can add to the consumer convenience. In this regard, the players in online retailing space require deep understanding about the relevant aspects of consumer convenience.
The concept of convenience has reference way back in 1923 in the literature by Copeland (1923) who used it in context of classification of goods. He related convenience goods with ease of accessibility and firequent purchase. Further, Brown, (1989) related convenience goods with consumer's low involvement during purchasing process. Seiders et al., (2007) argued to shift convenience's direction towards service dominated orientation fi-om good dominated direction. However, the authors identified two important determinants of convenience in traditional retail format namely; time saving and minimized efforts.
The Marketing literature associated the convenience with ease in shopping efforts (emotional, physical & cognitive). Many authors related convenience in offline retail context with ease in finding retail store, uncongested aisles, easily accessible products, consumer friendly store design, empathetic retail store employees etc. Taking cue fi-om the literature, Marketing scholars unanimously agreed to the fact that convenience does not relate to monetary costs rather it relates to time and energy (efforts) costs.
It has been seen in the literature that convenience is a context based concept and therefore it is bound to vary from one retail-setting to other. In online retail, service convenience was treated as independent variable along with customer value, customer service, trust etc. to predict customer satisfaction or assess customer loyalty with the help of behavioral intentions and word-of-mouth. According to Kim and Park, (2012), convenience is an important dimension of online service quality along with responsiveness, accuracy etc. There are a very few studies in online retail shopping literature which focus on in-depth research in the area that what all comprises of convenience and its dimensions. One study conducted by Beauchamp and Ponder (2010) in the area of convenience but this study had focus on comparison between online and offline retail's convenience dimensions. In this background, the current study intends to identify the dimensions of convenience in Indian online shopping context and their relative effects on customer satisfaction.
Theoretical Background
Time-saving feature of convenience has been studied in the service marketing literature to a great extent. Gehrt and Yale (1993) studied this feature of convenience and related it with waiting time perceptions of consumers. Waiting time till product possession may create stress among consumers as a simple emotional outcome (Hui and Tse, 1996). Higher waiting time leads to more fiiistration among consumers (Hui et al., 1998). Further Berry
et al. (2002) found inverse relationship between perceived waiting time and convenience. The advent of internet has changed the lives of people drastically. Internet has the ability to save time and effort for consumers. According to Bhatnagar et al. (2000), consumers become quite busy with their professional life during career progression and due to shortage of time, they start searching for easy shopping options. Consumers focus equally on saving time and energy. Therefore, they derive efficiency by using internet in order to save time and energy during shopping experience (Kaltcheva and Weitz, 2006). For a large number of consumers, saving time is as important as saving money. Online shopping has come as a big relief to these set of time starved customers and they attach highest importance to it (Beauchamp and Ponder, 2010). Customer convenience/inconvenience has been playing decisive role in building or aborting relationships.
Internet provides freedom from time and place of shopping. Consumers can do shopping firom any part of the globe and at any time with price comparisons by going through all the details of products like; manufacturing date, expiry date. Maximum Retail Price (MRP), quantity, batch number, place of manufacturing etc. (Ling et al., (2013). Authors found five dimensions of perceived online shopping convenience namely; access, search, transaction evaluation and possession. Earlier in 2002, Berry et al. extensively reviewed convenience literature and proposed a conceptual model for convenience as a multi-dimensional construct. They named the dimensions of convenience as access, decision, benefit, transaction, and post-benefit. Further, Seiders et al., (2007) extended the work of Berry et al. (2002) into developing a SERVCON scale to measure convenience construct in offline retail context. But the authors did not deliberate on online aspect of shopping. Later, in 2010, authors Beauchamp and Ponder conducted an empirical
study to identify common convenience dimensions for offline and online retail formats. They conducted comparative study in order to identify convenience intensity as perceived by customers across both channels. Their study results found that consumers perceive online shopping as more convenient in case of access and search, but not for transaction as sometimes due to technical glitches, there surfaces inconvenience. Existing literature explains shopping convenience through all aspects. However, relative effects of different dimensions of shopping convenience on customer satisfaction in online retail context need to be explored for its better use in strategy formulation.
Conceptual Framework
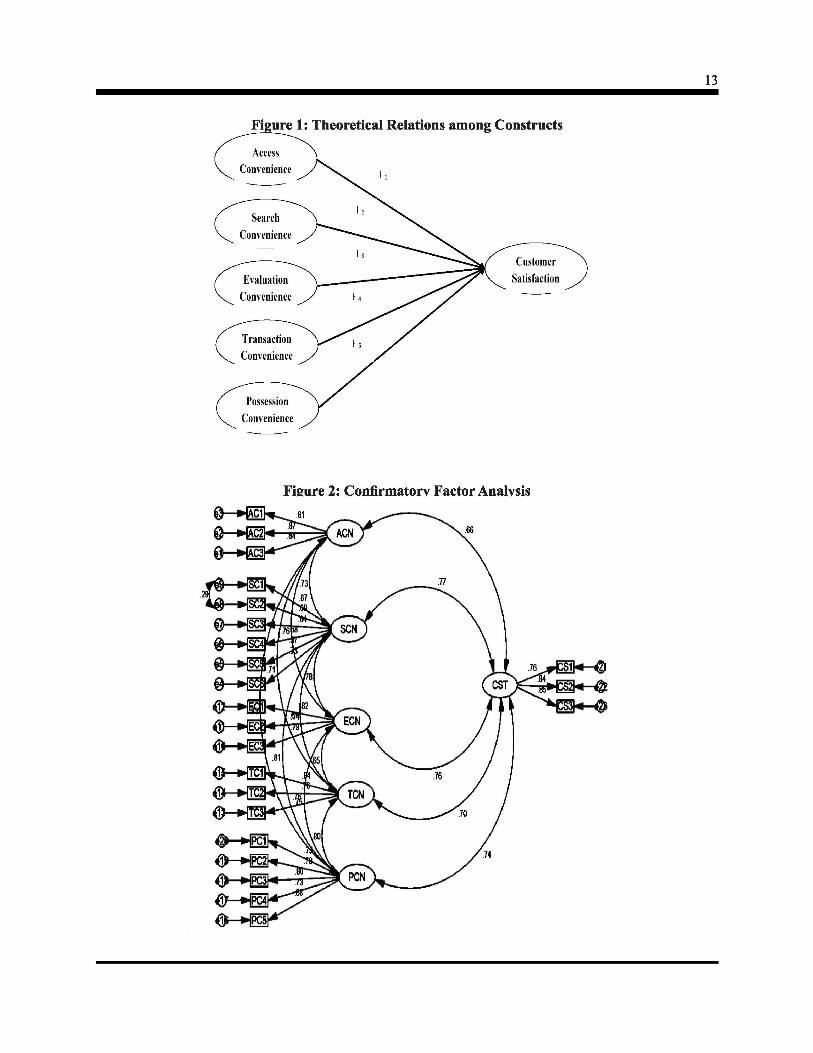
In order to have insight into consumer perceptions of online shopping convenience, the current study proposes five hypotheses and theoretical relations among constructs on the basis of determinants of Convenience as presented in theoretical model (Figure 1 in appendix I)
Figure 1: theoretical frame among constructs in Appendix I.
Access Convenience
This dimension deals with ease and speed with which customers can reach to the retailers in order to get choice products. According to Berry et al. (2002), "Access convenience is characterized as the speed and ease with which consumers can reach a retailer". In case of offline retail players, convenience can be increased for consumers with the help of accessible retail outlets located in proximity. However, in case of online retail outlets, physical location as access characteristic becomes irrelevant. According to Bhatnagar et al., (2000), online shopping saves time and effort of consumers in terms of travel time to reach retail store, searching for vehicle parking and reaching inside retail store firom parking space. Online retailers are accessible 24x7 irrespective of time and hour of the day (Hofacker, 2001). In
this respect, website accessibility is considered the most important dimension of perceived retail convenience in case of online retail context (King and Liou, 2004). Access convenience contributes significantly towards overall shopping convenience in online retail context (Ling et al., 2013). In this background, this study proposes the following hypothesis :-
HI: Access Convenience has positive significant effect on Customer Satisfaction.
Search Convenience
Internet has changed the way how we search, discuss, shop and share our experiences. At the same time, it provides ample opportunities to retailers for innovative promotions and publicity of their products or offerings. According to Berry et al., (2000), easy product searches with complete product information add to perceived shopping convenience. Online discussions, writing online reviews about product search or purchase and even after use, price comparisons etc. are possible because of internet facility. Consumers draw many psychological benefits through shopping online activities (Beauchamp and Ponder, 2010). Authors discussed flexibility in terms of product availability, website navigation and product selection. Whereas, psychological benefits included perceived retail crowing, time and effort saving etc. Search convenience is understood by consumers in terms of ease in finding desired products and the minimum time spent to complete this exercise. Search convenience aids in faster and logical decision-making for customers in online shopping. Hence, the following hypothesis is proposed:-
H2: Search Convenience has a positive significant effect on Customer Satisfaction.
Evaluation Convenience
This aspect of shopping convenience deals with use of graphics, text, audio-video files, product reviews etc. for describing products mentioned in
the website by the retailers. According to Ling et al., (2013), detailed product descriptions are made available to the target segment of customers by the online retailers with the help of textual details, computer graphics, videos or YouTube links. This facility helps customers in comparing offers from all the retailers in a short time and detailed product description leads to psychological satisfaction. Authors argued that easily available evaluation instruments have made consumers quite sensitive towards this dimension of perceived shopping convenience. Thus, the study hypothesis is proposed as under:-
H3: Evaluation Convenience has positive significant effect on Customer Satisfaction.
Transaction Convenience
In traditional retail outlets, consumers are required to be in queues (physically) to complete the shopping. According to Kumar et al. (1997), waiting times are perceived longer than actual and work against shopping convenience. Berry et al. (2000) conducted an empirical study across retail outlets and found that shoppers rated those outlets high in convenience which provided fast checkout and hassle free return policies to their customers. Authors fiirther argued that in case of online shopping context, consumers get freedom in completing or amending transactions. In case, they face glitches in completing or amending fransactions, it may lead to dissatisfaction of consumers. In online shopping mode, customers are never required to form a queue and wait for their turns in order to complete transaction (Wolfinbarger and Gilly, 2001). Beauchamp and Ponder, (2010) defined fransaction convenience as "speed and ease with which consumers can effect or amend fransactions". Safety/security, privacy concerns and easy to do fransactions are critical for customers during online shopping. With reference to the above discussion, the following hypothesis is formulated:
H4: Transaction Convenience has positive significant effect on Customer Satisfaction.
Possession Convenience
Possession convenience deals with the convenience customers got in order to get possession of purchased products. Traditional retail channels are preferred over online retail channels due to immediate possession of products after purchase (Rohm and Swaminathan, 2004). According to (Beauchamp and Ponder, 2010), possession convenience is defined as "the speed and ease with which consumers can obtain desired products". In case of online shopping, waiting time till product possession is considered as non-monetary cost for customers (Beauchamp and Ponder, 2010). It is already known to customers that in case of online shopping, some time is required to process and deliver the ordered products. Transaction dimension of perceived shopping convenience is related to consumers' perceptions about time and effort costs for desired product possession (Ling et al., 2013). Further, authors argue that online shopping helps consumers to forgo physical labor associated with offline shopping.
H5: Possession Convenience has positive significant effect on Customer Satisfaction
Research Methodology Sampling Design and Data Collection
The population for the current study includes consumers residing in Delhi, the capital mefropolitan city of India, a South Asian country. Being a country's capital, population of Delhi has people from all parts of India. This diversity of all religions, castes, creeds, ethnicity, age groups, gender etc. made it replica of the country. The study model needed primary data for estimation. The primary data were collected by using purposive sampling method (non-probability sampling method). A structured questionnaire with closed-ended questions was used for data collection. The
research instrument had a total of 30 questions to measure 6 study constructs (Access Convenience, Search Convenience, Evaluation Convenience, Transaction Convenience, Possession Convenience, and Customer Satisfaction) and 6 socio-economic variables. A total of 270 questionnaires were distributed among the respondents. 240 filled questionnaires fi-om the respondents were received. In the data preparation stage, 13 questionnaires were found incomplete. Incomplete questionnaires were removed and final data of 227 were taken for data analysis.
Sample Size Justification
To test the structural relationships among the study constructs, Structural Equation Modeling (SEM) with AMOS 21.0 (Covariance based SEM) with Maximum Likelihood Estimation (MLE) was used. According to Hoelter, (1983) and Hoe, (2008), as a rule of thumb, any number above 200 (critical sample size) is understood to provide sufficient statistical power for data analysis. In order to achieve the study objectives and as per above mentioned justification, a sample size of 227 is appropriate for testing model fit and hypotheses of the study.
Research Instrument
In order to achieve study objectives, measurement scales were adapted firom studies like; Berry et al., (2002), Anderson and Srinivasan, (2003), Seiders et al., (2007) and Ling et al., (2013).
Access Convenience was measured with the help of 3 items. Search Convenience with 6 items, Evaluation Convenience with 3 items. Transaction Convenience with 3 items. Possession Convenience with 5 items, and Customer Satisfaction with 3 items. All the study variables were measured on 7-point Likert's scale (1 = Strongly Disagree, 2 = Disagree, 3 = Somewhat Disagree, 4 = Neither Disagree Nor Agree, 5 = Somewhat Agree, 6 = Agree, 7 = Strongly Agree).
Data Analysis
In order to accomplish the objectives of the study, primary data were presented in tabular form for general sample description ( Table 1, appendix II). Further, structural equation modeling was used to estimate measurement and structural models by using IBM AMOS 21.0.
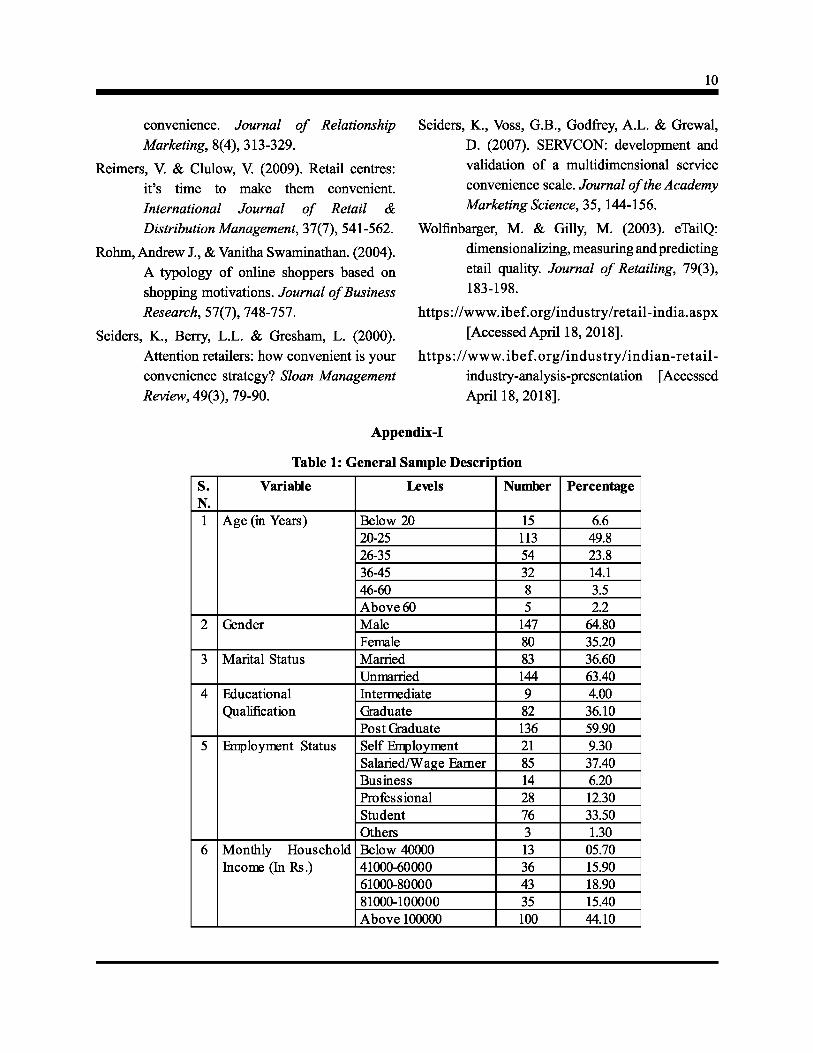
Table 1: General Sample Description in Appendix
It is evident fi-om the above table 1 that out of 227 sample respondents, 49.80 percent of the respondents were of the age group 20 to 25 years followed by 23.80 percent in the age group of 26-35 years. The sample had a majority of males with 64.80 percent composition. The ratio of married and unmarried respondents was of 63.40 percent and 36.60 percent. The sample had good representation of highly educated respondents (36.10 percent graduate and 59.90 percent postgraduates). Occupation wise, salaried respondents had highest representation of 37.40 percent. In case of monthly household income, 44.10 percent of the respondents were from above INR 100,000 income bracket.
Figure 2: Confirmatory Factor Analysis in Appendix I
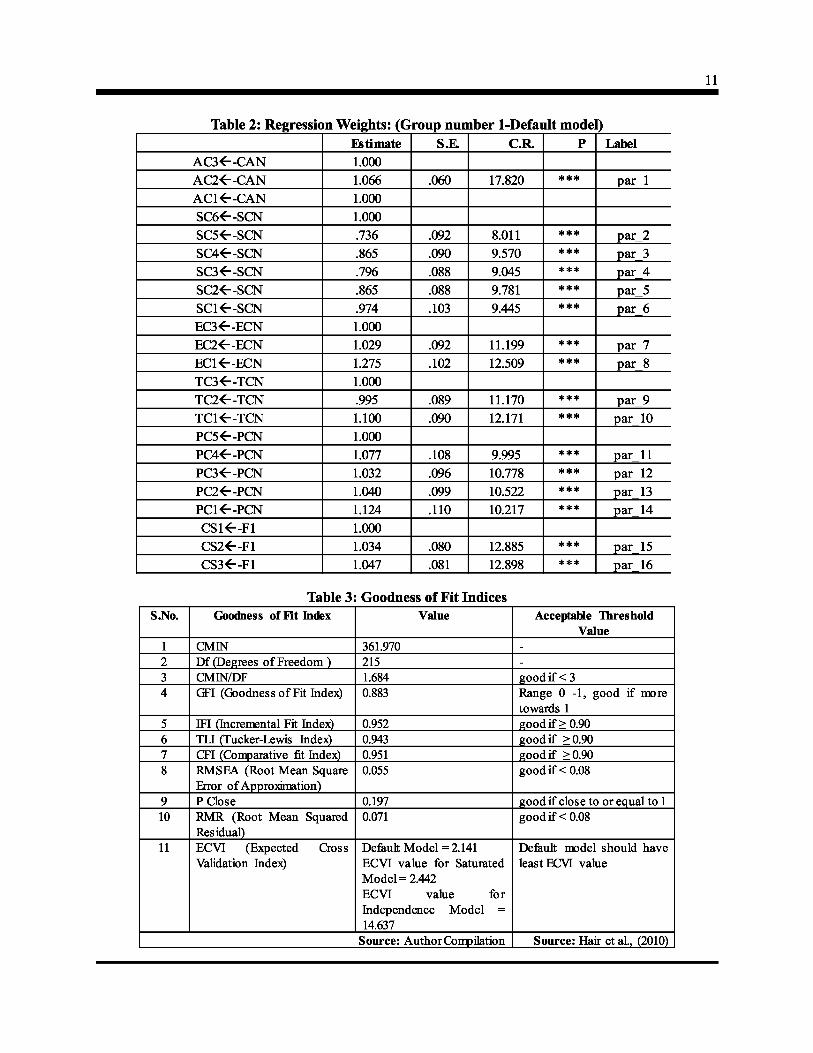
Table 2: Regression Weights: (Group number 1 -Default model) in Appendix I
Table 3 : Goodness of the fit Indices in Appendix I
Confirmatory Factor Analysis model with six first order constructs had a total of 61 distinct parameters and 276 distinct sample moments. The model was identified and a minimum was achieved. All the study parameters were practicable and standard errors in acceptable limits. Statistical significance of parameter estimates was established as test-statistic (t-value) in each case was greater than threshold limit of 2.58. It can be seen from the table that all goodness-of-fit indices exceeded
the recommended threshold levels (Browne and Cudeck 1993; Bagozzi and Yi 1988). Hence the study model was confirmed.
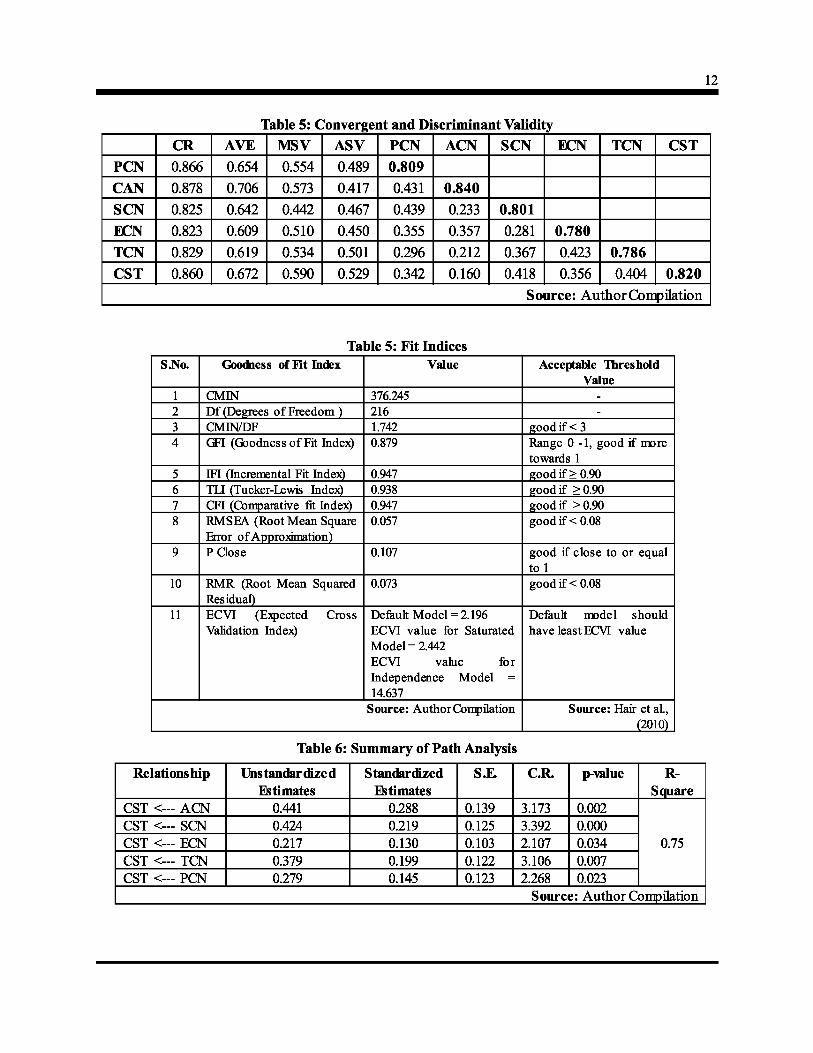
Table 4: Convergent and Discriminant Validity (in Appendtx-I)
The construct validity of measurement constructs must be ensured. Construct validity is ensured with the help of convergent and Discriminant validity (Hair et al., 2010). In the present research, convergent validity was checked by reviewing factor loadings, Average Variance Extracted (AVE) and Composite Reliability (CR) as suggested by Hair et al., (2010). It is clearly evident from the table 4 (in Appendix-I) that all factor loadings and composite reliability surpassed the requirement of 0.70 criteria. In addition, the average variances extracted (AVEs) in the case of all 6 study constructs were all above the 0.50 level (Bagozzi and Yi 1988; Fomell and Larcker 1981), thus indicating high levels of convergence among the indicators in measuring their respective constructs.
The procedure suggested by Fomell and Larcker (1981) and Hair et al., (2010) was followed to assess Discriminant Validity. The procedure states that the AVE should be greater than Maximum shared variance (MSV) or AVE should be greater than average shared variance (ASV) and the square root of AVE should be greater than correlation among the constructs. In the current study, all the AVEs were significantly greater than MSVs as well as ASVs. Also the square root of AVE was greater than inter-correlation of the study constructs. Hence, the constructs passed the Discriminant Validity test.
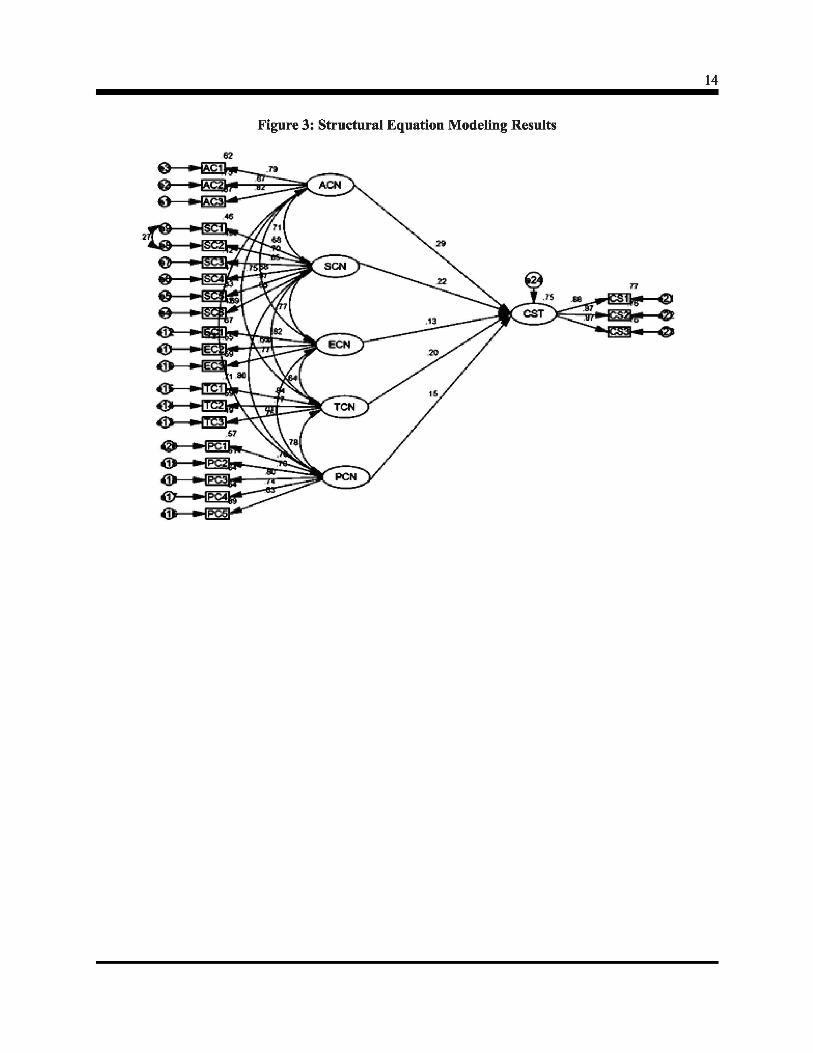
Figure 3: Structural Equation Modeling Results in Appendix II
Table 5 : Food ness of Fit indices in Appendix I
Structural model with six first order constructs with causal relationships had a total of 60 distinct parameters and 276 distinct sample moments. The model was identified and a minimum was achieved.
All the study parameters were practicable and standard errors in acceptable limits. Statistical significance of parameter estimates was established as test-statistic (t-value) in each case was greater than threshold limit of 2.58. It can be seen from the table that all goodness-of-fit indices exceeded the recommended threshold levels (Browne and Cudeck 1993; Bagozzi and Yi 1988). Hence the structural model was confirmed.
Table 6: Relationship-Unstandardized and Standardized in Appendix I
It can be seen from the first order Structural Equation Modeling results that Access Convenience had positive significant impact on Customer Satisfaction (P = 0.441, p = 0.002); . Search Convenience on Customer Satisfaction (P = 0.424, p < 0.000); Transaction Convenience on Customer Satisfaction (P = 0.379, p = 0.007); Possession Convenience on Customer Satisfaction (P = 0.279, p = 0.023); Evaluation Convenience on Customer Satisfaction (p = 0.217, p = 0.034). Therefore, all the study hypotheses were supported at 5 percent level of significance.
Conclusion This study intended to understand the key dimensions of shopping convenience and their effects on customer satisfaction in online retail context. The Customer perceived shopping convenience plays a vital role to assess satisfaction and subsequently success for online retail business. This study empirically tested the causal model of shopping convenience and customer satisfaction. First order Structural Equation Modeling (SEM) results confirmed access convenience as most important shopping convenience dimension to ascertain customer satisfaction followed by search, transaction and possession. Whereas evaluation convenience proved to be least important shopping convenience dimension in order to ascertain customer satisfaction.
Seiders et al. (2007) developed SERVCON scale to measure service convenience in case of offline retail. Authors identified five dimensions namely; access convenience, benefit convenience, decision convenience, transaction convenience, and post-benefit convenience. In case of online retail context, decision convenience does not remain relevant as searching for location and products are highly convenient in comparison to offline retail context.
Ling et al., (2013) identified three unique shopping convenience dimensions specific to online retail format namely; search, evaluation and possession. Search convenience is related to ease in searching for all required products without physical labor in terms of visiting multiple retail stores situated in multiple locations. Evaluation convenience means detailed description of products is made available through website, which helps customers in evaluating products in terms of prices, quantities, qualities, packaging etc. In case of possession convenience, online retail helps in placing order at any time during day or night, no physical labor to carry product fi-om store to home.
Managerial Implications
Information abundance has made it so easy for consumers to get information at a very low cost. In the current era of World Wide Web and mobile technologies, consumers are exposed to wide variety of products with a single click at highly competitive prices. In online retail mode, consumers got a lot of fi-eedom in terms of number of products, varieties, variants, offers (monetary and non-monetary) and price comparisons across the sellers or electronic-commerce companies. In this context, shopping convenience has got prime importance in addition to competitive prices, high quality products, seller reliability, responsiveness, empathy etc. with an objective of increasing customer satisfaction. Therefore, the findings of this study can help electronic-commerce players to strategize their marketing mix, discover areas
for improvement and subsequently put in place the result oriented solutions in order to attain better customer satisfaction.
Results of current study provide a good start for online retailers in order to manage shopping convenience activities effectively and efficiently. Access convenience was found most important dimension in order to predict customer satisfaction. Consumers use different platforms (like; facebook, twitter, whatsapp, instagram etc.) and different devices (cellphone, notebook, desktop, tablet etc.) to access online retail stores. Therefore, marketers need to make sure that consumers have flawless experience while accessing online services for shopping purpose across above mentioned platforms or devices.
Moreover, findings have confirmed search convenience as second most important predictor of customer satisfaction followed by transaction convenience, then possession convenience and lastly the evaluation convenience. To leverage on the satisfied consumer base, the online retailers need to strategically decide their course of actions.
First of all, online retailers need to focus on building a user-friendly website, so that consumers never face navigation problem and need minimal efforts in searching for their desired products. User-fiiendly website design is of vital importance as in online retail mode, there is no possibility for consumer training in using websites for product search. It is strongly recommended that online marketers should make use of advance technology in website designing about product search, filtering as per need and getting complete information about product, price including government taxes, all applicable discount coupons etc. Thus, all these activities will help online consumers in reducing their search efforts.
Further, transaction convenience deals with the speed of transaction and number of alternatives payment methods provided by online retailers to
the customers. Consumers perceive transaction convenience while comparing it with offline purchase in terms of time and energy expenditure. The types of difficulties online consumers face during online transactions are like larger transaction completion time during shopping session, slow internet speed, connection timeout etc. The online marketers are advised to take care of these issues by offering seamless transaction speed with the help of advanced technology, proper interface with payment channels, wide variety of payment methods, payment and product picking facility from own offline stores, cash on delivery option.
Another important aspect is related to possession convenience. Reaching product in a shortest possible time online to the online consumer gets highest priority. In addition, return convenience plays an important role to satisfy customer. The online retailers are strongly recommended that they need to put their efforts for fast delivery along with safe packaging, undamaged, avoiding stock-out situations with best inventory management skills & all products without missing items in an order. Real time tracking should be made available to the customers by using latest technology. Professional delivery persons are must and in case of product return, customers should be given 'No Question Ask' facility.
Online retailers should take some initiatives to provide evaluation or comparison options across products/sellers/online retailers to take care of fifth convenience dimension namely; Evaluation Convenience. Consumers never make purchases in silos irrespective of retail channels. They always search for references to compare in order to achieve psychological satisfaction.
In all, marketers are required to be very active in dealing with their customers. With the advent of new technology, the expectations of customers are increasing continuously. Therefore, marketers have to be on toes to meet the expectations of customers
(maximum shopping convenience) as well as cost of the company (profitability).
Limitations and Avenues for Future Research
This study focused on assessing relative effects of online shopping convenience dimensions on customer satisfaction. On this note, there is enough scope for further improvements in methodological parts. Customer loyalty is a consequence of customer satisfaction. Future study can be done to check for direct and indirect effects of all these five shopping convenience dimensions on customer loyalty through satisfaction. In addition, model fit can be compared by taking overall shopping convenience as second order construct with the fit of current study model.
Shopping convenience is perceived differently across demographics and socio-economic variables. Future studies can use these variables as moderating variables to get very useful insights. This study was conducted in one city Delhi, the capital of India. Therefore, generalizations of the results to the entire Indian market need caution. Since the internet has recently been accessible to Indian consumers, therefore there is a good scope for longitudinal studies as over the time, internet usage will impact attitude and preferences.
References Anderson. R. E., & Srinivasan, S. S. (2003).
E-satisfaction and e-loyalty: A contingency framework. Psychology and Marketing. 20(2), 123-138.
Bagozzi, R.P. & Yi, Y. (1988). On the evaluation of structural equation models. Journal of the Academy of Marketing Science, 16(1), 74-94.
Beauchamp, M.B. & Ponder, N. (2010). Perceptions of retail convenience for in-store and online shoppers. The Marketing Management Journal, 20(1), 49-65.
Berry, L.L., Seiders, K. & Grewal, D. (2002). Understanding service convenience. Journal of Marketing, 66(3), 1-17.
Bhatnagar, Amit, Sanjog Misra & H. Raghav Rao (2000). On risk, convenience, and internet shopping behavior. Communications of the ^CM, 43(11), 98-110.
Brown, Lew, G. (1989). The strategic and tactical implications of convenience in consumer product marketing. Journal of Consumer Marketing, 6(3), 13-19.
Browne, M. W., & Cudeck, R. (1992). Alternative ways of assessing model fit. Sociological Methods and Research, 21, 230—258.
Colwell, S.R., Aung, M., Kanetkar, V. & Holden, A.L. (2008). Toward a measure of service convenience: multiple-item scale development and empirical test. Journal of Services Marketing, 22(2), 160-169.
Copeland, M.T. (1923). Relation of consumers' buying habits to marketing methods. Harvard Business Review, 1(2), 282-289.
Fomell, C. & Larcker, D.F. (1981). Structural equation model with unobservable variables and measurement error: algebra and statistics. Journal of Marketing Research, 18(3), 382-389.
Gehrt, K.C. & Yale, L.J. (1993). The dimensionality of the convenience phenomenon: a qualitative reexamination. Journal of Business and Psychology, 18(2), 163-180.
Hair, J.F., Black, W.C., Babin, B.J., Anderson, R.E. & Tatham, R.L. (2010). Multivariate data analysis, 6th Edition. Upper Saddle River, New Jersey: Pearson Prentice Hall.
Hoe, S. L. (2008). Issues and procedures in adopting SEM technique. Journal of Applied Quantitative Methods, 3(1), 76-83.
Hoelter, D. R. (1983). The analysis of covariance
structures: Goodness-of-fit indices. Sociological Methods and Research, 11, 325-344.
Hofacker, C.F. (2001) Internet Marketing (3rd Edition), John Wiley and Sons, Inc., New York.
Hui, Michael K. & David K. Tse. (1996). What to tell consumers in waits of different lengths: an integrative model of service evaluation. Journal of Marketing, 60 (2), 81-90.
Hui, Michael K., Mrugank V. Thakor, & Ravi Gill. (1998). The effect of delay type and service stage on consumers' reactions to waiting. Journal of Consumer Research, 24 (1), 469-479.
Kaltcheva, Velitchka D.; & Weitz, Barton A. (2006). When should a retailer create an exciting store environment. Journal of Marketing, 70, 107-118.
Kim, B.C. & Park, YW. (2012). Security versus convenience? an experimental study of user misperceptions of wireless internet service quality. Decision Support Systems, Vol. 53(1), 1-11.
King, S. F., & Liou, J-S. (2004). A fi-amework for internet channel evaluation. International Journal of Information Management, 24(6), 473-488.
Kumar, Pijoish, Manohar U. Kalwani, & Maqbool Dada. (1997). The impact of waiting time guarantees on consumer waiting experiences. Marketing Science, 16 (4), 295-314.
Ling (Alice) Jiang, Zhilin Yang, & Minjoon Jun. (2013). Measuring consumer perceptions of online shopping convenience. Journal of Service Management, 24(2), 191-214.
Moeller, S., Fassnacht, M. & Ettinger, A. (2009). Retaining customers with shopping
10
convenience. Journal of Relationship Marketing, 8(4), 313-329.
Reimers, V. & Clulow, V. (2009). Retail centres: it's time to make them convenient. International Journal of Retail & Distribution Management, 37(1), 541-562.
Rohm, Andrew J., & Vanitha Swaminathan. (2004). A typology of online shoppers based on shopping motivations. Journal of Business Research, 57(7), 748-757.
Seiders, K., Berry, L.L. & Gresham, L. (2000). Attention retailers: how convenient is your convenience strategy? Sloan Management Review, 49(3), 79-90.
Seiders, K., Voss, G.B., Godfrey, A.L. & Grewal, D. (2007). SERVCON: development and validation of a multidimensional service convenience scale. Journal of the Academy Marketing Science, 35, 144-156.
Wolfinbarger, M. & Gilly, M. (2003). eTailQ: dimensionalizing, measuring and predicting etail quality. Journal of Retailing, 79(3), 183-198.
https://www.ibef.org/industry/retail-india.aspx [Accessed April 18, 2018].
https://www.ibef.org/industry/indian-retail-industry-analysis-presentation [Accessed April 18, 2018].
Appendix-I
Table 1: General Sample Description
s. 1
T
X X
T
6
VariaUe
Age (in Years)
Gender
Marital Status
Educational Qualification
Enployment Status
Monthly Household Income (hi Rs.)
Levels
Below 20 20-25 26-35 36-45 46-60 Above 60 Male Female Married Unmarried Intermediate Graduate Post Graduate Self Employment Salaried/Wage Earner Business Professional Student Others Below 40000 41000-60000 61000-80000 81000-100000 Above 100000
Number
15 113 54 32 8 5
147 80 83 144 9 82 136 21 85 14 28 76 3 13 36 43 35 100
Percentage
6.6 49.8 23.8 14.1 3.5 2.2
64.80 35.20 36.60 63.40 4.00 36.10 59.90 9.30 37.40 6.20 12.30 33.50 1.30
05.70 15.90 18.90 15.40 4410
11
Table 2; Regression Weights; (Group number 1-Default model)
S.No.
1 2 3 4
5 6 7 8
9 10
11
AC3^-CAN AC2^-CAN ACl^-CAN SC6^-SCN SC5^-SCN SC4^-SCN SC3^-SCN SC2^-SCN SCl^-SCN EC3^-ECN EC2^-ECN ECl^-ECN TC3<--TCN TC2^-TCN TCl^-TCN PC5^-PCN PC4^-PCN PC3^-PCN PC2^-PCN PCl^-PCN C S l ^ - F l CS2^-F1 CS3^-F1
Estimate 1.000 1.066 1.000 1.000 .736 .865 .796 .865 .974 1.000 1.029 1.275 1.000 .995 1.100 1.000 1.077 1.032 1.040 1.124 1.000 1.034 1.047
S.E
.060
.092
.090
.088
.088
.103
.092
.102
.089
.090
.108
.096 •099 .110
.080
.081
C R
17.820
8.011 9.570 9.045 9.781 9.445
11.199 12.509
11.170 12.171
9.995 10.778 10.522 10.217
12.885 12.898
Table 3: Goodness of Fit Indices Goodness of Fit Index
CMESr Df (Degrees of Freedom) CMIN/DF GFI (Goodness of Fit Index)
IFI (Incremental Fit TLT (Tucker-Lewis
Index) Index)
CFI (Comparative fit Index) RMSEA (Root Mean Square Error of Approximal P Close RMR (Root Mean
ion)
Squared
361.970 215 1.684 0.883
0.952 0.943 0.951
: 0.055
0.197 0.071
Value
P
# 4 : ^
*** *** # 4 : *
*** *9H^
^ 3 | C ^
^ 4 ( ^
*** # 4 : *
^ 9 | C ^
*!¥*
^*^ ^ 3 | e ^
*** # 9 ( S *
AcceptaUe
Label
p a r i
par_2 par_3 par_4 par_5 par_6
par_7 par_8
par_9 p a r l O
p a r l l par_12 par_13 par_14
par_15 par_16
Threshold Value
goodif <3 Rang( ; 0 -1, good if more towards 1 good: if > 0.90 goodif >0.90 good: good:
if >0.90 if < 0.08
good if close to good: if < 0.08
1 or equal to 1
Residual) ECVI (Expected Cross Validation Index)
Default Model = 2.141 ECVI value for Saturated Model =2.442 ECVI value for Independence Model = 14.637
Source: Author Compilation
Defeult model should have least ECVI value
Source: Hair et al, (2010)
12
Table 5: Convergent and Discriminant Validity CR AVE MSV ASV PCN ACN SCN ECN TCN CST
PCN
CAN
SCN
ECN
TCN
CST
0.866
0.878
0.825
0.823
0.829
0.860
0.654
0.706
0.642
0.609
0.619
0.672
0.554
0.573
0.442
0.510
0.534
0.590
0.489
0.417
0.467
0.450
0.501
0.529
0.809
0.431
0.439
0.355
0.296
0.342
0.840
0.233
0.357
0.212
0.160
0.801
0.281
0.367
0.418
0.780
0.423
0.356
0.786
0.404 0.820 Source; AuthorConpilation
Table 5: Fit Indices S,No.
1 2 3 4
5 6 7 8
9
10
11
Goodness of Fit Index
CMIN Df (Degrees of Freedom) CMIN/DF GFI (Goodnessof Fit Index)
IFI (Incremental Fit Index) TIJ (Tucker-Lewis Index) CFI (Comparative fit Index) RMSEA (Root Mean Square Error of Approximation) P Close
RMR (Root Mean Squared Residual) ECVI (Ej^jected Cross Validation Index)
Value
376.245 216 1.742 0.879
0.947 0.938 0.947 0.057
0.107
0.073
Default Model = ECVI value for Model =2.442
2.196 Saturated
ECVI value for Independence 14.637
Model =
Source: Author Compilation
Table 6: Summary of Patli
Relationship Unstandardized Estimates
CST <— ACN 0.441 CST <— SCN 0.424 CST <— ECN 0.217 CST <— TCN 0.379 CST <— PCN 0279
Standardized Estimates
0.288 0.219 0.130 0.199 0145
L Analysis
S.E
0139 0125 O103 0122 0123
Accej itaUe Threshold Value
goodif <3 Range i 0 -1, good towards 1 goodif >0.90 goodif >0.90 goodif >0.90 good if < 0.08
good if t o l
if more
' close to or equal
good if < 0.08
Default model should have least ECVI value
C R
3.173 3.392 2.107 3.106 2.268
Source: Hair et al.,
p-value
0.002 0.000 0.034 0.007 0.023
(2010)
^ Square
0.75
Source: Author Compilation
13
Figure 1: Theoretical Relations among Constructs
Figure 2: Confirmatory Factor Analysis
14
Figure 3: Structural Equation Modeling Results
15
Appendix-II
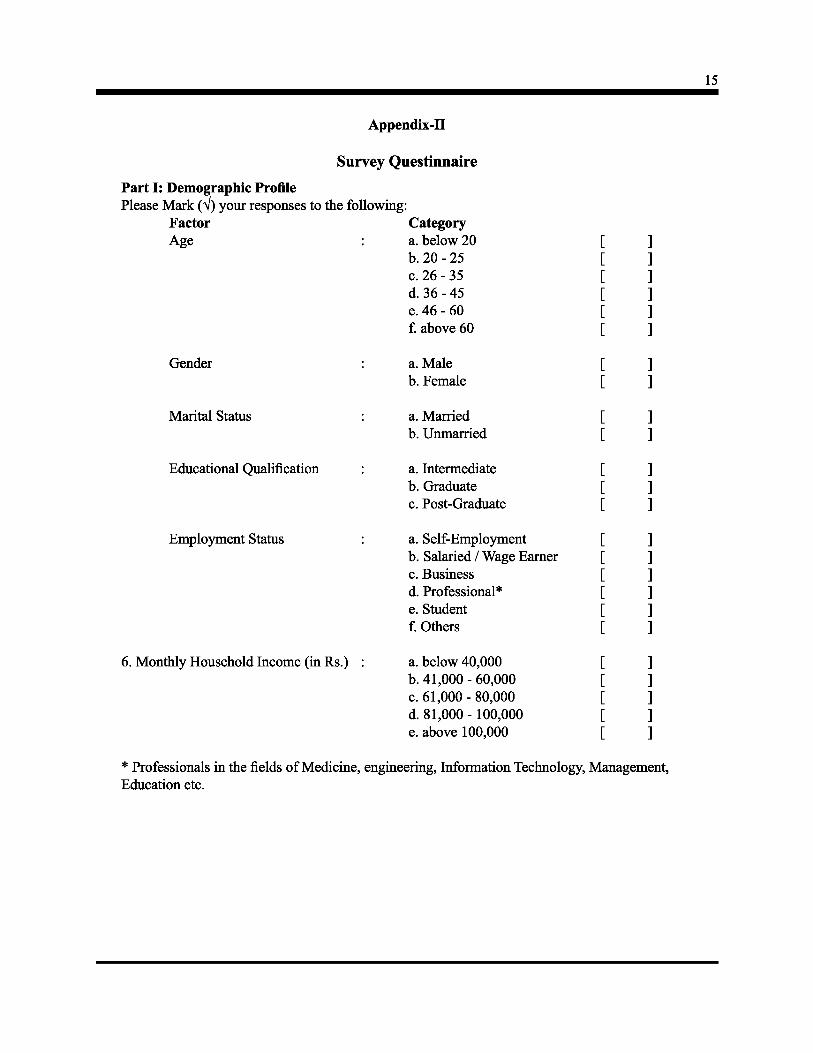
Survey Questinnaire
Part I: Demographic Profile Please Mark (V) your responses to the following:
Factor Age :
Gender
Marital Status
Educational Qualification
Employment Status
6. Monthly Household Income (in Rs.)
Category a. below 20 b. 20 - 25 c. 26 - 35 d. 36 - 45 e. 46 - 60 f. above 60
a. Male b. Female
a. Married b. Unmarried
a. Intermediate b. Graduate c. Post-Graduate
a. Self-Employment b. Salaried / Wage Earner c. Business d. Professional* e. Student f Others
a. below 40,000 b. 41,000 - 60,000 c. 61,000 - 80,000 d. 81,000 -100,000 e. above 100,000
* Professionals in the fields of Medicine, engineering. Information Technology, Management, Education etc.
16
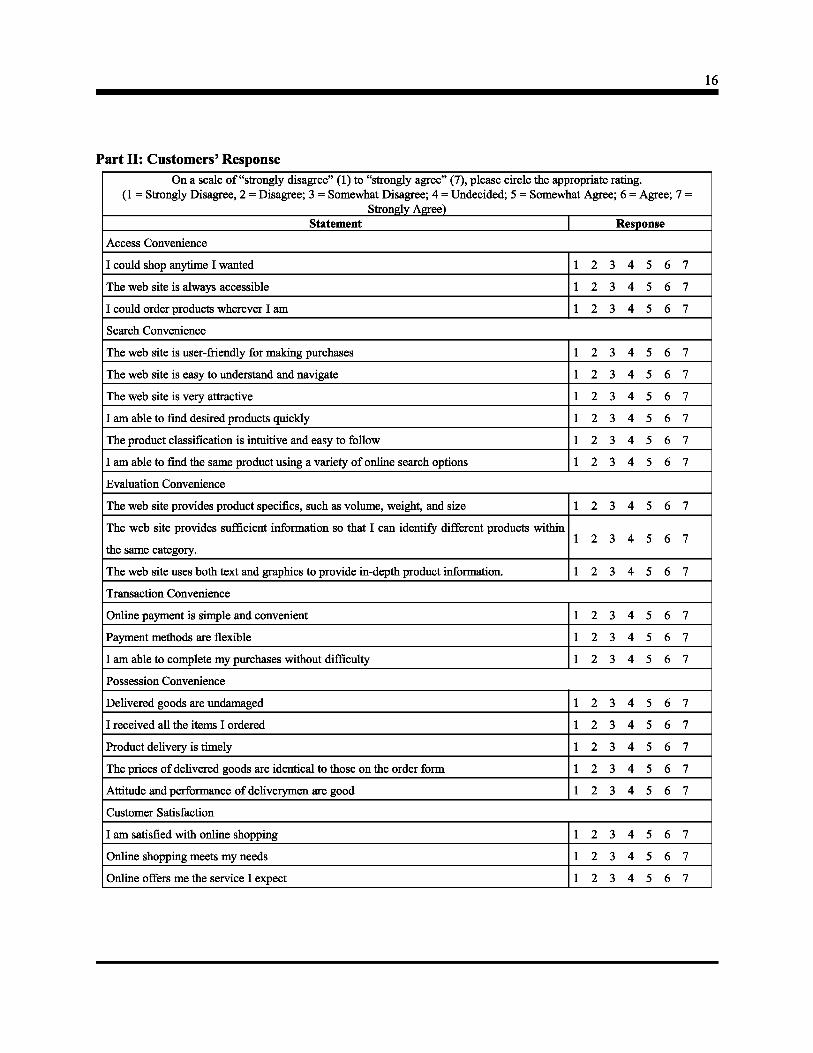
Part II: Customers' Response On a scale of "strongly disagree" (1) to "strongly agree" (7), please circle the appropriate rating.
(1 = Strongly Disagree, 2 = Disagree; 3 = Somewhat Disagree; 4 = Undecided; 5 = Somewhat Agree; 6 = Agree; 7 = Strongly Agree)
Statement | Responise
Access Convenience
I could shop anj time I wanted
The web site is always accessible
I could order products wherever I am
Search Convenience
The web site is user-friendly for making purchases
The web site is easy to understand and navigate
The web site is very attractive
I am able to find desired products quickly
The product classification is intuitive and easy to follow
I am able to find the same product using a variety of online search options
Evaluation Convenience
The web site provides product specifics, such as volume, weight, and size
The web site provides sufficient information so that I can identify different products within
the same category.
The web site uses both text and graphics to provide in-depth product information.
Transaction Convenience
Online payment is simple and convenient
Pajfment methods are flexible
I am able to complete my purchases without difficulty
Possession Convenience
Delivered goods are imdamaged
I received all the items I ordered
Product delivery is timely
The prices of delivered goods are identical to those on the order form
Attitude and performance of deliverymen are good
Customer Satisfaction
I am satisfied with online shopping
Online shopping meets my needs
Online offers me the service I expect
1
1
1
1
1
1
1
1
1
1
1
1
1
1
1
1
1
1
1
1
1
1
1
2
2
2
2
2
2
2
2
2
2
2
2
2
2
2
2
2
2
2
2
2
2
2
3
3
3
3
3
3
3
3
3
3
3
3
3
3
3
3
3
3
3
3
3
3
3
4
4
4
4
4
4
4
4
4
4
4
4
4
4
4
4
4
4
4
4
4
4
4
5
5
5
5
5
5
5
5
5
5
5
5
5
5
5
5
5
5
5
5
5
5
5
6
6
6
6
6
6
6
6
6
6
6
6
6
6
6
6
6
6
6
6
6
6
6
7
7
7
7
7
7
7
7
7
7
7
7
7
7
7
7
7
7
7
7
7
7
7


