Embed Size (px)
Citation preview


Shipping and Logistics Management

Y.H.V. Lun · K.-H. Lai · T.C.E. Cheng
Shipping and Logistics Management
123

Y.H.V. Lun, Dr. K.-H. Lai, Dr. T.C.E. Cheng, Prof.
The Hong Kong Polytechnic University Department of Logistics and Maritime Studies11 Yuk Choi Road Hung Hom, Kowloon Hong Kong SAR
[email protected] [email protected] [email protected]
ISBN 978-1-84882-996-1 e-ISBN 978-1-84882-997-8 DOI 10.1007/978-1-84882-997-8 Springer London Dordrecht Heidelberg New York British Library Cataloguing in Publication Data A catalogue record for this book is available from the British Library Library of Congress Control Number: 2010923781 © Springer-Verlag London Limited 2010 Apart from any fair dealing for the purposes of research or private study, or criticism or review, aspermitted under the Copyright, Designs and Patents Act 1988, this publication may only bereproduced, stored or transmitted, in any form or by any means, with the prior permission in writing ofthe publishers, or in the case of reprographic reproduction in accordance with the terms of licencesissued by the Copyright Licensing Agency. Enquiries concerning reproduction outside those termsshould be sent to the publishers. The use of registered names, trademarks, etc. in this publication does not imply, even in the absence ofa specific statement, that such names are exempt from the relevant laws and regulations and thereforefree for general use. The publisher makes no representation, express or implied, with regard to the accuracy of the information contained in this book and cannot accept any legal responsibility or liability for any errorsor omissions that may be made. Cover design: eStudioCalamar, Figueres/Berlin Printed on acid-free paper Springer is part of Springer Science+Business Media (www.springer.com)

v
Preface
This book serves to consolidate the knowledge we have acquired from being edu-cators and researchers of the shipping and logistics industry. It is our aim, in syn-thesizing the principles of shipping, to describe the core elements and to discuss pertinent strategic and operations issues in the industry. We also aim to share research outputs that promote best practices in and improve the management of shipping and logistics activities.
The book is organized in four parts. Chapters 1–4 present an overview of the shipping business. The shipping business is essential to the development of eco-nomic activities as international trade needs ships to transport cargoes from places of production to places of consumption. Chapter 1 discusses several basic ques-tions in the shipping business and these include the following: Why is there de-mand for shipping? What is a shipping system? Who are the actors in shipping? Chapter 2 examines the freight rate mechanism in the shipping market and intro-duces the concept of the “shipping cycle”. There are four separate but interrelated markets in the shipping industry, namely, the freight market, which trades sea transport, the second-hand market, which trades used ships, the new building mar-ket, which trades new ships, and the demolition market, which deals with scrap ships. These four shipping markets are closely interrelated. Chapter 3 provides managerial insights into the four shipping markets and explains how these ship-ping markets are related to each other. In analysing the container shipping indus-try, it is desirable to understand the factors influencing the capacity of the bulk shipping industry, explain how these factors affect the container shipping market grounded on a sound theoretical framework, and find empirical evidence to exam-ine these relationships. Chapter 4 reports a study in the container shipping industry based on the industrial organization paradigm that “industry structure determines the conduct of firms whose joint conduct then determines the collective perform-ance of the firms in the marketplace”.
Chapters 5–8 discuss issues related to shipping operations. Strategy is impor-tant in shipping because it facilitates the identification of business opportunities, gives an objective view to solve business problems, provides a framework to im-

vi Preface
prove internal and external collaboration, assists in controlling business activities, minimizes the negative effects when threats arise, helps make better decisions, guides effective allocation of resources, provides methods to manage changes, and nurtures consistency in the management of the shipping business. Chapter 5 dis-cusses the development and implementation of shipping strategies. An important factor affecting organizational performance relates to the continuous growth of firms. Chapter 6 analyses the decision of capacity adjustment in the container shipping industry with empirical evidence. In container shipping, carrying capac-ity is one of the essential resources to sustain business growth. Although deploy-ment of mega ships is a popular means by which carriers achieve efficiency gains, a balance between ship size and the scope of service is required when they deter-mine their fleet mix. Chapter 7 examines how fleet size in terms of the number of ships and the average ship size can influence the performance of shipping firms. In addition, the SCOPE framework, identifying service frequency, customer value, optimal vessel size, ports of call, and extensive market coverage as the important elements for determining fleet mix in shipping services, is presented for manage-rial reference on the fleet size decision. Chapter 8 examines the liner shipping industry from the network perspective with a focus on developing an analytical framework for the development and operations of liner shipping networks.
Chapters 9–12 are related to intermodal transport, which involves door-to-door services encompassing ocean-going services and land-based transport services. Chapter 9 identifies the key actors in the container transport chain, including the primary customers, transport facilitators, and transport operators, and discusses their roles in container transport. The rise of intermodal transport has resulted in dramatic changes in the patterns of freight transport. In an integrated transport system, intermodal freight transport is characterized by various operations ele-ments. Chapter 10 presents the INTERMODAL model using Hong Kong as an illustrative case to identify the operations elements of an intermodal transport system. Empty container management is a major cost item for many container shipping firms and reductions in handling costs can be profitable for them. Chap-ter 11 presents a model for managing empty containers with four major dimen-sions: strategic planning, procurement of empty containers, movement of empty containers, and technical efficiency. The importance of adoption of technology to enhance transport security has been well acknowledged in research and practice. Chapter 12 discusses the implications of the different types of institutional iso-morphic forces affecting adoption of technology from the perspectives of con-tainer transport operators that have taken the initiative to adopt technology for container transport security enhancement and those that have followed other firms to adopt technology.
Chapters 13–16 focus on port management. Ports are places where there are fa-cilities for berthing or anchoring ships and where there is cargo handling equip-ment to process cargoes from ships to shore, shore to ships, or ships to ships. Chapter 13 discusses the different roles of ports, the main facilities in container terminals, and the processes at container terminals. Chapter 14 starts with a dis-cussion of the development of global container terminal operators and the inter-

Preface vii
organizational interaction model in analysing the container terminal community, followed by an evaluation of the efficiency of global container terminal opera-tions. A PROFIT framework is provided for the reference of container terminal operators to plan and manage their operations and development. There is a need for the container port to operate as an “agile port” to cope with the uncertainties of the changing operating environment. Chapter 15 discusses the characteristics of agile ports. To facilitate the implementation of the concept of “agility” in ports, a ten-step implementation framework is presented. This structured ten-step ap-proach provides a useful road map for the container port industry to adopt an agile port system. Chapter 16 focuses on discussing port development. The chapter begins with an introduction to the 4C forces (i.e., containerization, concentration, collaboration, and competition) to examine the operating environment of container shipping. With growing complexity in shipping services, there is a trend in the shipping industry to use the hub-and-spoke approach. In any shipping hub, firms involved in upstream and downstream activities operate together and their collec-tive economic actions lead to the emergence of a transport complex economy.
This book consolidates selected research findings of significance and relevance to the practice of shipping and logistics management from our ongoing scholarly endeavours as educators and researchers in the field. We hope that the reader will find our book interesting and informative about the latest developments in the management and practices of shipping and logistics management.
The authors are grateful for the support we received from The Hong Kong Polytechnic University in the form of a grant (project code: J-BB77) to develop this book.
Y.H.V. Lun D.B.A. K.-H. Lai Ph.D.
T.C.E. Cheng Sc.D., Ph.D.

ix
Contents
1 International Trade and Shipping......................................................... 1 1.1 The Importance of Shipping .......................................................... 1
1.1.1 Why Is There a Demand for Shipping?............................ 2 1.1.2 What Is a Shipping System? ............................................ 2 1.1.3 Who Are the Actors in the Shipping Business? ............... 3
1.2 Freight Market ............................................................................... 4 1.2.1 Tramp Market .................................................................. 4 1.2.2 Liner Market .................................................................... 5
1.3 World Economic Development and Shipping ............................... 5 1.4 Sea Transport System .................................................................... 6
1.4.1 Shipping Intensity ............................................................ 7 1.4.2 Concept of Parcel Size Distribution................................. 8
1.5 International Trade Pattern ............................................................ 9 1.5.1 World Output and World Trade ....................................... 9 1.5.2 Overall Seaborne Trade ................................................... 10
1.6 International Maritime Passages.................................................... 12 1.6.1 The Panama Canal ........................................................... 12 1.6.2 The Suez Canal ................................................................ 13 1.6.3 The Strait of Malacca....................................................... 13 1.6.4 The Strait of Hormuz ....................................................... 13 1.6.5 The Strait of Magellan ..................................................... 14 1.6.6 The Cape of Good Hope .................................................. 14
1.7 Conclusions ................................................................................... 14 References................................................................................................. 15
2 Freight Rate Mechanism ........................................................................ 17 2.1 Demand for Sea Transport............................................................. 17
2.1.1 Political Factors ............................................................... 18 2.1.2 World Economy ............................................................... 19

x Contents
2.1.3 Seaborne Trade ................................................................ 19 2.1.4 Average Haul ................................................................... 19 2.1.5 Transport Cost.................................................................. 20 2.1.6 Shipping Demand Curve.................................................. 20 2.1.7 Elasticity of Demand........................................................ 21
2.2 Supply of Sea Transport ................................................................ 22 2.2.1 Shipping Supply Curve .................................................... 24 2.2.2 Short-run and Long-run Shipping Supply........................ 25 2.2.3 Rigidity of Supply............................................................ 27
2.3 The Freight Rate Mechanism ........................................................ 27 2.4 Shipping Cycle .............................................................................. 28
2.4.1 Characteristics of Shipping Cycles .................................. 29 2.4.2 What Causes the Shipping Cycle? ................................... 29 2.4.3 Recent Developments in the Shipping Market................. 29 2.4.4 Managing the Shipping Cycle.......................................... 30
References................................................................................................. 31
3 Bulk Shipping Market ............................................................................ 33 3.1 Introduction ................................................................................... 33 3.2 The Shipping Market ..................................................................... 35
3.2.1 New Buildings ................................................................. 36 3.2.2 Second-hand Vessels........................................................ 37 3.2.3 Demolition Vessels .......................................................... 38 3.2.4 Freight Rate...................................................................... 39 3.2.5 Seaborne Trade ................................................................ 39
3.3 The Empirical Model..................................................................... 40 3.4 Determinant of Fleet Size of Bulk Shipping.................................. 42 3.5 Discussion and Conclusions .......................................................... 44 Appendix .................................................................................................. 45 References................................................................................................. 46
4 Container Shipping Market ................................................................... 49 4.1 Introduction ................................................................................... 49 4.2 Industrial Organization in Container Shipping.............................. 50 4.3 Capacity Adjustment in the Container Shipping Market ............... 51
4.3.1 Seaborne Trade ................................................................ 51 4.3.2 Freight Rate...................................................................... 52 4.3.3 Capacity Adjustment........................................................ 52 4.3.4 An Empirical Model of the Container
Shipping Market............................................................... 53 4.4 The Determinant of Fleet Size in Container Shipping................... 54 4.5 Discussion and Conclusions .......................................................... 56 Appendix .................................................................................................. 57 References................................................................................................. 58

Contents xi
5 Business Strategy in Shipping................................................................ 61 5.1 Introduction ................................................................................... 61 5.2 Strategy for Shipping..................................................................... 63
5.2.1 Corporate Strategy ........................................................... 64 5.2.2 Business Strategy ............................................................. 65 5.2.3 Functional Strategy .......................................................... 65
5.3 Market Orientation in Shipping..................................................... 65 5.3.1 Customer Focus ............................................................... 66 5.3.2 Competitor Intelligence.................................................... 66 5.3.3 Cross-functional Coordination ......................................... 67 5.3.4 Performance Implications ................................................ 67
5.4 Operational Effectiveness Versus Competitive Strategy............... 67 5.4.1 Variety-based Positioning ................................................ 68 5.4.2 Needs-based Positioning .................................................. 68 5.4.3 Access-based Positioning................................................. 68
5.5 Development Process of Shipping Strategies ................................ 69 5.5.1 Strategic Analysis ............................................................ 69 5.5.2 Formulation of Strategies................................................. 70 5.5.3 Implementation and Control ............................................ 70
5.6 Structural Options for Shipping Companies.................................. 70 5.6.1 Organic Growth ............................................................... 71 5.6.2 Acquisitions ..................................................................... 71 5.6.3 Joint Ventures .................................................................. 72 5.6.4 Alliances .......................................................................... 72 5.6.5 Networks .......................................................................... 73
References................................................................................................. 74
6 Growth of Firms ..................................................................................... 77 6.1 Introduction ................................................................................... 77 6.2 Exchange Function ........................................................................ 78 6.3 Vertical Expansion ........................................................................ 81 6.4 Horizontal Expansion .................................................................... 83 6.5 Growth and Firm Performance ...................................................... 84 6.6 Discussion and Conclusions .......................................................... 86 References................................................................................................. 87
7 Fleet Mix Decision................................................................................... 89 7.1 Introduction ................................................................................... 89 7.2 Liner Shipping............................................................................... 90
7.2.1 Hub-and-spoke Services .................................................. 90 7.2.2 Fleet Mix.......................................................................... 91
7.3 Fleet Mix Decision ........................................................................ 93 7.3.1 Capacity ........................................................................... 93 7.3.2 Ship Size .......................................................................... 93 7.3.3 Number of Ships .............................................................. 95

xii Contents
7.4 The Fleet Mix Model..................................................................... 96 7.5 SCOPE Framework ....................................................................... 97
7.5.1 Service Frequency............................................................ 98 7.5.2 Customer Value ............................................................... 98 7.5.3 Optimal Vessel Size ......................................................... 98 7.5.4 Ports of Call ..................................................................... 98 7.5.5 Extensive Market Coverage ............................................. 99
7.6 Concluding Remarks ..................................................................... 99 References................................................................................................. 99
8 Liner Shipping Network......................................................................... 101 8.1 Introduction ................................................................................... 101 8.2 Network-based Organizations ....................................................... 103 8.3 SMART Driving Forces ................................................................ 104
8.3.1 Strategic Initiative for Performance Gain ........................ 104 8.3.2 Market Coverage.............................................................. 105 8.3.3 Additional Business ......................................................... 105 8.3.4 Reduction in Waste .......................................................... 106 8.3.5 Technology Development ................................................ 106
8.4 SHIPMENT Framework................................................................ 108 8.4.1 Space Management .......................................................... 109 8.4.2 Hinterland ........................................................................ 109 8.4.3 Intermodal Transport........................................................ 109 8.4.4 Port................................................................................... 110 8.4.5 Management Information Systems .................................. 111 8.4.6 Equipment Supply............................................................ 111 8.4.7 New Agents...................................................................... 112 8.4.8 Terminal Operators .......................................................... 112
8.5 The Case of Maersk Line............................................................... 113 8.5.1 Space Management .......................................................... 113 8.5.2 Hinterland ........................................................................ 114 8.5.3 Intermodal Transport........................................................ 114 8.5.4 Port................................................................................... 114 8.5.5 Management Information Systems .................................. 114 8.5.6 Equipment Supply............................................................ 114 8.5.7 New Agents...................................................................... 115 8.5.8 Terminal Operators .......................................................... 115
8.6 Conclusions ................................................................................... 115 References................................................................................................. 116
9 Container Transport Chain ................................................................... 119 9.1 Container Transport....................................................................... 119 9.2 International Transport .................................................................. 121 9.3 Primary Customers ........................................................................ 122 9.4 Transport Facilitators..................................................................... 123

Contents xiii
9.5 Transport Operators....................................................................... 127 9.5.1 Road Operators ................................................................ 127 9.5.2 Rail Operators .................................................................. 128 9.5.3 Inland Waterway Operators ............................................. 129 9.5.4 Ocean Container Carriers................................................. 129
9.6 Freight Transport Modes ............................................................... 131 9.6.1 Mode Choice.................................................................... 132 9.6.2 Modal Combinations........................................................ 133
References................................................................................................. 134
10 Intermodal Transport System ............................................................... 135 10.1 Introduction to Intermodal Transport ............................................ 135 10.2 The INTERMODAL Model .......................................................... 137
10.2.1 Infrastructure.................................................................... 138 10.2.2 New Technology.............................................................. 139 10.2.3 Transport Operators ......................................................... 140 10.2.4 External Business Environment ....................................... 141 10.2.5 Regional Location............................................................ 142 10.2.6 Management of Containers .............................................. 143 10.2.7 Operations of Container Terminals .................................. 144 10.2.8 Deregulation..................................................................... 144 10.2.9 Availability of Logistics Services .................................... 145 10.2.10 Logistics Security............................................................. 146
10.3 Concluding Remarks ..................................................................... 147 References................................................................................................. 148
11 Managing Empty Containers................................................................. 151 11.1 Introduction ................................................................................... 151 11.2 The Container ................................................................................ 152
11.2.1 Stakeholder Participation in Container Interchange......... 153 11.2.2 Key Terms in Empty Container Management.................. 153 11.2.3 Costs of Maintaining Container Equipment Service
and Capacity..................................................................... 154 11.2.4 Types of Containers ......................................................... 155
11.3 A Conceptual Model of Empty Container Management ............... 156 11.3.1 Strategic Planning ............................................................ 157 11.3.2 Procurement of Empty Containers ................................... 159 11.3.3 Movement of Empty Containers ...................................... 161 11.3.4 Technical Efficiency ........................................................ 162
References................................................................................................. 164
12 Container Transport Security ............................................................... 165 12.1 Container Transport Chain and Container Transport Security ...... 165 12.2 Container Transport Security Enhancement .................................. 167
12.2.1 Radio-frequency Identification Technology .................... 169

xiv Contents
12.2.2 Smart Box Initiative ......................................................... 169 12.2.3 Non-intrusive Inspection.................................................. 169
12.3 Diffusion of Technology to Enhance Container Transport Security ......................................................................... 170
12.4 Types of Institutional Isomorphism............................................... 170 12.4.1 Coercion........................................................................... 172 12.4.2 Mimesis............................................................................ 173 12.4.3 Norms............................................................................... 174 12.4.4 Comparison of Normative and Coercive Institutional
Isomorphic Processes....................................................... 175 12.5 Conclusions ................................................................................... 176 References................................................................................................. 176
13 Port Operations....................................................................................... 179 13.1 Introduction ................................................................................... 179 13.2 Multiuser and Dedicated Container Terminals .............................. 181 13.3 Terminal Facilities......................................................................... 183
13.3.1 Quay................................................................................. 183 13.3.2 Container Yard................................................................. 184 13.3.3 Container Freight Station ................................................. 184 13.3.4 Interchange Area .............................................................. 184 13.3.5 Gate Facility..................................................................... 185 13.3.6 Railhead ........................................................................... 185 13.3.7 Others............................................................................... 185
13.4 Processes at Container Terminals.................................................. 185 13.5 Physical Flows in the Container Transport Chain ......................... 187
13.5.1 Consignment Assembly ................................................... 188 13.5.2 Consignment Consolidation............................................. 188 13.5.3 Carriage............................................................................ 189 13.5.4 Port Handling ................................................................... 190
References................................................................................................. 191
14 Managing Container Terminals ............................................................ 193 14.1 Introduction ................................................................................... 193 14.2 Development of Global Container Terminal Operators................. 194
14.2.1 Terminal Networks .......................................................... 196 14.2.2 Regional Coverage........................................................... 196 14.2.3 Internationalization .......................................................... 197
14.3 Performance of Container Terminals............................................. 199 14.4 The PROFIT Framework............................................................... 202 14.5 Concluding Remarks ..................................................................... 203 References................................................................................................. 203

Contents xv
15 Agile Port................................................................................................. 205 15.1 Introduction ................................................................................... 205 15.2 Agility in Ports .............................................................................. 207 15.3 Characteristics of Agile Ports ........................................................ 210
15.3.1 Infrastructure of Their Own ............................................. 210 15.3.2 Commitment from Top Management............................... 210 15.3.3 Working with Upstream and Downstream Partners......... 211 15.3.4 Streamlined Operating Processes ..................................... 211
15.4 Implementing the Concept of an Agile Port .................................. 212 15.4.1 Step 1: Management Commitment................................... 213 15.4.2 Step 2: Process-improvement Team................................. 213 15.4.3 Step 3: Setting the Standards............................................ 214 15.4.4 Step 4: Awareness of Staff Members............................... 215 15.4.5 Step 5: Manager and Supervisor Training........................ 215 15.4.6 Step 6: Goal Setting ......................................................... 215 15.4.7 Step 7: Removal of Error ................................................. 216 15.4.8 Step 8: Corrective Actions ............................................... 216 15.4.9 Step 9: Recognition and Reward...................................... 216 15.4.10 Step 10: Continuous Improvement................................... 217
15.5 Concluding Remarks ..................................................................... 217 References................................................................................................. 218
16 Port Development ................................................................................... 219 16.1 Introduction ................................................................................... 219 16.2 The Operating Environment .......................................................... 220
16.2.1 Containerization............................................................... 220 16.2.2 Concentration................................................................... 221 16.2.3 Collaboration.................................................................... 222 16.2.4 Competition...................................................................... 222
16.3 Port Hinterland and Foreland ........................................................ 223 16.4 Evolution of a Port......................................................................... 225
16.4.1 Anyport Model................................................................. 226 16.4.2 Development of Shipping Hubs ....................................... 227
16.5 Transport Complex Economy........................................................ 227 16.6 Concluding Remarks ..................................................................... 229 References................................................................................................. 230
Index ................................................................................................................. 233

1 Y.H.V. Lun, K.-H. Lai and T.C.E. Cheng Shipping and Logistics Management, © Springer 2010
Chapter 1 International Trade and Shipping
Abstract The shipping business is essential to the development of economic activities as international trade needs ships to transport cargoes from places of production to places of consumption. In this chapter we discuss several fundamen-tal questions in the shipping business. These questions include the following: Why is there demand for shipping? What is a shipping system? Who are the actors in shipping? Broadly speaking, sea transport can be divided into tramp and liner shipping. The purpose of tramp shipping is to provide convenient and economical transport for bulk cargoes that require cross-ocean movement. Bulk cargoes can be classified into dry bulk and liquid bulk. The demand for the transport of liquid bulk by sea is served mainly by the sector of tanker shipping. The main function of liner shipping is to satisfy the demand for regular cargo transport. Shipping and international trade are interrelated. This chapter also examines fundamental topics in the shipping business such as the sea transport system, international trade pat-terns, and international maritime passages.
1.1 The Importance of Shipping
Shipping is concerned with the transport of cargo between seaports by ships. “Shipping” is a term that is open to interpretation. For some, “shipping” means ships and seaborne businesses. For others, “shipping” refers to any mode of trans-port that moves goods between two geographical points. Trends in the shipping business are moving towards the concept of economies of scale in operations, the development of network-based management, and the adoption of technology to improve efficiency and effectiveness. The varied interpretations of shipping imply that the shipping business has become increasingly dynamic and complex.
Shipping is one of the world’s most internationalized industries. Shipping should not be viewed only from a narrow national perspective. Rather, it should be

2 1 International Trade and Shipping
looked at from a broad view of world development, particularly in the interna-tional trade sector (Farthing 1993). In studying the shipping business, we need to understand the world economy as well. Shipping is fundamental to international trade as it provides a cost-effective means to transport large volumes of cargo around the world. Shipping and seaborne trade have made possible the progression from a world of isolated areas to an integrated global community. For example, China and India have been rapidly expanding their export of industrial parts and products, and this resulted in a global shortage of cargo vessels in 2004.
Shipping as a core element of economic development has a long history. Adam Smith, the father of economics, considered shipping as a source of low-cost trans-port that could open up markets. Smith (1776) mentioned that “as by means of water carriage a more extensive market is opened to every sort of industry … it is upon the sea-coast that industry of every kind naturally begins to subdivide and improve itself”. Water carriage facilitates specialization that enables products to be sold at low prices.
Movement of goods by sea is the economic lifeblood of many countries. The shipping business has been essential to the development of economic activities as business transactions and trade need ships to transport cargoes from the place of production to the place of consumption. This chapter starts by discussing some basic questions in shipping.
1.1.1 Why Is There a Demand for Shipping?
Demand for shipping services arises from demand for goods. Economists refer to merchant shipping as derived demand. The demand for a shipping service results from the demand for the goods that it transports. Freight, which generally refers to the cargo carried, is generally not transported to a location unless a demand for the product exists. Thus, demand for shipping is derived from customers’ demands for the product. The movement of cargo by sea transport comes about as a result of trade with one party (i.e., the consignor1) selling commodities to another party (i.e., the consignee2).
1.1.2 What Is a Shipping System?
The shipping business involves the physical transport of cargoes from an area of supply to an area of demand, together with the activities required to support and facilitate such transport. A transport system involves three key components that
————— 1 The consignor is the person or company shown on the bill of lading as the shipper. 2 The consignee is the person or company to whom commodities are shipped.

1.1 The Importance of Shipping 3
are used for the movement of goods, with nodes linking them together (Steen-brink 1974):
1. fixed infrastructure such as ports or terminals; 2. vehicles such as ships or barges using the fixed infrastructure to move cargoes; 3. organizational systems necessary to ensure that the vehicles and the fixed infra-
structure are used effectively and efficiently.
A shipping network is a kind of transport system comprising sea lanes that link up ports, with connecting services provided by other actors in the shipping indus-try. Hence, shipping services involve a number of commercial activities, including the provision of infrastructure, the operation of vehicles, and the management of organizational systems such as enterprise resource planning, which is an informa-tion system that integrates all the operations and related applications for an entire enterprise.
1.1.3 Who Are the Actors in the Shipping Business?
Shippers seek shipping services to transport their cargo from a port of loading to a port of discharge. The principal contributors for hiring ships include exporters and importers, shippers and receivers, and consignors and consignees. The shipping business involves a number of actors to support and facilitate the transport of car-goes by sea. These actors include:
• Shipowners: Parties that own ships and make decisions on how to use existing ships to provide shipping services, when and how to buy new ships, and what ships to buy.
• Shipbuilders: Parties that build new ships and sell them to shipowners. • Scrap dealers: Parties that buy old ships from shipowners for scrapping. • Terminal operators: Parties that provide port services to ships, such as berthing
and cargo handling. • Intermodal transport operators: Parties that provide intermodal transport ser-
vices for the door-to-door movement of cargoes.
Other actors in the shipping business that are closely related to the shipping business include:
• Ship agents: Companies that represent owners of the vessels, and are engaged in the routine business related to vessel arrival, operation, and departure of ships.
• Charterers: Entities that employ ships to transport cargoes. • Shipbrokers: Specialist intermediaries between shipowners and ship charterers,
or between buyers and sellers of ships. • Common carriers: Transport operators that provide services to the general
public at published rates. • Non-vessel-operating common carriers: Transport operators that have no oper-
ating vessels but coordinate the provision of shipping services.

4 1 International Trade and Shipping
As shipping involves a number of business activities, the transport of goods by sea is important from an economics perspective for many countries. The shipping business is essential to economic development since international trade and related business activities rely on the efficiency and availability of shipping services. Sea transport and economic development always go hand in hand with each other.
1.2 Freight Market
Although the shipping business is an economic sector, there are important subdivi-sions in the sea freight market. The sea freight market is linked with ships that can carry different types of cargoes. Generally, the freight market can be divided into the tramp market and the liner market.
1.2.1 Tramp Market
The purpose of tramp ships is to provide a convenient and economical means to transport goods that require cross-ocean movement. One of the key characteristics of tramp shipping is to seek cargoes all over the world and provide flexibility in sea transport to satisfy the needs of world trade (Kendall and Buckley 2001). The tramp ship can be any vessel that does not have a fixed itinerary and mainly car-ries dry cargoes in bulk from one or more ports to one or more different ports. Tramp ships go from place to place depending upon where they can find cargoes. Tramp shipping mainly carries only one commodity at a time and usually carries cargoes from one shipper. In the tramp market, cargoes are carried at freight rates, whereby the terms and conditions are negotiated usually on a case-by-case basis. Tramp ships carry dry bulk cargoes that are used by many industries.
Bulk cargoes can be classified into dry bulk and liquid bulk. Demand for the transport of liquid bulk by sea is served mainly by the sector of tanker shipping. Ships designed for the transport of liquid in bulk are called tankers. The main cargoes carried in tankers are liquid and gas. Ships designed to carry liquefied petroleum gas (LPG)/liquefied natural gas (LNG) are referred to as LPG carriers or LNG carriers. The design and construction of tankers and those of tramp ships are different since these vessels carry different types of cargo. For example, the methods used for the loading and discharging of tankers are pumps and pipes, which are not used in tramps. Another distinguishing characteristic is the physical size difference between tankers and dry bulk ships. Owing to economies of scale, the larger a ship is for the transport of cargoes, the lower is the unit cost. In gen-eral, tankers are larger than bulkers. Tanker shipping was one of the first types of shipping to make use of this important concept to improve operations efficiency (Metaxas 1971). An example is the deployment of ultralarge crude carriers with a carrying capacity of over 300,000 deadweight tons.

1.3 World Economic Development and Shipping 5
1.2.2 Liner Market
A main function of liner shipping is to satisfy the demand for regular transport under which cargoes are transported through regular routes and with regular schedules. Liners operate according to a schedule of ports of loading and dis-charge, usually adhering to a published timetable with set conditions of carriage. They operate like trains of international seaborne trade (Farthing and Brownrigg 1997), with cargoes made up of a large number of different consignments from different shippers. Liner cargo is mainly made up of manufactured or partly manu-factured goods. The majority of liner cargo is carried in containers. Containeriza-tion seems to have become a “must” for ports, as the provision of container facili-ties is considered to be one of the prerequisites for success in the new shipping business environment (Notteboom 2002).
Cargo liners are more expensive vessels than tramp ships because their building and operating costs are usually higher. For example, cargo liners usually deploy ships of speed higher than that of tramp ships. The full cellular container ships are separated into compartments, which enable containers to be dropped in vertically between systems of container guides and to be stacked in holds. Furthermore, several tiers of containers can be carried on top of the hatch cover. Their accom-modation is larger, with more facilities and comfort than tramp ships. As the car-goes transported by liners belong to many shippers, the administrative processes of cargo liners are far more complex. As a result, both the construction and the operational costs of liners are higher.
1.3 World Economic Development and Shipping
The economic development in the nineteenth century predetermined the path of the world’s shipping industry. Thanks to the industrialization of the West in the nineteenth century, the world experienced a boom in international exchange of goods, which brought an unprecedented boom of international trade by sea trans-port. The basis of the world trade system in the twentieth century originated in the West: it dealt with the flow of industrial goods from Europe to the rest of the world, as well as the flow of raw materials to Europe from the rest of the world. The pattern of seaborne trade changed from time to time. Some trade grew rapidly, some stagnated, and some declined. The West has maintained its leadership role in the global manufacturing of high-technology products, but there is no guarantee that this trend will continue.
Owing to changes in the world’s production pattern, economic developments in emerging countries such as China and India have increasingly contributed to the shipping business by generating more cargoes for sea transport (Stopford 2004). China, India, and other emerging economies are favourably competitive not only in terms of their low-value-added, high-labour-content jobs, but also in

6 1 International Trade and Shipping
terms of their advanced manufacturing activities. Their path to prosperity is by means of utilizing the world’s best manufacturing companies and the best tech-nologies to employ their workers and build their economies. Increasingly, the exports of China and India to the USA are composed of advanced-technology products. For instance, Intel and Microsoft announced huge investments in India to build world-class infrastructure for more complex, high-value-added works (Panchak 2006).
Among the world’s major emerging economies, known as BRICs (i.e., Brazil, Russia, India, and China), shippers are targeting cashing in on the growth of global trade. Rising demand from BRICs prompts liner shipping companies to increase their carrying capacity. For example, against the backdrop of growing demand for liner shipping services, shipping business leaders in Japan – NYK, MOL, and K Lines – have developed ambitious plans to expand their fleets. These three shipping companies increased their carrying capacity from 758,537 20 ft equivalent units (TEUs) (NYK 290,678 TEUs, MOL 246,895 TEUs, and K Lines 220,964 TEUs) in 2004 to 1,028,632 TEUs (NYK 349,040 TEUs, MOL 366,871 TEUs, and K Lines 312,721 TEUs) in 2008.
Seaborne trade has attained a growth rate of about 50% since 1990 (Morrison and Ward 2004). In 2004, it amounted to about six billion tons of goods annually, accounting for more than 90% of world trade by volume. This accelerating growth rate may be caused by China, which has become one of the world’s biggest con-sumers of raw materials. Bulk trade has experienced booms on China’s import side. On the other hand, China is rapidly expanding exports of manufactured parts and finished products. Chinese factories are producing huge quantities of seaborne exports. The majority of China’s export goods are transported in container ships. This has resulted in a global shortage of ships, both bulk ships to serve China’s imports and container ships to serve its exports. Therefore, since 2004, major shipping companies around the world have been aggressively developing their carrying capability and investing in vessel construction.
1.4 Sea Transport System
An important point to note in international trade is that emerging countries usually have a high trade volume and a high output level. For instance, much of the growth in bulk trade has centred on countries in Southeast Asia. For coal, the demand primarily comes from extra steam-grade coal imported into Japan and South Korea. Demand for iron ore mainly comes from China, whose imports to-talled 208 million tons in 2004. China is now not only producing a quarter of the world’s steel, but is also importing around 36% of global iron ore. On the other hand, containerized exports from Asia have increased dramatically since China has become the factory of the world in producing manufactured products. A study

1.4 Sea Transport System 7
from the Port Import–Export Reporting Service indicates that imports by the USA from China increased by 18.3% in 2003 (Mongelluzzo 2004).
The reasons for the high trade volume and high output level in emerging coun-tries are summarized below:
• Emerging countries have greater needs for raw materials. • Along the long road to economic development, local resources may be depleted
and the need for import arises. • Emerging countries, such as China and India, are able to supply low-cost labour
to produce manufactured products for export. • Emerging countries can afford imports as they have cargoes to export.
1.4.1 Shipping Intensity
It seems that economic growth generates international trade, which in turn creates demand for sea transport. Further to the relationship between seaborne trade and economic growth, we turn to discuss the concept of shipping intensity. Shipping intensity can be used to measure the propensity for sea transport in different eco-nomic sectors. Some economic activities have a higher propensity for sea trans-port. The concept of shipping intensity explains the relationship between eco-nomic activity and the level of sea transport being adopted. Table 1.1 shows the shipping intensity of different sectors of economic activity.
Agriculture, mining, and manufacturing are in general directly involved with trade, either through imports or through exports, where growth in these economic sectors usually generates demand for sea transport. On the other hand, businesses in the sectors of telecommunication and professional services generate fewer car-goes for shipping. Looking forward, economic activity is likely to shift away from trade-intensive sectors towards service sectors. Economic outputs are being dir-ected towards value-added products/services. Changes in economic activity will have consequences for trade. In general, service-based economies use less sea transport. The new sources of job growth in economies and industries, such as software development, education, biotechnology, tourism, and business services, are less likely to be contributors for shipping demand.
Table 1.1 Shipping intensity
Economic activity Shipping intensity
Agriculture High Mining High Manufacturing High Telecommunication None Professional services None

8 1 International Trade and Shipping
1.4.2 Concept of Parcel Size Distribution
To explain how the shipping business approaches the task of transporting cargoes, the concept of parcel size distribution (PSD) is useful. A “parcel” is an individual consignment of cargo for shipment. For a particular commodity trade, PSD de-scribes the range of parcel sizes in which cargo is transported (Stopford 2004). The use of PSD to determine the transport of bulk and general cargo is illustrated in Fig. 1.1.
PSD answers the question “which cargoes go in which ships?” Cargo of simi-lar sizes tends to use the same type of shipping service. For example, movement of bulk commodities such as iron ore and coal requires the use of bulk carriers since the cargo parcels are big enough to fill an entire ship. On the other hand, for movement of general cargoes such as radios and watches container liner shipping services are preferred since these cargoes are mainly small consign-ments, which are too small to fill a whole ship, and it is better to load them with other consignments on a ship for transport to fully utilize the shipping space and spread out the shipping cost. Hence, the PSD concept is useful for classifying cargoes into “bulk cargo” and “general cargo” to determine how cargoes are to be shipped.
Seaborne TradeSeaborne trade
Big Parcel(Bulk cargo)Big parcel
(Bulk cargo)
Small Parcel(General Cargo)
Small parcel(General Cargo)
Containerized / Loose Cargo
Containerized / loose cargo
Dry Bulk /Liquid Bulk cargo
Dry bulk /liquid bulk cargo
Liner ShippingLiner shippingBulk ShippingBulk shipping
Fig. 1.1 Transport of bulk and general cargo

1.5 International Trade Pattern 9
1.5 International Trade Pattern
Sargent (1930) commented that “the ultimate determining element in the employ-ment of shipping lies in the sum of geographical conditions of each region in rela-tion to other regions of the world, though the effect of such conditions may be modified greatly by economic or political policy on the part of individuals or gov-ernment”. With over 80% of the world trade by volume being handled by ocean carriers, sea transport remains the backbone supporting international trade and accelerating globalization (UNCTAD 2008).
1.5.1 World Output and World Trade
Economic indicators such as world output growth and trade volume play a deci-sive role for shipping mangers to make business decisions on adjusting shipping capacity (Branch 1998). Generally speaking, there is a positive relationship be-tween growth in world output and growth in world trade. Figure 1.2 presents the relationship between growth in GDP and trade volume from 2002 to 2007. The figure indicates a positive relationship between growth in seaborne trade and world output growth. A decrease in world output growth led to a decrease in both exports and imports. On the other hand, an increase in world output growth trig-gered demand for both exports and imports.
0.0
2.0
4.0
6.0
8.0
10.0
12.0
14.0
2002 2003 2004 2005 2006 2007Year
Gro
wth
rate
Growth in GDPGrowth in exportsGrowth in imports
Fig. 1.2 Growth rate of world output and world trade. (Source UNCTAD 2008)

10 1 International Trade and Shipping
Figure 1.2 also shows that world exports and imports have been growing at a faster pace than world GDP. Globalization and trade liberation are the main drivers for this high growth rate in seaborne trade. World markets have become increasingly globalized. To a large extent, this reflects that the majority of, if not all, countries are adjusting to trade liberalization pressures observable around the world (Branch 1998). These pressures have led countries to form international trading blocs, such as the World Trade Organization (WTO) and the North Ameri-can Free Trade Agreement (NAFTA). There are also other trading blocs such as the Association of Southeast Asian Nations (ASEAN) and the Asia–Pacific Eco-nomic Cooperation (APEC) to encourage the growth of intra-Asian trade.
These trading blocs have a common objective: to open up new trading opportu-nities by facilitating international trade. International trade brings widespread economic impact to local, regional, and national economies. The world’s most massive industrial developments over the past two centuries first took place in Europe, followed by North America, and then East Asia. These trade patterns have shaped the ocean trade routes. The growth in international trade has led to a rapid growth in manufactured sectors, which represent the world’s largest markets for seaborne shipment (Fleming 2002, 2003).
1.5.2 Overall Seaborne Trade
The volume of international seaborne trade increased significantly in the last few decades. Table 1.2 shows the development of international seaborne trade from 1970 to 2000. According to UNCTAD (2004), cargo transported by ships can be broadly classified into several categories, namely, seaborne trade in oil, main bulk, and dry cargoes. Oil includes crude plus products, whereas main bulk consists of five commodities, namely, iron ore, gains, bauxite, aluminium, and rock phos-phate. Dry cargoes include minor dry bulks and liner cargoes. Since 2000, the patterns of international seaborne trade have been experiencing constant changes where minor bulks and liner cargoes have evolved as major shipping commodities, with their cargo volume loaded reaching 2,533 million tons. Tanker trade remains in second position, whereas main bulk is the least important in terms of cargo volume loaded.
Transport demand is affected by both the volume of cargo and the distance for transport, which determine the time it takes the ship to complete the voyage. Table 1.3 provides data on total demand for shipping services measured in ton-miles. Ton-miles is the tonnage of the cargo shipped multiplied by the average distance over which it is transported. In 2007, world seaborne trade was estimated at 32,932 billion ton-miles. With China and other countries seeking to diversify their sourcing of energy from distant markets, the number of ton-miles for crude

1.5 International Trade Pattern 11
oil and oil products increased by 2.5%. For all other dry cargoes, the number of ton-miles increased by 6.1%. The number of ton-miles for dry bulk cargoes is expected to grow continuously as a result of the need of China to import iron ore from new suppliers located in Latin America to meet its increasing demand for these raw materials.
Major loading and unloading areas are located in developing regions, followed by developed economies and transition economies. Table 1.4 shows the geograph-ical breakdown of total goods loaded and unloaded by region. The results show that Asia ranked top in terms of percentage share of loaded tonnage, with a share of 40%, followed in descending order by the Americas, Europe, Africa, and Oceania. In terms of unloaded goods, Asia also ranked top, with a share of 48% of total trade volume, followed by Europe, the Americas, Africa, and Oceania.
Table 1.2 Development of international seaborne trade (in millions of tons loaded)
Year Oil Main bulk Other dry cargoes Total
1970 1,442 448 676 2,566 1980 1,871 796 1,037 3,704 1990 1,755 1,288 1,285 4,008 2000 2,163 1,876 2,533 5,987
Table 1.3 World seaborne trade (in billion ton-miles)
Year Oil Main dry bulks Other dry cargoes World total
1970 6,487 2,049 2,118 10,654 1980 9,405 3,652 3,720 16,777 1990 7,821 5,259 4,041 17,121 2000 10,265 6,638 6,790 23,693 2005 11,749 9,119 8,730 29,598 2007 12,440 10,827 9,665 32,932
Table 1.4 World seaborne trade by region in 2007 (in percentage share of tonnage)
Region Goods loaded Goods unloaded
Africa 10 5 Americas 23 19 Asia 40 48 Europe 18 27 Oceania 9 1

12 1 International Trade and Shipping
1.6 International Maritime Passages
In discussing international trade, it is essential to consider the world geographical pattern. The basic features of sea transport are constrained by the world’s geogra-phy. International maritime routes are forced to pass through specific locations corresponding to passages, capes, and straits. These routes are generally located between major economic zones, such as western Europe, North America, and East Asia. Figure 1.3 illustrates international maritime passages.
1.6.1 The Panama Canal
The Panama Canal is approximately 80 km long between the Atlantic Ocean and the Pacific Ocean (Panama Canal Authority 2009). This waterway cuts through one of the narrowest saddles of the isthmus that joins North America and South America. The Panama Canal uses a system of locks–compartments with entrance and exit gates. The locks function as water lifts: they raise ships from sea level (the Pacific or the Atlantic) to the level of Lake Gatun (26 m above sea level); ships then sail the channel through the Continental Divide. The Panama Canal handles about 12% of American international seaborne trade. In December 1999, the Panama Canal became the property of Panama under the jurisdiction of the Panama Canal Authority. The same year, Hong Kong port operator Hutchison-Whampoa took operational control of the ports at both the Atlantic (Port of Colon) and the Pacific (Port of Panama City) sides of the Panama Canal with a 25-year lease. The company also became involved in the improvement of the rail line between the two ports to handle the growing amount of containerized traffic. This
PanamaPanamaPanama
AtlanticOcean
PacificOcean
IndianOcean
Cape Horn
Cape ofGood Hope
Suez Hormuz
MalaccaMalaccaMalacca
Fig. 1.3 International maritime passages

1.6 International Maritime Passages 13
rail line is important as it offers an alternative to the size limitations of the Panama Canal, which prevents large – post-Panamax – container ships from going through.
1.6.2 The Suez Canal
The Suez Canal is an artificial waterway in Egypt, connecting the Mediterranean Sea to the Gulf of Suez, and then to the Red Sea. The Suez Canal is 163 km long, with a canal width of a minimum of 60 m (Suez Canal Authority 2008). The Suez Canal is extensively used by modern ships, as it is the fastest crossing from the Atlantic Ocean to the Indian Ocean. Taxes paid by the vessels represent an impor-tant source of income to the Egyptian government. The Suez Canal has no locks3 because the Mediterranean Sea and the Gulf of Suez have roughly the same water level. It acts as a shortcut for ships between both European and American ports and ports located in southern Asia, eastern Africa, and Oceania.
1.6.3 The Strait of Malacca
The Strait of Malacca is one of the most important strategic passages of the world because it supports the bulk of the maritime trade between Europe and Asia, which accounts for 50,000 ships per year (i.e., 600 ships per day). The Strait of Malacca forms the main ship passageway between the Indian Ocean and the Pa-cific Ocean. It is about 800 km in length, has an average width between 50 and 320 km (2.5 km at its narrowest point), and a minimum channel depth of 23 m. It represents the longest strait in the world used for international navigation.
1.6.4 The Strait of Hormuz
The Strait of Hormuz is a strategic link between the oil fields of the Persian Gulf and the Indian Ocean. It has a width of between 48 and 80 m, but an only 6-km-wide navigation channel (with two, 3-km wide channels, each exclusively used for inbound or outbound traffic, respectively). It represents the most important stra-tegic passage in the world for oil transport.
————— 3 A canal lock or a navigation lock is a device that lifts or lowers boats, barges, or other vessels from one water level to another. Locks used on canals allow the negotiation of hills without recourse to lengthy detours.

14 1 International Trade and Shipping
1.6.5 The Strait of Magellan
The Strait of Magellan is 530 km long and 4–24 km wide. It is a navigable route immediately south of mainland South America. The strait is arguably the most important natural passage between the Pacific Ocean and the Atlantic Ocean, but it is considered a difficult route to navigate because of the inhospitable climate and its narrow passage. This passage is a relatively narrow stretch of ocean separating Cape Horn (the southern tip of South America) from Antarctica, the waters of which are notoriously turbulent, unpredictable, and impeded by icebergs and sea ice. With the construction of the Panama Canal in 1916, this passage lost its stra-tegic importance.
1.6.6 The Cape of Good Hope
The Cape of Good Hope is located at the extreme southern tip of the African continent that separates the Atlantic Ocean and the Indian Ocean. It got its name because it offers a maritime passage towards India and Asia, and is regarded as the hope of a fortune for those who pass it. Since the widening of the Suez Canal in the 1970s, the Cape of Good Hope has lost some of its strategic importance.
1.7 Conclusions
Improvements in international shipping by developing trade routes are one of the main features of globalization. Together with progress in trade liberalization in many countries, sea transport has become faster, more reliable, and cheaper (Sanchez et al. 2003). Lower transport costs lead to higher levels of foreign in-vestment, a higher savings ratio, an increased volume of export, easier access to technology and knowledge, and a decline in unemployment. Analysing the com-ponents of transport costs is a complex issue. Demand for transport service is derived from trade, which is influenced by a number of factors that have an impact on the costs of transport. Generally speaking, the cost of transport is essentially the price of a transport service, and is determined by the supply and demand of that service. More discussions on shipping demand and supply will be presented in later chapters. Lower transport costs would reduce the final product price and lead to an increase in trade volume. Furthermore, expanding trade volume in the long run would reduce the unit cost of transport by allowing economies of scale and greater specialization in terms of efficiency, frequency, and reliability in shipping operations.

References 15
References
Branch EA (1998) Maritime economics. Thornes, Cheltenham Farthing B (1993) International shipping. Lloyd’s list practical guides. Lloyd’s of London Press,
London Farthing B, Brownrigg M (1997) Farthing on international shipping. Lloyd’s of London Press,
London Fleming KD (2002) Reflections on the history of US cargo liner services (part I). Marit Econ
Logist 4(4):369–389 Fleming KD (2003) Reflections on the history of US cargo liner services (part II). Marit Econ
Logist 5(1):70–89 Kendall LC, Buckley JJ (2001) The business of shipping. Cornell Maritime Press, Centreville Metaxas BN (1971) The economics of tramp shipping. Athlone Press of the University of Lon-
don, London Mongelluzzo B (2004) Playing catch-up: imports from China continue to grow faster than the
capacity of U.S. ports and intermodal rail network. J Commer 5(32):18–25 Morrison K, Ward A (2004) Shipping industry slow to ride wave of global demand. Financial
Times 8 March 2004 Notteboom T (2002) Current issues in port logistics and intermodality. Institute of Transport and
Maritime Management Antwerp and Institute of Maritime Transport and Seaborne Trade, Antwerp
Panama Canal Authority (2009) This is the Canal http://www.pancanal.com/eng/general/ asi-es-el-canal.html
Panchak P (2006) Wake-up call from Asia. Ind Week 255(1):9 Sanchez R, Hoffmann J, Micco A, Pizzolitto G, Sgut M, Wilmsmeier G (2003) Port efficiency
and international trade: port efficiency as a determinant of maritime transport costs. Marit Econom Logist 5(2):199–218
Sargent AJ (1930) Seaways of the Empire. Black, London Smith A (1776) The wealth of nations. Penguin, London Steenbrink P (1974) Optimization of transport network. Wiley, New York Stopford M (2004) Maritime economics. Routledge, New York Suez Canal Authority (2008) About Suez Canal. http://www.suezcanal.gov.eg/sc.aspx?show=17 UNCTAD (2004) Review of maritime transport. United Nations Conference on Trade and De-
velopment, Geneva UNCTAD (2008) Review of maritime transport. United Nations Conference on Trade and De-
velopment, Geneva

17 Y.H.V. Lun, K.-H. Lai and T.C.E. Cheng Shipping and Logistics Management, © Springer 2010
Chapter 2 Freight Rate Mechanism
Abstract This chapter analyses the freight rate mechanism in the shipping mar-ket. Sea transport is a derived demand where shipping demand occurs as a result of seaborne trade. The demand determinants affecting sea transport include gov-ernment and political factors, the world economy, seaborne commodity trade, average haul, and transport costs. On the other hand, determinants for shipping supply are fleet size and operational efficiency. The shipping supply function shows the quantity of shipping services by sea transport carriers that would be offered at each level of the freight rate, whereas the shipping demand function shows how shippers adjust their demand requirements to changes in freight rates. In the shipping market, the supply and demand curves intersect at the equilibrium price, where both carriers and shippers have reached a mutually acceptable freight rate. Furthermore, the concept of the “shipping cycle” is introduced in this chapter. A shipping cycle starts with a shortage of ships and increases in freight rates, which in turn stimulates excessive ordering of new ships. The delivery of new ships leads to more supply in shipping capacity. The shipping cycle is a competi-tive process in which supply and demand interact to determine freight rates.
2.1 Demand for Sea Transport
The shipping business uses the market mechanism to regulate supply and demand. Demand for freight transport is determined by demand for physical commodities in a given location. Because of the uneven distribution of natural resources and spe-cialization of production, some areas experience an oversupply of certain com-modities, whereas other areas suffer from a deficit. This geographical imbalance gives rise to the fluctuation in demand for freight transport (Coyle et al. 2000).
In the past few decades, there were occasions when shipping demand grew, stagnated, and then declined. Figure 2.1 illustrates the determinants of demand for sea transport. The determinants of shipping demand include variables, other than

18 2 Freight Rate Mechanism
freight rates, that affect the amount of sea transport buyers are willing and able to buy at some point in time. As far as the demand for sea transport is concerned, there are five key determinants influencing shipping demand. The five determi-nants for sea transport are political factors, the world economy, seaborne commod-ity trade, average haul, and transport costs (Stopford 2004).
2.1.1 Political Factors
Political factors cover the strategies adopted by a government (Branch 1998). These factors include the government’s intervention in trade and shipping matters, as well as the use of trade policies to protect home-made products against foreign goods. Considerations by government bodies on whether to intervene include whether the government is democratically elected by citizens and has predeter-mined fiscal policies, and whether the country is a member of any economic/ trad-ing bloc and its attitudes towards maintaining membership of international con-ventions such as the WTO.
Other political factors refer to occurrences such as wars, revolutions, national crises, or even strikes. Examples of political events include the Korean War in the 1950s, which led to commodity stockpiling in Western countries; the invasion of Kuwait by Iraq in 1990, which created a tanker boom because speculators used tankers for oil storage; and the incident on 11 September 2001, after which world output grew only by 1.3%, which was only one third of the remarkable growth recorded in the previous year (UNCTAD 2002).
Political factorsPolitical factors
World economyWorld economy
Seaborne tradeSeaborne trade
Average haulAverage haul
Transport costTransport cost
Fig. 2.1 Determinants of demand for sea transport
2.1 Demand for Sea Transport 19
2.1.2 World Economy
An important factor affecting shipping demand is the world economy. After the incident on 11 September 2001, decrease in world output growth led to a reduction in both global export and global import. On the other hand, world output growth has brought an increase in both global export and global import since 2002 (UNCTAD 2005). It seems that the world economy and the demand for sea trans-port are positively related because the world economy generates demand for sea transport through the export and import of various commodities. Fluctuations in world output growth create a cyclical pattern of demand for sea transport.
What is the relationship between the growth of sea trade and world output over time? The concept of “trade elasticity” can be used to describe this relationship. Trade elasticity is the percentage growth in sea trade divided by the percentage growth in world output. In the last three decades, trade elasticity was positive, with an average of 1.4 (Stopford 2004), indicating that sea trade grew 40% faster than world output growth over this period.
2.1.3 Seaborne Trade
To learn more about the relationship between seaborne trade volume and the world economy, it is desirable to examine seaborne commodity trade. A main reason for short-term volatility (usually within a year) in seaborne commodity trade is season-ality. For example, demand for energy trade can be characterized as a cycle due to a high level of energy consumption in winter in the northern hemisphere.
Long-term trends in commodity trade can be identified by observing economic characteristics of the industries that produce and consume the commodities in terms of form (i.e., change in demand for particular products), place (i.e., change in sources from which supplies of commodities are obtained), process (i.e., change due to the relocation of processing plants that change the trade pattern), and time (i.e., change in shippers’ requirements to obtain what they desire at designated times).
2.1.4 Average Haul
Demand for sea transport depends not only on the volume but also on the distance over which the cargo is shipped. A ton of iron ore transported from South America to China generates several times as much demand for sea transport as the same tonnage of iron ore shipped from Australia to China. This distance effect is gener-ally referred to as the “average haul” of the trade. Therefore, sea transport demand can be measured in terms of ton-miles, which is defined as the tonnage of cargo shipped multiplied by the average distance over which the cargo is transported.

20 2 Freight Rate Mechanism
The effect of demand for sea transport on average haul can be illustrated by China’s demand for bulk vessel capacity. Recently, China’s demand for raw ma-terials has been so enormous that it has exceeded the abilities of its relatively nearby suppliers, such as Australia, to meet its needs for iron ore, coal, and other commodities. Consequently, China needs to expand its supplier networks and source commodities further away from places such as Brazil, Chile, and South Africa (Leach 2005). This practice has consumed a large amount of global capac-ity of bulk ships because more ships are needed for longer voyages.
2.1.5 Transport Cost
In the last century, the development of transport systems, deployment of bigger ships, and adoption of more effective organization of shipping operations have resulted in a steady reduction in transport costs. Reduced transport costs stimu-late more demand for sea transport, with an impact on consumers’ purchasing decisions, locations of markets, sourcing, and pricing decisions (Coyle et al. 2000). Consumers make purchasing decisions on the basis of transport costs and product quality. Their product decisions (which affect manufacturers’ decisions on what products to produce or suppliers’ decisions on where to distribute them) are linked to transport costs and the availability of transport services. Decisions on where to market the products are largely affected by the ability of transport operators to deliver products to markets in a cost-effective manner. Decisions on where to source raw materials or finished goods depend on transport costs. Fur-thermore, pricing decisions are largely affected by transport costs, which can exert an influence on seaborne trade and long-term trade development.
2.1.6 Shipping Demand Curve
Demand is a functional relationship between the freight rate (i.e., price of sea transport) and the quantity demand for shipping services per time period. The demand curve for sea transport slopes downwards to the right, consistent with the law of demand. The law of demand states that buyers will increase their number of purchases of a product when its price falls, and will decrease their number of purchases when its price rises. A demand curve is a graphical repre-sentation of the relationship between the quantity demand for a product (e.g., sea transport tonnage capacity) and its price (e.g., freight rate). When the freight rate changes but other demand determinants remain constant, there is a change in quantity demand. A change in quantity demand refers to a movement along the demand curve leading to an adjustment from point A to point B, as shown in Fig. 2.2.

2.1 Demand for Sea Transport 21
Shipping demand depends on a number of factors. Seaborne trade is one of the most important determinants affecting the demand for sea transport. An increase or decrease in seaborne trade volume may lead to a change in the demand for sea transport. If any of the determinants for sea transport change, there will be a change in demand and the shipping demand curve will shift. For example, an increase in seaborne trade volume will bring an increase in the demand for sea transport. It shifts the demand curve to the right (i.e., from D to D1) in Fig. 2.2. On the other hand, a decrease in demand for sea transport shifts the demand curve to the left (i.e., from D to D2).
2.1.7 Elasticity of Demand
The concept of elasticity of demand for sea transport is useful for illustrating the relationships between the shipping industry’s gross revenue and output and changes in the freight rate. Demand for sea transport is a derived demand. For instance, the demand for tramp shipping depends on the demand for bulk materi-als. Furthermore, the demand for bulk materials depends on the level of consump-tion of the final products using the materials. On the basis of these derived demand characteristics, Metaxas (1971) made the following observations:
• The elasticity of demand for sea transport depends on the elasticity of consumer demand for the goods shipped by sea.
• The lower the cost of sea transport as a proportion of the total cost of the final good, the more inelastic the demand for sea transport will be.
Tonnagecapacity
Freightrates
A
B
DD2 D1
Fig. 2.2 Demand for sea transport

22 2 Freight Rate Mechanism
• The demand for sea transport will be more elastic if it can be easily substituted by another mode of transport.
• The demand for sea transport tends to be price-inelastic in the short run. • The magnitude of demand for sea transport is increasing in the long run as
shippers have sufficient time to adjust their shipping arrangements.
2.2 Supply of Sea Transport
Supply of sea transport is measured in terms of the supply of tonnage, which refers to the available capacity for carrying cargo from one or more ports to one or more ports by sea. All the ships that are trading in the freight market constitute “active shipping supply”. Ships that are not trading (i.e., laid-up tonnage1), consti-tute “available shipping supply”. All the ships that are suitable for trading (i.e., active shipping supply2) and the available shipping supply3 constitute the total shipping supply.
A unit of measure for estimating the quantity of shipping services produced or available is the capacity-ton-mile per unit of time. To estimate the supply of shipping services, both the cargo-carrying capacity and the distance of the voy-age must be taken into account. The shortage of bulk vessel capacity in the past few years has resulted from China’s huge demand for bulk commodities, which exceeded the ability of its nearby suppliers, such as Australia, to meet its re-quirements. Consequently, China feels the need to expand its supplier networks and source from more distant places such as South America and South Africa (Leach 2005).
The shipping market regulates shipping supply and demand. After discussing the issues of demand for sea transport, this section focuses on the supply of sea transport. The factors determining the supply of sea transport are illustrated in Fig. 2.3. The supply of ships is affected by four parties: shipowners, shippers or charterers, bankers, and various regulatory authorities. Ship owners decide whether to order new ships or scrap old ships. Shippers influence shipowners by ordering shipping space to transport their cargoes. Bankers influence capital investment as lenders to finance ship purchases. Regulators affect fleet capacity through safety or environmental legislation.
In the long run, deliveries of new ships and scrapping of old ships determine the rate of fleet growth. Owing to the shortage of ships in 2004, investors placed a large number of orders to build new ships. In 2006, carriers added to their global fleets about 110 post-Panamax vessels ranging in capacity from 5,500 to 9,500 TEUs. They also possessed an additional 72 Panamax-size ships ranging in capacity from 4,000 to 5,000 TEUs (Mongelluzzo and Leach 2006). As vessel
————— 1 Ships not in active service owing to awaiting better markets or needing work for classification. 2 Ships that are trading in the freight market. 3 Ships that are seaworthy but are not trading in the freight market (e.g., laid-up ships).

2.2 Supply of Sea Transport 23
capacity increased by nearly 15%, the freight rate became flat or even declined on certain trade lanes (Clarkson Research Limited 2006).
On the other hand, ship scrapping is a business decision dependent on ship-owners’ predictions of the future operating profitability of ships, as well as their own financial positions. During a recession, if a shipowner believes that there is a low chance of a freight boom in the foreseeable future, it is likely that unprofit-able ships will be scrapped. In the shipping market, supply of shipping capacity adjusts when demand for sea transport does not turn out as expected. This market mechanism determines the fleet size in the shipping market.
A striking feature of the world fleet in the last few decades is that there have been rapid technological developments over the period. Technical progress and innova-tions in ship design and operations of vessels have led to jumps in operational effi-ciency. As a result, bigger, faster, safer vessels can be built, which are capable of providing shipping services at a lower cost per ton-mile, as well as more tonnage for shipping supply. Nowadays, visitors to any large container port are told two things: how big the port’s new cranes are, and how deep the port’s water is. This basic information is important because new generations of large container ships (which are well over 300 m long, more than 40 m wide, and with a capacity of carry-ing more than 8,000 TEUs of containers) are being delivered, and they need deeper water and well-equipped terminals. Shipowners prefer big ships owing to the poten-tial gains from cost economies (Wright 2005). On a longer time frame, shipping supply can be increased by building more-efficient ships or can be reduced by scrapping old ones. Consequently, the average freight rate can be maintained at lower levels in the long run. The low transport cost makes possible the opening of new trading routes and the expansion of the world freight market.
Investment decisions
Investment decisions
Fleet sizeFleet size
Ordering new ships
Ordering new ships
Scrappingold ships
Scrappingold ships
Operational efficiency
Operational efficiency
Fig. 2.3 Determinants of supply of sea transport

24 2 Freight Rate Mechanism
2.2.1 Shipping Supply Curve
The term “supply” refers to a functional relationship between the freight rate and the quantity supplied by carriers (Truett and Truett 1998). The supply of sea trans-port is strongly influenced by the freight rate. The shipping supply function shows the quantity of shipping services supplied by carriers in response to freight rate changes. If the freight rate falls below operating costs, ships will be laid up and supply is consequently reduced.
The slope of the shipping supply curve (as shown in Fig. 2.4) depends on three factors:
1. Bigger ships have lower transport costs per unit of cargo; hence, bigger ships will have a lower lay-up point. This drives smaller or inefficient ships into lay-up during recessions.
2. Old ships have higher operating costs so the lay-up point will occur at a higher freight rate.
3. When all the available tonnage is in use, the supply of tonnage can only be increased with higher speeds and improvement in the operations efficiency of ships. Under such circumstances, there will be a steeper slope of the shipping supply curve.
Price elasticity of shipping supply measures its responsiveness to changes in the freight rate. During recessions, the supply of sea transport tends to be very elastic when many vessels are laid up. The elasticity of shipping supply is constant at all the levels of output from the lay-up point to a maximum operational speed. The shipping supply is almost totally elastic when vessels’ output is severely strained (Evans 1988). When all the ships are in service, the supply becomes in-
Ship supply function shows the amount of sea transport offered at each freight rate
Freight rate
Supply of tonnage
Inelastic in supply
Fig. 2.4 Supply of sea transport

2.2 Supply of Sea Transport 25
elastic. In Fig. 2.4, the shipping supply function is a J-shaped curve describing the amount of sea transport the carriers provide at each level of the freight rate.
2.2.2 Short-run and Long-run Shipping Supply
How do shipping firms adjust their supply of shipping services? The supply of ship-ping facilities cannot expand or contract in the short run.4 In the long run,5 there is a time lag between entrepreneurs’ decisions to expand their fleets and the actual time of delivery of new vessels. Thus, the supply of shipping services tends to be inelastic and incapable of responding instantly to demand and freight rate changes.
“Short run” can be described as a period in which all the fixed factors cannot be adjusted fully. The capital stock, such as ships, and other fixed inputs cannot be adjusted and entry is not free (Samuelson and Nordhaus 1992). With respect to shipping supply, Metaxas (1971) made the following suggestions for evaluating short-run shipping supply:
• Vessels under construction or under repair for long durations should not be considered as part of the total shipping supply.
• Vessels that will shortly proceed to scrapyards for breaking should not be con-sidered as part of the total shipping supply.
Considering the points above, it is unlikely that the number of ships will be in-creased or reduced in the short run. However, this does not mean that active sup-ply remains the same. If the freight rate is above equilibrium and if carriers antici-pate an upward trend in the freight market, active supply will increase as a result of the following developments:
• postponement of periodic surveys and maintenance; • maximization of the possible service speed at sea; • acceleration of the processes of loading and unloading to reduce the berthing
time; • reduction in laid-up tonnage.
On the other hand, if the freight rate is below equilibrium and if carriers do not anticipate an improvement in the shipping market, active supply will decrease as a result of the following incidents:
• decrease in the average speed of vessels at sea; • carrying quantities of cargo that are less than the maximum cargo-carrying
capacity of vessels; • slow operations in loading and discharging; • laying up of vessels.
————— 4 A time period sufficiently short where at least one input is fixed (e.g., vessel). 5 A time period sufficiently long so that all inputs are variables.

26 2 Freight Rate Mechanism
Depending on the level of the freight rate and carriers’ expectations of the shipping market, shipping firms adjust their output in the short run with a view to minimizing their costs and maximizing their profits. In the short run, there may be changes in the magnitude of active supply, but total supply cannot expand or con-tract. In other words, the supply of shipping services in the short run tends to be inelastic.
“Long run” is a term used to denote a period over which full adjustment to change can take place (Samuelson and Nordhaus 1992). It refers to the period in which capital stock, such as ships, can be replaced. It also denotes the time over which shipping firms can enter or leave the shipping industry. The magnitude of supply in the long run depends on the following factors:
• the level of demand for shipping services; • carriers’ expectations regarding the freight rate of the shipping market; • technical developments as technical progress and innovations in shipbuilding,
enabling more efficient provision of sea transport services.
Carriers’ expectations tend to be high when the freight rate is high. The supply of tonnage can be expanded when entrepreneurs follow one or more of the follow-ing courses:
• ordering new vessels; • repairing out-of-use vessels.
Ordering new ships is a way to increase shipping supply. Breaking up of old ships is a way to reduce shipping supply. Most orders to shipyards are placed during periods of high freight rates, whereas demand for new tonnage is at low levels during periods of low freight rates.
In periods of prosperity, demand for new tonnage tends to exceed the capacity of shipyards to supply it. If shipping firms decide to purchase ready-for-use ves-sels, they may look for ships in the second-hand market. During prosperous peri-ods, the prices of ready-for-use ships tend to be higher than the prices of new ships, which are to be ordered from shipyards. The price of a 5-year-old ship was higher than that of a new building in 2004 (Ocean Shipping Consultants Ltd 2004). This illustrates the importance of time lag between shipowners’ decisions to expand their fleets and the delivery times of new ships. As shipping firms seek tonnage supply by participating in the second-hand market for the sale and pur-chase of used tonnage, prices in the second-hand market tend to follow the market for new vessels.
During recession periods, an important factor affecting the contraction process can be the reluctance of shipowners to break up old ships. It is reasonable for shipowners to expect that, as long as the ship remains seaworthy,6 profitable trad-ing is highly possible in the future freight market. Another factor that can lead to the contraction of ship supply is related to the policy of shipyards. The shipbuild-ing industry relies on the demand for new ships. Owing to fluctuations in demand ————— 6 A ship is fit in all respects to cope with conditions likely to be encountered at sea.

2.3 The Freight Rate Mechanism 27
for new tonnage, shipyards offer shipping firms attractive terms for new orders, such as low prices or attractive financial terms for ship finance, to stimulate the demand for new ships.
2.2.3 Rigidity of Supply
Shipping is a capital-intensive industry. The costs of increasing or reducing the existing fleet size are high, and it takes about 25 years for the investment in new ships to be recovered. Moreover, since a long time interval (ranging from 1 to 4 years, depending on the capacity of shipyards) may elapse between ordering and delivering new ships, there are significant risks involved in ship investment. Therefore, managers usually do not order extra capacity until a definite trend for increased demand is assured. This situation can be viewed as supply rigidity. There are two types of supply rigidity, namely, institutional rigidity and techno-logical rigidity (Fusillo 2004). Technology constraints restrict instant ship supply owing to the time required to build new capacity. In liner shipping, technological constraints are a function of the adequacy of ports and related facilities to accom-modate new ships. An example is the intensity of China’s export growth since the 1990s, which created congestion at the port of Los Angeles–Long Beach, and the rapidly approaching full-capacity status of the Panama Canal (Tirschwell 2006).
Modern ships are large and expensive to purchase. Purchasing a ship also in-curs a significant financial risk as years pass between ordering and deploying a new ship. Moreover, addition to capacity in ocean shipping is subject to infra-structure constraints such as the capacity of seaports, the depth of harbours, and the width of canals. On the other hand, withdrawal of capacity during periods of low demand is costly. Sometimes, it may be more economical to leave ships laid up. This means that capacity is fixed in the short run. How fixed is liner shipping capacity? Fusillo (2004) proposed a stock-adjustment model to illustrate supply in liner shipping.
2.3 The Freight Rate Mechanism
The supply of sea transport is influenced by the freight rate. This is a mechan-ism that the market uses to motivate decision makers to adjust capacity in the short term and to find ways to reduce costs in the long run. On the demand side, the demand function shows how shippers adjust to changes in the freight rate. Figure 2.5 illustrates the freight rate mechanism.
Sellers and buyers transact in the market and their supply and demand require-ments cause the price to move. The “going price” is an equilibrium value of the price. This can be explained if we combine the demand and supply curve diagrams. The sea transport demand function shows the quantity of sea transport shippers

28 2 Freight Rate Mechanism
would purchase at each level of the freight rate. The sea transport supply function shows the quantity of sea transport carriers would offer at each level of the freight rate. The supply and demand curves intersect at the equilibrium price in the ship-ping market, which determines the freight rate at which the quantity demanded by shippers for shipping services is equal to the quantity supplied by carriers. At this point, both shippers and carriers reach a mutually acceptable freight rate level.
2.4 Shipping Cycle
Shipping cycles play an important role in the shipping industry for managing the risk of shipping investment. A ship is an expensive item of capital equipment. The return on investment of ships depends on the volume of trade. If ships are not invested in but trade grows, then business will come to a halt owing to a shortage of ships. If ships are invested in but trade does not grow, the expensive ships will be laid up. This is the shipping risk pertinent to ship investment. Cargo owners may decide to take this shipping risk when they are confident about their cargo volume in the future. Cargo owners may transport cargoes with their own fleets. This type of operation is known as “industrial shipping”. Alternatively, shippers may prefer shipowners to bear such shipping risk, and they go to the freight mar-ket to hire ships to transport their cargoes. Under such circumstances, shipowners trade ships and take the shipping risk. For shipping investors, it is necessary to understand the shipping market cycles.
Sea transport supply function shows the quantity of sea transport carriers would offer at each level of the freight rate
Freight rate
Sea transport demand function shows the quantity of sea transport skippers would purchase at each level of the freight rate
Sea transport demand and supply
Equilibriumfreight rates
Fig. 2.5 The freight rate mechanism

2.4 Shipping Cycle 29
2.4.1 Characteristics of Shipping Cycles
Shipping cycles are far more complex than a sequence of cyclical moves in the freight rate. Kirkaldy (1914) considered the shipping cycle as a consequence of the market mechanism. The market cycles create the business environment in which weak shipping companies are forced to leave and strong shipping compa-nies survive and prosper. Fayle (1933) suggested that the shipping cycle starts with a shortage of ships. The increase in the freight rate stimulates overordering of new buildings. Finally, it leads to market collapse and a prolonged slump. The shipping cycle is a mechanism to balance the supply of and demand for ships. If excessive demand exists, the market rewards investors with high freight rates until more ships are built. If there is excessive supply, the market squeezes the revenue with low freight rates until ships are scrapped.
2.4.2 What Causes the Shipping Cycle?
The shipping market is driven by a competitive process in which supply and de-mand interact to determine the freight rate. Excessive demand leads to a shortage of ships, which in turn increases the freight rate. On the other hand, excessive supply of ships leads to a reduction in the freight rate.
In general, the shipping cycle is unique, comprising the following characteris-tics (Stopford 2004):
• The shipping cycle is a mechanism to coordinate supply and demand in the shipping market.
• A complete shipping cycle has the following stages: trough, recovery, peak, and collapse.
• There are no set rules about the length of each stage. • There is no formula to predict the pattern of the next shipping cycle.
2.4.3 Recent Developments in the Shipping Market
Recent developments in the shipping market are useful managerial reference for shipping executives, and are summarized below:
• Stage of collapse: Between 1995 and 1998, the container shipping capacity grew at a faster rate than demand. Together with the Asian financial crisis in 1997–1998, this imbalance in supply and demand caused a sharp decline in the freight rate and profitability.
• Stage of trough: In 1999, an increase in demand for container shipping services and a low delivery of new buildings led to higher freight rates. In 2000, freight rates remained stable and the balance between container shipping demand and

30 2 Freight Rate Mechanism
supply improved. In 2001, the growth in international trade was adversely af-fected by the global economic slowdown, particularly in the USA, leading to another sharp decline in the freight rate and profitability. Consequently, the demand for shipping dropped dramatically.
• Stage of recovery: Led by increasing exports as well as imports, China’s econ-omy maintained a very positive development, and foreign direct investments in its manufacturing industries persisted remarkably well (Christensen 2004). Ow-ing to the increasing globalization effect, demand for international container trade showed strong growth during 2002–2003, and freight rates increased sig-nificantly across the important trade routes.
• Stage of peak: In 2004, world shipping prices were steaming ahead at record levels powered by China’s significant increase in demand for import com-modities and huge export of manufactured goods to the West. Second-hand vessel prices were high and scrapping rates for old ships were very low. Ow-ing to a shortage of ships, shipowners placed a significant number of new or-ders in 2004. More new ships were delivered and put into operation in the shipping market; the shipping capacity available in the market became stable in 2005–2006. With a big influx of vessel capacity into the market in the pe-riod 2006–2008, there was heavy downward pressure on the ocean freight rate (Traffic World 2005).
2.4.4 Managing the Shipping Cycle
Whereas a large ship could have been bought for about USD 32 million in late 2001, a few years later, in 2004, a large second-hand large ship could be sold for USD 62 million (Xinhua Financial Network News 2004). The real money in mer-chant shipping in the long term is made not only by people who trade in the freight market, but also by people who buy and sell ships at the right time. It is difficult to predict shipping cycles, but it is not impossible to understand the shipping market. Skilled investors use the principle of buying low and selling high. They acquire ships at the bottom of the shipping market when ships are cheap. They sell ships when the peak is reached and take time charters for operations long enough through the trough.
Nevertheless, shipping cycles are not “regular”. In reality, shipping cycles are loose sequences of ups and downs. Simple rules like the “5-year cycle” or the “7-year cycle” are unreliable tools as decision criteria to predict shipping cycles. There are cyclical booms and busts repeatedly in the shipping market. Careful study of the variables relating to the economic environment, trade growth, new ordering, and scrapping of ships can remove uncertain factors in the prediction. In addition, investors must also consider political issues such as wars, terrorist at-tacks, strikes, congestions, and infrastructure developments.
The global economic and political environment is complex. Shipping econo-mists need to wait months or years for statistical data to predict the market situa-

References 31
tion. Under such circumstances, shipowners are more or less in the same position as other speculators when they decide to invest in vessels. Investors in the market must understand the shipping cycle and be prepared to take the shipping risk.
Stopford (2004) observed the following characteristics of risk management in the shipping market:
• There are both winners and losers in the shipping market. Shipping is not a zero-sum game, but it is pretty close to it.
• Shipping cycles are not random. Although highly complex, economic and po-litical forces, which drive shipping cycles, can be analysed.
• Like poker, each player must assess his opponents then work out who will be the loser this time. In the end, no loser means no winner, especially in the sale and purchase market, in which second-hand ships are traded.
The job of shipowners is to make the best estimate of the shipping risk that they can afford. These decisions are complex and require decisive actions. For experi-enced investors, their decisions are based on their experience of past shipping cycles, together with an understanding of the global economic and political envir-onments, and access to up-to-date market information. A good understanding of the market mechanism also helps buying and selling ships at the right time. For instance, vessels aged over 20 years old that were considered for the scrapyard in 2002 were able to earn exceptional money in 2004. The return on one voyage in 2004 could exceed the return from scrapping the vessel 2 years earlier.
References
Branch EA (1998) Maritime economics. Thornes, Cheltenham Christensen EB (2004) Bright outlook for Hong Kong as PRD manufacturing base continues
growth. Hong Kong Shippers’ Council, Hong Kong Clarkson Research Limited (2006) Shipping Intelligence Weekly 3 February 2006 Coyle JJ, Bardi EJ, Novack RA (2000) Transportation. South-Western, Cincinnati Evans JJ (1988) The elasticity of supply of sea transport. Marit Policy Manag 15(4):309–313 Fayle EC (1933) A short history of the world’s shipping industry. Allen & Unwin, London Fusillo M (2004) Is liner shipping supply fixed? Marit Econ Logist 6(3):220–235 Kirkaldy AW (1914) British shipping. Kegan Paul, Trench, Trübner, London Leach P (2005) Bulking up. J Commer 6(12):34–37 Metaxas BN (1971) The economics of tramp shipping. Athlone Press of the University of Lon-
don, London Mongelluzzo B, Leach P (2006) Flexibility. J Commer 7(2):10–13 Ocean Shipping Consultants Ltd (2004) Shipping profitability to 2015 – the outlook for vessel
costs and revenue. Ocean Shipping Consultants, Chertsey Samuelson AP, Nordhaus DW (1992) Economics. McGraw-Hill, New York Stopford M (2004) Maritime economics. Routledge, New York Tirschwell P (2006) The Suez alternative. J Commer 7(5):54 Traffic World (2005) Bigger ships, bigger lines. Traffic World 19 December 2005 Truett L, Truett D (1998) Managerial economics. South-Western, Cincinnati UNCTAD (2002) Review of maritime transport. United Nations Conference on Trade and De-
velopment, Geneva

32 2 Freight Rate Mechanism
UNCTAD (2005) Review of maritime transport. United Nations Conference on Trade and De-velopment, Geneva
Wright R (2005) Size is not everything; growing ships: container vessels grow longer, wider, deeper. Where will it end? Financial Times 23 May 2005
Xinhua Financial Network News (2004) China’s wave of commodity buying fuels cargo shipping prices. Xinhua Financial Network News 6 December 2004

33 Y.H.V. Lun, K.-H. Lai and T.C.E. Cheng Shipping and Logistics Management, © Springer 2010
Chapter 3 Bulk Shipping Market
Abstract There are four separate but interrelated markets in shipping, namely, the freight market, which trades sea transport, the second-hand market, which trades used ships, the new building market, which trades new ships, and the demo-lition market, which deals with scrap ships. These four shipping markets are closely interrelated. This chapter aims to provide insights into the four shipping markets and explain how these separate markets interact to affect one another. We discuss an empirical study which shows that seaborne trade significantly affects fleet size and the freight rate. On the other hand, fleet size is affected by the freight rate, and the latter has a significant impact on vessel prices.
3.1 Introduction
Bulk shipping transport is a practicable and cost-effective means for transporting large volumes of cargo to serve international trade. Bulk ships carry dry cargoes in bulk from one port to another. Bulk shipping usually operates without a fixed route and schedule. In the freight market, cargoes are carried at freight rates, whereby the terms and conditions are negotiated between shippers and carriers through shipbrokers. There are numerous factors affecting the operation of the bulk shipping market. The performance of the bulk shipping market depends on the demand for and supply of bulk shipping services, as well as the characteristics of the market structure, such as the number of shipping firms, the sizes of their operations, and the degree of homogeneity of their services (Brooks 2000). Bulk shipping researchers have suggested that the bulk shipping industry operates under a market structure similar to that of perfect competition (Harlaftis and Theotokas 2002; Clarkson Research Studies 2004).

34 3 Bulk Shipping Market
The market structure of bulk shipping is characterized by several conditions:
• First, large numbers of firms that own bulk ships are able to provide similar bulk shipping services (Clarkson Research Studies 2004).
• In addition, entrants to the bulk shipping market can easily gain access to in-formation and customers such as freight rates from the Baltic Dry Index and customers from shipbrokers.
• Although the large capital investment required to purchase ships can deter new entrants to the bulk shipping market, assistance and support from shipping commercial banks are available to finance shipping investors.
• The entry barriers to the bulk shipping market are weak other than the large capital investment requirements.
• There are fewer regulatory or economic obstacles for bulk shipping firms to with-draw from the market. Their exit is unlikely to result in a corresponding decrease in the supply of tonnage as the exiting bulk shipping firms may have sold their tonnage to other shipping firms in the second-hand sale and purchase market.
• Product development and promotion activities are not necessary for bulk ship-ping firms to operate, and information about freight rates and other business mat-ters can be easily obtained through various sources such as the Baltic Dry Index.
• To a large extent, price (i.e., freight rate) and fleet size in the bulk shipping market are determined by the market.
From the industrial organization perspective, the demand and supply conditions in the bulk shipping market can influence the market structure. The market structure affects the operations and investment decisions of firms in the marketplace (Tirole 2003). In the bulk shipping market, buyers and sellers trade transport services to set the freight rate (i.e., price) and determine the fleet size (i.e., quantity). In the bulk shipping market, the freight rate is affected by seaborne trade, which is key to the demand for bulk shipping services. On the other hand, the freight rate can influ-ence carriers’ decisions on adjusting the fleet size to meet the market demand.
The bulk shipping market consists of four separate but interrelated markets (Stopford 2004), namely:
1. the freight market, where sea transport services are traded; 2. the new building market, where new ships are ordered and built; 3. the sale and purchase market, where second-hand ships are sold and brought; 4. the demolition market, where old ships are scrapped.
Figure 3.1 illustrates the composition of these four shipping market segments. These four shipping markets can further be divided into a real market and an aux-iliary market (Adland et al. 2006):
• The real market represents the new building and demolition markets, where an increase in new building leads to an increase in total capacity, whereas an in-crease in ship scrapping means a decrease in total capacity in the bulk shipping market.
• The auxiliary market corresponds to the freight market, which trades sea trans-port, as well as the sale and purchase market for second-hand ships. These are

3.2 The Shipping Market 35
auxiliary markets because the transactions in sea transport between shippers and shipping firms, as well as buying and selling of second-hand ships between shipowners, have no influence on the total capacity in the bulk shipping market.
3.2 The Shipping Market
These four shipping markets can be linked by cash flows among them (Stopford 2004). As shown in Fig. 3.2, the cash flow movement can be described as follows:
• The main cash inflow is the revenue generated from the freight market, where the ups and downs of freight rates are the primary mechanism driving investors to adjust their fleet sizes.
• In the demolition market, old ships sold to scrap dealers provide another source of cash inflow. In general, more old ships are delivered to scrapyards during a recession period. Demand for shipping services decreases during economic downturns. Scrapping of old ships in the demolition market reduces the total capacity in the bulk shipping market.
• Both cash inflow and cash outflow can be generated from the sale and purchase market, where shipowners buy and sell used ships. However, the transactions involving second-hand ships would not change the shipping capacity available in the shipping industry.
• Finally, the new building market is an outflow of cash as shipowners pay cash to shipyards for new ships.
Shipping Market
Shipping market
RealMarketReal
marketAuxiliaryMarket
Auxiliarymarket
New BuildingMarket
New buildingmarket
DemolitionMarket
Demolitionmarket
FreightMarket
Freightmarket
Sale & PurchaseMarket
Sale and purchasemarket
Fig. 3.1 Real market and auxiliary market in shipping

36 3 Bulk Shipping Market
Sale andPurchaseMarket
DemolitionMarket
New BuildingMarket
FreightMarket
ShippingCashFlow
Sale andpurchasemarket
Demolitionmarket
New buildingmarket
Freightmarket
Shippingcashflow
Fig. 3.2 Market segments that control shipping cash flow
3.2.1 New Buildings
Demand for new vessels reflects the need for sea transport capacity (Wright 1991). It usually takes a few years from ordering a new ship before the ship is ready to serve the freight market. A decision to order a ship should reflect a shipping inves-tor’s expectation of future freight rates. The price of building a new vessel can serve as a stabilization mechanism for the shipping industry. Figure 3.3 shows how the new vessel price can function to stabilize the shipping market:
• When sea transport demand goes up, the freight rate will increase and invest-ment in new vessels is accelerated subsequently.
• As a result, the new building price will rise, stabilizing the shipping market with a “barrier” to excessive profits (Dikos 2004).
• To increase the supply of sea transport at periods of high freight rates, ship-owners increase their fleet sizes by purchasing new ships (Leach 2004).
• Following the rise in the freight rate, shipbuilders will respond to the increased demand for new vessels by setting a higher price for new buildings. Thus, the freight rate can be considered as a determinant of the price of new buildings.
Building new ships is the primary method of increasing the supply of tonnage in the bulk shipping market. The demand for new ships by shipping firms is de-rived from the need for new tonnage to meet their increased sea transport require-ments. Because it requires a large capital investment to purchase a new ship, the

3.2 The Shipping Market 37
cost of building a new ship therefore becomes crucial in terms of return on in-vestment. Shipowners tend to favour a low new building price (Tsolakis et al. 2003). Investors opt for new ships when they perceive the price is low, with the expectation of selling the vessel later at a higher price (McConville 1999). There-fore, investors may order new ships when the price of building new ships is low. The price mechanism of the new building industry has implications for the de-mand for new vessels.
3.2.2 Second-hand Vessels
The main cash inflow of the bulk shipping business is the revenue generated from the freight market. Such inflow of cash from the freight market provides capital for shipowners to acquire new vessels, as well as second-hand ships to satisfy the market demand for sea transport (Clarkson Research Studies 2004). Because it takes a few years to build a new vessel, the second-hand ship market becomes an alternative source of ships during freight booms (Tsolakis et al. 2003). Indeed, Beenstock (1985) suggested that second-hand and new ships are substitutes as they are the same assets only differing in age.
The second-hand ship market can be considered as an auxiliary market because the buying and selling of second-hand ships is less likely to change the number of vessels or carrying capacity in the shipping market. On the other hand, the second-hand market is closely integrated with the freight market (Adland et al. 2006). The price of a second-hand vessel rises at the time of a freight boom and drops at the time of a freight depression. A key function of the second-hand ship market is to
Trade volumeTrade volume
Investment innew ships
Investment innew ships
Freight rateFreight rate
Price of new shipsPrice of
new shipsFirm’s profitFirm’s profit
Fig. 3.3 New vessel price as a stabilizing mechanism

38 3 Bulk Shipping Market
reallocate vessels among ship operators. Besides, the second-hand ship market improves the efficiency of the shipping market by reducing the market exit cost, where shipowners can sell their used ships when they leave the industry. It also facilitates market entry by allowing potential investors to buy used ships and enter the shipping market.
A ship could have been bought for about USD 32 million in late 2001. In 2004, a few years later, a used ship of similar size could be sold for USD 62 million (Xinhua Financial Network News 2004). To maximize their profits, investors acquire ships when ships are cheap and sell ships when the peak is reached. Owing to fluctuations in the price of second-hand ships, considerable profit opportunities may arise through “buy low and sell high” strategies. However, low freight rates usually coincide with low vessel prices, which are not desirable for shipowners with excessive tonnage, but they do provide a good opportunity for investors to buy ships at low prices (Tsolakis et al. 2003).
3.2.3 Demolition Vessels
The second-hand vessel sale and purchase market is highly competitive and cycli-cal, and the price movement is usually limited by the price of a new ship and the price of a scrap vessel (McConville 1999). The price of a new ship imposes a con-straint on the upper limits of second-hand ship prices. However, there are excep-tions during periods of a freight boom when shipowners pay in excess of new build-ing prices to secure timely tonnage to serve the freight market (Ocean Shipping Consultants Ltd 2004). On the other hand, the vessel scrapping price denotes the minimum price of a second-hand vessel. Similar to the second-hand vessel price, the scrap vessel price tends to follow the movement of the freight market (McCon-ville 1999). During the period of a freight boom, when expectation of future reve-nue is high, the second-hand vessel price is high and shipowners are reluctant to sell their tonnage for scrap. As such, there will be reduced scrap supply during the pe-riod of a freight boom, exerting pressure on the scrap dealers to increase the vessel scrapping price.
Old vessels sold to scrap dealers provide a cash source from the perspective of shipowners (Stopford 2004). The decision to scrap a ship is based on a carrier’s expectation of the future operating profitability of its ships and its own financial position. Usually, the supply of old ships to the scrap market depends on the scrapping value. The decision to scrap is related to shipowners’ expectations about the future prospects of international trading activities. Ships will be scrapped when profitability for ships is negative. A high scrap price motivates carriers to send more ships to the demolition market, which in turn reduces their fleet sizes. Scrap-ping can also be a tool for ship operators to adjust their capacity (Farthing and Brownrigg 1997). In sum, vessels in the bulk shipping market include new build-ings and second-hand and scrap vessels. Fleet size can be influenced by the prices of these vessels.

3.2 The Shipping Market 39
3.2.4 Freight Rate
The freight market trades shipping services for transporting cargoes. The demand for freight transport is a function of the freight rate and shipping demand per time period (Truett and Truett 1998). The freight market creates a situation where the freight rate moves to a level at which the shipping demand is equal to the shipping supply in the market (McConville 1999). Seaborne trade growth would lead to an increase in the freight rate. When the growth of seaborne trade triggers a shortage of ships, the shipping industry adjusts by increasing the fleet size (Leach 2004). Alternatively, the fleet size in the bulk shipping market will fall if there is a drop in the freight rate, reflecting the pessimistic view of carriers to generate profits from their existing fleet sizes.
3.2.5 Seaborne Trade
Bulk shipping allows flexibility in sea transport to satisfy the timely shipping requirements of seaborne trade by providing transport services worldwide (Kend-all and Buckley 2001). Carriage of cargo generally does not take place unless there is a need for cargo to be shipped. Shipping demand depends on the needs of shippers to transport their cargoes. Hence, seaborne trade is a major determinant of shipping services. An increase or a decrease in seaborne trade volume would change the demand for sea transport, which in turn influences the freight rate. In other words, the freight rate is determined by the demand for and supply of ship-ping services. The freight rate can serve as a signal for carriers and shippers to transact shipping services. If the seaborne trade volume increases, shippers de-mand more shipping services. When shipping demand exceeds shipping supply, the freight rate will go up. The freight rate coordinates the decision of carriers and shippers to transact shipping services in the bulk shipping market. A high freight rate tends to encourage growth in the world’s fleet. Such an association between the freight rate and fleet size can be regarded as the existence of an invisible hand that regulates the bulk shipping market (Smith 1776).
Whereas acquiring ships requires a high level of capital investment, the return on investment in ships depends on the volume of trade (Stopford 2004). If ships are invested in, but seaborne trade does not grow as expected, expensive ships could be laid up (Metaxas 1971). Demand for ships is derived from seaborne trade (Jansson and Shneerson 1987), and a change in seaborne trade can lead to a change in de-mand for ships. Demand for ships reflects the need for shipping capacity, whereas demand for sea transport is determined by the demand of consumers for goods. Such customer demands will subsequently lead to demand for bulk shipping. This suggests that shipping service providers have little control of shipping demand (McConville 1999). To cope with an increase in seaborne trade volume, carriers increase the supply of sea transport. In other words, shipping managers adjust their fleet sizes on the basis of changes in seaborne trade.

40 3 Bulk Shipping Market
3.3 The Empirical Model
In this section we discuss an empirical bulk shipping model, which provides an overview of a number of key factors that affect the bulk shipping market, and how these factors are related to one another. Lun and Quaddus (2009) used 16 years of data extracted from the bulk shipping industry to develop this empirical model. The data source is presented in the Appendix. Key findings are summarized below:
• Vessel prices and fleet size: The results show that both new building price and second-hand vessel price do not have a significant impact on fleet size. The findings indicate that a low new building price has no significant impact on the decision of shipping firms to increase their fleet sizes with new ships. On the other hand, a high vessel price does not have a significant impact on restrain-ing shipping firms from ordering new ships. Similarly, the price of second-hand vessels does not have a significant impact on the decision of ship operat-ors to adjust their fleet sizes.
• Four shipping market segments: The results suggest that there is a positive correlation between new building price and second-hand vessel price. The re-sults also suggest a positive correlation between new building price and scrap vessel price. On the other hand, the results indicate that the relationship be-tween new building price and the freight rate is weakly significant (with the p value between 0.050 and 0.100). In addition, second-hand vessel price is posi-tively correlated with scrap vessel price. The findings also show that both sec-ond-hand vessel price and scrap vessel price are positively correlated with the freight rate. Hence, the results indicate that the four markets in shipping (i.e., freight market, new building market, second-hand vessel market, and demoli-tion market) are interrelated, as demonstrated in Table 3.1.
• Freight rate, seaborne trade, and fleet size: The findings show that fleet size is affected by the freight rate, and the latter is influenced by seaborne trade. The study also found that fleet size is affected by seaborne trade.
The findings can be deployed to develop an empirical model of bulk shipping (as shown in Fig. 3.4). In the bulk shipping market, there are numerous shipping firms providing homogenous ships and services to compete for the revenue gen-erated from freight rates. In the freight market, the shipping demand is composed of many shippers who need ships to transport their goods by sea. The findings generally support the view that seaborne trade cargo volume positively affects the freight rate. More demand for shipping services leads to a higher freight rate. The capacity of the bulk shipping market is influenced by shipping firms’ re-sponses to changes in the freight rate. The findings suggest that there is a posi-tive relationship between the freight rate and fleet size. A trade boom that leads to increased freight rates would motivate shipping firms to increase their fleet sizes. The dynamics of the bulk shipping market determines the freight rate and fleet size. A market can be defined as “an arrangement whereby buyers and sell-

3.3 The Empirical Model 41
ers interact to determine the prices and quantities of a commodity” (Samuelson and Nordhaus 1992). In the bulk shipping market, higher seaborne trade volume leads to more demand for shipping services, resulting in a higher freight rate. The relationship between the freight rate and fleet size indicates that suppliers of shipping services tend to increase their capacity when they experience a high market price for shipping services.
There are different but interrelated markets in bulk shipping. Specifically, the new building and second-hand vessel markets where ships are bought and sold can be considered as the factor market. On the other hand, the product market is
Table 3.1 Correlations of new building price, second-hand vessel price, scrap vessel price, and the freight rate
New building price
Second-hand vessel price
Scrap vessel price
Freight rate
New building price 1 Second-hand vessel price
0.821a 1
Scrap vessel price 0.711a 0.915a 1 Freight rate 0.493b 0.847a 0.848a 1
a Significant at the 0.01 level (two-tailed) b Significant at the 0.10 level (two-tailed)
Seaborne tradeSeaborne trade
Fleet sizeFleet size
Freight rateFreight rate
Vessel priceVessel price
Fig. 3.4 An empirical model of bulk shipping

42 3 Bulk Shipping Market
the freight market where sea transport services are traded. In general, shipping firms engage in two exchange functions: they buy factors of production in the factor market, and they sell sea transport services in the product market. In bulk shipping, the factor market is the new building and second-hand vessel markets, where ships are bought and sold, whereas the product market is the freight mar-ket, where sea transport services are traded. The empirical model of bulk ship-ping indicates that vessel prices are not determinants of shipowners’ decisions to adjust their fleet sizes. This means that shipping firms do not buy ships in the factor market owing to low vessel prices. Instead, the freight rate is found to influence the decisions of shipping firms to adjust their fleet sizes. These results indicate that the product market (i.e., the freight market) is crucial in determining fleet size.
3.4 Determinant of Fleet Size of Bulk Shipping
In bulk shipping, fleet size has been experiencing continued growth in recent years. According to the empirical model of bulk shipping, both seaborne trade and the freight rate are determinants of fleet size. To understand how these determi-nants affect fleet size, Lun and Quaddus (2009) developed a regression equation to predict fleet size:
• The first step in developing the regression equation involves selection of a com-plete set of potential predictor variables. Any variable that might add to the ac-curacy of the prediction should be included. According to the empirical model, seaborne trade and the freight rate should be used to predict fleet size.
• The second step is to screen out the independent variables that are not appro-priate for inclusion in the analysis. Multicollinearity, which refers to the corre-lation among the independent variables, can reduce the independent variable’s predictive power by the extent to which it is associated with other independent variables (Tabachnick et al. 2007). Therefore, it is desirable to select variables that have low multicollinearity with the independent variables but have high correlations with the dependent variables. Table 3.2 shows the correlation rela-tionships among the independent variables (i.e., seaborne trade and the freight rate) that affect fleet size. The results suggest that these independent variables are highly correlated.
• The next step is to refine the list of predictor(s) to determine the “best” regres-sion equation. To select the best independent variable among the predictors, the value of the β coefficient of the independent variables was computed. The β coefficient indicates how much the value of the dependent variable changes when the value of that independent variable increases by 1.0 and the values of the other independent variables do not change. A positive β means that the pre-dicted fleet size increases when the values of the independent variables in-

3.4 Determinant of Fleet Size of Bulk Shipping 43
crease. The β coefficient allows for a direct comparison between coefficients as to their relative explanatory power for the dependent variable. According to Table 3.3, β of the independent variable of seaborne trade is the highest (i.e., 0.984) when compared with the others.
The findings indicate that the independent variable of seaborne trade is the best predictor among the three independent variables to predict fleet size. To show how much fleet size is affected by seaborne trade, a scatter plot is shown in Fig. 3.5. The pattern of dots slopes in the scatter plot from the lower left to the upper right, suggesting that fleet size and seaborne trade are positively correlated.
Table 3.2 Correlations of seaborne trade and the freight rate
Seaborne trade Freight rate
Seaborne trade 1 Freight rate 0.615a 1
a Significant at the 0.05 level (two-tailed)
Table 3.3 Comparison of the β coefficient
Dependent variable Independent variable R2 β coefficient
Fleet size Freight rate 0.309 0.556 Fleet size Seaborne trade 0.968 0.984
Fleet size
Seaborne trade
Fig. 3.5 Scatter plots of fleet size and seaborne trade of bulk shipping

44 3 Bulk Shipping Market
When firms operate in an atmosphere of uncertainty, forecasting is necessary for them to make decisions that affect their future. In the bulk shipping industry, quantitative forecasting of fleet size can be the starting point for effective decision making on fleet adjustment. The regression analysis technique is an excellent tool to predict fleet size in the bulk shipping market.
In a regression model, the fitted regression equation is formulated in the fol-lowing form
0 1 1,Y b b X= +
where b0 is the intercept and b1X1 is the linear effect of X1. The coefficient of the independent variable affecting fleet size is listed in the
final column in Table 3.4. On the basis of the regression results, the following regression equation to predict fleet size can be obtained:
FS 32.291 0.048ST,= − +
where FS is fleet size and ST is seaborne trade. In the regression equation, seaborne trade is the indicator of fleet size in the
bulk shipping market. β (i.e., 0.048) in the equation has a positive value, meaning that the predicted value of the fleet size increases when the value of seaborne trade increases. The regression equation indicates that shipping capacity will increase by 1 ton with a growth of 20.83 tons1 of seaborne trade in the bulk shipping market. Hence, the ratio of the increase in shipping capacity (in terms of tons) to the growth in annual seaborne trade (in terms of tons) is approximately 1:20.
3.5 Discussion and Conclusions
In the study of Lun and Quaddas (2009), both the freight rate and seaborne trade were found to have a significant effect on fleet size. The coefficient of seaborne trade (β = 0.984) was higher than that of the freight rate (β = 0.556). This indicates that shipowners tend to increase fleet size when cargoes are available to fill their ships. Return on investment in ships depends on the volume of trade. If the fleet size does not increase while trade grows, sea transport will be overburdened owing
————— 1 20.83 tons = 1/β, or 1/0.048.
Table 3.4 Results of regression analysis
R R2 df Significance Constant β 0.984 0.968 14 0.000 –32.291 0.048
The predictor is seaborne trade and the independent variable is fleet size. df degrees of freedom

Appendix 45
to a shortage of ships. On the other hand, if fleet size increases but trade does not grow, the expensive ships will be laid up. Shipping firms adjust the fleet size when they are optimistic about a growth in cargo volume that will demand more ship-ping services.
The empirical model suggests that the price for new buildings is positively cor-related with the freight rate and the relationship is weakly significant as the p value was between 0.050 and 0.100. As its p value was higher than 0.050, the price of new vessels seems to be suboptimal (i.e., a satisfactory but not optimal price). The suboptimal price can be explained by government subsidies in the shipbuilding industry (Dikos 2004), causing lack of incentives for shipyards to respond to the market for additional shipping capacity.
On the other hand, the correlation results of the study shows that new build-ing price affects second-hand vessel price, and the freight rate also affects sec-ond-hand vessel price. The results indicate that both the new building market and the freight market are related to the second-hand market in bulk shipping. In the second-hand ship market, timing of investment is critical because of the cyclical nature of the shipping market (Tsolakis et al. 2003). Ship value varies directly with the expected return on ships. A higher freight rate can lead to higher profitability and higher second-hand vessel price. The study found that new building price and second-hand ship price are correlated. The result is con-sistent with the view of Beenstock (1985) that the prices of new and second-hand ships are correlated. Second-hand and newly built ships are substitutes as they are similar assets serving the same purpose for sea transport; the only dif-ference is their age.
The empirical model found that both seaborne trade and the freight rate are important factors affecting the decisions of shipping firms to adjust their fleet sizes. A regression equation was formulated to predict fleet size. The equation indicates that fleet size is positively related to seaborne trade. Seaborne trade positively affects fleet size and such a relationship suggests that change in de-mand for sea transport can influence the decisions of shipping firms to adjust their fleet sizes. In the study, the regression equation contributed to predicting fleet size, and explained seaborne trade volume as a key determinant that affects fleet size in the bulk shipping market.
Appendix
In this study we used 16 years of data from Panamax Bulkers, from 1990 to 2005, collected from Clarkson Research Studies, to develop an empirical model of bulk shipping market. These secondary data included seaborne trade, the freight rate, fleet size, new building price, second-hand vessel price, and scrap vessel price (Table 3.5).

46 3 Bulk Shipping Market
Table 3.5 Data used for developing the empirical model of bulk shipping
Price Year Seaborne tradea Freight rateb Fleet sizec
New buildingd
Second-hand vessele
Scrap vesself
1990 1991 1992 1993 1994 1995 1996 1997 1998 1999 2000 2001 2002 2003 2004 2005
1,598.00 1,625.00 1,596.00 1,616.00 1,696.00 1,805.00 1,819.00 1,916.00 1,900.00 1,896.00 2,042.00 2,095.00 2,172.00 2,291.00 2,426.00 2,536.00
1,446.00 1,494.00 1,373.00 1,215.00 1,965.00 1,604.00 1,516.00 1,231.00 794.00 1,211.00 1,562.00 884.00 1,731.00 4,467.00 4,438.00 2,321.00
42.52 44.13 45.17 44.82 46.73 50.31 54.77 57.01 61.22 62.72 65.46 69.86 75.95 78.86 80.09 86.38
30.00 34.00 28.00 28.50 28.00 28.50 26.50 27.00 20.00 22.00 22.50 20.50 21.50 27.00 36.00 36.00
19.00 24.00 18.75 19.50 21.00 21.50 19.50 22.00 14.00 16.75 16.00 14.00 17.00 28.00 40.00 29.50
2.45 2.06 1.94 2.06 2.39 2.06 2.00 2.00 1.37 1.81 2.18 1.74 2.30 3.35 4.80 4.19
a Bulk trade in million tons b Baltic Dry Index, a weighted average of spot prices from different routes c Total shipping capacity in million deadweight tons d New building price in million US dollars e Five-year vessel price in million US dollars f Vessel scrapping price in million US dollars
References
Adland R, Jia H, Strandenes S (2006) Asset bubbles in shipping? Marit Econ Logist 8(3):223–233 Beenstock M (1985) A theory of ship prices. Marit Policy Manag 12(3):215–225 Brooks M (2000) Sea change in liner shipping. Pergamon, Amsterdam Clarkson Research Studies (2004) The tramp shipping market. Clarkson Research, London Dikos G (2004) New building prices: demand inelastic or perfectly competitive? Marit Econ
Logist 6(4):312–321 Farthing B, Brownrigg M (1997) Farthing on international shipping. Lloyd’s of London Press,
London Harlaftis G, Theotokas J (2002) Maritime business during the 20th century: continuity and
changes. In: The handbook of maritime economics and business. Lloyd’s of London Press, London
Jansson JO, Shneerson D (1987) Liner shipping economics. Chapman and Hall, London Kendall LC, Buckley JJ (2001) The business of shipping. Cornell Maritime Press, Centreville Leach P (2004) If it moves, charter it. J Commer 5(31):18–19 Lun YHV, Quaddus MQ (2009) An empirical model of the bulk shipping market. Int J Shipp
Transp Logist 1(1):37–54 McConville J (1999) Economics of maritime transport, theory and practice. Whiterby, London Metaxas BN (1971) The Economics of tramp shipping. Athlone Press of the University of Lon-
don, London

References 47
Ocean Shipping Consultants Ltd (2004) Shipping profitability to 2015 – the outlook for vessel costs and revenue. Ocean Shipping Consultants, Chertsey
Samuelson AP, Nordhaus DW (1992) Economics. McGraw-Hill, New York Smith A (1776) The wealth of nations. Penguin, London Stopford M (2004) Maritime economics. Routledge, New York Tabachnick BG, Fidell LS (2007) Using multivariate statistics. Pearson, Boston Tirole J (2003) The Theory of industrial organization. MIT Press Cambridge Truett L, Truett D (1998) Managerial economics. South-Western, Cincinnati Tsolakis SD, Cridland C, Haralambides HE (2003) Econometric modelling of second-hand ship
prices. Marit Econ Logist 5(4):347–377 Wright G (1991) Freight rates in the tramp shipping market. Int J Transp Econ 18(1):47–54 Xinhua Financial Network News (2004) China’s wave of commodity buying fuels cargo shipping
prices. Xinhua Financial Network News 6 December 2004

49 Y.H.V. Lun, K.-H. Lai and T.C.E. Cheng Shipping and Logistics Management, © Springer 2010
Chapter 4 Container Shipping Market
Abstract To fully understand the container shipping industry, it is imperative to identify the factors that influence the capacity of the industry, explain how these factors affect the container shipping market, and empirically test their relation-ships grounded in a sound theoretical framework. This chapter presents such a study built on the industrial organization paradigm that “industry structure de-termines the conduct of firms whose joint conduct then determines the collective performance of the firms in the marketplace”. In this chapter we interpret a firm’s conduct as its organizational choices on key decision variables such as capacity. On that basis, we identify the factors that affect total fleet size and develop an empirical model of container shipping to explain the relationships among these factors and evaluate their effects on the container shipping market.
4.1 Introduction
When demand for shipping capacity is uncertain and significant lead times exist for adding capacity, managers of shipping firms must carefully consider their capacity decisions. However, postponing the increase of shipping capacity can lead to the risk of a shipping firm having capacity shortage when shipping demand is expected to grow (Ryan 2004). A number of studies on capacity management have been reported in the economics and operations research literature. Traditional operations research relies heavily on mathematical modelling and optimization techniques to examine capacity management issues. Nevertheless, it can be useful to develop empirical studies (Scudder and Hill 1998) and theories to address op-erations management issues and to predict the adoption of good practices in the shipping industry. Empirical research is concerned with examining the relation-ships between relevant variables (O’Leary-Kelly and Vokurka 1998) by using empirical data for theory building (Flynn et al. 1990). Kerlinger (1986) defined theory as “a set of interrelated constructs, definitions and propositions that present

50 4 Container Shipping Market
a systemic view of phenomena by specifying relationships among variables, with the purpose of explaining and predicting the phenomena”. Theory can be used to explain observed phenomena by systematically specifying the relationships be-tween constructs (Malhotra and Grover 1998).
In this chapter we report on a study that we undertook to develop an empirical model for examining the container shipping industry. Specifically, we developed a container shipping model to determine capacity in the container shipping indus-try. We began with the industrial organization paradigm that “industry structure determines the conduct of firms, whose joint conduct then determines the collec-tive performance of the firms in the marketplace” (Porter 1981). We interpret conduct as a firm’s choices on key decision variables such as capacity. On that basis, we identified the factors that affect total fleet size in container shipping and developed a container shipping model to explain the relationships among the fac-tors and assess their effects on the capacity of the container shipping industry. We then performed an empirical analysis of the relationships among the factors that affect total fleet size in container shipping.
4.2 Industrial Organization in Container Shipping
Theory-driven empirical research provides insights and understanding of impor-tant issues by using empirical data to build and develop sound theories (Melnyk and Handfield 1998). Industrial organization theory, which takes industry as the unit of analysis, provides a useful theoretical framework for a study of the con-tainer shipping market. Identifying the structure of an industry in industrial or-ganization terms casts the spotlight on the various aspects of the industry’s envir-onment, which is valuable for understanding the conduct of firms in the industry and predicting their levels of performance that can be reasonably expected.
Industry structure refers to “certain stable attributes of the market that create the competitive context of the industry and influence the firm’s conduct in the market-place” (Bain 1972). Empirical researchers are concerned with how basic industry characteristics affect the adoption of business operational practices (Banker and Khosla 1995). For shipping managers to make effective decisions, it is important for them to understand the industry structure of the shipping industry. According to the industrial organization paradigm, the performance of the container shipping market depends on both the demand for and the supply of container shipping services, as well as the industry structure (Brooks 2000). Industry structure affects the character-istics of an industry, particularly the number and size of sellers, the extent of concen-tration among the seller firms, and the degree of homogeneity of their offerings. As far as its industry structure is concerned, the container shipping industry can be con-sidered as an oligopoly (Harlaftis and Theotokas 2002). There are several industrial characteristics in the container shipping business, including (1) high fixed cost, (2) little difference in the services offered, and (3) a few operators accounting for the majority of the total shipping supply. The increase in the carrying capacity of the

4.3 Capacity Adjustment in the Container Shipping Market 51
biggest container shipping operators has accentuated the characteristic of concen-trated operation in the industry. For instance, the world’s top three shipping firms, i.e., Maersk Line, MSC, and CMA CGM, had collectively increased their global market share to 28% in 2008 in terms of TEU carrying capacity (UNCTAD 2008).
4.3 Capacity Adjustment in the Container Shipping Market
A market is a collection of firms, each of which supplies products that have some degree of substitutability to the same potential buyers (Koch 1974). A market brings buyers and sellers together to set prices and exchange goods or services. The con-tainer shipping market is governed by a mechanism through which the demand for and the supply of shipping services interact to determine the freight rate and fleet size. The freight rate serves as a signal to shipping firms (i.e., carriers) and shippers about the status of supply and demand of container shipping services. If shippers need more container shipping services, shipping demand will rise. When carriers find that shipping demand exceeds their supply, they respond by increasing the freight rate, which in turn would stimulate an increase in the supply of the world fleet. In short, the freight rate coordinates the decisions of carriers to adjust supply in the container shipping market. A higher freight rate is conducive to stimulating growth in shipping capacity. This mechanism can be regarded as an invisible hand that regulates the demand and supply conditions in the container shipping market.
4.3.1 Seaborne Trade
International trade of general cargo is one of the key factors affecting the demand for container shipping services. World output growth plays a decisive role in de-termining the volume of container trade. Shipping and international trade are inter-related. Ships serve to transport cargo, whereas seaborne trade without ships will come to a halt (Farthing and Brownrigg 1997). A change in the volume of sea-borne trade can affect shipping demand as demand for sea transport is derived from demand for goods to be transported (Jansson and Schneerson 1987). On the other hand, shipping supply depends on two key decision makers, namely, ship-pers and carriers. Shippers can influence the decisions of carriers on whether or not to increase shipping supply to transport their cargoes.
In examining the container shipping industry, we should consider it not only from a national perspective, but also from a broader view of world development, particularly in the trade sector (Farthing 1993). Demand for container shipping services is derived from demand for container trade. International trade volume is an important factor that affects the demand for container shipping services. The continuous growth in the world’s standard of living strengthens the dependence of the world economy on international trade (Ronen 1983; Brooks 2002).

52 4 Container Shipping Market
4.3.2 Freight Rate
The freight market serves the demand for sea transport. Demand for freight ser-vices is a function of the freight rate and quantity demand for shipping services per time period. On the other hand, container shipping supply is a function of price (i.e., freight rate) and quantity supplied (i.e., fleet size) by container shipping firms (Truett and Truett 1998). The freight market determines the freight rate at the level where shipping demand from shippers is equal to shipping supply (McConville 1999). The growth of seaborne trade would lead to a shortage of ships and a sub-sequent increase in the freight rate. To tackle the shortage, the container shipping market will adjust by increasing fleet size through placing orders for new ship-building (Leach 2004). Shipping supply is therefore influenced by the freight rate. If the freight rate falls, shipping supply is reduced. On the other hand, fleet size is likely to be increased when the fright rate rises.
4.3.3 Capacity Adjustment
Container shipping is a capital-intensive industry, characterized by a high fixed to variable cost ratio and highly specialized productive capital (Fusillo 2004). Ships are expensive items, the building and acquisition of which require huge capital investment. The return on investment in ships depends on the volume of trade (Stopford 2004). If ships have been invested in, but trade does not grow as ex-pected, expensive ships will become idle (Metaxas 1971). As demand for ships is derived from seaborne trade (Jansson and Shneerson 1987), a change in seaborne trade will lead to a change in shipping demand. It is a rational decision for con-tainer shipping firms to increase their shipping supply when they are optimistic about the sea cargo volume. Demand for ships reflects the need for container ship-ping capacity. Such reflection suggests that a change in seaborne trade affects carriers’ decisions on whether or not to expand, and their decisions can influence the supply of world fleet capacity.
Ships are sold and purchased in different markets. The new building market trades new ships, whereas the demolition market deals with old or obsolete ships. Activities in the new building and demolition markets affect the total container capacity available to transport cargo. The supply and demand mechanism operat-ing in the demolition market is simple. When a carrier considers a ship unsuitable to serve the freight market, the ship could be offered to the demolition market (Stopford 2004).
Such a scrapping decision depends on the container shipping firm’s expectation of future operating profits that can be generated by the ship, as well as its own fi-nancial position (Metaxas 1971). During a recession, if a container shipping firm believes that there is a slim chance of a freight boom in the foreseeable future, it would likely sell unprofitable ships for scrap. In a period of economic downturn when seaborne trade volume is low, ships are broken up at younger ages. Alterna-

4.3 Capacity Adjustment in the Container Shipping Market 53
tively, in a boom period when seaborne trade volume is high, container shipping firms would choose to scrap their ships only when the ships are too old to operate.
In a recession period, ships are scrapped at younger ages. Scrapping ships at younger ages reduces the total shipping supply. Scrapping can also be a tool used by container shipping firms to mitigate the problem of overcapacity (Farthing and Brownrigg 1997). On the other hand, container shipping firms are less willing to reduce capacity by scrapping ships at a time of freight boom. The broken-up age of container ships usually ranges between 24 and 30 years (UNCTAD 2005). Con-tainer shipping firms can decide when to scrap their ships and use broken-up age as a reference to adjust their fleet capacity.
4.3.4 An Empirical Model of the Container Shipping Market
From the previous discussions, we identify that international seaborne trade is key to shipping demand. On the supply side, the decisions of container shipping firms on whether to adjust their fleet sizes depend on the timings of selling ships to the demolition market and of ordering new ships, as well as the volume of interna-tional seaborne trade. The freight rate in the container shipping market is influ-enced by seaborne trade volume. As shown in Fig. 4.1, factors considered to affect fleet size include broken-up age, new orders, seaborne trade, and world fleet.
To empirically test this research model on capacity adjustment in the con-tainer shipping market, we used 10 years of data, from 1995 to 2004, collected
Seaborne tradeSeaborne trade
New orderNew orders Broken up ageBroken-up age
Freight rateFreight rate Fleet sizeFleet size
Fig. 4.1 Capacity adjustment in the container shipping market

54 4 Container Shipping Market
from Clarkson Research Studies, the Review of Maritime Transport, and the Bureau of Labor Statistics. Details of the data sources can be found in the Ap-pendix. The research model identifies the factors that affect fleet size in the con-tainer shipping market.
To validate this model on capacity adjustment in the container shipping market, we used multiple regression as the analytical tool. A summary of the statistical relationships among the study variables in the capacity adjustment model and the regression coefficient (β) is reported in Table 4.1. The regression coefficient indi-cates the degree to which each predictor variable is explained by other predictor variables. Regression coefficients provide information about the functional rela-tionships between pairs of variables, predicting how much the dependent variable changes with a given change in any of the different causal variables.
As shown from the data sources, fleet size experienced continuing growth from 40.00 million deadweight tons in 1995 to 91.30 million deadweight tons in 2004. From our regression analyses, we found empirical support for the positive effects of four variables (factors) on fleet size and these factors were seaborne trade, the freight rate, new orders, and broken-up age.
4.4 The Determinant of Fleet Size in Container Shipping
In container shipping, fleet size has experienced continued growth in recent years. According to the results from the regression analyses, seaborne trade is a key determinant affecting fleet size. To understand how the determinants affect fleet size, we developed a scatter plot and regression equation to examine fleet size in container shipping.
Figure 4.2 shows the scatter plot of fleet size and seaborne trade in container shipping. Scatter plots are a type of display to demonstrate values for two vari-ables for a set of data. The data are displayed as a collection of points, each having the value of seaborne trade volume on the horizontal axis and the value of fleet
Table 4.1 Results of regression analyses
Independent variables
Dependent variables R2 β coefficient Significance Results
Seaborne trade Freight rate 0.863 0.929 0.000b Accept Seaborne trade Fleet size 0.980 0.990 0.000b Accept Seaborne trade Broken-up age 0.539 0.734 0.016a Accept Broken-up age Fleet size 0.474 0.689 0.028a Accept Seaborne trade New orders 0.563 0.751 0.012a Accept New orders Fleet size 0.496 0.704 0.023a Accept Freight rate Fleet size 0.838 0.916 0.000b Accept
a Significant at the p < 0.05 level b Significant at the p < 0.01 level

4.4 The Determinant of Fleet Size in Container Shipping 55
size on the vertical axis. As shown in Fig. 4.2, the pattern of dots slopes from the lower left to the upper right, suggesting a positive correlation between the vari-ables being studied.
The coefficients (β) of the independent variables that affect fleet size are listed in Table 4.2. On the basis of the regression results, we obtained the following regression equation for predicting fleet size:
FS 4.263 0.099ST,= +
where FS is fleet size and ST is seaborne trade. In the regression equation, seaborne trade is the indicator of fleet size in the con-
tainer shipping market. β (i.e., 0.099) in the equation has a positive value, meaning that the predicted value of the fleet size increases when the value of seaborne trade increases. The regression equation indicates that shipping capacity will increase by 1 ton with a growth of 10.10 tons1 of seaborne trade in the container shipping market. Hence, the ratio of increase in shipping capacity (in terms of tons) to growth in annual seaborne trade (in terms of tons) is approximately 1:10.
Table 4.2 Results of regression analysis
R R2 df Significance Constant β 0.990 0.980 8 0.000 4.263 0.099
The predictor is seaborne trade and the independent variable is fleet size.
————— 1 10.10 tons = 1/β, or 1/0.099.
Fleet size
Seaborne trade
100.00
90.00
80.00
70.00
60.00
50.00
40.00300.00 400.00 500.00 600.00 700.00 800.00 900.00 1000.00
ObservedLinear
Fig. 4.2 A scatter plot of fleet size and seaborne trade in container shipping

56 4 Container Shipping Market
The results show that the ratio of growth of shipping capacity to growth in an-nual seaborne trade is 1:10 in container shipping. In Chap. 3, we found that the ratio of growth in shipping capacity relative to growth in annual seaborne trade is 1:20 in bulk shipping. Hence, the capacity requirement of container shipping is much higher than that of bulk shipping. The higher requirement for shipping ca-pacity may be caused by the complex shipping operations. For instance, containers may transship at hub ports from ports of origin and therefore extra shipping capac-ity may be required. Another reason for the higher space requirement is attribut-able to the need for shipping empty containers from the areas of demand owing to imbalance of trade.
4.5 Discussion and Conclusions
The literature has suggested that seaborne commodities trade affects the demand for container shipping services (Ronen 1983; Jansson and Shneerson 1987; Branch 1998; Farthing 1993; Kendall and Buckley 2001; Stopford 2004). In our study on the determinants of fleet size in container shipping, container shipping demand, which is derived from seaborne trade volume, was identified as a key determinant. The result indicates that seaborne trade has a greater impact on fleet size than on the freight rate. Growth in seaborne trade provides incentives for ship operators to adjust their fleet sizes in response to the corresponding increase in shipping de-mand. Seaborne trade also affects the freight rate, but the magnitude in terms of β is smaller than that of fleet size. Furthermore, change in seaborne trade would lead ship operators adjusting their fleet sizes with respect to their decisions on broken-up age and ordering of new ships.
In our capacity adjustment model, the freight rate is another important factor that affects fleet size. Seaborne trade also positively affects fleet size. In compar-ing the magnitudes of their effects on fleet size, we found that seaborne trade (β = 0.990) has a stronger effect than the freight rate (β = 0.916). Our result indicates that ship operators consider cargo availability to fully utilize shipping spaces more important than the potential revenue generated from the freight market in deciding their shipping supply. In the last decade, growth in fleet size was mainly prompted by an increase in seaborne trade volume.
There are several factors influencing the supply of container services and these include seaborne trade, the freight rate, ordering of new ships, and scrapping of old ships (Metaxas 1971; Kendall and Buckley 2001; Alderton and Rowlinson 2002; Leach 2004; Dikos 2004; Stopford 2004). From the test results, fleet size is affected by seaborne trade (with β = 0.990), the freight rate (with β = 0.916), new orders (with β = 0.704), and broken-up age (with β = 0.689). In the container ship-ping market, supply of the world fleet varies when demand for sea transport changes. Such a market mechanism determines the fleet size available in the con-tainer shipping market. Shipowners control the supply of their container capacity. They respond to changes in seaborne trade volume by either scrapping old ships or

Appendix 57
ordering new ships. Our findings suggest that trade booms will lead to high bro-ken-up ages since container operators tend to be hesitant in taking their ships to the demolition market. It also explains why broken-up age has a significant impact on world fleet size. To increase container shipping supply, new orders are placed by container operators when world trade prospers.
The implications of the study results are twofold, which can be drawn from the perspectives of both researchers and managers. From a research perspective, our empirically tested container shipping market model identifies the factors that col-lectively affect fleet size in the container shipping market. Our empirical model suggests that seaborne trade is a key factor that affects container operators in ad-justing their fleet sizes through ordering and delivery of new ships, and scrapping of old ships. Seaborne trade also influences the freight rate. It implies that sea-borne trade is the most important determinant of fleet size in the container ship-ping market. With changes in seaborne trade volume, container operators adjust their shipping supply through various measures such as adding new ships and scrapping old ships. Our findings that the effect of seaborne trade is higher than that of the freight rate on capacity adjustment implies that shipowners would place a greater emphasis on cargo volume than the potential revenue generated from an increased freight rate when they determine their fleet sizes.
From a management perspective, our findings indicate that there are a number of determinants of fleet size in the container shipping market, which include seaborne trade, the freight rate, new orders, and broken-up age of ships. This study provides an insight into the relationships between the variables of seaborne trade and freight rates, seaborne trade and size of the world fleet, as well as the freight rate and size of the world fleet. Our results explain the important roles of interna-tional trade and the freight rate in the shipping industry. The freight rate is critical in generating revenues for shipowners, and seaborne trade is significant in provid-ing cargo to feed the ships. The importance of seaborne trade in container shipping implies that ship managers may need to acquire knowledge in economics and trade development to make better decisions on adjusting their fleet sizes. Our empirical model illustrates that fleet size can be adjusted in response to changes in seaborne trade volume. Our study advances knowledge on the key elements that affect the demand for container shipping services, the supply of container shipping services, and the freight rate. Stakeholders in the container shipping industry, which include bankers, shipbrokers, shippers, shipbuilders, and ship scrappers, can benefit from a better understanding of the determinants of fleet size, and how ship managers adjust their fleet sizes in the container shipping market.
Appendix
To test the research model, we used 10 years of data, from 1995 to 2004, collected from Clarkson Research Studies, the Review of Maritime Transport, and the Bu-reau of Labor Statistics. Clarkson Research Studies provides statistical services to

58 4 Container Shipping Market
shipbrokers and the shipping industry. The research team at Clarkson Research Studies compiles data on the world’s bulk, container, and general cargo fleets comprising some 30,000 vessels on a daily basis. The Review of Maritime Trans-port is one of the United Nations’ flagship publications, published annually since 1968. It reports the worldwide evolution of shipping, ports, and transportation related to the major traffic of liquid bulk, dry bulk, and container shipping. The Bureau of Labor Statistics is the principal fact-finding agency for the US Federal Government in the broad field of labour economics and statistics. The Bureau of Labor Statistics is an independent national statistical agency that collects, proc-esses, analyses, and disseminates essential statistical data to the public. Bureau of Labor Statistics data satisfy a number of criteria for data quality, including rele-vance to current social and economic issues, timeliness in reflecting today’s rap-idly changing economic conditions, accurate and consistently high statistical qual-ity, and impartiality in both subject matter and presentation.
The data are summarized in Table 4.3.
References
Alderton P, Rowlinson M (2002) The economics of shipping freight market. In: The handbook of maritime economics and business. Lloyd’s of London Press, London
Bain JS (1972) Essays on price theory and industrial organization. Little & Brown, Boston Banker RD, Khosla IS (1995) Economics of operations management: a research perspective.
J Oper Manag 12(4):423–425 Branch EA (1998) Maritime economics. Thornes, Cheltenham Brooks M (2000) Sea change in liner shipping. Pergamon, Amsterdam
Table 4.3 Data used for examining capacity adjustment in the container shipping market
Year Seaborne tradea New ordersb Broken-up agec Fleet sized Freight ratee
1995 389.00 579.40 24.00 40.00 71.60 1996 430.00 500.20 26.20 44.90 69.70 1997 470.00 202.00 22.80 50.00 65.80 1998 503.00 414.20 25.50 56.50 73.80 1999 560.00 555.20 24.80 62.20 97.70 2000 628.00 960.80 25.70 64.70 101.00 2001 647.00 524.80 26.90 70.20 92.80 2002 718.00 419.60 26.00 77.70 93.30 2003 804.00 2,059.30 25.50 84.70 117.80 2004 918.00 1,606.10 30.50 91.30 122.70
Source Lun et al. (2009) a Container seaborne trade volume in million tons b New orders of container ships in thousand 20 ft equivalent units (TEUs) c Container ship broken-up age d Total world container fleet in million deadweight tons e Ocean container freight index

References 59
Brooks M (2002) International trade in manufactured goods. In: The handbook of maritime economics and business. Lloyd’s of London Press, London
Dikos G (2004) New building prices: demand inelastic or perfectly competitive? Marit Econ Logist 6(4):312–321
Farthing B (1993) International shipping. Lloyd’s list practical guides. Lloyd’s of London Press, London
Farthing B, Brownrigg M (1997) Farthing on international shipping. Lloyd’s of London Press, London
Flynn BB, Sakakibara S, Schroeder RG, Bates KA, Flynn EJ (1990) Empirical research methods in operations management. J Oper Manag 9(2):250–284
Fusillo M (2004) Is liner shipping supply fixed? Marit Econ Logist 6(3):220–235 Harlaftis G, Theotokas J (2002) Maritime business during the 20th century: continuity and
changes. In: The handbook of maritime economics and business. Lloyd’s of London Press, London
Jansson JO, Shneerson D (1987) Liner shipping economics. Chapman and Hall, London Kendall LC, Buckley JJ (2001) The business of shipping. Cornell Maritime Press, Centreville Kerlinger FN (1986) Foundations of behavioral research. Holt, Rinehart and Winston, New
York Koch J (1974) Industrial organization and price. Prentice Hall, Upper Saddle River Leach P (2004) If it moves, charter it. J Commer 5(31):18–19 Lun YHV, Lai KH, Cheng TCE (2009) The container shipping market. Shipp Transp Logist
Book Ser 1:1–15 Malhotra MK, Grover V (1998) An assessment of survey research in POM: from constructs to
theory. J Oper Manag 16(4):407–425 McConville J (1999) Economics of maritime transport, theory and practice. Whiterby, London Melnyk SA, Handfield RB (1998) May you live in interesting time … the emergence of theory-
driven empirical research. J Oper Manag 16(4):311–319 Metaxas BN (1971) The economics of tramp shipping. Athlone Press of the University of Lon-
don, London O’Leary-Kelly SW, Vokurka RJ (1998) The empirical assessment of construct validity. J Oper
Manag 16(4):387–405 Porter M (1981) The contributions of industrial organization to strategic management. Acad
Manag Rev 6(4):609–620 Ronen D (1983) Cargo shipping routing and scheduling: survey of models and problems. Eur J
Opet Res 12(2):119–126 Ryan SM (2004) Capacity expansion for random exponential demand growth with lead time.
Manag Sci 50(6):740–748 Scudder GD, Hill CA (1998) A review and classification of empirical research in operations
management. J Oper Manag 16(1):91–101 Stopford M (2004) Maritime economics. Routledge, New York Truett L, Truett D (1998) Managerial economics. South-Western, Cincinnati UNCTAD (2005) Review of maritime transport. United Nations Conference on Trade and De-
velopment, Geneva UNCTAD (2008) Review of maritime transport. United Nations Conference on Trade and De-
velopment, Geneva

61 Y.H.V. Lun, K.-H. Lai and T.C.E. Cheng Shipping and Logistics Management, © Springer 2010
Chapter 5 Business Strategy in Shipping
Abstract Strategy is important in shipping because it facilitates the identification of business opportunities, gives an objective view to solve business problems, pro-vides a framework to improve internal and external collaboration, assists in control-ling business activities, minimizes negative effects when threats arise, helps make better decisions, guides effective allocation of resources, provides methods to man-age changes, and nurtures consistency in the management of the shipping business. Shipping firms have a hierarchy of interrelated strategies, each formulated at a dif-ferent level, which can be classified as corporate strategy, business strategy, and functional strategy. Formulating and implementing shipping strategies involve answering many interrelated decisions: What to do? When to do it? How to do it? The development of shipping strategies involves the process of strategic analysis, formulating strategies, and implementation and control of strategies. To seek busi-ness opportunities, a shipping firm needs to answer the question of how to structure the organization to sustain growth. The structural options for shipping firms in-clude organic growth, acquisitions, joint ventures, alliances, and networks.
5.1 Introduction
Shipping is concerned with the delivery of goods and services required by ship-pers. The opportunities and challenges faced by shipping companies are affected by the business environment in which they operate. As the business environment changes with technological, economic, and political developments, shipping lines face the challenges of developing strategies that give them an advantage in better serving their customers. For almost two decades, managers have been learning how firms should adapt to the changing business environment. Firms must be flexible and responsive to respond rapidly to competitive and market changes. They must benchmark continuously for best practices, and nurture a few core competencies to stay ahead of their competitors (Porter 1996).
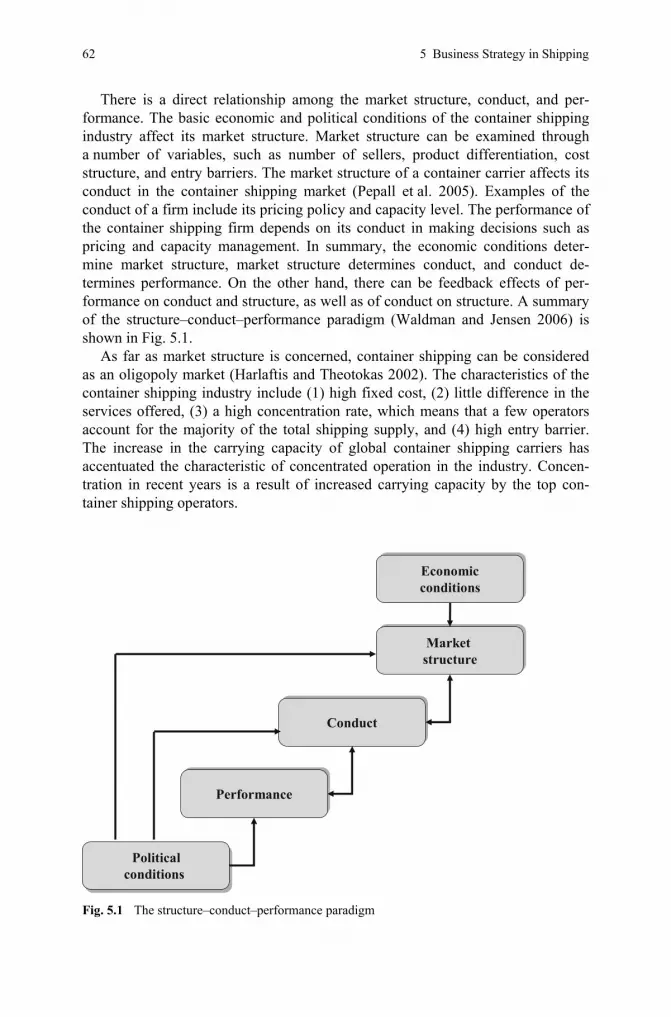
62 5 Business Strategy in Shipping
There is a direct relationship among the market structure, conduct, and per-formance. The basic economic and political conditions of the container shipping industry affect its market structure. Market structure can be examined through a number of variables, such as number of sellers, product differentiation, cost structure, and entry barriers. The market structure of a container carrier affects its conduct in the container shipping market (Pepall et al. 2005). Examples of the conduct of a firm include its pricing policy and capacity level. The performance of the container shipping firm depends on its conduct in making decisions such as pricing and capacity management. In summary, the economic conditions deter-mine market structure, market structure determines conduct, and conduct de-termines performance. On the other hand, there can be feedback effects of per-formance on conduct and structure, as well as of conduct on structure. A summary of the structure–conduct–performance paradigm (Waldman and Jensen 2006) is shown in Fig. 5.1.
As far as market structure is concerned, container shipping can be considered as an oligopoly market (Harlaftis and Theotokas 2002). The characteristics of the container shipping industry include (1) high fixed cost, (2) little difference in the services offered, (3) a high concentration rate, which means that a few operators account for the majority of the total shipping supply, and (4) high entry barrier. The increase in the carrying capacity of global container shipping carriers has accentuated the characteristic of concentrated operation in the industry. Concen-tration in recent years is a result of increased carrying capacity by the top con-tainer shipping operators.
EconomicconditionsEconomicconditions
Market structureMarket structure
ConductConduct
PerformancePerformance
PoliticalConditionsPolitical
conditions
Fig. 5.1 The structure–conduct–performance paradigm

5.2 Strategy for Shipping 63
The key changes that have taken place in the liner shipping industry over the past 20 years are related to increased horizontal and vertical integration. The for-mer has been the result of mergers and acquisitions, as well as the ongoing evolu-tion of strategic alliances among shipping lines. The latter has been achieved by shipping companies integrating with the corporations of which they are a part to provide a bundle of comprehensive services under one roof, including more value-added services such as cargo consolidation, container terminal services, and in-termodal and logistical services. Within the shipping industry, certain companies outperform others on a consistent basis in terms of cost and service advantages. They employ different strategies to improve performance on a variety of economic and operational performance measures in their efforts to outperform competitors.
In the era of globalization and severe competition, strategic decisions are critic-al to the growth or decline of a firm. The relationship between strategy and per-formance is of utmost importance in liner shipping. Shipping firms should apply the principles of strategic management (Jawkins and Gray 2000) in various aspects of their business because they:
• help shipping firms identify and prioritize business opportunities; • give shipping firms an objective view to solve business problems; • provide shipping firms with a management framework to improve their internal
and external collaborations; • assist carriers in controlling their business activities; • minimize the negative effects on shipping firms when threats arise; • help shipping firms make better decisions to support predefined organizational
goals and objectives; • guide shipping firms in the effective allocation of resources to improve their
overall efficiency and effectiveness; • provide shipping firms with methods and ways to manage changes in a dynamic
business environment; • nurture shipping firms to be consistent in the management of their business.
5.2 Strategy for Shipping
A strategy is a fundamental pattern of present and planned objectives, resource deployment, and interactions of an organization with its market, competitors, and other environmental factors (Walker et al. 2003). A well-developed shipping strat-egy should contain five key components:
1. Scope: Scope refers to the breadth of a firm’s strategic domain – the type of industry (such as a third-party logistics provider, a liner shipping company, or a container terminal operator), and market segments (such as European, North American, or Asian markets) it competes in or plans to enter.
2. Goals and objectives: Strategies also state the desired levels of accomplish-ments, such as growth of volume over a specific time period.

64 5 Business Strategy in Shipping
Hierarchy of strategiesHierarchy of strategies
Corporate strategiesCorporate strategies
Business strategiesBusiness strategies
Functional strategiesFunctional strategies
Fig. 5.2 Hierarchy of strategies
3. Resource deployment: Resource deployment refers to the availability of re-sources that a firm requires to achieve its goals and objectives. For example, liner shipping companies deploy ships to launch new container shipping ser-vices calling at ports in emerging countries.
4. Competitive advantage: An important part of a strategy is to specify how the firm will compete. For example, liner shipping companies may extend their services by providing integrated logistics services to their customers with a view to enhancing their competitiveness through maintaining a high level of services for years.
5. Synergy: Synergy can be defined as “the degree to which various resources’ deployment complement and reinforce one another”. The formation of alliances in the shipping industry is a typical example of the creation of synergy among the allied members.
These five basic components are part of the shipping strategy. In general, ship-ping companies deploy a hierarchy of interrelated strategies, each formulated at a different level. As shown in Fig. 5.2, strategies can be classified into three cat-egories: corporate strategy, business strategy, and functional strategy (Robbins and Coulter 2003).
5.2.1 Corporate Strategy
Corporate strategy seeks to determine what businesses a firm should be in or wants to be in. As an illustration of this, Malaysia International Shipping Corp

5.3 Market Orientation in Shipping 65
(MISC) proposed a corporate strategy of leaving the shipping industry in 2005. Lloyd’s List reported on 11 January 2005 that MISC was looking for buyers so it could sell a stake in its container shipping arm after exiting dry bulk shipping, with Hong Kong’s Orient Overseas Container Line (OOCL) as the front runner. MISC, which had been taking advantage of high market values to exit non-core businesses over the previous year, decided to sell a majority stake in its container shipping division.
5.2.2 Business Strategy
Business strategy seeks to determine how the firm should compete. Park Jung-won, President of Hanjin Shipping, demonstrated business strategy (Hankook 2004) by saying that “We expect to achieve 6 trillion won in sales and more than 750 billion won in operating profits this year. This will accelerate the re-structuring of the shipping industry. Hanjin has already started focusing on in-vestment to develop information technology for shipping and e-business sectors, while positively seeking strategic cooperation with other carriers.”
5.2.3 Functional Strategy
Functional strategy seeks to determine how to support business strategy. The adoption of electronic commerce to streamline documentation processes is an example of functional strategy in the liner shipping business. Senator Lines, headquartered in Bremen, Germany, completed integration with INTTRA, pro-viding another avenue for innovative e-commerce shipping solutions to their customers. Senator Lines’ customers will have access to INTTRA’s suite of e-tools, including tendering, sailing schedules, booking, shipping instructions, bills of lading, track and trace, and reporting. Senator Lines’ customers will benefit from the e-tools, which further streamline their ocean shipping processes, saving them time and money and improving data accuracy in documentation (Asia Pulse 2005).
5.3 Market Orientation in Shipping
Shippers of today expect a higher level of service quality than ever before be-cause they have more choices and possess better knowledge about service offer-ings. The challenge for shipping firms to stay competitive is to determine what their customers want and whether they are satisfied with the firms’ services (Miller 1992). Market orientation can be defined as the “organization-wide gen-

66 5 Business Strategy in Shipping
eration of market intelligence across departments, and organization-wide respon-siveness to it” (Kohli and Jaworski 1990). This marketing concept suggests that the long-term purpose of a firm is to satisfy customer needs for the purpose of maximizing corporate profits. In doing so, firms are required to take a proactive attitude in doing business and be responsive to customer needs and market changes. A firm must be market-oriented to gain long-term competitiveness, and the actions of market-oriented firms must be consistent with the marketing con-cept, i.e., placing customers at the very heart of business operations (Lai 2003).
A key advantage for a firm on becoming market-oriented is to get close to the market and understand how it is likely to change in the future. To obtain this knowledge, it requires acquisition of market intelligence about customers, com-petitors, and the market. Market-oriented firms need to view the information from a total business perspective, decide how to deliver superior customer values, and take actions to deliver value to customers. They should also be able to develop a customer focus, generate competitor intelligence, nurture cross-functional coor-dination, and understand the performance implications.
5.3.1 Customer Focus
A market-oriented firm is good at understanding customers’ preferences and re-quirements, and effectively deploying the required resources and skills to satisfy customers profitably. A customer focus orientation requires finding out what ser-vices customers value. Shippers’ decisions to support a shipping line are based on the attributes and features of the shipping services they value. Shipping lines’ sales representatives need to contact shippers and consignees directly to obtain informa-tion on what and how to provide better customer value.
5.3.2 Competitor Intelligence
A market-oriented firm recognizes the importance of understanding its customers and competitors. It is essential for shipping lines to identify competitive threats and develop strategies to counter the threats. For example, the eastbound trans-Pacific volume continued to grow strongly in 2005 and shipping lines were ex-pected to achieve freight rate increases of around USD 350 per 40-ft container, or around 70% of what they were seeking on all the routes from Asia to the USA. Under this market environment, shipping lines need to identify competitive threats and develop strategies as they lose shippers on this route compared with those routes moving goods from Asia to Europe. There could be some market downturn with so much new capacity scheduled for delivery, with the freight rate slipping by about USD 270 per 40 ft equivalent unit in 2006 (Porter 2005a).

5.4 Operational Effectiveness Versus Competitive Strategy 67
5.3.3 Cross-functional Coordination
Market-oriented firms are effective in coordinating business functions to provide superior customer value. For example, CMA CGM, a French shipping line, launched its new environmental protection policy with support from both seagoing and sup-porting functional members. CMA CGM’s chairman, Jacques Saad, said: “When it comes to protecting the environment, especially the marine environment, I expect our performance in this area to be something we can all be proud of. This is why we have defined a very strict environmental strategy, which I am asking all staff mem-bers, both seagoing and sedentary, to support” (SchedNet 2005a).
5.3.4 Performance Implications
Market-oriented firms begin strategic analysis with a penetrating view of the market. As an illustration of this, Kuehne & Nagle has a clear strategy (SchedNet 2005b) on expanding its integrated logistics and IT-based supply-chain management services with the aim of developing from a pure airfreight and sea freight forwarder into a global “one-stop shop” logistics provider. The company’s turnover in 2004 rose 21.1% year-on-year to 11.56 billion Swiss francs (USD 9.97 billion). Earnings be-fore interest, tax, and amortization increased 23.5% year-on-year to 390 million Swiss francs, and net earnings amounted to 241 million Swiss francs, up 23.1% over 2003 (SchedNet 2005b).
5.4 Operational Effectiveness Versus Competitive Strategy
One goal of shipping firms is to outperform their competitors. Both operational effectiveness and competitive strategy are essential to attain superior performance, but they usually work in different ways.
Operational effectiveness means performing similar activities better than com-petitors. It refers to any practices that allow a shipping company to better utilize its resources, e.g., delivering services cost-effectively. The empty container manage-ment model illustrated in Chap. 11 is an example of firms achieving operational effectiveness through better management and utilization of critical resources. Differences in operational effectiveness can affect profitability because they di-rectly influence relative cost positions. Through practising total quality manage-ment and benchmarking, managers can improve the performance of activities to eliminate waste and achieve customer satisfaction. Constant improvement in op-erational effectiveness is necessary to achieve higher profitability.
On the other hand, strategic positioning means performing activities different from those of one’s rivals or performing similar activities in different ways. Com-

68 5 Business Strategy in Shipping
petitive strategy is about being different. It means deliberately choosing a different set of activities to deliver a unique mix of customer value. Strategic positions can be attained from three distinct sources (Porter 1996), namely, variety-based posi-tioning, needs-based positioning, and access-based positioning.
5.4.1 Variety-based Positioning
Variety-based positioning is based on the choice of product or service variety rather than customer segments. Variety-based positioning makes economic sense when a company can best produce particular products or services using distinctive sets of activities. For instance, Lloyd’s Register, a classification society,1 is a ma-jor organization involved in classification of ships, which sets standards of quality and reliability during their design, construction, and operation. Classification so-cieties are organizations dedicated to delivering maritime services during the en-tire life of vessels from design to building and operation.
5.4.2 Needs-based Positioning
A second basis for positioning is that of serving most of or all the needs of a particular group of customers. Needs-based positioning arises when the same customer has different needs for different types of transactions. For example, manufacturers in the Pearl River Delta will ship cargoes to the USA, Europe, and other areas. Therefore, liner shipping companies have to offer a variety of liner shipping services to meet the various transport needs of the shippers in this ship-ping market segment.
5.4.3 Access-based Positioning
The third basis for positioning is that of segmenting customers who are accessible in different ways. Access can be a function of customer scale or of anything that requires different activities to reach customers in the best way. From the perspec-tive of liner operators, shippers can be segmented into several clusters for develop-ing shipping service strategies. In general, shippers can be segmented into three categories: international freight forwarders, global traders, and small domestic exporters. ————— 1 A classification society is a non-government organization that certifies a ship’s seaworthiness. Such an organization inspects design drawings and specifications before construction begins, supervises construction to ensure that standards are met, and performs periodic surveys to deter-mine continued seaworthiness of the ship.

5.5 Development Process of Shipping Strategies 69
5.5 Development Process of Shipping Strategies
Figure 5.3 shows the activities and decisions involved in the process of formulat-ing and implementing shipping strategies. Formulating and implementing a ship-ping strategy involves many interrelated decisions, such as what to do, when to do it, as well as how to do it. Objectives and strategies must be achievable with the shipping firm’s available resources and capabilities, and must be consistent with the direction and allocation of resources inherent in the firm’s corporate and business strategies.
5.5.1 Strategic Analysis
A major factor affecting the success of shipping strategies is whether the strategic elements are consistent with the business environment. Therefore, the first step in formulating a shipping strategy is to monitor and analyse the opportunities and threats by examining the business environment. Shippers and consignees use the same container services but they are located in different countries. Therefore, managers in shipping firms must be aware of the global business environment to identify opportunities and threats to their business.
Corporate objectives
Business objectives
External environment
Market analysis
Strategies formulation
Implement and control
Corporate objectives
Business objectives
External environment
Market analysis
Formulation of strategies
Implementation and control
Fig. 5.3 Development process of shipping strategies

70 5 Business Strategy in Shipping
5.5.2 Formulation of Strategies
Formulation of strategies should reflect market demand and the competitive situa-tion within the shipping market. Different strategies are typically more appropriate for different market conditions. Formulating a successful shipping strategy re-quires an understanding of the following issues (Walker et al. 2003):
• the company’s internal resources, capabilities, and strategies; • the environmental context, such as political, economic, and technological trends
in the shipping industry; • the relative strengths and weakness of competitors; • the needs, wants, and characteristics of current and potential customers.
5.5.3 Implementation and Control
Another determinant affecting the success of a shipping strategy is concerned with the organizational abilities to implement the strategy effectively. It depends on whether the strategy is consistent with the firm’s resources, organizational struc-ture, coordination efforts, and control system. For example, Hapag-Lloyd estab-lished a blueprint to acquire CP Ships by applying its own yield management systems in 2005. Hapag-Lloyd also looked for fleet saving, combining services where possible to reduce deployed capacity and operating costs. Synergies can be created by combining the two companies to form one of the world’s top five con-tainer shipping lines (Porter 2005b). Control is probably the most important but most neglected area in the strategic management process. It requires the provision of an effective and efficient system to monitor progress within the budget con-straints and to adjust the programme when performance is not up to expectation. This evaluation and control process can also serve as a basis to conduct market opportunity analysis.
5.6 Structural Options for Shipping Companies
Firms make their strategic choices after analysing their external business environ-ment, resources, capabilities, and competencies. To seek growth opportunities, a firm may consider diversification. Alternative growth opportunities can be iden-tified and achieved in related business (e.g., Maersk Group operates APM con-tainer terminals). Growth opportunities can also be realized through vertical inte-gration or development of the logistics service business (e.g., NYK Logistics and OOCL Logistics joined forces to become more fully integrated into the supply chain of their customers). Such diversification may be considered as strengths or weaknesses of shipping companies (Brooks 2000).

5.6 Structural Options for Shipping Companies 71
Organic growths
Organic growths
NetworksNetworks AlliancesAlliances
Joint ventures
AcquisitionsAcquisitions
Structuraloptions
Structuraloptions
Fig. 5.4 Structural options for shipping companies
An important question about growth opportunities is: how do shipping compa-nies plan to grow? As illustrated in Fig. 5.4, the structural options include organic growth, acquisitions, joint ventures, alliances, and networks.
5.6.1 Organic Growth
A company is considered to be growing organically when it is increasing the turn-over of its existing business, but not by acquiring other companies. Organic growth offers the greatest control without meshing organizational cultures. It is an excellent alternative for firms like OOCL Logistics when the opportunity and resources exist.
5.6.2 Acquisitions
Buying an existing firm can be one way to grow a business in a short time. An acquisition or merging may lead to market power and create economies of scale (Brouthers et al. 1998). For example, combining Hapag-Lloyd and CP Ships cre-ated one of the world’s top five container lines and yielded a great synergistic ad-vantage. The merging of Maersk Sealand and P&O Nedlloy in 2005, as well as that of CMA CGM and Delmas, has led to consolidation on an unprecedented scale in the liner shipping industry. Today, two or three players account for 40–50% of the capacity in the liner shipping market (Traffic World 2005).

72 5 Business Strategy in Shipping
5.6.3 Joint Ventures
A joint venture has a greater alignment of incentives that motivates partners to adapt to a changing environment than is the case in a contractual agreement (Kogut 1988). As an illustration, CMA CGM formed a joint venture with Jardine Shipping in 2000 to create the CMA CGM shipping agency in Hong Kong at the time when it was developing its agency business.
5.6.4 Alliances
The term “alliance”, or “strategic alliance”, can used to describe a wide range of organizational structures in which two or more shipping lines cooperate for mutual benefit and share common goals. Strategic alliance in the liner shipping industry is driven by the need to accomplish the organizational objective of achieving opera-tional gains. COSCO, K Line, Yang Ming, and Hanjin Shipping focused on strengthening their strategic CKYH alliance and service offerings in 2006. The shipping lines intended to upgrade services by providing a total of 14 loops, with eight serving northern Europe. It added two new loops in the first quarter of 2006. In the trans-Pacific trade, CKYH provided 17 loops. In addition, CKYH intended to extend its cooperation scope by establishing joint feeder networks in 2006 (Traffic World 2005). Table 5.1 shows that most of the liner shipping service providers in trans-Pacific trade are operated in the form of shipping alliances with capacity sharing among the member lines.
Table 5.1 Capacity sharing in trans-Pacific trade
Operator/ alliance Capacity (TEUs) Share (%)
Maersk (1,759,619 TEUs) 1,759,619 16.8
CHKY (COSCO, K Line, Yang Ming, and Hanjin) COSCO, 387,690 TEUs K Line, 275,634 TEUs Yang Ming, 240,305 TEUs Hanjin, 348,235 TEUs
1,251,864 12.0
Grand Alliance (Hapag-Lloyd, NYK, and OOCL) Hapag-Lloyd, 458,161 TEUs NYK, 329,324 TEUs OOCL, 281,113 TEUs
1,068,598 10.2
New World Alliance (MOL, APL, Hyundai, and CMA CGM) MOL, 281,807 TEUs APL, 339,036 TEUs Hyundai, 164,700 TEUs CMA CGM, 685,054 TEUs
1,470,597 14.0
Source Lun and Browne (2009)

5.6 Structural Options for Shipping Companies 73
In the face of global competition and pressure for higher profitability, liner shipping companies form strategic alliances to deliver liner shipping services. The formation of strategic alliances is driven by the need to accomplish the following objectives:
• Financial objectives: profit maximization, capital investment sharing, and finan-cial risk reduction.
• Economic objectives: cost reduction and economies of scale. • Strategic objectives: entry to new markets and expansion of geographical influ-
ence. • Marketing objectives: satisfying customer requirements, higher shipping fre-
quency, and greater variety of routes and destinations. • Operational objectives: increase in frequency of services, vessel planning, and
better coordination of global operations.
5.6.5 Networks
A network can be considered as “a transformation process of independent actors and resources into a more closely knit configuration of a network”. The transfor-mation process of a liner shipping network can be classified into a creation process and an operations process. The former refers to the formation of relationships among actors to deliver liner shipping services, whereas the latter refers to con-tinuous efforts to maintain and improve the relationships.
A complementary resource is a key driver for shipping firms in the liner ship-ping industry to cooperate. Through participation in a liner shipping network, actors in the shipping industry collaborate beyond firm boundaries to attain cost and service improvements (Dyer and Nobeoka 2000). Network members enter a liner shipping network to access resources for organizational survival and per-formance improvement. Strategic interdependence, a situation in which one firm has resources or capabilities beneficial to but not possessed by the others (Gulati and Gargiulo 1999), can be developed among actors within the liner shipping network. For instance, liner shipping companies enter into a network with railway operators to provide inland transport services to their customers so that a wider coverage of shipping services can be offered.
The success factors of a liner shipping network include cooperation and trust among network members, as well as their ability to deploy resources to form and operate the network. As an illustration of this, the concentration process in the liner shipping industry and its increased capacity has led some actors, such as container terminal operators, being more cooperative (Walker et al. 1997). In 2003, the top ten liner shipping companies increased their carrying capacity by 13.0% to 3.8 million TEUs, which was 45.7% of the world total container carry-ing capacity (UNCTAD 2004). The largest liner shipping companies possess the power to manage shipping networks. Their global operations allow them more

74 5 Business Strategy in Shipping
choices in calling at ports. On the other hand, if an actor in the liner shipping network, such as a container terminal operator, loses a global shipping line as one of its customers, it may lead to a substantial reduction in terminal through-puts (Song 2003).
Liner shipping networks can be considered facilitators for service integration and deepening service conformity (Bergantino and Veenstra 2002). From the per-spective of liner shipping companies, there are many benefits from entering into a liner shipping network. These benefits include:
• improved ability to provide better transport services and make them more at-tractive to shippers;
• expanded services to more markets in an inexpensive way; • efficient operations by increasing revenues and reducing costs in delivering the
liner shipping services; • decreased exposure to financial risk for expanded services owing to reduction
in capital investment; • increased market share by stimulating growth in acquiring new cargo • improved quality of their shipping services.
References
Asia Pulse (2005) Northern territory region, Senator line joins the fast growing INTTRA multi-carrier network. Asia Pulse 7 March 2005
Bergantino A, Veenstra WA (2002) Interconnection and coordination: an application of network theory to liner shipping. Int J Marit Econ 4(3):231–248
Brooks M (2000) Sea change in liner shipping. Pergamon, Amsterdam Brouthers KD, Hastenburg P, Ven J (1998) If most mergers fail why are they so popular? Long
Range Plan 31(3):347–353 Dyer J, Nobeoka K (2000) Creating and managing a high-performance knowledge-sharing
network: the Toyota case. Strateg Manag J 21(3):345–367 Gulati R, Gargiulo M (1999) Where do inter-organizational networks come from? Am J Sociol
14(5):1439–1493 Hankook I (2004) Hanjin shipping hits record high operating profit. Korea Times 10 Novem-
ber 2004 Harlaftis G, Theotokas J (2002) Maritime business during the 20th century: continuity and
changes. In: The handbook of maritime economics and business. Lloyd’s of London Press, London
Jawkins J, Gray R (2000) Strategies for Asia-Pacific shipping. Plymouth studies in contemporary shipping and logistics. Ashgate, Aldershot
Kogut B (1988) A study of the life cycle of joint ventures. In: Contractor F, Lorange P (eds) Cooperative strategies in international business. Lexington Books, Lexington, pp. 169–185
Kohli AK, Jaworski BJ (1990) Market orientation: the construct, research propositions, and managerial implications. J Mark 54(2):1–18
Lai KH (2003) Market orientation in quality-oriented organizations and its impact on their performance. Int J Prod Econ 84(1):17–34
Lun YHV, Browne M (2009) Fleet mix in container shipping operations. Int J Shipp Transp Logist 1(2):103–118
Miller TO (1992) A customer definition of quality. J Bus Strat 13(1):4–7

References 75
Pepall L, Richards D, Norman G (2005) Industrial organization, contemporary theory and prac-tice. Thomson South-Western, Cincinnati
Porter EM (1996) What is strategy? Harv Bus Rev 74(6):61–78 Porter J (2005a) Booming boxship cycle show no sign of slowing. Lloyd’s List International
58862, 2 March 2005 Porter J (2005b) IT is key to CP Ships, says Hapag-Lloyd. Lloyd’s List International 58986,
30 August 2005 Robbins SP, Coulter M (2003) Management. Prentice Hall, Upper Saddle River SchedNet (2005a) CMA CGM launches new environment web site. Shipping News 8 March 2005 SchedNet (2005b) Kuehne & Nagel is tops in logistics: chairman. Shipping News 7 May 2005 Song DW (2003) Port co-opetition in concept and practice. Marit Policy Manage 32(1):15–30 Traffic World (2005) Bigger ships, bigger lines. Traffic World 19 December 2005 UNCTAD (2004) Review of maritime transport. United Nations Conference on Trade and De-
velopment, Geneva Waldman DE, Jensen EJ (2006) Industrial organization. Pearson, London Walker G, Kogut B, Shang W (1997) Social capital, structural holes and the formation of an
industry network. Organ Sci 8(2):109–125 Walker OC, Boyd HW, Mullins J, Larreche JC (2003) Marketing strategy. McGraw-Hill, Boston

77 Y.H.V. Lun, K.-H. Lai and T.C.E. Cheng Shipping and Logistics Management, © Springer 2010
Chapter 6 Growth of Firms
Abstract There are two key functions in managing business operations, namely, the exchange and value-added functions. The exchange function coordinates input, whereas value is added by the firm engaged in a series of transformations. The combination of the exchange and value-added functions determines a firm’s per-formance. Another important factor affecting firm performance is the growth of the firm. This chapter provides empirical evidence to examine the exchange and value-added functions in the container shipping industry. The findings imply that the price on the product market (i.e., freight rate) is positively related to the total production capacity of the industry, but the price on the factor market (i.e., price of ships) is not a significant factor influencing the decision of container shipping firms to adjust their fleet size.
6.1 Introduction
The exchange function and the value-added function are the two key functions in business operations (Dunning 2003). The exchange function coordinates input, whereas value is added by the firm engaged in a series of transformations. Before the 1930s, business researchers focused on the production function of the firm. The discussion did not extend to the valued-added activities of the firm until the 1950s. Productive efficiency concerns the effective usage of input resources in producing output (Lin and Shao 2006). In business operations, the cost-minimiz-ing and value-maximizing approaches complement each other. On the other hand, firms possessing extensive resources expand continually not only in their existing fields, but also into new products and new markets as opportunities emerge (Pen-rose 1956). Such coordination may involve single or multiple functions and activ-ities. It is the combination of the exchange and value-added functions that will determine a firm’s performance. Dunning (2003) added another important point on

78 6 Growth of Firms
top of the exchange and value-added functions. He noted that the growth of the existing firm is a key element affecting firm performance.
This chapter illustrates the relevance of the exchange and value-added func-tions in explaining the business operations of the international container shipping industry. Container shipping is one of the world’s most internationalized indus-tries. Container shipping firms, also called liner shipping carriers, provide sched-uled, common-carrier-type services over fixed geographical trade routes. The carriers do not have cargoes of their own to transport. Instead, they offer shipping services to transport cargoes for different shippers. Containerization in the 1970s brought a revolution in the pattern of sea transport. Containerization led to a radic-ally new design of container ships and cargo-handling facilities. Carriers also bring structural changes to the container shipping industry through the formation of strategic alliances, enlargement of ship size, and development of global mega firms (Lun and Browne 2009). All these changes prompt container shipping firms to move towards global operations. This transformation goes further with the con-tinuous trend of internationalization.
We discuss a study that used empirical data to examine the exchange func-tion model and the growth of firms, and their implications for firm performance. To carry out the study, we developed the following questions to guide the inves-tigation:
• What are the roles of the prices of the input factor and the product factor in the container shipping industry?
• How does firm size affect horizontal expansion? • How does firm size affect vertical expansion? • What is the relationship between the growth of firm and firm performance?
6.2 Exchange Function
Firms buy the input factor on the factor market and they sell the output of their value-added activities to customers on the product market. Buyers and sellers interact to determine the prices and quantities of both input and output. The provi-sion of container shipping services to shippers is determined by both the price on the factor market and the price on the product market. In the context of container shipping, the factor market is the new building or the sale and purchase markets, where carriers buy the factor of production (i.e., ships), whereas the product mar-ket is the freight market, where carriers provide shipping services to shippers. The product market in container shipping is a marketplace in which sea transport ser-vices are bought and sold (Lun and Quaddus 2009). Container shipping operates according to a schedule of ports of loading and discharge, adhering to a published timetable on set conditions of carriage. It operates like trains of international seaborne trade (Farthing and Brownrigg 1997), with cargoes made up of a large number of different consignments from different shippers. The freight rate is the price on the product market. The quantity of transport services that carriers are

6.2 Exchange Function 79
willing to produce and sell depends on the freight rate. The freight rate plays an important role in the provision of a container shipping service. If shippers need more shipping services, shipping demand will rise. When carriers find that ship-ping demand exceeds their supply, they respond by increasing the freight rate, which in turn would stimulate an increase in their carrying capacity (Jansson and Shneerson 1987).
On the other hand, firms engage in exchanges along the value chain (i.e., verti-cally related exchanges) and across the value chain (i.e., horizontally related ex-changes). An example of a horizontal exchange in container shipping is the sharing of shipping space. Slot sharing is a way for container shipping firms to share ship-ping space with partner carriers to reduce financial risk on capital investment and achieve economies of scale by using larger container ships. This practice allows carriers to place more new building orders for larger container ships (Lun et al. 2009) owing to their collaborative sharing in areas such as slot sharing and sailing arrangements (Sheppard and Seidman 2001). An example of a vertical related activ-ity is when a carrier owns its ships by buying them from the factor market. The decision for carriers to engage in a vertical related activity to own their ships is influenced by a number of factors and the strategy differs greatly from carrier to carrier. As shown in Table 6.1, some carriers (e.g., Girmaldi and RCL) own in ex-cess of 70% of their entire fleet, whereas others may only own a small percentage.
In the factor market, the price of ships serves as a signal to carriers about the status of the supply of and demand for ships to provide shipping services to ship-pers. When carriers find that demand for shipping services exceeds their capacity, they buy more ships from either the new building market or the second-hand ves-sel market, which in turn would stimulate an increase in vessel price. However, a high factor price reduces the demand for the input factor on the basis of the “law of demand” (Samuelson and Nordhaus 1992). Carriers may reduce their capacity levels when the vessel price on the factor market is high.
There are two ways that can be applied to coordinate economic activities: price mechanism and conscious planning (Richardson 1972). From the perspective of price mechanism, a high vessel price reduces demand for input to provide shipping services, whereas a high freight rate encourages carriers to produce more output for shippers. On the other hand, interfirm cooperation is central to elaborating the concept of conscious planning. Interfirm cooperation refers to a trading relation-ship between parties that is stable enough to make demand expectation more reli-able, thereby facilitating production planning. There is no specific rule in the con-tainer shipping industry to determine how to manage resources. Some carriers prefer to own their ships to ensure stability in the supply of input to provide liner shipping services to their shippers, whereas others may rely on chartering ships from other shipowners. For instance, CSAV obtains 92.1% of its capacity from the chartering market, whereas Girmaldi owns 84.4% of its carrying capacity.
To examine the exchange function in the container shipping industry, we used empirical data on fleet size, the freight rate, new building price, and second-hand vessel price in the analysis. Descriptions of the data and the data sources are sum-marized in Table 6.2.

80 6 Growth of Firms
Table 6.1 Container fleet ownership as of March 2008
Carriers Carrier-owned capacitya
Percentage Chartered capacitya
Percentage Total capacitya
Maersk 1,030,456 52.5 934,114 47.5 1,964,570 MSC 712,512 57.4 528,527 42.6 1,241,039 CMA CGM 278,007 30.8 624,735 69.2 902,742 Evergreen 363,425 58.3 260,294 41.7 623,719 Hapag-Lloyd 256,581 51.5 241,233 48.5 497,814 China Shipping 251,195 58.2 180,523 41.8 431,718 COSCO 242,561 55.0 198,453 45.0 441,014 Hanjin Senator 126,821 35.8 227,406 64.2 354,227 APL 134,798 33.5 268,059 66.5 402,587 NYK 245,632 61.7 152,645 38.3 398,277 MOL 173,148 48.6 183,318 51.4 356,466 OOCL 204,915 58.3 146,383 41.7 351,298 K Line 169,306 54.3 142,568 45.7 311,874 CSAV 21,208 7.9 246,581 92.1 267,789 Zim 136,009 47.1 153,008 52.9 289,017 Yang Ming 172,825 63.0 101,456 37.0 274,281 Hamburg Süd 110,309 39.2 170,959 60.8 281,268 Hyundai 76,465 33.7 150,514 66.3 226,979 PIL 103,358 59.5 70,474 40.5 173,832 Wan Hai 98,591 68.5 45,352 31.5 143,943 UASC 77,176 66.2 39,415 33.8 116,591 IRIS 47,268 63.0 27,762 37.0 75,030 MISC 40,151 42.0 55,334 58.0 95,485 Girmaldi 45,133 84.4 8,345 15.6 53,478 RCL 38,782 75.6 12,507 24.4 51,289
Source Lun et al. (2010) a In TEUs
Table 6.2 Data to examine the exchange function in container shipping
Year New building pricea Second-hand vessel priceb Fleet sizec Freight rated
1995 100.00 88.00 40.00 71.60 1996 94.00 76.00 44.90 69.70 1997 79.00 62.00 50.00 65.80 1998 76.00 59.00 56.50 73.80 1999 82.00 75.00 62.20 97.70 2000 73.00 59.00 64.70 101.00 2001 71.00 61.00 70.20 92.80 2002 86.00 73.00 77.70 93.30 2003 106.00 125.00 84.70 117.80 2004 114.00 116.00 91.30 122.70
a Container ship new building price index (source Lun and Quaddus 2009) b Container ship second-hand vessel price index (source Lun and Quaddus 2009) c Total container fleet in million deadweight tons (source Lun and Quaddus 2009) d Ocean container freight index (source Lun et al. 2010)

6.3 Vertical Expansion 81
Table 6.3 Results of regression analyses
Exchange function Regression model R2 R Significance Results
Factor market NB FS 0.118 0.338 0.338 Reject SH FS 0.303 0.550 0.099 Reject Product market FR FS 0.838 0.916 0.000 Accept
NB new building price, FS fleet size, SH second-hand vessel price, FR freight rate
To examine the exchange function in the container shipping industry, we evalu-ated how the price on the factor market and the price on the product market affect the decision of carriers to adjust their fleet sizes. The prices on the factor market are vessel prices, which consist of new building price and second-hand vessel price, whereas the prices on the product market are the freight rates that shippers pay to carriers for transporting cargoes from loading ports to discharging ports. To evaluate how carrying capacity is affected by the prices on the factor market and the prices on the product market, we conducted several regression analyses. The results of the regression analyses are shown in Table 6.3.
In the exchange function, carriers buy the factor input on the factor market by buying ships and sell the output on the product market by charging a freight rate to shippers. The findings indicate that the prices on the factor market do not have a significant effect on carriers adjusting their capacity. On the other hand, the findings show that carrying capacity is significantly affected by the freight rate. Carriers increase their capacity when the freight rate is higher. The higher the freight rate is, the higher is the carrying capacity in the container shipping indus-try. These findings imply that the price on the product market is an important determinant, whereas the price on the factor market does not have a significant impact on capacity in the container shipping industry.
6.3 Vertical Expansion
Most successful firms grow over the long run. Table 6.4 presents the evolution of carriers operating fleets from 2000 to 2007. The findings of Tan et al. (2007) demonstrate a positive relationship between operations capability and firm per-formance. There is a strong tendency for firms possessing extensive resources to continually expand (Yin and Shanley 2008). Productive opportunity is largely determined by the resources of the firm (Teece 1982). One of the notable charac-teristics concerning the growth of firms is the extent to which they change the nature of the products they produce as they grow. The extent to which this process of expansion can continue depends upon the resources of the firm. So long as there are openings in which the firm expects a rate of return on investment sufficient to justify it entering the market, there is nothing in principle to limit its continued expansion (Penrose 1956). Carriers possessing extensive resources adopt the verti-cal expansion strategy to control the input by owning their ships instead of charter-ing ships from other shipowners.

82 6 Growth of Firms
To examine the relationship between firm capacity and vertical expansion in the liner shipping industry, we collected data on firm capacity and new orders from the top 100 carriers in 2007. According to Table 6.5, the results of the re-gression analysis show that firm capacity and ordering of a new fleet are positively related.
Table 6.4 Evolution of carriers operating fleets from 2000 to 2007
Container shipping carriers
January 2000 capacity (TEUs)
January 2007 capacity (TEUs)
Market share in 2007 (%)
Rank
Maersk 620,324 1,759,619 16.8 1 MSC 224,620 1,026.251 9.8 2 CMA CGM 122,848 685,054 6.5 3 Evergreen 317,292 547,576 5.2 4 Hapag-Lloyd 102,769 458,161 4.4 5 China Shipping 86,335 399,821 3.8 6 COSCO 198,841 387,690 3.7 7 Hanjin Senator 244,636 348,235 3.3 8 APL 207,992 339,036 3.2 9 NYK 166,206 329,324 3.1 10 MOL 136,075 281,807 2.7 11 OOCL 101,044 281,113 2.7 12 K Line 112,884 275,634 2.6 13 CSAV 69,745 250,452 2.4 14 Zim 132,618 241,951 2.3 15 Yang Ming 93,348 240,305 2.3 16 Hamburg Süd 68,119 204,960 2.0 17 Hyundai 102,314 164,700 1.6 18 PIL 60,505 145,500 1.4 19 Wan Hai 63,525 115,009 1.1 20 UASC 74,989 86,608 0.8 21 IRIS 19,920 59,900 0.6 22 MISC 41,738 58,013 0.6 23 Girmaldi 35,283 56,668 0.5 24 RCL 26,355 46,466 0.4 25 Others 1,306,388 1,677,643 16.0 – Total 5,150,000 10,467,496 100.0 –
Source Lun et al. (2010)
Table 6.5 Relationship between firm capacity and new orders
Model summary Parameter estimates R2 Significance Constant β
0.628 0.000 37,882.024 0.338
Source Lun et al. (2010). The dependent variable is new orders and the independent variable is firm capacity.

6.4 Horizontal Expansion 83
In Table 6.5, β is the coefficient of the independent variable. Using the constant value and the β coefficient, one can write the estimated regression equation as
Expected NO constant FC,β= +
i.e., NO 37,882.024 0.338FC,= +
where is NO is new orders and FC is firm capacity. In regression analysis, the regression coefficient for a variable tells how much
the value of the dependent variable changes when the value of the independent variable varies. A positive coefficient means that the predicted value of the de-pendent variable increases when the value of the independent variable increases. The coefficient for the variable of firm capacity indicates the capacity of expected new orders increases by 0.338 TEUs for a growth of 1.00 TEU in firm capacity.
6.4 Horizontal Expansion
Organization size plays a significant role in business research (Main et al. 1995; Stuart 2000). One of the most common size-based strategies cites low cost derived from economies of scale as a source of competitive advantage (Porter 2004). Large size leads to a scale mechanism by which a high production volume can be translated into cost-efficiency (Dobrev and Carroll 2003). Large size also serves as a strong entry barrier to new competitors (Porter 1999). Scale operations provide the means for geographical expansion and facilitate internationalization. Hence, economies of scale provide an advantage both directly by decreasing the per unit cost in the market and indirectly by leading to horizontal expansion. Owing to the advantages of scale operations, the capacity of large carriers has experienced continuous growth. For instance, the capacity of the world’s biggest carrier (i.e., Maersk) increased by 284% from 620,324 TEUs in 2000 to 1,759,619 TEUs in 2007.
To examine the relationship between firm capacity and horizontal expansion in the liner shipping industry, we collected data on the firm capacity and growth rate of the top 25 carriers in 2007. The sample size of 25 was adequate to represent the liner shipping industry as the top 25 carriers have 84% of the world market share. The summary statistics on firm capacity and growth rate are presented in Table 6.6. According to the table, the mean value of firm capacity was 351,594 TEUs, with a minimum value of 46,466 TEUs and a maximum value of 1,759,619 TEUs, whereas the mean value of the growth rate was 155.24%, with a minimum value of 15.00% and a maximum value of 458.00%.
Table 6.6 Descriptive statistics of firm capacity and growth rate
N Minimum Maximum Mean
Firm capacity 25 464,66.00 1,759,619.00 351,594.52 Growth rate 25 15.00 458.00 155.24
Source Lun et al. (2010)

84 6 Growth of Firms
Table 6.7 Correlations between firm capacity and growth rate
Variable Firm capacity Growth rate
Firm capacity 1 Growth rate 0.418a 1 (p = 0.038)
a Significant at the 0.05 level (two-tailed)
To examine the relationship between firm capacity and growth rate, we con-structed the Pearson correlation matrix to examine the direction, strength, and significance of the relationships among the variables used in this study. The results in Table 6.7 show that there is a positive correlation between firm capac-ity and growth rate.
6.5 Growth and Firm Performance
Regardless of whether the average profitability of the industry is high or low, some firms are more profitable than others (Bharadway et al. 1993). The rela-tionship between firm size and performance is an interesting topic to explore (Audia and Greve 2006). One of the most popular size-based strategies is the theory of low cost derived from scale as a primary source of competitive advan-tage (Barney 1991; Chandler 1999). A firm can be viewed as a collection of resources. An optimal pattern of firm expansion requires a balanced use of inter-nal and external resources. According to Wernerfelt (1984), what a firm wants is to create a situation where its own resource position directly or indirectly makes it more difficult for others to catch up. In the context of container shipping, ca-pacity is one of the resources for potential high returns. Production processes with increasing returns to scale yield high returns. Economies of scale in the use of resources is a prime example of product entry barriers. Nelson and Winger (1982) also noted that “a firm that is already successful in a given activity is a particularly good candidate for being successful with new capacity of the same sort.” This routine-based view of growth suggests that expansion will be easier and will lead to better performance.
In the container shipping industry, firm capacity has experienced continued growth. It is an interesting issue to explore how firm capacity influences firm performance. We examined the relationship between firm size and firm perform-ance by a regression analysis. In the regression model, the value of net profit was used as the dependent variable and the value of firm capacity in terms of TEUs was used as the independent variable, i.e., predictor.

6.5 Growth and Firm Performance 85
The results of the regression analysis show that firm capacity and net profit are positively related. Using the results in Table 6.8, one can write the estimated re-gression equation as
Expected NP constant FC,β= +
i.e., NP 150.217 0.001FC,= +
where NP is new profit (in million US dollars) and FC is firm capacity (in TEUs). The coefficient for the variable of firm capacity predicts that the expected new
profit increases by 0.001 for an increase of 1.0 in the value of the firm capacity. This means that the net profit increases by USD 1,000.00 for an increase of 1 TEU in firm capacity.
To provide a graphical presentation of the relationship between net profit and firm capacity, we show a curve-fit graph in Fig. 6.1. The curve-fit graph is a scat-ter plot of observed values of net profit expectancy and the line is derived from the regression equation.
Table 6.8 Relationship between firm capacity and firm performance
Model summary Parameter estimates R2 Significance Constant β
0.810 0.000 150.217 0.001
The dependent variable is net profit and the independent variable is firm capacity.
Net profit
Firm capacity
2000.00
1500.00
1000.00
500.00
0.000.00 500000.00 1000000.00 1500000.00 2000000.00
ObservedLinear
Fig. 6.1 Relationship between firm capacity and net profit

86 6 Growth of Firms
6.6 Discussion and Conclusions
This chapter started with an examination of the exchange function in the container shipping industry. The findings suggest that the price on the product market posi-tively affects carrying capacity, whereas the price on the factor market does not have a significant impact on the adjustment of carrying capacity in the container shipping industry. The change in vessel price does not significantly affect the level of the fleet size. In the factor market in container shipping, vessel price is not a significant factor affecting carriers’ decisions on adjusting their capacity. On the other hand, ocean carriers tend to increase their capacity when the freight rate is at a high level. The price on the product market (i.e., freight rate) plays an important role in the provision of shipping services. It indicates that container shipping is a market-driven industry as the price on the product market significantly affects ocean carriers’ production decisions. Carriers adjust their carrying capacity on the basis of the demand for shipping services.
Demand for shipping services depends on shippers’ demand for sea transport to consign their cargoes. As a result, seaborne trade is a key determinant that affects the demand for shipping services in the container shipping market. An increase or a decrease in seaborne trade volume would change the demand for shipping ser-vices, which in turn influences the freight rate. If the seaborne trade volume in-creases, shippers demand more shipping services. When shipping demand exceeds shipping supply, the freight rate will go up. The freight rate coordinates the deci-sions of carriers and shippers to transact business for shipping services in the con-tainer shipping market. A high freight rate tends to encourage growth in carrying capacity. Such an association between the freight rate and the carrying capacity can be regarded as the existence of an invisible hand that controls the container shipping market.
Our empirical study also indicates that there is a positive relationship between new orders and carrying capacity in the container shipping industry. This implies that bigger firms tend to use the strategy of vertical expansion. Vertical expansion represents a decision by the firm to utilize internal transactions rather than market transactions to accomplish its economic purpose (Porter 2004). In container ship-ping, larger firms find it advantageous to own their ships rather than chartering shipping space from other shipowners. Carriers may believe that it is cheaper, less risky, or easier to coordinate their activities when ships are owned internally. A vertically integrated decision is a “make or buy” decision to address the strate-gic issues of integration or use of market transactions. Vertical expansion has im-portant generic benefits. For instance, vertical expansion to own more ships as-sures carriers that they will have ships available in tight periods. Growth is related to a firm’s requirements for certainty and survival (Pfeffer 1972).

References 87
References
Audia PG, Greve HR (2006) Less likely to fail: low performance, firm size, and factory expan-sion in shipbuilding industry. Manag Sci 52(1):83–94
Barney J (1991) Firm resources and the theory of competitive advantage. J Manag 17(1):99–120 Bharadway SG, Varadarajan PR, Fahy J (1993) Sustainable competitive advantage in service
industries: a conceptual model and research propositions. J Mark 57(4):83–99 Chandler AD (1999) The enduring logic of industrial success. In: Montgomery CA, Porter ME
(eds) Strategy: seeking and securing competitive advantage. Harvard Business School Press, Boston, pp. 257–276
Dobrev SD, Carroll GR (2003) Size (and competition) among organizations: modeling scale-based selection among automobile producers in four major countries, 1885–1981. Strateg Manag J 24(6):541–558
Dunning JH (2003) Some antecedents of internalization theory. J Int Bus Stud 34(2):108–115 Farthing B, Brownrigg M (1997) Farthing on international shipping. Lloyd’s of London Press,
London Jansson JO, Shneerson D (1987) Liner shipping economics. Chapman and Hall, London Lin WT, Shao BBM (2006) Assessing the input effect on productive efficiency in production
systems: the value of information technology capital. Int J Prod Res 44(9):1799–1819 Lun YHV, Browne MJ (2009) Fleet mix in container shipping operations. Int J Shipp Transp
Logist 1(2):103–118 Lun YHV, Quaddus MA (2009) An empirical model of the bulk shipping market. Int J Shipp
Transp Logist 1(1):37–54 Lun YHV, Lai KH, Cheng TCE (2009) A descriptive framework for the development and opera-
tion of liner shipping networks. Transp Rev 29(4):439–457 Lun YHV, Pang KW, Panayides PM (2010) Organisational growth and firm performance in the
international container shipping industry. Int J Shipp Transp Logist 2(2):206–223 Main BG, O’Reilly C, Wade JB (1995) The CEO, the board of directors and executive compen-
sation. Ind Corp Change 4(2):293–332 Nelson RR, Winger S (1982) An evolutionary theory of economic change. Harvard University
Press, Cambridge Penrose ET (1956) Foreign investment and the growth of the firm. Econ J 66:220–235 Pfeffer J (1972) Merger as a response to organizational interdependence. Admin Sci Q 17(3):382–
394 Porter ME (1999) Strategy: seeking and securing competitive advantage. Harvard Business
School Press, Boston Porter ME (2004) Competitive strategy, techniques of analyzing industries and competitors. Free
Press, New York Richardson G (1972) The organization of industry. Econ J 82(327):883–896 Samuelson AP, Nordhaus DW (1992) Economics. McGraw-Hill, New York Sheppard E, Seidman D (2001) Ocean shipping alliances: the wave of the future? Int J Marit
Econ 3(4):351–367 Stuart T (2000) Inter-organizational alliances and the performance of firms: a study of growth
and innovation rates in a high-technology industry. Strateg Manag J 21(8):791–811 Tan KC, Kannan VR, Narasimhan R (2007) The impact of operations capability on firm per-
formance. Int J Prod Res 45(21):5135–5156 Teece DJ (1982) Towards an economic theory of the multiproduct firm. J Econ Behav Organ
3(1):39–63 Wernerfelt B (1984) A resource-based view of the firm. Strateg Manag J 5(2):171–180 Yin X, Shanley M (2008) Industry determinants of the merger versus alliance decision. Acad
Manag Rev 33(2):473–491

89 Y.H.V. Lun, K.-H. Lai and T.C.E. Cheng Shipping and Logistics Management, © Springer 2010
Chapter 7 Fleet Mix Decision
Abstract Carrying capacity is a critical resource in container shipping, Although it is beneficial for carriers to deploy mega ships to achieve cost-efficiency, a bal-ance between ship size and the scope of service is required when they determine their fleet mix. This chapter provides empirical evidence to support the proposal that the carrying capacity of the shipping firm positively affects the firm’s per-formance. As fleet mix is concerned with the number of ships and the size of ships, this chapter also examines the impact of the number of ships and the aver-age ship size on firm performance. In comparing the magnitudes of the effects, the number of ships has a stronger impact on firm performance than ship size. In add-ition, we present the SCOPE framework, which consists of the dimensions of service frequency, customer value, optimal vessel size, ports of call, and extensive market coverage, as a useful reference for shipping managers to determine the fleet mix for providing their shipping services.
7.1 Introduction
The world fleet has experienced continuous growth in all the categories of fully containerized ships. In 2000, the total capacity of the container shipping fleet was 5,150,000 TEUs. The fleet size increased to 10,467,497 TEUs in 2007. In view of increasing international business collaboration, the growth in seaborne trade is set to continue. Hence, container shipping capacity is expected to increase as sea-borne trade activities rely on the capacity of the world’s fleet. To adjust shipping capacity, carriers deploy ships of different sizes. Liner ships operate for interna-tional seaborne trade with cargo consolidated from a large number of consign-ments from different shippers. A key objective for liner shipping operations is to utilize their fleets optimally. Carries can gain efficiency from improving fleet utilization through ship routing, which is referred to as the assignment of the sequence of ports to be visited by a ship. The factors that shipping firms need to

90 7 Fleet Mix Decision
take into account in planning a liner shipping service include shipping service scope and fleet mix.
7.2 Liner Shipping
One important factor to consider when planning a liner service route is the deci-sion on the service scope and the type of shipping routes. In general, shipping routes can be classified into three main types, namely, port to port, pendulum, and round the world routes:
1. Port to port involves a regular shipping service between two ports, often mov-ing back and forth, but very likely the shipping route is unidirectional. This route pattern has the disadvantage of limited connectivity.
2. Pendulum involves a regular itinerary between a sequence of ports, often ser-viced by geographical proximity. A cluster of ports along one seaboard are ser-viced and then an ocean is crossed. This process is repeated on a regular basis.
3. Round the world involves serving continuously a sequence of ports, often in both directions, so that the sequence of ship visits enables a round trip around the world. A limited number of ports per continent are serviced. This type of maritime route planning is mainly used for container shipping.
7.2.1 Hub-and-spoke Services
With the growing complexity in liner shipping services, a hierarchical set of ship-ping networks has emerged (Robinson 1998). Key characteristics of the high-order shipping network include fewer ports of call and deployment of bigger vessels. The shipping network is operated by mega vessels and is based on scheduling vessels to travel back and forth between two major regions and is supported by a hub-and-spoke system (Gilman 1999). In a hub-and-spoke system of container-ized trade, an import container is first delivered to a primary hub port and is then transported to its final destination by feeder services. Similarly, export containers are collected in a primary hub and are then transported to final destinations by mega ships.
Although these hub ports are generally well equipped to facilitate a quick turn-around time of vessels, there are two main characteristics that set them apart from other ports. First, the hub port tends to be geographically central to a region or within a hinterland to attract a considerable number of containers. The second characteristic is that the hub port possesses excellent infrastructure and can ac-commodate larger vessels than other ports in the region. There is a trend in the shipping industry to change shipping operations from direct call at ports to hub-and-spoke services. Hubs, because of their direct connection to many spoke cities,

7.2 Liner Shipping 91
are highly accessible places to consolidate containers. Hubs also allow the devel-opment of indirect linkages between origins and destinations. As a result, the hub-and-spoke configuration can gain the benefits of cost-efficiency, diversity in ser-vice provisions, and strengthened market position.
A hub port serves as a transshipment port, where feeder shipping routes are connected with one another and with trunk routes for ocean-going voyages. The size and the level of integration of a port with its hinterland determine the stability of its transshipment activities. A port is linked with the dynamics of territories, notably their economic functions (Rodrigue and Comtois 1997). Recently, ship-ping lines have established connections with ports to make their transshipment operations more efficient and effective. Mega carriers tend to use transshipment hubs. Transshipment occurs where precarriage is arranged to transport containers by feeder vessels from feeder ports to hub ports for onward shipment to other vessels. Import containers follow the reverse process and on-carriage is arranged to transport containers to destinations.
This type of transshipment can be controlled by either the shipping line or the shipper:
• Line transshipment arises from coordinated schedules of the main line, whereas feeder vessels are controlled by the shipping line.
• Shipper transshipment is opportunistic – it often exploits the services of differ-ent lines or modes with the aim of reducing transit time and/ or costs.
Another form of transshipment is relay, which is wholly controlled by shipping lines or shipping alliances. This involves cargo carried on one mainline vessel relayed to another one at a hub port. This relay traffic is sensitive to port costs and operation efficiency in cargo handling. With increasing significance in transship-ment and high-order shipping networks, liner services on main shipping routes have transformed to the “line-bundling” pattern. According to Notteboom (2006), a line-bundling loop is defined as “a set of x roundtrips of y vessels each with a similar calling pattern in terms of the order of port calls and time intervals be-tween two consecutive port calls”. By the overlay of these round trips, shipping firms can offer a desired calling frequency to their customers.
7.2.2 Fleet Mix
Fleet mix is composed of the number of ships and the sizes of the ships to be de-ployed. Carriers normally offer a bundle of shipping services to the market. Liner shipping firms need to consider a trade-off between shipping service frequency and ship size. Deploying larger vessels will allow operators to benefit from economies of scale, but will potentially reduce the shipping service frequency. The optimal ship size therefore depends on cargo availability and the requirement of the transit time. As economies of ship size are more significant for long haul, bigger vessels are often deployed for deep-sea trade.

92 7 Fleet Mix Decision
Decisions on fleet mix (i.e., the number and the sizes of ships to be deployed) are often made jointly with partners in a carrier-cooperative scheme known as an alliance. Alliances through strategies such as individual service network integra-tion, vessel sharing, slot chartering, slot exchange, joint ownership, and utilization of equipment and terminals are set up to provide comprehensive liner shipping services to the market.
The port selection criteria adopted by carriers are essential to the successful performance of the liner shipping business in terms of capacity utilization and revenue management. Basic strategies are driven by the consideration of a number of factors, such as (Branch 1998; Lirn et al. 2004):
• The amount of profitable cargo that can be generated. • The existence of feeder networks affecting the flexibility of the cargo trans-
shipment arrangements to minimize ship turnaround time. • To facilitate rapid cargo transshipment, the port authority, shippers, agents,
customs, trade associations, and inland transport operators should be taken into consideration.
• The berth layout and other port facilities, e.g., stacking area at container yards and container handling equipment.
• The port should operate 24 h a day, 7 days a week to shorten vessel berthing time.
• The efficiency of port operations that can improve ship turnaround time and overall cargo transit time.
• A good intermodal network, where terminals are designed for ease of intermo-dal transfer to and from road, rail, and inland waterway transport.
• The port should be strategically located on a major shipping lane and should be supported by a strong hinterland.
• The availability of bunker and ship repair facilities in the port and their charges need to be considered.
• Modern ports are fully computerized in all the areas of terminal operations. The adoption of technology is essential to reduce the turnaround time of vessels.
• Port competitiveness in terms of cost is also important. Terminal handling charges, storage charges, and availability of free time at terminals are key de-terminants.
To serve mega-sized container ships, there are requirements that have to be met by ports. For instance, ports must have adequate depth of water, wide channels, long berths, efficient container handling equipment, a highly productive and rea-sonably priced workforce, adequate berths for feeder vessels, and good road and rail intermodal connections to the inland (Ircha 2001).
Shippers expect frequent liner shipping services to meet their flexible-produc-tion requirements, on the one hand, and require low transport costs, on the other hand. The liner shipping industry needs to enhance shipping services and cut costs by building larger ships. It potentially creates overcapacity that depresses the freight rate, which leads to a stronger need to cut costs (Haralambides 2000).

7.3 Fleet Mix Decision 93
7.3 Fleet Mix Decision
Growth leads to economies of scale and an increase in firm size is often associated with prestige and the ability to withstand changes in the dynamic business envi-ronment. On the other hand, a deeper and wider scope of service is required to satisfy the operational needs of shippers due to rising customer expectations for shipping services. Hence, carriers offer comprehensive services such as increasing the number of ports of call and the sailing frequency to enhance their global mar-ket coverage. To broaden their service scope, many shipping firms offer a wide range of integrated services, such as container terminal operations and logistics-related services.
7.3.1 Capacity
In the container shipping industry, the association of firm size with scale opera-tions affects the performance of firms. Firm size is therefore an important issue in business management, leading to abundant findings about firm size effects. For instance, increasing scale leads to lower cost (Porter 2004). In addition, large firms usually find themselves in a better position to spread the fixed cost over a larger production base. Large operations also provide the means for geographical expan-sion and facilitate global operation (Dobrev and Carroll 2003).
A firm can be viewed as a collection of resources and the optimal pattern of firm expansion requires a balanced use of its resources. In container shipping, capacity can be one of the most important resources for high returns. Production processes with increasing returns to scale yield high returns. Economies of scale in the use of resources are one of the prime examples of product entry barriers. As a result, the increase in the carrying capacity of the biggest container shipping firms reflects the characteristic of concentration operations in the industry. Large firms are more likely to acquire their competitors (Palmer and Barber 2001). Re-cently, several examples of consolidation of shipping lines can be found in the liner shipping industry. For instance, Hapag-Lloyd acquired CP Ships to form one of the world’s top five container shipping firms. Furthermore, the merging of Maersk and P&O Nedlloyd has led to consolidation of shipping lines on an un-precedented scale in the container shipping industry.
7.3.2 Ship Size
Operating larger ships can lead to reductions in operational cost per TEU. For instance, a vessel of 12,000 TEUs on the Europe/ Far East trade route would gener-
94 7 Fleet Mix Decision
ate an 11% cost saving per container slot compared with an 8,000-TEU vessel and a 23% cost saving compared with a 4,000-TEU ship (Notteboom 2004). Historical background can also be an important determinant of firm performance. The per-formance of a shipping firm depends not only on the industry structure but also on the path the firm has followed throughout its historical development to reach where it is today.
Mega ships are expensive. The return on investment of mega ships depends on the volume of trade. If investment in ships has been made but the volume of trade does not grow, then expensive ships will have to be laid up. The shipping market is driven by a market mechanism to determine the freight rate. Excessive demand leads to a shortage of ships, which in turn leads to a higher freight rate in the shipping market. Similarly, excessive supply of ships leads to a lower freight rate. The shipping cycle can be seen as a consequence of the market mechanism. Purchasing mega ships in-curs significant risks as the capital cost takes many years to recover. On the basis of the concept of “supply rigidity” (Fusillo 2004), shipping managers usually order new mega ships only when a definite trend in increased demand is assured.
Cost-efficiency is one of the most popular size-based strategies for shipping firms implemented through acquisition of mega ships. An interesting question to consider is: what is the relationship between ship size and shipping costs? Metaxas (1971) examined how ship size affects shipping costs. His findings are summa-rized as follows:
• Size reduces ship construction cost per slot. • The number of crew increases slightly with an increase in ship size. • Costs of lubes and stores, maintenance and repairing, and administration in-
crease in a diminishing proportion as the size of a ship increases. • Economies of scale can be gained by spreading the management and insurance
costs.
Other reasons for deploying mega ships include the following: large ships al-low the carriage of a higher cargo volume per ship, large ships equipped with efficient engines can travel at higher vessel speeds, there is greater flexibility in container stowage, there is better stability, and less heeling motion in the port reduces loading and unloading times.
Shipping cost is a key determinant of the cost of shipping operations. Generally speaking, shipping cost involves voyage cost and vessel operating cost. Voyage cost can be defined as the variable cost incurred for a particular voyage. The main items include fuel costs, port dues, service charges, and canal charges (Stopford 2004), as illustrated below:
VC FC PS CD ,tm tm tm tm= + +
where VC is voyage cost, FC is fuel costs, PS is port dues and service charges, CD is canal dues, t is time in years, m is the mth ship.

7.3 Fleet Mix Decision 95
In container shipping operations, vessel operating cost includes all the expenses incurred through vessel operations, which are made up of five key items (Ocean Shipping Consultants Ltd 2004):
OC M IN RM SL AD ,tm tm tm tm tm tm= + + + +
where OC is operating cost, M is manning cost, IN is insurance cost, RM is repair and maintenance costs, SL is store and lube costs, AD is administration cost, t is time in years, and m is the mth ship.
Economies of scale can be achieved through spreading the administration cost, store and lubes costs, and manning cost.
7.3.3 Number of Ships
The introduction of mega ships has placed additional burdens on port terminals by the provision of direct call services instead of the hub-and-spoke approach. There are several drawbacks of using mega ships, which include (Stopford 2004):
• Using very big ships requires deep dredging of ports and extensive feeder ser-vices to ports that may not be able to accommodate them.
• Feeder cost dwarfs the saving made by using bigger ships for deep-sea trade. • Feeder vessels can be highly inefficient. For instance, there is an extra set of
port costs involved because containers need to be unloaded (or loaded) from the feeder vessel and transferred to the main vessel at the hub port.
The regularity and frequency of the shipping service should be considered when determining the number and sizes of ships required. The emergence of com-plex logistics networks has led to demand for shipping services characterized by high frequency, high schedule reliability, and low transit time. Transit time can be defined as the number of sailing days on a port-to-port basis. Transit time can also be considered as the total time on a door-to-door basis, which includes dwell time at terminals and the time needed for precarriage at the port of loading and on-carriage from the port of discharge. A key factor affecting port-to-port transit time is the order of the ports of call on the shipping service loop. Decisions on the order of ports of call are determined by factors such as cargo volume generated at the ports, distribution of the hinterland, berth availability, and geographical location. On the other hand, a fast growth in cargo volume will lead to port congestion, which affects the reliability of shipping schedules. Shipping lines are constantly balancing factors such as the risk of late arrivals and the minimization of the tran-sit time (Notteboom 2006). Hence, the number of ships deployed also plays an important role in affecting the performance of shipping firms.

96 7 Fleet Mix Decision
7.4 The Fleet Mix Model
To evaluate the relationship between firm performance and the variables of firm capacity, ship size, and number of ships, we developed a fleet mix model based on empirical data on total carrying capacity, number of ships, and average ship size of the top 100 ocean carriers (Lun and Browne 2009). The descriptive statistics of the 100 container carriers are shown in Table 7.1.
The carrying capacity of the 100 container carriers ranged from 5,246 to 1,964,570 TEUs, with a mean of 115,045 TEUs. The number of ships operated by them was between three and 544, with a mean value of 47.14. The average ship size ranged from 291.44 to 4,450.57 TEUs, with a mean value of 1,456.40 TEUs. To evaluate the effects on firm performance, the data for the ocean carriers’ earn-ings before interest and tax was collected from Dekker (2006) to serve as perform-ance indicators.
We used regression to develop the fleet mix model to examine the relationship between firm performance and the independent variables. The results are shown in Table 7.2. According to the test results, carrying capacity is related to firm per-formance (with β = 0.901 at the p = 0.000 level). The findings also suggest that ship size is related to firm performance (with β = 0.539 at the p = 0.008 level). Furthermore, the findings indicate that number of ships deployed positively affects firm performance (with β = 0.874 at the p = 0.000 level).
The results indicate that the carrying capacity of a shipping firm positively af-fects the firm’s performance. Fleet mix involves the number of ships and the size of the ships deployed. To evaluate the relationship among the components of fleet mix and firm performance, we used structural paths to examine the causal rela-
Table 7.1 Descriptive statistics of the top 100 container carriers
N Minimum Maximum Mean
Carrying capacity (TEUs) 100 5,246 1,964,570 115,046 Number of ships 100 3 544 47 Average ship size (TEUs) 100 291 4450 1,456
Table 7.2 Results of regression analyses
Independent variables Dependent variables
R2 β coefficient Significance Results
Carrying capacity EBIT 0.812 0.901 0.000a Accept Average ship size EBIT 0.291 0.539 0.008a Accept Number of ships EBIT 0.765 0.874 0.000a Accept
EBIT earnings before interest and tax a Significant at the p < 0.01 level

7.5 SCOPE Framework 97
tionships among the variables and assess the strength of their influences on the performance of container shipping firms. On the basis of the results, we developed a path diagram illustrating how the factors of average ship size and number of ships affect firm performance; it is shown in Fig. 7.1.
7.5 SCOPE Framework
The study results generally supported that proposal that the capacity of container shipping firms positively affects firm performance. As fleet mix involves the number of ships and the sizes of ships, we used a structural path to examine the impacts of the number of ships and the average ship size. Both the average ship size and the number of ships positively affect firm performance. In comparing the magnitudes of the effects on firm performance, the number of ships (with β = 0.874) had a stronger effect than the average ship size (with β = 0.539). Although ship size and firm performance are positively associated, our results indicate that the number of ships is a key factor that affects the performance of container ship-ping firms.
Carriers can benefit from deploying mega ships when the ships are full. How-ever, a shipping service with broad scope achieved by deploying more ships can influence the performance of container shipping firms. When the fleet mix is being designed, the scope of the shipping service is a key factor to be determined. Lun and Browne (2009) proposed the SCOPE framework to facilitate decision making for fleet mix. This SCOPE framework consists of elements of service frequency, customer value, optimal vessel size, ports of call, and extensive market coverage.
FirmPerformance
Firmperformance
AverageShip SizeAverageship size
Number ofShips
Number ofships
0.8740.539
Fig. 7.1 Structural paths affecting firm performance

98 7 Fleet Mix Decision
7.5.1 Service Frequency
It is better to offer a highly frequent service that is offered at least on a weekly basis. However, there is a trade-off between service frequency and scale opera-tions. Smaller ships allow more frequent services, which are desirable from the shippers’ perspective, but larger vessels allow operators to benefit from economies of vessel size. The fleet mix decision needs to consider not only carrier-specific operation factors but also shippers’ needs for service frequency, reliability, and other service elements.
7.5.2 Customer Value
In the last two decades, carriers have reshaped the liner shipping network through the use of new types of end-to-end services, particularly on the high-volume inter-national trade routes. These types of pendulum service focus on the hub-and-spoke system, which allows carriers to deploy large ships to reduce cost. To create cus-tomer value, liner shipping services tend to change from a cost-driven operation to a more customer-oriented approach.
7.5.3 Optimal Vessel Size
The optimal vessel size depends on cargo availability, transit time, and service frequency. From the carrier’s point of view, efficient shipping systems are the lowest-cost operations via hubs and involve the deployment of the largest ships. However, shippers could avoid these services owing to poor service frequency, low accessibility, and long transit times. When deploying large ships, carriers need to search for cargoes to fill the ships and be aware of port restrictions. With the lack of flexibility in offering shipping services, it can be a potential burden in a shrinking market.
7.5.4 Ports of Call
Limiting the number of port calls will shorten the voyage time and increase the number of round trips per year. With fewer ports of call, the number of vessels deployed for a specific service can be reduced. Nevertheless, fewer ports of call mean poorer access to cargo catchment areas. More ports of call can generate more cargoes, which generate additional revenues for carriers. A cost-efficient liner shipping service from the carrier’s perspective could be an inconvenient service from the shipper’s perspective in terms of flexibility and transit time.

References 99
7.5.5 Extensive Market Coverage
Delivering superior service values and strengthening ongoing relationships with shippers are important goals for carriers. It is essential for shipping firms to have timely responses to evolving market changes. In essence, a liner shipping firm can be self-sustaining under one of two conditions: (1) attaining the firm size that would serve a specified range of international trade routes or (2) targeting regional markets. Because of the need to provide extensive market coverage to fill the ever-growing capacity of ships, many carriers have responded by pooling their re-sources together to establish networks. By doing so, they are able to extend market coverage and enter markets that cannot be served adequately by operating alone, resulting in firms pursuing network-based organizations.
7.6 Concluding Remarks
The implications of the study on fleet mix are useful for both researchers and managers. From the research perspective, the empirically tested fleet mix model identifies the factors that affect the performance of container shipping firms. The results suggest that carrying capacity is a key factor that influences firm perform-ance in the container shipping industry. Firm performance is also affected by the number of ships and the average ship size. The findings imply that the number of ships is a relatively more important determinant of fleet mix than ship size in in-fluencing firm performance. From the management perspective, the findings indi-cate that there are a number of factors affecting firm performance, such as carry-ing capacity, number of ships, and average ship size. According to the path analysis, the number of ships has a greater impact on firm performance than does average ship size. This highlights the important role of service scope in the liner shipping industry. In addition, the proposed SCOPE framework, comprising the five elements of service frequency, customer value, optimal vessel size, ports of call, and extensive market coverage, provides a useful tool for shipping managers to examine fleet mix issues in designing their liner shipping services.
References
Branch EA (1998) Maritime economics. Thornes, Cheltenham Dekker N (2006) The Drewry annual container market review and forecast. Drewry Shipping
Consultants, London Dobrev SD, Carroll GR (2003) Size (and competition) among organizations: modeling scale-
based selection among automobile producers in four major countries, 1885-1981. Strateg Manag J 24(6):541–558
Fusillo M (2004) Is liner shipping supply fixed? Marit Econ Logist 6(3):220–235 Gilman S (1999) The size economies and network efficiency of large containership. Int J Marit
Econ 1(1):5–18

100 7 Fleet Mix Decision
Haralambides HE (2000) A second scenario on the future of the hub-and-spoke system in liner shipping. Paper presented at the Latin port and shipping 2000 conference & exhibition, Miami
Ircha M (2001) Serving tomorrow's mega-size containerships: the Canadian solution. Int J Marit Econ 3(3):318–332
Lirn TC, Thanopoulou H, Beynon MJ, Beresford A (2004) An application of AHP on transship-ment port selection: a global perspective. Marit Econ Logist 6(1):70–91
Lun YHV, Browne M (2009) Fleet mix in container shipping operations. Int J Shipp Transp Logist 1(2):103–118
Metaxas BN (1971) The economics of tramp shipping. Athlone Press of the University of Lon-don, London
Notteboom T (2004) Container shipping and ports: an overview. Rev of Netw Econ 3(2):86–106 Notteboom T (2006) The time factor in liner shipping services. Marit Econ Logist 8(1):19–39 Ocean Shipping Consultants Ltd (2004) Shipping profitability to 2015 – the outlook for vessel
costs and revenue. Ocean Shipping Consultants, Chertsey Palmer D, Barber BM (2001) Challengers, elites, and owning families: a social class theory of
corporate acquisitions in the 1960s. Admin Sci Q 46(1): 87–120 Porter ME (2004) Competitive strategy, techniques of analyzing industries and competitors. Free
Press, New York Robinson R (1998) Asian hub/ feeder nets: the dynamics of restructuring. Marit Policy Manag
25(1):21–40 Rodrigue JP, Comtois C (1997) Transportation and spatial cycles: evidence from maritime
systems. J Transp Geogr 5(2):87–98 Stopford M (2004) Maritime economics. Routledge, New York

101 Y.H.V. Lun, K.-H. Lai and T.C.E. Cheng Shipping and Logistics Management, © Springer 2010
Chapter 8 Liner Shipping Network
Abstract A liner shipping network is a form of collaboration in the liner ship-ping industry where actors such as intermodal service providers, container man-agement service providers, and container terminal operators share resources and assets to develop mutually beneficial strategies to seek operational performance gains. This chapter examines the liner shipping industry from the network per-spective with a focus on developing an analytical framework for the development and operations of liner shipping networks. To achieve this objective, we use a case study to establish the framework for the reference of liner shipping companies and their business partners to operate and manage their networks competently. To understand the participation of liner shipping companies in liner shipping net-works, we also explore the driving forces for development and operation of the networks. The findings provide a useful framework for liner shipping companies and their business partners to evaluate their operations for cost and service im-provements in managing liner shipping networks.
8.1 Introduction
A liner shipping company operates a fleet of ships to provide a fixed liner shipping service, at regular intervals, between ports, and offers transport services for any cargoes in the catchment areas served by those ports that are ready for transport by the sailing dates (Lun and Browne 2009). In general, a liner shipping company accepts cargo from all the potential shippers to sail on the dates in a published shipping schedule. The primary functions of a liner shipping company are to:
• offer a regular service for cargo consignments and process the associated ship-ping documentation;
• charge individual consignments; • load containers onto ships and discharge containers from ships;

102 8 Liner Shipping Network
• run a shipping service on a fixed shipping schedule; • plan the tonnage availability to serve the shipping demand, which may require
building new vessels and chartering additional vessels to meet the demand re-quirements.
The operation of a liner shipping business consists of two key elements: trade demand and the physical shipping network (Song et al. 2005). Trade demand represents a requirement that a certain volume of cargo is transported from the cargo origin to its destination:
• The volume of global trade has consistently exceeded that of world output (Park and De 2004) because of:
− an increase in the integration of national economies across the globe; − a deepening of international division of labour; − an increase in standardized business operations; − a surge in the globalized production pattern.
• A physical liner shipping network, which exists to serve trade demand, encom-passes regular sea transport services between specified ports where vessel schedules are announced to shippers in advance. Operation of liner container shipping services requires extensive investment in shipping infrastructure in terms of container ships, advanced information and communications technolo-gies, containers, shipping agents, and network development among actors in the industry (Ting and Tzeng 2003, 2004).
A shipping network comprises sea lanes that link up ports, with connecting ser-vices provided by shipping lines, among which cooperation is a popular practice in areas such as slot-sharing agreements and multimodal transport (Ryoo and Thanopoulou 1999). In a liner shipping network, member companies and their network partners share resources and assets to seek operational gains (Sheppard and Seidman 2001). More aggressive liner shipping companies may strive to fully utilize their network to maximize their cost and service advantages, where access to network resources is an important source of competitive advantage for them. Therefore, a liner shipping network is a form of network in which firms share resources and assets among the network members and with other actors, such as intermodal service providers, container management service providers, and con-tainer terminal operators, to develop mutually beneficial strategies to seek opera-tional gains (Johnsen et al. 2000).
There has been a growing trend for firms to benefit from various forms of ex-ternal collaboration (Badatacco 1991; Gulati 1995). Enterprises in different indus-trial sectors are seeking external collaboration opportunities to improve their per-formance. The need to combine complementary assets plays a role in the growth of interfirm collaboration, and the network-based form of organizations is condu-cive to restructuring a mature industry (Powell 1996). In liner shipping, the growth of such network-based organizations has emerged as an important research topic. There is increasing agreement about the basic characteristics of network organiza-

8.2 Network-based Organizations 103
tions (Snow et al. 1992), where actors can benefit from entering a network. What remains unclear in the maritime literature includes why liner shipping networks are formed and how liner shipping networks are created and operated.
8.2 Network-based Organizations
The term “network” is often used to describe any relationship, ranging from an executive’s “black book” of useful contacts to an integrated company activity (Snow et al. 1992). The existence of networks can be explained by the resource-dependency theory, i.e., a network member provides a function that is complemen-tary to and synergistic with the differing contributions of other members in the network (Richardson 1972). The need for complementary resources is a key driver for network members in the liner shipping industry to network together (Tage 1999), where they collaborate beyond organizational boundaries to attain cost and service advantages (Kale et al. 2002; Dyer and Nobeoka 2000).
A move to a more flexible network-style structure took place in the 1980s in re-sponse to intense competition and a fast pace of change (Miles and Snow 1992). This network perspective is becoming important in organization theory (Nohria 1992), which directs attention away from the formal structure and patterns of so-cial relationships within organizations to informal ties. It also represents an alter-native perspective to recast the notion of a market in a more relational and socially embedded direction (Granovetter 1985). Many firms are organizing themselves into the network-based form of operations.
In liner shipping, network members enter networks to access resources for business growth and performance improvement (Galaskiewiez 1985; Gulati and Gargiulo 1999). Strategic interdependence, a situation in which one firm has the resources or capabilities beneficial to but not possessed by others (Gulati 1995), can be developed among actors within a liner shipping network. For instance, liner shipping companies collaborate with railway operators to provide inland transport services to their customers so that a wider coverage of transport services can be offered to them. A liner shipping network emerges when members in the network obtain performance benefits. Potential benefits motivate actors to invest in the relationships with others in the network (Dyer 1997). The success factors of ship-ping networks include cooperation and trust among network members, together with their ability to deploy resources to form and operate the network. The con-centration in the liner shipping industry has led to some actors, such as container terminal operators, to be more cooperative (Walker et al. 1997). In 2003, the top ten liner shipping companies increased their carrying capacity by 13.0% to 3.8 million TEUs, which was 45.7% of the world total container carrying capacity (UNCTAD 2004). The largest liner shipping companies are influential in manag-ing the networks within the liner shipping industry. Globalization of the shipping business has resulted in more bargaining power for liner shipping companies as they have more choices in calling at ports. On the other hand, if an actor in the

104 8 Liner Shipping Network
liner shipping network (e.g., a container terminal operator) loses one of the global liner shipping companies as its customers, it will face a substantial reduction in its container handling throughput (Song 2003).
8.3 SMART Driving Forces
The driving forces, referred to as the SMART factors, which explain why liner shipping companies use network-based management to deliver their liner shipping services can be classified into a strategic initiative for performance gain, market coverage, additional business, reduction in waste, and technology development.
8.3.1 Strategic Initiative for Performance Gain
Developing networks in the liner shipping industry reflects the goals of liner ship-ping companies to achieve operational performance gains (Panayides and Cullin-ane 2002). Cost reduction and risk avoidance are essential for liner shipping com-panies to reap operational performance gains. To achieve these objectives, it is desirable for liner shipping companies to integrate externally with other players and to join networks in response to the increasing competitive pressure to reduce operational costs and meet shippers’ expectations (Holcomb and Manrodt 2000). Developing strategies for reducing costs and lowering the exposure to risk for capital investment represents a driving force for liner shipping companies to join a liner shipping network (Slack et al. 2002).
From the perspective of risk avoidance, capacity sharing is a way to reduce ca-pacity risk because a liner shipping company can reduce its investment in fleet size by collaborating with other liner shipping companies if it wishes to offer its shipping services in new locations. Table 8.1 shows the percentage share of world slot capacity by line or alliance. Practices such as space sharing, strengthening multimodal transport systems, providing equipment to shippers in the right place and at the right time, and developing centralized information systems are common practices for liner shipping companies to pursue their strategic objectives.
Table 8.1 Percentage share of world slot capacity
Operator 2006 2007
Maersk 18.2 16.6 CHKY 11.7 11.9 Grand Alliance 10.8 11.8 New World Alliance 7.9 7.5 Total 48.6 47.8
Source UNCTAD (2008)

8.3 SMART Driving Forces 105
8.3.2 Market Coverage
Delivering superior service and strengthening ongoing relationships with shippers are important goals for liner shipping companies to pursue (Vincze 2004). It is essential for firms to have timely responses to evolving market changes (Sakar et al. 2001). By using the hub approach, liner shipping companies can bring car-goes from other spoke areas, extending their indirect linkages between origins and destinations. Such an approach is beneficial to liner shipping companies in improv-ing their service provisions and market positioning (O’Kelly and Miller 1994).
In essence, a liner shipping company can be self-sustained under one of two conditions, i.e., attaining the size that would serve a specified range of interna-tional trade routes or targeting regional markets (Thanopoulou and Ryoo 1999). For instance, CMA CGM arranges the direct call of the PRX service to the port of Xiamen, where the service is not available from other major shipping lines to obtain cargoes. Because of the need to provide extensive market coverage to fill the ever-growing capacity of ships, many liner shipping companies have re-sponded by pooling their resources to establish networks. In doing so, they are able to extend their market coverage and enter markets that cannot be served ad-equately by operating alone, a force that drives liner shipping companies to pursue network-based organizations.
8.3.3 Additional Business
Additional liner shipping business can be generated by creating new trade (Stop-ford 2004). In a globalized marketplace, with dwindling transport costs and rising global sourcing, the volume of international trade has grown dramatically (McCalla 1999; Robinson 2002). Operating in a global business environment, manufacturers, who are the key customers of liner shipping companies, search globally for cheaper manufacturing and assembly locations. Their global manufac-turing operations create new cargoes for the liner shipping industry. On the other hand, the liner shipping industry has stimulated the emergence of a virtuous cycle of expansion in global business by opening up maritime highways to new areas of opportunity. Countries such as China are adjusting to the strong urge for trade liberalization from global traders. These trade policy initiatives have the common objective of opening up new trade opportunities by facilitating international trade (Stopford 2004). All these developments contribute to the shifting of container trade dominance to Asian markets. As shown in Table 8.2, the increase in the volume of eastbound cargo in trans-Pacific trade to 15.4 million TEUs and of westbound cargo in Europe–Asia trade to 17.7 million TEUs in 2007 sheds light on the growth in trade on the Asian shipping routes (UNCTAD 2008). The oppor-tunities to gain additional business motivate liner shipping companies to develop networks for transporting cargo from new sources.

106 8 Liner Shipping Network
Table 8.2 Cargo flows on major trade routes (million TEUs)
Trans-Pacific Europe–Asia Year
Asia–USA USA–Asia Asia–Europe Europe–Asia
2006 15.0 4.7 15.3 9.1 2007 15.4 4.9 17.7 10.0
Source UNCTAD (2008)
8.3.4 Reduction in Waste
Unused space is waste in liner shipping. Shipping is one of the most perishable products as space cannot be stored once the ship has departed from the port. To reduce the average operational cost, shipping lines tend to employ large vessels to benefit from economies of scale in terms of ship size (Cullinane and Khanna 2000). As a wider scope of shipping services increases cost, it is desirable to strive for an enlarged network to solicit sufficient volume of cargo to fully utilize the shipping space. By combining purchasing power and volume, the develop-ment of shipping networks is useful for reducing the unit cost of shipping space and the costs in other areas, such as container handling and intermodal and feeder services (Midoro and Pitto 2000).
There are several operational benefits from cooperation among transport opera-tors. For instance, it reduces the need to introduce additional physical capacity by linking with operators of different transport modes. The development of an extended shipping network through cooperation leads to better destination coverage with lower operations costs being expected (Bergantino and Veenstra 2002). Extending liner services through developing liner shipping networks enables liner shipping companies to achieve economies of scale and generate additional revenues. For instance, the vessel cost per TEU can be reduced from USD 416 to USD 368 with the vessel size increasing from 6,800 to 8,800 TEUs (Tozer 2003). It is economically beneficial for liner shipping companies from developing networks to share resources and extend their services to wider geographical coverage.
8.3.5 Technology Development
Technologies in the liner container shipping industry include the use of contain-ers, the deployment and new designs of ships, and the adoption of advanced equipment to handle container operations (Muller 1999). Intermodal transport operations connect sea and inland transport to satisfy the need for greater effi-

8.3 SMART Driving Forces 107
ciency and effectiveness. As a result of containerization, technological develop-ments are linked to intermodal capability (Panayides and Cullinane 2002). The use of super post-Panamax quayside cranes to handle container loading and unloading activities is an example that illustrates the important role played by advanced equipment in improving the operational efficiency of a container termi-nal. Other than physical equipment, container terminal operating systems are also essential for achieving efficient operations of container terminals and improving the service levels of shippers (Choi et al. 2003). The development of centralized information systems has increased the potential of achieving economies of scale associated with handling increasing cargo volumes of liner shipping companies (Heaver 2001). Organizations in a container transport chain, including shippers, consignees, freight forwarders, transport operators, maritime carriers, container terminal operators, custom authorities, and government agencies, adopt technolo-gies owing to the institutional pressures exerted by the partners in the chain (Lun et al. 2008). The adoption of technology is fast becoming a necessity for enhanc-ing operational efficiency.
According to the above discussion, the driving forces that prompt liner shipping companies to join liner shipping networks can be classified into five categories, which we label as the SMART driving forces (as shown in Fig. 8.1). The next section presents a descriptive framework of the development and operations of a liner shipping network.
SMART driving forces
Strategic initiative for performance gain
Market coverage
Additional business
Reduction of waste
Technology development
Fig. 8.1 Driving forces to develop a liner shipping network

108 8 Liner Shipping Network
8.4 SHIPMENT Framework
Lun et al. (2009) identified eight underlying factors (as shown in Fig. 8.2) that influence the establishment of a liner shipping network based on a case analysis of the liner service PRX operated by CMA CGM. These eight elements are:
1. space management; 2. hinterland; 3. intermodal transport; 4. port; 5. management information system; 6. equipment supply; 7. new agents; 8. terminal operators.
The PRX service was selected as the case to illustrate this SHIPMENT model. Justifications for the selection of PRX as the case study included the following: (1) PRX provides a trans-Pacific service, which is the most important container trade route in the world, (2) the new PRX service uses 8,000-TEU container ships, which are among the largest fully cellular container ships in the world’s liner shipping service, and (3) CMA CGM is one of the top five liner shipping companies in the world. The core business of CMA CGM is to transport contain-erized cargoes.
SHIPMENT framework
Space management Management information system
Hinterland Equipment supply
Intermodal transport New agents
Port Terminal operators
Fig. 8.2 SHIPMENT framework to develop and operate a liner shipping network

8.4 SHIPMENT Framework 109
8.4.1 Space Management
Space sharing is a way for liner shipping networks to reduce financial risk on capital investment and achieve economies of scale by using larger container ships. This practice allows networked liner shipping companies to place more new-building orders for larger container ships (Cullinane and Khanna 2000) owing to their collaboration in areas such as space sharing, slot chartering, and sailing ar-rangements (Sheppard and Seidman 2001). The collaborative behaviours of liner shipping companies in space sharing will create concentration on particular routes serving large ports directly by sharing the available shipping space (McCalla 1999). The development of PRX requires the service of five vessels with a capac-ity of 8,200 TEUs. Five large vessels provided by two leading liner shipping com-panies are deployed on the shipping route. These two large liner shipping compa-nies pool their container ships and share space to support the PRX service. Space sharing enables them to enjoy economies of scale in their shipping operations and to reduce capital investment in container ships.
8.4.2 Hinterland
Hinterland is an area from which the demand for cargo movement is generated, representing the world’s largest market for seaborne shipment (Lun and Quaddus 2009). Owing to globalized consumption and production, there are structural changes in the port–hinterland relationship, which have strengthened the role of network development in the liner shipping industry (Robinson 1998; Park and De 2004). The Pearl River Delta is an important hinterland for PRX as the Pearl River Delta region accounts for about 37% of the eastbound trans-Pacific con-tainer volume moving to the USA (Mongelluzzo 2004). A contributor to this dramatic manufacturing growth in the Pearl River Delta region is the efficiency of the shipping business, especially in the liner container shipping sector. With the liner shipping services across the Pacific Ocean, cargoes produced in China can access the US market. The purpose of offering the PRX service by calling at various ports in south China is to expedite the transportation of cargoes from production areas to consumption places in the USA.
8.4.3 Intermodal Transport
Multimodal operations have the advantage of offering a through container ser-vice by interfacing with other transport operators such as those offering rail, truck, and barge services to ensure quick transshipment. Cooperation among players in a liner shipping network reduces the need to invest in additional

110 8 Liner Shipping Network
physical facilities by linking up resources with multimodal operators (Bergantino and Veenstra 2002). In liner shipping networks, collaboration of liner shipping companies with other multimodal operators is desirable to deliver a wider scope of services to shippers. Increasing expectations by shippers of service frequency, reliability of delivery, and capacity availability create pressure for transport op-erators to provide better intermodal services (Heaver 2001). As shippers have put a greater emphasis on reducing inventories in their supply chains, it is necessary for liner shipping companies to expand their transport service coverage. Yantian International Container Terminal (YICT) is an apt example to demonstrate mul-timodal operations in a liner shipping network. YICT, a port of call of PRX, is well connected with road and rail networks in southern China. Providing inland customers with multimodal transport via the Pingyan Railway, YICT extends terminal services to China’s hinterland markets. In addition, the Guanlan Inland Container Depot, near Dongguan, provides logistics support for YICT’s opera-tions and its customers (HPH 2005). The ability of the terminals to connect with multimodal networks is a key concern for liner shipping companies when they select members to participate in their liner shipping networks (Kendall and Buck-ley 2001).
8.4.4 Port
A port is a place characterized by the essential function of exchanging cargo between the ship and the shore and it can be seen as a special node located in such a way to facilitate connectivity between interacting places (O’Kelly 1998; Robinson 2003). A port can also be viewed as a transshipment place where feeder shipping routes are connected with one another and with trunk routes for ocean-going voyages. Liner shipping companies put much effort into establishing con-nections with ports to improve their transshipment operations (Rodrigue and Comtois 1997). Hong Kong is one of the ports within the PRX network (Wang and Slack 2004). With competition from other container ports, Hong Kong was able to set another cargo handling volume record in 2004, handling almost 22 million TEUs. The throughput growth was largely driven by international transshipment and the cargo shipped to Hong Kong via barges. International transshipment and cargo moved by barges in Hong Kong grew by 30 and 20%, respectively, in 2004 (Chiu 2005). This demonstrates that Hong Kong is a major hub port for handling transshipment, where feeder shipping routes are connected with one another and with trunk routes for ocean-going vessels. International transshipment explains why PRX calls at the port of Hong Kong even though the majority of the cargoes from the Pearl River Delta region can be obtained through other ports in Shenzhen.

8.4 SHIPMENT Framework 111
8.4.5 Management Information Systems
Information technology allows shipping firms to reap the benefits of economies of scale associated with business volume (Heaver 2001). Nowadays, many shipping services such as cargo track and trace, customs response, vessel schedules, and electronic document services are offered online by liner shipping companies (Lu et al. 2005). To ensure responsive and reliable information flows with shippers and other players in the industry, liner shipping companies are investing in liner shipping networks and making extensive use of information and communications technologies. CMA CGM has operations around the world and its offices and agents use information systems and Internet technology extensively to handle tasks such as booking, documentation, distributing sailing schedules, freight rat-ing, invoicing, and container tracking to ensure timely and accurate information flows in their operations with customers and partners. In adopting enabling infor-mation technologies for shipping operations, CMA CGM is upgrading its informa-tion systems with Lines and Agents Real Time Application (Lun et al. 2009). In addition, CMA CGM is also working with other major liner shipping companies to develop INTTRA, which is a free and single-source Internet portal through which shippers can access services offered by a community of liner shipping companies (Lun et al. 2009). Such actions reflect show liner shipping companies are making use of information systems to develop their liner shipping networks and connect with shippers and the other players for productivity and service improvements. The business implication of information sharing is that a higher than normal level of interfirm collaboration nurtures a common belief that greater collaboration among network members can provide significant competitive advantages for all the partners (Bailey and Francis 2008).
8.4.6 Equipment Supply
Equipment in the liner shipping industry refers to the supply of empty containers to shippers in the right place and at the right time. The use of containers makes cargo movement easier between transport modes. Yet, container management is a difficult task since containers are expensive to purchase, rent, and repair. In the case of PRX, China is a hinterland to source cargo for export to Long Beach and Oakland, USA. Owing to the imbalance of trade, it is costly in terms of container idle storage and empty backhaul (Muller 1999). Hence, there is an increasing need for liner shipping companies to establish cost-effective networks such that empty containers can be provided to shippers in the areas of demand at a low cost. One way for liner shipping companies to achieve this goal is to enter into agreements with leasing companies to lease containers through the terms of master leasing or long-term leasing. Such agreements will enhance the ability of liner shipping

112 8 Liner Shipping Network
companies to pick up the required equipment at the origin and supply adequate equipment to the areas needed. Lopez (2003) investigated carriers’ repositioning activities in the USA and found that handling empty containers is a costly opera-tion for CMA CGM. To reduce the repositioning cost for empty containers, liner shipping companies can coordinate with road operators, rail operators, and other intermediaries, and develop an industrial network to increase the benefits of work-ing together for empty container repositioning (Lopez 2003).
8.4.7 New Agents
New agents are concerned with establishing new subunits globally to provide local supporting services to customers and to coordinate with other players in a liner shipping network. To compete, many liner shipping companies are making use of agents to communicate with customers and vendors (O’Donnell 2000). Develop-ing new agents and offices is an important aspect of operating a liner shipping network. In 2004, there were 417 CMA CGM agencies and offices worldwide (Lun et al. 2009). To offer liner services in China and the USA, CMA CGM estab-lished 54 offices in China and 23 agencies in the USA. Agency networks are cru-cial to the operations of liner services because agents are able to provide flexible and responsive services to their import and export customers (Kent and Parker 1999). By networking with local agents and offices, CMA CGM can enhance its ability to offer global coverage and support to its customers with a wide range of shipping services from one end of the world to the other (Lun et al. 2009).
8.4.8 Terminal Operators
Terminal operations are concerned with activities such as loading and discharg-ing containers, container storage, and gate movement operations. For liner ship-ping companies, container terminals are their gateways to facilitate international trade (Boske and Cuttino 2003). The role of container terminals has changed from a node for transferring cargo between sea and other transport modes to a link in the logistics chain (Song 2003). Container terminals, as a subsystem of a total transportation network, serve as a meeting place of other transport modes to provide economic and physical infrastructure to handle containers (Robinson 2002; Park and De 2004). Therefore, selecting container terminal service provid-ers is an important decision for global liner shipping companies (Lirn et al. 2004). In the case of PRX, CMA CGM has selected Hong Kong International Terminals Ltd (HIT) as one of its container terminal operators. Its excellence in providing a container terminal service has earned HIT a reputation as a “catch-up” port, where the time lost elsewhere on a voyage can be made up in Hong

8.5 The Case of Maersk Line 113
Kong. As global trade activities and shipper requirements increase, HIT contin-ues to build strength on its port facilities and related operations in southern China and to create a strong shipping network based on the principles of effi-ciency and productivity (HPH 2005). Efficient container terminal operations are important for the provision of high-quality container shipping services and the maintenance of close connections with liner shipping companies. From this per-spective, container terminals play the role of providing high-quality container loading, discharge, storage, and other value-added services that are essential services to competently operate a liner shipping network.
8.5 The Case of Maersk Line
In Sect. 8.4 we introduced the SHIPMENT framework to describe the essential elements of a liner shipping network. These elements include space management, hinterland, intermodal transport, port, management information systems, equip-ment supply, new agents, and terminal operators. Although it is mutually benefi-cial to share resources with network members, some liner shipping companies choose to use other forms of operations. For instance, some liner shipping compa-nies prefer to deploy their internal resources through vertical growth to offer liner shipping services. Vertical growth is the development of a business into a different stage of the supply chain of which it is a part (Campbell et al. 2007).
Liner shipping companies deploying internal resources to develop liner shipping networks can also find the SHIPMENT framework useful. This section uses Maersk as a sample case to illustrate the descriptive ability of the SHIPMENT framework. As a result of acquisition and organic growth, the Maersk Line fleet operates more than 500 vessels, with a total capacity of more than 1,400,000 TEUs. According to BRS-Alphaliner (Lun et al. 2009), the market share of Maersk Line in the liner shipping industry was 16.6% in 2007, which ranked first among other global liner shipping companies. The route used to illustrate the SHIPMENT framework is Maersk’s TP9, which provides a service between Asia and the west coast of North America. The application of the SHIPMENT framework to describe Maersk’s TP9 service is illustrated next.
8.5.1 Space Management
Maersk does not belong to any liner shipping networks for space sharing activities. Owing to the scale of its operations, Maersk Line deploys its own vessels to pro-vide the TP9 service. The ten Maersk vessels used for this service route are Maersk Kyrenia, Kund Maersk, Maersk Kimi, Karen Maersk, Maersk Klaipeda, Kate Maersk, Maersk Karachi, Regina Mearsk, Mearsk Kiel, and Katrine Maersk.

114 8 Liner Shipping Network
8.5.2 Hinterland
The ports of call for TP9 include Singapore, Laem Chaband, Shekou, Yantian, Xiamen, Kaohsiung, Los Angeles, and Vancouver. Because of the development of direct services from Laem Chaband to Los Angeles, Thai customers can be assured of timely arrival of their commodities at the final destination. Thailand is an export-driven country, with the USA and Japan as its largest export markets. The TP9 ser-vice reflects Maersk’s efforts to meet the market demand for liner shipping services.
8.5.3 Intermodal Transport
By offering inland haulage in conjunction with containerized ocean transport, Maersk provides its customers with an integrated transport service. For transport services to or from the port by rail or road, MCC Transport, a division of Maersk, is able to provide its customers with a full range of effective and cost-efficient inland haulage services.
8.5.4 Port
The ports of call for TP9 encompass locations characterized by cargo exchange activities between ship and shore, as well as where feeder shipping routes are connected. For instance, MCC Transport is responsible for the operation and man-agement of feeder activities to meet the intra-Asia shipping needs for container connection services in ports.
8.5.5 Management Information Systems
Maersk offers a range of e-commerce-based services to its customers, such as Web sites, INTTRA, and electronic data interchange (EDI). These services enable Maersk to receive booking requests and shipping instructions from its customers. They also allow Maersk to electronically send sailing schedules, booking confir-mations, bills of lading, and container statuses to its customers.
8.5.6 Equipment Supply
To ensure adequate container supply, Maersk Container Industri was established in early 1990 with the purposes of designing, producing, and marketing ISO con-

8.6 Conclusions 115
tainers. Maersk Container Industri is part of the Maersk Group, which employs more than 110,000 staff members and has offices in 125 countries. The first Maersk factory was inaugurated in 1991 in Tinglev, Denmark, initially for manu-facturing dry containers. In 1995, the factory expanded with the addition of a new building to manufacture reefer containers with a unique design.
8.5.7 New Agents
To ensure consistent quality shipping services worldwide, Maersk Line serves its customers through a network of its own offices and third-party agents. It has more than 325 offices in over 125 countries, employing more than 30,000 staff members worldwide.
8.5.8 Terminal Operators
APM Terminals, part of Maersk Group, is one of the world’s largest operators of container terminals, with over 40 container terminals spanning five continents. In 2006, the company was recognized by Containerisation International’s Award as the “Best Global Terminal Operator”. APM Terminals has invested heavily in port infrastructure to support future demand for global container trade.
8.6 Conclusions
In this chapter, we introduced the SHIPMENT framework for liner shipping com-panies to identify the desirable elements to develop and operate a liner shipping network. By examining the driving forces, it enables firms in the liner shipping network to understand why players in the industry participate in network-based organizations. We used the liner shipping services of PRX and TP9 to illustrate the application of the SHIPMENT framework for managing liner shipping net-works to achieve cost and service advantages.
The SHIPMENT framework can serve as a road map for liner shipping com-panies to develop liner shipping networks when they launch liner shipping ser-vices. Liner shipping companies can also use the framework for self-assessment before deciding whether or not to adopt networks for new liner shipping services. A liner shipping network contains a number of influences that affect not only a liner shipping company itself but also other players in the industry. Therefore, the SHIPMENT framework can provide a reference for all the players in the liner shipping industry to evaluate the management of liner shipping networks. With insights from the SMART driving forces and the SHIPMENT framework,

116 8 Liner Shipping Network
a liner shipping company should be able to understand “why develop” and “how to operate” a liner shipping network. The sharing of resources will create more opportunities for liner shipping network members to make cost and service im-provements.
References
Badatacco JL (1991) The knowledge link: how firms complete through strategic alliances. Har-vard Business School Press, Boston
Bailey K, Francis M (2008) Managing information flows for improved value chain performance. Int J Prod Econ 111(2):2–12
Bergantino A, Veenstra WA (2002) Interconnection and co-ordination: an application of net-work theory to liner shipping. Int J Marit Econ 4(3):231–248
Boske L, Cuttino J (2003) Measuring the economic and transportation impacts of maritime-related trade. Marit Econ Logist 5(2):133–157
Campbell D, Stonehouse G, Houston B (2007) Business strategy. Elsevier, Burlington Chiu A (2005) High costs threaten throughput record; despite setting another handling mark, the
world's no. 1 container port is losing business to cheaper mainland rivals. South China Morning Post 18 January 2005
Choi HR, Kim HS, Park JB (2003) An ERP approach for container terminal operating system. Marit Policy Manag 30(3):197–210
Cullinane K, Khanna K (2000) Economies of scale in large containerships: optimal size and geographical implications. J Transp Geogr 8(3):181–195
Dyer J (1997) Effective inter-firm collaboration: how firms minimize transaction costs and maximize transaction value. Strateg Manag J 18(7):535–556
Dyer J, Nobeoka K (2000) Creating and managing a high-performance knowledge-sharing network: the Toyota case. Strateg Manag J 21(3):345–367
Galaskiewicz J (1985) Inter-organizational relations. Annu Rev Sociol 11:281–304 Granovetter M (1985) Economic action and social structure: a theory of embeddedness. Am J
Sociol 91(3):481–510 Gulati R (1995) Social structure and alliance formation: a longitudinal analysis. Admin Sci Q
40(4):619–652 Gulati R, Gargiulo M (1999) Where do inter-organizational networks come from? Am J Sociol
104(5):1439–1493 Heaver TD (2001) The evolving roles of shipping lines in international logistics. Int J Marit
Econ 4(3):210–230 Holcomb MC, Manrodt KB (2000) The shippers’ perspective: transportation and logistics trends
and issues. Transp J 40(1):15–25 HPH (2005) Connecting the world. Hutchison Port Holdings, Hong Kong Johnsen T, Wynstra F, Zheng J, Harland C, Lamming R (2000) Networking activities in supply
network. J Strateg Mark 8(2):161–181 Kale P, Dyer J, Singha H (2002) Alliance capability, stock market response, and long-term
alliance success: the role of the alliance function. Strateg Manag J 23(8):747–767 Kendall L, Buckley J (2001) The business of shipping. Cornell Maritime Press, Centreville Kent LJ, Parker RS (1999) International containership carrier selection criteria. Int J Phys
Distrib Logist Manag 29(6):398–408 Lirn TC, Thanopoulou H, Beynon MJ, Beresford A (2004) An application of AHP on transship-
ment port selection: a global perspective. Marit Econ Logist 6(1):70–91 Lopez E (2003) How do ocean carriers organize the empty containers reposition activity in the
USA? Marit Policy Manag 30(4):339–355

References 117
Lu CS, Lai KH, Cheng TCE (2005) An evaluation of web services in liner shipping in Taiwan. Transportation 32(3):293–318
Lun YHV, Browne M (2009) Fleet mix in container shipping operations. Int J Shipp Transp Logist 1(2):103–118
Lun YHV, Quaddus MA (2009) An empirical model of the bulk shipping market. Int J Shipp Transp Logist 1(1):37–54
Lun YHV, Wong WYC, Lai KH, Cheng TCE (2008) Institutional perspective on the adoption of technology for the security enhancement of container transport. Transp Rev 28(1):21–33
Lun YHV, Lai KH, Cheng TCE (2009) A descriptive framework for the development and opera-tion of liner shipping networks. Transp Rev 29(4):439–457
McCalla JR (1999) Global change, local pain: intermodal seaport terminals and their service areas. J Transp Geogr 7(4):247–254
Midoro R, Pitto A (2000) A critical evaluation of strategic alliances in liner shipping. Marit Policy Manag 27(1):31–40
Miles RE, Snow CC (1992) Causes of failure in network organizations. Calif Manag Rev 34(4):53–72
Mongelluzzo B (2004) High costs carry a price; Hong Kong, with its costly services, faces in-creasing threat as southern China ports boost efficiency. J Commer 5(44):52–56
Muller G (1999) Intermodal freight transportation. Eno Transportation Foundation, Washington Nohria N (1992) Is a network perspective a useful way of studying organizations? In: Nohria N,
Eccles RG (eds) Networks and organizations: structure, form, and action. Harvard Business School Press, Boston
O’Donnell SW (2000) Managing foreign subsidiaries: agents of headquarters, or an interde-pendent network? Strateg Manag J 21:525–548
O’Kelly EM (1998) A geographer's analysis of hub-and-spoke network. J Transp Geogr 6(6):171–186
O’Kelly EM, Miller JH (1994) The hub network design problem. J Transp Geogr 2(1):31–40 Panayides P, Cullinane K (2002) Competitive advantage in liner shipping. Int J Marit Econ
4(3):189–209 Park RK, De P (2004) Alternative approach to efficiency measurement of seaports. Marit Econ
Logistics 6(1):53–69 Powell WW (1996) Inter-organizational collaboration in the biotechnology industry. J Inst
Theor Econom 152(1):197–225 Richardson G (1972) The organization of industry. Econ J 82(327):883–896 Robinson R (1998) Asian hub/ feeder nets: the dynamics of restructuring. Marit Policy Manag
25(1):21–40 Robinson R (2002) Ports are elements in value-driven chain systems: the new paradigm. Marit
Policy Manag 29(3):241–255 Robinson R (2003) Ports as agents in value-driven chains: the new paradigm. Marit Policy
Manag 29(3):242–259 Rodrigue JP, Comtois C (1997) Transportation and spatial cycles: evidence from maritime
systems. J Transp Geogr 5(2):87–98 Ryoo DK, Thanopoulou HA (1999) Liner alliances in the globalization era: a strategic tool for
Asian container carriers. Marit Policy Manag 26(4):349–367 Sakar MB, Echambadi R, Harrison J (2001) Alliance entrepreneurship and firm market perform-
ance. Strateg Manag J 22(7):701–711 Sheppard E, Seidman D (2001) Ocean shipping alliances: the wave of the future? Int J Marit
Econ 3(4):351–367 Slack B, Comtois C, McCalla R (2002) Strategic alliances in the container shipping industry:
a global perspective. Marit Policy Manag 29(1):65–76 Snow CS, Miles RE, Coleman HJ (1992) Managing 21st century network organizations. Organ
Dyn 20(3):5–20 Song DP, Zhang J, Carter J, Field T, Marshall J, Polak J, Schumacher K, Sinha-Ray P, Wood J
(2005) On cost-efficiency of the global container shipping network. Marit Policy Manag 32(1):15–30

118 8 Liner Shipping Network
Song DW (2003) Port co-opetition in concept and practice. Marit Policy Manag 30(1):29–44 Stopford M (2004) Maritime economics. Routledge, New York Tage SL (1999) Third party logistics – from an interorganizational point of view. Int J Phys
Distrib Logist Manag 30(2):112–127 Thanopoulou AH, Ryoo DK (1999) Korean liner shipping in the era of global alliances. Marit
Policy Manag 26(3):209–229 Ting SC, Tzeng GH (2003) Ship scheduling and cost analysis for route planning in liner ship-
ping. Marit Econo Logist 5(4):378–392 Ting SC, Tzeng GH (2004) An optimal containership slot allocation for liner shipping revenue
management. Marit Policy Manag 31(3):199–211 Tozer D (2003) Ultra-large container ships: the green ships of the future? Available via Auck-
land Shipbrokers. http:/ /www.aucklandshipbrokers.com/ index.php?option=com_content&task= view&id= 172&Itemid=68
UNCTAD (2004) Review of maritime transport. United Nations Conference on Trade and De-velopment, Geneva
UNCTAD (2008) Review of maritime transport. United Nations Conference on Trade and De-velopment, Geneva
Vincze A (2004) Strategic marketing management. Houghton-Mifflin, New York Walker G, Kogut B, Shang W (1997) Social capital, structural holes and the formation of an
industry network. Organ Sci 8(2):109–125 Wang J, Slack B (2004) Regional governance of port development in China: a case of Shanghai
International Shipping Center. Marit Policy Manag 31(4):357–373

119 Y.H.V. Lun, K.-H. Lai and T.C.E. Cheng Shipping and Logistics Management, © Springer 2010
Chapter 9 Container Transport Chain
Abstract Container transport involves door-to-door services encompassing ocean-going and land-based transport services. Containers move along a network of shipping nodes and links. The nodes are physical locations such as container terminals where containers are handled or stored, whereas the links between nodes are served by transport modes such as ships, trucks, and trains. The container transport chain is characterized by interactions among a number of actors. To understand container transport, it is necessary to know who the actors are. In gen-eral, the key actors in the container transport chain include primary customers, transport facilitators, and transport operators. The primary customers in the con-tainer transport chain are buyers and sellers. Shippers may handle their export and import processes and transport activities themselves. Otherwise, they may out-source the jobs to intermediaries. An intermediary can be a transport facilitator as a third party in providing linkages between shippers and carriers. Transport opera-tors include road operators, rail operators, inland waterway operators, and ocean container carriers. Each transport mode has its own characteristics. The decision on mode choice is complex. Transport cost is important for carrier selection. Other service factors to consider include transit time and reliability, inventory and stock-out, capability and accessibility, and security.
9.1 Container Transport
Container transport involves intermodal door-to-door services comprising ocean-going services, as well as land-based transport services through trucks, rail, and/or barges to move containers in an end-to-end shipping linkage pattern (Muller 1999; Bichou 2004). In view of shippers’ rising expectations for logistics services, de-veloping capabilities to provide door-to-door services and efficient movements between several points of origin and destination have become a strategic impera-tive for many container transport carriers (Banomyong 2005).

120 9 Container Transport Chain
Consignee’spremise
Consignee’spremises
Rail yardRail yard
Container terminal(discharging)
Container terminal(discharging)
Container terminal(loading)
Container terminal(loading)
Shipper’spremise
Shipper’spremises
Truck
Ship
Rail
Truck
Fig. 9.1 Concept of nodes and links in container transport
Containers move along a network of shipping nodes and links. The nodes are physical locations such as container terminals or depots where containers are handled or transferred from one transport mode to another. The links between nodes are served by modes of transport such as roads, rail, and water, and are connected with infrastructure components such as roads, rail tracks, and container terminals. The concept of nodes and links in container transport is illustrated in Fig. 9.1.
To improve container transport operations, effective information flow at any one of the nodes or links is essential. For instance, information on a container load plan1 indicating the details of cargoes stuffed in a container is important for stuffing locations at the shipper’s premises. A container load plan represents the last point in the container transport chain where the physical contents of the container can be visually identified and verified with documents by the shipper or its representatives. Once the container has been locked with a seal,2 all infor-mation on the contents of the container cannot be verified until it is reopened by the consignee at the consignee’s premises. Thus, shippers play a critical role in the container transport chain by providing accurate and complete data on the containers they consign.
————— 1 A container load plan is a document that describes how the inside of a container is stowed with cargo. 2 A seal is attached to a locking device to prevent pilferage and to certify that no tampering has happened. It can be made of plastic or aluminium, and is attached by customs or a carrier.

9.2 International Transport 121
Furthermore, for containers moving through different shipping nodes the chal-lenges of obtaining shipment data need to be tackled since carriages involve mul-tiple stops in the container transport chain. Key data elements including informa-tion about the shipper, consignee and place of delivery, and cargo descriptions are important at those nodes in the transport network involving container yards and terminals where containers are stored, handled, loaded, and unloaded. As most containers for international transport pass through one or more container ports, it becomes difficult for transport carriers to control data exchange along the con-tainer transport chain. Effective transport of containers is dependent on responsive and reliable information exchange among actors in the container transport proc-esses. Coordination among transport carriers and related parties such as port and terminal operators is necessary to ensure effective information flow in the con-tainer transport chain.
To ship a container along a network of transport nodes requires correctly gen-erating, receiving, and processing information about container moves. Information exchange for container transport is important because examination and cross-examination of information flows can reveal discrepancies that might indicate terrorist or criminal involvement. It is also a regulatory requirement that essential data elements are transmitted to an automated manifest system 24 h before con-tainers are loaded on vessels.
9.2 International Transport
From the shipper’s perspective, the management of international transport in-volves planning, implementation, and control of the procurement and use of freight transport and related service providers (Coyle et al. 2000). An interna-tional transport process begins with a buying–selling agreement. The agreement between a buyer and a seller determines the specific transport criteria the seller must meet. These criteria are important to determine which products are to be shipped, the financial terms, delivery requirements and transport modes to be used, and cargo insurance.
The purpose of Incoterms is to provide a set of international rules to facilitate the interpretation of the most commonly used trade terms in foreign trade. Thus, uncertainty arising from different interpretations of such trading terms in differ-ent countries can be minimized. The scope of Incoterms is limited to matters relating to the rights and obligations of the parties to the contract of sale with respect to the delivery of goods. Incoterms deal with a number of identified obligations imposed on the parties and the distribution of risk between the par-ties. As shown in Table 9.1, 13 Incoterms have been defined, and these are grouped into basically four different categories (i.e., departure term, shipment term with main carriage unpaid, shipment term with main carriage paid, and delivery term), applicable to sea and inland waterway transport or to all the modes of transport:

122 9 Container Transport Chain
Table 9.1 Incoterms
Terms Applicable for sea transport only Applicable for all modes of transport (including water)
Departure term EXW (ex works) Shipment term, main carriage unpaid
FAS (free alongside ship) FOB (free on board)
FCA (free carrier)
Shipment term, main carriage paid
CFR (cost and freight) CIF (cost, insurance, and freight)
CPT (carriage paid to) CIP (carriage and insurance paid to)
Delivery term DES (delivered ex ship) DEQ (delivered ex quay)
DAF (delivered at frontier) DDU (delivered duty unpaid) DDP (delivered duty paid)
The container transport chain is characterized by complex interactions among a great multitude of actors, industries, regulatory agencies, modes of transport, operating systems, liability regimes, legal frameworks, etc. They have co-evolved over the past half-century into a global network for the delivery of goods at a low cost and on time. To understand the container transport chain, it is important to know who the actors are, how they relate to one another, and what type of infor-mation relating to the container they can access. In general, the key actors in the container transport chain include primary customers, transport facilitators, and transport operators.
9.3 Primary Customers
Purchasing, along with related activities such as production, storage, and container transport, is one of the links in the sequence of processes by which resources are converted into finished goods that satisfy the needs of customers. The role of pur-chasing is to “obtain materials of the right quality in the right quantity from the right source, delivered to the right place at the right prices” (Lysons and Gilling-ham 2003). Container transport is the physical manifestation of commercial trans-actions between buyers and sellers. In international trade, buyers express interests in acquiring goods that sellers are willing to offer. Sellers can be manufacturers, wholesalers, or originating shippers.
In a large export-oriented company, the degree of specialization usually in-volves the appointment of export sales and export shipping teams, each with de-fined responsibilities (Branch 2000). The export sales team is involved with the sales function, which includes the following stages:
• receiving the enquiry and preparing the quotation; • specifying the modes of transport; • following up the quotation; • receiving orders from customers;

9.4 Transport Facilitators 123
• arranging production if necessary; • confirming the date of dispatch to buyers, agents, or distributors, and notifying
them of any unavoidable changes; • tracking and tracing.
The export shipping function normally commences when the goods ordered have been produced and are ready for dispatch (Branch 2000). The function of export shipping includes:
• linking with the export sales team to check order compliance; • establishing from letters of credit relevant details of the items that have to be
reconciled with the ultimate forwarding arrangement; • deciding on the method of transport if it has not already been specified; • booking shipping space; • arranging documentation and insurance, and possibly packing; • arranging export licensing and customs clearance; • cross-checking all the documents after shipment; • passing documents to the accounting department for collection of payment.
A shipper generates considerable information regarding a consignment in the container transport chain. The shipper must ensure that the required information for import/export control is available to the authorities in both the exporting and the importing country.
9.4 Transport Facilitators
Shippers may handle their export and import processes and the transport activities themselves. Another alternative is to outsource the jobs to intermediaries. These intermediaries are important in the container transport chain as they have access to information on containers and their contents throughout the transaction. Transport facilitators are third parties that provide linkages between shippers and carriers. Third parties often do not own the transport equipment such as vessels themselves, but they partner with a number of carriers that provide the necessary equipment to transport their shipments.
The goals of logistics are concerned with the achievement of the “7Rs”, i.e., the ability to deliver the right amount of the right product at the right time in the right condition to the right place with the right information to satisfy the right customer fully (Lai and Cheng 2009). Logistics adds value to products by creating utility, which is concerned with the value or usefulness that an item or service has in fulfill-ing a want or need. Broadly speaking, there are four kinds of utility, namely, form, possession, time, and place. Logistics management contributes to the creation of time and place utility. The former is concerned with the ability to provide the prod-uct when it is needed, whereas the latter is about delivering the product where it is needed (Lambert et al. 1998). The ultimate goal of logistics management is to con-trol the total cost of all these activities in a cost-effective manner. As the survival

124 9 Container Transport Chain
and growth of a firm requires organizational effectiveness and efficiency in satisfy-ing customer demands and those of the requirements of other stakeholders, such an ability in logistics management is essential for improving the performance of the firm. The double-edged impact of logistics management in bringing about both increased profitability and reduced cost on a lower asset base can provide a substan-tial leverage on the return performance of a firm (Christopher 2005).
Porter’s value chain concept is useful in illustrating how business logistics can be applied across a series of organizational activities to create value. The concept pro-vides a managerial framework for firms to work through traditional organizational barriers in value creation. To this end, it is essential for firms to make continuous improvement efforts throughout the value creation process to succeed. According to Porter (1985), a firm should concentrate its effort on optimizing the resources used in coordinating all the activities in its value chain with the aim to establish a sustain-able competitive advantage. The value chain consists of a series of interdependent organizational activities, which are highly dependent on the performance of the involved firms in the design, production, sale, delivery, and support of the product flows. In other words, a firm belongs to a collection of interdependent activities that are carried out to produce its products/services. In general, these activities can be broadly grouped into two categories, namely, primary and supporting activities. Primary activities include inbound logistics, operations, outbound logistics, market-ing and sales, and service, whereas support activities encompass a firm’s organiza-tional structure, human resource management, and technology development.
Reducing cost or improving service in any one of the activities will not neces-sarily guarantee a sustainable competitive edge. From the resource-based view of the firm, a price cut or an enhanced service can easily be imitated by competitors. The goal of logistics management is to improve the performance of all the activ-ities in the value chain (i.e., delivering quality products at a low cost), which can represent a unique resource for firms to compete. Reducing costs or improving performance in any one of the activities alone without a coordinated effort is in-adequate for the achievement of a competitive edge.
There are two generic types of logistics management studies and they examine the research issues from the perspectives of either logistics users or logistics ser-vice providers. Logistics is part of the corporate strategy whereby firms contribute to the primary activities of their value chains (Lai et al. 2004) by creating cost and service advantages for the chain. From the perspective of logistics users, logistics activities include tasks such as inventory management, warehousing, materials handling, secondary assembly, distribution, and information-related services such as cargo tracking and tracing. On the other hand, many logistics users such as manufacturers and retailers nowadays have increasingly outsourced their logistics activities to third-party logistics (3PL) service providers.
In recent years, there has been a surge in academic interest in and the number of publications on 3PL service providers. Such a phenomenon can be partly explained by the growing importance of outsourcing logistics activities to 3PL service provid-ers by a wide variety of industrial sectors. Outsourcing logistics activities represents an increasing trend in the contemporary business world. Outsourcing offers a new

9.4 Transport Facilitators 125
alternative for achieving competitive advantage, which allows organizations to fo-cus on their core strengths. For instance, many firms outsource their logistics activ-ities to 3PL service providers in the hope of reducing operations cost, meeting fluc-tuations in demand, and lowering capital investment (Gunasekaran and Ngai 2004).
Nowadays, many firms are seeking to outsource their logistics activities to 3PL service providers. Their actions seem to reflect the trend of business firms using 3PL service providers to satisfy their increasing needs for logistics services (Lieb and Miller 2002). In general, a 3PL service provider can be broadly defined as a provider of logistics services that performs all or part of a client company’s logis-tics functions (Delfmann 2003). The service portfolio of a typical 3PL service provider consists of at least the managing and operating of the transport or ware-housing functions of its users. Some 3PL service providers also provide other services, such as materials management services (e.g., inventory management), information-related services (e.g., tracking and tracing), and other value-added services (e.g., secondary assembly and product inspection). The logistics service requirements of users are expected to expand in the years ahead (Lai et al. 2004). To compete, many 3PL service providers have taken the initiative to broaden the scope of the portfolio of their service offerings (Lun et al. 2009).
Lai et al. (2004) conducted a study on the service capability and performance of logistics service providers, identifying three types of logistics services (Fig. 9.2):
1. Freight forwarding service: This includes only a single service (i.e., freight forwarding).
2. Value-added logistics services: They consist of service elements relating to order processing, customer-specific label printing, fleet management, letter-of-credit compliance and negotiation, and warehousing and inventory management.
3. Technology-enabled logistics services: They are concerned with service ele-ments such as information management, tracking and tracing of shipments,
Types of logistics servicesTypes of logistics services
Freight forwarding serviceFreight forwarding service
Value-added logistics serviceValue-added logistics service
Technology-enabled logistics serviceTechnology-enabled logistics service
Fig. 9.2 Types of logistics services

126 9 Container Transport Chain
Web-based linkage, receiving/sending shipment notices, and receiving/sending advanced shipping notices through EDI. On the basis of the above-mentioned three logistics service categories, they
classified logistics service providers into four general types (Fig. 9.3): 1. Traditional freight forwarders: They only focus on operations efficiency in
freight consolidation services (i.e., taking a number of small shipments and combing them into a single larger shipment). They position themselves as a “cost leader” in freight forwarding by offering lower rates than customers can obtain from the transport carriers directly.
2. Transformers: They are firms that have expanded their service scope to offer value-added logistics services and technology-enabled logistics services. In addition to the services provided by traditional freight forwarders, they add value by sharing resources between customers (e.g., by running warehouses or developing EDI linkages for several customers).
3. Nichers: They target niche markets and are specialized in value-added logistics services and technology-enabled logistics services. They complement full-service providers by undertaking outsourced logistics activities where they have a comparative advantage.
4. Full-service providers: They position themselves as a “service leader” by lever-aging their service capability to create superior service performance. In addition to operational efficiency, the logistics services offered by them are wide-ranging in scope. Examples of these 3PL service providers include Maersk Logistics and NYK Logistics.
Types of logisticsservice providers Types of logisticsservice providers
Traditionalfreight forwarders
Traditionalfreight forwarders
TransformersTransformers
NichersNichers
Full services providersFull-services providers
Fig. 9.3 Classifications of logistics service providers

9.5 Transport Operators 127
9.5 Transport Operators
An efficient and inexpensive transport system contributes to greater competition in the marketplace, greater economies of scale in production, and reduced prices of goods (Coyle et al. 2000):
• Greater competition: Without a good transport system, the reach of the market is limited to areas immediately surrounding the point of production. With an ef-ficient transport system, the costs of products in distant markets can be com-petitive with those of other products for sale in the same markets.
• Economies of scale: Wider markets can result in lower production costs. With a greater volume supported by these markets, the producer could better utilize production facilities, from which specialization of labour usually follows. Inex-pensive transport also facilitates the separation of markets and production sites. This provides a degree of freedom in selecting production sites such that pro-duction can be located at places that offer cost advantages.
• Reduced price: Inexpensive transport also contributes to reducing product prices because transport is a component cost, along with production, selling, and other distribution costs, which make up the product price. As transport be-comes more efficient and product prices decrease, society can benefit from hav-ing a higher standard of living by consuming more products.
Freight transport systems are complex. In such systems, there are dynamic in-teractions among different market players, ranging from truckers, railway compa-nies, inland waterway operators, to maritime carriers. In the following sections, we discuss the operators within the container transport chain.
9.5.1 Road Operators
Most containers use road transport, usually at the beginning and the end of the transport chain (ECMT 2005). The road is designed for the passage of wheeled vehicles, which are controlled and guided independently by a driver. The road network is almost universal in that every place in the community has access to a road. Highways play a major role in the development of motor carriers because of the high accessibility provided by highway systems.
Road transport plays a major role in the movement of higher-valued and time-sensitive products because of its generally higher quality of service compared with other modes of transport. The general service characteristics of motor carriers include accessibility, speed, reliability, frequency, and lower loss and damage rates. These characteristics give motor carriers an advantage over other transport modes. The advantages of using road transport include:
• The comprehensive nature of the road network means that trucks are the most flexible form of freight transport. Trucks are able to provide “door-to-door” services to shippers. For any journey, there are many alternative routes avail-

128 9 Container Transport Chain
able. Drivers need to choose the best route on the basis of their experience and the information available to all the road users.
• With the vehicle controlled by the driver, the security of the cargo and the ve-hicle can be more easily monitored, making delivery on time more certain and performance easier to measure.
• Infrastructure is designed, built, and maintained by a government or other transport service operators. Payment for the infrastructure is spread over many users in the form of user charges such as a toll fee. Road haulage companies are able to concentrate their whole management effort on organizing their main business, leaving the design, building, and maintenance of highways to public organizations.
Trucks are probably the most accessible transport means owing to the physical openness of the road infrastructure. An extensive road network, including critical infrastructure components such as highways, tunnels, and bridges, is highly acces-sible and reaches most parts of the world. The majority of road transport enter-prises are small operators. For example, 99% of road enterprises operate with fewer than 50 employees (EMCT 2005).
9.5.2 Rail Operators
The rail mode needs a completely uninterrupted right of way3 to operate and there-fore the way is exclusive to rail operations. In many countries, such as the USA, railroads play a significant role in economic and social development, and continue to be the leading mode of transport in terms of intercity movement. With regard to container transport, there has been a dramatic growth in the movement of intermo-dal traffic such as containers on flat cars.4
The advantages of using a railway include:
• High average speeds for journeys, which are especially important for providing reliable transit times.
• The railway effectively utilizes land space (usually planned by a government). • Railways are cost-effective when handling bulk materials, thus relieving the
road system of large numbers of heavy trucks.
Rail operators are generally larger in size and fewer in number than trucking operators. Railroads have the characteristics of high fixed cost and relatively low variable cost (Coyle et al. 2000), as reflected below:
• The major cost elements borne by the railroad industry include operations, maintenance, and ownership of rights of way. A cause for the rail industry’s
————— 3 A right of way is a strip or area of land, including surface, overhead, or underground, granted by easement, for construction or maintenance according to designated use. 4 These are containers moving on articulated flat rail cars without a chassis.

9.5 Transport Operators 129
high fixed cost is the extensive investment in private terminal facilities. These terminal facilities include freight yards, where trains are sorted and marshalled, and terminal areas, where shippers and connecting railroads are serviced.
• Variable cost by definition varies proportionately with distance and volume. However, a degree of indivisibility exists in some kind of variable cost (such as labour), so variable cost per unit will decrease slightly as volume increases.
• The net effect of high fixed cost and relatively low variable cost creates signifi-cant economies of scale in railroad costs. Distributing fixed cost over greater volumes generally reduces the per-unit cost. Similarly, the rail ton-mile cost drops when the fixed cost is allocated over increasing lengths of haul.
9.5.3 Inland Waterway Operators
Inland waterways suitable for transporting goods can take the form of a natural river, an artificial man-made canal, or an area of water that is closely connected to the shore. Water carriers are the oldest mode of transport, and have facilitated the development of many established cities. The water carrier system is a viable part of the transport system, which competes with other inland transport modes such as roads and railways. Inland waterway carriers often offer all-in-one packages such as carriage from a seaport to a container inland depot and return of empty contain-ers (ECMT 2005).
An advantage of water transport is its low-cost nature. Water transport is gener-ally the lowest-cost transport mode to ship non-liquid products. For liquid products, a pipeline is usually the lowest-cost transport mode. However, water transport is slow. The transit time via water transport is the longest compared with other trans-port modes such as rail, roads, and air. Poor accessibility is another characteristic of water transport. To use water carriers, users must have access to waterways.
9.5.4 Ocean Container Carriers
Ocean container carriers are the most visible link for international movement of containers, as most container moves include at least one sea leg. There are 457 carriers operating vessels, and the majority of them are fully cellular ships. The world’s container vessel fleet is dominated by the presence of large carriers that operate high-capacity vessels on major trade routes such as the trans-Pacific, Asia–Europe, and trans-Atlantic routes. The top 20 operators account for 61% of the total capacity, and the top 40 operators account for 72% of the total capacity (ECMT 2005).
The key role of ocean container carriers in the container transport chain has traditionally been to provide liner services. Recently, major carriers have begun to offer door-to-door transport and logistics services to shippers. To operate the fleet

130 9 Container Transport Chain
and carry out commercial activities, ocean carriers have deployed an extensive agency network, which can be handled by the carriers’ own staff or by an inde-pendent agent. Shipping line agents typically perform the following functions:
• sales and marketing; • freight quotation and booking of shipments; • ensuring the timeliness and accuracy of all documentation; • handling claims; • managing carrier-owned or leased containers; • handling both vessel-related operations and cargo-related operations.
Recently, consideration for the liner shipping business has extended to three types of service, including the relationship of shipping lines with port terminals,5 the relationship with intermodal transport, and the relationship with logistics ser-vices (Heaver 2001).
9.5.4.1 Relationship of Shipping Lines with Terminals
Shipping lines are involved in container terminal operations through dedicated container terminals.6 An example is COSCO-HIT in Hong Kong, which exclu-sively serves COSCO and China Shipping. Another form of involvement in termi-nal management is to act as terminal investors, such as APM Terminals owned by Maersk Line. The terminal services provided are those of intermediaries as con-tainer terminal providers do not sell services directly to shippers. The customers of container terminal providers are shipping lines.
9.5.4.2 Relationship of Shipping Lines with Intermodal Services
To meet shippers’ increasing expectation, there is a need for transport service qual-ity. All the major shipping lines in Europe, North America, and Asia now offer door-to-door services. Integration of shipping with inland services has largely been achieved through shipping lines managing the collaboration with inland transport operators including road, rail, and inland waterway transport. Shipping lines have extended beyond ocean transport to door-to-door business through long-term con-tracts and short-term arrangements with independent inland carriers.
9.5.4.3 Relationship of Shipping Lines with Logistics Service Providers
Unlike intermodal services, which are managed within shipping lines, the opera-tions of logistics services are largely handled by an independent business unit.
————— 5 Terminals are facilities closely aligned to a dock and used to collect, store, and dispatch cargo. 6 A dedicated terminal container terminal is devoted exclusively for use by a carrier or alliance. It handles a customer’s container shipping fleet only.

9.6 Freight Transport Modes 131
Following its acquisition of APL, NOL established APL Logistics to advance its growth in the logistics area. On the other hand, with the acquisition of Sea-Land, A.P. Moller rebranded its logistics service as Maersk Logistics. The mission statement of Maersk Logistics is: “an independent organization operating world-wide through locally incorporated companies and is engaged in satisfying custom-ers’ expectations in respect of competitive, international export and import man-agement services” (Lun et al. 2009). The relationship of shipping lines with logistics service providers has become important. However, not all of the top con-tainer lines in the world have such a unit (as shown in Table 9.2). For example, Hapag-Lloyd and Evergreen focus on meeting shippers’ requirements through their shipping and door-to-door capability.
9.6 Freight Transport Modes
Container transport involves several transport modes, namely, roads, rail, and water. There are differences in the operational environment among the major freight shipping modes (Christiansen et al. 2004). Table 9.3 presents a summary of these differences:
Table 9.3 Operational differences in freight transport modes
Operational characteristics Ship Truck Train
Fleet variety Large Small Small Operational around the clock Always Seldom Usually Voyage (or trip) length Days or weeks Hours or days Days Operational uncertainty Larger Smaller Smaller Choice of port depends on vehicle size Yes No No
Table 9.2 Container service operators and their logistics service providers
Line’s ranking Operator Logistics service provider
1 Maersk Maersk Logistics 2 MSC – 3 CMA CGM – 4 Evergreen Group – 5 Hapag-Lloyd – 6 COSCO Container Line – 7 China Shipping – 8 Hanjin/Senator – 9 APL APL Logistics
10 NYK NYK Logistics 11 MOL MOL Logistics 12 OOCL OOCL Logistics

132 9 Container Transport Chain
9.6.1 Mode Choice
Each freight transport mode has different economic and technical structures, and provides different quality of transport services. The decision on mode choice is complex. Transport cost is important for carrier selection in the early stage of the selection process. Transport cost includes rates, loading and unloading charges, and special services available (e.g., stopping in transit) from carriers. Transport cost varies from mode to mode owing to the different cost structures of the modes, whereas there are cost variations among carriers within a transport mode because of their dissimilarities in cost structure (Coyle et al. 2000). The importance of trans-port cost is reduced as logistics now focuses more on the cost trade-off between the services provided and the operations cost (Gubbins 2003). In addition, delivery speed is also an important factor to consider. When a product is perishable, fast delivery ensures minimum loss as a result of product deterioration. If there is an urgent need for spare parts to repair a ship, which has to remain idle until the part is available, the loss from shipment delay will far outweigh the transport cost.
Other service factors (Lai and Cheng 2009) to consider include:
• Transit time and reliability: Transit time is the total time starting from the time the consignor makes the goods available for dispatch until the time the carrier delivers the same goods to the consignee. This includes the time required for pickup, handling, and delivery. Reliability refers to the consistency of the tran-sit time.
• Inventory and stock out: Transit time and reliability affect inventory and stock-out costs. Longer transit times result in higher inventory levels. If the transit time is not consistent, the firm has to increase its buffer inventory. If a carrier can provide its customer with a shorter and more reliable transit time than its competitors, the customer can reduce its buffer inventory. The reliability that a carrier provides to its customers eventually becomes its competitive advantage. Viewed from a marketing perspective, a reliable transit time allows buyers to reduce both inventory and stock-out cost, and provides carriers with service dif-ferentiation.
• Capability and accessibility: Capability is a carrier’s ability to provide equip-ment and facilities to expedite the movement of a particular type of cargo re-quired. An example is to provide a reefer container to move frozen cargo. Ac-cessibility refers to the carrier’s ability to provide the service over the route in question. An example of accessibility is the geographical limits of a carrier’s route network. Capability and accessibility determine whether a particular car-rier can physically perform the transport service desired.
• Security: Security is the ability of a carrier to preserve the products in the same condition as they were. Security considers the indirect transport service cost if the shipment is damaged or lost in transit. A product damaged or lost in transit is not available for use at the time of demand. In addition to the monetary loss involved, a damaged shipment has the same impact on inventory cost and stock-out cost as an unreliable transit time.

9.6 Freight Transport Modes 133
9.6.2 Modal Combinations
An advantage brought by containerization is the development of door-to-door and intermodal transport arrangements (UNCTAD 2004). Intermodalism is the process of moving goods by more than one transport mode in a single loading unit (i.e., containers). Intermodal transport has the following advantages:
• The combination of transport modes helps to lower both the cost and the tran-sit time for moving goods, and helps to improve the quality of transport ser-vices.
• Moving goods in a container through a door-to-door service can make the transport more secure and reduce damage to shipments.
• Significant economies of scale can be gained through the use of intermodal infrastructure and technology, such as double stacking and block trains.
Today, intermodal services intersect with different interfaces, including rail/ road (piggyback), air/road (birdyback), sea/road (fishyback), as well as sea/rail combinations. An important development in intermodal freight transport is bridge services. Bridge services allow substitution of land transport for part of water carriage to benefit from a shorter transit time. The characteristics of bridge ser-vices include (1) the entire movement is covered by one bill of lading and (2) goods remain in the same container for the entire movement (Muller 1999).
Land bridges, minibridges, and microbridges are three bridge services (Coyle et al. 2000) that have become important in international shipping:
• A land-bridge system involves two sea routes joined by a land transport system. Originally, containers were transported by ships between Asia and Europe across the Pacific Ocean and the Atlantic Ocean by passing through the Panama Canal. Owing to shipping costs and congestion problems in Panama, containers were moved by sea transport from Asia to the USA’s West Coast, then by rail-way to the East Coast to be loaded on another ship for trans-Atlantic transfer to Europe.
• A minibridge uses a land transport system as an alternative to transporting cargo to a final coastal port. For containers moving from Asia to the USA’s East Coast or Gulf Coast ports (such as New York, Baltimore, New Orleans, and Houston), a minibridge consisting of trans-Pacific water movement to the USA’s West Coast ports (such as Seattle, Oakland, and Long Beach), then by rail to the destination rather than transporting the shipment with all-water routes from Asia to these cities through the Panama Canal has been estab-lished.
• The microbridge is an adaptation of a minibridge. The only difference is that it applies to interior cities instead of coastal ports.

134 9 Container Transport Chain
References
Banomyong R (2005) The impact of port and trade security initiatives on maritime supply-chain management. Marit Policy Manag 32(1):3–13
Bichou K (2004) The ISPS code and the cost of port compliance: an initial logistics and supply chain framework for port security assessment and management. Marit Econ Logist 6(4):322–348
Branch EA (2000) Export practice and management. Thomson, London Christiansen M, Fagerholt K, Ronen D (2004) Ship routing and scheduling: status and perspec-
tives. Transp Sci 38(1):1–18 Christopher M (2005) Logistics and supply chain management. Financial Times and Prentice
Hall, Harlow Coyle JJ, Bardi EJ, Novack RA (2000) Transportation. South-Western, Cincinnati Delfmann W (2003) The impact of electronic commerce on logistics service providers. Int J Phys
Distrib Logist Manag 32(3):203–222 ECMT (2005) Container transport security across modes. European Conference of Ministers of
Transport, Bucharest Gubbins JE (2003) Managing transport operations. The Institute of Logistics and Transport,
Corby Gunasekaran A, Ngai EWT (2004) 3PL: experience from China resources logistics. Int J Logist
Syst Manag 1(1):81–97 Heaver TD (2001) The evolving roles of shipping lines in international logistics. Int J Marit
Econ 4(3):210–230 Lai KH, Cheng TCE, Yeung ACL (2004) An empirical taxonomy for logistics service providers.
Marit Econ Logist 6(3):199–219 Lai KH, Cheng TCE (2009) Just-in-time logistics. Gower, Aldershot Lambert MD, Stock RJ, Ellram ML (1998) Fundamentals of logistics management. McGraw-
Hill, Boston Lieb R, Miller J (2002) The use of third-party logistics services by large US manufacturers, the
2000 survey. Int J Logist Res Appl 5(1):1–12 Lun YHV, Lai KH, Cheng TCE (2009) A case study of logistics service management. Shipp
Transp Logist Book Ser 1:67–78 Lysons K, Gillingham M (2003) Purchasing and supply chain management. Prentice Hall, Har-
low Muller G (1999) Intermodal freight transportation. Eno Transportation Foundation, Washington Porter EM (1985) Competitive advantage creating and sustaining superior performance. Free
Press, New York UNCTAD (2004) Review of maritime transport. United Nations Conference on Trade and De-
velopment, Geneva

135 Y.H.V. Lun, K.-H. Lai and T.C.E. Cheng Shipping and Logistics Management, © Springer 2010
Chapter 10 Intermodal Transport System
Abstract Intermodal transport combines the accessibility of inland transport modes with the long-haul capabilities of ocean shipping. Intermodal transport can be defined as the movement of goods in one and the same loading unit that uses successively several modes of transport without handling the goods themselves in changing transport modes. The rise of intermodal transport has resulted in dra-matic changes in the pattern of freight transport. There is a contrast between the standardization of ocean transport services and that established on land. Regional differences characterizing Asia, Europe, and North America include geographical differences, differences in economic development, and differences in transport infrastructure. As an integrated transport system, intermodal freight transport con-sists of various elements. This chapter uses Hong Kong as a case to illustrate the INTERMODAL model to identify the elements of an intermodal transport system. The key elements of an intermodal transport system include infrastructure, new technology, transport operators, the external business environment, regional loca-tion, management of containers, operations of container terminals, deregulation, availability of logistics services, and logistics security.
10.1 Introduction to Intermodal Transport
In a globalizing marketplace, with dwindling transport costs, increased global sourcing activities, and widely diffused production sites, the volume of interna-tional trade has grown dramatically (Robinson 2002). Shippers increasingly expect their carriers and logistics service providers to supply more rapid and reliable delivery services so as to minimize their costs associated with warehousing, inven-tory holding, and other aspects of production and distribution. Facing a rise in customer expectation, carriers are providing a wider variety of, and more sophisti-cated options in, their transport logistics services (Andersson and Hasson 1998).

136 10 Intermodal Transport System
In liner shipping, ocean container carriers form alliances with other carriers and business partners to widen their service coverage and provide more cost-effective services. The liner shipping industry is currently characterized by acquisitions and mergers. However, cooperation among transport carriers in the operation of the oceanic side of the business will end when the goods reach ports. There is a con-trast between standardization of ocean services and that established on land (McCalla et al. 2004). Inland transport operations differ in various aspects and land-side operations in North America, Europe, and Asia are very different in their operating environments, as illustrated in Table 10.1.
Intermodalism combines the accessibility of inland transport modes with the economic line-haul capabilities of ocean shipping (Taylor and Jackson 2000). Intermodal transport, defined as combined transport by two or more transport modes, has a significant impact on the spatial–economic structure of the transport industry (Arjen and Berg 1998). Although there are considerable differences be-tween transport terminals of different transport modes in terms of size and site re-quirements, intermodal operators do share many common characteristics (McCalla et al. 2001):
• they enable the transfer of freight from one transport mode to another; • they are land-extensive; • they require a high degree of accessibility; • they are becoming operationally more alike.
The rise of intermodal transport has resulted in dramatic changes in freight transport operations. Intermodalism implies the use of at least two different modes of transport in an integrated manner in a door-to-door transport chain (OECD 2001). Muller (1999) defined intermodalism as “coordinated transport of goods in
Table 10.1 Regional differences
Characteristic Asia Europe North America
Geographical differences
Many small countries High population densitiesIsland and coastal countries (except China)
Many countries High population densities
Three large countries, i.e., USA, Canada, and Mexico Wide range of density (coastal high and inland low)
Economic development
Developing economies at various levels Exports as economic development tool Dominated by containerized exports
Mature economies Service-based
Mature economies Service-based Dominated by containerized imports
Transport infrastructure
Developing inland transport system Limited inland hinterland development One coast port range
Matured inland transport system Regional hinterlands Highly developed coastal and inland waterways
Mature inland transport system Continental hinterlands Rail and truck dominant Two coastal port ranges, i.e., west coast and east coast

10.2 The INTERMODAL Model 137
containers by combination of truck or rail, with ocean-going link”. The advantages of unitizing cargoes include:
• easier handling; • easier loading on or off a vehicle; • easier intermodal transfer; • fewer items lost or stolen; • less paperwork.
10.2 The INTERMODAL Model
Intermodal transport is concerned with the movement of goods in one and the same loading unit that uses successively two or more modes of transport without handling the goods themselves in changing modes. An intermodal transport sys-tem consists of various components. To understand the operations of an intermo-dal transport system, this chapter discusses the key components and summarizes them into ten elements in the INTERMODAL model in this section.
A model is a representation of reality. The INTERMODAL model (Fig. 10.1) consists of ten key elements to explain an intermodal transport system (Lun et al. 2009). The ten elements are infrastructure, new technology, transport operators, external business environment, regional location, management of containers,
INTERMODAL frameworkINTERMODAL framework
InfrastructureInfrastructure Management of containersManagement of containers
New technologyNew technology Operations of containerOperations of container terminals
Transport operatorsTransport operators DeregulationDeregulation
External business environmentExternal business environment AvailabilityAvailability of logistics services
Regional locationRegional location Logistics securityLogistics security
Fig. 10.1 INTERMODAL model

138 10 Intermodal Transport System
operations of container terminals, deregulation, availability of logistics services, and logistics security.
10.2.1 Infrastructure
According to Carbone and Martino (2003), the contribution of ports to the satis-faction of customer requirements depends on:
• the availability of efficient infrastructure and inland connections, as part of a global transport system;
• the ability of logistics and transport operators to contribute to value creation and to accomplish qualitative attributes of demand (i.e., reliability, punctuality, frequency, availability of information, and security).
The container transport chain has experienced operational changes due to the rise of intermodalism and ports having specialized in transshipment activities. The world has formed into a systemic transport chain in which individual ports are linked by hub and feeder relationships, as well as end-to-end shipping linkages that reflect increasing trade dependency among regions (Banomyong 2005). The change in the shipping industry has revolved around ship size and speed (Bendall
Table 10.2 Ranking of container ports of the world, 2007
Rank Port Throughputa
1 Singapore 27.932 2 Shanghai 26.150 3 Hong Kong 28.881 4 Shenzhen 21.099 5 Busan 13.270 6 Rotterdam 10.790 7 Dubai 10.653 8 Kaohsiung 10.256 9 Hamburg 9.900
10 Qingdao 9.462 11 Ningbo 9.360 12 Guangzhou 9.200 13 Los Angeles 8.355 14 Antwerp 8.177 15 Long Beach 7.312 16 Port Klang 7.120 17 Tianjin 7.103 18 Tanjung Pelepas 5.500 19 New York/New Jersey 5.400 20 Bremerhaven 4.892
a In million TEUs

10.2 The INTERMODAL Model 139
and Stent 1999). Serving mega-sized container ships, ports must possess deep water, wide channels, longer berths, suitable high-speed cargo-handling equip-ment, highly productive and reasonably priced labour supply, suitable berths for coastal feeder vessels, and good road and rail intermodal connections to inland destinations (Ircha 2001).
Hong Kong possesses a good intermodal infrastructure. Hong Kong is one of the busiest and most efficient international container ports in the world. Details of the world’s top container terminals and their throughput are shown in Table 10.2. The container terminals in Hong Kong are situated in the Kwai Chung-Tsing Yi basin. There are nine terminals under five different operators: Modern Terminals Ltd (MTL), HIT, COSCO-HIT, DPI Terminals, and Asia Container Terminals Ltd (ACT). They occupy 285 hectares of land, providing 24 berths and 8,530-m deep-water frontage. The water depth of the Kwai Chung-Tsing Yi basin is 15.5 m. The total handling capacity of the container terminals is over 18 million TEUs per year (Lun et al. 2009).
10.2.2 New Technology
New and emerging technology in intermodal transport can be found in containers and container ships, electronic data interchange, Internet technology, and mobile technology. The development of electronic commerce in shipping increases the potential for economies of scale associated with overall business volume (Heaver 2001). The Internet provides a transaction platform for the global marketplace and helps economic growth. Over the last decade, electronic commerce has been used to foster business growth. The shipping business has already been profoundly affected by the use of technology (Wagner et al. 2003) such as electronic com-merce (Zhao 2005) and mobile commerce (Ngai et al. 2007).
Shipping lines are investing in electronic networks to make extensive use of information technology and communications technology to ensure constant flows of information to and from their customers, suppliers, and business partners. Other than shipping lines and agents,1 container terminal operating systems are necessary and should be prepared for efficient operation and improved service for customers of container terminals. Most container terminal operating systems consist of separated functional modules. The modules include a database module, a planning module for loading/unloading sequences from vessels and movements of containers through the yard, and control modules for operating processes (Choi et al. 2003).
In Hong Kong, millions of containers are handled by container terminal opera-tors in Kwai Chung. To handle such a large volume, container terminal operators
————— 1 A shipping agent serves shipowners in a foreign port by looking after the ship’s interests; some of the duties include arranging for pilot operations and crew change. These agents can also be also known as port agents or ship agents.

140 10 Intermodal Transport System
develop their own terminal management systems designed for the unique business environment in Hong Kong. Each system is fully integrated with technology, processes, and people to ensure that excellent services are provided to shippers. The fully automated management system integrates all the terminal operations, including gate, yard, and vessel activities. The system provides optimization of operation parameters, a common database for terminal activities, and real-time updating of data. Container terminal operators are also equipped with real-time monitoring systems to ensure accurate and efficient shipping services (Port of Hong Kong 2004).
10.2.3 Transport Operators
Within an intermodal transport system, containers move through a transport chain involving many actors. A container transport chain with various actors does not necessarily entail longer transport times than a short-distance one in the same circumstances under a single management (Ohnell and Woxenius 2003). For in-stance, a system of frequent and reliable feeder trains is important to intermodal freight transport in obtaining additional cargo volume (Trip and Bontekoning 2002). Movement of goods can be made by combining several modes of transport from a point of origin via one or more interface points to a final point where one carrier or many carriers jointly organize the whole transport process. Integrated transport is an efficient transport system providing physical operations within the environment of simple streamlined documentation and a single liability system (Banomyong 2005).
Liner carriers were the initiators and developers of integrated containerized in-termodal water–rail and truck–rail freight movement. Land-based carriers were followers in the development of such a movement. Cooperation among various land-based transport operators, through the concept of network externalities, helps reduce the need for additional physical capacity (Bergantino and Veenstra 2002) by linking up with industrial networks of different types, including liner carriers and intermodal operators, forming an extended network to provide a wider spec-trum of transport services.
Fundamentally, contemporary liner shipping companies facilitate international trade. Their relative cost-efficiency gives them an edge to win business from large cargo bases. Because of the need to ship cargoes using intermodal bills of lading,2 liner operators sign contracts with railroad operators for dedicated unit train3 ser-vices on large-volume corridors, thus becoming major consumers of inland inter-modal services. Ultimately, liner-oriented intermodalism began as an extension of liner shipping with liner operators controlling the cargo and railroad operators.
————— 2 An intermodal bill of lading covers cargo moving via multimodal means. It is also known as a combined transport bill of lading or a multimodal bill of lading. 3 A dedicated unit train is a unit train that is operated by various railroads for exclusive usage.

10.2 The INTERMODAL Model 141
Shipping lines coordinate inland intermodal activities with their tightly scheduled ship arrival times. As shippers target the reduction of inventories in more respon-sive supply chains, they expect to receive quality transport services. High service frequency, reliability of delivery, and capacity availability are expected of trans-port systems, in addition to good shipping services, which gives rise to the need for better intermodal services (Heaver 2001).
Sea trade and logistics is an economic pillar of Hong Kong. This sector contrib-utes 22 and 15% of Hong Kong’s GDP and employment, respectively. It is critical for the Hong Kong government and all the transport operators, including trucking companies and barge operators, to work together to maintain Hong Kong’s com-petitiveness and its continued leadership as a logistics hub in Asia. One of the pro-posals made by McKinsey & Company (2004) was to build physical and policy bridges to the Pearl River Delta with the aim of positioning Hong Kong as a lead-ing player in the network of ports in southern China. To promote intermodal trans-port, there are several initiatives to be pursued: (1) reducing the cost of trucking goods to China, (2) improving customs and border crossing efficiencies, (3) im-proving barging services to secure traffic from the west of the Pearl River Delta, (4) building the Zhuhai–Macau–Hong Kong bridge, and (5) creating a southern China port network.
10.2.4 External Business Environment
Ports have evolved over various stages from cargo loading/unloading points to be the centres of the physical infrastructure, and have become crucial hubs in the transport chain. Ports act as an interface between production and consumption centres, and as a means to connect between sea and land transport. At the same time, port planning is essential to the main players in the port-related business sectors, which include port authorities, terminal operators, liner shipping compa-nies, transport operators, and logistics service providers, which focus on creating shipping networks to carry out and develop their activities. The growth in trade-related activities, owing to market integration, sheds light on the importance of developing a maritime port and logistics centre. Accordingly, port expansion cre-ates new opportunities to achieve economic growth, create employment, and bene-fit the areas linked to port activities (Moglia and Sanguineri 2003). Sanchez et al. (2003) found that efficient seaports are associated with lower freight costs after controlling for distance, cargo volume, availability of liner services, insurance costs, and other factors.
The external business environment plays a significant role in affecting the de-velopment of port communities and logistics service centres. For instance, Hong Kong is a free port, without language or regulation barriers to foreign investors doing business in the city. Hong Kong customs is transparent and efficient, using a global harmonized code system to simplify documentation. Hong Kong is con-sidered to be an ideal base for private companies to offer services such as vendor

142 10 Intermodal Transport System
management, online inventory management, order fulfilment and other port- and logistics-related services (Field 2005). Besides, Hong Kong has advantages that are related to its commercial infrastructure developed since the nineteenth century. Buyers of Chinese merchandise, especially Westerners, prefer the ease of using letters of credit and processing trade documentation in this city. Hong Kong can continue to thrive as a port city because of the spectacular economic growth of southern China. It has become a commercial and transport hub of Asia, but it needs to pay greater attention to the costs of its services if it wants to maintain its competitive position (Mongelluzzo 2004).
10.2.5 Regional Location
No freight moves from place to place merely for the sake of movement. The need for freight transport services is derived from the need for products to be shipped. In response to the freight market, liner operators need to watch the general trends and factors impinging directly on aggregate demand for liner services. Neverthe-less, the derived nature of the demand for shipping space highlights one of the liner operator’s primary objectives: to provide transport capacity when and where it is most needed (Fleming 2002). The distance of a port from a shipper’s location is an important variable determining port choice from the shipper’s perspective. Distance has negative elasticity (Tiwari et al. 2003).
The container shipping business has two key elements, namely, the physical shipping network and trade demand (Song 2003). World markets have become increasingly globalized. Changes in the world economic order, due to globaliza-tion of consumption and production, and structural changes in port–hinterland relationships, have strengthened the role of network development in liner shipping management (Park and De 2004). Arjen and Berg (1998) defined a seaport’s hin-terland as the continental area of origins and destinations of traffic flows through a port. In other words, it is the interior region served by the port. The concept of a hub port can be used to achieve an efficient shipping system. A shipping system can be divided into two parts (Fagerholt 2000). The first part of the shipping sys-tem, which is called the feeder system, concerns the transport from ports at pro-duction units to the hub. The second part is the transport from the hub to markets. Each of these two parts has its own, more or less independent shipping system, separated by the hub. The containerization and intermodal transport concepts af-fect competition between ports. With extended hinterlands, ports are facing an increased level of competition on an interregional basis, where the accessibility to large inland transport networks can give a competitive advantage. Container ports have become a link in a larger logistics chain, part of a global distribution channel. For them to succeed, such channels need to achieve a high degree of coordination and cooperation (Geraldo et al. 2003).
A good example to illustrate the regional location of an intermodal transport system is to consider China’s rapid economic growth. The growth in China is not

10.2 The INTERMODAL Model 143
only channelling more traffic to its local ports, but is also forcing regional hubs such as Hong Kong to look for new ways to become more competitive. For in-stance, the port of Hong Kong has experienced phenomenal growth in the con-tainer transport business over the past three decades owing largely to containeri-zation. Endowed with a deep-water harbour strategically located at the mouth of the Pearl River Delta, Hong Kong has evolved into a regional shipping hub in the global container transport chain. Recently, the port of Hong Kong has been facing increasing competitive pressure from neighbouring rivals where new port developments have enabled them to increase their market share of ocean cargo originating from southern China. In 2006, there were 61 container berths in the Pearl River Delta, including Hong Kong’s 24 berths. The number of berths in southern China, including Hong Kong, is expected to reach 89 by 2010, and probably 120–122 berths in the longer term.
10.2.6 Management of Containers
Intermodal freight transport provides advantages in unitizing freight, protects cargoes from weather and pilferage in container boxes, and makes it easier to load and unload between transport modes. In some cases, these units function like warehousing on the move. Containers pose disadvantages as well. They are expen-sive to purchase, rent, and repair, and are costly in terms of idle storage and empty backhaul.4 In some cases, multiple numbers of containers must be transported together to realize economies of scale (Muller 1999).
Liner shipping is a capital-intensive industry, with liner shipping companies in-vesting large amounts of financial capital in vessels and containers. It is also costly to reposition empty containers owing to trade imbalances. A container in-ventory control system – which records and provides all the locations and numbers of containers, both owned and leased – provides support for making the right deci-sions to handle container repositioning, on-hire5 and off-hire,6 so as to provide customers with the containers they need and to reduce container handling and storage costs (Ting and Tzeng 2003). Furthermore, the routing of empty containers is an inevitable activity of the container transport chain. In fact, inbound contain-ers arriving at a national port are sent towards a multiplicity of interior destina-tions. Then the empty containers must return to a port for an outbound voyage. Ocean carriers adopt network-based management to collaborate with other organi-zations to reposition their activities relating to empty containers by looking at their production costs and the characteristics of the services (distance and volume). It is important for shipping lines to establish a cost-effective shipping network to pro-vide the right equipment in the right place and at the right time (Lopez 2003).
————— 4 “Backhaul” means to haul a shipment back over part of a route it has already travelled. 5 “On-hire” means to lease an empty container from a leasing company. 6 “Off-hire” means to return an empty container to a leasing company.

144 10 Intermodal Transport System
Liner shipping companies usually collaborate with off-dock container depots to manage empty containers. In Hong Kong, off-dock container depots provide con-tainer storage and container maintenance services, as well as container return and pickup services (Ngai et al. 2007). They are usually located away from the mari-time terminals and have a high storage capacity. They provide major shipping lines and leasing companies with container management services.
10.2.7 Operations of Container Terminals
A container terminal is a place where cargo is loaded onto ships, unloaded from ships, and stowed on the pier at which the receipt and delivery of freight take place. A container terminal management system consists of a ship-operations system, a cargo-moving system, a storage system, a receipt and delivery system, a gate-operations system, and a management and operation information system (Lee et al. 2003).
The role of the container port has changed from that of a transport node for trans-ferring cargoes between sea and other transport modes to that of a link in the logistics chain (Song 2003). The choice of a transshipment port is made by shipping lines and it is not of direct importance to shippers/consignees. Apart from the port of origin or destination, users cannot influence this choice directly. Users, however, value the choice of a transshipment port on the basis of the impact it has on the value of its attributes, such as cost and transit time. Within an intermodal system, hubs are spe-cial nodes that are part of a network, located in such a way as to facilitate cargo movement between interacting places (O’Kelly 1998). Container terminals serving as a meeting place of other modes of transport are essentially a component of the economic infrastructure to handle containers (Park and De 2004; Robinson 2002).
To meet customers’ expectations, MTL in Hong Kong has undertaken a com-prehensive programme of customer-focused service enhancement (Port of Hong Kong 2004). The introduction of the rapidly expanding Inland Gate offers ship-ping lines, shippers, and consignees a faster, more efficient, more cost-effective, and more reliable way to transport their cargo to and from major Pearl River Delta ports. The Hong Kong container port is renowned for its efficiency and high pro-ductivity. With a total quay length of 8,532 m, a maximum water depth of 15.5 m, and modern state-of-the-art quay gantry cranes capable of lifting containers at more than 22 rows across, the Kwai Chung container terminals can accommodate the latest generation of container ships already in service and under construction.
10.2.8 Deregulation
Changes in international transport management towards a more integrated trans-port concept have put pressure on ports to adjust their role and function to the

10.2 The INTERMODAL Model 145
demanding shipping environment. This entails the rethinking of national port de-velopment strategies, as well as far-reaching reforms in the legislative, regulatory, and managerial environment in which commercial ports operate. In particular, the need to define new partnerships between the public and private sectors in port operations, financial support, and asset management necessitates a review of the respective roles of the public and private sectors, and the mission to be under-taken. Port authorities are likely to have a major role in fostering effective coop-eration between public and private players, which is essential to achieving the expected benefits of integrated transport and logistics operations (Juhel 2001).
The regulatory function of a port involves substantial powers being given to the port’s public or private sector management, the majority of which will be of a statutory nature. This function, in general, may be regarded as the primary role of a port authority, namely, to be involved in the maintenance of the conservancy function, to provide vessel traffic management, to enforce applicable laws and regulations, to license port works, to safeguard the interests of port users against the risk of monopoly formation, and to control natural monopolies. For inland transport, the liberalization of both road and rail transport in Western companies has been taken as a measure to increase efficiency in transport in the past few years (Profillidis 2004).
Hong Kong can be used as an example to illustrate the importance of balancing the public and private sectors in transport development. Hong Kong is one of the major international ports where the facilities are financed, owned, and operated by the private sector. The port is 100% privately run and there is no port authority in Hong Kong. The government does not run the port; its role is to undertake long-term strategic planning for port facilities and to provide the necessary support to port operations and development (Port of Hong Kong 2004).
10.2.9 Availability of Logistics Services
A major role of an integrated logistics system is to assist in the production, con-sumption, distribution, or management of the “supply chain” of goods and ser-vices. Integrated and seamless logistics services can play an important part in facilitating the global supply-chain process (Banomyong 2005). Logistics involves a wide range of related activities, including storage, inventory management, mate-rials handling, and order processing.
Stank and Roath (1998) suggested that value-added services for international trade, such as import and export documentation services, insurance, and banking and finance, are important for shippers. Traders use these services to enhance their overall transport and logistics capabilities. Warehousing, distribution, and logistics information services are also key components of an intermodal system. Like other businesses in the transport sector, global terminal operators are increasingly active in providing logistics services, particularly in operating logistics centres and con-tainer freight stations.

146 10 Intermodal Transport System
As a logistics hub of global importance, Hong Kong has been providing world-class logistics services and enjoys many advantages in sustaining this position. These advantages include a prime geographical location, world-class transport infrastructure, a wide choice of intermodal connections with the Chinese mainland and other countries, and cost-effective logistics services, particularly in freight forwarding and cargo operations. Consequent to the rapid growth in the economic development of China, the trade volumes between Hong Kong and China and other countries are expected to increase considerably. As the cargo volume han-dled through Hong Kong continues to grow, it is natural for logistics service pro-viders in Hong Kong to seek service improvements to fully satisfy the rising ser-vice needs of their customers. As a result, many logistics service providers in Hong Kong have been expanding their service menus and broadening the scope of their services (Lai and Cheng 2003, 2004).
10.2.10 Logistics Security
Intermodal container transport is complex in that transport functions often inter-sect at various levels (Bichou 2004). The search for global efficiency in transport containers has led to the development of capabilities to offer door-to-door ser-vices, which also requires a high level of security, coupled with efficient move-ments between several points of origin and destination (Banomyong 2005). In maritime transport, the security issue is mainly concerned with domestic issues such as theft, stowaways, and drug smuggling (Alderton 2002). Since the events of 11 September 2001, the highest-order definition of freight security has changed from theft-proof to tamper-proof. Suddenly, intermodal containers have become devices for potential weapons delivery. Governments and carriers are searching for ways to prevent terrorist attacks on or through the freight distribution system. Both shippers and carriers appreciate the need to keep commerce and trade active, while increasing logistics security. Although logistics security measures have targeted a variety of entities and facilities across the international shipping and logistics community, ports stand as the only transport node that can bring together all these transport functions, assets, processes, and flow-type elements (Bichou 2004). Thus, security initiatives in maritime transport are a prioritized issue in managing an intermodal transport system.
Today, X-ray and γ-ray non-intrusive container inspection (NII) equipment is being deployed in some ports to facilitate the inspection of containers. A key se-curity concern is the potential use of containers to transport a nuclear or radiologi-cal device. As a result, the Customs and Border Protection of the USA uses large-scale NII and radioactive sensor systems to safely and efficiently screen convey-ances for contraband, including weapons of mass destruction and radioactive sub-stances (DHS 2004). NII technology allows ports to screen a larger proportion of commercial traffic in less time. There is a reason to believe that container inspec-tion technology may be evolving in the foreseeable future to allow radiation and

10.3 Concluding Remarks 147
NII inspection of all the containers entering a port facility without significant delay to commercial activities. Provided that the radiation and image readings are of sufficient quality for security screening purposes, this capability would enable all the containers being loaded or unloaded at a particular port to be more effec-tively responsive to container transport security initiatives. MTL in Hong Kong is committed to implementing NII in its gatehouse and quayside. Both γ-ray reading equipment and radioactive scanning equipment are installed to screen containers at the time of moving to terminal gates and discharging from vessels at the quayside. The implementation of NII by MTL provides a good reference for other container terminals in ensuring logistics security (Lun et al. 2008).
10.3 Concluding Remarks
In this chapter we used Hong Kong as a case to illustrate the INTERMODAL framework, which provides a useful reference to evaluate the effectiveness of an intermodal transport system. From the perspective of intermodal development, ports nowadays act as an interface between the places of production and the places of consumption, which attracts the attention of market players in the shipping business. Intermodal transport operation is an important area in which ports should engage for performance enhancement. Port regionalization, which is concerned with integrating intermodal transport systems with marine terminals to accommo-date new port–inland linkages, has become essential in port development, whereby efficiency is derived from integration of ports with inland and freight transport systems.
The INTERMODAL framework provides a road map for the requirements to develop a port into an intermodal transport system from the perspectives of differ-ent user clusters. Users of an intermodal system can be classified into the follow-ing five categories (Lun et al. 2009):
1. First-party users physically own the cargo to be transported, e.g., global traders and small domestic exporters.
2. Second-party users own the vehicles and/or facilities to provide logistics and transport services, e.g., shipping lines, barge operators, truckers, container ter-minal operators, off-dock depot operators, and warehouse operators.
3. Third-party users directly offer services to shippers, e.g., freight forwarders, customs brokers, and other value-added service providers.
4. Fourth-party users supervise the third-party logistics service providers to pro-vide services to meet customer requirements.
5. Fifth-party users conduct research studies or provide consultation services to facilitate the development and growth of the region.
From 1992 to 2004, Hong Kong was the world’s busiest port for 12 out of the 13 years. Handling 28.88 million TEUs of cargo in 2007, Hong Kong has continued to be one of the world’s busiest container ports. Owing to the scale and history of

148 10 Intermodal Transport System
Hong Kong’s container transport operations, a study of the desirable elements of an intermodal transport system in the Hong Kong context advances knowledge in this important, but underexplored research area. The INTERMODAL framework cap-tures the key elements of an intermodal system that are essential to strengthening the role of a region as an intermodal transport hub. The INTERMODAL framework provides a more systematic framework for analysing intermodal transport develop-ment than what has been available in the existing literature.
References
Alderton PM (2002) The maritime economics of security. Marit Policy Manag 29(2):105–106 Andersson T, Hasson P (1998) Why integrated transport system? Organization for Economic
Cooperation and Development, Paris Arjen H, Berg G (1998) Gateways and intermodalism. J Transp Geogr 6(1):1–9 Banomyong R (2005) The impact of port and trade security initiatives on maritime supply-chain
management. Marit Policy Manag 32(1):3–13 Bendall HB, Stent AF (1999) Longhaul feeder services in an era of changing technology, an
Asia-Pacific perspective. Marit Policy Manag 26(2):145–159 Bergantino A, Veenstra WA (2002) Interconnection and co-ordination: an application of net-
work theory to liner shipping. Int J Marit Econ 4(3):231–248 Bichou K (2004) The ISPS code and the cost of port compliance: an initial logistics and supply
chain framework for port security assessment and management. Marit Econ Logist 6(4):322–348
Carbone V, Martino M (2003) The changing role of ports in supply chain management: an empirical analysis. Marit Policy Manag 30(4):305–320
Choi HR, Kim HS, Park JB (2003) An ERP approach for container terminal operating system. Marit Policy Manag 30(3):197–210
DHS (2004) Secure seas, open ports. Department of Homeland Security, Washington Fagerholt K (2000) Evaluation the trade-off between the level of customer service and transpor-
tation costs in a ship scheduling problem. Marit Policy Manag 27(2):145–153 Field MA (2005) The Hong Kong alternative. J Commer 6(26):38–39 Fleming KD (2002) Patterns of international ocean trade. In: The handbook of maritime eco-
nomics and business. Lloyd’s of London Press, London Geraldo J, Beresford A, Pettit S (2003) Liner shipping companies and terminal operators: inter-
nationalization or globalization? Marit Econ Logist 5(4):393–412 Heaver TD (2001) The evolving roles of shipping lines in international logistics. Int J Marit
Econ 4(3):210–230 Ircha M (2001) Serving tomorrow’s mega-size containerships: the Canadian solution. Int J Marit
Econ 3(3):318–332 Juhel M (2001) Globalization, privatization and restructuring or ports. Int J Marit Econ 3(2):139–
174 Lai KH, Cheng TCE (2003) Initiatives and outcomes of quality management implementation
across industries. Omega Int J Manag Sci 31(2):141–154 Lai KH, Cheng TCE (2004) A study of the freight forwarding industry in Hong Kong. Int J Lo-
gist Res Appl 7(2):71–84 Lee TW, Park NK, Lee DW (2003) A simulation study for the logistics planning of a container
terminal in view of SCM. Marit Policy Manag 30(3):243–254 Lopez E (2003) How do ocean carriers organize the empty containers reposition activity in the
USA? Marit Policy Manag 30(4):339–355

References 149
Lun YHV, Wong WYC, Lai KH, Cheng TCE (2008) Institutional perspective on the adoption of technology for security enhancement of container transport. Transp Rev 28(1):21–33
Lun YHV, Lai KH, Cheng TCE (2009) Intermodal transport capability. Shipp Transp Logist Book Ser 1:17–33
McCalla JR, Slack B, Comtois C (2001) Intermodal freight terminals: locality and industrial linkages. Can Geogr 45(3):404–413
McCalla JR, Slack B, Comtois C (2004) Dealing with globalization at the regional and local level: the case of contemporary containerization. Can Geogr 48(4):473–487
McKinsey & Company (2004) Restoring Hong Kong’s competitiveness as a sea trade logistics hub. The Better Hong Kong Foundation, Hong Kong
Moglia F, Sanguineri M (2003) Port planning: the need for a new approach? Marit Econ Logist 5(5):413–425
Mongelluzzo B (2004) High costs carry a price. J Commer 5(44):52–56 Muller G (1999) Intermodal freight transportation. Eno Transportation Foundation, Washington Ngai EWT, Cheng TCE, Au S, Lai KH (2007) Mobile commerce integrated with RFID technol-
ogy in a container depot. Decis Support Syst 43(1):62–76 OECD (2001) Intermodal freight transport: institutional aspects. Organization for Economic
Cooperation and Development, Paris Ohnell S, Woxenius J (2003) An industry analysis of express freight from a European railway
perspective. Int J Phys Distrib Logist Manag 33(8):735–751 O’Kelly M (1998) A geographer’s analysis of hub-and-spoke network. J Transp Geogr 6(6):171–
186 Park RK, De P (2004) Alternative approach to efficiency measurement of seaports. Marit Econom
Logist 6(1):53–69 Port of Hong Kong (2004) Port of Hong Kong, handbook and directory. Marine Department,
Government of the HKSAR, Hong Kong Profillidis VA (2004) Experiences from liberalization of road and rail transport. Marit Econ
Logist 6(3):270–273 Robinson R (2002) Ports are elements in value-driven chain systems: the new paradigm. Marit
Policy Manag 29(3):241–255 Sanchez R, Hoffmann J, Micco A, Pizzolitto G, Sgut M, Wilmsmeier G (2003) Port efficiency
and international trade: port efficiency as a determinant of maritime transport costs. Marit Econ Logist 5(2):199–218
Song DW (2003) Port co-opetition in concept and practice. Marit Policy Manag 30(1):29–44 Stank T, Roath A (1998) Some propositions on intermodal transportation and logistics facility
development: shipper’s perspectives. Transp J 37(3):13–24 Taylor J, Jackson G (2000) Conflict, power, and evolution in the intermodal transportation
industry’s channel of distribution. Transp J 39(3):5–17 Ting SC, Tzeng GH (2003) Ship scheduling and cost analysis for route planning in liner ship-
ping. Marit Econ Logist 5(4):378–392 Tiwari P, Itoh H, Doi M (2003) Shippers’ port and carrier selection behaviour in China: a discrete
choice analysis. Marit Econ Logist 5(1):23–29 Trip JJ, Bontekoning Y (2002) Integration of small freight flows in the intermodal transport
system. J Transp Geogr 10(3):221–229 Wagner BA, Fillis I, Johansson U (2003) E-business and e-supply strategy in SMEs. Supply Chain
Manag 8(4):343–354 Zhao HX (2002) Rapid internet development in China: a discussion of opportunities and con-
straints on future growth. Thunderbird Int Bus Rev 44(1):119–138

151 Y.H.V. Lun, K.-H. Lai and T.C.E. Cheng Shipping and Logistics Management, © Springer 2010
Chapter 11 Managing Empty Containers
Abstract Container cost is one of the most important items of a container ship-ping company’s total costs. The basic elements of container cost include long-term capital investment and the day-to-day operations cost. Equipment supply is neces-sary for liner shipping companies to secure cargoes. Carriers must supply the right containers at the right time and in right place to shippers. To manage empty con-tainers, it is necessary to have an understanding of the operations cost involved. The cost of maintaining containers includes equipment cost, storage cost, move-ment cost, and administrative cost. Managing empty containers efficiently is the goal for all the parties involved in the container transport chain. In this chapter we discuss a model for empty container management with four major dimensions: strategic planning, procurement of empty containers, movement of empty contain-ers, and technical efficiency.
11.1 Introduction
A container shipping company can operate in a cost-effective way by carefully integrating, building, and reconfiguring a set of internal and external resources to manage its empty containers. From the perspective of a container shipping com-pany, the key operational concern is related to the transport of loaded containers. However, empty container flows also need to be effectively managed. Supplies of empty containers are subject to a number of uncertain parameters, such as demand at container ports, timing of container returns, and vessel space available for empty container repositioning (Cheung and Chen 1998). The expenses associated with container handling constitute an important cost component for container shipping companies.
Long-term capital investments, such as purchase and lease of containers as well as day-to-day operations, including storage, repositioning, repair, and maintenance of containers, are two core elements of container cost. Container cost is one of the

152 11 Managing Empty Containers
five cost elements of container operations. Stopford (2002) identified five cost elements in container transport. The components of container transport cost are illustrated in Fig. 11.1. The key elements of the container transport cost are inland transport cost (25%), ship cost (23%), terminal cost (21%), container cost (18%), and other costs (13%).
11.2 The Container
Container ships carry cargoes using unitized containers both on deck and under deck. On-deck containers are stowed in vertical cells formed by angle corner guides. On-deck-stowed containers are usually stacked to the height equivalent to five to six containers, interlocked, and secured by special lashings. The distinction between carriage on and under deck has little significance in modern container operations. Container ships are now designed to carry a significant portion of cargo on deck. The container itself provides protection against some risks of stow-age on deck. Large container ships are usually not equipped with cargo handling gear. They rely on quay cranes on shore to handle cargo loading and discharge. With advanced quayside cranes, containers can be efficiently handled with rapid loading and discharge.
A container is an internationally standardized packing box for cargoes, which can be safely stowed, stored, and transported. It is designed for the efficient use of space and for any type of transport by road, rail, or sea. Standard ocean shipping containers are weatherproof, made of steel or similar materials, constructed to withstand high pressure, and designed to facilitate efficient cargo interchange with intermodal transport systems involving inland rail, road, or barge movement. Shipping containers are available in a variety of configurations. These include
Inland transport costs25%
Ship costs23%Terminal costs
21%
Container costs18%
Others13%
Fig. 11.1 Components of container transport cost

11.2 The Container 153
general-purpose, open-top, flat-rack, refrigerated, and tank containers. Containers generally conform to international standards that have been developed by the In-ternational Organization for Standardization. The size standards for the outer di-mensions of shipping containers are 20, 40, or 45 ft in length, 8 ft in width, and 8, 8.5, or 9.5 ft in height. Most container ships can carry containers of mixed height.
11.2.1 Stakeholder Participation in Container Interchange
To better understand empty container management, it is desirable to know the different parties involved in the container transport chain. They include:
• Container owner: an ocean carrier or a container leasing company that owns empty containers.
• Ocean carrier: a shipping line that operates container ships and controls much of the container transport chain. An ocean carrier may own or lease containers and provide the empty containers to shippers.
• Container terminal: an area designed for stowing loaded containers, empty containers, and chasses. The area is accessible to trucks, rail, and container ships, where containers are picked up, dropped off, maintained, and stored.
• Container yard: a materials handing and/or storage facility used for unitized loads in loaded or empty containers.
• Container depot operator: an entity that operates container depots where con-tainers are stored and repaired.
• Motor carrier: a drayage firm that takes responsibility for picking up and re-turning containers.
• Rail intermodal: use of rail equipment and operations to support the movement of containers.
• Container repairers: container repair services can be offered by marine terminal operators, container depot operators, or independent contractors.
• Container surveyor: a firm specialized in marine container inspection of con-tainers that are on-hired, off-hired, or received in damaged conditions.
• Third party: covers a broad array of potential participants who are neither carri-ers nor shippers/consignees. Third parties may load or unload containers and arrange for containers for ocean, road, or rail transport. They may include cus-toms brokers, consolidators, and freight forwarders.
11.2.2 Key Terms in Empty Container Management
The following terms are often encountered in empty container management:
• Interchange: Interchange is the transfer of a container from the responsibility of one party to the responsibility of another. The interchange process has three basic components:

154 11 Managing Empty Containers
− The party receiving empty containers has the responsibility to inspect and document the conditions of the containers. It is assumed that containers are received in good condition if no damage is reported at the time.
− Transfer and acceptance of liability for the containers. − Updated information should be provided to both parties.
• Free time and per diem: When a motor carrier receives a container for inter-change from an ocean carrier, the trucker normally grants some “free time” to return the container. The ocean carrier will charge a per diem fee for each extra day if the truck holds the container beyond the allowed free time.
• Container yards and depots: Containers are stored and interchanged at two principal locations: container yards of marine terminals, or off-dock container depots. Container yards are operated by container terminal operators on behalf of ocean carriers to handle containers. Many empty containers are stored off-dock in container depots. These depots handle both carrier-owned containers and leasing company containers, receive containers from trucks, and release containers to shippers.
• On-hiring and off-hiring: Containers can be owned by carriers or leasing com-panies. Containers owned by leasing companies can be leased to ocean carriers under leasing agreements. Ocean carriers fine-tune their leased fleets from time to time by off-hiring (returning empty containers to leasors1) containers in sur-plus areas and on-hiring (leasing more empty containers) fleets in locations of shortage. On the other hand, leasing companies constantly reposition from ar-eas where empty containers are being off-hired to areas where empty containers are being on-hired.
11.2.3 Costs of Maintaining Container Equipment Service and Capacity
Container supply is necessary for liner shipping companies or carriers to secure cargoes. Carriers must supply the right containers at the right time and in the right place. Ocean carriers need to ensure that empty containers are available for the use of shippers. To study empty container management, we need to know the funda-mental costs involved. Ocean carriers incur four types of cost to maintain con-tainer equipment service and capacity (Tioga Group 2002):
• Equipment cost: Whether leased or owned, the size of a container fleet is de-termined by the volume of traffic to be handled and the equipment velocity (i.e., the number of trips that each container can handle within a period of time). Carriers can minimize the container fleet size and equipment cost by turning equipment around faster.
————— 1 Container leasing companies lease containers to transport operators.

11.2 The Container 155
• Storage cost: Includes the costs of maintaining on-dock terminal storage capac-ity and off-dock depot storage. With seasonal demand in container shipping, storage cost is inevitable because even idle containers are expensive to store.
• Movement cost: Includes the costs involved in vessel operation, draying, and rail shipment.
• Management and administrative cost: Includes the payment for executive and clerical time, management information systems, survey fees, etc.
11.2.4 Types of Containers
Generally speaking, containers can be classified as (Lun et al. 2009):
• General-purpose container: A freight container, totally enclosed and weather-proof, with a rigid roof, rigid walls, and rigid floors, having at least one of its end walls equipped with doors suitable for the transport of cargo of different varieties. This is by far the most common type of container. It is suitable for the carriage of most types of dry cargoes, including those packed in cartons, cases, bales, pallets, etc.
• Ventilated container: A freight container similar to the general-purpose con-tainer but designed to allow air exchange between the interior of the container and the outside atmosphere. This type of container is usually used to prevent condensation inside the container during the transport of certain hygroscopic products from tropical countries to a temperate climate.
• Refrigerated and heated container: A thermal container served by a refrigerat-ing or heat-producing appliance. The container can be equipped with a mech-anical refrigerated unit capable of transporting cargo at temperatures usually from –25°C up to 25°C. These units are fitted with air vents to renew air inside the container.
• Open-top container: A freight container similar to the general-purpose con-tainer except that it has no rigid roof but may have a flexible and movable or removable cover such as canvas or reinforced plastic materials supported on movable or removable roof bows. These containers are primarily used to carry heavy and/or bulky finished products, whose handling and loading can be per-formed with a crane or rolling bridge.
• Flat-rack container: Flat racks are dedicated to the carriage of heavy, bulky, and those cargoes that are over-width and/or over-height. The container base is designed to transport heavy materials. Some flats are tested to withstand 45 tons. The flat racks with collapsible ends permit the transport of over-length cargo.
• Tank container: A freight container that includes two basic elements: the tank and the framework. This type of container is used to carry hazardous or non-hazardous liquids and gases. It is equipped with accessories to facilitate filling

156 11 Managing Empty Containers
and emptying. Tank containers are usually equipped with safety devices to pre-vent leaking. Some tank containers are dedicated to transporting foodstuffs, whereas others are used for transporting chemicals.
11.3 A Conceptual Model of Empty Container Management
Empty container logistics deals with the sourcing and distribution of empty con-tainers. As a segment of the whole container logistics cycle, empty container lo-gistics commences where a container is empty, such as empty containers returning from a consignee’s premises, storing at the carrier’s appointed container depots, repositioning from surplus areas to deficit areas, and so on. In any event, the movement of empty containers is a necessary aspect of the container business. Managing these empty containers efficiently is the goal for all the parties involved in the container transport chain, especially for liner shipping companies.
Figure 11.2 illustrates the empty container management model (Lun et al. 2009) with four key elements involved, which can be summarized by the follow-ing four major dimensions:
1. strategic planning; 2. procurement of empty containers; 3. movement of empty containers; 4. technical efficiency.
Empty container managementEmpty container management
Strategic planningStrategic planning
Procurement of empty containersProcurement of empty containers
Movement of empty containersMovement of empty containers
Technical efficiencyTechnical efficiency
Fig. 11.2 A model for empty container management

11.3 A Conceptual Model of Empty Container Management 157
11.3.1 Strategic Planning
Logistics strategic planning can be defined as “a unified, comprehensive, and integrated planning process to achieve competitive advantage through increased value and customer service, which results in superior customer satisfaction, by anticipating future demand for logistics services and managing the resources of the entire supply chain. This planning is done within the context of the overall corpo-rate goals and plans” (Lambert et al. 1998). For empty container management, strategic planning comprises two key elements: (1) long-term organizational goals for customer satisfaction and competitive advantages and (2) the means and proc-esses to achieve these goals. The management tools for empty container control include value-based pricing, length of planning horizon, and ABC analysis.
11.3.1.1 Value-based Pricing
Container shipping companies set their prices on the basis of perceived value and adopt the value-based pricing strategy, which uses shippers’ perceptions of value, not the liner shipping companies’ cost, as the basis for pricing. Liner shipping com-panies set cheaper freight rates for low-demand voyages than for high-demand voyages to attract bookings from shippers. Low demand in return voyages helps container repositioning by better utilizing empty slots of vessels. As shown in Table 11.1, the freight rates for westbound trans-Pacific cargoes are less than half those for eastbound cargoes, although the operational costs are almost identical. A similar scenario happens in the eastbound Europe–Asia trade. Freight rates fluc-tuate from time to time owing to market demand and supply, but the general trend of low freight rates for low-demand voyages remains unchanged. Liner shipping com-panies use the freight rate as a mechanism to motivate shippers to consign cargoes from empty container surplus areas to high-shipping-demand areas.
Table 11.1 Freight rate (market average) per TEU in US dollars
Trans-Pacific Europe–Asia Freight rates
Asia–USA USA–Asia Europe–Asia Asia–Europe
1st quarter 2006 1,836 815 793 1,454 2nd quarter 2006 1,753 828 804 1,408 3ed quarter 2006 1,715 839 806 1,494 4th quarter 2006 1,671 777 792 1,545 1st quarter 2007 1,643 737 755 1,549 2nd quarter 2007 1,675 765 744 1,658 3rd quarter 2007 1,707 780 777 1,952 4th quarter 2007 1,707 794 905 2,054
Source UNCTAD (2008)

158 11 Managing Empty Containers
11.3.1.2 Length of Planning Horizon
The length of the planning horizon is an important issue for empty container man-agement. The planning horizon can be defined as a set of consecutive time periods considered for planning purposes (Krajewski and Ritzman 2005). For empty con-tainer management, a longer planning horizon can give better empty container distribution plans (Choong et al. 2002). A longer horizon allows better manage-ment of container movement, encourages use of cheaper transport modes, and avoids unnecessary storage charges. However, the advantages of using a long planning horizon might not be obvious for a system that has a sufficient number of container supply locations. Furthermore, the information available on the future supply and demand of empty containers should also be considered when selecting the proper length of a planning horizon (Crainic et al. 1993). From a liner shipping company’s perspective, it is possible to obtain data on slot availability for its ves-sels and on importing cargoes for ports. In exported-oriented areas where vessels are always full, the number of empty containers required could be calculated by using the difference between slot availability and number of import containers, which can be used for export after devanning.2
11.3.1.3 ABC Analysis
The ABC analysis of inventory suggests that inventories are not of equal value to a firm. As a result, all the inventories should not be managed in the same way (Murrhy and Wood 2004). In terms of item importance, the concept of ABC might operate as follows: A items could be the ones with the highest criticality, B items could be those with moderate criticality, and C items could have low criticality. In general, container types include general-purpose containers, ventilated containers, open-top containers, pallet wide side door containers, flat-rack containers, refrig-erated containers, and tank containers. General-purpose containers are the ones with the highest criticality. They are suitable for the carriage of most types of dry cargoes, including those packed in cartons, boxes, cases, bales, pallets sacks, and drums. Therefore, general-purpose containers can be classified as an A item in analysing empty container inventory, and the monitoring and checking of this type of container should have the highest priority. General-purpose containers include 20GP, 40GP, 40HC, and 45HC. Data on slot availability for a liner shipping com-pany’s vessels can be obtained in advance. However, liner shipping companies need to estimate the demands for different types of empty containers so they can supply the right container types to shippers. Collaborative forecasting with ad-vanced booking information sharing from shippers could be a good way to obtain accurate data for planning the types of containers required.
————— 2 Devanning is the unloading of cargo from a shipping container.

11.3 A Conceptual Model of Empty Container Management 159
11.3.2 Procurement of Empty Containers
Container leasing is a major aspect of the liner shipping business. Throughout the past decade, the container equipment pool controlled by leasing companies has remained largely stable, varying from 46 to 49%. This means that a slight majority (around 51–54%) of all the containers in operation are owned by ocean carriers and other transport operators. Depending on a carrier’s business strategy, the amount of owned equipment can vary between 50 and 90%. Several operators, especially the smaller and regional lines, rely 100% on rented boxes. The distribu-tion of the world container fleet by ownership category is shown in Table 11.2.
Growth in world containerized trade will continue to fuel the need for new con-tainers. On the other hand, a modest decline is projected in the box-to-slot ratio. Details on the development of the box-to-slot ratio are shown in Table 11.3. When determining the stock level of containers, one should consider the procurement cost associated with the acquisition of empty containers for inventory replenish-ment. More specifically, procurement cost includes the price to buy or lease empty
Table 11.2 Distribution of world container fleet by ownership category
Leasing company Carrier Year
In 10,000 TEUs Share (%) In 10,000 TEUs Share (%)
Total
1991 3,160 45.8 3,735 54.2 6,895 1992 3,640 47.8 3,890 52.2 7,620 1993 3,835 47.3 4,280 52.7 8,115 1994 4,370 49.6 4,435 50.4 8,805 1995 4,810 49.4 4,925 50.6 9,735 1996 5,170 49.0 5,385 51.0 10,555 1997 5,720 49.8 5,770 50.2 11,490 1998 6,184 49.7 6,265 50.3 12,450 1999 6,710 49.7 6,785 50.3 13,495 2000 7,200 48.3 7,710 51.7 14,910 2001 7,175 46.3 8,335 53.7 15,510
Source Drewry (2002)
Table 11.3 Development of the box-to-slot ratio
Year Maritime container inventorya Effective total capacitya Box-to-slot ratio
1980 2,940 945,000 3.11 1985 4,900 1,581 3.10 1990 6,350 2,315 2.74 1995 9,373 3,590 2.63 2000 14,117 6,049 2.33
Source Drewry (2002) a In thousand TEUs

160 11 Managing Empty Containers
containers, the cost of transporting empty containers to container depots, and the cost of handling empty containers at receiving points.
When a container shipping company requires additional or replacement con-tainers in its fleet, it needs to decide whether to buy or lease the containers. If the need is long-term and the liner shipping company has the necessary financial resources to purchase containers at competitive prices, then the most likely deci-sion will be to buy the required number of containers. However, if the need is only short-term or there is a need for flexibility and/or with limited financial resources, then the liner shipping company’s decision will most likely favour the leasing option.
In addition to leasing containers, container leasing companies also help carriers to adjust shortfalls in the number of containers at high-demand locations. In the case of a shortage of containers in certain areas, carriers may sign master leasing contracts with leasing companies allowing shippers to pick up empty containers at areas they desire. Carriers can choose from many types of lease contracts. The one that is ultimately selected by a carrier is determined by its operating and trading requirements. The principal contracts for container leasing comprise long-term leases and master leases. The cost of master leasing includes container rental, depot lift-on/lift-off charges, on-hire/off-hire drayage, drop-off charge, and off-hire repair cost. Owing to off-hire quota limitations, the average on-hire period is around 73 days for 20GP/ 40GP and 102 days for 40HC. On average, the leasing cost is USD 500 for 20GP, USD 700 for 40GP, and USD 800 for 40HC (Lun et al. 2009). In general, the rental turnover and business risks associated with long-term leases are relatively low. Container leasing companies charge a per diem rate for long-term leases. A per diem rate is a charge made by a container leasing company against a liner shipping company for the use of its empty containers, with the charge based on a fixed rate per day.
In recent years, the container leasing industry has been shifting towards long-term leasing, and the majority of container leasing firms increasingly place more newly built containers on long-term leases, primarily on 5-year contracts. The container leasing industry operates globally and is concentrated. Under a long-term lease, a liner shipping company can have direct interchange of empty con-tainers with other transport carriers. Direct interchange is an item that appears in standard leasing terms and conditions. With direct interchange, a leasee may direct interchange of containers with a third party provided that each direct inter-change is preapproved in writing by the leasor’s office. A leasee is responsible for obtaining the receiving carrier’s written acceptance of the direct interchange prior to seeking approval from the leasor’s office. The leasee will charge a direct interchange fee as set forth in the agreement. Liner shipping companies can ac-cess an Internet-based SynchroBox system to review and select container inter-change in a real-time and online environment. In principle, this information pro-vides liner shipping companies with the ability to monitor and identify potential container interchanges, as well as to make logistics decisions on empty contain-ers (Hanh 2003).

11.3 A Conceptual Model of Empty Container Management 161
11.3.3 Movement of Empty Containers
If one liner shipping company experiences problems in finding return cargo for containers discharged at a particular location, there is a high chance other transport carriers will suffer similar problems. Moving empty containers efficiently, practi-cally, and economically is a goal of all the parties involved in the container busi-ness. The possible movement patterns in a cycle of container moves comprise empty container reuse and repositioning (Hanh 2003).
Empty container reuse is a strategy in which carriers try to match local export cargo with available containers. The idea of reusing empties is an effort to mini-mize the number and cost of truck trips. Two major methods can be considered for empty container reuse, namely, depot-direct and street-turn (Jula et al. 2006):
1. Depot-direct: In addition to container terminals, empty containers can be stored and interchanged at off-dock depots. The potential benefits of using the depot-direct method include establishing a supply point for reusable empties and fa-cilitating empty drop off and pick up when terminal gates are congested.
2. Street-turn: In the street-turn method, empty containers are directly moved from local consignees to local shippers. The potential benefits of street-turns include reducing the number of truck trips and saving the driving times to and from container terminals to avoid congested areas around the gates.
The transport of empty containers arising from the need to reposition contain-ers is estimated to account for more than 20% of the cost of a company operating a container pool (Drewry 2002). The routing of empty containers is a costly but unavoidable activity of the container transport chain. The goal of an empty con-tainer logistics strategy is to maximize the ability of the port and the intermodal community to reduce the number of vehicle miles travelled for empty containers, to reduce the number of trips to port marine terminals, to minimize empty con-tainer storage costs, and to minimize empty container dwell time (Tioga Group 2002).
Container shipping companies choose to collaborate with other actors in the container transport chain to reposition empty containers by examining their pro-duction costs and the characteristics of the services (Lopez 2003). Shipping lines, railroads, equipment leasing companies, and intermodal operators are making operational changes to help the repositioning of empty containers by carriers back to Asia to avoid shortages of containers in export-oriented regions (Mongelluzzo 2005a). Railroads in the USA are making operational changes to improve equip-ment flows on their networks. In 2005, Union Pacific Railroad instituted a “ship-ment balance surcharge” of $ 250 per unit for customers whose shipments back to the West Coast fall below 95% of the eastbound moves from intermodal facilities on the West Coast. Furthermore, railroads have reduced the free time allowed for storing containers at their intermodal yards and increased the demurrage fees for the storage of containers after expiry of the free time. Although railroads will gain economically by exercising their bargaining power in these operational areas, the

162 11 Managing Empty Containers
entire container transport chain will benefit as containers can move more quickly. Similarly, container terminals charge a demurrage tariff, a fee on all the containers left at terminals after a certain number of days of free storage time, to speed up the movement of containers (Mongelluzzo 2005a).
Container shipping companies are responsible for container repositioning and have to bear these container management costs. An interesting option to save re-positioning cost is to fold empty containers (Konings 2005). The use of foldable containers can lead to substantial net benefits by reducing both transport and stor-age costs. In principle, these benefits increase as foldable containers are used on longer distances through more links in the chain. The net benefits actually depend on the additional costs, namely, the costs of folding and unfolding containers, the additional exploitation cost of foldable containers, and the cost for additional transport movements to serve those places where facilities for folding and unfold-ing containers are available. The idea of foldable containers is not so new, and many designs have been proposed. However, the majority of these new ideas of foldable containers have never been adopted for industrial use. Only two designs have reached the experimental stage with a small-scale introduction in the market: the six-in-one container and the Fallpac container (Konings 2005).
11.3.4 Technical Efficiency
The development of larger and more important centralized information systems has increased the potential for economies of scale associated with the overall busi-ness volume of a liner shipping company (Heaver 2001). To implement electronic commerce, the Internet provides a platform for a global marketplace and contrib-utes to economic growth. Over the last decade, information technology and elec-tronic commerce have been used as an important lever to foster business growth. The global economy has already been profoundly affected by the use of the Inter-net (Zhao 2002). Container depots nowadays are equipped with advanced comput-erized equipment control systems, with the ability to maintain huge storage data-bases, providing up-to-date container statistical reports and industry-standard EDI functionality. Liner shipping companies invest resources to develop the liner ship-ping network to make extensive use of information technology and communica-tions technologies to ensure a constant flow of information among their operations with their customers and vendors. For instance, ocean carriers have worked with one another to create INTTRA, which is a free, single-source Internet portal, through which shippers can access services offered by a community of shipping lines to track and trace their containers, place bookings, download documents, and generate reports (Lun et al. 2009).
Similarly, an Internet-based system has given rise to a new concept of a “virtual container yard” in the USA. A virtual container yard has been called “an Internet dating service for empty containers” (Mongelluzzo 2005b). To utilize the virtual

11.3 A Conceptual Model of Empty Container Management 163
container yard concept, detailed information on a container’s status is required, and must be available to actors in the container transport chain. One reason to truck empty containers is the lack of access to information on the exact locations of empty containers. A virtual container yard allows liner shipping companies and shippers to post the availability and trace the locations of containers. The objective of using a virtual container yard is to increase exchanges of empty containers outside terminals as a way to ease truck traffic.
Technologies in liner shipping also include new designs of ships and the adop-tion of advanced equipment to handle container operations. Technological im-provements in both construction and propulsion3 systems have led to a steady growth in liner shipping companies’ carrying capacity. Liner shipping companies have been looking ahead to the next few years when more post-Panamax vessels are scheduled to be delivered from shipyards and have begun to lock themselves into long-term lease contracts so that they will have sufficient containers when big ships enter their fleets (Mongelluzzo 2005a).
Another major trend is vertical integration and diversification into inland trans-port and logistics. Integration of sea and inland transport was initiated by the need for greater efficiency and effectiveness, and became feasible as a result of con-tainerization and other technological developments linked to intermodal capability (Panayides and Cullinane 2002). The use of advanced equipment such as the super post-Panamax quayside crane by container terminal operators to handle container loading and unloading activities is an example that illustrates the role of advanced equipment in improving operational efficiency of a container terminal. Each super post-Panamax quayside crane has a 60-ton twinlift capacity and 60 m of boom length, enabling it to handle 22-row-wide super post-Panamax vessels (Lun et al. 2009).
Other than container terminals, off-dock depots also undertake upgrading of their equipment. Container depots, where empty containers are stored, usually operate a modern fleet of container-stacking forklifts. Such technical changes have greatly improved efficiency, saving enormous time and labour cost. Storage ca-pacity has therefore increased through multibox stackers, which are able to stack containers up to the height of eight to nine containers. Container depots also pro-vide maintenance and repair services in case containers require such services. Depots are usually equipped with qualified, experienced welders and metal fitters, who will perform the necessary repairs, fully accustomed to industry standards. Liner shipping companies outsource a number of container management activities to container depots and benefit from their advanced equipment for container op-erations, as well as container repair and maintenance.
————— 3 Propulsion is the force that drives the ship forward.

164 11 Managing Empty Containers
References
Cheung RK, Chen CY (1998) A two-stage stochastic network model and solution methods for the dynamic empty container allocation problem. Transp Sci 32(2):142–162
Choong ST, Cole M, Kutanoglu E (2002) Empty container management for intermodal transpor-tation networks. Transp Res Part E 38(6):423–438
Crainic TG, Gendreau M, Dejax P (1993) Dynamic and stochastic models for the allocation of empty containers. Oper Res 41(1):102–126.
Drewry (2002) Container leasing: seeking out the opportunities. Drewry Shipping Consultants, London
Hanh D (2003) The logistics of empty cargo containers in the southern California region. METRANS Transportation Center, Los Angeles
Heaver TD (2001) The evolving roles of shipping lines in international logistics. Int J Marit Econ 4(3):210–230
Jula H, Chassiakos A, Ioannou P (2006) Port dynamic empty container reuse. Transp Res Part E 42(1):43–60
Konings R (2005) Foldable containers to reduce the costs of empty transport: a cost-benefit analysis from a chain and multi-actor perspective. Marit Econ Logist 7(3):223–249
Krajewski L, Ritzman L (2005) Operations management: process and value chains. Prentice Hall, Upper Saddle River
Lambert MD, Stock RJ, Ellram ML (1998) Fundamentals of logistics management. McGraw-Hill, Boston
Lun YHV, Lai KH, Cheng TCE (2009) Empty container management. Shipp Transp Logist Book Ser 1:51–65
Lopez E (2003) How do ocean carriers organize the empty containers reposition activity in the USA? Marit Policy Manag 30(4):339–355
Mongelluzzo B (2005a) Boxes available for peak season. J Commer 6(28):38–39 Mongelluzzo B (2005b) Right turn for empties. J Commer 6(33):20–21 Murrhy RP, Wood FD (2004) Contemporary logistics. Prentice Hall, Upper Saddle River Panayides P, Cullinane K (2002) Competitive advantage in liner shipping. Int J Marit Econ
4(3):189–209 Stopford M (2002) Is the drive for ever bigger containerships irresistible? Lloyd’s List Shipping
Forecasting Conference, London Tioga Group (2002) Empty ocean container logistics industry. Gateway Cities Council of Gov-
ernment, Port of Long Beach, South California Association of Government, Long Beach UNCTAD (2008) Review of maritime transport. United Nations Conference of Trade and Devel-
opment, Geneva Zhao HX (2002) Rapid internet development in China: a discussion of opportunities and con-
straints on future growth. Thunderbird Int Bus Rev 44(1):119–138

165 Y.H.V. Lun, K.-H. Lai and T.C.E. Cheng Shipping and Logistics Management, © Springer 2010
Chapter 12 Container Transport Security
Abstract In the container shipping industry, the importance of adopting tech-nology for enhancing transport security has been well acknowledged. Institutional pressures can be a key driver of change for firms in a container transport chain and these firms include shippers, consignees, freight forwarders, transport opera-tors, maritime carriers, container terminal operators, customs authorities, and government agencies. Technological devices such as radio-frequency identifica-tion, the smart box initiative, and non-intrusive inspection are adopted to enhance container transport security. This chapter discusses the implications of the differ-ent types of institutional isomorphism from the perspectives of container transport operators that have taken the initiative to adopt technology for container transport security enhancement and those that have followed other firms to adopt technol-ogy. The possible impacts of the different types of institutional isomorphism, namely, coercion, mimesis, and norms, elaborated in this study can help shipping and logistics managers better understand the institutional pressures that are put on them, and the institutional pressures that drive them to adopt technologies in the container transport chain.
12.1 Container Transport Chain and Container Transport Security
A transport network consists of nodes and links (Song et al. 2005). In a container transport chain, the nodes are physical locations, such as container terminals and depots, where containers are handled and transferred from one transport mode to another. In addition, the links between nodes are served by various modes of trans-port, such as trucks, trains, and ships. From the perspective of transport security, the risk of a breach of security at any one of the nodes or links can compromise the secur-ity of the entire container transport chain (Lee and Whang 2005). For outbound

166 12 Container Transport Security
shipment, the stuffing area of a container transport chain is crucial to container transport security because it represents the last point in the container transport chain where the contents of a container can be visually identified and reconciled with re-lated documents such as container load plans. Once the container has been sealed by the shipper, the contents of the containers cannot be verified until the container is reopened. From this perspective, shippers play a critical role in container transport security by providing accurate and complete sets of data about the cargo in the con-tainers. On the other hand, containers moving through different transport modes need to tackle many security challenges. Door-to-door container transport involves multiple stops (such as cargo stuffing areas and container terminals), where contain-ers are stored and handled, and open transport infrastructure (such as highways and rail stations), which can be accessed by different parties (Vis 2006).
As container security involves a number of firms in a container transport chain (Cochran and Ramanujam 2006), it would be difficult for different parties to cap-ture the required data to conduct an efficient and effective risk assessment without using advanced technology (Davies et al. 2007). The adoption of enabling technol-ogy can enhance container transport security by providing timely information to monitor container flows in the container transport chain (Lun et al. 2009). On aver-age, a single container shipment generates approximately 25 documents, ranging from purchase orders to delivery orders, where each document has an average of 50 pieces of data (Tirschwell 2005). In other words, there are approximately 1,250 pieces of data related to each container shipment. Container transport chain man-agement focuses on effective and efficient flows of both information and contain-ers from the place of receipt to the place of delivery in a container transport chain (Lun et al. 2009). To ensure effective flows, it requires close collaboration between different firms in the container transport chain, including shippers, truckers, ocean carriers, and container terminal operators, to satisfy shipper requirements and re-duce cost. To ensure that shipments are delivered on time to the right place at a low cost, it is desirable to adopt enabling technology to track the status of container flows and provide the required information through data interchange in a container transport chain for enhancing the security of cargo movement (Lu et al. 2006).
Since containerization began in the 1950s, the importance of container security has been well acknowledged. More emphasis on improving container transport security has been made in the container shipping industry since the tragic incident of 11 September 2001 in the USA. The incident not only aroused the awareness of global transport security but also triggered changes in transport policies, and new regulations have been formulated and implemented to enhance container security. From the perspectives of global economic development and international trade, the security of container transport is crucial because (1) container transport is one of the most important forms of transport involved in international trade, (2) container transport involves intermodal transport as containers are carried by ocean carriers, inland waterway, road, and rail operators, and (3) container security is limited not only to transport infrastructure but also anywhere from container terminals to the roadside (OECD 2005).

12.2 Container Transport Security Enhancement 167
Recently, container transport security has become a popular research topic (Koch 2005). Research attention has mainly been paid to prescriptive mechan-isms for compliance with regulations. Nevertheless, research studies examining the institutional pressures experienced by practitioners in determining their adop-tion of technology remain scanty. Before embarking on any technological initia-tives for enhancing container transport security, it is essential that managers consider the diffusion and legitimacy of the technology for security enhancement to facilitate and support cargo movements along the container transport chain. Lun et al. (2008) explored the effects of different institutional isomorphic proc-esses on the adoption of information technology for enhancing the security of container transport. The study shed light on the adoption of technology in the realm of container transport chains, and the findings can help managers and researchers better understand and address the issues of institutional isomorphic influences that affect the adoption of technology for security enhancement in container transport management.
12.2 Container Transport Security Enhancement
Since the tragic events of 11 September 2001, the international community has paid increasing attention to the potential security threats to international trade and transport systems. It has been acutely alert to the need for improving container transport security. As a result, several conceptual frameworks aimed at enhancing container transport security have been introduced, with a special emphasis on protecting the vulnerability of containerized sea-trade operations. The US De-partment of Homeland Security has strengthened protection against threats and hazards by working towards the strategic goals of (DHS 2004):
• Awareness: enhance awareness of the importance of security in container trans-port.
• Prevention: build and administer an effective container transport security re-gime to detect and mitigate threats both domestically and internationally.
• Protection: increase military and civil operational presence in ports, coastal areas, and beyond to safeguard property and the economy.
• Response: improve responsiveness to events with which security is concerned. • Recovery: lead efforts to restore services and resume business after acts of
terrorism, natural disasters, or other emergencies.
By taking a layered approach to transport security, the US Customs and Border Protection (CBP 2006) has put forth a system of security measures to ensure that protective measures are in place from one end of a container transport chain to the other. Specifically, a multilayered defence strategy has been implemented to keep the container transport chain safe and secure. As shown in Figure 12.1, the multi-layered defence strategy consists of six elements:

168 12 Container Transport Security
1. Screening and inspection: Customs and Border Protection screens all the car-goes before their arrival using advanced technologies.
2. Container security initiative: This enables Customs and Border Protection to identify high-risk maritime containerized cargoes before they are loaded on board vessels.
3. 24-h rule: Under this requirement, manifest data must be provided 24 h prior to the maritime container being loaded onto the vessel in foreign ports.
4. Customs trade partnership against terrorism (C-TPAT): With C-TPAT, Cus-toms and Border Protection and partner firms in the container transport chain are working together to improve container security.
5. Use of cutting-edge technology: Customs and Border Protection utilizes large-scale X-ray and γ-ray machines and radiation detection devices to screen cargo.
6. Canine detection: Hundreds of canine detection teams capable of identifying narcotics, bulk currency, human beings, explosives, agricultural pests, and chemical weapons are deployed at the ports of entry.
In addition to these layered security measures, technology plays an important role in raising the efficiency and security of containerized cargo shipments. Koch (2005) highlighted three key technologies, namely, radio-frequency identification (RFID) technology, the smart box initiative, and NII, which can be deployed to support container transport chains to improve container transport security.
Elements of Port SecurityElements of port security
Screening and InspectionScreening and inspection
CSICSI
24-Hour Rule24-hour rule
C-TPATC-TPAT
Use of Cutting-Edge TechnologyUse of cutting-edge technology
Canine DetectionCanine detection
Fig. 12.1 Elements of a multilayered defence strategy. CSI container security initiative, C-TPAT customs trade partnership against terrorism

12.2 Container Transport Security Enhancement 169
12.2.1 Radio-frequency Identification Technology
Although the US Customs has announced that it is unlikely for the US government to take initiatives to develop and standardize technologies, such as an electronic container seal (e-seal) for container security (Edmonson 2003), considerable effort has been made by operators in the container transport industry to develop stan-dards for RFID (Koch 2005). An RFID container tag can serve as a licence plate comprising information about a container and enabling the shipper to embed de-tails of the shipment. RFID tags may also serve as an e-seal that provides an automated, effective, and efficient means to monitor the integrity of containers by alerting officials if a container has been tampered with.
12.2.2 Smart Box Initiative
One core element of the container security initiative is the use of smart containers that can offer better security to containerized shipping. A smart container couples an internationally approved mechanical seal affixed to an alternative location on the container with an electronic container security device designed to detect and deter tampering of the container door. A smart container, such as the one being developed by China International Marine Containers under the smart and secure trade lanes initiative, allows customs and exporters to monitor the container’s integrity and location. It also provides data on the contents of containers, as well as the exporters’ shipping patterns to detect anomalies and raise suspicion flags in real time (Barling 2005). An advanced version of smart containers enables ship-pers and consignees to integrate data with their back-end systems to monitor prod-uct flows and inventory levels.
12.2.3 Non-intrusive Inspection
One of the key security concerns is the potential use of a container to transport nuclear and radiological substances and devices. As a result, Customs and Border Protection uses large-scale X-ray and γ-ray NII and radioactive sensor systems to screen safely and efficiently the conveyance of contraband, such as weapons of mass destruction and radioactive substances (DHS 2004). NII technologies have been deployed in some ports to facilitate the inspection of containers. The use of NII technologies allows port operators to screen a larger portion of containers ar-riving at their ports with less time needed. The container inspection technology has proven its value to container security as it enables NII of containers entering a port facility without delaying the flow of containers (Rodriguez-Alvarez et al. 2007).

170 12 Container Transport Security
12.3 Diffusion of Technology to Enhance Container Transport Security
Uncertainty has been a concern to businesses and the world economy owing to container transport security threats (Barnes and Oloruntoba 2005). Firms can be negatively affected financially and operationally if they are not able to manage their container transport security well (Spich and Grosse 2005). For instance, firms failing to manage their container transport security and failing deploy appropriate technology to track and trace the status of trade item flows may suffer financial loss due to cargo damage or delay in delivery. It is therefore crucial for operators in container transport chains to ensure container security by adopting appropriate technologies.
The concept of technological diffusion is closely related to the adoption of technology for enhancing security in container transport chains. Diffusion of tech-nology refers to the process by which an innovation is communicated through certain channels over time among the members of a social system (Rogers 1995). From the perspective of technological diffusion, many prior studies on the adop-tion of technology (e.g., Loh and Venkatraman 1992; Hu et al. 1997) assumed that rational adopters make decisions and choices on the basis of the information that is received via communications and social networks (Rogers 1995). However, a key assumption of the concept of diffusion is that container transport operators within a container transport chain are free and independent to choose to adopt (or not to adopt) an innovation (March 1978). The concept of technological diffusion fails to recognize the effects of institutional isomorphic processes. Institutional pressure can affect the decisions of container transport operators on whether to adopt inno-vations (DiMaggio and Powell 1983; Abrahamson 1991). Supplementing the con-cept of diffusion to explain the adoption of technology for enhancing container transport security, institutional isomorphism, which refers to “constraining proc-esses that force one unit in a population to resemble other units that face the same set of environmental conditions” (DiMaggio and Powell 1983), provides a theo-retically sound basis to explain the adoption of technology by operators in con-tainer transport chains to enhance container transport security.
12.4 Types of Institutional Isomorphism
The institutional theoretical perspective suggests that the key factor affecting con-tainer transport operators in making a decision is the influence of other firms in the container transport chain (Aldrich 1979). Container transport operators are compet-ing for political power and institutional legitimacy for social and economic re-wards, in addition to competing for customers and resources (DiMaggio and Pow-ell 1983). For management of the container transport chain, Rand Crop and the Massachusetts Institute of Technology evaluated the costs and benefits of imple-

12.4 Types of Institutional Isomorphism 171
menting a cargo-security regime where 100% of the cargo containers that reach the USA would go through a container-scanning process. The study investigated the set-up cost for deploying the technologies and equipment, along with the necessary changes in business practices, and estimated the potential losses and disruptions to commerce that might be caused if a weapon of mass destruction was smuggled in. The findings suggest that for a value of trade activities of USD 100 billion a year, the benefits of adopting a container-scanning system outweigh the costs (Daggett 2005). The benefits may range from social to economic rewards.
The implications of institutional isomorphism are that operators in the container transport chain may base their decisions on one or more of the following mechan-isms to adopt technology for container security enhancement:
• Container transport operators may experience pressures from other firms in the container transport chain, such as ocean carriers, shippers and consignees, con-tainer terminal operators, and customs authorities, upon which they depend.
• Container transport operators may mimic other firms within the container transport chain that they perceive to be successful.
• Professional associations or government agencies may exert pressures on the container transport operators by establishing a cognitive base and legitimization for the autonomy of the container shipping industry.
From the theoretical perspective, institutional isomorphism is a useful tool to explain the institutional isomorphic influences on container transport operators in the container transport chain that faces the same environmental conditions. It also advances the knowledge frontier on adoption of technology for container transport security. Container transport operators are instrumental in the institutional isomor-phic processes of their container transport chain through the coordination and collaboration of their business processes to transport containers from the place of receipt to the place of delivery. Institutional isomorphism explains structural changes in the firms of a container transport chain when they deal with the uncer-tainty and constraints in container transport security enhancement in a rational way (DiMaggio and Powell 1983). The effect of rationalization affects container transport practices of partner firms in the container transport chain. This, in turn, causes the container transport operators to model their business operations and practices on those of their business partners and operate in a similar way. As a result, firms in the container transport chain tend to adopt similar container transport chain management practices as they integrate operating processes, de-velop standards, and adopt technology to achieve effective information flows and quality improvements to enhance container transport security. Owing to institu-tional isomorphism, firms in a container transport chain will perform in a similar manner through cascading “legitimate” container transport management and tech-nological practices along the container transport chain.
Institutional isomorphic processes in a container transport chain arise naturally at the intersection of the influence and regulatory powers of institutions such as the security measures listed in Figure 12.1 (King et al. 1994). To gain a better understanding of the adoption of technology in container transport chains, Lun

172 12 Container Transport Security
et al. (2008) discussed the influences of the different types of institutional isomor-phic processes from the viewpoints of both the initiators (i.e., technology-adopted organizations) and followers (i.e., technology-adopting organizations). The types of institutional isomorphism include coercion, mimesis, and norms (Figure 12.2; Lun et al. 2008).
12.4.1 Coercion
Coercive institutional isomorphism stems from political influence and legitimacy. The coercive pressures are exerted on a dependent firm by other firms in the same container transport chain by cultural expectations (DiMaggio and Powell 1983). Firms that have adopted technology to enhance their container security are likely to request their trading partners to adopt technology to maintain the efficiency and effectiveness of the information flows of their container transport chain. Depend-ent firms that rely heavily on a dominant firm’s business for survival will comply with the requirement to adopt the technology. In this regard, the dependent firms are coerced into adopting technology for close collaboration and operations to be eligible to participate in the container transport chain of the dominant firm. In other words, dependent organizations are willing to adopt technology to show their commitment to the trading relationship and demonstrate their conformance to legitimate practices.
Container transport operators in the container transport chain adopting technol-ogy to enhance transport security may require technical assistance from the domi-nant firm and support from relevant professional institutions, especially in the case of integrating their existing systems and processes with the newly adopted tech-nology. In some cases, the initiators will request their partners in adopting tech-
InstitutionalisomorphismInstitutionalisomorphism
CoercionCoercion MimesisMimesis NormsNorms
Fig. 12.2 Types of institutional isomorphism

12.4 Types of Institutional Isomorphism 173
nology to enhance container transport security by imposing the required technol-ogy without providing assistance. The followers will be forced to acquire the nec-essary technical support from relevant professional institutions if they wish to participate in the container transport chain. On the other hand, in some instances the initiators provide technical support and share their experience with the adopt-ing firms to ensure the quality and conformity of the adoption of technology. For example, Wal-Mart, as a dominant firm, requests its main suppliers to place RFID tags on every container and pallet supplied. To begin with, Wal-Mart takes the approach of discussing the plans for the adoption of the technology with its partner firms to ensure that the implementation plan and commitment are well communi-cated throughout its container transport chain.
In the coercive process, initiators face the risk of losing their investment in as-sisting followers. For instance, followers may not be able to utilize the technology to the full potential and realize the benefits and may decide to withdraw from the container transport chain relationship. Besides, initiators may face high switching costs, such as technical assistance and training costs, by offering support to fol-lowers. Similarly, even though the dominant firm provides support and assistance for adoption of technology, the adopting firm bears the risks of revealing its inter-nal operating processes and disclosing trade secrets to the dominant firm. As a result, the adopting firm may end up with a higher operating cost if the dominant firm shifts its container transport activities and cost to its followers (Clemons and Row 1993).
12.4.2 Mimesis
The second type of institutional isomorphism is the force of uncertainty that en-courages the imitation of container transport chain management practices from other container transport operators. When a firm has ambiguous goals and oper-ates in an uncertain business environment (Spich and Grosse 2005), it models itself on other firms, particularly on the firms that are closely associated with it, in response to the uncertainty. The followers may not be aware of their mimetic behaviour as the firm serving as a model may merely serve as a convenient source of imitation of container transport chain management practices (DiMaggio and Powell 1983).
Adoption of a technology for container transport security may occur indirectly through industrial agreements, employee transfers, and information interchange. When container transport operators face an uncertain environment, they try to outperform their competitors through low cost or differentiation (Porter 1996). For example, new technology solutions for container transport security, such as RFID-enabled smart containers, could enhance container security, as well as improve container visibility, throughout the container transport chain by enabling the timely tracking and tracing of containers. The potential operational benefits of receiving accurate and timely data could be obtained by adopting technology as a strategy to outperform competitors.

174 12 Container Transport Security
In the container transport chain, when container transport operators are seeking strategic tools and practices to outperform competitors, firms consciously or un-consciously imitate the practices of their partners in their container transport chain. There are several reasons for the mimetic behaviour to occur:
• Container transport operators have easy access to the container transport chain management practices of their partners through implementation of container security measures.
• Factors conducive to successful container transport chain management prac-tices of the partners are easily observed by the mimicking firms in the container transport chain.
• Partners in the container transport chain are willing to share their experiences and knowledge in the enhancement of container transport security with one an-other as the sharing of the information and knowledge among members in the same container transport chain can be mutually beneficial.
The easy access to the practices in the container transport chain, the recognition of critical success factors, and the spread of container transport management know-how would lead to intentional or unintentional imitation of practices of adopting technology to enhance container transport security. The adoption may range from the diffusion of container security technology to the management of technology. Firms tend to model themselves on similar firms in their field that they perceive to be successful (Kraatz and Zajac 1996), by imitating and adopting the container transport security attributes and practices that have been proven to be essential factors leading to success in operating the container transport. The adop-tion of technology for NII at MTL in Hong Kong is a typical example of the mi-mesis process. MTL’s adoption of NII technology has not only heightened the awareness of the potential benefits of adoption of technology in the container transport chain, but has also improved its operations efficiency at its gatehouse and quayside.
In the case of mimetic institutional isomorphism, the initiators create awareness and share knowledge of the technology. The initiators tend to avoid providing technical support to followers. On the other hand, the followers who are mimick-ing the adoption of technology to enhance container transport may hold back themselves from conforming to the legitimate practices of their container transport chains. Followers may also refrain from committing resources to their container transport chain. The reason why followers adopt the technology is to improve their performance in the container transport chain.
12.4.3 Norms
The third type of institutional isomorphism is normative processes. The normative processes stem from professionalization, which is concerned with the establish-ment of legitimization for the operations of a container transport chain. Container

12.4 Types of Institutional Isomorphism 175
transport operators in a container transport chain are subject to the norms, stan-dards, and expectations to achieve effective coordination and efficient operation of container transport activities. For instance, firms in a container transport chain that have adopted RFID technology are unlikely to establish new partnerships with non-RFID-adopters, as this would require the RFID-adopted container transport operators in the container transport chain to maintain an additional system for data interchange. The maintenance of a redundant system may have a negative impact on the operating efficiency of the container transport chain. A container transport operator operates under the normative institutional isomorphic process, whereby firms become eligible participants in the container transport chain to adopt the technology.
12.4.4 Comparison of Normative and Coercive Institutional Isomorphic Processes
The normative and coercive institutional isomorphic processes are similar in na-ture as they enforce standard practices and applications in a container transport chain. However, these two institutional isomorphic processes are indeed different in practice. In the case of the normative institutional isomorphic process, the followers adopt technology voluntarily even though there may not be a commit-ment for business. An example of a normative container transport security pro-gramme is the C-TPAT programme. C-TPAT is a voluntary initiative that seeks to develop cooperative container transport security relationships between the security agent and the firms in a container transport chain (e.g., importers, termi-nal operators, and carriers) (Thibault et al. 2006). The benefits associated with the participation of C-TPAT include speedy cargo clearance at US ports. Container transport operators adopt enabling C-TPAT technology for container security enhancement to meet the norms of the industry in the container transport chain. However, no commitment of business is guaranteed for the followers as a result of their adoption of technology for security enhancement. For instance, there is no guarantee of business from the C-TPAT-participating firms. The C-TPAT pro-gramme serves as a professional body that provides standardization of container security measures and recognition to container transport operations that possess the security measures.
In the process of normative institutional isomorphism, the initiators standardize the operations of their container transport chains by setting the standard require-ments for managing information flows. Container transport operators seeking entry to that container transport chain are expected to adopt the required technol-ogy for them to participate in the container transport chain. In the normative insti-tutional isomorphic process of adoption of technology, the initiators are not likely to provide support and share their knowledge with potential followers since the initiators have already formed efficient and effective processes of container trans-port operations by adopting technology for container security enhancement.

176 12 Container Transport Security
12.5 Conclusions
Prior studies on the diffusion of technology assumed that firms can make inde-pendent decisions to explain the adoption of technology for container transport security. This chapter applied the institutional isomorphism perspective to explore the institutional isomorphic processes that exist in groups of firms in a container transport chain to account for the adoption of technology to enhance container transport security. Specifically, the theory of institutional isomorphism was ex-tended from the individual decision level within a firm (Tingling and Parent 2002) to the interfirm level. The objectives and attributes of each of the three institutional isomorphic processes and how they may influence the intrafirm and interfirm op-erations for the adoption of technology for security enhancement were explored.
This chapter highlights the view that the adoption of technology to enhance container transport security is subject to the influence of three types of institu-tional isomorphic processes (i.e., coercion, mimesis, and norms). Furthermore, knowledge of the adoption of technology for container security enhancement is advanced from the institutional perspective. Moreover, the discussions in this chapter will help managers understand the pros and cons of the different types of institutional isomorphic processes that occur during the course of adopting tech-nology to enhance container transport security.
A firm may assume more than one role in the institutional isomorphic process. For instance, a container transport operator is mandated to adopt technology to satisfy the requirements of the dominant firm in its container transport chain. In the meantime, the container transport operator can also play the role of the initia-tor in the mimetic institutional isomorphic process to influence its container trans-port partners that do not participate in the container transport chain of the domi-nant firm. One key challenge is to make their container transport partners realize the benefits of adopting technology to facilitate further technological diffusion for enhancing container transport security. Another challenge for container transport operators is to select an institutional isomorphic process that fits their container transport practices where such a process has no negative impact on the efficiency of their existing operations.
References
Abrahamson E (1991) Managerial fads and fashions: the diffusion and rejection of innovations. Acad Manag Rev 16(3):86–612
Aldrich H (1979) Organizations and environments. Prentice Hall, Englewood Cliffs Barling R (2005) Smart box bill sharpens US focus on security; developers of new technology
point to potential savings from greater efficiency. South China Morning Post 14 March 2005 Barnes P, Oloruntoba R (2005) Assurance of security in maritime supply chains: conceptual
issues of vulnerability and crisis management. J Int Manag 11(4):519–540 CBP (2006) Port security. US Customs Border Protection. http:/ /www.cbp.gov/ linkhandler/ cgov/
newsroom/ fact_sheets/ port_security/ port_security.ctt/ port_security.pdf

References 177
Clemons EK, Row M (1993) Limits to interfirm coordination through information technology: results of a field study in consumer goods distribution. J Manag Inf Syst 10(1):73–95
Cochran JK, Ramanujam B (2006) Carrier-mode logistics optimization of inbound supply chains for electronics manufacturing. Int J Prod Econ 103(2):826–840
Daggett H (2005) Port security is back before Congress. J Commer 6(2):8 Davies I, Masion R, Lalwani C (2007) Assessing the impact of ICT on UK general haulage
companies. Int J Prod Econ 106(1):12–27 DHS (2004) Secure seas, open ports. Department of Homeland Security, Washington DiMaggio PJ, Powell WW (1983) The iron cage revisited: institutional isomorphism and collec-
tive rationality in organizational fields. Am Sociol Rev 48(2):147–160 Edmonson RG (2003) Closing in on the smart container. J Commer 4(45):20–21 Hu Q, Saunders C, Gebelt M (1997) Research report: diffusion of information systems outsourc-
ing: a reevaluation of influence sources. Inf Sys Res 8(3):288–301 King JL, Gurbaxani V, Kraemer KL, McFarlan FW, Raman KS, Yap CS (1994) Institutional
factors in information technology innovation. Inf Syst Res 5(2):139–169 Koch C (2005) Remarks made before the maritime trades department. World Shipping Council,
Washington Kraatz MS, Zajac EJ (1996) Exploring the limits of the new institutionalism: the causes and
consequences of illegitimate organizational change. Am Sociol Rev 61(5):812–836 Lee HL, Whang S (2005) Higher supply chain security with lower cost: lessons from total qual-
ity management. Int J Prod Econ 96(3):289–300 Loh L, Venkatraman N (1992) Diffusion of information technology outsourcing: influence
sources and the Kodak effect. Inf Syst Res 3(4):334–358 Lu CS, Lai KH, Cheng TCE (2006) Adoption of internet services in liner shipping: an empirical
study of shippers in Taiwan. Transp Rev 26(2):189–206 Lun YHV, Wong WYC, Lai KH, Cheng TCE (2008) Institutional perspective on the adoption of
technology for security enhancement of container transport. Transp Rev 28(1):21–33 Lun YHV, Lai KH, Cheng TCE (2009) Electronic commerce in container transport. Shipp Transp
Logist Book Ser 1:35–50 March JG (1978) Bounded rationality, ambiguity, and the engineering of choice. Bell J Econ
9(2):587–608 OECD (2005) Container transport security across modes. European Conference of Ministers of
Transport, Paris Porter ME (1996) What is strategy? Harv Bus Rev 74(6):61–78 Rodriguez-Alvarez A, Tovar B, Trujillo L (2007) Firm and time varying technical and allocative
efficiency: an application to port cargo handling firms. Int J Prod Econ 109(2):149–161 Rogers E (1995) Diffusion of innovations. Free Press, New York Song D.P, Zhang J, Carter J, Field T, Marshall J, Polak J, Schumacher K, Sinha-Ray P, Wood J
(2005) On cost-efficiency of the global container shipping network. Marit Policy Manag 32(1):15–30
Spich R, Grosse R (2005) How does homeland security affect U.S. firms’ international competi-tiveness? J Int Manag 11(4):457–478
Thibault M, Brooks MR, Button KJ (2006) The response of the U.S. maritime industry to the new container security initiatives. Transp J 45(1):5–15
Tingling P, Parent M (2002) Mimetic isomorphism and technology evaluation: does imitation transcend judgment? J Assoc Inf Syst 3(1):113–143
Tirschwell P (2005) How much is enough? J Commer 6(31):46 Vis IFA (2006) A comparative analysis of storage and retrieval equipment at a container termi-
nal. Int J Prod Econ 103(2):680–693

179 Y.H.V. Lun, K.-H. Lai and T.C.E. Cheng Shipping and Logistics Management, © Springer 2010
Chapter 13 Port Operations
Abstract Ports are places where there are facilities for berthing or anchoring ships and where there is cargo handling equipment to process cargoes from ships to shore, shore to ships, or ships to ships. There are different roles of ports, including
1. ports as places; 2. ports as operating systems; 3. ports as economic units; and 4. ports as administrative units.
The main facilities in container terminals include the quay, the container yard, the container freight station, the interchange area, the gate facility, and the rail-head. The process at container terminals can be divided into subprocesses: arrival of the ship, cargo unloading and loading, transport of containers from the ship to stack, stacking of containers, and interterminal transport and other modes of trans-port. As containers move along the container transport chain, they can have a different status, including empty container, full container load, and less than container load. Generally, the network of nodes and links involved in the container transport chain can be classified into four principal functions, i.e., consignment assembly, consignment consolidation, carriage, and port handling.
13.1 Introduction
Ports are places where there are facilities for berthing or anchoring ships, and where there is handling equipment to handle cargo transfer from ships to shore, shore to ships, or ships to ships. What are the roles of a port? Robinson (2002) listed the following roles of ports:
• Ports as places: They are places that handle ships and cargoes. • Ports as operating systems: They are places that handle ships and cargoes with
operational efficiency.

180 13 Port Operations
• Ports as economic units: They are places that handle ships and cargoes within an economic efficiency framework.
• Ports as administrative units: They are places that handle ships and cargoes within an efficient administrative and policy framework.
Ports are a vital part of the transport infrastructure (Alderton 2005). The impor-tant functions of ports include:
• their acting as nodes for linking with other inland transport modes such as highways, railways, and inland waterway systems;
• their acting not only act as gateways for trade, but also attracting agents of commercial infrastructure such as banks and insurance agents, as well as indus-trial activities.
Specialization in shipping has seen a significant development in sea transport. Since containerization, there has been a remarkable transition from conventional to unitized means of carriage in general cargo trade. The emergence of full cellular container ships has led to revolution in the way goods are packed, stuffed, and moved around the world.
There is a tendency towards logistics integration in the port and maritime in-dustry (Robinson 2002; Notteboom and Winkelmans 2001; Heaver et al. 2000). Inland access cost could be reduced significantly with appropriate regionalization strategies. For example, bringing a container from inland China to a main port in China, such as Shanghai, accounts for more than 60% of the total transport cost. In general, the portion of inland cost in total container shipping cost ranges between 40 and 80% (Notteboom and Rodrigue 2005). This indicates that inland container logistics is an important area for ports to make performance gains. Under such circumstances, port regionalization has become the next stage of port develop-ment, where efficiency is derived from integration with inland and freight distribu-tion systems.
Regionalization represents a new development in port systems, which involves a higher level of integration with intermodal transport systems and requires port terminals to accommodate new port–inland linkages (Notteboom and Rodrigue 2005). The development of rail hubs and barge networks in the hinterland contrib-utes to the transfer of the distribution function from road transport to rail and barges. There are several functions of inland terminals, including:
• Cargo bundling points in extensive transport networks. They can help load centre ports gain economies of scale and preserve their attractiveness.
• Cargo consolidation and deconsolidation centres, as well as depots for empty containers. They have become crucial in optimizing container logistics.
• Offer other related logistics services, such as value-added logistics services, distribution centres, shipping agents, and container management services.
When selecting the locations to operate their business, logistics service provid-ers prefer combining a central location with intermodal gateway functions. Logis-tics companies are usually located close to one another in the same location be-

13.2 Multiuser and Dedicated Container Terminals 181
cause of factors such as proximity to markets, availability of intermodal transport services, and other related logistics services. This geographical concentration creates synergy and external economies of scale that further encourage concentra-tion of logistics companies in a particular area. Geographical differences in labour cost, land cost, availability of support services, and government policy are among the many factors that determine the locations of logistics companies.
Ports have evolved from a cargo loading/unloading point to a distribution cen-tre with physical infrastructure serving as transport hubs in the container transport chain. Ports act as an interface between the areas of production and consumption, which attracts the strategic attention of market players in the port-related business.
13.2 Multiuser and Dedicated Container Terminals
Multiuser terminal operators1 encounter problems in managing equipment and fa-cilities to handle mega ships, especially during peak periods. Owing to the opera-tional difficulties generated in multiuser terminals and the limited number of termi-nals available to handle mega ships, the use of dedicated container terminals has witnessed an increase. The use of dedicated container terminals and the need for transshipment operations have led to an increase in the terminal costs for shipping lines. Together with the inadequacy of terminal capacity in some congested areas, shipping lines have considered securing the control of a number of terminal facilities all over the world. Other drivers for shipping lines to acquire control over terminals are the reduction in stevedoring costs and improvement in schedule reliability. Pioneer liners that have invested in container terminals are Maersk and Evergreen. Examples of followers are COSCO, China Shipping, MSC, and CMA CGM.
With the development of dedicated container terminals, the market share of multiuser terminal operators has diminished. For port authorities, dedicated termi-nals are a means to facilitate the development of integrated services and to engage the commitment of shipping companies to the terminals. Dedicated terminals can be a useful strategy if there is competition between terminal operators. The emer-gence of dedicated container terminals started in Asia and North America. In Europe, the concept of dedicated container terminals was introduced by Maersk in the 1990s in the transshipment facility in Algeciras. Dedicated container terminals offer carriers greater flexibility and reliability, shorter turnaround times, and en-hanced efficiency in the management of global container movements. The level and scope of accessibility to a dedicated container terminal are determined by agreement between carriers and port operators. As shown in Fig. 13.1, the deal between shipping lines and terminal operators can involve the use of berths for other container terminal operations such as stacking areas, as well as inland con-nections.
————— 1 Multiuser terminal operators are container terminal operators who offer terminal services to a number of customers.

182 13 Port Operations
Scope ofDCTs
Scope ofDCTs
BerthBerth QuayQuay Stacking areaStacking areaInland
connectionInland
connection
Sea side Land side
– +
Fig. 13.1 Scope of dedicated container terminals
Increased ship size has led to the division of container ports into three seg-ments: hub ports, feeder ports, and direct-call ports (Geraldo et al. 2003). Under these diversified port service market segments, the balance of power has moved in favour of shipping lines, which can exert pressure on ports to improve productivity and capacity (Martin and Thomas 2001). High terminal capacity utilization can lead to longer vessel turnaround times, which are unacceptable to carriers. The success of liner services in a hub-and-spoke system resulting from economies of scale achieved at sea should not be negated by diseconomies of scale in ports. Today, four or five crane operations are standard in major ports for post-Panamax ships. Clearly, efficient serving of large vessels incurs higher port costs due to excess port capacity and availability of cargo handling equipment.
Use of dedicated terminals has become a popular practice in the maritime in-dustry. Liner shipping companies consider port terminals as part of their interna-tional networks of transport and logistics services. The recent development in Rotterdam is a typical example. Maersk now has its own dedicated terminals; the other members of the Grand Alliance have also been granted dedicated terminals; and the World Alliance has moved to ECT’s Delta Dedicated West Terminal (Heaver et al. 2001). The market share of large multiuser terminal providers has gradually diminished.
A shipping company with a long-term commitment to a dedicated terminal is less inclined to switch to alternative ports of call. For port authorities, dedicated terminals can be used to encourage the development of port facilities and to bind shipping companies to port terminals. Dedicated terminals provide opportunities for port authorities to push for more investment in ports. It is also a useful strategy if there is competition between different port terminal operators.

13.3 Terminal Facilities 183
The choice of a terminal operator may affect the amount of interterminal com-petition in the port. With the shift of terminals to an integrated network-based transport system, the extent of transport system competition has increased. This suggests that competition among terminals can be expected to increase and port authorities need to consider the effects on efficiency of their agreements with terminal operators. For example, long-term leases encourage terminals to develop better strategies. An example is Antwerp’s granting of a 50-year concession to a consortium led by P&O Ports. Besides, port authorities need to make decisions in setting payment terms. Alternatively, port authorities may also adopt a private–public partnership such as the Port Authority of Rotterdam and Hutchison Port Holdings (HPH).
Ports need to consider competition from other ports. For instance, the port of Hong Kong faces severe competition from regional ports such as Singapore and ports located in southern China such as Yantian. Hong Kong’s leading position for China’s outbound cargo is under threat. On the other hand, port cooperation exists (e.g., cooperation exists between Hong Kong and Yantian because of the HPH group’s common share in the two container terminals). A similar situation exists between Hong Kong and Chiwan through MTL’s common ownership. As a result of rapid integration between Hong Kong and southern China, a structural transformation has been found in the territory’s economy. Hong Kong handles a very large share of China’s external trade. The China factor is undoubtedly a major driving force to sustain the economic development of Hong Kong. On the other hand, China is catching up fast as its port facilities are developing rapidly (Song 2002).
13.3 Terminal Facilities
The main facilities in container terminals are a quay, a container yard, a container freight station, an interchange area, a gate facility, a railhead, and others.
13.3.1 Quay
A quay is an essential facility where vessels berth to discharge and load con-tainers. With the deployment of super post-Panamax ships, a length of about 250–350 m with a depth of 15–16 m of water alongside can be considered about right. There may be a ramp at one end of the quay for serving roll on–roll off ships to allow vehicles to be driven directly on and off a ship and onto its quayside. The quay must be wide enough to accommodate large quayside gantry cranes that serve in most terminals for loading and discharging containers. It provides space for containers to be landed and for container-moving equipment to pick up and

184 13 Port Operations
drop off containers, and it provides space for containers to be temporarily stacked at the back of the quay for restowing purposes.
13.3.2 Container Yard
A container yard typically takes up about 60–70% of the total terminal area. It is primarily used to stack containers awaiting onward movement. Containers are stored in well-marked and numbered blocks. Blocks are linked by roadways and aisle ways along which vehicles and equipment travel. Some blocks are reserved for export containers (normally near the sea side of the yard) and some blocks are reserved for import containers.
Another area is reserved for stacking empty containers. Since space within con-tainer terminals is usually limited, empty containers may be located in an off-dock depot. Some stacking areas are set aside for special containers, such as reefers, out-of-gauge cargoes, and dangerous cargoes.
13.3.3 Container Freight Station
Not all container terminals have a container freight station. Inbound containers are unpacked in the container freight station and the separated consignments of cargo are stored awaiting collection. Outbound consignments are consolidated and packed into empty containers before being moved to the container yard for ship-ment. The container freight station consists of a covered area and open areas for storing cargoes. Some areas are set aside for various inspection functions such as customs’ examination of containers and their contents.
13.3.4 Interchange Area
An interchange allows road vehicles to deliver and collect containers. There are two types of interchange areas:
1. The interchange is a separate area. Containers are brought to or taken from road vehicles parked at slots at the interchange by transfer equipment.
2. The interchange is a series of lanes running along one side of each storage space. Road vehicles are permitted to drive into the container yard and to take and collect their containers at positions alongside the stacks, where stacking equipment lifts and lands the containers.

13.4 Processes at Container Terminals 185
13.3.5 Gate Facility
Movement of containers into and out of a terminal is controlled at a gate facility. Documentation, security, and inspection procedures are attended to. There is a series of lanes separated by cabins in which gate clerks and inspectors are based. The gate facility is usually equipped with a weight bridge and raised walkways to allow the inspection of container tops. Containers may be held at the gate because of either incomplete documentary formalities or congestion at the gatehouse. Park-ing areas may be provided for holding vehicles before allowing them to go into the container yard.
13.3.6 Railhead
For containers arriving or leaving by rail, an on-dock rail reception/dispatch rail-head may be provided. The wagon may need to be shunted into appropriate load-ing and unloading sequences. The railhead may have its own yard to store con-tainers and trailers, and its own gate facility. Inspection and administrative facilities are provided at the railhead.
13.3.7 Others
There are offices where staff members are engaged in planning, administrative, and documentary activities. Terminal operations are usually coordinated and con-trolled from a control tower in the office building. Office accommodation is pro-vided for customs, security, and other support services.
The maintenance workshop is the facility in a terminal that carries out regular maintenance and repair work on terminal equipment, and provides container re-pairing services for shipping lines.
13.4 Processes at Container Terminals
A terminal is a place where cargo is loaded onto the ship, unloaded from the ship, and stowed on the pier at which the receipt and delivery of freight happen. Vis and Koster (2003) presented an overview of a container terminal and discussed the cargo handling process at container terminals. A summary is shown in Fig. 13.2.
The processes at container terminals can be divided into several subprocesses:
• When a ship arrives at the port, inbound containers have to be discharged from the ship. This is handled by quay cranes, which take the containers from

186 13 Port Operations
the ship’s hold (for under-deck containers) or from the deck (for on-deck con-tainers).
• Next, the containers are transferred from quay cranes to vehicles that travel between the quayside to the stack at the container yard. This stack consists of a number of blocks where containers can be stored. The container yard is served by cranes (e.g., straddle carriers). A straddle carrier can transport containers and store them in a stack. It is also possible to use dedicated vehicles to trans-port containers, and to use stack cranes to discharge containers from the vehi-cles and store them in the stack.
• When containers are ready to move, they are retrieved from the stack by cranes for transport by vehicles to intermodal transport modes such as barges, deep-sea ships, trucks, or trains. This process can also be executed in the reverse or-der to load outbound containers on board a ship.
To manage a container terminal, an enterprise resource planning (ERP) system is useful. Choi et al. (2003) presented an ERP approach to developing container terminal operating systems. ERP is an enterprise-wide system that integrates all the business functions and information resources, databases, built-in best industry practices, packaged software, and open-source architecture. The advantages of using ERP include reduction of time in information system development, stan-dardization of workflows, and effective business planning capability. A container terminal ERP system is made up of planning and operation modules. The planning module consists of berth planning, yard planning, loading/unloading planning,
Processes at container terminal
Arrival of ship
Unloading of containers
Transport of containersfrom quayside to stack
Container yard operations
Interterminal transport /other modes of transport
Departure of ship
Loading of containers
Transport of containers from stack to quayside
Container yardoperations
Interterminal transport /other modes of transport
Fig. 13.2 Processes at container terminals

13.5 Physical Flows in the Container Transport Chain 187
railway planning, and resource allocation planning. The operations module con-sists of overall control and terminal operations:
• Berth planning: Berth planning includes berth configuration, vessel informa-tion management (which covers general information about vessels such as ser-vice routes and navigation features), vessel arrival/departure schedule man-agement, and berth allocation (which covers allocation management of berths and container cranes). The system must be flexible in design to cope with fre-quent changes in vessel arrival/departure schedules.
• Yard planning: Yard planning includes yard configuration management, yard planning for export, import, and transshipment containers, yard planning for empty containers, and relocation within the container yard. Planning the yard allocation for export cargo involves considerations of vessel status and yard status. Yard allocation for import cargo is performed after completing unload-ing planning.
• Loading/unloading planning: Loading/unloading planning consists of manage-ment of vessel data (which include detailed specifications of the vessel, the struc-ture of the cargo hold, draught, and special data for the calculation of vessel sta-bility and the strength of the structure), container crane planning, unloading planning, and loading planning. Container crane planning identifies the amount of cargo in each hatch by each port where the cargo will be unloaded and loaded, and determines what container cranes are allocated for which vessels, the starting time of the work, and the status and location of each container crane.
• Railway planning: This includes rail yard and freight train configurations, arri-val/departure control, and loading and unloading planning for railway transport.
• Resource allocation planning: This includes resource analysis such as equip-ment allocation and manpower allocation.
• Overall control: This relates to vessel control, yard control, and gate control. Terminal control sends work orders to workers of container cranes, yard trac-tors, and yard cranes on the basis of the details of the unloading and loading plan, as well as the equipment allocation plan.
• Terminal operations: These involve unloading and loading from and on ves-sels, gate in and out yard management, as well as reefer container and danger-ous goods container management.
13.5 Physical Flows in the Container Transport Chain
As containers move along the container transport chain, they can be handled in any one of the following states:
• Containers can be empty. • Containers can be loaded with one single consignment from one single shipper
(i.e., full container load). • Containers can be loaded with multiple consignments from different shippers
(i.e., less than container load).

188 13 Port Operations
Containertransportoperation
Containertransportoperation
Consignmentassembly
Consignmentassembly
Consignmentconsolidation
Consignmentconsolidation
CarriageCarriagePort
handlingPort
handling
Fig. 13.3 Container transport operations
As shown in Fig. 13.3, the network of nodes and links involved in the container transport chain can be classified into four principal functions: consignment assem-bly, consignment consolidation, carriage, and port handling (ECMT 2005).
13.5.1 Consignment Assembly
Consignment assembly is the first stage in the physical movement of goods. After a buyer and a seller have agreed on the terms of sale and the manner in which the goods are to be shipped, physical movement of goods will commence. In a full container load move, an empty container will be dispatched from a container depot to the exporter. At the shipper’s premises, the container will be stuffed, the con-tainer door will be closed, and a seal will be affixed. In some cases, containers could be stuffed directly in an open yard or on the street. In a less than container load move, the shipper will assemble the consignment and transport it to a freight consolidation facility, where container stuffing will take place.
13.5.2 Consignment Consolidation
The next step in the less than container load move involves a freight consolidation facility. A typical freight consolidation facility is the container freight station. The primary functions of the container freight station are summarized as follows:
• receipt and dispatch/delivery of cargo; • stuffing and stripping of containers; • transit operations by rail/road to and from serving ports; • customs clearance;

13.5 Physical Flows in the Container Transport Chain 189
• consolidation and deconsolidation of less than container load cargo; • temporary storage of cargo and containers; • reworking of containers; • maintenance and repair of container units.
The major benefits of using a container freight station include:
• concentration points for long-distance cargoes and their unitization; • service as a transit facility; • customs clearance facility available near the areas of production and consump-
tion; • issuance of a through bill of lading by shipping lines, thereby creating full li-
ability for shipments; • reduced overall level of empty container movement; • reduced transport cost; • increased trade flows.
13.5.3 Carriage
Inland transport of containers involves both shipping links and shipping nodes. The physical movement of goods involves transport from the shipper’s premises to a port or from the shipper’s premises to a consolidation facility. These transit legs may include multimodal moves, with each mode operating in its own infrastruc-ture: road on roadway, rail on rail track, water on navigable waterway. The con-tainer transport chain consists of the following operations:
• Initial road leg: transport of containers from the shipper’s premises or the for-warder’s facility to the transport terminal.
• Terminal transfer: transfer from road to rail or water mode in the departure terminal.
• Transport by long-distance mode: transport containers by long-distance rail or inland waterway.
• Terminal transfer: transfer to the port of loading by truck or direct on-dock transfer.
• Departure port terminal: customs clearance, temporary storage, and loading of the container on board a deep-sea vessel.
• Arrival port terminal: discharging the container from the deep-sea vessel, cus-toms clearance, and temporary storage.
• Inland transport: the inland transport process in the importing country is similar to the export operations.
• Delivery by road leg: transport to the receiver by truck.
Container transport can be occur in a variety of forms. Roll on–roll off enables a wheeled unit to load and unload straight on or off a vessel. Lift on–lift off in-volves lifting equipment to load and unload containers on or off a vessel. Contain-

190 13 Port Operations
ers may be interchanged among different transport modes and among carriers of the same mode. At every interchange point, container movements have to be slowed down or stopped for temporary storage of the containers. To operate effi-ciently, it is important to improve routing operations with fewer stops to (1) re-duce interim storage, (2) promote interoperability, and (3) promote efficient trans-fer between different modes of transport.
13.5.4 Port Handling
Most containers involved in international trade are transported by sea and they pass through ports. Many ports offer other trade-related activities such as multi-modal transfer centres, warehouses, container freight stations, and other logistics-related services. Recently, tight space constraints of maritime terminals have led to many inland container depots carrying out a number of container handling activ-ities (such as container storage and container maintenance and repairing) away from the quayside.
Entry into a container terminal usually goes through a gate area where a num-ber of functions are carried out. At the gate, information on the container and the consignment is checked against the booking information provided by carriers. Once the information has been checked and cleared, the container can move into the terminal and is unloaded from the truck. In the case of rail and barge consign-ments, these checking and clearing functions are carried out at the on-dock trans-fer facilities within the container terminal.
After the container has been checked and cleared, subsequent container move-ments are controlled by yard operations. Inside the container yard, rail-mounted gantry cranes and rubber-tyred grantry cranes are deployed for container ground-ing/pickup operations. All the container movement and inventory information will be updated in the terminal system instantly. Hence, fast and accurate information flow can be achieved by the container terminal for handling several thousands of movements daily.
At the quayside, several quay cranes, including Panamax and post-Panamax type, will be deployed to serve each container ship. Moreover, other parties such as stevedore gangs and pier-side checkers are deployed for lashing2 and unlashing operations. For discharge operations, quay crane operators pick up containers from vessels and ground them onto a bare chassis.3 For loading operations, containers are picked up by quay cranes and loaded onto vessels. After the vessel operations have been performed, terminal departure reports4 will be prepared by ship plan-ners and distributed to shipping lines and terminal management for evaluation of the vessel operations. ————— 2 Lashing is the act of securing objects in position. 3 A chassis is a frame with wheels and container locking devices to secure the container for movement. 4 A terminal departure report is prepared from time sheets and comprises container vessel opera-tional data and tabulation of productivity.

References 191
References
Alderton P (2005) Port management and operations. Lloyd’s list practical guides. Lloyd’s of London Press, London
Choi HR, Kim HS, Park JB (2003) An ERP approach for container terminal operating system. Marit Policy Manag 30(3):197–210
ECMT (2005) Container transport security across modes. European Conference of Ministers of Transport, Bucharest
Geraldo J, Beresford A, Pettit S (2003) Liner shipping companies and terminal operators: inter-nationalization or globalization? Marit Econ Logist 5(4):393–412
Heaver DT, Meersman H, Moglia F, Voorde ED (2000) Do mergers and alliances influence European shipping and port competition? Marit Policy Manag 27(4):363–373
Heaver DT, Meersman H, Voorde ED (2001) Co-opetition and competition in international container transport: strategies for port. Marit Econ Logist 8(1):82–99
Martin J, Thomas B (2001) The container community. Marit Policy Manag 28(3):279–292 Notteboom T, Rodrigue JP (2005) Port regionalization: towards a new phase in port develop-
ment. Marit Policy Manag 32(3):297–313 Notteboom T, Winkelmans W (2001) Structural changes in logistics: how do port authorities
face the challenge? Marit Policy Manag 28(1):71–89 Robinson R (2002) Ports are elements in value-driven chain systems: the new paradigm. Marit
Policy Manag 29(3):241–255 Song DW (2002) Regional container port competition and co-opetition: the case of Hong Kong
and south China. J Transp Geogr 10(2):99–110 Vis I, Koster R (2003) Transshipment of containers at a container terminal: an overview. Eur J
Oper Res 147(1):1–16

193 Y.H.V. Lun, K.-H. Lai and T.C.E. Cheng Shipping and Logistics Management, © Springer 2010
Chapter 14 Managing Container Terminals
Abstract This chapter starts with a discussion of the development of global con-tainer terminal operators and the interorganizational interaction model to analyse the container terminal community. We then use data envelopment analysis as a quantitative analytical tool to measure and evaluate the efficiency of global con-tainer terminal operations. In addition, we use regression modelling to formulate two regression equations as a reference for performance evaluation of container terminal operators. The findings indicate that efficient global terminal operators are global stevedores. In this chapter we introduce a PROFIT framework as a useful reference for container terminal operators to manage their terminal oper-ations and development.
14.1 Introduction
Once it has been built, a port is impossible to move to another location. It is hard to rectify wrong decisions in port management. This highlights the importance of port management. As shown in Fig. 14.1, the development of port management can be classified into four phases (Alderton 2008):
1. First generation: This is a cargo interface location between sea and land trans-port for cargo transfer from ship to shore and from shore to ship. Port operation is usually separated from trade-related activities and different port activities are isolated from one another.
2. Second generation: This is a transport and commercial service centre. Port-related activities are integrated to enjoy a closer relationship with transport and trade partners.
3. Third generation: Owing to containerization and intermodalism development, a port can be seen as a hub of an international production and distribution net-work. The port adds value to primary products and is commercially oriented.

194 14 Managing Container Terminals
4. Fourth generation: This focuses on standardization of information and proce-dures due to globalization among global shipping and terminal operators. The port also considers environmental protection as a performance goal.
Nowadays, container terminals link the key players of the container community, such as shipping lines and other intermodal transport operations, in the international container logistics chain (Lun et al. 2009). Container terminal operators control the activities from receiving containers to loading them onto ships and from dispatching containers to discharging them from ships. Container terminal operators also under-take activities such as yard planning, quayside planning, and vessel stowing plan-ning. On the other hand, shipping lines operate container ships and provide liner shipping services to shippers. Shipping lines offer shippers door-to-door services and integrated logistics services by coordinating with feeder operators, road carri-ers, rail operators, logistics service providers, and terminal operators.
14.2 Development of Global Container Terminal Operators
The development of global operations has put pressure on the provision of liner shipping services and the extension to land-side operations (Carbone and Martino 2003). Since the sailing of Ideal-X in April 1956 from Newark to Houston, contain-erization has changed ship routing, ship design, ship size, handling facilities, port management, inland transport operations, commercial practices, and information
Stages ofdevelopment
Stages ofdevelopment
Before 1960:First
generation
Before 1960:first
generation
1960s/1970s:Second
generation
1960s/1970s:second
generation
1980s:Third
generation
1980s:third
generation
After 1990s:Fourth
generation
After the 1990s:fourth
generation
Cargo interface location
Cargo interface location
Transport and
service centre
Transport and
service centre
Productionand
distribution networks
Productionand
distribution networks
Globaloperations of players
in port
Globaloperations of players
in ports
Fig. 14.1 Development of port management

14.2 Development of Global Container Terminal Operators 195
systems. To handle containers, ports have to invest in highly specialized equipment to offer container handling services to shipping lines (Bichou et al. 2007). To oper-ate cost-effectively, sea-side and land-side operational activities must be well coor-dinated because these activities such as transfer of containers from an intermodal yard to a container terminal and loading/unloading of containers on/from ships are closely interrelated and interdependent. To improve operational efficiency, con-tainer terminal operators have invested in state-of-the-art information systems to link up sea-side and land-side activities within an integrated system. Over the past few decades, technological developments have considerably altered the organiza-tional relationships within the port community.
Martin and Thomas (2001) identified the interorganizational relationships of players in the container transport chain as follows (Fig. 14.2):
• Shipping line–inland transport operator: The relationship between the shipping line and road haulage has become closer. To work with road operators closely, shipping lines often nominate a limited number of truckers to handle their road transport. From the perspective of intermodal transport development, liner-oriented intermodalism has emerged as an extension of liner shipping with liner operators controlling the cargo and rail operators, and coordinating their ser-vices with scheduled ship arrival times.
• Terminal operator–shipping line: The recent development of network-based management has contributed to the development of closer relationships be-tween terminal operators and shipping lines. However, from the perspective of terminal operators, the purchase of terminal services is confined to a few large ocean carriers, resulting in shipping lines wielding high bargaining power. Such a phenomenon is found to influence the operations of all types of ports, includ-ing feeder ports, hub ports, and direct-call ports.
• Shipping line–freight forwarder: As shipping lines may be in a conflicting position when they recommend shipping services to their shippers, many ship-pers prefer an independent freight forwarder. As a result, shipping lines need to treat freight forwarders as their customers and continue to be dependent on freight forwarders and their relationships with shippers for continued growth.
Shipping lines
Shipping lines
Inland transportoperator
Inland transportoperator
Terminaloperator
Terminaloperator
FreightforwarderFreight
forwarder
Fig. 14.2 Key players in the container transport chain

196 14 Managing Container Terminals
Pattern of developmentPattern of
development
TerminalnetworkTerminal
network
RegionalcoverageRegional
coverage
International-izationInternational-
ization
Fig. 14.3 Pattern of development in the terminal industry
The restructuring of international shipping and logistics systems has put pres-sure on container terminal operators to provide high-quality services at low cost (Notteboom 2004). In response to competition, there are three patterns of devel-opment in the terminal industry: terminal networks, regional coverage, and inter-nationalization (Fig. 14.3).
14.2.1 Terminal Networks
Faced with mergers and alliances among shipping lines,the development of global container terminal operators, and requirements for larger investment in terminal facilities, terminal operators feel the urgent need for networking with other oper-ators to improve their efficiency. For example, HWL announced in June 2005 that it had agreed to sell 20 and 10% effective equity in HIT and COSCO-HIT, re-spectively, to PSA for a cash amount of USD 925 million (Lun and Cariou 2009).
14.2.2 Regional Coverage
Increasing the intensity of container terminal operations in a region can be a strat-egy for terminal operators to serve markets more effectively and gain market power. This can be done by increasing the scope of services offered and providing similar services in adjacent locations. For example, multimodal transport services are provided at YICT. Its scope of services is wide-ranging, including railway transport, warehousing services, and support services. Railway transport offers bulk and containerized transport and transshipment services. Warehousing ser-vices include cargo loading and unloading, storage, packing, and labelling. Sup-port services include container storage and maintenance, assistance in customs declaration and inspection, trucking, and inland operations (Lun and Cariou 2009).

14.2 Development of Global Container Terminal Operators 197
With a wide range of logistics services provided, the intensity of a terminal oper-ator’s service coverage in a region will be increased.
14.2.3 Internationalization
The global expansion of container trade has encouraged the growth of specialized container terminal operations. Container terminal operators that are resourceful in terminal facilities and equipment, possessing rich experience in managing con-tainer terminals, and having expertise in port and terminal technology are in an advantageous position to extend their container terminal business internationally. An example of a global leader is HPH. HPH operates 247 berths in 42 ports, along with a clutch of transport-related service companies. In 2005 the HPH handled 51.8 million TEUs (Lun and Cariou 2009).
Major container terminal operators are groups with specialization and interna-tional expertise in container terminal management and development (Geraldo et al. 2003). The terminal throughputs of the top global container terminal oper-ators are listed in Table 14.1.
Table 14.1 Container throughput of the top global operators in 2006
Operator Throughput (million TEUs)
Percentage of total global throughput
HPH 60.9 13.80 APMT 52.0 11.80 PSA 47.4 10.10 DPW 41.6 9.40 COSCO 22.0 5.00 Eurogate 11.7 2.70 Evergreen 9.4 2.10 MSC 8.8 2.00 SSA 7.6 1.70 HHLA 6.6 1.50 APL 5.9 1.30 Hanjin 5.4 1.20 OOCL 4.8 1.10 Dragados 4.7 1.10 CMA CGM 4.5 1.00 NYK Line 4.1 0.90 MOL 3.3 0.80 K Line 3.1 0.70 Grup TCB 2.9 0.60 ICTSI 2.2 0.50
Source Drewry (2007)

198 14 Managing Container Terminals
In general, global container terminal operators can be categorized as global ste-vedores and global carriers (Drewry 2005).
Global stevedores are companies whose primary business is port operations. These companies were pioneers of international port development such as HPH and PSA. Characteristics of global stevedores’ terminal operations are:
• terminal operation is the primary focus of their business; • terminals are run as profit centres; • greater efficiency is gained by implementing common systems across the ter-
minal network to improve productivity; • extensive networks spread investment risk.
Global carriers are companies whose main business is container shipping, but they have made investments in container terminals as a vertical integration tool to support their core business. Examples are K Line and OOCL. Characteristics of global carriers’ terminal operations are:
• container shipping is the prime business focus; • terminals are often run as cost centres; • greater efficiency is gained by integrating the terminal with the wider service
network; • extensive networks support shipping activities/strategy.
Global carriers are subject to the influence of fluctuations in the freight rate. To reduce slot costs, they need to deploy large ships to pursue economies of scale. Using mega container ships involves extra operational resources (Midoro et al. 2005). First, the loading and unloading of containers for mega ships increases the time in port. When the ship size is increased from that of a 4,000-TEU Panamax to an 8,000-TEU super post-Panamax vessel, the time the vessel spends in ports increases from 17% of the overall voyage time to 24%. This means that terminal operations play a critical role in schedule reliability when mega ships are de-ployed. Besides, large ships usually adopt the hub-and-spoke approach (Lun and Browne 2009). In this way, transshipment activities in terms of world throughput increased from 18.3% in 1990 to 27% in 2002. In addition, the handling of mega ships increases stevedoring costs as mega ships require deeper water, longer berths, and more quay cranes to load and unload containers. Higher requirements for facilities mean that few ports can handle mega ships. Higher charges for ad-vanced container terminals with better facilities would increase shipping lines’ production costs.
Container terminal operators encounter problems in managing equipment and facilities to handle mega ships during peak periods. Owing to the operational difficulties generated in multiuser terminals and the limited number of terminals available to handle mega ships, the use of dedicated contained terminals has wit-nessed an increase. The use of dedicated contained terminals and the need for transshipment operations have led to an increase in terminal costs for shipping lines. Together with the inadequacy of terminal capacity in some congested areas, shipping lines are seeking to control a number of terminal facilities all over the

14.3 Performance of Container Terminals 199
world. Other drivers for shipping lines to acquire control over terminals are re-duction in stevedoring costs and improvement in schedule reliability. Pioneer liners that have invested in container terminals are APMT. Examples of followers are K Line and OOCL.
14.3 Performance of Container Terminals
We collected data on terminal throughput, profit in terms of total earnings, and operating cost (i.e., the difference between total revenue and total earnings) from Drewry (2007) to evaluate the performance of global container terminal operators. Data on the sample container terminal operators are shown in Table 14.2.
To understand how input affects output, we used linear regression analysis to find the relationship between terminal throughout and operating cost. The results of the regression analysis are summarized in Table 14.3. The results indicate that operating cost is a good indicator to predict terminal output as the R2 of 0.851 suggests that 85.1% of the observed variability is explained by the independent variable.
The coefficient (β) of the independent variable that affects terminal throughput is listed in Table 14.3. Using this coefficient, we obtain the following regression equation to predict terminal throughput:
TT 4.627 0.027OC,= − + (14.1)
where TT is terminal throughput and OC is operating cost.
Table 14.2 Data for evaluating the performance of global terminal operators
Terminal operator Terminal throughputa Terminal profitb Operating costb
Eurogate 12.20 92.36 647.07 HPH 62.00 1,456.00 2,767.00 ICTSI 2.30 51.04 191.56 K Line 4.80 61.34 875.26 OOCL 4.80 80.30 419.70 PSA 51.29 965.60 1,470.90 APMT 52.10 333.00 1,732.00
a In million TEUs b In million US dollars
Table 14.3 Results of regression analysis to examine the relationship between operating cost and terminal throughput
Independent variable
Dependent variable R R2 Significance Constant β
Operating cost
Terminal throughput 0.923 0.851 0.003 –4.627 0.027

200 14 Managing Container Terminals
Terminal throughput
Operating cost
60.00
40.00
20.00
0.00
ObservedLinear
0.00 1000.00 2000.00 3000.00
Fig. 14.4 Relationship between operating cost and terminal throughput
Equation 14.1 shows that operating cost is the determinant of terminal through-put in container terminal operations. The β coefficient (i.e., 0.027) in the equation has a positive value, meaning that the predicted value of terminal throughput in-creases when operating cost increases. Figure 14.4 demonstrates the relationship between operating cost and terminal throughput.
In addition, we used linear regression analysis to examine the relationship be-tween terminal profit and operating cost, and we report the results in Table 14.4. The results indicate that operating cost is a good indicator to predict terminal per-formance as the R2 of 0.787 suggests that 78.7% of the observed variance of ter-minal profit is explained by operating cost.
To predict the terminal profit, we applied regression analysis to develop a re-gression equation. On the basis of these results, we obtained the following regres-sion equation to predict terminal profit:
TP 203.411 0.551OC,= − + (14.2)
where TP is terminal profit and OC is operating cost. In the regression equation (Eq. 14.2), operating cost is an indicator of terminal
profit in container terminal operations. The β coefficient (i.e., 0.551) in the equa-
Table 14.4 Results of regression analysis to examine the relationship between operating cost and terminal profit
Independent variable
Dependent variable R R2 Significance Constant β
Operating cost
Terminal profit 0.887 0.787 0.008 –203.411 0.551

14.3 Performance of Container Terminals 201
tion has a positive value, meaning that the predicted values of terminal profit in-crease when operating cost increases. Figure 14.5 demonstrates the relationship between operating cost and terminal profit.
In the next step we evaluated terminal operators in terms of the input of oper-ating cost and output of both total terminal throughput and profit. To examine efficiency in terms of a single input (i.e., operating cost) and two outputs (i.e., terminal throughput and profit), we used the CCR model, initially proposed by Charnes, Cooper, and Rodes in 1978, to conduct the data envelopment analysis (Zhou et al. 2008). The CCR model consists of the CCR input-orient (CCR-I) model and the CCR output-orient (CCR-O) model. The CCR-I model aims to minimize input while satisfying the output levels, whereas the CCR-O model attempts to maximize output without requiring more input values. In this study, we used the DEA-Solver software program to run the CCR-I model. The results are shown in Table 14.5.
The results show that three decision-making units obtained a score of 1, whereas the scores of other decision-making units were 0.906, 0.606, 0.612, and 0.293, respectively. The results indicate that three decision-making units are effi-
Operating cost
Terminal profit
ObservedLinear
0.00 1000.00 2000.00 3000.00
1500.00
1000.00
500.00
0.00
Fig. 14.5 Relationship between operating cost and terminal profit
Table 14.5 The CCR input-orient results
Decision-making unit
PSA ICTSI HPH APMT Eurogate OOCL K Line
Score 1.00 1.00 1.00 0.906 0.696 0.612 0.293 Rank 1 1 1 4 5 6 7

202 14 Managing Container Terminals
cient container terminal operators and four decision-making units are inefficient container terminal operators.
14.4 The PROFIT Framework
The efficiency level of global stevedores’ terminal operations is high when com-pared with the efficiency level of global carriers’ terminal operations. Lun and Cariou (2009) proposed the PROFIT framework as an analytical framework for the operation and development of efficient container terminal operators (Fig. 14.6).
This PROFIT framework consists of the following elements:
• Productivity: Productivity measures the output from production processes per unit of input. Efficient container terminal operations have a high level of termi-nal throughput with the same level of input.
• Regional coverage: Enhancing the coverage of container terminal operations in a region can be a strategy for terminal operators to gain market power and serve markets more effectively.
• Operating efficiency: Efficient container terminal operation aims to minimize input while satisfying the output levels to achieve high operational efficiency.
PROFIT frameworkPROFIT framework
ProductivityProductivity
Regional coverageRegional coverage
Operating efficiencyOperating efficiency
Focus of businessFocus of business
InternationalizationInternationalization
Terminal networkTerminal network
Fig. 14.6 The PROFIT framework

References 203
• Focus of business: To improve efficiency, the primary business focus of the global container terminal operators should be terminal operations instead of container shipping. These terminals are run as profit centres instead of cost cen-tres.
• Internationalization: The container terminal operators that have rich experience and expertise in managing container terminals are in a competitive position to extend their container terminal operations internationally.
• Terminal network: In the face of the increasing trend for mergers and alliances among shipping lines and the requirements for greater investment in terminal facilities, container terminal operators develop an extensive network to spread investment risk.
14.5 Concluding Remarks
The findings confirm that both terminal throughput and terminal profit are posi-tively associated with operating cost. For a container terminal operator to deter-mine resource allocation for its operations, we developed two regression equa-tions using empirical data to estimate the levels of output. The first regression equation (Eq. 14.1) indicates that the expected terminal throughput is 0.027 of the operating cost beyond the constant level of 4.627 million TEUs. The second re-gression equation (Eq. 14.2) indicates that the expected terminal profit is 0.551 of the operating cost beyond the constant level of USD 203.522 million. These two equations provide a reference to guide terminal managers in making decisions in adjusting the input level in their container terminal operations.
Three decision-making units, i.e., HPH, PSA, and ICTSI, had an efficiency score of 1.0. The results indicate that these terminals are operating efficiently. The terminal throughputs of these three decision-making units were 62.00 million, 51.29 million, and 2.30 million TEUs, respectively. The results indicate that small terminal operators, such as ICTSI, can operate efficiently.
References
Alderton P (2008) Port management and operations. Lloyd’s list practical shipping guides. Informa, Zug
Bichou K, Lai KH, Lun YHV, Cheng TCE (2007) A quality management framework for the liner shipping companies to implement the 24-hour advance vessel manifest rule. Transp J 46(1):5–21
Carbone V, Martino M (2003) The changing role of ports in supply chain management: an empirical analysis. Marit Policy Manag 30(4):305–320
Drewry (2005) Annual review of global container terminal operators. Drewry Shipping Con-sultants, London

204 14 Managing Container Terminals
Drewry (2007) Annual review of global container terminal operators. Drewry Shipping Consult-ants, London
Geraldo J, Beresford A, Pettit S (2003) Liner shipping companies and terminal operators: inter-nationalization or globalization? Marit Econ Logist 5(4):393–412
Lun YHV, Browne M (2009) Fleet mix in container shipping operations. Int J Shipp Transp Logist 1(2):103–118
Lun YHV, Cariou P (2009) An analytical framework for managing container terminal. Int J Shipp Transport Logist 1(4):419–436
Lun YHV, Lai KH, Cheng TCE (2009) Intermodal transport capability. Shipp Transp Logist Book Ser 1:17–33
Martin J, Thomas B (2001) The container community. Marit Policy Manag 28(3):279–292 Midoro R, Musso E, Parola F (2005) Maritime liner shipping and the stevedoring industry:
market structure and competitive strategies. Marit Policy Manag 32(2):89–106 Notteboom T (2004) Container shipping and ports: an overview. Rev Netw Econ 32(2):86–106 Zhou G, Min H, Xu C, Cao Z (2008) Evaluating the comparative efficiency of Chinese third-
party logistics providers using data envelopment analysis. Int J Phys Logist Manag 38(4):262–279

205 Y.H.V. Lun, K.-H. Lai and T.C.E. Cheng Shipping and Logistics Management, © Springer 2010
Chapter 15 Agile Port
Abstract Ports are a critical part of the logistics system along a supply chain, which needs to be responsive to customers’ demand. Port efficiency is an impor-tant factor that affects the intention of users to use a port. Inefficient port oper-ations incur additional costs for shippers, increase operating costs for transport operators, and reduce the profitability of the port. Hence, there is a need for ports to operate as an “agile port” to cope with the uncertain operating environment. This chapter discusses the characteristics of the agile port. To facilitate the imple-mentation of the concept of agility in ports, we present a ten-step implementation framework. This structured ten-step approach is a useful road map for the port industry to adopt an agile port system.
15.1 Introduction
Driven by the challenges of global competition, manufactures have put pressure on transport operators to seek ways for reducing cost and improving the quality of their transport services. The increasing pressures on transport cost reduction have led ocean carriers to establish shipping alliances and deploy bigger ships towards achieving this goal. To improve the quality of their transport services, intermodal transport operations have been introduced to offer integrated transport services for shippers. Such a development reinforces the “network” concept, which consists of several nodes and links. In the context of transport services, the links represent various transport legs that connect one node to another, whereas the nodes repre-sent transport interfaces.
With the aim of delivering door-to-door transport solutions instead of providing port-to-port services, important organizational, commercial, and technological changes take place at nodes. From the technological point of view, improved communications systems allow quick access to information for enhancing oper-ational efficiency and productivity. To handle intermodal transport effectively and

206 15 Agile Port
efficiently along the transport chain, ports should become more agile. Agility means the capability of rapidly and cost-efficiently adapting to operational changes. It refers to the ability of a port to respond quickly to markets that are driven by sudden changes in the operating environment. By embracing the concept of agility, ports can evolve from a third-generation port to the fourth generation in port development (Paixão and Marlow 2003).
UNCTAD (1999) defined ports in terms of generations. In general, three gen-erations can be classified:
1. First-generation ports: Until 1960, ports played a simple role as the link be-tween sea and inland transport systems. The main activities in the port region were cargo handling and cargo storage. Thus, the only focus of port develop-ment was investment in port facilities for ship and cargo handling, whereas adoption of technology was largely neglected.
2. Second-generation ports: The second-generation ports were those built be-tween 1960 and 1980. The activities in ports were expanded to value-added services ranging from packaging and labelling to physical distribution. Players in the port communities, including ocean carriers and freight forwarders, had begun to realize the importance of customer services and of keeping a long-term relationship with customers.
3. Third-generation ports: From 1980, container transport developed quickly and the growth of an intermodal transport system emerged. The container transport chain had linkages to form an international network, which was enlarged to in-clude logistics and distribution services. In third-generation ports, customer service requirements were analysed in detail and ports were actively engaged in marketing-related activities.
In the 1960s and 1970s, firms in the container port sector were largely discrete with little horizontal or vertical integration. During the 1980s, ports began to offer value-added logistics services and port players became increasingly integrated into the transport chain. The 1990s represented the era of globalization, where integra-tion processes such as mergers, acquisitions, and joint venture operations became common and more complex in port development. The recent development of ports has taken several different forms and development paths. The UNCTAD (1999) model, implying that ports developed in discrete steps, may need further en-hancement. Beresford et al. (2004) proposed the WORKPORT model highlighting the way in which ports and their related services develop in an evolutionary way. Port players have begun to diversify their port services particularly into customer-tailored logistics packages (Pettit and Beresford 2009). The WORKPORT model identifies the important trends in port operations that have led to improved effi-ciency in port operations. Ports have been made more responsive in tailoring ser-vices to satisfy individual customers’ needs characterized by more agile oper-ations. An agile port system is an operational system capable of handling various types and numbers of containers while minimizing operation interruptions within the container terminal. It applies information technology and modifies business practices to improve efficiency and flexibility in terminal operations.

15.2 Agility in Ports 207
15.2 Agility in Ports
Traditionally, ports are areas made up of physical infrastructure capable of receiv-ing ships and servicing other transport modes, handling cargoes from ships to shore, and vice versa. Ports are also capable of providing value-added logistics services to users. Therefore, a port can be classified as a multimodal node where ocean ships, short-sea barges, and road and rail modes converge, and where a link exists between waterborne and land transport.
Ports are critical parts of the logistics system along a supply chain, which needs to take responsive actions to service customer demands. Logistics is a planning orientation framework that seeks to create plans to facilitate the flow of goods and information. The supply chain builds upon this framework and seeks to achieve linkage and coordination between players to enable the product flow activities. Christopher (2005) defined supply chain management as “the management of upstream and downstream relationships with suppliers and customers to deliver superior customer value at less cost to the supply chain as a whole.” Hence, the focus of supply chain management is “the management of relationships” to achieve a more profitable outcome for all players in the chain.
From the perspective of port management, it is essential that ports’ supply lev-els meet ports’ demand levels. There is also a need to transform ports to create value by providing value-added services such as cargo consolidation or cross-docking activities in addition to the basic operations of handling and storage of cargoes. As shown in Fig. 15.1, ports operate under bidirectional logistics sys-tems. Ports unload cargos from ships for distribution by inland transport modes such as rail, roads, or inland waterways. At the same time, ports also receive cargoes from inland transport modes and load these cargoes onto ships. Because of the bidirectional logistics systems, ports’ operations have become far more complex than the simple loading and discharging operations in the past. In add-
Ship loading and unloadingShip loading and unloading
ProcessingProcessing ProcessingProcessing
Cargo frominland
Cargo frominland
Cargo to inland Cargo
to inland
Fig. 15.1 Bidirectional logistics system of ports

208 15 Agile Port
ition, the need for effective information flow is growing as users are keen to know the status of their cargoes.
As in other logistics systems, port operations consist of two key flows: the physical and the information flows. The information flow relates to the inter-change of operational information on cargoes, ships, and other transport modes. On the other hand, the physical flow relates to the movement of cargoes to and from the ports. Port operations are structured as a functional entity where all the activities are performed by all the parties involved together. With the development of the intermodal transport system, the port operations system is made up of three subsystems: movements from ship to land (including road and rail transport), movements from land to ship, and movements from ship to ship (including inland waterway and feeder shipping). In addition to the port operations, the container transport chain has linkages to form an international network, which has expanded to include logistics and distribution services.
The shipping business is essential to economic development as international trade needs ships to transport cargoes from places of production to places of con-sumption. Nowadays, with more than 80% of world merchandise trade by volume being carried by sea, maritime transport remains the backbone of international trade and economic growth. Since containerization, containerized trade has gone through a significant growth phase. As shown in Table 15.1, the average growth rate of containerized trade has been above 9% since the 2000s, with the only ex-ception being 2001. Owing to adverse economic conditions, the growth rate in containerized trade in 2001 was only 2%. After 2001, containerized trade contin-ued to grow after the economic recovery. Hence, it is expected that global con-tainer shipping activities will regain their growth mode after the financial tsunami in 2008 and in the years ahead.
As reported by UNCTAD (2008), the world’s total container port traffic reached 485 million TEUs in 2007, which represents approximately a 10% in-crease when compared with the level in 2006. On the basis of the data from UNCTAD (2008), the top global container ports and their throughputs are sum-marized in Table 15.2. Ports compete locally and regionally. Port efficiency is an
Table 15.1 Growth in container shipping, 2000–2008
Year Growth in containerized trade (%) Growth in carrying capacity (%)
2000 11.0 7.8 2001 2.0 7.8 2002 11.0 8.5 2003 11.0 8.0 2004 13.0 8.0 2005 11.0 8.0 2006 11.0 13.6 2007 10.0 11.8 2008 9.0 13.1
Source UNCTAD (2008)

15.2 Agility in Ports 209
important determinant factor that affects the intention of users to use the port. Inefficient port operations result in additional inventory costs being incurred by shippers, increase the operating costs for transport operators, and reduce the prof-itability of the port. Hence, there is a need for ports to operate as an “agile port” to cope with the uncertain operating environment.
Agility is a strategy with an emphasis on strengthening the links between in-ternal operations and external operating environments. Knowledge-based sys-tems are a useful tool to implement the concept of the agile port. For this strat-egy to be successfully implemented, firms need to ensure that the right knowledge gets to the right place so as to increase the knowledge power of the firms and their knowledge workers. Knowledge-based systems are different from information systems because they store and handle knowledge rather than in-formation. The use of knowledge-based systems is associated with a variety of benefits: they may be used to “retain knowledge” even after an expert has left, they may improve the “consistency of decisions”, they can store the so-called corporate memory, and they may promote “knowledge sharing” (Hendriks and Vriens 1999). “Knowledge” is needed to improve the day-to-day routines and to change the routines when necessary. The use of knowledge-based systems al-lows ports to adapt quickly to the service delivery processes associated with service production and service development. Nevertheless, implementing “agil-
Table 15.2 Ranking of container ports of the world, 2007
Rank Port Throughputa
1 Singapore 27.932 2 Shanghai 26.150 3 Hong Kong 23.881 4 Shenzhen 21.099 5 Busan 13.270 6 Rotterdam 10.790 7 Dubai 10.653 8 Kaohsiung 10.256 9 Hamburg 9.900
10 Qingdao 9.462 11 Ningbo 9.360 12 Guangzhou 9.200 13 Los Angeles 8.355 14 Antwerp 8.177 15 Long Beach 7.312 16 Port Klang 7.120 17 Tianjin 7.103 18 Tanjung Pelepas 5.500 19 New York/ New Jersey 5.400 20 Bremerhaven 4.892
a In million TEUs

210 15 Agile Port
ity” in the port industry is a complex process as it requires ports to go through different stages of changes and also for there to be a strong top-management commitment.
15.3 Characteristics of Agile Ports
A container terminal is a vital part of the transport infrastructure. Container termi-nals are nodes that link with other inland transport modes such as highways, rail-ways, and inland waterway systems (Lun and Cariou 2009). Container terminals have evolved from a cargo handling point to a distribution centre with physical infrastructure serving as transport hubs in the container supply chains (Almotairi and Lumsden 2009). The port becomes an interface between the areas of produc-tion and consumption, attracting the attention of players in shipping and transport-related areas (Ugboma et al. 2009). An agile port is characterized by a number of features, such as port infrastructure, commitment from top management, working with upstream and downstream partners, and streamlined operating processes (Marlow and Paixão 2003).
15.3.1 Infrastructure of Their Own
In the context of port operations, infrastructure consists of hardware and software. Hardware infrastructure includes land for road and rail modes, and the layout for entry and exit of cargoes. Software infrastructure refers to port operating systems. These systems must be designed in such a way that all the activities related to port operations are constantly visible, and that the foreland and hinterland are controlled via network communications centres for control and monitoring pur-poses. Agility implies continuous improvement to follow market trends closely. To support the improvement of port operations, powerful infrastructure repre-sented by information systems to link with other players is required. For instance, the development of relationships with inland terminals is helpful to minimize the costs associated with delays and waste. It allows a quick response to volatile demands caused by market uncertainty, the development of reliable services, and the good maintenance of the rail and road infrastructure for the development of an efficient transport network.
15.3.2 Commitment from Top Management
To operate an agile port, all the parties in the port community must be able to make decisions just in time to avoid wasting resources (Lai and Cheng 2009).

15.3 Characteristics of Agile Ports 211
Knowledge-based systems are an excellent tool to make the right decision at the right time. The top-management committee is required to adopt the knowledge-based system. On the other hand, a human element is a key element for operating an agile port as the port needs to review the operating environment and introduce measures to improve port performance continuously. Top-management commit-ment to recruiting and retaining talented human capital is essential for an agile port to operate competently. Hence, the successful development of agile ports relies on both the intelligent application of knowledge and the human element.
15.3.3 Working with Upstream and Downstream Partners
Agility has become crucial in a competitive environment. Ports need to be flexi-ble, responsive, and adaptable centres to meet the needs of the dynamic operating environment. Ports are required to develop partnerships and strategic alliances in the port community in the hope of enhancing their competitiveness. Ports cooper-ate with upstream and downstream players in the port community to align with the partnership environment. Consequently, agile ports need to understand the requirements of their upstream and downstream partners and identify their service substitution rates. The service substitution rate can be defined as “the level of complexity reduction, i.e., how much the port would lose in terms of sales if the port decided to remove a certain service from its business portfolio” (Marlow and Paixão 2003). The service substitution rate can be a tool for ports to redesign their service scope to optimize throughput in accordance with their hinterlands and forelands.
15.3.4 Streamlined Operating Processes
Agile ports are expected to move cargo quickly and smoothly so as to deliver a ser-vice in alignment with market demand while eliminating waste within the processes. Streamlined operating processes are useful in eliminating waste in the physical and documentary processes associated with the cargoes and the different transport modes that service the port. An integrated supply chain network with total logistics management services can be used to streamline the operating processes. For in-stance, agile ports develop service-enhancing initiatives to deliver a new terminal management system in responding to the needs of the upstream and downstream partners. A terminal management system uses industry-standard technology to en-sure that the system is able to communicate effectively with partners’ information systems. A terminal management system usually consists of a number of unique features to facilitate information flows among supply chain partners within the terminal community.

212 15 Agile Port
A terminal management system has a number of features, and some examples of streamlined processes of a container port are listed below: • Electronic communications: The terminal management system develops elec-
tronic communications to link with the port’s customers and business partners. Through electronic communications, shipping documents are converted into electronic form to improve operational efficiency and reduce the use of paper. Shipping-related data such as export booking data, storage instructions, load-ing/ discharging container data, tractor preadvice data, and empty container de-livery and collection data are communicated with customers and business part-ners electronically via the terminal management system.
• Tractor appointment system: The tractor appointment system is a scheduling system for collecting containers from truckers. The system allows business partners to contact the port by tone-dial phone or via the Internet. The appoint-ment system enhances cost-efficiency and customer service by ensuring rapid turnaround. The system also benefits traffic flow by scheduling vehicle arrivals to avoid congestion in the port area.
• Barge identity card system: The terminal management system uses the bar-code-based or RFID-based barge identity system to verify the identity of barge vessels instead of a manual verification process. This barge identity system has the ad-vantages of streamlining barge movements, reducing paper work, strengthening terminal security, and extending the linkage with barge operators. An agile port system can be a measure to tackle unreliable port services as imple-
menting the concept of an agile port implies adopting a continuous measure of port performance. Within an agile port system, any form of waste, defect, or bottleneck can be easily identified when using techniques such as “value stream mapping”. Value stream mapping is a technique used to analyse the physical flow of informa-tion flow required for the movement of cargoes in the transport chain. This is a useful technique to identify improvement opportunities for port operations. To develop an agile port, feedback on port performance is required to compare the actual perform-ance with expected outcomes. Any deviations from targets imply the immediate adoption of corrective measures. These measures also need to be evaluated after implementation. This control process contributes to the development of a total qual-ity port management system, which is intended to respond to market pressures.
15.4 Implementing the Concept of an Agile Port
As a guide for the port industry to adopt an agile port system, Bichou et al. (2007) proposed a ten-step implementation framework, which is also valid for implementing the concept of an agile port and managing the agile port. For im-plementing the concept of an agile port, a structured approach on how to incorpo-rate the requirements into the operational and strategic management of a port is essential. Nevertheless, there currently exists limited appropriate framework to guide the implementation and the management. The proposed step-by-step frame-

15.4 Implementing the Concept of an Agile Port 213
work provides a road map for ports to implement an agile approach in port man-agement and achieve “zero defects” in the port operations.
15.4.1 Step 1: Management Commitment
The first step in implementing the agile port operating approach is to seek the commitment and support of management to make the process-improvement efforts sustainable. The lack of senior management support can be a main cause for the failure of implementing “agility” in the port. The importance of top management in providing a clear and strong message about its vision for agility must be articu-lated at all levels of port operation. The purpose of this step is to make clear to all members of the port that the top management requires agility. To start with, the need to implement agility should be discussed in detail by the top-management team. The vision for the implementation of the concept of the agile port is defined, which is to provide zero-defect port services with maximum efficiency through the workflow improvement of every aspect of work processes in the port operations, which ultimately meet customer demands and contributes to customer satisfaction.
15.4.2 Step 2: Process-improvement Team
With the support from top management, the next step is to define a set of measur-able performance indicators and formulate the corresponding strategies to guide the port towards achieving the objectives. To this end, the port operator conducts customer surveys from time to time to understand customer needs and identify performance indicators. The performance analysis provides directions for the port to set performance objectives and strive for performance improvement. Port per-formance objectives cover different aspects of workflow in the port services. Ex-amples of the performance objectives of an agile port are listed in Table 15.3. On the other hand, a quality-improvement team should be assembled to carry out the strategies to meet predetermined objectives. The quality-improvement team is responsible for the detailed plan to implement the concept of the agile port and develop operations standards and gather the resources required for successful implementation of the agile port objective.
Table 15.3 Port performance objectives
Port service Objectives
Loading and discharging at quay Provide a seamless movement of cargoes Reduce the turnaround time of ships in the port
Ship operation Provide a reliable sea passage Intermodal transport Provide a seamless movement of cargoes and vehicles
Reduce the turnaround time of trucks and trains

214 15 Agile Port
15.4.3 Step 3: Setting the Standards
This step is to develop an improvement model with appropriate measures to gauge performance. First, a number of measures should be identified to evaluate the work process in the port that would affect customer satisfaction. For instance, the measures for evaluating the intermodal process include:
• timeliness in picking up containers and delivering them; • reliability of the transit time; • responsiveness of transport operators; • adaptability of existing processes to satisfy customers’ requirements; • flexibility of operations; • accuracy of information regarding status of shipment; • compliance with legal requirements; • notification of any changes in the multimodal processes; • level of damage to the shipment; • overall transport cost; • employee interaction with customers.
On the other hand, a number of measures for evaluating an agile port are de-termined. Examples of these measures are listed in Table 15.4. The purpose of setting these measures is to reveal problems so that evaluative and corrective ac-
Table 15.4 Port performance indicators
Work process Performance indicators
Loading and discharging at quay
Ship’s waiting time for it to be berthed Ship’s waiting time for discharge and loading of cargoes to start Time spent in transferring cargoes from the storage area to the quay and from the quay to the storage area Overall time of the cargo in the port Degree of flexibility in using quay equipment Degree of process adaptability in meeting customer requirements Port costs by unit of cargo handled
Ship operation Ship’s time spent in route deviations Total time delays Cargo damage and loss of goods on board Degree of flexibility in using ship’s resources Degree of process adaptability in meeting customer requirements
Intermodal transport Time waiting for cargoes to be transferred from one transport mode to another Time spent in transferring cargo from storage to road, rail, or barge operations Time spent by cargo awaiting departure of next mode of transport (road, rail, or barge) Time spent in carrying out logistics activities required by customers that add value Overall time of cargoes spent in the port

15.4 Implementing the Concept of an Agile Port 215
tion can be taken. A workflow review should be conducted in each department to reveal where improvement is possible, where corrections are necessary, and to record actual improvements for assessment in subsequent stages. After the work-flow review, the written standards and procedures to govern the various aspects of the work processes in each department are established. The standards and proce-dures provide clear guidelines and instructions for all parties involved in the port operations such that they understand the requirements of each work process and the desired performance outcomes.
15.4.4 Step 4: Awareness of Staff Members
This step is to create awareness and communicate the vision of the implementation of the concept of an agile port to all members of the port. Managerial and supervi-sory staff members are expected to transfer the basic knowledge of an agile port to their subordinates. This involves a clear explanation of the objectives of an agile port and educating employees on the concepts of quality, thus eliminating their fear of the implementation and motivating them to participate.
15.4.5 Step 5: Manager and Supervisor Training
A series of training seminars on agile port operations should be conducted for managerial and supervisory staff in the port. The purpose is to provide the neces-sary training for managers and supervisors to carry out their functions as required by the agile port performance indicators. It is essential that all the managerial and supervisory staff members have a thorough understanding of the concepts and objectives regarding the implementation of the concept of an agile port. In doing so, they can explain them to their subordinates. After the training seminars, meet-ings should be organized between management and staff at different organiza-tional levels to ensure their support for implementing the concept of “agility” in the port.
15.4.6 Step 6: Goal Setting
This step is to turn commitment into action by encouraging individual departments to set improvement plans and goals towards the organizational goal of achieving “zero defects” with maximum efficiency in the work processes. Ultimately, the efforts to improve port performance should result in increased customer satisfac-tion. All the departments should incorporate “to meet customer demand” as a key objective in their work and establish goals that are specific and capable of being

216 15 Agile Port
measured. The set goals are to be realized through understanding the requirements of customers, followed by effective use of the port resources to meet those re-quirements. Examples of these initiatives are customizing services to meet specific customer needs, enhancing value for customers by offering flexible services, re-ducing order processing, and being responsive in handling customer enquiries.
15.4.7 Step 7: Removal of Error
This step is to motivate individual staff members to improve their service quality by giving them a way to communicate to management the difficulties they en-countered in actually implementing the agile port concept. Listening to feedback from employees and initiating positive changes are important because implemen-tation of an agile port concept might cause an increase in the daily workload of the staff. The increased workload might cause some employees to become dissatis-fied. As human capital is an essential resource in port operation, it is essential to consider employees’ concerns. In this step, individual staff members should be invited to describe in a simple form any problems that hinder them in carrying out streamlined error-free work. Under such circumstances, staff members realize that channels exist to make their grievances known and to help them deal with prob-lems arising from their efforts to pursue workflow improvement in their work.
15.4.8 Step 8: Corrective Actions
Error-free port services require periodic preventive maintenance of work proc-esses. Simply setting goals and identifying root causes for quality problems will not automatically lead to performance improvement of the services. Hence, there is a need to regularly assess the required level of performance from the work proc-esses and to improve them as necessary to remain competitive. This step is in-tended to provide a systematic method for resolving once and for all the problems that were identified in the previous steps. To this end, task forces should be formed to identify the specific problems in a proactive manner and to formulate solutions for the problems uncovered.
15.4.9 Step 9: Recognition and Reward
Employee empowerment and staff satisfaction based on motivation are crucial for a port progressing towards achieving the goal of implementing the agile port concept. It is therefore important to reward staff participation and celebrate achievements in performance improvement. This can help make the agile port implementation jour-

15.5 Concluding Remarks 217
ney relaxed and enjoyable. In this stage, award programmes should be established to recognize staff members who meet their goals or perform outstanding acts, in order to reinforce their commitment and support for performance improvement. As a result, the port will foster a culture of service excellence in its staff members by cultivating mutually supportive relations, and encouraging teamwork through means such as rewarding performance equitably.
15.4.10 Step 10: Continuous Improvement
The last step is to repeat the cycle of continuous improvement. The emphasis is on making performance improvement enduring as a never-ending action in the port. This is important because a typical implementation cycle spans 12–18 months. During the cycle, staff turnover and market changes might adversely affect the company’s efforts to enhance performance through the implementation of the agile port concept. To sustain the momentum for continuous improvement, it is necessary to conduct periodic reviews of the work processes to adapt to evolving market conditions. This step is important in preparing for a new performance im-provement cycle.
15.5 Concluding Remarks
With the implementation of the agile port concept, ports are able to anticipate the evolving services desired by the market and become proactive. Agile port operations allow better utilization of the resources available (equipment, storage space, and people) to support the daily operations in the container port. By effi-cient resource use, better planning, and improved scheduling of operations, ports also command a more advantageous position in responding to uncertainty in the market. Furthermore, agile port operations lead to an increase in throughput because of reductions in transit time and lead time. With ships staying in ports for a shorter time, there is higher availability of berths and flexibility to accom-modate future incoming ships, which are essential for developing customer satis-faction. Such a consequence should be seen as the starting point to offer reliable port services. An agile port is in a favourable position when carriers determine the “port of call” for their main line services. An agile port provides port oper-ators with the perception of possessing essential resources, a high degree of involvement in the supply chain, and being capable of offering seamless inter-modal transport services.
By enhancing its performance, an agile port becomes more efficient and effec-tive as waste and defects arising from the service provided are largely removed. This represents a reduction in operational cost and higher profitability. With more revenues, the port should be able to invest in technologically advanced systems to

218 15 Agile Port
further improve its efficiency and customer services. It also contributes to a higher ability in delivering innovative services and capturing a larger market share from its competitors.
References
Almotairi B, Lumsden K (2009) Port logistics platform integration in supply chain management. Int J Shipp Transp Logist 1(2):194–210
Bichou K, Lai KH, Lun YHV, Cheng TCE (2007) A quality management framework for the liner shipping companies to implement the 24-hour advance vessel manifest rule. Transp J 46(1):5–21
Beresford AKC, Gardner BM, Pettit SJ, Naniopoulos A, Wooldridge CF (2004) The UNCTAD and WORKPORT models of port development: evolution or revolution? Marit Policy Manag 31(2):93–107
Christopher M (2005) Logistics and supply chain management. Prentice Hall, London Hendriks PHJ, Vriens DJ (1999) Knowledge-based systems and knowledge management: friends
or foes? Inf Manag 35:113–125 Lai KH, Cheng, TCE (2009) Just-in-time logistics. Gower, Aldershot Lun YHV, Cariou P (2009) An analytical framework for managing container terminals. Int J
Shipp Transp Logist 1(4):419–436 Paixão AC, Marlow PB (2003) Fourth generation ports: a question of agility? Int J Phys Distrib
Logist Manag 33(4):355–376 Pettit SJ, Beresford AKC (2009) Port development: from gateways to logistics hubs. Marit Pol-
icy Manag 36(3):53–267 Ugboma C, Ugboma O, Damachi B (2009) A comparative assessment of service quality perspec-
tives and satisfaction in ports: evidence from Nigeria. Int J Shipp Transp Logist 1(2):172–193
UNCTAD (1999) Technical note: fourth generation port. United Nations Conference on Trade and Development, Geneva
UNCTAD (2008) Review of maritime transport. United Nations Conference on Trade and De-velopment, Geneva

219 Y.H.V. Lun, K.-H. Lai and T.C.E. Cheng Shipping and Logistics Management, © Springer 2010
Chapter 16 Port Development
Abstract This chapter begins with a discussion of the operating environment of container shipping by introducing the concept of the 4C forces, i.e., containeriza-tion, concentration, collaboration, and competition. In container transport, the port is a vital part of the transport chain. The Anyport model, which identifies port development as having phases of setting, expansion, and specialization, is useful to explain the evolution of a port. In addition to sea-based operations, land-based operations have become an important dimension in international shipping. With growing complexity in shipping services, there is a trend in the shipping industry to use the hub-and-spoke approach. In the shipping hub, firms involved in up-stream and downstream activities operate together and their collective economic actions lead to the emergence of a transport complex economy.
16.1 Introduction
In container transport, a container terminal is a vital part of the transport infra-structure (Bichou et al. 2007). Container terminals are nodes that link with other inland transport modes such as highways, railways, and inland waterway systems (Lun et al. 2008). The role of container terminals has been evolving from a cargo handling point to a distribution centre with physical infrastructure serving as transport hubs in the container supply chain (Almotairi and Lumsden 2009). Hence, container terminals function as an interface between the areas of produc-tion and consumption servicing the players in shipping and transport-related areas (Ugboma et al. 2009).
Container terminals connect key actors in the international container transport chain, including shippers, shipping lines, and intermodal transport operators. Con-tainer terminal operators handle activities ranging from receiving containers and loading them onto ships through to dispatching containers and discharging them

220 16 Port Development
from ships. In addition, container terminal operators undertake a series of planning activities such as yard planning, quayside planning, and vessel stowing planning. The role of shipping lines is to operate container ships and provide liner shipping services to consign cargoes (Lun and Browne 2009). Shipping lines offer door-to-door transport services by coordinating with feeder operators, road carriers, rail operators, logistics service providers, and container terminal operators.
The development of global supply chains requires high inland accessibility and efficient port operations. There is a tendency towards logistics integration in the shipping and port industry. The integration between ports and logistics-related activities contributes to the development of the concept of a “port–hinterland rela-tionship” (Notteboom and Rodrigue 2005).
16.2 The Operating Environment
Although container shipping represents a major business activity affecting con-temporary economic development, the concept of containerization in the 1970s revolutionized shipping operations. The 4C forces (Fig. 16.1), namely, containeri-zation, concentration, collaboration, and competition, are useful for explaining the operating environment of container shipping (Lun and Browne 2009). These 4C forces provide a systematic framework for analysing the growth of containerized business in the world.
16.2.1 Containerization
Since the introduction of container ships in 1956, container shipping has under-gone a phase of high growth (Song et al. 2005). According to Stopford (2004), containerization promotes international trade activities because (1) container ships replace the economically less efficient traditional vessels, (2) transport costs fall remarkably owing to improved cargo handling efficiency, and (3) there is cost-efficiency and this therefore encourages economic development. Contain-ers are helpful in reducing the cost and time required to load, discharge, and transport cargoes. Containers also support the growth of global production, dis-tribution, and consumption owing to convenient and cost-effective cargo move-ments. Nowadays, shipping goods via containers represents a 90% cost reduction compared with the era before containerization (Donova 2004). Ships, trains, trucks, barges, terminals, and warehouses have changed their designs and oper-ations for handling cargoes in the form of containers. Basically, both the land-based and the sea-based freight operations have been deeply influenced by the container revolution (Fleming 2002, 2003).

16.2 The Operating Environment 221
16.2.2 Concentration
Currently, the container shipping business competes on the basis of economies of scale in ship size (Cullinane and Khanna 2000). With bigger ships, carriers need to secure a larger cargo volume to fully utilize their shipping spaces. Concentra-tion is a preferred approach for the expansion of container shipping companies by enlarging their fleets and allocating more ships to service more geographical locations (Slack et al. 2002). Between January 2000 and January 2007, the TEU capacity deployed for container shipping rose from 5,150,000 to 10,467,496 TEUs, representing a more than 100% increase during the period as reflected by the data from BRS-Alphaliner. Over the last decade, the container transport in-dustry has seen the emergence of global container terminal operators. The in-creased operating capacity of large container operators has led to concentration in the shipping industry.
The concentration ratio is an indicator of the relative size of firms in relation to the industry as a whole. The concentration ratio of an industry is used as an indica-tor to determine the market form of the industry. One commonly used concentra-tion ratio is the four-firm concentration ratio (CR4), which consists of the market share of the four largest firms in the industry. In general, market forms can be classified as follows:
• perfect competition, with a concentration ratio slightly higher than 0.00; • monopolistic competition, with a concentration ratio below 0.40; • oligopoly, with a concentration ratio above 0.40; • monopoly, with a concentration ratio close to 1.00.
The concentration ratio has the advantage of being relatively easy to calculate and understand. Industrial data for calculating the concentration ratio are usually readily available. According to Table 16.1, the four largest container terminal op-erators increased their carrying capacity to 201.9 million TEUs, with a CR4 = 0.45
Table 16.1 Top ten global terminal operators’ throughput in 2006
Operator Throughput (million TEUs) Market share (%)
HPH 60.90 13.80 APMT 52.00 11.80 PSA 47.40 10.10 DPW 41.60 9.40 COSCO 22.00 5.00 Eurogate 11.70 2.70 Evergreen 9.40 2.10 MSC 8.80 2.00 SSA 7.60 1.70 HHLA 6.60 1.50
Source Drewry (2007)

222 16 Port Development
(i.e., 45% of the world total container-carrying capacity) in 2006. CR4 = 0.45 indi-cates that the container terminal industry is operating under an oligopoly market structure that is highly concentrated.
16.2.3 Collaboration
In container shipping, cooperation among container shipping companies and their investment in new and larger ships are largely interdependent and these strategic actions can reinforce one another (Lun et al. 2009). Space sharing among con-tainer shipping companies is important for container shipping operations as the use of larger container ships helps container shipping companies to reduce the finan-cial risk in new ship investment and achieve economies of scale in shipping oper-ations. Globalizing the shipping service through collaboration is a preferred strat-egy through which container shipping companies can benefit from collective negotiation power with terminal operators for favourable service charges and conditions. Similarly, terminal operators also provide their services on a world-wide basis and collaborate with shipping lines around the world. The operations of MSC-PSA Asia Terminal, a joint venture between PSA and MSC which started in Singapore in 2006, is an ample example to illustrate collaboration between ship-ping lines and terminal operators.
16.2.4 Competition
Owing to globalization of business, increased competition in international trade can be expected (Song et al. 2005). To compete, increasing the carrying capacity of container shipping firms has become a popular means to strengthen their lead-ership positions in the container shipping market. Owing to competitive pressure, once a shipping line has indicated its intention to build larger ships, competitors tend to follow. After deploying bigger ships, service rationalization, i.e., restruc-turing of the processes of delivering quality services to satisfy customers (Kim and Kim 2001), is necessary to ensure that additional shipping spaces can be fully utilized. On the other hand, competition also leads to increasing pressure on ports to reorient their roles and functions in adapting to the more demanding oper-ational environment. Mergers and alliances among large shipping lines can be accounted for by the transformation of some feeder ports into regional hubs and vice versa.
As a consequence, ports compete locally, as well as regionally, serving the same hinterland. Players in the container port market realize this inevitable trend of industry rivalry. For instance, the port of Hong Kong has experienced phe-nomenal growth in the container transport business over the past three decades owing largely to containerization. Endowed with a deep-water harbour strategi-

16.3 Port Hinterland and Foreland 223
cally located at the mouth of the Pearl River Delta, Hong Kong has evolved into a regional shipping hub in the global container transport chain. Recently, the port of Hong Kong has been facing increasing competitive pressure from neighbouring rivals because new port developments have enabled them to increase their market share of ocean cargoes originating from southern China. In 2006, there were 61 container berths in the Pearl River Delta, including Hong Kong’s 24 berths. The number of berths in southern China, including Hong Kong, is expected to reach 89 berths by 2010 and probably 120–122 berths in the longer term. As a result, the intense competition for container traffic will continue.
The 4C forces characterizing the shipping operation environment provide an analytical framework to explain the growth of container transport. The emergence of containers has changed the way in which goods are transported around the world. Being a vital part of the transport chain, ports are nodes that link with other inland transport modes such as highways, railways, and inland waterway systems (Lun et al. 2008).
16.3 Port Hinterland and Foreland
Location, accessibility, and infrastructure are the major attributes that affect the importance of a container port (Rodrigue et al. 2009):
• Location: The location of a port is important as the port serves industrial activ-ities. The hinterland represents a port’s market area.
• Accessibility: Accessibility at the local scale and how well the port is connected to the regional transport system are of high strategic importance. The through-
CollaborationCollaboration
CompetitionCompetition
ConcentrationConcentration
ContainerizationContainerization
4C forces4C forces
Fig. 16.1 The 4C operating environment

224 16 Port Development
put of a container port could be very low if it is efficiently handling ships and containers but is poorly connected to the market areas through an intermodal transport system.
• Infrastructure: The key function of a port is to handle ships and cargoes. The port infrastructure must accommodate current traffic, as well as anticipate fu-ture technological development and changes in the operating environment.
The port comprises of a set of intermodal infrastructure taking advantage of a geographical location, providing a high level of accessibility to connect with its hinterland and foreland (Rodrigue et al. 2009). Each port has its own hinterland representing a land space over which the port sells its services and interacts with its customers. It also refers to the market area that a port is servicing in that region. The port serves as a place of convergence for the traffic coming from different transport modes such as roads and railways or by feeders.
The hinterland is the area where the demand for cargo movement is generated. Its importance is closely related to the level of connectivity1 and the level of com-petition from other ports. The market areas served by a port can be classified into two major categories:
1. Main hinterland: The main hinterland illustrates an area where the port has a dominant share of cargo flows. The port is the core market area and its acces-sibility is the highest. It is possible for other ports to compete over the main hinterland if its service level is very poor.
2. Competition margin: The competition margin represents an area where a port can be competing with other ports. In Fig. 16.2, ports A and B are competing over the areas in the competition margin. Similarly, ports A and C are also competing in the competition margin.
On the other hand, foreland refers to the ports and overseas markets that are connected by shipping services from the cargo source. The foreland is an area where a port provides cargo delivery services. With the emergence of intermodal transport and door-to-door services, the hinterland and foreland of a port have become increasingly complex. Nowadays, a port can be seen as a node linking the transport chain. With the development of new logistics patterns of maritime trans-port and intermodal transport, modern ports can compete for far-reaching cargoes with far-distant competitors. On the other hand, the bargaining power of ocean carriers in international shipping indicates that modern ports bear a higher risk that their customers may switch to alternative ports of call.
To be competitive, the port operations need to extend beyond the simple func-tion of services to ships and cargoes. In addition to the role as the sea–land inter-face, a port is a location to provide value-added logistics services to its users. As a result, the port system not only serves as an integral component of the transport
————— 1 Connectivity refers to the ability of users to move their cargoes freely within and between the areas.

16.4 Evolution of a Port 225
system, but is also a major subsystem to link production, consumption, and other related activities. The business scope of a port has extended from ship–shore cargo management to land-side developments and supply chain management.
To collaborate with other market players in the shipping industry, port oper-ators undertake vertical and horizontal integration strategies. Strategies of vertical integration include integrating operations with ocean carriers and other transport operators (e.g., rail operators). Horizontal integration strategies have been gaining more support in recent years. However, port operators seeking to integrate either horizontally (merge with, manage or own terminals beyond the home port) and/or vertically (offer a wider range of logistics services) should be aware of possible conflicts with other players in the port community (Bichou and Gray 2005).
16.4 Evolution of a Port
Traditional ports were located close to city cores as shipping activities existed there in the first place. A supply of workers to perform labour-intensive cargo handing activities was also a reason for the port to be located close to the city. In the early 1950s, ports, such as those of London and New York, hired a number of dock workers. To meet the high growth rate of seaborne trade, the number of ships and their size grew very quickly. Over time, development of handling equipment and specialization of vessels (e.g., bulk carriers and full cellular carriers) resulted in new site requirements. For example, bigger ships need more dock space and greater water depths.
Mainhinterland
Mainhinterland
C
B
Competitionmargin
Competitionmargin
A D ForelandForeland
Fig. 16.2 Port hinterland and foreland

226 16 Port Development
16.4.1 Anyport Model
The Anyport model was developed by Bird (1980) to describe how port infrastruc-ture evolves. As shown in Fig. 16.3, the model identifies three major phases to explain the port development process:
1. Setting: The initial setting of a port depends on geographical considerations. Evolution of a port started from the original port, mainly a port equipped with cargo handling facilities to handle trading and related activities. Port-related ac-tivities were mainly confined to warehousing and wholesaling, located at sites directly adjacent to the port.
2. Expansion: The industrial revolution and growth in seaborne trade volume created impacts on port activities. Quays were expanded and docks were re-quired to handle growing amounts of freight and increasing numbers of larger ships. Furthermore, the development of intermodal transport enhanced the inte-gration of rail operations with port terminals to increase accessibility to hinter-lands. Port-related activities also expanded to include value-added activities such as cargo consolidation.
3. Specialization: This phase of development involved the construction of special-ized terminals to handle specialized freight such as containers. Larger ships of-ten required deeper channels, longer berths, more yard spaces, and comprehen-sive intermodal transport facilities. As a result, original port sites, located adjacent to downtown areas, became obsolete and were abandoned. This cre-ated opportunities for port operators to build large and new ports to cope with the increasing demand from port users.
The Anyport model has been tested in a variety of different conditions. The Anyport concept is useful for explaining traditional port development; however, it has some limitations in analysing contemporary port development. More impor-tantly, the model does not consider the recent development of shipping networks and the use of the hub-and-spoke approach in container shipping.
AnyportModel
Anyportmodel
SettingSetting ExpansionExpansion SpecializationSpecialization
Fig. 16.3 Stages of port development

16.5 Transport Complex Economy 227
16.4.2 Development of Shipping Hubs
With growing complexity in shipping services, a hierarchical set of shipping net-works has emerged (Robinson 1998). The key characteristics of contemporary shipping networks are fewer ports of call and the deployment of bigger vessels. The shipping networks are operated by mega vessels between major regions and supported by a hub-and-spoke system.
There is a trend in the shipping industry to change shipping operations to hub-and-spoke services. Hubs, because of their direct connections to many spoke cit-ies, are highly accessible places. Hubs also allow the development of indirect linkages among various locations. As a result, the hub-and-spoke operations can benefit from cost-efficiency, service provision, and market position. The devel-opment of shipping hubs indicates a higher level of integration between sea-based and land-based transport systems, particularly by using an intermodal transport system. The main forms of integration between maritime and inland transport systems include inland waterway and inland feeder operations:
• Inland waterway ports: These are inland maritime ports that are integrated with inland waterway services on direct shuttle services by barges or small ships.
• Inland feeder terminals: This is a recent concept proposed to enhance direct inland connection with a direct rail service. The agile port system is a typical example that benefits from intermodal transport with improved efficiency in port operations.
16.5 Transport Complex Economy
The development of global supply chains has increased the pressure on improving port operations, as well as maritime and inland transport. Inland accessibility has become a cornerstone in port competitiveness. A shipping hub is characterized by strong functional interdependency with the hinterland and foreland. It leads ulti-mately to the formation of extensive shipping networks. The development of shipping networks implies the development of shipping hubs with fewer ports of call. Shipping hubs can be operated by large vessels based on scheduling vessels back and forth between major ports. In a hub-and-spoke system of containerized trade, hub ports are generally well equipped to facilitate a quick turnaround time of large vessels.
In shipping hubs, firms involved in upstream and downstream activities operate together (Singer and Donoso 2008). Upstream activities are those related to the initial stages of freight transport. Downstream activities add value to transport services. Firms can also vertically integrate several activities, e.g., the Maersk shipping line, as a global container shipping carrier, also operates container termi-nals and provides value-added logistics services to its customers. For a given trad-ing location such as Hong Kong, both upstream firms in the transport chain, e.g.,

228 16 Port Development
feeder operators, and downstream firms, e.g., logistics service providers, converge over time on the location to conduct their businesses, where their economic activ-ities collectively lead to the emergence of an activity complex economy.
A transport complex economy (Fig. 16.4) refers to an economy that emerges from the joint location of transport-related activities that have substantial trading links with one another (Parr and Budd 2000). One of the most striking features of a transport complex economy is the presence of clusters of linked industries. A cluster can be defined as “a geographically proximate group of interconnected firms including suppliers, service providers and associated institutions in a particu-lar field, linked by externalities of various types” (Porter 2003). Cluster also refers to “geographically concentrated groups of interconnected firms and associated institutions in a similar field”. There is a tendency for successful enterprises to be grouped into “clusters” of related and supporting industries. The container trans-port industry in Hong Kong is an example of a cluster which consists of various firms such as logistics service providers, shipping lines, container terminal oper-ators, off-dock depot operators, truckers, feeder operators, as well as professional and academic institutions.
A transport complex economy is characterized by a set of identifiable and sta-ble business relations among firms. These relations among firms are conceived primarily in terms of trading links, and it is these patterns of transactions that are seen as principally governing their decision on where to locate (Gordon and McCann 2000). A transport complex economy is a phenomenon explaining why transport users and service providers move to and are located in the same area. For instance, there are different transport-related business operators, such as barge operators, truckers, container terminal operators, and logistics service providers, located at a busy transport hub such as Hong Kong.
Transport complex economyTransport complex economy
Domestics competitionDomestic competitionUpstream and downstream
activitiesUpstream and downstream
activities
Knowledge spillovers tofacilitate growth
Knowledge spillovers tofacilitate growth
Investment in specialized supporting services
Investment in specialized supporting services
Trigger subsequent rounds of investmentTrigger subsequent rounds of investment
Fig. 16.4 Transport complex economy

16.6 Concluding Remarks 229
A transport complex economy influences regional competitiveness in several ways. First, the geographical concentration of firms allows access to specialized upstream and downstream firms and workforce. Given that firms can access a well-established pool of resources, a transport complex economy also reduces the barriers to allow them entry into the industry to maintain competitiveness. More importantly, the concentration of an industry helps knowledge spillovers between firms and therefore facilitates industrial growth in that region. Through imitation and rapid interfirm movement of highly skilled labour, ideas are quickly spread among neighbouring firms.
A transport complex economy affects the location decision of international shipping firms. Location is important to firms because:
• the localization of industry provides support for specialized local providers of inputs to organize production;
• the diffusion of information is speedier where there is localized concentration of industry, thereby generating technological spillovers;
• the pooling of specialized labour in a locality creates important local demand.
Such geographical concentration is internal to an industrial sector in a region, but external to firms operating in the region. Investment in the area may trigger positive externalities, which in turn may produce growth effects via more intense and productive economic activities.
16.6 Concluding Remarks
The development of a transport complex economy can be a useful way to enhance regional competitiveness, which is defined as “the ability to produce goods and/ or services which meet the test of the international market, while at the same time maintaining high and sustainable levels of income, or more generally, the ability of regions to generate relatively high incomes and employment level while being exposed to external competition” (European Commission 1996). In container transport, regional competitiveness can be viewed as the ability of a country to provide integrated freight transport services that meet different user needs in the transport industry, whereby the country is able to generate relatively high incomes and a high employment level while tackling the increasingly competitive pressure from neighbouring rivals.
Regional competitiveness can be seen as the cumulative outcome of a number of factors, which include:
• Domestic rivalry for freight transport services stimulates the improvement of the container transport industry with enhancement of supporting services such as off-dock operations, container maintenance and repairing services, feeder connections, and container freight stations for cargo consolidation.
• Keen domestic competition leads to more sophisticated users, who expect con-tinuous improvement in the breath and depth of the shipping services by their

230 16 Port Development
providers. For example, Hong Kong International Terminals, the home base of the world’s biggest container terminal operations, adopts a high level of infor-mation technology to offer Mobile Terminal Message services to its users through which drivers can receive timely information on container pickup and grounding locations using their mobile phones.
• With a large number of carriers competing in Hong Kong, the industry will increase the supply-specific factors, such as the provision of comprehensive services to facilitate trade and customs declarations, as well as professional training by vocational and academic institutions.
• At the same time, upstream firms, such as container terminal operators and feeder operators, will invest in the transport service area. Besides, downstream firms, such as container freight station operators, will also invest in freight-transport-related businesses.
• Finally, other operators in related industries, such as buying offices and trade-related firms, will enhance their services as well. These competitive actions will trigger subsequent rounds of investment.
Regional competitiveness can be seen as a result of the development of a trans-port complex economy. To facilitate such development, it is necessary for port operators and port authorities to strengthen the role of the shipping hub. From the port development perspective, ports nowadays act as an interface between the places of production and consumption, which attracts the attention of market play-ers in transport-related business. Intermodal transport operations are a strategically important area for ports to focus on owing to the need for performance enhance-ment to service the growth of the amount of freight. The hub-and-spoke system, which is concerned with integrating intermodal transport with marine terminals to accommodate new port–inland linkages, has become essential in port develop-ment. In developing a transport complex economy, there can be efficiency gains by integrating ports with inland and freight transport systems.
References
Almotairi B, Lumsden K (2009) Port logistics platform integration in supply chain management. Int J Shipp Transp Logist 1(2):194–210
Bichou K, Gray A (2005) A critical review of conventional terminology for classifying seaports. Transp Res Part A 39:75–92
Bichou K, Lai KH, Lun YHV, Cheng TCE (2007) A quality management framework for the liner shipping companies to implement the 24-hour advance vessel manifest rule. Transp J 46(1): 5–21
Bird J (1980) Seaports and seaport terminals. Hutchinson University Library, London Cullinane K, Khanna M (2000) Economies of scale in large containerships: optimal size and
geographical implications. J Transp Geogr 8(3):181–195 Donova A (2004) The impact of containerization: from Adam Smith to the 21st century. Rev Bus
25(3):10–15 Drewry (2007) The Drewry annual container market review and forecast. Drewry Shipping
Consultants, London

References 231
European Commission (1996) Cohesion and competitiveness: trends in the Regions. 6th periodic report on social and economic situation and development of the regions in the community. European Commission, Luxembourg
Fleming KD (2002) Reflections on the history of US cargo liner services (part I). Marit Econ Logist 4(4):369–389
Fleming KD (2003) Reflections on the history of US cargo liner services (part II). Marit Econ Logist 5(1):70–89
Gordon IR, McCann P (2000) Industrial clusters: complexes, agglomeration and/ or social net-work? Urban Stud 37(3):513–532
Kim HW, Kim YG (2001) Rationalizing the customer service process. Bus Process Manag J 7(2): 139–156
Lun YHV, Browne M (2009) Fleet mix in container shipping operations. Int J Shipp Transp Logist 1(2):103–118
Lun YHV, Wong WYC, Lai KH, Cheng TCE (2008) Institutional perspective on the adoption of technology for security enhancement of container transport. Transp Rev 28(1):21–33
Lun YHV, Lai KH, Cheng TCE (2009) A descriptive framework for the development and oper-ation of liner shipping networks. Transp Rev 29(4):439–457
Notteboom TE, Rodrigue JP (2005) Port regionalization: towards a new phase in port develop-ment. Marit Policy Manag 32(3):297–313
Parr JB, Budd L (2000) Financial services and the urban system: an exploration. Urban Stud 37(3): 593–610
Porter ME (2003) The economic performance of regions. Reg Stud 37(6):548–578 Robinson R (1998) Asian hub/ feeder nets: the dynamics of restructuring. Marit Policy Manag
25(1): 21–40 Rodrigue JP, Comtois C, Slack B (2009) The geography of transport systems. Routledge, New
York Singer M, Donoso P (2008) Upstream and downstream in the value chain? J Bus Res 61(6):669–
677 Slack B, Comtois C, McCalla R (2002) Strategic alliances in the container shipping industry:
a global perspective. Marit Policy Manag 29(1):65–76 Song DP, Zhang J, Carter J, Field T, Marshall J, Polak J, Schumacher K, Proshum SR, Wood J
(2005) On cost-efficiency of the global container shipping network. Marit Policy Manag 32(1):15–30
Stopford M (2004) Maritime economics. Routledge, New York Ugboma C, Ugboma O, Damachi B (2009) A comparative assessment of service quality perspec-
tives and satisfaction in ports: evidence from Nigeria. Int J Shipp Transp Logist 1(2):172–193

233
Index
A
ABC analysis, 158 access-based positioning, 68 acquisition, 71 active shipping supply, 22 actor in the shipping business, 3 adoption of technology, 167 agency network, 112 agile port, 206 agility, 209 alliance, 72 Anyport model, 226 auxiliary market, 34, 35, 37 available shipping supply, 22 average haul, 19
B
bidirectional logistics system, 207 box-to-slot ratio, 159 BRIC, 6 broken-up age, 53 bulk cargo, 4 bulk shipping, 33, 34, 40 business environment, 61 business strategy, 65
C
canal lock, 13 capacity adjustment, 51, 52, 54, 57 capacity adjustment model, 56 capacity management, 49 Cape of Good Hope, 14 carrying capacity, 81, 86
cash flow, 35 coercive process, 173 collaboration, 222 competition, 222 competitive process, 29 competitive strategy, 68 competitor intelligence, 66 component of container transport cost,
152 concentration, 221 concentration ratio, 221 connectivity, 224 conscious planning, 79 consignee, 2 consignment assembly, 188 consignment consolidation, 188 consignor, 2 container depot, 162 container freight station, 184, 189 container management, 111 container security, 166, 172 container security initiative, 168, 169 container shipping, 50 container shipping market, 53 container shipping supply, 52 container trade, 51 container transport chain, 140, 172, 174,
175, 176, 189 container transport operation, 188 container transport security, 166, 173, 176 container yard, 184 container yard and depot, 154 containerization, 78, 220 corporate strategy, 64 correlation matrix, 84 cost economy, 23

234 Index
cost trade-off, 132 cross-functional coordination, 67 curve-fit graph, 85 customer focus, 66 customs trade partnership against terrorism
(C-TPAT), 168, 175 cyclical nature, 45
D
data element, 121 decision-making unit, 201 dedicated container terminal, 130, 181,
182, 198 demand for shipping, 2 demand function, 27 demolition market, 34 demolition vessel, 38 derived demand, 2, 21 determinant of demand for sea transport,
18 determinant of fleet size, 56 determinant of shipping demand, 17 development of port management, 194 diffusion of technology, 170 direct call service, 95 distance effect, 19 division of container ports, 182
direct-call port, 182 feeder port, 182 hub port, 182
door-to-door service, 119 downstream activity, 227
E
economy of scale, 84, 109 effective information flow, 120 efficiency score, 203 elasticity of demand, 21 electronic commerce, 139 emerging country, 7 empirical model, 40, 42 empty container, 143 empty container management, 156 empty container reuse, 161 enterprise resource planning (ERP), 186 equilibrium price, 28 exchange function, 42, 77, 79, 81, 86
F
factor market, 42, 78, 81, 86 financial risk, 109
firm expansion, 93 firm performance, 78 firm size, 93 flat-rack container, 155 fleet adjustment, 44 fleet mix, 91 fleet mix model, 96 fleet size, 23, 27, 34, 44 fluctuation in demand, 26 foldable container, 162 foreland, 224 formulation of strategy, 70 4C forces, 220, 223
collaboration, 220 competition, 220 concentration, 220 containerization, 220
free time and per diem, 154 freight market, 4, 34, 39 freight rate, 20, 24, 28, 34, 57, 86 freight transport mode, 131 functional strategy, 65
G
gate facility, 185 general-purpose container, 155 geographical concentration, 229 geographical imbalance, 17 geographical pattern, 12 global container terminal operator, 198
global carrier, 198 global stevedore, 198
going price, 27 growth rate in containerized trade, 208
H
hardware infrastructure, 210 hierarchical set of shipping networks,
90 hinterland, 224 horizontal expansion, 83 hub port, 90, 91 hub-and-spoke approach, 95 hub-and-spoke system, 90
I
importance of a container port, 223 Incoterms, 121 industrial organization, 34, 50 industrial shipping, 28 industry structure, 50

Index 235
information flow, 111 infrastructure constraint, 27 inland waterway operator, 129 institutional isomorphic process, 167 institutional isomorphism, 171, 172
coercion, 172 mimesis, 172 norm, 172
institutional rigidity, 27 integrated supply chain network, 211 integration strategy, 225 intelligent application, 211 interchange, 153 interchange area, 184 interfirm collaboration, 102 interfirm cooperation, 79 intermodal connection, 139 INTERMODAL framework, 147 intermodal infrastructure, 139 INTERMODAL model, 137
availability of logistics service, 138 deregulation, 138 external business environment, 137 infrastructure, 137 logistics security, 138 management of containers, 137 new technology, 137 operation of container terminals, 138 regional location, 137 transport operator, 137
intermodalism, 136 international trade, 2, 5 international trade pattern, 9 interorganizational relationship of players,
195 interterminal competition, 183
J
joint venture, 72
K
knowledge-based system, 209
L
laid-up tonnage, 22 land-based, 119 layered approach, 167 leasing container, 160 length of the planning horizon, 158 line transshipment, 91 line-bundling, 91
liner cargo, 5, 10 liner market, 4, 5 liner shipping carrier, 78 liner shipping network, 102 logistics integration, 180 logistics security measure, 146 logistics service provider, 126
full-service provider, 126 nicher, 126 traditional freight forwarder, 126 transformer, 126
low-cost transport, 2
M
magnitude of supply, 26 main bulk, 10 maritime route, 12 market integration, 141 market mechanism, 17 market orientation, 65 market structure, 33, 34 mega ship, 94, 95 merger and acquisition, 63 mimesis, 173 minor bulk, 10 modal combination, 133 mode choice, 132 movement of empty container, 161 multimodal network, 110 multiple stops, 166 multiuser terminal operator, 181 mutually beneficial strategy, 102
N
needs-based positioning, 68 network, 73 network-based organization, 102, 103 new building, 36 new building market, 34 new order, 53 node and link, 120 non-intrusive container inspection (NII),
146, 169 norm, 174
O
ocean container carrier, 129 ocean-going, 119 off-dock depot, 163 oligopoly, 50 on-hiring and off-hiring, 154

236 Index
open-top container, 155 operational effectiveness, 67 operations module, 187 optimal ship size, 91 organic growth, 71 outsourcing, 124
P
Panama Canal, 12 parcel size distribution (PSD), 8 pattern of development in the terminal
industry, 196 internationalization, 196 regional coverage, 196 terminal network, 196
perfect competition, 33 political factor, 18 port authority, 145 port community, 211, 225 port handling, 190 port management, 207 port selection criteria, 92 port–hinterland relationship, 109 price mechanism, 79 primary customer, 122 principle of buying low and selling high,
30 process at container terminal, 185, 186 procurement of empty container, 159 product market, 42, 78, 81, 86 PROFIT framework, 202
focus of business, 203 internationalization, 203 operating efficiency, 202 productivity, 202 regional coverage, 202 terminal network, 203
Q
quantity demand, 20, 28 quantity supply, 28 quay, 183
R
radio-frequency identification technology (RFID), 169
rail operator, 128 ranking of container ports, 209 ratio of growth, 56 rational decision, 52 real market, 34, 35
refrigerated and heated container, 155 regional competitiveness, 229, 230 regionalization, 180 regression equation, 44, 54, 55, 85,
199, 200 regulatory function, 145 repositioning of empty container, 161 rigidity of supply, 27 road operator, 127 role of a port, 179
S
sale and purchase market, 34 scale operation, 83 scatter plot, 43, 54 SCOPE framework, 97, 99
customer value, 97 extensive market coverage, 97 optimal vessel size, 97 port of call, 97 service frequency, 97
seaborne trade, 2, 9, 10, 19, 21, 34, 39, 56, 57, 86
seamless logistics service, 145 seaport’s hinterland, 142 second-hand vessel, 37 service scope, 90, 93 service substitution rate, 211 7Rs, 123
right amount, 123 right condition, 123 right customer, 123 right information, 123 right place, 123 right product, 123 right time, 123
ship size, 93 SHIPMENT framework, 108, 113, 115
equipment supply, 108 hinterland, 108 intermodal transport, 108 management information system, 108 new agent, 108 port, 108 space management, 108 terminal operator, 108
shipper transshipment, 91 shipping capacity, 44, 89 shipping cost, 94 shipping cycle, 28, 29 shipping demand, 17 shipping demand curve, 20 shipping hub, 227

Index 237
shipping intensity, 7 shipping risk, 28 shipping route, 90 shipping strategy, 63 shipping supply curve, 24 shipping supply function, 24 shipping system, 142 shortage of ships, 52 short-run shipping supply, 25 size-based strategy, 83, 94 SMART driving force, 115 SMART factor, 104
additional business, 104 market coverage, 104 reduction in waste, 104 strategic initiative for performance
gain, 104 technology development, 104
software infrastructure, 210 source of competitive advantage, 84 stabilization mechanism, 36 stage of collapse, 29 stage of peak, 30 stage of recovery, 30 stage of trough, 29 Strait of Hormuz, 13 Strait of Magellan, 14 Strait of Malacca, 13 strategic alliance, 63 strategic analysis, 69 strategic choice, 70 strategic decision, 63 strategic interdependence, 103 strategic planning, 157 strategic position, 68 strategic positioning, 67 streamlined operating process, 211 structural change, 78 structural option, 71 structure–conduct–performance paradigm,
62 suboptimal price, 45 Suez Canal, 13 supply chain management, 207 supply function, 28 supply of sea transport, 22 supply of shipping capacity, 23
T
tank container, 155 tanker trade, 10 technological rigidity, 27 technology constraint, 27
ten-step implementation framework, 212 step 01 - management commitment,
213 step 02 - process-improvement team,
213 step 03 - setting the standards, 214 step 04 - awareness of staff members,
215 step 05 - manager and supervisor
training, 215 step 06 - goal setting, 215 step 07 - removal of error, 216 step 08 - corrective actions, 216 step 09 - recognition and reward, 216 step 10 - continuous improvement, 217
terminal facility, 183 terminal management system, 140, 144,
212 terminal profit, 200, 201 terminal throughput, 197, 199, 201 3PL, 125 time lag, 26 trade elasticity, 19 trade imbalance, 143 trade route, 10 tramp market, 4 transit time, 95 transport complex economy, 227,
228, 229 transport cost, 20 transport facilitator, 122, 123 transport operator, 122, 127 transport system, 2, 3 transportation network, 112 transshipment operation, 110 transshipment port, 91 types of cost to maintain container
equipment service and capacity, 154 equipment cost, 154 management and administrative cost,
155 movement cost, 155 storage cost, 155
types of logistics service, 125 freight forwarding service, 125 technology-enabled logistics service,
125 value-added logistics service, 125
U
upstream activity, 227 user of an intermodal system, 147
fifth-party user, 147

238 Index
first-party user, 147 fourth-party user, 147 second-party user, 147 third-party user, 147
V
value chain, 79, 124 value-added function, 77 value-based pricing, 157 variety-based positioning, 68 ventilated container, 155
vertical expansion, 81, 82, 86 virtual container yard, 162
W
WORKPORT model, 206 world economy, 19
Z
zero-sum game, 31


