Embed Size (px)
Citation preview
The University Of Sheffield.
Corporate Governance, Finance, and Technological Capability in
Newly Industrialising Economies: A Framework and Evidence from Auto and
Electronics Industries in China
Submitted to the Management School, University of Sheffield in partial fulfilment of the requirement
for the degree of doctor philosophy
By Jiajia Liu
Management School University of Sheffield
July 2010
Abstract Based on empirical research in two of China's biggest and most important manufacturing sectors: Auto and Electronics, this study develops an analytical framework to understand, how firms in newly industrialising economies (NIEs) develop their technological capabilities, and how this is affected by the situation of finance and the practice of corporate governance (CG). Particularly, by further adaption of the theory to the Chinese context, it attempts to answer the questions: 1) 'What is the situation of technological capabilities in the firms in the Chinese Auto and Electronics Industries?'2) 'How has the development process of technological capabilities been?' 3) 'What is the situation of corporate governance and finance in Chinese Auto and Electronics firms?' and 4) 'How can the capabilities developed be explained from the finance/corporate governance aspect?'
Two frameworks are developed on the basis of previous research on technological capabilities and corporate governance. Three Propositions are derived from these frameworks. Five case studies are conducted in both sectors, and seven hypotheses are then generated from the findings of case studies. They are tested through a questionnaire survey of 195 firms in the Chinese electronics industry.
This thesis makes several theoretical contributions and has several policy implications. Primarily, this study contributes to the literature on the development of technological capability in NIEs by: 1) creating a better understanding of firm-level technological capability in the Chinese auto and (especially) electronics sectors; 2) providing a thorough account and explanations of how Chinese firms with typically flawed corporate governance (CG) fail to develop dynamic capabilities; how those with better CG succeed, and why there are not more of them. In addition this study has adapted the theoretical framework (the effect of corporate governance on technological development) to the Chinese situation and enriched it. It will enlighten future applications of such theory to the wider context of NIEs in general. For policy makers, the crucial implication is that any improvement in the governance factors studied in this study will significantly boost the development of technological capability.
I
Acknowledgement When I started this thesis, I was advised by my ex-PhD friends that never write the
acknowledgement before the main body is done: "it is the only part where you can write
whatever you want and not to worry about the examiners' comments, and you MUST save
the best till last!" However, I am not finding this any easy - Sisyphus' ordeal has always
been a consolation to my PhD study, in which he pushes a rock up a hill for eternity; but
now I envy him for not having to condense his feelings injust one page.
Nevertheless, my immense gratitude first goes to Professor Andrew Tylecote. He
has not only been an enlightening supervisor and academic, but also a friend and mentor
for life. I would also like to thank Professor Noel O'Sullivan, Phil Wright, Stuart
Macdonald, Dr. Jo Padmore and Gill Musson, for their timely inspiration and
encouragement. I am equally grateful to all members of staff at Management School, who
have provided me with generous help and support over these years, thank you Mandy, Loo,
Kenneth, Kath, Pauline, and Hilda.
I am very lucky to have shared my PhD journey with many nice and interesting
friends. Anna, Nicki, Shuping, Raquel, Nazia and Thomas, I will always remember and
cherish those sunny (and rainy and gloomy) afternoons when we chatted over a cuppa. I
also thank myoId friends in China - Aiqing and Xiang Hua - for their continuous
companionship; and my new and best friends in UK - Alex, Marian, Moritz, Steve, and
Rado, with whom my stay in the UK is no longer only a period of study, but a true
experience of life.
My study would have been impossible had it not been for my parents, my sister
and my parents-in-law. Thank you for your love, support and faith, and thank you for
whole-heartedly sharing my moments of joy and more importantly, putting up with me
during times of frustration.
Finally I dedicate this thesis to my husband Jun, who has also recently finished his
PhD. Having two broke PhD students under one roof can be so difficult, and I sincerely
believe that the hardest times are now finally behind us.
II
The majority of research reported in this thesis was based on an ESRC-funded
research project led by Professor Andrew Tylecote (Project title: Corporate governance
and technological development in China. Project reference: RES-000-22-1504), for which
I was the research assistant. Part of the results of the project have been published or
presented at academic conferences as joint efforts between me and Professor Andrew
Tylecote. Specifically, the case study on the three auto companies reported in Chapter 6 is
now a journal article in Industry and Innovation which includes Appendix V (see Liu &
Tylecote, 2009). I am immensely indebted to Professor Tylecote for writing section 1.3
and 2.3.5 of this Chapter. All potential errors and mistakes are however entirely mine.
III
Table of Contents
ABSTRACT .................................................................................................................................. 1
ACKNOWLEDGEMENT ........................................................................................................... II
ABBREVIATIONS AND ACRONYMS ....................•......•..............................•.................... VIII
LIST OF TABLES ••..............•..........................•..........•••..•.•........................•.....•....•.•.•.......•........ X
LIST OF FIGURES ..•......•.•.........•••..••..•......•....•.•.....•.•...•••••.........•.........••................•......... I •••• XII
CHAPTER 1 INTRODUCTION .•..............•••.........•••......••......................•....................•...•........ 1
1.1 China's challenge In developing Indigenous technological capability .................................................. 3
1.2 China's challenge In SOE reform ....................................................................................................... 5
1.3 Scope of this research ...................................................................................................................... 7
1.4 Research questions ......................................................................................................................... 9 1.4.1 Aims ..................................................................................................................................................... 9 1.3.2 Research questions and objectives ..................................................................................................... 9
1.5 Significance and Contribution ........................................................................................................ 11
1.6 Structure of this thesis ................................................................................................................... 12
CHAPTER 2 PRIOR STUDIES IN TECHNOLOGICAL CAPABILITY DEVELOPMENT15
2.1 Technological capability ................................................................................................................. 17 2.1.1 The definition of technological capability, dynamic capability, and innovation ............................... 17 2.1.2 Measurement of technological capabilities ...................................................................................... 23
2.2 Development of corporate technological capability In NIEs ~onceptual and theoretical building blocks ................................................................................................................................................. 32
2.2.1 NIE's three-stage technological trajectory theory ............................................................................. 32 2.2.2 The learning process framework ....................................................................................................... 35 2.2.3 The National System of Innovation framework ................................................................................. 39
2.3 The system of corporate governance & finance and technological capability development ............... 43 2.3.1 Technological regime and its dimensions .......................................................................................... 45 2.3.2 Properties of learning in technological regime, and their demands for corporate governance and finance ........................................................................................................................................................ 46 2.3.3 Adaptation of CGFS and technological capability development to the context of NIEs ................... 52
IV
2.4 Summary ...................................................................................................................................... 54
CHAPTER 3 CHINA'S AUTOMOTIVE AND ELECTRONICS INDUSTRIES IN THE CONTEXT OF TRANSiTION ................................................................................................ S6
3.1 Characteristics of China's economic transition and technological development ........................ 56 3.1.1 Growth of private sector and the persistence of state ownership ................................................... 57 3.1.2 Internationalisation and export-led growth ...................................................................................... 60 3.1.3 Dependence on foreign technology transfer and slow competitiveness upgrading ......................... 62
3.2 China's national system of Innovation .................................................................................... 67 3.2.1 Historical Overview of China's NSI and the role of the state ............................................................. 67 3.2.2 The main actors of innovation ........................................................................................................... 69
3.3 Corporate governance and finance system In Chlna ................................................................. 87 3.3.1 Corporate governance of state-owned enterprises in China ............................................................ 87 3.3.2 Corporate governance of private enterprises ................................................................................... 97 3.3.2 Financial system as a source of funding ............................................................................................ 99
3.4 The Chinese Automotive Industry: the Industrial context ....................................................... 111 3.4.1 Industrial evolution ......................................................................................................................... 112 3.4.2 Industrial policy ............................................................................................................................... 113 3.4.3 Current development in the passenger car industry ....................................................................... 117
3.5 The Chinese Electronics Industry: the Industrial context ........................................................ 122 3.5.1 Consumer electronics (non-white goods) ....................................................................................... 124 3.5.2 Telecommunications equipment ..................................................................................................... 125 3.5.3 The Chinese electronics industry- conclusion ................................................................................. 128
3.6 Summary .................................................................................................................................... 128
CHAPTER 4 THEORETICAL FRAMEWORKS USED IN THIS STUDY ....................... 129
4.1 Framework for measuring technological capability In this thesis .................................................... 130 4.1.1 Technological capability .................................................................................................................. 130 4.1.3 Performance measurement ............................................................................................................ 135
4.2 Corporate governance/finance and technological capability development In China ........................ 137
4.3 Propositions for empirical research .............................................................................................. 139
CHAPTER 5 RESEARCH METHODOLOGY ..................................................................... 140
5.1 Philosophical perspective ............................................................................................................ 140
5.2 Research methods In this project ................................................................................................. 145
5.3 Case studies and semistructured Interviews ................................................................................. 146
5.4 Quantitative questionnaire survey ............................................................................................... 151 5.4.1 Questionnaire formulation .............................................................................................................. 151
v
5.4.2 Pilot questionnaire survey ............................................................................................................... 154 5.4.3 Final stage of the large-scale questionnaire survey ........................................................................ 155
5.5 Summary .................................................................................................................................... 161
CHAPTER 6 FINDINGS FROM CASE STUDY AND HYPOTHESES GENERATED .... 162
6.1 Pilot Case studies - SAIC and Chery .............................................................................................. 163 6.1.1 SAIC (Shanghai Automotive Industry Corporation) ......................................................................... 163 6.1.2 Chery Automobile Co., Ltd .............................................................................................................. 170 6.1.3 Discussion of pilot case studies ....................................................................................................... 174
6.2 Guizhou Tyre: a long march to endogenous innovation ................................................................. 180 6.2.1 Company profile and performance ................................................................................................. 180 6.2.2 Technological capability development ............................................................................................ 183 6.2.3 Corporate Governance .................................................................................................................... 186
6.3 Longertek .................................................................................................................................... 191 6.3.1 Company profile and general performance .................................................................................... 191 6.3.2 Approach to technological development ........................................................................................ 192 6.3.3 Corporate governance and finance ................................................................................................. 195 6.3.4 Summary ......................................................................................................................................... 198
6.4 South Electro .............................................................................................................................. 199 6.4.1 Company profile and performance ................................................................................................. 199 6.4.2 Technological Development Strategy .............................................................................................. 200 6.4.3 Corporate Governance and Finance ................................................................................................ 203 6.4.4 Summary ......................................................................................................................................... 206
6.5 Discussion, hypotheses generation and further Insights ................................................................ 208 6.5.1 Proposition 1 and Hypothesis 1 &2: Ownership and CGFS ............................................................. 210 6.5.2 Proposition 2 and Hypothesis 3, 4 &5: engagement, visibility and technological capability development ............................................................................................................................................ 212 6.5.3 Proposition 3 and Hypothesis 6 and 7: Corporate governance, finance and technological capability .................................................................................................................................................................. 213 6.5.4 Further Insights: Unbundling, inclusion and technological capability ............................................. 214
6.6 Summary .................................................................................................................................... 216
CHAPTER 7 FINDINGS FROM QUESTIONNAIRE SURVEY (1): TESTING OF HYPOTHESES 1- 2 ............................................................................................................. 218
7.1 Data profile and variables ............................................................................................................ 218 7.1 .1 Data description - general profile .................................................................................................. 218 7.1.2 Measuring variables ........................................................................................................................ 221
7.2 Firms' technological capabilities and technology activities ............................................................ 229
7.2.1 Sampled firms' technological capabilities ....................................................................................... 229 7.2.2 Technological activities ................................................................................................................... 233
7.3 Sample firms' corporate governance and finance, and hypotheses 1 and 2 .................................... 242
VI
7.3.1 Corporate governance ..................................................................................................................... 242 7.3.2 Finance ............................................................................................................................................ 246
7.4 Summary .................................................................................................................................... 250
CHAPTER 8 FINDINGS FROM QUESTIONNAIRE SURVEY (2): TESTING OF HYPOTHESES 3 - 7 ........................................................... , ................................................. 2 5 1
8.1 Correlation matrix and regression models .................................................................................... 251
8.2 Testing of Hypotheses 3- 5 ........................................................................................................... 257
8.3 Testing of Hypotheses 6 & 7 ......................................................................................................... 262
8.4 Summary .................................................................................................................................... 268
CHAPTER 9 CONCLUSION ................................................................................................ 269
9.1 Main findings .............................................................................................................................. 269
9.2 contributions, policy Implications and limitations of this study ....................................................... 273 9.2.1: Contributions and policy implications ............................................................................................ 273 9.2.1 Limitations and Reflection ............................................................................................................... 275
BIBLIOGRAPHY .......... 11 •••••••••••••••••••••••••••••••••••••••••••••••••••••••••••••••••••••••••••••••••••••••••••••••••••••• 277
Appendix I. Sample questionnaire 1: Questions for CEOs about Corporate Governance ....................... 293
Appendix II. Sample questionnaire 2: Questions for R&D Managers about Technological Capballity ..... 301
Appendix III. China's current S& T Programmes ................................................................................... 307
Appendix V. Tyre technology and the Chinese tyre industry ................................................................ 309
VII
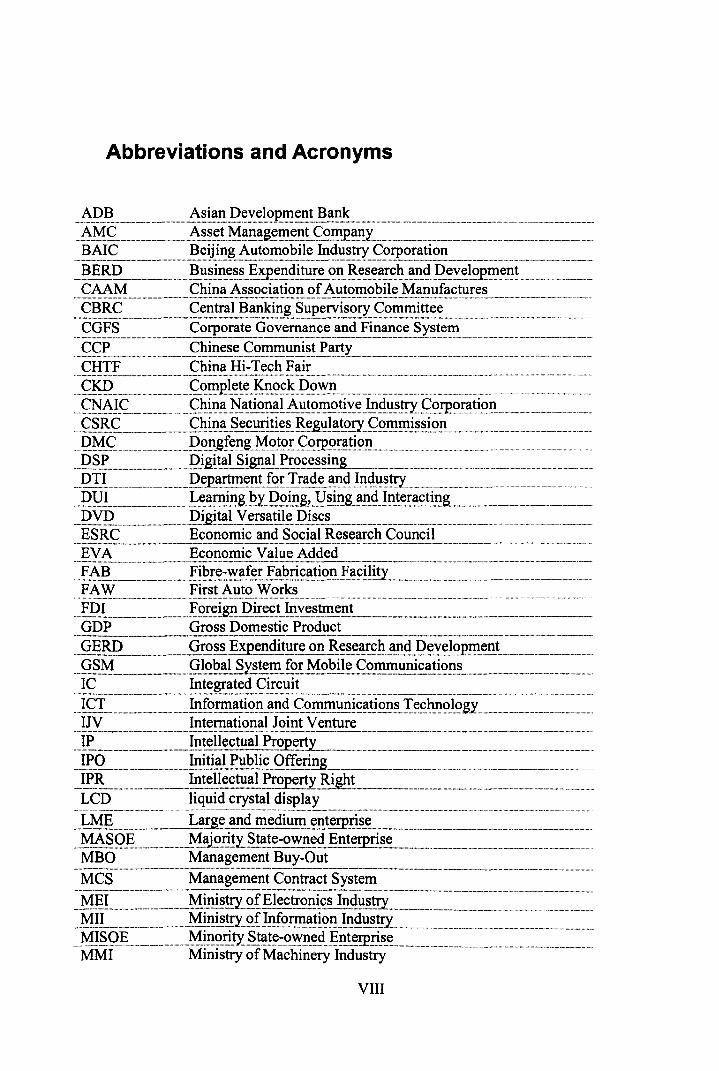
Abbreviations and Acronyms
EVA Economic Value Added
VIII
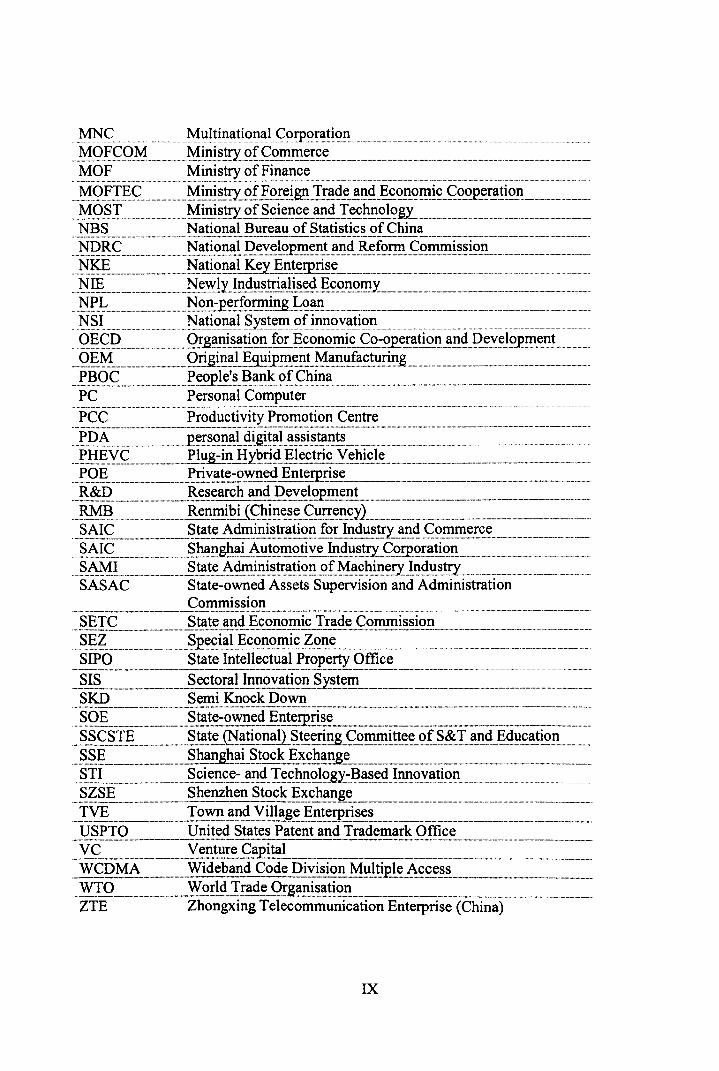
.... ~~_g .... _ ........... _._ .... _.~!~~~!~~i!l' ... ~~?~_?.!~.?.~.gen!!..~_ .. _ ...... _ ........ _ .. __ ... _ ... _ ........... _.......... . .. _._ ... _ .. _ ..
. ~P.~ ... _ ... _.. .............._p~~.Q!!~L~~g!!~!~~~~_~!!~~._ ... _ ...... _ ........... _............................................................ .................... . .... ~_~~y .. G. ............ ___ ._._PJ.~g..:i_r.!. H.~!?I.i~§!.ec.!ri~_Y.~Eic!~. ___ .. __ . _____ ........ _ ...... __ . __ .. _ .. _____ . ___ _ .... ~Q~ __ .. ____ ...... _. ___ ... __ J>.rt~~E..~_~~~~E!1.!~!E.~se ___ . _____ ._ .. ___ ._._ .. __ ._ ... _. __ .... ___ .... _ ....... __ ._._ .... _ .. _._ ......... __ .. ..... ~~Q_. __ .. _ .... _ ................ __ .~~.~~ar~~~!1_(!J?~~~~~~_~!!!. __ ... ___ ._ ....... _ ..... _._. ___ .. __ . __ . _______ ._._._ ......... _ .. __ . ... ~.~_ ... ___ .... _ ..... _ .... Rel!_~J.!?,Ug~!..~~~~~!!!!.<E!1~L __ ... ___ ... __ ....... __ ....... _ ... _ .... _ .... __ ... _____ ._ .. __ .... _._ ._.~.~!~L .. __ ...... _ .. __ .... _ .. _ .. ~_~.!~_~~~_l!i~.!!:~!i~r.!.X~!._.!~_d~~.!!Y~~~~~~!.!l~.~~~_._ .. _ ........ _ .. _...... .. .. .. ~.~!~ ....... _ .... ___ .....§~~!!g!!!L~!!!~~.~!!y.~J!1:~~ .. ~!!Y_g~t.P~!!~i~!.! ............ _ ... __ .. _ ...... __ ._ ....... . ~_~ML ... _ ...... _ .... _._ .. §!~!~.~~i_~j.~!!:~.!!.~!1..~.LM~~~i.!.!~!)'..!!1.~~~!!Y....................._........... ... SASAC State-owned Assets Supervision and Administration
Commission •• w __ ._ .. __ ._._ ... _~~ •• ____ • ____ • ___ ._. ____ ._ •• __ ._. ____ H ••• _' _______ ._._ •. _ ....... __ ....... _ .... __ .... _ ....... ___ •• _ •• _ .. _. ___ ••• _ •• _ .... ___ •• _ .•. _ .. H .•..•..•... H. __ ... _ .. _ •.• ___ .·_.··H···.· •. H ••• · .. '· ___ ····_··H. __ .. ___ ._H·"_H·. __ .
SETC State and Economic Trade Commission , __ ..... ___ . ______ . __ .. _._._. __ . ________ . ____ . __ . __ .... ______ ._._. ___ .. _._ .. _._. _____ . ___ .. __ .. ~ .. _M._ .. ~ .. ~~M_ .. M._ .... _ .. _ ........... ___ ... ___ · ___ .. · ...... ·· .. ·_·· .. ·· ___ .. ·_ .. ·· .... ___ ... __ .... _ ..... __
..... ~.~?: ....................................... ~P~~~.~!.g.~g~.Q!.r.!!~ .. ?:~.~.~_ ...................... _ ...................................................................................... .
... ~.~~Q. .. _ .... __ ........... _ .. _~!~}nt~_~~~!_~~!!!.~p.~~.t.2.f.!i:ce_._._ ... ___ ._ .. _ ..... _ ........ __ .......... __ .. __ .... _ ...... __ .. _ .... .
.... ~I~_ ... _._. _____ .... _. ____ ~~£tor~~ . .!!!!!~~.!!g.!!_~y~~!!l_ .. ___ ._. __ .. __ .. _._ .. _. _______ ._ .. _._ .. ___ .... __ .... _ ..... . SKD Semi Knock Down .. _ .. _, __ .. __ • __ • __ •• ___ •• ",,_ ... _ .. __ •• ___ ... __ .. __ • ____ .. __ M .. ___ ._ .. __ • __ .. , ____ ... _ .. __ ._ •• ___ • ___ ". _____ • __ , __ ,,_._ .. __ • __ ._._. ____ .. ___ ••• _._ ... _._ .. __ ...... _. __ .... _. ___ ._. ____ ... _ .. __ • ___ •
. ~Q~_ ... __ ... __ ..... _._ ... _ ..... _~! .. ~!~..:~~e_t~~~!P.!i~! .. _. __ ... ____ . ____ ........ _ ......... ____ ...... __ ._._ ..... _. __ ._ ... ___ .. ___ .. _ .. _._ ._~§.g.§.:r~_._ ..... _ .. _. __ ..... §.~~~._~.~~!.Q!1_~u..~!.~eri.!1..s .. gE!r.!!!!!!!~~_~i..§ .. ~I. ... ~_l!.~_~~~~!~i.~!1_._ .... __ ..... ~_~.~_ .. __ .. _._ .. _ ....... _. ___ §hal!g!!~L~_~Q£.k.~~~~~!!&~_. ____ ._ ........ _ .... _ ... _ ......... __ .. _ ... __ ._._ .. _ .......... __ ..... ___ .. .. .... ~.I! ...... _ ................ _.....~~i_~!!~~.~~!!~ .. I~~~I!Q!~ .. gy.=~~~~~J~q~.~!i.~I! ................................................... . .... ~~_~~. __ . __ ... _._._._ ..... ~~_~~er.!.§!~ck _g~£~_aES~. ___ . __ .... ___ .. _._ ...... __ ... _ ...... _ ............ ___ ... _ .. __ ............. ___ ... _ ..... . . _.!.y~_ .. _ .... ____ .. _I~~_~n~_Y5)!~~~_~E~~~!ises - .. -----.. --.-.--------.. -... -..... -.-.--.. -.. --.-.--.-.-. USPTO United States Patent and Trademark Office ._ .. _-_._---_._-_._----_._-_._---------------_ .. _--_._-._-.. _---"._."._-_ .. _--_ .. __ .. _---------_ .. _._ ...... _ .. _-_.-.. -.. _. __ ..... _ .. _-
... Y..~_ .. ___ ... __ ...... __ . __ ._y ent!1!e g~'pital ______ . ____ . ___ ... _ .. __ .. _ ............. __ ._ ... _ .. _ ..... _ ................ _ .............. " ...................... .
.. _ ~~P~~ .. _ .... _ .... _._.~ide~and c;:..9d~Piy.~j~!1 .. _Mul~p.~~_~E~~_~! __ ._ .. _ ... ________ ... __ ......... __ ... __ ." _!.Y...IQ. __ ... _. __ ._ .. _._ ... _ .. _."!!...Q!!~.I!~~.Q!8.~!1.!sa!i0!1 ______ . __ ._ ..... _._._. __ . __ .... _ .. _ .... __ .... __ ._ ...... _ ........ _ .. ZTE Zhongxing Telecommunication Enterprise (China)
IX
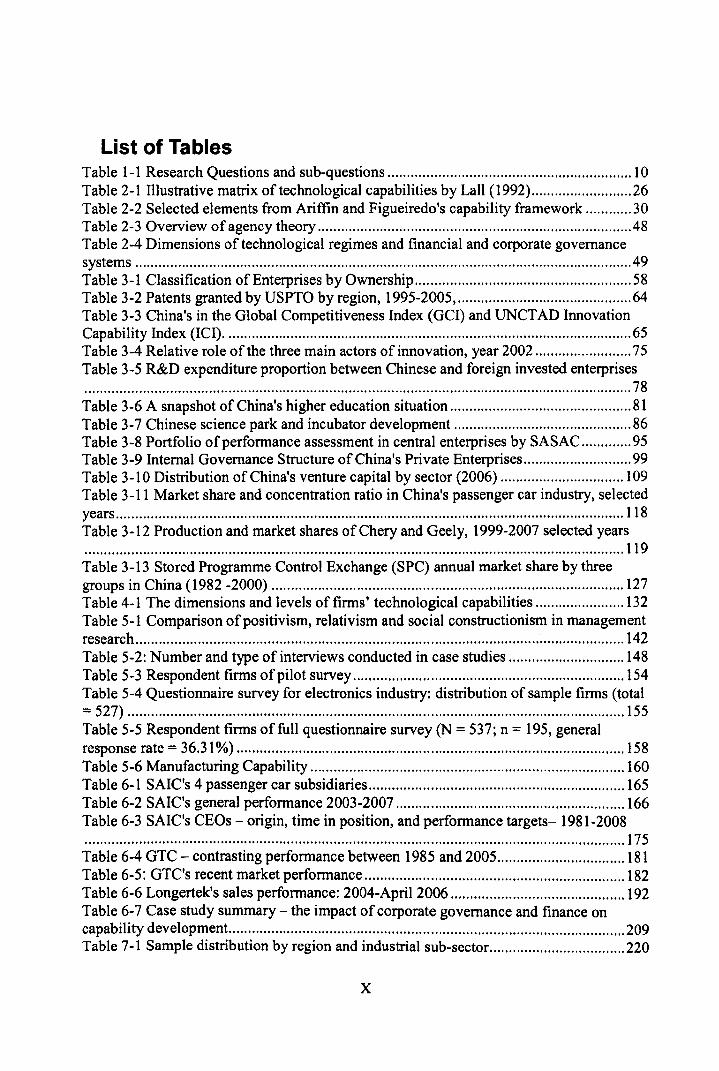
List of Tables Table 1-1 Research Questions and sub-questions ............................................................... 10 Table 2-1 Illustrative matrix of technological capabilities by Lall (1992) .......................... 26 Table 2-2 Selected elements from Ariffin and Figueiredo's capability framework ............ 30 Table 2-3 Overview of agency theory ................................................................................ .48 Table 2-4 Dimensions of technological regimes and financial and corporate governance systems ................................................................................................................................ 49 Table 3-1 Classification of Enterprises by Ownership ........................................................ 58 Table 3-2 Patents granted by USPTO by region, 1995-2005, ............................................. 64 Table 3-3 China's in the Global Competitiveness Index (GCI) and UNCT AD Innovation Capability Index (ICI) ......................................................................................................... 65 Table 3-4 Relative role of the three main actors of innovation, year 2002 ......................... 75 Table 3-5 R&D expenditure proportion between Chinese and foreign invested enterprises ............................................................................................................................................. 78 Table 3-6 A snapshot of China's higher education situation ............................................... 81 Table 3-7 Chinese science park and incubator development .............................................. 86 Table 3-8 Portfolio of performance assessment in central enterprises by SASAC ............. 95 Table 3-9 Internal Governance Structure of China's Private Enterprises ............................ 99 Table 3-10 Distribution of China's venture capital by sector (2006) ................................ 109 Table 3-11 Market share and concentration ratio in China's passenger car industry, selected years ................................................................................................................................... 118 Table 3-12 Production and market shares of Chery and Geely, 1999-2007 selected years ........................................................................................................................................... 119 Table 3-13 Stored Programme Control Exchange (SPC) annual market share by three groups in China (1982 -2000) ........................................................................................... 127 Table 4-1 The dimensions and levels of firms' technological capabilities ....................... 132 Table 5-1 Comparison of positivism, relativism and social constructionism in management research .............................................................................................................................. 142 Table 5-2: Number and type of interviews conducted in case studies .............................. 148 Table 5-3 Respondent firms of pilot survey ...................................................................... 154 Table 5-4 Questionnaire survey for electronics industry: distribution of sample firms (total = 527) ................................................................................................................................ 155 Table 5-5 Respondent firms of full questionnaire survey (N = 537; n = 195, general response rate = 36.31%) .................................................................................................... 158 Table 5-6 Manufacturing Capability ................................................................................. 160 Table 6-1 SAIC's 4 passenger car subsidiaries .................................................................. 165 Table 6-2 SAIC's general performance 2003-2007 ........................................................... 166 Table 6-3 SAIC's CEOs - origin, time in position, and performance targets- 1981-2008 ........................................................................................................................................... 175 Table 6-4 GTC - contrasting performance between 1985 and 2005 ................................. 181 Table 6-5: GTC's recent market performance ................................................................... 182 Table 6-6 Longertek's sales performance: 2004-April 2006 ............................................. 192 Table 6-7 Case study summary - the impact of corporate governance and finance on capability development. ..................................................................................................... 209 Table 7-1 Sample distribution by region and industrial sub-sector ................................... 220
x
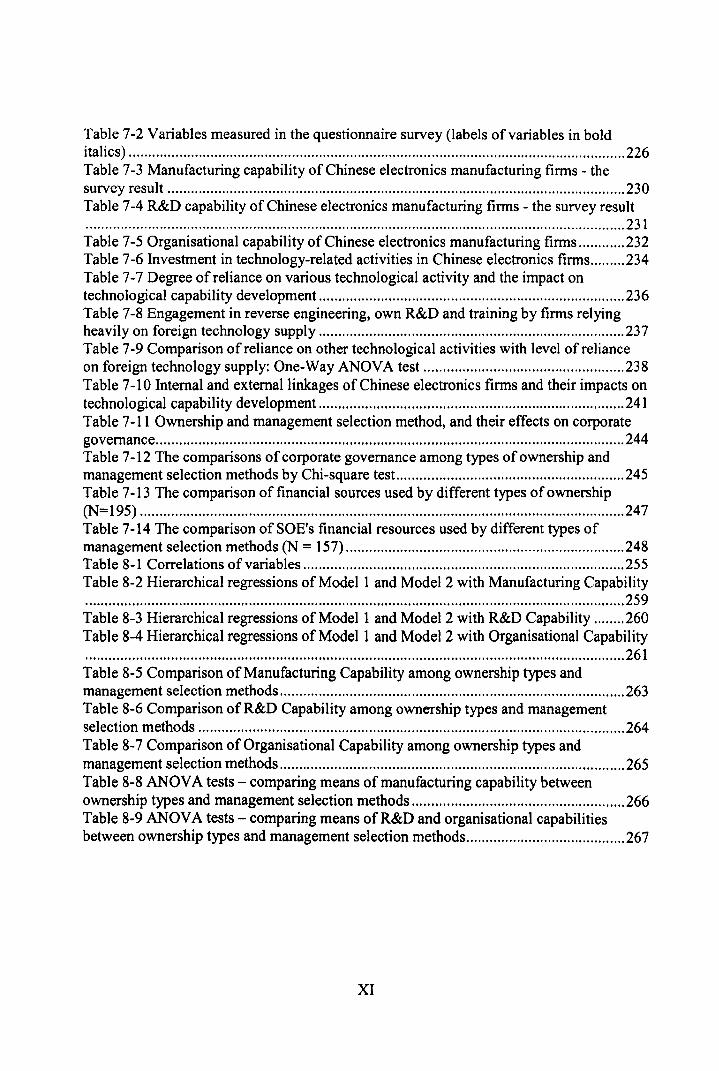
Table 7-2 Variables measured in the questionnaire survey (labels of variables in bold italics) ................................................................................................................................ 226 Table 7-3 Manufacturing capability of Chinese electronics manufacturing firms - the survey result ...................................................................................................................... 230 Table 7-4 R&D capability of Chinese electronics manufacturing firms - the survey result ........................................................................................................................................... 231 Table 7-5 Organisational capability of Chinese electronics manufacturing firms ............ 232 Table 7-6 Investment in technology-related activities in Chinese electronics firms ......... 234 Table 7-7 Degree of reliance on various technological activity and the impact on technological capability development ............................................................................... 236 Table 7-8 Engagement in reverse engineering, own R&D and training by firms relying heavily on foreign technology supply ............................................................................... 237 Table 7-9 Comparison of reliance on other technological activities with level of reliance on foreign technology supply: One-Way ANOV A test .................................................... 238 Table 7-10 Internal and external linkages of Chinese electronics firms and their impacts on technological capability development ............................................................................... 241 Table 7-11 Ownership and management selection method, and their effects on corporate governance ......................................................................................................................... 244 Table 7-12 The comparisons of corporate governance among types of ownership and management selection methods by Chi-square test.. ......................................................... 245 Table 7 -13 The comparison of financial sources used by different types of ownership (N=195) ............................................................................................................................. 247 Table 7 -14 The comparison of SOE's financial resources used by different types of management selection methods (N = 157) ........................................................................ 248 Table 8-1 Correlations of variables ................................................................................... 255 Table 8-2 Hierarchical regressions of Modell and Model 2 with Manufacturing Capability ........................................................................................................................................... 259 Table 8-3 Hierarchical regressions of Model 1 and Model 2 with R&D Capability ........ 260 Table 8-4 Hierarchical regressions of Model 1 and Model 2 with Organisational Capability ........................................................................................................................................... 261 Table 8-5 Comparison of Manufacturing Capability among ownership types and management selection methods ......................................................................................... 263 Table 8-6 Comparison of R&D Capability among ownership types and management selection methods .............................................................................................................. 264 Table 8-7 Comparison of Organisational Capability among ownership types and management selection methods ......................................................................................... 265 Table 8-8 ANOYA tests - comparing means of manufacturing capability between ownership types and management selection methods ....................................................... 266 Table 8-9 ANOVA tests - comparing means of R&D and organisational capabilities between ownership types and management selection methods ......................................... 267
XI
List of Figures
Figure 1-1 The logic of need for indigenous technological capability in China .................. .4 Figure 1-2 Structure of the thesis ........................................................................................ 14 Figure 2-1 Technological capability model by Arnold and Thuriaus ................................. 27 Figure 2-2 Kim's theory on technological trajectories in developed and catching-up countries .............................................................................................................................. 34 Figure 2-3Technologicallearning framework - the integrated Model ............................... 38 Figure 2-4 National System oflnnovation: key players and their relationships ................ .42 Figure 3-1 Growth Rate of China's Transformation Economy ........................................... 57 Figure 3-2 Growth Rates of Real Industrial Output in China, 1985, 1990-1999 ................ 59 Figure 3-3 Break-down of Chinese manufacturing exports, 1992 and 2005 (% of manufacturing exports) ........................................................................................................ 61 Figure 3-4 Trade balance in High-Tech products between China and U.S. 1996-2006 ..... 62 Figure 3-5 Primary actors involved in China's current innovation system and distribution of activities .......................................................................................................................... 70 Figure 3-6 Sources and destinations of R&D funding in China's NSI (2006) (billion RMB) ............................................................................................................................................. 71 Figure 3-7 The framework of Chinese technology policy according to Sun et al (2007) ... 74 Figure 3-8 Ministry of Education's research funding programmes ..................................... 83 Figure 3-9 Reshuffle of senior managers in China's three major telecom firms, 2005 ....... 97 Figure 3-10 Total market capitalization of SSE and SZSE as percentage ofGDP (%) 1995-2005 ................................................................................................................................... 102 Figure 3-11 Shareholding Structure of Chinese listed companies (2007) ......................... 103 Figure 3-12 Number and method oflisted private-holding firms. 1993-2006 .................. 105 Figure 3-13 Number of private firms registered vs. number of firms listed on SMEB .... 106 Figure 3-14 Firms listed on China's SME board by industry (2006) ................................ 107 Figure 3-15 Sources of Venture Capital Funding in China, 2003-2006 ........................... 108 Figure 3-16 Distribution of China's venture capital by development stage ...................... 110 Figure 3-17 China's automotive production, 1958-2006 ................................................... 113 Figure 3-18 Hypothetical trajectory of technological development in China's automotive industry- policy before 2004 ............................................................................................. 116 Figure 3-19 Market shares of domestic brands in passenger car segments, 2007-2008 ... 119 Figure 3-20: Local products vs. imported products in the telecom switch market in China (1982-2000) ...................................................................................................................... 126 Figure 3-21 Value of sales contract of Huawei: 2002-2007 (100 million US dollars) ..... 127 Figure 5-1. Research methodologies of this study ............................................................ 144 Figure 5-2 Map of China and geographic locations of case study firms ........................... 146 Figure 6-1 SAIC's organisational structure ....................................................................... 164 Figure 6-2 Illustration of Chery's initial unbundling behaviour: the making of QQ ......... 172 Figure 6-3 Corporate governance and technological development - lessons from SAIC and Chery cases ........................................................................................................................ 179 Figure 0-1. Structure ofTyre Production in China in Year 2005 (100 million units) ....... 310 Figure 0-2. Production of Radial Tyres in China, Years 2003-2005 (100 million units) .310
XII
Chapter 1 Introduction
This research responds to China's recent quest to build an innovative economy and develop
'indigenous' or 'home-grown' technological capability - the ability to assimilate, adapt and
in increasing measure create new technology!. It aims to understand, for the auto and
electronics sectors, how the development of technological capability in Chinese firms is
affected by the situation of finance and the practice of corporate governance. The
analytical framework developed in this research and empirical findings generated are
believed to have valuable implications for other newly industrialising economies (NIBs).
China's pursuit to catch up 2 with developed countries since 1979 has followed the
conventional wisdom of 'buy-absorb-innovate'. The government's logic was, by giving out
some market to foreign multinationals, and through encouraging them to invest directly or
to set up joint ventures in China, the domestic firms could acquire more advanced
technology from these firms3, they then understand, absorb and assimilate the knowledge
and new technology; then gradually develop their own capability to improve the imported
technology, and finally reach the stage of generating their own product or/and process
technology. However, many China-based scholars (Liao, 1999; Shi, 2001; Liang, 2004)
has confirmed that Chinese firms' technological capability has not benefited much from
the imported technology: the ratio of complete sets of equipment in technology acquisition
I The Chinese notion of 'indigenous technological capability' is thus consistent with that of 'dynamic technological capability' in the literature (Teece et aI, 1997; Eisenhardt & Martin, 2000; Winter 2003). As such, the term 'indigenous' will be replaced with 'dynamic' in the rest chapters of the thesis, which makes it more comparable to the theoretical literature. 2 The notion of catch up should not be only viewed in a linear way. 'As long as technology is understood as a cumulative unidirectional process, development will be seen as a race along a fixed track, where catching up will be merely a question of relative speed. Speed is no doubt a relevant aspect, but history is full of examples of how successful overtaking has been primarily based on running in a new direction' (Perez and Soete, 1988, p. 460). Indeed, in many developing countries instead of making efforts to move to the scientific frontiers, they plan to apply the acquired knowledge in developing products that are most relevant to local needs. Examples in China can be found in Lu (2005). Just as Lal1 (2000, p.13) noted: 'the process of technological change in developing countries, is one of acquiring and improving on technological capabilities rather than of innovation at frontiers of knowledge. This process essentially consists of learning to use and to improve technologies that already exist in advanced industrial economies.' 3 The form of acquisition varies: it can be done through tempering intel1ectual property, such as reverse engineering, or through capital-embedded transfer, such as purchase of plant, equipments, or through Foreign Direct Investment or setting up joint ventures. The last two forms of transfer are most prominent in China (Wang & Zhou, 1999)
1
Chapter 1,' Introduction
has been increasing over the last decades (from 89% in the 1950s, 91 % in the 1960s to
95% in the 1990s). Survey by Xu and Chen (2000) also shows that 90% of the 200 sample
firms have not significantly improved their technology five years after the transfer, and the
rest 10% have only 'partially' enhanced their technological capabilities. It seems that the
vicious circle of 'acquisition-lag-reacquisition-relag' is the problem faced by most
industries in China, where indigenous technological capability has not been substantially
developed.
In the literature there are two types of explanations to the unsuccessful story: one is that in
the past Chinese authorities have unduly protected and subsidised large state firms so that
they could survive in a competition-free environment, therefore these firms have lost
incentive and finally the ability to effectively acquire and develop dynamic capabilities
(Lu & Feng, 2004). They therefore argue that the Chinese government should have just left
it to market forces to decide which firms emerged to challenge the world in higher-tech
industry. Yet South Korean experience shows that many favoured firms, such as Samsung
in electronics and Hyundai in motor vehicles, did extremely well - as did the 100% state
owned firm POSCO in steel (Tylecote, 2006). The other main-stream criticism is towards
the inconsistent industrial and technology policy that has curbed development of firms in
mediumlhigh-tech sectors (Nolan, 2001; Qian, 2002; Lu & Feng, 2004; Xie & White,
2004). However, in spite of general 'failure', there are a small number of 'bridge-head'
firms that not only survived but also flourished, such as Lenovo, Huawei, Chery and
Guizhou Tyre (Lu & Feng, 2004; Xie & White, 2004; Liu & Tylecote, 2009). In this
context, it is pertinent to raise the following question: why has the performance of
enterprises varied so much under similar policy and market conditions?
Drawing on the arguments mentioned above, and the theoretical framework of corporate
governance, finance and technological development, this research project seeks to address
the following questions: from the finance and corporate governance angle, 1) why the
majority of the firms failed to develop technological capability that generates technical
change and enhance competitiveness; 2) how the minority succeeded and why there are
not more of them. It also aims to identify and examine the elements of corporate
2
Chapter 1: Introduction
governance that have impact on a firm's technological capability; whether these effects are
direct or indirect, and if indirect then how they are mediated. Any improvement in these
will greatly enhance firms' technological capability development and hence general
performance in the long run. Therefore findings from this research will help address the
two predominant issues in China's way up - 'technological catch-up' and 'modem
enterprise (corporate governance) system'. By the same token, such lesson and experience
will be transferrable to other NIEs and shed light on their technological upgrading and
reform of corporate governance and finance system.
1.1 China's challenge in developing indigenous technological capability
The spectacular growth of the Chinese economy commands global attention. From outside
China, it is hard to see anything but rapid, remorseless transformation into a modem, high
technology economy. Even within China, the spectacular development of parts of the
country leads to the easy assumption that big coastal cities such as Shanghai and
Hangzhou are simply showing the way. Yet, there is concern in China over the limited
extent to which Chinese-owned firms have been able to innovate. Their competitiveness,
especially in high technology sectors, has actually been declining (see Chapter 3.1 for
detailed evidences).
Thanks to the cheap labour, artificially undervalued currency, protectionist tariff and
export subsidies, China's growth pattern until 2001 has apparently worked so as to
maintain double-digit GDP growth rate. However, China has largely failed in one very
important aspect: to have a medium and high technology industry that can boast strong
domestic Chinese firms, which are capable of competing technologically with the best in
the world. The tide has now changed. Following China's entry into WTO in 2001, foreign
direct investment (FDI) by multinationals from advanced countries can now entre China
free of constraint. This means that domestic firms, private and state, are to be faced with
fiercer competition on product and labour market. It has now made it harder for Chinese
firms to be profitable or even survive without being innovative. Increasing constraint on IP
3
Chapter 1: Introduction
protection also prevents Chinese firms from 'copying' multinationals and not to be
punished. WTO rules and international pressure have also made it harder for Chinese
government to favour domestic firms through trade barriers and protectionist policies. In
addition, demand for cheap 'Made-in-China' low-technology products diminishes as the
economic recession sweeps across the world. Chinese firms have no time to waste, and the
need for innovation is more urgent than ever.
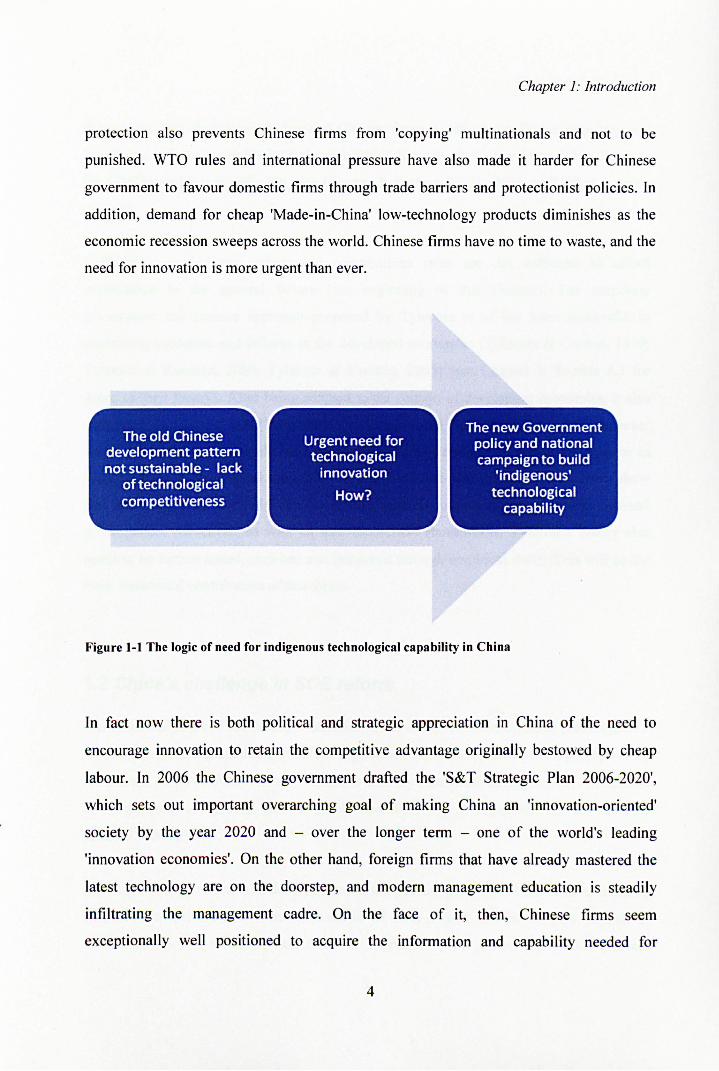
Figure 1-1 The logic of need for indigenous technological capability in China
In fact now there is both political and strategic appreciation In China of the need to
encourage innovation to retain the competitive advantage originally bestowed by cheap
labour. In 2006 the Chinese government drafted the 'S&T Strategic Plan 2006-2020',
which sets out important overarching goal of making China an 'innovation-oriented'
society by the year 2020 and - over the longer term - one of the world's leading
'innovation economies'. On the other hand, foreign firms that have already mastered the
latest technology are on the doorstep, and modern management education is steadily
infiltrating the management cadre. On the face of it, then, Chinese firms seem
exceptionally well positioned to acquire the information and capability needed for
4
Chapter I.' Introduction
innovation. Yet, there is no evidence of Chinese finns widely succeeding in acquiring and
improving indigenous technological capability in the way that many finns did in Japan in
the 60s/70s and Korea early 90s (see Chapter 3, Section 3.1.3). Why not? What is going
wrong?
Reflections on industry policy and competitions rules are not sufficient to afford
explanation to the general failure (see beginning of this chapter). The corporate
governance and finance approach proposed by Tylecote et al has been successful in
explaining successes and failures in the developed economies (Tylecote & Conesa, 1999;
Tylecote & Ramirez, 2006; Tylecote & Visintin, 2008) (see Chapter 2, Section 2.3 for
detail of their theory). After being adapted to the context of developing economies, it also
worked in the Chinese case (Tylecote & Cai, 2004; Cai & Tylecote, 2005, 2008). However,
Cai & Tylecote's work mainly focused on the effects of ownership as a primary factor in
shaping finns' technological capability development (see below). Our observations show
that other elements certainly can be at least equally important and therefore demand
investigation. Moreover, as with all new theoretical frameworks, Tylecote's theory also
needs to be further tested, enriched and improved through empirical study. This will be the
main theoretical contribution of this thesis.
1.2 China's challenge in SOE reform
It is commonly agreed that total privatisation is out of the question in China (see Chapter 3,
section 3.1.1 for explanation), therefore argument of this thesis needs to be placed within
the limited scope of SOB refonn - that is, to identify a mechanism that is both conductible
for developing indigenous technological capability, and is acceptable by the Chinese
political ideology.
Although China's refonn and development in the past 30 years have been accompanied by
quick rise of private sector and fast retreat of state-owned enterprises (see Chapter 3,
section 3.1.1), the state has had cautious approach in the ownership refonn process
5
Chapter 1: Introduction
(historical review of ownership reform from 1949 to date is in Chapter 3, section 3.3.1).
Whilst attitude towards the development of private sector has changed from suspicion and
suppression to official approval, the Chinese government is determined to continue, and
sometimes enhance the dominance of state ownership in sectors - mostly high-technology
industries - that are key to the country's development and security (see Chapter 3, section
3.1.1 for list of selected industries). Meanwhile, the state aims at restructuring SOEs by
establishing a 'Modem Enterprise System (Xiandai Qiye Zhidu), in which corporate
governance was the main focus. However, despite the effort to reform and enforce formal
arrangements, some fundamental flaws in the governance of Chinese firm, especially of
SOEs, remained, and these flaws have had an impact on firms' technological development
(Tylecote et ai, 2010) (see Chapter 3, Section 3.3.1 for SOE and corporate governance
reform). Cai and Tylecote (2005; 2008) have made some progress in trying to identify the
remedy. In their study in the Chinese telecommunications sector, they compared the firms'
levels of technological capabilities among three different ownership types: majority state
owned enterprises (MASOEs), minority state-owned enterprises (MISOEs), and private
enterprises (POEs). They found that the new hybrid form - the MISOEs - combines
advantages of both the state-owned and private firm, and has therefore out-performed
other types of ownership. Their findings are relevant to the research aim of this thesis, and
therefore become one of the key jumping off points of the present study.
The situation of POEs in China is very different SOEs. Their corporate governance system,
although flawed in other ways, tend to encourage strategies that may lead to the
development of more dynamic capabilities (see also Chapter 3, Section 3.3.2 for their
corporate governance). However, POEs suffer from an obvious problem that is rarely
shared by SOEs - difficult access to finance, as well as land and other resources (Cai &
Tylecote, 2005). Lack of funding too often prevents these private firms from technological
learning, since return on this type of investment does not meet their need for immediate
survival.
To sum up, China's goal to develop dynamic technological capability needs to be pursued
in conjunction with the construction of a 'modem, healthy CGFS system'. As such, in
6
Chapter 1.' Introduction
many other NIEs, firms' technological capability development should also be reviewed
with their CGFS in mind. This hence strengthened the practicality and validity of this
thesis, as it aims to do just that.
1.3 Scope of this research
Technological capability can be studied from different levels - firm level, sector level and
country level (Lall, 1990). The technological capability of countries ultimately depends on
the technological capability of firms, and because firms are the core of any market
economy, which China now is, predominantly. This research thus examines technological
capability on a firm-by-firm basis. Semi-structured interview-based case studies will be
first conducted to facilitate in-depth examination of individual instances to gain a
sharpened understanding of the subject matter, and to shape testable hypotheses.
Questionnaire survey will then be carried out to reach a wider population and draw more
generalisable conclusions. Finally the survey data will be aggregated and analysed at the
industry level, which is necessary for hypothesis testing and will improve the general
applicability of the findings. (For details of how the two phases of empirical research
address our research questions, see next section; for details of methodology and techniques
adopted in this thesis, see Chapter 5).
In this project the Chinese auto industry and electronics industry (broadly defined) have
been selected for empirical research. Such selection is based on the special features in
these two sectors: large, varied in ownership type, finance and corporate governance, and
technological capability, and both top-priority sectors for government (NDRC, 2006). It is
hoped that through the study of the two biggest and most important manufacturing
industries, experiences and conclusions can spill over to at least other high-tech industries.
More specifically, the possible difference among firms in finance and corporate
governance and capability development pattern, and the mechanism at work would shed
new light on the endeavour of Chinese firms to develop indigenous technological
capability.
7
Chapter 1: Introduction
Our empirical work in the auto industry is limited to 'Companies that manufacture and
distribute passenger cars, and suppliers of key parts and components, such as engines,
tyres and bodies4, (according to National Bureau of Statistics' [NBS] classification). The
choice of passenger car sector is because it is presumably the largest auto sector, and has
the highest technology demand in all vehicle sectors, and is also the most interesting sector
in terms of evolution (see Chapter 3, introduction of the Chinese auto industry [section
3.4]). In the past 20 years the Chinese passenger car sector has had very controversial
industrial policies and consequently staggered on the road to development (see also
Chapter 3 section 3.4). It has thus become the state's determination as well as a nationalist
ambition to build China's own-brand car with China's own intellectual property (IP). Since
late 2004 the Chinese passenger car industry seemed to have achieved significant
improvement. However the notion that the recent success is entirely due to a healthier
development environment (the relaxed industrial policy) needs to be challenged; and in
turn provides rich soil for empirical study. As for the auto parts sector, the reason for
selection is straightforward: it is the up-stream sector of automobile industry. Although not
necessary high-technology itself, it lends the researcher a unique lens to study China's
medium- and medium-high technology sectors5 without deviating to an entirely different
industry. More importantly, during the search for case study samples in the empirical work,
high quality access was provided by a Chinese tyre company, which has proved
instrumental in enhancing our insights.
In this study the 'electronics industry' is defined according to the United Nation's
'International Standard Industry Classification of all Economic Activities' (ISIC Rev. 3.1:
http://unstats.un.orglunsd/cr/registry/regcst.asp?CI= 17 &Lg= I ). It includes: 1)
manufactures of office, accounting and computing machinery (sector 30); 2) low-voltage
electrical machinery and apparatus (31), 3) radio, television and communication equipment
and apparatus (32), 4) electronic domestic appliances (2930), and electronic general
purpose appliances (2919). We checked the compatibility of such definition with the
industrial classification of NBS, of which many aggregate data was used in our study. In
4 Suppliers of electronic parts and components are categorised as electronics firms. 5 The whole of automotive industry is classified as medium-high technology industry by the Chinese standard, see NBS' definition: www.stats.gov.cn/industrydefinition.htm (accessed in April 2006).
8
Chapter 1,' Introduction
Chinese terms it refers to a two-digit industry codified 40 in the industrial classification,
plus some consumer electronics industries, which are in the scope of 'household electronic
appliances' industry (code 395) within the 'electric equipment and machinery' industry
(code39).
1.4 Research questions
1.4.1 Aims
This research aims to:
1. From the perspective of corporate governance and finance, why have the majority
of Chinese firms failed to develop technological capability that such that would
enhance their competitiveness in medium and high technology industries;
2. Explain how the minority succeeded and why there are not more of them.
3. Identify elements of corporate governance and finance which influence firms'
technological capability; and how these elements take effect.
1.3.2 Research questions and objectives
In order to achieve the above, four research questions with corresponding objectives are
developed (see Table 1-1 below). In particular, case studies are used to develop in-depth
answers to all of the research questions. Based on findings from the case studies, focuses
on the elements of corporate governance are narrowed down to those most relevant to
China's situation so that testable hypotheses can be developed for generalisation. It is then
followed by questionnaire survey, through which hypotheses are tested to address
Research Question 1 (measurement of technological capabilities in a systematic manner);
Question 3 (corporate governance and finance of firms); and Question 4 (the effect of
corporate governance and finance on technological capabilities).
9
Chapter 1: Introduction
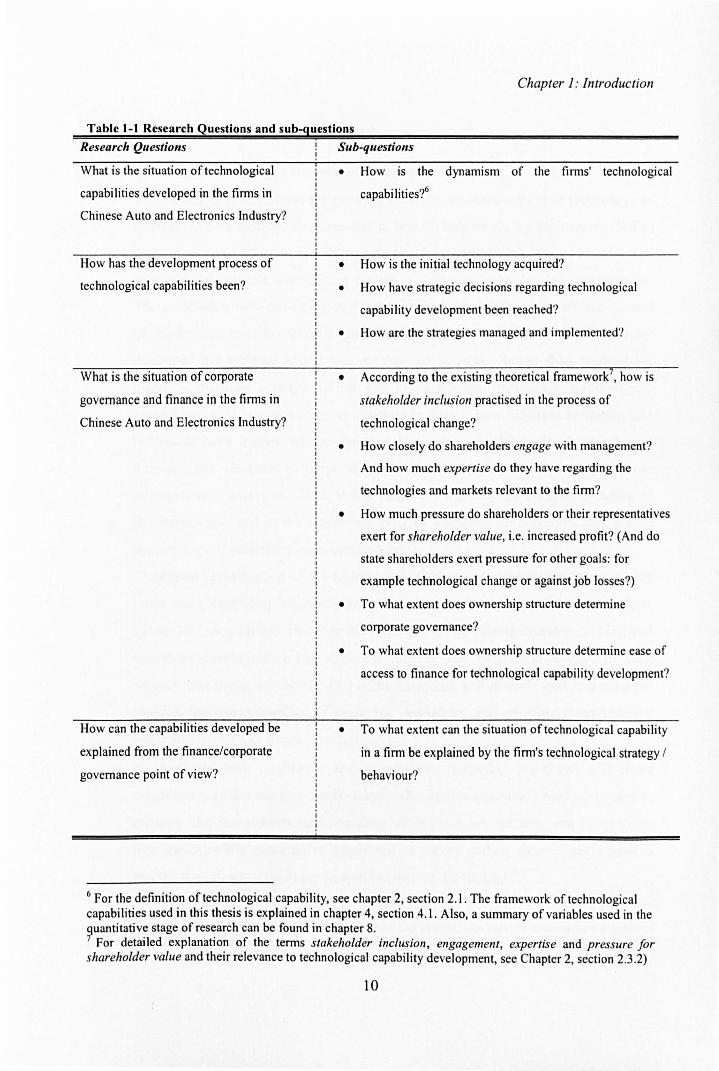
Table 1-1 Research Questions and sub-questions
Research Questiolls Sub-questiolls
What is the situation of technological
capabi lities developed in the finns in
Chinese Auto and Electronics Industry?
How has the development process of
technological capabilities been?
What is the situation of corporate
• How is the dynamism of the finns' technological
capabi lities?6
• How is the initial technology acquired?
• How have strategic decisions regarding technological
capability development been reached?
• How are the strategies managed and implemented?
• According to the existing theoretical framework', how is
governance and finance in the finns in stakeholder inclusion practised in the process of
Chinese Auto and Electronics Industry? technological change?
How can the capabilities developed be
explained from the finance/corporate
governance point of view?
• How closely do shareholders engage with management?
And how much expertise do they have regarding the
technologies and markets relevant to the finn?
• How much pressure do shareholders or their representatives
exert for shareholder value, i.e. increased profit? (And do
state shareholders exert pressure for other goals: for
example technological change or against job losses?)
• To what extent does ownership structure detennine
corporate govemance?
• To what extent does ownership structure detennine ease of
access to finance for technological capability development?
• To what extent can the situation of technological capability
in a finn be explained by the finn's technological strategy /
behaviour?
6 For the definition of technological capability, see chapter 2, section 2.1 . The framework of technological capabilities used in this thesis is explained in chapter 4, section 4.1. Also, a summary of variables used in the quantitative stage of research can be found in chapter 8. 7 For detailed explanation of the terms stakeholder inclusion, engagement, expertise and pressure for shareholder value and their relevance to technological capability development, see Chapter 2, section 2.3.2)
10
Chapter 1: Introduction
1.5 Significance and Contribution
This study will potentially make the following four contributions:
• Theoretically, it will add to the growing literature on management of technology in
general, and on industry development in Newly Industrialising Economies (NIEs)
in particular. Specifically, it will improve the theoretical framework of the effect of
corporate governance and finance system (CGFS) on technological development.
The association between CGFS and technological capabilities is an organic instead
of mechanical one; however empirical studies in the past have not successfully
explained the intricate effects and mechanism at work. Rather than establishing
direct correlations between CGFS and the dependent variable - technological
capabilities, this research aims to illustrate in detail, how different strategies and
behaviour have influenced the firms' technological capability development; and
how specific elements of corporate governance and finance have shaped these
strategies and behaviour. Thus, it will achieve a much deepened understanding of
the framework, and in the future will provide guidance for confident and skilled
applications of such theories to other contexts.
• Combined investigation of the China's two biggest and most important industries
(auto and electronics) has rarely been done in the same piece of research before,
except by Liang (2004). However his work (on foreign direct investment [FDI] and
industrial development) had different focuses and theoretical stance. In such
respect, this thesis will be the first of its kind, and will provide new and valuable
insights into understanding of these two industries, and of other manufacturing
industries in NIEs in future research.
• By applying both qualitative and quantitative methods, this thesis will make
contribution to the research methodology. Qualitative case study method is used to
enhance the researcher's understanding of the subject matters, and to generate
hypotheses; while quantitative questionnaire survey gathers data which is used to
test the hypotheses, and improve applicability of the findings8•
8 Although combined methods were also adopted before by Cai (2005), who sets out to consider a number of external factors that are possible determinants of technological development in the Chinese context. The importance of the role of CGFS then emerged at a later stage of her analysis - whereas this research, after
11
Chapter 1: Introduction
• This thesis will also propose a conceptual framework to measure technological
capabilities. By adopting the 'dynamic capability' approach, this research will
measure the degree of 'dynamism' in the firms' capabilities, and therefore will
develop a generally applicable framework for measuring capabilities in
manufacturing sectors. In addition to measuring the capabilities of firms, this
research will also measure the innovative performance of firms to gain a
triangulated insight into the subject matters.
For companies, this study will again provide them with a greater understanding of how
finance and governance have impact on, and even determine their strategic decisions
regarding technology development and how these decisions can shape the development
patterns of their technological capabilities. Last but not least, this research will contribute
to the policy debate, particularly in China and other NIEs, on how best the institutional
arrangements and practices can foster technical change and what should be done about the
corporate governance and financial system.
1.6 Structure of this thesis
This thesis is organised in the following way (see also Figure 1-2):
Chapter 2 reviews the most relevant prior studies on technological capability. The main
issues discussed in this chapter are the definition of technological capabilities, frameworks
of technological capabilities and streams of literature about technological capability
upgrading in emerging economies. Specifically, it links the array of literature on
technological development in developing countries to those on influences of CGFS on
technological capability. Chapter 3 describes the Chinese automotive and electronics
industry in the context of China's transition. This chapter starts with a review of the
general characteristics of China's economic growth and its national system of innovation.
drawing on her findings and arguments in other literature, will put the analysis of CGFS at centre stage. Therefore analysis of data (qualitative and quantitative) is much more focused and detailed.
12
Chapter 1.' Introduction
Issues directly related to this research are also closely examined - the corporate
governance and finance of Chinese SOEs and POEs. Finally it gives background
information about the Chinese automotive and electronics industries where empirical work
is conducted. Chapter 4 explains the framework of measuring technological capability in
this thesis, and how theories about corporate governance/finance and technological
capability (from Chapter 2) can be adapted to the Chinese reality (from Chapter 3), and
generates 3 propositions for the empirical study. Chapter 5 describes research
methodologies used in this study. The philosophical perspectives of positive, interpretivist
and relativist approaches are first discussed, followed by the description of the methods of
data collection and analysis. Chapter 6 discusses findings from the qualitative phase of the
empirical research in the auto and electronics sectors (interview-based case studies), where
the existing theory is enriched, and new theories start to emerge. 7 hypotheses are
generated from those findings. Chapter 7 and 8 present findings from the quantitative
phase of the empirical studies: the evaluation of corporate governance and finance of
Chinese electronics firms, and their technological capabilities. Hypotheses are also tested
to check the applicability and vigour of new theories developed in the qualitative study.
Chapter 9 concludes the thesis, which includes the overall findings, policy implications,
contributions and limitations of this study.
13
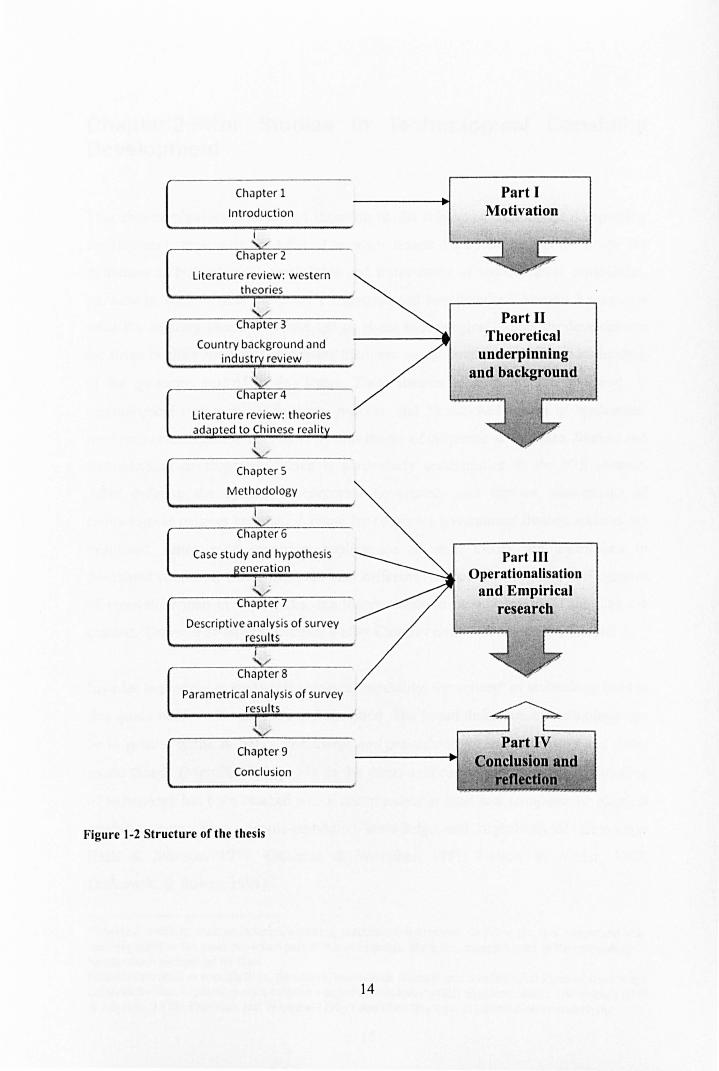
Ch<lpter 1
Introduction
r /
Chapter 2
Literature review: western
Country background <lnd indust review
C apter 4
Chapter 5
Methodology
Chapter 6
Case study and hypothesis
Descriptive analysis of survey results
Chapter 8
P<lrametrica l analysis of survey results
Ch<lpter 9
Conclusion
Figure t -2 Structure of the thesis
14
Part I Motivation
Part II Theoretical
underpinning and background
Part III Operationalisation
and Empirical research
Part IV Conclusion and
Chapter 2 Prior Studies in Technological Capability Development
This chapter provides a review of literature on the subject of technological capability
development, especially in NIBs. The main issues discussed in section 1 are the
definition of technological capabilities and frameworks of technological capabilities,
i.e. how is technological capability categorised and benchmarked. Section 2 examines
what the existing literature would tell us about technological capability development
for firms in NIBs and how the existing literature would contribute to the understanding
of the questions studied in this thesis. Three streams of literature are reviewed: 1)
technological trajectory, 2) learning process, and 3) national system of innovation.
Section 3 is dedicated to the relatively new theory of corporate governance, finance and
technological development, which is particularly understudied in the NIE context.
After defining the system of corporate governance and finance, dimensions of
technological regimes and their demand for corporate governance/ finance systems are
examined. Since most empirical applications of such theory are undertaken in
developed countries, where there are very different technological regimes and agendas
of innovation than in most NIEs, the theory needs to be adapted to fit the Chinese
context. This will be done in Chapter 4 after China's reality is examined in Chapter 3.
In order to proceed to study technological capability, the concept of technology used in
this thesis needs to be clarified and specified. The broad definition of technology can
be in general terms as 'skills, knowledge and procedures for making, using and doing
useful things' (Merrill, 1971, p. 15). In the thesis a more comprehensive understanding
of technology has been reached which encompasses at least four components: physical
artefacts, information, people-embodied knowledge and organisational knowledge
(Hall & Johnson, 1970; Dahlman & Westphal, 1981; Nelson & Winter, 1982;
Orlikowski & Robey, 1991).9
9 Physical artefacts: such as material, products, machinery, equipment, facilities etc. this component was once regarded as the most important part of the technology, since the intangible part of the technology had not been recognised by then. Information: such as specification, document, instruction, manual, etc. it refers to all kinds of knowledge embedded either in physical equipment or a series of processes which transform inputs into outputs (Hall & Johnson, 1970). Dahlman and Westphal (1981) described this type of information as underlying
15
Chapter 2: Prior Studies in Technological Capability Development
Prior to the 1950s, microeconomic analysis of orthodox neoclassical economIcs
assumed that technologies were exogenous factors and were readily available for
public use. When considering generating technology, firms compared the cost of the
technology with its expected returns; and decisions were mostly influenced by price
factors. Once purchased it was assumed that firms would naturally master those
technology acquired (UNCTAD, 1996).
From 1950s, different schools of economics have diverged from the mainstream of
neoclassical economics. 'Institutional economics' has recognised the important role
played by institutions in the process of technological change (Hodgson, 1994).
'Structuralism' has proposed the idea that technology does not occur in isolation, but
instead occur in relation to other phenomena which are as a whole defined by structure
(UNCT AD, 1996). During the late 1960s and 1970s, the 'development school' or
'evolutionary school' began to treat technology as an endogenous factor and analysed
technological changes within a political economy context (UNCT AD, 1996). However
the main focus was on the developed countries. Developing countries had been taken
as merely passive importers of technology: ' ... in the highly simplified models ... there is
no problem in assimilating the transferred technology; there is no adaptation required;
all firms remain equally efficient; firm-specific learning or technical efforts are
unnecessary and irrelevant ... ' (Nelson 1987 cited in Lall 1992).
From the late 1970s a number of studies started to emphasise strongly the success of
the Newly Industrialising Economies (NIEs) on the development of indigenous
technological capabilities. Many firms in developing countries are able to undergo
major technological transformations, from imitator to innovator. They did it by making
incremental, continuous improvements that adapt new technologies to meet specific
physical artefacts and giving expression in the technology. This component gives a new meaning to technology transfer and adaptation. People-embodied knowledge: people play an extremely important role in technology. Their levels of education and technological skills, and their attitudes towards work (such as persistence, diligence, creativity etc.) will largely determine their ability to utilise, modify or improve the existing technologies. Organisational knowledge: Nelson and Winter (1982) described organisational knowledge as routines. Routines are those norms, regulations and cultures by which organisations carry out day-t-day management and production-associated activities. Organisational routines decide what types of knowledge are legitimate, what kinds of problem-solving methods or tools are used in the creation of new knowledge, or what stocks of knowledge humans draw upon to interpret behaviour and evens (Orlikowski & Robey, 1991). Therefore much of the knowledge that underlies routine behaviour is what might be considered as the 'tacit' knowledge of the organisation, not consciously known or articulated by anyone in particular.
16
Chapter 2: Prior Studies in Technological Capability Development
demands (Dosi, 1988; Bell and Pavitt, 1993 b; 1995). Incremental changes at the firm
level can generate technological capabilities, and the appropriate macro environment
(regulation system, financial system, industrial policies etc) could help to expedite the
speed of firms' technological accumulation (Lundvall and Ernst, 2000; Costa, 2001).
Technological capabilities could also vary widely among firms even in the same
industry under the same circumstance. This is because the effort made to learn new
technologies strongly influences the effectiveness with which technologies are
assimilated, diffused, and improved.
What are then technological capabilities?
2.1 Technological capability
2.1.1 The definition of technological capability, dynamic capability,
and innovation
1) Technological capability
Technological capabilities are the major determinant of industrial competitiveness and
also the main source of innovation (aECD 1996; Schacht 1997; Kim 1997, 1999).
Study of technological capability in an industry of nation must start from firm level.
This is because that firms' are the main locus of technological change in any market
economy (Cooper, 1992), and are at the centre of a nation's technological capabilities
development. Depending on the aims of the research, definition of technological
capability varies in perspective. Lall (1990, p.17) defines technological capability (TC)
broadly as 'the entire complex of human skills (entrepreneurial, managerial and
technical) needed to set up and operate industries efficiently over time'. Westphal et al.
(1985) and Kim (1997) define the term from the aspect of corporate development.
According to them, technological capability refers to the ability to effectively use
technological knowledge to achieve assimilation, use, adaptation, and change of
existing technologies. Probably more importantly, it enables one to develop new
products and processes an to create new technologies to survive and compete in a
changing environment (Westphal et al., 1985; Kim, 1997). Based on East Asian studies,
several scholars recognized the fact that for the bulk of the developing countries: 'it is
17
Chapter 2: Prior Studies in Technological Capability Development
the ability to efficiently absorb, use and adapt technologies that matters' (Lall, 2001 ,po
1501). In the thesis we therefore use the concept of technological capability as below:
Technological capability refers to the capability of a firm to identify. acquire,
assimilate. adapt and make effective use of technical knowledge and skills, and then to
generate new knowledge and skills. We further distinguish between static capability -
capability to make effective use of technological knowledge and skills - and dynamic
technological capability - the rest of the capabilities set above. i.e. identify. acquire.
assimilate. adapt. and then to generate new knowledge and skills.
It is a broad consensus that 'dynamic capabilities' contrast with 'static (or ordinary)
capabilities' by being concerned with change (Winter, 2003). It is also argued that
dynamic capabilities are to some degree needed for innovation, at least at the firm level
(Collis, 1990; Bell & Pavitt, 1993a). As it is at the very centre of this thesis, the
concept of dynamic capability will be clarified below. We will then review the notion
of innovation, and how innovation is associated with dynamic capabilities.
2) Dynamic capability
Innovation depends heavily on dynamic capability, in other words, moving quickly to
sophisticated levels of capability (Bell & Pavitt, 1995). The most cited definition of
dynamic capability is by Teece, Pisano, & Shuen (1997), which is quite similar to ours
(see above) - the firm's ability to 'appropriately adapt, integrate, build, and reconfigure
internal and external skills and functional competences toward changing environment'
(Teece et a/., 1997, p.515). Pisano (1994) and Grant (1996) address dynamic capability
from a resource-based viewpoint, they emphasize the nature of dynamic capabilities as
the organisational and strategic routines by which managers alter their resource base
to generate new value-creating strategies, and this can be done through processes such
as resources acquisition, integration and recombination
Pisano and Grant are not alone in founding the concept of dynamic capability on the
broader concept of routines. Nelson and Winter's work in 1982 is among the pioneering
efforts, where they define 'routine' as behaviour that is ' .. .learned, highly patterned.
18
Chapter 2: Prior Studies in Technological Capability Development
repetitious, or quasi-repetitious, founded in part in tacit knowledge' (p. 12). Their
definition therefore excludes the phenomenon of brilliant improvisation, or 'general
purpose routines' (Winter, 2000, p. 991) The exclusion of the latter becomes
particularly evident when Winter and colleagues define dynamic capabilities not as
routines per se, but as ' ... collective activity through which the organisation
systematically generates and modifies its operating routines in pursuit of improved
effectiveness.' (Zollo & Winter, 2002, p.340; italics added). Clearly, distinction needs
to be made between those routines that are repositories of dynamic capabilities
(organisational and strategic routines, as Pisano and Grant's define it), and those that
are not. The second type of routine (operating routine, by Winter et al. 's definition)
involves the execution of known procedures for the purpose of ensuring smooth
operation for current revenue and profit!o. It can be brought about by dynamic
capabilities, as argued by Zollo and Winter, or in some cases be physically transferred
in through purchase of capital goods (Bell & Pavitt, 1993b). In contrast, the first type
of routine seeks to generate desirable changes in the existing operating routines to
enhance effectiveness in the future!!. In other words, routines that encapsulate dynamic
capabilities do not just preserve the past, but also pave the way for deliberate learning
within the firm, hence shaping the firm's future development (Dosi et al., 2000;
Bottazzi et al., 2002; Zollo & Winter, 2002; Winter, 2000; 2004).
We incorporate this view in our discussion here; in addition, we use the terms dynamic
and static routines, to indicate their corresponding relationship with dynamic and static
capabilities. Dynamic capabilities can be therefore be understood as learned pattern of
collective activities embedded in dynamic routines, through which they govern the rate
of change of static routines, when the latter manifests the finn's static capabilities. This
clarification of terminology is necessary, particularly for developing countries, where
gaps of static routines among firms - although more significant in these countries than
ditto developed countries - do not necessarily reflect the difference in dynamic
capabilities. It is already noted that firms with state-of-the-art operating routines do not
necessarily possess capabilities that are more dynamic than their smaller, less
glamorous competitors (see the cases of SAIC and Chery in Chapter 6; see also Liu &
10 Examples include manufacturing routine, shipping of the ordered goods, and receipt of corresponding ~ayment, etc
I Examples include knowledge creation routines whereby managers and others build new thinking within the firm, product development routine, alliance and acquisition routines, etc.
19
Chapter 2: Prior Studies in Technological Capability Development
Tylecote, 2009). The distinction of static routine/capability and dynamic
routine/capability will thus enable us to identify firms' true levels of static/dynamic
capabilities according to their types of routines.
There are two more issues that need to be addressed regarding dynamic capabilities.
First, as mentioned above, dynamic capabilities are a combination of highly patterned,
structured vehicles of change12• Just as cars have different engine sizes and purposes,
dynamic capabilities differ amongst each other by the rate of change they govern and
the type of functions. Examples of such typology in past research are: Investment
Capability by Lall (1992), Strategic Capability by Arnold and Thuriaus (1997);
Alliance and Acquisition Capability by Zollo and Singh (1998); and Product
Development Capability by Winter (2003) (for details about their frameworks see
section 2.1.2). On the other hand, while these capabilities may be distinctively different
in details, they do share common features that can be associated with effective
processes across firms (Eisenhardt & Martin, 2000). Again, just like driving cars, there
are more and less effective ways to execute particular dynamic capabilities. Therefore,
for most firms, the competitive advantage does not only lie in a single type of dynamic
capability, nor is it a matter of whether these firms have or have not dynamic
capabilities, but how 'effective' (quoting Eisenhardt & Martin, 2000) their portfolio of
dynamic capabilities are.
Based on the above argument, study of dynamic capability development at firm level
should reflect knowledge of its key characteristics. In particular, assessment of
dynamic capabilities should be oriented towards measuring 'dynamism' (effectiveness)
of dynamic capabilities, and incorporate a combination of routines.
12 It is quite possible to change without having a dynamic capability. For example. Winter (2003) mentioned 'Ad hoc problem-solving' behaviour under ftre-ftghting circumstances which may also bring about change. It however is not routine, neither is it dynamic capability. However this is beyond the scope of our research in this thesis.
20
Chapter 2: Prior Studies in Technological Capability Development
3) Innovation
Innovation is widely believed to be a major driving force of modem capitalism and
growth (Nelson & Nelson, 2002). In the 1930s Joseph Schumpeter defined five types
of innovation, and is often regarded as the first modem economist to draw attention to
the importance of innovation (Rogers, 1998):
• 'Introduction of a new product or a qualitative change in an existing product
• Process innovation new to an industry
• The opening of a new market
• Development of new sources of supply for raw materials or other inputs
• Change in industrial organisation' (OECD, 1997, p. 28)
Schumpeter's definition reveals the complex nature of innovation. It varies enormously
by industry (Nelson and Winter, 1982; Pavitt, 1998), by degree of novelty and cost
(whether it is new to the firm, new to the country or new to the world) (OECD, 1996),
by technology (Dosi, 1982) and by type (product, process, organisational, system,
Freeman, 1992). There have been some attempts to distinguish different types of
innovations. For example, Freeman (1971) ranks innovations on a five-point scale from
'systemic' to 'major', 'minor', 'incremental' and 'unrecorded'. Many authors make a two
fold distinction between 'radical' (or 'major') innovations and 'incremental' (or 'minor')
(e.g. Dewar & Dutton, 1986; Stobaugh, 1988). Taxonomy of innovations is difficult,
but nevertheless important. Since different types of innovation not only have very
different consequences for the economy and the firms which make them, but also
embody a very different mix of knowledge and skill (Utterback, 1993). Moreover, to a
significant extent the properties of innovation processes vary across countries and
specific to technologies or industrial sectors (Malerba and Orsenigo, 1996).
For NIEs, although one does not rule out the possibility of cutting-edge technologies or
'state-of-the-art' products being created, systemic or major innovation is still not a
central issue to these countries. For the bulk of developing countries, innovations that
are most relevant are innovations that are new to the firm, to the region, or to the
21
Chapter 2: Prior Studies in Technological Capability Development
country. Consequently, dynamic capabilities that are required, are those that enable
them to achieve these goals.
To sum up, there is a hierarchy of technological capabilities - there are capabilities that
can operate existing technology (static capability), and capabilities that can generate
minor and major technical change (dynamic capability). Dynamic technological
capability is normally needed for innovation 13. It is complex, structured and
multidimensional. It is sticky - hard to change in short-term (static capability on the
other hand, could be enhanced rather quickly, through acquisition of state-of-the-art
equipments, for example). However dynamic capability is also fluid - the dynamism of
technological capability - the ability of the capability to generate change, to enhance
competitiveness in response to the competitive environment, changes over time
(Winter, 2000; Zollo & Winter, 2002). Dynamic capabilities can be categorised
according to their functions (Lall, 1992), and firms' competitive advantage may rest in
a combination of dynamic capabilities, and their innovation performance is influenced
by how effective these capabilities are executed. Finally, dynamic capability in NIBs
that are required, are those that enable them to achieve innovations that are relevant to
NIBs.
\3 In some rare circumstances, fIrms with very limited dynamic capabilities may still be able to innovate through total reliance on infusion of technology. However this is beyond our scope of discussion here.
22
Chapter 2: Prior Studies in Technological Capability Development
2.1.2 Measurement of technological capabilities
The section above theorises technological capability, especially dynamic capability.
This section expands the topic on an empirical stance. In this thesis, technological
capability is studied as an outcome of combined detenninants: 1) institutional
environment (especially corporate governance and finance), 2) strategic decision and
technological activities (technological choices and endeavour). As such, technological
capabilities cannot be rigorously studied in an industry or country if it is not
taxonomized. Taxonomy of corporate technological capability can vary depending on
the research purpose, and one of the usual approaches is to place technological
capabilities in functional categories (Bell & Albu, 1999). Drawing upon Fransman
(1986), Dahlman et at (1987) and Lall (1987). Lall (1992) categorizes technological
capabilities according to the kind of activities which they facilitate: investment
technological capability, production technological capability, and linkage technological
capability (see Table 2-1).
In Lall's framework, Investment Capabilities contain skills necessary for identifying,
obtaining technology for design, construction and commission of new products/
facilities (Lall, 1992). Investment capabilities have two elements: pre-investment and
project execution. Under each element there are sub-elements to measure those ranging
from routine to innovative activities.
Production Capabilities decide the productivity of labour and capital as well as
efficiency in material and energy used. They have three elements: process engineering,
product engineering and industrial engineering. Process engineering includes necessary
activities from production. Product engineering are those necessary for production or
improving product specifications, such as assimilation of product design, improvement
in product quality, and basic research. Industrial engineering involves monitoring and
control functions for process and product engineering.
23
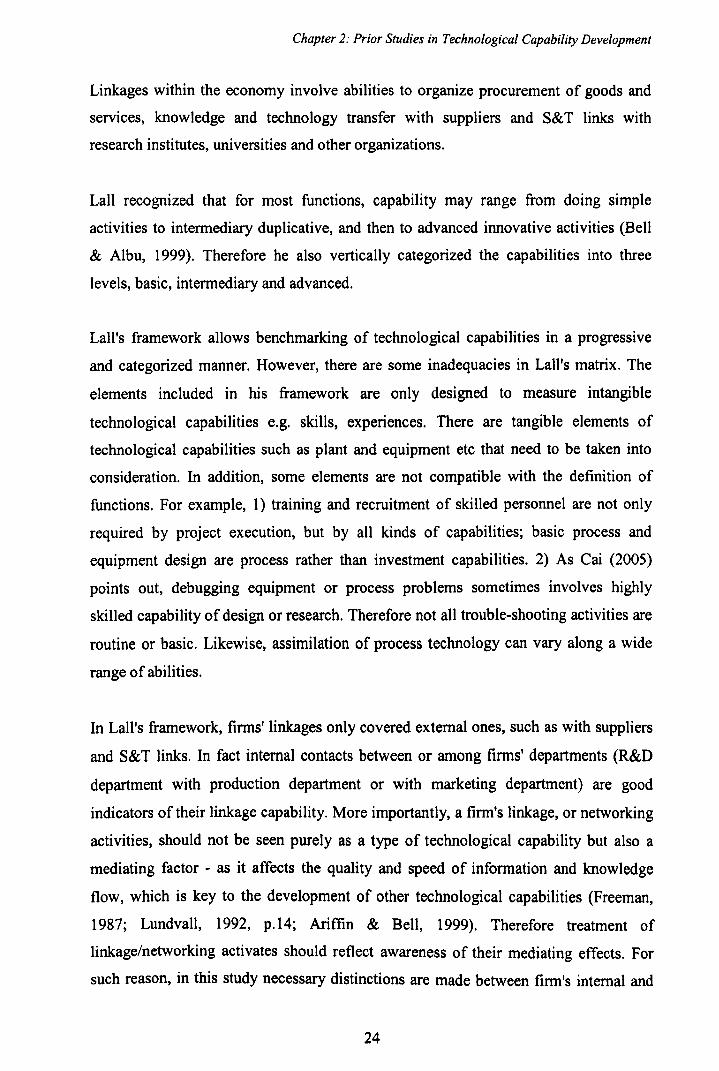
Chapter 2: Prior Studies in Technological Capability Development
Linkages within the economy involve abilities to organize procurement of goods and
services, knowledge and technology transfer with suppliers and S&T links with
research institutes, universities and other organizations.
Lall recognized that for most functions, capability may range from doing simple
activities to intermediary duplicative, and then to advanced innovative activities (Bell
& Albu, 1999). Therefore he also vertically categorized the capabilities into three
levels, basic, intermediary and advanced.
Lall's framework allows benchmarking of technological capabilities in a progressive
and categorized manner. However, there are some inadequacies in Lall's matrix. The
elements included in his framework are only designed to measure intangible
technological capabilities e.g. skills, experiences. There are tangible elements of
technological capabilities such as plant and equipment etc that need to be taken into
consideration. In addition, some elements are not compatible with the definition of
functions. For example, I) training and recruitment of skilled personnel are not only
required by project execution, but by all kinds of capabilities; basic process and
equipment design are process rather than investment capabilities. 2) As Cai (2005)
points out, debugging equipment or process problems sometimes involves highly
skilled capability of design or research. Therefore not all trouble-shooting activities are
routine or basic. Likewise, assimilation of process technology can vary along a wide
range of abilities.
In Lall's framework, firms' linkages only covered external ones, such as with suppliers
and S&T links. In fact internal contacts between or among firms' departments (R&D
department with production department or with marketing department) are good
indicators of their linkage capability. More importantly, a firm's linkage, or networking
activities, should not be seen purely as a type of technological capability but also a
mediating factor - as it affects the quality and speed of information and knowledge
flow, which is key to the development of other technological capabilities (Freeman,
1987; Lundvall, 1992, p.l4; Ariffin & Bell, 1999). Therefore treatment of
linkage/networking activates should reflect awareness of their mediating effects. For
such reason, in this study necessary distinctions are made between firm's internal and
24
Chapter 2: Prior Studies in Technological Capability Development
external (organisational) capabilities and their linkage/networking activities (see
Chapter 4, section 4.1).
Despite the imperfections, LaB's framework does highlight the process of capability
generation (from basic to more advanced capabilities) and functions: investment,
production and linkages) of firms' operation activities. His classification also makes it
possible to further breakdown individual capability, and distinguish basic or routine
capabilities from more advanced or more dynamic innovative capabilities. As a result,
in this thesis the framework of technological capability will follow the basic notion of
classification of LaB's, i.e. according to function and degree of efficiency.
25
Chapter 2: Prior Studies in Technological Capability Development
Table 2-1 Illustrative matrix of technological capabilities by Lall (1992)
u U; < a;,
f= iii x~ l.d~ ..Jw Q..!-o ~~ o t.Oo wl.l.l w U ~z C1< w> 00
<
PRE INVES1MEl'rr
SIMPLE, Proo5ibility and ROUTINE feasibility studies,
Table 1. illustrative matrix oftedmological capabilities
PROJECT EXEClJll0N
Cnril construction, ancillary seIVice5,
FUNCTIONAL INVES1MENT
PROCESS ENGINEERING
Debug£ing, balancing quality cootrol
PRODUCTION LINKAGES
PRODUCT lliTIUSTRLlQ WITHIN ENGINEERING ENGINIERING ECONOMY
Assimilation of product Wolk flow, l~ca1 procurement of design, minor adaptation scheduling, time· goods and seIvices,
(Experience Site selection, equip~nt erection pIeVffitive maintenance, to JD.aIket needs motion studies. infmmation e.~ange based)
DIPLICATI VE
lli"NOVATI VE RISKY (Researrh based)
schffiuling of COIllIl1lSSl0nmg
im'eS1ment
teclmology SOUIte.. procurement, detailed Negotiation of engineering, traiIring contracts. and recruitment of Bargaining suitable skilled pm~nnel tenm. Info. svstems
J'
asillnilation of process twology
Source:(Lall, 1992)
process adaptation and cost savilli~ hceruine t.,.i :- \oJ
new teclmology
Basic process design. In-house process Equipment design and innovation, basi\: supp~r research
26
improvement, hcenilllg and Assimilating OO'i
imported product technology
In-house product innovation, basic research
Inventory control \\iith suppliers
producti\~ty, local supplies, improved coordination coordinared dfiign, S& T
links
Turnkey capability, cooperative R&D licensing own Technology oothm.
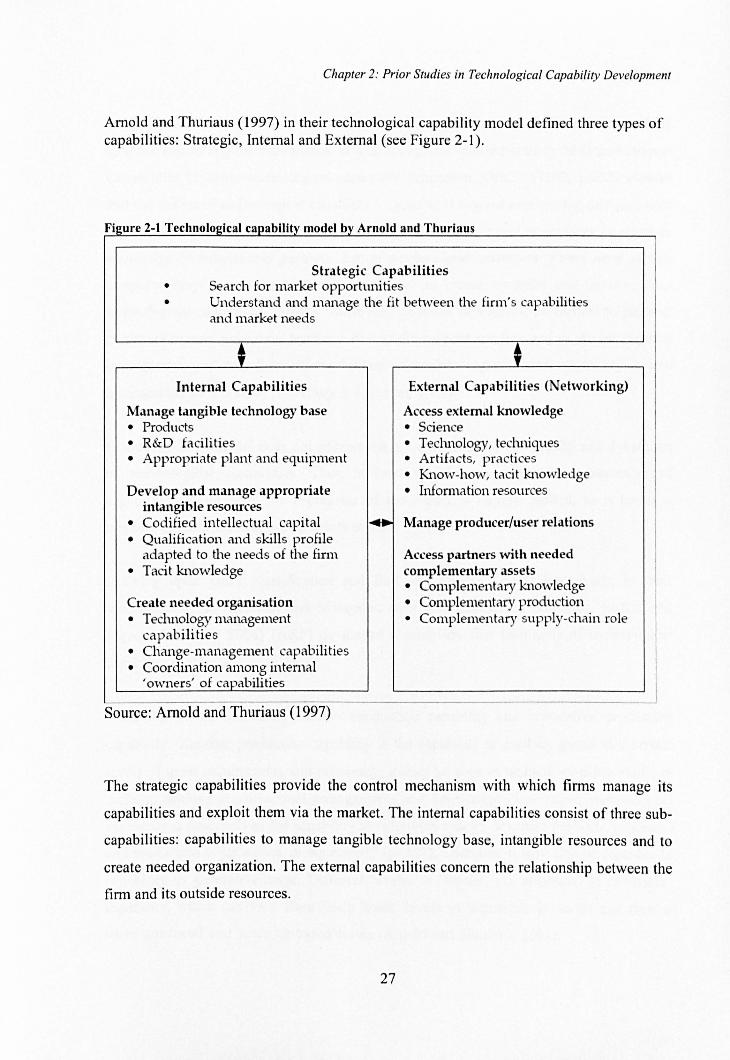
Chapter 2: Prior Studies in Technological Capability Development
Arnold and Thuriaus (1997) in their technological capability model defined three types of capabilities: Strategic, Internal and External (see Figure 2-1).
Strategic Clpabilities • Search for market opportunities • Understand and manage the fit beh-veen the finn's capabilities
and market needs
t t Internal Capabilities External Capabilities (Networking)
Manage tangible technology base Access external knowledge • Products • Science • R&D facilities • Tec1Ulo\ogy, tec1uLiques • Appropriate plant and equipment • Artifacts, practices
• Know-how, tacit knowledge Develop and manage appropriate • Information resources
intangible resources • Codified intellectual capital .. Manage producer/user relations • Qualification and skills profile
adapted to the needs of the firm Access partners with needed • Tacit knowledge complementary assets
• Complementary knowledge Create needed organisation • Complementary production • T edUlology management • Complementary supply-chain role
capabilities • Change-management capabilities • Coordination among internal
, owners' of capabilities
Source: Arnold and Thuriaus (1997)
The strategic capabilities provide the control mechanism with which firms manage its
capabilities and exploit them via the market. The internal capabilities consist of three sub
capabilities: capabilities to manage tangible technology base, intangible resources and to
create needed organization. The external capabilities concern the relationship between the
firm and its outside resources.
27
Chapter 2: Prior Studies in Technological Capability Development
One of the Arnold and Thuriaus (A&T) model's contribution is that it recognizes both
tangible and intangible capabilities. It also recognizes the importance of Organizational
Capabilities in firms' technological capability generation. OECD (1992, p.262) stresses
that the notion of technological capability' .. . goes well beyond engineering and technical
know-how to include knowledge of organizational structures and procedures as much as
knowledge of behavioural patterns, e.g. of workers and customers. Firms need certain
complementary assets and capabilities in order to create, mobilize and improve their
technological capabilities, among which may be noted organizational flexibility, finance,
quality of human resources, sophistication of the support services and of the information
management and coordination capabilities.' Therefore organizational capability is also
incorporated by this study (see Chapter 4, section 4.1.1).
However A&T's model does not address the issue of levels of complexity and dynamism
of technological capabilities. Thus, without showing a progressive perspective of
capability development, the usefulness of the model is largely limited, as it tends to
measure capabilities as sporadic points in time.
Drawing upon Lall's classification and Bell and Pavitt's (1995) framework, in their
research into the Brazilian and Malaysian steel and electronics industries, Ariffin and
Figueiredo (2001; 2004) (A&F) developed a relatively fine taxonomy of technological
capability (Table 2-2).
Their framework sets apart 'routine' production capability and 'innovative' production
capability. 'Routine' production capability is the capability to produce goods at a certain
levels of input requirements and efficiency; it may be seen as technology-using skills, or
those to achieve organisational arrangements and knowledge. 'Innovative' technological
capability is described as the capability to 'improve, change or create products, processes
and production organisation, or equipment' (p. 561). Therefore it may also be regarded as
capability to generate change. Different levels, or 'depths', are attributed to innovative
capability, which can vary from fairly 'basic' levels to 'intermediate' levels and then to
more 'advanced' and 'research-based' levels (Arnold and Thuriaus, 200 I).
28
Chapter 2: Prior Studies in Technological Capability Development
A & F's framework provides a perspective and link to total technological activity
particularly in the steel industries in developing countries. As a result, some elements used
in their research are also adopted for this project. However, since the objects of
investigation in this research range through a wider spectrum of scales and technology
types than A & F's (from high-tech telecommunication equipment to medium-tech
electronic components and parts, for example), it is not appropriate to measure firms'
capabilities with unanimous benchmarking activities. As a result, the framework used in
this research adopted a less activity-specific approach, but a more strategy-oriented one
(again, for details see chapter 4, section 4.2).
29
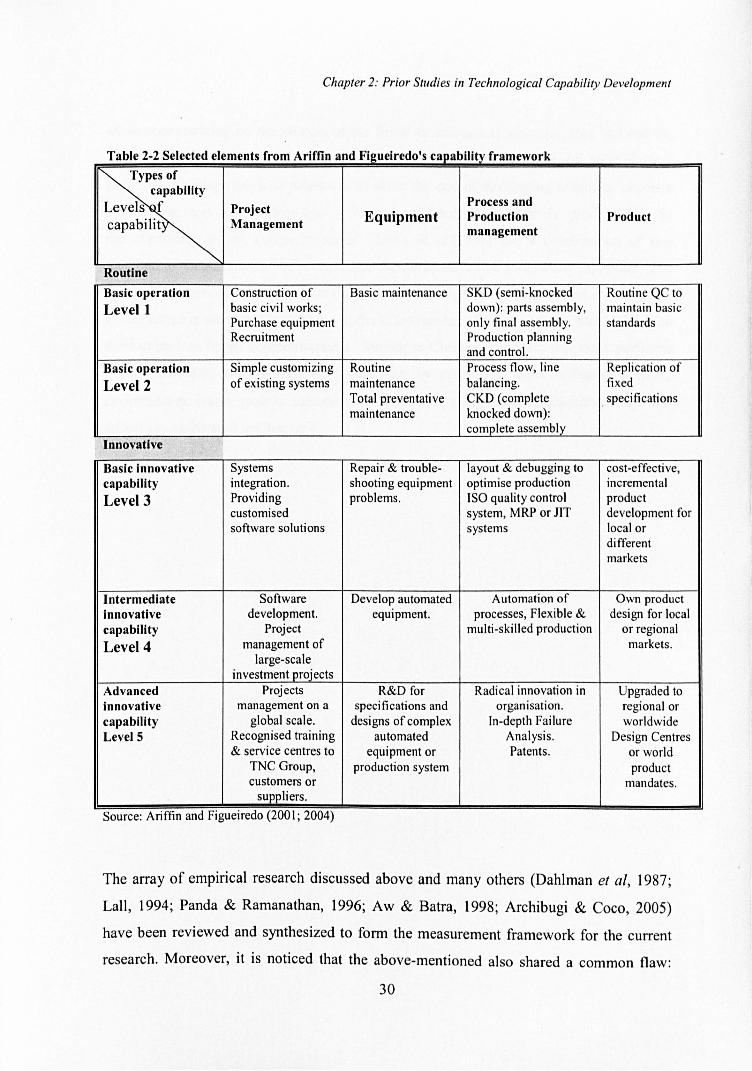
Chapter 2: Prior Studies in Technological Capability Development
Table 2-2 Selected elements from Ariffin and Fi2ueiredo's capability framework
Types of capability
Process and Levels f Project capabilit Management Equipment Production Product
management
Routine
Basic operation Construction of Basic maintenance SKD (semi-knocked Routine QC to Levell basic civil works; down): parts assembly, maintain basic
Purchase equipment only final assembly. standards Recruitment Production planning
and control. Basic operation Simple customizing Routine Process flow, line Replication of
Level 2 of existing systems maintenance balancing. fixed Total preventative CKD (complete speci fications maintenance knocked down):
complete assembly Innovative
Basic innovative Systems Repair & trouble- layout & debugging to cost-effective, capability integration. shooting equipment optimise production incremental
Level 3 Providing problems. ISO quality control product customised system, MRP or JlT development for software solutions systems local or
different markets
Intermediate Software Develop automated Automation of Own product innovative development. equipment. processes, Flexible & design for local capability Project multi-skilled production or regional
Level 4 management of markets. large-scale
investment projects Advanced Projects R&D for Radical innovation in Upgraded to Innovative management on a specifications and organisation . regional or capability global scale. designs of complex In-depth Failure worldwide LevelS Recognised training automated Analysis. Design Centres
& service centres to equipment or Patents. or world TNC Group, production system product customers or mandates.
suppliers.
Source: Anffin and Figueiredo (2001; 2004)
The array of empirical research discussed above and many others (Dahlman et ai, 1987;
Lall, 1994; Panda & Ramanathan, 1996; Aw & Batra, 1998; Archihugi & Coco, 2005)
have been reviewed and synthesized to form the measurement framework for the current
research. Moreover, it is noticed that the above-mentioned also shared a common flaw:
30
Chapter 2: Prior Studies in Technological Capability Development
while concentrating on the process of the firms' technological activities, they ignored the
importance of performance measurement - The ultimate purpose of technological
capability development as a process is to serve the end of developing unique or superior
advantages; and such advantage is best manifested by the firm's product (in the
manufacturing sector) competitiveness. Chiesa et al.(1996) use a combination of two
methods to measure both the process and the performance of innovation capability. The
process is measured by focusing on the processes through which innovations are achieved.
Performance is measured by looking at the effectiveness of the processes, with a focus on
their impact on firms' competitiveness. Similar to Chiesa's approach, this study performs
a complementary triangulation of capabilities, by measuring firms' technology-related
performances (sales growth, innovative performance and product competitiveness). The
details are elaborated in Chapter 4.
31
Chapter 2: Prior Studies in Technological Capability Development
2.2 Development of corporate technological capability in HIEs -conceptual and theoretical building blocks
This section critically reviews three analytical frameworks that have been used to examine
the process of corporate technological capability development in the NIB context -
technological trajectory, learning process, and national system of innovation. In spite of
their limitations which are discussed below, these frameworks helped to form the
theoretical underpinning of this thesis.
2.2.1 NIEls three-stage technological trajectory theory
It is argued in a wide range of research that developing countries take the opposite
technological direction from advanced countries, moving from mature technology, through
intermediate technology, to emerging technology (Kim, 1980; Westphal et al., 1985; Lee
& Bae, 1988; Lall, 1990; 1993; OECD, 1997; Hobday, 1995; Kumar et al., 1999; 2002)
1. Domestic companies in NIBs acquire mature technology from multinational
companies (duplicative imitation);
2. Then they absorb the transferred technology, make effective use of it, adapt it
and modify, and possibly making incremental improvement to it (creative
imitation);
3. They eventually develop their own technology (innovation).
By using his three-stage model (1980), Kim describes the TC development process and
analyzes the process of building technological capability in emerging countries (1997).
Figure 2-2 illustrates Kim's theory on technological development trajectories in both
developed and NIBs.
According to Kim's theory, during the early stage of their Te upgrading, companies in
NIBs acquire product design and production technologies from overseas. Production at this
32
Chapter 2: Prior Studies in Technological Capability Development
stage was mainly concerned with assembly operation of imported components and parts,
and the technological focus by the firm was essentially to realise mastery of a production
operation. Due to the lack of both technological capability and market incentives, there is
hardly any indigenous attempt of technological change in products and processes.
As some firms manage to implement transferred design and production technologies from
abroad, diffusion of technical know-how quickly take place within the country, resulting in
higher number of firms competing in the same market. Accumulated experience in product
design and production accumulates then provides a basis for limited indigenous efforts for
the assimilation of foreign technologies.
Finally, a combined force of: 1) assimilated foreign technology; 2) higher competency of
local scientific and engineering personnel together with 3) increased market competition; -
would lead to gradual improvement of foreign technology. Product improvement and
productivity enhancement based on indigenous efforts became more central to competition,
leading to a relatively more integrated and developed production system. If they succeed in
improving technology, some companies may even eventually develop the technological
capabilities to generate the emerging technologies independently, and compete with
companies in advanced countries on leading-edge innovation (Kim, 1980; 1997).
33
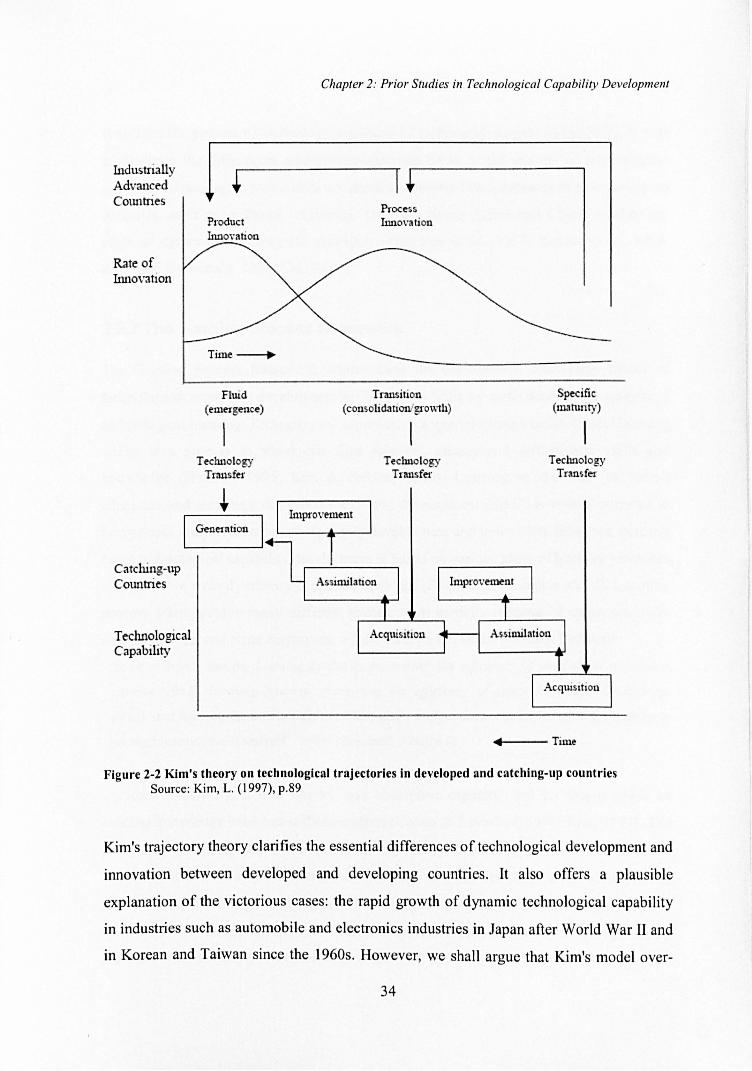
Indllstriilly Advance-d COlUltries
Rate of Innovation
Catching-up CotUltries
Teclulologic.al Capability
Product Innoyation
Time-.
Fluid (emergence)
Technology Transfet"
Generation
Chapter 2: Prior Studies in Technological Capability Development
Proce~s
Innovation
Tnmsition (con,>olid.,tionlgs"o"vth)
Technology Transfer
Specific (mannity)
Technology Transfer
• Time
Figure 2-2 Kim's theory on technological trajectories in developed and catching-up countries Source: Kim, L. (J 997), p.89
Kim's trajectory theory clarifies the essential differences of technological development and
innovation between developed and developing countries. It also offers a plausible
explanation of the victorious cases: the rapid growth of dynamic technological capability
in industries such as automobile and electronics industries in Japan after World War II and
in Korean and Taiwan since the 1960s. However, we shall argue that Kim's model over-
34
Chapter 2: Prior Studies in Technological Capability Development
simplifies the process of technology acquisition / technology transfer in the NIBs. It fails
to illustrate the differences among countries and finns in the process of technological
acquisition/learning; in tum it does not explain why only few companies in other emerging
countries, such as in Brazil, Indonesia, Thailand, South Africa and China, reached the
stage of dynamic technological capability (Dahlman et al., 1987; Kumar et al., 1999;
Ariffin & Figueiredo, 2001; Cai, 2005 ).
2.2.2 The learning process framework
The learning process framework compensates the conventional three-stage model of
technological capability development in finns from NIEs by understanding the process of
technological learning. Technological capability is acquired through technological learning,
which is a process in which the finn acquires, creates and diffuse new skills and
knowledge (Hobday, 1995; Kim & Nelson, 2000). Learning in the fonn of fonnal
education and searching through research and development (R&D) is widely accepted to
bring about much technological capability development and innovation. However, in many
cases technological capability development is based on various kinds oflearning processes,
which evolve around ordinary economic activities (Edquist, 1997, italics added). Learning
process often involve many different parties, such as daily routines of engineers, sales
representatives, and other employees, which matter a lot. In the words of Lundvall:
'Such activities involve learning-by-doing, increaSing the efficiency of production operations
(Arrow, 1962), learning-by-using, increasing the efficiency of complex systems (Rosenberg,
1982), and learning-by-interacting, involving users and producers in an interaction resulting in
product innovations (Lundvall, 1988)'. (Lundvall, 1992, p.9)
To learn effectively, a finn has to have absorptive capacity, and for that it needs an
existing knowledge base and sufficient effort (Cohen & Levinthal, 1990; Kim, 1997). The
processes of learning start from and are influenced by its existing knowledge base. Finns
can increase their ability to understand, assimilate and use new knowledge by increasing
their existing knowledge base (Kim, 1999). In developing countries, knowledge base can
be increased through technology transfer from advanced countries, or through hiring
personnel who already possess the knowledge (Bell & Albu, 1999). However, as argued in
35
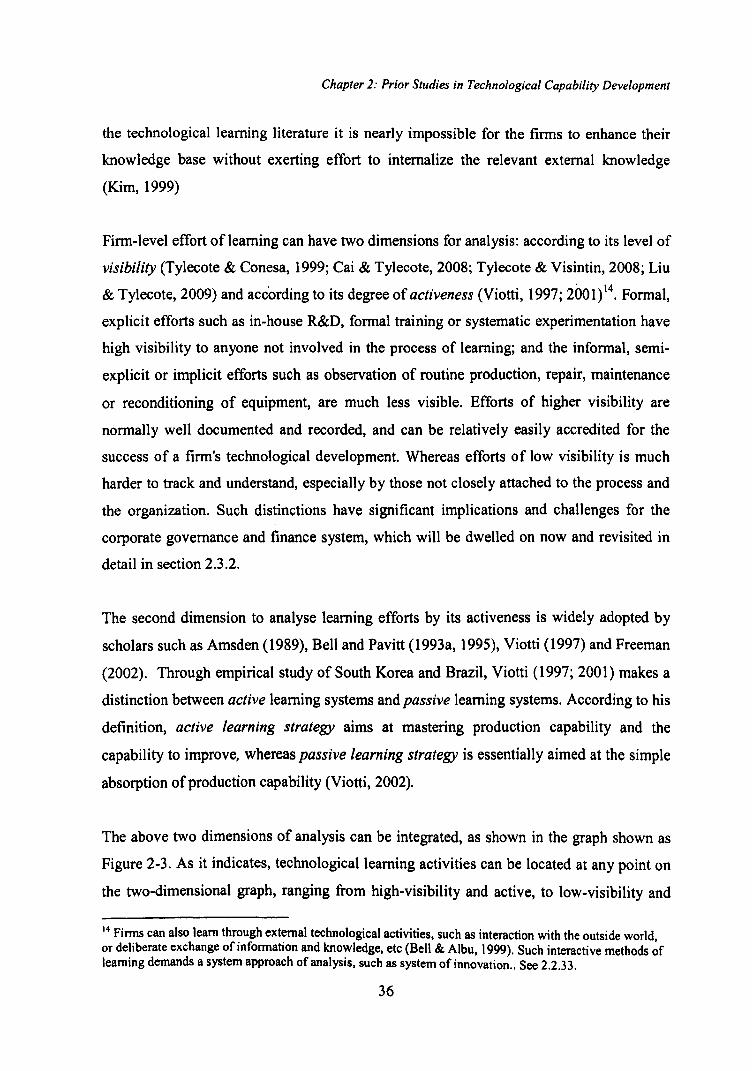
Chapter 2: Prior Studies in Technological Capability Development
the technological learning literature it is nearly impossible for the firms to enhance their
knowledge base without exerting effort to internalize the relevant external knowledge
(Kim, 1999)
Firm-level effort ofleaming can have two dimensions for analysis: according to its level of
visibility (Tylecote & Conesa, 1999; Cai & Tylecote, 2008; Tylecote & Visintin, 2008; Liu
& Tylecote, 2009) and according to its degree of activeness (Viotti, 1997; 2001) 14. Formal,
explicit efforts such as in-house R&D, formal training or systematic experimentation have
high visibility to anyone not involved in the process of learning; and the informal, semi
explicit or implicit efforts such as observation of routine production, repair, maintenance
or reconditioning of equipment, are much less visible. Efforts of higher visibility are
normally well documented and recorded, and can be relatively easily accredited for the
success of a firm's technological development. Whereas efforts of low visibility is much
harder to track and understand, especially by those not closely attached to the process and
the organization. Such distinctions have significant implications and challenges for the
corporate governance and finance system, which will be dwelled on now and revisited in
detail in section 2.3.2.
The second dimension to analyse learning efforts by its activeness is widely adopted by
scholars such as Amsden (1989), Bell and Pavitt (1993a, 1995), Viotti (1997) and Freeman
(2002). Through empirical study of South Korea and Brazil, Viotti (1997; 2001) makes a
distinction between active learning systems and passive learning systems. According to his
definition, active learning strategy aims at mastering production capability and the
capability to improve, whereas passive learning strategy is essentially aimed at the simple
absorption of production capability (Viotti, 2002).
The above two dimensions of analysis can be integrated, as shown in the graph shown as
Figure 2-3. As it indicates, technological learning activities can be located at any point on
the two-dimensional graph, ranging from high-visibility and active, to low-visibility and
14 Finns can also learn through external technological activities, such as interaction with the outside world or deliberate exchange of information and knowledge, etc (Bell & Albu, 1999). Such interactive methods ~f learning demands a system approach of analysis, such as system of innovation .. See 2.2.33.
36
Chapter 2: Prior Studies in Technological Capability Development
passive. Caution has to be taken when one classifies these efforts - it is important to
recognize the complexity and context-specific nature of such learning mechanisms. For
example, a passive form of learning strategy may be accompanied by an active endeavour
to master the technology (though it cannot be assumed to be widespread), therefore
becoming the initial stage of a generally active learning processJ5• Therefore examples of
learning efforts illustrated in Figure 2-3, such as reverse engineering and formal training,
can themselves range across deferent degrees of activeness. On the other hand, the
suitability of a learning strategy does not necessarily depend on the level of its visibility;
rather, it depends on the nature of the technology regime the firm operates in, i.e. the
learning and knowledge environment faced at a given time by firms in a particular sector
or sub-sector (Nelson & Winter, 1982). (See explanation in section 2.3 and Chapter 4 for
an illustration of Chinese electronics and auto industry).
IS This seems to be the case, for instance, of some large Korean conglomerates that deliberately utilized OEM (Original Equipment Manufacturing) agreements as just an initial step in an aggressive and active pathway towards technological learning, as described in Amsden (1989) and Viotti (200 I).
37
Chapter 2: Prior Studies in Technological Capability Development
Transfer of technology-embodied capital goods (turn-key
plant) Technology
licensing
I'urchasing of equipment packages linked with technical
assistance from the capital goods sup lier
Observation of operations by new employees in order to learn
routines and procedures
Passive
Organized R&D
Problem-solving
Reverse engineering
learning from production
learning from repair, maintenance and reconditioning of equipment
Figure 2-3Technologicallearning framework - the integrated Model
Active
Source: Own formulation with some examples drawn from Viotti (1997); Bell and Albu (1999)
The learning process approach helps to explain the general failure of most NIEs in
developing dynamic technological capabilities - that 'active learning ' (as Viotti defines it)
could not be regarded as a natural common feature of firms from these countries (Cooper,
1992, p.IS): 'The failure of learning processes in developing countries is in fact quite
common. It is reflected in what is often called a 'black-box' approach to production
technology encountered quite often in developing country firms which receive technology
via license agreements: firms may be unconcerned about how the technology works,
provided only that they are able to produce with it'. Freeman (2002) believes that an active
38
Chapter 2: Prior Studies in Technological Capability Development
learning strategy proposed by Viottie, Bell and Albu may lie at the centre of a late-corner's
approach to addressing its disadvantages.
However, learning process framework on its own does not explain why NIEs including
China have not chosen active learning policies, or have failed to make these strategies
work. This is because that, technological capability development, which revolves around
learning, is 'predominantly an interactive and therefore socially embedded process which
cannot be understood without taking into consideration its institutional and cultural
context' (Lundvall, 1992, p.l). In other words, firms do not operate and learn in isolation,
and their build-up of technological capabilities would often only occur if the institutional
environment works effectively. Moreover, learning approaches are not to be selected
freely by firms. Depending on who controls the firms and how, and the financing situation,
firms often do not have the incentive, or ability to 'choose' the appropriate learning strategy.
Therefore, learning approach in firms should be considered alongside: 1) the system of
learning and innovation which incorporates other institutions and relationships; 2) the
perspective of 'technological regimes and corporate governance/finance. These 2 issues are
discussed in the next 2 sections.
2.2.3 The National System of Innovation framework
From the geographical perspective, the National System of Innovation (NSI) approach has
been widely accepted in examining a country's innovative activities (Lundvall 1988, 1992;
Nelson 1988, 1993; Niosi et al. 2000). The concept, emerged since the early 1980s, was
intended to help develop an alternative analytical framework to static standard economics
and to criticize its neglect of dynamic process related to innovation, learning and
technological development (Lundvall, 2007). One of the general accepted definitions is by
Freeman: 'the network of institutions in the private and public sector whose activities and
interactions initiate, import and diffuse new technologies' (1987, p.1). Freeman's definition
indicates that NSI involves not only institutions and activities in innovation, but also
interactions amongst these institutions. Universities and research institutes are important
components in the NSI; so is government, partly because it mostly funds and largely
39
Chapter 2: Prior Studies in Technological Capability Development
directs these institutions (e.g., Nelson, 1993). However since finns are at the centre of any
market economy, they are also at the centre ofNSIs. Interaction among these units is also
important component of the system. According to Niosi et al., the interaction may be
, ... technical, commercial, legal, social and financial as much as the goal of the
interaction may be development. protection. financing or regulation of innovation' (1993,
p.139).
An array of academic work about NSI has been produced since the beginning of the 90s.
However there does not exist a consensus as to what is to be taken into account when
describing a nation's NSI; and the large majority ofNSI's studies are focused primarily on
innovation based on scientific and technical activities, especially, on R&D (Bell, 2008).
This is also true even with the most prominent scholars. In the studies of 15 national
systems of innovation co-ordinated by Nelson (1993) - including developing as well as
developed economies - he acknowledges that there exists a notional dichotomy of narrow
and broad understanding of NSI, whilst the latter, in few studies on the subject, embrace
institutions (and relationships) that directly and indirectly influence the innovation and
learning process. Narrowly conceptualized NSI has also to a large extent misled policy
practice in developing countries, as Bell (2008) puts it:
'Bodies responsible for science. technology and innovation policy in developing countries
inherited from the advanced countries a preoccupation with R&D as the core focus for policy.
This remained the case when concepts of'innovation system' were wrapped around existing
policy approaches and interests over the last decade or so. '
Therefore, the narrowly-defined NSI framework, which mainly focuses on R&D- and S&T
- based activities and institutions, is not sufficient for dealing with the processes of
technical change, especially those in developing countries, where R&D and S&T activities
have not been, and should not be, the only driving force of innovation. As Lundvall
stresses (2007), it is important to rebalance the S&T -based type of innovation (STI), and
another important mode of innovation: learning by doing, using and interacting (DUI).
Given that innovation in most NIEs display high levels of path-dependence and
technological cumulativeness (Bell & Pavitt, 1993b), NSI should be broadly understood,
40
Chapter 2: Prior Studies in Technological Capability Development
in the context of these countries, essentially as a system oflearning (Viotti, 2002). Hence a
much more broadly-defined framework needs to be used; it should incorporate any
institutions and relationships that are key to the process of innovation as well as learning.
Moreover, the research of NSI should be more careful with its normative function. Earlier
work by Freeman (1987) on Japan and more recent works by OECD on South Africa and
Hungary (OECD, 1997; 2005) acknowledge that regarding NSI, some ways appear to be
better than others. However it is believed that more should be done in this direction from
developing countries' perspective: to avoid copying or just following the latest policy
fashion. For example, a country-specific 'best practice' can be identified through the
suggestion of an NSI that meets the requirements of the technological regime its firms
operate in.
Last but not least, 'the failure to recognise the firm as the central player in the
accumulation oj technology has been a major shortcoming oj technology policy.' (Bell &
Pavitt, 1992, p.271) This is because countries do not innovate themselves, and it is the firm
that can be said to innovate in a capitalist economy (Tylecote & Visintin, 2008). The
interaction between capability accumulation and firm development should be seen as a
mutual one. In other words, firms do not simply passively receive the benefits from the
accumulation of technological capabilities,: they also shape the accumulation process.
Therefore policy intended to enhance technological capability has to recognise the central
role of firms in industrial upgrading and innovation to effectively enhance technological
capability (Juma & Clark, 2002). (A case in point is the car industry in China in the 90s
and early 2000s; see chapter 3, section 3.4).
We therefore argue that NSI should encompass institutions, organizations involved in the
process of both STI and DUI, and the interactions among them. Moreover, study of a
nation's system of innovation should put firms at the centre (see Figure 2-4).
UNIVERSITY OF SHEFFIELD
LIBRARY
41
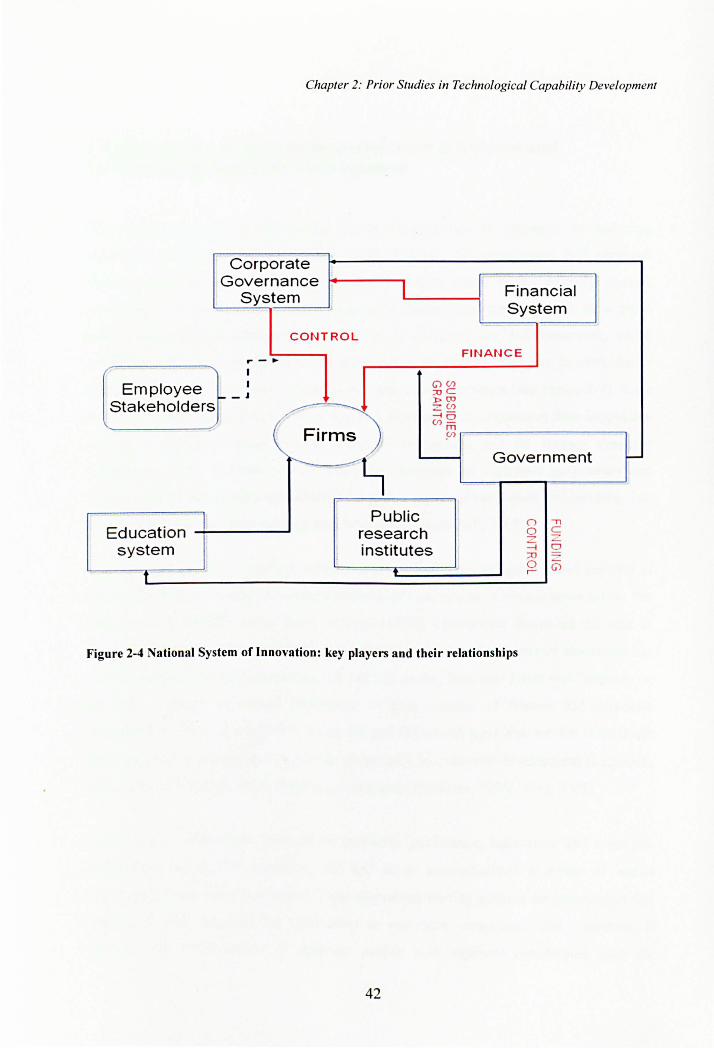
Chapter 2: Prior Studies in Technological Capability Development
Corporate Governance I Financial System
System
CONTROL
FINANCE .. - ~ , Employee
, C)(f)
~ - j ;oC
Stakeholders »(0
--...... -o-(f) ::;6 (f)-
m Firms 0
f'-- Government t-
~ ~-
Public II () .,
Education research 0 C -Z '"'-
system institutes -i 0 ;:u 0 -G)
f ~ .-
Figure 2-4 National System of Innovation: key players and their relationships
42
Chapter 2: Prior Studies in Technological Capability Development
2.3 The system of corporate governance & finance and technological capability development
The National System of Innovation framework proposes an approach to analyzing
innovation and learning at the national level. However the conventional NSI approach
which mainly focuses on S&T/R&D-based innovation needs to be critically revised,
particularly for newly industrializing economics. Particularly, there needs to be a much
more broadly defined approach nested within, or alongside the NSI framework, which
encompasses the socio-economical characteristics of developing countries. In particular, it
should incorporate the system of finance and corporate governance (see Figure 2-4), since
firms are central actors in innovation, and it is impossible to understand their innovation
activity without knowledge of their corporate governance and the finance available
(O'Sullivan, 2000; Tylecote, 2007). Moreover, inclusion of corporate governance and
finance systems should also help address the power aspect of innovation and learning - an
issue unduly neglected in most empirical NSI studies (Lundvall, 2007).
Over the past decade, a growing number of researches have recognized that analysis of
innovation systems should incorporate systems of finance and corporate governance. For
instance, in Lundvall's edited book on NSI (1992), Christensen discussed the role of
finance in innovation. Pavitt (1999) argued that the manner and outcome of innovation has
been decidedly different between the US and UK on one hand and Japan and Germany on
the other, because of radical differences in their systems of finance and corporate
governance (Tidd et al. 2001: 93). Lazonick and O'Sullivan have also written extensively
about the role of finance and corporate governance in industrial development (Lazonick,
1991; 2004; O'Sullivan, 2000; 2004; Lazonick and O'Sullivan, 1996; 2000; 2002).
Lazonick and O'Sullivan's research on corporate governance, innovation and economic
performance in the EU countries, US and Japan conceptualised a model of 'social
conditions of innovative enterprise'. Their theoretical starting point is the proposition that
learning process required for innovation is uncertain, cumulative and collective, it
'requires the collaboration of different people with different capabilities, and the
43
Chapter 2: Prior Studies in Technological Capability Development
integration of the work of these people into an organisation': organisational integration'
(Lazonick, 2004: 30). 'The essence of the innovative firm is the organisational integration
of a skill base that can engage in collective and cumulative learning' (Lazonick, 2004,
p.34). Moreover, Lazonick and O'Sullivan also proposed that firms need industrial
expertise to choose the product market to compete in, and the technologies competitive
with. Those who exercise strategic control need to ' ... be able to recognise the competitive
strengths and weaknesses of their firm's existing skill base and. hence. the changes in that
skill base that will be necessary' (Lazonick, 2004, p.34). It can be hence inferred that
providers of finance (shareholders) and venture capitalists, who are treated as sharing in
strategic control by Lazonick and O'Sullivan, are required to possess the necessary
knowledge and understanding of resources allocation in the innovation process.
Lazonick and O'Sullivan's perspective offered a generic understanding of the connection
between the system of corporate governance/finance (CGFS) and technological
development /innovation. That is, they are saying that innovation always requires x,y, or z
from the CGFS. Although they do differentiate sectors according to the type of skill base
that needs to be integrated - but as what we show below, higher degree of differentiation is
needed to address the issue of innovation in different sectors, and the level of development
of the countries. Just as Malerba and Orsenigo (1996) argued, innovation processes often
vary across countries and specific to technologies or industrial sectors, which have varied
demands on different aspects of finance and corporate governance system. Therefore at the
firm level, the technological regime this firm operates in needs to be identified, so do its
corresponding demands on CGFS, that improvement in the latter could generate desired
positive effects on the former. The part below is going to show that sectors vary in their
technological regime (section 2.3.1), and that this affects their demands on the CGFS
(section 2.3.2). Moreover the technological regime for a given sector is not necessarily the
same in a developing country to what it is in a developed country. Hence Section 2.3.3
adapts the framework mainly developed from experiences in developed countries to the
context ofNIEs.
44
Chapter 2: Prior Studies in Technological Capability Development
2.3.1 Technological regime and its dimensions
A 'technological regime' (Nelson & Winter, 1982) or 'technological paradigm' (Dosi, 1982)
defines the particular learning and knowledge environment in which firms operate (Winter,
1984). Technological regimes are important because they shape the pattern of innovation
in an industry or sector. Generally speaking, there are two opposite types of regimes
identified in the literature. An entrepreneurial regime enables entry of new innovative
firms or entry of new paradigm of innovation by incumbent firms where competence
destroying is often involved, while a routinised regime facilitates innovation firms
progressing within an established paradigm (Winter, 1984). This distinction is derived
from Schumpeter's innovation theory, which is a result of observation of economic
development at different historical phases (Schumpeter, 1934; 1942). Another way of
defining these regimes is as, respectively, Schumpeter Mark I, and Schumpeter Mark II
(Freeman 1982: Malerba & Orsenigo 1996; Malerba, 2004).
In the Schumpeter Mark I regime, the structure of innovative activities is often disruptive
and turbulent, and is often observed in nonelectrical machinery, instruments and traditional
technologies (Malerba et ai, 1997). The Schumpeter Mark II pattern of innovation, on the
other hand, may be associated with a structure of innovative activities that is concentrated
and stable, as observed in chemical and electrical-electronic (Dosi, 1982). These different
patterns of innovation among technologies and sectors can be explained by differences in
the nature of technological regimes (Malerba & Orsenigo, 1996).
The characteristics of learning play an important part in helping to define a technological
regime (Tylecote, 2007). Malerba and Orsenigo (M&O) identify three different properties
in learning: cumulativeness of learning; appropriability conditions; and technological
opportunity conditions, (Dosi & Orsenigo, 1988; Malerba & Orsenigo, 1996).
Technological opportunity determines the available technological solutions for firms to
solve problems, and how easily such solutions may be attained. The appropriability
conditions are concerned about how easily the benefits of innovation can be protected
from imitators (competitors), and the measures of appropriation used by firms. The degree
45
Chapter 2: Prior Studies in Technological Capability Development
of cumulativeness of innovation describes to what extent the processes of achieving
technical solutions by a firm are incremental.
2.3.2 Properties of learning in technological regime, and their demands for corporate governance and finance
Tylecote and Visintin (2008) argued that, in addition to the above three properties
proposed by Malerba et al., p.l) degree of cumulativeness of innovation (or in their term:
the extent of competence destruction); 2) degree of technological opportunity; 3)
appropriability (enriched by Tylecote and colleagues as stakeholder spill-over) of
innovation; there is a fourth property of learning which defines technological regime: 4)
visibility of innovation and learning (explanation of this concept can be found in section
2.2.2). It is argued by them that the above dimensions have significant indications for
finance and corporate governance. Below the corporate governance and finance system
will be defined, and the way it influences innovation will be examined according to
learning properties of technological regime.
1} System 0/ corporate governance and finance (CGFS) -definition and scope
The term 'corporate governance' came out of a seminal analysis in the 1920s (Berle &
Means, 1933), which looked at the increasing separation of ownership and control in
modem firms (Monks & Minnow, 2001). When ownership takes the form of dispersed
shareholding, and when management structures once dominated by family owners or
government are increasingly replaced by professional managers, it is believed that such a
separation allows - if it does not actually encourage - the firm's behaviour to diverge from
the ideal of profit maximizing (Keasey et al. 1997), hence there needs to be a system of
control over those managers to ensure that the company is run in the interests of the
shareholders and society at large. Therefore in its most commonly referred form, corporate
governance studies the structure through which 'suppliers of finance to corporations assure
themselves of getting a return on their investment' (Shleifer & Vishny, 1997).
46
Chapter 2: Prior Studies in Technological Capability Development
Shleifer and Vishny's definition of corporate governance fits into a simpler and broader
conceptualization of governance in general, that of Prakash and Hart (1999): 'organising
collective action'. Von Tunzelman (2003) proposes that the scope of 'governance' should
include issues of structure, control and process. For him, 'structure' relates to the forms
through which decisions are made, 'control' to the power to make them, within the
structures, and through 'process', structure and control are implemented.
We welcome Prakash & Hart and von Tunzelman's broader definition of governance, and
argue that the system of corporate governance and finance hence deals with the two
fundamental issues in any capitalist economies: capital and capitalists. The system of
finance is about how is the capital provided and allocated. Corporate governance is about
who controls the firm and how. In particular, we study the firm's 'structure' of control
(formal as well as de facto) and its dynamism of 'power' in the 'process' of corporate
decision-making and implementation. For the purpose of this research, corporate decisions
mainly refer to those technological ones. However due to the intrinsic nature of any profit
oriented corporations, economic decisions /- investment, production, distribution and
exchange - that are inseparable to this issue are also included.
A dominant and important aspect of corporate governance is referred to as 'the agency
perspective', or as 'finance perspective' (Jensen & Meckling, 1976; Fama & Jensen,1983).
A basic assumption of agency model is that due to human's opportunistic nature, managers
of firms will act to further their own interests before shareholders. An overview of agency
theory is given by Eisenhardt (1989, p.59), which is presented in Table 2-3:
47
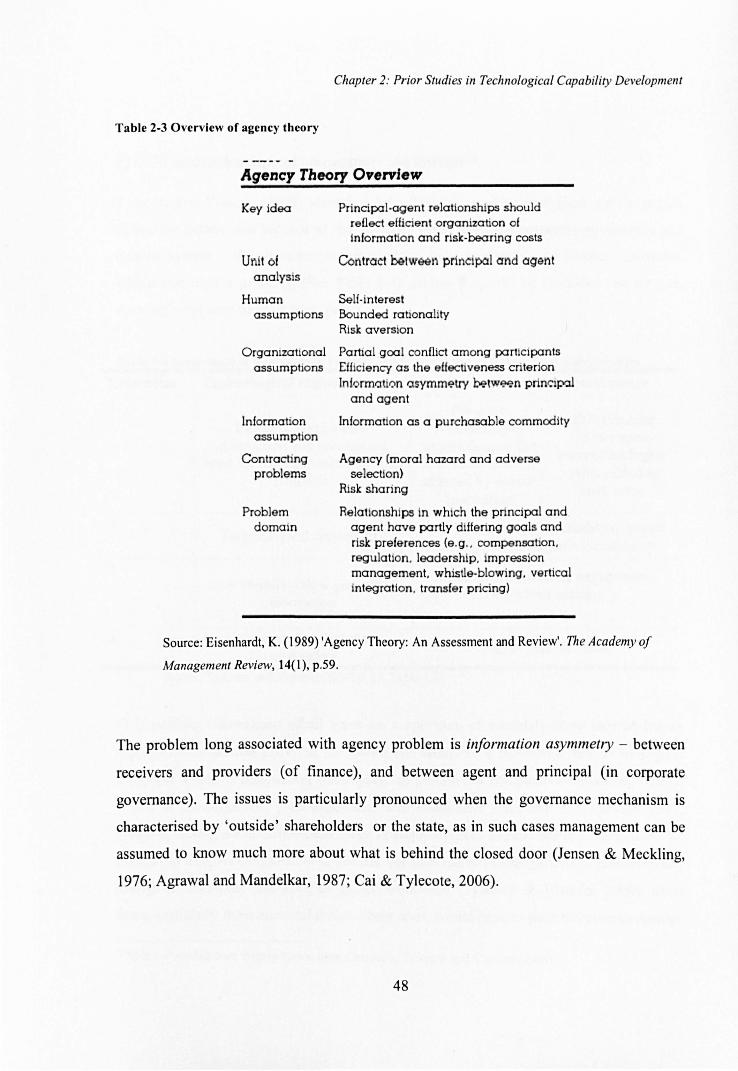
Chapter 2: Prior Studies in Technological Capability Development
Table 2-3 Overview of agency theory
Agency Theory OvervIew
Key idea
Unit of analysis
Human assumptions
Orgamzational assumptions
Information assumption
Contracting problems
Problem domain
Principal -agent relationships should reflect efficient organization of information and risk-bearing costs
Contract bQtwOOI'l principal and agent
Self- interest Bounded rationality Risk aversion
Partial gool conflict among partlcipants Efficiency as the effectiveness criterion In iormfl tiQn 'lsymmp.trY tw?lw~n prinr.lpol
and agent
Information as a purchasable commodity
Agency (moral hazard and adverse selection)
Risk sharing
ReJat onships In wh ch the principal and agent have partiy diffenng goals and risk preferences (e_g .. compensation. regulation. leadership. impression management. whistle-blowing. vertical integration, transfer pricing)
Source: Eisenhardt, K. (1989) 'Agency Theory: An Assessment and Review' , 171e Academy of
Management Review, 14(1), p.59,
The problem long associated with agency problem is information asymmetry - between
receivers and providers (of finance), and between agent and principal (in corporate
governance). The issues is particularly pronounced when the governance mechanism is
characterised by 'outside' shareholders or the state, as in such cases management can be
assumed to know much more about what is behind the closed door (Jensen & Meckling,
1976; Agrawal and Mandelkar, 1987; Cai & Tylecote, 2006).
48
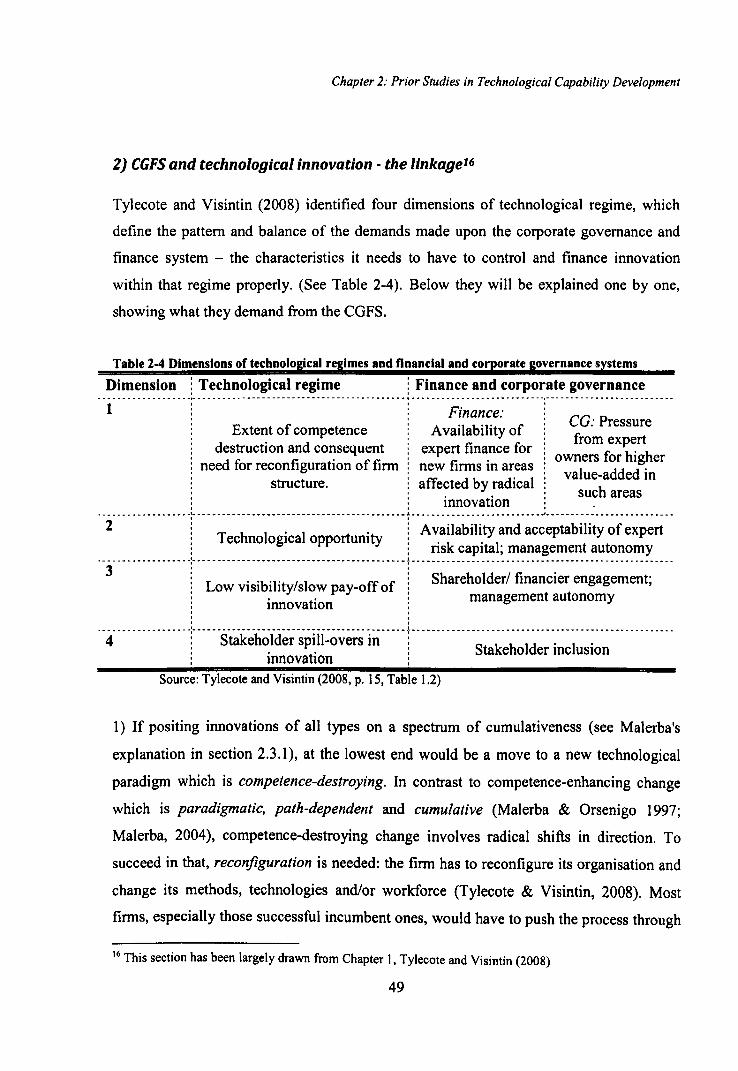
Chapter 2: Prior Studies in Technological Capability Development
2) CGFS and technological innovation - the Iinkage16
Tylecote and Visintin (2008) identified four dimensions of technological regime, which
define the pattern and balance of the demands made upon the corporate governance and
finance system - the characteristics it needs to have to control and finance innovation
within that regime properly. (See Table 2-4). Below they will be explained one by one,
showing what they demand from the CGFS.
Table 2-4 Dimensions of technological regimes and financial and corporate governance systems
Dimension : Technological regime : Finance and corporate governance , , - - - - - - - - - - - - - - - - - - -1- - - - - - - - - - - - - - - - - - - - - - - - - - - - - - - - - - - - - - - - - - - ,. - - - - - - - - - - - - - - - - - - - - - - - - - - -,- - - - - - - - - - - - - - - - - - - - - - - - - -
1 , " : : Finance: : ! Extent of competence ! Availability of ! , destruction and consequent : expert finance for 1
need for reconfiguration of firm new firms in areas : structure. affected by radical ;
, : innovation :
CG: Pressure from expert
owners for higher value-added in
such areas
.-----------------~-------------------------------------------~--------------------------~--------------------------
2 : Availability and acceptability of expert , Technological opportunity i risk capital; management autonomy
-------------------:-------------------------------------------r-----------------------------------------------------3: : i Low visibility/slow pay-off of i Shareholder/ financier engagement;
: innovation : management autonomy , , , , , , •••••• _____________ 1 ___________________________________________ 1. ___________________________________________ ________ _
4 : Stakeholder spill-overs in: Stak h ld . I . : . t' : e 0 er mc USlon : Innova IOn :
Source: Tylecote and Visintin (2008, p. 15, Table 1.2)
1) If positing innovations of all types on a spectrum of cumulativeness (see Malerba's
explanation in section 2.3.1), at the lowest end would be a move to a new technological
paradigm which is competence-destroying. In contrast to competence-enhancing change
which is paradigmatic, path-dependent and cumulative (Malerba & Orsenigo 1997;
Malerba, 2004), competence-destroying change involves radical shifts in direction. To
succeed in that, reconfiguration is needed: the firm has to reconfigure its organisation and
change its methods, technologies and/or workforce (Tylecote & Visintin, 2008). Most
firms, especially those successful incumbent ones, would have to push the process through
16 This section has been largely drawn from Chapter I, Tylecote and Visintin (2008)
49
Chapter 2: Prior Studies in Technological Capability Development
resistance from within their organisation. Empirical evidences have shown two effective
ways to overcome such resistance: one obvious way is to set up a new firm, in which case
strong and very well-informed venture capital will be very helpful (examples include Pixar
in digital animated cartoon, and Canon in digital camera); on the other hand, for existing
firms to succeed in reconfiguration, it requires pressure for higher value-added from
owners or financiers. They too need to be well-informed, especially about the industry as a
whole.
2) The second dimension is technological opportunity. It is widely recognised that the
development potential of a particular area of industrial activity - how far and how fast it
proceeds - is partly down to the technological opportunities that lie before it (Teece &
Pisano, 1997). In other words, technological opportunity represents the likelihood of
innovating successfully - profitably - for any given amount of money invested in search.
Where technological capability is high, there is often need for high R&D spending and
other innovative activities. Consequently, high technological opportunity requires high
level of financial input from the CGFS. Moreover, since high level of opportunity is often
associated with high level of risk, the provider of finance needs to be prepared to provide
generous amount of risk capital. On the other hand, sectors of high technological
capabilities often does not require the same level of industry-wide expertise as for radical
reconfiguration, however management autonomy may be sufficient as managers would
probably be glad to finance a high level of innovative expenditures with the firm's own
cash flow.
The third of 'regime dimensions' is visibility (Tylecote & Demirag, 1992; Tylecote &
Conesa, 1999). When the visibility of innovation is low (for example, investment of time
and money in low-visibility learning activities, see Section 2.2.2), shareholders would only
accept heavy spending on innovation and consequent lower profits (possibly for some
years) if they had a clear understanding of the inputs and likely outputs of innovation. To
achieve that owners and financiers need to engage closely with the firm, to develop firm
specific understanding - so as to be able to see below the surface to what is really being
50
Chapter 2: Prior Studies in Technological Capability Development
done for future innovative success. Failing that, a good second best is high management
autonomy: managers being able to spend more or less as they choose on innovation.
The last of the four dimensions is stakeholder spill-overs, which is referable to Malerba et
afs appropriability dimension. It is concerned about the extent to which employees and
related external stake holders (notably customers and suppliers) benefit from and are able
to contribute to the finn's technological changes. In some sectors this is of particularly
great importance. Von Hippel' s (1988; 2005) account of user-led innovation and the
situation in 'specialised suppliers' described by Malerba are some of the examples in sight.
Clearly for such firms, close and constructive relationships with stakeholders, such as
skilled employees and 'lead' industrial customers, are vital. Tylecote et al summed up such
relationships, with employees and other firms, as 'stakeholder inclusion'.
Stakeholder inclusion is relevant not only to the generation of innovations, but also to the
protecting of them, or appropriation. Teece (1986; 1998) developed four ways of
protecting innovation returns: 1) inherent difficulty in replicating the innovation (for
example, those types of innovation where tacit knowledge is heavily involved); 2)
intellectual property protection (patents, copyrights, etc); 3) investment in complementary
assets and technologies such as manufacturing and marketing facilities; and 4) dynamic
capabilities, which enables the firm to generate a stream of further innovations, making it
hard to competitors to catch up. Tylecote (2007) inserted stakeholder inclusion into
Teece's argument: i) trusted employees can make knowledge tacit, and therefore less
replicable by rivals. ii) When codification of innovation is necessary, such as formula for a
chemical, patenting can be delayed if employees can be trusted to keep the secret,
therefore increasing the life of the patent after launch (Tylecote & Visintin, 2008). iii) As
with dynamic capabilities, employee inclusion can also help the firm maintain its
competitive edge: with trustworthy employees and well-kept secret, rivals will not be able
to find out the firm's innovation in the pipeline. iv) Finally, one can see a relationship of
mutual loyalty with suppliers and lead customers as a way of getting by without
51
Chapter 2: Prior Studies in Technological Capability Development
investment in complementary assets and technologies. Again, secrecy is more easily
maintained if suppliers and customers are loyal 17 •
The whole discussion so far in this subsection has been with reference to developed
countries in which 'innovation' is the 'new to the world' variety. As promised earlier in this
subsection (before the start of 2.3.1), I will next show that in a given sector, the
technological regime that firms face in a developing countrylNIE (like China) is likely to
be quite different, and therefore adaption of the framework is made accordingly, to address
innovation and technological capability development in these countries.
2.3.3 Adaptation of CGFS and technological capability development to the context of NIEs
For NIEs, regardless of sectors, Visibility is a central issue in technological development.
As argued earlier, for the majority of NIEs, the main objective of technological change is
to catch up with the advanced countries. The process of catching-up - of mastering
increasingly advanced products and processes and at the same time gaining increasing self
reliance in each successive advance - demands small but complex arrangements of time
and money to conduct organisational learning. Technological catch-up takes time, and
sometimes there is nothing to show for a firm's effort for as long as a decade (Hobday's
[1995] description of Anam is such a case in point). Moreover, the key investments in
learning require more effort than money - and the money may have to be spent in a rather
low-visibility way. Examples include money spent on adaptation and modification of
second-hand equipments, and cost of materials during trial and error for a more efficient
production process, etc. Appreciation of the importance of such low-visibility activities
could only be possible for those financiers who take a great interest in the process - who
are engaged to understand what really is happening below the surface of operations.
17 The extent to which finns can or need to take advantage of stakeholder inclusion varies greatly by sector. For sectors such as phannaceuticals, the role of stakeholder inclusion is much less important, since a product innovation, is extremely easy to replicate but can be exceptionally well defended by patents.
52
Chapter 2: Prior Studies in Technological Capability Development
Spill-overs. For finns in NIEs, employees often benefit the most from spillover: their jobs
are more secure and salaries may be higher when product innovation takes place. For finns
from less developed regions, where management takes in account of employee interests, it
greatly enhances retention of staff and ensures a more stable base of employees, which in
tum makes it easier to keep the organizational knowledge tacit. More importantly, if
employees reciprocate they will put their energy into the development of new ideas and
new products. On the other hand, a relationship of trust and cooperation with local
suppliers may not only lead to easier (and often cheaper) facilitation of technical change,
but also trigger flow of crucial infonnation for innovation.
The majority of innovations in NIEs feature more cumulative nature of technological
change and learning (Bell & Pavitt, 1993a). This means that radical innovation in NIE
finns is often along a trajectory experienced by early industrialized economies, but has not
happened in the organisations before, therefore they may have competences to destroy to
make innovation happen, and the need for competence-destruction in NIEs is about
accepting new things to the finns. Consequently, in order to achieve innovation that is
radical by NIE standard, there is need for shareholder pressure for value and (decent)
level of industrial expertise.
Finally, technology opportunity - for developing countries, it's not about how fast and how
far the state of the art move forward, but how much behind they are, and how fast they can
catch up. 'The most essential aspect of the catching-up process is the rate at which a
follower is able to undertake technological imitation' (Juma & Clark, 2002, p.5). The
process of technological imitation is easily intuitively linked to pursuing the same path of
development. However technological imitation has a layer of meaning that is beyond
simple repetition of the same path taken by industrialized countries (Juma & Clark, 2002).
Japanese finns in the 1960s and 70s showed very well how technological imitation works,
in a complex series of processes, through recycling traditional ideas, exploring new ideas,
nurturing creativity, generating breakthroughs and refining existing ideas (Freeman, 1987).
The government of the imitating country must have conscious policies to guide the
imitation. At the industry and finn level, the rate at which it takes place depends very
53
Chapter 2: Prior Studies in Technological Capability Development
much on existing technological capabilities, and institutions. It also greatly challenges
CGFS. For poorer developing countries, the challenge mainly lies in the availability of
finance. For firms (especially well-financed ones) in more industrialized developing
countries like China, finance availability becomes less of a constraint 1 8. Therefore it is
more relevant that decision-makers/financiers of innovative activities possess the
necessary expertise to choose wisely among competing technological options - often
between import of most advanced technology embodied in the stock of capital goods
(given sufficient funds), and technology that is appropriate for the current stock of
capabilities in the firm.
2.4 Summary
This chapter reviews the literature related to main topics studied in this thesis. The concept
of technological capability used in this thesis is defined as the capability of a firm to
identify, acquire, assimilate, adapt and make effective use of technical knowledge and
skills, and then to generate new knowledge and skills. It combines various definitions in
the innovation literature, with the nature of innovation in NIEs in mind. We further
distinguish between static and dynamic technology capability in a way that is similar to
that of Teece et al and Pisano's, i.e. dynamic capabilities are associated with change - with
which firm resources can be acquired, shed, integrated and recombined to generate new
value-creating capabilities. Whereas static capabilities are concerned with the ability to
make effective use of current knowledge and skills - they are firm's given capabilities at a
point in time. The concept of dynamic capability inspires the empirical stage of the
research, where firms' technological capabilities are to be measured based on critical
review of popular measurement frameworks (see Section 2.1.2).
18 As of 2008. the total capital stock of Central Enterprises supervised by SASAC (State Asset Supervision and Administration Committee) has amounted to 25 trillion.
54
Chapter 2: Prior Studies in Technological Capability Development
As for the process of technological capability development in the NIE context, three
analytical frameworks in the literature have been examined. Particularly, Kim's trajectory
theory clarifies the essential differences of technological development and innovation
between developed and developing countries, which the latter often reverses the direction
of technology trajectory in advanced countries. Therefore innovation in these countries are
not mainly concerned with the introduction of ground-breaking new science and
technology, but about generating things that are new to the finn, the region, and the
country. Furthennore, in order to understand the mechanism behind success and failure of
innovation in NIEs, the instrumental role of learning is reviewed in the learning process
framework. Learning can be done in both fonnal and infonnal manners, and many
different kinds of actors and agents are involved in these learning processes. Moreover, we
propose analysis of learning in NIEs in two dimensions: activeness and visibility of
learning efforts. Although they are at the centre of innovation, finns do not operate and
learn in isolation. This chapter hence reviews the National System of Innovation
framework. We argue that a system of innovation should be understood essentially as a
system of learning, which not only includes R&D and S&T activities and institutions, but
also those institutions and relationships key to finns' innovation. Particularly, it should
incorporate the system of corporate governance and finance (CGFS).
In the rest of this chapter, the properties of learning in technological regime and their
demands for corporate governance and finance are analysed based on Malerba and
Tylecote's framework. Specifically, four properties of learning and four corresponding
challenges to the CGFS are reviewed, namely: 1) the extent of competence destruction and
the demand for shareholder pressure (and expert finance); 2) degree of technological
opportunity and the demand for expert risk capital and management autonomy; 3) low
visibility of innovation and shareholder/financier engagement; and 4) stakeholder spill
overs in innovation and the demand for stakeholder inclusion. Further, we adapt the theory
to the context ofNIEs according to the nature of innovation in these countries.
55
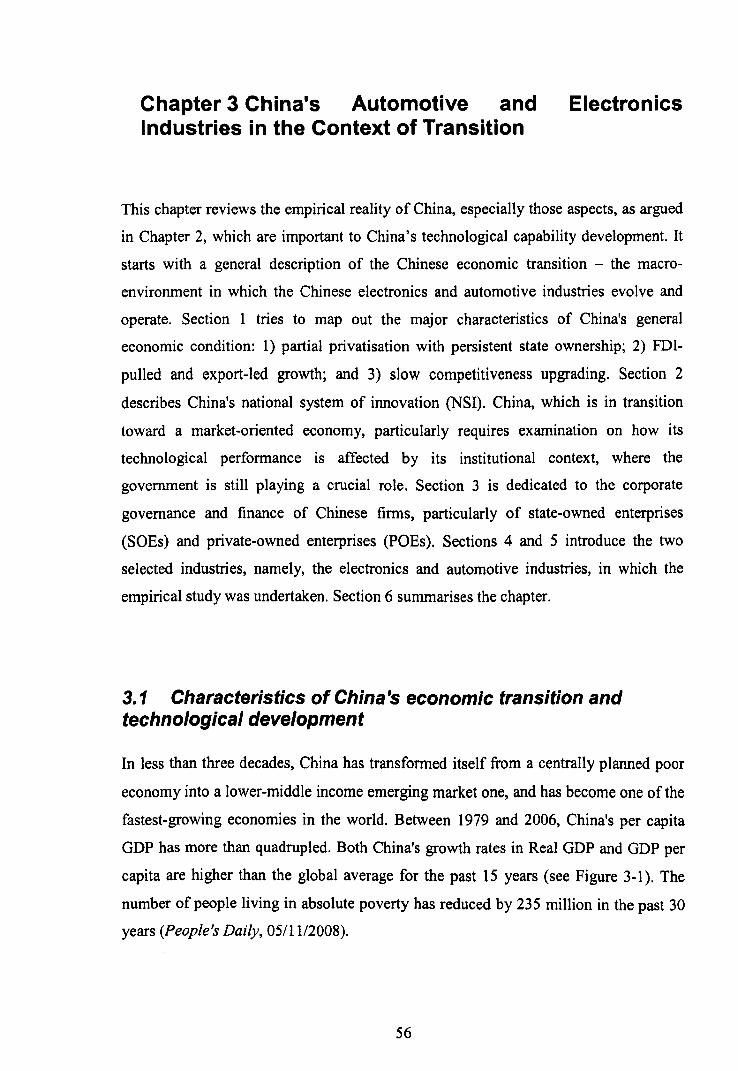
Chapter 3 China's Automotive and Electronics Industries in the Context of Transition
This chapter reviews the empirical reality of China, especially those aspects, as argued
in Chapter 2, which are important to China's technological capability development. It
starts with a general description of the Chinese economic transition - the macro
environment in which the Chinese electronics and automotive industries evolve and
operate. Section 1 tries to map out the major characteristics of China's general
economic condition: 1) partial privatisation with persistent state ownership; 2) FDI
pulled and export-led growth; and 3) slow competitiveness upgrading. Section 2
describes China's national system of innovation (NSI). China, which is in transition
toward a market-oriented economy, particularly requires examination on how its
technological performance is affected by its institutional context, where the
government is still playing a crucial role. Section 3 is dedicated to the corporate
governance and finance of Chinese firms, particularly of state-owned enterprises
(SOEs) and private-owned enterprises (POEs). Sections 4 and 5 introduce the two
selected industries, namely, the electronics and automotive industries, in which the
empirical study was undertaken. Section 6 summarises the chapter.
3. 1 Characteristics of China's economic transition and technological development
In less than three decades, China has transformed itself from a centrally planned poor
economy into a lower-middle income emerging market one, and has become one of the
fastest-growing economies in the world. Between 1979 and 2006, China's per capita
GDP has more than quadrupled. Both China's growth rates in Real GDP and GDP per
capita are higher than the global average for the past 15 years (see Figure 3-1). The
number of people living in absolute poverty has reduced by 235 million in the past 30
years (People's Daily, 05/1112008).
56
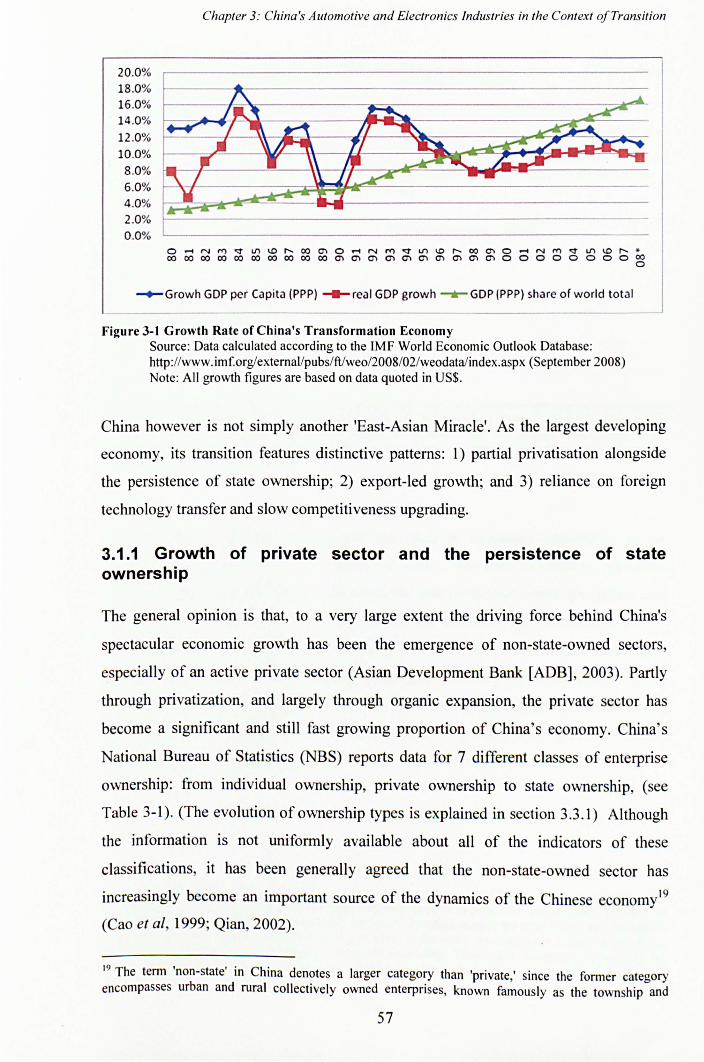
20.0% 18.0% 16.0% 14.0%
12.0%
10.0%
8.0%
6.0% 4.0% 2.0% 0.0%
Chapter 3: China's Automotive and Electronics Industries in the Context of Transition
-+-Growh GOP per Capita (PPP) _ real GOP growh --.- GOP (PPP) share of world total
Figure 3-1 Growth Rate of China's Transformation Economy Source: Data calculated according to the IMF World Economic Outlook Database: http://www.imf.org!externaVpubs/ft/weo/2008/02/weodataiindex.asp x (September 2008) Note: All growth figures are based on data quoted in US$.
China however is not simply another 'East-Asian Miracle'. As the largest developing
economy, its transition features distinctive patterns: 1) partial privatisation alongside
the persistence of state ownership; 2) export-led growth; and 3) reliance on foreign
technology transfer and slow competitiveness upgrading.
3.1.1 Growth of private sector and the persistence of state ownership
The general opinion is that, to a very large extent the driving force behind China's
spectacular economic growth has been the emergence of non-state-owned sectors,
especially of an active private sector (Asian Development Bank [ADB], 2003). Partly
through privatization, and largely through organic expansion, the private sector has
become a significant and still fast growing proportion of China's economy. China's
National Bureau of Statistics (NBS) reports data for 7 different classes of enterprise
ownership: from individual ownership, private ownership to state ownership, (see
Table 3-1). (The evolution of ownership types is explained in section 3.3.1) Although
the information is not uniformly available about all of the indicators of these
classifications, it has been generally agreed that the non-state-owned sector has
increasingly become an important source of the dynamics of the Chinese economyl9
(Cao e/ ai, 1999; Qian, 2002).
19 The term 'non-state' in China denotes a larger category than 'private,' since the former category encompasses urban and rural collectively owned enterprises, known famously as the township and
57
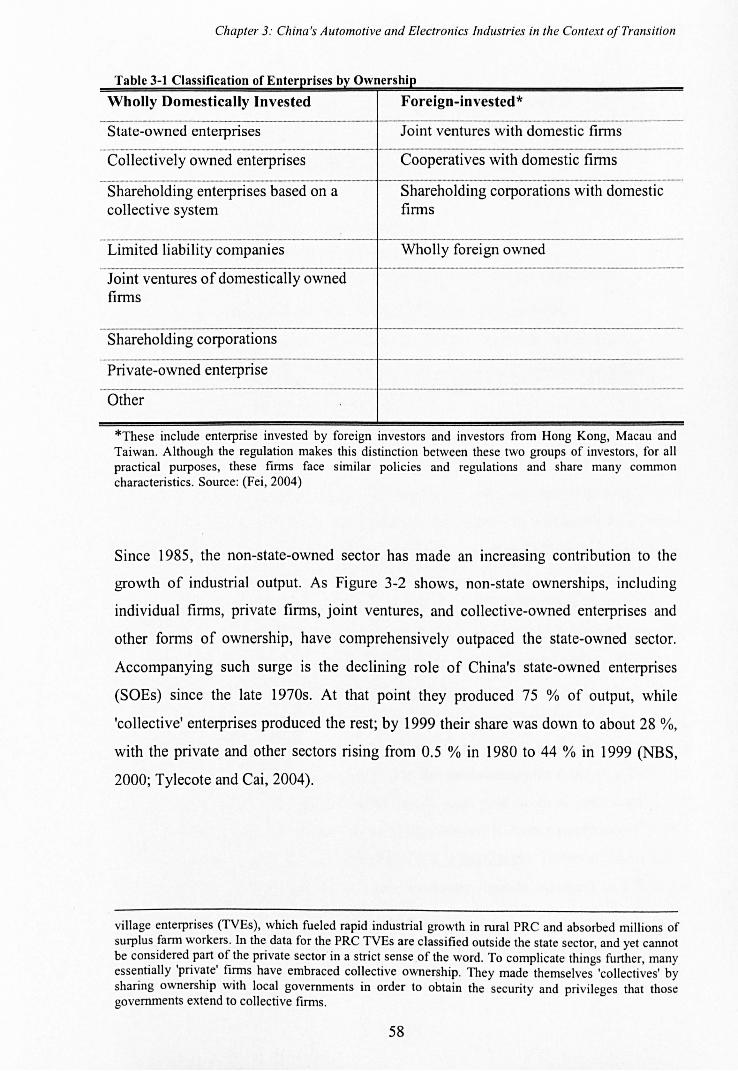
Chapter 3: China's Automotive and Electronics Industries in the Context of Transition
Wholly Domestically Invested Foreign-invested* f-------------.- -:--=---------
State-owned enterprises Joint ventures with domestic firms
Collectively owned enterprises Cooperatives with domestic firms
- Shareh-o Iding-e-nterpri ses-based-o;a--------Sha~eholding co-rporatio~·s"withdo~estic collective system firms
-.-.-------------.---------f Limited liability companies
Joint ventures of domestically owned firms
Shareholding corporations
Private-owned enterprise
Other
Wholly foreign owned
*These include enterprise invested by foreign investors and investors from Hong Kong, Macau and Taiwan. Although the regulation makes this distinction between these two groups of investors, for all practical purposes, these firms face similar policies and regulations and share many common characteristics. Source: (F ei, 2004)
Since 1985, the non-state-owned sector has made an increasing contribution to the
growth of industrial output. As Figure 3-2 shows, non-state ownerships, including
individual firms, private firms, joint ventures, and collective-owned enterprises and
other forms of ownership, have comprehensively outpaced the state-owned sector.
Accompanying such surge is the declining role of China's state-owned enterprises
(SOEs) since the late 1970s. At that point they produced 75 % of output, while
'collective' enterprises produced the rest; by 1999 their share was down to about 28 %,
with the private and other sectors rising from 0.5 % in 1980 to 44 % in 1999 (NBS,
2000; Tylecote and Cai, 2004).
village enterprises (TVEs), which fueled rapid industrial growth in rural PRC and absorbed millions of surplus farm workers. ]n the data for the PRC TVEs are classified outside the state sector, and yet cannot be considered part of the private sector in a strict sense of the word. To complicate things further, many essentially 'private' firms have embraced collective ownership. They made themselves 'collectives' by sharing ownership with local governments in order to obtain the security and privileges that those governments extend to collective firms .
58
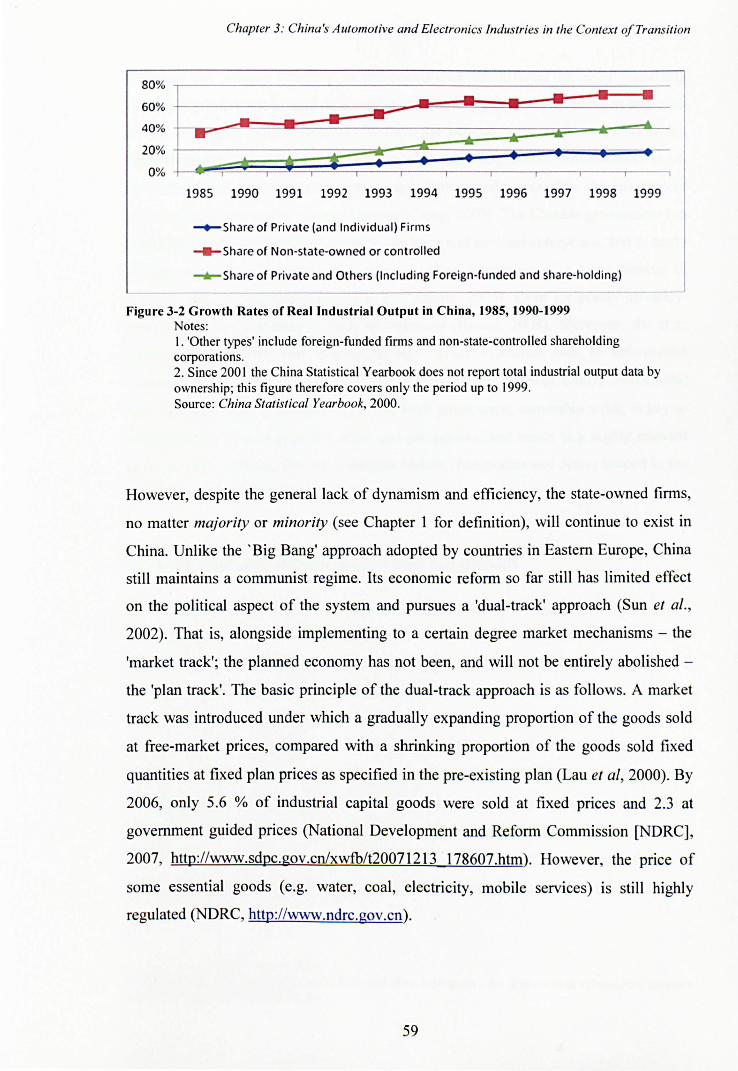
Chapter 3: China's Au/amative and Electronics Industries in the Con/ext a/Transition
80% .---------------------------------------------------------
1985 1990 1991 1992 1993 1994 1995 1996 1997 1998 1999
--+-Share of Private (and Individual) Firms
_ Share of Non-state-owned or controlled
--.-Share of Private and Others (Including Foreign-funded and share-holding)
Figure 3-2 Growth Rates of Real Industrial Output in China, 1985, 1990-1999 Notes: I. 'Other types' include foreign-funded firms and non-state-controlled shareholding corporations. 2. Since 2001 the China Statistical Yearbook does not report total industrial output data by ownership; this figure therefore covers only the period up to 1999. Source: China Statistical Yearbook, 2000.
However, despite the general lack of dynamism and efficiency, the state-owned firms,
no matter majority or minority (see Chapter 1 for definition), will continue to exist in
China. Unlike the 'Big Bang' approach adopted by countries in Eastern Europe, China
still maintains a communist regime. Its economic reform so far still has limited effect
on the political aspect of the system and pursues a 'dual-track' approach (Sun et ai. ,
2002). That is, alongside implementing to a certain degree market mechanisms - the
'market track'; the planned economy has not been, and will not be entirely abolished -
the 'plan track'. The basic principle of the dual-track approach is as follows . A market
track was introduced under which a gradually expanding proportion of the goods sold
at free-market prices, compared with a shrinking proportion of the goods sold fixed
quantities at fixed plan prices as specified in the pre-existing plan (Lau et ai, 2000). By
2006, only 5.6 % of industrial capital goods were sold at fixed prices and 2.3 at
government guided prices (National Development and Reform Commission [NDRC],
2007, http://www.sdpc.gov.cn/xwfb/t20071213178607.htm). However, the price of
some essential goods (e.g. water, coal , electricity, mobile services) is still highly
regulated (NDRC, http://www.ndrc.gov.cn).
59
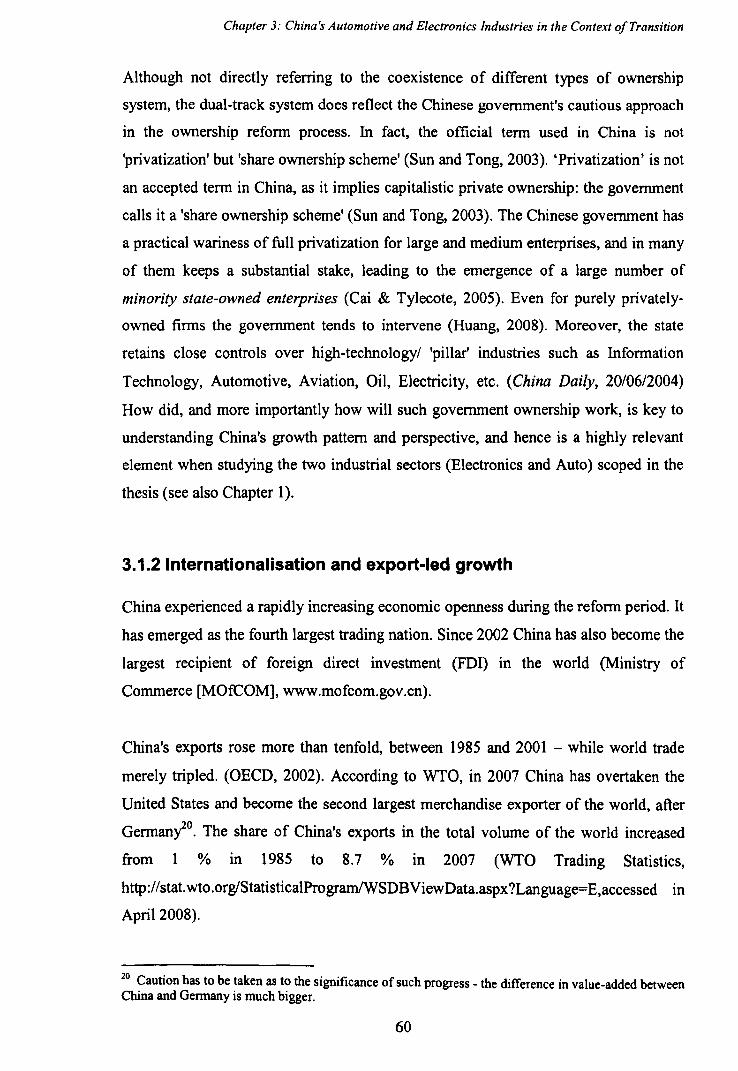
Chapter 3: China's Automotive and Electronics Industries in the Context of Transition
Although not directly referring to the coexistence of different types of ownership
system, the dual-track system does reflect the Chinese government's cautious approach
in the ownership reform process. In fact, the official term used in China is not
'privatization' but 'share ownership scheme' (Sun and Tong, 2003). 'Privatization' is not
an accepted term in China, as it implies capitalistic private ownership: the government
calls it a 'share ownership scheme' (Sun and Tong, 2003). The Chinese government has
a practical wariness of full privatization for large and medium enterprises, and in many
of them keeps a substantial stake, leading to the emergence of a large number of
minority state-owned enterprises (Cai & Tylecote, 2005). Even for purely privately
owned firms the government tends to intervene (Huang, 2008). Moreover, the state
retains close controls over high-technologyl 'pillar' industries such as Information
Technology, Automotive, Aviation, Oil, Electricity, etc. (China Daily, 20106/2004)
How did, and more importantly how will such government ownership work, is key to
understanding China's growth pattern and perspective, and hence is a highly relevant
element when studying the two industrial sectors (Electronics and Auto) scoped in the
thesis (see also Chapter 1).
3.1.2 Internationallsation and export-led growth
China experienced a rapidly increasing economic openness during the reform period. It
has emerged as the fourth largest trading nation. Since 2002 China has also become the
largest recipient of foreign direct investment (FDI) in the world (Ministry of
Commerce [MOfCOM], www.mofcom.gov.cn).
China's exports rose more than tenfold, between 1985 and 2001 - while world trade
merely tripled. (OECD, 2002). According to WTO, in 2007 China has overtaken the
United States and become the second largest merchandise exporter of the world, after
GermanYo. The share of China's exports in the total volume of the world increased
from 1 % In 1985 to 8.7 % In 2007 (WTO Trading Statistics,
http://stat.wto.org/StatisticaIProgramlWSDBViewData.aspx?Language=E,accessed In
April 2008).
20 Caution has to be taken as to the significance of such progress - the difference in value-added between China and Germany is much bigger.
60
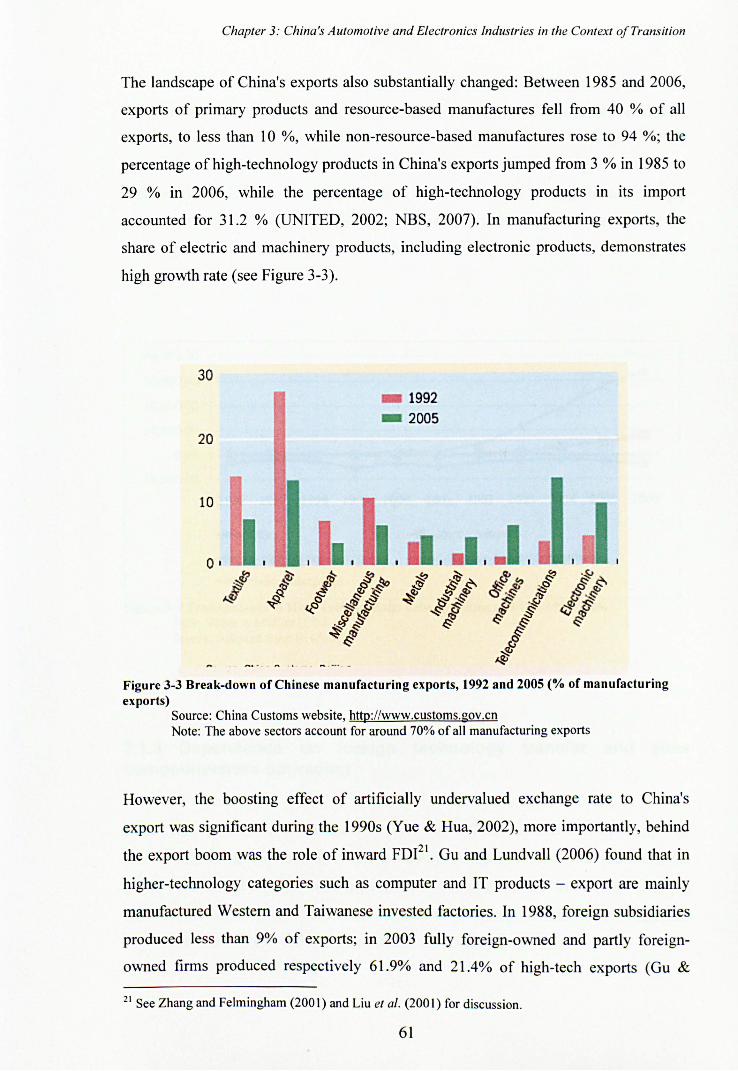
Chapter 3: China's Automotive and Electronics Industries in the Context a/Transition
The landscape of China's exports also substantially changed: Between 1985 and 2006,
exports of primary products and resource-based manufactures fell from 40 % of all
exports, to less than 10 %, while non-resource-based manufactures rose to 94 %; the
percentage of high-technology products in China's exports jumped from 3 % in 1985 to
29 % in 2006, while the percentage of high-technology products in its import
accounted for 31.2 % (UNITED, 2002; NBS, 2007). In manufacturing exports, the
share of electric and machinery products, including electronic products, demonstrates
high growth rate (see Figure 3-3).
30
20
10
I . I.
1992 2005
. .1.
Figure 3-3 Break-down of Chinese manufacturing exports, 1992 and 2005 (% of manufacturing exports)
Source: China Customs website, http: //www.customs.gov.cn Note: The above sectors account for around 70% of all manufacturing exports
However, the boosting effect of artificially undervalued exchange rate to China's
export was significant during the 1990s (Yue & Hua, 2002), more importantly, behind
the export boom was the role of inward FDfl. Gu and Lundvall (2006) found that in
higher-technology categories such as computer and IT products - export are mainly
manufactured Western and Taiwanese invested factories. In 1988, foreign subsidiaries
produced less than 9% of exports; in 2003 fully foreign-owned and partly foreign
owned firms produced respectively 61.9% and 21.4% of high-tech exports (Gu &
21 See Zhang and Felmingham (200 I) and Liu et at. (2001) for discussion.
61
Chapter 3: China's Automotive and Electronics Industries in the Context a/Transition
Lundvall, 2006: citing China S&T Indicators 2004). Meanwhile, between 1998 and
2005 the share in exports of high-tech products of Chinese-owned finns (excluding
international joint ventures) fell by more than 50%
(www.sts.org.cn/sjkllkjtjdtldata2006.Fig2-1O).AlthoughChina·shigh-tech product
trade surplus to U.S. increases rapidly since 2002, it has been mainly, and increasingly
so (at least up till 2006), contributed by foreign-owned and foreign-invested enterprises
(see Figure 3-4). In sharp contrast, domestic enterprises, especially SOEs, are
constantly in deficit.
1996 1997 1998 1999 2000 2001 2002 2003 2004 2005 2006
~SOEs _ Joint-Ventures
--.- Foreign-owned Enterprises - Collective-Owend Enterprises
-;-- Private Enterprises
Figure 3-4 Trade balance in High-Tech products between China and U.S. 1996-2006. Note: Value in Million U.S $. Source: Adapted from Bi (2007).
3.1.3 Dependence on foreign technology transfer and slow competitiveness upgrading
Since the opening of its markets in the late 1970s, the Chinese economy has
increasingly integrated into the world economy. Although China's insertion into the
global value chain through mass production of commodities has been overwhelming,
the industrialization process has not brought about a widespread and robust indigenous
innovation capability in Chinese firms (Ou & Lundvall , 2006).
62
Chapter 3: China's Automotive and Electronics Industries in the Context o/Transition
The general approach to acquiring foreign technology by Chinese finns can be
described as 'dependent' technology strategy (Freeman, 1992). They focus was on
getting production capability through licensing or joint venture deals with advanced
'Northern' finns. A good indicator of China's reliance on foreign technology transfer
would be the ratio between technology imports and the R&D expenditure of Chinese
industry. For all years in the 1990s, the expenditure on technology imports was well
above R&D expenditure by Chinese industry, as well as for China as a whole (OECD,
2002), and the gap further widened until 199922 (NBS Statistics Data on Science and
Technology Development, 2006, http://www.stats.gov.cn/tjsj/gtsj/kjtjjrnz1l2006D.
Moreover, statistics at the industrial level show an inverse relationship between the
R&D expenditure by different Chinese industries and the cost of their technology
imports, suggesting a substitution effect between technology imports and domestic
R&D (MOST, 1999: 116).
As a result of dependent technological strategy, import of complete-set machinery and
equipment (including core equipment) has been the most important item of technology
trade in China. Explicitly encouraged by the government through tax rebate policies23
(Notice by State Council on Tax Refund of Imported Equipments, 1997), its absolute
value increased by more than 40 % year on year since the late 80s (MOC,
http://zhs.mofcom.gov.cn/tongji.shtml), representing highest increase of all fonns.
Although finns with foreign investments serve as a mam channel of technology
imports to China, in most cases the core technology involved is still controlled by the
foreign partners of the joint venture, or by their headquarters (OECD, 2002). In China,
foreign invested finns perfonn some parts of the manufacturing process with little
technological innovation of product design (Liu & Wang, 2003). This channel of
technology diffusion is thus rather limited. The lack of effort on the Chinese side to
promote diffusion of imported technology has certainly further weakened the impact of
foreign technology transfer on domestic technological capability (Chinese enterprise
technological perfonnance will be discussed in Section 3.2.2). Low absorption has
reduced the opportunity for improving the technological capabilities of Chinese
22 Such a switch might be partially explained by China's refonns in its R&D system by merging about 200 state-owned R&D institutes with state-owned enterprises (Sun, 2002). 23 In Chinese: Guowuyuan guanyu tiaozhengjinkou shehei shuishou zhengce de tongzhi, available on line: http://www.people.com.cnlzixunlfl/gk/item/dwjjp/alv/6/6-J-08.html
63
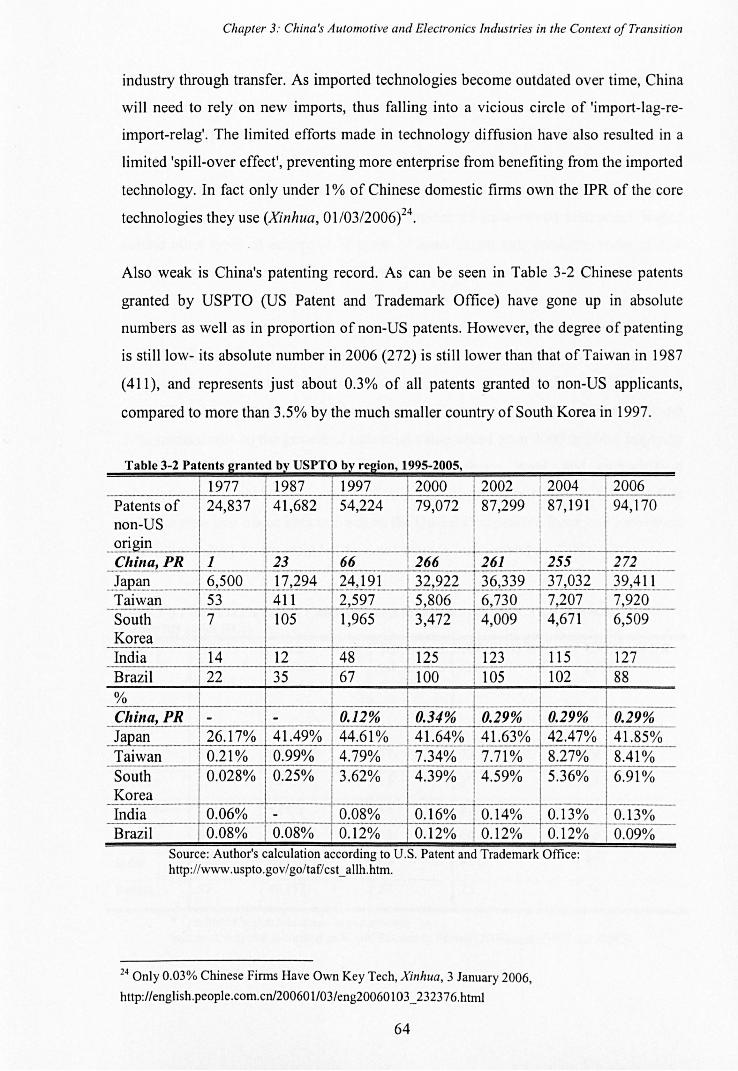
Chapter 3: China 's Automotive and Electronics Industries in the Context a/Transition
industry through transfer. As imported technologies become outdated over time, China
will need to rely on new imports, thus falling into a vicious circle of 'import-Iag-re
import-relag'. The limited efforts made in technology diffusion have also resulted in a
limited 'spill-over effect', preventing more enterprise from benefiting from the imported
technology. In fact only under 1 % of Chinese domestic firms own the IPR of the core
technologies they use (Xinhua, 01103/2006)24.
Also weak is China's patenting record. As can be seen in Table 3-2 Chinese patents
granted by USPTO (US Patent and Trademark Office) have gone up in absolute
numbers as well as in proportion of non-US patents. However, the degree of patenting
is still low- its absolute number in 2006 (272) is still lower than that of Taiwan in 1987
(411), and represents just about 0.3% of all patents granted to non-US applicants,
compared to more than 3.5% by the much smaller country of South Korea in 1997.
Table 3-2 Patents granted by USPTO by region, 1995-2005,
_____ -11_1_97_7 1987 1997 2000 2002 _2004 ~ 2006 Patents of 24,837 141,682 54,224 79,072 87,299 87,191 94,170
non-US --L
~~~f~~¥z~L~C: - South 7 1 105 1,965 3,472 '11 4,009 4,671 6,509 Korea __ -, _____ -+ ______ 1 _i--_____ + ____ -+-____ _ India 14 12 48 125 123 115 127
- Brazil 22 35 67 100 105 10-2---+-1 -88----
% - -China, PR - - 0.12% 0.34% 0.29% 0.29%
_J~p-'!!1 ____ 26.17% 41.49% 44.61% 41.64% 1 41.63% 42.47% _._._---_.- -------------17.71%
-------Taiwan 0.21% 0.99% 4.79% 7.34% 8.27%
--South 0.028% 0.25% 3.62% 4.39%
14.59% 5.36%
Korea -------10.14% India 0.06% - 0.08% 0.16% 0.13%
Brazil 0.08% 10.08% 0.12% 0.12% 10.12% 0.12% Source: Author's calculatIOn accordmg to U.S. Patent and Trademark Office: http://www.uspto.gov/go/taf/cst_allh .htm.
24 Only 0.03% Chinese Firms Have Own Key Tech, Xinhua, 3 January 2006,
http://english.people.com.cnl200601l03/eng20060 I 03 _23237 6.html
64
0.29% 41.85% ------8.41% 6.91%
0.13% 0.09%
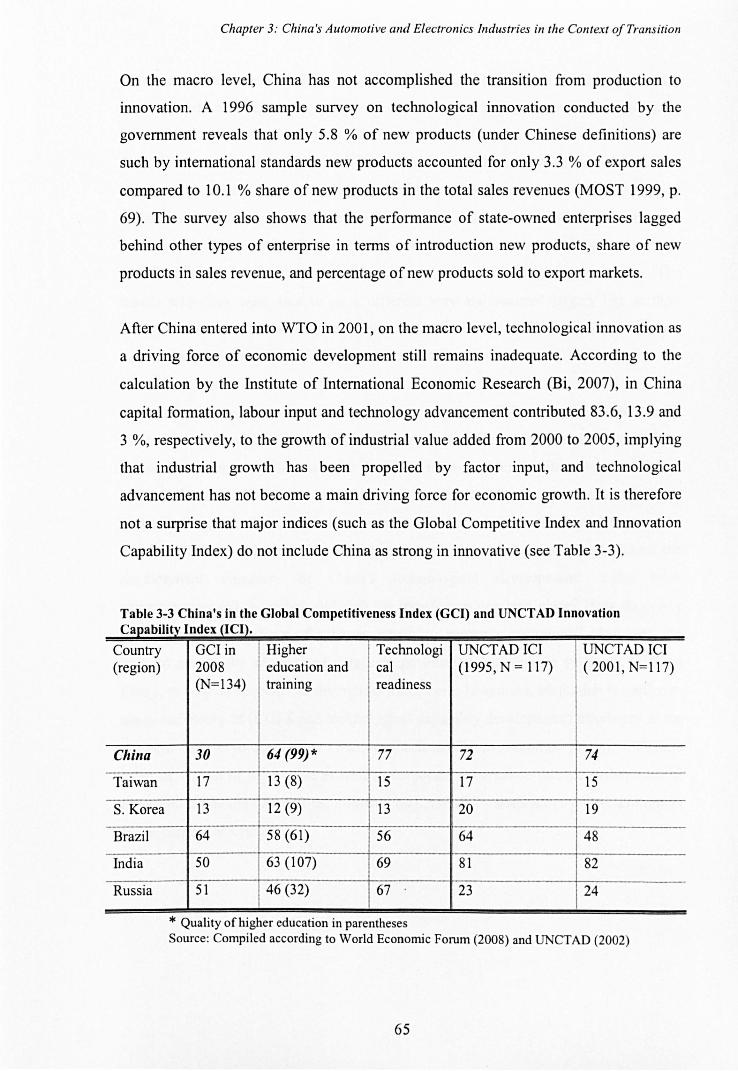
Chapter 3: China's Automotive and Electronics Industries in the Context a/Transition
On the macro level, China has not accomplished the transition from production to
innovation. A 1996 sample survey on technological innovation conducted by the
government reveals that only 5.8 % of new products (under Chinese definitions) are
such by international standards new products accounted for only 3.3 % of export sales
compared to 10.1 % share of new products in the total sales revenues (MOST 1999, p.
69). The survey also shows that the perfonnance of state-owned enterprises lagged
behind other types of enterprise in tenns of introduction new products, share of new
products in sales revenue, and percentage of new products sold to export markets.
After China entered into WTO in 2001, on the macro level, technological innovation as
a driving force of economic development still remains inadequate. According to the
calculation by the Institute of International Economic Research (Bi, 2007), in China
capital fonnation, labour input and technology advancement contributed 83.6, 13.9 and
3 %, respectively, to the growth of industrial value added from 2000 to 2005, implying
that industrial growth has been propelled by factor input, and technological
advancement has not become a main driving force for economic growth. It is therefore
not a surprise that major indices (such as the Global Competitive Index and Innovation
Capability Index) do not include China as strong in innovative (see Table 3-3).
Table 3-3 China's in the Global Competitiveness Index (GCI) and UNCTAD Innovation Capability Index (ICI).
Country GCI in Higher Technologi UNCTAD ICI UNCTAD ICI (region) 2008 education and cal ( 1 995, N = 1 1 7) ( 2001, N= 117)
(N=134) training readiness
China 30 64 (99)* 77 72 74
Taiwan 17 13 (8) 15 17 15
S. Korea 13 12 (9) 13 20 19 -----._---- f..-.--------. -------- -----_._.--------
Brazil 64 58 (61) 56 64 48
India 50 63 (107) 69 81 82
Russia 51 46 (32) 67 23 24
* Quality of higher education in parentheses Source: Compiled according to World Economic Forum (2008) and UNCTAD (2002)
65
Chapter 3: China's Automotive and Electronics Industries in the Context of Transition
On the other hand, despite of the disappointing overall performance of Chinese firms, a
small number of bridge-head companies are becoming highly innovative and globally
competitive. Huawei (Telecommunications); Haier (Consumer electronics); Lenovo
(PC); Chery (Automotive); and BYD (Battery and Auto) are those with the highest
profile. A common feature of these more innovative firms is that they adapted an
alternative approach to technology transfer (and upgrade); termed as 'imitative
strategy' by Freeman (1992), in which learning takes place more independently, with
little help from the firm(s) being imitated, and even without their permission. (The
reason why they were able to go a different way and succeed largely lies in their
different corporate governance and finance system, which will be explained in detail
with the help of case study of Chery in Chapter 6).
Obviously, the indicators above are not going to paint a full picture of China's really
technological strength .. To understand and to assess China's progress in moving from
static production capability to more dynamic, innovative capabilities, we need to not
only evaluate the outcome, but to assess the input. We also need to achieve an
understanding of the organisations, institutions and their relationships (namely,
National System of Innovation, see Chapter 2, section 2.2.3), which have shaped the
development trajectory of China's technological development: under what
circumstances did (or rather, did not) the transformations take place? How do policy
networks and institutions of such an emerging economy contribute? Moreover, we
need to review the situation of corporate governance and finance system (CGFS) in
China, to help us develop our theoretical framework: how much adaptation is needed to
apply the theory of (CGFS and technological capability development) developed in the
Western context to developing countries, such as China. Historical review of China's
national system of innovation as well as corporate governance finance system will be
presented in the next 2 sections, followed by Chapter 4 - adaptations of western theory .
to the context of China.
66
Chapter 3: China's Automotive and Electronics Industries in the Context o/Transition
3.2 China's national system of innovation
3.2.1 Historical Overview of China's NSI and the role of the state
The empirical reality of China's NSes has two defining characteristics: 1) a dominant
role played by the government, and 2) highly uneven regional distribution of resources
and activities which are mainly concentrated in the coastal regions and big cities. The
former feature persists and feeds to the latter, so that past reforms and transformations
have been relatively unsuccessful in addressing this problem (Huang, 2008).
• Pre-reform era: 1949-1979
Before the reform started in 1979, the industrial organisation structure of China
features high degree of centralisation and state ownership. During that time China's
NSI focused on the development of weaponry, particularly strategic weaponry (Sun,
2002). Consequently, the civilian industries were largely neglected and poorly
managed, lacking incentives for the development and adoption of new technologies
(Suttmeier, 2002). Moreover, there was a clear separation of activities among industries,
governmental laboratories and universities. For example, industrial enterprises
(factories) were centre of production; governmental laboratories focused on research
and development; and universities with few exceptions26 were education centres (Liu
and White, 2001; Sun,2002). There was little spontaneous interaction among the three
- industries, universities, and research institutes. Governments, particularly the central
government, funded and controlled all R&D activities (Sun et aI, 2003).
• NSI in transition during the reform: 1979-2009
In March 1978 Deng Xiaoping promoted the status of 'science and technology as the
primary force of productivity' at the National Science and Technology Conference. In
the same year the National Science and Technology Development Plan (197801985)
was issued, marking the start of S&T system reform in China. In 1999, after Zhu
Rongji was appointed Prime Minister, the central government issued the 'Decision on
2S Definition of National System of Innovation adopted in this study can be found in Chapter 2, section 2.2.3). 26 Research and development in universities were mainly for weapons, see Sun et al (2003).
67
Chapter 3: China's Automotive and Electronics Industries in the Context of Transition
Strengthening Technological Innovation, Developing High-Tech Firms, and Realizing
Commercialization of New Technologies.' The decision called for the creation of a
national innovation system, recognizing the intricate relationship among refonns in the
economy, S&T, education and innovation. In 2005 Hu lintao and Wen liabao made
important speeches on the National Science and Technology Conference and
established a long-term objective of constructing 'an innovative country'. Innovation,
especially indigenous innovation was elevated to national strategic level.
The reform of China's NSI thus has been a gradual process, consisting of a number of
successive policy changes and adjustments. The refonn experience resembles a process
of institutional learning based on results and lessons learned from previous policies
(Gu, 1999; Sun, 2002), which does not exclude the possibility of regression - after
1989 (Huang, 2008). Some trends can be identified: 1) a change from piecemeal reform
to the recent more systematic approach, 2) a shift in emphasis from government
research laboratories to individual enterprises; and 3) growing market orientation and
increased (although still insufficient) participation of industry (Sun, 2002). Despite the
government's intent to create an enterprise-centred innovation system, the state is still
central to China's innovation system ..
The rest of the section will describe the role and performances of particular actors,
institutions and policies, with a view to include the distribution of these activities
within the system, where do organisational boundaries lie, how is the mechanism
coordinated, and what do all these mean for a system to effectively introduce, diffuse
and exploit technological innovation ..
68
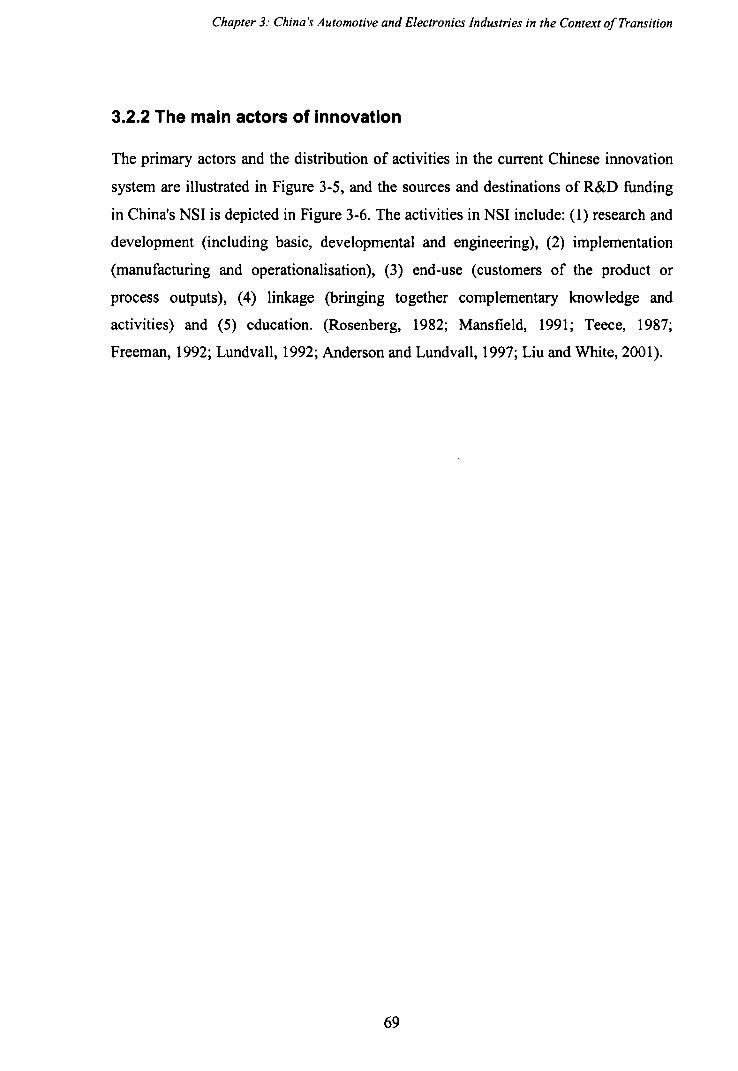
Chapter 3: China's Automotive and Electronics Industries in the Context o/Transition
3.2.2 The main actors of innovation
The primary actors and the distribution of activities in the current Chinese innovation
system are illustrated in Figure 3-5, and the sources and destinations of R&D funding
in China's NSI is depicted in Figure 3-6. The activities in NSI include: (1) research and
development (including basic, developmental and engineering), (2) implementation
(manufacturing and operationalisation), (3) end-use (customers of the product or
process outputs), (4) linkage (bringing together complementary knowledge and
activities) and (5) education. (Rosenberg, 1982; Mansfield, 1991; Teece, 1987;
Freeman, 1992; Lundvall, 1992; Anderson and Lundvall, 1997; Liu and White, 2001).
69
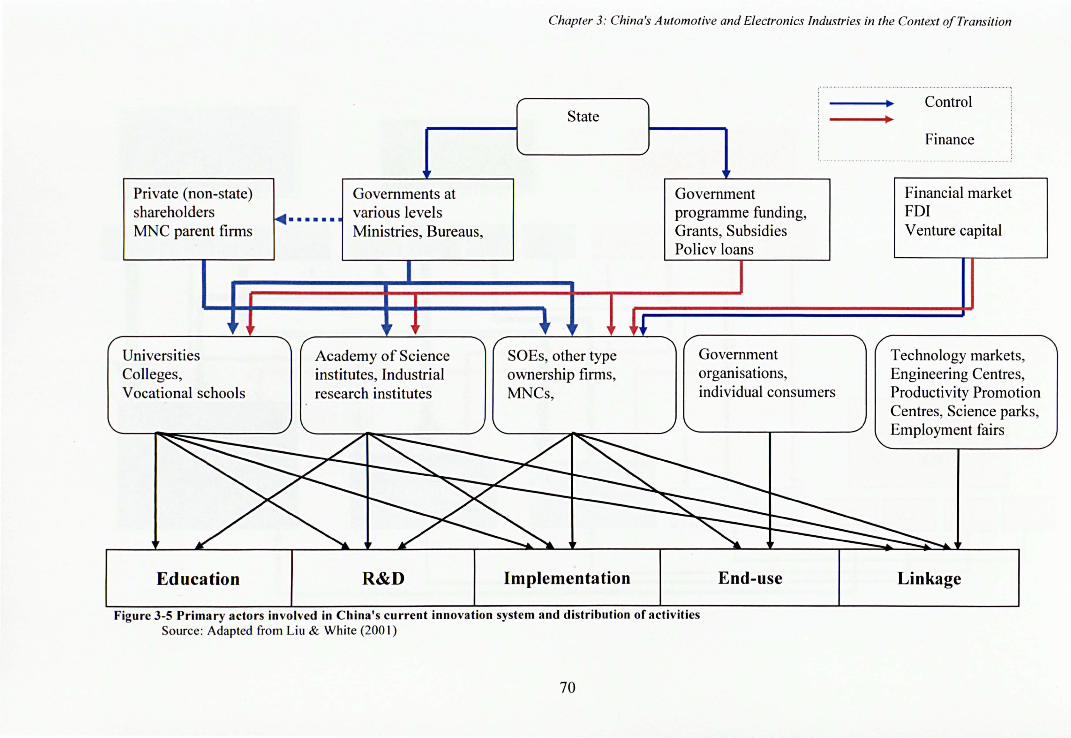
Private (non-state) shareholders MNC parent firms
Universities Colleges, Vocational schools
Education
••••••
Governments at various levels Ministries, Bureaus,
Academy of Science institutes, Industrial research institutes
R&D
Chapter 3: China's Automotive and Electronics Industries in the Context o/Transition
State
SOEs, other type ownership firms, MNCs,
Implementation
---.~ Control
Government programme funding, Grants, Subsidies Policy loans
Government organisations, individual consumers
End-use
Finance
Financial market FDI Venture capital
Technology markets, Engineering Centres, Productivity Promotion Centres, Science parks, Employment fairs
Linkage
Figure 3-5 Primary actors involved in China's current innovation system and distribution of activities Source: Adapted from Liu & White (200 I)
70
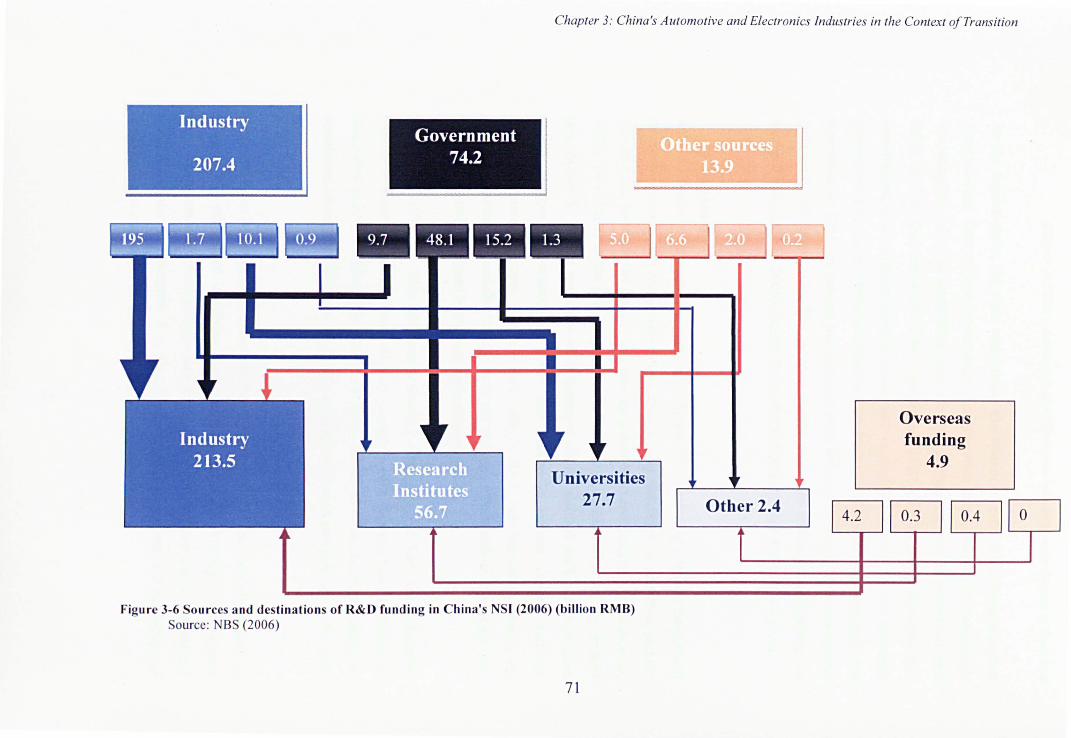
Chapter 3: China's Automotive and Electronics industries in the Context of Transition
I overnment 74.2
Universities 27.7
Figure 3-6 So urces a nd dest inations of R&D fund ing in China's NSI (2006) (billion RMB) Source: NBS (2006)
71
Other 2.4
Overseas funding
4.9
Chapter 3: China's Automotive and Electronics Industries in the Context o/Transition
As the figures show, the state orchestrates the system of innovation through control
over policies, finance, and governance. On the other hand, firms are increasingly
becoming the centre of innovation: they are now performing over two-thirds of total
R&D, up from less than 40 % at the beginning of 1990 (OECD, 2008). However their
contribution to innovation remains weak, and is confined by the flawed corporate
governance and finance. Research institutes are mainly involved in basic research; and
their share of R&D in general has declined from almost half to less than one-quarter
from early 1990s to 2004. The relative weight of higher education institutions has
changed little (OECD. 2008). Below their roles and performance are each reviewed.
1) Thestate After a decade of restructuring, although China's NSI increasingly feature heightened
enterprise participation and greater cooperation among industries, universities, and the
government, however the state is still playing a dominant and guiding role (Sun et ai,
2003). In addition to the persistence of state ownership in high-tech and key sectors
(see section 3.1.1), the government's influence is mainly through S&T and innovation
policy, corporate governance of SOEs, and finance in general. In this part our
discussion mainly focuses on the state's role in S&T and innovation policy. As
corporate governance and finance are the main subjects of research in this study, they
will be separately reviewed in the next section (section 3.3).
Founded in 1998, the State (National) Steering Committee of S&T and Education
(SSCSTE, Guowuyuan keji jiaoyu lingdao xiaozu) is most superior body in charge of
innovation policy in China. The Premier of State Council also has the responsibility to
coordinate strategic policies, such as S&T strategy, education and policies at the local
level.
Since 1998 the Ministry of Science and Technology (MOST) has been designated as
the principal participant in China's technological endeavour. Through its executive
body, it implements several programmes to fund basic and applied R&D, support and
guide innovation in enterprise. It is also in charge of management and promotion of
incubators and science parks, and S&T human resource plans ..
72
Chapter 3: China's Automotive and Electronics Industries in the Context o/Transition
However, in practice MOST is not the only body, or even the most important body in
issuing and implementing key policies in the Chinese innovation system. As shown in
by Sun et al (2007), in August 2006 over 40 departments were participating in
technology policy-making, and the department issuing most policy documents is not
Ministry of S&T, but Ministry of Foreign Trade and Economic Cooperation (see
Figure 3-7). Although Ministry of S&T and State Intellectual Property Office are
departments most relevant to technological development, their role in technology
policy making has not been central. It was the departments with key economic and
administrative resources and power that have been crucial departments for technology
policy issuing, such as State Economic and Trade Commission, Ministry of Foreign
Trade and Economic Cooperation.
Financially, the central government remained the primary source of S&T funding until
1992 when it was overtaken by industry (Sun et ai, 2003; see also Figure 3-6). Since
the 1980s the Chinese government has been utilizing a series of programmes with
different priorities as a mechanism to fund S&T activities. Such as the 863 programme,
Key Technology R&D Programme, and 973 Programme (Huang et ai, 2004i7
Although China is a mostly agricultural country, the Spark programme is the only
programme that targets China's agricultural and rural area. Initiated in 1986, it is
commissioned to promote technology transfer to, and development in the rural region.
Unlike other programmes in which the central government is the main financier, in fact,
the projects sponsorship mainly takes the form of bank loans. In 2006 only 16.8 % of
project funding was from bank loans (see Huang et ai, 2004, Table 4).
27 For details of these Programmes, see .(Huang et ai, 2004), and Appendix III
73
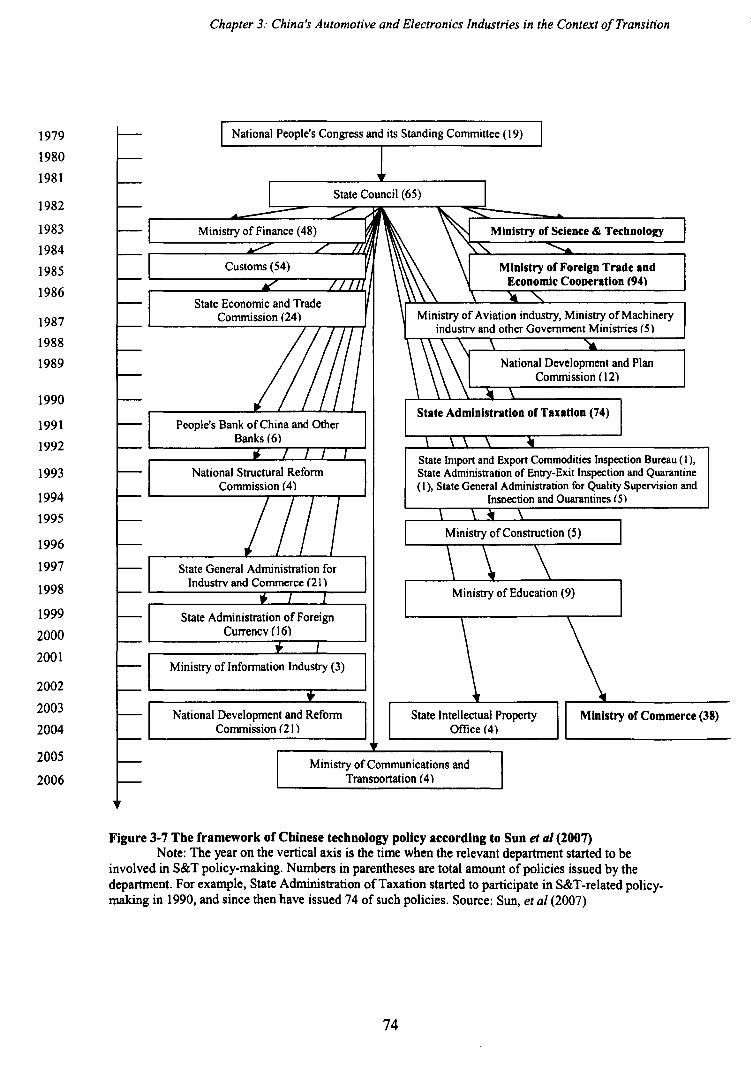
1979
1980
1981
1982
1983
1984
1985
1986
1987
1988
1989
1990
1991
1992
1993
1994
1995
1996
1997
1998
1999
2000
2001
2002
2003
2004
2005
2006
Chapter 3: China's Automotive and Electronics Industries in the Context o/Transition
National People's Congress and its Standing Committee (19)
National Development and Reform Commission (21)
National Development and Plan Commission (J 2)
State Import and Export Commodities Inspection Bureau (I), State Administration of Entry-Exit Inspection and Quarantine (I), State General Administration for Quality Supervision and
Insoection and Ouarantines (5)
State Intellectual Property Office (4)
Ministry of Communications and Transoortation (4)
Figure 3-7 The framework of Chinese technology policy according to Sun et al (2007) Note: The year on the vertical axis is the time when the relevant department started to be
involved in S&T policy-making. Numbers in parentheses are total amount of policies issued by the department. For example, State Administration of Taxation started to participate in S&T-related policymaking in 1990, and since then have issued 74 of such policies. Source: Sun, et al (2007)
74
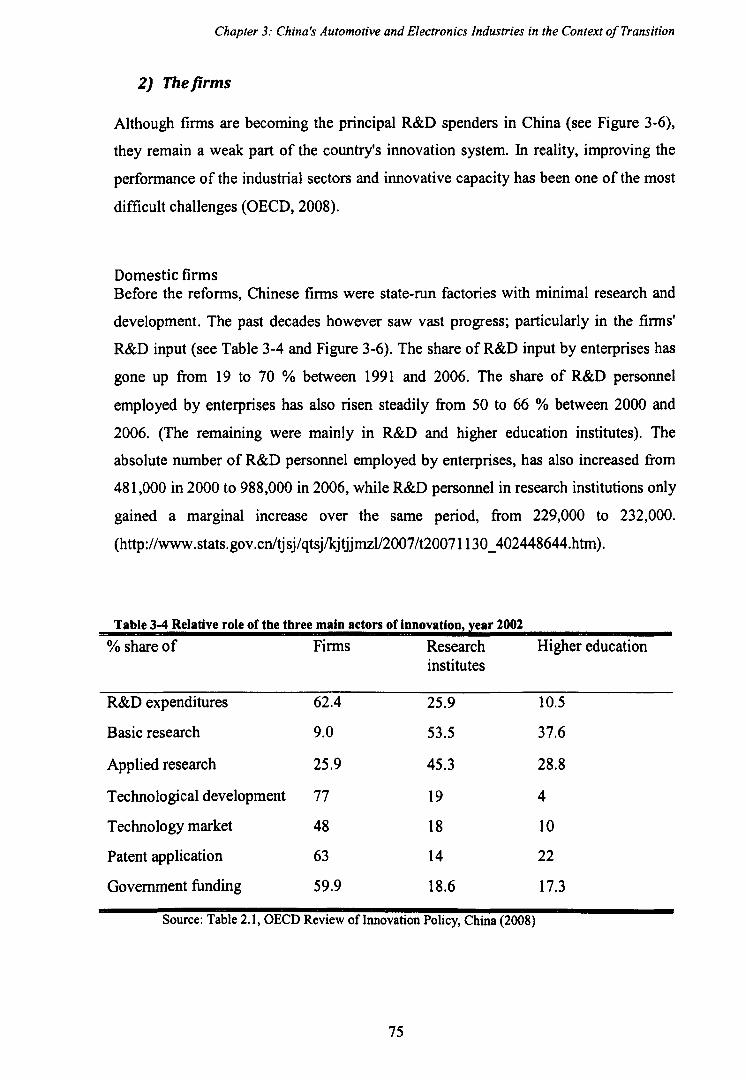
Chapter 3: China's Automotive and Electronics Industries in the Context of Transition
2) Thefirms
Although firms are becoming the principal R&D spenders in China (see Figure 3-6),
they remain a weak part of the country's innovation system. In reality, improving the
performance of the industrial sectors and innovative capacity has been one of the most
difficult challenges (OECD, 2008).
Domestic firms Before the reforms, Chinese firms were state-run factories with minimal research and
development. The past decades however saw vast progress; particularly in the firms'
R&D input (see Table 3-4 and Figure 3-6). The share of R&D input by enterprises has
gone up from 19 to 70 % between 1991 and 2006. The share of R&D personnel
employed by enterprises has also risen steadily from 50 to 66 % between 2000 and
2006. (The remaining were mainly in R&D and higher education institutes). The
absolute number of R&D personnel employed by enterprises, has also increased from
481,000 in 2000 to 988,000 in 2006, while R&D personnel in research institutions only
gained a marginal increase over the same period, from 229,000 to 232,000.
(http://www.stats.gov.cnltjsjlqtsjlkjtjjrnzV2007/t20071130_402448644.htm).
Table 3-4 Relative role of the three main actors of innovation, year 2002
% share of Firms Research Higher education institutes
R&D expenditures 62.4 25.9 10.5
Basic research 9.0 53.5 37.6
Applied research 25.9 45.3 28.8
Technological development 77 19 4
Technology market 48 18 10
Patent application 63 14 22
Government funding 59.9 18.6 17.3
Source: Table 2.1, OECD Review of Innovation Policy, China (2008)
75
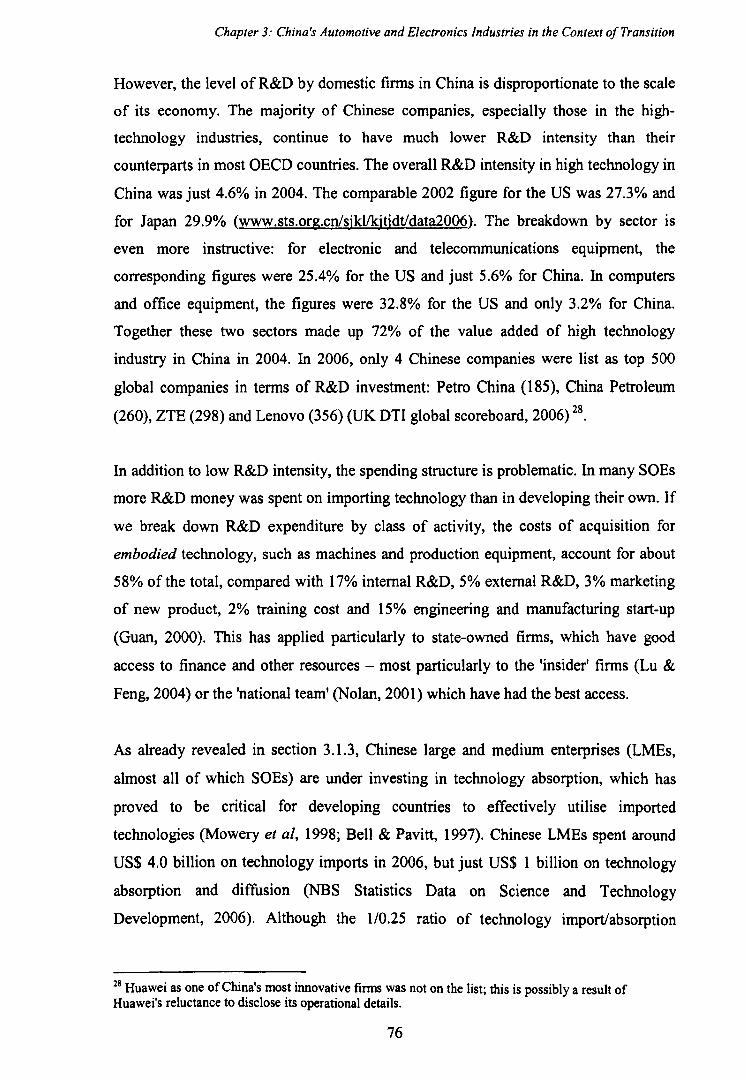
Chapter 3: China's Automotive and Electronics Industries in the Context o/Transition
However, the level of R&D by domestic firms in China is disproportionate to the scale
of its economy. The majority of Chinese companies, especially those in the high
technology industries, continue to have much lower R&D intensity than their
counterparts in most OECD countries. The overall R&D intensity in high technology in
China was just 4.6% in 2004. The comparable 2002 figure for the US was 27.3% and
for Japan 29.9% (www.sts.org.cn/sjkllkjtjdtldata2006). The breakdown by sector is
even more instructive: for electronic and telecommunications equipment, the
corresponding figures were 25.4% for the US and just 5.6% for China. In computers
and office equipment, the figures were 32.8% for the US and only 3.2% for China.
Together these two sectors made up 72% of the value added of high technology
industry in China in 2004. In 2006, only 4 Chinese companies were list as top 500
global companies in terms of R&D investment: Petro China (185), China Petroleum
(260), ZTE (298) and Lenovo (356) (UK DTI global scoreboard, 2006) 28.
In addition to low R&D intensity, the spending structure is problematic. In many SOEs
more R&D money was spent on importing technology than in developing their own. If
we break down R&D expenditure by class of activity, the costs of acquisition for
embodied technology, such as machines and production equipment, account for about
58% of the total, compared with 17% internal R&D, 5% external R&D, 3% marketing
of new product, 2% training cost and 15% engineering and manufacturing start-up
(Guan, 2000). This has applied particularly to state-owned firms, which have good
access to finance and other resources - most particularly to the 'insider' firms (Lu &
Feng, 2004) or the 'national team' (Nolan, 2001) which have had the best access.
As already revealed in section 3.1.3, Chinese large and medium enterprises (LMEs,
almost all of which SOEs) are under investing in technology absorption, which has
proved to be critical for developing countries to effectively utilise imported
technologies (Mowery et aI, 1998; Bell & Pavitt, 1997). Chinese LMEs spent around
US$ 4.0 billion on technology imports in 2006, but just US$ 1 billion on technology
absorption and diffusion (NBS Statistics Data on Science and Technology
Development, 2006). Although the 110.25 ratio of technology import/absorption
28 Huawei as one of China's most innovative firms was not on the list; this is possibly a result of Huawei's reluctance to disclose its operational details.
76
Chapter 3: China's Automotive and Electronics Industries in the Context of Transition
improved from 1/0.06 in 1997, it compared badly with those of more than 1/3 in other
industrialised countries in Asia in the 80s (Zhang, 1998).
Many of the private firms on the other hand actively seek to implement new
technology. They also undertake vital R&D even with resources constraints. However
since these firms mainly operate in the low-tech sectors, the scale of R&D investment
is very limited (MOST, 1999; Liu & White, 2001).
Chinese firms in general have not shown an increase m R&D outputs that is
comparable to their growing input. For example, Liu and White (2001) point out that
firms' increase in share and account for total patents is concentrated in design patents
(their Table 2 and Table 3). Although their R&D units and spending keep grow, it is
not matched by an enhanced performance in technologically intensive invention or
utility patents. In fact Chinese firms accounted for only 23 % of the total domestically
granted invention patents, much lower than R&D institutions (33 %) and universities
(26 %) (NBS Statistics Data on Science and Technology Development, 2006).
Multinational corporations (MNCs)
As argued above, despite higher R&D expenditure than foreign-funded enterprises
(Table 3-5), the Chinese domestic enterprises have not become the main force of
innovation. On the other hand, dynamism of overseas R&D centres in China varies
case by case, and their spill-over effects within Chinese industry are hard to measure.
77
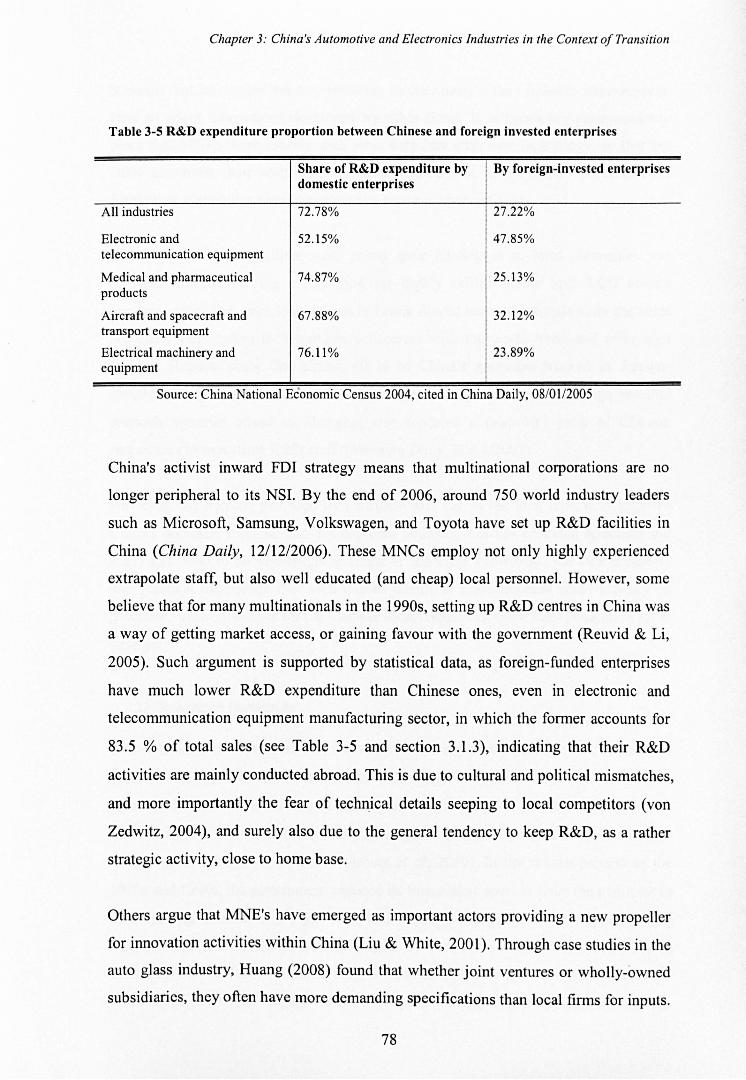
Chapter 3: China's Automotive and Electronics Industries in the Context a/Transition
Table 3-5 R&D expenditure proportion between Chinese and foreign invested enterprises
All industries
Electronic and telecommunication equipment
Medical and pharmaceutical products
Aircraft and spacecraft and transport equipment
Electrical machinery and equipment
Share of R&D expenditure by domestic enterprises
72.78%
52.15%
74.87%
67.88%
76.11%
By foreign-invested enterprises
27 .22%
47.85%
·25 .13%
32.12%
23 .89%
Source: China National Economic Census 2004, cited in China Daily, 08/01 /2005
China's activist inward FDI strategy means that multinational corporations are no
longer peripheral to its NSI. By the end of 2006, around 750 world industry leaders
such as Microsoft, Samsung, Volkswagen, and Toyota have set up R&D facilities in
China (China Daily, 12/1212006). These MNCs employ not only highly experienced
extrapolate staff, but also well educated (and cheap) local personnel. However, some
believe that for many multinationals in the 1990s, setting up R&D centres in China was
a way of getting market access, or gaining favour with the government (Reuvid & Li,
2005). Such argument is supported by statistical data, as foreign-funded enterprises
have much lower R&D expenditure than Chinese ones, even in electronic and
telecommunication equipment manufacturing sector, in which the former accounts for
83.5 % of total sales (see Table 3-5 and section 3.1.3), indicating that their R&D
activities are mainly conducted abroad. This is due to cultural and political mismatches,
and more importantly the fear of technical details seeping to local competitors (von
Zedwitz, 2004), and surely also due to the general tendency to keep R&D, as a rather
strategic activity, close to home base.
Others argue that MNE's have emerged as important actors providing a new propeller
for innovation activities within China (Liu & White, 2001). Through case studies in the
auto glass industry, Huang (2008) found that whether joint ventures or wholly-owned
subsidiaries, they often have more demanding specifications than local firms for inputs.
78
Chapter 3: China's Automotive and Electronics Industries in the Context of Transition
It means that local suppliers may loose out to their peers if they failed to innovate or at
least to adopt innovations developed by other firms. It is becoming more common
place that MNEs work closely with local suppliers with new technology, so that the
latter can meet their specifications. It is argued that at the macro level China's
innovation system has been improved as a result of such activity.
On the other hand, multinationals posed great challenges to local companIes and
research institutes in the competition for highly skilled labour and R&D human
resource. More and more local talents in China flowed to multinationals since the latter
are often more active in researches concurrent with the world trend and offer high
salaries. Reports show that almost 40 % of China's graduates worked in foreign
invested enterprises (Asia Times, 03/0112007). A survey conducted in foreign-invested
research agencies based in Shanghai also reported a near 40: 1 ratio of Chinese
researchers to expatriate R&D staff (Nanning Daily, 30/0112007).
However, the training provided by multinationals can in the long term help improve
China's domestic research and development potential. Locally educated scientists and
R&D staff tend to be well-taught in terms of academic knowledge, but lack creativity
and practical experience. The well-trained talents in multinationals could actually be
potential human resources for the Chinese local companies, once these companies grow
stronger.
3) Research institutes
Before China's reforms, research institutes were the primary performers of R&D and
other technology-related activates. Any technology brought in from abroad came to
them, in the form of technology licensing or sample machine procurement: they then
'fed' the enterprises, particularly the capital goods producers, whatever innovation or
technological change took place (Tylecote et ai, 2010). In the reform process of the
1980s and 1990s, the government reduced its financial support to force the institutes to
seek funding outside of the governmental channel. The government stopped giving
support, in 2000, for the operating budgets of over 5000 research institutes (Liu &
White, 2001). At the same time, the institutes' activities were liberated - they were
encouraged (tacitly) to engage in commercial technology services, such as licensing,
79
Chapter 3: China's Automotive and Electronics Industries in the Context of Transition
consultancy, etc. Some others managed to capitalised on their in-house technology by
setting up production facilities or creating spin-outs (Gu, 1999; Liu & White, 2001).
Meanwhile, the public research system was also downsized both in number and size of
institutes, rebalanced in favour of universities. In 1999, the R&D expenditure of
research institutes was 43.4% of national R&D spending, while that of enterprises was
41.6% (NBS, 2000). In 2005 these two ratios have changed to 19% and 71 %
respectively (Figure 3_6)29.
Currently, public-owned research institutes in China still play an important role in
supporting strategic and basic research, as well as commissioned research (OECD,
2008), mainly in the high-technology-related and natural sciences areas.
4) Universities
• Universities as Institutes of Higher Education
Human capital has been widely recognised as one of the crucial resources of
development (Wemerfelt, 1984; Peteraf, 1993; Teece et ai, 1997), and a crucial source
of human capital is formally organised education system. Since Cultural Revolution in
the late 1970s, China has not established a strong education system to support its
technological upgrade. According to DECD (2002), in the whole of 1990s China's
education constantly received fiscal appropriation that is disproportionate to its
economic growth)30. In addition, since the 1990s there exists an increasing tendency of
policy discrimination in favour of universities in general and universities in developed
coastal regions in particular. Meanwhile, the development of secondary and primary
education and vocational education as well s education in the rural areas have been
unduly neglected (Huang, 2008). As a result, preparation of human resource for the
innovation system has been mainly undertaken by universities in China. Table 3-6
gives some headline statistics of China's current situation in higher education:
29 The change appears to result in part from the conversion of government research institutes into SOEs (as described in the previous page) 30 The Education Law stipulates that the government at various levels have the legal obligation of enforcing that 'the increase of education expenditure of government at various levels shall be at a higher rate than the growth of normal fmancial revenue'. However, in 1996, 1997 and 1999-2001 the central government itself failed to fulfil this legal obligation.
80
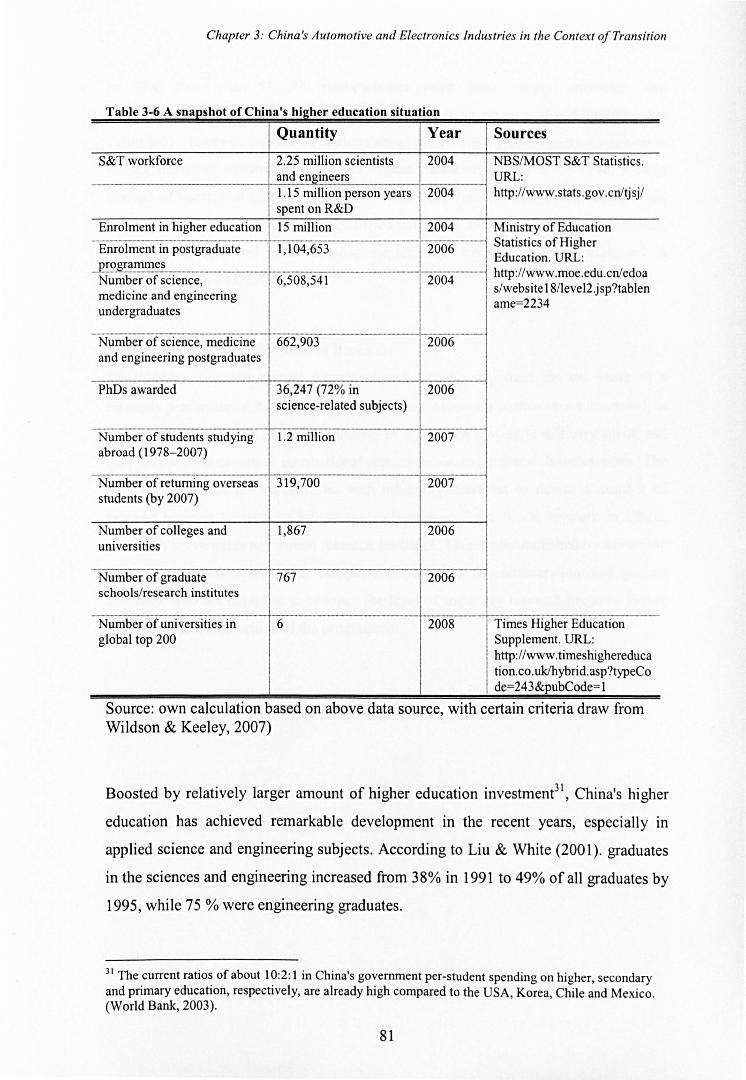
Chapter 3: China's Automotive and Electronics industries in the Context o/Transition
Table 3-6 A snapshot of China's higher education situation
Quantity Year I Sources
S&T workforce 2.25 million scientists 2004 NBSIMOST S&T Statistics. ~nd engineers URL:
- --1.15 million person years 2004 http://www.stats .gov.cnltjsjl spent on R&D
Enrolment in higher education IS million 2004 Ministry of Education -_. __ .. __ . __ ._---_. __ ._---_._-- -- Statistics of Higher Enrolment in postgraduate 1,104,653 2006
Education. URL: _.P.!:?.g!~.!!lfll~~_. __ . _____ . __________ . --_._----, 2 004---1 http: //www.moe.edu.cnledoa Number of science, 6,508,541
medicine and engineering s/website 18/IeveI2.jsp?tablen
undergraduates ame=2234
Number of science, medicine 662,903 · 2006--
and engineering postgraduates
PhDs awarded 36,247 (72% in 2006 science-related subjects)
Number of students studying 1.2 million 2007 abroad (1978-2007)
Number of returning overseas 319,700 2007 students (by 2007)
Number of colleges and 1,867 2006 universities
-------"--""------ -----_._--------Number of graduate 767 2006 schools/research institutes
_._--_._----------_._-- ----_._-_._--_._------2008--1-;-------
Number of universities in 6 Times Higher Education global top 200 Supplement. URL:
http://www.timeshighereduca tion.co.uklhybrid.asp?typeCo de=243&pubCode= 1
Source: own calculatIOn based on above data source, wIth certam cntena draw from Wildson & Keeley, 2007)
Boosted by relatively larger amount of higher education investment3!, China's higher
education has achieved remarkable development in the recent years, especially in
applied science and engineering SUbjects. According to Liu & White (200 I). graduates
in the sciences and engineering increased from 38% in 1991 to 49% of all graduates by
1995, while 75 % were engineering graduates.
3 1 The current ratios of about 10:2:1 in China's government per-student spending on higher, secondary and primary education, respectively, are already high compared to the USA, Korea, Chile and Mexico. (W orld Bank, 2003).
81
Chapter 3: China's Automotive and Electronics Industries in the Context of Transition
In 2006 more than 500,000 postgraduates were from SCIence, medicine, and
engineering subjects, and 72% of 36,000 PhDs were in science-related subjects (see
Table 3-6). However, there are questions about the efficiency of the current workforce.
During the rapid expansion of China's higher education system since 1998, a large
amount of vocational training institutions were converted to colleges and universities.
As a result, the quality of newly-qualified scientists and engineers is questionable,
while well trained and innovation-capable technical workers and technicians are in
short supply (OECD, 2008).
• Universities as Institutes of Research
The higher education system has developed significantly over the ten years as a
research performer. Although about 700 higher education institutes are recorded as
active in R&D (OECD, 2008), the number of significant players is still very small, and
only a few of them enjoy international reputation as major research universities. The
Ministry of Education collaborates with other organisations to devise a number of
funding regimes to attract Chinese researchers around the world to work in China,
mainly in universities and public research institutes. This is accomplished by rewarding
the leading researchers (with competitive packages of remuneration and project
funding), who are expected to enhance the level of some key research projects. Figure
3-8 describes the priorities of the programmes.
82
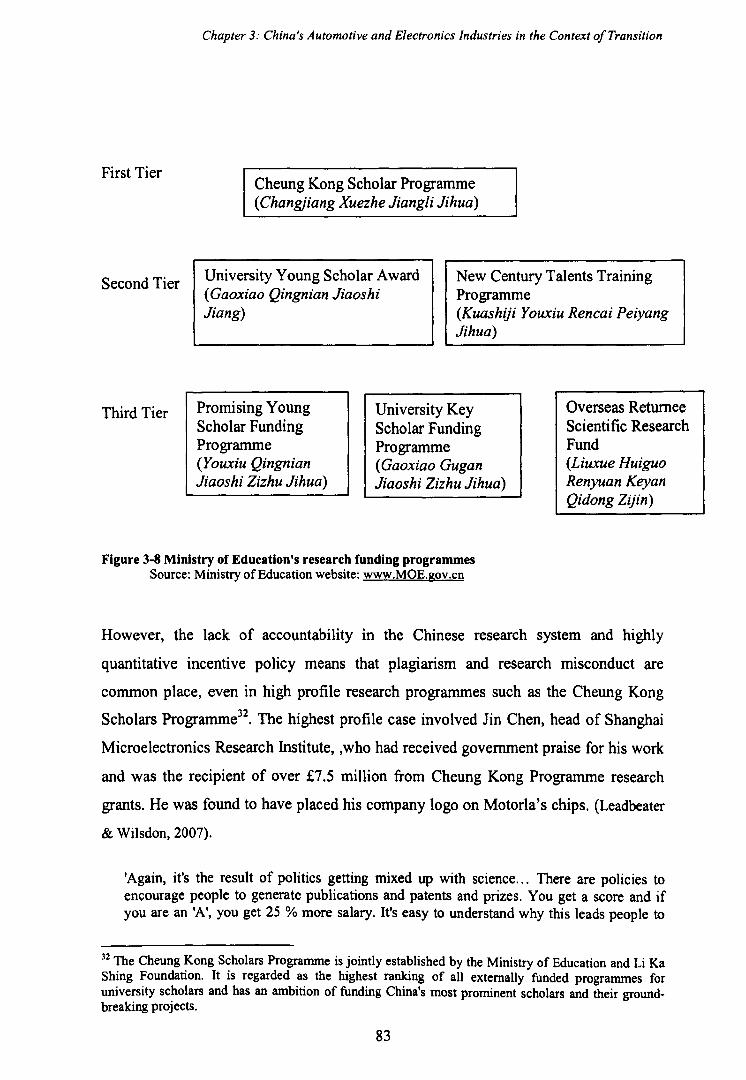
First Tier
Second Tier
Third Tier
Chapter 3: China's Automotive and Electronics Industries in the Context of Transition
Cheung Kong Scholar Programme (Changjiang Xuezhe Jiangli Jihua)
University Young Scholar Award (Gaoxiao Qingnian Jiaoshi Jiang)
New Century Talents Training Programme
Promising Young Scholar Funding Programme (Youxiu Qingnian Jiaoshi Zizhu Jihua)
(Kuashiji Youxiu Rencai Peiyang Jihua)
University Key Scholar Funding Programme (Gaoxiao Gugan Jiaoshi Zizhu Jihua)
Overseas Returnee Scientific Research Fund (Liuxue Huiguo Renyuan Keyan Qidong Zijin)
Figure 3-8 Ministry of Education's research funding programmes Source: Ministry of Education website: www.MOE.gov.cn
However, the lack of accountability in the Chinese research system and highly
quantitative incentive policy means that plagiarism and research misconduct are
common place, even in high profile research programmes such as the Cheung Kong
Scholars Programme32• The highest profile case involved Jin Chen, head of Shanghai
Microelectronics Research Institute, ,who had received government praise for his work
and was the recipient of over £7.5 million from Cheung Kong Programme research
grants. He was found to have placed his company logo on MotorIa's chips. (Leadbeater
& Wilsdon, 2007).
'Again, it's the result of politics getting mixed up with science... There are policies to encourage people to generate publications and patents and prizes. You get a score and if you are an 'A', you get 25 % more salary. It's easy to understand why this leads people to
32 The Cheung Kong Scholars Programme is jointly established by the Ministry of Education and Li Ka Shing Foundation. It is regarded as the highest ranking of all externally funded programmes for university scholars and has an ambition of funding China's most prominent scholars and their groundbreaking projects.
83
Chapter 3: China's Automotive and Electronics Industries in the Context o/Transition
plagiarise results. Every university has this problem. I've suffered from it myself. Some exstudents of mine took my data and published it in Science. This happened only five months ago.' (Ze Zhang, Vice President of Beijing University of Technology, in an interview recorded in Leadbeater & Wilsdon, 2007: 17)
There is concern, that this sharp rise in plagiarism is corroding the culture of research
within institutes and universities (Leadbeater & Wildson, 2007). 'Collaboration
becomes very difficult. You can't trust people not to steal your work. Everyone works
with the door closed, in secret. This is very bad for innovation. ' (Ze Zhang, see above).
• Foreign Universities - brain gain from overseas returnees
In the past five or six years, the trickle of overseas returnees, or vividly described as
'sea turtles ('Haigui') has become a steady flow. The annual number has soared from
only around 6000 per year in 1995, to over 40000 in 2006. Mostly from US (Silicon
Valley), UK, Germany, Japan and Australia (MOE website, accessed 2007), many of
the returnees were attracted by some combination of China's abundant economic and
business opportunities, national sentiment, family ties, and government incentives.
Among the returnees, those with established entrepreneurship in the west are most
valued with their creativity, managerial expertise, networks and access to venture
capital, even though the most benefited areas are those already-rich coastal cities
(Leadbeater & Wilsdon, 2007).
84
Chapter 3: China's Automotive and Electronics Industries in the Context a/Transition
5) Linkage and supporting structure
The dynamism of an innovation system largely depends on its ability to generate new
activities in existing firms, create new firms, and to promote knowledge diffusion and
absorption within the system (Fein son, 2003). China since the mid 1990s has started to
adapt the internationally prevalent approach to linkage and supporting structures, such
as science parks and incubators .. There are already over 400 business incubators and 53
high-tech zones set up at the national level (Huang et ai, 2004) (the name of high
technology development zones could be referred to as science parks in Chinese
translation [Deloitte Research, 2003]). These are mainly supported by a government
technology diffusion scheme called 'Torch Program' (see Appendix III: China's current
S&T Programmes).
Moreover, China Hi-Tech Fair (CHTF) as an intermediary event receives strong
support from the central government. It functions as a linkage between Chinese and
overseas high-tech industry sectors. Since 1999, the fair has been held annually in the
South-China hub of international trade and technology,Shenzhen, and is currently the
largest and most important exhibition and trade fair in China for high-tech
achievements (Huang et ai, 2004). According to its official website, in year 2006 alone
CHTF secured a contract value of 13.6 billion USD from over 20 attending economies
(China Hi-Tech Fair website, accessed 2006).
Another important intermediary is Productivity Promotion Centres (PCCs), it is
established in 1992 by a group of intermediary and consulting to support innovation in
the business sector (Huang et ai, 2004). As of 2006, there are over 800 PCC at
provincial, municipal and county levels, providing conSUltancy, technology promotion,
product testing and other technology related services. (CPPC website, accessed 2008).
85
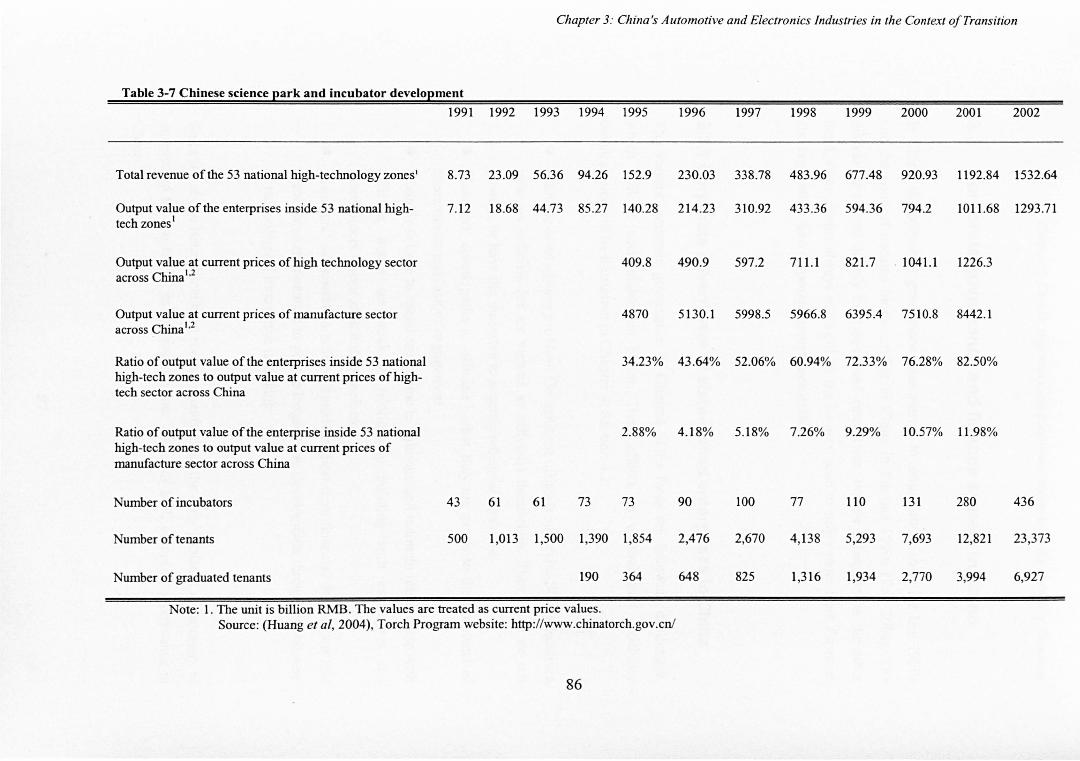
Chapter 3: China's Automotive and Electronics Industries in the Context o/Transition
Table 3-7 Chinese science park and incubator development
1991 1992 1993 1994 1995 1996 1997 1998 1999 2000 2001 2002
Total revenue of the 53 national high-technology zones' 8.73 23.09 56.36 94.26 152.9 230.03 338.78 483.96 677.48 920.93 1192.84 1532.64
Output value of the enterprises inside 53 national high-tech zones 1
7.12 18.68 44.73 85 .27 140.28 214.23 310.92 433 .36 594.36 794.2 1011.68 1293.71
Output value at current prices of high technology sector across Chinal
•2
409.8 490.9 597.2 711.1 821.7 1041.1 1226.3
Output value at current prices of manufacture sector across China 1,2
4870 5130.1 5998.5 5966.8 6395.4 7510.8 8442.1
Ratio of output value of the enterprises inside 53 national 34.23% 43.64% 52.06% 60.94% 72.33% 76.28% 82.50% high-tech zones to output value at current prices of high-tech sector across China
Ratio of output value of the enterprise inside 53 national 2.88% 4.18% 5.18% 7.26% 9.29% 10.57% 11 .98% high-tech zones to output value at current prices of manufacture sector across China
Number of incubators 43 61 61 73 73 90 100 77 110 131 280 436
Number of tenants 500 1,013 1,500 1,390 1,854 2,476 2,670 4,138 5,293 7,693 12,821 23,373
Number of graduated tenants 190 364 648 825 1,316 1,934 2,770 3,994 6,927
Note: 1. The unit is billion RMB. The values are treated as current price values. Source: (Huang et ai, 2004), Torch Program website: http://www.chinatorch.gov.cnl
86
Chapter 3: China's Automotive and Electronics Industries in the Context of Transition
3.3 Corporate governance and finance system in China
In China, the corporate governance issue started to arouse attention in the late 1980s
and the concept became more familiar to China in the late 1990s (Fei, 2004). The
discussion related mainly to state-owned enterprises. Private enterprise on the other
hand, since almost always managed by the owners, tend to suffer more from financial
shortage rather than corporate governance defects.
3.3.1 Corporate governance of state-owned enterprises in China
The current corporate governance of Chinese SOEs faces the following challenges,
which will be each elaborated below. Their effects on technological capability
development will be illustrated in Chapter 4, Section 4.2:
• Multiple-level agency problem. Government officials supervise SOE executives,
who are officials (or are viewed as officials) themselves. They often do not
possess, or have the incentive to acquire industrial expertise.
• Managers' career paths as officials - that they are prone to the problems of
shortermism and lack of engagement
• Executives have to spend much time to cultivate and maintain relationship with
officials, hence are weak in relationship building with employees and
shareholders - poor stakeholder inclusion.
• Managers' remuneration scheme based on short-term financial data means that
managements' incentive to pursue longer-term development through investment
in technological innovation is lacking.
Since the above issues have been rooted, mostly since the early 1950s, it is necessary to
understand the causes by examining the four stages of SOE corporate governance in
China.
87
Chapter 3: China's Automotive and Electronics Industries in the Context of Transition
Stage One: Mass nationalisation o/private enterprises: 1956·1966
From 1956 to 1966 China went through a massive nationalisation of enterprises (gong
si heying), entrepreneurs were forced to sell their businesses to the state in return for
shares and fixed dividends (both benefits were abolished by the government since
1966). Business corporations were gradually but completely delegalised and became
state-owned enterprises. SOEs were however, not complete business enterprises. 'State
ownership deprived them of legal independence, and the state planning apparatus
deprived them of economic independence.' (Meyer & Lu, 2004: 60) Most SOEs were
referred to as factories (Gongchang); which had only production function, and were
were administered geographically as government branches (Meyer & Lu, 2004). In
each SOE there was a committee of the Communist Party (Dangweihui), trade union
(Gonghui) and meeting of employees' representatives (Zhigong daibiao dahui) who
exercised monitoring rights over SOEs' managers. The government agencies were the
authorities to hire and fire SOE managers, and the latter were paid as government
officials themselves (Meyer & Lu, 2005). ). They functioned as government officials as
well, with neither obligation nor incentive to behave as entrepreneurs.
Stage Two: Management Contract System: 1979·1993 In order to revive a struggling public sector accounting for over 70% of the nation's
economy, in the late 1970s Chinese authorities aimed at restructuring SOEs by
establishing a 'Modem Enterprise System' (Xiandai qiye zhidu). The SOE reform
started in 1979 had no intention to abolish state ownership. Rather, it was intended to
consolidate and enhance the efficiency of state ownership. The dominant policy from
mid 1980s to 1990s was the management contract system (MCS) - contracts of profit
sharing rules and decision rights which were agreed between the firm and the
governing authorities ( administrative as well as financial departments) (Zhang, 1998).
The length of a contract varies between 3 and 5 years, and typically contained
conventional performance indicators including profit and tax target, debt repayments,
asset appreciation, and utilization of retained profits (Zhang, 1998). However, in most
cases, only profit target were weakly enforced and other only used as indicative, and in
many cases the same set of contracts were adapted by various firms by simply
changing name (Zhang, 1998; Firth et al. 2006).
88
Chapter 3: China's Automotive and Electronics Industries in the Context o/Transition
Under the management contract system, although SOE managers have gradually
received more business operational autonomy, the reform did not lead to generally
enhanced SOE performance in the early 1990s. World Bank conducted a survey in
1994 and found that those SOEs with management contracts appeared to even
performance worse than those without. This survey also reported lower capital and
labour productivity, plus more over-employment and more bank-finance by those with
management contracts (World Bank, 1997). If the direction of causation does come
from contract to performance, then it does require managers to have the expertise and
access to information to secure benefit from decentralized decision-making (Carlsson
& Eliasson, 1994), which the conditions were missing in Chinese SOE (Zhang, 1998):
• First, under the MCS system it was the officials from line ministries or
regulatory bureaus who had the right to select and dismiss SOE managers, and they did
not have to worry about the consequences of their selection. This implies that, they had
no adequate incentive to search for, or install good managers. Observation suggests
that officials often based their selections on guanxi (personal connections) rather than
yeji (performance) (Zhang, 1998). Naturally, SOB managers behaved more like
officials than entrepreneurs - they did not have the needed ability, nor did they have
the incentive to acquire such ability .
• Second, although the MeS system intended to mitigate government
intervention in enterprise operation, in fact local governments often were reluctant to
lose influence over these SOEs. Meanwhile, firms also actively sought good
relationships with the local authority for access to various state-controlled resources. In
return, they would inevitably suffer political intervention. Normally the size of the firm
is positively correlated to the degree of political benefits as well as political
intervention it suffers (Cai, 2005). The autonomy of managers was thus less than was
intended. Moreover, manager's contract term was normally 3-5 years, and their benefits
from the firm did not extend beyond departure. Consequently the short-term pressures
could all too easily arise. This induced managers of SOEs to invest in quick pay-off
projects rather than in long term R&D and other productivity-enhancing projects
(Huang et al. 2004). In many cases, abnormal short-term profits made at the large
expense of long-term productivity (Broadman & Xiao, 1997).
89
Chapter 3: China's Automotive and Electronics Industries in the Context o/Transition
Stage Three: Corporatisation and Company Law: 1993-2003
During the 1990s and early 2000s, Chinese planners tried to merge state firms to create
big 'national champions' (Nolan, 1996, p 12). Moreover, state firms were pushed onto
the stock market as a quick way to pump money from the public into state firm
investment. However, those efforts were accompanied by the old communist regime
and organisations (Batjargal, 2005), and relatively little improvement in the
governance practice.
Since the early 1990s Chinese policy makers started to look to the models of corporate
governance in western countries, in order to address the SOEs governance problems in
a way compatible with the market economy. The corporatization policy was formally
introduced by the Party in 1993 with some caution, but it soon became a law for SOE
reforms (Lin & Wei, 2006; Zhang, 2007). The guiding principle was later summarised
as 'zhua da, fang xiao' or, grasp the big and let go the small. In so doing the
government hoped to concentrate resources on nurturing the larger SOEs, while
gradually loosen state control over smaller SOEs. Through methods of government
initiated bankruptcies, mergers and divesting of small and medium SOEs, SOEs'
number has been significantly cut, from over a quarter of a million in 1995 to under
150,000 in 2005 33 (Imai, 2006, p.5). Most small SOEs quickly transformed their
ownerships into (employee) shareholding and POEs, while Medium SOEs and large
SOEs were transformed from straight state-owned into limited liability or stock
companies. By late 1997 around 9,000 SOEs had gone through the process (Xinhua,
18/12/2006), which allowed them to issue and list shares on the two stock exchanges in
Shanghai and Shenzhen, which were opened in 1990 and 1991 respectively. (Listed
firms and Chinese stock market will be described in detail in section 3.3.3) As of end
2003 there were 1287 enterprises listed on the exchanges, of which 940 were SOEs
(Hua et ai, 2004).
In 1993 Company Law was introduced to help the firms build their modem enterprise
systems. According to the Company Law, the organisational structure of a share
holding company should consist a shareholdings' meeting, a board of directors and a
supervisory board. In theory such structure of xinsanhui (the 'three new organisations')
33 During the same period, 3,484 SOEs were closed down as part of government-funded programs, with 6.67 million employees affected (Naughton, 2005)
90
Chapter 3: China's Automotive and Electronics Industries in the Context o/Transition
would replace the laosanhui, the 'three old organisations' (Communist Party committee,
labour union and employee representative meeting).
The Chinese government has also taken other measures, which can be regarded as
market-orientated in its bid for good corporate governance. For example the China
Securities Regulatory Commission (CSRC) adopted a detailed corporate governance
code in 2002 to promote best practice in terms of governance structure, shareholder
voting, board composition, and the conduct of board and shareholders' meetings etc34
(Zhang, 2007) (see Appendix IV. The formal corporate governance system of China).
Despite the emergence of new rules, regulations and organizations, fundamental
corporate governance flaws in the Chinese SOEs remained unaddressed. For example,
the Company Law requests that the board of directors 'appoint, dismiss and decide on
the remuneration of the company's general manager' (Company Law, 2006), most top
managers of Chinese listed SOEs were still selected or nominated and approved by
government authorities (Chen & Huang, 2001). According to a survey conducted in
2000, from 1979 to 2000 around 80% of SOEs top managers were appointed by
government authorities (http://www.cess.gov.cn!dcyj/diaocha.html).
Stage Four: State Asset Supervision and Administration Committee: 2003 to date
In 2003, State Assets Supervision and Administration Commission of the State Council
(SASAC) was set up. For the first time China has a dedicated body to be in charge of
the control and administration of state asset with distinctive and bold initiatives. This
demonstrated the strong determination of the central government to deal with the
unresolved problems and remaining challenges of Chinese SOEs (Altenburg et ai,
2008).
Officially, SASAC as a 'special entity' at the ministry level is able to report directly to
the State Council (Guowuyuan zhishu teshe jigou). According to NaUghton [2004, p.
34 The CSRC & the State Economic and Trade Commission, Corporate Governance Code for Listed Companies (9, January 2002).
91
Chapter 3: China's Automotive and Electronics Industries in the Context of Transition
12], this special status enables SASAC to bypass the legal and administrative constraint
of the National People's Congress.) It was even rumoured that State Councle has
exclusively creative this organisation category for SASAC (Matt lin, 2007).
According to Interim Regulations on the Management of Enterprise State-Owned
Assets, SASAC's mandate includes drafting laws and regulations regarding state
owned assets, managing and restructuring state assets, and hiring and firing the
executives of SOEs under its supervision, whilst the ultimate authority over key
appointment is still retained by the Party Committee).
The establishment of SASAC indicates the central government's attempt to both
decentralise and centralise. On the one hand, SOEs along the hierarchy of
administrative levels were clearly separated, and control over local SOEs was handed
over to local SASAC offices. Meanwhile, SASAC is commissioned to take over
several functions formerly dispersed among different government authorities and party
organisations. For the first time in modem China, there is a unitary administrative
organ to manage the state assets. Central SASAC's other key function is regulation and
supervision of more than 100 'Central Enterprises' (see below). Those are the
mammoth SOEs hand-picked by the central government in hope to foster China's
future global competitors (see below).
As of end 2009, there were 141 'central enterprises' under the direct management of
central SASAC 35. Although relatively small in number, these central enterprises
possess more resources than all of the other SOEs combined, and have crucial
importance to the national economy. Financially, central SASAC firms account for
roughly 70% of all SOE profits, which equals 20% of government revenue (Mattlin,
2007), and more than 30% of the entire valuation of China's domestic stock market is
from listed central SASAC subsidiaries. Together these firms have an asset value of
more than 1.6 trillion usn (Xinhua, 25/01/2007).
As mentioned above, local SOEs are controlled by SASAC offices at the corresponding
administrative level. For the first time, 'independent power over SOEs are delegated to
3S This list can be found in Chinese on SASAC's website at www.sasac.gov.cnlnllSO/n1226/n2425/index.html . The number of firms is slowly dropping due to SASAC-supervised restructuring and merging efforts.
92
Chapter 3: China's Automotive and Electronics Industries in the Context of Transition
the local level' (Central Enterprises Investment Supervision and Management [trial
directive], July 2006; see also Naughton 2006, pp. 3, 16).
Structure of Control
The establishment of SASAC as the first non-governmental representative of state
ownership in P.R. China's history clearly demonstrates the central government's
intention to separate state asset ownership from political administration. However, it is
still difficult to map out a standardised structure of control, i.e. the relationship
between central and local SASAC, local SASAC's relationship with local governments,
and the actual distribution of power (ownership) over most SOEs among central/local
SASAC. The reasons are listed below:
1) The multi-centric, or 'fragmented authoritarianism' (Lieberthal, 1995) system of
decision-making has made it impossible to clarify the distribution of state-asset
ownership at different levels (Naughton, 2006). Before the reform, power distribution
among government authorities was highly intricate: it has both vertical hierarchy as
well as horizontal cross-over (tiao and kuao). Mandates of departments/authorities
were defined in an ad hoc manner: they could either by type of activity (such as
education), industry (such as pharmaceuticals, machinery, and electronics) or
institution (such as pricing) (Liu & White, 2001) .. Moreover, the overall authority of
State Planning Commission at that time was more formal than real. During the reform,
authority of most of Chinese industries has experienced several decentralising and
recentralizing arrangements. For example, the administration of Chinese automotive
industry has been assigned to a sequence of 7 different authorities between 1982 and
2003 (Liang, 2004: Table 6-1). Consequently, the ownership structure of SOEs in
terms of 'who has invested, when, and by how much' is further complicated.
As mentioned above, for the first time SASAC is no longer in the established
ministerial structure (or at least it is intended not to be one). The relationship of central
and local SASACs is also not simply hierarchical; since the latter are also independent
special organs representing governments' state asset ownership at the local level - they
ought to answer to the commissioners of the ownership. Paradoxically, the 'Provisional
Ordinance of Enterprise State Asset Administration' (2006) requires the central
93
Chapter 3: China's Automotive and Electronics Industries in the Context of Transition
SASAC to guide and supervise local SASACs. 'The central government is in a
dilemma on the issue of separating state-ownership from government authorities -
without clarification of the duties and rights, the central SASA C can intrude the
decision-making of any local SOEs as it wishes, and thus become yet another
government authority. The relationship between central and local SASA Cs will also
remain much entangled.' (Li Shuguang, member of State Asset Law drafting committee:
http://finance.people.com.cnlGBIl 037/5559925 .html).
Efforts and achievements
Compared to its predecessors (industrial ministries at the central level and bureaus at
the local level), SASAC has more expertise in external supervision over the firms'
operational activities. We can expect that SASAC officials, given that their
responsibility is mainly about supervising firms, would be able do a better job. For
example, SASAC has become increasingly active in the restructuring and strategic
management of large SOEs, putting heavy. emphasis on developing indigenous
technological capabilities. According to the 11th five-year plan, this is in accordance
with China's current development priority (Guidelines for the 11 th five-year plan,
03/2006). Also, since its foundation in 2003, SASAC has been trying hard to formulate
systematic incentive mechanism and performance measurement for its SOEs (see Table
3-8). Meanwhile, it attempts to include innovation performance in the comprehensive
assessment system. To this extent, there should be a positive impact on firms'
technological strategy.
94
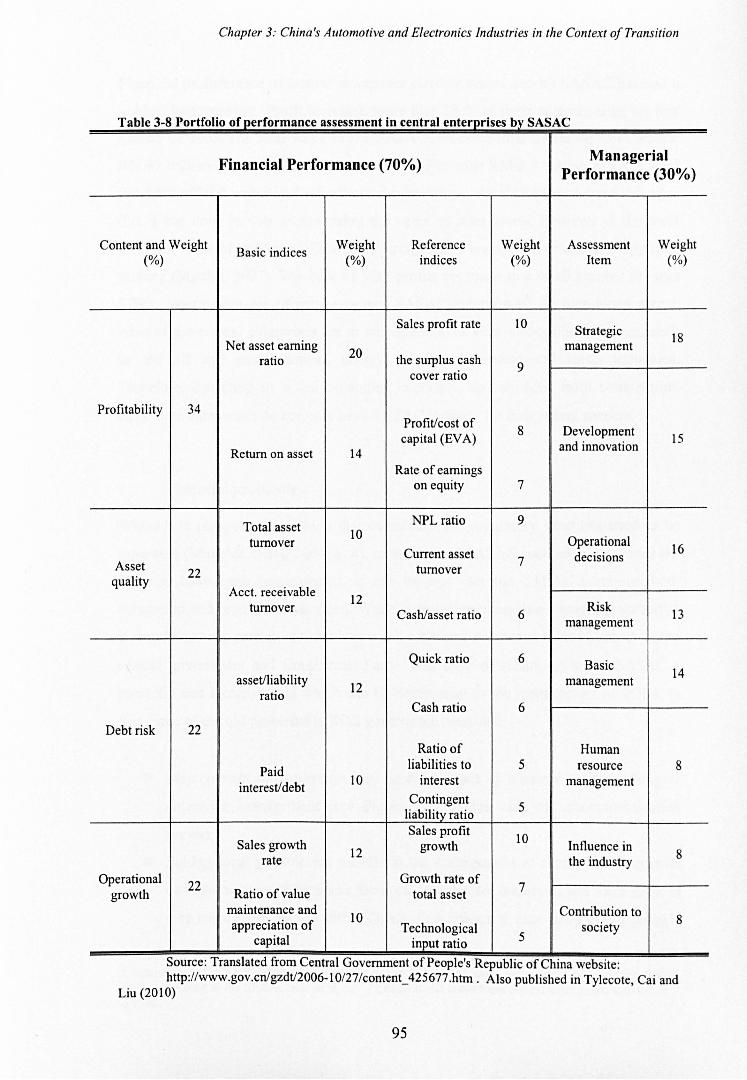
Chapter 3: China's Automotive and Electronics Industries in the Context o/Transition
Table 3-8 Portfolio of performance assessment in central enterprises by SA SAC
Financial Performance (70%) Managerial
Performance (30%)
Content and Weight Basic indices
Weight Reference Weight Assessment Weight (%) (%) indices (%) Item (%)
Sales profit rate 10 Strategic 18
Net asset earning 20
management ratio the surplus cash
9 cover ratio
Profitability 34 Profit/cost of
8 Development capital (EVA) 15
Return on asset 14 and innovation
Rate of earnings on equity 7
Total asset NPL ratio 9 10
turnover Operational 16 Current asset
7 decisions Asset
22 turnover quality
Acct. receivable 12
turnover Cash/asset ratio 6
Risk 13
management
Quick ratio 6 Basic 14 assetlliability
12 management
ratio Cash ratio 6
Debt risk 22
Ratio of Human
Paid liabilities to 5 resource 8
interest/debt 10 interest management
Contingent 5 liability ratio
Sales profit 10 Sales growth
12 growth Influence in 8 rate the industry
Operational 22
Growth rate of 7 growth Ratio of value total asset
maintenance and 10 Contribution to
8 appreciation of Technological society capital input ratio 5
Source: Translated from Central Government of People's Repubhc of China webSIte: http://www.gov.cnlgzdtJ2006-10/27/content_425677.htrn.AlsopublishedinTylecote. Caiand
Liu (2010)
95
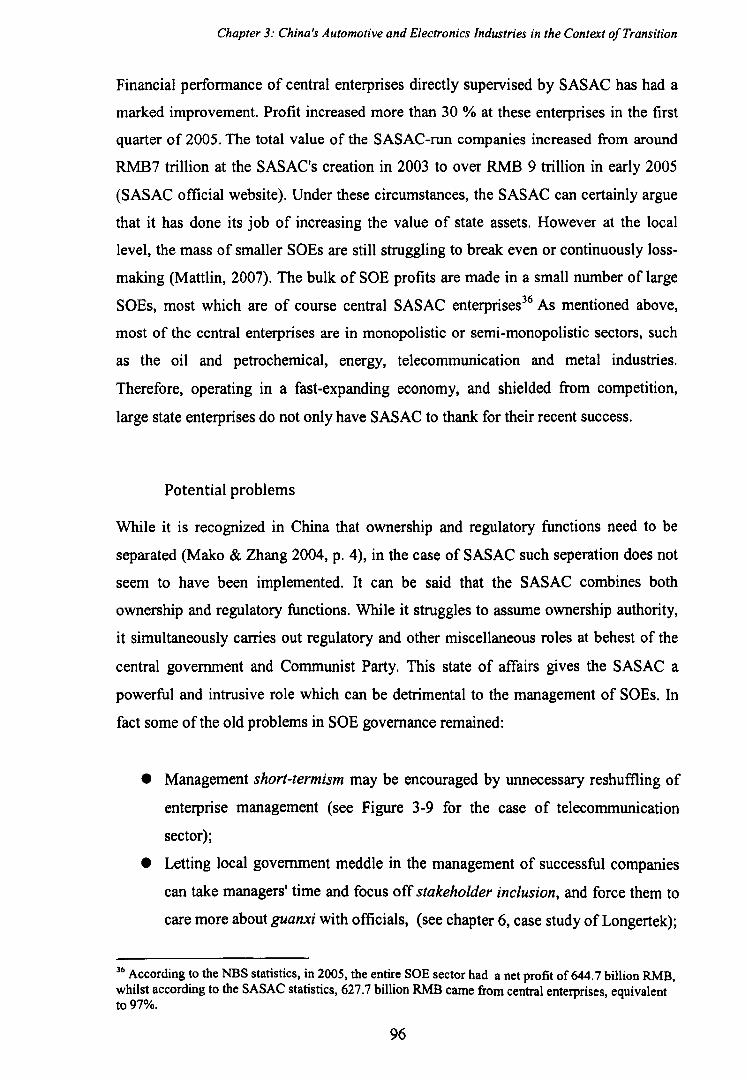
Chapter 3: China's Automotive and Electronics Industries in the Context o/Transition
Financial performance of central enterprises directly supervised by SASAC has had a
marked improvement. Profit increased more than 30 % at these enterprises in the first
quarter of 2005. The total value of the SASAC-run companies increased from around
RMB7 trillion at the SASAC's creation in 2003 to over RMB 9 trillion in early 2005
(SASAC official website). Under these circumstances, the SASAC can certainly argue
that it has done its job of increasing the value of state assets. However at the local
level, the mass of smaller SOEs are still struggling to break even or continuously loss
making (Mattlin, 2007). The bulk of SOE profits are made in a small number of large
SOEs, most which are of course central SASAC enterprises36 As mentioned above,
most of the central enterprises are in monopolistic or semi-monopolistic sectors, such
as the oil and petrochemical, energy, telecommunication and metal industries.
Therefore, operating in a fast-expanding economy, and shielded from competition,
large state enterprises do not only have SASAC to thank for their recent success.
Potential problems
While it is recognized in China that ownership and regulatory functions need to be
separated (Mako & Zhang 2004, p. 4), in the case of SASAC such seperation does not
seem to have been implemented. It can be said that the SASAC combines both
ownership and regulatory functions. While it struggles to assume ownership authority,
it simultaneously carries out regulatory and other miscellaneous roles at behest of the
central government and Communist Party. This state of affairs gives the SASAC a
powerful and intrusive role which can be detrimental to the management of SOEs. In
fact some of the old problems in SOE governance remained:
• Management short-term ism may be encouraged by unnecessary reshuffling of
enterprise management (see Figure 3-9 for the case of telecommunication
sector);
• Letting local government meddle in the management of successful companies
can take managers' time and focus off stakeholder inclusion, and force them to
care more about guanxi with officials, (see chapter 6, case study of Longertek);
36 According to the NBS statistics, in 2005, the entire SOE sector had a net profit of 644.7 billion RMB, whilst according to the SASAC statistics, 627.7 billion RMB came from central enterprises, equivalent to 97%.
96
Chapter 3: China's Automotive and Electronics Industries in the Context a/Transition
• Retained discretion by the Party Committee over appointment of key
management personnel, combined with highly quantitative performance
measurement criteria, may result in pursuit of short-term financial gain at any
costs and failed 'interest alignment' between the principal and the agent.
China Mobile retired CEO Wang Jianzhou
China Telecom CEO Wang Xiaochu
China Unicorn CEO Wang Jianzhou CEO Chang Xiaobing EVP Shang Bin -------.~ President Shang Bin
Figure 3-9 Reshuffle of senior managers in China's three major telecom firms, 2005 Source: (Naughton, 2006)
3.3.2 Corporate governance of private enterprises
The organisational forms of private enterprises (Siying qiye) can take many forms: sole
proprietorships, partnerships, limited liability companies, and shareholding
cooperatives. There are different requirements for registered capital and numbers of
shareholder associated with these forms of private ownership. Since the early 19905
limited liability companies have been the fastest growing form of private enterprises
(Qian, 2002).
According to a survey of the governance structures of private companies by Guo
(2000), private companies showed the typical characteristics of family-dominated
enterprises. The governance structure pattern in private enterprises is characterised as
the 'blood-relative based distribution and balance of power among family members'
(Chen & Huang, 2001,p. 12). Fei (2004) points out that, though a growing number of
large private companies have been set up as limited-liability companies and have
introduced the standard formal corporate governance system, the sources of the board
of directors, operators and managers have the characteristics of close family-orientation
(Fei, 2004, p.78). According to the third national POE census in 1998, more than half
of the spouses of the married proprietors of private companies were engaged in
97
Chapter 3: China's Automotive and Electronics Industries in the Context a/Transition
managerial work in the proprietors' companies. On the other hand, individual
entrepreneurs still played a dominant role in making decisions despite the formally
installed governance structure. The Asian Development Bank (ADB, 2003) concludes
that the owners of private firms still maintains a firm hand in the business. Their survey
(see Table 3-9 ) shows that private firms are currently still run by the shareholders
(owners) themselves.
Some scholars argue that such alternative, informal governance mechanisms have been
remarkably effective in the private sector (Allen et ai, 2005). It is understandable from
the Agency Theory viewpoint: the shareholders are much likely to be fully incentivised,
enthusiastic managers themselves, excepted cases where non-family majority
shareholders exploited minority family member shareholders. However, the informal
governance structure may generate other governance issues, as Morek and Yeung
(2003) points out. In China's situation, for the majority of POEs which are still under
the control of first generation entrepreneurs, there is not much evidence of corporate
governance (Huang, 2008). Many of these POEs are managed in an authoritarian
tradition - entrepreneurs still perceive the business as his own property even when
shares are sold to non-family members.
Other problems related to corporate governance in POEs need to be understood in the
context of the political system. For example, the long-standing inferior status and lack
of security for POEs means that entrepreneurs are prone to short-termism. Many prefer
quick realisation of profit rather than reinvestment or long-term development. The
difficulty in accessing and securing external finance, on the other hand, leads to risk
aversion - entrepreneurs are often reluctant to spend money on high-opportunity
technological activities where there are high demand for capital and high level of
uncertainty. Although not owned and run by the state, it is necessary for entrepreneurs
to spend time and (often money) to cultivate and maintain a good relationship with the
authorities, which means that they will have less to spare for activities for
technological development. Moreover, POEs are often under pressure of the local
governments to take in unwanted employees (Cooke, 2002).
98
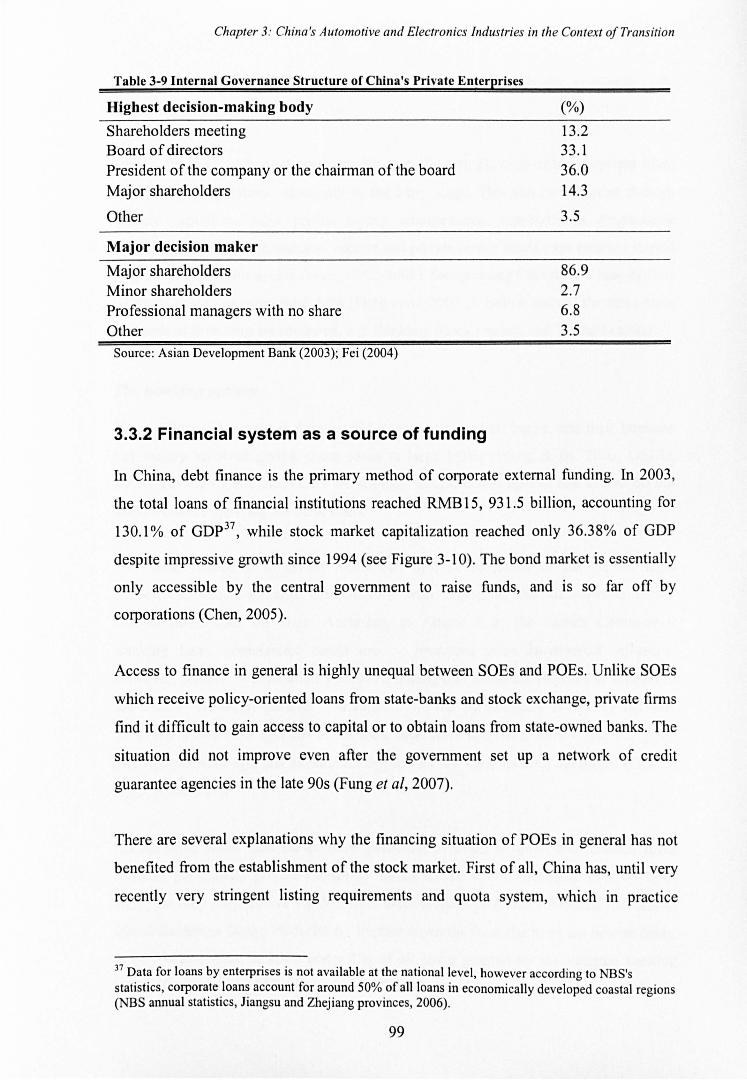
Chapter 3: China's Automotive and Electronics Industries in the Context o/Transition
Table 3-9 Internal Governance Structure of China's Private Enterprises
Highest decision-making body
Shareholders meeting Board of directors President of the company or the chairman of the board Major shareholders
Other
Major decision maker
Major shareholders Minor shareholders Professional managers with no share Other
Source: Asian Development Bank (2003); Fei (2004)
3.3.2 Financial system as a source of funding
(%)
13.2 33.1 36.0 14.3
3.S
86.9 2.7 6.8 3.S
In China, debt finance is the primary method of corporate external funding. In 2003,
the total loans of financial institutions reached RMB IS, 931.5 billion, accounting for
130.1 % of GDp 37, while stock market capitalization reached only 36.38% of GDP
despite impressive growth since 1994 (see Figure 3-10). The bond market is essentially
only accessible by the central government to raise funds, and is so far off by
corporations (Chen, 200S).
Access to finance in general is highly unequal between SOEs and POEs. Unlike SOEs
which receive policy-oriented loans from state-banks and stock exchange, private firms
find it difficult to gain access to capital or to obtain loans from state-owned banks. The
situation did not improve even after the government set up a network of credit
guarantee agencies in the late 90s (Fung et ai, 2007).
There are several explanations why the financing situation of POEs in general has not
benefited from the establishment of the stock market. First of all, China has, until very
recently very stringent listing requirements and quota system, which in practice
37 Data for loans by enterprises is not available at the national level, however according to NBS's statistics, corporate loans account for around 50% of al1loans in economically developed coastal regions (NBS annual statistics, Jiangsu and Zhejiang provinces, 2006).
99
Chapter 3: China's Automotive and Electronics Industries in the Context o/Transition
prevented private finns from fund raising via stock market. This also applies to cash
thirsty high-tech start-ups.
Due to the high technology opportunity (see Chatper 2), high-tech enterprises often
require high investment, especially in the early stage. This can be achieved through
venture capital or other private equity arrangements, especially in Anglophone
countries. Although international venture and private equity funds have recently started
to grow in China (Financial Times, 19/02/2008), fast-growing Chinese VC industry has
not been able to provide much help (Fung et ai, 2007),). Below each of the three main
channels of financing are reviewed, e.g. Banking, Stock market, and Venture capital.
The banking system
China's financial system is dominated by large state-owned banks, and their business
has mainly involved giving cheap loans to large SOEs (Wang & Bi, 2006; OECD,
2008). On the other hand, POEs are strongly discriminated against and almost do not
stand a chance applying for bank loans.
The banks' intention to favour SOEs can first be attributed to the current legal
framework, which remains contradictory with regard to the state-owned banks'
independence from the state. According to Article 6 of the current Commercial
Banking Law, 'commercial banks are ... protected from bureaucrati influence'
However, Article 34 contradicts the above, stating that banks are required to support to
the PRC's 'industrial policies'. Moreover, '... the traditionally close ties between
government and bank offiCials at the local level have created a culture that has given
local government officials substantial influence over bank lending decisions' (OECD,
2005, p.140-141).
On the other hand, state banks show particular aversion to small and medium finns
(SMEs), particularly private enterprise. SMEs on the whole contribute over 60 % of
GDP, yet they only receive 16 % of total loans granted by China's financial institutions
(Stock Exchange Daily, 19/0112006). Further down the food chain are the private finns,
mostly also SMEs. In 2001 under 1% of all loans granted by the national banking
system has reached SMEs (Tsai, 2002). Some researchers argue that most state banks
100
Chapter 3: China's Automotive and Electronics Industries in the Context of Transition
lack the administrative and technical expertise required for processing individual loan
requests (Yang, 2005). That inexperience notwithstanding, the banking system remains
institutionally biased toward state lending.
Many commercial shareholding banks and city or regional banks have recently
appeared in the financial system. However, even these banks appear to be averstive
towards the private sector: the new banks respond to guanxi like everybody else
(Tylecote et ai, 2010). This may be rational enough for these more commercially
sensitive banks: private firms are more vulnerable to bureaucratic actions or inactions
beyond their control; and if in trouble for any reason will not be bailed out by the state.
They hence bear higher risks. So most of the new banks tend to favour large POEs
with positive credit and those with collateral (Langlois, 2001)
In order to resolve the problem, the Central Government in the late 1990s, set up a
network of more than 200 guarantee agencies across the country, which were supposed
to help channel a total of US$ 4.8 billion in bank loans for the SMEs, including POEs
(Pei, 2002). Although well intended, the same obstacles were faced with the credit
guarantee system as had been faced by banks dealing with POEs and SMEs. First most
POEs did not even qualify for the service due to the tough criteria set by SETC: in fact
only less than 1 per cent of SMEs qualified (US Embassy in China, 2002). In addition,
ironically, these guarantee agencies continued to favour large enterprises (Fung et ai,
2007). Moreover, interest rate ceilings means that commercial banks would not be able
to structure commercially viable loans for private borrowers. The result has been that
formal credit channels are nearly closed to private businesses.
The stock market as source of funding
Originally, almost all listed companies are former SOEs. This was because that the
original purpose of setting up stock market was to help SOEs solve their funding
problems associated with the restructuring process. In fact this has not worked out (see
below). On the other hand, stock market is rarely utilised by the private firms as a
funding channel.
101
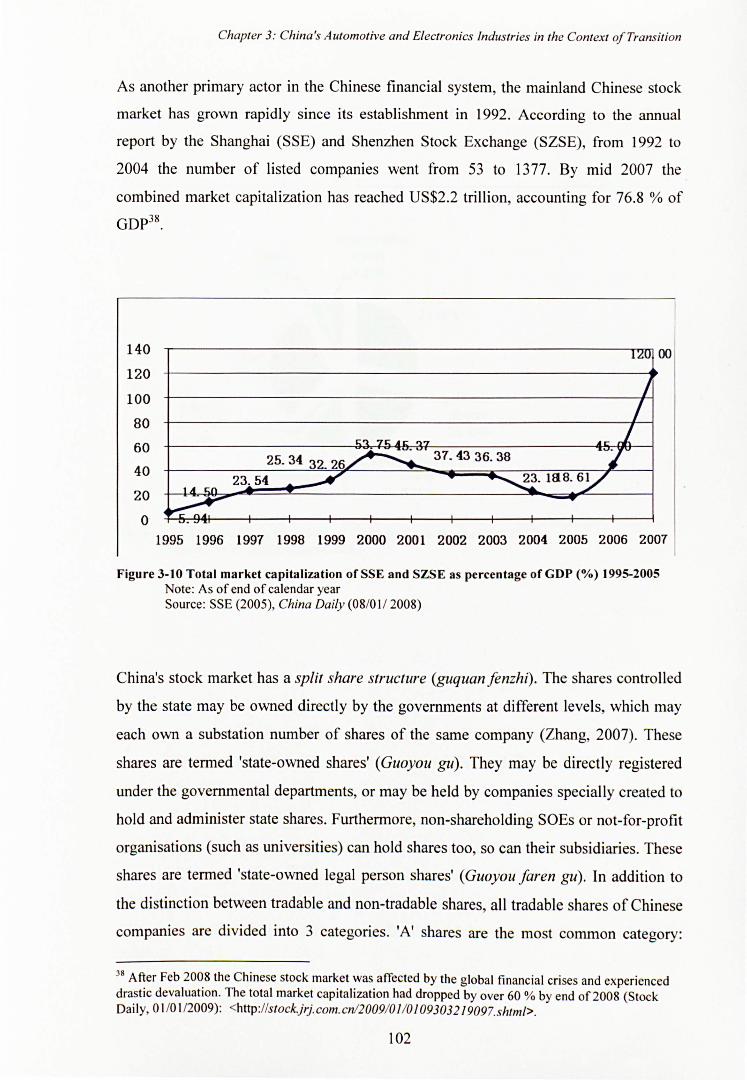
Chapter 3: China's Automotive and Electronics Industries in the Context a/Transition
As another primary actor in the Chinese financial system, the mainland Chinese stock
market has grown rapidly since its establishment in 1992. According to the annual
report by the Shanghai (SSE) and Shenzhen Stock Exchange (SZSE), from 1992 to
2004 the number of listed companies went from 53 to 1377. By mid 2007 the
combined market capitalization has reached US$2.2 trillion, accounting for 76.8 % of
GDP38 .
140
120
100
80
60
40
20
o
.-------------------------------------------------~oo
1995 1996 1997 1998 1999 2000 2001 2002 2003 2004 2005 2006 2007
Figure 3-10 Total market capitalization of SSE and SZSE as percentage of GDP (%) 1995-2005 Note : As of end of calendar year Source: SSE (2005), China Daily (08/01 / 2008)
China's stock market has a split share structure (guquan Jenzhi). The shares controlled
by the state may be owned directly by the governments at different levels, which may
each own a substation number of shares of the same company (Zhang, 2007). These
shares are termed 'state-owned shares' (Guoyou gu) . They may be directly registered
under the governmental departments, or may be held by companies specially created to
hold and administer state shares. Furthermore, non-shareholding SOEs or not-for-profit
organisations (such as universities) can hold shares too, so can their subsidiaries. These
shares are termed 'state-owned legal person shares' (Guoyou faren gu) . In addition to
the distinction between tradable and non-tradable shares, all tradable shares of Chinese
companies are divided into 3 categories. 'A' shares are the most common category:
38 After Feb 2008 the Chinese stock market was affected by the global financial crises and experienced drastic devaluation. The total market capitalization had dropped by over 60 % by end of2008 (Stock Daily, 0 I/O 1/2009): <http://stock.j rj.com. cnl2009101101093032 19097.shtml>.
102
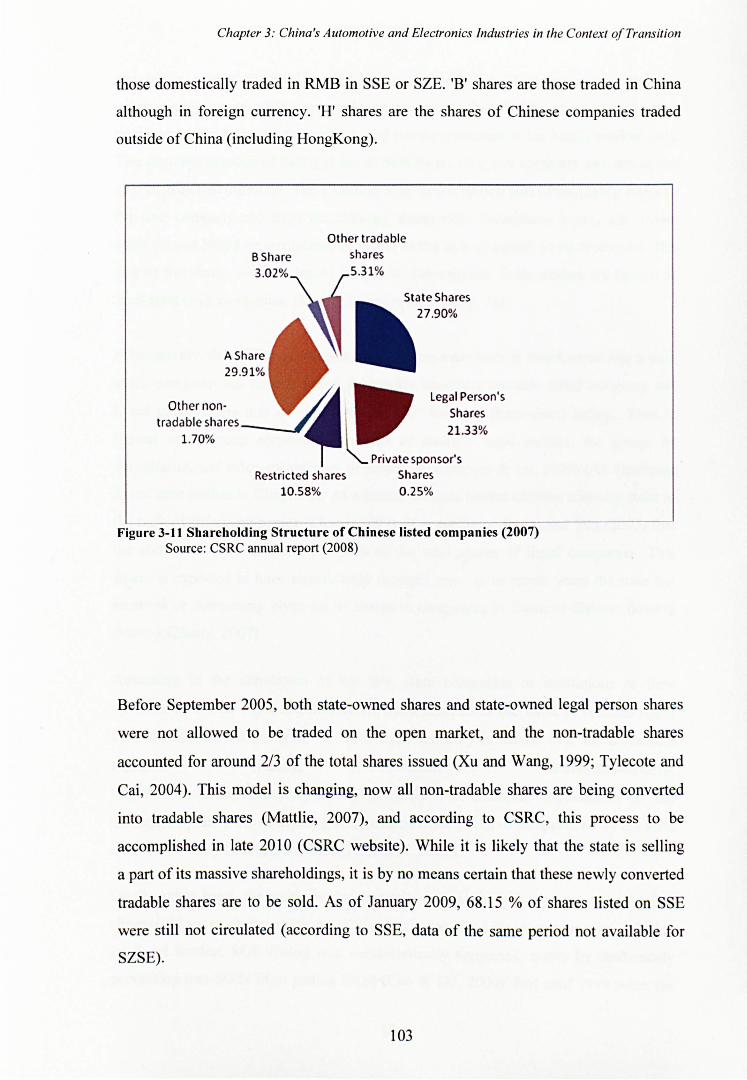
Chapter 3: China's Automotive and Electronics Industries in the Context of Transition
those domestically traded in RMB in SSE or SZE. 'B' shares are those traded in China
although in foreign currency. 'H' shares are the shares of Chinese companies traded
outside of China (including HongKong).
Other tradable
B Share shares
A Share 29 .91%
State Shares 27 .90%
Legal Person 's
Shares
21.33%
Private sponsor's Shares
0.25%
Figure 3- 11 Shareholding Structure of Chinese listed companies (2007) Source: CSRC annual report (2008)
Before September 2005, both state-owned shares and state-owned legal person shares
were not allowed to be traded on the open market, and the non-tradable shares
accounted for around 2/3 of the total shares issued (Xu and Wang, 1999; Tylecote and
Cai, 2004). This model is changing, now all non-tradable shares are being converted
into tradable shares (Matt lie, 2007), and according to CSRC, this process to be
accomplished in late 2010 (CSRC website). While it is likely that the state is selling
a part of its massive shareholdings, it is by no means certain that these newly converted
tradable shares are to be sold. As of January 2009, 68.15 % of shares listed on SSE
were still not circulated (according to SSE, data of the same period not available for
SZSE).
103
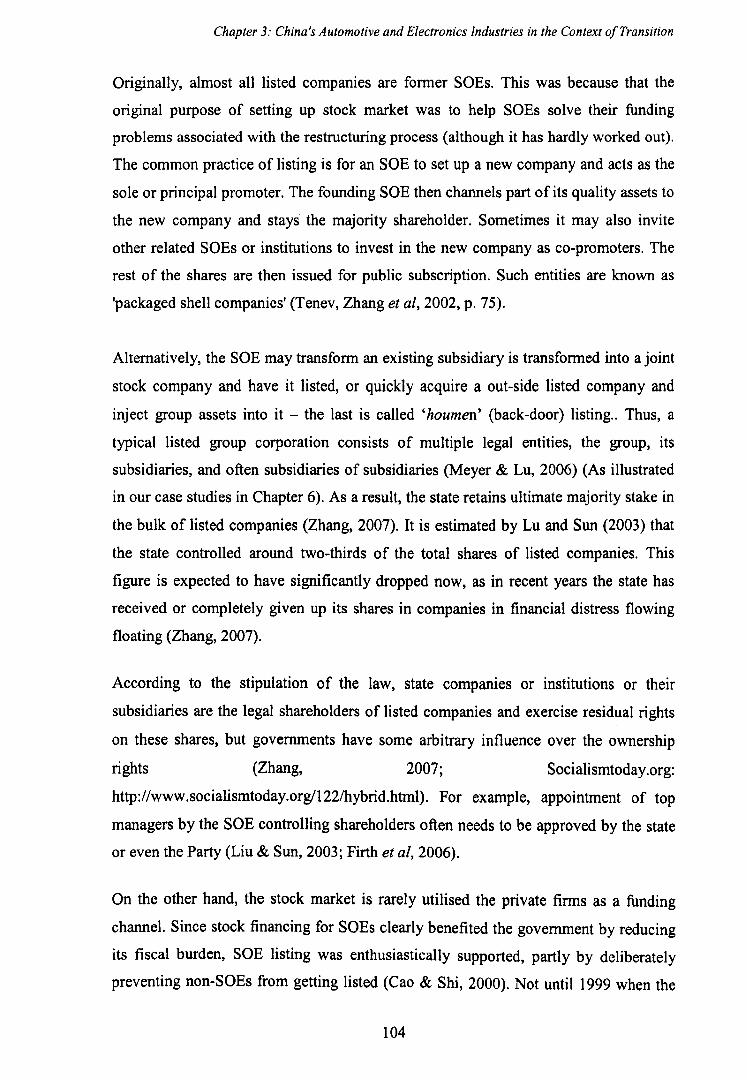
Chapter 3: China's Automotive and Electronics Industries in the Context o/Transition
Originally, almost all listed companies are former SOEs. This was because that the
original purpose of setting up stock market was to help SOEs solve their funding
problems associated with the restructuring process (although it has hardly worked out).
The common practice of listing is for an SOE to set up a new company and acts as the
sole or principal promoter. The founding SOE then channels part of its quality assets to
the new company and stays the majority shareholder. Sometimes it may also invite
other related SOEs or institutions to invest in the new company as co-promoters. The
rest of the shares are then issued for public subscription. Such entities are known as
'packaged shell companies' (Tenev, Zhang et ai, 2002, p. 75).
Alternatively, the SOE may transform an existing subsidiary is transformed into a joint
stock company and have it listed, or quickly acquire a out-side listed company and
inject group assets into it - the last is called 'houmen' (back-door) listing .. Thus, a
typical listed group corporation consists of mUltiple legal entities, the group, its
subsidiaries, and often subsidiaries of subsidiaries (Meyer & Lu, 2006) (As illustrated
in our case studies in Chapter 6). As a result, the state retains ultimate majority stake in
the bulk of listed companies (Zhang, 2007). It is estimated by Lu and Sun (2003) that
the state controlled around two-thirds of the total shares of listed companies. This
figure is expected to have significantly dropped now, as in recent years the state has
received or completely given up its shares in companies in financial distress flowing
floating (Zhang, 2007).
According to the stipulation of the law, state companles or institutions or their
subsidiaries are the legal shareholders of listed companies and exercise residual rights
on these shares, but governments have some arbitrary influence over the ownership
rights (Zhang, 2007; Socialismtoday.org:
http://www.socialismtoday.orglI22lhybrid.html). For example, appointment of top
managers by the SOE controlling shareholders often needs to be approved by the state
or even the Party (Liu & Sun, 2003; Firth et ai, 2006).
On the other hand, the stock market is rarely utilised the private firms as a funding
channel. Since stock financing for SOEs clearly benefited the government by reducing
its fiscal burden, SOE listing was enthusiastically supported, partly by deliberately
preventing non-SOEs from getting listed (Cao & Shi, 2000). Not until 1999 when the
104
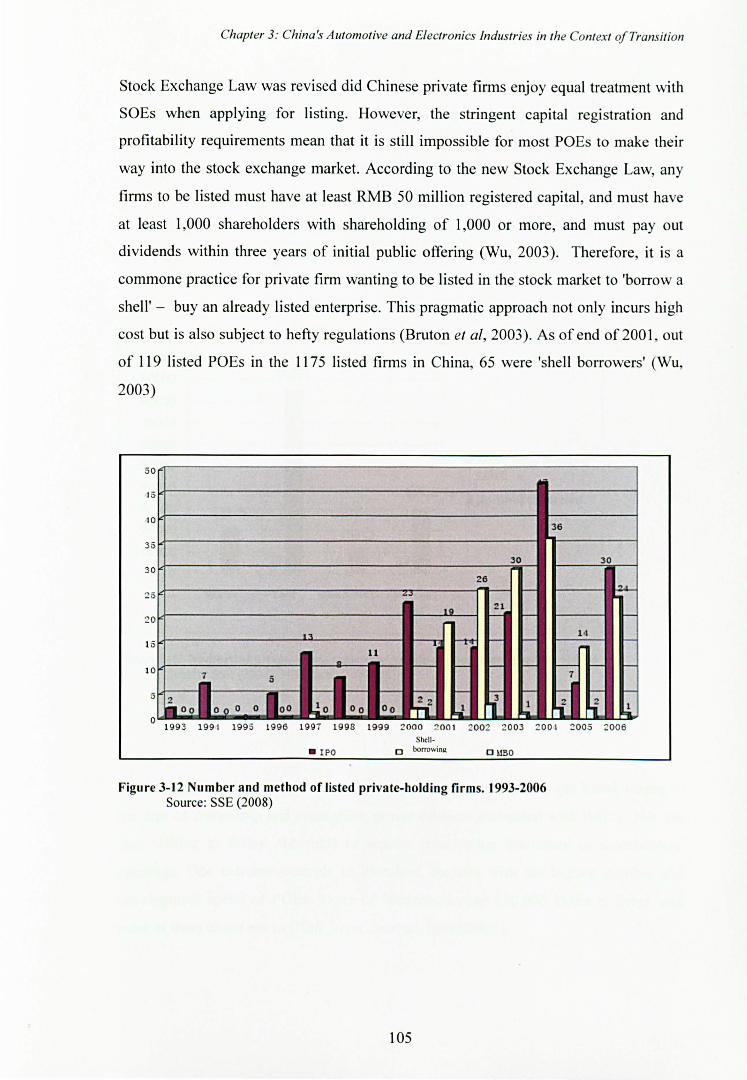
Chapter 3: China's Automotive and Electronics Industries in the Context o/Transition
Stock Exchange Law was revised did Chinese private firms enjoy equal treatment with
SOEs when applying for listing. However, the stringent capital registration and
profitabi lity requirements mean that it is still impossible for most POEs to make their
way into the stock exchange market. According to the new Stock Exchange Law, any
firms to be listed must have at least RMB 50 million registered capital, and must have
at least 1,000 shareholders with shareholding of 1,000 or more, and must payout
dividends within three years of initial public offering (Wu, 2003). Therefore, it is a
commone practice for private firm wanting to be listed in the stock market to 'borrow a
shell' - buy an already listed enterprise. This pragmatic approach not only incurs high
cost but is also subject to hefty regulations (Bruton et ai, 2003). As of end of 200 I, out
of 119 listed POEs in the 1175 listed firms in China, 65 were 'shell borrowers' (Wu,
2003)
5 0
15
,10 36
35
30 30 3 0
26
25 ~ .. r-19
21 r- r.-,.. 2 0
1:\ I-t" t-- t-: 11
15 I"' 0 - - - - t--
5 1 10
1 -
-:5 b l-r- -"3 - il t--2 22 .. 1 2 2
. 00 00 0 0 00 ~ ~ 2..0 n -l. -' 'I. l.J "L i. o 1993 199 1 1995 1996 1991 1998 1999 2000 200 1 2002 2 003 2 001 2005 2006
Shell -
. I PO o borrowinll. CUBO
Figure 3-12 Number and method of listed private-holding firms. 1993-2006 Source: SSE (2008)
105
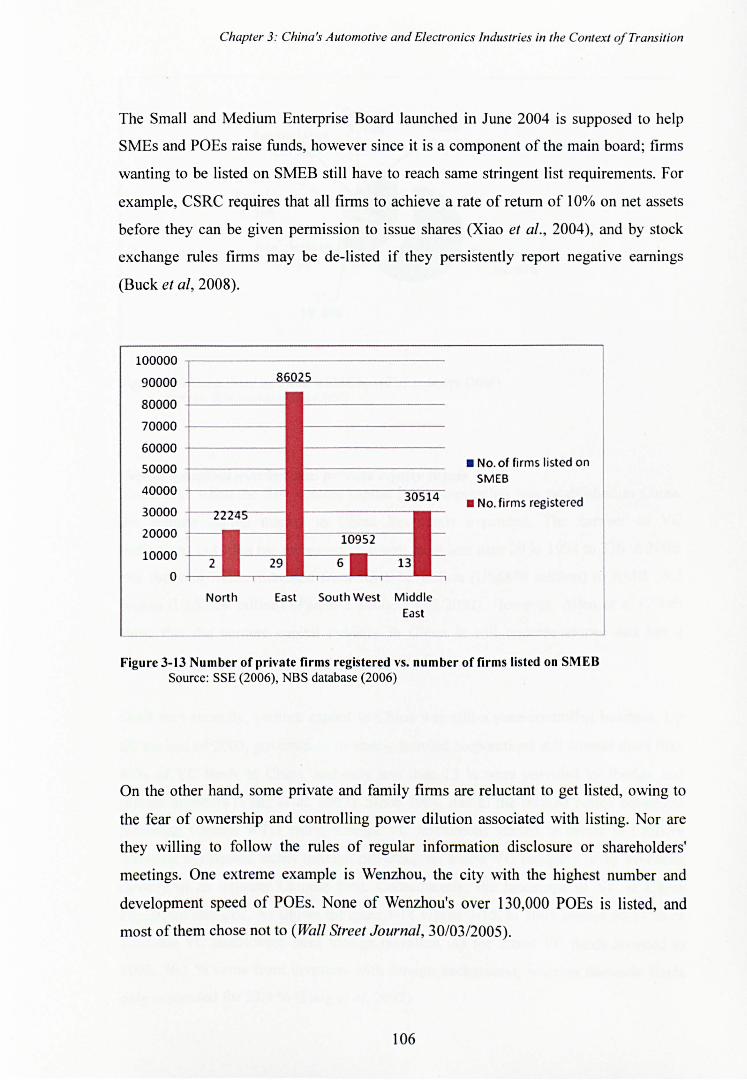
Chapter 3: China's Automotive and Electronics Industries in the Context a/Transition
The Small and Medium Enterprise Board launched in June 2004 is supposed to help
SMEs and POEs raise funds, however since it is a component of the main board; firms
wanting to be listed on SMEB still have to reach same stringent list requirements. For
example, CSRC requires that all firms to achieve a rate of return of 10% on net assets
before they can be given permission to issue shares (Xiao el al. , 2004), and by stock
exchange rules firms may be de-listed if they persistently report negative earnings
(Buck et ai, 2008).
100000 -,---------------
90000
80000
70000
60000
50000
40000
30000 +---.-..,..., ... ,~r---"-'
20000
10000
o North East South West M iddle
East
• No. of firms listed on SMEB
• No. firms registered
Figure 3-13 Number of private firms registered vs. number of firms listed on SMEB Source: SSE (2006), NBS database (2006)
On the other hand, some private and family firms are reluctant to get listed, owing to
the fear of ownership and controlling power dilution associated with listing. Nor are
they willing to follow the rules of regular information disclosure or shareholders'
meetings. One extreme example is Wenzhou, the city with the highest number and
development speed of POEs. None of Wenzhou's over 130,000 POEs is listed, and
most of them chose not to (Wall Street Journal, 30/03/2005).
106
Chapter 3: China's Automotive and Electronics Industries in the Context a/Transition
Agriculture
Service
1. 73'
2.
Wholesale/ Retail 5. 19'
10.621
Other 12.081
Figure 3-14 Firms listed on China's SME board by industry (2006) Source: SSE annual report (2007)
Venture capital market and private equity funds
uring
Since 1985 when the first venture capital (VC) corporation was established ' in China,
the venture capital market in China has vastly expanded. The number of VC
institutions in China has increased 16 times, from less than 20 in 1994 to 336 in 2006,
and the total funds increased from RMB7.2 billion (US$870 million) to RMB 58.3
billion (US$7.28 billion) (People's Daily, 15/02/2002). However, Allen et al (2006)
show that the venture capital industry in China is still underdeveloped and has a
limited role in supporting the growth of young firms.
Until very recently, venture capital in China was still a state-controlled business. Up
till the end of 2003 , government or state-controled corporations still control more than
80% of VC funds in China, and only less than 15 % were provided by foreign and
private investors (Fung et ai, 2007). Since 2004, due to the relaxed policy constraint
following China's WTO entry, foreign VC institutions started to invest in Chinese
domestic businesses, either through offsetting-up a new VC company or by investing
directly in an existing Chinese firm. Consequently, the landscape of VC in China
significant changed. As shown inFigure 3-14 Figure 3-15, in 2006 around 40.57 % of
available VC funds were from foreign investors. As for actual VC funds invested in
2006, 76.1 % came from investors with foreign background, whereas domestic funds
only accounted for 23.9 % (Fung et ai, 2007).
107
Chapter 3: China's Automotive and Electronics Industries in the Context a/Transition
60.0% 49.0%
50.0%
40.0%
30.0%
20.0%
10.0%
0 .0%
Government Financial Corporation Private Foreign Institution
Figure 3-15 Sources of Venture Capital Funding in China, 2003-2006
1.5%
Other
- 2003
_ 2005
_ 2006
Source: Composed based on annual report of Venture Capital in China (2006), China Venture Capital Research Institute
Venture capital investment in China features distinctive sectoral, development stage
and geographic concentration. Most VC chose to invest in high-technology projects.
As Table 3-10 shows, in 2006 the most invested VC projects were in 'internet-based
IT' sector, accounting for nearly 113 of all; other popular VC destinations included
'traditional manufacturing' and 'energy/environment' projects. These three sectors
together accounted for 64.05 % and 70.62 % of total projects and amount invested. In
contrast, 69.94 % of the RMB 4.46 bn (US$ 557 million) invested by foreign funds all
went to internet-based IT sector (Annual report of Venture Capital in China, 2006) -
foreign venture capital investment has a higher sectoral concentration rate.
108
Chapter 3: China's Automotive and Electronics Industries in the Context a/Transition
Geographically, venture capital investment in China has concentrated mostly in the
developed coastal regions. The Bohai Area (round Beijing), Yangtze Delta and
Guangdong province took 85.28 % of total investment projects and 93.28 % of
investment amount in 2006 (Yu et ai, 2007).
109
Chapter 3: China's Automotive and Electronics Industries in the Context of Transition
While more and more funds tend to shift to the later stages of firm development, less
than 10 % of venture capital investment projects were in the seed or start up phase (see
Figure 3-16). In 2006, 55.92 % of total venture capital investment went to projects in
their expansion or mature stages. This trend indicates that risk aversion of VC
investors has in fact become stronger, and is likely to impede the development of cash
thirsty high-tech young firms. A number of factors deter venture funds from injecting
into start-up POEs. Any firm seeking VC must show at least three years of financial
accounts - and accounts in China are unreliable anyway. To evaluate a firm, a venture
investor needs to know what sort of guanxi is possessed by the firm and by its
managers as individuals, and how much they can capitalise that: as we have shown,
these guanxi constitute valuable assets in Chinese context (Bruton et aI, 2003).
40.00% 35.00%
35.00%
30.00%
25.00% . 2003
20.00% _ 2004
15.00% _ 2005
. 2006 10.00%
5.00%
0 .00%
Seed/Start up Growth Expansion Mature Other
Figure 3-16 Distribution of China's venture capital by development stage Source: Annual report of Venture Capital in China (2006), China Venture Capital Research Institute
110
Chapter 3: China's Automotive and Electronics Industries in the Context of Transition
3.4 The Chinese Automotive Industry: the industrial contextl9
Globally, the automotive industry remains one of the most important industries in the
modern economy and contributes a prominent share of total GOP and employment.
China regards automotive as one of its pillar sectors and has given it high strategic
importance to develop. Quantitatively, it ranked fourth in the largest automotive
manufacturing countries in 2003 and progressed to third in 2008. Nevertheless, China's
passenger car industry is still in an early stage. The Chinese government seems to have
pursued a 'third road' of industrial development in which Inward Foreign Direct
Investment (FDI) was invited to reshape the industry during the reform period. During
a relatively short period of time, the national market developed rapidly against a
background of the fastest growing economy in the world. Most leading car-producing
multinationals (MNCs) have invested in China, primarily in the form of International
Joint Ventures (IJVs) - as a consequence of government policy constraints. Entry
barriers and trade barriers imposed by the government largely hampered the function of
the competition mechanism (Lu & Feng, 2003). Only in recent years, this pattern of
industry policy characterised by the 'twin barriers' was significantly revised. In such
context, China's passenger car market has witnessed high degree of market dominance
and consequently high level of prices and profits (until 2004). The SOEs and MNCs
have collaborated through INs to share the high profits guaranteed by restrictive
government policy. The slow improvement of the domestic technological capability
has highlighted the failure of the 'market for technology' strategy in this sector.
During the last ten years the landscape of China's automotive industry has been
transformed, with the gradual introduction of increasing competition from abroad, and
the sudden introduction of increased domestic competition from relatively small new
entrants such as Chery and Geely. In subsection 3.4.1 we first examine the evolution of
China's automotive industry in general and passenger car industry in particular, and
39 Unless otherwise stated, much of the information relevant to the development of the Chinese auto industry (including passenger car sector) is from the China Association of Automotive Manufacturer (CAAM) website (www.caam.org.cn).This is because information of this type is fact-based and official statistics are relatively reliable. Other sources used in this section include Liang (2004) 'New Competition -foreign direct investment and industrial development in China' which is a Ph.D thesis of Rotterdam School of Management, Erasmus University Rotterdam; Lu, F., & Feng, K. (2004) Fazhan woguo zizhu zhishichanquan qichegongye de zhengce xuanze (In Chinese: The Policy Choice in Developing China's Proprietary Car Industry). Beijing: Beijing University Press.
111
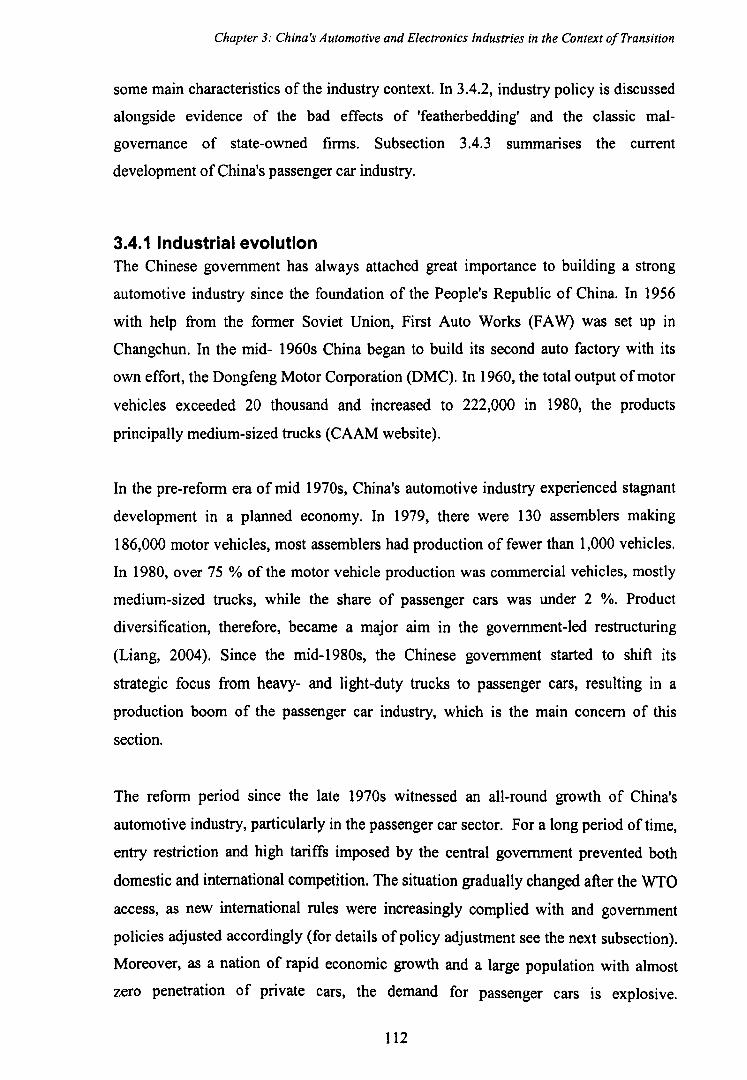
Chapter 3: China's Automotive and Electronics Industries in the Context o/Transition
some main characteristics of the industry context. In 3.4.2, industry policy is discussed
alongside evidence of the bad effects of 'featherbedding' and the classic mal
governance of state-owned firms. Subsection 3.4.3 summarises the current
development of China's passenger car industry.
3.4.1 Industrial evolution The Chinese government has always attached great importance to building a strong
automotive industry since the foundation of the People's Republic of China. In 1956
with help from the former Soviet Union, First Auto Works (FA W) was set up in
Changchun. In the mid- 1960s China began to build its second auto factory with its
own effort, the Dongfeng Motor Corporation (DMC). In 1960, the total output of motor
vehicles exceeded 20 thousand and increased to 222,000 in 1980, the products
principally medium-sized trucks (CAAM website).
In the pre-reform era of mid 1970s, China's automotive industry experienced stagnant
development in a planned economy. In 1979, there were 130 assemblers making
186,000 motor vehicles, most assemblers had production of fewer than 1,000 vehicles.
In 1980, over 75 % of the motor vehicle production was commercial vehicles, mostly
medium-sized trucks, while the share of passenger cars was under 2 %. Product
diversification, therefore, became a major aim in the government-led restructuring
(Liang, 2004). Since the mid-1980s, the Chinese government started to shift its
strategic focus from heavy- and light-duty trucks to passenger cars, resulting in a
production boom of the passenger car industry, which is the main concern of this
section.
The reform period since the late 1970s witnessed an all-round growth of China's
automotive industry, particularly in the passenger car sector. For a long period of time,
entry restriction and high tariffs imposed by the central government prevented both
domestic and international competition. The situation gradually changed after the WTO
access, as new international rules were increasingly complied with and government
policies adjusted accordingly (for details of policy adjustment see the next subsection).
Moreover, as a nation of rapid economic growth and a large population with almost
zero penetration of private cars, the demand for passenger cars is explosive.
112
Chapter 3: China's Automotive and Electronics Industries in the Context o/Transition
Consequentl y, a new phase of industrial development began since 2001 , and the
growth of automotive production accelerated with the structure dramatically shifting
towards passenger car manufacturing. In 1990, the total production of passenger cars in
China was merely 42.2 thousand. In 2006, China produced 2.33 million motor vehicles,
including 703.5 thousand passenger cars. In 2002 the two numbers increased
respectively to 7.28 and 3.87 million (see Figure 3-17). The percentage of passenger
cars in total automotive production increased to 53 %.
8000 60.00% ." 'l3
50.00% c: ~ 6000 ." ~ 40.00% 0 ~ .-. 4000 30.00%
20.00% 2000
10.00%
0 0.00%
1958196019751982199019952000200120022003200420052006
_ Total _ Passenger car -.-Share or Passenger car
Figure 3-17 China's automotive production, 1958-200640
Source: China Automotive Industry Yearbook 2007, China Association of Automotive
Manufacturers, Beijing.
3.4.2 Industrial policy
As an industry that had heavy legacies of state planning and central to the government's
development strategy, China's automotive industry has been largely led by government
policy and intervention. Two of the most influential policies that have hampered the
development of China's automotive industry have been 'entry restriction' and 'market
for technology'.
Based on the argument that the Chinese automotive industry was in a highly
fragmented structure, entry restriction was implemented continuously by the
government agencies responsible for the regulation of this industry (Liang, 2004). In
1986 the Automotive Industry was officially listed as one of China's 'Pillar Industry' for
explicit support. In 1988, the government sanctioned three major car assemblers, FA W,
40 This figure is also published in Tylecote, Cai and Liu (20 I 0).
113
Chapter 3: China's Automotive and Electronics Industries in the Context of Transition
DMC and SAIC, plus three smaller ones in Beijing, Tianjin, and Guangzhou. This was
known as the 'Three Big and Three Small' Strategy41. The effort to limit new entries
was confirmed by the later-formulated first industrial policy for the automotive
industry in 1994. From 1989, one year after the establishment of the 'Three Big and
Three Small' strategy, motor vehicle made by non-sanctioned firms has been included
in the list of products that need to be strictly controlled (Quanguo qi che, min yong gai
zhuang che he mo tuo che sheng chan qi ye ji chan pin mu lu guan Ii zan xing guiding
(Provisional Regulation for the Administration of Automotive Vehicle Production and
Producer), 1989: Item 5). Within the overall environment of strict entry control, two
more SOEs obtained special permission to produce compact cars. Although new
market entries were permitted since the early 1990s, new entrants were all IJVs formed
between MNCs and the identified six domestic firms (Liang, 2004, Figure 6-2). Only
after 2000, new entries other than the 'Three Big and Three Small' were permitted.
Since the mid 1980s, the Chinese government believed that the quick expansion of
export-oriented automotive industry in Japan and South Korea was due to active
government interventions (Aoki et aI, 1996). As a result, China's first formal industrial
policy was issued to the auto industry. The policy was formulated in 1994 and
modified in 2004. In February 1994, the formal State Planning Committee released the
'Automotive Industry Industrial Policy'. As a long-term plan for industrial development,
the automotive industrial policy highlighted the Chinese government's determination to
building a strong national automotive industry. In 2004, this policy was replaced by
'Automotive Industry Development Policy' released by National Development and
Reform Commission (NDRC).
The 1994 industrial policy reinforced the strategy of stringent entry control, and like
many other government policies it not only established objectives but also dictated
specific means. 1) It named the State Administration of Machinery Industry (SAMI), a
small bureau under the State Economic and Trade Commission (SETC) to implement
entry control through a system of product catalogue management (Automotive Industry
Industrial Policy, 1994, Chapter 2). 2) The policy also provided detailed administrative
41 In a meeting held by the State Council in August 1987, FAW, DMC and SAIC has been identified as the three car production bases. In 1988, the State Council declared the 'Three Big and Three Small' Strategy in 'Notification on the Strict Control of Passenger Car Production Locations'. In a later national meeting on automotive industry held in Shanghai, 1991, the strategy was re-stressed (www.caam.org.cn).
114
Chapter 3: China's Automotive and Electronics Industries in the Context o/Transition
screening at the product level, deterring the firm decision on the development of new
products (Automotive Industry Industrial Policy, 1994: Chapter 3, item 10). 3)
Moreover, according to Item l3 in the policy, firms reaching certain production
capacity, which could only possibly be large SOEs, were given an array of fiscal and
financial privileges, including tax refund, prioritised stock market floating, cheap bank
loans, priority to access foreign funding allocation and policy-related zero-interest
loans. 4) In addition, a product license system was established, serving as an effective
administrative measure of entry restriction. As a result, in order to avoid 'inefficient
competition', private firms and small SOEs were practically not allowed to enter the
Chinese automotive market in the whole of the 1990s (Liang, 2004).
The 1994 industrial policy also encouraged foreign investment in the automotive
industry. It was hoped that through establishing 50-50 shareholding international joint
ventures, the domestic firms would gain access to the most up-to-date technology from
their MNC partners. Such strategy was clearly reflected in the policy wording. In the
first sentence about the industry's technology policy, the document reads: 'the
government encourages and supports automotive enterprises ... to build product
development capability through assimilating and absorbing foreign technology ... the
foreign technology to be introduced needs to reach the current international standard'.
Nothing was mentioned about self-reliant learning and development.
Such strategy posed striking contrast to that of South Korea in the 1970s (Kim, 1997).
In 1973 the Korean government released its 'Long-Term Development Plan for the
Automotive Industry', in which it requested Korean firms to design and develop their
own cars. The Chinese policy on the other hand, only set 'product content localisation'
as the industry's development objective in the 1990s. The logic was linear and over
simplified - that by achieving parts and components localisation, the industry would
automatically achieve self-reliant R&D (see Figure 3-18). However content localisation
involves a different set of technological activities than product development, and
therefore requires (and consequently develops) different capabilities. Automotive
vehicle product development is R&D intensive, which requires the capability of system
integration (Teece et ai, 1997) bringing together the component
subsystems/technologies into one and ensuring that the subsystems function together as
a system. Parts and components manufacturing on the other hand is based on
115
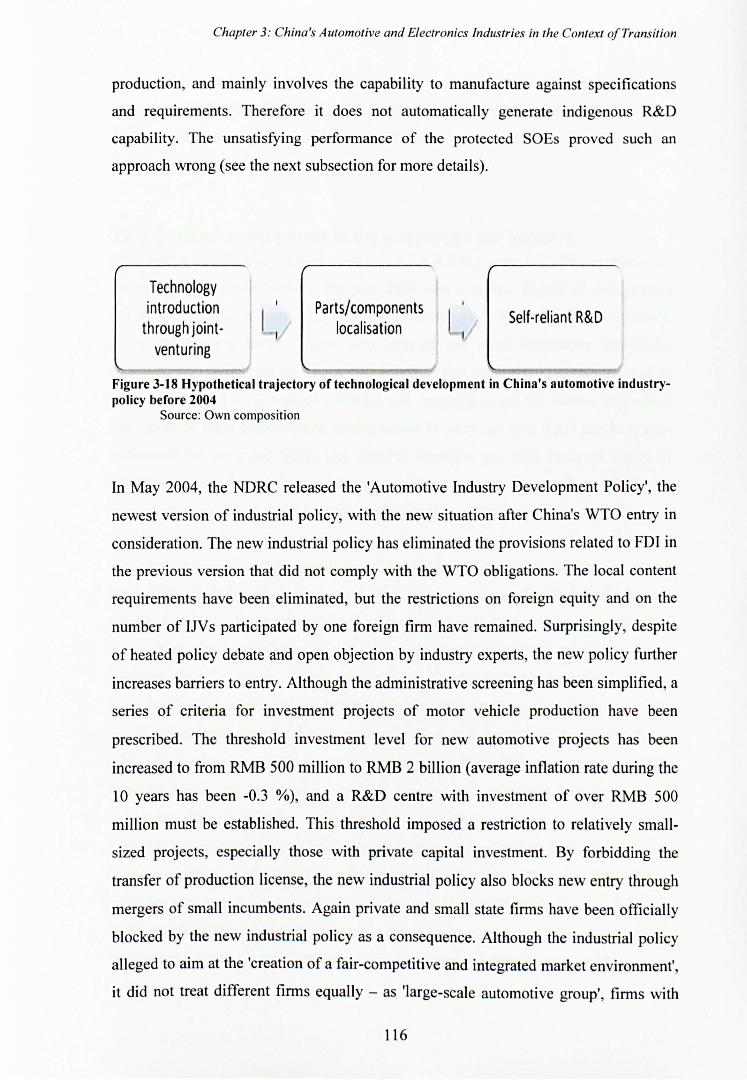
Chapter 3: China's Automotive and Electronics Industries in the Context of Transition
production, and mainly involves the capability to manufacture against specifications
and requirements. Therefore it does not automatically generate indigenous R&D
capability. The unsatisfying performance of the protected SOEs proved such an
approach wrong (see the next subsection for more details).
Technology introduction
through jointventuring
Parts/components 1/ localisation
Self·reliant R&D
Figure 3-18 Hypothetical trajectory of technological development in China's automotive industrypolicy before 2004
Source: Own composition
In May 2004, the NDRC released the 'Automotive Industry Development Policy', the
newest version of industrial policy, with the new situation after China's WTO entry in
consideration. The new industrial policy has eliminated the provisions related to FDI in
the previous version that did not comply with the WTO obligations. The local content
requirements have been eliminated, but the restrictions on foreign equity and on the
number of IJVs participated by one foreign firm have remained. Surprisingly, despite
of heated policy debate and open objection by industry experts, the new policy further
increases barriers to entry. Although the administrative screening has been simplified, a
series of criteria for investment projects of motor vehicle production have been
prescribed. The threshold investment level for new automotive projects has been
increased to from RMB 500 million to RMB 2 billion (average inflation rate during the
10 years has been -0.3 %), and a R&D centre with investment of over RMB 500
million must be established. This threshold imposed a restriction to relatively small
sized projects, especially those with private capital investment. By forbidding the
transfer of production license, the new industrial policy also blocks new entry through
mergers of small incumbents. Again private and small state firms have been officially
blocked by the new industrial policy as a consequence. Although the industrial policy
alleged to aim at the 'creation of a fair-competitive and integrated market environment',
it did not treat different firms equally - as 'large-scale automotive group', firms with
116
Chapter 3: China's Automotive and Electronics Industries in the Context o/Transition
over 15 % market share can implement their own development strategy with the
permission of the NDRC. Although no firms were specified, the SOEs with over 15 %
market share in 2004 were only FA W, SAIC and DMC - the Big Three
(www.caam.org.cn).
3.4.3 Current development in the passenger car Industry Following a heated policy debate triggered by Lu & Feng's report (2004), coupled with
the reduction of trade barriers, the year 2004 sees a certain degree of deregulation
toward a more open industrial environment has taken place in the automotive industry.
As a result, entry barriers have been reduced and more automotive (especially
passenger car) companies have been established. A few small-sized latecomers, such as
Geely, Chery and BYD walked sideways and managed to get the license to produce
cars. Most of them demonstrated determination to carry out own R&D and have out
performed the protected SOEs (for detailed example, see case study of Chery in
Chapter 6). As the production capacity of the industry increased rapidly, with
latecomers speeding up their presence, competition has been intensified.
Although industrial analysts agree that China still lag far behind leading nations in
innovation capability, production capabilities have expereienced remarkable and rapid
growth. Fuelled by the rapid expansion of domestic demand, in two decades China has
grown from a nation with almost zero automotive production to the third largest auto
producer globally (Noble, 2006). According to Goldman Sachs, between 2005 and
2025 the Chinese automotive market will boom another 10 times, from 19 million units
in 199 million, and overtake the US market (Wilson, Puroshothaman, & Fiotakis, 2004,
p.23). Meanwhile, in sharp contrast to their almost negligible presence in 2000,
domestic brands are now making speeded appearances and taking over the low-end
market (see Table 3-11 and
Figure 3-19). In early 2009, China's domestic brands for the first time take up more
than a quarter of China's passenger car market (Xinhua, 24/03/2009:
http://news.xinhuanet.com!auto/2009-03/24/content_11060476.htm). In the February
2009 top 10 ranking, 4 out of 10 brands were domestic, again an unprecedented rise.
Latecomers such as Geely, Chery and BYD have been the fastest growing Chinese car
firms.
117
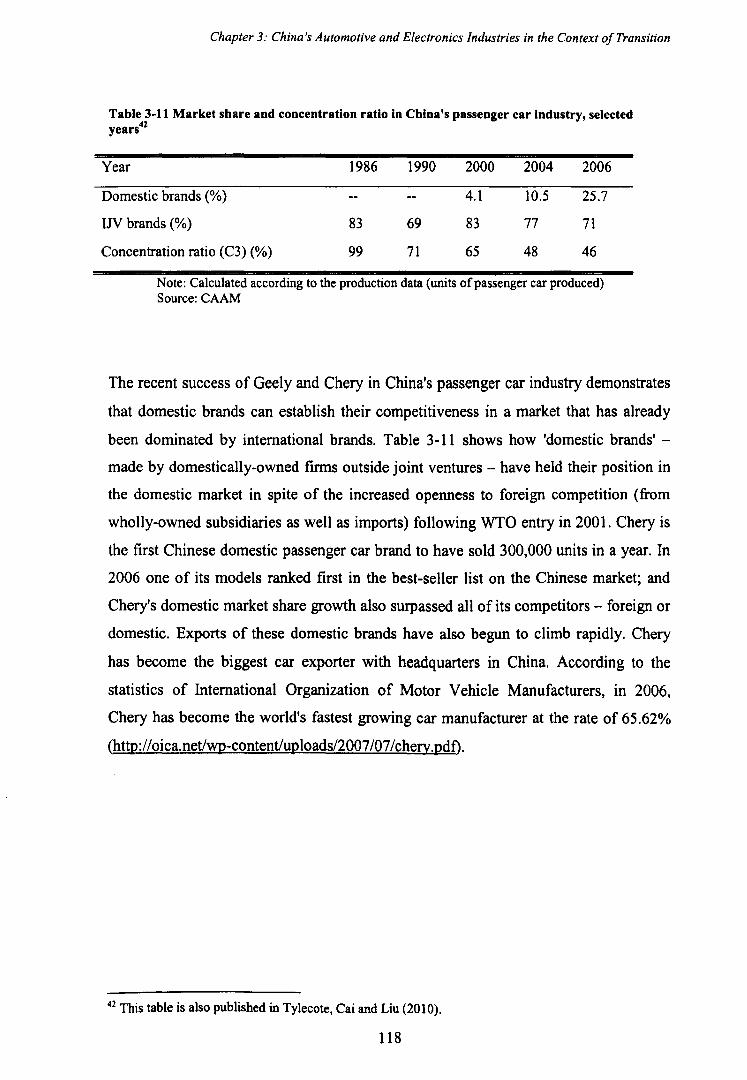
Chapter 3: China's Automotive and Electronics Industries in the Context of Transition
Table 3-11 Market share and concentration ratio in China's passenger car industry, selected years42
Year 1986 1990 2000 2004 2006
Domestic brands (%) 4.1 10.5 25.7
IN brands (%) 83 69 83 77 71
Concentration ratio (C3) (%) 99 71 65 48 46
Note: Calculated according to the production data (units of passenger car produced) Source: CAAM
The recent success of Geely and Chery in China's passenger car industry demonstrates
that domestic brands can establish their competitiveness in a market that has already
been dominated by international brands. Table 3-11 shows how 'domestic brands' -
made by domestically-owned firms outside joint ventures - have held their position in
the domestic market in spite of the increased openness to foreign competition (from
wholly-owned subsidiaries as well as imports) following WTO entry in 2001. Chery is
the first Chinese domestic passenger car brand to have sold 300,000 units in a year. In
2006 one of its models ranked first in the best-seller list on the Chinese market; and
Chery's domestic market share growth also surpassed all of its competitors - foreign or
domestic. Exports of these domestic brands have also begun to climb rapidly. Chery
has become the biggest car exporter with headquarters in China. According to the
statistics of International Organization of Motor Vehicle Manufacturers, in 2006,
Chery has become the world's fastest growing car manufacturer at the rate of 65.62%
(http://oica.netlwp-contentluploads/2007 /07 /chery.pdf).
42 This table is also published in Tylecote, Cai and Liu (2010).
118
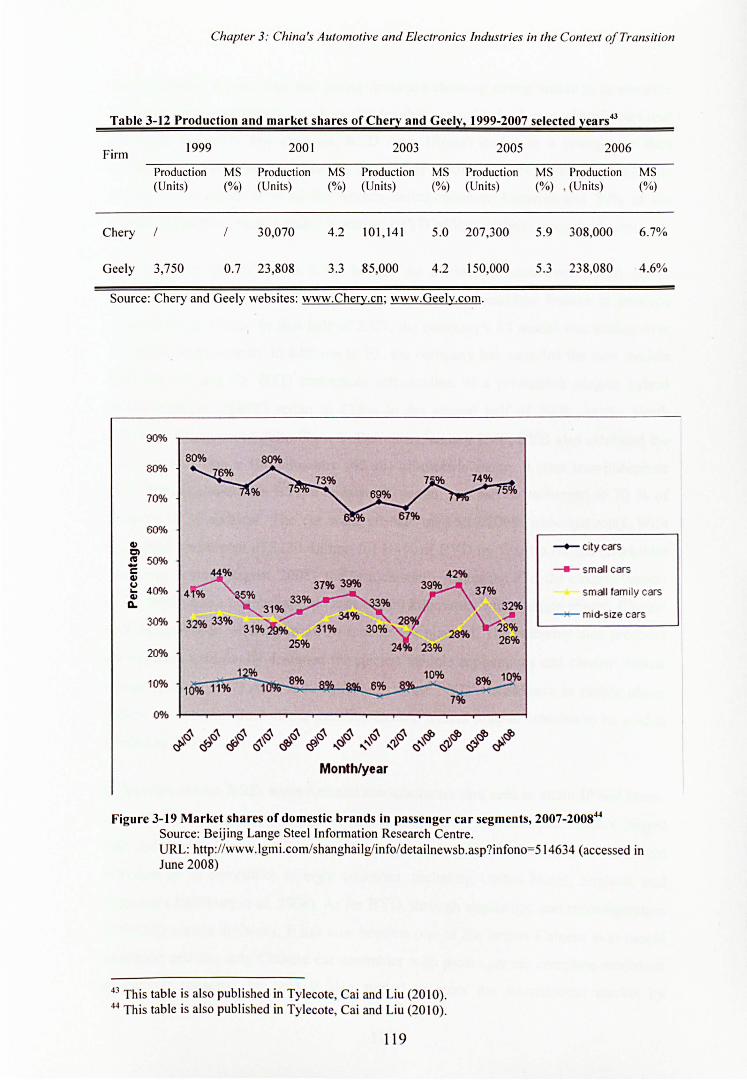
Chapter 3: China's Automotive and Electronics Industries in the Context of Transition
Table 3- 12 Product ion and market shares of Cherl: and Geell:' 1999-2007 selected l:ears4J
Firm 1999 2001 2003 2005 2006
Production MS Production MS Production MS Production MS Production MS (Units) (%) (Units) (%) (Units) (%) (Units) (%) , (Units) (%)
Chery 30,070 4.2 101 , 141 5.0 207,300 5.9 308,000 6.7%
Geely 3,750 0.7 23,808 3.3 85,000 4.2 150,000 5.3 238,080 4.6%
Source: Chery and Geely websites: www.Chery.cn; www.Geely.com.
90%
80% 80% 80%
70%
60% GI CI
--+- city cars IV 50% -C -+- small cars GI 1.1
40% ... GI ~
42% 37% 39% ,7\9% 37%
4 5% ~% small family cars CL
30%
20%
10%
0%
~% ~ ~% ~% ~
32% 33% 31% ~ 31% 30% '\.J' 28% ~8% 25% 24' 23% 26%
10%
7
~ ~ ~ ~ ~ ~ ~ ~ ~ ~ ~ ~ ~ ~~ ~~~ ~~ ~:~ ~~ ~~ ,,~~ ,,~~ ~~ ~~'J" ~~'J" ~'J" ~'J"
Month/year
- mid-size cars
Figure 3-19 Market shares of domestic brands in passenger car segments, 2007-200844
Source: Beijing Lange Steel Information Research Centre. URL: http://www.lgmi.com!shanghailglinfo/detailnewsb.asp?infono=514634 (accessed in June 2008)
43 This table is also published in Tylecote, Cai and Liu (20 I 0). 44 This table is also published in Tylecote, Cai and Liu (20 I 0).
119
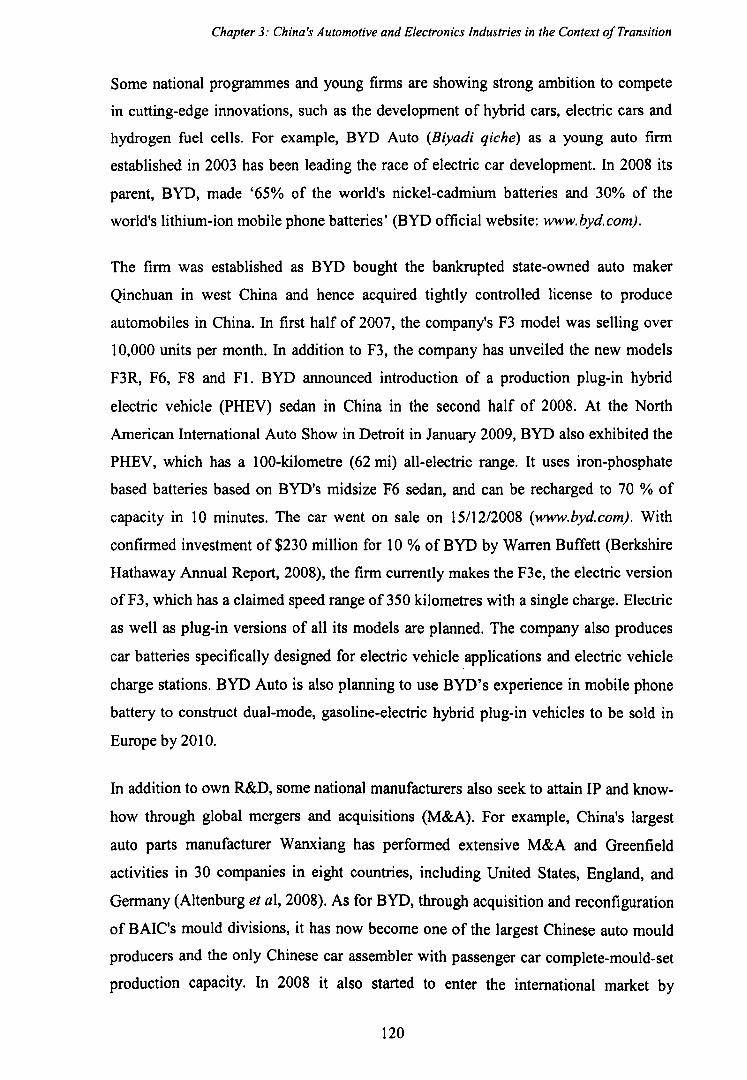
Chapter 3: China's Automotive and Electronics Industries in the Context o/Transition
Some national programmes and young firms are showing strong ambition to compete
in cutting-edge innovations, such as the development of hybrid cars, electric cars and
hydrogen fuel cells. For example, BYD Auto (Biyadi qiche) as a young auto firm
established in 2003 has been leading the race of electric car development. In 2008 its
parent, BYD, made '65% of the world's nickel-cadmium batteries and 30% of the
world's lithium-ion mobile phone batteries' (BYD official website: www.byd.com).
The firm was established as BYD bought the bankrupted state-owned auto maker
Qinchuan in west China and hence acquired tightly controlled license to produce
automobiles in China. In first half of 2007, the company's F3 model was selling over
10,000 units per month. In addition to F3, the company has unveiled the new models
F3R, F6, F8 and Fl. BYD announced introduction of a production plug-in hybrid
electric vehicle (PHEV) sedan in China in the second half of 2008. At the North
American International Auto Show in Detroit in January 2009, BYD also exhibited the
PHEV, which has a 100-kilometre (62 mi) all-electric range. It uses iron-phosphate
based batteries based on BYD's midsize F6 sedan, and can be recharged to 70 % of
capacity in 10 minutes. The car went on sale on 15/12/2008 (www.byd.com). With
confirmed investment of $230 million for 10 % of BYD by Warren Buffett (Berkshire
Hathaway Annual Report, 2008), the firm currently makes the F3e, the electric version
of F3, which has a claimed speed range of 350 kilometres with a single charge. Electric
as well as plug-in versions of all its models are planned. The company also produces
car batteries specifically designed for electric vehicle applications and electric vehicle
charge stations. BYD Auto is also planning to use BYD's experience in mobile phone
battery to construct dual-mode, gasoline-electric hybrid plug-in vehicles to be sold in
Europe by 2010.
In addition to own R&D, some national manufacturers also seek to attain IP and know
how through global mergers and acquisitions (M&A). For example, China's largest
auto parts manufacturer Wanxiang has performed extensive M&A and Greenfield
activities in 30 companies in eight countries, including United States, England, and
Germany (Altenburg et aI, 2008). As for BYD, through acquisition and reconfiguration
of BAIC's mould divisions, it has now become one of the largest Chinese auto mould
producers and the only Chinese car assembler with passenger car complete-mould-set
production capacity. In 2008 it also started to enter the international market by
120

Chapter 3: China's Automotive and Electronics Industries in the Context o/Transition
supplying moulds for Land Rover's new models (Moju zhizao [in Chinese, Mould
manufacturing], 1112008). The largest auto maker SAlC also acquired a majority stake
in Korean Ssangyong CLiu & Tylecote, 2009) as part of its intention to build Chinese
cars with its own brand. However it remains to be seen whether such capital
operatioins really boosts indigenous capabilities.
121
Chapter 3: China's Automotive and Electronics Industries in the Context o/Transition
3.5 The Chinese Electronics Industry: the industrial context
The electronics industry in China has developed remarkably during the reform era,
especially since the early 1990s. The total sales and profits increased from RMB 49.2
billion and 5.7 billion in 1989 to RMB 2,996.9 billion and 188.9 billion in 2005, and
the total export jumped from US$ 2.8 billion to US$ 268.2 billion during the same
period. In 2003, China surpassed Japan by almost 20 % to become the second largest
producer of electronics products (MIl). It has also become the single largest
manufacturing industry in China in terms of both output and export.
China's imports and exports of electronics and information products reached US$885.4
billion in 2008, up 10 % from the 2007 (Shanghai Daily, 19/02/2009).
Exports rose 13.6 % to US$521.8 billion, which accounted for more than a third of
China's total export. Imports expanded 5.4 % to US$ 363.7 billion, or 32.1 % of the
country's total import. More than 75 % of the industry's exports in 2008 were
telecommunications products, computers and home audio and video products.
According to the National Development and Reform Commission (NDRC), China's
production of mobile handset, colour TV, monitor and central office switches in 2006
accounted respectively for 35, 40, 55 and 30 % of the world's total. In 2006, 40 % of
colour TVs, 50 % of mobile handsets and PCs, and 60 % of monitors produced in
China was exported (NDRC website: www.ndrc.gov.cn).
It is a broad consensus that FDI played a central role in shaping China's electronics
industry (Ma, Nguyen, & Xu, 2006). The largest exporters remain foreign, but several
Chinese electronics firms have rapid grown to become global players in under 20 years,
and the most famous examples include Huawei Technologies, Lenovo, and the Haier
Group (see Altenburg et ai, 2008 for a snapshot of these firms)
Chinese electronics multinationals are serious about the competition, each dedicating
substantial resources to innovation. Huawei, for example, claims to have almost 30,000
employees in this field and to invest more than US$l billion in R&D (Altenburg et ai,
2008). Like in other export-oriented industries, Chinese electronics firms initially
122
Chapter 3: China's Automotive and Electronics Industries in the Context o/Transition
depended heavily on insertion in global value chains for technological catch-up:
through low-cost OEM according to the specifications of foreign customers, these
Chinese subcontractors quickly learned how to carry out mass production. Furthermore,
the explosive boom of domestic markets for PCs and consumer electronics also
brought enormous economies of scale. Chinese leading firms quick accumulated
experience in both the home and export market. For example, Chinese personal
computer brands in 2004 had roughly two thirds of the domestic market (Zhou, 2005, p.
1121 ).
However, the apparent prosperity in the Chinese electronics industry does not
withstand closer inspection. It is undeniable that apart from a small number of
enterprise mentioned above, the Chinese electronics industry as a whole still mainly
operate on the low value-added manufacturing, packaging and assembly end of the
global value chain. In value terms, more than 80 % of the exports were only processed
or assembled in China with materials supplied by overseas clients, according to MIl
(Shanghai Daily, 19/02/2009). From 1995 to 2001, foreign invested firms increased
their value added share in Chinese industry by an annual rate of 18% on average. In the
electronics industry, foreign invested firms account for at least 65% of total value
added (Hu & Jefferson, 2009).
In the next three subsectors, we examine three areas where China's manufacturing
strength lies: consumer electronics and telecommunication equipment.
123
Chapter 3: China's Automotive and Electronics Industries in the Context of Transition
3.5.1 Consumer electronics (non-white goods)
The consumer electronics industry was the first segment within the Chinese electronics
industry to grow up. According to international standard definition (ITU website), this
segment includes two broad ranges of consumer electronics categories: white goods
and brown goods. White goods include refrigerators, air conditioners, washing
machines, and other household appliances, which is not included in our observation.
Brown goods include home audio and video products such as television, DVD players,
MP3 players, digital still cameras, personal digital assistants (PDAs) and home stereo
systems, as well as portable audio products.
The development of the consumer electronics industry in China features temporary
success after foreign technology introduction in the 90s, and fierce price war
afterwards (Woetzel, 2003, Gao et aI, 2007). Starting from the early 1980s, MNCs
have gradually moved the production of consumer electronics products from South
East Asian economies to lower cost countries, such as China. Due to China's
protectionism industrial policy back then, these MNCs were not allowed to invest
directly; hence some international joint ventures (INs) were established, such as Panda
and Skyworth. They have been among the largest firms in this sector. On the other
hand, the development of INs has been accompanied by the rapid growth of domestic
firms, both SOEs and non SOEs. Home-grown firms such as Changhong (TV),
Chunlan (Air Conditioner) were initially actively involved in technological learning
and catch-up, and their effort brought them overwhelming success in the late 80s and
the whole of 1990s. Unfortunately, after absorbing and assimilating technology
introduced from foreign MNCs, these Chinese firms did not manage to gradually
develop indigenous products and upgrade their technological capabilities. Therefore,
most domestic Chinese firms continue to be located downstream of the global value
chain (Gao, 2005).
In the meantime, following the homogenisation and commoditisation of these
consumer electronics products, competition for Chinese firms was increasingly based
on price. One may argue that in the name of defending the home-owned industry, price
wars did help domestic firms fend off their foreign competitors temporarily. But the
124
Chapter 3: China's Automotive and Electronics Industries in the Context a/Transition
rising market share of some of the Chinese firms was at the cost of their domestic peers
or even themselves (Liang, 2004). For example, Changhong TV sets have been sold by
their weights - RMB 30 per kilogram. (Zhongguo jingji shibao [China Economic
Times), 12/06/2002). In 2001, the average profit level for Chinese TV manufacturers
further reduced from 2.26% in 1999 to 2.05%, and caused an industry-side loss of
nearly 3 billion Yuan (Hong Kong Mail, April 26th 2002, p. 2.).
3.5.2 Telecommunications equipment
Telecommunications equipment is an industry which is exceptional within the broader
area of 'electronics/ICT' in at least two ways. The first is its success - to be precise, the
success of mainland Chinese firms - in international competition. See Figure 3-20,
Table 3-13 and Figure 3-21. The second is its independent approach to technological
development45 (Gao, 2003; Cai and Tylecote, 2005; 2008).
The rise of Huawei, the largest Chinese telecoms equipment manufacturer, has been
remarkable. In less than 10 years, Huawei has set up 20 branches and 100 offices
outside China, selling to over 100 countries and regions with over 1 billion customers.
It has 12 foreign-based research centres and 28 regional training centres. In 2007, over
72% of its sales revenue was generated from the overseas market. In December 2005,
Huawei, together with three other multinationals: Ciena, Lucent and Siemens, became
supplier of British Telecom's $17.4 billion 21st Century Network (21 CN), which' ...
has been one of the largest single procurement programmes ever undertaken in the
communications industry worldwide'{BT Group, 9/12/05,
http://www.btplc.coml21CNlWhatisBTsaying/Keymilestones/Keymilestones.htm).
ZTE, the second-largest telecoms equipment manufacturer, is following the same
trajectory, approximately two years behind. From 2004 to 2006, the company entered
partnerships with the top 50 global GSM/WCDMA systems equipment operators, as
45 It can be, and has been, argued that it was this 'forced' independent development which made Chinese telecoms more successful than (for example) television manufacture (Gao et al., 2007). However what happened in the telecommunications sector is that the only people (and organisations) who get to 'first base' by the end of the 1990s, were the ones which were capable of understanding a certain type of innovation strategy which requires a certain type of corporate governance (Cai & Tylecote, 2005).
125
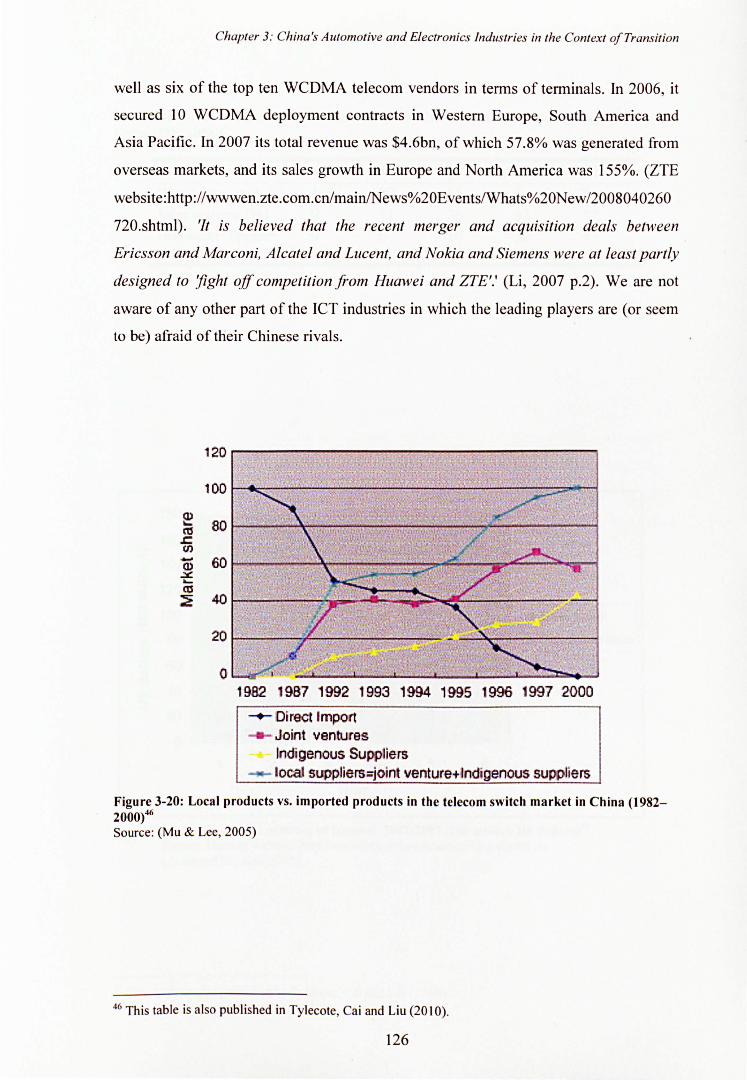
Chapter 3: China's Automotive and Electronics Industries in the Context a/Transition
well as six of the top ten WCDMA telecom vendors in terms of terminals. In 2006, it
secured 10 WCDMA deployment contracts in Western Europe, South America and
Asia Pacific. In 2007 its total revenue was $4.6bn, of which 57.8% was generated from
overseas markets, and its sales growth in Europe and North America was 155%. (ZTE
website:http://wwwen.zte.com.cnlmainlNews%20Events/Whats%20New/2008040260
720.shtml). 'It is believed that the recent merger and acquisition deals between
Ericsson and Marconi, Alcatel and Lucent, and Nokia and Siemens were at least partly
designed to 'fight off competition from Huawei and ZTE'.' (Li, 2007 p.2). We are not
aware of any other part of the ICT industries in which the leading players are (or seem
to be) afraid of their Chinese rivals.
120
100
~ 80 ctj ~ CI) .- 60 CD .::£ ~
a:s ~ 40
20
o 1982 1987 1992 1993 1994 1995 1996 1997 2000
-.- Direct Import ........ Joint ventures
Indigenous Suppliers local 'Suppliers.joint venture+'ndigenous suppliers
Figure 3-20: Local products vs. imported products in the telecom switch market in China (1982-2000)46 Source: (Mu & Lee, 2005)
46 This table is also published in Tylecote, Cai and Liu (20 I 0).
126
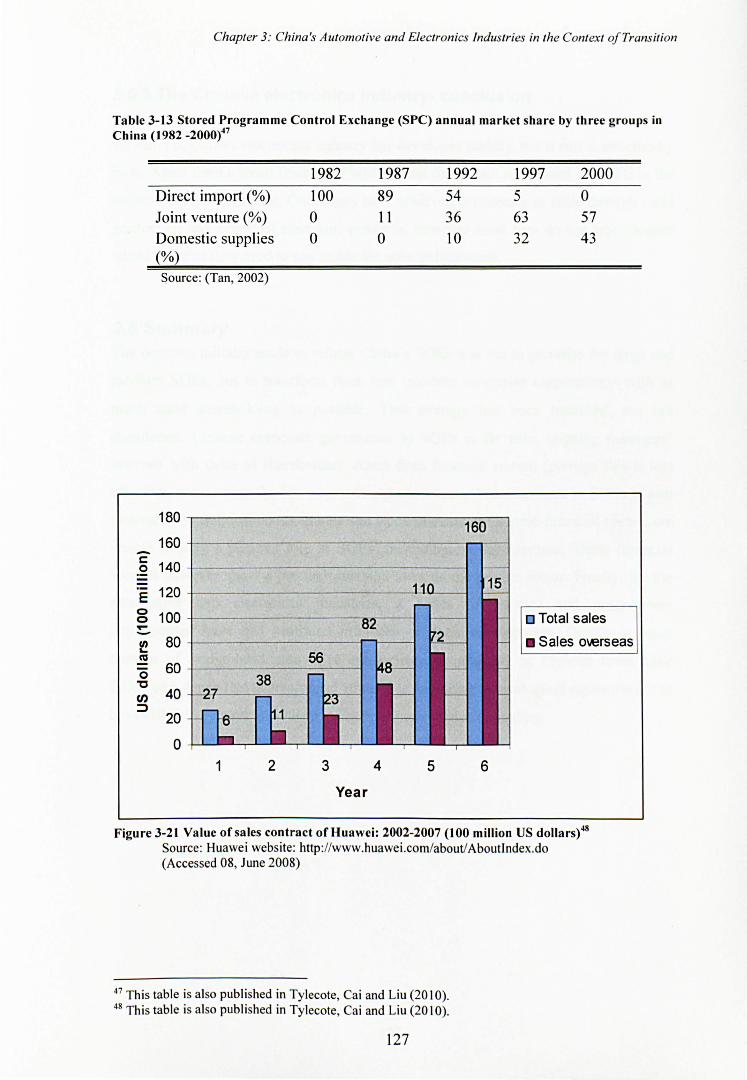
Chapter 3: China's Automotive and Electronics Industries in the Context o/Transition
Table 3-13 Stored Programme Control Exchange (SPC) annual market share by three groups in China (1982 _2000)47
1982 1987 1992 1997 2000 Direct import (%) 100 89 54 5 0 Joint venture (%) 0 1 1 36 63 57 Domestic supplies 0 0 10 32 43 (%) Source: (Tan, 2002)
180 160
160 -c 140 0
E 120 0 100 0 o Total sales --l!! 80 • Sales owrseas co 0 60 '0 CJ) 40 :::J
20
0
1 2 3 4 5 6
Year
Figure 3-21 Value ofsales contract ofHuawei: 2002-2007 (100 million US dolJars)48 Source: Huawei website: http: //www.huawei .com/about/Aboutlndex.do (Accessed 08, June 2008)
47 This table is also published in Tylecote, Cai and Liu (20 I 0). 48 This table is also published in Tylecote, Cai and Liu (20 I 0).
127
Chapter 3: China's Automotive and Electronics Industries in the Context of Transition
3.5.3 The Chinese electronics industry- conclusion
To sum up, China's electronics industry has developed rapidly, but it still is structurally
poor. Apart from a small fraction of bridge-head firms such as Huawei and ZTE in the
telecom equipment sector, China may have achieved economies of scale through mass
production and export of electronic products, however most firm do not enjoy higher
added value as they need to pay to use the core technologies.
3.6 Summary The decision initially made to reform China's SOEs was not to privatise the large and
medium SOEs, but to transform them into 'modem enterprise corporations' with as
much state shareholding as possible. This strategy has been modified, but not
abandoned. Chinese corporate governance in SOEs is far from aligning managers'
interests with those of shareholders. Apart from financial reward (perhaps this is less
effective, considering the low payment and short tenure) management in SOEs is also
motivated by political status. Banks and stock markets in Chinese financial system are
unable to playa positive role in SOEs' technological development. These financial
sources however show a peculiar aversion towards the private sector. Finally, for the
automotive and electronics industries, a series of policies and programmes
implemented have had profound influence on their development. Despite a small
number of bridge-head innovative companies, the majority of Chinese firms have
followed a dependent technological strategy in acquiring technological capabilities, and
have failed in general to achieve indigenous competence upgrading.
128
Chapter 4 Theoretical Frameworks Used in This Study
This chapter describes the theoretical frameworks used in this study. Section 4.1
discusses a conceptual framework developed to measure technological capability of
firms in newly industrialising economies. Measurement of capabilities in NIE firms
should serve a predictive function; it is important to assess the firm's potential to
enhance the dynamism of their technological capability. Therefore the concept of
'dynamic technological capability' is incorporated in the framework. Our definition is a
synthesis of those of Teece et al and Winter's - the ability or the capability to generate
change, to enhance future competitiveness in response to the competitive environment
(see also Chapter 2, section 2.1.1). Therefore, rather than assessing firms' static
capability - 'the ability at a given point in time to make a sophisticated product with
advanced processes' (Cai & Tylecote, 2008, p. 1794), we aim to measure the firms'
ability to achieve continuous, far-reaching improvements in product and processes
(independently). Based on critical review of previous attempts to measure
technological capability in the literature (see Chapter 2, Section 2.1.2), a framework is
proposed in Section 4.1 to capture the 'dynamism' of firms' technological capabilities.
Moreover, it is argued that the firms' technological performance should also be
measured to gain a complementary insight into their capability, namely, innovation
performance, sales performance and product performance.
After the reality of China's corporate governance and finance system are reviewed in
Chapter 3 Section 3.3, Section 4.2 adapts the theory of CGFS and technological
capability development to the Chinese context. Section 4.3 describes the five general
propositions to be investigated in the empirical research to follow.
129
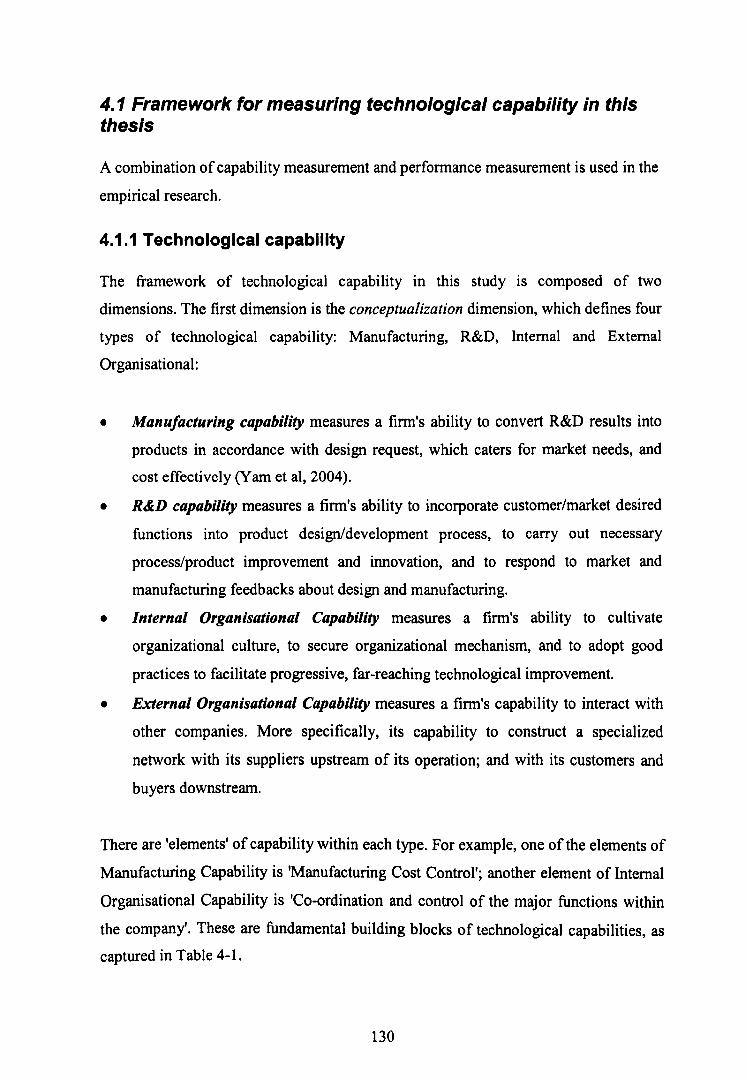
4. 1 Framework for measuring technological capability in this thesis
A combination of capability measurement and performance measurement is used in the
empirical research.
4.1.1 Technological capability
The framework of technological capability In this study is composed of two
dimensions. The first dimension is the conceptualization dimension, which defines four
types of technological capability: Manufacturing, R&D, Internal and External
Organisational:
• Manufacturing capability measures a firm's ability to convert R&D results into
products in accordance with design request, which caters for market needs, and
cost effectively (Yam et aI, 2004).
• R&D capability measures a firm's ability to incorporate customer/market desired
functions into product design/development process, to carry out necessary
process/product improvement and innovation, and to respond to market and
manufacturing feedbacks about design and manufacturing.
• Internal Organisational Capability measures a firm's ability to cultivate
organizational culture, to secure organizational mechanism, and to adopt good
practices to facilitate progressive, far-reaching technological improvement.
• External Organisational Capability measures a firm's capability to interact with
other companies. More specifically, its capability to construct a specialized
network with its suppliers upstream of its operation; and with its customers and
buyers downstream.
There are 'elements' of capability within each type. For example, one of the elements of
Manufacturing Capability is 'Manufacturing Cost Control'; another element of Internal
Organisational Capability is 'Co-ordination and control of the major functions within
the company'. These are fundamental building blocks of technological capabilities, as
captured in Table 4-1.
130
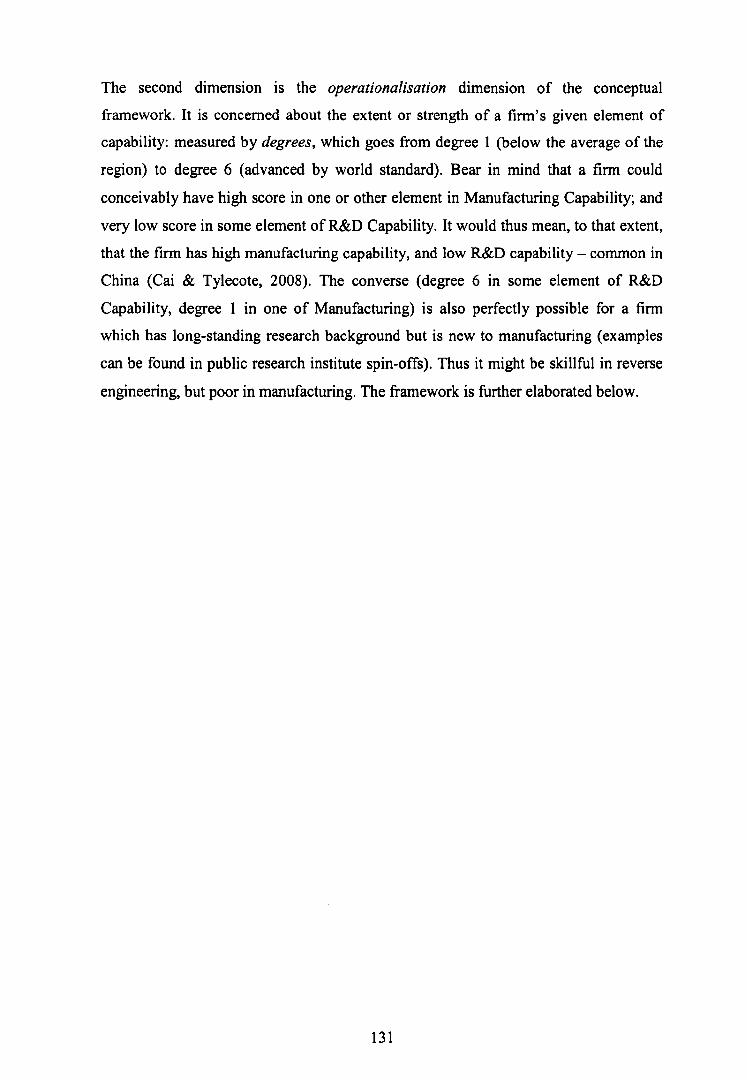
The second dimension is the operationalisation dimension of the conceptual
framework. It is concerned about the extent or strength of a firm's given element of
capability: measured by degrees, which goes from degree 1 (below the average of the
region) to degree 6 (advanced by world standard). Bear in mind that a firm could
conceivably have high score in one or other element in Manufacturing Capability; and
very low score in some element of R&D Capability. It would thus mean, to that extent,
that the firm has high manufacturing capability, and low R&D capability - common in
China (Cai & Tylecote, 2008). The converse (degree 6 in some element of R&D
Capability, degree 1 in one of Manufacturing) is also perfectly possible for a firm
which has long-standing research background but is new to manufacturing (examples
can be found in public research institute spin-offs). Thus it might be skillful in reverse
engineering, but poor in manufacturing. The framework is further elaborated below.
131
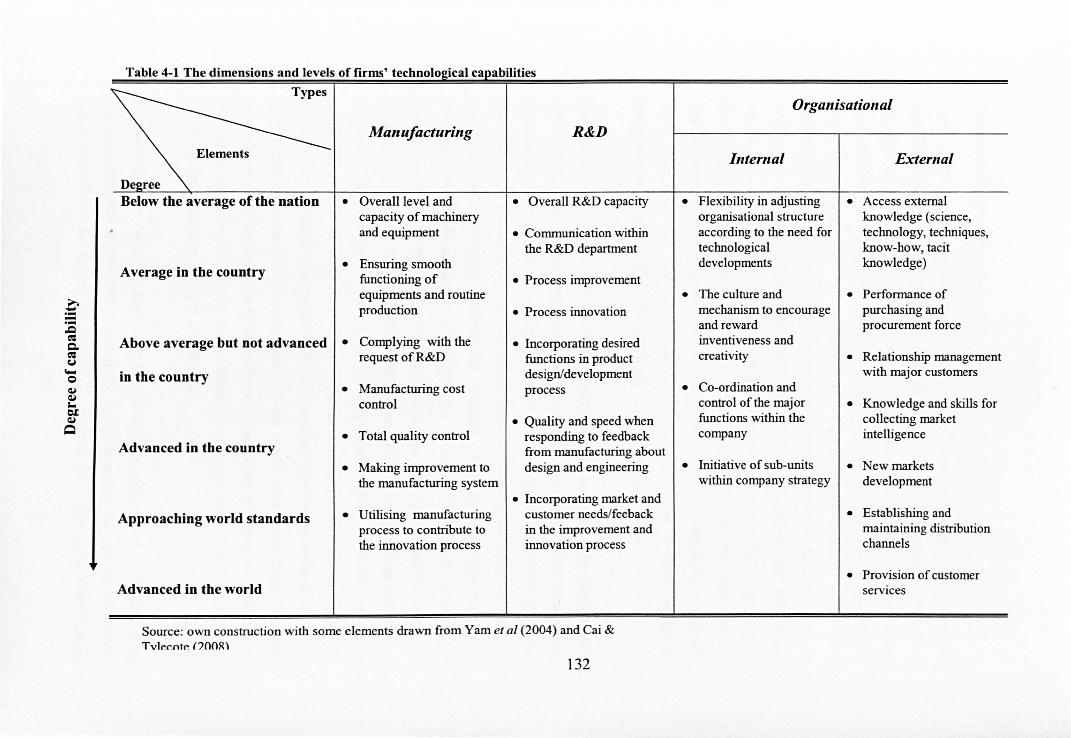
E = ~ ~ Co ~ y ... o ~ ~ -OL ~
~
.
Table 4-1 The d' - - _ .- d I ffi - h - iii . I
-- bir" - - 1; -- --
Types
Manufacturing R&D
Elements
De2ree Below the average of the nation • Overall level and • Overall R&D capacity
capacity of machinery and equipment • Communication within
the R&D department
Average in the country • Ensuring smooth functioning of • Process improvement equipments and routine production • Process innovation
Above average but not advanced • Complying with the • Incorporating desired request of R&D functions in product
in the country design/development • Manufacturing cost process
control • Quality and speed when
Advanced in the country • Total quality control responding to feedback
from manufacturing about • Making improvement to design and engineering
the manufacturing system • Incorporating market and
Approaching world standards • Utilising manufacturing customer needs/feeback process to contribute to in the improvement and the innovation process innovation process
Advanced in the world
Source: own construction with some elements drawn from Yam et at (2004) and Cai & Tvlp.l".otp. (?OOR)
l32
Organisational
Internal External
• Flexibility in adjusting • Access external organisational structure knowledge (science, according to the need for technology, techniques, technological know-how, tacit developments knowledge)
• The culture and • Performance of mechanism to encourage purchasing and and reward procurement force inventiveness and creativity • Relationship management
with major customers
• Co-ordination and control of the major • Knowledge and skills for functions within the collecting market company intelligence
• Initiative of sub-units • New markets within company strategy development
• Establishing and maintaining distribution channels
• Provision of customer services
Conceptualisation Dimensioin: Types and elements
Types. In this study, as mentioned in Chapter 2, the typology of technological
capability follows the basic notion of classification of Lall's, i.e. according to function.
An array of empirical research regarding measurement of technological capability,
have also been critically reviewed (see Chapter 2, section 2.1.2) and synthesized to
form the framework. Particularly, instead of categorising technological capability by
Product and Production as Lall did, we make a distinction between Manufacturing and
R&D capabilities. This is done with China's empirical reality in mind - that pronounced
separation between Manufacturing and R&D functions is commonplace, especially in
firms with a traditionlhistory of state-ownership (which is partly a legacy of the
planned economy; see Chapter 3, section 3.2.3). Therefore it is meaningful to measure
firms' Manufacturing and R&D capabilities separately, as a firm strong in
manufacturing might well be relatively weak in R&D, and vice versa.
The concept of Internal and External Organisational Capabilities is adapted from
Arnold & Thuraus's work (see Figure 2-1), especially their typology of Internal and
External capabilities, and the concept of organisational capabilities (OCED, 1992, see
also Chapter 2, section 2.1.2). As mentioned above, it measures the firms' capability to
coordinate and orchestrate internal and external efforts both on operational and
strategic levels. Moreover, it emphasises the intangible aspect as well as the
organisational characteristic of technological capabilities. As mentioned in Chapter 2,
Section 2.1.2, we take into consideration of the mediating effect of linkage activities on
capability development - that firms' linkage (networking) activities are partly
influential to their development of other types of capabilities. It is hence sensible to
leave out firm's specific linkage activities as elements of their organisational capability,
as this may cause multi-collinearity issues in the quantitative study stage. Therefore
when devising the elements for Organisational Capabilities, we focus on evaluation of
the firm's capability to handle relationships on the strategic level, i.e. structural
flexibility for innovation, cultural aspects, etc.
Elements used for capability evaluation have also been adapted and synthesized from
previous empirical frameworks. Particularly, we incorporate the concept of routine
based evaluation. As argued in Chapter 2, Section 2.1.1 (Dynamic Capabilities),
133
routines are good indicators of capability, and the efficiency of a certain routine reflects
the degree of this type of capability being achieved (see below for an example in a
routine in Manufacturing Capability). In this study we therefore include those routines
which are both good reflection of firms' capabilities, and are relevant to the industrial
sector.
Operationalisation Dimension: Degrees
In the second phase of empirical study (the questionnaire survey), in order to assess the
sophistication of types of capability achieved by firms, all elements under all
capabilities (Manufacturing capability, R&D capability, Internal and External
Organisational capability) are ranked from Degree 1 to 6 (degree 1 - below average in
the country; degree 2 - average in the country; degree 4 - advanced in the country,
degree 6 - advanced in the world)49. It was assumed that firms have fully developed
that element of capability when they reached 'Degree 5' The reason for using 'Degree 5'
as the threshold is that 'Degree 5' means those capabilities are approaching the worlds'
leading level. In empirical studies, an effective means to gather such information would
be through subjective comparison with peers in the same sector (see Chapter 5
Methodology for details about collection of data in this study).
By using Degrees to evaluate capability elements/routines (see top of this page), it
enabled us to apply the evaluation framework to a wide range of firms with varied
dynamism of capabilities - since the selection of routines/elements used in the survey
can indicate different Degrees of capability in different firms. For example, for the
capability ' ... to comply with the request of R&D', an element/routine of Manufacturing
Capabilities, Firm A may only have the basic ability to make to specification, hence is
at Degree 2 or below (average in the nation). In Firm B, such routine may involve
creation of new production systems or change of the current ones, and is therefore at
Degree 5 or above. It hence can be said that Firm B has acquired dynamic capability in
this element and Firm A has only acquired static capability.
49 Using a 6-scale Likert points instead of 5-scale has been proven to be effective in forestalling respondent's default choice of scale 3 (Jacoby & Matell, (1971) 'Are three-point likert scale good enough? Journal of Marketing Research, 8(4): 495-500 http://www.jstor.org/stable/3150242).Cai& Tylecote has also adapted similar scale points in their survey in the Chinese telecommunications industry (2008)
134
Reflections on the capability measures and further implications for this study
As with many other attempts to capture technological capabilities in the empirical work,
the list of elements given in Table 4-1 should be regarded as an indication rather than
definition. Its purpose was to ' ... allow respondents to identify with reasonable
precision the degree and types of capabilities they were rating in their firms' (Cai &
Tylecote, 2008, p.1798 ), and the case study and pilot survey (see Chapter 5, Section
5.3,5.4 and Chapter 6) reassured that they felt they could do this.
Another crucial element of this framework is that it also facilitates differentiation of
visibility among types of capabilities (see Chapter 2, section 2.3.3): the extent to which
the type of capabilities respond to low-visibility technological activities and
availability of finance. R&D capability and both internal and external Organisational
Capabilities are assumed to gain more from low visibility activities than high-visibility
ones (see Chapter 2, Section 3). Any such differential effect is likely to be less with
manufacturing capability. For example, the 'overall levels and capacity of machinery
and equipment' can be achieved via the purchase equipment and licenses - expensive
but highly visible (as argued in Chapter 2 Section 3). The same would not apply to
R&D capabilities, such as the capability of 'Incorporating desired functions in product
design/development process,50. There, relatively low-visibility efforts would be needed
and investment expected. Moreover, manufacturing capability should be most sensitive
to the availability of finance, organisational capabilities least.
4.1.3 Performance measurement
As discussed in Chapter 2, Section 2.1.2, we also measure the firms' technological
performance to gain a more complementary insight into their capability. We decide not
to rely entirely on financial performance measurements since Chinese firms are
normally very reluctant to reveal such sensitive data (Yam et ai, 2004). Therefore three
performance indicators - proposed by Chiesa et al.(1996) and successfully
so Weare aware that some of the activities could be outsourced, however even in such a case the firm's overall ability to coordinate and orchestrate internal and external efforts towards innovation still reflects its overall technological capability, and is also incorporated in the Organisational Capability category of this framework.
135
experimented by Yam et al (2004) - were adapted in this study, namely, innovation
performance, sales performance and product performance.
• Innovation performance is measured as 'the number of commercialized new products
expressed as a percentage of all products in the company over the last 3 years' (Yam
et ai, 2004, p.1127). It is generally accepted that the absolute number of innovations is
not a good indicator for innovation performance (DECO, 1997) as the numbers varies
significantly across sectors. On the other thand, innovation rate shows the relative
innovative strength and therefore is a better indicator. Moreover, how effective and
how efficient new product development takes place often reflects a finn's
competitiveness (Lawless & Fisher, 1990; Yam et ai, 2004).
• Sales performance is defined as 3-year average rate of average annual sales growth. It
is a good indicator of a firm's market advantage. It also shows whether the innovation
has been commercially successful (Yam et ai, 2004).
• Product performance also helps to demonstrate a firm's innovation impact on the
market. Chiesa et al.(l996) used a portfolio of elements to evaluate product
perfonnance, such as 'average concept-to-Iaunch time', 'programming product series',
'quality leve'l, 'cost',,'technology characteristics', and 'price/function advantage' (p.
121). Most dynamic technological capabilities are behind the market success of
products (Fu, 1998; Wu, 2001). In our study, eight different product related dimensions
are measured through subjective evaluations by top executives on a Likert-type scale
(see Chapter 5, Section 5.4).
136
4.2 Corporate governance/finance and technological capability development in China
As shown in Chapter 2, Section 2.3.3, the theory of the effects of corporate governance
and finance on technological capability, although originated from empirical research of
developed countries, can be adapted to NIEs. Following a thorough review of the general
technological strategy and the CGFS of Chinese firms in Chapter 3, this section further
adapts these frameworks to describe the reality of China.
As in any newly industrialising economy, domestic Chinese firms normally face the choice
between:
• Dependent technological strategy, which often involves buying state-of-the-art,
complete-sets of technology and equipment from abroad - a typical high-visibility
technological activity (see shown in Chapter 3, Section 3.1.3);
• Independent, or 'imitative' technology strategy (see also Chapter 3, Section 3.1.3),
by a deliberate and careful combination of sourcing (from abroad and domestically)
and self-reliant efforts. It is relatively cheaper, and crucially, less visible than the
first option, but will often benefit the firm's long-term technological capability
developmentS 1 •
Historical review of corporate governance in Chinese SOEs shows that (Chapter 3, Section
3.3.1), traditionally, SOE top managers progress in their career path as officials. They are
often chosen by officials, not necessarily for their entrpreneurship but political merit, and
are allocated to them with a view to rotate. The time horizon in the job is thus short, and
whilst in it there is need to quickly impress senior officials - who are takeo regular
rotations, and not likely to take a long-term interest in the firm (Cai & Tylecote, 2005).
51 Very well-funded firms connected to research institutes may have a third, very expensive option of complete self-reliance.
137
There are modifications of this situation alongside the move towards a more marketised
economy. Especially, according to Cai & Tylecote (2005), the most significant
modification happens when (fully or partial) sales of state stake take place. Although in
many SOEs key appointment are still made 'administratively' (see also Chapter 3, Section
3.3.1), i.e. directly by the state; some are now selected by the shareholders (state or not),
while the remaining adapt a middle route of recommendation or approval by the state.
Since how they started may largely determine how they progress, the distinction in
management selection method must will influence managers' behaviour and their decision
making. On the other hand, the size of the state shareholding is likely to affect the firm in
other ways. It is not hard to imagine that in the Chinese context, firms with higher state
presence would be better looked after by state finance providers, such as state-owned
banks. Cai & Tylecote argue that firms might be pursuing other financial sources when the
share of state falls below 50 % (2005; 2008). Therefore it may be useful to draw a line
between firms with 50% or more state share (Majority SOEs), and those with fewer
percentage of state shares (Minority SOEs).
Privately-owned firms (POEs) in China have a very different situation. As discussed in
Chapter 3, Sections 3.1.1 and 3.3.2, being young (since 1980) and predominantly family
owned, they have shareholders who has every intention to be full-engaged, and with deep
knowledge about their own firms. So information asymmetry does note often pose a
dominant issue for these firms. However they are often financially handicapped, with
discriminated access to finance and possibly other resources (Cai & Tylecote, 2005). As
mentioned in Chapter 3, although private sector has become much less discriminated, they
still clearly experience unequally treatment.
138
4.3 Propositions for empirical research Based on the initial review of theoretical literature and China's context, four propositions
are thus developed; each of them are operationalised for in-depth investigation in the
empirical phase of this study, which are presented in the next four chapters.
Proposition 1. For Chinese Auto and Electronics companies, different types of ownership
(e.g. MASOE, MISOE and POE) entail different patterns of corporate governance and
level of access to finance;
Proposition 2. Firms with a certain pattern of corporate governance (e.g. intelligent
engagement and inclusion) will excel (other things equal) in capability types which are
sensitive to low-visibility activities.
Proposition 3. Firms with better access to finance will excel (other things equal) in
capability types which are sensitive to high-visibility activities.
Of these 3 propositions, the 2nd and 3rd have higher weight, as they help answer the key
research question, i.e. what are the influential elements of corporate governance and
finance on a firm's technological capability; and how these elements take effect (see
Chapter 1, Research Questions).
139
Chapter 5 Research Methodology This chapter introduces research methodologies which have been used in this study.
Section 5.1 reviews the philosophical perspective underlying this research. Section 5.2
describes the two main research methods used in this study: multiple-case studies and
questionnaire survey. Section 5.3 introduces the techniques used for conducting
interviews and case studies. Section 5.4 describes how questionnaire surveys were
designed and circulated, including information about population, sample size,
administration of the pilot surveys and the final stage of large scale circulation. Section
5.5 summarises this chapter.
5. 1 Philosophical perspective All research (qualitative or quantitative) is based on some underlying assumption about
the validity of research and appropriateness of methods (De Vaus, 2002). There have
long been debates been two of the mainstream views of how research should be carried
out in social sciences. They are social constructionism and positivism.
The main thrust of positivism argues that reality is an external existence, and can only
be accessed through objective measures (Easterby-Smith et al., 2002).
Two fundamental assumptions lie beneath this statement and other propositions of
positivists: 1) Ontologically, reality exists as a piece of external, objective 'hard truth' ,
and is not influenced by human perception or interpretation. 2) Epistemologically,
knowledge can only be acquired through observations of the external reality, whilst the
observations themselves must take an equally external and objective form.
Consequently, positivists generally associate scientific research with the conventional
physics type of approach, where they tend to believe truth can only be accessible
through lab-condition experimenting, or in the case of social sciences, hypothesizing of
fundamental laws.
It has been strongly believed that positivism offers the best approach to studying and
understanding human and social behaviour, and for a long time dominated the literature.
However, a new and contrasting paradigm has come into being, and philosophers of
140
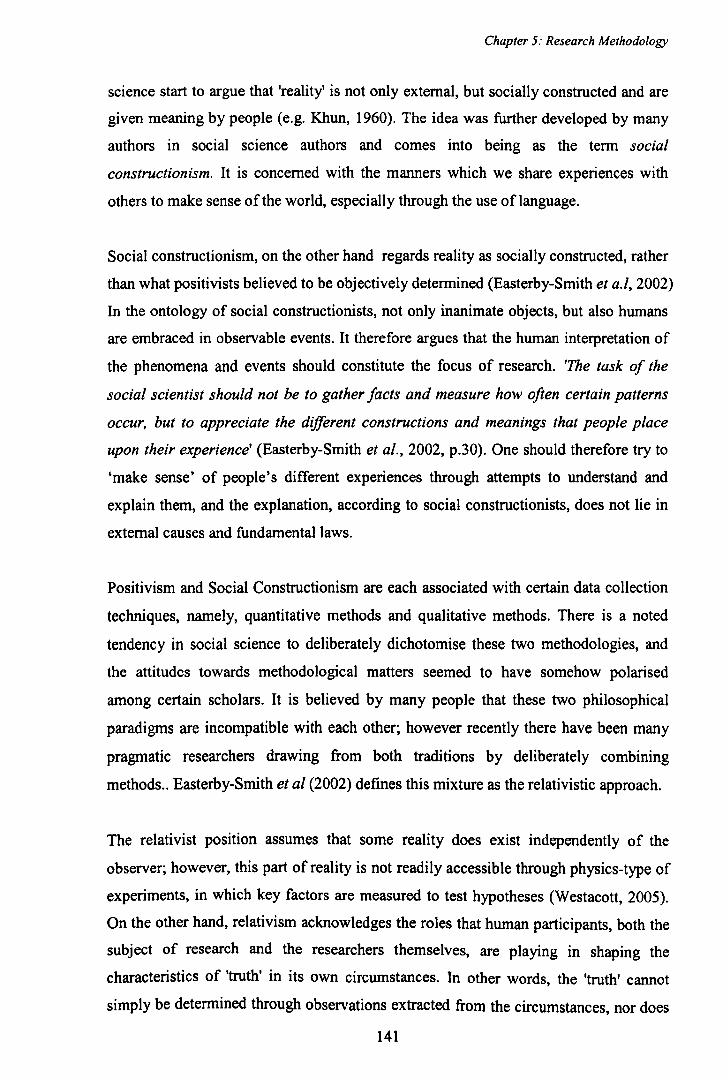
Chapter 5: Research Methodology
science start to argue that 'reality' is not only external, but socially constructed and are
given meaning by people (e.g. Khun, 1960). The idea was further developed by many
authors in social science authors and comes into being as the term social
constructionism. It is concerned with the manners which we share experiences with
others to make sense ofthe world, especially through the use oflanguage.
Social constructionism, on the other hand regards reality as socially constructed, rather
than what positivists believed to be objectively determined (Easterby-Smith et a.l, 2002)
In the ontology of social constructionists, not only inanimate objects, but also humans
are embraced in observable events. It therefore argues that the human interpretation of
the phenomena and events should constitute the focus of research. 'The task of the
social scientist should not be to gather facts and measure how often certain patterns
occur, but to appreciate the different constructions and meanings that people place
upon their experience' (Easterby-Smith et al., 2002, p.30). One should therefore try to
'make sense' of people's different experiences through attempts to understand and
explain them, and the explanation, according to social constructionists, does not lie in
external causes and fundamental laws.
Positivism and Social Constructionism are each associated with certain data collection
techniques, namely, quantitative methods and qualitative methods. There is a noted
tendency in social science to deliberately dichotomise these two methodologies, and
the attitudes towards methodological matters seemed to have somehow polarised
among certain scholars. It is believed by many people that these two philosophical
paradigms are incompatible with each other; however recently there have been many
pragmatic researchers drawing from both traditions by deliberately combining
methods .. Easterby-Smith et at (2002) defines this mixture as the relativistic approach.
The relativist position assumes that some reality does exist independently of the
observer; however, this part of reality is not readily accessible through physics-type of
experiments, in which key factors are measured to test hypotheses (Westacott, 2005).
On the other hand, relativism acknowledges the roles that human participants, both the
subject of research and the researchers themselves, are playing in shaping the
characteristics of 'truth' in its own circumstances. In other words, the 'truth' cannot
simply be determined through observations extracted from the circumstances, nor does
141
Chapter 5: Research Methodology
it merely depend on people's interpretations or predictions. Following this approach,
with its more open-ended, exploratory nature, qualitative methods are particularly
useful in the beginning of a study. Quantitative methods, on the other hand, can be
adopted to verify the reliability of the theory by testing the hypothesis .
Table 5-1 Comparison of positivism, relativism and social constructionism in management
research
Ontology : RepresentatWnalism ! i •
Relativism Nominalism i
~ -_ .......... -- ... ......". ... .. -----.. ~ : is determined through :
requires verification of : : depends on who . : consensus between :
prediction ' : establishes it. , different viewpoints :
Truth
------------~-----------------~ .---------------Facts are concrete, but cannot i depend on viewpoint : are all human
,
be accessed directly , of observer. creations , , --- ........... -.. -~ ----.. ... ----...-'- ... --- --". ~... .. - ---.. .. - ----.-.... ---.. ... ... _--- .. ~ ...... .. -----..... ~ ... --. _ ... .. -...... _ .... ... ~~--~-- . ..,. ~ .. --. -
Epistemology ; Positivism ~ . Relallvism ! Social ! ' ,
Elements of 1 I constructionism . .!!'.i!~!!l!..t!I!J!!.g!~s j~. . __ . ~ ~ _~_ ~ _~_~ __ ~_ ._ _L.... ~ ... ~~_ ~_~ Aims Discovery Exposure : Invention
Starting points Hypothesis Propositions Meanings
Designs Experiment Triangulation Reflexivity --------,-----------
Techniques ,
Measurement Survey ,
Conversation , ,
Analysis/interp Verification! , ,
retation falsification Probability Sense-making
--------,-Outcomes Causality Correlation
, Understand , , ,
Source: Easterby-Smith, Thorpe, and Jackson (2008, p. 62-63, Tables 4.4 - 4.5,) .
The relativistic approach is appropriate for this research. The ultimate goal of this study
is theory verification in relation to the effect of corporate governance and finance on
technological capability development in Chinese firms, however the theory to be
verified is insufficiently researched in the past and requires further development. In this
case a mixture of qualitative and quantitative methods is effective. As illustrated in
Figure 5-1 , both positivist and relativist approaches were utilised. In the early stage
qualitative method has been used to: 1) gain enriched insights into the issues (i.e. how
142
Chapter 5: Research Methodology
does corporate governance and finance influence technological capability development
in a developing country); 2) answer the 'why' questions relating to the observed
phenomenon (the failure of most Chinese firms and the success of a few of them and
why there are not more); and 3) further develop the proposition and generate
hypotheses (the specific effects of corporate governance and finance on technological
capability development). At the later stage, positivist methods (data collection through
questionnaire survey and parametric data analysis) have been used to evaluate the
sampled firms' technological capabilities and to test the hypothesis. A detailed
introduction to the specific methods and techniques employed will be provided in the
next section.
143
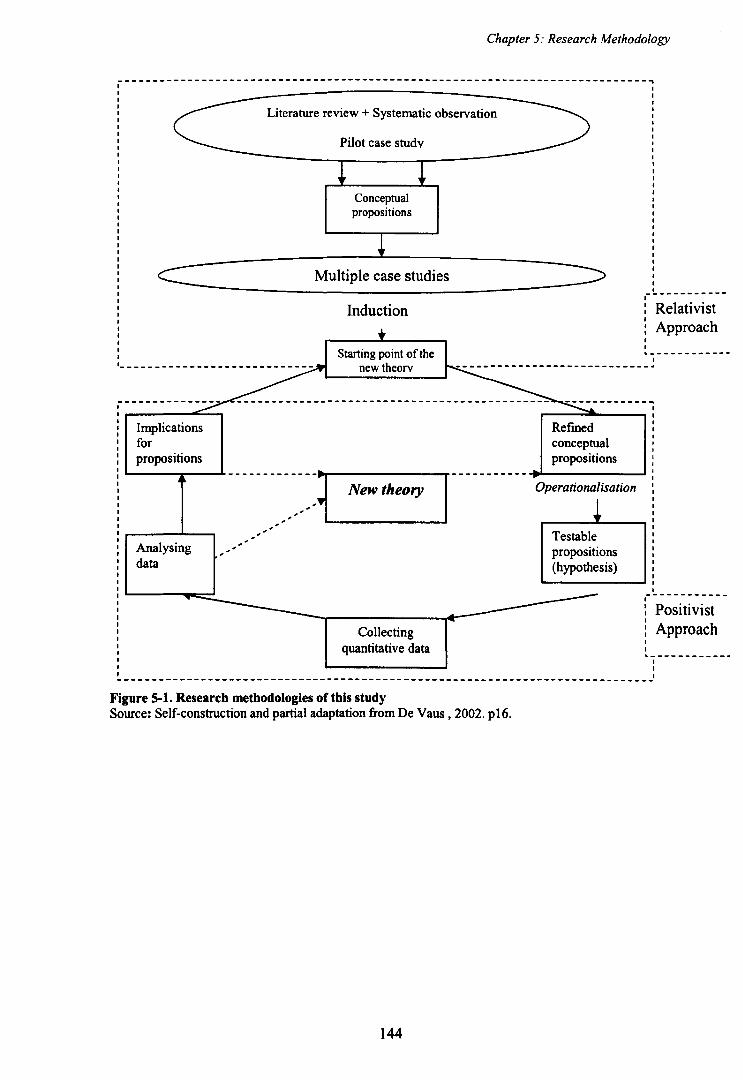
Chapter 5: Research Methodology
------------------------------------------------------ ---------------------~
Implications for propositions
Analysing data
Literature review + Systematic observation
Pilot case studv
Conceptual propositions
Multiple case studies
Induction
------: ~ .-.-. ~: :~L.._JV,_ew_t_he_o_ry_...JI-- -- -------
Collecting quantitative data
Refmed conceptual propositions
Operationalisation
~ Testable propositions (hypothesis)
, , , , , , , ,
, , , , , .L _________ _ , : Relativist , : Approach , , .. -----------,
,------------: Positivist , : Approach
______________________________________________________ ------------- ________ J
Figure 5-1. Research methodologies of this study Source: Self-construction and partial adaptation from De Vaus • 2002. p16.
144
Chapter 5: Research Methodology
5.2 Research methods in this project Main research methods used in this research are the case studies (including face-to-face
interviews and documentary data collection) and questionnaire surveys.
Case study. It is widely believed that case study is a useful method of research into
relatively new areas, especially those connected with social and organisational
development (Dyer & Wilkins, 1991; Yin, 1994). Gill and Johnson (1997) summarised
several advantages of case study: 1) it is an effective method to investigate a new topic,
since case study research does not rely on previous literature or empirical evidence; 2)
the case study can encompass a wide range of data, including documents, interviews
and observations, therefore it can provide a deepened insights into the research
objective; 3) the case study is also a preferred method of inquiring into those theories
that are concerned with the organisational planning, culture, institutional reform,
technological development, for its holistic, in-depth investigation. As our aims in this
project are to explore, explain and establish a relatively new theory (Yin, 2002;
Flyvbjerg, 2006), we therefore used multiple case-studies in the first stage to facilitate
in-depth, longitudinal examination of individual instances to gain a sharpened
understanding of the subject matter; then to decide what might become important to
look at more extensively later; and then to shape hypotheses for testing in the next
stage.
Questionnaire survey. The advantages of a questionnaire survey have several aspects: I)
it provides a widely reachable population and produces quantified and generalised
information (which is necessary for hypothesis testing in this study); 2) it enables
systematic analysis of results by using statistical methods; 3) it allows researchers to
test hypotheses through both open ended and closed ended questions, and through
multiple item scales and lor multiple questions; 4) it is well suited to make
classifications and comparisons in different categories (e.g. the comparison of different
levels of technological capabilities according to ownership types and management
selection methods in this study) (De Vaus, 2002). There are also disadvantages with a
survey method. De Vaus (2002,8-9) expressed a concern that the questionnaire survey
is too restricted, because it relies on highly structured questionnaires.
145
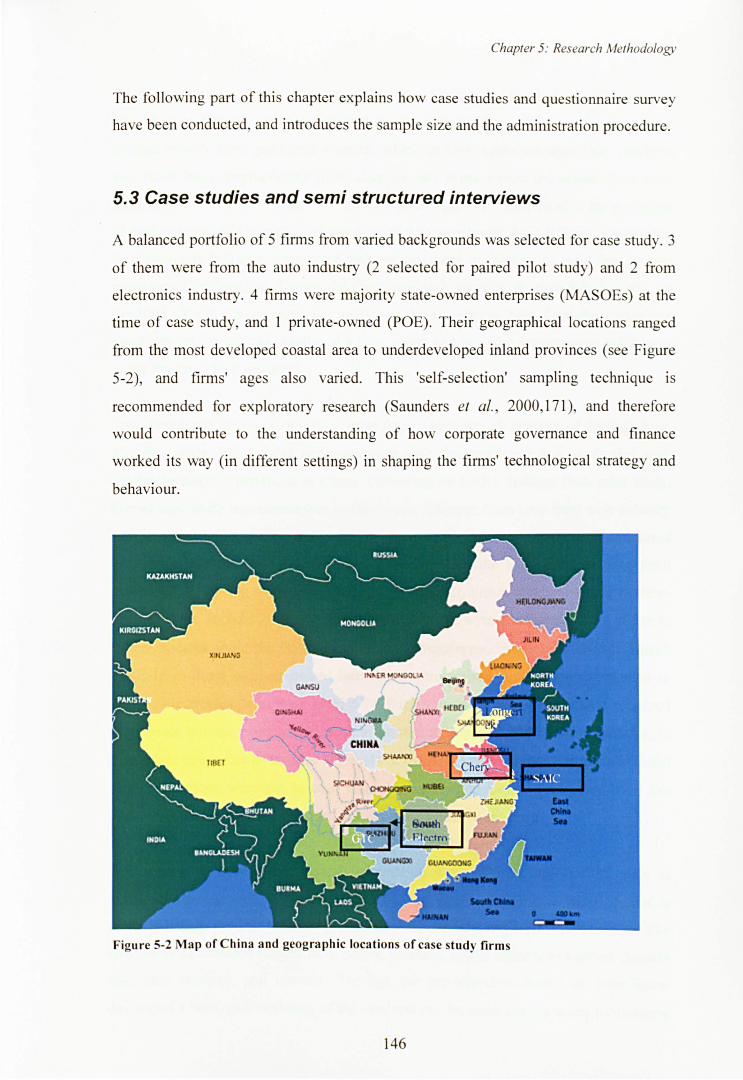
Chapter 5: Research Methodology
The following part of this chapter explains how case studies and questionnaire survey
have been conducted, and introduces the sample size and the administration procedure.
5.3 Case studies and semi structured interviews
A balanced portfolio of 5 firms from varied backgrounds was selected for case study. 3
of them were from the auto industry (2 selected for paired pilot study) and 2 from
electronics industry. 4 firms were majority state-owned enterprises (MASOEs) at the
time of case study, and I private-owned (POE). Their geographical locations ranged
from the most developed coastal area to underdeveloped inland provinces (see Figure
5-2), and firms' ages also varied. This 'self-selection' sampling technique is
recommended for exploratory research (Saunders el aI., 2000,171), and therefore
would contribute to the understanding of how corporate governance and finance
worked its way (in different settings) in shaping the firms' technological strategy and
behaviour.
Figure 5-2 Map of China and geographic location of case study firms
146
Chapter 5: Research Methodology
Pilot case studies of two state-owned firms - Shanghai Auto Industry Corporation
(SAIC), and Chery - were conducted in the auto industry. These two cases were
studied mainly from published sources, which in their cases are abundant. Analysis
was made both longitudinally (how changes take place within the organisation over
time) and laterally (how behaviour differ between the two). Specifically, the evolution
of both companies' technological capabilities was monitored; their different approaches
to capabilities building were compared and analysed in relation to their finance and
governance mechanisms. During the pilot case study three goals were fulfilled: to gain
practical experience in using the analytical framework; to help formulate interview
questions for formal case studies at a later stage; and to make necessary modifications
to the framework of research.
Semi-structured interview questions were formulated through analysis of findings from
the pilot study and through brain-storming with the supervisor and academics with
similar research experiences in China. Following on initial findings from pilot study,
formal case study was undertaken in three more Chinese firms (one from auto industry
and two from electronics industry). In June 2006, 8 face-to-face semi-structured
interviews was conducted in Guizhou Tyre Co., Ltd (the auto firm), starting from
company CEO, party secretary, to technology director, line manager and then to shop
floor workers. In June 2008 two follow-up interviews were conducted on the phone to
collect updates about the firm's most recent development. From May 2006 to March
2007, 16 in-depth semi-structured interviews were carried out in a similar manner in
the two electronics firms (see Table 5-2). Such 'top-down' interview technique helped
to generate holistic maps of the cases in limited time period and more importantly, to
triangulate key issues of interest (Tylecote & Cones a, 1999). In the interviews adjusted
sets of questions were put to each informant according to her operational role. See
Figure 5-3 for the detailed research process during case study stage.
Before each interview, background information was collected and studied, such as
historical development, evolution of shareholding structure (if the company studied is
publicly listed), product technology, and general industry and market information. The
sources of information ranged from books, journals, public reports, newspaper (mainly
electronic version), and internet. Through the pre-interview study, the interviewer
developed a brief understanding of the case and can be more precise when formulating
147
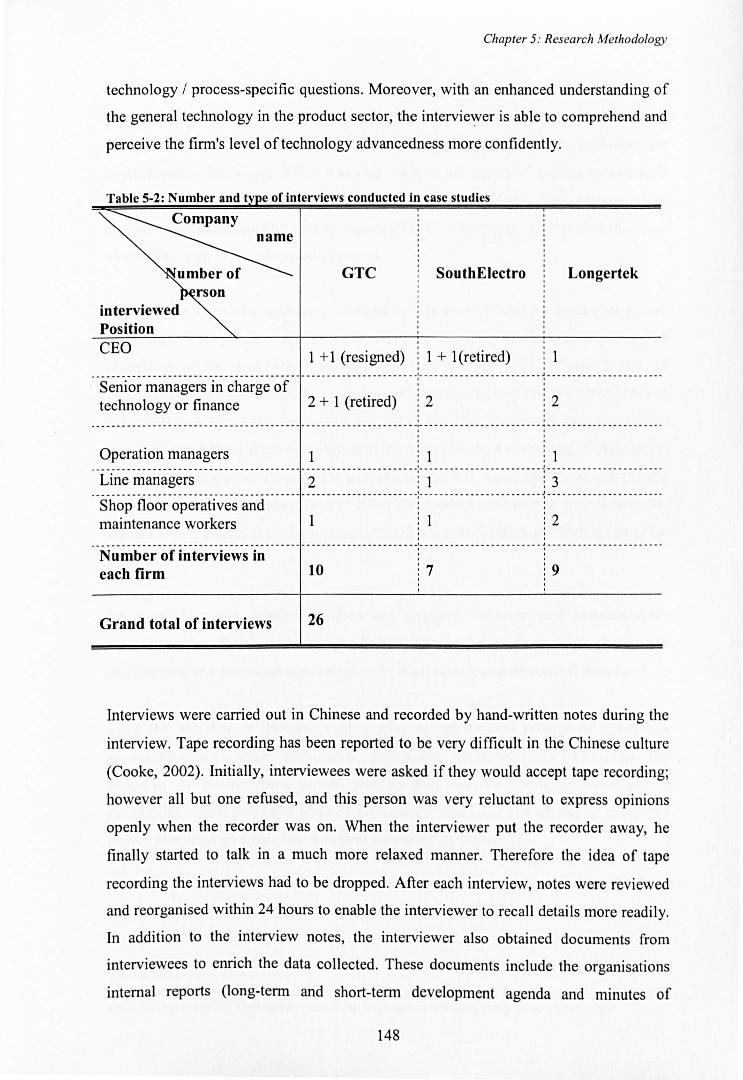
Chapter 5: Research Methodology
technology / process-specific questions. Moreover, with an enhanced understanding of
the general technology in the product sector, the intervie~er is able to comprehend and
perceive the firm's level of technology advancedness more confidently.
Table 5-2: Number and t e of interviews conducted in case studies
Company
interviewed Position CEO
name
GTe SouthElectro
1 + 1 (resigned) 1 + l(retired) ,
Longertek
------- ----- -------- --------------- - --- - -- - - -- ------------ - -----:----------- --- - ---------~--------------- ----- ---Senior managers in charge of : : technology or finance 2 + 1 (retired) i 2 i 2
, , - ---------------------------------------------------------------:------------------ - -----~------------- - ------ ---,
Operation managers 1 : 1 : 1 -- -------------- --- ---------------- ----- --- ---------------------:------------------------ i- ------- ---- ---------- -
Line managers 2 : I : 3 _. S·hop· fl~·~~· ~p~~·~if~~·s ·~~·d······· ·· ··················· . ·i· ···· ··· ·· ·············· . . .. ........ . ......... -
maintenance workers 1 i 1 : 2 , , --- - --------- - ---- ------- ------- -- - ------ -- ----- -- -------- ______ I_. __ _ •• - •••• -.----.-----~------------------ . ___ _
Number of interviews in : ' each firm 10 i 7 : 9 , , ,
Grand total of interviews 26
Interviews were carried out in Chinese and recorded by hand-written notes during the
interview. Tape recording has been reported to be very difficult in the Chinese culture
(Cooke, 2002). Initially, interviewees were asked if they would accept tape recording;
however all but one refused, and this person was very reluctant to express opinions
openly when the recorder was on. When the interviewer put the recorder away, he
finally started to talk in a much more relaxed manner. Therefore the idea of tape
recording the interviews had to be dropped. After each interview, notes were reviewed
and reorganised within 24 hours to enable the interviewer to recall details more readily.
In addition to the interview notes, the interviewer also obtained documents from
interviewees to enrich the data collected. These documents include the organisations
internal reports (long-term and short-term development agenda and minutes of
148
Chapter 5: Research Methodology
meetings), organisational structure, peer-comparison of market performance and R&D
project planning, etc. All interview reports were presented to the supervisor so that
feedback could be obtained for further improvement and as guidance for
supplementary interviews. Effort was also made to ask the chief interviewees or their
authorised representatives to review the reports (in English). The purpose is to
minimise misunderstanding and to ensure that all information collected in the case
studies has been at the informants' consent.
Face-to-face interviews were also followed by site visits, where the researcher gained
observational insights into the firm's organisational and daily routines, as they are often
reflections of its capability dynamism (Zollo & Winter, 1999; Winter, 2003). In
addition, after the interviews, the interviewees were invited to introduce some of his or
her colleagues who have previously worked in the firm. Follow-up interviews were
then made with these former employees (if possible) for their opinion on the key issues.
Such anecdotal approach reported in past accounting and management research (Lukka
& Kasanen, 1995; Hillebrand et al., 2001) has worked well in this project to cross
check answers provided by the incumbent starf2, and to clarify some findings from the
case study.
Interview data was carefully studied and analysed, together with supplementary
literature review. In Chapter 5 the key findings from pilot and formal case studies will
be described and discussed with reference to the literature and theoretical framework.
Once the analyses of the case studies were completed, the process of hypothesis
generation, questionnaire formulation, design and circulation was undertaken. The
objective of questionnaire survey was to find out the levels of technological
capabilities which had been attained by sampled firms and the effects of those key
factors identified on firm's technological capability development.
52 Such method proved useful especially when the fIrm has a hierarchical structure and the current staffs were reluctant to reveal their opinion about the corporate governance and general management.
149
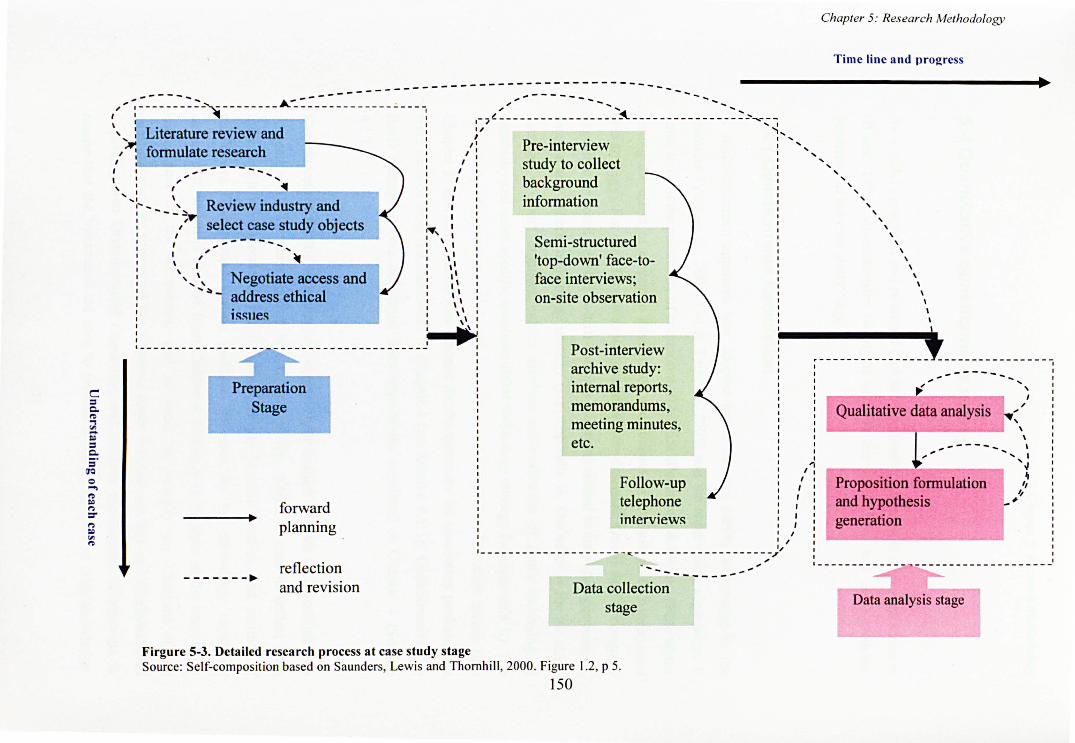
c:: = 0-t')
;;l ~ = 0-; .
IJQ c .... t') I<> n :r n I<>
'" t')
Chapter 5: Research Methodology
Time line and progress
" .. : ~ _-_ ~ ~ ___ : ~ _, __________ A __ ::: _-_ ~ ~ _-_ ~ ~:_ ~ ~ _-_ ~ - - - - - - - - - - - - - - - - - - - - - - - - - - -'" .,.--------... - .... , , , --!---------------- - ~---------------~~~---I
, I, , 1 Literature review and
fonnulate research , .-.:, , l
I , -----\ ---- - --::-----, ,I
"
, \
.. ,
,
,
--' '.-i Review industry and select case study objects , ,
, " /
, \ , , ',~
- -,. - --... ,
Negotiate access and address ethical ISSlJes
Preparation Stage
forward planning
-------~ reflection and revision
I , , ~, , , ,
\ , " " " "
I ~ .... I
'" '1,
': Pre-interview : ", , 1 ,
" 1 study to collect ", I background ~ ",
infonnation I \ " , , , , , , , , , , " \ , , \
Semi -structured 'top-down' face-toface interviews; on-site observation \ , ,
\ , M' ... Post-interview archive study: internal reports, memorandums, meeting minutes, etc.
Follow-up telephone interviews ,
/ ~
I ______ -------------- - ~--------------------~
---------Data collection
stage
,
.---------------~----------------
,'I , I I
.. , ------ , , I
Qualitative t ~~~:i~ _ r:~, " .... ',1
r-------~ ~ Proposition fonnulatio~ I ': '/ and hypothesis #
generation
Data analysis stage
Firgure 5-3. Detailed research process at case study stage Source: Self-composition based on Saunders, Lewis and Thornhill, 2000. Figure 1.2, p 5.
150
Chapter 5: Research Methodology
5.4 Quantitative questionnaire survey
As a widely practised and powerful tool for quantitative research in the social sciences
(Black, 1999), questionnaire survey is used in the research to test the hypothesis
generated in the case study stage.
5.4.1 Questionnaire formulation
A multi-informant approach was adopted based on past survey experience in the
literature (Yam et al., 2004; Cai & Tylecote, 2006) and the supervisor's suggestion. It
helps to limit the possibility of common method bias (Podsakoff & Organ, 1986) whilst
testing the effect of corporate governance and finance on technological development
(via strategy). For each firm two questionnaires were designed. One is for the company
executive or board member, which contains questions related to corporate governance,
finance and general technology strategy (see Appendix I). The other is for the R&D
manager or chief engineer, which involves self-evaluation of firm's technological
capability and more specific questions about technology strategy (see appendix II). The
main body of questionnaires for the executives were based on literature review (see
Chapter 2) and case studies (see Chapter 6); the questions for innovation performance
were derived from the framework in Chapter 4 (see Section 4.1.3). Questionnaires for
R&D managers were developed from frameworks explained in Chapter 4 (Section
4.1.1).
Questionnaires for the technological capability evaluation consists of 3 sections (see
Appendix II). The first section is company profile, which is used to collect such
information as respondent's job function, company's main product, and number of
employees. The second section includes elements for the technology capability
assessment, which is derived from Chapter 4 (Table 4-1). In light of the knowledge
background of the informants, and in order to simplify the structure of the
questionnaire, we regrouped the elements under Internal and External Organisational
Capability into Organisational Capability, and reduced the number of elements to
ensure that the informants are able to provide accurate answers to their knowledge.
151
Chapter 5: Research Methodology
Moreover, since it is not feasible to collect objective data about technological
capabilities of a large number of firms, and subjective measurements have been widely
adopted in organizational research (Powell & Micallef, 1997; Rouse & Daellenbach,
1999; Guan & Ma, 2003), we asked the R&D managers to provide their opinion about
the firms' technological capabilities. For manufacturing, R&D, and organisational
capabilities, all elements were measured on a six-point Likert-scale, where the scales
were labelled as 1 = less than average in the nation; 2 = average in the nation to 6 = advanced in the world (detailed explanations can be found in Chapter 4, Section 4.1).
The questions on innovative performance were not included in this questionnaire,
instead, we ask the CEOs to answer them in the other questionnaire. There are two
reasons for such arrangement. First it could reduce the common source bias and single
informant bias by gathering information from two groups of informants. Moreover, the
company CEOs are expected to have a more reliable overview on the firm's general
performance than the R&D managers; therefore they are in a better position to answer
performance related questions. The third section collects information about firm's
technology strategy and behaviour. The questions include internal and external links
that have been forged and their impacts on the firms' technological development; the
types of technologies that have been transferred; and the firms' reliance on certain
technological activity for technological development over the last five years.
The questionnaire for corporate governance and finance consists of four sections (see
Appendix I). The first is company profile and the firm's general and innovative
performance. Performance questions include: 1) the average annual sales growth rate
over the last 3 years; 2) the ratio of the sales revenue generated by innovative products
to that of the total revenue; and 3) evaluation of the competitiveness of products in
general. In the last question, company executives were asked to compare their main
products with the competitors' in eight dimensions: Average concept-to-Iaunch time;
Quality level; Cost advantage; Price/function ratio; Product manufacturing process;
Product technology features; Market need and growth potential; Market
competitiveness. The second section of this questionnaire collects information about
corporate governance issues, such as ownership structure, selection, evaluation and
penalties of top managers, internal power concentration, and shareholder engagement
that are proxied by evaluation of (financial) reporting. The third section is about access
to finance and project approval. Questions asked relate to sources of finance for firms'
152
Chapter 5: Research Methodology
business expansion. The last section asks questions about firm's general technology
strategy, such as the strategy for technology acquisition, proportion of expenditure on
technology-related activities with varied visibility, and factors that inhibit firms'
technological development.
Review of the supervisor's experience in collecting data in China (Cai and Tylecote,
2005) aided the design ofthe questionnaires. For example, after discussion of their past
survey experience in China, every anchor of the items on a Likert scale was
individually labelled. Moreover, explanatory texts were kept to a minimum to provide
a neat appearance and encourage response. Many versions of the questionnaires were
produced based on several meetings with the supervisor and a number of peer
researchers and industry experts in late 2006 and early 2007.
Finally, the issue of common response bias were taken into consideration. The question
of self-reporting arose with any attempt to collect and analyse data through surveys.
Several measures were used to address this. For instance, for different sets of items that
are related to each variables, we used different scales of response (5-, 6- and 7-point
Likert Scale). In the pilot questionnaire items that pertained to shareholder engagement
measures were also reversed to verify attention paid by respondents. The data validity
is also verified by comparing the firms' financial and market performance with archival
industry data (see Chapter 7, Section 7.1).
Questionnaires were first constructed in English and translated into Chinese for
circulation. The language translation of final version of the survey was verified by a
bilingual Chinese research professor in a similar area. After the translation had been
proofread as accurate and modifications have been made according to the supervisor's
and peer researchers' suggestion, the questionnaires (Chinese version) were taken to
China for pilot survey.
153
Chapter 5: Research Methodology
5.4.2 Pilot questionnaire survey
Table 5-3 Respondent firms of pilot survey
Ownership
No. of firm
Sub-sector
No. of firm
Firm location
No. of firm
Firm size
No. of firm
Majority SOE Minority SOE
4 3
Telecom
2
Guizhou
(inland)
4
Consumer TV & related
electronics
3
Guangdong
(coastal)
2
products
Sichuan
(inland)
1
Large size
full-time staff> 1 000
Medium size
500<staff<999
1 2
Private
3
Electronic
equipments
4
Qingdao
(coastal)
3
Small size
staff <499
7
The pilot questionnaire survey was first conducted in 3 electronic companies which
have participated in the case studies, and then in 7 other companies with which the first
3 had business connections - a sampling method called 'snow-balling'(Easterby-Smith
et al., 2008,218). All questionnaires at this stage were filled out in a face-to-face
manner with the researcher. Notes were carefully taken according to the respondents'
reaction - such as when they had a prolonged pause on a particular question and why.
Questions regarding ease of understanding were asked during and at the end of each
survey. All respondents were also invited to provide suggestions, such as the design of
questionnaire layout and question wording, to encourage future response. Moreover,
two questions which measure virtually the same issue were put in two different parts of
the pilot questionnaires as diagnostic questions to check if the respondents understand
the intended meaning of the questions and if they were paying enough attention to
answering them.
154
Chapter 5: Research Methodology
5.4.3 Final stage of the large-scale questionnaire survey
5.4.3.1 Questionnaire circulation
Table 5-4 Questionnaire survey for electronics industry: distribution of sample firms (total = 527)
Ownership Majority SOE Minority SOE Private firms
No. of firm 200 200 127
Sub-sector 01 02 03 04 05 06 07 08 09 10
No. of firm 88 75 57 55 55 53 46 45 40 13
Firm
location Coastal region Inland region
No. of firm 315 212
Large size Medium size Small size Firm size
full-time staff >1 000 500<staff<999 staff <499
No. of firm 115 79 333
Following the pilot study, a large-scale questionnaire survey was conducted between
March to August 2007. The target population of this research comprises 11655
domestic firms in the Chinese electronics industry. The name and contact address of
the firms were acquired through the database published in the Yearbook of Chinese
Electronics Industry 2006. We systematically sampled 527 firms according to the
following criteria: a) ownership type, we targeted firms of three ownership types:
majority SOE, minority SOE, and private firms. (b) industrial sub-sectors based on
China's National Bureau of Statistics' codes: telecommunication (coded 01), consumer
electronics (coded 02), TV& broadcasting equipments (03), computers and related
products (04), electronic equipments (05), integrated circuits & semi-conductors (06),
sealed vacuum electronic devices (07), electronic parts and components (08), electronic
material (09), and photo-electronic sectors (10); (b) 7 locations divided into two
regions: coastal region and inland region. Table 5-4 provides detailed distribution of
the sampled firms.
155
Chapter 5: Research Methodology
For each finn two letters were posted with return envelopes included: one to the CEO
and one to the R&D department c/o R&D manager. Since the objective of this research
is not only to evaluate technological capability attained by Chinese electronics finns,
but also factors in the corporate governance and financial system (CGFS) which
influence finns' capability building; we needed to collect both questionnaires from each
finn to ascertain the correlation between CGFS factors and capability development.
Therefore only if both types of questionnaires had been filled and returned, were they
regarded as a pair of valid responses. In order to tell whether the respondent belonged
to the same company, questionnaires were marked with numbers for identification. For
example, number 001 was marked for both questionnaires sent out for company A, and
number 002 was marked for company B.
During the period of circulation, postal reminders were mailed every two weeks to
encourage response. Moreover, various useful contacts were facilitated which included
fonner interviewees, friends and relatives who had had contacts with those targeted
sample finns. Personal connections turned out to be very effective to large-scale, state
owned finns (not private finns). Also, respondents were offered three alternatives to
fill out the questionnaire - either by post, or by email, or by filling out the on-line
version of questionnaire at www.surveymonkey.com. If postal mail was chosen, a
return envelope with pre-paid postage was provided and the respondent was asked to
mail his questionnaire to a local address in China. Every four weeks the collected
questionnaires were sent back to England. If email or on-line questionnaire was
chosen, the electronic questionnaire version or the web link to the on-line version will
be provided via emails. Appropriate coding was also used to differentiate respondents
from different finns.
For the final stage of the questionnaire survey, a total of 1054 (527 pairs)
questionnaires were mailed. 207 firms participated in this survey. Among them 124
had completed both types of questionnaires (one for corporate governance and finance
and one for technological capabilities and strategies) and 35 completed by email and 26
participated the online survey, the rest 22 finns had completed either type of
questionnaires. It generated a response rate of 35.1 % (185/527). 392 questionnaires had
been returned, of which 202 were for corporate governance and finance and 190 for
capabilities and strategies. The total number of qualifying sets of response is 195
156
Chapter 5: Research Methodology
including those respondents from pilot survey. If firms are grouped by type of
ownership (among 195 firms), 89 are MASOEs, 68 are MISOEs, and 38 are POEs. 21
firms have been listed on the stock market of which 18 contain more or less state share.
If grouped by size, there are 72 (37% ) large firms with more than 1000 full-time
employees, 27 (13.9%) medium firms with 500-999 employees, and 96 (49.2%) small
firms with less than 499 employees. (See Table 5-5).
157
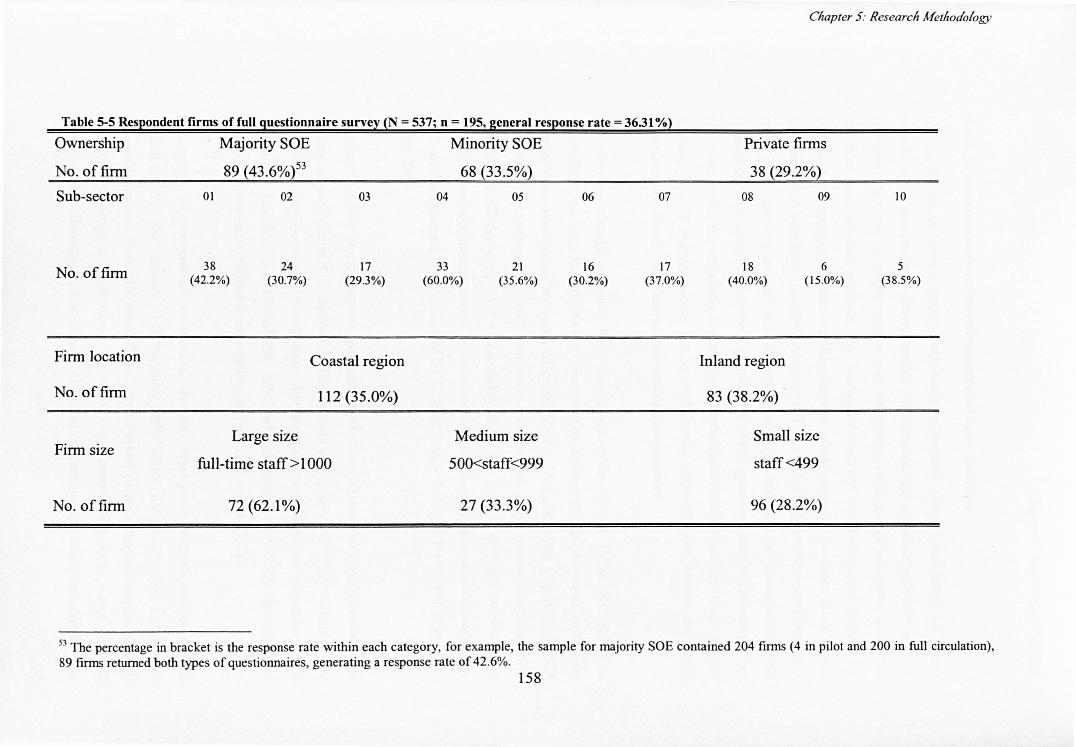
Table 5-5 Respondent firms of full questionnaire survey (N = 537; n = 195, general response rate = 36.31 %)
Ownership Majority SOE Minority SOE
No. of firm 89 (43.6%)53 68 (33 .5%)
Sub-sector
No. of firm
Firm location
No. of firm
Firm size
No. of firm
01
38 (42.2%)
02
24 (30.7%)
Large size
03
17 (29.3%)
Coastal region
112 (35.0%)
full-time staff> 1000
72 (62.1%)
04 05
33 (60.0%)
21 (35.6%)
Medium size
500<staff<999
27 (33.3%)
06
16 (30.2%)
07
17 (37.0%)
Chapter 5: Research Methodology
Private firms
38 (29.2%)
08
18 (40.0%)
Inland region
83 (38.2%)
09
6 (15.0%)
Small size
staff <499
96 (28.2%)
10
5 (38.5%)
53 The percentage in bracket is the response rate within each category, for example, the sample for majority SOE contained 204 firms (4 in pilot and 200 in full circulation), 89 firms returned both types of questionnaires, generating a response rate of 42.6%.
158
Chapter 5: Research Methodology
5.4.3.2 Questionnaire administration and data analysis
During the questionnaire survey, data was administered and put into SPSS 15, every
month. All of the returned questionnaires were printed out, coded and put into archive
for later reference. A unique number was assigned to each pair of responses so that in
the later stage of data analysis, any anomalies observed could be easily verified by
checking the original document. Respondents were required to leave their email
addresses and telephone numbers; therefore if one questionnaire was found to have
more than 3 missing answers, the respondent would be asked on the phone or by email
to answer these specific questions. 11 out of 17 such questionnaires were corrected in
this way. As for the remaining 6, reasonable discretion was taken to either treat them as
missing data (if analysis would not be significantly affected) or to discard the entire
questionnaire. Finally only one questionnaire was discarded.
In order to clearly interpret how this study evaluates the firms' technological
capabilities, we take Manufacturing Capability as an example, as shown in Table 5-6.
Survey data were sorted by types of capabilities - Manufacturing Capability, R&D
capability, and Organisational Capability (Table 5-6 only shows Manufacturing
Capability). Under each type of capability there are 4 to 8 elements which cover
various aspects of the capability. In order to assess the level of technological capability,
each of the elements were evaluated by Degree from 1 to 6 (see horizontal Degrees in
Table 5-6).
Analyses in this study measure percentage of those firms who have reached each
degree of each element of capability. The average of degrees were then calculated and
rounded to represent the overall level that the firms have reached in such type of
capability. Cronbach's a (Cronbach, 1951) was calculated to checked the elements'
internal consistency (further interpretation in Chapter 7, section 7.2).
According to the research framework, detailed descriptive analysis was conducted
which covered four aspects: 1) Firms' sales performance, innovation rates, and product
competitiveness; 2) details about firms' development of technological capabilities; 3)
Their technological endeavour, such as investment behaviour, technological
development strategies and activities; 4) Firms' corporate governance and finance (see
159
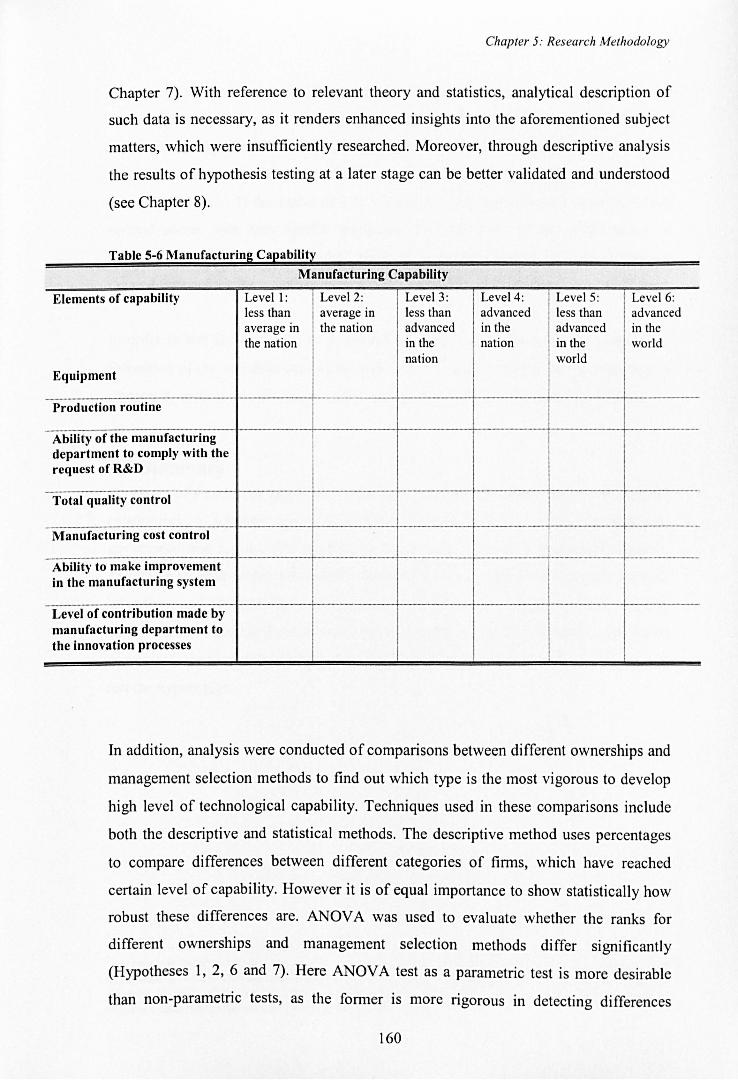
Chapter 5: Research Methodology
Chapter 7). With reference to relevant theory and statistics, analytical description of
such data is necessary, as it renders enhanced insights into the aforementioned subject
matters, which were insufficiently researched. Moreover, through descriptive analysis
the results of hypothesis testing at a later stage can be better validated and understood
(see Chapter 8).
Table 5-6 Manufacturing Capability
Manufacturing Capability
Elements of capability Levell: Level 2: Level 3: Level 4: LevelS : Level 6: less than average in less than advanced less than advanced average in the nation advanced in the advanced in the the nation in the nation in the world
nation world Equipment
•• _. __ •• M . ____ • ___ • ______ • _______ ._----- _. __ ._--- _._---_.-r-----.- --------Production routine
-AbilitY-of the manufacturing ----
department to comply with the request of R&D
--Tot-;iq~ality control ------.-._-_._-_._----. -_ .... _._-------. . -... _ .... __ ."._--._-- ---------_._- ---.... ----- -- ..
---------_ .. - ---.-.--.-- t----------- -. ---_ ...... _._-_._ ..... _. -_ .... _._._---_ .... ,,-Manufacturing cost control
--_.----_ .... _-_._-------- ._-------- _._-_ ..... _ .. _-_. __ . --. __ . __ .. _.-. -----_ .. _--. ----. __ ... _._-----_._-- ._. __ ._.-_ ... _ .. _--Ability to make improvement in the manufacturing system
----------_._---_._--_._-._-_._-_._-- -_._------ ._---_ ..... _._-- --------- ----------Level of contribution made by manufacturing department to the innovation processes
In addition, analysis were conducted of comparisons between different ownerships and
management selection methods to find out which type is the most vigorous to develop
high level of technological capability. Techniques used in these comparisons include
both the descriptive and statistical methods. The descriptive method uses percentages
to compare differences between different categories of firms, which have reached
certain level of capability. However it is of equal importance to show statistically how
robust these differences are. ANOV A was used to evaluate whether the ranks for
different ownerships and management selection methods differ significantly
(Hypotheses 1, 2, 6 and 7). Here ANOV A test as a parametric test is more desirable
than non-parametric tests, as the former is more rigorous in detecting differences
160
Chapter 5: Research Methodology
between groups - lower probability of a Type- II error54; on the other hand, it is better
than multiple T-tests in that the latter has relatively higher probability of Type-I errors,
i.e. ascribing significance to chance differences (Black, 1999). Careful checks of the
data was carried out beforehand to insure that the data meets the stringent requirements
for ANOV A tests: 1) the scales of I to 6 for measuring technological capabilities are
ordinal scores with very similar variances; 2) observation of the distributions of
capability scores were confirmed to be normal; 3) the smallest sub-group (Private
Owned Enterprise) has a sample of38 firms, which is higher than the threshold of30.
In order to test Hypotheses 3 to 5, hierarchical multiple regressions were conducted.
Definition of the variables used in the tests and the regression models are explained in
Chapter 8, section 8.1; the results of the testing are reported in Chapter 8, section 8.2.
5.5 Summary An essentially positivist approach is used in this study to evaluate firms' technological
capabilities. A relativist approach is used to identify the key factors in corporate
governance and finance which influence firms' technological development and how.
Two main research techniques used in this study are case studies (with its techniques of
interviews and archival data collection) and questionnaire surveys. Five case studies
have been conducted in the electronics and auto industries to develop seven hypotheses,
and paired questionnaire surveys have been undertaken in the electronics industry to
test the hypotheses.
54 A type -II error is also known as a fJ error, or a 'false negative': the error of failing to reject a null hypothesis when the alternative hypothesis is the true state of nature (Greene, W. (2007) Econometric Analysis (6 ed.). Upper S~ddle River: Prentice Hall.) In other words, this is the error of 'failing to observe a difference when 10 truth there is one' (Wikipedia).
161
Chapter 6 Findings from Case Study and Hypotheses Generated55
This chapter presents findings from the qualitative stage of the empirical study. Two
pilot case studies were first undertaken in the Chinese auto industry: Shanghai Auto
Industry Corporation (SAlC) and Chery. SAIC is a long-established 'favoured'
enterprise controlled on rather traditional lines. Chery is a small under-funded
latecomer that has received exceptional 'engagement' from its controlling local and
provincial government. The two firms were studied mainly from published sources,
which in their cases were abundant. Later, three more firms were studied on the basis
of semi-structured interviews with senior and middle managers, line supervisors and
shop-floor workers between June 2006 and May 2008. One of the case study firms is
from the auto sector: Guizhou Tyre Co. Ltd (MASOE), and the other two from
electronics industry: Longertek (POE), and South Electro (MASOE). GTC is a long
established state firm, relatively poorly financed, and located in one of the least
developed areas of China. From a very weak position, it managed to revive in less than
20 years and became the biggest heavy-duty tyre exporter in China. We found that in
GTC's long march to endogenous innovation, it was the low-visibility strategies
(unbundling, in progressive manner) that contributed more to its dynamic capability
building. Similarly, Longertek as a private firm excels in its niche market with
excellent shareholder (owner) engagement as well as expertise. Low-visibility
strategies which required hard work, long-term investment, staff cooperation were
evidently implemented enthusiastically and confidently. In contrast, Electro wanted a
quick-fix by joint-venturing (high-visibility strategy) and failed, lacking not only
appropriate corporate governance and finance, but also the portfolio of capabilities. It
failed again when trying to catch up.
In Section 6.1 we describe key findings from the pilot studies. The distinctive patterns
of technological capability development through 'bundling' (a typical type of high
visibility strategy) and 'unbundling' (a typical type of low-visibility strategy) emerged,
55 The three case studies in the auto industry - SAIC, Cbery and GTC, have been adapted from Liu & Tylecote (2009). Particularly, the majority of 6.1.3 and the last part of 6.2.3 (Potential problems and further insights) was written by Tylecote.
162
Chapter 6: Findings from Case Study and Hypotheses Generated
and then inspired the fonnal case studies. Sections 6.2 to 6.4 present key findings from
each of the three interview-based case studies. In particular, the three aspects of the
theoretical framework were investigated and analysed: 1) company profile and general
perfonnance (including ownership structure, technological perfonnance and product
competitiveness); 2) technological strategy and behaviour; 3) corporate governance
(including shareholder engagement, stakeholder inclusion, etc). Section 6.5 discusses
the findings from case studies with reference to the literature reviewed in Chapters 2
and 4, and generates seven hypotheses for quantitative testing at a later stage. Section
6.7 summarises the chapter.
6. 1 Pilot Case studies - SAIC and Chery
6.1.1 SAIC (Shanghai Automotive Industry Corporation)
Profile and general performance
Shanghai Automotive Industry Corporation (Group) is China's biggest auto
manufacturer both in tenns of capacity and market share (http://www.saicgroup.com).
Together with First Auto Works (FA W) and Dongfeng Motor Corporation (DMC), it is
also well-known as one of the state-favoured 'Big Three' auto manufacturers in China.
In 2007, the finn sold 2.26 million vehicles including 1.13 million passenger cars, and
achieved sales revenue of 22.6 billion USD, boasting to be one of the few Chinese
'Fortune 500s'. The history of SAiC can be traced back to 1 940s. In December 1955
Shanghai Car Plant was communi sed and renamed as 'Shanghai Internal Combustion
and Components Company' and was conglomerated and renamed again in 1996 as
'Shanghai Automotive Industry Corporation (Group)'.
163
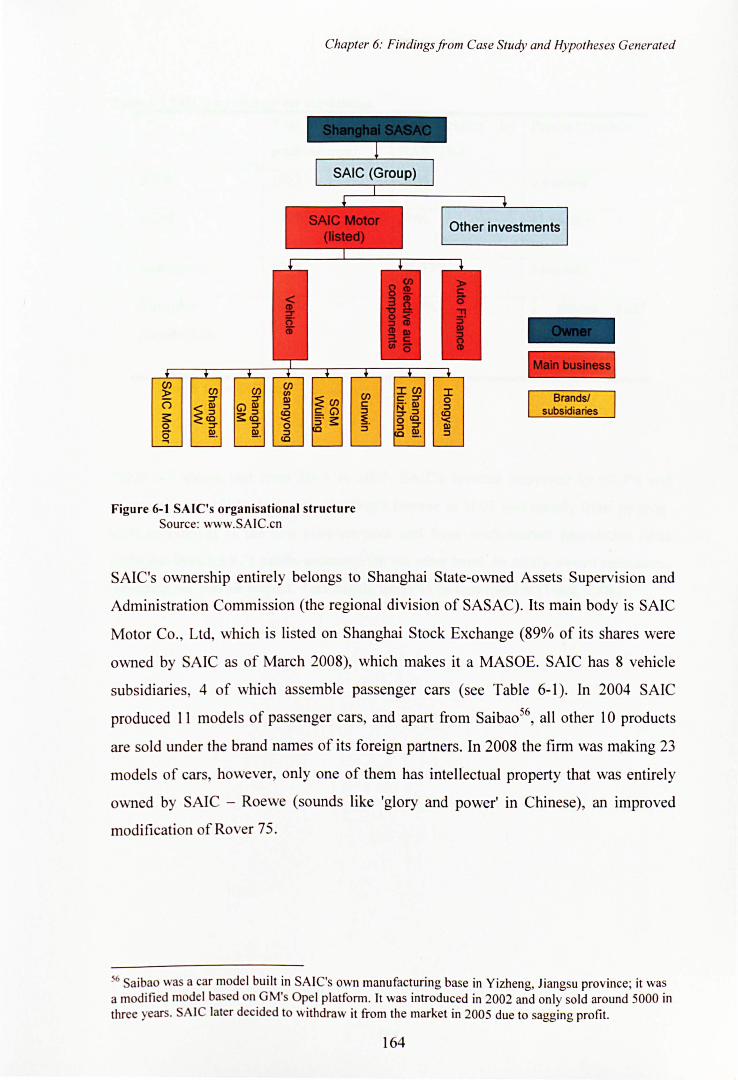
Chapter 6: Findings from Case Study and Hypotheses Generated
Figure 6-1 SAIC's organisational structure Source: www.SAIC.cn
Brands! subsidiaries
SAIC's ownership entirely belongs to Shanghai State-owned Assets Supervision and
Administration Commission (the regional division of SASAC). Its main body is SAIC
Motor Co., Ltd, which is listed on Shanghai Stock Exchange (89% of its shares were
owned by SAIC as of March 2008), which makes it a MASOE. SAIC has 8 vehicle
subsidiaries, 4 of which assemble passenger cars (see Table 6-1). ]n 2004 SAIC
produced 11 models of passenger cars, and apart from Saiba056, all other 10 products
are sold under the brand names of its foreign partners. In 2008 the firm was making 23
models of cars, however, only one of them has intellectual property that was entirely
owned by SAiC - Roewe (sounds like 'glory and power' in Chinese), an improved
modification of Rover 75.
56 Saibao was a car model built in SAIC's own manufacturing base in Yizheng, Jiangsu province; it was a modified model based on GM's Opel platform. It was introduced in 2002 and only sold around 5000 in three ears . S Ie later decided to withdraw it from the market in 2005 due to sagging profit.
164
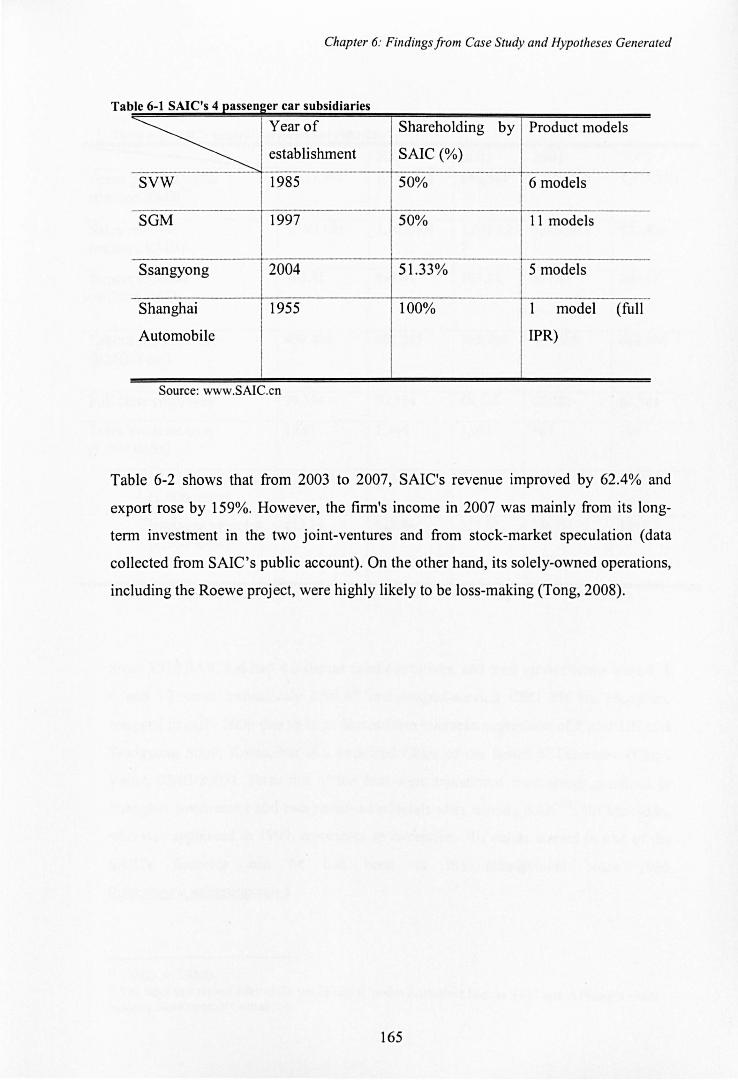
Chapter 6: Findings from Case Study and Hypotheses Generated
Tab 6 1 sAle' 4 Ie - s passen b 'd' . er car su SI lanes
~ Year of Shareholding by Product models
establishment SAle (%) ----.. -----~ "--------_._--_. -------------"
SVW 1985 50% 6 models
SGM 1997 50% 11 models
Ssangyong 2004 51.33% 5 models
Shanghai 1955 100% 1 model (full
Automobile IPR)
Source: www.SAIC.cn
Table 6-2 shows that from 2003 to 2007, SAle's revenue improved by 62.4% and
export rose by 159%. However, the firm's income in 2007 was mainly from its long
term investment in the two joint-ventures and from stock-market speculation (data
collected from SAle 's public account). On the other hand, its solely-owned operations,
including the Roewe project, were highly likely to be loss-making (Tong, 2008).
165
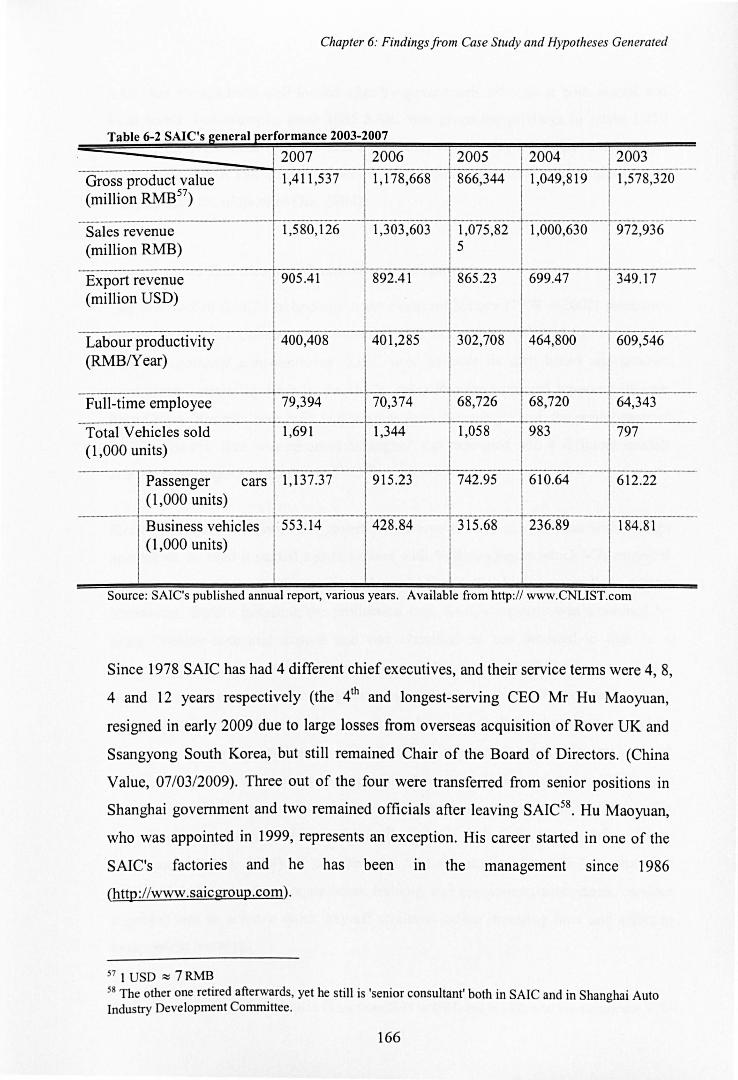
Chapter 6: Findings from Case Study and Hypotheses Generated
Table 6-2 SAle's general performance 2003-2007
2007 2006 2005 2004 2003 --
Gross product value 1,411 ,537 1,178,668 866,344 1,049,819 1,578,320
(million RMB57)
._---------- ------_. _. __ ._ .. _-----_.- r--c-.---.----Sales revenue 1,580,126 1,303,603 1,075,82 1,000,630 972,936
(million RMB) 5
-------_ .. __ ._-------_.-1----_ ... _---_._- -----------. r-::--:,-c--·-··----·· ._-------_._-1--._ .. _---
Export revenue 905.41 892.41 865.23 699.47 349.17
(million USD)
f------ ----_._- -----Labour productivity 400,408 401,285 302,708 464,800 609,546
(RMBNear)
--Full-time employee 79,394 70,374 68,726 68,720 64,343
----Total Vehicles sold 1,691 1,344 1,058 983 797 (1,000 units)
--_.
--Passenger cars 1,137.37 915 .23 742.95 610.64 612.22 (1,000 units)
f-.-.--... -------- _ ... _--_._-------_ . .. __ .. _----_._._-_ .... _--I Business vehicles --553.14---·-1~ 315.68 236.89 184.81
I (1,000 units)
Source: SAIC's published annual report, vanous years. AvaIlable from http: //www.CNLIST.com
Since 1978 SAlC has had 4 different chief executives, and their service terms were 4, 8,
4 and 12 years respectively (the 4th and longest-serving CEO Mr Hu Maoyuan,
resigned in early 2009 due to large losses from overseas acquisition of Rover UK and
Ssangyong South Korea, but still remained Chair of the Board of Directors. (China
Value, 07/03/2009). Three out of the four were transferred from senior positions in
Shanghai government and two remained officials after leaving SAIC58• Hu Maoyuan,
who was appointed in 1999, represents an exception. His career started in one of the
SAlC's factories and he has been m the management Since 1986
(http://www.saicgroup.com).
57 1 USD ~ 7RMB 58 The other one retired afterwards, yet he still is 'senior consultant' both in SAIC and in Shanghai Auto Industry Development Committee.
166
Chapter 6: Findings from Case Study and Hypotheses Generated
SAIC has always been well looked after by government officials at both central and
local levels. For example, since 1985 SAIC was given the privilege to retain 1,250
USD of the profit from each car sold by its joint venture. By 2002 this reservoir had
reached more than $50 million. However, at the same time SAIC's R&D expenditure
was less than 1 % of its sales (Jin, 2004).
Approaches to Technological Capabilities Development
The first half of SAIC's technological development history (1978 - 2002) resembles
that of most other Chinese car companies, that is, seeking technological spill-overs
from international joint-venturing. SAIC used to have its own brand and product
development capability back in the 1950s. After Russian technical support withdrew
from China, 'Phoenix' was built in Shanghai Auto Assembly Plant, the predecessor of
SAIC. 'Phoenix' later was renamed 'Shanghai' and expanded into 4 different models
and reached a capacity of 5,000 in 197559.
Since 1978, SAIC followed the government's urge to seek co-operation with foreign
companies. In 1985 it started a joint venture with Volkswagen, in which VW provided
comprehensive package of product and production technologies, as well as capital
investment. Before installing the production line, SAlC's capacity was examined by
some Chinese industrial experts and was classified as 'too outdated to use'. In a
company memorandum it read: 'the design capability was weak, the processing quality
was low, and there were not enough testing equipments; the staff were only used to
repairing and fixing tasks, and knew nothing about standardised streamline operation.
If we were to rely on ourselves for equipment improvement, it would take too long and
cost just about the same as importing ... therefore, it is highly recommended that we
import the technology as well as the key equipments... it requires some investment, but
it pays offvery quickly, and is economically feasible (italics are ours)' (Jiefang Ribao
[Liberation Daily], 2004). It can be seen that the motive for SAlC to choose a
packaged deal (technology, equipments, training, and components/subsystems, bundled
together) was to achieve quick pay-off whilst avoiding investing time and effort in
independent learning.
S9 There were only 70,000 cars built in China from 1958 to 1991, and in 1982 total production was 5,101.
167
Chapter 6: Findings from Case Study and Hypotheses Generated
In 1991 SAIC decided to cease production of its own brand 'Shanghai' and
devoted 90% of its retained profit from 'Shanghai' to the SVW Santana project. The
initial form of production in SVW was CKD (complete knocked-down) assembly with
components and parts shipped from Germany - according to the contract, without VWs
discretion SAIC cannot make adjustment to the original design ('not even a screw', Lu
& Feng, 2004). Although VW and SAIC shared equal investments in SVW, the later
was not happy to see disproportional profit distribution, especially after paying extra
for imported parts. Significant effort was hence made to develop parts and components
production capacity. In 1991 Santana became the first foreign-branded car to be
exempted from import licensing, symbolizing fully localised production. However,
after satisfactory profit margin - also thanks to the monopolistic policy - was secured6o,
little was achieved regarding independent product development. With only one major
design modification, Santana dominated SAIC's assembly lines as well as Chinese
roads until 2002, whilst production in Germany already stopped in 1993. Apart from its
two joint-venture cash cows, SAlC barely had car production in other divisions. In
1999, it purchased a loss-making plant in Yizheng city, Jiangsu province. Three years
later Saibao was launched as SAIC's first own-branded car since 1958. This model was
developed on GM's Opel platform. However, Saibao did not appeal to the market and
was short-lived; its total sale in 2003 and 2004 was 4,298, less than 10% of Chery's
best-seller QQ in 2004 alone. In 2005 its production came to an end (Daily Economic
Review, 15 Dec.2005).
From 2003, SAle started to resort to offshore acquisition. The logic underneath was
clear: blessed with cash but weak in R&D capability and bargaining power, SAIC
hoped to acquire technological competence by acquiring new organisations. The first
big target was Ssangyong, the loss-making South Korean company. In 2004 SAle
bought 48.92% of Ssanyong's shares and became its controlling shareholder. In 2005,
after giving up bidding on bankrupt Rover, SAIC paid £67 million on the technology
details and rights to all of Rover's engines and its 75, 25 series. It was hoped that the
injection of fresh blood could enhance SAIC's weak technology basis, however, as
Rover's equipments and human resources were bought by Nanjing Automobile (Group)
Corporation (NAC), another well-connected SOE, SAlC encountered difficulties in
60 7 of the 153 companies under SAle make 85% profit and 5 of them are foreign partnerships (Financial Times, 21 April 2004, p.31).
168
Chapter 6: Findings from Case Study and Hypotheses Generated
mastering its newly purchased technologies. ' ... we now have four potential sources of
technology, 1) Rover; 2) Ssangyong; 3) Ricardo in the UK (we pay them for engine
design and technological consultancy); 4) our own joint ventures, Shanghai VW and
Shanghai GM Apparently we are doing a lot better ... However we have a long way to
go in understanding and integrating Rover and Ssangyong's organisation and
technologies, plus we are still dependent on our partners in the two joint ventures for
turnkey technologies ... ' said a senior member of management (First Economic Daily,
03, Aug. 2005).
With government encouragement and support, in 2007 SAIC successfully merged with
its long-standing rival NAC. Most of NAC's operations were taken over by SAIC, and
in return the mother company of NAC, Yuejin Motor, received around 5% of SAlC's
shares. In doing so SAIC acquired the MG series sports car technology platform
(Forbes, 2007)
The effect of SAlC's serial mergers and acquisitions on its long-term success is yet to
be seen. However acquisition of organisations with desirable technology provides a
plausible alternative (considered as a 'short-cut' by rich SAIC) to capability
development. On the other hand, several challenges remain as to how to assimilate
newly acquired technology as well as to integrate new organisations. These issues are
particularly profound when acquiring foreign firms with distinctive cultural differences
- in year 2006 and 2008, strikes in Ssangyong have already cost SAIC billions
(Jinghua Ribao [Jinghua Daily], 25109/2006; China Value, 07/03/2009), which has
directly caused the CEO Hu Maoyuan's resignation. Even in the domestic environment,
the MG project division in NAC has also expressed disappointment over the merger
and threatened to resist the takeover through 'non-cooperation' (Li, 2007).
169
Chapter 6: Findings from Case Study and Hypotheses Generated
6.1.2 Chery Automobile Co., Ltd
Profile and general performance
Chery Automobile Co., Ltd. came into being in 1997, with an initial capital of RMB
1.752 billion channelled from five local state-owned investment companies61 (Chery
website, accessed in 2008). Plant construction commenced on March 1997 in Wuhu, a
medium sized city in the landlocked province of Anhui. The first car was produced on
December 18, 1999. This represents a mile stone in Chinese car manufacturing history
because it was the first car produced by a purely Chinese owned and managed
company (Chery website: http://www.cheryglobal.com/about_chery.jsp). Though small
in size, short in history and simple in structure, Chery has caught the nation by surprise
- it developed its first 2 models of cars in just 8 months, less than 2 years after its
establishment; it is the first Chinese car makers to export branded cars and the first to
build cars overseas with own IPR62. Shortly after the launch of 4 new models in 2006
and China's first full-IP passenger car engine, it became the biggest car exporter based
in China, with highest sales growth in 2006 and the first Chinese domestic passenger
car brand to have sold 300,000 units in a year in 2007. In the same year one of its
models became the best seller on Chinese market; meanwhile Chery's domestic market
share growth also surpassed all of its competitors - foreign or domestic. According to
the statistics of International Organization of Motor Vehicle Manufacturers, in 2006,
Chery has become the world's fastest growing car manufacturer at the rate of 65.62%
(http://oica.net/wp-content/uploads/2007/07/chery.pdf).
The foundation of Chery was however dramatic. The relatively remote city of Wuhu
was a latecomer to the fast-growing market economy. In desperate search of growth
potential, the local officials were fascinated by the lucrative business of auto parts
production. Despite the strict entry control by the central government, they decided to
build their own car company. In 1998, local officials bypassed the regulations and
recruited Yin Tongyao, a rising star in one of the VW joint ventures as a well trained
engineer (Hessler, 2005). Yin became vice-president of Chery and has been in effective
61 According to Lu and Feng (2004), this figure was an exaggeration to meet the scale threshold set up bl the National Committee of Development and Reform. 6 In 2003 Chery signed a contract with Iran to build a plant there, assembling CKDs with Chery's brand name.
170
Chapter 6: Findings from Case Study and Hypotheses Generated
charge since then - a total of 12 years by 2009. Chery received whole-hearted support
by Anhui and Wuhu government. National regulations forbade new entries, so the
officials named the enterprise 'automotive components' company. When Chery built its
first car, VW was furious due to the apparent imitation, so was the central government
(Hessler, 2005). Yet when authority has become decentralized during the reform erea
in China, an ancient tactic prevailed - Xianzhan Houzou (act first, and then ask for
forgiveness) (Hessler, 2005). After more than a year's negotiation between Wuhu and
the central government, finally a compromise was made: by giving out 20% of its
shares, Chery became affiliated to SAlC. In so doing it obtained the necessary licenses
to manufacture cars and to establish a sales network. However, SAIC in this deal
pictured its role as lenient rather than strategic, it made clear in the memorandum that
SAIC's relation with Chery does not involve investment, management, debt, or
dividend. SAlC realised its mistake afterwards; however, their marriage stopped
shortly after Chery won favour with high state officials, leaving settlement of the 20%
share a rumour (Jin, 2004).
Approaches to Technological Capabilities Development
Chery's strategy can be summarised as technological unbundling - acquiring the
capability to produce each component and sub-system. and system. separately. and
indeed at the extreme involves separate acquisition of each element (machinery from
one supplier. trainingfrom another. blueprints from a third).
A glimpse of Chery'S initial attempts to build its own engines and cars can be found in
Hessler (2005), where modest, yet extensive unbundling was evident: • ... first
manufacturing equipment from an outdated Ford engine factory in England and
moved ... to Wuhu (italics are ours)' .... 'manufacturing blueprints ... from a struggling
Ford subsidiary in Spain' ... - all were inexpensive alternatives to flashy new imports,
and obviously the Chery people were not shy of sourcing what suited them from across
the world.,. The first Chery-made engine was built in secret in May of 1999, followed
by the first Chery-made car merely seven months later. It used parts from suppliers
supposed to be exclusive to VW (Hessler, 2005). 2000 cars named 'Fengyun' were
made that year. Since Chery did not have the license to produce or sell assembled cars,
171
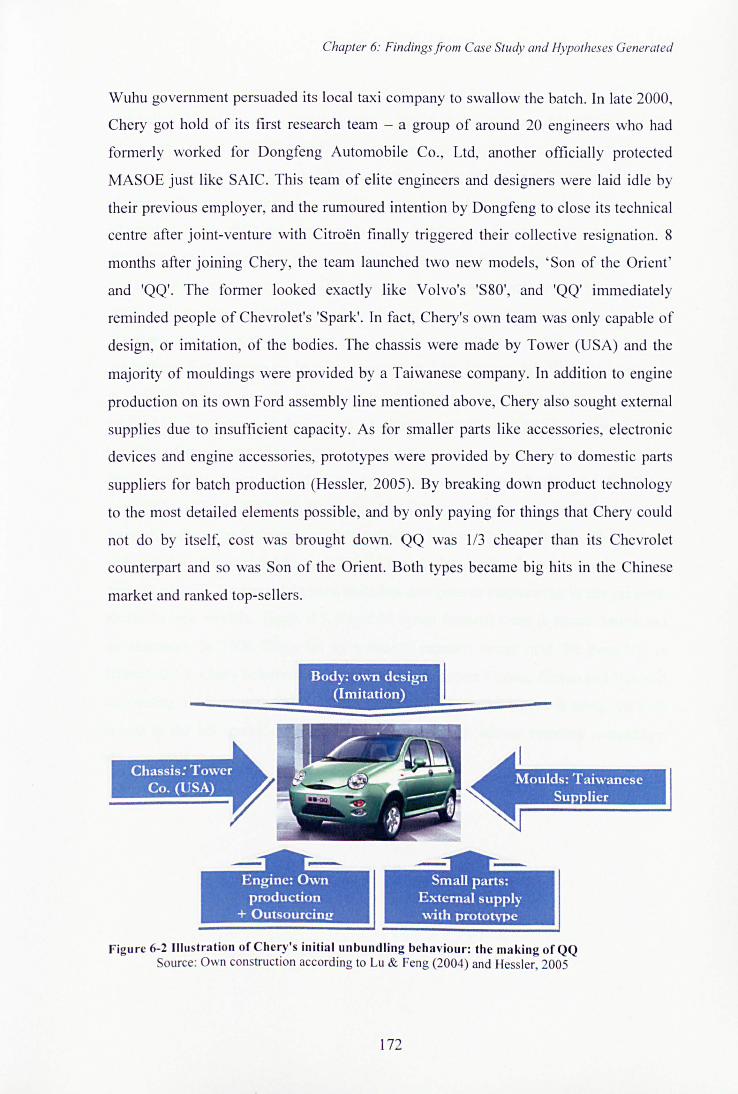
Chapter 6: Findings from Case Study and Hypotheses Generated
Wuhu government persuaded its local taxi company to swallow the batch. In late 2000,
Chery got hold of its first research team - a group of around 20 engineers who had
formerly worked for Dongfeng Automobile Co., Ltd, another officially protected
MASOE just like SAle. This team of elite engineers and designers were laid idle by
their previous employer, and the rumoured intention by Dongfeng to close its technical
centre after joint-venture with Citroen finally triggered their collective resignation. 8
months after joining Chery, the team launched two new models, 'Son of the Orient'
and 'QQ'. The former looked exactly like Volvo's 'S80', and 'QQ' immediately
reminded people of Chevrolet's 'Spark' . In fact, Chery's own team was only capable of
design, or imitation, of the bodies. The chassis were made by Tower (USA) and the
majority of mouldings were provided by a Taiwanese company. In addition to engine
production on its own Ford assembly line mentioned above, Chery also sought external
supplies due to insufficient capacity. As for smaller parts like accessories, electronic
devices and engine accessories, prototypes were provided by Chery to domestic parts
suppliers for batch production (Hessler, 2005). By breaking down product technology
to the most detailed elements possible, and by only paying for things that Chery could
not do by itself, cost was brought down. QQ was 113 cheaper than its Chevrolet
counterpart and so was Son of the Orient. Both types became big hits in the Chinese
market and ranked top-sellers.
Figure 6-2 Illustration of Chery's initial unbundling behaviour: the making of QQ Source: Own construction according to Lu & Feng (2004) and Hessler, 2005
172
Chapter 6: Findings from Case Study and Hypotheses Generated
After winning the first buckle of gold, Chery started investing heavily in R&D and
technological training. It is spending 10%-15% of its revenue on R&D (Chery website
March 06), and from 2000 to 2005 its research and technical team expanded 40 times
into 11 departments with over 800 members. On the other hand, Chery also worked
closely with foreign companies to cultivate its technological capabilities. However it
adopted a much different strategy in cross-border collaboration than most of its
domestic peers. Rather than going to multinational competitors (car manufacturers) for
turn-key plants or offering them OEM (own equipment manufacturing), Chery chose to
work with up-stream players who had aligned interest in its own success and were
therefore much more motivated to transfer their technology and skills than did those
car makers. For example, in its cooperation with AVL (the world's 4th engine designer
in Austria), it took over the responsibility of initiating ideas and setting up standards,
while AVL specialised in design and coaching/mentoring of Chery's engineers. 'The
baseline of our cooperation is that, we can ask any question regarding the technical
details of their design, and that we can send our staff to observe and finally to
participate.' (Wang, 2002: 29). More than 100 Chery engineers went to A VL to receive
training, some other 900 were sent to other countries over the past decade. The strategy
of learning by training and doing enabled Chery to develop the first China-made engine
with its own IP. Compared to pure imitation and reverse engineering in the previous
phase, its new models, Tiggo, AS, F and M series featured more in-house design and
development. In 2006 Chery set up a branch research centre near the Ford HQ in
Detroit, USA. Chery believes that, just like its forerunners Toyota, Nissan and Hyundai,
conducting R&D at the world's Mecca of automobile technology will bring not only
access to the US market but also a crucial edge in the human resource competition
(Zhang, 2006).
173
Chapter 6: Findings from Case Study and Hypotheses Generated
6.1.3 Discussion of pilot case studies83
SAlC's technological development (the first half) and that of Chery are manifestations
of two contrasting approaches, i.e. bundling and unbundling. In SAlC's joint-venturing
with VW and GM, components, key parts and sub-systems (brakes, engines, etc) were
provided either by the foreign companies or by their designated (and also foreign)
suppliers; while many of the process and product technologies were covered by patents
or other forms of IP protection, licenses were granted. In order to guarantee adoption
and implementation of newly introduced technologies, blueprints for production
methods were provided, along with training. Whenever there was a problem, there was
always on-site technical support from the technology provider. All of the above forms
a typical full technology bundle. (In the initial stage of the VW-SAIC deal, the
bundling activity even took a more extreme manner - a 'turnkey' plant, in which VW
took responsibility even for putting the equipment together on site.
The advantage of bundling from the technology seller's point of view is clear: the seller
keeps control. The main advantage from the buyer's point of view is speed and
simplicity: there is one bundle, one deal, one provider who (presumably) knows how
everything fits together and can quickly make sure it all works, as long as local
conditions do not get in the way. It can easily be seen that the speed and simplicity of a
bundle are of particular value for the typical Chinese SOE top manager. As shown in
Table 6-3, SAIC's CEOs, at least the first three, were functioning in a setting that
featured governance with typical Chinese characteristics: 1) All of the first three CEOS
were parachuted into the organisation, knowing little about the company, or even the
industry, they therefore had very limited industrial expertise to understand what would
be most beneficial for the firm's long-term technological competence. 2) With limited
time in position (maximum 8 years) and short-termist performance pressure, these
managers needed to deliver quickly - and bundled deals in this case did provide quick
fix: the 'disengaged' monitoring officials were shown and pleased with quick results, in
terms of technology: new products, new equipment, and new processes. The new
products showed quick results too in terms of market share. The bundle also delivered
quick profits: the main up-front payment was for equipment, and that would be shown
63 This part is written by Tylecote, which is published as Liu & Tylecote (2009)
174
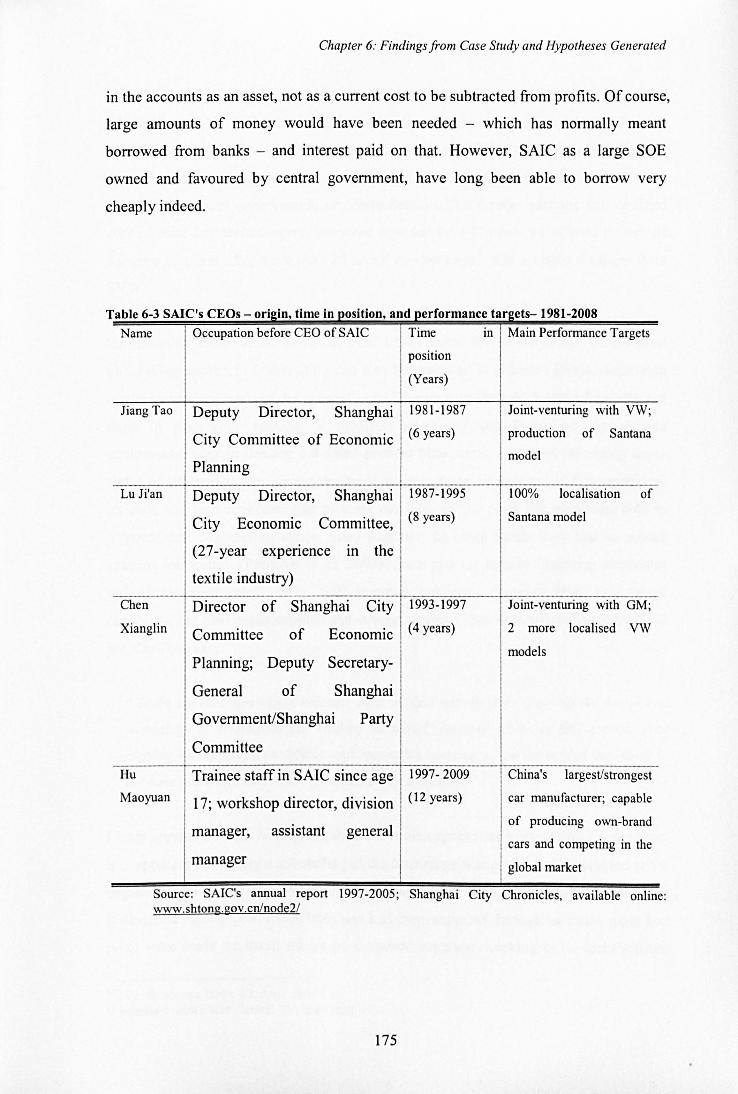
Chapter 6: Findings from Case Study and Hypotheses Generated
in the accounts as an asset, not as a current cost to be subtracted from profits. Of course,
large amounts of money would have been needed - which has normally meant
borrowed from banks - and interest paid on that. However, SAIC as a large SOE
owned and favoured by central government, have long been able to borrow very
cheaply indeed.
Table 6-3 SAle's CEOs - OrJ21O, time 10 posItion, and performance ar2ets-1981-2008
Name Occupation before CEO of SAIC Time m Main Performance Targets
position
(Years)
Joint-venturing with VW;
production of Santana
model Planning
Jiang Tao Deputy Director, Shanghai 1981-1987
I City Committee of Economic (6 Y'"")
----.------- 1-------------------Lu Ji'an Deputy Director, Shanghai 1987-1995 100% localisation of
City Economic Committee, (8 years)
(27-year expenence m the
textile industry)
Committee of Economic (4 years)
Planning; Deputy Secretary-
General of Shanghai
Government/Shanghai Party
Committee
Santana model
-------4-------------------------~---------.-.----~----------------Trainee staff in sAle since age 1997- 2009 China's Hu
Maoyuan 17; workshop director, division (12 years)
manager, assistant general
manager
largest/strongest
car manufacturer; capable
of producing own-brand
cars and competing in the
global market
Source: SAIC's annual report 1997-2005; Shanghai City Chronicles, available online: www.shtong.gov.cn/node2/
175
Chapter 6: Findings from Case Study and Hypotheses Generated
What was gained in terms of technological capability, then? By the end of its first stage
of bundling, SAIC had achieved full localisation of imported car models and leading
production capacity (mostly static manufacturing capabilities), however, due to lack of
dynamic R&D and organisational capabilities, it still had to rely heavily on foreign
partners for model improvement or diversification. The foreign partners still retained
control over key technologies: 'we were rejected by VW when we offered to buy its
Santana platform after more than 20 years' co-operation', said a senior manager from
svwM.
On the other hand, as an untypical SOE Chery opted for an untypical, independent
unbundling approach. Unbundling can also be practised at different levels, depending
on the technology basis of the unbundler. In Chery's case the initial unbundling was not
done in glamorous fashion; it involved scrubbing and fixing of second-hand
equipments: bargain-hunting out-dated product blue-prints, and even infringing copy
rights of car models, etc. However Chery did gain from the process of decomposition.
Its staff and technical team had to work out how all the parts and elements, both in
physical and engineering terms, fitted together. In other words they had to master
systems integration (Prencipe et aI, 2003). Such process requires learning endeavour
and if managed intelligently, will improve not only manufacturing and design
capability, but also organisational and strategic capabilities. Just as confirmed by CEO
Mr Yin Tongyao:
'Maybe the outsiders would consider what we had initially done (copying the design and
technology of established car models) as trivial, however when we first started, even
copying had appeared so difficult and impossible to manage ... yet we worked our hands to
the bone and did it, and went beyond the initial imitation ... ,65
Chery pressed on after having acquired the basic capabilities to assemble a copied car.
It is apparent that Chery's unbundling at the later stage was planned and executed at the
organisational and strategic level, and had much higher in-house technological content:
It designed its new production lines and had them supplied through auctions; more key
parts were made by itself, others by domestic suppliers working to its specification;
64 First Economic Daily, 03, Aug. 2005 65 Interview with China Central TV. July 2005
176
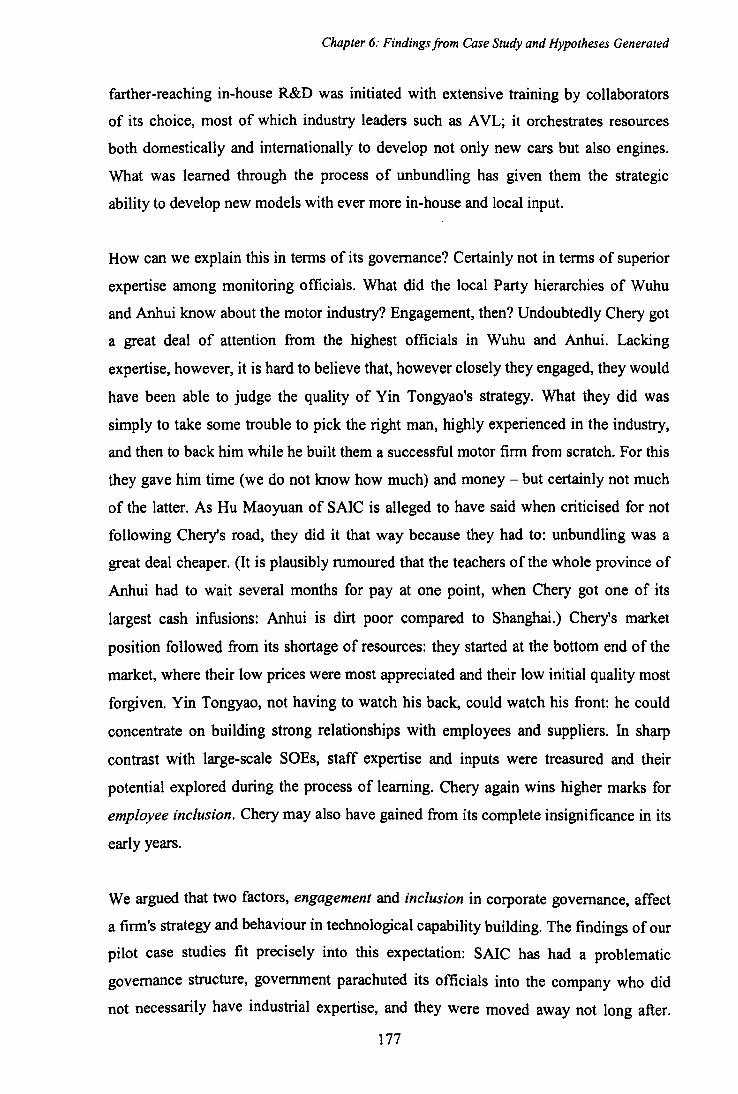
Chapter 6: Findings from Case Study and Hypotheses Generated
farther-reaching in-house R&D was initiated with extensive training by collaborators
of its choice, most of which industry leaders such as A VL; it orchestrates resources
both domestically and internationally to develop not only new cars but also engines.
What was learned through the process of unbundling has given them the strategic
ability to develop new models with ever more in-house and local input.
How can we explain this in terms of its governance? Certainly not in terms of superior
expertise among monitoring officials. What did the local Party hierarchies of Wuhu
and Anhui know about the motor industry? Engagement, then? Undoubtedly Chery got
a great deal of attention from the highest officials in Wuhu and Anhui. Lacking
expertise, however, it is hard to believe that, however closely they engaged, they would
have been able to judge the quality of Yin Tongyao's strategy. What they did was
simply to take some trouble to pick the right man, highly experienced in the industry,
and then to back him while he built them a successful motor firm from scratch. For this
they gave him time (we do not know how much) and money - but certainly not much
of the latter. As Hu Maoyuan of SAIC is alleged to have said when criticised for not
following Chery's road, they did it that way because they had to: unbundling was a
great deal cheaper. (It is plausibly rumoured that the teachers of the whole province of
Anhui had to wait several months for pay at one point, when Chery got one of its
largest cash infusions: Anhui is dirt poor compared to Shanghai.) Chery'S market
position followed from its shortage of resources: they started at the bottom end of the
market, where their low prices were most appreciated and their low initial quality most
forgiven. Yin Tongyao, not having to watch his back, could watch his front: he could
concentrate on building strong relationships with employees and suppliers. In sharp
contrast with large-scale SOEs, staff expertise and inputs were treasured and their
potential explored during the process of learning. Chery again wins higher marks for
employee inclusion. Chery may also have gained from its complete insignificance in its
early years.
We argued that two factors, engagement and inclusion in corporate governance, affect
a firm's strategy and behaviour in technological capability building. The findings of our
pilot case studies fit precisely into this expectation: SAlC has had a problematic
governance structure, government parachuted its officials into the company who did
not necessarily have industrial expertise, and they were moved away not long after.
177
Chapter 6: Findings from Case Study and Hypotheses Generated
Managers came to their posts with assigned tasks, either to increase capacity or to
enhance profit; anyway, both are quantitative, highly visible and easy to measure.
Remember that they did not have much time nor did they have sufficient knowledge,
hence it was sensible for them to choose bundled technologies which come from
multinational partners - these are easy to understand, readily available, and fast in
effect. Now threatened by competitors such as Chery, and having a CEO who came up
from within the organisation and who has the potential to stay, SAIC started to try to
fight its way out. Its advantage is that it need not worry much about its budget;
therefore it is able to buy not only technologies but also organisations that own the
technologies. It is too soon to say whether it will succeed, but at least this offers an
alternative to its previous practices. On the other hand, Chery benefited from better
practice. The CEO is highly experienced in the auto industry, and his aspiration level
comes from higher autonomy and longer service term, which determines his strategy of
technological unbundling. Such a process is more novel and low in visibility but
proved rewarding and sustainable. Moreover, in sharp contrast with large-scale SOEs,
staff expertise and inputs were treasured and their potential explored during the process
of learning. Chery again wins higher marks for employee inclusion. All these
contribute to its fast growth in capabilities.
Chery's current success also has implications for SAIC. As a large enterprise with
strength in finance and the capacity to produce against high standards, SAIC can
experiment with unbundling and can do so from an advanced starting point.
178
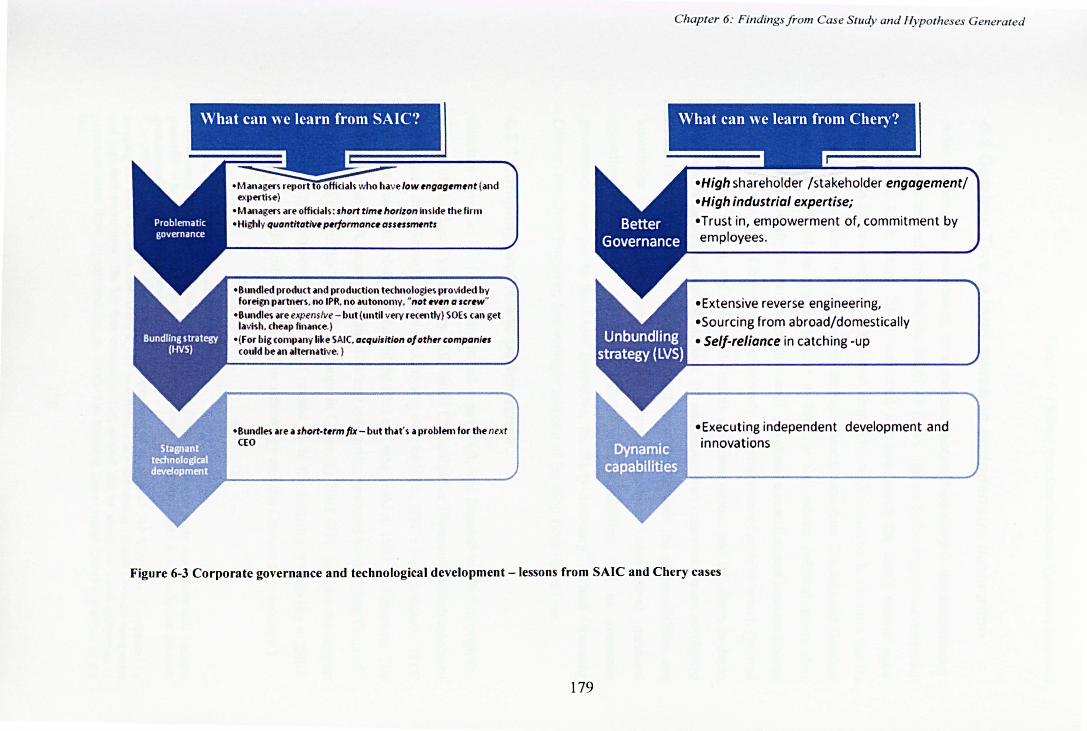
- Managers re,lorttoOfficiah who have low ~ngag~m~nt (and expertise)
-MMlagers "re offici"ls: short tlm~ horizon inside the firm - Highly quantitatlll~ p"formanc~ aSfn~nts
-Bundled produ<t and production technologl~ pro\.ided by foreign putners. no IPR. no ilutonolllY. "not ~~n a scr_" -B'"ldl~ are expensive - but (until very recently) SOEs can get lavish. cheap finance.)
- (For big company like SAIC. acquisition oloth~r companln (ould be.n iIlternatlve. )
-Bundles are II short·t~'m /1)(- but that's II problem for the ntxt CEO
Chapter 6: Findings f rom Case Study and Hypotheses Generated
What can we learn fr
-High shareholder /stakeholder engagement/ -High industrial expertise; -Trust in, empowerment of, commitment by employees.
-Extensive reverse engineering, -Sourcing from abroad/domestically
- Self-reliance in catching -up
-Executing independent development and innovations
Figure 6-3 Corporate governance and technological development -lessons from SAIC and Chery cases
179
Chapter 6: Findings from Case Study and Hypotheses Generated
6.2 Guizhou Tyre: a long march to endogenous innovation
After the two pilot case studies, we conducted another case study in the auto industry.
We wanted to find out, with the effect of firm's age on technological development
(Audretsch, 1995; Toby, 2000) controlled for, how much the firm's technological
strategy and hence development has been shaped by its governance. In the pilot studies
it has not been possible to pursue this through second-hand data. We selected Guizhou
Tyre Co., Ltd, whose age is similar to SAIC's; and whose political status (less
favoured/noticed by the central government), governance practice, and location (inland
China) are similar to Chery. In this case study a combination of archive search (journal
articles, news reports, and official statistics), site observations and top-down in-depth
interviews was adopted to collect data. 10 semi-structured interviews were conducted
in the firm and interviewees were selected according to their job responsibilities and
knowledge of different aspects of the research question. Longitudinal questions
regarding evolution of the firm's technological capabilities and its corporate
governance were put to the Chief Executive, the Party Secretary66/ Chief Operating
Officer, the Chief Engineer, line manager and one of the shop floor operatives.
6.2.1 Company profile and performance
Guizhou Tyre Co. Ltd (hereafter referred to as GTC), was founded in 1965 through the
merger of Guizhou Tyre Factory with Great China Rubber Company, which relocated
in that year from Shanghai to inland Guiyang city. In 1995, GTC's main business 'GTC
Tyre' was restructured as a shareholding firm and was listed in 1997 in Shenzhen. The
holding group GTC was one of the 520 'key enterprises' selected by the State Council67
in 1992 and one of the top 10 tyre groups in China. In 2002 GTC became the biggest
heavy-duty tyre exporter in China and ranked 38 in the industry worldwide in 2004.
(See Appendix V for introduction to tyre technology and the Chinese tyre industry.)
66 In Chinese state enterprises the secretary of the firm's communist party committee still remains powerful - he or she often holds key positions in senior management and is officially the ultimate decision-maker of key human resource. 67 In 2000, the State Council readjusted the composition of its original 512 'Key State Enterprises' by merging 113 into 14 ~oups and .taking in 107 new fIrms; many are well-performing private companies and high-tech enterpnses. The hst thus extends to 520, around 200 of which are listed companies or parents of listed fIrms. (www.sasac.gov.cn. 2000). The National Team (Nolan, 2002) is a subset of the list.
180
Chapter 6: Findings from Case Study and Hypotheses Generated
GTC's main products included bias-ply tyre, radial-ply tyre, steel-belted radial tyre,
heavy duty tyre, agricultural tyre, tubeless tyre and air spring. 25% of its product was
exported at the time of case study in 2006. At the end of 2005 it had 6,532 employees,
349 of which were R&D staff. Its shareholding structure before May 2006 has been:
state shares: 51 %, tradable shares 49%. (After May 2006 it became: state shares: 27.2%,
tradable shares: 72.8 %.) Therefore GTC has been a MASOE during the period studied
in this thesis. The recent state share reduction was operated through bonus issues to
original holders as a gift (10:3.6)68. The state shares officially belong to Guiyang State
Asset Management Co., Ltd, which is the provincial branch of SASAC; just as SAIC is
owned by the Shanghai branch of SASAC.
Table 6-4 GTe - contrasting performance between 1985 and 2005
1985
Below its 1965-designed capacity: 300,000 units per year.
2004
38th in the world in tyre output; heavy duty specialist; largest tyre exporter in China; 25% of output exported
Source: GTC internal document
2005
Radial tyre output reaches 1.5 million per annum; total sales income up 31 % on 04, exports up 39%. Most profitable listed tyre company in China
68 This is perhaps a neat expression of the fact that private property in a formal sense in China is less important than a clear recognition by the relevant people in power that one has the right to the yields from a particular asset
181
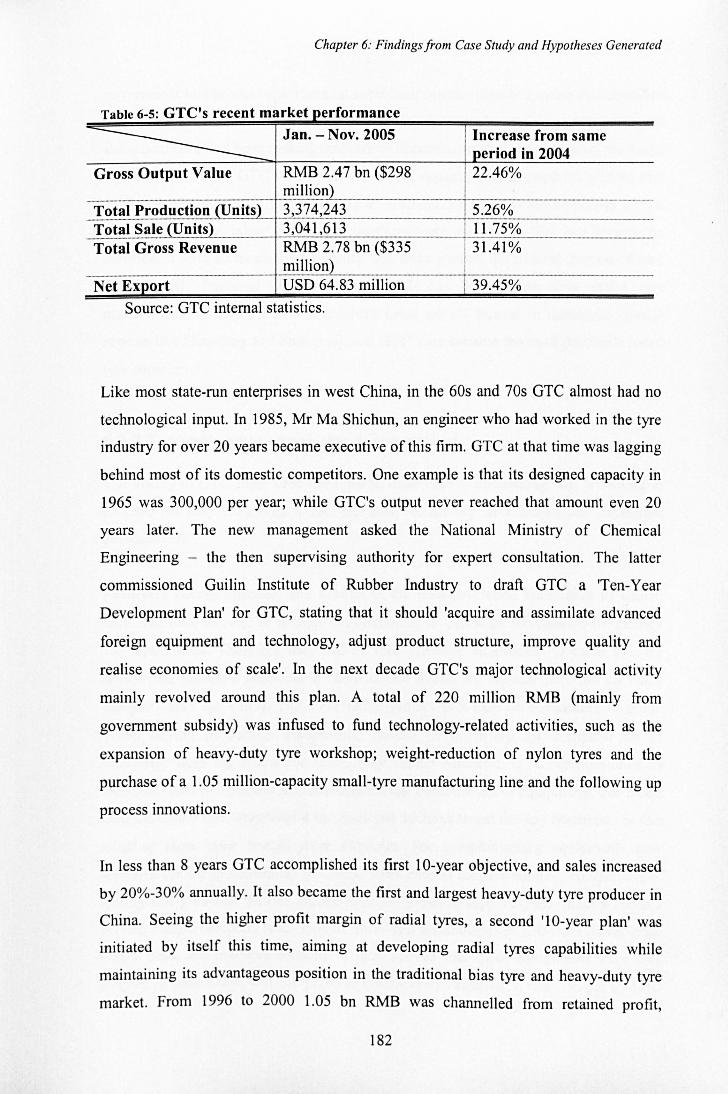
Chapter 6: Findings from Case Study and Hypotheses Generated
Table 6-5: GTe's recent market performance
---------------Jan. - Nov. 2005 Increase from same
period in 2004 Gross Output Value RMB 2.47 bn ($298 22.46%
.... --.. --.. -.--.. -...... -.-----.--.-.-... --.--.--.---.-
iE!~X::(-$~-3~~t1Th-== == __ !!:l_!~!.fr~~~ct!~~(Unil!) . _ .!~tal.§a!~jU nits} Total Gross Revenue
million) --_._-----------. ---Net Export USD 64.83 million 39.45%
Source: GTC internal statIstIcs.
Like most state-run enterprises in west China, in the 60s and 70s GTC almost had no
technological input. In 1985, Mr Ma Shichun, an engineer who had worked in the tyre
industry for over 20 years became executive of this finn. GTC at that time was lagging
behind most of its domestic competitors. One example is that its designed capacity in
1965 was 300,000 per year; while GTC's output never reached that amount even 20
years later. The new management asked the National Ministry of Chemical
Engineering - the then supervising authority for expert consultation. The latter
commissioned Guilin Institute of Rubber Industry to draft GTC a 'Ten-Year
Development Plan' for GTC, stating that it should 'acquire and assimilate advanced
foreign equipment and technology, adjust product structure, improve quality and
realise economies of scale'. In the next decade GTC's major technological activity
mainly revolved around this plan. A total of 220 million RMB (mainly from
government subsidy) was infused to fund technology-related activities, such as the
expansion of heavy-duty tyre workshop; weight-reduction of nylon tyres and the
purchase of a 1.05 million-capacity small-tyre manufacturing line and the following up
process innovations.
In less than 8 years GTC accomplished its first 10-year objective, and sales increased
by 20%-30% annually. It also became the first and largest heavy-duty tyre producer in
China. Seeing the higher profit margin of radial tyres, a second 'IO-year plan' was
initiated by itself this time, aiming at developing radial tyres capabilities while
maintaining its advantageous position in the traditional bias tyre and heavy-duty tyre
market. From 1996 to 2000 1.05 bn RMB was channelled from retained profit,
182
Chapter 6: Findings from Case Study and Hypotheses Generated
government bonds, and bank loans (at subsidised interest rate) to acquire the capability
to produce radial tyres. The initial product details were bought from Michelin, and
since then GTC has been making continuous improvement and innovation on the basis.
By the end of 2005 GTC's steel-belt radial tyre capacity had reached 1.5 million (the
national capacity is 11 million), ranking 8th in China and the only one of the top 10 that
was located in an inland areas. The products were among the first in China to be
certificated with international standards, and were granted the official 'Famous Brand
Product' title (mingpai chanpin) in 2004. It has become the only major tyre
manufacturer in inland China (the others firms are all located in developed coastal
regions like Shandong and Shanghai), and GTC Tyre became the most profitable listed
tyre company.
6.2.2 Technological capability development
The history of GTC since 1985 has been an older case of unbundling, and according to
its CEO Mr Ma, 'Sensitivity to cost has been the driving force behind our self-reliant
development. '
Relatively poorly financed, and located in the least-developed hinterlands of China,
GTC had little to offer to foreign multinationals in exchange for bundled technology
and equipments. Therefore they had to seek effective alternatives to catch up. 'We
always use domestic machines if there is one available, because they are so much
cheaper' (said the CEO). The 1998 radial project is a case of unbundling in point.
When buying production equipments, instead of importing the complete set of
machinery from the production technology vender Michelin, GTC commissioned its
technical team to work out the most appropriate combination of equipments that meets
their need, and then organised 4 international auctions to get the key machines. In fact
none of them were bought from Michelin. For complementary equipments they
searched for cheap substitutes in China. After careful bargain-hunting, comparison of
quality and after-sale service among over 30 domestic suppliers, they finally chose a
private Tianjin company (such type of lower-end unbundling has also been found in the
Chery case, see previous section). It later proved that these equipments were well
adapted in production, and compared to the quote by Michelin, it was cheaper by USD
183
Chapter 6: Findings from Case Study and Hypotheses Generated
3.41 million (key machinery) and RMB 4.43 million (complementary equipments)
respectively. GTC also cut cost through rigorous process innovation. According to the
purchasing plan drafted by Michelin, GTC needed to buy 7 forming machines for the
new project, which would cost over RMB 38.5 million. After studying the process of
radial tyre production in both Michelin and Dunlop, GTC technical staff found out that
they wouldn't need to invest that much in equipments if they could shorten the
sulfuration time. Sulfuration process improvement was accomplished in 5 months' time.
This enabled GTC to cut the purchase of sulfuration equipments by 6 units, forming
machines by 3 units, and in turn reduced the demand for radial parting moulds, which
saved the group a total ofRMB 29.46 million.
Other measures of low-visibility technological acquisition were master-minded by
GTC, with cost in mind of course. A retired tyre expert from Dunlop Australia
(cheaper than usual consultants, but had much more time available and higher
commitment, plus less need for GTC to bargain for technological details) was invited
to work in the radial division as managing director until 2003. Asking a foreign
manager to be fully responsible for a key division is a very rare case in Chinese SOEs,
especially when no joint-venturing is involved. GTC was rewarded by implementing
such an innovative strategy. By fully empowering this foreign manager it maximised
his commitment; and his technological and managerial expertise were well observed
and learned. GTC sent one of its deputy executives to shadow the foreign expert and
took over after his departure. In the interview the CEO commented that the radial
division had highly autonomous management style, largely inherited from the
A I· 69 ustra Ian manager .
Just like Chery, GTC also spent generously on staff training. Around ~ of employees
from its two R&D departments (the steel-belt radial project has its own R&D team) are
funded by the firm for part-time degree courses, either at Qingdao University of
Technology (MSc in Macromolecular material) or at Guizhou University of Industry
(MSc in Mechatronics). Regulations were enforced to insure that money was well
spent - only when the staff passed all modules and received the degree would they be
69 All medium level managers are university graduates and the division manager has HR rights to hire and flre people right under him. Wage rates are generally higher than same posts in other divisions and give more weight to workload rather than years of service.
184
Chapter 6: Findings from Case Study and Hypotheses Generated
reimbursed their fees. Training of managerial staff was also well planned. According to
the Human Resources manager Ms Wei, tailored short courses were provided to middle
and senior managers on weekends, organised in the form of seminars followed by
group discussions. The area of training ranged from management psychology, strategic
management, production safety, corporate culture, personalised leadership to logistic
management. Tutors were from top main land universities, renowned industry experts
from overseas, and professors from Taiwan. 'Flow of information and ideas from
outside of the organisation expanded the managers' vision, which is crucial for a firm
located in a land-locked province' (Ms Wei, May 2008). Moreover, during the courses,
case-related group discussion among staff from different corporate functions enhanced
mutual understanding and according to the HR manager has speeded up internal
communication and decision-making.
R&D expenditure in 2005 was RMB 140 million, thus 4.6% of its total turnover
(Michelin in the same period spent 4.2 %, according to GTC's internal document). 'All
the money that we got from GTe Tyre's IPO (Initial Public Offering) was invested in
technology activities,' said the Party Secretary, Mr Qian (September 2006). To further
enhance its endogenous basic research, in 2003 GTC set up a post-doctoral station and
hired two post-docs from Sichuan University to conduct research in the area of
macromolecule materials. Each of these researchers were assigned three GTe technical
staff, who provided on-site assistance and support and meanwhile to learn by working
closely with them (Mr Wang, Principal Engineer/ Deputy Chief Executive, September
2006).
GTe's attention to routine operations was also believed to have contributed to its
dynamic capability building (Mr Qian). According to site observations in the heavy
duty tyre and bias tyre divisions70, the level of routine operation was high; for example,
the rubber-kneading workshop was kept very tidy, which 'was hard for such type of
process' (Mr Qian, September 2006). Shop-floor workers mentioned during the
conversations with the author that their working conditions have been constantly
improved with ongoing process fine-tuning, carried out by engineers from the R&D
department and themselves.
70 A visit to GTC's radial tyre plants was rejected due to secrecy concerns.
185
Chapter 6: Findings from Case Study and Hypotheses Generated
6.2.3 Corporate Governance
Quality of shareholder engagement
Although officially supervised by Guiyang State Asset Management Co., Ltd which is
an independent entity, GTC still perceives itself as a state firm closely associated with
the local government (Mr Qian, Party Secretary). It can be seen how much support as
well as autonomy (a type of intelligent engagement in the case of lack of industrial
expertise) given by the local authority has helped GTC:
' ... The leaders are very busy and are in charge of thousands of firms, making tyres is a very
complicated thing, we cannot expect them to understand what we are doing, and all we can
expect is autonomy and support ... ' (Mr Ma Shichun, CEO)
'We were very lucky to be favoured as number one by the Guiyang government; it makes
our life a lot easier. We received financial supports such as interest subsidy on bank loans
in our radial project in the 1990s. Even now when subsidy is no longer allowed, we can still
get our projects approved by the bank much more easily than other local companies since
we have the local government as our guarantor... there have been occasions where the
senior officials stepped in to sort our problems out ... Because we are doing quite well now,
especially in a remote province like Guizhou, the central government starts to notice us and
has listed us in the mid-long-term Agenda of the National Technology Development, which
will provide us tax benefit. This has a crucial meaning because in the period of fierce
competition it not only gives us the financial edge but also political support.' (Mr Qian,
Party Secretary)
The Party Secretary of Guizhou province and Guiyang city and the Mayor often come
to GTC, sometimes spending a whole day working on the site. ' .. . the Mayor once said
if our output reaches RMB 5 bn in 2007 he will give us this and that. We don't know if he really means it, and we doubt if he could do so because of the finanCial constraint
that Guizhou faces as a whole, but at least we know that he cares about the whole thing
and would be pleased ifhe could ... ' (Mr Ma, CEO, September 2006.)
186
Chapter 6: Findings from Case Study and Hypotheses Generated
Management continuity and de facto shareholding
All senior managers have worked in GTC for at least 10 years and many of them have
been on their posts for more than 10 years. 'We think it is very important that we have a
relatively stable management team. I give you an example, there is another firm, for
some reasons their senior managers were changed almost every 6 months, and now the
firm is just about to go bankrupt, surely there are many other reasons to this, but the
management disruption was definitely not a positive factor ... ' said Mr Qian, who
started his career at GTC in 1965 and became Party Secretary in 1997.
CEO Mr MA Shichun, aged 68 in 2006, has been working in the tyre industry for over
38 years and remained chief executive until early 2008. His 48-years-old successor Mr
Chen was also a long-standing insider who started from the firm's shop floor and has
had extensive experiences in various posts.
Although there was no sign of significant shareholdings by the management team, the
CEO and other senior managers received discreet remunerations from the local
government. At the end of 2004, due to outstanding product and market performance,
Ma and his team was rewarded RMB 1 million each by the city government (Mr Qian,
Party Secretary; September 2006). This amount was 100 times the average staff pay
and 3 times the bonus paid to the company for winning the 'National Famous Brand'
title. So long as they realised this would happen, Ma and Co had every incentive (and
time) to aim and play long-term, as their personal wealth was tied to the firm's
prosperity - Guizhou province, Guiyang city and Mr Ma and his team in effect have
been co-owners of GTe.
The role 0/ CEO and inclusion
CEO Mr Ma was widely respected and regarded as the core of this enterprise. His name
was mentioned by almost all interviewees with admiration: 'If our enterprise were to be
described as a machine. then Mr Ma (the CEO) is the crucial axis that makes the
machine start and work properly', said Wang Hai, Principal Engineer/ Deputy Chief
Executive.
187
Chapter 6: Findings from Case Study and Hypotheses Generated
Mr Ma was thought to be able to make important, correct strategic decisions at the
correct time. For example, lorries in China are normally seriously overloaded, and
ordinary tyres are not durable enough. Ma asked research staff to modify the formula
of the heavy-duty tyres and sold them to the replacement market. Sales increased
dramatically and the profit was later injected into their new radial tyre project, which
partially solved the fund-shortage problem. It was proved that such strategy secured
GTC's market competence. He is also a diligent entrepreneur, shop-floor operatives are
very familiar with him coming into the workshop and consulting them on strategic
decisions (Mr Gou, operative, September 2006).
Mr Wang also believed that sufficient autonomy was given to the technical staff:
'We are encouraged to carry out experiments and trials, and don't need to worry about any
fine or punishment ifwe do not succeed in the first place ... '
As a state-owned company in Guizhou, GTC has relatively high wage rates. Salary
consists of two parts: basic pay and performance pay. Shop floor operatives are paid
according to their job type/workload, requirement for skills and job hazard.
Maintenance workers are paid slightly more than others. However, skilled workers still
tend to leave, and Mr Wang admitted that continuous loss of skilled maintenance
workers has had an impact on the firm.
' ... working in a tyre-making factory is a tough job, but we are not too worried about shop
floor workers, they are more or less attached to their jobs due to technical reasons
(although we have a job-rotation scheme) and it is not too difficult to recruit young
peasants from the countryside. It is maintenance workers that we are more concerned about
at the moment. It's a much more skilled job and it takes longer to train qualified stafJ. The
nature of their roles means that they must be very dedicated; there is hardly any time to sit
down and chill out in a day. For the same work they could find much higher-paid jobs in
other factories, either in Guiyang or in other big cities.'
Examination of remuneration policy by the author also revealed that GTC had various
awards for outstanding technical performances. The award committee was mainly
composed of senior engineers and experts from research institutes and universities,
188
Chapter 6: Findings from Case Study and Hypotheses Generated
while GTe's senior management is not involved in the selection process, which was
very rare for a Chinese SOE, according to Ms Wei, HR manager (May, 2008). Firm
level 'model workers' were rewarded very generously as well. The firm's bonus was
five times higher than the amount paid by the provincial trade union (Ms Wei, 2008).
Apart from staff inclusion schemes, GTC was also seeking to incorporate external
input from external stakeholders. It had close, friendly collaborations with local
research institutes and universities, and ongoing R&D projects with China Science
Academy and Qingdao University of Technology. According to the contracts, GTC
owns all of the IPRs of new developments (Mr Wang, Principal Engineer/ Deputy
Chief Executive).
Potential problems and further insights71
There are three key problems that GTC was still grappling with: the surplus of manual
workers and lower-level administrative staff that it was not allowed to fire because of
the poor employment situation in Guizhou (Mr Qian, Party Secretary, September 2006).
Its rather poor brand reputation largely due to being a domestic firm in an
unfashionable location; and its lack of basic R&D capacity which would allow it to
tackle challenges like making full use of glass fibre (Mr Wang Hai, Principal Engineer).
GTC's modest success since 1985 strongly confirms our view of Chery and SAlC.
While limited in financial resources, due to its weak initial technological and market
position, the poverty of its province, and its need to 'carry' surplus employees, GTC is
an impressive example of endogenous growth based on sound corporate governance.
The endogenous growth is clearly built on thorough and intelligent unbundling, as
illustrated by the radial tyre project, including the use of the retired Australian. The key
to the sound corporate governance was that the relevant officials picked the right man -
an experienced tyre engineer and manager - and backed him. He was still in charge 20
years later and with no end of his tenure in sight - a dramatic difference from the
traditional SOE rotation of officials doing a stint as an industrial manager. Clearly Mr
Ma's time horizon was very long: he had every opportunity and motivation to aim for
71 This part is written by Tylecote, which is published as Liu & Tylecote (2009)
189
Chapter 6: Findings from Case Study and Hypotheses Generated
real technological capability development and he did so. How expert and engaged the
monitoring officials have been over the years it is hard to tell, and the evidence
suggests, not very, but in this context it hardly matters: Mr Ma was very expert and
very engaged and in effect, though not in any fonnal sense, he was a major shareholder
of the finn: he could have every confidence that he would be handsomely rewarded if it
succeeded, and he was.
Under Mr Ma, there has been a great deal of inclusion, formally and informally. The
Party organization within the finn (one of the laosanhui, old three organizations that
controlled the finn) seems to continue to function and to do so in harmony with Mr Ma.
(Not only can a good Party secretary - who in this case doubled as Chief Operating
Officer - help to make relationships run smoothly within the finn, he can do the same
for important relationships outside the finn.) There is a stable management team. Shop
floor workers are made to feel included partly by Mr Ma's practice of Management by
Walking About, partly by the care taken to reward valuable contributors. (The loss of
skilled maintenance workers is however a point on the other side.) The cooperation
with outside research organizations is another aspect of stakeholder inclusion, and its
close cooperation with various domestic universities and the national academy of
science is clear evidence. On the other hand, although there is no fonnal collaboration
with other finns, according to Mr Qian, infonnal infonnation flow (Macdonald, 1992)
from peer research staff in competitor firms has always been active and largely
contributed to the growth of GTC's technological capabilities (for more detail and
direct quote, see the next section).
190
Chapter 6: Findings from Case Study and Hypotheses Generated
6.3 Longertek
After case studies of three firms with similar ownership types (MASOEs), we
understood that governance practise can strongly affect a firm's technological strategy
and capability. It would be meaningful, on the other hand, to find out how such
mechanism works in a different ownership structure. Therefore our second interview
based case study was conducted in a privately owned company. Also, we chose our
target firm from the electronics industry to settle how much such experience is
replicable in another industrial context.
6.3.1 Company profile and general performance
Longertek Technology (Group) Co. Ltd (hereafter referred to as Longertek) is a private
enterprise established in 2000 in the coastal city of Qingdao, Shandong province. As of
April 2006, Longertek Group's total assets were RMB 84.83 million, and had 285 full
time employees (60 university graduates and 55 technical staff). It had two subsidiaries,
Qingdao Longertek Co., Ltd (TLL) and Laiwu SANHE Technology Co., Ltd (SAN HE).
TLL specialises in the R&D and production of Intelligent Power Control Modules
(IPM), Universal Intelligent Power Modules (UIPM) and Permanent Magnet Variable
Refrigeration (PMRV) related products; and SANHE mainly makes energy-efficient
variable-frequency multiple-split system refrigerators and air-conditioners used on
locomotives and passenger trains.
Longertek has been awarded 16 national patents and 2 of its products have been named
'National Key New Products'. According to 'Electronic & Information Technology
Promotion Plan year 2008', it was the only Chinese firm to have independently
developed, patented and commercialised Permanent Magnet Variable Refrigeration
(PMRV) technology. Combining its PMRV and U1PM technologies, Longertek's
energy-efficient products were at least 113 cheaper than ordinary PMRV controllers
and much more user-friendly. Moreover, the unique re-programmable feature means it
can not only be used on air conditioners but also on any other electric and electronic
appliances and devices (Mr Li Jingrnao, CEO. September 2006).
Longertek's market performance has also been impressive. It supplied IPM-embedded
191
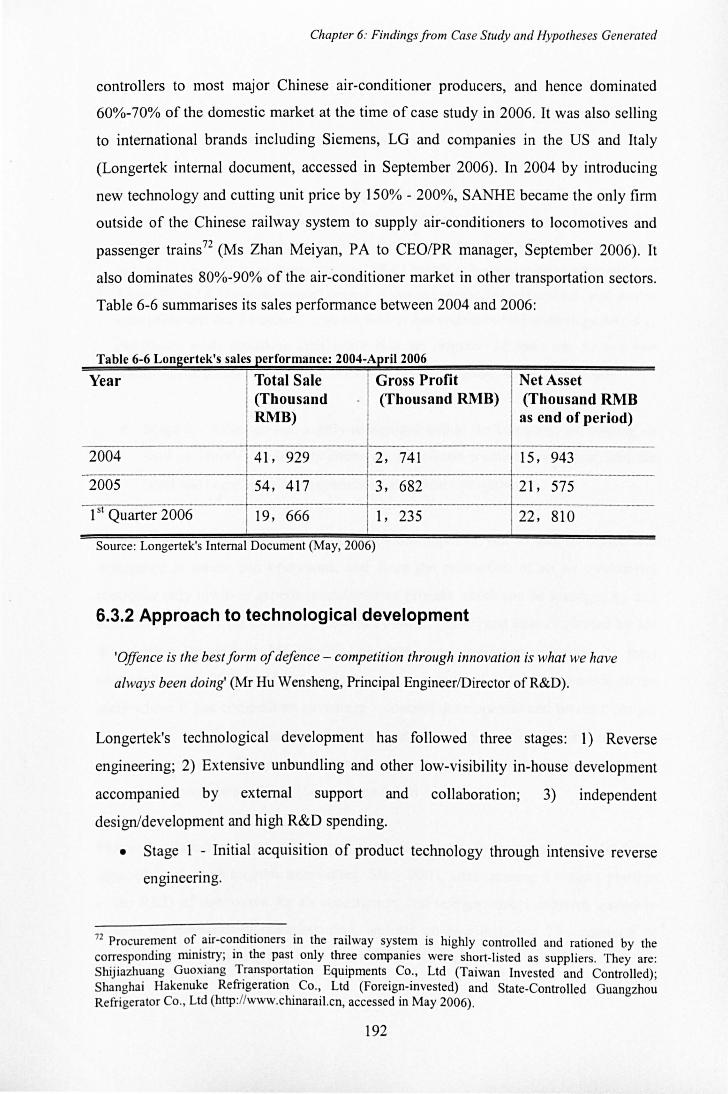
-
Chapter 6: Findings from Case Study and Hypotheses Generated
controllers to most major Chinese air-conditioner producers, and hence dominated
60%-70% of the domestic market at the time of case study in 2006. It was also selling
to international brands including Siemens, LG and companies in the US and Italy
(Longertek internal document, accessed in September 2006). In 2004 by introducing
new technology and cutting unit price by 150% - 200%, SANHE became the only firm
outside of the Chinese railway system to supply air-conditioners to locomotives and
passenger trains 72 (Ms Zhan Meiyan, P A to CEOIPR manager, September 2006). It
also dominates 80%-90% of the air-'conditioner market in other transportation sectors.
Table 6-6 summarises its sales performance between 2004 and 2006:
Table 6-6 Longertek's sales performance: 2004-April 2006
Year Total Sale Gross Profit Net Asset (Thousand (Thousand RMB) (Thousand RMB RMB) as end of period)
_.
2004 41, 929 2, 741 15, 943 -_.- --~-~ .. ---.--.-.. ----.---
2005 54, 417 3, 682 21, 575 r'
1 sl Quarter 2006 19, 666 1, 235 22, 810
Source: Longertek's Internal Document (May, 2006)
6.3.2 Approach to technological development
'Offence is the best form of defence - competition through innovation is what we have
always been doing' (Mr Hu Wensheng, Principal Engineer/Director of R&D).
Longertek's technological development has followed three stages: 1) Reverse
engineering; 2) Extensive unbundling and other low-visibility in-house development
accompanied by external support and collaboration; 3) independent
design/development and high R&D spending.
• Stage 1 - Initial acquisition of product technology through intensive reverse
engineering.
72 Procurement of air-conditioners in the railway system is highly controlled and rationed by the corresponding ministry; in the past only three companies were short-listed as suppliers. They are: Shijiazhuang Guoxiang Transportation Equipments Co., Ltd (Taiwan Invested and Controlled); Shanghai Hakenuke Refrigeration Co., Ltd (Foreign-invested) and State-Controlled Guangzhou Refrigerator Co., Ltd (bttp://www.chinarail.cn. accessed in May 2006).
192
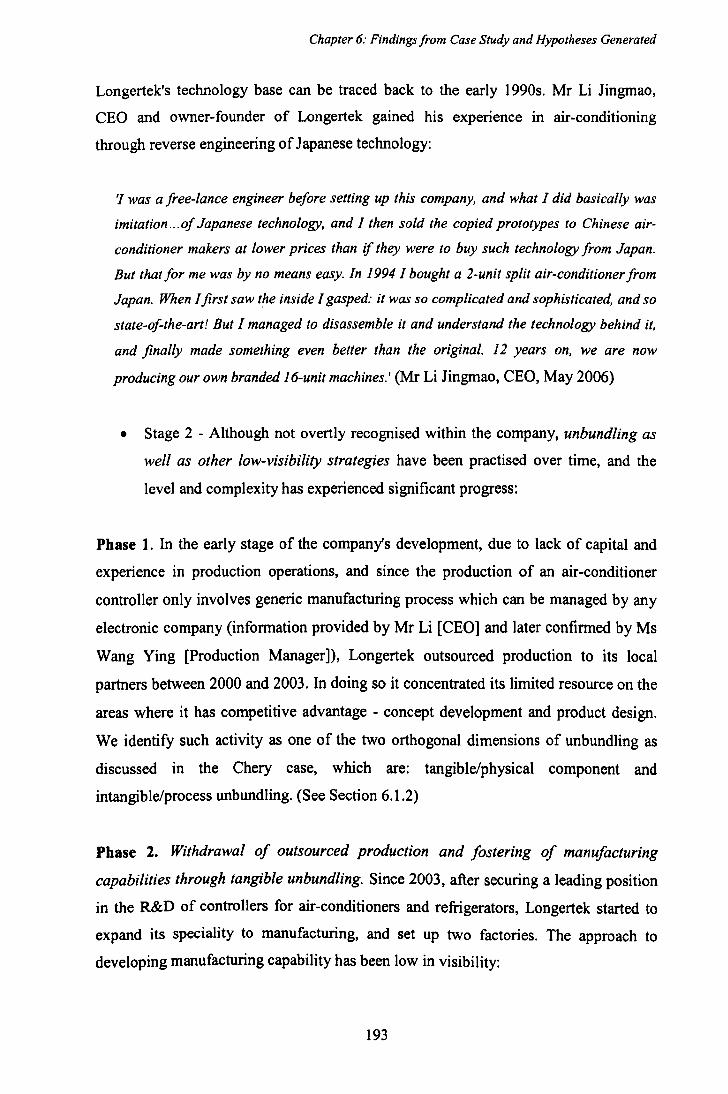
Chapter 6: Findings from Case Study and Hypotheses Generated
Longertek's technology base can be traced back to the early 1990s. Mr Li Jingmao,
CEO and owner-founder of Longertek gained his experience in air-conditioning
through reverse engineering of Japanese technology:
'/ was a free-lance engineer before setting up this company, and what I did basically was
imitation ... of Japanese technology, and I then sold the copied prototypes to Chinese air
conditioner makers at lower prices than if they were to buy such technology from Japan.
But that for me was by no means easy. In J 994 I bought a 2-unit split air-conditioner from
Japan. When I first saw the inside I gasped: it was so complicated and sophisticated, and so
state-of-the-art! But I managed to disassemble it and understand the technology behind it,
and finally made something even better than the original. J 2 years on, we are now
producing our own branded J 6-unit machines.' (Mr Li Jingmao, CEO, May 2006)
• Stage 2 - Although not overtly recognised within the company, unbundling as
well as other low-visibility strategies have been practised over time, and the
level and complexity has experienced significant progress:
Phase 1. In the early stage of the company's development, due to lack of capital and
experience in production operations, and since the production of an air-conditioner
controller only involves generic manufacturing process which can be managed by any
electronic company (information provided by Mr Li [CEO] and later confirmed by Ms
Wang Ying [Production Manager]), Longertek outsourced production to its local
partners between 2000 and 2003. In doing so it concentrated its limited resource on the
areas where it has competitive advantage - concept development and product design.
We identify such activity as one of the two orthogonal dimensions of unbundling as
discussed in the Chery case, which are: tangible/physical component and
intangible/process unbundling. (See Section 6.1.2)
Phase 2. Withdrawal of outsourced production and fostering of manufacturing
capabilities through tangible unbundling. Since 2003, after securing a leading position
in the R&D of controllers for air-conditioners and refrigerators, Longertek started to
expand its speciality to manufacturing, and set up two factories. The approach to
developing manufacturing capability has been low in visibility:
193
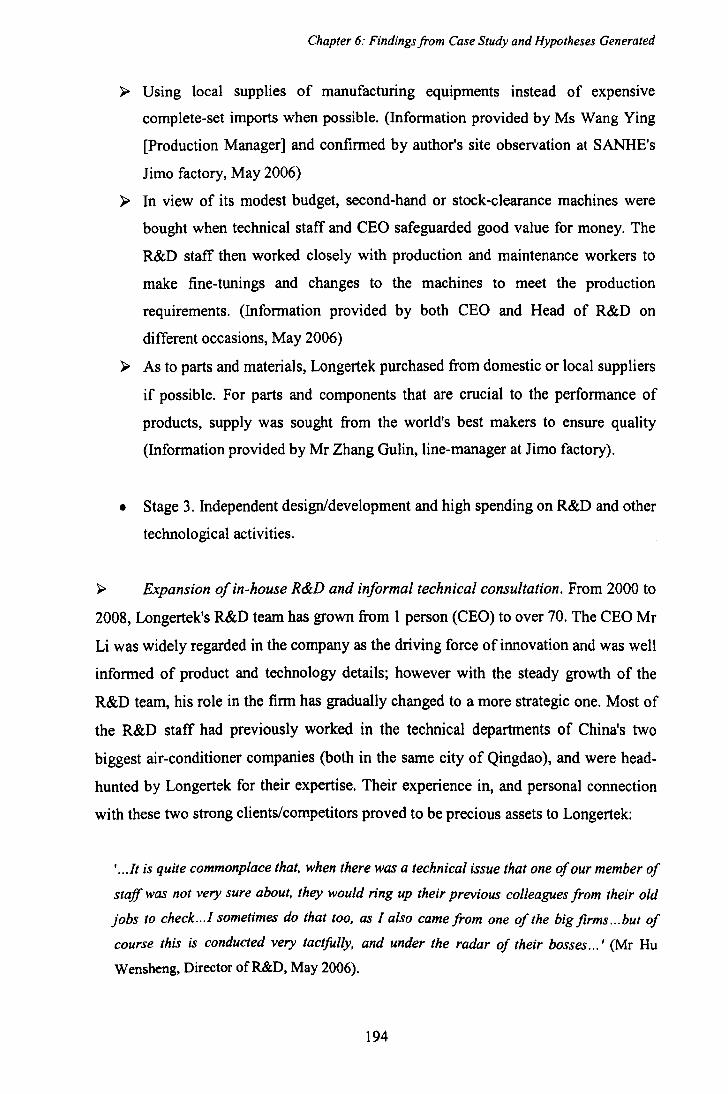
Chapter 6: Findings from Case Study and Hypotheses Generated
~ Using local supplies of manufacturing equipments instead of expensive
complete-set imports when possible. (Infonnation provided by Ms Wang Ying
[Production Manager] and confinned by author's site observation at SANHE's
Jimo factory, May 2006)
~ In view of its modest budget, second-hand or stock-clearance machines were
bought when technical staff and CEO safeguarded good value for money. The
R&D staff then worked closely with production and maintenance workers to
make fine-tunings and changes to the machines to meet the production
requirements. (lnfonnation provided by both CEO and Head of R&D on
different occasions, May 2006)
~ As to parts and materials, Longertek purchased from domestic or local suppliers
if possible. For parts and components that are crucial to the performance of
products, supply was sought from the world's best makers to ensure quality
(lnfonnation provided by Mr Zhang Gulin, line-manager at Jimo factory).
• Stage 3. Independent design/development and high spending on R&D and other
technological activities.
~ Expansion of in-house R&D and informal technical consultation. From 2000 to
2008, Longertek's R&D team has grown from 1 person (CEO) to over 70. The CEO Mr
Li was widely regarded in the company as the driving force of innovation and was well
informed of product and technology details; however with the steady growth of the
R&D team, his role in the firm has gradually changed to a more strategic one. Most of
the R&D staff had previously worked in the technical departments of China's two
biggest air-conditioner companies (both in the same city of Qingdao), and were head
hunted by Longertek for their expertise. Their experience in, and personal connection
with these two strong clients/competitors proved to be precious assets to Longertek:
' .. . It is quite commonplace that, when there was a technical issue that one of our member of
staff was not very sure about, they would ring up their previous colleagues from their old
jobs to check .. .l sometimes do that too, as I also came from one of the big firms ... but of
course this is conducted very tactfully, and under the radar of their bosses ... ' (Mr Hu
Wensheng, Director of R&D, May 2006).
194
Chapter 6: Findings from Case Study and Hypotheses Generated
As discussed in the previous case, informal information exchange among previous
university classmates and colleagues has also been noticed in GTe (see the end of
previous section):
'Many of our R&D members, especially younger ones, have university classmates who work
in the same (tyre) industry. Probably because they are workingfor firms in different regions,
the sense of competition is much weaker; rather, they seem to share a lot of empathy
amongst each other. I know some of my team members often consult their classmates for
technical problems, especially those in SOEs - who feel much less loyal towards their
employers than those in POEs ... '(Mr Qian, Party Secretary, GTe, June 2006).
Such pattern of peer consultation and informal information exchange are bound to have
benefited collective learning and development of technological capabilities in these two
companies.
~ High spending on R&D and technology-related activities. According to the
company's management accounting reports, between 2003 and 2007 Longertek's
investment in technology-related activities has exceeded 20% of its turnover. Besides
formal R&D investment, a fair share of the expenditure has been on low-visibility
technological activities. For example, Longertek pays executive-level salaries to three
retired Chinese engineers and university professors in the tyre industry for formal staff
training and technical consultancy. Through the CEO's personal network, two Japanese
experts from Panasonic and Sanyo were also invited regularly to provide training and
trouble-shooting. They were also financially rewarded for bringing market information
and business opportunities.
6.3.3 Corporate governance and finance
As a private company, Longertek is controlled by its sole shareholder and founder, the
CEO. There was thus no owner outside the firm; and the owner inside the firm was
guaranteed to be fully engaged, and a well trained and informed expert in the industry.
In the Chinese context however, absence of state shareholders does not necessarily
195
Chapter 6: Findings from Case Study and Hypotheses Generated
mean that the state has no share in control. We were informed that there is no excessive
intervention from outside Longertek: 'we are subject to lots of authorities ... but it only
involves quite ordinary stuff: paying taxesifees, renewing registration, handling routine
checks. We are left to mind our own business ... ' commented CEO Mr. Li. However, he
also admitted that ' .. . in China, it is essential for an enterprise to build and maintain a
good relationship with local authorities.' Li learned his lesson the hard way. According
to Li's old colleague from his free-lance job Mr Gu, as the first Chinese company to
develop (air-conditioner) controllers, in the 90s Longertek's technology level was not
very far behind its Japanese counterparts. However, not understanding the crucial
importance of winning government support, it was never funded either under
government projects or by banks, thus missing the opportunity of catching up.
Nowadays Li spends 80%-90% of his working life cultivating all sorts of relationships,
a significant proportion of which were spent on dining, drinking and entertaining with
local government officials. It was believed to be beneficial for the firm, according to
MrLi,
' ... the government controls a lot of key resources - favourable taxation, industrial policy
and the use of land - we need to have good guanxi to access them; on the other hand. we
also need government officials themselves - they could use their resources and personal
networks to help us with the sales of products. ,
Longertek's belated friendly gesture with the authorities finally took effect - it started
to receive the treatment it had long desired, but on the other hand, seeing the firm's
promising prospects some supervising bodies are getting over-excited.
'At times we are given unrealistic performance targets and so on ... actually they (the
authorities) don't quite understand what we are doing and what our situation is like. In
other words they just want to use us to showcase their political merits. which gives us
unnecessary pressure. ' (Li)
Employee Inclusion
The advantage of owner-management is that close committed relationships can be
developed between those who control the firm and those who work for it - employee
inclusion - starting of course at the top. At Longertek the CEO is not the only one who
196
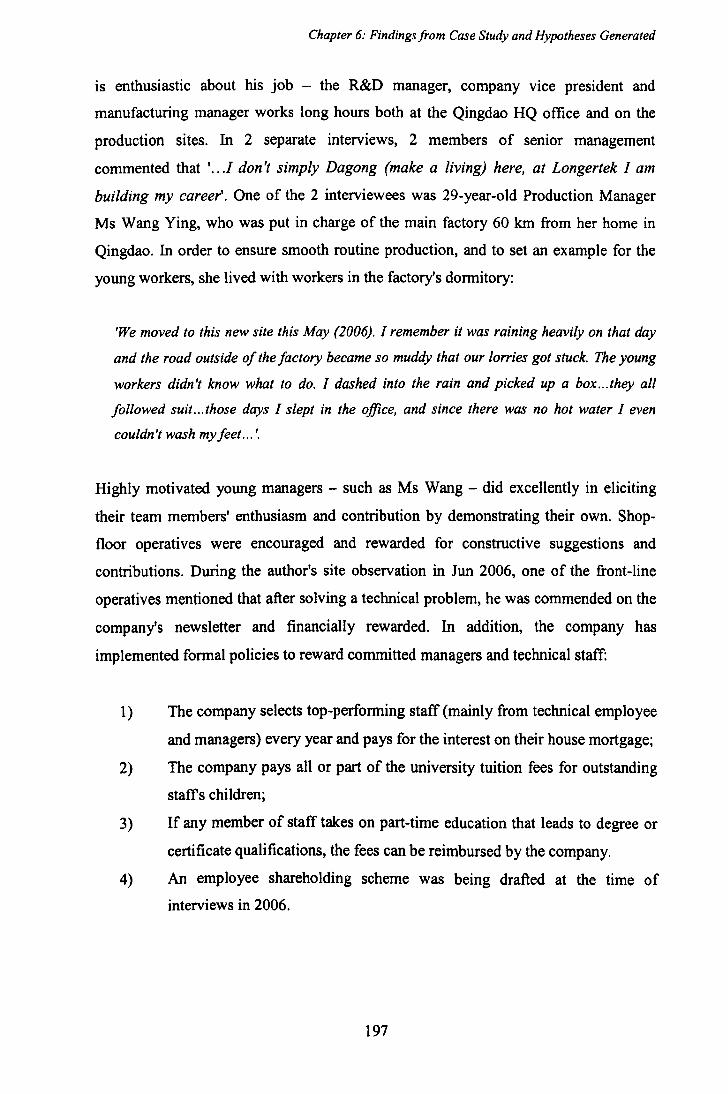
Chapter 6: Findings from Case Study and Hypotheses Generated
is enthusiastic about his job - the R&D manager, company vice president and
manufacturing manager works long hours both at the Qingdao HQ office and on the
production sites. In 2 separate interviews, 2 members of senior management
commented that ' .. ./ don 't simply Dagong (make a living) here, at Longertek I am
building my career'. One of the 2 interviewees was 29-year-old Production Manager
Ms Wang Ying, who was put in charge of the main factory 60 km from her home in
Qingdao. In order to ensure smooth routine production, and to set an example for the
young workers, she lived with workers in the factory's dormitory:
'We moved to this new site this May (2006). I remember it was raining heavily on that day
and the road outside of the factory became so muddy that our lorries got stuck. The young
workers didn't know what to do. I dashed into the rain and picked up a box ... they all
followed suit...those days I slept in the office, and since there was no hot water I even
couldn't wash my feet... I.
Highly motivated young managers - such as Ms Wang - did excellently in eliciting
their team members' enthusiasm and contribution by demonstrating their own. Shop
floor operatives were encouraged and rewarded for constructive suggestions and
contributions. During the author's site observation in Jun 2006, one of the front-line
operatives mentioned that after solving a technical problem, he was commended on the
company's newsletter and financially rewarded. In addition, the company has
implemented formal policies to reward committed managers and technical staff:
1) The company selects top-performing staff (mainly from technical employee
and managers) every year and pays for the interest on their house mortgage;
2) The company pays all or part of the university tuition fees for outstanding
staffs children;
3) If any member of staff takes on part-time education that leads to degree or
certificate qualifications, the fees can be reimbursed by the company.
4) An employee shareholding scheme was being drafted at the time of
interviews in 2006.
197
Chapter 6: Findings from Case Study and Hypotheses Generated
Finance
As a private company Longertek had to constantly battle for financing. Due to the past
discriminatory rules against small private firms, Li never managed to get a loan from
the banks.
' ... what we had at that time was nothing but ideas, patents and intellectual property rights,
and we needed money badly to commercia lise them, but the banks wouldn't accept
intangible assets as collaterals ... therefore we could not get even a penny'. The reason for
choosing to float in the US rather than on the domestic market is similar. According to the
current policy in China private firms have to go through a time consuming and painful
process to get listed. 'It means life and death to us that our project be launched in a certain
time frame, and I am afraid that by the time we finally got listed in China the dinner would
be cold already'. (Mr Li Jingmao, CEO)
6.3.4 Summary
Longertek was a bridgehead of technology and market in its area; showing endogenous
capabilities of executing independent development and innovations. The firm has had
extensive reverse engineering, coupled with various combinations of sourcing from
abroad, sourcing domestically, and different degrees of self-reliance in its early days of
catch-up. All its behaviour was indeed associated with the strategy of unbundling,
although the interviewees never used the exact term. Meanwhile, Longertek had a
governance that featured high shareholder engagement; strong industrial expertise of
corporate decision-makers; trust in, empowerment of, commitment by, lower-level
managers and shop-floor workers. The interviewees agreed that these factors
contributed to the process of organisational learning and capability building.
198
Chapter 6: Findings from Case Study and Hypotheses Generated
6.4 South Electro
6.4.1 Company profile and performance South Electro is one of the four affiliates of South (Group) S&T Co., Ltd, which was
among China's first batch of shareholding companies (all of its shares were state
owned in various forms). South Group was established in 1965 as one of the 'National
Defence Electronics Industry Bases' in inland China. Along with 6 other companies in
Guizhou province, South Group had enjoyed the privileged status of National Key
Enterprise73• In 1991 it became one of the first 57 'National Experimental Large-scale
Enterprises/Groups,74. As of end of May 2006, 50.3% of South Electro's shares were
tradable and the rest 49.7% were non-tradable state shares. However around half of the
tradable shares were owned by state shareholders - it was thus a'MASOE'.
At the time of field work in May 2006, South Electro had 570 full-time staff (large
sized by NBS' standard), 170 of whom were in management and administration
positions. The number of full-time-equivalent employees at South Electro was only
half compared to that of its best in the early 90s. The firm was suffering from severe
losses and struggling to survive.
South Electro as one of the four subsidiaries of South Group specialises in the
manufacturing of cathode-ray tubes (CRTs) for colour televisions and other generic
electronic circuit boards. Its CRT production started in the late 80s when TV
production and demand for CRTs started soaring in China. South Electro started off by
manufacturing CRTs and television remote-controls against specification for a
Japanese company which supplied the technology and equipments. A few years later,
the collaboration ended but South Electro managed to understand the technology and
continued its own production. By the end of 1992 its products ranged from 17" B/W to
25" colour CRTs. Annual sales reached over I million units with over 30% gross profit.
From 1997 on, however, when the competition among Chinese TV set firms became a
cut-throat price war, 70% of decrease in profit margin was passed on to parts and
73 GTe, on the other hand, as an SOE in the same province, was never given such status. 74 The purpose was to deepen internal reforms, improve the level of management, enhance competence of the firms and hence to set good examples for other enterprises, in 1998 another 63 large-scale companies were selected to join the list.
199
Chapter 6: Findings from Case Study and Hypotheses Generated
components suppliers (Kang, 2003). As one of the major suppliers to most domestic
TV brands, South Electro was then forced to cut its price by 40% compared to the mid
90s. From 2000 on, major breakthrough in TV display technology started to prevail,
such as rear projection, LCD and plasma. South Electro was still only capable of
producing traditional small-sized CRTs for a fast-shrinking market. Moreover, with
market perspectives for CRT TVs on the decline, many TV set firms ceased regular
orders and demanded 'just-in-time' supply, which again increased pressure on South ,
Electro's inventory control and cash-flow. From 2001 on, due to lack of investment, its
research and development team was cut by more than half compared to mid 1990s,
, .. . the company's R&D has almost ground to a halt ... ' (Mr Hou Song, retired Chief
Engineer, May 2006). In 2002 when the senior management found the firm was too
indebted to guarantee regular wage payment, they resigned collectively.
6.4.2 Technological Development Strategy South Electro's failure in developing technological capability can be attributed to the
following reasons:
1) Inconsistent product development strategy, due to decision-makers' lack of
industrial expertise and firm-wise understanding.
The strategic decision makers of the company, i.e. CEO and Party Secretary did not
understand the firm's core competence and hence were not able to cultivate it. The
management at South Electro was content with profit generated from its CRT division
and never aimed at new projects that were compatible with the firm's traditional
strength and long-term development. According to Mr Yang, Director of R&D (who
refused to reveal his full name), South Electro made a strategic mistake in the mid 90s
by entering into a product niche market where South Electro did not have any
advantageous resources to compete. In 1993 China started mass production of wireless
telecommunication devices, such as pagers and mobile phones. Seeing this as an
opportunity to revive the company from failing in the TV components market, the CEO
decided to chase the fashion by starting to produce chip resistors for mobile phones.
Knowing nothing about the sector and production, it invited Samsung, the industrial
leader to set up a joint venture - a quick-fix measure of technology transfer that is too
familiar to disengaged Chinese SOE managers. However, the Korean guests were not
200
Chapter 6: Findings from Case Study and Hypotheses Generated
impressed by South Electro's overall performance, especially its problematic
managerial practice (see explanation in section 6.4.3) and 500 retired employees 75.
After the failed attempt to gain technological expertise through joint-venturing, the
firm opted for the highest-visibility form of 'bundling' - complete sets of equipments
were bought in batches - with interest-free loans taken from state-owned banks.
2) The absence oftechnological and organisational learning.
'The firm has always relied entirely on disassembling prototype products and then mass
producing it. Such strategy worked and paid offin the early years of the reform (from 1979 to
1989), but there was no growth from there, nowadays in the market economy, if you don't try
hard to at least follow the tide, you are doomed to fail ... ' (Mr HOU Song, retired Chief
Engineer, May 2006)
Due to its poor endeavour in technological learning, the lack of knowledge stock
within its human resources has also caused the company's failure to adapt to the
industrial transformation:
' .. .from 1995. due to lack of special funding by the government, the previous CEO decided
to stop providing the technical staffs with on-the-job training and reduce the subsidy for
their qualification programmes, such as Dianda [distance undergraduate courses). Many
highly qualified and experienced R&D personnel started to leave for more lucrative jobs in
the coastal regions and the technology team shrank from over 100 people to around 30.
South Electro was not capable of carrying out any serious research and development
independently. In the early 2000s, new TV display technology started to emerge in China
and we knew we must do something to catch up; however, the gap between CRT and other
types of display technology is too big to be understood by us.' (Mr Chen Song, CEO, June
2006)
3) Lack of investment in R&D and technological activities
Sagging profits and the urgent need to meet all sorts of immediate payments meant that
South Electro hardly had any R&D expenditure since the mid 1990s. Mr Xie Mingfang,
line manager of circuit board workshop mentioned in the interview that sometimes,
even project proposals which could lead to significant process improvement and cost
75 In the mid 1990s Chinese firms were fully responsible for wage payment of retired employees.
201
Chapter 6: Findings from Case Study and Hypotheses Generated
reduction would be rejected: he once proposed to invest 7,000 RMB (1,OOOUSD) to
improve the lighting system which could lead to significant manufacturing cost
reduction.
'Last year I put in an application for some money to improve the lighting system in the
workshop. My proposal stated that the investment would payoff in only 2 to 3 months. They
(senior managers) told me to wait for my proposal to be discussed at the group level - for
heaven's sake all I askedfor was 7,000 yuan (less than 1,000 USD)! .. .1 was never given an
answer since.' (Mr Xie Mingfang, Line Manager, June 2006)
4) High priority for dependent technology strategy and high-visibility activities
It became clear during the interviews with the CEO of South Electro that, when
considering introducing a new technology, the senior managers' instinct was to buy
from world-leading multinationals:
"When we realised that we need to update our technology (from CRT to LCD and Plasma
[added by author)}, we tried to seek technology imports from Japan. Unfortunately, as a
monopolist in the industry NEC holds its technical details so tightly that it is impossible for
South Electro to do so. Then we thought about buying machines from them, so that at least
they can provide some production training. However by that time we were already in deep
debt and couldn't afford to do so either. " (Mr Chen Song, CEO, June 2006)
As mentioned before, South Electro also bought state-of-the-art machineries for its
production of chip resistors. During the site visit, the factory line manager was eager to
show the flashy chip-placement machines they imported from Mitsubishi, and referred
them as signs of the firm's technical strength. However, these machines are 'highly
automatic and don't require specific training to operate, and Mitsubishi provides 2417
on-call technical support' (Mr Jiang, Deputy Director). In other words, South Electro
did not have the opportunity to learn by operating or maintaining the machinery
independently, and its production capability remained static and completely dependent
on those foreign machinery vendors.
202
Chapter 6: Findings from Case Study and Hypotheses Generated
6.4.3 Corporate Governance and Finance
Corporate Governance
South Electro retained many legacies of a typical Chinese MASOE. For example,
despite stipulation of the Company Law, after South Electro's senior managers
collectively resigned in 2002, all replacement members were assigned by South Group,
rather than being nominated by the board and elected at the shareholders' meeting (Mr
Qian, Deputy Director, June 2002).
South Group as the biggest shareholder had overriding power and control over South
Electro 76, and their intervention was perceived to have been 'over-simplified,
inconsiderate and often detrimentaf (Mr Jiang, Deputy Director, August 2007). South
Electro's performance was measured by the Group against uniform criteria with
financial performance as a priority. Not truly appreciating the difficult situation South
Electro was in, the Group demanded an unrealistic target of 10%-15% annual asset
value increase. According to South Electro's CEO Mr Chen Song: 'there is no way we
can manage that given the current situation, but the report determines how much
funding we can get from the Group next year, therefore we must meet these targets.
So ... you know, if there is a will, there is a way.' (It was later indicated by R&D director
that South Electro could meet these targets through fraudulence of financial accounts).
Irregular inspections were conducted by the Group management; however, it only
involved financial reporting to the Group chief finance director and the chief
accountant (which had already been 'tailored' to meet their expectations). Sometimes
the Group executive in charge of production also comes to the workshops to inspect,
but he normally did not stay for more than 30 minutes. Afterwards, expensive
'souvenirs' and dinner at luxurious hotels were always arranged by South Electro as
part of the routine (Mr Jiang, Deputy Director, June 2006).
76 South Group on the other hand, had its ownership exercised by SASAC at the provincial level (just like SAIC and GTC).
203
Chapter 6: Findings from Case Study and Hypotheses Generated
All of the inte~iewees were very reluctant to gIve specific comment on the top
managers' involvement in innovation-related activities. Meanwhile, CEO Mr Chen felt
that he had better things to worry than technological improvement:
' ... Oh, I simply don't have the energy and time to go over all the details of daily operations -
relationship management with external officials for our company is definitely of higher
priority - otherwise we would have no money to pay and keep the workers, without workers
how can we be innovative?' (CEO Mr Chen Song, August 2007).
It can be seen that with the corporate governance typical in a major SOE, South
Electro's senior managers were not motivated to look after their company. Rather, the
highly quantified appraisal enforced by the main shareholder had forced managers to
go out of their ways to fabricate immediate financial gains. Also, the time spent to keep
government officials happy meant that the CEO would not have the chance to learn
about the firm's technological strengths and weakness. Nor was he aware of, or
concerned about the long-term price to be paid by the company by totally relying on
foreign technology.
By the same token, it became clear during the fieldwork that little was done in the firm
to harness stakeholders' input in the technological development. There was no well
defined and implemented scheme to promote healthy management-employee
relationship in the firm. Also, relationship between lower-ranking managers and senior
managers was highly hierarchical. The CEO of South Electro, Mr Chen, refused to
comment on the situation. However, Mr Xie and Mr Wu, two of the production line
managers, expressed their discontent:
'Our managers .. , are very stubborn and closed-minded. They don 'I seem to be bothered
about what their staffs think. Many of the younger senior managers also deliberately keep
distance from the lower-level employees to preserve their image of authority. I can say
there is a/ways an air of tension between upstairs and downstairs (meaning between the
managers and workers, author).' (Mr Xie Mingfang, June 2006)
'Many of my colleagues actually have a lot of ideas to improve their jobs and to improve
the workshop's performance. However they often choose to keep it to themselves - what's
the point? There have been occasions that, whenever things go wrong, a witch-hunting then
204
Chapter 6: Findings from Case Study and Hypotheses Generated
begins and it's always workers and junior supervisors who get the blame'. (Mr Wu Can,
June 2006)
On the other hand, like many other old-fashioned SOEs, South Electric had an
apprenticeship system to train new workers, where tacit experience was passed on
through life-long apprenticeship. It was particularly evident in South Electro's
maintenance work force that such close mentoring and coaching relationship had
cultivated a highly skilful and innovative team. In the team each new worker was
allocated to a Shifu (master worker). Whenever a problem occurs, (e.g. a minor
technical hiccup) the master worker would gather all of his apprentices around to brain
storm a solution. Everyone was encouraged to build on or challenge other people's
ideas. According to the Chief of R&D (Mr Yang), most maintenance workers had great
understanding of the machines/equipments, and shared a pool of knowledge and
experience among them. In the past they had made many important contributions to the
production department's innovation. For example, Mr Sun, director of the maintenance
team, found out that on three key equipments the boring bar and boring sheath does not
match. This situation was reported to the CEO and a budget worked out. A set of
matching bar/sheath costs at least 30,000 RMB. Sun suggested that the cost could only
be around 5,000 Yuan for each machine if right changes can be made on site. At the
time of site observation his team was experimenting on one of the equipments.
Site observations showed that front-line operatives were mainly middle-aged skilled
workers. 'They are well trained. responsible and loyal to the company. we are very
grateful to them' (Mr Xie, Production Line manager and Mr Yang, Chief of R&D,
2006). However, with more and more of them retiring or leaving, young workers were
recruited and could hardly match their old peers in experience and work ethic.
Managers described them as 'irresponsible. lazy cry babies' (Mr Xie). In order to
discipline the new workers, harsh measures were initiated. For example, the main gate
was kept locked and guarded to prevent workers from leaving earlier than they should.
205
Chapter 6: Findings from Case Study and Hypotheses Generated
Finance
As a MASOE with long-standing connection with the state, South Eletro used to enjoy
a privileged financial status. As mentioned in the previous section, up till the mid 1990
it could easily secure cheap or interest free loans from State-owned banks to purchase
expensive foreign-made machinery. However, since South Electro started to show
signs of loss-making, it gradually fell out of favour by the banks and governmental
funding authorities. The situation continued to deteriorate especially after state-owned
banks were required to tighten up their lending and carry out credibility scrutiny in the
late 1990s.
' ... we used to be the 'star' company in the group - we were outstanding in all aspects -
technology, sales, profit, staff income, and tax contribution ... and all banks were eager to
lend to us - because they know we didn't really need money, and even if we couldn't repay
the group could always bail us out ... sadly it's all history now. Our financial situation
started to dip when the government stopped providing direct finance in the late 1990s ... and
then the banks started to ask difficult questions. You know, nowadays without a good
project in the horizon we can't bid for government money, even when South Group agreed
to be our guarantor.' (In a separate interview, the R&D director commented that the firm
was not able to bid for any large-scale projects due to lack of technological competence)
Direct financial support from the government has been rare and limited since the mid
1990s. The latest infusion dated back to 2004 when South Electro received 150,000
RMB (20,000 USD) from the Provincial Committee of Economy and Trade for its
Enterprise Resource Planning (ERP) project and another few wan (10,000 RMB) for its
product improvement project.
6.4.4 Summary
To sum up, South Electro struggled to survive due to lack of capability to keep up with
the demand of product upgrade and development dictated by the market. Its corporate
governance conformed to that of old-fashioned MASOEs, which largely caused its
failure. Top managers were appointed on basis of relationships with their superiors but
not merit. They were pushed by the state shareholder to pursue immediate financial
206

Chapter 6: Findings from Case Study and Hypotheses Generated
perfonnance and cared more about guanxi with officials than what was best for the
company. Although starting off well-equipped and favourably-financed, South Electro
failed to preserve the momentum and adopted a highly dependent, high-visibility
technological strategy. Meanwhile, little did its employees feel valued for their effort
and ideas for technical improvement and innovation - the only exception was with the
maintenance team, however the positive experience was based on tradition and was not
disseminated outside of the department.
207
Chapter 6: Findings from Case Study and Hypotheses Generated
6.5 Discussion, hypotheses generation and further insights
In Chapter 4, Section 4.2 we developed 3 propositions: I) In Chinese firms, different
types of ownership (e.g. MASOE, MISOE and POE) entail different patterns of
corporate governance and level of access to finance; 2) Firms with intelligent
engagement will excel (other things equal) in capability types which are sensitive to
low-visibility activities. 3) Firms with better access to finance will excel (other things
equal) in capability types which are sensitive to high-visibility activities.
After initial findings of each of the case studies are analysed in the previous four
sections, it is important to develop an integrated overview of all five cases. This will be
used to identify patterns which can be related back to the three propositions, and to
generate testable hypotheses for stage two of the empirical research.
A synthesized summary of the five cases are presented in Table 6-7. In order to show
how these cases illustrate the theoretical framework, three types of factors were
selected, namely capability factors (Manufacturing, R&D and Organisational),
visibility of technological activities; and corporate governance and finance factors
(CEO's time-horizon/autonomy, quality of shareholder engagement, inclusion, pressure
for shareholder value, and ease of access to finance). When ascending scores from
low/short to high/long (with matching colour labels from green to red) were assigned to
the above factors, some interesting patterns start to emerge 77. Below each of the
propositions will be discussed with reference to patterns in the table, and 8
corresponding hypotheses will be generated.
77 Scoring of the finns' capabilities and CGFS factors was based on author's own assessment during the case studies, and was individually verified by each firm's respondents to the questionnaires survey conducted at a later stage. The survey results are reported in Chapter 7 and 8.
208
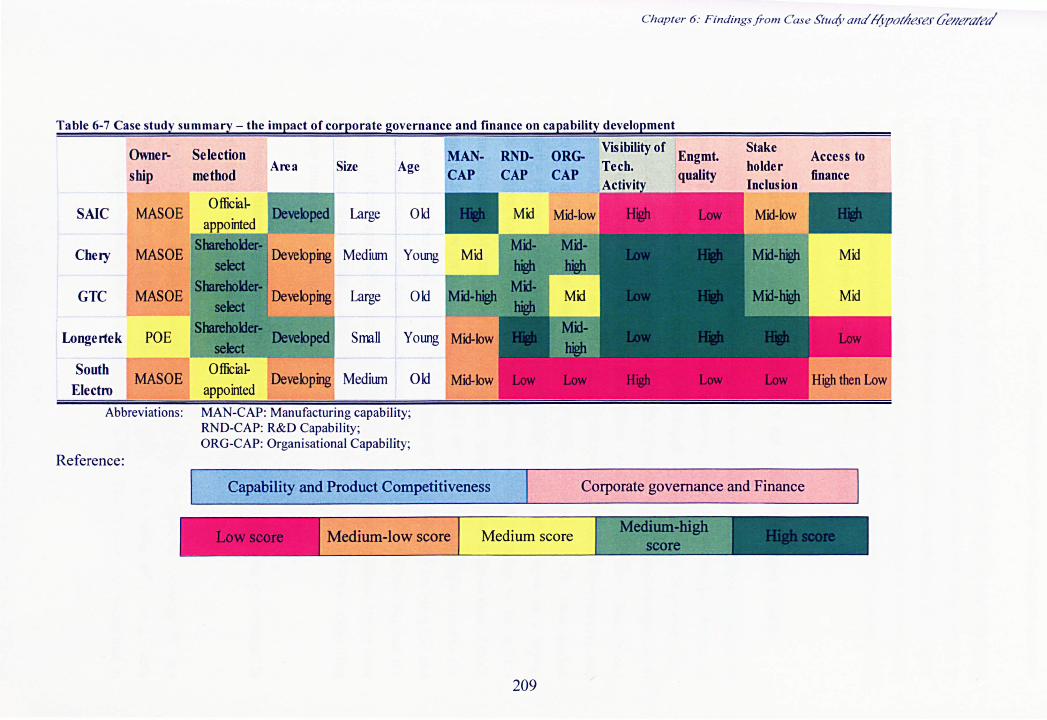
SAIC
Chery
GTC
Longe rtek
South Electro
Owner- Selection
ship method Area Size
MASOE Official-
,DeYebped l Large appointed
S""Utt; MASOE . i:t.~_!f~' Devebpilg~ Medium
MASOE Large
POE Small
MASOE Official
appointed I Devebpingl Medium
Age
Ok!
YOtmg
Ok!
YOlmg
Ok!
Abbreviations: MAN· CAP: Manufacturing capabil ity; RND·CAP: R&D Capability; ORG·CAP: Organisational Capabi lity;
Reference:
!MAN-CAP
Capability and Product Competitiveness
RND-CAP
Chapter 6: Findings fto m Case S'fuc!y al1a /(ypo!l1ef ef Uellelt:7lett'
ORG-CAP
Vis ibility of Stake bolder
Corporate governance and Finance
Access to finance
Mid
Mid
Medium-low score Medium score
209
Chapter 6: Findings from Case Study and Hypotheses Generated
Based on the case studies, only lout of 5 finns has scored 'High' in Manufacturing
Capability, another 1 scored 'High' in R&D Capability, and none has 'High' scores in
Organisational Capability (for definition and elements ofthese capabilities, see Chapter
4, Section I). Although the sample size is too small to produce a generalisable
conclusion, the finding enables us to tentatively infer that the situation of Chinese finns
in tenns of dynamic capability development is not optimistic.
6.5.1 Proposition 1 and Hypothesis 1 &2: Ownership and CGFS
It was proposed in PI that different types of ownership entail different patterns of
corporate governance and finance. This was mainly based on our literature review of
past research in the Chinese context (see Chapter 4, Section 4.2). Moreover, Cai,
Tylecote et al (2005; 2008) argue that MISOEs (Minority State-Owned Enterprises) in
China enjoy better corporate governance than MASOEs (Majority State-Owned
Enterprises), and easier access to finance than POEs (Private-Owned Enterprises), and
therefore outperfonn the other two in capability development. Our case studies
partially supported such argument, as a MASOE South Electro exhibited worrying
signs of poor corporate governance and quickly diminishing access to favourable
financial support. Moreover, all of its 3 types of capabilities scored the lowest of the 5
finns: Medium-Low for Manufacturing and Low for both R&D and Organisational. On
the other hand, Chery and GTC as 2 of the 4 MASOEs appeared have healthier CG and
have become successful. Arguably, they could have done even better had they had the
amount of cash enjoyed by the big favoured SAlC, but this was mainly due to their
geographical disadvantage - with their hands tied, the official of local authorities
simply could not have done more.
The finding hence begs two questions: is ownership a good indicator of governance? Is
there a better indicator of CG for capability development?
Cai and Tylecote pointed answers in the direction of selection method for top
management. They suggest that for Chinese SOEs, it is a better predictor of their
technological capability than is ownership type (2008). Specifically, they found that in
210
Chapter 6: Findings from Case Study and Hypotheses Generated
the telecommunication sector, firms with senior managers selected by the shareholders
out-perform firms with managers appointed by authorities.
To what extent does selection method influence CG for capability development then?
As the case study shows, for the four MASOEs, since SASAC was the main
shareholder as well as governing authority (for explanations see Chapter 3, Section
3.3.1), it requires a closer examination to understand whether the CEOs were selected
by the shareholders according to the law, or appointed as officials. We did so by
looking at the selection and appraisal procedure:
Yin Tongyao from Chery had been head-hunted by the local authorities for his
industrial expertise, and stayed in effective control from the beginning in 1997; Ma
Shichun had served GTC for 25 years. Although none of the supervisory authorities of
Chery and GTC displayed superior expertise, they compensated for this by giving the
real experts - the CEOs - full autonomy to pursue their goals. They both had every
opportunity and motivation to aim for real technological capability development, and
they did so. In sharp contrast, SAlC displayed the typical form of CEO rotation in
Chinese SOEs: firm executives were hand-picked by Shanghai government, with a
short-term target to deliver. Once failed, they were either forced to resign (Hu
Maoyuan), or moved to another company (two former CEOs). South Electro obviously
had a mechanism of authority-appointed senior managers, which is typical of old
fashioned MASOEs (see Section 6.4). It then explains why senior managers in SAIC
and South Electro could not think long - why would they risk their careers to undertake
long-term capability building, when the authorities were breathing down their necks for
immediate profitability?
It is therefore reasonable to infer that, for the two firms with better CG, their
management selection method resembled what is defined as 'shareholder-selection' -
selection based on expertise and competence. As for SAIC and South Electro, the
management selection conformed to 'appointed by the authority'. Two Hypotheses are
then developed:
211
Chapter 6: Findings from Case Study and Hypotheses Generated
RIa: In China, different types of ownership lead to different corporate governance for
the purpose of capability development. RIb: In China, in getting access to financial
resources, different types of ownership lead to different treatment.
R2: In China, different selection methods for top management in SOEs lead to
different corporate governance for the purpose of capability development. (There is no
R2b because theoretically, there is no reason why selection method should affect
finance).
6.5.2 Proposition 2 and Hypothesis 3, 4 &5: engagement, visibility and technological capability development
In Chapter 2, the existing Western-developed theory was adapted for the Newly
Industrialised Economies, that four corporate governance factors - 1) Quality of
shareholder engagement 2) Stakeholder Inclusion 3) Pressure for shareholder value and
4) Management autonomy - are each influential to four aspects of technological
learning and capability development: 1) Visibility of technological activity; 2)
Stakeholder spill-over; 3) Need for configuration and 4) Technological opportunity.
After the situation of Chinese firms was reviewed in Chapter 3, the framework was
further refined in Chapter 4. Specifically, since most unsuccessful technological
learning in Chinese firms has been in the form of highly dependent, high-visibility
activities, we proposed that firms with higher quality of shareholder engagement will
excel (other things being equal) in capability types which are sensitive to low-visibility
activities. Proposition 2 thus has the highest weight in all of the three propositions, that
if it holds, then any degree of improvement in engagement quality should have a
significant and positive impact on capability development in Chinese firms.
It is obvious that the case studies confirmed our prediction: in Table 6-7, the two firms
(SAIC and South Electro) with 'Low' scores of engagement quality had implemented
technological strategy/activities that were high-visibility. Consequently, they scored
'Mid-low' and 'Low' respectively in the type of capability (Organisational Capability)
that are most sensitive to low-visibility activities. The other three firms had higher
quality of engagement, and all had low-visibility technological capabilities, and
212
Chapter 6: Findings from Case Study and Hypotheses Generated
therefore exhibited higher dynamism in their capabilities, especially in Organisational
Capability. Three more hypotheses are thus developed:
H3: there will be a positive relationship between the quality of shareholder engagement
and the firm's technological capability.
H4: Poor engagement leads to strategy prioritising high-visibility activities; intelligent
engagement leads to strategy prioritising low-visibility activities.
H5: Strategy prioritising high-visibility activities leads to lower dynamic capabilities
than strategy prioritising low-visibility activities, does.
6.5.3 Proposition 3 and Hypothesis 6 and 7: Corporate governance, finance and technological capability
Proposition 3 predicted that firms with better access to finance will excel (other things
equal) in capability types which are sensitive to high-visibility activities. This is again
proved to be true for the case studies. As demonstrated in Table 6-7, SAIC enjoyed
very high access to finance, and scored the highest in Manufacturing Capability in all 5
firms. (According to the framework set out in Chapter 4, Manufacturing Capability is
most sensitively to high-visibility activities, compared to the other two capability
types). On the other hand, the two firms with low access to finance both had medium to
low dynamism of manufacturing capability, whilst Chery and GTC were favoured by
the local governments, but had medium financial advantage due to the finical constraint
intrinsic to their location, and each scored 'Medium' and 'Medium-high' in
Manufacturing capability. Therefore, if combining Proposition 1 with 3, and if the
previous six hypotheses all hold, two further hypotheses can be developed:
H6: Ownership form affects technological capability; more specifically, (H6a)
ownership forms giving more intelligent engagement will excel (other things equal) in
capability types which are sensitive to low-visibility activities. It would also be
expected (H6b) that ownership forms giving better access to finance will excel (other
things equal) in capability types which are sensitive to high-visibility activities.
213
Chapter 6: Findings from Case Study and Hypotheses Generated
H7: Technological capability in SOEs is affected by selection method for top
management. (H7a) Selection methods giving more intelligent engagement will excel
(other things equal) in capability types which are sensitive to low-visibility activities.
(There is no H7b because there is no reason why selection method should affect
finance.)
Hypotheses 6 and 7 can be seen to address the overall aim of this research, that is, to
identify the most influential factors of corporate governance and finance for
technological capability development in Chinese firms.
6.5.4 Further Insights: Unbundling, inclusion and technological capability
In addition to the above 7 hypotheses developed for testing in the questionnaire survey,
there are also a number of further insights from the case studies. Below each of them
will be discussed to explore opportunities for future research.
Unbundling and dynamic capability
In the case studies most successful firms have shared a pattern of behaviour which can
be termed as technological unbundling. As the word indicates, it refers to firms'
endeavour to acquire the capability to produce each component and sub-system, and
system, separately, and indeed at the extreme involves separate acquisition of each
element. Three key characteristics of unbundling have been identified:
1) As a commonplace example of low-visibility activity, unbundling may take either or
both of two orthogonal forms: tangible/component unbundling, such as acquisition of
machinery from one supplier and parts from another (Chery with SEAT, and GTC with
the Tianjin machinery supplier), and intangible/process unbundling, such as training
from a third party; or joint R&D (Chery with AVL). In terms of their effects on
dynamic capability development, tangible/component unbundling directly benefited the
case study finns' development of dynamic manufacturing and R&D capabilities; whilst
intangible/process unbundling required higher-level coordination of intra- and inters
organisational activities and strategic planning, and hence pushed the firm to improve
214
Chapter 6: Findings from Case Study and Hypotheses Generated
dynamism of its organisational capability. Although limited sample size is not
sufficient to test how the two forms of unbundling compare with each other, more can
be revealed with further study focused on such issue.
2) Firms in our case studies were mostly 'forced' to unbundle to tackle financial
constraints; however unbundling should not be considered exclusive to poor, small
firms. Just as other technological learning endeavour to enhance dynamic capabilities,
unbundling requires not only the intensity of effort, but also existing capability and
knowledge base to be able to learn (see discussion of the literature in Chapter 2).
Therefore firms with higher degree of static capabilities and better financial stance
could be in a better position to unbundle, and benefit even more from it. Likewise these
firms could execute unbundling at a much more advanced starting point - just as SAIC
did. The key to success - as argued in this thesis - is a sound corporate governance
mechanism to see the process through.
3) The applicability of unbundling and its benefit on capability development is
dependent on the sectors and the characteristics of technology. Clearly for firms in the
auto and electronics industries, unbundling provides them a unique opportunity of
learning by doing, and to understand systems integration. These two industries involve
assembly of components, to subsystems, to systems, then to final products. For those
that don't (chemical, plasma, etc), there is less scope for unbundling and less need for
systems integration. But the intangible unbundling is still relevant.
Inclusion, guanxi and dynamic capability
In the case study we confirm that although it is not a sufficient condition, stakeholder
inclusion is positively associated with dynamic capability - again shown in Table 6-7.
We also found that for firms with high quality of engagement, such as GTe and
Longertek, their quality of inclusion was equally higher, and the same pattern applies
to South Electro and SAlC where there was poor engagement, hence inclusion and
engagement tend to go together.
Two more findings from the case study enrich the existing theory. Specifically, 1)
intelligent inclusion benefits not only technological activities, but also flow of
215
Chapter 6: Findings from Case Study and Hypotheses Generated
information for innovation; 2) in the Chinese context, the convention of guanxi, which
often involves relationship between the government officials and the firm, may be
necessary for a firm's survival and sales growth in the short run, but in the long term
could be destructive to firms' other inclusion activities.
Our cases have shown that close and constructive relationship with stakeholders - such
as suppliers with Chery and GTC, skilled workers and technical staff with GTC and
Longertek, and 'lead' industrial customers with Longertek, are vital. Whilst some of
these relationships are based on transaction of commodities or collaboration of
activities, many focus on facilitation of information flow. Take Longertek as an
example: while accepting that their tougher resource constraints did inhibit formal
training, information scanning and formal R&D, most product development was
achieved through constant and open communication - not only within the firm, but with
external sources. Longertek's technological competitiveness depends on key
employees, including the owner/manager, bringing together the knowledge they have
gained by experience, and making the routines developed within the firm explicit:
thereby they are able to share knowledge, combine it, and create new knowledge.
Unfortunately, the CEO's time must be spent elsewhere - much more than he would
like to - to cultivate and expand his guanxi wang with officials. On the other hand,
South Electro's case was a different side of the story: its CEO's enthusiasm in guanxi
building reveals his incompetence and ill-willed motivation, which is largely attributive
to the selection method of official appointment (see 6.5.1).
6.6 Summary
In this chapter, findings from five in-depth case studies were described and analysed.
After integrated discussion was made based on the theoretical framework, seven
corresponding hypotheses were developed for testing through questionnaire survey in a
later stage:
216
Chapter 6: Findings from Case Study and Hypotheses Generated
Hla: In China, different types of ownership lead to different corporate governance for
the purpose of capability development. Hlb: In China, in getting access to financial
resources, different types of ownership lead to different treatment.
H2: In China, different selection methods for top management in SOEs lead to
different corporate governance for the purpose of capability development.
H3: there will be a positive relationship between the quality of shareholder engagement
and the firm's technological capability.
H4: Poor engagement leads to strategy prioritising high-visibility activities; intelligent
engagement leads to strategy prioritising low-visibility activities.
H5: Strategy prioritising high-visibility activities leads to lower dynamic capabilities
than strategy prioritising low-visibility activities, does.
H6: Ownership form affects technological capability; more specifically, (H6a)
ownership forms giving more intelligent engagement will excel (other things equal) in
capability types which are sensitive to low-visibility activities. It would also be
expected (H6b) that ownership forms giving better access to finance will excel (other
things equal) in capability types which are sensitive to high-visibility activities.
H7: Technological capability in SOEs is affected by selection method for top
management. (H7a) Selection methods giving more intelligent engagement will excel
(other things equal) in capability types which are sensitive to low-visibility activities.
Moreover, further insights from these cases which were not included in the hypotheses
have been identified and discussed.
217
Chapter 7 Findings from Questionnaire Survey (1):
Testing of Hypotheses 1 • 2
This chapter is dedicated to descriptive findings of quantitative surveys which
evaluated the technological capabilities and corporate governance lfinance of Chinese
electronics firms. Section 7.1 draws a general picture of the data collected from the
survey, such as firm size, age, location and sub-sectors. It also gives an overview of the
variables used in the survey. Section 7.2 gives a general assessment of firms'
technological capabilities and their technological endeavour. Section 7.3 evaluates the
firms' corporate governance and finance. Section 7.4 summarises the chapter.
7. 1 Data profile and variables
7.1 .1 Data description - general profile
The target population of this research comprised 11655 domestic firms in the Chinese
electronics industry. From March to September 2007, paired questionnaires were
circulated among 527 firms through post and email (for details about the circulation see
Chapter 5, Section 5.4). 195 sets of valid responses generated a response rate of 36.3%,
which is reasonably high for a multi-questionnaire survey. In the questionnaire survey,
89 firms (45.6%) were MASOEs, 68(34.9%) were MISOEs and the remaining 38
(19.5%) were POEs. About 76% of the respondents to questionnaires had worked in
the surveyed firm for a minimum of 5 years. This indicates that most informants had
sufficient firm-specific knowledge to answer these questions. The average age of the
firms was 25.64 years. (SD=15.24 years). The youngest firm was established in 2005
and the oldest in 1959. 72 firms (37 %) had more than 1000 full-time-equivalent
employees, which is large-scale according to the criteria of State Statistic Bureau
(http://www.stats.gov.cnltjsj/ndsil2007/indexce.htm. last accessed June 2008), 22
(13.9%) had between 500 to 999 staff, and 96 (49.2 %) had less than 499 staff, which is
small-scale. Among the 195 firms, 72 firms (36.9%) were located in developed coastal
region, and 53 (27.2%) in less-developed western regions. The three sub-sectors with
most respondents were: telecommunications (38, 19.5%), computers and related
products (33, 16.0%), and consumer electronics (24, 12.3%).
218
Chapter 7: Testing of Hypotheses J - 2
Table 7-1 gives detailed infonnation about the distribution of sample finns by region
and by sub-sector.
At the time of survey, 63.6% of the finns (124) had sales growth rates between 3 -
20% over the past three years, with only 2.6% finns suffering from sales reduction.
These percentages were comparable to the industrial figures reported in the Yearbook
of China Infonnation Industry 2006 (pp.94-98). In order to gain further insights into
the validity of the data set, especially its industrial characteristics, comparisons were
undertaken with industry statistics. For instance, we correlated the SOE sector's
general sales growth with that of the SOEs in our survey (POE data at the macro level
was not available) and observed a low but significant Pearson ratio of 0.12 (P<O.OI).
This again con finned that our data was representative of the population.
Sales increase however did not necessarily reveal how competitive the finns were. As
discussed in Chapter 5, innovation rates were collected in the survey to measure finns'
innovation strength - proxied by the average percentage of revenue from newly
introduced products to total revenue in the company over the last 3 years (Yam et al.,
2004). More than a quarter of the finns had less than 9% of sales generated from new
products in a 3-year period, and the top quartile was between 30-49%. This
perfonnance compared poorly to developed countries such as Sweden, Austria, Canada,
Denmark, Switzerland, Ireland, Netherlands and Gennany with innovation rates above
60%. It is also unsatisfactory compared to another BRIC78 country - Brazil- with 31 %
in 2000 (Cassiolato, 2001). Bearing in mind that newly introduced products were not
always innovative products (the latter was often a fraction of the fonner), the actual
strength of innovation in the surveyed finns would even be arguably lower. This
finding supported our prediction that despite the superficially satisfying sales data,
most electronics firms were faced with lack of sustainable growth propellers.
78 A tenn referred to the combination of Brazil, Russia, India, and China.
219
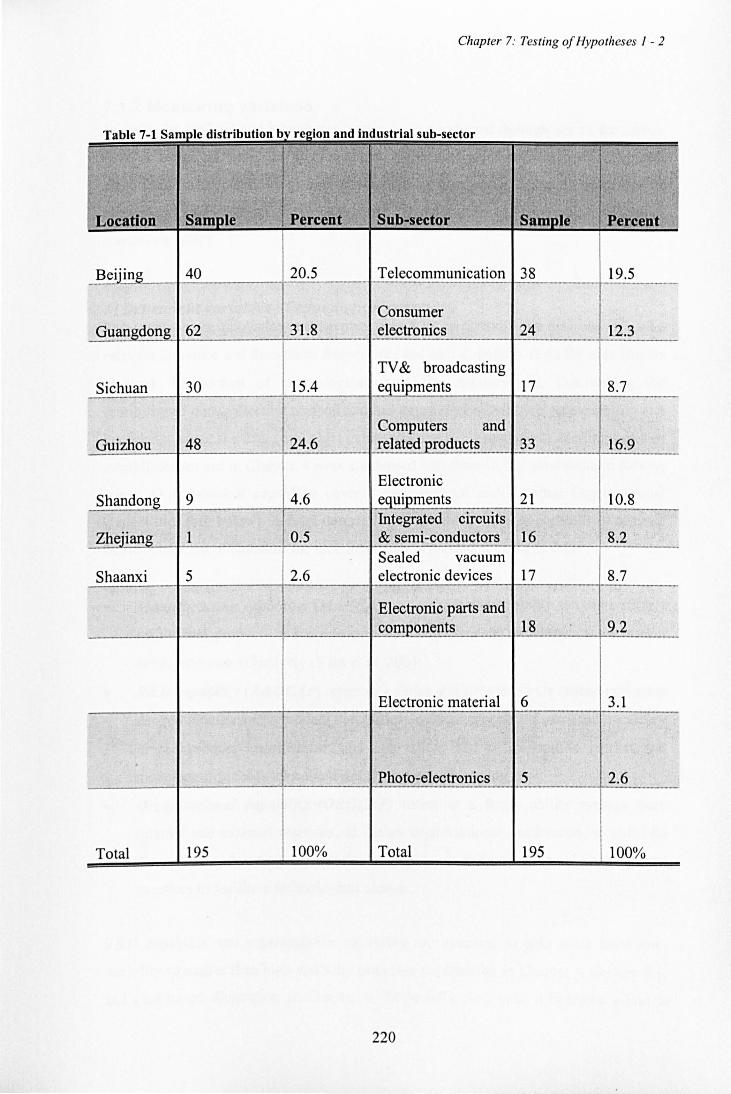
Chapter 7: Testing of Hypotheses I - 2
Table 7-1 Sample distribution by region and industrial sub-sector
Location Percent Sub-sector Percent
BeijJ.!!g 40 20.5 Telecommunication 38 19.5 -- ---_._---- ----.----
Consumer Guangdong 62 31.8 electronics 24 12.3 -._--------_. __ . _______ '_._H ._.-._---
TV& broadcasting Sichuan 30 15.4 e U1 ments 17 8.7
Computers and Guizhou 48 24.6 related product~_. __ . 33 16.9 --_._----- ---.. _---------
Electronic Shandon 9 4.6 ~~ments 21 10.8 -----
Integrated circuits Zhe'ian I 0.5 & semi-conductors 16 8.2 ------- ._--_.-
Sealed vacuum Shaanxi 5 2.6 electronic devices 17 8.7
Electronic parts and . components ____ 18 9.2 -----._--------
Electronic material 6 3.1 ---------~ ._-----
Photo-electronics 5 2.6 ,-------lr-------t-------J-=....:..:..:-.:..:....----.. --.--.--.--.--.... ---.. -----.----- --'---'---
Total 195 100% Total 195 100%
220
Chapter 7: Testing of Hypotheses J - 2
7.1.2 Measuring variables In order for analysis and hypotheses testing to be conducted through use of the survey
data, a series of variables were devised when the questionnaires were designed.
According to their definitions and the theoretical framework, these variables can be
categorised into four types: 1) dependent; 2) independent; 3) intennediate and 4)
control variables.
1) Dependent variables - Technological capability Past research on innovation management (see Chapter 2 and 4 for discussions of the
relevant literature and theoretical framework) and initial findings from the case studies
inspired the content of technological capability measurement. Considering the
feasibility of data collection method and the target respondents' job responsibility and
knowledge about the finn (firm chief executives and R&D managers), the four types of
capabilities set out in Chapter 4 were condensed into three in the questionnaire survey,
where Organisational capability covered both Internal and External Organisational
Capabilities (see below). A brief description of the three types of capabilities is given
below, and a list of elements for each capability is presented in Table 7-2:
• Manufacturing capability (MANCAP) refers to a finn's ability to convert R&D
results into products in accordance with design request, which caters for market
needs, and cost effectively (Yam et aI, 2004).
• R&D capability (R&DCAP) refers to a finn's ability to integrate customer/market
desired functions into product design/development process, to carry out necessary
process/product improvement and innovation, and to respond to market and
manufacturing feedbacks about design and manufacturing.
• Organisational capability (ORGCAP) refers to a finn's ability manage both
internal and external relations, to secure organizational mechanism, to cultivate
distinctive and strong organizational culture, and to adopt good management
practices to facilitate technological change.
R&D capability and organisational capability are assumed to gain more from low
visibility strategies than high-visibility ones (see explanation in Chapter 4, Section 4.1,
and case-based illustration in Chapter 6, Table 6-7). Any such differential effect is
221
Chapter 7: Testing of Hypotheses J - 2
likely to be less with manufacturing capability, since successive improvements in static
manufacturing capability could be bought with bundled foreign technology (see the
cases of SAIC and South Electro in Chapter 6). Moreover, manufacturing capability
should be most sensitive to the availability of finance, organisational capability least.
2) Independent variables: Corporate Governance factors According to the hypotheses generated from the case studies (see Chapter 6, Section
6.5), three corporate governance factors were included in the quantitative study as
independent variables: i) Ownership Type; ii) Management Selection Method; and iii)
Quality of Shareholder Engagement.
i) Ownership Type. Firms' ownership was categorised according to the theoretical
framework: Majority State-Owned [State share ~ 50%] (MASOE); Minority State
Owned [0 %< state share<50%] (MISOE); and Private-Owned (POE).
ii) Management Selection Method. Selection methods of management mainly take
through broad forms: selected by administrative authorities (ADMINS), recommended
or approved by administrative authorities (RECIAPPS) and selected by firms'
shareholders (SHARHS) (Cai & Tylecote, 2008).
iii) Quality of Shareholder Engagement. The findings from the case studies showed
that, shareholder assessment criteria are good proxies of the level and extent of their
engagement. Based on the case studies and SASAC's portfolio of performance
measurement in large-scale SOEs (see Chapter 3, Section 3.3.1), four of the most
representative criteria are selected to measure quality of shareholder engagement in the
survey. Profit rate (MEAS_PFT) and sales revenue (MEAS_SALES) are two of the
indicators most commonly used by Chinese authorities to evaluate firms' financial and
overall performance. Although containing some overview of firm's past financial and
market position, they do not show how these profits and sales have been generated (by
selling more new, innovative products, or by simply cutting down R&D to reduce
cost?), nor do they say anything about the firms' potential to sustain profits and sales.
Hence over-reliance on these figures can be seen as a sign of lack of engagement or
inappropriate engagement. Market share (MEAS_MKT) is a slightly better indicator,
222
Chapter 7: Testing of Hypotheses J - 2
as it reflects the finn's product competitiveness in the market and indirectly infonns the
finn's longer-tenn competence. Shareholders caring more for market shares can
therefore be regarded to have higher level of engagement. Finally, the innovation rate
(sales revenue from products introduced in last 3 years/total revenue) (MEAS_INNO)
is a new adoption from the western world at the tum of the century, among the four it
requires the highest expertise to prepare and understand, moreover, it best indicates the
finns' current technological capabilities - the capability to develop new products, and
the capability to profit from innovation. Close attention to, and emphasis on improving
this ratio can mean high level of engagement by the shareholders to enhance finns'
technological capability. In the questionnaire, finn executives were asked to rate the
weight of the above shareholder assessment criteria on a 5-point Likert Scale (there
was no cross-criterion ranking).
3) Intermediate variables - Technological Strategy/Activity As mentioned in the previous Chapter and in the literature review (Chapter 2, Section
2.3), technological activity/strategy can be influenced by a finn's corporate governance
and finance, and meanwhile is liable to detennine its technological capability
development and perfonnance. Therefore, they could be referred to as intermediate
variables - the ones which mediate the effects of corporate governance and finance on
technological capability development. In the survey three types of intermediate
variables were included as inspired by the literature and the case studies, namely: 1.
Technological strategic priority; 2. Technology-related financial input; 3. Non-
financial technological endeavour.
1. Technological strategic priority variable. Firm executives were asked to report
their preference between choosing the most advanced technology, given sufficient
funds (high visibility strategy [HVS]), and choosing the most appropriate technology
according to the finn's current situation (low-visibility strategy [LVS]).
2. Technology-related financial input - In light of the complexity of relationships
among different investment activities, the focus is on two types of technology
related investments which are most relevant to the research questions (average of last
three years):
223
Chapter 7: Testing of Hypotheses J - 2
Investment in tangible asset as percentage of total revenue [INV _TAN];
Investment in technology absorption as percentage of total revenue
[INV _ABSB].
High intensity of investment in tangible asset can be associated with high-visibility
strategy, which according to the hypothesis indicates poor engagement; whereas
high level of investment in technology absorption can be read as outcome of low
visibility strategy - deriving from intelligent engagement.
3. Non-financial technological endeavour - 7-point Likert scales were used to
measure firm's technology-related activities in the past five years.
Reliance on foreign technology supply (FRGN)
Reliance on reverse engineering (REVS)
Reliance on staff training (TRNG)
Reliance on networking activities both internally and externally (8-item
average, Cronbach's a=O.868, for item description see Table 7-2) (NTWK)
As observed, a high score for FRGN indicated HVS, whereas high scores for REVS,
TRNG, and NTWK indicated LVS.
4) Control variables
In the regression analysis, firms' R&D investment was treated as a control variable
(INV _RD), measured by the proportion of investment in R&D to total sales revenue
over the last 3 years. There are two explanations, first, the positive effect of R&D
intensity on technological capability development has been thoroughly studied and
widely proved (Cohen & Levinthal, 1989; Deeds, 2001), hence it is not pertinent to re
test the hypothesis. Moreover, since R&D activities are relatively easy to quantify and
fairly high-visibility, it does not effectively reflect the strength of shareholder
engagement.
Firm age and size were also control variables. Studies in the past have shown that older
firms may have cumulated experience that facilitates technological development; yet
they may also encounter difficulties in keeping in line with developments in the
external world (Hanson, 1992; Audretsch, 1995; Toby, 2000), therefore, Firm Age
(AGE) is controlled for. Likewise, larger firms may have more resources but lack the
224
Chapter 7: Testing of Hypotheses J - 2
necessary organisational flexibility; hence Firm Size (SIZE) was controlled for by
including the total number of full-time employees of the firm. Geographic location has
been confirmed as an important factor for a firm's development, particularly in the
Chinese context (Demurger et al., 2002), two regional dummies are created for the
three geographic locations in which the data was collected (RIG_DUM). In addition,
dummy variables for 9 of the 10 industrial Sub-sectoral Categories are included
(SECT_DUM).
Definitions of the variables and the questions designed to gather relevant data have
been summarised in Table 7-2 below:
225
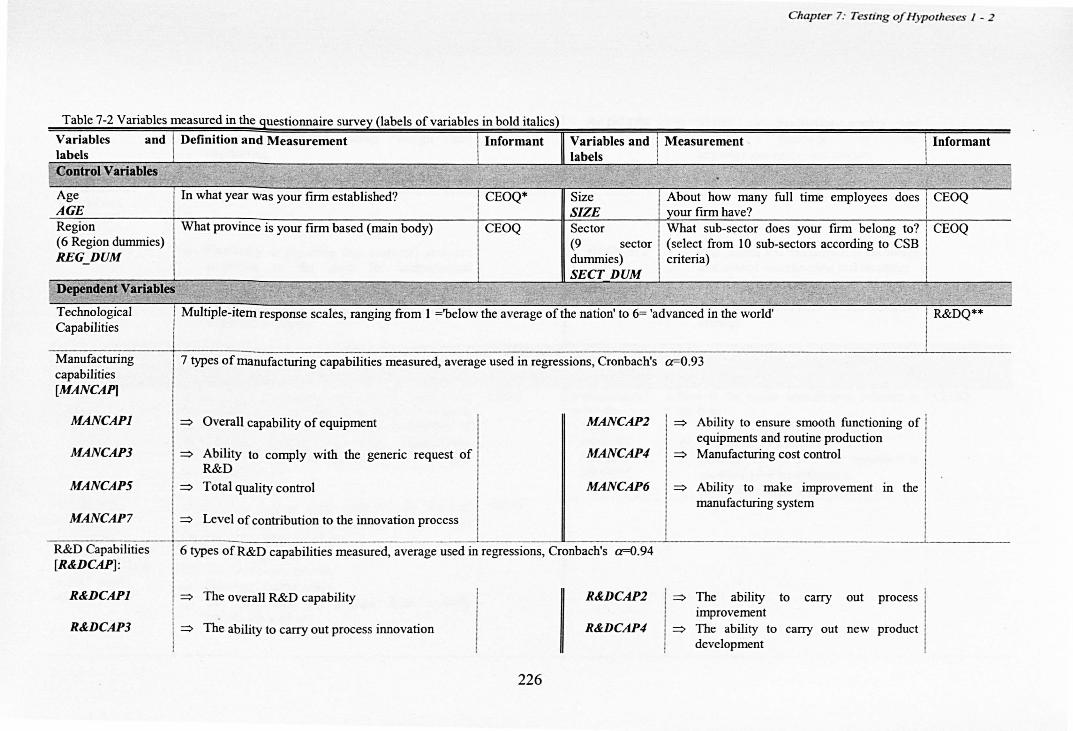
Table 7-2 Variables measured in the questionnaire survey (labels of variables in bold italics)
Variables and I Definition and Measurement I Informant labels ,control Variables
Age AGE Region (6 Region dummies) REG DUM
I In what year was your firm established?
What province is your firm based (main body)
Dependent Variables
I CEOQ*
CEOQ
Size SIZE Sector (9 sector dummies) SECT DUM
Chapter 7: Tesring of Hypotheses I - 2
Measurement i Informant I
'I About how many full time employees does CEOQ your firm have? What sub-sector does your firm belong to? CEOQ (select from 10 sub-sectors according to CSB criteria)
Technological Capabilities
Multiple-item response scales, ranging from 1 ='below the average of the nation' to 6= 'advanced in the world' R&DQ**
Manufacturing capabilities [MANCAPI
MANCAPI
MANCAP3
MANCAP5
MANCAP7
R&D Capabilities [R&:DCAP]:
R&:DCAPI
R&:DCAP3
7 types of manufacturing capabilities measured, average used in regressions, Cronbach's a=O.93
~ Overall capability of equipment I MANCAP2 => Ability to ensure smooth functioning of equipments and routine production
=> Ability to comply with the generic request of ! MANCAP4 => Manufacturing cost control R&D
=> Total quality control MANCAP6 => Ability to make improvement in the manufacturing system
~ Level of contribution to the innovation process
6 types of R&D capabilities measured, average used in regressions, Cronbach's a=O.94
=> The overall R&D capability
I R&:DCAP2 ! => The ability to carry out process I improvement R&:DCAP4 I ~ The ability to carry out new product
I development => The ability to carry out process innovation
226
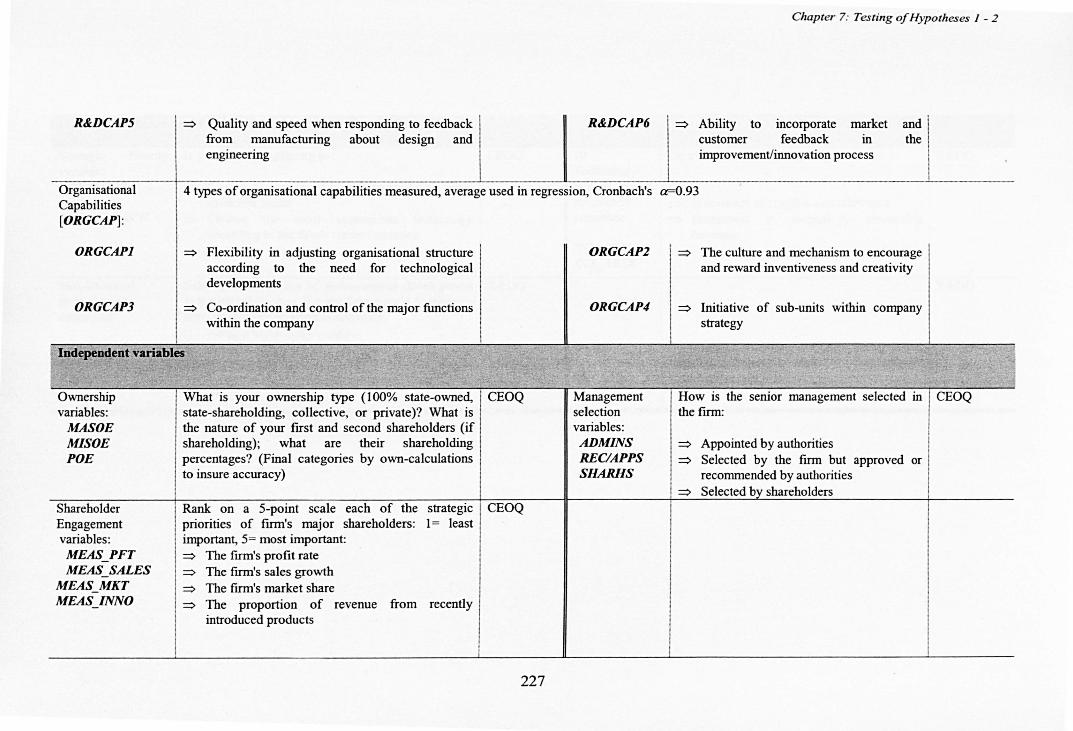
R&DCAP5 => Quality and speed when responding to feedback R&DCAP6 from manufacturing about design and engineering
Chapter 7: Testing of Hypotheses J - 2
=> Ability to incorporate market customer feedback in improvement/innovation process
and I the i
.1
Organisational Capabilities [ORGCAP) :
4 types of organisational capabilities measured, average used in regression, Cronbach's a=O.93
ORGCAPI
ORGCAP3
=> Flexibility in adjusting organisational structure according to the need for technological developments
=> Co-ordination and control of the major functions within the company
Independent variables
Ownership variables:
MASOE MISOE POE
Shareholder Engagement variables: MEAS PFT MEAS SALES
MEAS_MKT MEAS INNO
I What is your ownership type (100% state-owned, I CEOQ
I state-shareholding, collective, or private)? What is the nature of your first and second shareholders (if shareholding); what are their shareholding percentages? (Final categories by own-calculations to insure accuracy)
I Rank on a 5-point scale each of the strategic priorities of fum's major shareholders: 1 = least
I important, 5= most important: => The fum's profit rate => The fum's sales growth => The fum's market share => The proportion of revenue from recently
introduced products
CEOQ
227
ORGCAP2
OR GCAP4
Management selection variables: ADMINS RECIAPPS SHARHS
=> The culture and mechanism to encourage and reward inventiveness and creativity
=> Initiative of sub-units within company strategy
I How is the the fum:
senior management selected in
I =>
I => I =>
Appointed by authorities Selected by the finn but approved or recommended by authorities Selected bv shareholders
CEOQ
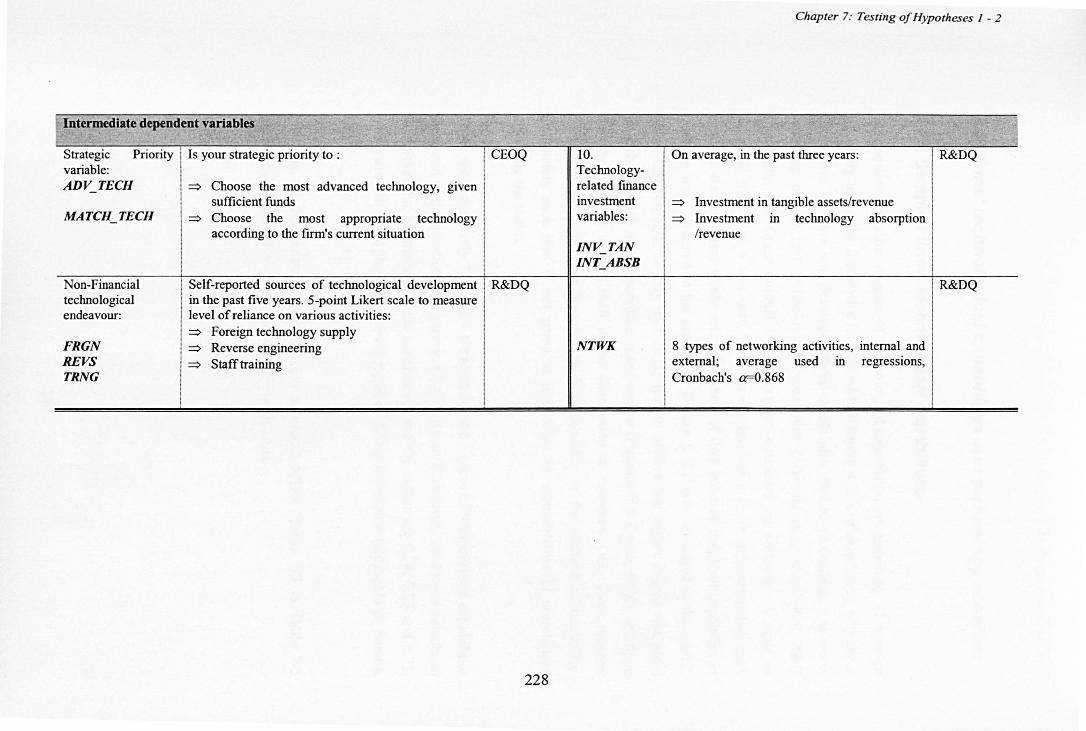
Intermediate dependent variables
Strategic Priority I Is your strategic priority to : variable: I I CEOQ
AD V_TECH I ~ . I Choose the most advanced technology, given I sufficient funds
MATCH TECH
N on-Financial technological endeavour:
FRGN REVS TRNG
~ Choose the most appropriate technology I according to the firm's current situation
i Self-reported sources of technological development I R&DQ I in the past five years. 5-point Likert scale to measure i level of reliance on various activities: I ~ Foreign technology supply I ~ Reverse .e~gineering i ~ Stafftrammg
I
228
Chapter 7: Testing of Hypotheses I - 2
10. 'I on average, in the past three years: Technologyrelated fmance
R&DQ
investment variables:
INV TAN INT ABSB
NTWK
~ Investment in tangible assets/revenue ~ Investment in technology absorption
/revenue
8 types of networking activities, internal and external; average used in regressions, Cronbach's a=O.868
R&DQ
Chapter 7: Testing of Hypotheses J - 2
7.2 Firms' technological capabilities and technology activities
7.2.1 Sampled firms' technological capabilities
This section describes degrees of technological capabilities developed by all sampled
finns. By using the framework introduced in Chapter 4, it explains briefly why these
finns have (or have not) developed these capabilities. Before proceeding, it is worth
repeating briefly that technological capabilities (Manufacturing Capability, R&D
Capability, and Organisational Capability) are evaluated by elements. A scale of
'Degrees' from 1 to 6 was used to assess the level of a finn's achievement in each
element. Sample finns would select Degree 4 if they believed that their capability in
question was 'advanced in the nation', or Degree 6 if it was 'advanced in the world'.
Given that respondents may lead themselves to believe that higher degree was more
'desirable', which is commonplace in self-reports (Podsakoff & Organ, 1986), and there
may hence be a upward shift in the distribution of response. Only those reached
'Degree 5' or higher are regarded as fully dynamic in the element of capability.
Fortunately such bias is not going to jeopardise the interpretation of correlations
involving the scales.
There are respectively 7, 6 and 4 elements for the 3 types of technological capabilities
measured in the questionnaire survey. Cronbach's a (Cronbach, 1951) was calculated
to checked the elements' internal consistency and the values are 0.74, 0.73 and 0.73,
which are all above the 0.70 cut-off value of being acceptable (Reynaldo & Santos,
1999).
Findings for the general assessment are presented below. Table 7-3 to Table 7-5
provides detailed assessment of all capability elements.
229
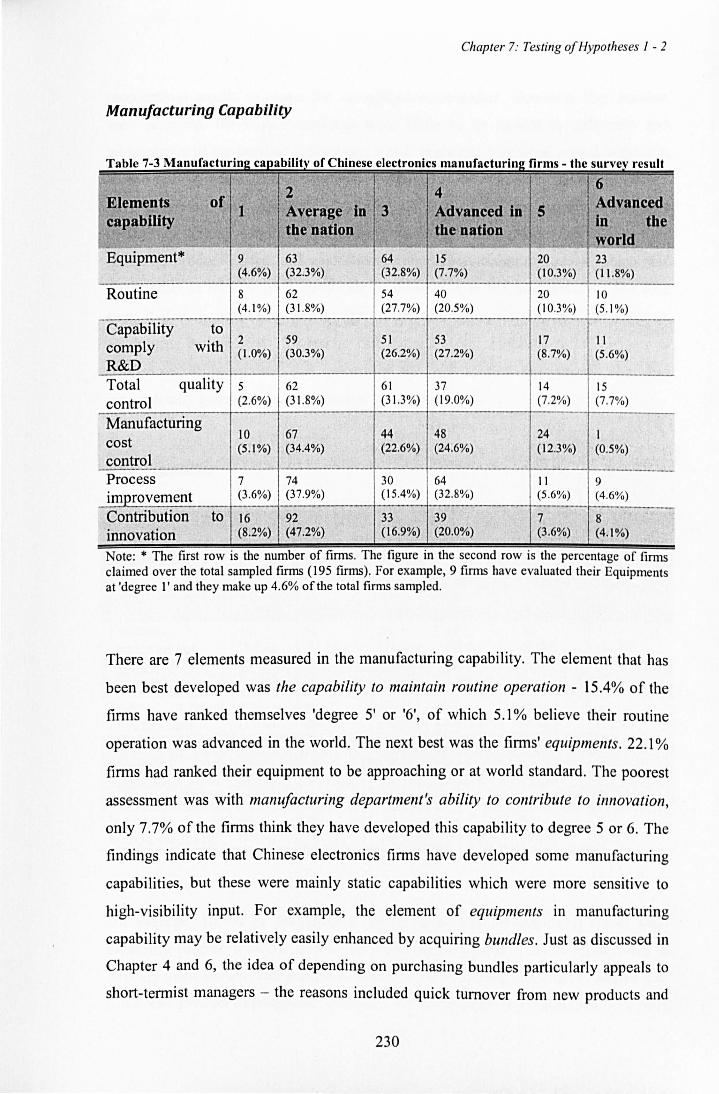
Chapter 7: Testing of Hypotheses / - 2
Manufacturing Capability
Table 7-3 ManufacturiDl~ capability of Chinese electronics manufacturin2 firms - the survey result ,
6 Elements of 2 4
Advan~ed 1 Average · in 3 Advanced in 5 capabiUty ,. . in tbe
I' tbe nation tbe nation world .J I- . ., - 1- ,-
Equipment* 9 63 64 15 20 23 (4.6%) (32.3%) (32.8%) (7.7%) (10.3%) (11.8%) -----... ____ M.M_M_ -- - -_ .... _ ..... __ ... __ .. _--_ .. --.--- --.-.---.---
Routine 8 62 54 40 20 10 (4.1%) (31 .8%) (27.7%) (20.5%) (10.3%) (5 .1%)
.... _ .. __ .. " .... _ ........ _ ... -_ ........... ----_ .... __ . . _---_. ...... __ ._ .. _ ... _-------_ .. , -._ .. _--- . __ .... _ .. _._._, ..... __ .. _--_._ .. .. _-.. _--_ .... _ . ._ ...... _-_ ... _-_ ... _. __ . __ . Capability to comply with 2 59 51 53 17 11
(1.0%) (30.3%) (26.2%) (27.2%) (8.7%) (5 .6%) R&D Total quality 5 62 61 37 14 15
control (2.6%) (31 .8%) (31.3%) (19.0%) (7.2%) (7 .7%) -Manufacturing
10 67 44 48 24 1 cost (5.1%) (34.4%) (22.6%) (24.6%) (12.3%) (0.5%) control ---- --- ----_._---_ .. . _--_ .. _ ... _ .. _---_._--.. __ .. _--_ .... .... _---_ ........ _-- _ ........ _--. __ .. __ .-.-Process 7 74 30 64 11 9 improvement (3.6%) (37.9%) (15.4%) (32.8%) (5.6%) (4.6%)
-f------ _. __ ... _---_ .. ..... _ ... _--- _ .. _. __ ._ ... _-_ ... _ .. _-_ .... _ ...... ---.... __ ... _- _ .. _-.. ,_ .... __ .... _-Contribution to 16 92 33 39 7 8
innovation (8 .2%) (47.2%) (16.9%) (20.0%) (3.6%) (4.1%)
Note: * The first row IS the number of firms . The figure In the second row IS the percentage of finns claimed over the total sampled firms (195 finns). For example, 9 firms have evaluated their Equipments at 'degree l' and they make up 4.6% of the total firms sampled.
There are 7 elements measured in the manufacturing capability. The element that has
been best developed was the capability to maintain routine operation - 15.4% of the
firms have ranked themselves 'degree 5' or '6', of which 5.1% believe their routine
operation was advanced in the world. The next best was the firms' equipments. 22.1 %
firms had ranked their equipment to be approaching or at world standard. The poorest
assessment was with manufacturing department's ability to contribute to innovation,
only 7.7% of the firms think they have developed this capability to degree 5 or 6. The
findings indicate that Chinese electronics firms have developed some manufacturing
capabilities, but these were mainly static capabilities which were more sensitive to
high-visibility input. For example, the element of equipments in manufacturing
capability may be relatively easily enhanced by acquiring bundles. Just as discussed in
Chapter 4 and 6, the idea of depending on purchasing bundles particularly appeals to
short-termist managers - the reasons included quick turnover from new products and
230
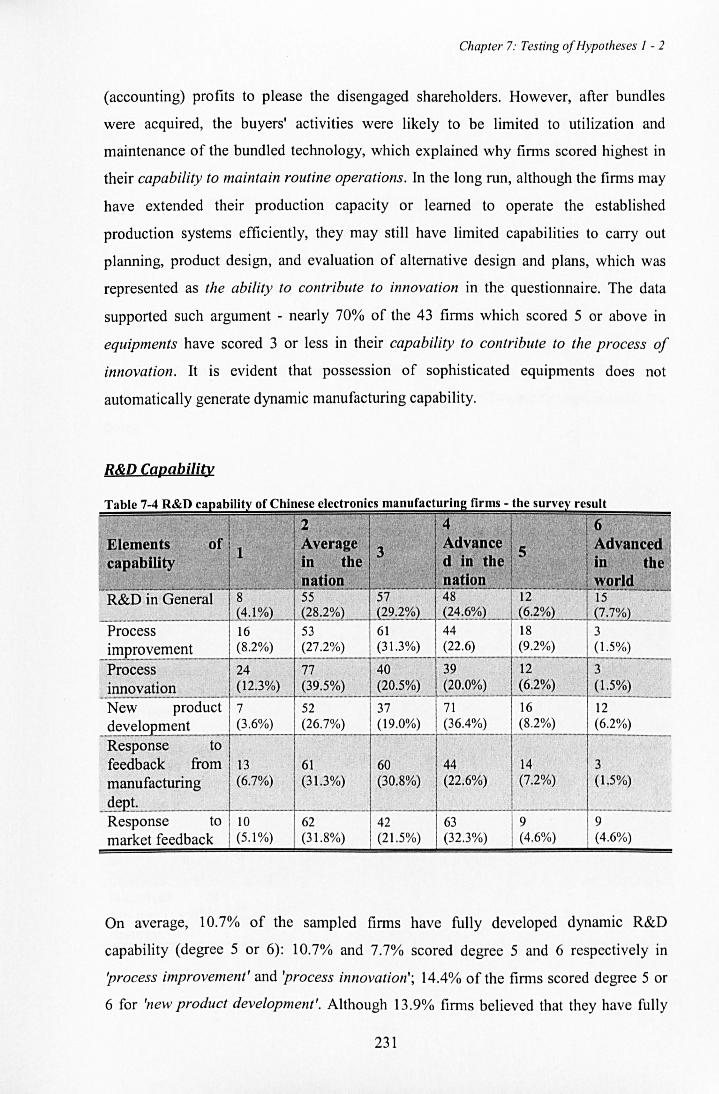
Chapter 7: Testing of Hypotheses I - 2
(accounting) profits to please the disengaged shareholders. However, after bundles
were acquired, the buyers' activities were likely to be limited to utilization and
maintenance of the bundled technology, which explained why finns scored highest in
their capability to maintain routine operations. In the long run, although the finns may
have extended their production capacity or learned to operate the established
production systems efficiently, they may still have limited capabilities to carry out
planning, product design, and evaluation of alternative design and plans, which was
represented as the ability to contribute to innovation in the questionnaire. The data
supported such argument - nearly 70% of the 43 finns which scored 5 or above in
equipments have scored 3 or less in their capability to contribute to the process of
innovation. It is evident that possession of sophisticated equipments does not
automatically generate dynamic manufacturing capability.
R&D Cqpability
Table 7-4 R&D capability of Chinese electronics manufacturing firms - the survey result
Elements capability
246
3 Advance 5 Advanced d in' the in the
nation . nation world R&D in General 8 -'--- 5-5----- 5-7-----48-----'- 12 -15--' ....... -~ .. -
_. __ ., .. __________ J!l.ill._ 28.2~ ___ Q2.2~L-+-,----'-'-'_'_::J.'___+-{6.2%) . __ . _(7.7CYO Process 16 53 61 18 3 _~mErov~m~nt (8.2%) (27.2%) _ ,2~%) (9.2%) _(1_. 5°_%~ ___ _
Process 24 77 40 39 12 3 innovation (12.3%) (39.5%) (20.5%) (20.0%) (6.2%) (1.5%) -_ ... _. __ ._-------- ----- ._--_. New product 7 52
_~~~~_!~.Ement _ _ (3~6%) (26.7%)
Response to feedback from 13 61 manufacturing (6.7%) (31.3%)
._ d~p!:'_. ___ ---f----Response to 10 market feedback (5.1 %)
62 (31.8%)
37 (19.0%) --
60 (30.8%)
42 (21.5%)
-------71 (36.4%) ----
44 (22.6%)
------63 (32.3%)
--------- ---_.-16 12 (8 ,2%) (6.2%) --_. __ . ----
14 3 (7.2%) (1.5%)
---, ----_. __ .-9 9 (4.6%) (4.6%)
On average, 10.7% of the sampled firms have fully developed dynamic R&D
capability (degree 5 or 6): 10.7% and 7.7% scored degree 5 and 6 respectively in
'process improvement' and 'process innovation'; 14.4% of the firms scored degree 5 or
6 for 'new product development'. Although 13.9% finns believed that they have fully
231
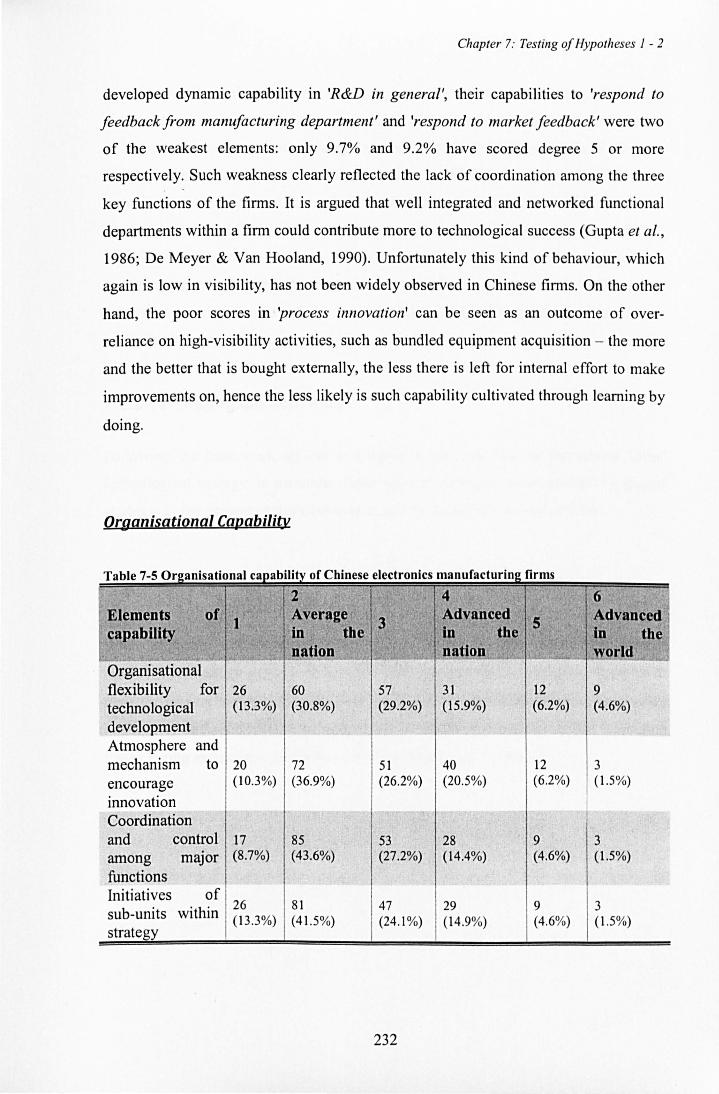
Chapter 7: Testing of Hypotheses I - 2
developed dynamic capability in 'R&D in general', their capabilities to 'respond to
feedback from manufacturing department' and 'respond to market feedback' were two
of the weakest elements: only 9.7% and 9.2% have scored degree 5 or more
respectively. Such weakness clearly reflected the lack of coordination among the three
key functions of the finns. It is argued that well integrated and networked functional
departments within a finn could contribute more to technological success (Gupta et aI.,
1986; De Meyer & Van Hooland, 1990). Unfortunately this kind of behaviour, which
again is low in visibility, has not been widely observed in Chinese finns. On the other
hand, the poor scores in 'process innovation' can be seen as an outcome of over
reliance on high-visibility activities, such as bundled equipment acquisition - the more
and the better that is bought externally, the less there is left for internal effort to make
improvements on, hence the less likely is such capability cultivated through learning by
doing.
Qrganisational Capability
Table 7-5 Organisational cal!abilit~ of Chinese electronics manufacturing firms
2 4 6 Elements 3
Advanced 5 Advanced capability In the In the
n~tlon orld Organisational flexibility for 26 60 57 31 12 9
technological (13.3%) (30.8%) (29.2%) (15.9%) (6.2%) (4.6%)
development Atmosphere and mechanism to 20 72 51 40 12 3
encourage (10.3%) (36.9%) (26.2%) (20.5%) (6.2%) (1.5%)
innovation Coordination and control 17 85 53 28 9 3 among major (8.7%) (43.6%) (27.2%) (14.4%) (4.6%) (1.5%)
functions Initiatives of sub-units within
26 81 47 29 9 3 (13.3%) (41.5%) (24.1%) (14.9%) (4.6%) (1.5%)
strategy
232
Chapter 7: Testing of Hypotheses 1 - 2
More than 50% the finns believed that their capability to 'coordinate and control major
junctions' was average or below average in the nation (degree 2 or 1), and the situation
of 'sub-units initiatives within strategy' was similar (54.8%). Only 10.8% of all finns
acquired the dynamic level of degree 5 or 6 for 'organisational flexibility for
technological development', and only 7.7% thought their finns to have fully developed
the 'atmosphere and mechanism to encourage innovation'. It has been argued that,
organisational capability is the one to benefit least from high-visibility strategy/activity,
and also the one to benefit the most from low-visibility strategy/activity (Chapter 4,
Section 4.1). Assessment of the sample finns' technology activities below will
reinforce the argument.
7.2.2 Technological activities
Following the framework set out in Chapter 4, we now look at the sample finns'
technological strategy. In partiCUlar, three types of strategies are examined: 1) general
strategy; 2) investment strategylbehaviour; and 3) technology-related activity.
General technological strategy
When acquiring new technology from outside, 58.7% of finns choose to buy 'most
advanced technology (if junded)' as opposed to 'appropriate technology compatible to
their existing technology'. Equally, over 57.2% of finns consider 'purchasing discrete
package of technology (such as equipment)' to be their first choice when upgrading
their existing technology; and only 4.6% finns prioritised 'training'.
233
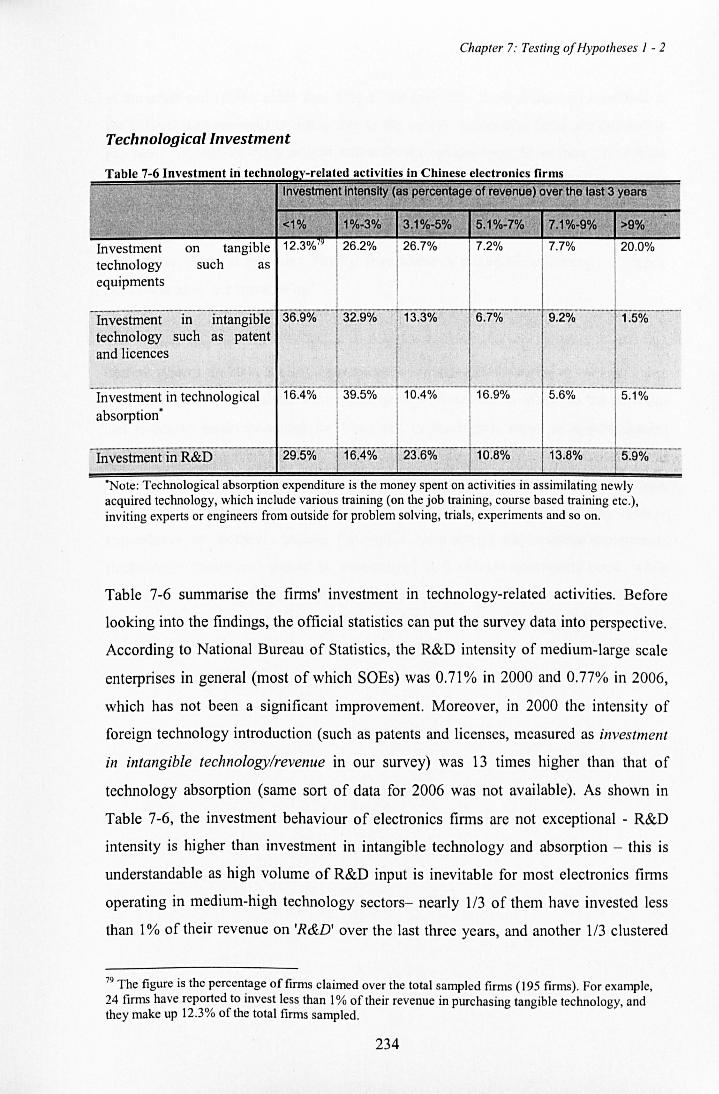
Chapter 7: Testing of Hypotheses I - 2
Techn%gica/lnvestment
Table 7-6 Investment in technology-related activities in Chinese electronics firms , 1 nvestme'1t in~e".~ity ~~8 percentage ~f revenue) over the la~t 3.years ." ",-
I
<1% ,
1%~3% 3.1%-5% 1"5.1%-7% ' 1'7.1%-9% >9% I
. "~
" '"
Investment on tangible 12.3%'Y 26 .2% 26.7% 7.2% 7.7% 20.0%
technology such as equipments
-investmenT-ill- intangible ' 36,90/0- 321fiir-- ------,-----13.3% 6.7% 9.2% 1.5%
technology such as patent and licences
MM .. _ •• _._._ •• _______ ·_· ____ ·M ____ _ •• . _----_. - 39.5% .,- ------_. ------- ,-,------- -----_ .. -
Investment in technological 16.4% 10.4% 16.9% 5.6% 5.1%
absorption 0
~:----'-'-'- -------, - rnvestmeniin R&D ' 29.50;-;-- 16.4% 23:6%----- 10.8% · 13.8o/~--'-- -5.9-%----'---'-
.. °Note: Technological absorption expenditure IS the money spent on activities m asslmllatmg newly acquired technology, which include various training (on the job training, course based training etc.), inviting experts or engineers from outside for problem solving, trials, experiments and so on.
Table 7-6 summanse the finns' investment in technology-related activities. Before
looking into the findings, the official statistics can put the survey data into perspective.
According to National Bureau of Statistics, the R&D intensity of medium-large scale
enterprises in general (most of which SOEs) was 0.71 % in 2000 and 0.77% in 2006,
which has not been a significant improvement. Moreover, in 2000 the intensity of
foreign technology introduction (such as patents and licenses, measured as investment
in intangible technologylrevenue in our survey) was 13 times higher than that of
technology absorption (same sort of data for 2006 was not available). As shown in
Table 7-6, the investment behaviour of electronics firms are not exceptional - R&D
intensity is higher than investment in intangible technology and absorption - this is
understandable as high volume of R&D input is inevitable for most electronics finns
operating in medium-high technology sectors- nearly 1/3 of them have invested less
than 1 % of their revenue on 'R&D' over the last three years, and another 1/3 clustered
79 The figure is the percentage of firms claimed over the total sampled firms (195 firms) . For example, 24 firms have reported to invest less than 1 % of their revenue in purchasing tangible technology, and they make up 12.3% of the total firms sampled.
234
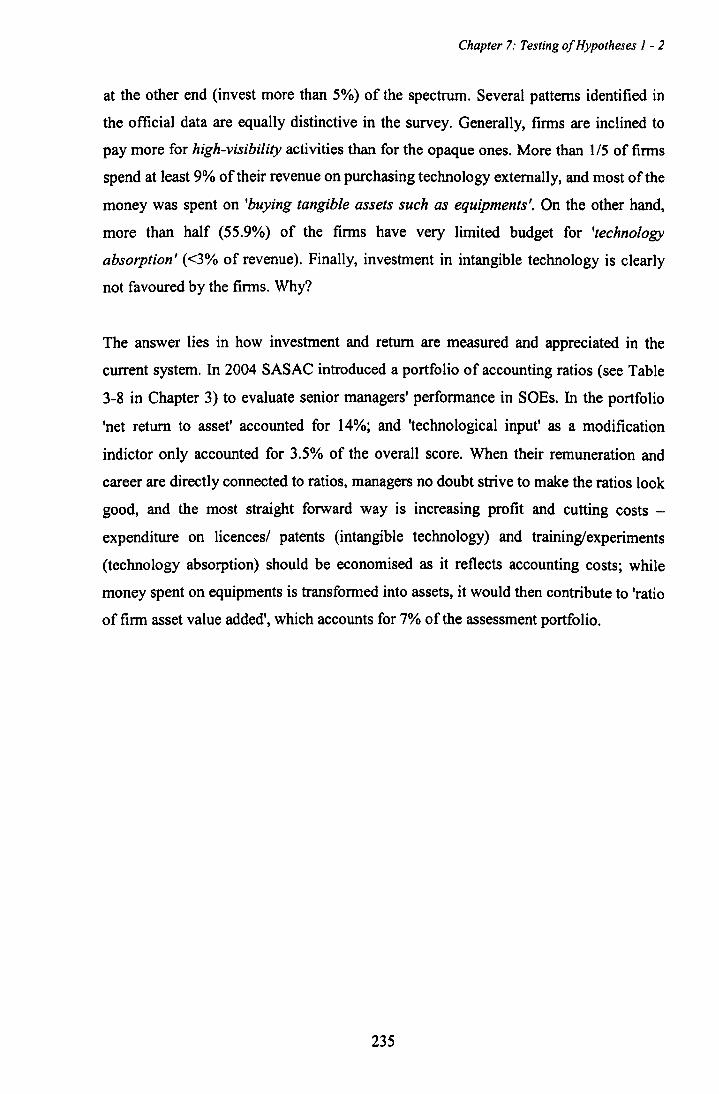
Chapter 7: Testing of Hypotheses J - 2
at the other end (invest more than 5%) of the spectrum. Several patterns identified in
the official data are equally distinctive in the survey. Generally, firms are inclined to
pay more for high-visibility activities than for the opaque ones. More than 115 of firms
spend at least 9% of their revenue on purchasing technology externally, and most of the
money was spent on 'buying tangible assets such as equipments'. On the other hand,
more than half (55.9%) of the firms have very limited budget for 'technology
absorption' «3% of revenue). Finally, investment in intangible technology is clearly
not favoured by the firms. Why?
The answer lies in how investment and return are measured and appreciated in the
current system. In 2004 SASAC introduced a portfolio of accounting ratios (see Table
3-8 in Chapter 3) to evaluate senior managers' performance in SOEs. In the portfolio
'net return to asset' accounted for 14%; and 'technological input' as a modification
indictor only accounted for 3.5% of the overall score. When their remuneration and
career are directly connected to ratios, managers no doubt strive to make the ratios look
good, and the most straight forward way is increasing profit and cutting costs -
expenditure on licences/ patents (intangible technology) and training/experiments
(technology absorption) should be economised as it reflects accounting costs; while
money spent on equipments is transformed into assets, it would then contribute to 'ratio
of firm asset value added', which accounts for 7% of the assessment portfolio.
235
Chapter 7: Testing of Hypotheses 1 - 2
TechnQlogical activity
Table 7-7 Degree of reliance on various technological activity and the impact on technological capability development
~ None or very little Moderate reliance Very heavy reliance reliance (Degrees 1 (Degrees 3 to 5) or indispensable and 2) (Degrees 6 ~d 7)
Type of activity -'"- ,,;. c- ,,-, i. ~"::.. ;'!.
Receiving foreign technology 2080
supply 95 24 10.3% 48.7% 12.3%
Reverse engineering 24 108 63 12.3% 55.3% 31.5%
Own R&D 37 99 58 19.5% 50.8% 29.8%
,---" .--. - __ • ___ 0 __ , __ -
Training 89 88 17 45.7% 45.2% 8.8%
Four types of technological activity commonly practised in Chinese firms were
investigated here: 1) reliance on foreign technology supply; 2) reverse engineering; 3)
own R&D; 4) training. The visibility of acquiring foreign technology, as discussed in
the previous chapters, is much higher than that of reverse engineering and own R&D,
and training has the lowest visibility - having no direct and immediate pay back in the
short term, and is recorded as a current accounting cost; therefore the demand of
engagement and expertise ascends: foreign technology acquisition the lowest and
training the highest. Meanwhile, purchase of technology from foreign firms normally
involves bundled deals, in which little input is required from other stakeholders, such
as employees or related firms, who also gain little from it - there is no obvious need for
stakeholder inclusion. By the same token, training has to be organised and managed in
the sense that trainees' (employees') needs and suggestions are considered. In other
words, they are the subject of such activity and ought to be included, and will gain
directly from the activity. Less inclusion can be linked with reverse engineering and
own R&D.
80 The number in the first row is the number of firms claimed, and the second row is the percentage of the total sample (195).
236
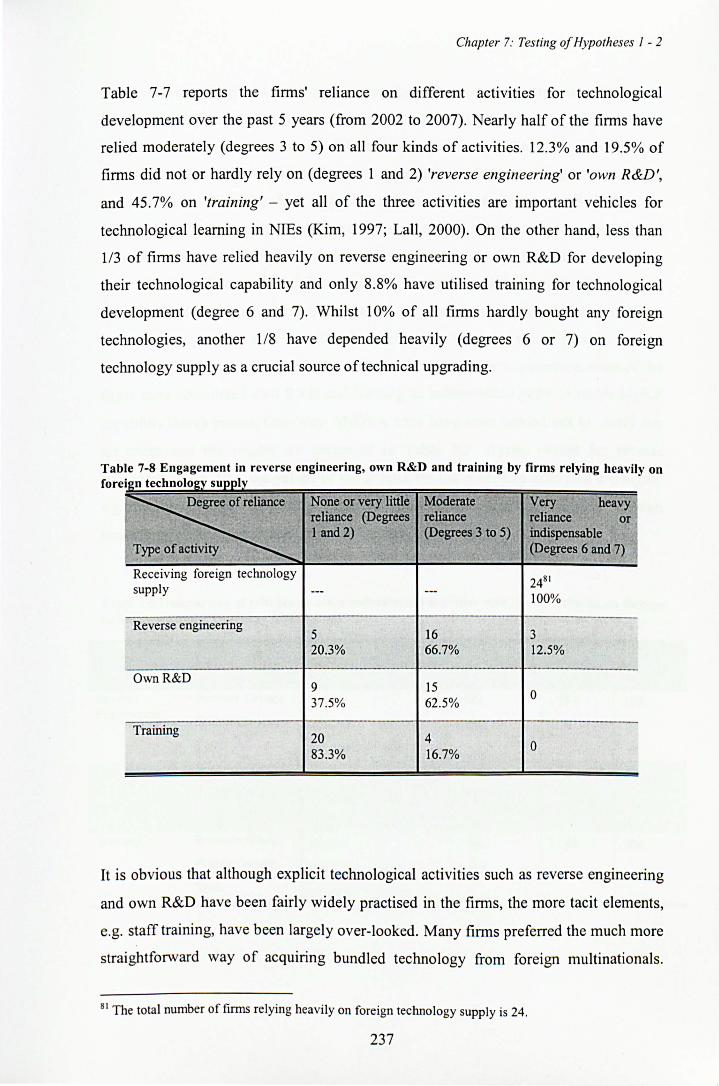
Chapter 7: Testing of Hypotheses J - 2
Table 7-7 reports the finns' reliance on different activities for technological
development over the past 5 years (from 2002 to 2007). Nearly half of the finns have
relied moderately (degrees 3 to 5) on all four kinds of activities. 12.3% and 19.5% of
finns did not or hardly rely on (degrees 1 and 2) 'reverse engineering' or 'own R&D',
and 45.7% on 'training' - yet all of the three activities are important vehicles for
technological learning in NIEs (Kim, 1997; Lall, 2000). On the other hand, less than
113 of finns have relied heavily on reverse engineering or own R&D for developing
their technological capability and only 8.8% have utilised training for technological
development (degree 6 and 7). Whilst 10% of all finns hardly bought any foreign
technologies, another 1/8 have depended heavily (degrees 6 or 7) on foreign
technology supply as a crucial source of technical upgrading.
Table 7-8 Engagement in reverse engineering, own R&D and training by firms relying heavily on forei2n technol02Y supply
~ None or very little Moderate Very heavy reliance (Degrees reliance reliance or 1 and 2) (Degrees 3 to 5) indispensable
Type of activity _ .... (Degrees 6 and 7) .~
Receiving foreign technology 2481
supply --- ---100%
Reverse engineering 5 16 3 20.3% 66.7% 12.5%
.1----------. ----.--.~-.---
Own R&D 9 15 37.5% 62.5%
0
Training 20 4 83.3% 16.7%
0
It is obvious that although explicit technological activities such as reverse engineering
and own R&D have been fairly widely practised in the finns, the more tacit elements,
e.g. staff training, have been largely over-looked. Many finns preferred the much more
straightforward way of acquiring bundled technology from foreign multinationals.
81 The total number of firms relying heavily on foreign technology supply is 24.
237
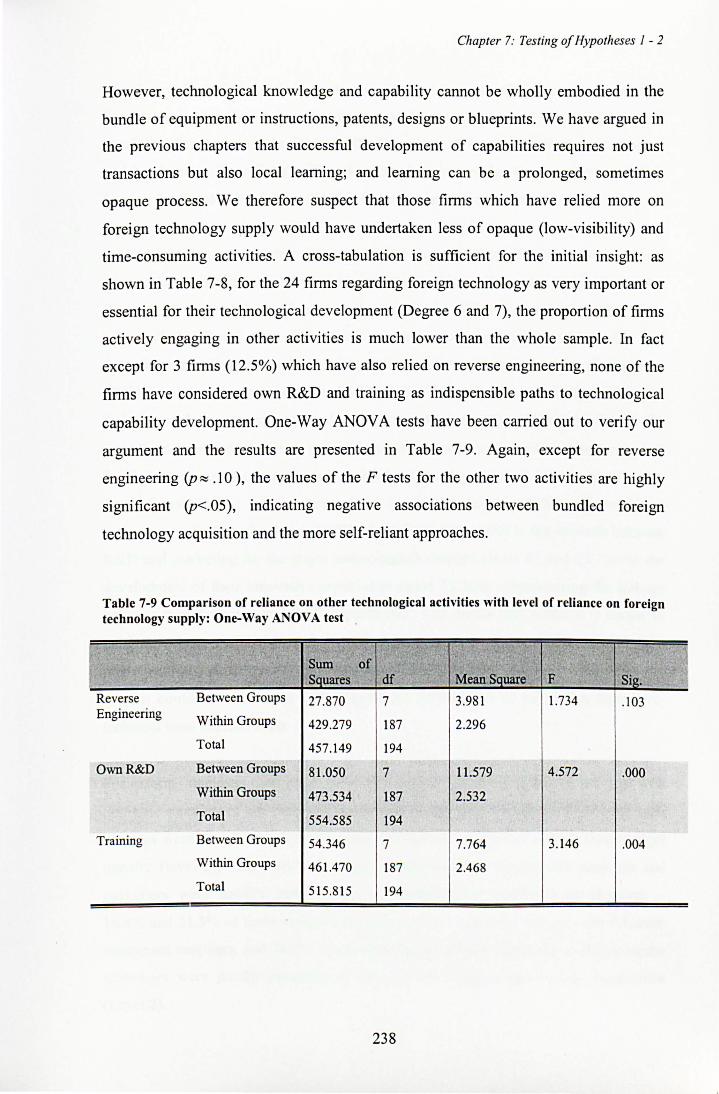
Chapter 7: Testing of Hypotheses 1 - 2
However, technological knowledge and capability cannot be wholly embodied in the
bundle of equipment or instructions, patents, designs or blueprints. We have argued in
the previous chapters that successful development of capabilities requires not just
transactions but also local learning; and learning can be a prolonged, sometimes
opaque process. We therefore suspect that those firms which have relied more on
foreign technology supply would have undertaken less of opaque (low-visibility) and
time-consuming activities. A cross-tabulation is sufficient for the initial insight: as
shown in Table 7-8, for the 24 firms regarding foreign technology as very important or
essential for their technological development (Degree 6 and 7), the proportion of firms
actively engaging in other activities is much lower than the whole sample. In fact
except for 3 firms (12.5%) which have also relied on reverse engineering, none of the
firms have considered own R&D and training as indispensible paths to technological
capability development. One-Way ANOVA tests have been carried out to verify our
argument and the results are presented in Table 7-9. Again, except for reverse
engineering (p ~ .10), the values of the F tests for the other two activities are highly
significant (p<.05), indicating negative associations between bundled foreign
technology acquisition and the more self-reliant approaches.
Table 7-9 Comparison of reliance on other technological activities with level of reliance on foreign technology supply: One-Way ANOVA test
Sum of Squares df -~, Mean Square F Sig.
Reverse Between Groups 27.870 7 3.981 1.734 .103 Engineering
Within Groups 429.279 187 2.296
Total 457.149 194 .~
Own R&D Between Groups 81.050 7 11.579 4.572 .000
Within Groups 473.534 187 2.532
Total 554.585 194
Training Between Groups 54.346 7 7.764 3.146 .004
Within Groups 461.470 187 2.468
Total 515 .815 194
238
. ~I ~:,,>.'>I
Chapter 7: Testing of Hypotheses 1 - 2
We also evaluate firms' endeavour to network to understand what internal and external
links have been harnessed by the firms, and how that impacted their technological
capability development (see Table 7-10). The extent of network utilisation is assessed
in 5 levels, from '1: no links' to '5: links centred on knowledge flows to innovate'. (See
Section 7.1.2 and Table 7-2 for details of variable and question design).
Successful product innovation is vital to many firms, and an effective design requires
that market possibilities for a product are linked with technological possibilities, e.g.,
Who are the users? What will they use the product for? What do the requirements mean
technically? Therefore collaboration among the technical, marketing, and
manufacturing departments is very important to a new product's success (Dougherty,
1992). For internal networks, around 10% of the firms claim that the linkages between
their internal departments were almost non-existent or only centred on day-to-day
operations. 56.4% of the firms believed that the communication of manufacturing and
R&D department encouraged minor technological changes (level 3), and significantly
fewer firms (36.9%) felt the same about the linkage between R&D and marketing
departments. On the other hand, 26.7% of the firms gave credit to the network between
R&D and marketing for the major technological changes (level 4), and 23.1 % for the
development of their innovative capabilities (level 5), both outnumbering the linkage
between manufacturing and R&D departments. This means that whilst it is harder to
cultivate close collaboration between marketing and the technical (R&D and
manufacturing) departments, once its importance is realised and fully utilised by the
firm, it could make an even more significant contribution to innovation than intra
technical team collaboration.
For external domestic (and local) networks, around 1/3 of the firms did not deal with
domestic suppliers of key parts and components at all (level 1); another 24.6% felt such
dealings were pure business transactions and did not involve new skills (knowledge)
transfer (level 2); The firms' relationships with domestic equipments suppliers and
customers were equally underutilised for technological capability development -
16.4% and 21.5% of firms ranked themselves levelland 2 for linkage with domestic
equipment suppliers, and 24.1 % of the firms believed their relationship with domestic
customers were purely transactional and did not enhance pre-existing capabilities
(Level 2).
239

Chapter 7: Testing of Hypotheses I - 2
As for networks with foreign finns, around 20% of the surveyed finns did not have
connections with foreign finns at all (Levell). Among the other finns the majority
claimed that their networking with the foreign suppliers (of equipments or
parts/components) encouraged little or minor technological changes (Level 3); 8% of
them believed that they have benefited from such relationships by involving substantial
knowledge flow to build up innovative capabilities (Level 5).
240
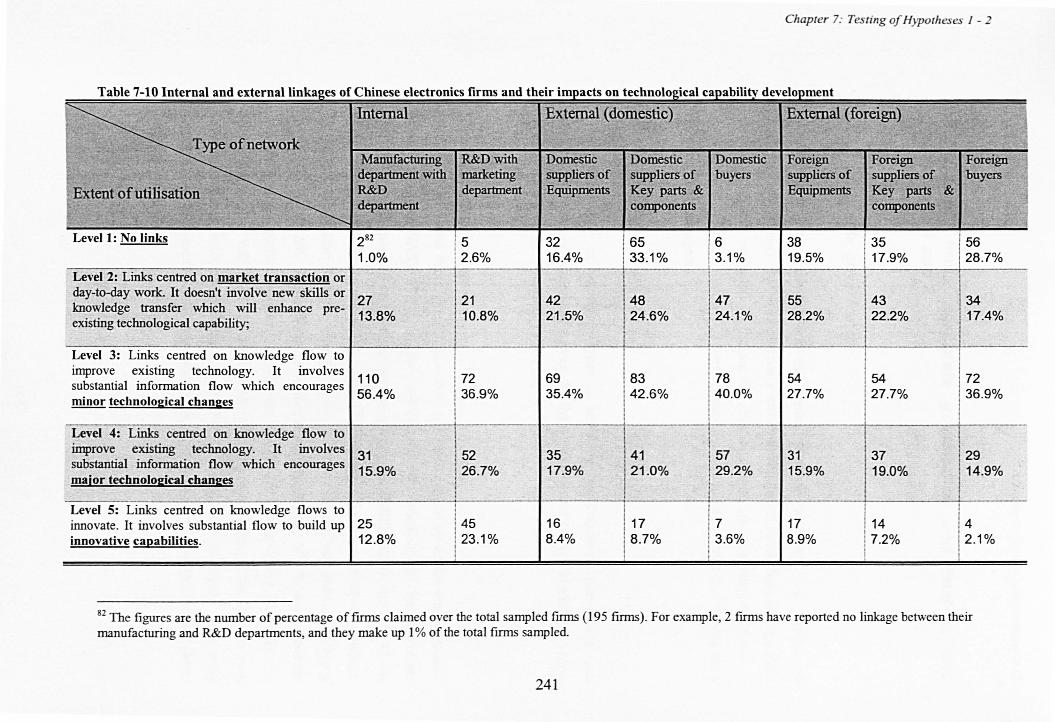
Chapter 7: Testing of HypoTh eses I - 2
Table 7-10 Internal and external linkages of Chinese electronics firms and their impacts on technological capability development -
- lIiternal ~xtemal (domestic) ~ E~emal (foreign) - -oL ~ -
:. '"'.' ;. co:' J ~ " ~ j,: ,,~~ -~ 17" ~ ~; ... .. , t:t·;-.. ~ - - .': ~1 ~ U ~, ' ... ' 7: •... '''. ::"! .Type. ofnetwo~ - ":,
.. /'t' _ . ~ .... ~ . .. r,,..: - ~ . :._ :tr .. - -~ -~~~< - rf"
MariufactUririg ,R&Dwitli Domestic - Domestic ~ Domestic ForelgIl Foreign Forc::ign I
~~ _." .c- '''~.~'"". '. .,-~~}~;, 1 ~
department with niark~ting Stlppliers of suppiiers of 'buyers ~uppliers of suppliers of buyers .. -
Extent. of utilisation ~; ·-.-·:--n
~D department .Equipments Key parts & Equipments Key Parts & 'I , -components ri~·~\:· " r
!='omponents I r, rijJ~ ..... "i d91artment ...:,11;,'
,;'<1." J ~ - __ ~ ~ ~_ ... ~~~:_,l~ ~. _;.~'~~ ~ "'-... " ~.: - : ~ -: "i.:" ) ... ' '.' ~ ••• _~,: o· ' , ~~~ .; "
'Ii>- , "L. ...... ~
Levell: No links 282 ,
/ 6 135
1
56 5 32 i 65 38 1.0% 2.6% 16.4% 1 33.1% 1 3.1% 19.5% 1 17.9% 28.7%
Level 2: Links centred on market transaction or I 147
I I
day-to-day work. It doesn't involve new skills or 27 21 42 148 55 ! 43 134 knowledge transfer which will enhance pre-
124.6% I
1 22.2% 1 17.4% 13.8% 10.8% 21 .5% 124.1% 28.2% existing technological capability; ! 1 I
I
i i ;
Level 3: Links centred on knowledge flow to ! I
172 ,
improve existing technology. It involves I 154 110 72 69 183 78 54 substantial information flow which encourages 56.4% 36.9% 35.4% 142.6% 40.0% 27.7%
127.7% 1
36.9% minor technoloJ:,ical cbanJ:,es i
I I I Level 4: Links centred on knowledge flow to I I I
137 I
improve existing technology. It involves 141
I
31 52 35 57 31 I ~~.9% substantial information flow which encourages 15.9% 26.7% 17.9% 121 .0% 29.2% 15.9% 119.0% major tecbnoloJ:.!cal cbanJ:,es I
I I I Level 5: Links centred on knowledge flows to I ! i
innovate. It involves substantial flow to build up 25 45 16 117 7 17 I 14 14 innovative capabilities. 12.8% 23.1 % 8.4% 1 8.7% 3,6% 8.9%
1 7.2% 12.1% I ,
82 The figures are the number of percentage of furns claimed over the total sampled firms (195 firms) . For example, 2 firms have reported no linkage between their manufacturing and R&D departments, and they make up 1 % of the total finns sampled.
241
Chapter 7: Testing of Hypotheses I - 2
7.3 Sample firms' corporate governance and finance, and hypotheses 1 and 2
7.3.1 Corporate governance
According to the framework and the current situation in China, four aspects of
corporate governance that are potentially influential to firms' technological capability
development are evaluated in the survey. Namely, they are 1) ownership type; 2)
management selection method; 3) performance measurement criteria; and 4) measures
of penalty to managers.
Ownership
The classification of ownership types is based on the theoretical framework (see
chapter 4). In the questionnaire survey, 89 firms (45.6% of 195) are MASOEs, 34.9%
are MISOEs and the remaining 19.5% are POEs.
Management Selection
In the 195 surveyed firms, 30.3% have their managers appointed by the administrative
authorities (ADMINS), 27.2% say they select their own managers but the candidates
are either recommended or approved by the authorities (RECIAPPS), the rest 42.6%
firms have shareholder selected managers (SHARHS). There is a clear-cut although
imperfect correlation between management selection methods and ownership types
(Table 7-11): 59.6% of MASOEs are administrative-selected, 37.1% are authority
recommended/approved, and only 3.4% are shareholder-selected. For MISOEs, the
percentages are: 8.8%, 27.9% and 63.3% respectively. None of the POEs have
administratively selected managers, 1 (2.6%) of them have managers who were
recommended or approved by the authorities, and the rest 97.4% have shareholder
selected managers.
242
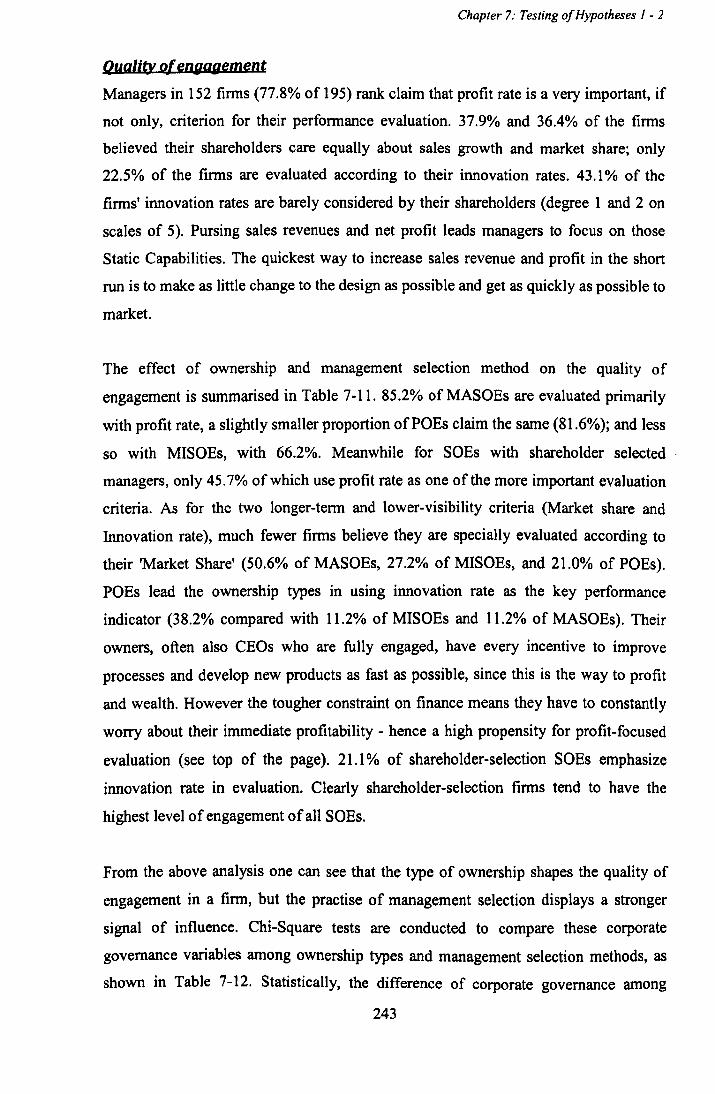
Chapter 7: Testing of Hypotheses 1 - 2
Quality Q/engagement
Managers in 152 firms (77.8% of 195) rank claim that profit rate is a very important, if
not only, criterion for their performance evaluation. 37.9% and 36.4% of the firms
believed their shareholders care equally about sales growth and market share; only
22.5% of the firms are evaluated according to their innovation rates. 43.1% of the
firms' innovation rates are barely considered by their shareholders (degree 1 and 2 on
scales of 5). Pursing sales revenues and net profit leads managers to focus on those
Static Capabilities. The quickest way to increase sales revenue and profit in the short
run is to make as little change to the design as possible and get as quickly as possible to
market.
The effect of ownership and management selection method on the quality of
engagement is summarised in Table 7-11. 85.2% of MASOEs are evaluated primarily
with profit rate, a slightly smaller proportion ofPOEs claim the same (81.6%); and less
so with MISOEs, with 66.2%. Meanwhile for SOEs with shareholder selected
managers, only 45.7% of which use profit rate as one of the more important evaluation
criteria. As for the two longer-term and lower-visibility criteria (Market share and
Innovation rate), much fewer firms believe they are specially evaluated according to
their 'Market Share' (50.6% of MASOEs, 27.2% of MISOEs, and 21.0% of POEs).
POEs lead the ownership types in using innovation rate as the key performance
indicator (38.2% compared with 11.2% of MISOEs and 11.2% of MASOEs). Their
owners, often also CEOs who are fully engaged, have every incentive to improve
processes and develop new products as fast as possible, since this is the way to profit
and wealth. However the tougher constraint on finance means they have to constantly
worry about their immediate profitability - hence a high propensity for profit-focused
evaluation (see top of the page). 21.1 % of shareholder-selection SOEs emphasize
innovation rate in evaluation. Clearly shareholder-selection firms tend to have the
highest level of engagement of all SOEs.
From the above analysis one can see that the type of ownership shapes the quality of
engagement in a firm, but the practise of management selection displays a stronger
signal of influence. Chi-Square tests are conducted to compare these corporate
governance variables among ownership types and management selection methods, as
shown in Table 7-12. Statistically, the difference of corporate governance among
243
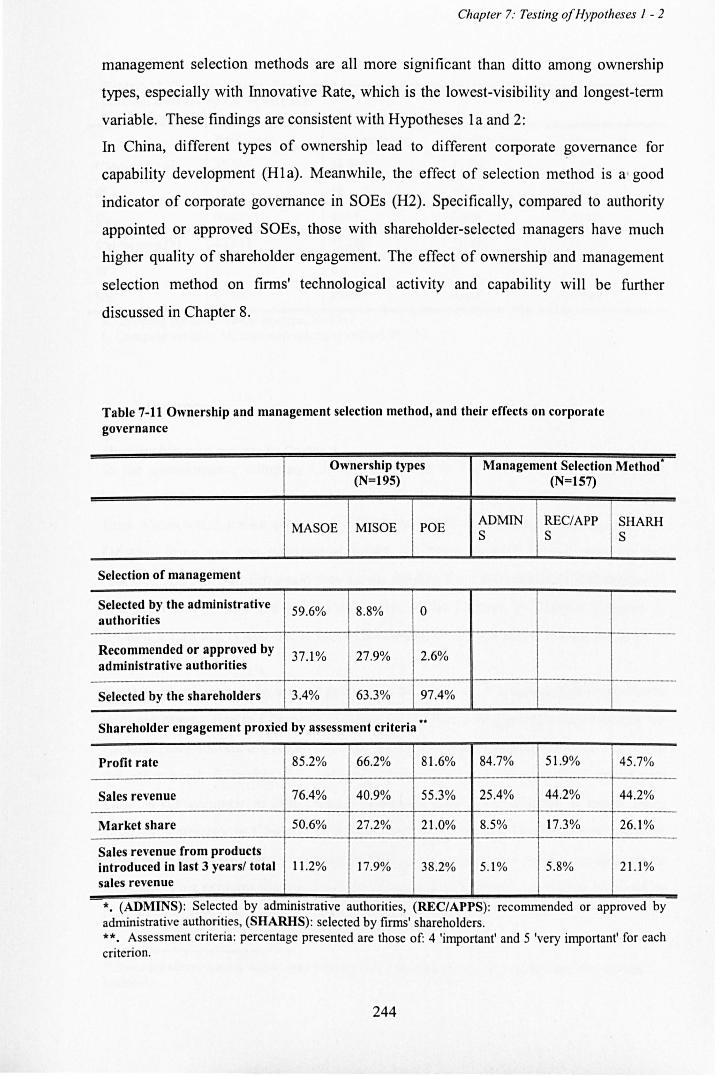
-
Chapter 7: Testing 0/ Hypotheses 1 - 2
management selection methods are all more significant than ditto among ownership
types, especially with Innovative Rate, which is the lowest-visibility and longest-term
variable. These findings are consistent with Hypotheses Ia and 2:
In China, different types of ownership lead to different corporate governance for
capability development (HI a). Meanwhile, the effect of selection method is a' good
indicator of corporate governance in SOEs (H2). Specifically, compared to authority
appointed or approved SOEs, those with shareholder-selected managers have much
higher quality of shareholder engagement. The effect of ownership and management
selection method on firms' technological activity and capability will be further
discussed in Chapter 8.
Table 7-11 Ownership and management selection method, and their effects on corporate governance
Selection of management
Selected by the administrative authorities
Recommended or approved by administrative authorities
Selected by the shareholders
Ownership types (N=195)
I MASOE I MISOE I POE
59.6% 8.8% 0
37.1 % 27.9% 2.6%
3.4% 63.3% 97.4%
Shareholder engagement proxied by assessment criteria **
Profit rate 85 .2% 66.2% 81.6%
Sales revenue 76.4% 40.9% 55.3%
Market share 50.6% 27.2% 21.0%
Sales revenue from products introduced in last 3 yearsf total 11 .2% 17.9% 38.2% sales revenue
Management Selection Method* (N=157)
I ~Mm I ~C/APP I ~HARH
84 .7% 51 .9% 45.7% 1---
M. ______
25.4% 44.2% 44.2%
8.5% 17.3% 26.1%
5.1% 5.8% 21.1%
.. *. (ADMINS): Selected by admimstratJve authorities, (RECfAPPS): recommended or approved by administrative authorities, (SHARDS): selected by ftrms' shareholders. **. Assessment criteria: percentage presented are those of: 4 'important' and 5 'very important' for each criterion.
244
Chapter 7: Testing of Hypotheses I - 2
Table 7-12 The comparisons of corporate governance among types of ownership and management selection methods by Chi-square test Test Statistics (a, b)
Profit rate Sales revenue Market share [nnov. rate
Chi-Square (a) 37.505 26.994 21.702 7.278
df 16 16 12 16
Sig. 0.002 0.001 0.005 0.507
Chi-Square (b) 40.942 72 .896 32.805 68.579 .... - .. -_ .. -
df 8 8 · 8 8 -_._-_._---- ------_._---Sig. 0.000 0.000 0.001 0.000
a. Groupmg vanable: Ownershlp type, N=195 b. Grouping variable: Management selection method N=157
7.3.2 Finance
Ownership and access to finance In the questionnaire company CEOs were asked to list the sources of finance for
business expansion over the past three years83, the most popular source of funding is
from state-owned banks (chosen by 90 firms, 46.2%). In sharp contrast, only 32
(16.4%) firms use non-state-owned banks. 76 firms claimed to use own savings
(38.9%), and 5.6% all firms said they access funding from the venture capital market. It
is a good reflection of the lack of dynamism in the Chinese VC market (Chapter 3,
Section 3.3.2), and is also due to lack of awareness (and confidence) among the firms.
Stock market is chosen by a small proportion of firms - 17.9%. Again, this is consistent
with our observation in Chapter 3 (Section 3.3.2), that stringent entry requirements for
Chinese stock market are responsible for the lack of equity funding by most firms. On
the other hand, following the loosening of restrictions on foreign direct investment
after WTO entrance in 2001, many multinationals have adopted a much more
aggressive strategy in China - rather than partial investment in established domestic
firms as in the 1990s, foreign firms are setting up their own full-funded subsidiaries or
branches. This explains the relatively small number of foreign investments received by
the surveyed firms over the last 3 years (21 and 13.3%).
83 Since the survey mainly targets established firms, it does not ask for sources of finance for start-up business.
245
Chapter 7: Testing of Hypotheses 1 - 2
Cross tabulation and Chi-Square tests are conducted between the three ownership types
and their use of financial sources (Table 7-13). The poor access to finance suffered by
most POEs becomes very obvious: 60.5% of them have to rely on own savings for
funding. Only 5.3% of the private firms have used the sources of state-owned banks,
compared with 60.7% ofMASOEs and 13.4% ofMISOEs which have used it. A very
small number of private firms have sought foreign investors (7.5%) and some have
turned to the venture capital market (23.1%). None of them have received direct
government or subsidy, and only 1 private finn, out of 39, has used the stock market
for financing. In comparison, loans from state-owned banks dominate MASOEs'
primary financing choice - 60.7%. None of them used the venture capital market, and
13.4% have had government funding. On the other hand, MISOEs have a more
diversified finance portfolio - 43.3% chose to use own saving, 13.4% and 11.9%
approached state-owned and non-state-owned banks, around a quarter are listed on the
stock market and a similar number of them received foreign investment. It is worth
noticing that MISOEs do not seem to share a same level of financial privilege as
MASOEs, a situation once observed in 2003 (Cai, 2003). Nevertheless, the fact that
MISOEs are utilising a more balanced portfolio of funding channels than the other two
ownership types can indicate higher financing capacity and stronger competence in
strategic investment.
Results from the Pearson Chi-Square test show a statistically significant difference in
access to finance between the three ownership types [z=79.099, p = .000 which is less
than 0.05]. These findings therefore are consistent with Hypothesis Ib:
HIb: In China, in getting access to financial resources, different types of ownership
lead to different treatment.
246
Chapter 7: Testing of Hypotheses I - 2
Table 7-13 The comparison of financial sources used by different types of ownership (N=195)
Finance for business expansion·
~ All MASOEs MISOEs POEs Financial sources used
ownership
Firm's own savings 27.0% 43.3% 60.5% 38.9% ---_. -- .----------_.- _ ___ ._.M __
State-owned banks 60.7% 13.4% 5.3% 46.2% -_. ._._- e---------
Non-state-owned banks 2.2% 11.9% 31.6% 16.4% -------. --~---.---
Stock market 16.7% 25.4% 2.6% 17.9% ----_. ---' H. __ ,""-_
Venture capital market 0 2.9% 23 .1% 5.6% .----r-.. ··--_ .. ·-.. -·-
Foreign investment 6.7% 24.4% 7.5% 13.3% - ---_. __ .. _.-.
Government subsidies 13.4% 6.0% 0 3.6%
• Sum of these percentages could be greater than 100%, as some finns would have access to more than one sources of funding.
Guanxi and access to finance
During the generation of hypotheses we argue that there is no reason why selection
method should affect finance, although comparisons of financial resources used by
SOEs with different management selection methods say otherwise. Particularly, as
shown in Table 7-14, SOEs with shareholder-selected managers rely mostly on stock
market (57.8%), they are also the only group of three that has actually used venture
capital market for financing (23.3%). Roughly 1/3 of these shareholder-selection firms
still reply on own savings for business expansion, however in general this type of firms
appear to have a much diversified portfolio of finance. In contrast, 10.2% of
administrative-selection SOEs still enjoy government subsidies; 64.4% of them rely on
state-owned banks; and none of them use either non-state-owned banks or venture
capital market. As for SOEs with authority-recommended managers, almost half of
them borrow from state-owned banks, and only 3.4% borrow from non-state-owned
banks. Why has this happened?
247
Chapter 7: Testing of Hypotheses 1 - 2
Table 7-14 The comparison of SOE's financial resources used by different types of management selection methods (N = 157)
Finance for business expansion·
~ ADMINS RECiAPPS SHARHS Financial sources used
Firm's own savings 16.9% 46.2% 37.8% --_. ---------------. -----_ .. _. _._._-_ .. _-
State-owned banks 64.4% 46.2% 6.7% ----- ---------- .. _---------
Non-state-owned banks 0 3.4% 17.8% --- --_._---_.- . __ ._-_._ .. _._._--- -_ .. __ ._._._ .. _ .. _-_._- .---_ .. __ ._-----_ .. -
Venture capital market 0 1.4 % 23 .3% -_._ .. _---------- --1-----------. -------.--------------
Foreign investment 16.7% 14.4% 17.5% --.
Stock market 5.1% 5.8% 57.8% f--.----- ------.-
Government subsidies 10.2% 1.9% 0
* Sum of these percentages could be greater than 100%, as some firms would have access to more than one sources of funding . ** (ADMINS) : Selected by administrative authorities, (REC/APPS): recommended or approved by administrative authorities (SHARHS): selected by firms' shareholders.
The explanation of financing variance among management selection methods lies in
the managers' relationship with government officials and authorities. Review of the
reality in China (Chapter 3, section 3.3.1) and the case studies in Chapter 6 (especially
those of South Electro and SAlC) have already shown that the conventional corporate
governance in Chinese SOEs features a heightened importance of the managers'
Guanxi with government officials. Managers count heavily on officials for promotion,
marketing resources, policy favours, insider intelligence, and most importantly,
financial help. Particularly, in addition to government subsidies, the local governments
still exert decisive power over lending decisions made by state-owned banks (Zhang,
2007). It is therefore easy to understand why firms with administratively-selected
managers have best access to the above two sources (followed closely by authority
recommended ones) - these managers could well have been officials themselves, or at
least have already established a good rapport with them. On the other hand,
shareholder-selected managers are probably not chosen for their political merit, but for
their competence to run a business. They are therefore not necessarily favoured by
officials. The combination of their entrepreneurship and the lack of political privilege
hence pushed them to look elsewhere, which explain why these firms have a much
more market-led and diversified financing landscape.
248
Chapter 7: Testing of Hypotheses J - 2
7.4 Summary
This chapter describes the primary findings from the questionnaire survey in Chinese
electronics industry.
The general evaluation of firms' technological capabilities shows that all sampled firms
have developed better Static than Dynamic Capabilities. Firms are more likely to invest
in tangibly advanced technology, which extends the process of technology absorption.
Problems in corporate governance cause managers' poor engagement, which we argue
inhibits firms' Dynamic Capability development, particularly in R&D and
Organisational Capabilities.
The comparison among different kinds of ownership reveals that different ownership
type entails different ease of access to finance. Particularly, private firms are
disadvantaged in terms of access to finance. Moreover, although theoretically there is
no reason why management selection method should affect finance, the survey result
shows that SOEs' relationship with officials and authorities does influence their finance.
This is because the latter still have great influence over key financial resources, such as
government subsidy and loans from state-owned banks.
249
Chapter 8 Findings from Questionnaire Survey (2): Testing of Hypotheses 3 -7
After general evaluation of the sample firms' technological capability and their CGFS
in Chapter 7, this chapter presents the results of regressions used to test Hypotheses 3-5,
and the tests of hypothesis 6 and 7.
All Hypotheses are supported. Section 8.1 reviews the correlation matrix and explains
the regression models. In Section 8.2, the regressions results are found to be consistent
with Hypotheses 3, 4, and 5, that corporate governance factors, especially quality of
engagement, are positively associated with technological capability, and part of the
correlation is achieved via its impact on technology strategy/activity. Section 8.3 goes
on to present and discuss the results of ANOV A tests for Hypotheses 6 and 7. It
compares the firms' capabilities among different types of ownership, and among
different methods of management selection. The conclusion also supports these two
Hypotheses, that ownership type affects technological capability, and there is an even
stronger impact on technological capability from management selection methods.
Section 8.4 summarises this chapter.
8.1 Correlation matrix and regression models
This chapter tests 5 more hypotheses generated in Chapter 6, which are based on the
theoretical framework and findings from the previous stage of case study:
Hypothesis 3: There will be a positive relationship between the quality of shareholder
engagement and the firm's technological capability.
Hypothesis 4: Poor engagement leads to strategy prioritising high-visibility activities;
intelligent engagement leads to strategy prioritising low-visibility activities.
Hypothesis 5: Strategy prioritising high-visibility activities leads to lower dynamic
capabilities than strategy prioritising low-visibility activities, does.
250
Chapter 8: Testing of Hypotheses 3 - 7
Hypothesis 6: Ownership form affects technological capability; more specifically, (H6a)
ownership forms giving more intelligent engagement will excel (other things equal) in
capability types which are sensitive to low-visibility activities. It would also be
expected (H6b) that ownership forms giving better access to finance will excel (other
things equal) in capability types which are sensitive to high-visibility activities.
Hypothesis 7: Selection method for top management in SOEs affects technological
capability. (H7a) Selection methods giving more intelligent engagement will excel
(other things equal) in capability types which are sensitive to low-visibility activities84•
H3, 4 and 5 are tested through mUltiple regressions, and since H6 and H7 involve
crosstabulation between categorical and ordinal data, ANOVA tests are used.
In order to facilitate the hypothesis testing, the elements of each capability are summed
and averages are taken (for definitions of these elements see Table 7-2, for summary of
firms reaching each degree, see Table 7-3, Table 7-4, and Table 7-5). The average
values are used to represent levels of corresponding capability type in the regressions.
Before developing the final regression models for testing H3, H4 and H5, correlation
matrix is created for all ordinal and scale variables and then examined for significant
relations. The correlation matrix in Table 8-1 computes correlation coefficients which
represent the linear relationship between two variables, and the significance level for
each correlation provides primary information about the reliability of the correlation.
Since the sample size of our study is more than 100, normal distributions of the
residual values of the dependent variables can be assumed. Therefore it is safe to make
inferences based on the significance values in the matrix (Greene, 2007). While
interpreting the correlation matrix, scatterplots are also employed to help detect any
potential outliers which may have a significant influence on the slope of the regression
line and therefore on the value of the correlation coefficient.
84 In the previous chapter we found that firms' finance does differentiate among selection method, therefore there should be an HTh, that that selection methods giving better access to finance will excel (other things equal) in capability types which are sensitive to high-visibility activities. However since this finding only emerged after the questionnaires were designed and circulated, there are no devisable variables to facilitate testing of the hypothesis. Future research could consider including that issue.
251
Chapter 8: Testing of Hypotheses 3 - 7
The correlation with the greatest magnitude between the variables was .533 (.614),
which is lower than the threshold of .80 that indicates a serious multicollinearity
problem (Kennedy, 1979; O'Connor et ai, 2006). However, in reality the relationship
among competing strategies and activities is mixed A solution for the resulting intrinsic
multicollinearity is needed.
Split-model multiple regressions are developed for testing hypotheses 3 to 5 and to
tackle the issue of multicollinearitl5• There are two parallel models; Model 1 consists
of independent variables representing poor engagement and high-visibility
strategy/activity, which are common in typical state-owned Chinese enterprises. It is
predicted that this model contributes to a very limited extent, but positively, to a firm's
manufacturing capability, and negatively to its R&D and organizational capabilities.
Model 2 contains independent variables that are proxies for intelligent engagement and
low-visibility strategy/activity. As explained in the next paragraph, such an
arrangement is theoretically feasible as well as reasonable according to the correlations.
Model 2 is predicted to serve better than Model 1 in explaining success of all three
types of capabilities (H3).
The matrix shows positive and significant correlations between the intelligent
engagement variable (MEAS_MKT, MEAS_INNO) and all LVS variables. The lowest
coefficient is between MEAS_INNO and TRNG,a = .l39,p = .002, and the highest is
between MEAS_INNO and NTWK, a = .388,p = .000. These engagement variables,
however, are not related to HVS variables (passive reliance on foreign tech. transfer
and investment in tangible assets). On the other hand, poor engagement variables'
(MEAS_PFT and MEAS_SALES) correlations with all HVS variables are positive and
significant, but with lower strength; and their correlations with L VS turned out to be all
negative and mostly significant. These primary findings support our predictions that
L VS tends to be associated with intelligent engagement; and poor engagement leads to
less L VS - if not leading to doing less of all. They also strengthen the validity of the
split-model approach in the regression that combines poor engagement variable with
HVS and ditto with intelligent variables and LVS.
8S Alternative econometric analysis (e.g. LooIT regressions and structural equation modelling) were conducted to verify the robustness of the regression model, and the results were all significant.
252
Control Variables
Capability Variables
Engagement Variables
Strategy/ Activity
variables
Chapter 8 : Testing of Hypotheses 3 - 7
Table 8-1 Correlations of variables
V 'abl I Mean 'I; S.D. Age size-T INV-='-T MAN R&D I ORG I MEAS I MEAS I MEAS an es i R&D I CAP CAP I CAP I PFT I SALES I MKT
MEAS !NV lNNO TAN
I INT I FRGN REVS TRNG ! ABSB !
{
I. Age 25.64 15.24 I I I . I I I I n T - I I I I 2. Size 2.81 1.30 I : ~~~ I I J I I I I . I I
. I " I I 'I I _~ I " --I 3. fNV _R&D 3.48 2.03 ~o~: ~3~~6 I .. I Iii ' . I I . __ ,
{
4. MANCAP 3.12 1.07 .188 .122 .223 I I ! I I I ,I i .009 .091 .002 i I I I !
5 R&DCAP 293 101 .163 .118 .250 1.567' 'I I I I i . .. .023 •. .099 .0~~~2... . i I
106 -.268" -.093 .277 I .541 i .614 ! I -1 ! 6.0RGCAP
7. MEAS PFT
2.72
4.20
. ~ .197 1 .000 1 .. 000 n 1.000 ...j L- J. I . 094 .303 .106 -.076 I -.315 I -.331 ~ I I I I I I ' .000 .141 .295 ! .000 I .000 I ~O~lS I I ---------l i
8. MEAS_ 278 140 .322 -.043 -.059 1 -.181 ' I' -.241 " -.223'~· I II I I SALES . . .000 .557 .416 L .012 .001 .002 I .000 I I 9. MEAS _ 3.01 1.22 .281 .007 .101 1.104 1.122 1 .180 I .268" , 1 .368' : MKT .000 .927 .169 : .157 .. I .097 .. I .014 .. ' .000 . .000 .. , I I I I 10. MEAS_ 2.68 I 1.10 -.250 -.003 .038 I .421 I .533 I .408 1 -·388 -.325 1-.147 1 1 1
\I INNO i .000 .969 .595 .-J. .000 i .000 . . 000 i .000 I 000 i .045 II. INV JAN 3.32 I 1.69 -.231 .061 .336" I ~ I .029 .107 I .130 I -.003 I -.300· · I -.05 I
I . : .001 .395 .000 •.• I .030. : .683 .135 j .002 I .971 I " .000 .476 .. 12. INV_ 271 1 136 1 -.412 -.155 .610 i .334 I .2 .. 84 .316 I -.155 ! -.262 I -.163 1.257 1-.259 ABSB .. .000 .031 .OOO ! .000 . j ,OQO .000 I .031 I .000 I .000 .000 .000 13.FRGN 318 i 158 I -.014 1.086 I -.129 Ii .127' I -.085 ! -.098 I .194' i .021 I .028 I .000 T .166" .073 I I I
. ! ' i .848 .234 I .071 , , .005.. I .238.. i .175.. I .003 .. I .076 ,..-!-.707 .996 .020 .309 I ! ---11 14.REVS 14.64 i 1.54 1-.150 1-.028 1.179 1.395 1 .477 1 .438 1-.224 I -.232 1.212 .298 1.003 .076 1-.232 I I
\I -l----l .038 .698 I .012 i .000 , I .000.. I .000, I .002 .001 : .004 .000.. I .965 I .292 .001 .. I ... ---;
I -.119 1 .017 I .2 ... 4. 7 1 .356 I .381 I .327 I -.006 -.063 I .268 I .139 I -.075 1.·.0 .. . 6 .. 9.... 1 .. -.·.281 I .204 1 I .100 . . 809 I .001 .000 .000 I .000 ! .932 .386 I .005 1-002 .. i .299 335 . . 000 I .004 . 15.TRNG 3.03 1.63
16.NTWK 2.95 ! 0.77 I -.359" .238" I .282" I .437" I .508" I .501 " I -.17Y-T=:29i"'--r-335" 1.388" I .254" '1 .187" 1-.005 I .215" ! .170 ! .000 .001 .000 I .000 I .000 I .000 I .013 I .000 ; .000 .000 I .000 .009 .994 I .000 I .018
253
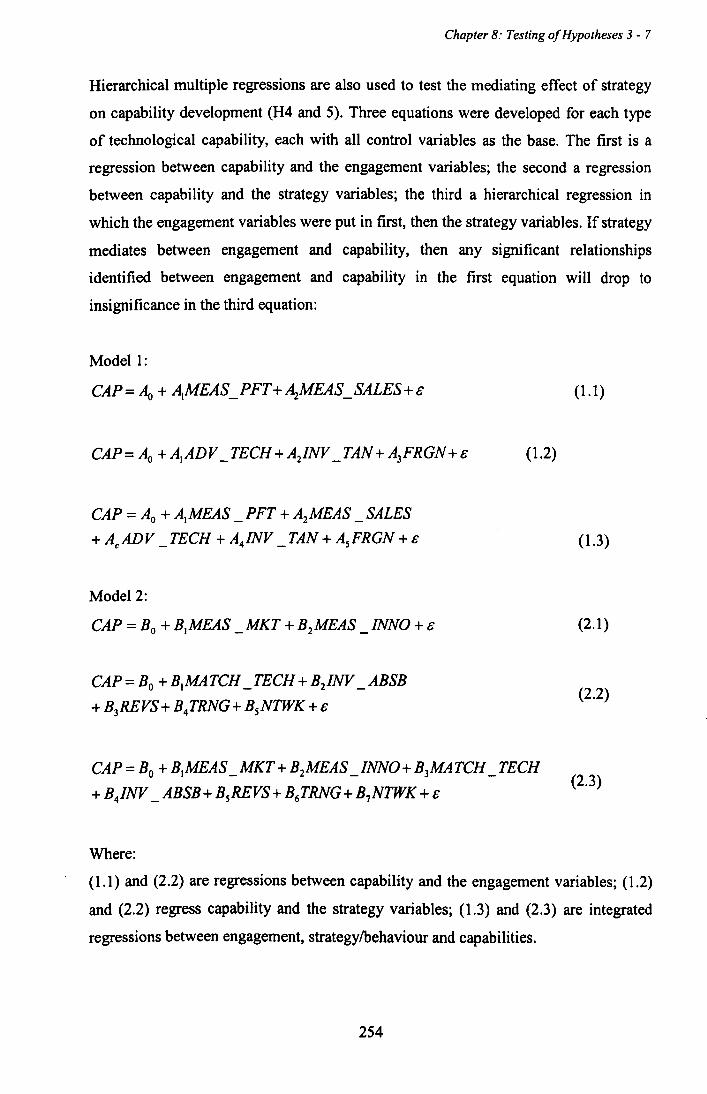
Chapter 8: Testing of Hypotheses 3 - 7
Hierarchical multiple regressions are also used to test the mediating effect of strategy
on capability development (H4 and 5). Three equations were developed for each type
of technological capability, each with all control variables as the base. The first is a
regression between capability and the engagement variables; the second a regression
between capability and the strategy variables; the third a hierarchical regression in
which the engagement variables were put in first, then the strategy variables. If strategy
mediates between engagement and capability, then any significant relationships
identified between engagement and capability in the first equation will drop to
insignificance in the third equation:
Modell:
CAP = Ao + ~MEAS _ PFT + ~MEAS _ SALES + &
CAP = Ao + A)MEAS _ PFT + A2MEAS _ SALES
+ Ac ADV _TECH+A4INV _TAN+AsFRGN+E
Model 2:
CAP = Bo + B)MEAS _MKT + B2MEAS _INNO + E
CAP=Bo +BJMATCH_TECH+B2INV _ABSB
+B3REVS+B4TRNG+BsNTWK +E
(1.2)
CAP = Bo + BJMEAS _MKT + B2MEAS _INNO+ B3MATCH _TECH
+ B4INV _ ABSB + BsREVS + B6TRNG + B7NTWK + E
Where:
(1.1)
(1.3)
(2.1)
(2.2)
(2.3)
(1.1) and (2.2) are regressions between capability and the engagement variables; (1.2)
and (2.2) regress capability and the strategy variables; (1.3) and (2.3) are integrated
regressions between engagement, strategylbehaviour and capabilities.
254
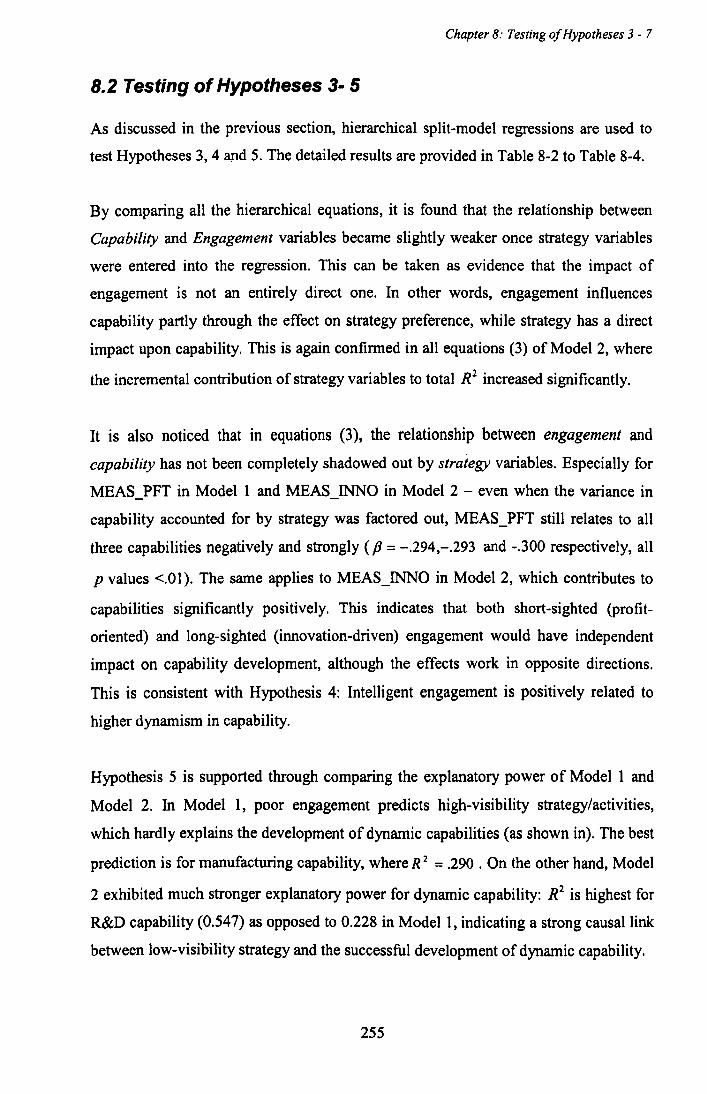
Chapter 8: Testing of Hypotheses 3 - 7
8.2 Testing of Hypotheses 3- 5
As discussed in the previous section, hierarchical split-model regressions are used to
test Hypotheses 3, 4 and 5. The detailed results are provided in Table 8-2 to Table 8-4.
By comparing all the hierarchical equations, it is found that the relationship between
Capability and Engagement variables became slightly weaker once strategy variables
were entered into the regression. This can be taken as evidence that the impact of
engagement is not an entirely direct one. In other words, engagement influences
capability partly through the effect on strategy preference, while strategy has a direct
impact upon capability. This is again confirmed in all equations (3) of Model 2, where
the incremental contribution of strategy variables to total R2 increased significantly.
It is also noticed that in equations (3), the relationship between engagement and
capability has not been completely shadowed out by strategy variables. Especially for
MEAS_PFT in Modell and MEAS_INNO in Model 2 - even when the variance in
capability accounted for by strategy was factored out, MEAS_PFT still relates to all
three capabilities negatively and strongly (f3 = -.294,-.293 and -.300 respectively, all
p values <.01). The same applies to MEAS_INNO in Model 2, which contributes to
capabilities significantly positively. This indicates that both short-sighted (profit
oriented) and long-sighted (innovation-driven) engagement would have independent
impact on capability development, although the effects work in opposite directions.
This is consistent with Hypothesis 4: Intelligent engagement is positively related to
higher dynamism in capability.
Hypothesis 5 is supported through comparing the explanatory power of Model I and
Model 2. In Modell, poor engagement predicts high-visibility strategy/activities,
which hardly explains the development of dynamic capabilities (as shown in). The best
prediction is for manufacturing capability, where R 2 = .290 . On the other hand, Model
2 exhibited much stronger explanatory power for dynamic capability: R2 is highest for
R&D capability (0.547) as opposed to 0.228 in Modell, indicating a strong causal link
between low-visibility strategy and the successful development of dynamic capability.
255
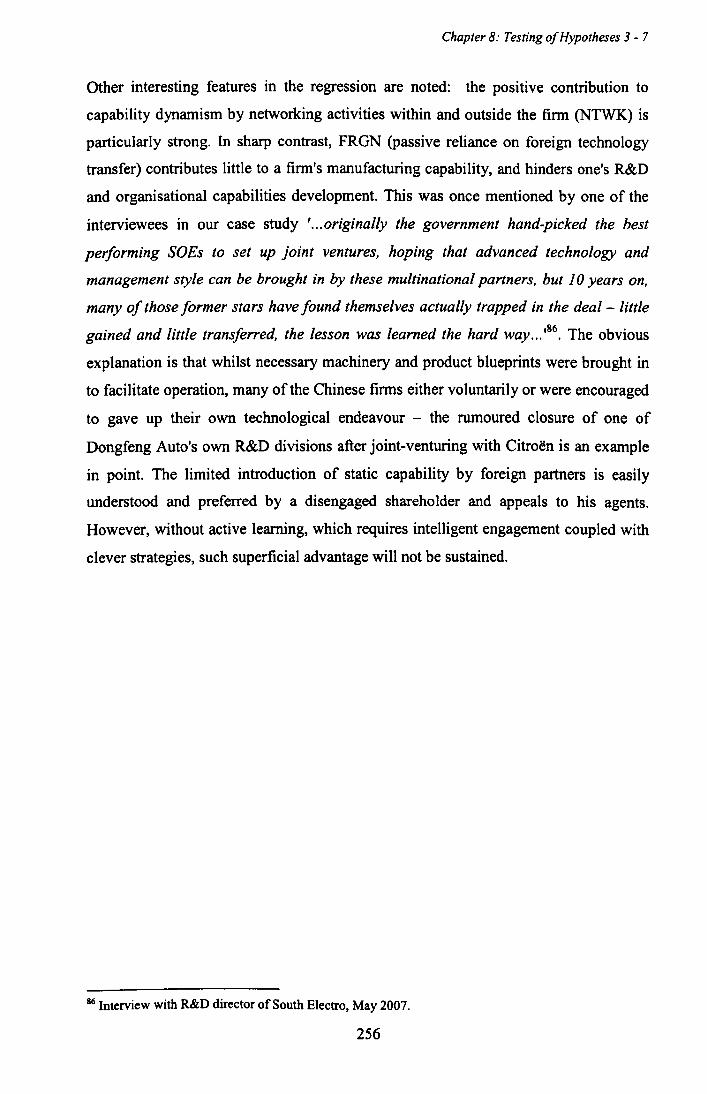
Chapter 8: Testing of Hypotheses 3 - 7
Other interesting features in the regression are noted: the positive contribution to
capability dynamism by networking activities within and outside the firm (NTWK) is
particularly strong. In sharp contrast, FRGN (passive reliance on foreign technology
transfer) contributes little to a firm's manufacturing capability, and hinders one's R&D
and organisational capabilities development. This was once mentioned by one of the
interviewees in our case study ' ... originally the government hand-picked the best
performing SOEs to set up joint ventures, hoping that advanced technology and
management style can be brought in by these multinational partners, but 10 years on,
many of those former stars have found themselves actually trapped in the deal - little
gained and little transferred, the lesson was learned the hard way ... ,86. The obvious
explanation is that whilst necessary machinery and product blueprints were brought in
to facilitate operation, many of the Chinese firms either voluntarily or were encouraged
to gave up their own technological endeavour - the rumoured closure of one of
Dongfeng Auto's own R&D divisions after joint-venturing with Citroen is an example
in point. The limited introduction of static capability by foreign partners is easily
understood and preferred by a disengaged shareholder and appeals to his agents.
However, without active learning, which requires intelligent engagement coupled with
clever strategies, such superficial advantage will not be sustained.
86 Interview with R&D director of South Electro, May 2007.
256
Chapter 8: Testing of Hypotheses 3 - 7
Table 8-2 Hierarchical regressIOns 0 fM d I o e 1 and Model 2 with Manufacturin2 Capability
MODEL 1 MODEL 2 Regression 1.1 1.2 1.3
Regression 2.1 2.2 2.3
Equation Equation Control Control Variables Variables
INV_R&D .176- .196- .189-- INV_R&D .227- .223- .12t Other Included Included Included Other Included Included Included
control control variables variables
Engagement Engagement variables variables
MEAS_ -.304 _. -.294-- .107- .095 PFT MEAS MKT
MEAS_ -.096 -.083 .294-- .205··
SALE MEAS_INNO
Strategy I
variables ADV .059 .065 MATCH .213- .21 t·
TECH TECH INV_TAN .076 .085 INV ABSB .274" .337"-
FRGN .002 .005 REVS .204-· .210·-TRNG .25t- .268·-NTWK .196·- .259-·
R2 .197 .129 .290 R2 .264 .421 .457 Adjusted R2 .175 .101 .254 Adjusted R2 .243 .396 .433 Standard error .988 I 1.01 .901 Standard error .948 .833 .816
257
Chapter 8: Testing of Hypotheses 3 - 7
Ta bl 83H' h' I c - Icrarc Ica rC2rCSSJOns 0 fMdl! dMdl2 o c an o c with R&D Capability
MODEL 1 MODEL 2 Regression 1.1 1.2 1.3
Regression 2.1 2.2 2.3 Equation Equation
Control Control Variables Variables
INY_R&D .267-- .249" .248" INV_R&D .273" .167" .112' Other Other
control Included Included Included control Included Included Included variables variables
Engagement Engagement variables variables
MEAS -.385" -.293"' MEAS
.101' .085 -PFT MKT
MEAS - -.153 • -.146' MEAS .339" .320" -
SALE INNO
Strategy Strategy variables variables
ADV_ .008 .061 MATCH .197'· .214"
TECH TECH INV_TAN .019 .059 INV_ABSB .206' .220·'
FRGN -.046 -.074 REVS .226·· .261·· TRNG .180· .230·'
NTWK .185- .267··
R2 .221 .142 .265 R2 .377 .490 .567 Adjusted R2 .200 .114 .228 Adjusted R2 .360 .467 .547 Standard error .945 .990 .899 Standard error .853 .769 .712
258
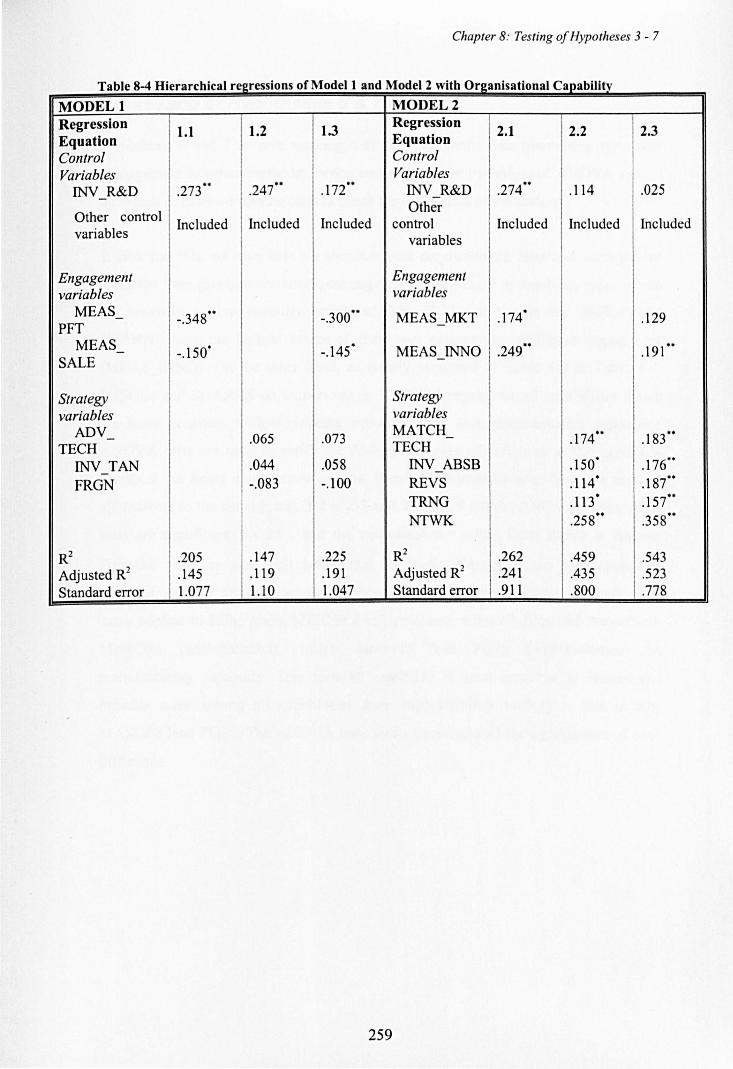
Chapter 8: Testing of Hypotheses 3 - 7
Table 8-4 Hierarchical regressIOns 0 fM d I o elan dM d 2 o el with o TI~anisational Capability
MODEL 1 MODEL 2 Regression
I Regression 1.1 1.2 1.3 2.1 2.2 2.3
Equation Equation Control Control Variables Variables
INV R&D .273 '" .247"" .172"" INV_R&D .274"· .114 .025
Other control Other
Included Included Included control Included Included Included variables variables
Engagement Engagement variables variables
MEAS - -.348"" -.300"" MEAS MKT .174" .129 PFT -
MEAS - -.150" -.145" MEAS !NNO .249"" .191"" SALE -
Strategy Strategy variables variables
ADV .065 .073 MATCH - .174"" .183"" -
TECH TECH
INV_TAN .044 .058 INV ABSB .150" .176""
FRGN -.083 -.100 REVS .114" .187""
TRNG .113" .157""
NTWK .258"" .358""
R2 .205 .147 .225 R2 .262 .459 .543 Adjusted R2 .145 .119 .191 Adjusted R2 .241 .435 .523 Standard error 1 1.077 1.10 1.047 Standard error .911 .800 .778
259
Chapter 8: Testing of Hypotheses 3 - 7
8.3 Testing of Hypotheses 6 & 7
Hypothesis 6 and 7 involve working with non-parametric data (ownership types and
management selection methods). hence we used descriptive tables and ANOVA as well
as Welch & Brown-Forsythe tests to check the robustness of the findings.
If H6a and H7a are true, then we should expect the ownership form and management
selection form giving more intelligent engagement will excel in capability types which
are sensitive to low-visibility activities. Table 7-11 has shown that MISOE and
SHARHS have the highest scores of their own category in intelligent engagement
(MEAS_INNO). On the other hand, as clearly presented in Table 8-5 to Table 8-7,
MISOEs and SHARHS do outperform in R&D and organisational capabilities which
are more sensitive to low-visibility activities than does manufacturing capability.
ANOV A tests are used to verify the findings. In case of variances of the capability
variables not being equal across groups, Welch & Brown-Forsythe tests are used as
alternatives to the usual F test. Table 8-8 and Table 8-9 list the ANOV A tables. All F
tests are significant (p < .05), and the equivalent p- values from Welch & Brown
Forsythe tests are also well below the .05 level. It supports the hypothesis that
capabilities differ among ownership types and management selection methods. The
same applies to H6b, where MISOEs (well-governed and well-financed) outperform
MASOEs (well-financed), which narrowly lead POEs (well-governed) on
manufacturing capability. This form of capability is most sensitive to finance and
benefits most among all capabilities from high-visibility strategy - that is why
MASOEs lead POEs. The ANOV A tests again demonstrated the significance of such
difference.
260
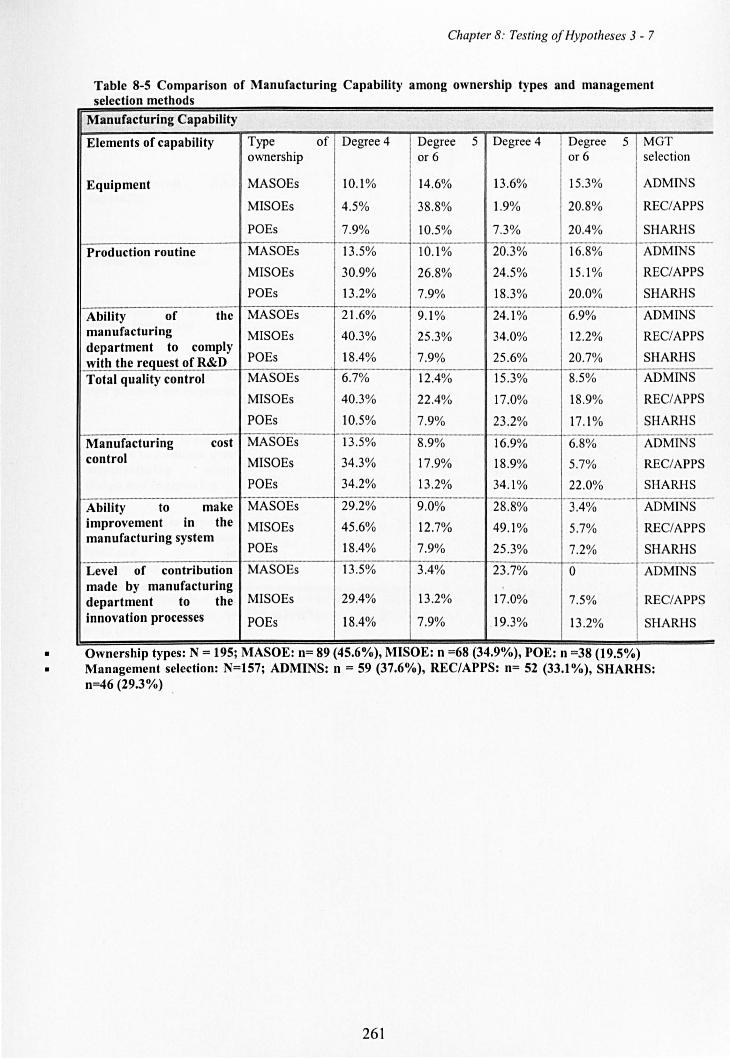
Chapter 8: Testing of Hypotheses 3 - 7
Table 8-5 Comparison of Manufacturing Capability among ownership types and management selection methods
Manufacturing Capability
Elements of capability Type of Degree 4 Degree 5 Degree 4 Degree 5 MGT ownership or 6 or 6 selection
Equipment MASOEs 10.1% 14.6% 13.6% 15.3% ADMINS
MISOEs 4.5% 38.8% 1.9% 20.8% REC/APPS
POEs 7.9% 10.5% 7.3% 20.4% SHARHS ------
Production routine MASOEs 13.5% 10.1 % 20.3% 16.8% ADMINS
MISOEs 30.9% 26.8% 24.5% 15 .1% REC/APPS
POEs 13 .2% 7.9% 18.3% 20.0% SHARHS ------ 24.1 % ---Ability of the MASOEs 21.6% 9.1 % 6.9% ADM INS
manufacturing MISOEs 40.3% 25 .3% 34.0% 12.2% REC/APPS department to comply with the request of R&D POEs 18.4% 7.9% 25.6% 20.7% SHARHS
Total quality control MASOEs 6.7% 12.4% 15.3% 8.5% ADMINS
MISOEs 40.3% 22.4% 17.0% 18.9% REC/APPS
POEs 10.5% 7.9% 23.2% 17.1 % SHARHS --
16.9% ._------
Manufacturing cost MASOEs 13.5% 8.9% 6.8% ADMINS control MISOEs 34.3% 17.9% 18.9% 5.7% REC/APPS
POEs 34.2% 13.2% 34.1% 22 .0% SHARHS __ .H ________
-- ._-_._-_._-_._-- ------_._ .. ----_ .... _. __ ._. ._----_ .. _--- -~--.---,--
Ability to make MASOEs 29.2% 9.0% 28 .8% 3.4% ADMINS improvement in the MISOEs 45 .6% 12.7% 49 .1% 5.7% REC/APPS manufacturing system
POEs 18.4% 7.9% 25.3% 7.2% SHARHS
Level of contribution MASOEs 13 .5% 3.4% 23 .7% 0 ADMINS made by manufacturing department to the MISOEs 29.4% 13.2% 17.0% 7.5% REC/APPS
innovation processes POEs 18.4% 7.9% 19.3% 13 .2% SHARHS
• Ownership types: N = 195; MASOE: n= 89 (45.6%), MISOE: n =68 (34.9%), POE: n =38 (19.5%) • Management selection: N=157; ADMINS: n = 59 (37.6%), REC/APPS: n= 52 (33.1 %), SHARHS:
n=46 (29.3%)
261
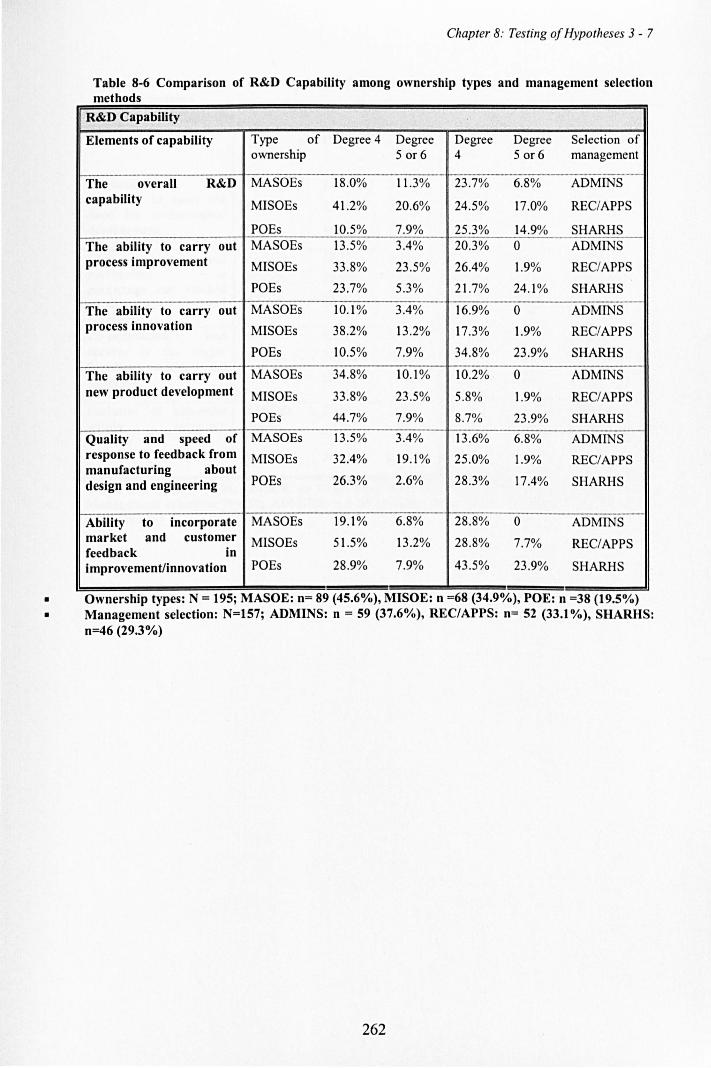
Chapter 8: Testing of Hypotheses 3 - 7
Table 8-6 Comparison of R&D Capability among ownership types and management selection methods
R&D Capability
Elements of capability Type of Degree 4 Degree Degree Degree Selection of ownership 5 or 6 4 5 or 6 management
~-.-. -----.~-.. --------.. ----.. ---.. -.-.---The overall R&D MASOEs 18.0% 11 .3% 23 .7% 6.8% ADMfNS capability MISOEs 41.2% 20.6% 24.5% 17.0% REC/AFPS
POEs 10.5% 7.9% 25.3% 14.9% SHARHS The ability to carry out MASOEs 13.5% 3.4% 20.3% 0 ADMfNS process improvement MISOEs 33.8% 23 .5% 26.4% 1.9% REC/APPS
POEs 23.7% 5.3% 21.7% 24.1% SHARHS
The ability to carry out MASOEs 10.1 % 3.4% 16.9% 0 ADMfNS process innovation MISOEs 38.2% 13 .2% 17.3% 1.9% REC/APPS
POEs 10.5% 7.9% 34.8% 23.9% SHARHS
The ability to carry out MASOEs 34.8% 10.1% 10.2% 0 ADMfNS new product development MISOEs 33.8% 23.5% 5.8% 1.9% REC/APPS
POEs 44.7% 7.9% 8.7% 23 .9% SHARHS
Quality and speed of MASOEs 13.5% 3.4% 13 .6% 6.8% ADMfNS response to feedback from MISOEs 32.4% 19.1% 25 .0% 1.9% REC/APPS manufacturing about design and engineering POEs 26.3% 2.6% 28 .3% 17.4% SHARHS
-28.8% --0 ---.-Ability to incorporate MASOEs 19.1% 6.8% ADMfNS market and customer MISOEs feedback in
51.5% 13.2% 28.8% 7.7% REC/APPS
improvement/innovation POEs 28.9% 7.9% 43 .5% 23 .9% SHARHS
• OwnershIp types: N = 195j MASOE: n= 89 (45.6%), MISOE: n =68 (34.9%), POE: n =38 (19.5%) • Management selection: N=157j ADMINS: n = 59 (37.6%), REC/APPS: n= 52 (33.1 %), SHARHS:
n=46 (29.3%)
262
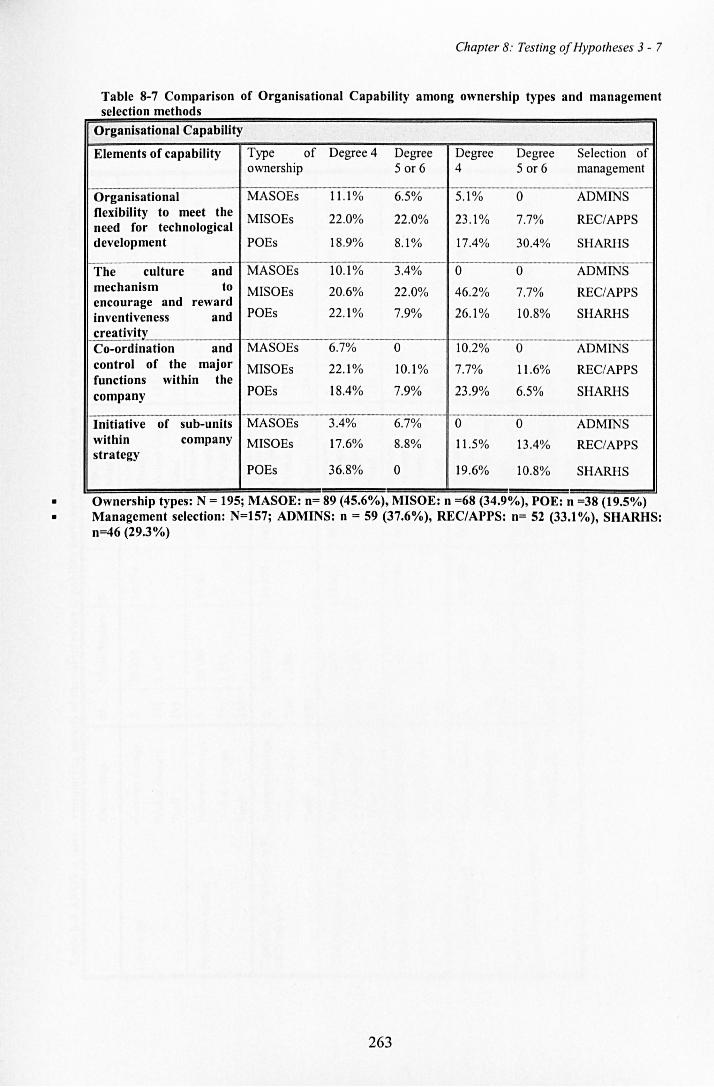
Chapter 8: Testing of Hypotheses 3 - 7
Table 8-7 Comparison of Organisational Capability among ownership types and management selection methods
Organisational Capability
Elements of capability Type of Degree 4 Degree Degree Degree Selection of ownership 5 or 6 4 5 or 6 management
-- ._------------_._-----_._-- --.--.----.. -.-... --.---.. -------.--.-.---.--.-~.---.. Organisational MASOEs 11 .1 % 6.5% 5.1 % 0 ADMINS flexibility to meet the MISOEs 22 .0% 22.0% 23.1 % 7.7% REC/APPS need for technological development POEs 18.9% 8.1 % 17.4% 30.4% SHARHS
_._----------------_. The culture and MASOEs 10.1 % 3.4% 0 0 ADMINS mechanism to MISOEs 20.6% 22.0% 46.2% 7.7% RECIAPPS encourage and reward inventiveness and POEs 22.1% 7.9% 26.1% 10.8% SHARHS
creativitr ._---------_._------_. Co-ordination and MASOEs 6.7% 0 10.2% 0 ADMINS control of the major MISOEs 22.1% 10.1 % 7.7% 11.6% REC/APPS functions within the company POEs 18.4% 7.9% 23.9% 6.5% SHARHS
----- ---'---'-'-- . __ ._-_._-_._-_._._--_._-------_ .. _-_ ... __ ._--_. Initiative of sub-units MASOEs 3.4% 6.7% 0 0 ADMINS within company MISOEs 17.6% 8.8% 11.5% 13.4% RECIAPPS strategy
POEs 36.8% 0 19.6% 10.8% SHARHS
• Ownership types: N = 195; MASOE: n= 89 (45.6%), MISOE: n =68 (34.9%), POE: n =38 (19.5%) • Management selection: N=157; ADMINS: n = 59 (37.6%), REC/APPS: n= 52 (33.1 %), SHARHS:
n=46 (29.3%)
263
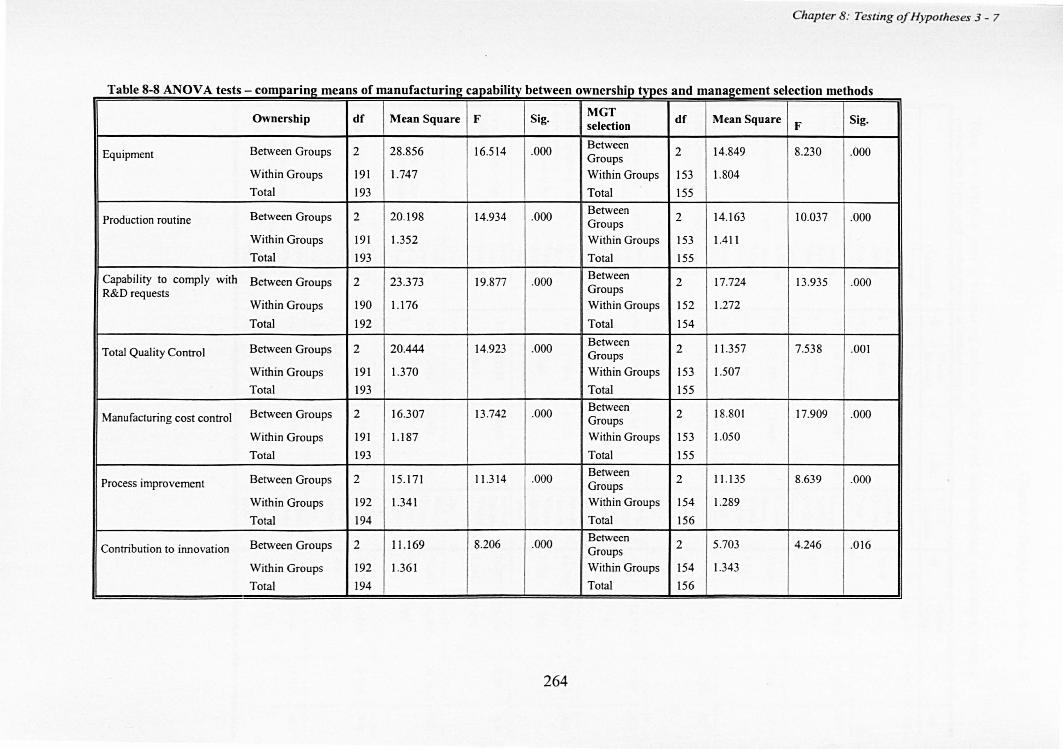
Chapter 8 : Testing of Hypotheses 3 - 7
- - - -- - - - - - -- - - - ----- -- ----- - - - -- - - - --_ ..... - - -- --- 'b~ -- - --- -- -- --.------ ..,
Ownership df Mean Square F Sig. MGT df Mean Square Sig. selection F
Between Groups 2 28.856 16.514 .000 Between
2 14.849 8.230 .000 Equipment Groups Within Groups 191 1.747 Within Groups 153 1.804
Total 193 Total 155
Between Groups 2 20.198 14.934 .000 Between
2 14.163 10.037 .000 Production routine Groups Within Groups 191 1.352 Within Groups 153 1.41 I
Total 193 Total 155
Capability to comply with Between Groups 2 23.373 19.877 .000 Between
2 17.724 13.935 .000 R&D requests Groups
Within Groups 190 1.176 Within Groups 152 1.272
Total 192 Total 154
Between Groups 2 20.444 14.923 .000 Between
2 11 .357 7.538 .001 Total Quality Control Groups
Within Groups 191 1.370 Within Groups 153 1.507
Total 193 Total 155
Between Groups 2 16.307 13.742 .000 Between 2 18.801 17.909 .000 Manufacturing cost control Groups
Within Groups 191 1.187 Within Groups 153 1.050
Total 193 Total 155
Between Groups 2 15.171 1\.314 .000 Between
2 1\.135 8.639 .000 Process improvement Groups
Within Groups 192 \.341 Within Groups 154 1.289
Total 194 Total 156
Between Groups 2 11.169 8.206 .000 Between
2 5.703 4.246 Contribution to innovation Groups .016
Within Groups 192 \.361 Within Groups 154 1.343
Total 194 Total 156
264
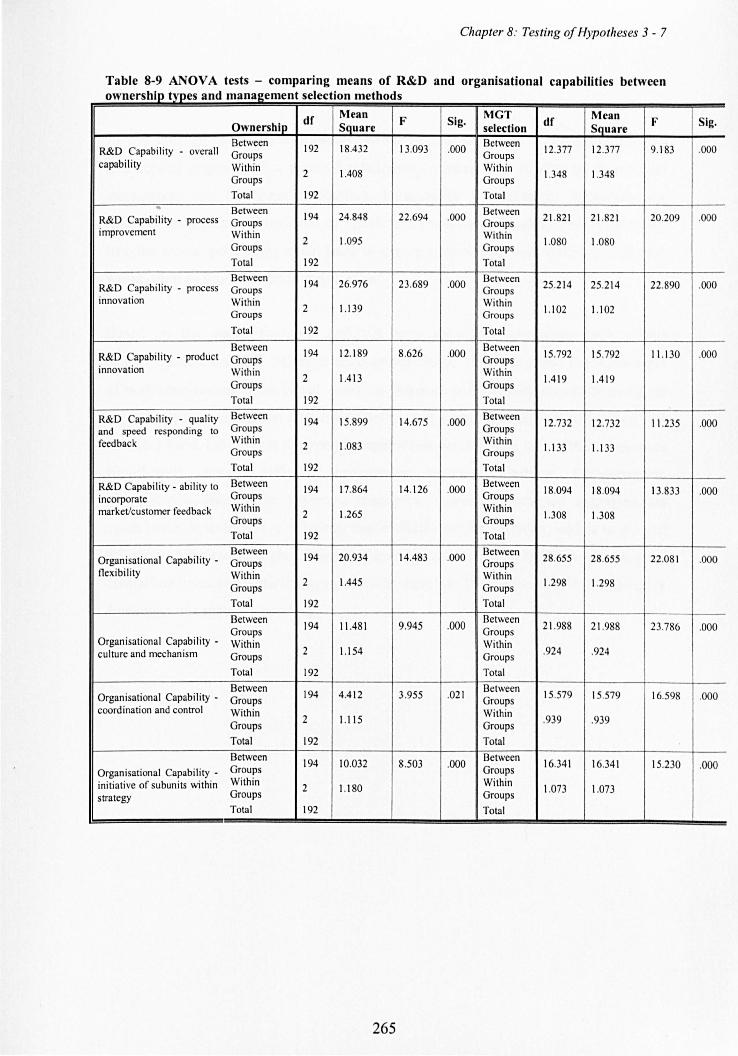
Chapter 8: Testing of Hypotheses 3 - 7
Table 8-9 ANOV A tests - comparing means of R&D and organisational capabilities between I h d ownership types and management se echon met o s
df Mean F Sig. MGT
df Mean F Sig. Ownership S..!luare selection Square
Between 192 18.432 13.093 .000 Between
12.377 12.377 9.183 .000 R&D Capabil ity - overall Groups Groups capabi lity Within 2 1.408 Within 1.348 1.348 Groups Groups
Total 192 Total . Between Between R&D Capability - process Groups
194 24.848 22.694 .000 Groups 21.82 1 21.82 1 20.209 .000
improvement Within 2 1.095 Within
1.080 1.080 Groups Groups Total 192 Total Between 194 26.976 23 .689 .000 Between
25 .214 25 .214 22 .890 .000 R&D Capabi li ty - process Groups Groups innovation Within Within
Groups 2 1.139 Groups 1.102 1.102
Total 192 Total
Between 194 12. 189 8.626 .000 Between 15.792 15.792 11.1 30 .000 R&D Capability - product Groups Groups
innovation Within Within Groups
2 1.4 13 Groups
1.41 9 1.4 19
Total 192 Total
R&D Capability - quality Between 194 15.899 14.675 .000 Between 12.732 12.732 11 .235 .000
and speed responding to Groups Groups feedback Within 2 1.083 Within
1.133 Groups Groups 1.1 33
Total 192 Total
R&D Capability - ability to Between 194 17.864 14.126 .000 Between 18.094 18.094 13.833 .000
incorporate Groups Groups market/customer feedback Within
2 1.265 Within 1.308 1.308 Groups Groups
Total 192 Total Between
194 20.934 14.483 .000 Between 28.655 28.655 22 .081 Organisational Capability - Groups Groups .000
flexibility Within 2 1.445
Wi th in 1.298 1.298 Groups Groups
Total 192 Total
Between 194 11.481 9.945 .000
Between 21.988 21.988 23 .786 .000 Groups Groups
Organisational Capability - Within 2 1.154
Within .924 .924 culture and mechanism Groups Groups
Total 192 Total
Between 194 4.412 3.955 .021 Between
15.579 15.579 16.598 .000 Organisational Capability - Groups Groups coordination and control Within Within
Groups 2 1.115 Groups .939 .939
Total 192 Total Between
194 10.032 8.503 .000 Between
16.34 1 16.34 1 15.230 .000 Organisational Capability - Groups Groups initiative of subunits within Within
2 1.180 Within 1.073 1.073
strategy Groups Groups Total 192 Total
265
Chapter 8: Testing of Hypotheses 3 - 7
8.4 Summary
In this chapter five more hypotheses are tested and supported. Through split-model
hierarchical regressions, a positive relationship between the quality of shareholder
engagement and the firms' technological capability is established. Moreover, the
relationship is partially mediated by the visibility level of technology strategy/activity.
In other words, poor engagement leads to strategy prioritising high-visibility activities,
which leads to lower dynamic capabilities.
Based on the above findings, ANOV A tests show that ownership type affects
technological capability. Minority-state-owned-firms, which combine the advantages
of both state-owned firms (good access to finance) and privately owned firms (good
corporate governance), can and did do better in dynamic capability development. On
the other hand, the degrees of dynamic capabilities developed in firms differ even more
significantly among different management selection methods. Compared to
administrative-selected or approved managers, shareholder-selected managers are
much better incentivised to prioritise low-visibility strategy/activity, which as H4 and
H5 show, will lead to higher dynamic capabilities. It is suggested that a much more
diversified financing portfolio by shareholder-selection SOEs also contributes to higher
dynamism of capability building.
266
Chapter 9 Conclusion
This chapter summarises the major findings, contributions and limitations of this study.
Section 9.1 discusses the findings related to the four research questions set out in
Chapter 1. Following theoretical frameworks developed from literature review and past
research, empirical work in the Chinese auto and electronics industry has generated
answers to these research questions: 1) What is the situation of technological
capabilities developed in the firms in Chinese Auto and Electronics Industry? 2) How
has the development process of technological capabilities been? 3) What is the
situation of corporate governance and finance in the firms in Chinese Auto and
Electronics Industry? 4) How can the capabilities developed be explained from the
finance/corporate governance point of view? Section 9.2 concludes this chapter with
contributions and limitations of this study.
9. 1 Main findings
This thesis sets out with the following aims:
(From the perspective of corporate governance and finance), explain why have the
majority of the Chinese firms failed to develop technological capability such that
would enhance their competitiveness; explain how have the minority succeeded
and why there are not more of them; and identify influential elements of corporate
governance and finance on a firm's technological capability; and how these
elements take effect. It is hoped that findings and new theories developed from the
Chinese context will shed light on dynamic capability development in NIEs in
general.
In order to achieve this aim, four research questions are developed to be answered in
this thesis. Through empirical research composed of both qualitative (case studies) and
quantitative (questionnaire survey) stages, all four research questions are answered:
1) What is the situation of technological capabilities developed in the firms in China,
especially medium-high/high technology industries?
267
Chapter 9 Conclusion
In this research, a paired questionnaire survey in 195 Chinese electronics finns was
conducted in 2007 using a capability evaluation framework inspired by previous
research. The aggregated result shows that in general, Chinese electronics firms have
developed better Static than Dynamic capabilities. In particular, finns have achieved
higher dynamism in capability type (Manufacturing) that is more sensitive to strategy
that prioritises high-visibility activities, and much lower dynamism in Organisational
Capability, which is more sensitive to low-visibility technological activities.
2) How has the development process of technological capabilities been?
This question is answered through five in-depth case studies in both auto and
electronics industry carried out between 2006 and 2008. It has found that finns'
strategies which prioritise low-visibility activities lead to higher dynamic capabilities
than strategies prioritising high-visibility activities, does. In addition, finns with better
access to finance will excel (other things equal) in capability types which are sensitive
to high-visibility activities. Three hypotheses are developed for testing in the
quantitative stage of empirical research:
H3: there will be a positive relationship between the quality of shareholder
engagement and the firm's technological capability.
H4: Poor engagement leads to strategy prioritising high-visibility activities; intelligent
engagement leads to strategy prioritising low-visibility activities.
H5: Strategy prioritising high-visibility activities leads to lower dynamic capabilities
than strategy prioritising low-visibility activities, does.
Split-model hierarchical regressions using data from the questionnaire survey support
these findings.
3) What is the situation of corporate governance and finance in the firms in Chinese
Auto and Electronics Industry?
Again, rich qualitative data collected from the case studies has been analysed to answer
this question. In the five case study firms, different corporate governance and finance
are observed in different ownership types. MASOEs, especially those with
administration- selected managers have enjoyed privileged access to finance, including
state subsidy and cheap loans from state-owned banks (South Electro and SAIC up till
268
Chapter 9 Conclusion
2001). However they tend to have deeply flawed corporate governance. Government
parachuted its officials into the company who did not necessarily have industrial
expertise, and they were moved away not long after. Managers came to their posts with
assigned tasks, either to increase capacity or to enhance profit; anyway, both are
quantitative, highly visible and easy to measure.
Moreover, based on observations of the other two MASOEs (GTC and Chery), we
argue that MASOE can too have better corporate governance - provided the
shareholders/governing officials are prepared to make it happen. They may not be
industrial experts themselves, yet they compensate with high quality engagement.
Failing that, they take some trouble to pick the right person, highly experienced in the
industry, and then gave him time, and possibly other key resources (including financial
ones) to think and act long-term. In other words, these are the SOEs with managers
selected for their entrepreneurship, not their guanxi with the officials. And whatever
the formal ownership position, in practice the management team are treated as though
they are co-owners, and behave as though they were. Thus in effect in these
(exceptional) SOEs there are highly engaged owners. On the other hand, POEs have
fully engaged owners/managers; however they struggle to access necessary finance to
support their business and technological development. Two corresponding hypotheses
are developed:
H 1 a: In China, different types of ownership lead to different corporate governance for
the purpose of capability development. H 1 b: In China, in getting access to financial
resources, different types of ownership lead to different treatment.
H2: In China, different selection methods for top management in SOEs lead to different
corporate governance for the purpose of capability development.
Hypotheses testing in the quantitative research supported above findings. Particularly,
MISOEs enjoy a combined advantage of better corporate governance than MASOE,
and better finance than POE 87. Moreover, different selection methods for top
management in SOEs lead to different corporate governance for the purpose of
capability development. Specifically, compared with SOEs with administration-
87 Unfortunately case studies of MISOEs were not undertaken in this research, and the corresponding hypothesis is partly inspired by previous research (Cai & Tylecote, 2008).
269
Chapter 9 Conclusion
selected or approved managers, SOEs with shareholder-selected managers display
significantly higher quality of shareholder engagement and more diversified portfolio
of finance.
4) How can the capabilities developed by the firms be explained from the perspective
of corporate governance and finance?
This question is answered by both case studies and questionnaire survey. As shown in
the case studies, the lack of dynamism in firms' capability development is largely due
to their situation of corporate governance and finance. Particularly, POEs normally
have highly engaged shareholders/owners and well included employees, which enable
them to choose technology strategy that prioritises low-visibility activities, which in
tum lead to higher dynamic capability. However, their poor access to financial
resources inevitably constrains their scope of static capabilities, which are necessary
for more radical innovations. On the other end of spectrum are MASOEs. As
mentioned above, their managers are often administratively-selected for their political
merits, or their guanxi with the officials. Poorly motivated and evaluated by short-term
quantitative performance criteria, it is not hard to see why the majority of them choose
highly dependent strategy that prioritises high-visibility activities, often in the form of
bundled technology. Consequently, they develop better Static than Dynamic
capabilities. Although no case study was undertaken in any MISOEs, one would expect
that by combining the advantage of better finance (than POEs) and better corporate
governance (than MASOEs), they should outperform technologically in all ownership
types. These findings are again consistent with hypotheses tested in the quantitative
study:
H6: Ownership form affects technological capability; more specifically, (H6a)
ownership forms giving more intelligent engagement will excel (other things equal) in
capability types which are sensitive to low-visibility activities. It would also be
expected (H6b) that ownership forms giving better access to finance will excel (other
things equal) in capability types which are sensitive to high-visibility activities.
H7: Technological capability in SOEs is affected by selection method for top
management. (H7a) Selection methods giving more intelligent engagement will excel
(other things equal) in capability types which are sensitive to low-visibility activities.
270
Chapter 9 Conclusion
9.2 contributions, policy implications and limitations of this study
9.2.1: Contributions and policy implications The contributions ofthis study are significant in several respects:
1) This study provided a thorough account of how finns with different corporate
governance and finance (CGFS) in the Chinese auto and electronics finns develop their
technological capabilities. Through mUltiple case studies, this study explained why the
majority of Chinese finns failed to acquire dynamic capabilities, and why the minority
of them succeeded. It finds that finns which succeeded have adopted an independent
technological strategy, where a lot of low-visibility learning activities took place. On
the other hand, trust and mutual loyalty from lower-level employees, local suppliers,
and lead customers made it possible to draw inputs from them during the process of
technological learning. It therefore indicates that in order for Chinese finns to
successfully develop sustainable competitiveness, a more independent approach to
technological capability development needs to be implemented. Specifically, in order
for the independent, low-visibility learning strategy to work, it is highly important for
shareholders (especially the state shareholders) to have a great interest in, and develop
an understanding of the industry in general, and the finn they own in particular. They
also need to align their interests with the management, possible through fonnal (in the
case of POEs and MISOEs) or de facto (in the case of MASOEs) co-ownership, or
through trust and decent autonomy; they also need to encourage their managers to think
long-tenn.
2) This study gives a thorough evaluation of finns' technological capabilities in
the Chinese electronics industry. For finns, they could learn from this study where their
efforts have been mostly put in so far, and where they should have endeavoured instead.
For policy makers, they could learn from the empirical results of how high-tech finns
develop and generate their capabilities under the current mechanism of corporate
governance and finance system. Based on findings from the case studies as well as
questionnaire survey, strong evidence has been established on the effects of corporate
governance on finn's technology development. This is has crucially important policy
implications for China's SOE refonns as well as the refonn of the corporate
271
Chapter 9 Conclusion
governance and finance system. China's SOE reform so far has been focusing on the
privatisation of small and medium SOEs. Those which remain (mainly large SOEs,
especially central enterprises under SASAC) are being controlled in an even more
conventional fashion. Clearly the trend is to increasing measure firm performance with
Wester-style financial accounting measures (Tylecote et aI, 2010). In particular, the
SASAC website in 2006 revealed the governing bodies' enthusiasm in using Economic
Value-Added - which, broadly speaking is a fair measure of a firm's profitability.
Clearly, the challenge for SASAC is to realize the potential (or inevitable) conflict
between long-term goals and the availability of any immediate measure of profitability.
It is particularly problematic with the new emphasis on circulation of outside top
managers (see Figure 3-9). Both of these developments can be highly effective in
bringing about short-term efficiency and return. However argued in the thesis, if a CEO
is under pressure to impressive in a relatively short time, and if the impression will
mainly be measured financially, low visibility investments in technological capability
will be discouraged.
On the other hand, it is found in the thesis that for most POEs and some small SOEs,
the lack of access to necessary finance has unduly impeded their technological
development. Although there have been some formal steps taken by the policy makers
to address this problem - such as the foundation of a dedicated Start-Up Board in the
Shenzhen Stock Exchange in summer 2009 (China Daily, 02/09/2009) - it remains to
be seen to what extent will these measures actually benefit the development of POEs
and less favoured SOEs.
3) As for theoretical contributions, this thesis contributes to the literature on
technological capability by creating a better understanding of firm-level technological
capability in the Chinese Electronics Sector. It also provides a new framework for
measuring firm-level technological capabilities in similar sectors in either China or
other NIEs. More importantly, this study has modified, enriched and tested Tylecote's
framework (see Chapter 2) in the Chinese context. Therefore it will provide guidance
for confident and skilled applications of such theories to other NIE contexts.
272
Chapter 9 Conclusion
9.2.1 Limitations and Reflection
This study has a number of limitations. Its quality could have been further improved if
a parallel survey had been conducted in the auto industry. However due to the fact that
study of technology development in any Chinese high-tech (or medium-high-tech)
industry has become increasingly sensitive to foreign-based scholars 88. attempts to
access the Chinese auto industry at a larger scale has thus not been successful.
As for generalisation of findings, some caution needs to be taken when generalising
findings to some other high-/medium-high-tech industries. As discussed in the
literature review (Chapter 2) and in the discussion of case studies (Chapter 6), low
visibility technological activities in general, and unbundling in particular, are more
applicable to sectors where product assembly and systems integration are central. It
would therefore be slightly harder to generalise (in high-tech) from electronics to
pharmaceutical industry, and (in medium-high-tech) from cars to chemicals -since for
those with non-assembled products, there is less scope for unbundling and less need for
systems integration.
This study looks at only one country. Further insights could be gained by conducting
comparative studies between countries/regions, for example, South Korea and Taiwan.
South Korea caught up with the technology frontiers 10 to 20 years ago, with highly
supportive industrial policies and firms' indigenous efforts focussed on incremental
improvement in process and product technologies. Taiwan is a thriving economy based
on strong family business, especially in the electronics industry. It would be highly
relevant and important to carry out similar studies on CGFS and technological
capability development in these two economies to shed more light on the current
theoretical framework.
In the empirical study, there may also be some problems that are intrinsically
associated with questionnaire-based data collection. For example, all multiple
regressions were performed with the assumptions that differences between each degree
88 ~uring an interview in one of the auto ftrms, the author was shown the offIcial notice issued by the Ministry of Commerce on protection of national business and technology secrecy. The document specified that any information provided to foreign-based institutes or scholars has to be carefully scrutinised and signed offby supervisory authorities.
273
Chapter 9 Conclusion
of capabilities were equal, which in reality is deemed impossible to guarantee. In
addition, although further analysis was conducted with the survey population to verify
representativeness of the data set, it has main drawn on second-hand data (NBS
statistics, see Chapter 7.1.1). Alternatively, a follow-up study of the non-respondents
would be an optimum approach.
One further limitation of this study is that, apart from the engagement dimension of
corporate governance, it has not fully explored - through hypotheses testing - the
effects of the other three CGFS dimensions on the capability development of firms: 1)
need for competence-destruction! reconfiguration and pressure for shareholder value; 2)
technology opportunity and expert risk capital and management autonomy; 3) spill
overs and stakeholder inclusion. Some attempts have been made on one aspect of
stakeholder inclusion, i.e. the positive effect of networking activities on capability
building. However more studies need to be done, to find out more about: 1) How much
pressure do shareholders in Chinese firms exert for shareholder value and is it possible
to measure it? 2) How do inter-firm relationships (both with domestic firms and
international firms) impact on strategy and capability development? And is it possible
to measure it?
274
Bibliography
Agrawal, A., G.N. Mandelkar (1987) 'Managerial incentives and corporate investment and financing
decisions', Journal of Finance 42:823-837. Altenburg T., Schmitz H. and Stanun A., (2008) 'Breakthrough? China's and India's transition from
production to innovation', World Development, 36 (2): 325-344.
Amsden, A.H. (1985) 'The State and Taiwan's economic development' in: P. Evans (eds.) Bringing the State Back In. Cambridge: Cambridge University Press, Chapter 3: 78-106.
Amsden, A. H. (1989) Asia's Next Giant. Oxford: Oxford University Press. Allen, F., Qian J., Qian M. (2005) 'Law, finance, and economic growth in China', Journal of Financial
Economics, 77: 57-116. Altenburg, T., Schmitz H. Stamm A. (2008) 'Breakthrough: China's and India's transition from
production to innovation', World Development, 38 (2): 325-344. Andersen, E., B.A.Lundvall (1997) 'National innovation systems and the dynamics of division oflabor",
in C. Edquist(ed) Systems of innovation: technologies, institutions and organizations, Cassel.
Aoki, M., Kim H. Okuno M. (eds.) (1996) The role of government in East Asian economic development,
comparative institutional analysis, Oxford: Clarendon Press.
Archibugi, D., Coco A. (2005) 'Measuring technological capabilities at the country level: A survey and a menu for choice', Research Policy, 34(2): 175-194.
Arocena, R., Sutz 1. (2000) 'Looking at national systems of innovation from the South', Industry and Innovation, 7( 1): 55-75.
Ariffm, N. Bell M. (1999) 'Firms, politics and political economy: patterns of subsidiary-parent linkages
and technological capability-building in electronics TNC subsidiaries in Malaysia.' In K.S. Jomo, G. Felker, and R. Rasiah (eds.), Industrial Technology Development in Malaysia. London: Routledge.
Ariffm, N., Figueiredo P. N. (2001) Technological Capability Building and Innovation in the Electronics Industry: Evidence from Manaus: Research Programme on Technological Leaming and Industrial Innovation, EBAPE-FGV.
Ariffm, N., Figueiredo P. N. (2004) 'Internationalization of innovative capabilities: counter-evidence
from the electronics industry in Malaysia and Brazil', Oxford Development Studies, 32(4):559-583. Arnold, E., Thuriaus B. (1997) 'Developing rums' technological capabilities'. URL:
www.technopolis.co.uklerports/oecd_cap.pdf.
Arrow, K. (1962) 'The economic implications oflearning by doing', Review of Economic Studies, 29(3): 155-173.
Asian Times, various dates. Asian Development Bank (1995) Technology transfer and development: implications for developing
Asia. Manila: Asian Development Bank.
Asian Development Bank (2003) The development of private enterprise in the People's Republic of
China, Manila.
Audretsch, D. B. (1995) 'Innovation, growth and survival', International Journal of Industrial Organization. 13(4): 441-457.
Aw, B-Y, Batra G. (1998) 'Technological capability and firm efficiency in Taiwan (China)', World Bank Economic Review, 12(1): 59- 80.
Batjargal, B. (2005) 'Comparative social capital: Networks of entrepreneurs and investors in China and Russia'. William Davidson Institute Working Paper 783: The University of Michigan Business School.
Beijing Morning, 30/06/2004 Bell, M. M. (2008) 'Design and engineering activities - the neglected heart of innovation systems in
developing countries: some questions about capability building'. SPRU, University of Sussex, Mimeo. http://www.sussex.ac. uklspruldocumentslbell_ abstract _ bio.doc.
275
Chapter 9 Conclusion
Bell, M. M., Pavitt K. (1992) 'National capacities for technological accumulation: evidence and implications for developing countries', In: Proceedings of the paper prepared for the World Bank's annual conference on development economics. Washington, D.C. 1992.
Bell, M., Cassiolato J. (1993) 'The access of developing countries to new technology'. Mimeo,
FECAMPIUNICAMP, Campinas.
Bell M. M., Pavitt K. (1993a) 'Technological accumulation and industrial growth: contrasts between
developed and developing countries'. Industrial and Corporate Change 2: 157-210.
Bell, M. M., Pavitt K. (1993b) 'Accumulating technological capability in developing countries', In
Proceedings of the World Bank Annual Conference on development economics, 1992. Washington,
D.C.: World Bank. Bell, M. M., Pavitt K. (1995) 'The development of technological capabilities', in UI Haque (eds.), Trade,
Technology and International Competitiveness, Washington D.C.: World Bank.
Bell, M. M., Hobday M., Abdullah S., Ariffin N., Malik J. (1996) Aiming for 2020: A demand-driven perspective on industrial technology policy in Malaysia. Final report to Ministry of Science,
Technology and Environment (Malaysia). World BanklUnited Nations Development Programme.
Bell, M., Albu M. (1999) 'Knowledge systems and technological dynamism in industrial clusters in
developing countries'. World Development 27: 1715-1734.
Berger, P., Luckman T. (1966) The social construction of reality. New York: Doubleday.
Berkshire Hathaway Annual Report, 2008. Available from: http://www.berkshirehathaway.coml2008ar/2008ar.pdf
Berle, A., Means G. (1933) The Modern Corporation and Private Property. New York: Macmillan. Beijing Review (1986) 'Economic growth in different areas'. Beijing Review 29(49),21-24.
Bi, J. (2007) 'China's high-tech industry and its trade with the U.S.', Presentation at the Conference on
China's Technology Trade, Beijing.
https://www.carnegieendowment.org/eventsl?fa=eventDetail&id=1064&prog=zgp&proj=znpp.
Black, T. R. (1999) Doing Quantitative Research in the Social Sciences. London: Sage.
Bottazzi, G., Cefis E., Dosi G. (2002) 'Corporate growth and industrial structure, some evidence from the Italian manufacturing industry'. Industrial and Corporate Change, 11: 705-723.
Boycko M., Shleifer A., Vishny R. W. (1996) 'A Theory of Privatisation', Economic Journal, 106: 309-
19. Broadman, G. H., Xiao G. (1997) 'The coincidence of material incentives and moral hazard in China
enterprises'. Development Discussion Paper, Harvard Institute for International Development.
Bruton G. D., Ahlstrom D., Wan J. (2003) 'Turnaround in East Asian firms: evidence from ethnic
overseas Chinese communities, Strategic Management Journal, 24(6): 519-540.
Buck, T., Liu X., Skovoroda R. (2008) 'Top executive pay and firm performance in China'. Journal of International Business Studies, 39: 833-850.
Burgelman, R., Maidique M. A., Wheelwright S. C. (2004) Strategic Management of Technology and Innovation. New York: MacGraw-Hill.
Cai, J., (2005) The Development of Technological Capability in the Chinese Mobile Telecommunications Sector, PhD Thesis, Management School, University of Sheffield, UK.
Cai, J., Tylecote A. (2005) 'A healthy hybrid: the technological dynamism of minority-state-owned firms
in China', Technology Analysis & Strategic Management, 17(3): 257-277.
Cai, J., Tylecote A. (2006) 'Corporate governance and technological dynamism of Chinese firms in
mobile telecommunications: a quantitative study' IAMOT 2006 International Conference. Beijing.
Cai, l, Tylecote A. (2008) 'Corporate governance and technological dynamism of Chinese firms in
mobile telecommunications: a quantitative study', Research Policy. 37(10): 1790-1811.
Cao, Y., Shi Y. (2000) 'Siying qiye shangshinan wenti chutan (in Chinese, Reflection on the difficulty of non-SOEs when seeking IPO in China). Zhengquan yanjiu (in Chinese Securities Research), 24: 35-39.
Cao, Y., Qian Y., Weingast B. R. (1999) 'From federalism, Chinese style to privatization, Chinese style', The Economics of Transition. 7(1), 103-131.
276
Chapter 9 Conclusion
Carlsson B., Eliasson G. (1994) "The nature and importance of economic competence'. Industrial and Corporate Change 3( 1): 687-711.
Cassiolato, J. E. (2001) The Brazilian Innovation System and the BRICS project. Rio de Janeiro: Economics Institute of Federal University of Rio de Janeiro.
Chen, Q. (2005) 'Zhongguo zhaiquan shichang dui qiye fazhan de yingxiang yanjiu, (in Chinese, The
impact of securities market on industrial development), Zhengquan yanjiu (in Chinese, Securities Research). 25: 120-125.
Chen, J., Huang Q. (2001) 'Comparison of governance structure of Chinese enterprises with different types of ownership', China and World Economy, 9 (6), 11-21.
Chen, W., Lei R. (2007) 'Woguo IC hangye fazhan IUjing yanjiu (in Chinese, A review of the development of China's IC industry)'. Dianzi shijie (in Chinese, The Electronic World), 5.
Chiesa, V., Caughlan P., Voss C.A. (1996) 'Development of a technical innovation audit', Journal of Product Innovation Management, 13: 105-135.
China Automotive Industry Yearbook. 2007 China Daily, various dates.
China Perspective, 20/05/2004 China Value, 07/03/2009 Christensen, J. (1992) 'The role of flnance in national systems of innovation' in National Systems of
Innovation. Bengt-Alee Lundvall (eds.) London: Pinter. : 146-168. CN Biddling (2006), Guowai cujin kejijinbu yu chuangxinji zhengfu youguan zhengce (in Chinese, A
review of S&T and innovation promotion policies by foreign governments). http://www.cnbidding.comlaircon_com_cnlaricledisp_aid_a456bdadc6db75.html.
Cohen, W. M., Levinthal D. A. (1989) 'Innovation and learning: the two faces ofR & D'. The Economic Journal. 99(397): 569-596.
Cohen W. M., Levinthal D. A. (1990) 'Absorptive capacity: A new perspective on learning and innovation'. Administrative Science Quarterly, 35: 128-152.
Collis D. J. (1990) 'Country and company determinants of the pattern of trade in the global bearings industry', mimeo.
Cooke, F. L. (2002). 'Ownership change and reshaping of employment relations in China: a study of two manufacturing companies'. Journal of Industrial Relations, 44(1): 19-39.
Cooper, C. (1992) 'Are innovation studies on industrialized economies relevant to technology policy in
developing countries?' In UNUIINTECH Working paper No.3, June 1992. Maastricht, Netherlands:
The United Nations University, Institute for New Technologies (mimeo).
Costa, I. (2001) 'FDI and technological capabilities in the Brazilian industry'. DRUID -Nelson and Winter conference, 2001.
Cronbach, L. J. (1951) 'Coefficient alpha and the internal structure of tests'. Psychometrika, 16: 297-334.
Dahlman, C. J., Westphal L. E. (1981) 'The meaning of technological mastery in relation to transfer of
technology', Annuals of the American Academy of Political and Social Sciences, 458: 12-26.
Dahlman, C. J., Ross-Larson B., Westphal L. B. (1987) 'Managing technological development: lessons
from newly industrializing countries' World Development, 15(6): 759-775. Daily Economic Review (2005) 'Saibaode duanzan huihuang (in Chinese, Saibao's short-lived glory)'. 15
December.
De Meyer, A., Van Hooland B. (2007) 'The contribution of manufacturing to shortening design cycle times'. R&D Management 20(3): 229-239.
De Vaus, D. (2002) Surveys in Social Research. St Leonards, NSW, Austrialia: Allen & Unwin.
Deeds, D. L. (2001) 'The role of R&D intensity, technical development and absorptive capacity in creating entrepreneurial wealth in high technology start-ups'. Journal of Engineering and Technology Management. 18(1): 29-47.
Demurger, S., Sachs J. D., Woo W. T., Bao S. G. C., Mellinger A. (2002) 'Geography, economic policy. and regional development in China'. National Bureau of Economic Research Working Paper Series, No. 8897.
277
Chapter 9 Conclusion
Deng, X. (1983) 'Jiefang sixiang. shishi qiushi. tuanjie yizhi xiangqiankan (in Chinese, Liberate ideas, be practical, united toward the future)'. In Deng Xiaoping wenxuan (/975-1982) [Selected works by Deng Xiaoping (1975-1982)], Beijing: People's Publishing House.
Deng, X. (1993) 'Jianshe you zhongguo tese de shehujzhuyi (in Chinese, Develop socialism with Chinese characteristics)', Speech on 30 June 1984 in Deng Xiaoping wenxuan (Selected works by Deng
Xiaoping]), nI, Beijing: People's Publishing House,.
Dertoutzos, M.L., Lester RK., Solow R.M. (1989), Made in America. Cambridge, Mass.: The MIT-press.
Dewar, R. D., Dutton J. E. (1986) 'The adoption or radical and incremental innovations: an empirical analysis'. Management Science 32: 1422-1433.
DeWenter, K. L., Malatesta P. H. (2001) 'State-owned and privately owned firms: an empirical analysis of profitability, leverage, and labor intensity', American Economic ReView, 91(1): 320-334.
Dosi. G. (1982) 'Technological paradigms and technological trajectories: a suggested interpretation of the determinants and directions of technical change', Research Policy, 11(3): 147-162.
Dosi, G (1988) 'Procedures and microeconomic effects of innovation', Journal of Economic Literature, 26(3): 1120-1171.
Dosi, G., Orsengio L. (1988) 'Coordination and transformation: an overview of structures, behaviours
and change in evolutionary environments', In Dosi, G. et al (Eds.) Technical Change and Economic
Theory, London.: 221 - 138. Dosi, G., Nelson R R, Winter S. G. (2000), The Nature and Dynamics of Organizational Capabilities.
New York: Oxford University Press. Dougherty, D. (1992) 'Interpretive barriers to successful product innovation in large fmns', Organization
Science, 3(2): 179-202. DTI (Department for Trade and Industry) (2006) Global R&D scoreboard.
http://www.innovation.gov.uk/rd_scoreboard/downloads/2006_rd_scoreboard_analysis.pdf
Dyer, W. G. J., Wilkins A. L. (1991) 'Better stories, not better constructs, to generate better theory: a rejoinder to Eisnhardt'. Academy of Management Review. 16(3): 613-619.
Easterby-Smith, M., Thorpe R., Lowe A. (2002) Management research: an introduction (2nd Ed.). London: SAGE Publications
Easterby-Smith, M., Thorpe R., Jackson P. R. (2008) Management Research (3rdEed.). London: SAGE
Publications. Edquist, C. (1997) Systems of Innovation: Technologies. Institutions and Organizations.
LondonIWashington: Frances Pinter.
Eisenhardt, K. (1989) 'Agency Theory: An Assessment and Review'. The Academy of Management
Review, 14(1): 59-72.
Eisenhardt, K.M., Martin J.A. (2000) 'Dynamic Capabilities: What Are They?' Strategic Management Journal, 21( 1 0/11), Special Issue: The Evolution ofFirm Capabilities: 1105-1121.
Fama, E., M. Jensen. (1983), 'Agency problems and residuals claims', Journal of Law and Economics 26: 327-349.
Fan, C. (1997) 'Uneven development and beyond: regional development theory in Post-Mao China', International Journal of Urban and Regional Research, 21 (4): 620-639.
Farrell, D., Lund S., Rosenfeld J., Morin F., Gupta N., Greenberg E., (2006), 'Putting China's capital to work: the value of financial system reform', McKinsey Global Institute Report
Fei, Y. (2004) The Institutional Change in China after its Reform in 1979- An Institutional AnalysiS with a Focus on Mergers and Acquisitions. PhD Thesis, Erasmus University Rotterdam 18 November
2004. Feinson, S. (2003) 'National innovation systems overview and country cases', in D.Sarewitz, et al (Eds).,
Knowledge Flows. Innovation and Learning in 189 Developing Countries, The Center for Science, Policy and Outcomes at Arizona State University.
Financial Times, various dates.
Firth, M., Fung P., Rui O. (2006) 'Corporate performance and CEO compensation in China'. Journal of Corporate Finance 12: 693-714.
First Economic Daily (2005) 03, Aug.
278
Chapter 9 Conclusion
Flyvbjerg, B. (2006) 'Five misunderstandings about case-study research'. Qualitative Inquiry, 12(2): 219-245.
Forbes, (2007) 'China's SAIC signs merger deal with Nanjing Auto - update 2'. 26th December 2007.
http://www.forbes.com!markets/feeds/afxl2007/12/26/afX4473759.html·
Fransman.M.(1986)TeChnOIOgyandECOnomicDevelopment.Brighton: Wheatsheaf Books.
Freeman, C. (1971) 'The role of small fIrms in innovation in the United Kingdom since 1945: Report to the Bolton Committee of inquiry on small fIrms', Research Report No.6. HMSO, London.
Freeman, C. (1987) Technology Policy and Economic Performance, London: Frances Pinter.
Freeman, C. (1992) 'Formal scientifIc and technical institutions in the national system of innovation'. In:
Lundvall, B., (Eds.), 1992. National Systems of Innovation: Towards a Theory of Innovation and Interactive Learning. London: Pinter
Freeman, C. (2002) 'Continental, national and sub-national innovation syste~omplementarity and economic growth', Research Policy, 31(2): 191-211.
Fung, P.M.Y. et al. (2002) 'Corporate governance and CEO compensation in China', Working paper, Hong Kong Polytechnic University.
Fung, H-G., Liu Q.F., Yau J. (2007) 'Financing alternatives for Chinese small and medium enterprises:
the case for a small and medium enterprise stock market', China & World Economy, 15 (1): 26-42.
Gao X. (2005) "'Latecomers' unfavorable position" and the development strategies of emerging
technology for fIrms in China', Chinese Journal of Management, 3. Gao, X., Hin Chai K., Liu J., Li. J. (2007) '''Overcoming -latecomer disadvantages" in small and
medium-sized firms: evidence from China. International Journal Technology and Globalization 3
(4):364-383. Gill, J., Johnson P. (1997) Research methods for managers. London: Paul Chapman.
Grant, R.M. (1996) 'Toward a knowledge-based theory of the fIrm', Strategic Management Journal, 17,
Summer Special Issue: 109-122. Greene, W. (2007) Econometric Analysis (6th Ed.). Upper Saddle River: Prentice Hall. Gu, S. (1999) China's Industrial Technology: Market Reform and Organizational Changes. Routledge,
New York. Gu, S., Lundvall B.A. (2006) 'China's innovation system and the move towards harmonious growth and
endogenous innovation', Innovation, Management, Policy and Practice 8(1): 126.
Gupta A. K., Raj S. P., Wilemon D. (1986) ~ model for studying R&D: marketing interface in the
product innovation process', Journal of Marketing 50(2): 7-17. Guan, J.C. (2002) 'Industrial innovation in China: a comparative study based on survey data', working
paper, Beijing University. Guan, J., Ma N. (2003) 'Innovation capability and export performance of Chinese fIrms'. Technovation,
23(9): 737-747. Guo C. (2000). 'Development of Private Companies & Related Governance Structure' in Aaichen Naiwu
(ed), Development and Forecast of Medium-Sized & Small Chinese Enterprises (1999), Democracy
and Construction Publishing House. Hall, G. R., Johnson R.E. (1970) 'Transfer of United States aerospace technology to Japan, the
technology factor in international trade'. In: R. E. Vernon (Eds.), New York: National Bureau of
Economics Research: 305-358. Hanson, J. A. (1992) 'Innovation, fum Size, and firm age'. Small Business Economics, 4(1): 37-44.
Hessler, P. (2005) 'Car town.' The New Yorker p. 90. 26 September. Higgins, A. (2004) 'Symbiotic ties to China are a boon and a burden for the American economy', Asian
Wall Street Journal, February 2nd 2004, p. Al and p. A5B. Hillebrand, B., Kok R. A. W., Biemans W. G. (2001) 'Theory-testing using case studies: a comment on
Johnston, Leach, and Liu'. Industrial Marketing Management, 30(8): 651-657. Hobday, M., (1995). Innovation in East Asia: the Challenge to Japan. Aldershot: Elgar. Hodgson, G. M. (eds) (1994) The economics of Institutions. Aldershot: Edward Elgar. Hornick, D. (2008) 'Venture Capital in China', Venture blog: a random walk down sand hill road,
http://www.ventureblog.com. Date accessed 0710112009.
Hong Kong Mail, April 26th 2002
279
Chapter 9 Conclusion
Hu, A.G., Jefferson G. (2009) 'A Great Wall of patents: What is behind China's recent patent explosion?' mimeo.
Huang, C., Amorim, c., Spinoglio, M., Gouveia, B., Medina, A. (2004) 'Organization, programme and
structure: an analysis of the Chinese innovation policy framework', R&D Management. 34(4): 367-
387. Huang, Y. S. (2008). Capitalism with Chinese Characteristics: Entrepreneurship and state during the
reform era. New York: Cambridge Univeristy Press. Huang, Y.P., Wing T. W., Kalirajan K.P. Duncan R. (1998) 'Enterprise reform, technological progress
and technical efficiency in China's state industry', memeo, National Centre for Development Studies, Australian National University.
lmai, K. (2006) 'Explaining the persistence of state-ownership in China', Discussion paper No. 64,
Institute of Developing Economics, Japan External Trade Organisation (IDE-JETRO). Jensen, M., W. Meckling (1976) 'Theory of the firm: Managerial behavior, agency costs, and ownership
structure', Journal of Financial Economics 3: 30S-360. Jiefang Ribao. (2004) 'Zhongde xiangyue: dazhong, shangqi zai qianshou 20 nian (in Chinese, A Sino
German tie - VW to resume 20- year-contract with SAIC)' 17, http://news.xinhuanet.comlauto/2002-
04/17/content_36161O.htm. Jin, L.Z. (2004) 'Qirui de chenggong fensuile Zhongguo qiche de sange shenhua (in Chinese, Chery's
success smashed 3 myths about car industry in China)', Qiche Jingji (in Chinese, Economics of Car Industry). 35(4): 34-37.
Jinghua Ribao (2006) 'Shangqi Shuanglong zhigong bagong jieshu, yi sunshi 30 Yi (in Chinese, SAIC Ssangyong strike hauled, costing the employer over 3 billions)'. 01, September 2006.
http://news.tom.coml2006-09-01/000N/060S7921.html. Jonassen D. H. (1994) 'Thinking technology: toward a constructivist design model'. Educational
Technology, 34(2): 34-37. Juma, C., Clark N. (2002) 'Technological catch-up: opportunities and challenges for developing
countries'. http://www.supra.ed.ac.uklPublicationslPaper_28.pdf. Kang, S. (2003) 'Zhong guo caidianye baituo jiagezhan de sikao (In Chinese, Reflection upon the war
against price-war in the Chinese Color TV set industry),. Shangye Yanjiu (in Chinese, Commercial Research) 3.
Katz, J. (Eds.) (1987) Technology Generation in Latin American Manufacturing Industries. London:
Macmillan.
Keasey, K., Thompson S., Write M. (1997). Corporate Governance: Economic and Financial Issues, Oxford: University Press.
Kennedy, P. (1979) A guide to econometrics. Cambridge: MIT Press.
Kim, L. (1980) 'Organizational innovation and structure', Journal of Business Research. 8: 22S-24S. Kim, L. (1997) Imitation to Innovation: the Dynamics of Korea's Technological Learning. Boston:
Mass.: Harvard Business School Press.
Kim, L. (1999) 'Building technological capability for industrialisation: analytical frameworks and Korea's experience'. Industrial and Corporate Change 8(1), 111-136.
Kim, L., Nelson R. (Eds.), (2000) Technology, Learning and Innovation: Experiences of Newly Industrializing Economies. Cambridge: Cambridge University Press.
Kuhn, T. S. (1962) The structure ofscientific revolutions. Chicago: University of Chicago Press.
Kumar, V., Kumar U., Persaud A. (1999) 'Building technological capability through importing technology', Journal of Technology Transfer. 24(1): 81-96.
Kumar, V., Cray D., Kumar U., Madammohan T.R. (2002) 'Key determinants of the mode of international technology transfer: evidence from India and Turkey', International Journal of Technology Transfer. 1 (112): 122-45.
Lall, S. (1987) Learning to Industrialize: The Acquisition of Technological Capability by India. London: Macmillan.
Lall, S. (1990) 'Building industrial competitiveness in developing countries'. Development Centre of the Organization for Economic Co-operation and Development, Paris.
280
Chapter 9 Conclusion
Lall, S. (1992) 'Technological capabilities and industrialization', World Development, 20: 165-186. Lall, S. (1993) 'Understanding technology development', Development Change. 24(4): 719-753. Lall, S. (1994) "'The East Asian Miracle" study: does the bell toll for industrial strategy?' World
Development 22(4): 645-654
Lall, S. (2000) 'Technological change and industrialization in the Asian newly industrializing economies: achievements and challenges'. In L. Kin and R. R. Nelson (Eds.), Technology, Learning, and Innovation: Experiences of Newly Industrializing Economies. Cambridge: Cambridge University Press.: 13-68
Lall, S. (2001) Competitiveness, Technology and Skills, Cheltenham: Edward Elgar. Langlois, J. D. Jr. (2001) 'The WTO and China's financial system', The China Quarterly, 167: 610-29 Lau, L. J., Qian Y., Roland G. (2000) 'Reform without losers: An interpretation of China's dual-track
approach to transition', Journal of Political Economy, 108(1): 120-143. Lazonick, W. (1991) Business organisation and the myth of the market economy. Cambridge: Cambridge
University Press. Lazonick, W. (2004) 'The innovative fIrm' In: J. Fagerberg, D. Mowery, and R. Nelson (Eds.), Oxford
handbook of innovation. Oxford: Oxford University Press. : 29-55.
Lazonick, W., O'Sullivan M. (1996) 'Organization, fInance and international competition'. Industrial
and Corporate Change 1(1): 1-36.
Lazonick, W., O'Sullivan M. (1997) 'Finance and industrial development. Part I: the United States and the United Kingdom '. Financial History Review.
Lazonick, W., O'Sullivan M. (2000) 'Maximizing shareholder value: A new ideology of corporate governance'. Economy and SOCiety, 29(1): 13-35.
Lazonick, W., O'Sullivan M. (Eds.) (2002) Corporate governance and sustainable prosperity. London: Palgrave.
Leadbeater, C., Wilsdon J. (2007) The Atlas of Ideas, London: Demos. Lee J., Bae Z. (1988) 'Technology development process: a model for a developing country with a global
perspective', R&D Management. 18(3): 225-250. Lewes, G. H. (2004) Comte's philosophy of the sciences being an exposition of the principles of the
Cours de philosophie positive of Auguste Comte. London: H.G. Bohn. Li, J. Y. (2005) Investing in China: The Emerging Venture Capital Industry- A GUide for Foreign
Investors, London: GMB Publishing Ltd. Li, Y. (2007)' Shangqi Nanqi zhongjiang qian heyue, liangzhe hezuo bada caixiang' (in Chinese: SAIC
and NAC to sign the contract - 8 conjectures over the cooperation). Tecent Auto News, 26th Dec. 2007. Available at: http://auto.qq.comlal20071226/000072.htm.
Liang, G. (2004). New Competition: Foreign Direct Investment and Industrial Development in China, Rotterdam: ERIM. Liao, D.M. (1999) 'Leader of the pack', China Business Review, 26(6): 28-37.
Lieberthal, K. (1995) Governing China: From Revolution through Reform. New York: Norton. Lin, S., Wei E. (2006) 'Determinants of the profItability of China's regional SOEs', China Economic
Review, 17:120-141.
Liu, C., Gao X. (2008) 'Five challenges for China's high-tech industry', China S&T Forum (Chinese), 10. Liu, J., Tylecote A. (2009) 'Corporate governance and technological capability development - three case
studies in the Chinese auto industry'. Industry and Innovation, 16 (4): 525-544.
Liu, X., Wang C., Wei Y. (2001) 'Causal links between foreign direct investment and trade in China'. China Economic Review. 12(2-3): 190-202.
Liu, X. (2001) Chinese Technology Innovation System in 21" Century. (in Chinese) Beijing: Peking University Press.
Liu, X., Wang C. (2003), 'Does foreign direct investment facilitate technological progress? Evidence from Chinese industries'. Research Policy, 32: 945-953.
Liu, X., White S. (2001) 'Comparing innovation systems: a framework and application to China's transitional context', Research Policy, 30: 1091-1114.
281
Chapter 9 Conclusion
Liu, X. Sun Z. (2003) 'Lun woguo guoyou qiye shangshi zbengce de yange ji yingxiang (in Chinese, The evolution and impact of the policies on listing of Chinese state ftrms)'. In Liu (ed.) Zhongguo Gushi (in Chinese, China's Stock Market). Beijing: People's Publishing House.
Lu, F., Feng K. (2004). Fazhan woguo zizhu zhishichanquan qichegongye de zhengce xuanze (In Chinese: The Policy Choice in Developing China's Proprietary Car Industry). Beijing: Peking
University Press. Lu, F. (2005) Learning by innovating: lessons from the development of the Chinese digital video player
industry. Mimeo. Lukka, K., Kasanen E. (1995). 'The problem of generalizability: anecdotes and evidence in accounting
research'. Accounting, Auditing and Accountability Journal, 8: 71-90.
Lundvall, B.A. (1988) 'Innovation as an interactive process: from user-producer interaction to the national system of innovation'. In: G. Dosi, R. Nelson & C. Freeman, (eds.), Technical Change and Economic Theory, 349-369. New York: Printer Publishers.
Lundvall, B.A. ed. (1992), National Systems of Innovation: Towards a Theory of Innovation and Interactive Learning. London: Printer Publishers.
Lundvall, B. A. (1997a) 'Competition and industrial dynamics in a small open economy', Paper
presented at the DRUID summer seminar on competition and industrial dynamics, 1997, Skagen.
Lundvall, B. A., (1997b) Development strategies in the learning economy, paper submitted at STEPI's
10tb Anniversary Conference in Seoul, 1997. Lundvall, B. A. (2007) 'National innovation systems: analytical concept and development tool'. Industry
& Innovation, 14(1): 95-119.
Lundvall, B. A., Ernst D. (2000) 'Information technology in the learning economy - challenges for developing countries', in Erich Reinert (ed), Evolutionary, economics and spatial income inequality, London: Edward Elgar Press.
Ma, J., Nguyen N., Xu J. (2006). China's innovation drive. Hong Kong: Deutsche Bank.
Mako, W. P., Zhang C. (2004) 'State equity ownership and management in China: issues and lessons from international experience'. Paper presented at the conference Policy Dialogue on Corporate Governance in China, Shanghai, 2004.
Malerba, F. (1996) Public policy in industrial dynamics: an evolutionary perspective, TSER-ISE
(Targeted Socio-Economic Research-Innovation System and European Integration), Milan, Dec,
1996. Malerba, F. (2004) Sectoral systems of innovation: concepts, issues and analyses of six major sectors in
Europe, Cambridge: Cambridge University Press.
Malerba, F., Orsenigo L. (1990) 'Technological regimes and patterns of innovation: a theoretical and empirical investigation of the Italian case'. In: Heertje, A. and Perlman, M., (Eds.), 1990. Evolving technology and market structure, Ann Arbour: Michigan University Press.: 283-306.
Malerba, F., Orsenigo L. (1993) 'Technological regimes and fl11l1 behaviour', Industrial and Corporate Change, 2(1): 45-74.
Malerba, F., Orsenigo L. (1996) 'Schumpeterian patterns of innovation are technology specific.' Research Policy, 25(3): 451-78.
Malerba, F., Orsenigo, L., Peretto, P., 1997, 'Persistence of innovative activities, sectoral patterns of nnovation and international technological specialization', International Journal of Industrial Organization 15: 801-826.
Mansfield, E. (1991) 'Academic research and industrial innovation', Research Policy. 20(1): 1-12.
Mattlin, M. (2007) 'The Chinese government's new approach to ownership and financial control of strategic state-owned enterprises', BOFIT Discussion Papers, n.l0.
Merrill, R.S. (1971) The study of technology, United Nations Institute for Training and Research (UNITAR) No. 14.
Meyer, M. W., Lu X. (2005). 'Managing indeftnite boundaries: the strategy and structure of a Chinese business fl11l1'. Management and Organization Review, 1:57-86.
MOC (Ministry of Commerce) (2006), 'Improving technology import standard for change of pattern of growth in foreign trade' in: China Trade in Services Report 2006. Available online: http://tradeinservices.mofcom.gov.cnlenlg/2007 -09-17 /6215 .shtrnl.
282
Chapter 9 Conclusion
Moju zhizao [in Chinese, Mould manufacturing], 1112008 Molnar, M., Tanaka K., (2007) 'What is different about monitoring by informal fmancial institutions?'
Opening and innovation on fmancial emerging markets, Beijing China.
Monks, R., Minnow N. (2001) Corporate governance and control. Simon and Schuster. Morck, R, Yeung, B. (2003) 'Agency problems in large family business groups'. Entrepreneurship
Theory and Practice, 27(4): 367-382. MOST (Ministry of Science and Technology) various years. Mowery, D.C., Oxley, J.E., Silverman, B.S., (1998). 'Technological overlap and interfmn cooperation:
implications for the resource- based view of the firm'. Research Policy 27: 507-523. Mu, Q., Lee K. (2005). 'Knowledge diffusion, market segmentation, and technological catch-up: the case
of the telecommunication industry in China'. Research Policy 34: 759-783.
Nanning Daily, 30/0112007. Naughton, B. (2004) 'Market economy, hierarchy, and single party rule: How does the transition path in
China shape the emerging market economy?' International Economic Association, Hong Kong, January 14-15,2004.
Naughton, B. (2005) 'SASAC rising', China leadership monitor, No. 14. Avaialble online:
http://media.hoover.orgldocumentslclmI4_bn.pdf.
NBS (National Bureau of Statistics), various years, China Statistical Yearbook, China Statistics
Publishing House, Beijing. (NDRC) National Development and Reform Commission (2006) The otline of the eeventh Five-Year plan
for national econoimc and social development of People's Republic of China. Available online: http://en.ndrc.gov.cn/hotlt20060529_71334.htm.
Nelson, R. R. (1987) 'Innovation and economic developments: theoretical retrospect and prospect', in J.
Katz (Ed.) Technology Generation in Latin American Manufacturing Industries. London: Macmillan.:
78-93. Nelson, R.R (1988) Preface to part v: national systems of innovation. In: G. Dosi, R. Nelson & C.
Freeman, (Eds.), Technical Change and Economic Theory, New York: Printer Publishers.: 312-329. Nelson, R.R, (Ed.) (1993) National Innovation Systems: A Comparative Analysis. New York: Oxford
University Press.
Nelson, RR, Winter, S. (1982) An evolutionary theory of economic change. Cambridge: Cambridge
University Press.
Nelson, R.R., Nelson, K. (2002) 'Technology, institutions and innovation systems', Research Policy
31:265-272. Niosi, J., Bellon B., Crow M., Saviotti P. (1993) 'National systems of innovation: in search of a workable
concept'. Technology in Society. 15: 207-227.
Niosi, J., Manseau A., Godin B. (Eds.) (2000) Canada's national systems of innovation. Montreal:
McGill-Queen's University Press.
Noble, G. (2006) 'The emergence of the Chinese and Indian automobile industries and implications for
other developing countries'. Background Paper for DanCing with Giants: China, India. and the Global Economy. Institute for Policy Studies and the World Bank. Washington, DC.
Nolan, P. (1996) 'Large fIrms and industrial reform in former planned economies: The case of China', Cambridge Journal of Economics, 20(1): 1-29.
Nolan, P. (2001) China and the global economy: national champions. industrial policy, and the big business revolution. Palgrave: New York.
O'Connor, N.G., Deng, J., Luo, Y., (2006) 'Political constraints, organization design and performance
measurement in China's SOEs', .Accounting. Organization and Society 21
OECD (Organization for Economic Cooperation and Development) (1992a) Technology and the Economy: The Key Relationship. Paris; OECD.
OECD (1992b) OECD Proposed Guidelines for Collecting and Interpreting Technological Innovation Data: Oslo Manual. Paris: OECD.
OECD (1996) Industrial Competitiveness. Directorate for Science. Technology and Industry. Paris: OECD.
283
Chapter 9 Conclusion
OECD (1997) The Oslo Manural: Proposed Guidelines for Collecting and Interpreting Technological Innovation Data. Paris: OECD.
OECD (2002) China in the World Economy: the Domestic Policy Challenges, Paris: OECD. OECD (2005) Economic Survey of China. Paris: OECD. Available online:
http://www.oecd.org/dataoecdll0/25/35294862.pdf OECD (2008) OECD reviews of innovation policy: China. Paris: OECD. Orlikowski, W.J., Robey D. (1991) Information technology and the structuring of organisations,
Information Systems Research, 2(2}: 143-169. O'Sullivan, M. (2000) 'The Innovative Enterprise and Corporate Governance', Cambridge Journal of
Economics, 24(4}: 393-416. O'Sullivan, M. (2004) 'Finance and innovation'. In: J. Fagerberg, D. Mowery and R. Nelson (Eds)
Oxford handbook of innovation. Oxford: Oxford University Press: 240-265. Panda, H., Ramanathan K. (1996) 'Technological capability assessment ofa firm in the electricity sector',
Technovation 16(10}: 561-588. Pavitt, K. (1984) 'Sectoral patterns of technical change: towards a theory and a taxonomy', Research
Policy 13: 343-373. Pavitt, K. (1998) 'Technologies, products, and organization in the innovating firm: what Adam Smith
tells us and Joseph Schumpeter doesn't'. Industrial and Corporate Change 7: 433-452. Pavitt, K. (1999) Technology. management and systems of innovation. Cheltenham: Elgar. People's Daily, various dates. Pei, S. W. (2002) 'Sheli baozhang )izhi dui zhongxiao qiye daikuannan wenti de yingxiang yanjiu. (in
Chinese, The impact of guarantee agencies on solving the difficulty of loans for SMEs in China). Zhengquan yan)iu (in Chinese. Securities Research), 34: 1-4.
People's Daily. various dates. Perez, C., Soete L. (1988) 'Catching up in technology: entry barriers and windows of opportunity'. In:
Dosi, G., et al. (Eds.), Technical Change and Economic Theory. New York: Pinter: 458-479. Peteraf, M. A. (1993) The cornerstones of competitive advantage: A resource-based view, Strategic
Management Journal, 14(3): 179-191. Pisano, G. P. (1994) 'Knowledge, integration, and the locus of learning: an empirical analysis of process
development'. Strategic Management Journal, 15, Winter Special Issue: Competitive Organizational
Behavior: 85-100. Prencipe, A., Davies A, Hobday M. (2003) The business of systems integration. Oxford: Oxford
University Press. PricewaterhouseCoopers (2008) China's impact on the semiconductor industry: 2008 update. Available
from: http://www.pwc.comlgx/enltechnology/publications/chinas-impact-on-semiconductor-industry-2008.jhtml
PodsakofT, P. M., Organ D. W. (1986) 'Self-reports in organizational research: problems and prospects'. Journalofmanagement, 12(4): 531-544.
Powell, T. C., Micallef A. D. (1997) 'Information technology as competitive advantage: the role of human, business, and technology resources'. Strategic Management Journal 18(5): 375-405.
Prakash, A., Hart lA. (Eds.) (1999). Globalization and governance. LondonlNew York: Routledge. PriceWaterhouseCoopers (2005) China's impact on the semiconductor industry. 2005 update. Qian, Y. (2002) How reform worked in China. William Davidson Institute (WDI) Reuvid, J., Li Y, (2000) Doing business with China, London: Kogan Page. Reynaldo, J., Santos A. (1999) 'Cronbach's Alpha: A tool for assessing the reliability of scales'. Journal
of Extension, 37(2): 25-37. Rogers, M. (1998) 'The definition and measurement of innovation', Melbourne Institute Working Paper
10/98.
Rosenberg, N. (1982) Inside the black box: technology and economics. Cambridge, MA.: Cambridge University Press.
Rothwell, R. (1992) 'Successful industrial innovation: critical factors for the 1990s'. R&D Management. 22(3): 221-240.
284
Chapter 9 Conclusion
Rouse, M. J., Daellenbach U. S. (1999) 'Rethinking research methods for the resource-based perspective: isolating sources of sustainable competitive advantage'. Strategic Management Journal, 20(5): 487-
494. Saunders, M., Lewis P., Thornhill A. (2000) Research Methods for Business Students (2nd ed.). Essex:
Pearson Education Limited.
Schacht, W.H. (1997) Industrial competitiveness and technological advancement: debate over governement policy. Washington, DC: Congressional Research Service.
Schumpeter, J. (1934, 1980) The theory of economic development. London: Oxford University Press.
Schumpeter, J. (1942, 1975) Capitalism, socialism and democracy, New York: Harper & Row.
Shanghai Daily, 19/02/2009 Shi, Y. (2001) 'Technological capabilities and international production strategy of firms: The case of
foreign direct investment in China'. Journal of World Business 36: 184-204.
Shleifer, A., Vishny R.W. (1997) 'A survey of corporate governance', Journal of Finance, 52: 737-783.
Shotter, J. (1993) Cultural politics of everyday life: social constructionism, rhetoric and knowing of the thrid kind. Toronto; Buffalo: University of Toronto Press.
Sill, I. M. (2007) China's emerging venture capital opportunities, EscapeArtist.com, Inc., Available
online: http://www.escapeartist.com
SSE (Shanghai Securities Exchange) SSE annual report, various years.
Sternberg, R., Mu··ller C. (2005). 'Return migration in regional innovation systems'. Asian Journal of Technology Innovation, 13(2): 71-93.
Stobaugh, R. (1988). Innovation and competition: The global management of petrochemical products. Cambridge, MA.: Harvard University Press
Stock Exchange Daily, 19/0112006. Sun, Q., Tong W.H.S. (2003) 'China share issue privatization: the extent of its success', Journal of
Financial Economics, 70( 2): 183-222.
Sun, W., Peng J., Zhong W., Yan X. (2007) 'Why no absorption: an empirical study on the evolution and
performance of Chinese technology policy (1978-2006)'. In X. Wu, Y. Shi, J. Du and B. Guo (Eds.),
The 3rd International Symposium on global manufacturing and China. Hangzhou: 81-97.
Sun Y, (2000), 'China's national system of innovation in transition;,Eurasian Geography and Economics 43 (3): 476-492.
Suttmeier, R. P. (2002) 'Globalisation, structural change, and the role of government in China's search
for a national innovation strategy', Unpublished manuscript, University of Oregon.
Tan, J. (2006) 'Growth of industry clusters and innovation: lessons from Beijing Zhongguancun science
park,' Journal of Business Venturing, 21: 827-850.
Tan, Z. A. (2002) 'Product cycle theory and telecommunications industry - foreign direct investment,
government policy, and indigenous manufacturing in China'. Telecommunications Policy, 24 (1-2):
17-30.
Teece, D. J. (1986) 'Profiting from technological innovation: Implications for integration, collaboration,
licensing, and public policy'. Research Policy, 15: 286-305.
Teece, D.J. (1987) (Ed) The competitive challenge. Cambridge, MA.: Ballinger
Teece, 0.1. (1998). 'Research directions for knowledge management'. California Management Review 40(3): 289-292.
Teece, D. J., Pisano G., Shuen A. (1997), 'Dynamic capabilities and strategic management'. Strategic Management Journal 18(7): 509-533.
Tenev, S., Zhang C., Brefort L. (2002) Corporate governance and enterprise reform in China, building the institutions of modern markets. Washington D.C.: World Bank Publications
Terrill, R. (2003) The new Chinese empire. New York: McGraw-Hill,
Tidd, J., Bessant 1., Pavitt K. (2001) Management of technological innovation. Chichester: Wiley. Toby, E. S. (2000) Interorganizationa1 alliances and the performance of fmns: a study of growth and
innovation rates in a high-technology industry. Strategic Management Journal 11(8):791-811.
285
Chapter 9 Conclusion
Tong, W. (2008) 'Shanghai, zizhu qiche pingpai jiangkeneng kuisun (in Chinese: Shanghai: own-brand cars making a loss?)'. Pacific auto news, 14th August. Available at: http://txnews.zjol.com.cnltxnews/systeml2008/08/13/01 06040 II.shtml.
Tsai, K. S. (2002). Back-alley banking: Private entrepreneurs in China. Ithaca: Cornell University Press.
Tylecote, A. (2006) Corporate governance and the crisis of Chinese technology policy, IAMOT 2006
conference: Beijing.
Tylecote, A. (2007) 'The Role of Finance and Corporate Governance in National Systems ofInnovation', Organization Studies 28(10): 1461-1481.
Tylecote, A., Conesa E. (1999) 'Corporate governance innovation systems and industrial performance'. Industry and Innovation, 6(1): 25-50.
Tylecote, A., Cai J. (2004) 'Chinas SOE reform and technological change: a corporate governance perspective'. Asian business & management 3: 57-84.
Tylecote, A., Demira I. (1992) 'Short-termism: culture and structures as factors in technological innovation', in R.Coombs, Walsh V.& Saviotti P. (Eds.) Technological change and company strategies. London: Academic Press. : 201- 225. Tylecote, A., Ramirez P. (2006). 'Corporate governance and innovation: the UK compared with the US
and "insider" economies'. Research Policy 35(1): 160-180.
Tylecote, A., Visintin, F. (2008), Corporate governance, finance and the technological advantage of nations, London: Routledge.
Tylecote, A., Cai, 1., Liu, J. (2010) 'Why do mainland Chinese fmns succeed in some sectors and fail in others? A critical view of the Chinese system of innovation', International Journal of Learning and Intellectual Capital. 7(2): 123-144.
UNITED (2002) World investment report, United Nations conference on trade and development, Geneva.
Available on line: http://www.unctad.orglenldocs/wir2002p2ch6_en.pdf.
UNCTAD (United Nations Conference on Trade and Development) (1996) Fostering technological dynamism: evolution of thought on technological development proceses and completitiveness - A review of the literature, Geneva Switzerland: UNCTAD.
Utterback, J. (1993) Mastering the Dynamics of Innovation, Boston, MA.: Harvard Business School,
Utterback, J., Abernathy W. (1975) A Dynamic Model of Process and Product Innovation, Omega 3.
Viotti, E.B. (1997) Passive and active national learning systems. PhD. Dissertation. New School for
Social Research.
Viotti, E.B. (2001) National learning systems: a new approach to technological change in late
industrializing economies and evidence from the cases of Brazil and South Korea, Technol. Forecast.
Soc. Change 68: 1-28.
von Hippel E. (1976) 'The dominant role of users in the scientific instruments innovation process'
Research Policy, 5(3): 212-239.
von Hippel, E. (1988) The sources of innovation, New York: Oxford University Press
von Hippel, E. (2005) Democratizing innovation. Cambridge, MA.: MIT Press.
von Tunzelmann, N. (2003) 'Historical coevolution of governance and technology in the industrial
revolutions', Structural Change and Economic Dynamics, 14: 365-384.
von Zedwitz, M. (2004)'Managing forieng R&D labs in China', R&D Management, 34(4): 439-452. Wall Street Journal, 30/03/2005 Wang, R. (2002) Woguo yi'wu jiaoyu jingfei de diquxing chayi yanjiu (in Chinese, Research on regional
discrepancy of China's compulsory education expenditure). Beijing: People's Education Press.
Wang, x., Bi K. (2006) 'Zhongxiao qiye jishu chuangxin zhichi tixi yanjiu zongshu' (in Chinese, A
review of the research on supporting system for small-medium-enterprise innovation) Industrial and Technology Economics, 25(3):2-6. http://www.moe.gov.cnljytourulzlwenxianl02.htm.
Wang, X. M., Zhou X. (1999) A new strategy of technology transfer to China. International Journal of Operations & Production Management 19(5/6): 527-537.
Wei, D. (1999) 'Regional inequality in China', Progress in Human Geography, 23 (1): 48-58.
Wernerfelt, B. (1984) 'A resource-based view of the fum', Strategic Management Journal, 5 (2):171-180.
Westphal, L., Kim L., Dahlman C. (1985), 'Reflections on the Republic of Korea's acquisition of technological capability', in Nathan Rosenberg and Claudio Frischtak (Eds.), International Technology Transfer, New York: Praeger.
286
Chapter 9 Conclusion
Wilson, D., Puroshothaman R., Fiotakis D. (2004). 'The BRICs and global markets: Crude, cars, and capital'. Goldman Sachs, Global Economics Paper No. 118, <http://www.new-frontiers.org/classicdocs/thebricsreport.pdf>
Winter, S.G. (2000) 'The satisfying principle in capability learning'. Strategic Management Journal, Special Issue 21(10-11): 981-996.
Winter, S. G. (2003) 'Understanding dynamic capabilities'. Strategic Management Journal, 24(10): 991-
995.
Winter, S. G. (2004) 'Specialised perception, selection, and strategic surprise: learning from the moths and bees,' Long Range Planning, 37(2): 163-170.
World Bank (1997) 'China's Management of Enterprise Assets: The State as Shareholder'. A World Bank Country Study, Wathington, D.C.
World Bank (2003) China country economic memorandum: promoting growth with equity. Poverty
reduction and economic management unit, East Asia and Pacific Region, W orId Bank, 15 October
2003. Report No. 24169-CHA. Available from: http://www.worIdbank.org.cnlEnglishlcontenticem03 .pdf.
World Ecnomic Forum (2008) The Power of Collaborative
23-27 January, Davos, Switzerland. Available
http://www.weforum.org/enieventsiArchivedEventsiAnnualMeeting2008/index.htm
Innovation
from:
Wu, M.(2003) 'Zhongguo siqi shangshi wenti yanj;u (in Chinese, A survey of listed private enterprises).
Zhengquan yanjiu (in Chinese, Securities Research). 34: 46-50.
Xiao, J. Z., Weetman P., Sun M. (2004) 'Political influence and coexistence of a uniform accounting system and accounting standards: Recent developments in China'. Abacus, 40(2): 193-218.
Xiao, W. (2007) 'The new economy and venture capital in China', Perspectives, 3(9) Overseas Young
Chinese Forum (OYCF).
Xie, W., White S. (2004) Sequential learning in a Chinese spin-off: the case of Lenovo Group Limited. R&D Management 34(4): 407-422
Xinhua News Agency, various dates.
XU, Q., Chen J. (1997) 'Innovation strategy for building indigenous
technological innovation capability in China', Journal ofZhejiang University 1(2): 229-232.
Xu, X., Wang Y. (1999) 'Ownership structure and corporate governance in Chinese stock companies'.
China Economic Review, 10 (1): 75-98.
Yam, R. C. M., Guan 1. C., Pun K. F., Tang E. P. Y. (2004) 'An audit of technological innovation
capabilities in Chinese firms: some empirical findings in Beijing, China'. Research Policy, 33(8): 1123-1140.
Yang, H. (2005) 'Political connection, credit rating and bank loans in Chinese private sector', Paper
presented at the annual meeting of the American Sociological Association, Philadelphia, USA.
Online from: http://www.allacademic.com/metalp231 03_ index.html.
Yu, C., Chang S., Mao M (2007) 'Fengxian touzi zai woguo de fanzhan xianzhuang (in Chinese, The
development of venture capital in China). Touzi Jingliren (in Chinese, Investment Manager) Autumn
2007: 5-8.
Yue, C., Hua P. (2002) 'Does comparative advantage explain export patterns in China?', China Economic Review, 13(2-3): 276-296.
Yin, R. K. (1994) Case study research: design and methods. California: SAGE Publications.
Yin, R. K. (2002) Applications of case study research. California: SAGE Publications.
Zhang, W. (1998) 'A principal-agent theory of the public economy and its applications to China.' Economics of Planning 31 (2-3):231-251.
Zhang, B. (2002) Zhongguo jiaoyu jingfei wenti de huigu yu sikao (in Chinese, Review and reflections on China's education expenditure). Available online: http://www.edu.cnl20010823/207528.shtml.
Zhang, Q., Felmingham B. (2002) 'The relationship between inward direct foreign investment and China's provincial export trade', China Economic Review, 12(1): 82-99.
Zhang, Q. (2006) 'Shui toule Pizibao de nailao? (in Chinese, Who has stolen Pittsburgh's cheese?), Jingji Xin Guancha (in Chinese, New Economic Observation). 23 September.
287
Chapter 9 Conclusion
Zhang, Z. (2007) 'Legal deterrence: the foundation of corporate governance? Evidence from China'. Corporate Governance: An International Review 15(5): 741-767.
Zhao, Y. (2003) 'Zhongguo guoji jishu maoyi de wenti ji duiche yanjiu (in Chinese, The problems in China's international technology trade, and suggested solutions)', Yunnan University of Finance and
Trade Journal, 19(5): 18-21. Zhongguo jingji shibao [China Economic Times], 12/06/2002 Zhou, Y. (2005) 'The making of an innovative region from a centrally planned economy: Institutional
evolution in Zhongguancun Science Park in Beijing', Environment and Planning A (37): 1113-1134. Zollo, M., Singh H. (1998) 'The impact of knowledge codification, experience trajectories and
integration strategies on the performance of corproate acquisitions'. Academy of Management Best
Paper Proceedings, San Diego, CA. Zollo, M., Winter S. G. (1999) From organizational routines to dynamic capabilities: Fontainebleau,
France: INSEAD. Zollo, M., Winter S. G. (2002) 'Deliberate learning and the evolution of dynamic capabilities'. Organization Science 13: 339-351
288
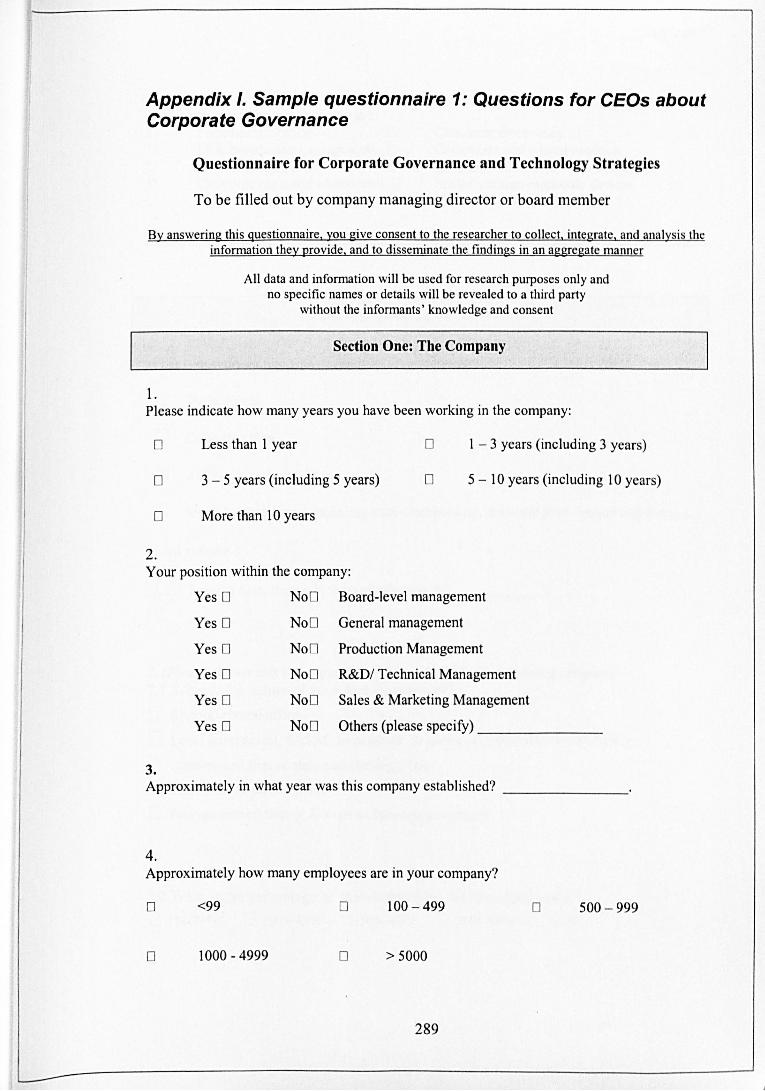
Appendix I. Sample questionnaire 1: Questions for CEOs about Corporate Governance
Questionnaire for Corporate Governance and Technology Strategies
To be filled out by company managing director or board member
By answering this questionnaire, you give consent to the researcher to coUect, integrate, and analysis the information they provide, and to disseminate the findings in an aggregate manner
1.
AJI data and information will be used for research purposes only and no specific names or details will be revealed to a third party
without the informants ' knowledge and consent
Section One: The Company
Please indicate how many years you have been working in the company:
o Less than 1 year o 1 - 3 years (including 3 years)
D 3 - 5 years (including 5 years) D 5 - 10 years (including 10 years)
D More than 10 years
2. Your position within the company:
Yes D NoD Board-level management
Yes D NoD General management
Yes D NoD Production Management
Yes D NoD R&D/ Technical Management
Yes D No D Sales & Marketing Management
Yes D No D Others (please specify)
3. Approximately in what year was this company established? _______ _
4. Approximately how many employees are in your company?
o <99 o 100 - 499 o 500 - 999
D 1000 - 4999 D > 5000
289
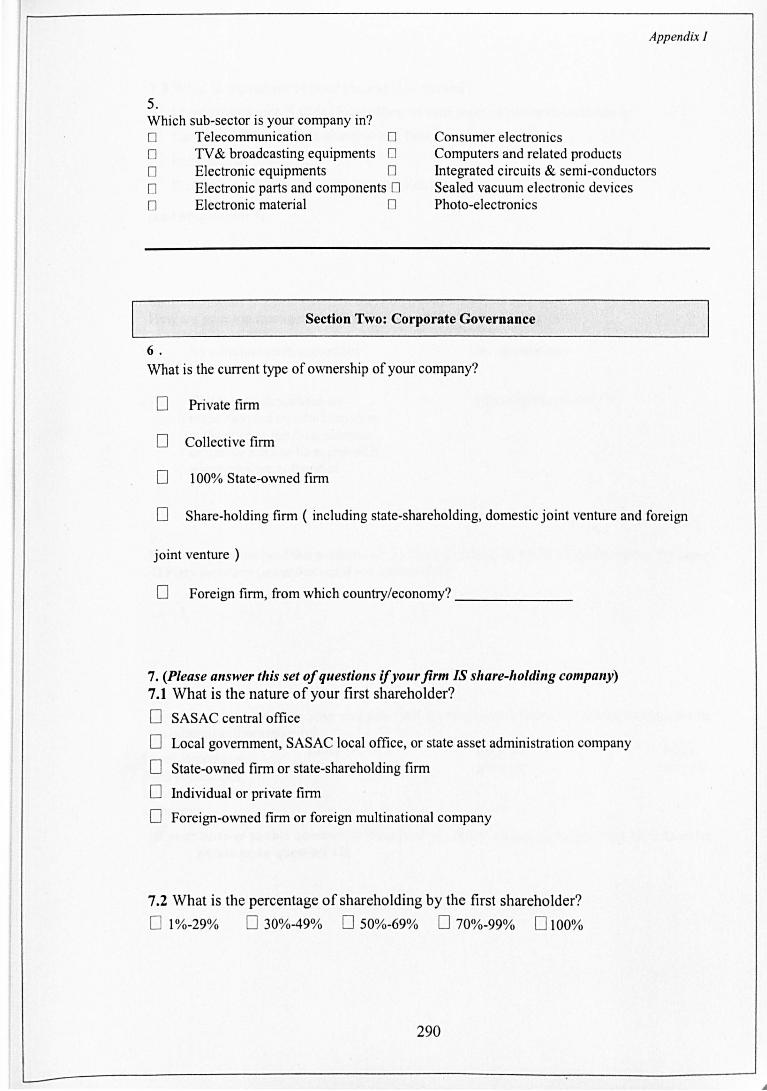
Appendix I
5. Which sub-sector is your company in? o Telecommunication 0 Consumer electronics o TV & broadcasting equipments 0 o Electronic equipments 0 o Electronic parts and components 0 o Electronic material 0
Computers and related products Integrated circuits & semi-conductors Sealed vacuum electronic devices Photo-electronics
Section Two: Corporate Governance
6. What is the current type of ownership of your company?
o Private firm
o Collective firm
o 100% State-owned firm
o Share-holding firm ( including state-shareholding, domestic joint venture and foreign
joint venture)
o Foreign firm, from which country/economy? ______ _
7. (P/ease answer this set of questions if your firm IS share-Iw/dillg company) 7.1 What is the nature of your first shareholder?
o SASAC central office
o Local government, SASAC local office, or state asset administration company
o State-owned firm or state-shareholding firm
o Individual or private firm
o Foreign-owned firm or foreign multinational company
7.2 What is the percentage of shareholding by the first shareholder?
o 1%-29% 0 30%-49% 0 50%-69% 0 70%-99% 0 100%
290
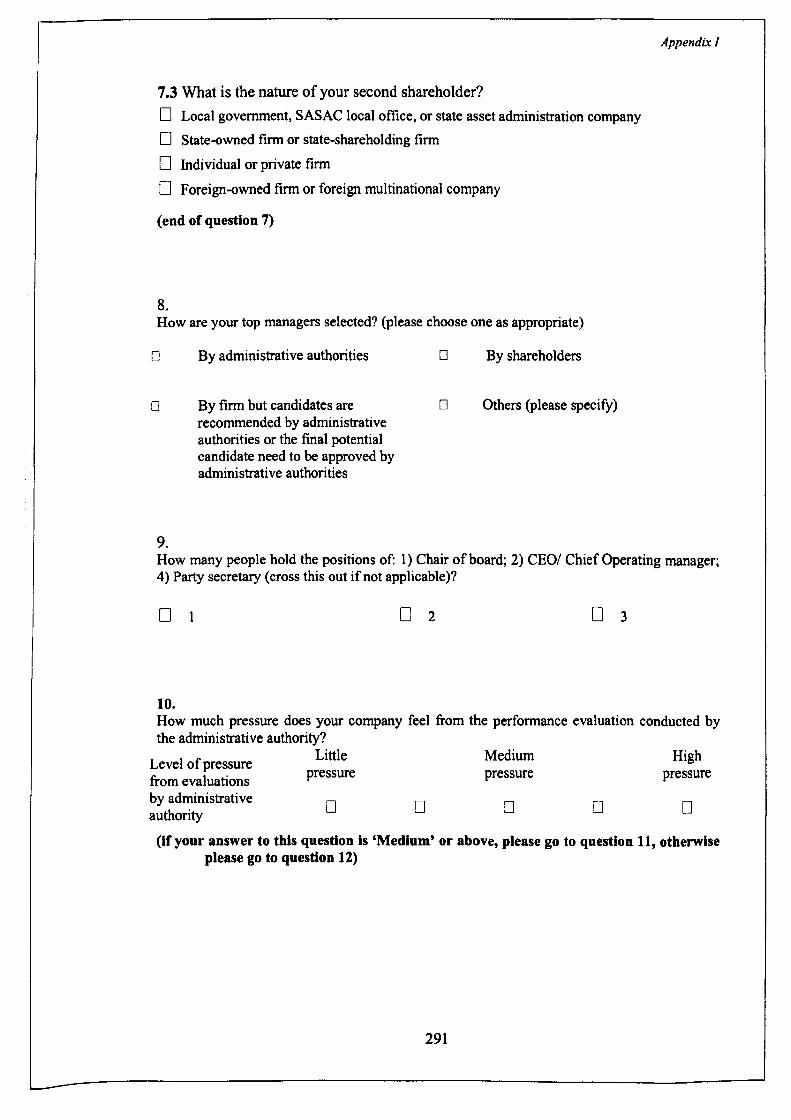
7.3 What is the nature of your second shareholder? D Local government, SASAC local office, or state asset administration company
D State-owned firm or state-shareholding firm
D Individual or private firm
o Foreign-owned firm or foreign multinational company
(end of question 7)
8. How are your top managers selected? (please choose one as appropriate)
D
D
9.
By administrative authorities
By firm but candidates are recommended by administrative authorities or the final potential candidate need to be approved by administrative authorities
D By shareholders
D Others (please specify)
Appendix I
How many people hold the positions of: 1) Chair of board; 2) CEOI Chief Operating manager; 4) Party secretary (cross this out if not applicable)?
o o 2 o 3
10. How much pressure does your company feel from the performance evaluation conducted by the administrative authority?
Level of pressure from evaluations by administrative authority
Little pressure
o o
Medium High pressure pressure
o o o (if your answer to this question is 'Medium' or above, please go to question 11, otherwise
please go to question 12)
291
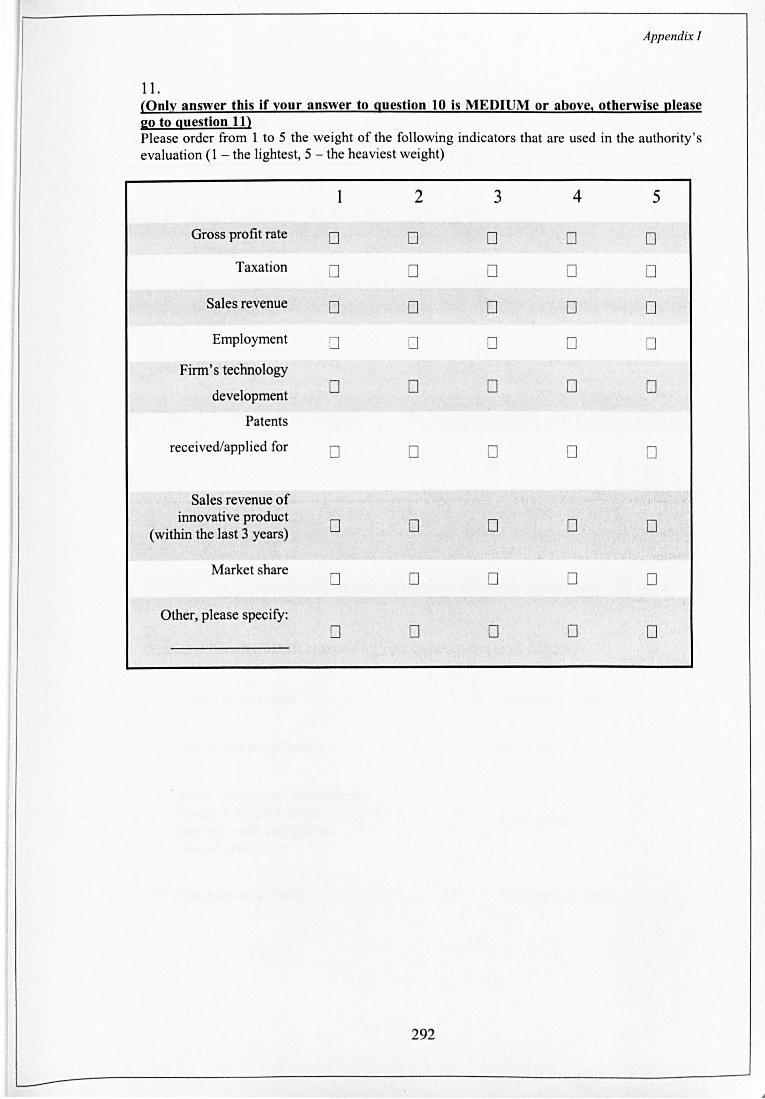
Appendix I
11. (Only answer this if your answer to guestion 10 is MEDIUM or above l otherwise (!Iease 20 to guestion Il} Please order from 1 to 5 the weight of the following indicators that are used in the authority 's evaluation (1 - the lightest, 5 - the heaviest weight)
1 2 3 4 5
Gross profit rate 0 0 0 0 0
Taxation 0 0 0 0 0
Sales revenue 0 0 0 0 0
Employment 0 0 0 0 0
Firm's technology
development 0 0 0 0 0
Patents
received/applied for 0 0 0 0 0
Sales revenue of innovative product
0 0 0 0 0 (within the last 3 years)
Market share 0 0 0 0 0
Other, please specify: 0 0 0 0 0
292
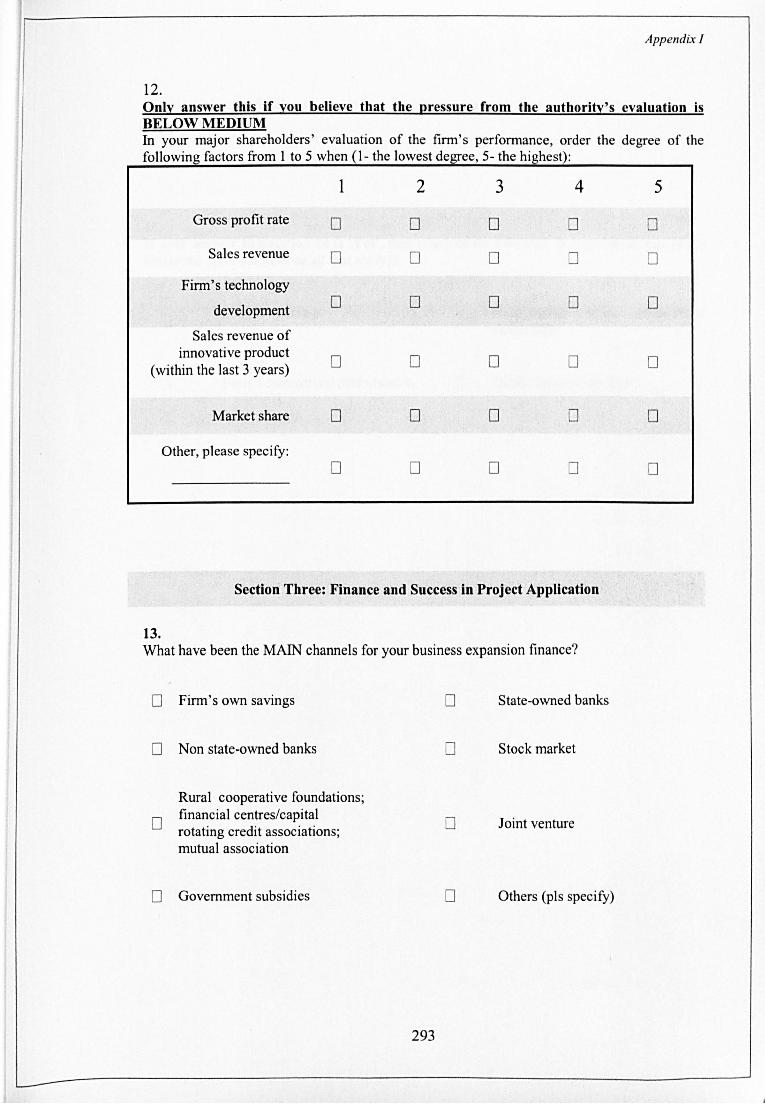
Appendix I
12. Only answer this if you believe that the I!ressure from the authority's evaluation is BELOW MEDIUM In your major shareholders' evaluation of the firm's performance, order the degree of the following factors from 1 to 5 when (1- the lowest de ee, 5- the hi hest :
1 2 3 4
Gross profit rate 0 0 0 0
Sales revenue 0 0 0 0
Firm's technology
development 0 0 0 0
Sales revenue of innovative product
0 0 0 0 (within the last 3 years)
Market share 0 0 0 0
Other, please specify: 0 0 0 0
Section Three: Finance and Success in Project Application
13. What have been the MAIN channels for your business expansion finance?
o
o
o
o
Firm' s own savings
Non state-owned banks
Rural cooperative foundations; financial centres/capital rotating credit associations; mutual association
Government subsidies
293
o State-owned banks
o Stock market
o Joint venture
o Others (pIs specify)
5
0
0
0
0
0
0
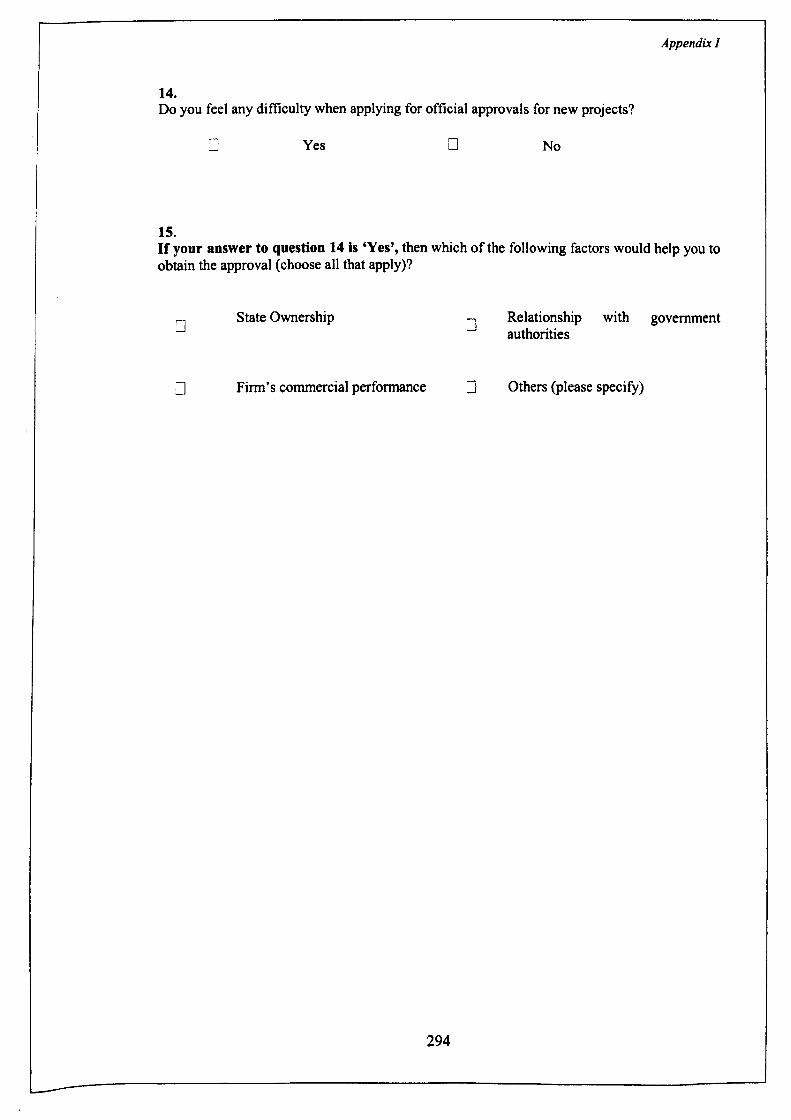
Appendix I
14. Do you feel any difficulty when applying for official approvals for new projects?
o Yes o No
IS. If your answer to question 14 is 'Yes', then which of the following factors would help you to obtain the approval (choose all that apply)?
State Ownership o Relationship with government authorities o
[J Firm's commercial performance o Others (please specify)
294
Appendix I
Section Four: Technological Strategy
16. When considering acquiring new technology from outside, what is the strategy most likely to be chosen?
o Choose the most advanced technology given sufficient capital
o Choose appropriate technology which is compatible to firm's existing technology
o Others (please specify): ___________ _
17. What is the average proportion (in the last 3 years) of the following categories of technological expenditure to total revenue? (please tick as appropriate)
Tangible technology purchasing such as 0 <1% 0 1% -3% 03.1%-5% 0 5.1%-7% 0 7.1 % -9"10 0 10%-19"10 020% -29"10 030% -39 0
equipment
Intangible technology such as
0 <1% 0 1%-3% 0 3.1%-5% 05.1% -7% 0 7.1% -9% 0 10%-19% 0 20%-29% 0 30% -39. patent, licences
Process technology
0<1% 01%-3% 03.1%-5% 0 5.1%-7% 0 7.1% -9"/. 0 10%-19% 020%-29% 030% -39' 0 improvement
Technological absorption . 0 <1% 0 1% -3% 0 3.1 %-5% 0 5.1% -7% 0 7.1%-9% 0 10% -19% 0 20% -29% 030% -39 0
R&D 0<1% 0 1% -3% 03.1% -5% 05.1% -7% 0 7.1%-9"10 0 10% -1 9"10 020% -29"10 030% -390
295

Appendix I
18. How important are the following factors in hampering firm's technological development?
Factors hampering technological development
Lack of appropriate finance
Lack of skilled technical personnel
Lack of skilled managerial personnel
Lack of government support and assistance in initiating R&D activities and/or innovation projects
Others (pIs specify):
Unimportant Neutral
0 0 0
0 0 0
0 0 0
0 0 0
0 0 0
Important Crucial
0 0 0 0
0 0 0 0
0 0 0 0
0 0 0 0
0 0 0 0
°Note: Technological absorption expenditure is the money spent on activities in assimilating newly acquired technology, which include various training (on the job training, course based training etc.), inviting expert or engineers from outside for problem solving, trials, experiments and so on.
Thank you very much for taking the time to complete this survey! If you want to expand on any of your answers to one, or more, of the questions please do
add them here:
If you have any additional comments that you would like to add, or comments about the
survey then please add them here:
If you would like to receive a copy of the report please add your name and company address here.
Name: -----------------------------------Address: -----------------------------------------
296
Appendix II. Sample questionnaire 2: Questions for R&D Managers about Technological Capbai/ity
1.
Questionnaire for evaluation of technological capabilities and strategies
(To be filled out by the R&DITechnical director) By answering this questionnaire, you give consent to the researcher to
collect, integrate, and analysis the infonnation they provide, and to disseminate the findings in an aggregate manner
All data and information will be used for research purposes only and no specific names or details wi ll be revealed to a third party
without the informants' knowledge and consent
Section One: The Company
Please indicate how many years you have been working in the company:
D Less than 1 year D 1 - 3 years (including 3 years)
D 3 - 5 years (including 5 years) D 5 - 10 years (including 10 years)
D More than 10 years
2. Your chief position within the company:
Yes D No D Board-level management
Yes D No D General management
Yes D NoD Production Management
Yes D NoD R&D/ Technical Management
Yes D NoD Sales & Marketing Management
Yes D NoD R&D/ Technical project supervisor
Yes D NoD Others (please specify)
3. Approximately how many employees are in your company?
D <99 D 100 - 499 D 500 - 999
o 1000 - 4999 o > 5000
297
Appendix II
Section Two: Technological Capabilities
5. Evaluating manufacturing capability Please circle the most appropriate number to the right of each statement.
Manufacturing Capability Elements of manufacturing 1 2 3 4 5 6
capabilities (average (advanced (advanced in the in the in the
country) country) world)
Ability to ensure smooth functioning of equipments and 0 .0 0 0 0 0 routine production
Ability of the manufacturing department to comply with the 0 0 0 0 0 0 request of R&D
Level of total quality control 0 0 0 0 0 0
Manufacturing cost control 0 0 0 0 0 0
Overall technical capability of equipment 0 0 0 0 0 0 Ability to make continuous improvement in the manufacturing
D D D D D 0 system
The level of contribution made by manufacturing department to the
0 0 0 [J 0 0 innovation processes
298
Appendix /l
6. Evaluating R&D capability Please circle the most appropriate number to the right of each statement.
R&D Capability Elements of R&D 1 2 3 4 5 6
capabilities (average (advanced (advanced in the in the in the
country) country) world)
The overall R&D capability 0 0 0 0 0 0 The ability to carry out process improvement 0 0 0 0 0 0 The ability to carry out process innovation 0 0 0 0 0 0 Ability to incorporate desired functions in product
0 0 0 0 0 0 design/development process
Quality and speed when responding to feedback from manufacturing about design and 0 0 0 0 0 0 engineering
Ability to incorporate market and customer feedback in the
0 0 0 0 0 0 improvement/innovation process
299
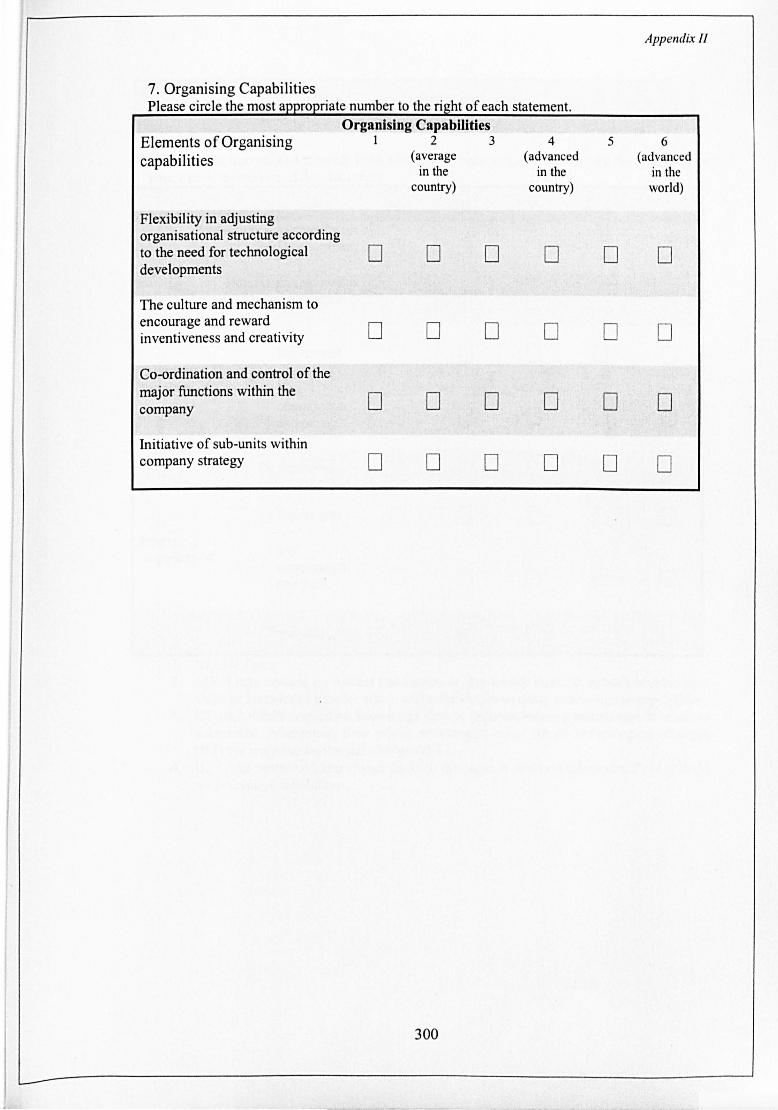
Appendix II
7. Organising Capabilities Please circle the most appropriate number to the right of each statement.
Organising Capabilities Elements of Organising 1 2 3 4 5 6
capabilities (average (advanced (advanced in the in the in the
country) country) world)
Flexibility in adjusting organisational structure according to the need for technological 0 0 developments
0 0 0 0
The culture and mechanism to encourage and reward 0 0 0 0 0 0 inventiveness and creativity
Co-ordination and control of the major functions within the
0 0 0 0 0 0 company
Initiative of sub-units within company strategy 0 0 0 0 0 0
300
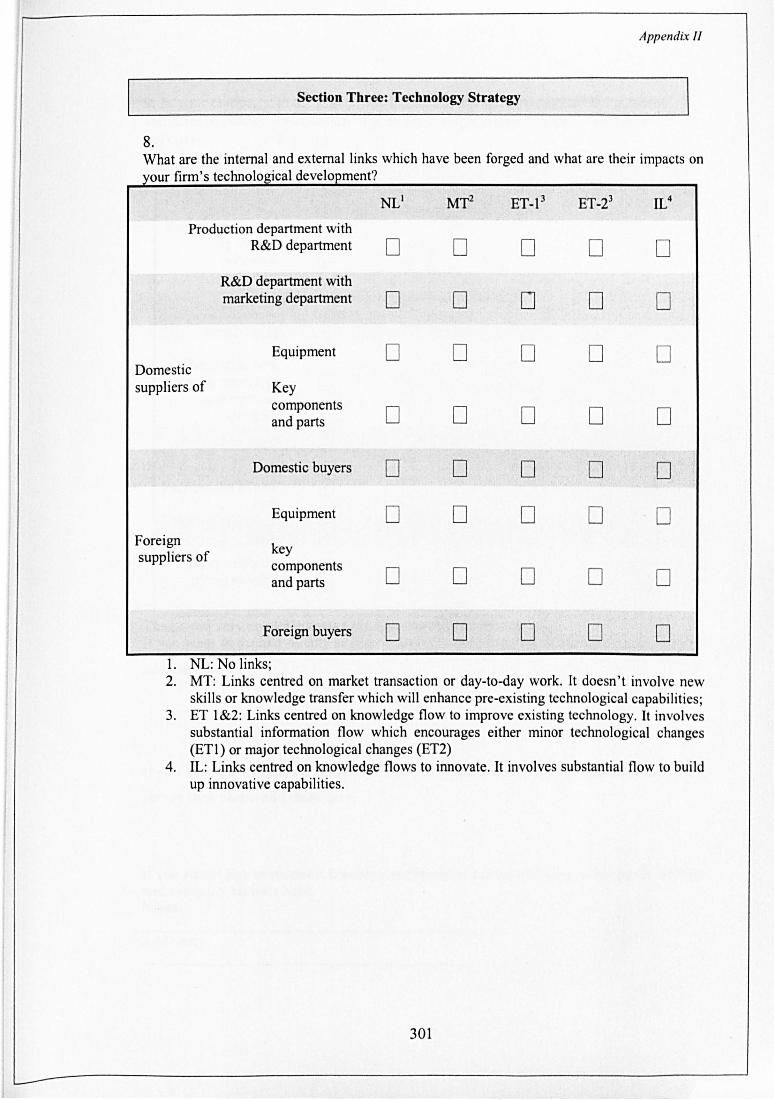
Appendix /I
Section Three: Technology Strategy
8. What are the internal and external links which have been forged and what are their impacts on your firm's technological development?
NL1 Mr ET-1 3 ET-23 IL4
Production department with R&D department 0 0 0 0 0
R&D department with marketing department 0 0 0 0 0
Equipment 0 0 0 0 0 Domestic suppliers of Key
components 0 0 0 0 0 and parts
Domestic buyers 0 0 0 0 0
Equipment 0 0 0 0 0 Foreign
key suppliers of
components 0 0 0 0 0 and parts
Foreign buyers 0 0 0 0 0 1. NL: No links; 2. MT: Links centred on market transaction or day-to-day work. ]t doesn ' t involve new
skills or knowledge transfer which will enhance pre-existing technological capabilities; 3. ET 1&2: Links centred on knowledge flow to improve existing technology. It involves
substantial information flow which encourages either minor technological changes (ETl) or major technological changes (ET2)
4. IL: Links centred on knowledge flows to innovate. It involves substantial flow to build up innovative capabilities.
301
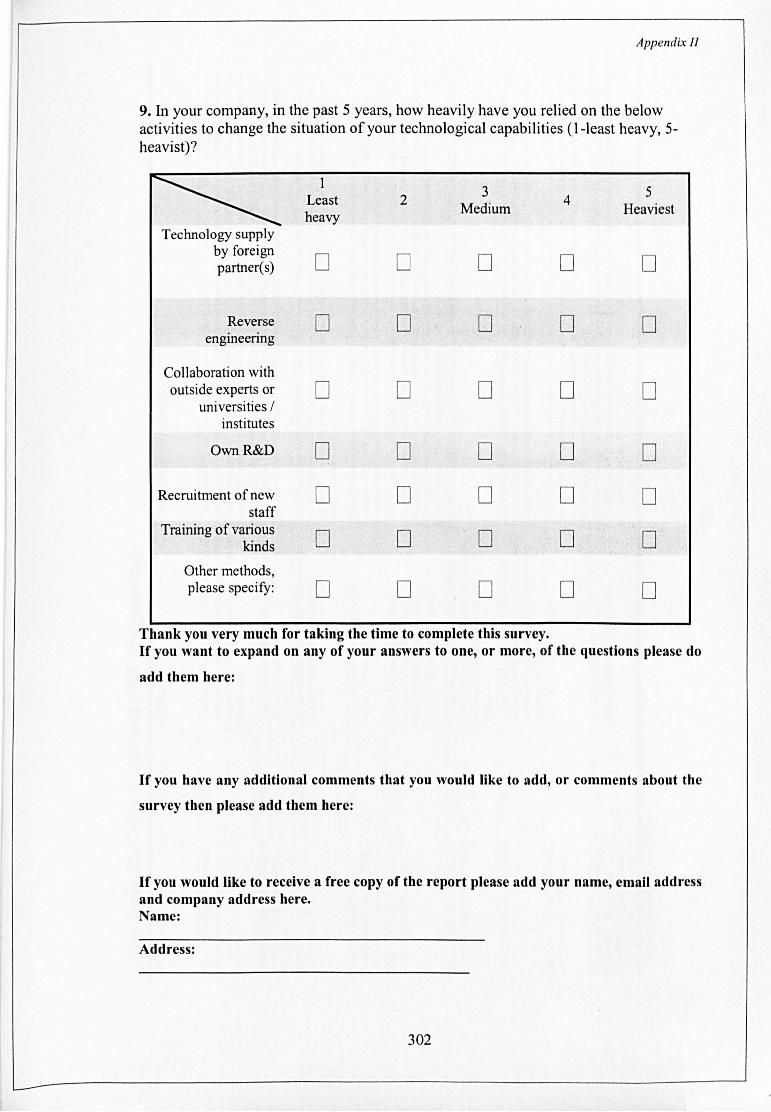
Appendix 11
9. In your company, in the past 5 years, how heavily have you relied on the below activities to change the situation of your technological capabilities (l-least heavy, 5-heavist)?
1 3 5 Least 2 4
heavy Medium Heaviest
Technology supply by foreign
D D D 0 0 partner(s)
Reverse D D engineering
0 0 0
Collaboration with outside experts or D D D D D
universities / institutes
Own R&D D D D D D
Recrui tment of new D 0 0 0 0 staff
Training of various D D 0 D 0 kinds
Other methods, please specify: D 0 0 0 0
Thank you very much for taking the time to complete this survey. If you want to expand on any of your answers to one, or more, of the questions please do
add them here:
If you have any additional comments that you would like to add, or comments about the
survey then please add them here:
If you would like to receive a free copy of the report please add your name, email address and company address here. Name:
Address:
302
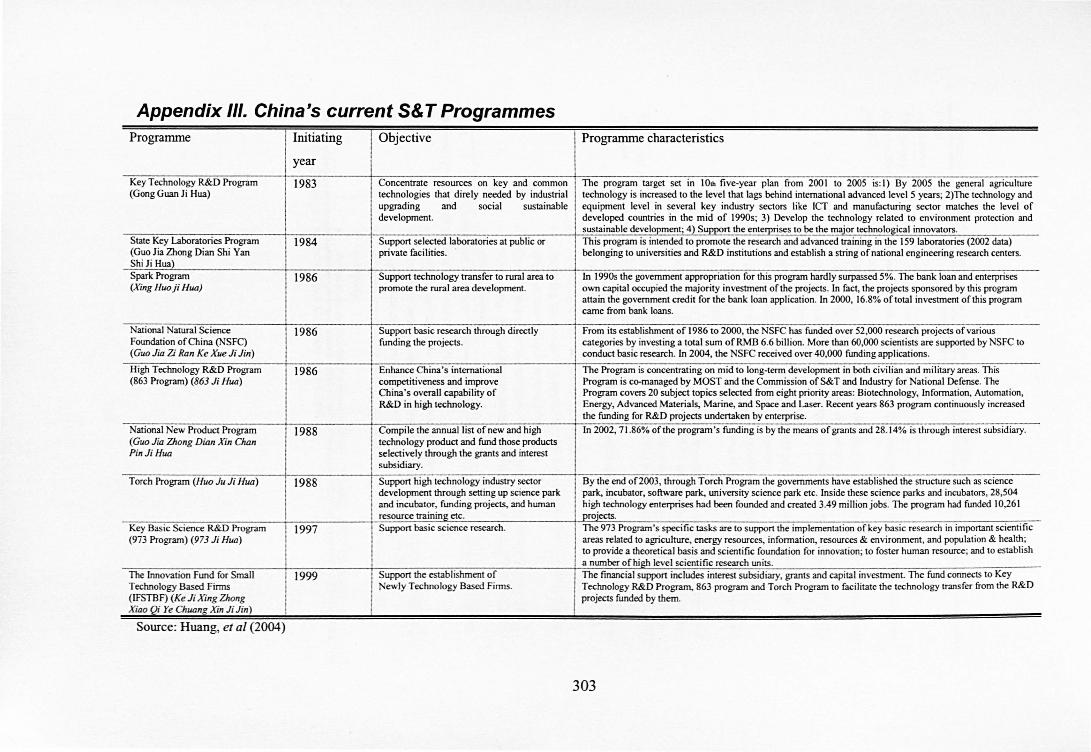
Appendix III. China's current S& T Programmes Prograrrune I Initiating I Objective . Progranune characteristics
L~e<l1" I Key Technology R&D Program 1983 Concentrate resources on key and common The program target set in 10th five-year plan from 200 I to 200S is: I) By 200S the general agriculture (Gong Guan Ji Hua) technologies that direly needed by industrial technology is increased to the level that lags behind international advanced level 5 years; 2)The technology and
upgrading and social sustainable equipment level in several key industry sectors like ICT and manufacturing sector matches the level of development. developed countries in the mid of 199Os; 3) Develop the technology related to environment protection and
sustainable develo ment; 4 Su rt the ente rises to be the ma·or technolo ical innovators. State Key Laboratories Program I 1984 Support selected laboratories at public or I This program is intended to promote the research and advanced training in the 159 laboratories (2002 data) (Guo Jia Zhong Dian Shi Yan ! private facilities . belonging to universities and R&D institutions and establish a string of national engineering research centers. Shi Ji Hua) I I Spark Program I 1986 Support technology transfer to rural area to In I 990s the government appropriation for this program hardly surpassed 5%. The bank loan and enterprises (Xing Huoji Hua) I promote the rural area development. own capital occupied the majority investment of the projects. In fact, the projects sponsored by this program
i altain the government credit for the bank loan application. In 2000, 16.8% of total investment of this program , came from bank loans. I
National Natural Science 1986 Support basic research through directly From its establishment of 1986 to 2000, the NSFC has funded over 52,000 research projects of various Foundation of China (NSFC) funding the projects. categories by investing a total sum ofRMB 6.6 billion. More than 60,000 scientists are supported by NSFC to (Guo Jia Zi Ran Ke Xue Ji Jjn)
High Technology R&D Program (863 Program) (863 Ji Hun)
National New Product Program (Guo Jia Zhong Dian Xjn Chan PinJi HULl
Torch Program (Huo Ju Jj Hun)
Key Basic Science R&D Program (973 Program) (973 Ji Hun)
1986
1988
1988
1997
Enhance China's international competitiveness and improve China's overall capability of R&D in high technology.
conduct basic research. In 2004, the NSFC received over 40,000 funding applications.
The Program is concentrating on mid to long-term development in both civilian and mil itary areas. This Program is co-managed by MOST and the Commission ofS&T and Industry for National Defense. The Program covers 20 subject topics selected from eight priority areas: Biotechnology, Information, Automation, Energy, Advanced Materials, Marine, and Space and Laser. Recent years 863 program continuously increased the funding for R&D projects undertaken by enterprise.
Compile the annual list of new and high In 2002, 71.86% of the program 's funding is by the means of grants and 28.14% is through interest subsidiary. technology product and fund those products selectively through the grants and interest subsidiary.
Support high technology industry sector By the end of2oo3, through Torch Program the governments have established the structure such as science development through setting up science park park, incubator, software park, university science park etc. Inside these science parks and incubators, 28,504 and incubator, funding projects, and human high technology enterprises had been founded and created 3.49 million jobs. The program had funded 10,261 resource training etc. projects. Support basic science research. The 973 Program's specific tasks are to support-the implement3ii(;;;-()fkey basic research in important scientific
areas related to agriculture, energy resources, information, resources & environment, and population & health; to provide a theoretical basis and scientific foundation for innovation; to foster human resource.; and to establish
__________ . a number of high level scientific research units. The Innovation Fund for Small 1 1999--------- Support the establishment of I The financial support includes interest subsidiary, grants and capital investment. The fund connects to Key Technology Based Firms I Newly Technology Based Firms. I' Technology R&D Program, 863 program and Torch Program to facil itate the technology transfer from the R&D (IFSTBF) (Ke Ji Xing Zhong J . projects funded by them. Xiao Qi Ye Chuang Xin Ji Jin) I I
Source: Huang, et al (2004)
303
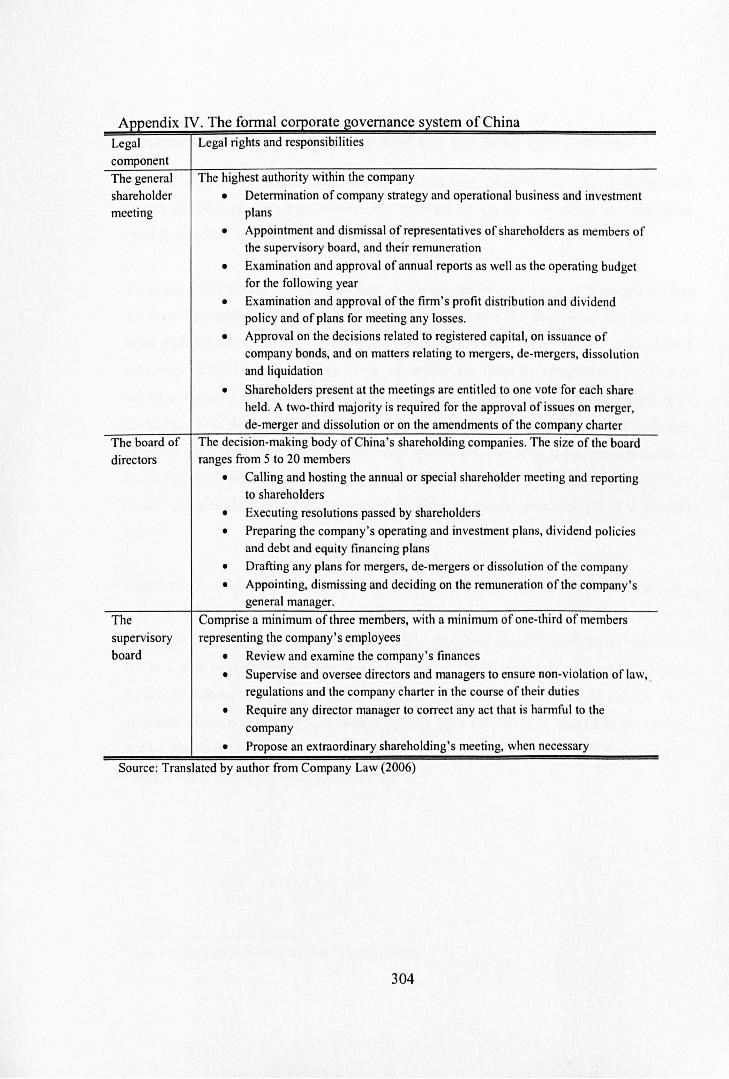
Appendix N. The formal corporate governance system of China
Legal component
The general shareholder meeting
Legal rights and responsibilities
The highest authority within the company
• Determination of company strategy and operational business and investment plans
• Appointment and dismissal of representatives of shareholders as members of the supervisory board, and their remuneration
• Examination and approval of annual reports as well as the operating budget for the following year
• Examination and approval of the firm's profit distribution and dividend policy and of plans for meeting any losses.
• Approval on the decisions related to registered capital, on issuance of company bonds, and on matters relating to mergers, de-mergers, dissolution
and liquidation
• Shareholders present at the meetings are entitled to one vote for each share held. A two-third majority is required for the approval of issues on merger,
de-merger and dissolution or on the amendments of the company charter
The board of The decision-making body of China's shareholding companies. The size of the board directors ranges from 5 to 20 members
The
supervisory
board
• Calling and hosting the annual or special shareholder meeting and reporting to shareholders
• Executing resolutions passed by shareholders
• Preparing the company's operating and investment plans, dividend policies and debt and equity financing plans
• Drafting any plans for mergers, de-mergers or dissolution of the company
• Appointing, dismissing and deciding on the remuneration of the company's general manager.
Comprise a minimum of three members, with a minimum of one-third of members
representing the company's employees
• Review and examine the company's finances
• Supervise and oversee directors and managers to ensure non-violation of law, regulations and the company charter in the course of their duties
• Require any director manager to correct any act that is harmful to the
company
• Propose an extraordinary shareholding's meeting, when necessary
Source: Translated by author from Company Law (2006)
304
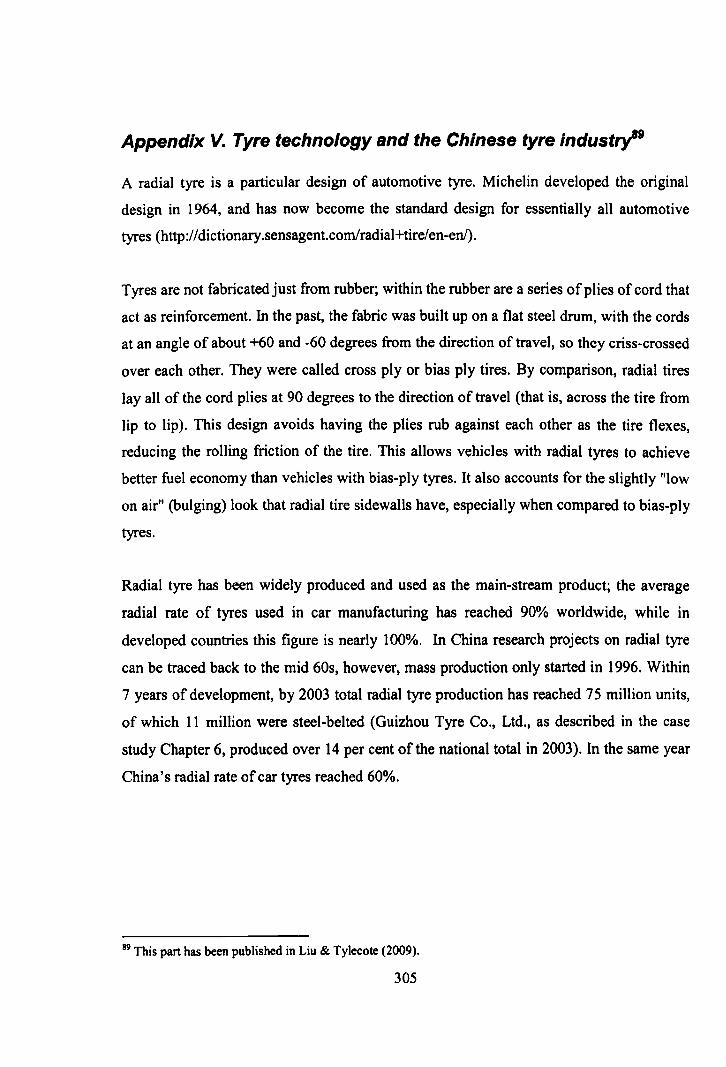
Appendix V. Tyre technology and the Chinese tyre industry'9
A radial tyre is a particular design of automotive tyre. Michelin developed the original
design in 1964, and has now become the standard design for essentially all automotive
tyres (http://dictionary.sensagent.comlradial +tire/en-enl).
Tyres are not fabricated just from rubber; within the rubber are a series of plies of cord that
act as reinforcement. In the past, the fabric was built up on a flat steel drum, with the cords
at an angle of about +60 and -60 degrees from the direction of travel, so they criss-crossed
over each other. They were called cross ply or bias ply tires. By comparison, radial tires
lay all of the cord plies at 90 degrees to the direction of travel (that is, across the tire from
lip to lip). This design avoids having the plies rub against each other as the tire flexes,
reducing the rolling friction of the tire. This allows vehicles with radial tyres to achieve
better fuel economy than vehicles with bias-ply tyres. It also accounts for the slightly "low
on air" (bulging) look that radial tire sidewalls have, especially when compared to bias-ply
tyres.
Radial tyre has been widely produced and used as the main-stream product; the average
radial rate of tyres used in car manufacturing has reached 90% worldwide, while in
developed countries this figure is nearly 100%. In China research projects on radial tyre
can be traced back to the mid 60s, however, mass production only started in 1996. Within
7 years of development, by 2003 total radial tyre production has reached 75 million units,
of which 11 million were steel-belted (Guizhou Tyre Co., Ltd., as described in the case
study Chapter 6, produced over 14 per cent of the national total in 2003). In the same year
China's radial rate of car tyres reached 60%.
89 This part has been published in Liu & Tylecote (2009).
305
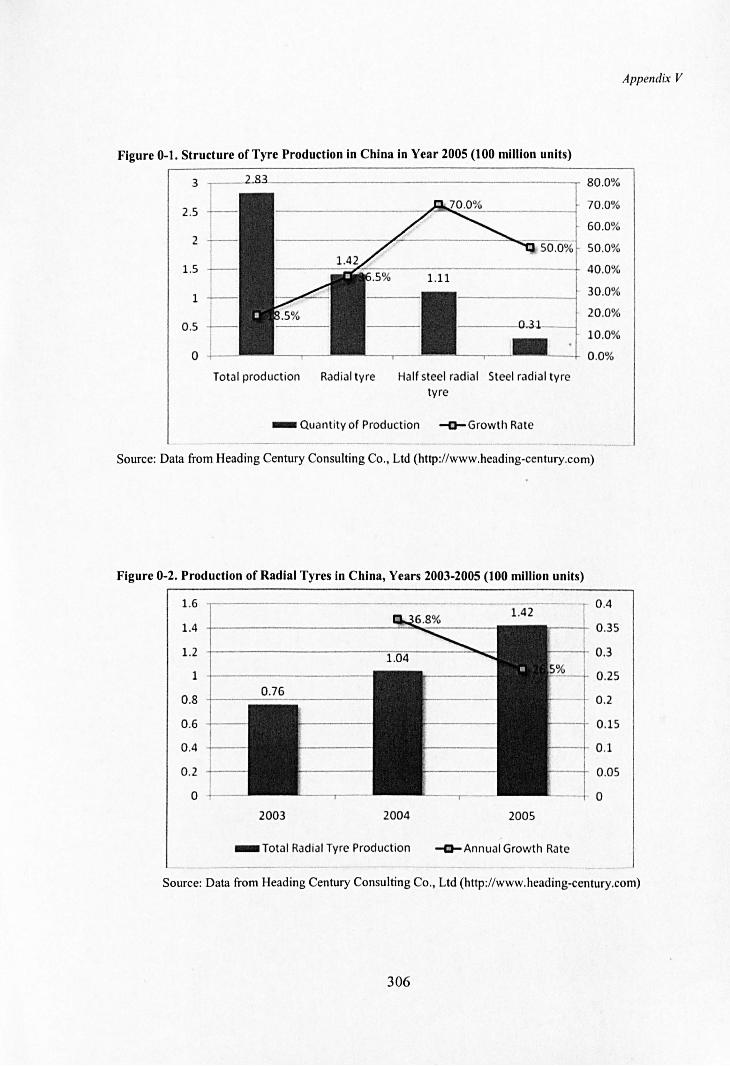
Figure 0-1. Structure of Tyre Production in China in Year 2005 (100 million units)
3
2.5
2
1.5
1
0.5
o
.,.-_-L..O.:>. ___________________ -.,- 80 .0%
70.0%
60.0%
50.0%
-----="'---------------+ 40.0%
Total production Radial tyre Half steel radial Steel radial tyre tyre
- Quantity of Production ~Growth Rate
30.0%
20.0%
10.0%
0.0%
Source: Data from Heading Century Consulting Co., Ltd (http://www.heading-century.com)
Figure 0-2. Production of Radial Tyres in China, Years 2003-2005 (100 million units)
1.6 0 .4
1.4 0 .35
1.2 0.3
1 0 .25
0.8 0 .2
0.6 0.15
0 .4 0 .1
0 .2 0.05
0 0
2003 2004 2005
_ Total Radial Tyre Production -a-Annual Growth Rate
Appendix V
Source: Data from Heading Century Consulting Co., Ltd (http://www.heading-century.com)
306


