Embed Size (px)
Citation preview

MATERIALS SCiEWCE &
ENGINEERING
ELSEVIER Materials Science and Engineering A222 (1997) 45-57
Shear and tensile thermomechanical behavior of near equiatomic NiTi alloy
Pierre-Yves Manach”, Denis Favierb “Laboratoire G&e Mtkztziqtte et MatCriaux, LkioersitP de Bretagtte Sud, Cetrtre de GEnie Itzdtcsriel, 56520 Guidei: Frame ‘Laboratoire Sols-Solides-Slrltctltres, titlir$ Mine de Recherche CA:RS 5521, Ittstitur Xationnl Polvtechnique de Grenoble,
Linicersirfi Joseph Fourier, BP53X, 38031 Grenoble, Ftmce
Received 20 Map 1996
Abstract
The industrial development of devices usin g the intriguing properties of shape memow alloys involves accurate prediction of their thermomechanical behavior. This may be achieved using Computer Aided Design together with Finite Element programs. Reliabie constiiutive laws are needed for the execution of such programs. Several tensorial constitutive laws have been proposed to model the unusual thermomechanical properties of shape memory alloys. However, for all these tensorial models. it is necessary to make assumptions which cannot be verified when only tensile property data are available. The purpose of this paper is to present a new set of experimental mechanical data, including tensile and simple shear tests performed on sheet samples of near equiatomic NiTi allcy. Both mechanica! behaviors are compared for 2 !arge iemperature range {from below .bIf to above ,4f). It is shown that the von Mises assumptions usually made in the establishment of tensorial constitutive equations are not always valid. Other yield locus forms are proposed to model the typical tension and simple shear thermomechanical behavior of shape memory alloys.
Ke~~words: Shape memory alloys; Equiatomic nickel titanide; Thermomechanical behavior
1. Introduction
The development of new materials that can be ap- plied in contemporary engineering structures deter- mines progress in modern technology. One set of such promising materials are shape memory alloys @MA). Though experimental evidence has been gathered for material like NiTi SMA for forty years [I], theoretical models intended to describe their mechanical behavior appeared only at the beginning of the 1980s. Implemen- tation of these models into finite element code started only two or three years ago [2,3].
Several authors modeled the thermomechanical be- havior of SMAs, using mostly one-dimensional models [d-7]; such models are only able to describe the behav- ior of simple bodies (e.g. wires) for one type of stress state (e.g. tension). Thus they do not predict behavior of bodies having more complicated shapes or undergo- ing complex stress states. The few theoretical three-di- mecsionz! models which have been proposed [8-lo] consider isotropic materials and generally assume that
0921-5093!96,.515.00 0 1996 - Elsevier Science S.A. All rights reserved PII SO92i-5093(96)105iO-4
the shear behavior is independent of the pressure, thus neglecting the volumetric deviatoric coupling effects. Furthermore, most of the models which use the notion of transformation strain [ 1 l] are based on the defini- tions of equivalent strain and stress leading to a behav- ior conforming to a von Mises yield criterion. Experimental studies concerning the mechanical behav- ior of SMA focus essentially on the behavior in tension and are not sufficient to assess the validity of such constitutive laws and their related assumptions. Thus, in order to establish reliable constitutive lairs for their integration in finite element programs [3], thermome- chanical tests under several stress states are ‘needed.
In that respect, experimental thermomechanical ten- sile and shear tests have been performed on a near equiatomic KiTi alloy,, which is the most widely used SMA. These two mechanical tests have been chosen for several reasons. First, tensile and shear tests can be performed on the same sample form,. such as sheet. Second: the sheet shape is particularly suitable for investigating the infuence of different thermomechani-

16 P.-Y. Manadl, D. Fa‘cloier ,’ Mmrials Science and Engirlreririg A222 (1997) 45-57
cal treatments such as cold rolling and/or annealing on the resulting properties.
The first part (Section 2) of this paper describes the experimental procedures concerning the tensile and shear tests. In both cases, particular attention has been paid to obtain uniform temperature and an accurate measurement of the strain. The second part (Section 3) presents experimental results. Finally in the last part of the paper (Section 4), these results are discussed and yield locus forms are proposed.
2. Experimental
The experimental study is carried out with two types of homogeneous loading: uniasial tension and simple shear. These tests are performed at several temperatures using a hydraulic tension-compression machine with a maximum load capacity of 50 kS. The sample is im- mersed in a bath of silicon oil which temperature is regulated by a cryothermostat. Temperature is con- trolled with an accuracy of 0.1 K and is measured by a thermocouple in contact with the sample. Test tempera- tures range from 243 to 373 K. Each test is performed after an isothermal hold time of 30 min.
2.1. Tensile testing machine
The tensile test specimens are bone-shaped and ma- chined by spark cutting to a gauge length of 35 mm and a total length of 100 mm, the thickness being e = 0.5 mm. A tensile apparatus, sketched on Fig. 1, has been constructed for the thermomechanical testing of shape memory alloys. The apparatus is made up of two different parts, an external bath part (5) which contains the silicon oil: and an internal frame part (4). The sample (1) is first clamped between the upper (2) and the lower (3) grips, the ion-er grip (3) being immovably attached to the frame part (4). Then the whole is immersed in the bath part (5): the junction between the frame and the bath parts being achieved through two pins (6). The main advantage of this gathering system is that it allows an easy assembly of the specimen and of the extensometer (S) outside the bath. The sample elongatioli is measured by an extensometer directly connected to the sample. The extensometer gauge length is 12.5 mm. The accuracy of the axial deforma- tion measurement is of the order of lo-“. In order to reduce viscous effects and to keep constant the speci- men temperature during the test [12]. a strain rate of C = 10 m-4 s- ’ is used. Axial stress and strain are defined using the following conventional expressions: Go = F/S, and E = In L!:.& where FJ S,: L, and L are the tensile load, the initial cross-section, the initial and current lengths of the specimen respectively.
2.2. Shear testi/zg wzachirze
The shear test specimens have a rectangular shape of L x I= 30 x 18 mm2 with a shear gauge width 11 of 3 mm; the plate thickness is again e = 0.5 mm and the shear direction is along the length of the specimen. The shear testing device (Fig. 2) has been especially de- signed for the study of simple shear testing of shape memory alloys. The sample (1) is clamped between two grips (2) and (3): immovably attached to the fixed part (4) and the moving part (5) of the apparatus respec- tively. The whole ((1): (2) and (3)) is immersed in a silicon oil bath (6): the relative motions between (4) and (5) being obtained by pairs of linear guides symmetri- cally positioned with respect to the sample. This ap- paratus allows a heating and cooling rate of the order of 1 K min-‘. The imposed strain rate is 9 = 10m4 s-‘.
Shear tests have several advantages. First, both shear and tensile samples can be machined from the same plate material form. Second, a shear test enables cyclic or reversed deformations to be carried out. Third, there are no artifacts due to thermal dilatation: which is important for shape memory alloys for which the tem- perature plays an essential role in their behavior. Fi- nally, the deformation can be considered as homogeneous throughout the shear gauge section; actu- ally near the free ends of the sample, boundary effects disturb the strain homogeneity, but it has been shown that these effects may be neglected by using a long and thin shear zone [13].
Fig. 1. Schematic overview of the tensile tesring apparhtus. 1, sample; 2, upper fixed grip; 3, louver movable grip; 4, internal frame part; 5, silicon oil bath; 6, junction pins; 7, thermocouple; S, exten.someter; 9, load cell; 10, hydraulic actuator; 11, actuator displacement sensor; 12: silicon oil inflow; 13> silicon oil outflow; 14, frame; 15, computer. The dotted region represents the fluid.

P.-Y. Manach, D. Faviel 1 Materials Science and Engineering A222 (1997) 45-57 47
$3 IS
Fig. 2. Schematic overview of the simple shear testing apparatus. 1, sample; 2, fixed grip; 3, movable grip; 4, upper frame part; 5, lower frame part; 6, silicon oil bath; 7, thermocouple; 8, LVDT; 9, load cell; 10, hydraulic actuator; 11, actuator displacement sensor; 12, silicon oil inflow; 13, silicon oil outflow; 14, frame; 15, computer. The dotted region represents the fluid.
2.3. Measurement of shear deformation
The measurement of the shear strain y is quite com- plex [ 141. An original measurement of the shear defor- mation based on an optical method has been developed at room temperature [13]. Two initially orthogonal lines (L, and L2) are drawn on the sample with a serigraphic painting, L, being in line with the shear direction. During the test, a video camera records this marking every second. This method enables an accuracy on the y measurement of the order of 2 x 10 - 5 at room tem- perature. The value, obtained using this method of measurement may be considered as the exact value of the shear deformation. However this optical method can not be adopted in our shear device, for it is incompatible with the fluid flow required to heat and cool the sample.. In our case, the shear strain is evalu- ated from the relative grip displacements. This shear strain value is then corrected by a coefficient k which takes into account the sliding of the sample under the grips. The value of IC (k = 0.985) has been measured at room temperature by comparison with the previous optical method.
The material studied is a NiTi (50.5 at.% Ni) shape memory alloy supplied ’ by Memometal Industries (France). The material has been forged to 10 mm
200 310 -340 350 370 TEMPERATURE (IS j
Fig. 3. Differential scanning calorimetry measurement @SC). Heat flow (arbitrary units) as a function of the temperature. MS = 306 K, Mf = 277 K, As = 317 K, Af = 335 K.
thickness, then hot rolled to 5 mm thickness and subse- quently cold rolled to 0.5 mm thickness in several operations (with intermediate annealing of 5 min at 973 K under argon atmosphere). Differential scanning calorimetry (Fig. 3), gives the transformation enthalpy AH = - 22 J g-r and the following transformation temperatures: MS = 306 K, Mf = 277 K;> As = 317 K and Af=‘335 K. This alloy, at least during’ the first thermal cycle, does not exhibit an R-phase transforma- tion.
In order to investigate possible anisotropy in the sheet plane, five samples having various orientations with respect to the’rolling direction are deformed by shearing at room temtierature (Fig. 4). For small strains (y < 10%) no significant anisotropy is observed, In the range of deformation used for the remaining ,part of this study, the assumption of planar iSotropy of this alloy (revolution orthotropy) is thus reasonable.
Two way memory effect (TWME) may develop dur- ing any mechanical testing of SMA. In order to charac- terize the magnitude of this potential effect for the studied NiTi, 12 training thermomechanical cycles are performed. Each cycle begins with an isothermal simple
I/ , ,d 10 -; 2P 40 50 ,
SHEAR. S,TRAI! ‘(Z) ! . :
Fig.‘4. Stress-strain curvei obtained during simple shear tests at room temperAre (T= 293 K) from an initial auslenific state: (1) rolling direction (RD), ,(2) transvkke direction, (3) 67.5O/RD (4) 22.5”/RD and (5) 45’/RD. .1 I_
48 P.-Y. Manach, D. Fauier / Materials Science and Engineering A222 (1997) 45-57
0 1 2 3 3 5 6 0 12 2 4 6 8 10
SHEAR STRAIN (,Z) NUMBER OF CYCLES
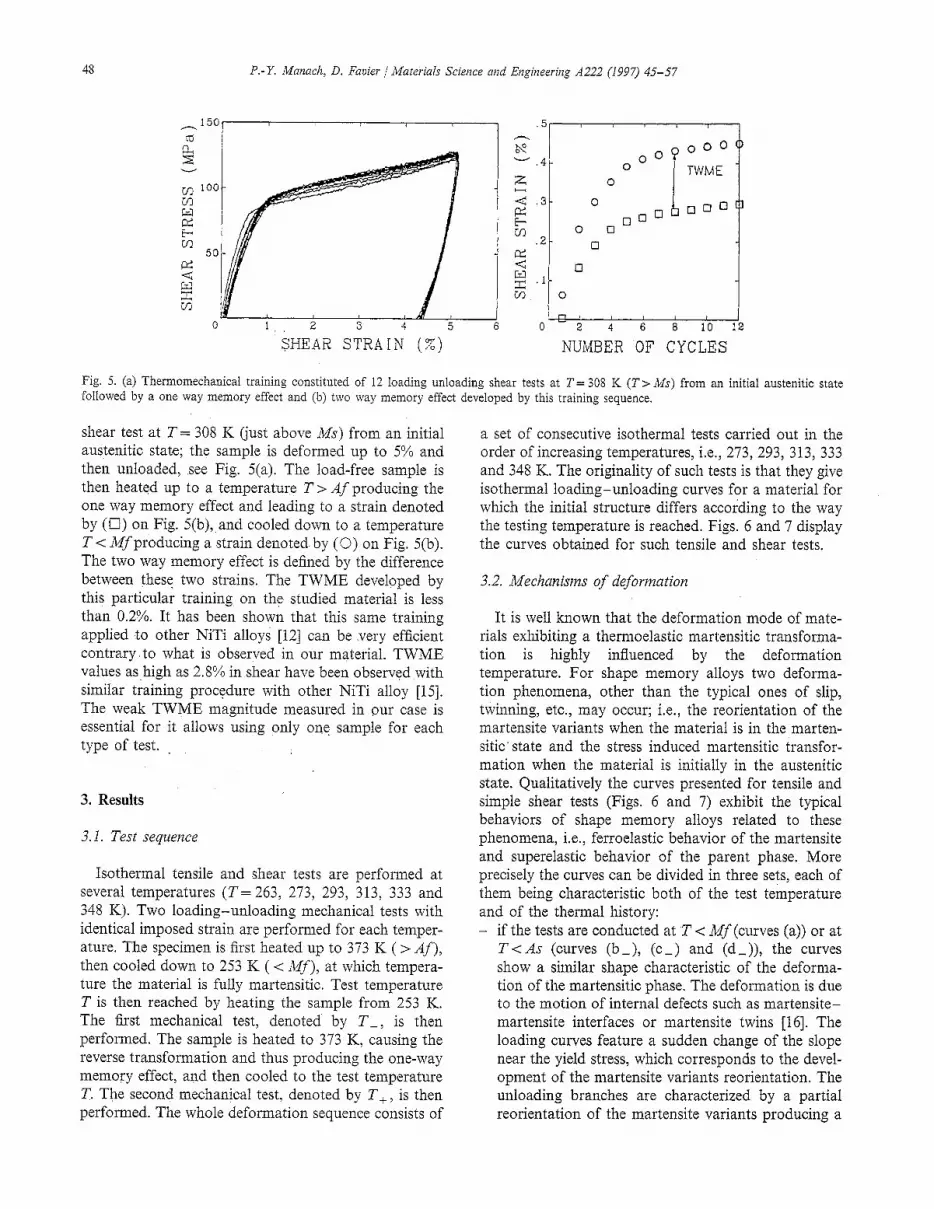
Fig. 5. (a) Thermomechanical training constituted of 12 loading unloading shear tests at T= 308 K (T> MS) from an initial austenitic state followed by a one way memory effect and (b) two way memory effect developed by this training sequence.
shear test at T= 308 K (‘just above MS) from an initial austenitic state; the sample is deformed up to 5% and then unloaded, see Fig. 5(a). The load-free sample is then heated up to a temperature T > Af producing the one way memory effect and leading to a strain denoted by (Ii) on Fig. 5(b),,and cooled down to a temperature T < Mfproducing a strain denoted. by (0) on Fig. 5(b). The two way memory effect is defined by the difference between these two strains. The TWME developed by this particular training on the studied material is less than 0.2%. It has been shown that this same training applied to other NiTi alloys [12] can be very efficient contrary to what is observed in our material. TWME values as high as 2.8% in shear have been observed with similar training procedure with other NiTi alloy [15]. The weak TWME magnitude measured in our case is essential for it allows using only one sample for each type of test.
3. Results
3.1. Test sequence
Isothermal tensile and shear tests are performed at several temperatures (T= 263, 273, 293, 313, 333 and 348 K). Two loading-unloading mechanical tests with identical imposed strain are performed for each temper- ature. The specimen is first heated up to 373 K ( > Af), then cooled down to 253 K ( < Mf), at which tempera- ture the material is fully martensitic. Test temperature T is then reached by heating the sample from 253 K. The first mechanical test, denoted by T-, is then performed. The sample is heated to 373 K, causing the reverse transformation and thus producing the one-way memory effect, and then cooled to the test temperature T. The second mechanical test, denoted by T,, is then performed. The whole deformation sequence consists of
a set of consecutive isothermal tests carried out in the order of increasing temperatures, i.e., 273, 293, 313, 333 and 348 K. The originality of such tests is that they give isothermal loading-unloading curves for a material for which the initial structure differs according to the way the testing temperature is reached. Figs. 6 and 7 display the curves obtained for such tensile and shear tests.
3.2. Mechanisms of deformation
It is well known that the deformation mode of mate- rials exhibiting a thermoelastic martensitic transforma- tion is highly influenced by the deformation temperature. For shape memory alloys two deforma- tion phenomena, other than the typical ones of slip, twinning, etc., may occur; i.e., the reorientation of the martensite variants when the material is in the marten- sitic’ state and the stress induced martensitic transfor- mation when the material is initially in the austenitic state. Qualitatively the curves presented for tensile and simple shear tests (Figs. 6 and 7) exhibit the typical behaviors of shape memory alloys related to these phenomena, i.e., ferroelastic behavior of the martensite and superelastic behavior of the parent phase. More precisely the curves can be divided in three sets, each of them being characteristic both of the test temperature and of the thermal history: - if the tests are conducted at T < Mf (curves (a)) or at
T < As (curves (b-), (c-) and (d-)), the curves show a similar shape characteristic of the deforma- tion of the martensitic phase. The deformation is due to the motion of internal defects such as martensite- martensite interfaces or martensite twins [16]. The loading curves feature a sudden change of the slope near the yield stress, which corresponds to the devel- opment of the martensite variants reorientation. The unloading branches are characterized by a partial reorientation of the martensite variants producing a

P.-Y. Manach, D. Favier / Mnteriais Science and Engineering A222 (1997) 45-57 49
a)
i
T = 2731<
T = 333Ii T = 34.W - - GOO- 4
AXIAL STRAIN (%) AXIAL STRAIN (%)
Fig. 6. Stress-strain curves obtained during loading unloading tensile tests for (a) T= 263 K. (b) T- 273 K. {c) T= 293 K, (d) T= 313 K. (e) T= 333 K and (f) T= 348 K. The curves in full and dotted lines are rejpecrively obtained by heating from an initial martensitic state (T-) and by cooling from an initia! austenitic s!a?e (T,).
greater reverse deformation than classical elastic de- formation. This behavior is usually called ferroelastic or rubber-like behavior and depends only weakly on the testing temperature [17];
- if the tests are performed at T > Af (curves (e) and (f)), the main deformation mechanisms are the stress ir.dcced ?a:‘exi*;c . - . . trzxfomatior? dnring !cading and the reverse transformation during unloading. It is worth to be noted that the stress width of the - hysteresis loop is nearly constant in this temperature range? and that the value of the stress required to produce the martensitic transformation increases with increasing temperature. In our case, one does not observe a. plateau during the stress induced martensitic transformation neither in shear or in tension. Such a plateau, typical of a Liiders-like deformation, has been observed in XiTi single crys- tals [18] and in NiTi polycrystals [19,20]. According. to Liu [19]: the absence of a plateau is a feature of NiTi alloys which have not recrystallized and have a
large grain size; for such material, internal stresses are more critical to the deformation mode and provide an increase in elastic energy and in the,slope of the curve during the martensitic transformation. Moreover, Liu emphasizes the large influence of the size and shape of the specimen on the appearance of the plateau; in the range M~-c T < Af (curves (b): (c) arid (d)), the mechanical behavior depends on the thermal history. For temperatures such as T- -: As reached by heating (curves (b -), (c-) and (.d -)), it has been seen that the stress-strain curves are very. similar to those obtained for T < filf((curves (a)). For the same teaperatures obtair.ed by ccoling (curves (b -), Cc,) and (dJ), the initial structure is a misture of austenite and martensite with the amount of initial austenite increasing with increasing ,testing tempera- ture. However as the transformation temperature changes during thermal and/or mechanical cycling

P.-Y. Mafzach, D. Favier / Materials Science and Engineering A222 (1997) 45-57
SHEAR STRAIN (Z)
/ 0
T = 2731C b)
T = 313IC d)
T = 34UK 0
Fig. 7: Stress-strain curves obtained during loading unloading shear tests for (a) T= 263 X,. (b) T= 273 K, (c) T= 293 K, (d) T= 313 K, (e) T= 333 K and (f) T= 348 K. The curves in full and dotted lines are respectively obtained by heating from an initial martensitic state (T-) and by cooling from an initial austentic state (T,).
[21-241, it is not possible to precisely determine the initial austenite fraction, In that case, both stress induced transformation and martensite reorientation occur during loading .and unloading. Thus, the varia- tion of the slope of the stress-strain curves during loading is less sudden compared to T < Mf, for in this temperature range the stress induced martensitic transformation is produced by low stress levels. Dur- ing unloading the relative contribution of the two ‘phenomena’deperids both on the testing temperature and on the initial state; leading to the difference observed between the unloading branches of curves (d-) and (d,) (T > MS but also close to Af). The residual deformation after unloading is then less for a temperature’ reached by cooling than when the material is initially completely martensitic due to the reverse transformation of a significant amount of martensite ‘during unloading. This discrepancy is more obvious for the tensile tests for which the maximum, deformation is large enough to consider
that the transformation is complete [25], so that the amount of martensite is the same at the beginning of the unloading for both the T- and T, cases. The results obtained at T = 313 K during unloading thus demonstrate that the martensites formed mechani- cally or induced thermally do not have the same mechanical behavior. It can be concluded that for temperatures T < Mf
and T > Af, the mechanical response is well determined by the testing temperature. For intermediate tempera- tures, the difference between the curves obtained with the two different initial structures clearly indicates the key role of the thermal history. For temperature T < MS, the loading curves depend on the initial state, but the unloading curves are identical regardless of the deformation mechanism during loading. As observed by Liu [19], the stress values for large enough strain are virtually similar during loading. Conversely for temper- atures such as MS < T < Af, both loading and unload- ing curves depend on the initial structure.
P.-Y. Manach, D. Fad, / Materials Scierlce ad Engineer~itrg 4222 (1997) 45-57 51
3.3. Chamcteristic values of the isothemal tests
3.3. I. Shear tests In order to quantify experimental results, we now
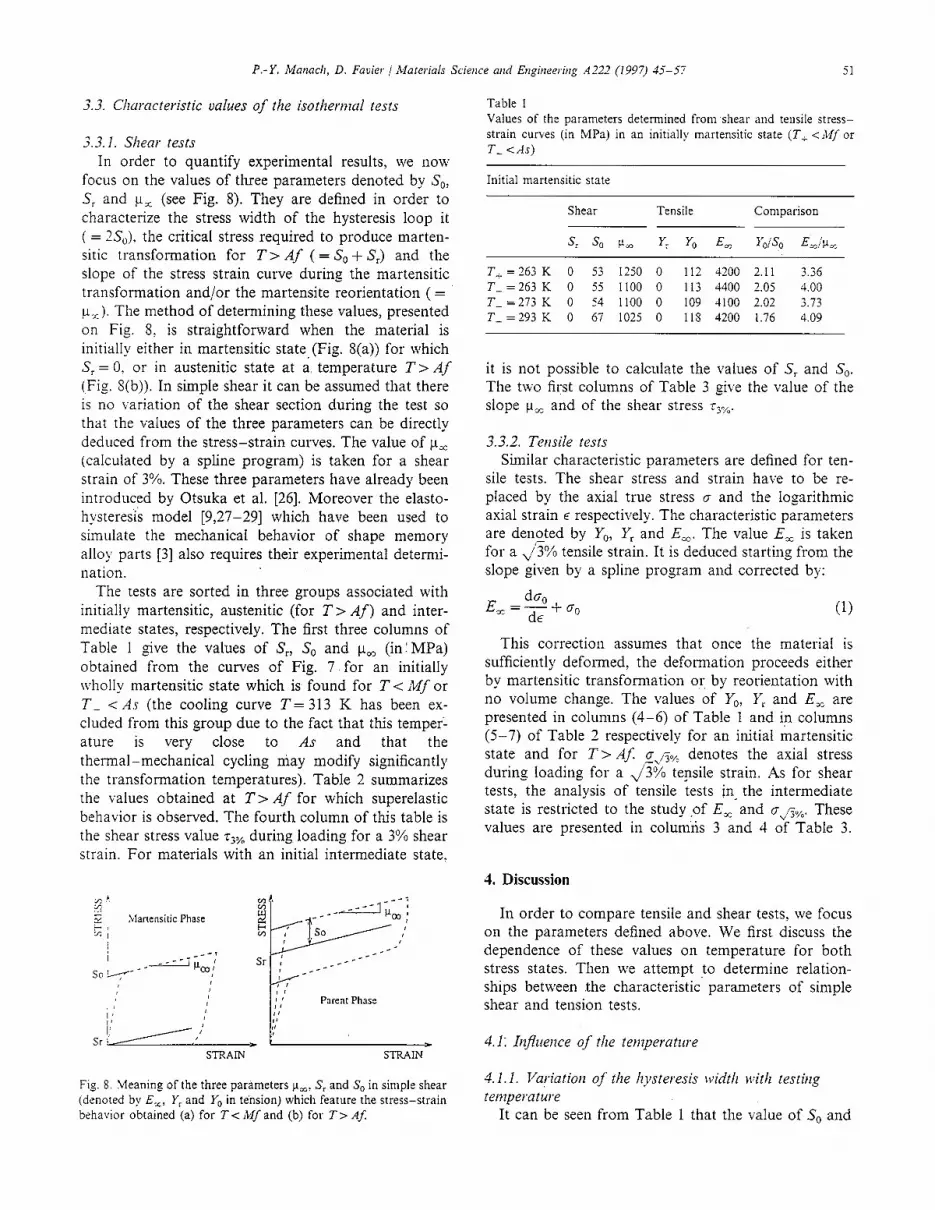
focus on the values of three parameters denoted by S,, S, and u, (see Fig. 8). They are defined in order to characterize the stress width of the hysteresis loop it ( = ZS,), the critical stress required to produce marten- sitic transformation for T> Af (= SO + S,) and the slope of the stress strain curve during the martensitic transformation and/or the martensite reorientation (= u,). The method of determining these values, presented on Fig. S: is straightforward when the material is initially either in martensitic state (Fig. S(a)) for which S, = 0. or in austenitic state at a. temperature T > Af (Fig. S(b)). In simple shear it can be assumed that there is no variation of the shear section during the test so that the values of the three parameters can be directly deduced from the stress-strain curves. The value of J.L~ (calculated by a spline program) is taken for a shear strain of 3%. These three parameters have already been introduced by Otsuka et al. [26]. 1Moreover the elasto- hysteresis model [9,27-291 which have been used to simulate the mechanical behavior of shape memory alloy parts [3] also requires their experimental determi- nation.
The tests are sorted in three groups associated with initially martensitic, austenitic (for T > Af) and inter- mediate states, respectively. The first three columns of Table 1 give the values of S,, S,, and uL, (in: MPa) obtained from the curves of Fig. 7 for an initially wholly martensitic state which is found for T < iWf or T- < As (the cooling curve T = 313 K has been ex- cluded from this group due to the fact that this temper- ature is very close to As and that the thermal-mechanical cycling may modify significantly the transformation temperatures). Table 2 summarizes the values obtained at T> Af for which superelastic behavior is observed. The fourth column of this table is the shear stress value zjs during loading for a 3% shear strain. For materials with an initial intermediate state,
;, I’ 2’
:I’ >
STRAIN STRAIN
Fig. S. kleaning of the three parameters uzo, S, and So in simple shear (denoted by E,, Y, and Y, in te’nsion) which feature the stress-strain behavior obtained (a) for 7~ kif and (b) for T> AJ
Table I Values of the parameters determined fromshear and tensile stress- strain curves (in MPa) in an initially martensitic state (T+ <MJ or T- <As)
Initial martensitic state
Shear Tensile Comparison
& so u, Yy Y, E, Ye/So E,?L
7-A = 263 K 0 53 1250 0 112 4200 2.11 3.36 7-e =263 K 0 55 1100 0 I13 4400 2.05 4.00 7-e =273 K 0 54 1100 0 109 4100 2.02 3.73 T- = 293 K 0 67 1025 0 IIS 4200 1.76 4.09
it is not possible to calculate the values of S, and S,. The two first columns of Table 3 give the value of the slope u= and of the shear stress rjT/,.
3.3.2. Teruile tests Similar characteristic parameters are defined for ten-
sile tests. The shear stress and strain have to be re- placed by the axial true stress cr and the logarithmic axial strain E respectively. The characteristic parameters are denoted by Y,, Y, and E,. The value E, is taken for a \&o tensile strain. It is deduced starting from the slope given by a spline program and corrected by:
E, =$+, (1)
This correction assumes that once the material is sufficiently deformed, the deformation proceeds either by martensitic transformation or by reorientation with no volume change. The values of Y,, Y, and E, are presented in columns (4-6) of Table 1 and in columns (5-7) of Table 2 respectively for an initial martensitic state and for T> AJ ~5% denotes the axial stress during loading for a \/3% tensile strain. As for shear tests, the analysis of tensile tests in- the intermediate state is restricted to the study ,of E, and G~,T%. These values are presented in colum’ris 3 and 4 of Table 3.
3. Discussion
In order to compare tensile and shear tests, we focus on the parameters defined above. We first discuss the dependence of these values on temperature for both stress states. Then we attempt to determine relation- ships between the characteristic’ parameters of simple shear and tension tests.
4.1: Iizfliience of the temperature
4.1.1. Variation of the hysteresis width with testing temperature
It can be seen from Table 1 that the value of .S, and

52
Table 2
P.-Y. Manach, D. Favier / Materials Science and Engineering A222 .(1997) 4.5-57
Values of the parameters determined from shear and tensile stress-strain curves (in MPa) in an initially austenitic state (T>Af)
Initial austenitic state
Shear
sr
Tensile Comparison
Y* Yo Kc “.& Y,lS, YOISO WPCO ~.&lsw
T, = 333 K 106 35 1400 183 180 70 4275 325 1.70 2.00 3.05 1.78 T- = 333 K 101 42 1450 187 170 90 4300 335 1.68 2.14 2.91 1.79 T, = 348 K 144 40 1450 228 250 75 4300 400 1.73 1.88 2.96 1.75 T- = 348 K 154 40 1400 237 240 85 4300 400 1.56 2.12 3.07 1.69
Y, are essentially constant in the martensitic state; S, M 57 MPa in simple shear and Y, M 113 MPa in tension. Table 2 shows that S, and Y0 are also approx- imately constant during superelastic deformation ( NN 39 MPa and = 80 MPa respectively). The fact that the hysteresis width characterized here by &, and Y, is constant for superelastic behavior has been observed previously [30]. Miyazaki et al. [16] report that, in the martensitic state, the hysteresis increases with decreas- ing temperature. However, their results were established over ‘a large temperature range, and it seems probable that the temperature range which has been studied here is not large enough to exhibit this effect if present.
4.1.2. Variation of the transformation stress with testing temperature
We now consider the variation of the stresses z3% and aah with testing temperature, for the situation where temperature is attained by cooling down the sample from T > A$ The curves in Fig. 9 are deduced from the five isothermal sets of shear and tensile tests performed at T, = 273 K, 293 K, 313 K, 333 K and 348 K and presented in Figs. 6 and 7. For T, > MS, the variation of 73% and ~fi/ reflects the dependence of the transfor- mation stress with temperature represented by a Clau- sius-Clapeyron type of relation. This one is written:
dz pAH and d”, _- ~AH -= -- dT TOYO dT Toe0 (2)
Table 3 Values of the parameters determined from shear and tensile stress- strain curves (in MPa) in an initially intermediate state (Mf< T<Af)
Intermediate state
Shear Tensile Comparison
!4c X3% ECC G&A UP, ~,,w/%
T, = 273 K 1025 70 4100 105 4.00 1.5 T, = 293 K 1250 85 4900 135 3.92 1.6 T-=313 K 1100 117 4200 205 3.82 2.13 T; =313 K 1200 112 4400 250 3.67 1.83
in simple shear and in tension respectively, where dr/dT and da/dT are the temperature dependence coefficients of the transformation stress in simple shear and in tension respectively. y0 and e,, are the strains associated with the transformation, and AH is the enthalpy of transformation. When energy dissipative processes are ignored, the above relations are obtained by consider- ing a thermoelastic transformation as taking place un- der local equilibrium and representing a balance between competing forces at the transforming interface [31,32]. For the studied alloy, the linear dependence [32] of T3% and afih with the temperature is rather well verified, the slope being 3.1 MPa K- l in simple shear and 4.25 MPa K-l in tension, Values of the transfor- mation strains. y0 and e0 can be tentatively estimated from Eq. (2) and from the results of the DSC measure- ments. Using AH = -+22 Jg-‘, T0=4(Ms+Af)=311 K and p = 6.45 x lo3 kg rnm3, we determine y,, = 14~7% and E,, = 10.7%. Such values for the transformation strains are not consistent with other results {19,25]. This discrepancy may be explained by the fact that the Clausius Clapeyron relation has been established con- sidering local quantities and by assuming that the only mechanism of deformation is due to the transforma-
5ool---- .
Tau(3X)
01 I 270 290 310 330 350
TE\lPERATURE (I() 0
Fig. 9. Tensile and shear stresses for deformation of .J’&I and 3% respectively. The plotted transformation temperatures have been de- termined by differential scanning calorimetry.

P.-Y. Manach, D. Fauier / Materials Science and Engineering A222 (1997) 45-57 53
tion. Relation (2) has been indeed quantitatively well experimentally verified at macroscopical scale when the material behavior exhibits a yield plateau during the transformation [19]. In this case, the temperature de- pendence coefficient of the transformation stress has been measured equal to 7.6 MPa K-’ in tension. The low values of dz/dT and dcrJdT observed with the studied material is characteristic of materials annealed at low temperature. For such alloys, there is no plateau during superelastic tensile tests and the training effect is weak, as observed previously.
4.1.3. Variation of p, and E, with testing temperature The values of ua and Em are almost constant for the
entire temperature range investigated. This indicates that the elastic energies required to develop either the reorientation of the martensite variants or the stress induced martensitic transformation are of the same order. One explanation for such a behavior is that the final annealing treatment on this alloy has not com- pletely relaxed internal stresses, which tend to hinder the transformation and/or reorientation. This explana- tion is consistent with the weak two way memory effect and the absence of plateau characteristic of a material annealed at low temperature.
4.1.4. Vuridtion of S, and Y, with testing temperature
for T>Af It has been seen previously that the values of S,, Y,,
I-L and E, are almost constant in this temperature range. Therefore, the variations of S, and Y, with the temperature are similar to those of the transformation stresses z3% and ~3~.
4.2. Comparison of the mechanical behaviors
The stress state paths involved in our tests are purely radial since they can be written in simple shear:
0 1 0 z=z(t) 1 0 0 2j:io2j
: I
(3) 0 0 0
and in tension:
1 0 0 G=G(t) 0 0 0 &@zj
; I (4)
0 0 0
The comparison of such simple loading paths is then often performed using plasticity theory and the notion of equivalent strain and stress even for pure transfor- mation plasticity [331. In plasticity theory, the elasto- plastic transient is not considered so that the behavior is treated as elastic for stresses less than the yield stress. Several forms of yield locus have been proposed even
for isotropic materials, the most common being the von Mises criterion. This criterion expresses that to initiate plasticity, it is necessary to store a critical amount of shear elastic energy per unit volume Eshear. The increase of elastic energy dE is equal to the elementary work per unit of volume. For isotropic linear elasticity, the elastic energy can be expressed for any stress state as:
E=~G,EV=~Gii~,~+Ibiiiii + -L
(5)
GOi EShW
where 5 and 7 denote the deviatoric parts of the stress tensor (r and the strain tensor c respectively. By using the Lame’s coefficient u, the shear elastic energy is written as:
The term J2 = i (s,j~ji is usually called the second invari- ant of the deviatoric stress tensor and may be written in the form:
This expression leads to J2 = r2 and J2 = ~‘13 in simple shear and tension respectively. The same amount of shear elastic energy is stored in the material when the stress ratio a/z = 3 which leads to a ratio of the yield stresses Y/S= /- 3 for the von Mises criterion.
Once yielding commences, the material flows plasti- cally. A first assumption is to consider that the equiva- lence between stress state according to the von Mises criterion is still valid during plastic flow. The equivalent von Mises stress is then decked by:
Geq=&=G=& (8) The equivalent strain rate i,, is defined by equating the rate of plastic work:
Get, gees 79 in simple shear = (j-:f = a< in tension (9
which in the von Mises case leads to the expression:
<,, = &p/J? SO) This expression justifies the comparison of shear and tensile stress values for shear and tensile strains of 3% and &%I respectively. The alteration of the shape of the yield locus constitutes the so-called hardening ef- fect. The isotropic hardening assumption expresses that the yield locus remains of the von Mises form, and that the increase of the equivalent von Mises stress is a function of the plastic work. This assumption leads to the following ‘relation during plastic flow:
dGp, da -=-&=3$ de,,
(11)

54 P.-Y. Munnch, D. Favier / Materials Science and Engineering A222 (1997) 45-57
In the next sections, we consider the relevance of the above approach to our experimental results. We focus on the ratios presented in the columns of Tables l-3.
4.2.1. Comparison in martensitic state: Table 1 At T= 263 K and T- = 273, 293 K, the material is
in an initial martensitic state and the deformation oc- curs mainly by the stress directed reorientation of ther- mally induced self accommodated martensite variants: the behavior in this state is then mainly hysteretic. It can be observed in Table 1 that the ratio Y,/S,, is close to a value of 2, which is far from that expected using the von Mises criterion. Moreover, the value of E,/ p, = 3,8 is not expected from such a criterion.
The Tresca’s criterion considers plastic yielding re- lated to the maximum shear stress. By assuming that the deformation proceeds with no volume change, this criterion leads to the relation a/z = 2 and E,/po, = 4. These values are well verified. Recently Orgeas and Favier [34] have shown that ferroelastic tension and compression ~behaviours are symmetric in martensitic state, which is a necessary condition to use such crite- rion. This means that the Tresca criterion is suitable to describe the ferroelastic behavior of the martensitic state.
4.2.2. Comparison of superelastic behaviours for T > Af: Table 2
The relevance of the von Mises criterion can be examined when the deformation of the material is of superelastic type (T = 333 K and 348 K). The experi- mental results are summarized in Table 2. For such temperatures, the mean ratio between the tensile and shear transformation stresses G*~/z~% is of the order of 1.75 which is in good accordance with the von Mises criterion ratio of ,/?. The value of the slopes E, and II, are related to the increases of tension and shear transformation stresses respectively. These stresses are considered as linear functions of the strain (da/d6 = E, = constant and dz/dy = ~1, = constant). Assuming isotropic hardening and von Mises criterion, expression 11 leads to a theoretical value of E,/l.r, of 3. The experimental ratio of 3.01 is again close to this theoret- ical value.
However, the von Mises yield locus form is ‘in dis- agreement with at least two experimental results. First, several authors have shown that the transformation stress level in compression is higher than in tension. This has been observed in CuZnAl alloys [35] as well as in equiatomic NiTi alloys [34]. Second, the ratio Y,/S,, allows to compare hysteresis stress width in tension and in shear. The mean experimental value of this ratio is determined to be equal to 2.03. This value is far from fi which is expected when using a von Mises criterion. Such observations argue against the use of the von Mises criterion and show that alternative yield locus forms have to be proposed.
4.2.3. Comparison in intermediate state: Table 3 When the test temperature is located between Mf and
Af and the initial material being a mixture of austenitic and martensitic phases, the deformation response strongly depends on the initial state. In particular it has been pointed out in Section 3.2 that both loading and unloading curves are different at T = 3 13 K depending whether the testing temperature has been reached by heating (curves (d-)) or by cooling (curves (d,)). This is explained by a more important effect of the reorien- tation of the variants in the first case (i.e., initial state mainly martensitic) and of the stress induced reverse transformation in the second case (i.e., initial state mainly austenitic).
The evolution of the ratio E-/p, in column 5 of Table 3 agrees well with the values obtained for ferroe- lastic (Table 1) and superelastic (Table 2) deformation modes. First, for testing temperatures reached by cool- ing, T,, the ratio E&L, increases with decreasing temperature with an asymptotical value equal to that observed for ferroelastic deformation. Second, the weaker value of E&L, observed for T, = 313 K com- pared to that for T- = 313 K is also due to the initial larger amount of austenite in the first case (T,).
The value of aah/z3% (column 6 in Table 3) has to be interpreted cautiously in this temperature range. Indeed, the martensite start temperature MS has been determined to be initially 306 K for the studied mate- rial. However, it is well known that both thermal and mechanical cycling [21] may significantly decrease MS as well as MJ It means that the austenite initially present in the material for all testing temperatures of Table 3 is thermodynamically unstable. The transfor- mation stress of the present austenitic phase is very low, especially for tensile tests at T, = 273 K and 293 K. The value g@,Jz3% is thus very doubtful and no quan- titative conclusions should be drawn from our experi- mental results on this point. However, it has to be noted that the above ratio is much greater at T = 3 13 K when the testing temperature has been reached by heating, i.e., for the smaller initial amount of austenite.
4.3. A jirst proposal of yield criterion forms suitable for SMA
For isotropic materials, yield surfaces are usually described in invariant forms, i.e., by use of the principal stress components or of a set of stress invariants. The von Mises yield criterion is a particular surface ex- pressed entirely in terms of the second deviatoric stress invariant J2. A first extension of such a criterion is obtained by incorporating the first stress invariant Ig. This has been extensively used to propose yield surface as well as failure surface and plastic *potential for granular materials [36]. When a shape memory alloy deforms by martensitic transformation, the martensite

P.-Y. Manach, D. Favier 1 Materials Science and Exgineering A222 (1997) 45-57 55
variants upon forming are coherently connected to the surrounding matrix. This coherency is maintained as the variants grow or shrink and the volume change associated with the transformation is very small. Caneiro and Chandrasekaran [37] have determined for example that the volume change for CuZnAl is about 0.08%. This very low value permits neglecting the effect of the first stress invariant. Moreover, the volume de- creases when transforming from the parent in marten- sitic phase [37] which would lead to a weaker transformation stress for compression stress state com- pared to tension.
The yield forms suitable to model superelastic be- haviour of shape memory alloys thus need not be a function of the first stress invariant. This conclusion is still valid when deformation is due to martensite reori- entation, which proceeds also without volume change. The yielding criterion has thus to be assumed pressure insensitive, the deformation being related to martensitic transformation and/or variants reorientation.
The experimental results presented above show that the von Mises yield criterion is unable to model either ferroelastic or superelastic deformation of the studied NiTi. It has been demonstrated that the ferroelastic deformation can be rather well modelled using Tresca’s yield criterion. The Tresca’s criterion is the simplest criterion which includes the third deviator% stress in- variant J3 defined as:
J3 = ; a, Sjk dki (12)
The Tresca’s surface has a hexagonal contour identical in any deviatoric plane, i.e. independent of 1,. How- ever, this form is not valid to model the superelastic behavior since it leads to similar behavior in tension and compression.
Other yielding surfaces depending on J2 and J3 have also been proposed [38]. Krenk [39] has recently de- scribed a family of smooth surfaces given in terms of I,, J, and J3. For materials for which the behavior is pressure independent, these surfaces reduce to a simple smooth contour in the deviatoric stress plane. The form of the contour is given by:
$j++ SO
where v is a shape parameter and so is the value of J2 at points where J3 = 0, i.e. in shear stress state. The size parameter s0 represents the magnitude of the deviatoric stress components. Introducing the polar stress repre- sentation presented in Fig. 10, the polar angle q with respect to the $,-axis is expressed as:
3$ J3 cos3(p=-- 2 J;j” (14)
Fig. lb. Yield criterion for superelastic behavior depending on the third deviatoric stress invariant. Representation in the stress devia- toric plane with v = 0.0, 0.3, 0.6, 0.8, 0.9, 1.0.
This relation leads to the expression of a smooth yield criterion expressed in terms of the second deviatoric stress invariant J2 and of the angle of the solicitation (D in the deviatoric plane, such as:
J2 = d 2 J:j2
(15)
lfll - cos 3p 3&o
This expression indicates that the yield stress values depend on the direction of the solicitation in the devia- toric plane as shown in Fig. 10. These values are located on a circle .in the deviatoric plane for the von Mises criterion. The yield values reached using the proposed criterion may be higher in compression than in tension depending on the value of the parameter y.
5. Conclusion
This paper compares thermomechanical shear and tensile tests on a NiTi shape memory alloy. Particular attention has been paid to the experimental procedure. Original tensile and simple shear machines with fluid controlled temperature have been constructed for this purpose. It has been shown that these devices allow study of the behavior of NiTi sheet samples at several temperatures, and that the stress-strain curves ob- tained during both tension and shear tests exhibit ther- momechanical behavior typical of shape memory alloys. The set of curves obtained over a wide range of temperature has been discussed with regard to experi- mental results obtained by other authors using only tensile tests.

56 P.-Y. Manach, D. Favier / Materials Science and Engineering A222 (1997) 45-57
The comparison between the two kinds of experimen- tal tests has been performed using two sets of values characterizing the transformation or reorientation stress together with the hysteresis width and the stress-strain slope during the stress-induced martensitic transforma- tion or the martensite reorientation. Owing to the dis- crepancy between theoretical comparison using von Mises’ yielding criterion and experimental results, other yield locus forms have been proposed. Ferroelastic behavior of the studied NiTi alloy is well modelled using Tresca’s criterion. In order to model superelastic behaviour, we have proposed to use pressure indepen- dent yield criterion expressed as a function of the second and third deviatoric stress invariants. The quan- titative assessment of these criteria requires the per- forming of tension, shear and compression tests. Such experimental work is in progress [34].
Acknowledgements
The authors are grateful to the STPA (Service tech- nique des programmes akronautiques) of the French Ministry of Defence for financial support.
References
[l] T. Saburi, TiNi shape memory alloys and martensitic transfor- mations, Proc. Int. Cons. Marteiuitic Transformations, iMonterey, USA, 1993, p. 857.
[2] L.C. Brinson and R. Lammerin g, Finite element analysis of the behavior of shape memory alloys and their applications, ht. J. Solids Strut., 30 (1993) 3261.
[3] G. Rio, P.Y. Manach and D. Favier, Finite element simulation of 3D mechanical behavior of NiTi shape memory alloys, Arch. Mech., 47 (1995) 537.
[4] I. Miiller and K. Wilmanski, A model for phase transition in pseudoelastic bodies, II Nueuo Cimento, 57B (1980) 283.
[5] F. Faik, Model free energy, mechanics and thermodynamics of shape memory alloys, Acra Metall., 28 (1980) 1773.
[6] L. Lii, E. Aernoudt, P. Wollants, J. Van Humbeeck and L. Delaey, Simulation of transformation hysteresis, 2. Metalk., 81 (1990) 613.
[7] J. Ortin, Partial hysteresis cycles in shape memory alloys: exper- iments and modelling, J. Phys., C4 (1991) 13.
[8] K. Tanaka, S. Kobayashi and Y. Sato, Thermomechanics of transformation pseudoelasticity and shape memory effect in al- loys, Int. J. Plast., 2 (1986) 59.
[9] D. Favier, Contribution & l’ttude theorique de l’&lastohyst&sis a temperature variable: application aux propri&t?s de m&moire de forme, Thke d’Etat, Institut National Polytechnique de Grenoble, Grenoble, France, 1988.
[lo] B. Raniecki, C. Lexcellent and K. Tanaka, Thermodynamic models of pseudoelastic behavior of shape memory alloys, Arch. Me& 44 (1992) 261.
[l I] E. Patoor, A. Eberhardt and M. Berveiller, Potentiel pseudoClas- tique et plasticit de transformation martensitique dans les mono et polycristaux mbtalliques, Acta Metallurgica, 35 (1987) 2779.
[12] P.G. McCormick, S. Miyazaki and Y. Liu, Intrinsic transforma- tion influenced mechanical behavior in a NiTi alloy, Proc. Int. Conf. Martezsitic Transformations, Monterey, USA, 1993, p. 999.
[13] E.F. Rauch and C. G’Sell, Flow localization induced by a change in strain path in mild steel, Mater. Sci. Etzg., A111 (1989) 71.
[14] B. Wack and A. Tourabi, Cyclic simple shear of metallic sheets: application to aluminium-lithium alloy, J. Mater. Sci., 28 (1993) 4735.
1151 P.Y. Manach and D. Favier, Origin of the two way memory effect in NiTi shape memory alloy, Ser. Metall. Mater., 28 (1993) 1417.
[16] S. Miyazaki, K. Otsuka and Y. Suzuki, Transformation pseu- doelasticity and deformation behavior in a Ti-50,6at.%Ni alloy, Ser. Metall., 15 (1981) 287.
[17] W. Tang, J. Cederstrtjm and R. SandstrGm, Property database for the development of shape memory alloy applications, J. Phys., C4 (1991) 129.
[IS] T. Saburi, M. Yoshida and S. Nenno, Deformation behavior of shape memory TiNi alloy crystals, Ser. Metall., 18 (1984) 363.
[19] Y. Liu, Shape memory behavior in NiTi, Ph.D. T/lesis, Univer- sity of Western Australia, Perth Australia, 1990.
[20] Y. Liu and P.G. McCormick, Influence of heat treatment on the mechanical behavior of a NiTi alloy, ISiJ Ink, 9 (1989) 417.
[21] S. Miyazaki, Y. Igo and K. Otsuka, Effect of thermal cycling on the transformation temperatures of TiNi alloys, Acta Metall., 34 (1986) 2045.
[22] G.B. Stachowiak and P.G. McCormick, Shape memory behavior associated with the R and martensitic transformations in a NiTi alloy, Acta Metall., 36 (1988) 291.
[23] S. Miyazaki, T. Imai, Y. Igo and K. Otsuka, Effect of cyclic deformation on the pseudoelasticity characteristics of TiNi al- loys, Metall. Trans., 17A (1986) 115.
[24] S. Eucken and T.W. Duerig, The effects of pseudoelastic pre- straining on the tensile behavior and two way shape memory effect in aged NiTi, Acta Metall., 37 (1989) 2245.
[25] P.Y. Manach and D. Favier, Comparison between isothermal tensile and shear tests on a NiTi shape memory alloy, Proc. Int. Co16 Martensitic Transformation, Monierey, USA, 1993, p. 941.
[26] K. Otsuka, C.M. Wayman, K. Nakai, H. Sakamoto and K. Shim& Superelasticity effects and stress-induced martensitic transformation in CuAlNi alloys, Acta Metall., 24 (1976) 207.
[27] D. Favier, P. Gublin and P. Pegon, Thermomechanics of hys- teresis effects in shape memory alloys, Proc. Int. CorSf. Marten- sitic Transformation, Sydney, Australia, 1989, p. 559.
[28] P.Y. Manach, Etude du comportement thermomecanique d’al- liages & m&moire de forme NiTi, Thhe de Doctoral, Institut National Polytechnique de Grenoble, Grenoble, France, 1993.
[29] D. Favier, P. Guelin and R. Cammarano, Application of a phenomenological elastohysteresis theory to the modelling of magnetisation, Proc. Int. Symp. Magnetic Anisotropy and Co- ercitivity in Rare-Earth Transition Metal Alloys, Camberra, Aus- tralia, 1992, p. 137.
[30] S. Miyazaki, Y. Ohmi, K. Otsuka and Y. Suzuki, Characteristics of deformation and transformation pseudoelasticity in TiNi al- loys, J. Phys., 43 (1982) 255.
[31] S. Miura, T. Mori, N. Nakanishi, Y. Murakami and S. Kachi, Study of superelasticity associated with the thennoelastic martensitic transformation in AuCd alloys, Philos. Mag., 34 (1976) 377.
[32] P. Wollants, J.R. Roos and L. Delaey, Thermally and stress induced thermoelastic martensitic transformations in the refer- ence frame of equilibrium thermodynamics, Prog. Mater. Sci., 37 (1993) 227.
[33] E. Patoor, A. Eberhardt and M. Berveiller, Thennomechanical behavior by martensitic transformation in single and polycrys- tals, Proc. 8th R&5 Int. Symp. Metallurgy and Materials Science, Roskilde, Denmark, 1987, p. 465.
[34] L. Orgeas and D. Favier, Non-symmetric tension-compression behaviour of NiTi alloy, J. Phys., C8 (1995) 605.

P.-Y. Manack, D. Fauier / Materials Science awl Engineering A222 (1997) 45-57 57
[35] P. Vacher, Etude du comportement pseudo6lastique d’alliages B m&moire de forme CuZnAl polycristallins, T&e de Doctorat, Universite de Franche ComtB, BesanGon, France, 1991.
[36] D.C. Drucker and W. Prager, Soil mechanics and plasticity analysis of limit design, Q. Appl. Ma& IO (1952) 157.
[37] A. Caneiro and M. Chandrasekaran, Thermoelastic martensitic
transformation in p CuZnAl studied by density changes, Ser. Metall. Mater., 22 (1988) 1797.
1381 P.V. Lade, Elasto-plastic stress-strain theory for cohesionless soil with curved yield surfaces, Int. J. Solids &wet., 13 (1977) 1019.
[39] S. Krenk, Family of invariant stress surfaces, J. Eng. Me&., 122 (1996) 201.


