Embed Size (px)
Citation preview
Corporate Ownership & Control / Volume 6, Issue 4, Summer 2009
3
CORPORATE
OWNERSHIP & CONTROL
Postal Address:
Postal Box 36
Sumy 40014
Ukraine
Tel: +380-542-611025
Fax: +380-542-611025
e-mail: [email protected]
www.virtusinterpress.org
Journal Corporate Ownership & Control is published
four times a year, in September-November,
December-February, March-May and June-August, by
Publishing House ―Virtus Interpress‖, Kirova Str.
146/1, office 20, Sumy, 40021, Ukraine.
Information for subscribers: New orders requests
should be addressed to the Editor by e-mail. See the
section "Subscription details".
Back issues: Single issues are available from the
Editor. Details, including prices, are available upon
request.
Advertising: For details, please, contact the Editor of
the journal.
Copyright: All rights reserved. No part of this
publication may be reproduced, stored or transmitted
in any form or by any means without the prior
permission in writing of the Publisher.
Corporate Ownership & Control
ISSN 1727-9232 (printed version)
1810-0368 (CD version)
1810-3057 (online version)
Certificate № 7881
Virtus Interpress. All rights reserved.
КОРПОРАТИВНАЯ
СОБСТВЕННОСТЬ И КОНТРОЛЬ
Почтовый адрес редакции:
Почтовый ящик 36
г. Сумы, 40014
Украина
Тел.: 38-542-611025
Факс: 38-542-611025
эл. почта: [email protected]
www.virtusinterpress.org
Журнал "Корпоративная собственность и
контроль" издается четыре раза в год в сентябре,
декабре, марте, июне издательским домом Виртус
Интерпресс, ул. Кирова 146/1, г. Сумы, 40021,
Украина.
Информация для подписчиков: заказ на подписку
следует адресовать Редактору журнала по
электронной почте.
Отдельные номера: заказ на приобретение
отдельных номеров следует направлять Редактору
журнала.
Размещение рекламы: за информацией
обращайтесь к Редактору.
Права на копирование и распространение:
копирование, хранение и распространение
материалов журнала в любой форме возможно
лишь с письменного разрешения Издательства.
Корпоративная собственность и контроль
ISSN 1727-9232 (печатная версия)
1810-0368 (версия на компакт-диске)
1810-3057 (электронная версия)
Свидетельство КВ 7881 от 11.09.2003 г.
Виртус Интерпресс. Права защищены.
Corporate Ownership & Control / Volume 6, Issue 4, Summer 2009
4
EDITORIAL
Dear readers!
This issue of the journal Corporate Ownership and Control delivers to the reading audience the most important issues of corporate governance, such as corporate social responsibility, shareholders’ and stakeholders’ rights, board diversity and responsibility, ownership structure, executive compensation. From the point of view of the international comparision of the corporate governance practices we did our utmost to compose the issue of the journal of various countries. These are Japan, Germany, Spain, China, Taiwan, Malaysia, Jordan, Pakistan. An Asian perspective of corporate governance was considered by the authors with a deep concern. The financial crisis is not going to finish as fast as it was expected by experts. The year 2009 is the time for testing the new corporate governance standards which were failed during the crisis. The most critical issues to be reconsidered are the board committees’ practices, with application to the decision control, directors’ independence, with application to the new criteria of independence, executive compensation, with application to the control of the compensation practices, independent directors’ remuneration, with application to the committees’ remuneration, and stakeholders’ rights, wih application to searching for the mechanisms of participation of the stakeholders in corporate governance, especially in financial companies and banks. We are going to invite the authors to send us the papers which are entirely devoted to the issue of financial crisis. It is expected to publish a special issue of the journal describing the corporate governance practices during the crisis. Taking into account tha we have many institutional, corporate subscribers, more than 220 corporations and banks, from 32 countries of the world we guarantee that all new ideas how to overcome the crisis will be delivered to the corporate world immediately. Moreover, we expect to invite the corporate leaders to publish in our journal the most effective approaches to improve corporate governance practices during the crisis. This will concern both regulators and corporations. In general, this year is expected to be a test for abilities of academics and practitioners to unite their efforts to overcome the crisis. Our journal is going to be on a forefront of these efforts!
Corporate Ownership & Control / Volume 6, Issue 4, Summer 2009
5
CORPORATE OWNERSHIP & CONTROL Volume 6, Issue 4, Summer 2009
CONTENTS
Editorial 4
SECTION 1. ACADEMIC INVESTIGATIONS AND CONCEPTS RESPONSIBLE CORPORATE GOVERNANCE: TOWARDS A STAKEHOLDER BOARD OF DIRECTORS? 9 Silvia Ayuso, Antonio Argandoña The central question posed in this paper will be how to organize board composition in order to ensure a responsible corporate governance both from a CSR and a good governance perspective. Adopting a stakeholder approach to corporate governance, we analyze the arguments given by different theoretical approaches for linking specific board composition with financial performance and CSR, and discuss the empirical research conducted. Despite the inconclusive findings of empirical research, it can be argued that diverse stakeholders on the board will promote CSR activities within the firm, but at the same time will increase board capital (which ultimately may lead to a better financial performance). Finally, we propose a model for selecting board members based both on ethical and pragmatic arguments. SHAREHOLDERS’ ACCESS TO COMPANY’S INFORMATION: TOWARDS ENSURING SHAREHOLDERS’ MONITORING RIGHT AND MINORITY SHAREHOLDERS’ PROTECTION 20 Junko Ueda This article aims to revisit how minority shareholders’ right to company’s information can be secured under Japanese company law to execute their substantial rights (to collect proxies, to sue management, etc.) particularly in the process of mergers and acquisitions. Section I overviews the structure of shareholders’ monitoring rights under Japanese company law against their historical background. Section II focuses on the shareholders’ rights to company’s information and its significance amongst shareholders’ rights and its linkage with other shareholders’ rights. Section III analyses leading cases before the Japanese courts regarding shareholders’ rights of inspection. Section IV surveys the shareholders’ right under Japanese company law to have access to company’s information in parallel with their right to apply for the courts to appoint inspectors who investigate into company’s business activities and financial situations. Section V assumes an expected shareholders’ role in association with the other monitoring function ensured under company law and pursues a “good governance” system. THE DECREASE IN DIVERSIFICATION AND CORPORATE GOVERNANCE: EVIDENCE FROM JAPANESE FIRMS 28 Hidetaka Aoki This paper analyzes the effects of firm performance and governance factors on the decrease in diversification of Japanese firms in the 1990s. We focus on the cases of the decrease in diversification, because many previous studies proved that diversification caused firm value discount. Adjusting an
Corporate Ownership & Control / Volume 6, Issue 4, Summer 2009
6
excessive unrelated diversification would be an important topic, because the problems of low synergy between business units, inefficiency in management and so on were more serious in this type of diversification. CORPORATE SOCIAL RESPONSIBILITY IN THE TOP SPANISH HOTEL COMPANIES 40 Eugenia Suárez-Serrano Corporate social responsibility (CSR) in tourism is particularly interesting given the fact that society is part of the service and companies should assume a responsibility with the places they are located in. Several studies analyse the reporting of CSR activities, however, there is modest research relating CSR practices in the hospitality industry. The purpose of this paper is to provide two case studies in the Spanish hospitality industry, Sol Meliá and NH, which are the only top hotel companies that offer information about their CSR practices in their web sites and Annual Reports. Although the tourism industry still has a long way to do in the reporting of CSR activities to become equal to other industries, in the two cases analysed a clear commitment to CSR matters it is observed within its various spheres of action. NEW ZEALAND CEO COMPENSATION FACTORS 47 Sam Hurst, Ed Vos This paper analyses a combination of factors to try and determine whether they explain CEO compensation, and in turn help determine what makes the board of directors more effective. Factors include busy boards, local or international board members, dependent and not independent board members, director’s pay and tenure variables. Of the new and old factors considered in this approach and using a sample size of 31 NZ firms over the 2006/2007 years, a correlation existed between firm size/firm performance and CEO compensation. Further distinctions in regards to busy boards showed no significant relationship to CEO compensation, differing from previous studies, and casting doubt on whether it matters how busy the board is. Also the locality of the board was not a determining factor in CEO compensation. OWNERSHIP AND CONTROL IN GERMANY: DO CROSS-SHAREHOLDINGS REFLECT BANK CONTROL ON LARGE COMPANIES? 54 Alberto Onetti, Alessia Pisoni
This paper aims to analyse the relationships (equity and non-equity) between German banks and German firms, which are the peculiarities of the German institutional system of corporate governance. Scholars agree on the fact that cross shareholdings among banks, insurance companies and institutional firms (Charkham 1994, Baums 1993), combined with long term shareholdings (Gerschenkron 1989), and close relationships and interlocking between board members of different companies (Tilly 1969, Hopt and Prigge 1998), are the main features of bank-firms relationships in Germany. Specifically the main purpose of the paper is to demonstrate, for the panel of German companies investigated, that bank-firm relationship relies not only on patrimonial linkages but also on personal relationships. THE IMPACT OF PROBLEM LOAN, OWNERSHIP STRUCTURE, AND MARKET STRUCTURE UPON THE BANK PERFORMANCE 78 Andy Chein Some research on the causes of bank failure finds that failing institutions had large proportions of problem loans prior to failure, and that the extra costs of administering these loans reduced the bank performance. At this moment, if bank management goes after maximizing one’s utility, not the bank performance, in addition confronting from rising competitive environment, it would be quite dangerous. So, this article studies the impact of problem loan, ownership structure, and market structure upon the bank performance with the basis of cost efficiency. Empirical results show that
Corporate Ownership & Control / Volume 6, Issue 4, Summer 2009
7
problem loan, ownership structure, and market structure have a significant effect upon the bank performance.
INFORMATION SHARES: EMPIRICAL EVIDENCE FROM THE FTSE CHINA A50 INDEX AND THE ISHARES FTSE A50 CHINA TRACKER 83 Yih-Wenn Laih, Chun-An Li We study the price discovery process and common factor weights of SS50 (the FTSE China A50 Index traded in Mainland China) and A50 (the iShares FTSE A50 China Tracker traded in Hong Kong) using daily open-to-open price pairs and close-to-close price pairs. Due to Qualified Domestic Institutional Investor (QDII) scheme (13 April 2006) and US subprime mortgage crisis (middle 2007), our sample, which covers from November 18, 2004 to October 31, 2008, is divided into three periods. We find A50 has a much larger common factor weight than SS50, and A50 dominants for both open and close prices during all periods. The QDII enlarges the contribution of SS50, but financial crisis reduces it. SECTION 2. OWNERSHIP STRUCTURE MANAGEMENT OWNERSHIP AND FIRM PERFORMANCE: EVIDENCE FROM AN EMERGING ECONOMY 88 Talat Afza, Choudhary Slahudin Due to the separation of ownership and control in modern corporation, the form of relationship between firm performance and insider ownership has been the subject of empirical investigation for last many decades. It is argued, that as managers' equity ownership increases, their interests coincide more closely with those of outside shareholders, and hence, the conflicts between managers and shareholders are likely to be resolved. Thus, management's equity ownership helps resolve the agency problem and improve the firm's performance (Jensen and Meckling, 1976; Agrawal and Knoeber, 1996; Chen et al., 2003). However, several studies suggest that management's ownership does not always have a positive effect on corporate performance (Demsetz and Villalonga, 2000; Cheung and Wei, 2006). Most of the empirical studies on this issue have focused on the developed economies and there is little empirical evidence on the emerging economies in general and almost no work has been done on emerging economy of Pakistan in particular. Therefore, present study is an effort to analyze the relationship between insider ownership and firm performance in emerging market of Pakistan while taking a sample of 100 firms listed on Karachi Stock Exchange. OWNERSHIP STRUCTURE, CORPORATE PERFORMANCE AND FAILURE: EVIDENCE FROM PANEL DATA OF EMERGING MARKET THE CASE OF JORDAN 96 Rami Zeitun This study investigates the impact of ownership structure (mix and concentrate) on a company’s performance and failure in a panel estimation using 167 Jordanian companies during 1989-2006. The empirical evidence in this paper shows that ownership structure and ownership concentration play an important role in the performance and value of Jordanian firms. It shows that inefficiency is related to ownership concentration and to institutional ownership. A negative correlation between ownership concentration and firm’s performance both, ROA and Tobin’s Q, is found, while there is a positive impact on firm performance MBVR. The research also found that there is a significant negative relationship between government ownership and a firm’s accounting performance, while the other ownership structure mixes have significant coefficients only in Tobin’s Q using the matched sample. Firm’s profitability ROA was negatively and significantly correlated with the fraction of institutional ownership, and positively and significantly related to the market performance measure, MBVR. The result is robust when indicators of both concentration and ownership mix are included in the regressions. The results of this study are, to some extent, inconsistent with previous findings.
Corporate Ownership & Control / Volume 6, Issue 4, Summer 2009
8
THE IMPACTS OF MANAGERIAL AND INSTITUTIONAL OWNERSHIP ON FIRM PERFORMANCE: THE ROLE OF STOCK PRICE INFORMATIVENESS AND CORPORATE GOVERNANCE 115 William Cheung, Scott Fung, Shih-Chuan Tsai This paper provides new evidence on the relations between managerial and institutional ownerships and firm performance. These relations are found to be affected by firm’s stock price informativeness and corporate governance. Based on a sample of US firms from NYSE, AMEX, and NASDAQ between 1989 and 2006, we document three important findings. First, managerial ownership and firm future performance are non-linearly related; the positive relation is stronger for firms with less informative prices or more agency problems. This finding suggests that poor governance and uninformative price increase the importance of managerial value creation for their firms by improving internal governance. OWNERSHIP STRUCTURE AND CORPORATE VOLUNTARY DISCLOSURE-EVIDENCE FROM TAIWAN 128
Grace M. Liao, Chilin Lu
In this study, we explore the association between ownership structure and voluntary information disclosure in Taiwan. Annual report index data from Information Disclosure and Transparence Ranking System (IDTRS) are used as the proxy of the firm’s voluntary information. The empirical results indicate that the level of information disclosure is likely to be less in “insider” or family-controlled companies. SECTION 3. CORPORATE GOVERNANCE: MALAYSIA CORPORATE GOVERNANCE IN FAMILY RUN BUSINESS – A MALAYSIAN CASE STUDY 135 C.H. Ponnu, C.K. Lee, Geron Tan, T.H. Khor, Adelyn Leong This paper addresses the debate on family run business and corporate governance before and after the Asian Financial Crisis in 1997. As there are only few studies on the corporate governance of family businesses in Malaysia, this paper aims to provide a broad view of the corporate governance practises of family run companies in Malaysia. The majority of family-run companies in Malaysia are operated by ethnic Chinese families in Malaysia. To understand the practices of corporate governance in these companies, this study selected 3 of the top 10 family run companies by market capitalization in Malaysia. CORPORATE GOVERNANCE COMPLIANCE VERSUS SYARIA’ COMPLIANCE AND ITS LINK TO FIRM’S PERFORMANCE IN MALAYSIA 148 Noriza Mohd Saad The purpose of this study is to investigate level of compliance by corporate governance (CG) code of best practices and sharia’ principles among public listed companies in main board of Bursa Malaysia and to provide insights view in determining significance association between the corporate governance and sharia’ compliance with firm’s performance. Corporate governance compliance was measured by three board of directors (henceforth; BOD) facets; (i) director’s remuneration, (ii) directors training and (iii) number of family members. Meanwhile, Syaria’ compliance is based on six proxies, (i) riba, (ii) gambling, (iii) sale of non halal product, (iv) conventional insurance, (v) entertainment and (vi) stockbroking. SUBSCRIPTION DETAILS 155
Corporate Ownership & Control / Volume 6, Issue 4, Summer 2009
9
РАЗДЕЛ 1 НАУЧНЫЕ ИССЛЕДОВАНИЯ
И КОНЦЕПЦИИ
SECTION 1 ACADEMIC INVESTIGATIONS & CONCEPTS
RESPONSIBLE CORPORATE GOVERNANCE: TOWARDS A STAKEHOLDER BOARD OF DIRECTORS?
Silvia Ayuso*, Antonio Argandoña**
Abstract The central question posed in this paper will be how to organize board composition in order to ensure a responsible corporate governance both from a CSR and a good governance perspective. Adopting a stakeholder approach to corporate governance, we analyze the arguments given by different theoretical approaches for linking specific board composition with financial performance and CSR, and discuss the empirical research conducted. Despite the inconclusive findings of empirical research, it can be argued that diverse stakeholders on the board will promote CSR activities within the firm, but at the same time will increase board capital (which ultimately may lead to a better financial performance). Finally, we propose a model for selecting board members based both on ethical and pragmatic arguments. Keywords: board composition, corporate governance, corporate social responsibility, financial performance, stakeholders.
*Researcher, ESCI International Trade Business School, Pg. Pujadas, 1, 08003 Barcelona (Spain)
[email protected], Tel + 34 93 295 47 10, Fax + 34 93 295 47 20
**Professor, “la Caixa” Chair of Corporate Social Responsibility, and Corporate Governance, IESE Business School, Av. Pearson,
21, 08034 Barcelona (Spain)
[email protected], Tel + 34 93 253 42 00, Fax + 34 93 253 43 43
Introduction
As corporate social responsibility (CSR) has become
an increasingly prominent issue for companies,
corporate boards of directors are becoming more
involved in assessing and shaping company policies
and practices on a wide range of social and
environmental topics. At the same time that
companies‘ overall CSR performance has come under
the spotlight, a parallel ―good governance‖ movement
has put the structure, composition and behaviour of
corporate boards under scrutiny. Shareholder activists
and other stakeholders are demanding that corporate
directors be more active and independent of
management, and that corporate boards more
accurately reflect a broad range of constituents. But,
how does good corporate governance relate to CSR?
The present paper attempts to address this question.
Usually, the term corporate governance refers to
the system by which organizations are directed and
controlled and which specifies the distribution of
rights and responsibilities among shareholders and
managers and the rules and procedures for making
decisions on corporate affairs. However, in a wider
Corporate Ownership & Control / Volume 6, Issue 4, Summer 2009
10
sense, corporate governance also includes the
relationships with a broader range of firm
stakeholders, both internal (employees) and external
(customers, suppliers, etc.). In this regard, Tirole
(2001, p. 4) proposes a definition of corporate
governance as ―the design of institutions that induce
or force management to internalize the welfare of
stakeholders‖. Broadly speaking, we can differentiate
between a shareholder perspective and a stakeholder
perspective of the firm (Letza et al., 2004;
Szwajkowski, 2000; Vinten, 2001). The shareholding
model regards the corporation as a legal instrument
for shareholders to maximize their own interests, i.e.
investment returns. More in line with the CSR
strategy is the stakeholding approach that views the
corporation as a locus of responsibility in relation to a
wide array of stakeholders‘ interests or, in words of
Tirole (2001, p. 24), as ―maximizing the sum of the
various stakeholders‘ surpluses‖.
This stakeholder approach to corporate
governance implies a shift in the traditional role of the
board of directors as defenders of shareholders‘
interests. As the highest governance body, directors
are responsible for setting the values and standards
within the organization through their decisions
regarding strategy, incentives and internal control
systems. Thus, a board that commits to CSR and
seeks to address the needs of diverse stakeholders
may have to adapt its composition and functioning to
this new role. However, as noted by Ricart et al.
(2005), little attention has been paid so far to the
implications of CSR for corporate governance.
Academic research has focused until now on two
aspects of socially responsible firms: CEO
compensation (e.g. Frye et al., 2006; Mahoney and
Thorn, 2006; McGuire et al., 2003) and board
structure (Ayuso et al., 2007; Hillman et al., 2001;
Webb, 2004). In this paper, we will only look at board
composition as a governance mechanism for taking
into account the stakeholder concerns.
The central question posed in this paper will be
how to organize board composition in order to ensure
responsible corporate governance both from a CSR
and a good governance perspective. This question will
be approached in the following way. First, we review
the stakeholder approach to corporate governance as
an alternative to the shareholder-focused conception
of the firm. Second, we focus on the composition of
the board of directors, and examine the
recommendations made by corporate governance
guidelines and codes of best practices. We analyze the
arguments given by different theoretical approaches
for linking specific board composition with financial
performance and CSR, and discuss the empirical
research conducted. Finally, we propose a model for
selecting board members based both on ethical and
pragmatic arguments.
The stakeholder approach to corporate governance
According to stakeholder theory, companies should
design their corporate strategies considering the
interests of their stakeholders – groups and
individuals who can affect or are affected by the
organization‘s purpose (Freeman, 1984). In this sense,
stakeholders of a firm can be defined as ―individuals
and constituencies that contribute, either voluntarily
or involuntarily, to its wealth-creating capacity and
activities, and who are therefore its potential
beneficiaries and/or risk bearers‖ (Post et al., 2002, p.
8). The company can pay attention to these groups for
at least two reasons (Donaldson and Preston, 1995).
First, it can be considered that their demands have
intrinsic value (normative approach), so that the
company has the responsibility to meet their
legitimate claims. Second, addressing the interests of
stakeholders who are perceived to have influence can
improve company profitability (instrumental
approach). Stakeholder theory is related to the
literature of corporate sustainability and CSR, since it
provides a convincing theoretical framework for
analyzing the relationship between company and
society (Clarkson, 1995; Harrison and Freeman, 1999;
Mintzberg, 1983). Some authors, like Freeman and
Velamuri (2006), even affirm that the main objective
of CSR is to create value for stakeholders and to fulfil
responsibilities towards them.
With regard to corporate governance,
stakeholder theory has led to an alternative approach
to the conventional shareholder-wealth-maximizing
firm. Compared to the singular goal of raising
shareholder returns, the stakeholder firm has multiple
objectives related with its diverse stakeholders. The
shareholder-maximizing model is premised on the
notion that owners risk their investment capital and
are the sole residual claimants, while other parties
(e.g., employees) are compensated on the basis of
their marginal products (i.e., paid wages set by
competitive labour markets). The governance process,
therefore, is controlling managers and other
organizational participants to ensure that they act in
the owners‘ interests. In contrast, one can argue that
multiple firm stakeholders risk their ‗investments‘ to
achieve their goals, and thus each of them has a
legitimate or moral right to claim a share of the value
created or the firm‘s residual resources (Blair, 1995).
Under this view, the governance structure shifts from
a principal-agent to a team production problem, and
the critical governance tasks become to ensure
effective negotiations, coordination, cooperation and
conflict resolution to maximize and distribute the joint
gains among multiple parties of interest. For a
stakeholder firm to be viable over time, it must
demonstrate its ability both to achieve the multiple
objectives of the different parties and to distribute the
Corporate Ownership & Control / Volume 6, Issue 4, Summer 2009
11
value created in ways that maintain their commitment.
According to the normative stream of
stakeholder theory, the consideration of the
company‘s different stakeholder groups can be seen as
an ethical demand. Consequently, some authors
propose the representation of diverse stakeholders on
corporations‘ boards in order to legitimize (Evan and
Freeman, 1993) and safeguard the interests of
corporate stakeholders (Freeman and Evan, 1990) and
to ensure that their concerns are considered in
corporate decision-making (Jones and Goldberg,
1982). According to Luoma and Goodstein (1999),
three dimensions of board structure and composition
are particularly important in reflecting the degree to
which concern about stakeholders has been integrated
into corporate decision-making: the presence of
stakeholders as directors, their appointment in
monitoring or oversight board committees (audit,
compensation, executive or nominating), and the
existence of a committee composed mainly of
stakeholders or dedicated to CSR.
Within the instrumental approach of the
stakeholder model, several economic arguments have
been proposed to justify this vision of the firm. One of
the main arguments is the recognition of the
firm-specific investments made by stakeholders.
Rajan and Zingales (1998) and Zingales (1998) argue
that the company has to safeguard the interests of all
who contribute to the general value creation, that is,
make specific investments to a given corporation.
These firm-specific investments can be diverse and
include physical, human and social capital. These
specific investments are of little or no value outside of
the firm and cannot be protected by full contracts ex
ante, nor evaluated independently from the firm‘s
functioning.
The problem with these firm-specific
investments is that they produce quasi-rents that can
be expropriated by some of the firm constituencies
(included the external stakeholders). Thus, they can
cause a potential conflict among stakeholders that
may shrink the cooperation and, therefore, the
creation of value. Blair and Stout (1999) claim that it
is the board that has to take on the task of governing
the firm-specific investments and mediating between
investors‘ possible conflicting interests in
firm-specific assets. Recently, Kaufman and
Englander (2005) used the team production model to
recommend that company board members should
represent all those stakeholders that add value,
assume unique risks and possess strategic information
for the corporation. In sum, the board must have
directors who can knowledgeably express the multiple
constituents‘ interests both for ethical and economic
reasons. But the question remains: How should the
board choose members to represent, either directly or
indirectly, the different stakeholder groups?
Board composition and its effect on financial performance and CSR
Board composition is a central issue in the
multiplicity of corporate governance guidelines and
codes of best practices that have been published at the
international and national level. Most of these
guidelines are directed at increasing board
accountability to shareholders and improving board
effectiveness. There have also emerged voluntary
codes of conduct that include governance as part of a
larger corporate social responsibility agenda. Usually,
these governance recommendations call for more
board independence, and in some instances also for
increased board diversity and better response to
stakeholders.
Board composition has also been a focus of
much of the academic research on corporate
governance, particularly with regard to its effects on
corporate performance. Compared to the extant
research on the board-financial performance
relationship, much less attention has been paid to the
question of how specific board attributes influence
CSR. Next, we review the arguments put forward by
different theoretical approaches (mainly agency
theory and resource dependency theory) for linking
specific board composition with financial
performance and CSR, and examine the empirical
research conducted so far.
Independent directors
A common recommendation in corporate governance
codes is to increase the proportion of independent
directors on the board. The vast majority of
governance research has argued for this prescription
from an agency theory perspective. Agency theorists
see the primary function of boards of directors as
monitoring the actions of managers on behalf of
shareholders (Eisenhardt, 1989; Jensen and Meckling,
1976). Board independence – the degree to which
board members are dependent on the current CEO or
organization - is considered key to the effectiveness of
board monitoring (Fama and Jensen, 1983; Jensen and
Meckling, 1976). Boards consisting primarily of
insiders (current or former managers/employees of the
firm) or dependent outside directors (directors who have
business relationships with the firm and/or family or
social ties with the CEO) are considered to be less
effective in monitoring because of their dependence on
the organization. Independent boards – those
primarily consisting of independent outside directors
– are thought to be the most effective at monitoring
because their incentives are not compromised by
dependence on the CEO or the organization. Although
some empirical support has been found for this
hypothesis linking independent boards with firm
performance, other research does not support this
Corporate Ownership & Control / Volume 6, Issue 4, Summer 2009
12
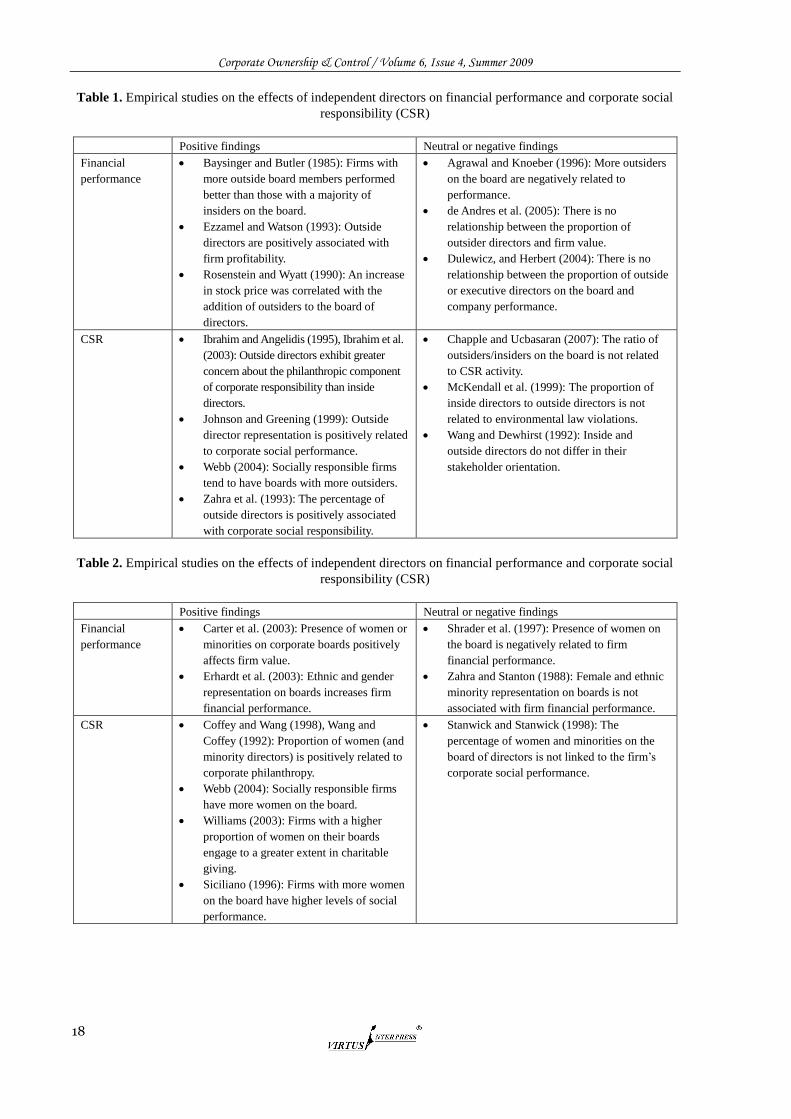
position (see Table 1).
An alternative perspective would suggest that
inside directors have more and better information
which allows them to evaluate managers more
effectively (Baysinger and Hoskisson, 1990). This
approach fits with resource dependence theory.
Resource dependence theorists view a firm as an open
system, dependent on external organizations and
environmental contingencies (Pfeffer and Salancik,
1978). Proponents of this perspective see corporate
boards as providers of four types of resources: advice
and counsel, legitimacy, channels for communicating
information between the firm and external
organizations, and preferential access to commitments
or support from important elements outside the firm
(Hillman et al. 2000). By linking the firm with its
external environment, resources help reduce external
dependency (Pfeffer and Salancik, 1978), diminish
environmental uncertainty (Pfeffer, 1972) and lower
transaction costs (Williamson, 1984), and ultimately
improve firm performance. Both inside and outside
directors may bring important linkages and resources to
the board, but directors who have ties to the current
CEO/organization will be more motivated to provide
resources (Hillman and Dalziel, 2003).1 Despite the
empirical support for this assertion (e.g. Kesner, 1987;
Westphal, 1999), a recent meta-analysis of fifty-four
studies showed no statistically significant relationship
between board dependence and the firm‘s financial
performance (Dalton et al., 1998).
With regard to CSR, most recommendations
favour the role of independent directors because they
will tend to be more sensitive to society‘s needs
(Ibrahim and Angelidis, 1994; Ibrahim et al., 2003).
In addition, outside directors may be more
knowledgeable about the changing demands of
various stakeholders and may feel freer to advocate
costly or unpopular decisions, such as those that
involve compliance issues (Johnson and Greening,
1999; Zahra et al., 1993). Although some empirical
support has been found for a better CSR performance
of firms with independent boards, several studies
found no relationship between board independence
and CSR (see Table 1).
INSERT TABLE 1 HERE
Although similar in its discussion of the
relationship between board composition and financial
performance, agency theory may suggest the opposite
argument. Assuming that CSR offers no obvious direct
financial benefit to shareholders, agents are more
likely than principals to invest in CSR because they
have no direct residual claims on a firm‘s income
(Wang and Coffey, 1992). Furthermore, agents may be
driven by self-interests to pursue CSR activities, such
as membership of a social elite, immortality and
distracting from mismanagement (Coffey and Wang,
1998). Thus, following agency theory logic, inside or
dependent directors will have a stronger interest in
CSR than independent directors. In contrast, boards
dominated by independent directors will be more
effective in monitoring and limiting managerial
opportunism linked to CSR.
Female and minority directors
Numerous governance guidelines advocate increased
representation by women and minorities on corporate
boards of directors to better reflect the gender and
racial diversity of their customers, employees, and
other stakeholders. The request for greater boardroom
diversity is based primarily on normative grounds of
equity and fairness (Carter et al., 2007). Corporations,
organizations and individuals seldom publicly dispute
the proposition that women and ethnic minorities
deserve equitable opportunities to serve on the board
and in upper management positions. But at the same
time, several arguments are made for the business
case for board diversity. Agency theory suggests that a
more diverse board is a better monitor of managers
because board diversity increases board independence
(Carter et al., 2007). According to this view, diverse
directors are less likely to collude with other directors
to subvert shareholders than more homogeneous
boards are. Furthermore, board diversity can increase
board independence because people with different
gender, ethnicity or cultural background might ask
questions that would not be asked by directors with
more traditional backgrounds. Other propositions for
promoting board diversity can be supported by
resource dependence theory, since a more diverse
board appears to increase the resources brought in by
individual board members and the organization‘s
access to external resources. Hence, board diversity
has been advocated as a mean of providing new
insights and perspectives, increasing creativity and
innovation, enhancing board decision-making and
promoting more effective global relationships (Carter
et al., 2003; van der Walt and Ingley, 2003).
Consequently, most researchers assume a positive
relationship between board diversity and
organizational performance. However, empirical
studies analyzing the effects of the gender and
ethnicity characteristics of board members have
produced mixed results (see Table 2). Whereas Carter
et al. (2003) and Erhardt et al. (2003) found
significant positive relationships between the presence
of women and ethnic minorities (i.e. African,
Hispanic, Asian and Native Americans) on corporate
boards and their impact on firm performance or
shareholder wealth, other studies found negative or no
statistically significant relationships between board
diversity and financial performance.
Female and minority directors are also usually
assumed to play an important role in favouring CSR
Corporate Ownership & Control / Volume 6, Issue 4, Summer 2009
13
strategies. Since resource dependence theory suggests
that board members bring resources to the
organization as a result of their individual background,
an increased representation of women and ethnic
minorities will increase board attention to CSR issues
of racial and gender imbalances. Some studies also
affirm that female directors tend to be more sensitive
to CSR than their male counterparts (e.g. Ibrahim and
Angelidis, 1994). In any case, as members of
underrepresented groups in corporations, women and
minority directors are expected to be more interested
in the welfare of various stakeholders. As shown in
Table 2, several studies support this view.
INSERT TABLE 2 HERE
Stakeholder directors
Although codes of corporate governance increasingly
refer to stakeholders‘ interests, they seldom propose
including representatives of non-shareholder
stakeholders in the board. So far, not much attention
has been paid either to stakeholder directors in
corporate governance research. The dominant
theoretical perspective, agency theory, does not offer
many arguments for adding stakeholder directors to
the board. As Kassinis and Vafeas (2002) point out,
environmental (and CSR) policies give rise to a
different set of conflicts from the ―agency conflict‖:
management and shareholder interests are relatively
aligned and focused on maximizing profits, and
opposed to the interests of the community at large (or
other stakeholders). Following their argumentation, it
is not important to discern and separate directors who
are likely to protect shareholders over management,
but instead to discern those directors who are likely to
protect the community over management and
shareholders. Nonetheless, as in the case of female
and minority directors, it can also be argued that a
more plural board is a more independent board.
Resource dependency theory provides a better
argument for including stakeholder directors on the
boards. Different stakeholder directors can provide
valuable resources because of their business
relationships with the firm (for instance, customers,
suppliers and creditors) or non-business connections
(government officials, academics and community
representatives) (Luoma and Goodstein, 1999). Even
though this argument seems convincing, there has
been very little research examining the performance
effects of specific stakeholder directors (an exception
is Hillman (2005)). A particular case are employee
representatives on the board.2 Originally justified as a
form of industrial democracy or democracy at the
company level, today workers participation is mainly
emphasized as a contribution to value creating and
necessary organizational change (Hagen and Huse,
2006). While some authors argue that board employee
representation is dependent on executive managers
and contributes to managerial entrenchment (e.g.
Hollandts 2007), others highlight that employees, as
internal stakeholders, can provide exclusive company
information that may improve board efficiency (e.g.
Hagen and Huse, 2006). Empirical research on
employee representation on the board and its effect on
company performance has shown mixed and partly
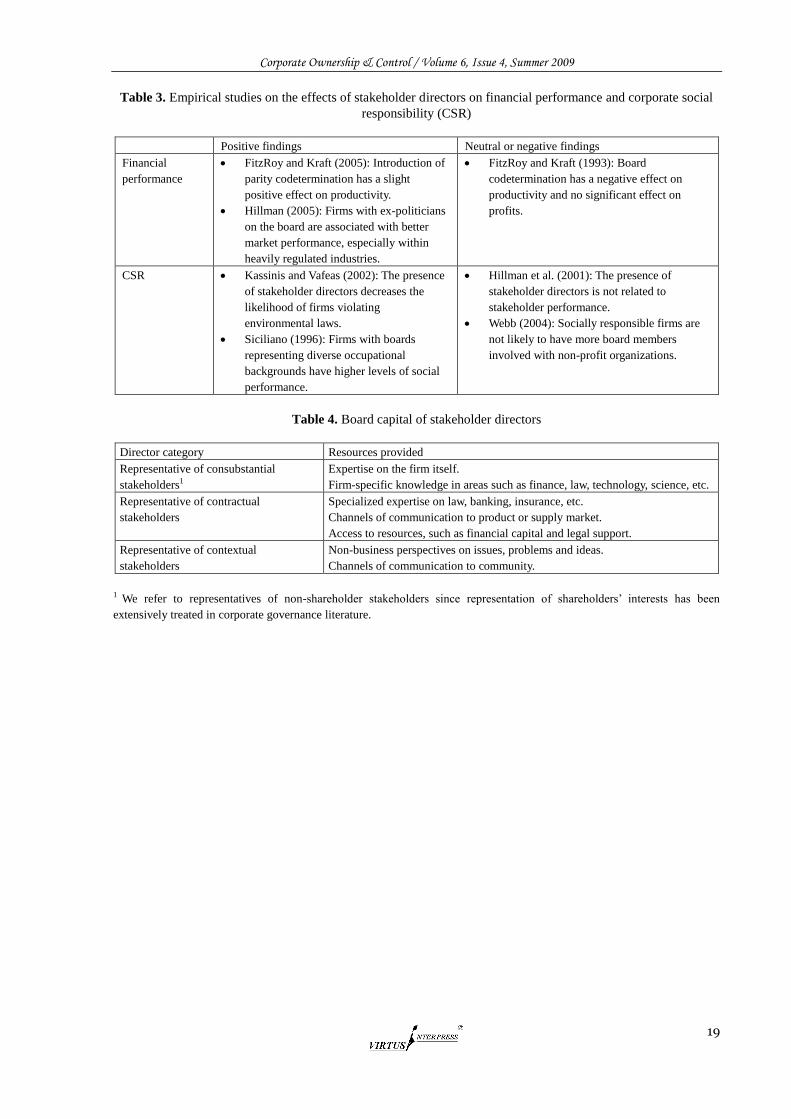
contradictory results (see Table 3).
Although directors with a business background
can leverage their experience on CSR adoption from
other boards (Kakabadse et al., 2006; Kassinis and
Vafeas, 2002; Webb, 2004), the inclusion of
stakeholder directors will presumably lead to more
explicit recognition of stakeholder issues and thus
CSR. In addition to the argument of resource
dependence theory, some authors refer to stakeholder
theory in their call for board directors as
representatives and protectors of a broad range of
stakeholders (Hillman et al., 2001; Wang and
Dewhirst, 1992). Kassinis and Vafeas (2002) suggest
that stakeholder directors, such as academics,
members of the military and clergy, and politicians
have interests that are more closely aligned with the
interests of the community at large. Thus, the role of
stakeholders‘ representatives is to enhance not only
corporate financial performance, but also, more
important, corporate social performance. As shown in
Table 3, the few empirical studies that have been
conducted so far deliver mixed results for this
assertion.
INSERT TABLE 3 HERE
Towards a stakeholder board
Empirical findings on the effects of board
composition support different corporate governance
theories. The coexistence of different theoretical
approaches can be explained by the fact that each
perspective emphasizes a different role of the board of
directors. Whereas agency theory focuses on the
monitoring or control function of the board, resource
dependency theory stresses the role of the board as a
provider of resources (Hillman and Dalziel, 2003).
There is general consensus in the corporate
governance literature that outside directors, especially
those without any other affiliation with the firm, will
be more effective in evaluating management based on
their increased objectivity (Dalton et al., 1998). From
the literature reviewed, it becomes evident that
directors from a variety of constituencies and with a
variety of expertise will be more effective in
performing the resource provision function.3
Stakeholder theory introduces a new role of the
board: balancing stakeholder interests (Kakabadse and
Kakabadse, 2007). As referred earlier, stakeholder
theory has both normative (moral/ethical) and
Corporate Ownership & Control / Volume 6, Issue 4, Summer 2009
14
instrumental (profit/wealth-enhancing) implications.
From the normative viewpoint, we can argue that if
the function of the board is to protect the interests of
the corporation‘s stakeholders, the board should
comprise members that are representative of these
stakeholders. Including stakeholders on corporate
boards can be a formal mechanism that acknowledges
the importance of their relationship with the firm
(Mitchell and Agle, 1997) and ensures that the
interests and well-being of constituents other than
shareholders are given legitimate consideration in
board decision-making (Luoma and Goodstein, 1999).
Furthermore, the institutionalization of stakeholders
inclusion on the board will become an important
element of the firm‘s CSR strategy, by formally
introducing non-economic considerations into
corporate decision-making.
Stakeholder directors are likely to be
knowledgeable about the interests of the groups from
which they are drawn and to bring a broader
perspective on the interests of stakeholders in general
(Hillman et al., 2001). At the same time, firms with
stakeholders on their boards are signalling their
commitment to stakeholders in a visible way. This
may in turn provide increased legitimacy for the firm
and increase a firm‘s linkages to important external
and internal contingencies. Hence, from the
instrumental viewpoint, including stakeholders on
corporate boards increases what Hillman and Dalziel
(2003) call board capital. This capital consists of both
human capital (expertise, experience, knowledge,
reputation and skills) and relational capital (ties to
strategically relevant organizations). Ultimately, the
presence of various stakeholder directors will secure
an increased provision of relevant resources by the
board and facilitate the firm‘s interactions with its
multiple stakeholder groups.
In our view, stakeholder theory suggests
incorporating various firm‘s stakeholders on the board,
both to give them a legitimate voice and to respond
better to the resource dependencies the firm faces. In
order to differentiate among stakeholder types, we adopt
the classification made by Rodriguez et al. (2002):
consubstantial, contractual and contextual stakeholders.
Consubstantial stakeholders are the stakeholders that
are essential for the business‘s existence (shareholders
and investors, strategic partners, employees).
Contractual stakeholders, as their name indicates,
have some kind of formal contract with the business
(financial institutions, suppliers and sub-contractors,
customers). Contextual stakeholders are
representatives of the social and natural systems in
which the business operates and play a fundamental
role in obtaining business credibility and, ultimately,
the acceptance of their activities (public
administration, local communities, countries and
societies, knowledge and opinion makers). Firms
must assess the stakeholders that are relevant to them
because of their specific business and environment
and select board members who represent them
adequately, also bearing in mind diversity issues such
as giving equal opportunities to women and ethnic
minorities. These stakeholders, in turn, will be able to
provide the needed board capital, i.e. human and
relational capital, to allow the firm to create value.
Table 4 shows the different types of stakeholder
directors and outlines the kinds of resources and
linkages which the director is expected to bring to the
board.
INSERT TABLE 4 HERE
Our proposal for stakeholder directors is similar
to Hillman et al. (2000) taxonomy of the resource
dependence role of directors. But while Hillman and
colleagues focus on a firm‘s need for resources from
the external environment, we also consider internal
resources. In this sense, our proposal for a stakeholder
board is more in line with Kaufman and Englander
(2005) board selection criteria based on a team
production model: the board should represent
stakeholders that add value, assume unique risks and
possess strategic information. However, we
emphasize that consubstantial, contractual and
contextual stakeholders of the firm contribute to its
wealth creation and should be included in the
governance board, and that the board also has the
responsibility to reflect societal diversity.
Conclusion
The present paper attempts to explore the question of
how to organize board composition in order to ensure
responsible corporate governance. Since CSR
suggests that companies have responsibilities that go
beyond the interests of their shareholders, it advocates
a stakeholder approach to corporate governance. In
contrast to the conventional shareholder-
wealth-maximizing firm, the stakeholder approach to
corporate governance views the firm as a
socio-economic organization built to create wealth for
its multiple constituencies, and, ultimately, calls for
representing the different stakeholders on the board.
From an ethical point of view, having stakeholder
directors on the board ensures that their rights and
legitimate expectations will be respected. From an
economic perspective, a board that replicates the
firm‘s internal and external stakeholders fosters their
commitment in contributing to value creation and
guarantees that their firm-specific investments will
not be ―expropriated‖ and their assumed risks will be
properly protected. Directors who represent the firm‘s
internal and external stakeholders will also bring
strategic information to the board. This argument
connects with the managerial perspective and, in
particular, resource dependency theory, since directors
Corporate Ownership & Control / Volume 6, Issue 4, Summer 2009
15
from a variety of constituencies will be able to
provide important resources in order to assist the firm
in creating and sustaining competitive advantage.
Despite the inconclusive findings of empirical
research, it can be argued that diverse stakeholders on
the board will promote the firm‘s CSR activities, but,
at the same time, will increase board capital (which
ultimately may lead to a better financial performance).
The present paper makes several contributions.
First, it challenges the often-made assumption that
good corporate governance focuses exclusively on
shareholders‘ interests and argues for taking
stakeholders‘ interest into account. Second, it seeks to
reconcile different corporate governance theories and
connect economic and managerial argumentations.
Third, it makes a proposal that is relevant for both
researchers and practitioners. For scholars, it shows
the relevance of board directors as providers of
important resources and adds a new role of the board:
balancing stakeholders‘ interests. For practitioners, it
suggests a normative and strategic dimension when
selecting directors in order to ensure responsible
corporate governance, both from a CSR and a good
governance perspective.
References
1. Agrawal, A. and Knoeber, C.R. (1996) ‗Firm
performance and mechanisms to control agency
problems between managers and shareholders‘,
Journal of Financial & Quantitative Analysis, Vol. 31,
No. 3, pp. 377-397.
2. Ayuso, S.; Rodríguez, M.A.; García, R. and Ariño,
M.A. (2007) ‗Maximizing stakeholders‘ interests: An
empirical analysis of the stakeholder approach to
corporate governance‘, IESE Working Paper WP No
670.
3. Baysinger, B.D. and Butler, H.N. (1985) ‗Corporate
governance and the board of directors: Performance
effects of changes in board composition‘, Journal of
Law, Economics & Organization, Vol. 1, No. 1, pp.
101-124.
4. Baysinger, B. and Hoskisson, R. (1990) ‗The
composition of boards of directors and strategic control:
Effects on corporate strategy‘, Academy of Management
Review, Vol. 15, No. 1, pp. 72-87.
5. Blair, M. (1995) Ownership and Control: Rethinking
Corporate Governance for the Twenty-First Century,
Brookings, Washington.
6. Blair, M.M. and Stout, L.A. (1999) ‗A team
production theory of corporate law‘, Virginia Law
Review, Vol. 85, No. 2, pp. 247-328.
7. Carter, D.A.; Simkins, B.J.and Simpson, W.G. (2003)
‗Corporate governance, board diversity, and firm
value‘, Financial Review, Vol. 38, No. 1, pp. 33-53.
8. Carter, D.A.; D'Souza, F.; Simkins, B.J. and Simpson,
W.G. (2007) ‗The diversity of corporate board
committees and firm financial performance‘ Available
at SSRN: Http://ssrn.com/abstract=972763
9. Chapple, W. and Ucbasaran, D. (2007) ‗The effects of
corporate governance on corporate social
responsibility.‘ Unpublished. (available from the
authors)
10. Clarkson, M.E. (1995) ‗A stakeholder framework for
analyzing and evaluating corporate social
performance‘, Academy of Management Review, Vol.
20, No. 1, pp. 92-117.
11. Coffey, B.S. and Wang, J. (1998) ‗Board diversity and
managerial control as predictors of corporate social
performance‘, Journal of Business Ethics, Vol. 17, No.
1, pp. 1595-1603.
12. Dalton, D.R.; Daily, C.M.; Ellstrand, A.E. and
Johnson, J.L. (1998) ‗Meta-analytic reviews of board
composition, leadership structure, and financial
performance‘, Strategic Management Journal, Vol. 19,
No. 3, pp. 269-290.
13. de Andrés, P.; Azofra, V. and López, F. (2005)
‗Corporate boards in OECD countries: Size,
composition, functioning and effectiveness‘,
Corporate Governance: An International Review,Vol.
13, No. 2, pp. 197-210.
14. Donaldson, T. and Preston, L.E. (1995) ‗The
stakeholder theory of the corporation: Concepts,
Evidence, and implications‘, Academy of Management
Review, Vol. 20, No. 1, pp. 65-91.
15. Dulewicz, V. and Herbert, P. (2004) ‗Does the
composition and practice of boards of directors bear
any relationship to the performance of their
companies?‘, Corporate Governance: An
International Review, Vol. 12, No. 3, pp. 263-280.
16. Eisenhardt, K.M. (1989) ‗Agency theory: An
assessment and review‘, Academy of Management
Review, Vol. 14, No. 1, pp. 57-74.
17. Erhardt, N.L.; Werbel, J.D. and Shrader, C.B. (2003)
‗Board of director diversity and firm financial
performance‘, Corporate Governance: An International
Review, Vol. 11, No. 2, pp. 102-111.
18. Evan, W.F. and Freeman, R.E. (1993) ‗A stakeholder
theory of the modern corporation: Kantian capitalism‘,
in Beauchamp, T. and Bowie, N. (Eds.) Ethical
Theory and Business, Prentice Hall, Englewood Cliffs,
NJ, pp. 75-84.
19. Ezzamel, M. and Watson, R. (1993) ‗Organizational
form, ownership structure and corporate performance:
A contextual empirical analysis of UK companies‘,
British Journal of Management, Vol. 4, No. 3, pp.
161-176.
20. Fama, E.F. and Jensen, M.C. (1983) ‗Separation of
ownership and control‘, Journal of Law & Economics,
Vol. 26, No. 2, pp. 301-326.
21. FitzRoy, F.R. and Kraft, K. (1993) ‗Economic effects
of codetermination‘, Scandinavian Journal of
Economics, Vol. 95, No. 3, pp. 365-375.
22. FitzRoy, F. and Kraft, K. (2005) ‗Co-determination,
efficiency and productivity,‘ British Journal of
Industrial Relations, Vol. 43, No. 2, pp. 233-247.
Corporate Ownership & Control / Volume 6, Issue 4, Summer 2009
16
23. Freeman, R.E. (1984) Strategic Management: A
Stakeholder Approach, Pitman, Boston.
24. Freeman, R.E. and Evan, W.M. (1990) ‗Corporate
governance: a stakeholder interpretation‘, Journal of
Behavioral Economics, Vol. 19, No. 4, pp. 337-359.
25. Freeman, R.E. and Velamuri, S.R. (2006) ‗A new
approach to CSR: Company stakeholder
responsibility‘, in Kakabadse, A. and Morsing, M.
(Eds.) Corporate Social Responsibility: Reconciling
Aspiration with Application, Palgrave Macmillan,
Houndmills, pp. 9-23.
26. Frye, M.B.; Nelling, E. and Webb, E. (2006)
‗Executive compensation in socially responsible
firms‘, Corporate Governance: An International
Review, Vol. 14, No. 5, pp. 446-455.
27. Hagen, I.M. and Huse, M. (2006) ‗Do employee
representatives make a difference on corporate
boards? Examples from Norway.‘ Proceedings of the
European Academy of Management (EURAM)
Annual Conference 2006.
28. Harrison, J.S. and Freeman, R.E. (1999) ‗Stakeholders,
social responsibility, and performance: Empirical
evidence and theoretical perspectives‘, Academy of
Management Journal, Vol. 42, No. 5, pp. 479-485.
29. Hillman, A.J. (2005) ‗Politicians on the board of
directors: Do connections affect the bottom line?‘,
Journal of Management, Vol. 31, No. 3, pp. 464-481.
30. Hillman, A.J.; Cannella Jr., A.A. and Paetzold, R.L.
(2000) ‗The resource dependence role of corporate
directors: strategic adaptation of board composition in
response to environmental change‘, Journal of
Management Studies, Vol. 37. No. 2, pp. 235-255.
31. Hillman, A.J.; Keim, G.D. and Luce, R.A. (2001)
‗Board composition and stakeholder performance: do
stakeholder directors make a difference?‘, Business &
Society, Vol. 40, No. 3, pp. 295-314.
32. Hillman, A.J. and Dalziel, T. (2003) ‗Boards of
directors and firm performance: Integrating agency
and resource dependence perspectives‘, Academy of
Management Review, Vol. 28, No. 3, pp. 383-396.
33. Hollandts, X. (2007) ‗The moderation effect of board
employee representation on employee ownership-firm
performance relationship: an empirical examination.‘
Proceedings of the European Academy of
Management (EURAM) Annual Conference 2007.
34. Ibrahim, N.A. and Angelidis, J.P. (1994) ‗Effect of
board members' gender on corporate social
responsiveness orientation‘, Journal of Applied
Business Research, Vol. 10, No. 1, pp. 35-40.
35. Ibrahim, N.A. and Angelidis, J.P. (1995) ‗The corporate
social responsiveness orientation of board members: Are
there differences between inside and outside directors?‘,
Journal of Business Ethics, Vol. 14, No. 5, pp. 405-410.
36. Ibrahim, N.I.A.; Howard, D.P. and Angelidis, J.P.
(2003) ‗Board members in the service industry: An
empirical examination of the relationship between
corporate social responsibility orientation and
directorial type‘, Journal of Business Ethics, Vol. 47,
No. 4, pp. 393-401.
37. Jensen, M.C. and Meckling, W.H. (1976) ‗Theory of
the firm: Managerial behavior, agency costs and
ownership structure‘, Journal of Financial Economics,
Vol. 3, No. 4, pp. 305-360.
38. Johnson, R.A. and Greening, D.W. (1999) ‗The effects
of corporate governance and institutional ownership
types of corporate social performance,‘ Academy of
Management Journal, Vol. 42, No. 5, pp. 564-576.
39. Jones, T. and Goldberg, L.D. (1982) ‗Governing the
large corporation: More arguments for public
directors‘, Academy of Management Review, Vol. 7,
No. 4, pp. 603-611.
40. Kakabadse, A.P. and Kakabadse, N.K. (2007) ‗CSR in
the boardroom: Myth or mindfulness‘, in Kakabadse,
A. and Kakabadse, N. (Eds.) CSR in Practice: Delving
Deep, Palgrave Macmillan, Houndmills, pp. 180-205.
41. Kakabadse, A.P.; Kakabadse, N.K. and Barratt, R.
(2006) ‗CSR in the boardroom: Contribution of the
non-executive director (NED)‘, in Kakabadse, A. and
Morsing, M. (Eds.) Corporate Social Responsibility:
Reconciling Aspiration with Application, Palgrave
Macmillan, Houndmills, pp. 284-299.
42. Kassinis, G. and Vafeas, N. (2002) ‗Corporate boards
and outside stakeholders as determinants of
environmental litigation‘, Strategic Management
Journal, Vol. 23, No. 5, pp. 399-414.
43. Kaufman, A. and Englander, E. (2005) ‗A team
production model of corporate governance‘, Academy
of Management Executive, Vol. 19, No. 3, pp. 9-22.
44. Kesner, I.F (1987) ‗Directors' stock ownership and
organizational performance: An investigation of
fortune 500 companies‘, Journal of Management, Vol.
13, No. 3, pp. 499-508.
45. Letza, S.; Sun, X. and Kirkbridge, J. (2004)
‗Shareholding versus stakeholding: a critical review of
corporate governance‘, Corporate Governance: An
International Review, Vol. 12, No. 3, pp. 242-262.
46. Luoma, P. and Goodstein, J. (1999) ‗Stakeholders and
corporate boards: institutional influences on board
composition and structure‘, Academy of Management
Journal, Vol. 42, No. 5, pp. 553-563.
47. Mahoney, L. and Thorn, L. (2006) ‗An examination of
the structure of executive compensation and corporate
social responsibility: A Canadian investigation‘,
Journal of Business Ethics, Vol. 69, No. 2, pp.
149-162.
48. McGuire, J.; Dow, S. and Archgeyd, K. (2003) ‗CEO
incentives and corporate social performance‘, Journal
of Business Ethics, Vol. 45, No. 4, pp. 341-359.
49. McKendall, M.; Sanchez, C. and Sicilian, P. (1999)
‗Corporate governance and corporate illegality: The
effects of board structure on environmental violations‘,
International Journal of Organizational Analysis, Vol.
7, No. 3, pp. 201-223.
50. Mintzberg, H. (1983) ‗The case for corporate social
responsibility‘, Journal of Business Strategy, Vol. 4,
No. 2, pp. 3-15.
Corporate Ownership & Control / Volume 6, Issue 4, Summer 2009
17
51. Mitchell, R.K. and Agle, B.R. (1997) ‗Toward a
theory of stakeholder identification and salience:
Defining the principle of who and what really counts‘,
Academy of Management Review, Vol. 22, No. 4, pp.
853-886
52. Osterloh, M.; Frey, B. and Zeitoun, H. (2007)
‗Voluntary co-determination produces sustainable
competitive advantage.‘ Proceedings of the European
Academy of Management (EURAM) Annual
Conference 2007.
53. Pfeffer, J. (1972) ‗Size and composition of corporate
boards of directors: the organization and its
environment‘, Administrative Science Quarterly, Vol.
17, No. 2, pp. 218-228.
54. Pfeffer, J. and Salancik, G.R. (1978) The External
Control of Organizations: A Resource-Dependence
Perspective, Harper & Row, New York.
55. Post, J.E.; Preston, L.E. and Sachs, S. (2002)
‗Managing the extended enterprise: The new
stakeholder view‘, California Management Review,
Vol. 45, No. 1, pp. 6-28.
56. Rajan, R.G. and Zingales, L. (1998) ‗Power in a
theory of the firm‘, Quarterly Journal of Economics,
Vol. 113, No. 2, pp. 387-432.
57. Ricart, J.E.; Rodríguez, M.A. and Sánchez, P. (2005)
‗Sustainability in the boardroom: An empirical
examination of Dow Jones Sustainability World Index
Leaders‘, Corporate Governance: The International
Journal of Effective Board Performance, Vol. 5, No. 3,
pp. 24-41.
58. Rodriguez, M.A.; Ricart, J.E. and Sánchez, P. (2002)
‗Sustainable development and the sustainability of
competitive advantage: A dynamic and sustainable
view of the firm‘, Creativity & Innovation
Management, Vol. 11, No. 3, pp. 135-146.
59. Rosenstein, S. and Wyatt, J.G. (1990) ‗Outside
directors, board independence, and shareholder
wealth‘, Journal of Financial Economics, Vol. 26, No.
2, pp. 175-191.
60. Shrader, C.B.; Blackburn, V.B. and Iies, P. (1997)
‗Women in management and firm financial value: an
exploratory study‘, Journal of Managerial Issues, Vol.
9, No. 3, pp. 355-372.
61. Siciliano, J.I. (1996) ‗The relationship of board
member diversity to organizational performance‘,
Journal of Business Ethics, Vol. 15, No. 12, pp.
1313-1320.
62. Stanwick, P.A. and Stanwick, S.D. (1998) ‗The
determinants of corporate social performance: An
empirical examination‘, American Business Review,
Vol. 16, No. 1, pp. 86-93.
63. Szwajkowski, E. (2000) ‗Simplifying the principles of
stakeholder management: The three most important
principles‘, Business & Society, Vol. 39, No. 4, pp.
379-396.
64. Tirole, J. (2001) ‗Corporate governance‘,
Econometrica, Vol. 69, No. 1, pp. 1-35.
65. van der Walt, N. and Ingley, C. (2003) ‗Board
dynamics and the influence of professional
background, gender and ethnic diversity of directors‘,
Corporate Governance: An International Review, Vol.
11, No. 3, pp. 218-234.
66. Vinten, G. (2001) ‗Shareholder versus stakeholder – is
there a governance dilemma?‘, Corporate
Governance: An International Review, Vol. 9, No. 1,
pp. 36-47.
67. Wang, J. and Coffey, B.S. (1992) ‗Board composition
and corporate philanthropy‘, Journal of Business
Ethics, Vol. 11, No. 10, pp. 771-778.
68. Wang, J. and Dewhirst, H.D. (1992) ‗Boards of
directors and stakeholder orientation‘, Journal of
Business Ethics, Vol. 11, No. 2, pp. 115-123.
69. Webb, E. (2004) ‗An examination of socially
responsible firms‘ board structure‘, Journal of
Management and Governance, Vol. 8, No. 3, pp.
255-277.
70. Westphal, J. (1999) ‗Collaboration in the boardroom:
behavioral and performance consequences of CEO-board
social ties‘, Academy of Management Journal, Vol. 42,
No. 1, pp. 7-24.
71. Williams, R.J. (2003) ‗Women on corporate boards of
directors and their influence on corporate
philanthropy‘, Journal of Business Ethics, Vol. 42, No.
1, pp. 1-10.
72. Williamson, O.E. (1984) ‗Corporate governance‘, Yale
Law Journal, No. 93, pp. 1197-1230.
73. Zahra, S.A.; Oviatt, B.M. and Minyard, K. (1993)
‗Effects of corporate ownership and board structure
on corporate social responsibility and financial
performance.‘ Academy of Management Proceedings
1993, pp. 336-340.
74. Zahra, S.A. and Stanton, W.W. (1988) ‗The
implications of board of directors' composition for
corporate strategy and value‘, International Journal of
Management, Vol. 5, No. 2, pp. 229-236.
75. Zingales, L. (1998) ‗Corporate governance‘, in
Newman, P. (Ed.) The New Palgrave Dictionary of
Economics and the Law, Macmillan, London, pp.
497-503.
Footnotes 1 In line with Hillman and Dalziel (2003), we refer to
resource dependence theory in the sense of dependence of
the firm on both external and internal resources. This
interpretation is more in line with the resource-based theory
of the firm. 2 Many European countries have laws concerning
mandatory codetermination that allow employees to select
up to one third of the (supervisory) board members
(Osterloh et al., 2007). 3 Hillman and Dalziel (2003) argue that other board
roles considered in the corporate governance literature like
―strategy‖ and ―service‖, can be understood as part of the
provision of resources function.
Corporate Ownership & Control / Volume 6, Issue 4, Summer 2009
18
Table 1. Empirical studies on the effects of independent directors on financial performance and corporate social
responsibility (CSR)
Positive findings Neutral or negative findings
Financial
performance
Baysinger and Butler (1985): Firms with
more outside board members performed
better than those with a majority of
insiders on the board.
Ezzamel and Watson (1993): Outside
directors are positively associated with
firm profitability.
Rosenstein and Wyatt (1990): An increase
in stock price was correlated with the
addition of outsiders to the board of
directors.
Agrawal and Knoeber (1996): More outsiders
on the board are negatively related to
performance.
de Andres et al. (2005): There is no
relationship between the proportion of
outsider directors and firm value.
Dulewicz, and Herbert (2004): There is no
relationship between the proportion of outside
or executive directors on the board and
company performance.
CSR Ibrahim and Angelidis (1995), Ibrahim et al.
(2003): Outside directors exhibit greater
concern about the philanthropic component
of corporate responsibility than inside
directors.
Johnson and Greening (1999): Outside
director representation is positively related
to corporate social performance.
Webb (2004): Socially responsible firms
tend to have boards with more outsiders.
Zahra et al. (1993): The percentage of
outside directors is positively associated
with corporate social responsibility.
Chapple and Ucbasaran (2007): The ratio of
outsiders/insiders on the board is not related
to CSR activity.
McKendall et al. (1999): The proportion of
inside directors to outside directors is not
related to environmental law violations.
Wang and Dewhirst (1992): Inside and
outside directors do not differ in their
stakeholder orientation.
Table 2. Empirical studies on the effects of independent directors on financial performance and corporate social
responsibility (CSR)
Positive findings Neutral or negative findings
Financial
performance
Carter et al. (2003): Presence of women or
minorities on corporate boards positively
affects firm value.
Erhardt et al. (2003): Ethnic and gender
representation on boards increases firm
financial performance.
Shrader et al. (1997): Presence of women on
the board is negatively related to firm
financial performance.
Zahra and Stanton (1988): Female and ethnic
minority representation on boards is not
associated with firm financial performance.
CSR Coffey and Wang (1998), Wang and
Coffey (1992): Proportion of women (and
minority directors) is positively related to
corporate philanthropy.
Webb (2004): Socially responsible firms
have more women on the board.
Williams (2003): Firms with a higher
proportion of women on their boards
engage to a greater extent in charitable
giving.
Siciliano (1996): Firms with more women
on the board have higher levels of social
performance.
Stanwick and Stanwick (1998): The
percentage of women and minorities on the
board of directors is not linked to the firm‘s
corporate social performance.
Corporate Ownership & Control / Volume 6, Issue 4, Summer 2009
19
Table 3. Empirical studies on the effects of stakeholder directors on financial performance and corporate social
responsibility (CSR)
Positive findings Neutral or negative findings
Financial
performance
FitzRoy and Kraft (2005): Introduction of
parity codetermination has a slight
positive effect on productivity.
Hillman (2005): Firms with ex-politicians
on the board are associated with better
market performance, especially within
heavily regulated industries.
FitzRoy and Kraft (1993): Board
codetermination has a negative effect on
productivity and no significant effect on
profits.
CSR Kassinis and Vafeas (2002): The presence
of stakeholder directors decreases the
likelihood of firms violating
environmental laws.
Siciliano (1996): Firms with boards
representing diverse occupational
backgrounds have higher levels of social
performance.
Hillman et al. (2001): The presence of
stakeholder directors is not related to
stakeholder performance.
Webb (2004): Socially responsible firms are
not likely to have more board members
involved with non-profit organizations.
Table 4. Board capital of stakeholder directors
Director category Resources provided
Representative of consubstantial
stakeholders1
Expertise on the firm itself.
Firm-specific knowledge in areas such as finance, law, technology, science, etc.
Representative of contractual
stakeholders
Specialized expertise on law, banking, insurance, etc.
Channels of communication to product or supply market.
Access to resources, such as financial capital and legal support.
Representative of contextual
stakeholders
Non-business perspectives on issues, problems and ideas.
Channels of communication to community.
1 We refer to representatives of non-shareholder stakeholders since representation of shareholders‘ interests has been
extensively treated in corporate governance literature.
Corporate Ownership & Control / Volume 6, Issue 4, Summer 2009
20
SHAREHOLDERS’ ACCESS TO COMPANY’S INFORMATION: TOWARDS ENSURING SHAREHOLDERS’ MONITORING RIGHT AND MINORITY
SHAREHOLDERS’ PROTECTION
Junko Ueda*
Abstract This article aims to revisit how minority shareholders’ right to company’s information can be secured under Japanese company law to execute their substantial rights (to collect proxies, to sue management, etc.) particularly in the process of mergers and acquisitions. Section I overviews the structure of shareholders’ monitoring rights under Japanese company law against their historical background. Section II focuses on the shareholders’ rights to company’s information and its significance amongst shareholders’ rights and its linkage with other shareholders’ rights. Section III analyses leading cases before the Japanese courts regarding shareholders’ rights of inspection. Section IV surveys the shareholders’ right under Japanese company law to have access to company’s information in parallel with their right to apply for the courts to appoint inspectors who investigate into company’s business activities and financial situations. Section V assumes an expected shareholders’ role in association with the other monitoring function ensured under company law and pursues a “good governance” system. Keywords: Japanese Companies Act of 2005, minority shareholders, right to inspect a register of shareholders, right to inspect books and records, right to appoint inspectors who investigate into company’s business activities and financial situations, internal auditors, expected shareholders’ role, good corporate governance, mergers and acquisitions (M&As)
*Professor, PhD (London), LLD (Nagoya), Shizuoka University, Shizuoka, Japan
Introduction
This article conducts a review of how shareholders
under company law can monitor management
(directors and officers) through executing their right
to inspect company‘s information on their own
initiative. The scope is limited to governance within
the company. Thus, disclosure of a company‘s
financial information from a public interest
perspective is not dealt with in this article.
Section I overviews the structure of
shareholders‘ monitoring rights under Japanese
company law and outlines their historical background
along each right. Section II focuses on the
shareholders‘ rights to company‘s information and its
significance amongst shareholders‘ rights and its
linkage with other shareholders‘ rights. Section III
analyses leading cases before the Japanese courts
regarding shareholders‘ rights of inspection. Section
IV surveys the shareholders‘ right under Japanese
company law to have access to company‘s
information in parallel with their right to apply for the
courts to appoint inspectors who investigate into
company‘s business activities and financial situations.
Section V assumes an expected shareholders‘ role in
association with the other monitoring function
ensured under company law and pursues a ―good
governance‖ system. The last part of this article draws
a tentative conclusion.
The new Japanese Companies Act has
introduced flexible governance structures particularly
for private companies.1 Therefore, companies whose
share capital is less than 500 million yen and total
debt is less than 20 billion yen, and which restrict
transfer of their shares wholly may have a most
simple structure of shareholders‘ meeting with one
director (one shareholder is one director). However,
this article considers the standard structure based on a
power balance between shareholders‘ meeting and
board of directors.
I. Structure of Shareholders’ Monitoring under Japanese Company Law
Shareholders are legally defined as owners of the
company. They subscribe shares in exchange for their
1 Until the new companies act came into being in 2006,
there was a special act for limited liability companies to
allow a one director one shareholder structure for that type
of a company. The new act no longer allows formation of a
limited liability company but a share company can adopts
the same structure instead. Most deregulating provisions for
private companies largely succeed to the former provisions
in the Limited Liability Companies Act (enacted in 1938).
Corporate Ownership & Control / Volume 6, Issue 4, Summer 2009
21
money or assets. The fund collected as such is used
for the company‘s business activities. Thus, it is
natural that they manage the company to make profits
and distribute them among themselves. However,
modern share companies, in particular when they are
large enough to be financed by the public, do not
necessarily assume that they are run by shareholders
themselves. Division of power between shareholders
and management2 is inevitable as shareholders in
large companies have a reasoned apathy to company
management. Management does not necessarily
consist of shareholders but rather with professional
skills and care. Shareholders elect management and
have monitoring power over management. They
monitor management through general meetings, but in
addition they monitor through executing their specific
monitoring rights. The latter complements functional
limitation of general meetings which are subject to a
majority rule.
The monitoring rights can be divided into those
which are vested with every single shareholder
(regardless of whether he/she has voting rights), those
which can be executed by any single shareholder with
a voting right and those which are vested with
shareholders of specified percentage or number of
voting rights or shares. The line is drawn between the
three to consider the balance of ensuring shareholders‘
rights with protecting companies from shareholders‘
venomous or frivolous claims.
Under the 2005 Japanese Companies Act, right
to attend general meetings, to express opinions,3 to
raise questions,4 to raise motions
5, voting right
6 at
2 Expansion of management structure under Japanese
company law might be outside the scope of this report but it
might be worth noting here. Since 1950 when board system
was introduced into Japanese company law, share
companies, regardless of their size, must have boards which
consist of directors appointed at shareholders‘ meetings.
Board of directors must appoint representative director(s)
who have representing power. This type of company must
have internal auditors who organise the board of auditors.
However, since 2002 a new management structure has been
able to be adopted. This, roughly, follows Anglo-American
one-tier board system which has committees of directors
organised by at least three directors, the majority of which
are outside directors within the board and executive officers
(at least one of whom must be a chief executive officer)
who are appointed at board. Both types must have an
external auditor (a certified public accountant or accounting
firm). Under the 2005 new Companies Act, private
companies, share capital of which is less than 500 million
yen and debt of which is less than 20 billion yen, can have a
single director (no board and internal auditor)(see
Introduction). 3 There is no express provision but shareholders‘ voting
right is based on their right to express any opinion relevant
to agendas before making their decision by executing their
voting right. 4 Section 314. This right is provided as a directors and
officers‘ duty to answer shareholders‘ questions. 5 Section 304.
general meetings, right to inspect proxies,7 rights to
inspect a register of shareholders,8
financial
statements9 and minutes of general meetings,
10 right
to pursue injunction of directors‘ reckless or illegal act
which could drain company‘s assets out,11
right to
derivative suit,12
right to contest legality of
company‘s formation, issuance of new shares and of
share options, mergers, de-mergers, share exchanges,
etc.13
and legality and validity of resolutions of
general meetings before the courts14
are in the hands
of every single shareholder. It is conceivable that
except those regarding meetings every single
shareholder with or without a voting right executes
his/her monitoring right of this type.
Rights to submit agendas of general meetings,15
to convene general meetings,16
to apply for a court to
appoint an inspector(s) who will investigate
procedures and resolutions of general meetings,17
to
inspect books and records,18
to apply for a court to
appoint an inspector(s) who will investigate
company‘s affairs and financial status19
are executed
only by shareholders who meet the requirements of
prescribed shareholdings.20
As in the first type of
rights, those concerning general meetings can only be
executed by shareholders with voting rights. The
present act allows company‘s constitution to mitigate
6 Section 105 (1)(c). 7 Sections 310 (7), 311 (4) and 312 (5). 8 Section 125 (2) and (3). A register of shareholders shows
each shareholder‘s shareholdings; however, substantial
shareholders in any listed company who acquire more than
5 % of the issued shares of the company must report the fact
to the prime minister. The matter of substantial
shareholdings is regulated by the 2006 Financial Services
and Market Regulation as part of regulation for takeover
bids (Section 27-2). 9 Section 442 (3). 10 In contrast, minutes of board of directors, board
committees or board of internal auditors are open to
shareholders only with permission by the courts (see section
371 (2) and (3)). 11 Section 360. Directors‘ act beyond company‘s object is
also a matter for shareholders‘ injunction. 12 Section 847. 13 Section 828. 14 Sections 830 and 831. 15 Sections 303 and 305. 16 Section 297. 17 Section 306. 18 Section 433. 19 Section 358. 20 1% (voting right basis) threshold is provided for: the
right to submit agendas, the right to apply for the courts to
appoint an inspector(s) investigating into procedures or
resolutions of general meetings; 3% (voting right basis)
threshold is provided for: the right to convene general
meetings (also with the requirement for duration of
shareholding for public companies); 3% (both voting right
and share basis) threshold is provided for: the right to
inspect books and records, the right to apply for the courts
to appoint an inspector(s) investigating into company‘s
affairs and financial status.
Corporate Ownership & Control / Volume 6, Issue 4, Summer 2009
22
the voting right or shareholding requirements (this
means more in the interest of shareholders).
II. Shareholders’ Rights to Company’s Information
From amongst the enumerated rights in the previous
section, this article focuses on shareholders‘ rights to
company‘s information. This sort of rights are most
commonly utilised prior to executing other substantial
monitoring rights such as voting right at general
meetings and the right to bring derivative suits. This
section deals with a shareholders‘ right to inspect a
register of shareholders as well as to inspect books
and records. These rights are on the subtle balance
between secrecy of the company‘s information and
shareholders‘ remedial actions against management. If
they are executed properly, it will be in the best
interest of all shareholders of the company and vice
versa. The balance is subtle but the conflict between
the company (as representing shareholders‘ common
interests) and a claiming shareholder(s) is severe.
Recently, some interpretative questions have been
raised revolving around these rights in the process of
hostile share acquisitions and managerial
restructuring.
Section 125 (2) of the Japanese Companies Act
provides that every single shareholder and creditor
with a statement of its purpose may request inspection
of a register of shareholders at any time within
company‘s business hours. Section 125 (3) stipulates
five reasons for the company to reject shareholder or
creditor‘s request. This was newly written into a
provision,21
but the wording may have been
transformed from Section 433 (2), which was
originally introduced by the 1950 amendment.
Therefore, the wording of the two provisions is given
concurrently in the following outline put for Section
433 (2).
Section 433 (1) of the Japanese Companies Act
provides that shareholders who hold at least 3 per cent
of the total voting rights or 3 per cent of all issued
shares (excluding the company‘s own shares22
) may
request inspection of books and records at any time
within its business hours. As noted, this percentage
can be lowered by the company‘s constitution. The
previous act only provided for the voting right
requirement but the new act adds the share
requirement to it under the consideration that this
right can be executed widely by those who do not
21 The previous act did not have an express provision but
the courts have supported company‘s rejection when the
right is abused by a right holder. However, there has not
been any case before the court that relates to a claim by a
right holder who runs a competing business of the company. 22 The company is not allowed to vote at its general
meetings for its own shares. Therefore this is relevant only
to the case with the share basis requirement.
have voting rights.23
The request by a shareholder
must be written and with reasons in a concrete manner.
Section 433 (2) also expressly provides reasons for
the company to reject shareholders‘ requests. Five
reasons are given in the present act almost in the same
manner as in Section 125 (3) that reads; (a) where the
shareholder has requested on the grounds other than
collecting information to secure his/her right or
execute his/her right; (b) where the shareholder has
requested for the purpose of impeding company‘s
businesses and of undermining common interests of
shareholders as a whole; (c) where the shareholder
who has made the request is doing materially
competing business with the company or an employee
of any such business; (d) the shareholder has
requested for the purpose of disseminating the
information from books and records to a third party
for a return; or (e) where the shareholder has
disseminated the information from books and records
to the third party for a return over the past two years.
Historically, this provision was introduced in
1950 under the GHQ‘s occupational policy; thus,
under the strong influence of states‘ business
corporations‘ legislation in the USA.24
But unlike in
the USA where causes for the rejection are not
expressly provided (developed in common law and
case law built up on the relevant provision), as noted
above regarding Section 433 (2), the Japanese
provision has written them ever since it was
introduced.
The questions that have been arising regarding
this provision are (1) what are the contents of books
and records which can be requested by a shareholder?,
(2) does a shareholder who is going to make a request
need to identify the name of books or records of the
company?, and (3) to what extent a shareholder who
wishes to make a request needs to clarify reasons for
the request in the form?
23 T.Aizawa,Ichimon-itto Shin-kaisha-ho (Tokyo:
Shoji-homu, 2005), p.154. This requirement has been
changeable. Before the amendments of June of 2001,
company law only provided for the 3% share requirement.
The amendment changed it to the 3% voting right
requirement. Now a company can widely issue shares
without voting rights for instance as a class of shares
(section 108(1)(c)). 24 For the historical background of the provisions, see for
example, H.Shinkai, ‗Kabunushi no chobo-etsuran-ken (1):
Shoho 293-6 wo chushin to shite‘, (1972) 13-3
Kurume-daigaku Sangyo-keizai-kenkyu 265ff;
M.Nagahigashi,‘ Showa 25-nen shoho-kaisei: GHQ-bunsho
kara mita seiritukeika no kosatsu (1)-(4)‘, (1995) 30-3
Chukyohogaku 1ff; (1996) 31-1 Chukyohogaku 129ff;
(1996) 31-2 Chukyohogaku 21ff; (1997) 31-3
Chukyohogaku 107ff; S.Fujita,‘ Chobo-etsuran-ken ni t
suite‘, (2005) 75 Takushoku-daigaku-keiei-keiri-kenkyu
38ff.
Corporate Ownership & Control / Volume 6, Issue 4, Summer 2009
23
III. Some Cases before the Courts
To obtain a clue to solve the above questions, this
section refers to the relevant cases before the Japanese
courts. Until very recently, only a few cases regarding
the provisions, particularly the latter clause of the
same provisions regarding rejection25
, have been
brought before the courts. This is mainly because
onus of proof is imposed on the company when it
contests before the courts that it has any reason to
reject the shareholder‘s request. Normally, it is not
easy for the company to show shareholder‘s purpose
and intention. As for Section 433, most cases
contested the above three points. The courts have
given their views at least to these points. To question
(1), the courts have interpreted that the meaning of
books and records are confined literally to books and
records made and used in accounting practice.26
To
question (2), the courts have consistently held that
books and records which are permitted for the
inspection are confined to those closely related to and
identified by the reason and purpose of inspection.27
For the last question (3), the Supreme Court has given
that requesting shareholders must state clearly and
concretely the reasons for their inspection but they are
not required to show the facts behind the reasons.28
Reported cases regarding the rejection based on
Sections 125 (3) and 433 (2) have been to date all
grounded on (c). This section refers to these cases.
Case I Tokyo District Court Decision of 4 March 199429
This was the first reported case regarding the rejection
of shareholders‘ request to inspect company‘s books
and records based on statutory grounds. A shareholder
25 As noted, Section 125 (3) had not been in its existence
until the present Companies Act was enacted in 2005.
Before that, only a few cases relating to rejection by a
shareholder or creditor‘s request due to a claimant‘s
competing business. 26 Tokyo District Court Decision of 22 June 1989. The
similar statements were given again in Yokohama District
Court Judgment of 19 April 1991; Tokyo Court of Appeal
Judgment of 29 March 2006. 27 Sendai Court of Appeal Judgment of 18 February 1974;
Takamatsu Court of Appeal Judgment of 29 September
1986; Tokyo Court of Appeal Judgment of 29 March 2006,
appealed by both parties from Tokyo District Court
Judgment of 2 November 2005. 28 Supreme Court Judgment of 1 July 2006. 29 Reported at 1495 Hanrei-jiho 139; 875 Hanrei-times 265;
942 Kinyu-shoji-hanrei 17; 122 Shiryo-ban shoji-homu 135.
Case comments by N.Sakamoto, (1994) Kinyu-shoji-hanrei
1; H.Katagi, (1995) 1515 Hanrei-jiho 243; H.Kansaku,
(1995) 1068 Jurist (special issue) 104; N.Yoshida, (1995)
30-1 Asia-hogaku 97; U.Tamura, (1996) 12
Shiho-hanrei-remarks 100; M.Nakahigashi, (1997) 938
Hanrei-times 197;.Y.Ito, (1998) 1482 Shoji-homu 27;
R.Tsuchida, (1998) 1142 Jurist 108.
who had been holding approximately 13.1 per cent of
company A‘s all issued shares made a request to
inspect books and records of company A but was
rejected for the reason of its competing businesses.
Company A‘s main business was to provide
broadcasting services; however, it also had planning
film, music, art and sporting events, consulting
services regarding intellectual property rights and
providing information about politics, economy,
culture and living plans, etc. in its object clauses. The
shareholder had been a representative director of
company A and retained a position of director after
retirement from a representative director due to
hegemony between the directors, and was well known
among broadcasting entrepreneurs and had
considerable knowhow of broadcasting businesses as
well as economic power. At the time of making a
request as a shareholder, he was still a substantial
shareholder but had already retired as a director of
company A and established his own company B,
having taken its representative directorship. Company
B‘s objects were similar to those of company A except
broadcasting services, though company B had not yet
started actual business.
Tokyo District Court held that, although company
B had not yet started its business, since possibility of
the information so collected would be disseminated in
favour of any future competing business was not zero
it must be interpreted as a competing business. In
light that the cause for the rejection had been
introduced in order to protect a company from any
risks of misappropriation of the financial information
by shareholders regardless of whether they are actual
or potential, predictability of unfair or distorted
competition was enough to reject the request.
Case II Nagoya Court of Appeal Decision of 7 February 199630
Company A held half of all issued shares of company
B which had run golf courses. Company A requested
inspection of books and records of company B but
was rejected. A director of company B was a
representative director of company A. Company B
was set up by dividing company A into two and
company A had run sporting facilities including
developing and managing golf courses. The case was
brought against the background that there had been a
growing conflict between a director and a
representative director of company B, who once
jointly set up new businesses. The reasons for the
rejection invoked were that (a) reasons for the
inspection were not clearly and concretely given; (b)
books and records it wished to inspect were not
30 Reported at 938 Hanrei-times 221. Case comments by
K.Kobayashi, (1998) 978 Hanrei-times 168; M.Mori, (2000)
18-1 Matsuzaka-seikei-kenkyu 97.
Corporate Ownership & Control / Volume 6, Issue 4, Summer 2009
24
identified; and (c) a requesting shareholder itself had
been conducting competing businesses with company
B. Company A in its capacity as a shareholder of
company B and its representative director in his
capacity as a director of company B jointly brought an
action against company B.31
In the argument
concerning the reason (c), Nagoya District Court
rejected plaintiff company A‘s argument that company
B must permit company A‘s inspection as long as
company A shows its intention not to misappropriate
the information.32
Company A appealed to Nagoya
Court of Appeal. It again rejected company A‘s
argument and said that company B only showed the
fact of requesting shareholder‘s competing businesses
in rejecting the request. Or, even if it could be
interpreted as what the plaintiff had argued, it had not
shown enough to ensure the lack of its intention not to
misappropriate the information.
Case III Tokyo District Court Judgment of 20 September 200733
This case was also related to the rejection grounded
on (c). But its significance was to regard the holding
company‘s competing business as requesting
shareholder‘s competing business and supported the
rejection of the company. Company B was set up in
1951 as a broadcasting company and its shares were
traded on the main board of the Tokyo Stock
Exchange, Inc. Company A set up an internet
technology (IT) venture business in 1997 (changed its
business name to its present one in 1999) whose
shares were traded on JASDAQ (originally a market
for OTC securities), and had shown rapid growth.
Company A and its group companies had acquired
company B‘s shares for the purpose of proposing joint
businesses pursuing the fusion of broadcasting
services with internet providing services. However,
company B did not welcome company A‘s proposal.
A wholly-owned subsidiary of company A
(company C) was a substantial shareholder of
company B. Company C requested an inspection of
books and records of company B. The reasons for the
inspection were to (a) check up how company B had
invested in other companies which would be white
knights to prevent company A and its group
companies including company C from more
acquiring; that (b) if directors of company B
31 The court also referred to director‘s eligibility to request
an inspection of his/her company. However, this point is not
within the scope of this report and not to be dealt with. 32 Nagoya District Court Decision of 20 February 1995. 33 Reported at 1985 Hanrei-jiho 140; 1253 Hanrei-times 99;
285 Shiryo-ban-shoji-homu 135; 1276 Kinyu-shoji-hanrei
28. Case comments by K. Toriyama, (2008) 637
Hogaku-seminar 116; M.Yanaga, (2008) Hanreijiho 205;
J.Ueda, (2008) 1354 Jurist (special issue) 113, J.Yamada,
(2008) 37 Shiho-hanrei-remarks 100; M.Yanaga, (2008)
1357 Jurist 164.
purchased other companies‘ shares only to protect the
company (ultimately to protect themselves by
securing their positions) from share acquisitions by
company A, such directors‘ activities could be
assessed as inappropriate management activities,
information was necessary to pursue directors‘
liability, etc.; and (c) there had been a real threat for
company C because company B would decide to take
defensive measures against company C and group
companies by modifying its anti-share acquisition
rules at general meetings, thus, company C needed to
collect information before voting against such
modification at general meetings.
Tokyo District Court held that company A and
company C were in the wholly parent-subsidiary
relationship and inseparably connected. They were
not only regarded as having financially the same
personality but also the latter has been perfectly
commanded by the former. The court also recognised
the fact that they jointly collected proxies from
company B‘s shareholders to control company B‘s
general meetings. In conclusion, the court found that
company C‘s request could be rejected for the reason
that wholly subsidiary‘s request could be regarded as
parent‘s request which run competing businesses with
company B. Tokyo District Court held in the same
direction that once the objective fact of competing
businesses of the requesting shareholder (or its parent
company) was confirmed, the request had to be
rejected without any further proof of shareholder‘s
intention not to misappropriate.
The above cases all rejected the shareholders‘
request. On the one hand, the court has interpreted
competing business as recognisable only by proof of
the fact of possibility of competition. Burden of proof
is on the company but this is not too difficult. On the
other hand, this is attributable to the nature of
information itself. Once information leaks, no one can
block its flow. Who knows who utilises it and when,
where and how it is utilised? An overly protective
approach to the threat of misuse of inside information
is quite natural.
From the perspective of minority shareholders‘
protection, criticisms have been made of this series of
courts‘ judgment or decisions. If the courts followed
another interpretation that shareholders could prove
their intention not to misappropriate the information
for their success, some of them should have drawn the
opposite conclusions.
By contrast a very recent case concerning the
ground of competing business for rejection under
Section 125 (3) is worth attention. Because it was the
first case that accepted shareholder‘s right to request
an inspection of a register of shareholders. Soon after
the introduction of this ground of rejection, one case
was brought before Tokyo District Court.34
This was
34 Tokyo District Court Decision 15 June 2007, (2007) 280
Corporate Ownership & Control / Volume 6, Issue 4, Summer 2009
25
the first-ever case regarding rejection grounded on
125 (3). Despite practical concern, the Court
interpreted the provision almost in parallel with 433
(2) and rejected a shareholder‘s request to inspect a
register of shareholders. Another case was brought in
June 2008, which will be noted below.
Case IV Tokyo Court of Appeal Decision 12 June 200835
Company A is a real estate agent, developer and real
estate asset manager and Company B runs almost the
same businesses. Shares of the two companies are
listed on the second board of Osaka Stock Exchange,
Inc. and the second board of Tokyo Stock Exchange,
Inc, respectively. Company A intended to jointly run
businesses with Company B and for this purpose it
started to acquire Company B‘s shares on or
off-market. However, Company B never agreed on
joint businesses with Company A. Company A and its
wholly subsidiary acquired 16.16% of Company B‘s
shares and Company A made a request to inspect
Company B‘s register of shareholders. Company A‘s
subsidiary submitted agenda items on 10 April 2008
to the proposed annual general meeting (AGM) of
Company B which was scheduled on 27 June 2008,
through executing its minority shareholder‘s right.
The purpose of inspection was to identify
shareholders with voting rights at that AGM and to
win a proxy fight with Company B‘s management and
the other shareholders friendly to the management.
Company B rejected Company A‘s request for
the reason that a) Company A runs competing
businesses with Company B (on a ground listed in
Section 125 (3)) and b) violating shareholders‘
privacy without any reason undermines shareholders‘
common interest and brings disbenefit to Company B.
Company A sought a interim relief before courts.
Tokyo District Court made a decision on 15 May
2008 to reject Company A‘s claim by literally
interpreting ―competing businesses‖. By contrast, on
appeal, Tokyo Court of Appeal took a different
approach to Company A‘s claim. Whilst recognising
Company A‘s competing businesses with Company B,
it held that Company B was successful to show that it
had no intention to abuse the information it assumed
to obtain from a register of shareholders. When
Company A made a request, it submitted a statement
that Company A would only check shareholders‘
Shiryobanshojihomu 220. Case comments by K.Toriyama,
(2007) 641 Hogaku-seminar 121; S.Masai,(2007) 1294
Kinyu-shoji-hanrei 2. 35 Reported at (2008) 1836 Shoji-homu 104; (2008) 292
Shiryo-ban-shoji-homu 104; (2008) 1295
Kinyu-shoji-hanrei 12. Case comments by K.Toriyama,
(2008) 645 Hogaku-seminar 129; M. Shintani, (2008) 1297
Kinyu-shoji-hanrei 6; M. Yanaga, (2008) 1361 Jurist 146;
K.Shimada, et al., (2008) 1841 Shoji-homu 59.
names for the purpose of collecting proxies. Thus, it
was the first case to uphold a right holder‘s request
and has attracted attention to date as its real impact on
the business world should be serious.
To ensure an effective minority protection
scheme within a company law framework, the courts
should pursue each right of minority shareholders in
the consistency with all other shareholders‘ schemes
and ultimately, so to say, within a governance system
of the company as a whole. The next two sections
relate to this.
IV. Harmonisation with Minority Shareholders’ Right to Apply for the Courts to Appoint Inspectors for Company’s Business Activities and Financial Situations
As noted above, Japanese company law has had
minority shareholders‘ right to apply for the courts to
appoint inspectors since its original document‘s
version in 1890.36
This was introduced by referring to
some model legislation particularly that of Europe. A
German drafter Hermann Roesler, employed by the
then government, noted that he modelled on British
companies legislation.37
Appointing an inspector or a
verifier who is external and neutral to the company to
collect information to correct malpractice of
management was originated in Europe and differed
from a USA idea of obtaining the same effect by
companies‘ autonomous corrective interactions (but
often with the court‘s intervention).
This is a typical example of the inconsistency
within Japanese company law due to its following the
Continental model during the pre-war period and the
USA model after World War II. To harmonise (and
even avail from) this right with the above right to
inspect books and records, being derived
coincidentally from the different models, it should be
interpreted that right to inspect company‘s books and
records and right to appoint inspectors are not
competing with each other and shareholders who meet
3 per cent threshold (both have the same requirement)
can rely on both rights. However, the right to appoint
inspectors is not only to investigate financial
situations of the company but also to investigate the
whole of the company‘s affairs. In this sense, the
36 Section 239, the Draft Commercial Code and
Commercial Code of 1890; Section 198, the Commercial
Code of 1899 (the same provision remains renumbered to
date). 37 See Shiho-sho, Roesler-shoho-soan (1)(reprinted)
(Tokyo: Shinsei-shuppan, 1995), pp. 443ff; H.Roesler,
Entwurf eines Handelsgesetzbuches für Japan mit
Commentar (reprinted), 1 Band 1996, S. 61, 348. For the
historical background and legislative process for the original
Commercial Code, see J.Ueda, ‗Kabushiki-gaisha ni okeru
keiei no kantoku to kensayaku-seido (1)‘, (1997) 116-1
Minsho-ho-zasshi 47.
Corporate Ownership & Control / Volume 6, Issue 4, Summer 2009
26
scope of the latter is broader than that of the former.38
Therefore, if shareholders who are suspicious of
directors‘ financial statements, they primarily rely on
their right to request an inspection of company‘s
books and records. This is an indoor matter of the
company and the courts will intervene only if
unsolvable conflicts arise between the company and
the requesting shareholders. By contrast, the right to
appoint inspectors is to rely on the courts to control
over the company which has been unable to expect
sound management by its self autonomy. Whatever
the background is, the two systems could be
harmonised within the Japanese company law
framework and advantage should be taken of them to
strengthen shareholders‘ rights.
V. An Expected Role of Shareholders in Corporate Governance
Japanese company law has struggled for a ―good
governance‖ system. Since its introduction of board
system in 1950, strongly influenced by USA business
corporation law, board has been expected primarily its
monitoring function against directors. Through board
meetings, directors monitor other directors, regardless
of whether they are representative or
non-representative, or executive or non-executive.39
However, in practice most companies were not
accustomed to the idea of outside (or more precisely
independent) directors and have only internal
executive directors. They were deeply committed to
the company‘s daily affairs, while at the same time
they were expected to have a monitoring function.
Who could imagine that they ―bark‖ at reckless or
illegal findings for the act of directors?
Instead, Japanese company law has rather put
more emphasis on the roles of an internal auditor(s).
Internal auditors are appointed at general meetings.40
They do not need any professional qualifications.41
38 For the argument suggesting to the possible combination
of these two provisions for effective inspection, see
K.Yamada, ‗Kabunushi no kaikei-chobo-etsuran-seikyuken
to kensayaku senninseikyu-ken‘, in C.Suzuki, Kaisha to
sosho (Tokyo:Yuhikaku, 1968), pp.553, 568. 39 The Supreme Court has interpreted that directors have
duty to mutually monitor themselves through board
meetings (they have power to convene board meetings and
they are expected to monitor other directors‘ activities
outside the boardroom by executing that power)(see
Supreme Court Judgment of 22 May1973). Right to
convene board meetings vested to each director (Section
361) may give actual effect to perform this duty. 40 Section 329(1). 41 They do not need to be professionals. However, certain
matters which disqualify them (e.g. being a corporate body,
a person with limited legal capability, etc.) are provided and
also because of the nature of their auditing duty, they are
subject to a prohibition that they cannot be at the same time
a director, an employee, etc. of the company and its
subsidiary (see Section 335).
Their expected function is to check the legality of
directors‘ business activities and of financial
statements.42
They can act as independent watch dogs
barking at directors. Japanese company law has
amended duties, powers and liability of internal
auditors over the decades. Their longer duration than
that of directors,43
duty to attend board meetings,44
veto to personnel matters of internal auditors at
board,45
submit agendas of appointing new internal
auditors to board, 46
statement of reasons and
opinions for their appointment, resignation and
removal at general meetings47
have been introduced
into company law since the 1970s. However, in
corporate practice directors are at the top end and
auditors are at the second top of the ladder for
employees and they share the feeling of same family
members of a corporate house. What is worse is that,
albeit the introduction of various manoeuvres
strengthening and widening internal auditors‘ powers,
auditors have been regarded just as being subservient
to directors. Retiring directors and those who failed to
hold the position of director have often been
appointed as internal auditors. The long-standing
practice has shown that they cannot play any
supervisory role over directors.
Shareholders‘ function becomes significant in
particular to supplement auditors‘ function. As long as
shareholders are owners of the company, they should
manage and control the company as they wish.
Directors are only delegated by shareholders to
manage the company. Shareholders‘ monitoring rights
are derived from this delegator-delegated relationship.
If minority shareholders‘ interest collides with that of
directors (majority shareholders), the courts should
not take a strict interpretation against minority‘s
interest.
Conclusion
Although the world financial crisis occurred in the
middle of 2008 has considerably reduced the total
number of proposed mergers & acquisitions (M&As)
at global level, Japan still retains a good number of
42 The scope of auditors‘ auditing function is controversial.
Many commentators have argued that auditors are unlike
directors not expected to audit validity of business judgment
by directors. They just audit whether or not directors‘
business judgment is legal. 43 The duration of auditors is four years (336(1)) while that
of directors is two years (332(1)) unless company articles
stipulate any shorter period (in case of a company having
board committees one year (332(3))). A company whose
shares are not allowed to transfer freely may extend the
duration of directors and auditors up to ten years if it
provides so in its articles (332(2) and 336(2)). 44 Section 383(1). 45 Section 343(1). 46 Section 343(2). 47 Section 345(4).
Corporate Ownership & Control / Volume 6, Issue 4, Summer 2009
27
M&A cases, particularly in-out M&A cases.48
M&As
as an extravagant, social phenomenon posed again hot
discussions about ―of whose interest management
takes account in running the company?‖. In the arena
of M&As, money makes power. Shareholders who
have suddenly appeared by acquiring certain
percentage of the company‘s shares obtain power to
control management through their voting rights,
monitoring rights as above, etc (It should be
remembered that the most notable, recent cases above
were brought before the courts in the process of
hostile M&As). This may inevitably lead to
management activities to run the company in the best
interest of its shareholders for the two very different
reasons: (a) in order to protect the company and its
management from hostile bidders, management takes
into account the best interest of friendly shareholders
for their long-term investment; and (b) management is
forced to listen to strong voice of hostile major
shareholders who vote for maximisation of the
company‘s short-term profits. Interests of employees,
creditors, customers, communities, etc. are
disregarded, or are at best behind those of
shareholders. As a counterargument to this, a
traditional idea about ―shareholders‘ supremacy‖ has
ever been strongly proposed to be replaced. However,
this article is not to contribute to such an argument.
Rather, the article aims to warn that before
considering other stakeholders‘ interests even
shareholders‘ interest and rights under the law have
not been appropriately ensured.
Japanese companies are said to have taken great
care of employees. Each company has its own trade
union and negotiation and co-decision of management
with its union is common. By contrast, yearly
distribution of profits to shareholders stays almost at
the same level no matter how much it earns. The
M&A trend has gradually changed this practice. Not
an approach of ―shareholders‘ supremacy‖ but that of
―enlightened shareholders‘ supremacy‖ should be
explored in the harmonisation with all other
stakeholders of the company.
48 At international level, the period 1 January 2008-20
October 2008 saw the cancellation of 1,203 M&A cases.
The statistics for Japan shows that target assets involved in
M&A cases during the period 1 January 2008-31 October
2008 went 39 per cent up compared to those involved in
M&A cases during the same period of the previous year. See,
e.g., The Nihon Keizai Shimbun, 6 November 2008.
Corporate Ownership & Control / Volume 6, Issue 4, Summer 2009
28
THE DECREASE IN DIVERSIFICATION AND CORPORATE GOVERNANCE: EVIDENCE FROM JAPANESE FIRMS+
Hidetaka Aoki*
Abstract This paper analyzes the effects of firm performance and governance factors on the decrease in diversification of Japanese firms in the 1990s. We focus on the cases of the decrease in diversification, because many previous studies proved that diversification caused firm value discount. Adjusting an excessive unrelated diversification would be an important topic, because the problems of low synergy between business units, inefficiency in management and so on were more serious in this type of diversification. The findings of this study are as follows. In the first half of the 1990s, immediately after the collapse of bubble economy, lower firm performance and main bank relationship encouraged firms to decrease the level of diversification of their businesses. On the other hand, in the latter half of the 1990s when the decrease in diversification itself was activated, higher performing non-manufacturing firms and manufacturing firms with lower profitability but facing higher growth in their main business tried to decrease diversification in order to strengthen the competitiveness in main businesses. Also, this kind of decrease in diversification was supported by the governance characteristics such as insider majority smaller boards of directors and the pressure from capital market. Keywords: Decrease in diversification, Corporate governance, Business portfolio restructuring, Selection and concentration, Diversification, Capital market
*Associate professor, Chiba University of Commerceб E-mail:[email protected]
Mailing address:1-3-1,Konodai, Ichikawa-shi, Chiba 272-8512, Japan
Phone:+81-47-372-4111б Fax:+81-47-375-1105
+ This research was partially supported by the Ministry of Education, Culture, Sports, Science and Technology, Grant-in-Aid for
Young Scientists (B), 19730262, 2008.
1. Introduction
While many studies investigated the effects of
business diversification, most of recent studies found
the negative relationship between diversification and
firm value. It is almost common that diversification
results in firm value discount. Basically, this research
also takes the stance that diversification causes the
firm value discount. From the viewpoint of this basic
consideration, in order to enhance firm value, it is
meaningful for companies to restructure their business
portfolio, with decrease in diversification.
Accordingly, the research questions of this study are
as follows. What facilitated Japanese firms‘ business
portfolio restructuring? More concretely, what effects
did firms‘ governance structure have on the decrease
in diversification as a business portfolio restructuring?
This paper does not discuss the reason why
diversification causes firm value discount, but
considers the leading factors, especially governance
factors that facilitate the decrease in diversification.
The targets of this study are Japanese businesses in
the 1990s, because they experienced drastic change,
both in corporate strategy and corporate governance.
For corporate strategy, in the background of the
collapse of bubble economy in the early 90s, selection
and concentration of business and reorganization of
group companies became more and more important.
In particular in the latter half of the 1990s,
concentration of resources on a core business and
withdrawal from an unprofitable business were
simultaneously required. Also, it was a time when
strategic alliances and strengthening group
management were actively utilized.
For corporate governance, while the discipline
from main banks that had played an important role in
Japanese corporate governance so far had become
weaker, the pressure from capital market had become
stronger. This shift could be confirmed by some facts
as follows; in the latter half of the 1980s, excellent
companies that had good market reputation shifted
their financing pattern from indirect to direct one. In
the 1990s, while the ratio of cross shareholding
decreased, institutional investors including foreigners
increased their influence. Besides, the 1990s was the
time when companies actively worked on the reform
Corporate Ownership & Control / Volume 6, Issue 4, Summer 2009
29
of internal governance, especially the reform of top
management showed progress. While the downsizing
of board of directors had been progressed through the
1990s, the introduction of the executive officer system
and outside directors accelerated the reform of
managerial organization. These reforms were intended
to strengthen the effectiveness of strategic decision
making and monitoring. The incentive of corporate
managers also tried to be enhanced by the
introduction of stock option. Therefore, it was a
turning point for the Japanese companies that they
experienced a great change both in corporate strategy
and corporate governance in the 1990s.
This paper proceeds as follows. Section 2
reviews the previous studies and clarifies the
meanings of the decrease in diversification. Section 3
presents the method of analysis including hypotheses,
estimation model and variables. Section 4 outlines the
decrease in diversification in the 1990s. Section 5
shows the estimation results and discuss the effects of
governance structure. Section 6 presents conclusions.
2. Diversification and performance
For the relationship between diversification and
performance, Rumelt(1974) found that
Dominant-Constrained and Related-Constrained
showed high performance. Since then, many studies
investigated the correlation between them. For the
recent studies, the results of Berger and
Montgomely(1988), Wernerfelt and
Montgomery(1988), Lang and Stulz(1994), Berger
and Ofek(1995) clarified that excessive diversification
causes the inefficiency of management, and results in
the firm value discount. For the results from Japanese
companies, Lins and Servaes(1999) confirmed the
diversification discount from the results of cross
section analysis of 1992 and 1995. Hiramoto(2002)
also confirmed the same result using the cross section
data of 1995.
Concerning the type of diversification, while
positive evaluation is usually given to the related
diversification, negative evaluation is absolutely
given to the unrelated diversification. For example,
Wernerfelt and Montgomery(1988) showed that
related rather than unrelated diversification had the
positive effects on firm performance. Markides and
Williamson(1994) pointed out that related
diversification had an advantage from the viewpoints
of economies of scope and accumulation of resources.
In addition, Morck,Shleifer and Vishny(1990) found
that while related diversification had a positive effects
on shareholder value, unrelated diversification had a
negative effects. Furthermore, Rumelt(1982),
Varadarajan and Ramanujam(1987) also positively
evaluate the related diversification. On the other hand,
Hiramoto(2002) found the firm value discount not
only in unrelated diversification but also in related
diversification. Therefore, the synergy effect is
expected by using management resources, especially
informational resources such as know-how,
simultaneously among business divisions in related
diversification. On the contrary, disadvantage caused
by less synergy, decreased specialty in management,
increased coordination costs among business divisions,
asymmetries of information between top management
and divisional managers etc. is stronger than
advantage in risk dispersion in unrelated
diversification. Accordingly, a negative variation on
unrelated diversification is almost a common
understanding. Then, this paper basically considers
that unrelated diversification has a lot of problems,
and focuses on business portfolio restructuring that
may contribute to dissolving the excessive
diversification.
On the other hand, Kikutani et.al.(2007)
approached diversification from the viewpoints of
entry to new business and exit from existing business.
They showed that Japanese companies have done
many new entries and withdrawals in gross than
observed in net, companies with many entries did a
number of exits, and companies with simultaneous
entry and exit achieved high performance. However,
the influences of corporate governance structure on
business portfolio restructuring had not been so
clarified. This research tries to contribute to this point
by estimating the effects of governance factors on
business restructuring. By the way, because many
previous studies limited their sample only in
manufacturing companies, this paper included
non-manufacturing companies also. If the inefficiency
in unrelated diversification originates in the low
professions and relations, it is very important to
comprehend the business expansion beyond the
manufacturing and nonmanufacturing section. And it
is meaningful to analyze the effects of corporate
governance on business portfolio restructuring
including the withdrawals from different types of
business.
3. Method 3.1. Definition of business portfolio restructuring
Our research interest is how governance factors
influence the strategic decision making of business
portfolio restructuring. Here, we define the decrease
in diversification as the business portfolio
restructuring, based on the negative evaluations on
diversification in many previous studies49
. We
comprehend the decrease in diversification whether
the reduction in number of business sections occurred
or not. Because, previous studies concerning
49 See Denis,Denis and Sarin(1997), Berger and
Ofek(1999) etc.
Corporate Ownership & Control / Volume 6, Issue 4, Summer 2009
30
diversification discount showed the tendency that the
negative influence of diversification became stronger
as the number of business increase. Therefore,
downsizing the number of business attempted by
―selection and concentration‖ would contribute to
improve the firm value50
.
Concerning the business portfolio restructuring,
its concrete contents are important. Kikutani and
Saito(2006) investigated the change in a qualitative
business composition for this respect. They found the
shift to main business related type, by the
combination of withdrawals from unrelated business
and new entry to related business. They also found
this tendency was accelerated in the latter half of
1990s.
By the way, it is necessary to specify the
business field itself to comprehend the reduction in
the number of business. In this study, we allocated the
3-digit(detailed) and 2-digit(middle) standard industry
codes based on the Japanese standard industry
code(Nihon Hyoujun Sangyo Bunrui) to all business
sections that had positive sales, using the segment
data. Then, we identified the code of each business
section and classified into one single business if they
had the same code. In the end, we set up the database
of the number of business based on the 2digit and
3digit code. Concerning the types of diversification,
we may consider unrelated diversification as the case
that had two or more business sections beyond the
2digit code, and related diversification as the case that
had two or more 3-digit code business sections within
one 2-digit code business section51
. Considering the
decrease in diversification by the context of
withdrawal from unrelated business fields, it would be
adequate to specify the business by using the 2-digit
code rather than the 3-digit code. Therefore, this study
considers the effects of corporate governance on the
decrease in diversification, in case companies have
two or more unrelated businesses, measured by the
2-digit code criteria.
3.2. Hypotheses Firm performance
It is thought that the strength of a pressure to decrease
diversification depends on the firm performance.
Intuitively, if the inefficiency caused by an excessive
diversification results in the deterioration in firm
performance, the pressure to reform would be
increased and the probabilities of decrease in
diversification would increase. On the other hand,
diversification contributes to lessen the volatility of
50 Hiramoto(2002) indicates that selection of business
without concentration within core business field does not
contribute to enhance firm value. 51 This way of identification is basically the same as
Hiramoto(2002) which used Nikkei NEES classification.
performance and stabilize the profitability according
to the risk dispersion hypothesis. Thus, in case that
the business risk is high, decrease in diversification
which lessens the effects of risk dispersion would
hardly occur. Therefore, we consider the profitability
and risk as a firm performance, and set the following
hypothesis.
H1. Decrease in firm performance and increase in
business risk increase the probability of decrease in
diversification.
Governance factors
We consider top management characteristics,
ownership structure, main bank relationship, debt, and
employee as governance factors. A basic idea is that,
if a certain governance factor works effectively as a
disciplinary mechanism against management, this
factor restrains diversification and encourages the
decrease in diversification. Therefore, we set the
following hypothesis and explain the backgrounds of
each factor.
H2. Governance factors that work as a disciplinary
mechanism increase the probability of decrease in
diversification.
Board of directors
As characteristics of a typical Japanese board of
directors, a large number of directors, the low
percentage of outsiders, those who promoted within a
firm make up the majority could be pointed out.
Those characteristics, supplying ample positions in
the boards of directors for corporate insiders, had an
incentive effect on employees in terms of increasing
their chances of promotion and motivations to
accumulate firm specific skills. The characteristics of
boards of directors were complementary to the
long-term employment system, in a sense that it
enhanced an incentive in promotional competition
through ranking hierarchy(Miyajima and Aoki,2002).
On the other hand, Japanese board of directors had
problems in terms of strategic decision making and
monitoring(Aoki,2004). It would be difficult to carry
out active debate with an oversized board of directors.
Also, the objective evaluation would be difficult
because the insiders monitor the insiders. The reform
of top management system activated in the 1990s
tried to recover those functions. The introduction of
the executive officers system and outside directors
intended to strengthen strategic decision making and
objective monitoring by dividing directors and
officers and including outsiders.
Therefore, the board with a large number of
directors could be considered to have a negative effect
on strategic decision makings because of high
coordination costs among directors who is
representative of each business section, less activated
Corporate Ownership & Control / Volume 6, Issue 4, Summer 2009
31
discussions on the boards and so on. Then, a large
board of directors could have a negative effect on the
strategic decision making of decrease in
diversification. On the other hand, insider dominated
board of directors may have a weak monitoring
system, thus outsiders on the board of directors would
strengthen the monitoring function. Accordingly, the
higher ratio of outsiders on the board would increase
the probability of occurring decrease in
diversification.
Ownership structures
In contrast to the ratio of cross shareholding gradually
decreasing in the 1990s, the presence of institutional
investors such as the increase in foreign investors.
When companies hold shares each other, both of them
are silent partners. This situation contributed to
releasing managers from the pressure of capital
market and enabled to avoid the myopic management.
However, it had a problem of weakening discipline on
management, even if corporate performance declined.
In contrast to the influence of cross shareholding,
foreign investors that are known as an active investors
gave pressures to management by opposing in the
general meetings. Therefore, it could be thought that
cross shareholding mitigates the pressure of
restructuring when diversified companies face the
firm value discount. On the contrary, foreign investors
would enhance the pressure of decrease in
diversification.
Main banks and debt
As is well known, main banks played an important
disciplinary role in Japanese corporate governance,
differently from the takeover mechanism in an Anglo
American countries. The relationship that main banks
intervene in management depending on the
performance of client companies was characterized in
contingent governance by Aoki(1994a,b). However,
with the decline in bank financing, it is often said that
the role of main banks stepped back. We take into
account this change, and confirm the effects of main
bank relationship on the decrease in diversification, in
the sense to confirm whether bank-centred
governance structure had transformed into the
market-based structures. If main bank monitoring was
effective, the probabilities of decrease in
diversification would be increased.
Concerning the role of debt, the function of
reorganization is important(Aghion and Bolton,1992).
High ratio of debt increases the risks of default that
verifiably proves the moral hazard of managers. The
pressures of restraining excess diversification would
be increased under the situation that the ratio of debt
is high, because the control rights would transfer from
managers to debt holder in case the company defaults.
Therefore, the higher debt ratio reinforces the
discipline on management, and would increase the
probabilities of decrease in diversification.
Employee commitment
Lastly we discuss the effects of employees‘
commitment on decrease in diversification. It is often
pointed out that there is the difference among
companies in employees‘ commitment, and the
change in long-term employment system takes place
in the 1990s. Although it is difficult to find the
appropriate variable that directly represents the
strength of employee‘s commitment, we consider the
effects of the average tenure of employees as a proxy
of employees‘ sunk costs for their firm. According to
Allen and Gale(2000), the longer the employees
worked for a firm and the more they invested their
resources in firms specific skill, the stronger incentive
of voluntarily reforming instead of exiting they had
when firms performed badly. Therefore, the strong
commitment of employees to their firm would restrain
the excess diversification. Accordingly, the
probability of decrease in diversification would be
increased in firms with longer average tenure of
employees where employees are more cooperative for
enhancing firm value.
3.3. Data
In order to test the hypotheses mentioned above, this
study used the sample of firms listed on the first
section of Tokyo stock exchange except firms in
financial sections52
. Especially concerning the effects
of corporate governance, it is important to consider
the situation in big businesses where the agency
problems are relatively serious. That is the reason
why we used the firms listed on the first section of
Tokyo stock exchange. Here, the average number of
firms is 918 and its standard deviation is 30 during the
year from 1990 to 1998. We divided our sample into
two periods, from 1990 to 1993, and from 1994 to
1997, and confirmed the change in factors that
triggered the decrease in diversification.
The information about each segment that was
used for specifying business fields, the information
about financial performance that was used for making
variables of corporate performance, main bank
relationship, and the information about ownership
structure and employment were all obtained from the
Development Bank of Japan‘s ‗Company Financial
52 Strictly, even if a company was categorized in a
non-financial section when downloading data, in case that
the company had financial businesses as a result of new
entry or as a second business, the standard industry codes
were assigned to those business sections. Therefore, our
data set captured those financial businesses.
Corporate Ownership & Control / Volume 6, Issue 4, Summer 2009
32
Affairs Data(non-consolidated base)‘53
. The
information about top management was obtained from
the Toyo Keizai directors‘ handbook and the annual
reports of each company. The information about cross
shareholding was obtained from NLI Research
Institute‘s ‗database of cross shareholdings‘.
3.4. Estimation model and variables
The estimation method for testing the hypotheses is
the logistic regression model with the dependent
variable is weather the decrease in diversification was
occurred or not. The estimation formula is as follows.
],,,,,[1 YDIDFRMMKTGOVPEFfDID ttttttt
Dependent variable
Here, the dependent variable DIDt→t+1 is a dummy
variable that equals to 1 if the decrease in the number
of business section was confirmed in the 2-digit basis
of Japanese standard industry code, and is equal to 0
if it was not confirmed. Here, the decrease in
diversification in the year t is defined as the case
when the decrease in the number of business sections
comparing the number of business in the end of fiscal
year t to the counterparts in the end of fiscal year t+1.
It is not necessary that the condition of firm
performance and the features of governance structure
at the end of a certain fiscal year immediately trigger
the decrease in diversification. It could be considered
that there is a certain time lag between the strategic
decision making and its implementation. In order to
take this possibility into account, and to confirm the
stability of estimation results, we tested the models
using not only one-year-base change(from t to t+1)
but also two-year-change(from t to t+2) in decrease in
diversification.
Independent variables
For the performance factors(PEFt), we adopted the
following three variables. First, we used the
standardized return on asset(roa;operating plofit/total
asset) as a performance variable that represents the
profitability of the firm. For standardization, the
remainder in roa between raw data and the industry
average is divided by industry standard deviation.
Here, we captured the industry by the 2-digit standard
industry code. Accordingly, we confirm basically the
effects of the level of profitability compared to the
rival companies within the same industry on the
decrease in diversification. Second, we generated the
growth rate of main business(gmain) that represents
53 The fiscal year of 1998(the end of March in 1999) was a
final year that we could use the nonconsolidated data in
JDB database.
the growth of main business. Here, we specified the
business section that had the maximum sales as a
main business in the 2-digit standard industry code
base, and calculated the average growth rate in the
past three years54
. Finally, we adopted the coefficient
of variation in sales of past three years(salecv) as a
variable that represents the business risk.
For the governance structure(GOVt), we used
the following variables. As a characteristics of top
management, the number of directors(nod) and the
ratio of outside directors(outr;number of outside
directors/total number of directors) are adopted. As an
ownership structure, the ratio of shareholding by
foreign investors(foreign) and the ratio of
shareholding by cross shareholders(cross) are adopted.
For the main bank relationship, we made a dummy
variable by the following procedures. At first, we
specified the bank with the largest amount of
financing measured by bank loan as main banks. Then,
we gave the dummy variable 1 in case that these main
banks are the largest shareholder among banks. In
order to confirm the effects of debt, the ratio of
debt(debt;(debt+bond)/total liability) is used. Lastly to
check the effects of employee‘s commitment, an
average tenure of employees(emptenu) is adopted.
Control variables
The following factors that may have influences on the
decrease in diversification were controlled. Many
previous studies that had tested the relationships
between diversification and firm performance, had
pointed out the possibility that market structure and
the industry factors would intervene the relations
between them55
. As factors of a market structure, we
made the growth rate of the whole market(mgrowth)
and the concentration in top 3 companies(mctop3) in
main business based on a 2digit industry code. The
mgorwth is an average growth rate(one year change)
of total sales of each main business in the past three
years. The mctop3 is the sum of sales shares of sales
top three companies in each main business. Here, the
total market sales of each main business used in the
calculation process of those two variables are
aggregated data of all listed companies not only in the
first section of Tokyo stock exchange but also all the
stock market in Japan(except financial sections). Then,
we added the industry dummy(ID) specified by the
2-digit industry code of the main business to the
estimation model. In addition, we included the
number of business based on the 2-digit industry
code(nob). According to the discussion on the
inefficiency of diversification, enlarged number of
54 In case when a main business changed, we captured the
sales of the business section in the former year, and
calculated the growth rate of the main business. 55 For example, see Cristensen and Montgomery(1981).
Corporate Ownership & Control / Volume 6, Issue 4, Summer 2009
33
business sections makes it serious the problems of
coordination costs and asymmetry of information,
thus the probability of the decrease in diversification
would be increased in the company with many
business sections. Lastly, in order to control the
effects of macro shock, year dummy(YD) is included
to the estimation model.
Therefore, this estimation model considers the
effects of performance and governance factors at the
end of fiscal year t on the probability of the decrease
in diversification in the year t+1(in addition t+1 and
t+2) , after controlling the effects of market structure
and industry and so on.
Table 1
Because this paper analyzes the leading factors
on the decrease in diversification, we excluded the
cases of single business, when a company has only
one business section at the end of year t. Besides,
concerning the strategic decision making on business
portfolio restructuring, it would be doubtful that a
company makes decision independently when it has a
parent company. Then, we excluded the cases when
more than 50% of shareholding by nonfinancial
company is confirmed. We also excluded the cases
when the number of business increased compared to
the former year, because these cases would not be the
same as the case of no change.
Table 1 shows the basic statistics of each
variable. For the governance factors, while the
number of directors had decreased, the ratio of outside
directors had increased comparing the period of
1990-93 with 1994-97. This is consistent with the
direction of top management reforms in Japan. For the
ownership structure, the ratio of shareholding by
foreign investors increased especially in a
manufacturing section, from 4.8% to 7.3%. The
average tenure of employees became a slight longer in
manufacturing section.
4. Decrease in diversification―Outline in 1990s
Let us confirm easily about the transition of business
development in the 1990s. As usual, a diversified firm
is considered to have multi-business fields. Here, we
identify the firms with two or more business sections
based on the 2-digit and 3-digit Japanese standard
industry code as a diversified firm. Table 2 panel 1
shows the change in percentage of diversified firms.
The ratio of a diversified firm is 59.9% based on the
2-digit industry code, and 71.1% based on the 3-digit
industry code on average. As is expected that the ratio
of diversified firm decreases when the number of
business based on the 3-digit criteria is reclassified
into the 2-digit base, however its difference is not so
large as expected. This result means that
approximately 85% of diversified firms with the
criteria of the 3-digit industry code develop their
businesses beyond the 2-digit industry code. When we
see the change in the 1990s, although its magnitude is
small, decline in 1997 to 98 could be confirmed. This
indicates that the decrease in diversification
progressed in the latter half of the 1990s, and the
number of firms with single business increased.
Table 2
Then we confirm the number of business the
diversified firms have on average. Table 2 panel 2
shows the change in the number of business in
diversified firms. Here, the sample is limited to the
firms with more than two businesses, in order to
eliminate the effects of increase and decrease in the
number of single business firm. The average number
of businesses is 2.60 based on the 2-digit industry
code and 2.90 based on the 3-digit industry code.
Therefore, diversified firms had two or three
businesses on average. Although the fluctuation in the
time series was stable, this was a net result of new
entry and withdrawal from existing business. We
should pay attention to the fact that firms engaged in a
lot of entry and exit if we see the gross results behind.
Now, we confirm the frequency of the decrease in
diversification that this study pays attention. Table 3
shows the change in the decrease in diversification
based on the 2-digit industry code divided by
manufacturing and non-manufacturing sections56
.
First, it could be confirmed that the decrease in
diversification activated in the latter half of the 1990s.
The number of the decrease in diversification was
increased from 22 cases, 1.59% of the first half of the
1990s to 51 cases, 3.60% in manufacturing firms, and
from 12 cases, 1.65% to 39 cases, 5.15% in
non-manufacturing firms. Second, the decrease in
diversification was more activated in
non-manufacturing firms compared to manufacturing
firms. Table 4 shows the decrease in diversification by
industries. In the manufacturing section, the decrease
in diversification was generally seen widely across the
industries. It was also confirmed that the ratio of the
decrease in diversification was almost under average
in the first half of the 1990s; however, the number of
industries with the ratio more than average, such as
food, precision machine, increased in the latter half of
the 1990s. In this sense, the decrease in diversification
in manufacturing section was activated over
comparatively wider industries in the latter half of the
1990s. On the other hand, the ratio of the decrease in
diversification in non-manufacturing section was kept
highly through the 1990s. In particular, it is
56 The distinction between manufacturing and
non-manufacturing is based on a 2digit industry code of
the business section with largest sales.
Corporate Ownership & Control / Volume 6, Issue 4, Summer 2009
34
remarkable that the decrease in diversification was
activated in industries that had suffered from the
problem of excessive liability, such as construction,
distribution, and real estate in the latter half of the
1990s.
Therefore, the decrease in diversification was
activated in the latter half of the 1990s when the
selection and concentration became strongly
conscious as an important task for corporate
management. Also, this tendency was obvious in
non-manufacturing section rather than in
manufacturing section.
Tables 3-4 5. Determinants of Decrease in Diversification
Table 5 shows the estimation results concerning the
effects of performance and governance factors on the
decrease in diversification. At first, for the effects of
firm performance, standardized roa did not have any
significant correlation with the decrease in
diversification in the first half of the 1990s. However,
in the latter half of the 1990s, standardized roa
showed the contrast results over industries. It was
negatively correlated to the decrease in diversification
in manufacturing section(model 3,4). On the contrary,
it was positively correlated to the decrease in
diversification in non-manufacturing section(model 8).
For the growth of main business, gmain was
statistically significant only in manufacturing section.
It showed the negative correlation with the decrease in
diversification in the first half of the 1990s(model 1,2),
but it showed the positive correlation in the latter half
of the 1990s(model 3). For the risk, we could not find
any significant correlations. Therefore, for the effects
of firm performance on the decrease in diversification,
hypothesis 1 is partially supported, but it is more
important that the results showed the different
influences from first and latter half of the 1990s and
from manufacturing to non-manufacturing section.
This indicates that the main player that forwarded the
decrease in diversification had changed. In the first
half of the 1990s, manufacturing firms that had faced
the moderation of the growth rate of its main business
would forward business portfolio restructuring. On
the other hand, in the latter half of the 1990s, good
performing non-manufacturing firms with high
profitability, and manufacturing firms with low
profitability but facing high market growth of its main
business, aiming at reinforcing the competitiveness in
their main business, would forward the decrease in
diversification.
Table 5
For the governance factors, the estimation results
are as follows. First, for the effects of top
management factors, the number of directors(nod) and
the ratio of outside directors(outr) showed negatively
significant correlation with the decrease in
diversification in manufacturing section in the latter
half of the 1990s(model 3). Although it is not
statistically significant, these variables show mostly
the same tendency as in two-year change in the
decrease in diversification, so these results are
comparatively reliable. Therefore, manufacturing
firms with smaller boards of directors, and with less
outside directors on the board decreased
diversification actively in the latter half of the 1990s.
Second, for the ownership structure, the ratio of
shareholding by foreign investors(foreign) showed a
strong positive correlations with the decrease in
diversification at significant level of 5% and 1% in
manufacturing section in the latter half of the 1990s,
though it showed a negative correlation in the first
half of the 1990s(model 3,4). Therefore, firms with
high ratio of shareholding by foreign investors
decreased diversification more actively in the latter
half of the 1990s. On the other hand, the ratio of cross
shareholding(cress) showed a significant negative
correlation at the 10% level with the decrease in
diversification in non-manufacturing section in the
first half of the 1990s(model 5,6). Therefore, firms
with less cross shareholding decreased diversification
more, and this implies that the situation of less stable
shareholder would increase the pressure of reforming
businesses on managers. This result is consistent to
the negative view of cross shareholding that it
weakens the discipline.
Third, strong relationship with a main
bank(mbdum) was positively correlated to the
decrease in diversification, in non-manufacturing
section in the first half of the 1990s(model 5,6). It was
significant at the 10% level based on one-year change
and at the 1% level based on two-year change. It is
important that this relationship is confirmed in the
section where cross shareholding mitigates the
pressure of decrease in diversification. Therefore,
main banks would have a kind of disciplinary effects
that encouraged the decrease in diversification on
non-manufacturing firms in the first half of the 1990s.
However, this significance had lost in the latter half of
the 1990s when a financial crisis became serious.
Finally, the average tenure of
employees(emptenu) showed significant negative
correlations at the 1% level with the decrease in
diversification in non-manufacturing section in the
first half of the 1990s(model 5,6). Accordingly, the
probability of the decrease in diversification decreases
the average tenure of employees gets longer. This
result implies that comparatively young firms would
be more active in restructuring businesses. When we
see the tenure of employee as a proxy of accumulation
of firm specific skills, the costs of withdrawal would
be low before accumulating firm specific skills, so it
Corporate Ownership & Control / Volume 6, Issue 4, Summer 2009
35
would be easier for firms to engage in restructuring
businesses.
Discussion
Here, we consider the implications obtained from the
estimation results concerning governance factors.
The effects of board of directors
The characteristics of typical Japanese type of board
of directors, such as a large number of directors, and
an insider majority structure were important for
enhancing the incentive effects on Japanese type of
employment system such as long term employment
and promotional competition trough ranking
hierarchy57
. On the other hand, the Japanese boards of
directors also had problems such as lack of leadership,
or obscure managerial responsibility. Many Japanese
firms begum to reform of top management, facing the
globalization and changing business chances, and
those cost became serious in the 1990s.
Here, it is interesting that the reform of top
management in Japan had two directions. One is to
strengthen the strategic decision making, through
activation of discussion on the board by decreasing
the number of directors. Another is to strengthen the
monitoring, by increasing the number of outside
directors58
. The estimation results of this study that
the probability of the decrease in diversification is
significantly high in firms with smaller boards of
directors implies that the conflicts among directors
who represents each business section and the
coordination costs of diversification strategy are more
serious in firms with larger boards of directors.
Accordingly, it is indicated that downsizing the boards
of directors would contribute to strengthen strategic
decision making. Therefore, the result concerning the
size of the boards of directors is consistent with the
direction of actual top management reform in Japan.
In contrast, the estimation results concerning
outside directors were the opposite from our
expectation. We had expected that the stake and the
bond were stronger for insiders rather than outsiders,
especially in the cases of the decrease in
diversification usually accompanied by withdrawal
from existing business sections. Thus, we had
expected that boards of directors with higher ratio of
outsiders could show stronger leadership in
decreasing diversification. However, the estimation
results of this study showed that boards of directors
with higher ratio of insiders were more active in
decreasing diversification. This result indicates the
probability that insiders have higher ability of
interpreting the firm specific managerial information.
57 See Miyajima and Aoki(2002). 58 See Aoki(2004).
Also, it is implied that the autonomous governance by
insiders had begun to work in the 1990s59
.
The effects of foreign investors
It was an outstanding change in Japanese corporate
governance that the foreign investors increased their
presence in the 1990s. Then, its increase was more
obvious in manufacturing firms. It could be seen that
the influence of foreign investors on restructuring
businesses of manufacturing firms worked as a
pressure to forward the decrease in diversification
activated in the latter half of the 1990s. Actually,
Miyajima and Inagaki(2003) showed that foreign
investors preferred the stocks of firms with less
diversified. Hiramoto(2002) confirmed the positive
correlation between the ratio of shareholding by
foreign investors and firm value based on a cross
sectional analysis of the year 1995, and showed the
viewpoint that foreign shareholders invested highly
performing firm rather than that they enhanced firm
value. However, the results of this study may show
the opposite causality that foreign investors prompt to
decrease the level of diversification, and accelerate
the selection and concentration. As a result, firm value
would be enhanced.
The effects of main banks The estimation results that main bank relationship
worked as a pressure to prompt the decrease in
diversification in non-manufacturing section in the
first half of the 1990s are important. In the latter half
of the 1980s, the financing pattern shifted from
indirect financing to direct financing. This tendency
was obvious in excellent firms. As a result, banks
facing the deterioration in the pool of client firms
increased the new loan to firms in non-manufacturing
industries such as construction and real estate. At this
time, in order to lessen the monitoring costs, banks
lend out with collateral land60
. In this sense, the main
bank loan lacked in strict ex ante monitoring. Despite
of these facts, main banks had a certain effects on the
decrease in diversification for new client firms. The
main bank monitoring stepped back in the 1990s, but
in the non-manufacturing section in early 1990s, main
banks would have a kind of disciplinary effects.
Hiramoto(2002) also reported that main bank
relationship had a positive influence on firm value.
Therefore, it is indicated that, disciplinary mechanism
of main banks and the situation that less cross
shareholding, in other words, the pressure from
capital market coexisted in the non-manufacturing
section in the first half of the 1990s. However, the
59 Miyajima and Aoki(2002) approached this possibility by
the analysis on CEO turnover. 60 See Miyajima and Arikawa(1999), Hasimoto et.al.(2006).
Corporate Ownership & Control / Volume 6, Issue 4, Summer 2009
36
relationship that main banks accelerate the decrease in
diversification lost statistical significance in the latter
half of the 1990s when the decrease in diversification
activated. Main bank monitoring would step back
because of their bad debt problem and financial
distress in 1997 and so on.
6. Conclusions
This paper analyzed the determinants of the decrease
in diversification for Japanese firms in the 1990s,
based on the well-known fact that diversification
resulted in firm value discount. Concerning the types
of diversification, it would be important for business
portfolio restructuring that unrelated diversification
was corrected, because the problems of low synergy,
inefficiency and so on were more serious in this type
of diversification. So, we analyzed the cases when the
number of businesses specified by the 2-digit
Japanese standard industry code was decreased.
Concerning the leading factors for business portfolio
restructuring, we could confirm that some of
governance factors and the conditions of firm
performance had positive effects on the decrease in
diversification. As a result of our estimation that
analyzed the hypotheses concerning the determinants
of the decrease in diversification, it was remarkable
that the effects of governance ware not universally
invariable assumed theoretically. The governance
factors showed the different effects between periods
of the first and the latter half of the 1990s, and
between manufacturing and non-manufacturing
sections. Therefore, the effects of corporate
governance were contingent. Here, we summarize the
estimation results.
At first, the decrease in diversification was
activated in the late 1990s. And it was more activated
in the non-manufacturing section rather than the
manufacturing section. This indicates that the
decrease in diversification was activated especially in
industries where the problem of excess liability was
serious, such as construction, distribution, and real
estate. The proportion of diversified firms with two or
more businesses declined in the late 90s. However,
the average number of business sections was almost
fixed throughout the 1990s. These results indicate that
the restructuring businesses including new entries not
only the withdrawals were activated in the 1990s.
Second, the backgrounds of the decrease in
diversification had changed through the 1990s. In the
first half of the 1990s, manufacturing firms facing low
growth of their main business forwarded to decrease
diversification. This would be close to our general
image that low performance firms advance
restructuring desperately. On the other hand,
non-manufacturing firms with high profitability and
manufacturing firms with low profitability but facing
high market growth of their main business advanced
the decrease in diversification in order to strengthen
the competitiveness in main business in the latter half
of the 1990s. This was an offensive decrease in
diversification by high performing firms. This trend
would contribute to the recovery of macro economics
in the first half of the 2000s. However, seen from the
different viewpoint, the fact that firms with higher
performance forwarded the decrease in diversification
actively implies the possibility of strategic fixation in
firms with lower performance. This possibility would
enlarge the difference between winners and losers.
Accordingly, the governance problems would become
more resinous for firms whose performance became
worse and worse steadily.
Finally, we here summarize the effects of
governance factors on the decrease in diversification.
For the top management characteristics, firms with
smaller boards of directors showed a positive attitude
toward the decrease in diversification. This result
indicates that the downsizing board of directors
contributes to reduce the coordination costs among
business sections and strengthen strategic decision
making. On the other hand, firms with boards of
directors consist of fewer outsiders showed a positive
tendency in decreasing diversification. This result
implies that insiders have an advantage in interpreting
the firm specific information. It also indicates a
possibility that the autonomous governance led by
insiders began to work. In contrast, it indicates that
the problems of strategic decision making and
incentives and so on still remain for the role of
outside directors. Concerning the effects of ownership
structure, the possibility that stable shareholders based
on cross shareholdings mitigates the pressure on the
decrease in diversification, for the non-manufacturing
firms in the first half of the 1990s. On the other hand,
foreign shareholders that increased their presence in
the 1990s would encourage the ‗selection and
concentration‘ especially in manufacturing firms. The
main banks gave pressures on the decrease in
diversification for non-manufacturing firms in the
first half of the 1990s. In this sense, main banks
would have kept some degree of influence on the
restructuring business in their client firms. However,
main bank influence was stepped back in the latter
half of the 1990s when their bad debt problem became
serious.
Therefore, the decrease in diversification in
Japan, as a whole, could be summarized as follows. In
the first half of the 1990s, the factors such as low firm
performance(in manufacturing section) and main bank
relationship(in non-manufacturing section) rather than
the pressure from capital market encouraged the
decrease in diversification. In the latter half of the
1990s when the decrease in diversification itself
activated, high performing non-manufacturing firms
and manufacturing firms with low profitability but
high growth in their main business tried to decrease
Corporate Ownership & Control / Volume 6, Issue 4, Summer 2009
37
diversification in order to strengthen the
competitiveness in main business. And this decrease
in diversification was supported by the governance
characteristics such as insider majority small boards
of directors and the pressure from capital market,
mainly from foreign shareholders.
Finally, we mention about the future tasks. First,
we need to complement our estimation results by
using the consolidated data. We used
non-consolidated data because it was better to capture
the strategic decision making such as spin-offs
activated in the latter half of the 1990s aiming at
reinforcing the incentive of subsidiaries by
empowerment. However, it is very important to use
the consolidated base data especially in the analysis of
after the year 2000 because the non-consolidated base
accounting became popular. Second, although we
have discussed the cases of the decrease in
diversification, based on the assumption that
diversification result in firm value discount,
diversification also had the positive effects of risk
dispersion, seeking synergy and so on. Accordingly, it
is also needed to discuss about the cases of new
business entry, from the viewpoint of corporate
management. The governance factors discussed in this
paper may not only encourage the decrease in
diversification but also promotes the new entry, thus
encourage the business portfolio restructuring61
.
Therefore, it would be important to analyze the effects
of corporate governance from the viewpoints of
change in strategic decision making.
References
1. Aghion,P.and P.Bolton(1992), ―An Incomplete
Contracts Approach to Financial Contracting‖,Review
of Economic Studies,59,pp.473-494.
2. Allen,F. and D.Gale(2000), Comparing Financial
Systems,MIT Press.
3. Aoki,H.(2004),―Boardroom Reform in Japanese
Business:An Analysis of the Introduction of the
Executive Officer System and its Effects‖, Asian
Business & Management,Vol.3 No.2.
4. Aoki,M.(1994a),―Monitoring Characteristic of the
Main Bank System: An Analytical and Developmental
View‖,Aoki , M.and H.Patrick eds [ 1994 ] ,The
Japanese Main Bank System,Oxford University Press.
5. Aoki,M.(1994b),―The Contingent Governance of
Teams: An Analysis of Institutional
Complementarity‖,International Economic Review,
35,pp.657-676.
6. Berger,P. and E.Ofek(1995), ―Diversification‘s effect
on firm value,‖Journal of Financial Economics,37,
pp.39-65.
7. Berger,P. and E.Ofek(1999), ―Causes and Effects of
61 Kikutani et.al.(2007) pointed out that the same factor
encourages entry and exit simultaneously.
Corporate Refocusing Programs,‖Review of Financial
Studies,12,pp.311-345.
8. Berger,W. and C.Montgomely(1988), ―Tobin‘s q and
the structure performance relationship,‖American
Economic Review,78,pp.246-250.
9. Cristensen,H.K. and C.A.Montgomery(1981),
―Corporate Economic Performance:Diversification
Strategy Versus Market Structure‖,Strategic
Management Journal,2, pp.327-343.
10. Denis,D.J.,D.K.Denis and A.Sarin(1997), ―Agency
Problems, Equity Ownership, and Corporate
Diversification,‖Journal of Finance,52,pp.135-160.
11. Hashimoto,J.,S.Hasegawa and H.Miyajima(2006),
Modern Japanese Economy, Yuhikaku Aruma. (in
Japanese)
12. Hiramoto,T.(2002),―Diversification and Firm
Value‖,Modern Finance, 12,pp.31-55. (in Japanese)
13. Kikutani,T.,H.Itoh and O.Hayashida(2007), ―Business
Portfolio Restructuring of Japanese Firms in the
1990s : Entry and Exit Analysis‖,Aoki,M.,G.Jackson
and H.Miyajima,eds., Corporate Governance in
Japan : Institutional Change and Organizational
Diversity, Oxford University Press.
14. Kikutani, T. and T. Saito(2006),―Entry and Exit as a
Business Governance‖, Organizational Science, 40,
pp.15-26.(in Japanese)
15. Lang,L. and R.Stulz(1994), ―Tobin‘s q, Corporate
Diversification and Firm Performance,‖Journal of
Political Economics,102,pp.1248-1291.
16. Lins,K. and H.Servaes(1999), ―International Evidence
on the Value of Corporate Diversification,‖Journal of
Finance,45,pp.31-48.
17. Markides, C. and P.Williamson(1994), ―Related
Diversification, Core Competences, and Corporate
Performance‖, Strategic Management Journal, 15,
pp.149-165.
18. Miyajima, H. and H. Aoki(2002),―Change in the
J-type Firm : From Bank-centred Governance to
Internal Governance‖, Maswood,J., J.Graham and
H.Miyajima eds. Japan‐Change and Continuity,
RoutledgeCurzon.
19. Miyajima,H. and Y.Arikawa(2000),―Relationship
Banking and Debt Choice : Evidence from the
Liberalization in Japan‖, Ministry of Finance,Policy
Research Institute Discussion Paper 00A-07.
20. Miyajima,H. and K.Inagaki(2003),Variety of Japanese
Firms and Corporate Governance, Ministry of
Finance,Policy Research Institute(in Japanese)
21. Morck,R.,A.Shleifer and R.Vishny(1990), ―Do
Managerial Objectives Drive Bad Acquisitions?,‖
Journal of Finance,45,pp.31-48.
22. Rumelt,R.P.(1974), Strategy, Structure and Economic
Performance, Division of Research, Harvard Business
School.
23. Rumelt,R.P.(1982), ―Diversification Strategy and
Profitability‖, Strategic Management Journal,3,
pp.359-369.
24. Varadarajan,P. and V.Ramanujam(1987),
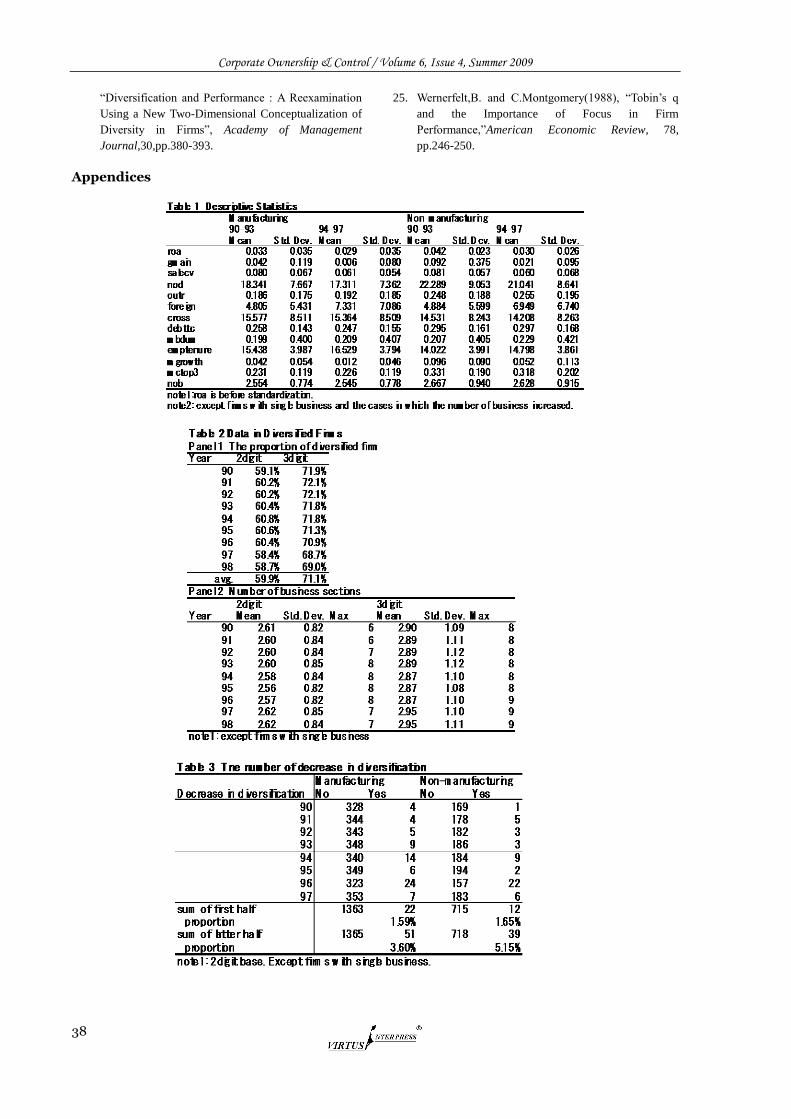
Corporate Ownership & Control / Volume 6, Issue 4, Summer 2009
38
―Diversification and Performance : A Reexamination
Using a New Two-Dimensional Conceptualization of
Diversity in Firms‖, Academy of Management
Journal,30,pp.380-393.
25. Wernerfelt,B. and C.Montgomery(1988), ―Tobin‘s q
and the Importance of Focus in Firm
Performance,‖American Economic Review, 78,
pp.246-250.
Appendices
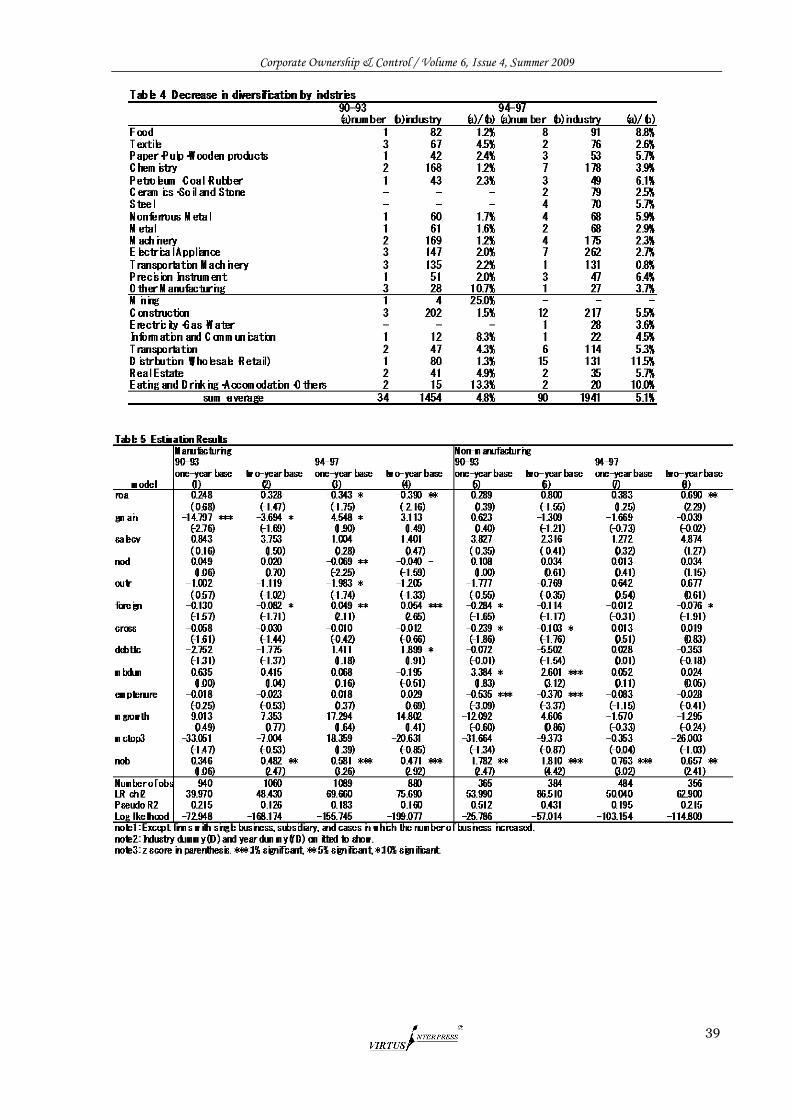
Corporate Ownership & Control / Volume 6, Issue 4, Summer 2009
39
Corporate Ownership & Control / Volume 6, Issue 4, Summer 2009
40
CORPORATE SOCIAL RESPONSIBILITY IN THE TOP SPANISH HOTEL COMPANIES
Eugenia Suárez-Serrano*
Abstract Corporate social responsibility (CSR) in tourism is particularly interesting given the fact that society is part of the service and companies should assume a responsibility with the places they are located in. Several studies analyse the reporting of CSR activities, however, there is modest research relating CSR practices in the hospitality industry. The purpose of this paper is to provide two case studies in the Spanish hospitality industry, Sol Meliá and NH, which are the only top hotel companies that offer information about their CSR practices in their web sites and Annual Reports. Although the tourism industry still has a long way to do in the reporting of CSR activities to become equal to other industries, in the two cases analysed a clear commitment to CSR matters it is observed within its various spheres of action. Keywords: corporate social responsibility, hospitality industry, hotel companies, Spain *Oviedo University, Spain
1. Introduction
Corporate social responsibility seems to be a matter of
increasing interest among scholars and practitioners.
The World Bark defines CSR as ―a term describing a
company´s obligation to be accountable to all of its
stakeholders in all its operations and activities.
Socially responsible companies consider the full
scope of their impact on communities and the
environment when making decisions, balancing the
needs of stakeholders with their need to make a
profit‖. The European Commission affirms that ―CSR
is about enterprises deciding to go beyond minimum
legal requirements and obligations stemming from
collective agreements in order to address societal
needs‖. In the same line, the United Nations defend
that ―corporations have a social responsibility and
moral duty to use the power of markets to make
globalization a positive force for all‖. As it can be
seen, the raison d‘être of CSR is that firms have other
responsibilities beyond financial and commercial
conscientiousness (Hopkins, 1999). Furthermore,
these definitions include business ethics and the
relevance of stakeholders beyond owners
(Schmidheiny et al., 1997). In other words, CSR is
related to the triple pillars of sustainable development:
social, environmental and economic returns (Zadeck,
2002) and it has become a core activity in many
corporations as there is a general view that CSR is
―the right thing to do‖ (Gan, 2006).
Despite the positive effect of CSR practices on
the society is undeniable, the relationship between
CSR and firm performance is arguable (Knox and
Maklan, 2004). Porter and Kramer (2006) affirm that
if corporations were to analyse their options for CSR
using the same view that guides their core business
choices, they would discover that CSR can be a
source of competitive advantage. However, the
strategic value of CSR is questionable as neoclassical
theories do not easily reconcile social welfare with
firm performance because imperfect markets do no
maximize social welfare (Allison, 2004). In fact,
studies conducted in order to analyse this relationship
offer diverse results (Barnett, 2007; Vogel, 2005;
McWilliams and Siegel, 2006; Nicolau, 2008).
According to Maxfield (2008), while market
imperfections (externalities, information asymmetries
and compromised competition) partly explain the
need for CSR, they are also the source of competitive
advantage. On the one hand, in the face of market
failures, society finds need for CSR. On the other
hand, under Resourced-based View, CSR practices
may be used as a differentiation strategy (Branco and
Rodrigues, 2006), if and only if firms can prevent
competitors from imitating their strategy (Reinghardt,
1998). Moreover, CSR activities closely linked to
innovation strategies might be more profitable than
those oriented toward public relation, marketing, etc.
(Maxfield, 2008).
Henderson (2007) affirms that the particularities
of tourism add an extra dimension to CSR: society is
part of the product and firms should be thorough and
responsible with the places they are located in. In this
way, Porter and Kramer (2006) suggest that engaging
socially responsibility as part of organizational
strategy offers the host companies competitive
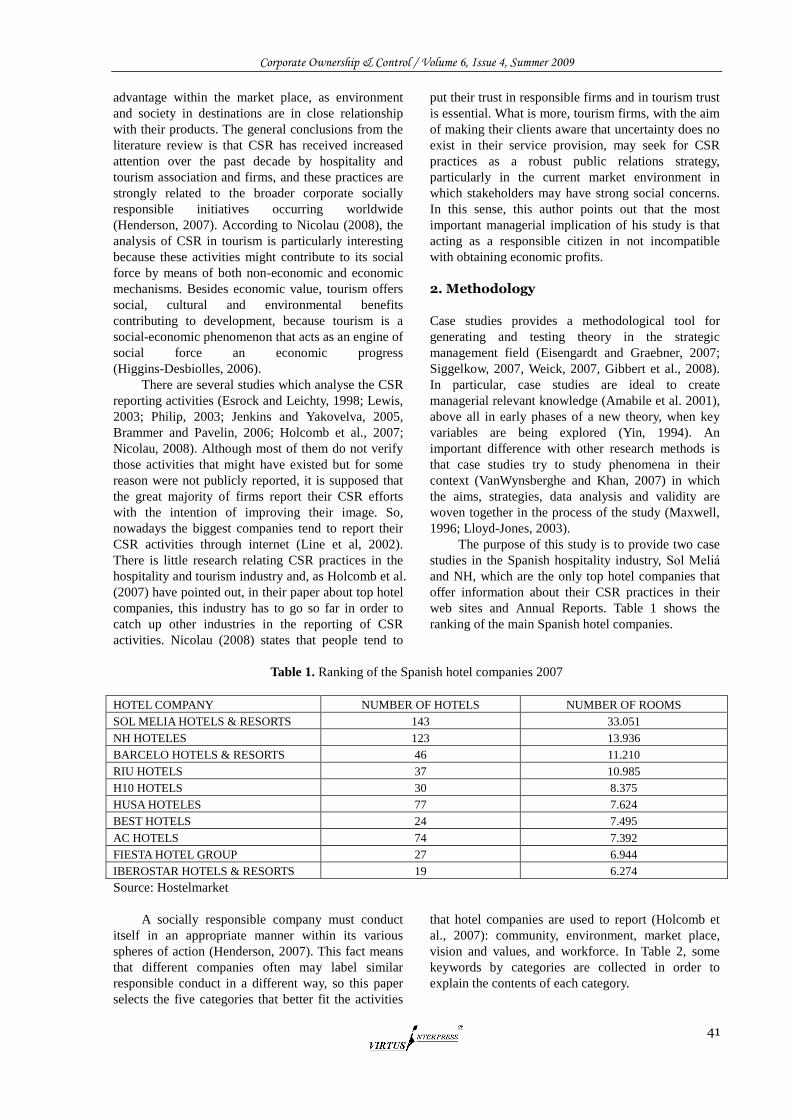
Corporate Ownership & Control / Volume 6, Issue 4, Summer 2009
41
advantage within the market place, as environment
and society in destinations are in close relationship
with their products. The general conclusions from the
literature review is that CSR has received increased
attention over the past decade by hospitality and
tourism association and firms, and these practices are
strongly related to the broader corporate socially
responsible initiatives occurring worldwide
(Henderson, 2007). According to Nicolau (2008), the
analysis of CSR in tourism is particularly interesting
because these activities might contribute to its social
force by means of both non-economic and economic
mechanisms. Besides economic value, tourism offers
social, cultural and environmental benefits
contributing to development, because tourism is a
social-economic phenomenon that acts as an engine of
social force an economic progress
(Higgins-Desbiolles, 2006).
There are several studies which analyse the CSR
reporting activities (Esrock and Leichty, 1998; Lewis,
2003; Philip, 2003; Jenkins and Yakovelva, 2005,
Brammer and Pavelin, 2006; Holcomb et al., 2007;
Nicolau, 2008). Although most of them do not verify
those activities that might have existed but for some
reason were not publicly reported, it is supposed that
the great majority of firms report their CSR efforts
with the intention of improving their image. So,
nowadays the biggest companies tend to report their
CSR activities through internet (Line et al, 2002).
There is little research relating CSR practices in the
hospitality and tourism industry and, as Holcomb et al.
(2007) have pointed out, in their paper about top hotel
companies, this industry has to go so far in order to
catch up other industries in the reporting of CSR
activities. Nicolau (2008) states that people tend to
put their trust in responsible firms and in tourism trust
is essential. What is more, tourism firms, with the aim
of making their clients aware that uncertainty does no
exist in their service provision, may seek for CSR
practices as a robust public relations strategy,
particularly in the current market environment in
which stakeholders may have strong social concerns.
In this sense, this author points out that the most
important managerial implication of his study is that
acting as a responsible citizen in not incompatible
with obtaining economic profits.
2. Methodology
Case studies provides a methodological tool for
generating and testing theory in the strategic
management field (Eisengardt and Graebner, 2007;
Siggelkow, 2007, Weick, 2007, Gibbert et al., 2008).
In particular, case studies are ideal to create
managerial relevant knowledge (Amabile et al. 2001),
above all in early phases of a new theory, when key
variables are being explored (Yin, 1994). An
important difference with other research methods is
that case studies try to study phenomena in their
context (VanWynsberghe and Khan, 2007) in which
the aims, strategies, data analysis and validity are
woven together in the process of the study (Maxwell,
1996; Lloyd-Jones, 2003).
The purpose of this study is to provide two case
studies in the Spanish hospitality industry, Sol Meliá
and NH, which are the only top hotel companies that
offer information about their CSR practices in their
web sites and Annual Reports. Table 1 shows the
ranking of the main Spanish hotel companies.
Table 1. Ranking of the Spanish hotel companies 2007
Cadena N. hoteles est. Total unid.
HOTEL COMPANY NUMBER OF HOTELS NUMBER OF ROOMS
SOL MELIA HOTELS & RESORTS 143 33.051
NH HOTELES 123 13.936
BARCELO HOTELS & RESORTS 46 11.210
RIU HOTELS 37 10.985
H10 HOTELS 30 8.375
HUSA HOTELES 77 7.624
BEST HOTELS 24 7.495
AC HOTELS 74 7.392
FIESTA HOTEL GROUP 27 6.944
IBEROSTAR HOTELS & RESORTS 19 6.274
Source: Hostelmarket
A socially responsible company must conduct
itself in an appropriate manner within its various
spheres of action (Henderson, 2007). This fact means
that different companies often may label similar
responsible conduct in a different way, so this paper
selects the five categories that better fit the activities
that hotel companies are used to report (Holcomb et
al., 2007): community, environment, market place,
vision and values, and workforce. In Table 2, some
keywords by categories are collected in order to
explain the contents of each category.
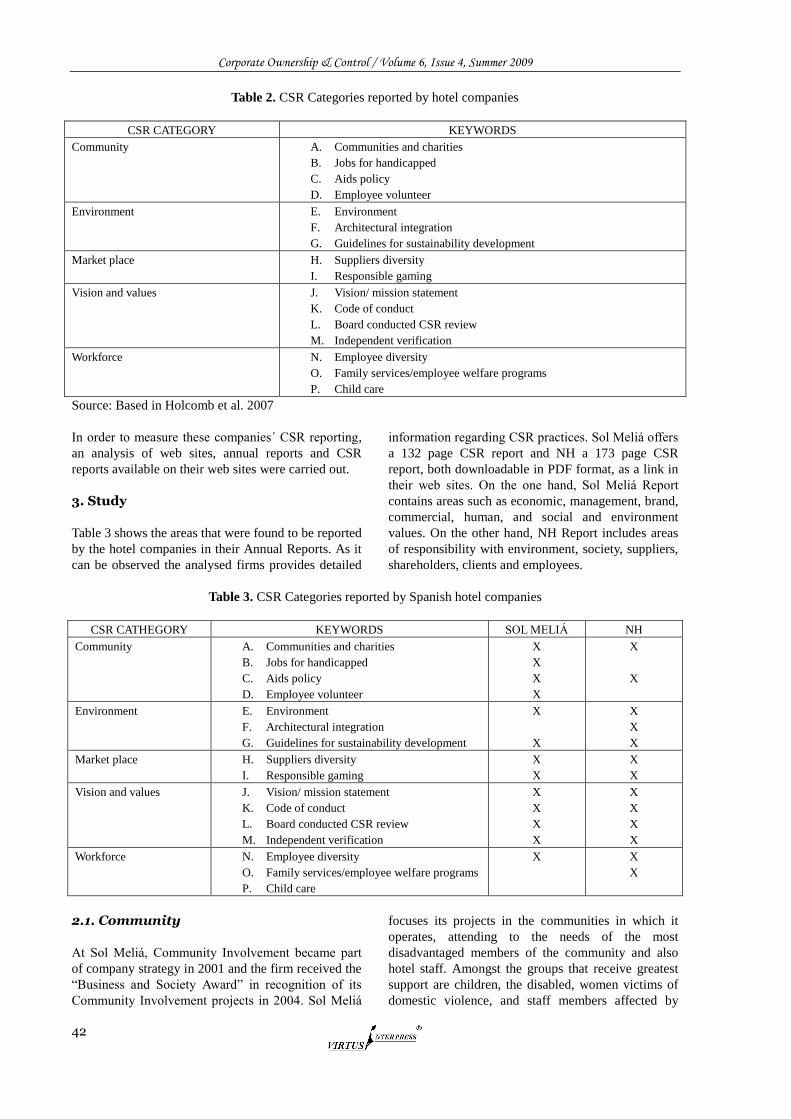
Corporate Ownership & Control / Volume 6, Issue 4, Summer 2009
42
Table 2. CSR Categories reported by hotel companies
CSR CATEGORY KEYWORDS
Community A. Communities and charities
B. Jobs for handicapped
C. Aids policy
D. Employee volunteer
Environment E. Environment
F. Architectural integration
G. Guidelines for sustainability development
Market place H. Suppliers diversity
I. Responsible gaming
Vision and values J. Vision/ mission statement
K. Code of conduct
L. Board conducted CSR review
M. Independent verification
Workforce N. Employee diversity
O. Family services/employee welfare programs
P. Child care
Source: Based in Holcomb et al. 2007
In order to measure these companies´ CSR reporting,
an analysis of web sites, annual reports and CSR
reports available on their web sites were carried out.
3. Study
Table 3 shows the areas that were found to be reported
by the hotel companies in their Annual Reports. As it
can be observed the analysed firms provides detailed
information regarding CSR practices. Sol Meliá offers
a 132 page CSR report and NH a 173 page CSR
report, both downloadable in PDF format, as a link in
their web sites. On the one hand, Sol Meliá Report
contains areas such as economic, management, brand,
commercial, human, and social and environment
values. On the other hand, NH Report includes areas
of responsibility with environment, society, suppliers,
shareholders, clients and employees.
Table 3. CSR Categories reported by Spanish hotel companies
CSR CATHEGORY KEYWORDS SOL MELIÁ NH
Community A. Communities and charities
B. Jobs for handicapped
C. Aids policy
D. Employee volunteer
X
X
X
X
X
X
Environment E. Environment
F. Architectural integration
G. Guidelines for sustainability development
X
X
X
X
X
Market place H. Suppliers diversity
I. Responsible gaming
X
X
X
X
Vision and values J. Vision/ mission statement
K. Code of conduct
L. Board conducted CSR review
M. Independent verification
X
X
X
X
X
X
X
X
Workforce N. Employee diversity
O. Family services/employee welfare programs
P. Child care
X X
X
2.1. Community
At Sol Meliá, Community Involvement became part
of company strategy in 2001 and the firm received the
―Business and Society Award‖ in recognition of its
Community Involvement projects in 2004. Sol Meliá
focuses its projects in the communities in which it
operates, attending to the needs of the most
disadvantaged members of the community and also
hotel staff. Amongst the groups that receive greatest
support are children, the disabled, women victims of
domestic violence, and staff members affected by
Corporate Ownership & Control / Volume 6, Issue 4, Summer 2009
43
natural disasters. These projects form part of two
different areas: ―Top-Down‖ projects which originate
in corporate offices and ―Bottom-Up‖ projects which
are created in hotels and reported to corporate offices.
In 2007 the company achieve an investment of
€1638 thousand, €230 more than in 2006.
For NH Hotels, the company must be an active
agent in the fair development of society, creating
wealth through their activity in the community in
which they operate and sharing part of the profits
obtained with society. To this end, the Corporate
Responsibility Department of NH has designed its
own ―Solidarity Index‖ to evaluate all projects that
are presented by NGOs, foundations and institutions,
analysing them under the same criteria and selecting
those that are most in line with the Company's
strategy. NH Hotels collaborated in a total of 224
actions in 2007, up 59 on the previous year. There was
also a considerable increase of investment, which
totalled €638,317 as against €537,048 in 2006.
2.2. Environment Responsibility to the environment at Sol Meliá is
replicated both in the daily activity in hotels and in
the actions promoted by corporate offices. 2007 may
be considered the year of the definitive consolidation
of environmental activities in the company, collecting
all of the individual activities together and learning
from the experience already acquired, and becoming
one of the key strategic areas of company activity.
The major areas of activity are as follows:
Mitigate the effects of climate change,
mainly through energy savings and greater energy
efficiency.
Minimization of the environmental impact
generated, by reducing the generation of waste
products and the consumption of water and other
resources.
Protection and conservation of habitats with
high ecological value to help preserve their
biodiversity.
Compliance with environmental regulations.
In 2007 the company had 22 hotels with a total
of 28 environmental management certifications based
on ISO 14001: 2004 rules, the European EMAS
regulations or the Green Globe XXI and Biosphere
Hotel Standards, which do no only include
environmental requirements but also requirements on
sustainability.
Relating to NH, in 2007 the environmental
policy has been endorsed by the Chairman and the
board of the Company as a strategic line to define the
―working principles‖ at NH Hotels:
1. To ensure that all activities satisfy current
environmental legislation, as well as our policy and
other environmentally friendly commitments acquired
by NH Hotels.
2. To set up a Waste Management Plan to minimise
waste production. To foster selective refuge collection
as well as the three R‘s rule (Reduce, Reuse and
Recycle).
3. To promote the conservation of natural resources
through reduction in consumption of water, energy
and gas using the best clean technologies possible.
4. To promote training, raising of awareness and
information with all NH Hotels staff.
5. To inform our clients of our environmental
undertakings and try to raise their awareness of what
we do so that they can provide valuable collaboration.
6. To periodically review the environmental policy
and its aims so that we can continually improve our
environmental conduct.
7. The Sustainable Construction Criteria on the basis
of which we build and remodel our hotels.
The certifications NH holds are: 4 hotels with
ISO 14001, 15 with Green Key certification, 3 hotels
with Single Environmental License in Mexico, and 17
hotels with Catalonia Environmental Licence.
2.3. Marketplace
The mission of the Sol Meliá Purchasing Department
is ―to apply supplier management criteria that meet
the needs of hotels and corporate offices in a balanced
and sustainable way‖. The following criteria, however,
are also taken into account:
• The geographical limits of the supplier
• Type of industry: manufacturer, importer, exporter,
distributor, installer and/or maintenance supplier
• Quality certification
• Environmental certification
• Health and safety certification
• Special Employment Centre certification
• Economic conditions
During the registration process, suppliers must
fill in a form related to human rights. The department
is very strict in this respect and if any suppliers do not
respect human rights their contracts are cancelled
immediately.
NH corporate purchasing policy stems from the
premise of ensuring that the highest standards of
quality and service along with commercial ethics are
put into practice. With this aim the Purchasing
Department of NH Hotels lays down and updates the
standards and tries to ensure these are always above
the rest of the market. The standards are subject to
ongoing assessment to ensure compliance of the
following principles:
• Equal opportunities for all offers.
• Transparency and documentation of all contracts
awarded.
• Stability in our commercial dealings.
• Cordial and polite treatment, avoiding unnecessary
upsets, to improve the fluidity of our dealings.
• Promotion of responsible practices.
Corporate Ownership & Control / Volume 6, Issue 4, Summer 2009
44
Bearing in mind the relevant role of NH Hotels in
driving responsibility, in 2007 NH compiled a
Supplier Ethics Code which ensures that their
suppliers respect human rights, good labour practices,
environmental practices and the international
anticorruption fight.
2.4. Vision and values
The mission at Sol Meliá is ―to add value for all of
our stakeholders through hotel brands and residential
tourism positioned as reference points for responsible
tourism in their different market segments, satisfying
our guest experience needs and developing our human
capital‖.
Its vision is ―to be a leader and point of
reference for responsible tourism, employability
profitability, increasing the value of our brands and
using the hotel business to promote the growth of
associated businesses such as residential tourism or
the vacation club‖.
Values at Sol Meliá are the following:
• First generation values: For 52 years, Sol Meliá
based its development on solid corporate values such
as austerity, hard work, simplicity and ethics, leading
by
example, encouraging responsibility and constant
self-improvement as well as
delegation, personalised service, value for money and
control.
• Second generation values: The company today
maintaining this basic ―cultural‖ tradition, adds new
21st. century values to its philosophy and values such
as globalisation, diversity, equality and no
discrimination, conciliation of work and family life,
dialogue with shareholders, loyalty to the company,
proximity and, in particular, sustainability.
The full modernisation and consolidation of the
new Sol Meliá brand values will be tackled during the
course of the current Strategic Plan 2008-2010.
The regulation of corporate governance of Sol
Meliá is contained in Company Bylaws, in the
Regulations of the Board of Directors and in the Rules
on Internal Conduct in latter related to the stock
market, and to the Regulations of the Shareholders‘
Meeting. All of the mentioned documents are
available for shareholders and investors in company
headquarters and in at the website in the Corporate
Governance section.
The vision at NH Hotels can be summarised as
―offering hotel services that cater to the current and
future needs of our internal and external stakeholders
(employees, clients, shareholders, suppliers, etc.), the
communities in which we operate and future
generations, whilst always paying the utmost attention
to detail and providing efficient and sustainable
solutions‖.
This vision is reflected in the values that
characterise the culture of NH Hotels and the firm‘s
activities as a highly responsible Company:
• Reliability
• Business sense
• Enjoyment
• People focus
• Innovation
The Investor Relations Department adopts a
constantly proactive policy when communicating with
investors, and provides them with the Company‘s
quarterly results and any other relevant information
that may arise. To illustrate its commitment to
communicating transparently as part of our strategy of
responsibility with shareholders and investors, the
company elaborated a Corporate Governance Code in
2006, but in 2007 the firm decided to revise and
update it with a view to increasing its rigor and
raising its standards to meet the recommendations of
the Unified Code of Good Governance.
2.5. Workforce
In the opinion of Sol Meliá, one of the basic
requirements for guest satisfaction is the satisfaction
of their employees. For that reason, every year the
company applies a specific internal quality and
workplace programme and action plan to improve the
working environment of all workers. In this line,
every year, hotels conduct workplace surveys to
provide a global and objective vision of the state of
each of the dimensions of the company and areas for
improvement (teamwork, pride in belonging,
leadership, clarity, work conditions, recognition,
training and development, promotion expectations,
communications and self improvement). So these
surveys highlight, on the one hand, employee
requirements and expectations, and on the other hand,
the quality of the service provided by corporate
departments in terms of humanity, speed of the
response, ease of contact, capacity to find solutions
and flexibility.
The importance of human resources at Sol Meliá
is shown in the fact that one of the five firm key
strategic areas is Talent Management and
Empowerment. The different stages of talent
management, identification, recruitment, development
and promotion, allow the company to employ a highly
qualified human team and to improve service levels
on a daily basis, as service and staff skills are the
aspects most appreciated by guests in the external
quality audits carried out in hotels.
Employees at NH are one of the key players
when it comes to corporate responsibility. As is
quoted in the CSR Report, ―one of our priorities is to
increase their levels of motivation and satisfaction, as
it is through them that we manage to improve the
quality of our service and enhance the way we
manage our relationships with all other public
Corporate Ownership & Control / Volume 6, Issue 4, Summer 2009
45
stakeholders‖.
The Code of Conduct at NH seeks to integrate,
bringing the Company‘s inspiring principles to all
employees in their daily tasks, promoting
communication. Therefore, internal communication is
a priority in the relationship with employees and,
during 2007 the firm has reinforced its internal
channels of communication with the aim of spreading
corporate values and collecting employee initiatives.
At NH Hotels the Satisfaction Surveys of its
employees, which are carried out every two years, are
considered as a key tool to enable them to
communicate their level of involvement, motivation,
as well as make suggestions for improvements.
Moreover, these surveys also allow the company to
detect areas for improvement where it is necessary to
establish Action Plans to be implemented at each
hotel, Business Unit or corporate level with the
supervision of the Human Resources department.
3. Conclusions
The study illustrates that only the two top Spanish
hotel companies, Sol Meliá and NH, reported social
responsible activities through CSR Reports,
downloadable in PDF format, as a link in their web
sites. This differs from the study conducted by
Holcomb et al. (2007) where the ten US large hotel
companies reported CSR activities to some extent.
Nonetheless, in our case a clear commitment to CSR
issues is observed, above the hotels analysed by
Holcomb et al. (2007), given that environmental
category, vision, value statements and stated code of
ethics were not heavily reported in the reviewed
media by these authors.
In closing with other studies, this paper shows
how far the hospitality industry is from other
industries in relation to CSR coverage. However,
reporting efforts of CSR activities are progressive in
the analysed firms, as in the last two years they have
included separate CSR reports. In this sense, as web
sites are continuously evolving, it is expected that the
rest of companies could start to report CSR practices
in order to improve their image in a
consumer-orientated industry such as tourism.
References
1. Allison, R.E. (2004): ―Circles within a circle: The
conditions for the possibility of ethical business
institutions within a market system‖, Journal of
Business Ethics, 53(1-2): 17-28.
2. Amabile, T.M., Patterson, C., Mueller, J. , Wojcik, T,
Odomirok, P.W., Marsh, M., Kramer, S.J. (2001):
―Academy-practitioner collaboration in management
research: a case of cross-profession collaboration‖,
Academy of Management Journal, 44(2), 418-431.
3. Barnett, M.L. (2007): ―Stakeholders influence
capacity and the variability of financial returns to
corporate social responsibility‖, Academy of
Management Review, 33(3), 606-628.
4. Brammer, S, Pavelin, S. (2006): ―Corporate reputation
and social performance: the importance of fit‖, The
Journal of Management Studies, 43(3): 435-456.
5. Branco, C.M., Rodrigues,L.L. (2006): ―Corporate
responsibility and resource-based perspectivas‖,
Journal of Business Ethics, 69:111-132.
6. Eisengardt, K.M., Graebner, M.E. (2007): ―Theory
building from cases: opportunities and challenges‖,
Academy of Management Journal, 50(1): 25-32.
7. Esrock , S, Leichty, G. (1998): ―Social responsibility
and corporate web pages: self-presentation or
agenda-setting?, Public Relations Review, 24(3),
305-326.
8. Gan, A. (2006): ―The impact of public scrutiny on
corporate philanthropy‖, Journal of Business Ethics,
69 (3): 217-336.
9. Gibbert, M., Ruigrok, W., Wicki, B. (2008): ―What
passes as a rigorous case study?‖, Strategic
Management Journal, 29, 1465-1474.
10. Henderson, J.C. (2007): ―Corporate social
responsibility and tourism: hotel companies in Phuket,
Tahiland, after the Indian Ocean tsunami‖, Hospitality
Management, 26: 228-239.
11. Higgins-Desbiolles, F.(2006): ―More than an industry:
the forgotten power of tourism as a social force‖,
Tourism Management, 27: 1192-1208.
12. Holcomb, J., Upchurch, R., Okumus, F. (2007):
―Corporate social responsibility: what are top hotel
companies reporting?‖, International Journal of
Contemporary Hospitality Management, 19(6):
461-475.
13. Hopkins, M. (1999): The planetary bargain:
Corporate Social Responsibility comes of age.
Macmillan Press, London.
14. Jenkins, H., Yakovelva, N. (2005): ―Corporate social
responsibility in the mining industry: exploring trends
in social and environmental disclosure‖, Journal of
Cleaner Production, 14(3-4): 271-284.
15. Knox, S., Maklan, S. (2004): ―Corporate Social
Responsibility: Moving beyond investment towards
measuring outcomes, European Management Journal,
22: 508-516.
16. Lewis, S. (2003): ―Reputation and corporate
responsibility‖, Journal of Communication
Management, 7(4): 356-365.
17. Line, M., Hawley, H., Krut, R. (2002): ―The
development of global environmental and social
reporting‖, Corporate Environmental Strategy,
9(1):69-78.
18. Lloyd-Jones, G. (2003): ―Design and control issues in
qualitative case study research‖, International Journal
of Qualitative Methods, 2(2): 33-42.
19. Maxfield, S. (2008): ―Reconciling corporate
citizenship and competitive strategy: insights from
economic theory‖, Journal of Business Ethics, 80:
Corporate Ownership & Control / Volume 6, Issue 4, Summer 2009
46
367-377.
20. Maxwell, J.A. (1996): Qualitative research design: an
interactive approach”, Thousand Oaks, Sage.
21. McWilliams, A, Siegel, D. (2006): ―Corporate social
responsibility: strategic implications‖, Journal of
Management Studies, 43(1), 1-18.
22. Nicolau, J.L. (2008): ―Corporate Social Responsibility.
Worth-creating activities‖, Annals of Tourism
Research, 35(4): 990-1006.
23. Philip, R. (2003): ―Corporate social reporting‖,
Human Resource Planning, 26(3): 10-13.
24. Porter, M.E., Kramer, M.R. (2006): ―Strategy and
society: the link between competitive advantage and
corporate social responsibility‖, Harvard Business
Review, 84(12): 78-89.
25. Reinghardt, F.L.(1998): ―Environmental product
differentiation: implications for corporate strategy‖,
California Management Review, 40(4): 43-73.
26. Schmidheiny, S., Chase, R., DeSimone, L. (1997):
Signals of change: business progress towards
sustainable development. World Business Council for
Sustainable Development, Geneva.
27. Siggelkow, N. (2007): ―Persuasion with case studies‖,
Academy of Management Journal, 50(1): 20-24.
28. VanWynsberghe, R. Khan, S, (2007): ―Redefining
case study‖, International Journal of Qualitative
Methods, 6(2): 80-94.
29. Vogel, D.J. (2005): ―Is there a market for virtue?‖,
California Management Review, 47(4): 19-45.
30. Weick, K. (2007): ―The generative properties of
richness‖, Academy of Management Journal, 50(1):
14-19.
31. Yin, R.K. (1994): Case study research: design and
methods, Sage, London.
32. Zadeck, S. (2002): Third generation corporate
citizenship. www.accountability.org.uk.
Corporate Ownership & Control / Volume 6, Issue 4, Summer 2009
47
NEW ZEALAND CEO COMPENSATION FACTORS
Sam Hurst, Ed Vos*
Abstract This paper analyses a combination of factors to try and determine whether they explain CEO compensation, and in turn help determine what makes the board of directors more effective. Factors include busy boards, local or international board members, dependent and not independent board members, director’s pay and tenure variables. Of the new and old factors considered in this approach and using a sample size of 31 NZ firms over the 2006/2007 years, a correlation existed between firm size/firm performance and CEO compensation. Further distinctions in regards to busy boards showed no significant relationship to CEO compensation, differing from previous studies, and casting doubt on whether it matters how busy the board is. Also the locality of the board was not a determining factor in CEO compensation. Keywords: CEO, compensation, board of directors *Correspondence to: Ed Vos, Professor, Department of Finance, Waikato Management School, University of Waikato
Private Bag 3105, Hamilton, New Zealand
Email: [email protected]
Introduction
It is well documented that CEO compensation is
notably high and rarely significantly related to firm
performance or factors that it should be tied to
(Anderson, Cavanagh, Collins, and Pizzigati, 2007).
Some say that CEOs get paid too much (Moriaty,
2005). The trend is increasing, and one of the most
important reasons relate to the board of directors
(CEO pay: sky high gets even higher, 2005). It seems
no matter what laws are put in place, CEO
compensation continues to have an unrelenting
upward trend that seems destined to never end. More
recent studies have been conducted to do with a
variety of explanations and relations, including
managers being awarded in up markets but not for
penalised for bad runs in the market (Garvey &
Milbourn, 2006). Hartzell and Starks (2003) agree
with many other researchers that higher institutional
ownership has a degree of bearing towards impacting
and controlling a CEO‘s compensation. Many of these
studies are also based on the large firms in the US
market, whereas this study focuses on the unique
situation of New Zealand with many smaller firms
and a much smaller market in which to compete.
This paper sets out to try and examine the more
behavioural implications behind each board member
and to see more clearly if any of them relate to CEO
compensation and therefore impact on their
effectiveness. These factors include the relative
importance of whether a busier board is less
concerned with making accurate decisions in regards
to fair compensation. The findings in this paper
suggest that there is little difference between a busy
boards CEO pay package and a non busy board. Also
analysed is the locality of the board members, which
involves identifying whether the board members are
in fact local to the business and/or the country, and
this reveals no significant relationship, suggesting it
does not matter whether the directors are local or
foreign. Further examined is whether the CEO sits on
the board, the percentage of inside/outside directors,
the directors pay, the tenures on the CEO and board
members, firm performance and firm size, with the
last two being the only significant variables that help
determine the level of CEO compensation.
The next section conducts a literature review,
with sections three, four, and five covering the sample,
method, and results respectively.
2. Literature Review
The Board of Directors
The best place to analyse implications behind CEO
pay is to look at where and who makes the decisions.
The board of directors have come under increasing
scrutiny (CEO pay: sky high gets even higher, 2005)
for the level of pay CEO‘s are currently getting for
failing companies. This paper attempts to justify what
is a suitable board of directors set up in regards to the
following factors, all of which have had their own
relevant attention in the prior literature. With regards
with past research covering many elements, Cahan,
Chua and Nyamori (2005) analyse board structure
traits such as board size, whether the CEO is on the
Corporate Ownership & Control / Volume 6, Issue 4, Summer 2009
48
board, busy and independent directors. They find that
board structure is important even only when focusing
on CEO pay decisions. Ghosh and Sirmans (2004)
also find that board structure variables should be
included in a CEO package, as well as economic
factors. There is no doubt that board structures are
important and related to CEO compensation, and the
rest of the literature review is broken down into the
major specific factors to be analysed further.
Busy boards
The founding papers studying busy boards includes
Fama and Jensen (1983) and Fama (1980), who argue
that having a market for outside directors makes them
strive for maintaining a good reputation as monitoring
members of a board. Core, Holthausen, and Larcker,
(1999), along with Fich and Shivdasani (2006)
studied the effectiveness of the busy directors and
found that boards that had members who sat on 3 or
more boards on average were linked to weaker
corporate governance. Petra and Dorata (2008) also
discover that firms should restrict the amount of
boards their directors sit on in order to reduce CEO
compensation. This contrasts to Ferris, Jagannathan,
and Adam Pritchard (2003) who found no evidence
for limiting the amount of boards one person can sit
on. Currently there is no definitive method for
identifying correctly what a busy board is, so two
methods are followed in this paper to help see
whether the differing determinants contribute to
further significance. An important note also is the
level of compliance regulations required by a typical
NZ director. It is found that there are over 40 acts of
parliament that they need to recognise or at least be
aware of (Healy, 2002). So experience or busyness
could be a positive as well, with busy directors having
a greater awareness of the rules, or could possibly
know how to in fact bend them further than a less
busy director.
Locality of the board
Much of the previous research has failed to recognise
locality of the directors as an important factor due to
the more intensive research needed to obtain this
information. This can be analysed for New Zealand
companies as they go to great lengths to talk about
their directors and their histories in their annual
reports. A possible hypothesis of this factor is that the
more local the board, in terms of nationality and years
with the business, the more incentive they will have
for the business to succeed, and will therefore be
more in line with maximising shareholder wealth, not
CEO wealth. Contrary to this however, it could imply
that they will let the CEO do what they want as they
would be long-term friends and will not want to go
against their wishes. Therefore this is a justifiable
factor as it could potentially have a negative or a
positive relation in the context of CEO compensation,
and if a relation is found then there could be further
implications for current NZ business laws in which
some industries require three or more directors to be
of local residence (Air NZ, 2007).
Dependent/independent board
There has been much attention given to dependent
and independent boards over the years. The evidence
suggests that there is an inverse relation between CEO
compensation and the level of control the board of
directors has. That is, the less control a board has, the
higher the pay for the CEO. The value of independent
directors has long been stressed (Felton, Hudnut, Witt,
& Valda, 1995). Wright, Kroll, and Elenkov (2002)
found that having directors that are independent with
no ties to the business resulted in better board
effectiveness and improved firm performance. More
recently Petra (2005) finds that having independent
directors does appear to strengthen corporate boards.
Also Choi, Park, and Too (2007) find in Korea that
the effects of independent directors on firm
performance are strongly related. Contrary to these
findings however are Kumar and Sivaramakrishnan
(2008) who find that more independent boards
actually perform worse, which is attributed from their
monitoring efficiency decreasing as they improve the
incentive efficiency of executive compensation
contracts. These results indicate that the benefits of
having independent directors may somewhat be
construed. In terms of New Zealand NZX, at least one
third of directors must be independent of the firm
(Corporate Governance in New Zealand, n.d.).
Board Size, board composition, firm size and performance
Directly relating to NZ firms, Chin, Vos, and Casey
(2004) had a sample of 426 annual observations and
found board size and composition factors did not
relate to firm performance. Conversly Petra and
Dorata (2008) find that firms wishing to keep the
CEO‘s pay lower will opt for a board with nine or less
members on it. With regards to firm size, it has long
been considered the best explanatory variable in terms
of CEO compensation (Tosi et aL, 2000), (Lau & Vos,
2004).
Based on the literature review, these hypotheses
are created and will be tested further: the more local
the board, the greater impact (negative relation) it will
have on CEO compensation in regards to a more
justified amount. Agreeing with much of the literature,
there is predicted to be a negative relation between
independent directors and CEO compensation. That is,
the more independent directors there are, the lower
the level of CEO pay. A positive relation is predicted
Corporate Ownership & Control / Volume 6, Issue 4, Summer 2009
49
to be seen between CEO compensation and board
busyness, similar to Fich and Shivdasani (2006)
findings. A final test will show whether these
variables gain or lose explanatory power controlling
for size. Other predictions also considered are a
relationship between directors pay, CEO tenure,
director‘s tenure, firm size, and firm performance
with regards to CEO compensation.
3. Data
The data set contains the majority of the largest public
firms that are listed on the NZX stock exchange.
These were preferred in the study as it was more
likely they would have a more detailed description of
each board of director member, which is not
mandatory in their annual reports. Similar to Fich &
Shivdasani (2006), utility and financial companies are
ignored due to possible further regulations they have
on their board of directors. Companies were excluded
if the relevant details could not be found in their
proxy statements gathered from DATEX.
Performance and size criteria were retrieved from
Datastream and Thompson Financial respectively.
The total size of the data set is 31 companies over the
periods 2006-2007. Where the level of CEO pay
could not be found, it was assumed that the highest
paid employee was the CEO. Firms also must have
had the appropriate data across the two years. The
variables used are further explained in Table 1, which
shows the summary statistics. Where tenure data
could not be found, a Google search was done to
retrieve the information from news reports.
Methodology
In contrast to Fich & Shivdasani (2006) the relative
busyness of the board was determined by having 50%
or over of board members has 3 or more directorships.
Busy board (2) takes into account Fich & Shivdasanis
(2006) method of totalling the amount of directorships
then averaging this amount. This change in method
changes the average of total busy firms from 58% to
68%. In regards to the level of directorships, this
study also takes into consideration directors who are
CEO‘s, and committee members in other firms.
However, being on a committee is given less value
compared with directorships, and this was taken into
account when it came to extracting the data from the
annual reports.
In terms of locality, this was determined by the
description provided in the annual reports, where
most go into detail about their nationality and career
paths leading up to their respective positions. Each
board member was determined to be either a local of
the business and country, otherwise they were
considered of foreign descent. In assessing the
locality factor, the threshold for a board to be
determined local is 70%. 50% or more was not used
as there are contributing factors that require some
firms to have local board members, and also there was
a relative small amount of foreign directors in regards
to local directors. This percentage gives a greater
chance for the foreign board factor to be seen.
The return on assets was used as a proxy for firm
performance, and the market value of equity was used
for the company‘s size.
The first step is to provide descriptive statistics
on each variable considered, and these are shown in
Table 1. The total average pay for a CEO in this
sample was $919,050, with the lowest payout being
$105,980. Inside directors get paid on average
$20,464.88 more than independent directors. Outside
directors averaged out to be 61% of each board, with
the highest percentage of not independent directors at
71%. The average directors pay stands at $104,030,
which is relatively high, however this figure involves
the chairman, but never the CEO‘s pay unless directly
stated that they get directors fees. The average board
size in this sample is 6.8, with the maximum being 11
directors on one board. The total number of directors
analysed in this study is 211, which is a relatively
representative figure based on the limited size of New
Zealand and the public companies. Comparing with
Fich & Shivdasani (2006), New Zealand directors are
much busier; with US directors in their study only
21% of the boards are considered busy, compared
with 68% and 58% of boards in this sample being
busy.
The second step in this empirical analysis
involved a pair-wise regression which was estimated
between the 11 dependent variables to ascertain any
connections with one another. As table 2 indicates, a
negative correlation can be seen between the locality
of the directors and whether or not the CEO sits on
the board, showing that when the CEO is on the board
less of the directors are local. Also in regards to
locality, the director‘s tenure has a positive relation
indicating that boards are more likely to be local if the
majority of directors have not been rotated. The
larger firms are more likely to possess outside
directors, and have a higher firm performance.
Also of important note from Table 2 is the fact
that the number of directors is positively related to a
busy board, indicating that the larger boards have the
busiest directors. When the CEO sits on the board
there is a negative correlation with busy boards,
suggesting that boards are less busy when the CEO is
on the board. This can also be explained in that the
CEO‘s rarely have other responsibilities in terms of
directorships and committees. Also the directors last
on the board longer when the CEO is on the board,
indicative that perhaps CEO‘s have more power and
influence when they sit on the board. With regards to
outside directors, there is a positive relation with
director tenure and firm size, implying that outside
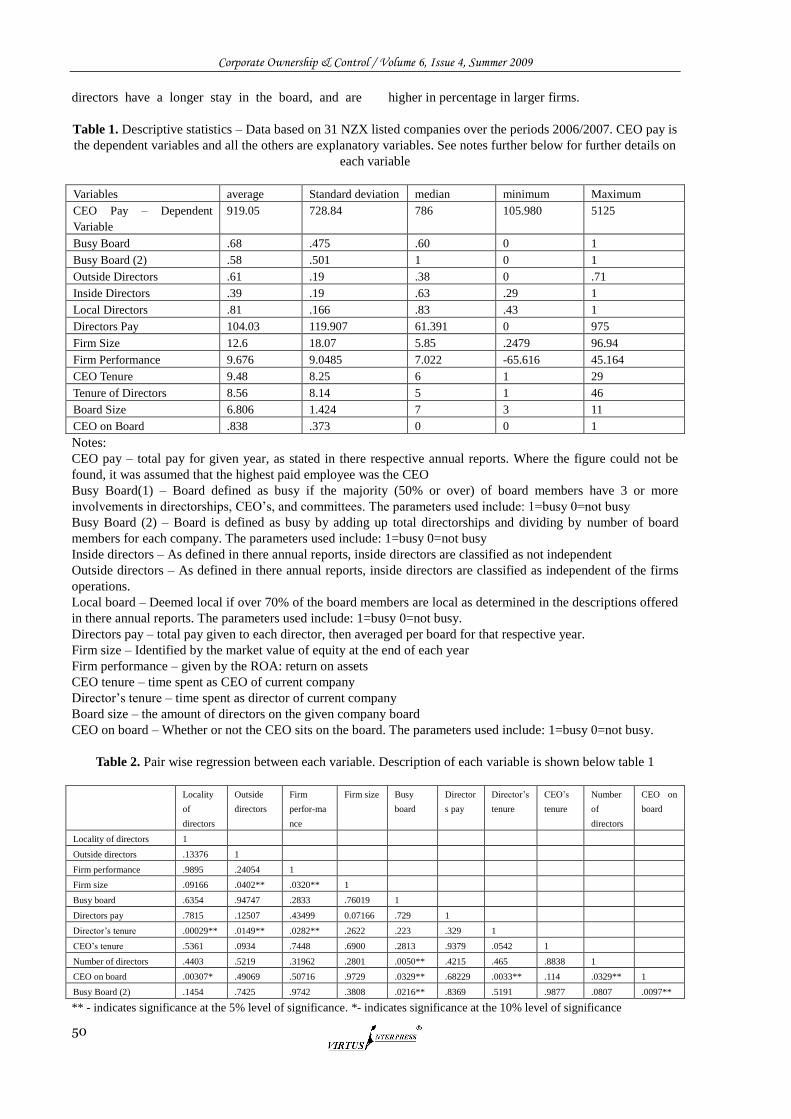
Corporate Ownership & Control / Volume 6, Issue 4, Summer 2009
50
directors have a longer stay in the board, and are higher in percentage in larger firms.
Table 1. Descriptive statistics – Data based on 31 NZX listed companies over the periods 2006/2007. CEO pay is
the dependent variables and all the others are explanatory variables. See notes further below for further details on
each variable
Variables average Standard deviation median minimum Maximum
CEO Pay – Dependent
Variable
919.05 728.84 786 105.980 5125
Busy Board .68 .475 .60 0 1
Busy Board (2) .58 .501 1 0 1
Outside Directors .61 .19 .38 0 .71
Inside Directors .39 .19 .63 .29 1
Local Directors .81 .166 .83 .43 1
Directors Pay 104.03 119.907 61.391 0 975
Firm Size 12.6 18.07 5.85 .2479 96.94
Firm Performance 9.676 9.0485 7.022 -65.616 45.164
CEO Tenure 9.48 8.25 6 1 29
Tenure of Directors 8.56 8.14 5 1 46
Board Size 6.806 1.424 7 3 11
CEO on Board .838 .373 0 0 1
Notes:
CEO pay – total pay for given year, as stated in there respective annual reports. Where the figure could not be
found, it was assumed that the highest paid employee was the CEO
Busy Board(1) – Board defined as busy if the majority (50% or over) of board members have 3 or more
involvements in directorships, CEO‘s, and committees. The parameters used include: 1=busy 0=not busy
Busy Board (2) – Board is defined as busy by adding up total directorships and dividing by number of board
members for each company. The parameters used include: 1=busy 0=not busy
Inside directors – As defined in there annual reports, inside directors are classified as not independent
Outside directors – As defined in there annual reports, inside directors are classified as independent of the firms
operations.
Local board – Deemed local if over 70% of the board members are local as determined in the descriptions offered
in there annual reports. The parameters used include: 1=busy 0=not busy.
Directors pay – total pay given to each director, then averaged per board for that respective year.
Firm size – Identified by the market value of equity at the end of each year
Firm performance – given by the ROA: return on assets
CEO tenure – time spent as CEO of current company
Director‘s tenure – time spent as director of current company
Board size – the amount of directors on the given company board
CEO on board – Whether or not the CEO sits on the board. The parameters used include: 1=busy 0=not busy.
Table 2. Pair wise regression between each variable. Description of each variable is shown below table 1
Locality
of
directors
Outside
directors
Firm
perfor-ma
nce
Firm size Busy
board
Director
s pay
Director‘s
tenure
CEO‘s
tenure
Number
of
directors
CEO on
board
Locality of directors 1
Outside directors .13376 1
Firm performance .9895 .24054 1
Firm size .09166 .0402** .0320** 1
Busy board .6354 .94747 .2833 .76019 1
Directors pay .7815 .12507 .43499 0.07166 .729 1
Director‘s tenure .00029** .0149** .0282** .2622 .223 .329 1
CEO‘s tenure .5361 .0934 .7448 .6900 .2813 .9379 .0542 1
Number of directors .4403 .5219 .31962 .2801 .0050** .4215 .465 .8838 1
CEO on board .00307* .49069 .50716 .9729 .0329** .68229 .0033** .114 .0329** 1
Busy Board (2) .1454 .7425 .9742 .3808 .0216** .8369 .5191 .9877 .0807 .0097**
** - indicates significance at the 5% level of significance. *- indicates significance at the 10% level of significance
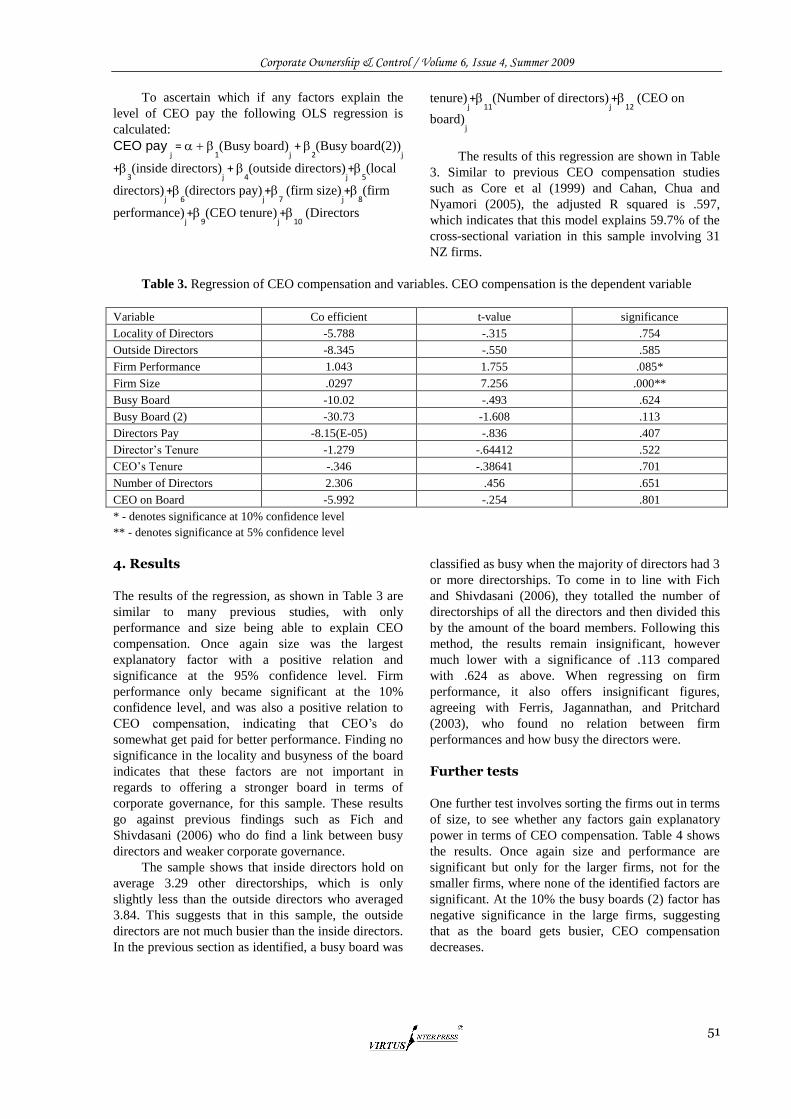
Corporate Ownership & Control / Volume 6, Issue 4, Summer 2009
51
To ascertain which if any factors explain the
level of CEO pay the following OLS regression is
calculated:
CEO pay j =
1(Busy board)
j +
2(Busy board(2))
j
+3(inside directors)
j +
4(outside directors)
j+
5(local
directors)j+
6(directors pay)
j+
7 (firm size)
j+
8(firm
performance)j+
9(CEO tenure)
j+
10 (Directors
tenure)j+
11(Number of directors)
j+
12 (CEO on
board)j
The results of this regression are shown in Table
3. Similar to previous CEO compensation studies
such as Core et al (1999) and Cahan, Chua and
Nyamori (2005), the adjusted R squared is .597,
which indicates that this model explains 59.7% of the
cross-sectional variation in this sample involving 31
NZ firms.
Table 3. Regression of CEO compensation and variables. CEO compensation is the dependent variable
Variable Co efficient t-value significance
Locality of Directors -5.788 -.315 .754
Outside Directors -8.345 -.550 .585
Firm Performance 1.043 1.755 .085*
Firm Size .0297 7.256 .000**
Busy Board -10.02 -.493 .624
Busy Board (2) -30.73 -1.608 .113
Directors Pay -8.15(E-05) -.836 .407
Director‘s Tenure -1.279 -.64412 .522
CEO‘s Tenure -.346 -.38641 .701
Number of Directors 2.306 .456 .651
CEO on Board -5.992 -.254 .801
* - denotes significance at 10% confidence level
** - denotes significance at 5% confidence level
4. Results
The results of the regression, as shown in Table 3 are
similar to many previous studies, with only
performance and size being able to explain CEO
compensation. Once again size was the largest
explanatory factor with a positive relation and
significance at the 95% confidence level. Firm
performance only became significant at the 10%
confidence level, and was also a positive relation to
CEO compensation, indicating that CEO‘s do
somewhat get paid for better performance. Finding no
significance in the locality and busyness of the board
indicates that these factors are not important in
regards to offering a stronger board in terms of
corporate governance, for this sample. These results
go against previous findings such as Fich and
Shivdasani (2006) who do find a link between busy
directors and weaker corporate governance.
The sample shows that inside directors hold on
average 3.29 other directorships, which is only
slightly less than the outside directors who averaged
3.84. This suggests that in this sample, the outside
directors are not much busier than the inside directors.
In the previous section as identified, a busy board was
classified as busy when the majority of directors had 3
or more directorships. To come in to line with Fich
and Shivdasani (2006), they totalled the number of
directorships of all the directors and then divided this
by the amount of the board members. Following this
method, the results remain insignificant, however
much lower with a significance of .113 compared
with .624 as above. When regressing on firm
performance, it also offers insignificant figures,
agreeing with Ferris, Jagannathan, and Pritchard
(2003), who found no relation between firm
performances and how busy the directors were.
Further tests
One further test involves sorting the firms out in terms
of size, to see whether any factors gain explanatory
power in terms of CEO compensation. Table 4 shows
the results. Once again size and performance are
significant but only for the larger firms, not for the
smaller firms, where none of the identified factors are
significant. At the 10% the busy boards (2) factor has
negative significance in the large firms, suggesting
that as the board gets busier, CEO compensation
decreases.
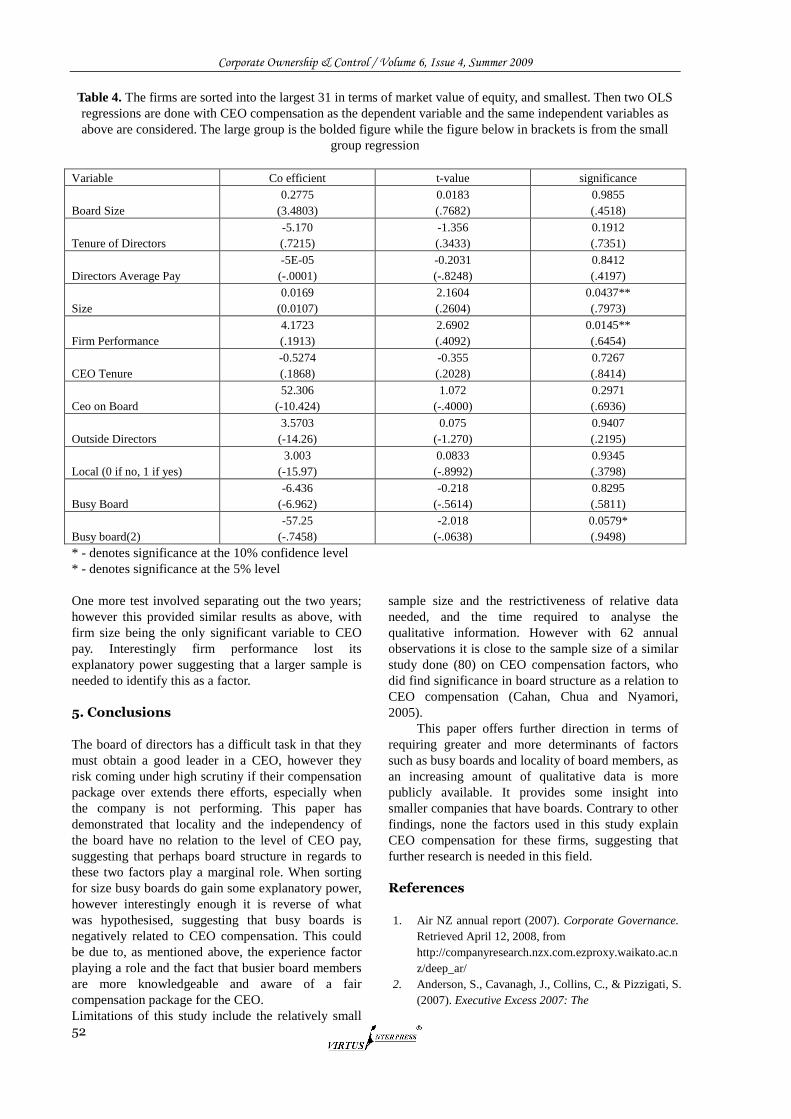
Corporate Ownership & Control / Volume 6, Issue 4, Summer 2009
52
Table 4. The firms are sorted into the largest 31 in terms of market value of equity, and smallest. Then two OLS
regressions are done with CEO compensation as the dependent variable and the same independent variables as
above are considered. The large group is the bolded figure while the figure below in brackets is from the small
group regression
Variable Co efficient t-value significance
Board Size
0.2775
(3.4803)
0.0183
(.7682)
0.9855
(.4518)
Tenure of Directors
-5.170
(.7215)
-1.356
(.3433)
0.1912
(.7351)
Directors Average Pay
-5E-05
(-.0001)
-0.2031
(-.8248)
0.8412
(.4197)
Size
0.0169
(0.0107)
2.1604
(.2604)
0.0437**
(.7973)
Firm Performance
4.1723
(.1913)
2.6902
(.4092)
0.0145**
(.6454)
CEO Tenure
-0.5274
(.1868)
-0.355
(.2028)
0.7267
(.8414)
Ceo on Board
52.306
(-10.424)
1.072
(-.4000)
0.2971
(.6936)
Outside Directors
3.5703
(-14.26)
0.075
(-1.270)
0.9407
(.2195)
Local (0 if no, 1 if yes)
3.003
(-15.97)
0.0833
(-.8992)
0.9345
(.3798)
Busy Board
-6.436
(-6.962)
-0.218
(-.5614)
0.8295
(.5811)
Busy board(2)
-57.25
(-.7458)
-2.018
(-.0638)
0.0579*
(.9498)
* - denotes significance at the 10% confidence level
* - denotes significance at the 5% level
One more test involved separating out the two years;
however this provided similar results as above, with
firm size being the only significant variable to CEO
pay. Interestingly firm performance lost its
explanatory power suggesting that a larger sample is
needed to identify this as a factor.
5. Conclusions
The board of directors has a difficult task in that they
must obtain a good leader in a CEO, however they
risk coming under high scrutiny if their compensation
package over extends there efforts, especially when
the company is not performing. This paper has
demonstrated that locality and the independency of
the board have no relation to the level of CEO pay,
suggesting that perhaps board structure in regards to
these two factors play a marginal role. When sorting
for size busy boards do gain some explanatory power,
however interestingly enough it is reverse of what
was hypothesised, suggesting that busy boards is
negatively related to CEO compensation. This could
be due to, as mentioned above, the experience factor
playing a role and the fact that busier board members
are more knowledgeable and aware of a fair
compensation package for the CEO.
Limitations of this study include the relatively small
sample size and the restrictiveness of relative data
needed, and the time required to analyse the
qualitative information. However with 62 annual
observations it is close to the sample size of a similar
study done (80) on CEO compensation factors, who
did find significance in board structure as a relation to
CEO compensation (Cahan, Chua and Nyamori,
2005).
This paper offers further direction in terms of
requiring greater and more determinants of factors
such as busy boards and locality of board members, as
an increasing amount of qualitative data is more
publicly available. It provides some insight into
smaller companies that have boards. Contrary to other
findings, none the factors used in this study explain
CEO compensation for these firms, suggesting that
further research is needed in this field.
References
1. Air NZ annual report (2007). Corporate Governance.
Retrieved April 12, 2008, from
http://companyresearch.nzx.com.ezproxy.waikato.ac.n
z/deep_ar/
2. Anderson, S., Cavanagh, J., Collins, C., & Pizzigati, S.
(2007). Executive Excess 2007: The
Corporate Ownership & Control / Volume 6, Issue 4, Summer 2009
53
3. staggering social cost of US business leadership. 14th
Annual CEO Compensation Survey. Retrieved May 1,
2008, from
http://www.ips-dc.org/reports/070829-executiveexces
s.pdf
4. Brick, I.E., Palmon, O., & Wald, J.K (2002). CEO
compensation, director compensation, and
5. Firm performance: Evidence of cronyism. SSRN
Working Paper Series. Retrieved May 13, 2008, from
http://proquest.umi.com/pqdweb?did=1450919781&si
d=1&Fmt=2&clientId=8119&RQT=309&VName=P
QD
6. Cahan, S.F., Chua, F., & Nyamori, R.O. (2005).
Board structure and executive compensation In the
public sector: New Zealand evidence. Financial
Accountability & Management, 21(4), pp.437-465.
7. Choi, J.J., Park, S.W., & Too, S.S (2007). The value
of outside directors: evidence from corporate
governance reform in Korea. Journal of Financial and
Quantitative Analysis, 42(4), p.941.
8. CNN Money. (2005). CEO pay: Sky high gets even
higher. Retrieved May 12, 2008, from
http://money.cnn.com/2005/08/26/news/economy/ceo
_pay/
9. Core, J., Holthausen R., & Larcker, D. (1999).
Corporate governance, chief executive officer
compensation, and firm performance. Journal of
Financial Economics, 51, pp. 371-406.
10. Fama, E. (1980). Agency problems and the theory of
the firm. Journal of Political Economy, 88,
pp.288-307.
11. Fama, E, & Jensen, M. (1983). The separation of
ownership and control. Journal of Law and
Economics, 26, 301-325.
12. Felton, R.F., Hudnut, A., & Witt, V. (1995). Building
a stronger board. The Mckinsey
Quarterly, pp.162-176.
13. Ferris, S., Jagannathan, M., & Pritchard, A. (2003).
Too busy to mind the business? Monitoring by
directors with multiple board appointments. Journal
of Finance, 58, 1087-1111.
14. Fich, E.M., & Shivdasani, A. (2006). Are busy boards
effective monitors? The Journal of Finance, 61(2), p.
689.
15. Garvey, G.T., & Milbourn, T.T. (2006). Asymmetric
benchmarking in compensation: Executives are
rewarded for good luck but not penalised for bad.
Journal of Financial Economics, 82(1), p. 197.
16. Ghosh, C., & Sirmans, C.F. (2005). On REIT
compensation: does board structure matter?
Journal of Real Estate Finance and Economics, 30(4),
pp.397-428.
17. Hartzell, J.C., & Starks, L.T. (2003). Institutional
investors and executive compensation. Journal of
Finance, 58(6), pp. 2351-2374.
18. Healy, J. (2002). Shareholder value: is there a
corporate governance crisis in New Zealand?
Amcham. Retrieved April 25, 2008, from
www.amcham.co.nz/Presentations/HealySpeech.doc
19. Hermalin, B.E., & Weisbach, M.S. (1998).
Endogenously chosen boards of directors and
Their monitoring of the CEO. American Economic
Review, 88, pp. 96-118.
20. Lau A., & Vos, E. (2004). Relation between CEO
compensation, firm size and firm performance. New
Zealand Journal of Applied Business Research, 3(1),
pp. 51-64.
21. Moriaty, J. (2005). Do CEO‘s get paid too much?
Business Ethics Quarterly, 15(2), p.257.
22. Petra, S.T. (2005). Do outside independent directors
strengthen corporate boards? Corporate Governance,
5(1), 55-65.
23. Petra, S.T., & Dorata, N.T. (2008). Coporate
governance and chief executive officer
Compensation. Corporate Governance, 8(2), p.141.
24. Praveen, K., & Sivaramakrishnan, K. (2008). Who
monitors the monitor? The effect of board
Independence on executive compensation and firm
value. The Review of Financial Studies, 21(3),
pp.1371-1402.
25. Securities Commission New Zealand, (n.d.).
Corporate governance in New Zealand: Consultation
on issues and principles. Retrieved April 17, 2008,
from
http://www.seccom.govt.nz/publications/documents/c
orporate-governance/doco.shtml#6
26. Wright, P., Kroll, M., & Elenkov, D. (2002).
Acquisition returns, increase in firm size, and
Chief executive officer compensation: the moderating
role of monitoring. Academy of Management Journal,
45(3), p.599.
Corporate Ownership & Control / Volume 6, Issue 4, Summer 2009
54
OWNERSHIP AND CONTROL IN GERMANY: DO CROSS-SHAREHOLDINGS REFLECT BANK CONTROL ON LARGE
COMPANIES?
Alberto Onetti*, Alessia Pisoni**
Abstract This paper aims to analyse the relationships (equity and non-equity) between German banks and German firms, which are the peculiarities of the German institutional system of corporate governance. Scholars agree on the fact that cross shareholdings among banks, insurance companies and institutional firms (Charkham 1994, Baums 1993), combined with long term shareholdings (Gerschenkron 1989), and close relationships and interlocking between board members of different companies (Tilly 1969, Hopt and Prigge 1998), are the main features of bank-firms relationships in Germany. Specifically the main purpose of the paper is to demonstrate, for the panel of German companies investigated, that bank-firm relationship relies not only on patrimonial linkages but also on personal relationships. In the light of the sweeping changes that this model has undergone since the late 1990s, an empirical study has been carried out regarding relationships (patrimonial and personal) among the first 100 German companies with the highest turnover and the 6 main German financial institutions, showing the evolving trend along a period of 8 years and comparing the collected data with previous research. Therefore, in order to try to measure the extent of the banks role in Corporate Governance and to evaluate in a deeper sense the effective influence they have on the industry management, we carried out two different analyses. The first, takes into consideration the equity relationships between banks/insurances and the German industrial firms, the second analyses the number of seats held by the same banks in the correspondent supervisory board. In particular, in our opinion, the analysis of the composition of the supervisory boards can help to outline the personal relationships above mentioned. Therefore is understood, that we consider the presence of bank’s representatives in others than banks’ supervisory boards as signal of banks’ opportunity to exert power and influence. Keywords: corporate governance, interlocking, cross-shareholdings () Associate Professor of Strategic Management – Faculty of Economics – Insubria University – Via Monte Generoso 71 – 21100 Varese – Italy. e-mail: [email protected] () Lecturer – Faculty of Economics – Insubria University – Via Monte Generoso 71 – 21100 Varese – Italy. e-mail:
1. The German “financial capitalism”: traditional features and evolving trends
The system of relationships between banks and
companies is traditionally considered as one of the
main success factors of German industrialisation and
the distinguishing aspects of the national capitalism
model (Gerschenkron 1968). The Hilferding‘s
expression ―financial capitalism‖ is still used to
characterize a national system where banks play a
central role in dealing with industrial companies. The
specificity of the German model derives from a
combination of different factors as described below.
1) Universal banks. The German law, contrary
to other systems based on a pure banking model,
allows banks to hold relevant equity shares in
industrial companies (Großl 1989). Holding equity
shares enables banks to influence the management
board and therefore the company‘s decisions. The
greater the equity share is, the stronger the influence
the bank may exert (Porter 1992, defines this situation
as ―shareholder direction‖). Although, according to
the German law there are long-term banking
institutions62
, the universal banks are the most
common. At the end of 2005, universal banks made
up 80% of the total number of financial institutions
and accounted for 79% of total banking revenues
(Table 1).
62 Among these specialist banks there are mortgage banks
(Hypothekenbank) and building and loan associations
(Bausparkassen) (Banfi, Locatelli, Schena 1991).
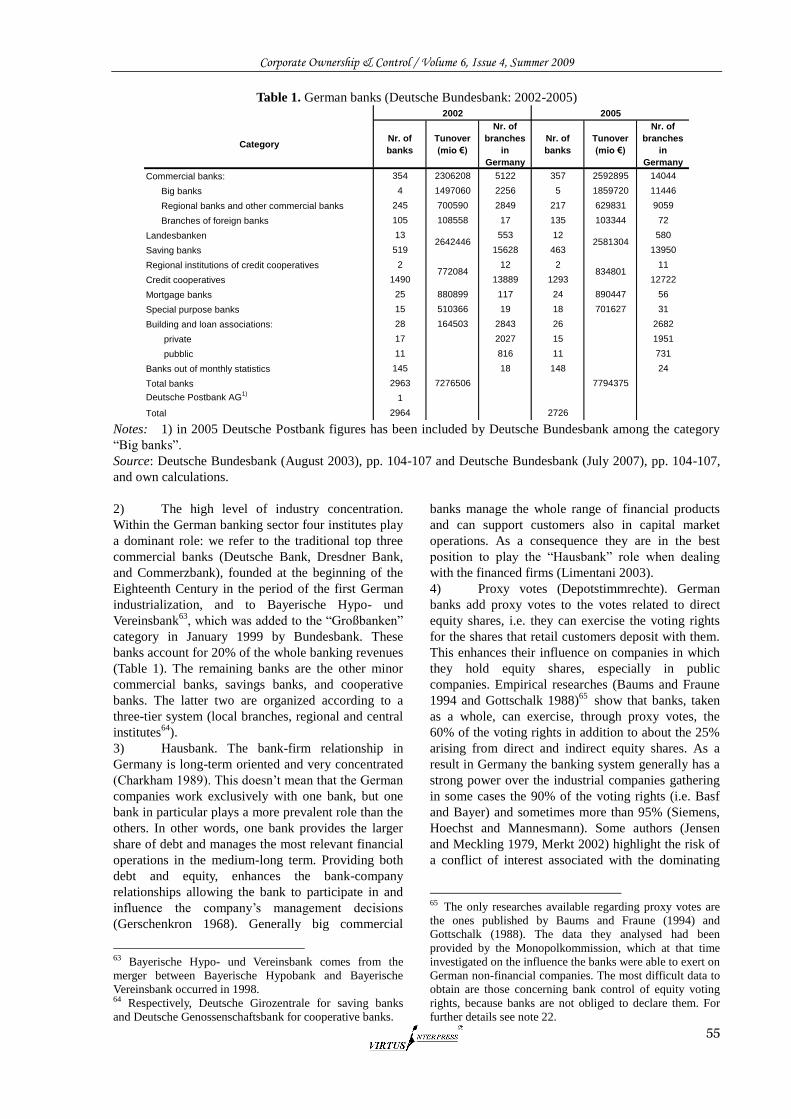
Corporate Ownership & Control / Volume 6, Issue 4, Summer 2009
55
Table 1. German banks (Deutsche Bundesbank: 2002-2005)
CategoryNr. of
banks
Tunover
(mio €)
Nr. of
branches
in
Germany
Nr. of
banks
Tunover
(mio €)
Nr. of
branches
in
Germany
Commercial banks: 354 2306208 5122 357 2592895 14044
Big banks 4 1497060 2256 5 1859720 11446
Regional banks and other commercial banks 245 700590 2849 217 629831 9059
Branches of foreign banks 105 108558 17 135 103344 72
Landesbanken 13 553 12 580
Saving banks 519 15628 463 13950
Regional institutions of credit cooperatives 2 12 2 11
Credit cooperatives 1490 13889 1293 12722
Mortgage banks 25 880899 117 24 890447 56
Special purpose banks 15 510366 19 18 701627 31
Building and loan associations: 28 164503 2843 26 2682
private 17 2027 15 1951
pubblic 11 816 11 731
Banks out of monthly statistics 145 18 148 24
Total banks 2963 7276506 7794375
Deutsche Postbank AG1)
1
Total 2964 2726
2005
2581304
834801
2002
2642446
772084
Notes: 1) in 2005 Deutsche Postbank figures has been included by Deutsche Bundesbank among the category
―Big banks‖.
Source: Deutsche Bundesbank (August 2003), pp. 104-107 and Deutsche Bundesbank (July 2007), pp. 104-107,
and own calculations.
2) The high level of industry concentration.
Within the German banking sector four institutes play
a dominant role: we refer to the traditional top three
commercial banks (Deutsche Bank, Dresdner Bank,
and Commerzbank), founded at the beginning of the
Eighteenth Century in the period of the first German
industrialization, and to Bayerische Hypo- und
Vereinsbank63
, which was added to the ―Großbanken‖
category in January 1999 by Bundesbank. These
banks account for 20% of the whole banking revenues
(Table 1). The remaining banks are the other minor
commercial banks, savings banks, and cooperative
banks. The latter two are organized according to a
three-tier system (local branches, regional and central
institutes64
).
3) Hausbank. The bank-firm relationship in
Germany is long-term oriented and very concentrated
(Charkham 1989). This doesn‘t mean that the German
companies work exclusively with one bank, but one
bank in particular plays a more prevalent role than the
others. In other words, one bank provides the larger
share of debt and manages the most relevant financial
operations in the medium-long term. Providing both
debt and equity, enhances the bank-company
relationships allowing the bank to participate in and
influence the company‘s management decisions
(Gerschenkron 1968). Generally big commercial
63 Bayerische Hypo- und Vereinsbank comes from the
merger between Bayerische Hypobank and Bayerische
Vereinsbank occurred in 1998. 64 Respectively, Deutsche Girozentrale for saving banks
and Deutsche Genossenschaftsbank for cooperative banks.
banks manage the whole range of financial products
and can support customers also in capital market
operations. As a consequence they are in the best
position to play the ―Hausbank‖ role when dealing
with the financed firms (Limentani 2003).
4) Proxy votes (Depotstimmrechte). German
banks add proxy votes to the votes related to direct
equity shares, i.e. they can exercise the voting rights
for the shares that retail customers deposit with them.
This enhances their influence on companies in which
they hold equity shares, especially in public
companies. Empirical researches (Baums and Fraune
1994 and Gottschalk 1988)65
show that banks, taken
as a whole, can exercise, through proxy votes, the
60% of the voting rights in addition to about the 25%
arising from direct and indirect equity shares. As a
result in Germany the banking system generally has a
strong power over the industrial companies gathering
in some cases the 90% of the voting rights (i.e. Basf
and Bayer) and sometimes more than 95% (Siemens,
Hoechst and Mannesmann). Some authors (Jensen
and Meckling 1979, Merkt 2002) highlight the risk of
a conflict of interest associated with the dominating
65 The only researches available regarding proxy votes are
the ones published by Baums and Fraune (1994) and
Gottschalk (1988). The data they analysed had been
provided by the Monopolkommission, which at that time
investigated on the influence the banks were able to exert on
German non-financial companies. The most difficult data to
obtain are those concerning bank control of equity voting
rights, because banks are not obliged to declare them. For
further details see note 22.
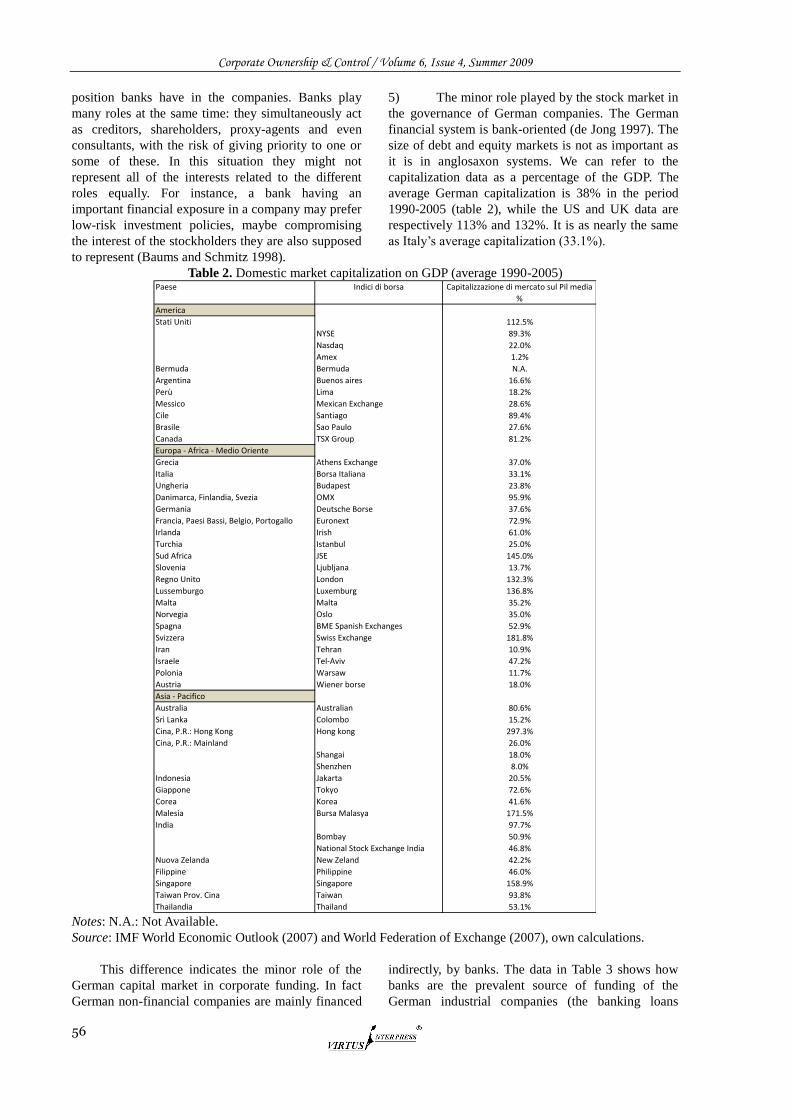
Corporate Ownership & Control / Volume 6, Issue 4, Summer 2009
56
position banks have in the companies. Banks play
many roles at the same time: they simultaneously act
as creditors, shareholders, proxy-agents and even
consultants, with the risk of giving priority to one or
some of these. In this situation they might not
represent all of the interests related to the different
roles equally. For instance, a bank having an
important financial exposure in a company may prefer
low-risk investment policies, maybe compromising
the interest of the stockholders they are also supposed
to represent (Baums and Schmitz 1998).
5) The minor role played by the stock market in
the governance of German companies. The German
financial system is bank-oriented (de Jong 1997). The
size of debt and equity markets is not as important as
it is in anglosaxon systems. We can refer to the
capitalization data as a percentage of the GDP. The
average German capitalization is 38% in the period
1990-2005 (table 2), while the US and UK data are
respectively 113% and 132%. It is as nearly the same
as Italy‘s average capitalization (33.1%).
Table 2. Domestic market capitalization on GDP (average 1990-2005) Paese Indici di borsa Capitalizzazione di mercato sul Pil media
%
America
Stati Uniti 112.5%
NYSE 89.3%
Nasdaq 22.0%
Amex 1.2%
Bermuda Bermuda N.A.
Argentina Buenos aires 16.6%
Perù Lima 18.2%
Messico Mexican Exchange 28.6%
Cile Santiago 89.4%
Brasile Sao Paulo 27.6%
Canada TSX Group 81.2%
Europa - Africa - Medio Oriente
Grecia Athens Exchange 37.0%
Italia Borsa Italiana 33.1%
Ungheria Budapest 23.8%
Danimarca, Finlandia, Svezia OMX 95.9%
Germania Deutsche Borse 37.6%
Francia, Paesi Bassi, Belgio, Portogallo Euronext 72.9%
Irlanda Irish 61.0%
Turchia Istanbul 25.0%
Sud Africa JSE 145.0%
Slovenia Ljubljana 13.7%
Regno Unito London 132.3%
Lussemburgo Luxemburg 136.8%
Malta Malta 35.2%
Norvegia Oslo 35.0%
Spagna BME Spanish Exchanges 52.9%
Svizzera Swiss Exchange 181.8%
Iran Tehran 10.9%
Israele Tel-Aviv 47.2%
Polonia Warsaw 11.7%
Austria Wiener borse 18.0%
Asia - Pacifico
Australia Australian 80.6%
Sri Lanka Colombo 15.2%
Cina, P.R.: Hong Kong Hong kong 297.3%
Cina, P.R.: Mainland 26.0%
Shangai 18.0%
Shenzhen 8.0%
Indonesia Jakarta 20.5%
Giappone Tokyo 72.6%
Corea Korea 41.6%
Malesia Bursa Malasya 171.5%
India 97.7%
Bombay 50.9%
National Stock Exchange India 46.8%
Nuova Zelanda New Zeland 42.2%
Filippine Philippine 46.0%
Singapore Singapore 158.9%
Taiwan Prov. Cina Taiwan 93.8%
Thailandia Thailand 53.1% Notes: N.A.: Not Available.
Source: IMF World Economic Outlook (2007) and World Federation of Exchange (2007), own calculations.
This difference indicates the minor role of the
German capital market in corporate funding. In fact
German non-financial companies are mainly financed
indirectly, by banks. The data in Table 3 shows how
banks are the prevalent source of funding of the
German industrial companies (the banking loans
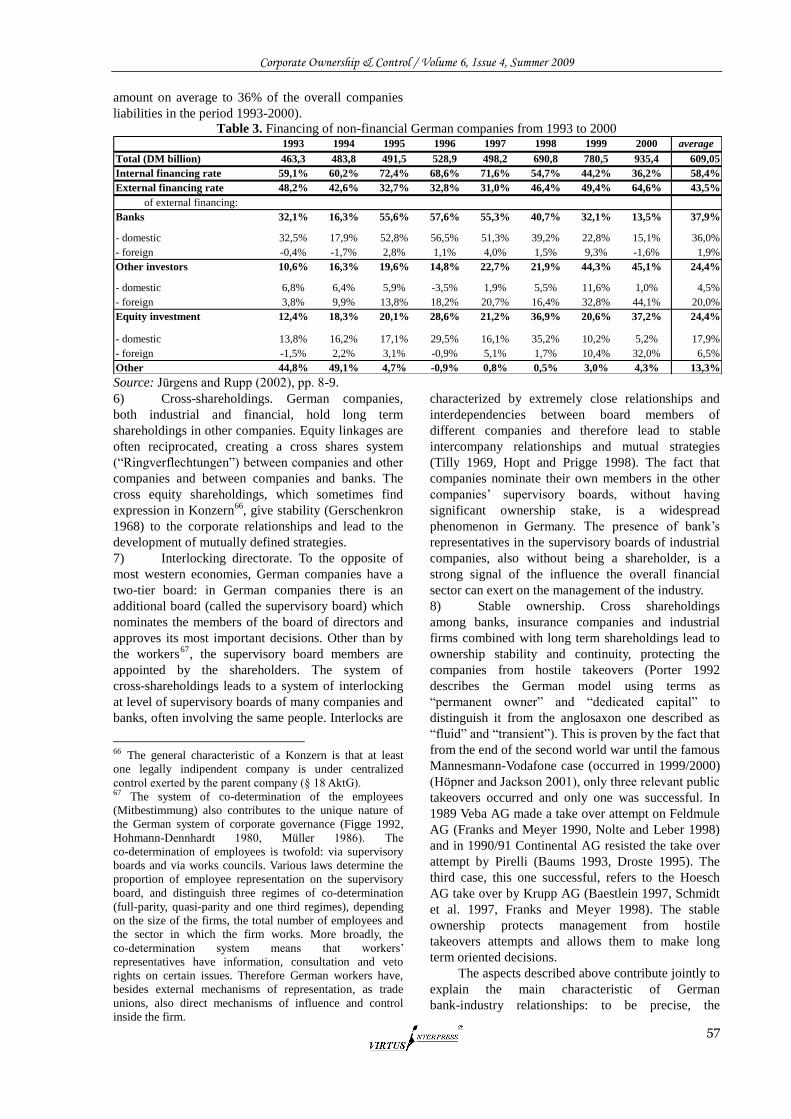
Corporate Ownership & Control / Volume 6, Issue 4, Summer 2009
57
amount on average to 36% of the overall companies
liabilities in the period 1993-2000).
Table 3. Financing of non-financial German companies from 1993 to 2000 1993 1994 1995 1996 1997 1998 1999 2000 average
Total (DM billion) 463,3 483,8 491,5 528,9 498,2 690,8 780,5 935,4 609,05
Internal financing rate 59,1% 60,2% 72,4% 68,6% 71,6% 54,7% 44,2% 36,2% 58,4%
External financing rate 48,2% 42,6% 32,7% 32,8% 31,0% 46,4% 49,4% 64,6% 43,5%
of external financing:
Banks 32,1% 16,3% 55,6% 57,6% 55,3% 40,7% 32,1% 13,5% 37,9%
- domestic 32,5% 17,9% 52,8% 56,5% 51,3% 39,2% 22,8% 15,1% 36,0%
- foreign -0,4% -1,7% 2,8% 1,1% 4,0% 1,5% 9,3% -1,6% 1,9%
Other investors 10,6% 16,3% 19,6% 14,8% 22,7% 21,9% 44,3% 45,1% 24,4%
- domestic 6,8% 6,4% 5,9% -3,5% 1,9% 5,5% 11,6% 1,0% 4,5%
- foreign 3,8% 9,9% 13,8% 18,2% 20,7% 16,4% 32,8% 44,1% 20,0%
Equity investment 12,4% 18,3% 20,1% 28,6% 21,2% 36,9% 20,6% 37,2% 24,4%
- domestic 13,8% 16,2% 17,1% 29,5% 16,1% 35,2% 10,2% 5,2% 17,9%
- foreign -1,5% 2,2% 3,1% -0,9% 5,1% 1,7% 10,4% 32,0% 6,5%
Other 44,8% 49,1% 4,7% -0,9% 0,8% 0,5% 3,0% 4,3% 13,3% Source: Jürgens and Rupp (2002), pp. 8-9.
6) Cross-shareholdings. German companies,
both industrial and financial, hold long term
shareholdings in other companies. Equity linkages are
often reciprocated, creating a cross shares system
(―Ringverflechtungen‖) between companies and other
companies and between companies and banks. The
cross equity shareholdings, which sometimes find
expression in Konzern66
, give stability (Gerschenkron
1968) to the corporate relationships and lead to the
development of mutually defined strategies.
7) Interlocking directorate. To the opposite of
most western economies, German companies have a
two-tier board: in German companies there is an
additional board (called the supervisory board) which
nominates the members of the board of directors and
approves its most important decisions. Other than by
the workers67
, the supervisory board members are
appointed by the shareholders. The system of
cross-shareholdings leads to a system of interlocking
at level of supervisory boards of many companies and
banks, often involving the same people. Interlocks are
66 The general characteristic of a Konzern is that at least
one legally indipendent company is under centralized
control exerted by the parent company (§ 18 AktG). 67 The system of co-determination of the employees
(Mitbestimmung) also contributes to the unique nature of
the German system of corporate governance (Figge 1992,
Hohmann-Dennhardt 1980, Müller 1986). The
co-determination of employees is twofold: via supervisory
boards and via works councils. Various laws determine the
proportion of employee representation on the supervisory
board, and distinguish three regimes of co-determination
(full-parity, quasi-parity and one third regimes), depending
on the size of the firms, the total number of employees and
the sector in which the firm works. More broadly, the
co-determination system means that workers‘
representatives have information, consultation and veto
rights on certain issues. Therefore German workers have,
besides external mechanisms of representation, as trade
unions, also direct mechanisms of influence and control
inside the firm.
characterized by extremely close relationships and
interdependencies between board members of
different companies and therefore lead to stable
intercompany relationships and mutual strategies
(Tilly 1969, Hopt and Prigge 1998). The fact that
companies nominate their own members in the other
companies‘ supervisory boards, without having
significant ownership stake, is a widespread
phenomenon in Germany. The presence of bank‘s
representatives in the supervisory boards of industrial
companies, also without being a shareholder, is a
strong signal of the influence the overall financial
sector can exert on the management of the industry.
8) Stable ownership. Cross shareholdings
among banks, insurance companies and industrial
firms combined with long term shareholdings lead to
ownership stability and continuity, protecting the
companies from hostile takeovers (Porter 1992
describes the German model using terms as
―permanent owner‖ and ―dedicated capital‖ to
distinguish it from the anglosaxon one described as
―fluid‖ and ―transient‖). This is proven by the fact that
from the end of the second world war until the famous
Mannesmann-Vodafone case (occurred in 1999/2000)
(Höpner and Jackson 2001), only three relevant public
takeovers occurred and only one was successful. In
1989 Veba AG made a take over attempt on Feldmule
AG (Franks and Meyer 1990, Nolte and Leber 1998)
and in 1990/91 Continental AG resisted the take over
attempt by Pirelli (Baums 1993, Droste 1995). The
third case, this one successful, refers to the Hoesch
AG take over by Krupp AG (Baestlein 1997, Schmidt
et al. 1997, Franks and Meyer 1998). The stable
ownership protects management from hostile
takeovers attempts and allows them to make long
term oriented decisions.
The aspects described above contribute jointly to
explain the main characteristic of German
bank-industry relationships: to be precise, the
Corporate Ownership & Control / Volume 6, Issue 4, Summer 2009
58
presence of strong and stable ties among companies
(both financial and industrial) which leads to widely
shared strategies.
This aspect has been discussed by many authors
and defined in different ways. To mention a few,
Porter (1992) refers to a ―relation oriented‖ model,
indicating how investment decisions are long term
oriented and not only aimed at capital gain. Shonfield
(1965) uses the term ―collective management‖ in
order to highlight the widespread agreements among
companies often leading to cartels creation. Albert
(1991) with the term ―dialogue sociale‖ describes the
widespread practice in German society in looking for
consent involving all the stakeholders in decision
making.
In our opinion the specific feature of bank-firm
relationships depends on the characteristics of the
German institutional system of governance68
. Taking
mutual decisions as well as looking for broad consent
characterize not only bank-firm relationships, but also
the whole German system, at all levels and for both
private companies and public offices. In our opinion
the widespread use of this modus operandi can be
explained only referring to institutional variables.
Business behaviour is embedded in the institutional
model and becomes routine (de Jong 1997, Guatri and
Vicari 1994, Kirat and Lung 1999, Porter and Sölvell
1999, Warglien 1997). The German institutional and
constitutional framework (and in particular
subsidiarity) plays a key role in this process of
―contextualization‖69
(Onetti 2001).
At the moment the German system is quickly
evolving as a consequence of a variety of factors. In
the following points, without aiming to cover all the
sweeping changes, that, since the late 1990s, have
undergone this model, we will discuss those as
considered with the most relevance.
68 The term governance refers to different concepts. In this
paper we use it referring to its broader meaning,
highlighting the influence that the institutional environment
exerts on stakeholder behaviour. Therefore, quoting
Warglien (1997), for governance model we intend (p. 1):
―institutional arrangements within and between firms, as
well as (…) the institutional environment within which such
arrangements emerge‖. In this way is possible to show up
both the regulatory and institutional aspects (―formal
regulation‖, de Jong 1997, p. 5) and the informal one
(―social factors and processes‖, Warglien 1997, p. 1;
―informal customs‖, de Jong 1997, p. 5). In general ―a
system of corporate governance is defined as a more or less
country specific framework‖ (Weimer and Pape 1999, p.
152), even if the recent debate regarding economic
geography (Zucchella and Maccarini 1999) leads to the
definition of the new concept of economic regions, where
the national border are loosing importance. 69 Boschma (2005) refers to (p. 63) ―institutional
proximity‖ pointing out as ―interactions between players are
influenced, shaped and constrained by the institutional
environment‖.
1) The growing internationalization of German
companies. The German companies have been
increasing their international presence since the
beginning of the nineties. This happened both through
the listing of many important German companies on
foreign stock exchanges (i.e. Daimler and SAP on
NYSE) and through the acquisition of foreign
companies70
: two prime examples are the acquisition
of Morgan Grenfell and Bankers Trust by Deutsche
Bank and of Kleinwort Benson by Dresdner Bank.
2) The growth of foreign direct investments in
German companies. A prime example is the takeover
of Mannesmann by Vodafone Air Touch71
. Given that
it involved a leading German company and large
capital, it has often been cited by many authors
(Jürgens et al. 2000) as a turning point in the
transformation of the German system of corporate
governance.
3) Banks‘ growing attention towards economic
performance. The internationalization of financial
markets puts the banks in competition with one
another to raise capital. As a consequence banks have
to meet investors‘ expectations in terms of value
creation also in the short term (as regards the growing
attention paid by banks to the shareholder value, see
Jürgens and Rupp 2002). This reduces the possibility
for banks to manage their investment portfolio
exclusively on a long term basis72
.
4) The increase of German companies‘
bankruptcy. As shown in Figure 1, the number of
companies that faced bankruptcy in the decade
1995-2004 almost doubled.
70 This phenomenon regarding the growing
internationalization of German companies is in particular so
much related to the USA to lead some authors
(Meyer-Larsen 1999) to define it as ―Germany Inc.‖. 71 Initially this takeover attempt was hosted by the
supervisory board of Mannesmann, then after months of
negotiations the two involved parts reach an agreement and
Vodafone could acquire the second German operator of
mobile telephony. The Vodafone-Mannesmann takeover
leads the German legislator to promulgate in December
2001, the Takeover Act (Wertpapierwerbs- und
Übernahmegesetz – WpÜG), in order to regulate all the
tender offer, which take place on the German financial
market or any other tender offer, which regards a German
company. 72 Porter (1992) describes the German traditional approach
pointing out (p. 70) as ―owners are virtually permanent, they
seek long term appreciation of their shares, which they hold
in perpetuity‖.
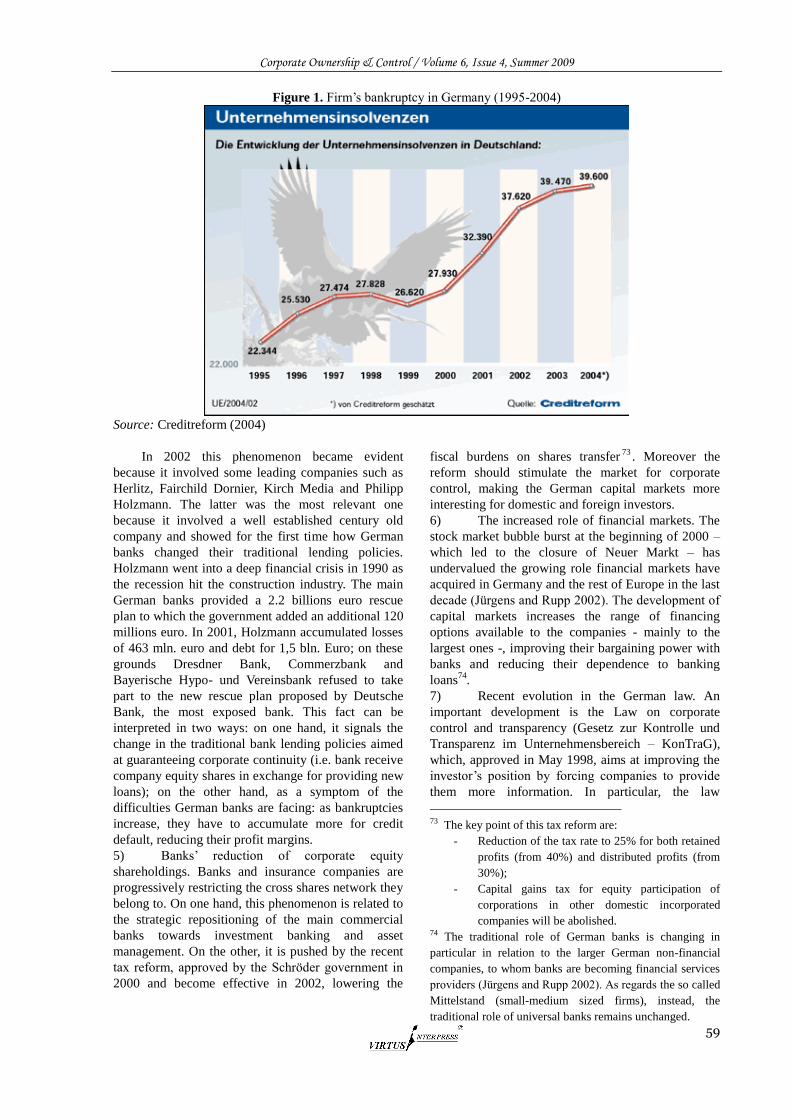
Corporate Ownership & Control / Volume 6, Issue 4, Summer 2009
59
Figure 1. Firm‘s bankruptcy in Germany (1995-2004)
Source: Creditreform (2004)
In 2002 this phenomenon became evident
because it involved some leading companies such as
Herlitz, Fairchild Dornier, Kirch Media and Philipp
Holzmann. The latter was the most relevant one
because it involved a well established century old
company and showed for the first time how German
banks changed their traditional lending policies.
Holzmann went into a deep financial crisis in 1990 as
the recession hit the construction industry. The main
German banks provided a 2.2 billions euro rescue
plan to which the government added an additional 120
millions euro. In 2001, Holzmann accumulated losses
of 463 mln. euro and debt for 1,5 bln. Euro; on these
grounds Dresdner Bank, Commerzbank and
Bayerische Hypo- und Vereinsbank refused to take
part to the new rescue plan proposed by Deutsche
Bank, the most exposed bank. This fact can be
interpreted in two ways: on one hand, it signals the
change in the traditional bank lending policies aimed
at guaranteeing corporate continuity (i.e. bank receive
company equity shares in exchange for providing new
loans); on the other hand, as a symptom of the
difficulties German banks are facing: as bankruptcies
increase, they have to accumulate more for credit
default, reducing their profit margins.
5) Banks‘ reduction of corporate equity
shareholdings. Banks and insurance companies are
progressively restricting the cross shares network they
belong to. On one hand, this phenomenon is related to
the strategic repositioning of the main commercial
banks towards investment banking and asset
management. On the other, it is pushed by the recent
tax reform, approved by the Schröder government in
2000 and become effective in 2002, lowering the
fiscal burdens on shares transfer73
. Moreover the
reform should stimulate the market for corporate
control, making the German capital markets more
interesting for domestic and foreign investors.
6) The increased role of financial markets. The
stock market bubble burst at the beginning of 2000 –
which led to the closure of Neuer Markt – has
undervalued the growing role financial markets have
acquired in Germany and the rest of Europe in the last
decade (Jürgens and Rupp 2002). The development of
capital markets increases the range of financing
options available to the companies - mainly to the
largest ones -, improving their bargaining power with
banks and reducing their dependence to banking
loans74
.
7) Recent evolution in the German law. An
important development is the Law on corporate
control and transparency (Gesetz zur Kontrolle und
Transparenz im Unternehmensbereich – KonTraG),
which, approved in May 1998, aims at improving the
investor‘s position by forcing companies to provide
them more information. In particular, the law
73 The key point of this tax reform are:
- Reduction of the tax rate to 25% for both retained
profits (from 40%) and distributed profits (from
30%);
- Capital gains tax for equity participation of
corporations in other domestic incorporated
companies will be abolished. 74 The traditional role of German banks is changing in
particular in relation to the larger German non-financial
companies, to whom banks are becoming financial services
providers (Jürgens and Rupp 2002). As regards the so called
Mittelstand (small-medium sized firms), instead, the
traditional role of universal banks remains unchanged.
Corporate Ownership & Control / Volume 6, Issue 4, Summer 2009
60
proposes to limit the ―Depotstimmrecht effect‖ by
obliging the banks, owning more than 5% of voting
rights of listed companies or participating in the
syndicate for public offering of their shares, to inform
their customers how the bank will exert the voting
rights75
. To the same purpose is the modification of
the Article 135, par. 3 of Act on stock corporation
(AktienGesetz – AktG). According to this, banks are
not allowed to exert voting rights on behalf of their
depositing customers when they own more than 5% of
the company equity shares, unless they received
specific voting instructions from their customers or
give up their own voting rights76
. As a consequence of
the above mentioned measures, the banks‘ discretional
power in exerting proxy voting rights has been
strongly restricted (Martin 2004). Moreover the
German corporate governance code (Deutscher
Corporate Governance Codex – DCGC), become
effective in February 2002, limits the banks‘ practice
of nominating their own representatives in the
supervisory boards of companies, in which they hold
equity shares (Hopt 2003). According to the new code,
the number of external supervisory board positions
that the same person may hold in listed companies is
limited to five77
.
8) The current law harmonisation process in
the EU and the international self-regulation process.
The process of law harmonization, at EU level, is
going to reduce the law specificity of the German
system. To mention the most relevant cases, we have:
the German securities trading Act78
adopted in 1995
(implementing the European Union‘s Large Holdings
Directive 88/627/EEC), which deals with the
disclosure of information on the company‘s
shareholder structure and with insider trading
regulation; other measures aiming at standardizing the
different types of companies (the Regulation on the
statute for a European company in 2000, the Directive
2002/14/CE regarding worker‘s information and
participation rights in 2002). At the same time we can
see the diffusion of international agreements, as for
example the Basel one, regarding the banks‘
patrimonial requirements, which is going to have
effects on the behaviour of financial institutions.
The recent changes in the German model above
75 To the same information duties are also subjected banks,
whose officials are members of the supervisory board or of
the board of management of the company at issue. 76 Moreover, banks are forced to disclose, in their annual
reports, all the mandates in other supervisory or
management boards accumulated by their officials. 77 Before the DCGC this limit was fixed in 10 mandates. 78 The German securities trading Act
(Wertpapierhandelsgesetz – WpHG) states that stakes above
thresholds of 5% of the voting rights need to be disclosed to
the Financial Supervisory Authority (BaFin), which makes
than this information public. Prior to 1995, shareholders
only had to report their stakes if they exceeded the threshold
of 25%.
described indicate a certain trend towards a
market-oriented system. Although there has been
some degree of convergence, in particular to the
anglo-saxon model, the fundamental differences with
respect to a market-based system are still significant79
.
Therefore, despite the importance of the evolutionary
trends above described, is our opinion that the
peculiar features of the German bank-industry
relationship won‘t change, at least in the short time,
because they are expression of the culture of
co-decision and co-responsibility (the so called
Mitbestimmung) deeply rooted in the German system
(Shonfield 1965, Albert 1991, de Jong 1997, Warglien
1997 and Hacketal et al. 2003). Only considering all
these aspects, we can explain the stability
characterizing the bank-firm relationship, stability
which presumes a widespread participation and
sharing in decisions. Stability, which comes out not
only from reciprocated equity linkages
(cross-shareholdings), which rarely are substantial
enough to assert effective control, but rather from
strategic co-decision, deeply embedded in the
institutional model. Talking about strategic
co-decision we refer to the common participation of
the different subject involved in the decision making
process, whose behaviour and answers, at strategic
and organizational level are expression of this culture.
Is therefore our opinion that the evolutionary aspects
of the German model can be interpreted and faced,
only taking into consideration this point of view.
What said above finds confirmation so far, in the
empirical research we carried out on the German
bank-industry relationship. If, on one hand, we find
out that the patrimonial ties among financial and
industrial sector are rarefying, on the other hand, we
observe how the personal linkages among supervisory
boards remained unaltered. These findings seem to
validate the thesis regarding the existence and the
importance of the culture of strategic co-decision. As
this modus operandi is deeply rooted in the German
system, unlikely will be modified by the recent
changes above described. On the opposite this culture
will probably help to direct the evolutionary process,
characterizing it with the specificities of which the
German model is traditionally bearer.
2. Research hypothesis, data and methodology
This paper aims at analysing the characteristics of the
bank-industry relationship in Germany, showing the
ties among financial and industrial companies, both in
terms of cross-equity-shareholdings and interlocking
directorates for the 1998, 2001 and 2005. The
79 As regards the persistence of the fundamental
peculiarities of the German corporate governance system,
see also: Baliga and Polak (2004), Mayer and Whittington
(2004) and Goergen, Manjon and Rennenboog (2004).
Corporate Ownership & Control / Volume 6, Issue 4, Summer 2009
61
relationships among the German financial and
industrial sector create a close and complex network
of companies. The analysis of equity shareholdings
can explain the ties among the companies, but is our
opinion that does not provide a complete and
exhaustive picture of the network. Around the
patrimonial linkages develop wider relationships,
which often are personal, that are of crucial
importance to explain the behaviour, the strategic
choices, in other terms the governance of the involved
companies.
Sample
The sample investigated is made of:
on the industrial side: the 100 largest
German non-financial companies for turnover at the
end of 2005 (chosen from the ―top 500 deutsche
Unternehmen‖ – WELT ONLINE ranking);
on the financial side: the 4 Großbanken
(Deutsche Bank, Dresdner Bank, Commerzbank and
Bayerische Hypo- und Vereinsbank) and the 2 main
German insurance companies (Allianz and Münchener
Rückversicherungsgesellschaft).
As regards the time period, it has been decided
to consider the sample over 8 years, from 1998 to
2005. The year 1998 was chosen because only after
the issue of the KonTraG (Gesetz zur Kontrolle und
Transparenz im Unternehmensbereich) in 1998, banks
have been forced by law to publish in their annual
reports all the mandates that their collaborators have
on the supervisory and management board of large
companies, and all the stakes above thresholds of 5%
of the voting rights they held in the same companies80
.
Data collection
The data on shareholdings has been collected
analysing the annual reports of all the 106 companies
of the sample for the time period considered, and
through a database (―Wer Gehört zu wem?‖,
Commerzbank) that every year gathers the data
regarding the major shareholders (if existing) of about
12,000 German companies. The data on the
composition of the supervisory boards has been
collected only through annual reports because they are
the only official documents that display such
information. The information of the mandates that
each bank/insurance‘s employee detects in the
supervisory board of other German companies was
first gathered from the annual reports of the 6
80 Before the KonTraG states this principle, the WpHG
(Wertpapierhandelsgesetz – Security Trading Act) requires
that stakes above thresholds of 5% of the voting rights need
to be disclosed to the Financial Supervisory Authority
(BaFin), which then makes this information public. Prior to
1995, shareholders only had to report their stakes if they
exceeded the threshold of 25%.
financial institutions, then, this data has been
cross-checked with the information published in the
annual reports of the 100 companies in the sample.
Methodology
In order to investigate the relationship between
German banks and German firms (equity and
non-equity) two different empirical analysis have
been carried out:
First, the analysis of the equity linkages
among banks/insurance companies and the 100 largest
German non-financial firms;
The second analysis has been carried out on
personal linkages among the 6 financial institutions
and the 100 largest German non-financial firms to
evaluate in a deeper sense the role that banks and
insurances have in German corporate governance and
to provide evidences of the effective influence they are
able to exert in corporate management. The object of
the study has been the composition of the supervisory
board of all the 100 largest German non-financial firms
and all the mandates detained by all the employees
(managers, collaborators, supervisors, and so on) of the
6 financial institutions in these companies identifying
the number and type of seats (if chairman or not) held
by the same financial institutions in the supervisory
board of the firms. Such a methodological choice, i.e.,
to consider the presence of banks‘ representatives in
other than banks‘ supervisory boards as a signal of
banks‘ opportunity to exert power and influence and as
a proxy of banks‘ influence in the system of corporate
governance is strongly supported in the literature (see
among the others, Pfannschmidt 1993, Windolf and
Beyer 1995, Leimkühler 1996, Hopt and Prigge 1998).
Specifically the main purpose of the analysis is to
demonstrate, for the panel of German companies
investigated, that bank-firm relationship relies not
only on patrimonial linkages but also on personal
relationships. To provide evidence of this fact, we
statistically test how the stock participations held by
the six financial institutions considered are not able to
completely explain the considerable number of seats
they have in the supervisory boards of the firms we
chose for the panel.
Variables and research hypotheses
The variables analysed are two:
Shareholders‘ structure: in this framework,
what should be pointed out, is that the analysis of the
banks/insurances shareholdings in the German
industry along with the analysis of the shareholders‘
structure of the 100 German firms in the sample, will
be the basis for providing a map showing the wide
relationship network, which directly or indirectly joins
a high number of firms and financial institutions.
Corporate Ownership & Control / Volume 6, Issue 4, Summer 2009
62
Composition of the supervisory board: the
study of this variable is on the basis of the second
analysis previously described. Studying the presence
of banks/insurances‘ members seated on the
supervisory boards of non-financial firms is important
in understanding the governance mechanisms used by
banks to exert their influence in the firms‘ management
(see among the others, Pfannschmidt 1993, Windolf
and Beyer 1995, Leimkühler 1996, Hopt and Prigge
1998). It has been decided to focus on the composition
of this board because it is the one that appointed the
members of the other one (the board of managing
directors), and because of its, at least theoretically,
correspondence to the shareholdings (Windolf and
Beyer 1995, Gorton and Schmid 1996).
The hypotheses developed are concentrated
mainly on the relationship between corporate
ownership and interlock ties:
Hp. 1: On the supervisory boards of sample
companies there are only members of financial
institutions participating in the company‘s equity.
Support for this research hypothesis can be found in
various studies carried out on the German corporate
governance model. As the supervisory board‘s
members are nominated at the annual general meeting
of shareholders, except for the seats reserved for the
workers‘ representatives, it is expected to find,
theoretically, a certain correspondence between the
representatives of shareholders in the Aufsichtsrat and
the stock held by the same shareholders (Gorton and
Schmid, 1996; Böhm, 1992; Edwards and Fischer,
1994; Seger, 1997).
Hp. 2: Most of the personal linkages through banks‘
representatives are among the first 10/50 German
companies.
The main studies carried out on the composition
of supervisory boards outlined that the banks‘
members are mainly represented on the boards of the
largest German companies and in particular the DAX
ones (see among the others André 1996, Seger 1997,
Hansen 1994).
3. Bank-firm relationship and cross-shareholdings
The German system of relationships between banks
and companies is traditionally considered as one of
the main features of the German model of corporate
governance (Gerschenkron 1968, Charkham 1989,
Baums 1993). The issue related to the dominant role
that banks play in German corporate governance,
based on direct share ownership and on a system of
proxy voting, under which they cast votes for other
shareholders, has been under debate from the early
seventies. Several studies (Gessler 1979, Gottschalk
1988, Baums and Fraune 1994) have been carried out
with the purpose of measuring the extent of banks‘
influence and control they exert in corporate
governance.
The most quoted researches carried out on this
issue are the Gottschalk one (1988) and the study of
Baums and Fraune (1994). Gottschalk‘s study took
into consideration 33 among the 100 major German
enterprises listed in 1986 (column a, Table 4), while
Baums and Fraune the 24 biggest German companies
listed in 1992 (column b, Table 4).
In Table 481
we put together the data related to
the 16 German firms considered by both authors in
their researches. We can observe that the data
collected in 1986 are not far from the data of Baums
and Fraune of 1992: this fact can be interpreted as a
signal of relative stability of the phenomenon under
examination. Analysing the data in Table 4, comes out
how the German bank system, considered as a
whole82
holds the majority of exerted voting rights in
almost all cases (15 enterprises in 1986 and 13 in
1992). Moreover we can observe how the majority of
exerted voting rights is often (6 companies in 1988
and 3 in 1992) concentrated in the hands of the 3
Großbanken, which anyhow exceed the 20% of
exerted voting rights in 14 cases in 1986 and 11 cases
in 1992.
As a consequence, from the analysed data comes
out how the banks, as a whole, could appoint the
majority of the members which represent the
shareholders in the supervisory boards, of almost the
considered companies. Moreover, the voting rights
appear to be, on average, concentrated in the hands of
the 3 Großbanken, confirming the role of guide they
traditionally have in the German system.
81 In both studies the role of banks has been quantified in
terms of voting rights presented by German banks in the
AGMs of the analysed firms as a percentage of all voting
rights presented in each AGM. Both studies considered,
besides the voting rights related to direct shares held by
banks, also the votes casted on the basis of proxy voting as
well as the votes casted by the subsidiaries and the
management companies possessed by the respective bank. 82 As sum of the voting rights exerted by the 3 big
commercial banks (Großbanken), by the regional banks
(Regionalbanken), by the saving banks (Sparkassen), by the
credit cooperatives (Kreditgenossenschaften) and by other
banks.
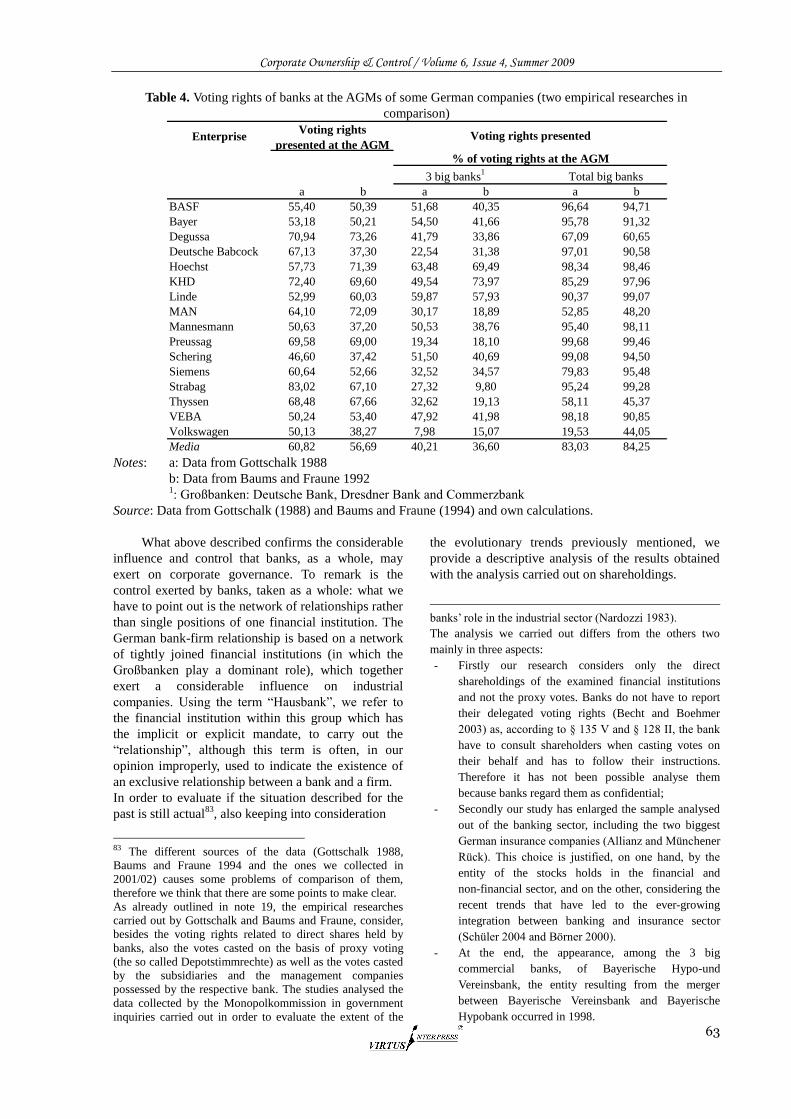
Corporate Ownership & Control / Volume 6, Issue 4, Summer 2009
63
Table 4. Voting rights of banks at the AGMs of some German companies (two empirical researches in
comparison)
Enterprise
a b a b a b
BASF 55,40 50,39 51,68 40,35 96,64 94,71
Bayer 53,18 50,21 54,50 41,66 95,78 91,32
Degussa 70,94 73,26 41,79 33,86 67,09 60,65
Deutsche Babcock 67,13 37,30 22,54 31,38 97,01 90,58
Hoechst 57,73 71,39 63,48 69,49 98,34 98,46
KHD 72,40 69,60 49,54 73,97 85,29 97,96
Linde 52,99 60,03 59,87 57,93 90,37 99,07
MAN 64,10 72,09 30,17 18,89 52,85 48,20
Mannesmann 50,63 37,20 50,53 38,76 95,40 98,11
Preussag 69,58 69,00 19,34 18,10 99,68 99,46
Schering 46,60 37,42 51,50 40,69 99,08 94,50
Siemens 60,64 52,66 32,52 34,57 79,83 95,48
Strabag 83,02 67,10 27,32 9,80 95,24 99,28
Thyssen 68,48 67,66 32,62 19,13 58,11 45,37
VEBA 50,24 53,40 47,92 41,98 98,18 90,85
Volkswagen 50,13 38,27 7,98 15,07 19,53 44,05
Media 60,82 56,69 40,21 36,60 83,03 84,25
Voting rights
presented at the AGMVoting rights presented
% of voting rights at the AGM
3 big banks1
Total big banks
Notes: a: Data from Gottschalk 1988
b: Data from Baums and Fraune 1992
1: Großbanken: Deutsche Bank, Dresdner Bank and Commerzbank
Source: Data from Gottschalk (1988) and Baums and Fraune (1994) and own calculations.
What above described confirms the considerable
influence and control that banks, as a whole, may
exert on corporate governance. To remark is the
control exerted by banks, taken as a whole: what we
have to point out is the network of relationships rather
than single positions of one financial institution. The
German bank-firm relationship is based on a network
of tightly joined financial institutions (in which the
Großbanken play a dominant role), which together
exert a considerable influence on industrial
companies. Using the term ―Hausbank‖, we refer to
the financial institution within this group which has
the implicit or explicit mandate, to carry out the
―relationship‖, although this term is often, in our
opinion improperly, used to indicate the existence of
an exclusive relationship between a bank and a firm.
In order to evaluate if the situation described for the
past is still actual83
, also keeping into consideration
83 The different sources of the data (Gottschalk 1988,
Baums and Fraune 1994 and the ones we collected in
2001/02) causes some problems of comparison of them,
therefore we think that there are some points to make clear.
As already outlined in note 19, the empirical researches
carried out by Gottschalk and Baums and Fraune, consider,
besides the voting rights related to direct shares held by
banks, also the votes casted on the basis of proxy voting
(the so called Depotstimmrechte) as well as the votes casted
by the subsidiaries and the management companies
possessed by the respective bank. The studies analysed the
data collected by the Monopolkommission in government
inquiries carried out in order to evaluate the extent of the
the evolutionary trends previously mentioned, we
provide a descriptive analysis of the results obtained
with the analysis carried out on shareholdings.
banks‘ role in the industrial sector (Nardozzi 1983).
The analysis we carried out differs from the others two
mainly in three aspects:
- Firstly our research considers only the direct
shareholdings of the examined financial institutions
and not the proxy votes. Banks do not have to report
their delegated voting rights (Becht and Boehmer
2003) as, according to § 135 V and § 128 II, the bank
have to consult shareholders when casting votes on
their behalf and has to follow their instructions.
Therefore it has not been possible analyse them
because banks regard them as confidential;
- Secondly our study has enlarged the sample analysed
out of the banking sector, including the two biggest
German insurance companies (Allianz and Münchener
Rück). This choice is justified, on one hand, by the
entity of the stocks holds in the financial and
non-financial sector, and on the other, considering the
recent trends that have led to the ever-growing
integration between banking and insurance sector
(Schüler 2004 and Börner 2000).
- At the end, the appearance, among the 3 big
commercial banks, of Bayerische Hypo-und
Vereinsbank, the entity resulting from the merger
between Bayerische Vereinsbank and Bayerische
Hypobank occurred in 1998.
Corporate Ownership & Control / Volume 6, Issue 4, Summer 2009
64
As regards the financial sector, we take into
consideration the six financial institutions (4
Großbanken and 2 insurance companies) previously
mentioned. This choice, on one hand, limits the range
of our research in comparison with the ones carried
out by Gottschalk and Baums and Fraune, which
considered the banking sector as a whole; on the other
hand we include also the two main German insurance
company, whose consideration (also by the light of
what said in note 22) cannot, in our opinion, be set
aside. As regards the industrial sector, we chose the
100 largest German non-financial companies for
turnover at the end of 2005 (chosen from the ―top 500
deutsche Unternehmen‖ – WELT ONLINE ranking)84
.
The importance of cross-shareholdings both among
non-financial enterprises and between financial
institutions and industrial firms is a principal feature
of German corporate governance aimed at cementing
long-term relationships between companies.
Moreover, in our opinion, the tight network of
linkages cannot be neutral as regards the strategies
definition of the involved enterprises. The existence
of reciprocated equity linkages leads to common or, at
least, widely shared strategies. Under this point of
view, an analysis limited to equity shareholdings does
not provide a complete and exhaustive picture of the
strategic linkages within the network, which often are
based on informal aspects, like the existence of close
relationships and interdependencies between board
members of different companies (Windolf and Beyer
1995)85
.
84 The choice we made in integrating the analysis of equity
shareholdings with the analysis of the composition of the
supervisory boards answer to the purpose of making up for
two structural limits that our study meet. On one hand,
German banks are forced by German law to disclose all the
directly held participation of more than 5%. Therefore, in
our research we could not consider the shareholdings under
that threshold, unless they are voluntarily disclosed (as for
example the case of Allianz). On the other hand, we could
not analyse the proxy votes exerted by banks, because they
are not disclosed (see note 22). The data collected through
the lists of mandates included in the annual report of every
German company and the study of the composition of the
supervisory boards we carried out, enables us to compare
the number of seats that banks representatives effectively
hold in the boards of other companies and the number of
seats that the same representatives should hold theoretically
on basis of the declared shareholdings. Moreover this study
enables us to make up the limits that structurally a research
based on annual reports has to face. 85 It has been noted, for example that: ―The members of the
supervisory board have to control company management
and to prevent the misuse of power. At the same time, they
are part of an encompassing network which functions as a
means of social integration and cohesion among the
business elites and to which they owe the position they
have‖ (Windolf and Beyer 1995).
An example of this can be found analysing the
linkages of three of the DAX 30 companies: RWE
(multi-utility of energy generation and sales and
water), E.ON. (multi-utility of energy sector) and
Thyssenkrupp (steel producer). The relationship
among these three companies, as it is indirect and not
immediately noticeable (these companies control
RAG, a firm of the energy sector, with shareholdings
of 20-30% each one), risks of not being completely
estimated by only considering the equity linkages.
Therefore, the opportunity of integrating the analysis
of equity relationships with the analysis of the
composition of the supervisory boards is particularly
important because it can help to outline in a deeper
sense the linkages existing among the considered
companies. In fact, taking into consideration the
above mentioned example again, we can notice how
the supervisory boards of each company seat
members of the boards of the other two firms,
pointing out, therefore, the existence of a strong
interrelation and interdependency between the
corporate organs of these companies.
The total number of shareholdings, held by the 6
financial institutions in the 100 largest German
non-financial companies, more or less halved in 2005
when compared to the total numbers obtained from
2001 and 1998. This is mainly ascribable as an effect
of the tax reform, approved by the Schröder‘s
government in 2000 and it became effective in 2002,
lowering the fiscal burdens on the transfer of shares.
Such a reform, as already explained in note 12,
reducing taxation on capital gains, allowed the banks
to sell the shareholdings they held in their portfolio
that they considered no more to be core. Looking at
the column total numbers, it is worth noting that the
banks/insurances‘ shareholdings are mainly
concentrated in the top 10 firms and more in the first
50 companies than in the firms ranked between 51
and 100. Such an evidence shows that the interest of
the 6 leading German financial institutions is mainly
focused in the biggest German companies. An
explanation is needed as regards the positions
between 31 to 40, that shows quite a huge number of
banks/insurances‘ shareholdings. Within this ranking
there are historical German firms such as MAN,
Karstadt Quelle and Deutsche Lufthansa that in the
past joined higher positioning. The interest that the 6
financial institutions have in such firms is mainly
ascribable to historical reasons because they are firms
with more or less a century of history. Such an interest
will be better explained in the next pages when
talking about interlocking directorates.
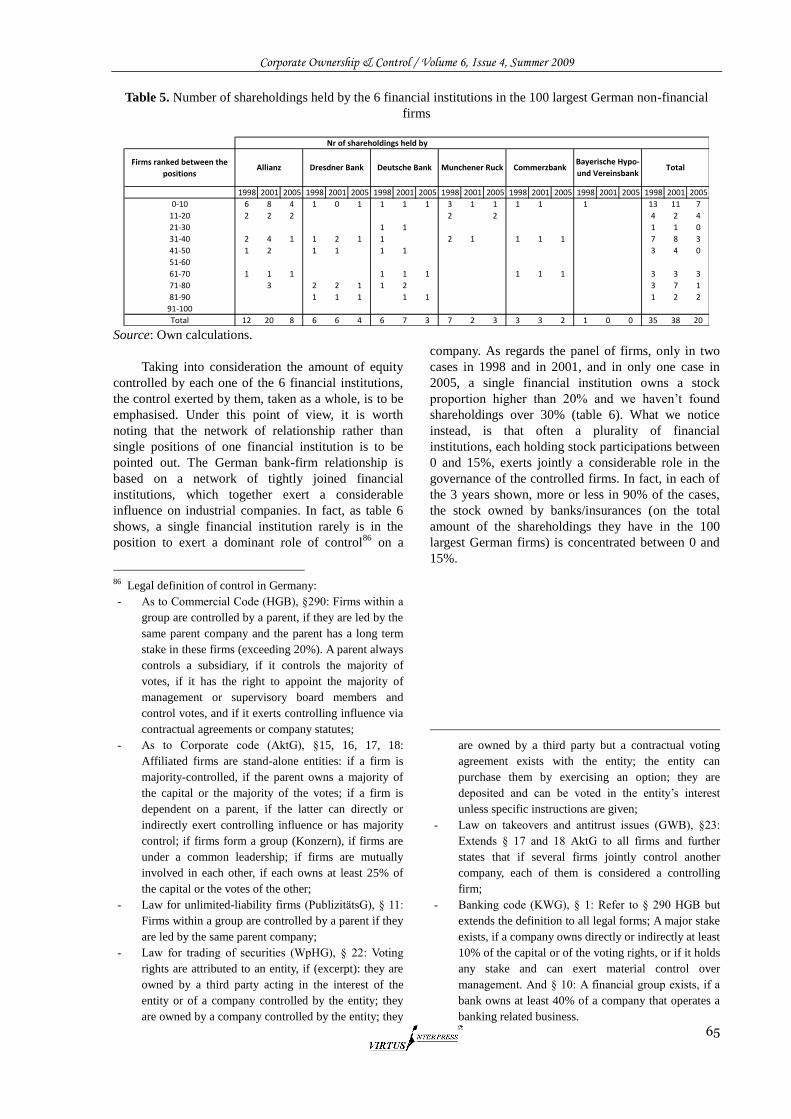
Corporate Ownership & Control / Volume 6, Issue 4, Summer 2009
65
Table 5. Number of shareholdings held by the 6 financial institutions in the 100 largest German non-financial
firms
Nr of shareholdings held by
Firms ranked between the
positions
1998 2001 2005 1998 2001 2005 1998 2001 2005 1998 2001 2005 1998 2001 2005 1998 2001 2005 1998 2001 2005
0-10 6 8 4 1 0 1 1 1 1 3 1 1 1 1 1 13 11 7
11-20 2 2 2 2 2 4 2 4
21-30 1 1 1 1 0
31-40 2 4 1 1 2 1 1 2 1 1 1 1 7 8 3
41-50 1 2 1 1 1 1 3 4 0
51-60
61-70 1 1 1 1 1 1 1 1 1 3 3 3
71-80 3 2 2 1 1 2 3 7 1
81-90 1 1 1 1 1 1 2 2
91-100
Total 12 20 8 6 6 4 6 7 3 7 2 3 3 3 2 1 0 0 35 38 20
TotalAllianz Dresdner Bank Deutsche Bank Munchener Ruck CommerzbankBayerische Hypo-
und Vereinsbank
Source: Own calculations.
Taking into consideration the amount of equity
controlled by each one of the 6 financial institutions,
the control exerted by them, taken as a whole, is to be
emphasised. Under this point of view, it is worth
noting that the network of relationship rather than
single positions of one financial institution is to be
pointed out. The German bank-firm relationship is
based on a network of tightly joined financial
institutions, which together exert a considerable
influence on industrial companies. In fact, as table 6
shows, a single financial institution rarely is in the
position to exert a dominant role of control86
on a
86 Legal definition of control in Germany:
- As to Commercial Code (HGB), §290: Firms within a
group are controlled by a parent, if they are led by the
same parent company and the parent has a long term
stake in these firms (exceeding 20%). A parent always
controls a subsidiary, if it controls the majority of
votes, if it has the right to appoint the majority of
management or supervisory board members and
control votes, and if it exerts controlling influence via
contractual agreements or company statutes;
- As to Corporate code (AktG), §15, 16, 17, 18:
Affiliated firms are stand-alone entities: if a firm is
majority-controlled, if the parent owns a majority of
the capital or the majority of the votes; if a firm is
dependent on a parent, if the latter can directly or
indirectly exert controlling influence or has majority
control; if firms form a group (Konzern), if firms are
under a common leadership; if firms are mutually
involved in each other, if each owns at least 25% of
the capital or the votes of the other;
- Law for unlimited-liability firms (PublizitätsG), § 11:
Firms within a group are controlled by a parent if they
are led by the same parent company;
- Law for trading of securities (WpHG), § 22: Voting
rights are attributed to an entity, if (excerpt): they are
owned by a third party acting in the interest of the
entity or of a company controlled by the entity; they
are owned by a company controlled by the entity; they
company. As regards the panel of firms, only in two
cases in 1998 and in 2001, and in only one case in
2005, a single financial institution owns a stock
proportion higher than 20% and we haven‘t found
shareholdings over 30% (table 6). What we notice
instead, is that often a plurality of financial
institutions, each holding stock participations between
0 and 15%, exerts jointly a considerable role in the
governance of the controlled firms. In fact, in each of
the 3 years shown, more or less in 90% of the cases,
the stock owned by banks/insurances (on the total
amount of the shareholdings they have in the 100
largest German firms) is concentrated between 0 and
15%.
are owned by a third party but a contractual voting
agreement exists with the entity; the entity can
purchase them by exercising an option; they are
deposited and can be voted in the entity‘s interest
unless specific instructions are given;
- Law on takeovers and antitrust issues (GWB), §23:
Extends § 17 and 18 AktG to all firms and further
states that if several firms jointly control another
company, each of them is considered a controlling
firm;
- Banking code (KWG), § 1: Refer to § 290 HGB but
extends the definition to all legal forms; A major stake
exists, if a company owns directly or indirectly at least
10% of the capital or of the voting rights, or if it holds
any stake and can exert material control over
management. And § 10: A financial group exists, if a
bank owns at least 40% of a company that operates a
banking related business.
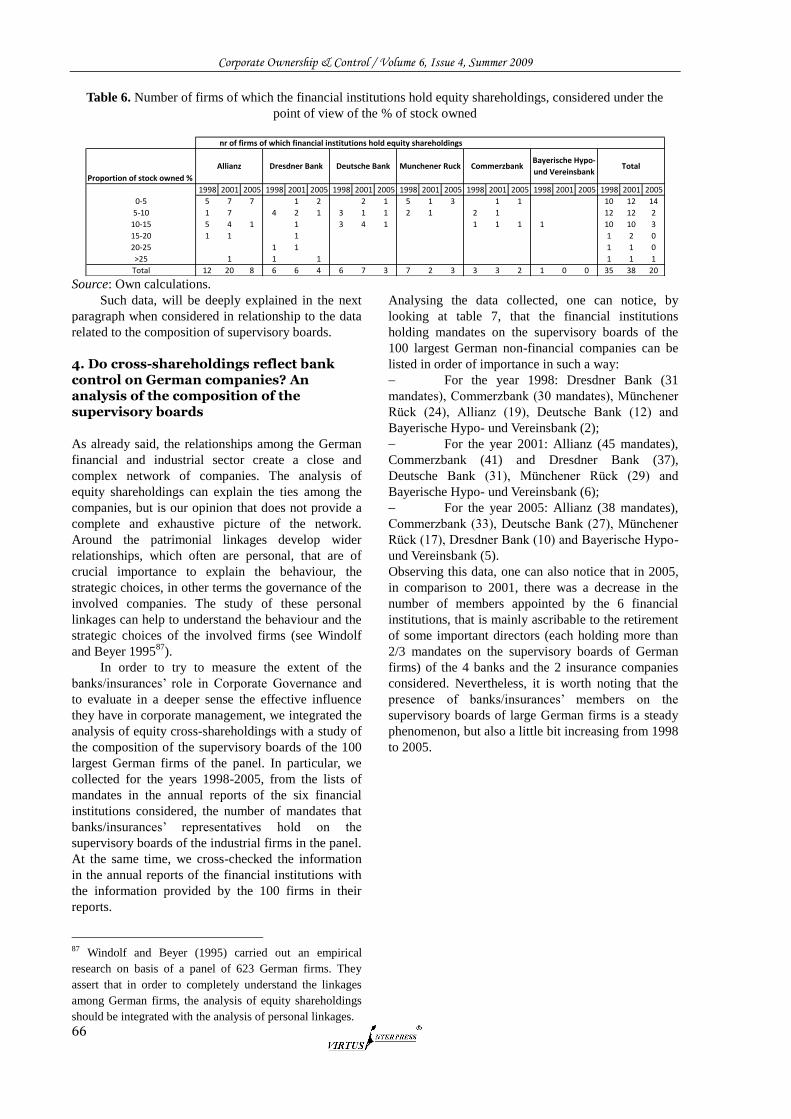
Corporate Ownership & Control / Volume 6, Issue 4, Summer 2009
66
Table 6. Number of firms of which the financial institutions hold equity shareholdings, considered under the
point of view of the % of stock owned
nr of firms of which financial institutions hold equity shareholdings
Proportion of stock owned %
1998 2001 2005 1998 2001 2005 1998 2001 2005 1998 2001 2005 1998 2001 2005 1998 2001 2005 1998 2001 2005
0-5 5 7 7 1 2 2 1 5 1 3 1 1 10 12 14
5-10 1 7 4 2 1 3 1 1 2 1 2 1 12 12 2
10-15 5 4 1 1 3 4 1 1 1 1 1 10 10 3
15-20 1 1 1 1 2 0
20-25 1 1 1 1 0
>25 1 1 1 1 1 1
Total 12 20 8 6 6 4 6 7 3 7 2 3 3 3 2 1 0 0 35 38 20
Allianz Dresdner Bank Deutsche Bank Munchener Ruck CommerzbankBayerische Hypo-
und VereinsbankTotal
Source: Own calculations.
Such data, will be deeply explained in the next
paragraph when considered in relationship to the data
related to the composition of supervisory boards.
4. Do cross-shareholdings reflect bank control on German companies? An analysis of the composition of the supervisory boards
As already said, the relationships among the German
financial and industrial sector create a close and
complex network of companies. The analysis of
equity shareholdings can explain the ties among the
companies, but is our opinion that does not provide a
complete and exhaustive picture of the network.
Around the patrimonial linkages develop wider
relationships, which often are personal, that are of
crucial importance to explain the behaviour, the
strategic choices, in other terms the governance of the
involved companies. The study of these personal
linkages can help to understand the behaviour and the
strategic choices of the involved firms (see Windolf
and Beyer 199587
).
In order to try to measure the extent of the
banks/insurances‘ role in Corporate Governance and
to evaluate in a deeper sense the effective influence
they have in corporate management, we integrated the
analysis of equity cross-shareholdings with a study of
the composition of the supervisory boards of the 100
largest German firms of the panel. In particular, we
collected for the years 1998-2005, from the lists of
mandates in the annual reports of the six financial
institutions considered, the number of mandates that
banks/insurances‘ representatives hold on the
supervisory boards of the industrial firms in the panel.
At the same time, we cross-checked the information
in the annual reports of the financial institutions with
the information provided by the 100 firms in their
reports.
87 Windolf and Beyer (1995) carried out an empirical
research on basis of a panel of 623 German firms. They
assert that in order to completely understand the linkages
among German firms, the analysis of equity shareholdings
should be integrated with the analysis of personal linkages.
Analysing the data collected, one can notice, by
looking at table 7, that the financial institutions
holding mandates on the supervisory boards of the
100 largest German non-financial companies can be
listed in order of importance in such a way:
For the year 1998: Dresdner Bank (31
mandates), Commerzbank (30 mandates), Münchener
Rück (24), Allianz (19), Deutsche Bank (12) and
Bayerische Hypo- und Vereinsbank (2);
For the year 2001: Allianz (45 mandates),
Commerzbank (41) and Dresdner Bank (37),
Deutsche Bank (31), Münchener Rück (29) and
Bayerische Hypo- und Vereinsbank (6);
For the year 2005: Allianz (38 mandates),
Commerzbank (33), Deutsche Bank (27), Münchener
Rück (17), Dresdner Bank (10) and Bayerische Hypo-
und Vereinsbank (5).
Observing this data, one can also notice that in 2005,
in comparison to 2001, there was a decrease in the
number of members appointed by the 6 financial
institutions, that is mainly ascribable to the retirement
of some important directors (each holding more than
2/3 mandates on the supervisory boards of German
firms) of the 4 banks and the 2 insurance companies
considered. Nevertheless, it is worth noting that the
presence of banks/insurances‘ members on the
supervisory boards of large German firms is a steady
phenomenon, but also a little bit increasing from 1998
to 2005.
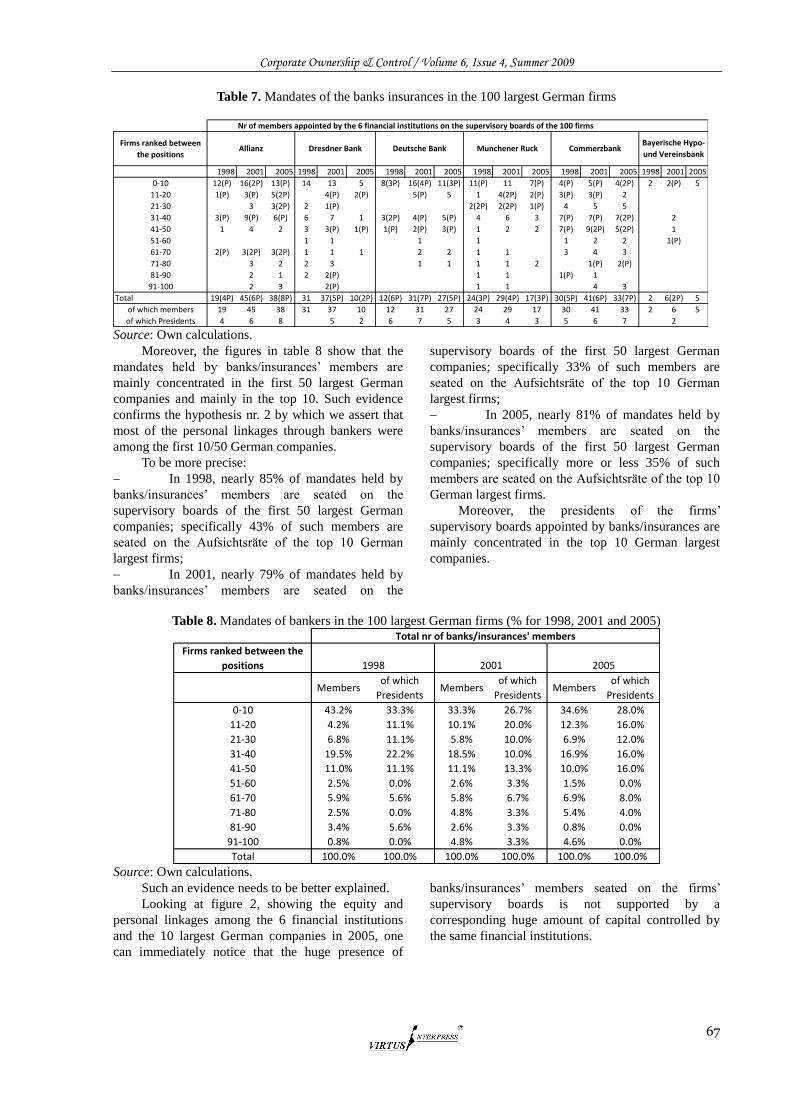
Corporate Ownership & Control / Volume 6, Issue 4, Summer 2009
67
Table 7. Mandates of the banks insurances in the 100 largest German firms
Nr of members appointed by the 6 financial institutions on the supervisory boards of the 100 firms
Firms ranked between
the positions
1998 2001 2005 1998 2001 2005 1998 2001 2005 1998 2001 2005 1998 2001 2005 1998 2001 2005
0-10 12(P) 16(2P) 13(P) 14 13 5 8(3P) 16(4P) 11(3P) 11(P) 11 7(P) 4(P) 5(P) 4(2P) 2 2(P) 5
11-20 1(P) 3(P) 5(2P) 4(P) 2(P) 5(P) 5 1 4(2P) 2(P) 3(P) 3(P) 2
21-30 3 3(2P) 2 1(P) 2(2P) 2(2P) 1(P) 4 5 5
31-40 3(P) 9(P) 6(P) 6 7 1 3(2P) 4(P) 5(P) 4 6 3 7(P) 7(P) 7(2P) 2
41-50 1 4 2 3 3(P) 1(P) 1(P) 2(P) 3(P) 1 2 2 7(P) 9(2P) 5(2P) 1
51-60 1 1 1 1 1 2 2 1(P)
61-70 2(P) 3(2P) 3(2P) 1 1 1 2 2 1 1 3 4 3
71-80 3 2 2 3 1 1 1 1 2 1(P) 2(P)
81-90 2 1 2 2(P) 1 1 1(P) 1
91-100 2 3 2(P) 1 1 4 3
Total 19(4P) 45(6P) 38(8P) 31 37(5P) 10(2P) 12(6P) 31(7P) 27(5P) 24(3P) 29(4P) 17(3P) 30(5P) 41(6P) 33(7P) 2 6(2P) 5
of which members 19 45 38 31 37 10 12 31 27 24 29 17 30 41 33 2 6 5
of which Presidents 4 6 8 5 2 6 7 5 3 4 3 5 6 7 2
Allianz Dresdner Bank Deutsche Bank Munchener Ruck CommerzbankBayerische Hypo-
und Vereinsbank
Source: Own calculations.
Moreover, the figures in table 8 show that the
mandates held by banks/insurances‘ members are
mainly concentrated in the first 50 largest German
companies and mainly in the top 10. Such evidence
confirms the hypothesis nr. 2 by which we assert that
most of the personal linkages through bankers were
among the first 10/50 German companies.
To be more precise:
In 1998, nearly 85% of mandates held by
banks/insurances‘ members are seated on the
supervisory boards of the first 50 largest German
companies; specifically 43% of such members are
seated on the Aufsichtsräte of the top 10 German
largest firms;
In 2001, nearly 79% of mandates held by
banks/insurances‘ members are seated on the
supervisory boards of the first 50 largest German
companies; specifically 33% of such members are
seated on the Aufsichtsräte of the top 10 German
largest firms;
In 2005, nearly 81% of mandates held by
banks/insurances‘ members are seated on the
supervisory boards of the first 50 largest German
companies; specifically more or less 35% of such
members are seated on the Aufsichtsräte of the top 10
German largest firms.
Moreover, the presidents of the firms‘
supervisory boards appointed by banks/insurances are
mainly concentrated in the top 10 German largest
companies.
Table 8. Mandates of bankers in the 100 largest German firms (% for 1998, 2001 and 2005)
Firms ranked between the
positions
Membersof which
PresidentsMembers
of which
PresidentsMembers
of which
Presidents
0-10 43.2% 33.3% 33.3% 26.7% 34.6% 28.0%
11-20 4.2% 11.1% 10.1% 20.0% 12.3% 16.0%
21-30 6.8% 11.1% 5.8% 10.0% 6.9% 12.0%
31-40 19.5% 22.2% 18.5% 10.0% 16.9% 16.0%
41-50 11.0% 11.1% 11.1% 13.3% 10.0% 16.0%
51-60 2.5% 0.0% 2.6% 3.3% 1.5% 0.0%
61-70 5.9% 5.6% 5.8% 6.7% 6.9% 8.0%
71-80 2.5% 0.0% 4.8% 3.3% 5.4% 4.0%
81-90 3.4% 5.6% 2.6% 3.3% 0.8% 0.0%
91-100 0.8% 0.0% 4.8% 3.3% 4.6% 0.0%
Total 100.0% 100.0% 100.0% 100.0% 100.0% 100.0%
Total nr of banks/insurances' members
1998 2001 2005
Source: Own calculations.
Such an evidence needs to be better explained.
Looking at figure 2, showing the equity and
personal linkages among the 6 financial institutions
and the 10 largest German companies in 2005, one
can immediately notice that the huge presence of
banks/insurances‘ members seated on the firms‘
supervisory boards is not supported by a
corresponding huge amount of capital controlled by
the same financial institutions.
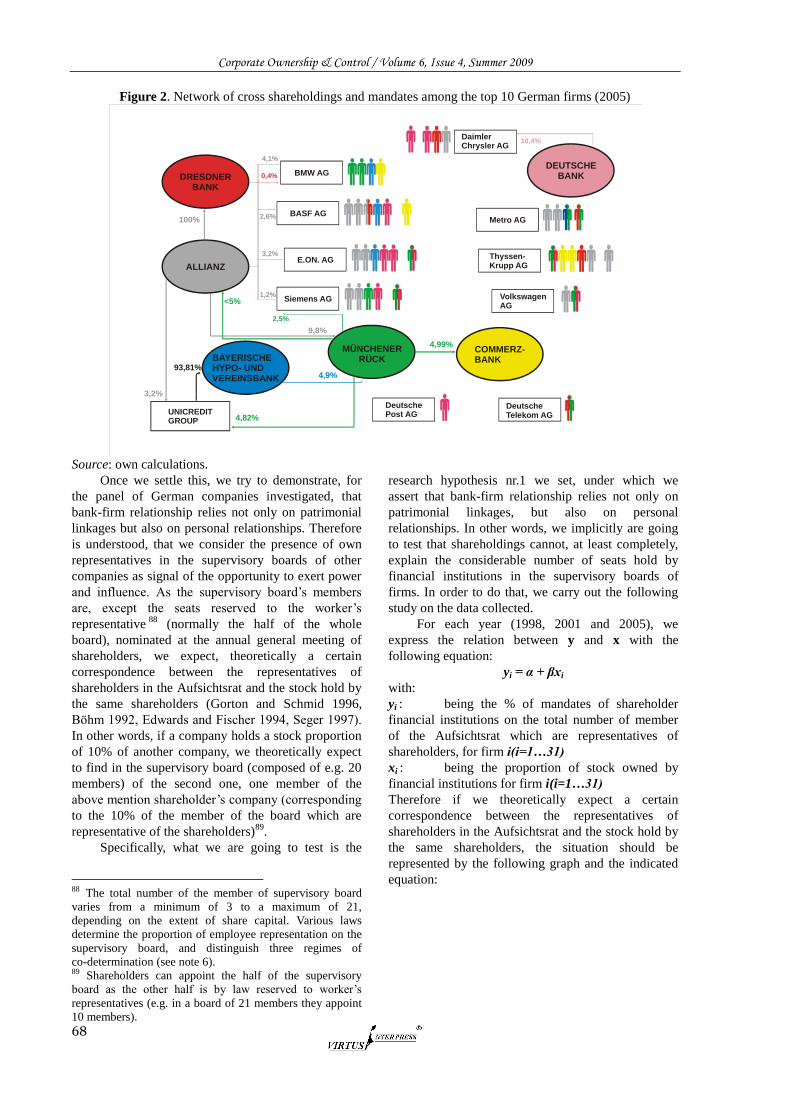
Corporate Ownership & Control / Volume 6, Issue 4, Summer 2009
68
Figure 2. Network of cross shareholdings and mandates among the top 10 German firms (2005)
DEUTSCHE BANK
MÜNCHENER RÜCKBAYERISCHE
HYPO- UND VEREINSBANK
COMMERZ-BANK
ALLIANZ
DRESDNERBANK
Siemens AG
DaimlerChrysler AG
Volkswagen AG
BMW AG
E.ON. AG Thyssen-Krupp AG
Deutsche Telekom AG
DeutschePost AG
Metro AGBASF AG
UNICREDITGROUP
4,9%93,81%
100%
4,99%
<5%
9,8%
3,2%
4,82%
10,4%
2,5%
1,2%
3,2%
2,6%
4,1%
0,4%
Source: own calculations.
Once we settle this, we try to demonstrate, for
the panel of German companies investigated, that
bank-firm relationship relies not only on patrimonial
linkages but also on personal relationships. Therefore
is understood, that we consider the presence of own
representatives in the supervisory boards of other
companies as signal of the opportunity to exert power
and influence. As the supervisory board‘s members
are, except the seats reserved to the worker‘s
representative88
(normally the half of the whole
board), nominated at the annual general meeting of
shareholders, we expect, theoretically a certain
correspondence between the representatives of
shareholders in the Aufsichtsrat and the stock hold by
the same shareholders (Gorton and Schmid 1996,
Böhm 1992, Edwards and Fischer 1994, Seger 1997).
In other words, if a company holds a stock proportion
of 10% of another company, we theoretically expect
to find in the supervisory board (composed of e.g. 20
members) of the second one, one member of the
above mention shareholder‘s company (corresponding
to the 10% of the member of the board which are
representative of the shareholders)89
.
Specifically, what we are going to test is the
88 The total number of the member of supervisory board
varies from a minimum of 3 to a maximum of 21,
depending on the extent of share capital. Various laws
determine the proportion of employee representation on the
supervisory board, and distinguish three regimes of
co-determination (see note 6). 89 Shareholders can appoint the half of the supervisory
board as the other half is by law reserved to worker‘s
representatives (e.g. in a board of 21 members they appoint
10 members).
research hypothesis nr.1 we set, under which we
assert that bank-firm relationship relies not only on
patrimonial linkages, but also on personal
relationships. In other words, we implicitly are going
to test that shareholdings cannot, at least completely,
explain the considerable number of seats hold by
financial institutions in the supervisory boards of
firms. In order to do that, we carry out the following
study on the data collected.
For each year (1998, 2001 and 2005), we
express the relation between y and x with the
following equation:
yi = α + βxi
with:
yi : being the % of mandates of shareholder
financial institutions on the total number of member
of the Aufsichtsrat which are representatives of
shareholders, for firm i(i=1…31)
xi : being the proportion of stock owned by
financial institutions for firm i(i=1…31)
Therefore if we theoretically expect a certain
correspondence between the representatives of
shareholders in the Aufsichtsrat and the stock hold by
the same shareholders, the situation should be
represented by the following graph and the indicated
equation:
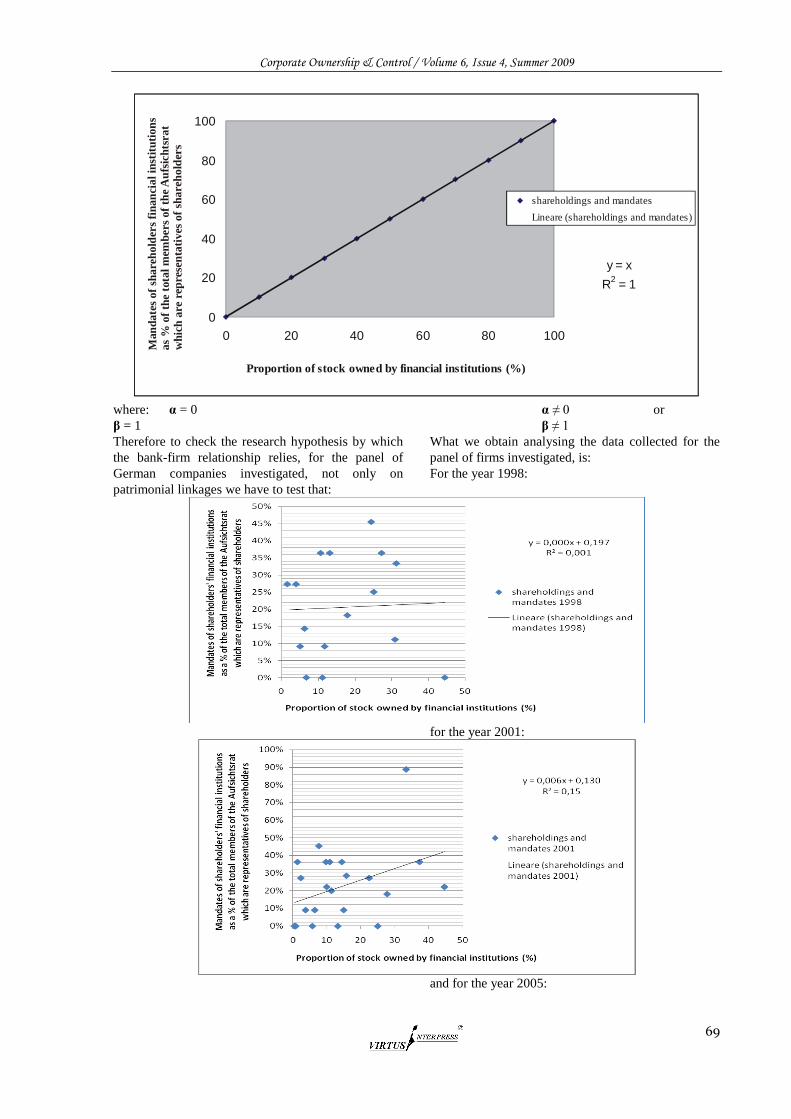
Corporate Ownership & Control / Volume 6, Issue 4, Summer 2009
69
y = x
R2
= 1
0
20
40
60
80
100
0 20 40 60 80 100
Proportion of stock owned by financial institutions (%)
shareholdings and mandates
Lineare (shareholdings and mandates)
Man
da
tes
of
sha
reh
old
ers
fin
an
cia
l in
stit
uti
on
s
as
% o
f th
e t
ota
l m
emb
ers
of
the
Au
fsic
hts
ra
t
wh
ich
are
rep
rese
nta
tiv
es o
f sh
are
ho
lder
s
where: α = 0
β = 1
Therefore to check the research hypothesis by which
the bank-firm relationship relies, for the panel of
German companies investigated, not only on
patrimonial linkages we have to test that:
α ≠ 0 or
β ≠ 1
What we obtain analysing the data collected for the
panel of firms investigated, is:
For the year 1998:
for the year 2001:
and for the year 2005:
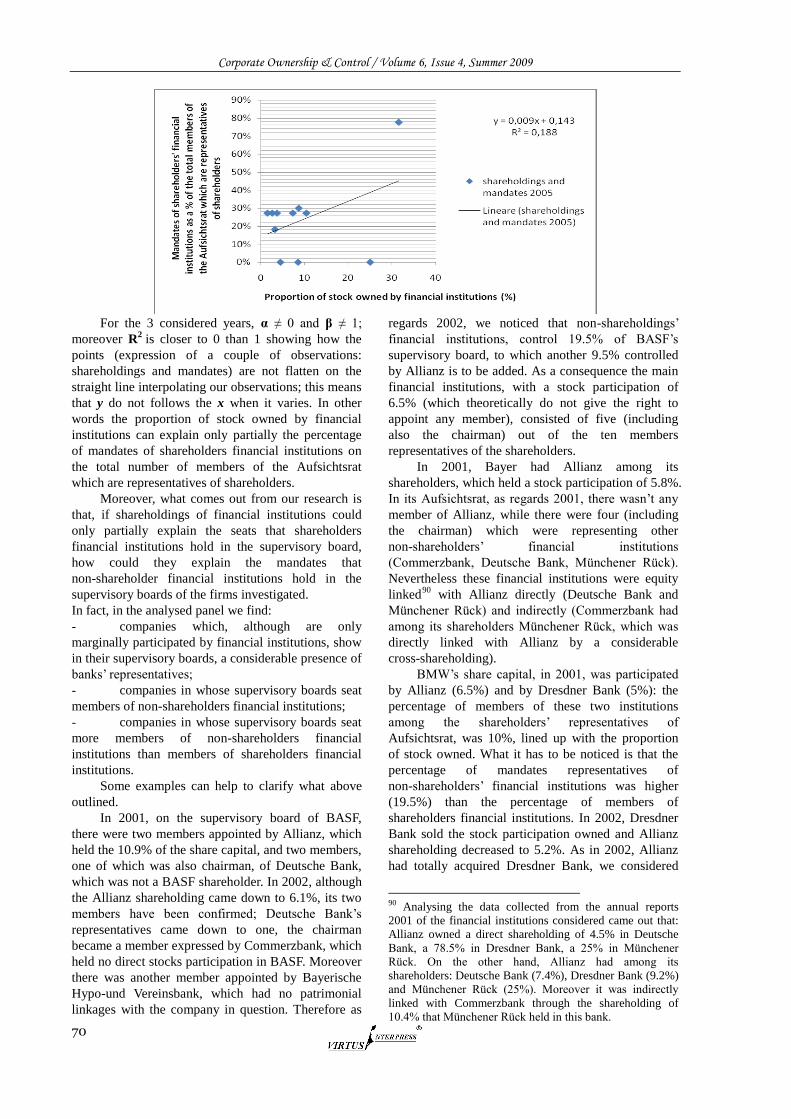
Corporate Ownership & Control / Volume 6, Issue 4, Summer 2009
70
For the 3 considered years, α ≠ 0 and β ≠ 1;
moreover R2
is closer to 0 than 1 showing how the
points (expression of a couple of observations:
shareholdings and mandates) are not flatten on the
straight line interpolating our observations; this means
that y do not follows the x when it varies. In other
words the proportion of stock owned by financial
institutions can explain only partially the percentage
of mandates of shareholders financial institutions on
the total number of members of the Aufsichtsrat
which are representatives of shareholders.
Moreover, what comes out from our research is
that, if shareholdings of financial institutions could
only partially explain the seats that shareholders
financial institutions hold in the supervisory board,
how could they explain the mandates that
non-shareholder financial institutions hold in the
supervisory boards of the firms investigated.
In fact, in the analysed panel we find:
- companies which, although are only
marginally participated by financial institutions, show
in their supervisory boards, a considerable presence of
banks‘ representatives;
- companies in whose supervisory boards seat
members of non-shareholders financial institutions;
- companies in whose supervisory boards seat
more members of non-shareholders financial
institutions than members of shareholders financial
institutions.
Some examples can help to clarify what above
outlined.
In 2001, on the supervisory board of BASF,
there were two members appointed by Allianz, which
held the 10.9% of the share capital, and two members,
one of which was also chairman, of Deutsche Bank,
which was not a BASF shareholder. In 2002, although
the Allianz shareholding came down to 6.1%, its two
members have been confirmed; Deutsche Bank‘s
representatives came down to one, the chairman
became a member expressed by Commerzbank, which
held no direct stocks participation in BASF. Moreover
there was another member appointed by Bayerische
Hypo-und Vereinsbank, which had no patrimonial
linkages with the company in question. Therefore as
regards 2002, we noticed that non-shareholdings‘
financial institutions, control 19.5% of BASF‘s
supervisory board, to which another 9.5% controlled
by Allianz is to be added. As a consequence the main
financial institutions, with a stock participation of
6.5% (which theoretically do not give the right to
appoint any member), consisted of five (including
also the chairman) out of the ten members
representatives of the shareholders.
In 2001, Bayer had Allianz among its
shareholders, which held a stock participation of 5.8%.
In its Aufsichtsrat, as regards 2001, there wasn‘t any
member of Allianz, while there were four (including
the chairman) which were representing other
non-shareholders‘ financial institutions
(Commerzbank, Deutsche Bank, Münchener Rück).
Nevertheless these financial institutions were equity
linked90
with Allianz directly (Deutsche Bank and
Münchener Rück) and indirectly (Commerzbank had
among its shareholders Münchener Rück, which was
directly linked with Allianz by a considerable
cross-shareholding).
BMW‘s share capital, in 2001, was participated
by Allianz (6.5%) and by Dresdner Bank (5%): the
percentage of members of these two institutions
among the shareholders‘ representatives of
Aufsichtsrat, was 10%, lined up with the proportion
of stock owned. What it has to be noticed is that the
percentage of mandates representatives of
non-shareholders‘ financial institutions was higher
(19.5%) than the percentage of members of
shareholders financial institutions. In 2002, Dresdner
Bank sold the stock participation owned and Allianz
shareholding decreased to 5.2%. As in 2002, Allianz
had totally acquired Dresdner Bank, we considered
90 Analysing the data collected from the annual reports
2001 of the financial institutions considered came out that:
Allianz owned a direct shareholding of 4.5% in Deutsche
Bank, a 78.5% in Dresdner Bank, a 25% in Münchener
Rück. On the other hand, Allianz had among its
shareholders: Deutsche Bank (7.4%), Dresdner Bank (9.2%)
and Münchener Rück (25%). Moreover it was indirectly
linked with Commerzbank through the shareholding of
10.4% that Münchener Rück held in this bank.
Corporate Ownership & Control / Volume 6, Issue 4, Summer 2009
71
the Dresdner‘s representatives as members appointed
by Allianz. For 2002, the position of the members of
Allianz on the supervisory board was unchanged. At
the same time, the position of non-shareholders‘
financial institutions appeared to be reinforced
(raising up to 23.5%). Analysing the situation from
the point of view of the shareholdings, the control
exertable by financial institutions appears as not
particularly remarkable (11.5% in 2001 and 5.2% in
2002); while taking into consideration the control they
are able to exert on corporate governance through the
control of the supervisory board, their position
appears to be noticeable (28.5% in 2001 and 35% in
2002).
Moreover, what is to be pointed out from the
three examples above described, is that the chairmen
of the Aufsichtsrat have been appointed by the
financial institutions, which are not shareholders of
the three companies.
These three examples are emblematic of the
widespread phenomenon in the German system by
which the main financial institutions are able to exert
influence and control on the main German industrial
firms. In fact, analysing91
the aggregated data of the
panel under evaluation, we notice that:
- as regards 1998, the six financial institutions,
holding directly on average the 2.7% of the share
capital (altogether considered) of the industrial
companies of the panel, appointed the 3.3% of the
part of the Aufsichtsrat reserved to the shareholders‘
representatives. To this percentage we can add another
6.5% of members that represent non-shareholders‘
financial institutions. Summarizing, the main financial
institutions owing on average a 2.7% stock proportion
of the industrial firms considered, express the 9.8% of
the seats reserved to the shareholders‘ representatives
on the supervisory boards (in other words nearly the
20% of the total number of members of the
Aufsichtsrat). Therefore, they are able to exert a
considerable influence and control on the boards of
these firms.
- as regards 2001, the six financial institutions,
holding directly on average the 3.2% of the share
capital (altogether considered) of the industrial
companies of the panel, appointed the 5.1% of the
part of the Aufsichtsrat reserved to the shareholders‘
representatives. To this percentage we can add another
10% of members that are representatives of
91 To analyse aggregated data of the panel, we calculate the
percentage of share capital owned by financial institutions
as a mean of all shareholdings they owned in the firms of
the panel. The percentage referred to the proportion of seats
of representatives of the financial institutions on supervisory
boards has been calculated as a mean of the number of seats
they hold (taking into consideration the double vote that the
chairman can exert, as though there was an additional
member on the board) on the total amount of member
representatives of shareholders of different boards.
non-shareholders‘ financial institutions. To summarize,
the main financial institutions owing on average a
3.2% stock proportion of the industrial firms
considered, express the 15.1% of the seats reserved to
the shareholders‘ representatives on the supervisory
boards (in other words nearly the 30% of the total
number of members of the Aufsichtsrat). Therefore
they are able to exert a considerable influence and
control on the boards of these firms.
- repeating the same calculations for 2005, we
noticed that: the six financial institutions, holding
altogether the 1.1% of the share capital of all
industrial firms, express the 12.4% of the members on
the supervisory board which are shareholders‘
representatives (of which 2.6% are representatives of
shareholders‘ financial institutions and 9.8% of
non-shareholder financial institutions). In other words
they can express nearly the 25% of the total members
of the Aufischtsrat92
.
To summarize, for the 3 considered years, the
proportion of voting rights, which the six financial
institutions can exert in the supervisory boards of the
industrial firms considered, is clearly higher (with a
multiplier set between 4 and 5)93
than the proportion
of stocks they directly own. Therefore, also
considering the results of the statistic test above
carried out, does not seem to be the shareholdings to
determine the proportion of voting rights that the
financial institutions are able to express in the
supervisory boards of the industrial firms considered.
The evidence resulting from the test and from
these last calculations showing a weak
correspondence between shareholdings and mandates,
require an explanation. In particular, we try to verify
if these results are to be attributed to proxy voting‘s
phenomenon, that we could not analyse, or to other
factors, that are peculiar of the German institutional
model (see note 22).
The fact that financial institutions can express a
higher proportion of members in the supervisory
boards than the one they are expected to control
according to their shareholdings, can be justify by the
exercise of proxy voting. As already said our study
could not quantify this aspect because banks are not
obliged to disclose the votes casted on behalf of their
92 Our results are lined up to what was obtained by
Charkham (1995) and Andreani (2003), who assert that
analysis carried out on different samples and in different
years show as a result that banks‘ representatives seated on
the supervisory boards of industrial firms are about 20% of
all seats of the Aufsichtsrat. 93 This multiplier has been calculated as a ratio between the
proportion of stock owned by the financial institutions and
the proportion of voting rights they can express (through
their representatives) on the part of the Aufsichtsrat which is
expression of shareholders‘ representatives (instead,
considering the last proportion on the total number of the
members of the supervisory board, the same multiplier will
be set from 4 and 5).
Corporate Ownership & Control / Volume 6, Issue 4, Summer 2009
72
clients94
.
Nevertheless we assert that this aspect, by its
own, cannot explain the founded out misalignments.
This on basis of two considerations:
- On the one hand, a study carried out by
Edwards and Nibler (2000) of the University of
Cambridge, on the German model of corporate
governance and specifically on the aspect of
ownership concentration, provides empirical evidence
of the poor relevance of the phenomenon of proxy
voting. Their research takes into consideration 156
companies among the main German industrial firms
for turnover of 1992, aiming at finding any
correspondence between proxy voting and the
considerable presence of banks‘ representatives on the
supervisory boards of German firms. The regression
analysis they carried out explains this relation only
partially: they conclude that noticeable presence of
banks representatives cannot be interpreted
exclusively as a reflection of the control that financial
institutions exert on voting rights at annual general
meetings. Moreover, as other authors point out
(Westermann 1996), the practice of delegating voting
rights to banks without specific instructions is bound
to reappraise (Martin 2004), also considering the
recent law disposals (KonTraG and AktG reform). As
a consequence, as regards the years 1998-2005,
Depotstimmrechte should be of less importance in
comparison to what can be noticed in a study carried
out at the beginning of the nineties.
- On the other hand, the weak correspondence
we noticed between mandates and shareholdings
regards not only banks but also insurance companies.
For example, considering the composition of the
supervisory boards of Metro, Thyssen-Krupp and
Volkswagen, we noticed how in their boards seat
representatives of Allianz and Münchener Rück,
which do not hold any stock proportion in these firms.
As Allianz and Münchener Rück are insurance
companies, the presence of their representatives on
these supervisory boards cannot be explained by
proxy votes, because only banks can be delegated by
their client to exert these rights on their behalf.
Taking into consideration what has been said
above, we assert that the explanation of the
considerable presence of representatives of financial
institutions on the supervisory boards of other
companies is not to be found in proxy voting, but
elsewhere.
In our opinion, the strong and stable ties, both
patrimonial and personal, which traditionally
characterize the relationships among the six main
German financial institutions, have a dominant role in
94 Banks do not have to report their delegated voting rights
as, according to § 135 V and § 128 II, the banks have to
consult shareholders when casting votes on their behalf and
have to follow their instructions. Therefore, theoretically,
banks cannot exert them on discretionary basis.
explaining the composition of the supervisory boards
of industrial firms. This network of relationships
among financial institutions is reflected on the
industrial sector, showing the considerable influence
the financial sector is able to exert on the latter. These
assertions need to be clarified.
On the one hand, it‘s necessary to specify that,
when we talk about linkages, we do not refer
exclusively to the equity ones, and in particular to the
cross-shareholdings which traditionally and still
characterize the German system. Obviously the
cross-shareholdings help to explain the phenomenon
described (considerable presence of banks‘
representatives on the supervisory boards of other
companies), but under this point of view we noticed
how the presence of representatives of
non-shareholders‘ companies could be explained by
other equity linkages they have with other
shareholders of the company in question.
Moreover, we have to point out the considerable
role that personal relationships have among members
of the supervisory board of these institutions. The
habit of sharing the seats on the boards of other
companies with representatives of other financial
institutions, and of keeping at the top organs of the
company members, who have participated in the
company management for a long time95
(Hopt and
Prigge 1998), has led to the establishment of
significant personal relationships among managers
which are part of a close network (Pfannschmidt 1993,
Leimkühuler 1996). These linkages persist with time,
independently of the existence of a cross-shareholding.
For example, companies such as Volkswagen,
Daimler Chrysler and Thyssenkrupp, maintain the
composition of their supervisory board unaltered,
having banks‘ representatives seated on them, also
after the shareholders‘ financial institutions have sold
their equity participations.
On the other hand, to emphasise the control
exerted by the main financial institutions, taken as a
whole; the network of relationships rather than single
positions of one financial institution is to be pointed
out. The German bank-firm relationship is based on a
network of tightly joined financial institutions, which
together exert a considerable influence on industrial
companies. In fact, as table 6 shows, a single financial
institution rarely is in the position to exert a dominant
role of control on a company.
The fact that this potential exertable influence
will become effective depends on the eventuality that
these financial institutes express a common position.
In our opinion the presence on the supervisory boards
95 This fact is confirmed also in a study carried out by
Korn-Ferry International (1996), which states that, in almost
43% of the companies, at least one member of the board of
management (normally the managing director), after retiring
from the role filled on that board, became a member (often
the chairman) of the supervisory board.
Corporate Ownership & Control / Volume 6, Issue 4, Summer 2009
73
of most of the analysed firms of representatives of
these non-shareholders‘ institutions, which are
indirectly linked to shareholders‘ institutions, seems
to be a sign that this common position has been found
in reality.
The fact that the main financial institutions
express a common position of considerable
importance does not mean that they necessarily exert
control on industrial firms. What we would like to
point out is that the German banking system,
according to the German culture marked by
co-decision and consensus-research (Albert 1991,
Onetti 2001), represents, as a whole, an important
interlocutor for German firms. Nevertheless German
companies, also taking into consideration the
positions expressed by these stakeholders, make their
strategic and management decisions essentially in
autonomy.
5. Conclusion
One of the main traditional features that the
researchers generally attribute to the German national
capitalism model is the system of relationships
between financial institutions and between these and
the main industrial companies.
This system has supported and led the German
industrialization, contributing to create and maintain a
stable industrial basis (Velo 1996). The system of
cross-shareholdings, guaranteed to firms stable
ownership and continuity in corporate management.
At the same time, it allowed financial institutions to
gain a substantial control‘s power on industrial
companies and led to the creation of a network of
personal relationships, not always clear, among a
restricted number of managers of different companies.
Moreover cross-holdings served as restraints of
competition in the market for corporate control.
The recent changes, we noticed occurred in the
German model, indicate a certain trend towards a
market-oriented system.
In particular, some important functions of banks
in the corporate governance of firms are changing.
The main traditional mean of control they have on
industrial system (through shareholdings) is loosing
its importance. German banks, in order to face global
competition in a financial market becoming more and
more wide, integrated and competitive, are selling
their shareholdings in the industry. Nevertheless, the
process of reduction of their equity portfolio does not
seem to be stood by a reappraisal of the control they
are able to exert through their representatives in the
supervisory board of the German industrial companies
analysed, which is in our opinion still relevant.
The study carried out prove that bank-firm
relationship do not only rely, for the panel of firms
investigated, on patrimonial linkages. In other words
the proportion of stock owned by financial institutions
(2.7% in 1998 and 1.1% in 2005) can explain only
partially the considerable and slightly increasing
percentage of bankers seated on the supervisory
boards of the firms in the panel (20% in 1998 and
25% in 2005). Moreover, it has been shown that
bankers are mostly represented on the supervisory
boards of the top 10 German firms, showing the
important role that banks and insurance companies
maintains in the corporate governance of such firms.
Limits of our empirical research are various. To
mention someone:
- The fact that we could not take into
consideration the proxy votes, as already said, which
could help to explain the non correspondence between
the proportions of stocks owned by financial
institutions and the percentage of members they can
appoint on the supervisory boards of the firms
analysed;
- The sample analysed refers to big German
companies, the Mittelstand has not been taken into
consideration in the present study, but conscious of
the importance to add such a comparison to the
analysed data to provide a much more complete
picture of German corporate governance, we can say
that this will be one of our future research interests.
Concluding, is our opinion that the explanation of the
considerable presence of banks representatives in the
supervisory boards of other companies, is to be found
in the personal linkages that are the peculiar feature of
the German bank-industry relationship. This type of
relationship, despite many regulatory and structural
changes occurred in the German model, won‘t change,
at least in the short time, because it is expression of
the culture of co-decision and co-responsibility deeply
rooted in the German insitutional system of
governance (Shonfield 1965, Albert 1991, de Jong
1997, Warglien 1997, Hacketal et al. 2003).
References
1. Adams M. (1999), Cross holdings in Germany,
Journal of institutional and theoretical economics,
155(1), pp. 80-109.
2. Albert M. (1991), Capitalisme contre capitalisme,
Paris, Editions du Seuil.
3. Albert M. (1998), Quale futuro per il modello renano?,
in: Arcelli M. (ed.), Globalizzazione dei mercati e
orizzonti del capitalismo, Roma-Bari, Laterza, pp.
47-70.
4. Albert M. (2001), Capitalismo contro capitalismo.
Dieci anni dopo, Il Mulino, 395(3), pp. 383-395.
5. André T.J. (1996), Some Reflections on Corporate
Governance: A Glimpse at German Supervisory
Boards, Tul. L. Rev., 70, pp. 1819-79.
6. Andreani E. (2003), Il rapporto tra banche ed imprese
in Germania: consigli di sorveglianza delle grandi
banche tedesche, e il ruolo dei rappresentanti delle
grandi imprese, Banca Impresa e Società, XXII(3), pp.
Corporate Ownership & Control / Volume 6, Issue 4, Summer 2009
74
321-353.
7. Baliga S. and Polak B. (2004), The Emergence and
Persistence of the Anglo-Saxon and German
Financial System, The Review of Financial Studies,
17(1).
8. Banfi A., Locatelli R. and Schena C. (1991), Il
sistema finanziario tedesco, Bologna, Il Mulino.
9. Baums T. (1993), Corporate Governance in Germany,
System and recent developments, Universität
Osnabrück, Paper presented at the Corporate
Governance Forum on Dec. 10, Stockholm.
10. Baums T. (1993), The German Banking System and its
Impacts on Corporate Finance and Governance,
Arbeitspapier 2/93, Institut für Handels- und
Wirtschaftsrecht der Universität Osnabrück.
11. Baums T. (1993), Macht von Banken und
Versicherungen - Stellungnahme für den
Wirtschaftsausschuß des Deutschen Bundestages -,
Arbeitspapier 10/93, Institut für Handels- und
Wirtschaftsrecht der Universität Osnabrück.
12. Baums T. (1995), Vollmachtstimmrecht der Banken –
Ja oder Nein?, Arbeitspapier 8/95, Institut für
Handels- und Wirtschaftsrecht der Universität
Osnabrück.
13. Baums T. (1999), Il sistema di corporate governance
in Germania e i suoi recenti sviluppi, Rivista delle
Società, 44(1), pp. 1-19.
14. Baums T. and Fraune C. (1994), Institutionelle
Anleger und Publikumsgesellschaft: Eine empirische
Untersuchung, Arbeitspapier 6/94, Institut für
Handels- und Wirtschaftsrecht der Universität
Osnabrück.
15. Baums T. and Schmitz R. (1998), Shareholder voting
in Germany, Arbeitspapier 76, Institut für Handels-
und Wirtschaftsrecht der Universität Osnabrück.
16. Becht M. and Boehmer E. (2003), Voting control in
German corporations, International Review of Law
and Economics, 23:29.
17. Beyer J. (2002), Deutschland AG a. D.: Deutsche
Bank, Allianz und das Verflechtungszentrum großer
deutscher Unternehmen, MPIfG Working Paper 02/4.
18. Boehmer E. (1998), Who controls Germany? An
exploratory analysis, Arbeitspapier 71, Institut für
Handels- und Wirtschaftsrecht der Universität
Osnabrück.
19. Boehmer E. (1999), Corporate governance in
Germany: Institutional background and empirical
results, Arbeitspapier 78, Institut für Handels- und
Wirtschaftsrecht der Universität Osnabrück.
20. Boehmer E. and Becht M. (1999), Transparency of
Ownership and Control in Germany, Arbeitspapier 69,
Institut für Handels- und Wirtschaftsrecht der
Universität Osnabrück.
21. Böhm J. (1992), Der Einfluß der banken auf
Großunternehmen, Dissertation University of
Duisburg, Hamburg.
22. Börner C. J. (2000), Allfinanz, neue Bankvertiebswege
und Resource–based view, Mitteilung und Berichte
des Instituts für Bankwirtschaft und Bankrecht an der
Universität zu Köln, 31(83).
23. Boschma R.A. (2005), Proximity and Innovation: A
Critical Assessment, Regional Studies, 39(1), pp.
61-74.
24. Buck T., Sharim A. and Winter S. (2004), Executive
Stock Options in Germany: The Diffusion or
Translation of US-Style Corporate Governance?,
Journal of Management and Governance, 8(1).
25. Charkham J. (1989), Corporate Governance and the
Market for Corporate Control of Companies, Bank of
England Panel Paper, 25.
26. Charkham J. (1994), Germany, in: Keeping Good
Company: A Survey of Corporate Governance in Five
Countries, Oxford, Oxford University Press.
27. Comolli M. (2002), I sistemi di controllo interno nella
corporate governance, Milano, Egea.
28. Creditreform (2004), Insolvenzen, Neugründungen
und Löschungen – Eine Untersuchung zur
Unternehmensentwicklung der Creditreform
Wirtschafts- und Konjunkturforschung, Neuss,
Verband der Vereine Creditreform e. V.
29. de Jong H.K. (1997), The Governace Structure and
Performance of Large European Corporations,
Journal of Management and Governance, 1(1), pp.
5-27.
30. Deeg R. (1998), What makes german banks different,
Small Business Economics, 10(2), pp. 93-101.
31. Deutsche Bundesbank, Bankenstatistik, ―Statistisches
Beiheft zum Monatsbericht‖, August 2003.
32. Deutsche Bundesbank, Bankenstatistik, Statistisches
Beiheft zum Monatsbericht, July 2007.
33. Dherment-Ferere I., Köke J. and Renneboog L. (2001),
Corporate monitoring by blockholders in Europe:
empirical evidence of managerial disciplining in
Belgium, France, Germany and the UK, ZEW-
Zentrum für die Europäisches Wirtschaftsrecht,
Discussion Paper 01-24.
34. Easterbrook F.H. (1991), The economic structure of
corporate law, Cambridge, Harvard University Press.
35. Edwards J.S.S. and Fischer K. (1994), Banks, Finance
and Investment in Germany, Cambridge, Cambridge
University Press.
36. Edwards J. and Nibler M. (2000), Corporate
governance in Germany: the role of banks and
ownership concentration, Economic Policy, 15(31),
pp. 239-267.
37. Ehrentreich N. and Schmidt R. (2002), Situation and
Trends in the German Corporate Governance System,
Betriebwirtschaftliche Discussionsbeiträge 44/02,
Halle, Wirtschaftswissenschaftliche Fakultät der
Martin-Luther-Universität Halle-Wittenberg.
38. Emmons W.R. and Schmid F.A. (1998), Universal
Banking, Allocation of Control Rights, and Corporate
Finance in Germany, working paper 1998-001A,
Federal Reserve Bank of St. Louis.
39. Figge J. (1992), Mitbestimmung auf
Unternehmensebene in Vorschläge der Europäischen
Corporate Ownership & Control / Volume 6, Issue 4, Summer 2009
75
Gemeinschaften, Baden-Baden, Nomos.
40. Franks J. and Meyer C. (1990), Takeovers: Capital
Markets and Corporate Control: A Study of France,
Germany and the UK, Economic Policy: A European
Forum, 10, 189-231.
41. Franks J. and Meyer C. (1998), Ownership and
Control in Europe, in: Newman, P (ed.), New
Palgrave Dictionary of Economics and the Law,
Palgrave Publishers Ltd, 1998.
42. Fohlin C. (2005), The History of Corporate
Ownership and Control in Germany, in: Morck R.
(ed.), The History of Corporate Governance: Family
Business Groups and Professional Managers, Chicago,
NBER and University of Chicago Press
(forthcoming).
43. Gall L., Feldman G.D., James H., Holtfrerich C.L. and
Büschgen H.E. (1995), The Deutsche Bank 1870-1995,
London, Weidenfeld & Nicolson.
44. Gerschenkron A. (1968), The Modernization of the
Entrepreneurship, in: Gerschenkron A. (ed.),
Continuity and History and Other Essays, Cambridge,
Harvard University Press.
45. Gessler Kommission (1979), Grundsatzfragen der
Kreditwirtschaft: Bericht der Studienkommission,
Schriftenreihe des BMF, 28.
46. Goergen M., Manjon M.C. and Renneboog L. (2004),
Recent Developments in German Corporate
Governance, ECGI Finance Working Paper 41/2004.
47. Gorton G. and Schmid F.A. (1996), Universal Banking
and the Performance of Germany Firms, NBER
Working Paper 5453, Cambridge.
48. Gorton G. and Schmid F.A. (2002), Class Struggle
inside the Firm: A Study of German Codetermination,
Working Paper 2000-025B, Federal Reserve Bank of
St. Louis.
49. Gros-Pietro G.M., Reviglio E. and Torrisi A. (2001),
Assetti proprietari e mercati finanziari europei,
Bologna, Il Mulino.
50. Großl L. (1989), Banking Groups in the Federal
Republic of Germany and their relationship with
industrial companies, Research Papers in Banking and
Finance 90/27, Institute of European Finance.
51. Gottschalk A. (1988), Der Stimmrechteinfluß der
Banken in den Aktionärsversammlungen von
Großunternehmen, WSI Mitteilungen, 5,
Hans-Böckler-Stiftung.
52. Guatri L. and Vicari S. (1994), Sistemi d‘impresa e
Capitalismi a Confronto, Milano, Egea.
53. Hackethal A. Schmidt R. and Tyrell M. (2003),
Corporate Governance in Germany: Transition to a
Modern Capital Market-Based System?, Journal of
Institutional and Theoretical Economics, 149, pp.
664-674.
54. Hansen H. (1994), Das Gewicht der Banken in den
Aufsichträten deutscher Aktiengesellschaften, Die
Aktiengesellschaften, 39.
55. Heinze T. (2003), Dynamics in the German System of
Corporate Governance? Empirical Findings
regarding Interlocking Directorates, Economy and
Society, 33.
56. Hilferding R. (1910), Das Finanzkapital. Eine Studie
über die jüngste Entwicklung des Kapitalismus, Wien,
Wiener Volksbuchhandlung.
57. Hirte H. (2003), L‟evoluzione del diritto delle imprese
e delle società in Germania negli anni 1998-1999,
Rivista delle Società, 48(2-3), pp. 587-641.
58. Hirte H. and Pfeifer U. (2002), L‟evoluzione del
diritto delle imprese e delle società in Germania negli
anni 1996-1997, Rivista delle Società, 47(2-3), pp.
667-764.
59. Hohmann-Dennhardt C. (1980),
Entscheidungsstrukturen im Unternehmen und
Arbeitnehmerinteressen, Baden-Baden, Nomos.
60. Höpner M. and Jackson G. (2001), An Emerging
Market for Corporate Control? The Mannesmann
Takeover and German Corporate Governance, MPIfG
Discussion Paper 01/4.
61. Höpner M. and Krempel L. (2003), The Politics of the
German Company Network, MPIfG Working Paper
03/9.
62. Hopt K.J. (2003), Direzione dell‟impresa, controllo e
modernizzazione del diritto azionario: la relazione
della Commissione governativa tedesca sulla
corporate governance, Rivista delle Società, 48(1), pp.
183-229.
63. Hopt K.J., Kanda H., Roe M.J. Wymeersch E. and
Prigge S. (1998), Comparative Corporate governance
– The State of the Art and Emerging Research, Oxford,
Oxford University Press.
64. Jensen M. and Meckling W. (1979), Rights and
Production Functions: An application to
Labor-Managed firms and Co-determination, Journal
of Business, 52(4), pp. 469-506.
65. Jensen M. and Meckling W. (1976), Theory of the
firm: managerial behaviour, agency costs and
ownership structure, Journal of Financial Economics
3(4), pp. 305-60.
66. Jürgens U. and Rupp J. (2002), The German System of
Corporate Governance, Characteristics and Changes,
Veröffentlichungsreihe der Abteilung Regulierung von
Arbeit des Forschungsschwerpunkts
Technick-Arbeit-Umwelt des Wissenschafts-zentrum
Berlin für Sozialforschung, FS II 02-203.
67. Jürgens U., Rupp J. and Vitols K. (2000), Corporate
Governance and Shareholder Value in Deutschland,
Veröffentlichungsreihe der Abteilung Regulierung von
Arbeit des Forschungsschwerpunkts
Technick-Arbeit-Umwelt des Wissenschafts-zentrum
Berlin für Sozialforschung, FS II 00-202.
68. Kier M. (2002), Die Kontrolle der
Publikumsgesellschaft durch Ihre Aktionäre –
Überlegungen zu einer Reform des
Depotstimmrechtes, Dissertation –
Rechtwirtschaftliche Fakultät der Westfälischen
Wilhelms-Universität zu Münster.
Corporate Ownership & Control / Volume 6, Issue 4, Summer 2009
76
69. Kirat T. and Lung Y. (1999), Innovation and proximity.
Territories as loci of collective learning process,
European Urban and Regional Studies, 6(1), pp. 27-39.
70. Knauer S. (2003), Neuregelung des Depotstimmrechts
nach dem KonTraG, praktische Bewährung und
weitere Reformbedürftigkeit, Peter Lang –
Europäischer Verlag der Wissenschaften.
71. Köke F.J. (1999), New Evidence on Ownership
Structure in Germany, ZEW-Zentrum für die
Europäisches Wirtschaftsrecht, Discussion Paper
99-66.
72. Korn-Ferry International (1996), Board Meeting in
Session. European Board of Directors Study.
73. Korn-Ferry International (2003), Board Praktiken in
Europa: eine 30-järige evolution.
74. Kregel J. (1997), Il governo delle banche: la
Germania, in Proprietà, controllo e governo delle
banche, supplemento al nr. 197 di Moneta e Credito,
BNL Edizioni.
75. Lai A. (1997) (ed.), I rapporti tra impresa e lavoro:
esperienze collaborative in Francia, Germania e
Italia, Milano, Egea.
76. Leimkühler C. (1996), Ist die öffentliche Kritik am
deutschen Aufsichtsratssystem gerechtfertigt?
Empirische Untersuchung über die personellen
Verflechtungen zwischen den Vorständen und
Aufsichtsräten der in Deutschland börsennotierten
Aktiengesellschaften, Die Wirtschaftsprüfung 49, pp.
305-13.
77. Limentani R. (2003), Evoluzione del rapporto
banca-impresa: dalla Hausbank al financial service
advisor, Banca Impresa e Società, XXII(1), pp. 23-38.
78. Lomi A. (1991), Reti organizzative – Teoria, tecnica e
applicazioni, Bologna, Il Mulino.
79. Lovato G. (1988), Il 1992 è una sfida impegnativa
anche per le banche tedesche, Bancaria, 4, pp. 7-12.
80. Lurz M.A. (1993), I finanziamenti agli enti locali in
Germania – La situazione attuale, le prospettive future
ed il posizionamento nel mercato della B.f.G. Bank AG,
in: Velo D. (ed.), Il finanziamento degli enti locali
nell‟unione economico-monetaria europea, Milano,
Giuffrè.
81. Lutter M. (2003), Una introduzione al Codice tedesco
di corporate governance, Rivista delle Società, 48(1),
pp. 231-236.
82. Manow P. (2001), Globalization, Corporate Finance,
and Coordinated Capitalism: Pension Finance in
Germany and Japan, MPIfG Working Paper 01/5.
83. Martin K. (2004), The German System of Financing
and Corporate Governance – On the way from a
bank-based to a market-based model?, Luiss-Ceradi
Articoli, August.
84. Mayer M. and Whittington R. (2004), Economics,
Politics and Nations: Resistance to the Multidivisional
Form in France, Germany and the United Kingdom,
1983-1993, Journal of Management Studies, 41(7).
85. Merkt H. (2002), Die Rolle des Kapitalmarktrechts in
der Diskussion um die Corporate Governance,
ZEW-Zentrum für die Europäisches Wirtschaftsrecht,
Discussion Paper 129.
86. Meyer-Larsen W. (1999), Germany, Inc.: The New
German Juggernaut and Its Challenge to World
Business, Wiley & Sons.
87. Müller H. (1986), Mitbestimmung im Aufsichtrat und
Kontrolle der Unternehmenspolitik, Frankfurt a.M.,
Peter Lang.
88. Nardozzi G. (1983), Tre sistemi creditizi. Banche ed
economia in Francia, Germania e Italia, Bologna, Il
Mulino.
89. Onetti A. (2001), Subsidiarity as an organisational
principle. The non-profit experience in Germany, The
European Union Review, 6(1-2), pp. 47-76.
90. Osservatorio Giordano Dell‘amore (1993), Le
strutture del capitalismo e l‟impresa nella società
contemporanea, Congresso Internazionale, Milano,
18-20 marzo.
91. Owen Smith E. (1994), The german economy, London,
Routledge.
92. Pfannschmidt A. (1993), Personelle Verflechtungen
über Aufsichtsräte, Mehrfachmandate in deutschen
Unternehmen, Dissertation University of Bonn,
Wiesbaden.
93. Porter M.E. (1992), Capital Disadvantage: America‟s
Failing Capital Investment System, Harvard Business
Review, 70(5), pp. 65-82.
94. Porter M.E. and Sölvell Ö. (1998), The Role of
Geography in the Process of Innovation and the
Sustainable Competitive Advantage of Firms, in:
Chandler Jr. A.D., Hagström P. and Sölvell Ö. (eds.),
The Dynamic Firm. The Role of Technology, Strategy,
Organization, and Regions, Oxford University Press.
95. Schmid F.A. and Wahrenburg M. (2002), Mergers and
Acquisitions in Germany, Working Paper 2002-027A,
Federal Reserve Bank of St. Louis.
96. Schmidt H.J.D., Prigge S., Schuler A. and Tetens G.
(1997), Corporate Governance in Germany,
Baden-Baden Nomos Verlagsgesellschaft.
97. Schüler M. (2004), Integrated Financial Supervision
in Germany, ZEW-Zentrum für Europäische
Wirtschaftsforschung, Discussion Paper 04-35.
98. Seger F. (1997), Banken, Erfolg und Finanzierung.
Eine Analyse für deutsche Unternehmen, Dissertation
University of Mannheim 1996, Wiesbaden.
99. Shonfield A. (1965), Modern Capitalisms. The
Changing Balance of Public and Private Power,
London, Oxford University Press.
100. Tilly R. (1969), Germany, 1815-1870, in: Cameron R.,
Crisp O., Patrick H. and Tilly R. (eds.), Banking in the
Early Stages of Industrialization: A Study in
Comparative Economic History, New York, Oxford
University Press.
101. Thurow L. (1992), Head to head : the coming
economic battle among Japan, Europe and America,
New York, William Morrow and Company.
102. Velo D. (1996), La specificità del caso italiano nelle
esperienze europee, in: Beretta S. and Bianchi P.
Corporate Ownership & Control / Volume 6, Issue 4, Summer 2009
77
(eds.), Cambiamento delle istituzioni e nuovo sviluppo
in Italia e in Europa, Bologna, Il Mulino.
103. Warglien M. (1997), Presentation, Journal of
Management and Governance, 1(1), pp. 1-4.
104. Weimer J. and Pape J. (1999), A Taxonomy of System
of Corporate Governance, Corporate Governance: An
International Review, 7(2), pp. 152-166.
105. Weimer W. (1998), Deutsche Wirtschaftsgeschichte.
Von der Währungsreform bis zum Euro, Hamburg,
Hoffmann und Campe.
106. Westermann H.P. (1996), Vollmachtstimmrecht und
Streubesitzaktionäre in der Hauptversammlung
deutscher Aktiengesellschaften, in: Feddersen D.,
Hommelhoff P. and Schneider U.H. (eds.), Corporate
Governance. Optimierung der Unternehmensführung
und der Unternehmenskontrolle im deutschen und
amerikanischen Aktienrecht, Köln, Otto Schmidt, pp.
264-86.
107. Windolf P. and Beyer J. (1995), Kooperativer
Kapitalismus. Unternehmensverflechtungen im
internationalen Vergleich, Kölner Zeitschrift für
Soziologie und Sozialpsycologie, 47(1), pp. 1-36.
108. Witt P. (2004), The Competition of International
Corporate Governance System – A German
Perspective, Management International Review, 44(3),
pp. 309-333.
109. Wójcik D. (2001), Change in the German model of
Corporate Governance – Evidence from
blockholdings 1997-2001, Oxford, University of
Oxford.
Corporate Ownership & Control / Volume 6, Issue 4, Summer 2009
78
THE IMPACT OF PROBLEM LOAN, OWNERSHIP STRUCTURE, AND MARKET STRUCTURE UPON THE BANK PERFORMANCE
Andy Chein*
Abstract
Some research on the causes of bank failure finds that failing institutions had large proportions of problem loans prior to failure, and that the extra costs of administering these loans reduced the bank performance. At this moment, if bank management goes after maximizing one’s utility, not the bank performance, in addition confronting from rising competitive environment, it would be quite dangerous. So, this article studies the impact of problem loan, ownership structure, and market structure upon the bank performance with the basis of cost efficiency. Empirical results show that problem loan, ownership structure, and market structure have a significant effect upon the bank performance.
Keywords: problem loan, ownership structure, market structure National Kaohsiung First University of Science and Technology, Kaohsiung, Taiwan Email: [email protected]
Tel: 886-7-6011000#3111; Fax: 886-7-6011039
1.Introduction
For the dramatic changes of financial environment,
rising competition in the banking services has been
spurred on by deregulation. After the government
agency opening new bank chartering in 1991, the
intensity of competition has grown to make banks
face a far heavier burden. Hence, how to improve
ones‘ operating efficiency to confront big challenge in
the future should be the most important and urgent
mission for the banks. But, the relevant literatures
often put the direction of main research in the
measurement of the bank performance, but
infrequently focus upon the factor influencing
performance. So, this paper tries to fill up the above
deficiency through the determinants of banks
performance.
The quality of making loans in recent years was
confronting some deterioration, and the adverse
situation may make the bank management expend
more cost to deal with. Hence, how the problem loan
affect bank performance will be an important issue to
explore. Because the studies about the ownership
structure influencing bank performance are diverse, so
this paper attempts to comprehend the possibility that
the CEO can reconcile the benefit between principal
and agent. The traditional literature point out the bank
with high market concentration, its profit could be
relatively high. But, some articles cast doubt on this
argument and develop a contrary opinion. When the
trend of consolidation is growing, this study seeks to
find out the impact that the banks may suffer due to
the rising market concentration.
This article modifies the stochastic frontier
production model of Schmidt and Sickles (1984) and
Cornwell et al. (1990), and transforms it into a
stochastic frontier dual cost model. Thus, the model is
mainly expressed as the function of problem loan,
ownership structure, and market structure.
2.Literature
Quite a lot of studies probe into the performance of
the bank. Farrell (1957) pioneers the frontier concept
into the production function. Farrell defines the
efficient production function (or frontier) and
recognizes the output that a perfectly efficient firm
could obtain from any given combination of inputs.
That means if a perfectly efficient firm uses the same
input proportion, it can achieve the maximum output
in its production frontier and takes the value of 100
per cent. But, the efficiency will become indefinitely
small if the amounts of input per unit output become
indefinitely large. Forsund et al. (1980) divide the
frontier studies into the four empirical models:
deterministic nonparametric frontier approach,
deterministic parametric frontier approach,
deterministic statistical frontier approach, and
stochastic frontier approach.
The representative method of deterministic
nonparametric frontier approach is data envelopment
analysis (DEA). The merit of DEA is no need to
specify the form of the production function. However,
a crucial weakness of DEA is that it neglects the
influence of random error. The deterministic
parametric frontier approach estimates the parameters
Corporate Ownership & Control / Volume 6, Issue 4, Summer 2009
79
through the specification of the production function,
but it does not make special statistical assumption to
the random error. The deterministic statistical frontier
approach makes assumption to the random error in
order to get a statistical property of estimates, but may
result in some bias if the assumption is wrong. The
stochastic frontier approach specifies a functional
form but with an error term including random error
and inefficiency.
Schmidt and Sickles (1984) use fixed effect and
random effect model to estimate a stochastic frontier
production function with panel data in an attempt to
solve three serious difficulties that stochastic frontier
approach may suffer. Cornwell et al. (1990) revise
slightly to the above way. And, their approach can
estimate time-varying efficiency levels for individual
firms without invoking strong distributional
assumptions for technical inefficiency or random
noise. Because the stochastic frontier approaches of
Schmidt and Sickles (1984) and Cornwell et al.
(1990) are better than the other efficiency
measurement ways, this paper uses them as the basis
of the empirical model. Considering the multi-product
characteristics of banks, so the paper modifies the
stochastic frontier production function with panel data
to the stochastic frontier dual cost function with panel
data. The dual cost function adopts a transcendental
logarithmic (translog) model to allow the substitution
elasticity of input factor being flexible.
Mester (1993) applies the logit regression
method to investigate efficiency in mutual stock and
stock S&Ls using 1991 data on U.S. S&Ls. But, the
result shows that the problem loans do not have
significant influence on the cost efficiency. Berger
and DeYoung (1997) employ Granger-causality
techniques to test hypotheses regarding the
relationships among loan quality, cost efficiency, and
bank capital. The data suggest that problem loans
precede reductions in measured cost efficiency.
Besides, a number of researchers find that failing
banks tend to have large proportions of problem loans.
So this study tries to examine the relationship
between problem loans and bank performance.
Pi and Timme (1993) utilize the ordinary least
squares to find an inconsistent relationship between
cost efficiency and CEO ownership for the bank
holding companies from 1987-1990. Berger and
Hannan (1998) utilize ordinary least squares and two
stage least squares methods to probe into the impact
of board ownership on cost efficiency for the bank
holding companies from 1980-1989. But, there is no
obvious relation to exist between both of board
ownership and cost efficiency. Because the result of
academic topic on the ownership structure and bank
cost efficiency is diverse, so this paper tries to explore
linearity and nonlinearity among the ownership
structure and cost efficiency. Besides, this study takes
CEO ownership, board of directors ownership, and
major shareholders equity as the proxy variables of
ownership structure.
According to the analysis of the traditional
structure-conduct-performance(SCP) such as
Heggestad (1977), Short (1979) and Hannan (1991),
the banks with higher market concentration obtain
more profit. Berger and Humphrey (1997) give
explanation that it may be due to market-power
explanations in which banks in concentrated markets
exercise market power in pricing and earn
supernormal profits. However, Berger and Hannan
(1998) find the banks with higher market
concentration, their cost efficiency is lower instead.
This phenomenon can be explained by the quote from
Hicks (1935): the best of all monopoly profits is a
quiet life. It means that the banks with higher market
concentration may prefer to pursue a ―quiet life‖ than
to maximize operating efficiency within a less
competitive pressure. So, this paper seeks to study the
relationship between the market structure and cost
efficiency of banks. In addition, this article takes
market concentration and market share, as the proxy
variables of market structure.
3.Methodology 3.1.Hypothesis
Hypothesis 1: The problem loan has a negative
relationship with bank performance.
According to Berger and DeYoung (1997), after
the loans becoming past due or nonaccruing, the bank
begins to expend extra costs to deal these problem
loans. Under this circumstance, one can expect
increases in nonperforming loans to cause decreases
in measured cost efficiency.
Hypothesis 2-1: The CEO ownership structure has a
nonlinear relationship with banks performance.
Hypothesis 2-2: The board of directors ownership
structure has a nonlinear relationship with banks
performance.
The convergence-of-interests hypothesis
suggests a uniformly positive relationship between
management ownership and firm value, but the
entrenchment hypothesis suggests that market
valuation can be adversely affected for some range of
high ownership stakes. Thus, Stulz (1988) predict a
nonlinear relationship between management
ownership and market valuation of the firm‘s assets.
And, Morck et al. (1988) support the above
prediction.
Hypothesis 2-3: The major shareholders equity has a
positive relationship with banks performance.
According to the viewpoint of Berle and Mean
(1932) and Jensen and Meckling (1976), there may
exist a positive relationship between main
shareholders ownership concentration and cost
efficiency. Since the agency cost will decline as major
shareholders equity increases.
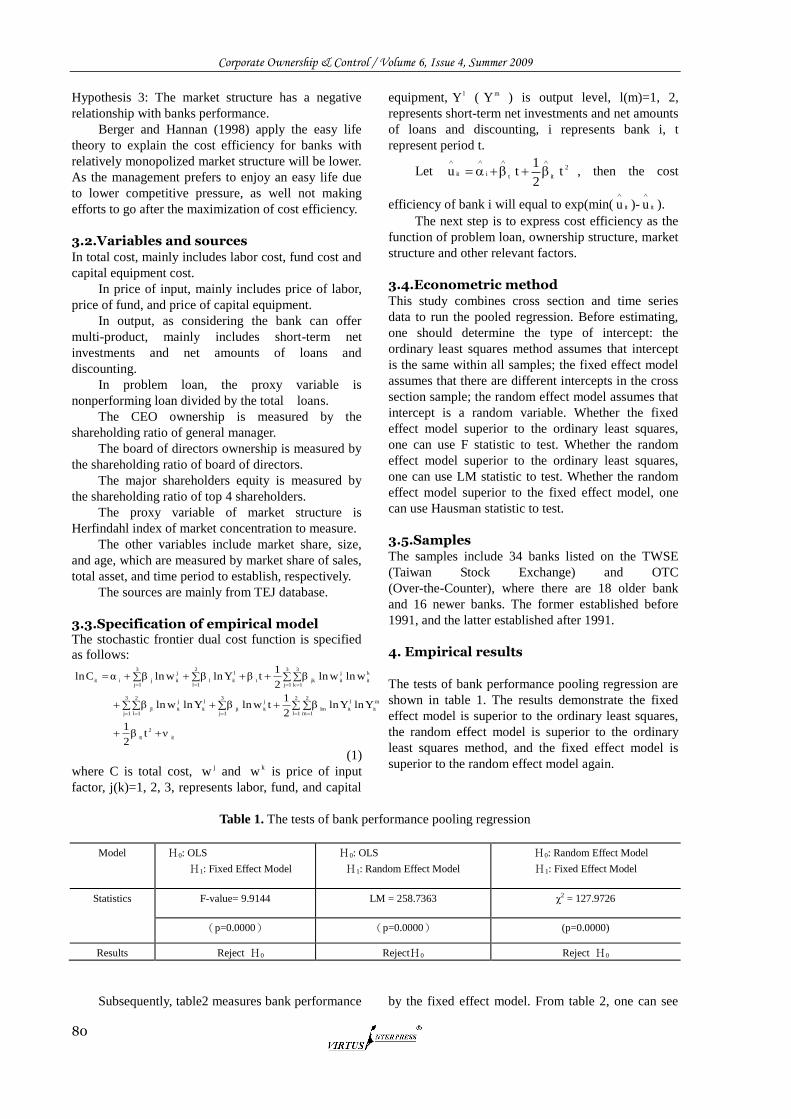
Corporate Ownership & Control / Volume 6, Issue 4, Summer 2009
80
Hypothesis 3: The market structure has a negative
relationship with banks performance.
Berger and Hannan (1998) apply the easy life
theory to explain the cost efficiency for banks with
relatively monopolized market structure will be lower.
As the management prefers to enjoy an easy life due
to lower competitive pressure, as well not making
efforts to go after the maximization of cost efficiency.
3.2.Variables and sources In total cost, mainly includes labor cost, fund cost and
capital equipment cost.
In price of input, mainly includes price of labor,
price of fund, and price of capital equipment.
In output, as considering the bank can offer
multi-product, mainly includes short-term net
investments and net amounts of loans and
discounting.
In problem loan, the proxy variable is
nonperforming loan divided by the total loans.
The CEO ownership is measured by the
shareholding ratio of general manager.
The board of directors ownership is measured by
the shareholding ratio of board of directors.
The major shareholders equity is measured by
the shareholding ratio of top 4 shareholders.
The proxy variable of market structure is
Herfindahl index of market concentration to measure.
The other variables include market share, size,
and age, which are measured by market share of sales,
total asset, and time period to establish, respectively.
The sources are mainly from TEJ database.
3.3.Specification of empirical model The stochastic frontier dual cost function is specified
as follows:
it
2
tt
m
it
l
it
2
1l
2
1mlm
j
it
3
1jjt
l
it
j
it
3
1j
2
1ljl
k
it
j
it
3
1j
3
1kjkt
l
it
2
1ll
j
it
3
1jjiit
νtβ2
1
YlnYlnβ2
1twlnβYlnwlnβ
wlnwlnβ2
1tβYlnβwlnβαCln
(1)
where C is total cost, jw and kw is price of input
factor, j(k)=1, 2, 3, represents labor, fund, and capital
equipment, lY ( mY ) is output level, l(m)=1, 2,
represents short-term net investments and net amounts
of loans and discounting, i represents bank i, t
represent period t.
Let 2
ittiit t2
1tu
, then the cost
efficiency of bank i will equal to exp(min( itu
)- itu
).
The next step is to express cost efficiency as the
function of problem loan, ownership structure, market
structure and other relevant factors.
3.4.Econometric method This study combines cross section and time series
data to run the pooled regression. Before estimating,
one should determine the type of intercept: the
ordinary least squares method assumes that intercept
is the same within all samples; the fixed effect model
assumes that there are different intercepts in the cross
section sample; the random effect model assumes that
intercept is a random variable. Whether the fixed
effect model superior to the ordinary least squares,
one can use F statistic to test. Whether the random
effect model superior to the ordinary least squares,
one can use LM statistic to test. Whether the random
effect model superior to the fixed effect model, one
can use Hausman statistic to test.
3.5.Samples The samples include 34 banks listed on the TWSE
(Taiwan Stock Exchange) and OTC
(Over-the-Counter), where there are 18 older bank
and 16 newer banks. The former established before
1991, and the latter established after 1991.
4. Empirical results
The tests of bank performance pooling regression are
shown in table 1. The results demonstrate the fixed
effect model is superior to the ordinary least squares,
the random effect model is superior to the ordinary
least squares method, and the fixed effect model is
superior to the random effect model again.
Table 1. The tests of bank performance pooling regression
Model H0: OLS
H1: Fixed Effect Model
H0: OLS
H1: Random Effect Model
H0: Random Effect Model
H1: Fixed Effect Model
Statistics F-value= 9.9144 LM = 258.7363 χ2 = 127.9726
(p=0.0000) (p=0.0000) (p=0.0000)
Results Reject H0 RejectH0 Reject H0
Subsequently, table2 measures bank performance by the fixed effect model. From table 2, one can see
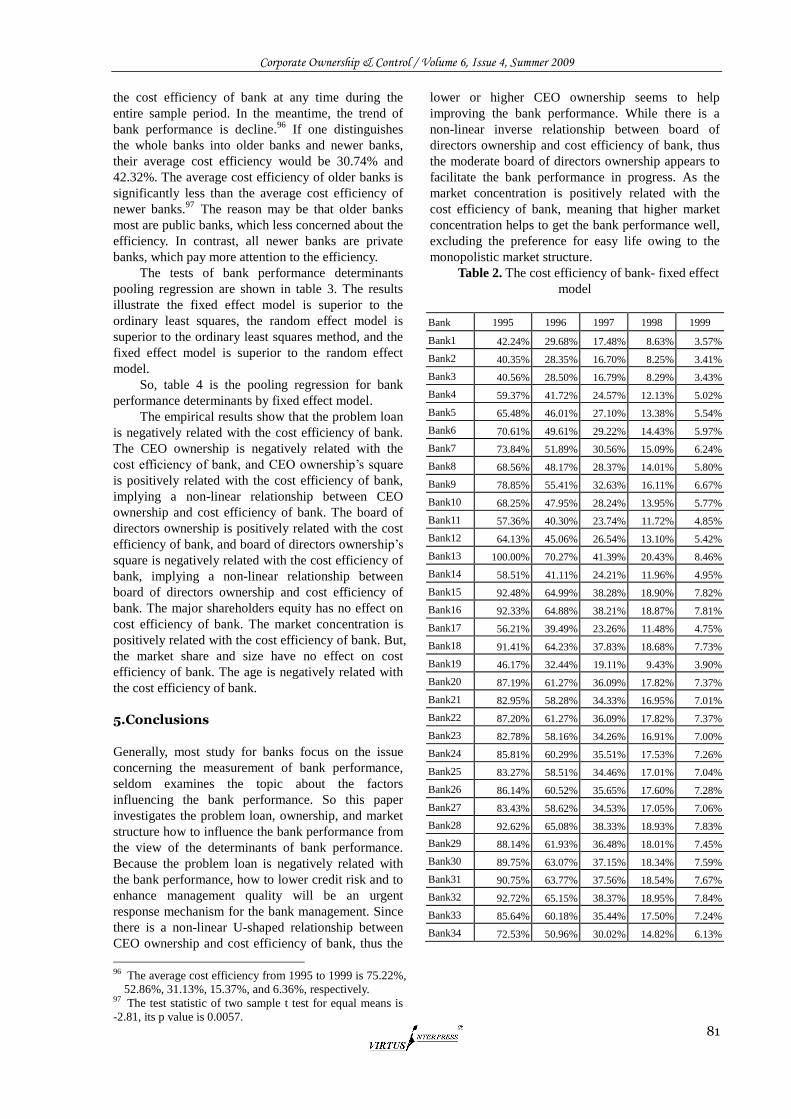
Corporate Ownership & Control / Volume 6, Issue 4, Summer 2009
81
the cost efficiency of bank at any time during the
entire sample period. In the meantime, the trend of
bank performance is decline.96
If one distinguishes
the whole banks into older banks and newer banks,
their average cost efficiency would be 30.74% and
42.32%. The average cost efficiency of older banks is
significantly less than the average cost efficiency of
newer banks.97
The reason may be that older banks
most are public banks, which less concerned about the
efficiency. In contrast, all newer banks are private
banks, which pay more attention to the efficiency.
The tests of bank performance determinants
pooling regression are shown in table 3. The results
illustrate the fixed effect model is superior to the
ordinary least squares, the random effect model is
superior to the ordinary least squares method, and the
fixed effect model is superior to the random effect
model.
So, table 4 is the pooling regression for bank
performance determinants by fixed effect model.
The empirical results show that the problem loan
is negatively related with the cost efficiency of bank.
The CEO ownership is negatively related with the
cost efficiency of bank, and CEO ownership‘s square
is positively related with the cost efficiency of bank,
implying a non-linear relationship between CEO
ownership and cost efficiency of bank. The board of
directors ownership is positively related with the cost
efficiency of bank, and board of directors ownership‘s
square is negatively related with the cost efficiency of
bank, implying a non-linear relationship between
board of directors ownership and cost efficiency of
bank. The major shareholders equity has no effect on
cost efficiency of bank. The market concentration is
positively related with the cost efficiency of bank. But,
the market share and size have no effect on cost
efficiency of bank. The age is negatively related with
the cost efficiency of bank.
5.Conclusions
Generally, most study for banks focus on the issue
concerning the measurement of bank performance,
seldom examines the topic about the factors
influencing the bank performance. So this paper
investigates the problem loan, ownership, and market
structure how to influence the bank performance from
the view of the determinants of bank performance.
Because the problem loan is negatively related with
the bank performance, how to lower credit risk and to
enhance management quality will be an urgent
response mechanism for the bank management. Since
there is a non-linear U-shaped relationship between
CEO ownership and cost efficiency of bank, thus the
96 The average cost efficiency from 1995 to 1999 is 75.22%,
52.86%, 31.13%, 15.37%, and 6.36%, respectively. 97 The test statistic of two sample t test for equal means is
-2.81, its p value is 0.0057.
lower or higher CEO ownership seems to help
improving the bank performance. While there is a
non-linear inverse relationship between board of
directors ownership and cost efficiency of bank, thus
the moderate board of directors ownership appears to
facilitate the bank performance in progress. As the
market concentration is positively related with the
cost efficiency of bank, meaning that higher market
concentration helps to get the bank performance well,
excluding the preference for easy life owing to the
monopolistic market structure.
Table 2. The cost efficiency of bank- fixed effect
model
Bank 1995 1996 1997 1998 1999
Bank1 42.24% 29.68% 17.48% 8.63% 3.57%
Bank2 40.35% 28.35% 16.70% 8.25% 3.41%
Bank3 40.56% 28.50% 16.79% 8.29% 3.43%
Bank4 59.37% 41.72% 24.57% 12.13% 5.02%
Bank5 65.48% 46.01% 27.10% 13.38% 5.54%
Bank6 70.61% 49.61% 29.22% 14.43% 5.97%
Bank7 73.84% 51.89% 30.56% 15.09% 6.24%
Bank8 68.56% 48.17% 28.37% 14.01% 5.80%
Bank9 78.85% 55.41% 32.63% 16.11% 6.67%
Bank10 68.25% 47.95% 28.24% 13.95% 5.77%
Bank11 57.36% 40.30% 23.74% 11.72% 4.85%
Bank12 64.13% 45.06% 26.54% 13.10% 5.42%
Bank13 100.00% 70.27% 41.39% 20.43% 8.46%
Bank14 58.51% 41.11% 24.21% 11.96% 4.95%
Bank15 92.48% 64.99% 38.28% 18.90% 7.82%
Bank16 92.33% 64.88% 38.21% 18.87% 7.81%
Bank17 56.21% 39.49% 23.26% 11.48% 4.75%
Bank18 91.41% 64.23% 37.83% 18.68% 7.73%
Bank19 46.17% 32.44% 19.11% 9.43% 3.90%
Bank20 87.19% 61.27% 36.09% 17.82% 7.37%
Bank21 82.95% 58.28% 34.33% 16.95% 7.01%
Bank22 87.20% 61.27% 36.09% 17.82% 7.37%
Bank23 82.78% 58.16% 34.26% 16.91% 7.00%
Bank24 85.81% 60.29% 35.51% 17.53% 7.26%
Bank25 83.27% 58.51% 34.46% 17.01% 7.04%
Bank26 86.14% 60.52% 35.65% 17.60% 7.28%
Bank27 83.43% 58.62% 34.53% 17.05% 7.06%
Bank28 92.62% 65.08% 38.33% 18.93% 7.83%
Bank29 88.14% 61.93% 36.48% 18.01% 7.45%
Bank30 89.75% 63.07% 37.15% 18.34% 7.59%
Bank31 90.75% 63.77% 37.56% 18.54% 7.67%
Bank32 92.72% 65.15% 38.37% 18.95% 7.84%
Bank33 85.64% 60.18% 35.44% 17.50% 7.24%
Bank34 72.53% 50.96% 30.02% 14.82% 6.13%
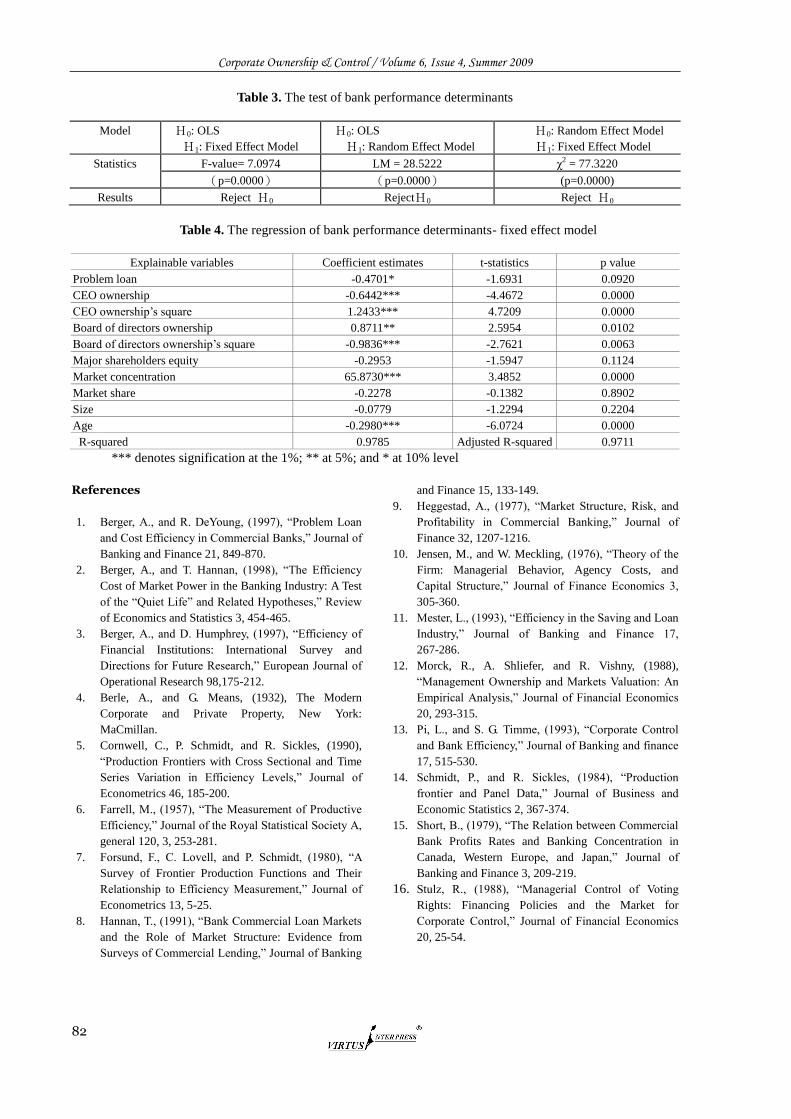
Corporate Ownership & Control / Volume 6, Issue 4, Summer 2009
82
Table 3. The test of bank performance determinants
Model H0: OLS
H1: Fixed Effect Model
H0: OLS
H1: Random Effect Model
H0: Random Effect Model
H1: Fixed Effect Model
Statistics F-value= 7.0974 LM = 28.5222 χ2 = 77.3220
(p=0.0000) (p=0.0000) (p=0.0000)
Results Reject H0 RejectH0 Reject H0
Table 4. The regression of bank performance determinants- fixed effect model
Explainable variables Coefficient estimates t-statistics p value
Problem loan -0.4701* -1.6931 0.0920
CEO ownership -0.6442*** -4.4672 0.0000
CEO ownership‘s square 1.2433*** 4.7209 0.0000
Board of directors ownership 0.8711** 2.5954 0.0102
Board of directors ownership‘s square -0.9836*** -2.7621 0.0063
Major shareholders equity -0.2953 -1.5947 0.1124
Market concentration 65.8730*** 3.4852 0.0000
Market share -0.2278 -0.1382 0.8902
Size -0.0779 -1.2294 0.2204
Age -0.2980*** -6.0724 0.0000
R-squared 0.9785 Adjusted R-squared 0.9711
*** denotes signification at the 1%; ** at 5%; and * at 10% level
References
1. Berger, A., and R. DeYoung, (1997), ―Problem Loan
and Cost Efficiency in Commercial Banks,‖ Journal of
Banking and Finance 21, 849-870.
2. Berger, A., and T. Hannan, (1998), ―The Efficiency
Cost of Market Power in the Banking Industry: A Test
of the ―Quiet Life‖ and Related Hypotheses,‖ Review
of Economics and Statistics 3, 454-465.
3. Berger, A., and D. Humphrey, (1997), ―Efficiency of
Financial Institutions: International Survey and
Directions for Future Research,‖ European Journal of
Operational Research 98,175-212.
4. Berle, A., and G. Means, (1932), The Modern
Corporate and Private Property, New York:
MaCmillan.
5. Cornwell, C., P. Schmidt, and R. Sickles, (1990),
―Production Frontiers with Cross Sectional and Time
Series Variation in Efficiency Levels,‖ Journal of
Econometrics 46, 185-200.
6. Farrell, M., (1957), ―The Measurement of Productive
Efficiency,‖ Journal of the Royal Statistical Society A,
general 120, 3, 253-281.
7. Forsund, F., C. Lovell, and P. Schmidt, (1980), ―A
Survey of Frontier Production Functions and Their
Relationship to Efficiency Measurement,‖ Journal of
Econometrics 13, 5-25.
8. Hannan, T., (1991), ―Bank Commercial Loan Markets
and the Role of Market Structure: Evidence from
Surveys of Commercial Lending,‖ Journal of Banking
and Finance 15, 133-149.
9. Heggestad, A., (1977), ―Market Structure, Risk, and
Profitability in Commercial Banking,‖ Journal of
Finance 32, 1207-1216.
10. Jensen, M., and W. Meckling, (1976), ―Theory of the
Firm: Managerial Behavior, Agency Costs, and
Capital Structure,‖ Journal of Finance Economics 3,
305-360.
11. Mester, L., (1993), ―Efficiency in the Saving and Loan
Industry,‖ Journal of Banking and Finance 17,
267-286.
12. Morck, R., A. Shliefer, and R. Vishny, (1988),
―Management Ownership and Markets Valuation: An
Empirical Analysis,‖ Journal of Financial Economics
20, 293-315.
13. Pi, L., and S. G. Timme, (1993), ―Corporate Control
and Bank Efficiency,‖ Journal of Banking and finance
17, 515-530.
14. Schmidt, P., and R. Sickles, (1984), ―Production
frontier and Panel Data,‖ Journal of Business and
Economic Statistics 2, 367-374.
15. Short, B., (1979), ―The Relation between Commercial
Bank Profits Rates and Banking Concentration in
Canada, Western Europe, and Japan,‖ Journal of
Banking and Finance 3, 209-219.
16. Stulz, R., (1988), ―Managerial Control of Voting
Rights: Financing Policies and the Market for
Corporate Control,‖ Journal of Financial Economics
20, 25-54.
Corporate Ownership & Control / Volume 6, Issue 4, Summer 2009
83
INFORMATION SHARES: EMPIRICAL EVIDENCE FROM THE FTSE CHINA A50 INDEX AND THE ISHARES FTSE A50 CHINA TRACKER
Yih-Wenn Laih*, Chun-An Li**
Abstract We study the price discovery process and common factor weights of SS50 (the FTSE China A50 Index traded in Mainland China) and A50 (the iShares FTSE A50 China Tracker traded in Hong Kong) using daily open-to-open price pairs and close-to-close price pairs. Due to Qualified Domestic Institutional Investor (QDII) scheme (13 April 2006) and US subprime mortgage crisis (middle 2007), our sample, which covers from November 18, 2004 to October 31, 2008, is divided into three periods. We find A50 has a much larger common factor weight than SS50, and A50 dominants for both open and close prices during all periods. The QDII enlarges the contribution of SS50, but financial crisis reduces it. Keywords: corporate governance, stock market, China
* Corresponding author
1 Ling Tung Road, 40852 Taichung Taiwan R.O.C.
phone: +886+968064403, fax: +886+4+27056896
e-mail: [email protected]
**Dept. of Finance, National Yunlin University of Science and Technology
1. Introduction
Price discovery is a dynamic process of finding
equilibrium price. In a perfectly integrated system, all
markets impound information simultaneously, such
that prices adjust to a new equilibrium with no lag. In
fact, different market structures uniquely affect
processing of incoming information, each security
design distinguished from others by the speed at
which it digests new information. Consequently, one
security may be more capable of registering impact of
new information than another, although both are
based on the same underlying asset. Once venue or
security design is known to dominate the price
discovery process, it is possible to infer that who are
the most informed traders and what is the nature and
source of their informational advantage.
This article examines price discovery and
common factor weights of the FTSE China A50 Index
(traded in Mainland China‘s stock market; hereafter
SS50) and the iShares FTSE A50 China Tracker
(traded in Hong Kong‘s stock market; hereafter A50)
using daily open-to-open price pairs and
close-to-close price pairs. SS50 is designed to
represent performance of the largest firms in China‘s
stock markets and consists of 50 of the largest liquid
Chinese companies. Securities in the Index are
weighted by total market value of their shares, so
those with higher total market value generally have
higher representation in the Index, all of whose
securities are traded on Shanghai and Shenzhen Stock
Exchanges. A50, a sub-fund of iShares Asia Trust, is
an exchange traded fund (ETF) established in Hong
Kong; its objective is to track performance of SS50.
The fund does not directly hold A-shares but rather
Chinese A-shares Access Products (CAAPs) issued by
a Qualified Foreign Institutional Investor (QFII). The
QFII is a scheme which allows qualified foreign
financial institutions to trade Chinese A shares via
special accounts opened at designated custodian bank.
On November 5, 2002, the China Securities
Regulatory Commission and the People‘s Bank of
China introduced the QFII program to provide a
means for foreign capital to access China‘s financial
markets. A CAAP is a security (such as a warrant,
note or participation certificate) linked to an A-share,
which synthetically replicates the economic benefit of
the relevant A-share that is traded on the Shanghai or
Shenzhen stock exchange. Each CAAP constitutes a
direct, general and unsecured contractual obligation of
the CAAP issuer, and subject to counterparty risk.
China‘s stock exchanges are relatively new
players among the world‘s financial markets. Official
Shanghai Stock Exchange (SHSE) and Shenzhen
Stock Exchange were established in December 1990
and July 1991, respectively. Since that time, they have
expanded rapidly in terms of capitalization, turnover,
and number of firms listed. The market capitalization
of the SHSE was 10,093.5 billion RMB (about
US$1,477.8 billion) in November 2008, 81.6% of
total market capitalization in all Chinese stock
markets. It is obvious that the SHSE plays a dominant
Corporate Ownership & Control / Volume 6, Issue 4, Summer 2009
84
role in Chinese stock market, which is also the reason
why the FTSE China A50 Index is selected for this
study.
The SHSE and Hong Kong Stock Exchange
(HKSE) are order-driven markets using electronic
trading without market makers. Both markets have a
lunch break at midday, between the morning and
afternoon trading sessions, which are thoroughly
continuous from opening to close of trading. Morning
session of SHSE is from 9:30 to 11:30, its afternoon
session from 13:00 to 15:00. HKSE trades
10:00-12:30 and 14:30-16:00. There are some
differences in trading rules, such as price limit, tick
size and short-selling restriction. Finally, like many
other emerging markets, SHSE has a relatively
immature infrastructure: e.g., inadequate disclosure,
opaque legal and governance framework,
inexperienced regulator. Co-existence of the latter
with a limited number of informed investors with
financial strength, plus enormous member of
uninformed and unprotected investors with budget
constraint, gives informed investors an opportunity to
manipulate stock prices to earn a profit at the expense
of uninformed investors (Lu and Lee, 2004).
As one of the most successful financial
innovations in the past two decades, ETFs are popular
and growing rapidly in global markets. ETFs have
characteristics of both closed-end funds and open-end
funds. They offer possible tax benefits compared to
open-end mutual funds. Since ETFs are not actively
managed and managers do not need to sell some of
the underlying securities when demand for ETFs
decreases, they rarely have capital gains distributed to
investors. Hence they provide a tax advantage over
mutual funds with lower trading costs. Furthermore,
introduction of ETFs also improves the price
formation efficiency of underlying securities. Chu et
al. (1999) employ Gonzalo and Granger (1995)
common factor weight model to investigate the price
discovery function of S&P 500 index markets and
propose four hypotheses to explain why index
products should contribute to the price discovery
process based on market microstructure information
models. The main idea is that prices reflect new
information through the trading of informed traders; a
particular market that informed traders prefer should
lead other markets. Four hypotheses are: (1) leverage
hypothesis, which predicts that informed traders tend
to trade in higher leveraged markets to generate
higher returns than lower leveraged markets with the
same amount of capital; (2) trading cost hypothesis,
which states that informed traders are more likely to
trade in a market with lower transaction costs; (3)
trading restriction hypothesis, which predicts that
informed traders prefer a market with fewer
restrictions; and (4) market information hypothesis,
which states that informed traders tend to trade
baskets of securities in order to avoid adverse
selection risk (Subrahmanyam, 1991). Thus, index
funds should dominate price discovery relative to
individual component stocks.
Here we use SS50 as a proxy for Chinese
domestic investors‘ assessment, A50 as a proxy for
foreign investors‘ assessment, and employ Gonzalo
and Granger‘s (1995) common factor weight model to
compute information dominant between SS50 and
A50 to find price discovery contribution. We divide
our study into periods: [I] A50 was listed on the
HKSE to enforce Qualified Domestic Institutional
Investor (QDII) scheme (from November 18, 2004 to
April 12, 2006); [II] after QDII but before US
subprime mortgage crisis (from April 13, 2006 to June
30, 2007); and [III] after the subprime mortgage crisis
(from July 1, 2007 to October 31, 2008). The QDII is
a capital market scheme allowing financial
institutions in Mainland China to invest in offshore
markets such as securities and bonds in Hong Kong.
One goal is to probe common factor weights between
assessments of domestic and foreign investors, using
matched daily open-to-open price pairs and
close-to-close price pairs. A second is to observe the
difference of common factor weights during these
three periods.
The rest of the paper is organized as follows.
Section 2 introduces and discusses empirical models.
Section 3 describes data. Section 4 reports and
analyses empirical results. Section 5 offers some
conclusions.
2. Methodology
We utilize formal econometric models regarding price
discovery and common factor weights for a relation
between SS50 and A50. First, we specify empirical
vector error-correction model (VECM). Next, we use
the common factor weight model of Gonzalo and
Granger (1995) to estimate common factor weights of
variables.
2.1. Vector error-correction model We formulate the long-term equilibrium relationship
between variables:
p
i
p
i
titiititt ASZS1 1
111111
p
i
p
i
titiititt ASZA1 1
222122
where tS and tA indicate changes in natural
logs of SS50 and A50, respectively. Optimal
lag-length of VECM is determined using the modified
Schwartz Information Criteria (MSIC). We use
Johansen‘s (1991, 1995) methodology to test how
many co-integration vectors span cointegration space.
1tZ is the lagged log-level of each variable in the
cointegrating equation estimated by Johansen‘s
Corporate Ownership & Control / Volume 6, Issue 4, Summer 2009
85
methodology.
2.2. Common factor weight model Based on VECM, Gonzalo and Granger (1995)
proposed a decomposition model for the common
factor in the cointegration system. As suggested by
Stock and Watson (1988), I(1) cointegrated series can
be portrayed by a common factor model:
Yt = θft + tY~
,
where Yt is the vector of variables considered: i.e., Yt
=(SS50t, A50t)‘; θ is a loading matrix; ft is a vector of
I(1) common stochastic trends; and tY~
is a vector of
I(0) transitory components. Following Johansen‘s
framework, Gonzalo and Granger showed the
common factor given by
ft ='
Yt,
where α⊥ is a matrix of full rank orthogonal to the
error correction matrix α. Let matrix X
=1
uuX uvX 1
vvX vuX , where X is a
variance-covariance matrix for residual vectors from
ordinary least squares regression; and subscripts u and
v denote the level and first-difference regression,
respectively. By solving eigenvalues 1̂ > 2̂ > …
> n̂ and corresponding eigenvectors 1m̂ , 2m̂ ,
…, nm̂ of matrix X, satisfying M̂ ‘X M̂ = I where
M̂ = ( 1m̂ , 2m̂ , …, nm̂ ), we find maximum
likelihood estimator for the long-run common factor
is now α⊥ = ( 1ˆ
rm , …, nm̂ ), where r is the number of
cointegration relations in the system, as found in the
Johansen approach. Specifically, ft ='
Yt indicates
common factor as linear combination of all
cointegrated variables, where coefficients of α⊥
determine the weights of variables. A variable with
greater weight contributes more to a common factor
and moves more closely with common long-run
stochastic trend. Gonzalo and Granger developed a χ2
distributed test statistic for examining whether any
individual series represents a common stochastic
trend. If χ2 test shows the variable having greatest
weight is weighted more significantly than the other
variables, this variable can be viewed as dominant.
3. Data Description and Sample Description 3.1. Data description Interday data used in this study come from two
sources. Daily quote data for SS50 is from the Taiwan
Economic Journal (TEJ) China stock markets
database, A50 from Datastream Hong Kong stock
market files. This study covers from November 18,
2004 to October 31, 2008. On April 13, 2006, the
Beijing government announced the QDII scheme,
letting Chinese institutions and residents entrust
Chinese commercial banks to invest in financial
products overseas, limited to fixed-income and money
market products. In mid-2007, both markets suffered
from the US subprime mortgage crisis. We divide our
sample as: [I] from November 18, 2004 to April 12,
2006; [II] from April 13, 2006 to June 30, 2007; and
[III] from July 1, 2007 to October 31, 2008.
Opening hours and trading mechanisms differ
between SHSE and HKSE. Both conduct trading from
Monday to Friday except for public holidays, which
could differ for two regions. Therefore, our sample
eliminates days when only one market data is
available, since our cointegration and price discovery
analysis requires the interaction between two markets.
Besides, SS50 is traded in Chinese Yuan and A50 is
traded in Hong Kong dollars, we use corresponding
days‘ exchange rates between Yuan and Hong Kong
dollars to transfer A50 price to comparable Chinese
Yuan to make prices consistent in terms of
denomination and magnitude. We obtain everyday
exchange rate between Chinese Yuan and Hong Kong
dollars from the Datastream database.
To acquire synchronous assessment from
investors, we form matched pair data sets that
minimize span (i.e., observation interval) between
SS50 and A50. Morning session of SHSE starts at 9:30
versus HKSE‘s 10:00; afternoon sessions end at 15:00,
and 16:00 respectively, so two price pairs constructed
by daily open-to-open prices and daily close-to-close
prices are examined.
3.2. Sample description Some sample statistics and correlation coefficients
among variables appear in Table 1. Period III
averages a larger standard deviation than Periods I
and II. Besides, daily close prices have larger standard
deviation than open prices, except for Period I.
4. Empirical Results
In this section, we test price discovery between SS50
and A50 for open and close prices at Periods I, II, and
III. To avoid scalar problem, we transfer involved
variables into natural log forms during our study
period. First we assess whether all variables are
non-stationary, then long-term contemporaneous
relation between variables. Lastly, we estimate
common factor weights reflecting which has
dominant information.
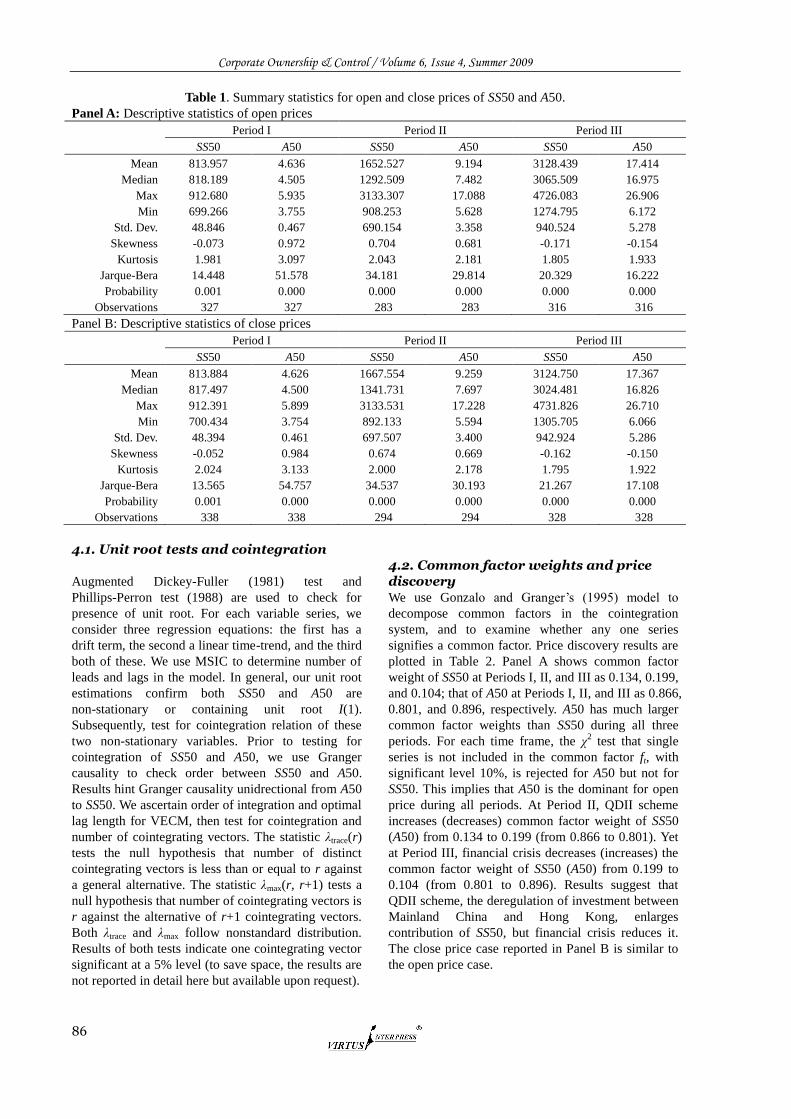
Corporate Ownership & Control / Volume 6, Issue 4, Summer 2009
86
Table 1. Summary statistics for open and close prices of SS50 and A50.
Panel A: Descriptive statistics of open prices
Period I Period II Period III
SS50 A50 SS50 A50 SS50 A50
Mean 813.957 4.636 1652.527 9.194 3128.439 17.414
Median 818.189 4.505 1292.509 7.482 3065.509 16.975
Max 912.680 5.935 3133.307 17.088 4726.083 26.906
Min 699.266 3.755 908.253 5.628 1274.795 6.172
Std. Dev. 48.846 0.467 690.154 3.358 940.524 5.278
Skewness -0.073 0.972 0.704 0.681 -0.171 -0.154
Kurtosis 1.981 3.097 2.043 2.181 1.805 1.933
Jarque-Bera 14.448 51.578 34.181 29.814 20.329 16.222
Probability 0.001 0.000 0.000 0.000 0.000 0.000
Observations 327 327 283 283 316 316
Panel B: Descriptive statistics of close prices
Period I Period II Period III
SS50 A50 SS50 A50 SS50 A50
Mean 813.884 4.626 1667.554 9.259 3124.750 17.367
Median 817.497 4.500 1341.731 7.697 3024.481 16.826
Max 912.391 5.899 3133.531 17.228 4731.826 26.710
Min 700.434 3.754 892.133 5.594 1305.705 6.066
Std. Dev. 48.394 0.461 697.507 3.400 942.924 5.286
Skewness -0.052 0.984 0.674 0.669 -0.162 -0.150
Kurtosis 2.024 3.133 2.000 2.178 1.795 1.922
Jarque-Bera 13.565 54.757 34.537 30.193 21.267 17.108
Probability 0.001 0.000 0.000 0.000 0.000 0.000
Observations 338 338 294 294 328 328
4.1. Unit root tests and cointegration
Augmented Dickey-Fuller (1981) test and
Phillips-Perron test (1988) are used to check for
presence of unit root. For each variable series, we
consider three regression equations: the first has a
drift term, the second a linear time-trend, and the third
both of these. We use MSIC to determine number of
leads and lags in the model. In general, our unit root
estimations confirm both SS50 and A50 are
non-stationary or containing unit root I(1).
Subsequently, test for cointegration relation of these
two non-stationary variables. Prior to testing for
cointegration of SS50 and A50, we use Granger
causality to check order between SS50 and A50.
Results hint Granger causality unidrectional from A50
to SS50. We ascertain order of integration and optimal
lag length for VECM, then test for cointegration and
number of cointegrating vectors. The statistic λtrace(r)
tests the null hypothesis that number of distinct
cointegrating vectors is less than or equal to r against
a general alternative. The statistic λmax(r, r+1) tests a
null hypothesis that number of cointegrating vectors is
r against the alternative of r+1 cointegrating vectors.
Both λtrace and λmax follow nonstandard distribution.
Results of both tests indicate one cointegrating vector
significant at a 5% level (to save space, the results are
not reported in detail here but available upon request).
4.2. Common factor weights and price discovery We use Gonzalo and Granger‘s (1995) model to
decompose common factors in the cointegration
system, and to examine whether any one series
signifies a common factor. Price discovery results are
plotted in Table 2. Panel A shows common factor
weight of SS50 at Periods I, II, and III as 0.134, 0.199,
and 0.104; that of A50 at Periods I, II, and III as 0.866,
0.801, and 0.896, respectively. A50 has much larger
common factor weights than SS50 during all three
periods. For each time frame, the χ2 test that single
series is not included in the common factor ft, with
significant level 10%, is rejected for A50 but not for
SS50. This implies that A50 is the dominant for open
price during all periods. At Period II, QDII scheme
increases (decreases) common factor weight of SS50
(A50) from 0.134 to 0.199 (from 0.866 to 0.801). Yet
at Period III, financial crisis decreases (increases) the
common factor weight of SS50 (A50) from 0.199 to
0.104 (from 0.801 to 0.896). Results suggest that
QDII scheme, the deregulation of investment between
Mainland China and Hong Kong, enlarges
contribution of SS50, but financial crisis reduces it.
The close price case reported in Panel B is similar to
the open price case.
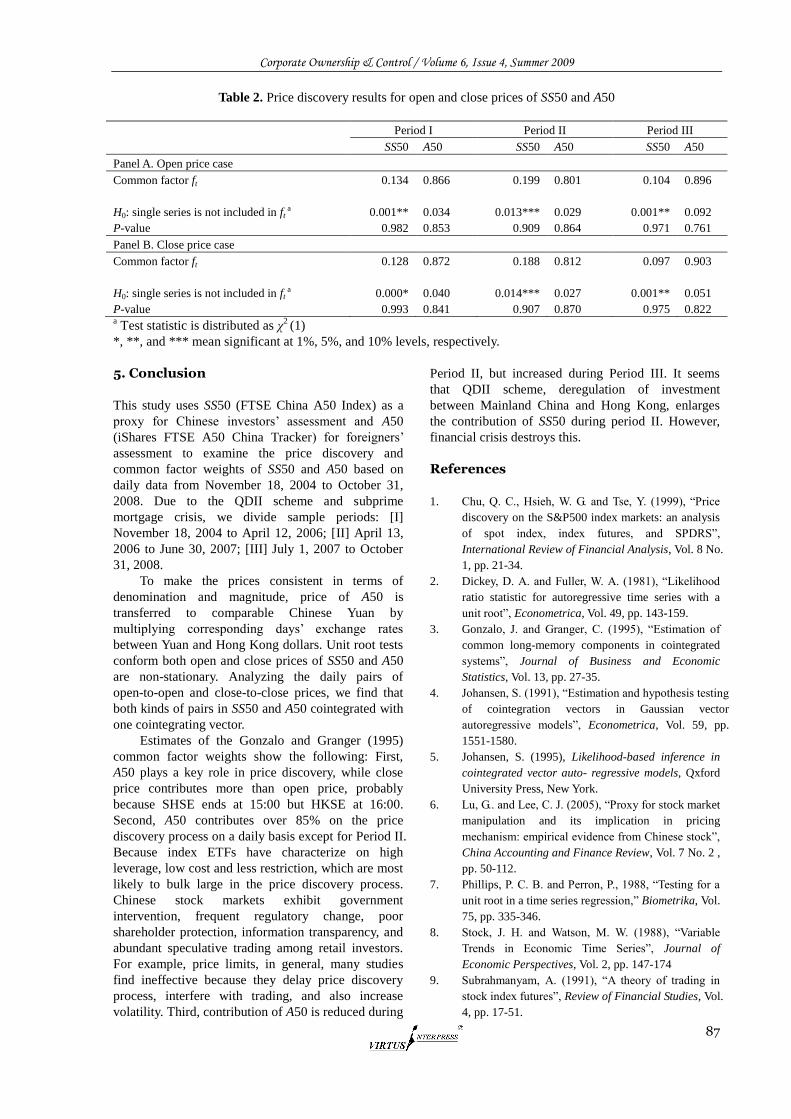
Corporate Ownership & Control / Volume 6, Issue 4, Summer 2009
87
Table 2. Price discovery results for open and close prices of SS50 and A50
Period I Period II Period III
SS50 A50 SS50 A50 SS50 A50
Panel A. Open price case
Common factor ft 0.134 0.866 0.199 0.801 0.104 0.896
H0: single series is not included in ft a 0.001** 0.034 0.013*** 0.029 0.001** 0.092
P-value 0.982 0.853 0.909 0.864 0.971 0.761
Panel B. Close price case
Common factor ft 0.128 0.872 0.188 0.812 0.097 0.903
H0: single series is not included in ft a 0.000* 0.040 0.014*** 0.027 0.001** 0.051
P-value 0.993 0.841 0.907 0.870 0.975 0.822 a Test statistic is distributed as χ
2 (1)
*, **, and *** mean significant at 1%, 5%, and 10% levels, respectively.
5. Conclusion
This study uses SS50 (FTSE China A50 Index) as a
proxy for Chinese investors‘ assessment and A50
(iShares FTSE A50 China Tracker) for foreigners‘
assessment to examine the price discovery and
common factor weights of SS50 and A50 based on
daily data from November 18, 2004 to October 31,
2008. Due to the QDII scheme and subprime
mortgage crisis, we divide sample periods: [I]
November 18, 2004 to April 12, 2006; [II] April 13,
2006 to June 30, 2007; [III] July 1, 2007 to October
31, 2008.
To make the prices consistent in terms of
denomination and magnitude, price of A50 is
transferred to comparable Chinese Yuan by
multiplying corresponding days‘ exchange rates
between Yuan and Hong Kong dollars. Unit root tests
conform both open and close prices of SS50 and A50
are non-stationary. Analyzing the daily pairs of
open-to-open and close-to-close prices, we find that
both kinds of pairs in SS50 and A50 cointegrated with
one cointegrating vector.
Estimates of the Gonzalo and Granger (1995)
common factor weights show the following: First,
A50 plays a key role in price discovery, while close
price contributes more than open price, probably
because SHSE ends at 15:00 but HKSE at 16:00.
Second, A50 contributes over 85% on the price
discovery process on a daily basis except for Period II.
Because index ETFs have characterize on high
leverage, low cost and less restriction, which are most
likely to bulk large in the price discovery process.
Chinese stock markets exhibit government
intervention, frequent regulatory change, poor
shareholder protection, information transparency, and
abundant speculative trading among retail investors.
For example, price limits, in general, many studies
find ineffective because they delay price discovery
process, interfere with trading, and also increase
volatility. Third, contribution of A50 is reduced during
Period II, but increased during Period III. It seems
that QDII scheme, deregulation of investment
between Mainland China and Hong Kong, enlarges
the contribution of SS50 during period II. However,
financial crisis destroys this.
References
1. Chu, Q. C., Hsieh, W. G. and Tse, Y. (1999), ―Price
discovery on the S&P500 index markets: an analysis
of spot index, index futures, and SPDRS‖,
International Review of Financial Analysis, Vol. 8 No.
1, pp. 21-34.
2. Dickey, D. A. and Fuller, W. A. (1981), ―Likelihood
ratio statistic for autoregressive time series with a
unit root‖, Econometrica, Vol. 49, pp. 143-159.
3. Gonzalo, J. and Granger, C. (1995), ―Estimation of
common long-memory components in cointegrated
systems‖, Journal of Business and Economic
Statistics, Vol. 13, pp. 27-35.
4. Johansen, S. (1991), ―Estimation and hypothesis testing
of cointegration vectors in Gaussian vector
autoregressive models‖, Econometrica, Vol. 59, pp.
1551-1580.
5. Johansen, S. (1995), Likelihood-based inference in
cointegrated vector auto- regressive models, Qxford
University Press, New York.
6. Lu, G.. and Lee, C. J. (2005), ―Proxy for stock market
manipulation and its implication in pricing
mechanism: empirical evidence from Chinese stock‖,
China Accounting and Finance Review, Vol. 7 No. 2 ,
pp. 50-112.
7. Phillips, P. C. B. and Perron, P., 1988, ―Testing for a
unit root in a time series regression,‖ Biometrika, Vol.
75, pp. 335-346.
8. Stock, J. H. and Watson, M. W. (1988), ―Variable
Trends in Economic Time Series‖, Journal of
Economic Perspectives, Vol. 2, pp. 147-174
9. Subrahmanyam, A. (1991), ―A theory of trading in
stock index futures‖, Review of Financial Studies, Vol.
4, pp. 17-51.
Corporate Ownership & Control / Volume 6, Issue 4, Summer 2009
88
РАЗДЕЛ 2 СТРУКТУРА
СОБСТВЕННОСТИ SECTION 2 OWNERSHIP STRUCTURE
MANAGEMENT OWNERSHIP AND FIRM PERFORMANCE: EVIDENCE FROM AN EMERGING ECONOMY
Talat Afza*, Choudhary Slahudin**
Abstract Due to the separation of ownership and control in modern corporation, the form of relationship between firm performance and insider ownership has been the subject of empirical investigation for last many decades. It is argued, that as managers' equity ownership increases, their interests coincide more closely with those of outside shareholders, and hence, the conflicts between managers and shareholders are likely to be resolved. Thus, management's equity ownership helps resolve the agency problem and improve the firm's performance (Jensen and Meckling, 1976; Agrawal and Knoeber, 1996; Chen et al., 2003). However, several studies suggest that management's ownership does not always have a positive effect on corporate performance (Demsetz and Villalonga, 2000; Cheung and Wei, 2006). Most of the empirical studies on this issue have focused on the developed economies and there is little empirical evidence on the emerging economies in general and almost no work has been done on emerging economy of Pakistan in particular. Therefore, present study is an effort to analyze the relationship between insider ownership and firm performance in emerging market of Pakistan while taking a sample of 100 firms listed on Karachi Stock Exchange. In spite of entirely different characteristics of data, it has been observed that there is strong positive relationship between insider ownership and firm performance in Pakistan and the results of cross-sectional regression are consistent with theory of “convergence of interest” of relationship between insider ownership and firm performance. Although these results did not conform with the theory “ownership entrenchment” that have proved true in many developed economies yet the empirical results have provided the Pakistani corporate sector positive indications to solve the agency problem through stock options for their employees. Keywords: Insider Ownership, Firm Performance, Convergence of interest theory, Pakistan
* Corresponding author: Dean, Faculty of Business Administration, COMSATS Institute of Information Technology, Defence
Road off Rawind Road, Lahore, Pakistan:
Ph: ++92-42-5321092, Fax: ++92-42-9203100, e-mail: [email protected], [email protected]
**Department of Finance and Economics, University of Management and Technology
1. Introduction
The role of ownership structure in solving the agency
problem and improving the firm performance has
been the subject of an important and ongoing debate
in the corporate finance literature for last few decades.
This debate rooted back to the thesis (Berle and
Means, 1932), which proved an inverse relationship
between the diffusion of shareholders and firm
performance. It is believed that the classical problem
of corporate governance lies within the separation of
ownership and control, i.e. the agency cost resulting
Corporate Ownership & Control / Volume 6, Issue 4, Summer 2009
89
from a divergence of interest between the owners and
the managers of the firm (Jensen and Meckling, 1976).
However, it may become convergent either when a
large fraction of shares are held by few owners or the
owners are performing as managers in the firm.
Researchers have extensively studied the conflict
between managers and owners and its influence on
firm‘s performance, yet, the research on
understanding the differences in behavior of different
shareholder identities is limited. On the one hand, a
rich empirical literature has investigated the efficacy
of alternative mechanisms in terms of the relationship
between takeovers, performance, managerial pay
structure and performance of the firm and on the other
hand, the separation of ownership and control, and
form of the relationship between the performance of
firms and insider ownership has been the subject of
empirical investigation for last many decades. It is
argued, that as managers' equity ownership increases,
their interests coincide more closely with those of
outside shareholders, and hence the conflicts between
managers and shareholders are likely to be resolved.
Thus, management's equity ownership helps resolve
the agency problems and improve the firm's
performance (Jensen and Meckling, 1976; Agrawal
and Knoeber, 1996; Chen et al., 2003).
However, several studies suggest that
management's ownership does not always has a
positive effect on corporate performance. (Fama and
Jensen, 1983) demonstrate various possibilities that
managers who own enough stock to dominate the
board of directors could expropriate corporate wealth.
A large-block shareholder could, for example, pay
himself an excessive salary, negotiate 'sweetheart'
deals with other companies he controls, or invest in
negative-net-present-value projects. (Stulz, 1988)
explains how owning large blocks makes it easier for
managers to be entrenched. Thus, greater stock
ownership by managers increases the power of the
internal constituency, but decreases the power of the
external constituency in influencing corporate
performance.
The existing empirical studies focusing on the
relationship between insider ownership and firm
performance have provided contradictory evidence in
developed as well as developing economies.
Moreover, most of the empirical studies on this topic
have covered the developed economies and there is
little work done on the emerging economies in general
and economy of Pakistan in particular. In case of
Pakistan, it is a fact that during the period under study
(2002-05), the low interest rate environment and
investor friendly policies of the Government of
Pakistan coupled with positive geopolitical
developments have paved the way for the
macroeconomic conditions conducive for the
development of the equity and money markets of the
country. The increased investor‘s confidence along
with the improvements in the corporate earnings has
contributed to the impressive performance of the
equity markets as compared to the other South East
Asian economies. Therefore, it is imperative to study
the corporate governance characteristics of this
growing market to achieve a consistent positive
performance of the equity market. Therefore, the
present study is an effort to provide empirical
evidence on the insider ownership and its impact on
firm performance from emerging economy of
Pakistan. It is expected that the outcome of research
may provide an insight into this important issue which
will be useful for both the investors and regulators of
the emerging economies.
2. Literature Review
Existing literature on the relationship between insider
ownership and corporate performance has reported
three different dimensions of this relationship. It can
take the form of convergence of interest (Linear
positive) or entrenchment behavior (Non-linear) or
ownership structure as indigenous outcome (No
relationship). As firm size increases, diffuseness of
ownership renders owners of shares powerless to
constrain professional management that owns a small
portion of shares. The separation of ownership and
control creates conflict of interest between owners
(principals) and managers (agents). When the interests
of managers do not naturally coincide with that of the
owners of the firm, this would seem to imply that
corporate resources are not used efficiently to pursue
the goals of shareholders. Therefore, managers are
inclined to use the resources of the firm for their own
benefits. In this scenario, owners may offer stock
option for managers to reduce the agency cost and
create the convergence in the interest of both parties.
Jensen and Meckling (1976) investigated this
issue first time and showed empirically how the
allocation of shares among management and owner
can influence the firm performance. The stockholders
were divided into two groups: insider shareholders
who manage the firm and have exclusive voting rights
and outside shareholders who have no voting rights
but, both groups were entitled for the same dividends
per share. However, the insider shareholders were
able to augment this stream of cash flow by
consuming additional non-marketable perquisites. In
this situation, there was an incentive for the mangers
to adopt investment and financing policies that benefit
them, but reduce the payoff to outside stockholders.
Thus, the value of the firm depends on the amount of
shares owned by the insiders. The greater the
proportion of shares owned by the insiders, the greater
would be the value of the firm.
Later, (Agrawal and Knoeber, 1996) selected the
Forbes 800 firms to study the firm performance and
mechanism to control the agency cost. The findings of
Corporate Ownership & Control / Volume 6, Issue 4, Summer 2009
90
cross-sectional OLS regression reported a positive
relationship between insider shareholding and Tobin‘s
Q of largest firms of the world. Furthermore, (Sarkar
and Sarkar, 2000) provided the evidence on the role of
insider shareholders in monitoring the firm value with
respect to a developing and emerging economy of
India. A sample of 1567 manufacturing Indian firms
listed at Bombay Stock Exchange during the period of
1995-96 was selected. The results of piece-wise linear
regression reported a positive relationship between
insider holding and firm value which is consistent
with ―convergence of interest‖ hypothesis.
Ang et. al. (2000) postulated the following
hypotheses derived from agency theory when
compared to the base case: (i) agency costs are higher
at firms whose managers own none of the firm‘s
equity, (ii) agency cost is an inverse function of the
managers‘ ownership stake, and (iii) agency costs are
an increasing function of the number of non-manager
shareholders. They utilized a sample of 1,708 small
corporations from the FRB/NSSBF database of
private US firms and found that agency costs (i) are
significantly higher when an outsider rather than an
insider manages the firm; (ii) are inversely related to
the manager‘s ownership share; (iii) increase with the
number of non-manager shareholders, and (iv) to a
lesser extent, are lower with greater monitoring by
banks. The relationship between insider ownership
and firm performance in Asian markets was studied
by (Mitton, 2002) who took a sample of 398 firms
from Indonesia, Korea, Malaysia, Philippines, and
Thailand, to study the firm-level differences in
variables related to corporate governance and their
impact on firm performance during the East Asian
financial crisis of 1997–1998. The regression results
of crisis-period stock returns and ownership structure
variables are consistent with the idea that if
shareholders are involved in management they could
have more opportunity and power to enhance
efficiency of the firm. Therefore, relationship between
insider holding and firm performance is positive for
the selected Asian economies during the study period.
Recently, (Chen et al., 2003) studied the
relationship between insider ownership and Tobin‘s Q
for 123 Japanese firms from 1987 to 1995. Managers
in Japanese firms own a smaller stake in their firms
relative to their US counterparts. The initial analyses
using an Ordinary Least Squares (OLS) regression
model showed a negative relation between Tobin‘s Q
and managerial ownership at low levels of ownership
and vice-versa at higher level. However, when the
fixed effects of the firm were controlled, as suggested
by the literature, a different conclusion was reported.
Specifically, results indicated that Tobin‘s Q increases
monotonically with managerial ownership. Therefore,
the findings suggested that as ownership increases,
there is a greater alignment of managerial interests
with those of stockholders. Furthermore, (Lemmon
and Lins, 2003) investigated the effect of managerial
shareholding on firm valuation by taking the sample
of 800 firms from eight East Asian economies during
the financial crises of 1997-98. They reported a
positive and linear relationship between managerial
ownership and firm value.
On the other hand, most of the researchers
recognized that when a manager owns a stake in the
firm‘s shares, it would motivate him to work for the
value maximization of their shares. In contrast, the
managers who control a substantial fraction of the
firm may have enough voting power to guarantee
their employment with the firm at an attractive salary.
With effective control, the managers may indulge
themselves in non-value maximizing behavior. This
entrenchment theory predicts that corporate assets can
be less valuable when the stake of managers increase
from a certain level in firm‘s equity. Therefore, the
relationship between the insider ownership and firm
performance will be non-linear.
In the same context, (Morck et al., 1988)
validated the relationship of insider ownership and
firm performance on a sample of 371 Fortune-500
firms in 1980. Their reasoning was based on the
argument that there are two forces that shape the
behavior of managers, first is the tendency to use
corporate sources for their own best interest and
second for the value maximization of shareholders.
The managers‘ response to these opposing forces and
the relationship between ownership & performance
depends upon the force that dominates the other over
any particular range of insider ownership. It is a
natural tendency that managers prefer to allocate
corporate resources in their own best interests, which
may conflict with the interests of owners. As insider
ownership increases, their interests are likely to
coincide more closely with those of shareholders. The
first of these forces has a negative effect on the firm
performance, whereas the second has a positive effect.
Based on this reasoning, their tests reported that the
Tobin‘s Q rises as the board ownership increases from
0% to 5%, falls form 5% to 25%, and then rises
slowly. The entrenchment effect dominates the
convergence of interest effect in the range between
5% to 25% insider ownership.
Stulz (1988) focused on the importance of the
takeovers for disciplining corporate managers. The
mathematical models proved that the premium that a
hostile bidder must pay to gain control of target firm
increases as the insider ownership increases, but the
probability that the takeover will succeed decreases.
When insiders own a small fraction of the shares, it is
more likely that a hostile takeover will succeed at a
relative lower premium. As insider ownership
increases, the probability of a successful hostile
takeover, for a given premium will decline. At 50 %
insider ownership, the probability of a hostile
takeover is zero. This reasoning leads to a curvilinear
Corporate Ownership & Control / Volume 6, Issue 4, Summer 2009
91
relation between insider ownership and firm
performance. In this relation, firm performance first
increase then decrease as insider ownership increases.
In the end, the firm‘s value reaches at minimum when
insider ownership reaches to 50%.
Later, (McConnell and Servaes, 1990)
investigated the relationship between Tobin's Q and
the structure of equity ownership for a sample of
1,173 firms for 1976 and 1,093 firms for 1986. A
significant curvilinear relation between Tobin‘s Q and
the fraction of common stock owned by corporate
insider was reported. The curve slopes upward until
insider ownership reaches approximately 40% to 50%
and then slopes downward, which is consistent with
the hypothesis of entrenchment. Furthermore, (Han
and Suk, 1998) examined the non-linear relationship
between insider ownership of 301 firms and average
stock returns during 1988 to 1992. To capture the
potential of the non-linear relationship, the insider
ownership and insider ownership squared variables
are used. The insider ownership consists of not only
the board members, but also the officers, beneficial
owners and principal stock holders owning ten
percent or more of the firm‘s stock. The results show
that the insider ownership is positively related to the
stock returns whereas the insider ownership square is
negatively related. The results concluded that as
insider ownership increases, stock returns also
increase however, excessive insider ownership rather
hurts corporate performance.
To study the same issue in a different market,
(Short and Keasey, 1999) have chosen a sample 225
UK based firms quoted on the official list of the
London Stock Exchange for the period 1988-99. The
empirical results of the regression, confirm that UK
management becomes entrenched at higher levels of
ownership than their US counterparts. Moreover, the
results from extending the analysis to consider
different measures of firm performance and a more
generalized form of the relationship confirm the
general finding of the US literature of a non-linear
relationship between firm performance and
managerial ownership.
Recently, (Beiner et al., 2006) examined the
relationship between insider ownership and firm value
with cross-sectional data of 109 Swiss firms in 2002.
The results of OLS and 3SLS regression revealed a
curvilinear relationship between shareholdings of
officers & directors and firm valuation, i.e., higher
managerial shareholdings are associated with higher
firm valuation up to some point (even in the presence
of alternative corporate governance mechanisms). The
negative effect on firm value for levels of insider
shareholding beyond this point might be explained by
managerial entrenchment (for example, managers
controlling a substantial fraction of the firm‘s equity
may have enough voting power and/or influence to
guarantee their employment and attractive salaries).
However, the same issue was taken up by
(Cheung and Wei, 2006) who examined the
relationship between insider ownership and corporate
performance by using the data of 1430 US firms for
the period of 1991-2000. The regression results of the
study are consistent with many earlier studies that
there is no relationship between insider holding and
firm performance.
3. Research Design
A large number of studies in literature have analyzed
the relationship between insider ownership and firm
performance from different angles. However, the most
recent dimension is non-linear relationship between
the insider ownership and firm performance (Beiner et
al., 2006; Short and Keasy, 1999). In the light of the
existing literature, the present study attempts to
explore the nature of relationship (linear or nonlinear)
between the insider ownership and firm performance
and provides the empirical support to ―convergence of
interest‖ or ―ownership entrenchment‖ theory(ies)
from an emerging economy of Pakistan. To validate
the non-linear relationship between ownership
structure and firm performance in the context of
Pakistan, current study has adopted the (Short and
Keasy‘s, 1999) cubic form model given below:
Performance = a +1 O w n + 2 O w n 2
+ 3 O w n 3 + Control Variables (3.1)
The variables of Own2 and Own
3 are defined as
the square and the cube, respectively, of the
percentage of shares held by the respective group, are
used to capture this non-liner relationship. To be
consistent with the non-linear relationship estimated
by the previous studies, such as (Short and Keasy,
1999), the estimated coefficients for the Own and
Own3 variables should be positive, and that of the
Own2 variable should be negative.
On the basis of above model and objectives of
present study the following two types of the equations
have been formulated to test the non-linear as well as
linear relationship between insider ownership
structure and firm performance. Two control variables,
firm size and debt have also been used to validate the
results in their presence besides the variables of
insider ownership and performance.
Non-linear relationship between insider
ownership and Firm Performance for company i and
year t can be expressed as:
(a) ROA = 0 + 1 Insider i,t + 2 Insider2 it + 3
Insider3 it + 4 Debt it + 5 Size it +it (3.2)
(b)Tobin’s Q = 0+1Insider i,t +2 Insider2 it
+3 Insider3 it + 4 Debt it + 5 Size it +it (3.3)
Linear relationship between insider ownership
and Firm Performance for company i and year t can
be expressed as:
(a) ROA = 0 + 1 Insider it + 2 Debt it +
3 Size it +it (3.4)
Corporate Ownership & Control / Volume 6, Issue 4, Summer 2009
92
(b) Tobin’s Q = 0 + 1 Insider it + 2 Debt
it + 3 Size it +it (3.5)
Where,
0 = Intercept
Insider i,t = Fraction of shares owned by Board of Directors
(BOD) and employees of company i for year t
Insider2 i t = Square of fraction of shares owned by BOD
and employees of company i for year t
Insider3 i t = Cube of fraction of shares owned by BOD and
employees of company i for year t
DEBT i,t =Ratio of total liabilities to total assets in
company i for year t
SIZEi,t = Log of total assets held by company i for year t
it = Error term
The most frequently used performance variables
in literature are Return on Assets (ROA) and Tobin‘s
Q. Although (Demsetz and Lehn, 1985) study used
accounting profit rate to measure firm performance
whereas most of the empirical studies used the
Tobin‘s Q. These two performance variables differ on
two important aspects. On the one hand, is the time
perspective, where accounting profits are taken as
backward looking whereas the Tobin‘s Q is assumed
to be forward-looking. In an attempt to assess the
effect of ownership structure on firm performance, is
it more sensible to look at an estimate of what
management has accomplished or at an estimate of
what management will accomplish? On the other hand,
second difference is, in measuring performance. For
the accounting profit rate, this is the accountant
constrained by standards set by the professional
body(ies). Whereas, for Tobin‘s Q, this is primarily
the community of investors constrained by their
acumen, optimism, or pessimism. The proclivity of
economists, most of whom have a better
understanding of market constraints than of
accounting constraints, favor Q. Accounting profit
rate is not affected by the psychology of investors,
and it only partially involves estimates of future
events, mainly in the valuations of goodwill and
depreciation. Tobin‘s Q, however, is buffeted by
investor psychology pertaining to forecasts of a
multitude of world events that include the outcomes
of present business strategies. Since, both of the
performance variables carry their own bag of
advantages and disadvantages, therefore, both the
variables have been used in this study. The
institutional shareholding will be measured by the
fraction of total shares owned by the financial
institutions at the end of the respective accounting
year.
3.1 Sample Description The following criteria have been used while selecting
the firms for study during the period 2002-05.
1. Firm should be in profit for the whole window
period
2. Listed at Karachi Stock exchange (KSE) for the
whole window period.
3. It should not be a SOE (State Owned
Enterprises).
As per the above criteria only 310 firms
qualified as the population of the study out of 736
listed companies at Karachi Stock exchange and a
sample of 100 firms has been taken through
systematic random sampling method. The insider
ownership is the shareholding of board of directors &
their spouses, company executives & their spouses
and employees. The descriptive statistics of insider
ownership in selected sample across different
industrial sectors has been reported in Table 3.1. The
maximum holding of insider is in Auto and Allied
Engineering sector which is 93.22 percent for the year
2005, whereas, the minimum holding is in
Non-Banking Financial Institutions (NBFIs) which is
very low of just 0.02 percent. On the average, there is
53.44 percent insider ownership in selected sample
for the year 2005. However, the lowest mean insider
holding of 44.80 percent is for NBFIs and highest is
for the Pharmaceutical industry with 68.92 percent.
For the rest of the sectors, five sectors have mean
insider ownership above the sample mean and six
below the sample mean. Which shows a good spread
in the data to produce more reliable results for
statistical estimation from regression analysis.
The descriptive statistics of Table 1 reflect that
in case of Pakistan majority of the shareholdings are
with board of directors, company executives and their
spouses. Most of the businesses are owned by few big
business families. Family firms are a fundamental and
intrinsic feature of the Pakistani economy.
Approximately 80% of all listed companies on the
Karachi Stock Exchange have family involvement or
are indirectly affiliated to a large business family
(Zaidi, 2005). These family firms were established
traders in different parts of united India, and it was a
historical accident that gave them the opportunity to
establish themselves in new land of Pakistan. Post
privatization era in Pakistan also brought a new class
of industrial and family businesses.
Pre-nationalization ( pre 1973) business families like
Adamjees, Habibs or Valikas were so adversely
affected that they never really invested in businesses
in Pakistan. At the same time privatization and
liberalization of the economy during the last 20 years
have mostly helped textile tycoons to venture into
other sectors which include Dewans, Mansha,
Sherazis, Elahis, Munoos etc. (Slahudin, 2007). Due
to this fact, there is a lot of cross ownership in family
firms and it has increased the ratio of insider
ownership across the whole economy of Pakistan.
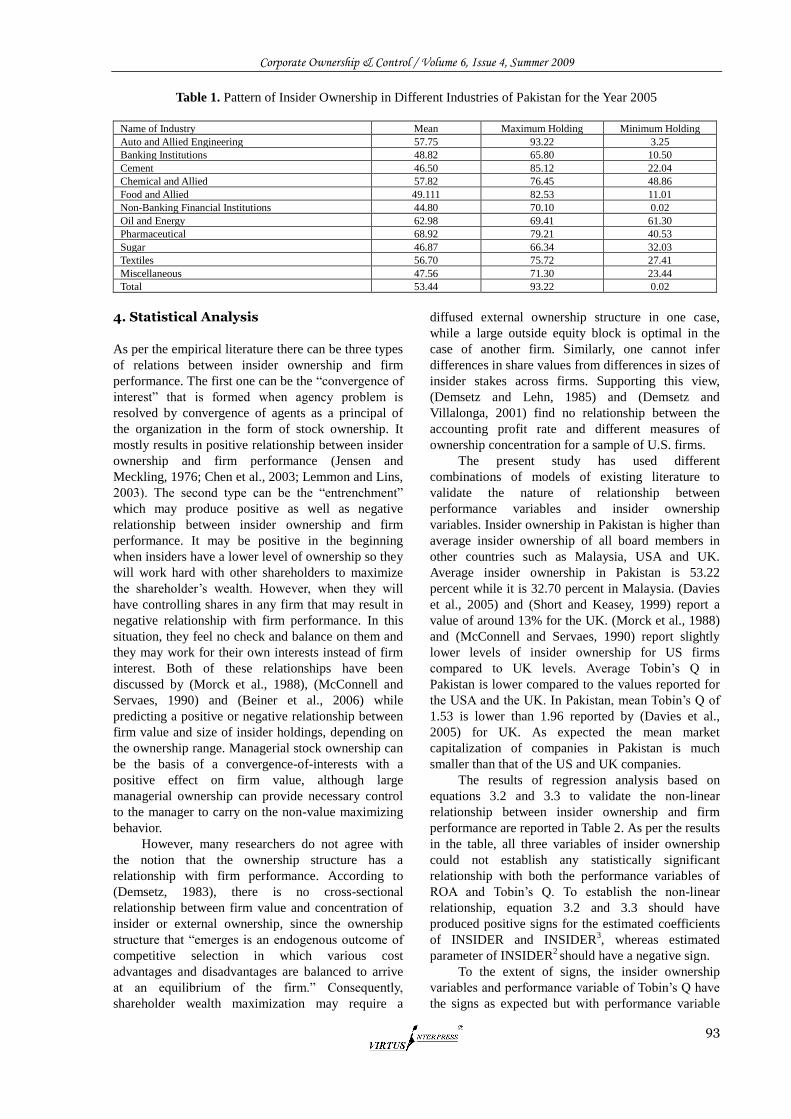
Corporate Ownership & Control / Volume 6, Issue 4, Summer 2009
93
Table 1. Pattern of Insider Ownership in Different Industries of Pakistan for the Year 2005
Name of Industry Mean Maximum Holding Minimum Holding
Auto and Allied Engineering 57.75 93.22 3.25
Banking Institutions 48.82 65.80 10.50
Cement 46.50 85.12 22.04
Chemical and Allied 57.82 76.45 48.86
Food and Allied 49.111 82.53 11.01
Non-Banking Financial Institutions 44.80 70.10 0.02
Oil and Energy 62.98 69.41 61.30
Pharmaceutical 68.92 79.21 40.53
Sugar 46.87 66.34 32.03
Textiles 56.70 75.72 27.41
Miscellaneous 47.56 71.30 23.44
Total 53.44 93.22 0.02
4. Statistical Analysis
As per the empirical literature there can be three types
of relations between insider ownership and firm
performance. The first one can be the ―convergence of
interest‖ that is formed when agency problem is
resolved by convergence of agents as a principal of
the organization in the form of stock ownership. It
mostly results in positive relationship between insider
ownership and firm performance (Jensen and
Meckling, 1976; Chen et al., 2003; Lemmon and Lins,
2003). The second type can be the ―entrenchment‖
which may produce positive as well as negative
relationship between insider ownership and firm
performance. It may be positive in the beginning
when insiders have a lower level of ownership so they
will work hard with other shareholders to maximize
the shareholder‘s wealth. However, when they will
have controlling shares in any firm that may result in
negative relationship with firm performance. In this
situation, they feel no check and balance on them and
they may work for their own interests instead of firm
interest. Both of these relationships have been
discussed by (Morck et al., 1988), (McConnell and
Servaes, 1990) and (Beiner et al., 2006) while
predicting a positive or negative relationship between
firm value and size of insider holdings, depending on
the ownership range. Managerial stock ownership can
be the basis of a convergence-of-interests with a
positive effect on firm value, although large
managerial ownership can provide necessary control
to the manager to carry on the non-value maximizing
behavior.
However, many researchers do not agree with
the notion that the ownership structure has a
relationship with firm performance. According to
(Demsetz, 1983), there is no cross-sectional
relationship between firm value and concentration of
insider or external ownership, since the ownership
structure that ―emerges is an endogenous outcome of
competitive selection in which various cost
advantages and disadvantages are balanced to arrive
at an equilibrium of the firm.‖ Consequently,
shareholder wealth maximization may require a
diffused external ownership structure in one case,
while a large outside equity block is optimal in the
case of another firm. Similarly, one cannot infer
differences in share values from differences in sizes of
insider stakes across firms. Supporting this view,
(Demsetz and Lehn, 1985) and (Demsetz and
Villalonga, 2001) find no relationship between the
accounting profit rate and different measures of
ownership concentration for a sample of U.S. firms.
The present study has used different
combinations of models of existing literature to
validate the nature of relationship between
performance variables and insider ownership
variables. Insider ownership in Pakistan is higher than
average insider ownership of all board members in
other countries such as Malaysia, USA and UK.
Average insider ownership in Pakistan is 53.22
percent while it is 32.70 percent in Malaysia. (Davies
et al., 2005) and (Short and Keasey, 1999) report a
value of around 13% for the UK. (Morck et al., 1988)
and (McConnell and Servaes, 1990) report slightly
lower levels of insider ownership for US firms
compared to UK levels. Average Tobin‘s Q in
Pakistan is lower compared to the values reported for
the USA and the UK. In Pakistan, mean Tobin‘s Q of
1.53 is lower than 1.96 reported by (Davies et al.,
2005) for UK. As expected the mean market
capitalization of companies in Pakistan is much
smaller than that of the US and UK companies.
The results of regression analysis based on
equations 3.2 and 3.3 to validate the non-linear
relationship between insider ownership and firm
performance are reported in Table 2. As per the results
in the table, all three variables of insider ownership
could not establish any statistically significant
relationship with both the performance variables of
ROA and Tobin‘s Q. To establish the non-linear
relationship, equation 3.2 and 3.3 should have
produced positive signs for the estimated coefficients
of INSIDER and INSIDER3, whereas estimated
parameter of INSIDER2 should have a negative sign.
To the extent of signs, the insider ownership
variables and performance variable of Tobin‘s Q have
the signs as expected but with performance variable
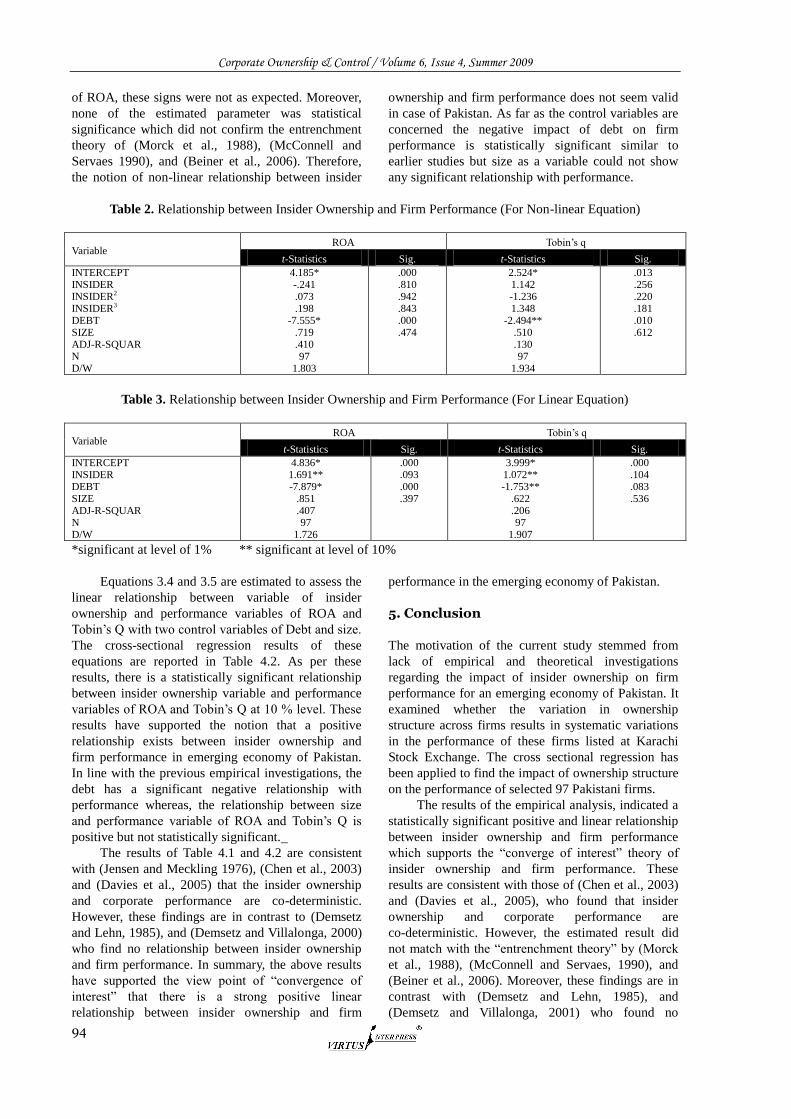
Corporate Ownership & Control / Volume 6, Issue 4, Summer 2009
94
of ROA, these signs were not as expected. Moreover,
none of the estimated parameter was statistical
significance which did not confirm the entrenchment
theory of (Morck et al., 1988), (McConnell and
Servaes 1990), and (Beiner et al., 2006). Therefore,
the notion of non-linear relationship between insider
ownership and firm performance does not seem valid
in case of Pakistan. As far as the control variables are
concerned the negative impact of debt on firm
performance is statistically significant similar to
earlier studies but size as a variable could not show
any significant relationship with performance.
Table 2. Relationship between Insider Ownership and Firm Performance (For Non-linear Equation)
Variable ROA Tobin‘s q
t-Statistics Sig. t-Statistics Sig.
INTERCEPT INSIDER INSIDER2 INSIDER3 DEBT SIZE ADJ-R-SQUAR N D/W
4.185* -.241 .073 .198
-7.555* .719 .410 97
1.803
.000
.810
.942
.843
.000
.474
2.524* 1.142 -1.236 1.348
-2.494** .510 .130 97
1.934
.013
.256
.220
.181
.010
.612
Table 3. Relationship between Insider Ownership and Firm Performance (For Linear Equation)
Variable ROA Tobin‘s q
t-Statistics Sig. t-Statistics Sig.
INTERCEPT INSIDER DEBT SIZE ADJ-R-SQUAR N D/W
4.836* 1.691** -7.879*
.851
.407 97
1.726
.000
.093
.000
.397
3.999* 1.072** -1.753**
.622
.206 97
1.907
.000
.104
.083
.536
*significant at level of 1% ** significant at level of 10%
Equations 3.4 and 3.5 are estimated to assess the
linear relationship between variable of insider
ownership and performance variables of ROA and
Tobin‘s Q with two control variables of Debt and size.
The cross-sectional regression results of these
equations are reported in Table 4.2. As per these
results, there is a statistically significant relationship
between insider ownership variable and performance
variables of ROA and Tobin‘s Q at 10 % level. These
results have supported the notion that a positive
relationship exists between insider ownership and
firm performance in emerging economy of Pakistan.
In line with the previous empirical investigations, the
debt has a significant negative relationship with
performance whereas, the relationship between size
and performance variable of ROA and Tobin‘s Q is
positive but not statistically significant.
The results of Table 4.1 and 4.2 are consistent
with (Jensen and Meckling 1976), (Chen et al., 2003)
and (Davies et al., 2005) that the insider ownership
and corporate performance are co-deterministic.
However, these findings are in contrast to (Demsetz
and Lehn, 1985), and (Demsetz and Villalonga, 2000)
who find no relationship between insider ownership
and firm performance. In summary, the above results
have supported the view point of ―convergence of
interest‖ that there is a strong positive linear
relationship between insider ownership and firm
performance in the emerging economy of Pakistan.
5. Conclusion
The motivation of the current study stemmed from
lack of empirical and theoretical investigations
regarding the impact of insider ownership on firm
performance for an emerging economy of Pakistan. It
examined whether the variation in ownership
structure across firms results in systematic variations
in the performance of these firms listed at Karachi
Stock Exchange. The cross sectional regression has
been applied to find the impact of ownership structure
on the performance of selected 97 Pakistani firms.
The results of the empirical analysis, indicated a
statistically significant positive and linear relationship
between insider ownership and firm performance
which supports the ―converge of interest‖ theory of
insider ownership and firm performance. These
results are consistent with those of (Chen et al., 2003)
and (Davies et al., 2005), who found that insider
ownership and corporate performance are
co-deterministic. However, the estimated result did
not match with the ―entrenchment theory‖ by (Morck
et al., 1988), (McConnell and Servaes, 1990), and
(Beiner et al., 2006). Moreover, these findings are in
contrast with (Demsetz and Lehn, 1985), and
(Demsetz and Villalonga, 2001) who found no
Corporate Ownership & Control / Volume 6, Issue 4, Summer 2009
95
relationship between insider ownership and firm
performance. In summary, the above results have
validated that there is a strong positive linear
relationship between insider ownership and firm
performance in the context of the emerging economy
of Pakistan. Moreover, debt appeared to have a
negative and linear relationship with firm
performance, consistent to most of the previous
studies, indicating that higher level of debt increases
interest and financial charges which leads to lower
earnings or retunes. However, the firm‘s size variable
has a positive but statically insignificant relationship
between the firm‘s size and performance indicating
that large size firms may perform better than smaller
size firms. The above results indicates that in case of
the emerging economy of Pakistan, the relationship
between the insider ownership and firm performance
is consistent with the theory ―convergence of interest‖
rather than the theory ―ownership entrenchment‖ that
have proved true in many developed economies. In
spite of entirely different characteristics of data,
estimated result have supported a strong positive
relationship between insider ownership and firm
performance. As shown in table 3.1, that most of the
Pakistani firms have is also shown concentrated
ownership, which means they are efficiently managed
and may perform better in future. The policy
implication is that the agency problems in Pakistan
can be solved by offering the stock options to the
employees as there are many successful examples of
good governance/ management by employees in post
privatization era of many state owned enterprises in
Pakistan, for examples, Allied Bank Limited and
Engro Chemicals Limited.
References
1. Agrawal, A. and C. Knoeber (1996), ―Firm
Performance and Mechanisms to Control Agency
Problems between Managers and shareholders‖
Journal of Financial and Quantitative Analysis 31: PP
377-397.
2. Ang, S. J., Rebel A. Cole, and James Wuh L. (2000),
―Agency Costs and Ownership Structure‖ The Journal
of Finance 1: PP 81-106.
3. Beiner, S., Drobetz, W., Schmid, M. M. and
Zimmermann, H. (2006), ―An Integrated Framework
of Corporate Governance and Firm Valuation:
Evidence from Switzerland‖, European Financial
Management Journal 12: PP 137-285.
4. Berle, A. and Means, G. (1932), the Modern
Corporation and Private Property, MacMillan, New
York.
5. Chen, C. R., Guo,W. (2003), ―Managerial Ownership
and Firm Valuation: Evidence from Japanese Firms‖,
Pacific-Basin Finance Journal 11: PP 267–283.
6. Cheunga W.K. and K.C. Wei (2006), ―Insider
Ownership and Corporate Performance: Evidence
from the Adjustment Cost Approach‖ Journal of
Corporate Finance 12: PP 906–925.
7. Davies, Hillier, and McColgan (2005), ―Ownership
Structure, Managerial Behavior and Corporate Value‖,
Journal of Corporate Finance 11: PP 645-660.
8. Demsetz, H. (1983). ―The Structure of Ownership and
the Theory of the Firm‖, Journal of Law and
Economics 26: PP 375-90.
9. Demsetz, H. and Lehn, K. (1985), ―The Structure of
Corporate Ownership: Cause and Consequences‖
Journal of Political Economy 93: PP 1155-1177.
10. Demsetz, Harold, and Villalonga, B. (2000),
―Ownership Structure and Corporate Performance‖,
Journal of Corporate Finance 7: PP 209-233.
11. Fama, E. F. and Jensen, M. C. (1983), ―Separation of
Ownership and Control‖, Journal of Law &
Economics XXVI: PP 301-325.
12. Han, C. K. and Suk, D. Y. (1998), ―The Effect of
Ownership Structure on Firm Performance: Additional
Evidence‖, Review of Financial Economics 7.
13. Jensen, M. C. and Meckling, W. H. (1976), ―Theory
of the Firm: Managerial Behavior, Agency Cost, and
Ownership Structure‖ Journal of Financial
Economics 3: PP 305-360.
14. Lemmon, M. L., and Lins, K. V. (2003), ―Ownership
Structure, Corporate Governance and Firm Value:
Evidence from East Asian Financial Crisis‖, Journal
of Finance 58: PP 1445-1468.
15. McConnell, J. and Servaes, H. (1995), ―Equity
ownership and the two faces of debt‖, Journal of
Financial 39: PP 131–57.
16. Mitton, T. (2002), ―A Cross-Firm Analysis of the
Impact of Corporate Governance on the East Asian
Financial Crisis‖, Journal of Financial Economics 64.
17. Morck, R., Shleifer, A. and Vishny, R. (1988),
―Management Ownership and Market Valuation: An
Empirical Analysis‖, Journal of Financial Economics
20: PP 293-315.
18. Sarkar, J. and S. Sarkar (2000), ―Large Shareholder
Activism in Corporate Governance in Developing
Countries: Evidence from India‖ International Review
of Finance 1: PP 161–194.
19. Scott R.W. (1998), Financial Accounting Theory,
Prentice Hall, New Jersey.
20. Short, H. and K. Keasey (1999), ―Managerial
Ownership and the Performance of Firm: Evidence
from the UK.‖ Journal of Corporate Finance 5.
21. Slahudin, C. (2007), ―Role of Founding Families in
Sustaining Entrepreneurial Spirit in Their Firms‖
Proceedings of 9th South Asian Management Forum,
Bangladesh, (February 24-25 2007).
22. Stulz, R. (1988), ―Managerial Control of Voting
Rights: Financing Policies and the Market for
Corporate Control‖ Journal of Financial Economics
20: PP 25-54.
23. Zaidi, R. (2005), ―Corporate Governance and Family
Firms in Weak Legal Environment: Evidence from
Pakistan‖ Mimeo: University of Cambridge.
Corporate Ownership & Control / Volume 6, Issue 4, Summer 2009
96
OWNERSHIP STRUCTURE, CORPORATE PERFORMANCE AND FAILURE: EVIDENCE FROM PANEL DATA OF EMERGING MARKET
THE CASE OF JORDAN
Rami Zeitun*
Abstract
This study investigates the impact of ownership structure (mix and concentrate) on a company’s performance and failure in a panel estimation using 167 Jordanian companies during 1989-2006. The empirical evidence in this paper shows that ownership structure and ownership concentration play an important role in the performance and value of Jordanian firms. It shows that inefficiency is related to ownership concentration and to institutional ownership. A negative correlation between ownership concentration and firm’s performance both, ROA and Tobin’s Q, is found, while there is a positive impact on firm performance MBVR. The research also found that there is a significant negative relationship between government ownership and a firm’s accounting performance, while the other ownership structure mixes have significant coefficients only in Tobin’s Q using the matched sample. Firm’s profitability ROA was negatively and significantly correlated with the fraction of institutional ownership, and positively and significantly related to the market performance measure, MBVR. The result is robust when indicators of both concentration and ownership mix are included in the regressions. The results of this study are, to some extent, inconsistent with previous findings. This paper also used ownership structure to predict the corporate failure. The results suggest that government ownership is negatively related to the likelihood of default. Government ownership decreases the likelihood of default, but has a negative impact on a firm’s performance. The results suggest that, in order to increase a firm’s performance and decrease the likelihood of default, it is reasonable to reduce government ownership to some extent. Furthermore, a certain degree of ownership concentration is needed to increase the firm’s performance and to decrease the firm’s chance of default. Keywords: Ownership Structure, Ownership Concentration, Corporate Performance, Failure, Jordan
* Assistant professor of finance in the Finance Discipline, Department of Finance and Economic, College of Business and
economic, Qatar University. Emails: [email protected] and [email protected]. I would like to thank Gary Tian,
Steve Keen, Don Ross, Yanrui Wu and Subba Reddy Yarram for their very helpful comments on the earlier draft of this paper.
The author remains responsible for all errors.
1. Introduction
The literature includes the hypotheses that ownership
concentration may improve performance by
decreasing monitoring costs (Shleifer and Vishny,
1986). The financial literature assumes that managers
are imperfect agents for investors, as managers may
attempt to pursue their own goals rather than
shareholders‘ wealth maximisation. Also, it has been
stated that there may be a conflict of interest between
shareholders and managers, as managers may have
incentives which serve their own benefit rather than
maximising shareholders wealth (Jensen and
Meckling, 1976). One approach that may control this
conflict, suggested by Jensen and Meckling (1976), is
to increase the equity ownership of managers in the
firms, therefore encouraging managers to work more
efficiently to maximise shareholders‘ wealth and carry
out less activities of self-interest (see Jensen and
Meckling (1976); Fama and Jensen (1983); Shleifer
and Vishny, (1986)). However, it may also work in the
opposite direction, as large shareholders may use their
control rights to achieve private benefits.
The corporate governance mechanisms vary
around the world which could affect the relationship
between ownership structure and corporate
performance (Shleifer and Vishny, 1997). For
example, in Europe and Japan, there is less reliance
on elaborate legal protection, and more reliance on
large investors while, in the US, firms rely on legal
protection. So, due to the differences between US
corporate governance and other systems, a different
relationship between ownership and firm value could
be expected. Also, recent studies of corporate
governance suggest that geographical position, the tax
system, industrial development, and cultural
Corporate Ownership & Control / Volume 6, Issue 4, Summer 2009
97
characteristics, along with other factors, affect
ownership structure which in turn impacts on a firm‘s
performance and its failure (Pedersen and Thompson,
1997). Therefore, this study is important as it provides
evidence from the emerging markets and, more
specifically, from Middle Eastern countries using
Jordan as a case study98
.
Privatisation of publicly held shares is an
ongoing program in Jordan. Managing state holdings
in Jordanian listed companies has become a top
government priority, with the government supporting
the private sector to takeover and participate more in
economic growth99
. So, it could be anticipated that
privatisation in Jordan would affect a firm‘s
performance and failure as it changed the ownership
structure of firms. One of the main reasons for low
performance and distress or bankruptcy might be bad
management, which drives the firm out of the market
as a consequence of unsolved problems in corporate
governance. The inefficiency that might lead firms to
default is as a result of the agency problem that could
arise from a conflict of interest between managers and
shareholders (see, for example, Jensen and Meckling
(1976); Shleifer and Vishny (1997)).
This paper investigates the effect of ownership
structure on a firm‘s performance and its failure in
Jordan. In this paper I argue that if ownership
structure variables are relevant to corporate
performance, then they will have a significant effect
in determining and predicting corporate failure.
Therefore, they could be used to determine and
predict corporate failure. To the best of the author‘s
knowledge, this is the first study that utilises real
figures about ownership structure (mix and
concentration) to investigate the effect of ownership
structure on corporate performance for Jordanian
companies. Furthermore, it could be considered as the
first effort to utilise ownership structure variables
(mix and concentration) to determine corporate failure
as there is a lack of empirical evidence about the
effect of ownership structure on corporate failure.
It is worth noting that collecting the data on
ownership structure (mix and concentration) for each
firm and for each year over the period 1989-2006
constituted a large part of the research for this paper
as the data were collected manually. This vast effort
made this research possible.
The remainder of this paper is organized as
follows. Section 2 provides a descriptive discussion
about ownership concentration and ownership mix for
98 For more details about the effect of corporate governance
on the incentives for the private sector to invest, see Stone,
Hurly and Khumani (1998). 99 Privatisation is part of the overall economic package that
the government has adopted since the economic adjustment
program of the early nineties, and self-reliance in the
aftermath of the economic crisis in 1989 that befell the
country.
the Jordanian companies used in the study. Section 3
introduces the estimation method. Section 4 introduces
the empirical results and the hypotheses test. Section 5
concludes the paper.
2. Ownership Structure and Firm Performance: a Descriptive Discussion 2.1 Ownership Structure (Mix) and Firm Performance
Since the establishment of the ASE in the 1970s, the
number of listed companies, trading volume, and total
market capitalisation have increased drastically. Table
1 reports the ownership structure of listed companies
by sectors100
. Despite its privatisation program, the
government still holds a large stake in Media, Utility
and Energy, and Steel, Mining and Heavy Engineering
companies (43.20%, 33.70 %, and 22.04 %,
respectively) because they are considered strategic
industries. Institutional ownership is very high in
transportation, real estate, and trade and commercial
services and rental, and communication (44.80%,
44.00%, and 36.89%, respectively). Individual
citizens as a group are the largest shareholder of
Educational Services, Medical Pharmacies, Textiles
and Clothing, and Construction and Engineering. The
largest foreign ownership stakes are in Steel, Mining
and Heavy Engineering, followed by Tobacco
(16.05% and 13.41%, respectively); foreign
ownership is also high in the Insurance sector.
Table 2 presents the basic statistics of the
ownership structure for defaulted and non-defaulted
firms. The individual (citizen) owns an average of
51.42 percent of defaulted firms, a figure which is
larger than 45.36 percent in non-defaulted firms. The
fractions of government and foreigner ownership have
their lowest median in the defaulted firms, 0.58 and
1.21 percent respectively, compared with 2.37 and
4.20 percent in non-defaulted firms for government
and foreigner respectively.
There are several notable differences. First of all,
defaulted firms have a lower median of government
ownership. Also, the median of institutional
ownership is lower, as is the median of foreigner
ownership. Table 2 suggests that Jordanian firms with
government, institutional, and foreign ownership have
a lower risk of failure (default) (in this analysis, we
will concentrate on the joint factor of Arab and
foreign ownership rather than taking each one
separately as both of them are considered foreign
owners). The next section discusses the characteristics
of defaulted firms in terms of ownership
concentration.
100 The classification of these sectors is based on the
Amman Stock Exchange (ASE) classification for firms
based on their activities. The author got this classification
from the ASE management.
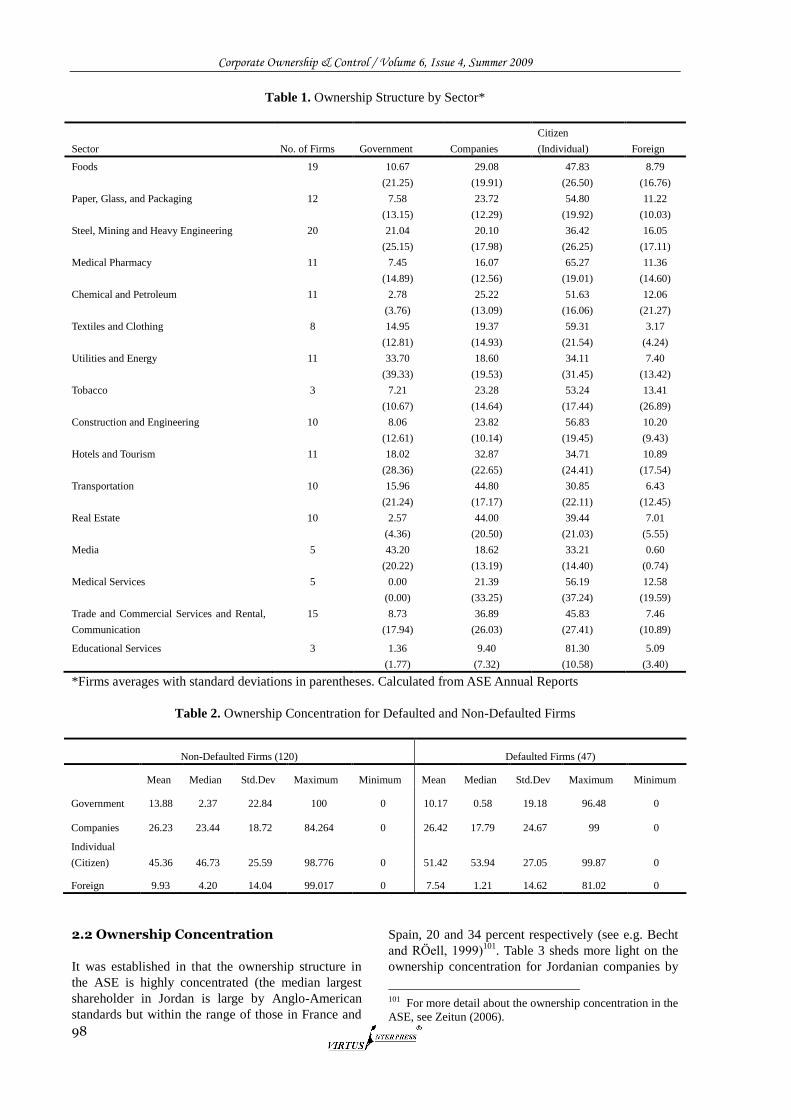
Corporate Ownership & Control / Volume 6, Issue 4, Summer 2009
98
Table 1. Ownership Structure by Sector*
Sector No. of Firms Government Companies
Citizen
(Individual) Foreign
Foods
19
10.67
(21.25)
29.08
(19.91)
47.83
(26.50)
8.79
(16.76)
Paper, Glass, and Packaging
12
7.58
(13.15)
23.72
(12.29)
54.80
(19.92)
11.22
(10.03)
Steel, Mining and Heavy Engineering
20
21.04
(25.15)
20.10
(17.98)
36.42
(26.25)
16.05
(17.11)
Medical Pharmacy
11
7.45
(14.89)
16.07
(12.56)
65.27
(19.01)
11.36
(14.60)
Chemical and Petroleum
11
2.78
(3.76)
25.22
(13.09)
51.63
(16.06)
12.06
(21.27)
Textiles and Clothing
8
14.95
(12.81)
19.37
(14.93)
59.31
(21.54)
3.17
(4.24)
Utilities and Energy
11
33.70
(39.33)
18.60
(19.53)
34.11
(31.45)
7.40
(13.42)
Tobacco
3
7.21
(10.67)
23.28
(14.64)
53.24
(17.44)
13.41
(26.89)
Construction and Engineering
10
8.06
(12.61)
23.82
(10.14)
56.83
(19.45)
10.20
(9.43)
Hotels and Tourism
11
18.02
(28.36)
32.87
(22.65)
34.71
(24.41)
10.89
(17.54)
Transportation
10
15.96
(21.24)
44.80
(17.17)
30.85
(22.11)
6.43
(12.45)
Real Estate
10
2.57
(4.36)
44.00
(20.50)
39.44
(21.03)
7.01
(5.55)
Media
5
43.20
(20.22)
18.62
(13.19)
33.21
(14.40)
0.60
(0.74)
Medical Services
5
0.00
(0.00)
21.39
(33.25)
56.19
(37.24)
12.58
(19.59)
Trade and Commercial Services and Rental,
Communication
15
8.73
(17.94)
36.89
(26.03)
45.83
(27.41)
7.46
(10.89)
Educational Services
3
1.36
(1.77)
9.40
(7.32)
81.30
(10.58)
5.09
(3.40)
*Firms averages with standard deviations in parentheses. Calculated from ASE Annual Reports
Table 2. Ownership Concentration for Defaulted and Non-Defaulted Firms
Non-Defaulted Firms (120) Defaulted Firms (47)
Mean Median Std.Dev Maximum Minimum Mean Median Std.Dev Maximum Minimum
Government 13.88 2.37 22.84 100 0 10.17 0.58 19.18 96.48 0
Companies 26.23 23.44 18.72 84.264 0 26.42 17.79 24.67 99 0
Individual
(Citizen) 45.36 46.73 25.59 98.776 0 51.42 53.94 27.05 99.87 0
Foreign 9.93 4.20 14.04 99.017 0 7.54 1.21 14.62 81.02 0
2.2 Ownership Concentration
It was established in that the ownership structure in
the ASE is highly concentrated (the median largest
shareholder in Jordan is large by Anglo-American
standards but within the range of those in France and
Spain, 20 and 34 percent respectively (see e.g. Becht
and RÖell, 1999)101
. Table 3 sheds more light on the
ownership concentration for Jordanian companies by
101 For more detail about the ownership concentration in the
ASE, see Zeitun (2006).
Corporate Ownership & Control / Volume 6, Issue 4, Summer 2009
99
sectors using five measures of ownership
concentration across all firm-years102
. The largest
shareholder (C1) owns the highest percentage in the
Hotel and Tourism sector and Media sector (35.32
percent and 35.50 percent respectively). The largest
shareholder C1 owns the lowest percentage in the
Educational sector (7.86 percent). The data also
reveals that there is a substantial variation across
firms and sectors in ownership concentration.
Given that the holding of the largest shareholder
(C1) is so large, the other shareholders are small. As
shown in Table 3, the cumulative percentage of
ownership tapers rapidly103
, and there is little
difference between C3 and C5 in all sectors. The
average of C3 is highest in the Media sector followed
by the Transportation sector with 49.53 percent and
45.94 percent in each sector respectively.
The Educational, Medical Pharmacy, Tobacco,
and Paper, Glass, and Packaging sectors have the
lowest ownership concentration in terms of the largest
five shareholders (C5), compared with highest stake
in Transportation, Media, and Trade, Commercial
Services, Rental and Communication. The variation
could relate to the capital required in these sectors,
and also the importance of the sector; often there is
high state ownership in sectors regarded as strategic.
Table 4 presents the basic statistics of ownership
concentration for defaulted and non-defaulted firms.
Considering the median, the largest shareholder (C1)
owns 20 percent in the defaulted firms, a figure which
is larger than the 18.86 percent in the non-defaulted
firms. The largest two shareholders (C2) own 29.09
percent in the defaulted firms, a figure which is only
marginally larger than 28.60 percent in the
non-defaulted firms. The other measures of
concentration C3, C5, and HERF are all larger in
defaulted than non-defaulted firms. The data also
reveals that there is a substantial variation across
firms in ownership concentration: despite the high
average, the largest owner‘s value varies between 0
and 100 percent. In this study, we used C5 and HERF
indexes as indictors of ownership concentration to
investigate whether ownership concentration
increased the firm's performance and contributed to
the firm's default.
3. Estimation Method 3.1 Data
The data used in this study is derived from publicly
102 The results provided are for 167 firms and over the
period of 1989 to 2006. These ownership concentration
statistics were collected and computed by the author. 103 The second largest shareholder (C2) does, in fact, tend
to have a substantially smaller stake, although the largest
(C1) still quite large compared with the second largest
shareholder.
traded companies quoted on the Amman Stock
Exchange (ASE), over the period 1989-2006. The
data set contains detailed information about each
enterprise. The major items of interest are: balance
sheets, income statements, ownership structure, and
the percentage holdings of all direct shareholders104
.
The full balance sheets and income statements are
usually available from firms as the law requires
disclosure.
The ownership data was collected manually, as it
is not available for all firms and for all years from the
Amman Stock Exchange (ASE) reports. Collecting
this data on ownership structure and concentration for
each firm and for each year constituted a large part of
the research for this thesis. This vast effort made this
research possible, since the analysis uses real figures
rather than dummy variables for ownership structure.
Furthermore, the changes in real figures over years
are more valuable, as they shed light on the effect of
changes in ownership structure on both the firm‘s
health and failure. It is worth noting that the
unavailability of data for the managerial ownership
and ownership held by outside block holders
prevented the researcher from further investigation for
the effect of these variables.
104 The ownership concentration is defined as any owner
possessing more than 5% and 10% of the company's shares.
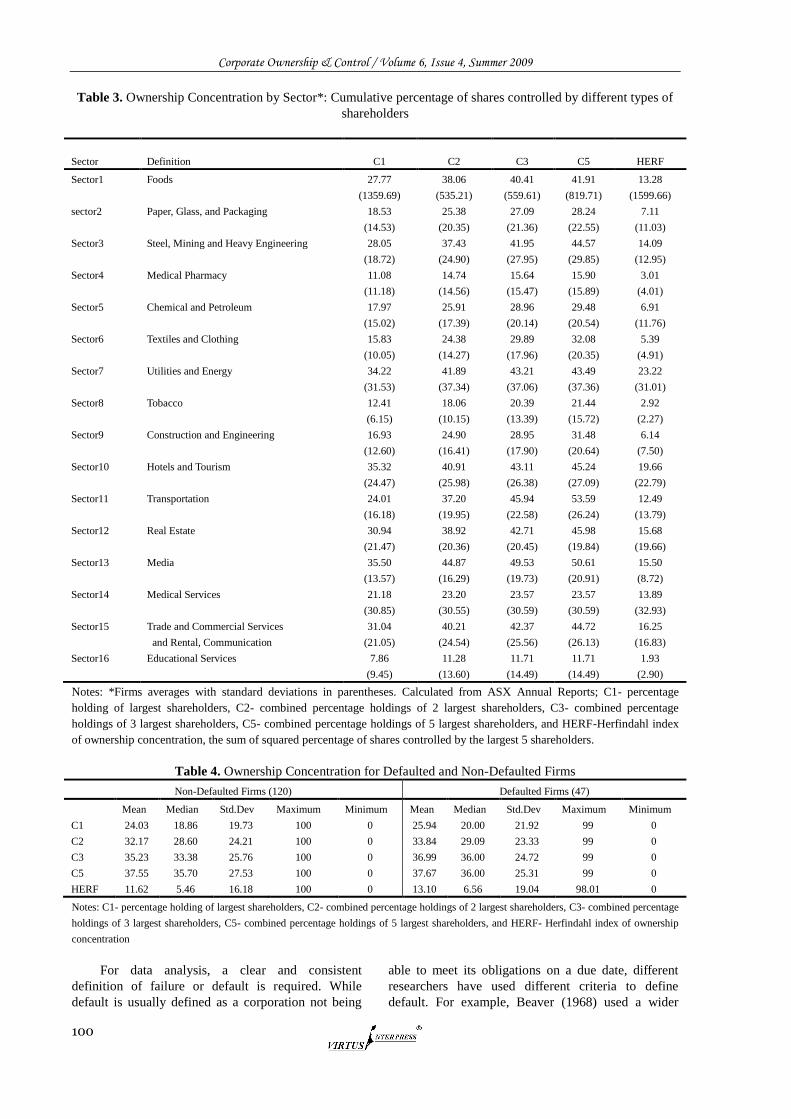
Corporate Ownership & Control / Volume 6, Issue 4, Summer 2009
100
Table 3. Ownership Concentration by Sector*: Cumulative percentage of shares controlled by different types of
shareholders
Sector Definition C1 C2 C3 C5 HERF
Sector1
Foods
27.77
(1359.69)
38.06
(535.21)
40.41
(559.61)
41.91
(819.71)
13.28
(1599.66)
sector2
Paper, Glass, and Packaging
18.53
(14.53)
25.38
(20.35)
27.09
(21.36)
28.24
(22.55)
7.11
(11.03)
Sector3
Steel, Mining and Heavy Engineering
28.05
(18.72)
37.43
(24.90)
41.95
(27.95)
44.57
(29.85)
14.09
(12.95)
Sector4
Medical Pharmacy
11.08
(11.18)
14.74
(14.56)
15.64
(15.47)
15.90
(15.89)
3.01
(4.01)
Sector5
Chemical and Petroleum
17.97
(15.02)
25.91
(17.39)
28.96
(20.14)
29.48
(20.54)
6.91
(11.76)
Sector6
Textiles and Clothing
15.83
(10.05)
24.38
(14.27)
29.89
(17.96)
32.08
(20.35)
5.39
(4.91)
Sector7
Utilities and Energy
34.22
(31.53)
41.89
(37.34)
43.21
(37.06)
43.49
(37.36)
23.22
(31.01)
Sector8
Tobacco
12.41
(6.15)
18.06
(10.15)
20.39
(13.39)
21.44
(15.72)
2.92
(2.27)
Sector9
Construction and Engineering
16.93
(12.60)
24.90
(16.41)
28.95
(17.90)
31.48
(20.64)
6.14
(7.50)
Sector10
Hotels and Tourism
35.32
(24.47)
40.91
(25.98)
43.11
(26.38)
45.24
(27.09)
19.66
(22.79)
Sector11
Transportation
24.01
(16.18)
37.20
(19.95)
45.94
(22.58)
53.59
(26.24)
12.49
(13.79)
Sector12
Real Estate
30.94
(21.47)
38.92
(20.36)
42.71
(20.45)
45.98
(19.84)
15.68
(19.66)
Sector13
Media
35.50
(13.57)
44.87
(16.29)
49.53
(19.73)
50.61
(20.91)
15.50
(8.72)
Sector14
Medical Services
21.18
(30.85)
23.20
(30.55)
23.57
(30.59)
23.57
(30.59)
13.89
(32.93)
Sector15
Trade and Commercial Services
and Rental, Communication
31.04
(21.05)
40.21
(24.54)
42.37
(25.56)
44.72
(26.13)
16.25
(16.83)
Sector16
Educational Services
7.86
(9.45)
11.28
(13.60)
11.71
(14.49)
11.71
(14.49)
1.93
(2.90)
Notes: *Firms averages with standard deviations in parentheses. Calculated from ASX Annual Reports; C1- percentage
holding of largest shareholders, C2- combined percentage holdings of 2 largest shareholders, C3- combined percentage
holdings of 3 largest shareholders, C5- combined percentage holdings of 5 largest shareholders, and HERF-Herfindahl index
of ownership concentration, the sum of squared percentage of shares controlled by the largest 5 shareholders.
Table 4. Ownership Concentration for Defaulted and Non-Defaulted Firms
Non-Defaulted Firms (120) Defaulted Firms (47)
Mean Median Std.Dev Maximum Minimum Mean Median Std.Dev Maximum Minimum
C1 24.03 18.86 19.73 100 0 25.94 20.00 21.92 99 0
C2 32.17 28.60 24.21 100 0 33.84 29.09 23.33 99 0
C3 35.23 33.38 25.76 100 0 36.99 36.00 24.72 99 0
C5 37.55 35.70 27.53 100 0 37.67 36.00 25.31 99 0
HERF 11.62 5.46 16.18 100 0 13.10 6.56 19.04 98.01 0
Notes: C1- percentage holding of largest shareholders, C2- combined percentage holdings of 2 largest shareholders, C3- combined percentage
holdings of 3 largest shareholders, C5- combined percentage holdings of 5 largest shareholders, and HERF- Herfindahl index of ownership
concentration
For data analysis, a clear and consistent
definition of failure or default is required. While
default is usually defined as a corporation not being
able to meet its obligations on a due date, different
researchers have used different criteria to define
default. For example, Beaver (1968) used a wider
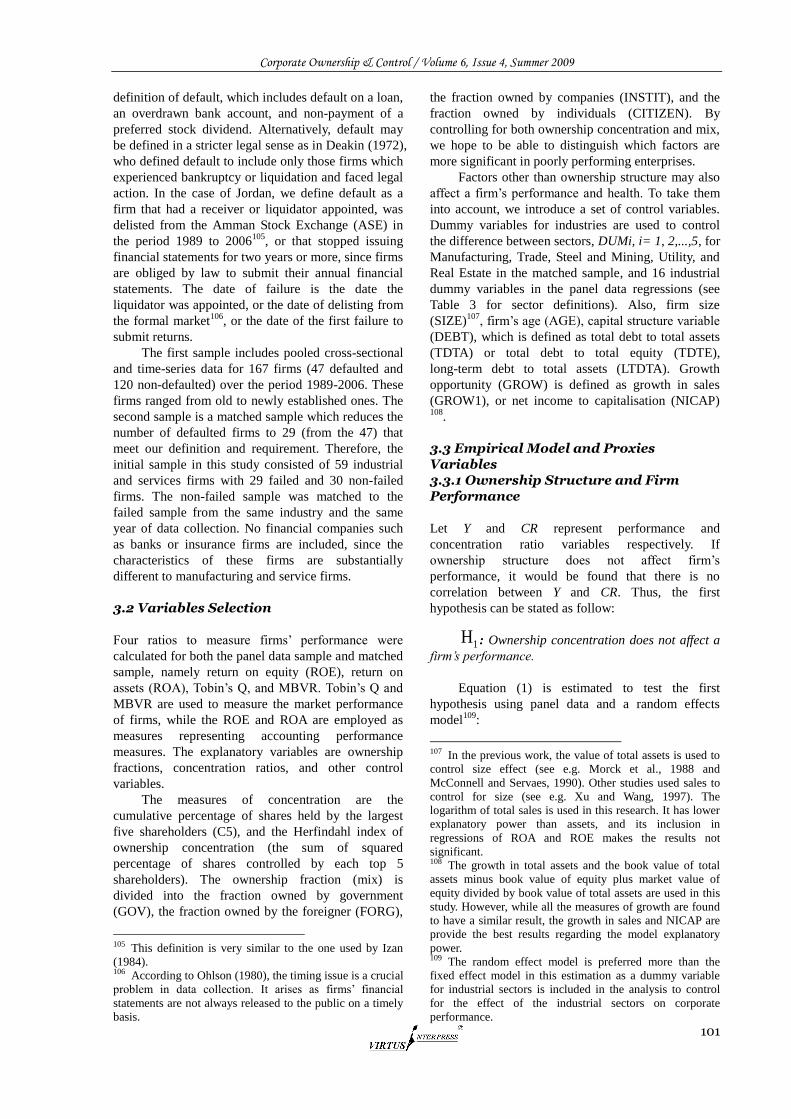
Corporate Ownership & Control / Volume 6, Issue 4, Summer 2009
101
definition of default, which includes default on a loan,
an overdrawn bank account, and non-payment of a
preferred stock dividend. Alternatively, default may
be defined in a stricter legal sense as in Deakin (1972),
who defined default to include only those firms which
experienced bankruptcy or liquidation and faced legal
action. In the case of Jordan, we define default as a
firm that had a receiver or liquidator appointed, was
delisted from the Amman Stock Exchange (ASE) in
the period 1989 to 2006105
, or that stopped issuing
financial statements for two years or more, since firms
are obliged by law to submit their annual financial
statements. The date of failure is the date the
liquidator was appointed, or the date of delisting from
the formal market106
, or the date of the first failure to
submit returns.
The first sample includes pooled cross-sectional
and time-series data for 167 firms (47 defaulted and
120 non-defaulted) over the period 1989-2006. These
firms ranged from old to newly established ones. The
second sample is a matched sample which reduces the
number of defaulted firms to 29 (from the 47) that
meet our definition and requirement. Therefore, the
initial sample in this study consisted of 59 industrial
and services firms with 29 failed and 30 non-failed
firms. The non-failed sample was matched to the
failed sample from the same industry and the same
year of data collection. No financial companies such
as banks or insurance firms are included, since the
characteristics of these firms are substantially
different to manufacturing and service firms.
3.2 Variables Selection
Four ratios to measure firms‘ performance were
calculated for both the panel data sample and matched
sample, namely return on equity (ROE), return on
assets (ROA), Tobin‘s Q, and MBVR. Tobin‘s Q and
MBVR are used to measure the market performance
of firms, while the ROE and ROA are employed as
measures representing accounting performance
measures. The explanatory variables are ownership
fractions, concentration ratios, and other control
variables.
The measures of concentration are the
cumulative percentage of shares held by the largest
five shareholders (C5), and the Herfindahl index of
ownership concentration (the sum of squared
percentage of shares controlled by each top 5
shareholders). The ownership fraction (mix) is
divided into the fraction owned by government
(GOV), the fraction owned by the foreigner (FORG),
105 This definition is very similar to the one used by Izan
(1984). 106 According to Ohlson (1980), the timing issue is a crucial
problem in data collection. It arises as firms‘ financial
statements are not always released to the public on a timely
basis.
the fraction owned by companies (INSTIT), and the
fraction owned by individuals (CITIZEN). By
controlling for both ownership concentration and mix,
we hope to be able to distinguish which factors are
more significant in poorly performing enterprises.
Factors other than ownership structure may also
affect a firm‘s performance and health. To take them
into account, we introduce a set of control variables.
Dummy variables for industries are used to control
the difference between sectors, DUMi, i= 1, 2,...,5, for
Manufacturing, Trade, Steel and Mining, Utility, and
Real Estate in the matched sample, and 16 industrial
dummy variables in the panel data regressions (see
Table 3 for sector definitions). Also, firm size
(SIZE)107
, firm‘s age (AGE), capital structure variable
(DEBT), which is defined as total debt to total assets
(TDTA) or total debt to total equity (TDTE),
long-term debt to total assets (LTDTA). Growth
opportunity (GROW) is defined as growth in sales
(GROW1), or net income to capitalisation (NICAP)
108.
3.3 Empirical Model and Proxies Variables 3.3.1 Ownership Structure and Firm Performance
Let Y and CR represent performance and
concentration ratio variables respectively. If
ownership structure does not affect firm‘s
performance, it would be found that there is no
correlation between Y and CR. Thus, the first
hypothesis can be stated as follow:
1H : Ownership concentration does not affect a
firm‟s performance.
Equation (1) is estimated to test the first
hypothesis using panel data and a random effects
model109
:
107 In the previous work, the value of total assets is used to
control size effect (see e.g. Morck et al., 1988 and
McConnell and Servaes, 1990). Other studies used sales to
control for size (see e.g. Xu and Wang, 1997). The
logarithm of total sales is used in this research. It has lower
explanatory power than assets, and its inclusion in
regressions of ROA and ROE makes the results not
significant. 108 The growth in total assets and the book value of total
assets minus book value of equity plus market value of
equity divided by book value of total assets are used in this
study. However, while all the measures of growth are found
to have a similar result, the growth in sales and NICAP are
provide the best results regarding the model explanatory
power. 109 The random effect model is preferred more than the
fixed effect model in this estimation as a dummy variable
for industrial sectors is included in the analysis to control
for the effect of the industrial sectors on corporate
performance.
Corporate Ownership & Control / Volume 6, Issue 4, Summer 2009
102
0 1 2 3 4it it it it it itY SIZE DEBT GROW CR (1)
After testing the hypothesis of the irrelevance
ownership concentration on firm performance, this
study further addresses the effect of ownership
structure on a firm‘s performance by studying the
effects of ownership mix on a firm's performance. If
ownership mix is irrelevant, there will be no
correlation between firm performance and firm value
and ownership mix. Thus, to test the irrelevance of
ownership mix on firm performance, the second
hypothesis is stated as:
2H : Ownership mix does not affect firm
performance.
If this hypothesis is rejected, the government
ownership, GOV, is hypothesised to be negatively
related to a firm‘s performance as its main focus is
social benefit rather than profit. It is hypothesised that
firms with both foreign (FORG) and institutional
(INSTIT) ownership will have a higher performance.
Equation (2) is estimated to test the second
hypothesis using the panel data model:
0 1 2 3 4it it it it it itY SIZE DEBT GROW F (2)
If ownership mix and concentration are relevant
to firm performance, this study will investigate
whether there is any effect of ownership concentration
on the significance of ownership mix. This study
explores the effect of both ownership concentration
and mix on firm performance by estimating the
following equation:
0 1 2 3 4 5it it it it it it itY SIZE DEBT GROW CR F (3)
Finally the matched sample110
is used to test the
irrelevance of ownership structure by estimating the
following equation:
0 1 2 3 4
5 6 7
Y SIZE AGE DEBT LTDTA
GROW CR F
(4)
where Y is alternatively ROA, ROE, Tobin‘s Q,
and MBVR for firm i as a measure of performance.
The independent variables are represented by
concentration ratio (CR), ownership fraction (F),
SIZE, AGE, DEBT (TDTA111
or TDTE), LTDTA112
,
110 The purpose of including the matched sample model
estimation is to provide evidence of how ownership
structure could have an impact on defaulted and
non-defaulted firms from the same industry and having the
same year of data. Furthermore, the pooled data model is
used in this study and is found to give better results than the
panel data model. An example of this is the result from the
matched sample. 111 It is worth noting that I re-estimated these equations by
introducing instrumental variables in order to investigate the
endogeneity problem; however, the results remain almost
the same without changing the estimated parameters
and GROW. Only C5 and the HERF are used as
concentration ratios113
in the estimation to investigate
the effect ownership concentrations on a firm‘s
performance. F is alternately GOV, FORG, INSTIT,
and CITIZEN. is a error term. The government
ownership, GOV, is hypothesised to be negatively
related to a firm‘s performance, while both foreign
(FORG) and institutional (INSTIT) ownership are
hypothesised to have a positive impact on corporate
performance. The next section will introduce the
empirical model that investigates the impact of
ownership structure on a firm‘s likelihood of default.
3.3.2 Ownership Structure and Corporate Failure
To further examine the issue of ownership structure
and its effect on a firm‘s likelihood of default, a test
estimating the likelihood of default was conducted
using both mix and concentration ownership structure
variables. Many studies used Logit models, such as
Martin (1977), Ohlson (1980), Zavgren (1985),
Johnsen and Melicher (1994), Lennox (1999),
Westgaard and Wijst (2001), and Ginoglou, Agorastos
and Hatzigagios (2002), among others. The Logit
model is formulated for Jordanian companies‘
conditions, and contains two state dependent
variables: state 1 for default firms, otherwise 0 for
non-default.
To investigate whether ownership concentration
and mix contributes to a firm‘s default, two
hypotheses are developed. If ownership structure (mix
and concentration) is irrelevant to default probability,
the ownership concentration and fraction will produce
an insignificant correlation between ownership
structure and corporate failure. Thus, the two
hypotheses can be stated as follows:
3H : Ownership concentration does not affect a
firm‟s default.
4H : Ownership mix does not affect firm
default.
The basic estimating equation for the matched
sample is as follows:
0 1 2 3 4 5 6*iY SIZE AGE TDTA NICAP CR F
(5)
significantly. In order to save space, these results are not
reported in this research. 112 The purpose of including the LTDTA and the DEBT
ratios in the matched sample is to control for the effect of
debt structure as this sample focused more on the defaulted
and the non-defaulted firms, and as DEBT is defined in the
matched sample as TDTE. 113 It is worth noting that the ownership concentration C1,
C2, and C3 are tried in this study, but C5 is found to have
more predictive power.
Corporate Ownership & Control / Volume 6, Issue 4, Summer 2009
103
Equation (6) is estimated to test hypotheses three
and four ( 3H and 4H ) using panel data and the
random effects model:
0 1 2 3 4 5 6*it it it it it it it itY SIZE AGE TDTA NICAP CR F
(6)
where Y* represents the firm‘s status with
Yit
=1 if firm i defaults at period t and it
y =0
otherwise, CR represents ownership concentration
ratios, C5 and HERF. F represents ownership
fractions, GOV, FORG, and INSTIT. is the
stochastic disturbance term corresponding to the ith
(estimated error).
Government ownership, GOV, is hypothesised to
be negatively related to a firm‘s default, as their main
focus is social benefit rather than profit. Priorities of
government do not necessarily coincide with a firm's
performance maximisation. For instance, the
government may care more about unemployment or
control over certain strategic industries than the value
of state assets. So, the government will support
distressed firms even until they default. Therefore,
government ownership could affect a firm's
performance negatively and, at the same time,
decrease the likelihood of default. Institutional
shareholders (INSTIT) are more profit-oriented and
may have more incentive to monitor the firm. It is
hypothesised that firms with institutional ownership,
INSTIT, will have a lower risk of failure as they
monitor the firm more closely and their goal is profit
maximisation.
Foreign shareholders (FORG) are also more
profit-oriented than government and may have more
incentive to monitor the firm. It is hypothesised that
firms with foreign ownership, FORG, will have a
lower risk of default (failure). Furthermore,
ownership concentration, C5, is expected to have a
negative effect on the likelihood of default. Four
control variables are used in this study: the firm‘s size,
the firm‘s age, TDTA114
, and the growth ratio NICAP.
These variables are expected to contribute to a firm‘s
default. It is expected that firms with high debt ratio
will have a high corporate failure and firms with a
high profit ratio will have a lower corporate failure.
Furthermore, it is argued that larger and older firms
will have a lower corporate failure.
4. Empirical Results
The analysis of the results is presented here in
separate subsections. It begins with an analysis of the
114 I re-estimated these equations by introducing
instrumental variables in order to investigate the
endogeneity problem; however, the results remain almost
the same without changing the estimated parameters
significantly. In order to save space, these results are not
reported in this research.
effect of ownership structure on corporate
performance, where ownership concentration and mix
are used in the analysis. The analysis then moves to
examining the effect of ownership structure (mix and
concentration) on corporate failure. This includes an
analysis of the statistical significance of each variable.
The random-effects model is used to examine the
effect of ownership structure and control for the effect
of industrial sectors on corporate performance.
4.1 Ownership Structure and Corporate Performance
In order to explore the appropriateness of a
random-effects model, a Breusch-Pagan Lagrange
Multiplier test is conducted to determine the overall
significance of these effects. According to the
Breusch-Pagan test the null hypothesis is that random
components are equal to zero. This test also provided
support for the Generalized Least Squares (GLS) over
a pooled Ordinary Least Squares (OLS) regression. In
all models, the Breusch-Pagan Lagrange Multiplier
test supported the use of the random-effects model.
Also, the Hausman test failed to reject the null
hypothesis of no difference between the coefficients
of the random- and the fixed-effects models. For
example, the 2Chi (4) = 0.36, P=0.98 and
2Chi
(4) = 3.4, P=0.49 for Tobin‘s Q and MBVR,
respectively. Our model also contains time-invariant
variables which cannot be estimated using the
fixed-effects model.
The overall goodness of fit (2R ) for the
random-effects model, using both ownership mix and
concentration and industrial sector variables, is
greater than the goodness of fit for the random-effects
model using only ownership concentration. A general
test for serial autocorrelation in panel data has been
conducted using the test developed by Wooldridge
(2002) (see Drukker, 2003). The null hypothesis is
that there is no serial autocorrelation for the data
examined. The hypothesis is strongly accepted as ((F1,
134) =0.847, P=0.3591). Therefore, our models do not
have a serial autocorrelation. The overall significance
of the models was tested using the Wald test, which
has a Chi-square (2 ) distribution under the null
hypothesis that all the exogenous variables are equal
to zero. For all models, the value of the 2 statistic
is significant at least at the 1 % level of significance
using ROA.
The estimation results of Equation (1) are
presented in Table 5 and Table 6 using the
random-effects model. Table 7 and Table 8 report the
results for the estimation of Equation 2. To examine
the robustness of our results, the model included
dummy variables to control for industry effects, and
the results are reported in Appendix 1. Appendix 2
and Appendix 3 report the result of the cross-sectional
analysis for the matched sample to provide more
Corporate Ownership & Control / Volume 6, Issue 4, Summer 2009
104
evidence on the effect of ownership structure on
corporate performance. The regression model using
price per share to earnings per share, ROE115
, is not
significant and, hence, is not reported using the panel
data analysis.
4.1.1 Ownership Concentration Results
From Hypothesis 1, the variables representing
ownership concentration are expected not to have any
significant impact on corporate performance. Two
variables are used, C5 and HERF. From the regression
results in Table 5, the variable C5 was found to have a
negative and significant impact on ROA at the 10%
level of significance, while it has a positive and
significant impact on MBVR. The estimated
coefficient of the HERF indicates that it does not have
a significant impact on any measure of firm
performance or value. Neither the HERF nor the C5
have any significant impact on Tobin‘s Q (although
the sign of the coefficient was positive in both
equations). The result for Tobin‘s Q and MBVR are
more robust as proved by the R-square and Waled test.
Hypothesis 1 is thus rejected as C5 is significantly
different from zero in regressions of ROA and MBVR.
As concentration is immensely different from industry
to industry, this gives rise to the potential for industry
effects of ownership concentration on a firm‘s value
(see Table 4). It can be argued that the effect of
ownership concentration may be different from one
industry to another (see Wei, Xie and Zhang, 2005).
To control for potential industry effects, 15
industrial dummy variables116
were taken and
Equation (1) was re-estimated. The results, reported in
Table 6, almost changed the significance of C5. The
largest five shareholders, C5, became insignificant in
ROA, while the significance of C5 increased in
MBVR. Furthermore, of the 15 industrial dummy
variables, only that for sector 8 was found to have a
positive impact on a firm‘s performance ROA. Also,
all the coefficients of the industrial variables were
found to have a negative and significant impact on a
firm‘s value measured by Tobin‘s Q. It should be
noted that the significance of these industrial sectors
may imply presence of industry sector.
The significant impact of concentration ratios on
MBVR supports the Shleifer and Vishny hypothesis
(1986) that large shareholders may reduce the
problem of small investors and, hence, increase the
firm‘s performance. The finding of a positive and
significant relationship between ownership
concentration and corporate performance is consistent
with prior research based on advanced capital markets
including Hill and Snell (1988, 1989), Kaplan and
115 The only variable that is found to be significant is
DEBT. 116 The analysis included 16 dummy variables but one
dummy variable (sector 16) is dropped due to collinearity.
Minton (1994), and Morck, Nakamura and Shivdasani
(2000), among others.
However, this finding is inconsistent with the
result of Wu and Cui (2002) that there is a positive
relationship between ownership concentration and
accounting profits (indicated by ROA), but consistent
with the result of Leech and Leahy (1991) and
Mudambi and Nicosia (1998). The insignificant
results for concentration variables in the Tobin‘s Q
equation could suggest that the Jordanian equity
market is inefficient (or there could be other factors
that affect the market performance measure, which
were missed in our models). These results are
consistent with Abdel Shahid (2003), that ROA is the
most important factor used by investors rather than
the market measure of performance.
4.1.2 Ownership Mix and Corporate Performance
This section presents the results of ownership mix.
The hypothesis is that if ownership mix is irrelevant
to firm performance (Hypothesis 2), then the
ownership fractions will be expected to be
insignificant in Equation 2. Hypothesis 2 is rejected
decisively as GOV, INSTIT and CITIZEN are
significantly different from zero in regressions of
ROA and Tobin‘s Q. The results of the panel
regression are reported in Table 7. The results in Table
7 indicate that the fraction of equity owned by
government, GOV, has a positive coefficient in ROA
performance equations, and it is statistically
significant at the 10% level. However, GOV is found
to have a negative but insignificant impact on both
Tobin‘s Q and MBVR. The fraction owned by
institutions, INSIT, has a negative coefficient on both
ROA and Tobin‘s Q measure of performance, and
these coefficients are highly significant. The fraction
of equity owned by foreign shareholders, FORG, does
not seem to have any significant impact on the
profitability of firms as measured by ROA, Tobin‘s Q,
and MBR.
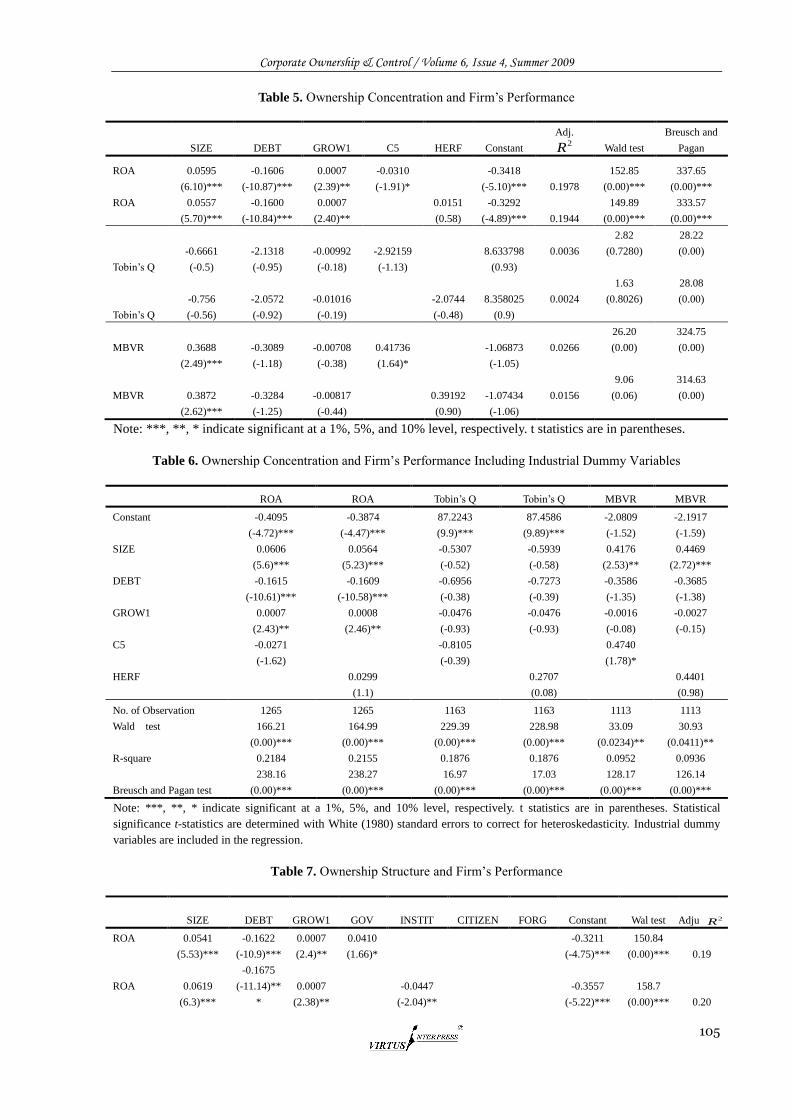
Corporate Ownership & Control / Volume 6, Issue 4, Summer 2009
105
Table 5. Ownership Concentration and Firm‘s Performance
SIZE DEBT GROW1 C5 HERF Constant
Adj. 2R Wald test
Breusch and
Pagan
ROA
0.0595
(6.10)***
-0.1606
(-10.87)***
0.0007
(2.39)**
-0.0310
(-1.91)*
-0.3418
(-5.10)*** 0.1978
152.85
(0.00)***
337.65
(0.00)***
ROA
0.0557
(5.70)***
-0.1600
(-10.84)***
0.0007
(2.40)**
0.0151
(0.58)
-0.3292
(-4.89)*** 0.1944
149.89
(0.00)***
333.57
(0.00)***
Tobin‘s Q
-0.6661
(-0.5)
-2.1318
(-0.95)
-0.00992
(-0.18)
-2.92159
(-1.13)
8.633798
(0.93)
0.0036
2.82
(0.7280)
28.22
(0.00)
Tobin‘s Q
-0.756
(-0.56)
-2.0572
(-0.92)
-0.01016
(-0.19)
-2.0744
(-0.48)
8.358025
(0.9)
0.0024
1.63
(0.8026)
28.08
(0.00)
MBVR
0.3688
(2.49)***
-0.3089
(-1.18)
-0.00708
(-0.38)
0.41736
(1.64)*
-1.06873
(-1.05)
0.0266
26.20
(0.00)
324.75
(0.00)
MBVR
0.3872
(2.62)***
-0.3284
(-1.25)
-0.00817
(-0.44)
0.39192
(0.90)
-1.07434
(-1.06)
0.0156
9.06
(0.06)
314.63
(0.00)
Note: ***, **, * indicate significant at a 1%, 5%, and 10% level, respectively. t statistics are in parentheses.
Table 6. Ownership Concentration and Firm‘s Performance Including Industrial Dummy Variables
ROA ROA Tobin‘s Q Tobin‘s Q MBVR MBVR
Constant
-0.4095
(-4.72)***
-0.3874
(-4.47)***
87.2243
(9.9)***
87.4586
(9.89)***
-2.0809
(-1.52)
-2.1917
(-1.59)
SIZE
0.0606
(5.6)***
0.0564
(5.23)***
-0.5307
(-0.52)
-0.5939
(-0.58)
0.4176
(2.53)**
0.4469
(2.72)***
DEBT
-0.1615
(-10.61)***
-0.1609
(-10.58)***
-0.6956
(-0.38)
-0.7273
(-0.39)
-0.3586
(-1.35)
-0.3685
(-1.38)
GROW1
0.0007
(2.43)**
0.0008
(2.46)**
-0.0476
(-0.93)
-0.0476
(-0.93)
-0.0016
(-0.08)
-0.0027
(-0.15)
C5
-0.0271
(-1.62)
-0.8105
(-0.39)
0.4740
(1.78)*
HERF
0.0299
(1.1)
0.2707
(0.08)
0.4401
(0.98)
No. of Observation 1265 1265 1163 1163 1113 1113
Wald test
166.21
(0.00)***
164.99
(0.00)***
229.39
(0.00)***
228.98
(0.00)***
33.09
(0.0234)**
30.93
(0.0411)**
R-square 0.2184 0.2155 0.1876 0.1876 0.0952 0.0936
Breusch and Pagan test
238.16
(0.00)***
238.27
(0.00)***
16.97
(0.00)***
17.03
(0.00)***
128.17
(0.00)***
126.14
(0.00)***
Note: ***, **, * indicate significant at a 1%, 5%, and 10% level, respectively. t statistics are in parentheses. Statistical
significance t-statistics are determined with White (1980) standard errors to correct for heteroskedasticity. Industrial dummy
variables are included in the regression.
Table 7. Ownership Structure and Firm‘s Performance
SIZE DEBT GROW1 GOV INSTIT CITIZEN FORG Constant Wal test Adju 2R
ROA
0.0541
(5.53)***
-0.1622
(-10.9)***
0.0007
(2.4)**
0.0410
(1.66)*
-0.3211
(-4.75)***
150.84
(0.00)*** 0.19
ROA
0.0619
(6.3)***
-0.1675
(-11.14)**
*
0.0007
(2.38)**
-0.0447
(-2.04)**
-0.3557
(-5.22)***
158.7
(0.00)*** 0.20
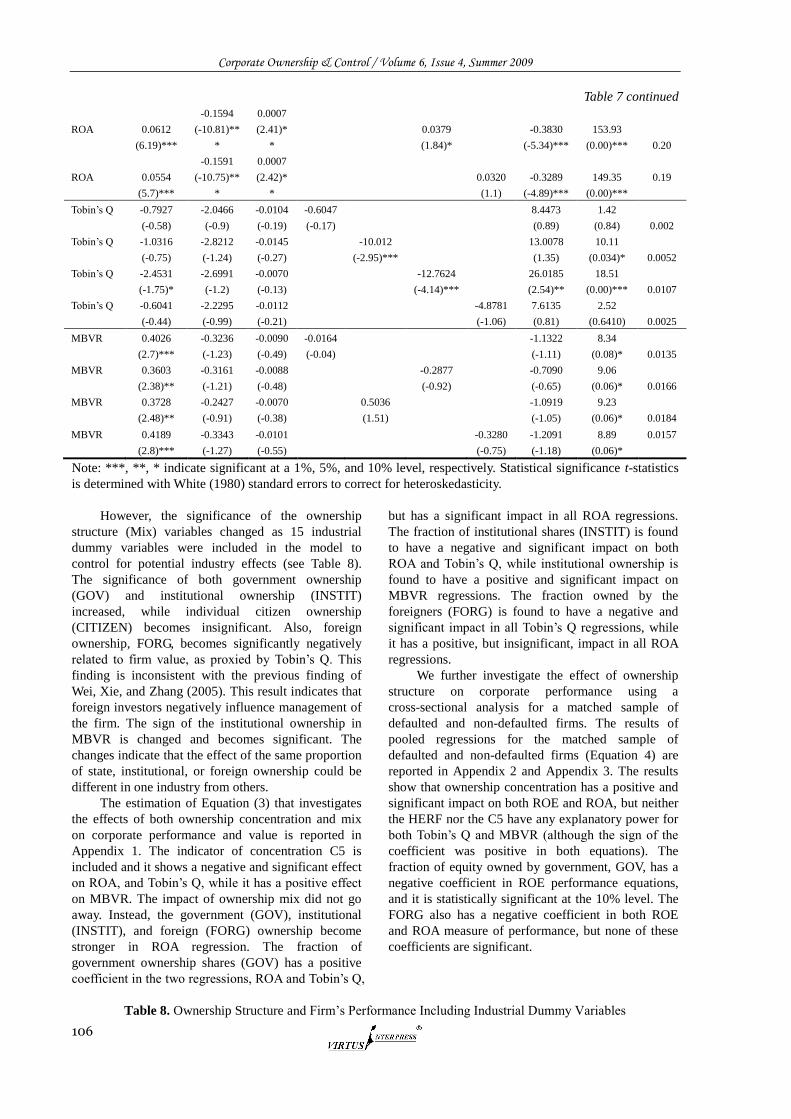
Corporate Ownership & Control / Volume 6, Issue 4, Summer 2009
106
Table 7 continued
ROA
0.0612
(6.19)***
-0.1594
(-10.81)**
*
0.0007
(2.41)*
*
0.0379
(1.84)*
-0.3830
(-5.34)***
153.93
(0.00)*** 0.20
ROA
0.0554
(5.7)***
-0.1591
(-10.75)**
*
0.0007
(2.42)*
*
0.0320
(1.1)
-0.3289
(-4.89)***
149.35
(0.00)***
0.19
Tobin‘s Q
-0.7927
(-0.58)
-2.0466
(-0.9)
-0.0104
(-0.19)
-0.6047
(-0.17)
8.4473
(0.89)
1.42
(0.84) 0.002
Tobin‘s Q
-1.0316
(-0.75)
-2.8212
(-1.24)
-0.0145
(-0.27)
-10.012
(-2.95)***
13.0078
(1.35)
10.11
(0.034)* 0.0052
Tobin‘s Q
-2.4531
(-1.75)*
-2.6991
(-1.2)
-0.0070
(-0.13)
-12.7624
(-4.14)***
26.0185
(2.54)**
18.51
(0.00)*** 0.0107
Tobin‘s Q
-0.6041
(-0.44)
-2.2295
(-0.99)
-0.0112
(-0.21)
-4.8781
(-1.06)
7.6135
(0.81)
2.52
(0.6410) 0.0025
MBVR
0.4026
(2.7)***
-0.3236
(-1.23)
-0.0090
(-0.49)
-0.0164
(-0.04)
-1.1322
(-1.11)
8.34
(0.08)* 0.0135
MBVR
0.3603
(2.38)**
-0.3161
(-1.21)
-0.0088
(-0.48)
-0.2877
(-0.92)
-0.7090
(-0.65)
9.06
(0.06)* 0.0166
MBVR
0.3728
(2.48)**
-0.2427
(-0.91)
-0.0070
(-0.38)
0.5036
(1.51)
-1.0919
(-1.05)
9.23
(0.06)* 0.0184
MBVR
0.4189
(2.8)***
-0.3343
(-1.27)
-0.0101
(-0.55)
-0.3280
(-0.75)
-1.2091
(-1.18)
8.89
(0.06)*
0.0157
Note: ***, **, * indicate significant at a 1%, 5%, and 10% level, respectively. Statistical significance t-statistics
is determined with White (1980) standard errors to correct for heteroskedasticity.
However, the significance of the ownership
structure (Mix) variables changed as 15 industrial
dummy variables were included in the model to
control for potential industry effects (see Table 8).
The significance of both government ownership
(GOV) and institutional ownership (INSTIT)
increased, while individual citizen ownership
(CITIZEN) becomes insignificant. Also, foreign
ownership, FORG, becomes significantly negatively
related to firm value, as proxied by Tobin‘s Q. This
finding is inconsistent with the previous finding of
Wei, Xie, and Zhang (2005). This result indicates that
foreign investors negatively influence management of
the firm. The sign of the institutional ownership in
MBVR is changed and becomes significant. The
changes indicate that the effect of the same proportion
of state, institutional, or foreign ownership could be
different in one industry from others.
The estimation of Equation (3) that investigates
the effects of both ownership concentration and mix
on corporate performance and value is reported in
Appendix 1. The indicator of concentration C5 is
included and it shows a negative and significant effect
on ROA, and Tobin‘s Q, while it has a positive effect
on MBVR. The impact of ownership mix did not go
away. Instead, the government (GOV), institutional
(INSTIT), and foreign (FORG) ownership become
stronger in ROA regression. The fraction of
government ownership shares (GOV) has a positive
coefficient in the two regressions, ROA and Tobin‘s Q,
but has a significant impact in all ROA regressions.
The fraction of institutional shares (INSTIT) is found
to have a negative and significant impact on both
ROA and Tobin‘s Q, while institutional ownership is
found to have a positive and significant impact on
MBVR regressions. The fraction owned by the
foreigners (FORG) is found to have a negative and
significant impact in all Tobin‘s Q regressions, while
it has a positive, but insignificant, impact in all ROA
regressions.
We further investigate the effect of ownership
structure on corporate performance using a
cross-sectional analysis for a matched sample of
defaulted and non-defaulted firms. The results of
pooled regressions for the matched sample of
defaulted and non-defaulted firms (Equation 4) are
reported in Appendix 2 and Appendix 3. The results
show that ownership concentration has a positive and
significant impact on both ROE and ROA, but neither
the HERF nor the C5 have any explanatory power for
both Tobin‘s Q and MBVR (although the sign of the
coefficient was positive in both equations). The
fraction of equity owned by government, GOV, has a
negative coefficient in ROE performance equations,
and it is statistically significant at the 10% level. The
FORG also has a negative coefficient in both ROE
and ROA measure of performance, but none of these
coefficients are significant.
Table 8. Ownership Structure and Firm‘s Performance Including Industrial Dummy Variables
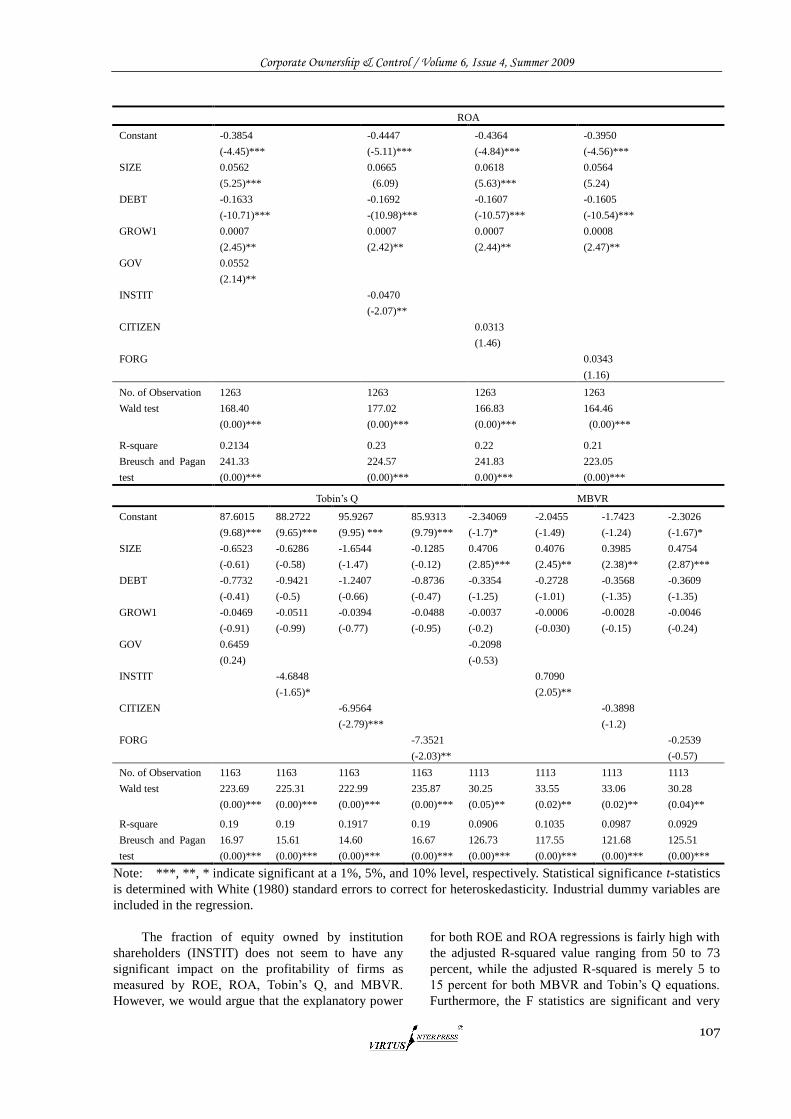
Corporate Ownership & Control / Volume 6, Issue 4, Summer 2009
107
ROA
Constant
-0.3854
(-4.45)***
-0.4447
(-5.11)***
-0.4364
(-4.84)***
-0.3950
(-4.56)***
SIZE
0.0562
(5.25)***
0.0665
(6.09)
0.0618
(5.63)***
0.0564
(5.24)
DEBT
-0.1633
(-10.71)***
-0.1692
-(10.98)***
-0.1607
(-10.57)***
-0.1605
(-10.54)***
GROW1
0.0007
(2.45)**
0.0007
(2.42)**
0.0007
(2.44)**
0.0008
(2.47)**
GOV
0.0552
(2.14)**
INSTIT
-0.0470
(-2.07)**
CITIZEN
0.0313
(1.46)
FORG
0.0343
(1.16)
No. of Observation 1263 1263 1263 1263
Wald test
168.40
(0.00)***
177.02
(0.00)***
166.83
(0.00)***
164.46
(0.00)***
R-square 0.2134 0.23 0.22 0.21
Breusch and Pagan
test
241.33
(0.00)***
224.57
(0.00)***
241.83
0.00)***
223.05
(0.00)***
Tobin‘s Q MBVR
Constant
87.6015
(9.68)***
88.2722
(9.65)***
95.9267
(9.95) ***
85.9313
(9.79)***
-2.34069
(-1.7)*
-2.0455
(-1.49)
-1.7423
(-1.24)
-2.3026
(-1.67)*
SIZE
-0.6523
(-0.61)
-0.6286
(-0.58)
-1.6544
(-1.47)
-0.1285
(-0.12)
0.4706
(2.85)***
0.4076
(2.45)**
0.3985
(2.38)**
0.4754
(2.87)***
DEBT
-0.7732
(-0.41)
-0.9421
(-0.5)
-1.2407
(-0.66)
-0.8736
(-0.47)
-0.3354
(-1.25)
-0.2728
(-1.01)
-0.3568
(-1.35)
-0.3609
(-1.35)
GROW1
-0.0469
(-0.91)
-0.0511
(-0.99)
-0.0394
(-0.77)
-0.0488
(-0.95)
-0.0037
(-0.2)
-0.0006
(-0.030)
-0.0028
(-0.15)
-0.0046
(-0.24)
GOV
0.6459
(0.24)
-0.2098
(-0.53)
INSTIT
-4.6848
(-1.65)*
0.7090
(2.05)**
CITIZEN
-6.9564
(-2.79)***
-0.3898
(-1.2)
FORG
-7.3521
(-2.03)**
-0.2539
(-0.57)
No. of Observation 1163 1163 1163 1163 1113 1113 1113 1113
Wald test
223.69
(0.00)***
225.31
(0.00)***
222.99
(0.00)***
235.87
(0.00)***
30.25
(0.05)**
33.55
(0.02)**
33.06
(0.02)**
30.28
(0.04)**
R-square 0.19 0.19 0.1917 0.19 0.0906 0.1035 0.0987 0.0929
Breusch and Pagan
test
16.97
(0.00)***
15.61
(0.00)***
14.60
(0.00)***
16.67
(0.00)***
126.73
(0.00)***
117.55
(0.00)***
121.68
(0.00)***
125.51
(0.00)***
Note: ***, **, * indicate significant at a 1%, 5%, and 10% level, respectively. Statistical significance t-statistics
is determined with White (1980) standard errors to correct for heteroskedasticity. Industrial dummy variables are
included in the regression.
The fraction of equity owned by institution
shareholders (INSTIT) does not seem to have any
significant impact on the profitability of firms as
measured by ROE, ROA, Tobin‘s Q, and MBVR.
However, we would argue that the explanatory power
for both ROE and ROA regressions is fairly high with
the adjusted R-squared value ranging from 50 to 73
percent, while the adjusted R-squared is merely 5 to
15 percent for both MBVR and Tobin‘s Q equations.
Furthermore, the F statistics are significant and very
Corporate Ownership & Control / Volume 6, Issue 4, Summer 2009
108
high for the two measures of performance, ROE and
ROA, but very low though still significant for Tobin‘s
Q. In all of the regression, five industrial dummy
variables were included as control variables and their
coefficients were not significant at any level of
significance. The results from the cross-sectional
regression confirm our finding that ownership
structure (mix and concentration) has a significant
effect on corporate performance.
In all regressions, the controlling variable firm‘s
size (SIZE) has a positive impact on the firm‘s
performance measures, ROA and MBVR, and they
are significant, at least at a 1% and 5% level, in both
ROA and MBVR, respectively. The controlling
variable growth, GROW, has a positive and
significant impact on firm performance measure ROA
only. The controlling variable for capital structure,
DEBT, is found to have a negative and significant
impact on ROA and ROE, while DEBT does not have
any significant impact on Tobin‘s Q and MBVR.
There are some conflicting results regarding the
coefficient‘s sign between ROA, Tobin‘s Q and
MBVR equations indicating that ownership structure
(mix and concentration) affects corporate
performance measures differently.
The findings of a significant impact of
ownership structure (mix) on corporate performance
and value are consistent with prior research including
Agrawal and Mandelker (1990), Xu and Wang (1997),
Miguel and Pindado (2001), Lizal (2002), Abed
Shahid (2003), Wei, Xie, and Zhang (2005), among
others. Therefore, the results provide support for
Shleifer and Vishny (1986) and for the agency theory
(Jensen and Meckling, 1976).
4.2 Ownership Structure and Corporate Failure
The estimation results of Equation (5) for the matched
sample of defaulted and non defaulted firms using
Logit estimation are presented in Table 9. The fraction
of equity owned by government, GOV, is found to
have a negative coefficient on the likelihood of
default, and it is statistically significant at a 5% level
of significance in Table 9 panel A. The variable GOV
is found to have a negative but statistically
insignificant coefficient using the panel data
(Equation 6) in Table 9 panel B. This indicates that
government ownership decreases the likelihood of
default as the government has objectives other than
profit. This result is consistent with other studies, such
as Lizal (2002), who finds that government ownership
reduces corporate failure. The fraction of foreign
owned equity, FORG, has a positive but insignificant
coefficient. The fraction of equity owned by
institution shareholders, INSTIT, does not seem to
have any significant impact on the likelihood of
default, while the coefficient of the institutional
ownership is negative.
From the results of the estimation in Table 9
panel A, we find that the ownership concentration
measure C5 has a positive and significant impact on
the likelihood of default, and the effect is statistically
significant at the 5% level in Models 1 and 3. In
Model 2, we find that the ownership concentration C5
is not significant in combination with the fraction of
foreign owners, but it still has a negative effect on
corporate failure. Our finding also supports the
findings in the previous section that ownership
concentration affects corporate performance and
participates in corporate failure. This finding can be
explained by the fact that only a few firms are
family-controlled in Jordan as supported by
Al-Malkawi (2005). Therefore, the managers
(insiders) may have incentives to pursue activities for
their own benefits. The agency conflict between
insiders (mangers) and outsiders (shareholders) results
in the managers‘ tendency to appropriate perquisites
out of the firm‘s resources for their own benefit which
leads to corporate failure.
The estimated coefficient of the HERF is not
significant using the matched sample data. However,
HERF is found to have a positive and significant
impact on Jordanian corporate failure using the
pooled cross-sectional and time-series data. The
impact of ownership mix with ownership
concentration measure HERF does not affect the
significance of government ownership GOV.
Government ownership is still significant at the 5%
level in the matched sample. Neither FORG nor
INSTIT has any significant impact on the likelihood
of default in both panels. Controlling variables such
as the firm‘s size, SIZE, and the firm‘s age, AGE, do
not have any explanatory power in predicting the
corporate failure in panel A, while both SIZE and
AGE are found to decrease the likelihood of default
for Jordanian companies. The firm‘s growth, NICAP,
has a significant effect on the likelihood of default in
both estimations. This result is consistent with the
theory that firms with high growth rates have a low
risk of default. The results also provide support for
agency theory.
For the Logit models, the Pseudo 2R ranges
from 47 to 60 percent, while the LR ranges from 38 to
49 percent, and is statistically highly significant in the
corresponding asymptotic Chi-squared distribution for
the cross-sectional data in panel A. For the
cross-sectional and time-series data, the Pseudo 2R
ranges from 18 to 19 percent, while the Wald test
ranges from 62.85 to 63.30 and is statistically
significant at the 1% level. To sum up, results from
cross-sectional and panel data analysis provide
evidence of the effect of ownership structure on
corporate failure. The result shows that ownership
concentration affects corporate performance
negatively and participates in corporate failure. The
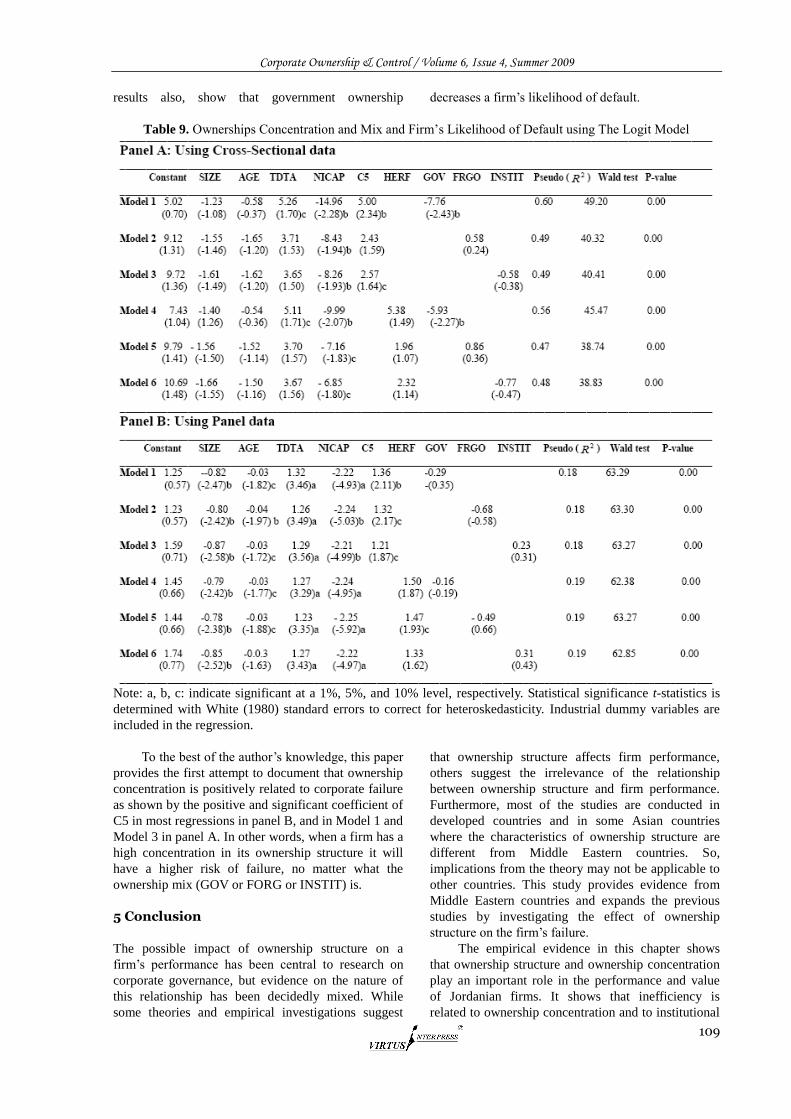
Corporate Ownership & Control / Volume 6, Issue 4, Summer 2009
109
results also, show that government ownership decreases a firm‘s likelihood of default.
Table 9. Ownerships Concentration and Mix and Firm‘s Likelihood of Default using The Logit Model
Note: a, b, c: indicate significant at a 1%, 5%, and 10% level, respectively. Statistical significance t-statistics is
determined with White (1980) standard errors to correct for heteroskedasticity. Industrial dummy variables are
included in the regression.
To the best of the author‘s knowledge, this paper
provides the first attempt to document that ownership
concentration is positively related to corporate failure
as shown by the positive and significant coefficient of
C5 in most regressions in panel B, and in Model 1 and
Model 3 in panel A. In other words, when a firm has a
high concentration in its ownership structure it will
have a higher risk of failure, no matter what the
ownership mix (GOV or FORG or INSTIT) is.
5 Conclusion
The possible impact of ownership structure on a
firm‘s performance has been central to research on
corporate governance, but evidence on the nature of
this relationship has been decidedly mixed. While
some theories and empirical investigations suggest
that ownership structure affects firm performance,
others suggest the irrelevance of the relationship
between ownership structure and firm performance.
Furthermore, most of the studies are conducted in
developed countries and in some Asian countries
where the characteristics of ownership structure are
different from Middle Eastern countries. So,
implications from the theory may not be applicable to
other countries. This study provides evidence from
Middle Eastern countries and expands the previous
studies by investigating the effect of ownership
structure on the firm‘s failure.
The empirical evidence in this chapter shows
that ownership structure and ownership concentration
play an important role in the performance and value
of Jordanian firms. It shows that inefficiency is
related to ownership concentration and to institutional
Corporate Ownership & Control / Volume 6, Issue 4, Summer 2009
110
ownership. A negative correlation between ownership
concentration C5 and firm‘s performance both, ROA
and Tobin‘s Q, is found, while there is a positive
impact on firm performance MBVR. The HERF is not
significant at any level of significance in any measure
of performance. The insignificance of the HERF
shows that there could be a non-linear relationship
between ownership concentration and a firm‘s
performance.
The research also found that there is a significant
negative relationship between government ownership
and a firm‘s accounting performance, while the other
ownership structure mixes have significant
coefficients only in Tobin‘s Q using the matched
sample. However, government ownership had a
positive impact on the firms performance measure
ROA only. Firm‘s profitability ROA was negatively
and significantly correlated with the fraction of
institutional ownership, and positively and
significantly related to the market performance
measure, MBVR. The result is robust when indicators
of both concentration and ownership mix are included
in the regressions. The results of this study are, to
some extent, inconsistent with previous findings.
This paper also used ownership structure to
predict the corporate failure. The results suggest that
government ownership is negatively related to the
likelihood of default. Government ownership
decreases the likelihood of default, but has a negative
impact on a firm‘s performance. The results suggest
that, in order to increase a firm‘s performance and
decrease the likelihood of default, it is reasonable to
reduce government ownership to some extent.
Individual share holders have no apparent capability
to monitor and influence the behaviour of
management. Furthermore, a certain degree of
ownership concentration is needed to increase the
firm‘s performance and to decrease the firm‘s chance
of default. This paper also provides evidence that the
performance of the firms is a non-linear function of
ownership structure.
6. References
1. Abdel Shahid, S., 2003, Does Ownership Structure
Affect Firm Value? Evidence from The Egyptian
Stock Market, Working Paper, [online],
(www.ssrn.com).
2. Agrawal, A., and G. Mandelker, 1990, Large
Shareholders and the Monitoring of Managers: The
Case of Antitakeover Charter Amendments, Journal of
Financial Quantitative Analysis 25, 143-161.
3. Al-Malkawi, Husam-Aladin Nizar Y, 2005, Dividend
Policy of Publicly Quoted
4. Companies in Emerging Markets - The Case Of
Jordan, PhD Thesis, University of Western Sydney,
Australia.
5. Beaver, W., 1968, Alternative Financial Ratios as
Predictors of Failure, Accounting Review XLIII, 113-
122.
6. Becht, M., and A. ROell, 1999, Blockholding in
Europe: An International Comparison, European
Economic Review 43, 1049-1056.
7. Deakin, E. B., 1972, A Discriminant Analysis of
Predictors of Business Failure, Journal of Accounting
Research 10, 167-79.
8. Drukker, D. M., 2003, Testing For Serial Correlation
in Linear Panel-Data Models, Stata Journal 3, 168-
177.
9. Fama, E. F., and M. C. Jensen, 1983, Separation of
Ownership and Control, Journal of Law and
Economics 26, 301-325.
10. Ginoglou, D., K. Agorastos, and T. Hatzigagios, 2002,
Predicting Corporate Failure of Problematic Firms in
Greece with LPM Logit, Probit, and Discriminant
Analysis Models, Journal of Financial Management
and Analysis 15, 1-15.
11. Hill, C., and S. Snell, 1988, External Control,
Corporate Strategy, and Firm Performance in
Research-Intensive Industries, Strategic Management
Journal 9, 577-590.
12. Hill, C., and S. Snell, 1989, Effects of Ownership
Structure and Control on Corporate Productivity,
Academy of Management Journal 32, 25-46.
13. Izan, H. Y., 1984, Corporate Distress in Australia,
Journal of Banking & Finance 8, 303-320.
14. Jensen, M., and W. Meckling, 1976, Theory of the
Firm: Managerial Behavior, Agency Costs and
Ownership Structure, Journal of Financial Economics
3, 305-360.
15. Johnsen, T., and R. W. Melicher, 1994, Predicting
Corporate Bankruptcy and Financial Distress:
Information Value Added By Multinomial Logit
Models, Journal of Economics and Business 46, 269-
286.
16. Kaplan, S., and B. Minton, 1994, Appointments of
Outsiders to Japanese Boards, Determinants and
Implications for Managers, Journal of Financial
Economics 23, 225- 258.
17. Leech, D., and J. Leahy, 1991, Ownership Structure,
Control Type Classifications and the Performance of
Large British Companies, The Economic Journal 101,
1418-1437.
18. Lennox, C., 1999, Identifying Failing Companies: a
Re-Evaluation of the Logit, Probit and DA
Approaches, Journal of Economics and Business 51,
347-364.
19. Lizal, L., 2002, Determinants of Financial Distress:
What Drives Bankruptcy in A Transition Economy?,
The Czech Republic Case, [online], (www.ssrn.com).
20. Martin, D., 1977, Early Warnings of Bank Failure: A
Logit Regression Approach, Journal of Banking and
Finance 1, 249-276.
21. McConnell, J. J., and H. Servaes, 1990, Additional
Evidence on Equity Ownership and Corporate Value,
Journal of Financial Economics 27, 595-612.
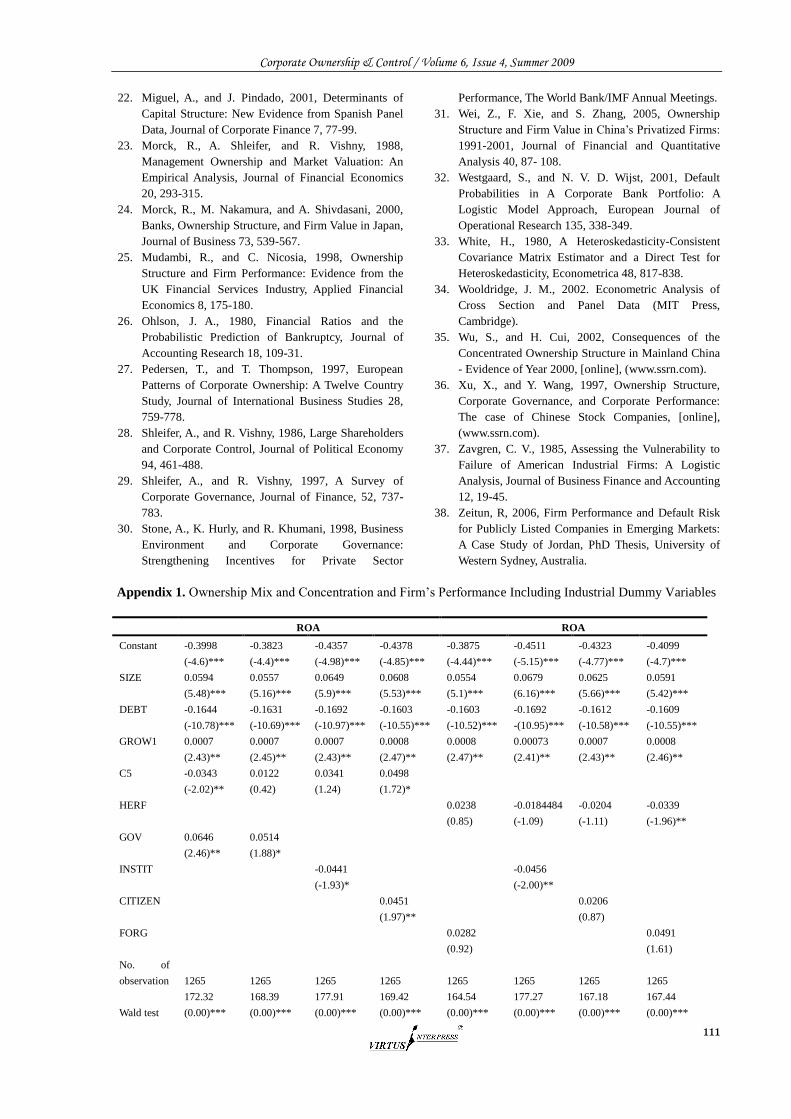
Corporate Ownership & Control / Volume 6, Issue 4, Summer 2009
111
22. Miguel, A., and J. Pindado, 2001, Determinants of
Capital Structure: New Evidence from Spanish Panel
Data, Journal of Corporate Finance 7, 77-99.
23. Morck, R., A. Shleifer, and R. Vishny, 1988,
Management Ownership and Market Valuation: An
Empirical Analysis, Journal of Financial Economics
20, 293-315.
24. Morck, R., M. Nakamura, and A. Shivdasani, 2000,
Banks, Ownership Structure, and Firm Value in Japan,
Journal of Business 73, 539-567.
25. Mudambi, R., and C. Nicosia, 1998, Ownership
Structure and Firm Performance: Evidence from the
UK Financial Services Industry, Applied Financial
Economics 8, 175-180.
26. Ohlson, J. A., 1980, Financial Ratios and the
Probabilistic Prediction of Bankruptcy, Journal of
Accounting Research 18, 109-31.
27. Pedersen, T., and T. Thompson, 1997, European
Patterns of Corporate Ownership: A Twelve Country
Study, Journal of International Business Studies 28,
759-778.
28. Shleifer, A., and R. Vishny, 1986, Large Shareholders
and Corporate Control, Journal of Political Economy
94, 461-488.
29. Shleifer, A., and R. Vishny, 1997, A Survey of
Corporate Governance, Journal of Finance, 52, 737-
783.
30. Stone, A., K. Hurly, and R. Khumani, 1998, Business
Environment and Corporate Governance:
Strengthening Incentives for Private Sector
Performance, The World Bank/IMF Annual Meetings.
31. Wei, Z., F. Xie, and S. Zhang, 2005, Ownership
Structure and Firm Value in China‘s Privatized Firms:
1991-2001, Journal of Financial and Quantitative
Analysis 40, 87- 108.
32. Westgaard, S., and N. V. D. Wijst, 2001, Default
Probabilities in A Corporate Bank Portfolio: A
Logistic Model Approach, European Journal of
Operational Research 135, 338-349.
33. White, H., 1980, A Heteroskedasticity-Consistent
Covariance Matrix Estimator and a Direct Test for
Heteroskedasticity, Econometrica 48, 817-838.
34. Wooldridge, J. M., 2002. Econometric Analysis of
Cross Section and Panel Data (MIT Press,
Cambridge).
35. Wu, S., and H. Cui, 2002, Consequences of the
Concentrated Ownership Structure in Mainland China
- Evidence of Year 2000, [online], (www.ssrn.com).
36. Xu, X., and Y. Wang, 1997, Ownership Structure,
Corporate Governance, and Corporate Performance:
The case of Chinese Stock Companies, [online],
(www.ssrn.com).
37. Zavgren, C. V., 1985, Assessing the Vulnerability to
Failure of American Industrial Firms: A Logistic
Analysis, Journal of Business Finance and Accounting
12, 19-45.
38. Zeitun, R, 2006, Firm Performance and Default Risk
for Publicly Listed Companies in Emerging Markets:
A Case Study of Jordan, PhD Thesis, University of
Western Sydney, Australia.
Appendix 1. Ownership Mix and Concentration and Firm‘s Performance Including Industrial Dummy Variables
ROA ROA
Constant
-0.3998
(-4.6)***
-0.3823
(-4.4)***
-0.4357
(-4.98)***
-0.4378
(-4.85)***
-0.3875
(-4.44)***
-0.4511
(-5.15)***
-0.4323
(-4.77)***
-0.4099
(-4.7)***
SIZE
0.0594
(5.48)***
0.0557
(5.16)***
0.0649
(5.9)***
0.0608
(5.53)***
0.0554
(5.1)***
0.0679
(6.16)***
0.0625
(5.66)***
0.0591
(5.42)***
DEBT
-0.1644
(-10.78)***
-0.1631
(-10.69)***
-0.1692
(-10.97)***
-0.1603
(-10.55)***
-0.1603
(-10.52)***
-0.1692
-(10.95)***
-0.1612
(-10.58)***
-0.1609
(-10.55)***
GROW1
0.0007
(2.43)**
0.0007
(2.45)**
0.0007
(2.43)**
0.0008
(2.47)**
0.0008
(2.47)**
0.00073
(2.41)**
0.0007
(2.43)**
0.0008
(2.46)**
C5
-0.0343
(-2.02)**
0.0122
(0.42)
0.0341
(1.24)
0.0498
(1.72)*
HERF
0.0238
(0.85)
-0.0184484
(-1.09)
-0.0204
(-1.11)
-0.0339
(-1.96)**
GOV
0.0646
(2.46)**
0.0514
(1.88)*
INSTIT
-0.0441
(-1.93)*
-0.0456
(-2.00)**
CITIZEN
0.0451
(1.97)**
0.0206
(0.87)
FORG
0.0282
(0.92)
0.0491
(1.61)
No. of
observation 1265 1265 1265 1265 1265 1265 1265 1265
Wald test
172.32
(0.00)***
168.39
(0.00)***
177.91
(0.00)***
169.42
(0.00)***
164.54
(0.00)***
177.27
(0.00)***
167.18
(0.00)***
167.44
(0.00)***
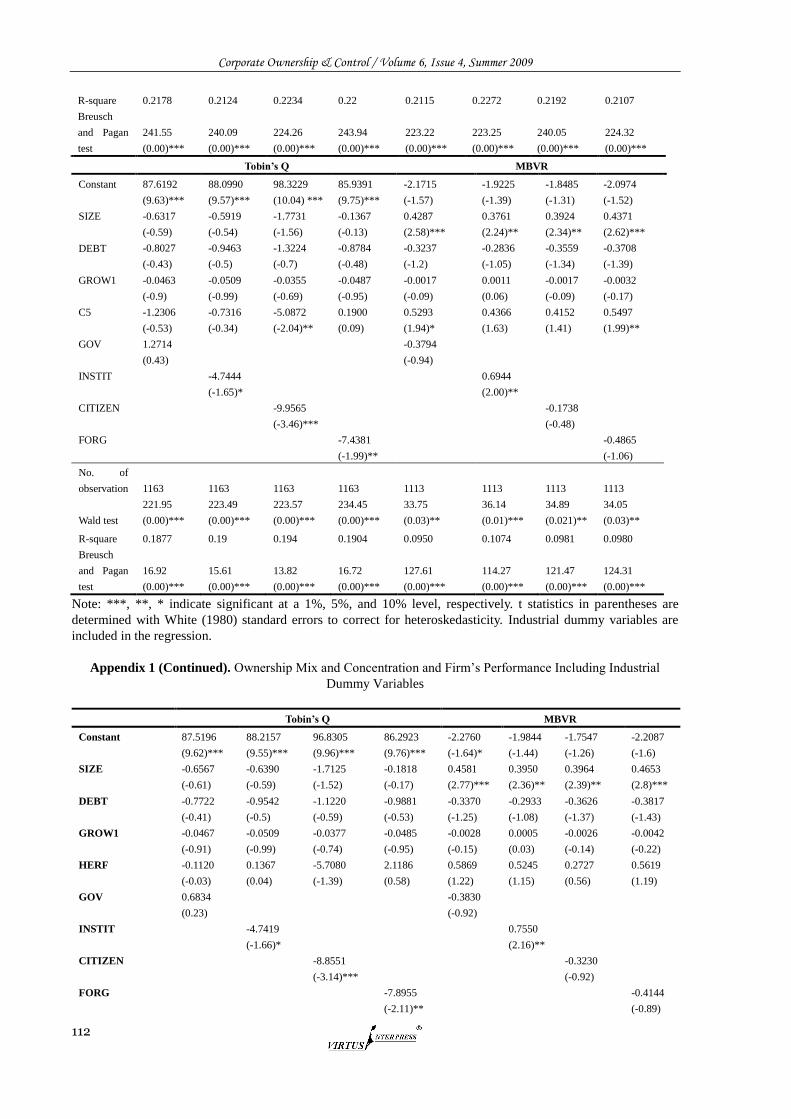
Corporate Ownership & Control / Volume 6, Issue 4, Summer 2009
112
R-square 0.2178 0.2124 0.2234 0.22 0.2115 0.2272 0.2192 0.2107
Breusch
and Pagan
test
241.55
(0.00)***
240.09
(0.00)***
224.26
(0.00)***
243.94
(0.00)***
223.22
(0.00)***
223.25
(0.00)***
240.05
(0.00)***
224.32
(0.00)***
Tobin’s Q MBVR
Constant
87.6192
(9.63)***
88.0990
(9.57)***
98.3229
(10.04) ***
85.9391
(9.75)***
-2.1715
(-1.57)
-1.9225
(-1.39)
-1.8485
(-1.31)
-2.0974
(-1.52)
SIZE
-0.6317
(-0.59)
-0.5919
(-0.54)
-1.7731
(-1.56)
-0.1367
(-0.13)
0.4287
(2.58)***
0.3761
(2.24)**
0.3924
(2.34)**
0.4371
(2.62)***
DEBT
-0.8027
(-0.43)
-0.9463
(-0.5)
-1.3224
(-0.7)
-0.8784
(-0.48)
-0.3237
(-1.2)
-0.2836
(-1.05)
-0.3559
(-1.34)
-0.3708
(-1.39)
GROW1
-0.0463
(-0.9)
-0.0509
(-0.99)
-0.0355
(-0.69)
-0.0487
(-0.95)
-0.0017
(-0.09)
0.0011
(0.06)
-0.0017
(-0.09)
-0.0032
(-0.17)
C5
-1.2306
(-0.53)
-0.7316
(-0.34)
-5.0872
(-2.04)**
0.1900
(0.09)
0.5293
(1.94)*
0.4366
(1.63)
0.4152
(1.41)
0.5497
(1.99)**
GOV
1.2714
(0.43)
-0.3794
(-0.94)
INSTIT
-4.7444
(-1.65)*
0.6944
(2.00)**
CITIZEN
-9.9565
(-3.46)***
-0.1738
(-0.48)
FORG
-7.4381
(-1.99)**
-0.4865
(-1.06)
No. of
observation 1163 1163 1163 1163 1113 1113 1113 1113
Wald test
221.95
(0.00)***
223.49
(0.00)***
223.57
(0.00)***
234.45
(0.00)***
33.75
(0.03)**
36.14
(0.01)***
34.89
(0.021)**
34.05
(0.03)**
R-square 0.1877 0.19 0.194 0.1904 0.0950 0.1074 0.0981 0.0980
Breusch
and Pagan
test
16.92
(0.00)***
15.61
(0.00)***
13.82
(0.00)***
16.72
(0.00)***
127.61
(0.00)***
114.27
(0.00)***
121.47
(0.00)***
124.31
(0.00)***
Note: ***, **, * indicate significant at a 1%, 5%, and 10% level, respectively. t statistics in parentheses are
determined with White (1980) standard errors to correct for heteroskedasticity. Industrial dummy variables are
included in the regression.
Appendix 1 (Continued). Ownership Mix and Concentration and Firm‘s Performance Including Industrial
Dummy Variables
Tobin’s Q MBVR
Constant
87.5196
(9.62)***
88.2157
(9.55)***
96.8305
(9.96)***
86.2923
(9.76)***
-2.2760
(-1.64)*
-1.9844
(-1.44)
-1.7547
(-1.26)
-2.2087
(-1.6)
SIZE
-0.6567
(-0.61)
-0.6390
(-0.59)
-1.7125
(-1.52)
-0.1818
(-0.17)
0.4581
(2.77)***
0.3950
(2.36)**
0.3964
(2.39)**
0.4653
(2.8)***
DEBT
-0.7722
(-0.41)
-0.9542
(-0.5)
-1.1220
(-0.59)
-0.9881
(-0.53)
-0.3370
(-1.25)
-0.2933
(-1.08)
-0.3626
(-1.37)
-0.3817
(-1.43)
GROW1
-0.0467
(-0.91)
-0.0509
(-0.99)
-0.0377
(-0.74)
-0.0485
(-0.95)
-0.0028
(-0.15)
0.0005
(0.03)
-0.0026
(-0.14)
-0.0042
(-0.22)
HERF
-0.1120
(-0.03)
0.1367
(0.04)
-5.7080
(-1.39)
2.1186
(0.58)
0.5869
(1.22)
0.5245
(1.15)
0.2727
(0.56)
0.5619
(1.19)
GOV
0.6834
(0.23)
-0.3830
(-0.92)
INSTIT
-4.7419
(-1.66)*
0.7550
(2.16)**
CITIZEN
-8.8551
(-3.14)***
-0.3230
(-0.92)
FORG
-7.8955
(-2.11)**
-0.4144
(-0.89)
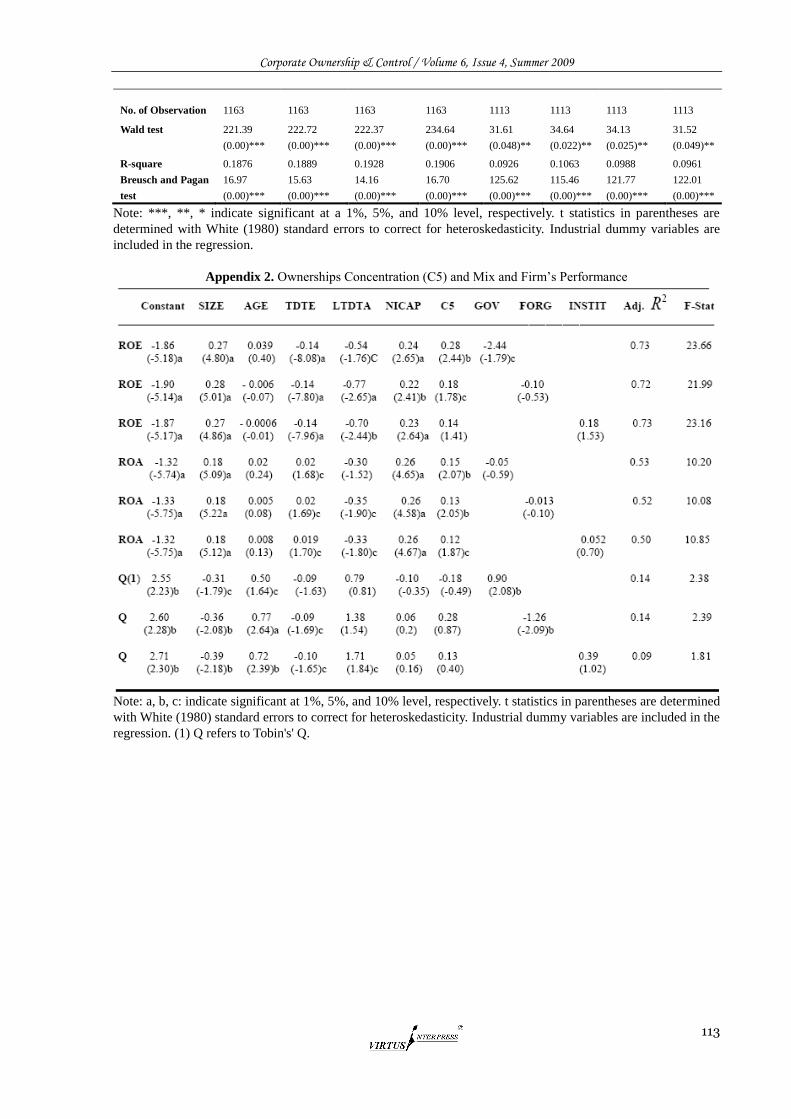
Corporate Ownership & Control / Volume 6, Issue 4, Summer 2009
113
No. of Observation 1163 1163 1163 1163 1113 1113 1113 1113
Wald test
221.39
(0.00)***
222.72
(0.00)***
222.37
(0.00)***
234.64
(0.00)***
31.61
(0.048)**
34.64
(0.022)**
34.13
(0.025)**
31.52
(0.049)**
R-square 0.1876 0.1889 0.1928 0.1906 0.0926 0.1063 0.0988 0.0961
Breusch and Pagan
test
16.97
(0.00)***
15.63
(0.00)***
14.16
(0.00)***
16.70
(0.00)***
125.62
(0.00)***
115.46
(0.00)***
121.77
(0.00)***
122.01
(0.00)***
Note: ***, **, * indicate significant at a 1%, 5%, and 10% level, respectively. t statistics in parentheses are
determined with White (1980) standard errors to correct for heteroskedasticity. Industrial dummy variables are
included in the regression.
Appendix 2. Ownerships Concentration (C5) and Mix and Firm‘s Performance
Note: a, b, c: indicate significant at 1%, 5%, and 10% level, respectively. t statistics in parentheses are determined
with White (1980) standard errors to correct for heteroskedasticity. Industrial dummy variables are included in the
regression. (1) Q refers to Tobin's' Q.
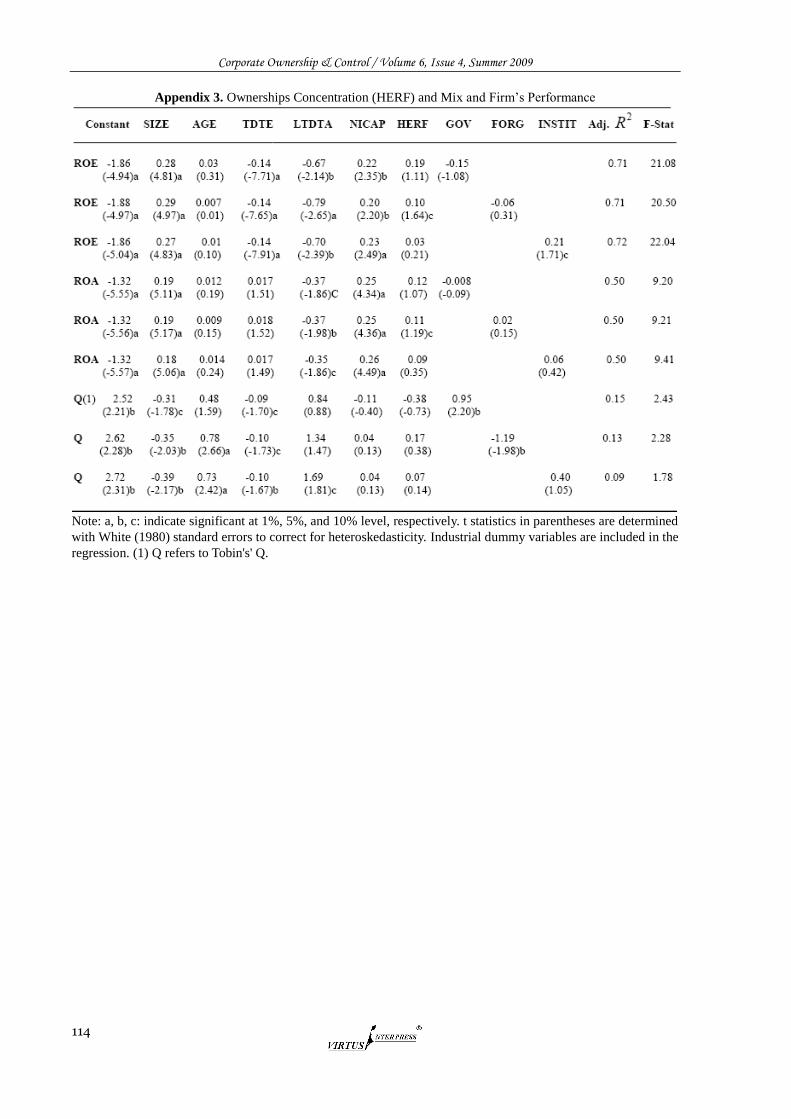
Corporate Ownership & Control / Volume 6, Issue 4, Summer 2009
114
Appendix 3. Ownerships Concentration (HERF) and Mix and Firm‘s Performance
Note: a, b, c: indicate significant at 1%, 5%, and 10% level, respectively. t statistics in parentheses are determined
with White (1980) standard errors to correct for heteroskedasticity. Industrial dummy variables are included in the
regression. (1) Q refers to Tobin's' Q.
Corporate Ownership & Control / Volume 6, Issue 4, Summer 2009
115
THE IMPACTS OF MANAGERIAL AND INSTITUTIONAL OWNERSHIP ON FIRM PERFORMANCE: THE ROLE OF STOCK PRICE INFORMATIVENESS AND CORPORATE GOVERNANCE
William Cheung, Scott Fung, Shih-Chuan Tsai*
Abstract This paper provides new evidence on the relations between managerial and institutional ownerships and firm performance. These relations are found to be affected by firm’s stock price informativeness and corporate governance. Based on a sample of US firms from NYSE, AMEX, and NASDAQ between 1989 and 2006, we document three important findings. First, managerial ownership and firm future performance are non-linearly related; the positive relation is stronger for firms with less informative prices or more agency problems. This finding suggests that poor governance and uninformative price increase the importance of managerial value creation for their firms by improving internal governance. Second, institutional ownership has a significant positive impact on firm future performance, with larger impact for firms with less informative prices or good governance. However, institutional ownership, which reflects external monitoring, has a weaker positive effect compared to managerial ownership, which controls for internal governance. Third, the interaction between managerial ownership and institutional ownership has a significant positive impact on firm future performance, suggesting that there are synergistic effects of internal and external corporate governance mechanisms in improving firm value. Keywords: Managerial Ownership; Institutional Ownership; Corporate Governance; Stock Price Informativeness * William Cheung is at University of Macau. Scott Fung is at California State University, East Bay, and Shih-Chuan Tsai is at Ling Tung University in Taiwan. Cheung would like to acknowledge the financial supports from Research Grant Committee of University of Macau. Fung would like to acknowledge the financial supports from Faculty Research Grant from College of Business and Economics, California State University East Bay, July 2008. Tsai would like to acknowledge the financial support from National Science Council of Taiwan (grant #NSC97-2410-H-275-005). Address correspondence to Shih-Chuan Tsai, 11F-2, No. 18, Sec. 2, Jin-Shan South Road, Taipei, Taiwan; e-mail: [email protected].
1. Introduction
The economic relation between ownership structure
and firm performance has long been a key issue in
corporate finance and governance. Morck, Shleifer
and Vishny (1988) document a non-linear relation
between ownership and firm performance. They
conjecture that the non-linear relation between
managerial ownership and firm performance is due to
the balance of alignment of interest and entrenchment
between shareholders and managers. Shleifer and
Vishny (1986) model the large shareholders, including
banks, insurance companies and funds, find that they
have enough incentives to monitor the management,
initiate takeover if necessary and thereby improve
firm value. Voluminous researchers study the
ownership-performance relation under various
paradigms [Demsetz (1983), Demsetz and Lehn
(1985) Holderness and Sheehan (1988), Himmelberg,
Hubbard and Palia (1999), Demsetz and Villalonga
(2001), Claessens, Djankov, Fan and Lang (2002),
Anderson and Reeb (2003), Cronqvist and Nilsson
(2003), and Lins (2003)].117
Whilst firm performance
is related to ownership structure, Faure-Grimuad and
Gromb (2004) show that public trading (smaller
shareholder activities) affects large shareholder‘s
private incentives to engage in value-increasing
activities and increases firm value. They suggest that
ownership concentration and stock price
informativeness ―are likely not to be independent‖.
Wurgler (2000) and Durnev, Morck and Yeung (2003)
117 Holderness and Sheehan (1988) find that family firms
have a lower Tobin‘s q than non-family firms while
Anderson and Reeb (2003) find that opposite. Demsetz
(1983) argues that ownership concentration is the
endogenous outcome of profit-maximizing decisions by
current and potential shareholders and should have no effect
on firm value. Demsetz and Lehn (1985), Himmelberg,
Hubbard and Palia (1999), and Demsetz and Villalonga
(2001) provide supporting evidences of Demsetz (1983).
Claessens et al. (2002) and Lins (2003) evident that in East
Asian economies, ownership concentration improve firm
values. Cronqvist and Nilsson (2003) further find that in
Sweden, the cash flow ownership has a negative impact on
firm value. Excellent literature survey are in Villalonga and
Amit (2006) and Cheung and Wei (2006).
Corporate Ownership & Control / Volume 6, Issue 4, Summer 2009
116
provide direct evidences of informative prices
enhance firm value.
In essence, there are two important dimensions –
stock price informativeness and corporate governance
(control rights) – that can affect a firm‘s
ownership-performance relation. Aforementioned
studies find that ownership structure and firm value
are both related to insiders‘ incentives. More recent
studies provide evidence that insider incentives to
create firm value are determine by stock price
informativeness and corporate governance (control
rights). An informative price is vital for manager
incentives to have positive effects on the performance
of a firm. Faure-Grimaud and Gromb (2004) suggest
that an informative stock price increases the manager
incentives to engage in value-increasing activities
because of his activities can be publicly observed
through the informative price. Hence, when
mitigating owner-manager agency conflicts,
managerial incentives and ownership are positively
aligned with the stock price informativeness.
Similar to stock price informativeness, corporate
governance and agency cost can also affect the
impacts of manager ownership on performance.
Classic corporate finance problem of owner-manager
conflicts [e.g. Berle and Means (1932) and Jensen and
Meckling (1976)] can be mitigated by giving large
shareholders enough equity stakes as incentives to
monitor the manager. As such, firm value may
increase as the advisory and monitoring benefit excess
the private benefit of expropriating minority
shareholders. Villalonga and Amit (2006) suggest that
the classic owner-manager conflict in non-family
firms is more costly than the conflict between family
and nonfamily shareholders in founder-CEO firms.
Claessens et al. (2002) and Lins (2003) find support
of excess large shareholders voting right over cash
flow rights may reduces firm values but not enough to
tradeoff the benefits from ownership concentration.
Cronqvist and Nilsson (2003) find evidence in
Sweden that cash flow ownership, rather than the
excess voting rights, has a negative impact on firm
value. However, the effectiveness of the corporate
ownerships and their impacts on firm performance
remain important research questions.
Moreover, managerial ownership is not the only
type of corporate ownerships that determine firm
performance. Existing literature shows that
institutional ownership can affect stock market
valuation of the firm. Davis and Steil (2001) discuss
the corporate governance role of institutional
investors. Gompers and Metrick (2001) support the
impacts of institutional ownership on stock returns.
Woidtke (2002) examines valuation effects with
respect to public and private pension funds in a firm.
Recent studies suggest that institutional investors can
have direct impact on firm value (in additional to
valuation effect). Hartzell and Starks (2003) show that
institutional investors serve as monitor and affect
executive compensation. Cornett, Marcus, Saunders,
and Tehranian (2007) find a significant relation
between institutional ownership and firm‘s operating
performance – especially for institutional investors
with potential business relations with the firm in
which their investment are considered as monitoring.
Chen, Harford, and Li (2007) show that independent
institutions with long-term investments will specialize
in monitoring during takeover.
Similar to managerial ownership, the impact of
institutional investors on firm value can also depend
on the availability of firm-specific information and
corporate governance practices. Informed institutional
investors with sufficient ownerships can perform
governance and monitoring on the management
(external governance), replace the incumbents and
initiate takeover if necessary [Jensen and Meckling
(1976), Shleifer and Vishny (1986), Admati,
Pfleiderer and Zechner (1994)]. Recent studies,
including Kahn and Winton (1998) and Noe (2002),
suggest that instead of exerting external governance,
institutional investors may choose to benefit from the
information asymmetry from outsiders and avoid the
cost of activism. Nonetheless, empirical evidences of
the impact of institutional investors on firm value are
far from conclusive.
Given the motivations above, this study sets out
to examine the relationship between managerial
ownerships and firm performance, and the variations
of such relationship with respect to stock price
informativeness and corporate governance. Equally
important, we provide parallel examinations of the
relationship between institutional ownerships and firm
performance, and how the relationship varies with
stock price informativeness and corporate governance.
By examining the ownership-performance relations
above, we are able to gain insightful comparison
between internal governance (incentives) provided by
managerial ownerships, and external governance
(monitoring) provided by institutional investors.
Further, this study considers the joint impacts of
managerial and institutional ownerships provide
important insights into the effectiveness of different
corporate ownership and control mechanisms. It is not
uncommon to have both manager and institutional
investors to own significant proportion of a public
firm. Manager‘s ownership can provide internal
corporate governance such as incentives and control,
while institutional ownership can provide external
governance, such as monitoring and control.
Based on a sample of US firms from NYSE,
AMEX, and NASDAQ between 1989 and 2006, we
document three sets of new empirical findings.
First, consistent with Morck, Shleifer and
Vishny (1988), managerial ownership and firm future
performance are non-linearly related. Interestingly,
this relation is stronger for firms with less informative
prices or more agency problems. This finding
suggests that managers improve firm value by (i)
reducing costs of agency problem with better internal
governance and (ii) lowering monitoring costs with
more informative prices. We find that with sufficient
equity stake, managers create more value for firms
Corporate Ownership & Control / Volume 6, Issue 4, Summer 2009
117
with poor governance or less informative stock prices,
i.e. where information transparency is low and agency
cost is high. The reason is that poor governance and
uninformative price increase the importance of
managerial value creation for their firms by
improving internal governance. This creates
additional incentives for managers with sufficient
equity stake.
Second, institutional ownership can predict firm
future performance, with larger impact for firms with
less informative prices or better corporate governance.
Institutional investors, contrast to traditional view of
advisory and monitoring roles, improve firm value by
producing information but not by providing external
monitoring. However, the institutional ownership,
which reflects external monitoring, has weaker effect
compared to managerial ownership, which controls
for internal governance.
Third, the interaction between managerial
ownership and institutional ownership has a
significant positive impact on firm future performance.
This result suggests that internal governance (by
manager) and external monitoring (institutional
investors) have complementary economic impacts on
firm performance. In addition, institutional investors
create more value for a firm, by providing monitoring
service, when managers have more incentives to
co-operate results from their holdings of the firm. Our
overall results are consistent with Shleifer and Vishny
(1986) that large minority shareholders, such as the
institution investors, mitigate free rider problem of
managerial performance monitoring. This value
creation by large minority shareholders is more
profound when the stock price of a firm is less
informative or better corporate governance. Finally
the external monitoring role of institutional investors
enhances firm value only when both institutional
investors and managers have enough equity stakes to
create the synergistic effects on improving corporate
governance.
Overall, our results suggest that both manager
and institutional investors has an informational role in
creating firm value. However, the institutional
investors cannot resolve the governance problem on
their own when agency is high but can mitigate the
agency problem with collective effort from them and
a firm‘s management with incentives aligns with firm
performance.
In terms of contributions, our study presents new
empirical evidence on how institutional investors,
managers and their interactions can enhance firm
value, and how these impacts are dependent upon
firms‘ corporate governance and information
environments. Our findings provide the following
contributions. First, for the ownership-performance
relation, we identify two important firm
characteristics which affect this relation, namely
corporate governance and price informativeness. Our
findings enrich the theory on manager ownership and
its relation with firm performance [Morck, Shleifer
and Vishny (1988) among others] by looking into
what price informative or governance condition will
managerial ownership matter for firm value; our
findings are also consistent with Ferreira and Laux
(2007) that better corporate governance firms has also
more informative prices. Second, our overall findings
add to the existing literature by demonstrating that
internal governance (incentives) provided by
managerial ownerships have largest positive impacts
on firm value for firms with less informative stock
prices and higher agency problems; in contrast,
external governance (monitoring) provided by
institutional investors can increase firm value when
firms are subject to less informative stock prices, but
it cannot mitigate agency problems. Our findings
suggest that role of institutional investors is
informational, while the role of manager
ownership/incentives are both informational and
governance (e.g. monitoring, incentives, control).
Third, managerial ownerships can complement
institutional ownerships in improving firm value
when firms are subject to less informative stock prices
and higher agency problems. Our study is among the
first to document that that managerial incentives and
institutional influences are complement, rather than
substitute, governance mechanisms.
The remainder of the paper is organized as
follows. Section 2 provides a description of the
empirical framework and the methodology and data
adopted for this study. Section 3 presents the
descriptive statistics and the empirical findings on the
relationships between managerial and institutional
ownerships and firm performance. Further evidence
on joint impacts of managerial and institutional
ownerships is provided in Section 4, followed by the
conclusions drawn from this study in Section 5.
2. Framework and testable hypotheses
Our paper focuses on the net effect of managerial and
institutional ownership on firm value in separate
framework and in joint consideration under various
governance level and price informativeness. In this
section, we develop testable hypotheses on both types
of ownership with respect to the existing evidences.
Our test not only identifies different roles of managers
and institutional investors but also constructs the
environment of governance and price informativeness.
Ferreira and Laux (2007) suggest that better
governance firms are associated with more
informative prices. Our tests enable us to identify this
unobservable relation of corporate governance and
stock price informativeness, by looking at their
impact on the each type of ownership-performance
relations.
2.1 Managerial ownership on firm value
Jin and Myers (2006) model how control rights and
information affect the division of risk-bearing
between insiders and outside investors, predict that
less transparent stocks are more likely to crash. Their
Corporate Ownership & Control / Volume 6, Issue 4, Summer 2009
118
model suggests that firm value is related to (i) control
rights and (ii) firm-specific information content in
stock prices. Faure-Grimuad and Gromb (2004) show
that public trading (smaller shareholder activities) can
affect large shareholder‘s private incentives to engage
in value-increasing activities and thus increase firm
value. An insider may have to sell part of his stake
such that his value-increase activities can be observed
by the general public through trading activities. A
more informative price rewards his activities and
increases his incentive to do so. Their model predicts
that insider ownership has stronger relation with firm
performance when stock prices are more informative.
Durnev, Morck and Yeung (2004) and Ferreira and
Laux (2007) suggest that firms with better corporate
governance is associated more informative stock
prices. Based on the theories, we develop the
following hypothesis.
H1: Manager of firms with more informative
prices (less stock price synchronicity) or better
corporate governance (less agency problem) has
stronger impact on firm‘s performance when his
ownership increase because stock price increases the
manager incentives to engage in value-increasing
activities because of his activities can be publicly
observed through the informative price
[Faure-Grimaud and Gromb (2004)].
On the other hand, for firms with less
informative prices and poorer governance, the
marginal productivity is the higher than those firms
which are of more informative stock prices and good
governance. As such, we have the following
alternative hypothesis.
H2: Manager of firms with less informative prices
(more stock price synchronicity) or poorer
governance (more agency problem) has stronger
impact on firm‘s performance when his ownership
increase, because managerial incentive can mitigate
agency problem when information transparency is
low and agency cost is high. In Faure-Grimaud and
Gromb (2004)‘s model, there is no agency problem.
2.2 Institutional investors on firm value
In the presence of owner-manager conflict, informed
institutional investors with sufficient ownership can
exert external governance, replace the incumbent
management and initiate takeover if necessary [Jensen
and Meckling (1976), Shleifer and Vishny (1986),
Admati, Pfleiderer and Zechner (1994)]. These studies
implicitly assume some degree of information
efficiency. However, Kahn and Winton (1998) and
Noe (2002) suggest that instead of exerting external
governance, institutional investors may choose to
benefit from the information asymmetry from
outsiders and avoid the cost of activism. These studies
collectively suggest that the impact of institutional
investors on firm value depends on the availability of
firm-specific information and corporate governance
practices. Therefore, stock price synchronicity or
corporate governance can affect the impact of
institutional investors on firm performance in two
possible ways.
H3: Institutional investors of less informative
price or poorer governance firm has stronger impact
on firm performance when his ownership increase as
they have better opportunity to improve the firm‘s
operations through their advisory and monitoring
ability (Shleifer and Vishny, 1986).
H4: Institutional investors of more informative
price or good governance firm has stronger impact on
firm performance when his ownership increase as the
informative price (or good governance) lowers their
monitoring costs (Holmstrom and Tirole, 1993), make
them less costly to provide their expertise.
3. Data collection and variable definitions
3.1. Managerial and Institutional Ownerships and Performance
This study analyzes a sample of 49,907 firms,
excluding finance and utilities from NYSE, AMEX,
and NASDAQ over the 1989 to 2006 period. We
construct the sample from different databases
including CRSP, Compustat and Thomson Ownership
Data. Annual financial data (including managerial
ownerships) are obtained from the CRSP and
Compustat database, and the percentage equity stake
data, as of June-end of every year of different
institutional investors, comes from the Thomson
Ownership Data. Thomson reports the security
holdings of institutional investors with greater than
$100 million of securities under discretionary
management. Institutional ownership data are then
matched to the following fiscal year financial
statement data from Compustat.
Similar to other studies that examine the relation
between ownerships and the firm performance [e.g.
Morck, Shleifer and Vishny (1988)], we use Tobin‘s Q
as a measure of firm value, which is computed as the
market value of equity plus the book value of assets
minus the book value of equity, scaled by book assets.
We lag the explanatory variables so that ownership
available in the beginning of the year can predict
performance (Q) in the following year. Our regression
of Tobin‘s Q includes different cohorts of explanatory
variables that are useful to predict firm performances.
These control variables have been used by Chung and
Jo (1996), and Gompers and Metrick (2001), plus
additional control variables as follows: (i)
Log(Number of Shareholders); (ii) Beta (estimated
using OLS, from a standard CAPM model on
value-weighted market returns over a rolling 5-year
period); (iii) Residual variance (estimated using OLS,
from a standard CAPM model on value-weighted
market returns over a rolling 5-year period); (iv)
Log(firm age); (v) Firm size proxy by log(total
assets); (vi) Indicator of NYSE firms; and (vii)
Log(shares turnover).
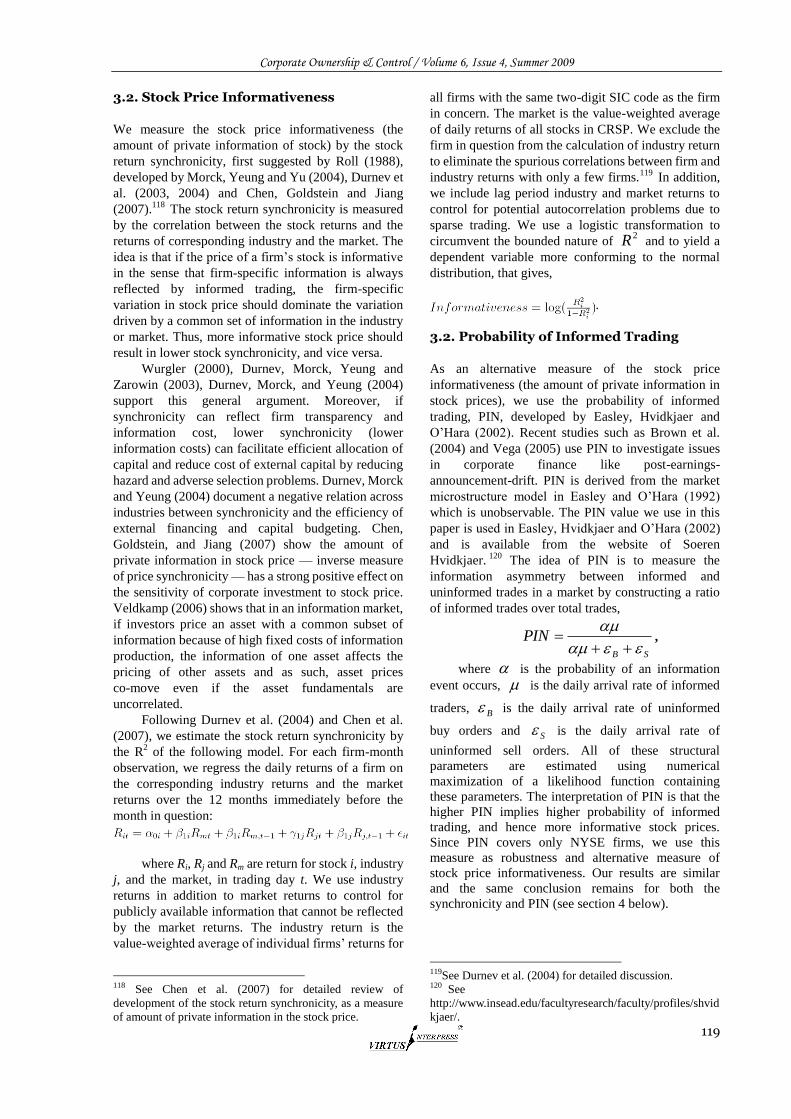
Corporate Ownership & Control / Volume 6, Issue 4, Summer 2009
119
3.2. Stock Price Informativeness
We measure the stock price informativeness (the
amount of private information of stock) by the stock
return synchronicity, first suggested by Roll (1988),
developed by Morck, Yeung and Yu (2004), Durnev et
al. (2003, 2004) and Chen, Goldstein and Jiang
(2007).118
The stock return synchronicity is measured
by the correlation between the stock returns and the
returns of corresponding industry and the market. The
idea is that if the price of a firm‘s stock is informative
in the sense that firm-specific information is always
reflected by informed trading, the firm-specific
variation in stock price should dominate the variation
driven by a common set of information in the industry
or market. Thus, more informative stock price should
result in lower stock synchronicity, and vice versa.
Wurgler (2000), Durnev, Morck, Yeung and
Zarowin (2003), Durnev, Morck, and Yeung (2004)
support this general argument. Moreover, if
synchronicity can reflect firm transparency and
information cost, lower synchronicity (lower
information costs) can facilitate efficient allocation of
capital and reduce cost of external capital by reducing
hazard and adverse selection problems. Durnev, Morck
and Yeung (2004) document a negative relation across
industries between synchronicity and the efficiency of
external financing and capital budgeting. Chen,
Goldstein, and Jiang (2007) show the amount of
private information in stock price — inverse measure
of price synchronicity — has a strong positive effect on
the sensitivity of corporate investment to stock price.
Veldkamp (2006) shows that in an information market,
if investors price an asset with a common subset of
information because of high fixed costs of information
production, the information of one asset affects the
pricing of other assets and as such, asset prices
co-move even if the asset fundamentals are
uncorrelated.
Following Durnev et al. (2004) and Chen et al.
(2007), we estimate the stock return synchronicity by
the R2 of the following model. For each firm-month
observation, we regress the daily returns of a firm on
the corresponding industry returns and the market
returns over the 12 months immediately before the
month in question:
where Ri, Rj and Rm are return for stock i, industry
j, and the market, in trading day t. We use industry
returns in addition to market returns to control for
publicly available information that cannot be reflected
by the market returns. The industry return is the
value-weighted average of individual firms‘ returns for
118 See Chen et al. (2007) for detailed review of
development of the stock return synchronicity, as a measure
of amount of private information in the stock price.
all firms with the same two-digit SIC code as the firm
in concern. The market is the value-weighted average
of daily returns of all stocks in CRSP. We exclude the
firm in question from the calculation of industry return
to eliminate the spurious correlations between firm and
industry returns with only a few firms.119
In addition,
we include lag period industry and market returns to
control for potential autocorrelation problems due to
sparse trading. We use a logistic transformation to
circumvent the bounded nature of 2R and to yield a
dependent variable more conforming to the normal
distribution, that gives,
.
3.2. Probability of Informed Trading As an alternative measure of the stock price
informativeness (the amount of private information in
stock prices), we use the probability of informed
trading, PIN, developed by Easley, Hvidkjaer and
O‘Hara (2002). Recent studies such as Brown et al.
(2004) and Vega (2005) use PIN to investigate issues
in corporate finance like post-earnings-
announcement-drift. PIN is derived from the market
microstructure model in Easley and O‘Hara (1992)
which is unobservable. The PIN value we use in this
paper is used in Easley, Hvidkjaer and O‘Hara (2002)
and is available from the website of Soeren
Hvidkjaer.120
The idea of PIN is to measure the
information asymmetry between informed and
uninformed trades in a market by constructing a ratio
of informed trades over total trades,
SB
PIN
,
where is the probability of an information
event occurs, is the daily arrival rate of informed
traders, B is the daily arrival rate of uninformed
buy orders and S is the daily arrival rate of
uninformed sell orders. All of these structural
parameters are estimated using numerical
maximization of a likelihood function containing
these parameters. The interpretation of PIN is that the
higher PIN implies higher probability of informed
trading, and hence more informative stock prices.
Since PIN covers only NYSE firms, we use this
measure as robustness and alternative measure of
stock price informativeness. Our results are similar
and the same conclusion remains for both the
synchronicity and PIN (see section 4 below).
119See Durnev et al. (2004) for detailed discussion. 120 See
http://www.insead.edu/facultyresearch/faculty/profiles/shvid
kjaer/.
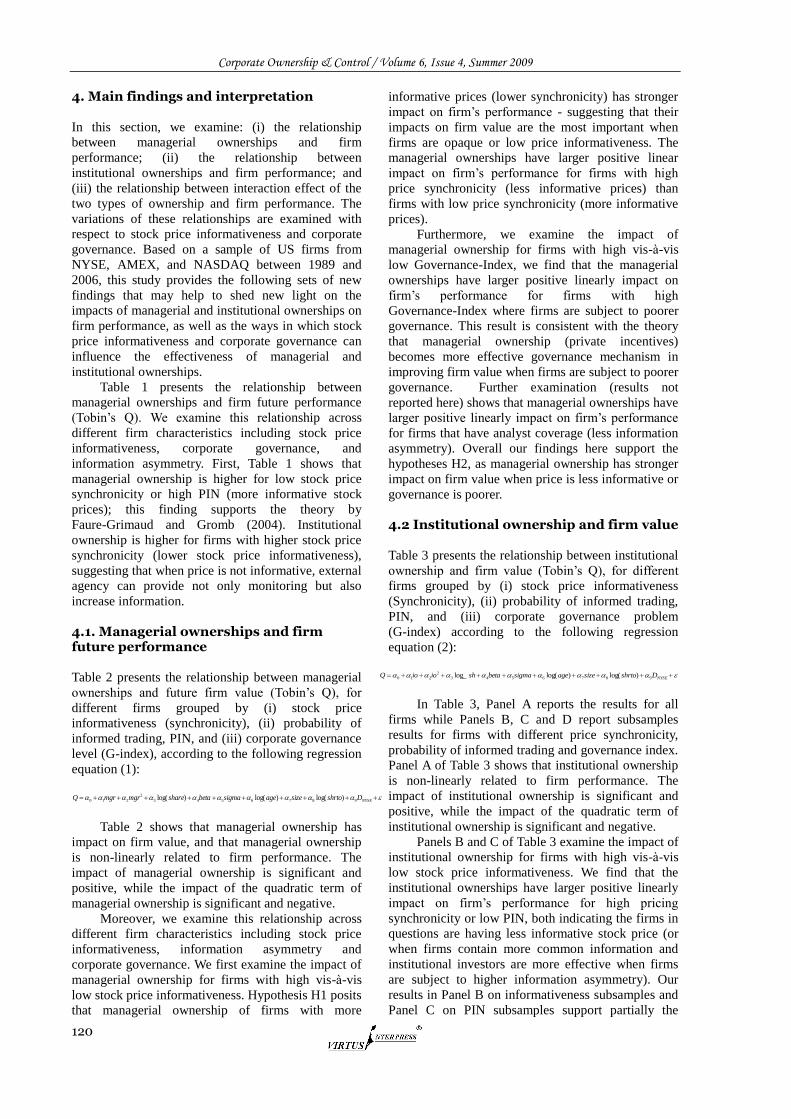
Corporate Ownership & Control / Volume 6, Issue 4, Summer 2009
120
4. Main findings and interpretation
In this section, we examine: (i) the relationship
between managerial ownerships and firm
performance; (ii) the relationship between
institutional ownerships and firm performance; and
(iii) the relationship between interaction effect of the
two types of ownership and firm performance. The
variations of these relationships are examined with
respect to stock price informativeness and corporate
governance. Based on a sample of US firms from
NYSE, AMEX, and NASDAQ between 1989 and
2006, this study provides the following sets of new
findings that may help to shed new light on the
impacts of managerial and institutional ownerships on
firm performance, as well as the ways in which stock
price informativeness and corporate governance can
influence the effectiveness of managerial and
institutional ownerships.
Table 1 presents the relationship between
managerial ownerships and firm future performance
(Tobin‘s Q). We examine this relationship across
different firm characteristics including stock price
informativeness, corporate governance, and
information asymmetry. First, Table 1 shows that
managerial ownership is higher for low stock price
synchronicity or high PIN (more informative stock
prices); this finding supports the theory by
Faure-Grimaud and Gromb (2004). Institutional
ownership is higher for firms with higher stock price
synchronicity (lower stock price informativeness),
suggesting that when price is not informative, external
agency can provide not only monitoring but also
increase information.
4.1. Managerial ownerships and firm future performance
Table 2 presents the relationship between managerial
ownerships and future firm value (Tobin‘s Q), for
different firms grouped by (i) stock price
informativeness (synchronicity), (ii) probability of
informed trading, PIN, and (iii) corporate governance
level (G-index), according to the following regression
equation (1):
NYSEDshrtosizeagesigmabetasharemgrmgrQ 9876543
2
210 )log()log()log(
Table 2 shows that managerial ownership has
impact on firm value, and that managerial ownership
is non-linearly related to firm performance. The
impact of managerial ownership is significant and
positive, while the impact of the quadratic term of
managerial ownership is significant and negative.
Moreover, we examine this relationship across
different firm characteristics including stock price
informativeness, information asymmetry and
corporate governance. We first examine the impact of
managerial ownership for firms with high vis-à-vis
low stock price informativeness. Hypothesis H1 posits
that managerial ownership of firms with more
informative prices (lower synchronicity) has stronger
impact on firm‘s performance - suggesting that their
impacts on firm value are the most important when
firms are opaque or low price informativeness. The
managerial ownerships have larger positive linear
impact on firm‘s performance for firms with high
price synchronicity (less informative prices) than
firms with low price synchronicity (more informative
prices).
Furthermore, we examine the impact of
managerial ownership for firms with high vis-à-vis
low Governance-Index, we find that the managerial
ownerships have larger positive linearly impact on
firm‘s performance for firms with high
Governance-Index where firms are subject to poorer
governance. This result is consistent with the theory
that managerial ownership (private incentives)
becomes more effective governance mechanism in
improving firm value when firms are subject to poorer
governance. Further examination (results not
reported here) shows that managerial ownerships have
larger positive linearly impact on firm‘s performance
for firms that have analyst coverage (less information
asymmetry). Overall our findings here support the
hypotheses H2, as managerial ownership has stronger
impact on firm value when price is less informative or
governance is poorer.
4.2 Institutional ownership and firm value
Table 3 presents the relationship between institutional
ownership and firm value (Tobin‘s Q), for different
firms grouped by (i) stock price informativeness
(Synchronicity), (ii) probability of informed trading,
PIN, and (iii) corporate governance problem
(G-index) according to the following regression
equation (2):
NYSEDshrtosizeagesigmabetashioioQ 9876543
2
210 )log()log(log_
In Table 3, Panel A reports the results for all
firms while Panels B, C and D report subsamples
results for firms with different price synchronicity,
probability of informed trading and governance index.
Panel A of Table 3 shows that institutional ownership
is non-linearly related to firm performance. The
impact of institutional ownership is significant and
positive, while the impact of the quadratic term of
institutional ownership is significant and negative.
Panels B and C of Table 3 examine the impact of
institutional ownership for firms with high vis-à-vis
low stock price informativeness. We find that the
institutional ownerships have larger positive linearly
impact on firm‘s performance for high pricing
synchronicity or low PIN, both indicating the firms in
questions are having less informative stock price (or
when firms contain more common information and
institutional investors are more effective when firms
are subject to higher information asymmetry). Our
results in Panel B on informativeness subsamples and
Panel C on PIN subsamples support partially the
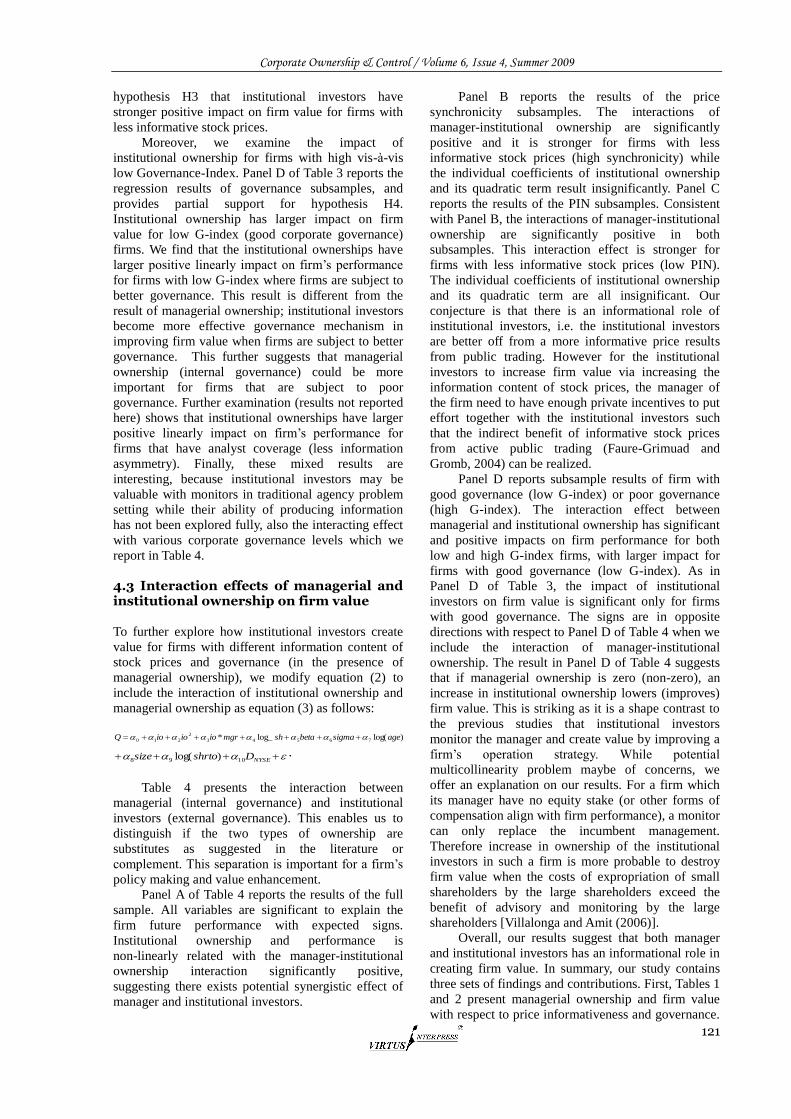
Corporate Ownership & Control / Volume 6, Issue 4, Summer 2009
121
hypothesis H3 that institutional investors have
stronger positive impact on firm value for firms with
less informative stock prices.
Moreover, we examine the impact of
institutional ownership for firms with high vis-à-vis
low Governance-Index. Panel D of Table 3 reports the
regression results of governance subsamples, and
provides partial support for hypothesis H4.
Institutional ownership has larger impact on firm
value for low G-index (good corporate governance)
firms. We find that the institutional ownerships have
larger positive linearly impact on firm‘s performance
for firms with low G-index where firms are subject to
better governance. This result is different from the
result of managerial ownership; institutional investors
become more effective governance mechanism in
improving firm value when firms are subject to better
governance. This further suggests that managerial
ownership (internal governance) could be more
important for firms that are subject to poor
governance. Further examination (results not reported
here) shows that institutional ownerships have larger
positive linearly impact on firm‘s performance for
firms that have analyst coverage (less information
asymmetry). Finally, these mixed results are
interesting, because institutional investors may be
valuable with monitors in traditional agency problem
setting while their ability of producing information
has not been explored fully, also the interacting effect
with various corporate governance levels which we
report in Table 4.
4.3 Interaction effects of managerial and institutional ownership on firm value
To further explore how institutional investors create
value for firms with different information content of
stock prices and governance (in the presence of
managerial ownership), we modify equation (2) to
include the interaction of institutional ownership and
managerial ownership as equation (3) as follows:
)log(log_* 76543
2
210 agesigmabetashmgrioioioQ
NYSEDshrtosize 1098 )log( .
Table 4 presents the interaction between
managerial (internal governance) and institutional
investors (external governance). This enables us to
distinguish if the two types of ownership are
substitutes as suggested in the literature or
complement. This separation is important for a firm‘s
policy making and value enhancement.
Panel A of Table 4 reports the results of the full
sample. All variables are significant to explain the
firm future performance with expected signs.
Institutional ownership and performance is
non-linearly related with the manager-institutional
ownership interaction significantly positive,
suggesting there exists potential synergistic effect of
manager and institutional investors.
Panel B reports the results of the price
synchronicity subsamples. The interactions of
manager-institutional ownership are significantly
positive and it is stronger for firms with less
informative stock prices (high synchronicity) while
the individual coefficients of institutional ownership
and its quadratic term result insignificantly. Panel C
reports the results of the PIN subsamples. Consistent
with Panel B, the interactions of manager-institutional
ownership are significantly positive in both
subsamples. This interaction effect is stronger for
firms with less informative stock prices (low PIN).
The individual coefficients of institutional ownership
and its quadratic term are all insignificant. Our
conjecture is that there is an informational role of
institutional investors, i.e. the institutional investors
are better off from a more informative price results
from public trading. However for the institutional
investors to increase firm value via increasing the
information content of stock prices, the manager of
the firm need to have enough private incentives to put
effort together with the institutional investors such
that the indirect benefit of informative stock prices
from active public trading (Faure-Grimuad and
Gromb, 2004) can be realized.
Panel D reports subsample results of firm with
good governance (low G-index) or poor governance
(high G-index). The interaction effect between
managerial and institutional ownership has significant
and positive impacts on firm performance for both
low and high G-index firms, with larger impact for
firms with good governance (low G-index). As in
Panel D of Table 3, the impact of institutional
investors on firm value is significant only for firms
with good governance. The signs are in opposite
directions with respect to Panel D of Table 4 when we
include the interaction of manager-institutional
ownership. The result in Panel D of Table 4 suggests
that if managerial ownership is zero (non-zero), an
increase in institutional ownership lowers (improves)
firm value. This is striking as it is a shape contrast to
the previous studies that institutional investors
monitor the manager and create value by improving a
firm‘s operation strategy. While potential
multicollinearity problem maybe of concerns, we
offer an explanation on our results. For a firm which
its manager have no equity stake (or other forms of
compensation align with firm performance), a monitor
can only replace the incumbent management.
Therefore increase in ownership of the institutional
investors in such a firm is more probable to destroy
firm value when the costs of expropriation of small
shareholders by the large shareholders exceed the
benefit of advisory and monitoring by the large
shareholders [Villalonga and Amit (2006)].
Overall, our results suggest that both manager
and institutional investors has an informational role in
creating firm value. In summary, our study contains
three sets of findings and contributions. First, Tables 1
and 2 present managerial ownership and firm value
with respect to price informativeness and governance.
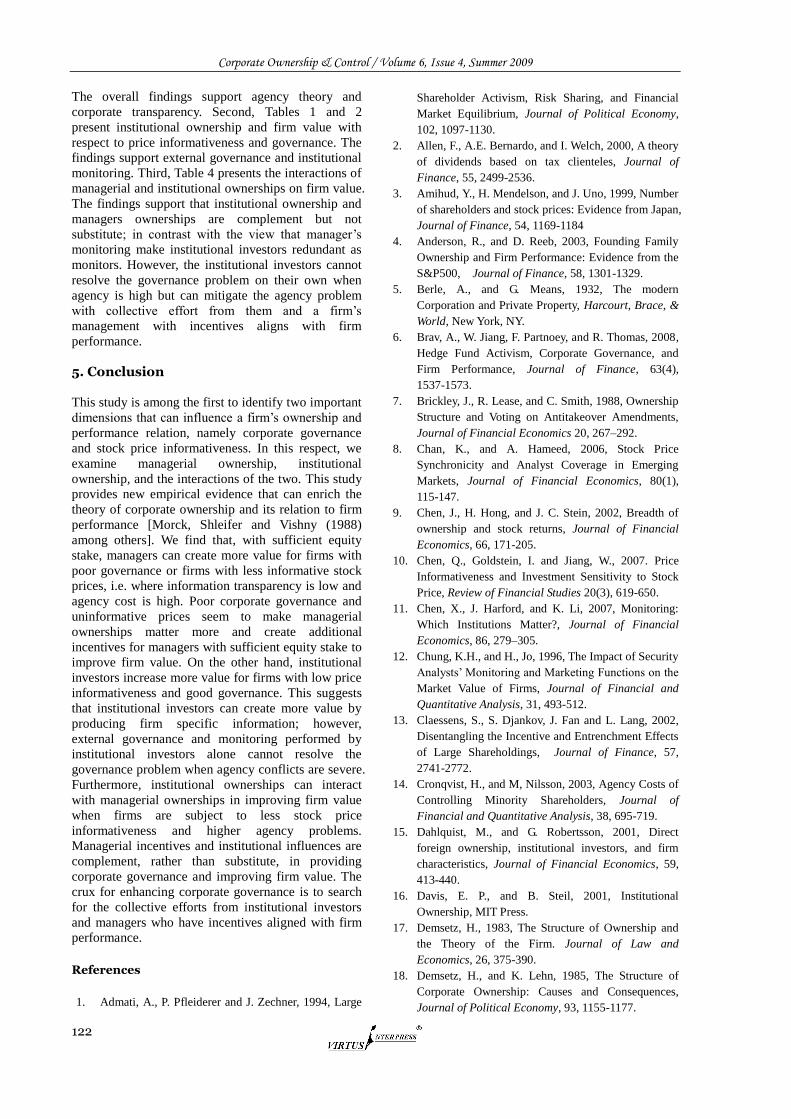
Corporate Ownership & Control / Volume 6, Issue 4, Summer 2009
122
The overall findings support agency theory and
corporate transparency. Second, Tables 1 and 2
present institutional ownership and firm value with
respect to price informativeness and governance. The
findings support external governance and institutional
monitoring. Third, Table 4 presents the interactions of
managerial and institutional ownerships on firm value.
The findings support that institutional ownership and
managers ownerships are complement but not
substitute; in contrast with the view that manager‘s
monitoring make institutional investors redundant as
monitors. However, the institutional investors cannot
resolve the governance problem on their own when
agency is high but can mitigate the agency problem
with collective effort from them and a firm‘s
management with incentives aligns with firm
performance.
5. Conclusion
This study is among the first to identify two important
dimensions that can influence a firm‘s ownership and
performance relation, namely corporate governance
and stock price informativeness. In this respect, we
examine managerial ownership, institutional
ownership, and the interactions of the two. This study
provides new empirical evidence that can enrich the
theory of corporate ownership and its relation to firm
performance [Morck, Shleifer and Vishny (1988)
among others]. We find that, with sufficient equity
stake, managers can create more value for firms with
poor governance or firms with less informative stock
prices, i.e. where information transparency is low and
agency cost is high. Poor corporate governance and
uninformative prices seem to make managerial
ownerships matter more and create additional
incentives for managers with sufficient equity stake to
improve firm value. On the other hand, institutional
investors increase more value for firms with low price
informativeness and good governance. This suggests
that institutional investors can create more value by
producing firm specific information; however,
external governance and monitoring performed by
institutional investors alone cannot resolve the
governance problem when agency conflicts are severe.
Furthermore, institutional ownerships can interact
with managerial ownerships in improving firm value
when firms are subject to less stock price
informativeness and higher agency problems.
Managerial incentives and institutional influences are
complement, rather than substitute, in providing
corporate governance and improving firm value. The
crux for enhancing corporate governance is to search
for the collective efforts from institutional investors
and managers who have incentives aligned with firm
performance.
References
1. Admati, A., P. Pfleiderer and J. Zechner, 1994, Large
Shareholder Activism, Risk Sharing, and Financial
Market Equilibrium, Journal of Political Economy,
102, 1097-1130.
2. Allen, F., A.E. Bernardo, and I. Welch, 2000, A theory
of dividends based on tax clienteles, Journal of
Finance, 55, 2499-2536.
3. Amihud, Y., H. Mendelson, and J. Uno, 1999, Number
of shareholders and stock prices: Evidence from Japan,
Journal of Finance, 54, 1169-1184
4. Anderson, R., and D. Reeb, 2003, Founding Family
Ownership and Firm Performance: Evidence from the
S&P500, Journal of Finance, 58, 1301-1329.
5. Berle, A., and G. Means, 1932, The modern
Corporation and Private Property, Harcourt, Brace, &
World, New York, NY.
6. Brav, A., W. Jiang, F. Partnoey, and R. Thomas, 2008,
Hedge Fund Activism, Corporate Governance, and
Firm Performance, Journal of Finance, 63(4),
1537-1573.
7. Brickley, J., R. Lease, and C. Smith, 1988, Ownership
Structure and Voting on Antitakeover Amendments,
Journal of Financial Economics 20, 267–292.
8. Chan, K., and A. Hameed, 2006, Stock Price
Synchronicity and Analyst Coverage in Emerging
Markets, Journal of Financial Economics, 80(1),
115-147.
9. Chen, J., H. Hong, and J. C. Stein, 2002, Breadth of
ownership and stock returns, Journal of Financial
Economics, 66, 171-205.
10. Chen, Q., Goldstein, I. and Jiang, W., 2007. Price
Informativeness and Investment Sensitivity to Stock
Price, Review of Financial Studies 20(3), 619-650.
11. Chen, X., J. Harford, and K. Li, 2007, Monitoring:
Which Institutions Matter?, Journal of Financial
Economics, 86, 279–305.
12. Chung, K.H., and H., Jo, 1996, The Impact of Security
Analysts‘ Monitoring and Marketing Functions on the
Market Value of Firms, Journal of Financial and
Quantitative Analysis, 31, 493-512.
13. Claessens, S., S. Djankov, J. Fan and L. Lang, 2002,
Disentangling the Incentive and Entrenchment Effects
of Large Shareholdings, Journal of Finance, 57,
2741-2772.
14. Cronqvist, H., and M, Nilsson, 2003, Agency Costs of
Controlling Minority Shareholders, Journal of
Financial and Quantitative Analysis, 38, 695-719.
15. Dahlquist, M., and G. Robertsson, 2001, Direct
foreign ownership, institutional investors, and firm
characteristics, Journal of Financial Economics, 59,
413-440.
16. Davis, E. P., and B. Steil, 2001, Institutional
Ownership, MIT Press.
17. Demsetz, H., 1983, The Structure of Ownership and
the Theory of the Firm. Journal of Law and
Economics, 26, 375-390.
18. Demsetz, H., and K. Lehn, 1985, The Structure of
Corporate Ownership: Causes and Consequences,
Journal of Political Economy, 93, 1155-1177.
Corporate Ownership & Control / Volume 6, Issue 4, Summer 2009
123
19. Demsetz, H., and B. Villalonga, 2001, Ownership
Structure and Corporate Performance, Journal of
Corporate Finance, 7, 209-233.
20. Diamond, D., and R. Verrecchia, 1982, Optimal
Managerial Contracts and Equilibrium Security Prices,
Journal of Finance, 275-287.
21. Durnev, A., R. Morck, and B. Yeung. 2003, Value
Enhancing Capital Budgeting and Firm-Specific Stock
Returns Variation, Journal of Finance, 59, 65-106.
22. Faure-Grimaud, A., and D. Gromb, 2004, Public
Trading and Private Incentives, Review of Financial
Studies, 985-1014.
23. Gompers, P., and A. Metrick, 2001, Institutional
Investors and Equity Prices, Quarterly Journal of
Economics, 116(1), 229-259.
24. Himmelberg, P., R. Hubbard and D. Palia, 1999,
Understanding the Determinants of Managerial
Ownership and the Link between Ownership and
Performance, Journal of Financial Economics, 53,
353-384.
25. Holderness, C., and D. Sheehan, 1988, The Role of
Majority Shareholders in Publicly Held Corporations,
Journal of Financial Economics, 20, 317-346.
26. Holmstrom, B., and J. Tirole, 1993, Market Liquidity
and Performance Monitoring, Journal of Political
Economy, 101, 678-709.
27. Hong, H., T. Lim, and J. Stein, 2005, Poor News
Travels Slowly: Size, Analyst Coverage, and the
Profitability of Momentum Strategies, Journal of
Finance, 55, 265-295.
28. Jensen, M., and W. Meckling, 1976, Theory of the
Firm: Managerial Behavior, Agency Costs and
Ownership Structure, Journal of Financial Economics,
3, 305-360.
29. Kahn, C., and A. Winton, 1998, Ownership Structure,
Speculation, and Shareholder Intervention, Journal of
Finance, 53, 99-129.
30. Lin, K., 2003, Equity ownership and Firm Value in
Emerging Markets, Journal of Financial and
Quantitative Analysis, 38, 159-184.
31. Morck, R., A. Shleifer, and R. Vishny, 1990a. The
stock market and investment: is the market a
sideshow? Brookings Papers on Economic Activity 2,
157–215.
32. Noe, T., 2002, Investor Activism and Financial Market
Structure, Review of Financial Studies, 15, 289-318.
33. Piotroski, J.,and D., Roulstone, Do Insider Trades
Reflect Superior Knowledge of Future Cash Flow
Realizations?, Working Paper, University of Chicago.
34.
Shapiro, A., 2002, The Investor Recognition
Hypothesis in a Dynamic General Equilibrium:
Theory and Evidence, Review of Financial Studies, 15,
97-141.
35. Shleifer, A., and R. Vishny, 1986, Large Shareholders
and Corporate Control, Journal of Political Economy,
94, 461-488.
36. Shleifer, A., and R. Vishny, 1997, A Survey of
Corporate Governance, Journal of Finance, 52,
737-783.
37. Villalonga, B., and R. Amit, 2006, How do Family
Ownership, Control and Management affect Firm
Value?, Journal of Financial Economics, 80, 385-417.
38. Woidtke, T., 2002, Agents watching agents?: Evidence
from pension fund ownership and firm value, Journal
of Financial Economics, 63, 99-131.
39. Wurgler, J., 2000, Financial Markets and the
Allocation of Capital, Journal of Financial Economics,
58, 187-214.
40. Yan, X., and Z. Zhang, 2008, Institutional investors
and Equity Returns: Are Short-term Institutions Better
Informed?, Review of Financial Studies, forthcoming.
Table 1. Summary Statistics
This table reports the summary statistics of 49,907 firms, excluding finance and utilities from NYSE, AMEX, and NASDAQ over the
1989 to 2006 period. Tobin‘s Q is the market value of equity plus the book value of assets minus the book value of equity, scaled by
book assets computed. Percentage equity stake data, as of June-end of every year of different institutional investors, comes from the
Thomson Ownership Data. Thomson reports the security holdings of institutional investors with greater than $100 million of
securities under discretionary management. Institutional ownership data are then matched to the following fiscal year financial
statement data from Compustat. Monthly price synchronicity, SYNCH, is measured by the R-square from the market model of
regressing the individual stock returns on market index daily over the 12 months immediately before the month in question.
Corporate governance index, G-INDEX, is from the Gompers, Ishii and Metrick (2003). The probability of informed trading, PIN, is
from Easley, Hvidkjaer and O‘Hara (2002). Beta is estimated using OLS, from a standard CAPM model on value-weighted market
returns over a rolling 5-year period. Residual variance is estimated using OLS, from a standard CAPM model on value-weighted
market returns over a rolling 5-year period. N represents number of observations used in computing the relevant statistics. Panel A
reports the summary statistics for full sample. Panel B reports the summary statistics based on subsamples of cross-sectional median
of firm‘s synchronicity. Panel C reports the summary statistics based on subsamples of cross-sectional median of firm‘s probability of
informed trading. Panel D reports the summary statistics of subsamples split in cross-sectional median of firm‘s corporate governance
index.
Corporate Ownership & Control / Volume 6, Issue 4, Summer 2009
124
Panel A: Full sample
Panel B Stock Price Synchronicity
LOW HIGH
N
Mean
(Median)
Standard
Deviation N
Mean
(Median)
Standard
Deviation N
Mean
(Median)
Standard
Deviation
Tobin‘s Q
One Year Ahead 62,100 0.4304 0.5705 29,973 0.3179 0.5353 30,139 0.5353 0.5758
(0.3259) (0.2156) (0.4308)
Institutional Ownership 70,545 0.2497 0.2807 33,842 0.1894 0.2339 33,842 0.3237 0.3085
(0.1339) (0.0854) (0.2729)
Managerial Ownership in % 21,960 0.2371 0.4009 12,452 0.2658 0.4937 8,942 0.1950 0.2190
(0.1615) (0.1978) (0.1152)
Share outstanding 62,988 0.3253 1.6672 30,768 0.0518 1.4535 29,938 0.6783 1.7890
(0.2414) (0.0065) (0.6302)
Beta 59,306 1.0067 0.6670 29,750 0.8521 0.6270 29,227 1.1659 0.6694
(0.9318) (0.7767) (1.0847)
Sigma 59,306 0.1281 0.0443 29,750 0.1317 0.0419 29,227 0.1241 0.04630
(0.1265) (0.1313) (0.1202)
Firm Age 70,209 2.0466 1.0200 33,763 2.0287 0.9610 33,785 2.1543 1.0043
(2.1972) (2.0794) (2.1972)
Size / Total Asset 70,545 5.3767 1.9822 33,842 4.6651 1.6994 33,842 6.1556 1.9590
(5.1480) (4.4761) (6.0162)
Share Turnover 57,917 0.7284 0.5353 29,025 0.6035 0.5704 28,843 0.8544 0.5185
(0.6143) (0.4909) (0.7613)
Table 1 (Continued). Summary Statistics
This table reports the summary statistics of 49,907 firms, excluding finance and utilities from NYSE, AMEX, and NASDAQ over the
1989 to 2006 period. Tobin‘s Q is the market value of equity plus the book value of assets minus the book value of equity, scaled by
book assets computed. Percentage equity stake data, as of June-end of every year of different institutional investors, comes from the
Thomson Ownership Data. Thomson reports the security holdings of institutional investors with greater than $100 million of
securities under discretionary management. Institutional ownership data are then matched to the following fiscal year financial
statement data from Compustat. Monthly price synchronicity, SYNCH, is measured by the R-square from the market model of
regressing the individual stock returns on market index daily over the 12 months immediately before the month in question.
Corporate governance index, G-INDEX, is from the Gompers, Ishii and Metrick (2003). The probability of informed trading, PIN, is
from Easley, Hvidkjaer and O‘Hara (2002). Beta is estimated using OLS, from a standard CAPM model on value-weighted market
returns over a rolling 5-year period. Residual variance is estimated using OLS, from a standard CAPM model on value-weighted
market returns over a rolling 5-year period. N represents number of observations used in computing the relevant statistics. Panel C
reports the summary statistics based on subsamples of cross-sectional median of firm‘s probability of informed trading. Panel D
reports the summary statistics based on subsamples of cross-sectional median of firm‘s corporate governance index.
Panel C Probability of Informed Trading, PIN Panel D Corporate Governance Index, G-INDEX
LOW HIGH LOW HIGH
N
Mean
(Median
)
Standard
Deviation N
Mean
(Median
)
Standard
Deviation N
Mean
(Median
)
Standard
Deviation N
Mean
(Median
)
Standard
Deviatio
n
Tobin‘s Q
One Year Ahead 8,555
0.4632(
0.3810) 0.4646 8,475
0.2521(
0.1734) 0.4445 3,487
0.1545
(0.4127) 0.5417 3,438
0.4516
(0.3739) 0.4477
Institutional
Ownership 9,042
0.4299
(0.5094) 0.3001 9,042
0.2670
(0.2162) 0.2484 3,645
0.4302
(0.4784) 0.3098 3,590
0.4979
(0.5798) 0.2910
Managerial
Ownership in % 3,603
0.1277
(0.0409) 0.1874 4,950
0.2280
(0.1491) 0.2344 1,055
0.1781
(0.0903) 0.2106 1,281
0.0925
(0.0337) 0.1399
Share
outstanding 8,593
1.7118
(1.7829) 1.5929 8,791
0.3462
(0.3750) 1.3215 3,516
0.8876
(0.8040) 1.5747 3,464
1.8273
(1.8152) 1.4275
Beta 8,758 0.9912
(0.9685) 0.4629 8,537
0.9154
(0.8966) 0.5363 3,601
1.1526
(1.0792) 0.6448 3,536
0.9797
(0.9388) 0.5160
Corporate Ownership & Control / Volume 6, Issue 4, Summer 2009
125
Sigma 8,758 0.0948
(0.0891) 0.0358 8,537
0.1134
(0.1097) 0.0366 3,601
0.1189
(0.1144) 0.0425 3,536
0.0978
(0.0910) 0.0365
Firm Age 9,040 2.6790
(3.0910) 0.8656 9,027
2.4168
(2.7726) 0.9367 3,645
2.4283
(2.4849) 0.7387 3,590
2.8729
(3.1355) 0.7233
Size / Total Asset 9,042 7.2648
(7.2777) 1.5762 9,042
5.2191
(5.2441) 1.4249 3,645
6.6759
(6.4978) 1.3833 3,590
7.2550
(7.1341) 1.4104
Share Turnover 8,589 0.6518
(0.6060) 0.3221 8,371
0.4377
(0.3666) 0.3145 3,545
0.8911
(0.8010) 0.5165 3,480
0.7796
(0.6996) 0.3968
Table 2. Impact of Managerial Ownership on Firm Value
This table reports the results of the impact of managerial ownership on firm value, measured by 1-year ahead Tobin‘s q, includes
18,110 firm-year observations from 1989 to 2006,
NYSEDshrtosizeagesigmabetasharemgrmgrQ 9876543
2
210 )log()log()log(
where Q is one year ahead Tobin‘s q of the firm in question. Tobin‘s Q is computed as the market value of equity plus the book value
of assets minus the book value of equity, scaled by book assets. Independent variables include the followings: (i) managerial
ownership in percentage of total shares. (ii) square percentage of managerial ownership, (iii) share outstanding, (iv) beta computed by
CAPM model on value-weighted market returns over a rolling 5-year period, (v) Residual variance, Sigma, is estimated using OLS,
from a standard CAPM model on value-weighted market returns over a rolling 5-year period, (vi) firm size computed by market
capitalization over total asset. (vii) share turnover, and (viii) indicator variable of NYSE listed firms. Partitioning variables include
the followings: (i) Monthly price synchronicity, SYNCH, is measured by the R-square from the market model of regressing the
individual stock returns on market index daily over the 12 months immediately before the month in question, (ii) Corporate
governance index, G-INDEX, is from the Gompers, Ishii and Metrick (2003), and (iii) probability of informed trading, PIN, is from
Easley, Hvidkjaer and O‘Hara (2002). Panel A reports the regression results for full sample. Panel B reports the regression results
based on subsamples of cross-sectional median of firm‘s synchronicity. Panel C reports the regression results of subsamples based on
subsamples of cross-sectional median of firm‘s probability of informed trading. Panel D reports the regression results based on
subsamples of cross-sectional median of firm‘s corporate governance index. t-statistics are reported in parentheses. *, ** and *** are
ten, five and one percent significance respectively.
Panel A: FULL SAMPLE Panel B: SYNCH Panel C: PIN Panel D: G-INDEX
LOW HIGH LOW HIGH LOW HIGH
Managerial
ownership 0.1791*** 0.1458*** 0.2781*** 0.2137 0.0694 0.3906* 0.4956**
(6.55) (4.89) (2.65) (1.28) (0.63) (1.83) (2.44)
(Managerial
ownership)2 -0.0033*** -0.0026*** -0.0229 -0.1406 0.0298 -0.2267 -0.4777**
(-5.87) (-4.28) (-0.18) (-0.68) (0.22) (-0.86) (-1.97)
log(share
outstanding) 0.0441*** 0.0310*** 0.0558*** 0.0634*** 0.0210** 0.0644*** 0.0682***
(7.84) (5.11) (7.02) (5.24) (2.26) (3.79) (4.21)
Beta 0.0579*** 0.0446*** 0.0455*** 0.0119 0.0211 0.0348 0.0233
(6.33) (4.35) (3.32) (0.48) (1.07) (0.94) (0.67)
Sigma -3.2231*** -2.2750*** -4.6163*** -5.6633*** -2.8761*** -6.4732*** -5.2656***
(-15.90) (-11.12) (-14.38) (-10.85) (-8.91) (-8.90) (-7.72)
log(firm age) -0.0485*** -0.0417*** -0.0558*** -0.648*** -0.0660*** -0.0747*** -0.03577
(-5.97) (-4.69) (-4.95) (-3.40) (-4.81) (-2.74) (-1.13)
Firm size -0.0556*** -0.0554*** -0.0868*** -0.0928*** -0.0644*** -0.0892*** -0.0904***
(-9.21) (-8.22) (-10.04) (-6.83) (-6.22) (-4.37) (-5.64)
log(share turnover) 0.4933*** 0.4585*** 0.4848*** 0.2677*** 0.4518*** 0.4395*** 0.3425***
(30.23) (25.19) (21.84) (4.99) (10.73) (8.09) (5.71)
NYSE indicator 0.1109*** 0.1107*** 0.0917*** 0.0998** 0.0892*** -0.0116 -0.0576
(6.61) (6.14) (3.94) (2.00) (3.23) (-0.26) (-0.92)
R square 0.2859 0.2750 0.2872 0.2166 0.2081 0.2800 0.2640
F Statistics 1,660.48*** 1,819.23*** 59.69*** 18.24*** 20.53*** 13.75*** 15.66***
N 18,110 10,521 7,581 3,255 4,491 1,003 1,205
Corporate Ownership & Control / Volume 6, Issue 4, Summer 2009
126
Table 3. Institutional Ownership on Firm Value
This table reports the results of the impact of institutional ownership on firm value, measured by 1-year ahead Tobin‘s q, includes
49,907 firm-year observations from 1989 to 2006,
NYSEDshrtosizeagesigmabetashioioQ 9876543
2
210 )log()log(log_
where Q is one year ahead Tobin‘s q of the firm in question. Tobin‘s Q is computed as the market value of equity plus the book value
of assets minus the book value of equity, scaled by book assets. Independent variables include the followings: (i) institutional
ownership in percentage of total shares. (ii) square percentage of institutional ownership, (iii) share outstanding, (iv) beta computed
by CAPM model on value-weighted market returns over a rolling 5-year period, (v) Residual variance, Sigma, is estimated using
OLS, from a standard CAPM model on value-weighted market returns over a rolling 5-year period, (vi) firm size computed by market
capitalization over total asset, (vii) share turnover, and (viii) indicator variable of NYSE listed firms. Partitioning variables include
the followings: (i) Monthly price synchronicity, SYNCH, is measured by the R-square from the market model of regressing the
individual stock returns on market index daily over the 12 months immediately before the month in question, (ii) Corporate
governance index, G-INDEX, is from the Gompers, Ishii and Metrick (2003), and (iii) probability of informed trading, PIN, is from
Easley, Hvidkjaer and O‘Hara (2002). Panel A reports the regression results for full sample. Panel B reports the regression results
based on subsamples of median of firm‘s synchronicity. Panel C reports the regression results based on subsamples of cross-sectional
median of firm‘s probability of informed trading. Panel D reports the regression results based on subsamples of cross-sectional
median of firm‘s corporate governance index. t-statistics are reported in parentheses. *, ** and *** are ten, five and one percent
significance respectively.
Panel A: FULL SAMPLE Panel B: SYNCH Panel C: PIN Panel D: G-INDEX
LOW HIGH LOW HIGH LOW HIGH
Institutional ownership 0.4339*** 0.2522*** 0.5227*** 0.2635** 0.1727** 0.3723*** 0.1619
(9.19) (4.68) (8.78) (2.56) (1.97) (2.94) (1.23)
(Institutional ownership)2 -0.2968*** -0.0664 -0.4391*** -0.1153 -0.0564 -0.2421 -0.1057
(-4.84) (-0.93) (-5.82) (-0.88) (-0.47) (-1.58) (-0.68)
log(share outstanding) 0.0311*** 0.0179*** 0.0362*** 0.0544*** 0.0191*** 0.0345*** 0.0669***
(9.14) (4.74) (8.65) (6.83) (2.68) (4.11) (6.61)
Beta 0.0506*** 0.0434*** 0.0299*** 0.0314* 0.0118 0.0059 0.0333
(8.07) (5.80) (3.57) (1.77) (0.79) (0.31) (1.61)
Sigma -2.3799*** -1.6169*** -3.2918*** -4.1312*** -1.9714*** -4.3572*** -4.6375***
(-17.35) (-10.95) (-17.68) (-12.02) (-7.74) (-9.93) (-11.50)
log(firm age) -0.0471*** -0.0453*** -0.0466*** -0.0424*** -0.0659*** -0.0603*** -0.0175
(-8.34) (-7.22) (-6.37) (-3.33) (-6.17) (-3.32) (-1.05)
Firm size -0.0452*** -0.0465*** -0.0610*** -0.0784*** -0.0623*** -0.0682*** -0.0699***
(-11.09) (-10.40) (-11.23) (-8.44) (-7.59) (-5.24) (-5.82)
log(share turnover) 0.4139*** 0.3915*** 0.4135*** 0.1927*** 0.3749*** 0.3848*** 0.2411***
(41.47) (31.72) (32.59) (5.51) (12.32) (13.70) (7.33)
NYSE indicator 0.0620*** 0.0874*** 0.0208 0.0954** 0.1055*** 0.0047 -0.1599***
(4.64) (6.41) (1.20) (2.36) (4.74) (0.14) (-4.11)
R square 0.2788 0.2644 0.2667 0.2120 0.2213 0.2661 0.2604
F Statistics 194.02*** 116.82*** 112.58*** 26.36*** 29.02*** 30.05*** 25.27***
N 49,907 25,116 24,751 7,914 7,850 3,331 3,275
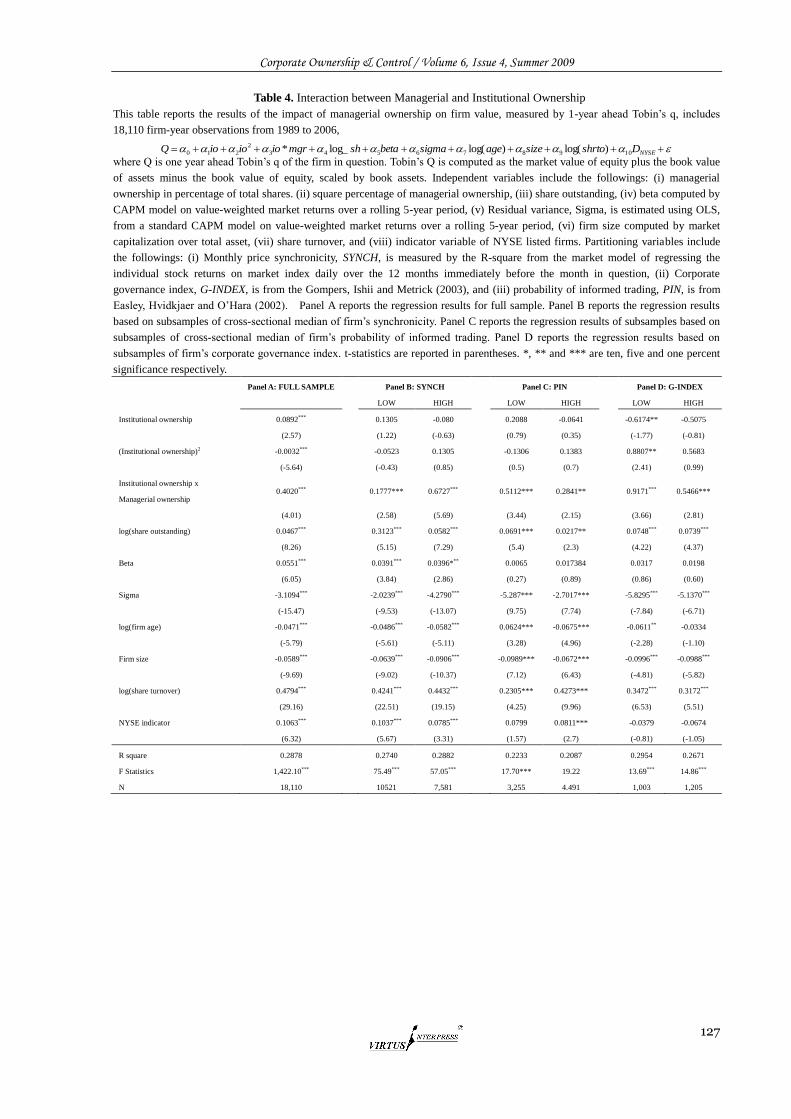
Corporate Ownership & Control / Volume 6, Issue 4, Summer 2009
127
Table 4. Interaction between Managerial and Institutional Ownership
This table reports the results of the impact of managerial ownership on firm value, measured by 1-year ahead Tobin‘s q, includes
18,110 firm-year observations from 1989 to 2006,
NYSEDshrtosizeagesigmabetashmgrioioioQ 109876543
2
210 )log()log(log_*
where Q is one year ahead Tobin‘s q of the firm in question. Tobin‘s Q is computed as the market value of equity plus the book value
of assets minus the book value of equity, scaled by book assets. Independent variables include the followings: (i) managerial
ownership in percentage of total shares. (ii) square percentage of managerial ownership, (iii) share outstanding, (iv) beta computed by
CAPM model on value-weighted market returns over a rolling 5-year period, (v) Residual variance, Sigma, is estimated using OLS,
from a standard CAPM model on value-weighted market returns over a rolling 5-year period, (vi) firm size computed by market
capitalization over total asset, (vii) share turnover, and (viii) indicator variable of NYSE listed firms. Partitioning variables include
the followings: (i) Monthly price synchronicity, SYNCH, is measured by the R-square from the market model of regressing the
individual stock returns on market index daily over the 12 months immediately before the month in question, (ii) Corporate
governance index, G-INDEX, is from the Gompers, Ishii and Metrick (2003), and (iii) probability of informed trading, PIN, is from
Easley, Hvidkjaer and O‘Hara (2002). Panel A reports the regression results for full sample. Panel B reports the regression results
based on subsamples of cross-sectional median of firm‘s synchronicity. Panel C reports the regression results of subsamples based on
subsamples of cross-sectional median of firm‘s probability of informed trading. Panel D reports the regression results based on
subsamples of firm‘s corporate governance index. t-statistics are reported in parentheses. *, ** and *** are ten, five and one percent
significance respectively.
Panel A: FULL SAMPLE Panel B: SYNCH Panel C: PIN Panel D: G-INDEX
LOW HIGH LOW HIGH LOW HIGH
Institutional ownership 0.0892*** 0.1305 -0.080 0.2088 -0.0641 -0.6174** -0.5075
(2.57) (1.22) (-0.63) (0.79) (0.35) (-1.77) (-0.81)
(Institutional ownership)2 -0.0032*** -0.0523 0.1305 -0.1306 0.1383 0.8807** 0.5683
(-5.64) (-0.43) (0.85) (0.5) (0.7) (2.41) (0.99)
Institutional ownership x
Managerial ownership 0.4020***
0.1777*** 0.6727*** 0.5112*** 0.2841**
0.9171*** 0.5466***
(4.01) (2.58) (5.69) (3.44) (2.15) (3.66) (2.81)
log(share outstanding) 0.0467*** 0.3123*** 0.0582*** 0.0691*** 0.0217** 0.0748*** 0.0739***
(8.26) (5.15) (7.29) (5.4) (2.3) (4.22) (4.37)
Beta 0.0551*** 0.0391*** 0.0396*** 0.0065 0.017384 0.0317 0.0198
(6.05) (3.84) (2.86) (0.27) (0.89) (0.86) (0.60)
Sigma -3.1094*** -2.0239*** -4.2790*** -5.287*** -2.7017*** -5.8295*** -5.1370***
(-15.47) (-9.53) (-13.07) (9.75) (7.74) (-7.84) (-6.71)
log(firm age) -0.0471*** -0.0486*** -0.0582*** 0.0624*** -0.0675*** -0.0611** -0.0334
(-5.79) (-5.61) (-5.11) (3.28) (4.96) (-2.28) (-1.10)
Firm size -0.0589*** -0.0639*** -0.0906*** -0.0989*** -0.0672*** -0.0996*** -0.0988***
(-9.69) (-9.02) (-10.37) (7.12) (6.43) (-4.81) (-5.82)
log(share turnover) 0.4794*** 0.4241*** 0.4432*** 0.2305*** 0.4273*** 0.3472*** 0.3172***
(29.16) (22.51) (19.15) (4.25) (9.96) (6.53) (5.51)
NYSE indicator 0.1063*** 0.1037*** 0.0785*** 0.0799 0.0811*** -0.0379 -0.0674
(6.32) (5.67) (3.31) (1.57) (2.7) (-0.81) (-1.05)
R square 0.2878 0.2740 0.2882 0.2233 0.2087 0.2954 0.2671
F Statistics 1,422.10*** 75.49*** 57.05*** 17.70*** 19.22 13.69*** 14.86***
N 18,110 10521 7,581 3,255 4.491 1,003 1,205
Corporate Ownership & Control / Volume 6, Issue 4, Summer 2009
128
OWNERSHIP STRUCTURE AND CORPORATE VOLUNTARY DISCLOSURE-EVIDENCE FROM TAIWAN
Grace M. Liao*, Chilin Lu**
Abstract
Compared to western markets, listed firms in East Asia typically have low levels of information transparency and do not motivate to disclose proprietary information to the public. One of the most frequently cited reasons for the low level of transparency and disclosure quality is poor corporate governance structures in this region. In this study, we explore the association between ownership structure and voluntary information disclosure in Taiwan. Annual report index data from Information Disclosure and Transparence Ranking System (IDTRS) are used as the proxy of the firm’s voluntary information. The empirical results indicate that the level of information disclosure is likely to be less in “insider” or family-controlled companies. Keywords: voluntary disclosure; family firms, Taiwan * Lecturer/Ph D Candidate, Chung Jung Christian University, e-mail: [email protected]
**Associate Professor, National Formosa University, e-mail: [email protected]
1. Introduction
Corporate disclosure has been the focus of an
increasing research subject in recent years. Since
Enron, corporate American has come under even
greater scrutiny and increased regulation. E.g.,
Sarbanes Oxley is, at least in part, intended to
enhance the role of corporate governance in safe
guarding the quality of reported earnings and overall
corporate disclosure.
With growing interests in the topic, recently
researchers have attempted to examine directly
whether and how corporate governance affects
corporate disclosure quality in US, UK and
Continental European countries (Meek et al., 1995;
Turpin & DeZoort, 1998; Ball et al., 2003; Bushman
et al., 2004; Khanna et al., 2004). In contrast, very
few studies have been examined with the nature and
extent of corporate disclosure in Asian countries.
Accordingly, this study aims to examine the corporate
disclosure in Taiwan listed companies.
Corporate disclosure deserves special attention
in the Asian context because firms in these countries
have less incentives for transparent disclosure than
US and UK markets (Ball et al., 2003). Taiwan capital
market plays an important role in Asian emerging
stock market. Research made in Taiwan provides us
with an opportunity to examine empirically the firm
characteristics affecting corporate information
disclosure in emerging economies. Further, the
disclosure orientation in Asian market is also greatly
influenced by the form of their ownership and
management structure (Lam et al., 1994; Mok et al.,
1992). In Asian market, especially in Chinese society,
listed companies are usually controlled by a family
group who staff many of the senior positions and also
own a large proportion of the shares. As Taiwan
become one of the major international capital market,
there is an increase demand from market users for
more corporate disclosure for proper evaluation of
firm‘s performance.
This study examines whether ownership
structure is associated with the corporate disclosure of
listed companies in Taiwan. It is also investigates
whether family ownership and control of firms has an
impact on the level of disclosure.
The rest of the paper is organized as follows.
Section 2 discusses our hypotheses. Section 3
discusses the sample and research method. Section 4
presents the results. Section 5 concludes the paper.
2. Hypotheses development 2.1 Ownership structure and disclosure
Voluntary disclosure is greatly influenced by the form
of the ownership and management structure (Chau &
Gray, 2002; Gelb, 2000; Ho & Wong, 2001). Jensen
and Meckling (1976) assert that when ownership and
control are separated, the potential for agency costs
arises because of conflicts of interests between the
contracting parities (manager and shareholders). As a
result, information disclosure is likely to be greater in
widely held firms so that principals can effectively
monitor that their economic interests are optimized
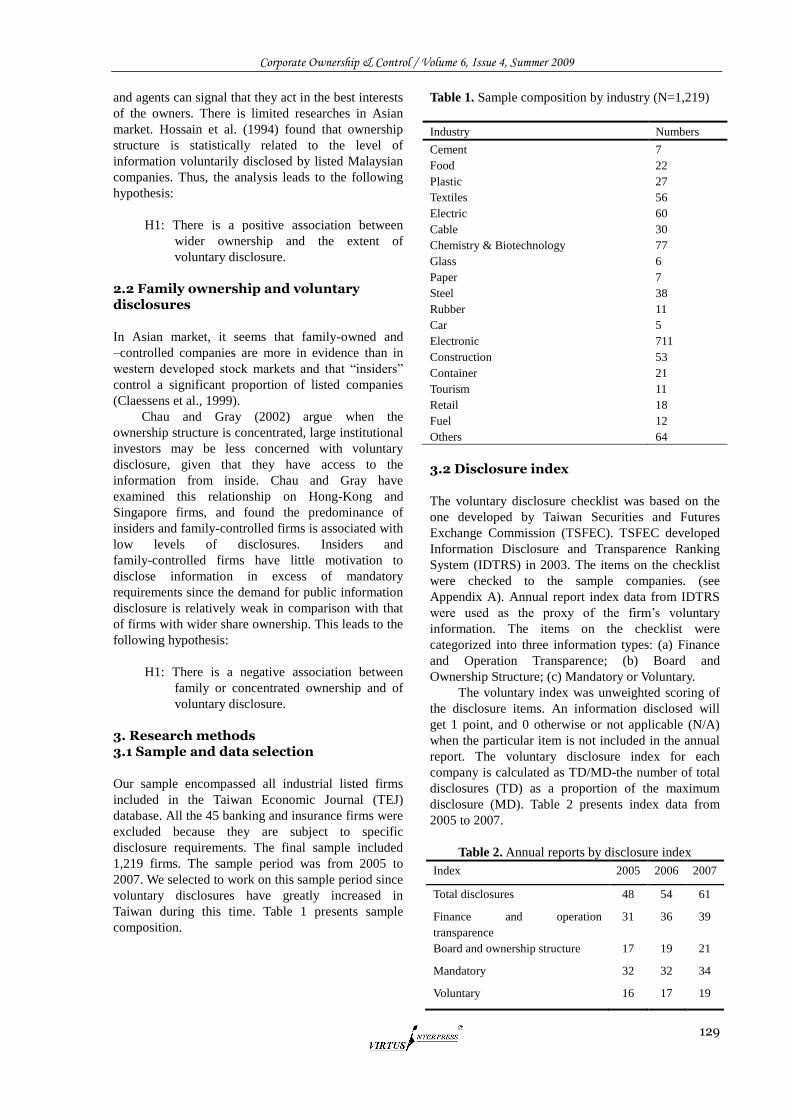
Corporate Ownership & Control / Volume 6, Issue 4, Summer 2009
129
and agents can signal that they act in the best interests
of the owners. There is limited researches in Asian
market. Hossain et al. (1994) found that ownership
structure is statistically related to the level of
information voluntarily disclosed by listed Malaysian
companies. Thus, the analysis leads to the following
hypothesis:
H1: There is a positive association between
wider ownership and the extent of
voluntary disclosure.
2.2 Family ownership and voluntary disclosures
In Asian market, it seems that family-owned and
–controlled companies are more in evidence than in
western developed stock markets and that ―insiders‖
control a significant proportion of listed companies
(Claessens et al., 1999).
Chau and Gray (2002) argue when the
ownership structure is concentrated, large institutional
investors may be less concerned with voluntary
disclosure, given that they have access to the
information from inside. Chau and Gray have
examined this relationship on Hong-Kong and
Singapore firms, and found the predominance of
insiders and family-controlled firms is associated with
low levels of disclosures. Insiders and
family-controlled firms have little motivation to
disclose information in excess of mandatory
requirements since the demand for public information
disclosure is relatively weak in comparison with that
of firms with wider share ownership. This leads to the
following hypothesis:
H1: There is a negative association between
family or concentrated ownership and of
voluntary disclosure.
3. Research methods 3.1 Sample and data selection
Our sample encompassed all industrial listed firms
included in the Taiwan Economic Journal (TEJ)
database. All the 45 banking and insurance firms were
excluded because they are subject to specific
disclosure requirements. The final sample included
1,219 firms. The sample period was from 2005 to
2007. We selected to work on this sample period since
voluntary disclosures have greatly increased in
Taiwan during this time. Table 1 presents sample
composition.
Table 1. Sample composition by industry (N=1,219)
Industry Numbers
Cement 7
Food 22
Plastic 27
Textiles 56
Electric 60
Cable 30
Chemistry & Biotechnology 77
Glass 6
Paper 7
Steel 38
Rubber 11
Car 5
Electronic 711
Construction 53
Container 21
Tourism 11
Retail 18
Fuel 12
Others 64
3.2 Disclosure index
The voluntary disclosure checklist was based on the
one developed by Taiwan Securities and Futures
Exchange Commission (TSFEC). TSFEC developed
Information Disclosure and Transparence Ranking
System (IDTRS) in 2003. The items on the checklist
were checked to the sample companies. (see
Appendix A). Annual report index data from IDTRS
were used as the proxy of the firm‘s voluntary
information. The items on the checklist were
categorized into three information types: (a) Finance
and Operation Transparence; (b) Board and
Ownership Structure; (c) Mandatory or Voluntary.
The voluntary index was unweighted scoring of
the disclosure items. An information disclosed will
get 1 point, and 0 otherwise or not applicable (N/A)
when the particular item is not included in the annual
report. The voluntary disclosure index for each
company is calculated as TD/MD-the number of total
disclosures (TD) as a proportion of the maximum
disclosure (MD). Table 2 presents index data from
2005 to 2007.
Table 2. Annual reports by disclosure index
Index 2005 2006 2007
Total disclosures 48 54 61
Finance and operation
transparence
31 36 39
Board and ownership structure 17 19 21
Mandatory 32 32 34
Voluntary 16 17 19
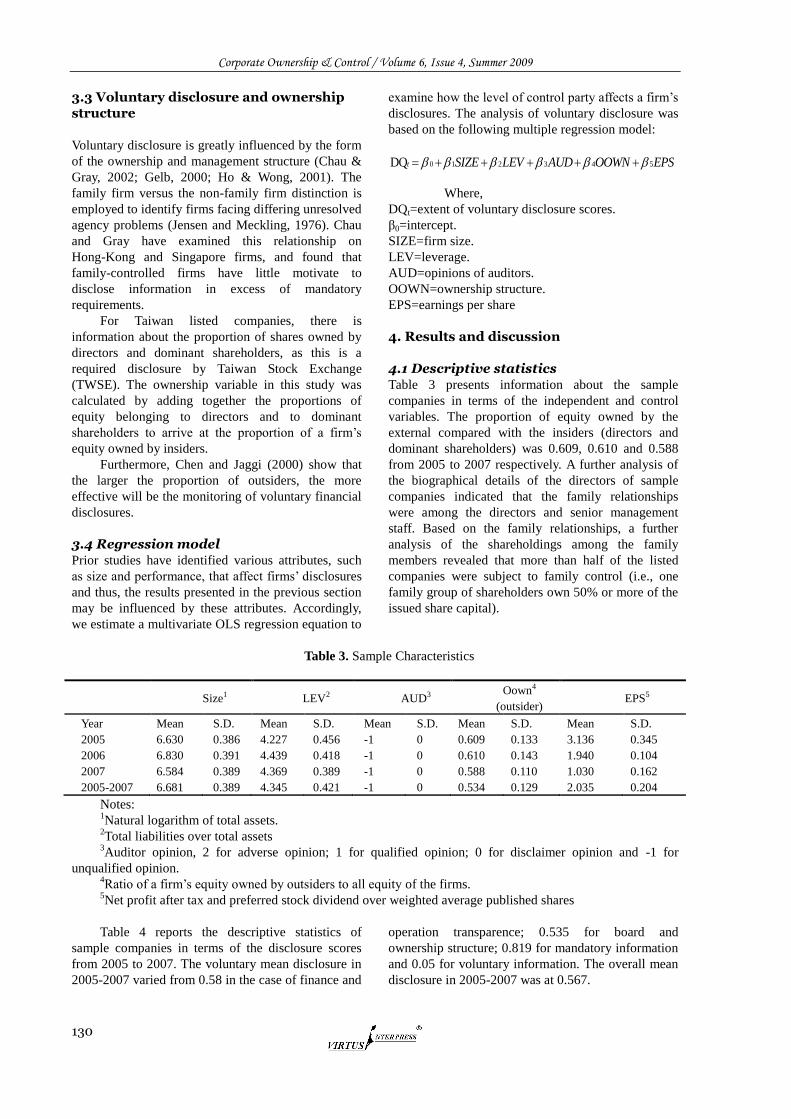
Corporate Ownership & Control / Volume 6, Issue 4, Summer 2009
130
3.3 Voluntary disclosure and ownership structure
Voluntary disclosure is greatly influenced by the form
of the ownership and management structure (Chau &
Gray, 2002; Gelb, 2000; Ho & Wong, 2001). The
family firm versus the non-family firm distinction is
employed to identify firms facing differing unresolved
agency problems (Jensen and Meckling, 1976). Chau
and Gray have examined this relationship on
Hong-Kong and Singapore firms, and found that
family-controlled firms have little motivate to
disclose information in excess of mandatory
requirements.
For Taiwan listed companies, there is
information about the proportion of shares owned by
directors and dominant shareholders, as this is a
required disclosure by Taiwan Stock Exchange
(TWSE). The ownership variable in this study was
calculated by adding together the proportions of
equity belonging to directors and to dominant
shareholders to arrive at the proportion of a firm‘s
equity owned by insiders.
Furthermore, Chen and Jaggi (2000) show that
the larger the proportion of outsiders, the more
effective will be the monitoring of voluntary financial
disclosures.
3.4 Regression model Prior studies have identified various attributes, such
as size and performance, that affect firms‘ disclosures
and thus, the results presented in the previous section
may be influenced by these attributes. Accordingly,
we estimate a multivariate OLS regression equation to
examine how the level of control party affects a firm‘s
disclosures. The analysis of voluntary disclosure was
based on the following multiple regression model:
0 1 2 3 4 5DQ t SIZE LEV AUD OOWN EPS
Where,
DQt=extent of voluntary disclosure scores.
β0=intercept.
SIZE=firm size.
LEV=leverage.
AUD=opinions of auditors.
OOWN=ownership structure.
EPS=earnings per share
4. Results and discussion 4.1 Descriptive statistics Table 3 presents information about the sample
companies in terms of the independent and control
variables. The proportion of equity owned by the
external compared with the insiders (directors and
dominant shareholders) was 0.609, 0.610 and 0.588
from 2005 to 2007 respectively. A further analysis of
the biographical details of the directors of sample
companies indicated that the family relationships
were among the directors and senior management
staff. Based on the family relationships, a further
analysis of the shareholdings among the family
members revealed that more than half of the listed
companies were subject to family control (i.e., one
family group of shareholders own 50% or more of the
issued share capital).
Table 3. Sample Characteristics
Size1 LEV2 AUD3
Oown4
(outsider) EPS5
Year Mean S.D. Mean S.D. Mean S.D. Mean S.D. Mean S.D.
2005 6.630 0.386 4.227 0.456 -1 0 0.609 0.133 3.136 0.345
2006 6.830 0.391 4.439 0.418 -1 0 0.610 0.143 1.940 0.104
2007 6.584 0.389 4.369 0.389 -1 0 0.588 0.110 1.030 0.162
2005-2007 6.681 0.389 4.345 0.421 -1 0 0.534 0.129 2.035 0.204
Notes: 1Natural logarithm of total assets.
2Total liabilities over total assets
3Auditor opinion, 2 for adverse opinion; 1 for qualified opinion; 0 for disclaimer opinion and -1 for
unqualified opinion. 4Ratio of a firm‘s equity owned by outsiders to all equity of the firms.
5Net profit after tax and preferred stock dividend over weighted average published shares
Table 4 reports the descriptive statistics of
sample companies in terms of the disclosure scores
from 2005 to 2007. The voluntary mean disclosure in
2005-2007 varied from 0.58 in the case of finance and
operation transparence; 0.535 for board and
ownership structure; 0.819 for mandatory information
and 0.05 for voluntary information. The overall mean
disclosure in 2005-2007 was at 0.567.
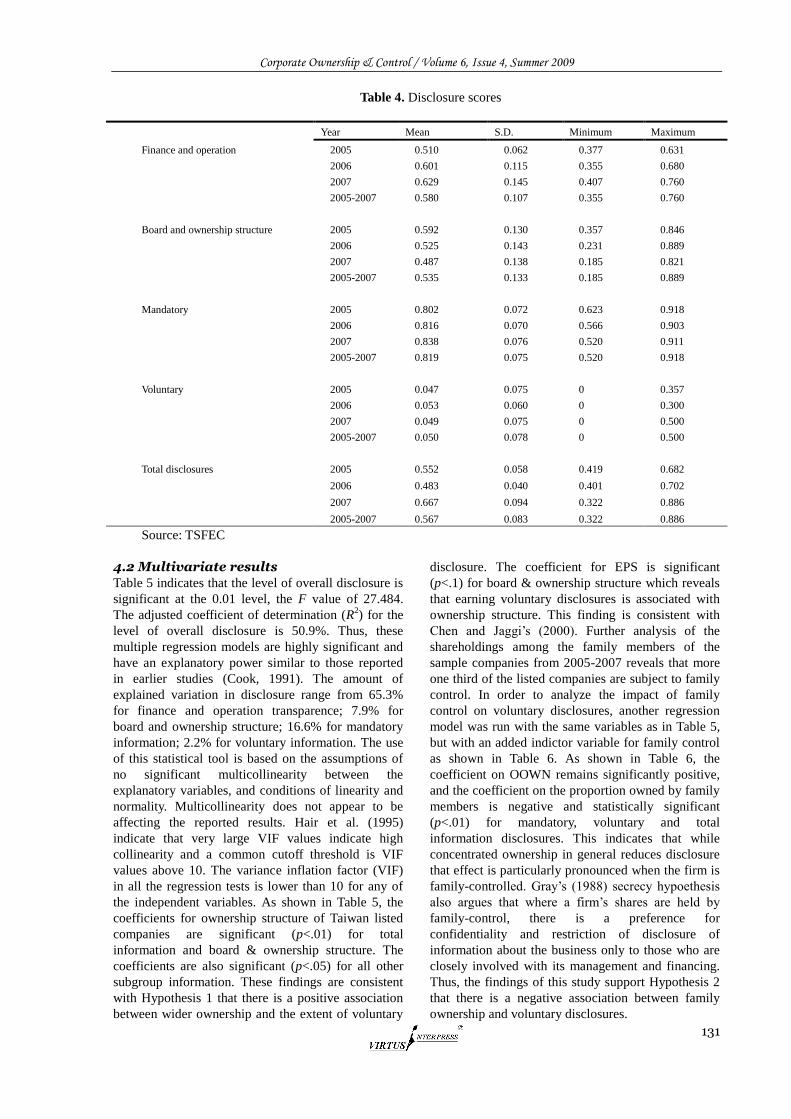
Corporate Ownership & Control / Volume 6, Issue 4, Summer 2009
131
Table 4. Disclosure scores
Year Mean S.D. Minimum Maximum
Finance and operation 2005 0.510 0.062 0.377 0.631
2006 0.601 0.115 0.355 0.680
2007 0.629 0.145 0.407 0.760
2005-2007 0.580 0.107 0.355 0.760
Board and ownership structure 2005 0.592 0.130 0.357 0.846
2006 0.525 0.143 0.231 0.889
2007 0.487 0.138 0.185 0.821
2005-2007 0.535 0.133 0.185 0.889
Mandatory 2005 0.802 0.072 0.623 0.918
2006 0.816 0.070 0.566 0.903
2007 0.838 0.076 0.520 0.911
2005-2007 0.819 0.075 0.520 0.918
Voluntary 2005 0.047 0.075 0 0.357
2006 0.053 0.060 0 0.300
2007 0.049 0.075 0 0.500
2005-2007 0.050 0.078 0 0.500
Total disclosures 2005 0.552 0.058 0.419 0.682
2006 0.483 0.040 0.401 0.702
2007 0.667 0.094 0.322 0.886
2005-2007 0.567 0.083 0.322 0.886
Source: TSFEC
4.2 Multivariate results Table 5 indicates that the level of overall disclosure is
significant at the 0.01 level, the F value of 27.484.
The adjusted coefficient of determination (R2) for the
level of overall disclosure is 50.9%. Thus, these
multiple regression models are highly significant and
have an explanatory power similar to those reported
in earlier studies (Cook, 1991). The amount of
explained variation in disclosure range from 65.3%
for finance and operation transparence; 7.9% for
board and ownership structure; 16.6% for mandatory
information; 2.2% for voluntary information. The use
of this statistical tool is based on the assumptions of
no significant multicollinearity between the
explanatory variables, and conditions of linearity and
normality. Multicollinearity does not appear to be
affecting the reported results. Hair et al. (1995)
indicate that very large VIF values indicate high
collinearity and a common cutoff threshold is VIF
values above 10. The variance inflation factor (VIF)
in all the regression tests is lower than 10 for any of
the independent variables. As shown in Table 5, the
coefficients for ownership structure of Taiwan listed
companies are significant (p<.01) for total
information and board & ownership structure. The
coefficients are also significant (p<.05) for all other
subgroup information. These findings are consistent
with Hypothesis 1 that there is a positive association
between wider ownership and the extent of voluntary
disclosure. The coefficient for EPS is significant
(p<.1) for board & ownership structure which reveals
that earning voluntary disclosures is associated with
ownership structure. This finding is consistent with
Chen and Jaggi‘s (2000). Further analysis of the
shareholdings among the family members of the
sample companies from 2005-2007 reveals that more
one third of the listed companies are subject to family
control. In order to analyze the impact of family
control on voluntary disclosures, another regression
model was run with the same variables as in Table 5,
but with an added indictor variable for family control
as shown in Table 6. As shown in Table 6, the
coefficient on OOWN remains significantly positive,
and the coefficient on the proportion owned by family
members is negative and statistically significant
(p<.01) for mandatory, voluntary and total
information disclosures. This indicates that while
concentrated ownership in general reduces disclosure
that effect is particularly pronounced when the firm is
family-controlled. Gray‘s (1988) secrecy hypoethesis
also argues that where a firm‘s shares are held by
family-control, there is a preference for
confidentiality and restriction of disclosure of
information about the business only to those who are
closely involved with its management and financing.
Thus, the findings of this study support Hypothesis 2
that there is a negative association between family
ownership and voluntary disclosures.
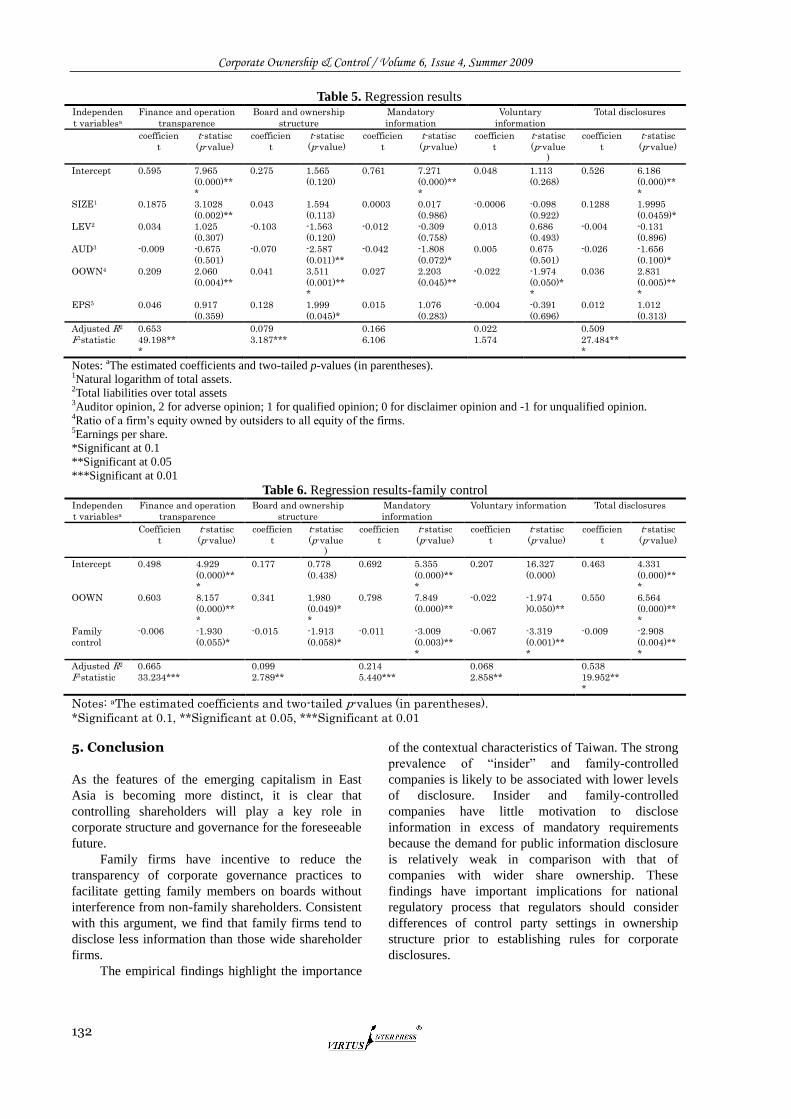
Corporate Ownership & Control / Volume 6, Issue 4, Summer 2009
132
Table 5. Regression results Independen
t variablesa
Finance and operation
transparence
Board and ownership
structure
Mandatory
information
Voluntary
information
Total disclosures
coefficien
t
t-statisc
(p-value)
coefficien
t
t-statisc
(p-value)
coefficien
t
t-statisc
(p-value)
coefficien
t
t-statisc
(p-value
)
coefficien
t
t-statisc
(p-value)
Intercept 0.595 7.965
(0.000)**
*
0.275 1.565
(0.120)
0.761 7.271
(0.000)**
*
0.048 1.113
(0.268)
0.526 6.186
(0.000)**
*
SIZE1 0.1875 3.1028
(0.002)**
0.043 1.594
(0.113)
0.0003 0.017
(0.986)
-0.0006 -0.098
(0.922)
0.1288 1.9995
(0.0459)*
LEV2 0.034 1.025
(0.307)
-0.103 -1.563
(0.120)
-0.012 -0.309
(0.758)
0.013
0.686
(0.493)
-0.004 -0.131
(0.896)
AUD3 -0.009 -0.675
(0.501)
-0.070 -2.587
(0.011)**
-0.042 -1.808
(0.072)*
0.005 0.675
(0.501)
-0.026 -1.656
(0.100)*
OOWN4 0.209 2.060
(0.004)**
0.041 3.511
(0.001)**
*
0.027 2.203
(0.045)**
-0.022 -1.974
(0.050)*
*
0.036 2.831
(0.005)**
*
EPS5 0.046 0.917
(0.359)
0.128 1.999
(0.045)*
0.015 1.076
(0.283)
-0.004 -0.391
(0.696)
0.012 1.012
(0.313)
Adjusted R2 0.653 0.079 0.166 0.022 0.509
F-statistic 49.198**
*
3.187*** 6.106 1.574 27.484**
*
Notes: aThe estimated coefficients and two-tailed p-values (in parentheses). 1Natural logarithm of total assets. 2Total liabilities over total assets 3Auditor opinion, 2 for adverse opinion; 1 for qualified opinion; 0 for disclaimer opinion and -1 for unqualified opinion. 4Ratio of a firm‘s equity owned by outsiders to all equity of the firms. 5Earnings per share.
*Significant at 0.1
**Significant at 0.05
***Significant at 0.01 Table 6. Regression results-family control
Independen
t variablesa
Finance and operation
transparence
Board and ownership
structure
Mandatory
information
Voluntary information Total disclosures
Coefficien
t
t-statisc
(p-value)
coefficien
t
t-statisc
(p-value
)
coefficien
t
t-statisc
(p-value)
coefficien
t
t-statisc
(p-value)
coefficien
t
t-statisc
(p-value)
Intercept 0.498 4.929
(0.000)**
*
0.177 0.778
(0.438)
0.692 5.355
(0.000)**
*
0.207 16.327
(0.000)
0.463 4.331
(0.000)**
*
OOWN 0.603 8.157
(0.000)**
*
0.341 1.980
(0.049)*
*
0.798 7.849
(0.000)**
-0.022 -1.974
)0.050)**
0.550 6.564
(0.000)**
*
Family
control
-0.006 -1.930
(0.055)*
-0.015 -1.913
(0.058)*
-0.011 -3.009
(0.003)**
*
-0.067 -3.319
(0.001)**
*
-0.009 -2.908
(0.004)**
*
Adjusted R2 0.665 0.099 0.214 0.068 0.538
F-statistic 33.234*** 2.789** 5.440*** 2.858** 19.952**
*
Notes: aThe estimated coefficients and two-tailed p-values (in parentheses).
*Significant at 0.1, **Significant at 0.05, ***Significant at 0.01
5. Conclusion
As the features of the emerging capitalism in East
Asia is becoming more distinct, it is clear that
controlling shareholders will play a key role in
corporate structure and governance for the foreseeable
future.
Family firms have incentive to reduce the
transparency of corporate governance practices to
facilitate getting family members on boards without
interference from non-family shareholders. Consistent
with this argument, we find that family firms tend to
disclose less information than those wide shareholder
firms.
The empirical findings highlight the importance
of the contextual characteristics of Taiwan. The strong
prevalence of ―insider‖ and family-controlled
companies is likely to be associated with lower levels
of disclosure. Insider and family-controlled
companies have little motivation to disclose
information in excess of mandatory requirements
because the demand for public information disclosure
is relatively weak in comparison with that of
companies with wider share ownership. These
findings have important implications for national
regulatory process that regulators should consider
differences of control party settings in ownership
structure prior to establishing rules for corporate
disclosures.
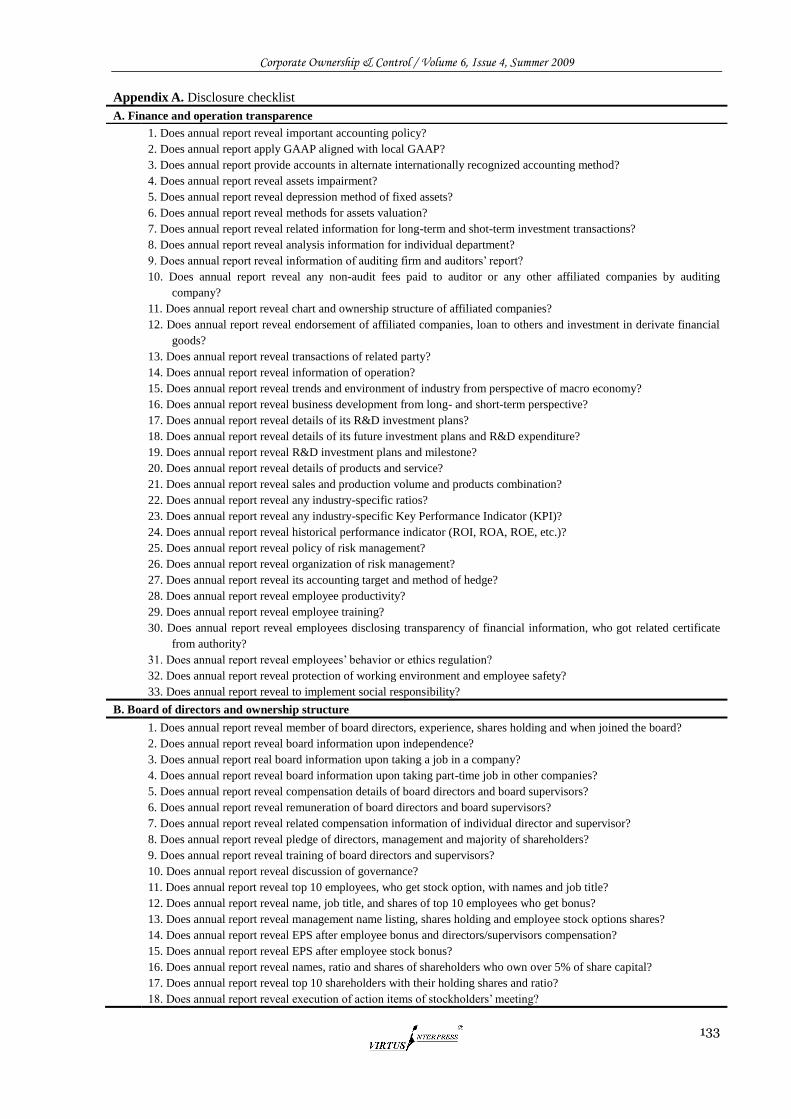
Corporate Ownership & Control / Volume 6, Issue 4, Summer 2009
133
Appendix A. Disclosure checklist
A. Finance and operation transparence
1. Does annual report reveal important accounting policy?
2. Does annual report apply GAAP aligned with local GAAP?
3. Does annual report provide accounts in alternate internationally recognized accounting method?
4. Does annual report reveal assets impairment?
5. Does annual report reveal depression method of fixed assets?
6. Does annual report reveal methods for assets valuation?
7. Does annual report reveal related information for long-term and shot-term investment transactions?
8. Does annual report reveal analysis information for individual department?
9. Does annual report reveal information of auditing firm and auditors‘ report?
10. Does annual report reveal any non-audit fees paid to auditor or any other affiliated companies by auditing
company?
11. Does annual report reveal chart and ownership structure of affiliated companies?
12. Does annual report reveal endorsement of affiliated companies, loan to others and investment in derivate financial
goods?
13. Does annual report reveal transactions of related party?
14. Does annual report reveal information of operation?
15. Does annual report reveal trends and environment of industry from perspective of macro economy?
16. Does annual report reveal business development from long- and short-term perspective?
17. Does annual report reveal details of its R&D investment plans?
18. Does annual report reveal details of its future investment plans and R&D expenditure?
19. Does annual report reveal R&D investment plans and milestone?
20. Does annual report reveal details of products and service?
21. Does annual report reveal sales and production volume and products combination?
22. Does annual report reveal any industry-specific ratios?
23. Does annual report reveal any industry-specific Key Performance Indicator (KPI)?
24. Does annual report reveal historical performance indicator (ROI, ROA, ROE, etc.)?
25. Does annual report reveal policy of risk management?
26. Does annual report reveal organization of risk management?
27. Does annual report reveal its accounting target and method of hedge?
28. Does annual report reveal employee productivity?
29. Does annual report reveal employee training?
30. Does annual report reveal employees disclosing transparency of financial information, who got related certificate
from authority?
31. Does annual report reveal employees‘ behavior or ethics regulation?
32. Does annual report reveal protection of working environment and employee safety?
33. Does annual report reveal to implement social responsibility?
B. Board of directors and ownership structure
1. Does annual report reveal member of board directors, experience, shares holding and when joined the board?
2. Does annual report reveal board information upon independence?
3. Does annual report real board information upon taking a job in a company?
4. Does annual report reveal board information upon taking part-time job in other companies?
5. Does annual report reveal compensation details of board directors and board supervisors?
6. Does annual report reveal remuneration of board directors and board supervisors?
7. Does annual report reveal related compensation information of individual director and supervisor?
8. Does annual report reveal pledge of directors, management and majority of shareholders?
9. Does annual report reveal training of board directors and supervisors?
10. Does annual report reveal discussion of governance?
11. Does annual report reveal top 10 employees, who get stock option, with names and job title?
12. Does annual report reveal name, job title, and shares of top 10 employees who get bonus?
13. Does annual report reveal management name listing, shares holding and employee stock options shares?
14. Does annual report reveal EPS after employee bonus and directors/supervisors compensation?
15. Does annual report reveal EPS after employee stock bonus?
16. Does annual report reveal names, ratio and shares of shareholders who own over 5% of share capital?
17. Does annual report reveal top 10 shareholders with their holding shares and ratio?
18. Does annual report reveal execution of action items of stockholders‘ meeting?
Corporate Ownership & Control / Volume 6, Issue 4, Summer 2009
134
References
1. Ball, R., Robin, A., & Wu, J. S. (2003). Incentives
versus standards: Properties of accounting income in
four East Asia countries. Journal of Accounting and
Economics, 36, 235-270.
2. Bushman, R., M., Piotroski, J. D., & Smith, A., J.
(2004). What determines corporate transparency.
Journal of Accounting Research, 42, 207-252.
3. Chau, G., K., & Gray, S. J. (2002). Ownership
structure and corporate voluntary disclosure in Hong
Kong and Singapore. The International Journal of
Accounting, 37(2), 247-265.
4. Chen, J. P., & Jaggi, B. L. (2002). The association
between independent non executive directors, family
control and financial disclosures. Journal of
Accounting and Public Policy, 19(4-5), 285-310.
5. Cook, T. E. (1991). An assessment of voluntary
disclosure in the annual reports of Japanese
corporations. International Journal of Accounting,
26(3), 174-189.
6. Claessens, S., Djankov, S.; Fan, Js., & Lang L. H. P.
(1999). Expropriation on minority shareholders:
Evidence from East Asia. Policy Research. Working
Paper 2088, The World Bank.
7. Gelb, D. S. (2000). Managerial ownership and
accounting disclosure: an empirical study. Review of
Quantitative Finance and Accounting, 15, 169-185.
8. Gray, S. J. (1988, March). Towards a theory of
cultural influence on the development of accounting
systems internationally. Abacus, 24(1), 1-15. (fod027)
9. Khanna, t., Palepu, K. P., & Srinivasan, S. (2004).
Disclosure practices of foreign companies interacting
with US markets. Journal of Accounting Research, 42,
475-508.
10. Hair, J. F., Anderson, R. E., Tatham, R. L., & Black,
W. C. (1995). Multivariate data analysis with
readings. New York: Prentice-Hall.
11. Ho, S. M., & Wong, K. S. (2001). A study of the
relationship between corporate governance structures
and the extent of voluntary disclosure. Journal of
International Accounting, Auditing and Taxation, 10,
139-156.
12. Hossain, M., Tan, L. M., & Adams, M. B. (1994).
Voluntary disclosure in an emerging capital market:
some empirical evidence from companies listed on the
Kuala Lumpur Stock Exchange. International Journal
of Accounting, 29(4), 334-351.
13. Jensen, J., & Meckling, W. (1976). Theory of the firm:
managerial behavior, agency costs and ownership
structure. Journal of Financial Economics, 3,
305-360.
14. Lam, K., Mok, H. M. K., Cheung, I., & Yam, H. C. S.
(1994). Family groupings on performance of portfolio
selection in the Hong Kong Stock market. Journal of
Banking and Finance, 18(4), 725-742.
15. Meek, G. K., Robert, C. B., & Gray, S., J. (1995, Third
Quarter). Factors influencing voluntary annual report
disclosures by US, UK and continental European
multinational corporations. Journal of International
Business Studies, 555-572.
16. Mok, J. M. K., Lam, K., & Cheung, I. (1992). Family
control and return covariation in Hong Kong‘s
common stocks. Journal of Business Finance and
Accounting, 19(2), 277-293.
17. Turpin, R.A., & DeZoort, F. T. (1998). Characteristics
of firms that include an audit committee report in their
annual report. International Journal of Auditing, 2(1),
33-48.
Corporate Ownership & Control / Volume 6, Issue 4, Summer 2009
135
РАЗДЕЛ 3 КОРПОРАТИВНОЕ
УПРАВЛЕНИЕ В МАЛАЙЗИИ
SECTION 3 СORPORATE GOVERNANCE: MALAYSIA
CORPORATE GOVERNANCE IN FAMILY RUN BUSINESS – A MALAYSIAN CASE STUDY
C.H. Ponnu*, C.K. Lee*, Geron Tan*, T.H. Khor*, Adelyn Leong*
Abstract This paper addresses the debate on family run business and corporate governance before and after the Asian Financial Crisis in 1997. As there are only few studies on the corporate governance of family businesses in Malaysia, this paper aims to provide a broad view of the corporate governance practises of family run companies in Malaysia. The majority of family-run companies in Malaysia are operated by ethnic Chinese families in Malaysia. To understand the practices of corporate governance in these companies, this study selected 3 of the top 10 family run companies by market capitalization in Malaysia. This paper discusses the issues and problems related to family run businesses in the light of the separation of ownership and control, lack of board independence and protection of minority shareholders, lack of independence of external auditors, lack of transparency and disclosure as well as managerial entrenchment. Keywords: corporate governance, family run business, Malaysia
*University of Malaya, Malaysia
1. Introduction to Family-Based Business in Asia
In many countries of East Asia, ownership is
concentrated within founding families (La Porta et al.,
1999; Claessens et al., 2002). According to Claessens
et al. (1999), analysis of ownership control conducted
by world bank found that ten largest families in
Indonesia, the Philippines, and Thailand control half
the corporate sector (in terms of market capitalization),
while the ten largest in Hong Kong and Korea control
about a third. More extreme, in Indonesia and the
Philippines ultimate control of about 17 percent of
market capitalization can be traced to a single family
and also in Malaysia, 28.3 percent of market
capitalization was controlled by 15 families.
According to Suehiro (1993) the family business
can be thought of “ … as a form of enterprise in
which both ownership and management are controlled
by a family kinship group, either nuclear or extended,
and the fruits of which remain inside that group, being
distributed in some way among its members.” (p.
378).
Suehiro (1993) draws his inspiration from
Chandler (1977) who defines family business in the
following way:
―In some firms the entrepreneur and his close
associates (and their families) who built the
enterprise continued to hold the majority of stock.
They maintained a close personal relationship with
their managers, and they retained a major say in top
management decisions, particularly those concerning
Corporate Ownership & Control / Volume 6, Issue 4, Summer 2009
136
financial policies, allocation of resources, and the
selection of senior managers. Such a modern business
enterprise may be termed an entrepreneurial or family
one, and an economy or sectors of an economy
dominated by such firms may be considered a system
of entrepreneurial or family capitalism‖.
Interestingly, many Asian family firms are
owned and operated by Chinese (Tan & Fock, 2001).
In Malaysia, the Chinese (typically family oriented)
controls more than half of the public listed companies
in Bursa Malaysia (Low, 2003). Their strong presence
has made sense for this article to analyse the
characteristics of Chinese family business in order to
understand how the family run businesses in Malaysia
work. The aggressive nature of entrepreneurship and
strong cohesiveness of families are key factors in
Chinese family businesses (Yen, 1994). Zapalska &
Edwards (2001) also found that there are significant
links between Chinese culture and entrepreneurial
activities in China. There are, however, significant
differences between the Chinese and Western culture
as regards business activity (Pistrui et al, 2001;
Gatfield & Youseff, 2001; Begley & Tan, 2001).
Many aspects of Chinese culture, influenced by
Confucianism, combine to promote collectivism and
traditional respect for age, hierarchy, and authority in
the Asian business environment (Zapalska & Edwards,
2001). Confucian culture emphasizes the values of
paternalism and collectivism, both of which
contribute to Asian business relations. More
importantly, Chinese culture advocates conformity
rather than individuality (Begley & Tan, 2001) and
this is important in shaping managerial style (Hugh,
1986). The centralization of decision-making is
acceptable in such a cultural context. Moreover,
Chinese have a strong commitment to family, and thus
business is perceived as an extension of the family
system (Zapalska & Edwards, 2001).
Taiwanese family CEOs‘ sense of
professionalism and family loyalty are derived from
the enterprise system and the family system which
coalesce in family firms (Yen, 1996). Informal family
influence is more powerful than formal authority in
family firms because CEOs and top management are
also family members (Yen, 1996). The family system
is designed to increase family welfare and status and
preserve them for future family members. The family
mentality of local entrepreneurs is a key motivator in
the growth stage of an organization; but it may also
obstruct the development of family firms (Yen, 1994).
Recently, Chinese corporate culture has been
experiencing dramatic changes. Lee and Chan (1998)
found that the second generation of Singaporean
entrepreneurs is quite different from their parents
because they have absorbed many values of Western
culture. Moreover, the division of family properties is,
as a rule, rigid in Chinese culture, though it is also a
factor in business diversification (Yen, 1994).
2. Research Objective and Methodology
This paper makes references to the corporate
structures of Genting, IOI, YTL and Public Bank
Berhad, to understand the practice of corporate
governance in the context of Malaysian family run
businesses. These 3 companies are the top 10 family
run companies based on Starbiz‘s Malaysia Top 100
Companies by market Capitalization on 7th
August
2008. As there is only limited literature in Malaysia
on family-based corporate governance, we review a
broad cross section of the literature from Asia and
Europe to analyse the issues and problems of
family-run companies to gain better insight. This
paper also elaborates on some of the good practises of
corporate governance in Malaysian family-run
companies. Having presented both the weaknesses
and strengths of family run businesses, we look into
some of the reforms that can be explored to improve
the overall corporate governance of family-run
companies by maintaining some of the key features
while implementing the western based corporate
governance system. In this study, data and literature
were mainly secondary.
3. Family-Based Corporate Governance
Even before the crisis in Asia, extensive debate was
taking place in Europe, the United States and Japan
about the relative merits of different types of
corporate governance systems. Broadly speaking, two
general types of corporate governance structures have
been discussed.
The first type can be called a shareholder or
equity market-based governance system of the
Anglo-American type (EMS). This is usually
contrasted with the continental European or
Japanese-type stakeholder or relationship model. In
this model (for example, the Japanese main bank
system) banks rather than equity markets play a key
role in monitoring the performance of corporations.
Therefore, this type of governance structure could be
called a bank-led governance system (BLS). Note that
BLS can either be a Japanese-style main bank system
as mentioned above, or a German-type of universal
banking system. However, the BLS and EMS are not
the only two possible types of corporate governance
systems.
In both Northeast and Southeast Asia there is a
preponderance of family-based firms that are not
necessarily controlled by banks or by equity markets.
Nevertheless they do operate as economic entities
within the context of a relationship-based system.
Thus corporate governance of family businesses or
family-based corporate governance system (FBS) can
constitute a third type of corporate governance.
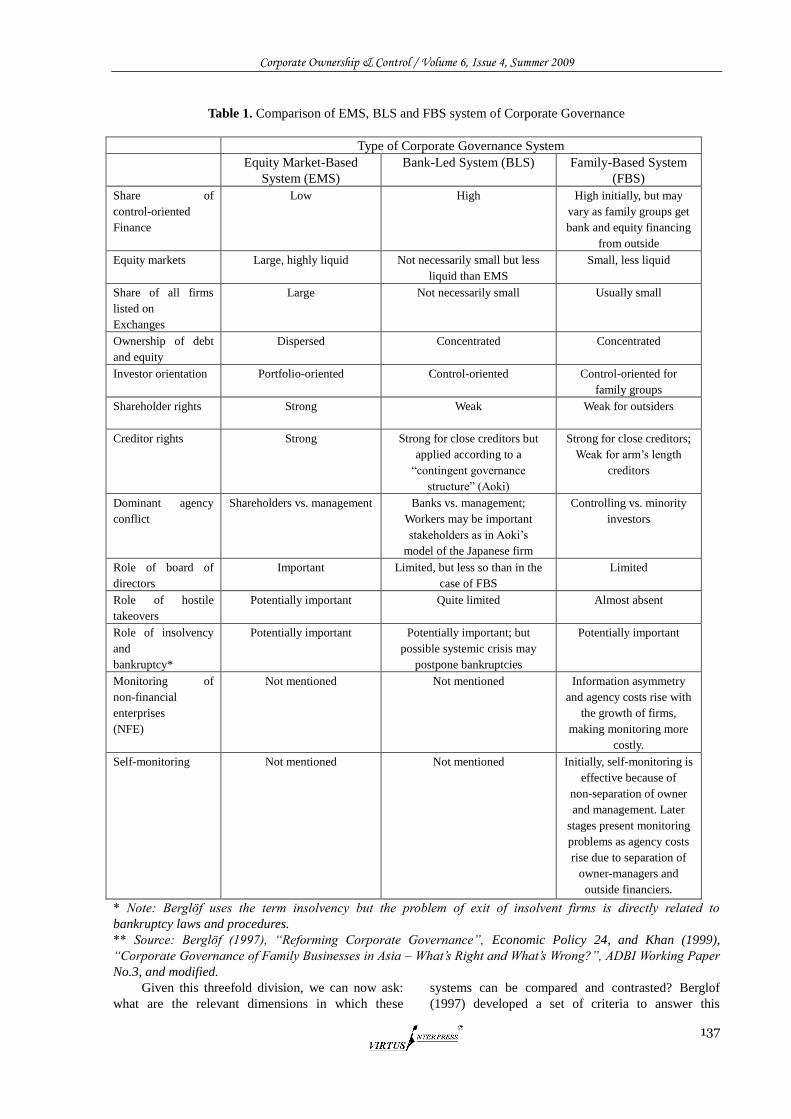
Corporate Ownership & Control / Volume 6, Issue 4, Summer 2009
137
Table 1. Comparison of EMS, BLS and FBS system of Corporate Governance
Type of Corporate Governance System
Equity Market-Based
System (EMS)
Bank-Led System (BLS) Family-Based System
(FBS)
Share of
control-oriented
Finance
Low High High initially, but may
vary as family groups get
bank and equity financing
from outside
Equity markets Large, highly liquid Not necessarily small but less
liquid than EMS
Small, less liquid
Share of all firms
listed on
Exchanges
Large Not necessarily small Usually small
Ownership of debt
and equity
Dispersed Concentrated Concentrated
Investor orientation Portfolio-oriented Control-oriented Control-oriented for
family groups
Shareholder rights Strong Weak Weak for outsiders
Creditor rights
Strong Strong for close creditors but
applied according to a
―contingent governance
structure‖ (Aoki)
Strong for close creditors;
Weak for arm‘s length
creditors
Dominant agency
conflict
Shareholders vs. management Banks vs. management;
Workers may be important
stakeholders as in Aoki‘s
model of the Japanese firm
Controlling vs. minority
investors
Role of board of
directors
Important Limited, but less so than in the
case of FBS
Limited
Role of hostile
takeovers
Potentially important Quite limited Almost absent
Role of insolvency
and
bankruptcy*
Potentially important Potentially important; but
possible systemic crisis may
postpone bankruptcies
Potentially important
Monitoring of
non-financial
enterprises
(NFE)
Not mentioned Not mentioned Information asymmetry
and agency costs rise with
the growth of firms,
making monitoring more
costly.
Self-monitoring Not mentioned Not mentioned Initially, self-monitoring is
effective because of
non-separation of owner
and management. Later
stages present monitoring
problems as agency costs
rise due to separation of
owner-managers and
outside financiers.
* Note: Berglöf uses the term insolvency but the problem of exit of insolvent firms is directly related to
bankruptcy laws and procedures.
** Source: Berglöf (1997), “Reforming Corporate Governance”, Economic Policy 24, and Khan (1999),
“Corporate Governance of Family Businesses in Asia – What‟s Right and What‟s Wrong?”, ADBI Working Paper
No.3, and modified.
Given this threefold division, we can now ask:
what are the relevant dimensions in which these
systems can be compared and contrasted? Berglof
(1997) developed a set of criteria to answer this
Corporate Ownership & Control / Volume 6, Issue 4, Summer 2009
138
question for EMS and BLS types of corporate
governance. Table 3.1 compares and contrasts the
EMS, BLS and FBS types of corporate governance,
using Berglöf‘s and Khan‘s original criteria with
modification of layout arrangement.
In discussing family business in East Asia, the
emphasis will be on ultimate control and de facto
control rights more than on formal ownership. In their
studies of corporate control in Hong Kong, China,
Indonesia, Korea, Malaysia and Thailand, Claessens,
Djankov, Fan and Lang (1998, 1999b) and Claessens,
Djankov and Lang (1998, 1999) have pointed out two
important features of industrial organization in East
Asia. These are:
a) Families have control over the majority of
corporations.
b) Such control is also magnified ―… through
the use of pyramid structures, crossholdings and
deviations from one-share-one-vote rules‖ (Claessens,
Djankov, Fan and Lang, 1999b, p. 3).
In addition to Berglofs original criteria for
comparing the BLS and EMS, Khan (1999)
introduced two additional features related specifically
to corporate governance of family businesses. The
first is monitoring of non-financial enterprises by the
system, i.e., how the managers of corporations are
monitored by outside financiers such as banks on the
one hand, and equity markets or shareholders, on the
other. This type of governance is intimately associated
with how corporations are financed, i.e., corporate
finance. Such monitoring by the firms‘ financiers is
clearly an important function of the financial system.
The monitoring of non-financial enterprises by the
financiers has special relevance because a priori it is
not clear if the financial distress of family-based firms
is always signalled accurately to the outside financiers.
Secondly and more generally, the issue of
self-monitoring needs to be addressed.
Self-monitoring is important because without some
degree of self-monitoring FBS cannot function
adequately.
Both BLS and EMS are closely associated with
the dominant modes of corporate finance by banks
and equity markets, respectively. In the case of FBS in
East Asia, the financing can come from three different
sources. First, under FBS in the initial phases of
growth of family businesses, firms could be financed
internally. Second, as the enterprise grows over time,
the role of banks becomes more prominent. Third, at
some point in time equity markets may become an
even more significant source of corporate finance.
However, the key difference between FBS as a
governance system and BLS and EMS lies in the fact
that neither the banks nor the equity markets
ultimately control or oversee the family business
groups. That control resides with the family (or
families) in the final analysis. This is because of
various mechanisms of control such as control
through subsidiaries that are at the disposal of the
family groups, as will be discussed in the next
sections.
4. Issues and Problems of Corporate Governance in Family-Based System
In general, discussions on corporate governance relate
issues to 5 major areas: rights and responsibilities of
shareholders, role of shareholders, equitable treatment
of shareholders, disclosure and transparency and
duties and responsibilities of the board. Other issues
include internal controls and independence of the
company‘s auditors, oversight and management risk,
oversight of the preparation of the company‘s
financial statement, review of the compensation
arrangements for CEO and other senior executives,
the resources made available to directors in carrying
out their duties, the way in which individuals are
nominated for positions on the board and dividend
policy Jaffer & Sohail (2007)
There are some specific problems in corporate
governance in relation to family-based business.
These are:
4.1. Lack of Separation of Ownership and Control
In Malaysia, the Listing Requirements are modeled
after the Anglo Saxon model more particularly the
UK Codes comprising of the Cadbury, Greenbury and
Hampel Report (Kang, 2001). Besides, the Malaysia
Code of Corporate Governance (MCCG) is also
modeled from these reports. In relation to the MCCG,
the code requires the separation of ownership and
control.
The code suggests that the separation of
ownership and control in order to stay objective when
making strategic policy decision (Robert, 2002). The
separation of two roles is to ensure effective check
and balance over the management performance
(Haniffa and Cooke, 2002). If the owner also becomes
the manager and chairman, he will be unlikely to
monitor the activities of the management in an
independent and objective matter (Lai, 2007). This is
due to the fact that the Chairman of the board is also
responsible for the selection of new board members,
monitoring the performance of the executive directors
and settling any conflicts which arise within the board
(Laing and Weir, 1999). Therefore, the separation is to
prevent the owner to make any decision for his own
benefit or own-self-interest at the expense of
shareholders and to avoid concentration of power.
However, this separation of ownership and
control can hardly be seen in Malaysia‘s
family-owned companies. We can see many FBS
companies are owned and managed by the founder or
their generations such as Genting Berhad, YTL
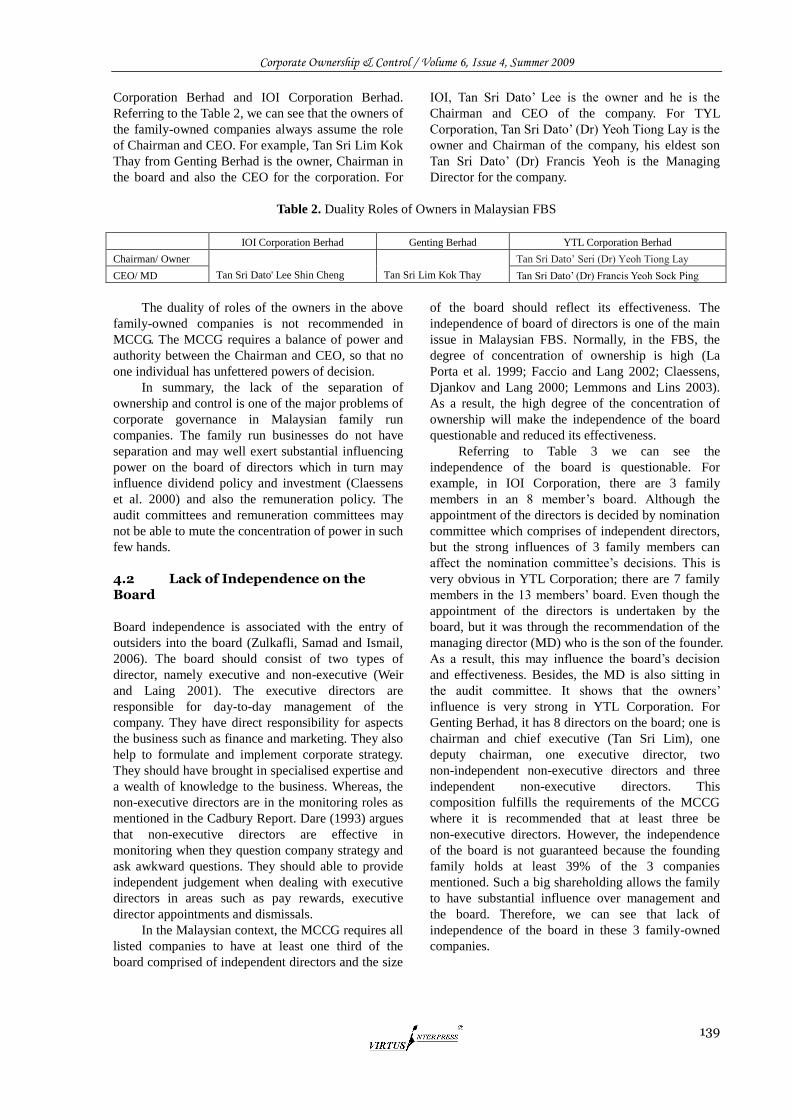
Corporate Ownership & Control / Volume 6, Issue 4, Summer 2009
139
Corporation Berhad and IOI Corporation Berhad.
Referring to the Table 2, we can see that the owners of
the family-owned companies always assume the role
of Chairman and CEO. For example, Tan Sri Lim Kok
Thay from Genting Berhad is the owner, Chairman in
the board and also the CEO for the corporation. For
IOI, Tan Sri Dato‘ Lee is the owner and he is the
Chairman and CEO of the company. For TYL
Corporation, Tan Sri Dato‘ (Dr) Yeoh Tiong Lay is the
owner and Chairman of the company, his eldest son
Tan Sri Dato‘ (Dr) Francis Yeoh is the Managing
Director for the company.
Table 2. Duality Roles of Owners in Malaysian FBS
IOI Corporation Berhad Genting Berhad YTL Corporation Berhad
Chairman/ Owner
Tan Sri Dato' Lee Shin Cheng
Tan Sri Lim Kok Thay
Tan Sri Dato‘ Seri (Dr) Yeoh Tiong Lay
CEO/ MD Tan Sri Dato‘ (Dr) Francis Yeoh Sock Ping
The duality of roles of the owners in the above
family-owned companies is not recommended in
MCCG. The MCCG requires a balance of power and
authority between the Chairman and CEO, so that no
one individual has unfettered powers of decision.
In summary, the lack of the separation of
ownership and control is one of the major problems of
corporate governance in Malaysian family run
companies. The family run businesses do not have
separation and may well exert substantial influencing
power on the board of directors which in turn may
influence dividend policy and investment (Claessens
et al. 2000) and also the remuneration policy. The
audit committees and remuneration committees may
not be able to mute the concentration of power in such
few hands.
4.2 Lack of Independence on the Board
Board independence is associated with the entry of
outsiders into the board (Zulkafli, Samad and Ismail,
2006). The board should consist of two types of
director, namely executive and non-executive (Weir
and Laing 2001). The executive directors are
responsible for day-to-day management of the
company. They have direct responsibility for aspects
the business such as finance and marketing. They also
help to formulate and implement corporate strategy.
They should have brought in specialised expertise and
a wealth of knowledge to the business. Whereas, the
non-executive directors are in the monitoring roles as
mentioned in the Cadbury Report. Dare (1993) argues
that non-executive directors are effective in
monitoring when they question company strategy and
ask awkward questions. They should able to provide
independent judgement when dealing with executive
directors in areas such as pay rewards, executive
director appointments and dismissals.
In the Malaysian context, the MCCG requires all
listed companies to have at least one third of the
board comprised of independent directors and the size
of the board should reflect its effectiveness. The
independence of board of directors is one of the main
issue in Malaysian FBS. Normally, in the FBS, the
degree of concentration of ownership is high (La
Porta et al. 1999; Faccio and Lang 2002; Claessens,
Djankov and Lang 2000; Lemmons and Lins 2003).
As a result, the high degree of the concentration of
ownership will make the independence of the board
questionable and reduced its effectiveness.
Referring to Table 3 we can see the
independence of the board is questionable. For
example, in IOI Corporation, there are 3 family
members in an 8 member‘s board. Although the
appointment of the directors is decided by nomination
committee which comprises of independent directors,
but the strong influences of 3 family members can
affect the nomination committee‘s decisions. This is
very obvious in YTL Corporation; there are 7 family
members in the 13 members‘ board. Even though the
appointment of the directors is undertaken by the
board, but it was through the recommendation of the
managing director (MD) who is the son of the founder.
As a result, this may influence the board‘s decision
and effectiveness. Besides, the MD is also sitting in
the audit committee. It shows that the owners‘
influence is very strong in YTL Corporation. For
Genting Berhad, it has 8 directors on the board; one is
chairman and chief executive (Tan Sri Lim), one
deputy chairman, one executive director, two
non-independent non-executive directors and three
independent non-executive directors. This
composition fulfills the requirements of the MCCG
where it is recommended that at least three be
non-executive directors. However, the independence
of the board is not guaranteed because the founding
family holds at least 39% of the 3 companies
mentioned. Such a big shareholding allows the family
to have substantial influence over management and
the board. Therefore, we can see that lack of
independence of the board in these 3 family-owned
companies.
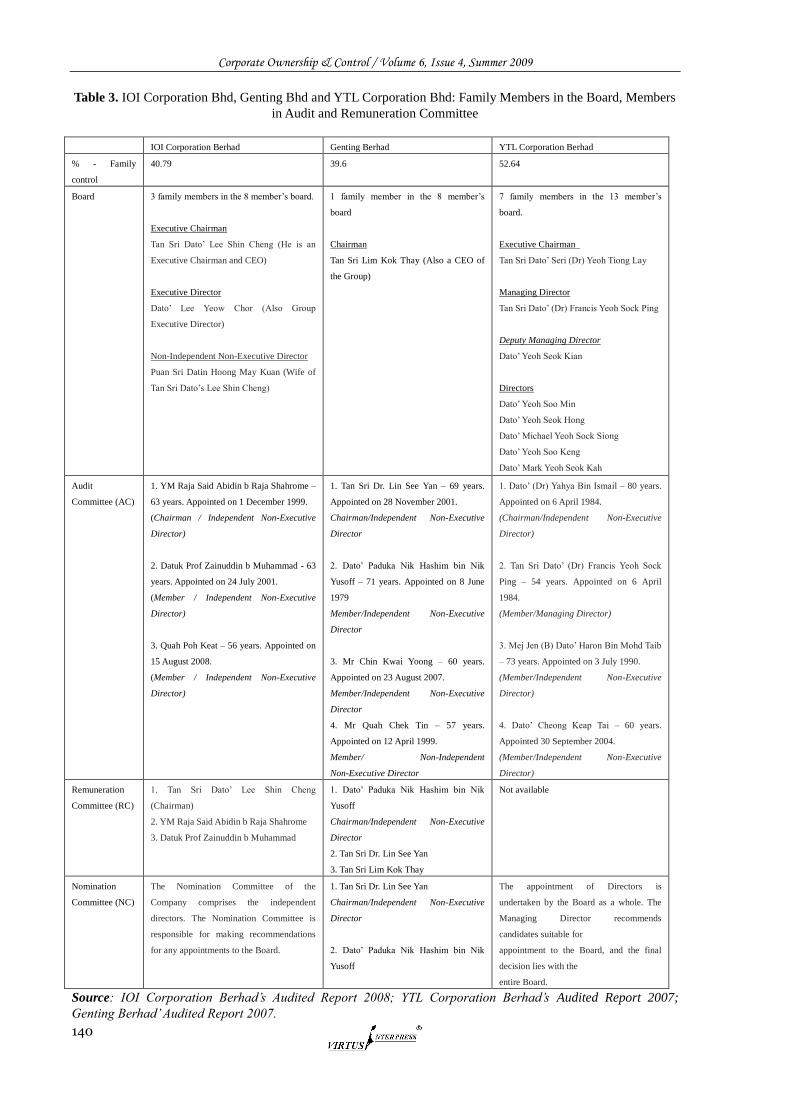
Corporate Ownership & Control / Volume 6, Issue 4, Summer 2009
140
Table 3. IOI Corporation Bhd, Genting Bhd and YTL Corporation Bhd: Family Members in the Board, Members
in Audit and Remuneration Committee
IOI Corporation Berhad Genting Berhad YTL Corporation Berhad
% - Family
control
40.79 39.6 52.64
Board 3 family members in the 8 member‘s board.
Executive Chairman
Tan Sri Dato‘ Lee Shin Cheng (He is an
Executive Chairman and CEO)
Executive Director
Dato‘ Lee Yeow Chor (Also Group
Executive Director)
Non-Independent Non-Executive Director
Puan Sri Datin Hoong May Kuan (Wife of
Tan Sri Dato‘s Lee Shin Cheng)
1 family member in the 8 member‘s
board
Chairman
Tan Sri Lim Kok Thay (Also a CEO of
the Group)
7 family members in the 13 member‘s
board.
Executive Chairman
Tan Sri Dato‘ Seri (Dr) Yeoh Tiong Lay
Managing Director
Tan Sri Dato‘ (Dr) Francis Yeoh Sock Ping
Deputy Managing Director
Dato‘ Yeoh Seok Kian
Directors
Dato‘ Yeoh Soo Min
Dato‘ Yeoh Seok Hong
Dato‘ Michael Yeoh Sock Siong
Dato‘ Yeoh Soo Keng
Dato‘ Mark Yeoh Seok Kah
Audit
Committee (AC)
1. YM Raja Said Abidin b Raja Shahrome –
63 years. Appointed on 1 December 1999.
(Chairman / Independent Non-Executive
Director)
2. Datuk Prof Zainuddin b Muhammad - 63
years. Appointed on 24 July 2001.
(Member / Independent Non-Executive
Director)
3. Quah Poh Keat – 56 years. Appointed on
15 August 2008.
(Member / Independent Non-Executive
Director)
1. Tan Sri Dr. Lin See Yan – 69 years.
Appointed on 28 November 2001.
Chairman/Independent Non-Executive
Director
2. Dato‘ Paduka Nik Hashim bin Nik
Yusoff – 71 years. Appointed on 8 June
1979
Member/Independent Non-Executive
Director
3. Mr Chin Kwai Yoong – 60 years.
Appointed on 23 August 2007.
Member/Independent Non-Executive
Director
4. Mr Quah Chek Tin – 57 years.
Appointed on 12 April 1999.
Member/ Non-Independent
Non-Executive Director
1. Dato‘ (Dr) Yahya Bin Ismail – 80 years.
Appointed on 6 April 1984.
(Chairman/Independent Non-Executive
Director)
2. Tan Sri Dato‘ (Dr) Francis Yeoh Sock
Ping – 54 years. Appointed on 6 April
1984.
(Member/Managing Director)
3. Mej Jen (B) Dato‘ Haron Bin Mohd Taib
– 73 years. Appointed on 3 July 1990.
(Member/Independent Non-Executive
Director)
4. Dato‘ Cheong Keap Tai – 60 years.
Appointed 30 September 2004.
(Member/Independent Non-Executive
Director)
Remuneration
Committee (RC)
1. Tan Sri Dato‘ Lee Shin Cheng
(Chairman)
2. YM Raja Said Abidin b Raja Shahrome
3. Datuk Prof Zainuddin b Muhammad
1. Dato‘ Paduka Nik Hashim bin Nik
Yusoff
Chairman/Independent Non-Executive
Director
2. Tan Sri Dr. Lin See Yan
3. Tan Sri Lim Kok Thay
Not available
Nomination
Committee (NC)
The Nomination Committee of the
Company comprises the independent
directors. The Nomination Committee is
responsible for making recommendations
for any appointments to the Board.
1. Tan Sri Dr. Lin See Yan
Chairman/Independent Non-Executive
Director
2. Dato‘ Paduka Nik Hashim bin Nik
Yusoff
The appointment of Directors is
undertaken by the Board as a whole. The
Managing Director recommends
candidates suitable for
appointment to the Board, and the final
decision lies with the
entire Board.
Source: IOI Corporation Berhad‟s Audited Report 2008; YTL Corporation Berhad‟s Audited Report 2007;
Genting Berhad‟ Audited Report 2007.
Corporate Ownership & Control / Volume 6, Issue 4, Summer 2009
141
In addition, the independence of non-executive
directors is difficult to justify when he or she is
appointed to the board many times and for more than
3 years. According to O‘Sullivan and Wong (1999),
non-executive directors with many years of
experience on the same board may become less
effective monitors as they build up close relationships
with executive director/ owner/dominant shareholders
in FBS. For example, one of the independent
non-executive director has sat on the Genting board
since June 1979. This is similar to YTL Corporation
and IOI Corporation as we look at the members of
audit committee in YTL and IOI in Table 4.2 above.
This close relationship has caused problems for the
independence board of directors in FBS.
4.3 Lack of Protection for Minority Shareholders in Family-Based System
PricewaterhouseCoopers Corporate Governance
Survey of 2002 showed that many public listed
companies have substantial shareholders who act as
directors and are involved in the management as well
(Satkunasingam and Shanmugan, 2006). As a result,
minority shareholders under such conditions have
very little say in the management, ethics and practices
of these types of corporations (Reed, 2002;
Thillainathan, 1999). Under such circumstances, will
the minority shareholders in family-based companies
take action against the errant corporations on their
own?
According to Satkunasingam and Shanmugan
(2006), minority shareholders in Malaysia are at a
greater disadvantage than minority shareholders in
developed countries like Australia because they do not
only have to contend with conflicting interests with
dominant shareholders at times, but they also have to
contend with government interference that at times
prevents even dominant shareholders from exercising
their rights as shareholders; a move which may
indirectly harm minority shareholders who seldom
have the clout to make themselves heard. It is
therefore left to the minority shareholders to represent
their own interests. They are unlikely to do this in
light of the local culture and politics. Even with the
Minority Shareholder Watchdog Group (MSWG), the
minority shareholders‘ interest still can not be
guaranteed in the FBS because the dominant
shareholders or concentration of shareholding can rule
over any minority shareholders‘ decision in the
Annual General Meeting (AGM).
In FBS, although shareholders including
minority shareholders can enjoy one-share-one-vote
rule, with proxy voting legally allowed and practiced.
However, the minority shareholders could not
influence the vote, and there is no real discussion of
board decisions during such meetings. As a result,
many major transactions of the FBS companies such
as amendment of the articles, bonded indebtedness,
sale of major corporate assets, investments in other
companies and mergers managed approved by
two-thirds majority vote of shareholders. In short, all
these created problem of exploitation of minority
shareholders‘ interests in FBS.
4.4 Lack of Independence of External Auditor
In FBS, the appointment and removal of a director is
done according to simple majority vote by
shareholders. Therefore, major shareholders such as
family-owned companies would have a
disproportionate influence over the proceedings (RHB,
2008). The same method applied to appointing
external auditor; therefore, auditor independence
could be weakened due to the influence of dominant
shareholders. Some auditors may even collude with
the management in order to continue providing
services to the company.
4.5 Lack of Transparency and Disclosure: Continuous Disclosure and Related-Party Transactions
In FBS, small investors are often at a great
informational disadvantage compared with controlling
family shareholders. Normally, the information flow
very fast to the family members because of the duality
roles of owners in FBS. It is arguably of greater
importance for family companies to effectively
implement a policy of continuous public disclosure of
relevant operational, financial, and corporate events to
enhance transparency for all shareholders.
Although the FBS companies fulfil the
requirements of Bursa by publicising the Audited
Report annually and continuously providing important
information to Securities of Commission (SC) and
Bursa Malaysia, yet we cannot guarantee there is no
insider trading in FBS companies. This is because the
owners have access to non-public information about
the company.
4.6 Managerial Entrenchment
Due to the strong influence of founding family in the
board, there is high chance that the nomination
committee may not appointing directors out of pure
merit consideration, particularly the position of CEO.
Likewise, this invisible hand may also influence the
selection process of the professionals to run the
various functions of the company‘s operation. This
will deprive the family run companies of efficient
labour market which is enjoyed by non family-run
public listed company (Schulze, et al. 2001). Further
supporting this claim, studies done in Europe
suggested that family-run companies are more
Corporate Ownership & Control / Volume 6, Issue 4, Summer 2009
142
exposed to managerial entrenchment (e.g.
Gomez-Mejia, Nunez-Nickel and Gutierrez, 2001;
Thomsen and Pedersen, 2000). The problem of
managerial entrenchment is due to perception that
family-run companies have natural inclination to
favour applicants related to the founding family, this
perception could subsequently reduce the quality of
applicants for key managerial positions in the
company.
5. The Benefits of the Family-based System
Despite the problems and issues raised above, family
based corporate governance system certainly are still
relevant to the corporate world not just the East Asia,
where families still control sizeable businesses across
the world, but also in the United States where families
control as much as 30 percent of the largest public
firms and participate in management of as much as
one third of these (Kang, 2000). The key strengths of
FBS include reduced agency cost and altruistic
behaviours, efficient leadership structure and business
continuity.
5.1 Reduce Agency Cost and Altruism
There is no current literature exploring the benefit and
strength of family-run companies in terms of agency
cost and altruism in the context of Malaysia.
Fortunately, we can draw on some of the research
carried out in Europe to understand the strength in this
regard. Dalton and Daily (1992) argued that
family-run companies are one of the most efficient
forms of organizations because of the little separation
between control and management decisions. This
alignment between control and management reduce
the agency cost which is typically associated with the
widely held public companies (Berle and Means,
1932). In widely held public companies, the
alignment of control and management requires the
incentive schemes such as performance based salary
or stock options, external monitoring from auditors
and capital financers, as well as close monitoring and
regulations from statuary boards to ensure both
director board and management act in the interest of
the company in both short and long time horizon.
In contrary, family-run companies may benefit
from employment relationships based on altruism and
trust. Altruism refers to decisions that are made for
selfless reasons to benefit others, rather than decisions
made for selfish reasons typically assumed by
classical economics literature (Lunati, 1997). In fact,
researchers in several fields have long recognized the
value of altruism in employment contracts. For
instance, Chami and Fullenkamp (2002) recognized
that developing trust via mutual, reciprocal altruism
can reduce the necessity of increase monitoring and
incentive-based pay. Moreover, this altruistic
behaviour reduces excessive private consumption of
perks and effort aversion of managers at the expense
of the company owner. De Paola and Scoppa (2001)
also suggested that altruism within the family could
lead to superior employment contracts by the
companies. In addition, because of
owner-management alignment in family-run
companies, both parties are naturally patient investors
with a long time horizon (Kang, 2000). A founder
who plans to pass his business to an heir will be more
likely to use firm resources efficiently than a founder
who does not plan on transferring the business to a
family member. Another demonstration of altruistic
behaviour is the synonyms of company with the
family, thus giving the company leader as the
patriarch, the motivation to run the business with the
interest of company in mind (Lai, 2007). Moreover,
Family ties, loyalty, insurance, and stability provide
the necessary incentives for family managements to
make decisions according to market rules (James,
1999).
5.2 Structure of Leadership for Family Based System Corporation
Leadership structure has important impacts on the
nature of decision making process for a company.
Politically correct ―good corporate governance‖ in this
regard, means transparency on decision making
process by encouraging various groups to form the
committees and votes on the decision openly, however
this process may take long time to reach consensus,
and also subjected to the possibility of confidential
information leakage to competitors, this is in contrary
to family based system, which emphasis on trust and
believe important decision should be made privately
for the interest of the company. The founder often
unilaterally makes business decisions, and seeks board
endorsements subsequently (Yueng & Soh, 2000).
This unitary leadership structure becomes important in
maintaining the decision making process to sustain
competitive advantage in the market, because it offers
a clear mandate to a single leader to react faster to
external events (Fan, Lau and Wu, 2002).
Normally founding family members assume
positions of chairman and CEO to preserve the
powers to decide within the corporate structure. This
arrangement is always attacked by EMS‘ s school of
thought followers, however one must not forget that
companies like Enron, World-com, Vivendi and
Deutsche Telecom practised the separate management
and board and yet the scandals could not be avoided
(Sonnenfeld, 2004).
As shown in Table 4.2, typically the Malaysian
family run companies have founding family members
for the position of Chairman and CEO, this is same as
FBS in other countries such as Hong Kong. For
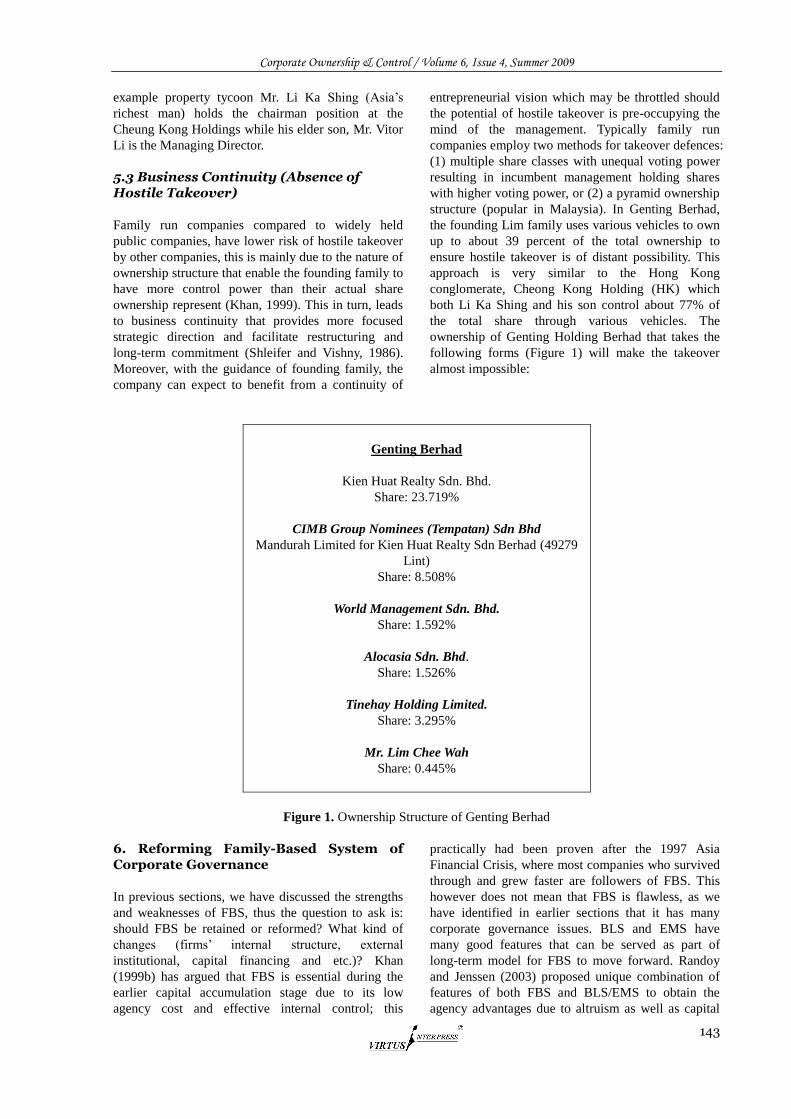
Corporate Ownership & Control / Volume 6, Issue 4, Summer 2009
143
example property tycoon Mr. Li Ka Shing (Asia‘s
richest man) holds the chairman position at the
Cheung Kong Holdings while his elder son, Mr. Vitor
Li is the Managing Director.
5.3 Business Continuity (Absence of Hostile Takeover)
Family run companies compared to widely held
public companies, have lower risk of hostile takeover
by other companies, this is mainly due to the nature of
ownership structure that enable the founding family to
have more control power than their actual share
ownership represent (Khan, 1999). This in turn, leads
to business continuity that provides more focused
strategic direction and facilitate restructuring and
long-term commitment (Shleifer and Vishny, 1986).
Moreover, with the guidance of founding family, the
company can expect to benefit from a continuity of
entrepreneurial vision which may be throttled should
the potential of hostile takeover is pre-occupying the
mind of the management. Typically family run
companies employ two methods for takeover defences:
(1) multiple share classes with unequal voting power
resulting in incumbent management holding shares
with higher voting power, or (2) a pyramid ownership
structure (popular in Malaysia). In Genting Berhad,
the founding Lim family uses various vehicles to own
up to about 39 percent of the total ownership to
ensure hostile takeover is of distant possibility. This
approach is very similar to the Hong Kong
conglomerate, Cheong Kong Holding (HK) which
both Li Ka Shing and his son control about 77% of
the total share through various vehicles. The
ownership of Genting Holding Berhad that takes the
following forms (Figure 1) will make the takeover
almost impossible:
Genting Berhad
Kien Huat Realty Sdn. Bhd.
Share: 23.719%
CIMB Group Nominees (Tempatan) Sdn Bhd
Mandurah Limited for Kien Huat Realty Sdn Berhad (49279
Lint)
Share: 8.508%
World Management Sdn. Bhd.
Share: 1.592%
Alocasia Sdn. Bhd.
Share: 1.526%
Tinehay Holding Limited.
Share: 3.295%
Mr. Lim Chee Wah
Share: 0.445%
Figure 1. Ownership Structure of Genting Berhad
6. Reforming Family-Based System of Corporate Governance
In previous sections, we have discussed the strengths
and weaknesses of FBS, thus the question to ask is:
should FBS be retained or reformed? What kind of
changes (firms‘ internal structure, external
institutional, capital financing and etc.)? Khan
(1999b) has argued that FBS is essential during the
earlier capital accumulation stage due to its low
agency cost and effective internal control; this
practically had been proven after the 1997 Asia
Financial Crisis, where most companies who survived
through and grew faster are followers of FBS. This
however does not mean that FBS is flawless, as we
have identified in earlier sections that it has many
corporate governance issues. BLS and EMS have
many good features that can be served as part of
long-term model for FBS to move forward. Randoy
and Jenssen (2003) proposed unique combination of
features of both FBS and BLS/EMS to obtain the
agency advantages due to altruism as well as capital
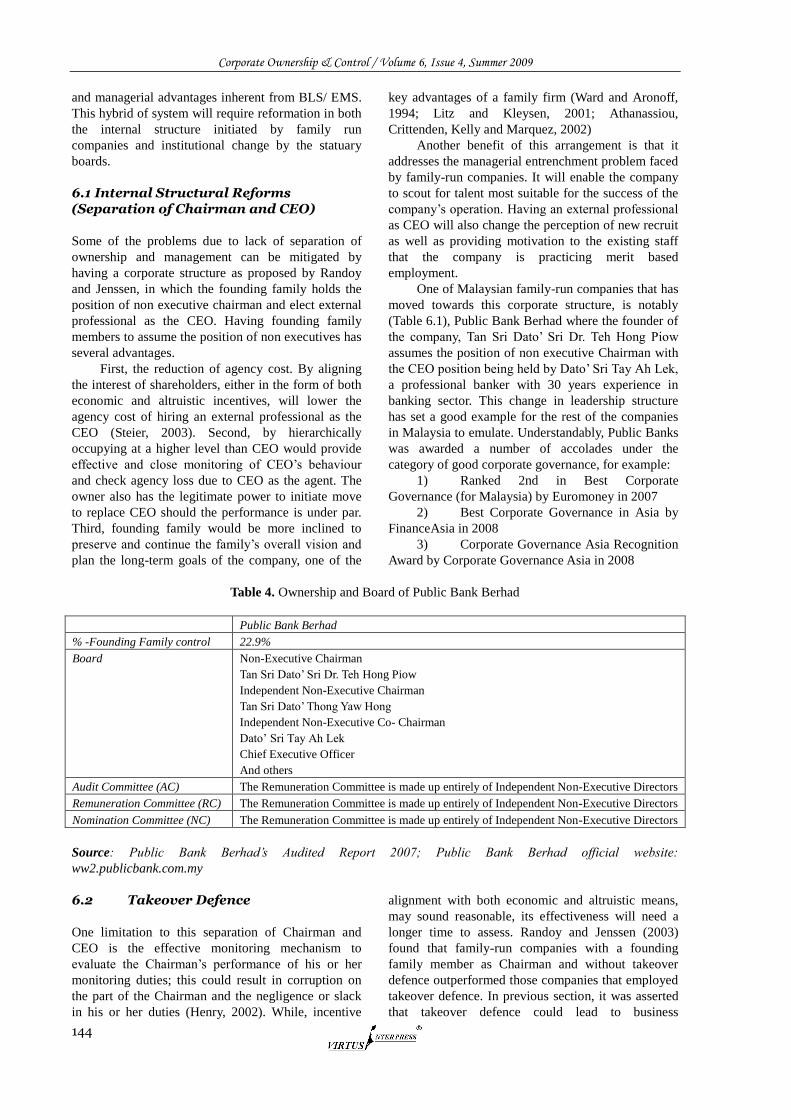
Corporate Ownership & Control / Volume 6, Issue 4, Summer 2009
144
and managerial advantages inherent from BLS/ EMS.
This hybrid of system will require reformation in both
the internal structure initiated by family run
companies and institutional change by the statuary
boards.
6.1 Internal Structural Reforms (Separation of Chairman and CEO)
Some of the problems due to lack of separation of
ownership and management can be mitigated by
having a corporate structure as proposed by Randoy
and Jenssen, in which the founding family holds the
position of non executive chairman and elect external
professional as the CEO. Having founding family
members to assume the position of non executives has
several advantages.
First, the reduction of agency cost. By aligning
the interest of shareholders, either in the form of both
economic and altruistic incentives, will lower the
agency cost of hiring an external professional as the
CEO (Steier, 2003). Second, by hierarchically
occupying at a higher level than CEO would provide
effective and close monitoring of CEO‘s behaviour
and check agency loss due to CEO as the agent. The
owner also has the legitimate power to initiate move
to replace CEO should the performance is under par.
Third, founding family would be more inclined to
preserve and continue the family‘s overall vision and
plan the long-term goals of the company, one of the
key advantages of a family firm (Ward and Aronoff,
1994; Litz and Kleysen, 2001; Athanassiou,
Crittenden, Kelly and Marquez, 2002)
Another benefit of this arrangement is that it
addresses the managerial entrenchment problem faced
by family-run companies. It will enable the company
to scout for talent most suitable for the success of the
company‘s operation. Having an external professional
as CEO will also change the perception of new recruit
as well as providing motivation to the existing staff
that the company is practicing merit based
employment.
One of Malaysian family-run companies that has
moved towards this corporate structure, is notably
(Table 6.1), Public Bank Berhad where the founder of
the company, Tan Sri Dato‘ Sri Dr. Teh Hong Piow
assumes the position of non executive Chairman with
the CEO position being held by Dato‘ Sri Tay Ah Lek,
a professional banker with 30 years experience in
banking sector. This change in leadership structure
has set a good example for the rest of the companies
in Malaysia to emulate. Understandably, Public Banks
was awarded a number of accolades under the
category of good corporate governance, for example:
1) Ranked 2nd in Best Corporate
Governance (for Malaysia) by Euromoney in 2007
2) Best Corporate Governance in Asia by
FinanceAsia in 2008
3) Corporate Governance Asia Recognition
Award by Corporate Governance Asia in 2008
Table 4. Ownership and Board of Public Bank Berhad
Source: Public Bank Berhad‟s Audited Report 2007; Public Bank Berhad official website:
ww2.publicbank.com.my
6.2 Takeover Defence
One limitation to this separation of Chairman and
CEO is the effective monitoring mechanism to
evaluate the Chairman‘s performance of his or her
monitoring duties; this could result in corruption on
the part of the Chairman and the negligence or slack
in his or her duties (Henry, 2002). While, incentive
alignment with both economic and altruistic means,
may sound reasonable, its effectiveness will need a
longer time to assess. Randoy and Jenssen (2003)
found that family-run companies with a founding
family member as Chairman and without takeover
defence outperformed those companies that employed
takeover defence. In previous section, it was asserted
that takeover defence could lead to business
Public Bank Berhad
% -Founding Family control 22.9%
Board Non-Executive Chairman
Tan Sri Dato‘ Sri Dr. Teh Hong Piow
Independent Non-Executive Chairman
Tan Sri Dato‘ Thong Yaw Hong
Independent Non-Executive Co- Chairman
Dato‘ Sri Tay Ah Lek
Chief Executive Officer
And others
Audit Committee (AC) The Remuneration Committee is made up entirely of Independent Non-Executive Directors
Remuneration Committee (RC) The Remuneration Committee is made up entirely of Independent Non-Executive Directors
Nomination Committee (NC) The Remuneration Committee is made up entirely of Independent Non-Executive Directors
Corporate Ownership & Control / Volume 6, Issue 4, Summer 2009
145
continuity, however the drawback is that, without the
risk of losing control, the comfort zone may breed
errant and unrepentant Chairman, therefore, it must be
a trade off between business continuity for stable
growth and effective check on the performance of the
Chairman. In the case of family-run companies in
Malaysia with high ownership concentration, it will
not be an easy task to have the founding family giving
up some of the controlling power, unless, the state
formulates statuary requirement to increase the
floating share in the capital market for family-run
companies. The reform in this aspect will not happen
in the near future, however, if the founding family
recognizes the benefit of trade off between ownership
control and efficient external capital financing, the
FBS will be more robust and transparent, thus being
able to provide an alternative system to EMS / BLS.
6.3 Institutional Reform for FBS
In principle, EMS is by far the more efficient system
of corporate governance compared to FBS. Whilst we
cannot ignore the current recession due to the fall of
financial institutions in EMS-based corporations such
as Merrill Lynch, Bear Stearns and Lehman Brothers
in the US, as well as Northern Rock and Bradford &
Bingley in the UK; in terms of corporate governance,
the EMS system still shows reasonable accountability
and transparency compared to that of the FBS. Taking
Hong Kong as example, they had recovered a lot
faster than other East Asia countries‘ FBS-based
companies such as Thailand, Indonesia, and South
Korea. The significant difference is that Hong Kong
has comparably stronger banks and equity markets
unlike Malaysia where the government opts to
intervene in the market.
Khan (1999b) has suggested a few ways of
reforming FBS in Malaysia, by taking into account
Malaysia‘s social and political environment:
a. Financial firm’s managerial expertise
Recruitment and training competent professionals so
that financial institutions can understand and monitor
the firms they finance efficiently and effectively.
b. Role of competition and contestability of the
market structure
The elimination of inefficient firms and encouraging
the entry of new firms through competition will
improve corporate governance and firm performance.
Shareholder activism is another important aspect
of corporate governance to protect the rights of
minority shareholders. As a result, Minority
Shareholder Watchdog Group (MSWG) was
established in 2000 to provide assistance to minority
shareholders and to act as a watchdog over companies.
The group‘s five founding shareholders were PNB,
the Employees Provident Fund, Lembaga Tabung
Angkatan Tentera (LTAT), Lembaga Tabung Haji
(LTH) and Pertubuhan Keselamatan Sosial
(PERKESO) which are government investment
agencies. This is certainly the correct path for
promoting greater transparency when these
shareholders take ownership of the family-run
companies, however this is merely first step towards
shareholders activism, these founding shareholders
must take more proactive approach by demanding
participation in the board activities or minimum,
constantly applying pressure to the board when there
is sign of exploitation on the rights of minority
shareholders
7. Conclusion
Family-run businesses, especially the public listed
companies in Malaysia and East Asia have their own
set of corporate governance compared to western
based or Japan based systems. While, the western
based system, particularly the Anglo Saxon model has
gained traction in many Asian countries, which
prompted the governments to impose some corporate
governance practices into local companies, this
enforcement has resulted the divergence of corporate
governance practices and policies among the Asian
companies. Nonetheless, many family-run companies
in Hong Kong, Korea, Taiwan, Thailand, Malaysia
and others still uphold few key elements of their
corporate governance characteristics. We have
examined many of the issues and problems of
family-run companies in the perspective of prevailing
EMS, it is no surprise that the separation of
owner/management, lack of transparency and an
independent board, exploitation of minority
shareholders‘ rights are the major problems of the
FBS. Family-run companies encompass different
management values than those of the equity based
company.
The biggest advantage of FBS would be the
altruistic behaviours that naturally align the interest of
the board and management, thus ensuring internal
control is effective and less costly. Yet, we think that
internal control is insufficient to ensure good
corporate governance as a whole. From past studies, it
is evident that institutional reforms such as the
financier‘s monitoring as well as minority
shareholders activism could provide extra monitoring
of the family run companies. This multi pronged
approach could be the best mean to ensure effective
corporate governance for family run companies.
The altruistic behaviours in relation to corporate
governance have not been verified in the Malaysian
context empirically, thus it will be a valuable insight
in this regard by future studies of these behaviours.
References
1. Anderson, R. C., & Reeb, D. M. (2003). Founding
family ownership and firm performance: Evidence
Corporate Ownership & Control / Volume 6, Issue 4, Summer 2009
146
from the S&P 500. Journal of Finance, Vol. 58 No. 3,
pp. 1301-1329.
2. Athanassiou, N., Crittenden, W. F., Kelly, L. M.,
Marquez, P. (2002), ―Founder centrality effects on the
Mexican family firm‘s top management group: Firm
culture, strategic vision and goals, and firm
performance‖, Journal of World Business, Vol. 37 No.
2, pp. 139-150.
3. Begley, T. M., & Tan, W. (2001), ―The socio-cultural
environment for entrepreneurship: A comparison
between East Asian and Anglo-Saxon countries‖,
Journal of International Business Studies, Vol. 3, pp.
537-553.
4. Berle, A. and Means, C. (1932), The modern
corporation and private property, New York:
MacMillian.
5. Burkart, M., Panunzi, F., & Shleifer, A. (2003),
―Family Firms‖, Journal of Finance, Vol. 58 No. 5, pp.
2167-2201.
6. Chami, R., and Fullenkamp, C. (2002), ―Trust and
efficiency‖, Journal of Banking and Finance, Vol. 26,
pp. 1785-1810.
7. Claessens, S., Djankov, S., Fan, J. P. H., & Lang, L. H.
P. (2002), ―Disentangling the incentive and
entrenchment effects of large shareholdings‖, Journal
of Finance, Vol. 57, pp. 2741-2771.
8. Claessens, Stijn, Simeon Djankov, Simeon and Lang,
Larry H.P. (2000), ―The separation of ownership and
control in East Asian Corporations‖, Journal of
Financial Economics Vol. 58, pp. 81-112.
9. Claessens, Stijn, Simeon Djankov, Simeon and Lang,
Larry H.P. (1999), Who Controls East Asian
Corporations: and the Implications for Legal Reform,
Public Policy for Private Sector, World Bank
10. Dalton, D.R. and Daily, C.M. (1992), ―Financial
performance of founder-managed versus
professionally managed corporations‖, Journal of
Small Business Economics, Vol. 30, pp. 25-34.
11. Dare, P. (1998), ―Corporate Governance – an investors
perspective‖, The Treasurer, September, pp. 26-29.
12. De Paola, M., and Scoppa, V. (2001), ―The role of
family ties in the labour market: An interpretation
based on efficiency wage theory‖, Review of Labour
Economics and Industrial Relations, Vol. 15,
pp.603-624.
13. Eisenhardt, K.M. (1989), ―Agency theory: An
assessment and review‖, Academy of Management
Review, Vol. 14, pp. 57-74.
14. Faccio, M. and Lang, L. H. P. (2002), ―The Ultimate
Ownership of Western European corporations‖,
Journal of Financial Economics, Vol. 65, pp. 365-395.
15. Fama E. and Jensen, M. (1983), ―Separation of
ownership and control‖ Journal of Law and
Economics, Vol. 26, pp.301-25.
16. Fan, DKK, Lau, CM & Wu, S 2002, ‗Corporate
Governance Mechanisms‘, The Chinese University of
Hong Kong Discussion Paper, pp. 211-240.
17. Gatfield, T., & Youseff, M. (2001), ―A critical
examination of and reflection on the Chinese family
business unit and the Chinese business clan‖, Family
Business Review, Vol. 14 No. 2, pp. 153-158.
18. Genting Annual Report 2007.
19. Gomez-Mejia, L.R, Nunez-Nickel, M., and Gutierrez,
I (2001), ―The role of family ties in agency contracts‖,
Academy of Management Journal, Vol. 44, pp. 81-95
20. Hendry, J. (2002), ―The principal‘s other problems:
Honest incompetence and the specification of
objectives‖, Academy of Management Review, Vol. 27,
pp. 98-113.
21. Hugh, M. (1986), ―Entrepreneurship and economic
growth in Taiwan‖, Business Forum, Vol. 11 No. 4, pp.
35-39.
22. James, H. S. (1999), ―Owner as manager, extended
horizons and the family firm‖, International Journal
of the Economics of Business, Vol. 6, pp. 41-56.
23. Jensen, M.C. and Meckling, W. (1976), ―Theory of
the firm: Managerial behavior, agency costs and
ownership structure‖, Journal of Financial Economics,
Vol. 3, pp. 5-60.
24. Khan, H.A. (1999). Corporate Governance of Family
Business in Asia: What‘s Right and What‘s Wrong?
ADBI Working Paper No.3.
25. Khan, H.A. (1999). Corporate Governance of Family
Business in Asia: Which Road To Take? ADBI
Working Paper No.3
26. La Porta, R., F. Lopez-De-Silanes, and A. Shleifer
(1999), ‗Corporate Ownership around the World‘,
Journal of Finance, Vol. LIV, pp. 471-517.
27. Lai, Dominic Yew Hock (2007), "Leadership and
ethnicity in public companies in Malaysia", Journal of
Business Systems, Governance and Ethics, Vol. 2 No.
2
28. Laing, David and Weir, Charles M (1999),
―Governance structures, size and corporate
performance in UK firms‖, Management Decision,
Vol. 37 No. 5, pp.457-464.
29. Lee, J., & Chan, J. (1998), ―Chinese entrepreneurship:
A study in Singapore‖, The Journal of Management
Development, Vol. 17 No. 2, pp. 131-141.
30. Lemmons, M.L and K.V. Lins (2003), ‗Ownership
Structure, Corporate Governance, and firm Value:
Evidence from the East Asian Financial Crisis‘,
Journal of Finance, Vol. 58, pp.1445-1468.
31. Litz, R. A., and Kleysen, R. F. (2001), ―Your old men
shall dream dreams, your young men shall see visions:
Toward a theory of family firm innovation with help
from the Brubeck family‖, Family Business Review,
Vol. 14 No. 4, pp.335-351.
32. Low, C. K. 2003, A road map for Corporate
Governance in East Asia, The Chinese University of
Hong Kong
33. Lunati, M. T. (1997), Ethical Issues in Economics:
From Altruism to Cooperation to Equity, London,
MacMillan Press.
34. Jaffer, Mahomed J. and Sohail, Syed Bulent (2007),
Corporate Governance Issues in Family-Owned
Corporate Ownership & Control / Volume 6, Issue 4, Summer 2009
147
Enterprises, Economy Reform, U.S.
35. Kang. D. (2000), ―The impact of activist institutional
investors on performance in public corporations: A
study of the U.S. Fortune 500, 1982-1994‖, Academy
of Management Best Paper Proceedings, Toronto.
36. O‘Sullivan, N. and Wong, P. (1999), ―Board
composition, ownership structure and hostile
take-overs; some UK evidence‖, Accounting and
Business Research, Vol. 29, pp. 139-155.
37. Pistrui, D., Huang, W., Oksoy, D., Jing, Z., & Welsch,
H. (2001), ―Entrepreneurship in China: Characteristics,
attributes, and family forces shaping the emerging
private sector‖, Family Business Review Vol. 14 No. 2,
pp. 141-152.
38. Randoy and Jenssen (2003), Family Firms and Good
Corporate Governance: Altruism and Agency
Considerations, Agder University College, Norway
39. Reed, D. (2002), ―Corporate Governance Reforms in
Developing Countries‖, Journal of Business Ethics,
Vol. 37 No.3, pp. 223 -248.
40. RHB, Research (2008), ―Corporate governance
analysis in Malaysia‖, The Edgedaily. Available at
http://www.theedgedaily.com/cms/content.jsp?id=co
m.tms.cms.article.Article_d7f99de4-cb73c03a-c8c7d6
00-e2f24a60
41. Satkunasingam, Elsa and Bala Shanmugam, Bala
(2006), ―The Consequences of Culture on Shareholder
Activism in Malaysia‖, Journal of Applied
Management and Accounting Research, Vol. 4 · No. 1.
42. Schulze, W.S, M.H.Lubatkin, R.N.Dino, A.K.
Buchholtz (2001), ―Agency Relationships in Family
Firms‖, Organization Science Vol. 12, pp.99-116.
43. Shleifer, A., and Vishny, R.W. (1986), ―Large
shareholders and corporate control‖, Journal of
Political Economy, Vol. 94, pp. 461-488.
44. Sonnenfeld, J. (2004), ―Good governance and the
misleading myths of bad metrics‖, Academy of
Management Executive, Vol. 18, No. 1, pp. 108-113.
45. Steier, L. (2003), ―Variants of agency contracts in
family-financed ventures as a continuum of familial
altruistic and market rationalities‖, Journal of
Business Venturing Vol. 18 No. 5, pp. 597- 618.
46. Tan, W., and Fock, S. T. (2001). Coping with growth
transitions: The case of Chinese family businesses in
Singapore. Family Business Review. 14(2), 123-140.
47. Thillainathan, R. (1999), ―Corporate governance and
restructuring in Malaysia; A review of markets,
mechanisms, agents and the legal infrastructure‖,
World Bank/OECD Survey of Corporate Governance
paper.
48. Thomsen, S. and Pedersen, T. (2000), ―Ownership
structure and economic performance in the largest
European companies‖, Strategic Management Journal,
Vol. 21, pp. 689-705.
49. Ward, J. L., and Aronoff, C. E. (1994), ―How family
affects strategy‖, Small Business Forum, Vol. 12 No. 2,
pp. 85-90.
50. Weir, Charlie and Laing, David (2001), ―Governance
structures, director independence and corporate
performance in UK‖, European Business review, Vol.
13 No. 2.
51. Yen, G. F. (1994), ―A study on the problems of
organizational growth of family business in Taiwan:
Socio-cultural aspect and the phenomena of
autonomous obstruction to size‖, Sun Yat-Sen
Management Review, Vol. 2 No. 4, pp. 55-68.
52. Yen, G. F. (1996), ―A research on cultural-structural
relationship of Taiwan family enterprises: the
dual-system model and some related managerial
problems‖, Chung Yuan Journal, Vol. 24 No. 4, pp.
1-9.
53. Yeung, H. W. C. and Soh, T. M. (2000), ―Corporate
Governance and the Global Reach of Chinese Family
Companies in Singapore‖ in Conference on „Corporate
Governance and Restructuring in East Asia‟, South
Korea, pp. 1-42.
54. Zapalska, A. M., and Edwards, W. (2001), ―Chinese
entrepreneurship in a cultural and economic
perspective‖, Journal of Small Business Management,
Vol. 39 No. 3, pp. 286-292.
55. Zulkafli, Abdul Hadi, Samad, M. Fazilah and Ismail,
Md Ishak (2006), ―Corporate Governance in
Malaysia‖, 2006, in The Malaysian Financial System
– An Overview, edited by M. Fazilah Abdul Samad,
University of Malaya Press, ISBN 983-100-371-3.
Corporate Ownership & Control / Volume 6, Issue 4, Summer 2009
148
CORPORATE GOVERNANCE COMPLIANCE VERSUS SYARIA’ COMPLIANCE AND ITS LINK TO FIRM’S PERFORMANCE IN
MALAYSIA
Noriza Mohd Saad*
Abstract
The purpose of this study is to investigate level of compliance by corporate governance (CG) code of best practices and sharia’ principles among public listed companies in main board of Bursa Malaysia and to provide insights view in determining significance association between the corporate governance and sharia’ compliance with firm’s performance. Corporate governance compliance was measured by three board of directors (henceforth; BOD) facets; (i) director’s remuneration, (ii) directors training and (iii) number of family members. Meanwhile, syaria’ compliance is based on six proxies, (i) riba, (ii) gambling, (iii) sale of non halal product, (iv) conventional insurance, (v) entertainment and (vi) stockbroking. The data are gathered from the analysis of companies’ annual report and Thompson DataStream for a sample of 147 companies (for corporate governance compliance) and 36 companies (for syaria’ compliance) over the period of 2003 to 2007. The study employs multiple regression analyses, independent sample T-test and Pearson correlation on the hypotheses tested. The preliminary results reveal most of the company has complied well with the code of best practices and syaria’ principles and there is a significant association to the firm’s performance besides syaria’ compliance firms show a better performance compared to corporate governance compliance firms. Keywords: Corporate Governance, Syariah, Compliance, Firm’s Performance, Board of Directors’ Facets
*Universiti Tenaga Nasional, Kampus Sultan Haji Ahmad Shah, Pahang, Malaysia, [email protected]
1. Introduction
Corporate governance is important for several reasons.
First, corporate governance is most often viewed as
both the structure and the relationships which
determine corporate direction and performance.
Second, the board of directors is typically central to
corporate governance. Its relationship to the other
primary participants, typically shareholders and
management, is critical. Additional participants
include employees, customers, suppliers, and
creditors. The corporate governance framework also
depends on the legal, regulatory, institutional and
ethical environment of the community. Whereas the
20th century might be viewed as the age of
management, the early 21st century is predicted to be
more focused on governance. Both terms address
control of corporations but governance has always
required an examination of underlying purpose and
legitimacy.
The evidence on the empirical failure of the
Enron and others mentioned has brought attention to
the duties and responsibility played by the board of
directors (BOD) in the company. It failure also
produced discussion of further regulations that will, it
is hoped, can prevent another company collapse that
similar to the Enron. For that reason, after detailed
study and recommendation by the high level finance
committee which was formed in 1998, Malaysian
Code of Corporate Governance was introduce in
March 2000 with the objectives of improving the
corporate governance practice by the corporate sectors.
In this code of best practice, it was highlight that the
company was highly recommended to comply with
the code such as the company should disclose the
number of board meeting during the financial year in
the annual report to make sure the interest of the
company and the goal can be achieved. The company
also should have a detail of level remuneration
received per directors, have a clear job description on
BOD in order to avoid management conflict
especially those who have family members among
company‘s director. Besides, also disclose in
companies‘ annual report on the training attended by
BOD for Mandatory Accreditation Program (MAP) as
highlighted in the MCCG code of best practices.
A Compliant to syaria‘ principle is different with
corporate governance where it does not have a code of
best practices to follow. However, the Syariah
Advisory Council (SAC) has applied a standard
criterion in focusing on the activities of the companies
listed on Bursa Malaysia. As such, subject to certain
Corporate Ownership & Control / Volume 6, Issue 4, Summer 2009
149
conditions, companies whose activities are not
contrary to the Sharia‘ principles will be classified as
Sharia‘-compliant securities. On the other hand,
companies will be classified as Sharia‘ non-compliant
securities if they are involved in the following core
activities such as financial services based on riba
(interest), gambling and gaming, manufacture or sale
of non-halal products or related products,
conventional insurance, entertainment activities that
are non-permissible according to Sharia‘, manufacture
or sale of tobacco-based products or related products
and stockbroking or share trading in Sharia‘
non-compliant securities and other activities deemed
non-permissible according to Sharia‘.
In this new era, most of the investors are
demanding nearly perfect information to analyze the
companies‘ performance to make sure their
investment can generate income and increase their
satisfaction in the business market. Measuring
companies‘ performance is importance especially to
the management, shareholders, government,
customers, suppliers, and other stakeholders that have
interest to the company directly or indirectly.
Consider to this issue, this study was used three
important financial ratios to measure the companies‘
performance, that is return on assets (ROA), return on
equity (ROE) and operating profit margin (OPM). It
also used to forecast the future success of companies,
while the researcher's main interest is to develop
models exploiting this ratio.
The remainder of the study is structured as
follows. Section 2 review the existing literature on
corporate governance and syaria‘ compliance towards
firm‘s performance. Section 3 describes the data and
methodology. Section 4 presents the findings and
discussion on the results while, section 5 concludes
and recommendations to the company.
2. Literature review
The discussion on Corporate Governance in Malaysia
as well as other East Asian countries should be
initiated from the event of East Asian economies
collapsed in the second half of 1997.The period
placed a greater concern and recognition of Corporate
Governance to the public and private sector in those
countries. The financial crisis was triggered in
Thailand when foreign investors lost their confidence
and started to withdraw capital due to currency
devaluation. The problems transmitted to other
neighboring countries. The most affected countries
included Indonesia, Malaysia, South Korea, and the
Philippines. In Malaysia, attempts to contain further
devaluation caused higher level of interest rate and
credit contraction. This created severe contractions in
output and corporate profitability which was reflected
in massive fall of equity prices. The Kuala Lumpur
Composite Index declined by 72% during the period
from end-June 1997 to end-August 1998. Real estate
markets declined sharply due to high interest rates and
in crisis environment. Banks, which had significant
portion of their loan exposure in the construction and
real estate sector; and stock purchase financing, were
badly affected.
From the economic perspective, corporate
governance is an important element of achieving an
allocative efficiency in which scarce funds are moved
to investment project with the highest returns. In
practice, efficiency is achieved when at given level of
risk, investments project offer the highest return
exceeding its cost of capital. The crisis indicated how
the failure to regulate good governance affected the
mobilization of funds in an effective way. Corporate
finance on the other hand, concerns on the
effectiveness of corporate governance as an assurance
in protecting the invested funds and to generate
returns. As highlighted by Scheifer and Vishny (1997),
corporate governance mechanisms assure investor in
organizations that they will receive adequate returns
in their investments.
Hollis Ashbaugh-Skaife, Daniel W. Collins, and
Ryan LaFond (2006) investigate whether firms with
strong corporate governance benefit from higher
credit ratings relative to firms with weaker
governance. They concluded that weak corporate
governance has been singled out as the leading cause
for recent high-profile cases of corporate fraud. They
provide evidence that, CEOs of firms with
speculative-grade credit ratings are overcompensated
to a greater degree than their counterparts at firms
with investment-grade ratings, thus providing one
explanation for why some firms operate with weak
governance. Allan Chang Aik Leng (2004) analyzes
the impacts of corporate governance practices with
the firm‘s performance. Using return on equity as the
dependent variables, the degree of impact on firm‘s
performance followed a quadratic fashion, with
performance increase with the size of the firm, up to
an optimal size of RM8, 839 million in turnover.
Beyond that size, firm‘s performance declined with
the increasing size. Another definition is corporate
governance is about promoting corporate fairness,
transparency and accountability. It was defined by J.
Wolfensohn, president of the Word bank, as quoted by
an article in Financial Times, June 21, 1999.
As highlighted by Scheifer and Vishny (1997),
corporate governance mechanisms assure investor in
organizations that they will receive adequate returns
in their investments. To relate this with the crisis, it is
concluded that efforts on shareholders protection were
inadequate during the crisis and as such contributed to
the destruction of the value of their investment.
Furthermore, Abdul Hadi bin Zulkafli (2006) defined
from the economic perspective, corporate governance
is an important element of achieving an allocate
efficiency in which scarce funds are moved to
Corporate Ownership & Control / Volume 6, Issue 4, Summer 2009
150
investment project with the highest returns. In
practice, efficiency is achieved when at given level of
risk, investments project offer the highest return
exceeding its cost of capital. The crisis indicated how
the failure to regulate good governance affected the
mobilization of funds in an effective way. Corporate
finance on the other hand, concerns on the
effectiveness of corporate governance as an assurance
in protecting the invested funds and to generate
returns.
From the Securities Commission Malaysia Book,
(Nov 2007). List of Shariah-compliant Securities by
the Shariah Advisory Council of the Securities
Commission, pp 15, and paragraph 2 said that, the
SAC also takes into account the level of contribution
of interest income received by the company from
conventional fixed deposits or other interest bearing
financial instruments. In addition, dividends received
from investment in Sharia‘ non-compliant securities
are also considered in the analysis carried out by the
SAC. For companies with activities comprising both
permissible and non-permissible elements, the SAC
considers two additional criteria which is the public
perception or image of the company must be good and
the core activities of the company are important and
considered maslahah (―benefit‖ in general) to the
Muslim ummah (nation) and the country, and the
non-permissible element is very small and involves
matters such as `umum balwa (common plight and
difficult to avoid), `uruf (custom) and the rights of the
non-Muslim community which are accepted by Islam.
The first reasoning holds for Sharia‘ compliance
in that price, competitive and profitability differences
may accrue from adherence to Islamic principles.
However, it is not clear how Sharia‘ compliance may
improve efficiency or create new opportunities
relative to a non-constrained universe. If the universe
for Islamic investment is defined differently, then
there is, in theory, no inefficiency or loss in
opportunities. At the property-investment level, there
is a belief held by some investors that Sharia‘
compliance leads to a poorer portfolio performance,
even though there is no clear consensus view
( Ibrahim, Ong and Parsa, 2006).
3. Research methodology 3.1 Data Sampling
This study utilizes the secondary data , which are
gathered from the analysis of companies‘ annual
report taken from a sample of 147 companies for
corporate governance compliance and 36 companies
for syaria‘ compliance firms listed in the Main Board,
Bursa Malaysia had been randomly selected in year
2003 to 2007. The industry that involved in this
corporate governance analysis is consumer product,
industrial product, trading & service, construction,
plantation, properties and hotels. Data on firm‘s
performance were gathered from Thompson
DataStream and Bloomberg software.
3.2 Variables
For this study, it differentiates the variables into two
parts, which is dependent and independent variables.
The dependent variables for the corporate governance
and sharia‘ compliance consists of return on asset,
return on equity and operating profit margin while the
independent variables for the corporate governance
are board remuneration, board training, and board
family members while for the sharia‘ compliance are
gambling, riba, sale/ manufacture non halal product,
conventional insurance, entertainment activities and
stockbroking transaction that are non permissible
according to sharia‘ principle.
3.3 Methodology
There are three main purposes of this study which is
1) to identify the level of compliance in corporate
governance and syaria‘ practices by using descriptive
statistics, 2) to analyze an association between BOD
facets and syaria‘ principles towards companies‘ ROA,
ROE and OPM by using multiple regression and
Pearson correlation method and 3) to compare the
firm‘s performance between corporate governance
compliance firms and syaria‘ compliance firms by
using independent sample T-test.
Then, the companies‘ ROA, ROE and OPM is
calculated using the following equation;
ii sTotalAsset
ofitNetROA
Pr
i
ii yTotalEquit
ofitNetROE
Pr
i
ii Sales
ofitOperatingOPM
Pr
Where iofitNet Pr = Net profit of the ith
company for each year,
isTotalAsset = Total assets of the ith company for
each year,
iyTotalEquit = Total equity of the ith company for
each year, and
iSales = Sales of the ith company for each year.
Next, the relationship between the BOD facets
and syaria‘ principles to the firm‘s performance will
be estimated using the following regression equations
model:
iiiii FMDTBRROA )()()( 321 (1)
iiiii FMDTBRROE )()()( 321 (2)
iiiii FMDTBROPM )()()( 321 (3)
iiiiiiii SBENTCINHPGBRBROA )()()()()()( 654321
(4)
iiiiiiii SBENTCINHPGBRBROE )()()()()()( 654321
(5)
iiiiiiii SBENTCINHPGBRBOPM )()()()()()( 654321
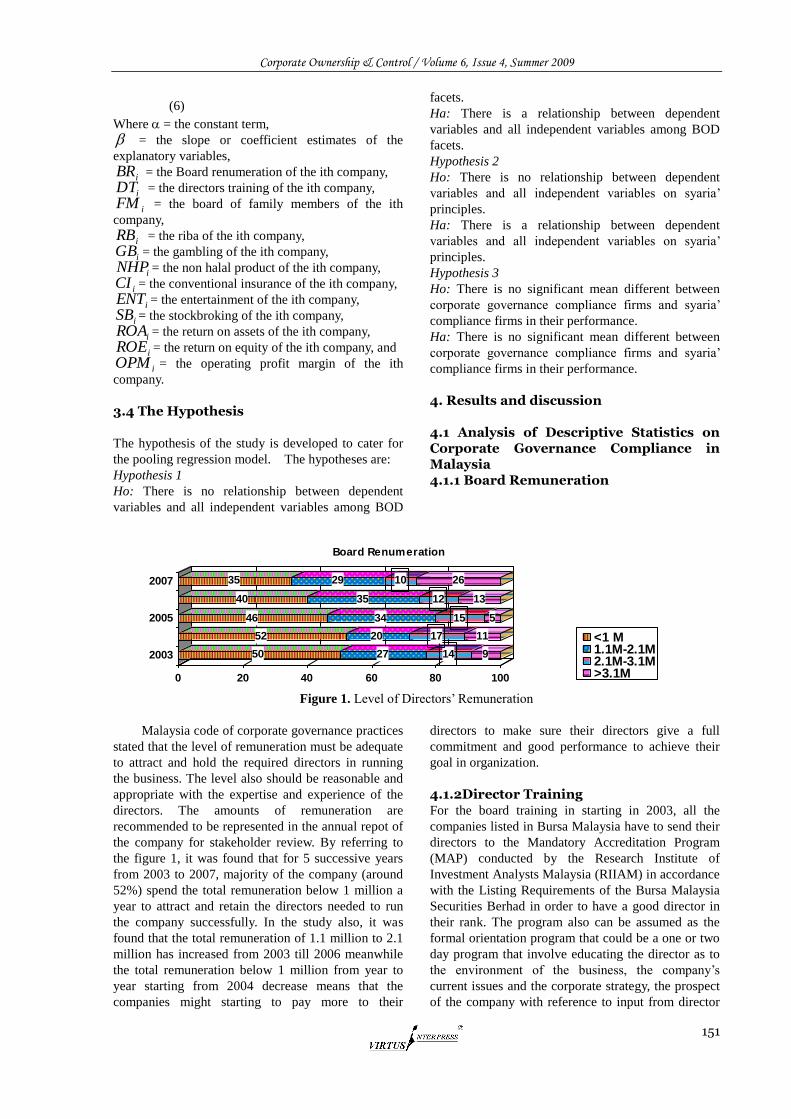
Corporate Ownership & Control / Volume 6, Issue 4, Summer 2009
151
(6)
Where = the constant term,
= the slope or coefficient estimates of the
explanatory variables,
iBR = the Board renumeration of the ith company,
iDT = the directors training of the ith company,
iFM = the board of family members of the ith
company,
iRB = the riba of the ith company,
iGB = the gambling of the ith company,
iNHP = the non halal product of the ith company,
iCI = the conventional insurance of the ith company,
iENT = the entertainment of the ith company,
iSB = the stockbroking of the ith company,
iROA = the return on assets of the ith company,
iROE = the return on equity of the ith company, and
iOPM = the operating profit margin of the ith
company.
3.4 The Hypothesis
The hypothesis of the study is developed to cater for
the pooling regression model. The hypotheses are:
Hypothesis 1
Ho: There is no relationship between dependent
variables and all independent variables among BOD
facets.
Ha: There is a relationship between dependent
variables and all independent variables among BOD
facets.
Hypothesis 2
Ho: There is no relationship between dependent
variables and all independent variables on syaria‘
principles.
Ha: There is a relationship between dependent
variables and all independent variables on syaria‘
principles.
Hypothesis 3
Ho: There is no significant mean different between
corporate governance compliance firms and syaria‘
compliance firms in their performance.
Ha: There is no significant mean different between
corporate governance compliance firms and syaria‘
compliance firms in their performance.
4. Results and discussion 4.1 Analysis of Descriptive Statistics on Corporate Governance Compliance in Malaysia 4.1.1 Board Remuneration
Figure 1. Level of Directors‘ Remuneration
Malaysia code of corporate governance practices
stated that the level of remuneration must be adequate
to attract and hold the required directors in running
the business. The level also should be reasonable and
appropriate with the expertise and experience of the
directors. The amounts of remuneration are
recommended to be represented in the annual repot of
the company for stakeholder review. By referring to
the figure 1, it was found that for 5 successive years
from 2003 to 2007, majority of the company (around
52%) spend the total remuneration below 1 million a
year to attract and retain the directors needed to run
the company successfully. In the study also, it was
found that the total remuneration of 1.1 million to 2.1
million has increased from 2003 till 2006 meanwhile
the total remuneration below 1 million from year to
year starting from 2004 decrease means that the
companies might starting to pay more to their
directors to make sure their directors give a full
commitment and good performance to achieve their
goal in organization.
4.1.2Director Training For the board training in starting in 2003, all the
companies listed in Bursa Malaysia have to send their
directors to the Mandatory Accreditation Program
(MAP) conducted by the Research Institute of
Investment Analysts Malaysia (RIIAM) in accordance
with the Listing Requirements of the Bursa Malaysia
Securities Berhad in order to have a good director in
their rank. The program also can be assumed as the
formal orientation program that could be a one or two
day program that involve educating the director as to
the environment of the business, the company‘s
current issues and the corporate strategy, the prospect
of the company with reference to input from director
50 27 14 9
52 20 17 11
46 34 15 5
40 35 12 13
35 29 10 26
0 20 40 60 80 100
2003
2005
2007
Board Renumeration
<1 M1.1M-2.1M2.1M-3.1M>3.1M
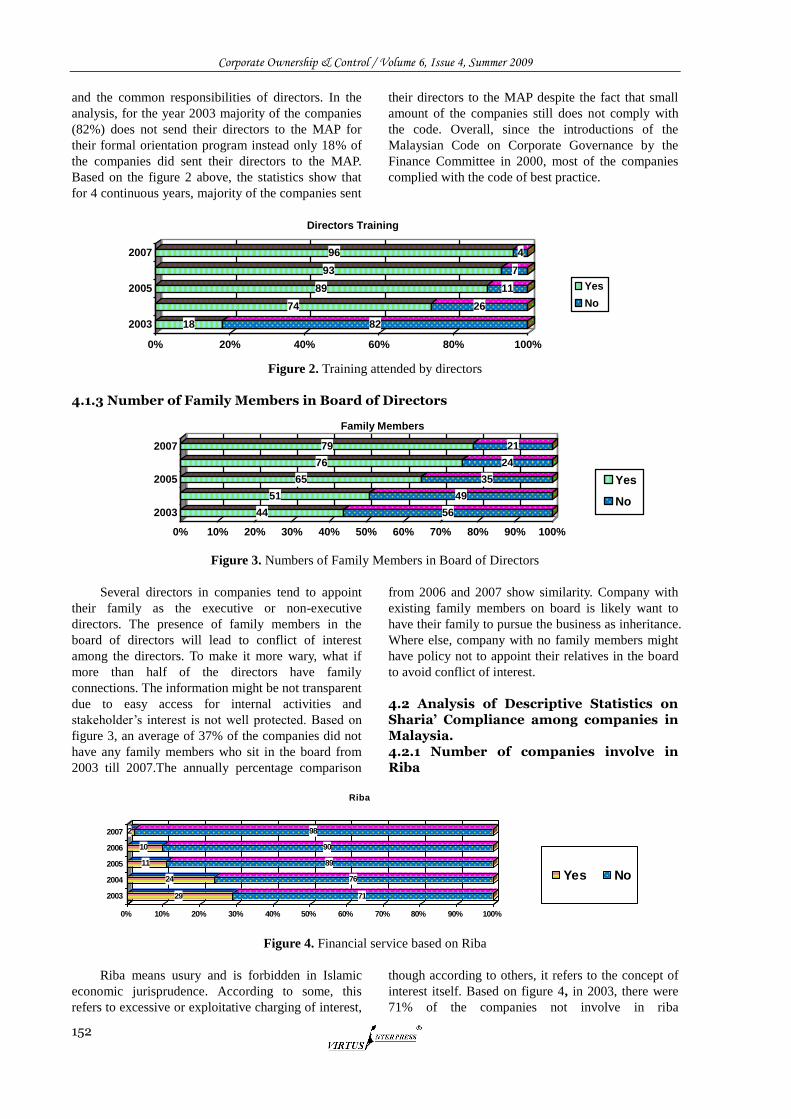
Corporate Ownership & Control / Volume 6, Issue 4, Summer 2009
152
and the common responsibilities of directors. In the
analysis, for the year 2003 majority of the companies
(82%) does not send their directors to the MAP for
their formal orientation program instead only 18% of
the companies did sent their directors to the MAP.
Based on the figure 2 above, the statistics show that
for 4 continuous years, majority of the companies sent
their directors to the MAP despite the fact that small
amount of the companies still does not comply with
the code. Overall, since the introductions of the
Malaysian Code on Corporate Governance by the
Finance Committee in 2000, most of the companies
complied with the code of best practice.
Figure 2. Training attended by directors
4.1.3 Number of Family Members in Board of Directors
Figure 3. Numbers of Family Members in Board of Directors
Several directors in companies tend to appoint
their family as the executive or non-executive
directors. The presence of family members in the
board of directors will lead to conflict of interest
among the directors. To make it more wary, what if
more than half of the directors have family
connections. The information might be not transparent
due to easy access for internal activities and
stakeholder‘s interest is not well protected. Based on
figure 3, an average of 37% of the companies did not
have any family members who sit in the board from
2003 till 2007.The annually percentage comparison
from 2006 and 2007 show similarity. Company with
existing family members on board is likely want to
have their family to pursue the business as inheritance.
Where else, company with no family members might
have policy not to appoint their relatives in the board
to avoid conflict of interest.
4.2 Analysis of Descriptive Statistics on Sharia’ Compliance among companies in Malaysia. 4.2.1 Number of companies involve in Riba
Figure 4. Financial service based on Riba
Riba means usury and is forbidden in Islamic
economic jurisprudence. According to some, this
refers to excessive or exploitative charging of interest,
though according to others, it refers to the concept of
interest itself. Based on figure 4, in 2003, there were
71% of the companies not involve in riba
18 82
74 26
89 11
93 7
96 4
0% 20% 40% 60% 80% 100%
2003
2005
2007
Directors Training
Yes
No
44 56
51 49
65 35
76 24
79 21
0% 10% 20% 30% 40% 50% 60% 70% 80% 90% 100%
2003
2005
2007
Family Members
Yes
No
29 71
24 76
11 89
10 90
2 98
0% 10% 20% 30% 40% 50% 60% 70% 80% 90% 100%
2003
2004
2005
2006
2007
Riba
Yes No
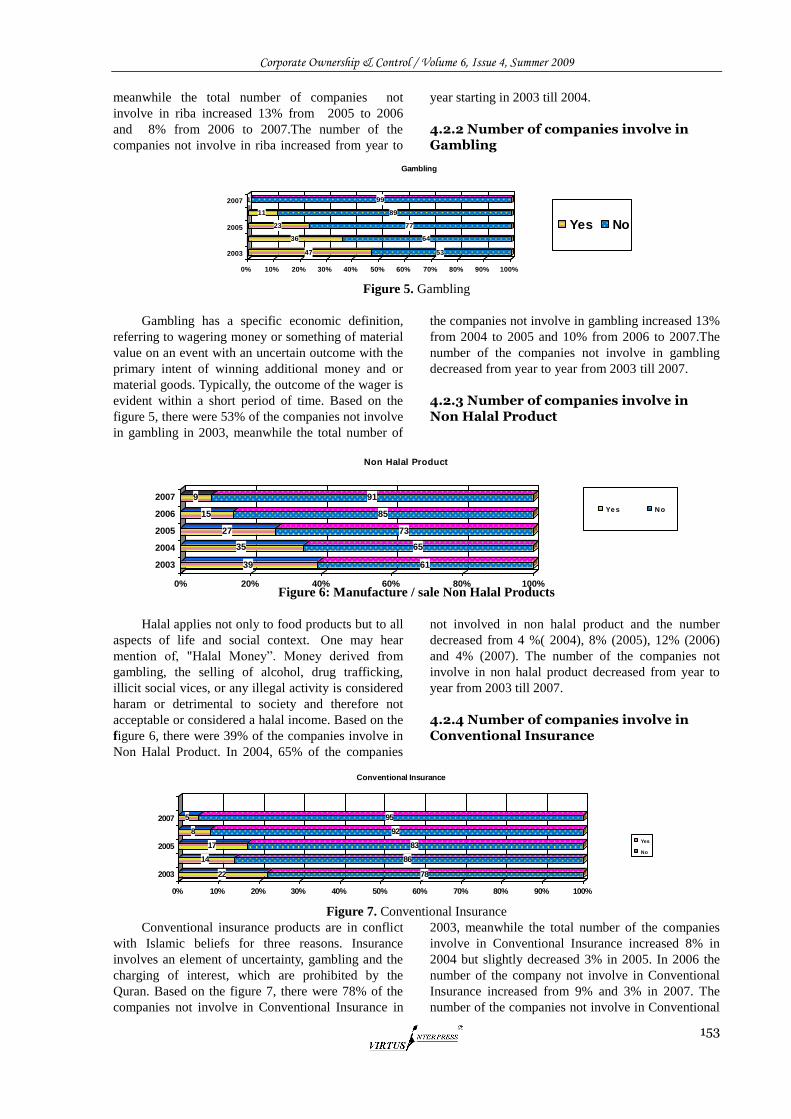
Corporate Ownership & Control / Volume 6, Issue 4, Summer 2009
153
meanwhile the total number of companies not
involve in riba increased 13% from 2005 to 2006
and 8% from 2006 to 2007.The number of the
companies not involve in riba increased from year to
year starting in 2003 till 2004.
4.2.2 Number of companies involve in Gambling
Figure 5. Gambling
Gambling has a specific economic definition,
referring to wagering money or something of material
value on an event with an uncertain outcome with the
primary intent of winning additional money and or
material goods. Typically, the outcome of the wager is
evident within a short period of time. Based on the
figure 5, there were 53% of the companies not involve
in gambling in 2003, meanwhile the total number of
the companies not involve in gambling increased 13%
from 2004 to 2005 and 10% from 2006 to 2007.The
number of the companies not involve in gambling
decreased from year to year from 2003 till 2007.
4.2.3 Number of companies involve in Non Halal Product
Figure 6: Manufacture / sale Non Halal Products
Halal applies not only to food products but to all
aspects of life and social context. One may hear
mention of, "Halal Money‖. Money derived from
gambling, the selling of alcohol, drug trafficking,
illicit social vices, or any illegal activity is considered
haram or detrimental to society and therefore not
acceptable or considered a halal income. Based on the
figure 6, there were 39% of the companies involve in
Non Halal Product. In 2004, 65% of the companies
not involved in non halal product and the number
decreased from 4 %( 2004), 8% (2005), 12% (2006)
and 4% (2007). The number of the companies not
involve in non halal product decreased from year to
year from 2003 till 2007.
4.2.4 Number of companies involve in Conventional Insurance
Figure 7. Conventional Insurance
Conventional insurance products are in conflict
with Islamic beliefs for three reasons. Insurance
involves an element of uncertainty, gambling and the
charging of interest, which are prohibited by the
Quran. Based on the figure 7, there were 78% of the
companies not involve in Conventional Insurance in
2003, meanwhile the total number of the companies
involve in Conventional Insurance increased 8% in
2004 but slightly decreased 3% in 2005. In 2006 the
number of the company not involve in Conventional
Insurance increased from 9% and 3% in 2007. The
number of the companies not involve in Conventional
47 53
36 64
23 77
11 89
1 99
0% 10% 20% 30% 40% 50% 60% 70% 80% 90% 100%
2003
2005
2007
Gambling
Yes No
22 78
14 86
17 83
8 92
5 95
0% 10% 20% 30% 40% 50% 60% 70% 80% 90% 100%
2003
2005
2007
Conventional Insurance
Yes
No
39 61
35 65
27 73
15 85
9 91
0% 20% 40% 60% 80% 100%
2003
2004
2005
2006
2007
Non Halal Product
Ye s No
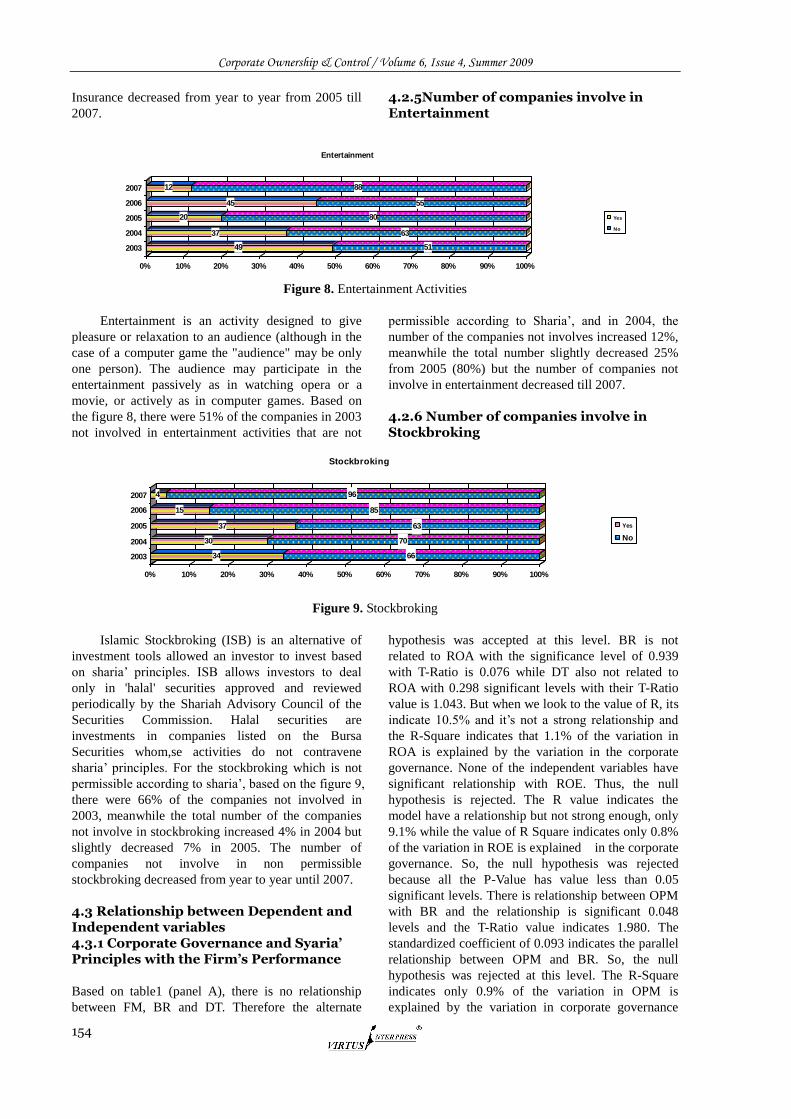
Corporate Ownership & Control / Volume 6, Issue 4, Summer 2009
154
Insurance decreased from year to year from 2005 till
2007.
4.2.5Number of companies involve in Entertainment
Figure 8. Entertainment Activities
Entertainment is an activity designed to give
pleasure or relaxation to an audience (although in the
case of a computer game the "audience" may be only
one person). The audience may participate in the
entertainment passively as in watching opera or a
movie, or actively as in computer games. Based on
the figure 8, there were 51% of the companies in 2003
not involved in entertainment activities that are not
permissible according to Sharia‘, and in 2004, the
number of the companies not involves increased 12%,
meanwhile the total number slightly decreased 25%
from 2005 (80%) but the number of companies not
involve in entertainment decreased till 2007.
4.2.6 Number of companies involve in Stockbroking
Figure 9. Stockbroking
Islamic Stockbroking (ISB) is an alternative of
investment tools allowed an investor to invest based
on sharia‘ principles. ISB allows investors to deal
only in 'halal' securities approved and reviewed
periodically by the Shariah Advisory Council of the
Securities Commission. Halal securities are
investments in companies listed on the Bursa
Securities whom,se activities do not contravene
sharia‘ principles. For the stockbroking which is not
permissible according to sharia‘, based on the figure 9,
there were 66% of the companies not involved in
2003, meanwhile the total number of the companies
not involve in stockbroking increased 4% in 2004 but
slightly decreased 7% in 2005. The number of
companies not involve in non permissible
stockbroking decreased from year to year until 2007.
4.3 Relationship between Dependent and Independent variables 4.3.1 Corporate Governance and Syaria’ Principles with the Firm’s Performance
Based on table1 (panel A), there is no relationship
between FM, BR and DT. Therefore the alternate
hypothesis was accepted at this level. BR is not
related to ROA with the significance level of 0.939
with T-Ratio is 0.076 while DT also not related to
ROA with 0.298 significant levels with their T-Ratio
value is 1.043. But when we look to the value of R, its
indicate 10.5% and it‘s not a strong relationship and
the R-Square indicates that 1.1% of the variation in
ROA is explained by the variation in the corporate
governance. None of the independent variables have
significant relationship with ROE. Thus, the null
hypothesis is rejected. The R value indicates the
model have a relationship but not strong enough, only
9.1% while the value of R Square indicates only 0.8%
of the variation in ROE is explained in the corporate
governance. So, the null hypothesis was rejected
because all the P-Value has value less than 0.05
significant levels. There is relationship between OPM
with BR and the relationship is significant 0.048
levels and the T-Ratio value indicates 1.980. The
standardized coefficient of 0.093 indicates the parallel
relationship between OPM and BR. So, the null
hypothesis was rejected at this level. The R-Square
indicates only 0.9% of the variation in OPM is
explained by the variation in corporate governance
49 51
37 63
20 80
45 55
12 88
0% 10% 20% 30% 40% 50% 60% 70% 80% 90% 100%
2003
2004
2005
2006
2007
Entertainment
Yes
No
34 66
30 70
37 63
15 85
4 96
0% 10% 20% 30% 40% 50% 60% 70% 80% 90% 100%
2003
2004
2005
2006
2007
Stockbroking
Yes
No
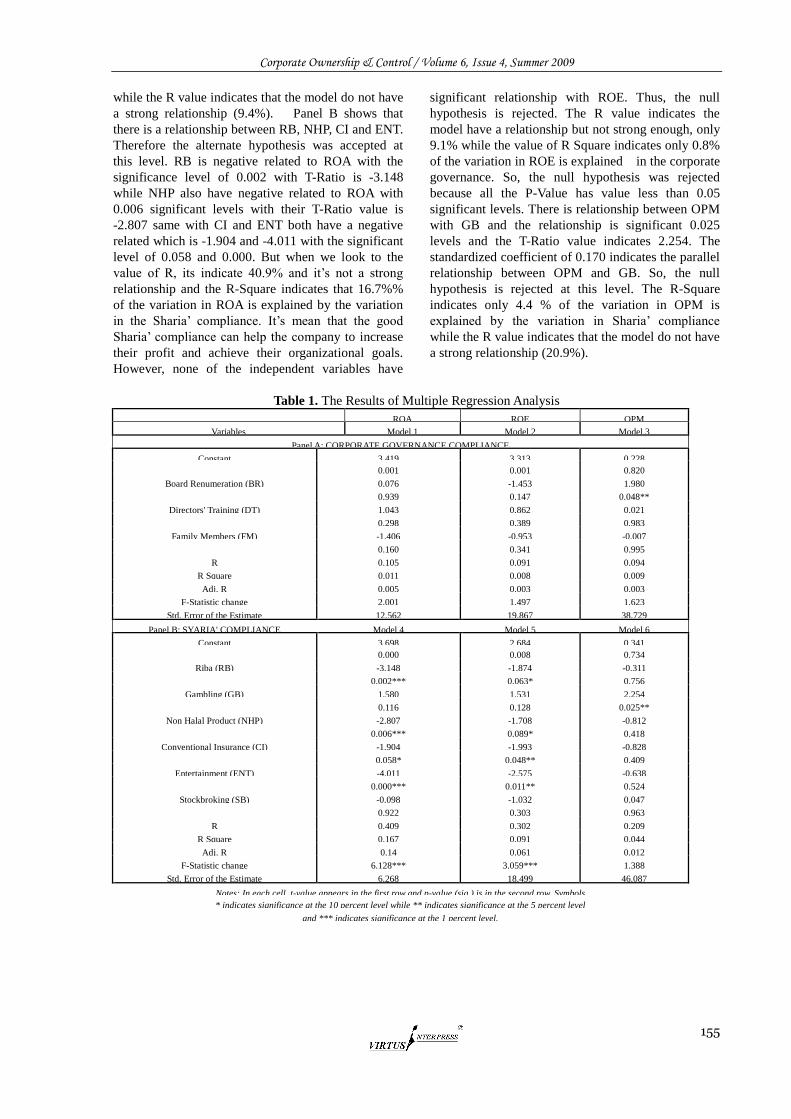
Corporate Ownership & Control / Volume 6, Issue 4, Summer 2009
155
while the R value indicates that the model do not have
a strong relationship (9.4%). Panel B shows that
there is a relationship between RB, NHP, CI and ENT.
Therefore the alternate hypothesis was accepted at
this level. RB is negative related to ROA with the
significance level of 0.002 with T-Ratio is -3.148
while NHP also have negative related to ROA with
0.006 significant levels with their T-Ratio value is
-2.807 same with CI and ENT both have a negative
related which is -1.904 and -4.011 with the significant
level of 0.058 and 0.000. But when we look to the
value of R, its indicate 40.9% and it‘s not a strong
relationship and the R-Square indicates that 16.7%%
of the variation in ROA is explained by the variation
in the Sharia‘ compliance. It‘s mean that the good
Sharia‘ compliance can help the company to increase
their profit and achieve their organizational goals.
However, none of the independent variables have
significant relationship with ROE. Thus, the null
hypothesis is rejected. The R value indicates the
model have a relationship but not strong enough, only
9.1% while the value of R Square indicates only 0.8%
of the variation in ROE is explained in the corporate
governance. So, the null hypothesis was rejected
because all the P-Value has value less than 0.05
significant levels. There is relationship between OPM
with GB and the relationship is significant 0.025
levels and the T-Ratio value indicates 2.254. The
standardized coefficient of 0.170 indicates the parallel
relationship between OPM and GB. So, the null
hypothesis is rejected at this level. The R-Square
indicates only 4.4 % of the variation in OPM is
explained by the variation in Sharia‘ compliance
while the R value indicates that the model do not have
a strong relationship (20.9%).
Table 1. The Results of Multiple Regression Analysis
ROA ROE OPM
Variables Model 1 Model 2 Model 3
Panel A: CORPORATE GOVERNANCE COMPLIANCE
Constant 3.419 3.313 0.228
0.001 0.001 0.820
Board Renumeration (BR) 0.076 -1.453 1.980
0.939 0.147 0.048**
Directors' Training (DT) 1.043 0.862 0.021
0.298 0.389 0.983
Family Members (FM) -1.406 -0.953 -0.007
0.160 0.341 0.995
R 0.105 0.091 0.094
R Square 0.011 0.008 0.009
Adj. R 0.005 0.003 0.003
F-Statistic change 2.001 1.497 1.623
Std. Error of the Estimate 12.562 19.867 38.729
Panel B: SYARIA' COMPLIANCE Model 4 Model 5 Model 6
Constant 3.698 2.684 0.341
0.000 0.008 0.734
Riba (RB) -3.148 -1.874 -0.311
0.002*** 0.063* 0.756
Gambling (GB) 1.580 1.531 2.254
0.116 0.128 0.025**
Non Halal Product (NHP) -2.807 -1.708 -0.812
0.006*** 0.089* 0.418
Conventional Insurance (CI) -1.904 -1.993 -0.828
0.058* 0.048** 0.409
Entertainment (ENT) -4.011 -2.575 -0.638
0.000*** 0.011** 0.524
Stockbroking (SB) -0.098 -1.032 0.047
0.922 0.303 0.963
R 0.409 0.302 0.209
R Square 0.167 0.091 0.044
Adj. R 0.14 0.061 0.012
F-Statistic change 6.128*** 3.059*** 1.388
Std. Error of the Estimate 6.268 18.499 46.087
Notes: In each cell, t-value appears in the first row and p-value (sig.) is in the second row. Symbols
* indicates significance at the 10 percent level while ** indicates significance at the 5 percent level
and *** indicates significance at the 1 percent level.
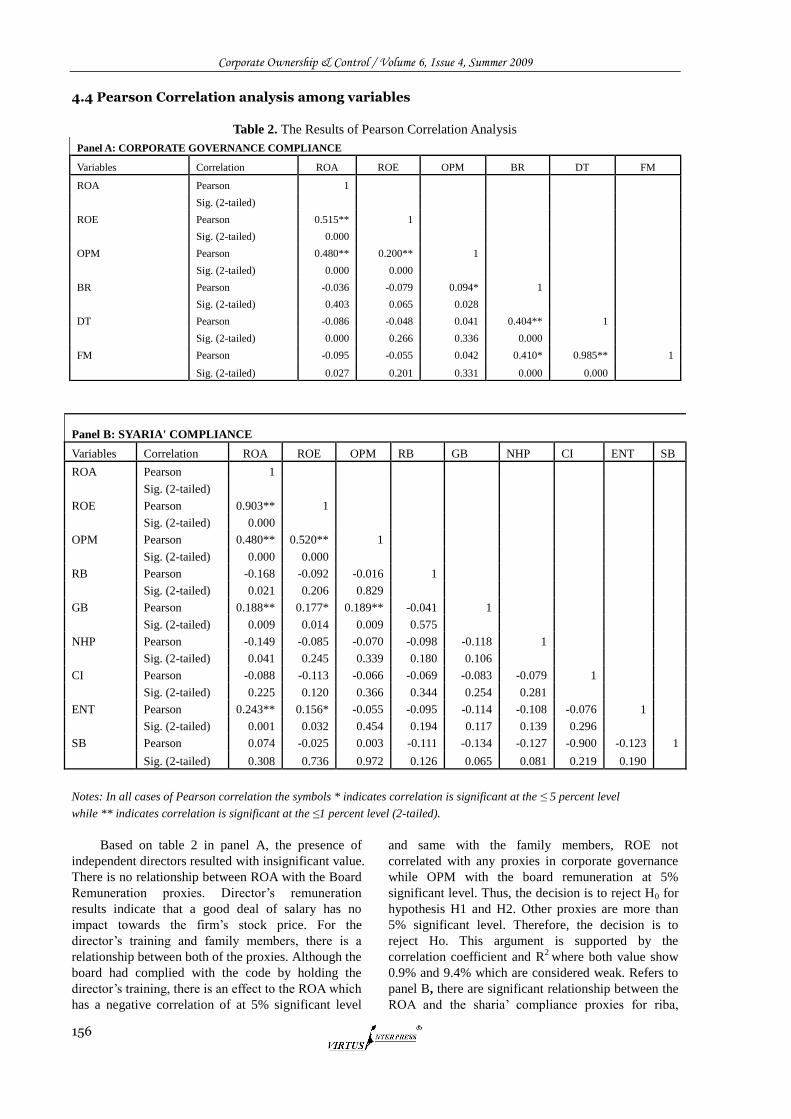
Corporate Ownership & Control / Volume 6, Issue 4, Summer 2009
156
4.4 Pearson Correlation analysis among variables
Table 2. The Results of Pearson Correlation Analysis
Panel B: SYARIA' COMPLIANCE
Variables Correlation ROA ROE OPM RB GB NHP CI ENT SB
ROA Pearson 1
Sig. (2-tailed)
ROE Pearson 0.903** 1
Sig. (2-tailed) 0.000
OPM Pearson 0.480** 0.520** 1
Sig. (2-tailed) 0.000 0.000
RB Pearson -0.168 -0.092 -0.016 1
Sig. (2-tailed) 0.021 0.206 0.829
GB Pearson 0.188** 0.177* 0.189** -0.041 1
Sig. (2-tailed) 0.009 0.014 0.009 0.575
NHP Pearson -0.149 -0.085 -0.070 -0.098 -0.118 1
Sig. (2-tailed) 0.041 0.245 0.339 0.180 0.106
CI Pearson -0.088 -0.113 -0.066 -0.069 -0.083 -0.079 1
Sig. (2-tailed) 0.225 0.120 0.366 0.344 0.254 0.281
ENT Pearson 0.243** 0.156* -0.055 -0.095 -0.114 -0.108 -0.076 1
Sig. (2-tailed) 0.001 0.032 0.454 0.194 0.117 0.139 0.296
SB Pearson 0.074 -0.025 0.003 -0.111 -0.134 -0.127 -0.900 -0.123 1
Sig. (2-tailed) 0.308 0.736 0.972 0.126 0.065 0.081 0.219 0.190
Notes: In all cases of Pearson correlation the symbols * indicates correlation is significant at the ≤ 5 percent level
while ** indicates correlation is significant at the ≤1 percent level (2-tailed).
Based on table 2 in panel A, the presence of
independent directors resulted with insignificant value.
There is no relationship between ROA with the Board
Remuneration proxies. Director‘s remuneration
results indicate that a good deal of salary has no
impact towards the firm‘s stock price. For the
director‘s training and family members, there is a
relationship between both of the proxies. Although the
board had complied with the code by holding the
director‘s training, there is an effect to the ROA which
has a negative correlation of at 5% significant level
and same with the family members, ROE not
correlated with any proxies in corporate governance
while OPM with the board remuneration at 5%
significant level. Thus, the decision is to reject H0 for
hypothesis H1 and H2. Other proxies are more than
5% significant level. Therefore, the decision is to
reject Ho. This argument is supported by the
correlation coefficient and R2
where both value show
0.9% and 9.4% which are considered weak. Refers to
panel B, there are significant relationship between the
ROA and the sharia‘ compliance proxies for riba,
Panel A: CORPORATE GOVERNANCE COMPLIANCE
Variables Correlation ROA ROE OPM BR DT FM
ROA Pearson 1
Sig. (2-tailed)
ROE Pearson 0.515** 1
Sig. (2-tailed) 0.000
OPM Pearson 0.480** 0.200** 1
Sig. (2-tailed) 0.000 0.000
BR Pearson -0.036 -0.079 0.094* 1
Sig. (2-tailed) 0.403 0.065 0.028
DT Pearson -0.086 -0.048 0.041 0.404** 1
Sig. (2-tailed) 0.000 0.266 0.336 0.000
FM Pearson -0.095 -0.055 0.042 0.410* 0.985** 1
Sig. (2-tailed) 0.027 0.201 0.331 0.000 0.000
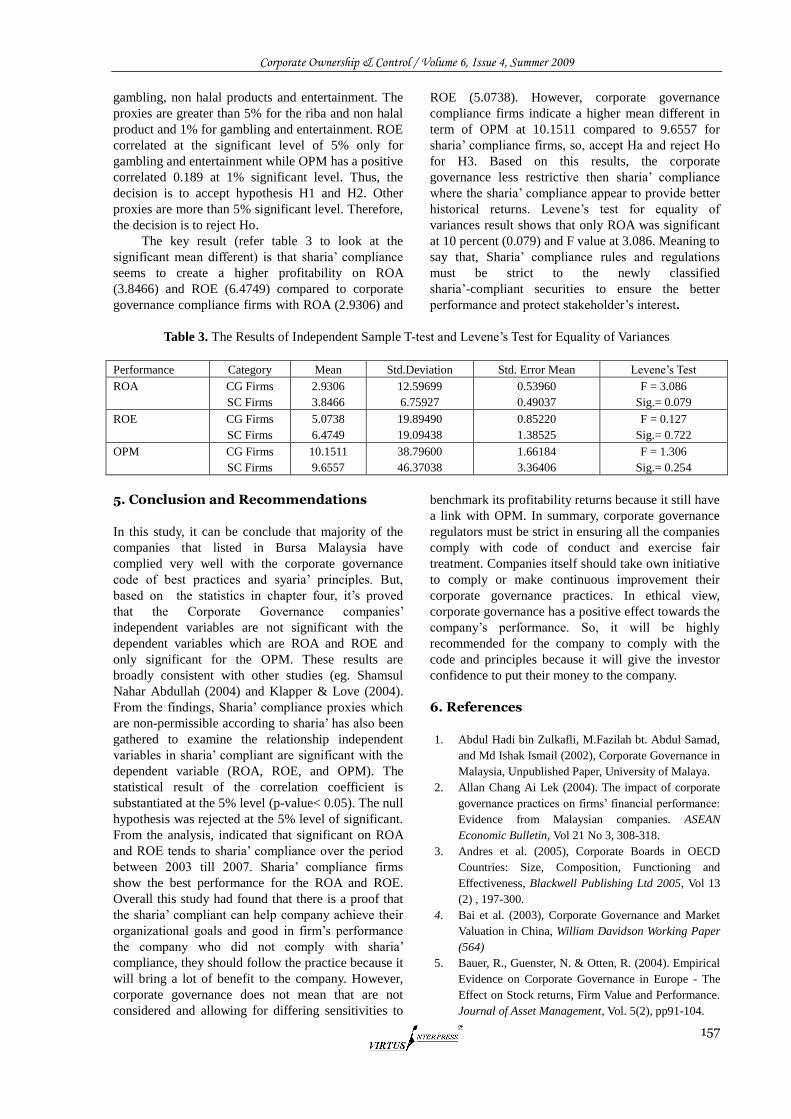
Corporate Ownership & Control / Volume 6, Issue 4, Summer 2009
157
gambling, non halal products and entertainment. The
proxies are greater than 5% for the riba and non halal
product and 1% for gambling and entertainment. ROE
correlated at the significant level of 5% only for
gambling and entertainment while OPM has a positive
correlated 0.189 at 1% significant level. Thus, the
decision is to accept hypothesis H1 and H2. Other
proxies are more than 5% significant level. Therefore,
the decision is to reject Ho.
The key result (refer table 3 to look at the
significant mean different) is that sharia‘ compliance
seems to create a higher profitability on ROA
(3.8466) and ROE (6.4749) compared to corporate
governance compliance firms with ROA (2.9306) and
ROE (5.0738). However, corporate governance
compliance firms indicate a higher mean different in
term of OPM at 10.1511 compared to 9.6557 for
sharia‘ compliance firms, so, accept Ha and reject Ho
for H3. Based on this results, the corporate
governance less restrictive then sharia‘ compliance
where the sharia‘ compliance appear to provide better
historical returns. Levene‘s test for equality of
variances result shows that only ROA was significant
at 10 percent (0.079) and F value at 3.086. Meaning to
say that, Sharia‘ compliance rules and regulations
must be strict to the newly classified
sharia‘-compliant securities to ensure the better
performance and protect stakeholder‘s interest.
Table 3. The Results of Independent Sample T-test and Levene‘s Test for Equality of Variances
Performance Category Mean Std.Deviation Std. Error Mean Levene‘s Test
ROA CG Firms
SC Firms
2.9306
3.8466
12.59699
6.75927
0.53960
0.49037
F = 3.086
Sig.= 0.079
ROE CG Firms
SC Firms
5.0738
6.4749
19.89490
19.09438
0.85220
1.38525
F = 0.127
Sig.= 0.722
OPM CG Firms
SC Firms
10.1511
9.6557
38.79600
46.37038
1.66184
3.36406
F = 1.306
Sig.= 0.254
5. Conclusion and Recommendations
In this study, it can be conclude that majority of the
companies that listed in Bursa Malaysia have
complied very well with the corporate governance
code of best practices and syaria‘ principles. But,
based on the statistics in chapter four, it‘s proved
that the Corporate Governance companies‘
independent variables are not significant with the
dependent variables which are ROA and ROE and
only significant for the OPM. These results are
broadly consistent with other studies (eg. Shamsul
Nahar Abdullah (2004) and Klapper & Love (2004).
From the findings, Sharia‘ compliance proxies which
are non-permissible according to sharia‘ has also been
gathered to examine the relationship independent
variables in sharia‘ compliant are significant with the
dependent variable (ROA, ROE, and OPM). The
statistical result of the correlation coefficient is
substantiated at the 5% level (p-value< 0.05). The null
hypothesis was rejected at the 5% level of significant.
From the analysis, indicated that significant on ROA
and ROE tends to sharia‘ compliance over the period
between 2003 till 2007. Sharia‘ compliance firms
show the best performance for the ROA and ROE.
Overall this study had found that there is a proof that
the sharia‘ compliant can help company achieve their
organizational goals and good in firm‘s performance
the company who did not comply with sharia‘
compliance, they should follow the practice because it
will bring a lot of benefit to the company. However,
corporate governance does not mean that are not
considered and allowing for differing sensitivities to
benchmark its profitability returns because it still have
a link with OPM. In summary, corporate governance
regulators must be strict in ensuring all the companies
comply with code of conduct and exercise fair
treatment. Companies itself should take own initiative
to comply or make continuous improvement their
corporate governance practices. In ethical view,
corporate governance has a positive effect towards the
company‘s performance. So, it will be highly
recommended for the company to comply with the
code and principles because it will give the investor
confidence to put their money to the company.
6. References
1. Abdul Hadi bin Zulkafli, M.Fazilah bt. Abdul Samad,
and Md Ishak Ismail (2002), Corporate Governance in
Malaysia, Unpublished Paper, University of Malaya.
2. Allan Chang Ai Lek (2004). The impact of corporate
governance practices on firms‘ financial performance:
Evidence from Malaysian companies. ASEAN
Economic Bulletin, Vol 21 No 3, 308-318.
3. Andres et al. (2005), Corporate Boards in OECD
Countries: Size, Composition, Functioning and
Effectiveness, Blackwell Publishing Ltd 2005, Vol 13
(2) , 197-300.
4. Bai et al. (2003), Corporate Governance and Market
Valuation in China, William Davidson Working Paper
(564)
5. Bauer, R., Guenster, N. & Otten, R. (2004). Empirical
Evidence on Corporate Governance in Europe - The
Effect on Stock returns, Firm Value and Performance.
Journal of Asset Management, Vol. 5(2), pp91-104.
Corporate Ownership & Control / Volume 6, Issue 4, Summer 2009
158
6. Black et al. (2005), Does Corporate Governance
Predict Firm‘s Market Values?: Evidence from Korea,
Working paper N 86/2005, http://ssrn.com/
abstract=311275
7. Bhasa, M.P. (2004). Understanding Corporate
Governance Quadrilateral. Corporate Governance,
Vol. 4(4), pp7-15.
8. Burke, R.J. (2003). Woman on Corporate Board of
Directors - The Timing is Right. Women in
Management Review, Vol. 18(7), pp346-348.
9. Chiang (2005), An Empirical Study of Corporate
Governance and Corporate Performance, The Journal
of American Academy of Business, Cambridge,
95-101.
10. Corporate Governance Committee (1997). Corporate
Governance Principles: A Japanese View (Interim
Report). http://www.ssrn.com/
11. Drobetz et al. (2003), Corporate Governance and
Expected Stock Returns: Evidence from Germany,
WWZ/Department of Finance, Working Paper No.2/03
12. Finance Committee on Corporate Governance (March
2002), Malaysian Code on Corporate Governance,
Http://www.sc.com.my
13. Klapper & Love (2004), Corporate Governance,
Investor Protection and Performance in Emerging
Markets, Journal of Corporate Finance, Vol 10(5),
703-728.
14. Korac-Kakabadse, N., K.Kakabadse, A. & Kouzmin,
A. (2001). Board Governance and Company
Performance - Any Correlations. Corporate
Governance, Vol. 1(1), pp24-30.
15. Kula (2005), The Impact of the Roles, Structure and
Process of Boards on Firm Performance: Evidence
from Turkey, Blackwell Publishing Ltd 2005, Vol.13 N
2, 256-276.
16. Mardjono, A. (2005). A Tale of Corporate Governance.
Managerial Auditing Journal, Vol. 20, pp272-283.
17. Mohamad Ishak, Hartini and Noriza (2004), The
Disclosure of Corporate Compliance Program: A
Study on the Board of Directors in the Bursa Malaysia
Public-Listed Companies, Proceedings UIBMC 2004,
250-263.
18. Nikomborirak, D. (2001). An Assessment of the Role
of Board of Directors in Building Good Governance:
The Case of Thailand. Paper presented at the ―Third
Asian Round Table on Corporate Governance: The
Role of Boards and Stakeholders in Corporate
Governance‖.
19. Shamsul Nahar Abdullah. (2004). Board Composition,
CEO Duality and Performances Among Malaysian
Listed Companies. Corporate Governance, Vol. 4(4),
pp47-61.
20. Thomsen, S. (2005). Corporate Governance as
Determinant of Corporate Values. Corporate
Governance, Vol. 5(4), pp10-27.
21. Werther Jr, W.B. & Kerr, J.L. (1995). Strengthening
Corporate Governance Through Board Level
Consultants. Journal of Organizational Change, Vol.
8(3), pp63-74.
22. Wier, C. & Laing, D. (2001). Governance Structures,
Director Independence and Corporate Performance in
the UK. European Business Review, Vol. 13(2),
pp86-94.
23. Zandstra, G. (2002). Enron, Board Governance and
Moral Failings. Corporate Governance, Vol. 2(2),
pp16-19.
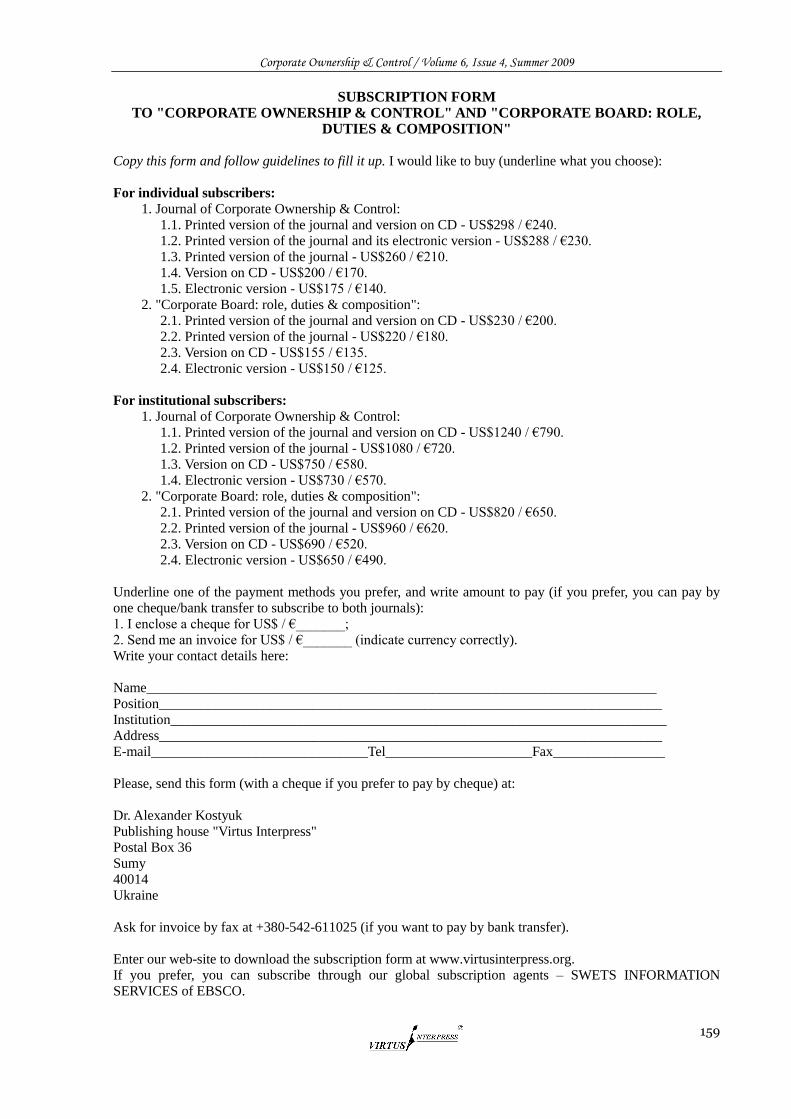
Corporate Ownership & Control / Volume 6, Issue 4, Summer 2009
159
SUBSCRIPTION FORM TO "CORPORATE OWNERSHIP & CONTROL" AND "CORPORATE BOARD: ROLE,
DUTIES & COMPOSITION"
Copy this form and follow guidelines to fill it up. I would like to buy (underline what you choose):
For individual subscribers:
1. Journal of Corporate Ownership & Control:
1.1. Printed version of the journal and version on CD - US$298 / €240.
1.2. Printed version of the journal and its electronic version - US$288 / €230.
1.3. Printed version of the journal - US$260 / €210.
1.4. Version on CD - US$200 / €170.
1.5. Electronic version - US$175 / €140.
2. "Corporate Board: role, duties & composition":
2.1. Printed version of the journal and version on CD - US$230 / €200.
2.2. Printed version of the journal - US$220 / €180.
2.3. Version on CD - US$155 / €135.
2.4. Electronic version - US$150 / €125.
For institutional subscribers:
1. Journal of Corporate Ownership & Control:
1.1. Printed version of the journal and version on CD - US$1240 / €790.
1.2. Printed version of the journal - US$1080 / €720.
1.3. Version on CD - US$750 / €580.
1.4. Electronic version - US$730 / €570.
2. "Corporate Board: role, duties & composition":
2.1. Printed version of the journal and version on CD - US$820 / €650.
2.2. Printed version of the journal - US$960 / €620.
2.3. Version on CD - US$690 / €520.
2.4. Electronic version - US$650 / €490.
Underline one of the payment methods you prefer, and write amount to pay (if you prefer, you can pay by
one cheque/bank transfer to subscribe to both journals):
1. I enclose a cheque for US$ / €_______;
2. Send me an invoice for US$ / €_______ (indicate currency correctly).
Write your contact details here:
Name_________________________________________________________________________
Position________________________________________________________________________
Institution_______________________________________________________________________
Address________________________________________________________________________
E-mail_______________________________Tel_____________________Fax________________
Please, send this form (with a cheque if you prefer to pay by cheque) at:
Dr. Alexander Kostyuk
Publishing house "Virtus Interpress"
Postal Box 36
Sumy
40014
Ukraine
Ask for invoice by fax at +380-542-611025 (if you want to pay by bank transfer).
Enter our web-site to download the subscription form at www.virtusinterpress.org.
If you prefer, you can subscribe through our global subscription agents – SWETS INFORMATION SERVICES of EBSCO.