Embed Size (px)
Citation preview

Gondwana Research xxx (2015) xxx–xxx
GR-01515; No of Pages 10
Contents lists available at ScienceDirect
Gondwana Research
j ourna l homepage: www.e lsev ie r .com/ locate /gr
Severe selenium depletion in the Phanerozoic oceans as a factor in three global massextinction events
John A. Long a,b,⁎, Ross R. Large c, Michael S.Y. Lee d,e, Michael J. Benton f, Leonid V. Danyushevsky c,Luis M. Chiappe g, Jacqueline A. Halpin c, David Cantrill h, Bernd Lottermoser c,i
a School of Biological Sciences, Flinders University, POB 2100, Adelaide, SA 5001, Australiab Museum Victoria, PO Box 666, Melbourne, VIC 3001, Australiac ARC Centre of Excellence in Ore Deposits (CODES), School of Physical Sciences, University of Tasmania, Private Bag 79, Hobart Tasmania, 7001, Australiad South Australian Museum, North Terrace, Adelaide, SA 5000, Australiae School of Earth and Environmental Sciences, The University of Adelaide, SA 5005, Australiaf School of Earth Sciences, University of Bristol, Bristol BS8 1RJ, UKg The Natural History Museum of Los Angeles County, 900 Exposition Blvd, Los Angeles, CA 90007, USAh Royal Botanic Gardens Victoria, Melbourne, VIC 3004, Australiai Institute of Mining Engineering, RWTH Aachen University, Aachen, Germany
⁎ Corresponding author at: School of Biological SciencesAdelaide, South Australia, Australia 5001.
E-mail address: [email protected] (J.A. Long).
http://dx.doi.org/10.1016/j.gr.2015.10.0011342-937X/© 2015 International Association for Gondwa
Please cite this article as: Long, J.A., et al., SevGondwana Research (2015), http://dx.doi.or
a b s t r a c t
a r t i c l e i n f oArticle history:Received 4 September 2015Received in revised form 6 October 2015Accepted 6 October 2015Available online xxxx
Handling Editor: M. Santosh
Keywords:Trace elementsGeochemistryOceansMass extinctions
Selenium (Se) is one of the key trace elements required by all animal and most plant life, and Se deficiencies inthe food chain cause pathologies or death. Here we show from new geochemical analyses of trace elements inPhanerozoic marine pyrite that sustained periods of severe Se depletion in the past oceans correlate closelywith threemajor mass extinction events, at the end of the Ordovician, Devonian and Triassic periods. These rep-resent periods of Se depletion N1.5–2 orders of magnitude lower than current ocean abundances, being withinthe range to cause severe pathological damage in extant Se-reliant organisms. Se depletion may have been oneof several factors in these complex extinction scenarios. Recovery from the depletion/extinction events is likelypart of a natural marine cycle, although rapid rises in global oxygen from suddenmajor increases in marine pro-ductivity and plant biomass after each extinction event may also have played a crucial role.
© 2015 International Association for Gondwana Research. Published by Elsevier B.V. All rights reserved.
1. Introduction
Many trace elements (TEs) are essential for the formation andsustainability of life (Mertz, 1957; Klasing, 1998; Eisler, 2000). In thisstudy we use a new dataset of TE abundances in past oceans (Large etal., 2014; Large et al., 2015a), to discuss whether three of the five Phan-erozoic mass extinction events could have been influenced by extremelow abundances in the trace element selenium (Se).
New laser ablation-inductively coupled plasma mass spectrometry(LA-ICPMS) techniques have been used to measure such TE with accu-racy down to single parts per billion in pyrite from marine black shales(Large et al., 2014). This dataset of TE throughout the past 3.5 billionyears, based initially on some 1885 pyrite analyses (Large et al., 2014),and now updated to include over 2200 analyses for the LateNeoproterozoic–Phanerozoic (Large et al., 2015a) has revealed that es-sential TEs in the oceans fell below critical thresholds during three
, Flinders University, POB 2100,
na Research. Published by Elsevier B.
ere selenium depletion in theg/10.1016/j.gr.2015.10.001
mass extinction events at the end of the Ordovician, Devonian and Tri-assic. Mechanisms for these extinction events are debated, althoughscenarios for these events involve global climate change associatedwith widespread anoxia and eustatic sea level changes (Ordovician, De-vonian) aswell as the Central AtlanticMagmatic Province (CAMP) erup-tions (Triassic) (Table 1). Herewe present the evidence based on knownenvironmental and tolerance levels of Se in a range of extant organismsfrom phytoplankton to vertebrates to propose how distinct periods ofsevere Se depletion in past oceans offer a potential new causal factorin these mass extinction events.
1.1. Selenium, weathering and oceans
Se, a naturally occurringmetalloid, is unique in that although it is anessential micronutrient in most organisms, including bacteria, archaea,fish and shellfish, it may be toxic at high concentrations and has a verynarrow concentration window for sustaining marine life, as discussedfurther below. The Se content of the crust averages 0.05 ppm, with thehighest levels found in shales (up to 675 ppm), coals (up to 20 ppm)and volcanic tuffs (up to 9.2 ppm), compared with igneous rocks that
V. All rights reserved.
Phanerozoic oceans as a factor in three global mass extinction events,
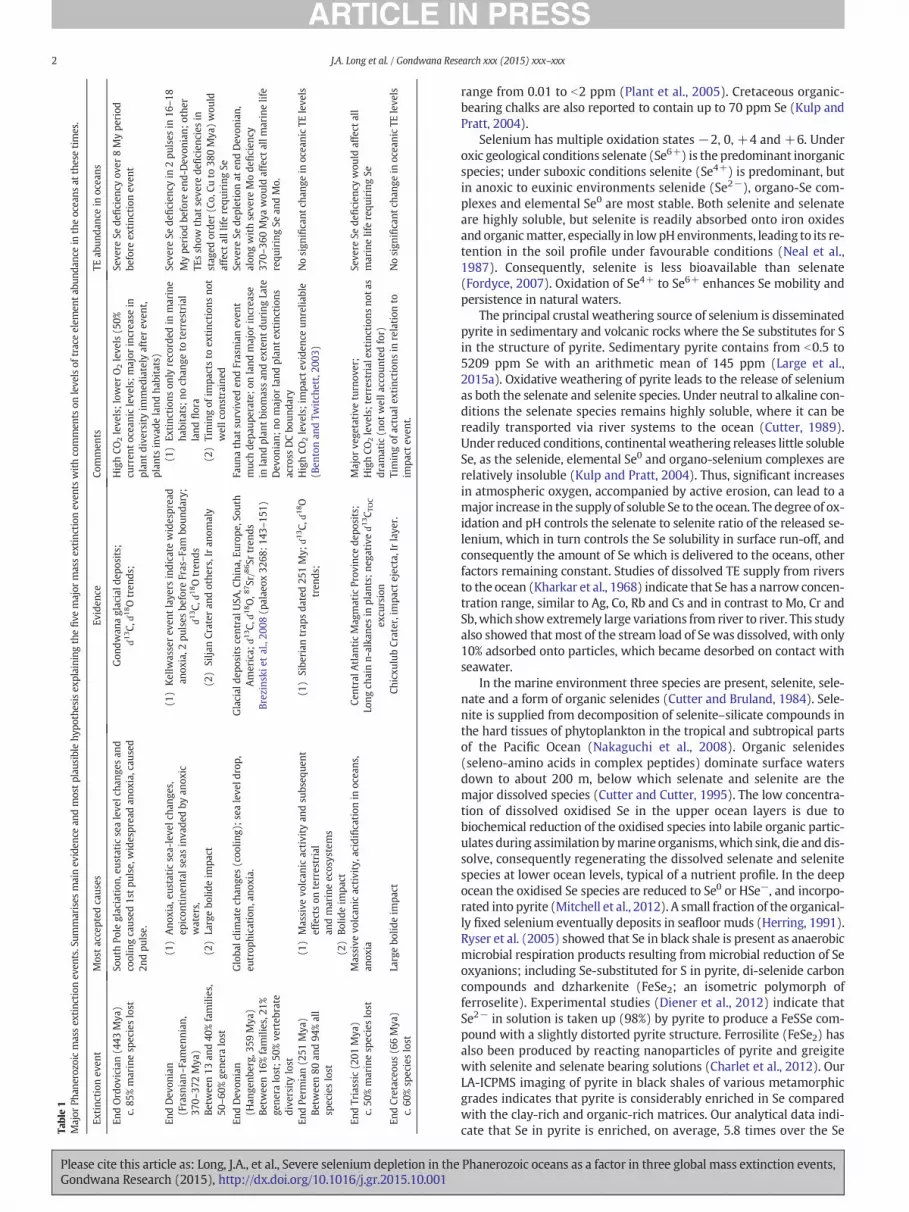
Table1
Major
Phan
eroz
oicmassex
tinc
tion
even
ts.Sum
marises
mainev
iden
cean
dmostp
laus
ible
hypo
thesisex
plaining
thefiv
emajor
massex
tinc
tion
even
tswithcommen
tson
leve
lsof
traceelem
entab
unda
ncein
theocea
nsat
thesetimes.
Extinc
tion
even
tMostaccepted
caus
esEv
iden
ceCo
mmen
tsTE
abun
danc
ein
ocea
ns
EndOrdov
ician(4
43Mya
)c.85
%marinesp
ecieslost
SouthPo
leglaciation
,eus
taticsealeve
lcha
nges
and
coolingcaus
ed1s
tpu
lse,
widesprea
dan
oxia,cau
sed
2ndpu
lse.
Gon
dwan
aglaciald
eposits;
ɗ13C,
ɗ18Otren
ds;
HighCO
2leve
ls;low
erO2leve
ls(5
0%cu
rren
toc
eanicleve
ls;m
ajor
increa
sein
plan
tdive
rsityim
med
iately
afterev
ent,
plan
tsinva
deland
habitats)
Seve
reSe
defic
ienc
yov
er8Mype
riod
before
extinc
tion
even
t
EndDev
onian
(Frasn
ian–F
amen
nian
,37
0–37
2Mya
)Be
twee
n13
and40
%families,
50–6
0%ge
nera
lost
(1)
Ano
xia,
eustatic
sea-leve
lcha
nges,
epicon
tine
ntal
seas
inva
dedby
anox
icwaters,
(2)
Largebo
lideim
pact
(1)
Kellw
asserev
entlaye
rsindicate
widesprea
dan
oxia,2
pulses
before
Fras–F
ambo
unda
ry;
ɗ13C,
ɗ18Otren
ds(2
)Silja
nCrater
andothe
rs,Iran
omaly
(1)
Extinc
tion
son
lyreco
rded
inmarine
habitats;no
chan
geto
terrestrial
land
flora
(2)
Timingof
impa
ctsto
extinc
tion
sno
twellc
onstrained
Seve
reSe
defic
ienc
yin
2pu
lses
in16
–18
Mype
riod
before
end-Dev
onian;
othe
rTE
ssh
owthat
seve
rede
ficienc
iesin
stag
edorde
r(C
o,Cu
to38
0Mya
)wou
ldaffect
alllife
requ
iringSe
EndDev
onian
(Han
genb
erg,
359Mya
)Be
twee
n16
%families,2
1%ge
nera
lost;5
0%ve
rteb
rate
dive
rsitylost
Globa
lclim
atech
ange
s(coo
ling);sealeve
ldrop,
eutrop
hication
,ano
xia.
Glacial
depo
sits
centralU
SA,C
hina
,Europ
e,So
uth
America;
ɗ13C,
ɗ18O,8
7Sr/8
6Sr
tren
dsBrez
inskie
tal.,20
08(p
alae
ox32
68:1
43–1
51)
Faun
athat
survived
endFrasnian
even
tmuc
hde
paup
erate;
onland
major
increa
sein
land
plan
tbiom
assan
dex
tent
during
Late
Dev
onian;
nomajor
land
plan
tex
tinc
tion
sacross
DCbo
unda
ry
Seve
reSe
depletionat
endDev
onian,
alon
gwithseve
reMode
ficienc
y37
0–36
0Mya
wou
ldaffect
allm
arinelife
requ
iringSe
andMo.
EndPe
rmian(2
51Mya
)Be
twee
n80
and94
%all
specieslost
(1)
Massive
volcan
icactivity
andsu
bseq
uent
effectson
terrestrial
andmarineecosystems
(2)
Bolid
eim
pact
(1)
Sibe
rian
trap
sda
ted25
1My;
ɗ13C,
ɗ18O
tren
ds;
HighCO
2leve
ls;impa
ctev
iden
ceun
relia
ble
(Ben
tonan
dTw
itch
ett,20
03)
Nosign
ificant
chan
gein
ocea
nicTE
leve
ls
EndTriassic
(201
Mya
)c.50
%marinesp
ecieslost
Massive
volcan
icactivity,acidific
ationin
ocea
ns,
anox
iaCe
ntralA
tlan
ticMag
matic
Prov
ince
depo
sits;
Long
chainn-
alka
nesin
plan
ts;ne
gative
ɗ13C T
OC
excu
rsion
Major
vege
tative
turn
over;
HighCO
2leve
ls;terrestrial
extinc
tion
sno
tas
dram
atic
(not
wella
ccou
nted
for)
Seve
reSe
defic
ienc
ywou
ldaffect
all
marineliferequ
iringSe
EndCretaceo
us(6
6Mya
)c.60
%sp
ecieslost
Largebo
lideim
pact
Chicxu
lubCrater,impa
ctejecta,Irlaye
r.Timingof
actual
extinc
tion
sin
relation
toim
pact
even
t.Nosign
ificant
chan
gein
ocea
nicTE
leve
ls
2 J.A. Long et al. / Gondwana Research xxx (2015) xxx–xxx
Please cite this article as: Long, J.A., et al., Severe selenium depletion in theGondwana Research (2015), http://dx.doi.org/10.1016/j.gr.2015.10.001
range from 0.01 to b2 ppm (Plant et al., 2005). Cretaceous organic-bearing chalks are also reported to contain up to 70 ppm Se (Kulp andPratt, 2004).
Selenium has multiple oxidation states −2, 0, +4 and +6. Underoxic geological conditions selenate (Se6+) is the predominant inorganicspecies; under suboxic conditions selenite (Se4+) is predominant, butin anoxic to euxinic environments selenide (Se2−), organo-Se com-plexes and elemental Se0 are most stable. Both selenite and selenateare highly soluble, but selenite is readily absorbed onto iron oxidesand organicmatter, especially in lowpH environments, leading to its re-tention in the soil profile under favourable conditions (Neal et al.,1987). Consequently, selenite is less bioavailable than selenate(Fordyce, 2007). Oxidation of Se4+ to Se6+ enhances Se mobility andpersistence in natural waters.
The principal crustal weathering source of selenium is disseminatedpyrite in sedimentary and volcanic rocks where the Se substitutes for Sin the structure of pyrite. Sedimentary pyrite contains from b0.5 to5209 ppm Se with an arithmetic mean of 145 ppm (Large et al.,2015a). Oxidative weathering of pyrite leads to the release of seleniumas both the selenate and selenite species. Under neutral to alkaline con-ditions the selenate species remains highly soluble, where it can bereadily transported via river systems to the ocean (Cutter, 1989).Under reduced conditions, continentalweathering releases little solubleSe, as the selenide, elemental Se0 and organo-selenium complexes arerelatively insoluble (Kulp and Pratt, 2004). Thus, significant increasesin atmospheric oxygen, accompanied by active erosion, can lead to amajor increase in the supply of soluble Se to the ocean. The degree of ox-idation and pH controls the selenate to selenite ratio of the released se-lenium, which in turn controls the Se solubility in surface run-off, andconsequently the amount of Se which is delivered to the oceans, otherfactors remaining constant. Studies of dissolved TE supply from riversto the ocean (Kharkar et al., 1968) indicate that Se has a narrow concen-tration range, similar to Ag, Co, Rb and Cs and in contrast to Mo, Cr andSb,which show extremely large variations from river to river. This studyalso showed that most of the stream load of Se was dissolved, with only10% adsorbed onto particles, which became desorbed on contact withseawater.
In the marine environment three species are present, selenite, sele-nate and a form of organic selenides (Cutter and Bruland, 1984). Sele-nite is supplied from decomposition of selenite–silicate compounds inthe hard tissues of phytoplankton in the tropical and subtropical partsof the Pacific Ocean (Nakaguchi et al., 2008). Organic selenides(seleno-amino acids in complex peptides) dominate surface watersdown to about 200 m, below which selenate and selenite are themajor dissolved species (Cutter and Cutter, 1995). The low concentra-tion of dissolved oxidised Se in the upper ocean layers is due tobiochemical reduction of the oxidised species into labile organic partic-ulates during assimilation bymarine organisms,which sink, die and dis-solve, consequently regenerating the dissolved selenate and selenitespecies at lower ocean levels, typical of a nutrient profile. In the deepocean the oxidised Se species are reduced to Se0 or HSe−, and incorpo-rated into pyrite (Mitchell et al., 2012). A small fraction of the organical-ly fixed selenium eventually deposits in seafloor muds (Herring, 1991).Ryser et al. (2005) showed that Se in black shale is present as anaerobicmicrobial respiration products resulting frommicrobial reduction of Seoxyanions; including Se-substituted for S in pyrite, di-selenide carboncompounds and dzharkenite (FeSe2; an isometric polymorph offerroselite). Experimental studies (Diener et al., 2012) indicate thatSe2− in solution is taken up (98%) by pyrite to produce a FeSSe com-pound with a slightly distorted pyrite structure. Ferrosilite (FeSe2) hasalso been produced by reacting nanoparticles of pyrite and greigitewith selenite and selenate bearing solutions (Charlet et al., 2012). OurLA-ICPMS imaging of pyrite in black shales of various metamorphicgrades indicates that pyrite is considerably enriched in Se comparedwith the clay-rich and organic-rich matrices. Our analytical data indi-cate that Se in pyrite is enriched, on average, 5.8 times over the Se
Phanerozoic oceans as a factor in three global mass extinction events,

Table 2LA-ICPMS trace element data (from Large et al., 2015a).
Sample Age (Ma) Mn(ppm)
Co(ppm)
Ni(ppm)
Cu(ppm)
Zn(ppm)
Se(ppm)
Mo(ppm)
Cd(ppm)
0.1 2238.19 39.74 363.11 280.39 538.46 132.47 479.07 11.5753 414.19 160.24 104.16 264.87 261.25 46.09 211.84 5.4256 220.95 95.74 261.63 545.28 342.93 58.42 185.98 2.3283 297.54 37.51 135.72 214.96 35.18 4.13 2.52 0.4391 14.54 220.21 528.46 121.64 13.39 10.42 8.52 0.1292 14.03 171.21 495.82 109.77 8.96 3.54 8.65 0.08125 440.12 36.74 73.80 289.10 159.19 25.57 130.96 0.17131 27.60 8.82 35.71 5.34 17.87 3.24 25.83 1.56142 109.31 50.64 283.56 79.78 42.46 5.92 10.04 0.16145 38.55 159.67 455.64 61.95 17.51 4.63 7.00 bd169 11.28 107.23 251.88 4.95 4.32 2.13 13.65 2.11180 50.07 33.95 187.24 48.59 12.54 11.17 95.66 0.54190 865.02 238.55 287.47 76.93 47.91 1.52 18.41 0.06202 4.67 25.63 157.35 42.14 5.45 1.82 32.15 0.03205 239.71 7.32 338.88 285.88 58.12 62.57 11.29 2.77230 bd 267.65 107.96 464.27 1093.35 6.50 4.21 0.62235 8.87 1372.33 360.15 398.48 139.03 60.98 30.87 1.52250 1093.93 1017.08 255.82 1107.78 3399.74 8.48 19.15 2.17251 411.74 79.20 111.13 139.31 73.90 10.47 44.40 1.74253 30.50 249.36 708.70 143.57 16.59 22.38 17.49 0.52272 814.94 32.77 1088.44 499.53 835.38 1259.03 819.30 85.65285 15.95 204.17 275.18 1.54 6.13 18.92 27.48 0.81297 14.76 90.74 166.82 25.20 8.35 19.17 4.47 0.14305 538.01 59.45 3262.73 180.68 2104.11 328.29 1886.80 74.15310 515.38 85.03 2290.85 542.28 1630.65 1347.39 630.39 25.41328 594.25 7.34 1466.84 1390.71 2919.58 2400.78 324.73 283.85331 520.52 41.71 312.96 41.00 14.42 18.04 57.40 1.18332 898.54 86.85 240.65 48.48 122.66 10.38 8.98 1.09333 19.72 6.42 344.89 177.61 5.25 235.78 125.89 4.27338 78.90 202.39 346.70 253.08 13.27 6.20 0.62 0.75339 34.65 493.92 1029.19 715.25 11.27 6.47 1.65 0.41340 438.20 238.12 353.53 647.27 43.37 9.89 12.40 1.80349 277.73 119.94 208.65 105.69 10.84 4.60 7.26 1.46350 387.48 184.52 1053.59 497.43 43.35 22.57 12.63 0.22352 1493.86 195.96 572.98 475.63 186.26 17.86 15.59 1.06355 275.69 68.50 323.17 242.15 34.70 53.81 123.81 2.01356 327.38 407.35 418.54 273.98 87.50 5.35 2.41 1.20357 88.86 457.92 1249.90 228.94 30.74 4.08 9.33 0.31359 244.41 472.99 309.17 203.23 169.78 4.65 1.00 0.16365 1622.16 137.53 225.56 260.75 155.98 7.30 83.00 0.50366 248.22 179.80 111.82 61.64 149.32 10.79 3.80 0.53367 277.97 610.97 787.50 389.75 63.80 1.76 4.72 1.40368 482.90 311.90 248.82 177.39 116.36 8.22 6.02 0.47370 596.70 338.26 184.37 144.18 99.57 3.58 9.02 0.41375 453.09 193.25 499.84 174.24 85.75 20.25 25.52 0.86376 773.46 113.16 276.49 119.29 289.13 20.07 30.71 5.52377 160.14 262.01 943.94 611.85 109.76 52.28 29.78 1.11378 69.77 133.58 601.47 237.57 30.43 21.39 35.43 1.05379 277.17 343.42 1320.83 189.31 38.24 22.75 19.74 0.72380 158.15 303.42 842.16 247.93 47.84 25.73 33.17 0.88381 138.70 15.20 122.42 192.47 5.17 18.65 4.11 0.38382 19.63 60.83 811.52 176.83 10.72 173.08 24.80 3.12383 216.05 257.33 249.08 239.46 12.74 11.56 12.97 0.85384 13.90 17.00 108.38 42.06 22.65 78.45 23.39 1.10385 20.37 15.88 122.43 45.49 12.10 110.51 32.26 1.51386 10.70 8.15 83.26 35.85 14.82 45.89 32.19 0.90387 7.62 3.53 268.83 159.03 24.95 168.75 25.39 2.83388 207.72 29.83 258.62 244.91 51.98 80.90 20.16 2.62390 1402.97 1.07 281.52 1111.56 101.37 1381.37 333.16 12.54393 56.70 312.57 434.97 57.29 8.19 4.98 25.58 0.12395 1111.76 1.15 230.59 312.57 105.09 298.96 18.51 2.00400 868.60 0.62 215.54 274.46 151.45 183.30 14.16 2.35410 45.97 73.82 108.99 34.08 10.57 25.18 26.48 1.66415 160.59 5.28 526.16 178.34 108.85 109.94 258.98 10.11416 3676.46 134.49 1119.55 922.45 307.35 91.29 106.38 2.94418 38.24 3.54 224.20 10.04 3.21 9.30 19.95 0.39420 369.14 75.39 947.32 276.44 114.88 114.47 180.05 7.49444 1307.83 25.46 247.14 325.05 115.19 56.49 281.58 5.23450 810.18 133.33 745.33 462.43 320.98 3.16 48.67 1.41455 27.08 29.19 331.63 367.60 27.24 1.64 10.53 0.35456 3.96 18.12 268.87 56.27 2.91 2.60 2.50 0.15457 2.65 112.30 553.19 32.46 1.97 2.20 2.03 0.15458 213.63 66.40 496.37 98.40 161.74 12.50 33.61 0.50
(continued on next page)
3J.A. Long et al. / Gondwana Research xxx (2015) xxx–xxx
Please cite this article as: Long, J.A., et al., Severe selenium depletion in the Phanerozoic oceans as a factor in three global mass extinction events,Gondwana Research (2015), http://dx.doi.org/10.1016/j.gr.2015.10.001

Table 2 (continued)
Sample Age (Ma) Mn(ppm)
Co(ppm)
Ni(ppm)
Cu(ppm)
Zn(ppm)
Se(ppm)
Mo(ppm)
Cd(ppm)
459 2.82 17.97 151.69 150.38 16.61 3.11 14.38 0.28463 5.25 1.46 17.15 29.21 10.56 1.93 6.04 0.55470 17.89 505.07 567.43 120.72 15.95 41.75 1.61 0.36490 144.48 88.22 2425.44 397.66 45.64 88.89 27.54 3.33500 12.97 131.29 362.56 240.43 57.54 109.99 3.19 1.26510 1443.41 19.33 762.69 2226.45 540.25 366.32 358.11 14.16523 622.37 3.52 884.62 141.97 78.72 547.65 3235.55 0.76540 122.71 122.40 713.00 744.13 18.51 62.71 4.47 0.47550 486.28 35.32 482.85 369.64 39.96 322.99 278.67 13.12555 759.77 645.03 568.54 1319.73 22.88 10.62 4.35 0.96560 353.85 330.56 869.15 589.39 201.67 9.20 8.77 1.45
bd = below detection
4 J.A. Long et al. / Gondwana Research xxx (2015) xxx–xxx
content of the black shale matrix (which commonly contains micro-scopic grains of pyrite). This compares with Mo, which is only enriched2.5 times relative to the matrix.
2. Analytical methods
2.1. Trace element analysis
Trace element analysis of sedimentary pyrite was performed usingLA-ICPMS. All analyses were conducted at the ARC Centre of Excellencein Ore Deposits (CODES), University of Tasmania. Instrumentation usedinvolved a 213 nm solid-state laser microprobe (UP213, NewWave Re-search) coupled to an Agilent 7500a quadrupole mass-spectrometer,and a 193 nm solid-state laser microprobe (UP193ss, New WaveResearch) coupled to Agilent 7700 s quadrupole mass-spectrometer.Laser microprobes are equipped with custom-made constant-geometry ablation cells. The proof of concept paper demonstratinghow this method works, detailing exact methods used and quality ofTE data collected is discussed in Large et al. (2014) and this is furtherdiscussed in Large et al. (2015a,b). Locations of the 182 black shale sam-ples and individual pyrite analyses used in this research are given in theSupplementary information of Large et al. (2015a) and the Phanerozoicdata are reproduced here as Table 2. All samples are black carbonaceousshales containing from 1 wt.% to 15 wt.% pyrite. The pyrite commonlyformed under variable anoxic to euxinic water columns, principally incontinental margin marine environments. Detailed sedimentologicalenvironmental data necessary for precise definition of the tectonic/sed-imentary setting of each sample is not available.
2.2. Determining selenium levels in Phanerozoic oceans
Levels of Se in the current oceans are between 60 and 120 ppt in sur-face water, and 200 ppt in deep waters (Sugimura et al., 1976). TE levelin seawater is robustly correlatedwith TE abundance in pyrite, based onsamples forming in the Cariaco Basin in Venezuela (Large et al., 2015a).Based on current Se levels in seawater of 155 ppt (http://www.mbari.org/chemsensor/summary.html) and the pyrite dataset presented inLarge et al. (2015a),which yields a geometricmean for Se inmodern py-rite from the Cariaco Basin (0.1Ma) of 132 ppm (n= 92), the followingrelationship can be generated:
Seawater Se ppt ¼ pyrite Se ppmð Þ=0:85:
This is a first order relationship that is unlikely to apply to all marineenvironments at all periods of ocean history. However it is the best es-timate available and is applicable to continental margin basins in thePhanerozoic, which is the dominant environment sampled in this study.
Please cite this article as: Long, J.A., et al., Severe selenium depletion in theGondwana Research (2015), http://dx.doi.org/10.1016/j.gr.2015.10.001
2.3. Selenium tolerance levels in extant organisms
Se is an essential TE for all animal life utilised in the formation of nec-essary anti-oxidising enzymes and selenoproteins. A selenium cycle in-volving bacteria, fungi and higher plants metabolising selenite andselenate was first proposed by Shrift (1964). Although not essential forplant growth, low concentrations improve growth, and some obligateplants hyperaccumulate Se with dry tissue containing from 1000 to10,000 ppm (Fan and Kizer, 1990). Se is utilised in the formation of theanti-oxidising enzymes glutathione peroxidase and thioredoxin reduc-tase. Selenocysteine, an amino acid containing Se, is found in both eukary-otes and prokaryotes, with aquatic organisms having larger andmore Se-dependent selenoproteomes, and inparticular all vertebrates, both terres-trial and aquatic, have large selenoproteomes (Thisse et al., 2003;Lobanov et al., 2007). Se can be used to accelerate growth in higher organ-isms, such as in sea bream larvae fed on Se-enriched rotifers (Kim et al.,2014). Se, however, is toxic if ingested in concentrations greater than5 ppm per day, and if livestock ingest plants containing 20–50 ppm thiscauses ‘alkali disease’ an acute form of Se poisoning (Fan and Kizer,1990). In high doses Se can also cause carcinostatic activity (Spallhoz,1994).
Dissolved organic selenides account for nearly 80% of dissolved Se inthe uppermost levels of seawater and represent the source of Se for phy-toplankton (Price and Harrison, 1988), of which 89% of oceanic diatomspecies require Se (Harrison et al., 1988). Within the food chain this inturn accounts for a large number of selenoproteins occurring in algaeand fishes. Plankton cultures deprived of Se in seawater for N5 days didnot recover even when Se was added afterwards (Fig. 1; Harrison et al.,1988). The study concluded that it was more difficult for these Se-dependent microorganisms to recover after exposure to Se depletionthan from exposure to nitrogen or phosphorus limitation. Similar resultsare found in Doblin et al. (1999) where three phytoplankton species(Gymnodinium catenatum, Alexandrium minutum, Chaetoceros cf.tenuissimus) showed rapid decline in Se deficient seawater, resulting incessation of cell division after eight weeks of Se depletion. Many otherstudies confirm the dependency of plankton on minimal levels of Se inseawater (e.g. Wheeler et al., 1982; Keller et al., 1984; Price et al., 1987).
Se, thus, has a narrowmargin of tolerance in biological systems (Fanand Kizer, 1990; Wang et al., 2012). Se levels at, or lower than, two or-ders ofmagnitude relative to current levels in current seawater stronglyretard phytoplankton growth (Harrison et al., 1988). Se requirements inmolluscs andfishes indicate lower limits for healthy growth that vary byone or two orders of magnitude (Hilton et al., 1980; Hamilton, 2004;Wang et al., 2012). Molluscs, such as abalone, have ingestion rangesfor Se tolerance around 1.4–9 ppm (Wang et al., 2012) and fishes haveSe tolerance ranges from 0.15 to 0.38 ppm (trout, Hilton et al., 1980)to 7 ppm (juvenile grouper, Lin and Shai, 2005). These data aresummarised in Fig. 1 and form the basis of our interpretation of past
Phanerozoic oceans as a factor in three global mass extinction events,

Fig. 1. Seleniumdeficiency in two common taxa of phytoplankton (diatoms, A, Chaetoceros; B, Thalassiosira),with transfers of subcultures from artificial seawater (ESAW)with Se added toartificial seawater with Se depleted. Note dramatic decrease after 250 h if threshold level for minimum selenium drops by 1–2 orders of magnitude for Thalassiosira pseudonana.From Harrison et al. (1988).
5J.A. Long et al. / Gondwana Research xxx (2015) xxx–xxx
oceanic levels reaching critically low in Se levels. We postulate that ex-treme levels of Se deficiency in the oceans in past times would havestressed a high proportion of the biota dependent upon Se, makingthem unable to make sufficient vital selenoproteins and enzymes. It is,however, difficult to quantify the exact magnitude of this effect on themarine food chain without more detailed taxon-specific knowledgeabout organismal tolerance levels.
3. Results
3.1. Se depletion and mass extinctions
The overall trend for Se levels observed throughout the Phanerozoicshows that, relative to modern levels, Se dropped dramatically in theoceans below critical thresholds during three mass extinction events atthe end of the Ordovician, Devonian, and Triassic (Figs. 2–6). Thesethree key biotic crises are further analysed and discussed in detail below.
3.2. End-Ordovician extinction event
The end-Ordovician extinction was a complex event that com-menced ~455 Ma and ended with two pulses, 445 Ma and 443 Ma,which were preceded by south pole glaciations (Harper et al., 2013).Dramatic changes in sea level coupled with tropical ocean cooling pos-sibly played a role in the extinctions (Finnegan et al., 2012), whileothers suggest euxinia and a sudden drop in oxygen caused the firstpulse, with transgression of anoxic water onto continental shelves driv-ing the second pulse (Hammerlund et al., 2012). The Se curve shows amassive drop in Se levels in pyrite from a peak at 523 Ma of 548 ppmSe (geometric mean), or 365 ppt for seawater Se using the concentra-tion factor outlined above (Fig. 3), to lows of around 2 ppm (Se in py-rite) equivalent to c. 1 ppt (seawater Se) by 455 Ma (Fig. 3), whichequates to approximately b1% of the level of current Se levels in themodern ocean, well within a Se-deficient zone based on known toler-ance levels for many extant marine organisms as discussed above. Sele-nium levels in pyrite then rise steeply into the Silurian.
The two end-Ordovician extinction pulses thus occur after twoprolonged pulses of Se depletion (Fig. 3). The first major extinctionsare documented as beginning in the later half of the second Se depletedphase (c. 457–449 Ma) with select families of brachiopods (Foliomeriaand Probosciambon faunas, early virgianid faunas, Fig. 3, labelled A,B) which decline from around 450–448 Ma (Sutcliffe et al., 2001). Ex-treme Se deficiency in the oceans fluctuated for about 13 Myr beforethe first major pulse of the extinction took effect, with the second,most severe pulse at the end of the Hirnantian only 2 Ma later(Harper et al., 2013). This extended phases of severe marine Se deple-tion at the end of Se cycle 1 (Fig. 2) would have made it difficult for
Please cite this article as: Long, J.A., et al., Severe selenium depletion in theGondwana Research (2015), http://dx.doi.org/10.1016/j.gr.2015.10.001
complex organisms with large selenoproteomes to survive, and thuscould have affected much of the marine food chain, with those speciesthat were more dependent on Se being the first to succumb. The greatOrdovician biodiversification event, which took place throughout theOrdovician, and peaked before the Katian (Servais et al., 2010), was ap-parently not affected by the Se depletion events at the end of the period.
3.3. Middle–Late Devonian extinction events
The Middle–Late Devonian extinctions fall into two pairs of pulsesstarting with the Taghanic and Frasne Crises (House, 2002; McGheeet al., 2013; McGhee, 2014), followed by two events near theFrasnian–Famennian boundary (Kellwasser event; Gereke andSchindler, 2012) and at the end of the Devonian (Hangenberg event;Sallan and Coates, 2010). The Mid-Givetian Taghanic Event (c.385Ma) is ranked as the 7thmost severe biotic crisis in the Phanerozoic,with some 71 families of marine invertebrates going extinct (McGheeet al., 2013). The Frasnian–Famennian Kellwasser event, dated at 373–374 Ma, saw widespread loss of marine species (13–40% loss at familylevel, 50–60% of all genera, 72–80% of all marine species lost; McGhee,2014). The Hangenberg event (c. 359 Ma) saw further extinctions,with some 50% of all vertebrate diversity lost (Sallan and Coates,2010). The Kellwasser event has been characterised by the spread ofoceanic anoxia (Riquier et al., 2006), but may have been restricted toepicontinetal shelf seas and not necessarily as widespread as previouslythought (George et al., 2014).
Analyses of bio-essential TE abundance (such as Co, Cu, Ni, Mn, Zn,Mo and Cd) through theDevonian show a trend of sequential deficiencyat staggered periods between 400 and 350Ma (Fig. 4A, 5). The sequenceof deficiency is Co (Emsian), Mn, Cu, Ni, Zn (Givetian), Mo and Se(Famennian) and Cd (Famennian–Tournasian). The sequential deficien-cy ismost likely related to redox potential and residence times of the re-spective TE. Co and Mn are the least soluble under oxidised conditions,with short residence times, whereas Se, Mo and Cd are themost solublewith longer residence times (Large et al., 2015a). Cu, Ni and Zn have in-termediate residence times. Thus, as global anoxia increased throughtheMiddle to Late Devonian, the TEwas drawn down sequentially. Ma-rine organisms not affected by the sequential deficiencies of Co, Cu, Niand Zn in the Emsian to Givetian, could have been affected by thepeak Mo, Se and Cd deficiencies in seawater over the Famennian toTournasianperiod. The cycling of Cd,Ni andZn in the oceans is intimate-ly tied to biogenic cycles (Armouroux et al., 2001), and Cu is associatedwith micronutrient cycles and a deep water scavenging process(Daniellson et al., 1985). Both Co andCd can substitute for Zn in diatomsin Zn depleted waters, so it has been suggested that in certain TE-impoverished conditions substitution by other trace metals ormetalloenzymes could be a common strategy for phytoplankton
Phanerozoic oceans as a factor in three global mass extinction events,

Fig. 2. Phanerozoic time chart showing geometric mean values of Se in pyrite defining five cycles of relative TE enrichment, bracketed by shorter periods of TE depletion (Large et al.,2015a). Three major mass extinction events correlate with extreme Se deficiency preceding times of very low global oxygen (boxes A, C, E). Two models for global oxygen levels(Falkowski et al., 2005; Berner, 2009) are plotted against Alroy's (2010, Fig. 7) marine biodiversity curve using global data. Major times of peak global oxygen labelled in green boxes,peak lows of Se and O2 in dark boxes. Major mass extinction events: E1, end Ordovician; E2, Frasnian–Famennian; Hangenberg; E3, Permo-Triassic; E4, end Triassic; E5, Cretaceous–Paleogene. Minor biotic crisis: Ta, Taghanic event; PETM, Paleocene–Eocene Thermal Maximum. IUGS time scale, v.2013/01, January 2013. (For interpretation of the references to colourin this figure legend, the reader is referred to the web version of this article.)
6 J.A. Long et al. / Gondwana Research xxx (2015) xxx–xxx
survival (Price and Morel, 1990). This strategy may not have been pos-sible at certain critical times based on our data, which shows overlap-ping periods of peak depletion for many elements.
Another observation arising from the Devonian Se chart (Fig. 4) isthe sudden drop at the end of the Emsian, c. 393 Ma. This corresponds
Fig. 3.Mass extinction events at the end Ordovicianwithmodelled levels of global oxygen(orange squares; Berner, 2009) and measured Se in pyrite (red diamonds, blue line) plot-tedwith Alroy's (2010)marine biodiversity curve (green line). Extinction pulses shown inred. The end Ordovician event, with diversity diagrams ofmajor groups of brachiopods (A,B) that begin to decline at around 450 Ma (Sutcliffe et al., 2001) just before the major ex-tinction pulses (P1, P2). (For interpretation of the references to colour in thisfigure legend,the reader is referred to the web version of this article.)
Please cite this article as: Long, J.A., et al., Severe selenium depletion in theGondwana Research (2015), http://dx.doi.org/10.1016/j.gr.2015.10.001
with another series of minor extinction event in the marine realm,where many vertebrate groups (most families of osteostracans,galeaspids, heterostracans, and several placoderm families) went ex-tinct (Long, 1993; Janvier, 1996) followed by two extinction pulseswhere guilds of invertebrates went extinct in the early and end-Eifelian (lower and upper Kacak events; McGhee et al., 2013).
Se has the longest period of deficiency, reaching its most depletedlevel at around 367 Ma, just following the Frasnian–Famennian event(Fig. 4A). Thiswas the time leading up to 370Ma that fish began breath-ing air (Clack, 2007; Clement and Long, 2010) and tetrapods, the firstvertebrates equipped to leave thewater and invade land, also appeared(Clack, 2014). Perhaps the collapse of the food chain resulting from thebiotic crises at this timewas a factor in tetrapods attempting to leave thewater and invade land, although complete tetrapod terrestriality wasnot achieved effectively until the Early Carboniferous (Long andGordon, 2004).
As SeO32− and SeO4
2− are relatively soluble under an oxygenated at-mosphere, they were likely drawn down as insoluble HSe− speciesthrough the long span of Frasnian–Famennian anoxia. This patterncould have been reversed by large inputs of oxygen from the rapid in-crease in terrestrial plant biomass over the Middle–Late Devonian(Algeo et al., 2001; Gibling and Davies, 2012). The evolution of second-ary growth in plants saw an increase in heights from around 2 m in theMiddle Devonian to large trees up to 20mby the Late Famennian (Algeoet al., 2001). Land coverage by plants increased from ~10% to ~30% atthis time and spread from lowland to also include upland habitats(Gibling and Davies, 2012). Both factors helped significantly increaseglobal plant biomass between the Mid–Late Devonian, and thus, alarge source of new atmospheric oxygen. We also note that massivesea floor exhalation frommid-ocean ridges and continentalmargins oc-curring as part of the Variscan orogeny from 356 to 345Ma accounts forfurther injection of nutrients into the oceans bringing about increasedmarine photosynthesis and thus more oxygen (Tornos, 2006).
Phanerozoic oceans as a factor in three global mass extinction events,

Fig. 4. (A) The Mid–Late Devonian extinction events with measured Se in pyrite curve (red diamonds, blue line), modelled global oxygen (orange squares and line, Berner, 2009) andAlroy's (2010) biodiversity curve (green line). Extinction events in red, minor biotic crisis are in orange (extinction zone as shaded red background): TE, Taghanic event; FE, Frasneevent; FF, Frasnian–Famennian event (Kellwasser); and HE, Hangenberg event (end Devonian). End Emsian extinctions (Long, 1993) are also here defined by a short, rapid Se decline.Examples of major vertebrate extinctions and events related to marine conditions: all placoderms (B), thelodonts (D), osteostracans (E), and in fact all armoured jawless fishes andmany osteichthyan families (e.g. onychodonts, C) went extinct at the end of the Devonian (HE event). From the Taghanic event onwards, fishes began to show adaptations for breathingair (Clement and Long, 2010), as seen here in the large spiracles of the osteolepid Gogonasus (F, Long et al., 2006; Clack, 2007). (For interpretation of the references to colour in this figurelegend, the reader is referred to the web version of this article.)
7J.A. Long et al. / Gondwana Research xxx (2015) xxx–xxx
3.4. End-Triassic extinction event
Extinctions at the endof the Triassic (c. 201Ma) includemajor lossesin both marine and terrestrial habitats and are ranked as the secondmost severe Phanerozoic biodiversity crisis. In the marine realm about20% of families and up to 50% of generawent extinct, including the icon-ic conodonts (Onoue et al., 2012). Terrestrial vertebrate extinctions in-cluded large archosaurs, except for dinosaurs, which paved the wayfor niche occupation by the dinosaur radiation in the Jurassic.
The event has been linked to the massive volcanic eruptions of theCentral Atlantic Magmatic Province that caused a rapid rise in atmo-spheric carbon dioxide and methane, with ensuing acidification andlocalised anoxia drivingmarine extinctions (Blackburn et al., 2013). As-teroid impacts have been invoked at this time based on the recognitionof shocked quartz (Bice et al., 1992), but dismissed as having only local-ised extinction effects (Onoue et al., 2012). Data from long chain n-alkanes preserved in fossil plants suggest a strong warming effect onland caused by increased greenhouse gases (Ruhl et al., 2011).
Our data imply extremely low Se levels in the ocean between 202and 190 Ma close to levels at the end of the Ordovician and Late Devo-nian as pyrite Se levels are about 2 orders of magnitude lower than inmodern ocean pyrite, and therefore a similar extinction mechanismcould have been operating as during these earlier mass extinctions(Fig. 6). Extremely low levels of Cd at 202–190 Ma are also lower thanat any other time in the Phanerozoic.
As mentioned above, the end-Triassic was also a time of increasingCO2 levels (Royer, 2006) and widespread high fire regimes (Belcheret al., 2010). One model shows O2 levels rising from around 10% PAL
Please cite this article as: Long, J.A., et al., Severe selenium depletion in theGondwana Research (2015), http://dx.doi.org/10.1016/j.gr.2015.10.001
at 205Ma to about 17% PAL by 190Ma (Falkowski et al., 2005), whereasanother shows O2 dropping from high levels at the end of the Triassic(23% PAL: c. 220Ma) to a peak low at around 180Ma of 14% PAL, follow-ed by a gradual rise (Berner, 2009). However, despite conflicting esti-mates of oxygen levels at this time, the rapid decline in marine Selevels is clear (Fig. 6) and might therefore have been a more significantfactor in the marine extinctions. Gaseous exchange of Se from phyto-plankton to the atmosphere has been proposed as a way in which thebiogenic cycle of oceanic Se can directly influence terrestrial Se levels(Armouroux et al., 2001), so could have affected the terrestrial foodchain.
4. Discussion
What caused severe Se and other TE depletions in the oceans isnot yet resolved, but theoretically explainable. High atmospheric ox-ygen levels increase oxidative erosion, releasingmore Se, Mo, Ni, andother TEs into the oceans (Large et al., 2014, 2015a,b). Increased nu-trients in the oceans drive increased biogenic productivity and con-sequently more burial of organic matter which further fuelsincreased oxygen production as a positive feedback loop (Largeet al., 2015a). As this regime continued, Se levels increased in theocean. Subsequently, lower atmospheric oxygen or higher sea-levelcover of land areameant less erosion due to less terrestrial oxidation,so lower amounts of TEs moved into the oceans. This caused rapiddrawdown of Se and certain other TEs, leading to levels fallingbelow critical thresholds necessary for sustaining most marine life.Based on the TE data the periods of minimum Se may have lasted
Phanerozoic oceans as a factor in three global mass extinction events,

Fig. 5.Patterns ofmean trace elements in pyrite through theDevonian. Blue arrows indicateminimumvalueswhere TEwas likely deficient in the oceans. Trace elementminima are shownto be sequential from Co in the Early Devonian to Se, Mo and Cd in the latest Devonian. (For interpretation of the references to colour in this figure legend, the reader is referred to thewebversion of this article.)
8 J.A. Long et al. / Gondwana Research xxx (2015) xxx–xxx
up to 10 Ma before rebound. Because of the low ocean productivityduring the Se minima, nutrient TE drawdown would have sloweddramatically; however, nutrient supply related to continental
Please cite this article as: Long, J.A., et al., Severe selenium depletion in theGondwana Research (2015), http://dx.doi.org/10.1016/j.gr.2015.10.001
erosion would be on-going. This resulted in a gradual build-up ofTEs in the ocean, activating a rebound of marine life and a conse-quent positive feedback of increased atmosphere oxygen. Thus, the
Phanerozoic oceans as a factor in three global mass extinction events,

9J.A. Long et al. / Gondwana Research xxx (2015) xxx–xxx
upturn in oxygen and Se and recovery from extinction conditionsmay have been a part of the ocean–atmosphere cycles.
Alternatively, the Se depletion cycles may have been broken byjumps in global oxygen from sudden major increases in plant biomass.In the Silurian, the primary invasion of land plants was widespread(Gibling and Davies, 2012). The Late Devonian saw a massive increasein land plant size from the predominantly mid-sized forms (around 2–3 m) in the Middle Devonian, to an abundance of tree-sized forms upto 20 m by the end Devonian, with plants occupying much larger landareas (Algeo et al., 2001). The end Triassic is also characterised bymajor increases in global CO2 associated with high floristic turnover(Belcher et al., 2010). Thus, in each of the three extinction scenarios itwas possible that the increase of atmospheric oxygen supplied by in-creasing plant biomass could have been the significant factor in break-ing the anoxia-Se cycle and restoring balance to the marine TE cycle.
The new data also fit well with the current explanation for the massextinction event at the end of the Permian caused by massive volcaniceruptions (Table 1), where major marine extinctions are not related toanomalous TE levels (Knoll et al., 2007). There are also several Se deple-tion events prior to the major K–Pg boundary extinctions at 66 Ma. Wefind no evidence in the fossil record to suggest that these depletions hadany major effect on marine ecosystems at the time, although we notethat the combination of low Se levels with low oxygen (Falkowskiet al., 2005) was only attained during the other three prior mass extinc-tion events that we have discussed (Fig. 2). The global extinction of ich-thyosaurs around 93 Ma (Bardet, 1992) might potentially reflect thebeginning of changes to the marine food chain caused by such effectsor simply be an artefact of poor sampling (Benson et al., 2009).
5. Conclusions
We suggest that depletion of essential TEs (in particular Se) to po-tentially lethal levels is shown to be highly correlated with, and a likelycontributing factor to, at least three mass extinction events in the ma-rine realm, in association with a range of other environmental factorssuch as increasing/decreasing global oxygen and carbon dioxide levels,euxinia andmajor eustatic sea level changes in the oceans. Increased at-mospheric oxidation increased oxidative erosion, releasing more Se,Mo, Ni, and other TEs into the oceans. Increased nutrients in the oceansdrove increased biogenic productivity and consequently more burial of
Fig. 6. The end Triassic extinction event (ETE) showing two modelled oxygen curves(orange squares and lines, Berner, 2009; orange curved line, Falkowski et al., 2005), mea-sured Se in pyrite curve (red diamonds, blue line), modelled carbon dioxide levels (browncurve, Ruhl et al., 2011) and Alroy's (2010) biodiversity curve (green line). Note the sud-den decline in Se here marks the timing of the main extinction event well before oxygenreaches its peak low. (For interpretation of the references to colour in this figure legend,the reader is referred to the web version of this article.)
Please cite this article as: Long, J.A., et al., Severe selenium depletion in theGondwana Research (2015), http://dx.doi.org/10.1016/j.gr.2015.10.001
organic matter which further fuelled increased oxygen production as apositive feedback loop. As this regime continued, Se levels increased inthe ocean. Increased global anoxia in the oceans caused rapid draw-down of Se and certain other TEs. Lower atmospheric oxygen or highersea-level cover of land areameant less erosion due to less terrestrial ox-idation, so lower amounts of TEs flowed back into the oceans, leading tolevels falling below critical thresholds necessary for a high percentage ofmarine life. The cycle was broken by sudden changes in oxygen levels,perhaps as result of rapid recovery by increased biomass of plants onland responding to higher CO2 levels or by invading more land area, aswas the case at each of the three mass extinction events.
The new data also fit well with the current explanation for the massextinction event at the end of the Permian (Table 1), where major ma-rine extinctions are not seen to have been related to anomalous TElevels. We have no Se data across the Cretaceous–Paleogene boundary,so cannot make any comment here.
Our hypothesis is based on a 3.5 billion year history of trace elementabundance in the oceans, but now needs further refinement from addi-tional data, not only from pyrite samples filling in temporal gaps in ourdatabase, but also on minimal Se and other essential TE requirementsacross a wider range of living organisms to develop and test models ofecosystem collapse under times of severe TE oceanic depletion.
Acknowledgements
For general discussion, or commenting on sections of the draft MS,we thank Dr. Gavin Prideaux (Flinders University), Prof Peter Ward(University of Adelaide) and Dr Jim Gehling (SA Museum). Analysis ofsedimentary pyrite used in this study was completed by ElenaLounejeva, Dan Gregory and Charles Makoundi. JAL's involvement inthis research was supported by Flinders University's strategic professorfund. RRL, LD and JAH are supported by the Australian Research Council(DP 150102578) and the University of Tasmania.
References
Algeo, T.J., Schheckler, S.E., Maynard, J.B., 2001. Effects of Middle to late Devonian spreadof vascular land plants and weathering regimes. In: Gensel, P.G., Edwards, D. (Eds.),Plants Invade the Land. Columbia University Press, NY, pp. 213–237.
Alroy, J., 2010. Geographical, environmental and intrinsic biotic controls on Phanerozoicmarine diversification. Palaeontology 53, 1211–1235.
Armouroux, D., Liss, P.S., Tessier, E., Hamren-Larson, M., Donard, O.F.X., 2001. Role ofoceans as biogenic sources of selenium. Earth and Planetary Science Letters 189,277–283.
Bardet, N., 1992. Stratigraphic evidence for the extinction of ichthyosaurs. Terra Nova 4,649–656.
Belcher, C.M., Mander, L., Rein, G., Jervis, F.X., Haworth, M., Hesselbo, S.P., Glasspool, I.J.,McElwain, J.C., 2010. Increased fire activity at the Triassic/Jurassic boundary in Green-land due to climate-driven floral change. Nature Geoscience 3, 426–429.
Benson, R.B.J., Butler, R.J., Lindgren, J., Smith, A.S., 2009. Mesozoic marine tetrapod diver-sity: mass extinctions and temporal heterogeneity in geological megabiases affectingvertebrates. Proceedings of the Royal Society of London B 272, 829–834.
Benton, M., Twitchett, J., 2003. How to kill (almost) all life: the end Permian extinctionevent. Trends in Ecology and Evolution 18, 358–365.
Berner, R.A., 2009. Phanerozoic atmospheric oxygen: new results using the GEOCARBSULFmodel. American Journal of Science 309, 603–606.
Bice, D.M., Newton, C.R., McCaughley, S.M., et al., 1992. Shocked quartz at the Triassic–Ju-rassic boundary in Italy. Science 255, 443–446.
Blackburn, T.J., Olsen, P.E., Bowring, S.A., et al., 2013. Zircon U–Pb geochronology links theend-Triassic extinction with the Central Atlantic Magmatic Province. Science http://dx.doi.org/10.1126/science.12134204.
Brezinski, D.K., Blaine cecil, C., Skema, V.W., Stamm, R., 2008. Late Devonian glacial de-posits from the eastern United States signal an end of the mid−Paleozoic warm pe-riod. Palaeogeography, Palaeoclimatology, Palaeoecology 268, 143–151.
Charlet, L., Kang, M., Bardelli, F., Kirsch, R., Géhin, A., Grenèche, J.M., Chen, F., 2012. Nano-composite pyrite–greigite reactivity toward Se(IV)/Se(VI). Environmental Science &Technology 46, 4869–4876.
Clack, J.A., 2007. Devonian climate change, breathing, and the origin of the tetrapod stemgroup. Integrative and Comparative Biology 47, 510–523.
Clack, J.A., 2014. Gaining Ground. Indian University Press.Clement, A., Long, J.A., 2010. Air-breathing adaptation in a marine Devonian lungfish. Bi-
ology Letters 6, 509–512.Cutter, G.A., 1989. The estuarine behaviour of selenium in San Francisco Bay. Estuarine,
Coastal and Shelf Science 28, 13–34.
Phanerozoic oceans as a factor in three global mass extinction events,

10 J.A. Long et al. / Gondwana Research xxx (2015) xxx–xxx
Cutter, G.A., Bruland, K.W., 1984. The marine biogeochemistry of selenium: a re-evaluation. Limnology & Oceanography 29, 1179–1192.
Cutter, G.A., Cutter, L.S., 1995. Behavior of dissolved antimony, arsenic, and selenium inthe Atlantic Ocean. Marine Chemistry 49, 295–306.
Daniellson, L.-G., Magnusson, B., Westerlund, S., 1985. Cadmium, copper, iron, nickel andzinc in the north-east Atlantic Ocean. Marine Chemistry 17, 23–41.
Diener, A., Neumann, T., Kramar, U., Schild, D., 2012. Structure of selenium incorporated inpyrite and mackinawite as determined by XAFS analyses. Journal of Contaminant Hy-drology 133, 30–39.
Doblin, M.A., Blackburn, S.I., Hallegraeff, G.M., 1999. Comparative study of selenium re-quirements of three phytoplankton species: Gymnodinium catenatum, Alexandriumminutum (Dinophyta) and Chaetoceros cf. tenuissiumus (Bacillarophyta). Journal ofPlankton Research 21, 1153–1169.
Eisler, R., 2000. Selenium. Handbook of Chemical Risk Assessment: Health Hazards toHumans, Plants and Animals vol. 3. Lewis Publishers, CRC Press, Boca Raton, FL,pp. 1649–1705.
Falkowski, P.G., Katz, M.E., Millegan, A.J., Fennel, K., Cramer, B.S., Aubry, M.P., Berner, R.A.,Novacek, M.J., Zapol, W.M., 2005. The rise of oxygen over the past 205 million yearsand the evolution of large placental mammals. Science 309, 2202–2204.
Fan, A.M., Kizer, K.W., 1990. Selenium — nutritional, toxicologic and clinical aspects.Western Journal of Medicine 153, 160–167.
Finnegan, S., Heim, N.A., Peters, S.E., Fischer, W.W., 2012. Climate change and selectivesignature of the late Ordovician mass extinction. Proceedings of the National Acade-my of Sciences of the United States of America 109, 6829–6834.
Fordyce, F., 2007. Selenium geochemistry and health. Ambio 36, 94–97.George, A.D., Chow, N., Trinajstic, K.M., 2014. Oxic facies and the Late Devonian mass ex-
tinction, Canning Basin, Australia. Geology http://dx.doi.org/10.1130/G35249.1.Gereke, M., Schindler, E., 2012. “Time-specific facies” and biological crisis — the
Kellwasser event interval near the Frasnian/Famennian boundary (Late Devonian).Palaeogeography, Palaeoclimatology, Palaeoecology 367–368, 19–29.
Gibling, M.R., Davies, N.S., 2012. Palaeozoic landscapes shaped by plant evolution. NatureGeoscience 5, 99–105.
Hamilton, S.J., 2004. Review of selenium toxicity in the aquatic food chain. Science of theTotal Environment 326, 1–31.
Hammerlund, E.U., Dahl, T.W., Harper, D.A.T., et al., 2012. A sulfidic driver for the end Or-dovician mass extinction. Earth and Planetary Science Letters 331–332, 128–139.
Harper, D.A.T., Hammarlund, E.U., Rasmussen, C.M.Ø., 2013. End Ordovician extinctions: acoincidence of causes. Gondwana Research 25, 1294–1307.
Harrison, P.J., Yu, P.W., Thompson, P.A., et al., 1988. Survey of selenium requirements inmarine phytoplankton. Marine Ecology Progress Series 47, 89–96.
Herring, J.R., 1991. Selenium geochemistry—a conspectus. US Geological Survey Circular1064, 7–23.
Hilton, J.W., Hodson, P.V., Slinger, S.J., 1980. The requirements and toxicity of selenium inrainbow trout (Salmo gairdneri). Journal of Nutrition 110, 2527–2535.
House, M., 2002. Strength, timing, setting and cause of mid Palaeozoic extinctions.Palaeogeography, Palaeoclimatology, Palaeoecology 181, 5–25.
Janvier, P., 1996. Early Vertebrates. Oxford University Press (393 pp.).Keller, M., Guillard, R.R.L., Provasoli, L., Pintner, I.J., 1984. Nutrition of some marine
ultraplankton clones from the Sargasso Sea. Eos 65, 898.Kharkar, D.P., Turekian, K.K., Bertine, K.K., 1968. Stream supply of dissolved silver, molyb-
denum, antimony, selenium, chromium, cobalt, rubidium and cesium to the oceans.Geochimica et Cosmochimica Acta 32, 285–298.
Kim, H.-J., Sakakura, Y., Maruyama, I., Nakamura, T., takiyama, K., Fujiki, H., Hagiwara, A.,2014. Feeding effect of selenium enriched rotifers on larval growth and developmentin red sea bream Pagrus major. Aquaculture 432, 273–277.
Klasing, K.C., 1998. Comparative Avian Nutrition. Oxford University Press, New York.Knoll, A.H., Bambach, R.K., Payne, J.L., Pruss, S., Fischer, W.W., 2007. Paleophysiology and
end-Permian mass extinction. Earth and Planetary Science Letters 256, 295–313.Kulp, T.R., Pratt, L.M., 2004. Speciation and weathering of selenium in Upper Cretaceous
chalk and shale from South Dakota andWyoming, USA. Geochimica et CosmochimicaActa 68, 3687–3701.
Large, R.R., Halpin, J.A., Danyushevsky, L.V., Maslennikov, V.V., Bull, S.W., Long, J.A.,Gregory, D.D., Lounejeva, E., Lyons, T.W., Sack, P.J., McGoldrick, P.J., Calver, C.R.,2014. Trace element content of sedimentary pyrite as a new proxy for deep-timeocean–atmosphere evolution. Earth Planet Science Letters. 389, 209–220.
Large, R.R., Halpin, J.A., Lounejeva, E., Danyushevsky, L.V., Maslennikov, V.V., Lottermoser,B.G., Sack, P.J., Haines, P.W., Long, J.A., Makoundi, C., 2015a. Selenium and cobalt insedimentary pyrite reveal Phanerozoic cycles of Earth's oxygenation. Gondwana Re-search http://dx.doi.org/10.1016/j.gr.2015.06.004.
Large, R.R., Gregory, D.D., Steadman, J.A., Tomkins, A.G., Lounejeva, E., Danyushevsky, L.V.,Halpin, J.A., Maslennikov, V.V., Sack, P.J., Mukherjee, I., Berry, R., Hickman, A., 2015b.Gold in the oceans through time. Earth and Planetary Science Letters 428, 139–150.
Lin, Y.H., Shai, S.Y., 2005. Dietary selenium requirements of juvenile grouper, Epinephelusmalabaricus. Aquaculture 250, 356–363.
Lobanov, A.V., Fomenko, D.E., Zhang, Y., Sengupta, A., Hatfield, D.L., Gladyshev, V.N., 2007.Evolutionary dynamics of eukaryotic selenoproteomes: large selenoproteomes may
Please cite this article as: Long, J.A., et al., Severe selenium depletion in theGondwana Research (2015), http://dx.doi.org/10.1016/j.gr.2015.10.001
associate with aquatic life and small with terrestrial life. Genome Biology 8, R198.http://dx.doi.org/10.1186/gb-2007-8-9-r198.
Long, J.A., 1993. Early–Middle Palaeozoic vertebrate extinction events. In: Long, J. (Ed.),Palaeozoic Vertebrate Biostratigraphy and Biogeography. Belhaven Press, London,pp. 54–63.
Long, J.A., Gordon, M., 2004. The greatest step in vertebrate history: a paleobiological re-view of the fish–tetrapod transition. Physiological and Biochemical Zoology 77 (5),700–719.
Long, J.A., Young, G.C., Holland, T., Senden, T.J., Fitzgerald, E.M.G., 2006. An exceptional De-vonian fish from Australia sheds light on tetrapod origins. Nature 444, 199–202.
McGhee Jr., G.R., 2014. When the Invasion of Land Failed. The Legacy of the Devonian Ex-tinctions. Columbia University Press, New York (317 pp.).
McGhee Jr., G.R., Clapham,M.E., Sheehan, P.M., et al., 2013. A newecological-severity rank-ing ofmajor Phanerozoic biodiversity crises. Palaeogeography, Palaeoclimatology, Pa-laeoecology 370, 260–270.
Mertz, W., 1957. The essential trace elements. Science 213, 1332–1338.Mitchell, K., Mason, P.R.D., Van Cappellan, P., Johnson, T.M., Gill, B.C., Owens, J.D., Diaz, J.,
Ingall, E.D., Reichart, G.-J., Lyons, T.W., 2012. Selenium as paleo-oceanographic proxy:a first assessment. Geochimica et Cosmochimica Acta 89, 302–317.
Nakaguchi, Y., Mitsuhashi, Y., Kitahata, K., Fujita, A., Sumiyoshi, A., Kawai, Y., 2008. Seleni-um speciation in the eastern tropical and subtropical South Pacific Ocean. Science andTechnology 21, 25–33.
Neal, R.H., Sposito, G., Holtzclaw, K.M., Traina, S.J., 1987. Selenite adsorption on alluvialsoils: I. Soil composition and pH effects. Soil Science Society of America Journal 51,1161–1165.
Onoue, T.S., Sato, H., Nakamura, T., et al., 2012. Deep-sea record of impact apparently un-related to mass extinction in the Late Triassic. Proceedings of the National Academyof Sciences of the United States of America 109, 19134–19139.
Plant, J.A., Korre, A., Reeder, S., Smith, B., Voulboulis, N., 2005. Chemicals in the environ-ment: implications for global sustainability. Transactions of the Institution of Miningand Metallurgy Section B: Applied Earth Science 114, B65–B97.
Price, N.M., Harrison, P.J., 1988. Specific selenium-containing macromolecules in the ma-rine diatom Thalassiosira pseudonana. Plant Physiology 86, 192–199.
Price, N.N., Morel, F.M.M., 1990. Cadmium and cobalt substitute for zinc in a marine dia-tom. Nature 344, 658–660.
Price, N.M., Thompson, P.A., Harrison, P.J., 1987. Selenium: an essential element forgrowth of the coastal marine diatom Thalassiosira pseudonana (Bacillariophyceae).Journal of Phycology 23, 1–9.
Riquier, L., Tribovillard, N., Averbuch, O., Devleeschouwer, X., Riboulleau, A., 2006. TheLate Frasnian Kellwasser horizons of the Harz Mountains (Germany): two oxygen-deficient periods resulting from different mechanisms. Chemical Geology 233(1–2), 137–155.
Royer, D.L., 2006. CO2-forced climate thresholds during the Phanerozoic. Geochimica etCosmochimica Acta 70, 5665–5675.
Ruhl, M., Bonis, N.R., Reichart, G.-J., Sinninghe Damste, J.S., Kurschener, W.M., 2011. Atmo-spheric carbon injection linked to end-Triassic mass extinction. Science 333,430–433.
Ryser, A.L., Strawn, D.G., Marcus, M.A., Johnson-Maynard, J.L., Gunter, M.E., Möller, G.,2005. Micro-spectroscopic investigation of selenium-bearing minerals from theWestern US phosphate resource area. Geochemical Transactions 6, 1–11.
Sallan, L.C., Coates, M.C., 2010. End-Devonian extinction and a bottleneck in the early evo-lution of modern jawed vertebrates. Proceedings of the National Academy of Sciencesof the United States of America 107, 10131–10136.
Servais, T., Owen, A.W., Harper, D.A.T., Kröger, B., Munnecke, A., 2010. The great Ordovicianbiodiversification event (GOBE): the palaeoecological dimension. Palaeogeography,Palaeoclimatology, Palaeoecology 294, 99–119.
Shrift, A., 1964. A selenium cycle in nature? Nature 201, 1304–1305.Spallhoz, J.E., 1994. On the nature of selenium toxicity and carcinostatic activity. Free Rad-
ical Biology and Medicine 17, 45–64.Sugimura, Y., Suzuki, Y., Miyake, Y., 1976. The content of selenium and its chemical form
in sea water. Journal of the Oceanographical Society of Japan 32, 235–241.Sutcliffe, O.E., Harper, D.A.T., Salem, A., Whittington, R.J., Craig, J., 2001. The development
of an atypical Hirnantia-brachiopod fauna and the onset of glaciation in the late Or-dovician of Gondwana. Transactions of the Royal Society of Edinburgh: Earth Sciences92, 1–14.
Thisse, C., Degraves, A., Kryukov, G.V., et al., 2003. Spatial and temporal expression pat-terns of selenoprotein genes during embryogenesis in zebrafish. Gene ExpressionPatterns 3, 525–532.
Tornos, F., 2006. Environment of formation and styles of volcanogenic massive sulfides:the Iberian Pyrite Belt. Ore Geology Reviews 28, 259–307.
Wang, W., Mai, K.M., Zhang, W., 2012. Dietary selenium requirement and its toxicity injuvenile abalone Haliotis discus hannai Ino. Aquaculture 330–333, 42–46.
Wheeler, A.E., Zingaro, R.A., Irgolic, K., Bottino, N.R., 1982. The effect of selenate, seleniteand sulphate on the growth of six unicellular green algae. Journal of ExperimentalMarine Biology and Ecology 57, 181–194.
Phanerozoic oceans as a factor in three global mass extinction events,


