Embed Size (px)
Citation preview

Seven Years of Membranes: Feature Paper 2017
Spas D. Kolev
www.mdpi.com/journal/membranes
Edited by
Printed Edition of the Special Issue Published in Membranes

Seven Years of Membranes: Feature Paper 2017


Seven Years of Membranes: Feature Paper 2017
Special Issue Editor
Spas D. Kolev
MDPI • Basel • Beijing • Wuhan • Barcelona • Belgrade

Special Issue Editor
Spas D. Kolev
University of Melbourne
Australia
Editorial Office
MDPI
St. Alban-Anlage 66
Basel, Switzerland
This is a reprint of articles from the Special Issue published online in the open access journal
Membranes (ISSN 2077-0375) from 2017 to 2018 (available at: http://www.mdpi.com/journal/
membranes/special issues/membr feature paper 2017)
For citation purposes, cite each article independently as indicated on the article page online and as
indicated below:
LastName, A.A.; LastName, B.B.; LastName, C.C. Article Title. Journal Name Year, Article Number,
Page Range.
ISBN 978-3-03842-991-3 (Pbk)
ISBN 978-3-03842-992-0 (PDF)
Articles in this volume are Open Access and distributed under the Creative Commons Attribution
(CC BY) license, which allows users to download, copy and build upon published articles even for
commercial purposes, as long as the author and publisher are properly credited, which ensures
maximum dissemination and a wider impact of our publications. The book taken as a whole isc© 2018 MDPI, Basel, Switzerland, distributed under the terms and conditions of the Creative
Commons license CC BY-NC-ND (http://creativecommons.org/licenses/by-nc-nd/4.0/).

Contents
About the Special Issue Editor . . . . . . . . . . . . . . . . . . . . . . . . . . . . . . . . . . . . . . vii
Preface to ”Seven Years of Membranes: Feature Paper 2017” . . . . . . . . . . . . . . . . . . . . ix
Yanfei Liu, Tonghu Xiao, Chenghuan Bao, Jifei Zhang and Xing Yang
Performance and Fouling Study of Asymmetric PVDF Membrane Applied in the Concentrationof Organic Fertilizer by Direct Contact Membrane Distillation (DCMD)Reprinted from: Membranes, 2018, 8, 9, doi: 10.3390/membranes8010009 . . . . . . . . . . . . . . 1
Tiziana Marino, Francesca Russo, Lina Rezzouk, Abderrazak Bouzid and Alberto Figoli
PES-Kaolin Mixed Matrix Membranes for Arsenic Removal from WaterReprinted from: Membranes, 2017, 57, , doi: 10.3390/membranes7040057 . . . . . . . . . . . . . . 14
Juliana I. Clodt, Volkan Filiz and Sergey Shishatskiy
Perfluorinated Compounds as Test Media for Porous MembranesReprinted from: Membranes, 2017, 7, 51, doi: 10.3390/membranes7030051 . . . . . . . . . . . . . . 29
Francois-Marie Allioux, Oana David, Miren Etxeberria Benavides, Lingxue Kong,
David Alfredo Pacheco Tanaka and Ludovic F. Dumee
Preparation of Porous Stainless Steel Hollow-Fibers through Multi-Modal Particle Size Sinteringtowards Pore EngineeringReprinted from: Membranes, 2017, 7, 40, doi: 10.3390/membranes7030040 . . . . . . . . . . . . . . 41
Joerg Winter, Benoit Barbeau and Pierre Berube
Nanofiltration and Tight Ultrafiltration Membranes for Natural Organic MatterRemoval—Contribution of Fouling and Concentration Polarization to Filtration ResistanceReprinted from: Membranes, 2017, 7, 34, doi: 10.3390/membranes7030034 . . . . . . . . . . . . . . 56
Jochen A. Kerres and Henning M. Krieg
Poly(vinylbenzylchloride) Based Anion-Exchange Blend Membranes (AEBMs): Influence ofPEG Additive on Conductivity and StabilityReprinted from: Membranes, 2017, 7, 32, doi: 10.3390/membranes7020032 . . . . . . . . . . . . . . 70
Mohammed Kadhom, Weiming Hu and Baolin Deng
Thin Film Nanocomposite Membrane Filled with Metal-Organic Frameworks UiO-66 andMIL-125 Nanoparticles for Water DesalinationReprinted from: Membranes, 2017, 7, 31, doi: 10.3390/membranes7020031 . . . . . . . . . . . . . . 94
Gisela Bengtson, Silvio Neumann and Volkan Filiz
Membranes of Polymers of Intrinsic Microporosity (PIM-1) Modified by Poly(ethylene glycol)Reprinted from: Membranes, 2017, 7, 28, doi: 10.3390/membranes7020028 . . . . . . . . . . . . . . 110
Xuezhong He
Fabrication of Defect-Free Cellulose Acetate Hollow Fibers by Optimization ofSpinning ParametersReprinted from: Membranes, 2017, 7, 27, doi: 10.3390/membranes7020027 . . . . . . . . . . . . . . 131
Alejandro Ruiz-Garcıa, Noemi Melian-Martel and Ignacio de la Nuez
Short Review on Predicting Fouling in RO DesalinationReprinted from: Membranes, 2017, 7, 62, doi: 10.3390/membranes7040062 . . . . . . . . . . . . . . 140
v

Armineh Hassanvand, Kajia Wei, Sahar Talebi, George Q. Chen and Sandra E. Kentish
The Role of Ion Exchange Membranes in Membrane Capacitive DeionisationReprinted from: Membranes, 2017, 7, 54, doi: 10.3390/membranes7030054 . . . . . . . . . . . . . . 157
Patrizia Formoso, Elvira Pantuso, Giovanni De Filpo and Fiore Pasquale Nicoletta
Electro-Conductive Membranes for Permeation Enhancement and Fouling Mitigation:A Short ReviewReprinted from: Membranes, 2017, 7, 39, doi: 10.3390/membranes7030039 . . . . . . . . . . . . . . 180
vi

About the Special Issue Editor
Spas D. Kolev, PhD, FRACI, is a Professor in the School of Chemistry at the University of Melbourne.
His research is focused mainly in the areas of membrane-based separation and flow analysis
techniques. He has co-authored 195 refereed articles, four book chapters, and he has co-edited
a book. He has received a number of prestigious awards: the Ronald Belcher Memorial Award
from the journal Talanta (1988), the Lloyd Smythe Medal (2009) and the Environmental Chemistry
Medal (2017) from the Analytical and Environmental Chemistry Division of the Royal Australian
Chemical Institute, the Medal of the Japanese Association for Flow Injection Analysis (2010), the
Grimwade Prize in Industrial Chemistry from the University of Melbourne (2012), and the Max
O’Connor Prize for Chemistry from La Trobe University (2017). He is the Founding Editor-in-Chief
of the journal Membranes, Co-Editor-in-Chief of the Journal of Chemical Sciences, and a member
of the Editorial/Advisory Boards of Analytica Chimica Acta, Talanta, Environmental Modeling and
Assessment, Sensors, Challenges, and the International Journal of Analytical Chemistry.
vii


Preface to ”Seven Years of Membranes:
Feature Paper 2017”
For the last seven years Membranes has provided an outstanding platform for the publication of articles at the forefront of research in the areas of membrane fabrication, characterization and application. This Special Issue, entitled “Seven Years of Membranes: Feature Paper 2017,” celebrates this achievement. The articles included in it, by prominent researchers in the field, provide an authoritative and up-to-date account of advances in membrane science and technology. They describe new methods for the fabrication of organic, inorganic and mixed matrix membranes and their utilization in improving the efficiency of membrane-based separation processes, such as membrane distillation, nanofiltration, ultrafiltration, reverse osmosis, and gas permeation. A number of articles are focused on water treatment, which, because of its significance to sustainable development, is one of the main areas of membrane research and application. These articles report novel techniques for the clean-up of contaminated waters, and the desalination of industrial effluents, brackish water and seawater.
Spas D. Kolev
Special Issue Editor
ix


membranes
Article
Performance and Fouling Study of Asymmetric PVDFMembrane Applied in the Concentration of OrganicFertilizer by Direct Contact MembraneDistillation (DCMD)
Yanfei Liu 1, Tonghu Xiao 1,*, Chenghuan Bao 1, Jifei Zhang 1 and Xing Yang 2,*
1 Faculty of Materials Science and Chemical Engineering, Ningbo University, Ningbo 315211, China;[email protected] (Y.L.); [email protected] (C.B.); [email protected] (J.Z.)
2 College of Engineering and Science, Victoria University, P.O. Box 14428, Melbourne, VIC 8001, Australia* Correspondence: [email protected] (T.X.); [email protected] (X.Y.);
Tel.: +86-136-8589-2736 (T.X.); +61-9919-7690 (X.Y.)
Received: 11 January 2018; Accepted: 13 February 2018; Published: 16 February 2018
Abstract: This study proposes using membrane distillation (MD) as an alternative to the conventionalmulti-stage flushing (MSF) process to concentrate a semi-product of organic fertilizer. By applyinga unique asymmetric polyvinylidene fluoride (PVDF) membrane, which was specifically designed forMD applications using a nonsolvent thermally induced phase separation (NTIPS) method, the directcontact membrane distillation (DCMD) performance was investigated in terms of its sustainability inpermeation flux, fouling resistance, and anti-wetting properties. It was found that the permeationflux increased with increasing flow rate, while the top-surface facing feed mode was the preferredorientation to achieve 25% higher flux than the bottom-surface facing feed mode. Compared to thecommercial polytetrafluoroethylene (PTFE) membrane, the asymmetric PVDF membrane exhibitedexcellent anti-fouling and sustainable flux, with less than 8% flux decline in a 15 h continuousoperation, i.e., flux decreased slightly and was maintained as high as 74 kg·m−2·h−1 at 70 ◦C.Meanwhile, the lost flux was easily recovered by clean water rinsing. Overall 2.6 times concentrationfactor was achieved in 15 h MD operation, with 63.4% water being removed from the fertilizersample. Further concentration could be achieved to reach the desired industrial standard of 5xconcentration factor.
Keywords: direct contact membrane distillation; asymmetric PVDF membrane; concentration oforganic fertilizer; anti-fouling
1. Introduction
Livestock manure and crop straw have been used as fertilizer as they are rich in nitrogen,phosphorus, and organic matter that can improve the physical and chemical properties of soil andprovide nutrients essential to crops [1]. However, such fertilizers need to be concentrated to a certainlevel, i.e., at least 3–5 times concentration from an initial organic content of 3%, to achieve the desirednutrient strength. Currently, several technologies have been applied in industry to concentrateliquid fertilizers, such as multistage flash distillation (MSF), multiple-effect distillation (MED),or reverse osmosis (RO). Both MSF and MED plants are known to be inefficient, energy-intensive, andland-consuming [2]. The major limitation of RO in such applications is its relatively low water removal(~35%) due to the high osmotic pressure limited by the concentration effect and thus the low overallconcentration factor (<1.0) [3,4]. Also, RO is highly susceptible to membrane fouling [5].
Membrane distillation (MD) is an alternative emerging technology that combines the comparativeadvantages of thermal distillation and membrane processes and involves the transport of water vapor
Membranes 2018, 8, 9 1 www.mdpi.com/journal/membranes

Membranes 2018, 8, 9
across a microporous hydrophobic membrane [6,7]. The driving force of MD is supplied by the vaporpressure difference generated by the temperature gradient imposed between the liquid/vapor interfaces [8].Compared to other separation processes, MD has many advantages [9]. It exhibits a complete rejection ofdissolved, non-volatile species, and lower (ambient) operating pressure than the pressure-driven membraneprocesses. Highly saturated solutions can be treated in MD [10]. Meanwhile, MD has the potential toachieve a high concentration factor while operating at low temperature differences that are achievable usingwaste-grade waste heat [11] or a renewable energy source, such as solar and geothermal energy [12,13].MD has the potential to concentrate and recover valuable resources. For example, MD has been widelyinvestigated for desalination [14], concentration of juices [15], crystallization of minerals [16], recoveryof volatiles such as nitrogen [17], and waste water purification [18] and treatment [19] in recent years.However, the concentration of organic fertilizer using MD has not been studied thus far, where abundantwaste heat (70–80 ◦C) will be available from the fertilizer production process [20].
Although MD has great potential for treating highly concentrated solutions, membrane fouling inMD is inevitable in the treatment of real industrial effluents [21]. Fouling results in a decrease in membranepermeability due to a deposition of suspended or dissolved substances, including organic and inorganiccomponents, on the membrane surface and within its pores, reducing the effective vapor transportarea and causing potential pore wetting problems that are detrimental to MD performance [22]. In thedewatering process of aqueous solutions such as juice [23] and RO brines [24], the occurrence of fouling onthe MD membrane surface is highly possible but this aspect has not been thoroughly investigated [21].Fouling control in MD lies in the process operating strategies (i.e., hydrodynamics) [25] and membraneproperties [26] (i.e., surface roughness and hydrophobicity, etc.). In particular, the development of suitableMD membranes for sustaining the concentration processes is desirable. The long-term stability of themembranes in terms of deterioration of hydrophobicity and pore wetting needs to be resolved. To date, nocommercial membranes with superior anti-fouling have been specifically developed for MD applications.Overall, the implementation of MD on an industrial scale is limited by the availability of robust membranes.
Recent studies showed that most of the MD membranes currently used are fabricated for otherprocesses, such as microfiltration (MF), due to the similar hydrophobic nature and the microporousstructure [27]. The desired MD performance with high permeability, long-term stability, and highenergy efficiency is typically associated with the following membrane characteristics: a relatively smallmaximum pore size, the highest possible porosity, a narrow pore size distribution with a high degreeof pore interconnectivity, and good anti-wetting properties with high liquid entry pressure of water(LEPw) [28,29]. The membrane properties directly affect the membrane performance and, therefore,an optimized membrane specifically designed for MD is vital for implementing industrial applications [27].Common membrane materials include poly (vinylidene fluoride) (PVDF), which is widely used forfabricating MD membranes via various fabrication methods, such as conventional nonsolvent inducedphase separation (NIPS) [30] and thermally induced phase separation (TIPS) [31], as well as the recentlyproposed nonsolvent thermally induced phase separation (NTIPS, also referred to as combined NIPSand TIPS) [32]. Our recent work [32] showed that a unique asymmetric PVDF membrane could befabricated via the NTIPS method to achieve an ultra-thin separation skin layer with a highly porousand interconnected pore structure. Such a membrane exhibited extraordinary permeability as high as85.6 kg·m−2·h−1 at 80 ◦C.
In this MD study a previously developed polyvinylidene fluoride (PVDF) membrane was applied inthe concentration of liquid organic fertilizer. The membrane was prepared by the nonsolvent thermallyinduced phase separation (NTIPS) method and exhibited superior permeability and anti-wetting propertieswith a unique asymmetric structure. Firstly, the effects of operating parameters in direct contact membranedistillation (DCMD) were investigated with the as-prepared PVDF membrane, such as flow rate, membraneorientation, and solution salinity. Secondly, the application of the membrane in the dewatering of realorganic fertilizer stream to the desired concentration was examined in terms of the process stability andmembrane fouling behavior, which was then compared with the commercial polytetrafluoroethylene(PTFE) membrane after previous systematic research into industrial applications [33–35].
2

Membranes 2018, 8, 9
2. Experimental
2.1. Membranes
The asymmetric poly(vinylidene fluoride) membranes used in this study were prepared bythe nonsolvent thermally induced phase separation (NTIPS) method, with 15 wt % PVDF polymer(Model: 1015, Solvay Co, Brussels, Belgium) dissolved into water-soluble diluent ε-Caprolactam (CPL,Sinopharm Reagent Inc, Shanghai, China) at 150 ◦C. The nascent membrane was obtained at 20 ◦C ina coagulation bath with deionized water. Details on the membrane preparation and characterizationcan be found elsewhere [32]. The commercial polytetrafluoroethylene (PTFE) membrane provided byNingbo Changqi Porous Membrane Technology Co., Ltd. (Ningbo, China) was also used in this work.
2.2. Feed Solutions
Three synthetic solutions were prepared as feed in MD with various salt concentrations Cf,:(1) bitter salt solution: 1.7 wt % sodium chloride (NaCl, 99.5%, Sinopharm Reagent Inc, Shanghai,China); (2) synthetic seawater: 3.5 wt % NaCl; (3) 6.0 wt % NaCl solution.
The organic fertilizer sample was obtained from the Environmental Technology Development Co., Ltd.(Ningbo, China). It is a semi-product in the fertilizer production process, made of mixed solution ofmanure and milled crop straw after purification, pressurized hydrolysis, and pH adjustment. This streamcoming from the pressurized hydrolysis process carries certain thermal energy (70 ◦C) that could bereadily used in MD for dewatering. Based on the “Organic Fertilizer Content Standard” (DB33/699-2008)formulated by the National Center for Fertilizer Inspection and Supervision (Beijing, China), the companyexpected to concentrate the organic matter of the fertilizer product to 15%. The adjusted pH of the sampleis within the range of 4.0–8.0 with minimal volatile ammonia nitrogen present. However, the semi-productof the organic fertilizer has only low organic matter around 3%, which needs to be concentrated about 5x toachieve useful strength for industrial applications. Thus, dewatering or concentration of the semi-productwill be conducted in MD.
2.3. Membrane Characterization
The top/bottom surface and cross-sections of PVDF flat sheet membrane were observed usinga scanning electron microscope (SEM, NOVA NANOSEM 450, FEI, Hillsboro, OR, USA). Prior to thescan, membrane samples were immersed in liquid nitrogen, fractured, and then coated with platinumusing a coater (VACUUM DEVICE MSP-1S, FEI, Hillsboro, OR, USA).
The overall membrane porosity (ε) was calculated from the ratio of the pore volume to the totalvolume of the membrane. The membrane pore volume was determined by measuring the dry and wetweights of membrane using isopropyl alcohol (IPA) as a wetting agent [36].
The measurement of liquid entry pressure of water (LEPw) of the membranes was conducted usinga customized setup with synthetic seawater (i.e., 3.5 wt % NaCl solution, conductivity ~60 ms·cm−1)as the testing liquid on the feed side and DI water (conductivity < 10 μs·cm−1) as the reference atthe permeate side to detect the occurrence of pore wetting. During testing, the pressure of the NaClsolution side was increased steadily using compressed N2 gas, by 0.01 MPa increments every 15 min.The pressure at which there was a drastic initial increase in the conductivity of the permeate sideand a continuous conductivity increase was taken as the LEP. The conductivity of the solution wasmonitored by a conductivity meter (DDSJ-308A, INESA Instrument, Shanghai, China).
The mean pore size of the PVDF membrane was determined by the liquid–liquid displacementmethod based on an isobutanol–DI water system. The detailed experimental procedure can be foundelsewhere [37].
The contact angle (CA) of prepared PVDF membranes is measured by a goniometer(Kruss DSA100, Hamburg, Germany). Five points on each membrane are tested and the averageof the measured values is reported.
3

Membranes 2018, 8, 9
2.4. DCMD Experiments
The DCMD experiments were conducted with the laboratory setup shown in Figure 1. In allDCMD experiments, the membrane was installed into a flat sheet membrane cell, giving an effectivemembrane area of 10 × 10−4 m2. The feed and permeate were flowing counter-currently, withthe feed pumped through a magnetic drive pump at a flow rate range of Qf = 50–110 L/h andthe permeate recirculated through another centrifugal pump at Qp = 50–110 L/h. A magneticstirrer was used in the feed tank to improve the mixing of solutions. The feed temperature Tf isin the range of 50–80 ◦C and permeate temperature Tp was kept constant at 16 ◦C. Both syntheticsolutions and real industrial samples were tested under the identified operating conditions throughthis study. The continuous weight gain of the distillate was measured using a digital balance(EK-2000i, A&D Co. Ltd., Tokyo, Japan) for membrane flux calculation. The total dissolved solids (TDS)of the permeate stream was monitored by the conductivity meter to calculate rejection of non-volatiles.For each membrane, DCMD experiments were repeated three times to ensure reproducibility.
Figure 1. DCMD experimental setup.
2.5. Evaluation of DCMD Performance
The permeation flux (J, Kg·m−2·h−1) in MD was calculated by Equation (1):
J =ΔW
A•Δt, (1)
where ΔW (Kg) is the weight of permeation, A (m2) is the total effective membrane area, and Δt (h) isthe operation time.
The normalized/relative flux (%) before and after fouling was calculated by Equation (2):
JN =JiJ0
× 100%, (2)
where J0 (Kg·m−2·h−1) is the initial flux, and Ji (Kg·m−2·h−1) is the instantaneous flux during thefiltration of real industrial sample, which could cause flux decline due to fouling.
The rejection (R) of solute was calculated by Equation (3):
R =Cf 0 − Cpt
Cf 0, (3)
where Cf0 (mg/L) is the total dissolved solids (TDS) in the original feed, and Cpt (mg/L) is the TDSconcentration in the permeate water collected at time t.
4

Membranes 2018, 8, 9
3. Results and Discussion
3.1. Membrane Characterization
The membranes used in this study are asymmetric PVDF and commercial PTFE membranes.The characteristics of the PVDF membrane are given in Table 1; the characteristics of the commercialPTFE membrane were provided by the manufacturer and the relevant literature [33,34]. The PVDFmembrane has a much smaller mean pore size (rm) of 34 nm than that of PTFE (450 nm) [33,34],leading to a much higher liquid entry pressure of water (LEPw) of 3.5 bar, indicating excellentanti-wetting properties. Aside from the high porosity (ε) of 86%, which is similar to that of thePTFE membrane [33,34], the total membrane thickness (δ) is as thin as 95 μm, which is indicativeof high permeability. SEM images of both membranes are shown in Figure 2. In Figure 2a,d,it was found that the asymmetric PVDF membrane exhibits a dense and smooth top surface,which is significantly different from the rough fibrous structure of the commercial PTFE membrane.The asymmetric structure of the PVDF membrane with an ultra-thin skin top surface, finger-like pores,and a bicontinuous network beneath the skin are observed in the cross section in Figure 2c.
Table 1. Characterization of asymmetric PVDF membrane and PTFE membrane.
Membrane TypePorosity
(ε, %)LEPw
(Bar)Mean Pore Size
(rm, nm)Total Thickness
(δ, μm)Contact Angle
(θ, ◦)
Asymmetric PVDF 86 ± 1 3.5 ± 0.1 34 ± 3 95 ± 5 85 ± 3Commercial PTFE 92.5 ± 0.5 0.8 ± 0.05 450 ± 50 36 ± 1 (PTFE layer) 140 ± 2.5
Figure 2. SEM images of membranes (a) top surface of virgin PVDF membrane (5000×); (b) bottomsurface of virgin PVDF membrane (5000×); (c) cross section of virgin PVDF membrane (1000×); (d) topsurface of virgin PTFE membrane (5000×).
3.2. Effects of Operating Parameters in DCMD
3.2.1. Effect of Flow Rate
Figure 3 shows the relationship between permeation flux and the flow rates of feed and permeate,where the flow rate of both sides were kept the same. The membrane flux increases as the flow
5

Membranes 2018, 8, 9
rate increases from 50 to 110 L/h (linear velocity: 0.28–0.61 m/s). This is because the increaseof flow rate helps reduce the thickness of the liquid boundary layer adjacent to the membranesurface, which alleviates the effect of concentration and temperature polarization, resulting inenhanced mass and heat transfer coefficients [38]. Thus, it improves the process driving force andsubsequently permeation flux. Similar investigations on flow rate have been reported [12,39]. Therefore,the highest flow rate of 110 L/h within the testing range was selected for the following tests. It isalso noted that during the above DCMD experiments the salt rejection was stable at 99.99% to ensuremembrane integrity.
Figure 3. Effect of flow rate on permeation flux of asymmetric PVDF membrane in DCMD (Cf =3.5 wt % NaCl, Tf = 70 ◦C, Tp = 16 ◦C, Qf = Qp).
3.2.2. Effect of Membrane Orientation
The effect of membrane orientation was investigated at varying feed temperatures from 50 to80 ◦C, i.e., with the feed solution facing the top or bottom surface of the membrane. The resultsare presented in Figure 4. Compared to the bottom-surface-facing feed mode, the top-surface facingthe feed solution produces at least 25% higher flux. For example, the flux of the top-surface facingthe feed mode showed up to 123 kg·m−2·h−1 at 80 ◦C. This is due to the different pore structure ofthe two surfaces of the asymmetric PVDF membrane fabricated by the NTIPS method, producingan ultra-thin, dense and smooth top surface exhibiting no macropores that is potentially smallerthan the mean free path (<0.11 μm) of the water molecules and thus will likely follow the Knudsendiffusion mechanism in the classic MD mass transfer model [40,41]; the highly porous and roughbottom surface of the membrane exhibits much larger pores and hence may fall into the regime ofcombined Knudsen/molecular diffusion [39,42]. Thus, MD flux involving the Knudsen mechanism isconsidered higher than that of the combined Knudsen/molecular diffusion mechanism, as reportedin the literature [32,43]. Hence, the orientation of top surface facing the feed was used in subsequentinvestigations. It is noted that the salt rejection was stable at 99.99% in the above DCMD tests forboth orientations.
6

Membranes 2018, 8, 9
Figure 4. Effect of membrane orientation on permeation flux of asymmetric PVDF in DCMD at varyingfeed temperature (Cf = 3.5 wt % NaCl, Tp = 16 ◦C, Qf = Qp = 110 L·h−1).
3.2.3. Effect of Feed Salinity
Four synthetic solutions with varying salinity from 0 to 60 g/L were tested in DCMD with theasymmetric PVDF membranes. The influence of salinity on the permeation flux is presented in Figure 5.It was found that the permeate flux decreased slightly by 12%, i.e., from 88.6 to 77.6 kg·m−2·h−1,as the salt concentration increased from 0 to 6 wt %. This can be explained by the reduction ofvapor pressure and water activity coefficient of the feed when increasing the solute concentration [9],which leads to decreased driving force for vapor transport in MD. However, within a given salinityrange, the concentration polarization effect was not known to significantly affect the flux. Overall,the membrane performance was only slightly influenced by the salt concentration of the feed, up tothe salinity level of the real industrial sample to be investigated in this work.
Figure 5. Effects of different salt concentrations of feed (Tf = 70 ◦C, Tp = 16 ◦C, δ = 95 μm, Qf = Qp =110 L·h−1).
7

Membranes 2018, 8, 9
3.3. Concentration of Real Organic Fertilizer by DCMD
In this section, with the synthetic seawater testing as a benchmark, the concentration of realorganic fertilizer was measured using both the as-prepared PVDF and commercial PTFE membranes.
3.3.1. Permeation Flux of Organic Fertilizer as Feed
The PVDF membrane performance was evaluated by testing both the NaCl solution (3.5 wt % atthe beginning) and an organic fertilizer in 15-h continuous DCMD runs in batch mode to concentratethe fertilizer. The concentration results are presented in terms of permeation flux, as illustrated inFigure 6. The initial flux of the organic fertilizer feed was around 80 kg·m−2·h−1, which is similar tothat of the synthetic seawater, i.e., 86 kg·m−2·h−1. Although a minor decrease in the flux was observedfor the industrial sample after 15 h of operation, it still remained around 74 kg·m−2·h−1, where 2.6xconcentration has been achieved to obtain a fertilizer of 7.8% organic matter, i.e., 63.4% water wasremoved from the fertilizer sample containing approximately 3% organic nutrients. It is noted thatthe TDS rejection of the membrane was stable at 99.99% for both feed solutions. Figure 7 showsa comparison of the original organic fertilizer sample (A) and the permeate (B). The feed solution isturbid and dark brown, which is in contrast to the transparent permeate solution.
Figure 6. Continuous DCMD runs of organic fertilizer and NaCl feed using asymmetric PVDFmembrane (Tf = 70 ◦C, Tp = 16 ◦C, Qf = Qp = 110 L·h−1).
Figure 7. Images of original organic fertilizer sample (A) and MD permeate sample (B).
8

Membranes 2018, 8, 9
3.3.2. Membrane Fouling and Surface Inspection
As a result of the 15-h continuous operation of the organic fertilizer, flux decline was observed.This may be due to the reduction in vapor pressure of the feed solution and hence the transmembranedriving force as concentration increased. Also, the build-up of the fouling layer on the surface of thePVDF membrane could cause further flux decline, as evidenced by the surface inspection by SEM inFigures 8 and 9. To reveal the fouling behavior of the PVDF membrane, surface inspection was carriedout. Figure 8 shows the SEM images of the fouled membrane (a) and the cleaned membrane rinsedwith pure water (b). Correspondingly, Figure 9 shows pictures of the fouled (A) and cleaned membrane(B). As shown in Figures 8a and 9a, the entire surface of the PVDF membrane was covered by a layerof amorphous deposition, which has the same dark brown color as the fertilizer feed; the fouling layerwas almost completely removed through clean water rinsing, as shown in Figures 8b and 9b. The easycleaning of the membrane after 15 h of running may be attributed to the unique dense and smooth topsurface structure of the asymmetric PVDF membrane.
Figure 8. SEM images of PVDF membrane after 15-h continuous DCMD experiments (a) fouledmembrane after 15 h operation (5000×); (b) cleaned membrane rinsed with pure water (5000×).
Figure 9. Pictures of as-prepared PVDF membrane (a) fouled membrane after fertilizer testing and(b) cleaned membrane rinsed with pure water.
9

Membranes 2018, 8, 9
3.3.3. Comparison of the Anti-Fouling Performance of Different Membranes
The anti-fouling property of the asymmetric PVDF membrane has been further investigated incomparison to the commercial PTFE membrane. The normalized fluxes (Equation (2)) were used toevaluate the fouling tendency associated with performance deterioration of both membranes. Figure 10shows the normalized flux of both membranes, where both a synthetic 3.5 wt % salt solution andorganic fertilizer feed were tested in the initial 1-h experiments. Compared to 14% flux decrease of thePTFE membrane, the PVDF membrane showed only a minor flux decline of 1.8%, indicating a moresustainable performance in treating challenging feed solutions.
Figure 10. Comparison of initial normalized fluxes of as-prepared asymmetric PVDF and commercialPTFE membrane with synthetic and organic fertilizer (Tf = 70 ◦C, Tp = 16 ◦C, Qf = Qp = 110 L·h−1).
The comparison of normalized fluxes of the asymmetric PVDF and commercial PTFE membranewas further investigated with an organic fertilizer feed in a 15-h continuous operation. The results areshown in Figure 11, in which the normalized flux of the PVDF membrane exhibits a very slow andminor decrease of 8% and remains relatively constant after a 15-h continuous operation. In contrast,a rapid decrease was observed with the PTFE membrane, resulting in 56% flux decline after 15 h.This could be due to the quick build-up of the fouling layer on the surface of the PTFE membrane,which exhibits a rough and fibrous surface structure, as indicated in Figure 2. Pictures of the fouledmembranes after the 15-h operation are given in Figure 11: the deposit on the smooth surface ofthe PVDF membrane (top picture) was minor and relatively loose, while the cake layer on the PTFEmembrane was dense.
10

Membranes 2018, 8, 9
Figure 11. Comparison of normalized flux of asymmetric PVDF and commercial PTFE membraneswith organic fertilizer tested in 15-h continuous MD runs (Cf = organic fertilizer feed, Tf = 70 ◦C,Tp = 16 ◦C, Qf = Qp = 110 L·h−1).
4. Conclusions
Membrane distillation is an emerging technology for solute concentration and value recoveryfrom aqueous streams. As an alternative to the conventional MSF process, the potential of MD tobe applied in the concentration of a semi-product of organic fertilizer was evaluated with a uniqueasymmetric PVDF membrane prepared by the unconventional NTIPS method. The MD process’sstability was examined in terms of the membrane integrity and fouling tendency associated with fluxloss and membrane cleaning. Investigations revealed that the asymmetric PVDF membrane exhibitedsuperior permeability up to 86 kg·m−2·h−1 at 70 ◦C. Consistent with the literature data, the membraneflux increased with increasing flow rate and decreasing solution salinity. Interestingly, the selectionof membrane orientation, i.e., top-surface- or bottom-surface-facing feed mode, was proven to beimportant in determining the membrane permeability. As a result, the top-surface-facing feedmode was chosen due to the smaller pore size contributed by the Knudsen diffusion mechanismof mass transport. Furthermore, compared to the commercial PTFE membrane, the asymmetric PVDFmembrane showed superior sustainability in permeability and fouling propensity, maintaining morethan 92% membrane flux after a 15-h continuous operation. The flux was easily recovered by simplewater rinsing. As a result, a 2.6x concentration factor was achieved in one MD run. Thus, the potentialto achieve a much higher concentration factor is feasible with MD due to the ease of flux recovery andthe excellent anti-fouling and anti-wetting properties of the as-developed PVDF membrane.
Acknowledgments: This study was financially supported by the Social Development Research Projects of theScience and Technology Department of Zhejiang Province (No. 2016C33023), the Natural Science Foundationof Ningbo (No. 2017A610042), and the Ningbo International Science and Technology Cooperation Project(No. 2014D10017). This work was also sponsored by the K.C. Wong Magna Fund from Ningbo University.Xing Yang gratefully acknowledges the Australian Research Council Discovery Project (No. DP170102391).
Author Contributions: Tonghu Xiao and Yanfei Liu conceived and defined the problem. Yanfei Liu, Tonghu Xiao,and Chenghuan Bao developed the methodology and case studies. Yanfei Liu wrote the paper. Jifei Zhang andXing Yang contributed to the discussion. Xing Yang supervised Yanfei Liu through the experiments and technicalwriting, and reviewed and finalized the paper structure.
Conflicts of Interest: The authors declare no conflict of interest.
11

Membranes 2018, 8, 9
References
1. Qureshi, A.; Lo, K.V.; Liao, P.H.; Mavinic, D.S. Real-time treatment of dairy manure: Implications ofoxidation reduction potential regimes to nutrient management strategies. Bioresour. Technol. 2008, 99,1169–1176. [CrossRef] [PubMed]
2. Al-Karaghouli, A.; Kazmerski, L.L. Energy consumption and water production cost of conventional andrenewable-energy-powered desalination processes. Renew. Sustain. Energy Rev. 2013, 24, 343–356. [CrossRef]
3. Fritzmann, C.; Löwenberg, J.; Wintgens, T.; Melin, T. State-of-the-art of reverse osmosis desalination.Desalination 2007, 216, 1–76. [CrossRef]
4. Jiao, B.; Cassano, A.; Drioli, E. Recent advances on membrane processes for the concentration of fruit juices:A review. J. Food Eng. 2004, 63, 303–324. [CrossRef]
5. Malaeb, L.; Ayoub, G.M. Reverse osmosis technology for water treatment: State of the art review. Desalination2011, 267, 1–8. [CrossRef]
6. Khayet, M. Membranes and theoretical modeling of membrane distillation: A review. Adv. Colloid Interface Sci.2011, 164, 56–88. [CrossRef] [PubMed]
7. Drioli, E.; Ali, A.; Macedonio, F. Membrane distillation: Recent developments and perspectives. Desalination2015, 356, 56–84. [CrossRef]
8. Al-Obaidani, S.; Curcio, E.; Macedonio, F.; Di Profio, G.; Al-Hinai, H.; Drioli, E. Potential of membranedistillation in seawater desalination: Thermal efficiency, sensitivity study and cost estimation. J. Membr. Sci.2008, 323, 85–98. [CrossRef]
9. El-Bourawi, M.S.; Ding, Z.; Ma, R.; Khayet, M. A framework for better understanding membrane distillationseparation process. J. Membr. Sci. 2006, 285, 4–29. [CrossRef]
10. Martinetti, C.R.; Childress, A.E.; Cath, T.Y. High recovery of concentrated RO brines using forward osmosisand membrane distillation. J. Membr. Sci. 2009, 331, 31–39. [CrossRef]
11. Khraisheh, M.; Benyahia, F.; Adham, S. Industrial case studies in the petrochemical and gas industry inqatar for the utilization of industrial waste heat for the production of fresh water by membrane desalination.Desalin. Water Treat. 2013, 51, 1769–1775. [CrossRef]
12. Cath, T.Y.; Adams, V.D.; Childress, A.E. Experimental study of desalination using direct contact membranedistillation: A new approach to flux enhancement. J. Membr. Sci. 2004, 228, 5–16. [CrossRef]
13. Suárez, F.; Tyler, S.W.; Childress, A.E. A theoretical study of a direct contact membrane distillation systemcoupled to a salt-gradient solar pond for terminal lakes reclamation. Water Res. 2010, 44, 4601–4615.[CrossRef] [PubMed]
14. Hsu, S.T.; Cheng, K.T.; Chiou, J.S. Seawater desalination by direct contact membrane distillation. Desalination2002, 143, 279–287. [CrossRef]
15. Quist-Jensen, C.A.; Macedonio, F.; Conidi, C.; Cassano, A.; Aljlil, S.; Alharbi, O.A.; Drioli, E. Direct contactmembrane distillation for the concentration of clarified orange juice. J. Food Eng. 2016, 187, 37–43. [CrossRef]
16. Christensen, K.; Andresen, R.; Tandskov, I.; Norddahl, B.; du Preez, J.H. Using direct contact membranedistillation for whey protein concentration. Desalination 2006, 200, 523–525. [CrossRef]
17. Yang, X.; Pang, H.; Zhang, J.; Liubinas, A.; Duke, M. Sustainable waste water deammonification by vacuummembrane distillation without ph adjustment: Role of water chemistry. Chem. Eng. J. 2017, 328, 884–893.[CrossRef]
18. Macedonio, F.; Drioli, E. Pressure-driven membrane operations and membrane distillation technologyintegration for water purification. Desalination 2008, 223, 396–409. [CrossRef]
19. Khayet, M. Treatment of radioactive wastewater solutions by direct contact membrane distillation usingsurface modified membranes. Desalination 2013, 321, 60–66. [CrossRef]
20. Antal, M.J., Jr.; Allen, S.G.; Deborah Schulman, A.; Xu, X.; Divilio, R.J. Biomass gasification in supercriticalwater. Ind. Eng. Chem. Res. 2000, 39, 4040–4053. [CrossRef]
21. Tijing, L.D.; Woo, Y.C.; Choi, J.S.; Lee, S.; Kim, S.H.; Shon, H.K. Fouling and its control in membranedistillation—A review. J. Membr. Sci. 2015, 475, 215–244. [CrossRef]
22. Gryta, M. Fouling in direct contact membrane distillation process. J. Membr. Sci. 2008, 325, 383–394.[CrossRef]
23. Bhattacharjee, C.; Saxena, V.K.; Dutta, S. Fruit juice processing using membrane technology: A review.Innov. Food Sci. Emerg. Technol. 2017, 43, 136–153. [CrossRef]
12

Membranes 2018, 8, 9
24. Ge, J.; Peng, Y.; Li, Z.; Chen, P.; Wang, S. Membrane fouling and wetting in a DCMD process for RO brineconcentration. Desalination 2014, 344, 97–107. [CrossRef]
25. Ding, Z.; Liu, L.; Liu, Z.; Ma, R. Fouling resistance in concentrating TCM extract by direct contact membranedistillation. J. Membr. Sci. 2010, 362, 317–325. [CrossRef]
26. Guillen-Burrieza, E.; Thomas, R.; Mansoor, B.; Johnson, D.; Hilal, N.; Arafat, H. Effect of dry-out on thefouling of PVDF and PTFE membranes under conditions simulating intermittent seawater membranedistillation (SWMD). J. Membr. Sci. 2013, 438, 126–139. [CrossRef]
27. Eykens, L.; De Sitter, K.; Dotremont, C.; Pinoy, L.; Van der Bruggen, B. Membrane synthesis for membranedistillation: A review. Sep. Purif. Technol. 2017, 182, 36–51. [CrossRef]
28. Yang, X.; Fane, A.G.; Wang, R. Membrane Distillation: Now and Future; John Wiley & Sons: Hoboken, NJ, USA,2014; pp. 373–424.
29. Wang, P.; Teoh, M.M.; Chung, T.S. Morphological architecture of dual-layer hollow fiber for membranedistillation with higher desalination performance. Water Res. 2011, 45, 5489–5500. [CrossRef] [PubMed]
30. Deshmukh, S.P.; Li, K. Effect of ethanol composition in water coagulation bath on morphology of PVDFhollow fibre membranes. J. Membr. Sci. 1998, 150, 75–85. [CrossRef]
31. Gu, M.; Zhang, J.; Wang, X.; Tao, H.; Ge, L. Formation of poly(vinylidene fluoride) (PVDF) membranes viathermally induced phase separation. Desalination 2006, 192, 160–167. [CrossRef]
32. Xiao, T.; Wang, P.; Yang, X.; Cai, X.; Lu, J. Fabrication and characterization of novel asymmetric polyvinylidenefluoride (PVDF) membranes by the nonsolvent thermally induced phase separation (NTIPS) method formembrane distillation applications. J. Membr. Sci. 2015, 489, 160–174. [CrossRef]
33. Zhang, J.; Li, J.D.; Gray, S. Effect of applied pressure on performance of PTFE membrane in DCMD. J. Membr. Sci.2011, 369, 514–525. [CrossRef]
34. Zhang, J.; Gray, S.; Li, J.D. Predicting the influence of operating conditions on DCMD flux and thermalefficiency for incompressible and compressible membrane systems. Desalination 2013, 323, 142–149.[CrossRef]
35. Hausmann, A.; Sanciolo, P.; Vasiljevic, T.; Weeks, M.; Schroën, K.; Gray, S.; Duke, M. Fouling mechanisms ofdairy streams during membrane distillation. J. Membr. Sci. 2013, 441, 102–111. [CrossRef]
36. Smolders, K.; Franken, A.C.M. Terminology for membrane distillation. Desalination 1989, 72, 249–262.[CrossRef]
37. Hu, N.; Xiao, T.; Cai, X.; Ding, L.; Fu, Y.; Yang, X. Preparation and characterization of hydrophilicallymodified PVDF membranes by a novel nonsolvent thermally induced phase separation method. Membranes2016, 6, 47. [CrossRef] [PubMed]
38. Bouguecha, S.; Chouikh, R.; Dhahbi, M. Numerical study of the coupled heat and mass transfer in membranedistillation. Desalination 2003, 152, 245–252. [CrossRef]
39. Srisurichan, S.; Jiraratananon, R.; Fane, A. Mass transfer mechanisms and transport resistances in directcontact membrane distillation process. J. Membr. Sci. 2006, 277, 186–194. [CrossRef]
40. Phattaranawik, J.; Jiraratananon, R.; Fane, A.G. Effect of pore size distribution and air flux on mass transportin direct contact membrane distillation. J. Membr. Sci. 2003, 215, 75–85. [CrossRef]
41. Alklaibi, A.M.; Lior, N. Heat and mass transfer resistance analysis of membrane distillation. J. Membr. Sci.2006, 282, 362–369. [CrossRef]
42. Qtaishat, M.; Matsuura, T.; Kruczek, B.; Khayet, M. Heat and mass transfer analysis in direct contactmembrane distillation. Desalination 2008, 219, 272–292. [CrossRef]
43. Khayet, M.; Matsuura, T.; Mengual, J.I.; Qtaishat, M. Design of novel direct contact membrane distillationmembranes. Desalination 2006, 192, 105–111. [CrossRef]
© 2018 by the authors. Licensee MDPI, Basel, Switzerland. This article is an open accessarticle distributed under the terms and conditions of the Creative Commons Attribution(CC BY) license (http://creativecommons.org/licenses/by/4.0/).
13

membranes
Article
PES-Kaolin Mixed Matrix Membranes for ArsenicRemoval from Water
Tiziana Marino 1 , Francesca Russo 1, Lina Rezzouk 2, Abderrazak Bouzid 2 and Alberto Figoli 1,*
1 Institute on Membrane Technology, ITM-CNR, Via P. Bucci 17C, 87036 Cosenza, Italy;[email protected] (T.M.); [email protected] (F.R.)
2 Materials and Electronic Systems Laboratory (LMSE), University of Bordj Bou Arreridj, El-Anasser 34030,Bordj Bou Arreridj, Algeria; [email protected] (L.R.); [email protected] (A.B.)
* Correspondence: [email protected]; Tel.: +39-0984-49-2027
Received: 11 August 2017; Accepted: 26 September 2017; Published: 30 September 2017
Abstract: The aim of this work was the fabrication and the characterization of mixed matrixmembranes (MMMs) for arsenic (As) removal from water. Membrane separation was combinedwith an adsorption process by incorporating the kaolin (KT2) Algerian natural clay in polymericmembranes. The effects of casting solution composition was explored using different amounts ofpolyethersufone (PES) as a polymer, polyvinyl-pyrrolidone (PVP K17) and polyethylene glycol (PEG200) as pore former agents, N-methyl pyrrolidone (NMP) as a solvent, and kaolin. Membraneswere prepared by coupling Non-solvent Induced Phase Separation and Vapour Induced PhaseSeparation (NIPS and VIPS, respectively). The influence of the exposure time to controlled humidair and temperature was also investigated. The MMMs obtained were characterized in terms ofmorphology, pore size, porosity, thickness, contact angle and pure water permeability. Adsorptionmembrane-based tests were carried out in order to assess the applicability of the membranes producedfor As removal from contaminated water. Among the investigated kaolin concentrations (rangingfrom 0 wt % to 5 wt %), a content of 1.25 wt % led to the MMM with the most promising performance.
Keywords: arsenic; kaolin KT2; phase inversion; polyethersulfone; mixed matrix membranes;water treatment
1. Introduction
Arsenic (As) is a natural element, which behaves like a dangerous agent to human health andthe environment. Several studies have shown a relationship between As exposure and teratogenicity,mutagenicity carcinogenic effects [1,2]. The harmful effects concern skin, bladder, lung liver, prostatecancer, as well as cardiovascular, pulmonary, immunological, neurological and endocrine diseases [3].Drinking water represents the most As polluted source, especially in countries such as Argentina,Banghadesh, China, Chile, India and Mexico [4,5]. The World Health Organization [6] has setthe maximum concentration limit to 10 μg/L or 10 ppb [6]. Arsenic exists in two primary forms:inorganic and organic. Inorganic compounds occur in two valence states (arsenite As(III) andarseniate As(V)), while organic compounds mainly are monomethyl arsenic acid and dimethylarsenic acid [7]. Arsenic removal from water has been carried out in different ways. Classicoptions include coagulation, ion exchange, adsorption and membrane-based operations. Althoughthese techniques are suitable for As removal, some of them still present disadvantages. In fact,coagulation requires a pre-oxidation step [8]. The efficiency of ion exchange strongly depends onthe pH solution and concentration of anions [9,10]. Adsorption may represent one of the mostpromising removal process, offering the possibility to operate with high-removal efficiency, lower cost,simplicity, easy operation [11,12]. Molecules are removed from the aqueous solution by adsorption intosolid surfaces. However, as reported in literature [8] this process is highly pH sensitive and requires
Membranes 2017, 7, 57 14 www.mdpi.com/journal/membranes

Membranes 2017, 7, 57
periodical adsorbents regeneration. Moreover, this technique needs the recovery of adsorbents particles,contributing to the increase of cost maintenance [13]. Membrane technology should offer a promisingsolution for water treatment, especially when coupled with other removal techniques [5,14–16].In this context, the mixed matrix membranes (MMMs) are particularly interesting; they pose a validalternative, combining the positive properties of polymeric membrane and adsorbents. A MMMis composed of inorganic filler particles embedded in the polymeric matrix. Gohari et al. [17] andZheng et al. [18] highlighted that the presence of adsorbents inside the membrane bulk should improvethe separation selectivity, decrease fouling and increase membrane hydrophilicity. Mohan andPittman [19] identified different adsorbents to remove As, such alumina, iron oxide, manganesia,titania and ferric phosphate. Metal oxides have large adsorption capacities due to their extremelyhigh surface areas [20]. Fe(II) is present in different natural materials, such as magnetite, siderite andhematite, which have been investigated for removing As from water. The removal mechanism is mainlybased on electrostatic attraction and adsorption on the surface of Fe(II)-bearing minerals [21,22]. Mohanand Pittman [19] studied the possibility of using activated carbon, showing that As(V) can be removedmore efficiently than As(III). Among the naturally occurring materials, kaolinite, montmorillionite andillite [23,24] represent particularly attracting clay minerals with good adsorption capabilities. Kaoliniteis a group of alumina silicates clay minerals which comprise the principal ingredients of kaolin and itis characterized by fine particle size, brightness and whiteness, chemical inertness, structure [24].
“KT2” (Table 1), is an Algerian kaolin coming from the original EL Milia deposit “TAMAZERT”in the region of Jijel (Algeria). This kaolin is abundant in soils and sediments [25], it is odorless whiteto yellowish or grayish powder and it has density 2.65 g/cm3 [26]. It has been selected for watertreatment studies for its high capacity adsorbents on the surface, very low cost material and aluminosilicate-based compositions (Al2O3(SiO2)2(H2O)2) [24,25,27–31].
Table 1. Chemical composition of KT2 kaolin [28].
Components (wt %)
SiO2 Al2O3 Fe2O3 MgO CaO Na2O K2O TiO2 LOI49.30 33.50 1.59 0.40 0.08 0.09 2.75 0.24 10.50
Zen et al. [28] tested two Algerian kaolin clays, DjebelDebagh “DD3” and Tamazert “KT2” forthe adsorption of Derma Blue R67 acid dye, commonly used in the tanning industry. The resultsobtained evidenced the efficiency and the feasibility of dye adsorption at ambient temperature, thusdemonstrating that natural clays work as promising adsorbent candidates for waste water treatments.
Sarbatly [30] described the preparation of kaolin–polyethersufone (PES) membranes via NIPSand sintering techniques, investigating the effect of the clay/polymer ratio and sintering temperatureon pore size and porosity. The registered data showed that the pore size changed from 20 to 8 μm andthe porosity decreased from 26% to 11% when additive/polymer and sintering temperature increasedfrom 1 to 3.5 and from 1100 to 1500 ◦C, respectively.
Han et al. [31] worked on the production of Al2O3, Al2O3–SiO2 and Al2O3–kaolin hollow fibersusing a wet-spinning method using PES as polymeric material. Hollow fiber membranes were preparedby combining preheating and sintering processes. The addition of SiO2 was beneficial for Al2O3 hollowfiber membranes, even if the amount of SiO2 should be rigorously controlled. When kaolin was usedinstead of SiO2, the introduction of both the reactions of Al2O3–SiO2 were achieved. In fact, kaolin,acting as an inorganic binder, contributed to the sintering of the membranes, thus the structure wasmaintained and the particles fixed up by the reaction of alumina and silica in kaolin.
In this work, kaolin was chosen as a natural adsorbent for the preparation of a MMM flat sheetmembrane using PES as polymeric material.
The adsorption capability of the natural clay was tested for As removal from water. Consideringthe outstanding property of kaolin as an inorganic binder in the membrane preparation process,
15

Membranes 2017, 7, 57
its natural abundance, fine texture, grain size of 0.2–1 μm, high chemical and thermal stability and lowcost, kaolin should be adopted in membrane preparation as substitute of Al2O3, TiO2 and ZrO2 [28–31].
PES is among the most used amorphous thermoplastics which finds applications in manyindustrial sectors, such as electronic, medical, aerospace, food service [32]. It presents excellentthermal and chemical stability, dimensional stability and resistance in a wide range of pH [33].
The aim of this work was the fabrication and the characterization of organic-inorganic PES–kaolinmembranes for arsenic removal from water. Membrane separation was coupled with the adsorptionprocess by including Algerian natural clay (kaolin KT2) into the polymeric solution.
MMMs were prepared by coupling NIPS (Non-solvent Induced Phase Separation) and VIPS(Vapour Induced Phase Separation) procedures in order to study the influence of several parameterswhich affect the final membrane structure and properties, such as kaolin and pore former agent content,as well as the exposure time to relative humidity.
2. Materials and Methods
2.1. Materials
Polyethersulfone (PES) polymer (Veradel®3000 P; Mw = 60 kg/mol) was kindly supplied bySolvay Specialty Polymers (Bollate, Italy) and N-methyl pyrrolidone (NMP) synthetic grade waspurchased by Sigma Aldrich (Milan, Italy).
Polyvinylpyrrolidone (PVP, Luviskol K17; Mw = 9 kg/mol) was purchased by BASF (Ludwigshafen,Germany) and as well as for the polymer, was desiccated under vacuum at 50 ◦C for 24 h before itsuse. Polyethylene glycol (PEG; Mw = 0.2 kg/mol) was purchased by Sigma Aldrich. The precipitationmedium was i-distilled water (at 15 ◦C). Kaolin (KT2), was obtained from Guelma region (Algeria).
2.2. Membrane Preparation
Membranes were prepared via phase inversion, based on the separation of an initially stablesolution, in a polymer-rich phase and a polymer poor-phase [34].
Thermodynamic instability during phase inversion can be induced by:
• Adding a non-solvent (non-solvent induced phase separation, NIPS).• Exposing the polymeric solution to a non-solvent vapour (vapour induced phase separation, VIPS)
up to the complete polymer precipitation or prior to immersion in a non-solvent coagulation bath.• Evaporating the solvent (evaporation induced phase separation, EIPS).• Cooling down a polymer solution obtained at elevated temperature promoting polymer precipitation
and the formation of the final membrane (thermally induced phase separation, TIPS).
In this work, membranes were produced via NIPS or by coupling NIPS and VIPS.In particular, MMMs with different morphology and properties were prepared by changing in the
dope solution the kaolin and the PEG content, and by varying the exposure time of the nascent film tohumid air (Table 2).
Table 2. Compositions of the casting solutions and exposure time to controlled temperature (25 ◦C)and RH %.
Membrane CodePES
(wt %)KT2 Kaolin
(wt %)PVP K17(wt %)
PEG 200(wt %)
NMP(wt %)
Exposure Timeto RH % (min)
M112 0 5 35 48
0M2 5
M312 1.25 5 35 46.75
0M4 5
M512 2.5 5 35 45.5
0M6 5
M712 5 5 35 43
0M8 5
16

Membranes 2017, 7, 57
The optimized procedure for preparing casting solution was the following:
1. The liquid phase (NMP and PEG) was magnetically stirred.2. Kaolin was added and the suspension sonicated in an ultrasonic bath (for 90 min at 25 ◦C) in
order to assure a homogeneous nanoparticles dispersion.3. The solid components (i.e., PES and PVP) were added and kept under stirring until a
homogeneous casting suspension was observed.
The dope solution were cast on a glass plate using a manual casting knife (Elcometer 3700/1Doctor Blade, Aalen, Germany; adjustable gap size: 30–4000 μm) with a 300 μm gap, at 25 ◦C and 55%of relative humidity (RH %) in a climatic chamber (DeltaE srl, Rende, Italy).
Membranes were washed three consecutive times with hot water (60 ◦C), dried at roomtemperature for 4 h and then dried in an oven at 40 ◦C for 24 h before characterize them.
2.3. Experimental Set up
The experimental set-up is composed of Amicon Model 8200 (EMD Millipore, Billerica, MA, USA),equipped with a filtration unit (180 mL). 1 ppm of Sodium arsenate dibasic heptahydrate was placedinto 200 mL of water. As aqueous solution was forced to pass through the membrane by means of aperistaltic pump (Masterflex®7518-10, Cole-Parmer, Vernon Hills, IL, USA) (Figure 1).
Figure 1. Experimental set up used for Arsenic (As) removal from aqueous solutions.
Both the feed and the permeate composition were evaluated by Inductively Coupled Plasma (ICP)analysis (performed by GEOLAB S.r.l. laboratory, Rende, Italy) after specific contact time. Before ICPanalysis, all the samples were stabilized with ultrapure nitric acid (1.0% HNO3).
The percentage of Arsenic removal %R was determined as follows:
%R = ((C0 − Ct) × 100)/C0 (1)
where C0 is the initial As concentration and Ct is the As content at time t.
2.4. Pure Water Permeability (PWP)
The membrane performance was tested in a cross flow system in recycle mode. In this setup permeate is pumped back to the feed water solution. The permeate flux was determined bymonitoring the permeate weight during time. PWP was measured at 25 ◦C by means of a cross-flow
17

Membranes 2017, 7, 57
cell (DeltaE srl, Italy). Pure water at 25 ◦C was driven across the membrane with 8 cm2 area, by usingTuthill Pump Co. (Alsip, IL, USA) gear pump. PWP was calculated using the following equation:
PWP =Q
A t ΔP(2)
where Q is the permeate volume (L), A is the membrane area (m2), t is the time (h), and ΔP is thepressure difference across the membrane sides.
Three different transmembrane pressures (i.e., 1.0/0.8/0.6 bar separated by a stabilization periodof one to another of 20 min), were used to calculate PWP.
2.5. Thickness
The thickness was determined by the multiple point method using a digital micrometer (CarlMahr, Göttingen, Germany; precision of ±0.001 mm). Thickness was verified for seven regions ofmembrane, the average value and the standard deviation were taken into account.
2.6. Porosity
Membrane porosity was determined by cutting three different samples of the same membrane,drying them in a vacuum oven at 50 ◦C for 12 h and measuring their weight by means of an analyticalbalance. Then, the samples were soaked in Kerosene for 24 h before verifying the wet membraneweight. The average and the standard deviation values were then calculated. Membrane porosity (ε) isdefined as the volume of the pores divided by the total volume of the membrane. The porosity wascalculated by the following equation [35]:
ε =
wtw−wtdρk
wtw−wtdρk
+ wtdρp
× 100 (3)
where ε is the porosity (%), wtw and wtd are the wet and dry weight of the membrane, respectively; ρkand ρp are the density of kerosen and PES, respectively.
2.7. Pore Size and Pore Size Distribution
The analysis was performed three times for each membrane, and by extrapolating the averageand the standard deviation. A capillary flow porometer (CFP-1500 AEXL, Porous Materials Inc.,Ithaca, NY, USA) was used. Dried membranes were kept in a wetting liquid (Fluorinert®FC-40,Sigma-Aldrich) having low surface tension (16 dynes/cm) for 24 h prior analyzing the pore size.
The microflow porometer measures pressure close to the membrane. Differential pressures andgas flow rates through dry and wet samples were recorded. The pore structure characteristics includebubble point, mean flow pore size, pore fraction distribution and air permeability.
2.8. Mechanical Properties of Membranes
The mechanical properties which include the Young’s modulus and elongation at break of theprepared membranes were measured using a Zwick Roell Z2.5 test unit (Zwick Roell Group, Ulm,Germany) with pneumatic clamps and 50 N maximum load cell. The stress (σ) calculated as the ratiobetween the applied force (F) per unit area (A).
While the strain is defined as:ε = ln(L)/L0 (4)
where L is the sample length at break and L0 is the initial sample length, allow to calculate Young’smodulus (E) corresponding to: E = σ/ε from the initial part of the slope from the stress/straincurve [36]. Membranes were cut into strips of 1 cm width and 5 cm length. Tests were carried outby starting with an initial 50 mm gauge length and by stretching the membranes unidirectional at
18

Membranes 2017, 7, 57
a constant rate of 5 mm/min. 5 specimens were used for each membrane and the average and thestandard deviation were extrapolated.
Three samples (1 cm × 5 cm) of each type of membrane were tested at ambient temperature witha cross head speed of 0.5 mm/min. The tension strength and elongation at break average values aswell as their standard deviations were determined.
2.9. Scanning Electron Microscopy (SEM) Analysis
Cross section and surface of the membranes produced were observed with a Zeiss-EVO MA10instrument (Zeiss, Milano, Italy). The membranes were first freeze fractured using liquid nitrogen forcross section preparation. Then for both surface and cross-section analyses, the samples were sputteredfor making a thin gold layer (by using a Quorum Q150 RS sputter (Quorum Technologies, Laughton,East Sussex, UK) in order to enhance membrane conductivity and prevent electrical charging.
2.10. Contact Angle
The static contact angle of water can be defined as the angle comprised between the membranesurface and the tangent line at the water droplet contact point on the membrane surface. An opticalcontact angle meter (CAM100, KSV Instruments, Helsinki, Finland) was used to measure the contactangle of the membranes prepared. A water droplet of 5 μL was positioned on the membrane topsurface. For each membrane, five measurements were carried out, at the end of which the average andthe standard deviation were calculated.
3. Results and Discussions
3.1. Membrane Morphology
The influence of the concentration of kaolin, as well as the adopted membrane preparationprocedure, was investigated using scanning electron microscopy (SEM) apparatus. The SEM imagesof the cross-sections of pristine PES and MMMs membranes prepared with different concentrationsof kaolin via NIPS are represented in Figure 2. PES membrane (M1) exhibited a typical asymmetricstructure, composed of a thin skin layer and a porous bulk with a finger-like structure. Similarlyto what was observed for the pristine PES membrane, by increasing the kaolin content in the dopesolution, the membrane exhibited porous finger-like morphology (Figure 3). The bounding of PESchains and kaolin nanoparticles could be observed with further SEM magnification (1000×), whichshowed that the kaolin particles were entrapped in the membrane structure by means of interactionswith polymer chains.
By coupling the NIPS and VIPS procedures, M2, M4, M6 and M8 membranes were obtained bychanging the kaolin concentration (Figure 3).
During VIPS process, the cast film is first exposed to humidity prior to immersion in thecoagulation bath. The non-solvent in liquid and vapour form leads to the phase separation. Typically,by adjusting some parameters, such as temperature, relative humidity and exposure time, membraneswith large pores on the top surface can be obtained [37].
Although the presence of non-solvent in the vapour phase may reduce the exchange rate betweensolvent and non-solvent, leading to sponge-like symmetric structures, the presence of hydrophilic kaolinnanoparticles may contribute to the faster water–NMP demixing, promoting the formation of fingers.
Kaolin nanoparticle dispersion was visibly homogeneous without evident defects across themembrane morphology. However, as reported in the literature [31], a small number of aggregationsformed with nanoparticles with particularly high surface would contribute to reduce the surfaceenergy, thus enhancing the system stability.
All the membranes prepared displayed a very compact polymeric layer on the top and thebottom surface, with few bare kaolin particles. This might be related to the intrinsic binderproperties of kaolin [38]. In fact, it is used in ceramic preparation thanks to its tremendous molding
19

Membranes 2017, 7, 57
performance. At lower kaolin content, inorganic binding of the membranes could be established byinorganic nanoparticles, promoting membrane formation and particle dispersion. However, at higherconcentrations, kaolin would negatively affect the particle dispersion, giving rise to the formation ofsome defects in the membrane structure [31].
Figure 2. Scanning electron microscopy (SEM) images of the PES and PES–kaolin membranes preparedvia the Non-solvent Induced Phase Separation (NIPS) procedure.
20

Membranes 2017, 7, 57
Figure 3. SEM images of the PES and PES–kaolin membranes prepared via NIPS–Vapour InducedPhase Separation (VIPS) procedure.
3.2. Membrane Pore Size
In order to achieve separation, membrane systems rely on membranes which are able to removeundesirable compounds or allow the passage only of selected kinds of solutes. It is evident that pore
21
Membranes 2017, 7, 57
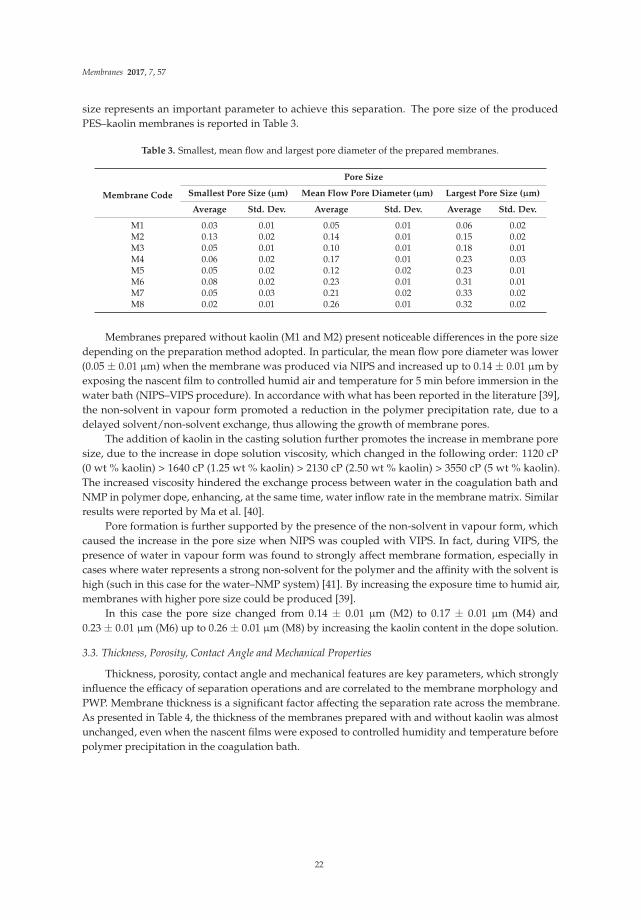
size represents an important parameter to achieve this separation. The pore size of the producedPES–kaolin membranes is reported in Table 3.
Table 3. Smallest, mean flow and largest pore diameter of the prepared membranes.
Membrane Code
Pore Size
Smallest Pore Size (μm) Mean Flow Pore Diameter (μm) Largest Pore Size (μm)
Average Std. Dev. Average Std. Dev. Average Std. Dev.
M1 0.03 0.01 0.05 0.01 0.06 0.02M2 0.13 0.02 0.14 0.01 0.15 0.02M3 0.05 0.01 0.10 0.01 0.18 0.01M4 0.06 0.02 0.17 0.01 0.23 0.03M5 0.05 0.02 0.12 0.02 0.23 0.01M6 0.08 0.02 0.23 0.01 0.31 0.01M7 0.05 0.03 0.21 0.02 0.33 0.02M8 0.02 0.01 0.26 0.01 0.32 0.02
Membranes prepared without kaolin (M1 and M2) present noticeable differences in the pore sizedepending on the preparation method adopted. In particular, the mean flow pore diameter was lower(0.05 ± 0.01 μm) when the membrane was produced via NIPS and increased up to 0.14 ± 0.01 μm byexposing the nascent film to controlled humid air and temperature for 5 min before immersion in thewater bath (NIPS–VIPS procedure). In accordance with what has been reported in the literature [39],the non-solvent in vapour form promoted a reduction in the polymer precipitation rate, due to adelayed solvent/non-solvent exchange, thus allowing the growth of membrane pores.
The addition of kaolin in the casting solution further promotes the increase in membrane poresize, due to the increase in dope solution viscosity, which changed in the following order: 1120 cP(0 wt % kaolin) > 1640 cP (1.25 wt % kaolin) > 2130 cP (2.50 wt % kaolin) > 3550 cP (5 wt % kaolin).The increased viscosity hindered the exchange process between water in the coagulation bath andNMP in polymer dope, enhancing, at the same time, water inflow rate in the membrane matrix. Similarresults were reported by Ma et al. [40].
Pore formation is further supported by the presence of the non-solvent in vapour form, whichcaused the increase in the pore size when NIPS was coupled with VIPS. In fact, during VIPS, thepresence of water in vapour form was found to strongly affect membrane formation, especially incases where water represents a strong non-solvent for the polymer and the affinity with the solvent ishigh (such in this case for the water–NMP system) [41]. By increasing the exposure time to humid air,membranes with higher pore size could be produced [39].
In this case the pore size changed from 0.14 ± 0.01 μm (M2) to 0.17 ± 0.01 μm (M4) and0.23 ± 0.01 μm (M6) up to 0.26 ± 0.01 μm (M8) by increasing the kaolin content in the dope solution.
3.3. Thickness, Porosity, Contact Angle and Mechanical Properties
Thickness, porosity, contact angle and mechanical features are key parameters, which stronglyinfluence the efficacy of separation operations and are correlated to the membrane morphology andPWP. Membrane thickness is a significant factor affecting the separation rate across the membrane.As presented in Table 4, the thickness of the membranes prepared with and without kaolin was almostunchanged, even when the nascent films were exposed to controlled humidity and temperature beforepolymer precipitation in the coagulation bath.
22

Membranes 2017, 7, 57
Table 4. Thickness, porosity, contact angle and mechanical properties of the prepared PES andPES–kaolin membranes.
Membrane Code Thickness (mm) Porosity (%)
Contact Angle (◦) Mechanical Properties
Top SurfaceYoung’s Modulus
(n/mm2)Elongation at
Break (%)
M1 0.099 ± 0.000 85.40 ± 0.18 52.30 ± 0.14 98.85 ± 1.69 2.48 ± 0.70M2 0.094 ± 0.001 86.45 ± 0.99 66.11 ± 1.17 96.77 ± 1.04 2.62 ± 0.49M3 0.103 ± 0.013 89.36 ± 0.45 66.48 ± 0.24 77.35 ± 1.72 2.81 ± 0.40M4 0.099 ± 0.002 89.74 ± 0.69 62.04 ± 0.89 76.52 ± 1.88 2.29 ± 0.54M5 0.109 ± 0.004 89.67 ± 0.00 71.97 ± 2.38 74.85 ± 2.54 2.81 ± 0.95M6 0.110 ± 0.001 89.97 ± 0.43 75.32 ± 1.09 72.41 ± 2.09 2.94 ± 0.55M7 0.111 ± 0.008 90.54 ± 0.78 73.80 ± 3.66 72.15 ± 0.75 1.17 ± 0.76M8 0.100 ± 0.013 90.57 ± 2.30 67.26 ± 2.45 70.94 ± 2.55 1.15 ± 0.36
The contact angle is an important parameter, which proves the hydrophilic or hydrophobicmembrane characteristic [42,43]. The contact angles of the MMMs obtained are reported in Table 4.By preparing membrane via NIPS, the addition of kaolin nanoparticles into the polymeric solution,resulted in an increase in contact angle from about 60◦ for the control membrane (M1) to 70◦ (M7)for the highest investigated kaolin content (5.00 wt %). Similarly, also by producing membranes viaNIPS–VIPS, membranes exhibited increasing contact angle values by increasing kaolin concentrationin the dope solution. In this case, the contact angle passed from 65◦ (M2) to 70◦ (M8). These results maybe related to increases in membrane roughness, and, as reported by Mierzwa et al. [33], the increasein contact angle may also depend on nanosize effects. However, a more in-depth investigationon factors affecting membrane hydrophilicity would be necessary to completely understand theeffect of kaolin on the final membrane properties. Mierzwa et al. [33] also reported the preparationof PES–clay ultrafiltration membranes via NIPS, varying the clay content in the range between 1wt % and 5 wt %. In agreement with what was observed in this work, the contact angles of themembranes prepared increased with the increase in clay content. However, in other studies clay-dopedmembranes were reported to have lower or similar contact angle to the undoped polymeric membranes.Anadao et al. [44] described the preparation and the characterization of nanocomposite polysulfone(PSf) and sodium montmorillonite (MMT) membranes, for which the water contact angle slightlydecreased with the increase in MMT content. Also Ghaemi et al. [45] reported the production ofsignificantly more hydrophilic PES–organically modified MMT membranes when the clay mineralcontent increased, with corresponding increases in water flux. In contrast, Monticelli et al. [46]registered minor changes in contact angle for the membranes fabricated with pristine PSf andPSf–cloisite 93A mixtures.
The presence of kaolin had a positive effect on membrane porosity (Table 4). In fact, theporosity gradually increased with the increasing clay content in the polymeric solution, passingfrom 85.40 ± 0.18 for M1 to 90.57 ± 2.30 for M8. Similar observations were reported by Ma et al. [40],who attributed the porosity increase to the lower solvent-non solvent exchange rate which in turn wascaused by the incorporation of clay nanoparticles in the polymeric matrix. The increased water inflowrate in the nascent film was responsible for the formation of more porous membranes. The membranesprepared via NIPS–VIPS procedure presented higher porosity than those obtained by NIPS. Also in thiscase the reasons may lie with the decreased demixing rate between NMP and water due to the delayedwater vapour adsorption into the nascent membrane, which promote the formation of membraneswith more pores and larger pore size.
Elastic modulus and elongation at break are two important factors to define the mechanicalresistance of membranes. The effects of kaolin concentration on mechanical strengths of PES-kaolinmembranes is shown in Table 4. By increasing the clay content, Young’s modulus decreased from 98.85± 1.69 (M1) to 70.94 ± 2.55 (M8) MPa, while the elongation at break passed from 2.48% ± 0.70% (M1)to 1.15% ± 0.36% (M8). The increased pore size and porosity of MMMs may induce worsening
23

Membranes 2017, 7, 57
of the mechanical properties. Moreover, by increasing the kaolin dosage in the dope solution,the inhomogeneity of filler distribution inside the membrane matrix may lead to particle agglomeration,which further deteriorates membrane mechanical resistance. A similar effect was also reported byMa et al. [40].
3.4. Pure Water Permeability (PWP)
Pure water permeability (PWP), or pure water flux, represents a critical parameter for porousmembranes, and it is directly correlated with membrane pore size and porosity [31,40,47]. Figure 4shows the effects of kaolin content on PWP (average and standard deviation) for the membranesproduced. PES membranes prepared via NIPS and NIPS–VIPS methods (M1 and M2, respectively)displayed similar PWP. In contrast, the preparation methods had a critical influence on PWP for thePES–kaolin membranes. In fact, MMMs exposed to controlled humid air and temperature beforethe immersion in the coagulation bath exhibited considerably higher PWP than those obtained viaNIPS, and showed higher values than the pristine PES membranes. PWP changed from 843 ± 29 to8781 ± 32 L/m2·h·bar for M3 and M8, respectively. The results obtained indicated that PWP reflectedpore size and porosity data, but may be ascribed also to the presence of kaolin in the membrane matrix.Ma et al. [40] reported that the addition of clay in the polymeric solution led to an increase in the largepore ratio in the skin layer, which explained the registered increased pure water flux with the increaseof clay dosage.
Figure 4. Pure water permeability (PWP) of the prepared PES and PES–kaolin membranes.
3.5. Membrane Performance Evaluation: As Removal from Water
In order to evaluate the applicability of PES–kaolin membranes on water treatment, As adsorptiontests were carried out using 4 h as contact time. As reported by Zen et al. [28], As removal capacity isa parameter ruled by physical adsorption over the membrane, and the adsorption rate for the contacttime is influenced by several parameters, such as the clay particle size entrapped into the membrane,the ionic strength and the size of As compounds. Figure 5a illustrates As adsorption capacity after 4 h forthe unmodified PES membranes as well as for PES–kaolin membranes. It can be noted that As removalby adsorption through the PES membranes was very low (5% for M1 and 1.5% for M2). When kaolinwas used, As removal significantly increased, reaching a value of up to 30% when 2.5 wt % kaolin wasincorporated into the polymeric solution and the membrane was prepared via NIPS method (M5).
24

Membranes 2017, 7, 57
(a) (b)
Figure 5. (a) As adsorption after 240 min test by using PES and PES–kaolin membranes prepared viaNIPS and NIPS–VIPS; (b) Kinetic of As adsorption on the M5 PES–kaolin membrane.
By using MMMs membranes, As removal firstly increased by increasing the clay dosage from1.25 wt % to 2.5 wt %, then decreased when kaolin concentration was further increased up to 5 wt %.These results may be related to the active adsorbent sites of clay particles distributed in the membranebulk. In fact, an initial rapid increase in the adsorption upon a higher kaolin dosage may be related toa higher number of As-adsorption available sites. In presence of 2.5 wt % kaolin, the removal of Asreached the maximum value of 30%. However, by increasing the adsorbent load, there was a decreasein the As removal, which means that, among the kaolin dosages investigated, 2.5 wt % was the optimalamount of clay necessary to remove As from water. When a 5 wt % clay was used, the active siteswere probably occluded due to the kaolin particles’ aggregation. A similar behavior was reportedfor Derma Blue R67 acid dye [48], cationic starch derivatives [49], methyl orange, Ponceau 6R, andCongo Red adsorbed on pullulan microspheres [50]. All the membranes prepared via NIPS presenteda better performance in comparison to that of the analogue membranes obtained via NIPS–VIPS.This may be related to the combination of some membrane characteristics, such as morphology,pore size and porosity, but also PES–kaolin–As interactions that favored the arsenic adsorption inthe membrane matrix. However, further investigations are needed to better understand how theoperational conditions can affect the adsorption process.
On the basis of the adsorption results discussed above, the adsorption dynamic kinetics of As onM5 was analyzed (Figure 5b).
The adsorption capacity increased rapidly in the first hour (15% As removal after 60 min) andreached a value of 30% after 250 min. After this time, an adsorption equilibrium was observed, andthe variation of As removal was maintained unchanged during the extended contact time (420 min).These observations may arise from the accessibility of kaolin bonding sites, which resulted completelyhindered by the adsorbed As.
4. Conclusions
Flat sheet PES–kaolin membranes with different clay dosages were prepared by NIPS andNIPS–VIPS procedure. The membranes prepared exhibited asymmetric structure, in which theincorporation of well-dispersed kaolin nanoparticles can be clearly observed. The combination ofthe operational conditions adopted to produce the membranes allowed us to tailor their properties.The presence of kaolin promoted pore formation and the increase in its content led to an increase inthe membrane pore size and PWP. In contrast, membrane hydrophilicity and mechanical resistanceworsened when the clay was included in the polymeric solution. Preliminary tests on As removalfrom water were carried out, showing that inorganic-organic membranes had a better performancethan the analogue PES membranes. Even though further investigations are needed to improve themembrane-based As adsorption, this work demonstrated that kaolin can be efficiently used as a lowcost natural material for the preparation of MMMs to be used for water treatment.
25

Membranes 2017, 7, 57
Author Contributions: Alberto Figoli, Abderrazak Bouzid and Tiziana Marino conceived and designed theexperiments; Lina Rezzouk, Tiziana Marino and Francesca Russo performed the experiments; Tiziana Marino,Alberto Figoli and Francesca Russo analyzed the data; Alberto Figoli and Abderrazak Bouzid contributedreagents/materials/analysis tools; Tiziana Marino, Francesca Russo and Alberto Figoli wrote the paper.
Conflicts of Interest: The authors declare no conflict of interest.
References
1. Mandal, B.K.; Suzuki, T.K. Arsenic round the world—A review. Talanta 2002, 58, 201–235. [CrossRef]2. Jain, C.K.; Ali, I. Arsenic: Occurence, toxicity and speciation techniques. Water Res. 2000, 34, 4304–4312.
[CrossRef]3. United States Environmental Protection Agency (EPA). Technical Fact Sheet: Final Rule for Arsenic in Drinking
Water; 815-F-00-016; United States Environmental Protection Agency: Washington, DC, USA, January 2001.4. Mukherjee, A.; Bhattacharya, P.; Savage, K.; Foster, A.; Bundschuh, J. Distribution of geogenic arsenic in
hydrologic systems: Controls and challenges. J. Contam. Hydrol. 2008, 99, 1–7. [CrossRef] [PubMed]5. Marino, T.; Figoli, A. Arsenic removal by liquid membranes. Membranes 2014, 4, 1–21. [CrossRef] [PubMed]6. World Health Organization. Guidelines for Drinking Water Quality; World Health Organization:
Geneva, Switzerland, 2006.7. Criscuoli, A.; Carnevale, M. Membrane Distillation for the Treatment of Waters Contaminated by Arsenic, Fluoride
and Uranium in Membrane Technologies for Water Treatament: Removal of Toxic Trace Elements whit Emphasis onArsenic, Fluoride and Uranium; Figoli, A., Hoinkis, H., Bundschuh, J., Eds.; CRC Press: Boca Raton, FL, USA,2016; Volume 13, pp. 238–252.
8. Norton, M.V.; Chang, Y.J.; Galeziewski, T.; Kommineni, S.; Chowdhury, Z. Throwawayiron andaluminium sorbents versus conventional activate dalumina for arsenic removal—Pilot testing results.In Proceedings—Annual Conference; Water Works Association: Washington, DC, USA, 2001; pp. 2073–2087.
9. Oehmen, A.; Viegas, R.; Velizarov, S.; Reis, M.A.M.; Crespo, J.G. Removal of heavy metals from drinkingwater supplie sthrough the ionex change membrane bioreactor. Desalination 2006, 199, 405–407. [CrossRef]
10. Mahmoudi, H.; Ghaffour, N.; Goosen, M. Fluoride Arsenic and Uranium Removal from Water Using AdsorbentMaterials and Inegrated Membrane Systems; Figoli, A., Hoinkis, H., Bundschuh, J., Eds.; CRC Press: Boca Raton,FL, USA, 2016; Volume 13, pp. 91–113.
11. Mar, K.K.; Karnawati, D.; Putra Sarto, D.P.E.; Igarashi, T.; Tabelina, C.B. Comparison of arsenic adsorption onlignite, bentonite, shale, and ironsand from Indonesia. Procedia Earth Planet. Sci. 2013, 6, 242–250. [CrossRef]
12. Hua, J. Synthesis and characterization of bentonite base dinorgano–organo-composites and theirperformances for removing arsenic from water. Appl. Clay Sci. 2015, 114, 239–246. [CrossRef]
13. Basso, M.C.; Cerrella, E.G.; Cukierman, A.L. Empleo de algas marinas para la biosorcion de metales pesadosde aguas contaminadas. Avances en Energias Renovables y. Medio Ambiente 2002, 6, 669–674.
14. Criscuoli, A.; Figoli, A.; Leopold, A.; Simone, S.; Benamor, M.; Drioli, E. Removal of As(V) by PVDF hollowfibers membrane contactors using Aliquat-336 as extractant. Desalination 2010, 264, 193–200.
15. Criscuoli, A.; Bafaro, P.; Drioli, E. Vacuum membrane distillation for purifying waters containing arsenic.Desalination 2013, 323, 17–21. [CrossRef]
16. Mondal, P.; Bhowmick, S.; Chatterjee, D.; Figoli, A.; Van der Bruggen, B. Remediation of inorganic arsenic ingroundwater for safe water supply: A critical assessment of technological solutions. Chemosphere 2013, 92,157–170. [CrossRef] [PubMed]
17. Gohari, R.J.; Lau, W.J.; Matsuura, T.; Ismail, A.F. Fabrication and characterization of novel PES/Fe–Mn binaryoxide UF mixed matrix membrane for adsorptive removal of As(III) from contaminated water solution.Sep. Purif. Technol. 2013, 118, 64–72. [CrossRef]
18. Zheng, Y.-M.; Zhou, S-.W.; Nanayakkara, K.G.N.; Matsuura, T.; Paul Chen, J. Adsorptive removal of arsenicfrom aqueous solution by a PVDF/zirconia blend flat sheet membrane. J. Membr. Sci. 2011, 374, 1–11.[CrossRef]
19. Mohan, D.; Pittman, C.U. Arsenic removal from water/waste water using adsorbents—A critical review.J. Hazard. Mater. 2007, 142, 1–53. [CrossRef] [PubMed]
20. Dixit, S.; Hering, J.G. Comparison of arsenic(V) and arsenic(III) sorption onto iron oxide minerals:Implications for arsenic mobility. Environ. Sci. Technol. 2003, 37, 4182–4189. [CrossRef] [PubMed]
26

Membranes 2017, 7, 57
21. Guo, H.; Stuben, D.; Berner, Z. Removal of arsenic from aqueous solution by natural siderite and hematite.Appl. Geochem. 2007, 22, 1039–1051. [CrossRef]
22. Jönsson, J.; Sherman, D.M. Sorption of As(III) and As(V) to siderite, green rust (fougerite) and magnetite:Implications for arsenic release in anoxic ground waters. Chem. Geol. 2008, 255, 173–181. [CrossRef]
23. Lin, Z.; Pulse, R.W. Adsorption, desorption and oxidation of arsenic affected by clay minerals andaging process. Environ. Geol. 2000, 39, 753–759. [CrossRef]
24. Chandrasekhar, S.; Ramaswamy, S. Influence of mineral impurities on the properties of kaolin and itsthermally treated products. Appl. Clay Sci. 2002, 21, 133–142. [CrossRef]
25. Hosseini, M.R.; Ahmadi, A. Biological beneficiation of Kaolin: A review on ironremoval. Appl. Clay Sci. 2015,107, 238–245. [CrossRef]
26. PubChem Home Page. Available online: https://pubchem.ncbi.nlm.nih.gov/compound/kaolin(accessed on 11 August 2017).
27. De Mesquita, L.M.S.; Rodrigues, T.; Gomes, S.S. Bleaching of Brazilian kaolin using organic acids andfermented medium. Miner. Eng. 1996, 9, 965–971. [CrossRef]
28. Zen, S.; El Berrichi, F.Z. Adsorption of tannery anionic dyes by modified kaolin from aqueous solution.Desalin. Water Treat. 2014, 52, 1–9. [CrossRef]
29. Gürses, A.; Karaca, S.; Dogar, C.; Bayrak, R.; Acikyildiz, M.; Yalcin, M. Determination of adsorptive propertiesof clay/water system: Methylene blue sorption. J. Colloid Int. Sci. 2004, 269, 310–314. [CrossRef]
30. Sarbatly, R. Effect of kaolin/PESf ration and sintering temperature on pore size and porosity of the kaolinmembrane support. J. Appl. Sci. 2011, 11, 2306–2312.
31. Han, L.F.; Xu, Z.L.; Cao, Y.; Wei, Y.M.; Xu, H.T. Preparation, characterization and permeation property ofAl2O3, Al2O3–SiO2 and Al2O3–kaolin hollow fiber membranes. J. Membr. Sci. 2011, 372, 154–164. [CrossRef]
32. Dizman, C.; Tasdelen, M.A.; Yagci, Y. Recent advances in the preparation of functionalized polysulfones.Polym. Int. 2013, 62, 991–1007. [CrossRef]
33. Mierzwa, J.C.; Arieta, V.; Verlage, M.; Carvalho, J.; Vecitis, C.D. Effect of clay nanoparticles on the structureand performance of polyethersulfone ultra filtration membranes. Desalination 2013, 314, 147–158. [CrossRef]
34. Yip, Y.; McHugh, A.J. Modeling and simulation of nonsolvent vapor-induced phase separation. J. Membr. Sci.2006, 271, 163–176. [CrossRef]
35. Marino, T.; Blefari, S.; Di Nicolò, E.; Figoli, A. A more sustainable membrane preparation using triethylphosphate as solvent. Green Process. Synth. 2017, 6, 295–300. [CrossRef]
36. Goetz, L.A.; Jalvo, B.; Rosal, R.; Mathew, A. Superhydrophilic anti-fouling electrospun cellulose acetatemembranes coated with chitin nanocrystals for water filtration. J. Membr. Sci. 2016, 510, 238–248. [CrossRef]
37. Khare, V.P.; Greenberg, A.R.; Krantz, W.B. Vapor-induced phase separation—Effect of the humid air exposurestep on membrane morphology: Part I. Insights from mathematical modeling. J. Membr. Sci. 2005, 258,140–156. [CrossRef]
38. Chen, C.Y.; Lan, G.S.; Tuan, W.H. Preparation of mullite by the reaction sintering of kaolinite and alumina.J. Eur. Ceram. Soc. 2000, 20, 2519–2525. [CrossRef]
39. Susanto, H.; Stahra, N.; Ulbricht, M. High performance polyethersulfone microfiltration membranes havinghigh flux and stable hydrophilic property. J. Membr. Sci. 2009, 342, 153–164. [CrossRef]
40. Ma, Y.; Shi, F.; Wang, Z.; Wu, M.; Ma, J.; Gao, C. Preparation and characterization of PSf/clay nanocompositemembranes with PEG 400 as a pore forming additive. Desalination 2012, 286, 131–137. [CrossRef]
41. Tan, P.C.; Low, S.C. Role of hygroscopic triethylene glycol and relative humidity in controlling morphologyof polyethersulfone ultrafiltration membrane. Desalin. Water Treat. 2015, 57, 1–11. [CrossRef]
42. Keurentjes, J.T.F.; Harbrecht, J.G.; Brinkman, D.; Hanemaajer, J.H.; Cohen Stuart, M.A.; van’t Riet, H.Hydrophobicity measurements of MF and UF membranes. J. Membr. Sci. 1989, 47, 333–337. [CrossRef]
43. Palacio, L.; Calvo, J.I.; Prádanos, P.; Hernández, A.; Väisänen, P.; Nyström, M. Contact angles and externalprotein adsorption onto ultrafiltration membranes. J. Membr. Sci. 1999, 152, 189–201. [CrossRef]
44. Anadão, P.; Sato, L.F.; Wiebeck, H.; Valenzuela-Díaz, F.R. Montmorillonite as a component of polysulfonenanocomposite membranes. Appl. Clay Sci. 2010, 48, 127–132. [CrossRef]
45. Ghaemi, N.; Madaeni, S.S.; Alizadeh, A.; Rajabi, H.; Daraei, P. Preparation, characterization andperformance of polyethersulfone/organically modified montmorillonite nanocomposite membranes inremoval of pesticides. J. Membr. Sci. 2011, 382, 135–147. [CrossRef]
27

Membranes 2017, 7, 57
46. Monticelli, O.; Bottino, A.; Scandale, I.; Capanelli, G.; Russo, S. Preparation and propertiesof polysulfone-claycomposite membranes. J. Appl. Polym. Sci. 2007, 103, 3637–3644. [CrossRef]
47. Han, M.-J.; Nam, S.-T. Thermodynamic and rheological variation in polysulfone solution by PVP and itseffect in the preparation of phase inversionmembrane. J. Membr. Sci. 2002, 202, 55–61. [CrossRef]
48. Zen, S.; El. Berrichi, F.Z.; Abidi, N.; Duplay, J.; Jada, A.; Gasmi, B. Activated Algerian kaolin’s as low-coastpotential adsorbents for the removal from industrial effluents of Derma Blue R67 acid dye. Kinetic andthermodynamic studies. In Proceedings of the 5th International Conference on Sustainable Solid WasteManagement, Athens, Greece, 21–24 June 2017.
49. Khalil, M.I.; Aly, A.A. Use of cationic starch derivatives for the removal of anionic dyes from textile effluents.J. Appl. Polym. Sci. 2004, 93, 227–234. [CrossRef]
50. Constantina, M.; Asmarandeia, I.; Harabagiua, V.; Ghimicia, L.; Ascenzib, P. Removal of anionic dyes fromaqueous solutions by an ion-exchange based on pullulan microspheres. Carbohyd. Polym. 2013, 91, 74–84.[CrossRef] [PubMed]
© 2017 by the authors. Licensee MDPI, Basel, Switzerland. This article is an open accessarticle distributed under the terms and conditions of the Creative Commons Attribution(CC BY) license (http://creativecommons.org/licenses/by/4.0/).
28

membranes
Article
Perfluorinated Compounds as Test Media forPorous Membranes
Juliana I. Clodt, Volkan Filiz and Sergey Shishatskiy *
Helmholtz-Zentrum Geesthacht, Institute of Polymer Research, Max-Planck-Str.1, 21502 Geesthacht, Germany;[email protected] (J.I.C.); [email protected] (V.F.)* Correspondence: [email protected]; Tel.: +49-4152-87-2467
Received: 19 July 2017; Accepted: 29 August 2017; Published: 5 September 2017
Abstract: We suggest a failure-free method of porous membranes characterization that givesthe researcher the opportunity to compare and characterize properties of any porous membrane.This proposal is supported by an investigation of eight membranes made of different organic andinorganic materials, with nine different perfluorinated compounds. It was found that aromaticcompounds, perfluorobenzene, and perfluorotoluene, used in the current study show propertiesdifferent from other perfluorinated aliphatics. They demonstrate extreme deviation from the generalsequence indicating the existence of π-π-interaction on the pore wall. The divergence of the flow forcyclic compounds from ideal e.g., linear compounds can be an indication of the pore dimension.
Keywords: ultrafiltration; membrane characterization; perfluorinated compounds; porousmembranes; permeance
1. Introduction
Ultrafiltration (UF) membranes have attracted the increasing interests of scientists during the lastdecades. In the meantime, they are common in several applications as waste-water treatment [1–3],biomolecule separation [1,4], and controlled drug release [5]. UF membranes can be made from organicand inorganic materials by different techniques suitable for the material nature including casting,phase inversion, track-etching, anodizing, sintering, and film-stretching as conventional examples.Since each membrane is limited in their separation performance [6–8], new methods for the formationof UF membranes, especially of isoporous membranes [9], will be still present on the agenda ofmembrane scientists.
For many years the only type of commercially available isoporous membranes was track-etchedmembranes. One success story to implement other methods to fabricate isoporous membranesstarting ten years ago is the combination of self-assembly of amphiphilic block copolymers (S),and the non-solvent induced phase separation process (NIPS) called SNIPS [10]. With this method,UF membranes from various block copolymers can be prepared in a fast one-step process, leading toa new type of integral-asymmetric membrane with highly ordered, hexagonally arranged poreson the surface [11–14]. During the last few years, significant advances towards mass productionof isoporous structures based on amphiphilic polymers has been achieved [15–17]. Nevertheless,the characterization of such membranes will cause problems if swellable polymer blocks areimplemented and a standard solvent, e.g., water, will be used. In consequence, flux decline canoccur as shown in Figure 1 [11,18–21].
Membranes 2017, 7, 51 29 www.mdpi.com/journal/membranes

Membranes 2017, 7, 51
2 4 6 8 10 12
0
400
800
1200
1600
3rd step:Increasing pH value
2nd step:Decreasing
pH valueFlux
[L/(m
²hba
r)]
pH
1st step:Water flux drop at initial state
(a) (b)
Figure 1. (a) pH-dependent water flux measurement of an isoporous block copolymer membrane withflux decline at initial state (water flux drop). (Reproduced from [11] with permission; Copyright 2012Wiley-VCH Verlag GmbH & Co., KGaA). (b) Water flux measurements for membranes made frompolystyrene-block-poly(4-vinylpyridine) with different pore sizes and with different flux decline.(Reproduced from [20] with permission; Copyright 2014 Royal Society of Chemistry).
Other problems for the characterization of UF membranes using water as liquid includefouling [22–24] and the unstable flow at different pressures [20]. The quality of water also plays animportant role since deionized water made with different techniques, general tap water, or UV-treatedwater are used in different laboratories, dependent on the application and available facilities. The waterflux values for UF membranes given in the literature are measured so far with several techniques,involving different: Pressures, time to stabilize the system until the value is measured, temperature,pre-treatment of the membranes in case of hydrophobic material, and so on.
In order to solve the aforementioned problems, one important question arises: How can wecharacterize UF membranes and get comparable data independent of the membranes’ chemicalcomposition? The probing liquid which is inert for as many membrane materials as possible is needed,as well as an easy to implement method of the membranes permeance measurement. From the varietyof liquid compounds available on the market, perfluorinated (PF) compounds were found to bethe most promising. PF compounds are known for their very limited interaction/affinity with/tosubstances not containing fluorine, offering low surface tension, high density, and the wide variationin dynamic viscosity. In this work, PF compounds were chosen as a test media for the characterizationof UF membranes of various nature. The PF compounds were chosen to cover as big a range ofviscosity as possible, and included linear, cyclic and aromatic compounds. As examples of commercialmembranes, ceramic anodic alumina, polymeric track-etched, and standard ultrafiltration membraneswith isotropic and anisotropic morphology were chosen.
The results of our experiments confirm that porous membranes of almost any nature can be testedusing PF liquids, and membrane properties can be compared. The membranes do not swell during theexperiments and are not altered by PF compounds.
2. Results and Discussion
In this work, we want to justify the method suitable for standard membrane characterization withexamples of membranes of different nature, cross-sectional morphology, and membrane preparationmethod: Polymeric membranes prepared from homopolymers by the phase inversion process andresulting in a broad pore size distribution, two mostly isoporous membranes: Polymeric track-etchedand inorganic anodic alumina and highly isoporous membrane prepared from amphiphilic diblockcopolymer manufactured by SNIPS. The PF compounds used for the membrane characterization havea carbon backbone of different arrangements, which allows for investigating the dependence of thefluid flow through the pores on the shape of the fluid molecule.
30

Membranes 2017, 7, 51
The first section will be dedicated to the verification of the method of permeance measurementswith a water sensitive membrane and PF hexane. Later, we apply the method for the characterizationof different membranes with various PF compounds.
2.1. Verification of the Experimental Method for Sensitive Membranes
Since block copolymer membranes (BCPM) are the most sensitive of all membranes underinvestigation in this work, BCPM will be used to verify the method by using PF hexane for fluxmeasurements. We chose one of the most common in-house made isoporous block copolymermembrane system, membranes made from polystyrene-b-poly(4-vinylpyridine) (PS-b-P4VP) with4-vinylpyridine as a water swellable block.
Figure 2 depicts the permeance of PF hexane for a BCPM made from PS82.8-b-P4VP17.2190k diblock
copolymer. One membrane stamp was measured three times in a row using the same PF hexane in orderto evaluate the stability of the permeance which was found to be similar for all three measurements.Only a small deviation of less than 2% was found coming from the accuracy of the measurementcollecting the data each second. Compared to water flux measurements, where big flux declines canbe found at the beginning of the measurements (compare to Figure 1), this is an improvement for thecharacterization of performances of BCPM made from copolymers containing water swellable blocks.Deviation of the permeances at the beginning of the measurement may occur due to the wetting of themembrane and the instability of the pressure when the device is set on.
Figure 2. Permeance of PF hexane through the block copolymer membranes (BCPM) of PS82.8-b-P4VP17.2190k.
For the purpose of examining the stability of permeances depending on the transmembranepressure, measurements were carried out at different pressures between 0.5 and 2 bar, i.e., within thedesign pressure range of the flux measurement facility. Figure 3 depicts the flux of three differentPF compounds through the BCPM examined for the permeance stability (Figure 2) as a function of atrans-membrane pressure. For three PF compounds chosen to cover the full range of dynamic viscositythe permeance increases linearly, with the pressure indicating that in the selected pressure range anypressure suitable for the measurement can be chosen in dependence on the liquid viscosity.
31

Membranes 2017, 7, 51
Figure 3. Flux through the BCPM of three perfluorinated (PF) compounds of various viscosity plottedagainst the trans-membrane pressure.
2.2. Permeance of Ultrafiltration Membranes
In general, the theoretical volume flow rates of membranes may be calculated by the Equation (1)of Hagen-Poiseuille for a laminar flow in a simple straight cylinder:
Volume flow rate =πr4Δp8ηL
(1)
where r is the radius of the open pore, Δp is the transmembrane pressure, η is the dynamic viscosity ofa liquid, and L the length of the cylindrical pore. Assuming that the r and L will be constant if onemembrane sample is used for experiments with different liquids, and Δp is kept constant throughthe experiment, the volume flow rate normalized to the transmembrane pressure, here labeled aspermeance, is proportional to the reciprocal dynamic viscosity (See Equation (2)):
Permeance ∼ 1η
(2)
The permeances of different linear aliphatic, cyclic aliphatic, and aromatic PF compounds werestudied for an anodic alumina membrane, Anodisc® (GE Healthcare, Chalfont St Giles, UK) with20 nm pore diameter, and a UPZP05205 polyethylene membrane (Millipore, Billerica, MA, USA) inorder to prove applicability of the Equation (2) for PF compounds in general. The results are depictedin Figure 4 and at first sight a linear trend can be seen for both types of membranes, as expected.On the other hand, a small difference in the flow of molecules with different shapes is apparent.The permeance of aromatic PF compounds is lower than those of the linear aliphatic compounds,and additionally, a discontinuity in the trend of the linear and cyclic compounds appears.
32

Membranes 2017, 7, 51
(a) (b)
Figure 4. Permeances of Anodisc® membrane with 20 nm pore diameter (a) and PE membrane with50 nm pore diameter (b) against reciprocal dynamic viscosity of linear, cyclic aliphatic and aromaticPF compounds.
In order to explore further the break in the Hagen-Poiseuille trend for permeances found for thecompounds with different molecule shapes, three PC track-etched membranes with different poresizes were investigated. Figure 5 summarizes the relative permeances of different PF compounds forthe case of three PC track-etched membranes (pore diameters 30, 50 and 80 nm) in dependence of thereciprocal viscosity. The relative permeance is shown in the graph where the highest permeance ofPF hexane for each membrane is set to unity, and the others are set in proportion to it. The followingtendencies were observed: Linear aliphatic as well as cyclic aliphatic PF compounds indicate each aproportional relative permeance to the reciprocal viscosity, as expected from Equation (2). However,track-etched PC membranes show considerable differences of relative permeances of PF compoundsdepending on the shape of the PF molecule. The permeances of cyclic aliphatic PF compounds,and especially aromatic PF compounds, are significantly smaller than the permeances of linear PFaliphatics, indicating, most probably, that the formation of immobilized molecular layers on the porewalls. Linear compounds are more flexible, and additionally, can be more easily oriented in thedirection of the liquid flow, while in the case of cyclic compounds, steric hindrance may play anadditional role leading to more distinctive immobilization on the pore wall. Immobilization of themolecules on the pore wall can cause a significant change of the permeance since the pore diameter ofthe studied membranes is comparable to the characteristic size of the molecule [25]. This trend increaseswith the decreasing pore diameter of the PC track-etched membranes and could further be used todetermine the pore size without microscopy studies. Very small or neglectable differences of relativepermeances between cyclic and linear PF compounds one indicate that the pore sizes are below 30 nmfor PC track-etched membranes. This behavior could be implemented for other membrane materialsas well, especially membranes with isoporosity, probably dependent on the materials nature andsubstructure. Aromatic compounds undergo immobilization more readily than aliphatic compoundssince they have a tendency of π-π-interaction, which can be induced by the shear force near (inmolecular size terms) the pore wall where the flow velocity is minimal [25]. Since PC track-etchedmembranes are, in general, made from polycarbonates with an aromatic backbone, π-π-interactionwith the pore wall itself will also occur especially for track-etched membranes containing straightcylindrical pores.
33

Membranes 2017, 7, 51
Figure 5. Relative permeance (dimensionless) of PC track-etched membranes with 30, 50 and 80 nmpore diameters against reciprocal dynamic viscosity of linear, cyclic, and aromatic PF compounds.
In order to investigate liquid permeances for phase inversion membranes with broader poresize distribution as compared to the membranes discussed before, a PAN (polyacrylonitrile)ultrafiltration anisotropic membrane was selected exemplarily, and the results are depicted in Figure 6.The permeance for aromatic PF compounds has the same trend as we discussed for PC track-etchedand the Anodisc® membranes before. Interestingly, the gap between linear and cyclic PF compoundsis lower than for the PC30, even though the PAN membrane has a smaller average pore diameterof 22 nm. For this type of membranes, the aforementioned influence of substructure may play anadditional role for the immobilization of PF molecules on pore or substructural walls. The porosity ofPAN membranes is much higher than for track-etched membranes, 12.4% as compared with 0.4% forPC30, and the PAN membranes have a wide pore size distribution that plays an important role [26].
Figure 6. Permeance of a PAN membrane against reciprocal viscosity of linear, cyclic, and aromaticPF compounds.
The question of whether the observed behavior of aromatic, cyclic, and linear PF compounds canbe found for the aforementioned BCPM arises. Therefore, the permeances were measured for the set ofdifferent PF compounds and water, as depicted in Figure 7. Each compound was measured at leasttwo times in a row to ensure the reproducibility of the obtained results. Similar to the other polymericmembranes used in this work, the permeance of aromatic PF compounds is lower as compared to
34

Membranes 2017, 7, 51
aliphatic compounds. Interestingly, the permeances of cyclic aliphatic are again lower when comparedto linear aliphatic compounds, but in this case the corresponding slopes overlap around 0.8 cP−1, and asteeper slope is observed for linear compounds as compared to the slope of cyclic compound withouta gap of the trend line between linear and cyclic compounds. Furthermore, the trend for linear PFcompounds unexpectedly does not approach zero at infinite dynamic viscosity, a fact to be examinedfurther. On the one hand the average pore diameter of this BCPM is 42 nm, which should lead only tosmall differences in the pemeances of linear and cyclic compounds as observed for PC track-etchedmembranes discussed above. On the other hand, the substructure of BCPM plays an important role intheir performances, as studied before [26]. Nevertheless, permeance measurements of PF compoundcould help to understand the behavior of BCPM, and should be studied in detail in future worksdepending on the pore sizes and substructure. In case of water, the flux decreases to about 30% alreadyduring the second measurement (compare first and second measurement in Figure 7), leading tofurther problems when the performance of such membranes is under investigation.
Figure 7. Permeances of BCPM made from PS82.8-b-P4VP17.2190k against reciprocal viscosity of linear,
cyclic, and aromatic PF compounds, respectively, and water. Each point represents the average valuefor one experiment with a liquid.
In order to compare the experimental and theoretical fluxes, the theoretical fluxes were calculatedaccording to Hagen-Poiseulle’s law as follows, taking the porosities of the membranes into account(See Equation (2)):
Theoretical water fluxes =πr4ΔpPorosity
8ηLAΔp=
r2Porosity8ηL
(3)
where A is the area of the pore corresponding A = πr2, L the length of the cylindrical pore, and theaverage surface porosity values were used as listed in Table 1. The tortuosity of the membraneis not taken into account since it is impossible to obtain the reliable value from any source ofinformation either flow experiment or microscopy. Theoretical fluxes were calculated accordingto Equation (3) for the track-etched membranes, PC30, PC50, and PC80, which should have straightcylindrical pores through the whole membrane thickness. Surprisingly, theoretical permeances forPF hexane are around ten times lower than the experimental fluxes, namely theoretical fluxes 350, 80,and 10 L/m−2·h−1·bar−1 as compared to the experimental fluxes 3685, 775, and 211 L/m−2·h−1·bar−1
for PC80, PC50, and PC30. The calculation was based on the pore diameter of the entrance ofthe pore given by the supplier, and with the assumption that track-etched membranes have straightcylindrical pores perpendicular to the membrane surface through the whole thickness of the membrane.For track-etched membranes, the surface pore size is smaller than in the bulk of a membrane [27].
35

Membranes 2017, 7, 51
On the other hand, double and multiple pores having an origin in the overlapping of tracks of particlesused for the polymer bombardment are often found on the membrane surface of the track-etchedmembranes [28]. Both of the facts are leading to higher experimental fluxes than the calculated one.For example, for the PC50 membrane, the theoretical, and experimental permeances would match eachother when the average pore diameter is 88 nm.
Table 1. Membranes and geometrical features used in this work.
Membrane Abbr. Used in This Work Average Pore Diameter (nm) Porosity (%)
Polycarbonate track-etched PCN8CP04700 PC80 80 a 2.0 a
Polycarbonate track-etched PCN5CP04700 PC50 50 a 1.2 a
Polycarbonate track-etched PCN3CP04700 PC30 30 a 0.4 a
Polyethylene UPZP05205 PE50 50 a – c
Anodized alumina Anodisc® Anodisc 20 a 40 b
Polyacrylonitrile PAN 22 b 12.3 b
Block copolymer membranes BCPM 42 b 29.5 b
a as stated by supplier; b calculated from SEM images as shown in previous work [12,29–31]; c accurate surfaceporosity is not possible to acquire from the SEM image due to very complex membrane morphology.
3. Materials and Methods
3.1. Membranes Used in This Work
Polyacrylonitrile membranes were prepared by the phase inversion process [32]. Commercialpolycarbonate track-etched membranes were purchased from Pieper (Germany): Supplier numberPCN8CP04700, pore size 80 nm, thickness 6 μm, typical water flow rate 2 mL/(cm2·min) at 0.67 bar(in this work labelled as PC80); supplier number PCN5CP04700, pore size 50 nm, thickness 6 μm,typical water flow rate 1 mL/(cm2·min) at 0.67 bar (in this work labelled as PC50); supplier numberPCN3CP04700 pore size 30 nm, thickness 6 μm, typical water flow rate 0.2 mL/(cm2·min) at 0.67 bar(in this work labelled as PC30); and, data as stated by the supplier. Polyethylene (PE) membranes,supplier number UPZP05205, pore size 50 nm were purchased from Millipore. An anodized aluminamembrane Anodisc® circle with support ring, 47 mm, 0.02 μm pore size was purchased from GEHealthcare GmbH. Isoporous diblock copolymer membranes (BCPM) used in this work were preparedaccording to a procedure published by Rangou et al. [12]. All membranes, their abbreviation used inthis work, and their geometrical features are listed in Table 1.
3.2. Perfluorinated Compounds Used in This Work and Their Physical Data
The PF compounds used for the membrane performance measurements and their physicalproperties are listed in the Table 2. PF compounds were selected in order to analyze three differentgroups: Linear aliphatic compounds: Perfluorohexane, hexadecafluoroheptane, perfluorooctane;PF cyclic aliphatic compounds: Perfluoro(methylcyclohexane), perfluoro-1,3-dimethylcyclohexane,perfluorocycloether labeled as FC-77; and, aromatic compounds: Perfluorobenzene andperfluorotoluene. In order to compare the measurement data of the PF compounds with water,commonly used for flux measurements, demineralized water with an electrical conductivity of≈0.055 μS·cm−1 was employed.
Dynamic viscosity was calculated from kinematic viscosity of the PF compounds, measuredusing a Lauda iVisc Viscometer Version 1.01 at 23 ± 1 ◦C in agreement with the temperature of thepermeance measurement.
36

Membranes 2017, 7, 51
Table 2. Liquids used in this work and their physical data.
Substance Abbreviation Mwa (g/mol) Density a (g/cm−3) BP a (◦C) Dyn. Viscosity (cP) at 23 ◦C
Perfluorohexane PF Hexane 339.04 1.686 59 0.690Hexadecafluoroheptane PF Heptane 388.05 1.731 83 0.936
Perfluorooctane PF Octane 438.06 1.757 103 1.27Perfluoro(methylcyclohexane) PF MCH 350.05 1.784 76 1.62Perfluoro-1,3-imethylcyclohexane PF DMCH 400.06 1.838 101 1.93
Perfluorodecalin PF Decalin 462.08 1.926 142 5.50Perfluorocycloether FC-77 416 1.767 97 1.27Perfluorobenzene PF Benzene 186.05 1.613 81 0.889Perfluorotoluene PF Toluene 236.06 1.664 104 0.903
Water Water 18.02 0.995 100 0.932a The data as available by material safety data sheet or stated by a supplier.
3.3. Liquid Permeance Measurement
Liquid permeance measurements were performed in a simple dead-end mode at roomtemperature using an in-house designed and manufactured testing facility, as schematically shown inFigure 8. A Millipore inline stainless steel filter with 20 mm sample diameter was used as a membranesample holder. Nitrogen at relative pressures from 0.5 to 2.5 bar was used to create a driving force.The liquid flow rate through the membrane was measured gravimetrically every second by weightacquisition from the Mettler Toledo NewClassic MF MS1003S precision balance with 0.001 g accuracy.In our case, all data including pressure, temperature, and weight was transmitted to a computer for aneasy evaluation.
Figure 8. Scheme of the measurement facility for determination of liquid permeance for porous membranes.
The permeance (P) was calculated by normalizing the flux by the trans-membrane pressure (SeeEquation (4)):
P =ΔV
A Δt Δp(4)
where ΔV is the volume of PF compound collected between two mass measurements, A isthe membrane surface area, Δt is the time between two mass measurements, and Δp is thetrans-membrane pressure.
37

Membranes 2017, 7, 51
The flux (J) through the membrane was calculated according to the Equation (5):
J =ΔV
A Δt(5)
The trans-membrane pressure was varied in the range 0.5 to 2.5 bar depending on the PF liquidviscosity in order to ensure the collection of the experimental data during similar time intervals forall liquids. The independence of the flux on the trans-membrane pressure was studied and will bedescribed further.
4. Conclusions
In this work we examined the use of PF compounds as possible universal media for thecharacterization of ultrafiltration membranes in order to avoid e.g., swelling of membranes in water,as discussed before [11,20]. Therefore, PF compounds of different molecular shape and electronicnature were studied. The following results were observed:
1. PF compounds can be used to study the permeances of sensitive membranes made from wateror other solvent swellable materials.
2. Pressure dependent measurements show that the permeances of PF compounds are stable in thepressure difference range 0.5 to 2 bar, and the flux does not change significantly with time.
3. All studied PF aliphatic compounds, both linear and cyclic, show permeance gradually changingwith the viscosity in full agreement with the Hagen–Poiseuille equation.
4. The Hagen–Poiseuille trends for linear and cyclic aliphatic compounds deviated increasinglywith decreasing average pore diameter: The slope for the cyclic compounds is smaller than thatfor linear compounds and this observation may possibly be used for estimating the pore size ofthe membrane without microscopic study each time.
5. The permeances of aromatic PF compounds through ultrafiltration membranes made of materialsof different nature are lower than the fluxes of aliphatic compounds presumably due tosupramolecular interaction between aromatic PF molecules and pore walls.
6. Taking into account the considerations discussed above, one can conclude that most suitable PFcompounds for the membrane characterization are perfluorooctane and FC-77 by 3M Company(St. Paul, MN, USA). These two compounds have very similar density and viscosity, while oneis linear aliphatic and another cyclic ether.
Acknowledgments: The authors thank Kristian Buhr, Janina Hahn, Adina Jung and Jan Wind for preparing thePAN and BCP membranes; Janina Hahn and Kristian Buhr for their help with the permeance measurements;Jan Pohlmann for data acquisition program; Volker Abetz, Thomas Bucher, Torsten Brinkmann and Sofia Rangoufor scientific discussion.
Author Contributions: The authors have contributed equally to the experimental work and to the manuscript.The work load was distributed: Juliana I. Clodt: BCPM membrane preparation, liquid flux measurements,data analysis, manuscript preparation; Volkan Filiz: BCPM membrane preparation, data analysis,manuscript preparation; Sergey Shishatskiy: Commercial membranes choice purchase; liquid flux measurements,experimental data analysis, manuscript preparation.
Conflicts of Interest: The authors declare no conflict of interest.
References
1. Van Reis, R.; Zydney, A. Membrane separations in biotechnology. Curr. Opin. Biotechnol. 2001, 12, 208–211.[CrossRef]
2. Savage, N.; Diallo, M. Nanomaterials and water purification: Opportunities and challenges. J. Nanopart. Res.2005, 7, 331–342. [CrossRef]
3. Van Der Bruggen, B.; Vandecasteele, C.; Van Gestel, T.; Doyen, W.; Leysen, R. A review of pressure-drivenmembrane processes in wastewater treatment and drinking water production. Environ. Prog. 2003, 22, 46–56.[CrossRef]
38

Membranes 2017, 7, 51
4. Saxena, A.; Tripathi, B.P.; Kumar, M.; Shahi, V.K. Membrane-based techniques for the separation andpurification of proteins: An overview. Adv. Colloid Interface Sci. 2009, 145, 1–22. [CrossRef] [PubMed]
5. Jeon, G.; Yang, S.Y.; Kim, J.K. Functional nanoporous membranes for drug delivery. J. Mater. Chem. 2012, 22,14814–14834. [CrossRef]
6. Stroeve, P.; Ileri, N. Biotechnical and other applications of nanoporous membranes. Trends Biotechnol. 2011,29, 259–266. [CrossRef] [PubMed]
7. Clark, W.M.; Bansal, A.; Sontakke, M.; Ma, Y.H. Protein adsorption and fouling in ceramic ultrafiltrationmembranes. J. Membr. Sci. 1991, 55, 21–38. [CrossRef]
8. Robertson, B.C.; Zydney, A.L. Protein adsorption in asymmetric ultrafiltration membranes with highlyconstricted pores. J. Colloid Interface Sci. 1990, 134, 563–575. [CrossRef]
9. Freeman, B. Not all membrane pores are made equal; some are more equal than others. Nature 2008, 454, 671.[CrossRef] [PubMed]
10. Peinemann, K.V.; Abetz, V.; Simon, P.F. Asymmetric superstructure formed in a block copolymer via phaseseparation. Nat. Mater. 2007, 6, 992–996. [CrossRef] [PubMed]
11. Jung, A.; Rangou, S.; Abetz, C.; Filiz, V.; Abetz, V. Structure formation of integral asymmetric compositemembranes of polystyrene-block-poly(2-vinylpyridine) on a nonwoven. Macromol. Mater. Eng. 2012, 297,790–798. [CrossRef]
12. Rangou, S.; Buhr, K.; Filiz, V.; Clodt, J.I.; Lademann, B.; Hahn, J.; Jung, A.; Abetz, V. Self-organized isoporousmembranes with tailored pore sizes. J. Membr. Sci. 2014, 451, 266–275. [CrossRef]
13. Abetz, V. Isoporous block copolymer membranes. Macromol. Rapid Commun. 2015, 36, 10–22. [CrossRef][PubMed]
14. Höhme, C.; Hahn, J.; Lademann, B.; Meyer, A.; Bajer, B.; Abetz, C.; Filiz, V.; Abetz, V. Formation of highthermally stable isoporous integral asymmetric block copolymer membranes. Eur. Polym. J. 2016, 85, 72–81.[CrossRef]
15. Hahn, J.; Clodt, J.I.; Abetz, C.; Filiz, V.; Abetz, V. Thin isoporous block copolymer membranes: It is all aboutthe process. ACS Appl. Mater. Interfaces 2015, 7, 21130–21137. [CrossRef] [PubMed]
16. Radjabian, M.; Abetz, C.; Fischer, B.; Meyer, A.; Abetz, V. Influence of solvent on the structure of anamphiphilic block copolymer in solution and in formation of an integral asymmetric membrane. ACS Appl.Mater. Interfaces 2017. [CrossRef] [PubMed]
17. Radjabian, M.; Abetz, V. Tailored pore sizes in integral asymmetric membranes formed by blends of blockcopolymers. Adv. Mater. 2015, 27, 352–355. [CrossRef] [PubMed]
18. Hahn, J.; Filiz, V.; Rangou, S.; Clodt, J.; Jung, A.; Buhr, K.; Abetz, C.; Abetz, V. Structure formation ofintegral-asymmetric membranes of polystyrene-block-poly(ethylene oxide). J. Polym. Sci. Polym. Phys. 2013,51, 281–290. [CrossRef]
19. Hahn, J.; Filiz, V.; Rangou, S.; Lademann, B.; Buhr, K.; Clodt, J.I.; Jung, A.; Abetz, C.; Abetz, V. PtBS-b-P4VPand PTMASS-b- P4VP isoporous integral-asymmetric membranes with high thermal and chemical stability.Macromol. Mater. Eng. 2013, 298, 1315–1321. [CrossRef]
20. Hahn, J.; Clodt, J.I.; Filiz, V.; Abetz, V. Protein separation performance of self-assembled block copolymermembranes. RSC Adv. 2014, 4, 10252–10260. [CrossRef]
21. Shukla, R.; Cheryan, M. Performance of ultrafiltration membranes in ethanol-water solutions: Effect ofmembrane conditioning. J. Membr. Sci. 2002, 198, 75–85. [CrossRef]
22. Miller, D.J.; Dreyer, D.R.; Bielawski, C.W.; Paul, D.R.; Freeman, B.D. Surface modification of water purificationmembranes. Angew. Chem. Int. Ed. Engl. 2017, 56, 4662–4711. [CrossRef] [PubMed]
23. Sun, W.; Liu, J.; Chu, H.; Dong, B. Pretreatment and membrane hydrophilic modification to reduce membranefouling. Membranes 2013, 3, 226–241. [CrossRef] [PubMed]
24. Li, X.; Mo, Y.; Li, J.; Guo, W.; Ngo, H.H. In-situ monitoring techniques for membrane fouling and localfiltration characteristics in hollow fiber membrane processes: A critical review. J. Membr. Sci. 2017, 528,187–200. [CrossRef]
25. Bitsanis, I.; Somers, S.A.; Davis, H.T.; Tirrell, M. Microscopic dynamics of flow in molecularly narrow pores.J. Chem. Phys. 1990, 93, 3427–3431. [CrossRef]
26. Clodt, J.I.; Bajer, B.; Buhr, K.; Hahn, J.; Filiz, V.; Abetz, V. Performance study of isoporous membranes withtailored pore sizes. J. Membr. Sci. 2015, 495, 334–340. [CrossRef]
39

Membranes 2017, 7, 51
27. Hernandez, A.; Calvo, J.I.; Pradanos, P.; Tejerina, F. Pore size distributions of track-etched membranes;comparison of surface and bulk porosities. Colloid Surface A 1998, 138, 391–401. [CrossRef]
28. Calvo, J.I.; Hernández, A.; Caruana, G.; Martínez, L. Pore size distributions in microporous membranes.J. Colloid Interface Sci. 1995, 175, 138–150. [CrossRef]
29. Grünauer, J.; Filiz, V.; Shishatskiy, S.; Abetz, C.; Abetz, V. Scalable application of thin film coating techniquesfor supported liquid membranes for gas separation made from ionic liquids. J. Membr. Sci. 2016, 518, 178–191.[CrossRef]
30. Grünauer, J.; Shishatskiy, S.; Abetz, C.; Abetz, V.; Filiz, V. Ionic liquids supported by isoporous membranesfor CO2/N2 gas separation applications. J. Membr. Sci. 2015, 494, 224–233. [CrossRef]
31. Abetz, V.; Brinkmann, T.; Dijkstra, M.; Ebert, K.; Fritsch, D.; Ohlrogge, K.; Paul, D.; Peinemann, K.V.;Pereira-Nunes, S.; Scharnagl, N.; et al. Developments in membrane research: From material via processdesign to industrial application. Adv. Eng. Mater. 2006, 8, 328–358. [CrossRef]
32. Scharnagl, N.; Buschatz, H. Polyacrylonitrile (pan) membranes for ultra- and microfiltration. Desalination2001, 139, 191–198. [CrossRef]
© 2017 by the authors. Licensee MDPI, Basel, Switzerland. This article is an open accessarticle distributed under the terms and conditions of the Creative Commons Attribution(CC BY) license (http://creativecommons.org/licenses/by/4.0/).
40

membranes
Article
Preparation of Porous Stainless Steel Hollow-Fibersthrough Multi-Modal Particle Size Sintering towardsPore Engineering
Francois-Marie Allioux 1,*, Oana David 2, Miren Etxeberria Benavides 2, Lingxue Kong 1,
David Alfredo Pacheco Tanaka 2and Ludovic F. Dumée 1
1 Deakin University, Institute for Frontier Materials, Geelong, VIC 3216, Australia;[email protected] (L.K.); [email protected] (L.F.D.)
2 Tecnalia, Energy and Environment Division, Mikeletegi Pasealekua 2, 20009 San Sebastian-Donostia, Spain;[email protected] (O.D.); [email protected] (M.E.B.);[email protected] (D.A.P.T.)
* Correspondence: [email protected]; Tel.: +61-479-191-078
Received: 31 May 2017; Accepted: 31 July 2017; Published: 4 August 2017
Abstract: The sintering of metal powders is an efficient and versatile technique to fabricate porousmetal elements such as filters, diffusers, and membranes. Neck formation between particles is,however, critical to tune the porosity and optimize mass transfer in order to minimize the densificationprocess. In this work, macro-porous stainless steel (SS) hollow-fibers (HFs) were fabricated by theextrusion and sintering of a dope comprised, for the first time, of a bimodal mixture of SS powders.The SS particles of different sizes and shapes were mixed to increase the neck formation between theparticles and control the densification process of the structure during sintering. The sintered HFsfrom particles of two different sizes were shown to be more mechanically stable at lower sinteringtemperature due to the increased neck area of the small particles sintered to the large ones. In addition,the sintered HFs made from particles of 10 and 44 μm showed a smaller average pore size (<1 μm) ascompared to the micron-size pores of sintered HFs made from particles of 10 μm only and those of10 and 20 μm. The novel HFs could be used in a range of applications, from filtration modules toelectrochemical membrane reactors.
Keywords: porous stainless steel hollow-fiber; metal membrane; multi-modal distributions;coalescence; neck formation
1. Introduction
Membrane separation processes are well-established alternatives to conventional separationprocesses and physico-chemical treatments, offering lower energy consumption, compact, andscalable module systems [1]. The unique ability of membrane processes to treat chemically and heatsensitive effluents is of particular importance in the food, pharmaceutical, and biofuel industries [2,3].Porous membrane elements are designed into a variety of shapes and geometries [4]. Among them,hollow-fiber (HF) membranes, which are self-supported structures, offer specific advantages, such as ahigher surface to volume ratio and a uniform flow dynamic across the length of the HFs [2,5,6].
The first porous HFs were made of polymer materials, and were developed almost 60 yearsago [7]. Since then, and with the use of novel polymeric materials, polymeric HF membranes havefound extensive use in industrial gas separation and water treatment, and in the biotechnology fieldas well as in the medical sector for blood filtration and treatment . Polymeric HF membranes areproduced at low cost and in large quantities via a dry–wet spinning process, and can be assembled asone module, which can be composed of thousands of polymeric HFs [3,8]. However, polymeric-based
Membranes 2017, 7, 40 41 www.mdpi.com/journal/membranes
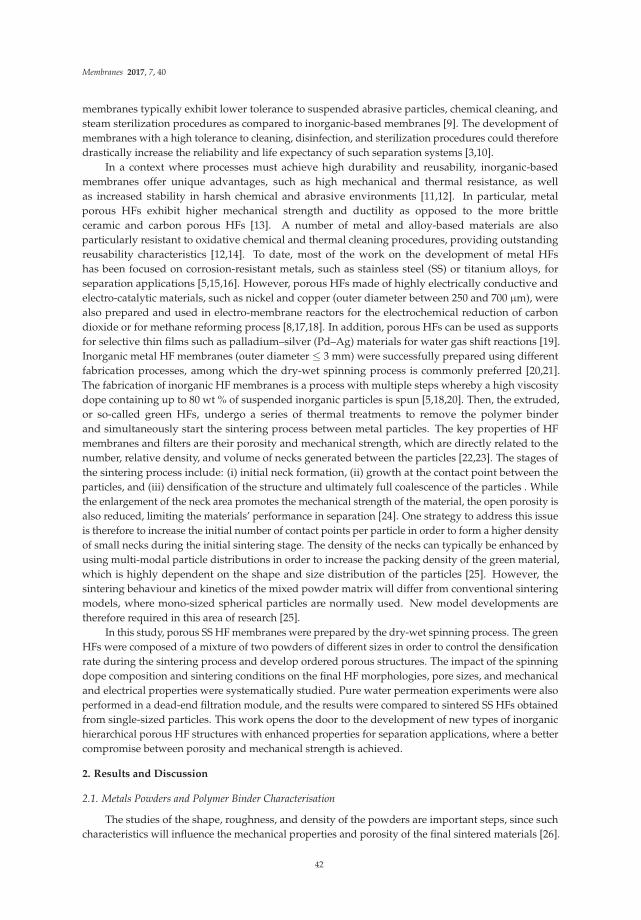
Membranes 2017, 7, 40
membranes typically exhibit lower tolerance to suspended abrasive particles, chemical cleaning, andsteam sterilization procedures as compared to inorganic-based membranes [9]. The development ofmembranes with a high tolerance to cleaning, disinfection, and sterilization procedures could thereforedrastically increase the reliability and life expectancy of such separation systems [3,10].
In a context where processes must achieve high durability and reusability, inorganic-basedmembranes offer unique advantages, such as high mechanical and thermal resistance, as wellas increased stability in harsh chemical and abrasive environments [11,12]. In particular, metalporous HFs exhibit higher mechanical strength and ductility as opposed to the more brittleceramic and carbon porous HFs [13]. A number of metal and alloy-based materials are alsoparticularly resistant to oxidative chemical and thermal cleaning procedures, providing outstandingreusability characteristics [12,14]. To date, most of the work on the development of metal HFshas been focused on corrosion-resistant metals, such as stainless steel (SS) or titanium alloys, forseparation applications [5,15,16]. However, porous HFs made of highly electrically conductive andelectro-catalytic materials, such as nickel and copper (outer diameter between 250 and 700 μm), werealso prepared and used in electro-membrane reactors for the electrochemical reduction of carbondioxide or for methane reforming process [8,17,18]. In addition, porous HFs can be used as supportsfor selective thin films such as palladium–silver (Pd–Ag) materials for water gas shift reactions [19].Inorganic metal HF membranes (outer diameter ≤ 3 mm) were successfully prepared using differentfabrication processes, among which the dry-wet spinning process is commonly preferred [20,21].The fabrication of inorganic HF membranes is a process with multiple steps whereby a high viscositydope containing up to 80 wt % of suspended inorganic particles is spun [5,18,20]. Then, the extruded,or so-called green HFs, undergo a series of thermal treatments to remove the polymer binderand simultaneously start the sintering process between metal particles. The key properties of HFmembranes and filters are their porosity and mechanical strength, which are directly related to thenumber, relative density, and volume of necks generated between the particles [22,23]. The stages ofthe sintering process include: (i) initial neck formation, (ii) growth at the contact point between theparticles, and (iii) densification of the structure and ultimately full coalescence of the particles . Whilethe enlargement of the neck area promotes the mechanical strength of the material, the open porosity isalso reduced, limiting the materials’ performance in separation [24]. One strategy to address this issueis therefore to increase the initial number of contact points per particle in order to form a higher densityof small necks during the initial sintering stage. The density of the necks can typically be enhanced byusing multi-modal particle distributions in order to increase the packing density of the green material,which is highly dependent on the shape and size distribution of the particles [25]. However, thesintering behaviour and kinetics of the mixed powder matrix will differ from conventional sinteringmodels, where mono-sized spherical particles are normally used. New model developments aretherefore required in this area of research [25].
In this study, porous SS HF membranes were prepared by the dry-wet spinning process. The greenHFs were composed of a mixture of two powders of different sizes in order to control the densificationrate during the sintering process and develop ordered porous structures. The impact of the spinningdope composition and sintering conditions on the final HF morphologies, pore sizes, and mechanicaland electrical properties were systematically studied. Pure water permeation experiments were alsoperformed in a dead-end filtration module, and the results were compared to sintered SS HFs obtainedfrom single-sized particles. This work opens the door to the development of new types of inorganichierarchical porous HF structures with enhanced properties for separation applications, where a bettercompromise between porosity and mechanical strength is achieved.
2. Results and Discussion
2.1. Metals Powders and Polymer Binder Characterisation
The studies of the shape, roughness, and density of the powders are important steps, since suchcharacteristics will influence the mechanical properties and porosity of the final sintered materials [26].
42

Membranes 2017, 7, 40
The 10 and 20 μm 316L stainless steel particles, SS10 and SS20 respectively, exhibited smoothsurfaces with spheroidal shapes and an aspect ratio of 1.09 ± 0.05 and 1.13 ± 0.1, respectively. On theother hand, the shape distribution of the 44 μm 316L stainless steel particles (SS44) was irregular (aspectratio of 2.17 ± 0.3) and showed greater surface roughness. The particle size distribution of the SSpowders and blends was measured in distilled (DI) water and isopropanol (IP) to evaluate potentialaggregation mechanisms in the different dispersants. The distributions in both solvents were similar;the SS10 powders showed a narrower size distribution as compared to the SS20 and SS44 particles,which were 40% and 20% wider, respectively. The use of water resulted in little or no clumping of theparticles as seen in Figure 1d–f. The information on particle size distributions is shown in Table S1for the calculated equivalent spherical diameters. The particle size distributions of the SS44 particleswere found to be almost twice larger than the specifications of the manufacturer, with 90% of thedistribution in volume of the particles (d0.9) lying below 72 ± 1.1 μm in water. The surface area of thepowder samples was measured using Brunauer-Emmett-Teller (BET) analysis, the data are reported inTable S2. The BET surface areas of the SS10 and SS20 particles were similar; 0.034 and 0.036 m2.g−1,respectively. However, the BET surface area of the SS44 particles was found to be greater, 0.052 m2.g−1,which might be due to the textured surface of the SS44 particles. The weight ratio of the SS particleblends can therefore be expressed in terms of surface area ratio, corresponding to 72:28 (%). and 92:8(%) for the SS10:SS20 and SS10:SS44 blends, respectively. Furthermore, the particle size distributionsof the SS powder blends (Figure 2c,d) indicated that the particles did not aggregate in the solutions.The SS10 and SS44 powders exhibited similar average absolute and relative densities. However, theSS20 powders showed a higher relative density due to the wider particle size distribution (Table S2).
Figure 1. SEM images of (a): the 10 μm stainless steel (SS) powder, (b): the 20 μm SS powder and (c): the44 μm SS powder. (d–f) are their respective size measurements in distilled (DI) water and isopropanol (IP).
43

Membranes 2017, 7, 40
Figure 2. SEM images of (a): the 10/20 μm SS powder blend and (b): the 10/44 μm SS powder blend.(c,d) are the respective size measurements of the powder blends in DI water and isopropanol (IP).
During the sintering process, the bonding of the metal particles occurred through the formation ofa sintered neck area between the particles. However, sufficient neck formation required the reduction ofthe surface oxides during the early stages of the sintering [27]. In order to study the oxidation behaviorof the SS particles at high temperature, thermogravimetry (TGA) experiments were performed, andconsisted of heating a small bed of metal particles (10 mg) to 1000 ◦C with a heating rate of 10 ◦C min−1
in air, N2, and N2:H2 (95:5 v/v %) (Figure 3a–c). These gases were chosen in order to mimic theenvironment of the furnace during the sintering of the green HFs. In particular, SS alloys becomesusceptible to corrosion and oxidation when exposed to a high temperature, typically referred to as thesensitization temperature [28,29]. In air and N2 atmospheres, the sensitization temperatures of the SS10
and SS20 were found to be 310 ◦C and 500 ◦C, respectively, and as high as 650 ◦C for the SS44. The TGAcurves of the SS44 in air revealed the presence of residual organic contaminants, probably resultingfrom the fabrication process and associated with the slight weight loss from 200 to 400 ◦C (Figure 3c).
The weight gains of the three powders were found to occur at higher temperatures in reducingN2:H2 atmosphere with sensitization temperatures above 650 ◦C for the SS10 and SS20 particles andabove 750 ◦C for the SS44 particles. The finest SS powders (SS10 and SS20) showed the greatest weightgain upon reaching the 1000 ◦C mark due to the higher surface area to volume ratio of the particlesin comparison to the larger SS44 particles. The SS20 and SS44 powders were found to be more proneto oxidation as compared to the SS10 powder due to their as-received oxidized surface state, whichwas analysed by EDS analysis. The oxygen content was 1.7 and 1.5 ± 0.1 wt % for the SS20 and SS44
powders, respectively, and was below the detection limit for the SS10 powder. Similarly, the carboncontent of the SS20 and SS44 powders was found to be higher; 7.4 and 8.5 ± 0.3 wt %, respectively.Furthermore, the high carbon content of the SS44 particles could also explain the lower weight gain athigh temperature. The weight gain was associated with the formation and growth of stable surfacemetal oxide compounds across their surface [30,31]. The weight gain of the particles observed in N2
44

Membranes 2017, 7, 40
and N2:H2 atmospheres was due to the uptake of nitrogen atoms by the SS materials, leading to theformation of nitride species [32–34]. The kinetics of oxide formation and growth were shown to begreatly increased in air; however, the presence of oxygen did not seem to influence the sensitizationtemperature of the different particles.
Figure 3. Thermogravimetry (TGA) thermal profiles measured in air, inert, and reducing atmosphereof (a): 10 μm SS powder, (b): 20 μm SS powder, (c): 44 μm SS powder and (d): PESU polymer binder.
The thermal characterization of the polymer binder is also of particular importance for thefabrication of metal HFs, since the polymer burn-out should occur below the sensitization temperaturesof the metal particles in order to avoid any reaction and oxidation with the metal particles. In addition,the polymer matrix should be maintained at a lower temperature to ensure the structural integrity ofthe HF during the polymer de-binding step. Figure 3d shows the thermal decomposition of PESU inair, inert (N2), and reducing (N2:H2 5%) atmosphere. The decomposition of PESU occurred abruptlyat 600 ◦C below the temperature corresponding to the sensitization temperature of the SS particles.The TGA profile of the green SS10 HF in air atmosphere is presented in Figure S1, and shows a similardecomposition of the PESU matrix during the de-binding step at 600 ◦C. However, a weight gain wasobserved during the thermal treatment, suggesting that sensitization could not be avoided duringthe de-binding step. The thermal treatment of the green HF was therefore performed in reducingatmosphere in order to prevent the oxidation of the particles, promote metal-to-metal contact, andform neck area between the metal particles [27,31]. However, the thermal decomposition of PESU ininert and reducing atmosphere (Figure 3d) revealed that up to 35 wt % of organic residues remained.The sintered HFs were therefore thoroughly cleaned first with ethanol and distilled water before anycharacterization tests.
2.2. Green and Sintered HF Morphologies
The dopes comprised of SS particles and PESU polymer binder were then extruded to form thegreen HF material. The SEM images of the green HFs are shown in Figure 4. The average outer
45

Membranes 2017, 7, 40
diameter of the green HFs made of SS10 particles was found to be 1.23 ± 0.03 mm, and to exhibitcircular cross-sectional morphology with a uniform distribution of SS10 particles within the PESUmatrix. The outer diameters of the green SS10/20 and SS10/44 HFs, 2.24 ± 0.05 and 2.17 ± 0.45 mmrespectively, were found to be larger than the SS10 HFs due to a shorter air gap, resulting in less stretchand elongation stress on the forming HFs [3]. The ellipsoidal shape and irregular circularity of thegreen SS10/20 and SS10/44 HFs were attributed to aggregates and clusters of metal particles of differentsizes, which may have formed in the dope during the degas step prior to spinning. The circularityof the green HFs could be further improved by increasing the bore flow rate in order to break theaggregates in the dope solution. The SEM images reveal the presence of macro-voids and finger-likestructures, starting from both sides of the HFs exposed to the bore and external coagulation liquid andgoing toward the inner core of the HFs. This structure is more pronounced for the SS10/20 and SS10/44HFs due to the presence of clusters of metal particles inside the continuous PESU phase.
Figure 4. Cross-sectional SEM images of (a,b): the SS10 green hollow-fibers (HFs); (c,d): the SS10/20
HFs; (e,f): the SS10/44 HFs.
As seen in Figure 5, the sintered HFs retained their original lumen shapes upon thermal treatment.The HFs made of SS10 and SS10/20 particles exhibited smooth surfaces, whereas the macro-voidspresent across the wall of the green HFs also remained after the thermal treatment. On the otherhand, the HFs made of SS10/44 particles presented extremely rough surfaces, with some of the largestparticles pointing out of the structure. This geometry may be due to the shear displacement of thelargest particles across the matrix of small particles during the sintering [35]. As opposed to the SS10
and SS10/20 HFs, the cross-sectional SEM images of the SS10/44 HFs revealed a denser structure. Theoriginal macro-voids observed in the green HFs were also absent after sintering, as expected due tothe high diffusion rate of the smaller particles, which were able to fill the macro-voids during thethermal treatment. The shape of the metal particles present in the SS10 and SS10/20 green HFs becameindistinguishable when sintered at 1100 ◦C, indicating that the sintering process was completed,which was not the case for the SS10/44 HFs where the shapes of the particles were still well-defined(Figure 5(f1,f2)). The SEM images of the sintered HFs across the whole range of sintering temperatureand time are displayed in Figures S2–S4.
46

Membranes 2017, 7, 40
Figure 5. Cross-sectional SEM images of the sintered SS10 HFs for 90 min at 650 ◦C (a1,a2) and 1100 ◦C(b1,b2); sintered SS10/20. HFs for 90 min at 650 ◦C (c1,c2) and 1100 ◦C (d1,d2); sintered SS10/44. HFsfor 90 min at 650 ◦C (e1,e2) and 1100 ◦C (f1,f2).
2.3. Sintered HF Properties
The radial shrinkage was measured based on the SEM cross-sectional images, and the measurementresults (%) are shown in Figure 6. The sintered HFs exhibited isotropic radial shrinkage stronglydependent on the sintering temperature. A slight increase in shrinkage values was noticed for theSS10 and SS10/20 HFs when sintered for a longer duration (90 min) as shown in Figure 6a,b. The radialshrinkage of the SS10 HFs remained below 10% up to 900 ◦C, which corresponded to the first stageof the sintering process only. On the other hand, the SS10/20 and SS10/44 HFs showed greater radialshrinkage (>15%) across the range of sintering temperature. This effect was particularly noticeable forthe SS10/44 HFs due to the difference in size and shapes of the metal particles, which promoted thedensification of the structures across the whole range of sintering temperature [24].
As observed in cross-sectional SEM images (Figure 5(a1,c1,e1)), the denser structures resultingfrom the thermal treatment at a lower temperature can be explained by the incomplete degradation of
47

Membranes 2017, 7, 40
the polymer during the de-binding step. This observation is supported by the EDX chemical analysisand SEM images (Figure S5 and Figure 5), which revealed that the de-binding step was incompleteat the lowest temperatures (650 and 700 ◦C), and that a large amount of carbon remained in thestructure. The densification of the structure at a lower temperature is therefore not sufficient to inducethe collective sintering of the metal particles due to the residual carbon hampering particle-to-particlecontacts and particle neck formation. This effect may be alleviated by using a different polymer binderwith a lower decomposition temperature or by prolonging the duration of the de-binding phase.
Figure 6. Radial shrinkage from green to sintered HFs as a function of the sintering time andtemperature. (a): SS10 HFs, (b): SS10/20 HFs and (c): SS10/44 HFs. (d–f) are the electrical resistance ofthe SS HFs as a function of the sintering temperature and time for the SS10, SS10/20 and SS10/44 HFs.
The electrical resistance measurements (Figure 6d–f) of the HFs sintered at a temperature lowerthan 900 ◦C indicated that the densification of the structure is not sufficient to create a significantconductive pathway across the inter-particle neck area. The enhanced mechanical strength of theSS10/20 and SS10/44 HFs at lower temperatures can be explained from the increased initial neck growthof the smallest particles to the largest particle. The initial neck growth between the smallest and largestmetal particles is able to form a scaffold maintaining the structural integrity of the HFs even at the
48

Membranes 2017, 7, 40
lowest sintering temperatures. Across all of the HF samples, the electrical resistance was drasticallyreduced from 900 ◦C of sintering temperature, indicating that the neck areas were able to form acontinuous and conductive scaffold across the HFs [20,21]. No significant differences were, however,found between the HFs sintered for 60 or 90 min, suggesting that a percolation threshold had beenreached by that time.
The mechanical properties of the sintered SS HFs are therefore highly related to the dopecomposition and to the thermal treatment conditions, including the sintering temperature, duration,and atmosphere. The mechanical strength of the SS10 HFs was found to be acceptable for handlingand testing only when sintered above 900 ◦C (Figure 7a,b) with a maximal flexural stress of 23.9± 1.2 and 17.2 ± 0.9 N mm−2 when sintered for 60 and 90 min, respectively. On the other hand,the SS10/20 and SS10/44 HFs exhibited sufficient mechanical strength right from the lowest sinteringtemperature (650 ◦C), with a value above 37 N mm−2 when sintered for 60 or 90 min, and valuesslightly lower for the SS10/20 HFs when sintered for 90 min (<40 N mm−2). In these conditions, theextended sintering time was therefore unable to make up for the lower sintering temperature and toachieve a significant degree of bonding between the metal particles. The SS10 and SS10/20 HFs exhibitexceptional mechanical strength and flexibility when sintered above 1000 ◦C. The maximal flexuralstress of the SS10 HFs sintered at 1000 ◦C exceeded 200 and 300 N mm−2 for a sintering time of 60and 90 min, respectively, while the SS10/20 HFs showed values twice as high as the SS10 HFs. SS10
HFs sintered at 1100 ◦C showed a further mechanical strength improvement, with values increasedby up to 5 and 10 times depending on the sintering time (Figure 7a,b). However, the SS10/20 HFssintered at 1100 ◦C for 60 or 90 min did not show any significant mechanical strength improvement.This lack of improvement indicates that the densification of the structure is at a maximum [24]. Themechanical strength of the SS10/44 HFs sintered at the same temperatures were, however, found to besignificantly lower (<60 N mm−2) compared to the SS10 and SS10/20 HFs. Although the densificationof the SS10/44 system occurred at lower temperatures and reached a maximum sooner, the lack ofcoalescence between the large and the small particles formed a more rigid and denser structure. Thedifference in shape and size between the two SS powders promoted the densification of the systems,with the small particles filling the pores between the large particles. Therefore, it may be preferentialto decrease the size ratio difference between the particles as well as to work with uniform sphericalparticles. The SS10 and SS10/20 HFs fabricated in this work exhibited similar mechanical performancewhen compared to previous studies available in the literature; however, the mechanical properties ofthe SS10/44 were found to be inferior [20,34,36].
Figure 7. Maximal flexural stress of the SS HFs as a function of the sintering temperature with (a): HFssintered for 60 min and (b): HFs sintered for 90 min.
2.4. Pore Size Distribution and Water Permeance
The average pore sizes of the sintered HF membranes, which correspond to the average dimensionof the inter-particle domains, were measured by capillary flow porometry. Capillary flow porometry
49

Membranes 2017, 7, 40
techniques have the advantage to be able to measure the open pores across materials, and is particularlysuited to micron-ranged pore distributions [37]. The average pore sizes of the sintered HFs arepresented in Figure 8a,b. The SS10 and SS10/20 HFs sintered at 900 ◦C presented a similar averagepore size—around 5 μm—for a sintering time of 60 min, and around 3 μm when sintered for 90 min.The same trend was observed for a sintering temperature of 1000 ◦C, with similar average pore sizesbetween the SS10 and SS10/20 HFs, and smaller values when sintered for 90 min (Figure 8b). However,the SS10/20 HFs sintered at 1100 ◦C presented larger pore sizes as compared to the SS10 HFs. Theaverage pore size of the SS10 HFs sintered at 1100 ◦C for 90 min was reduced to 0.5 μm as opposedto the average pore size of 2.4 ± 0.3 μm found in the SS10/20 HFs. The average pore sizes of theSS10/44 HFs were found to be below 1 μm for a sintering temperature ranging from 900 to 1100 ◦Cwithout significant effect on the sintering time. The smaller average pore size of the SS10/44 HFs wasrelated to the greater size difference between the two series of particles, which led to a denser structurewith smaller pores [24]. A general aspect of sintering is that as the sintering time and temperatureincrease, the coalescence between the particles is promoted [38]. However, in the case of SS10/20 HFs,the maximum density was limited due to the larger particles within the system. As opposed to theSS10 HFs, the increase in sintering temperature and time therefore promoted the creation of largerpores in the SS10/20 HF structure [38]. On the other hand, the SS10 HFs could potentially form densematerials by further intensification of the sintering conditions [18].
Figure 8. Average pore size measurements of the SS HFs as a function of the sintering temperature, for(a): 60 min and (b): 90 min sintering time. Water permeance values of (c): the SS10 and SS10/20 HFs as afunction of the sintering temperature and time. (d): Pure water fluxes of the SS10/44 HFs as a functionof the sintering temperature and time.
Pure water fluxes were measured across a range of pressures varying from 0.2 to 1 bar. The purewater flux measurements exhibited a linear relationship with respect to the applied pressure, andare shown in the supplementary materials (Figure S6). Membrane permeances as a function of thesintering temperature and time are shown in Figure 8c,d. The SS10/20 HFs sintered at 900 ◦C for 90 minexhibited the greatest water permeance among all of the SS HFs (Figure 8c). The SS10/20 HFs waterpermeance values were shown to progressively diminish with respect to the sintering temperature dueto the densification process. The highest water permeance, corresponding to the SS10 HFs, was attained
50

Membranes 2017, 7, 40
at a sintering temperature of 1000 ◦C and for a sintering time of 90 min, likely due to an increased openporosity across the structure. The SS10 HFs water permeance drastically diminished at the sinteringtemperature of 1100 ◦C, which was therefore considered to be close to the full densification of thematerial. The SS10/44 HFs also presented the lowest water permeance due to their denser structuresand smaller pore size distributions, as previously reported (Figure 8d).
3. Materials and Methods
3.1. Metal Particles and Chemicals
The 10 μm 316L stainless steel (SS10) was purchased from Sandvik Osprey Ltd., Neath, UK, whilethe 20 μm (SS20) and 325 mesh size (SS44, 44 μm) 316L SS powders were sourced from Huarui GroupLtd., Hangzhou, China. Poly(ethersulfone) (PESU, Ultrason®, BASF, Tarragona, Spain) was dried in avacuum oven at 120 ◦C for 6 h before being used as the polymer binder. N-Methyl-2-pyrrolidone (NMP,ACS reagent ≥99.0%, Sigma-Aldrich, Madrid, Spain) was chosen as a solvent for PESU and used asreceived. Distilled water (DI) and isopropanol (IP, ACS reagent ≥99.5%, Sigma-Aldrich, Madrid, Spain)were used during the green HFs drying procedure and for the determination of the metal particlesize distributions.
3.2. Preparation of the Green HFs
Spinning dopes were prepared by first dissolving the polymer binder into NMP for more than24 h on a roller tube mixer. Subsequently, the metal particles were added in multiple steps and finallythe mixture was stirred overnight. The spinning dope mixture was then loaded into the spinning pumpand degassed by applying a vacuum 24 h before the date of the spinning experiment. The compositionsof the spinning dopes were as follows: 70 wt % of metal particles, 7.5 wt % of polymer binder, and22.5 wt % of NMP. In the spinning experiments, where a mixture of SS particles of different sizedistributions was used, the blend of SS particles comprised 60 wt % of SS10 powder and 40 wt % ofeither SS20 or SS44 powder.
The spinning setup allowed the spinning of green HFs of various geometries by controllingdifferent process parameters such as air gap (cm) and dope and bore flow rates (mL h−1).The temperature was maintained at 25 ◦C through heating bands wrap around the spinneret assemblyand spinning line. The spinning conditions are listed in the Supporting Information section’s Table S3.The spinneret used had an inner and outer diameter of 0.7 and 1.3 mm, respectively.
3.3. Drying and Thermal Treatments of Green HFs
The green HFs were firstly kept in a DI bath for 24 h followed by an IP bath for another 24 hin order to exchange the NMP solvent. Finally, the green HFs were dried at room temperature for24 h. Once dried, thermal treatments were performed in a tubular furnace (model GSL-1100 X, MTICorporation, Richmond, CA, USA) in order to remove the PESU polymer binder and sinter theSS particles.
The polymer was removed at 600 ◦C for 60 min followed by a sintering process with temperaturesranging from 650 to 1100 ◦C for 60 or 90 min at a heating rate of 5 ◦C min−1 under a reducingatmosphere nitrogen/hydrogen mixture (N2:H2, 85:15 v/v %). The gas was first flown 30 min beforethe thermal treatment in order to purge the air from the furnace, and was maintained at 1 dm3·min−1
during the thermal treatment.
3.4. Materials Characterization
The morphology of the metal particles and the green and sintered HFs was characterizedby Scanning Electron Microscopy (SEM, JEOL Neoscope, JCM-5000, Peabody, MA, USA). Theelemental distributions on the surface of the samples were evaluated by an Electron DispersiveX Ray Spectroscopy (EDS) analysis with an Oxford detector on a JEOL JSM 7800F model. SEM imaging
51

Membranes 2017, 7, 40
(surface and cross-section) was performed at 10 keV and a 10 mm working distance, while surfaceelemental mapping was performed at 20 keV and 10 mm working distance.
The particle size distribution of the metal powders dispersed in water or isopropanol wereanalysed by Dynamic Light Scattering (DLS) using a Mastersizer 2000 (Malvern Instrument, Worcester,UK). The aspect ratio of the metal particles was determined using ImageJ software (version 1.50i).The specific surface area of the metal powders was measured by the BET method using a TriStar 3000instrument (Micromeritics, Norcross, GA, USA). The average absolute and relative densities of themetal powders were determined with a 50 mL pycnometer bottle using ethanol as the wetting liquid.The temperature-dependence of the wetting fluid was taken into account. Thermogravimetry (TGA)experiments were performed under air, N2, and N2:H2 mixture (95:5 v/v %) using a Q50 TGA (TAinstrument, New Castle, DE, USA). During the TGA experiments, the gas flow was maintained at60 cm3·min−1, and the heating rate was fixed at 1, 5, or 10 ◦C·min−1.
The pore size and pore size distribution were measured using a capillary flow porometer(Porometer 3GZH Quantachrome Instruments, Boynton Beach, FL, USA) after wetting the sintered HFswith Porofil® (Quantachrome Instruments) wetting solution. The electrical resistivity of the green andsintered HFs was determined using an electrical resistivity cell with a variable resistor. Three-pointbending tests were performed on a DMA Q800 (TA instrument, USA) in order to characterize themechanical resistance of the HFs. The stress rate was set at 0.5 N·min−1, and the temperature keep at25 ◦C. The bending stress or flexural stress was calculated using the following equation:
σ =8FKD0
π(
D40 − D4
i) (1)
where σ is the bending stress (MPa), F is the measured maximal flexure load (N), K is the support span(mm), and D0 and Di are the outer and inner diameters of the HFs (mm), respectively.
Pure water permeation tests were performed in a lab-scale polyurethane module. The metal HFmembranes with an effective length of 40 mm were first cleaned with ethanol, flushed thoroughlywith distilled water, and dried at room temperature. The metal HF membranes were then placedinto the module and the distilled feed water was circulated onto the membranes and forced throughthe membrane walls under pressure varying from 0.2 to 1 bar. The pure water flux of the metal HFmembranes was calculated using the equation:
J =Q
Am=
QnπDHFle f f
(2)
where J is the membrane pure water flux (L m−2·h−1), Q is water flux rate (L h−1), Am is the effectivemembrane surface area (m2), n is the number of HFs, DHF the outer diameter, and le f f is the effectivelength of the HFs.
4. Conclusions
Macro-porous SS HFs were successfully fabricated by the dry-wet spinning of a dope comprisedof SS metal powders of different sizes and a polymer binder. A systematic study of the effect of thesintering parameters on the starting materials and sintered HFs was performed. Both the mechanicalstrength and water permeance of the HFs made of different sized SS particles were improved at a low(900 ◦C) sintering temperature due to the increased neck density offered by the multi-modal particles’distribution. At a sintering temperature higher than 1000 ◦C, SS particle repacking during the thermaltreatment gave rise to a denser structure with a lower water permeance. The porous sintered HFswere highly electrically conductive and able to sustain high filtration pressures, making them valuablemembranes for micro-filtration applications. Particularly, the SS HF membranes and filters developedin this study presented appropriate pore size distributions for bacteria and yeast rejection towardbeverage sterilization applications. In addition, the optimization of the mixed particles’ aspect and
52

Membranes 2017, 7, 40
size ratio could lead to the development of composite HFs with enhanced mechanical properties anddefined pore geometry and porosity for filtration applications, or that act as an electrically conductivediffuser in electro-catalytic reactors.
Supplementary Materials: The following are available online at http://www.mdpi.com/2077-0375/7/3/40/s1,Figure S1: Thermal treatment and TGA profile of the green SS10 HF in air atmosphere with a heating rate of10◦C.min-1, Figure S2: SEM images of the green and sintered SS10 HFs at temperature ranging from 650 to 1100◦Cfor 60 or 90 min, Figure S3: SEM images of the green and sintered SS10/20 HFs at temperature ranging from 650 to1100◦C for 60 or 90 min, Figure S4: SEM images of the green and sintered SS10/44 HFs at temperature rangingfrom 650 to 1100◦C for 60 or 90 min, Figure S5: Carbon and oxygen elemental analysis of the SS10 HFs (a and d),SS10/20 HFs (b and e) and SS10/44 HFs (c and f), Figure S6: Pure water fluxes as a function of the feed pressure:(a), (b) and (c): SS10 HFs; (d), (e) and (f): SS10/20 HFs; g: SS10/44 HFs; Table S1: Size distribution of stainlesssteel particles, Table S2: Metal powder properties: surface area, total BET surface area, average absolute densityand relative density determined versus average bulk density of 316L grade stainless steel (8 g.cm-3), Table S3:Spinning conditions.
Acknowledgments: Francois-Marie Allioux would like to thank the Institute for Frontier Materials,Deakin University, Victoria, Australia, for funding his Ph.D scholarship and his Travel Award, which enable himto work at TECNALIA, San Sebastian-Donostia, Spain, and thanks AINSE Ltd for providing financial assistance(PGRA Award-30290). Ludovic F. Dumée acknowledges Deakin University for his Alfred Deakin PostdoctoralFellowship. This research did not receive any specific grant from funding agencies in the public, commercial, ornot-for-profit sectors.
Author Contributions: The manuscript was written through contributions of all authors.
Conflicts of Interest: The authors declare no conflict of interest.
References
1. Li, N.N.; Fane, A.G.; Ho, W.S.W.; Matsuura, T. Advanced Membrane Technology and Applications;John Wiley & Sons: Hoboken, NJ, USA, 2011.
2. Mat, N.C.; Lou, Y.; Lipscomb, G.G. Hollow fiber membrane modules. Curr. Opin. Chem. Eng. 2014, 4, 18–24.[CrossRef]
3. Feng, C.; Khulbe, K.C.; Matsuura, T.; Ismail, A.F. Recent progresses in polymeric hollow fiber membranepreparation, characterization and applications. Sep. Purif. Technol. 2013, 111, 43–71, Repeated with 10.[CrossRef]
4. Baker, R.W. Membrane Technology; Wiley Online Library: Hoboken, NJ, USA, 2000.5. Luiten-Olieman, M. Inorganic porous Hollow Fiber Membranes: With Tunable Small Radial Dimensions; Gildeprint
Drukkerijen: Enschede, The Netherlands, 2012.6. Wickramasinghe, S.; Semmens, M.J.; Cussler, E. Mass transfer in various hollow fiber geometries. J. Membr.
Sci. 1992, 69, 235–250. [CrossRef]7. Peng, N.; Widjojo, N.; Sukitpaneenit, P.; Teoh, M.M.; Lipscomb, G.G.; Chung, T.-S.; Lai, J.-Y. Evolution of
polymeric hollow fibers as sustainable technologies: Past, present, and future. Prog. Polym. Sci. 2012, 37,1401–1424. [CrossRef]
8. Kas, R.; Hummadi, K.K.; Kortlever, R.; de Wit, P.; Milbrat, A.; Luiten-Olieman, M.W.J.; Benes, N.E.;Koper, M.T.M.; Mul, G. Three-dimensional porous hollow fibre copper electrodes for efficient and high-rateelectrochemical carbon dioxide reduction. Nat. Commun. 2016, 7, 10748. [CrossRef] [PubMed]
9. Lai, C.Y.; Groth, A.; Gray, S.; Duke, M. Enhanced abrasion resistant PVDF/nanoclay hollow fibre compositemembranes for water treatment. J. Membr. Sci. 2014, 449, 146–157. [CrossRef]
10. Irfan, M.; Idris, A. Overview of PES biocompatible/hemodialysis membranes: PES–blood interactions andmodification techniques. Mater. Sci. Eng. 2015, 56, 574–592. [CrossRef] [PubMed]
11. Dumee, L.F.; He, L.; Lin, B.; Ailloux, F.-M.; Lemoine, J.-B.; Velleman, L.; She, F.; Duke, M.C.; Orbell, J.D.;Erskine, G.; et al. The fabrication and surface functionalization of porous metal frameworks—A review.J. Mater. Chem. A 2013, 1, 15185–15206. [CrossRef]
12. Dumée, L.F.; He, L.; Wang, Z.; Sheath, P.; Xiong, J.; Feng, C.; Tan, M.Y.; She, F.; Duke, M.; Gray, S. Growth ofnano-textured graphene coatings across highly porous stainless steel supports towards corrosion resistantcoatings. Carbon 2015, 87, 395–408. [CrossRef]
53

Membranes 2017, 7, 40
13. Gitis, V.; Rothenberg, G. Ceramic Membranes: New Opportunities and Practical Applications; John Wiley & Sons:Hoboken, NJ, USA, 2016.
14. Cassano, A.; Rastogi, N.K.; Basile, A. 18-Membrane technologies for water treatment and reuse in the foodand beverage industries. In Advances in Membrane Technologies for Water Treatment; Woodhead Publishing:Oxford, UK, 2015; pp. 551–580.
15. Luiten-Olieman, M.W.J.; Winnubst, L.; Nijmeijer, A.; Wessling, M.; Benes, N.E. Porous stainless steel hollowfiber membranes via dry–wet spinning. J. Membr. Sci. 2011, 370, 124–130. [CrossRef]
16. David, O.; Gendel, Y.; Wessling, M. Tubular macro-porous titanium membranes. J. Membr. Sci. 2014, 461,139–145. [CrossRef]
17. Lee, S.-M.; Choi, I.-H.; Myung, S.-W.; Park, J.-Y.; Kim, I.-C.; Kim, W.-N.; Lee, K.-H. Preparation andcharacterization of nickel hollow fiber membrane. Desalination 2008, 233, 32–39. [CrossRef]
18. Meng, B.; Tan, X.; Meng, X.; Qiao, S.; Liu, S. Porous and dense Ni hollow fibre membranes. J. Alloys Compd.2009, 470, 461–464. [CrossRef]
19. Fernandez, E.; Helmi, A.; Coenen, K.; Melendez, J.; Viviente, J.L.; Tanaka, D.A.P.; van Sint Annaland, M.;Gallucci, F. Development of thin Pd–Ag supported membranes for fluidized bed membrane reactorsincluding WGS related gases. Int. J. Hydrogen Energy 2015, 40, 3506–3519. [CrossRef]
20. Schmeda-Lopez, D.R.; Smart, S.; Nunes, E.H.M.; Vasconcelos, D.; Vasconcelos, W.L.; Bram, M.;Meulenberg, W.A.; da Costa, J.C.D. Stainless steel hollow fibres—Sintering, morphology and mechanicalproperties. Sep. Purif. Technol. 2015, 147, 379–387. [CrossRef]
21. Luiten-Olieman, M.W.J.; et al. Towards a generic method for inorganic porous hollow fibers preparationwith shrinkage-controlled small radial dimensions, applied to Al2O3, Ni, SiC, stainless steel, and YSZ.J. Membr. Sci. 2012, 407–408, 155–163. [CrossRef]
22. German, R.M. Chapter Four—Measurement Tools and Experimental Observations. In Sintering: FromEmpirical Observations to Scientific Principles; Butterworth-Heinemann: Boston, MA, USA, 2014; pp. 71–130.
23. Dumée, L.F.; She, F.; Duke, M.; Gray, S.; Hodgson, P.; Kong, L. Fabrication of meso-porous sintered metalthin films by selective etching of silica based sacrificial template. Nanomaterials 2014, 4, 686–699. [CrossRef][PubMed]
24. German, R.M. Chapter Eleven—Mixed Powders and Composites. In Sintering: From Empirical Observations toScientific Principles; Butterworth-Heinemann: Boston, MA, USA, 2014; pp. 335–385.
25. Bouvard, D.; Lange, F.F. Relation between percolation and particle coordination in binary powder mixtures.Acta Metall. Mater. 1991, 39, 3083–3090. [CrossRef]
26. Spierings, A.; Levy, G. Comparison of density of stainless steel 316L parts produced with selective lasermelting using different powder grades. In Proceedings of the Annual International Solid FreeformFabrication Symposium, Austin, TX, USA, 3–5 August 2009.
27. Higgins, P.; Munir, Z. Influence of Surface Oxide Layer on Sintering Process. of Lead. Powder Metall. 1978,21, 188–194. [CrossRef]
28. Lima, A.S.; Nascimento, A.M.; Abreu, H.F.G.; de Lima-Neto, P. Sensitization evaluation of the austeniticstainless steel AISI 304L, 316L, 321 and 347. J. Mater. Sci. 2005, 40, 139–144. [CrossRef]
29. German, R.M. Sintering theory and practice. Solar-Terr. Phys. 1996, 568.30. Tarabay, J.; Peres, V.; Pijolat, M. Oxidation of Stainless Steel Powder. Oxid. Met. 2013, 80, 311–322. [CrossRef]31. Bergman, O. Influence of Oxygen Partial Pressure in Sintering Atmosphere on Properties of Cr–Mo Prealloyed
Powder Metallurgy Steel. Powder Metall. 2013, 50, 243–249. [CrossRef]32. Nayar, H.S.; Wasiczko, B. Nitrogen absorption control during sintering of stainless steel parts.
Met. Powder Rep. 1990, 45, 611–614. [CrossRef]33. Karlsson, H.; Nyborg, L.; Frykholm, R. Surface Reactions During Fabrication and Sintering of 410 L Stainless
Steel Powder. Powder Metall. Prog. 2005, 5, 220–233.34. Rui, W.; Zhang, C.; Cai, C.; Gu, X. Effects of sintering atmospheres on properties of stainless steel porous
hollow fiber membranes. J. Membr. Sci. 2015, 489, 90–97. [CrossRef]35. Bordia, R.K.; Raj, R. Sintering Behavior of Ceramic Films Constrained by a Rigid Substrate. J. Am. Ceram. Soc.
1985, 68, 287–292. [CrossRef]36. Luiten-Olieman, M.W.J.; Raaijmakers, M.J.T.; Winnubst, L.; Wessling, M.; Nijmeijer, A.; Benes, N.E. Porous
stainless steel hollow fibers with shrinkage-controlled small radial dimensions. Scr. Mater. 2011, 65, 25–28.[CrossRef]
54
Membranes 2017, 7, 40
37. Dumee, L.; Velleman, L.; Sears, K.; Hill, M.; Schutz, J.; Finn, N.; Duke, M.; Gray, S. Control of porosity andpore size of metal reinforced carbon nanotube membranes. Membranes 2010, 1, 25–36. [CrossRef] [PubMed]
38. Kang, S.-J.L. Sintering: Densification, Grain Growth and Microstructure; Butterworth-Heinemann:Oxford, UK, 2004.
© 2017 by the authors. Licensee MDPI, Basel, Switzerland. This article is an open accessarticle distributed under the terms and conditions of the Creative Commons Attribution(CC BY) license (http://creativecommons.org/licenses/by/4.0/).
55

membranes
Article
Nanofiltration and Tight Ultrafiltration Membranesfor Natural Organic Matter Removal—Contributionof Fouling and Concentration Polarization toFiltration Resistance
Joerg Winter 1, Benoit Barbeau 2and Pierre Bérubé 1,*
1 Department of Civil Engineering, The University of British Columbia, 6250 Applied Science Lane,Vancouver, BC V6T1Z4, Canada; [email protected]
2 Department of Civil, Geological and Mining Engineering, École Polytechnique de Montréal, Montréal,QC H3T 1J4, Canada; [email protected]
* Correspondence: [email protected]; Tel.: +1-604-822-5665
Received: 14 March 2017; Accepted: 26 June 2017; Published: 2 July 2017
Abstract: Nanofiltration (NF) and tight ultrafiltration (tight UF) membranes are a viable treatmentoption for high quality drinking water production from sources with high concentrations ofcontaminants. To date, there is limited knowledge regarding the contribution of concentrationpolarization (CP) and fouling to the increase in resistance during filtration of natural organic matter(NOM) with NF and tight UF. Filtration tests were conducted with NF and tight UF membranes withmolecular weight cut offs (MWCOs) of 300, 2000 and 8000 Da, and model raw waters containingdifferent constituents of NOM. When filtering model raw waters containing high concentrationsof polysaccharides (i.e., higher molecular weight NOM), the increase in resistance was dominatedby fouling. When filtering model raw waters containing humic substances (i.e., lower molecularweight NOM), the increase in filtration resistance was dominated by CP. The results indicate thatlow MWCO membranes are better suited for NOM removal, because most of the NOM in surfacewaters consist mainly of humic substances, which were only effectively rejected by the lower MWCOmembranes. However, when humic substances are effectively rejected, CP can become extensive,leading to a significant increase in filtration resistance by the formation of a cake/gel layer at themembrane surface. For this reason, cross-flow operation, which reduces CP, is recommended.
Keywords: nanofiltration; tight ultrafiltration; concentration polarization; fouling; natural organic matter
1. Introduction
Over the past 20 years, membrane filtration has been increasingly implemented in waterpurification processes [1]. This increase has mainly been driven by the decreasing costs of membranesystems, and increasingly stringent drinking water quality regulations. In drinking water treatmentapplications, ultrafiltration membranes (UF) can effectively remove particulate contaminants, such asprotozoa and bacteria, from raw water sources. However, effective removal of natural organic matter(NOM) and viruses is generally limited [2,3]. This is because the molecular weight cut off (MWCO) ofUF membranes typically used in drinking water treatment applications is relatively large (i.e., greaterthan 100,000 Da). Membranes with a MWCO of less than 10,000 Da are required to effectively removeNOM and all pathogens [4–8]. The present study investigated the use of membranes with MWCOsranging from 300 to 8000 Da for the removal of NOM. In this range, membranes are commonly referredto as nanofiltration (NF) membranes (i.e., with a typical MWCO range of 200–1000 Da) and tight UFmembranes (i.e., with a typical MWCO range of 1000 to 10,000 Da). The removal of NOM from sourcewaters is of importance in drinking water treatment because it can cause color, taste, and odor issues,
Membranes 2017, 7, 34 56 www.mdpi.com/journal/membranes

Membranes 2017, 7, 34
increase chlorine demand, as well as contribute to disinfection by-product formation and microbialregrowth in distribution systems [9–14]. Because NF and tight UF membranes can achieve sufficientprimary disinfection (i.e., >4-log removal of all pathogens) and extensive removal of NOM, they canprovide effective and comprehensive drinking water treatment in a single step. A simple, single-stepapproach is of particular interest for small/remote communities, because of the limited financial andtechnical resources generally available to implement and operate water treatment systems.
The use of NF and tight UF membranes in drinking water treatment applications is stilllimited. This is mainly because spiral wound configurations, which generally require extensivepre-treatment and a high trans-membrane pressure, have historically been used for NF and tightUF membrane applications. In addition, fouling control measures, such as backwashing or surfacescouring, cannot be applied to spiral wound configurations. Recent developments in NF and tightUF membrane configurations, such as hollow fiber configurations, promise to address some of theselimitations [15–18]. Frank et al. have also reported that a substantially higher permeability can bemaintained using hollow fiber configurations [16]. However, other studies have reported that hollowfiber configurations are less effective in mitigating concentration polarization (CP) than spiral woundconfigurations [19,20]. Because CP and fouling are still major challenges in the application of NF andtight UF membranes for drinking water treatment, insight into CP and fouling is necessary to developrecommendations for the design and operation of NF and tight UF membranes, and to enable greateradoption of this advanced treatment technology.
Fouling occurs as material that is retained at the membrane surface or inside the membrane pores,accumulates, and increases resistance to the permeate flow. Material accumulates when the permeationdrag—the force that transports potential foulants towards the membrane—is greater than forcesacting in the opposite direction (i.e., away from the membrane) [21,22]. NOM is generally consideredto be a main contributor to membrane fouling in drinking water treatment applications [4,23–27].The extent of fouling is not necessarily proportional to the total amount of NOM retained, but israther governed by the retention of specific NOM fractions [28–31]. The NOM fractions that havebeen reported to be mainly relevant to membrane fouling are biopolymers and humic substances,which are mainly of aquatic and terrestrial origin, respectively [32–34]. For UF membranes, thebiopolymer fraction of NOM generally contributes the most to fouling [35–38]. Fouling due to humicsubstances is generally not as extensive, although it is more difficult to control hydraulically (e.g., bybackwashing) [25,35]. The extent and the hydraulic reversibility of UF fouling can also be affected byother constituents in raw waters, notably calcium [25,35,39]. Calcium can form bridges between NOMmolecules, between the membrane surface and NOM, as well as contribute to aggregation of NOM bycharge destabilization [25,35,39]. Biopolymers have also been reported to substantially contribute tofouling of NF and tight UF membranes [28,38,40]. Humic substances, although effectively rejected,have not been reported to substantially contribute to fouling of NF membranes [41]. The limitedcontribution of humic substances to fouling has been attributed to charge repulsion effects, whichenhance the back transport of humic substances in cross-flow systems [41,42]. The extent to whichelectrostatic repulsion contributes to fouling control has been demonstrated to increase with the ratio ofcross-flow velocity to permeate flux [39]. Therefore, the effect of electrostatic repulsion on fouling dueto humic substances, is likely to be substantially less pronounced in dead-end systems. The reportedeffects of calcium on fouling in NF and tight UF membranes systems have been inconsistent, and likelydepend on the concentration in the solution being filtered [29,39,43,44].
CP, resulting from the accumulation of dissolved material rejected by the membrane, can alsoincrease the resistance to permeate flow [45–47]. Unlike the situation with fouling, material does notdeposit on the membrane surface or inside the membrane pores, but accumulates in proximity to themembrane surface. CP is characterized by an equilibrium between the convective transport of materialtowards the membrane, and the diffusive transport of retained material away from the membrane;a steady state that is expected to develop within the first minutes of filtration [29,45,48]. CP can affectthe resistance to permeate flow by increasing the viscosity, the osmotic pressure of the solution being
57

Membranes 2017, 7, 34
filtered, and the back-diffusion of retained solutes [45]. If CP effects become extensive, solutes at themembrane surface can reach a critical concentration (i.e., solubility limit), beyond which they form acake/gel layer which fouls the membrane surface [26,46–48]. In literature, this critical concentrationis also referred to as the “gel concentration” [46,47]. If a material reaches the critical concentration,the back-diffusion of material is limited by the formation of a cake/gel layer. Under such conditions,the convective transport towards the membrane becomes greater than the diffusive transport awayfrom the membrane, and fouling occurs, which increases the resistance to permeate flow throughout thefiltration phase. According to the Stokes–Einstein equation, the diffusivity and the diffusive transportof material depends on its size. NOM ranges in size from a few hundred Daltons (low molecularweight acids and neutrals) to over 20,000 Da (biopolymers) [39,49–51]. The size of NOM also generallyincreases with ionic strength, and decreases with pH of a solution, due to changes in the shape ofNOM from uncoiled to coiled [52]. CP due to the retention of salts in Reverse Osmosis (RO) and NFsystems has been extensively investigated [19,53–56]. However, only a few studies have investigatedCP due to the retention of NOM in NF membranes. These studies have indicated that NOM canresult in CP, and therefore, affect system performance [26,57]. Also, comprehensive knowledge onthe effect of (i) the type of NOM (e.g., polysaccharides and humic substances), and (ii) the membraneMWCO on the contribution of CP to the total increase in filtration resistance, is not currently available.This is a knowledge gap that limits the ability to develop recommendations for the optimal design andoperation of NF and tight membrane systems for drinking water treatment.
The objective of the present study was to quantify the contribution of fouling and CP tothe total increase in resistance during filtration of model raw waters containing polysaccharides,humic substances, and a mixture of both (as typical constituents of NOM in natural surface waters),and to identify conditions under which an extensive increase in filtration resistance occurs. Sincefouling and CP are not only expected to depend on the raw water characteristics, but also onthe membrane’s selectivity, the impact of the MWCO of a membrane on CP and fouling was alsoinvestigated. As previously discussed, CP is expected to develop rapidly within the first minutesof filtration [39,45]. However, this has never been investigated for NF and tight UF membranes indrinking water applications.
2. Material and Methods
2.1. Experimental Approach
Model raw waters of various compositions were considered. The biopolymer and humic materialcontent of the raw waters were modeled using polysaccharide alginate derived from brown algae(Sodium Alginate, Sigma Aldrich, Oakville, ON , Canada) and Suwannee River NOM (SRNOM)2R101N (International Humic Substances Society, St. Paul, MN, USA), respectively. Model raw waterswith three different NOM compositions were considered: (i) alginate, (ii) SRNOM, and (iii) mixtures ofSRNOM and alginate with a carbon mass ratio of 4:1. The ratio of 4:1 in the mixtures of SRNOM andalginate was selected based on humic substances to biopolymers ratios obtained from size exclusionchromatography (SEC) analyses of local surface water (Jericho Pond, Vancouver, BC, Canada) and isalso consistent with the ratios reported in literature, which indicates that humic substances account for70–80% of the NOM in natural waters [32]. All three model raw water compositions were tested at twodissolved organic carbon (DOC). concentrations: 5 mg/L, and 10 mg/L.
To prepare the model raw waters, NOM surrogates (i.e., the polysaccharide alginate and/orSRNOM) were dissolved in Milli-Q laboratory water (MilliporeSigma, Temecula, CA, USA).Sodium bicarbonate at a concentration of 1 mM was added as a buffer. This concentration ofbicarbonate also corresponds to an alkalinity that is within a range typical of that present in naturalsource waters [58]. The retention of alkalinity during filtration ranged from approximately 2% to 40%(depending on the membrane MWCO), and the impact of alkalinity rejection on CP and resistanceduring filtration was calculated [28], and found to be negligible relative to the overall increases in
58

Membranes 2017, 7, 34
resistance observed in the present study (results not shown), and hence, is not further discussed.The pH was then adjusted to 7.0 (± 0.1), using sodium hydroxide or hydrochloric acid, as needed.Prior to all filtration tests, all model raw water solutions were filtered through a 0.45 μm nitrocellulosefilter. Milli-Q laboratory water was used for clean water flux tests prior- and post-filtration of modelraw waters. The pH of the Milli-Q laboratory water used for clean water flux tests was also adjusted to7.0 (±0.1), using sodium hydroxide.
The experimental setup, illustrated in Figure 1, consisted of feed vessels, membrane cells, bleedlines and permeate collection systems. Two feed vessels were used, one containing clean water andthe other containing a model raw water. The pressure applied to both vessels was equal, enablingthe feed to the membrane to be switched between model raw water and clean water without causingany pressure variation in the membrane cells. Three CF042 membrane cells (Sterlitech, Seattle, WA,USA) were used in parallel. These accommodated flat sheet membrane coupons, 39.2 mm wide and85.5 mm long. Flat sheet, thin film composite polyamide (PA) membranes with nominal MWCOsof approximately 300 Da (DK series, GE Osmonics, Trevose, PA, USA), 2000 Da (GH series, GEOsmonics) and 8000 Da (GM series, GE Osmonics) were considered as a representative range forNF–tight UF range membranes. The intrinsic membrane resistances for the 300 Da, 2000 Da and8000 Da MWCO membranes were 9.0 × 10¹³ ± 1.1 × 10¹³ m−1, 8.1 × 10¹³ ± 1.1 × 10¹³ m−1 and2.2 × 1013 ± 2.0 × 10¹² m−1, respectively. The transmembrane pressure applied to the vessels waskept constant at 40.0 ± 1.0 psi (i.e., 2.8 ± 0.1 bar). The tests were conducted at room temperature(23 ± 1 ◦C). The membrane cells were operated in a pseudo dead-end mode with a continuous bleedthat introduced a very low and constant cross-flow of less than 0.006 m/min along the membranesurface. The bleed line allowed the liquid to be purged from the membrane cell when the feed wasswitched, while still providing pseudo dead-end operation. Based on preliminary tests, this cross-flowvelocity had a negligible effect on fouling and concentration polarization (results not presented).All filtration tests were conducted in triplicate in three sequential phases:
1. Pre-clean water filtration phase (for a minimum of 3 h).2. Filtration phase with model raw waters (for approximately 3 h).3. Post-clean water filtration phase (for a minimum of 45 min).
The filtration tests were conducted in these three sequential phases to quantify the contributionof CP and fouling to the increase in the resistance to permeate flow, as discussed in more detail inSection 3.2.
Figure 1. Experimental setup.
Immediately prior to the start of the filtration phase with model raw water, the drain valve wasopened and the content of the flow cell was purged, ensuring that the concentration of NOM in the
59

Membranes 2017, 7, 34
flow cell at the start of the filtration of model raw water, was equivalent to that of the model raw water.The drain was then partially closed to generate a constant low cross-flow velocity of 0.006 m/min.
2.2. Data Evaluation and Sample Analyses
The rate of fouling was quantified based on fouling coefficients obtained from standard filtrationlaws fitted to the experimental data collected during the filtration of model raw water [59]. Based onthe minimum R2 value for all conditions investigated in the present study, the permeate flux could bebest modeled by assuming that fouling was predominantly due to the formation of a cake layer onthe membrane surface (see Equation (1); results not presented). Therefore, the results are presented interms of a cake fouling coefficient (kc) (see Table 1).
J =J′0
1 + kc × μΔP × V × J′0
[m3 m−2 s−1
](1)
In Equation (1), J represents the permeate flux [m3 m−2 s−1], V the specific volume of waterfiltered [m3 m−2], μ the dynamic viscosity [Pa s] and ΔP the trans-membrane pressure [Pa]. The initialflux J′0 was defined as the measured clean water flux (J0), minus any rapid decrease observed inthe flux within the first few minutes of a filtration test. Because CP is expected to develop withinthe first minutes of filtration, the difference between J0 and J′0 was assumed to be due to CP [39,45].The estimated cake fouling coefficient kc [m−1 m−3 m2] quantifies the increase in resistance [m−1] perspecific volume filtered [m3 m−2].
Size exclusion chromatography (SEC) was performed using High Performance LiquidChromatography (HPLC) (Perkin Elmer, Burnaby, BC, Canada) with DOC detection for the analysisof NOM in the feed and permeate. The method used was adopted from Huber et al. [51]. A TSKHW-50S column (Tosoh, Tokyo, Japan) was used as the stationary phase, and a phosphate buffer(2.5 g/L KH2PO4 + 1.5 g/L Na2HPO4·H2O) was used as the mobile phase. The sample injectionvolume and flow rate were 1 mL and 1 mL/min, respectively. A GE Sievers 900 Turbo Portable TOCAnalyzer (GE Sievers, Boulder, CO, USA) with a sampling rate of 4 s and a detection range of 0.2 mgC/L to 10 mg C/L was used as the DOC detector.
3. Results
3.1. NOM Rejection
The amount of material rejected by the membranes was defined as the difference between materialpresent in the feed (i.e., the model raw water) and material present in the permeate. As illustrated inFigure 2, the membranes with MWCOs of 300 Da and 2000 Da could effectively reject all of the alginatepresent in model raw waters, and the membrane with a MWCO of 8000 Da could reject most of thealginate present in model raw waters. This was expected because the molecular weight of alginateis greater than 10,000 Da [39,51] and the MWCOs of all the membranes considered are lower than10,000 Da (i.e., ranging from 300 Da to 8000 Da). Only a small amount of the larger constituents inSRNOM was rejected by the membrane with a MWCO of 8000 Da. The extent of the rejection increasedas the MWCO of the membranes decreased, with all of the organic material being rejected by themembrane with a MWCO of 300 Da. Again, this was expected, because most of the constituents ofSRNOM have a molecular weight in between 300 Da and 8000 Da [49,50].
Note that NOM in most surface waters consists mainly of humic substances (i.e., lowermolecular weight NOM) [32]. Because effective NOM removal is one of the main motivations behindimplementing NF and tight UF membranes in drinking water treatment, membranes with lowerMWCOs (i.e., <2000 Da) are recommended for this application.
60

Membranes 2017, 7, 34
Figure 2. Typical size exclusion chromatograms of model raw water and permeate samples: (a) modelraw water containing Suwannee River natural organic matter (SRNOM) at 10 mg/L; (b) model rawwater containing alginate at 10 mg/L. Dalton values correspond to the molecular weight cut offs(MWCOs) of the different membranes; note that the retention time of the chromatograms is inverselyproportional to the log of the molecular weight.
3.2. NOM Fouling and Concentration Polarization
Typical results from the filtration tests are presented in Figure 3. For all conditions investigated,the permeate flux remained constant during the pre-clean water filtration phase, then decreased overtime (i.e., volume filtered) when filtering model raw waters, and increased during the post-clean waterfiltration phase.
As previously discussed, CP is characterized by an equilibrium between the convective transportof material towards the membrane, and the diffusive transport of retained material away from themembrane. Steady state is expected to be established within minutes once filtration of model rawwater begins [39,45]. Hence, the rapid initial decrease in the permeate flux when filtering model rawwaters was attributed to CP, and the subsequent slower longer term decrease in permeate flux wasattributed to fouling.
Fouling occurs if the permeation drag is greater than the forces acting on potential foulantsaway from the membrane [22]. Because the permeation drag remains constant when switching fromthe model raw water filtration phase to the post-clean water filtration phase, no back transport andno recovery in resistance is expected during post-clean water filtration. However, a recovery inresistance due to CP is expected during post-clean water filtration. This is because a concentrationgradient of retained material is still present, for a relatively short period of time, after switching fromthe model raw water filtration phase to the post-clean water filtration phase. During this time, theconvective transport of material towards the membrane is zero (i.e., clean water filtration), whilethe diffusive transport of retained material away from the membrane surface is greater than zero,resulting in a reduction in resistance (i.e. recovery in resistance). Note, that if CP becomes extensive,and a cake/gel layer is formed, the recovery in resistance during post-clean water resistance will belimited [26,46–48]. Therefore, although a high recovery during post-clean water filtration suggests thatCP likely dominates the increase in resistance due to permeate flow, other indicators of fouling and CPmust be considered when interpreting the results.
As previously discussed, for all conditions investigated, the permeate flux could be best modeledassuming fouling was predominantly due to the formation of a cake layer on the membrane surface(see Section 2.2). The fit of the cake fouling model (Equation (1)) to typical data is presented inFigure 3. For all conditions investigated, the extent of fouling was quantified with respect to thefouling coefficient, as discussed in Section 3.2.1, and the contributions of CP and fouling to the increasein filtration resistance was analyzed as discussed in Section 3.2.2.
61

Membranes 2017, 7, 34
Figure 3. Typical results from filtration tests: (a) MWCO = 300 Da and SRNOM at 5 mg/L of DOC,(b) MWCO = 8000 Da and alginate at 5 mg/L of DOC.
3.2.1. Contribution of Fouling to the Total Increase in Filtration Resistance
The fouling coefficients (kc) for the different experimental conditions investigated are summarizedin Table 1. When filtering model raw waters containing alginate, the fouling coefficients were similarfor the membranes with MWCOs of 300 and 2000 Da and only slightly lower (and not statisticallydifferent) for the membrane with the MWCO of 8000 Da. These results are consistent with thosepresented in Section 3.1, where the rejection of alginate was similar when filtering with membraneswith MWCOs of 300 Da and 2000 Da MWCO, and slightly lower when filtering with the membranewith a MWCO of 8000 Da. Considering the substantially different initial permeate fluxes for themembranes with different MWCOs, and the similar fouling coefficients observed for all membranes, itcan be concluded that the fouling coefficient was independent of the initial permeate flux. Further,the fouling coefficient was proportional to the concentration of alginate in the model raw waterbeing filtered (i.e., the fouling coefficient doubled when the concentration of alginate in the rawwater was twice as high), suggesting that for all membranes, fouling was similar and predominantlydue to convective transport and the accumulation of a cake layer with similar characteristics for allmembranes. These results are also consistent with the fact that the molecular weight of alginate isgreater than the MWCO of all membranes considered (see Section 3.1).
When filtering model raw waters containing SRNOM, the fouling coefficient was substantiallyhigher for the membrane with a MWCO of 300 Da than for the membranes with MWCOs of 2000 and8000 Da. This is again consistent with the higher rejection of SRNOM by the membrane with a MWCOof 300 Da, than the membranes with MWCOs of 2000 and 8000 Da. It should be noted that the foulingcoefficient was similar for the membranes with MWCOs of 2000 and 8000 Da, even though the rejectionof organic material present in SRNOM was greater for the membrane with a MWCO of 2000 Da, than
62

Membranes 2017, 7, 34
for the membrane with a MWCO of 8000 Da. For the membrane with a MWCO of 8000 Da, the foulingcoefficient was proportional to the concentration of SRNOM in the model raw water. However, forthe membranes with MWCOs of 300 and 2000 Da, the fouling coefficient was not proportional to theconcentration of SRNOM in the model raw water. The deviation from proportionality increased asthe MWCO of the membrane decreased. These results indicate that, in contrast to filtering model rawwater containing alginate, when filtering model raw water containing SRNOM (i.e., using membraneswith low MWCOs), fouling was not only governed by the convective transport of material towards themembrane, but also likely by the formation of a CP-induced cake/gel layer at the membrane surface,as discussed in Section 3.2.2.
When filtering model raw waters containing a mixture of SRNOM and alginate, the foulingbehavior was similar to that of model raw water containing SRNOM, suggesting that the higherpercentage of low molecular weight NOM (i.e., 80% low molecular weight NOM versus 20% highmolecular weight NOM) governed the fouling behavior.
Table 1. Fouling coefficient kc for different filtration tests (ranges correspond to observedminimum/maximum values).
NOM Constituents NOM Concentration [mg/L]Fouling Coefficient kc [1011 m−1 m−3 m2] Average (Range)
MWCO = 300 Da MWCO = 2000 Da MWCO = 8000 Da
SRNOM5 0.7 (0.5–0.9) 0.1 (0–0.1) 0.1 (0.1–0.1)10 3.5 (3.5–3.5) 0.6 (0–1.1) 0.2 (0.2–0.2)
Alginate 5 1.1 (0.8–1.6) 0.8 (0.5–1.1) 0.8 (0.7–0.9)10 2.1 (2.0–2.2) 2.1 (1.6–2.4) 1.6 (1.5–1.7)
SRNOM + Alginate 4 + 1 0.7 (0.4–1.0) 0.2 (0.1–0.3) 0.2 (0.2–0.2)8 + 2 5.1 (4.7–5.5) 1.2 (0.7–2.0) 0.5 (0.5–0.5)
3.2.2. Contribution of CP to the Total Increase in Filtration Resistance
The contribution of CP to the total increase in resistance during filtration of the model raw waterswas quantified by the relative recovery. The relative recovery was defined as the ratio of the absoluterecovery to the total increase in resistance during filtration of model raw water (Figure 3). The totalincrease in resistance was calculated based on the difference between the permeate flux during apre-clean water filtration phase, and at the end of a filtration of model raw water phase. The absoluterecovery was calculated as the difference between the permeate flux at the end of a filtration of modelraw water phase, and at the end of a post-clean water filtration phase. Figure 4 illustrates the relativerecoveries for the different conditions investigated.
The relative recovery generally increased as the MWCO of the membrane decreased. Also, therelative recovery generally increased when the concentration of NOM in the raw water increased.When filtering model raw water containing alginate, the relative recovery was generally low, rangingfrom approximately 10% to 40%. Also, the fouling coefficient increased proportionally with theconcentration of alginate in the model raw water (see Section 3.2.1). This, combined with the lowrelative recoveries, suggest that the increase in resistance to permeate flow was dominated by foulingwhen filtering model raw waters containing alginate, at all of the considered concentrations (i.e.,5 mg L−1 and 10 mg L−1). However, when filtering model raw waters containing SRNOM, therelative recovery was generally higher, ranging from approximately 50% to 100%. The greater relativerecoveries when filtering model raw waters containing SRNOM, rather than alginate, was attributed tothe differences in the diffusion coefficients of these types of NOM. Diffusion coefficients of 2.2 × 10⁻¹⁰
to 3.8 × 10⁻¹⁰ m2 s−1 have been reported for humic substances [29], which account for most of theorganic material in SRNOM, while that for alginate is in the order of 9.4 × 10⁻¹¹ m2 s−1, an estimatebased on Dextran T-70 [29]. The diffusive transport of retained material from the membrane back intosolution is expected to increase relative to the molecular diffusion [29]. Also, the permeation drag isexpected to be greater for alginate than for SRNOM because of the larger size of alginate comparedto SRNOM [22]. The relative recovery for the membrane with a MWCO of 300 Da was lower when
63

Membranes 2017, 7, 34
the concentration of SRNOM in the model raw water increased (i.e., from 5 to 10 mg/L). Under theseconditions, the concentration at the membrane surface is expected to be high, and likely resulted in theformation of a cake/gel layer at the membrane surface [26,46–48]. Once formed, the resistance offeredby the cake/gel layer could not be reversed during post-clean water filtration, which is consistent withprevious research where humic substances fouling was observed to be irreversible [25,26,29,35].
When filtering model raw waters containing a mixture of SRNOM and alginate, the relativerecovery was similar to that of model raw waters containing SRNOM, again suggesting that the higherpercentage of low molecular weight NOM (i.e., 80% low molecular weight NOM versus 20% highmolecular weight NOM) was mainly responsible for the observed changes in permeate flux.
Figure 4. Relative recovery during post-clean water filtration (a) MWCO = 300 Da;(b) MWCO = 2000 Da; (c) MWCO = 8000 Da; SR5: SRNOM at 5 mg/L; SR10: SRNOM at 10 mg/L;Alg5: Alginate at 5 mg/L; Alg10: Alginate at 10 mg/L; SR4 + Alg1: SRNOM at 4 mg/L + alginateat 1 mg/L; SR8 + Alg2: SRNOM at 8 mg/L + alginate at 2 mg/L; error bars correspond to observedminimum/maximum values).
64

Membranes 2017, 7, 34
As illustrated in Figure 5, when filtering model raw waters containing SRNOM or a mixtureof SRNOM and alginate, a linear correlation was observed between the initial rapid increase inresistance during model raw water filtration and the absolute recovery during post-clean waterfiltration (R2 = 0.97). When filtering model raw waters containing alginate, no correlation was observed(R2 = 0.04, results not shown). The correlation supports the assumption that the initial rapid increasein resistance is due to CP rather than fouling, that CP develops rapidly within the first minutes offiltration when filtering raw waters containing NOM, and confirms that the relative recovery observedwhen filtering model raw waters containing SRNOM can be attributed to CP. In addition, these resultsconfirm that the total increase in filtration resistance is mainly impacted by CP when filtering modelraw waters containing SRNOM.
Figure 5. Correlation between Absolute Recovery and Initial Rapid Increase in Resistance (model rawwaters containing SRNOM and a mixture of SRNOM + alginate; solid line: linear regression, R2 = 0.97,slope = 1.31 ± 0.35, intercept = 3 × 10 11; p = 0.05; error bars correspond to minimum/maximum values).
3.2.3. Overall Impact of Fouling and CP to the Increase in Resistance to Permeate Flow
Overall, the results suggest that when filtering model raw waters containing alginate, the totalincreases in the filtration resistance is dominated by fouling, while the total increase in filtrationresistance is dominated by CP when filtering model raw waters containing SRNOM (i.e., humicsubstances, lower molecular weight NOM). The impact of CP is greatest for membranes with lowerMWCOs (i.e., <2000 Da), which are recommended for the effective removal of NOM in drinking watertreatment applications. Filtration using membranes with higher MWCOs (e.g., 8000 Da) is not prone toCP because the lower molecular weight NOM, responsible for CP, is not effectively retained.
It should be noted that when the impact of CP is extensive (i.e., filtration of raw waters containingmainly humic substances/low molecular weight NOM with low MWCO membranes), the increasein resistance is much greater than when filtration was dominated by fouling. For this reason, andbecause NOM in surface waters consist predominantly of humic substances [32], operation with controlmeasures to continuously limit CP, such as cross-flow operation, should be considered for drinkingwater treatment using NF and tight UF range membranes. Dead-end operation, which is typically usedfor drinking water production by UF, is not recommended because it cannot continuously limit CP.
Future research will investigate the impact of control measures (e.g., cross-flow) and differentmembrane configurations (e.g., hollow fiber versus spiral wound membrane configurations) to mitigateCP and fouling in NF and tight UF membrane systems applied to the treatment of drinking water.
65
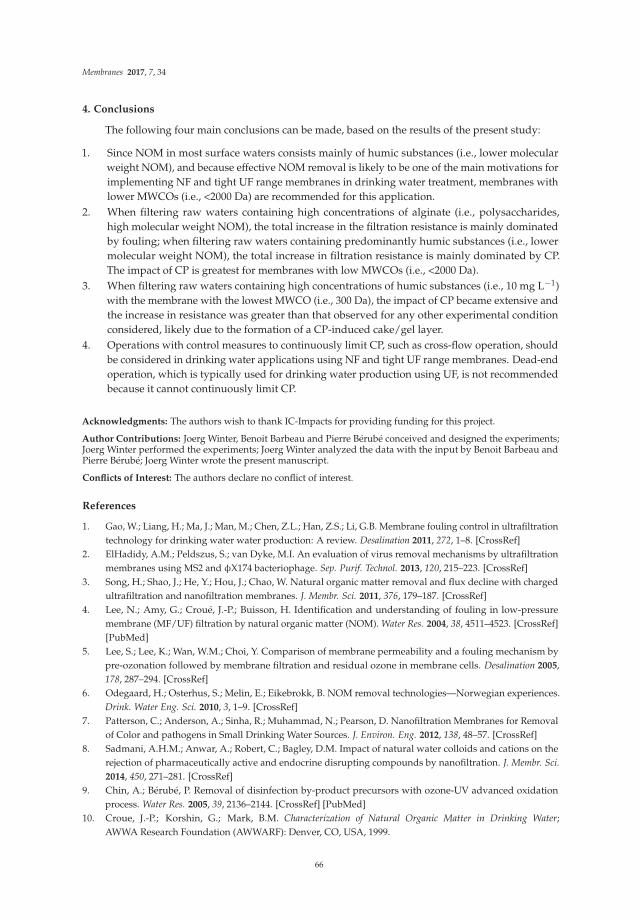
Membranes 2017, 7, 34
4. Conclusions
The following four main conclusions can be made, based on the results of the present study:
1. Since NOM in most surface waters consists mainly of humic substances (i.e., lower molecularweight NOM), and because effective NOM removal is likely to be one of the main motivations forimplementing NF and tight UF range membranes in drinking water treatment, membranes withlower MWCOs (i.e., <2000 Da) are recommended for this application.
2. When filtering raw waters containing high concentrations of alginate (i.e., polysaccharides,high molecular weight NOM), the total increase in the filtration resistance is mainly dominatedby fouling; when filtering raw waters containing predominantly humic substances (i.e., lowermolecular weight NOM), the total increase in filtration resistance is mainly dominated by CP.The impact of CP is greatest for membranes with low MWCOs (i.e., <2000 Da).
3. When filtering raw waters containing high concentrations of humic substances (i.e., 10 mg L−1)with the membrane with the lowest MWCO (i.e., 300 Da), the impact of CP became extensive andthe increase in resistance was greater than that observed for any other experimental conditionconsidered, likely due to the formation of a CP-induced cake/gel layer.
4. Operations with control measures to continuously limit CP, such as cross-flow operation, shouldbe considered in drinking water applications using NF and tight UF range membranes. Dead-endoperation, which is typically used for drinking water production using UF, is not recommendedbecause it cannot continuously limit CP.
Acknowledgments: The authors wish to thank IC-Impacts for providing funding for this project.
Author Contributions: Joerg Winter, Benoit Barbeau and Pierre Bérubé conceived and designed the experiments;Joerg Winter performed the experiments; Joerg Winter analyzed the data with the input by Benoit Barbeau andPierre Bérubé; Joerg Winter wrote the present manuscript.
Conflicts of Interest: The authors declare no conflict of interest.
References
1. Gao, W.; Liang, H.; Ma, J.; Man, M.; Chen, Z.L.; Han, Z.S.; Li, G.B. Membrane fouling control in ultrafiltrationtechnology for drinking water water production: A review. Desalination 2011, 272, 1–8. [CrossRef]
2. ElHadidy, A.M.; Peldszus, S.; van Dyke, M.I. An evaluation of virus removal mechanisms by ultrafiltrationmembranes using MS2 and φX174 bacteriophage. Sep. Purif. Technol. 2013, 120, 215–223. [CrossRef]
3. Song, H.; Shao, J.; He, Y.; Hou, J.; Chao, W. Natural organic matter removal and flux decline with chargedultrafiltration and nanofiltration membranes. J. Membr. Sci. 2011, 376, 179–187. [CrossRef]
4. Lee, N.; Amy, G.; Croué, J.-P.; Buisson, H. Identification and understanding of fouling in low-pressuremembrane (MF/UF) filtration by natural organic matter (NOM). Water Res. 2004, 38, 4511–4523. [CrossRef][PubMed]
5. Lee, S.; Lee, K.; Wan, W.M.; Choi, Y. Comparison of membrane permeability and a fouling mechanism bypre-ozonation followed by membrane filtration and residual ozone in membrane cells. Desalination 2005,178, 287–294. [CrossRef]
6. Odegaard, H.; Osterhus, S.; Melin, E.; Eikebrokk, B. NOM removal technologies—Norwegian experiences.Drink. Water Eng. Sci. 2010, 3, 1–9. [CrossRef]
7. Patterson, C.; Anderson, A.; Sinha, R.; Muhammad, N.; Pearson, D. Nanofiltration Membranes for Removalof Color and pathogens in Small Drinking Water Sources. J. Environ. Eng. 2012, 138, 48–57. [CrossRef]
8. Sadmani, A.H.M.; Anwar, A.; Robert, C.; Bagley, D.M. Impact of natural water colloids and cations on therejection of pharmaceutically active and endocrine disrupting compounds by nanofiltration. J. Membr. Sci.2014, 450, 271–281. [CrossRef]
9. Chin, A.; Bérubé, P. Removal of disinfection by-product precursors with ozone-UV advanced oxidationprocess. Water Res. 2005, 39, 2136–2144. [CrossRef] [PubMed]
10. Croue, J.-P.; Korshin, G.; Mark, B.M. Characterization of Natural Organic Matter in Drinking Water;AWWA Research Foundation (AWWARF): Denver, CO, USA, 1999.
66

Membranes 2017, 7, 34
11. Hozalski, R.M.; Bouwer, E.J.; Goel, S. Removal of natural organic matter from drinking water supplies byozone-biofiltration. Water Sci. Technol. 1999, 40, 157–163. [CrossRef]
12. Rittmann, B.E.; Stilwell, D. Modelling biological processes in water treatment: The integrated biofiltrationmodel. J. Water Supply Res. Technol. AQUA 2002, 51, 1–14.
13. Sarathy, S.; Mohseni, M. The fate of natural organic matter during UV/H2O2 advanced oxidation of drinkingwater. Can. J. Civ. Eng. 2009, 36, 160–169. [CrossRef]
14. Wang, G.-S.; Hsieh, S.-T. Monitoring natural organic matter in water with scanning spectrophotometer.Environ. Int. 2001, 26, 205–212. [CrossRef]
15. Bequet, S.; Remigy, J.C.; Rouch, J.C. From ultrafiltration to nanofiltration hollow fiber membranes:A continuous UV-photografting process. Desalination 2002, 144, 9–14. [CrossRef]
16. Frank, M.; Bargeman, G.; Zwijnenburg, A. Capillary hollow fiber nanofiltration membranes.Sep. Purif. Technol. 2001, 22, 499–506. [CrossRef]
17. Spruck, M.; Hoefer, G.; Fili, G.; Gleinser, D.; Ruech, A.; Schmidt-Baldassari, M.; Rupprich, M. Preparation andcharacterization of composite multichannel capillary membranes on the way to nanofiltration. Desalination2013, 314, 28–33. [CrossRef]
18. Verberk, J.Q.J.C.; van Dijk, J.C. Air Sparging in Capillary Nanofiltration. J. Membr. Sci. 2006, 284, 339–351.[CrossRef]
19. Geraldes, V.; Semião, V.; de Pinho, M.N. Flow management in nanofiltration spiral wound modules withladder-type spacers. J. Membr Sci. 2002, 203, 87–102. [CrossRef]
20. Thorsen, T.; Flogstat, H. Nanofiltration in Drinking Water Treatment—Literature Review. Available online:https://www.techneau.org/fileadmin/files/Publications/Publications/Deliverables/D5.3.4b.pdf(accessed on 13 March 2017).
21. Song, L.; Elimelech, M. Particle deposition onto a permeable surface in laminar flow. J. Colloid Interface Sci.1995, 173, 165–180. [CrossRef]
22. Belfort, G.; Davis, R.H.; Zydney, A.L. The behavior of suspensions and macromolecular solutions incross-flow microfiltration. J. Membr. Sci. 1994, 96, 1–58. [CrossRef]
23. Fonseca, A.C.; Summers, R.S.; Greenberg, A.R.; Hermandez, M.T. Extra-cellular Polysaccharides, solublemicrobial products, and natural organic matter impact on nanofiltration flux decline. Environ. Sci. Technol.2007, 41, 2491–2497. [CrossRef] [PubMed]
24. Huang, H.; Lee, N.; Young, T.; Amy, G.; Lozier, J.C.; Jacangelo, J.G. Natural organic matter fouling oflow-pressure, hollow-fiber membranes: Effects of NOM source and hydrodynamic conditions. Water Res.2007, 41, 3823–3832. [CrossRef] [PubMed]
25. Jermann, D.; Pronk, W.; Kägi, R.; Halbeisen, M.; Boller, M. Influence of interactions between NOM andparticles on UF fouling mechanism. Water Res. 2008, 42, 3870–3878. [CrossRef] [PubMed]
26. Schäfer, A.I.; Fane, A.G.; Waite, T.D. Nanofiltration of natural organic matter: Removal, fouling and influenceof multivalent ions. Desalination 1998, 118, 109–122. [CrossRef]
27. Zheng, X.; Ernst, M.; Jekel, M. Identification and quantification of major organic foulants in treated domesticwastewater affecting filterability in dead-end ultrafiltration. Water Res. 2009, 43, 238–244. [CrossRef][PubMed]
28. Her, N.; Amy, G.; Park, H.-R.; Song, M. Characterizing algogenic organic matter (AOM) and evaluatingassociated NF membrane fouling. Water Res. 2004, 38, 1427–1438. [CrossRef] [PubMed]
29. Schäfer, A.I. Natural Organics Removal Using Membranes—Principles, Performance and Cost;Technomic Publishing: Lancaster, PA, USA, 2007.
30. Zularisam, A.W.; Ismail, A.F.; Salim, M.R.; Sakinah, M.; Ozaki, H. The effects of natural organic matter(NOM) fractions on fouling characteristics and flux recovery of ultrafiltration membranes. Desalination 2007,212, 191–208. [CrossRef]
31. Winter, J.; Uhl, W.; Bérubé, P.R. Integrated Oxidation Membrane Filtration Process—NOM Rejection andMembrane Fouling. Water Res. 2016, 104, 418–424. [CrossRef] [PubMed]
32. Zumstein, J.; Buffle, J. Circulation of Pedogenic and Aquagenic Organic Matter in an Eutrophic Lake.Water Res. 1989, 23, 229–239. [CrossRef]
33. Amy, G.; Her, N. Size exclusion chromatography (SEC) with multiple detectors: A powerful tool in treatmentprocess selection and performance. Water Sci. Technol. 2004, 4, 19–24.
67

Membranes 2017, 7, 34
34. Biber, M.V.; Guelacar, F.O.; Buffle, J. Seasonal Variations in Principal Groups of Organic Matter in a EutrophicLake using Pyrolysis/GC/MS. Environ. Sci. Technol. 1996, 30, 3501–3507. [CrossRef]
35. Jermann, D.; Pronk, W.; Meylan, S.; Boller, M. Interplay of different NOM fouling mechanisms duringultrafiltration of drinking water production. Water Res. 2007, 41, 1713–1722. [CrossRef] [PubMed]
36. Laabs, C.; Amy, G.; Jekel, M. Understanding the Size and character of Fouling-Causing Substances fromEffluent Organic Matter (EfOM) in Low Pressure Membrane filtration. Environ. Sci. Technol. 2006, 40,4495–4499. [CrossRef] [PubMed]
37. Wray, H.E.; Andrews, R.C.; Bérubé, P.R. Surface shear stress and membrane fouling when consideringnatural water matrices. Desalination 2013, 330, 22–27. [CrossRef]
38. Jarusutthirak, C.; Amy, G.; Croue, J.-P. Fouling characteristics of wastewater effluent organic matter (EfOM)isolates on NF and UF membranes. Desalination 2002, 145, 247–255. [CrossRef]
39. Seidel, A.; Elimelech, M. Coupling between chemical and physical interactions in natural organic matter(NOM) fouling of nanofiltration membranes: Implications for fouling control. J. Membr. Sci. 2002, 203,245–255. [CrossRef]
40. Sari, M.A.; Chellam, S. Surface water nanofiltration incorporating (electro) coagulation-microfiltrationpretreatment: Fouling control and membrane characterization. J. Membr. Sci. 2013, 437, 249–256. [CrossRef]
41. Cho, J.; Amy, G.; Pellegrino, J. Membrane filtration of natural organic matter: Initial comparison of rejectionand flux decline characteristics with ultrafiltration and nanofiltration membranes. Water Res. 1999, 33,2517–2526. [CrossRef]
42. Her, N.; Amy, G.; Plottu-Pecheux, A.; Yoon, Y. Identification of nanofiltration foulants. Water Res. 2007, 41,3936–3947. [CrossRef] [PubMed]
43. Listiarini, K.; Chun, W.; Sun, D.D.; Leckie, J. Fouling mechanism and resistance analyses of systemscontaining sodium alginate, calcium, alum and their combination in dead-end fouling of nanofiltrationmembranes. J. Membr. Sci. 2009, 344, 244–251. [CrossRef]
44. Mahlangu, T.O.; Thwala, J.M.; Mamba, B.B.; D’Haese, A.; Verliefde, A.R.D. Factors governing combinedfouling by organic and colloidal foulants in cross-flow nanofiltration. J. Membr. Sci. 2015, 49, 53–62.[CrossRef]
45. Schäfer, A.I.; Fane, A.G.; Waite, T.D. Nanofiltration: Principles and Applications; Elsevier: Oxford, UK; New York,NY, USA, 2005.
46. Mulder, M. Basic Principles of Membrane Technology, 2nd ed.; Kluwer Academic: Dordrecht, The Netherlands,1996.
47. Van den Berg, G.B.; Smolders, C.A. Flux Decline in Ultrafiltration Processes. Desalination 1990, 77, 101–133.[CrossRef]
48. Elimelech, M.; Bhattacharjee, S. A novel approach for modeling concentration polarization in crossflowmembrane filtration based on the equivalence of osmotic pressure model and filtration theory. J. Membr. Sci.1998, 145, 223–241. [CrossRef]
49. Chin, Y.-P.; Aiken, G.; O’Loughlin, E. Molecular Weight, Polydispersity, and Spectroscopic Properties ofAquatic Humic Substances. Environ. Sci. Technol. 1994, 28, 1853–1858. [CrossRef] [PubMed]
50. Her, N.; Amy, G.; Foss, D.; Cho, J.; Yoon, Y.; Kosenka, P. Optimization of Method for Detecting andCharacterizing NOM by HPLC-Size Exclusion Chromatography with UV and On-Line DOC detection.Environ. Sci. Technol. 2002, 36, 1069–1076. [CrossRef] [PubMed]
51. Huber, S.A.; Balz, A.; Abert, M.; Pronk, W. Characterisation of aquatic humic and non-humic matterwith size-exclusion chromatograpgy-organic carbon detection-organic nitrogen detection (LC-OCD-OND).Water Res. 2011, 45, 879–885. [CrossRef] [PubMed]
52. Cornel, P.K.; Summers, S.R.; Roberts, P.V. Diffusion of Humic Acid in Dilute Aqueous Solution. J. ColloidInterface Sci. 1986, 110, 149–164. [CrossRef]
53. Bhattacharjee, S.; Chen, J.C.; Elimelech, M. Coupled model of concentration polarization and pore transportin cross-flow nanofiltration. AIChE J. 2001, 47, 2733–2745. [CrossRef]
54. Brian, P.L.T. Concentration Polarization in Reverse Osmosis Desalination with Variable Flux and IncompleteSalt Rejection. Ind. Eng. Chem. Fundam. 1965, 4, 439–445. [CrossRef]
55. Hoek, E.M.V.; Elimelech, M. Cake-Enhanced Concentration Polarization—A New Fouling Mechanism forSalt-Rejecting Membranes. Environ. Sci. Technol. 2003, 37, 5581–5588. [CrossRef] [PubMed]
56. Rautenbach, R.; Albrecht, R. Membrane Processes; John Wiley & Sons: New York, NY, USA, 1989.
68

Membranes 2017, 7, 34
57. Yoon, Y.; Amy, G.; Cho, J.; Her, N. Effects of retained natural organic matter (NOM) on NOM rejection andmembrane flux decline with nanofiltration and ultrafiltration. Desalination 2005, 173, 209–221. [CrossRef]
58. Hincks, S.S.; Mackie, G.L. Effect of pH, calcium, alkalinity, hardness, and chlorophyll on the survival, growth,and reproductive success of zebra mussel (Dreissena polymarpha) in Ontario lakes. Can. J. Fish. Aquat. Sci.1997, 54, 2049–2057. [CrossRef]
59. Hermia, J. Constant Pressure Blocking Filtration Laws—Application to Power-Law Non-Newtonian Fluids.Chem. Eng. Res. Des. 1982, 60, 183–187.
© 2017 by the authors. Licensee MDPI, Basel, Switzerland. This article is an open accessarticle distributed under the terms and conditions of the Creative Commons Attribution(CC BY) license (http://creativecommons.org/licenses/by/4.0/).
69
membranes
Article
Poly(vinylbenzylchloride) Based Anion-ExchangeBlend Membranes (AEBMs): Influence of PEGAdditive on Conductivity and Stability
Jochen A. Kerres 1,2,* and Henning M. Krieg 2
1 Institute of Chemical Process Engineering, University of Stuttgart, 70199 Stuttgart, Germany2 Faculty of Natural Science, North-West University, Focus Area: Chemical Resource Beneficiation,
Potchefstroom 2520, South Africa; [email protected]* Correspondence: [email protected]; Tel.: +49-711-68585-244
Academic Editor: Tongwen XuReceived: 4 May 2017; Accepted: 7 June 2017; Published: 16 June 2017
Abstract: In view of the many possible applications such as fuel cells and electrolysers, recentinterest in novel anion exchange membranes (AEMs) has increased significantly. However, their lowconductivity and chemical stability limits their current suitability. In this study, the synthesis andcharacterization of several three- and four-component anion exchange blend membranes (AEBMs)is described, where the compositions have been systematically varied to study the influence of theAEBM’s composition on the anion conductivities as well as chemical and thermal stabilities understrongly alkaline conditions. It was shown that the epoxide-functionalized poly(ethylene glycol)sthat were introduced into the four-component AEBMs resulted in increased conductivity as wellas a marked improvement in the stability of the AEBMs in an alkaline environment. In addition,the thermal stability of the novel AEBMs was excellent showing the suitability of these membranesfor several electrochemical applications.
Keywords: anion-exchange blend membrane; poly(vinylbenzylchloride); polybenzimidazole;ionic cross-link; Cl− conductivity; impedance spectroscopy; TGA-FTIR coupling
1. Introduction
Over the past decades, the research interest in anion exchange membranes (AEMs) forelectrochemical conversion processes has increased significantly with possible applications of AEMs inalkaline polymer electrolyte fuel cells (APEFCs) [1], alkaline polymer electrolyte electrolysis (APEE) [2],redox flow batteries (RFBS) [3], reverse electrodialysis (RED) [4] and bio-electrochemical systems,including microbial fuel cells (MFC) [5] and enzymatic fuel cells [6]. In addition, AEMs are used inelectrodialysis (ED) [7] and Donnan Dialysis [8]—or diffusion dialysis (DD) [9]. A significant advantageof using AEMs in electrochemical conversion processes such as fuel cells or electrolysis is that nonoble metal catalysts (consisting of platinum group metals (PGM)) are required for the electrocatalyticreactions at the electrodes, as was shown by Piana et al. [1], which implies that AEM containingmembrane electrode assemblies (MEAs) are potentially much cheaper than cation exchange membranes(CEM) containing MEAs. However, AEMs have, compared to CEM, the following disadvantages:
• The ionic conductivity of AEMs is significantly lower than that of CEMs despite havingcomparable ion exchange capacity (IEC), which is partly due to the fact that most AEM typeshave a hydrocarbon backbone, which is significantly less hydrophobic than, for example,the perfluorinated polymer main chain of the perfluorinated membranes of the Nafion®
(Fayetteville, NC, USA) type, leading to a smaller separation between ionic groups and thepolymer backbone and, therefore, to lower ionic conductivities due to the lower local density of
Membranes 2017, 7, 32 70 www.mdpi.com/journal/membranes

Membranes 2017, 7, 32
the anion-exchange groups, particularly since in most AEM types the cationic head groups areconnected to the polymer backbone only via a CH2 (benzylic) bridge [10] which hinders clusteringof the anion-exchange groups.
• If the AEMs are exchanged specifically with OH− counterions, their chemical stability is limitedwhen used in APEFCs or APEEs, since the OH− counterion can degrade the cationic headgroup [11] or even the polymer backbone [12].
Most current research aims at minimizing these disadvantages of AEMs thereby improving theirproperties. The starting polymers for commonly used AEM polymers are aromatic group-containingpolymers, such as polystyrene, polyphenylene ether, or other aromatic polyethers such aspolyethersulfones or polyether ketones which are substituted with methyl groups. The first step for thepreparation of an AEM is the introduction of halomethyl groups into the polymer. This halomethylationis achieved by either: (1) bromomethylation with hydrogen halide, formaldehyde and a Lewisacid such as ZnCl2 or AlCl3 (Blanc reaction [13,14]); or (2) bromination of the –CH3 side groupsof aromatic polymers using N-bromo-succinimide (NBS) and a radical starter as the brominationagent (Wohl–Ziegler reaction [15]). Since the Blanc reaction includes the strongly carcinogenicintermediate bis(chloromethyl) ether, the Wohl–Ziegler reaction is currently preferably used forthe synthesis of halomethylated aromatic polymers. Literature examples of the preparation ofbromomethylated aromatic polymers by the Wohl–Ziegler reaction are the bromomethylation ofpoly(phenylene oxide) [16], or methylated poly(ether sulfone) [17]. The conversion of the –CH2Halgroup (Hal = Cl, Br) to an anion exchange group can be attained by the reaction with a tertiaryamine such as trimethylamine [14], pyridine [18], pentamethylguanidine [19] or an N-alkylated(benz)imidazole [20]. The conductivity of AEMs can be increased by increasing the distance betweenthe polymer backbone and the cationic head groups thereby obtaining a greater local concentration ofion-conducting groups. Phase-segregated AEMs with improved ionic conductivity can be achieved bypreparing linear (multi) block copolymers composed of hydrophobic and ion-containing blocks [21]or graft copolymers with an anion-exchange graft side chain [22] (for example, by the grafting ofvinyl benzyl side chains onto an e−-irradiated ETFE (ethylene-tetrafluoroethylene copolymer) filmand by quaternizing the chloromethylated side chains with trimethylamine [23]). Another promisingapproach to improve the distance between the backbone and cationic group, to facilitate the clusteringof anion-exchange groups to increase the anion conductivity, is to place the anion-exchange groupseither within or at the end of an aliphatic side chain or both. For example, Dang and Jannasch haverecently prepared novel PPO AEMs by a four-step procedure [24]: First, PPO was lithiated at themethyl groups, followed by quenching with an excess of a dihalogenoalkane, e.g., dibromohexane.The formed PPO-AEMs with the halomethyl group at the end of the aliphatic side chain were thenreacted with an excess of a hexanediamine, e.g. N,N,N’,N’-tetramethyldiaminohexane, affordingAEMs with the cationic group between the first and the second aliphatic group. The tertiary aminogroup remaining at the end of the side chain was then quaternized with CH3I, ending up with AEMscontaining two ammonium groups in the side chain. These AEMs showed the expected high anionconductivity and, surprisingly, excellent chemical stabilities in an alkaline environment which wasascribed to the absence of chemically labile benzylic links in these AEMs. Hickner et al. used asimilar multication approach for the synthesis of side-chain AEMs based on PPO. Similar to thoseof the Jannasch group, the membranes were highly conductive (up to 80 mS·cm−1) and remarkablystable (15%–50% conductivity loss after 20 days in 1 M NaOH at 80 ◦C) [25]. In order to achieve animprovement of the chemical stability of AEMs, the combination of the anion exchange groups andthe polymer main chain must be studied as the stability of the anion exchange always also dependson the polymeric main chain. For example, it was shown that a benzyltrimethylammonium (BTMA)head group bound to a poly(styrene) backbone shows slightly better chemical stability in an alkalinemedium (0.6 M KOH, 80 ◦C) than BTMA bound to PPO and a much higher chemical stability thanBTMA bound to a poly(phenylene ether sulfone (PES)) backbone [12]. It is obviously not easy to predictwhich polymer backbone is stable, which can be seen from the above example, since all three polymers
71

Membranes 2017, 7, 32
(PSt, PPO and PES) contain aromatic groups of comparable electron density. However, it has beenfound that the alkali stability of the cationic head groups of AEMs can be significantly improved bysterically shielding the anion-exchange groups from nucleophilic OH− counterion attack. In a study byThomas et al., two different polybenzimidazolium- (PBIm+) based AEMs were studied in terms of theirstability in an alkaline environment [26]. One of the PBIm+-AEMs contained methyl groups adjacentto the dimethylbenzimidazolium cation, the other not. While the sterically hindered PBIm+-AEMshowed high stability in 2 M KOH, the unhindered one was rapidly degraded. The high stability ofthe hindered PBIm+-AEM was explained as follows: at the sterically hindered PBIm+-AEM, the OH−
group cannot attack the imidazolium ring. At the unhindered PBIm+-AEM, the OH− group can attackthe imidazolium ring leading to ring opening [27]. From these results, it is clear that shielding theanion-exchange groups from a possible OH− attack by introducing bulky groups in the vicinity of theanion-exchange group is a promising concept. Other groups have also synthesized AEMs where thecationic group is surrounded by bulky functional groups. For example, Liu et al. synthesized stericallyhighly hindered PPO AEMs containing 1,4,5-trimethyl-2-(2,4,6-trimethoxyphenyl) imidazolium headgroups, which possessed excellent alkaline stabilities (no decrease of ion exchange capacity (IEC) after25 h storage in 1 M KOH at 80 ◦C [28]). Contrary, dimethylimidazolium group-modified PPO showeda strong IEC decrease (approximately 50% in 2 M KOH at 60 ◦C) after nine days [29]. Other strategiesto reduce the chemical degradation of AEMs include:
• search for alternative fixed cations;• chemical and/or physical cross-linking; and• embedding of the anion-exchange polymers in an inert polymer matrix.
As an alternative to the most commonly used trialkylammonium cationic groups, the alreadymentioned pentamethylguanidinium group (PMG) has been introduced. However, it was found thatthe PMG cations are only chemically stable when they are resonance-stabilized, i.e., the positive chargeof the PMG-cation is delocalized, which is the case when the PMG group is attached to an aromaticgroup which should preferably be electron-deficient, as shown by Kim et al. [30,31]. Another example ofa cationic functional group chemically stabilized by steric hindrance is the tris (2,4,6-trimethoxyphenyl)phosphonium cation, which was bound to polyvinylbenzyl-graft chains [32], exhibiting no degradationafter 75 h of storage in 1 N NaOH at 60 ◦C. In a study by Zha et al., a positively charged bis(terpyridine)ruthenium (II) complex was attached to a norbornene polymer [33]. This AEM exhibited excellentstability in alkaline environment as immersion of the polymer in 1 N NaOH at room temperatureshowed no degradation even after half a year. Another option of stabilizing AEMs is crosslinking. Heet al. reported the synthesis of mechanically robust PPO-based AEMs which have been covalentlycross-linked (via quaternization) in a multistage process with tertiary diamines and vinyl benzylchloride [34]. In a study by Cheng et al. chloromethylated PSU was cross-linked (via quaternization)with the new N-basic difunctional reagent guanidimidazol. These novel crosslinked polymers hadbetter stability to alkali than similar AEMs, which have been quaternized with 1-methylimidazolewithout cross-linking [35].
In our group, bromomethylated PPO was quaternized with the diamine DABCO and1.4-diiodobutane and embedded in the matrix polymer PVDF. Mechanically and chemically stablecovalently crosslinked AEMs were obtained, which exhibited no degradation (IEC and conductivity)even after 10 days of storage in 1 N KOH at 90 ◦C, while yielding a high performance in direct methanolfuel cells (DMFC) (4 M MeOH and 5 M KOH) [36]. In another study methylated PBIOO obtained fromFuma-Tech (Bietigheim-Bissingen, Germany), which had been prepared using a novel non-carcinogenicreagent, was blended with sulfonated PSU and covalently crosslinked (quaternized) using DABCOand 1.4-diiodobutane [37]. In a DMFC using non-platinum catalysts (anode: 6% Pd/CeO2/C, cathode:4% FeCo/C) these AEMs at 80 ◦C (anode Feed 4 M MeOH + 5 M KOH) performed comparable to thatof a commercial Tokuyama-AEM (maximum power density 120 mW/cm2). In another study from ourgroup, ionic and covalently crosslinked AEM blends were synthesized with bromomethylated PPO or
72

Membranes 2017, 7, 32
a bromomethylated and partially fluorinated arylene main-chain polymer and a partially fluorinatedPBI (F6PBI) as the mechanically and chemically stable matrix and sulfonated polyethersulfone sPPSUas the ionic macromolecular cross-linker. The halomethylated blend component was quaternized withN-methylmorpholine (NMM) [38]. Due to the interaction of the sulfonate groups of the sulfonatedpolymer and the basic N-methylmorpholinium cations, ionic crosslinking sites were formed, leadingto an improved mechanical and chemical stability of the AEM blends. Covalent cross-links inthe membrane matrix were formed during evaporation of the solvent by the reaction of a minorportion of the –CH2Cl groups of the PVBCl with some of the N–H-functional groups of the PBI blendcomponents [39]. The alkaline stability of the membranes was investigated in 1 M KOH at 90 ◦C overa period of 10 days and compared to a commercial AEM of Tokuyama (A201). The most stable ofthe manufactured AEM blends lost about 40% of their initial Cl− conductivity, while the commercialA201 possessed only 21% of the initial conductivity after this time period. Similar AEM blends weresynthesized in a further study where NBS-brominated PPO was blended with PBIOO or F6PBI asthe matrix polymer, while sPPSU was added as ionic cross-linker to the blend of brominated PPOand F6PBI. The quaternization of bromomethylated PPO leading to the anion-exchange groups wasattained with 1-methylimidazole or 1-ethyl-3-methylimidazole [40]. After the stability tests (1 M KOH,90 ◦C, 10 days), the blend membrane of 1-methylimidazole-quaternized PPO, F6PBI and sPPSU showeda conductivity of 69% of the original conductivity, while blends from PBIOO and PPO quaternizedwith the two imidazoles mentioned above exhibited a residual ion conductivity which was 31–43% ofthe original value.
A further interesting new approach was suggested by Hickner et al. where they synthesizedmechanically strong and chemically stable AEMs from rigid-flexible semi-interpenetrating networkswith trimethylammonium PPO as the rigid compound and a flexible network built up frompoly(ethylene glycol)s (PEGs). These membranes possessed, probably due to the high hydrophilicityof PEG, high OH− conductivities (up to 75 mS·cm−1), and good alkaline stabilities (conductivitydecreased 25%–61% after 30 days at 80 ◦C in 1 M NaOH) [41].
In this study, several of the approaches described above were combined resulting in two typesof novel anion-exchange blend membranes (AEBMs). Poly(vinylbenzylchloride) (PVBCl), was usedas the AEM precursor, as this polymer is known to form stable AEMs [12], while different stericallyhindered tertiary N-basic compounds were used for the quaternization of the PVBCl. The two novelAEBMs consisted of:
(a) Three-component blends (after quaternization of the chlormethyl groups with the tertiary N-basiccompounds) consisting of PVBCl, a sterically hindered tertiary N base, the polybenzimidazolesPBIOO or F6PBI, and a nonfluorinated and a partially fluorinated aromatic sulfonated polyetheras ionic cross-linker (Figure 1a);
(b) Four-component blends (after quaternization of the chlormethyl groups with the tertiary N-basiccompounds) consisting of PVBCl, a sterically hindered tertiary N base, PBIOO, a nonfluorinatedaromatic sulfonated polyethersulfone polymer as ionic cross-linker, and poly(ethylenglycol)s(PEGs) with different chain lengths and epoxide groups at the end of the PEG chain for anchoringin the PBI matrix by reacting the epoxy groups with the N–H groups of the imidazole moiety(Figure 1b). The reaction of the epoxy end groups of the PEG with the N-H groups of the PBIblend component is illustrated in Figure 2.
In this study, the synthesis and characterization of several three- and four-component AEBMs isdescribed, where the compositions were systematically varied to study the influence of the AEMBscomposition on the resulting properties. AEBMs prepared from nonfluorinated blend components(PBIOO and sPPSU) were compared to those containing partially fluorinated polymeric compounds(F6PBI and sFPE (FPE = fluorinated polyether)). In the framework of the investigations, a particularfocus was to study the influence of the AEBM composition on the anion conductivities and chemicaland thermal stabilities under strongly alkaline conditions.
73

Membranes 2017, 7, 32
(a)
(b)
Figure 1. Preparation schemes for the: (a) three-component; and (b) four-component AEBMs.
Figure 2. Reaction of epoxide end groups of PEGs with the imidazole groups of PBI.
Figure 3 shows the polymers used for the preparation of the AEBMs.
Figure 3. Polymers used for the AEBMs.
74

Membranes 2017, 7, 32
2. Results and Discussion
2.1. Membrane Properties
2.1.1. Brief Discussion of the Physico-Chemical Properties of the AEBMs
In this study, three- and four-component AEBMs using poly(vinylbenzylchloride) as theanion-exchange precursor polymer were prepared, where the composition was systematically variedin terms of the blend component type and mass ratio. Most membranes were prepared using TMIm asthe tertiary N compound as this sterically hindered methylated imidazole was found to be more stablein alkaline environments than other imidazoles that were used in an earlier study [40]. For comparativepurposes, two AEBMs quaternized with PMP (2256) and NMM (2257), respectively, were also addedto this study.
Before varying the composition of the blend membranes, the extent of quaternization of theCH2Cl groups of poly(vinylbenzylchloride) (PVBCl) with TMIm was investigated by AttenuatedTotal Reflection Fourier-Transform Infrared Spectroscopy (ATR-FTIR). According to the literature,the stretching vibrations of the CH2Cl group of PVBCl are found in the vicinity of 675, 709 and1267 cm−1 [42]. Since the band around 1267 cm−1 is very strong, this band was selected as indication ofunreacted CH2Cl groups in the AEBMs. In Figure 4, the ATR-FTIR spectra of several of the AEBMs arecompared to that of PVBCl (in this study, the CH2Cl band was found at 1279 cm−1), clearly indicatingthat no unreacted CH2Cl groups were present in the AEBMs.
Figure 4. FTIR spectra of PVBCl and several of the prepared AEBMs.
The membrane compositions were varied in terms of: (a) the nonfluorinated/partially fluorinatedcontent (for the nonfluorinated AEBMs, PBIOO was used as matrix polymer and sulfonated PPSUas the ionic macromolecular cross-linker, and for the partially fluorinated AEBMs, F6PBI as matrixpolymer and SFPE001 as the ionic macromolecular cross-linker (Table 1, Figure 3); (b) the differentanion-exchange polymer contents leading to different IECs of the AEBMs; and (c) two different types ofPEGs (PEG-diglycidylether with MW = 500 Da or 6000 Da) and their amounts in the AEBMs resultingin varying hydrophilicity of the blends. The purpose of these variations was to investigate theirimpact on important membrane properties such as membrane conductivity, alkaline stability andthermal stability.
75
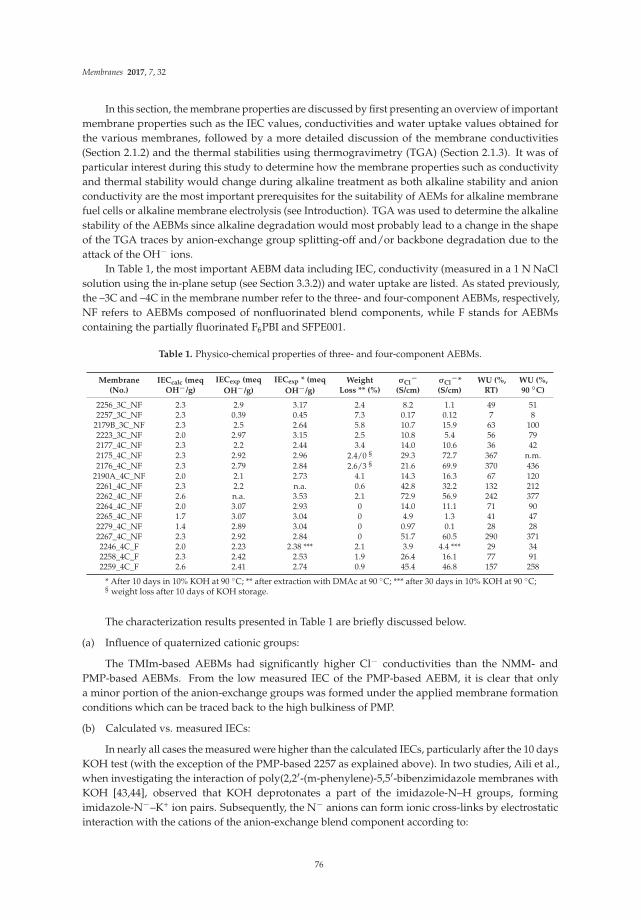
Membranes 2017, 7, 32
In this section, the membrane properties are discussed by first presenting an overview of importantmembrane properties such as the IEC values, conductivities and water uptake values obtained forthe various membranes, followed by a more detailed discussion of the membrane conductivities(Section 2.1.2) and the thermal stabilities using thermogravimetry (TGA) (Section 2.1.3). It was ofparticular interest during this study to determine how the membrane properties such as conductivityand thermal stability would change during alkaline treatment as both alkaline stability and anionconductivity are the most important prerequisites for the suitability of AEMs for alkaline membranefuel cells or alkaline membrane electrolysis (see Introduction). TGA was used to determine the alkalinestability of the AEBMs since alkaline degradation would most probably lead to a change in the shapeof the TGA traces by anion-exchange group splitting-off and/or backbone degradation due to theattack of the OH− ions.
In Table 1, the most important AEBM data including IEC, conductivity (measured in a 1 N NaClsolution using the in-plane setup (see Section 3.3.2)) and water uptake are listed. As stated previously,the –3C and –4C in the membrane number refer to the three- and four-component AEBMs, respectively,NF refers to AEBMs composed of nonfluorinated blend components, while F stands for AEBMscontaining the partially fluorinated F6PBI and SFPE001.
Table 1. Physico-chemical properties of three- and four-component AEBMs.
Membrane(No.)
IECcalc (meqOH−/g)
IECexp (meq
OH−/g)
IECexp * (meq
OH−/g)
WeightLoss ** (%)
σCl−
(S/cm)σCl
−*(S/cm)
WU (%,RT)
WU (%,90 ◦C)
2256_3C_NF 2.3 2.9 3.17 2.4 8.2 1.1 49 512257_3C_NF 2.3 0.39 0.45 7.3 0.17 0.12 7 8
2179B_3C_NF 2.3 2.5 2.64 5.8 10.7 15.9 63 1002223_3C_NF 2.0 2.97 3.15 2.5 10.8 5.4 56 792177_4C_NF 2.3 2.2 2.44 3.4 14.0 10.6 36 422175_4C_NF 2.3 2.92 2.96 2.4/0 § 29.3 72.7 367 n.m.2176_4C_NF 2.3 2.79 2.84 2.6/3 § 21.6 69.9 370 436
2190A_4C_NF 2.0 2.1 2.73 4.1 14.3 16.3 67 1202261_4C_NF 2.3 2.2 n.a. 0.6 42.8 32.2 132 2122262_4C_NF 2.6 n.a. 3.53 2.1 72.9 56.9 242 3772264_4C_NF 2.0 3.07 2.93 0 14.0 11.1 71 902265_4C_NF 1.7 3.07 3.04 0 4.9 1.3 41 472279_4C_NF 1.4 2.89 3.04 0 0.97 0.1 28 282267_4C_NF 2.3 2.92 2.84 0 51.7 60.5 290 3712246_4C_F 2.0 2.23 2.38 *** 2.1 3.9 4.4 *** 29 342258_4C_F 2.3 2.42 2.53 1.9 26.4 16.1 77 912259_4C_F 2.6 2.41 2.74 0.9 45.4 46.8 157 258
* After 10 days in 10% KOH at 90 ◦C; ** after extraction with DMAc at 90 ◦C; *** after 30 days in 10% KOH at 90 ◦C;§ weight loss after 10 days of KOH storage.
The characterization results presented in Table 1 are briefly discussed below.
(a) Influence of quaternized cationic groups:
The TMIm-based AEBMs had significantly higher Cl− conductivities than the NMM- andPMP-based AEBMs. From the low measured IEC of the PMP-based AEBM, it is clear that onlya minor portion of the anion-exchange groups was formed under the applied membrane formationconditions which can be traced back to the high bulkiness of PMP.
(b) Calculated vs. measured IECs:
In nearly all cases the measured were higher than the calculated IECs, particularly after the 10 daysKOH test (with the exception of the PMP-based 2257 as explained above). In two studies, Aili et al.,when investigating the interaction of poly(2,2′-(m-phenylene)-5,5′-bibenzimidazole membranes withKOH [43,44], observed that KOH deprotonates a part of the imidazole-N–H groups, formingimidazole-N−–K+ ion pairs. Subsequently, the N− anions can form ionic cross-links by electrostaticinteraction with the cations of the anion-exchange blend component according to:
76

Membranes 2017, 7, 32
PBI-N−-K+ + Poly-N+-Cl− → PBI-N−-+N-Poly + K+-Cl−
When determining the IEC, the AEBM that is in the OH− form is immersed in an excess of HClsolution which not only neutralizes the OH− counter ions but also splits the N−–+N ionic cross-linkswhich consumes additional HCl, leading to the increased measured IEC.
(c) Cl− conductivities of the three- and four-component AEBMs:
The conductivities of the PEG-containing four-component AEBMs are higher than those ofthe three-component AEBMs, which clearly highlights the positive effect of the hydrophilic PEGblend component on the conductivity. It is particularly noteworthy that already small amounts of PEG(8–10%) lead to a marked conductivity rise. These results confirm literature stating that the introductionof a PEG component into the AEMs increases the anion-conductivity [41,45]. When comparing theconductivities of membranes 2179B, 2177 and 2176, it is clear that the Cl− conductivity increased withincreasing PEG content in the AEBM (see also Figure 5).
(d) Dependence of Cl− conductivity on the anion-exchange polymer content of the four-componentAEBMs:
As expected and reported in the literature (e.g., [46]), the conductivity of the AEBMs increasedwith increasing anion-exchange polymer content of the blend membranes. The dependence of theCl− conductivity on the anion-exchange polymer content for AEBMs composed of PVBCl, TMIm,PBIOO and sPPSU is displayed in Figure 6. Interestingly, the decrease of the Cl− conductivity whentreated with KOH became less with increasing anion-exchange polymer content, indicating the highOH− stability of the anion-exchange polymers containing PVBCl and TMIm.
(e) Conductivities of partially and non-fluorinated AEBMs with similar calculated IECs:
As can be seen in Table 1, the conductivities of nonfluorinated AEBMs were higher thanthose of partially fluorinated AEBMs (examples: 2264 (nonfluorinated)/2246 (partially fluorinated;2261 (nonfluorinated)/2258 (partially fluorinated); 2262 (nonfluorinated)/2259 (partially fluorinated)).
(f) Water uptake:
In general, the water content of the AEBMs increased with increasing Cl− conductivity.
(g) Membrane weight loss during extraction:
The weight loss remained below 7% for all investigated membranes indicating completecross-linking within the AEBM blend components. The small weight decrease during extractionis due to the leaching of residual low-molecular tertiary N compounds (they were introduced in 100%excess, as mentioned before) and residual solvents. For two of the membranes (2175 and 2176, seeTable 2), the extracted amounts before and after KOH treatment were nearly the same, suggestingalkaline stability of the AEBMs and particularly of the covalent cross-links formed by reaction of thePEGs’ end groups with the PBI-N–H-groups.
(h) Cl− conductivities before and after KOH treatment:
In all cases, the conductivity declined with KOH storage except for the PBIOO-based AEBMs (2175,2176 and 2190A), where the Cl− conductivity was higher after 10 days of KOH storage. Particularlyfor 2175 and 2176, the conductivity rise after KOH treatment was significant. The reason for thisis unclear, but it can be speculated that these membranes might contain residual KOH physicallybound to the PBI blend component by electrostatic interaction (see (b)) which was not completelywashed out during the membrane rinsing after the KOH test. Another possible explanation is thepossible rearrangement of the microstructure of the membranes during the 10 days KOH treatment.To further investigate this phenomenon, the impedance of some of the membranes were measured
77

Membranes 2017, 7, 32
using the Scribner Impedance facility which allows the determination of the Cl− conductivity in avapor state as a function of temperature under constant relative humidity (the amount of relativehumidity chosen was 90%). Moreover, the 2176 membrane was subjected to a 30-day exposure toKOH (1 M). The impedance of this membrane was measured after 20 and 30 days of KOH treatment.The results of the detailed impedance investigations of selected AEBMs are presented in Section 2.1.2.
2179B2177
2176
0
5
10
15
20
25
0 2 4 6 8 10
Cl− /
mS·
cm−1
PEG6000 content / wt %
Figure 5. Dependence of Cl− conductivity on the PEG 500 content (measured at room temperature in 1M NaCl solution) for AEBMs composed of PVBCl, TMIm, PBIOO and sPPSU.
0.1
1.0
10.0
100.040 45 50 55 60 65 70 75
Cl− /
mS·
cm−1
AEM content / wt %
Cl- conductivityCl- conductivity (after KOH)
Figure 6. Dependence of Cl− conductivity on the anion-exchange polymer content (measured at roomtemperature in 1 M NaCl solution) for AEBMs composed of PVBCl, TMIm, PBIOO and sPPSU.
2.1.2. Membrane Conductivities of the AEBMs as a function of Temperature
A selection of membranes were investigated in terms of Cl− conductivity as a function oftemperature using the Scribner Membrane Test System (Southern Pines, NC, USA) at a relativehumidity of 90% and a temperature range of 30–90 ◦C. The following comparisons were done:
• Membranes with the same calculated IECs (IECcalc = 2.3 meq/g), but with or without PEGs(NF-AEBM 2179B without PEG, and 2176 with PEG, see Figure 7).
• Membranes with different calculated IECs, but the same PBI:PEG molar ratios (NF-AEBMs 2176and 2190A, see Figure 8).
• Membranes with the same composition, but different PEG molecular weights (NF-AEBM 2175with PEG500, and NF-AEBM 2176 with PEG6000, see Figure 9)
• Conductivities of selected NF-AEBMs and two F-AEBMs before and after KOH treatment (2176(Figure 10a), 2190A (Figure 10b), 2177 (Figure 10c), 2179B (Figure 10d), 2258 (Figure 10e) and 2259(Figure 10f)).
78

Membranes 2017, 7, 32
• Conductivities of NF-AEBMs in comparison with F-AEBMs (membranes 2264/2246, 2261/2258and 2262/2259 with the calculated IECscalc 2.0, 2.3 and 2.6, respectively, where the IEC variationwas obtained by varying the TMIm-quaternized PVBCl content in the blend (Figure 11).
Figure 7 shows that the conductivity was roughly doubled from the membrane without PEG(2179B) to that containing 7.8% PEG (2176) reaching conductivity values of nearly 80 mS·cm−1 at 90 ◦C.
In Figure 8, the strong influence of the IEC on the conductivity is demonstrated. With an IECcalcincrease of 0.3 meq/g at 30 ◦C, the Cl− conductivity was more than doubled. Moreover, due to thehigher water uptake of the 2176 membrane (because of its higher IEC), the conductivity increase withtemperature was much more pronounced compared to that of the 2190A membrane.
Figure 9 presents the Cl− conductivity vs. T curves of the two membranes 2175 and 2176 withthe same composition, but containing PEGs with different molecular weights (2175: PEG 500, 2176:PEG 6000). In Figure 9, it is clear that the molecular weight of the PEG does not have an impact onthe conductivity.
In Figure 10, the Cl− conductivity vs. T curves of several of the investigated membranes arecompared before and after 10 days of KOH treatment. In the case of the 2176 membrane, the plot wasobtained after 30 days of KOH treatment.
020406080
100
30 40 50 60 70 80 90
Cl-/
mS
cm-1
T / °C
21762179В
Figure 7. Cl− conductivities of AEBMs with the same calculated IEC, but without PEG (2179B) andwith PEG (2176) in dependence of temperature @r.h. of 90% (used PEG: PEG 6000).
0
20
40
60
80
100
30 40 50 60 70 80 90
Cl−/mS·cm
−1
T/°C
2176
2190A
Figure 8. Cl− conductivities of AEBMs with different calculated IEC, but same molar ratio betweenPBI and PEG component in dependence of temperature @r.h. of 90% (used PEG: PEG 6000; calculatedIEC of 2176: 2.3 meq OH−/g, and calculated IEC of 2190A: 2.0 meq OH−/g).
79

Membranes 2017, 7, 32
10
30
50
70
90
30 40 50 60 70 80 90
Cl−/mS·cm
−1
T/°C
21752176
Figure 9. Cl− conductivity vs. T curves of two membranes, 2175 and 2176, with the same composition,but PEGs with different molecular weights (2175: PEG 500, 2176: PEG 6000).
(a)
(b)
(c)
(d)
0
20
40
60
80
100
30 50 70 90
Cl−/mS·cm
−1
T/ C
2176_before KOH2176_KOH_30d
0
10
20
30
40
50
30 50 70 90
Cl−/mS·cm
−1
T/°C
2190A2190A_afterKOH
0
5
10
15
20
25
30
30 50 70 90
Cl−/mS·cm
−1
T/°C
21772177_afterKOH
05
10152025303540
30 50 70 90
Cl−/mS·cm
−1
T/°C
2179В
2179B_afterKOH
Figure 10. Cont.
80

Membranes 2017, 7, 32
(e)
(f)
0
10
20
30
40
50
60
30 50 70 90
Cl−/mS·cm
−1
T/°C
2258
2258_after KOH
0
20
40
60
80
100
30 50 70 90
Cl−/mS·cm
−1
T/°C
2259
2259_after KOH
Figure 10. Comparison of Cl− conductivities of several PBIOO-based AEBMs before and after 10days of KOH treatment (2176: after 30 d KOH treatment) as a function of temperature @90% r.h.: (a)membrane 2176; (b) membrane 2190A; (c) membrane 2177; (d) membrane 2179B; (e) membrane 2258;and (f) membrane 2259.
The fact that the 2176 membrane lost only 14% of Cl− conductivity after a 30 days KOH treatment(Figure 10a) confirms the excellent alkaline stability of this membrane, which is among the bestalkaline stability values reported for anion-exchange membranes to date. When comparing thebefore/after KOH conductivity results of the 2190A membrane, which comprises a lower calculated(and experimental) IEC than 2176, it is clear (Figure 10b) that this membrane possessed a higherconductivity after 10 days, which was even more pronounced at higher temperatures. This behaviorcannot currently be satisfactorily explained, but it could be that low-molecular hydrophilic residues inthe membrane, which had not been washed out completely from the membrane during the washingprocedure after KOH immersion (particularly KOH which is able to deprotonate the N–H group ofthe PBI blend compound forming a salt pair Im-N−K+), might also have contributed to the observedincreased conductivity. A similar increase of conductivity with KOH treatment time has been reportedfor another type of PEG-containing AEM [45].
In contrast, 2177 (with roughly half the PEG content of 2176 (Figure 10c)), and 2179B (withoutPEG (Figure 10d)) showed lower Cl− conductivities after 10 days of KOH treatment. This behavior is astrong indication that the PEG blend component stabilizes the membrane in an alkaline environment,with this effect increasing with increasing PEG content. However, the origin of this behavioris, as already stated, still unclear and requires a more in-depth investigation in ongoing studies.When comparing the two partially fluorinated AEBMs 2258 (Figure 10e) and 2259 (Figure 10f), it isclear that the membrane possessing the higher anion-exchange polymer content (2259) is more stable inKOH than that having the lower anion-exchange polymer content (2258) as would have been expected.
Figure 11 compares the conductivities of NF- and F-four-component AEBMs for the threecalculated IECs of 2.0, 2.3, and 2.6 meq OH−/g. It is clear that, for all three different anion-exchangepolymer contents, the nonfluorinated AEBMs had higher conductivities than the partially fluorinatedAEBMs. This can be ascribed to the higher hydrophobicity of the F-AEBMs leading to lower wateruptake values causing lower Cl− conductivities in comparison to the nonfluorinated AEBMs.
81

Membranes 2017, 7, 32
0
20
40
60
80
100
120
140
30 40 50 60 70 80 90
Cl−/mS·cm
−1
T/°C
2262 (IEC(calc)=2.6, nonfluorinated)2259 (IEC(calc)=2.6, partially fluorinated)2261 (IEC(calc)=2.3, nonfluorinated)2246 (IEC(calc)=2.0, partially fluorinated)2264 (IEC(calc)=2.0, nonfluorinated)2258(IEC(calc)=2.3, partially fluorinated)
Figure 11. Cl− conductivities of nonfluorinated and partially fluorinated AEBMs.
2.1.3. Thermal Stability of the AEBMs
A high thermal stability is an important prerequisite for the application of ionomer membranes tothose electrochemical applications with working temperatures above room temperature such as fuelcells and electrolysers which should be operated in the T range > 60–80 ◦C to benefit from improvedelectrode kinetics at elevated temperatures. The thermal stability of the AEBMs was determined usingthermogravimetry (TGA). Of particular interest was whether the shapes of the TGA traces were alteredafter KOH treatment, indicating membrane degradation.
In Figure 12, the TGA traces of membranes 2176, 2177 and 2179B with similar calculated IECvalues, but different PEG contents (see Figure 5), are depicted. It is clear that all displayed membranespossess high and comparable thermal stabilities.
40
50
60
70
80
90
100
100 150 200 250 300 350 400 450 500
Mas
s / %
T/°C
217621772179B
Figure 12. TGA traces of membranes 2176, 2177 and 2179B (different PEG 6000 content).
To further elucidate the TGA traces, coupling of the TGA with other spectroscopical techniquescan be used. In our group, TGA-FTIR coupling experiments were done to identify the thermal
82

Membranes 2017, 7, 32
degradation processes during heating of the membranes in the TGA measurement cell [47]. This willbe exemplified with the example of membrane 2176 and its blend components.
In Figure 13, the TGA traces of the 2176 and its blend components are depicted. It can be seenthat the blend membrane is more stable than the least stable of the blend components, PEG-diepoxide,which reflects the high chemical reactivity of the epoxide group and the relatively low thermal stabilityof the poly(ethylene glycol) macromolecular chains. This obviously also indicates the high thermalstability of the blend membrane. The shape of the TMIm TGA trace is similar to a vapor evaporationcurve, which means that the TMIm is probably not thermally decomposed during the TGA experiment.This finding was confirmed by the TGA-FTIR coupling experiment where the series spectra showedthe signature FTIR spectrum of TMIm.
[1.3] MJK2176
[2.3] PEGDE 6000
[3.3] PVBCI
[4.4] sPPSU (SAC98)
[5.3] Tetramethylimidazole
[6.3] PBIOO
Figure 13. TGA traces of 2176 and its blend components.
Figure 14 shows the Gram–Schmidt traces of the 2176 and its blend components, again confirmingthat the PEG has the lowest thermal stability among the blend components. In Figure 14, the largepeak after roughly 8 min of FTIR running time is the CO2 marker signal which allows the assignmentof temperatures to the passed time of the TGA-FTIR experiment, or, in other words, the assignmentof the temperature to each FTIR spectrum of the gaseous degradation products. The low thermalstability of the PEG-diepoxide blend compound can be confirmed by its Gram–Schmidt trace, i.e.,the large peak between 20 and 32 min. This large degradation peak has only a weak echo in the2176 membrane, showing a slight raise in the 20–32 min. range. It seems that the thermal stability ofthe PEG blend component was increased by the proposed cross-linking reaction between the epoxideend groups and the imidazole N–H groups of the PBIOO blend component. The high thermal stabilityof the cross-linked AEBM can be explained not only by the covalent cross-linking reaction between thePEG-epoxide and the PBIOO–N–H, but also by ionic cross-linking between the sPPSU and the basicblend components, the TMIm-quaternized PVBCl and the PBIOO. Figure 15 depicts a more detailedGram–Schmidt trace of 2176, where the correlation between temperature and FTIR running time isrepresented. In Figure 15 the large peak after roughly 8 min of FTIR running time is again the CO2
marker signal.
83

Membranes 2017, 7, 32
Figure 14. Gram–Schmidt traces of 2176 and its blend components.
Figure 15. Gram–Schmidt trace of 2176 as intensity vs. FTIR running time and temperature.
84

Membranes 2017, 7, 32
The next step of the analysis of the TGA-FTIR coupling results is the assignment of TGA tracesteps and Gram–Schmidt trace peaks to the FTIR spectra behind them. In Figure 16, the FTIR spectraof the TGA-FTIR experiments of 2176 assigned to T = 37, 267, 430, and 450 ◦C are presented. The firstFTIR spectrum in Figure 16 displays the CO2 band (2250–2400 cm−1) from the CO2 marker signalinjected into the TGA cell. At T = 267 ◦C, the following bands were found:
• water evaporating from the membrane(4000 to 3400 cm−1)• onset of CO2 development indicating the beginning degradation of the blend membrane,
probably originating from the PEG blend component (the TGA-FTIR coupling experiment of purePEG-diepoxide also showed an onset of CO2 formation in the same temperature range).
Figure 16. FTIR spectra of the TGA-FTIR experiment of 2176 assigned to T = 37, 267, 430, and 450 ◦C.
The FTIR spectrum of the TGA decomposition products at 430 ◦C indicates an ongoingdegradation of the AEBM confirmed by CO2 and CO development (CO band from 2000 to 2300 cm−1).Moreover, at this temperature, a SO2 band (1300–1400 cm−1) appeared, indicating the onset of thesplitting-off of the sulfonate groups of the sulfonated PPSU blend component [48]. In addition, a broadband appears between 2800 and 3000 cm−1, which can be assigned to the TMIm being split off fromthe quaternized anion-exchange polymer blend component. Water vapor is also observed, probablyoriginating from the thermal decomposition of the AEBM (keeping in mind that the TGA experimentswere performed under an oxygen-enriched air which facilitates the thermal oxidation of the organicconstituents of the AEBM finally leading to CO2/CO and H2O formation). The bands between 1700 and1800 cm−1 and between 1100 and 1200 cm−1 observed at this temperature probably originated fromthe decomposition of the PEG blend component as had been observed for the pure PEG-diepoxide.
The FTIR spectrum of 2176 at 450 ◦C (where the maximum intensity of the Gram–Schmidt tracewas observed) confirms the ongoing degradation of the AEBM. In Figure 17, the weight gain vs. TGArunning time (Figure 17a) and weight gain vs. temperature (Figure 17b) TGA traces are presentedwhere the onset of CO2 formation, the onset of SO2 formation, and the maximum of the Gram–Schmidttrace are highlighted.
85

Membranes 2017, 7, 32
Figure 17. Weight gain vs. TGA running time (a) and weight gain vs. temperature (b) TGA traces withhighlighted points.
The first step of the TGA trace (from room temperature to 200 ◦C) was due to water vaporevaporation from the water-swollen membrane, as confirmed by the FTIR spectra in this temperaturerange. Interestingly enough, CO2 development was only observed at the beginning of the second stage(from 260 to 430 ◦C) of the TG vs. T TGA trace. While the second step of the TGA trace was mainlycaused by the degradation of the PEG blend component, the weight loss within this step was higherthan the PEG content of the membrane (PEG content of 2176 was 7.8%, while the weight loss duringthe second step was 13.5%). This implies that not only the PEG was degraded during the second step,but also other constituents of the membrane which contributed to the formation of CO2 and CO.
At the end of the second stage at 430 ◦C, the onset of both SO2 and TMIm was observed, indicatingthe onset of the splitting-off of ionically-cross-linking anion-exchange and cation-exchange groupswhich intensified during the third step of the TGA trace. At 450 ◦C, the maximum intensity of theGram–Schmidt trace was observed for 2176. The complex FTIR spectrum at this temperature indicatesthe simultaneous existence of different thermal degradation processes of both the functional groups andpolymer backbones of the blend components. Since the alkaline stability of anion-exchange membranesis an important prerequisite for their application in alkaline fuel cells, the comparison of the TGAtraces and the TGA-FTIR coupling experiment results is of interest, as the chemical degradation of theAEBMs by the KOH treatment would result in a change of the shape of both the TGA traces and theTGA-FTIR coupling results, where an OH attack might lead to partial splitting-off of anion-exchangegroups and possibly also to partial degradation of the polymer backbone of the blend components.In Figure 18a,b, the TGA traces and the Gram–Schmidt traces of 2176 before and after 30 days of KOHtreatment are presented.
Figure 18 shows only small differences in both TGA and Gram–Schmidt traces in the T rangeup to 420–430 ◦C, which implies that the structure of 2176 basically remained intact during the KOHtreatment. This is also supported by the conductivity results obtained with 2176, which decreased byonly 14%.
The conductivity results of the AEBMs suggest that the chemical stability of the AEBMs againstKOH-induced degradation of the anion-exchange groups increased with increasing anion-exchangepolymer content (see Figure 5), which should also reflect in the TGA traces. As an example, the TGAtraces of 2262 (calculated IEC = 2.6 meq/g) and 2279 (calculated IEC = 1.4 meq/g) before and afterKOH treatment are presented in Figure 19.
From the TGA traces of 2262, it can be seen that the height of the third step of the TGA tracesbetween 420 and 460 ◦C, where the largest part of the anion-exchange groups was split off (see the
86

Membranes 2017, 7, 32
analysis of the TGA-FTIR results of 2176), was nearly the same before and after KOH treatment,confirming the significant alkaline stability that had been discussed in Table 1 (conductivity resultsof 2262). In the case of 2279, the third stage of degradation is much less pronounced after KOHtreatment than before, indicating a substantial degradation of anion-exchange groups during the KOHimmersion time. This was again confirmed by the 90% conductivity decrease of conductivity by theKOH treatment.
Figure 18. TGA traces (a) and Gram–Schmidt traces (b) of the 2176 before and after 30 days ofKOH treatment.
40
50
60
70
80
90
100
50 150 250 350 450 550
Mass/%
T/°C
2279/%
2279_KOH/%
40
50
60
70
80
90
100
50 150 250 350 450 550
Mass/%
T/°C
2262/%
2262_KOH/%
Figure 19. TGA traces of the AEBMs 2262 and 2279 before and after KOH treatment (10 days).
Subsequently, the influence of the molecular weight of the applied PEG-diepoxide on the thermalstability of the AEBMs was determined. In Figure 20, the TGA traces of 2175 (containing PEG500) and2176 (containing PEG6000) are presented. It is clear that the molecular weight of the applied PEG didnot influence the thermal stability.
Finally, the TGAs of nonfluorinated and partially fluorinated AEBMs was compared using thenonfluorinated 2261 and the partially fluorinated 2258 (Figure 21). One can see that the thermalstability of both membranes was comparable. This implies that it is not necessarily advantageous toprepare partially fluorinated anion-exchange membranes, which has the further disadvantage that
87

Membranes 2017, 7, 32
C–F bonds are not very stable in an alkaline environment as F can be split off by an OH− ion attack inboth aliphatic and aromatic C–F bonds [48,49]
40
50
60
70
80
90
100
100 150 200 250 300 350 400 450 500
Mass/%
T/°C
2175/%2176/%
Figure 20. TGA traces of membranes 2175 and 2176 (different PEG molecular weight).
40
60
80
100
50 150 250 350 450 550
Mass/%
T/°C
2258/%2261/%
onset of SO2
onset of SO2development
Figure 21. TGA traces of 2258 (partially fluorinated) and 2261 (nonfluorinated).
3. Materials and Methods
3.1. Materials
The solvents (DMAc and DMSO) were used as received. The sulfonated polymer (SPPSU098) wassynthesized as described earlier [50]. PBIOO was purchased from Fuma-Tech (Bietigheim-Bissingen,Germany). N-methylmorpholine (NMM) and 1,2,4,5-tetramethylimidazole (TMIm) were purchasedfrom TCI Chemicals, and 1,2,2,6,6-pentamethylpiperidine (pempidine, PMP) from ManchesterOrganics. PEG-diglycidyl ether (Mn = 500 Da, product No. 475696, and Mn = 6000 Da, productNo. 731803, respectively) were obtained from Sigma-Aldrich Germany (Munich, Germany).Poly(vinylbenzyl chloride) (PVBCl), 60/40 mixture of 3- and 4- isomers, was purchased fromSigma-Aldrich, product number 182532. Following the information provided by Sigma-Aldrich,the average molecular weight of PVBCl was: average Mn ≈ 55,000 Da, average Mw ≈ 100,000 Da(determined by GPC/MALLS according to the Sigma-Aldrich website).
88
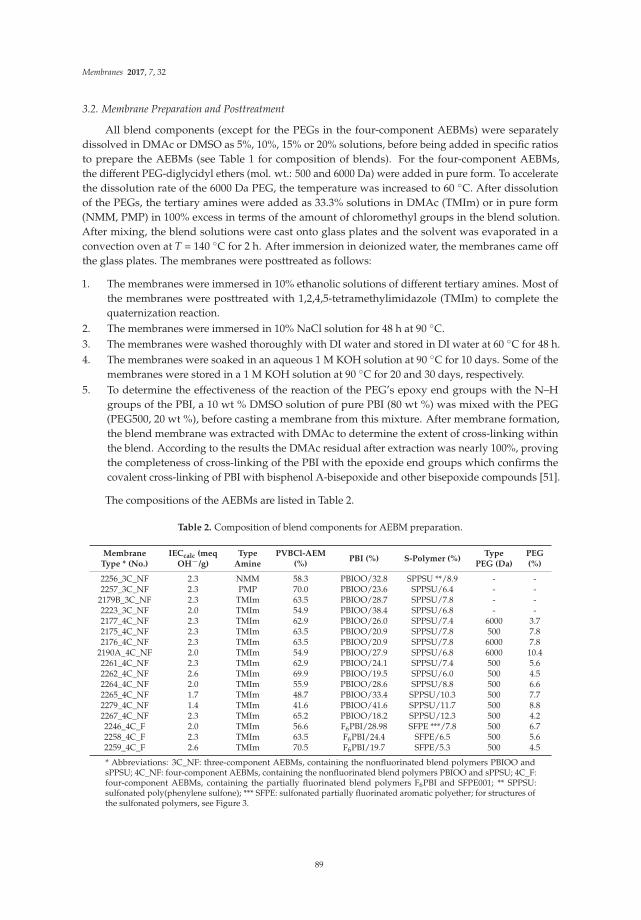
Membranes 2017, 7, 32
3.2. Membrane Preparation and Posttreatment
All blend components (except for the PEGs in the four-component AEBMs) were separatelydissolved in DMAc or DMSO as 5%, 10%, 15% or 20% solutions, before being added in specific ratiosto prepare the AEBMs (see Table 1 for composition of blends). For the four-component AEBMs,the different PEG-diglycidyl ethers (mol. wt.: 500 and 6000 Da) were added in pure form. To acceleratethe dissolution rate of the 6000 Da PEG, the temperature was increased to 60 ◦C. After dissolutionof the PEGs, the tertiary amines were added as 33.3% solutions in DMAc (TMIm) or in pure form(NMM, PMP) in 100% excess in terms of the amount of chloromethyl groups in the blend solution.After mixing, the blend solutions were cast onto glass plates and the solvent was evaporated in aconvection oven at T = 140 ◦C for 2 h. After immersion in deionized water, the membranes came offthe glass plates. The membranes were posttreated as follows:
1. The membranes were immersed in 10% ethanolic solutions of different tertiary amines. Most ofthe membranes were posttreated with 1,2,4,5-tetramethylimidazole (TMIm) to complete thequaternization reaction.
2. The membranes were immersed in 10% NaCl solution for 48 h at 90 ◦C.3. The membranes were washed thoroughly with DI water and stored in DI water at 60 ◦C for 48 h.4. The membranes were soaked in an aqueous 1 M KOH solution at 90 ◦C for 10 days. Some of the
membranes were stored in a 1 M KOH solution at 90 ◦C for 20 and 30 days, respectively.5. To determine the effectiveness of the reaction of the PEG’s epoxy end groups with the N–H
groups of the PBI, a 10 wt % DMSO solution of pure PBI (80 wt %) was mixed with the PEG(PEG500, 20 wt %), before casting a membrane from this mixture. After membrane formation,the blend membrane was extracted with DMAc to determine the extent of cross-linking withinthe blend. According to the results the DMAc residual after extraction was nearly 100%, provingthe completeness of cross-linking of the PBI with the epoxide end groups which confirms thecovalent cross-linking of PBI with bisphenol A-bisepoxide and other bisepoxide compounds [51].
The compositions of the AEBMs are listed in Table 2.
Table 2. Composition of blend components for AEBM preparation.
MembraneType * (No.)
IECcalc (meqOH−/g)
TypeAmine
PVBCl-AEM(%)
PBI (%) S-Polymer (%)Type
PEG (Da)PEG(%)
2256_3C_NF 2.3 NMM 58.3 PBIOO/32.8 SPPSU **/8.9 - -2257_3C_NF 2.3 PMP 70.0 PBIOO/23.6 SPPSU/6.4 - -
2179B_3C_NF 2.3 TMIm 63.5 PBIOO/28.7 SPPSU/7.8 - -2223_3C_NF 2.0 TMIm 54.9 PBIOO/38.4 SPPSU/6.8 - -2177_4C_NF 2.3 TMIm 62.9 PBIOO/26.0 SPPSU/7.4 6000 3.72175_4C_NF 2.3 TMIm 63.5 PBIOO/20.9 SPPSU/7.8 500 7.82176_4C_NF 2.3 TMIm 63.5 PBIOO/20.9 SPPSU/7.8 6000 7.8
2190A_4C_NF 2.0 TMIm 54.9 PBIOO/27.9 SPPSU/6.8 6000 10.42261_4C_NF 2.3 TMIm 62.9 PBIOO/24.1 SPPSU/7.4 500 5.62262_4C_NF 2.6 TMIm 69.9 PBIOO/19.5 SPPSU/6.0 500 4.52264_4C_NF 2.0 TMIm 55.9 PBIOO/28.6 SPPSU/8.8 500 6.62265_4C_NF 1.7 TMIm 48.7 PBIOO/33.4 SPPSU/10.3 500 7.72279_4C_NF 1.4 TMIm 41.6 PBIOO/41.6 SPPSU/11.7 500 8.82267_4C_NF 2.3 TMIm 65.2 PBIOO/18.2 SPPSU/12.3 500 4.22246_4C_F 2.0 TMIm 56.6 F6PBI/28.98 SFPE ***/7.8 500 6.72258_4C_F 2.3 TMIm 63.5 F6PBI/24.4 SFPE/6.5 500 5.62259_4C_F 2.6 TMIm 70.5 F6PBI/19.7 SFPE/5.3 500 4.5
* Abbreviations: 3C_NF: three-component AEBMs, containing the nonfluorinated blend polymers PBIOO andsPPSU; 4C_NF: four-component AEBMs, containing the nonfluorinated blend polymers PBIOO and sPPSU; 4C_F:four-component AEBMs, containing the partially fluorinated blend polymers F6PBI and SFPE001; ** SPPSU:sulfonated poly(phenylene sulfone); *** SFPE: sulfonated partially fluorinated aromatic polyether; for structures ofthe sulfonated polymers, see Figure 3.
89

Membranes 2017, 7, 32
3.3. Membrane Characterization
3.3.1. Ion-Exchange Capacity (IEC)
The IEC was determined as described in a recent paper of our group [38].
3.3.2. Ionic Conductivity
The ionic Cl− conductivity of the membranes was determined via impedance spectroscopy(EIS). For the measurement, two different setups were used: for series impedance measurementsan in-plane self-constructed impedance cell was used which allowed EIS measurements in a liquidstate (1 N NaCl) at room temperature (25 ◦C). The cell was connected to a Zahner elektrik IM6impedance spectrometer (Kronach, Germany). The impedances of the membranes were investigatedin a frequency range of 200 Hz–8 MHz (amplitude: 5 mV). Details of the measurement are describedin [38]. The ohmic resistance obtained from EIS measurement was converted into conductivity usingthe following equation:
σ =1
Rsp=
dR × A
(1)
where, σ: Conductivity, mS·cm−1; Rsp: resistivity, Ω·cm; d: thickness of the membrane, cm; R: ohmicresistance, Ω; A: electrode area, cm2.
The second impedance setup used for selected membranes was a Membrane Test System(MTS 740, Scribner Associates Inc., Southern Pines, NC, USA), which allows through-plane impedancemeasurements in a vapour phase as a function of temperature and relative humidity independentlyfrom each other, connected to a Solartron 1260 impedance analyser. Details of the measurements aredescribed in a previous paper [40].
3.3.3. Gel Content
The gel content of the membranes, which is a measure for the extent of cross-linking within theAEBMs, was determined by extraction with 90 ◦C hot DMAc, as described in [40].
3.3.4. Water Uptake
The water uptake of the membranes was determined by immersion in water at the respectivetemperature until equilibration had been reached, as described in [40].
3.3.5. Thermal Stability
Characterization of the thermal stability of the membranes in the chloride form was performedby thermogravimetry (TGA, Netzsch, model STA 499C, Netzsch, Selb, Germany) at a heating rate of20 ◦C·min−1 under O2-enriched O2/N2 atmosphere (65%–70% O2) which was coupled with a FTIR forFTIR analysis of the gaseous thermal degradation products.
3.3.6. Alkaline Stability
Due to the application of AEMs in electrochemical systems such as alkaline membrane fuel cellsor alkaline membrane electrolysis where the AEMs are in the hydroxide form, the stability in stronglyalkaline environments is the most important prerequisite for determining their suitability for theseprocesses. Consequently, the stability of the AEBMs was investigated under harsh conditions, i.e.,in 1 M KOH at a temperature of 90 ◦C for 10 days, or even in one case (membrane 2176) for up to 30days. Membranes were characterized before and after the stability tests using Cl− conductivity, IECand thermal stability.
90

Membranes 2017, 7, 32
4. Conclusions
In this study, novel AEBMs based on poly(vinylbenzyl chloride) quaternized with differenttertiary basic N compounds, PBIOO or F6PBI as the stabilizing matrix polymer and a sulfonatedpoly(ethersulfone) or a partially fluorinated sulfonated aromatic polyether as ionic macromolecularcross-linker were synthesized and characterized. Epoxide-end-functionalized poly(ethylene glycol)swere introduced into the AEBMs as an additional hydrophilic microphase, leading to a significantincrease in the chloride conductivity of the AEBMs. In addition, the introduction of the PEG also ledto a marked improvement of the stability of the AEBMs in an alkaline environment. It seems thatthe presence of the PEG led to a microphase-separation of the AEBMs, which, with high probability,facilitated the clustering of the anion-exchange groups within the AEBM microstructure therebycontributing to the observed conductivity increase of the PEG-containing AEBMs. The thermal stabilityof the novel AEBMs was excellent. The favorable properties determined for the novel AEBMs makethem promising candidates for several electrochemical applications such as redox-flow batteries,alkaline membrane fuel cells and alkaline membrane electrolysers.
Author Contributions: Jochen A. Kerres conceived and designed the experiments. Jochen A. Kerres performedthe experiments. Jochen A. Kerres and Henning M. Krieg analysed the data. Jochen A. Kerres and Henning M.Krieg wrote the paper.
Conflicts of Interest: The authors declare no conflict of interest.
References
1. Piana, M.; Boccia, M.; Filpi, A.; Flammia, E.; Miller, H.A.; Orsini, M.; Salusti, F.; Santiccioli, S.; Ciardelli, F.;Pucci, A. H2/air alkaline membrane fuel cell performance and durability, using novel ionomer andnon-platinum group metal cathode catalyst. J. Power Sources 2010, 195, 5875–5881. [CrossRef]
2. Marini, S.; Salvi, P.; Nelli, P.; Pesenti, R.; Villa, M.; Berrettoni, M.; Zangari, G.; Kiros, Y. Advanced alkalinewater electrolysis. Electrochim. Acta 2012, 82, 384–391. [CrossRef]
3. Schwenzer, B.; Zhang, J.; Kim, S.; Li, L.; Yang, Z. Membrane Development for Vanadium Redox FlowBatteries. ChemSusChem 2011, 4, 1388–1406. [CrossRef] [PubMed]
4. Logan, B.E.; Elimelech, M. Membrane-based processes for sustainable power generation using water. Nature2012, 488, 313–319. [CrossRef] [PubMed]
5. Leong, J.X.; Daud, W.R.W.; Ghasemi, M.; Liew, K.B.; Ismail, M. Ion exchange membranes as separators inmicrobial fuel cells for bioenergy conversion: A comprehensive review Renew. Sustain. Energy Rev. 2013, 28,575–587. [CrossRef]
6. Gellett, W.; Schumacher, J.; Kesmez, M.; Le, D.; Minteer, S.D. High Current Density Air-Breathing LaccaseBiocathode. J. Electrochem. Soc. 2010, 157, B557–B562. [CrossRef]
7. Sandeaux, J.; Sandeaux, R.; Gavach, C. Competition between the electrotransports of acetate and chlorideions through a polymeric anion-exchange membrane. J. Memb. Sci. 1991, 59, 265–276. [CrossRef]
8. Kliber, S.; Wisniewski, J.A. Removal of bromate and associated anions from water by Donnan dialysis withanion-exchange membrane. Desal. Water Treatm. 2011, 35, 158–163. [CrossRef]
9. Emmanuel, K.; Cheng, C.; Erigene, B.; Mondal, A.N.; Hossain, M.M.; Khan, M.I.; Afsar, N.U.; Liang, G.;Wu, L.; Xu, T. Imidazolium functionalized anion exchange membrane blended with PVA for acid recoveryvia diffusion dialysis process. J. Memb. Sci. 2016, 497, 209–215. [CrossRef]
10. Varcoe, J.R.; Atanassov, P.; Dekel, D.R.; Herring, A.M.; Hickner, M.A.; Kohl, P.A.; Kucernak, A.R.;Mustain, W.E.; Nijmeijer, K.; Scott, K.; Xu, T.; Zhuang, L. Anion-exchange membranes in electrochemicalenergy systems. Energy Environ. Sci. 2014, 7, 3135–3191. [CrossRef]
11. Slade, R.C.T.; Varcoe, J.R. Prospects for alkaline anion-exchange membranes in low temperature fuel cells.Fuel Cells 2005, 5, 187–200.
12. Nunez, S.A.; Hickner, M.A. Quantitative H-1NMR Analysis of Chemical Stabilities in Anion-ExchangeMembranes. ACS Macro Lett. 2013, 2, 49–52. [CrossRef]
13. Fuson, R.C.; McKeever, C.H. Chloromethylation of Aromatic Compounds. In Organic Reactions;John Wiley & Sons: Hoboken, NJ, USA, 1942; pp. 63–90.
91

Membranes 2017, 7, 32
14. Zschocke, P.; Quellmalz, D. Novel ion-exchange membranes based on an aromatic polyethersulfone.J. Memb. Sci. 1985, 22, 325–332. [CrossRef]
15. Wohl, A. Brominised unsaturated compounds with N-bromo-acetamide, a report on the knowledge of theprogression of chemical processes. Ber. Dt. Chem. Ges. 1919, 52, 51–63. [CrossRef]
16. Liska, J.; Borsig, E.; Tkac, I. A route to preparation of bromomethylated poly(2,6-dimethyl-1,4-phenyleneoxide). Macromol. Mat. Eng. 1993, 211, 121–129.
17. Zhao, C.H.; Gong, Y.; Liu, Q.L.; Zhang, Q.G.; Zhu, A.M. Self-crosslinked anion exchange membranes bybromination of benzylmethyl-containing poly(sulfone)s for direct methanol fuel cells. Int. J. Hydrogen Energy2012, 37, 11383–11393. [CrossRef]
18. Sata, T.; Yamane, Y.; Matsusaki, K. Preparation and properties of anion exchange membranes havingpyridinium or pyridinium derivatives as anion exchange groups. J. Polym. Chem. Part A Polym. Chem. 1998,36, 49–58. [CrossRef]
19. Wang, J.; Li, S.; Zhang, S. Novel Hydroxide-Conducting Polyelectrolyte Composed of an Poly(aryleneether sulfone) Containing Pendant Quaternary Guanidinium Groups for Alkaline Fuel Cell Applications.Macromolecules 2010, 43, 3890–3896. [CrossRef]
20. Zhang, F.; Zhang, H.; Qu, C. Imidazolium functionalized polysulfone anion exchange membrane for fuel cellapplication. J. Mater. Chem. 2011, 21, 12744–12752. [CrossRef]
21. Rebeck, N.T.; Li, Y.; Knauss, D.M. Poly(phenylene oxide) Copolymer Anion Exchange Membranes. J. Polym.Sci. Part B Polym. Phys. 2013, 51, 1770–1778. [CrossRef]
22. Hibbs, M.R.; Hickner, M.A.; Alam, T.M.; McIntyre, S.K.; Fujimoto, C.H.; Cornelius, C.J. Transport propertiesof hydroxide and proton conducting membranes. Chem. Mater. 2008, 20, 2566–2573. [CrossRef]
23. Poynton, S.D.; Varcoe, J.R. Reduction of the monomer quantities required for the preparation ofradiation-grafted alkaline anion-exchange membranes. Solid State Ion. 2015, 277, 38–43. [CrossRef]
24. Dang, H.S.; Jannasch, P. Exploring Different Cationic Alkyl Side Chain Designs for Enhanced AlkalineStability and Hydroxide Ion Conductivity of Anion-Exchange Membranes. Macromolecules 2015, 48,5742–5751. [CrossRef]
25. Zhu, L.; Pan, Y.; Wang, Y.; Han, J.; Zhuang, L.; Hickner, M.A. Multication Side Chain Anion ExchangeMembranes. Macromolecules 2016, 49, 815–824. [CrossRef]
26. Thomas, O.D.; Soo, K.J.W.Y.; Peckham, T.J.; Kulkarni, M.P.; Holdcroft, S. A Stable Hydroxide-ConductingPolymer. J. Am. Chem. Soc. 2012, 134, 10753–10756. [CrossRef] [PubMed]
27. Wright, A.G.; Holdcroft, S. Hydroxide-Stable Ionenes. ACS Macro Lett. 2014, 3, 444–447. [CrossRef]28. Liu, Y.; Wang, J.; Yang, Y.; Brenner, T.M.; Seifert, S.; Yan, Y.; Liberatore, M.W.; Herring, A.M. Anion Transport
in a Chemically Stable, Sterically Bulky α-C Modified Imidazolium Functionalized Anion ExchangeMembrane. J. Phys. Chem. C 2014, 118, 15136–15145. [CrossRef]
29. Lin, X.; Varcoe, J.R.; Poynton, S.D.; Liang, X.; Ong, A.L.; Ran, J.; Li, Y.; Xu, T. Alkaline polymer electrolytescontaining pendant dimethylimidazolium groups for alkaline membrane fuel cells. J. Mater. Chem. A 2013, 1,7262–7269. [CrossRef]
30. Kim, D.S.; Labouriau, A.; Guiver, M.D.; Kim, Y.S. Guanidinium-Functionalized Anion Exchange PolymerElectrolytes via Activated Fluorophenyl-Amine Reaction. Chem. Mater. 2011, 23, 3795–3797. [CrossRef]
31. Kim, D.S.; Fujimoto, C.H.; Hibbs, M.R.; Laboriau, A.; Choe, Y.K.; Kim, Y.S. Resonance StabilizedPerfluorinated lonomers for Alkaline Membrane Fuel Cells. Macromolecules 2013, 46, 7826–7833. [CrossRef]
32. Maurya, S.; Shin, S.H.; Kim, M.K.; Yun, S.H.; Moon, S.H. Stability of composite anion exchange membraneswith various functional groups and their performance for energy conversion. J. Memb. Sci. 2013, 443, 28–35.[CrossRef]
33. Zha, Y.; Disabb-Miller, M.L.; Johnson, Z.D.; Hickner, M.A.; Tew, G.N. Metal-Cation-Based Anion ExchangeMembranes. J. Am. Chem. Soc. 2012, 134, 4493–4496. [CrossRef] [PubMed]
34. He, Y.; Wu, L.; Pan, J.; Zhu, Y.; Ge, X.; Yang, Z.; Ran, J.; Xu, T. A mechanically robust anion exchangemembrane with high hydroxide conductivity. J. Memb. Sci. 2016, 504, 47–54. [CrossRef]
35. Cheng, J.; Yang, G.; Zhang, K.; He, G.; Jia, J.; Yu, H.; Gai, F.; Li, L.; Hao, C.; Zhang, F.Guanidimidazole-quaternized and cross-linked alkaline polymer electrolyte membrane for fuel cellapplication. J. Memb. Sci. 2016, 501, 100–108. [CrossRef]
36. Katzfuss, A.; Gogel, V.; Jörissen, L.; Kerres, J. The application of covalently cross-linked BrPPO as AEM inalkaline DMFC. J. Memb. Sci. 2013, 425–426, 131–140. [CrossRef]
92

Membranes 2017, 7, 32
37. Katzfuss, A.; Poynton, S.; Varcoe, J.; Gogel, V.; Storr, U.; Kerres, J. Methylated polybenzimidazole andits application as a blend component in covalently cross-linked anion-exchange membranes for DMFC.J. Memb. Sci. 2014, 465, 129–137. [CrossRef]
38. Morandi, C.G.; Peach, R.; Krieg, H.M.; Kerres, J. Novel morpholinium-functionalized anion-exchangePBI-polymer blends. J. Mater. Chem. A 2015, 3, 1110–1120. [CrossRef]
39. Kerres, J.; Atanasov, V. Cross-linked PBI-based high-temperature membranes: Stability, conductivity andfuel cell performance. Int. J. Hydrogen Energy 2015, 40, 14723–14735. [CrossRef]
40. Morandi, C.G.; Peach, R.; Krieg, H.M.; Kerres, J. Novel imidazolium-functionalized anion-exchange polymerPBI blend membranes. J. Memb. Sci. 2015, 476, 256–263. [CrossRef]
41. Pan, J.; Zhu, L.; Han, J.; Hickner, M.A. Mechanically Tough and Chemically Stable Anion ExchangeMembranes from Rigid-Flexible Semi-Interpenetrating Networks. Chem. Mater. 2015, 27, 6689–6698.[CrossRef]
42. Lu, W.; Shao, Z.-G.; Zhang, G.; Zhao, Y.; Yi, B. Crosslinked poly(vinylbenzyl chloride) with a macromolecularcrosslinker for anion exchange membrane fuel cells. J. Power Sources 2014, 248, 905–914. [CrossRef]
43. Aili, D.; Jankova, K.; Li, Q.; Bjerrum, N.J.; Jensen, J.O. The stability of poly(2,2′-(m-phenylene)-5,5′-bibenzimidazole) membranes in aqueous potassium hydroxide. J. Membr. Sci. 2015, 492, 422–429. [CrossRef]
44. Aili, D.; Jankova, K.; Han, J.; Bjerrum, N.J.; Jensen, J.O.; Li, Q. Understanding ternary poly(potassiumbenzimidazolide)-based polymer electrolytes. Polymer 2016, 84, 304–310. [CrossRef]
45. Yang, C.; Wang, S.; Ma, W.; Zhao, S.; Xu, Z.; Sun, G. Highly stable poly(ethylene glycol)-grafted alkalineanion exchange membranes. J. Mater. Chem. A 2016, 4, 3886–3892. [CrossRef]
46. Ran, J.; Wu, L.; Wei, B.; Chen, Y.; Xu, T. Simultaneous Enhancements of Conductivity and Stability for AnionExchange Membranes (AEMs) through Precise Structure Design. Sci. Rep. 2014, 4, 6486–6490. [CrossRef][PubMed]
47. Kerres, J.; Ullrich, A.; Hein, M.; Gogel, V.; Friedrich, K.A.; Jörissen, L. Cross-Linked Polyaryl BlendMembranes for Polymer Electrolyte Fuel Cells. Fuel Cells 2004, 4, 105–112. [CrossRef]
48. Danks, T.N.; Slade, R.C.T.; Varcoe, J.R. Comparison of PVDF- and FEP-based radiation-grafted alkalineanion-exchange membranes for use in low temperature portable DMFCs. J. Mater. Chem. 2002, 12, 3371–3373.[CrossRef]
49. Zhang, Q.; Zhang, Q.; Wang, J.; Zhang, S.; Li, S. Synthesis and alkaline stability of novel cardo poly(arylether sulfone)s with pendent quaternary ammonium aliphatic side chains for anion exchange membranes.Polymer 2010, 51, 5407–5416. [CrossRef]
50. Chromik, A.; Kerres, J. Degradation studies on acid-base blends for both LT and intermediate T fuel cells.Solid State Ion. 2013, 252, 140–151. [CrossRef]
51. Yang, J.; Xu, Y.; Liu, P.; Gao, L.; Che, Q.; He, R. Epoxides cross-linked hexafluoropropylidenepolybenzimidazole membranes for application as high temperature proton exchange membranes.Electrochim. Acta 2015, 160, 281–287. [CrossRef]
© 2017 by the authors. Licensee MDPI, Basel, Switzerland. This article is an open accessarticle distributed under the terms and conditions of the Creative Commons Attribution(CC BY) license (http://creativecommons.org/licenses/by/4.0/).
93

membranes
Article
Thin Film Nanocomposite Membrane Filled withMetal-Organic Frameworks UiO-66 and MIL-125Nanoparticles for Water Desalination
Mohammed Kadhom 1,2, Weiming Hu 3 and Baolin Deng 1,3,*
1 Department of Chemical Engineering, University of Missouri, Columbia, MO 65211, USA;[email protected]
2 Al-Dour Technical Institute, Northern Technical University, Al-Dour, Saladin, Iraq3 Department of Civil and Environmental Engineering, University of Missouri, Columbia, MO 65211, USA;
[email protected]* Correspondence: [email protected]; Tel.: +1-573-882-0075
Academic Editor: Mohamed KhayetReceived: 10 May 2017; Accepted: 9 June 2017; Published: 14 June 2017
Abstract: Knowing that the world is facing a shortage of fresh water, desalination, in its differentforms including reverse osmosis, represents a practical approach to produce potable water from asaline source. In this report, two kinds of Metal-Organic Frameworks (MOFs) nanoparticles (NPs),UiO-66 (~100 nm) and MIL-125 (~100 nm), were embedded separately into thin-film compositemembranes in different weight ratios, 0%, 0.05%, 0.1%, 0.15%, 0.2%, and 0.3%. The membranes weresynthesized by the interfacial polymerization (IP) of m-phenylenediamine (MPD) in aqueous solutionand trimesoyl chloride (TMC) in an organic phase. The as-prepared membranes were characterizedby scanning electron microscopy (SEM), transmission electron microscopy (TEM), contact anglemeasurement, attenuated total reflection Fourier transform infrared (ATR FT-IR) spectroscopy, andsalt rejection and water flux assessments. Results showed that both UiO-66 and MIL-125 couldimprove the membranes’ performance and the impacts depended on the NPs loading. At theoptimum NPs loadings, 0.15% for UiO-66 and 0.3% for MIL-125, the water flux increased from62.5 L/m2 h to 74.9 and 85.0 L/m2 h, respectively. NaCl rejection was not significantly affected(UiO-66) or slightly improved (MIL-125) by embedding these NPs, always at >98.5% as tested at2000 ppm salt concentration and 300 psi transmembrane pressure. The results from this studydemonstrate that it is promising to apply MOFs NPs to enhance the TFC membrane performancefor desalination.
Keywords: metal-organic framework; thin film nanocomposite membrane; reverse osmosis;desalination; nanoparticles
1. Introduction
Reverse osmosis (RO) is now the most employed method of desalination to convert saline orbrackish water source to freshwater. The process uses a membrane as a selective barrier throughwhich water molecules, but not the salts or organics, pass under pressure [1]. Desalination by variousapproaches, especially RO, represents a solution to address the water shortage problem that hasbecome increasingly serious in the recent decades [2]. Development of RO processes and membraneshas gone through many stages and forms since the first applicable membrane synthesis in the early1960s [3]. The state-of-the-art membrane is the thin film composite (TFC) membrane invented byJohn Cadotte in the early 1980s. The TFC membrane has a polyamide dense layer with a thickness of afew hundred nanometers supported by an ultrafiltration membrane. This polyamide layer is the active
Membranes 2017, 7, 31 94 www.mdpi.com/journal/membranes

Membranes 2017, 7, 31
layer for salt rejection, formed by the interfacial polymerization of the MPD dissolved in water andTMC dissolved in organic solvent [4].
Numerous researches have been devoted to developing and improving the performance of TFCmembranes [5]. One approach is to embed nano-sized materials such as zeolite [6–12], silica [13–18],titanium dioxide [19–22], or carbon nanotubes [23–25] inside the membrane to improve its propertiesand performance. Another way is to select proper materials and control the manufacturing conditionsaffecting the membrane’s efficiency [6,26–29]. In addition, the engineering process could be optimizedto increase the pure water production efficiency and lower the energy cost [30–34].
Metal-Organic Frameworks (MOFs) are a class of materials consisting of an inorganic or metalcore surrounded by an organic linker material [35]. MOFs have very high specific surface area,a high number of adsorption sites, different particle structures, distinct pore size and structure,and can be applied for various purposes [35–39]. These include applications for ion exchange [40],light harvesting [41], sensing [42], catalyst [43], drug delivery [44], gas storage [45,46], andseparation [47,48]. Such a wide range of applications are possible because MOFs can be easily designedtoward desired uses.
MOFs have been widely used for gas separation. Their porous structure can generate exceptionallyhigh pore volume and surface area reaching over 7000 m2/g [49], which is particularly suitablefor gas storage and separation. Beginning with the first MOFs membrane synthesized and usedfor gas separation [50], different forms of MOFs membranes have been prepared, often on anorganic or inorganic support layer. MOFs particles have been incorporated into polyamide layerof thin film nanocomposite (TFN) membrane with improved properties [35,51]. In water treatment,MOFs have been used as adsorbents of heavy metals and as fillers in alumina hollow fibermembranes for water desalination [52,53]. MOFs have also been employed in TFN membraneto treat water in different applications. Lee et al. used A100 (aluminum terephthalate) and C300(copper benzene-1,3,5-tricarboxylate) as water soluble MOFs, which were embedded and dissolvedinto the ultrafiltration membrane to increase its porosity [54]. For reverse osmosis, Hu et al. [55]and Gupta et al. [56] reported two simulation studies that used Zeolitic Imidazolate Framework(ZIFs)—MOFs based on zeolite as membranes for water desalination. Xu et al. [57] filled MIL-101(Cr)NPs into the TFN membrane to improve the desalination performance. Findings showed that thewater flux increased by 44% comparing to the plain membrane by adding 0.05% MIL-101 NPs to theorganic solution, while the salt rejection remained almost the same. Similar outcomes were observedby Ma et al. [58] when embedding UiO-66 in membranes used in forward osmosis. By loading 0.1%NPs to the membrane, the water flux increased from 2.19 to 3.33 LMH/bar. Nevertheless, the use ofMOFs membranes in water treatment is still in its infancy when compared with their applications forgas separation.
UiO-66 (MOFs based on zirconium) [59] and MIL-125 (MOFs based on titanium) [60] arewater stable, carboxylate ligand–based MOFs [61]. The materials possess many metal atom centers,which give them high structural symmetry and steadiness. Figure 1 shows these structures as reportedby Wang et al. [52] for UiO-66 and Devic and Serre for MIL-125 [62]. Properties including their highsurface area, chemicals resistance, and functionalization ability made these MOFs good candidates fordifferent applications [63,64].
In this paper, UiO-66 and MIL-125 MOFs nanoparticles were synthesized and then embedded intothe TFN membrane. The NPs were incorporated by mixing different amounts of materials (0–0.3 wt %)in the trimesoyl chloride solution during membrane fabrication, and the membranes’ performancein reverse osmosis application was tested. MOFs NPs were characterized by SEM, zeta potentialmeasurement, and surface area evaluation, while the membranes’ physicochemical properties wereexamined by SEM, TEM, contact angle, and ATR FT-IR tests. It was found that embedding UiO-66and MIL-125 NPs to the TFN membrane improved its performance to a level that is considered to beamong the best for brackish water desalination.
95

Membranes 2017, 7, 31
(a)
(b)
Figure 1. Metal-Organic Frameworks (MOFs) structure: (a) UiO66 [52], reproduced with permissionfrom Springer Nature and (b) MIL-125 [62], reproduced with permission from Royal Societyof Chemistry.
2. Materials and Methods
2.1. Materials
Zirconium (IV) chloride (ZrCl4, 99.5%), titanium (IV) isopropoxide (Ti [OCH(CH3)2]4, 97%),1,4-benzenedicarboxylic acid (BDC, 98%), dimethylformamide (DMF, 99.9%), and methanol(CH3OH, 99.8%) were obtained from Sigma-Aldrich (St. Louis, MO, USA) for the preparation ofMOFs NPs.
The PSU support sheets were prepared by dissolving polysulfone pellets (PSU, MW = 35,000,Sigma-Aldrich) in DMF solvent. The chemicals for the IP, m-phenylenediamine (MPD, ≥99%) andtrimesoyl chloride (TMC, ≥98.5%), were purchased from Fisher Scientific (Pittsburgh, PA, USA)and Sigma Aldrich, respectively. 2,2,4-trimethylpentane (isooctane, 99%) was obtained from FisherScientific and used as TMC solvent. Our recent study demonstrated that isooctane could replacecommonly used hexane during the IP process as a more environmental-friendly solvent [18].Millipore DI water (Synergy185, 18.2 MΩ-cm, EMD Millipore Corp., Billerica, MA, USA) was usedto prepare MPD solution and for cleaning purposes. Calcium chloride (CaCl2) and sodium chloride(NaCl) were obtained from Fisher Scientific and Sigma Aldrich, respectively. CSA/TEA salt materials,
96

Membranes 2017, 7, 31
triethylamine (TEA, ≥99%) and (1s)-(+)-10-camphorsulfonic acid (CSA, 99%), were purchased fromSigma Aldrich.
2.2. Synthesis and Characterizations of MOFs NPs
UiO-66 and MIL-125 MOFs NPs used in this research were synthesized through the microwaveand solvothermal methods, respectively. For UiO-66 preparation, ZrCl4, BDC, and H2O were dissolvedin DMF under stirring in molar ratios of 1:1:1:500, respectively [52]. After a complete mixing,the solution was placed in a GE microwave (Model no. J VM131K 002) and irradiated for 5 minat a power of 220 W. The 5 min irradiation was separated into 4 steps: 2 min, 1 min, 1 min, and 1 minwith 1 min relaxing time between each irradiation section to prevent solvent from heating over boilingpoint. The MOF precipitates appeared during the last 2 steps of irradiation. MIL-125 NPs wereprepared in different formula, in which 3 mmol Ti[OCH(CH3)2]4, 6 mmol BDC, 50 mL methanol,and 20 mL acetic acid were dissolved in 100 mL DMF [60]. After mixing, the solution was transferredto a 500 mL Teflon liner and put into a metallic digestion bomb at 150 ◦C for 24 h. Precipitates of bothMOFs were washed and centrifuged with DMF and methanol, three times each. The washed sampleswere dried in an oven overnight at 80 ◦C and collected for later use.
The NPs size and morphology were tested by SEM (Hitachi S-4700 Field Emission ScanningElectron Microscope, Hitachi, Ltd., Tokyo, Japan). First, the particles were spread on a carbon adhesivedisc. After that, they were coated with platinum on a sputter coater (K575x, Emitech, Kent, UK)for 1 min at 20 milliAmps, prior to imaging. Zetasizer (Malvern nano series, Malvern InstrumentsLtd., Malvern, UK) was used to measure the NPs zeta potential. 0.1 g of the NPs was placed in20 mL DI water of pH 5.7 and sonicated for 10 min to avoid aggregation. The specific surface areawas determined by N2-adsorption using the Beckman coulter SA 3100 (Beckman Coulter, Inc., Brea,CA, USA) surface area analyzer, according to the Brunauer-Emmett-Teller (BET) method.
2.3. Preparation of PSU Support Sheets
The casting solution was made by dissolving 15 wt % of PSU grains in DMF. The solution washeated to 60 ◦C and stirred for at least 5 h, till a colorless solution formed. The solution was removedfrom the heater and cooled down at room temperature while allowing vent of the organic vapor;then left overnight for degassing.
A solution aliquot was spread over a glass plate and cast to a thickness of 130 μm by a castingknife (EQ-Se-KTQ-150, MTI Corp., Richmond, CA, USA). The glass plate with the PSU solution wasdirectly immersed into a water bath. The colorless solution then turned to a white sheet instantlyand detached from the glass in a few seconds, in a process of phase inversion. The support sheetswere collected and washed three times in DI water for the removal of any remaining solvent. Finally,the sheets were stored in DI water at 4 ◦C for at least 24 h before use.
2.4. Preparation of TFN Membranes
The prepared support sheet was placed on a piece of glass with the excess water removed by asqueegee roller. MPD solution was then poured on the PSU sheet for 25 s, then excess solution wasremoved by the squeegee roller. MPD solution was prepared by dissolving 2 wt % of MPD in DI water.The solution also contained 1% of CAS/TEA salt and 0.01% CaCl2, which were added to improvemembrane’s hydrophilicity and performance. The membrane with MPD was left for 2 min to dry,then the TMC solution, which was prepared by dissolving 0.15 wt % TMC in isooctane, was added tothe sheet for 15 s, and the reaction of TMC and MPD led to the formation of a thin polyamide film bythe interfacial polymerization (IP). After disposing the extra TMC solution, the sheets were dried inoven at 80 ◦C for 6 min for the evaporation of any residual solvent. Finally, the sheets were washedin DI water three times and stored in water at 4 ◦C for at least 18 h before test. Since the MOFs havehigher dispersion affinity in organic solutions than in water due to the relatively hydrophobic organic
97

Membranes 2017, 7, 31
shells, the MOFs NPs were dispersed in TMC solution in different loading ratios, 0.05, 0.1, 0.15, 0.2,and 0.3 wt %.
2.5. TFN Membrane Characterizations
The prepared membranes were dried at room temperature for around 24 h and stored at 4 ◦Cprior to characterizations. The membrane’s morphology was examined by SEM (Hitachi S-4700).The samples were coated with platinum by a sputter coater (Emitech, K575x) for 1 min at20 milliAmps. After placing the samples inside the SEM device, different voltages were used toachieve various resolutions.
The membrane’s cross sectional view was observed using TEM (JEOL JEM-1400, JEOL Ltd.,Peabody, MA, USA) device. The samples were prepared by soaking them in a resin (Eponate 12,Ted Pella, Inc., Redding, CA, USA) overnight, then cut by the Reichert–Jung Ultracut E ultramicrotome(Reichert, Depew, NY, USA).
The membrane surface functional groups were assessed by the ATR FT-IR spectroscopy, usingthe Nicolet 4700 FT-IR with the multi-reflection Smart Performer® ATR accessory (Thermo Electron,Waltham, MA, USA).
The contact angle between DI water drop and membrane’s surface was measured to understandthe surface hydrophilicity. A sessile drop technique-based contact angle video system, VCA-2500 XE(AST products, Inc., Billerica, MA, USA), was employed for this measurement. Each reported value ofcontact angle was the average of six measurements tested on different locations.
A cross flow reverse osmosis system was used to measure the water flux and salt rejection asshown in our previous work [18]. The membrane was placed in a filter holder cell (HP Filter Holder,47 mm, stainless steel, EMD Millipore, Billerica, MA, USA) and tested, under conditions of 300 psi,25 ◦C, and 2000 ppm NaCl solution, for eight hours. The permeate water flux was calculated basedon its transferred volume per unit time; the LABVIEW software was used to track the water flux,calculated based on Equation (1).
J =V
A × t(1)
where J is the water flux (L/m2 h), V the permeate water volume (L), A the membrane area (m2), and tthe accumulation time (h).
A conductivity meter (HACH Company, Loveland, CO, USA) was employed to measure the totaldissolved salts in feed solution and permeate water. NaCl rejection was calculated by Equation (2).
R =
(1 − Cp
Cf
)× 100 (2)
where R is the salt rejection ratio, Cp the permeate conductivity and Cf the feed conductivity.The salt solubility maintained the same by controlling the system temperature at 25 ◦C using
external water bath.
3. Results and Discussion
3.1. MOFs NPs Characterizations
UiO-66 and MIL-125 NPs had measured surface areas of 293.6 and 515.5 m2/g, respectively.Although these numbers seem to indicate the materials are highly porous, they are low comparedwith what had been reported in the literature [60,65]. The reason for this difference is not clear but thematerials’ aggregation could have contributed to the difference.
The zeta potential values of UiO-66 and MIL-125 NPs were 7.66 mV and −46.1 mV, respectively,when they were tested at a concentration of 0.1% in DI water. Although both zirconium and titaniumcould be in the oxidation state of +4, different surface charges, positive and negative, were measured
98

Membranes 2017, 7, 31
for UiO-66 and MIL-125, respectively. The measured zeta potential of UiO-66 at pH 5.7 was close to theliterature-reported value of 0 mV at almost the same pH 5.5 [66]. MIL-125’s zeta potential was lowerthan what was previously reported, around +2 mV at pH of 5.5 [67,68]. This could be due to the use ofdifferent titanium raw materials; titanium isopropoxide was used in this research instead of titaniumbutoxide used in previous studies.
Figure 2a,b presents the SEM morphology of UiO-66 (100–200 nm, cubic shape) and MIL-125(100 nm, spherical shape) respectively. The sizes of NPs were appropriate to be embedded in TFNmembranes, as it would be shown later.
(a) (b)
Figure 2. Scanning electron microscopy (SEM) images for (a) UiO-66 and (b) MIL-125 MOFsnanoparticles (NPs).
3.2. TFN Membrane Characterizations
ATR FT-IR spectra were collected from the surface of various membrane specimens. The spectraof the PSU support sheet, TFC membrane, and the TFN membranes with UiO-66 and MIL-125 NPs,respectively, were illustrated in Figure 3a,b. The spectral features of the PSU layer and TFC membranechemical groups are repeated in TFN membranes spectra, in which the peaks corresponding to MOFswere also observed. Generally, by increasing NPs percentage, the reflected spectra had new peaksrelevant to the embedded materials. Starting with the PSU spectrum, two featured peaks at 1150 and1245 cm−1 were observed, which could be allocated to the O=S=O symmetric stretching of sulfonegroup [69] and C–O–C asymmetric stretching of aryl ethyl group, respectively [70]. The peaks at1298 and 1325 cm−1 could indicate the asymmetric stretching of O=S=O sulfone group. At 1488 and1590 cm−1, the peaks could be attributed to the aromatic C–C stretching [69,70]. By adding polyamidethin film layer, peaks at 1350 and 1610 cm−1 appeared due to the N–H deforming (amide III) and C=O(carboxylic), respectively [71]. Furthermore, N–H bending and C–N stretching could be representedby the peak around 1545 cm−1 (amide II). The vibration at 1660 cm−1 could be assigned to the C=Ostretching (amide I) [71,72].
When MOFs NPs were added at very low amounts, new peaks corresponding to these NPs werenot apparent. By increasing UiO-66 molar ratio to 0.15 and above, an obvious peak around 1380 cm−1
and a tiny one at 1565 cm−1 appeared, which could be assigned to the Zr-OH vibration [73–76],as shown in Figure 3a. At 0.3%, the peak disappeared; this might be caused by the particles’ aggregationso no proper NP dispersion was obtained. For MIL-125 at 0.3%, a clear peak was observed around1416 cm−1, which could be assigned to the Ti–O–Ti stretching vibrations [77].
99

Membranes 2017, 7, 31
The SEM images of membranes surface with UiO-66 and MIL-125 NPs are illustrated inFigures 4 and 5, respectively. The TFC membrane, for which there was no particles added, showeda leaf-like shape characteristic of normal polyamide layer. Addition of up to 0.05% UiO-66 NPs didnot cause much change in leaf-like morphology, as illustrated in Figure 4b. When the loading wasincreased to 0.1% and 0.15%, the membranes’ surface began to change due to NPs filling into themembrane. The nanoparticles covered a wide area and had a good distribution in the membranestructure. At 0.2% and 0.3%, the solid clusters/aggregates were easily observable, which might have animpact on salt rejection. At loading of 0.3%, the NPs aggregated and formed even larger clusters, andcovered the surface more sparsely. This is consistent with the FT-IR results and trends, as discussed inthe previous section.
(a)
(b)
500700900110013001500170019002100
Tran
smitt
ance
Wavenumber (cm-1)
PSU
0 %
0.05 %
0.1 %
0.15 %
0.2 %
0.3 %
Zr-OH vibration
4000
500700900110013001500170019002100
Tran
smitt
ance
Wavenumber (cm-1)4000
Ti-O-Ti stretching
PSU
0 %
0.05 %
0.15 %
0.1 %
0.2 %
0.3 %
Figure 3. Attenuated total reflection Fourier transform infrared (ATR FT-IR) spectra for (a) UiO-66 and(b) MIL-125.
100

Membranes 2017, 7, 31
(a) (b) (c)
(d) (e) (f)
Figure 4. SEM images for membranes surface with UiO-66 NPs injection, (a) 0%, (b) 0.05%, (c) 0.1%,(d) 0.15%, (e) 0.2%, and (f) 0.3%.
(a) (b) (c)
(d) (e) (f)
Figure 5. SEM images for membranes surface with MIL-125 NPs injection, (a) 0%, (b) 0.05%, (c) 0.1%,(d) 0.15%, (e) 0.2%, and (f) 0.3%.
101

Membranes 2017, 7, 31
In Figure 5, the impact of embedding MIL-125 NPs on the morphology was presented.Unlike UiO-66 filling, MIL-125 appeared to have changed the leaf-shaped morphology, in addition tothe aggregation. The leaves are connected to each other, making long leaves. This could be because ofMIL-125’s quasi-cubic tetragonal structure, or the smaller size of MIL-125 comparing with UiO-66 NPs,which might give better filling into the membrane.
Figure 6 shows the measured contact angles between DI water drop and the membrane’s surface.By adding the MOFs NPs, the contact angle did not decrease significantly. The result is different fromfilling other nanomaterials such as hydrophilic silica [18] and oxidized graphene [78] where significantdecreases of contact angle were observed. This may be attributed to the MOFs structure, which containsorganic linkers surrounding the metal core. The organic part is slightly hydrophobic, leading todecreased particle hydrophilicity [38]. From the figure, the UiO-66 had more hydrophilic effect thanMIL-125. This could be because MIL-125 has more linkers on the surface shielding the metal atom.The observation is also in consistence with the fact that MIL-125 had a higher surface area.
Figure 6. Pure water contact angle with the modified thin film nanocomposite (TFN)membranes surface.
TEM cross section images for the plain membrane and UiO-66 and MIL-125 nanocompositemembranes are illustrated in Figure 7a–c, respectively. Figure 7b is the cross-sectional view of TFNmembrane at an optimal UiO-66 NPs loading (0.15%); while Figure 7c is at an optimal MIL-125 NPsloading (0.3%). The TEM examination showed that the particles were filled into the membranes andappeared as black clusters; MIL-125 NPs were highly homogenized with the membrane and affectedits texture. From the images, the membrane thickness is found to be 200–400 nm.
(a) (b) (c)
Figure 7. Transmission electron microscopy (TEM) images of (a) thin film composite (TFC) membrane,(b) TFN membrane of 0.15% UiO-66, and (c) TFN membrane of 0.3% MIL-125.
102

Membranes 2017, 7, 31
3.3. TFN Membranes Performance
The salt rejection and water flux for UiO-66 and MIL-125 modified membranes were documentedin Figure 8a,b. For UiO-66, the optimal addition was 0.15%, where the permeate water flux and saltrejection increased from 62.5 L/m2 h and 98.4% to 74.9 L/m2 h and 98.8%, respectively. From Figure 8a,adding UiO-66 NPs increased NaCl rejection at low loadings, but a further increase of the NPs resultedin a decrease of salt rejection. The rejection increase at low loading could be attributed to UiO-66’spore size (∼6.0 Å) [59], which is larger than water molecule (~2.8 Å) but smaller than the hydratedions (Na+ = 7.16 and Cl− = 6.64 Å) [79]. Increasing the NPs amount too much could decrease saltrejection, as the particles aggregation may generate cracks in TFN membranes structure. On theother hand, the flux increase by adding NPs reached its maximum at 0.15%. This is likely due to thehydrophilic nature of UiO-66 [59,80]. At percentages higher than 0.15%, the water flux decreased,again likely due to NPs aggregation [13]. Here, both salt rejection and water flux decreased because ofparticle aggregation. Aggregation may have created micro gaps between particle blocs that allowedthe saline water to pass through. The particle aggregates could also block the water transfer throughthe membrane by the hydrophobic linkers overlapping, thus decreased water flux. Thereby, reductionin both salt rejection and water flux occurred.
(a)
(b)
Figure 8. TFN membranes performance with injected (a) UiO-66 and (b) MIL-125 NPs.
103

Membranes 2017, 7, 31
Figure 8b shows the effect of adding MIL-125 NPs to TFN membrane. The water flux increasedby increasing NPs loading, for example, with a solid loading of 0.3%, the permeate water fluxwas increased from 62.5 to 85.0 L/m2 h, while the salt rejection maintained almost the same(98.4% vs. 98.6%). At filling of 0.5% NPs, a drop in salt rejection happened. The effective porediameter of MIL-125 is 12.55 Å [60] which is larger than both the water molecule and hydrated ionsof Na+ and Cl−. However, the salt rejection remained the same even at a higher loading, the highnegative charge of MIL-125 could play a role here as the formed electrical double layer could repel thenegatively-charged ions. The reported water flux here at 0.3%, 85.0 L/m2 h, is considered one of thehighest in comparison with the reported values in the literature [81]. The high flux could be due tothe NPs hydrophilicity and their large surface area and pore size. Figure 9 shows the permeability ofoptimal membranes by adding 0.15 wt % of UiO-66 or 0.3 wt % MIL-125 at different feed pressures.
Figure 9. Membranes permeability at an optimal NPs filling.
3.4. Why MOFs for TFN Membranes?
MOFs are valuable materials due to their unique structure and wide applications in variousareas [35]. It is anticipated that by the coming decade, mixed matrix membranes based on MOFs couldgrow, including those for large scale applications [38]. Among various nanocomposite membranes,MOFs-enabled membranes are advantageous because they can overcome the traditional fillingproblems of low affinity with the membrane, porosity blocking, and segregation [82,83]. The hybridMOFs structure with organic and inorganic parts is generally compatible with polymeric layers inmembrane [84]. This concept is illustrated in Figure 10, where MOFs particles can be more convenientlyembedded into the TFN membrane with less gaps than those created by traditional inorganic fillers.Another advantage is the low cost of the polymeric membranes and the vast selection range of linkerstoward controlling MOFs shape, morphology, and surface chemistry, making it potentially possible todesign membrane for specific applications.
Figure 10. MOFs filling into polymeric substance diagram.
104

Membranes 2017, 7, 31
4. Conclusions
Incorporation of UiO-66 and MIL-125 MOFs NPs in reverse osmosis membranes is reported inthis study. The results showed that MOFs were embedded well inside the membranes and increasedthe water flux and salt rejection. Different techniques were used to exam the NPs and TFN membranes’physicochemical properties. The organic linker enhanced the compatibility of MOFs particles withthe polyamide thin film. The results indicated that the water flux was increased from 62.5 to 74.9 or85.0 L/m2 h at a transmembrane pressure of 300 psi, by addition of 0.15% of UiO-66 or 0.3% of MIL-125,respectively, while salt rejection was slightly increased. These high flux results indicate filling of MOFsNPs in TFN membrane might be advantageous because of the NPs containing an organic part thatcould link properly to polyamide, and inorganic part that could enhance the membrane performance.
Acknowledgments: We gratefully acknowledge the Higher Committee for Education Development in Iraq(HCED-Iraq) for supporting Mohammed Kadhom. The project was partial supported by the Missouri WaterResources Research Center. We would like to thank Qingsong Yu in the Department of Mechanical and AerospaceEngineering and Maria Fidalgo and Zhiqiang Hu in the Department of Civil and Environmental Engineeringat the University of Missouri-Columbia for the access to contact angle video system, BET, and zeta potentialdevice, respectively. We would like to acknowledge Martin Schauflinger from the Electron Microscopy Core at theUniversity of Missouri-Columbia for his help in preparing and characterizing TEM samples.
Author Contributions: Mohammed Kadhom and Baolin Deng conceived and designed the experiments.Weiming Hu prepared the NPs. Mohammed Kadhom performed the experiments, analyzed the date, andwrote the first draft. All authors contributed to put the paper in its final form.
Conflicts of Interest: The authors declare no conflicts of interest.
References
1. Nobel, R.; Stern, S.A. Membrane Separations Technology Principles and Applications; Elsevier:Amsterdam, The Netherlands, 1995.
2. Service, R.F. Desalination Freshens Up. Science 2006, 313, 1088–1090. [CrossRef] [PubMed]3. Sagle, A.; Freeman, B. Fundamentals of membranes for water treatment. Tex. Water Dev. 2004, 2, 137–153.4. Cadotte, J. Interfacially Synthesized Reverse Osmosis Membrane. U.S. Patent 4,277,344, 7 July 1981.5. Pabby, A.K.; Rizvi, S.S.; Sastre, A.M. Handbook of Membrane Separations: Chemical, Pharmaceutical, Food,
and Biotechnological Applications; Taylor & Francis Group: Boca Raton, FL, USA, 2015.6. Dong, H.; Zhao, L.; Zhang, L.; Chen, H.; Gao, C.; Ho, W.S.W. High-flux reverse osmosis membranes
incorporated with NaY zeolite nanoparticles for brackish water desalination. J. Membr. Sci. 2015, 476, 373–383.[CrossRef]
7. Lind, M.L.; Ghosh, A.K.; Jawor, A.; Huang, X.; Hou, W.; Yang, Y.; Hoek, E. Influence of zeolite crystal sizeon zeolite–polyamide thin film nanocomposite membranes. Langmuir 2009, 25, 10139–10145. [CrossRef][PubMed]
8. Kong, C.L.; Shintani, T.; Tsuru, T. Pre-seeding assisted synthesis of a high performance polyamide–zeolitenanocomposite membrane for water purification. New J. Chem. 2010, 34, 2101–2104. [CrossRef]
9. Huang, H.; Qu, X.; Dong, H.; Zhang, L.; Chen, H. Role of NaA zeolites in the interfacial polymerizationprocess towards a polyamide nanocomposite reverse osmosis membrane. RSC Adv. 2013, 3, 8203–8207.[CrossRef]
10. Huang, H.; Qu, X.; Ji, X.; Gao, X.; Zhang, L.; Chen, H.; Hou, L. Acid and multivalent ion resistance of thin filmnanocomposite RO membranes loaded with silicalite-1 nanozeolites. J. Mater. Chem. A 2013, 1, 11343–11349.[CrossRef]
11. Dong, H.; Qu, X.Y.; Zhang, L.; Cheng, L.H.; Chen, H.L.; Gao, C.J. Preparation and characterization ofsurface-modified zeolite–polyamide thin film nanocomposite membranes for desalination. Desal. Water Treat.2011, 34, 6–12. [CrossRef]
12. Li, L.; Dong, J.; Nenoff, T.M.; Lee, R. Desalination by reverse osmosis using MFI zeolite membranes.J. Membr. Sci. 2004, 243, 401–404. [CrossRef]
13. Yin, J.; Kim, E.; Yang, J.; Deng, B. Fabrication of a novel thin-film nanocomposite (TFN) membrane containingMCM-41 silica nanoparticles (NPs) for water purification. J. Membr. Sci. 2012, 423–424, 238–246. [CrossRef]
105

Membranes 2017, 7, 31
14. Wu, H.; Tang, B.; Wu, P. Optimizing polyamide thin film composite membrane covalently bonded withmodified mesoporous silica nanoparticles. J. Membr. Sci. 2013, 428, 341–348. [CrossRef]
15. Ma, X.; Lee, N.; Oh, H.; Hwang, J.; Kim, S. Preparation and characterization of silica/polyamide-imidenanocomposite thin films. Nanoscale Res. Lett. 2010, 5, 1846–1851. [CrossRef] [PubMed]
16. Tiraferri, A.; Kang, Y.; Giannelis, E.P.; Elimelech, M. Highly hydrophilic thin-film composite forward osmosismembranes functionalized with surface-tailored nanoparticles. Appl. Mater. Interfaces 2012, 4, 5044–5053.[CrossRef] [PubMed]
17. Jadav, G.L.; Singh, P.S. Synthesis of novel silica-polyamide nanocomposite membrane with enhancedproperties. J. Membr. Sci. 2009, 328, 257–267. [CrossRef]
18. Kadhom, M.; Yin, J.; Deng, B. A thin film nanocomposite membrane with MCM-41 silica nanoparticles forbrackish water purification. Membranes 2016, 6, 1–12. [CrossRef] [PubMed]
19. Emadzadeh, D.; Lau, W.J.; Matsuura, T.; Ismail, A.F.; Rahbari-Sisakht, M. Synthesis and characterization ofthin film nanocomposite forward osmosis membrane with hydrophilic nanocomposite support to reduceinternal concentration polarization. J. Membr. Sci. 2014, 449, 74–85. [CrossRef]
20. Yadaa, M.; Inouea, Y.; Akihitoa, G.; Nodab, I.; Torikaia, T.; Wataria, T.; Hotokebuchi, T. Apatite-formingability of titanium compound nanotube thin films formed on a titanium metal plate in a simulated bodyfluid. Colloids Surf. B Biointerfaces 2010, 80, 116–124. [CrossRef] [PubMed]
21. Emadzadeha, D.; Laua, W.J.; Matsuura, T.; Hilal, N.; Ismail, A.F. The potential of thin film nanocompositemembrane in reducing organic fouling in forward osmosis process. Desalination 2014, 348, 82–88. [CrossRef]
22. Tettey, K.E.; Yee, M.Q.; Lee, D. Photocatalytic and conductive MWCNT/TiO2 nanocomposite thin films.Appl. Mater. Interfaces 2010, 2, 2646–2652. [CrossRef] [PubMed]
23. Shen, J.; Yu, C.; Ruan, H.; Gao, C.; Bruggen, B.V. Preparation and characterization of thin-film nanocompositemembranes embedded with poly(methyl methacrylate) hydrophobic modified multiwalled carbonnanotubes by interfacial polymerization. J. Membr. Sci. 2013, 442, 18–26. [CrossRef]
24. Roy, S.; Ntim, S.A.; Mitra, S.; Sirkar, K.K. Facile fabrication of superior nanofiltration membranes frominterfacially polymerized CNT-polymer composites. J. Membr. Sci. 2011, 375, 81–87. [CrossRef]
25. Ma, L.; Dong, X.; Chen, M.; Zhu, L.; Wang, C.; Yang, F.; Dong, Y. Fabrication and Water Treatment Applicationof Carbon Nanotubes (CNTs)-Based Composite Membranes: A Review. Membranes 2017, 7, 1–21. [CrossRef][PubMed]
26. Ghosh, A.K.; Jeong, B.-H.; Huang, X.; Hoek, E.M.V. Impacts of reaction and curing conditions on polyamidecomposite reverse osmosis membrane properties. J. Membr. Sci. 2008, 311, 34–45. [CrossRef]
27. Ding, C.; Yin, J.; Deng, B. Effects of polysulfone (PSf) support layer on the performance of thin-film composite(TFC) membranes. J. Chem. Process Eng. 2014, 1, 1–8. [CrossRef]
28. Kuehne, M.A.; Song, R.Q.; Li, N.N.; Petersen, R.J. Flux enhancement in TFC RO membranes. Enivron. Prog.2001, 20, 23–26. [CrossRef]
29. Zhao, L.; Ho, W.S.W. Novel reverse osmosis membranes incorporated with a hydrophilic additive forseawater desalination. J. Membr. Sci. 2014, 455, 44–54. [CrossRef]
30. Gu, H.; Rahardianto, A.; Gao, L.X.; Christof, P.D.; Cohen, Y. Ultrafiltration with self-generated RO concentratepulse backwash in a novel integrated seawater desalination UF-RO system. J. Membr. Sci. 2016, 520, 111–119.[CrossRef]
31. Hai, Y.; Zhang, J.; Shi, C.; Zhou, A.; Bian, C.; Li, W. Thin film composite nanofiltration membrane preparedby the interfacial polymerization of 1,2,4,5-benzene tetracarbonyl chloride on the mixed amines cross-linkedpoly(ether imide) support. J. Membr. Sci. 2016, 520, 19–28. [CrossRef]
32. Shaffer, D.L.; Yip, N.Y.; Gilron, J.; Elimelech, M. Seawater desalination for agriculture by integrated forwardand reverse osmosis: Improved product water quality for potentially less energy. J. Membr. Sci. 2012, 415–416,1–8. [CrossRef]
33. Elimelech, M.; Phillip, W.A. The future of sea water desalination: Energy, technology, and the environment.Science 2011, 333, 712–717. [CrossRef] [PubMed]
34. Fritzmann, C.; Löwenberg, J.; Wintgens, T.; Melin, T. State-of-the-art of reverse osmosis desalination.Desalination 2007, 216, 1–76. [CrossRef]
35. Li, W.; Zhang, Y.; Li, Q.; Zhang, G. Metal−organic framework composite membranes: Synthesis andseparation applications. Chem. Eng. Sci. 2015, 135, 232–257. [CrossRef]
36. James, S.L. Metal-organic frameworks. Chem. Soc. Rev. 2003, 32, 276–288. [CrossRef] [PubMed]
106

Membranes 2017, 7, 31
37. Li, J.; Sculley, J.; Zhou, H.C. Metal-organic frameworks for separations. Chem. Rev. 2012, 112, 869–932.[CrossRef] [PubMed]
38. Zornoza, B.; Tellez, C.; Coronas, J.; Gascon, J.; Kapteijn, F. Metal organic framework based mixedmatrix membranes: An increasingly important field of research with a large application potential.Microporous Mesoporous Mater. 2013, 166, 67–78. [CrossRef]
39. Gascon, J.; Aktay, U.; Hernandez-Alonso, M.D.; van Klink, G.P.; Kapteijn, F. Amino-based metal-organicframeworks as stable, highly active basic catalysts. J. Catal. 2009, 261, 75–87. [CrossRef]
40. An, J.; Rosi, N. Tuning MOF CO2 adsorption properties via cation exchange. J. Am. Chem. Soc. 2010,132, 5578–5579. [CrossRef] [PubMed]
41. Lee, C.Y.; Farha, O.K.; Hong, B.J.; Sarjeant, A.A.; Nguyen, S.T.; Hupp, J.T. Light-Harvesting MetalOrganicFrameworks (MOFs): Efficient Strut-to-Strut Energy Transfer in Bodipy and Porphyrin-Based MOFs. J. Am.Chem. Soc. 2011, 133, 15858–15861. [CrossRef] [PubMed]
42. Allendorf, M.D.; Bauer, C.A.; Bhakta, R.K.; Houk, R.J.T. Luminescent metal–organic frameworks.Chem. Soc. Rev. 2009, 38, 1330–1352. [CrossRef] [PubMed]
43. Ma, L.; Abney, C.; Lin, W. Enantioselective catalysis with homochiral metal-organic frameworks.Chem. Soc. Rev. 2009, 38, 1248–1256. [CrossRef] [PubMed]
44. Rocca, J.D.; Liu, D.; Lin, W. Nanoscale Metal–Organic Frameworks for Biomedical Imaging and DrugDelivery. Acc. Chem. Res. 2011, 44, 957–968. [CrossRef] [PubMed]
45. Murray, L.J.; Dincă, M.; Long, J.R. Hydrogen storage in metal-organic frameworks. Chem. Soc. Rev. 2009,38, 1294–1314. [CrossRef] [PubMed]
46. Hu, Y.H.; Zhang, L. Hydrogen Storage in Metal–Organic Frameworks. Adv. Mater. 2010, 22, E117–E130.[CrossRef] [PubMed]
47. Li, J.-R.; Kuppler, R.J.; Zhou, H.C. Selective gas adsorption and separation in metal-organic frameworks.Chem. Soc. Rev. 2009, 38, 1477–1504. [CrossRef] [PubMed]
48. An, J.; Geib, S.J.; Rosi, N.L. High and selective CO2 uptake in a cobalt adeninate metal-organic frameworkexhibiting pyrimidine- and amino-decorated pores. J. Am. Chem. Soc. 2010, 132, 38–39. [CrossRef] [PubMed]
49. Farha, O.K.; Eryazici, I.; Jeong, N.C.; Hauser, B.G.; Wilmer, C.E.; Sarjean, A.A.; Snurr, R.Q.; Nguyen, S.T.;Yazaydın, A.O.; Hupp, J.T. Metal−Organic Framework Materials with Ultrahigh Surface Areas: Is the Skythe Limit? J. Am. Chem. Soc. 2012, 134, 15016–15021. [CrossRef] [PubMed]
50. Liu, Y. Synthesis of continuous MOF-5 membranes on porous a-alumina substrates.Microporous Mesoporous Mater. 2009, 118, 296–301. [CrossRef]
51. Shen, J.; Liu, G.; Huang, K.; Li, Q.; Guan, K.; Li, Y.; Jin, W. UiO-66-polyether block amide mixed matrixmembranes for CO2 separation. J. Membr. Sci. 2016, 513, 155–165. [CrossRef]
52. Wang, C.; Liu, X.; Chen, J.P.; Li, K. Superior removal of arsenic from water with zirconium metal-organicframework UiO-66. Sci. Rep. 2015, 5, 1–10. [CrossRef] [PubMed]
53. Liu, X.; Demir, N.K.; Wu, Z.; Li, K. Highly water-stable zirconium metal−organic framework UiO-66membranes supported on alumina hollow fibers for desalination. J. Am. Chem. Soc. 2015, 137, 6999–7002.[CrossRef] [PubMed]
54. Lee, J.-Y.; Tang, C.Y.; Huo, F. Fabrication of porous matrix membrane (PMM) using metal-organic frameworkas green template for water treatment. Sci. Rep. 2014, 4, 3740. [CrossRef] [PubMed]
55. Hu, Z.; Chen, Y.; Jiang, J. Zeolitic imidazolate framework-8 as a reverse osmosis membrane for waterdesalination: Insight from molecular simulation. J. Chem. Phys. 2011, 134, 134705. [CrossRef] [PubMed]
56. Gupta, K.; Zhang, K.; Jiang, J. Water desalination through zeolitic imidazolate framework membranes:Significant role of functional groups. Langmuir 2015, 31, 13230–13237. [CrossRef] [PubMed]
57. Xu, Y.; Gao, X.; Wang, X.; Wang, Q.; Ji, Z.; Wang, X.; Wu, T.; Gao, C. Highly and stably water permeable thinfilm nanocomposite membranes doped with MIL-101 (Cr) nanoparticles for reverse osmosis application.Materials 2016, 9, 870. [CrossRef]
58. Ma, D.; Peh, S.B.; Han, G.; Chen, S.B. Thin-film nanocomposite (TFN) membranes incorporated withsuper-hydrophilic metal−organic framework (MOF) UiO-66: Toward enhancement of water flux and saltrejection. ACS Appl. Mater. Interfaces 2017, 9, 7523–7534. [CrossRef] [PubMed]
59. Cavka, J.H.; Jakobsen, S.; Olsbye, U.; Guillou, N.; Lamberti, C. A new zirconium inorganic building brickforming metal organic frameworks with exceptional stability. J. Am. Chem. Soc. 2008, 130, 13850–13851.[CrossRef] [PubMed]
107

Membranes 2017, 7, 31
60. Dan-Hardi, M.; Serre, C.; Frot, T.; Rozes, L.; Maurin, G.; Sanchez, C.; Férey, G. A new photoactive crystallinehighly porous titanium(IV) dicarboxylate. J. Am. Chem. Soc. 2009, 131, 10857–10859. [CrossRef] [PubMed]
61. Jasuja, H.; Jiao, Y.; Burtch, N.C.; Huang, Y.-G.; Walton, K.S. Synthesis of cobalt, nickel, copper, and zinc-Based,water-Stable, pillared metal−organic frameworks. Langmuir 2014, 30, 14300–14307. [CrossRef] [PubMed]
62. Devic, T.; Serre, C. High valence 3p and transition metal based MOFs. Chem. Soc. Rev. 2014, 43, 6097–6115.[CrossRef] [PubMed]
63. Jeremias, F.; Lozan, V.; Henninger, S.K.; Janiak, C. Programming MOFs for water sorption:Aminofunctionalized MIL-125 and UiO-66 for heat transformation and heat storage applications.Dalton Trans. 2013, 42, 15967–15973. [CrossRef] [PubMed]
64. Stassen, I.; Styles, M.; van Assche, T.; Campagnol, N.; Fransaer, J.; Denayer, J.; Tan, J.-C.; Falcaro, P.;de Vos, D.; Ameloot, R. Electrochemical film deposition of the zirconium metal−organic framework UiO-66and application in a miniaturized sorbent trap. Chem. Mater. 2015, 27, 1801–1807. [CrossRef]
65. Kandiah, M.; Nilsen, M.H.; Usseglio, S.; Jakobsen, S.; Tilset, M.; Larabi, C.; Quadrelli, E.A.; Bonino, F.;Lillerud, K.P. Synthesis and stability of tagged UiO-66 Zr-MOFs. Chem. Mater. 2010, 22, 6632–6640. [CrossRef]
66. Seo, Y.S.; Khan, N.A.; Jhung, S.H. Adsorptive removal of methylchlorophenoxypropionic acid from waterwith a metal-organic framework. Chem. Eng. J. 2015, 270, 22–27. [CrossRef]
67. Wang, H.; Yuan, X.; Wu, Y.; Zeng, G.; Dong, H.; Chen, X.; Leng, L.; Wu, Z.; Peng, L. In situ synthesis ofIn2S3@MIL-125(Ti) core-shell microparticle for the removal of tetracycline from wastewater by integratedadsorption and visible-light-driven photocatalysis. Appl. Catal. B Environ. 2016, 186, 19–29. [CrossRef]
68. Wang, H.; Yuan, X.; Wu, Y.; Zeng, G.; Chen, X.; Leng, L.; Wu, Z.; Jiang, L.; Li, H. Facile synthesis ofamino-functionalized titanium metal-organic frameworks and their superior visible-light photocatalyticactivity for Cr(VI) reduction. J. Hazard. Mater. 2015, 286, 187–194. [CrossRef] [PubMed]
69. Deng, H.; Xu, Y.; Chen, Q.; Wei, X.; Zhu, B. High flux positively charged nanofiltration membranes preparedby UV-initiated graft polymerization of methacrylatoethyl trimethyl ammonium chloride (DMC) ontopolysulfone membranes. J. Membr. Sci. 2011, 366, 363–372. [CrossRef]
70. Tarboush, B.A.; Rana, D.; Matsuuraa, T.; Arafat, H.; Narbaitz, R. Preparation of thin-film-compositepolyamide membranes for desalination using novel hydrophilic surface modifying macromolecules.J. Membr. Sci. 2008, 325, 166–175. [CrossRef]
71. Lee, H.; Im, S.; Kim, J.; Kim, H.; Kim, J.; Min, B. Polyamide thin-film nanofiltration membranes containingTiO2 nanoparticles. Desalination 2008, 219, 48–56. [CrossRef]
72. Shawky, H.; Chae, S.; Lin, S.; Wiesner, M. Synthesis and characterization of a carbon nanotube/polymernanocomposite membrane for water treatment. Desalination 2011, 272, 46–50. [CrossRef]
73. Simmons, C. Corrosion of heavy-metal fluoride glasses. In Corrosion of Glass, Ceramics andCeramic Superconductors: Principles, Testing, Characterization and Applications; Noyes Publications:Park Ridge, NJ, USA, 1992.
74. Toullec, M.L.; Simmons, C.J.; Simmons, J.H. Infrared spectroscopic studies of the hydrolysis reaction duringleaching of heavy-metal fluoride glasses. J. Am. Chem. Soc. 1988, 71, 219–224. [CrossRef]
75. Sarkar, D.; Mohapatra, D.; Ray, S.; Bhattacharyya, S.; Adak, S.; Mitra, N. Synthesis and characterization ofsol–gel derived ZrO2 doped Al2O3 nanopowder. Ceram. Int. 2007, 33, 1275–1282. [CrossRef]
76. Liu, H.; Sun, X.; Yin, C.; Hu, C. Removal of phosphate by mesoporous ZrO2. J. Hazard. Mater. 2008,151, 616–622. [CrossRef] [PubMed]
77. Vetrivel, V.; Rajendran, K.; Kalaiselvi, V. Synthesis and characterization of Pure Titanium dioxidenanoparticles by Sol- gel method. Int. J. ChemTech Res. 2015, 7, 1090–1097.
78. Perreault, F.; Tousley, M.E.; Elimelech, M. Thin-film composite polyamide membranes functionalized withbiocidal graphene oxide nanosheets. Environ. Sci. Technol. Lett. 2014, 1, 71–76. [CrossRef]
79. Nightingale, E.R.J. Phenomenological theory of ion solvation. Effective radii of hydrated ions. J. Phys. Chem.1959, 63, 1381–1387. [CrossRef]
80. Furukawa, H.; Gándara, F.; Zhang, Y.-B.; Jiang, J.; Queen, W.L.; Hudson, M.R.; Yaghi, O.M. Water adsorptionin porous metal-organic frameworks and related materials. J. Am. Chem. Soc. 2014, 136, 4369–4381. [CrossRef][PubMed]
81. Zhao, L.; Chang, P.C.-Y.; Ho, W. High-flux reverse osmosis membranes incorporated with hydrophilicadditives for brackish water desalination. Desalination 2013, 308, 225–232. [CrossRef]
108

Membranes 2017, 7, 31
82. Nik, O.G.; Chen, X.Y.; Kaliaguine, S. Amine-functionalized zeolite FAU/EMT-polyimide mixed matrixmembranes for CO2/CH4 separation. J. Membr. Sci. 2011, 379, 468–478. [CrossRef]
83. Bae, T.-H.; Liu, J.; Lee, J.S.; Koros, W.J.; Jones, C.W.; Nair, S. Facile high-yield solvothermal deposition ofinorganic nanostructures on zeolite crystals for mixed matrix membrane fabrication. J. Am. Chem. Soc. 2009,131, 14662–14663. [CrossRef] [PubMed]
84. Centrone, A.; Yang, Y.; Speakman, S.; Bromberg, L.; Rutledge, G.C.; Hatton, T.A. Growth of metal−organicframeworks on polymer surfaces. J. Am. Chem. Soc. 2010, 132, 15687–15691. [CrossRef] [PubMed]
© 2017 by the authors. Licensee MDPI, Basel, Switzerland. This article is an open accessarticle distributed under the terms and conditions of the Creative Commons Attribution(CC BY) license (http://creativecommons.org/licenses/by/4.0/).
109

membranes
Article
Membranes of Polymers of Intrinsic Microporosity(PIM-1) Modified by Poly(ethylene glycol)
Gisela Bengtson, Silvio Neumann and Volkan Filiz *
Helmholtz-Zentrum Geesthacht, Institute of Polymer Research, Max-Planck-Strasse 1, 21502 Geesthacht,Germany; [email protected] (G.B.); [email protected] (S.N.)* Correspondence: [email protected]; Tel.: +49-4152-87-2425; Fax: +49-4152-87-2499
Academic Editor: Klaus RätzkeReceived: 27 April 2017; Accepted: 31 May 2017; Published: 5 June 2017
Abstract: Until now, the leading polymer of intrinsic microporosity PIM-1 has become quite famousfor its high membrane permeability for many gases in gas separation, linked, however, to a rathermoderate selectivity. The combination with the hydrophilic and low permeable poly(ethylene glycol)(PEG) and poly(ethylene oxides) (PEO) should on the one hand reduce permeability, while on theother hand enhance selectivity, especially for the polar gas CO2 by improving the hydrophilicityof the membranes. Four different paths to combine PIM-1 with PEG or poly(ethylene oxide) andpoly(propylene oxide) (PPO) were studied: physically blending, quenching of polycondensation,synthesis of multiblock copolymers and synthesis of copolymers with PEO/PPO side chain.Blends and new, chemically linked polymers were successfully formed into free standing densemembranes and measured in single gas permeation of N2, O2, CO2 and CH4 by time lag method.As expected, permeability was lowered by any substantial addition of PEG/PEO/PPO regardless themanufacturing process and proportionally to the added amount. About 6 to 7 wt % of PEG/PEO/PPOadded to PIM-1 halved permeability compared to PIM-1 membrane prepared under similar conditions.Consequently, selectivity from single gas measurements increased up to values of about 30 forCO2/N2 gas pair, a maximum of 18 for CO2/CH4 and 3.5 for O2/N2.
Keywords: polymers of intrinsic microporosity (PIM-1); poly(ethylene glycol); copolymers;gas separation; membranes
1. Introduction
Polymers of intrinsic microporosity have been and continue to be the objects of many researchpapers (see, e.g., citations in [1]) since Budd and McKeown launched their first publication aboutPIM-1 in 2004 [2].
PIM-1 is a hydrophobic polymer formed as a molecular ladder; the polymer chains cannot packtightly because of their contorted molecular structure, provided by spiro fused rings in the polymerchain. Thus, intrinsic nanopores are formed resulting in a large inner surface [3]. Membranes preparedfrom this polymer show a large fractional free volume and therefore high permeability for manygases [4], but especially for CO2 (4000 to 10,000 Barrer) because of an also very high solubility [5].However, the trade-off between permeability and selectivity, as it was evaluated by Robeson [6],consequently results for PIM-1 in a moderate permselectivity of CO2 over N2 of about 16 to 20 and thisis not at all comparable to the selectivity values obtained with membranes made from polymers suchas PEBAX® (Arkema, Colombes, France) or Polyactive™ (Polyvation, Groningen, The Netherlands),ranging from 30 to 40 [7]. Both latter polymers are block copolymers, containing poly(ethylene (orhigher equivalents) oxide) (PEO) chains for soft blocks, thus performing the transport of CO2 [8]. As adrawback, they are of low overall permeability for gases (e.g., 100 to 300 Barrer CO2). The hard blocks(polyamides) necessary for mechanical stability do not contribute to permeability at all and PEOs in
Membranes 2017, 7, 28 110 www.mdpi.com/journal/membranes

Membranes 2017, 7, 28
general show low permeability [9]. The PEO blocks in PEBAX® and Polyactive™ derive of ethylene orbutylene glycol units and they are rather short to avoid crystallization of PEO because crystallites arealmost impermeable to any gases and would additionally reduce the overall permeability [10].
In combining PIM-1 and low molecular PEG- or PEO-blocks, it is expected to get a reducedpermeability but an enhanced selectivity for CO2 due to its preferred solubility in PEGs and also dueto a reduction of permeability of non-polar gases like N2. In recently published research Wu et al. [11]followed this idea by blending PIM-1 and PEGs of different molecular weights (2 up to 20 kg/mol)in concentrations up to 5 wt % PEGs to enhance the selectivity of CO2 over N2 as well as over CH4,clearly without crucifying permeability too much. They observed a reduction to about half of thepermeability of pure PIM-1 blended with 2.5 wt % PEG. With increasing molecular weight of PEGthe permeability increased somewhat again coupled to a slight decrease in selectivity. Therefore, theychose PEG with 20 kg/mol for further experiments regarding PEG content and feed pressure. At 3.5 wt% PEG (20 kg/mol), a permeability of almost 2000 Barrer CO2 and a selectivity for CO2/CH4 of 39 wasachieved. Selectivity of CO2 over N2 was highest with 2.5 wt % PEG (2 kg/mol), with a value of 23.
In our study, we followed four different paths to combine PIM-1 and PEG or PEO. First, we alsoblended PIM-1 with PEGs of different molecular weights to evaluate the optimum amount of PEG andto check on the influence of PEG chain length. Long PEO chains are favorable for CO2 solubility [10]but tend to crystallize and separate from PIM-1 phase. Therefore, we favored PEGs with smallerchain lengths of ≤5 kg/mol. The permeability of blended membranes should not be reduced toomuch; the influence of the added PEGs on solubility of CO2 and other gases is going to be estimated.A similar approach was followed in [12,13] by blending PEBAX® (Arkema, France) with PEGs indifferent amounts, although in these cases it was thought as an attempt to increase the rather lowpristine permeability of the block copolymer.
Along the following Paths 2–4, we strived for a chemical bondage between PIM-1 and PEO bydifferent substitution reactions. In Path 2, we added PEG-monomethylethers, bound by esterification totrihydroxybenzoic acid (THBA), as quenching compounds to terminate the polycondensation reactionforming PIM-1. This resulted in (di)block copolymers with rather large PIM-1 blocks fenced by smallPEO end group(s). The procedure was performed with PEGs of different chain lengths.
Within Path 3, we combined small PIM-1 blocks (at least smaller blocks than in Paths 1 and 2) withdifferent PEO-containing co-monomers (PEG di-substituted by esterification with dihydroxybenzoicacid (DHBA)) to form multiblock copolymers (PIM1-b-PEO). This approach increased the influence ofPEO further by avoiding large parts/blocks of pure PIM-1.
Within the fourth path, PEO were built in as side chains to the PIM-1 main chain bycopolymerization with PEO substituted anthracene based maleimides. The synthesis of thesemaleimides followed the procedure published in [14]. The roof shaped tetrahydroxy-anthracenemonomers were employed in polycondensation reaction together with the PIM-1 antecessors.
The temperature is surely an important factor for permeability of polymeric structures,with permeability being the product of diffusivity and solubility of gases in polymers [15].While diffusion increases with rising temperature because of a higher mobility of the polymer chains,solubility usually decreases. However, PEG/PEO chains tend to crystallize with increasing molecularweight and crystallites do not contribute to permeability. At elevated temperature, these crystallites willmelt, influencing diffusivity and solubility favorably [10]. Therefore, we also include measurements ofgas permeability at elevated temperatures to inquire the influence of melting PEO chains.
2. Experimental
Methods
(1) For descriptions of Equipment used in NMR, FT-IR, SEC, TGA and DSC, see our former paper [14].
111

Membranes 2017, 7, 28
(2) Size Exclusion Chromatography (SEC) was performed in CHCl3 solution, detection by RefractiveIndex (RI) with polystyrene standards and/or Multi Angle Light Scattering (MALS) using dn/dcincrement measured at different concentrations by RI detection.
(3) Details of the synthesis of monomers and polymers are given in Supplementary Materials S1.(4) Details of the gas separation calculation are given in Supplementary Materials S2.
3. Results and Discussion
The aim of this study in polymeric membrane research is the combination of PIM-1, the rigidhydrophobic high flux polymer, with hydrophilic poly(ethylene glycol) (PEGs) of various polymerweights to form stable membranes of improved gas separation properties, especially for CO2.Low molecular PEGs are hydrophilic viscous liquids that are (in principle) quite permeable to gasesbecause of their very good solubility, e.g., for CO2, but obviously they lack the required mechanicalstability necessary for a useful membrane. Higher molecular PEGs (>1000 g/mol) are waxy solids,but their crystalline structure diminishes their permeability considerably [10].
In the following (Sections 3.1–3.4), four different approaches have been evaluated to combinePIM-1 with PEGs and PEO/PPO, described schematically in Table 1. In Section 4, a summary of thedifferent paths is given.
Table 1. Description and schematic (not true to scale) presentation of the four different approachesto combine PEG and PEO (ellipsoids) and PIM-1 (rectangles), physically mixed or chemically bound.Anthracene based copolymer (Section 3.4, Path 4) is depicted as triangle to distinguish from PIM-1.
Path 1 (Section 3.1) Path 2 (Section 3.2) Path 3 (Section 3.3) Path 4 (Section 3.4)
Blend membranes fromPIM-1 and different low
molecular PEGs
Quenching to form PEOend groups of PIM-1
chains
PIM1(X)-b-PEO(Y)—multiblockcopolymers
PEO/PPO in side chainof PIM1 copolymer
3.1. Blend Membranes (Path 1)
Our blending of PEGs in PIM-1 membranes is a similar approach that was already followedin [11] with a PEG of 20 kg/mol. In our study, however, we used PEGs of low molecular weight, 200,1000 and 2000 g/mol; PEGs were added in 5 and 10 wt % relative to polymer mass by dissolving inPIM-1 casting solutions (solvent CHCl3). The solvent was evaporated slowly in a nitrogen streamduring 24 h to allow a sufficient packing of polymer chains. Dense membranes of 70–100 μm thicknesswere formed. They are flexible and mostly transparent with exception of the blends with PEG-2000,these are slightly turbid, caused supposedly by some partial internal phase separation. However,by blending with even longer chained PEG of 20 kg/mol phase, separation was already observed at2.5 wt % [11].
The prepared membranes were measured with single gases (N2, O2, CO2, and CH4) in a time lagapparatus [16,17] at pressure differences below 1 bar. In the course of Path 1 we decided to compareto the measured values of a freshly prepared PIM-1 membrane originating from the identical PIM-1batch (Mw ca. 300 kg/mol, preparation at 150 ◦C as described in [18] procedure III) we used forall experiments of blending. To confirm that the blend membranes are (thermally) stable, TGA wasconducted before and after a time lag measurement cycle at different temperatures ranging from 20 to80 ◦C. Especially low molecular PEG-200 is sufficiently volatile to be squeezed out of the membrane byrepeated differences in pressure. However, less than 1% of the membranes weight was lost duringthe first time lag cycle measured with 4 different gases and temperatures up to 80 ◦C. These smalllosses could be easily explained by removal of some residual solvent. No further losses were observedduring repetitions of time lag cycle. These results are in stark contrast to the report on blends of
112

Membranes 2017, 7, 28
PEBAX® and PEGs of low molecular weight (<500 g/mol) losing about 30 wt % PEG during time lagmeasurement [13].
Additionally, we used TGA measurements up to 500 ◦C to estimate the actual blend compositionby the observed specific decompositions/weight losses of the PIM-1-PEG blends. While PIM-1 inArgon atmosphere is stable up to at least 430 ◦C, decomposition of the blending PEGs starts alreadybelow 400 ◦C. Therefore, the weight loss up to 400 ◦C was taken for a measure of the actual PEG content.Deviations from calculated compositions (5 and 10 wt %) were probably caused by the water contentof the “as received” PEG samples in use for blending or by solvent residues within the PIM-1 polymer.
Setup and details of gas separation measurements are given in Supplementary Materials S2.Gas separation measurements at 30 ◦C are presented in Table 2, together with the measured values forthe pristine PIM-1 we used for blending.
Table 2. Time lag measurements at 30 ◦C of four gases using membranes formed by blending PIM-1with different PEGs.
PEG-Content wt % d)Permeability (Barrer b)) Selectivity c)
N2 O2 CO2 CH4 O2/N2 CO2/N2 CO2/CH4
PIM-1 a) 0 360 1030 7160 590 2.8 19.9 12.1+ PEG-200 6.2 115 310 2335 199 2.7 20.2 11.7+ PEG-1000 5.3 120 361 2776 211 3.0 23.0 13.1+ PEG-2000 5.0 100 314 2513 177 3.2 25.5 14.2
+ PEG-200 10.0 40 122 1097 78 3.0 26.8 14.1+ PEG-1000 12.2 28 95 806 46 3.3 28.4 17.6+ PEG-2000 11.0 20 74 660 37 3.5 30.9 18.0
a) Mw ca. 300 kg/mol (SEC/MALS detector); b) 1 × 10⁻¹⁰ (cm3(STP)cm cm−2 s−1cm Hg−1); c) Calculated fromsingle gas measurements; d) Content of PEG as calculated from TGA.
As expected from the very different basic permeability of PIM-1 and PEG, the PEG-blendedmembranes showed a considerable reduction of permeability compared to the measured values ofpristine PIM-1 membrane. The reduction depends directly on the amount of PEG added. With ca. 5wt % of PEG added, the permeability was reduced to 30–40%, with ca. 10 wt % PEG the permeabilitydropped to 10–20% of the original PIM-1 value. From these results we concluded that addition of morethan 10 wt % PEG is inappropriate. Permeability reduction of CO2 and O2, however, was less severecompared to N2 and CH4 and therefore improved selectivity for CO2/N2 and for O2/N2 gas pairswere calculated by division of single gas measurements (see Table 2).
In Figure 1 are shown diffusivity (Figure 1a) and solubility coefficients (Figure 1b) of threeblended membranes (ca. 10 wt % of the three different PEGs) calculated from time lag experiments(see Supplementary Materials S2) and set in relation to the pristine PIM-1 (=100%). As expected,the solubility of CO2 is reduced less compared to O2, N2, and CH4 (Figure 1b). It is known thatenhanced solubility is the reason for the high flux of CO2 in PIM-1 and other polymers [19], and alsoin PEGs [13] while N2 has a low solubility in PIM-1 as well as in PEGs. Therefore, selectivity of CO2
over N2 increased up to a value of 30 at 10 wt % PEG content. The chain length of the PEGs affectedsolubility only slightly but with PEG-1000 in favor.
113

Membranes 2017, 7, 28
(a)
(b)
Figure 1. Calculated diffusivity (a) and solubility (b) of PIM-1 + PEG-blends (ca. 10 wt% PEGs) inrelation to plain PIM-1 (=100%); results of time-lag experiments with single gases at 30 ◦C.
Within PIM-1, membrane diffusion of O2 is highest (2.41 × 10⁻⁶ cm2/s) followed by CO2
(0.95) and N2 (0.86), while CH4 is slowest (0.35), and introduction of PEG does not change thisorder. All measured gases are affected quite evenly (Figure 1a). Diffusivity is higher in blendswith PEG-200 than in PEG-1000 and PEG-2000, caused probably by the absence of any crystallinitywithin the originally liquid PEG-200, the higher amount of the small PEG molecules and the hencebetter distribution of the small PEG-200 chains into the intrinsic microporosity of the PIM-1 ladders.The larger PEG molecules represent parts within the PIM-1 matrix that are of low permeability andconsequently slow down diffusion of all gases.
Blends of PIM-1/PEG-2000 were measured at different temperatures from 30 to 80 ◦C to inquirefor the influence of PEG crystallites. While PEG-200 is liquid, PEG-1000 and PEG-2000 are solidsand show distinctive melting points (40 and 54 ◦C, respectively). PEG-2000 has the highest Mw,a melting point of 53.8 ◦C and a crystallinity of ca. 70% was calculated from DSC (crystallinitycalculated after [20]). The blend of PIM-1 + 11 wt % PEG-2000 in DSC measurement showed a (slightly)lowered melting peak at 49 ◦C and a very low crystallinity (<1%). It was concluded that crystallizationof PEG-2000 was successfully inhibited within the PIM-1 matrix although the membrane was notfully transparent. Consequently, it was not expected to observe a deviation in thermal dependencyof permeability or diffusion when compared to PIM-1. In Figure 2, permeability of four gases attemperatures from 20 to 80 ◦C is depicted and the prospected melting region of PEG-2000 is marked bya grey zone. Permeability of N2, O2 and CH4 increase linearly with temperature, while permeabilityof CO2 decreases also linearly with T; the different behaviors caused by the considerable decreasingsolubility of CO2 within the polymer with rising temperature. As expected from measured crystallinity,the permeability showed no inconsistency in the curves depending on temperature.
Figure 2. PIM-1 + 11 wt% PEG-2000: Permeability of four different gases at temperatures up to 80 ◦C.Colored in grey is the melting region prospected for PEG-2000.
114

Membranes 2017, 7, 28
Because of the clearly different behavior of CO2 from the other measured gases, in Figure 3diffusion and solubility of CO2 in pristine PIM-1 and PIM-1 blended by 11% PEG-2000 versustemperature are compared. Solubility of CO2 (Figure 3, left side, triangles) in blended PIM-1 membrane(pale triangles) decreased exponentially from a high level and very similar compared to PIM-1 (darktriangles), at 80 ◦C only 20% of the solubility coefficient at 30 ◦C is left. According to the low degreeof crystallinity, diffusivity of CO2 could be described by exponential curves too (Figure 3, right side,squares). The increase in diffusivity from 30 to 80 ◦C is about 2.5 times for PIM-1 (dark squares) and4 times for the blended membrane (pale squares) involving the pronounced miscibility of PIM-1 andPEG-2000 at higher temperature. The other three gases, measured but not depicted, showed a similarbehavior in diffusion as well as a decrease in solubility but on a much lower level.
Gas permeation is clearly dominated by PIM-1, and the selective slow down by PEG results inbetter selectivity for the very soluble CO2 compared to N2 and CH4 (see Table 2).
At higher temperature, however, this effect is more than neutralized by the decreasing solubilityof CO2 (Figure 3).
Figure 3. Time lag measurement of CO2 with PIM-1 (dark color) and PIM-1 blended with 11 wt %PEG-2000 (light color): Diffusion (left, squares) and solubility (right, triangles) of CO2 dependingon temperature.
From these orienting results derived from blending PIM-1 and PEG, it was concluded thatthe amount of PEG should stay below 10 wt %, or even lower, to rescue a better part of the highpermeability of PIM-1. Introduction of PEG, even one as crystalline as PEG-2000, into PIM-1 membranedoes not change the temperature dependency of permeability and diffusion. Melting of PEG chainsseems to have no recognizable influence on permeation behavior. Consequently, further evaluation ofhigher temperatures was skipped for the following paths; all following measurements were performedat 30 ◦C.
3.2. Quenching to Form PEO End Groups of PIM-1 Chains (Path 2)
Path 2 to introduce PEG and PEO into PIM-1 polymer employed the use of PEG-substitutedtrihydroxy-benzoic compounds to terminate the PIM-1 polycondensation reaction. Details of synthesisare given in Supplementary Materials S1. PIM-1 was prepared as described in [1] by low temperaturepolycondensation reaction of equimolar amounts of 1 and 2 catalyzed by potassium carbonate (seeupper part of Scheme 1). The reaction runs smoothly and reproducibly in DMF at 55 ◦C. To achievea film and membrane forming polymer an average Mw of about 50 kg/mol is necessary and thisparticular molecular weight is obtained after ca. 3 h of reaction time. Usually, the polycondensationreaction would be terminated by precipitation in water or methanol restoring the hydroxy end groups.
115

Membranes 2017, 7, 28
By adding a compound, e.g., 1,2-dihydroxybenzene, as quencher, providing two aromatic hydroxylgroups, the chains’ growth would be stopped at the fluoro substituted ends. The fluoro end groups inthis case are quenched preferentially by the small and therefore more easily accessible molecules of thequencher instead of PIM-1 chains. To introduce PEG structures by this method, we prepared estersof different poly(ethylene glycol) monomethyl ethers and trihydroxybenzoic acid (3a–c) (Scheme 1)by standard synthetic procedures and used them for quenching. THBA provides the necessaryphenolic OH-groups to react as phenolate in alkaline solution with the PIM-1 fluoro ends. Within theseexperiments, THBA was chosen over dihydroxybenzoic acid (DHBA) to improve the availability ofhydroxy groups for quenching. Poly(ethylene glycol) monomethyl ethers with molecular weights of350 (3a), 750 (3b) and 5000 (3c) g/mol were employed. The latter one was included to improve theamount of PEG in comparison to a PIM-1 polymer of 50 kg/mol.
Scheme 1. Preparation of PIM-1-(THBA-PEG-OMe)2 polymers (4a–c) by termination of PIM-1polycondensation with THBA-PEG-OMe (3a–c).
A growing PIM-1 polymer chain has fluoro as well as hydroxy end groups; therefore, a simplequenching would lead to positioning of the quenching molecule at one end of each polymer chain.To improve the amount of end groups to be quenched by THBA-PEG-OMe (3a–c) most end groupsfavorably should be fluoro substituted. Unfortunately it is not feasible to run the reaction with aconsiderable excess of 2 from the start, while this leads to rather short chains of low molecular weightpolymer (8000 to 10,000 g/mol) without any film forming properties (compare to Section 3.3, Figure 5).Therefore, to achieve entire fluoro substitution on both ends of the polymer chains an additional smallamount of 2 was added after 3 h of reaction time to react for another 15 min with the already presentphenolates. The respective trihydroxy-benzoic acid-PEG-monoester 3 was added to the reactionsolution, stirred for another 0.5 h and the polymer was worked up as usual by precipitation in water.The isolated polymers PIM1-(THBA-PEG-OMe)2 (4a–c) are film forming and readily soluble in CHCl3.They were characterized by 1H-NMR, FT-IR, SEC with RI/MALS (multi angle light scattering) detector,TGA and DSC (see Polymerization example 3 in Supplementary Materials S1).
In 1H-NMR the signals of the PEG, –OCH2 groups at 3.6 ppm are clearly visible and the carboxylicgroup of the respective glycol esters is found at 1700 cm−1 in FT-IR. The molecular weights measured
116

Membranes 2017, 7, 28
by SEC are quite similar to PIM-1 prepared under identical conditions and within the usually observeddeviations (Mw = 48–55 kg/mol). Regarding the low molecular weights of PEG-350 and PEG-750,it was clear that the overall PEG content of polymers 4a–b is rather low, a considerable amount wasachieved only by adding PEG-5000 in polymer 4c. In TGA measurements, the decomposition of thePEO-containing polymers 4a–c was observed to identify the PEO-part of polymers 4a–c. While PIM-1 isstable up to 430 ◦C, decomposition of PEO-containing polymers starts already below 350 ◦C. Therefore,it seemed reasonable to use the weight loss up to 400 ◦C (splitting off of PEG-esters) for a measureof the PEO containing part. Measured mass changes of the first decomposition step, re-calculatedto the solely PEO content, are 0.6 (4a), 0.9 (4b) and 3.1 (4c) wt %. Calculation of PEG-contents via1H-NMR integrals of the polymers gave similar values for 4a of 0.5 and for 4b of 0.9 wt %. 4c wasdifficult to evaluate from 1H-NMR spectrum because of enclosed amounts of the quencher 3c. After aseries of washing steps, finally a content of 2.6 wt % was estimated. A probable reason for deviationfrom originally aspired higher content could be an only partly successful quenching; especially for thelong chained PEG-5000-OMe with its restricted mobility the reaction time was probably insufficient toquench all possible fluoro ends of PIM-1.
The polymers 4a–c were successfully formed into dense membranes by solution casting fromCHCl3. Gas permeability of the polymers 4a–c with four different gases at 30 ◦C were measured in thetime lag apparatus and presented in Table 3 in comparison to a freshly prepared PIM-1 membraneof comparable molecular weight (50 kg/mol). As expected by the low contents, the influence of thePEO end groups on gas permeation performance is quite small, especially for the low molecular PEGsadded in 4a and 4b. The gas permeability and selectivity for 4a and 4b changed only slightly comparedto a PIM-1 membrane prepared similarly.
Table 3. Time lag results at 30 ◦C for PIM-PEG-polymers 4a–c synthesized by quenching withPEG-esters of trihydroxybenzoic acid (3a–c) and compared to a freshly prepared PIM-1 membranesynthesized along the first part of Scheme 1.
PEG-Content wt % a,b) N2 O2 CO2 CH4 O2/N2 CO2/N2 CO2/CH4
PIM-1 (50 kg/mol) 0 530 1480 10,000 900 2.8 18.8 10.9Polymer (4a) 0.6 (0.5) 490 1360 9270 830 2.8 18.9 11.2Polymer (4b) 0.9 (0.9) 450 1265 8700 780 2.8 19.2 11.2Polymer (4c) 3.1 (2.6) 140 370 2210 270 2.7 15.8 8.2
a) Because of TGA measurements of the 1st decomposition step; b) In brackets: Calculated by 1H-NMR integrals.
By differentiating time lag measurements in diffusivity and solubility, it was found that 4a and 4b
had a slightly reduced diffusivity compared to PIM-1 but similar or even slightly enhanced (in caseof CH4) solubility (Figure 4). These results explain quite well the observed permeability. Polymer 4c,however, showed a serious reduction in permeability, and selectivity of CO2 over N2 was lower thanwith PIM-1 membrane. Despite its low content of PEO, it lost more than half of diffusivity and onethird of the solubility compared to PIM-1 values (Figure 4). However, diffusivity of N2 is affectedless than the other gases and this caused the lowered selectivity of CO2 and O2 on N2 compared toPIM-1. The long chain of PEO-5000 has an original crystallinity of more than 95%; the crystallinity ofquenching compound 3c is still at ca. 67%. From DSC measurements, a crystallinity of polymer 4c ofca. 1% was calculated (after [21]).
117

Membranes 2017, 7, 28
(a)
(b)
Figure 4. Diffusivity (a); and solubility (b) coefficients of polymers 4a–c, calculated from time lagmeasurements at 30 ◦C and set in relation to PIM-1 membrane (see Table 3).
To Summarize, the effect of the PEG-mono-esters (3a–c) as quenching compounds inpolycondensation and on PIM-1 performance is quite limited. The low molecular PEG-compounds3a and 3b react (quench) better because of their enhanced mobility in solution. Their achievedpermeability and selectivity are quite comparable to PIM-1. PEG-5000-ester 3c with its 100(O–CH2–CH2) repetition units is too large to gain a similar degree of substitution to PEG-350 andPEG-750. It reduces permeability, diffusion and solubility considerably, but not in the desired direction.
3.3. Formation of PIM-1-b-PEO Multiblock Copolymers (Path 3)
Within the polymers described in Path 2 (Section 3.2), the PIM-1 fraction is relatively largecompared to the PEG part, e.g., 50 kg/mol versus 0.2–5 kg/mol. While the PIM-1 fraction is already afilm forming polymer, the prepared PEO containing polymers represented a PIM-1 intercepted by moreor less small inclusions of PEO. Unfortunately, PEGs of high molecular weight, e.g., 50 kg/mol, arenot useful because of their high crystallinity and consequently very low permeability [10]. Therefore,on Path 3, we decided to reduce the chain length of PIM-1 to approximate the level of the used PEGs.Multiblock copolymers were formed by two consequent steps of polycondensation combining lowmolecular PIM-1 treated to end in fluoro groups and di-esters of dihydroxybenzoic acid formed withPEGs of different chain length (see Scheme 2).
Scheme 2. Preparation of PIM(X)-b-PEO(Y) multiblock copolymers in two reaction steps. Step 1:polycondensation with excess of 2 over 1 to achieve low molecular PIM-1 (1.1:1 = 8–10 kg/mol,and 1.025:1 = 20–30 kg/mol); and Step 2: polycondensation with DHBA-di-esters 5a–c.
118

Membranes 2017, 7, 28
The influence of excess of tetrafluoro-1,4-dicyanobenzene (2) on the molecular weight of theformed PIM-1 was examined in a series of polycondensations that ran exactly 3 h of reaction time at55 ◦C under identical conditions. The resulting PIM-1 polymers were dissolved in CHCl3 and measuredin SEC; achieved molecular weights were determined by two different detection modes: Refractiveindex (RI) and multi angle laser light scattering (MALS). The achieved molecular weights are depictedin Figure 5 as a function of the ratio of 2 versus 1 (detection: RI (squares) and MALS (triangles)). At anequimolar relation of hydroxy (OH) and fluoro (F)-groups and a moderate excess of K2CO3 (2.04 molar)the achieved molecular weight is in the range of 45 to 55 kg/mol with PDI of ca. 3, comparable to theresults of Guiver et al.: Mw of 65 kg/mol and PDI of 2.2 at 60 ◦C within 3 h [22]. An increase of therelation F:OH up to 1.025:1 (2.5% excess of 2 above 1) came out to about 20–30 kg/mol with PDI of 2.2to 3.2. A relation of F:OH = 1.1:1 (10% excess of 2) resulted in approximately 8–10 kg/mol, with PDIof 2. These results are fairly reproducible, by using the identical conditions, the respective molecularweight of the prepared PIM-1 can be directed by the ratio of F:OH monomers.
Figure 5. Molecular weight of PIM-1 prepared by polycondensation with excess of 2 above 1. Reactionconditions: K2CO3 (2.04 molar towards 1), 3 h at 55 ◦C in DMF. SEC measurements detected by RI(squares) and MALS (triangles).
Subsequently, low molecular PIM-1 of defined molecular weight reacted in a successive secondpolycondensation step at 55 ◦C, with one of di-esters 5a–c (Scheme 2) and catalyzed by an additionalamount of K2CO3. Monomers 5a–c were prepared from DHBA and poly(ethylene glycol) (200, 1000,and 2000 kg/mol) by standard method identical to monoesters in Section 3.2 (see SupplementaryMaterials S1. Monomer synthesis example 2). The slowly formed multiblock copolymers were namedPIM(X)-b-PEO(Y): X gives the approximately molecular weight of PIM-1, Y the molecular weightof the PEG as given by the manufacturer, both numbers representing kg/mol units. Progress of thereaction was followed by sampling and subsequent analysis in SEC (see below). The reactivity of thePEG- di-DHBA-esters 5a–c as tetrahydroxy component in polycondensation reaction is definitely lowercompared to 1 and therefore reaction times needed to obtain film forming polymers (Mw of at least40 kg/mol) turned out to be longer than with PIM-1(1–14 days). Final work up of polycondensationreactions was by precipitation in water, filtering and drying at 60 ◦C (see Supplementary Materials S1.Polymerization example 4).
3.3.1. SEC of PIM(25)-b-PEO(2)
In Figure 6 are depicted typical SEC measurements of samples taken during an extendedpoly-condensation resulting finally in PIM(25)-b-PEO(2) with rather high molecular weight. These
119

Membranes 2017, 7, 28
samples were prepared by precipitation in water and worked up either by extraction with CHCl3(samples from the start) or by direct filtration. All samples were measured in SEC (liquid phase CHCl3).Black lines show the eluted volumes, differentiated by reaction time and detected by RI, the red lineswere results of MALS detection. The black line at the bottom of Figure 6 (PIM-1 reactant) representsthe starting PIM-1 sample with F-end groups and approximately 20–25 kg/mol with a broad peakat 16–17 mL eluted volume. Monomer PEG-2000-di-DHBA-ester (5c) was added and after 60 minthe next black line was measured. During progress of reaction the initial PIM-1 peak broadenedtowards lower elution volume (=higher molecular weights). Additional samples were drawn after10 h, 45 h and 75 h of reaction time. Finally, the product is represented by the black line on top ofFigure 6. Distribution of molecular weights is very broad. The final Mw measured by RI detection wascalculated by universal calibration (polystyrene (PS)) standards to average 380 kg/mol with quite largedeviations. However, a basic problem with RI detection is the universal calibration by polystyrenestandards. The contorted structure of PIM-1 (and the similar polymers in our study), introduced by thespiro-formation of 1, is the reason for the apparent intrinsic microporosity by hindering the polymerchains to pack efficiently and thus forming molecular nano-sized pores in between the chains. As theproduct of a polycondensation reaction, PIM-1 shows a rather broad mixture of different chain lengths(PDI >> 1), therefore many deviations towards higher and also lower molecular weights. Averagemolecular weight of polymers is usually estimated by SEC on calibrated separation columns andin most SEC labs the universal calibration by commercial available PS standards and detection byrefraction index (RI) and/or UV signals is the acknowledged standard method. Separation on SECcolumns also depends on the hydrodynamic volume of the polymers and PIM-1 with its contortedstructure is quite different from PS. Therefore, this standard method provides not always reliablemolecular weight values. However, from SEC measurements at different concentrations and detectionby RI the determination of the refractive index (RI) increment dn/dc is available comparing thedeviation from respective PS standards. Using the dn/dc value measured for the employed polymers,it is possible to detect also by Multi Angle Light Scattering (MALS) (method see for example [23])and to achieve more reliable molecular weight values for PIM-1 and the structural variations that aredescribed in this study.
The red lines in Figure 6 display the detection of the identical samples by MALS, the final product(on top) was calculated to 130 kg/mol/PDI 1.1 by MALS using the measured value of dn/dc = 0.174.The results for Mw and Mn obtained by MALS detection are in most cases more reasonable than thoseby RI detection. Although, during these experiments it was also observed that detection by MALSis of rather low sensitivity to molecular weights below ca. 15 kg/mol. The first two red lines in acomparable experiment to produce PIM(10)-b-PEG(1) (sample of low molecular PIM-1 and reactionafter 60 min) show even lower intensities above 18 mL of elution volume compared to RI signals. Therestricted sensitivity of the laser light for small polymer molecules explains also the rather low valuesof PDI (1.1 to 2.1) calculated from Mw and Mn estimated by MALS in comparison to PDI values of 3 to>10 calculated from RI detection. Therefore, it was decided to follow polycondensation reactions by acombination of RI and MALS to get the complete information.
All prepared PIM(X)-b-PEG(Y) multiblock copolymers were characterized by 1H-NMR, FT-IR,SEC with RI/MALS detector, TGA and DSC (see Supplementary Materials S1). In 1H-NMR the signalof PEO at 3.6 ppm is clearly visible and because of the relatively high PEO-diester content, compared toPath 2 in Section 3.2, also the aromatic protons of DHBA (>7 ppm) as well as the ester COOCH2 groupat 3.8 ppm are detected. The integrals of the PIM-1 block (two singlets at 6.8 and 6.4 ppm representingthe aromatic hydrogen of spirobisindane 1) and of the PEO block (OCH2 at 3.6 ppm) are sufficientlyseparated to allow calculation of the approximate content of PEO within the polymers (see Table 4).All synthesized polymers are eventually film forming; SEC analysis (MALS) proved Mw to be in therange of 45 up to 70 kg/mol with PDI of 1.1–2.1 (Table 4).
120

Membranes 2017, 7, 28
Figure 6. SEC during polycondensation of PIM(10)-b-PEO(1); detection by RI (black lines) and byMALS (red lines).
Table 4. PEO content by 1H-NMR and TGA, molecular weight of film forming polymers by SEC andMALS detection, and measured crystallinity of multiblock copolymers PIM(X)-b-PEG(Y) from DSC.
MultiblockCopolymer a,b)
Intended PEOContent wt %
PEO Content(1H-NMR) wt %
PEO Content(TGA) wt %
Mw (MALS)kg/mol
PDICalc.
Crystallinity(DSC) %
PIM(10)-b-PEO(0.2) 2 2.5 2.5 n.m. 0.06PIM(10)-b-PEO(1) 9 10.8 9.3 67 1.3 0.7PIM(10)-b-PEO(2) 16 n.m. 18 41 2.1 n.m.PIM(25)-b-PEO(0.2) 1 1.2 1.6 57 1.1 0.08PIM(25)-b-PEO(1) 4 3.6 4.1 43 1.3 0.11PIM(25)-b-PEO(2) 7 7 7.5 44 1.1 0.14
a) Mw of PIM-1 was roughly estimated by reaction time and excess of TFTDN (see Figure 5); b) Mw of PEG as givenby deliverer.
The approximate PEO content of the multiblock copolymers was calculated also from TGAmeasurements: A 1st (minor) weight loss step up to 200 ◦C was caused by the loss of some adsorbedwater and residual solvent, while the PEO-containing DHBA-diester block disintegrates in the 2ndstep between 250 ◦C and 400 ◦C. Depending on the PEG chain included, the 2nd weight loss step wasconverted to the solely PEO content, e.g., the polymer block with monomer 5a (PEG-200) contains
121

Membranes 2017, 7, 28
42% PEO, 5b (PEG-1000) 78% and 5c (PEG-2000) 88%. A 3rd step above 450 ◦C marked the finaldecomposition of the PIM-1block.
From DSC measurements the crystallinity was calculated (Table 4). Multiblock copolymerswith PEO-200 showed a very low crystallinity below 0.1%, with PEO-1000 and PEO-2000 thecrystallinity was still below 1%, which proves the quite even distribution of the blocks within therespective polymers.
All prepared multiblock-copolymers are sufficiently soluble in CHCl3 to allow the formationof dense membranes by solution casting. However, the resulting membranes are rather brittle andnot as flexible as PIM-1. They required membrane thicknesses of 70 to 100 μm to withstand thepressure difference in time lag apparatus. Permeability and selectivity results of PIM-b-PEG multiblockcopolymer membranes at 30 ◦C are presented in Table 5. A direct comparison to a respective PIM-1membrane is not possible because neither PIM-1 of 10 nor 25 kg/mol is film forming. PIM(10)-b-PEO(2)
was prepared solely to check the feasibility of the polycondensation reaction, the PEO content of16–18 wt % is definitely too high for tests in gas separation and these membranes are therefore notincluded in Table 5.
Table 5. Permeability and selected selectivity of PIM-b-PEG multiblock copolymers of different PEOcontent from time lag measurements with four gases at 30 ◦C.
Multiblock Copolymers PEG wt %Permeability (Barrer) Selectivity
N2 O2 CO2 CH4 CO2/N2 O2/N2 CO2/CH4
PIM(25)-b-PEO(0.2) 1.6 260 700 5240 480 20.1 2.7 10.9PIM(10)-b-PEO(0.2) 2.5 250 650 4660 420 18.6 2.6 11.1PIM(25)-b-PEO(1) 4.1 200 520 3830 330 19.1 2.6 11.6PIM(25)-b-PEO(2) 7.5 150 380 2690 250 18.0 2.5 10.8PIM(10)-b-PEO(1) 9.3 140 370 3000 270 22.3 2.8 11.1
In Figure 7, permeability of the usual set of four gases is depicted versus the approximate PEOcontent and turned out to be in good linear dependency. A graphical extension to 0% of PEO leadsto quite reasonable permeability of 300 (N2), 800 (O2), 5800 (CO2) and 500 (CH4) Barrer for thehypothetical PIM-1 block and matches approximately the values of PIM-1 membrane mentioned inTable 2.
Figure 7. Permeability of 4 different gases depicted versus PEO content (values from TGA, see Table 4)in PIM-b-PEO multiblock copolymers, measured in time lag apparatus at 30 ◦C. Left: Permeability ofN2, O2, CH4; right: CO2.
122

Membranes 2017, 7, 28
PIM(25)-b-PEO(0.2) represents the lowest PEO content (ca. 1 wt %) and showed rather highpermeabilities, e.g., more than 5000 Barrer of CO2. The separation behavior is also similar to PIM-1with separation factors of 20 for CO2 over N2 and 10.9 for CO2 over CH4. With rising content ofPEO up to 7–9 wt % permeability decreased to about a half of the 1 wt % PEO value but selectivityat higher PEO-contents increases only slightly (see Table 5, right side). Differentiating the time lagmeasurements into diffusion and solubility gives the already expected result that diffusion is linearlyreduced with rising PEO content for all four measured gases. Solubility coefficients, however, stayedalmost the same with O2 and N2 (ca. 0.02), while the solubility of CH4 (0.1–0.12) as well as solubilityof CO2 (0.50–0.60 cm3/(cm3 bar)) increased slightly.
3.4. Path 4: PEG as Side Chain in PIM-1-Copolymer
To introduce a PEG side chain into a PIM-1-copolymer we used the monomer tetrahydroxy-9,10-dibutylanthracene (6) as vehicle and added maleimides to 6 in a similar chemistry as published recentlyby Khan et al. [14]. 6 is easy to prepare, although in low yield (ca. 25%), from 1,2-dimethoxybenzeneand pentanal following the synthesis described in [23] using pentanal instead of acetaldehyde. It showsgood solubility in many common solvents, caused presumably by the butyl substitution in 9,10-position.Methyl substitution in the related tetrahydroxy-9,10-dimethylanthracene resulted in a hardly solublecomponent [14].
By Diels–Alder-reaction at elevated temperature anthracene 6 offers the possibility to add adienophilic substituted double bond (see Scheme 3). Maleimide-(PEO)44 7a ( Specific Polymers,Castries, France) is commercially available and has a molecular weight of 2032 g/mol providing a PEOchain of 1936 g/mol. The maleic double bond adds successfully to tetrahydroxy-monomer 6 at 140 ◦Cin 24 h and with a good yield (90%). The product of cycloaddition, monomer 8a, was characterized by1H-NMR, IR, TGA and DSC (see Supplementary Materials S1); it shows a distinctive melting point of46 ◦C determined by the long PEO side chain.
Scheme 3. Preparation of tetrahydroxy-monomers 8a and 8b, and in the following polycondensationto PIM1-co-8a and PIM1-co-8b (55 ◦C in DMF/3–5 days).
123

Membranes 2017, 7, 28
Tetrahydroxy-monomer 8b was prepared analogously by Diels–Alder addition of maleimide-methoxypolypropylene glycol (7b), with a PPO chain of ca. 600 g/mol, to 6 (see Scheme 3).7b was synthesized by a low temperature method [24] from commercially available Jeffamine®-M600(Huntsman, Germany) and maleic anhydride. It has a molecular weight of 677 g/mol and adds to 6 atsimilar conditions as mentioned above. 8b was obtained in 70% yield as highly viscous oil and wasalso fully characterized by 1H-NMR, FT- IR, TGA and DSC (see Supplementary Materials S1).
Both components 8a and 8b were successfully employed as comonomers in PIM-1polycondensation in various relations to 1. Reaction conditions are similar to PIM-1 polycondensationbut with prolonged reaction times of at least three days at 55 ◦C to achieve a film forming polymer(see Supplementary Materials S1. Polymerization example 5). Introduction of the long hydrophilic PEOchain changes the quality of the (co)polymer decisively, e.g., copolymers with content of 8a higher than40 wt % became in fact water soluble and too soft for membrane formation. However, the experienceof the Paths 1–3 suggested a desirable PEG content below 10 wt % to avoid exceeding reduction ofgas permeability. Therefore it required only 2.5 mol-% of 8a for tetrahydroxy component togetherwith 1 in polycondensation with 2 to obtain a calculated overall PEO content of 9.4 wt %. The meltingpoint of the long PEO chain of 8a was also observed in DSC measurement of the formed copolymerPIM1-co-8a-1.
Within copolymer PIM1-co-8a-1 averagely every 40th molecule of 1 is substituted by 8a.Nevertheless, in FT-IR the O-C stretching at 1100 cm−1 can be seen perfectly, filling in a gap within thePIM-1 spectrum. 1H-NMR spectrum shows the prominent OCH2 singlet at 3.64 ppm, but because ofthe low molar quantity of 8a only OCH2 is visible, while the aromatic and aliphatic hydrogen peaks of8a are overlaid by PIM-1. For reasons of comparison and without any impact of 8a the singlet of PIM-1at 6.42 ppm was suited best for calculation of composition, integration estimates the PEO content to2.7 mol %. From the 1st step of decomposition in TGA at an onset of 377 ◦C, about 9.1 wt% weightloss was identified that represents the Retro-Diels–Alder reaction splitting off the maleimide-PEO7a, corrected to PEO a content of 9 wt % was estimated. SEC with MALS detection (dn/dc = 0.2611)revealed molecular weight of ca. 40 kg/mol and PDI of 1.4. Transparent membranes were formed fromCHCl3 solutions of this copolymer; they are quite stable and were measured in time lag apparatuswith the usual set of four gases (results in Table 6).
Table 6. Time lag measurements of PIM-copolymers 8a,b with PEO and PPO in side chain at 30 ◦C.
PolymerPEO/PPO-Content
(TGA) wt%
Permeability (Barrer) Selectivity
N2 O2 CO2 CH4 O2/N2 CO2/N2 CO2/CH4
PIM-co-8b-1 6.0 110 400 2650 160 3.6 24.1 16.5PIM-co-8b-2 8.6 73 230 1735 123 3,2 23.8 14.1PIM-co-8a-1 9.0 64 190 1570 107 2.9 24.5 14.7
Monomer 8b contains a shorter chain of about 600 g/mol that additionally introduce a branchingoriginating from its polypropylene glycol (PPO) basis. It should be less hydrophilic than poly(ethyleneglycol). It was added in 5 and 10 mol % of tetrahydroxy component in PIM-polycondensation,resulting in copolymers of 6 and 11 wt% calculated PPO content (PIM1-co-8b-1 and PIM1-co-8b-2),respectively. In 1H-NMR spectrum the multiplet between 3.36 and 3.6 ppm covers OCH2, CH as wellas OCH3 signals within the PPO-chain. Compared to the singlet of the PIM-1unit at 6.42 ppm, the PPOcontent was calculated to 4.5 mol % (PIM1-co-8b-1) and 8.8 mol % (PIM1-co-8b-2). Furthermore,TGA measurements include the Retro-Diels–Alder reaction as the loss of maleimide 7b (observedas a first weight loss step below 400 ◦C), re-calculation to PPO content yielded 6.0 wt % PPO inPIM1-co-8b-1 and 8.6 wt % PPO in PIM1-co-8b-2, respectively. These latter values are included inTable 6. Both new copolymers dissolve easily in CHCl3. SEC was measured with MALS detection to46 kg/mol and 42 kg/mol, with PDI = 1.2 for both polymers. By casting from CHCl3 solution, stablemembranes could be formed.
124

Membranes 2017, 7, 28
Gas permeability of PIM-copolymers with PEO and PPO in side chain was measured at 30 ◦C intime lag apparatus; results are presented in Table 6. Caused by the quite high PEO/PPO content of 6–9wt %, permeability is low and selectivity is enhanced compared to a pristine PIM-1 membrane,as presented in Table 2. The difference between PEO and PPO is not very pronounced whenconsidering that a PPO chain of 600 g/mol in 8b is rather short compared to the PEO chain ofca. 2000 g/mol in 8a. The low permeability is caused primarily by a reduction to 30–40% diffusivity(see Figure 8a, directly compared to PIM-1 value given in Table 2), as was already observed withinPath 1. Solubility is affected less, especially for CO2 and CH4 (Figure 8b).
(a)
(b)
Figure 8. Diffusivity (a); and solubility coefficients (b) of polymers PIM-CO-8, calculated from timelag measurements at 30 ◦C and in relation to pristine PIM-1 membrane (in Table 2).
4. Summary of All Approaches
Permeability of PIM-1 membrane in gas separation depends on several variables such as process ofpreparation and casting solvent [22], as well as pre-/treatment [25]. Values, e.g., for CO2 permeabilityat 20–30 ◦C have been presented in the literature, ranging from 2300 Barrer [4] to 12,600 Barrer [5].We also observed the phenomenon that was already mentioned by Guiver et al. [22] that PIM-1membranes prepared from CHCl3 or CH2Cl2 have definitely higher permeability than those madefrom tetrahydrofurane or dichlorobenzene under otherwise identical conditions. To exclude differenceson this account, all membranes in our study were cast from the same solvent and, fortunately, we coulduse CHCl3 for all membranes. As with most high flux glassy polymers, a severe ageing/compactionover time takes place reducing permeability significantly within a rather short measure of time [26].Actually, we measured permeability of N2 and O2 of several membrane examples from our study forat least 100 h but observed a quite similar ageing behavior like PIM-1. However, ageing of PIM wasnot the task of our study and would have gone beyond the scope of this article.
Apparently, it is all together no easy task to define a base line to rank newly developed membraneson PIM-1 basis. In this study, we referred to PIM-1 mostly to directly measure equivalent values (Path 1)or chose a fresh batch of PIM-1 prepared under identical conditions (Paths 2 and 4). In the case ofPath 3, we had no reference value; therefore, we referred to the lowest concentration of PEO and to thegraphical reduction of measured permeability to 0% of PEO. All membranes were measured as soonas possible after casting to avoid a noticeable influence of ageing effects.
The outstanding of the four gases examined in this study with new combinations of PIM-1 andPEG and PEO/PPO is CO2, displaying the highest permeability because of a high solubility in PIM-1as well as in PEG. The other measured gases, N2, O2, and CH4, follow the behavior of CO2 on regardof diffusivity on a similar level, but they are much less soluble.
In Figure 9, a summary of all paths is presented, comparing CO2 permeability of PEG/PEO/PPOcontaining membranes by means of the actual PEG/PEO/PPO content. Addition of trend lines leadsthe eyes and allows consequently comparison of all approaches to combine PIM-1 and PEG/PEO/PPO.Two data points for pristine PIM-1 permeability are included (from Tables 2 and 3), these both already
125

Membranes 2017, 7, 28
displaying the variety of measured CO2 permeability of PIM-1 membranes under research. In Figure 9,it is obvious that every substantial addition of PEG or PEO to PIM-1 leads to a linear reduction inmembrane permeability, caused by the low permeability of PEG(s) in comparison to the superiorproperties of PIM-1. Differences within the paths are diminishing with increase of PEO content towardsand above 10 wt %. An amount of PEO above 10 wt % reduces permeability of CO2 clearly below 1000Barrer and consequently the other gases in our study were reduced below 100 Barrer. Nevertheless,the effect of an increased hydrophilicity of produced membranes is noticeable in all four paths.
Figure 9. Graphical summary of all approaches compares measured CO2 permeability (time lag,single gases, 30 ◦C) versus PEG and PEO/PPO-content from this work: blends with PEG-200 andPEG-2000 (dark squares), quenched polymers (crosses), multiblock-copolymers (triangles), and sidechain-copolymers (circles). Data from [11] are also included: Blends of PIM-1 with PEG 20 kg/mol(pale squares).
The very low addition (<<1 wt %) in case of Path 2 (Figure 9, crosses) seems not substantialenough to change the permeability of PIM-1 noticeably. Without the quenching by dihydroxybenzoicesters 3a–b but simply precipitating in H2O membranes made of this PIM-1 batch showed about10,000 Barrer of CO2 and a selectivity of ca. 19 for CO2/N2 and that did not change by quenchingwith 3a–b (Table 3). The high values of permeability of these membranes are achieved by a shortreaction time in polycondensation and a rather low molecular PIM-1 of ca. 50 kg/mol. By addinga large PEO chain like PEG 5000 (3c) resulting in polymer 4c the influence of PEO on permeabilitybecomes definitely visible by a severe decrease to less than 3000 Barrer CO2. The low selectivity ofpolymer 4c for CO2/N2 of ca.16, however, points to a similar phase separation by extended regionsof PEG as in [11] when a blend of PIM-1 with 2.5 wt % PEG-20000 (pale squares) has a still quitehigh permeability of CO2 of ca. 2300 Barrer but also a rather high permeability of N2 of 140 Barrer.Although, the membranes prepared from polymer 4c were optically rather transparent.
Preparation of blends of PIM-1 and different PEGs (Path 1, Figure 9, dark squares) is surelythe simplest method to combine PIM-1 and PEG. Membranes prepared from the physical mixtureswithin Path 1 behave quite similar: With increasing PEG content, permeability of all measured gasesdecreased and selectivity of CO2/N2 increased slightly (from 18 up to 30). Influence of PEG chainlength of the employed PEGs between 200 and 2000 g/mol in our study is not very pronounced andcan be distinguished merely in high resolution of the graphs. Wu et al. [11] presented only one blendmembrane with a content as high as 5 wt % but prepared with PEG-20,000 (Figure 9, pale squares).Permeability of CO2 of this membrane (2550 Barrer) is comparable to our own blend with 5 wt %PEG-2000 (2500 Barrer, Figure 9, dark square) but permeability of N2 (200 Barrer) is higher withPEG-20000, resulting in a selectivity of CO2/N2 = 12, compared to 25 with PEG-2000 (N2 permeability100 Barrer) in our study. Their experiments in consequence concentrated on low amounts of PEG-20000
126

Membranes 2017, 7, 28
to save a better part of PIM-1 permeability. It should be mentioned that they used a PIM-1 of lowerinitial permeability, which explains the shift to lower permeability in Figure 9 (pale squares) comparedto our results. Nevertheless, they achieved lower selectivity of CO2 with respect to N2 in the range of16–12, obviously reducing N2 permeability less than CO2 by addition of high molecular PEG. Thiscould be caused by the formation of separated phases within the membranes forming nanochannelsthat discriminate only larger molecules like CH4. The remarkable found of their work indeed was anincrease of selectivity for CO2 over CH4 up to 39, compared to a selectivity of 10–12 of pristine PIM-1.The low molecular PEGs in our work allow a continuous membrane phase in most cases with a similarreduction of all measured gases in diffusion, compensated by an only moderate reduction of solubilityof the highly soluble CO2. Therefore, selectivity of CO2/CH4 is influenced only moderately up to avalue of 14, except the blend with PEG-2000 that reached a value of 18.
Graphical prolongation of the trend lines of our experiments with PEG-200 and PEG-2000 to 0%of PEG leads to 4000 to 4300 Barrer of CO2, while the original PIM-1 batch had shown a permeabilityof more than 7000 Barrer. The dependency of P on addition of PEG and PEO seems to be non-linear atlow amounts as the experience of Path 2 already pointed to.
Multiblock copolymers PIM(x)-b-PEO(Y) contain PIM-1 parts of quite low molecular weight (10and 25 kg/mol) and blocks of even smaller PEO (0.2, and 1.2 kg/mol), but these blocks are dividedevenly among the polymer chain without a chance of phase formation. Pure PIM-1 polymers of lowmolecular weight like that are not film forming therefore no comparable membranes could be provided.In Figure 9 multiblock copolymers (triangles) show the highest permeability of all paths on regard ofthe PEO content. At ca. 5 wt % of PEO a multiblock copolymer membrane would show 3500 Barrer ofCO2, about 1000 Barrer more than a membrane made from PIM-1-PEG blend of similar PEG chainlength. A graphical prolongation to 0% PEO achieved about 5600 Barrer CO2 of the remaining PIM-1polymer, a value definitely higher than that calculated from the PEG blended membranes in Path 1.
PEO and PPO introduced as a side chain was described in Path 4, using the different co-monomers8a and 8b to partly substitute tetrahydroxyspirobisindane (1) in PIM-1 polycondensation. The roofshaped bridged anthracene introduced an additional bend angle to the already contorted PIM-1 chainas described in [27]. PEO and PPO side chains fixed to the ethane bridge adding up to 6 to 10 wt% PEOand PPO within the copolymers PIM1-co-8a and PIM1-co-8b, respectively. Obtained permeabilityis located within the values measured on Path 1 and Path 3. PEO and PPO chains are of limitedmobility as in Path 3 but pure PIM-1 parts within are quite large and therefore these polymers aremore comparable to Path 1.
In Figure 10 is depicted exemplarily a section from Robeson’s plot (the “upper bound” of 2008 [6]represented by the black line) for selectivity of CO2/N2 versus permeability of CO2 at 30 ◦C. Includedare only PIM-1 values from our study, one of them is above the upper bound, one below. Permeabilityof our PIM-1–PEO combinations is reduced compared to the pristine PIM-1 and therefore, followingRobeson’s trade-off, an increase in selectivity for CO2/N2 distinctively above 20 is achieved in mostcases, however, by relinquishing a considerable part of permeability (Figure 9). Diagrams made up forCO2/CH4 (increase in selectivity from 10 up to 14–18), or O2/N2 (increase in selectivity from 2.8 upto 3.5) (neither shown) provide identical information but on a much lower (as well permeability asselectivity) level.
127

Membranes 2017, 7, 28
Figure 10. Selectivity of CO2/N2 versus permeability of CO2 at 30 ◦C: blends with PEG-200/-2000(dark squares), quenched polymers (crosses), multiblock-copolymers (triangles), side chain-copolymers(circles), and, for comparison data, from [11]: Blends of PIM-1 with PEG 20 kg/mol (pale squares).The depicted section of Robeson’s upper bound for CO2/N2 was extracted from [6].
5. Conclusions
In our study, we tested four different paths to combine PIM-1 with up to 10 wt % PEG andPEO/PPO to enhance the hydrophilicity of the mixed polymer considerably. Physical mixtures andnew, chemically linked polymers were successfully formed into free standing dense membranes andmeasured in single gas separation of N2, O2, CO2 and CH4 in time lag method. Melting of long PEGchains (2–5 kg/mol) at elevated temperatures up to 80 ◦C had no observable influence on permeability;further measurements were performed at 30 ◦C.
Permeability was lowered by any substantial addition of PEG/PEO/PPO, almost regardless themanufacturing process and quite proportional to the added amount. It can be stated that roughly about6 to 7 wt % of PEG/PEO/PPO in PIM-1 combination halved the permeability of the original PIM-1membrane. Selectivity calculated from single gas measurements increased slightly up to values ofabout 30 for CO2/N2, a maximum of 18 for CO2/CH4 and 3.5 for O2/N2. In all combinations, PIM-1 isthe highly permeable part and obtained gas fluxes are defined by the amount and the distributionof PEG and PEO. Blending of PIM-1 and PEGs of different chain length led to phase separation athigher concentrations of PEGs and an even lower selectivity than with PIM-1. An even distributionwithin the multiblock copolymers PIM(X)-b-PEO(Y) resulted in slightly higher permeability at similarconcentration than a PEO part with a long chain, as in 4c or PIM1-co-8a.
By differentiating permeability in diffusivity and solubility, it was shown that addition ofPEG/PEO/PPO affected diffusivity of all measured gases quite uniformly. Solubility of CO2, O2,and CH4, however, was reduced less than solubility of N2 resulting in increased selectivity for theformer gases. Concentration optimum for the combination of PIM-1 and PEO between gainingsolubility for selected gases and losing not too much permeability for all gases under consideration isin the range of 2–5 wt % PEO.
For perspective, these modified PIM-1 membranes of enhanced hydrophilicity should be usefulin other membrane techniques such as nanofiltration and pervaporation, by combining the very goodchemical resistance of PIM-1 with a selective permeance because of a higher hydrophilicity. Additionand even distribution of nanoparticles or other more polar fillers should also be facilitated in presenceof PEG chains.
128

Membranes 2017, 7, 28
Supplementary Materials: The following are available online at http://www.mdpi.com/2077-0375/7/2/28/s1,S1: Synthesis of Monomers and Polymers, S2: Gas Separation.
Acknowledgments: The authors want to thank Silke Dargel for her valuable work in lab, and Petra Merten andMaren Brinkmann for performing many SEC measurements. Muntazim Munir Khan is thanked for provision oftetrahydroxy-9,10-dibutylanthracene (6).
Author Contributions: Gisela Bengtson and Volkan Filiz conceived and designed the experiments;Silvio Neumann performed the experiments, Gisela Bengtson and Silvio Neumann analyzed the data;Gisela Bengtson and Volkan Filiz wrote the paper.
Conflicts of Interest: The authors declare no conflict of interest.
References
1. Carta, M.; Clarizia, G.; Jansen, J.C.; McKeown, N.B. Gas Permeability of Hexaphenylbenzene Based Polymersof Intrinsic Microporosity. Macromolecules 2014, 47, 8320–8327. [CrossRef]
2. Budd, P.M.; Makhseed, S.; McKeown, N.B.; Msayib, K.J.; Tattershall, C.E. Polymers of intrinsic microporosity(PIMs): Robust, solution-processable, organic nanoporous materials. Chem. Commun. 2004, 230–231.[CrossRef] [PubMed]
3. Budd, P.M.; Elabas, E.S.; Ghanem, B.S.; Makhseed, S.; McKeown, N.B.; Msayib, K.J.; Tattershall, C.E.; Wang, D.Solution processed, organophilic membrane derived from a polymer of intrinsic microporosity. Adv. Mater.2004, 16, 456–459. [CrossRef]
4. Budd, P.M.; Tattershall, C.E.; Ghanem, B.S.; Reynolds, K.J.; McKeown, N.B.; Fritsch, D. Gas separationmembranes from polymers of intrinsic microporosity. J. Membr. Sci. 2005, 251, 263–269. [CrossRef]
5. Budd, P.M.; Ghanem, B.S.; Msayib, K.J.; Fritsch, D.; Starannikova, L.; Belov, N.; Sanfirova, O.; Yampolskii, Y.;Shantarovich, V. Gas permeation parameters and other physicochemical properties of a polymer of intrinsicmicroporosity: Polybenzodioxane PIM-1. J. Membr. Sci. 2008, 325, 851–860. [CrossRef]
6. Robeson, L.M. The upper bound revisited. J. Membr. Sci. 2008, 320, 390–400. [CrossRef]7. Brinkmann, T.; Pohlmann, J.; Wind, J.; Wolff, T.; Esche, E.; Müller, D.; Wozny, G.; Hoting, B. Pilot scale
investigations of the removal of carbondioxide from hydrocarbon gas streams using poly(ethyleneoxide)–poly(butylene terephthalate)PolyActiveTM) thin film composite membranes. J. Membr. Sci. 2015, 489,237–247. [CrossRef]
8. Freeman, B. (Ed.) Membrane Gas Separation; Wiley: Chichester, UK, 2011; p. 265.9. Car, A.; Yave, W.; Peinemann, K.-V. PEG modified poly(amide-b-ethylene oxide) membranes for CO2
separation. J. Membr. Sci. 2008, 307, 88–95. [CrossRef]10. Freeman, B.D.; Lin, H. Gas solubility, diffusivity and permeability in poly(ethylene oxide). J. Membr. Sci.
2004, 239, 105–117.11. Wu, X.M.; Peng, J.L.; Qu, Y.; Zhu, A.M.; Liu, Q.L. Towards enhanced CO2 selectivity of the PIM-1 membrane
by blending with polyethyleneglycol. J. Membr. Sci. 2015, 493, 147–155.12. Metz, J.; Wessling, M. Gas-Permeation Properties of Poly(ethylene oxide) Poly(butyleneterephthalate) Block
Copolymers. Macromolecules 2004, 37, 4590–4597. [CrossRef]13. Lillepärg, J.; Shishatskiy, S. Stability of blended polymeric materials for CO2 separation. J. Membr. Sci. 2014,
467, 269–278. [CrossRef]14. Khan, M.M.; Neumann, S.; Rahman, M.M.; Abetz, V.; Filiz, V. Synthesis, characterization and gas permeation
properties of anthracene maleimide-based polymers of intrinsic microporosity. RSC Adv. 2014, 4, 32148–32160.[CrossRef]
15. Wijmans, J.G.; Baker, R.W. The solution-diffusion model: A review. J. Membr. Sci. 1995, 107, 1–21. [CrossRef]16. Al-Ismaily, M.; Kruczek, B. A shortcut method for faster determination of permeability coefficient from time
lag experiments. J. Membr. Sci. 2012, 423–424, 165–179. [CrossRef]17. Mason, C.R.; Al-Harbi, N.M.; Budd, P.M.; Bernardo, P.; Bazzarelli, F.; Clarizia, G.; Jansen, J.C. Polymer of
Intrinsic Microporosity Incorporating Thioamide Functionality: Preparation and Gas Transport Properties.Macromolecules 2011, 44, 6471–6479. [CrossRef]
18. Fritsch, D.; Carta, M.; McKeown, N.B. Synthesis and Gas Permeation Properties of Spirobischromane-BasedPolymers of Intrinsic Microporosity. Marcomol. Chem. Phys. 2011, 212, 1137–1146. [CrossRef]
129

Membranes 2017, 7, 28
19. Vopicka, O.; Du, N.; Li, N.; Guiver, M.D.; Sarti, G.C. Mixed gas sorption in glassy polymeric membranes:II. CO2/CH4 mixtures in a polymer of intrinsic microporosity (PIM-1). J. Membr. Sci. 2014, 459, 264–276.[CrossRef]
20. Li, Y.; Huang, C.; Liu, G. Crystallization of poly(ethylene glycol) in poly(methyl methacrylate) networks.Mater. Sci. 2013, 19, 147–151. [CrossRef]
21. Fan, W.; Tian, W.; Zhu, X.; Zhang, W. Differential analysis on precise determination of molecular weight oftriblock copolymer using SEC/MALS and MALDI-TOF MS. Polym. Test. 2014, 40, 116–123. [CrossRef]
22. Song, J.; Dai, Y.; Robertson, G.P.; Guiver, M.D.; Thomas, S.; Pinnau, I. Linear High MolecularWeight Ladder Polymers by Optimized Polycondensation of Tetrahydroxytetramethylspirobisindane and1,4-Dicyanotetrafluorobenzene. Macromolecules 2008, 41, 7411–7417. [CrossRef]
23. Balaban, T.S.; Krische, M.J.; Lehn, J.-M. Hierarchic Supramolecular Interactions within Assemblies inSolution and in the Crystal of 2,3,6,7-Tetrasubstituted 5,5′-(Anthracene-9,10-diyl)bis[pyrimidin-2-amines].Helv. Chim. Acta 2006, 89, 333–351. [CrossRef]
24. Mehta, N.B.; Lui, F.F.; Brooks, R.E. Maleamic and Citraconamic Acids, Methyl Esters, and Imides. J. Org. Chem.1960, 25, 1012–1015. [CrossRef]
25. Jue, M.L.; McCool, B.A.; Finn, M.G.; Lively, R.P. Effect of Nonsolvent Treatments on the Microstructure ofPIM-1. Macromolecules 2015, 48, 5780–5790. [CrossRef]
26. Swaidan, R.; Litwiller, E.; Pinnau, I. Physical Aging, Plasticization and Their Effects on Gas Permeation in“Rigid” Polymers of Intrinsic Microporosity. Macromolecules 2015, 48, 6553–6563. [CrossRef]
27. Emmler, T.; Fritsch, D.; Budd, P.M.; Chaukura, N.; Ehlers, D.; Raetzke, K.; Faupel, F. Free Volume Investigationof Polymers of Intrinsic Microporosity (PIMs): PIM-1 and PIM1 Copolymers Incorporating EthanoanthraceneUnits. Macromolecules 2010, 43, 6075–6084. [CrossRef]
© 2017 by the authors. Licensee MDPI, Basel, Switzerland. This article is an open accessarticle distributed under the terms and conditions of the Creative Commons Attribution(CC BY) license (http://creativecommons.org/licenses/by/4.0/).
130

membranes
Article
Fabrication of Defect-Free Cellulose Acetate HollowFibers by Optimization of Spinning Parameters
Xuezhong He
Department of Chemical Engineering, Faculty of Natural Sciences, Norwegian University of Science andTechnology, NO-7491 Trondheim, Norway; [email protected]; Tel.: +47-7359-3942; Fax: +47-7359-4080
Academic Editor: Klaus RätzkeReceived: 15 April 2017; Accepted: 31 May 2017; Published: 5 June 2017
Abstract: Spinning of cellulose acetate (CA) with the additive polyvinylpyrrolidone (PVP) inN-methyl-2-pyrrolidone (NMP) solvent under different conditions was investigated. The spinningparameters of air gap, bore fluid composition, flow rate of bore fluid, and quench bath temperaturewere optimized based on the orthogonal experiment design (OED) method and multivariate analysis.FTIR and scanning electron microscopy were used to characterize the membrane structure andmorphology. Based on the conjoint analysis in Statistical Product and Service Solutions (SPSS)software, the importance of these parameters was identified as: air gap > bore fluid composition >flow rate of bore fluid > quench bath temperature. The optimal spinning condition with the bore fluid(water + NMP (85%)), air gap (25 mm), flow rate of bore fluid (40% of dope rate), and temperature ofquench bath (50 ◦C) was identified to make high PVP content, symmetric cross-section and highlycross-linked CA hollow fibers. The results can be used to guide the spinning of defect-free CA hollowfiber membranes with desired structures and properties as carbon membrane precursors.
Keywords: spinning; cellulose acetate; hollow fiber membrane; orthogonal experiment design;conjoint analysis
1. Introduction
Carbon membranes have been studied in the last few years as a promising candidate forenergy-efficient gas separation technology due to their improved permselectivity, thermal andmechanical stability, and chemical stability compared to those that are already used [1–4]. Hollowfiber carbon membranes are usually prepared by the carbonization of hollow fiber precursors. Howto prepare cheaper, defect-free hollow fiber precursors becomes a key issue in the fabrication ofcarbon membranes. Many studies have reported that polymer membranes such as polyimide,polyacrylonitrile (PAN), and cellulose were used as the precursor for carbon membranes [2,5–7].Cellulose is the most abundant biorenewable material with many important commercial applications.However, the potential of cellulosic materials has not been fully exploited for use as the precursors forcarbon membranes because cellulose cannot be dissolved in conventional solvents due to stronginter- and intra-molecular hydrogen bonding [8]. The recently developed Lyocell process usesN-methylmorpholine-N-oxide (NMMO) to dissolve cellulose directly from biomass, and was reportedto have higher efficiency compared to other processes [9], but this process embodies significantengineering challenges with regard to solvent stability, safety, and recovery. Ionic liquids are greensolvents that have recently been reported to dissolve the cellulose and spin cellulose fibers [8,10,11].However, ionic liquids are very expensive, and many of them are still not commercially available.
Fortunately, the regeneration of spun cellulose acetate (CA) hollow fiber membranes provideda potential solution to make cellulosic hollow fibers. Some studies have reported the spinning ofcellulose acetate fibers [12–18], but mainly used in reverse osmosis (RO) and ultrafiltration (UF), and
Membranes 2017, 7, 27 131 www.mdpi.com/journal/membranes

Membranes 2017, 7, 27
only a few of them were used as precursors for carbon membranes. Defect-free precursors are crucialfor the preparation of high-performance carbon membranes. Thus, in this work, we will investigateand optimize the spinning parameters to obtain defect-free CA hollow fiber membranes.
In the present work, the well-known dry-jet wet spinning technology was used to fabricatethin and defect-free CA hollow fiber membranes. This process consists of the formation of nascentmembrane, followed by the interfacial phase separation within the air gap. After that, the nascentmembrane was immersed in a non-solvent (water) quench bath at a certain temperature where thephase separation occurred throughout the rest of the membranes. Many parameters, such as air gap,bore fluid composition, flow rate of bore fluid, and temperature of quench bath, etc. can affect thefinal fiber structure and morphology. Qin [13] and Chung [19] reported that air gap length duringthe spinning greatly affected the performance of membranes, and an increase in air gap resulted in asignificant decrease in membrane permeation. The orthogonal experimental design (OED) methodis well used in the multi-factor optimization field, and can consider the effects of all investigatedparameters while significantly reducing the experimental runs. This study aims to introduce theOED method to optimize the spinning parameters. The defect-free CA hollow fiber membranes werespun under the optimal spinning conditions. The cellulosic-based membranes can be regeneratedfrom the spun CA membranes by deacetylation treatment, and further used as precursors for carbonmembranes preparation.
2. Materials and Methods
2.1. Materials
CA (MW 100,000, average acetyl content: 39.8%) was purchased from the ACROS (Pittsburgh,PA, USA). Polyvinylpyrrolidone (PVP K30, MW 10,000) was purchased from Sigma (Darmstadt,Germany). The solvent, N-methyl-2-pyrrolidone (NMP > 99.5%) was purchased from Merck(Darmstadt, Germany).
2.2. Spinning of CA Fibers
CA hollow fiber membranes were spun using the well-known dry-jet wet spinning process [13,20].The dope solution consisted of CA, NMP, and the additive PVP (used to increase the porosity of thecarbon membrane). A schematic diagram for the spinning process is shown in Figure 1. The extrusionrate for dope and bore fluid were controlled by two gear pumps, respectively. A double spinneret(ID/OD, 0.5/0.7 mm) was used in this study with the aim of spinning defect-free hollow fibers bycontrolling the spinning parameters. In order to systematically investigate the effects of spinningparameters and reduce the experimental times, an orthogonal experimental design (OED) methodtogether with multivariate analysis was introduced to optimize the spinning conditions. The factorsand levels for the OED are given in Table 1, and Statistical Product and Service Solutions (SPSS)software was used to generate the experimental plan.
Figure 1. Schematic diagram of membrane spinning process.
132

Membranes 2017, 7, 27
Table 1. Factors and levels for orthogonal experimental design (OED) of spinning conditions.
Level Bore Fluid Composition Air Gap Flow Rate of Bore Fluid * Quench Bath Temp.
1 H2O 15 mm 20% 20 ◦C2 H2O + NMP (85%) 25 mm 40% 50 ◦C3 35 mm 60%
* 100% means the same flow rate as the dope flow rate.
2.3. Measurement and Characterization
Fourier transform infrared spectroscopy (FTIR) spectra of the samples were obtained from theBruker Tensor 27 FTIR instrument (Billerica, MA, USA), which was used to determine the acetylcontent, PVP content, and cross-linking degree between CA and PVP in the spun hollow fibers.The morphology of spun CA hollow fibers were characterized by a scanning electron microscope(SEM) (Zeiss SUPRA 55VP, Oberkochen, Germany).
3. Results and Discussion
3.1. Experimental Results
The FTIR spectra of the pure CA, the pure PVP, the physical mixture of CA and PVP, and spunhollow fiber membrane were shown in Figure 2. The characteristic adsorption peaks of 1030 cm−1,1230 cm−1, and 1740 cm−1 are attributed to the ether group (νC−O−C), acetyl ester group (νCH3−C=O),and carbonyl group (νC=O) of CA, respectively. The peak at 1665 cm−1 is attributed to the carbonylgroup in the PVP. Moreover, the assumption that an additional hydrogen bond may form between theCA and tertiary amide group of PVP is possible because the IR spectrum displays a strong absorptionband in the region of 2250–2700 cm−1 that is characteristic of hydrogen bond for tertiary amide [21],as illustrated in Figure 3.
Figure 2. Fourier transform infrared spectroscopy (FTIR) spectra of cellulose acetate (CA) andpolyvinylpyrrolidone (PVP), 1:4.5 Physical Mixture (CA and PVP power mixed) and Membrane(spun CA/PVP hollow fibers).
133

Membranes 2017, 7, 27
Figure 3. Structure for the formation of hydrogen bond between CA and PVP.
The FTIR spectra for spun membranes of OED are shown in Figures 4 and 5. The absorptionratios of A2320 cm−1/A1030 cm−1 and A1665 cm−1/A1030 cm−1 were used to characterize thecross-linking degree and the PVP content in the membrane, respectively. The cross sections ofmembrane morphology were characterized by SEM. Table 2 gives the OED results for differentspinning conditions.
Figure 4. FTIR spectra of the spun hollow fiber membranes for the experiment plan, which were shownin Table 2.
134

Membranes 2017, 7, 27
Figure 5. FTIR spectra of spun membranes for holdout experiments, which were shown in Table 2.
Table 2. The OED results for the optimization of spinning parameters.
No. Bore FluidAir Gap
(mm)Flow Rate of
Bore Fluid (%) *Quench Bath
Temperature (◦C)Cross-Linking
Degree cPVP Content
(%)Membrane
Morphology
1 water 15 40 20 5.19 9.41
2 water 35 20 50 3.14 9.01
3water +NMP(85%)
15 60 50 3.68 9.11
4 water 25 60 20 5.63 10.08
5water +NMP(85%)
35 40 20 8.61 8.59
6water +NMP(85%)
25 20 20 3.03 8.16
7 water 25 40 50 4.07 9.41
8 water 15 20 20 21.47 10.83
9 water 35 60 20 7.34 7.75
10(a) water 15 60 20 2.79 7.72
135

Membranes 2017, 7, 27
Table 2. Cont.
No. Bore FluidAir Gap
(mm)Flow Rate of
Bore Fluid (%) *Quench Bath
Temperature (◦C)Cross-Linking
Degree cPVP Content
(%)Membrane
Morphology
11(a)water +NMP(85%)
25 60 20 7.17 10.37
12(b) water 25 40 20
13(b)water +NMP(85%)
25 40 20
3.2. Conjoint Analysis
The conjoint analysis in the SPSS package was used to analyze the results of the orthogonalexperimental design [22]. The utilities (part-worth) reflect the importance of each factor level. Therange (highest minus lowest) of the utility values for each factor provides a measurement of howimportant the factor was to overall preference [23]. Factors with larger utility ranges play a moresignificant role compared to those with smaller ranges. The importance score (IMP) of factor i (%) iscalculated as:
IMPi = 100Rangei
p∑
i=1Rangei
(1)
where p = factor number. If several subjects are used in the analysis, the importance of each factor isseparately calculated for each subject, and then averaged. For the prediction, the probability of eachsimulation (pi) can be estimated according to the three different methods: (1) The maximum utilitymodel determines the probability as the number of respondents predicted to choose the case divided bythe total number of respondents; (2) The BTL (Bradley–Terry–Luce) model determines the probabilityas the ratio of one case utility to that for all simulation cases; and (3) The logit model is similar to BTL,but uses the natural log of the utilities instead of the utilities. The conjoint analysis method reportedin our previous work [23] was used to estimate the part worth of the contribution from each factor’slevel in this work, and the response is the combination of three subjects (the PVP content, cross-linkingdegree, and membrane morphology; these parameters will accordingly influence the microporosity,mechanical strength, and structure and morphology of carbon membrane). The importance of eachfactor was calculated separately for each subject, and then averaged. The correlations of Pearson’s Rand Kendall’s τ were 0.964 and 0.957, respectively, which indicated a good consistency between theestimated results from the model and the experimental data. Table 3 shows the utilities (part-worth) ofeach factor level, and averaged importance score of each factor. Higher utility values indicate greaterpreference in the selection of spinning condition.
Table 3. Utilities and averaged importance scores for different factors.
Factors and Levels Utility Averaged Importance Score (%)
Bore fluid composition water −0.91728.731water + NMP(85%) 0.917
Air gap15 mm −1.111
29.46725 mm 0.88935 mm 0.222
Flow rate of bore fluid20% −0.778
27.86040% 0.88960% −0.111
Quench bath Temp. 20 ◦C −0.75013.94250 ◦C 0.750
(Constant) 5.556
136

Membranes 2017, 7, 27
The range of the utility values (averaged importance score) for each factor provides a measure ofthe importance of each factor to the overall performance. Factors with greater averaged importancescore play a more significant role than those with smaller values. From Table 3, one could find that theimportance of these four factors was sorted as follows:
• air gap > bore fluid composition > flow rate of bore fluid > quench bath temperature.
It can be clearly seen that air gap was the most important parameter of the spinning process,which kept a good consistency with the previous results [13,19]. Therefore, the length of air gap needsto be well controlled during the spinning process to prepare defect-free CA hollow fiber membraneswith desired structure and property. Moreover, all the utilities are expressed in a common unit, andcan be summed to give the total utility of any combination. Table 4 shows the comparison between anarbitrary selected combination of factor level and the optimal spinning condition. It can be found thatutility of the optimal condition (Case 2) is much higher compared to Case 1.
Table 4. An example for combination of different spinning conditions.
Case
Utility
Total Utility RemarksBore FluidComposition
Air GapFlow Rate ofBore Fluid
Quench BathTemp
Constant
1 water (−0.917) 35 mm (0.222) 60% (−0.111) 20 ◦C (−0.75) 5.556 4
2 water + NMP(85%) (0.917) 25 mm (0.889) 40% (0.889) 50 ◦C (0.75) 5.556 9.001 Optimal
3.3. Predictions
The real power of conjoint analysis is to predict the performance (structure and property) of thespun hollow fibers that have not been investigated in the experiments—the simulation cases (see No. 12and 13 in Table 2). The simulation results are given in Table 5. It was found that the utility of Case 2 waslarger than that of Case 1 across the three response variables (PVP content, cross-linking degree, andmembrane morphology) in this study. All three models—maximum utility, Bradley–Terry–Luce (BTL),and logit—indicated that simulation Case 2 would be preferred. In order to validate this simulationresult, CA hollow fiber membranes were spun under these two conditions and characterized by FTIR,as shown in Figure 6. The PVP content (A1665 cm−1/A1030 cm−1) was higher and cross-linkingdegree was weaker for Case 2, which indicated that the membrane spun from Case 2 was better for useas a precursor for carbonization. The predicted score of Case 2 was also higher compared to Case 1.Thus, the generated model from the conjoint analysis can be used to guide the spinning of hollowfibers with the desired structure and properties.
Figure 6. FTIR spectra for simulation cases, which has been mentioned in Table 2.
137

Membranes 2017, 7, 27
Table 5. Simulation results by conjoint analysis. BTL: Bradley–Terry–Luce.
Card Number Score Maximum Utility(a) BTL Logit
1 5.667 33.3% 43.7% 26.9%2 7.500 66.7% 56.3% 73.1%
4. Conclusions
CA hollow fiber membranes were spun from a dope solution containing (CA + PVP)/NMP atdifferent conditions using a dry-jet wet spinning process. The orthogonal experimental design methodwas firstly used for the optimization of spinning conditions. The experimental results showed that theimportance of these four factors was sorted as:
air gap > bore fluid composition > flow rate of bore fluid > quench bath temperature.The spinning parameter air gap was identified as the most important factor during the spinning
process, which kept the consistency with the results reported in the literature. Moreover, the optimalspinning condition with a bore fluid composition (water + NMP (85%)), an air gap (25 mm), a flowrate of bore fluid (40% of dope flow rate), and a temperature of quench bath (50 ◦C) was obtained formaking cellulose acetate hollow fibers with high PVP content, symmetrical cross-section, and highcross-linking degree. The proposed OED method can be well used for the optimization of spinningconditions, and the simulation results based on conjoint analysis can be applied to guide the spinningof hollow fibers with desired structure and properties.
Acknowledgments: The author would like to acknowledge the Research Council of Norway for the funding ofthis work in the CO2Hing project (PETROMAKS2 #267615).
Conflicts of Interest: The author declares no conflict of interest.
References
1. Barsema, J.N. Carbon Membranes Precursor, Preparation And Functionalization. Ph.D. Thesis, University ofTwente, Enschede, The Netherlands, 2007.
2. Favvas, E.P.; Kapantaidakis, G.C.; Nolan, J.W.; Mitropoulos, A.C.; Kanellopoulos, N.K. Preparation,characterization and gas permeation properties of carbon hollow fiber membranes based on Matrimid(R)5218 precursor. J. Mater. Process. Technol. 2007, 186, 102–110. [CrossRef]
3. Lie, J.A. Synthesis, Performance and Regeneration of Carbon Membranes for Biogas Upgrading—A FutureEnergy Carrier. Ph.D. Thesis, Norwegian University of Science and Technology, Trondheim, Norway, 2005.
4. Saufi, S.M.; Ismail, A.F. Development and characterization of polyacrylonitrile (PAN) based carbon hollowfiber membrane. Songklanakarin J. Sci. Technol. 2002, 24, 843–854.
5. Vu, D.Q.; Koros, W.J.; Miller, S.J. High Pressure CO2/CH4 Separation Using Carbon Molecular Sieve HollowFiber Membranes. Ind. Eng. Chem. Res. 2002, 41, 367–380. [CrossRef]
6. David, L.I.B.; Ismail, A.F. Influence of the thermastabilization process and soak time during pyrolysisprocess on the polyacrylonitrile carbon membranes for O2/N2 separation. J. Membr. Sci. 2003, 213, 285–291.[CrossRef]
7. Soffer, A.; Koresh, J.; Saggy, S. Separation Device. U.S. Patent 4,685,940, 11 August 1987.8. Sun, N.; Swatloski, R.P.; Maxim, M.L.; Rahman, M.; Harland, A.G.; Haque, A.; Spear, S.K.; Daly, D.T.;
Rogers, R.D. Magnetite-embedded cellulose fibers prepared from ionic liquid. J. Mater. Chem. 2008, 18, 1–9.[CrossRef]
9. Rosenau, T.; Potthast, A.; Sixta, H.; Kosma, P. The chemistry of side reactions and byproduct formation inthe system NMMO/cellulose (Lyocell process). Prog. Polym. Sci. 2001, 26, 1763–1837. [CrossRef]
10. Swatloski, R.P.; Spear, S.K.; Holbrey, J.D.; Rogers, R.D. Dissolution of Cellose with Ionic Liquids. J. Am.Chem. Soc. 2002, 124, 4974–4975. [CrossRef] [PubMed]
11. Zhang, H.; Wu, J.; Zhang, J.; He, J. 1-Allyl-3-methylimidazolium Chloride Room Temperature Ionic Liquid:A New and Powerful Nonderivatizing Solvent for Cellulose. Macromolecules 2005, 38, 8272–8277. [CrossRef]
138

Membranes 2017, 7, 27
12. Jie, X.; Cao, Y.; Qin, J.-J.; Liu, J.; Yuan, Q. Influence of drying method on morphology and properties ofasymmetric cellulose hollow fiber membrane. J. Membr. Sci. 2005, 246, 157–165. [CrossRef]
13. Qin, J.-J.; Li, Y.; Lee, L.-S.; Lee, H. Cellulose acetate hollow fiber ultrafiltration membranes made fromCA/PVP 360 K/NMP/water. J. Membr. Sci. 2003, 218, 173–183. [CrossRef]
14. Liu, H.; Hsieh, Y.-L. Ultrafine fibrous cellulose membranes from electrospinning of cellulose acetate. J. Polym.Sci. Part B Polym. Phys. 2002, 40, 2119–2129. [CrossRef]
15. Son, W.K.; Youk, J.H.; Lee, T.S.; Park, W.H. Electrospinning of Ultrafine Cellulose Acetate Fibers: Studies of aNew Solvent System and Deacetylation of Ultrafine Cellulose Acetate Fibers. J. Polym. Sci. Part B Polym. Phys.2004, 42, 5–11. [CrossRef]
16. Hao, J.-H.; Dai, H.-P.; Yang, P.-C.; Wei, J.-M.; Wang, Z. Cellulose acetate hollow fiber performance forultra-low pressure reverse osmosis. Desalination 1996, 107, 217–221. [CrossRef]
17. He, X.; Lie, J.A.; Sheridan, E.; Hägg, M.-B. Preparation and Characterization of Hollow Fiber CarbonMembranes from Cellulose Acetate Precursors. Ind. Eng. Chem. Res. 2011, 50, 2080–2087. [CrossRef]
18. He, X.; Hägg, M.-B. Structural, kinetic and performance characterization of hollow fiber carbon membranes.J. Membr. Sci. 2012, 390–391, 23–31. [CrossRef]
19. Chung, T.-S.; Hu, X. Effect of air-gap distance on the morphology and thermal properties of polyethersulfonehollow fibers. J. Appl. Polym. Sci. 1997, 66, 1067–1077. [CrossRef]
20. Qin, J.-J.; Wong, F.-S.; Li, Y.; Liu, Y.-T. A high flux ultrafiltration membrane spun from PSU/PVP(K90)/DMF/1,2-propanediol. J. Membr. Sci. 2003, 211, 139–147. [CrossRef]
21. Tang, H.T. Spectroscopic Identification for Organic Compounds; Beijing University Press: Beijing, China, 1992.22. SPSS Conjoint™ 17.0. Available online: http://www.sussex.ac.uk/its/pdfs/SPSS_Conjoint_17.0.pdf
(accessed on 15 May 2017).23. He, X.; Hagg, M.-B. Optimization of Carbonization Process for Preparation of High Performance Hollow
Fiber Carbon Membranes. Ind. Eng. Chem. Res. 2011, 50, 8065–8072. [CrossRef]
© 2017 by the author. Licensee MDPI, Basel, Switzerland. This article is an open accessarticle distributed under the terms and conditions of the Creative Commons Attribution(CC BY) license (http://creativecommons.org/licenses/by/4.0/).
139

membranes
Review
Short Review on Predicting Fouling inRO Desalination
Alejandro Ruiz-García 1,*, Noemi Melián-Martel 2 and Ignacio Nuez 3
1 Department of Mechanical Engineering, University of Las Palmas de Gran Canaria,Las Palmas de Gran Canaria 35017, Spain
2 Department of Process Engineering, University of Las Palmas de Gran Canaria,Las Palmas de Gran Canaria 35017, Spain; [email protected]
3 Department of Electronic and Automatic Engineering, University of Las Palmas de Gran Canaria,Las Palmas de Gran Canaria 35017, Spain; [email protected]
* Correspondence: [email protected]; Tel.: +34-928-451-888
Received: 8 June 2017; Accepted: 20 October 2017; Published: 24 October 2017
Abstract: Reverse Osmosis (RO) membrane fouling is one of the main challenges thatmembrane manufactures, the scientific community and industry professionals have to deal with.The consequences of this inevitable phenomenon have a negative effect on the performance of thedesalination system. Predicting fouling in RO systems is key to evaluating the long-term operatingconditions and costs. Much research has been done on fouling indices, methods, techniques andprediction models to estimate the influence of fouling on the performance of RO systems. This paperoffers a short review evaluating the state of industry knowledge in the development of fouling indicesand models in membrane systems for desalination in terms of use and applicability. Despite majorefforts in this field, there are gaps in terms of effective methods and models for the estimation offouling in full-scale RO desalination plants. In existing models applied to full-scale RO desalinationplants, neither the spacer geometry of membranes, nor the efficiency and frequency of chemicalcleanings are considered.
Keywords: reverse osmosis; membrane fouling; fouling indices; predicting models
1. Introduction
Despite improvements and advances in our knowledge of water desalination, one of the mainchallenges of membrane technology, particularly in Reverse Osmosis (RO) technology, has been howto deal with membrane fouling [1–3].
Membrane fouling results from the accumulation of undesirable materials on, in or near themembrane and involves one or more of the following types [3,4]: (a) particulate and colloidal matterdeposition on the membrane surface [5]; (b) organic fouling [6]; (c) scaling and inorganic fouling [7];and (d) biofouling due to adhesion and bacterial growth on the surface of the membrane generating alayer of gel [8].
The consequences of this inevitable phenomenon have a negative effect on the performance ofthe desalination system (decline in water production over time for constant pressure operations or anincrease in required feed) that requires costly pretreatment, higher operating pressures and frequentchemical cleanings, which can damage membranes, degrade permeate quality, and hasten membranereplacement. This additionally increases water cost and energy consumption [9,10]. Therefore, one ofthe most important challenges is to understand the factors involved in membrane fouling and thesubsequent reduction of permeate flux or applied pressure increase that is inevitably associated withmembrane processes.
Membranes 2017, 7, 62 140 www.mdpi.com/journal/membranes

Membranes 2017, 7, 62
A great deal of research has been carried out to this field in the last 30 years, and althoughdesalination technology is being extensively studied, much remains to be done and researchedin the field of membrane fouling. Research that has been undertaken focuses on six key areas:(1) characterization of foulant agents by autopsy studies of membrane elements; (2) understandingof fouling mechanisms; (3) indices for predicting fouling; (4) modeling for full-scale systems;(5) optimization of pre-treatment and chemical cleaning; and (6) optimizing the membrane material andenhanced module design. The first four areas attempt to address directly how fouling occurs and howto predict it, while the others focus more on the mitigation and prevention of fouling, as for examplethrough the use of antifouling membranes [11–15].
Focusing on attempts to address directly and predict model membrane fouling, severalfouling prediction tools and techniques have been developed to describe membrane fouling [16–20].The traditional and most widely-applied fouling indices in RO systems are the Silt Density Index (SDI)and the Modified Fouling Index (MFI). However, these indices have a limitation in predicting ROfouling rate such as lack of precision with small (<0.45 μm) foulant agents [21–23].
Some recent research has focused on modifying these methods and using membranes more similarto those of RO in order to evaluate fouling potential [17,22,24,25], while another research focus is theproposal of prediction models based on experience in full-scale RO desalination plants [26–29].
This paper provides a critical review evaluating the state of industry knowledge in thedevelopment of fouling indices and models in membrane systems for desalination in terms of useand applicability.
2. Membrane Fouling Indices
The Silt Density Index (SDI) and Modified Fouling Index (MFI) are common parametersor indices to determine the fouling potential (mainly colloidal) of feedwaters in RO systems.Microfiltration (MF) membranes with a pore size of 0.45 μm, which is larger by several orders ofmagnitude than the pore size of the RO membranes, are used to calculate these indices. Although theseindices were developed to evaluate RO membrane fouling, they can also serve as a reference in theevaluation of fouling in porous membranes like MF and Ultrafiltration (UF).
These indices are based on conventional and dead-end filtrations, while commercial applicationsare performed in cross-flow filtration. This implies that the flow conditions in the module are nottaken into account, though this is a crucial parameter in the optimization of the process. However,the experimental determination of these data is very simple and frequently used.
2.1. Silt Density Index
SDI is used to predict the colloidal fouling potential of feedwaters in RO systems and the efficiencyof pre-treatments. SDI measurement is performed using the standard ASTM D4189 [30]. The feedwateris filtrated in dead-end mode by an MF membrane with a diameter of 47 mm and a pore size of 0.45 μmat a constant pressure of 207 kPa (30 psi). The two time intervals measured at the beginning of filtrationare the initial (ti) and final (tf) time to collect 500 mL of permeate, respectively. The third time interval(t) can be 5, 10 or 15 min, which is the period between ti and tf. SDI is calculated by the followingEquation (1):
SDI =1 − ti
tf
t· 100 (1)
Generally, membrane manufactures suggest a value below three for SDI, but four or five are alsoacceptable values. Most pre-treatment studies are based on SDI15 < 3. Standard ASTM D4189 [30]specifies that the membranes must have a mean pore size of 0.45 ± 0.2 μm, and the values of SDIobtained with membranes of different suppliers, which present differences in their morphology(porosity, for example), may differ.
SDI has its limitations, and a lack of reliability has been demonstrated in several studies [31–33].SDI is a static measurement of resistance assuming lineal permeate flux decline. This allows good
141

Membranes 2017, 7, 62
results to be obtained when the water has a high quality, as the initial and final fluxes would be similar.However, the use of SDI may not be appropriate when the water has a high fouling potential, since SDIhas no linear relation with the colloidal content. In this case, derivation of this index is very empiricaland is not based on any mechanisms of fouling [31,34]. For these reasons, SDI should not be usedas input in the mathematical model to predict fouling rates [35]. To overcome the limitations of SDI,J.C. Schippers and J. Verdouw [31] proposed a different parameter: the Membrane Fouling Index (MFI).
2.2. Modified Fouling Index
MFI (also called MFI0.45) is a parameter based on the filtration mechanism of layer depositionor cake formation and takes into account the mechanism of the reduction of flow that takes place inmembrane systems. Therefore, it better represents the operating conditions of the membranes thanSDI and can be used to measure water with a high and low fouling potential.
MFI [36] is determined using similar equipment and procedures as SDI, except that the volumeof permeate water is measured in 30-s intervals over 15 min of filtration. In this period, the data ofpermeate volume and t are collected. A better understanding of the experimental data that are obtainedis achieved by using Equation (2) as proposed by J.C. Schippers and J. Verdouw [31]. Equation (2) isbased on the resistances-in-series model and considers that fouling resistance is due to cake formationon membrane surfaces. Equation (2) shows a lineal relation between t/V (s/L) and V (L). The slope ofthis equation is the value of MFI (Equation (3)).
tV
=μ · Rm
Δp · A+
μ · α · Cb
2 · Δp · A2 · V (2)
MFI =μ · α · Cb
2 · Δp · A2 (3)
where Δp (Pa) is the transmembrane pressure, μ (Pa s) is the water viscosity, Rm (m−1) is the hydraulicresistance of the membranes, α (m/kg) is the specific resistance of the cake, A (m2) is the membranesurface, V (L) is the volume and Cb (kg/m3) is the concentration of particles in feedwater.
MFI is determined in the second region of the curve t/V vs. V (Figure 1). It can be divided intothree stages: blocking filtration, cake filtration (lineal) and cake filtration with clogging and/or cakecompressure. In case of a high concentration of colloids, the graph t/V vs. V has non-linear behaviorthroughout the entire period, so MFI is calculated from the first region [37].
Figure 1. Ratio of filtration time and filtrate volume (t/V) as a function of filtrate volume (V) [38].Copyright Elsevier, 2012.
142
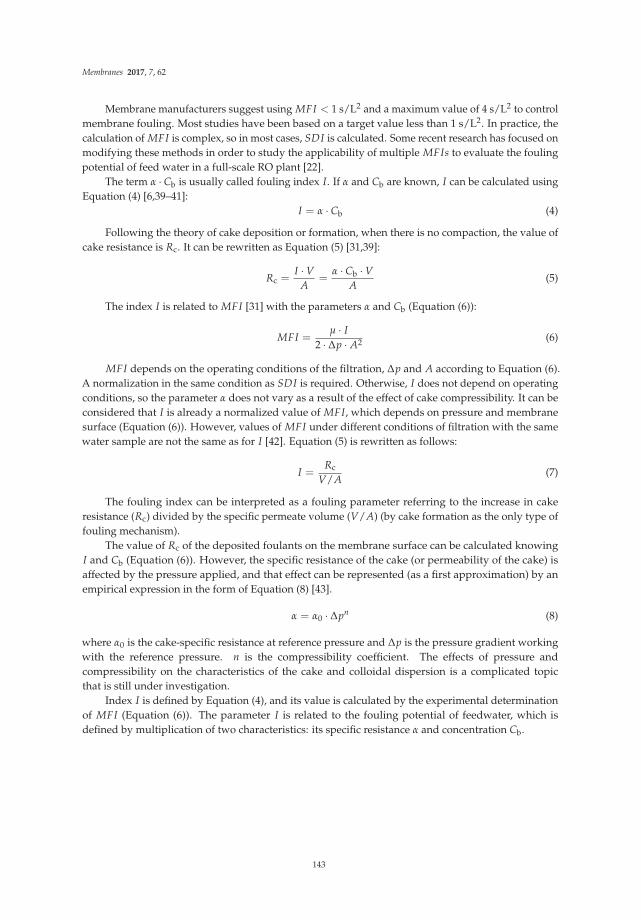
Membranes 2017, 7, 62
Membrane manufacturers suggest using MFI < 1 s/L2 and a maximum value of 4 s/L2 to controlmembrane fouling. Most studies have been based on a target value less than 1 s/L2. In practice, thecalculation of MFI is complex, so in most cases, SDI is calculated. Some recent research has focused onmodifying these methods in order to study the applicability of multiple MFIs to evaluate the foulingpotential of feed water in a full-scale RO plant [22].
The term α · Cb is usually called fouling index I. If α and Cb are known, I can be calculated usingEquation (4) [6,39–41]:
I = α · Cb (4)
Following the theory of cake deposition or formation, when there is no compaction, the value ofcake resistance is Rc. It can be rewritten as Equation (5) [31,39]:
Rc =I · V
A=
α · Cb · VA
(5)
The index I is related to MFI [31] with the parameters α and Cb (Equation (6)):
MFI =μ · I
2 · Δp · A2 (6)
MFI depends on the operating conditions of the filtration, Δp and A according to Equation (6).A normalization in the same condition as SDI is required. Otherwise, I does not depend on operatingconditions, so the parameter α does not vary as a result of the effect of cake compressibility. It can beconsidered that I is already a normalized value of MFI, which depends on pressure and membranesurface (Equation (6)). However, values of MFI under different conditions of filtration with the samewater sample are not the same as for I [42]. Equation (5) is rewritten as follows:
I =Rc
V/A(7)
The fouling index can be interpreted as a fouling parameter referring to the increase in cakeresistance (Rc) divided by the specific permeate volume (V/A) (by cake formation as the only type offouling mechanism).
The value of Rc of the deposited foulants on the membrane surface can be calculated knowingI and Cb (Equation (6)). However, the specific resistance of the cake (or permeability of the cake) isaffected by the pressure applied, and that effect can be represented (as a first approximation) by anempirical expression in the form of Equation (8) [43].
α = α0 · Δpn (8)
where α0 is the cake-specific resistance at reference pressure and Δp is the pressure gradient workingwith the reference pressure. n is the compressibility coefficient. The effects of pressure andcompressibility on the characteristics of the cake and colloidal dispersion is a complicated topicthat is still under investigation.
Index I is defined by Equation (4), and its value is calculated by the experimental determinationof MFI (Equation (6)). The parameter I is related to the fouling potential of feedwater, which isdefined by multiplication of two characteristics: its specific resistance α and concentration Cb.
143

Membranes 2017, 7, 62
2.3. Indices Derived from SDI
A. Alhadini et al. [44] proposed a normalized SDI (SDI+). This index takes into considerationthe temperature (T), Δp, Rm and different fouling mechanisms by using a line chart assuming cakefiltration and 100% particle retention. In the same work, they proposed the volume-based SDI (SDIv).This fouling index compares the initial flow rate with the flow rate after the filtration of the standardvolume. SDIv has a linear relationship with the particle concentration if complete blocking is thedominant fouling mechanism in the test. They concluded that SDIv is a better index to estimate thefouling potential of feedwater in RO than SDI.
2.4. Indices Derived from MFI
J.C. Schippers and J. Verdouw [31] showed that MFI depends on the membrane molecular weightcut-off. Few authors have developed procedures to calculate MFI using membranes with smaller poresize. Table 1 shows a summary of procedures for calculating MFI, as well as the indices, parametersand methods used to measure the fouling potential. The advantages and disadvantages of eachprocedure have been commented on in works referenced in Table 1 and others [38,45].
S.F.E. Boerlage et al. [35] showed that the MF membrane (0.45 μm) used for MFI was not suitablefor fouling of small size colloids. This fouling can happen in RO membranes if the pre-treatmentdoes not separate these particles. The same authors [35] developed MFI − UF at constant pressure(MFI − UFconst. pressure). This procedure uses a UF membrane instead of an MF membrane to separatemore particles, but it can take more than 20 h.
The aforementioned fouling indices have been measured at constant pressure, whereas mostmembrane systems works at constant flux. S.F.E. Boerlage et al. [46] further developed theMFI − UFconst. pressure in order to adapt it to constant flux conditions. This resulted in a noticeabledifference in the duration of the test compared to MFI −UF at constant pressure; MFI −UF at constantflux (MFI − UFcont. flux) could be obtained in 2 h.
Recently, S. Khirani et al. [42] proposed NF − MFI using a Nanofiltration (NF) membraneto measure MFI. As is shown in Table 1, the NF − MFI is measured at constant pressure.Khirani et al. [42] showed that fouling potential could be measured by the NF − MFI, even forsmall organic particles. Although this method is a step towards obtaining more realistic fouling indices,the mode of operation was still at constant pressure and dead-end flow.
Modified methods for measuring MFI have the disadvantage that they require a long measuringtime with more complex systems than SDI or MFI itself. The filtration mode is dead-end flow, so it isnot close to real conditions in terms of hydrodynamic flux in RO process. Cross-flow hydrodynamicconditions influence the selective deposition of smaller particles or colloids, which are the most likelyto be deposited on membranes, as illustrated in Figure 2.
Figure 2. Filtration modes: dead-end and cross-flow.
144

Membranes 2017, 7, 62
Due to the balance between the convection flow and the backscattering of particles, the largerparticles with higher backscattering speeds tend to move away from the surface of the membrane,whereas the smaller particles are preferably deposited as soiling agents. These cross-flow hydrodynamicconditions lead to a different composition and structure of the cake when compared to the finalblind filtration [47].
Figure 2 shows the cross-flow filtration. All foulants in the feedwater are deposited or passedthrough the membrane, as in the case of the measurements of SDI, MFI and MFI − UF, while incross-flow filtration, foulants are fractionated by selective deposition. These hydrodynamic effectscould lead to inaccuracies in the extension of SDI and MFI that is performed in dead-end flow.
To take into consideration, the effect of small particles or colloids in MFI, S.S. Adham andA.G. Fane [48] proposed the use of a selective MF membrane to be operated in cross-flow mode.They called this index the Cross-Flow Sampler-MFI (CFS − MFI). After MF membrane filtration(colloid matter passes though this membrane), MFI/SDI is measured as shown in Table 1. Althoughthis method is a better approach, the cross-flow MF is separated from the measurement device indead-end flow, so CFS − MFI is determined in discontinued mode.
M.A. Jaaved et al. [49] calculated CFS − MFI in continuous operation mode with MFI(in dead-end flow) directly connected to CFS. Recently, L.N. Sim et al. [50] applied CFS to MFI − UFcont.
to simulate selective colloidal deposition in real RO systems. The proposed index is known asCFS − MFIUF and uses a UF membrane for MFI. The particles that pass across CFS and that aredeposited on the UF membrane will foul the RO membranes. In a later work, L.N. Sim et al. [51]combined CFS − MFIUF with a Cake-Enhanced Osmotic Pressure (CEOP) [52] model to predict thecross-flow RO fouling profile under constant flux filtration. They concluded that incorporating theCEOP effect was a very promising method in predicting colloidal fouling in RO.
J. Choi et al. [53] proposed procedures for measuring MFI with different types of membranes(Table 1). The test was called the Combination Fouling Index-MFI (CFI − MFI). It takes into accountvarious foulant agents separated by different membranes. However, the proposed approach is notsimple since several types of membranes are required. Although the different measurement systems ofMFI improve the prediction of fouling in RO membranes, they are complex and require long times tobe determined.
An evaluation of membrane fouling potential by Multiple Membrane Array System (MMAS) wasproposed by Y. Yu et al. [54]. MF, UF and NF membranes were connected in series to calculate threeMFI values, particle-MFI, colloid-MFI and organic-MFI. MMAS allows the simultaneous separationof target foulants from the feed water and the evaluation of fouling potential of the feed water focusingon the target foulants. The authors suggested that the MMAS could give valuable information aboutthe best candidates for pretreatment and the fouling influence on full-scale RO desalination plants.
M. W. Naceur [55] determined the Dimensionless Fouling Index (DFI). It can be interpreted as theratio of the membrane resistance to that of the cake due to the concentration of feedwater. The authorsmentioned that this index requires performing experiments under different operating conditions to beproperly validated.
145

Membranes 2017, 7, 62
Ta
ble
1.
Sum
mar
yof
vari
ous
met
hod
s,in
dic
esan
dpa
ram
eter
sus
edin
foul
ing
eval
uati
on(a
dap
ted
from
[38,
45,5
6]).
SDI,
Silt
Den
sity
Ind
ex;M
F,M
icro
filtr
atio
n;M
FI,
Mod
ified
Foul
ing
Inde
x;U
F,U
ltrafi
ltrat
ion;
CFS
,Cro
ss-F
low
Sam
pler
;RO
,Rev
erse
Osm
osis
;MM
AS,
Mul
tiple
Mem
bran
eA
rray
Syst
em;D
FI,
Dim
ensi
onle
ssFo
ulin
gIn
dex;
CEO
P,C
ake-
Enha
nced
Osm
otic
Pres
sure
.
Me
tho
ds,
Ind
ice
sa
nd
Pa
ram
ete
rsC
ha
ract
eri
stic
sE
qu
ati
on
Co
mm
en
ts
SDI
(199
5,[3
0])
-M
embr
ane:
MF
0.45
μm
(flat
shee
t)-
Foul
ant:
part
icul
ate
mat
ter
-O
per
atio
nm
ode:
dea
d-e
ndan
dco
nsta
ntpr
essu
re-
Foul
ing
mec
hani
sms:
none
-Te
st:t
ime
vs.v
olum
e
SDI=
1−t i t f
t·1
00
Dis
adva
ntag
es:S
DI
isa
stan
dard
ized
met
hod
(AST
MD
4189
),bu
tem
piri
cal,
and
itis
notb
ased
onfo
ulin
gm
echa
nism
s.It
isno
trel
ated
tofo
ulan
tcon
cent
rati
onin
feed
wat
er.I
tdoe
sno
ttak
ein
toac
coun
tthe
tem
pera
ture
orva
riat
ion
inm
embr
ane
resi
stan
ce.
MF
I(J
.C.S
chip
pers
and
J.Ve
rdou
w,
1980
[31]
)
-M
embr
ane:
MF
of0.
45μ
m(fl
atsh
eet)
-Fo
ulan
t:pa
rtic
ulat
em
atte
r-
Op
erat
ing
mod
e:d
ead
-end
and
cons
tant
pres
sure
-Fo
ulin
gm
echa
nism
s:ca
kefil
trat
ion
-Te
st:t
/V
vs.V
(i.e
.,ea
ch30
s)
MF
I=
μ·I
2·Δp·A
2
Cha
ract
eris
tics
:M
FI 0
.45
isan
imp
rove
dve
rsio
nof
SDI
and
isre
late
dto
cake
filtr
atio
nth
eory
.The
foul
ing
inde
xI
isob
tain
edfr
omth
esl
ope
ofth
elin
ealr
egio
nof
the
grap
ht/
Vvs
.V(fi
ltra
ted
volu
me)
.D
isad
vant
ages
:Iti
sno
tver
yac
cura
teas
foul
anta
gent
sw
ith
adi
amet
erle
ssth
an0.
45μ
mpa
ssac
ross
the
mem
bran
e.
SDI+
(A.A
lhad
inie
tal.,
2011
[44]
)
-M
embr
ane:
MF
0.45
μm
(flat
shee
t)-
Foul
ant:
part
icul
ate
mat
ter
-O
per
atio
nm
ode:
dea
d-e
ndan
dco
nsta
ntpr
essu
re-
Foul
ing
mec
hani
sms:
none
-Te
st:t
ime
vs.v
olum
e
—
Cha
ract
eris
tics
:SD
I+is
ano
rmal
izat
ion
ofSD
Ita
king
into
cons
ider
atio
nth
eva
riat
ion
ofte
mp
erat
ure
,p
ress
ure
and
mem
bran
ere
sist
ance
.D
iffe
rent
fou
ling
mec
hani
sms
coul
dbe
assu
med
base
don
line
char
tsan
dpa
ram
eter
s’ca
lcul
atio
n.D
isad
vant
ages
:It
isno
tve
ryac
cura
teas
fou
lant
agen
tsw
ith
ad
iam
eter
less
than
0.45
μm
pas
sac
ross
the
mem
bran
e.
SDI v
(A.A
lhad
inie
tal.,
2011
[44]
)
-M
embr
ane:
MF
0.45
μm
(flat
shee
t)-
Foul
ant:
part
icul
ate
mat
ter
-O
per
atio
nm
ode:
dea
d-e
ndan
dco
nsta
ntpr
essu
re-
Foul
ing
mec
hani
sms:
none
-Te
st:t
ime
vs.v
olum
e
SDI v
=10
0·AM
0V f
0
( 1−
t 1 t 2
)C
hara
cter
isti
cs:S
DI v
show
eda
mor
elin
ear
rela
tion
ship
wit
hfo
ula
ntco
ncen
trat
ion
infe
edw
ater
than
stan
dar
dSD
I.B
esid
es,
itis
ind
epen
den
tof
test
ing
par
amet
ers,
such
aste
mp
erat
ure
and
pre
ssu
re,a
ndle
ssse
nsit
ive
tom
embr
ane
resi
stan
ce.
Dis
adva
ntag
es:
Itis
not
very
accu
rate
asfo
ula
ntag
ents
wit
ha
dia
met
erle
ssth
an0.
45μ
mp
ass
acro
ssth
em
embr
ane.
146

Membranes 2017, 7, 62
Ta
ble
1.
Con
t.
Me
tho
ds,
Ind
ice
sa
nd
Pa
ram
ete
rsC
ha
ract
eri
stic
sE
qu
ati
on
Co
mm
en
ts
MF
I−U
F con
st.p
ress
ure
(S.F
.E.B
ooer
lage
etal
.,19
97[5
7])
-M
embr
ane:
UF
(hol
low
fiber
,13
kDa)
-Fo
ulan
t:pa
rtic
ulat
em
atte
r-
Op
erat
ing
mod
e:d
ead
-end
and
cons
tant
pres
sure
.-
Foul
ing
mec
hani
sms:
cake
filtr
atio
n-
Test
:t/
Vvs
.Vor
Δt/
ΔV
vs.V
(i.e.
,eac
h10
s)
MF
I−U
F=
μ·I
2·Δp·A
2
MF
I−U
F=
μ·α 0
·Cb·Δ
pω
2·Δp·A
2
Cha
ract
eris
tics
:U
Fm
embr
ane
isu
sed
inst
ead
ofM
F,so
collo
idal
fou
ling
can
bed
etec
ted
.α
0is
aco
nsta
nt,
ωth
eco
mp
ress
ibili
tyfa
ctor
ofth
eca
kean
dC
bth
eco
ncen
trat
ion
ofpa
rtic
les
inth
efe
edw
ater
.D
isad
vant
ages
:M
FI−
UF c
onst
.pre
ssur
eis
not
able
tosh
owfo
ulin
gbe
havi
orin
cons
tant
flow
pre
cess
es.
Twen
tyho
urs
are
requ
ired
toob
tain
am
easu
rem
ent,
and
the
met
hod
toob
tain
the
dep
osit
ion
fact
oris
ted
iou
s.A
lthou
ghth
eU
Fm
embr
ane
used
inth
ete
sts
isca
pabl
eof
reta
inin
gpa
rtic
les
and
collo
idal
mat
ter,
itis
note
ffici
ent
enou
ghto
reta
inor
gani
cm
atte
r.
MF
I−U
F con
st.fl
ux(S
.F.E
.Boe
rlag
eet
al.,
2004
[46]
)
-M
embr
ane:
UF
(flat
shee
t,10
–200
kDa)
-Fo
ulan
t:co
lloid
s-
Ope
rati
ngm
ode:
dead
-end
and
cons
tant
flux.
-Fo
ulin
gm
echa
nism
s:ca
kefil
trat
ion
-Te
st:Δ
pvs
.tor
Δt/
ΔV
vs.V
MF
I−U
F con
st.fl
ux=
μ20
o·cI
2·Δp 0·A
2 0
MF
I−U
F=
μ·α 0
·Cb·Δ
pω
2·Δp·A
2
Cha
ract
eris
tics
:T
heop
erat
ing
mod
eis
cons
tant
flow
asha
ppen
sin
the
maj
orit
yof
actu
alR
Op
roce
sses
.T
hefo
ulin
gin
dex
Iis
obta
ined
from
the
slop
eof
the
grap
hN
DP
(Net
Dri
ven
Pre
ssu
re)
vs.
filt
rati
onti
me.
Δp 0
isth
est
anda
rdpr
essu
re(2
bar)
.D
isad
vant
ages
:The
test
ispe
rfor
med
und
erco
ndit
ions
ofac
cele
rate
dfl
owth
atd
ono
tal
low
rep
rese
ntat
ion
ofth
ebe
havi
orof
foul
ing
toflo
ws
of20
–30
L/m
2 h.A
sw
ithM
FI−
UF c
onst
.pre
ssur
e,th
ed
epos
itio
nof
par
ticl
esis
cons
ider
edth
rou
gha
dep
osit
ion
fact
or,
and
alth
ough
thro
ugh
the
UF,
itis
pos
sibl
eto
reta
inp
arti
cula
tem
atte
ran
dco
lloid
s,it
isno
ten
ough
tore
tain
the
orga
nic
mat
ter
pre
sent
inth
efe
ed.
Des
pit
eth
eim
pro
vem
ents
ofM
FI−
UF c
onst
.flux
,the
mea
sure
men
tca
nnot
besi
mul
ated
incr
oss-
flow
.
NF−
MF
I(S
.Khi
rani
etal
.,20
06[4
2])
-M
embr
ane:
NF
-Fo
ulan
t:or
gani
cm
atte
r-
Op
erat
ing
mod
e:d
ead
-end
and
cons
tant
pres
sure
.-
Foul
ing
mec
hani
sms:
cake
filtr
atio
n-
Test
:t/(V
/A)
vs.V
/A
MF
I −N
F=
μ·I
2·Δp·A
2
Cha
ract
eris
tics
:The
test
trie
sto
take
into
cons
ider
atio
nth
eor
gani
cm
atte
rin
the
feed
wat
er.
Dis
adva
ntag
es:
The
test
isca
rrie
dou
tu
nder
cons
tant
pre
ssu
re,
and
the
dep
osit
ion
fact
orof
par
ticl
esin
cros
s-fl
owis
not
cons
ider
ed.
The
tota
lre
tent
ion
ofor
gani
cm
atte
ris
nota
chie
ved
inth
ispr
oced
ure.
147

Membranes 2017, 7, 62
Ta
ble
1.
Con
t.
Me
tho
ds,
Ind
ice
sa
nd
Pa
ram
ete
rsC
ha
ract
eri
stic
sE
qu
ati
on
Co
mm
en
ts
CFS
−M
FI
(S.S
.Adh
aman
dA
.G.F
ane,
2008
[48]
)
-M
embr
ane:
MF
-Fo
ulan
t:pa
rtic
ulat
em
atte
r-
Op
erat
ing
mod
e:cr
oss-
flow
and
dea
d-e
nd(s
epar
ated
)/co
nsta
ntpr
essu
re.
-Fo
ulin
gm
echa
nism
s:ca
kefil
trat
ion
-Te
st:t
/V
vs.V
CFS
−M
FI=
μ·α·
Cb
2·Δp·A
2=
μ·I
2·Δp·A
2
Cha
ract
eris
tics
:T
his
ind
exin
corp
orat
esth
ehy
dro
dyn
amic
beha
vior
ofth
ecr
oss-
flow
inth
em
easu
rem
ent
ofth
efo
ulin
gin
dex
.C
FSal
low
smal
lpa
rtic
leto
pass
acro
ssth
eM
Fm
embr
ane
tobe
depo
site
don
the
MF
mem
bran
elo
cate
din
MF
Iin
dead
-end
flow
.D
isad
vant
ages
:Dis
cont
inue
dop
erat
ing
mod
e.
CFS
−M
FI
(M.A
.Jav
eed
etal
.,20
09[4
9])
-M
embr
ane:
MF
-Fo
ulan
t:pa
rtic
ulat
em
atte
r-
Op
erat
ing
mod
e:cr
oss-
flow
and
dea
d-e
nd/
cons
tant
pres
sure
-Fo
ulin
gm
echa
nism
s:ca
kefil
trat
ion
-Te
st:t
/V
vs.V
CFS
−M
FI=
η20◦ C
·α·C
b2·Δ
p·A2
=η
20◦ C
·I2·Δ
p·A2
Cha
ract
eris
tics
:C
FS−
MF
Iis
mea
sure
din
cont
inuo
usm
ode.
Dis
adva
ntag
es:
Itu
ses
the
sam
eM
Fm
embr
ane
asin
MF
I,an
dth
eop
erat
ing
mod
eis
atco
nsta
ntpr
essu
re.
CFS
−M
FI U
F(L
.N.S
imet
al.,
2011
[58]
)
-M
embr
ane:
MF
and
UF
-Fo
ulan
t:co
lloid
s-
Op
erat
ing
mod
e:cr
oss-
flow
and
dea
d-e
nd,
cons
tant
flow
-Fo
ulin
gm
echa
nism
s:ca
kefil
trat
ion
-Te
st:Δ
pvs
.t
CFS
−M
FI U
F=
μ·I′
2·Δp·A
2
Cha
ract
eris
tics
:T
his
ind
exta
kes
into
acco
unt
the
hyd
rod
ynam
icef
fect
ofcr
oss-
flow
and
the
dep
osit
ion
fact
or.
I′is
the
mod
ified
resi
stiv
ity
ofth
eca
ke.
CFS
−M
FI U
Fca
nbe
am
ore
pre
cise
met
hod
tode
term
ine
the
effe
ctof
foul
ing
agen
tson
the
RO
proc
ess.
The
met
hod
isea
sydu
eto
its
shor
ttim
eof
filtr
atio
n.
CF
I(J
.Cho
ieta
l.,20
09[5
3])
-M
embr
ane:
MF
and
NF
-Fo
ulan
t-
Ope
rati
ngm
ode:
cons
tant
pres
sure
-Fo
ulin
gm
echa
nism
s:-
Test
:t/
Vvs
.V
CF
I=
μ·α·
Cb
2·Δp·A
2=
μ·I
2·Δp·A
2
CF
I=
w1·M
1+
w2·M
2+
w3·M
3+
w4
Cha
ract
eris
tics
:It
isa
com
bina
tion
ofva
riou
sin
dic
es,
den
oted
asM
FI−
HL
(usi
nga
Hyd
rop
hilic
MF
mem
bran
e),
MF
I−
HP
(usi
nga
MF
Hyd
rop
hobi
cm
embr
ane)
and
MF
I−
UF
(usi
nga
hyd
rop
hilic
UF
mem
bran
e).T
his
test
trie
sto
take
into
cons
ider
atio
nal
lty
pes
offo
ula
ntag
ents
usi
ngd
iffe
rent
mem
bran
es.
M1
isth
eva
lue
ofM
FI−
HL;
M2
isth
eva
lue
ofM
FI−
HP
;an
dM
3is
the
valu
eof
MF
I−U
F.Th
ew
eigh
ting
fact
ors
w1,
w2,
w3
and
w4
dep
end
onth
ech
arac
teri
stic
sof
the
mem
bran
e.D
isad
vant
ages
:The
met
hod
isd
iffi
cult
sinc
eit
requ
ires
dif
fere
ntty
pes
ofm
embr
anes
,an
dth
ep
roce
du
reto
obta
inC
FI
isve
ryte
diou
s.In
addi
tion,
the
foul
ing
inde
xis
still
mea
sure
dun
der
cons
tant
pres
sure
cond
itio
ns.
148

Membranes 2017, 7, 62
Ta
ble
1.
Con
t.
Me
tho
ds,
Ind
ice
sa
nd
Pa
ram
ete
rsC
ha
ract
eri
stic
sE
qu
ati
on
Co
mm
en
ts
MM
AS
(Y.Y
uet
al.,
2010
[54]
)
-M
embr
ane:
MF,
UF
and
NF
-Fo
ula
nt:
par
ticu
late
,co
lloid
san
dor
gani
cm
atte
r-
Ope
rati
ngm
ode:
dead
-end
flow
and
cons
tant
pres
sure
-Fo
ulin
gm
echa
nism
s:
-Te
st:t
/V
vs.V
—
Cha
ract
eris
tics
:M
F,U
Fan
dN
Fm
embr
anes
are
conn
ecte
din
seri
esfo
rsi
mu
ltan
eou
sse
par
atio
nof
targ
etfo
ulan
ts.T
his
ind
exw
assh
own
tobe
prec
ise
and
sele
ctiv
ein
the
pre
dic
tion
ofth
efo
ulin
gp
oten
tial
ofdi
ffer
entf
eedw
ater
s.D
isad
vant
ages
:T
hem
etho
dis
not
sim
ple
sinc
eit
requ
ires
dif
fere
ntty
pes
ofm
embr
anes
tod
eter
min
eth
epa
rtic
le- M
FI,
collo
id-M
FI
and
orga
nic-
MF
I.Fu
rthe
rmor
e,th
efo
ulin
gin
dice
sar
est
illm
easu
red
unde
rco
nsta
ntpr
essu
reco
ndit
ions
.
DF
I(M
.W.N
aceu
r,20
14[5
5])
-M
embr
ane:
MF
of0.
45μ
m(fl
atsh
eet)
-Fo
ulan
t:pa
rtic
ulat
em
atte
r-
Op
erat
ing
mod
e:d
ead
-end
and
cons
tant
pres
sure
-Fo
ulin
gm
echa
nism
s:ca
kefil
trat
ion
-Te
st:t
/V
vs.V
DF
I=
R2 m
2·r·C
Cha
ract
eris
tics
:T
heex
per
imen
talp
roce
du
reis
sim
ilar
toM
FI.
By
intr
odu
cing
the
equ
atio
nof
Ru
thin
the
mod
el,
the
auth
ors
obta
ined
ad
imen
sion
less
fou
ling
inde
x,w
hich
isa
sim
ple
linea
req
uati
on.
Dis
adva
ntag
es:E
xper
imen
talw
ork
tova
lidat
eD
FI
was
notc
arri
edou
t,so
the
accu
racy
ofth
isin
dex
has
notb
een
valid
ated
.
“Nor
mal
ized
Foul
ing
Rat
e”(N
FR)
(H.R
.Rab
ieet
al.2
001
[21]
)
-M
embr
ane:
-Fo
ulan
t:-
Ope
rati
ngm
ode:
-Fo
ulin
gm
echa
nism
s:-
Test
:t/
V svs
.Vs
—
Cha
ract
eris
tics
:T
his
met
hod
isu
sed
toan
alyz
ed
ata
from
ap
ilot
pla
ntin
ala
rge-
scal
efa
cilit
y.N
FRis
the
curv
eof
the
grap
ht/
V svs
.V s
,whe
reV s
isth
esp
ecifi
cvo
lum
e(t
hevo
lum
eco
llect
edpe
run
itar
eaan
dpe
rN
DP
inti
me
t).
Dis
adva
ntag
es:I
tcan
notb
eu
sed
asa
fou
ling
pot
enti
alin
dica
tor
offe
edw
ater
.
k fp
(L.S
ong
etal
.200
4[5
9])
-M
embr
ane:
UF
and
RO
-Fo
ulan
t:co
lloid
s-
Ope
rati
ngm
ode:
cons
tant
pres
sure
-Fo
ulin
gm
echa
nism
s:ca
kefil
trat
ion
-Te
st:
Jvs
.t
k fp=
R∗ t−R
∗ 0v t
Cha
ract
eris
tics
:T
his
norm
aliz
atio
nm
etho
dha
sth
eob
ject
ive
ofel
imin
atin
gth
eef
fect
sof
diff
eren
tope
rati
ngp
aram
eter
sin
the
det
erm
inat
ion
ofth
efo
ulin
gra
te.
Inth
isw
ay,
the
fou
ling
pot
enti
alof
feed
wat
erca
nbe
com
pare
don
afa
irba
sis.
Dis
adva
ntag
es:
One
ofit
sre
sult
sin
dic
ates
that
the
foul
ing
pote
ntia
lofl
arge
collo
idal
part
icle
sin
crea
ses
asth
eop
erat
ing
pre
ssu
rein
crea
ses.
Thi
sis
mai
nly
du
eto
the
com
pre
ssib
ility
effe
ctof
the
cake
,whi
chis
stro
ngly
rela
ted
toth
ena
ture
ofth
eco
lloid
.
149

Membranes 2017, 7, 62
Ta
ble
1.
Con
t.
Meth
od
s,In
dic
es
an
dP
ara
mete
rsC
hara
cteri
stic
sE
qu
ati
on
Co
mm
en
ts
Mem
bran
eFo
ulin
gSi
mul
ator
(MFS
)(J
.S.V
row
enve
lder
etal
.200
6[6
0])
—
MFS
uses
the
sam
em
embr
ane
mat
eria
lsas
spir
al-w
ound
RO
/N
Fm
embr
ane,
wit
hth
esa
me
dim
ensi
ons
and
hyd
rod
ynam
icbe
havi
or,
and
iseq
uip
ped
wit
ha
viso
r.Su
itab
lefo
rin
situ
obse
rvat
ions
inre
alti
me,
non-
des
tru
ctiv
eob
serv
atio
nsan
dp
aram
eter
ssu
chas
pre
ssu
red
rop
can
bem
onit
ored
.It
ism
ainl
yu
sed
asa
biof
oulin
gm
onit
or[6
1].
Dis
adva
ntag
es:
The
reis
noin
stan
tre
spon
seof
the
foul
ing
pote
ntia
l.
Feed
Foul
ing
Mon
itor
(FFM
)(A
.H.T
aher
ieta
l.,20
13[1
7])
—
Thi
ste
chni
que
use
sa
UF
mem
bran
eto
pre
dic
tth
ein
crea
seof
tran
smem
bran
ep
ress
ure
atco
nsta
ntfl
uxe
sin
the
pre
senc
eof
collo
idal
fou
ling.
Thi
sp
red
icti
onin
clu
des
the
dev
elop
ing
hyd
rau
licre
sist
ance
and
the
CEO
Pco
mpo
nent
s.D
isad
vant
ages
:Lac
kof
exte
nsio
nof
this
mon
itori
ngan
dm
odel
ing
appr
oach
tore
al-w
orld
foul
ants
and
afu
ll-sc
ale
RO
desa
linat
ion
plan
t.
Feed
Foul
ing
Mon
itor
-Sal
tTra
cer
Res
pons
e(F
FM-S
TRT)
(A.H
.Tah
erie
tal.,
2015
[16]
)—
Thi
sm
etho
du
ses
the
FFM
incl
ud
ing
anST
RT
tom
easu
reth
ed
evel
opm
ento
fcon
cent
rati
onpo
lari
zati
onin
esti
mat
ing
(CEO
P)th
eco
ntri
buti
on.F
oula
nts
stud
ied
wer
ehu
mic
acid
and
collo
idal
silic
aD
isad
vant
ages
:T
here
isno
inst
ant
resp
onse
ofth
efo
ulin
gpo
tent
ial.
150

Membranes 2017, 7, 62
2.5. Fouling Potential Parameter (kfp)
L. Song et al. [59] defined a new standardization method for the determination of fouling potentialin membrane processes. Initially, it was developed to evaluate the potential of colloidal foulingin UF membranes, but later was also applied in the characterization of fouling in large-scale ROprocesses [62–64].
Index kfp (Pa s/m2) (called the fouling potential) is defined by Equation (9):
Rt = R0 + kfp ·∫ t
0J dt (9)
In Equation (9), J (m/s) is the specific permeate flux, and R and Rt (Pa s/m) are the initial andfinal resistance of the membrane R0. In this resistance, the resistive effect of the viscosity is includedand is equivalent to multiplication of the resistance as is usually considered, R (m−1), and the dynamicviscosity of the fluid μm (Pa s) (Equation (10)):
Rt = μ · R (10)
If the parameter kfp is assumed constant over time, it can be calculated using Equation (11):
kfp =Rt − R0
vt(11)
vt =∫ t
0J dt (12)
where vt is the total specific volume of permeate over time t.
3. Predictive Models
These models are an alternative to fouling indices in the prediction of the fouling influence onRO systems. Some authors [26–29] have proposed equations to estimate the decline of the permeateflux (Jw) over time due to long-term variation of the water permeability coefficient (A). Generally,these correlations are applicable for the respective membrane type and for specific operating conditions.
One of the main drawbacks in the development of this type of model is the availability oflong-term operating data for a wide range of operating conditions and different types of full-scalemembranes. All models aim to describe the permeate flow decline over time or the variation of thenormalized water permeability coefficient An due to compaction, fouling, etc.
A proposed model to predict the decline of Jw due to membrane compaction was used byM. Wilf et al. [26] to estimate the Jw decline in the long term (Equation (13)). Three years of experimentaldata from different Sea Water Reverse Osmosis (SWRO) desalination plants were used to identify theparameter of the model. They calculated the parameter for permeate flow decrements of 25% and 20%.
An = tm (13)
where m is a parameter with values between −0.035 and −0.041 [26] related to permeate flow declineof 20% and 25%, respectively, and t is the operating time in days.
151

Membranes 2017, 7, 62
Zhu et al. [27] also proposed a model (Equation (14)) to predict the coefficient A. This involvesan exponential equation, but in this case, a hollow fiber membrane was utilized (DupontTM B-10,Wilmington, DE, USA) during one year of operating time. This correlation is not based onexperiments, but on model-based simulation: variable feed pressure (6.28–7.09 MPa), constant feedwaterconcentration and temperature (35,000 mg/L and 27 ◦C, respectively). Belkacem et al. [65] used the Zhumodel in terms of membrane resistance increase. The membrane used was the BW30LE-440 FilmtecTM
(Midland, MI, USA) in a two-stage desalination plant with re-circulation during one year of operation.
An = A0 · e(−tτ ) (14)
where τ is a correlative parameter, and the value was 328 under the aforementioned operating conditions.Abbas et al. [28] (Equation (15)) proposed a model to determine the variation of the normalized
average water permeability coefficient An = A/A0, where A0 is the initial average water permeabilitycoefficient. It was an exponential equation depending on three parameters and time, and the utilizedmembrane was the BW30-400 FilmtecTM. Five years of operating data were used for the parameteridentification. The feedwater temperature was between 28 and 30 ◦C, the concentration being in arange of 2540–2870 mg/L, and the feed pressure was around 1200 kPa.
An = α · e(β
t+γ ) (15)
where α = 0.68, β = 79 and γ = 201.1 for the aforementioned membrane and operating conditions.A forth model was proposed by Ruiz-García et al. [29] (Equation (16)). They include the parameter
kfp in the model and gave specific information about the behavior of the performance decline in the longterm. They proposed a two-stage pattern in the decline of A in RO systems: an initial Stage I, where amore pronounced decline than Stage II was shown. This is mainly due to membrane compaction,irreversible fouling (strongly adherent films) and kfp. Stage II is related to a gradual decrease mostlydue to irreversible fouling and the frequency and efficiency of the Chemical Cleaning (CC). The modeldescribed the mentioned stages by the superposition of two exponential functions. The used about3300 operating days of a full-scale brackish water reverse osmosis (BWRO) desalination plant to fit theparameters of the model. They got three equations, one related to maximum values of the normalizedwater permeability coefficient (An) (Post-Chemical Cleaning (Post-CC)), average and minimum values(Pre-Chemical Cleaning (Pre-CC)). This allowed obtaining equations to estimate a range of values forthe coefficient An in time.
An = δ1 · e−t
τ1·kfp + δ2 · e−
tτ2·kfp (16)
The first exponential function is dependent on three parameters (δ1, τ1 and kfp) and is related tothe behavior in Stage I (Figure 3), while the second is dependent on two parameters (δ2, τ2 and kfp)and is more related to Stage II (Figure 3). The first function gets closer to zero as Stage I ends. The δ arerelated to the weight of each exponential: the lower δ1 is and the higher δ2 is, the higher An is whenthe desalination plant is stabilized. τ concerns the decline in each stage (i.e., how fast is the irreversibleeffects (mainly fouling) affecting performance): the larger the value, the more constant is the function.Generally, the higher kfp results in a faster decline of An in Stages I and II. They also carried out acomparison between the different models by using their experimental data.
152

Membranes 2017, 7, 62
Figure 3. Schematic presentation of the two stages in An decline. (I) initial more pronounced drop dueto compaction and irreversible fouling; (II) gradual decline mainly caused by irreversible fouling [29].
4. Conclusions and Perspective of Future
The analysis of the different techniques, parameters, indexes and models that have been developedto date in the characterization and evaluation of RO membrane fouling potential reveals the existenceof gaps in effective methods for the characterization and evaluation of fouling. It seems that the effortsmade to advance our knowledge have turned out to be ineffective in terms of the mitigation andcontrol of membrane fouling due to gaps in effective methods for the characterization and evaluationof fouling. The task of developing reliable fouling prediction tools is extremely important for thedesalination industry, since fouling is one of the main causes of performance decrease in full-scale ROdesalination plants. There are different fouling rates that have been developed and used in this field,but there remains much work to be done to improve these methods, indices and evaluation parameters.Among the weaknesses or deficiencies observed in the current methods of fouling assessment arethe following:
(a) Most conventional indexes, SDI and MFI are not appropriate.(b) There are very few studies about indices or parameters applied directly to spiral wound
membranes and feedwater with high salinity. Most of the studies are applied at the laboratoryscale with well-controlled operating conditions, flat membrane systems and at low salinity.However, it is preferable for fouling potential to be determined with RO membranes and underoperating conditions similar to those of full-scale desalination plants.
(c) Currently, the effect of Cake-Enhanced Osmotic Pressure (CEOP) has not been taken extensivelyinto account in measuring fouling potential. However, CEOP can contribute to a significant lossof performance, even more than the hydraulic resistance brought about by cake formation.
The aforementioned prediction models are based on long-term data of full-scale RO desalinationplants under full-scale operating conditions. Unfortunately, these models do not take into considerationimportant features of membranes such as the spacer geometry. The efficiency and frequency of chemicalcleanings, which play an important role in the performance of this process, should also be consideredin these models.
Conflicts of Interest: The authors declare no conflict of interest.
153

Membranes 2017, 7, 62
References
1. Misdan, N.; Ismail, A.; Hilal, N. Recent advances in the development of (bio)fouling resistant thin filmcomposite membranes for desalination. Desalination 2016, 380, 105–111.
2. Zhang, R.; Liu, Y.; He, M.; Su, Y.; Zhao, X.; Elimelech, M.; Jiang, Z. Antifouling membranes for sustainablewater purification: strategies and mechanisms. Chem. Soc. Rev. 2016, 45, 5888–5924.
3. Jiang, S.; Li, Y.; Ladewig, B.P. A review of reverse osmosis membrane fouling and control strategies.Sci. Total Environ. 2017, 595, 567–583.
4. She, Q.; Wang, R.; Fane, A.G.; Tang, C.Y. Membrane fouling in osmotically driven membrane processes:A review. J. Membr. Sci. 2016, 499, 201–233.
5. Tang, C.Y.; Chong, T.; Fane, A.G. Colloidal interactions and fouling of NF and RO membranes: A review.Adv. Colloid Interface Sci. 2011, 164, 126–143.
6. Karabelas, A.; Sioutopoulos, D. New insights into organic gel fouling of reverse osmosis desalinationmembranes. Desalination 2015, 368, 114–126.
7. Shirazi, S.; Lin, C.J.; Chen, D. Inorganic fouling of pressure-driven membrane processes—A critical review.Desalination 2010, 250, 236–248.
8. Matin, A.; Khan, Z.; Zaidi, S.; Boyce, M. Biofouling in reverse osmosis membranes for seawater desalination:Phenomena and prevention. Desalination 2011, 281, 1–16.
9. Hoek, E.M.; Allred, J.; Knoell, T.; Jeong, B.H. Modeling the effects of fouling on full-scale reverse osmosisprocesses. J. Membr. Sci. 2008, 314, 33–49.
10. Ruiz-García, A.; Ruiz-Saavedra, E. 80,000 h operational experience and performance analysis of a brackishwater reverse osmosis desalination plant. Assessment of membrane replacement cost. Desalination 2015,375, 81–88.
11. Kang, G.D.; Cao, Y.M. Development of antifouling reverse osmosis membranes for water treatment: A review.Water Res. 2012, 46, 584–600.
12. Shahkaramipour, N.; Tran, T.N.; Ramanan, S.; Lin, H. Membranes with Surface-Enhanced AntifoulingProperties for Water Purification. Membranes 2017, 7, 13.
13. Lee, K.P.; Arnot, T.C.; Mattia, D. A review of reverse osmosis membrane materials for desalination—Development to date and future potential. J. Membr. Sci. 2011, 370, 1–22.
14. Lawler, J. Incorporation of Graphene-Related Carbon Nanosheets in Membrane Fabrication for WaterTreatment: A Review. Membranes 2016, 6, 57.
15. Nady, N. PES surface modification using green chemistry: New generation of antifouling membranes.Membranes 2016, 6, 23.
16. Taheri, A.; Sim, L.; Chong, T.; Krantz, W.; Fane, A. Prediction of reverse osmosis fouling using the feedfouling monitor and salt tracer response technique. J. Membr. Sci. 2015, 475, 433–444.
17. Taheri, A.; Sim, S.; Sim, L.; Chong, T.; Krantz, W.; Fane, A. Development of a new technique to predictreverse osmosis fouling. J. Membr. Sci. 2013, 448, 12–22.
18. Ho, J.S.; Sim, L.N.; Webster, R.D.; Viswanath, B.; Coster, H.G.; Fane, A.G. Monitoring fouling behavior ofreverse osmosis membranes using electrical impedance spectroscopy: A field trial study. Desalination 2017,407, 75–84.
19. Esfahani, I.J.; Kim, M.; Yun, C.; Yoo, C. Proposed new fouling monitoring indices for seawater reverseosmosis to determine the membrane cleaning interval. J. Membr. Sci. 2013, 442, 83–96.
20. Koo, C.; Mohammad, A. Experimental Investigation on Performance of Fouling Prediction Devices forNF/RO System. Int. J. Chem. Eng. Appl. 2015, 6, 179.
21. Rabie, H.R.; Côté, P.; Adams, N. A method for assessing membrane fouling in pilot- and full-scale systems.Desalination 2001, 141, 237–243.
22. Jin, Y.; Lee, H.; Jin, Y.O.; Hong, S. Application of multiple modified fouling index (MFI) measurements atfull-scale SWRO plant. Desalination 2017, 407, 24–32.
23. Wei, C.H.; Laborie, S.; Aim, R.B.; Amy, G. Full utilization of silt density index (SDI) measurements forseawater pre-treatment. J. Membr. Sci. 2012, 405–406, 212–218.
24. Jin, Y.; Ju, Y.; Lee, H.; Hong, S. Fouling potential evaluation by cake fouling index: Theoretical development,measurements, and its implications for fouling mechanisms. J. Membr. Sci. 2015, 490, 57–64.
154

Membranes 2017, 7, 62
25. Ju, Y.; Hong, S. Nano-colloidal fouling mechanisms in seawater reverse osmosis process evaluated by cakeresistance simulator-modified fouling index nanofiltration. Desalination 2014, 343, 88–96.
26. Wilf, M.; Klinko, K. Performance of commercial seawater membranes. Desalination 1994, 96, 465–478.27. Zhu, M.; El-Halwagi, M.M.; Al-Ahmad, M. Optimal design and scheduling of flexible reverse osmosis
networks. J. Membr. Sci. 1997, 129, 161–174.28. Abbas, A.; Al-Bastaki, N. Performance decline in brackish water Film Tec spiral wound RO membranes.
Desalination 2001, 136, 281–286.29. Ruiz-García, A.; Nuez, I. Long-term performance decline in a brackish water reverse osmosis desalination
plant. Predictive model for the water permeability coefficient. Desalination 2016, 397, 101–107.30. ASTM. The Annual Book of ASTM Standard, Designation: D 4189-95. Standard Test Method for Silt Density Index
(SDI) of Water; American Society for Testing and Materials: West Conshohocken, PA, USA, 2010.31. Schippers, J.; Verdouw, J. The modified fouling index, a method of determining the fouling characteristics of
water. Desalination 1980, 32, 137–148.32. Boerlage, S.F.; Kennedy, M.; Aniye, M.P.; Schippers, J.C. Applications of the MFI-UF to measure and predict
particulate fouling in RO systems. J. Membr. Sci. 2003, 220, 97–116.33. Yiantsios, S.G.; Karabelas, A.J. An assessment of the Silt Density Index based on RO membrane colloidal
fouling experiments with iron oxide particles. Desalination 2003, 151, 229–238.34. Boerlage, S. Understanding the SDI and Modified Fouling Indices (MFI0. 45 and MFI-UF). In Proceedings
of the IDA World Congress On Desalination and Water Reuse 2007-Desalination: Quenching a Thirst,Maspalomas, Gran Canaria, Canary Islands, Spain, 21–26 October 2007.
35. Boerlage, S.F.; Kennedy, M.D.; Dickson, M.R.; El-Hodali, D.E.; Schippers, J.C. The modified fouling indexusing ultrafiltration membranes (MFI-UF): Characterisation, filtration mechanisms and proposed referencemembrane. J. Membr. Sci. 2002, 197, 1–21.
36. ASTM. D 8002-15, Standard Test Method for Modified Fouling Index (MFI-0.45) of Water. In Annual Book ofASTM Standards; American Society for Testing and Materials: West Conshohocken, PA, USA, 2015.
37. Sanz Ataz, J.; Guerrero Gallego, L.; Taberna Camprubí, E.; Peña García, N.; Carulla Contreras, C.;Blavia Bergós, J. Prevención del ensuciamiento coloidal en sistemas de ósmosis inversa y nanofiltración.Aplicación del ánalisis de superficies con haces de electrones. Tecnol. Agua 2003, 239, 58–63.
38. Koo, C.H.; Mohammad, A.W.; Suja, F.; Talib, M.Z.M. Review of the effect of selected physicochemical factorson membrane fouling propensity based on fouling indices. Desalination 2012, 287, 167–177.
39. Sioutopoulos, D.C.; Karabelas, A.J. Correlation of organic fouling resistances in RO and UF membranefiltration under constant flux and constant pressure. J. Membr. Sci. 2012, 407, 34–46.
40. Sioutopoulos, D.C.; Karabelas, A.J. Evolution of organic gel fouling resistance in constant pressure andconstant flux dead-end ultrafiltration: Differences and similarities. J. Membr. Sci. 2016, 511, 265–277.
41. Sioutopoulos, D.; Karabelas, A.; Yiantsios, S. Organic fouling of RO membranes: Investigating the correlationof RO and UF fouling resistances for predictive purposes. Desalination 2010, 261, 272–283.
42. Khirani, S.; Aim, R.B.; Manero, M.H. Improving the measurement of the Modified Fouling Index usingnanofiltration membranes (NF-MFI). Desalination 2006, 191, 1–7.
43. Sioutopoulos, D.; Yiantsios, S.; Karabelas, A. Relation between fouling characteristics of RO and UFmembranes in experiments with colloidal organic and inorganic species. J. Membr. Sci. 2010, 350, 62–82.
44. Alhadidi, A.; Kemperman, A.; Schippers, J.; Blankert, B.; Wessling, M.; van der Meer, W. SDI normalizationand alternatives. Desalination 2011, 279, 390–403.
45. Koo, C.H.; Mohammad, A.W.; Suja, F.; Talib, M.Z.M. Use and Development of Fouling Index in PredictingMembrane Fouling. Sep. Purif. Rev. 2013, 42, 296–339.
46. Boerlage, S.F.; Kennedy, M.; Tarawneh, Z.; Faber, R.D.; Schippers, J.C. Development of the MFI-UF inconstant flux filtration. Desalination 2004, 161, 103–113.
47. Chellam, S.; Wiesner, M.R. Evaluation of crossflow filtration models based on shear-induced diffusionand particle adhesion: Complications induced by feed suspension polydispersivity. J. Membr. Sci. 1998,138, 83–97.
48. Adham, S.; Fane, A. Crossflow Sampler Fouling Index; National Water Research Institute:Fountain Valley, CA, USA, 2008.
155

Membranes 2017, 7, 62
49. Javeed, M.; Chinu, K.; Shon, H.; Vigneswaran, S. Effect of pre-treatment on fouling propensity of feed asdepicted by the modified fouling index (MFI) and cross-flow sampler-modified fouling index (CFS-MFI).Desalination 2009, 238, 98–108.
50. Sim, L.N.; Ye, Y.; Chen, V.; Fane, A.G. Crossflow Sampler Modified Fouling Index Ultrafiltration(CFS-MFIUF)-An alternative Fouling Index. J. Membr. Sci. 2010, 360, 174–184.
51. Sim, L.N.; Ye, Y.; Chen, V.; Fane, A.G. Investigations of the coupled effect of cake-enhanced osmotic pressureand colloidal fouling in RO using crossflow sampler-modified fouling index ultrafiltration. Desalination2011, 273, 184–196.
52. Hoek, E.M.V.; Elimelech, M. Cake-Enhanced Concentration Polarization: A New Fouling Mechanism forSalt-Rejecting Membranes. Environ. Sci. Technol. 2003, 37, 5581–5588, PMID:14717167.
53. Choi, J.S.; Hwang, T.M.; Lee, S.; Hong, S. A systematic approach to determine the fouling index for a RO/NFmembrane process. Desalination 2009, 238, 117–127.
54. Yu, Y.; Lee, S.; Hong, K.; Hong, S. Evaluation of membrane fouling potential by multiple membrane arraysystem (MMAS): Measurements and applications. J. Membr. Sci. 2010, 362, 279–288.
55. Naceur, M. The Modified Fouling Index Revisited: Proposal of A Novel Dimensionless Fouling Index forMembranes. Int. J. Eng. 2014, 3.
56. Hong, K.; Lee, S.; Choi, S.; Yu, Y.; Hong, S.; Moon, J.; Sohn, J.; Yang, J. Assessment of various membranefouling indexes under seawater conditions. Desalination 2009, 247, 247–259.
57. Boerlag, S.F.; Kennedy, M.D.; Bonne, P.A.; Galjaard, G.; Schippers, J.C. Prediction of flux decline in membranesystems due to particulate fouling. Desalination 1997, 113, 231–233.
58. Sim, L.N.; Ye, Y.; Chen, V.; Fane, A.G. Comparison of MFI-UF constant pressure, MFI-UF constant flux andCrossflow Sampler-Modified Fouling Index Ultrafiltration (CFS-MFIUF). Water Res. 2011, 45, 1639–1650.
59. Song, L.; Chen, K.L.; Ong, S.L.; Ng, W.J. A new normalization method for determination of colloidal foulingpotential in membrane processes. J. Colloid Interface Sci. 2004, 271, 426–433.
60. Vrouwenvelder, J.; van Paassen, J.; Wessels, L.; van Dam, A.; Bakker, S. The Membrane Fouling Simulator:A practical tool for fouling prediction and control. J. Membr. Sci. 2006, 281, 316–324.
61. Vrouwenvelder, J.; Bakker, S.; Wessels, L.; van Paassen, J. The Membrane Fouling Simulator as a new tool forbiofouling control of spiral-wound membranes. Desalination 2007, 204, 170–174.
62. Tay, K.G.; Song, L. A more effective method for fouling characterization in a full-scale reverse osmosisprocess. Desalination 2005, 177, 95–107.
63. Zhao, Y.; Song, L.; Ong, S.L. Fouling behavior and foulant characteristics of reverse osmosis membranes fortreated secondary effluent reclamation. J. Membr. Sci. 2010, 349, 65–74.
64. Chen, K.L.; Song, L.; Ong, S.L.; Ng, W.J. The development of membrane fouling in full-scale RO processes.J. Membr. Sci. 2004, 232, 63–72.
65. Belkacem, M.; Bekhti, S.; Bensadok, K. Groundwater treatment by reverse osmosis. Desalination 2007,206, 100–106.
c© 2017 by the authors. Licensee MDPI, Basel, Switzerland. This article is an open accessarticle distributed under the terms and conditions of the Creative Commons Attribution(CC BY) license (http://creativecommons.org/licenses/by/4.0/).
156

membranes
Review
The Role of Ion Exchange Membranes in MembraneCapacitive Deionisation
Armineh Hassanvand 1, Kajia Wei 2, Sahar Talebi 1,3, George Q. Chen 1,3 and
Sandra E. Kentish 1,3,*
1 Department of Chemical Engineering, University of Melbourne, Parkville, VIC 3010, Australia;[email protected] (A.H.); [email protected] (S.T.);[email protected] (G.Q.C.)
2 Key Laboratory of Jiangsu Province for Chemical Pollution Control and Resources Reuse,School of Environment and Biological Engineering, Nanjing University of Science and Technology,Nanjing 210094, China; [email protected]
3 The ARC Dairy Innovation Hub, Department of Chemical Engineering, University of Melbourne,Parkville, VIC 3010, Australia
* Correspondence: [email protected]; Tel.: +61-8344-6682
Received: 7 July 2017; Accepted: 5 September 2017; Published: 14 September 2017
Abstract: Ion-exchange membranes (IEMs) are unique in combining the electrochemical propertiesof ion exchange resins and the permeability of a membrane. They are being used widely totreat industrial effluents, and in seawater and brackish water desalination. Membrane CapacitiveDeionisation (MCDI) is an emerging, energy efficient technology for brackish water desalination inwhich these ion-exchange membranes act as selective gates allowing the transport of counter-ionstoward carbon electrodes. This article provides a summary of recent developments in the preparation,characterization, and performance of ion exchange membranes in the MCDI field. In some parts ofthis review, the most relevant literature in the area of electrodialysis (ED) is also discussed to betterelucidate the role of the ion exchange membranes. We conclude that more work is required to betterdefine the desalination performance of the proposed novel materials and cell designs for MCDI intreating a wide range of feed waters. The extent of fouling, the development of cleaning strategies,and further techno-economic studies, will add value to this emerging technique.
Keywords: cation exchange membrane; anion exchange membrane; desalination; carbon
1. Introduction
An ion-exchange membrane consists of a polymer matrix in which ionic groups are fixed tothe polymeric backbone. Depending upon the charge of the ionic group, IEMs are categorized aseither anion-exchange membranes (AEMs) or cation-exchange membranes (CEMs). The most commonpositively charged groups fixed in the former are –NH3
+, –NRH2+, –NR2H+, and NR3
+, which allowthe transport of anions and reject cations. On the other hand, CEMs contain –SO3
−, –COO−, PO32−,
and PO3H−, which allow the transport of cations and reject anions [1,2]. The combination of a cationand anion exchange membrane produces a third type of membrane known as a bipolar ion exchangemembrane [3].
IEMs are used for mass separation, chemical synthesis, energy conversion, and storageprocesses [4]. The most commonly known applications are chloroalkali electrolysis and fuel cells [3,5,6],but these applications are not the focus of this paper. Rather, this paper focuses on separationprocesses where cations and/or anions are selectively transferred through the membrane uponapplying an external electrical current [4]. This is the basis for electrodialysis (ED), Donnan dialysis,
Membranes 2017, 7, 54 157 www.mdpi.com/journal/membranes

Membranes 2017, 7, 54
electrodialysis with bipolar membranes (EDBM), reverse electrodialysis (RED), and MembraneCapacitive Deionisation (MCDI).
As shown in Figure 1a, in electrodialysis (ED), the application of an electric field causes the cationsand anions present in the feed stream to migrate toward the cathode and anode, respectively [7].The cations pass through the CEM, but are then retained in the permeate channel due to the presenceof an AEM. Similarly, anions are captured between an AEM and CEM. Hence, by placing theIEMs alternatively, the feed compartments (diluate side) become depleted of ions and the permeatecompartments (concentrate side) become more concentrated [8].
(a)
(b)
Figure 1. (a) Electrodialysis (adapted from [9]); and (b) Membrane Capacitive Deionisation (MCDI)during adsorption.
While ED is considered a mature technology in water desalination, Capacitive Deionisation (CDI)is an emerging technology. This approach has very low energy consumption at low salinity, is easy tooperate and is low maintenance [10,11]. In CDI, an electric field is applied to carbon electrodes, causingcharged species to be adsorbed within the carbon micropores [12]. During regeneration, the electricfield is removed and the adsorbed ions are released back into a brine stream. One of the drawbackslimiting the charge efficiency in CDI is co-ion adsorption, i.e., the adsorption of ions to an electrodecarrying the same surface charge [13]. In 2006, Lee et al. [14] suggested introducing ion-exchangemembranes in front of the carbon electrodes to reduce this effect. As depicted in Figure 1b, in a MCDIcell, an anion-exchange membrane is placed in front of the anode to block the passage of cations and a
158

Membranes 2017, 7, 54
cation-exchange membrane is placed in front of the cathode to reject the anions [15]. This approachsignificantly limits the co-ion adsorption. It also allows for the electrical charge to be reversed duringthe regeneration cycle, rather than being simply turned off. Zhao et al. [16] found that MCDI can bemore energy efficient than Reverse Osmosis (RO) technology, when the feed water salinity is <2 g L−1
Total Dissolved Solids (TDS) and effluent water TDS >0.5 g L−1 (see Figure 2).
Figure 2. Comparison of energy consumption between MCDI and reverse osmosis. Triangles: energyconsumption of MCDI to bring salt concentration to the level of 0.5 g L−1 Total Dissolved Solids (TDS).Diamonds: energy consumption of MCDI to reduce salt concentration to 1 g L−1 TDS. Circles: energyconsumption of Reverse Osmosis (RO) collected from literature studies. Reproduced with permissionfrom [16], copyright Elsvier, 2013.
This review provides a summary of recent accomplishments in the fast evolving area of MCDIand the novel IEMs being prepared for this purpose. Additionally, the effect of fouling and scaling inthese systems is discussed. Recent progress in the area of ion transport through IEMs is also discussedbriefly. In the final section, we describe the most recent MCDI stack designs where novel features areintroduced to the conventional MCDI cell.
2. Ion Exchange Membranes for Membrane Capacitive Deionisation (MCDI) Applications
2.1. Homogeneous Ion Exchange Membranes
Within a homogeneous ion exchange membrane, the ionic groups are chemically bound to apolymeric backbone making a coherent ion-exchanger gel [1,2]. These functionalised polymers wouldswell greatly in water if not crosslinked; thus, crosslinking agents, most commonly divinyl benzenemonomers, are also incorporated [17]. In addition to less swelling, crosslinking also results in animproved structure of the IEM that can facilitate the introduction of a greater density of fixed chargegroups [18]. In a traditional production process, the divinyl monomers are mixed with a linear polymer,polymerisation initiators, and plasticisers to form a paste. This paste is then coated onto a backingfabric or net and the composite structure is heated to copolymerise the divinyl monomers. The ionexchange functionality is added after membrane formation by impregnation of chemicals such aschlorosulfonic acid, sulfuric acid, trimethylamine, or methyl iodide. However, the dangerous natureof these chemicals is resulting in an increasing tendency to instead use monomers that are alreadyfunctionalised [2]. In this case, a water soluble crosslinking agent, typically formaldehyde, is used inplace of divinyl benzene [19]. An alternate CEM can be prepared from a perfluorinated sulfonic acidpolymer such as Nafion™ (DuPont, DE, USA).
IEMs that are commercially available for MCDI applications include Fumasep IEMs produced byFuMA-Tech GmbH (Bietigheim-Bissingen, Baden-Württemberg, Germany), Selemion IEMs produced
159

Membranes 2017, 7, 54
by Asahi Glass Co., Ltd. (Tokyo, Japan), and Neosepta IEMs produced by ASTOM Co. (Tokyo, Japan)(Tables 1 and 2). These membranes benefit from high permselectivity, low electrical resistance, andhigh chemical and mechanical stability [3].
Several workers have developed IEMs specifically for MCDI. In this application, the membranescan be thinner than in ED applications, as they do not need to be self-supporting. This results in lowerelectrical resistance. Kwak et al. [20] developed a cation exchange membrane through heat crosslinkingand esterification of three monomers, 4-styrenesulfonic acid sodium salt hydrate (NaSS), methacrylicacid (MAA), and methyl methacrylate (MMA). The synthesis of a poly(vinylidene fluoride)-sodium4-vinylbenzene sulfonate copolymer (PVDF-g-PSVBS) CEM for deionisation applications wasalso reported by Kang et al. [21]. Jeong et al. [22] synthesized an aminated poly(vinylidenefluride-g-4-vinylbenzyl chloride) (PVDF-g-VBC) anion exchange membrane, while Qiu et al. [23]used γ-irradiation to crosslink a thin sulfonated polystyrene film as a CEM.
2.2. Composite Electrodes for MCDI
The carbon electrodes used in CDI applications are generally prepared from activated carbon,or other forms of carbon such as graphene or carbon nanotubes. These carbon particles are boundtogether through the addition of a weakly hydrophilic polymer binder such as polyvinylidene fluoride(PVDF). Lee et al. [24] were the first to combine ion-exchange resin directly into a CDI electrode toimprove the hydrophilicity of these structures. They achieved salt removal efficiencies 35% higherthan a conductive carbon black/carbon composite electrode when Purolite anion exchange resin wasadded to both electrodes. Hou et al. [25] similarly used polyvinyl alcohol as a more hydrophilic binder.
However, later work has focused on incorporating ion exchange resin into the carbon electrodeor coating it with an ion selective coating. This provides a composite structure within which the ionselectivity is comparable to separate IEM and electrode layers. Application of such electrodes canpotentially result in a system that is lower in capital cost and electrical resistance than a conventionalMCDI unit, but with the same current efficiency. This approach is referred to as modified MCDI(m-MCDI) [26].
Table 1. Fabrication and characterization properties of different cation-exchange membranes (CEMs)and composite electrodes for use in membrane capacitive deionisation (MCDI) processes.
MaterialsPolymer or Polymer
Coating
WaterUptake(wt %)
IEC(meq g−1)
ElectricalResistance
(Ω cm2)
Thickness ofPolymer or
Coating (μm)
SpecificCapacitance
(F g−1)Ref.
CommercialMembranes
Fumasep FKS 12–15 0.8–1.2 2.0–4.5 120 - SupplierNeosepta CMX 25–30 1.5–1.8 3.0 170 - [9]Selemion CMV 25 2.4 - 120 - [9]Dupont Nafion 16 0.9 1.5 117 - [9]
IEMs forMCDI
NaSS-MAA-MMA 121 0.99 0.7 90–140 - [20]PVDF-g-PSVBS 61 1.14 2 - - [21]
Crosslinked Sulfonatedpolystyrene 30 0.9 0.37 25 - [23]
CompositeElectrodes
Polyethyleneimine (PEI) - - - - 52 [26]PVA/SSA-coated - - 0.67–1.17 - 97–116 [27]
SG-CNFs a - - - <1 117 [28]PVA/SSA-coated - - 0.64 10 0.74 F cm−2 [29]Sulfonated PPO b - 0.93 - 4.9 - [30]
Sulfonated BPPO c coated - - - - - [31]Sulfonated graphene - - - - 108 [32]PVA/SSA/SSA-MA 44 2.8 - 6.4 - [33]
a Sulfonated graphene-carbon nanofibres; b poly(phenlylene oxide); c Bromomethylated poly (2,6-dimethyl-1,4-phenylene oxide).
160

Membranes 2017, 7, 54
Table 2. Fabrication and characterization properties of different anion-exchange membranes (AEMs)and composite electrodes for MCDI process.
MaterialsPolymer or Polymer
Coating
WaterUptake(wt %)
IEC(meq g−1)
ElectricalResistance
(Ω cm2)
Thickness ofPolymer or
Coating (μm)
SpecificCapacitance
(F g−1)Ref.
CommercialMembranes
Fumasep FAS 15–3013–23 1.6–2.01.0–1.3 0.3–0.61.7–3.0 30135 - SupplierNeosepta AMX 25–30 1.4–1.7 2.4 140 - [9]Selemion AMV 19 1.9 2.8 120 - [9]
IEMs forMCDI
Aminated PVDF-g-VBC 25 1.0 4.8 - - [34]
CompositeElectrodes
Purolite - - - - 19 [24]dimethyldiallyl ammonium
chloride - - - - 53 [26]
Anion exchange resin - 1.20 - - - [35]- 2.9 - ~40 - [36]
Aminated PVA - 1.76 - 20–40 180 [37]Aminated PVA - - - - 184 [38]Aminated PSF a - 1.0 5.2 - - [30]Aminated BPPO - - - - - [31]
Aminated Graphene 91 [32]Aminated PSF 37 2.1 - 10.6 - [33]
a Polysulfone.
Kim and Choi [27,29] were the first to try this approach and coated a mixture of poly(vinylalcohol) (PVA) and sulfosuccinic acid (SSA) directly onto a carbon electrode to form a cation selectiveelectrode (Figure 3a). The other electrode was left uncoated. This approach gave a 15 to 30%increase in specific capacitance for the electrode, while giving less electrical resistance than commercialIEMs. The same group [35,36] later fabricated nitrate-selective composite electrodes (Figure 3b) bycoating anion exchange resin powder onto a carbon electrode. In MCDI experiments, they coupledthis novel electrode with a standard Neosepta CMX membrane attached to the other electrode.Tian et al. [37] synthesised an anion exchange membrane electrode that combined a cross-linked PVAlayer functionalised with quaternary amine groups above an activated carbon layer, while Gu et al. [38]used a similar coating on a graphene sponge electrode (Figure 3c). Qian et al. [28] used sulfonatedgraphene to prepare an ultrathin cation-selective coating achieving enhanced electrochemical specificcapacitance and charge efficiency.
Figure 3. SEM images of three typical composite electrodes. (a) Carbon electrode coated with PVA/SSApolymer solution, copyright Elsvier, 2010; (b) composite carbon electrode coated with resin powder,copyright Elsvier, 2012; (c) Sulfonated graphite (SG) carbon nanofibre composite. Reproduced withpermission from [27,28,35], copyright John Wiley and Sons, 2015.
While these researchers developed only one ion selective electrode in isolation, other researchershave developed electrode pairs, generally by sulfonation and amination of a base polymer, which isthen sprayed or coated onto the carbon electrode [30,31]. Liu et al. [32] similarly directly sulfonatedand aminated 3D graphene. Kim et al. [33] blended and crosslinked PVA with sulfur succinic acid(SSA) and poly(styrene sulfonic acid-co-maleic acid) (PSSA-MA) to provide a CEM and used animatedpolysulfone for the AEM. Liu et al. [26] introduced the anion exchange polymer dimethyldiallyl
161

Membranes 2017, 7, 54
ammonium chloride and cation exchange polymer polyethyleneimine (PEI) as a binder in carbonnanotube electrodes to form such a pair.
These composite electrodes appear a promising approach to reducing electrical resistance.However, more work is required to determine if they are indeed lower in cost than the traditionalarrangement and to evaluate their long term performance in desalination of a wide range ofcharged species.
3. MCDI Performance Parameters
There are several key parameters that indicate MCDI or CDI performance. The salt removalefficiency is the percentage of salt removed from the feed stream in each adsorption cycle and reflectsthe cell geometry, feed flowrates, charge applied, and carbon properties. In general, MCDI providesbetter salt removal efficiency compared with CDI due to the almost complete elimination of co-ionadsorption (Figure 4). Such efficiencies are mainly above 70% for MCDI and m-MCDI, while for CDIcells, these are mostly below 70%.
Figure 4. Salt removal efficiencies as a function of feed salt concentration from recent research reportson Capacitive Deionisation (CDI), MCDI, and modified MCDI (m-MCDI) [14,24,26,29–31,39–42].
The adsorption capacity is the amount of salt adsorbed per gram of capacitive materials withinthe adsorption cycle. This capacity depends most strongly upon the type of electrode used, but isgenerally higher in direct experimental comparisons for m-MCDI or MCDI versus CDI (Table 3).
Table 3. A comparison of salt adsorption capacities from parallel studies of m-MCDI or MCDI versusCapacitive Deionisation (CDI).
Feed Salt Concentration Adsorption Capacity (mg g−1)
(mg L−1) m-MCDI MCDI CDI Reference
50 - 2.04 1.05 [41]100 2.09 - 2.0 [31]200 - 5.3 3.7 [40]200 - 10.2 8.1 [29]300 - 3.5 1 [43]400 - 4.3 3 [44]400 9.5 - 5.0 [28]500 9.3 6.5 - [26]750 - 45.6 30.3 [45]
1000 9 6 1.9 [46]
162

Membranes 2017, 7, 54
CDI and MCDI cells are operated either at constant current (CC) where the voltage varies duringthe cycle, or constant voltage (CV) where the current is varied. The charge efficiency (Λ) is used tocharacterise the CV mode and is defined as the ratio of adsorbed salt (Γ, mol g−1) per cycle to thecharge (Σ, C g−1) transferred in this cycle [47]:
Λ =Γ × F
Σ(1)
where F represents Faraday constant (96,485 C mol−1), Γ is the adsorption capacity, and Σ is calculatedby integrating the corresponding current [48].
The current efficiency, λ, describes the CC mode and is similarly defined as the amount of ionsadsorbed over current applied.
λ =(Cin − Cout)VF
Itads(2)
where Cin and Cout are the salt concentrations (mol L−1) of influent and effluent, I is the appliedelectrical current, tads is the adsorption duration, and V is the solution volume (L) [49].
The charge efficiencies and current efficiencies for MCDI are mostly above 50%, while those forCDI are lower (see Figure 5). The use of composite electrodes (m-MCDI) shows even higher chargeefficiencies. Choi [50] found that the charge efficiency in CV mode was greater than the comparablecurrent efficiency in CC mode, although this trend is less evident when a range of data is consideredsuch as in Figure 5 [51].
Figure 5. Charge and current efficiencies as a function of feed salt concentration for a range of recentstudies [25,28,29,40,42–45,52–54].
The energy consumption in both CDI and MCDI is a direct function of the feed salt concentration.In a pilot scale CDI study, Mossad and Zou [55] proposed a minimum energy consumption of1.85 kWh m−3 (10 kJ g−1) for CDI at the highest flow rate. In lab-scale tests, MCDI has been shown toprovide lower energy consumption, below 1 kWh m−3 or 6 kJ g−1 [44,49]. Dlugolecki et al. [56] wereable to achieve a value of 0.26 kWh m−3 by recovering the energy during the discharge part of theMCDI cycle. Choi [50] found that the MCDI energy consumption was much lower while operatedunder CC mode against CV mode.
It should be noted that most work to date has considered only the separation of NaCl using MCDI.Choi et al. [57] considered the selective removal application of nitrate, while Ryu et al. [58] suggesteda novel recovery system for lithium with a modified MCDI cell. Yoon et al. [59] proposed the use ofcalcium alginate as a cation exchange coating material on a negative electrode and used this approacheffectively for calcium removal. In this case, the salt sorption capacity and charge efficiency were15.6 mg g−1 and 95%, respectively; much higher than that for CDI (9.8 mg g−1 and 55%).
163

Membranes 2017, 7, 54
In another study, Choi et al. [60] used a commercial monovalent cation permselective membraneto produce calcium-rich solutions from an MCDI process, by selectively removing sodium. They mixedNaCl and CaCl2 at similar mass ratios and achieved a selectivity of 1.8 (removal of Na+ to that ofCa2+). This selectivity fell at higher feed TDS concentrations, lower pH values, lower applied voltage,and longer operation time. The authors compared this approach to the use of nanofiltration (NF) andargued that the NF approach was unable to produce a divalent-rich solution. However, this result isnot consistent with other literature sources that do indicate NF can provide divalent selectivity [61–64].The authors also compared the electrical energy consumption in MCDI to that of NF. With specificenergy consumption of around 0.2 KWh m−3, MCDI was comparable with NF only at low salinity andwater recoveries. However, it is worth mentioning that Choi et al. [60] considered the electrical energyconsumption during both during adsorption and desorption. The use of energy recovery systemsduring MCDI regeneration can reduce this energy requirement [56]. Overall, there is limited data onMCDI with such alternative salts, making this a fruitful area for further research.
The research outcomes discussed in this section are also mostly collected from lab scale MCDIunits. More work is required to test these membranes at a larger scale. van Limpt et al. [65] are oneof the few groups to report results from commercial MCDI systems. They monitored the operationof two MCDI modules in series (each providing 6 m2 cell area) on cooling water recycle streams.The modules were operated under constant current conditions for more than six months at twodifferent site locations. MCDI operation resulted in 70% conductivity removal, 83% water recovery,and savings of 85% in chemical usage. High water recovery was achieved by lowering the flowrate during regeneration. An energy consumption of 0.1 to 0.2 kWh m−3 was reported, which issignificantly lower than that of RO in brackish water deioniziation (0.85–1.55 kWh m−3).
4. Fouling
Fouling is an unfavorable phenomenon caused by the attachment of a substance or a livingorganism to the surface of the membrane. Mikhaylin et al. [66] classified IEM fouling into threecategories—colloidal fouling, organic fouling, and biofouling. Non-dissolved suspended solidssuch as aluminium silicate clays contribute to colloidal fouling, while organic fouling is causedby organic materials such as oils, proteins, and humic acid. Biofouling is initiated by deposition ofbacteria or algae onto the membrane, where these microorganisms proliferate and exude extracellularpolymeric substances [67,68]. Alternatively, scaling occurs when a dissolved species precipitates ontothe membrane surface.
4.1. Fouling in Capacitive Deionisation
In CDI mode, fouling directly affects the carbon electrodes. Mossad et al. [69] used the sodiumsalt of humic acid as a model foulant of CDI electrodes and reported a fall in salt removal efficiencyand feed flow rate over 30 h of operation. They attributed this deterioration to organic fouling blockingthe carbon pores. Energy consumption increased by 39% with the introduction of only 10 mg L−1 oforganic matter to the feed composition. For a feed containing NaCl and humic acid, neither hydraulicor acid cleaning was effective in recovering the flow rate; an alkaline solution, however, could recover86% of the initial flow rate [69]. For a feed containing both humic acid and a range of divalent salts,hydraulic cleaning was less effective, with only 62.5% of the flow rate recovered with alkaline cleaning.These researchers also observed that the amount of iron in the effluent during cleaning was significantlyhigher than the iron concentration in the feed, suggesting that Fe ions accumulated more readily thanCa or Mg ions on the carbon electrodes.
Zhang et al. [70] similarly reported an increase in energy consumption during the long-termoperation of two inland brackish water desalination CDI units in Australia. It was suggested thatdissolved organic matter should be removed prior to the CDI unit to maintain the unit sustainabilityand efficiency [69]. These researchers [70] cleaned their CDI unit with 0.01 M citric acid for calcium
164

Membranes 2017, 7, 54
and magnesium scaling, followed by 0.01 M NaOH solution to remove organic fouling to recover thecell performance.
Wang et al. [71] observed a deterioration in CDI desalination and regeneration performancein the presence of humic acid in domestic wastewater biotreated feed. Using impedance spectra,they calculated the resistance of fouled and virgin electrodes as 1.7 and 1.2 Ω cm−2, respectively.They reported that cleaning with water was capable of removing protein-like substances, while 0.01 MNaOH was most effective in the removal of humic-like substances from the carbon surface.
4.2. Fouling of Ion Exchange Membranes
To the best of our knowledge, Kim et al. [52] is the only research group who have studied the useof MCDI technology in the presence of foulants. They observed a decrease in salt removal efficiency inthe first 6 cycles of operation when using a solution of 17 mM NaCl containing 5 and 10 mg L−1 ofoctane as the model foulant. However, this efficiency reached a stable value in the four subsequentcycles. They attributed this trend to octane reaching adsorption equilibrium on the IEM surface.They assumed octane fouling interrupted the access of ions to the carbon electrodes, lessening the saltremoval efficiency.
It is anticipated that fouling of IEMs in the MCDI arrangement should generally be less damagingto process operations than fouling of the electrodes in CDI arrangements. Further, we anticipate thatfouling in these systems should replicate trends observed in electrodialysis studies, so the followingsection summarizes literature in this field.
In most electrodialysis studies, peptide and protein fouling is observed on the AEM [1,72,73].This reflects the fact that these species are generally negatively charged and hence accumulate in theboundary layer near the surface of this membrane. Conversely, Langevin et al. [74] reported thatCEM membranes are doubly more prone to peptide fouling in comparison to AEMs. This contrastingresult probably arises from the fact that these authors completed their investigations in the absence ofelectrical current. Therefore, the interaction between the charged amino acids and the membrane’sfixed charged groups became the only governing factor. With systems involving proteins, the processshould also be maintained at temperatures lower than 40 ◦C to avoid protein denaturation andagglomeration [75].
Lee et al. [76] used zeta potential to obtain the surface charges of three organic foulants, humate,bovine serum albumin (BSA), and sodium dodecylbenzenesulfonate (SDBS). They then used batchequilibrium experiments to determine the adsorption capacity of these negatively charged organicfoulants on a Neosepta AMX membrane and fitted the results to Langmuir isotherms. Among thethree model foulants, SDBS showed the highest adsorption capacity, even though the humate wasmore negatively charged. In subsequent ED trials, the SDBS (at 52 mg L−1) also caused a greaterincrease in membrane resistance and decline in current efficiency, relative to 1.0 g L−1 of humate andBSA. Lee et al. [76] then examined the reversibility of the fouling step by running three experiments ina row, comparing the ED performance before and after fouling without the application of any cleaningagent. They observed that the organic fouling on AMX was not reversible; it was adsorbed chemicallyto the membrane.
Lindstrand et al. [77] investigated the fouling of a surface active fatty acid (octanoic acid), asurfactant (SDBS) and an alkaline bleach plant filtrate on Selemion AMV and CMV membranes. Whilethe CEM resistance increased marginally due to scaling with the bleach plant filtrate, that of theAEM increased significantly in the presence of octanoic acid, due to electrostatic attractive forces.The authors argued that this fouling was more significant at surfactant concentrations approaching thecritical micelle concentration. The AEM fouling was also more severe for octanoic acid at pH 3–3.5than at pH 9. Since octanoic acid is not dissociated at the low pH values, they were expecting toobserve similar fouling on both the AEM and CEM, but the CEM was not affected. They argued thatthe repulsion of the electrical dipole in the acid molecules by the CEM fixed charges outweighed thehydrophobic forces. However, it is also likely that the electric field caused the dissociation of the
165

Membranes 2017, 7, 54
octanoic acid even at this lower pH, as has been observed by our own group and others for similarweak acids [78].
The pH of the feed solution promotes different types of fouling to take place. Diblíková et al. [79]reported protein precipitation on the AEM when processing cheese whey at a diluate pH of 4–5. It isknown that at such pH, β-lactoglobulin has low solubility [80]. In addition, the negatively chargedwhey proteins cannot pass through the AEM due to their large size and thus precipitate on the surfaceof the membrane [81,82]. Under acidic conditions, the presence of Ca2+ and CO3
2− in the feed solutionalso promotes the precipitation of proteins on the CEM [82,83]. Several researchers reported that thegel-like protein layer noticed on AEM during whey demineralization is reversible, as it detaches easilyduring equipment disassembly [81,84]. However, Bleha et al. [85] argued that protein fouling becomesirreversible once it reacts with functional groups of the IEMs.
Mineral fouling (scaling) occurs most readily on the CEM in an acidic environment andupon the AEM in a neutral or basic environment where the solubility of hydroxides and carbonatesreduces [8,66,75,82,86,87]. Increases in temperature also exacerbate the precipitation of calcium saltsdue to their well-known reverse solubility [88]. The presence of certain ions in the feed solution canfurther promote the precipitation of other components. Bazinet and Araya-Farias [86] noted that whena solution containing CaCl2 and Na2CO3 were used, calcium hydroxide was the main deposit, whileno calcium carbonate was detected. This was explained by the absence of magnesium in the solution,as magnesium is required to induce calcium carbonate nucleation.
Fouling in Electrodialysis Reversal (EDR) systems may provide a better analogue to MCDI, asin both operations the DC current is periodically reversed [89]. Vermass et al. [90] demonstrated theeffectiveness of polarity reversal in EDR to remove multivalent ions and organic fouling. However,they reported that not all fouling is reversible and a combination of antifouling strategies must beemployed for long-term charge efficiency stability [90].
4.3. Alterations to Membrane Chemistry
Salts in the feed solution can alter the counter-ion concentration within the membrane itselfand thus affect performance. For example, Ayala-Bribiesca et al. [84] showed that calcium presentin the feed solution could replace the counter-ion of the membrane and hence change its electricalconductivity. Shee et al. [91] similarly observed changes in the membrane composition in responseto changes in the feed. Langevin et al. [74] observed that a CEM pretreated with acid (1 M HCl) wasmore prone to fouling in a soy protein hydrolysate solution than membrane pretreated in an alkali orneutral solution. This was attributed to the reaction of the H+ counter-ion within the membrane withthis negatively charged species.
A number of researchers have shown that strongly alkaline solutions will damage ion exchangemembranes [92,93]. Sata et al. [92] investigated the effect of NaOH concentrations ranging from 3.0to 9.0 N on common AEMs. They showed that while all membrane showed a loss of anion exchangefunctionality, the N-methyl-pyridinium groups were more rapidly degraded, compared with benzyltrimethylammonium groups. The degradation reactions were slower at low concentrations of NaOHand lower temperatures. Membranes based on a polysulfone backbone weakened mechanically uponalkali exposure, while those made with a polyethylene fabric retained their mechanical strength.Similarly, Vega et al. [94] reported that the extent of damage to a Neosepta AMX membrane was lessunder low KOH concentrations (pH 10) than at higher concentrations (pH 14). This membrane isreinforced by ploy(vinyl chloride) fabric and alkali exposure that caused both the color to darken andmechanical strength to weaken due to dehydrochlorination of this fabric. Garcia-Vasuez at al. [95]showed that while AEMs exhibit both loss of functional groups and polymer backbone integrity,the sulfonate groups on the CEM are not directly affected, with only backbone chain scission occurring.
Ghalloussi et al. [96] analysed the structure and physiochemical properties of four different ionexchange membranes after 2 years of ED operation with a food industry solution containing organicacids. They found that the AEMs were most severely damaged, with evidence of organic colloidal
166

Membranes 2017, 7, 54
particles being sorbed into the membrane structure itself. This led to increased water content andthickness, greater surface hydrophilicity, as well as structural damage (see Figure 6). Conversely,there was evidence of a loss of sulfonic acid functional sites from the CEM, leading to a decreasein water content, greater hydrophobicity, and a more dense structure. Both membranes suffereda loss in specific conductivity and ion exchange capacity, with the CEM also experiencing a lossin permselectivity.
Figure 6. SEM micrographs of Neosepta® membranes. New CEM (a); used CEM (b) and usedAEM (c,d). Reproduced with permission from [96], copyright Elsvier, 2013.
4.4. Cleaning Solutions
Physical cleaning of membranes involves forward or backwashing, air sparging, or vibration.Those processes have proven to be effective for pressure-driven membrane processes, but not for densenon-porous ion-exchange membranes such as used in MCDI processes [97]. For these operations,chemical membrane cleaning is preferred as it utilizes chemical reactions to weaken the bonds betweenthe foulants themselves and the foulant-membrane surface [88]. There are five groups of chemicalsthat can be used as cleaning agents for membrane processes, namely: alkalis, acids, metal chelatingagents, surfactants, and enzymes—each targeting different types of deposits. The type of cleaningchemical to be utilized is usually selected based upon the nature of the foulant, the compatibility ofthe chemical with the processing equipment, chemical availability, cost, and safety [88,98]. However,chemical cleaning has many disadvantages, namely: membrane damage, usage of large quantities ofchemicals, and waste generation.
Generally, alkaline cleaning agents are known for their ability to remove organic foulants, suchas peptides and proteins, as the functional groups of those foulants deprotonate at pH 11 [74], whilean acid clean can remove mineral deposits. Similarly, chlorinating agents are often used to removebiological fouling from membranes. However, Garcia-Vasuez at al. [95] has shown that both AEM andCEM membranes degrade upon exposure to sodium hydochlorite, losing electrical conductivity, ionexchange capacity, and mechanical strength. Furthermore, although the use of sequestering agents,such as EDTA, are found useful for mineral deposit removal from pressure driven membranes [88],they should be used with care for ion-exchange membranes, as they may tend to remove the chargedions from the membrane structure.
167

Membranes 2017, 7, 54
Cleaning thus needs to be carried out with some care for ion exchange membranes, as they arereadily degraded by extremes of pH, particularly alkalinity, as discussed in Section 4.3. The AmericanWater Works Association claims that 2–5% HCl solution, 3–5% NaCl solution adjusted to a pH of 8–10using NaOH, and 10–50 mg L−1 chlorine solution are the only chemicals that should be utilized forion-exchange membranes in ED stacks [99]. Langevin and Bazinet [74] investigated the effect of 2%and 5% NaCl solutions as cleaning agents. They found that such solutions were able to remove largerfoulant particles (>900 Da) from a Neosepta CMX membrane, but was less effective on smaller particles.
The interaction between membrane charge and foulant should be taken into account [100], as alkaliand acid cleaning agents have the tendency to replace the equilibrated counter-ions in the membranewith H+ and OH−, respectively. This can cause problems in later operation as these ions are replacedwith other salts. Research has shown that AEMs are more sensitive to cleaning chemicals compared toCEM. Garcia-Vasquez et al. [101] repeated an ex-situ clean-in-place (CIP) cycle for 400 h on an AEMand a CEM both having the same materials as the support and binder, but different ion-exchangegroups. The cycle consisted of soaking for 30 min in 0.1 M HCl; rinsing with deionized water; soakingfor 30 min in 0.1 M NaOH and rinsing again with deionized water. The cycle resulted in an increase inthe hydrophilicity of the AEM causing higher water uptake, greater membrane electrical conductivity,formation of pores and cavities in the membrane, loss of toughness and flexibility, and modification ofthe binder material. Less damage was noted for the CEM, which was attributed to the minimal changein water uptake as the charged groups changed from Na+ to H+.
5. Modelling MCDI Behaviour
An MCDI stack can be modelled by considering the resistance to flow of ions from the flowchannel, through the IEMs, through the macropores in the carbon, and into the carbon micropores(Figure 7). The modified Donnan theory proposed by Biesheuvel et al. [102] can be used to describethe ion storage within these pores. This theory specifies the relationship between the concentration inthe micropores with the Donnan potential drop of these micropores (Δϕelectrode,donnan) and the Sternlayer potential drop (ΔϕSt) within the electrical double layer (see Figure 7). However, in this Section,we focus on the role of the IEMs, as these are the defining difference between CDI and MCDI.
Figure 7. Schematic illustration of counter-ion concentration (C) and dimensionless voltage (ϕ)distribution over a half-cell within an MCDI stack. Subscripts ms, m, me, Ma, and Mi stand formembrane/spacer interface, membrane phase, membrane/electrode interface, carbon macropores, andmicropores, respectively. Reproduced with permission from [103], copyright Elsvier, 2017.
168

Membranes 2017, 7, 54
The flux of counter-ions (J+,m) through the IEM can be described by the Nernst-Planck equation.In the absence of convective flow, this equation is composed of a diffusion term driven by a chemicalpotential gradient, and an electromigration term driven by an electrical potential gradient:
J+,m = −D+,m
(dC+,m
dy+ C+,m
dlnγ+,m
dy
)−Di,m
ziC+,mFRT
dψm,di f f
dy(3)
where C+,m is the concentration, D+,m is the diffusion coefficient and γ+,m is the activity coefficientof the counter-ion, Cf ix,m is the concentrations of fixed charge groups in the membrane, ψm,di f fis the diffusion electrical potential, zi is the charge of the ion, R is the universal gas constant(8.314 J mol−1 K−1), T is the temperature (K), and y is the distance perpendicular to themembrane surface.
In general, the fixed charge group concentration [104–106], affinity of the competing ions [107–109],and water uptake of the membrane [106,110] are known to affect the ultimate ion concentration withinthe membrane (Ci,m). The ion activity coefficients (γ+,m) in the membrane cannot be measureddirectly and in most studies, these are either assumed to be unity, or equal to that in the solution(i.e., γ+/γ+,m = 1) [111–113]. However, the activity coefficient of the counter-ions is indeed expectedto be significantly lower than that of the free aqueous solution [114], due to the high concentrationof the counter-ions (C+,m) within this phase [115]. In contrast, the concentration of co-ions in themembrane (C−,m) is much lower hence this activity coefficient is expected to be closer to unity. Recentadvancements have been made by Kamcev et al. [116] to relate the ion activity coefficients to theconcentration of fixed charges in the membrane (Cf ix,m) and a dimensionless linear charge density(ζ) of the polymer chains, based on Manning’s counter-ion condensation theory for polyelectrolytesolutions [15]. For a 1:1 electrolyte γ+,mγ−m is:
γ+,mγ−m = [X/ζ+ 1
X + 1]· exp[− X/(X + 2ζ)] (4)
where X is the ratio of fixed charge group to mobile ion concentration (i.e., X =Cf ix,mC−,m
).The Meares model is widely used to describe the co-ion diffusion coefficient through the swollen
polymer network (D−,m) [114]:D−,m
D−,s=
(1 − Φp
1 + Φp
)2(5)
where D−,s is the diffusion coefficient of the co-ion in the solution and Φp is the polymer volumefraction in the membrane [117–119]. For counter-ions, the electrostatic effect from the fixed chargegroups cannot be neglected. To account for this effect, Manning’s model [120] can again be applied,by assuming that ion diffusion is affected by the local electric field and that condensed counter-ionshave no mobility. This results in the extended Meares/Manning Model [121] for the counter-iondiffusion coefficient of 1:1 electrolytes D+,m:
D+,m
D+,s=
(Xζ + 1X + 1
)(1 − 1
3A(1;
Xζ)
)(
Φw
2 − Φw)
2(6)
where Φw is the water volume fraction in the membrane, the parameter A is dependent uponmeasurable parameters X and ζ.
While a range of research groups have established techniques to evaluate the concentration,activity, and diffusivity coefficients in IEMs, this knowledge has not been widely employed in MCDImodels. The application of more accurate membrane related parameters will further improve the iontransport models evolving for MCDI.
169

Membranes 2017, 7, 54
6. MCDI Novel Stack Developments and Outlook
The search for novel MCDI configurations has led to the introduction of various technologieswhere researchers aimed to overcome the restrictions and drawbacks associated with conventionalMCDI systems. In this section, recent developments in this area are described to frame future directionsin this field.
6.1. Radial Deionisation (RDI)
Atlantis Technologies are currently commercialising an MCDI cell which has been modified toprovide up to 100 electrode pairs in a cylindrical arrangement [122]. This approach has been testedon phosphate mining wastewater, shale gas produced water and landfill leachate and been shown toeffectively remove trace metals such as selenium, mercury, arsenic, and uranium, in addition to morecommon salts [123].
6.2. Flow Chamber Modification
In an approach similar to electrodeionisation, Liang et al. [42], filled the flow channel in an MCDIcell with ion exchange resin to reduce the electrical resistance at low salinities. This approach gavea salt removal efficiency of 90%, higher than that of either MCDI (60%) or CDI (19%) at comparableconditions. Similarly, Bian et al. [124] filled the flow chamber with granular activated carbon (GAC)(as shown in Figure 8). They observed an enhanced desalination rate compared with a conventionalMCDI cell, which was attributed to a lower electrical resistance within the flow channel, as well as theintroduction of additional storage sites within the GAC.
Figure 8. Schematic diagram of GAC (granular activated carbon)-MCDI as depicted by Bian et al. [124].Reproduced with permission, copyright Elsvier, 2015.
The approach was most effective for NaCl solutions of <200 mg L−1. A smaller GAC particle size(0.4–0.8 mm compared with 2–5 mm) showed a better desalination rate, which was attributed to alower energy barrier for ion transport from the bulk to the GAC pores [124]. Using non-conductiveglass beads was less effective, indicating that the GAC was not just acting to increase turbulence.Conversely, while porous graphite granules showed similar ohmic resistance to the activated carbon,these could not match the desalination rate of regular MCDI due to the higher ionic resistance.
170

Membranes 2017, 7, 54
6.3. Flow-Electrodes Capacitive Deionisation
In 2013, Jeon et al. [125] introduced a novel configuration called flow-electrode capacitivedeionisation (FCDI) in which a flowing carbon suspension replaced the solid carbon electrodes.As depicted in Figure 9, in FCDI, the ions are adsorbed into the suspended carbon materials flowingbetween the current collectors and ion-exchange membranes.
Figure 9. Schematic diagram of Flow-electrode capacitive deionisation (FCDI). Reproduced withpermission from Gendel et al. [126], copyright Elsvier, 2014.
This approach allows capacitive deionisation to operate in a continuous mode, rather than inadsorption and desorption cycles [125,126]. Further, whereas in a conventional MCDI process, the ionsorption capacity is restricted to the size of the fixed carbon electrodes, the ion exchange capacity of anFCDI system can be enhanced by altering the flow path size and flow rate of carbon slurry [127,128].
To regenerate the carbon suspensions, some research groups simply mix the suspension collectedat the anode with that of the cathode and then let the carbon materials settle [125,127]. Alternatively,Gendel et al. [126] coupled two FCDI cells with opposing electrical potentials in which desalinationand regeneration occurred separately. Later, Rommerskirchen et al. [129] developed a smart designby combing the desalination and regeneration cells into a single electrosorption module. In this case,one type of ions transfers through the ion-exchange membrane placed in the middle of the cell froma diluate compartment to a concentrate compartment. The opposite ion is adsorbed into the carbonslurry flowing on the diluate side (see Figure 10). Then, by circulating the carbon suspension into theconcentrate side, the adsorbed ion is desorbed back in to the brine stream [129].
Figure 10. Single module flow-electrode capacitive deionisation concept as depicted byRommerskirchen et al. [129]. Reproduced with permission, copyright Elsvier, 2015.
171

Membranes 2017, 7, 54
Gendel el al. [126] examined the effect of flow rate and water splitting ratio between thedesalination and regeneration cells in FCDI, while Porada et al. [127] studied the effect of carboncontent and water residence time. The latter reported that while salt removal rate increased with carboncontent, beyond 20 wt % the flowing slurry was prone to clogging. Yang et al. [130] demonstrated thatdispersing carbon particles in 2 wt % NaCl solution resulted in significantly improved desalinationefficiency compared to the use of deionized water. Ma et al. [131] developed redox-active flowelectrodes with the addition of aqueous hydroquinone and benzoquinone to increase the chargetransfer efficiency. Further research and long-term performance data will help to determine theoptimum composition of these suspensions, with high conductivity and low viscosity to achieve highcharge transfer and avoid clogging.
The authors believe that the introduction of flow-electrodes is a major step forward towards thecommercialization of MCDI since it enables continuous operation and provides higher water recovery.However, Hoyt et al. [132] are among the few who have modelled the flowing carbon slurry. We believethis area requires more attention to justify the significantly higher salt adsorption and to predict theperformance of FCDI under different operational conditions.
6.4. Hybrid Capacitive Deionisation (CDI)
Lee et al. [133] replaced the cathode with a sodium manganese oxide electrode that benefitedfrom higher specific capacity (Figure 11). In this approach, sodium ions are adsorbed into the sodiummanganese electrode, while chloride ions adsorb in a standard format MCDI anode.
Figure 11. Schematic diagram of hybrid capacitive deionisation (HCDI). Reproduced with permissionfrom Lee et al. [133], copyright Royal Society of Chemistry, 2014.
Using this approach, Lee et al. [133] could improve the ion removal capacity from 13.5 mg g−1 inCDI and 22.4 mg g−1 of MCDI to 31.2 mg g−1 (per total mass of sodium manganese oxide and carbon).While the adsorption rate was higher than that of CDI, the performance was slower compared withregular MCDI. Further, the cost of these electrodes is likely to be well above those of simple activatedcarbon. As noted by Suss et al. [134], the ultimate performance-normalized costs associated with suchnovel CDI configurations requires assessment.
172

Membranes 2017, 7, 54
7. Conclusions and Future Research Directions
This article has provided an overview of the current status of MCDI, with a focus on the role ofthe ion exchange membrane in this process. Recent developments in the area of composite electrodes,novel IEMs, performance metrics, fouling and cleaning, and innovative configurations of MCDI werediscussed in details. MCDI is a promising technique for desalination at low feedwater salinities,where the energy consumption appears lower than in comparable membrane processes, at least at thelab scale. However, further techno-economic studies comparing this approach to other desalinationtechnologies including electrodialysis, nanofiltration, and reverse osmosis are of great importance toencourage more pilot-plant development and larger scale investments in the area. Additionally, whilemany research groups are enhancing the performance of MCDI by the fabrication of novel IEMs orcomposite electrode-IEM electrodes, or by introducing novel MCDI configurations, more attentionmust be paid to operational issues. Specifically, the performance of these materials must be evaluatedwith a much wider range of monovalent and multivalent salts, not just NaCl. Their stability must alsobe assessed in fouling systems where regular cleaning will be necessary. Such fouling is an importantissue that can jeopardize the efficiency of MCDI at a commercial scale and is thus worthy of furtherinvestigation. Finally, while ion transport through IEMs was only briefly described in this paper, thisresearch field requires in-depth analysis and mathematical modelling to better distinguish the role ofthe membrane in MCDI applications.
Acknowledgments: Funding from the Dairy Innovation Research Hub, an Industrial Transformation ResearchHub (IH120100005) of the Australian Research Council is acknowledged.
Conflicts of Interest: The authors declare no conflict of interest.
References
1. Xu, T. Ion exchange membranes: State of their development and perspective. J. Membr. Sci. 2005, 263, 1–29.[CrossRef]
2. Sata, T. Ion Exchange Membranes: Preparation, Characterization, Modification and Application; Royal Society ofChemistry: London, UK, 2004.
3. Ran, J.; Wu, L.; He, Y.; Yang, Z.; Wang, Y.; Jiang, C.; Ge, L.; Bakangura, E.; Xu, T. Ion exchange membranes:New developments and applications. J. Membr. Sci. 2017, 522, 267–291. [CrossRef]
4. Strathmann, H. Ion-Exchange Membrane Separation Processes; Elsevier: Amsterdam, The Netherlands, 2004;Volume 9.
5. Nagarale, R.K.; Gohil, G.S.; Shahi, V.K. Recent developments on ion-exchange membranes andelectro-membrane processes. Adv. Colloid Interface Sci. 2006, 119, 97–130. [CrossRef] [PubMed]
6. Merle, G.; Wessling, M.; Nijmeijer, K. Anion exchange membranes for alkaline fuel cells: A review.J. Membr. Sci. 2011, 377, 1–35. [CrossRef]
7. Strathmann, H. Electrodialysis and its application in the chemical process industry. Sep. Purif. Methods 1985,14, 41–66. [CrossRef]
8. Bazinet, L. Electrodialytic phenomena and their applications in the dairy industry: A review. Crit. Rev. FoodSci. Nutr. 2005, 45, 307–326. [CrossRef] [PubMed]
9. Kentish, S.E.; Kloester, E.; Stevens, G.W.; Scholes, C.A.; Dumée, L.F. Electrodialysis in aqueous-organicmixtures. Sep. Purif. Rev. 2015, 44, 269–282. [CrossRef]
10. Demirer, O.N.; Naylor, R.M.; Rios Perez, C.A.; Wilkes, E.; Hidrovo, C. Energetic performance optimization ofa capacitive deionization system operating with transient cycles and brackish water. Desalination 2013, 314,130–138. [CrossRef]
11. Li, Y.; Zhang, C.; Jiang, Y.; Wang, T.-J.; Wang, H. Effects of the hydration ratio on the electrosorption selectivityof ions during capacitive deionization. Desalination 2016, 399, 171–177. [CrossRef]
12. Porada, S.; Zhao, R.; van der Wal, A.; Presser, V.; Biesheuvel, P.M. Review on the science and technology ofwater desalination by capacitive deionisation. Prog. Mater. Sci. 2013, 58, 1388–1442. [CrossRef]
173

Membranes 2017, 7, 54
13. Han, L.; Karthikeyan, K.G.; Anderson, M.A.; Wouters, J.J.; Gregory, K.B. Mechanistic insights into the useof oxide nanoparticles coated asymmetric electrodes for capacitive deionisation. Electrochim. Acta 2013, 90,573–581. [CrossRef]
14. Lee, J.-B.; Park, K.-K.; Eum, H.-M.; Lee, C.-W. Desalination of a thermal power plant wastewater by membranecapacitive deionization. Desalination 2006, 196, 125–134. [CrossRef]
15. Biesheuvel, P.M.; Zhao, R.; Porada, S.; van der Wal, A. Theory of membrane capacitive deionisation includingthe effect of the electrode pore space. J. Colloid Interface Sci. 2011, 360, 239–248. [CrossRef] [PubMed]
16. Zhao, R.; Porada, S.; Biesheuvel, P.M.; van der Wal, A. Energy consumption in membrane capacitivedeionisation for different water recoveries and flow rates, and comparison with reverse osmosis. Desalination2013, 330, 35–41. [CrossRef]
17. McRae, W.A. Electroseparations, Electrodialysis. In Kirk-Othmer Encyclopedia of Chemical Technology;John Wiley & Sons, Inc.: Hoboken, NJ, USA, 2000.
18. He, S.; Liu, L.; Wang, X.; Zhang, S.; Guiver, M.D.; Li, N. Azide-assisted self-crosslinking of highly ionconductive anion exchange membranes. J. Membr. Sci. 2016, 509, 48–56. [CrossRef]
19. Kariduraganavar, M.Y.; Nagarale, R.K.; Kittur, A.A.; Kulkarni, S.S. Ion-exchange membranes: Preparativemethods for electrodialysis and fuel cell applications. Desalination 2006, 197, 225–246. [CrossRef]
20. Kwak, N.-S.; Koo, J.S.; Hwang, T.S.; Choi, E.M. Synthesis and electrical properties of NaSS–MAA–MMAcation exchange membranes for membrane capacitive deionisation (MCDI). Desalination 2012, 285, 138–146.[CrossRef]
21. Kang, K.W.; Hwang, C.W.; Hwang, T.S. Synthesis and properties of sodium vinylbenzene sulfonate-graftedpoly(vinylidene fluoride) cation exchange membranes for membrane capacitive deionisation process.Macromol. Res. 2015, 23, 1126–1133. [CrossRef]
22. Jeong, K.S.; Hwang, W.C.; Hwang, T.S. Synthesis of an aminated poly(vinylidene fluride-g-4-vinyl benzylchloride) anion exchange membrane for membrane capacitive deionisation(MCDI). J. Membr. Sci. 2015, 495,316–321. [CrossRef]
23. Qiu, Q.; Cha, J.-H.; Choi, Y.-W.; Choi, J.-H.; Shin, J.; Lee, Y.-S. Preparation of stable polyethylene membranesfilled with crosslinked sulfonated polystyrene for membrane capacitive deionisation by γ-irradiation.Macromol. Res. 2017, 25, 92–95. [CrossRef]
24. Lee, J.-B.; Park, K.-K.; Yoon, S.-W.; Park, P.-Y.; Park, K.-I.; Lee, C.-W. Desalination performance of acarbon-based composite electrode. Desalination 2009, 237, 155–161. [CrossRef]
25. Hou, C.-H.; Liu, N.-L.; Hsu, H.-L.; Den, W. Development of multi-walled carbon nanotube/poly(vinylalcohol) composite as electrode for capacitive deionisation. Sep. Purif. Technol. 2014, 130, 7–14. [CrossRef]
26. Liu, Y.; Pan, L.; Xu, X.; Lu, T.; Sun, Z.; Chua, D.H. Enhanced desalination efficiency in modifiedmembrane capacitive deionisation by introducing ion-exchange polymers in carbon nanotubes electrodes.Electrochim. Acta 2014, 130, 619–624. [CrossRef]
27. Kim, J.-S.; Choi, J.-H. Fabrication and characterization of a carbon electrode coated with cation-exchangepolymer for the membrane capacitive deionisation applications. J. Membr. Sci. 2010, 355, 85–90. [CrossRef]
28. Qian, B.; Wang, G.; Ling, Z.; Dong, Q.; Wu, T.; Zhang, X.; Qiu, J. Sulfonated Graphene as Cation-SelectiveCoating: A New Strategy for High-Performance Membrane Capacitive Deionization. Adv. Mater. Interfaces2015, 2. [CrossRef]
29. Kim, Y.-J.; Choi, J.-H. Improvement of desalination efficiency in capacitive deionization using a carbonelectrode coated with an ion-exchange polymer. Water Res. 2010, 44, 990–996. [CrossRef] [PubMed]
30. Kim, J.; Kim, C.; Shin, H.; Rhim, J. Application of synthesized anion and cation exchange polymers tomembrane capacitive deionization (MCDI). Macromol. Res. 2015, 23, 360–366. [CrossRef]
31. Lee, J.-Y.; Seo, S.-J.; Yun, S.-H.; Moon, S.-H. Preparation of ion exchanger layered electrodes for advancedmembrane capacitive deionization (MCDI). Water Res. 2011, 45, 5375–5380. [CrossRef] [PubMed]
32. Liu, P.; Wang, H.; Yan, T.; Zhang, J.; Shi, L.; Zhang, D. Grafting sulfonic and amine functional groups on 3Dgraphene for improved capacitive deionization. J. Mater. Chem. A 2016, 4, 5303–5313. [CrossRef]
33. Kim, J.S.; Jeon, Y.S.; Rhim, J.W. Application of poly(vinyl alcohol) and polysulfone based ionic exchangepolymers to membrane capacitive deionization for the removal of mono- and divalent salts. Sep. Purif. Technol.2016, 157, 45–52. [CrossRef]
34. Jeong, J.S.; Kim, H.S.; Cho, M.D.; Kang, H.R. Regeneration Methods of Capacitive Deionization Electrodes inWater Purification. U.S. Patent 20,160,289,097 A1, 6 October 2016.
174

Membranes 2017, 7, 54
35. Kim, Y.-J.; Choi, J.-H. Selective removal of nitrate ion using a novel composite carbon electrode in capacitivedeionization. Water Res. 2012, 46, 6033–6039. [CrossRef] [PubMed]
36. Yeo, J.-H.; Choi, J.-H. Enhancement of nitrate removal from a solution of mixed nitrate, chloride and sulfateions using a nitrate-selective carbon electrode. Desalination 2013, 320, 10–16. [CrossRef]
37. Tian, G.; Liu, L.; Meng, Q.; Cao, B. Preparation and characterization of cross-linked quaternised polyvinylalcohol membrane/activated carbon composite electrode for membrane capacitive deionisation. Desalination2014, 354, 107–115. [CrossRef]
38. Gu, X.; Deng, Y.; Wang, C. Fabrication of anion-exchange polymer layered graphene-melamine electrodesfor membrane capacitive deionisation. ACS Sustain. Chem. Eng. 2017, 5, 325–333. [CrossRef]
39. Li, H.; Gao, Y.; Pan, L.; Zhang, Y.; Chen, Y.; Sun, Z. Electrosorptive desalination by carbon nanotubes andnanofibres electrodes and ion-exchange membranes. Water Res. 2008, 42, 4923–4928. [CrossRef] [PubMed]
40. Kim, Y.-J.; Choi, J.-H. Enhanced desalination efficiency in capacitive deionisation with an ion-selectivemembrane. Sep. Purif. Technol. 2010, 71, 70–75. [CrossRef]
41. Li, H.; Zou, L. Ion-exchange membrane capacitive deionisation: A new strategy for brackish waterdesalination. Desalination 2011, 275, 62–66. [CrossRef]
42. Liang, P.; Yuan, L.; Yang, X.; Zhou, S.; Huang, X. Coupling ion-exchangers with inexpensive activatedcarbon fiber electrodes to enhance the performance of capacitive deionisation cells for domestic wastewaterdesalination. Water Res. 2013, 47, 2523–2530. [CrossRef] [PubMed]
43. Omosebi, A.; Gao, X.; Landon, J.; Liu, K. Asymmetric electrode configuration for enhanced membranecapacitive deionisation. ACS Appl. Mater. Interfaces 2014, 6, 12640–12649. [CrossRef] [PubMed]
44. Zhao, Y.; Wang, Y.; Wang, R.; Wu, Y.; Xu, S.; Wang, J. Performance comparison and energy consumptionanalysis of capacitive deionization and membrane capacitive deionization processes. Desalination 2013, 324,127–133. [CrossRef]
45. Ding, M.; Shi, W.; Guo, L.; Leong, Z.Y.; Baji, A.; Yang, H.Y. Bimetallic metal–organic framework derivedporous carbon nanostructures for high performance membrane capacitive desalination. J. Mat. Chem. A 2017,5, 6113–6121. [CrossRef]
46. Duan, F.; Li, Y.; Cao, H.; Wang, Y.; Zhang, Y.; Crittenden, J.C. Activated carbon electrodes: Electrochemicaloxidation coupled with desalination for wastewater treatment. Chemosphere 2015, 125, 205–211. [CrossRef][PubMed]
47. Zhao, R.; Biesheuvel, P.M.; Miedema, H.; Bruning, H.; van der Wal, A. Charge efficiency: A functional tool toprobe the double-layer structure inside of porous electrodes and application in the modeling of capacitivedeionisation. J. Phys. Chem. Lett. 2010, 1, 205–210. [CrossRef]
48. Porada, S.; Bryjak, M.; van der Wal, A.; Biesheuvel, P.M. Effect of electrode thickness variation on operationof capacitive deionisation. Electrochim. Acta 2012, 75, 148–156. [CrossRef]
49. Huyskens, C.; Helsen, J.; de Haan, A.B. Capacitive deionisation for water treatment: Screening of keyperformance parameters and comparison of performance for different ions. Desalination 2013, 328, 8–16.[CrossRef]
50. Choi, J.-H. Comparison of constant voltage (CV) and constant current (CC) operation in the membranecapacitive deionisation process. Desalination Water Treat. 2014, 56, 921–928. [CrossRef]
51. Qu, Y.; Campbell, P.G.; Gu, L.; Knipe, J.M.; Dzenitis, E.; Santiago, J.G.; Stadermann, M. Energy consumptionanalysis of constant voltage and constant current operations in capacitive deionisation. Desalination 2016,400, 18–24. [CrossRef]
52. Kim, Y.-J.; Hur, J.; Bae, W.; Choi, J.-H. Desalination of brackish water containing oil compound by capacitivedeionisation process. Desalination 2010, 253, 119–123. [CrossRef]
53. Li, H.; Nie, C.; Pan, L.; Sun, Z. The study of membrane capacitive deionisation from charge efficiency.Desalin. Water Treat. 2012, 42, 210–215. [CrossRef]
54. Wimalasiri, Y.; Mossad, M.; Zou, L. Thermodynamics and kinetics of adsorption of ammonium ions bygraphene laminate electrodes in capacitive deionisation. Desalination 2015, 357, 178–188. [CrossRef]
55. Mossad, M.; Zou, L. A study of the capacitive deionisation performance under various operational conditions.J. Hazard. Mater. 2012, 213–214, 491–497. [CrossRef] [PubMed]
56. Dlugolecki, P.; van der Wal, A. Energy recovery in membrane capacitive deionisation. Environ. Sci. Technol.2013, 47, 4904–4910. [CrossRef] [PubMed]
175

Membranes 2017, 7, 54
57. Kim, Y.-J.; Kim, J.-H.; Choi, J.-H. Selective removal of nitrate ions by controlling the applied current inmembrane capacitive deionisation (MCDI). J. Membr. Sci. 2013, 429, 52–57. [CrossRef]
58. Ryu, T.; Lee, D.-H.; Ryu, J.C.; Shin, J.; Chung, K.-S.; Kim, Y.H. Lithium recovery system using electrostaticfield assistance. Hydrometallurgy 2015, 151, 78–83. [CrossRef]
59. Yoon, H.; Lee, J.; Kim, S.-R.; Kang, J.; Kim, S.; Kim, C.; Yoon, J. Capacitive deionisation with Ca-alginatecoated-carbon electrode for hardness control. Desalination 2016, 392, 46–53. [CrossRef]
60. Choi, J.; Lee, H.; Hong, S. Capacitive deionisation (CDI) integrated with monovalent cation selectivemembrane for producing divalent cation-rich solution. Desalination 2016, 400, 38–46. [CrossRef]
61. Rice, G.; Barber, A.R.; O’Connor, A.J.; Stevens, G.W.; Kentish, S.E. Rejection of dairy salts by a nanofiltrationmembrane. Sep. Purif. Technol. 2011, 79, 92–102. [CrossRef]
62. Garcia-Aleman, J.; Dickson, J.M. Permeation of mixed-salt solutions with commercial and pore-fillednanofiltration membranes: Membrane charge inversion phenomena. J. Membr. Sci. 2004, 239, 163–172.[CrossRef]
63. Labbez, C.; Fievet, P.; Szymczyk, A.; Vidonne, A.; Foissy, A.; Pagetti, J. Retention of mineral salts by apolyamide nanofiltration membrane. Sep. Purif. Technol. 2003, 30, 47–55. [CrossRef]
64. Schaep, J.; Vandecasteele, C.; Mohammad, A.W.; Bowen, W.R. Analysis of the salt retention of nanofiltrationmembranes using the Donnan-steric partitioning pore model. Sep. Sci. Technol. 1999, 34, 3009–3030.[CrossRef]
65. Van Limpt, B.; van der Wal, A. Water and chemical savings in cooling towers by using membrane capacitivedeionisation. Desalination 2014, 342, 148–155. [CrossRef]
66. Mikhaylin, S.; Bazinet, L. Fouling on ion-exchange membranes: Classification, characterization and strategiesof prevention and control. Adv. Colloid Interface Sci. 2016, 229, 34–56. [CrossRef] [PubMed]
67. Ong, C.S.; Goh, P.S.; Lau, W.J.; Misdan, N.; Ismail, A.F. Nanomaterials for biofouling and scaling mitigationof thin film composite membrane: A review. Desalination 2016, 393, 2–15. [CrossRef]
68. Piyadasa, C.; Ridgway, H.F.; Yeager, T.R.; Stewart, M.B.; Pelekani, C.; Gray, S.R.; Orbell, J.D. The applicationof electromagnetic fields to the control of the scaling and biofouling of reverse osmosis membranes—Areview. Desalination 2017, 418, 19–34. [CrossRef]
69. Mossad, M.; Zou, L. Study of fouling and scaling in capacitive deionisation by using dissolved organic andinorganic salts. J. Hazard. Mater. 2013, 244–245, 387–393. [CrossRef] [PubMed]
70. Zhang, W.; Mossad, M.; Zou, L. A study of the long-term operation of capacitive deionisation in inlandbrackish water desalination. Desalination 2013, 320, 80–85. [CrossRef]
71. Wang, C.; Song, H.; Zhang, Q.; Wang, B.; Li, A. Parameter optimization based on capacitive deionisation forhighly efficient desalination of domestic wastewater biotreated effluent and the fouled electrode regeneration.Desalination 2015, 365, 407–415. [CrossRef]
72. Korngold, E.; De Korosy, F.; Rahav, R.; Taboch, M.F. Fouling of anion-selective membranes in electrodialysis.Desalination 1970, 8, 195–220. [CrossRef]
73. Lee, H.-J.; Moon, S.-H.; Tsai, S.-P. Effects of pulsed electric fields on membrane fouling in electrodialysis ofNaCl solution containing humate. Sep. Purif. Technol. 2002, 27, 89–95. [CrossRef]
74. Langevin, M.-E.; Bazinet, L. Ion-exchange membrane fouling by peptides: A phenomenon governed byelectrostatic interactions. J. Membr. Sci. 2011, 369, 359–366. [CrossRef]
75. Fidaleo, M.; Moresi, M. Electrodialysis applications in the food industry. Adv. Food Nutr. Res. 2006, 51,265–360. [PubMed]
76. Lee, H.-J.; Hong, M.-K.; Han, S.-D.; Cho, S.-H.; Moon, S.-H. Fouling of an anion exchange membrane inthe electrodialysis desalination process in the presence of organic foulants. Desalination 2009, 238, 60–69.[CrossRef]
77. Lindstrand, V.; Sundström, G.; Jönsson, A.-S. Fouling of electrodialysis membranes by organic substances.Desalination 2000, 128, 91–102. [CrossRef]
78. Chen, G.Q.; Eschbach, F.I.I.; Weeks, M.; Gras, S.L.; Kentish, S.E. Removal of lactic acid from acid whey usingelectrodialysis. Sep. Purif. Technol. 2016, 158, 230–237. [CrossRef]
79. Diblíková, L.; Curda, L.; Kincl, J. The effect of dry matter and salt addition on cheese whey demineralisation.Int. Dairy J. 2013, 31, 29–33. [CrossRef]
80. Sienkiewicz, T.; Riedel, C.-L. Whey and Whey Utilization; VEB Fachbuchverlag: Leipzig, Germany, 1986.
176

Membranes 2017, 7, 54
81. Ayala-Bribiesca, E.; Pourcelly, G.; Bazinet, L. Nature identification and morphology characterization ofcation-exchange membrane fouling during conventional electrodialysis. J. Colloid Interface Sci. 2006, 300,663–672. [CrossRef] [PubMed]
82. Ayala-Bribiesca, E.; Pourcelly, G.; Bazinet, L. Nature identification and morphology characterization ofanion-exchange membrane fouling during conventional electrodialysis. J. Colloid Interface Sci. 2007, 308,182–190. [CrossRef] [PubMed]
83. Bazinet, L.; Montpetit, D.; Ippersiel, D.; Mahdavi, B.; Amiot, J.; Lamarche, F. Neutralization of hydroxidegenerated during skim milk electroacidification and its effect on bipolar and cationic membrane integrity.J. Membr. Sci. 2003, 216, 229–239. [CrossRef]
84. Ayala-Bribiesca, E.; Araya-Farias, M.; Pourcelly, G.; Bazinet, L. Effect of concentrate solution pH and mineralcomposition of a whey protein diluate solution on membrane fouling formation during conventionalelectrodialysis. J. Membr. Sci. 2006, 280, 790–801. [CrossRef]
85. Bleha, M.; Tishchenko, G.; Šumberová, V.; Kudela, V. Characteristic of the critical state of membranes inED-desalination of milk whey. Desalination 1992, 86, 173–186. [CrossRef]
86. Bazinet, L.; Araya-Farias, M. Effect of calcium and carbonate concentrations on cationic membrane foulingduring electrodialysis. J. Colloid Interface Sci. 2005, 281, 188–196. [CrossRef] [PubMed]
87. Casademont, C.; Farias, M.A.; Pourcelly, G.; Bazinet, L. Impact of electrodialytic parameters on cationmigration kinetics and fouling nature of ion-exchange membranes during treatment of solutions withdifferent magnesium/calcium ratios. J. Membr. Sci. 2008, 325, 570–579. [CrossRef]
88. Trägårdh, G. Membrane cleaning. Desalination 1989, 71, 325–335. [CrossRef]89. Katz, W.E. The electrodialysis reversal (EDR) process. Desalination 1979, 28, 31–40. [CrossRef]90. Vermaas, D.A.; Kunteng, D.; Veerman, J.; Saakes, M.; Nijmeijer, K. Periodic feedwater reversal and air
sparging as antifouling strategies in reverse electrodialysis. Environ. Sci. Technol. 2014, 48, 3065–3073.[CrossRef] [PubMed]
91. Shee, F.L.T.; Angers, P.; Bazinet, L. Microscopic approach for the identification of cationic membrane foulingduring cheddar cheese whey electroacidification. J. Colloid Interface Sci. 2008, 322, 551–557. [CrossRef][PubMed]
92. Sata, T.; Tsujimoto, M.; Yamaguchi, T.; Matsusaki, K. Change of anion exchange membranes in an aqueoussodium hydroxide solution at high temperature. J. Membr. Sci. 1996, 112, 161–170. [CrossRef]
93. Komkova, E.N.; Stamatialis, D.F.; Strathmann, H.; Wessling, M. Anion-exchange membranes containingdiamines: Preparation and stability in alkaline solution. J. Membr. Sci. 2004, 244, 25–34. [CrossRef]
94. Vega, J.A.; Chartier, C.; Mustain, W.E. Effect of hydroxide and carbonate alkaline media on anion exchangemembranes. J. Power Sources 2010, 195, 7176–7180. [CrossRef]
95. Garcia-Vasquez, W.; Ghalloussi, R.; Dammak, L.; Larchet, C.; Nikonenko, V.; Grande, D. Structure andproperties of heterogeneous and homogeneous ion-exchange membranes subjected to ageing in sodiumhypochlorite. J. Membr. Sci. 2014, 452, 104–116. [CrossRef]
96. Ghalloussi, R.; Garcia-Vasquez, W.; Chaabane, L.; Dammak, L.; Larchet, C.; Deabate, S.V.; Nevakshenova, E.;Nikonenko, V.; Grande, D. Ageing of ion-exchange membranes in electrodialysis: A structural andphysicochemical investigation. J. Membr. Sci. 2013, 436, 68–78. [CrossRef]
97. Wang, Q.; Yang, P.; Cong, W. Cation-exchange membrane fouling and cleaning in bipolar membraneelectrodialysis of industrial glutamate production wastewater. Sep. Purif. Technol. 2011, 79, 103–113.[CrossRef]
98. Haddad, M.; Mikhaylin, S.; Bazinet, L.; Savadogo, O.; Paris, J. Electrochemical acidification of kraft blackliquor: Effect of fouling and chemical cleaning on ion exchange membrane integrity. ACS Sustain. Chem. Eng.2016, 5, 168–178. [CrossRef]
99. Association, A.W.W. Electrodialysis and Electrodialysis Reversal: M38; American Water Works Association:Washington, DC, USA, 1995; Volume 38.
100. Guo, H.; You, F.; Yu, S.; Li, L.; Zhao, D. Mechanisms of chemical cleaning of ion exchange membranes:A case study of plant-scale electrodialysis for oily wastewater treatment. J. Membr. Sci. 2015, 496, 310–317.[CrossRef]
101. Garcia-Vasquez, W.; Dammak, L.; Larchet, C.; Nikonenko, V.; Grande, D. Effects of acid-base cleaningprocedure on structure and properties of anion-exchange membranes used in electrodialysis. J. Membr. Sci.2016, 507, 12–23. [CrossRef]
177

Membranes 2017, 7, 54
102. Biesheuvel, P.M.; Porada, S.; Levi, M.; Bazant, M.Z. Attractive forces in microporous carbon electrodes forcapacitive deionisation. J. Solid State Electrochem. 2014, 18, 1365–1376. [CrossRef]
103. Hassanvand, A.; Chen, G.Q.; Webley, P.A.; Kentish, S.E. Improvement of MCDI operation and design throughexperiment and modelling: Regeneration with brine and optimum residence time. Desalination 2017, 417,36–51. [CrossRef]
104. Xie, W.; Cook, J.; Park, H.B.; Freeman, B.D.; Lee, C.H.; McGrath, J.E. Fundamental salt and water transportproperties in directly copolymerized disulfonated poly(arylene ether sulfone) random copolymers. Polymer2011, 52, 2032–2043. [CrossRef]
105. Geise, G.M.; Freeman, B.D.; Paul, D.R. Characterization of a sulfonated pentablock copolymer fordesalination applications. Polymer 2010, 51, 5815–5822. [CrossRef]
106. Geise, G.M.; Paul, D.R.; Freeman, B.D. Fundamental water and salt transport properties of polymericmaterials. Prog. Polym. Sci. 2014, 39, 1–42. [CrossRef]
107. Sata, T.; Sata, T.; Yang, W. Studies on cation-exchange membranes having permselectivity between cations inelectrodialysis. J. Membr. Sci. 2002, 206, 31–60. [CrossRef]
108. Van der Bruggen, B.; Koninckx, A.; Vandecasteele, C. Separation of monovalent and divalent ions fromaqueous solution by electrodialysis and nanofiltration. Water Res. 2004, 38, 1347–1353. [CrossRef] [PubMed]
109. Galama, A.H.; Daubaras, G.; Burheim, O.S.; Rijnaarts, H.H.M.; Post, J.W. Seawater electrodialysis withpreferential removal of divalent ions. J. Membr. Sci. 2014, 452, 219–228. [CrossRef]
110. Ju, H.; Sagle, A.C.; Freeman, B.D.; Mardel, J.I.; Hill, A.J. Characterization of sodium chloride and watertransport in crosslinked poly(ethylene oxide) hydrogels. J. Membr. Sci. 2010, 358, 131–141. [CrossRef]
111. Crank, J.; Park, G.S. Diffusion in Polymers; Academic Press: Cambridge, MA, USA, 1968.112. Pintauro, P.N.; Bennion, D.N. Mass transport of electrolytes in membranes. 2. Determination of sodium
chloride equilibrium and transport parameters for Nafion. Ind. Eng. Chem. Fundam. 1984, 23, 234–243.[CrossRef]
113. Helfferich, F.G. Ion Exchange; Dover Publications: New York, NY, USA, 1995.114. Mackie, J.; Meares, P. The diffusion of electrolytes in a cation-exchange resin membrane I. Theoretical.
In Proceedings of the Royal Society of London A: Mathematical, Physical and Engineering Sciences; The RoyalSociety: London, UK, 1955.
115. Kamcev, J.; Paul, D.R.; Freeman, B.D. Ion activity coefficients in ion exchange polymers: Applicability ofManning’s counterion condensation theory. Macromolecules 2015, 48, 8011–8024. [CrossRef]
116. Kamcev, J.; Galizia, M.; Benedetti, F.M.; Jang, E.-S.; Paul, D.R.; Freeman, B.; Manning, G.S. Partitioningof Mobile Ions Between Ion Exchange Polymers and Aqueous Salt Solutions: Importance of Counter-ionCondensation. Phys. Chem. Chem. Phys. 2016, 18, 6021–6031. [CrossRef] [PubMed]
117. Mackay, D.; Meares, P. The electrical conductivity and electro-osmotic permeability of a cation-exchangeresin. Trans. Faraday Soc. 1959, 55, 1221–1238. [CrossRef]
118. Kamo, N.; Toyoshima, Y.; Kobatake, Y. Fixed charge density effective to membrane phenomena.Colloid Polym. Sci. 1971, 249, 1069–1071.
119. Ueda, T.; Kamo, N.; Ishida, N.; Kobatake, Y. Effective fixed charge density governing membrane phenomena.IV. Further study of activity coefficients and mobilities of small ions in charged membranes. J. Phys. Chem.1972, 76, 2447–2452. [CrossRef]
120. Manning, G.S. Limiting laws and counterion condensation in polyelectrolyte solutions II. Self-Diffusion ofthe small ions. J. Phys. Chem. 1969, 51, 934–938. [CrossRef]
121. Kamcev, J.; Paul, D.R.; Manning, G.S.; Freeman, B.D. Predicting salt permeability coefficients in highlyswollen, highly charged ion exchange membranes. ACS Appl. Mater. Interfaces 2017, 9, 4044–4056. [CrossRef][PubMed]
122. Curran, P.M. Concentric Layer Electric Double Layer Capacitor Cylinder, System, and Method of Use.U.S. Patent 9,193,612, 24 November 2015.
123. RDI™ Desalination System. 2017. Available online: http://www.atlantis-water.com/rdi-desalination-system-2/ (accessed on 7 July 2017).
124. Bian, Y.; Yang, X.; Liang, P.; Jiang, Y.; Zhang, C.; Huang, X. Enhanced desalination performance of membranecapacitive deionisation cells by packing the flow chamber with granular activated carbon. Water Res. 2015,85, 371–376. [CrossRef] [PubMed]
178

Membranes 2017, 7, 54
125. Jeon, S.-I.; Park, H.-R.; Yeo, J.-G.; Yang, S.C.; Cho, C.H.; Han, M.H.; Kim, D.K. Desalination via a newmembrane capacitive deionisation process utilizing flow-electrodes. Energy Environ. Sci. 2013, 6, 1471–1475.[CrossRef]
126. Gendel, Y.; Rommerskirchen, A.K.E.; David, O.; Wessling, M. Batch mode and continuous desalinationof water using flowing carbon deionisation (FCDI) technology. Electrochem. Commun. 2014, 46, 152–156.[CrossRef]
127. Porada, S.; Weingarth, D.; Hamelers, H.V.; Bryjak, M.; Presser, V.; Biesheuvel, P. Carbon flow electrodes forcontinuous operation of capacitive deionisation and capacitive mixing energy generation. J. Mater. Chem. A2014, 2, 9313–9321. [CrossRef]
128. Yang, S.; Jeon, S.-I.; Kim, H.; Choi, J.; Yeo, J.-G.; Park, H.-R.; Kim, D.K. Stack design and operation for scalingup the capacity of flow-electrode capacitive deionisation technology. ACS Sustain. Chem. Eng. 2016, 4,4174–4180. [CrossRef]
129. Rommerskirchen, A.; Gendel, Y.; Wessling, M. Single module flow-electrode capacitive deionisation forcontinuous water desalination. Electrochem. Commun. 2015, 60, 34–37. [CrossRef]
130. Yang, S.-C.; Choi, J.; Yeo, J.-G.; Jeon, S.-I.; Park, H.-R.; Kim, D.K. Flow-electrode capacitive deionisation usingan aqueous electrolyte with a high salt concentration. Environ. Sci. Technol. 2016, 50, 5892–5899. [CrossRef][PubMed]
131. Ma, J.; He, D.; Tang, W.; Kovalsky, P.; He, C.; Zhang, C.; Waite, T.D. Development of redox-active flowelectrodes for high-performance capacitive deionisation. Environ. Sci. Technol. 2016, 50, 13495–13501.[CrossRef] [PubMed]
132. Hoyt, N.C.; Savinell, R.F.; Wainright, J.S. Modeling of flowable slurry electrodes with combined Faradaicand nonfaradaic currents. Chem. Eng. Sci. 2016, 144, 288–297. [CrossRef]
133. Lee, J.; Kim, S.; Kim, C.; Yoon, J. Hybrid capacitive deionisation to enhance the desalination performance ofcapacitive techniques. Energy Environ. Sci. 2014, 7, 3683–3689. [CrossRef]
134. Suss, M.; Porada, S.; Sun, X.; Biesheuvel, P.; Yoon, J.; Presser, V. Water desalination via capacitive deionisation:What is it and what can we expect from it? Energy Environ. Sci. 2015, 8, 2296–2319. [CrossRef]
© 2017 by the authors. Licensee MDPI, Basel, Switzerland. This article is an open accessarticle distributed under the terms and conditions of the Creative Commons Attribution(CC BY) license (http://creativecommons.org/licenses/by/4.0/).
179

membranes
Review
Electro-Conductive Membranes for PermeationEnhancement and Fouling Mitigation:A Short Review
Patrizia Formoso 1, Elvira Pantuso 1, Giovanni De Filpo 2,* and Fiore Pasquale Nicoletta 1
1 Department of Pharmacy, Health and Nutritional Sciences, University of Calabria, I-87036 Rende (CS), Italy;[email protected] (P.F.); [email protected] (E.P.); [email protected] (F.P.N.)
2 Department of Chemistry and Chemical Technologies, University of Calabria, I-87036 Rende (CS), Italy* Correspondence: [email protected]; Tel.: +39-0984-492-095
Received: 22 June 2017; Accepted: 20 July 2017; Published: 28 July 2017
Abstract: The research on electro-conductive membranes has expanded in recent years. Thesemembranes have strong prospective as key components in next generation water treatment plantsbecause they are engineered in order to enhance their performance in terms of separation, flux,fouling potential, and permselectivity. The present review summarizes recent developments in thepreparation of electro-conductive membranes and the mechanisms of their response to externalelectric voltages in order to obtain an improvement in permeation and mitigation in the foulinggrowth. In particular, this paper deals with the properties of electro-conductive polymers and thepreparation of electro-conductive polymer membranes with a focus on responsive membranes basedon polyaniline, polypyrrole and carbon nanotubes. Then, some examples of electro-conductivemembranes for permeation enhancement and fouling mitigation by electrostatic repulsion, hydrogenperoxide generation and electrochemical oxidation will be presented.
Keywords: membrane fouling; membrane cleaning; stimuli responsive polymer membranes;electro-responsive membranes; fouling mitigation; permeation enhancement
1. Introduction
The most important property for assessing the quality of a separation process through a membraneis its selectivity for a compound on another compound, also known as permselectivity.
Higher permeability values require lower membrane areas to separate a given compound, anda very good selectivity leads to higher purity products and, accordingly, to optimized values ofrejection [1,2]. Nevertheless, the onset of fouling, due to the deposition/adsorption of particulateand soluble materials on membrane surfaces with time, causes a decrease in the permeability andselectivity with detrimental effects on membrane processes.
The present review summarizes recent developments in the preparation of electro-conductivemembranes and the mechanisms of their response to external electric voltages in order to obtain animprovement in permeation and mitigation in the fouling growth. In particular, this paper dealswith the properties of electro-conductive polymers and the preparation of electro-conductive polymermembranes with a focus to responsive membranes based on polyaniline, polypyrrole and carbonnanotubes, which represent the most used electro-conductive polymers. Then, some examples ofelectro-conductive membranes for permeation enhancement and mitigation of membrane fouling byelectrostatic repulsion, hydrogen peroxide generation and electrochemical oxidation will be presented.
Membranes 2017, 7, 39 180 www.mdpi.com/journal/membranes

Membranes 2017, 7, 39
2. Electro-Conductive Membranes
Membranes are selective barriers able to separate components with different sizes orphysical/chemical properties. The efficiency of a membrane separation process depends on theselectivity and permeability of used membranes. Selectivity, i.e., the ability to separate solutes,contaminants and particles with different sizes or physical/chemical properties is determined bythe rejection of the unwanted compound and the permeation of desired compound. Generally, themembrane selectivity depends on the affinity between the substances and membrane porous surface,effective pore size and distribution. The permeability of a membrane is typically quantified bythe trans-membrane flux and influenced by the pore size and surface properties of membranes [3].Therefore, the performance of porous membranes can be weakened upon adsorption and depositionof foulants, present in the feed mixtures, on the porous surface.
Thus, for various size-based membrane separation applications, tunable/switchable pore sizesare required to achieve adjustable selectivity and permeability in response to external stimuli (singleor multiple) or to environmental changes in feed conditions.
All responsive membranes have channels able to self-regulate their permselectivity in responseto environmental stimuli, such as temperature, pH, specific molecules/ions, light, electric/magneticfields, ionic strength, and redox reactions [4–18]. A common method to add responsiveness to amembrane is the use of stimuli-responsive polymers, copolymers and mixtures of polymers andadditives during or after the membrane formation [19].
Such responsive membranes can act as smart valves, allowing an on demand flux controlby dynamic modification of their structure and transport properties (e.g., permselectivity andhydrophilicity). In such a way, it is possible to enable a fouling mitigation and tunable self-cleaningmembrane surfaces without the use of physical/chemical cleaning methods required for membranesunder normal operating conditions.
Electro-Responsive Polymer Membranes (ERPMs), i.e., polymer membranes able to respond to anelectric potential, can be obtained by membrane functionalization with custom-designed electricallyconductive polymers.
According such a rationale several biosensors, electronic devices, and biomimetic deviceshave been prepared from electrically conductive polymer membranes [20–23]. The specificreactivity/polarity/conformation of used conducting polymers, virgin or properly functionalized fora better integration in the pore structure, enables an electro-responsiveness in filtration membranesusually adopted for water treatment [24,25].
Porous membranes used for microfiltration (MF) and ultrafiltration (UF) processes arecharacterized by a pore size ranging from 0.1 μm to 10 μm and 2 nm to 100 nm, respectively. The coatingwith a thin and selective polymer layer enables their use in nanofiltration (NF), reverse osmosis (RO),desalinization [26], and crystallization [27] processes. Some of such membranes can gain a responsivebehavior by grafting electro-responsive polymers onto their surface or inside pore walls [3,28].
Unfortunately, only a limited number of electrically conductive polymers are suitable to be easilyintegrated into the most common production process of composite membranes, such as Non-SolventInduced Phase Separation for MF and UF membranes, and interfacial polymerization or coating for NFand RO membranes. Recently, a different method based on using responsive polymer self-assemblyhas been proposed for functionalizing commercial membranes (either by a post-processing procedureor in a single step process) and improving permselectivity and fouling potential [29,30].
2.1. Electro-Conductive Polymers
In water treatment applications, it is important that membranes show opportune surface structure(e.g., pore size and distribution), purposeful hydrophilicity, adequate chemical-physical properties,high mechanical stability, and long term durability. ERPMs can contain specific organic and/orinorganic solid nanofillers in their porous structure (nanocomposite or hybrid membranes) to give
181

Membranes 2017, 7, 39
or enhance the membrane properties that would otherwise not be met by the conducting polymeralone [31].
Electro-conductive polymers can be classified according to the movement of electriccharges [32] in:
1. Intrinsic electro-conductive polymers, characterized by conjugated π-π or p-π systems;2. Redox polymers that possess redox potentials within their structure groups (reduction/oxidation
capacity).
The electronic transport in intrinsic electro-conductive polymers is due to the electron transferfrom π type bonds to nearby simple σ bonds, due to the repulsion effect of same type charges.In presence of heteroatoms (N, S or O type) within the macromolecular polymer chains, the electrontransfer is from π type bonds to non-participating p electrons of the heteroatoms that, moving toσ single bonds, further induces the movement of π electrons from the nearby double bonds byelectrostatic repulsion effect. The conductivity of intrinsic conductive polymers significantly increasesby oxidative and reductive doping (p-doping and n-doping, respectively).
The electronic movement in the case of redox polymers is gained through “donor-acceptor”reversible chemical reactions, according to Equation (1):
Ox + n e− � Red (1)
if the chemical groups, with their redox potential distributed within the macromolecular structure,enable electronic jumps between groups [32].
Table 1 shows the most representative electro-conductive polymers, but not their numerousderivatives. Nevertheless, there are few stable conducting polymers in harsh aqueous environment andmost of recent studies on ERPM are limited to the use of commercially available conducting polymers.
Table 1. Some electro-conductive polymers and their abbreviations.
Chemical Name Abbreviation
Polyacetylene PAcPolyaniline PANIPolyazulene PAZ
Polybutadiene PBDPolyisopren PIP
Poly(isothianaphtene) PITNPolyfuran PFu
Poly(α-naphthylamine) PNAPoly(p-phenylene) PPP
Polythiophene PTh
2.2. Preparation of Electro-Responsive Polymer Membranes
Surface material research has recently led to the manufacturing of many smart membranesby either chemical bonds or physical incorporation of electro-responsive materials on porousmembrane substrates. It is well known that in typical processes for preparation of conventionalmembranes, the enrichment of membranes with conductive polymers is limited by the dopingamounts used to improve membrane electro-responsiveness without loss of the mechanical properties.Electro-responsive membranes can be obtained from casting of conductive polymer thin films orself-assembling of monolayers onto the membrane surface by different methods such as plasmadeposition, chemical vapour deposition, spin coating, chemical and electrochemical reactions, andlayer-by-layer assembly [3]. The physical coating with a conductive polymer generally leadsto variations in membrane swelling degree and changes in membrane permselectivity [33,34].Alternatively, functional polymers, as well known as polymer brushes, can be attached in a controlled
182

Membranes 2017, 7, 39
manner on the membrane surfaces or within membrane pores by physical adsorption or covalentbonds [35–38]. Polymer brushes can be covalently attached to membrane surfaces and pores eitherby ‘grafting-from’ methods or by ‘grafting-to’ techniques. In the ‘grafting-from’ methods, functionalmonomers are polymerized onto active sites present on the membrane pores and surface. The‘grafting-from’ method is considered very advantageous because the presence of linear polymersor crosslinked networks in the pores can reduce the steric hindrance of neighbouring bonded polymerchains [39,40]. On the contrary, in the ‘grafting-to’ methods responsive membranes are fabricatedby chemical/physical incorporation of opportunely end-functionalized polymers that can reactonto the desired surfaces. In both grafting methods, the presence of an electro-responsiveness inthe grafted polymer brushes can be used to alter the chain conformation and lead to responsivesurfaces with an electro-tuneable permselectivity. Grafting can be usually induced by plasma,photo-irradiation, redox reactions, temperature and controlled radical reactions such as reversibleaddition fragmentation chain transfer polymerization and atom transfer radical polymerization.Polymer self-assembly methods to prepare ERPM membrane in a single step are limited by thedifficulties generally found in the synthesis of conductive copolymers. Recently, polymer self-assemblymethods have used amphiphilic copolymers in order to prevent membrane fouling and retainpermeability [41–45]. Barghi et al. [46] synthesized a flexible, biocompatible, semi-hydrophilic,and electro-conductive membrane by crosslinking copolymerization of a highly electro-conductivemonomer (hydroxymethyl-3,4-ethylenedioxy thiophene, HMEDOT) with a highly mechanical resistantpolyamide (polytetramethylene-N-hydroxyethyl adipamine, PTMHEA) opportunely hydrophilizedwith acetaldehyde and in situ polymerized by an oxidative plasma treatment. The PHMEDOThomopolymer grafted onto the PHMEDOT-co-PTMHEA surface reduced considerably the copolymerelectrical resistance both in dry and wet conditions (105 kΩ cm−2 and 2 kΩ cm−2, respectively). Poresize and distribution, roughness, and water flux were finely controlled by changing the thickness ofPHMEDOT homopolymer.
2.2.1. Responsive Membranes Based on Polyaniline
Polyaniline (PANI) is one of the most investigated conductive polymers because of its long termenvironmental stability, high conductivity, and relative low cost. The high chemical selectivity of PANIand its composites makes them particularly attractive as sensors for the detection of a number of gasesand vapours, including methanol, ammonia, HCl, CHCl3, NO2, and CO [47,48]. Distinctive drawbacks,such as low solubility in the majority of solvents commonly used for membranes preparation, lowmechanical flexibility, and thermal instability at temperatures above 160 ◦C, do not allow obtainingpure PANI membranes. Therefore, PANI-based responsive membranes are blends of PANI with otherpolymers suitable for membrane preparation. Polysulphone (PSF), polystyrene (PS), polypropylene(PP), cellulose (CEL) and its derivatives are some chemically inert polymers used for PANI-basedmembrane preparation. PANI-based membranes are mainly used in selective separation processesof gases and some chemical species from complex liquid solutions, in antistatic textile materials,biosensors, anticorrosive films, and electric and electronic devices (e.g., light emitting diodes andphotovoltaic cells).
PSF/PANI-based membranes are designed for advanced separation of polar compounds fromvarious mixtures and obtained from simultaneous formation of a PSF-based membrane and anilinepolymerization within membranes in oxidative conditions. PANI results generally well distributed inthe whole microporous structure and not only on membrane surface [49]. In addition, PS/PANI-basedmembranes can be obtained via phase inversion processes, whereas phase changes take place throughprecipitation in vapour phase [50]. Obviously, conductive properties of PS/PANI-based membranesdepend on PS/PANI weight ratio within the composites. PP/PANI-based membranes maintain themicroporous structure of the supporting polypropylene. Different pore diameters can be obtained aslong as PANI is formed within the PP pores through soaking of supporting polymer films in aniline,followed by aniline oxidative polymerization using ammonium peroxydisulphate and HCl [51].
183

Membranes 2017, 7, 39
PP/PANI-based composites can be used for selective separation of chemical species from variousliquid media through reverse osmosis, microfiltration, ultrafiltration, and nanofiltration processes.CEL/PANI nanocomposites can be prepared by in situ chemical oxidative polymerization routesof aniline within the fibre microstructure of CEL [52]. An enhancement in the PANI content insidemembrane nanocomposites and a consequent increase in their electric conductivity is observed byincreasing the reaction time. Longer reaction times give rise to PANI aggregation and formation ofdiscontinuities within the nanocomposite structure with a consequent decrease of electric conductivity.Other CEL/PANI-based membranes can be prepared by deposition of a thin layer of PANI ontomembrane interface (cellulose or its esters) by in situ oxidative polymerization of aniline [53]. Therefore,the electric conductivities of cellulose acetate/PANI membranes increase from 10−3 to 11 S m−1 and98 S m−1 using liquid [54] and vapour [55] phase polymerization, respectively.
2.2.2. Responsive Membranes Based on Polypyrrole
Polypyrrole (PPy) is characterized by very low conductivity and a low processability due to itspoor mechanical strength. An appropriated doping with anions such as dodecylsulphate, chloride,sulphate and perchlorate can easily increase conductivity. Doped PPy shows a good chemical andthermal stability, a higher conductivity compared with other conductive polymers, and improvedplasticity and elasticity by inclusion within polymer structure. PPy-based composite membranesare frequently used in concentration- (gas separation from complex mixtures and pervaporation)and electric potential-gradient processes (electro-dialysis). PPy is polymerized by electrochemicaland chemical oxidative polymerization [56–61]. The vapour-phase polymerization of pyrrole is anadditional method to form conducting PPy films on membranes [62–65]. Addition of surfactants suchas sodium dodecylbenzensulphonate, sodium alkylnaphtalenesulphonate and sodium alkylsulphonatewithin the chemical oxidation reaction media gives higher PPy electro-polymerization efficiencies,larger electric conductivities, better fluxes and selectivity control in the composite membranes [60].The resulting nanoporous membranes are able to tune their pore sizes by application of an electricalpotential, whose strength is less than 1.1 V.
Tsai et al. [60] prepared a PPy-based nanoporous membrane with tuneable wettability from apolypyrrole film doped with dodecylbenzenesulfonate anions (DBS) and electropolymerized on acoated Si wafer. Due to the reorientation of DBS dopant molecules, the membrane surface wettabilitywas tuned from a more hydrophobic behaviour (with a contact angle of 134◦) to a less hydrophobicbehaviour (with a contact angle of 107◦) by application of low electrical potentials (from 0.7 to −1.0 V).
2.2.3. Responsive Membranes Based on Carbon Nanotubes
The use of metal nanoparticles and carbon nanotubes (CNTs) as conducting elements is avaluable approach for the preparation of effective electro-sensitive materials to be used in severalfields including drug delivery [66,67], liquid crystal displays [68], solar energy cells [69], conductivedevices [70–72]. CNTs are commonly employed in hybrid polymer membranes to improve theirperformance in terms of fouling potential, permselectivity, and flux. The specific features of CNTs,such as well-defined structure, chemical bonding properties and high aspect ratio, concur to theirinteresting electro-mechanical properties that can improve the morphological, rheological, thermal,mechanical, and electrical properties of the host polymers. Commercially available and laboratory-scaleproduced single-walled (SWCNT), double-walled (DWCNT) and multi-walled (MWCNT) CNTs canbe incorporated into final and/or intermediate polymer materials. The most important challenges inthe preparation and effective utilization of CNTs in polymer membranes are an adequate interfacialadhesion between polymer matrix and CNTs and a homogeneous distribution of CNTs throughout thecomposite matrix in order to prevent their agglomeration [73]. Moreover, CNTs concentration limitsand inhomogeneous orientation in membranes represent additional issues to be overcome. Someapproaches to face these challenges include the use of surfactant molecules, polymer wrapping, long
184

Membranes 2017, 7, 39
sonication times and chemical sidewall-functionalization in order to favour debundling and enhancehydrophilicity [74].
2.3. Electro-Conductive Membranes for Permeation Enhancement
In recent years, the use of stimuli responsive membranes has become a promising method forreducing fouling potential. Treatments with stimuli responsive molecules in the form of thin filmsand nano-brushes give surface functionality to conventional membranes and reduce their foulingpotential [75–83] (Figure 1). For example, it is possible to increase the membrane permeability andsolve the problem of foulant deposition within pores by opening gates and enlarging pore size [84–86].
Figure 1. Examples of Stimuli Responsive Membranes. Reprinted from [83], with permission fromRoyal Society of Chemistry.
Lalia et al. [87] proposed self-cleaning PVDF membranes by using highly tangled carbonnanostructures (CNS) with an average diameter of 7–8 nm. Membranes were characterized byimproved processability, high electrical conductivity and large surface area [88] (Figure 2).
(a) (b)
Figure 2. SEM images of carbon nanotube structures: (a) pure and (b) cast on PVDF membrane.Reprinted from [87], with permission from Elsevier.
185

Membranes 2017, 7, 39
These membranes were prepared via vacuum filtration, followed by a heat treatment at 160 ◦C tomelt PVDF and provide binding sites inside the entangled CNS structure with the aim to improve themembrane mechanical strength. Then, membrane performance was tested for in situ surface cleaningin a cross-flow filtration using a yeast suspension as feed. In the electrolytic cleaning the CNS/PVDFsurface acted as the cathode, a platinum foil was used as the anode and Ag/AgCl was employedas the reference electrode in 0.5 M H2SO4 solution. Electrolysis led to the generation of hydrogenmicro-bubbles on the membrane surface, which removed foulants and recovered flux in successivecycles. Permeation fluxes exponentially decreased with time in absence of periodic electrolysis, whilethey increased of about 40% respect to their original values after 4.6 h of filtration in the presence ofperiodic electrolysis (Figure 3).
Figure 3. Time behaviour of normalized flux for CNS/PVDF membrane with and without electrolysis.Reprinted from [87], with permission from Elsevier.
Recently, Duan et al. [89] used a polyvinyl alcohol and carboxylated MWCNTs (PVA/MWCNT-COOH) membrane to remove Cr(VI) from water through a combined process of electrostaticrepulsion, electrochemical reduction, and precipitation. The overall removal efficiency exceeded 95%,a very high value if compared with the maximum rejection of 20% by commercial UF polysulfonemembranes with a cut-off of 10 kDa. An electrochemical treatment of Cr(VI) is usually conducted in amass-transport limited batch process that needs long contact times, making the process hard to scale up.These mass transfer restrictions can be overcome by electrochemical filtration, where the contaminatedwater is forced through a porous electrode, as a PVA/MWCNT-COOH membrane, capable ofsupporting electrochemical reactions, such as oxygen reduction, chlorine oxidation, and watersplitting [90,91]. The removal mechanism resulted to be highly dependent on solution conductivity:higher solution conductivities involved electrochemical reduction and precipitation of Cr(III) on themembrane surface, while very low conductivities led to electrostatic repulsions accounting for Cr(VI)rejection from the permeate. The increase of membrane surface charge density by application of anexternal potential (3, 5 and 7 V, with membrane as cathode), increased the Cr(VI) removal from 45.0%(for non-polarized PVA/MWCNT-COOH membrane) to 86.5% (at the highest cell potential). Themembrane contact time and background ionic strength of the feed solution influenced significantly theCr(VI) removal. Electrostatic repulsive forces between the negatively charged PVA/MWCNT-COOHmembrane and CrO4
2− could prevent chromium ions permeation under low salinity conditionswithout applying external potentials. At high electrolyte concentrations, soluble Cr(VI) is reducedto insoluble Cr(III) and precipitates on the membrane surface primarily as Cr(OH)3 by reaction withhydroxide ions generated by the water splitting on the MWCNT network, and can be removed fromthe treated water stream. Moreover, thicker membranes (6 μm-tick) showed superior performance withbetter rejection/removal and higher current densities, also when PVA/MWCNT-COOH membraneswere used to treat tap water spiked with 1 ppm Cr (VI) by application of 7 V to the membrane counterelectrode (Figure 4).
186

Membranes 2017, 7, 39
Figure 4. Removal of chromium from tap water spiked with 1 ppm Cr(VI) using a 6 μm-tick membrane.Reprinted from [89], with permission from Elsevier.
3. Membrane Fouling
Fouling can be considered the “Achilles heel” of membrane processes. It is essentially due tothe deposition/adsorption of particulate and soluble materials on membrane surface and, in caseof porous membranes, to the entrapment of foulant molecules inside membrane pores [92]. Severalfactors can influence fouling: the feed conditions (e.g., ionic strength, pH and presence of cations),membrane surface morphology and properties such as roughness, charge and hydrophilicity [93].
Membrane fouling can be essentially classified into three main categories: reversible, irreversibleand irrecoverable, depending on the nature of foulant attachment onto membrane surface. Reversiblefouling is caused by external deposition of material and can be removed by simple cleaning methods,while irreversible fouling refers to foulants, which can only be removed by harsh chemical and/orthermal treatments. The term irrecoverable fouling refers to fouling that cannot be removed by anycleaning method, but only by a long operational period [92] (Figure 5).
Figure 5. Reversible, irreversible and irrecoverable fouling in membrane processes. Reprinted from [92],with permission from Elsevier.
Another important classification divides fouling in abiotic fouling and biofouling. Abiotic foulingis responsible of the formation of a “cake layer” consisting of rejected material, while biofouling is theaccumulation of microorganisms onto the surfaces and within the pores of membranes [94].
187

Membranes 2017, 7, 39
Fouling can significantly reduce membrane performance by:
1. a lowering in productivity because of longer filtration times,2. an alteration of membrane selectivity as a consequence of a change in pore size,3. a shortening of membrane life because of the severe chemical cleaning [95,96],4. an increase of operational costs [97].
The material accumulated onto surface or within pores may reduce the membrane permeabilityand results in a general reduction of the permeate flux over time [94]. For constant pressure operations,where the transmembrane pressure is maintained at a constant value during filtration, fouling causesan increase in filtration resistance, that leads to a flux decline, FD, over time defined as [98]:
FD =Fi − Ff
Fi× 100 (2)
whereFi and Ff are the initial and final fluxes, respectively.The characteristics and the position of deposited materials determinate the extent and reversibility
of permeate flux decline. A partial restore of permeate flux can be obtained by membrane cleaning(either by hydraulic or chemical methods) in order to remove some/all the accumulated material [94](Figure 5).
Conventional cleaning methods include back-flushing, feed pulsing, permeate back-pulsingand air sparging [99]. However, these methods have some limits because they can provide only atemporary relief to flux losses (Figure 6) and damage membranes [100] causing significant changes intheir properties (e.g., surface charge, hydrophobicity and permeability) [101]. Further drawbacks arethe increased operational costs, reduction of membrane lifetime, and need to interrupt the productionto activate such cleaning procedures [99].
Figure 6. Effects of periodic back-flushings on permeate flux over time.
Obviously, a highly fouling-resistant membrane requires infrequent cleanings, reduces operatingand disposal costs, increases the operational life and provides consistent permeate quality overtime [94].
3.1. Novel Approaches to Mitigate Fouling
Extensive work has been done on developing methods to mitigate the negative effects offouling on membrane performance including optimisation of the membrane composition to minimiseattractive interactions between foulants and surface [102], pre-treatment to remove the most reactivefoulants [103] and enhanced module design and operation that reduce fouling through a more effective
188

Membranes 2017, 7, 39
hydrodynamics [104]. A novel approach suggested to prevent fouling is the formulation of membranescharacterised by an active layer with a low surface energy so that attached foulants can be readilywashed away with reduced changes in water fluxes and permeations [105].
Surface modification of commercial membranes by post-treatment is one of the most frequentlymethod to decrease membrane fouling potential [106,107]. Some post-synthesis modificationsinclude [94]:
1. a decrease in the membrane hydrophobicity,2. a reduction of the surface roughness,3. an increase in the membrane selectivity,4. a modification of the surface charge.
Since main polymer membranes are hydrophobic, a frequent problem in membrane processes isthe hydrophobic interactions between membrane surface and hydrophobic solutes present in the feedsolution. The use of a hydrophilic membrane could decrease the fouling potential [92]. Numerousattempts have been made to improve anti-fouling performance by increasing membrane surfacehydrophilicity and smoothness [6,108]. Du et al. [109] proposed a new post treatment process toincrease membrane surface hydrophilicity and smoothness by a surface microstructure reassembly.
Recently, the attention of researchers has shifted to Electrically Responsive Polymer Membranes(ERPMs) characterised by high electrical conductivities. These self-cleaning membranes can beused to mitigate the effects of fouling in several types of separation processes [87]. The cleaningmechanism in ERPMs can be based on electrostatic repulsion, electrochemical oxidation, hydrogenperoxide production, surface morphology changes, piezoelectric vibrations, electro-chemical bubblegeneration [32,110–113].
3.1.1. Electrostatic Repulsion and Hydrogen Peroxide Generation
A possible method to mitigate fouling consists in the generation of electrostatic repulsion betweencharged surfaces and foulants because most of the membrane foulants are negatively charged such assludge flocs, soluble microbial products and polymer substances [114]. In addition, electrically chargedmembranes have been used as electro-catalytic platforms in order to transform various aqueouscontaminants through electrochemical reactions [115].
Huang et al. [116] proposed a simple method to control fouling introducing a stainless steelmesh between the supporting layer and active layer of a MF polymer membrane without changing itssurface physical-chemical properties. A homogeneous conducting polyvinylidene difluoride (PVDF)solution was cast on a stainless steel mesh (pore size 96 μm, thickness 43 μm) assembled on a polyesternonwoven fabric. The composite membrane was made by immersion precipitation in a non-solventbath. Experiments were performed applying an electrical field of 2 V cm−1 with the membrane actingas cathode. A high water flux and low electrical resistance were found (66 L m−2 h−1 and around 200 Ω,respectively). The antifouling performance of these membranes was attributed to the combinationof electrostatic repulsive forces between charged membranes and tested foulants, as well as to theorganic oxidation by electrochemically generated hydrogen peroxide at the cathode (in situ membranecleaning), leading to a decreased fouling potential (Figure 7). The electrical potential decreased thefouling rates for all tested model foulants (bovine serum albumin, sodium alginate, humic acid, andsilicon dioxide).
CNTs are frequently used as additives in view of improving membrane performance [73,117].In particular, electrically conductive membranes obtained by CNT entrapment in a crosslinked networkhave been demonstrated to mitigate several forms of fouling through the application of electricalpotentials [118–123].
Dudchenko et al. [124] used a sequential pressure/deposition process to set up robustand electrically conductive thin films made of glutaraldehyde-based cross-linked PVA andMWCNTs-COOH on a polysulfone UF support. This membrane exhibited high electrical conductivity
189

Membranes 2017, 7, 39
(2500 S m−1), excellent robustness and permeability. PVA/MWCNT-COOH were used in cross-flowdevices (Figure 8) for electro-filtration process and showed separation properties similar to thecommercially available PSF-35 UF membranes.
Figure 7. Schematic illustration of anti-fouling mechanism. Reprinted from [116], with permissionfrom Nature Publishing Group.
Figure 8. Electro-filtration set-up with: (a) conventional and (b) conductive membranes. Reprintedfrom [124], with permission from Elsevier.
When an electric potential was applied, PVA/MWCNT-COOH membranes were able to inhibitfouling at very high concentrations (3.0–5.0 g/L) of alginic acid, which was used as a negative chargedmodel foulant. After 100 min of operation with the PVA/MWCNT-COOH membrane working asa cathode element (−3.4 V vs. Ag/AgCl reference electrode), the change in operating pressure wasreduced by 51% compared with the control membrane working without voltage. Fouling mitigationwas explained using a modified Poisson-Boltzmann equation and a DLVO-type theory, indicating thatelectrostatic interactions gave significant repulsive forces between the membrane surface and chargedorganic foulant molecules.
ERPMs have been demonstrated to be efficient in solving fouling problems in anaerobicbioreactors, when vigorous air scouring cannot be used to clean membrane surfaces [125,126].
Duan et al. [127] prepared a UF conductive membrane by deposition of CNT–COOH on a PSFsupport followed by the crosslinking of a PVA layer. The PVA/CNT–COOH network deposited on PSF
190

Membranes 2017, 7, 39
surface created a smooth (46 ± 2 nm) electrically conducting (1132 ± 32 S m−1) layer. The applicationof an electric voltage (5 V) using membrane as cathode, led to a significant reduction of membranefouling because the main degradation products of the anaerobic processes are negatively charged smallmolecules. When the system operated at a constant flux of 30 L m−2 h−1 with no applied potential,pressure increased from 1.5 to 3 psi over the time. On the contrary, when the membrane was used as acathode, the pressure increased from 1.5 psi to 2.4 and 2.2 psi, when an electric potential of 3 V and 5 Vwas applied, respectively (Figure 9).
Figure 9. Impact of applied electrical potential on transmembrane pressure. Reprinted from [127], withpermission from Elsevier.
Interestingly, during back-flushing, when the membrane was anodically switched (1.5 V), a rapidand irreversible fouling was recorded confirming that most of foulants were negatively charged.
Another effective cleaning method to mitigate fouling without membrane damage is thegeneration of microbubbles on the membrane surface through electro-reduction [128].
3.1.2. Electrochemical Oxidation
The electrically conducting form of PANI is emeraldine, which is obtained through theelectrochemical polymerization of PANI under acidic condition (Figure 10) [32,129–132].
Figure 10. Emeraldine synthesis and structure.
PANI/CNT electrically conducting membranes were designed to evaluate their capacity for insitu electrochemical cleaning via electro-oxidation, without any external chemical addition [122].
Recently, Duan et al. [122] made an highly conductive and anodically stable polyaniline/carboxylated carbon nanotubes (PANI/CNT–COOH) UF membrane by electro-polymerization ofaniline on a PSF/CNT substrate under different acidic conditions (sulfuric, hydrochloric, and oxalicacid). Electrochemical polymerization under acidic conditions forms PANI in the emeraldine form. Inaddition, hydrophilic PANI-based membranes are usually more resistant to organic and biologic foulingas well as more conductive than PVA/CNT membranes. The PANI/CNT–COOH membranes obtained
191

Membranes 2017, 7, 39
from sulfuric acid exhibited the best stability, conductivity and hydrophilicity with no impact onselectivity and permeability (Figure 11) and resulted ideal membranes for water treatment applications.
Figure 11. (a) Flux and (b) fouling behavior in PANI/CNT-COOH membranes. Reprinted from [122],with permission from American Chemical Society.
Moreover, PANI/CNT–COOH membranes showed enhanced resistance to anodic oxidation, withlittle degradation observed up to 3 V vs. Ag/AgCl (Figure 12) under neutral pH conditions.
Figure 12. (a) Resistance and (b) stability in PANI/CNT–COOH and PVA/CNT-COOH membranes.Reprinted from [122], with permission from American Chemical Society.
Experiments conducted with bovine serum albumin showed an easy fouling cleaning ofPANI/CNT–COOH membrane surfaces by in situ oxidation and fluxes restored to their initial values byapplication of a 3 V potential. Moreover, a methylene blue (MB) solution was easily electrochemicallyoxidized with 90% efficiency in a single pass through an anodically charged ERPM (3 V, 1 μm thickmembrane, membrane residence time lower than 0.2 s), avoiding the need for additional and expensivechemical cleaning agents [133]. The electro-oxidation of 5 ppm of MB on PANI/CNT–COOH ERPMrequired only 2.5 kW m−3 with a contact time lower than 1 s. In contrast, typical photocatalyticprocesses for MB on titanium dioxide require up to 40 kW m−3 and contact times ranging from 30 to60 min [134,135].
Recently, many researches underlined the huge potential of CNT/polymer composites in watertreatment such as desalination. Shawky et al. [73] synthesized polyamide/MWCNT nanocompositemembranes (PA/ MWCNT) by a polymer grafting process and investigated the NaCl and humic acidrejection. The strong interactions between MWCNTs and PA matrix resulted in a remarkable structuralcompactness and significant improvement of mechanical properties of the obtained membranes.In addition, the salt rejection considerably increased, even if the permeate flux was slightly reduced.
De Lannoy et al. [136] evaluated the effects of MWCNTs-COOH on a hydrophobic PSF membrane,widely used in UF processes in spite of its relatively low tensile strength. Surface hydrophilicity,
192

Membranes 2017, 7, 39
membrane permeability and tensile strength of PSF/MWCNTs-COOH composites increased as afunction of CNT carboxylation. However, a decreased MWCNT retention within the membranes andan increased leaching during membrane cleaning were observed at higher carboxylation efficiencies.
A highly conducting and flexible composite membrane was realized with a thin layer of PVA,covalently cross-linked to MWCNTs–COOH and succinic acid, onto a cellulose nitrate membrane(Figure 13) [137].
Figure 13. Thin layer of PVA covalently cross-linked to MWCNTs–COOH and succinic acid onto acellulose nitrate membrane. The succinic acid molecules and MWCNTs–COOH cross-linked the PVAstrands, immobilizing MWCNTs and altering the spacing between PVA strands. Reprinted from [137],with permission from Elsevier.
This PVA/MWCNT–COOH composite showed high electrical conductivity and permeateflux with low polymer crystallinity and surface tension. Membranes prepared with 20 wt %MWCNT–COOH and 20 min curing time exhibited conductivities as high as 3.6 × 10³ S m−1, purewater flux of 1440 L/m2 h at pressures of 550 kPa, and triple-point initial contact angles as low as40◦ with high hysteresis. Better separation characteristics were achieved in PVA/MWCNT–COOHmembranes by incorporating smaller amounts of MWCNT–COOH (2 and 5 wt %), but at the expenseof the membrane permeability (Figure 14). The authors suggest that the MWCNT-COOH loadingcould be easily employed to control the molecular weight cut-off.
Figure 14. Solute rejection as a function of MWCNT–COOH wt % content with respect to PVA inPVA/MWCNT–COOH composites. Reprinted from [137], with permission from Elsevier.
CNT-based ERPMs show long-term stability (no notable change in their conductivity overtime is observed when they are used as cathodes) and interesting electro-cleaning properties,as previously reported. Nevertheless, CNT-based ERPMs result to be unstable under elevated anodic
193

Membranes 2017, 7, 39
potentials in aqueous environments due to CNT oxidation and breakdown when exposed to hydroxylradicals produced on their surfaces [122]. Coating and anchoring of stable metal nanoparticles (e.g.,bismuth-doped tin oxide and cobalt oxide) on CNT surfaces increase stability up to 2.2 V vs. Ag/AgClreference electrode.
Graphene is a two-dimensional, one-atom-thick layer of graphite with tunable size and structureand can be engineered for different filtration processes, ranging from ultrafiltration to reverse osmosis.Graphene shows enhanced physical-chemical properties such as electrical and thermal conductivity,mechanical strength, optical transparency, solution processability, and specific surface area up to2630 m2 g−1. Therefore, graphene has been widely used in flexible transparent electrodes, energystorage devices, solar cells, and electronics and optoelectronics applications. Usually, graphene canbe obtained by exfoliation of highly pure graphite and, therefore, does not retain the CNTs metalimpurities deriving from their metal-catalysis-driven growth process. Graphene nano-platelets (GNP)can lead to highly ordered membranes or films by means of different routes (filtration-assisted assembly,chemical vapor deposition, electrochemical deposition, and layer-by-layer methods). Moreover,the rich surface chemistry of bidimensional graphene favors the fine-tuning of the interfacingproperties with numerous porous supporting materials, such as PSF, PES (polyethersulfone) andPTFE (polytetrafluoroethylene).
Liu et al. [138] developed a novel electrochemical filter for water purification by graphenenano-platelets enabled by carbon nanotubes (GNP:CNT) in a polytetrafluoroethylene membrane(PTFE/GNP:CNT). CNTs were the conductive binders for graphene nano-platelets (Figure 15).
Figure 15. Schematic representation of PTFE/GNP:CNT electrochemical filter. Reprinted from [138],with permission from Royal Society of Chemistry.
In particular, the researchers dispersed different weight ratios (from 50:50 to 100:0) of GNPs andCNTs in N-methyl-2-pyrrolidone, and vacuum filtered the stable suspension onto a PTFE membrane.Anodic oxidation of the PTFE/GNP:CNT electrode was tested using ferrocyanide (Fe(CN)−4
6 ) asa model electron donor. When the anodic filter was used in batch mode, electro-oxidation ratesincreased linearly with applied potential and plateaued because of mass transfer limitations. Whenthe PTFE/GNP:CNT filter was evaluated as part of a flow-through system, no plateau was observedfor high concentrations of (Fe(CN)−4
6 ) (10 mmol L−1) as a result of increased mass transfer rates.Overall, electro-oxidation rates increased up to 15-fold due to convection enhanced transfer of thetarget molecule to the electrode surface and reduction of mass transfer over potential.
Moreover, the efficiency of PTFE/GNP:CNT filters for anodic degradation was evaluated withthree selected organic pollutants (tetracycline, phenol and oxalate). For all three organic compounds,electro-oxidation kinetics increased with increasing anode potential until a maximum removal rate(0.010, 0.064, and 0.050 mol h−1 m−2 for tetracycline, phenol, and oxalate, respectively) achieved at0.8 V (Figure 16).
194

Membranes 2017, 7, 39
Figure 16. Electro-oxidative filtration of tetracycline, phenol and oxalate as a function of anodepotential. Reprinted from [138], with permission from Royal Society of Chemistry.
3.2. Biofouling Mitigation with Electro-Responsive Membranes
Membrane processes are vulnerable to bacterial adhesion and biofilm growth on the membranesurface. Development of biofouling leads to a dramatic decrease of productivity, especially whenin the feed solution are present organic matter and nutrients, as in the case of wastewater effluents.Most efforts to prevent biofilm development are based on limiting the initial bacterial attachment orincreasing detachment. Methods to develop surfaces with anti-biofouling properties include linkingand embedding of antimicrobial nanoparticles [139–142], grafting of polymer brushes, that form ahydrated gel layer that prevents bacteria from interacting with surfaces [143], and electrically chargedsurfaces [144,145]. These coating methods have been demonstrated to be effective, but the coatingmaterial loss causes the decline of their performance over time [146–148]. Ronen et al. [120] studiedthe bacterial deposition and detachment rates as a function of the electrical potential applied tothe membrane surface. In the experiment, the authors used a conducting PVA/CNT composite UFmembrane and ITO electrodes positioned on both sides of a modified cuvette containing EscherichiaColi suspension at a concentration of 108 cells mL−1. The microbial attachment was investigated usinga direct observation cross-flow membrane system mounted on a fluorescent microscope. Differentelectrical potentials (0, 0.5, 1, and 1.5 V) were applied to the electrodes and the impact of the electricvoltage was investigated by measuring cell integrity and cell viability using propidium iodide and5-cyano-2,3-ditolyltetrazolium chloride as fluorescent indicators, respectively.
SEM images of membrane surface after detachment phase showed that cells had a regular shapeon membranes without applied potential, while the irregular structure of cells, that were remainedattached to membrane subjected to a potential of ±1.5 V, was indicative of cell damage (Figure 17).
Figure 17. SEM images of membranes after detachment with: (a) no applied potential, (b) 1.5 V appliedwith membrane as anode, and (c) 1.5 V applied with membrane as cathode. Scale bars are 2 μm.Reprinted from [120], with permission from American Chemical Society.
195

Membranes 2017, 7, 39
The main mechanism proposed to explain the antifouling properties of these membranes was thegeneration of hydrogen peroxide due to electro-reduction of oxygen, when a low electrical potentialwas applied. The production of hydrogen peroxide on membrane surfaces caused the reduction ofmicrobial cell viability, increased cellular permeability and prevented bacterial attachment.
Another interesting anti-biofouling method based on the electrostatic repulsion betweenmembrane surface and attached bacteria was investigated by Baek et al. [149]. They produced anelectro-conductive feed spacer (ECFS) in a lab-scale cross flow membrane system, in which low electricpotentials were applied to minimize chlorine gas generation. A titanium mesh and a stainless steelmesh were used as model ECFS, on which an electrical polarization was induced. After 24 h frombiofouling occurrence, the permeate flux was decreased to about 47%, while was recovered to 80%,89%, and 91% when the ECFS was polarized for 30 min with +1.0 V, −1.0 V, and alternating electricalpotentials (cycles of +1.0 V for 1 min and −1.0 V for 1 min), respectively.
The electrically conductive PA/MWCNT nanocomposites by de Lannoy et al. [74] showed higherbiofilm-preventing capabilities, larger electrical conductivity (∼400 S m−1), better monovalent ionrejection (greater than 95%), and higher water permeability than commercially available membranes.Biofilm induced a non-reversible flux decline, while the flux decrease for membranes with an appliedelectric potential (1.5 V) was lower (due just to bacteria deposition) and fully recoverable with a shortrinse with the feed solution without added cleaning agents. The prevention of microbial biofilms wasprobably due to local pH instabilities and unfavourable conditions for bacterial growth arising fromthe electrical potential.
4. Conclusions
This paper reviewed the recent progresses in electro-conductive membranes as smart devices ableto respond to the application of an electric signal. Different classes of electro-conductive membraneswere examined and the advantages in their using were discussed with particular emphasis to thebeneficial effects on membrane transport properties and fouling mitigation.
Acknowledgments: MIUR, the Italian Ministry for University and Research, is acknowledged for financialsupport (EX-60/2016).
Author Contributions: Patrizia Formoso and Elvira Pantuso collected literature and wrote the manuscript.Giovanni De Filpo and Fiore Pasquale Nicoletta gave suggestions on the organization of the manuscript,supervised the work and revised the manuscript. All authors read and approved the final manuscript.
Conflicts of Interest: The authors declare no conflict of interest.
References
1. Giorno, L. Permselectivity. In Encyclopedia of Membranes; Drioli, E., Giorno, L., Eds.; Springer:Berlin/Heidelberg, Germany, 2016; ISBN 978-3-662-44323-1.
2. Mulder, M. Basic Principles of Membrane Technology, 2nd ed.; Kluwer Academic Publishers: Dordrecht,The Netherlands, 1996; ISBN 978-0-7923-4247-2.
3. Wandera, D.; Wickramasinghe, S.R.; Husson, S.M. Stimuli-responsive membranes. J. Membr. Sci. 2010, 357,6–35. [CrossRef]
4. Yu, S.; Liu, X.; Liu, J.; Wu, D.; Liu, M.; Gao, C. Surface modification of thin-film composite polyamide reverseosmosis membranes with thermoresponsive polymer (TRP) for improved fouling resistance and cleaningefficiency. Sep. Purif. Technol. 2011, 76, 283–291. [CrossRef]
5. Bhattacharyya, D.; Schäfer, T.; Wickramasinghe, S.R.; Daunert, S. Responsive Membranes and Materials; Wiley:New York, NY, USA, 2012; ISBN 978-0-470-97430-8. [CrossRef]
6. Nicoletta, F.P.; Cupelli, D.; Formoso, P.; De Filpo, G.; Colella, V.; Gugliuzza, A. Light responsive polymermembranes: A review. Membranes 2012, 2, 134–197. [CrossRef] [PubMed]
7. Wang, R.; Xiang, T.; Yue, W.; Li, H.; Liang, S.; Sun, S.; Zhao, C. Preparation and characterizationof pH-sensitive polyethersulfone hollow fiber membranes modified by poly(methyl methylacrylate-co-4-vinylpyridine) copolymer. J. Membr. Sci. 2012, 423–424, 275–283. [CrossRef]
196

Membranes 2017, 7, 39
8. Wang, Z.; Yao, X.; Wang, Y. Swelling-induced mesoporous block copolymer membranes with intrinsicallyactive surfaces for size-selective separation. J. Mater. Chem. 2012, 22, 20542. [CrossRef]
9. Frost, S.; Ulbricht, M. Thermoresponsive ultrafiltration membranes for the switchable permeation andfractionation of nanoparticles. J. Membr. Sci. 2013, 448, 1–11. [CrossRef]
10. Gugliuzza, A. Intelligent membranes: Dream or reality? Membranes 2013, 3, 151–154. [CrossRef] [PubMed]11. Katsuno, C.; Konda, A.; Urayama, K.; Takigawa, T.; Kidowaki, M.; Ito, K. Pressure-responsive polymer
membranes of slide-ring gels with movable cross-links. Adv. Mater. 2013, 25, 4636–4640. [CrossRef] [PubMed]12. Li, H.; Liao, J.; Xiang, T.; Wang, R.; Wang, D.; Sun, S.; Zhao, C. Preparation and
characterization of pH- and thermo-sensitive polyethersulfone hollow fiber membranes modified withP(NIPAAm-MAA-MMA)terpolymer. Desalination 2013, 309, 1–10. [CrossRef]
13. Qiu, X.; Yu, H.; Karunakaran, M.; Pradeep, N.; Nunes, S.P.; Peinemann, K-V. Selective separation of similarlysized proteins with tunable nanoporous block copolymer membranes. ACS Nano 2013, 7, 768–776. [CrossRef][PubMed]
14. Yang, Q.; Himstedt, H.M.; Ulbricht, M.; Qian, X.; Wickramasinghe, S.R. Designing magnetic field responsivenanofiltration membranes. J. Membr. Sci. 2013, 430, 70–78. [CrossRef]
15. Chen, P.R.; Chuang, Y.J. The development of conductive nanoporous chitosan polymer membrane forselective transport of charged molecules. J. Nanomater. 2013, 2013. [CrossRef]
16. He, Y.; Chen, X.; Bi, S.; Fu, W.; Shi, C.; Chen, L. Conferring pH-sensitivity on poly (vinylidene fluoride)membrane by poly (acrylic acid-co-butyl acrylate) microgels. React. Funct. Polym. 2014, 74, 58–66. [CrossRef]
17. Ma, S.; Meng, J.; Li, J.; Zhang, Y.; Ni, L. Synthesis of catalytic polypropylene membranes enablingvisible-light-driven photocatalytic degradation of dyes in water. J. Membr. Sci. 2014, 453, 221–229. [CrossRef]
18. Xiao, L.; Isner, A.; Waldrop, K.; Saad, A.; Takigawa, D.; Bhattacharyya, D. Development of bench and full-scaletemperature and pH responsive functionalized PVDF membranes with tunable properties. J. Membr. Sci.2014, 457, 39–49. [CrossRef] [PubMed]
19. Kaner, P.; Bengani-Lutz, P.; Sadeghi, I.; Asatekin, A. Responsive filtration membranes by polymerself-assembly. Technology 2016, 4, 1–12. [CrossRef]
20. Meng, H.; Hu, J. A brief review of stimulus—Active polymers responsive to thermal, light, magnetic, electric,and water/solvent stimuli. J. Intell. Mater. Syst. Struct. 2010, 21, 859–885. [CrossRef]
21. Otero, T.F.; Martinez, J.G.; Arias-Pardilla, J. Biomimetic electrochemistry from conducting polymers.A review: Artificial muscles, smart membranes, smart drug delivery and computer/neuron interfaces.Electrochim. Acta 2012, 84, 112–128. [CrossRef]
22. Ates, M. A review study of (bio) sensor systems based on conducting polymers. Mater. Sci. Eng. C 2013, 33,1853–1859. [CrossRef] [PubMed]
23. Guo, B.; Glavas, L.; Albertsson, A-C. Biodegradable and electrically conducting polymers for biomedicalapplications. Prog. Polym. Sci. 2013, 38, 1263–1286. [CrossRef]
24. Asatekin, A.; Mayes, A.M. Polymer filtration membranes. In Encyclopedia of Polymer Science and Technology;Mark, H.F., Bikales, N.M., Eds.; Wiley: New York, NY, USA, 2009; ISBN 9780471440260. [CrossRef]
25. Baker, R.W. Membrane Technology and Applications, 2nd ed.; Wiley: New York, NY, USA, 2004;ISBN 9780470743720. [CrossRef]
26. Majidi Salehi, S.; Di Profio, G.; Fontananova, E.; Nicoletta, F.P.; Curcio, E.; De Filpo, G. Membrane distillationby novel hydrogel composite membranes. J. Membr. Sci. 2016, 504, 220–229. [CrossRef]
27. Di Profio, G.; Polino, M.; Nicoletta, F.P.; Belviso, B.D.; Caliandro, R.; Fontananova, E.; De Filpo, G.; Curcio, E.;Drioli, E. Tailored hydrogel membranes for efficient protein crystallization. Adv. Funct. Mater. 2014, 24,1582–1590. [CrossRef]
28. Hernandez, S.; Saad, A.; Ormsbee, L.; Bhattacharyya, D. Nanocomposite and responsive membranes forwater treatment. In Emerging Membrane Technology For Sustainable Water Treatment; Hankins, N.P., Singh, R.,Eds.; Elsevier: Amsterdam, The Netherlands, 2016; pp. 389–431. ISBN 978-0-444-63312-5. [CrossRef]
29. Asatekin, A.; Vannucci, C. Self-assembled polymer nanostructures for liquid filtration membranes: A review.Nanosci. Nanotechnol. Lett. 2015, 7, 21–32. [CrossRef]
30. Bengani, P.; Kou, Y.; Asatekin, A. Zwitterionic copolymer self-assembly for fouling resistant, high fluxmembranes with size-based small molecule selectivity. J. Membr. Sci. 2015, 493, 755–765. [CrossRef]
31. Yin, J.; Deng, B.L. Polymer-matrix nanocomposite membranes for water treatment. J. Membr. Sci. 2015, 479,256–275. [CrossRef]
197

Membranes 2017, 7, 39
32. Batrinescu, G.; Constantin, L.A.; Cuciureanu, A.; Constantin, M.A. Conductive polymer-based membranes.In Conducting Polymers; Yilmaz, F., Ed.; Intech (Open Science): Rijeka, Croatia, 2016; ISBN 978-953-51-2691-1.[CrossRef]
33. Wesson, R.D.; Dow, E.S.; Williams, S.R. Responsive membranes/material-based separations: Researchand development needs. In Responsive Membranes and Materials; Bhattacharyya, D., Schäfer, T.,Wickramasinghe, S.R., Daunert, S., Eds.; Wiley: New York, NY, USA, 2013; pp. 385–393.ISBN 978-0-470-97430-8. [CrossRef]
34. Chen, H.; Hsieh, Y.L. Dual temperature- and pH-sensitive hydrogels from interpenetrating networks andcopolymerization of N-isopropylacrylamide and sodium acrylate. J. Polym. Sci. Part A: Polym. Chem. 2004,42, 3293–3301. [CrossRef]
35. Chun, Y.; Mulcahy, D.; Zou, L.; Kim, I.S. A short review of membrane fouling in forward osmosis processes.Membranes 2017, 7, 30. [CrossRef] [PubMed]
36. Azzaroni, O.; Brown, A.A.; Huck, W.T.S. Tunable wettability by clicking counterions into polyelectrolytebrushes. Adv. Mater. 2007, 19, 151–154. [CrossRef]
37. Husson, S.M. Synthesis aspects in the design of responsive membranes. In Responsive Membranes andMaterials; Bhattacharyya, D., Schäfer, T., Wickramasinghe, S.R., Daunert, S., Eds.; John Wiley & Sons, Ltd.:Chichester, UK, 2013; pp. 73–96. ISBN 978-0-470-97430-8. [CrossRef]
38. Yang, Q.; Wickramasinghe, S.R. Responsive membranes for water treatment. In Responsive Membranes andMaterials; Bhattacharyya, D., Schäfer, T., Wickramasinghe, S.R., Daunert, S., Eds.; John Wiley & Sons, Ltd.:Chichester, UK, 2013; ISBN 978-0-470-97430-8. [CrossRef]
39. Mendes, P.M. Stimuli-responsive surfaces for bio-applications. Chem. Soc. Rev. 2008, 37, 2512–2529.[CrossRef] [PubMed]
40. Kastantin, M.; Tirrell, M. Helix formation in the polymer brush. Macromolecules 2011, 44, 4977–4987.[CrossRef] [PubMed]
41. Hester, J.F.; Banerjee, P.; Mayes, A.M. Preparation of protein-resistant surfaces on poly(vinylidene fluoride)membranes via surface segregation. Macromolecules 1999, 32, 1643–1650. [CrossRef]
42. Hester, J.F.; Banerjee, P.; Won, Y.Y.; Akthakul, A.; Acar, M.H.; Mayes, A.M. ATRP of amphiphilic graftcopolymers based on PVDF and their use as membrane additives. Macromolecules 2002, 35, 7652–7661.[CrossRef]
43. Jung, B. Preparation of hydrophilic polyacrylonitrile blend membranes for ultrafiltration. J. Membr. Sci. 2004,229, 129–136. [CrossRef]
44. Asatekin, A.; Kang, S.; Elimelech, M.; Mayes, A.M. Anti-fouling ultrafiltration membranes containingpolyacrylonitrile-graft-poly(ethylene oxide) as an additive. J. Membr. Sci. 2007, 298, 136–146. [CrossRef]
45. Wang, Y.Q.; Su, Y.L.; Sun, Q.; Ma, X.L.; Jiang, Z.Y. Generation of anti-biofouling ultrafiltration membranesurface by blending novel branched amphiphilic polymers with polyethersulfone. J. Membr. Sci. 2006, 286,228–236. [CrossRef]
46. Barghi, H.; Taherzadeha, M.J. Synthesis of an electroconductive membrane using poly(hydroxymethyl-3,4-ethylenedioxythiophene-cotetramethylene-N-hydroxyethyl adipamide). J. Mater. Chem. C 2013, 1, 6347–6354.[CrossRef]
47. Bai, H.; Shi, G. Gas sensors on conducting polymers. Sensors 2007, 7, 267–307. [CrossRef]48. Nicolas-Debarnot, D.; Poncin-Epaillard, F. Polyaniline as a new sensitive layer for gas sensors. Anal. Chim.
Acta 2003, 475, 1–15. [CrossRef]49. Cuciureanu, A.; Batrinescu, G.; Badea, N.N.; Radu, D.A. The influence of changing the polyaniline and
polysulphone ratio on composite Psf–PANI membranes performances. Mater. Plast. 2010, 47, 416–420.Available online: http://www.revmaterialeplastice.ro/article_eng.asp?ID=2758 (accessed on 16 June 2017).
50. Guimaraes, I.S.; Hidalgo, A.A.; Cunha, H.N.; Santos, L.M.; Santos, J.A.V.; Santos, J.R., Jr. Thermal andmorphological characterization of conducting polyaniline/polystyrene blends. Synth. Met. 2012, 162,705–709. [CrossRef]
51. Yang, J.; Hou, J.; Zhu, W.; Xu, M.; Wan, M. Substituted polyaniline-polypropylene film composite: Preparationand properties. Synth. Met. 1996, 80, 283–289. [CrossRef]
52. Mattoso, L.H.; Medeiros, E.S.; Baker, D.A.; Avloni, J.; Wood, D.F.; Orts, W.J. Electrically conductivenanocomposite made from cellulose nanofibrils and polyaniline. J. Nanosc. Nanotech. 2009, 9, 2017–2022.[CrossRef]
198
Membranes 2017, 7, 39
53. Blinova, N.V.; Stejskal, J.; Trchova, M.; Cirici-Marjanovic, G.; Sapurina, I. Polymerization of aniline on anilinemembranes. J. Phys. Chem. B 2007, 111, 2440–2448. [CrossRef] [PubMed]
54. Qaiser, A.A.; Hyland, M.M.; Patterson, D.A. Effects of various polymerization techniques on PANI depositionat the surface of cellulose ester microporous membrane: XPS and electrical studies. Synth. Met. 2012, 162,958–967. [CrossRef]
55. Shehzad, M.A.; Qaiser, A.A.; Javaid, A.; Saeed, F. In situ solution-phase polymerization and chemical vapordeposition of polyaniline on microporous cellulose ester membranes: AFM and electrical conductivitystudies. Synth. Met. 2015, 200, 164–171. [CrossRef]
56. Wang, L.X.; Li, X.G.; Yang, Y.L. Preparation, properties and applications of polypyrroles. React. Funct. Polym.2001, 47, 125–139. [CrossRef]
57. Liu, J.; Liu, L.; Gao, B.; Yang, F. Integration of bio-electrochemical cell in membrane bioreactor for membranecathode fouling reduction through electricity generation. J. Membr. Sci. 2013, 430, 196–202. [CrossRef]
58. Liu, L.; Liu, J.; Bo, G.; Yang, F.; Crittenden, C.Y. Conductive and hydrophilic polypyrrole modified membranecathodes and fouling reduction in MBR. J. Membr. Sci. 2013, 429, 252–258. [CrossRef]
59. Liu, L.; Zhao, F.; Liu, J.; Yang, F. Preparation of highly conductive cathodic membrane with graphene(oxide)/PPy and the membrane antifouling property in filtrating. J. Membr. Sci. 2013, 437, 99–107. [CrossRef]
60. Tsai, Y.T.; Choi, C.H.; Gao, N.; Yang, E.H. Tunable wetting mechanism of polypyrrole surfaces andlow-voltage droplet manipulation via redox. Langmuir 2011, 27, 4249–4256. [CrossRef] [PubMed]
61. Zhao, F.; Liu, L.; Yang, F.; Ren, N. E-Fenton degradation of MB during filtration with Gr/PPy modifiedmembrane cathode. Chem. Eng. J. 2013, 230, 491–498. [CrossRef]
62. Wang, C.; Song, H.; Zhang, Q.; Wang, B.; Li, A. Parameter optimization based on capacitive deionization forhighly efficient desalination of domestic wastewater biotreated efficient and the fouled electrode regeneration.Desalination 2015, 365, 407–415. [CrossRef]
63. Wang, S.; Liang, S.; Liang, P.; Zhang, X.; Sun, J.; Wu, S.; Huang, X. In-situ combined dual-layer CNT/PVDFmembrane for electrically enhanced fouling resistance. J. Membr. Sci. 2015, 491, 37–44. [CrossRef]
64. Xu, L.; Zhang, G.-Q.; Yuan, G.-E.; Liu, H.-Y.; Liu, J.-D.; Yang, F.-L. Anti-fouling performance and mechanismof anthraquinone/polypyrrole composite modified membrane cathode in a novel MFC–aerobic MBR coupledsystem. RSC Adv. 2015, 5, 22533–22543. [CrossRef]
65. Jeon, G.; Yang, S.Y.; Byun, J.; Kim, J.K. Electrically actuatable smart nanoporous membrane for pulsatile drugrelease. Nano Lett. 2011, 11, 1284–1288. [CrossRef] [PubMed]
66. Curcio, M.; Spizzirri, U.G.; Cirillo, G.; Vittorio, O.; Picci, N.; Nicoletta, F.P.; Iemma, F.; Hampel, S. On demanddelivery of ionic drugs from electro-responsive CNT hybrid films. RSC Adv. 2015, 5, 44902–44911. [CrossRef]
67. Formoso, P.; Muzzalupo, R.; Tavano, L.; De Filpo, G.; Nicoletta, F.P. Nanotechnology for the environmentand medicine. Mini-Rev. Med. Chem. 2016, 16, 668–675. [CrossRef] [PubMed]
68. De Filpo, G.; Siprova, S.; Chidichimo, G.; Mashin, A.; Nicoletta, F.P.; Cupelli, D. Alignment of single-walledcarbon nanotubes in polymer dispersed liquid crystals. Liq. Cryst. 2012, 39, 359–364. [CrossRef]
69. De Filpo, G.; Mormile, S.; Nicoletta, F.P.; Chidichimo, G. Fast, self-supplied, all-solid photoelectrochromicfilm. J. Power Sources 2010, 195, 4365–4369. [CrossRef]
70. Kudryashov, M.A.; Mashin, A.I.; Tyurin, A.S.; Chidichimo, G.; De Filpo, G. Metal-polymer composite filmsbased on polyacrylonitrile and silver nanoparticles. Preparation and properties. J. Surf. Investig X-raySynchrotron Neutron Tech. 2010, 4, 437–441. [CrossRef]
71. Kudryashov, M.A.; Mashin, A.I.; Logunov, A.A.; Chidichimo, G.; De Filpo, G. Filpo Frequency dependenceof the electrical conductivity in Ag/PAN nanocomposites. Tech. Phys. 2012, 57, 965–970. [CrossRef]
72. Tyurin, A.; De Filpo, G.; Cupelli, D.; Nicoletta, F.P.; Mashin, A.I.; Chidichimo, G. Particle size tuning insilver-polyacrylonitrile nanocomposites. eXPRESS Polym. Lett. 2010, 4, 71–78. [CrossRef]
73. Shawky, H.; Chae, S.-R.; Lin, S.; Wiesner, M.R. Synthesis and characterization of a carbon nanotube/polymernanocomposite membrane for water treatment. Desalination 2011, 72, 46–50. [CrossRef]
74. De Lannoy, C.F.; Jassby, D.; Gloe, K.; Gordon, A.D.; Wiesner, M.R. Aquatic biofouling prevention byelectrically charged nanocomposite polymer thin film membranes. Environ. Sci. Technol. 2013, 47, 2760–2768.[CrossRef] [PubMed]
75. Reddy, A.V.R.; Trivedi, J.J.; Devmurari, C.V.; Mohan, D.J.; Singh, P.; Rao, A.P.; Joshi, S.V.; Ghosh, P.K. Foulingresistant membranes in desalination and water recovery. Desalination 2005, 183, 301–306. [CrossRef]
199
Membranes 2017, 7, 39
76. Mansouri, J.; Harrisson, S.; Chen, V. Strategies for controlling biofouling in membrane filtration systems:Challenges and opportunities. J. Mater. Chem. 2010, 22, 4567–4586. [CrossRef]
77. Gullinkala, J.; Escobar, I. A green membrane functionalization method to decrease natural organic matterfouling. J. Membr. Sci. 2010, 360, 155–164. [CrossRef]
78. Cai, G.; Gorey, C.; Zaky, A.; Escobar, I.; Grunden, C. Thermally responsive membrane-based microbiologicalsensing component for early detection of membrane biofouling. Desalination 2011, 270, 116–123. [CrossRef]
79. Chen, Y.; Bose, A.; Bothun, G. Controlled release from bilayer-decorated magneto-liposomes viaelectromagnetic heating. ACS Nano 2010, 4, 3215–3221. [CrossRef] [PubMed]
80. Frimpong, R.; Fraser, S.; Hilt, J. Synthesis and temperature response analysis of magnetic-hydrogelnanocomposites. J. Biomed. Mater. Res. Part A 2007, 80, 1–6. [CrossRef] [PubMed]
81. Preiss, M.; Bothun, G. Stimuli-responsive liposome-nanoparticle assemblies. Expert Opin. Drug Deliv. 2011, 8,1025–1040. [CrossRef] [PubMed]
82. Stuart, M.A.; Huck, W.T.; Genzer, J.; Muller, M.; Ober, C.; Stamm, M.; Sukhorukov, G.B.; Szleifer, I.;Tsukruk, V.V.; Urban, M.; et al. Emerging applications of stimuli-responsive polymer materials. Nat. Mater.2010, 9, 101–113. [CrossRef] [PubMed]
83. Liu, Z.; Wang, W.; Xie, R.; Ju, X.J.; Chu, L.Y. Stimuli responsive smart gating membranes. Chem. Soc. Rev.2016, 45, 460–475. [CrossRef] [PubMed]
84. Jiang, Y.; Lee, A.; Chen, J.; Cadene, M.; Chait, B.T.; MacKinnon, R. The open pore conformation of potassiumchannels. Nature 2002, 417, 523–526. [CrossRef] [PubMed]
85. Liu, H.; Liu, X.; Meng, J.; Zhang, P.; Yang, G.; Su, B.; Sun, K.; Chen, L.; Han, D.; Wang, S.; et al. Hydrophobicinteraction-mediated capture and release of cancer cells on thermoresponsive nanostructured surfaces.Adv. Mater. 2013, 25, 922–927. [CrossRef] [PubMed]
86. Shannon, M.A.; Bohn, P.W.; Elimelech, M.; Georgiadis, J.G.; Marinas, B.J.; Mayes, A.M. Science andtechnology for water purification in the coming decades. Nature 2008, 452, 301–310. [CrossRef] [PubMed]
87. Lalia, B.S.; Ahmed, F.E.; Shah, T.; Hilal, N.; Hashaikeh, R. Electrically conductive membranes based oncarbon nanostructures for self-cleaning or biofouling. Desalination 2015, 360, 8–12. [CrossRef]
88. Wang, J.; Zhu, M.; Holloway, B.C.; Outlaw, R.A.; Manos, D.M.; Zhao, X. Carbon Nanostructures and Methodsof Making and Using the Same. Patent WO2005084172 A3, 19 October 2006.
89. Duan, W.; Chen, G.; Chen, C.; Sanghvi, R.; Iddya, A.; Walker, S.; Liu, H.; Ronen, A.; Jassby, D. Electrochemicalremoval of hexavalent chromium using electrically conducting carbon nanotube/polymer compositeultrafiltration membranes. J. Membr. Sci. 2017, 531, 160–171. [CrossRef]
90. Lu, X.; Zhao, C. Highly efficient and robust oxygen evolution catalysts achieved by anchoring nanocrystallinecobalt oxides onto mildly oxidized multiwalled carbon nanotubes. J. Mater. Chem. A 2013, 1, 12053–12059.[CrossRef]
91. Liu, H.; Vajpayee, A.; Vecitis, C.D. Bismuth-doped tin oxide-coated carbon nanotube network: Improvedanode stability and efficiency for flow-through organic electrooxidation. ACS Appl. Mater. Interfaces 2013, 5,10054–10066. [CrossRef] [PubMed]
92. Meng, F.; Chae, S.R.; Drews, A.; Kraume, M.; Shin, H.S.; Yang, F. Recent advances in membrane bioreactors(MBRs): Membrane fouling and membrane material. Water Res. 2009, 43, 1489–1512. [CrossRef] [PubMed]
93. Singh, R.; Hankins, N.P. Introduction to membrane processes for water treatment. In EmergingMembrane Technology for Sustainable Water Treatment; Hankins, N.P., Singh, R., Eds.; Elsevier: Amsterdam,The Netherlands, 2016; pp. 15–52. ISBN 978-0-444-63312-5. [CrossRef]
94. Gorey, C.; Hausman, R.; Escobar, I.C. Functionalization of polymeric membranes and feed spacers for foulingcontrol in drinking water treatment applications. In Responsive Membranes and Materials; Bhattacharyya, D.,Schäfer, T., Wickramasinghe, S.R., Daunert, S., Eds.; John Wiley: New York, NY, USA, 2014; pp. 163–186.ISBN 9780470974308. [CrossRef]
95. Ulbricht, M.; Richau, K.; Kamusewitz, H. Chemically and morphologically defined ultrafiltration membranesurfaces prepared by heterogeneous photo-initiated graft polymerization. Colloid Surf. A 1998, 138, 353–366.[CrossRef]
96. Sun, M.P.; Su, Y.L.; Mu, C.X.; Jiang, Z.Y. Improved antifouling property of PES ultrafiltration membranesusing additive of silica-PVP nanocomposite. Ind. Eng. Chem. Res. 2010, 49, 790–796. [CrossRef]
97. Nils, J.A.; Digiano, F.A. Influence of NOM composition on NF. J. Am. Water Works Assoc. 1996, 88, 53–66.Available online: http://www.jstor.org/stable/41295534 (accessed on 16 June 2017).
200

Membranes 2017, 7, 39
98. Pabby, A.K.; Rizvi, S.S.H.; Sastre, A.M. Membranes in chemical and pharmaceutical industriesand in conservation of natural resources: An introduction. In Handbook on MembraneSeparations Chemical Pharmaceutical Food and Biotechnological Applications; Pabby, A.K., Rizvi, S.S.H.,Sastre, A.M., Eds.; CRC Press: Boca Raton, FL, USA, 2008; ISBN 9780849395499. Available online:https://www.crcpress.com/Handbook-of-Membrane-Separations-Chemical-Pharmaceutical-Food-and-Biotechnological/Pabby-Rizvi-Requena/p/book/9781466555563 (accessed on 16 June 2017).
99. Akhtar, S.; Hawes, C.; Dudley, L.; Reed, I.; Stratford, P. Coatings reduce the fouling of microfiltrationmembranes. J. Membr. Sci. 1995, 107, 209–218. [CrossRef]
100. Chen, J.; Kim, S.L.; Ting, Y.P. Optimization of membrane physical and chemical cleaning by a statisticallydesigned approach. J. Membr. Sci. 2003, 219, 27–45. [CrossRef]
101. Simon, A.; Price, W.E.; Nghiem, L.D. Influence of formulated chemical cleaning reagents on the surfaceproperties and separation efficiency of nanofiltration membranes. J. Membr. Sci. 2013, 432, 73–82. [CrossRef]
102. Childress, A.E.; Elimelech, M. Effect of solution chemistry on the surface charge of polymeric RO and NFmembranes. J. Membr. Sci. 1996, 119, 253–268. [CrossRef]
103. Rautenbach, R.; Linn, T.; Al-Gobaisi, D.M.K. Present and future pretreatment concepts and strategies forreliable and low-maintenance RO seawater desalination. Desalination 1997, 110, 97–106. [CrossRef]
104. Chellam, S.; Wiesner, M.R. Particle back-transport and permeate flux behaviour in cross-flow membranefilters. Environ. Sci. Technol. 1997, 31, 819–824. [CrossRef]
105. Elimelech, M.; Philip, W.A. The future of seawater desalination: Energy, technology, and the environment.Science 2011, 333, 712–717. [CrossRef] [PubMed]
106. Liu, F.; Hashim, N.A.; Liu, Y.; Abed, M.R.M.; Li, K. Progress in the production and modification of PVDFmembranes. J. Membr. Sci. 2011, 375, 1–27. [CrossRef]
107. Nady, N.; Franssen, M.C.R.; Zuilhof, H.; Eldin, M.S.M.; Boom, R.; Schroën, K. Modification methods forpoly(arylsulfone)membranes: A mini-review focusing on surface modification. Desalination 2011, 275, 1–9.[CrossRef]
108. Rana, D.; Matsuura, T. Surface modification for antifouling membranes. Chem. Rev. 2010, 110, 2448–2471.[CrossRef] [PubMed]
109. Du, J.R.; Peldszus, S.; Huck, P.M.; Feng, X. Modification of membrane surface via microswelling for foulingcontrol in drinking water treatment. J. Membr. Sci. 2014, 475, 488–495. [CrossRef]
110. Ronen, A.; Walker, S.L.; Jassby, D. Electroconductive and electroresponsive membranes for water treatment.Rev. Chem. Eng. 2016, 32, 533–550. [CrossRef]
111. Wu, Z.; Chen, H.; Dong, Y.; Mao, H.; Sun, J.; Chen, S.; Craig, V.S.J.; Hu, J. Cleaning using nanobubbles:Defouling by electrochemical generation of bubbles. J. Colloid Interface Sci. 2008, 328, 10–14. [CrossRef][PubMed]
112. Agarwal, A.; Ng, W.J.; Liu, Y. Principle and applications of microbubble and nanobubble technology forwater treatment. Chemosphere 2011, 84, 1175–1180. [CrossRef] [PubMed]
113. Wang, Z.; Ci, L.; Chen, L.; Nayak, S.; Ajayan, P.M.; Koratkar, N. Polarity-dependent electrochemicallycontrolled transport of water through carbon nanotube membranes. Nano Lett. 2007, 7, 697–702. [CrossRef][PubMed]
114. Wang, S.; Guillen, G.; Hoek, E.M.V. Direct observation of microbial adhesion to membranes. Environ. Sci.Technol. 2005, 39, 6461–6469. [CrossRef] [PubMed]
115. Zaky, A.M.; Chaplin, B.P. Porous substoichiometric TiO2 anodes as reactive electrochemical membranes forwater treatment. Environ. Sci. Technol. 2013, 47, 6554–6563. [CrossRef] [PubMed]
116. Huang, J.; Wang, Z.; Zhang, J.; Zhang, X.; Ma, J.; Wu, Z. A novel composite conductive microfiltrationmembrane and its antifouling performance with an external electric field in membrane bioreactors. Sci. Rep.2015, 5, 9268. [CrossRef] [PubMed]
117. Gugliuzza, A. Smart membrane surfaces: Wettability amplification and self-healing. In Smart Membranesand Sensors Synthesis Characterization and Applications; Gugliuzza, A., Ed.; Wiley: New York, NY, USA, 2014;pp. 161–184. ISBN 978-1-118-42379-0. [CrossRef]
118. Liu, L.; Liu, J.; Gao, B.; Yang, F.; Chellam, S. Fouling reductions in a membrane bioreactor using anintermittent electric field and cathodic membrane modified by vapor phase polymerized pyrrole. J. Membr.Sci. 2012, 394–395, 202–208. [CrossRef]
201
Membranes 2017, 7, 39
119. Gao, G.; Zhang, Q.; Vecitis, C.D. CNT-PVDF composite flow-through electrode for single-pass sequentialreduction-oxidation. J. Mater. Chem. A 2014, 2, 6185–6190. [CrossRef]
120. Ronen, A.; Duan, W.; Wheeldon, I.; Walker, S.L.; Jassby, D. Microbial attachment inhibition through lowvoltage electrochemical reactions on electrically conducting membranes. Environ. Sci. Technol. 2015, 49,12741–12750. [CrossRef] [PubMed]
121. Duan, W.; Dudchenko, A.; Mende, E.; Flyer, C.; Zhu, X.; Jassby, D. Electrochemical mineral scaleprevention and removal on electrically conducting carbon nanotube–polyamide reverse osmosis membranes.Environ. Sci. Processes Impacts 2014, 16, 1300–1308. [CrossRef] [PubMed]
122. Duan, W.; Ronen, A.; Walker, S.L.; Jassby, D. Polyaniline-coated carbon nanotubes ultra-filtration membranes:Enhanced anodic stability for in situ cleaning and electro-oxidation processes. ACS Appl. Mater. Interfaces2016, 8, 22574–22584. [CrossRef] [PubMed]
123. Vecitis, C.D.; Schnoor, M.H.; Rahaman, S.; Schiffman, J.D.; Elimelech, M. Electrochemical multiwalled carbonnanotube filter for viral and bacterial removal and inactivation. Environ. Sci. Technol. 2011, 45, 3672–3679.[CrossRef] [PubMed]
124. Dudchenko, A.V.; Rolf, J.; Russell, K.; Duan, W.; Jassby, D. Organic fouling inhibition on electricallyconducting carbon nanotube–polyvinyl alcohol composite ultrafiltration membranes. J. Membr. Sci. 2014,468, 1–10. [CrossRef]
125. Hong, S.; Bae, T.; Tak, T.; Hong, S.; Randall, A. Fouling control in activated sludge submerged hollow fibermembrane bioreactors. Desalination 2002, 143, 219–228. [CrossRef]
126. Sofia, A.; Ng, W.J.; Ong, S. Engineering design approaches for minimum fouling in submerged MBR.Desalination 2004, 160, 67–74. [CrossRef]
127. Duan, W.; Ronen, A.; Valle de Leon, J.; Dudchenko, A.; Yao, S.; Corbala-Delgado, J.; Yan, A.; Matsumoto, M.;Jassby, D. Treating anaerobic sequencing batch reactor effluent with electrically conducting ultrafiltrationand nanofiltration membranes for fouling control. J. Membr. Sci. 2016, 504, 104–112. [CrossRef]
128. Sun, X.; Wu, J.; Chen, Z.; Su, X.; Hinds, B.J. Fouling characteristics and electrochemical recovery of carbonnanotube membranes. Adv. Funct. Mater. 2013, 23, 1500–1506. [CrossRef]
129. Camalet, J.L.; Lacroix, J.C.; Aeiyach, S.; Chane-Ching, K.; Lacaze, P.C. Electrosynthesis of adherent polyanilinefilms on iron and mild steel in aqueous oxalic acid medium. Synth. Met. 1998, 93, 133–142. [CrossRef]
130. Brett, C.M.A.; Oliveira Brett, A.-M.C.F.; Pereira, J.L.C.; Rebelo, C. Properties of polyaniline formed at tindioxide electrodes in weak acid solution: Effect of the counterion. J. Appl. Electrochem. 1993, 23, 332–338.[CrossRef]
131. Murugesan, R.; Subramanian, E. Effect of organic dopants on electrodeposition and characteristics ofpolyaniline under the varying influence of H2SO4 and HClO4 electrolyte media. Mater. Chem. Phys. 2003, 80,731–739. [CrossRef]
132. Gloukhovski, R.; Oren, Y.; Linder, C.; Freger, V. Thin-film composite nanofiltration membranes prepared byelectropolymerization. J. Appl. Electrochem. 2008, 38, 759–766. [CrossRef]
133. Novoselov, K.S.; Geim, A.K.; Morozov, S.V.; Jiang, D.; Zhang, Y.; Dubonos, S.V.; Grigorieva, I.V.; Firsov, A.A.Electric field effect in atomically thin carbon films. Science 2004, 306, 666–669. [CrossRef] [PubMed]
134. Lachheb, H.; Puzenat, E.; Houas, A.; Ksibi, M.; Elaloui, E.; Guillard, C.; Herrmann, J.-M. PhotocatalyticDegradation of Various Types of Dyes (Alizarin S, Crocein Orange G, Methyl Red, Congo Red, MethyleneBlue) in Water by UV-Irradiated Titania. Appl. Catal. B 2002, 39, 75–90. [CrossRef]
135. Jiang, Y.; Biswas, P.; Fortner, J.D. A review of recent developments in graphene-enabled membranes forwater treatment. Environ. Sci. Water Res. Technol. 2016, 2, 915–922. [CrossRef]
136. De Lannoy, C.-F.; Soyer, E.; Wiesner, M.R. Optimizing carbon nanotube-reinforced polysulfone ultrafiltrationmembranes through carboxylic acid functionalization. J. Membr. Sci. 2013, 447, 395–402. [CrossRef]
137. De Lannoy, CF.; Jassby, D.; Davis, D.D.; Wiesner, M.R. A highly electrically conductive polymer–multiwalledcarbon nanotube nanocomposite membrane. J. Membr. Sci. 2012, 415–416, 718–724. [CrossRef]
138. Liu, Y.; Lee, J.H.D.; Xia, Q.; Ma, Y.; Yu, Y.; Yung, L.Y.L.; Xie, J.; Ong, C.N.; Vecitis, C.D.; Zhou, Z.A graphene-based electrochemical filter for water purification. J. Mater. Chem. A 2014, 2, 16554–16562.[CrossRef]
139. Liu, Y.; Rosenfield, E.; Hu, M.; Mi, B. Direct observation of bacterial deposition on and detachment fromnanocomposite membranes embedded with silver nanoparticles. Water Res. 2013, 47, 2949–2958. [CrossRef][PubMed]
202

Membranes 2017, 7, 39
140. Chou, W.L.; Yu, D.G.; Yang, M.C. The preparation and characterization of silver-loading cellulose acetatehollow fiber membrane for water treatment. Polym. Adv. Technol. 2005, 16, 600–607. [CrossRef]
141. Tiraferri, A.; Vecitis, C.D.; Elimelech, M. Covalent binding of single-walled carbon nanotubes to polyamidemembranes for antimicrobial surface properties. ACS Appl. Mater. Interfaces 2011, 3, 2869–2877. [CrossRef][PubMed]
142. Balta, S.; Sotto, A.; Luis, P.; Benea, L.; Van der Bruggen, B.; Kim, J. A new outlook on membrane enhancementwith nanoparticles: The alternative of ZnO. J. Membr. Sci. 2012, 389, 155–161. [CrossRef]
143. Tang, L.; Gu, W.; Yi, P.; Bitter, J.L.; Hong, J.Y.; Fairbrother, D.H.; Chen, K.L. Bacterial anti-adhesive propertiesof polysulfone membranes modified with polyelectrolyte multilayers. J. Membr. Sci. 2013, 446, 201–211.[CrossRef]
144. Diagne, F.; Malaisamy, R.; Boddie, V.; Holbrook, R.D.; Eribo, B.; Jones, K.L.; States, U. Polyelectrolyte andsilver nanoparticle modification of microfiltration membranes to mitigate organic and bacterial fouling.Environ. Sci. Technol. 2012, 46, 4025–4033. [CrossRef] [PubMed]
145. Gall, I.; Herzberg, M.; Oren, Y. The effect of electric fields on bacterial attachment to conductive surfaces.Soft Matter 2013, 9, 2443. [CrossRef]
146. Miller, D.J.; Araújo, P.A.; Correia, P.B.; Ramsey, M.M.; Kruithof, J.C.; van Loosdrecht, M.C.M.; Freeman, B.D.;Paul, D.R.; Whiteley, M.; Vrouwenvelder, J.S. Short-term adhesion and long-term biofouling testing ofpolydopamine and poly(ethylene glycol) surface modifications of membranes and feed spacers for biofoulingcontrol. Water Res. 2012, 46, 3737–3753. [CrossRef] [PubMed]
147. Li, Z.; Lee, D.; Sheng, X.; Cohen, R.E.; Rubner, M.F. Two-level antibacterial coating with both release-killingand contact-killing capabilities. Langmuir 2006, 22, 9820–9823. [CrossRef] [PubMed]
148. Li, D.; Lyon, D.; Li, Q.; Alvarez, P.J.J. Effect of soil sorption and aquatic natural organic matter on theantibacterial activity of a fullerene water suspension. Environ. Toxicol. Chem. 2008, 27, 1888–1894. [CrossRef][PubMed]
149. Baek, Y.; Yoon, H.; Shim, S.; Choi, J.; Yoon, J. Electroconductive feed spacer as a tool for biofouling control ina membrane system for water treatment. Environ. Sci. Technol. Lett. 2014, 1, 179–184. [CrossRef]
© 2017 by the authors. Licensee MDPI, Basel, Switzerland. This article is an open accessarticle distributed under the terms and conditions of the Creative Commons Attribution(CC BY) license (http://creativecommons.org/licenses/by/4.0/).
203

204

MDPISt. Alban-Anlage 66
4052 BaselSwitzerland
Tel. +41 61 683 77 34Fax +41 61 302 89 18
www.mdpi.com
Membranes Editorial OfficeE-mail: [email protected]
www.mdpi.com/journal/membranes


MDPI St. Alban-Anlage 66 4052 Basel Switzerland
Tel: +41 61 683 77 34 Fax: +41 61 302 89 18
www.mdpi.com ISBN 978-3-03842-992-0


