Embed Size (px)
Citation preview

Selection of shares for a shareholder by Multiple Objectives Optimization
Willem K. M. Brauers1*
Vilnius Gediminas Technical Universityand University of Antwerp, Faculty of Applied Economics,
F. Birontlaan, 97, B2600 AntwerpenRomualdas Ginevicius2
Faculty of Business Management, Dept. of Economics and Management of EnterprisesVilnius Gediminas Technical University, Saulėtekio al. 11, 10223 Vilnius, Lithuania
E-mails: [email protected]; 2 Romualdas [email protected]*Corresponding Author
Abstract: Investments in stocks from a selection of companies with a different activity or a different location will diminish the risk after the saying: "you must not put all your eggs in one basket". In addition, the advices of experts will help too. These advices may have different forms, such as from: Credit Rating Agencies like Moody, Standard&Poor's and Fitch, a general theory about investment in stocks such as the Buffet philosophy, the advice of one or different experts based on: their personal experience, company balance analyses, interviews with managers or sampling. Why not on basis of Multiple Objectives Optimization, which would be new and then preferable for leading World Indices such as: Dow Jones-Industrial New York, FTSE100 London or Nikkei225 Tokyo?
Taking into consideration for instance 6 objectives would lead to a matrix of 600 elements for the FTSE100 London and for Nikkei225 Tokyo even much more. Therefore a MOO approach which can handle large matrices has to be chosen. MULTIMOORA responds to this condition and even more, is composed of three different methods which can control each other and is based on dimensionless measures, excluding the difficult problem of normalization. In order to summarize the three outcomes a Theory of Domination is applied.
To make the application much simpler the Belgian Bel20 Index was used but with 9 objectives, specific for Belgium.
Key words: Ratio System, Reference Point Theory, MOORA, Full Multiplicative Form, MULTIMOORA, Ordinal Dominance, BEL20 Index.
JEL: G14, G2; M2.
1. Introduction
In principle shareholders are the owners of a company. In fact they have nothing to say in that
company. During the general assembly of shareholders they are surpassed by their number or by the
reference shareholders. Moreover, investments in stocks from a selection of companies with a
different activity or a different location will diminish the risk after the saying: "you must not put all
your eggs in one basket". In average a shareholder may have shares in 10 till 20 companies, with the
impossibility to follow all shares in detail. Therefore, the advices of experts will help.
These advices may have different forms, coming from:
The Credit Rating Agencies like Moody, Standard&Poor's and Fitch (White, 2010).
A general theory about investment in stocks such as the Buffet philosophy from his
publications and his yearly speech to his shareholders.
The advice of one or different experts based on: their personal experience, company balance
analyses, interviews with managers or sampling.
After the authors' opinion up until now no advices on share selection exists based on a multi-
objective ranking in leading World Indices such as: Dow Jones-Industrial New York,
FTSE100 London, or Nikkei225 Tokyo.
As an example the much smaller BEL20 Index will be used. The BEL20 Index assembles the most
important Belgian shares on NYSE-EURONEXT. These 20 shares form rather a defensive
investment. More speculative would be to take a selection of the Brussels Mid Cap shares.
The authors decided not to include the bank shares, namely KBC and Dexia. Their book value
was very uncertain not only given the still existing consequences of the Sub Prime Crisis but also given
their very important investments in countries in financial difficulties like Ireland, Portugal and Greece.
Also Ageas, though an insurance company, is excluded as Ageas is the heritor from Fortis, now Paribas
BNP, for parts of a Bad Bank. In this way, the BEL 20-index is reduced to 17 shares. Moreover, GDF
Suez, though a French share, is included as being the successor of Electrabel, dominating the electricity
market in Belgium. In addition, Belgian Electrabel is one of the most important crown jewels of GDF
Suez, if not the most important.
No study is known which compare and rank all Belgian shares of the BEL 20 or of the Brussels
Mid Cap.
2. The Objectives chosen for Selection of Shares
Different multiple objectives expressed in different units characterize Multi-Objective Optimization
(MOO), a method followed in this study. Therefore, MOO has not to be mixed up with Cost-Benefit
Analysis where all objectives are translated in money terms.
A matrix assembles the data with vertically different objectives to be optimized and
horizontally the 17 shares. The objectives concern the activity of the Belgian Stock Exchange on the
last full day of 2010, namely Thursday December 30, 2010.
The best share will be the outcome of the following objectives:
1. Minimization of the last notation in EURO. The 20 shares of the Bell20-index are the most
important Belgian shares. The cheaper they are, but limited above a threshold, the more they
are attractive, with the most chance for a price rise.
2. Minimization of the percentage deviation of this notation during the whole year 2010. Too
much deviation would falsify the previous figure.
3. Maximization of the average day volume of trading during the last week divided by the
average day volume of last year. A figure larger than one indicates more trading than normal.
4. Minimization of the notation divided by the earnings before interests, taxes, depreciation and
amortization (EBITDA or Cash Flows).
5. Minimization of the notation to profit.
6. Maximization of the dividend to the notation.
7. Minimization of the notation to the book value.
8. Minimization of the PEG-ratio being the last notation of the share to profit divided by the
profit growth being the cumulated profit growth between 2008 and 2009 translated on a
yearly basis. A figure smaller than one indicates a relative cheap share.
9. Importance has still to be given to the different objectives. Until now all objectives were
2
based on an equal importance. The introduction of the opinions of the analysts under the form
of ratios will give more importance or not to some objectives on basis of their individual
preferences. Minimization of the opinion ratio of the analysts is therefore the ninth objective.
The analysts gave their opinion over the last 75 days.
The opinions of the analysts lead to the following advices:
1 - 1.49 buy
1.5. – 2.49 increase your stock
2.5 – 3.49 hold
3.5 – 4.49 decrease your stock
4.5 – 5 sell.
Information from financial newspapers will assist to fill in a table of data. This table is composed of
17 shares with 9 objectives or a total of 153 elements. At that moment, a method for optimization has
to be chosen.
3. The Data assembled in a Matrix
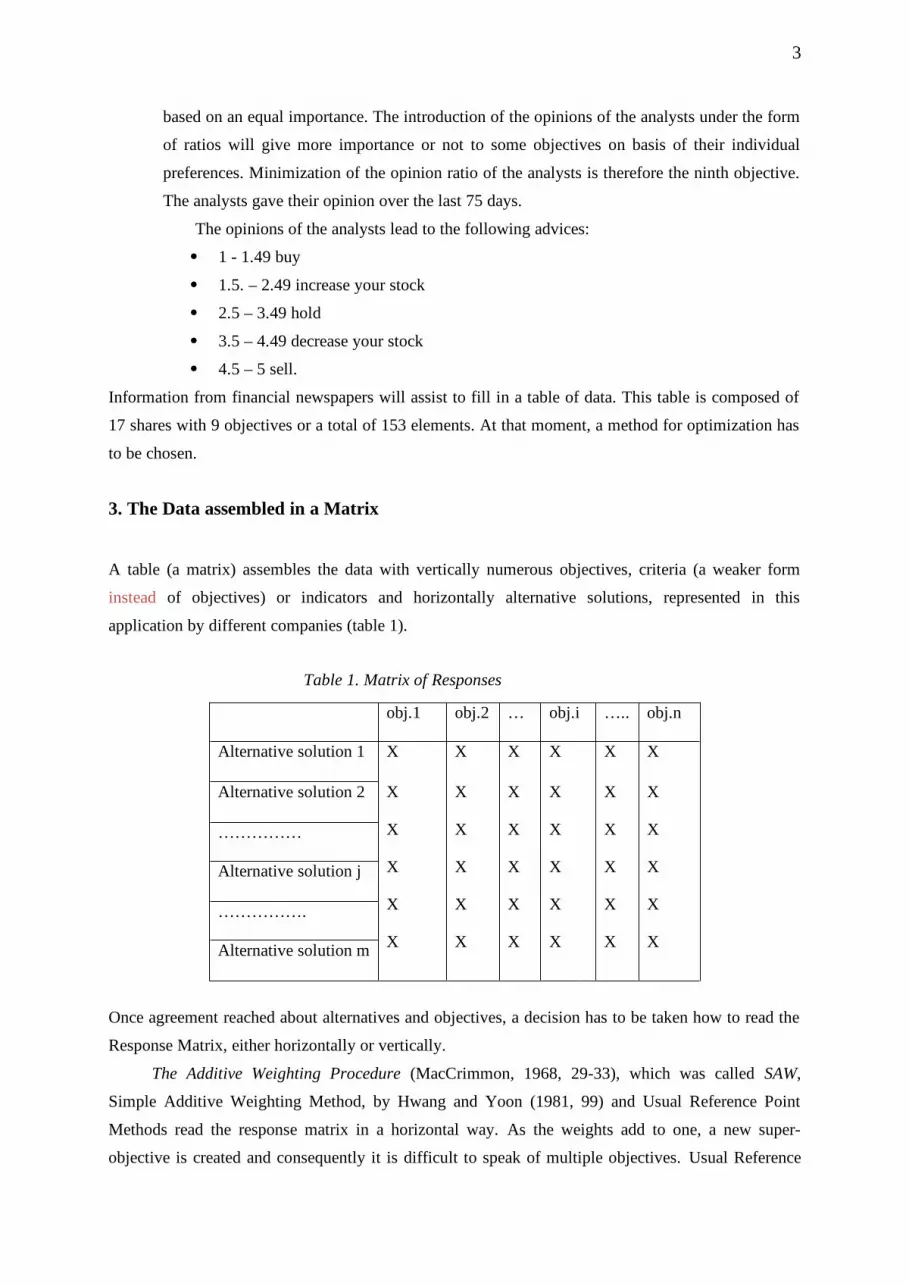
A table (a matrix) assembles the data with vertically numerous objectives, criteria (a weaker form
instead of objectives) or indicators and horizontally alternative solutions, represented in this
application by different companies (table 1).
Table 1. Matrix of Responses
obj.1 obj.2 … obj.i ….. obj.n
Alternative solution 1 X X X X X X
Alternative solution 2 X
X
X
X
X
X
X
X
X
X
X
X
X
X
X
X
X
X
X
X
X
X
X
X
X
X
X
X
X
X
……………
Alternative solution j
…………….
Alternative solution m
Once agreement reached about alternatives and objectives, a decision has to be taken how to read the
Response Matrix, either horizontally or vertically.
The Additive Weighting Procedure (MacCrimmon, 1968, 29-33), which was called SAW,
Simple Additive Weighting Method, by Hwang and Yoon (1981, 99) and Usual Reference Point
Methods read the response matrix in a horizontal way. As the weights add to one, a new super-
objective is created and consequently it is difficult to speak of multiple objectives. Usual Reference
3
Point Theory is non-linear, whereas non-additive scores replace the weights. The non-additive scores
take care of normalization, but being non-additive the comments on the weights adding to one and
consequently creating a super-objective is absent here.
With weights and scores normalization of different units is mixed with the importance of
objectives. Consequently, the proportion between normalization and importance is unknown.
Nevertheless many methods for multi-objective optimization use weights like AHP (Saaty since 1988)
or methods of the French School (starting with ELECTRE, Roy et al. since 1966).
Vertical reading of the Response Matrix means that normalization is not needed as each column
is expressed in the same unit. TOPSIS (Hwang and Yoon, 1981) and VIKOR (Opricovic, Tzeng,
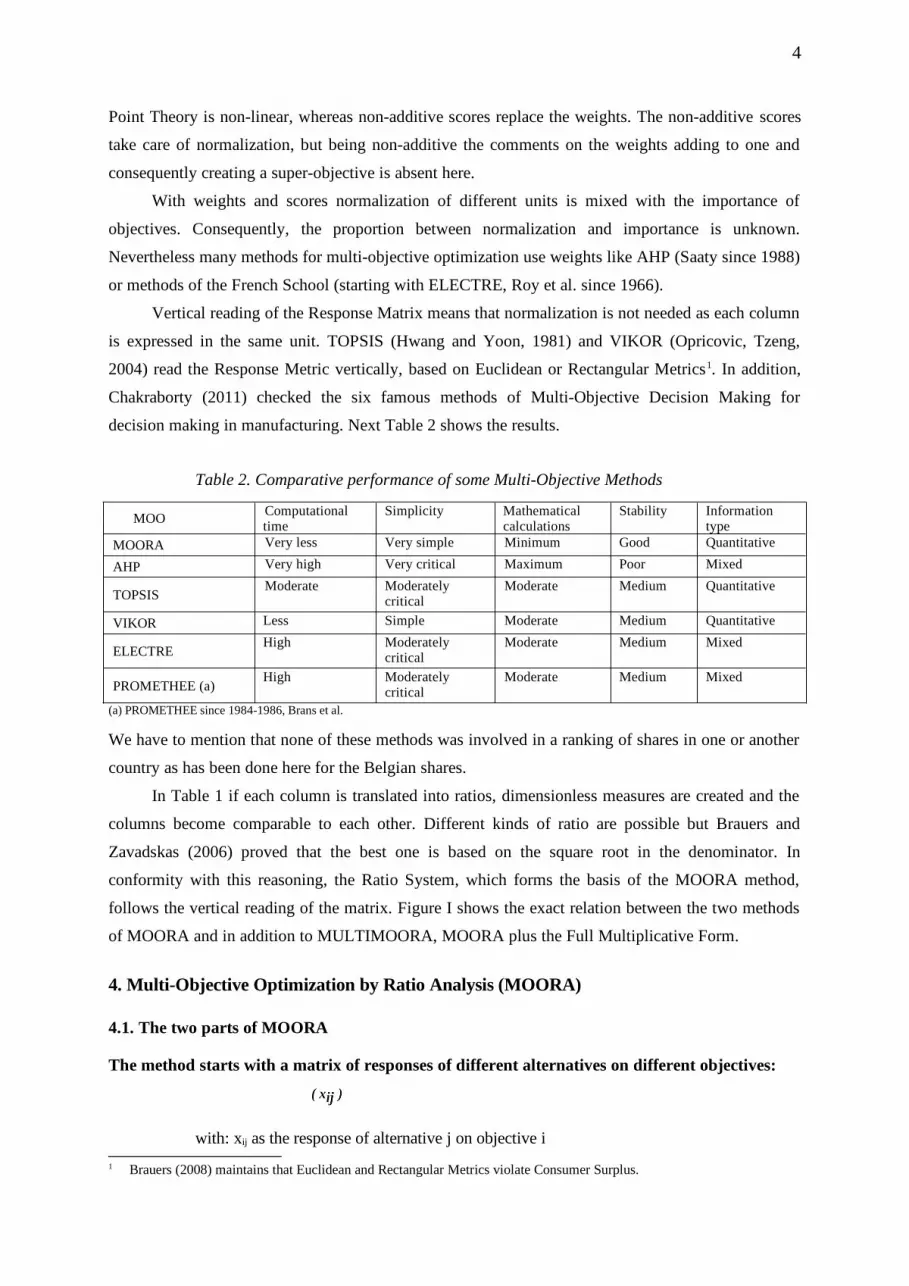
2004) read the Response Metric vertically, based on Euclidean or Rectangular Metrics1. In addition,
Chakraborty (2011) checked the six famous methods of Multi-Objective Decision Making for
decision making in manufacturing. Next Table 2 shows the results.
Table 2. Comparative performance of some Multi-Objective Methods
MOO Computational time
Simplicity Mathematical calculations
Stability Information type
MOORA Very less Very simple Minimum Good Quantitative
AHP Very high Very critical Maximum Poor Mixed
TOPSISModerate Moderately
criticalModerate Medium Quantitative
VIKOR Less Simple Moderate Medium Quantitative
ELECTREHigh Moderately
criticalModerate Medium Mixed
PROMETHEE (a)High Moderately
criticalModerate Medium Mixed
(a) PROMETHEE since 1984-1986, Brans et al.
We have to mention that none of these methods was involved in a ranking of shares in one or another
country as has been done here for the Belgian shares.
In Table 1 if each column is translated into ratios, dimensionless measures are created and the
columns become comparable to each other. Different kinds of ratio are possible but Brauers and
Zavadskas (2006) proved that the best one is based on the square root in the denominator. In
conformity with this reasoning, the Ratio System, which forms the basis of the MOORA method,
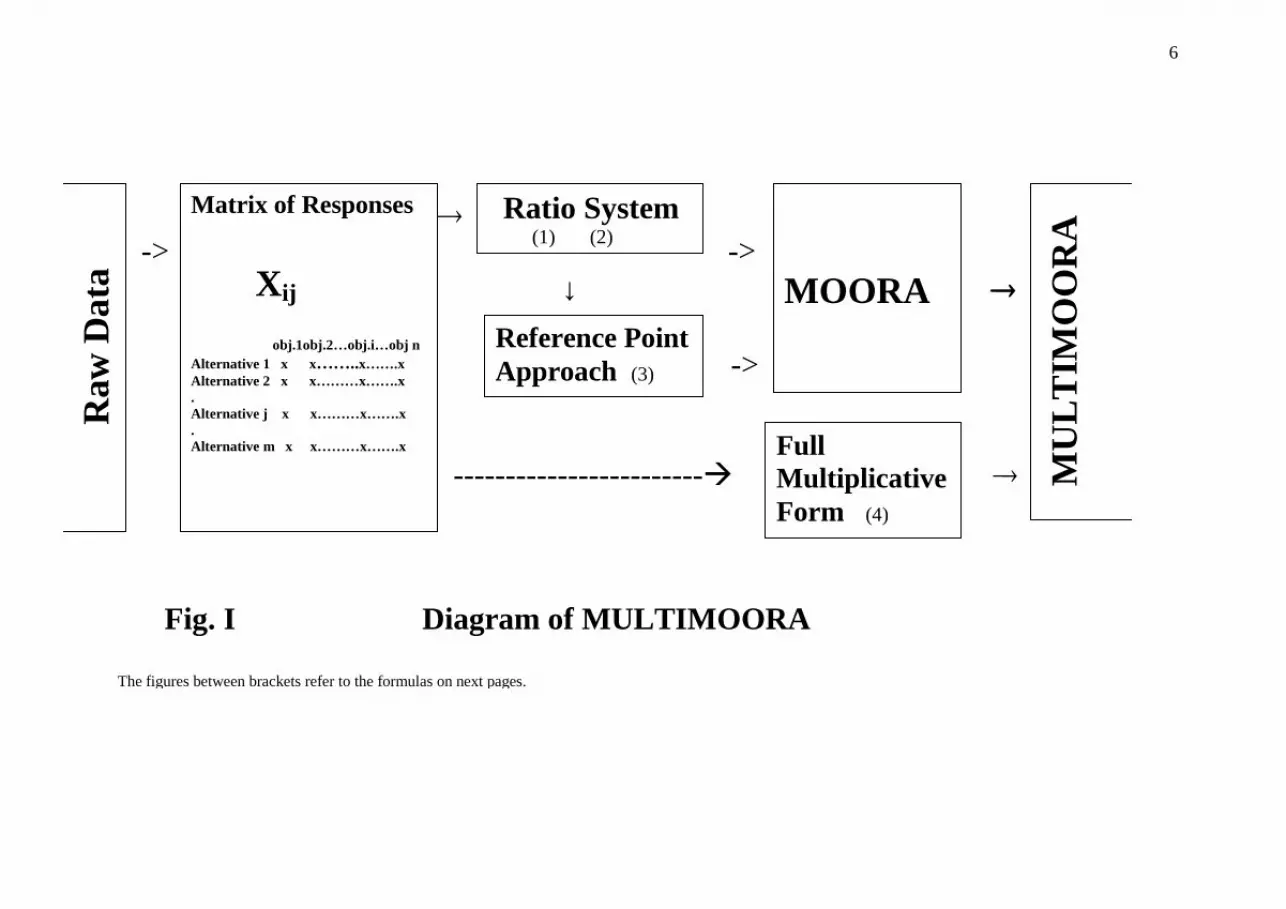
follows the vertical reading of the matrix. Figure I shows the exact relation between the two methods
of MOORA and in addition to MULTIMOORA, MOORA plus the Full Multiplicative Form.
4. Multi-Objective Optimization by Ratio Analysis (MOORA)
4.1. The two parts of MOORA
The method starts with a matrix of responses of different alternatives on different objectives:
with: xij as the response of alternative j on objective i1 Brauers (2008) maintains that Euclidean and Rectangular Metrics violate Consumer Surplus.
4
i=1,2,…,n as the objectivesj=1,2,…,m as the alternatives
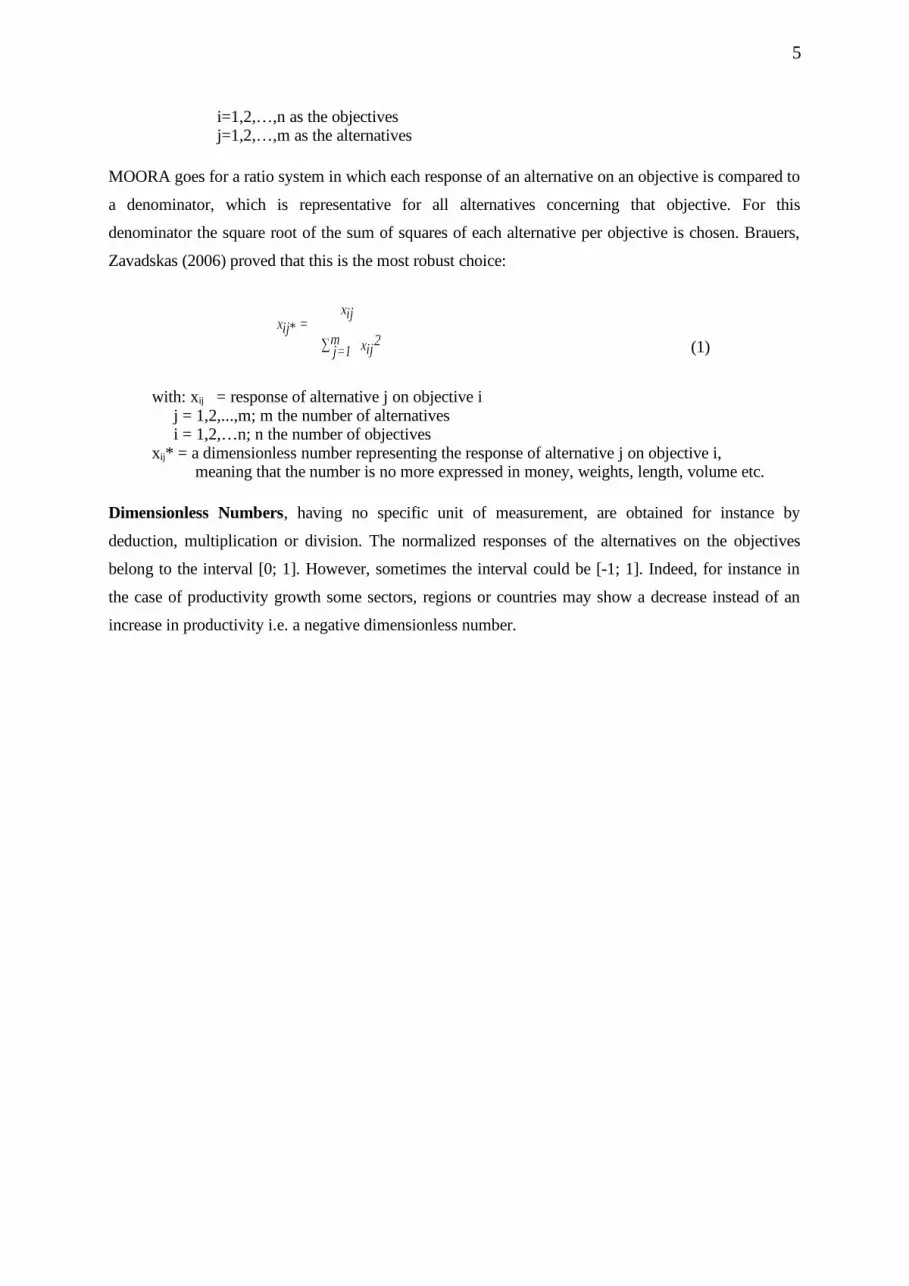
MOORA goes for a ratio system in which each response of an alternative on an objective is compared to
a denominator, which is representative for all alternatives concerning that objective. For this
denominator the square root of the sum of squares of each alternative per objective is chosen. Brauers,
Zavadskas (2006) proved that this is the most robust choice:
(1)
with: xij = response of alternative j on objective ij = 1,2,...,m; m the number of alternativesi = 1,2,…n; n the number of objectives
xij* = a dimensionless number representing the response of alternative j on objective i, meaning that the number is no more expressed in money, weights, length, volume etc.
Dimensionless Numbers, having no specific unit of measurement, are obtained for instance by
deduction, multiplication or division. The normalized responses of the alternatives on the objectives
belong to the interval [0; 1]. However, sometimes the interval could be [-1; 1]. Indeed, for instance in
the case of productivity growth some sectors, regions or countries may show a decrease instead of an
increase in productivity i.e. a negative dimensionless number.
5
-> -> ↓
-> ------------------------
Fig. I Diagram of MULTIMOORA The figures between brackets refer to the formulas on next pages.
Raw
Dat
a
Matrix of Responses Xij obj.1obj.2…obj.i…obj n Alternative 1 x x……..x…….x Alternative 2 x x………x…….x . Alternative j x x………x…….x . Alternative m x x………x…….x
Ratio System (1) (2)
Reference Point Approach (3)
MOORA
Full Multiplicative Form (4)
MU
LT
IMO
OR
A
6
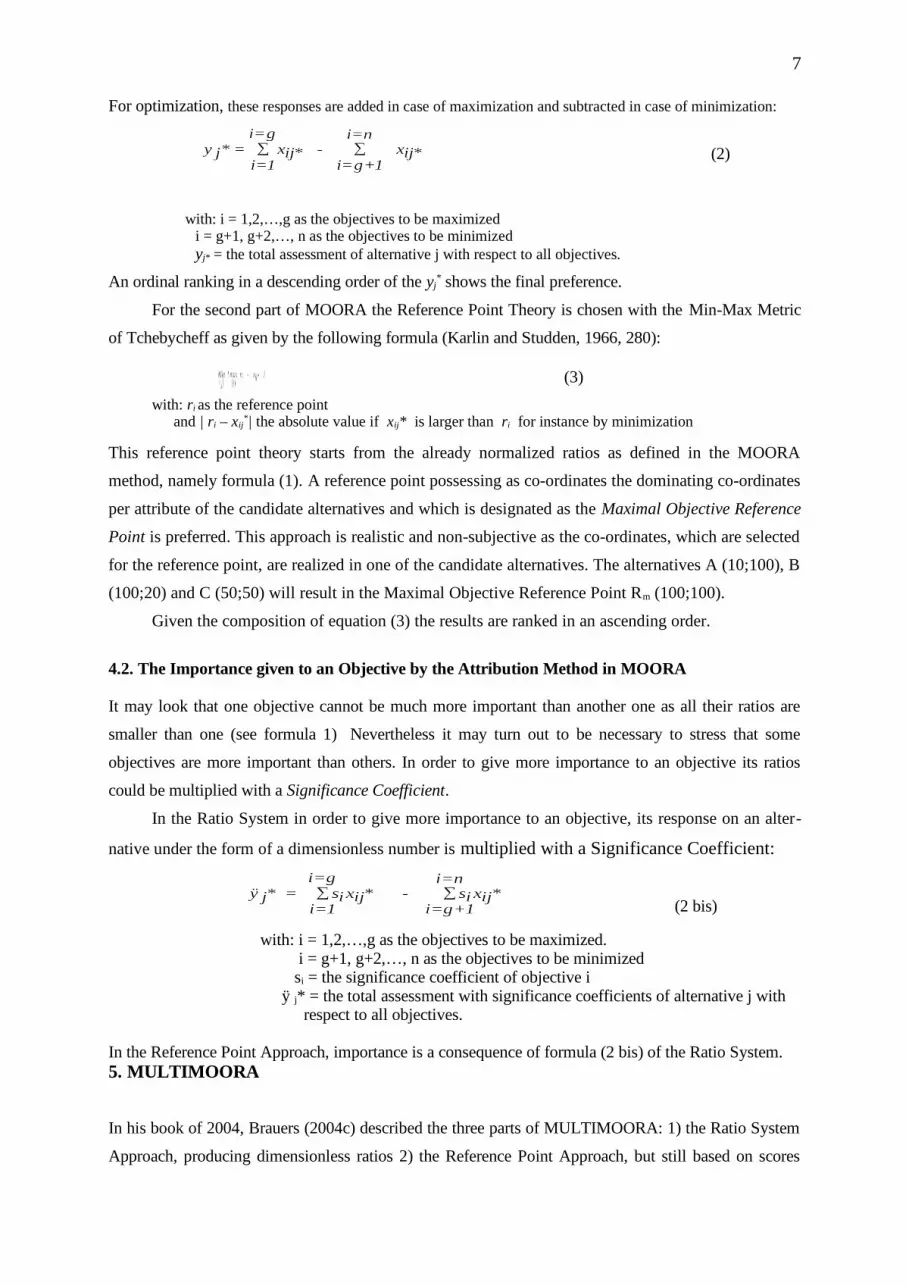
For optimization, these responses are added in case of maximization and subtracted in case of minimization:
(2)
with: i = 1,2,…,g as the objectives to be maximizedi = g+1, g+2,…, n as the objectives to be minimizedyj* = the total assessment of alternative j with respect to all objectives.
An ordinal ranking in a descending order of the yj* shows the final preference.
For the second part of MOORA the Reference Point Theory is chosen with the Min-Max Metric
of Tchebycheff as given by the following formula (Karlin and Studden, 1966, 280):
(3)
with: ri as the reference pointand | ri – xij
*| the absolute value if xij* is larger than ri for instance by minimization
This reference point theory starts from the already normalized ratios as defined in the MOORA
method, namely formula (1). A reference point possessing as co-ordinates the dominating co-ordinates
per attribute of the candidate alternatives and which is designated as the Maximal Objective Reference
Point is preferred. This approach is realistic and non-subjective as the co-ordinates, which are selected
for the reference point, are realized in one of the candidate alternatives. The alternatives A (10;100), B
(100;20) and C (50;50) will result in the Maximal Objective Reference Point Rm (100;100).
Given the composition of equation (3) the results are ranked in an ascending order.
4.2. The Importance given to an Objective by the Attribution Method in MOORA
It may look that one objective cannot be much more important than another one as all their ratios are
smaller than one (see formula 1) Nevertheless it may turn out to be necessary to stress that some
objectives are more important than others. In order to give more importance to an objective its ratios
could be multiplied with a Significance Coefficient.
In the Ratio System in order to give more importance to an objective, its response on an alter-
native under the form of a dimensionless number is multiplied with a Significance Coefficient:
(2 bis)
with: i = 1,2,…,g as the objectives to be maximized. i = g+1, g+2,…, n as the objectives to be minimized si = the significance coefficient of objective i
ÿ j* = the total assessment with significance coefficients of alternative j with respect to all objectives.
In the Reference Point Approach, importance is a consequence of formula (2 bis) of the Ratio System.5. MULTIMOORA
In his book of 2004, Brauers (2004c) described the three parts of MULTIMOORA: 1) the Ratio System
Approach, producing dimensionless ratios 2) the Reference Point Approach, but still based on scores
7

3) the Full Multiplicative Form. Some time later (2004b and 2004a) he switched over to a Reference
Point Approach which uses for coordinates of each alternative the ratios found in the ratio system. These
coordinates are then compared to the coordinates of the Maximal Objective Reference Point (see
therefore 4.1). In this way, dimensionless measures were obtained again. The synthesis of these two
approaches was called later: MOORA (Brauers, Zavadskas, 2006). In 2010, a third approach was added
and MULTIMOORA was born (Brauers, Zavadskas, 2010a). Indeed, MULTIMOORA is composed of
MOORA and of the Full Multiplicative Form of Multiple Objectives. In this way as up till now no other
approach is known satisfying all conditions of robustness towards multi-objective optimization and
including three or more methods, MULTIMOORA becomes the most robust system of multiple
objectives optimization (for the conditions of robustness in multi-objective optimization, see: Brauers;
Zavadskas, 2010b, 70-71 and 2010c).
Point 4 above explained MOORA (Multi-Objective Optimization by Ratio Analysis). The Full
Multiplicative Form of Multiple Objectives of MULTIMOORA remains to be explained.
5.1. The Full Multiplicative Form of Multiple Objectives
Mathematical economics is familiar with the multiplicative models like in production functions (e.g.
Cobb-Douglas and Input-Output formulas) and demand functions (Teekens, Koerts, 1972).
Allen (1957, 473) launched the "bilinear and quadratic form" as: , for us
concerning weights and objectives but with interrelations only examined two by two.
For Keeney and Raiffa (1993, 234) besides additive utilities, a utility function may also include
a multiplication of the attributes. The two dimensional u(y,z) can then be expressed as a multilinear
utility function. This representation mixes additive and multiplicative parts (Brauers, 2004c, 228).
For Keeney (1973, 110) the additive form is rather a limiting case of the multiplicative utility
function, for us the SAW method as explained earlier in section 3.
The danger exists that the multiplicative part becomes explosive. The multiplicative part of the
equation would then dominate the additive part and finally would bias the results.
Considering these shortcomings, preference is given to a method that is non-linear, non-
additive, does not use weights and does not require normalization. Such multiplicative form for multi-
objectives was introduced by Miller and Starr in 1964 (2nd edition 1969, 237-239) and further
developed by Brauers (2004c, 227-245).
The following n-power form for multi-objectives is called from now on a Full-Multiplicative
Form in order to distinguish it from the above-mentioned mixed forms:
(4)with: j = 1,2,...,m; m the number of alternatives
i = 1,2,…,n; n being the number of objectivesxij = response of alternative j on objective iUj = overall utility of alternative j.
8
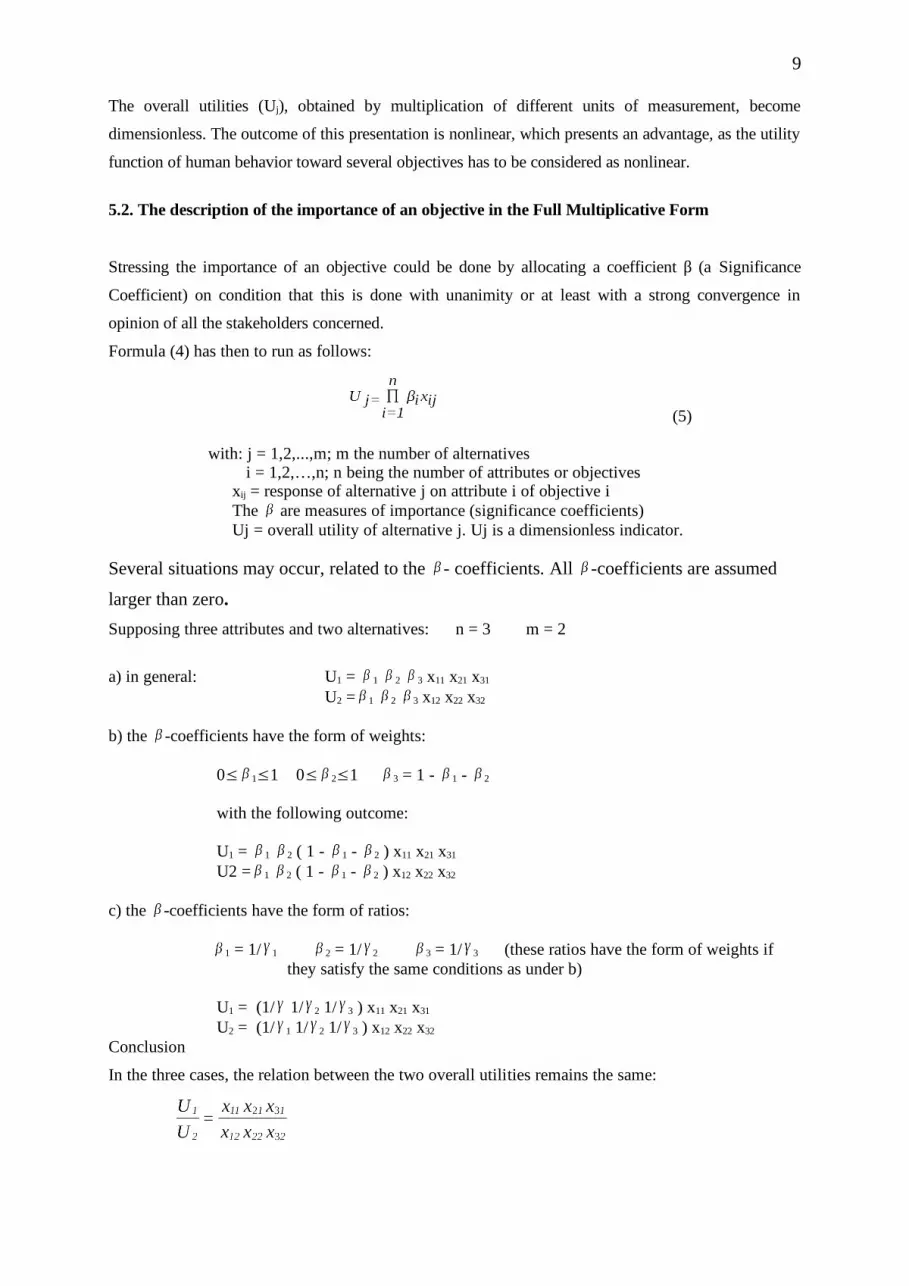
The overall utilities (Uj), obtained by multiplication of different units of measurement, become
dimensionless. The outcome of this presentation is nonlinear, which presents an advantage, as the utility
function of human behavior toward several objectives has to be considered as nonlinear.
5.2. The description of the importance of an objective in the Full Multiplicative Form
Stressing the importance of an objective could be done by allocating a coefficient β (a Significance
Coefficient) on condition that this is done with unanimity or at least with a strong convergence in
opinion of all the stakeholders concerned.
Formula (4) has then to run as follows:
(5)
with: j = 1,2,...,m; m the number of alternativesi = 1,2,…,n; n being the number of attributes or objectives
xij = response of alternative j on attribute i of objective iThe are measures of importance (significance coefficients)Uj = overall utility of alternative j. Uj is a dimensionless indicator.
Several situations may occur, related to the - coefficients. All -coefficients are assumed
larger than zero.Supposing three attributes and two alternatives: n = 3 m = 2
a) in general: U1 = 1 2 3 x11 x21 x31
U2 = 1 2 3 x12 x22 x32
b) the -coefficients have the form of weights:
0 11 0 21 3 = 1 - 1 - 2
with the following outcome:
U1 = 1 2 ( 1 - 1 - 2 ) x11 x21 x31
U2 = 1 2 ( 1 - 1 - 2 ) x12 x22 x32
c) the -coefficients have the form of ratios:
1 = 1/ 1 2 = 1/ 2 3 = 1/ 3 (these ratios have the form of weights if they satisfy the same conditions as under b)
U1 = (1/ 1/ 2 1/ 3 ) x11 x21 x31
U2 = (1/ 1 1/ 2 1/ 3 ) x12 x22 x32
Conclusion
In the three cases, the relation between the two overall utilities remains the same:
9
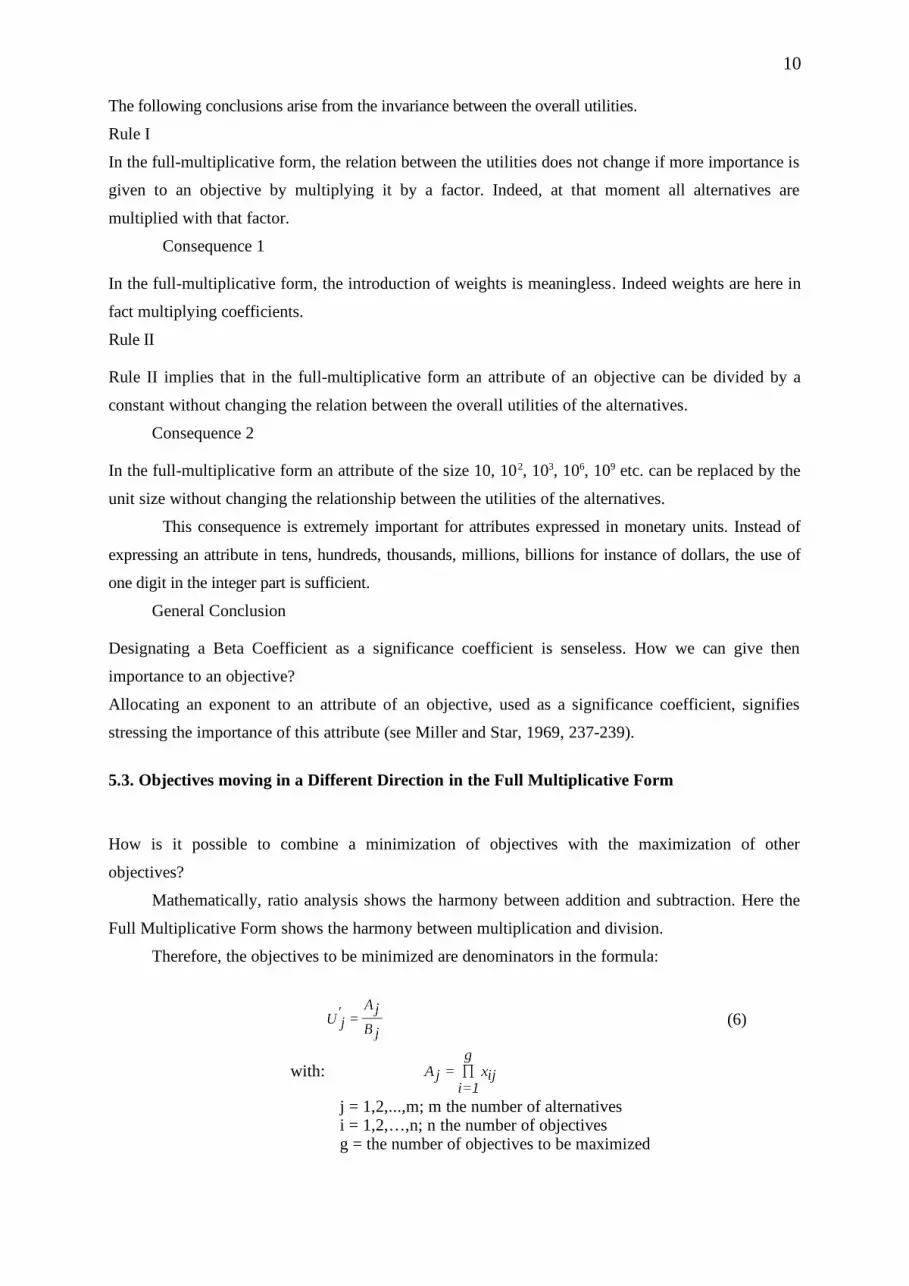
The following conclusions arise from the invariance between the overall utilities.
Rule I
In the full-multiplicative form, the relation between the utilities does not change if more importance is
given to an objective by multiplying it by a factor. Indeed, at that moment all alternatives are
multiplied with that factor.
Consequence 1
In the full-multiplicative form, the introduction of weights is meaningless. Indeed weights are here in
fact multiplying coefficients.
Rule II
Rule II implies that in the full-multiplicative form an attribute of an objective can be divided by a
constant without changing the relation between the overall utilities of the alternatives.
Consequence 2
In the full-multiplicative form an attribute of the size 10, 102, 103, 106, 109 etc. can be replaced by the
unit size without changing the relationship between the utilities of the alternatives.
This consequence is extremely important for attributes expressed in monetary units. Instead of
expressing an attribute in tens, hundreds, thousands, millions, billions for instance of dollars, the use of
one digit in the integer part is sufficient.
General Conclusion
Designating a Beta Coefficient as a significance coefficient is senseless. How we can give then
importance to an objective?
Allocating an exponent to an attribute of an objective, used as a significance coefficient, signifies
stressing the importance of this attribute (see Miller and Star, 1969, 237-239).
5.3. Objectives moving in a Different Direction in the Full Multiplicative Form
How is it possible to combine a minimization of objectives with the maximization of other
objectives?
Mathematically, ratio analysis shows the harmony between addition and subtraction. Here the
Full Multiplicative Form shows the harmony between multiplication and division.
Therefore, the objectives to be minimized are denominators in the formula:
(6)
with:
j = 1,2,...,m; m the number of alternativesi = 1,2,…,n; n the number of objectivesg = the number of objectives to be maximized
10
with:
n-g = the number of objectives to be minimized
Uj' : the utility of alternative j with objectives to be maximized and objectives to be
minimized.
It is true that the Full Multiplicative Form reads horizontally in the Response Matrix of Table 1.
Nevertheless, with the full-multiplicative form, the overall utilities, obtained by multiplication of
different units of measurement, become dimensionless measures. This situation would not bias the
outcomes amidst the several alternatives as the last ones are represented by dimensionally
homogeneous equations, being: "formally independent of the choice of units"(De Jong 1967, 28).
In the Full Multiplicative Form, a problem may arise for zero and negative values. In formulas
4 and 6 a zero for one alternative would make the outcome equal to zero. A negative number would
make the outcome negative. Even worse, in formula 6 a zero in the denominator with a non-zero
numerator will make the outcome non-defined, with once again a negative denominator making the
outcome negative.
Therefore, the index number 100 replaces the zero number. At that moment for instance 96.6
substitutes the negative number of minus 3.4. Consequently, 103.4 represents the positive number of
3.4. Is this solution acceptable? The answer is yes if this change is logically applied for an entire
column of table 1. At that moment, the results of the multiplication will change, anyway of no
importance as these results are senseless as being dimensionless measurements. However, the overall
ranking will become meaningful.
The fact that MULTIMOORA assembles all existing methods expressed in dimensionless
measures for multi-objective optimization presents a unique feature for this multi-objective
optimization.
6. The Theory of Ordinal Dominance
First, in the not too complicated cases, a summary of the ranking of the three MULTIMOORA
methods was done on view. Later, for very large matrices a Theory of Ordinal Dominance was
developed (Brauers, Zavadskas, 2011a; Brauers et al. 2011).
6.1. Axioms on Ordinal and Cardinal Scales
1. A deduction of an Ordinal Scale, a ranking, from cardinal data is always possible (Arrow, 1974)
2. An Ordinal Scale can never produce a series of cardinal numbers (Arrow)
3. An Ordinal Scale of a certain kind, a ranking, can be translated in an ordinal scale of another
kind.
In application of axiom 3, we shall translate the ordinal scales of the three methods of
11
MULTIMOORA in other ordinal scales.
6.2. Ordinal Dominance, being Dominated, Transitiveness and Equability
Stakeholders or their representatives may give a different importance to objectives in a multi-objective
problem but this is not the case with the three methods of MULTIMOORA. These three methods
represent all possible methods with dimensionless measures in multi-objective optimization and one
can not argue that one method is better than or more important than the others.
Ordinal Dominance
Absolute Dominance means that an alternative, solution or project is dominating absolutely in
ranking all other alternatives, solutions or projects, which are all being absolutely dominated. This
absolute dominance shows as rankings for MULTIMOORA: (1-1-1).
General Dominance in two of the three methods with a P b P c Pd (P preferred to) is for instance of
the form:
(d-a-a) is generally dominating (c-b-b)
(a-d-a) is generally dominating (b-c-b)
(a-a-d) is generally dominating (b-b-c)
and further on, transitiveness plays fully.
Transitiveness
If a dominates b and b dominates c than a will dominate c.
Overall Dominance of one alternative on another
For instance (a-a-a) is overall dominating (b-b-b) which is overall being dominated by (a-a-a).
Equability
Absolute Equability has the form: for instance (e-e-e) for 2 alternatives.
Partial Equability of 2 on 3 exists e. g. (5-e-7) and (6-e-3).
Circular Reasoning
Despite all distinctions in classification, some contradictions remain possible in a kind of Circular
Reasoning.
We can cite the case of:
Object A (11-20-14) dominates generally object B (14-16-15)
Object B (14-16-15) dominates generally Object C (15-19-12)
but Object C (15-19-12) dominates generally Object A (11-20-14).
In such a case, the three objects receive the same ranking.
Similar rules apply for the three methods of MULTIMOORA with no significance coefficients
12
proposed, as the three methods are assumed to have the same importance.
7. Previous Applications of MOORA and MULTIMOORA
MOORA and MULTIMOORA made many applications in the micro-economic as well as in the
macro-economic field.
In the micro-economic field can be mentioned for instance: privatization (Brauers, 2004b;
Brauers, Zavadskas, 2006), facilities management (Brauers, 2004a), redevelopment alternatives for
buildings (Brauers et al. 2006), location theory (Brauers, Zavadskas, 2008), highway construction in
Thüringen, Germany (Brauers et al., 2008b), Contractor's ranking (Brauers et al., 2008a), heating
losses in a building (Kracka et al. 2010), bank loans (Brauers, Zavadskas, 2011a) and manufacturing
(Chakraborty, 2011).
In the macro-economic field can be mentioned for instance: Poland and Lithuania facing the
European Union (Brauers et al. 2007), the Well-Being Economy (Brauers, 2008), the Industrialization
of Tanzania (Brauers, Zavadskas, 2010b), the development of the regions in Lithuania (Brauers,
Ginevicius, 2009; Brauers et al. 2010), the economy of the Belgian Regions tested with
MULTIMOORA (Brauers, Ginevicius, 2010), Lithuania in the European Union (Balezentis et al.,
2010), Strategy Europe 2020 (Balezentis et al., 2011) and Project Optimization for China (Brauers,
Zavadskas, 2011b).
8. Application on the Belgian Shares
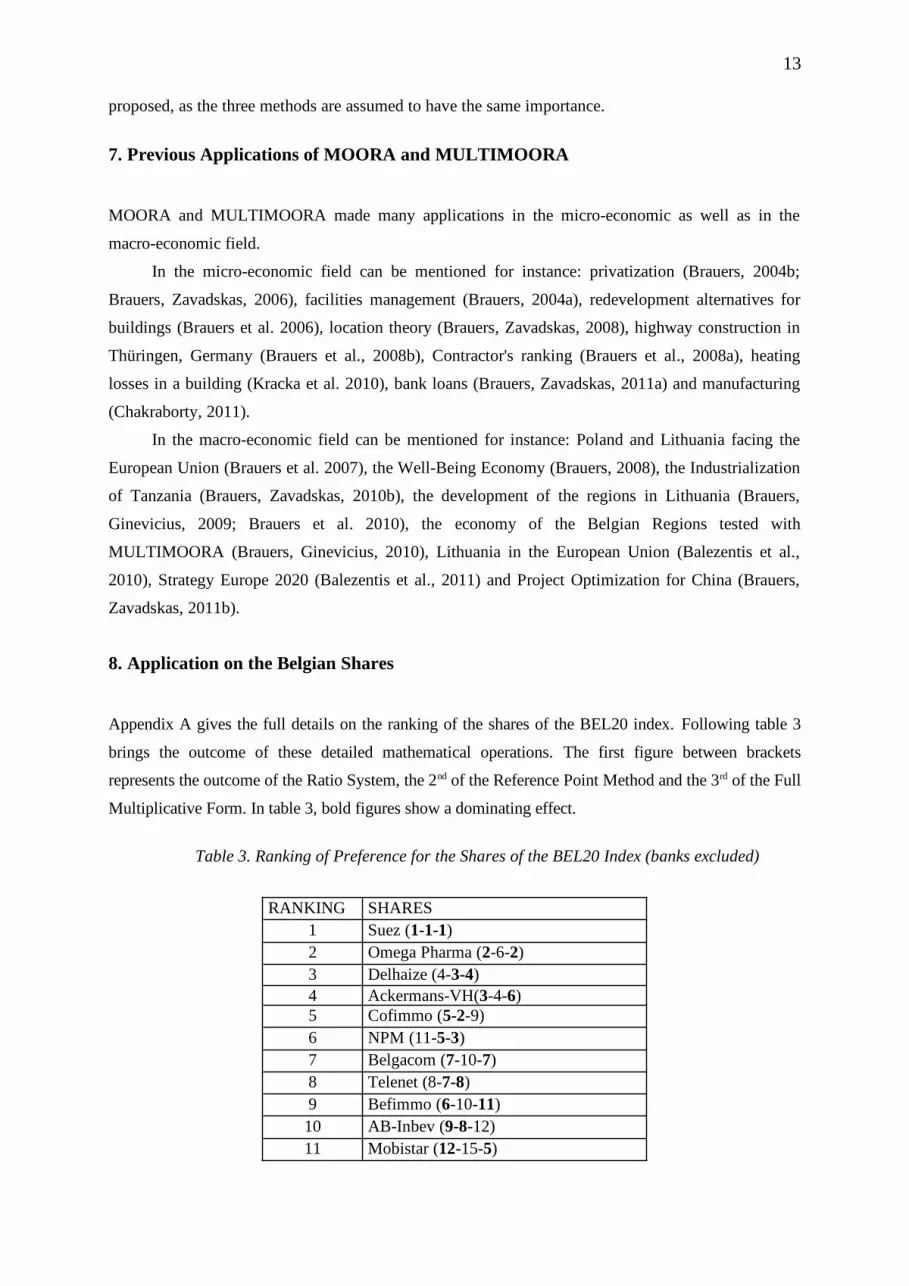
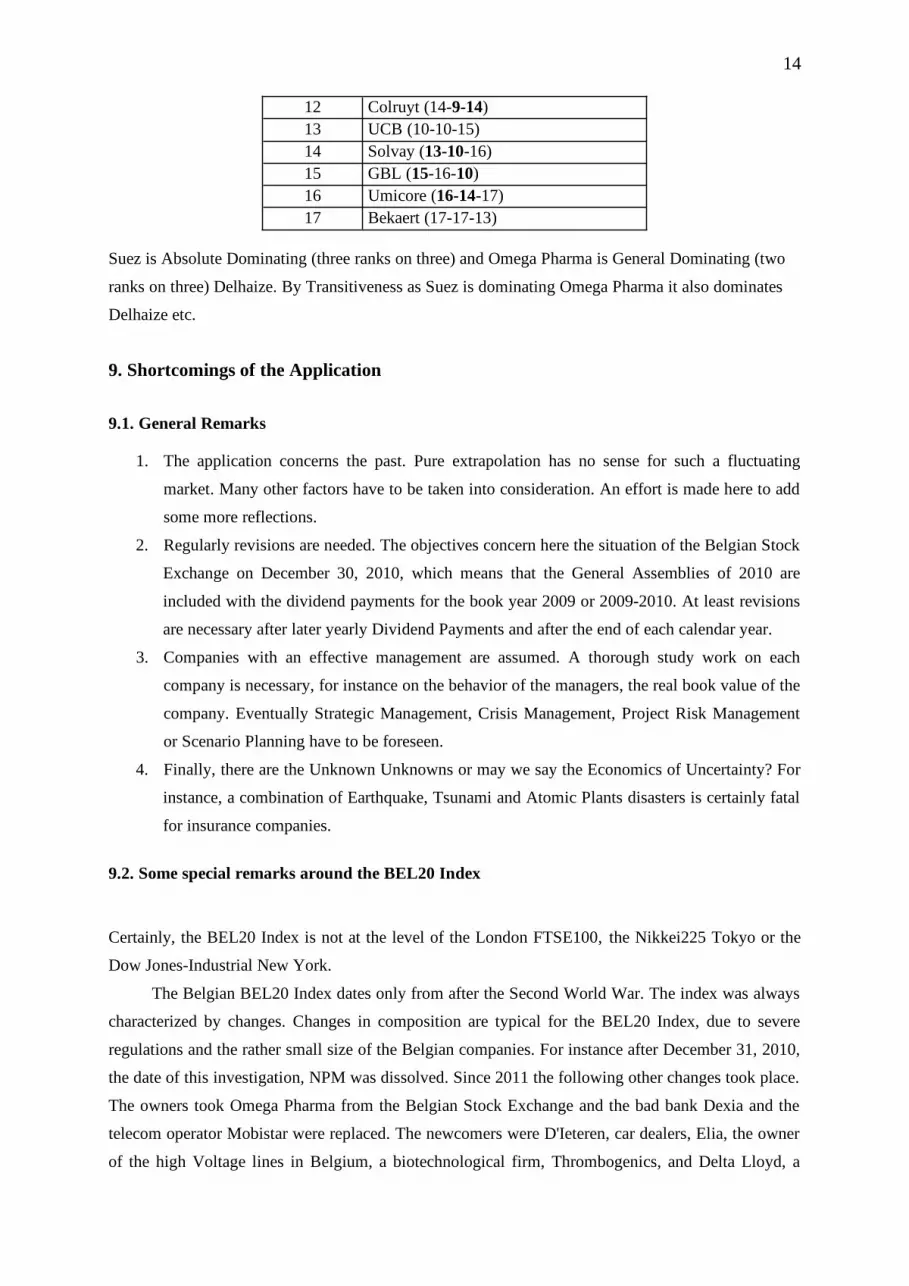
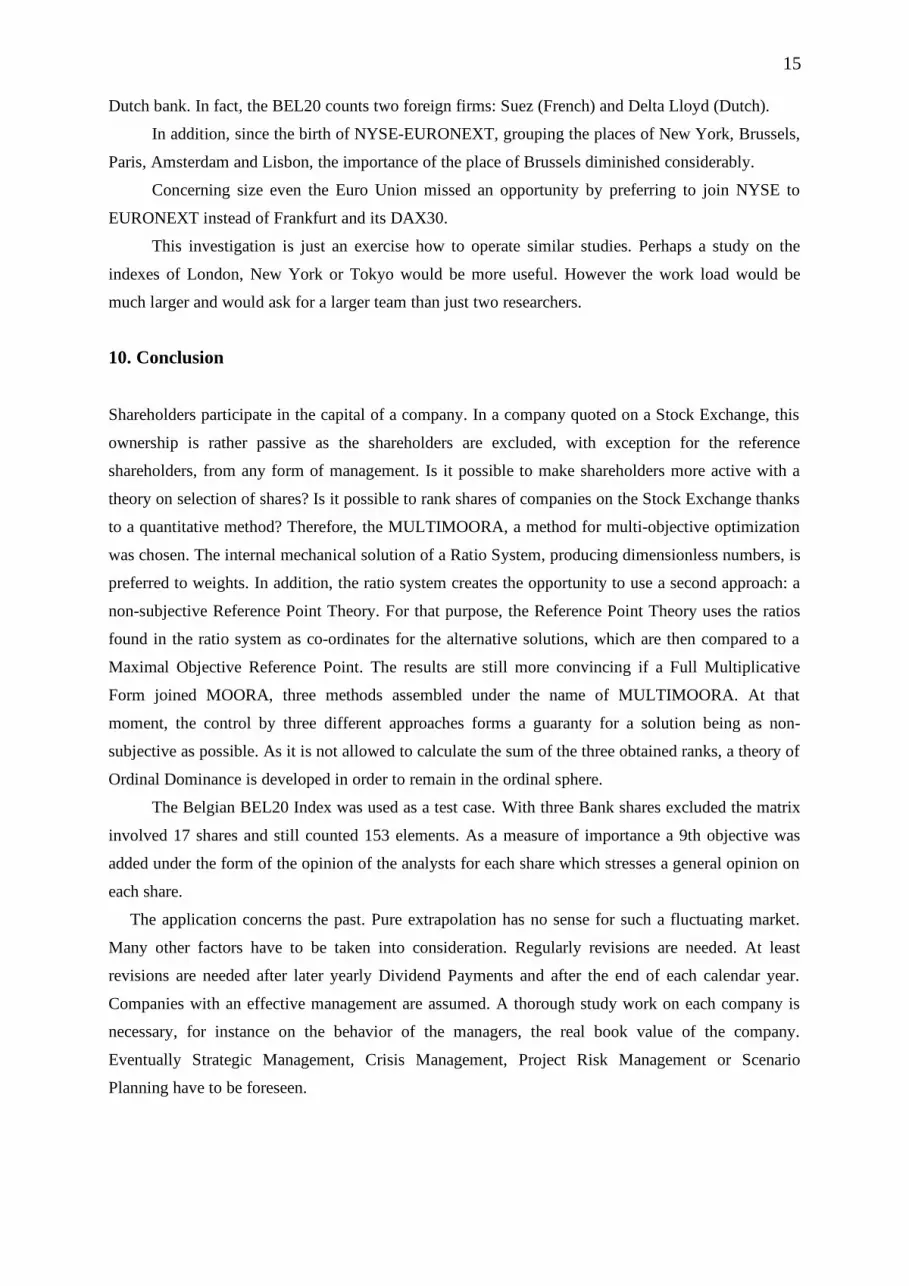
Appendix A gives the full details on the ranking of the shares of the BEL20 index. Following table 3
brings the outcome of these detailed mathematical operations. The first figure between brackets
represents the outcome of the Ratio System, the 2nd of the Reference Point Method and the 3rd of the Full
Multiplicative Form. In table 3, bold figures show a dominating effect.
Table 3. Ranking of Preference for the Shares of the BEL20 Index (banks excluded)
RANKING SHARES1 Suez (1-1-1)2 Omega Pharma (2-6-2)3 Delhaize (4-3-4)4 Ackermans-VH(3-4-6)5 Cofimmo (5-2-9)6 NPM (11-5-3)7 Belgacom (7-10-7)8 Telenet (8-7-8)9 Befimmo (6-10-11)10 AB-Inbev (9-8-12)11 Mobistar (12-15-5)
13
12 Colruyt (14-9-14)13 UCB (10-10-15)14 Solvay (13-10-16)15 GBL (15-16-10)16 Umicore (16-14-17)17 Bekaert (17-17-13)
Suez is Absolute Dominating (three ranks on three) and Omega Pharma is General Dominating (two
ranks on three) Delhaize. By Transitiveness as Suez is dominating Omega Pharma it also dominates
Delhaize etc.
9. Shortcomings of the Application
9.1. General Remarks
1. The application concerns the past. Pure extrapolation has no sense for such a fluctuating
market. Many other factors have to be taken into consideration. An effort is made here to add
some more reflections.
2. Regularly revisions are needed. The objectives concern here the situation of the Belgian Stock
Exchange on December 30, 2010, which means that the General Assemblies of 2010 are
included with the dividend payments for the book year 2009 or 2009-2010. At least revisions
are necessary after later yearly Dividend Payments and after the end of each calendar year.
3. Companies with an effective management are assumed. A thorough study work on each
company is necessary, for instance on the behavior of the managers, the real book value of the
company. Eventually Strategic Management, Crisis Management, Project Risk Management
or Scenario Planning have to be foreseen.
4. Finally, there are the Unknown Unknowns or may we say the Economics of Uncertainty? For
instance, a combination of Earthquake, Tsunami and Atomic Plants disasters is certainly fatal
for insurance companies.
9.2. Some special remarks around the BEL20 Index
Certainly, the BEL20 Index is not at the level of the London FTSE100, the Nikkei225 Tokyo or the
Dow Jones-Industrial New York.
The Belgian BEL20 Index dates only from after the Second World War. The index was always
characterized by changes. Changes in composition are typical for the BEL20 Index, due to severe
regulations and the rather small size of the Belgian companies. For instance after December 31, 2010,
the date of this investigation, NPM was dissolved. Since 2011 the following other changes took place.
The owners took Omega Pharma from the Belgian Stock Exchange and the bad bank Dexia and the
telecom operator Mobistar were replaced. The newcomers were D'Ieteren, car dealers, Elia, the owner
of the high Voltage lines in Belgium, a biotechnological firm, Thrombogenics, and Delta Lloyd, a
14
Dutch bank. In fact, the BEL20 counts two foreign firms: Suez (French) and Delta Lloyd (Dutch).
In addition, since the birth of NYSE-EURONEXT, grouping the places of New York, Brussels,
Paris, Amsterdam and Lisbon, the importance of the place of Brussels diminished considerably.
Concerning size even the Euro Union missed an opportunity by preferring to join NYSE to
EURONEXT instead of Frankfurt and its DAX30.
This investigation is just an exercise how to operate similar studies. Perhaps a study on the
indexes of London, New York or Tokyo would be more useful. However the work load would be
much larger and would ask for a larger team than just two researchers.
10. Conclusion
Shareholders participate in the capital of a company. In a company quoted on a Stock Exchange, this
ownership is rather passive as the shareholders are excluded, with exception for the reference
shareholders, from any form of management. Is it possible to make shareholders more active with a
theory on selection of shares? Is it possible to rank shares of companies on the Stock Exchange thanks
to a quantitative method? Therefore, the MULTIMOORA, a method for multi-objective optimization
was chosen. The internal mechanical solution of a Ratio System, producing dimensionless numbers, is
preferred to weights. In addition, the ratio system creates the opportunity to use a second approach: a
non-subjective Reference Point Theory. For that purpose, the Reference Point Theory uses the ratios
found in the ratio system as co-ordinates for the alternative solutions, which are then compared to a
Maximal Objective Reference Point. The results are still more convincing if a Full Multiplicative
Form joined MOORA, three methods assembled under the name of MULTIMOORA. At that
moment, the control by three different approaches forms a guaranty for a solution being as non-
subjective as possible. As it is not allowed to calculate the sum of the three obtained ranks, a theory of
Ordinal Dominance is developed in order to remain in the ordinal sphere.
The Belgian BEL20 Index was used as a test case. With three Bank shares excluded the matrix
involved 17 shares and still counted 153 elements. As a measure of importance a 9th objective was
added under the form of the opinion of the analysts for each share which stresses a general opinion on
each share.
The application concerns the past. Pure extrapolation has no sense for such a fluctuating market.
Many other factors have to be taken into consideration. Regularly revisions are needed. At least
revisions are needed after later yearly Dividend Payments and after the end of each calendar year.
Companies with an effective management are assumed. A thorough study work on each company is
necessary, for instance on the behavior of the managers, the real book value of the company.
Eventually Strategic Management, Crisis Management, Project Risk Management or Scenario
Planning have to be foreseen.
15
Finally, there are the Unknown Unknowns or may we say the Economics of Uncertainty? For
instance, a combination of Earthquake, Tsunami and Atomic Plants disasters is certainly fatal for
insurance companies.
Concerning the Belgian BEL20 Index changes in composition are typical, due to severe
regulations and the rather small size of the Belgian companies. Certainly, the BEL20-Index is not at
the level of the London FTSE100, the Nikkei225 Tokyo or the Dow Jones-Industrial New York.
Moreover, it lost much of its importance when the Stock Exchange of Brussels was incorporated into
NYSE-EURONEXT.
If the MULTIMOORA method is used for share evaluation, the evaluation would have to be
reconsidered regularly, perhaps with including more objectives. Until now, eight objectives were
considered, with the importance of the objectives measured by the opinion of a selection of analysts
assumed as a ninth objective. With these changes, MULTIMOORA could become a favorable
instrument to follow the evolution of share quotations all over the world. Therefore, the author hopes
that similar studies on the most famous share indices of the major countries would be made one day.
In order to see similarities and dissimilarities it may be preferable to use the same objectives and the
same method for comparing these most famous share indices.
REFERENCES
Allen R.G.D., 1957. Mathematical Economics, Macmillan, London.Arrow K.J., 1974. General Economic Equilibrium: Purpose, Analytic Techniques, Collective Choice, American Economic
Review, June, 253-272.Balezentis A, Balezentis T., Brauers, W.K.,2011. Implementation of the Strategy Europe 2020 by the Multi-Objective
Evaluation Method MULTIMOORA, Economics and Management, 2/2011, several Czech Universities, Praha, 6-21.Balezentis A, Balezentis T., Valkauskas R., 2010. Evaluating Situation of Lithuania in the European Union: Structural
Indicators and MULTIMOORA Method, Technological and Economic Development of Economy, ISSN 2029-4913, Vol. 16 (4), 578-602.Brans J.P., Mareschal B., Vincke P.,1986. How to select and how to rank Projects: the PROMETHEE Method, EJOR,
volume 24, issue 2, 228-238.Brans J.P., Mareschal B., Vincke P.,1984. Prométhée: a new family of Outranking Methods in Multicriteria Analysis, in
Brans (ed.) Proceedings of the IFORS 84 Conference, Washington. 408-421.Brauers, W.K.,Balezentis A and Balezentis T., 2011. MULTIMOORA for the EU Member States updated with Fussy
Number Theory, Technological and Economic Development of Economy, ISSN 2029-4913, Vol. 17, 2, 259-290..Brauers, W.K., Zavadskas E.K., 2011a. MULTIMOORA optimization used to decide on a bank loan to buy property,
Technological and Economic Development of Economy, ISSN 2029-4913, Vol. 17, 1, 174-188.Brauers, W.K., Zavadskas E.K., 2011b. From a Centrally Planned Economy to Multi-Objective Optimization in an
Enlarged Project Management. The case of China, Economic Computation and Economic Cybernetics Studies and Research, Academy of Economic Studies, ISSN 0424-267X, Bucharest, Vol.45 N°1, 167-188.
Brauers, W.K., Zavadskas E.K., 2010a, Project Management by MULTIMOORA as an instrument for Transition Economies, Technological and Economic Development of Economy, ISSN 2029-4913, Vol. 16, 1, 5-24.Brauers, W.K., Zavadskas E.K., 2010b, Robustness in the MULTIMOORA Model, the example of Tanzania,
Transformations in Business and Economics, Vol. 9, N°3, 67-83. Brauers, W.K., Zavadskas E.K., 2010c, Is Robustness really Robust? Robustness from the point of view of Statistics and
Econometrics with an application for Multi-Objective Optimization, Chapter 2 in: Multiple Criteria Decision Aiding. Editors C. Zopounidis, M. Doumpos et al. ISBN 978-1-61668-231-6, Nova Science Publishers, Inc. Hauppage, NY,
17- 42.Brauers W.K., Zavadskas E.K., 2008. Multi-Objective Optimization in Location Theory, with a simulation for a Department Store, Transformations in Business and Economics, ISSN 1648-4460, 2008, VOL. 7, N°3 (15), 163-183.Brauers W.K., Zavadskas E.K., Turskis Z., Vilutiene T., 2008a. Multi-Objective Contractor's Ranking by applying the
Moora Method, Journal of Business Economics and Management, ISSN 1611-1699,9 (4), 245-256.Brauers W.K., Zavadskas E.K.,Peldschus F., 2008b. Multi-objective decision-making for road design, Transport, 23(3), 183- 193.Brauers, W.K., Ginevicius, R. Podvesko, V., 2010.Regional development in Lithuania considering multiple objectives by
the MOORA method, Technological and Economic Development of Economy, ISSN 2029-4913, Vol. 16 (4),613-640.
16
Brauers, W.K., Ginevicius, R., 2010. The economy of the Belgian Regions tested with MULTIMOORA, Journal of Business Economics and Management, ISSN 1611-1699, 11(2), 173-209.
Brauers, W.K., Ginevicius, R., 2009. Robustness in Regional Development Studies, the Case of Lithuania, Journal of Business Economics and Management, ISSN 1611-1699, 10(2), 121-140.
Brauers, W.K., Ginevicius, R., Zavadskas E.K., Antucheviciene J., 2007. The European Union in a Transition Economy, Transformations in Business and Economics, ISSN 1648-4460, Vol. 6, N°2 (12), 21-37.
Brauers, W.K., Zavadskas E.K., 2006. The Moora Method and its Application to Privatization in a Transition Economy, Control and Cybernetics, Vol.35 N° 2, 443-468.
Brauers W.K., Zavadskas E.K., Turskis Z., Antucheviciene J., 2006. Evaluating redevelopment alternatives of buildings with an application of the MOORA method, Simulation and Optimisation in Business and Industry, ISBN 9955-25-061-5, Technologija, Kaunas, 131-135.
Brauers W.K., 2008. Multi-Objective Decision Making by Reference Point Theory for a wellbeing economy, International Journal of Operations Research; Springer, 89-104.Brauers, W.K., 2004a. Multi-Objective Optimization for Facilities Management, Journal of Business Economics and
Management, ISSN 1611-1699, North-German Academy of Informatology (Stralsund), 2004, vol. 5, N°4, 173-182. Brauers, W.K., 2004b “Multiobjective Optimization (MOO) in Privatization" Journal of Business Economics and
Management, ISSN 1611-1699, North-German Academy of Informatology (Stralsund), 2004, vol. 5, N°2, 59-66.Brauers, W.K., 2004c. Optimization Methods for a Stakeholder Society, a Revolution in Economic Thinking by Multi-
Objective Optimization, Series: Nonconvex Optimization and its Applications Volume 73, ISBN 1-4020-7681-9, Kluwer Academic Publishers and Springer, Boston-Dordrecht-London, 342p.
Chakraborty, Shankar 2011. Applications of the MOORA method for decision making in manufacturing environment, International Journal Advanced Manufacturing Technology, 54; 1155-1166, Springer.
De Jong F.J. 1967. Dimensional Analysis for Economists, North-Holland, Amsterdam, 1967, 28.Hwang, Ching-Lai, and Kwansun Yoon. 1981. Multiple Attribute Decision Making, Methods and Applications, Lecture
Notes in Economics and Mathematical Systems, 186, Berlin, Springer.Karlin, S., Studden, W.J., 1966. Tchebycheff Systems: with Applications in Analysis and Statistics, Interscience
Publishers, New York.Keeney, R.L., Raiffa, H. 1993. Decisions with Multiple Objectives. Preferences and Value Tradeoffs , Cambridge University Press, USA.Keeney, R.L. 1973. A Decision Analysis with Multiple Objectives: the Mexico City Airport, the Bell Journal of Economics and Management Sciences, Vol. 4, N°1, 101-117.Kracka, M., Brauers, W.K., Zavadskas E.K., 2010, Ranking Heating Losses in a Building by Applying MULTIMOORA,
Inzinerine Ekonomika-Engineering Economics, 21(4), 352-359 MacCrimmon, K. R. 1968. Decision Making among Multiple Attribute Alternatives. A Survey and Consolidated Approach. RM-4823- ARPA, the Rand Corporation, Santa Monica (CAL).Miller, D.W., Starr M.K., 1969. Executive Decisions and Operations Research, 1969, 2nd Edition, Prentice-Hall Inc.
Englewood Cliffs(N.J.).Opricovic S., Tzeng G-H., 2004. Compromise solution by MCDM methods: a comparative analysis of VIKOR and TOPSIS,
EJOR, 156, 445-455.Roy, B., R. Benayoun, and B. Sussman, 1966. ELECTRE, Société d'Economie et de Mathématique appliquées, Paris.Saaty,T. L. 1988. The Analytic Hierarchy Process, Mcgraw-Hill, New York.Teekens, R., Koerts, J., 1972. Some Statistical Implications of the Log Transformation of Multiplicative Models,
Econometrica, Vol. 40, N°5, 793-819.White, L. J., 2010. The Credit Rating Agencies, Journal of Economic Perspectives, Vol. 24, N°2, 211-226.
17
APPENDIX A MOORA (1a until 1c) and REFERENCE POINT THEORY (1d, 1e)
Table A1 - MOORA applied on 9 objectives for the BELGIUM 20 (minus banks)
1a - Matrix of Responses of Alternatives on Objectives: (xij)1 2 3 4 5 6 7 8 9
Weekly vol. /average last year
Dividend % Last Notation€
% Develop-ment in 1 year
Enterprise Value / EBITDA
Notation to Profit
Nota-tion / Book Value
PEG Ratio
Opinion Analysts
MAX. MAX. MIN. MIN. MIN. MIN. MIN. MIN. MIN.1.AB Inbev 0.43 0.88 43.1 18.9 10.52 22.68 2.25 0.89 2.312.Ackermans 0.79 2.3 61.78 17.88 11.81 17.21 1.3 0.67 2.44.Befimmo 0.86 7.2 61 1.61 18.48 12.92 1.04 100 4.55.Bekaert 0.39 1.07 82.2 138.12 16.77 40.09 1.33 0.13 1.646.Belgacom 0.25 8.22 25.3 0.63 5.51 9.84 3.22 100 3.297.Cofimmo 0.75 6.78 95.15 1.14 17.24 12.84 0.86 55.56 3.318.Colruyt 0.26 1.93 38.38 13.28 11.04 19.99 5.14 2.36 4.59.Delhaize 0.22 2.6 55.76 3.53 5.38 11.13 1.27 2.26 2.5711.GBL 0.3 3.79 63.55 3.93 100 13.55 0.69 1.62 2.2512.GDF Suez 0.31 5.58 27.24 9.34 6.48 13.42 1.02 1.58 2.1114.Mobistar 0.29 8.65 47.96 0.1 5.6 11.21 6.53 100 3.215.NPM 0.45 2.23 36.75 1.17 46.64 32.52 0.73 0.61 4.516.Omega Phar. 0.4 1.61 35.92 1.9 9.68 12.18 1.32 1.38 2.0817.Solvay 0.24 3.24 80.04 5.58 6.98 13.85 1.43 100 2.9518.TELENET 0.49 1.45 28.9 46 8.84 31.08 0.94 0.56 2.2219.UCB 0.33 3.45 25.82 14.41 8.14 16.44 1.07 100 2.8620.Umicore 0.25 1.57 39.4 67.07 19.08 58.8 3.27 0.65 2.38
18
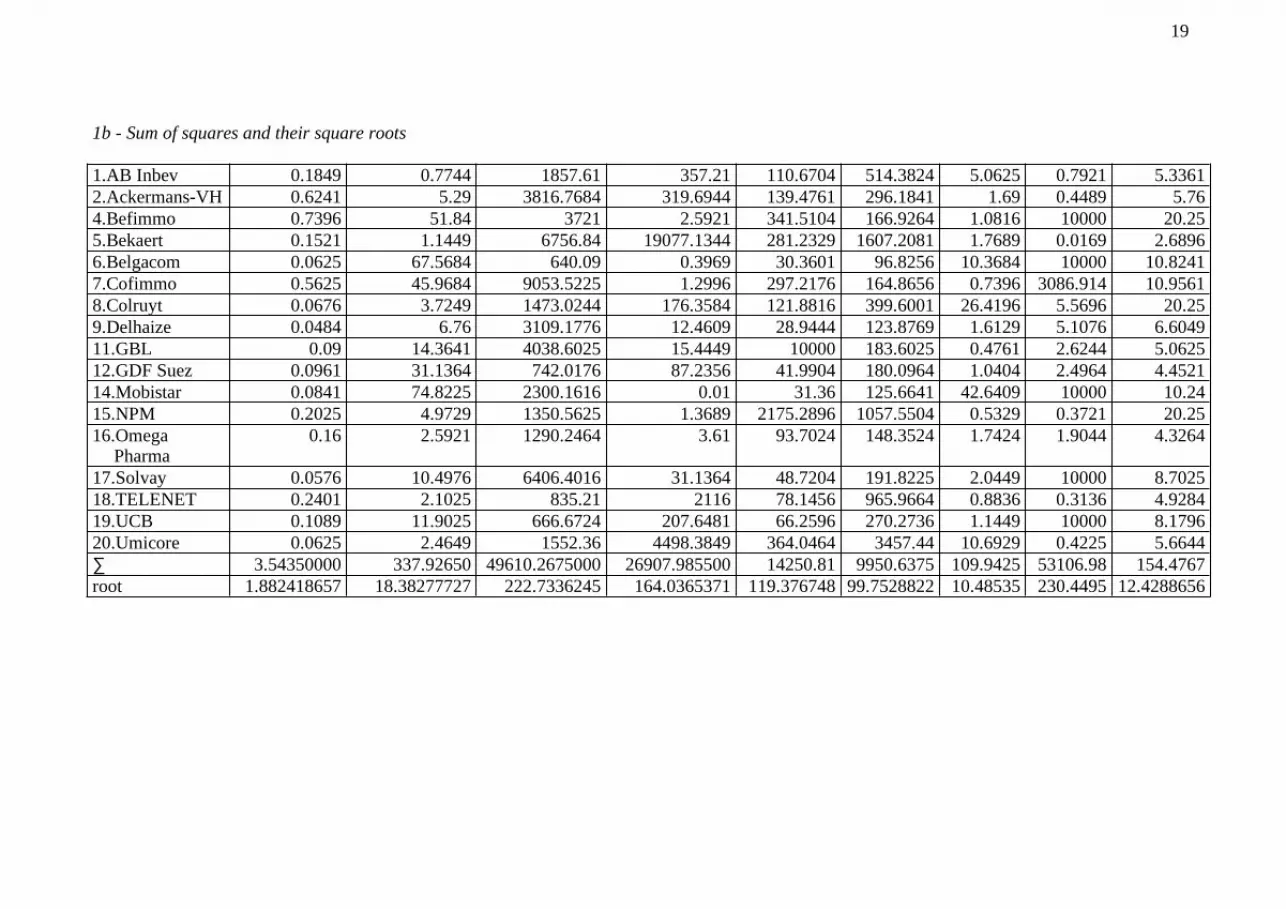
1b - Sum of squares and their square roots 1.AB Inbev 0.1849 0.7744 1857.61 357.21 110.6704 514.3824 5.0625 0.7921 5.33612.Ackermans-VH 0.6241 5.29 3816.7684 319.6944 139.4761 296.1841 1.69 0.4489 5.764.Befimmo 0.7396 51.84 3721 2.5921 341.5104 166.9264 1.0816 10000 20.255.Bekaert 0.1521 1.1449 6756.84 19077.1344 281.2329 1607.2081 1.7689 0.0169 2.68966.Belgacom 0.0625 67.5684 640.09 0.3969 30.3601 96.8256 10.3684 10000 10.82417.Cofimmo 0.5625 45.9684 9053.5225 1.2996 297.2176 164.8656 0.7396 3086.914 10.95618.Colruyt 0.0676 3.7249 1473.0244 176.3584 121.8816 399.6001 26.4196 5.5696 20.259.Delhaize 0.0484 6.76 3109.1776 12.4609 28.9444 123.8769 1.6129 5.1076 6.604911.GBL 0.09 14.3641 4038.6025 15.4449 10000 183.6025 0.4761 2.6244 5.062512.GDF Suez 0.0961 31.1364 742.0176 87.2356 41.9904 180.0964 1.0404 2.4964 4.452114.Mobistar 0.0841 74.8225 2300.1616 0.01 31.36 125.6641 42.6409 10000 10.2415.NPM 0.2025 4.9729 1350.5625 1.3689 2175.2896 1057.5504 0.5329 0.3721 20.2516.Omega
Pharma0.16 2.5921 1290.2464 3.61 93.7024 148.3524 1.7424 1.9044 4.3264
17.Solvay 0.0576 10.4976 6406.4016 31.1364 48.7204 191.8225 2.0449 10000 8.702518.TELENET 0.2401 2.1025 835.21 2116 78.1456 965.9664 0.8836 0.3136 4.928419.UCB 0.1089 11.9025 666.6724 207.6481 66.2596 270.2736 1.1449 10000 8.179620.Umicore 0.0625 2.4649 1552.36 4498.3849 364.0464 3457.44 10.6929 0.4225 5.6644∑ 3.54350000 337.92650 49610.2675000 26907.985500 14250.81 9950.6375 109.9425 53106.98 154.4767root 1.882418657 18.38277727 222.7336245 164.0365371 119.376748 99.7528822 10.48535 230.4495 12.4288656
19
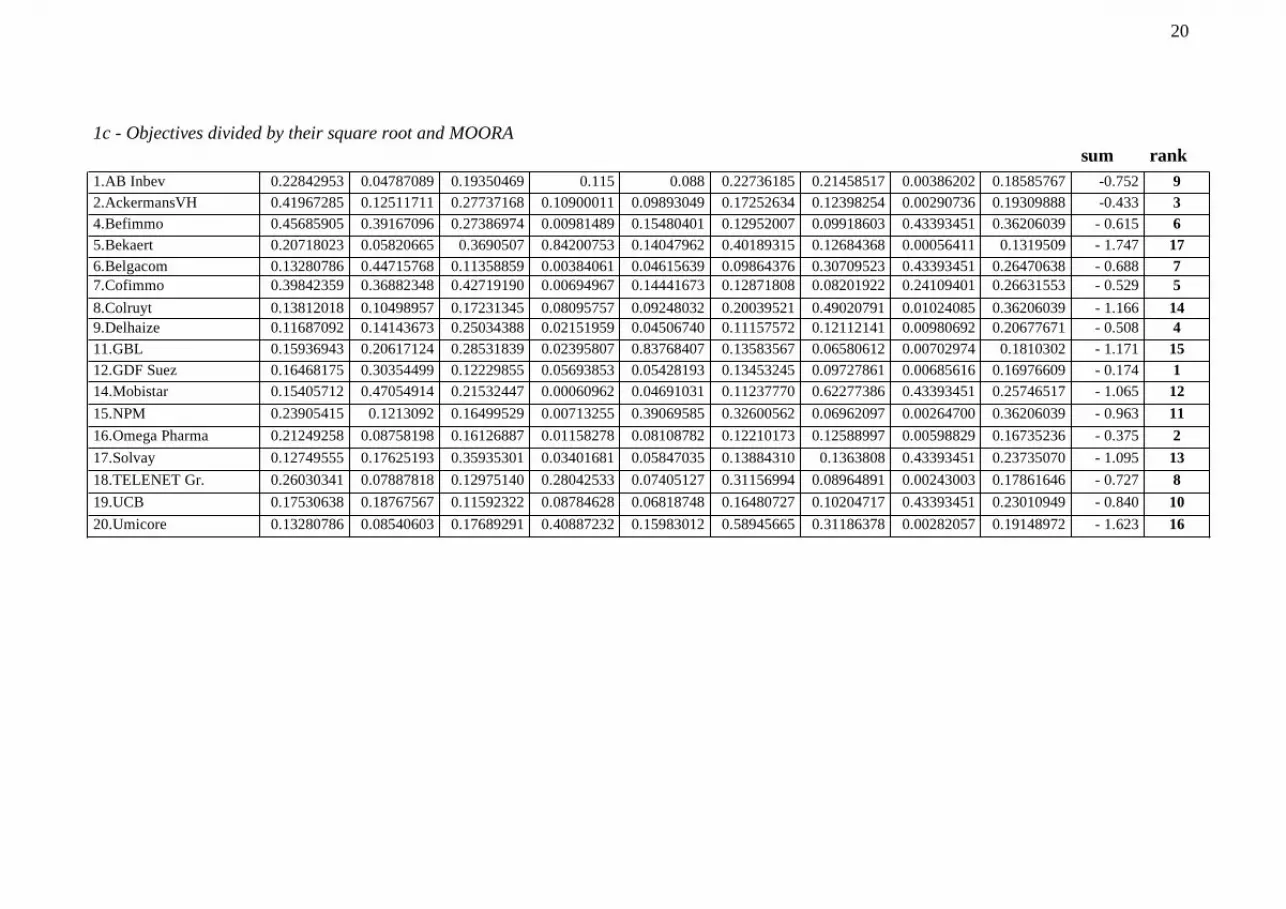
1c - Objectives divided by their square root and MOORA sum rank
1.AB Inbev 0.22842953 0.04787089 0.19350469 0.115 0.088 0.22736185 0.21458517 0.00386202 0.18585767 -0.752 92.AckermansVH 0.41967285 0.12511711 0.27737168 0.10900011 0.09893049 0.17252634 0.12398254 0.00290736 0.19309888 -0.433 34.Befimmo 0.45685905 0.39167096 0.27386974 0.00981489 0.15480401 0.12952007 0.09918603 0.43393451 0.36206039 - 0.615 65.Bekaert 0.20718023 0.05820665 0.3690507 0.84200753 0.14047962 0.40189315 0.12684368 0.00056411 0.1319509 - 1.747 176.Belgacom 0.13280786 0.44715768 0.11358859 0.00384061 0.04615639 0.09864376 0.30709523 0.43393451 0.26470638 - 0.688 77.Cofimmo 0.39842359 0.36882348 0.42719190 0.00694967 0.14441673 0.12871808 0.08201922 0.24109401 0.26631553 - 0.529 58.Colruyt 0.13812018 0.10498957 0.17231345 0.08095757 0.09248032 0.20039521 0.49020791 0.01024085 0.36206039 - 1.166 149.Delhaize 0.11687092 0.14143673 0.25034388 0.02151959 0.04506740 0.11157572 0.12112141 0.00980692 0.20677671 - 0.508 411.GBL 0.15936943 0.20617124 0.28531839 0.02395807 0.83768407 0.13583567 0.06580612 0.00702974 0.1810302 - 1.171 1512.GDF Suez 0.16468175 0.30354499 0.12229855 0.05693853 0.05428193 0.13453245 0.09727861 0.00685616 0.16976609 - 0.174 114.Mobistar 0.15405712 0.47054914 0.21532447 0.00060962 0.04691031 0.11237770 0.62277386 0.43393451 0.25746517 - 1.065 1215.NPM 0.23905415 0.1213092 0.16499529 0.00713255 0.39069585 0.32600562 0.06962097 0.00264700 0.36206039 - 0.963 1116.Omega Pharma 0.21249258 0.08758198 0.16126887 0.01158278 0.08108782 0.12210173 0.12588997 0.00598829 0.16735236 - 0.375 217.Solvay 0.12749555 0.17625193 0.35935301 0.03401681 0.05847035 0.13884310 0.1363808 0.43393451 0.23735070 - 1.095 1318.TELENET Gr. 0.26030341 0.07887818 0.12975140 0.28042533 0.07405127 0.31156994 0.08964891 0.00243003 0.17861646 - 0.727 819.UCB 0.17530638 0.18767567 0.11592322 0.08784628 0.06818748 0.16480727 0.10204717 0.43393451 0.23010949 - 0.840 1020.Umicore 0.13280786 0.08540603 0.17689291 0.40887232 0.15983012 0.58945665 0.31186378 0.00282057 0.19148972 - 1.623 16
20
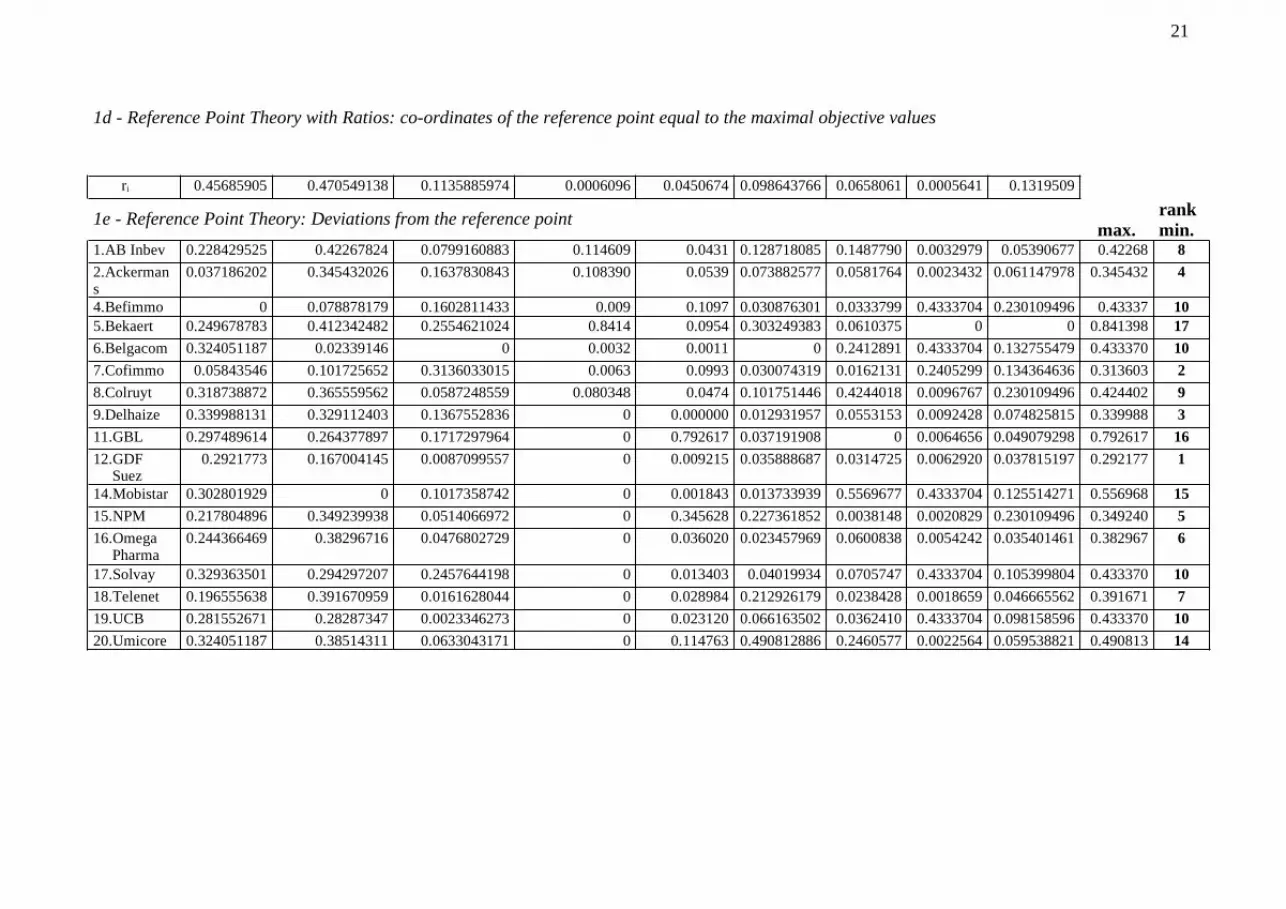
1d - Reference Point Theory with Ratios: co-ordinates of the reference point equal to the maximal objective values
ri 0.45685905 0.470549138 0.1135885974 0.0006096 0.0450674 0.098643766 0.0658061 0.0005641 0.1319509
1e - Reference Point Theory: Deviations from the reference point max.
rank min.
1.AB Inbev 0.228429525 0.42267824 0.0799160883 0.114609 0.0431 0.128718085 0.1487790 0.0032979 0.05390677 0.42268 82.Ackermans
0.037186202 0.345432026 0.1637830843 0.108390 0.0539 0.073882577 0.0581764 0.0023432 0.061147978 0.345432 4
4.Befimmo 0 0.078878179 0.1602811433 0.009 0.1097 0.030876301 0.0333799 0.4333704 0.230109496 0.43337 105.Bekaert 0.249678783 0.412342482 0.2554621024 0.8414 0.0954 0.303249383 0.0610375 0 0 0.841398 176.Belgacom 0.324051187 0.02339146 0 0.0032 0.0011 0 0.2412891 0.4333704 0.132755479 0.433370 107.Cofimmo 0.05843546 0.101725652 0.3136033015 0.0063 0.0993 0.030074319 0.0162131 0.2405299 0.134364636 0.313603 28.Colruyt 0.318738872 0.365559562 0.0587248559 0.080348 0.0474 0.101751446 0.4244018 0.0096767 0.230109496 0.424402 99.Delhaize 0.339988131 0.329112403 0.1367552836 0 0.000000 0.012931957 0.0553153 0.0092428 0.074825815 0.339988 311.GBL 0.297489614 0.264377897 0.1717297964 0 0.792617 0.037191908 0 0.0064656 0.049079298 0.792617 1612.GDF
Suez0.2921773 0.167004145 0.0087099557 0 0.009215 0.035888687 0.0314725 0.0062920 0.037815197 0.292177 1
14.Mobistar 0.302801929 0 0.1017358742 0 0.001843 0.013733939 0.5569677 0.4333704 0.125514271 0.556968 1515.NPM 0.217804896 0.349239938 0.0514066972 0 0.345628 0.227361852 0.0038148 0.0020829 0.230109496 0.349240 516.Omega
Pharma0.244366469 0.38296716 0.0476802729 0 0.036020 0.023457969 0.0600838 0.0054242 0.035401461 0.382967 6
17.Solvay 0.329363501 0.294297207 0.2457644198 0 0.013403 0.04019934 0.0705747 0.4333704 0.105399804 0.433370 1018.Telenet 0.196555638 0.391670959 0.0161628044 0 0.028984 0.212926179 0.0238428 0.0018659 0.046665562 0.391671 719.UCB 0.281552671 0.28287347 0.0023346273 0 0.023120 0.066163502 0.0362410 0.4333704 0.098158596 0.433370 1020.Umicore 0.324051187 0.38514311 0.0633043171 0 0.114763 0.490812886 0.2460577 0.0022564 0.059538821 0.490813 14
21

Table A2- Full Multiplicative Form
PRODUCT MAXIMA PRODUCT MINIMA TOTAL PRODUCT Rank0.37840 899046.9438 4.20890146647242E-07 12 AB Inbev1.81700 469327.0471 3.87150071870873E-06 6 Ackermans-VH6.19200 10974027.51 5.64241341018721E-07 11 Befimmo0.41730 2164394.13 1.92802223145015E-07 13 Bekaert2.05500 915502.5063 2.24466889596770E-06 7 BELGACOM5.08500 3797559.711 1.33901778681744E-06 9 Cofimmo0.50180 6140059.062 8.17255982305262E-08 14 Colruyt0.57200 86940.11172 6.57924160332702E-06 4 Delhaize1.13700 851126.3262 1.33587690224664E-06 10 GBL1.72980 75235.22345 2.2991890242548E-05 1 Suez2.50850 629123.5952 3.98729282972713E-06 5 Mobistar1.00350 130682.5177 7.67891542056547E-06 3 NPM0.64400 30487.99939 2.11230652326591E-05 2 Omega Pharma0.77760 18213966.29 4.26925134141235E-08 16 Solvay0.71050 426832.8189 1.66458615311545E-06 8 Telenet1.13850 15236887.03 7.47199869375556E-08 15 UCB0.39250 14997479.98 2.61710634344356E-08 17 Umicore
22
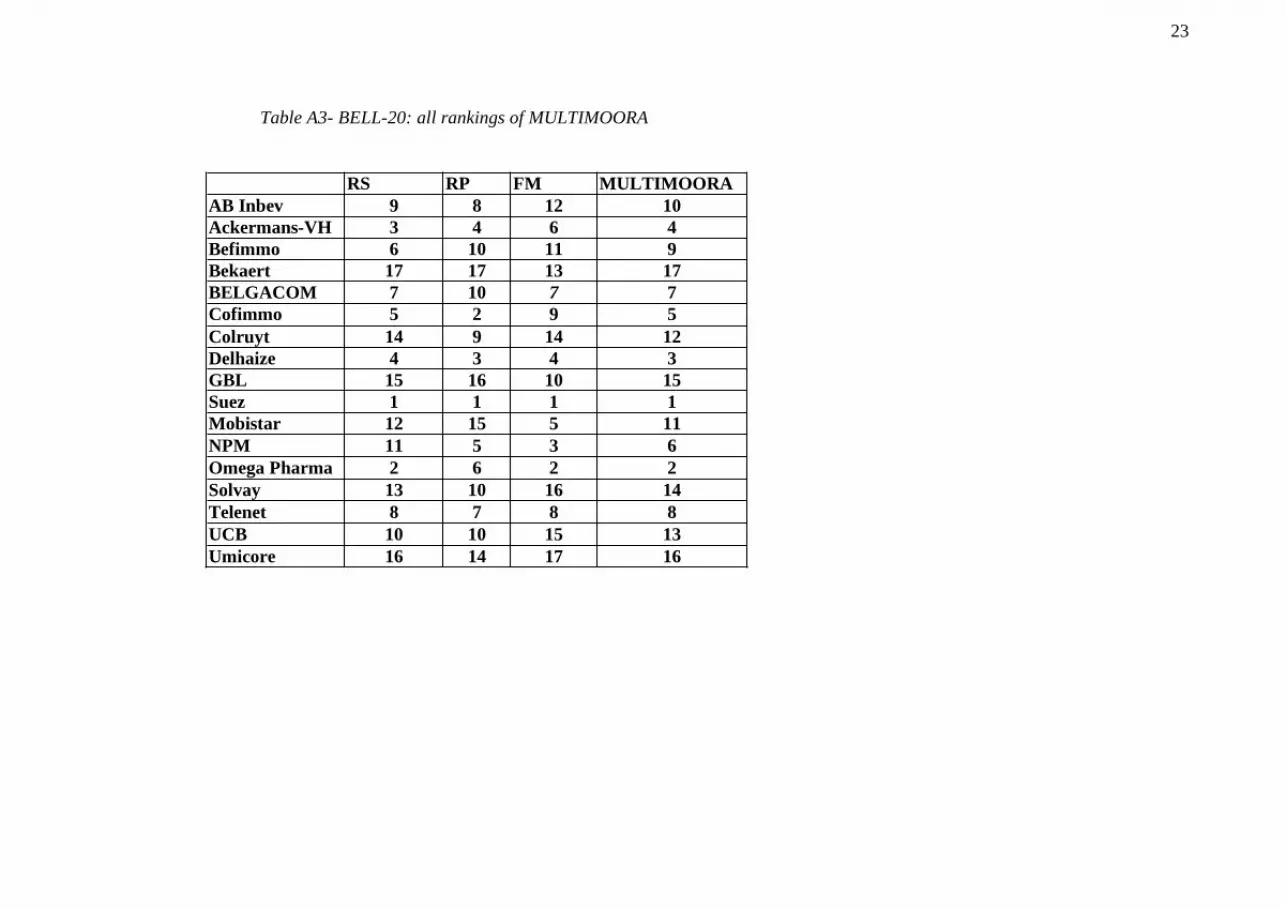
Table A3- BELL-20: all rankings of MULTIMOORA
RS RP FM MULTIMOORAAB Inbev 9 8 12 10Ackermans-VH 3 4 6 4Befimmo 6 10 11 9Bekaert 17 17 13 17BELGACOM 7 10 7 7Cofimmo 5 2 9 5Colruyt 14 9 14 12Delhaize 4 3 4 3GBL 15 16 10 15Suez 1 1 1 1Mobistar 12 15 5 11NPM 11 5 3 6Omega Pharma 2 6 2 2Solvay 13 10 16 14Telenet 8 7 8 8UCB 10 10 15 13Umicore 16 14 17 16
23


