Embed Size (px)
Citation preview
Kidney International, Vol. 46 (1994), pp. 627—638
Segmental localization of mRNAs encoding Na-K-ATPase a-and n-subunit isoforms in rat kidney using RT-PCR
WILLIAM L. CLAPP, PAULA BOWMAN, GERALDINE S. SHAW, PINKAL PATEL, and BRUCE C. KONE
DCI Laborato,y of Molecular Biology in Nephrology, Division of Nephrology, Hypertension and Transplantation, and The Hypertension Center, Universityof Florida College of Medicine, Gainesville, Florida, USA
Segmental localization of mRNAs encoding Na-K-ATPase a- andfl-subunit isoforms in rat kidney using RT-PCR. To characterize theexpression of genes encoding the a- and 13-subunit isoforms of theNa-K-ATPase in rat kidney, we used reverse transcription (RT)-PCRof microdissected renal structures combined with quantitation of subunitisoform mRNAs in the major renal parenchymal zones. Transcripts for al,a2, a3, 131, and /32 subunit isoforms were detected by RT-PCR inmicrodissected glomeruli, proximal convoluted tubules, medullary thickascending limbs of Henle, cortical and inner medullary collecting ducts.The truncated al (al-T) isoform was also amplified from cortex, outerand inner medulla and isolated glomeruli, but it was not detected in thesenephron segments. The DNA sequence of the renal al-T PCR productwas identical to that of the cDNA previously cloned from aortic smoothmuscle cells. RNA dot-blot analysis indicated that the al, a2, and a3isoforms contributed —70%, —20%, and —10%, respectively, of the totala isoform mRNA in each parenchymal zone. RNase protection assaysdetermined that the f31 and /32 isoforms accounted for —95% and —5%,respectively, of the /3 isoform mRNA in each zone. These data providedefinitive evidence for the differential expression of mRNAs encoding allthe a and /3 isoforms in the renal parenchyma, and for the coexpression ofthese isoforms in the nephron segments examined. The results suggest thepotential expression of up to eight different Na-K-ATPase isoenzymesin the kidney, and for multiple molecular levels of regulation of renalNa-K-ATPase expression.
The Na-K-ATPase is an oligomeric membrane protein re-sponsible for the primary active transport of Na and K in allanimal cells. By maintaining or restoring the normal distributionof these ions across the plasma membrane, the Na-K-ATPaseplays a central role in the regulation of membrane potential, cellion content, and cell volume. In renal tubular epithelial cells, thisenzyme provides the principal driving force for net sodiumreabsorption, as well as for the secondary active transport of otherions and organic solutes [1]. Structurally, the enzyme is comprisedof two protein subunits linked by noncovalent bonds: the —100 kDa subunit is responsible for ATP hydrolysis, cation transport, andcardiac glycoside (that is, ouabain) binding, whereas the —40 to 50kD glycoprotein /3 subunit appears to play a role in directing thea subunit to the plasma membrane [2], in K activation of theholoenzyme [31, and perhaps in cellular adhesion [4]. The twosubunits are encoded by multigene families, and appear to be
Received for publication July 9, 1993and in revised form March 22, 1994Accepted for publication March 24, 1994
© 1994 by the International Society of Nephrology
differentially expressed among tissues and during development[5—11]. In rat, cDNAs encoding three a- [6, 12] and two /3-subunit[4, 7, 8] isoforms of the Na-K-ATPase have been cloned andsequenced, and a truncated al isoform, termed al-T, has recentlybeen identified in aortic smooth muscle cells and canine kidney[13]. The al-T isoform appears to arise by alternative RNAprocessing of the al gene and encodes a protein of 581 aminoacids whose functional properties, ability to assemble with the /3subunit, and precise renal expression are unknown. The alsubunit is expressed ubiquitously among tissues and is thought toplay a "housekeeping" role in maintaining Na and K gradients,whereas the a2 and a3 subunits differ in their tissue expression[reviewed in 14, 15], regulation, and in affinity for Na and K[16, 17]. The a2 subunit has been identified principally in neuraland muscle tissue, and the a3 isoform has been detected primarilyin neural tissues.
Because the different Na-K-ATPase isoenzymes are subjectto unique regulatory controls and appear to possess distinctfunctional properties [15—17], it has been proposed that differ-ences in their expression or regulation might account for theknown functional diversity of the Na-K-ATPase along thenephron. Biochemical studies have demonstrated differences inthe affinities of the enzyme for ouabain and Na [18—20] amongdifferent nephron segments. Recent studies of the rat corticalcollecting duct (CCD), for example, distinguished two distinctpopulations of Na-K-ATPase molecules based on their affini-ties for ouabain [20]. The authors further observed that thelow-affinity Na-K-ATPase population of the CCD was differ-entially stimulated in rats with puromycin-induced nephroticsyndrome. Since the rat a isoforms possess very different sensi-tivities to ouabain, these results implied that al (low ouabainaffinity) together with a2 and/or a3 (high ouabain affinity)isozymes are coexpressed in this nephron segment, and that theyrespond differently to the same pathophysiologic stimulus. Inaddition, Barlet-Bas et al [21] reported that an antibody specificfor the a3 isoform inhibited >80% of Na-K-ATPase activity inthe rabbit CCD, whereas an al-specific antibody had no effect onenzymatic activity in this segment.
Unfortunately, analysis of the specific a- and /3-subunit isoformgenes in the kidney has been complicated by both the molecularvariety of the Na-K-ATPase isoforms and the complex struc-tural heterogeneity of this organ. In general, previous studies ofNa-K-ATPase isoform gene expression in the kidney have
627
628 Clapp eta!: Na-K-ATPase isoforms in kidney
yielded inconsistent results and have been limited by their inabil-ity to determine unambiguously the molecular identity and intra-renal location of the Na-K-ATPase isoforms under question.Recently we reported that the major a and /3 isoforms arecoexpressed in specific segments of the rat nephron as detected byin situ hybridization with isoform-specific riboprobes [22]. Whilethis study provided a useful map of the cellular distribution of thevarious Na-K-ATPase isoforms, it did not characterize therelative abundance of the subunit isoform mRNAs. Moreover,even though the riboprobes used in that study shared less than70% identity with one another, cross-hybridization of the probeswith homologous isoforms was difficult to exclude conclusively bythis method. Therefore, in the present study we have used RNAdot-blot analysis and RNase protection assays to characterize thesteady-state renal expression of the various a and /3 subunitisoform mRNAs, and reverse transcription-PCR (RT-PCR) com-bined with nephron microdissection and nucleotide sequenceanalysis to determine definitively the segmental location of thespecific mRNAs encoding the Na-K-ATPase isoenzymes in thenormal rat kidney. Our results demonstrate that al, a2, a3, 131,and /32 subunit mRNAs are coexpressed in glomeruli and definedsegments along the nephron. Moreover, we report that al-TmRNA is expressed in each parenchymal zone and isolatedglomeruli, but not in several tubule segments, and that it isstructurally identical to that cloned from vascular smooth muscle.
Methods
Animals
Male Sprague Dawley rats (150 to 200 g body wt were allowedfree access to tap water and standard chow.
Macrodissection and microdissection
For macrodissection of cortex, outer and inner medulla, ratswere anesthetized with sodium pentobarbital (10 mg/kg i.p.), andthe kidneys were perfused free of blood via the abdominal aortawith an ice-cold buffer (Buffer A) containing (in mM) 135 NaCl,5 KCI, 1.2 MgSO4, 1.0 Na2HPO4, 1.2 Na2SO4, 2.0 CaCI2, 5.5glucose, 5.0 HEPES, pH 7.4. The kidneys were excised, and thethree zones isolated with dissection scissors. For microdissectionof nephron segments, we used the protocol described byMoriyama et al [23] with a few modifications. Following anesthe-sia of the animal, the kidneys were infused via the abdominalaorta with ice-cold Buffer A containing 1.5 mg/ml collagenase(Type I, Sigma Chemical, St. Louis, Missouri, USA) and 0.38mg/mi Pronase (Sigma) that was bubbled with 100% 02. Thekidneys were excised, and thin coronal slices were cut andincubated at 37°C for 20 to 25 minutes for inner medullarycollecting ducts (IMCD), or 30 to 40 minutes for glomeruli,proximal convoluted tubules (PCT), meduilary thick ascendinglimbs of Henle (mTAL), and CCDs, in Buffer A containing 1.5mg/mi collagenase but only 0.19 mg/mI Pronase. Microdissectionwas carried out at 4°C in Buffer A without the enzymes. Incontrast to other investigators [22], we did not include vanadylribonucleoside complex in the dissection medium, because wefound that it increased the difficulty of dissection (by renderingthe medium more opaque) without significantly improving thequantity or apparent quality of the RNA isolated from thetubules. We had roughly equivalent success in amplifying thevarious Na-K-ATPase isoform cDNAs reverse transcribed
from RNA harvested when vanadyl ribonucleoside complex wasomitted from the dissection medium as when it was included.However, this result may not be the case for all target genes or forother microdissected renal structures. The tubule structures weredissected with fine steel forceps, their lengths measured, and thenthey were transferred with a micro-glass tube precoated with 1%bovine serum albumin (RNase-free, Sigma) to a wash dish inwhich they were quickly rinsed free of debris. After two washes, 4to 6 tubules (each —2 mm in length) or 8 to 10 glomeruli werethen pipetted directly into a microcentrifuge tube, flash frozen ina dry ice/ethanol bath, and stored at —80°C until the time of RNAisolation. As a control for possible contamination, 10 d of thefinal wash buffer was carried through the RNA isolation, reversetranscription, and PCR steps.
RNA isolation, cDNA synthesis, and PCR
Total RNA was extracted from the heart, brain, macrodissectedcortex, outer medulla, or inner medulla, or from pooled tubules orglomeruli using a commercially available kit, RNAz0L II (TEL-TEST, Inc., Friendswood, Texas, USA). For the glomeruli andtubuie segments, we scaled down the procedure to smallervolumes. The final RNA pellets from heart, brain, and renalcortex, outer, and inner medulla were resuspended in 100 j.d ofdiethylpyrocarbonate (DEPC)-treated water and quantified byabsorbance at 260 nm. The RNA pellets isolated from theglomeruli and tubules were resuspended in DEPC-treated watersuch that 5 jLl of RNA corresponded to —1 mm tubule or ——-2glomeruli. First strand cDNA was synthesized from 1 g of totalRNA harvested from each of the three macrodissected zones orfrom 5 jtl of the microdissection RNA sample, using oligo-(dT)17primer, 200 U MMLV reverse transcriptase (Gibco-BRL, Gaith-ersburg, Maryland, USA), and the buffer supplied by the manu-facturer in a 20 d reaction volume for one hour at 37°C. Thereaction was stopped by incubation at 99°C for five minutes, andthe cDNA was stored at —80°C until used.
Isoform-specific primers (Table 1) were selected by compara-tive nucleotide sequence analysis of published cDNA sequences[7, 8, 12, 13] and with the aid of the Oligo 4.0 Primer DesignSoftware (National Biosciences, Inc., Plymouth, Minnesota,USA). With the exception of the /32 primers, each of the primerscontained recognition sequences for restriction endonucleases tofacilitate directional subcloning. Given the considerable structuralhomology of the various a subunit isoforms, we exploited thesequence differences in the 3' termini of the isoforms to lendspecificity to our primers, and to frame regions of structuraldiversity for use as isoform-specific probes in blot and in situhybridization studies [22]. The reverse primer of the al subunitwas located 223 bases into the 3' untranslated region, whereas thea2 primer was located 40 bases into the 3' untranslated region.For amplification of the al-T transcript, the forward primer beganwith the third nucleotide of Cys459 of allocated on exon 11, andthe reverse primer began at the termination codon of the al-Topen reading frame located in intron 12.
Although the genomic sequences for the isoforms in the rat areunknown, the exon-intron structure of the a subunit genes isconserved between widely divergent species (chickens [24] andhumans [25—28]). Assuming similar genomic organization in therat, the a isoform primer pairs would span at least one intron,Likewise, if one assumes similar exon-intron arrangement be-tween rat and the cloned mouse /3 subunit genes [29, 30], the 13
Clapp et al: Na-K-ATPase isofonns in kidney 629
Table 1. Oligonucleotide primers used for RT-PCR of Na-K-ATPase subunit isoforms
NucleotidesIsoform Primer sequence of eDNA
alSense 5' CCGGAATFCTGCC11TCCCCTACTCCCTFCTCATC 3' 3207-3529Antisense 5' TGCTCTAGAC'llTCCCCGCTGTCGTCCCCGTCCAC 3'
alTSense 5' CGCCTGCAGATCGAGGTCTGCTGTGGCT 3' 1615-1897Antisense 5' GTCGACGAATFCTACGTTAAGAGGAACAC 3' + intron
cr2Sense 5' CCGGAATFCCGGC11TcTFCACCTAC11TGTAATA 3' 2681-3192Antisense 5' TGCTCTAGAATCTCCCCTGTTCTFCC'TTrFGTCG 3'
cr3Sense 5' CCGGAATTCTCGCCTACACTCTGCACCAGCAACAT 3' 2440-2742Antisense 5' GCGGGATCCCATITFCTGCCAGGATGACAAAGTA 3'
131Sense 5' GTCGAATTCCCTFCCGTCCTAATGACCCCAAGA 3' 725-943Antisense 5' GCGGGATCCGACCAGAGCAGTFCCCCAGCCAGTC 3'
132Sense 5' TTGGGAAGAAAGATGAAGAT 3' 1063-1366Antisense 5' AGGAGGGTATGGGTGAGAGG 3'
eDNA sequences for the various subunit isoforms were obtained from published work: cr1, cr2, and cr3 [12], crl-T [13], (31 [81, and (32 [7].
subunit primers would also span at least one intron. PCR wasperformed in a Perkin Elmer 4800 Thermal Cycler (PerkinElmer-Cetus, Norwalk, Connecticut, USA) on identical 2 to 4 daliquots of the first strand cDNA with the GeneAmp kit (PerkinElmer-Cetus). The PCR mixture contained 25 to 50 pmol of eachprimer, 200 fLM of each dNTP, 2.5 units of AmpliTaq polymerase,10 mM dithiothreitol, 10 fM Tris-HCI (pH 8.3), 50 mrvi KC1, and1.5 to 2.5 mrvt MgCI2 in a 50 to 100 tl volume. The concentrationsof primers and MgC12 were optimized for each primer pair. Forthe cr1, cr3, 131, and (32 isoforms, amplification was performed asfollows: 95°C >< two minutes (initial denaturation), 35 cycles of95°C X one minute, 55°C X one minute, and 72°C X two minutes,followed by a final extension at 72°C X seven minutes. For the cr2primers, the amplification consisted of 95°C X one minute, 37°CX one minute, and 72°C X two minutes for 3 cycles, followed by35 cycles of 95°C X one minute, 55°C X one minute, and 72°C Xtwo minutes, and a final extension at 72°C x seven minutes. Tocontrol for genomic DNA contamination of the eDNA samples,the original RNA was directly amplified with each set of primerswithout reverse transcription. Moreover, PCR of the common"master mix" of reagents and primers was performed in theabsence of template DNA or RNA to exclude the possibility ofsample contamination.
Analysis, cloning, and sequencing of PCR productsOur previous molecular cloning and nucleotide sequencing data
[22] demonstrated the authenticity of the cr1, cr2, cr3, and (32products amplified with the respective primers from renal cortex.To verify the molecular identities of the 131 and crl-T PCRproducts, 10 .c1 of the PCR products amplified from renal cortexwere size-fractionated by electrophoresis through a 1.5% agarosegel containing 0.5 j.cg/ml ethidium bromide in Tris boratelEDTAbuffer. Ethidium bromide-stained product bands of expected sizewere visualized under ultraviolet (UV) light, excised from the gel,and the DNA purified using the PREP-A-GENE kit (Bio-RadLaboratories, Richmond, California, USA). The purified DNAwas then cut with the respective restriction endonucleases, sub-cloned into pBluescript KS + (Stratagene, La Jolla, California,
USA), and transformed into DH5cr competent cells (Gibco-BRL). Recombinant plasmid DNA was purified by the alkalinelysis method and used as double-stranded templates for sequenc-ing with Sequenase (U.S. Biochemical Corp., Cleveland, Ohio,USA). In subsequent experiments, the size-fractionated PCRproducts amplified from the microdissected renal structures withthe cr1, cr2, cr3, (31, and (32 primers were transferred to nylonmembranes and hybridized at high stringency to digoxigenin-labeled eDNA probes specific for each isoform PCR product. Theprobes were generated by PCR amplification of the cloned eDNAfragments of the different isoforms in the presence of digoxigenin-1 1-dUTP (Boehringer Mannheim, Indianapolis, Indiana, USA)using the isoform-specific primers employed in the original am-plification [31]. The blots were washed to a final stringency of 0.1x SSC (1 X SSC is 0.15 M NaC1 and 0.015 M sodium citrate, pH7.0), 0.1% SDS at 68°C. Immunological detection of DNA hybridswas carried out using alkaline phosphatase-conjugated anti-digoxigenin antibody and 5-bromo-4-chloro-3-indolyl phosphateand 4-nitro blue tetrazolium chloride as described in the technicalbulletin accompanying the Genius DNA Labeling and DetectionKit (Boehringer Mannheim). The blots were photocopied ontotransparency sheets and then photographed. A product migratingat the predicted size that hybridized under high stringency condi-tions with the cloned and sequenced eDNA probe from renalcortex was interpreted as a positive result.
cRNA probe preparationThe cloned cr1 and 132 PCR products [21] (Table 1) were used
to generate isoform-specific riboprobes. Isoform-specific eDNAfragments for the cr2 (nucleotides 121-502), cr3 (nucleotides50-330), and (31 (nucleotides 913-1184) subunits were provided byDr. Jerry Lingrel, University of Cincinnati. The isoform specificityof these probes has been well established [9, 11, 12]. The f31fragment was cloned into the HindIII and PstI sites of the plasmidvector pIBI3O (IBI), whereas the cr3 eDNA fragment was sub-cloned into the PstI and SmaI sites of pBluescript KS+. Toincrease the isoform specificity of the cr2 probe further (from—68% to <50% identity with the corresponding regions of the cr1
I00
al
''—28S
44#e
—28S
a2 Sea-18 S
4Qj' Q°
—285
S—18 S
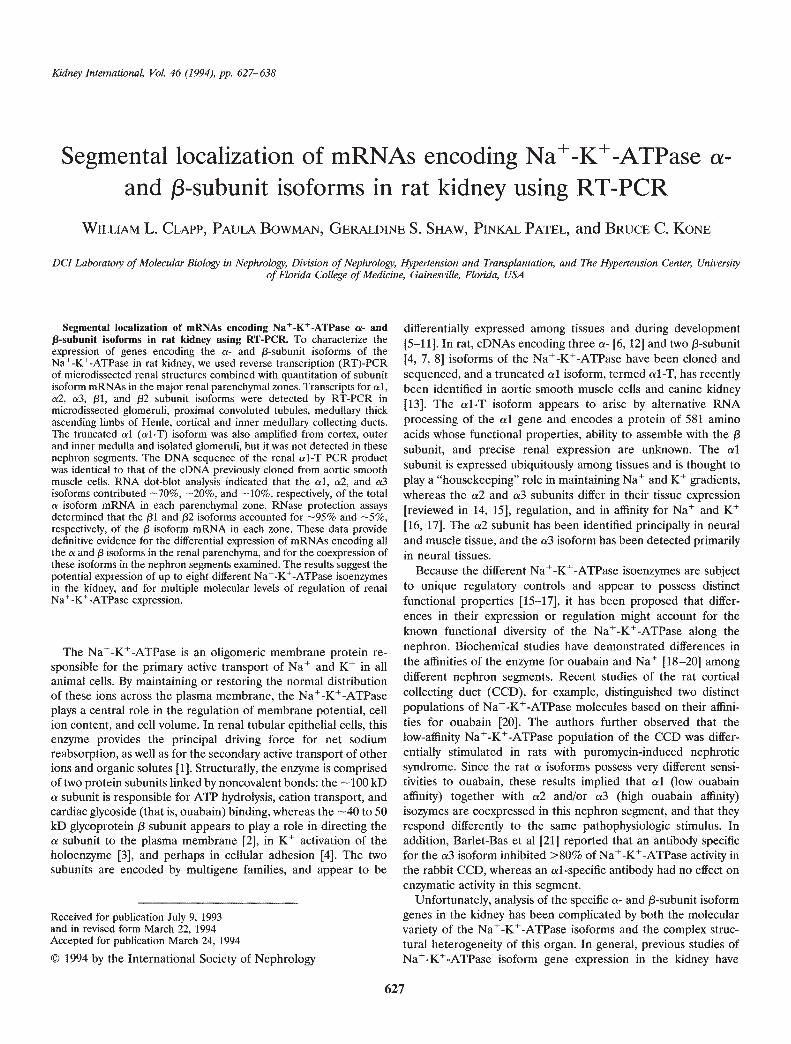
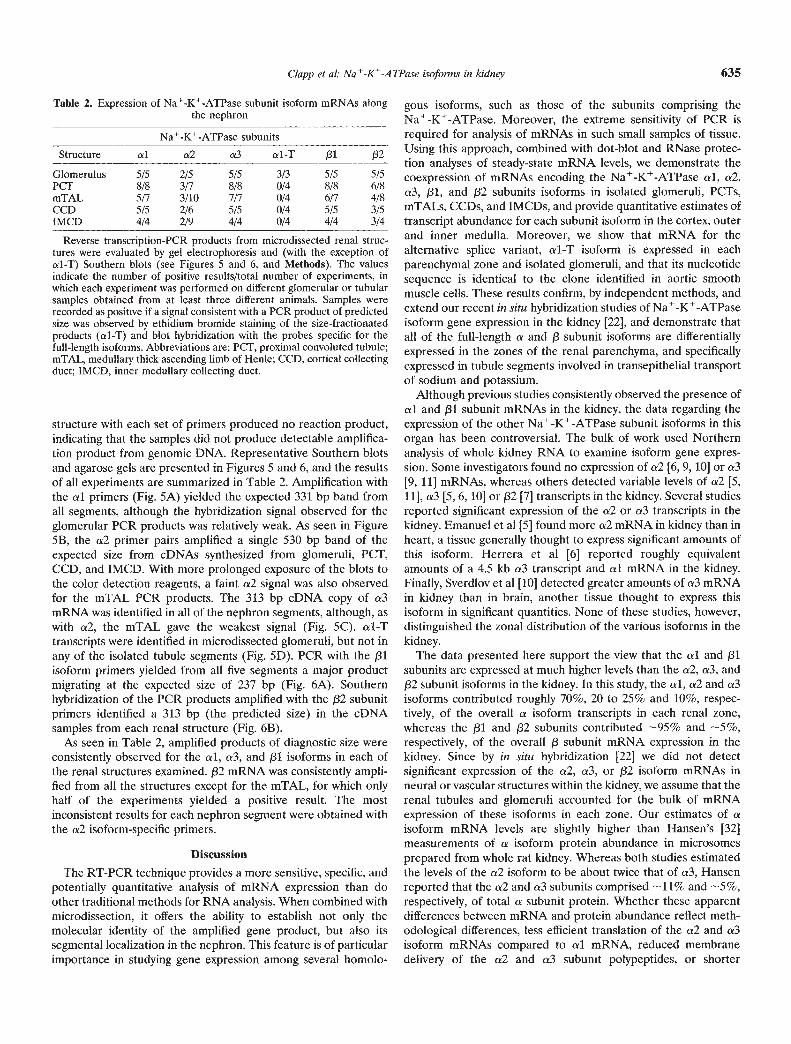
Fig. 1. Northern analysis of Na-K-ATPase a isoform mRNAs. TotalRNA from rat kidney cortex (10 ig for a!, 20 j.g for a2 and a3), brain (10rg), and heart (10 g) were electrophoresed and blotted onto nylonmembranes. Separate filters were hybridized with 32P-labeled cRNAprobes specific for each a subunit isoform as described in Methods. Anautoradiogram for each probe is shown. Migration positions of 28S and18S RNA bands are shown at the right.
and cs3 subunits), a 109 bp Sad-Sad segment (nucleotides183-292) of the a2 cDNA was subcloned into the Sad site ofpBluescript KS + for use as a probe. Using the University ofWisconsin Genetics Computer Group Sequence Analysis GAPprogram to calculate the degree of identity of the a isoform andthe p isoform probes when optimally aligned with their homo-logues, the a isoform probes were < 55% identical, whereas the13 isoform probes were < 50% identical. Moreover the probesshowed no significant homology with any other ion motiveATPase in the current GENBANK database.
The recombinant plasmids were linearized with appropriate
restriction endonucleases to allow synthesis of cRNAs as run-offtranscripts with T7 RNA polymerase. One microgram of linear-ized recombinant plasmid was incubated for two hours at 37°C ina solution containing transcription buffer, 20 U of human placen-tal RNase inhibitor (Boehringer Mannheim), 10 mrv dithiothrei-to!, GTP, ATP, C'!? (1 mrvi each), 0.65 mM unlabeled UTP, 0.35mM [a-PJ-UTP (800 Ci/mmol; Amersham Corp.), and 50 U ofT7 RNA polymerase (Ambion). The reaction was terminated bydigestion of the DNA template with 10 U RNase-free DNase I(Sigma), and the labeled riboprobes were precipitated in ethanol.
Northern and dot-blot analyses
Total RNA (10 to 20 j.g) isolated from renal cortex, brain, orheart was electrophoresed through 1% agarose-formaldehydegels, transferred to nylon membranes (Boehringer-Mannheim),and immobilized by UV cross-linking, The membranes wereprehybridized for a minimum of two hours at 52°C in 50%formamide, 5X SSC, 5X Denhardt's solution (0.1% Ficoll, 0.1%polyvinylpyrolidine, 0.1% bovine serum albumin), 0.2% SDS, 200g/ml denatured salmon sperm DNA, and 200 g/ml yeast tRNA.For hybridization, 5 X 10⁶ cpm/ml 32P-labeled cRNAs for al, a2,a3, 131, and 132 isoforms of the Na-K-ATPase were added toseparate membranes, and hybridized at 52°C for 16 hours. Thefilters were washed three times at high stringency in 0.1X SSC-0.1% SDS at 65°C for 30 minutes each wash, and exposed to X-rayfilm using an intensifying screen for 4 to 24 hours at —70°C.
For dot-blot analysis, serial dilutions (0.15, 0.3, 0.6, 1.25, 2.5,
630
*73%
72% *
66%
L
Clapp et a!: Na-K-ATPase isoforms in kidney
5
4>'0C. 3—.) c'
2
I)
0
25%-I-
Cortex Outer Innermedulla medulla
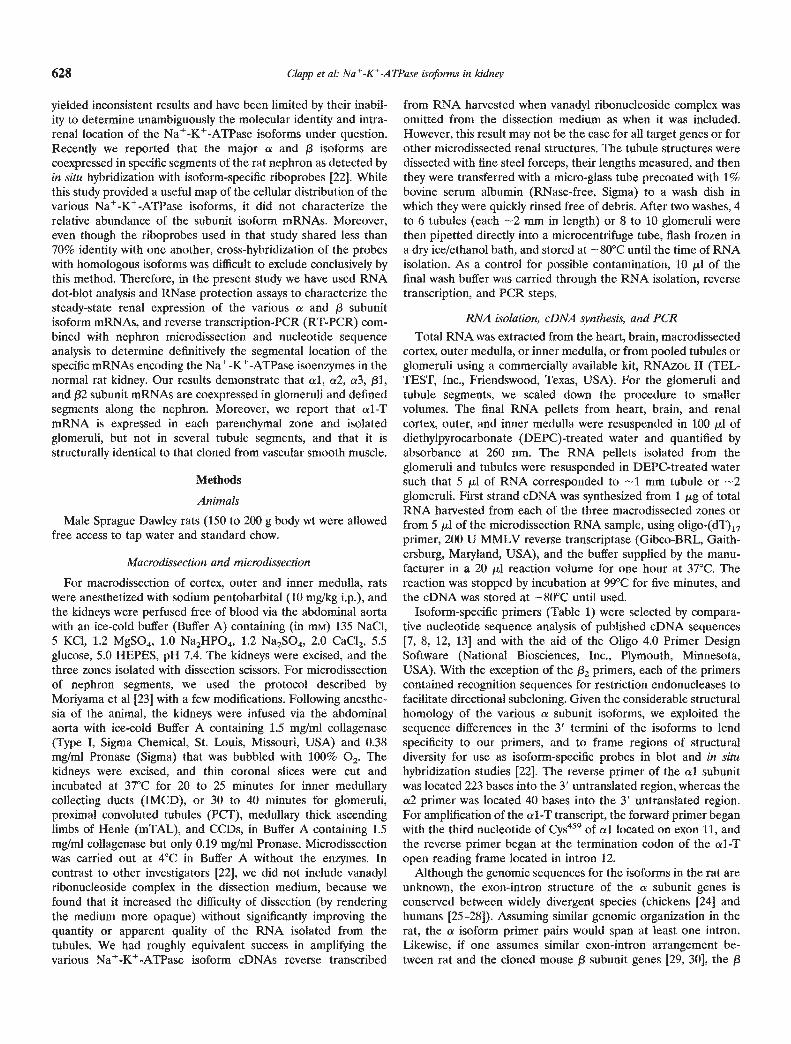
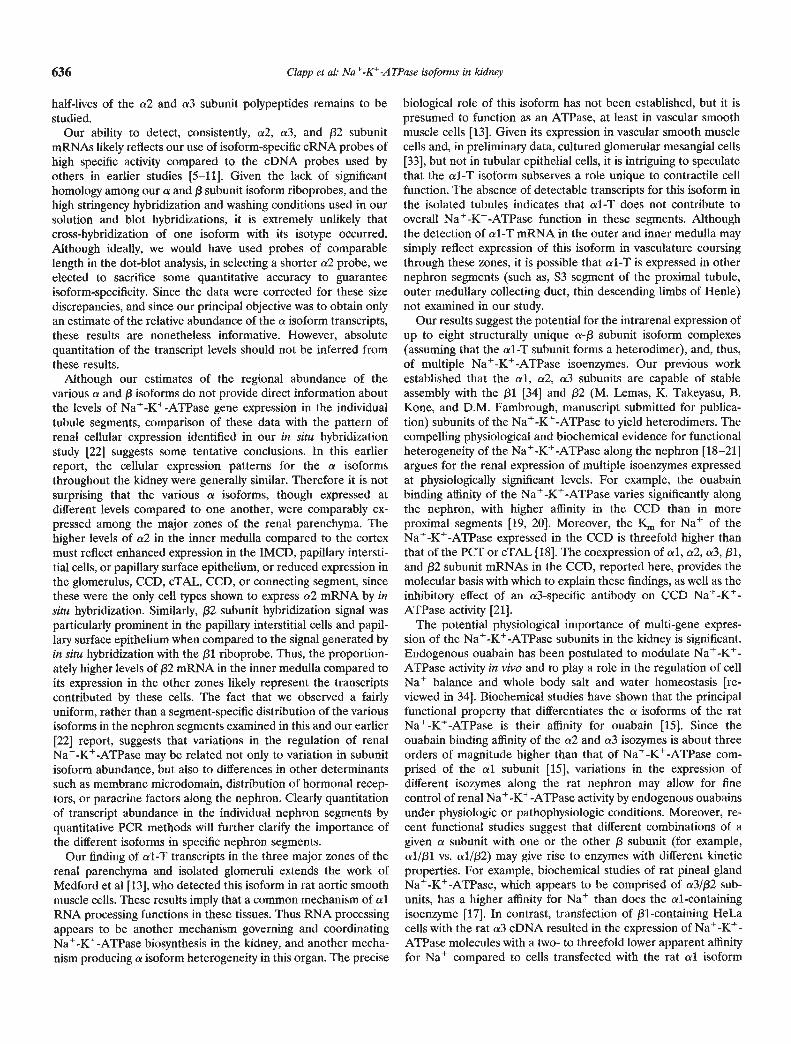
Fig. 2. Relative abundance of a subunits isoforms of the Na -K-A TPase inthe renal parenchyma. Dot blots were prepared by hybridization of totalRNA harvested from the indicated renal zones with 32P-labeled antisenseRNAs for each a subunit isoform. The relative signal intensities of thedots were measured by scanning densitometry of autoradiograms, and thedata were corrected for size differences of the probes. The histogrampresents the mean SEM of the corrected data obtained from threeexperiments from separate rats. The percentages above each bar indicatethe percentage of the total mRNA abundance contributed by the meanvalues of each a isoform in each zone. The sum of the al, a2, and a3isoform mRNA levels was assumed to represent 100% of total, full-lengtha isoform mRNA. P < 0.05 vs. a2 and a3 values in each zone; #P < 0.05vs. cortex a3 level.
31 32
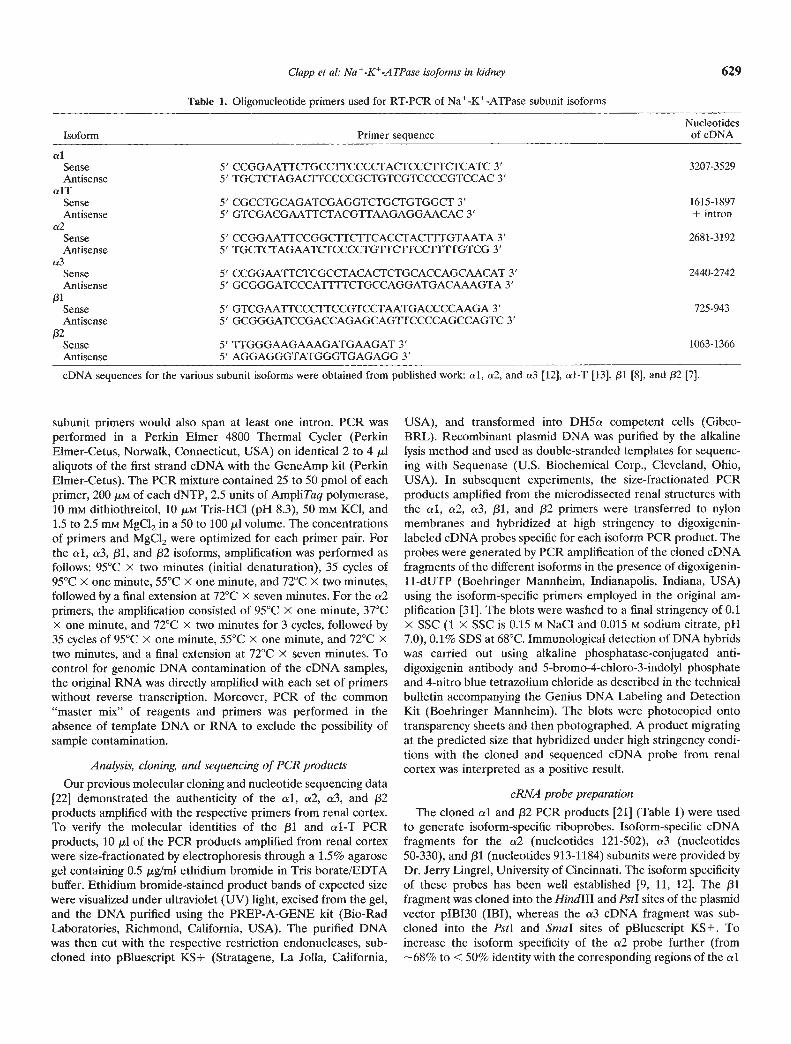
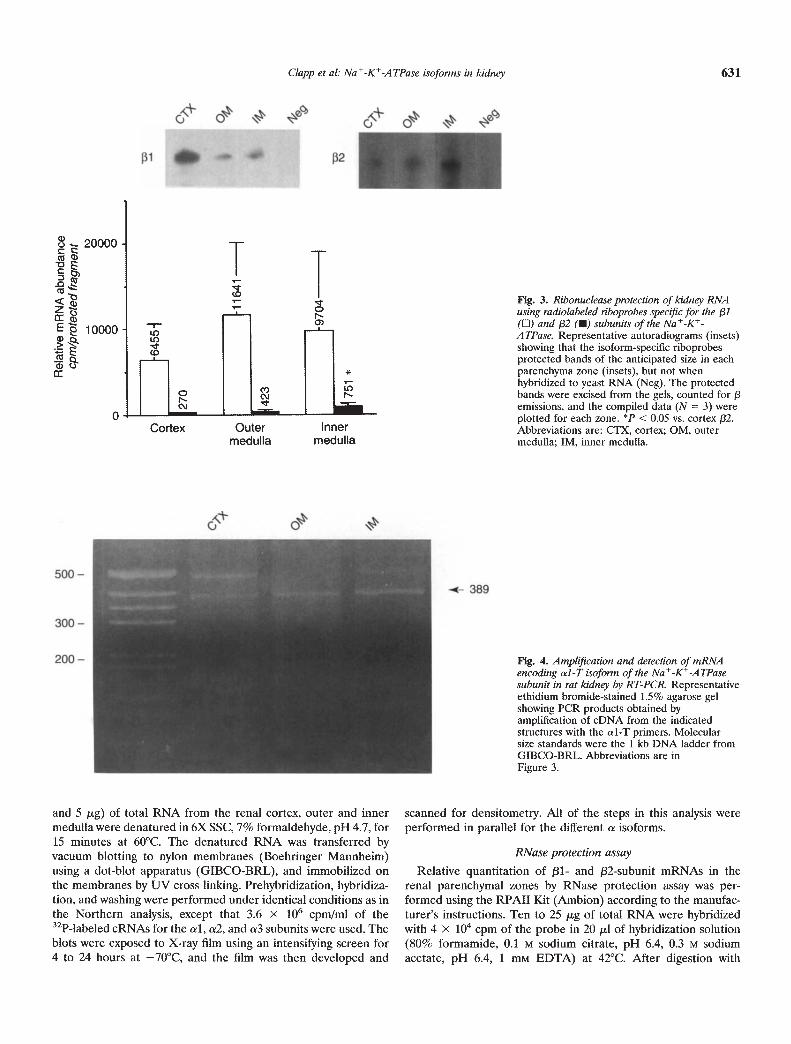
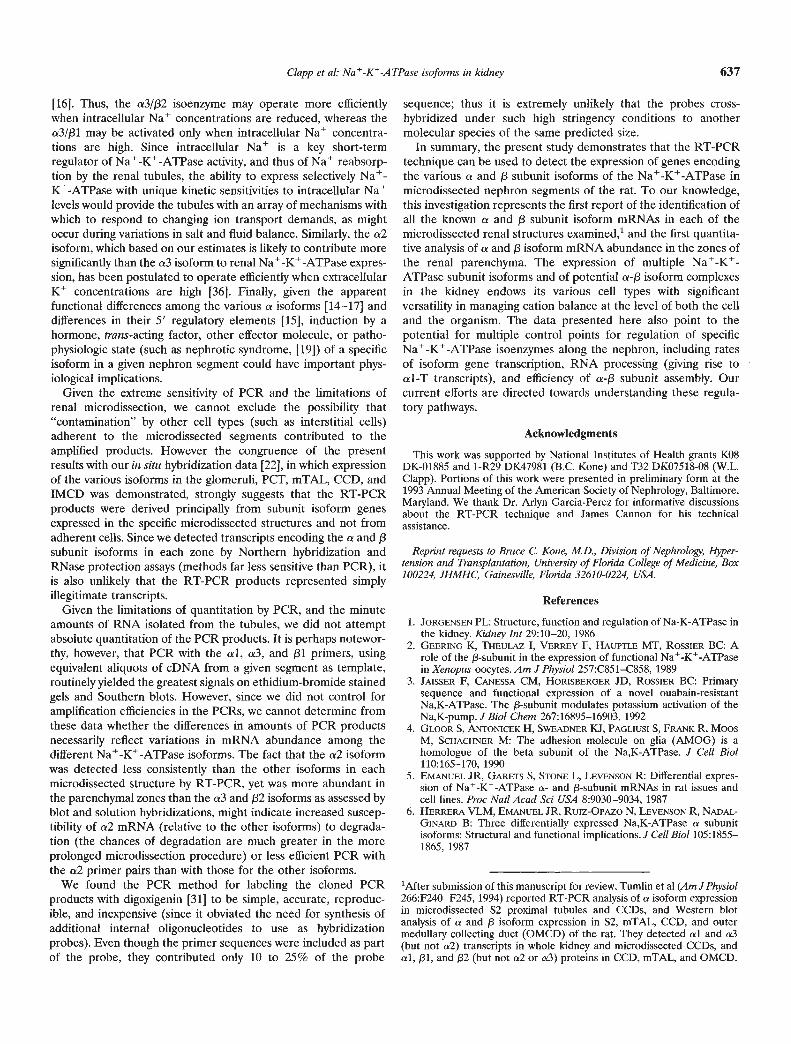
Fig. 3. Ribonuclease protection of kidney RNAusing radiolabeled riboprobes specific for the 131(El) and 132 (•) subunits of the Na -K-A TPase. Representative autoradiograms (insets)showing that the isoform-specific riboprobesprotected bands of the anticipated size in eachparenchyma zone (insets), but not whenhybridized to yeast RNA (Neg). The protectedbands were excised from the gels, counted for 13emissions, and the compiled data (N = 3) wereplotted for each zone. P < 0.05 vs. cortex 132.Abbreviations are: CTX, cortex; OM, outermedulla; IM, inner medulla.
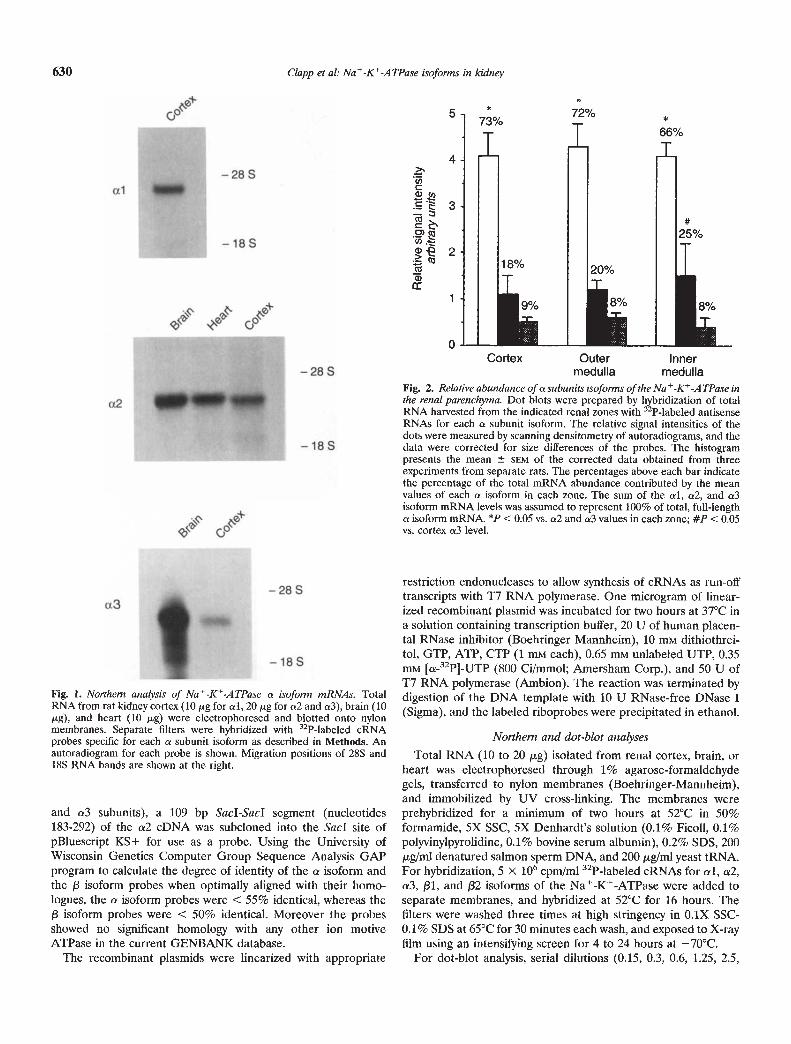
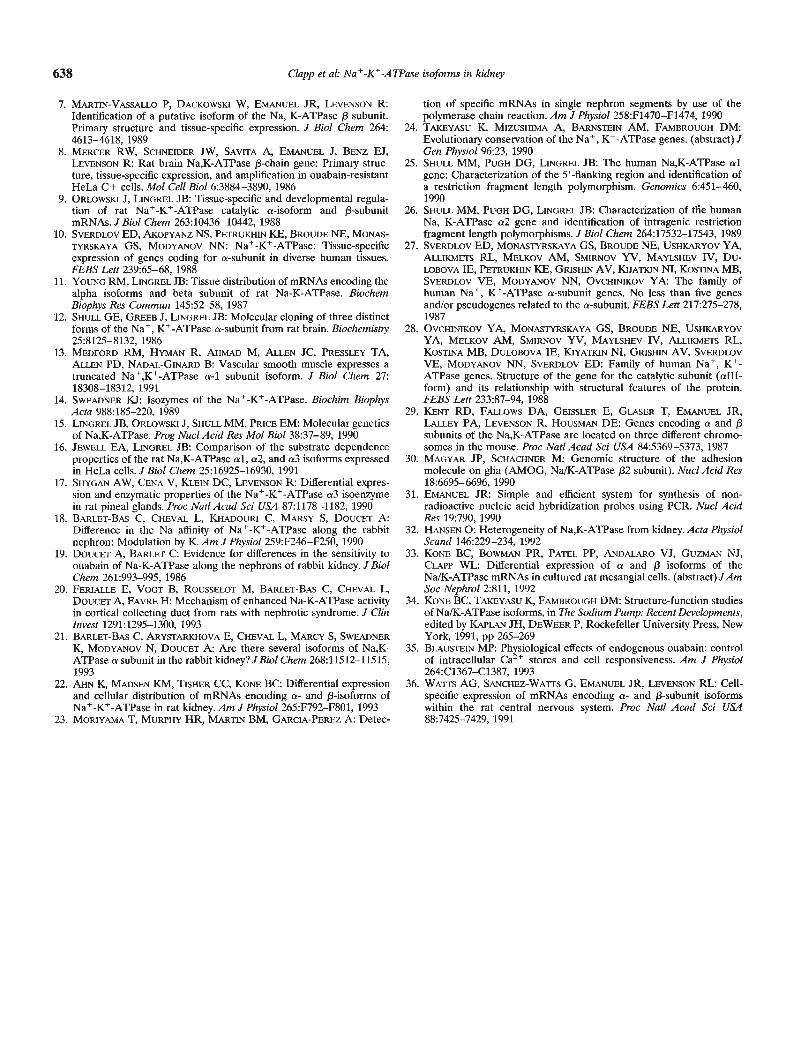
Fig. 4. Amplification and detection of mRNAencoding al-T isoform of the Na-K-ATPasesubunit in rat kidney by RT-PCR. Representativeethidium bromide-stained 1.5% agarose gelshowing PCR products obtained byamplification of eDNA from the indicatedstructures with the al-T primers. Molecularsize standards were the 1 kb DNA ladder fromGIBCO-BRL. Abbreviations are inFigure 3.
and 5 p.g) of total RNA from the renal cortex, outer and innermedulla were denatured in 6X SSC, 7% formaldehyde, pH 4.7, for15 minutes at 60°C. The denatured RNA was transferred byvacuum blotting to nylon membranes (Boehringer Mannheim)using a dot-blot apparatus (GIBCO-BRL), and immobilized onthe membranes by UV cross linking. Prehybridization, hybridiza-tion, and washing were performed under identical conditions as inthe Northern analysis, except that 3.6 x 10⁶ cpm/ml of the32P-labeled cRNAs for the al, a2, and a3 subunits were used. Theblots were exposed to X-ray film using an intensifring screen for4 to 24 hours at —70°C, and the film was then developed and
scanned for densitometiy. All of the steps in this analysis wereperformed in parallel for the different a isoforms.
RNase protection assayRelative quantitation of 131- and 132-subunit mRNAs in the
renal parenchymal zones by RNase protection assay was per-formed using the RPAII Kit (Ambion) according to the manufac-turer's instructions. Ten to 25 jg of total RNA were hybridizedwith 4 x iO cpm of the probe in 20 l of hybridization solution(80% formamide, 0.1 M sodium citrate, pH 6.4, 0.3 M sodiumacetate, pH 6.4, 1 mtvi EDTA) at 42°C. After digestion with
C/app et al: Na-K-ATPase isoforms in kidney 631
I20000
C
z.3q)E 10000
W.)
0
(0
*U,N-
Cortex Outer Innermedulla medulla
300 —
200 —
*- 389
---nS ——
-4-- 331 bp
-530bp
000
Ar
-. a
• ?
gO C)
632 Clapp et al: Na-K-ATPase isoforms in kidney
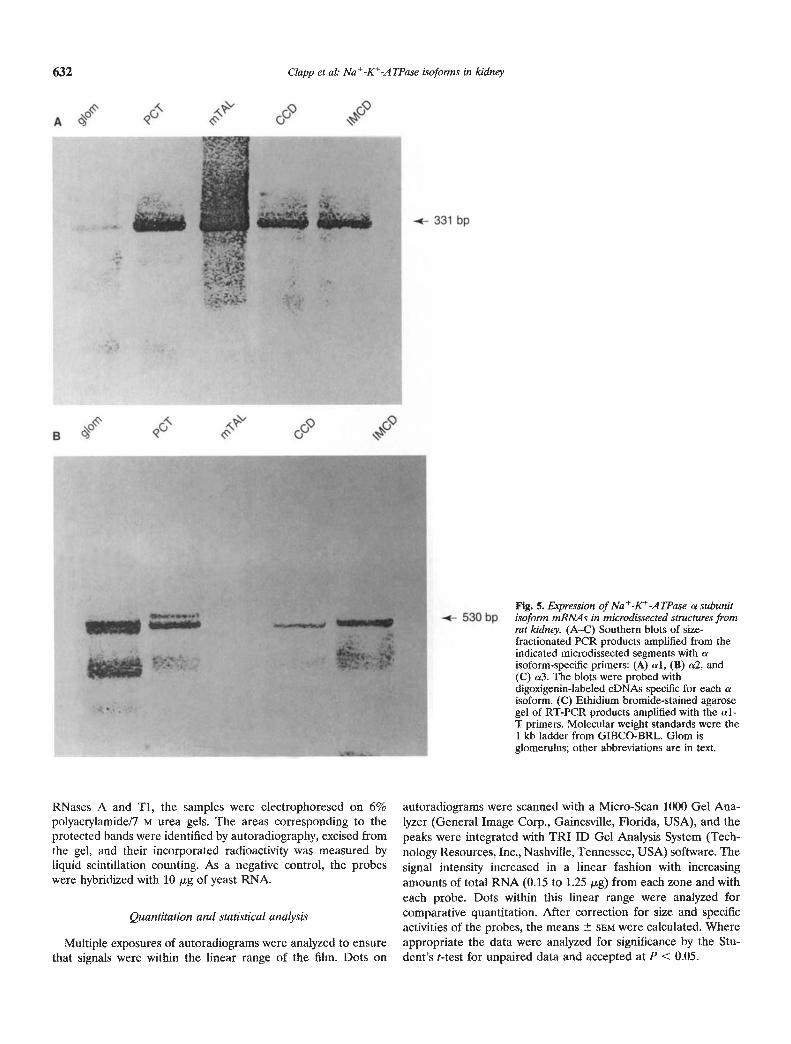
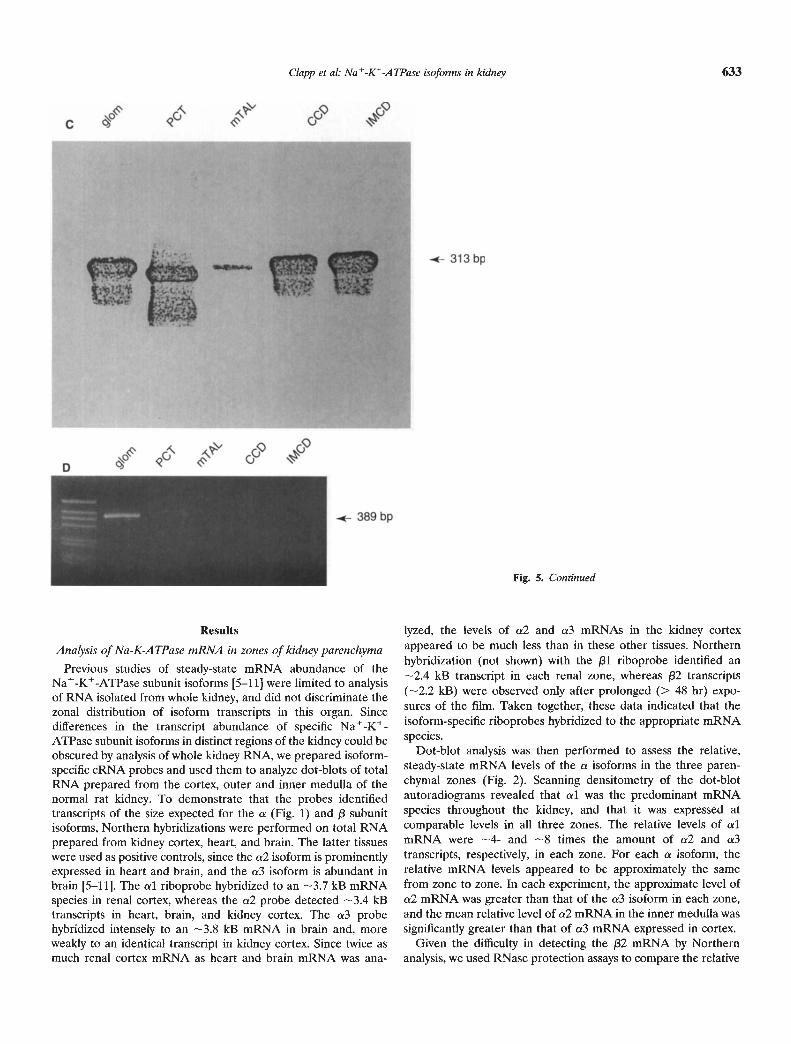
Fig. 5. Expression of NatKtATPase a subunitisoform mRNAs in microdnsected structures fromrat k'dney. (A—C) Southern blots of size-fractionated PCR products amplified from theindicated microdissected segments with aisoform-specific primers: (A) al, (B) a2, and(C) a3. The blots were probed withdigoxigenin-labeled cDNAs specific for each aisoform. (C) Ethidium bromide-stained agarosegel of RT-PCR products amplified with the al-T primers. Molecular weight standards were the1 kb ladder from GIBCO-BRL. Glom isglomerulus; other abbreviations are in text.
RNases A and Ti, the samples were electrophoresed on 6%polyacrylamide/7 M urea gels. The areas corresponding to theprotected bands were identified by autoradiography, excised fromthe gel, and their incorporated radioactivity was measured byliquid scintillation counting. As a negative control, the probeswere hybridized with 10 g of yeast RNA.
Quantitation and statistical analysis
Multiple exposures of autoradiograms were analyzed to ensurethat signals were within the linear range of the film. Dots on
autoradiograms were scanned with a Micro-Scan 1000 Gel Ana-lyzer (General Image Corp., Gainesville, Florida, USA), and thepeaks were integrated with TRI ID Gel Analysis System (Tech-nology Resources, Inc., Nashville, Tennessee, USA) software. Thesignal intensity increased in a linear fashion with increasingamounts of total RNA (0.15 to 1.25 Jhg) from each zone and witheach probe. Dots within this linear range were analyzed forcomparative quantitation. After correction for size and specificactivities of the probes, the means SEM were calculated. Whereappropriate the data were analyzed for significance by the Stu-dent's t-test for unpaired data and accepted at P < 0.05.
A
389
-4- 313bp
rOCt,
eq Ct'
0
Clapp et al: Na-K-ATPase isoforms in kidney 633
Fig. 5. Continued
Results
Analysis of Na-K-A TPase mRJ'JA in zones of kidney parenchyma
Previous studies of steady-state mRNA abundance of theNa-K-ATPase subunit isoforms [5—11] were limited to analysisof RNA isolated from whole kidney, and did not discriminate thezonal distribution of isoform transcripts in this organ. Sincedifferences in the transcript abundance of specific Na-K-ATPase subunit isoforms in distinct regions of the kidney could beobscured by analysis of whole kidney RNA, we prepared isoform-specific cRNA probes and used them to analyze dot-blots of totalRNA prepared from the cortex, outer and inner medulla of thenormal rat kidney. To demonstrate that the probes identifiedtranscripts of the size expected for the a (Fig. 1) and /3 subunitisoforms, Northern hybridizations were performed on total RNAprepared from kidney cortex, heart, and brain. The latter tissueswere used as positive controls, since the a2 isoform is prominentlyexpressed in heart and brain, and the a3 isoform is abundant inbrain [5—111. The al riboprobe hybridized to an —3.7 kB mRNAspecies in renal cortex, whereas the cr2 probe detected —3.4 kBtranscripts in heart, brain, and kidney cortex. The cr3 probehybridized intensely to an -—3.8 kB mRNA in brain and, moreweakly to an identical transcript in kidney cortex. Since twice asmuch renal cortex mRNA as heart and brain mRNA was ana-
lyzed, the levels of cr2 and cr3 mRNAs in the kidney cortexappeared to be much less than in these other tissues. Northernhybridization (not shown) with the /31 riboprobe identified an—2.4 kB transcript in each renal zone, whereas /32 transcripts(—2.2 kB) were observed only after prolonged (> 48 hr) expo-sures of the film. Taken together, these data indicated that theisoform-specific riboprobes hybridized to the appropriate mRNAspecies.
Dot-blot analysis was then performed to assess the relative,steady-state mRNA levels of the a isoforms in the three paren-chymal zones (Fig. 2). Scanning densitometry of the dot-blotautoradiograms revealed that cr1 was the predominant mRNAspecies throughout the kidney, and that it was expressed atcomparable levels in all three zones. The relative levels of cr1mRNA were --4- and —8 times the amount of cr2 and cr3transcripts, respectively, in each zone. For each a isoform, therelative mRNA levels appeared to be approximately the samefrom zone to zone. In each experiment, the approximate level ofcr2 mRNA was greater than that of the a3 isoform in each zone,and the mean relative level of cr2 mRNA in the inner medulla wassignificantly greater than that of cr3 mRNA expressed in cortex.
Given the difficulty in detecting the /32 mRNA by Northernanalysis, we used RNase protection assays to compare the relative
r.1
I,
.t 304 bp
634 Clapp et al: Nat -K-A TPase isoforms in kidney
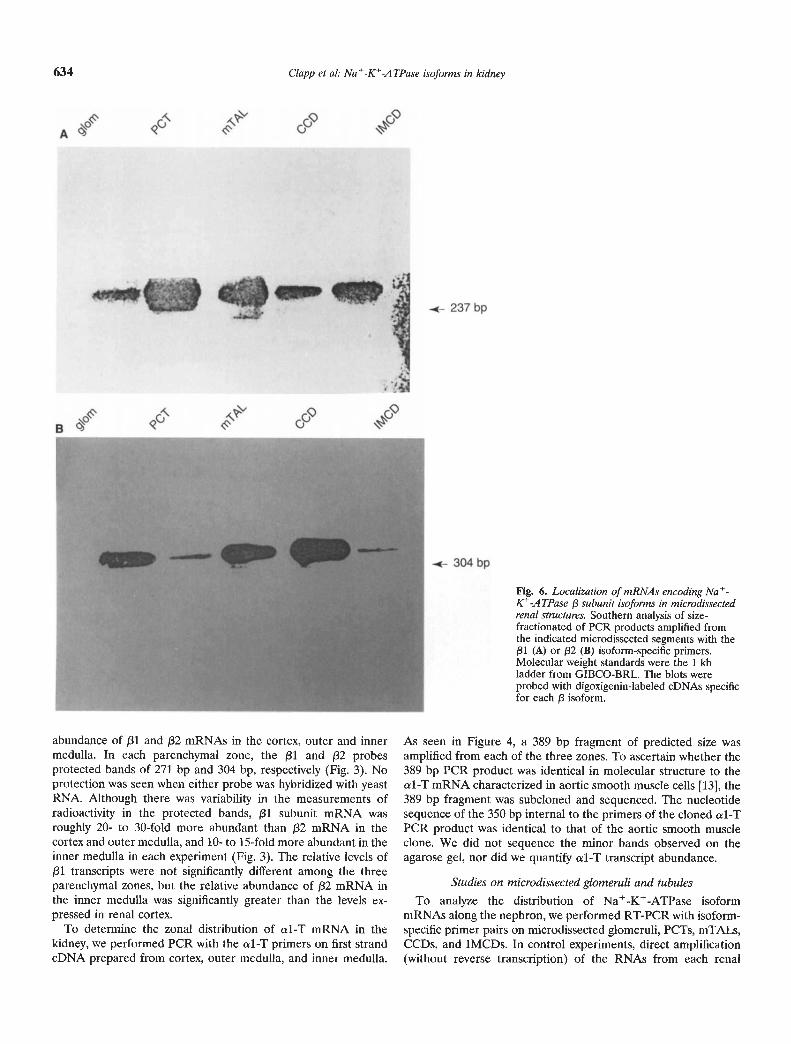
Fig. 6. Localization of mRNAs encoding NatC-ATPase J3 subunit isoforms in microdissectedrenal structures. Southern analysis of size-fractionated of PCR products amplified fromthe indicated microdissccted segments with the/31 (A) or /32 (B) isoform-specific primers.Molecular weight standards were the 1 kbladder from GIBCO-BRL. The blots wereprobed with digoxigenin-labeled cDNAs specificfor each /3 isoform.
abundance of /31 and /32 mRNAs in the cortex, outer and innermedulla. In each parenchymal zone, the /31 and j32 probesprotected bands of 271 bp and 304 bp, respectively (Fig. 3). Noprotection was seen when either probe was hybridized with yeastRNA. Although there was variability in the measurements ofradioactivity in the protected bands, /31 subunit mRNA wasroughly 20- to 30-fold more abundant than /32 mRNA in thecortex and outer medulla, and 10- to 15-fold more abundant in theinner medulla in each experiment (Fig. 3). The relative levels of/31 transcripts were not significantly different among the threeparenchymal zones, but the relative abundance of /32 mRNA inthe inner medulla was significantly greater than the levels ex-pressed in renal cortex.
To determine the zonal distribution of al-T mRNA in thekidney, we performed PCR with the csl-T primers on first strandcDNA prepared from cortex, outer medulla, and inner medulla.
As seen in Figure 4, a 389 bp fragment of predicted size wasamplified from each of the three zones. To ascertain whether the389 bp PCR product was identical in molecular structure to thecvl-T mRNA characterized in aortic smooth muscle cells [13], the389 bp fragment was subcloned and sequenced. The nucleotidesequence of the 350 bp internal to the primers of the cloned ul-TPCR product was identical to that of the aortic smooth muscleclone, We did not sequence the minor bands observed on theagarose gel, nor did we quantify al-T transcript abundance.
Studies on microdissected glomeruli and tubules
To analyze the distribution of Na-K-ATPase isoformmRNAs along the nephron, we performed RT-PCR with isoform-specific primer pairs on microdissected glomeruli, PCTs, mTALs,CCDs, and IMCDs. In control experiments, direct amplification(without reverse transcription) of the RNAs from each renal
Clapp et a!: Na-K-ATPase isofonns in kidney 635
Table 2. Expression of Na-K-ATPase subunit isoform mRNAs alongthe nephron
Na-K -ATPase subunitsStructure al a2 a3 al-T /31 /32
Glomerulus 5/5 2/5 5/5 3/3 5/5 5/5PCT 8/8 3/7 8/8 0/4 8/8 6/8mTAL 5/7 3/10 7/7 0/4 6/7 4/8CCD 5/5 2/6 5/5 0/4 5/5 3/5IMCD 4/4 2/9 4/4 0/4 4/4 3/4
Reverse transcription-PCR products from microdissected renal struc-tures were evaluated by gel electrophoresis and (with the exception ofal-T) Southern blots (see Figures 5 and 6, and Methods). The valuesindicate the number of positive results/total number of experiments, inwhich each experiment was performed on different glomerular or tubularsamples obtained from at least three different animals. Samples wererecorded as positive if a signal consistent with a PCR product of predictedsize was observed by ethidium bromide staining of the size-fractionatedproducts (al-T) and blot hybridization with the probes specific for thefull-length isoforms. Abbreviations are: PCT, proximal convoluted tubule;mTAL, medullary thick ascending limb of Henle; CCD, cortical collectingduct; IMCD, inner medullary collecting duct.
structure with each set of primers produced no reaction product,indicating that the samples did not produce detectable amplifica-tion product from genomic DNA. Representative Southern blotsand agarose gels are presented in Figures 5 and 6, and the resultsof all experiments are summarized in Table 2. Amplification withthe al primers (Fig. 5A) yielded the expected 331 bp band fromall segments, although the hybridization signal observed for theglomerular PCR products was relatively weak. As seen in Figure5B, the a2 primer pairs amplified a single 530 bp band of theexpected size from cDNAs synthesized from glomeruli, PCT,CCD, and IMCD. With more prolonged exposure of the blots tothe color detection reagents, a faint a2 signal was also observedfor the mTAL PCR products. The 313 bp eDNA copy of a3mRNA was identified in all of the nephron segments, although, aswith a2, the mTAL gave the weakest signal (Fig. 5C). al-Ttranscripts were identified in microdissected glomeruli, but not inany of the isolated tubule segments (Fig. SD). PCR with the f31isoform primers yielded from all five segments a major productmigrating at the expected size of 237 bp (Fig. 6A). Southernhybridization of the PCR products amplified with the /32 subunitprimers identified a 313 bp (the predicted size) in the eDNAsamples from each renal structure (Fig. 6B).
As seen in Table 2, amplified products of diagnostic size wereconsistently observed for the al, a3, and /31 isoforms in each ofthe renal structures examined. $32 mRNA was consistently ampli-fied from all the structures except for the mTAL, for which onlyhalf of the experiments yielded a positive result. The mostinconsistent results for each nephron segment were obtained withthe a2 isoform-specific primers.
Discussion
The RT-PCR technique provides a more sensitive, specific, andpotentially quantitative analysis of mRNA expression than doother traditional methods for RNA analysis. When combined withmicrodissection, it offers the ability to establish not only themolecular identity of the amplified gene product, but also itssegmental localization in the nephron. This feature is of particularimportance in studying gene expression among several homolo-
gous isoforms, such as those of the subunits comprising theNa-K-ATPase. Moreover, the extreme sensitivity of PCR isrequired for analysis of mRNAs in such small samples of tissue.Using this approach, combined with dot-blot and RNase protec-tion analyses of steady-state mRNA levels, we demonstrate thecoexpression of mRNAs encoding the Na-K-ATPase al, a2,a3, /31, and $32 subunits isoforms in isolated glomeruli, PCTs,mTALs, CCDs, and IMCDs, and provide quantitative estimates oftranscript abundance for each subunit isoform in the cortex, outerand inner medulla. Moreover, we show that mRNA for thealternative splice variant, al-T isoform is expressed in eachparenchymal zone and isolated glomeruli, and that its nucleotidesequence is identical to the clone identified in aortic smoothmuscle cells. These results confinn, by independent methods, andextend our recent in situ hybridization studies of Na-K-ATPaseisoform gene expression in the kidney [22], and demonstrate thatall of the full-length a and /3 subunit isoforms are differentiallyexpressed in the zones of the renal parenchyma, and specificallyexpressed in tubule segments involved in transepithelial transportof sodium and potassium.
Although previous studies consistently observed the presence ofal and 131 subunit mRNAs in the kidney, the data regarding theexpression of the other Na-K-ATPase subunit isoforms in thisorgan has been controversial. The bulk of work used Northernanalysis of whole kidney RNA to examine isoform gene expres-sion. Some investigators found no expression of a2 [6, 9, 10] or a3[9, 11] mRNAs, whereas others detected variable levels of cs2 [5,11], a3 [5, 6, 10] or $32 [7] transcripts in the kidney. Several studiesreported significant expression of the a2 or a3 transcripts in thekidney. Emanuel et al [5] found more a2 mRNA in kidney than inheart, a tissue generally thought to express significant amounts ofthis isoform. Herrera et al [6] reported roughly equivalentamounts of a 4.5 kb cr3 transcript and cr1 mRNA in the kidney.Finally, Sverdlov et al [10] detected greater amounts of a3 mRNAin kidney than in brain, another tissue thought to express thisisoform in significant quantities. None of these studies, however,distinguished the zonal distribution of the various isoforms in thekidney.
The data presented here support the view that the al and $31subunits are expressed at much higher levels than the cr2, a3, and/32 subunit isoforms in the kidney. In this study, the al, a2 and a3isoforms contributed roughly 70%, 20 to 25% and 10%, respec-tively, of the overall a isoform transcripts in each renal zone,whereas the /31 and /32 subunits contributed —.95% and --.5%,respectively, of the overall $3 subunit mRNA expression in thekidney. Since by in situ hybridization [22] we did not detectsignificant expression of the a2, a3, or /32 isoform mRNAs inneural or vascular structures within the kidney, we assume that therenal tubules and glomeruli accounted for the bulk of mRNAexpression of these isoforms in each zone. Our estimates of aisoform mRNA levels are slightly higher than Hansen's [32]measurements of a isoform protein abundance in microsomesprepared from whole rat kidney. Whereas both studies estimatedthe levels of the a2 isoform to be about twice that of a3, Hansenreported that the a2 and a3 subunits comprised —11% and —5%,respectively, of total a subunit protein. Whether these apparentdifferences between mRNA and protein abundance reflect meth-odological differences, less efficient translation of the a2 and a3isoform mRNAs compared to al mRNA, reduced membranedelivery of the a2 and cr3 subunit polypeptides, or shorter
636 Clapp et al: Na-K-ATPase isofonns in kidney
half-lives of the a2 and a3 subunit polypeptides remains to bestudied.
Our ability to detect, consistently, a2, a3, and /32 subunitmRNAs likely reflects our use of isoform-specific cRNA probes ofhigh specific activity compared to the cDNA probes used byothers in earlier studies [5—11]. Given the lack of significanthomology among our a and /3 subunit isoform riboprobes, and thehigh stringency hybridization and washing conditions used in oursolution and blot hybridizations, it is extremely unlikely thatcross-hybridization of one isoform with its isotype occurred.Although ideally, we would have used probes of comparablelength in the dot-blot analysis, in selecting a shorter a2 probe, weelected to sacrifice some quantitative accuracy to guaranteeisoform-specificity. Since the data were corrected for these sizediscrepancies, and since our principal objective was to obtain onlyan estimate of the relative abundance of the a isoform transcripts,these results are nonetheless informative. However, absolutequantitation of the transcript levels should not be inferred fromthese results.
Although our estimates of the regional abundance of thevarious a and /3 isoforms do not provide direct information aboutthe levels of Na-K-ATPase gene expression in the individualtubule segments, comparison of these data with the pattern ofrenal cellular expression identified in our in situ hybridizationstudy [22] suggests some tentative conclusions. In this earlierreport, the cellular expression patterns for the a isoformsthroughout the kidney were generally similar. Therefore it is notsurprising that the various a isoforms, though expressed atdifferent levels compared to one another, were comparably ex-pressed among the major zones of the renal parenchyma. Thehigher levels of a2 in the inner medulla compared to the cortexmust reflect enhanced expression in the IMCD, papillary intersti-tial cells, or papillary surface epithelium, or reduced expression inthe glomerulus, CCD, cTAL, CCD, or connecting segment, sincethese were the only cell types shown to express a2 mRNA by insitu hybridization. Similarly, /32 subunit hybridization signal wasparticularly prominent in the papillary interstitial cells and papil-lary surface epithelium when compared to the signal generated byin situ hybridization with the /31 riboprobe. Thus, the proportion-ately higher levels of /32 mRNA in the inner medulla compared toits expression in the other zones likely represent the transcriptscontributed by these cells. The fact that we observed a fairlyuniform, rather than a segment-specific distribution of the variousisoforms in the nephron segments examined in this and our earlier[22] report, suggests that variations in the regulation of renalNa-K-ATPase may be related not only to variation in subunitisoform abundance, but also to differences in other determinantssuch as membrane microdomain, distribution of hormonal recep-tors, or paracrine factors along the nephron. Clearly quantitationof transcript abundance in the individual nephron segments byquantitative PCR methods will further clarify the importance ofthe different isoforms in specific nephron segments.
Our finding of al-T transcripts in the three major zones of therenal parenchyma and isolated glomeruli extends the work ofMedford et al [13], who detected this isoform in rat aortic smoothmuscle cells. These results imply that a common mechanism of alRNA processing functions in these tissues. Thus RNA processingappears to be another mechanism governing and coordinatingNatKATPase biosynthesis in the kidney, and another mecha-nism producing a isoform heterogeneity in this organ. The precise
biological role of this isoform has not been established, but it ispresumed to function as an ATPase, at least in vascular smoothmuscle cells [13]. Given its expression in vascular smooth musclecells and, in preliminary data, cultured glomerular mesangial cells[331, but not in tubular epithelial cells, it is intriguing to speculatethat the al-T isoform subserves a role unique to contractile cellfunction. The absence of detectable transcripts for this isoform inthe isolated tubules indicates that al-T does not contribute tooverall Na-K-ATPase function in these segments. Althoughthe detection of al-T mRNA in the outer and inner medulla maysimply reflect expression of this isoform in vasculature coursingthrough these zones, it is possible that al-T is expressed in othernephron segments (such as, S3 segment of the proximal tubule,outer medullary collecting duct, thin descending limbs of Henle)not examined in our study.
Our results suggest the potential for the intrarenal expression ofup to eight structurally unique a-/3 subunit isoform complexes(assuming that the al-T subunit forms a heterodimer), and, thus,of multiple Na-K-ATPase isoenzymes. Our previous workestablished that the al, a2, a3 subunits are capable of stableassembly with the /31 [34] and /32 (M. Lemas, K. Takeyasu, B.Kone, and D.M. Fambrough, manuscript submitted for publica-tion) subunits of the Na-K-ATPase to yield heterodimers. Thecompelling physiological and biochemical evidence for functionalheterogeneity of the Na-K-ATPase along the nephron [18—21]argues for the renal expression of multiple isoenzymes expressedat physiologically significant levels. For example, the ouabainbinding affinity of the Na-K-ATPase varies significantly alongthe nephron, with higher affinity in the CCD than in moreproximal segments [19, 20]. Moreover, the Km for Na of theNa-K-ATPase expressed in the CCD is threefold higher thanthat of the PCT or cTAL [18]. The coexpression of al, a2, a3, /31,and /32 subunit mRNAs in the CCD, reported here, provides themolecular basis with which to explain these findings, as well as theinhibitory effect of an a3-specific antibody on CCD Na-K-ATPase activity [21].
The potential physiological importance of multi-gene expres-sion of the Na-K-ATPase subunits in the kidney is significant.Endogenous ouabain has been postulated to modulate Na-K-ATPase activity in vivo and to play a role in the regulation of cellNa balance and whole body salt and water homeostasis [re-viewed in 34]. Biochemical studies have shown that the principalfunctional property that differentiates the a isoforms of the ratNatKATPase is their affinity for ouabain [15]. Since theouabain binding affinity of the a2 and a3 isozymes is about threeorders of magnitude higher than that of Na4-K-ATPase com-prised of the at subunit [15], variations in the expression ofdifferent isozymes along the rat nephron may allow for finecontrol of renal Na-K-ATPase activity by endogenous ouabainsunder physiologic or pathophysiologic conditions. Moreover, re-cent functional studies suggest that different combinations of agiven a subunit with one or the other /3 subunit (for example,al//il vs. al//32) may give rise to enzymes with different kineticproperties. For example, biochemical studies of rat pineal glandNa-K-ATPase, which appears to be comprised of a3//32 sub-units, has a higher affinity for Na than does the al-containingisoenzyme [17]. In contrast, transfection of 131-containing HeLacells with the rat a3 cDNA resulted in the expression of Na-K-ATPase molecules with a two- to threefold lower apparent affinityfor Na compared to cells transfected with the rat al isoform
Clapp eta!: Na-K-ATPase isoforms in kidney 637
[16]. Thus, the a3/(32 isoenzyme may operate more efficientlywhen intracellular Na concentrations are reduced, whereas thea31/31 may be activated only when intracellular Na concentra-tions are high. Since intracellular Na is a key short-termregulator of Na-K-ATPase activity, and thus of Na reabsorp-tion by the renal tubules, the ability to express selectively Na-K-ATPase with unique kinetic sensitivities to intracellular Nalevels would provide the tubules with an array of mechanisms withwhich to respond to changing ion transport demands, as mightoccur during variations in salt and fluid balance. Similarly, the a2isoform, which based on our estimates is likely to contribute moresignificantly than the a3 isoform to renal Na-K-ATPase expres-sion, has been postulated to operate efficiently when extracellularK concentrations are high [36]. Finally, given the apparentfunctional differences among the various a isoforms [14—17] anddifferences in their 5' regulatory elements [15], induction by ahormone, trans-acting factor, other effector molecule, or patho-physiologic state (such as nephrotic syndrome, [19]) of a specificisoform in a given nephron segment could have important phys-iological implications.
Given the extreme sensitivity of PCR and the limitations ofrenal microdissection, we cannot exclude the possibility that"contamination" by other cell types (such as interstitial cells)adherent to the microdissected segments contributed to theamplified products. However the congruence of the presentresults with our in situ hybridization data [22], in which expressionof the various isoforms in the glomeruli, PCT, mTAL, CCD, andIMCD was demonstrated, strongly suggests that the RT-PCRproducts were derived principally from subunit isoform genesexpressed in the specific microdissected structures and not fromadherent cells. Since we detected transcripts encoding the a and f3subunit isoforms in each zone by Northern hybridization andRNase protection assays (methods far less sensitive than PCR), itis also unlikely that the RT-PCR products represented simplyillegitimate transcripts.
Given the limitations of quantitation by PCR, and the minuteamounts of RNA isolated from the tubules, we did not attemptabsolute quantitation of the PCR products. It is perhaps notewor-thy, however, that PCR with the al, a3, and 131 primers, usingequivalent aliquots of cDNA from a given segment as template,routinely yielded the greatest signals on ethidium-bromide stainedgels and Southern blots. However, since we did not control foramplification efficiencies in the PCRs, we cannot determine fromthese data whether the differences in amounts of PCR productsnecessarily reflect variations in mRNA abundance among thedifferent Na-K-ATPase isoforms. The fact that the a2 isoformwas detected less consistently than the other isoforms in eachmicrodissected structure by RT-PCR, yet was more abundant inthe parenchymal zones than the a3 and f32 isoforms as assessed byblot and solution hybridizations, might indicate increased suscep-tibility of a2 mRNA (relative to the other isoforms) to degrada-tion (the chances of degradation are much greater in the moreprolonged microdissection procedure) or less efficient PCR withthe a2 primer pairs than with those for the other isoforms.
We found the PCR method for labeling the cloned PCRproducts with digoxigenin [31] to be simple, accurate, reproduc-ible, and inexpensive (since it obviated the need for synthesis ofadditional internal oligonucleotides to use as hybridizationprobes). Even though the primer sequences were included as partof the probe, they contributed only 10 to 25% of the probe
sequence; thus it is extremely unlikely that the probes cross-hybridized under such high stringency conditions to anothermolecular species of the same predicted size.
In summary, the present study demonstrates that the RT-PCRtechnique can be used to detect the expression of genes encodingthe various a and /3 subunit isoforms of the Na-K-ATPase inmicrodissected nephron segments of the rat. To our knowledge,this investigation represents the first report of the identification ofall the known a and 13 subunit isoform mRNAs in each of themicrodissected renal structures examined,1 and the first quantita-tive analysis of a and f3isoform mRNA abundance in the zones ofthe renal parenchyma. The expression of multiple Na-K-ATPase subunit isoforms and of potential a-/3 isoform complexesin the kidney endows its various cell types with significantversatility in managing cation balance at the level of both the celland the organism. The data presented here also point to thepotential for multiple control points for regulation of specificNa-K-ATPase isoenzymes along the nephron, including ratesof isoform gene transcription, RNA processing (giving rise toal-T transcripts), and efficiency of a-/3 subunit assembly. Ourcurrent efforts are directed towards understanding these regula-tory pathways.
Acknowledgments
This work was supported by National Institutes of Health grants KOSDK-01885 and 1-R29 DK47981 (B.C. Kone) and T32 DK07518-08 (W.L.Clapp). Portions of this work were presented in preliminary form at the1993 Annual Meeting of the American Society of Nephrology, Baltimore,Maryland. We thank Dr. Arlyn Garcia-Perez for informative discussionsabout the RT-PCR technique and James Cannon for his technicalassistance.
Reprint requests to Bnwe C. Kone, MD., Division of Nephrology, Hyper-tension and Transplantation, Universily of Florida College of Medicine, Box100224, JHMHC, Gainesville, Florida 32610-0224, USA.
References
1. JORGENSEN PL: Structure, function and regulation of Na-K-ATPase inthe kidney. Kidney mt 29:10—20, 1986
2. GEERING K, THEULAZ I, VERREY F, HAUPTLE MT, RosslER BC: Arole of the /3-subunit in the expression of functional Na-K-ATPasein Xenopus oocytes. Am J Physiol 257:C851—C858, 1989
3. JAISSER F, CANESSA CM, HORISBERGER JD, RossIER BC: Primarysequence and functional expression of a novel ouabain-resistantNa,K-ATPase. The /3-subunit modulates potassium activation of theNa,K-pump. J Biol Chem 267:16895—16903, 1992
4. GLOOR 5, ANTONICEK H, SWEADNER KJ, PAGLIUSI 5, FRANK R, MoosM, SCHACHNER M: The adhesion molecule on glia (AMOG) is ahomologue of the beta subunit of the Na,K-ATPase. J Cell Biol110:165—170, 1990
5. EMANUEL JR, GARETS S, STONE L, LEVENSON R: Differential expres-sion of Na-K-ATPase a- and /3-subunit mRNAs in rat issues andcell lines. Proc Nati Acad Sci USA 8:9030—9034, 1987
6. HERRERA VLM, EMANUEL JR, RuIz-OPA.zo N, LEVENSON R, NADAL-GINARD B: Three differentially expressed Na,K-ATPase a subunitisoforms: Structural and functional implications. J Cell Biol 105:1855—1865, 1987
'After submission of this manuscript for review, Tumlin et al (Am JPhysiol266:F240—F245, 1994) reported RT-PCR analysis of a isoform expressionin microdissected S2 proximal tubules and CCDs, and Western blotanalysis of a and /3 isoform expression in S2, mTAL, CCD, and outermedullary collecting duct (OMCD) of the rat. They detected al and a3(but not a2) transcripts in whole kidney and microdissected CCDs, andal, /31, and /32 (but not a2 or a3) proteins in CCD, mTAL, and OMCD.
638 Clapp et al: Na-Kt-ATPase isoforms in kidney
7. MARTIN-VASSALLO P, DACKOWSKI W, EMANUEL JR, LEVENSON R:Identification of a putative isoform of the Na, K-ATPase 13 subunit.Primary structure and tissue-specific expression. J Biol Chem 264:4613—4618, 1989
8. MERCER RW, SCHNEIDER JW, SAVITA A, EMANUEL J, BENZ EJ,LEVENSON R: Rat brain Na,K-ATPase p-chain gene: Primary struc-ture, tissue-specific expression, and amplification in ouabain-resistantHeLa C+ cells. Mol Cell Biol 6:3884—3890, 1986
9. Oru.owsn J, LINGREL JB: Tissue-specific and developmental regula-tion of rat Nat-Kt-ATPase catalytic a-isoform and 13-subunitmRNAs. J Biol Chem 263:10436—10442, 1988
10, SVERDLOV ED, AKOPYANZ NS, PETRUKHIN ICE, BROUDE NE, M0NA5-TYRSKAYA GS, MODYANOV NN: Nat-K-ATPase: Tissue-specificexpression of genes coding for a-subunit in diverse human tissues.FEBS Lea 239:65—68, 1988
11. YOUNG RM, LINGREL JB: Tissue distribution of mRNAs encoding thealpha isoforms and beta subunit of rat Na-K-ATPase. BiochemBiophys Res Commun 145:52—58, 1987
12. SHULL GE, G1EEa J, LINGREL JB: Molecular cloning of three distinctforms of the Nat Kt-ATPase a-subunit from rat brain. Biochemistry25:8125—8132, 1986
13. MEDFORD RM, Hnti R, AUMAD M, ALLEN JC, PRESSLEY TA,ALLEN PD, NADAL-GINARD B: Vascular smooth muscle expresses atruncated Nat,Kt-ATPase a-i subunit isoform. J Biol Chem 27:18308—18312, 1991
14. SWEADNER KJ: Isozymes of the Nat-Kt-ATPase. Biochim BiophysActa 988:185—220, 1989
15. LINGREL JB, ORLowsM J, SHULL MM, PRICE EM: Molecular geneticsof Na,K-ATPase. Frog Nucl Acid Res Mol Biol 38:37—89, 1990
16. JEWELL EA, LINGREL JB: Comparison of the substrate dependenceproperties of the rat Na,K-ATPase ai, a2, and a3 isoforms expressedin HeLa cells. J Biol Chem 25:16925—16930, 1991
17. SHYGAN AW, CENA V, KLEIN DC, LEVENSON R: Differential expres-sion and enzymatic properties of the Nat-Kt-ATPase a3 isoenzymein rat pineal glands. Proc Nat! Acad Sci USA 87:1178—1182, 1990
18. BARLET-BAS C, CHEVAL L, KHADOURI C, MARsv 5, DOUCET A:Difference in the Na affinity of Nat-Kt-ATPase along the rabbitnephron: Modulation by K. Am J Physiol 259:F246—F250, 1990
19. DOUCET A, BARLET C: Evidence for differences in the sensitivity toouabain of Na-K-ATPase along the nephrons of rabbit kidney. J BiolChem 261:993—995, 1986
20. FERLALLE E, VOGT B, RoussEwT M, BARLET-BAS C, CHEVAL L,DOUCET A, FAVRE H: Mechanism of enhanced Na-K-ATPase activityin cortical collecting duet from rats with nephrotic syndrome. J ClinInvest 1291:1295—1300, 1993
21. BARLET-BA5 C, ARYSTARKHOVA E, CHEVAL L, MARCY 5, SWEADNERK, MODYANOV N, DOUCET A: Are there several isoforms of Na,K-ATPase a subunit in the rabbit kidney? JBiol Chem 268:11512—11515,1993
22. Aim K, MADSEN KM, TISHER CC, Kor'm BC: Differential expressionand cellular distribution of mRNAs encoding a- and /3-isoforms ofNat-K-ATPase in rat kidney. Am J Physiol 265:F792—F801, 1993
23. MORIYAMA T, MURPHY HR, MARTIN BM, GARCIA-PEREZ A: Detec-
tion of specific mRNAs in single nephron segments by use of thepolymerase chain reaction. Am J Physiol 258:F1470—F1474, 1990
24. TAKEYASU K, MIZUSHIMA A, BARNSTEIN AM, FAMaROUGH DM:Evolutionary conservation of the Nat, Kt-ATPase genes. (abstract) JGen Physiol 96:23, 1990
25. SHULL MM, PUGH DG, LINGREL JB: The human Na,K-ATPase algene: Characterization of the 5'-fianking region and identification ofa restriction fragment length polymorphism. Genomics 6:451—460,1990
26. SHULL MM, PUGH DG, LINGREL JB: Characterization of the humanNa, K-ATPase a2 gene and identification of intragenic restrictionfragment length polymorphisms. J Biol Chem 264:17532—17543, 1989
27. SVERDLGV ED, MONASTYRSKAYA GS, BROUDE NE, USHKARYGv YA,ALLIKMETS RL, MELKOV AM, SMIRNOV YV, MAYLSHEV IV, Du-LOBOVA IE, PETRUKHIN ICE, GRISHIN AV, KIJATKIN NI, K05TINA MB,SVERDLOV VE, MODYANOV NN, OVCHINIKOV YA: The family ofhuman Na, Kt-ATPase a-subunit genes. No less than five genesand/or pseudogenes related to the a-subunit. FEBS Lett 217:275—278,1987
28. OvCHINIKOV YA, MONASTYRSKAYA GS, BROUDE NE, UsFncRYovYA, Mnucov AM, SMIRNOV YV, MAYLSHEV IV, ALLIKMET5 RL,KOSTINA MB, DULOBOVA IE, KIYATKIN NI, GRISHIN AV, SVERDLOVVE, MODYANOV NN, SVERDLOV ED: Family of human Nat, KtATPase genes. Structure of the gene for the catalytic subunit (all!-form) and its relationship with structural features of the protein.FEBS Lett 233:87—94, 1988
29. KEr'rr RD, FAiLows DA, GEISSLER E, GLASER T, EMANUEL JR,LALLEY PA, LEVENSON R, HOUSMAN DE: Genes encoding a and 13subunits of the Na,K-ATPase are located on three different chromo-somes in the mouse. Proc Nat! Acad Sci USA 84:5369—5373, 1987
30. MAGYAR JP, SCHACHNER M: Genomic structure of the adhesionmolecule on glia (AMOG, Na/K-ATPase 132 subunit). Nucl Acid Res18:6695—6696, 1990
31. EMANUEL JR: Simple and efficient system for synthesis of non-radioactive nucleic acid hybridization probes using PCR. Nucl AcidRes 19:790, 1990
32. HANSEN 0: Heterogeneity of Na,K-ATPase from kidney. Acta PhysiolScand 146:229—234, 1992
33. KONE BC, BOWMAN PR, PATEL PP, ANDALARO VJ, GUZMAN NJ,CLAPS' WL: Differential expression of a and /3 isoforms of theNa/K-ATPase mRNAs in cultured rat mesangial cells. (abstract) JAmSoc Nephrol 2:811, 1992
34. KONE BC, TAKEYASU K, FAMBROUGH DM: Structure-function studiesof Na/K-ATPase isoforms, in The Sodium Pump: Recent Developments,edited by KAPLAN JH, DEWEER P, Rockefeller University Press, NewYork, 1991, pp 265—269
35. BLAUSTEIN MP: Physiological effects of endogcnuus ouabain: controlof intracellular Ca2 stores and cell responsiveness. Am J Physiol264:C1367—C1387, 1993
36. WAnS AG, SANcssnZ-WAns G, EMANUEL JR. LEVENSON RL: Cell-specific expression of mRNAs encoding a- and 13-subunit isoformswithin the rat central nervous system. Proc Nat! Acad Sci USA88:7425—7429, 1991


