Embed Size (px)
Citation preview

Conference Proceedings
Building a Knowledge-Based Economy in Nigeria: The Role of Information TechnologyT
he
me
: Building a Knowledge-Based Economy in Nigeria:
Volume 25
Knowledge-Based Economy 2014
Edited By
Professor Charles O. UWADIAProfessor Adesola ADEROUNMU
Dr. Adesina SODIYA
ISSN: 2141-9663

i
ACKNOWLEDGEMENT
It is with great pleasure that the Nigeria Computer Society (NCS) acknowledges the immense and reveredsupport received from the following organisaions:
Active Edge Limited Chams Plc Coollink Limited Computer Professionals (Registration Council of Nigeria) (CPN) Data Foundation Data Sciences Nigeria limited Dataflex Limited Enugu State Government Image Technologies Limited Inlaks Computers Limited MainOne Cable Limited National Information Technology Development Agency Sidmach Technologies Limited Zinox Technologies Limited
We also recognize the laudable efforts of all others in cash or in kind towards the success of the 25th NationalConference
REVIEWERS:Prof. G. A. ADEROUNMUDr. A.S. SODIYAProf. J. O. A. AYENIProf. L. O. KEHINDEProf. G. M. M. OBIProf. 'Dele OLUWADEDr. Vincent E. ASORProf. O. S. ADEWALEDr. D. K. ALESEDr. ' Sesan ADEYEMODr. (Mrs.) S.A. ONASHOGA
Dr. A. P. ADEWOLEDr. A. O. AJAYIDr. S.E ADEWUMIDr. I. K. OYEYINKADr. S. O. OLABIYISIDr. O. B. AJAYIDr. O. FOLORUNSODr. (Mrs.) O.S. ONAOLAPODr. A. I. OLUWARANTIDr. A. T. AKINWALEDr. E. O. OLAJUBU
Dr. O. A. OJESANMIDr. E. ESSIENDr. E. G. ESEYINDr. (Mrs.) O. R. VINCENTDr. Olumide B. LONGEDr. A. A. O. OBINIYIDr. F. T. IBRAHALUDr. O. T. AROGUNDADEDr. O. R. VINCENTDr. S. A. AREKETEDr. O. J. OYELADE
Publication Office:Nigeria Computer Society (NCS): Plot 10, Otunba Jobi Fele Way, Behind MKO Abiola Garden, Alausa, Ikeja
P.M.B. 4800 Surulere, Lagos, Nigeria. Phone: 01-7744600E-mail: [email protected], [email protected] Website: www.ncs.org.ng
© All rights reserved. No part of this publication may be reproduced in whole or in part, in any form or by anymeans, electronically or mechanically without the written permission of the Nigeria Computer Society (NCS).

ii
Table of ContentsPage
1 Acknowledgement i
2. Forward ii
3. Table of Contents iii
4. A Cloud-Based Vmmodel to Enhance Traffic Management on Nigerian Roads – A.Obiniyi and H.A. Sulaimon
1
5. A Model for maintaining Data Security and Authenticity in Voice-driven System – W.O.Adesanya, O.B. Alaba, and A.B. Adeyemo
8
6. Development of a Digital Yoruba Phrasebook on a Mobile Platform - O. Fagbolu, B.K.Alese and O.S. Adewale
13
7. HH-CLOUD: A Network Based Knowledge Management Framework for R&DOrganizations in Nigeria – F.N. Ugwoke, K.C. Okafor, C.C. Udeze
20
8. Modeling Mobile Cellular Signal Loss Prediction in Suburban Propagation Environmentin Nigeria – Okumbor Nkem Anthony and Okonkwo Obikwelu, Raphael
32
9. Measuring Information Security Awareness Efforts in Social Networking Sites – AProactive Approach – J.O. Okesola, and M. Grobler
39
7. Nigeria Youths: Major Contributor to ICT Tools or Major Consumers of ICT? – F.Y.Osisanwo, C. Ajaegbu and O. Akande
46
10. Phishing e-Mail Detection Mechanism Based on Middleware Technology – A.A.Orunsolu, A.S. Sodiya and A.T. Akinwale
55
11. Secure face Authentication using Visual Cryptography - S.O. Asakpa, B. K. Alese, O.S.Adewale and A.O. Adetunmbi
61
12. Mobile Technologies: Adopting Application Model for Economic Productivity inNigeria – Babatunde B. Olofin, Clement J. and C. Ayatalumo
67
13. Analysis of Smart Video Surveillance Systems – Akintola K.G., Akinyokun O.C.,Olabode O. and Iwasokun G.B.
79
14. Text to Speech Based Application for Enhanced Learning in Computer AssistedEnvironment – O. Oladipo, B.A. Oke and A.F. Falola
95

1
__________________________________________________________________________________________________________________________________________________
A CLOUD-BASED VMmodel TO ENHANCE TRAFFICMANAGEMENT ON NIGERIAN ROADS
__________________________________________________________________________________________________________________________________________________
A. A. ObiniyiDept. of Mathematics, Ahmadu Bello University, Zaria, Nigeria
H. A. SulaimonDept. of Computer Science, Federal College of Education, Zaria,
1. INTRODUCTIONCloud Computing refers to both the
applications delivered as services over the Internet andthe hardware and systems software in the datacentersthat provide those services (Software as a Service -SaaS). The datacenter hardware and software is whatis called a Cloud. When a Cloud is made available in apay-as-you-go manner to the public, it is called a PublicCloud; the service being sold is Utility Computing”(Armbrust et al, 2009). The idea of cloud computingstarted from the realization of the fact that businesses
may find it useful to rent the infrastructures andsometimes the needed software to run theirapplications instead of investing on them. One majoradvantage of cloud computing is its scalable access tocomputing resources. With cloud computing,developers do not need large capital outlays inhardware to deploy their service for Internetapplications and services. Keeping the noble benefit ofcloud computing, the idea of Vehicular Cloud (V-Cloud)comes into light (http:// abhi-carmaniacs.blogspot.com/2012/02/ vehicular-ad-hoc-network.html).
A recent study by Vashitz et.al, (2008)suggests that in-vehicle visual display may increasemental workload causing distractions while driving. Onthe other hand, in-vehicle notification of safetyinformation can add substantial value to increasedriving attention. In Nigeria, the Federal Road SafetyCorps (FRSC) has a legislation set for ensuringappropriate driving behavior that helps to qualify thedrivers from their provisional license period to fullyprofessional license holders. Traffic congestion occurswhen a city’s road network is unable to accommodatethe volume of traffic that uses it. Attempts made bygovernments to ensure that the congestions weremanaged through the various traffic managements’techniques have not yielded the desired results(Onasanya and Akanmu, 2002). The transportinfrastructures and traffic management put in place inthe city have not been able to ameliorate trafficcongestion. This inadequacy called for additional trafficmanagement techniques to the existing traditionalmethod, which could be found in cloud computing. Sofar, the conventional approaches to trafficmanagement have not been able to make the desiredimpact, judging from the traffic congestion patterns inNigerian cities.
Modern cars are equipped with permanentInternet presence, featuring substantial on-boardcomputational, storage, and sensing capabilities andrather than keeping these huge resources idle, thispaper proposed to use them in the co-operation withvarious authorities to solve problems which takeslonger time to solve due to lack of additional resources.
ABSTRACT
Attempts made by Nigeria governments to ensure thatthe congestions were managed through the varioustraffic management techniques have not yielded thedesired results. The transport infrastructures andtraffic management put in place in the city have notbeen able to ameliorate traffic congestion in the city.This paper introduces a cloud computing provision forthe Vehicular Mobility Model (VMmodel) that providesadditional traffic management techniques to theexisting traditional method. The proposed VMmodel isbased on an intelligent method of storing and trackingthe licensed holding drivers that violate the trafficrules for road safety authority to take legal actions onthem. The study proposes a conceptual frameworkand possible benefits for deploying a cloud-basedVMmodel.
Keywords: cloud computing, road safety, traffic rules,VMmodel.

2
The remainder of the paper is organized as follows: arelevant related works of different researchers arereviewed in the next section, while the proposedVMmodel concepts on cloud are discussed in section 3.The vehicular cloud architecture and case study of thedesign of VMmodel are outline in the section. Finallydiscussions and conclusion of the research are given insection 4.
2.0 RELATED WORKSThe work of Le-Tien and Phung (2010) was
based on both Short Message Services (SMS) andGeneral Package Radio Service (GPRS) technology tolocating the vehicle. The work collects positions of thevehicle via Global Positioning System (GPS) receiverand then sends the data of positions to specializedserver by the SMS or GPRS service. The specializedserver is composed of a development kit that supportsGSM techniques-WMP100 of the Wavecom Company.After processing data, the positions of the mobilevehicle are displayed on Google Map. The work of Jin-Cyuan et al.(2013) mainly consists of three stepsincluding vehicle region extraction, vehicle tracking,and classification. The background subtraction methodis firstly utilized to extract the foreground regions fromthe highway scene. Some geometric properties areapplied to remove the false regions and shadowremoval algorithm is used for obtaining more accuratesegmentation results. After vehicle detection, a graph-based vehicle tracking method is used for building thecorrespondence between vehicles detected.
In the work of Aravind et al.(2009), Vehicletracking system is one of such applications possible byembedding wireless sensor devices on the vehicles.Most of the state-of the-art technology uses GPS fortracking vehicles which is very expensive. The focus ofthis work is vehicle tracking system which is to trackthe desired vehicle with low-cost, effectiveimplementation as in contrast to the existing high-costtracking systems. Miah et al, (2011) proposed decisionsupport systems based on an intelligent method inwhich decision/policy makers of the Australian roadsafety authorities can obtain on-demand monitoringrecords regarding the behavior of license holdingdrivers. The studies outline a conceptual frameworkthat can automatically detect when a driver is using ahand-held device, generating an alert message throughan onboard device. In order to minimize the risk, if theuse of the device continues, they also proposed that
relevant information should be automatically wirelesslysent to the legal authority. If the use of a hand-helddevice continues after the warning, the processing unitwill automatically start communicating with adesignated server or a legal authority through thecloud server by sending urgent messages. Thecommunication includes vehicle details with its currentlocation (automatically obtainable from the on-boardGPS navigation system) and the type of driver activity.
Fernandez-Caballero et al. (2008) present animage-analysis approach for monitoring road traffic toensure safer behavior. However, this approach isunable to identify driver behavior as the image is takenfrom outside the vehicle. However, Delen and Pratt(2006) demonstrated the limitation of simulation ormodel-based Decision Support System as it is foundlacking when addressing real needs for manufacturingmanager‘s decision making. As such, an intelligentDecision Support System was proposed to solve theproblems of the manufacturing systems by introducinga new Decision Support System approach that iscapable of helping decision makers to identify decisionmaking life-cycle (Delen and Pratt, 2006). Consideringthe benefits of cloud computing and informationdemanded from various service delivery locations,research is required for empirical solution design,particularly for user-specific services. The newapproach should also promote rapid decision makingthrough the utilization of cloud computing.
2.1 State-of-the-Art Review on Traffic MobilityModelThe current state-of-the-art reviewed are the
two urban road mobility models which are Manhattanmobility model and City Section mobility model. On thesame note, rural road traffic simulation which includethe Traffic on Rural Roads (TRARR) model developedby the Australian Road Research Board (Hoban et al.,1991), the Two-Lane Passing (TWOPAS) modeloriginally developed by the Midwest Research Institute(McLean, 1989) and the Swedish National Road andTransport Research Institute model that is VersatileTraffic micro-simulation model (VTISim) (Brodin andCarlsson, 1986) were reviewed. The development ofthe named model is briefly discussed as follows:
TRARR model utilized the theory of car-following model. Within TRARR model, each vehicle isassigned a desired following distance. This distance iscomposed of a time component and a distance

3
component. Vehicles that are constrained by a vehiclein front strive to follow their leader at the followingdistance. The follower adopts a speed that will allow itto achieve its desired following distance smoothly ifthe leader maintains a constant speed. Free vehiclesstrive to travel at its desired speed. Each vehicle isassigned a basic desired speed for ideal roadconditions. A vehicle will always commence anovertaking if the time available for the overtaking is atleast a safety factor times the estimated overtakingtime. The desired speed and available power of theovertaking vehicle are increased during overtaking. AVehicle which is being overtaken may however notcommence an overtaking. A vehicle in the slow lane willmove to the fast lane to overtake a slower vehicle if ithas a sufficiently high aggression index and is not beingovertaken. The model has been used by Australia, theUS and Canada for evalua-tion of road alignment andpassing lane alternatives (Botha et al., 1993). Availableoutput of the TRARR model includes derivedmacroscopic traffic measures such as travel times,journey speeds, percent of time spent following andovertaking rates.
TWOPAS includes an empirically basedovertaking model. The model is stochastic and includesovertaking gap-acceptance functions that determinethe overtaking probability given the speed of theleader and the distance available for the overtaking(McLean, 1989). The distance available for theovertaking is given by the clear sight distance or thedistance to the closest oncoming vehicle. The latestversion of TWOPAS also includes an automaticprocedure for sight distance calculation with respect tothe road alignment and a user defined offset toroadside objects. The overtaking statistics include bothovertaking rates and safety margins, i.e. time margins,at the end of overtaking. TWOPAS also provide traveltimes at zero traffic, i.e. free vehicle speeds, and thegeometrical delay. VTISim is a microscopic rural roadtraffic simulation model. In this model, vehicles areclassified as free or constrained depending on theheadway to the vehicle in front. Constrained vehicleswill strive to follow the vehicle in front at a given timeheadway. This time headway is a property of the leaderrather than the follower, all followers will consequentlyfollow at the same distance behind a given leader. Ifthe leader decelerates then the follower will decelerateto obtain the speed of the leader after a certaindistance given by the road geometry and restrictionson the follower’s decelera-tion rate.
The Manhattan mobility model was proposedto model movement in an urban area (Zhou et al, 2004)where the streets are in an organized manner. Themodel focuses on nodes moving along horizontal orvertical streets, which is not enough to model nodesmoving along non-horizontal and non-vertical streets.The City Section mobility model (Boudec and Vojnovic,2006) limits the movement of nodes on a grid roadtopology. They proposed that, the node will at mostmake one horizontal and one vertical movement. Thespeed that the vehicle will travel at depends on theroad it chooses to travel on. There are two roadclasses, high-speed, and low speed roads to choosefrom. Since all adjacent vehicles travel at the samespeed, Car-to-car interactions will all be overlooked. Allthe models from the state-of-the-art reviewed eithermakes the design capable of modeling variations in thetraffic flow over time and as a continuous flow calledmacroscopic models or tend to model individualvehicles, but describe their behaviour in a simplifiedmanner, (Mesos-copic models).
This research captures the behaviour ofvehicles and drivers in more detail, which makes themappropriate for evaluation of Intelligent TransportationSystems (ITS) at the operational level. For instance, themodel will look at the drivers violating the rules of thetraffic authority, free flow movement of vehicles andother better control traffic strategies using Cloudtechnology.
3.0 PROPOSED VMModel CONCEPT ON CLOUDThis section describes cloud archi-tectural
considerations for the proposed VMModel solutionmodel. Technical detail of a conceptual VMModel wasalso presented.
3.1 Vehicular-Cloud ArchitectureVehicular cloud architecture includes
Infrastructure as a service (IaaS), Platform as a service(PaaS), Software as a service (SaaS) and Storage as aservice (STaaS) to operate the cloud environment. InIaaS, the wireless sensor network through GeneralPacket Radio Service (GPRS) connected to the carscollect the information, traffic and road informationabout the vehicle. More so, as every car has Internetconnections, the wireless sensors connected to thecars for measuring Global Position System (GPS)information use the approved minimum gap

4
acceptance by the road safety authority as thecommunication range, hence, informa-tion isautomatically sent to a cloud controlled by the trafficpolice. This information is then passed to either STaaSor SaaS through PaaS. This kind of system willcommunicate with the users within the cloud, processall information and give useful services such as velocity,positioning, time of occurrence and security gapbetween the vehicle and the front vehicle, inform offeedback.
Finally, all the information within the cloud arestored and retrieved from the STaaS (figure 1). Thecloud architectural model has been classified into threetypes: a) private cloud, in which resources are sharedacross the local network, b) public cloud, in whichresources are shared from the public network, and c)hybrid cloud, in which a combination of both provisionsis presented.
Figure 1: Schematic diagram of cloud architecturewhich included VANET as IaaS
The combined cloud has the potential to accommodateVMmodel applications because most of the targetdecision makers require access through private andpublic networks (e.g., road safety authorities workfrom their LAN).
Studies identify some considerations that mustcomply for cloud application design Whitepaper (2010).Design consider-ations are: the simplest applicationdesign, splitting functions of the applications intoclusters, realizing network communication, andtestability. With these guidelines, VMmodel can becomposed into three clusters: the user interface,received vehicle detail and activities, and thepreservation of databases. This helps improve
application performance in clusters and monitors itsintegration points from the network environment.Figure 2 below illustrates the architecturalconsideration of the proposed VMmodel design oncloud.
Figure 2: Proposed VMmodel design clusters on cloudcomputing (adapted from Miah et.al, 2011)
3.2 Concept and Modeling of VMmodelThe objective of the study is to outline a
conceptual framework that can automatically detect alicense holding driver violating the rules and regulationof the proposed traffic control strategies such asentering or moving within the minimum gapacceptance between two vehicles, moving above thespeed limit, doing wrong overtaken and unnecessarylane changing, generating an alert message through anonboard device. To minimize risk, if the driver violatesany of these rules, relevant information will beautomatically wirelessly sent to the legal authority. Atthe same time, in terms of keeping continuous recordsin a dynamic database and providing facilities for user-behavior analysis for recommendation systems, thepotential of a cluster-based approach are examined.Two important goals has been identified, the first oneis the design/deployment of an automatic system thatwould detect the presence of the vehicle at therecommended front and backward space of anothervehicle and it is assumed that all vehicles are using anonboard processing device containing a video sensor,GPS navigator, and/or in-built speedometer reading andwireless communication device. Secondly, the systemfacilitates the automatic generation of an alertmessage for a certain period of time and at a particulardistance so that the driver could be warned againstviolation of the rules of the road. To minimize the risk,wireless transmission of relevant information isprocessed to notify the legal authority for necessary

5
action. The following four processes have also beenidentified to meet the goals defined in this section:a) Determining vehicle motionThe main purpose here is to prevent drivers fromviolating the rules and regulation of the trafficauthority so as to maintain free flow movement ofvehicles on the road, reducing accident rate or vehiclecollision and make tracking of violator of the rules easyto detect. The first processing step is to determinewhether the vehicle is moving. The processing unit candetermine this either from the odometer reading orusing an onboard GPS navigation system. The optimalgap acceptance (G(s)) for any given vehicle speed(G(s)) is calculated as follows provided the two vehiclesstart at the same time:
G0- value of the gap acceptance for vehicles at rest(distance)Rn- rate of increase of gap acceptance when vehiclespeed is between 0, S and Slimit (distance/speed)Slimit - speed limitS – speed of the vehicleG min– minimum gap acceptance (distance)ln – length of Vehicle n
b) Detecting the vehicle’s detailsThe smart processing unit of each vehicle would havecontained the vehicle plate number, chasses numbersand vehicle type for vehicle to vehicle communications.c) Transmitting and generating warning message
The car-following model utilized in thisVMmodel works as follows. Within the ad hoc network,each vehicle is assigned a desired following MinimumGap Accept-ance (G min) of the length of the vehicle.This Gmin is composed of a time component and adistance component. Vehicles that are constrained by avehicle in front strive to follow their leader at thisfollowing Gmin . The follower adopts a speed that willallow it to achieve its desired following G min smoothly ifthe leader maintains a constant speed.
The smart processing unit will start generatingwarning message as soon as the following vehicleenters into the optimal gap acceptance but the alertwill be different from the one to be issued when thevehicle enters the minimum gap acceptance. TheOptimal Gap Acceptance (G(s)) is modeled as apiecewise, linear, monotonously increasing function ofthe vehicle’s speed. addition of the minimum gapacceptance and the length of the vehicle. The basicassumption of these models is that vehicle should haveminimum gap acceptance (Gmin) of at least the lengthof a car between lead vehicle and the following vehicle.
Figure 3: Diagram of the followed vehicle
and lead vehicle on a free flow way
Where Vn and Vn+1 are the speed of the follower andthe leader, respectively, it shows that the optimal gapacceptance is greater than the minimum gapacceptance and it is not the same for every vehicle typeso that driver will not always fall into violation of thetraffic rules.If Vn> Slimit then Rrv otherwise Rff
Where: n is the number of vehicles in the ad hocnetwork.
Rff- report “free_ flow” to the cloudRrv – report “rule_ violated” to the cloud
The smart processing unit will be able totransmit records of the car and drivers to a databaselocated at cloud server. The processing unit will havethe ability to generate a warning relevant to eachvehicle.The model describes a vehicle which can either be inthe free flow, or rule violation. The different areas aredefined by minimum gap acceptance (Gmin). The G(S) is

6
defined by a minimum gap acceptance that depends onthe speed of both the follower and the leader. Itconsists of an estimation of the distance needed foracceleration from the follower’s speed up to theleader’s speed with a normal acceleration rate. TheOptimal Gap Acceptance (G(s)) can be calculated whilethe vehicle is accelerating. From the Newton’s secondlaw of motion,v2 = u2 + 2axa = (v2 – u2)/2xhence,x = (where a = acceleration of the vehicle.
where Vn and Vn+1 are the speed of the follower and theleader, respectively, T is the length of a time intervalwhich is equal to the reaction time of the driver, Ln isthe length of the follower vehicle, x is the displacementand an is the normal accele-ration rate. The last term,Gmin is the minimum distance between stationaryvehicles, which is depending on the length consideredby the traffic safety authority.
When travelling in the free flow, the followedvehicle is not allowed to accelerate more than thespeed limit. If the vehicle travels faster than the speedlimit and enters the minimum gap acceptance, thesensor in the lead vehicle will upload the informationabout the position, velocity, time of occurrence aboutthe vehicle, gap distance and the plate number as thevehicle’s identification for detection to the cloud. Thenthe road safety authority is notified from the cloudsystem, traces the vehicle, captures it and takes actionagainst the car. Hence, from the cloud, the vehicle canbe monitored and find irregularities when necessary.This method of monitoring the vehicle on the road willreduce the necessity of too many base stations aroundthe city, reduce the density of vehicles on the urbanarea as well as creating better opportunities for thedrivers in the urban area to be a part of the Internetaccess when required. It will create a new dimension tothe traffic control system.
If the speed of the lead vehicle is zero, thefollowing vehicle decelerates its speed so that it canstop before a collision occurs.Vn,t+1 = Vn,t – an,d T for Vn-1,t=0 & Vn,t ≠0The distance that the following vehicle can movebefore collision is equaled to the spacing minusminimum gap acceptance. If the lead vehicle is movingand the following vehicle is stopped, the follower willnot start to move immediately. The follower usuallyremains stopped, and only moves once the spacing isgreater than a specific spacing (i.e. the start spacing).The follower then moves at the next time step, with itsacceleration equaling its desired startVn,t+1 = an,dT for Vn-1,t ≠ 0 & Vn,t=0 Posn,t≥ Gmin otherwiseRrv
Finally, if the following vehicle stops and the spacing isless than the start spacing, the follower remainsstopped at the next time stepVn,t+1 = 0, for Vn,t = 0 & Posn,t<Gmin
d) Communicating automatically with a designatedserver and/or legal authorityIf the following vehicle (FV) enters into the minimumgap acceptance, the lead vehicle (LV) gives warningmessage and record the information on the FV (time,distance and speed) on its processing unit. The smartprocessing unit of the LV will automatically startcommunicating with a designated server or a legalauthority through the cloud server by sending urgentmessages. The communication includes vehicle detailswith its current location (automatically obtainable fromthe on-board GPS navigation system), time andvehicle’s speed.
4.0 DISCUSSIONS AND CONCLUSIONThis article is a potential research avenue for
developing a VMmodel that will take care of Nigerianroad traffic control system and how road safetyauthority could track the drivers that violate the roaddriving rule and regulation. The conceptual studyoutlined a research requirement for develop-ing anovel cloud-based VMmodel in the bedrock of anintelligent traffic control system. This initiative wouldenhance VMmodel scholarship within new provision-ing cloud technology. The successful imple-mentationof the design VMmodel would potentially provideinvaluable services to the road transport authority anddrivers by enhancing road safety features, and thus

7
help prevent risky driving practices. For instance,traditional intelligent VMmodel is designed particularlyfor monitoring purpo-ses and the model can beextended to capture other rules and regulation as itmay be spell out by the road authority. Further study isrequired for evaluating the conceptual framework andextension of the model to capture other rules throughoutdoor experiment or simulation to reduce the cost.
5.0 REFERENCESAravind, K.G.; Chakravarty, T.; Chandra, M.G.;
Balamuralidhar, P. 2009. "On the architectureof vehicle tracking system using wirelesssensor devices", TCS Innovation Labs., TataConsultancy Services, Bangalore, India, 1-5.
Armbrust, M., Fox, A., Griffith, R., Joseph, A.D. andKatz, R. 2009. "Above the Clouds: A BerkeleyView of Cloud Computing", retrieved on 23rdOctober, 2010, from http://www.eecs.berkeley.edu/Pubs/TechRpts /2009/EECS-2009-28.pdf
Boudec, J. Y and Vojnovic, M. 2006. The random tripmodel: stability, stationary regime, and perfectsimu-lation. IEEE/ACM Trans. Netw., 14(6):1153–1166,
Botha, J. L., Zeng, X. and E.C. Sullivan, E.C. 1993.Comparison of Perfor-mance of TWOPAS andTRARR Models When Simulating Traffic onTwo-Lane Highways with Low Design Speeds.Transportation Research Record: Journal ofthe Transportation Research Board,Washington, D.C.,(1398), 7-16.
Delen, D. Pratt, D.B. 2006 "An Integrated andIntelligent DSS for Manufac-turing Systems,"Expert Systems with Applications, 30, 325–336.
Fernandez-Caballero, A., Gomez, F.J., and Lopez-Lopez,J. 2008. "Road Traffic Monitoring byKnowledge-Driven Static and Dynamic ImageAnalysis," Expert Systems with Applications, 35,701–719.
Jin-Cyuan L., Shih-Shinh H., and Chien-Cheng T. 2013."Image-Based Vehicle Tracking andClassification on the Highway". Department ofComputer and Communication Engineering,National Kaohsiung First University of Scienceand Technology.
Hoban, C.J., Shepherd, R.J., Fawcett, G.J. andRobinson, G.K. 1991. A Model for SimulatingTraffic on Two-Lane Rural Roads: User guide andmanual for TRARR version 3.2, Australian RoadResearch Board Technical Manual ATM 10B,Victoria http://abhi-carmaniacs.bog-spot.com/2012/02/vehicular-ad-hoc-network.html. Retrieved on 3rd July, 2013.
McLean, J.R. 1989. Two-Lane Highway TrafficOperations. Transportation Studies, eds. N.Ashford and W.G. Bell, Gordon and BreachScience Publishers, Amsterdam, 11, 121- 124.
Miah, S.J. and Ahamed, R. 2011. A Cloud-Based DSSModel for Driver Safety and Monitoring onAustralian Roads. International Journal ofEmerging Science, 1(4), 634-648,
Onasanya, A. O and J.O. Akanmu. 2002. “QuantitativeEstimates of Traffic Congestion on Lagos –Abeokuta Road, Lagos, Nigeria. Journal of CivilEngineering, Nigeria Institu-tion of CivilEngineering. In Ogunbodede, E. F. (eds).Assessment Of Traffic Congestions In Akure(Nigeria) Using GIS Approach: Lessons andChallenges for Urban Sustenance. Retrievedon 21/01/2014 from http:/www.Sue-Mot.Org/Conference-2007/Papers/Ogun-bodede.Pdf
Vashitz, G., Shinar, D., and Blum, Y. 2008. "In-VehicleInformation Systems to Improve Traffic Safetyin Road Tunnels," Transportation Research PartF, 11, 61–74.
Whitepaper 2010. "Application Architecture for CloudComputing," retrieved on 20th October, 2010,from http://www.rpath.com/corp/images/stories/white_papers/WP_ Architecture For CloudComputing.pdf.
Zhou, B., Xu, K. and Gerla, M. 2004. Group and swarmmobility models for ad hoc network scenarios usingvirtual tracks,” Proceedings of the MilitaryCommunications Conference, MIL-COM 2004. IEEE, 41-46.

8
_____________________________________________________________________________________________________________________________________
A MODEL FOR MAINTAINING DATA SECURITY ANDAUTHENTICITY IN VOICE-DRIVEN SYSTEM
_____________________________________________________________________________________________________________________________________
W.O. AdesanyaGeneral Studies Department, Federal College of Agriculture, Akure,[email protected]
O. B. AlabaDepartment of Computer Science, Tai Solarin University ofEducation, Ijagun, Ijebu-Ode. Ogun State, [email protected]
A. B. AdeyemoComputer Science Department, University of Ibadan, Ibadan, OyoState, [email protected]
1.0 INTRODUCTIONAccessing protected resources is always
carried out through the use of personal tokens like akey or badge, knowledge of certain information like apassword or combination of numbers Aladesanmi et al.(2012). A password is a string of characters used tologin to a computer and other systems for files access,program access, and other resources. They are used toensure that people do not access any system unlessthey are authourized to do so (Aborisade et al., 2013). Itis however observed that these passwords (or keys orbadges) can be lost, stolen or counterfeited, therebyposing a threat to information or data security. Thus, inorder to reduce this security threat, this paper focuseson real-time voice-driven access to the restrictedresources, since voice is unique to each person andcannot be lost or stolen. Voice-driven based solutionsare able to provide for confidential financialtransactions and personal data privacy.The remaining section is organized as follows: section 2reviews a number of relevant literatures on speakerrecognition system; section 3 describes the metho-dology for the proposed system while 4 and 5 describethe results and concludes the work respectively.
2.0 RELATED WORKThere have been numerous researches in the
application of techniques and models used inextracting voice feature or matching feature in order toidentify and verify speaker in speaker recognitionsystem. A number of such relevant researches werereviewed in this paper. David (2004) found thatVerification system authenticates a person’s identity bycomparing the captured biometric charac-terristic withits own biometric template(s) pre-stored in the systemwhich conducts one-to-one comparison to determinewhether the identity claimed by the individual was true.A verification system either rejects or accepts thesubmitted claim of identity and that the identification
ABSTRACT
There were cases of lost or stolen or counterfeited password,thus we present a model for real-time voice recognition inaccess control. Voice-driven involves identification andverification of the speaker. At each stage, the voiceprint iscompared with model voices of all speakers in the database.The comparison is a measure of the similarity (score) fromwhich rejection or acceptance of the verified speaker ischosen. The Dynamic Time Warping (DTW) and VectorQuantization (VQ) models were employed to investigateprocessing time and memory requirements. The LinearPredictive Coding (LPC) and Cepstral analysis for featureextraction techniques were used for damping. The system wastrained and tested using a population of ten users, withadditional ten impostors. The average call success of a truespeaker was 96.5%. The impostor’s success rate wasstatistically computed to be 0.0036%.. The DTW was found tobe more suitable for real-time application with the real-timeaverage speaker recognition time of 7.80 seconds. The systemwas able to make access decision in an average of 2.80seconds after the voice sampling was completed. In general,our model compares favourably with what obtained inliterature with better recognition and access decision times.
Key words: Voice-driven, Real-time, Dynamic Time Warping,Vector Quantization, Linear Predictive Coding

9
system recognizes an individual by searching the entiretemplate database for a match which conducts one-to-many comparisons to establish the identity of theindividual. The delimitations of (David, 2000) were thatthe rate of fingerprint capture and feature extractionwere not considered, although in a real-time worldscenario, this is an important factor.
In (Julius et al., 2005), a stochastic model wasdeveloped to solve the problem of speech processingin speaker recognition. The research was able todevelop a high-quality, multivariate and Hidden MarkovModel (HMM) by means of Hidden Markov Toolkit(HTK) tool software to determine the speaker butprovision for grammar testing enlargement as the newmodels are needed for the new words training.However, the limitations of the research were thedirect counting of the probability that was verycomplicated; and that the current state depends on theprevious state. A new feature selection method forspeaker recognition was proposed by Hanwu et al.(2008) to keep the high quality speech frames forspeaker modelling and to remove noisy and corruptedspeech frames. The research adopted spectralsubtraction algorithm to estimate the frame power. Anenergy based frame selection algorithm was thenapplied to indicate the speech activity at the framelevel. The research was able to use the eigenchannelbased GMM-UBM speaker recognition system toevaluate the proposed method. However, the researchrequired long-term spectral analysis and computationfound to be complex. Sara (1998) concentrated onoptimized speech processing in the DSP56001hardware platform, especially in the application ofnoise reduction and speech enhancement. Kwek(2000) worked on a hardware based speechrecognition system. Both work by Kwek (2000) andSara (1998) were hardware based but were notconcentrated in the area of speaker recognition, whichis the focus of this paper, based on the observationthat the size of the speaker database grows when thenumber of speakers in a system is increased. This posestwo problems in terms of memory requirement forvoice database storage, and processing time requiredby the system and these problems are being analyzedin this paper using a comparative analysis on DynamicTime Warping and Vector Quantization based modelsto determine a suitable model with better responsetime in real-time application for voice-drivenrecognition system.
3.0 METHODOLOGYA voice-driven system involves two phases. In
the first phase, a user enrols by providing voicesamples to the system. The system extracts speaker-specific information from the voice samples to build avoice model of the enrolling speaker, Figure 1.
Figure 1: Model of a Voice Identification System
In the second phase, a user provides a voicesample (also referred to as test sample) that is used bythe system to measure the similarity of the user’s voiceto the model(s) of the previously enrolled user(s) and,
subsequently, to make a decision. In a speakeridentification task, the system measures the similarityof the test sample to all stored voice models. Inspeaker verification task, Figure 2, the similarity ismeasured only to the model of the claimed identity.
Figure 2: Model of a Voice Verification System
Several conversational telephone calls inEnglish and Yoruba languages were conducted andrecorded. The collected voices were processed throughthe use of notebook computer with an externalmicrophone attached, where all the voices wererecorded digitally into the computer via themicrophone. Voice sampling was required to convertan analogue signal into a discrete signal, to be digitallyprocessed by a digital computer. Further pre-processing such as speech framing, edge detection and

10
windowing were performed to improve the rawdigitized signal to be used in the feature extractionprocess, further steps taken is as shown in Figure 3.
A digital signal processor running at 50MHzwas used to execute the voice recognition algorithm.The Linear Predictive Coding (LPC) Cepstral techniquewas used for feature extraction of speech signal as thespeech sample s(t) at time t was approximated as alinear combination of the past p samples
(1)
Figure 3: Block diagram of software modulesdeveloped for the voice recognitionsystem
where the coefficients a1,a2,...,ap were assumedconstant over a single speech frame. Theautocorrelation method with function
(2)
was used for estimating the coefficients whichprovided the energy of the speech frame, and wasused for discarding silent frames. The LPC coefficientsai(t), 0 ≤ t ≥ T-1 were computed from the autocor-relation vector using a recursion method known asDurbin’s method where the equations were solved
+recursively for i = 1,2,...,p. On completion of thealgorithm, the final solution was given as:
(3)
Vector quantization (VQ) codebook was used forfeature matching, to efficiently represent speakerspecific characteristics. One codebook was created foreach i speaker during the training stage. Duringrecognition, the total distance for the i-th speaker wascomputed by:
(4)
where Cij is the j-th code vector of the i-th speaker’s
codebook, Nc is the codebook size, y1,y2,...,yL representthe feature vector of the test utterance, Di is thematching score and d(yi, Ci
j) the distance between thefeature vector and the codebook vector, where thespeaker identification decision was based on thematching score. The speaker model with the smallestmatching score, Di was accepted as the producer of thevoice sample, otherwise, rejected.Speaker identification using Dynamic Time Warping(DTW) was implemented using a training or referencetemplate for each speaker. During identification stage,a DTW score of the test utterance was made againsteach training template. Speaker identification wascarried in favour of the speaker whose trainingtemplate produced the lowest score, provided thescore is within the threshold value. For speakerverification application, the test utterance wascompared against the training template of the speakerwho was being verified. The obtained DTW score wascompared against a threshold value and the user wasonly verified if the score was lower than the thresholdvalue set for the speaker. The verification threshold Twas computed using equation 5:
(5)
Where (i) The mean, μspk, and standard deviation, σspk,is computed from the DTW score from each digit; and(ii) The mean, μimp, and standard deviation, σimp, iscomputed from the DTW score against this userstemplate and speech samples of impostors.

11
For the real-time experiment, the memoryrequirements for VQ and DTW were computed whenimplemented on a voice recognition system. Theclassifiers compared were the VQ and DTW. Thememory required for the types of classifierimplementations were noted along with the executiontime. The execution time was only given for theclassifier training and recognition routine. The memoryand processing time results were recorded. Voiceaccess was only granted if both identification andverification were successful. An application softwarewas developed using C programming language withCode Composer Studio (CCS) to generate the sourcecodes for autocorrelation analysis, LPC Cepstrum andDTW. The DSP Starter Kit (DSK) Debugger was used todownload source code to the speaker recognitionsystem, which executes decoding and monitoring. Theaverage identification success rate and averageverification success rate for both original speakers andimpostors were given in percentage. The systemperformance was evaluated using Equal Error Rate.
4.0 DISCUSSION OF RESULTSThe speaker identification and verification result of atrue speaker is given in Table 1.
Table 1: The voice identification and veri-ficationsuccess count
SPk
SuccessfulIdentificat
ion(True
Acceptance)
Unsuccessful
Identification(False
Rejection)
Successful
Verification
(TrueAccepta
nce)
Unsuccessful
Verification
(FalseRejectio
n)S 1 47 3 47 3
S 2 50 0 50 0
S 3 45 5 50 0
S 4 50 0 49 1
S 5 47 3 48 2
S 6 47 3 50 0
S 7 49 1 44 6
S 8 48 2 50 0
S 9 49 1 47 3
S10 48 2 50 0
The average identification success rate was 96%, andaverage verification success rate was 97%. The overallcall success result of a true speaker is given in Table 2.The average call success rate for a true speaker was96.5%. The total Storage/memory and processing timeis summarized in Table 3.
The training time listed is for each enrolmentsession. The speaker identifi-cation time was calculatedon assumption that there were 100 enrolled users.From Table 3, the storage requirement needed for theVQ implementation was the least, with the DTWimplementation required larger storage area.
Table 2: True Voice call attempts success countSpeaker Successful Entry
(TrueAcceptance)
Unsuccessful Entry(False Rejection)
S 1 45 5
S 2 50 0
S 3 45 5
S 4 49 1
S 5 45 5
S 6 47 3
S 7 44 6
S 8 48 2
S 9 46 4
S10 48 2
Table 3: Storage and processing time for VQ andDTW classifiers
StorageLocatio
n
Training
Time
Speaker
Identifi-cationTime
SpeakerVerificati
onTime
TotalProces-
singTime
VQ 1.2Mb 8.50s 15.82s 0.26s 16.08sDTW 4.2Mb 0.50s 0.90s 0.06s 0.96s
The VQ implement-tation requires a comparativelymoderate amount of memory. The VQ consumes lessmemory than the DTW, which was expected due to thelousy compression nature of the VQ implementation.All the classifiers evalua-ted required memory locationwhich was easily made possible in current design.
The time needed to enrol a user variesdrastically between the classifiers. The DTW

12
implementation required 0.50 second for training andfound to be acceptable, and may be used for onlinetraining. A person can be made to wait during anenrolment session, and thereafter the trained databasemay be verified. If the verification is unsuccessful,speech samples may be prompted again from the userto retrain the user database. The training time of VQwas well beyond the waiting time for a user who wasenrolling. The training may be carried out offline,during the idle processing time of the voice recognitionsystem.
The speaker identification time for DTWclassifier was within acceptable limit. The identificationtime of the VQ was quite long and may not be suitablein certain applications like telephone banking andtelephone credit cards. The training time can bereduced by using a more powerful DSP.
The time needed for all 10 speakers whoenrolled in the speaker recognition system wererecorded. Prior to training, all speakers were briefed ofthe training procedure. Average training time wasnoted at 50.0 seconds. This included the voice samplingtime of a minimum of 16.72 seconds. Sampling timeincreased due to verification of digit and login namesample. Speakers were requested by the system threetimes, if verification failed.The average speaker recognition time was noted at7.80 seconds. This timing included the prompt andsample time of 5 seconds. The system was able tomake access decision in an average of 2.80 secondsafter the voice sampling was completed.
5.0 CONCLUSIONAs the level of security breaches and
transaction fraud increases, the need for highly secureidentification and personal verification technologies isbecoming apparent. Therefore, in order to aid forensicsin criminal identification, authentication in civilianapplications and for preventing un-authorized access,there is a need to develop a voice recognition systemthat would be able to provide solutions for confidentialfinancial transactions and personal data privacy thatreduces the high-tech computer theft or fraud in termsof access control, telephone banking and telephonecredit cards.
This paper presents a model for maintainingdata security and authenticity in voice-driven systemwhereby a system designed consists of memories anddata acquisition modules that were well suited for avoice recognition system. Voice as a special
characteristic of an individual, a form of biometricfeature, could be used as a form of personal systemidentification and verification, and is recommended tobe part of feature to be captured in the on-goinggovernment’s activities like the acquisition of NationalIdentification Number, Drivers Licence, InternationalPassport, Integrated Payroll and Personnel InformationSystem (IPPIS), etc.
6.0 REFERENCESAborisade D.O., Alowosile O.Y., Odunlami K.O., and
Odumosu A. (2013). Nigeria Computer Society2013 Conference Proceedings. June 2013, pp 5-12.
Aladesanmi O. A. T., Afolabi B .S and Oyebisi T. O.(2012). “Assessing Network Services andSecurity in Nigeria Universities”. AnInternational Journal of the Nigeria ComputerSociety (NSC). Vol.19 No 1, June 2012, pp 60-65.
David D. Zhang (2000). “Auto-mated Biometrics.Boston: Kluwer: Academic PublishersMcDowall, R.D., “Biometrics: The PasswordYou’ll Never Forget” retrieved fromhttp://www.21cfr11.com/files/library/compliance/lcgc10_00.pdf.
David P. Beach (2004), “Finger-print Recognition andAnalysis System”. Ph.D thesis submitted tothe Department of Electronics and ComputerTechnology, Indiana State University.TerreHante, Indiana.

13
_____________________________________________________________________________________________________________________________________
DEVELOPMENT OF A DIGITAL YORUBAPHRASEBOOK ON A MOBILE PLATFORM
_____________________________________________________________________________________________________________________________________
O. O. FagboluThe Polytechnic, Ibadan.tolatalk2mii@ yahoo.com
B. K. AleseFederal University of Technology, [email protected]
O. S. [email protected]
1. INTRODUCTIONIn the 21st century, it is reasonable to
expect that some of the most importantdevelopment in science and engineering willcome about through interdisciplinary research.Mobile application of Digital Yoruba Phrasebookcut across information theory, computer science,statistics and lingual. The design of phrasebookfor foreign language users has been one of thechallenges of modern applied linguistics undertranslation since it became an autonomous fieldof study. Of emphatic mention was the onedesigned for the United States army during the
second world war – a phrasebook of commonChinese (Rabina, 1999). Its aim is to understandhow certain Yoruba words and phrases can beunderstood by visitors through electronic media.It must identify the inquisitiveness of a typicallearner or tourist, promote its ethical values topotential students, accept the enquiry of thereaders of Yoruba language, deliver the readers’or learners’ request and support learners’ use fornon Yoruba tourists that wish to converse withYoruba speakers. Digital phrasebook can be CD-ROM based, network based, intranet or internetbased or mobile application which provides newchannel for communication between travellers(tourist) and their guide (tutor) in theirrespective destinations.
Yoruba is a dialect of West Africa withover 50 million speakers (Wikipedia, 2010). It is amember of Niger-Congo family of language andit is spoken among other language in Nigeria,Togo, Benin and partly in some communities inBrazil, Ghana, Sierra Leone (where it is calledOku) and Cuba (where it is called Nago)(Bamgbose, 1965). Yoruba is one of the threemajor languages in Nigeria and language is theprincipal means used by human beings tocommunicate with one another (Encarta, 2009);it is spoken and considered as the third mostspoken native African language. Yorubalanguage has ancestral speakers who accordingto their oral traditions is Oduduwa (son ofOlúdùmarè), the supreme god of the Yoruba(Biobaku, 1973). Yoruba first appeared in writingduring the 19th century and the first publicationswere a number of teaching booklets producedby John Raban in 1830 – 1832 and another majorcontributor to orthography of Yoruba wasBishop Samuel Ajayi Crowther (1806 – 1891) whostudied many of the languages of Nigeria(Oyenuga, 2007), he wrote and translated someof the Yoruba phrases and words. Yorubaorthography appeared in about 1850 althoughwith many inherent changes since then. In the17th century Yoruba was written in the Ajamiscript and major development in thedocumentation of Yoruba words and phrases
ABSTRACTYoruba phrasebook is a book of useful words andphrases in a Yoruba language with translations, forthe use of visitors to places where the language isspoken; it can be likened to bilingual dictionary ofYoruba-English.Digital Yoruba phrasebook was developed in thisresearch using the latest technologies such as PHP,Mysql, .net, Mssql 2005, 2008, Ajax techies, C# andlots of cloud computing services all on bothWindows and Linux platform.Mobile application for the design of phrasebookbrings the usefulness of Information Technology tothe doorstep of non Yoruba tourists who wishes toconverse, make friends with Yoruba people that arenot literate or transact business with Yorubaindigenes.
KEYWORDS: BILINGUAL, YORUBA-ENGLISH, PHP,LINUX PLATFORM, INFORMATION TECHNOLOGY.

14
were done by Anglican (CMS) missionaries thatwere working in places like Sierra Leone, Brazil,Cuba and they assembled the grammatical unitsin Yoruba together which were published asshort notes (Adetugbo, 1982), in 1875 Anglicancommunion organized a conference on Yorubaorthography.
Digital phrasebook is done with an easyto read and pronunciation guide for all thephrases and words that readers (learners) needto communicate effectively and efficiently so asto solve visitors-dwellers predicament whilevisitors are abroad (Howe and Henriksson, 2007).It would cover all must–know vocabulary andphrases for typical situations from makingreservations and getting around to shopping andobtaining all forms of help. In the time past, thequality of communication and fluency was linkedto your mother’s tongue language while in thefuture; the quality of communication will belinked with digital phrasebooks (Geere, 2009)and with the advent of internet which isbecoming the most important source ofinformation, tourist or prospective learners ofany language can obtain all necessary words andphrases to communicate in Yoruba. Internetbrings people together from any country in theworld and reduces the distance between peoplein many ways (Schneider and Perry, 2001).Prospective tourist or learner of Yorubalanguage can use digital phrasebook to learn alanguage that are geographically separated froma typical learner. The web as a virtualenvironment helps learners and teachers ofYoruba language to share a common interest byreducing the cost and increase thecommunication skills of intended tourists orlearners. Today a web is frequently the first placeteachers, learners or researchers go to conductany research or find out any information and alsoany tourist to a Yoruba nation would consult theweb for a guide to have an enjoyable momentabroad and the availability of Yoruba phrasebookon the web would be an added value to Yorubanations and enhance better relationshipbetween the visitors (learners) and dwellers. Itwould also portray and rebrand the images ofYoruba nations. Digital phrasebook increases theopportunities of conversing in other languagesapart from one’s mother tongue, webenhancement feature of the digital phrasebookwould increase the speed and accuracy withwhich learners and teachers can exchangeinformation and cost of learning are drastically
reduced. It would provide wide range of phrasesand words in Yoruba language for any interestedlearner to read or study 24hours a day. Ifdistance education is making it possible forpeople to learn skills and earn degrees no matterwhere they live or which hours they are availablefor study, so also is digital phrasebook inteaching spoken Yoruba language.
The first kind of phrasebook is Chinesemilitary phrase book that was printed in China in1945 and was used by American Soldier duringWorld War; phrasebooks are guiding manual thatoffers a collection of phrases you are likely to useduring your travel in another country, rangingfrom simple introductions to asking fordirections to casual conversa-tions (Howe andHenriksson, 2007).
1.1 MotivationTranslation is inevitable because
communication is the lifeblood of business ortransaction and hence need for large-scaletranslation of Yoruba to English and vice versafor non indigenes of Yoruba that intend to dealwith Yoruba natives. The efforts to developdigital Yoruba phrasebook have one source ofmotivation which is to solve associated problemswith communication and language barriers.There are numerous predicaments that manualYoruba phrasebook cannot solve, language aswe are aware is primarily spoken and there aremany languages in the world today that have notbeen committed to writing whereas alllanguages in the world are spoken. This meansthat, the spoken language takes precedenceover written languages. The necessity of spokenlanguage over written has been the focal pointfor the development of digital Yorubaphrasebooks with their pronunciation for nonindigenes to be familiar with Yoruba nation,cultural values and creed.
Considering a tourist and languagestudent from the United States, Clara wholanded in Osogbo, Nigeria. For four years she hadbeen nursing the ambition to witness theUNESCO recognized Osun Osogbo Festival. Shecannot wait to experience the charm thatarrested Adunni (Suzzaire Wenger). Of course,she is prepared; she had earlier read publicationsabout Nigeria as a whole, the Yoruba people andculture, as well as Osogbo specifically. She is apost graduate student, someone who knows thepower of language at negotiating andnavigating, its effect on native speakers and

15
foreigner who even if crumbly, could use somephrases in such language.
You see, Africans (and indeed Nigerians)are fond of you when you can say something intheir native languages – it does not matter howwell. Oh, she loves that bead (necklace) andmust buy, Clara will like to own one too. So shecalled on the seller, “Mama, e lo ni?”, touchingthe beads. Instead of saying the price, the beadseller laughed, danced round her colleagues inboth amusement and surprise “Oyibo n soYoruba!”. Clara smiled at her, it was thebeginning of a good bargain and she was sure.And when the bead seller said her price, Claraslashed it by half, again surprisingly in Yoruba“Ko gba igba naira ni?” she won the seller andbargained well. Above all, she has sown the seedof bond between herself and not just the sellerbut also her colleagues. In the later days, therewas not anything that Clara needed that was notprovided by those women. What worked forClara in those illustrations was the advent ofelectronic phrasebook compiled on the internet.The phrasebook contained important expres-sions for situational communication between aforeigner and native Yoruba speakers in theareas of bargaining, greetings, descriptions,numbers, colours, etc. Without doubt, Clara willenjoy her stay than someone else who could notlay his hands on such facility, which is exactlywhat this present research work aims to achieve.All human beings have natural propensity tospeak language but not all human beings canwrite or read in a particular language and withadvances in computer technology Yoruba wouldbe spoken amidst all people who may intend tovisit or transact business with the indigenes ofYoruba nations, spoken language saves time anddigital Yoruba phrasebook will provide the abilityto learn the language in the shortest timepossible unlike the written that takes a lot oftime for preparation. Once the web enabledYoruba phrases and words are learnt on theinternet feedback would be immediate and otherparalinguistic features combined would givemore meaning to the spoken Yoruba language.Computer has been an indispensable tool inlexicography for decades which prompt thedevelopment of phrasebook for Yorubalanguage electronically. The need to store, sortand retrieve large amounts of linguisticinformation drew the attention to work on thisresearch work. Without pretending to teach youa new language, this phrasebook will hopefully
prove to be a helpful tool in your communicationarsenal, it will offer an essential guide in all areasbecause translation is inescapable. Otherresearch works including Microsoft (Kinect andTreelet), Systran, Marclator, Pangloss, Cunei,Yeminli Sozluk, Gaijin, EUROTRA, OPENMaTrEx,Susy, Meteo, Ariane(GETA), METAL, Rosetta,Babel-Fish, ALEPH and so on have motivated thisresearch work.
1.2 ObjectivesThe objectives of the research are to:
(a) design electronic Yoruba phrasebook thatwill carry out its basic operations
(b) design and implement a mathema-ticalmodel for (a).
(c) determine its efficiency and usage withinterface to beautify various touristcentres in Yoruba speaking countries.
2.0 LITERATURE REVIEWThe ability to process human langu-age by
computers is as old as computers themselves, soit became imperative to perform useful tasksinvolving human language like enabling human-machine communication, improving human-human communication or simply doing usefulprocessing of text or speech. There are severalresearch works in this domain and key insight oflast 50 years of research in language processingare captured through the use of models ortheories.
Descartes and Leibniz first suggestedmechanical dictionary in 17th century (Wikipedia,2008) and French-Armenian (George Artsrouni)designed a storage device on paper tape whichcan find equivalent of any word in anotherlanguage (Cohen, 1986) and Russian PetrSmirnov-Troyanskii supported the proto-type.IBM and Leon Dostert collaborated to translatesample of Russian words to English in January1954. Other major contributors are WarrenWeaver, Andrew Booth, Richard H. Richens whoproduce crude word-for-word translations ofscientific abstracts on punched cards. IBM, MIT,University of Texas, US Air Force, University ofWashington (Seattle), CLRU, ALPAC is one of theorganizations with immense contributions.ALPAC report of 1966 inhibits the prospect ofcomputers for translation. Here are few ofexamples of related works in this domain andthere are numerous researches both ongoingresearch works (research in motion) and

16
concluded works by Microsoft ResearchTranslation System but to mention few, Kinecttranslation and Treelet translation system.Others that are done outside Microsoft ResearchTranslation System which includes SemanticTranslation System, Rule Based MachineTranslation (RBMT), Distributed MachineTranslation, Example Based Machine Translation(EBMT). Various approaches to translation arerepresented in Figure 1.
Fig 1: Machine Translation approaches
3.0 RESEARCH METHODOLOGYA comprehensive review of manually
composed phrasebooks such as French, German,Spanish, Italian and other languages would beappraised, funda-mental features of web andinternet would be applied in this research workwhich will enhance the development of digitalYoruba phrasebook. This Digital Yoruba phrase-book is developed using the latest technologiessuch as PHP, Mysql, Mssql 2005, 2008, Ajaxtechies, .net C# and lots of cloud computingservices all on both windows and linux platform.All these aforementioned technologies wereinteg-rated together in such a way that the front-end processor of the software will allow the userto enter or make a selection of one or morephrases or word as desire, determine in whichlanguage will the pronunciation be made andtranslate too. After these, the back-endprocessor will then analyse all the choices madeby the user using the front-end processor toproduce the desire output in the alternativelanguage specified by the user and then give theuser choice to click and listen to thepronunciation of the output produced.
The basic mathematical object of thisresearch work is the joint probability distributionwith statistical decision theory that revolveround set theory, probability and mapping todepict the iterative idea of translating Englishword or phrase into its Yoruba equivalent and
vice versa. The approach is to take a particularphrase or word and examine it against thedatabase to see if it is available or not, sets arecollections, the objects “in” the collection are itsmembers and set theory. Set theory is a theoryabout what sets are like- bunch of principleswhich are important foundational tools inmathematics, linguis-tics and philosophy. Allmathematical structure can be regarded as setsand phrases and words are naturally consideredas members of a set, by articulating someassumptions about sets and rigorous theory ofinfinite collections using axiomatic method ofZermelo-Franenkel set theory we have Axiom ofextension in which two sets of both source andtarget languages are equal if and only if theyhave the same elements∀E∀Y((E=Y)↔∀x((x∈E)↔(x∈Y))) (1.0)where E is a set of all English words and phrasesand Y is a set of all Yoruba words and phrases. Allthe remaining axioms are valid for the design ofweb-enabled Yoruba phrasebook. Let E and Y beany two non-empty sets.
Let E = {p, q, r} and Y = {a, b, c, d}.
Suppose by some rule or other, we assign toeach element of E a ‘unique’ element of Y. Let pbe associated to a, q be associated to b, r beassociated to c etc. The set {(p, a), (q, b), (r, c)} iscalled a function from set E to set Y.If we denote this set by ‘f’ then we write f : E Y
which is read as "f " is a function of E to Y or ‘f’ isa mapping from English words or phrases E toYoruba words or phrases Y.
The probability distribution of thetranslation P(e/y) that a string e in the targetlanguage (for example, English) is the translationof a string y in the source language(for example,Yoruba). Modelling the probability distributionfunction for translation P(e/y) would beapproached by intuitive and iterative Bayes’Theorem that is P(e/y) can be calculated from aknowledge of P(y/e) and gives the relationshipbetween the probabilities of E and Y, P(E) andP(Y), the conditional probabilities of E given Yand Y given E, P(E/Y) and P(Y/E), here is thegeneral form:
)1.1.....()(
)()/()/(
YP
EPEYPYEP
where the translation model P(Y/E) is theprobability that the source string is the

17
translation of the target string, language modelP(E) is the probability of seeing the targetlanguage string and P(Y) is the probability ofsource language. Baye’s theorem help to keepthe number of wrong translations as minimal aspossible and corresponding result is provided byStatistical Decision Theory (SDT). The generalframework for this research is based on SDT andproblem specific modelling, the prototypical areawhere this approach has been used is speechrecognition. The approach is expressed by thisequation:Machine Translation (MT) = Linguistic Modelling+ Statistical Decision Theory (SDT)It translates Yoruba to English language usingSDTê=arge max P(e/y)=arge max( P(e).P(y/e)….. (1.2)
(search process)
Hidden Markov Model (HMM) would beapplied and the idea is to build a multi layermodel to translate from Yoruba words to Englishand vice versa. HMM is a powerful statistical toolfor modeling generative sequence.
Digital Yoruba phrasebook is likebusiness activities conducted using electronicdata transmission via internet and wide worldweb (www). There are three main elements ofthe web enabled digital Yoruba phrasebook. Theelements include: Learners shopping on the web called Teacher
to Learner (T2L). Learning conducted between Teachers on the
web called Teacher to Teacher (T2T). The learning procedures that support human
communication and symbiotic relationshipbetween language and communication on theweb.
Fig 3:1 Typical elements of Yorubaphrasebook
3.0 SYSTEM OVERVIEWThe framework of digital Yoruba
phrasebook employed online support withsynchronous training, it is a bilingual system fortranslating a single pair of languages (Englishand Yoruba) which is capable of translating fromboth languages because of the difficulties inpractice and theoretically, the design employedtwo similar unidirectional systems running on thesame system that is method of analysis andgeneration for either languages were designindependently. Transfer method is the indirectapproach used in the framework design of thedigital Yoruba phrasebook without language-independent that convert source texts intotarget texts with interpose bilingual modulesthat link separate modules (interface representa-tion).
A simple 3-states Markov model forYoruba phrasebook are employed in thisresearch work, the assumptions that once aword or phrase is checked for, translation wasmade, the word or phrase is observed as being inone of the following states
State 1: foundState 2: not foundState 3: Add/Create
It is in a discrete state from among afinite number of possible states at each “step”and Markov property states that the probabilityof being in any particular state only depends onthe previous state it was before. If a set of statesQ = q1, q2…qN; the state at time t is qt
Transition probabilities: a set of probabilities A =a01a02…an1…ann. Each aij represents theprobability of transitioning from state i to state jand the set of these is the transition probabilitymatrix A
Various HMM elements, basic Viterbi algorithmand Forward and Backward algorithms wereemployed in its design as the mathematicaltechniques before decoding process buildstranslation from left to right, by picking sourcelanguage to translate into target language. Itcould be done with explosion of search space orpruning. Decoding can be likened to parsing inwhich source language e.g. Yoruba words orphrases are translated into tree stumps andmore entries can be added, entries can be
Fig 2: Typical elements of Yorubaphrasebook

18
combined, etc. which aids synthesis of targettext(s) from source text(s).
Fig 3: Deployed interface for mobileapplication
3.2 Benefits of Mobile Platform for YorubaPhrasebookThe following would be the bene-fits of
this research work in its entirety:(a) A web enabled Yoruba phrasebook that
gives orderly and clear cut definitions ofYoruba words and simple expressions inEnglish langu-age was designed.
(b) Provide solution to problems associa-tedwith the language barrier among visitorsand the native in the intonation and soundthat are closer to English language.
(c) Teaching spoken Yoruba language andtutoring would be made avail-able to nonindigenous learners with high reliability atanytime.
(d) Yoruba as mother tongue which isgradually going into extinction canbecome relevant in virtues with the adventof mobile application for Yoruba phrasesand words.
(e) Flexibility of the phrasebook wouldproffer the ability to add more words orphrases in either English or Yorubalanguage.
4.0 CONCLUSIONThis paper has described, developed and
implement Yoruba translator on mobile devicesand enhance the rate at which Yoruba languageis learned, spoken and used as means ofcommunication for indigenes and non indigenes.With mobile platform for Yoruba words
(phrases) at all time of the day, Yoruba languagecan not go into extinction and Yoruba creed,culture and virtue would be extol.
5.0 REFERENCESAdetugbo A, 2003. The Yoruba Language in
Yoruba History.Adewale O. S, 2006. University Digital Libraries,
Akure, Nigeria, Ade-yemo publishinghouse ISBN 0-619-03375-9.
Arnold D. J. et al., 1993. Machine Translation:Introductory guide, London, Blackwells-NCC.
Bamgbose A, 1965. Yoruba orthography, Ibadan,University Press.
Bar-Hillel Y, 1960. A demonstration of the nonfeasibility of fully automatic translation.Appendix III of ‘The present status ofautomatic transla-tion of languages’,Reprinted in Bar- Hillel Y, 1964.Language and Information, Reading,Mass. Addi-son-Wesley, pp 174-179
Benett C.H, Brassard G, 1985. Proceeding ofconference on Computer System andSignal Processing, Banglore pp175
Biobaku S. O, 1923. Sources of Yoruba History,London, Oxford Clarence press.
Bogart K, Drysdale S and Stein C, 2004. DiscreteMathematics for Compu-ter ScienceStudents
Booth A.D et al., 1958. Mechanical Resolution ofLinguistic Problems, New York,Academic press.
Brown P.F et al, 1993. The mathematics ofstatistical machine translation:parameter and estimation; pp 263-311.
Dugast L, Senellart J and Koehn P, 2008. Can were learn an RBMT system? ACL-08:HLT.Third Workshop on Statistical MachineTranslation, Proceedings, June 19, 2008,The Ohio State University, Columbus,Ohio, USA (ACL WMT-08); pp.175-178.
Dugast L, Senellart J and Koehn P, 2007.Statistical post-editing on SYS-TRAN’srule based translation system. ACL 2007:proceedings of the second Workshop onStatistical Machine Translation, June 23,2007, Prague, |Czech Republic; pp 220-223
Gary Schneider and James Perry, 2001. Electroniccommerce, Canada, Learning Inc.

19
Hutchins W. J and Somers H. L, 1992. AnIntroduction to machine transla-tion,London, Academic Press
Oyenuga S, 2007. www.YorubaForKidsAbroad.com.
Oyenuga S and Oyenuga T, 2007. Learn Yoruba in27 days, Canada, Saskatoon, GaptelInnovative Solu-tions Inc
Och F. J and Weber H, 1998. Improving StatisticalNatural Language Trans-lation withcategories and rules. Coling-ACL’98:36th Annual Meeting of the Associationfor computational Linguistics and 17thInternational Conference onComputational Linguistics, August 10-14,1998, Universite de Montreal, Montreal,Quebec, Canada; pp 704-710
Papineni K, Roukos S, Ward T and Zhu W, 2002.BLEU: A method for automaticevaluation of machine translation. ACL-2002:40th Annual Meeting of theAssociation for ComputationalLinguistics, Phila-delphia, July 2002;pp311-318
Rabiner L.R, 1999. A tutorial on Hidden MarkovModels and selected appli-cations inSpeech Recognition, proceedings of theIEEE vol 77, 2
Senellart J, Dienes P and Varadi T, 2001. Newgeneration SYSTRAN translation system.MT Summit VIII: Machine Translation inthe Information Age, Proceedings,Santiago de Compostela, Spain, 18-22September 2001; pp 311-316
Stephen Howe and Kristina Henriksson, 2007.Phrase books for writing papers andresearch in English, London, Cambridge,
The Whole World Company Press,England. ISBN 978-1-903384-02-2
Toma P, 1997. My first 30 years with MT. MTSummit VI, Machine Transla-tion: Past,Present, Future, Procee-dings 29October -1 November 1997, San Diego,California, USA; pp 33-34
Toma P, 1976. SYSTRAN (summary): FBISSeminar on Machine Trans-lation 8-9March 1976, Rosslyn, Virginia, AmericanJournal of Computational Linguistics,Micro-fiche 46; pp 40 -45
Vauquios B, 1968. A survey of formal grammarsand algorithms for recognition andtransformation in machine translation,IFIP Congress -68 (Edinburgh); pp 254-260.
Whitten J, Bentley L and Dittman K, 2001. SystemAnalysis and Design Methods, North America,McGraw -Hill Companies, ISBN 0-07-231539-3.
Hanwu Sun, Bin Ma and Haizhou Li (2008) “Anefficient feature selection method forspeaker recognition” retrieved fromhttp:// www.isca-speech.org.
Julius Zimmermann and Julius Zimmer-mann, Jr(2005). “Stochastic Speaker RecognitionModel”. Retrieved [email protected] <htk.eng.cam.ac.uk>.
Kwek, Ser Wee. (2000). “Real TimeImplementation of Speech RecognitionSystem Using TI Floa-ting-Point ProcessorTMS320C31”. Universiti TeknologiMalaysia: Final Year Project Thesis.
Sara Grassi (1998). “Optimized imple-mentationof speech processing algorithms”. University ofNeuc-hatel: Ph.D. Thesis.

20
_____________________________________________________________________________________________________________________________________
HH-CLOUD: A NETWORK BASED KNOWLEDGEMANAGEMENT FRAMEWORK FOR R&D ORGANIZATIONS IN
NIGERIA_____________________________________________________________________________________________________________________________________
F. N. UgwokeDept. of Computer Science, Michael Okpara Universityof Agriculture Umudike, [email protected]
K.C OkaforDept. of Electrical Electronic Engineering, FederalUniversity of Technology, [email protected] (CORRESPONDING AUTHOR)
C.C UdezeR&D III Dept. of Electronics Development Institute,ELDI-NASENI, Awka,[email protected]
1.0 INTRODUCTION
More recently, with the advent of thecloud computing, the concept of knowledgemanagement has evolved towards a vision basedon people partici-pation through virtualcollaboration, in depth project management anddocument-tation as well as paperless officeemergence. This line of evolution is termedSmart Virtual Knowledge Manage-ment (SVKM)which we seek to deploy on a hotspot hybridcloud (HH-CLOUD).
On-going discussions on the need foreffectiveness and archiving of R&D works havebrought two concepts into limelight in thisresearch. In this regard, KnowledgeManagement (www.enwiki-pedia.org/knowledge management) and cloudcomputing (Okezie, et al., 2012) are two conceptsthat have attracted a lot of attention toresearchers, professionals and other stakeholders in the IT industry. For KM, a wide rangeof thoughts on the KM discipline is found inliterature, though the approaches vary byauthors and schools (Bray and David, 2013, andRobbins, 2006). As the discipline keeps evolving,research debates have kept on increasing in boththeory and practice. These perspectives aresegmented into three major dimensions viz: Techno-Centric Dimension with a focus on
technologies that enhances knowledgesharing and creation (Alavi, et al., 1999 andRosner et al., 1998).
Organizational Dimension with a focus onhow an organization can be designed tofacilitate knowledge processes best (Rachaelet al., 2006) as well as engineering andtechnical discipline on research in carryingout documentation activities.
Ecological Dimension with a focus on theinteraction of people, identity, knowledge,and environmental factors as a complexadaptive system which is similar to a naturalecosystem (Bray and David, 2013, and
ABSTRACTThis paper proposes a framework for KnowledgeManagement (KM) using a derivative of cloud computingoffering. This is referred to as Software as a Service (SaaS)intended to be deployed on a Mini Private CloudDataCenter using Electronic Development Institute, Awkaas a deployment context. From the simulated networkmodel, the throughput and utilization values (100kb and0.0289) were obtained from the simulation resultsshowing over 85% efficiency for non mission criticalapplications. We observed that the absence of aneffective knowledge sharing, and poor documentationpractices for R&D works, could mainly arise partly fromnetwork design considerations. From our survey,following the ongoing debate and discussions as towhether the proposed Smart Virtual KnowledgeManagement (SVKM) paradigm will facilitate researchactivities in Nigeria, we argue that the proposed SVKMproposal will securely deliver the future of effectiveresearch undertakings and enforce research disciplineamong researchers in research organizations.
KEYWORDS: KNOWLEDGE MANAGEMENT,COLLABORATION, SAAS, VIRTUAL,PROJECT MANAGEMENT, HOTSPOT

21
Okurowsk, 2013). Regardless of the school ofthought, core components of KM includepeople, processes, technology (or) culture,structure, technology, depending on thespecific perspective(www.enwikipedia.org/knowledgemanagement). Also, irrespective of theevolving schools of thoughts and variousparadigms, this work leverages the first twodimensions to propose solutions tointelligent research docu-mentation,collaboration and resource sharing amongresearchers in isolated and distributedenvironments.
The proposed framework will serve as ageneric template for every R&D intensiveenvironments, but for deploy-ment purposes,our adopted testbed is Electronic DevelopmentInstitute, Awka in the south eastern part ofNigeria. Furthermore, the practical relevance ofthe SVKM in R&D organizations will be discussedin the later section of this work.
2.0 CLOUD COMPUTING TAXONOMYIn this section, this paper will discuss
various key concepts found in cloud computingfield and then carried out a review discussion ofthe Knowledge Management ideologies as wellas the limitations of existing KM paradigms.
2.1 Definition of Cloud ComputingCloud computing is a collection of
applications and technologies which can beaccessed and manipulated by a large number ofusers in real time (Mainkar et al., 2013). Cloudcomputing is a style of computing wheredynamically scalable and virtualized resourcesare provided as a service over the Internet. Thecloud refers to the datacenter hardware andsoftware that supports a client’s needs, often inthe form of datastores and remotely hostedapplications (Goyal and Dadizadeh, 2009).
Several definitions have been studied inliterature, but the work defines Cloud computingas the use of computing resources (hardwareand software) that are delivered as a service,platform or infrastructure over a network(typically the Internet).
In cloud taxonomy, the following are thedeployment models (Silky, 2012).
(a) Private Cloud
The cloud infrastructure is operatedsolely for an organization. It may be managed bythe organization or a third party and may existon premise or off premise.
(b) Community CloudThe cloud infrastructure is shared by
several organizations and supports a specificcommunity that has shared concerns (e.g.mission, security require-ments, policy, andcompliance considera-tions). It may be managedby the organizations or a third party and mayexist on premise or off premise.
(c) Public CloudThe cloud infrastructure is made
available to the general public or a large industrygroup and is owned by an organization sellingcloud services.
(d) Hybrid CloudThe cloud infrastructure is a
composition of two or more clouds (private,community or public) that remain unique entitiesbut are bound together by standardized orproprietary technology that enables data andapplication portability (e.g., cloud bursting forload balancing between clouds) . The maindifference between cloud computing andtraditional enterprise internal IT services is thatthe owner and the user of cloud ITinfrastructures are separated in cloud (Li et al.,2010). The three major cloud computing offeringincludes (Hughes, 2009): Software as a Service (SaaS): These are the
applications, such as e-mail, social media,office software, and online games enrich thefamily of SaaS-based services. For instance,web Mail, Google Docs, Microsoft online,NetSuit, MMOG Games, Facebook, etc.Figure 1 shows the SaaS Multilayer model(Hughes et al., 2009), that people use everyday. Firstly, Software as a Service is amultilayer model, existing on top of aninfrastructure as a service (IaaS) andplatform as a service (PaaS), complementedby the applications developed and owned bythe service provider as shown in Figure 1.

22
Figure 1: SaaS Multilayer Model (Hughes,2009)
Platform as a Service (PaaS): The operatingenvironment in which applications run. PaaScloud computing delivery mode offers ahigh-level integrated environment to build,test, deploy and host customer-created oracquired applications. Typical examples ofPaaS are Google App Engine, WindowsAzure, Engine Yard, Force.com, Heroku,MTurk. (Figure 1).
Infrastructure as a Service (IaaS):Infrastructure as a Service (IaaS) providesprocessing, storage, networks, and otherfundamental computing resources to userson-demand. IaaS users can deploy arbitraryapplication, software, operating systems onthe infrastructure, which is capable ofscaling up and down dynamically. IaaS usersends programs and related data, while thevendor’s computer does the computationprocessing and returns the result.
The infrastructure is virtualized, flexible,scalable and manageable to meet userrequirements. Examples of IaaS include AmazonEC2, VPC, IBM Blue Cloud, Eucalyptus, FlexiScale,Joyent, Rack space Cloud, etc.
2.2 Cloud Computing Platform ResourceRequirements/ CharacteristicsTypical cloud platforms such as Google
App Engine, Google drive, drop box, exo-cloud,etc. share similar characteristics. The nextsection discussed the key resourcesrequirements of a typical cloud platform.
2.2.1 The dynamic DataCenter (DC)A Data Centre run the applications that
deliver business processes, services that providecritical information and rich, differentiatedcontent for users. In DC, users can leverage onan agile, and responsive infrastructure thatprovides exactly the access that they need. Thiscan be 24x7x365 for services that must be alwayson and accessible from anywhere, or a series ofscheduled updates set to meet user needs fortime-based information (hourly, daily, weekly,monthly, or quarterly). Basically, the compositionof datacenter includes (Figure 2):
Figure 2: Sun Microsystem MD 200 (Randy,2009)
Network Infrastructure which providesconnectivity and transport for applicationsand services between users and the datacenter, within the data center and acrossmultiple data centers. The Networkinfrastructure has three main subcomponents, namely the access network,the core network and the edge network.
Compute and Storage which represents thecompute and storage infrastructureappropriate for applications (rack-mountand chassis-based, cost-effec-tive and multi-core, with unstructured content and highlystructured transact-tion databases). Thecompute and storage functional area hostsall business applications such as Enterprise

23
Resource Planning (ERP), SaaS, SOA andWeb 2.0 applications (among others).
Services which supports applications withsecurity, user verification, and entitlement,and application support, includingapplication acceleration, deep packetinspection (DPI), and load balancing.
Management and Orchestration which tiestogether all of the elements of the cloud-computing infrastructure, enab-ling efficientand responsive monito-ring, management,and planning The datacenter model for thecloud application must support dynamicinfrastructure that unifies the strengths ofthe Web-centric cloud computing model andthe conventional enterprise data center(Whitepaper, 2009).
Usually DCs are virtualized for efficiencywhile employing the tools and techniquesadopted by SaaS cloud offering to enhance andsupport secure transac-tional workloads. Withthis highly efficient and shared infrastructure, itbecomes possible for cooperate entities torespond rapidly to new business needs, tointerpret large amounts of information in realtime and to make sound business decisionsbased on moment-in-time insights. The datacenter that supports a dynamic infrastructure isan evolutionary new model that provides aninnovative, efficient and flexible approach inhelping to align IT with business goals.
2.2.2 Cloud virtualizationA key characteristic of a cloud DC is
virtualization. This refers to the abstraction oflogical resources away from their underlyingphysical resources in order to improve agility andflexibility, reduce costs and thus enhancebusiness value. In a virtualized environment,computing environments can be dynamic-allycreated, expanded, shrunk or moved as demandvaries. There can be network virtualization, andserver virtualization.
Our discussion in this paper is mainly inthe context of our proposed HH-Cloud setup.
In any Cloud DC, virtualization is wellsuited to a dynamic cloud infra-structure. Ideally,a common interpretation of server virtualizationis the mapping of a single physical resource tomultiple logical representations or partitionswhich are basically accomplished a HypervisorInterface (HI). A hypervisor logically assigns andseparate physical resources on the server. It alsoallows a guest operating system, running on the
virtual machine, to function independently. Inthis case, it acts as if it were solely in control ofthe hardware, unaware that other guests aresharing it. Each guest operating system isshielded from the others via its virtual instanceand is thus unaffected by any instability orconfiguration issues of the others. Applicationscan run concurrently in multiple virtual instanceson the server centric DC.
Today, hypervisors are the core virtualizationlayer on client and server systems in a DC. Thereare two major types of hypervisors visible in DCservers viz: Bare-Metal Hypervisors (BMH): A BMH runs
directly on server hardware to providevirtual machines with fine-grainedtimesharing of resources. Virtualizationimplemented at the server hardware levelcan provide the highest efficiency andperformance.
Hosted Hypervisors (HH): A hostedhypervisor runs on a host operating systemand uses operating system services toprovide timesharing of resources to virtualmachines. Examples of software-basedhosted hypervisors include VMware Serverand Microsoft Virtual Server.
In summary, the benefits of virtua-lization in server centric cloud designs are:
Firstly, it provides important advantagesin sharing, manageability and isolation asmultiple users and applications can sharephysical resources without affecting oneanother.
Secondly, it allows a set of underutilizedphysical servers to be consolidated into a smallernumber of more fully utilized physical servers,contributing to significant cost savings.
2.2.3 Infrastructure ManagementIn Cloud DCs, some identified cloud
infrastructural requirements/charac-teristicsinclude: Virtualization Automation: It is known that
infrastructure adminis-tration is a keychallenge in a cloud computingenvironments. Simply building avirtualization environment without theproper approach to administration canincrease complexity and thus generateadded expenditures (CAPEX and OPEX).These costs could be high enough to reduce

24
the cost savings derived from virtualiza-tionwhich is unacceptable.
Automated Provisioning: Automation is veryessential in any dynamic process. In cloudparadigm, this scheme could be directlyapplied dynamic DCs operations ofonboarding and off-boarding of applicationsand services. Basically, Onboarding is theprocess of installing and configuring theoperating system and additional software onservers so that they can be made available todo useful work. On the other hand, offboarding refers to the steps necessary toautomatically reclaim a server so that it isavailable for other purposes. DC Servers forcloud computing must be enabled forapplication Onboarding so as to optimizetime- and labor in computing environments.It will eradicate time consuming processsuch as installation of the operating systemand software and configuration of thenetwork and storage.
Automated Reservations and Sche-duling:This makes for the ability to understand thecurrent and future capacity requirements foruser’s requests. Essentially, a cloud shouldbe able to communicate the provisioningstatus and availability of resources, providethe capability to schedule the provisioningand re-provisioning of resources and reserveresources for future use.
Self-Service Portal/Convergence: A self-service portal provides systematic requesthandling and change manage-mentcapabilities. This is needed to allow endusers to request computing resourcesthrough a SaaS offering. A cloud data centermust be able to flexibly handle and executechange requests rapidly to align with fast-changing business needs. In cloudconvergence, provisioning of compu-tingresources, operating systems etc, should belogical and automatically stored by thesystem.
Monitoring: Monitoring resources andapplication performance is an impor-tantelement of any environment. The task ofmonitoring becomes harder, yet morecritical in a cloud virtualized environment.The benefits provided by monitoring include: Collecting historic data to assist with
planning future data center resource
needs and to optimize virtualizedresource placement;
Capturing real-time data to quickly reactto unexpected resource needs;
Measuring adherence to perfor-manceservice level agreements (SLAs);
Proactively generating alerts and detaildata to quickly detect and solveapplication problems; and
Reporting resource usage data byapplication, necessary for alloca-tingcosts appropriately.All these requirements are adapted in
the proposed private cloud datacenter that willconsequently host the SaaS based on SVKMdeveloped in this work. Figure 2 shows a typicalSun Microsystem Modular Datacenter 200 with280 blade Servers, Monitoring and ControlEquipment, using a total of 185KW (Randy,2009).
2.3 Review on Knowledge ManagementUsing cloud computing to harness KM is a
novel research area as frameworks andstandards are still evolving. Sample studiesshowed that different frameworks fordistinguishing between different types of'knowledge exist (Sanchez, 1996). Figure 3 showsthe spiral KM.
Figure 3: The Spiral Knowledge Management(www.enwikipedia.org/knowledgemanagement)
The various strategies on KM are studied insample works (Bontis et al., 2002; Benbasat andRobert, 1999; and Whitepaper, 2013). Knowledgemay be accessed at three stages: before, during, or

25
after KM-related activities (Bontis et al., 2002].Different organizations have tried various knowledgecapture incentives, including making contentsubmission mandatory and incorporating rewardsinto performance measurement plans (Benbasat.and Robert, 1999).
One strategy to KM involves activelymanaging knowledge (push strategy) (White-paper,2013). In such an instance, individuals strive toexplicitly encode their knowledge into a sharedknowledge repository, such as a database, as well asretrieving knowledge they need that otherindividuals have provided to the repository(Whitepaper, 2013). This is also commonly known asthe Codification approach to KM (Whitepaper, 2013).Other knowledge management strategies and instru-ments for companies as studied in (www.en-wikipedia.org/knowledge management) include: Rewards (as a means of motivating for
knowledge sharing) Storytelling (as a means of transferring tacit
knowledge) Cross-project learning After action reviews Knowledge mapping (a map of knowledge
repositories within a company accessible byall)
Communities of practice Expert directories (to enable know-ledge
seeker to reach to the experts) Best practice transfer Knowledge fairs Competence management (systematic
evaluation and planning of compe-tences ofindividual organization members)
Proximity and architecture (the phy-sicalsituation of employees can be eitherconducive or obstructive to knowledgesharing)
Master-Apprentice relationship Collaborative technologies (group-ware,
etc.) Knowledge repositories (databases,
bookmarking engines, etc.) Measuring and reporting intellectual capital
(a way of making explicit knowledge forcompanies)
Knowledge brokers (some organiza-tionalmembers take on responsibility for a specific"field" and act as first reference on whom totalk about a specific subject)
Social software (wikis, social book-making,blogs, etc.)
Inter-project knowledge transfer.
In this work, our study shows that anumber of claims exist as to the motivationsleading organizations to undertake a KM effort.Typical conside-rations driving a KM effort asfound in (www.enwikipedia.org/knowledgemanagement), include: Making available increased knowledge
content in the development and provision ofproducts and services.
Achieving shorter new product developmentcycles
Facilitating and managing innovation andorganizational learning
Leveraging the expertise of people acrossthe organization
Increasing network connectivity betweeninternal and external individuals
Managing business environments andallowing employees to obtain relevantinsights and ideas appropriate to their work
Solving intractable or wicked problems Managing intellectual capital and intellectual
assets in the workforce (such as theexpertise and know-how possessed by keyindividuals).
Documentation and Knowledge sharingremains a challenging issue for knowledgemanagement. While there is no clear agreement,barriers may include time issues for knowledgeworks, the level of trust, lack of effective supporttech-nologies and culture. Again, from literaturesurvey, existing Knowledge managementsystems can thus be categorized as falling intoone or more of the following groups:Groupware, document management systems,expert systems, semantic networks, relationaland object oriented databases, simulation tools,and artificial intelligence (Gupta and Sashil,2004).
This work observes that existing KMsystems such as social computing tools(bookmarks, blogs, and wikis) have allowedmore unstructured, self-governing or ecosystemapproaches to the transfer, capture and creationof knowledge. This however includes thedevelopment of new forms of communities,networks, or matrixes organizations. In addition,there is the lack of intranet functionality forprivate cloud operations.
3.0 METHODOLOGYAn investigative research design was
used. Firstly. A sampling study at ELDI wascarried out to ascertain the level of awareness

26
and usage of SVKM using a survey approach.Analysis of the survey led to a postulation on theintegration of SVKM on large scale network forperformance evaluations.
3.1 Smart Virtual Knowledge Mana-gementon Hotspot Hybrid Cloud (HH-CLOUDD)Figure 4 shows the proposed Virtual
R&D scenario which will engender optimal R&Dperformance in related organizations. Using thebenefits of cloud computing SaaS, our SVKMframework is a collection of native technologiesto provision project documentation andknowledge sharing in a Hybrid Hotspot CloudComputing infrastructure. We opine that the useof IT in ELDI considering SVKM will facilitate R&Ddecision making with optimal results whilespending less on strategies required to solve anyR&D peculiar challenges.
In our framework shown in figure 4, R&Dactivities from various departments, real-time
collaboration, research resources in form ofmaterials, etc can be provided through theprivate DC domiciled in an organization as well asfrom a cloud provider. The applicationframework for the HH-Cloud is shown in figure 5while figure 6 shows the HH-CLOUDD Networklayer Framework. Using ELDI scenario as a casestudy, we propose four major modules for theSaaS, viz: A project management module, acollaboration module, Library managementSystem module and R&D resources module.Other features such as file conversion, backups,downloads, etc are inclusive in our proposedSaaS integration. Figure 4 formed the simulationbasis where the throughput and utilizationresponses will be ascertained.Furthermore, our proposed private mini DC willliterally migrate computing and storage from theuser’s desktops/laptop to remote locationswhere huge collection on of servers, storagesystems and network
Figure 4: A Conceptual Framework for SVKM
equipment can form a seamless infrastru-cturefor applications and storage.
All these will help researchers todemonstrate efficiency and productivity in theirresearch undertakings while encour-agingdocumentation and experience sharing fromremote locations.
In the proposed SVKM model, (Figure 5)is the SaaS framework which runs on HH-CLOUDD(Figure 6). In our present research, the use ofcommercial off the Shelf (COTS) equipment withfollowing configurations and settings is leveragedviz:
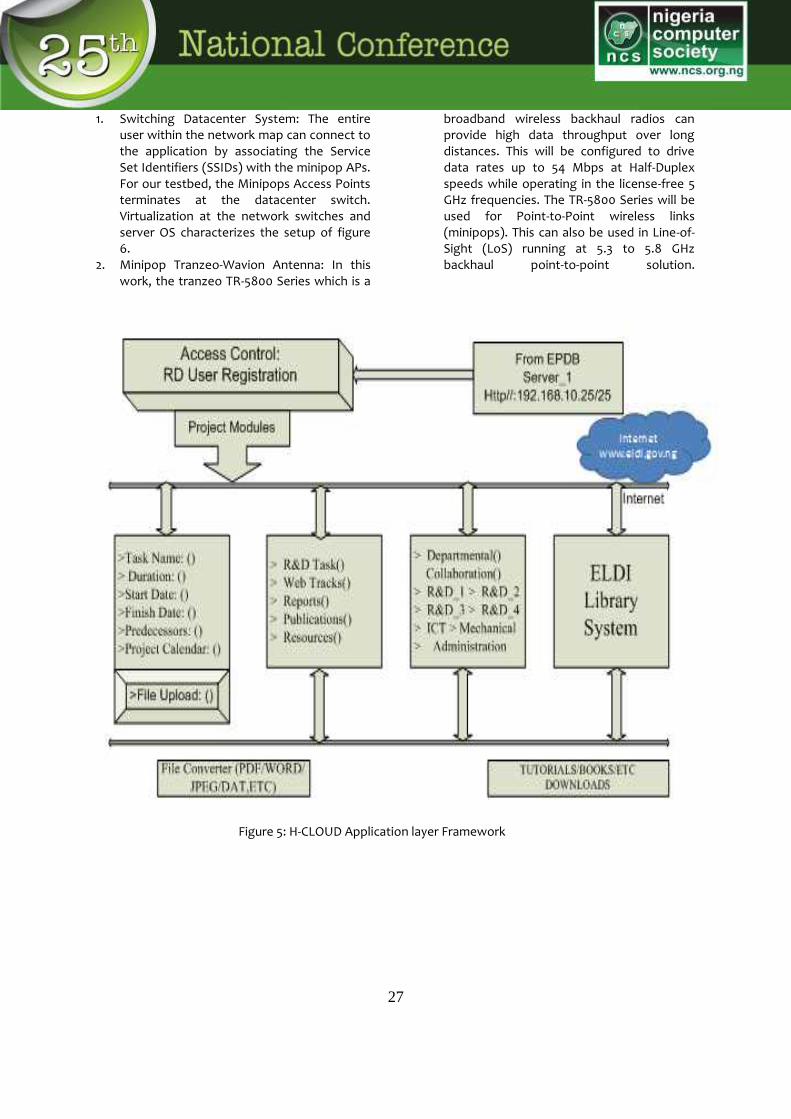
27
1. Switching Datacenter System: The entireuser within the network map can connect tothe application by associating the ServiceSet Identifiers (SSIDs) with the minipop APs.For our testbed, the Minipops Access Pointsterminates at the datacenter switch.Virtualization at the network switches andserver OS characterizes the setup of figure6.
2. Minipop Tranzeo-Wavion Antenna: In thiswork, the tranzeo TR-5800 Series which is a
broadband wireless backhaul radios canprovide high data throughput over longdistances. This will be configured to drivedata rates up to 54 Mbps at Half-Duplexspeeds while operating in the license-free 5GHz frequencies. The TR-5800 Series will beused for Point-to-Point wireless links(minipops). This can also be used in Line-of-Sight (LoS) running at 5.3 to 5.8 GHzbackhaul point-to-point solution.
Figure 5: H-CLOUD Application layer Framework

28
Internetwww.eldi.gov.ng
Figure 6: HH-CLOUDD Network layer Framework

29
The Wavion’s 5800 beamforming technologyadopted is based on Wavion’s Beam forming Wi-Fi chip.Figure 7a and figure 7b depicts the RF radios for ourdeployment shown in figure 6.
Figure 7a:Wavion Nanostations
Figure7b: Antenna mast with Tranzeo and WavionRadios
3.2 Implementation StrategyAs discussed earlier, the project (HH-CLOUD)
leads to the development of a software platform thatsupports energy-efficient management and allocationof Cloud data center resources. In order to reduce thecost of software engineering, we will extensively reuseexisting Cloud middleware and associatedtechnologies. We will leverage third party Cloudtechnologies and services offerings including (a) VMtechnologies such as open source Xen and commercialone from VMWare fro server virtualization. We will alsoleverage Google App Engine, which is a platform forbuilding enterprise Clouds. In the simulationenvironment, we will implement a generic connection
resource manager in the SaaS to allow interaction withany Cloud management system.(a) System Requirements: The work is still ongoing,
but in the initial phase, the following are therequirements for the HH-CLOUD, viz: Reliable Internet/Intranet backbone A 1000 capacity Hotspot Infrastructure with
APs, Access Points/Minipops (Tranzeo TR-5800 and Wavion’s 5800 )
Router/firewall File Converters Chat RMI modules Licensed Microsoft Server 2008- Dedicated Server Machine- Itanium X64 with
Virtualization ( On a customized Server rack)with 4G RAM, 1Tb HDD, 2G Swap disk
The EDB Application based Php, MySQL/ Oracle 11g) Ventilation Air conditioning Systems
(b) Simulation Results: Figure 5 was characterizedas http service while figure 6 was simulatedwith OPNET IT guru for subnetted nodes. Thesimulation paramters used by an ealier work(Udeze et al., 2012) was also used for our intialevaluations. Figure 8a and figure 8b showssimulation results in a run mode. It shows theaverage traffic throughput response and theresource utilization response of the proposedHH-CLOUD. Figure 8a depicts the trafficthroughput response. In the network model,the topological properties of the network andstatistical properties of the traffic ismaximized as the routing algorithm tries tominimize the packet delivery time. At thiscritical load, we consider that the network iscongested.
Figure 8a: Traffic Throughput Response

30
No critical behavior is noticed in the networkthroughput which is defined as the number of packetsreaching their destination per unit time per host.Starting from a low load, the throughput increasesproportionally as the increase of the load, untilcongestion is reached. At this point the network has itsmaximum throughput (Over 100kb). Figure 8bshowing Resource Utilization at Traffic peaks depictssymmetry at the traffic conditions on the network. Thisyields about 0.0289 which is very considerable for highdensity networks. The conceptual frame-work forSVKM as depicted in figure 4 showed a great potentialfor stable peer to peer interactions under increasinglyrealistic load conditions.
Figure 8b: Resource Utilization at Traffic peaks.The realistic specification for end users
significantly impacts the network performanceconsidering file sharing scenarios.
Finally, much work remains to be done in peer-to-peer information retrieval, especially in investigatingthe properties that hold in large-scale simulations. Weconclude that by maintaining a mini private DataCenternetwork, large scale SVKM platform will continue toserve today’s computing requirements regardless ofconstraints of the collaboration application. SVKM isbelieved to address the challenges of security, QoS,stability and flexibility in campus layer domain.
4.0 OUR CONTRIBUTIONSELDI private cloud is a pre-requisite for the
functionality of SVKM framework. However, for thepublic Cloud, the Cloud providers have to ensure thattheir DataCenter network is flexible in their servicedelivery to meet with service delivery requirements ofthe researchers and for the file backups on demandwhile keeping the consumers isolated from theunderlying infrastructure. It is however necessary tonote that to support the Cloud computinginfrastructure, green energy infrastructures is
recommended to minimise the energy consumption ofCloud infrastructure, while enforcing service delivery.
The main objective of this work is to initiateresearch and development of a flexible document andcollaboration platform that will run on hotspot facilitiesin an energy-aware and secured data centre. This isintended to make our HH-CLOUD more sustainable,with eco-friendly technologies that will drive scientificand technological advancement for R&D organizationsin Nigeria.
Specifically, our work aims to define anarchitectural framework of the documentation andcollaboration platform intended for an energy-efficientHotspot Cloud computing Infrastructure. The rest ofthe work is organized as follows: Section II: presentsCloud Computing taxonomies, Section III: Presentsrelated works on KM ideologies and its limitations.Section IV: discussed the Smart Virtual KnowledgeManagement Model and outlined the merits of theframework. Section V: Shows the implementationStrategy and the Bill of Measurement and EvaluationWhile the conclusion and future work is detailed inSection VI
5.0 CONCLUSION AND FUTURE WORKSThis research work advances Knowledge
Management using cloud computing SaaS to show thefeasibility of developing a SVKM model that will fit intoR&D organizations in Nigeria. We explored on thecharacteristics of cloud paradigm, but identified theneed for discipline and productivity in R&Dorganizations through project document-tation andcollaboration initiatives. These consequently lead toconceptual frame-works while outlining theimplementation strategy and the initial system require-ments. We argue that as Nigerian government plans tojoin the League of Nations in driving the economythrough technology, the R&D sector will faceenormous challenges resulting from poor R&Ddocumentation practices as well as having poorresearch outputs as a result of alienation from R&Dcollaborations of various forms. To develop a strong,competitive R&D industry especially in Nigeria, it is ofgreat need that researchers understand theimportance of document-tation using platforms thatwill facilitate such processes. This work is still ongoingbut will help to facilitate and drive research interestsvia collaboration and knowledge sharing at large.Therefore, we expect researchers world-wide to put ina strong thrust on open challenges in R&D contextidentified and or unidentified in this paper in orderenhance research documentation and project

31
management using cloud computing SaaS and energy-efficient private cloud computing infra-structure.Future works will focus on the following:(i) An investigate on energy-aware resource
provisioning and alloca-tion scheme that provisiondata-center resources to client R&D applications ina way that improves the efficiency of thedatacenter, without violating the negotiatedService Level Agreements (SLA)
(a) Development of autonomic and trafficmechanisms that self-manage changes in the stateof resources effectively and efficiently to satisfyservice obligations and achieve performanceefficiency;
(b) Investigate heterogeneous workloads of variousother types of R&D Cloud applications and developalgorithms for resource-efficient mixing andmapping of Virtual machines (VMs) to suitableCloud resources in addition to dynamicconsolidation of VM resource partitions.
(c) To implement a prototype system – incorporatingsecurity, application SaaS and resourcemanagement mechanisms, and consequentlydeploy it within the state-of-the-art operationalHotspot Cloud infrastructures with real worlddemonstrator applications. Finally, we will also,validate different aspects of our implementationsas outlined in this work.
6.0 REFERENCESwww.en.wikipedia.org/knowlege managementAddicot, R. et al., (2006). "Networks, Organizational
Learning and Knowledge Management: NHSCancer Networks". Public Money &Management 26 (2): 87–94. doi:10.1111/j.1467-9302.2006. 00506.x.
Alavi, Maryam; Leidner, Dorothy E. (1999). "Knowledgemanage-ment systems: issues, challenges, andbenefits". Communications of the AIS 1 (2).
Amit G. and Sara D. (2009). A Survey on CloudComputing, University of British Columbia,Technical Report for CS 508.
Benbasat, Izak; Zmud, Robert (1999). "Empiricalresearch in information systems: The practiceof rele-vance". MIS Quarterly 23 (1): 3–16.doi:10.2307/249403. JSTOR 249403.
Bontis, N., Choo, C.W. (2002). The Stra-tegicManagement of Intellectual Capital andOrganizational Know-ledge. New York: OxfordUniver-sity Press. ISBN 0-19-513866-X.
Bray D. (2013). "SSRN-Literature Review – KnowledgeManagement Research at the OrganizationalLevel". Papers. ssrn.com.
Carlson M.O. et al., (2013). "Building a Discourse-Tagged Corpus in the Framework of RhetoricalStructure Theory".
Gupta, J. and Sharma, S. (2004). Creating KnowledgeBased Organizations. Boston: Idea GroupPublishing. ISBN 1-59140-163-1.
Hughes S. (2009). The Enterprise Cloud Businesswithout Walls‖, October, 15, Colt TechnologyServices Group Limited, presentation givenduring the SaaS Congress at Business FacultyBrussels.
Langton Robbins, N. S. (2006). Organiza-tionalBehaviour (Fourth Canadian Edition). Toronto,Ontario: Pearson Prentice Hall.
Ms.Madhavi et al., (2013). Cloud Computing A GameChanger. In Education, ASM’s International E-Journal of Ongoing Research in managementand IT, INCON13-IT-033, pp. 1 -7.
Okezie C.C. et al., 2012). Cloud Computing: A CostEffective Approach to Enterprise WebApplication Implementation (A Case for CloudERP Web Model). In Academic Research Inter-national, Vol,3, No.1, pp 432- 433.
Randy H.K. (2009). “Tech Titans Building Boom”, IEEESpectrum.
Rosner D. et al. (1998). "From natural languagedocuments to sharable product knowledge: aknowledge engineering approach". InBorghoff, Information technology forknowledge management. Springer Verlag.pp. 35–51.
Sanchez, R. (1996). Strategic Learning and KnowledgeManagement. Chichester: Wiley.
Silky B. et al. (2012). Use of Cloud Computing inAcademic Institu-tions, IJCST Vol. 3, Issue 1.
Udeze C.C. et al. (2012). A Conceptual design model forhigh performance hotspot network infra-structure (GRID WLAN) in International Journalof Advanced Computer Science and Applica-tions (IJACSA).” Vol. 3, No. 1, Pp 93-99,www.ijacsa.thesai.org.
Whitepaper (2009). Seeding the Clouds: KeyInfrastructure Elements for Cloud Computing,
Whitepaper (2013). Knowledge Manage-ment for DataInter-operability.
Xiao-Yong Li, et al., (2010). A Trusted ComputingEnvironment Model in Cloud Architecture, Proceedings

32
of the Ninth Inter-national Confe-rence on MachineLearning and Cybernetics, Qingdao

33
_____________________________________________________________________________________________________________________________________
MODELING MOBILE CELLULAR SIGNAL LOSS PREDICTION INSUBURBAN PROPAGATION ENVIRONMENT IN NIGERIA
_____________________________________________________________________________________________________________________________________
Okumbor Nkem AnthonyDepartment of Computer Science, Delta State Polytechnic,
Otefe-Oghara, [email protected]
Okonkwo Obikwelu RaphaelDepartment of Computer Science, Nnamdi Azikiwe University,Awka [email protected]
1.0 INTRODUCTIONCellular radio communication technology
has been undergoing rapid evolution over the pastcouple of decades and is still growing rapidly.Recently wireless network provide users with awide range of network services, but poor quality ofservices such as frequent call drop, echo during
radio conversion, cross talk, poor inter and intraconnectivity, network congestion and many othernetwork problems, may be attributed to poorquality of signal strength deliver to the end user ofthe GSM Mobile Unit (MU).
The mechanisms behind electro-magneticwave propagation are diverse, but they arecharacterized by reflection, refraction, path loss,fading, scattering and shadowing. Hence, the needfor efficient planning in mobile radio systems isextremely important because imprecisepropagation loss prediction models always lead tonetworks with high co-channel inter- ference andwaste of power (Rappaport, 2002). An accurateestimation of path loss is useful for predictingcoverage areas of base stations, frequencyassignments, and proper determination of electricfield strength, interference analysis, handoveroptimiza-tion, and power level adjustments.
Importantly, the knowledge of thepropagation characteristics of a mobile radiochannel is essential for designing any wireless(mobile) communication system in a given region(Hess, 1993). In terrestrial cellular radio systems,radio signals generally propagate by means of anyor a combination of these three basic propagationmechanisms; reflection, diffraction, and scattering(Stuber, 2001, Sharma, 2007). One of the mostimportant features of the propagationenvironment is path (propagation) loss. Theaccurate qualitative understanding of the radiopropagation using path loss model as a function ofdistance from where the signal level could bepredicted is essential for reliable mobile wirelesssystem design. Hence, in this paper, we present apractical seasonal measurement of signal strengthover a GSM network in a suburban town ofAmukpe-Sapele in Niger-Delta of Nigeria anddetermination of the signal attenuation bystatistical analysis of measured data, using theseparameters to develop a model that appropriatesfor certain geographical areas, that would assist
ABSTRACTIn this work, the log-normal shadowing method wasused to model mobile cellular signal propagationloss. The data used for this analysis were gatheredbetween November 2012 and March 2013 in asuburban town cellular link in Niger-delta Nigeria.The measured data were applied to somepropagation loss model equation and analyzedusing linear regression method to obtain the linkparameters such as the propagation loss exponentn = 3.38, the standard deviation = 9.2dB, toformulate the model equation )( dBPL = 75.16 +33.8logd for the design of a mobile radio link in thetest bed areas. This will assist system engineersdetermine signal strength in error and as efficientpropagation loss prediction tool thus improve thequality of GSM signal.
KEYWORDS: AVERAGE SIGNAL LEVEL, LINEARREGRESSION, LOG-NORMAL SHADOWING,PROPAGATION LOSS, MODELS, RADIO LINK

34
system engineers determine signal strength inerror and efficient path loss prediction thusenhances proper network design to improve thequality of GSM signal strength for transformation.
1.1 BackgroundCommunication System engineers are
generally concern with the application of two mainradio channel links. These channel links are themobile radio link parameters and time dispersionnature of the channel. The mobile radio linkparameters consist of the path loss exponent (n)and the standard deviation (σ). The Path lossexponent indicates the rate at which a signaldepreciates with increase in distance while thestandard deviation accounts for the randomshadowing effects which occur over a largenumber of measurement locations which have thesame transmitter-receiver separation, but havedifferent levels of clutter on the propagation path.This paper also aimed at determination of thesemobile link parameters in a given seasonalpropagation environment.
Performing on site calculations andconsidering link loss in the practical environmentand their result may be applied to existing modelsfor correction (Moinuddin and Singh, 2007). Boththeoretical measurement based propagationmodels indicate that average received signalpower decreases logarithmically with distance,whether in outdoor or indoor radio channels. Theaverage large-scale path loss for an arbitrary T-Rseparation is expressed as a function of distanceby using a path loss exponent n
00 log10)()(
d
dndPLdBPL
(1)Where n is the path loss exponent, which
indicates the rate at which the path loss increaseswith distance, od is reference distance and d is
the T-R separation distance (Faruque, 1996). ndepends on specific propagation environment forfree space 2n and when obstructions arepresent n will have a larger value. The referencedistance should always be in the far field of theantenna so that near field effects do not alter thereference path loss. Its typical value is 1 Km inmacro cell system, 100m in micro cell systems and 1m in Pico cell systems.
Usually, the calculation of path loss iscalled path loss prediction. On the basis of themobile radio environment, path loss predictionmodels are classified into two main categories:outdoor and indoor prediction models (Rappaport,2002).
Furthermore, with respect to the size ofthe coverage areas the outdoor path lossprediction models are subdivided intomegacellular, macrocellular, and micro-cellular,whereas the indoor prediction models aresubdivided into two classes: Picocellular andfemtocellular (Sharma, 2007). Megacell areas areextremely large cells spanning hundreds ofkilometers. Megacells are served mostly by low-earth orbiting mobile satellites".
Macrocellular areas span a few kilometersto tens of kilometers, depending on the location(Neskovic, 2002). These are the traditional cellscorresponding to the coverage area of a basestation associated with traditional cellulartelephony base stations. Macrocells can beclassified into different channel types: urban,suburban, and rural propagation environments(Hogue et.al, 2006). Microcells are cells that spanhundreds of metres to a kilometre. The span ofpicocells is between 30m and 100m, whilefemtocells span from a few metres to few tens ofmetres.
2.0 PATH-LOSS MODELSThe most important aspect of any radio
propagation is how field strength varies as afunction of distance and location. This property isusually captured in the concept of path loss.Pathloss tends to increase linearly with thelogarithm of the carrier frequency (Hata, 1980).This is also known as large scale fading, whichaccount for the attenuation of the signal level.Other forms of fading are; the small scale fadingwhich causes signal distortion, dissipation and are,relatively insensitive to the carrier frequency, buteffects can depend on the service bandwidth.Multipath could arise from diffraction, scatteringand reflection of related objects such as buildingand cars in the physical environments. The existingpath-loss models can be classified into: theoreticaland empirical models. Theoretical models predicttransmission losses by mathematical analysis ofthe path geometry of the terrain between thetransmitter and the receiver and the refractivity of

35
the troposphere (Adeseko, 2012). Empirical modelson the other hand add environmental-dependentloss variables to the free-space loss to computesthe net path loss in the correspondingenvironment. This method requires thatmeasurements be made and so considered moreaccurate in view of its environmental compatibility.Path-loss models are needed for effective wirelessdesign. These models help via simulation to predictsignal level and coverage. Path-loss along with thetransmitter power and the gain at each end of theradio path, the analyst/designer can determinehow much power is received from particulartransmitter. In this work, we consider only theempirical models which use measurement data tomodel a propagation loss equation.
2.1 Link Budget Design using Loss ModelMost radio propagation models are
derived using a combination of analytical andempirical methods. The empirical approach isbased on curve fittings whereas analytical is basedon a set of measured data. However, the validity ofan empirical model at transmission frequencies orenvironment other than those used to derive themodel can only be established by additionalmeasured data in the new environment at therequired frequency. The two practical mobile radiolink design estimation techniques are: The log-distance path loss model and the log-normalshadowing model (Seidel , 1991). The Log-distance path loss model:- This model
indicated that the average receive signalpower decreases logarithmically with distance;the average large-scale path loss for anarbitrary Transmitter-Receiver (T-R) separationis expressed as a function of distance(d) byusing a path loss exponent(n) as in equation(1).
The log-normal shadowing model: - The log-distance path loss model does not considerthe fact that the surrounding environmentalclutter may be vastly different at twodifference locations having the same T-Rseparation. This leads to measured signals,which are vastly different from the averagevalue predicted by equation (1).
The log-normal distribution des-cribe therandom shadowing effects which occur over alarge number of measurement locations whichhave the same T-R separation, but have different
levels of clutter on the propagation path. Thisphenomenon is referred to as log-normalshadowing. Log-normal shadowing implies thatmeasured signal levels at a specific T-R separationhave a Gaussian (normal) distribution about thedistance-dependent mean of equation (1); wherethe measured signal levels have values in dB units.The standard deviation of the Gaussian distributionthat describes the shadowing also has units indecibel dB.
Measurement have shown that at anyvalue of d , the path loss )(dPl at a particularlocation is random and distributed log-normally(normal in dB) about the mean distance dependentvalue, that is:
Xd
dndPLXdPLdBdPL
00 log10)()(])[(
(2)
Where Xσ is a zero-mean Gaussiandistributed variable (in dB) with standard deviationσ also in dB. The close-in reference distance od ,
the path loss exponent (n), and the standarddeviation (σ) statistically describe the path lossmodel for an arbitrary location having a specific T-Rseparation and this model may be used incomputer simulation to provide received powerlevels for random locations in communicationsystem design and analysis (Seidel , 1991).3.0 MATERIALS AND METHOD
Pavlos et al. (2007) provides thatmeasurement reports over the GSM network aretransmitted periodically (480ms) from the MobileTerminal (MT) to the Base Transceiver Station(BTS) on the Stand Alone Common Channel(SACCH) assigned to each communica-tion,according to which the measured received signalLevel (RXLEVs) from the serving BTS and from aneighbor BTS (in situations requiring handover) aresubmitted. In this work, RXLEV data or signalstrength data measurement was done with dataacquisition software. The losses in signal strengththat do occur during transmission from theTransmitting antenna TX to the Receiving antennaRX are given by the path loss, while the receivepower is the result of the path loss phenomenon.
The Field test measurement in theenvironment explicitly, has the advantage of takinginto account all the environmental effects. Usingthe NOKIA 1265 test phone systems operated in

36
the active mode which was provided by the GSMnetwork service provider, to measure receivedsignal from the serving BTS, accompanied with anHP portable laptop and a GAMINI GPS (Globalpositioning system) receiver for accurate location,measurement survey was conducted on receivedsignal strength propagation level, transmitting in13000MHz. The system links compromises of fiveBTS site cells the links characteristics is shown inTable 1 and schematic diagram of measurementsetup in Figure 1.
Table 1: System Link CharacteristicsSystem Parameters StationsLatitude and Longitude 050 53.961’/
0050 41.139’Antenna Type SectoralBS Antenna Height 30mTransmitting Frequency 13GhzTx Pwr 15.0 (dBm)Path Length 1km – 10km
The cells in the environment investigatedhave sectoral antenna placed at 30 meters aboveground level.
3.1 MethodsThe measurement setup is shown in
Figure1. A NOKIA handset equipped with net-monitor software (Transmission Eva-luationMonitoring System TEMS) was used to measurethe received signal strength level (power received)at a distance (d) from the base station. Thesoftware comprises of a scale, which represent thepower received in dBm. For every cell in theenvironment investigated, power received at adistance 1000 meters from the base station wasmeasured. Power received at a distance interval of1000 m from the initial test point up till thedistance of 10km was measured. The globalpositioning system GPS was used to determine thegeographic coordinate and distance. The field test
was done between November 2012 and March 2013at Amukpe-Sapele suburban area in Niger-DeltaNigeria using existing GSM network and five BS cellsites selected in the locations of study. With the aidof testing tool (i.e. NOKIA mobile handset) runningon the software mode, calls were initiated at eachtest point until it is established and the signalstrength information sent over the air interfacebetween the base and the mobile station wereread and recorded with the laptop computer. Forevery site, received signal strength was measuredat a reference distance of 1000m from the basestation and at subsequent interval of 1000m up to10000m. All measurements were taken in themobile active mode and in three sectors of eachbase station. This was to ensure that the mobilephone was in constant touch with the base station.Averaging is done to compensate for variation insignal strength at a given location over time.
The distances of these measure-mentspoints from the reference point of the base stationwere recorded using the global positioning system(GPS). The GPS showed the T-R separationdistances. The GPS was first switched on at thefoot of the BTS tower; before the ENTER buttonwas pressed. We moved away from the referenceBTS, and when the radial distance on the GPSbecomes equal to the desired close-in referencedistance, the radio propagation simulator wasswitched on to take the readings. Table 2showcases the results obtained.
4.0 DATA PRESENTATIONFollowing the measurement procedures
above the average of power received signal levelat different months cum sites was computed andpresented in Table 2.
Table 2 show case the average powerreceived during the dry season between
BaseStation
TEMSPhone
LaptopComputer
GPS
Figure 1: A schematic diagram ofmeasurement setup
CellsT-R
Separation(m)
Months Nov 2012 – March 2013
Nov(dBm)
Dec(dBm)
Jan(dBm)
Feb(dBm)
Mar(dBm)
Cell1 1000 -51.3 -51.9 -51.5 -50.0 -50.1Cell2 2000 -54.7 -54.9 -54.7 -49.5 -53.2Cell3 3000 -58.6 -58.8 -58.7 -53.5 -57.2Cell4 5000 -66.7 -66.4 -66.5 -61.5 -65.6Cell5 10000 -98.5 -98.3 -98.8 -98.2 -97.5
Table 2: Mean Received Power (Pr) at DifferentMonths Nov 12 – March 13.
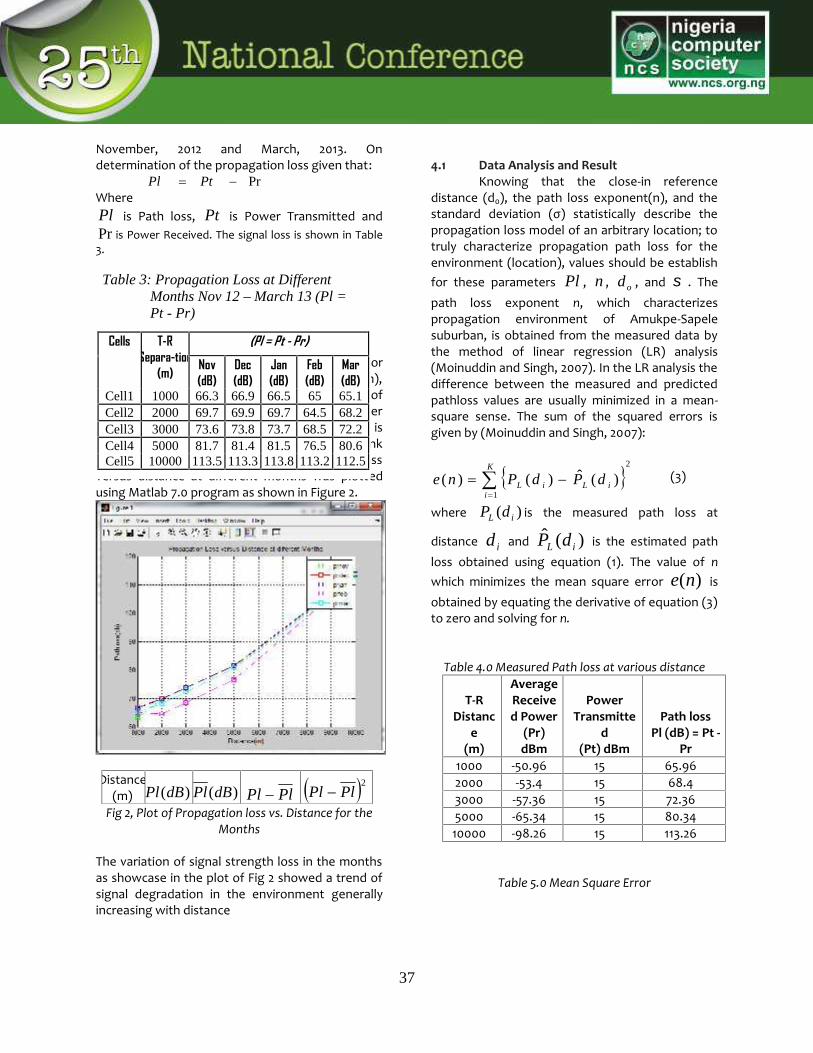
37
November, 2012 and March, 2013. Ondetermination of the propagation loss given that:
Pr PtPlWherePl is Path loss, Pt is Power Transmitted andPr is Power Received. The signal loss is shown in Table3.
From the Table 3 the reference path loss (do) forthe months is Cell 1. At a distance of 1000m (1km),for the month of November is 66.3 dB. The value ofpath loss is obtained from subtracting powerreceived (Pr) from power transmitted (Pt) which is15.0 dBm as shown in Table 1 of System Linkcharacteristics. The data of the propagation lossversus distance at different months was plottedusing Matlab 7.0 program as shown in Figure 2.
Fig 2, Plot of Propagation loss vs. Distance for theMonths
The variation of signal strength loss in the monthsas showcase in the plot of Fig 2 showed a trend ofsignal degradation in the environment generallyincreasing with distance
4.1 Data Analysis and ResultKnowing that the close-in reference
distance (d0), the path loss exponent(n), and thestandard deviation (σ) statistically describe thepropagation loss model of an arbitrary location; totruly characterize propagation path loss for theenvironment (location), values should be establishfor these parameters Pl , n , od , and . The
path loss exponent n, which characterizespropagation environment of Amukpe-Sapelesuburban, is obtained from the measured data bythe method of linear regression (LR) analysis(Moinuddin and Singh, 2007). In the LR analysis thedifference between the measured and predictedpathloss values are usually minimized in a mean-square sense. The sum of the squared errors isgiven by (Moinuddin and Singh, 2007):
2
1
)(ˆ)()(
K
iiLiL dPdPne (3)
where )( iL dP is the measured path loss at
distance id and )(ˆiL dP is the estimated path
loss obtained using equation (1). The value of nwhich minimizes the mean square error )(ne is
obtained by equating the derivative of equation (3)to zero and solving for n.
Table 4.0 Measured Path loss at various distance
T-RDistanc
e(m)
AverageReceived Power
(Pr)dBm
PowerTransmitte
d(Pt) dBm
Path lossPl (dB) = Pt -
Pr1000 -50.96 15 65.962000 -53.4 15 68.43000 -57.36 15 72.365000 -65.34 15 80.3410000 -98.26 15 113.26
Table 5.0 Mean Square Error
Distance(m) )(dBPl )(dBPl PlPl 2PlPl
Cells T-RSepara-tion
(m)
(Pl = Pt - Pr)
Nov(dB)
Dec(dB)
Jan(dB)
Feb(dB)
Mar(dB)
Cell1 1000 66.3 66.9 66.5 65 65.1Cell2 2000 69.7 69.9 69.7 64.5 68.2Cell3 3000 73.6 73.8 73.7 68.5 72.2Cell4 5000 81.7 81.4 81.5 76.5 80.6Cell5 10000 113.5 113.3 113.8 113.2 112.5
Table 3: Propagation Loss at DifferentMonths Nov 12 – March 13 (Pl =Pt - Pr)

38
Evaluating the value of the mean square error fromthe table gives:
2490.988+1222.4898n-180.5334nˆ 22
1
k
i
lPPl(4)
Differentiating equation (4) and equating it to zerogives the value of n in equation (5):
d dnen =
0
dn
2490.988+1222.4898n-180.5334n2d
(5)
38.3n
Having derived the parameter of the propagationloss exponent n, therefore the standard deviationσ (dB) of random shadowing effect is computedusing the relationship in equation (6):
K
iiLiL kdPdPdB
1
2 /)]()([)((6)
Recalling that n=3.38 and k = 5 i.e. thenumber of sites cell investigated, thereforesubstituting these values in equation (6) gives thecomputed to be ][dB = 9.2.dBSubstituting the above calculated propagationpath loss exponent n and the standard deviation into the log-normal shadowing model inequation (2) gives the model that describes thedesign parameters the mobile link in that location.
2.9)log()38.3(1096.65)( ddBPLddBPL log8.3316.75)( (7)
The equation (7) models the radiopropagation channel/link for the mobile system inthe location the research was carried out. Thismodel can also be used in computer simulation toprovide received power levels for randomlocations in mobile communication system designand analysis.
5.0 RECOMMENDATIONThe telecommunication companies in
Nigeria whether based on GSM or CDMAtechnologies operating at radio frequency bands,should apply the knowledge presented in thispaper in radio link budget design and analysis so asto further improve their services, thereby servinghigh quality signals to their teeming subscribers insub/urban areas.
Researchers who are motivated toperform propagation surveys for the purpose ofradio system development and deployment shoulduse this model to predict signal strength loss inenvironment with similar characteristics and use asvalidation propagation prediction tool.
6.0 CONCLUSIONThe objective of the paper was to develop
a model that appropriates for certain geographicalareas, that would assist system engineersdetermine signal strength in error and efficientpath loss prediction tool that would enhancesproper network design to improve the quality ofGSM signal strength for transformation.Measurement of received signal level wasconducted in the test-bed area of Niger-Delta inNigeria with the use NOKIA handset equipped withnet-monitor soft-ware Transmission EvaluationMonitoring System TEMS. The measured data wereanalyzed by the method of linear regression (LR)analysis to formulate this model the mobile radiolink parameters that Communication Systemengineers are generally concern with weredetermined. The mobile radio link parametersconsist of the path loss exponent (n) = 3.38 andthe standard deviation (σ) = 9.2dB thatcharacterized the propagation environ-ment.
Conclusively, it is essential that for reliablemobile wireless system design the accuratequalitative understanding of the propagation usingpropagation loss model as a function of distancefrom where the signal level could be predicted.
1000 65.96 65.96 0 02000
68.465.96 +
3.01n 2.44 – 3.01n
9.0601n2 –14.689n +
5.95363000
72.3665.96 +4.77n 6.4 – 4.77n
22.7529n2 –61.056n +
40.965000
80.3465.96 +6.98n
14.38 –6.98n
48.7204n2 –200.7448n +
206.784410000
113.2665.96 +
10.0n 47.3 + 10.0n
100.0n2 –946n +2237.29

39
7.0 REFERENCESAdeseko Ayeni, (2012), Comparative Assessments
of some selected existing RadioPropagation Models: A study of Kano City,Nigeria, European Journal of Scientificresearch, Euro Journals Publishing, Inc.
Faruque, Saleh (1996), Propagation Pre-dictionBased on Environmental Classification andFuzzy Logic Approximation, Proc. IEEE ICC’96, 1996, Pp 272-276.
Hata M., (1980). Empirical formula for propagationloss in land mobile radio services, IEEETrans. Veh. Technol., vol. VT-29, 317–325,(Aug. 1980).
Hess, G.C. (1993). Land-Mobile Radio SystemEngineering, Norwood, MA; Artech House,1993.
Hogue, M. R. Islam, HMR. Abedin, J. and Song, J. B.(2006). Comparative Analysis of CDMABased Wireless Communication underRadio Pro-pagation EnvironmentConference on Wireless Broadband andUltra Wideband Communications (AUSwireless '06), Sydney, Australia, 2006, pp.116- 121.
Moinuddin A.A and S Singh (2007). Accurate PathLoss Prediction in Wireless Environment,The Institu-tion of Engineers (India) Volume88, July 2007, Pp: 09-13.
Neskovic, A. Neskovic N. and Paunovi, D. (2002).Macrocell. Electric Field StrengthPrediction Model Based Upon ArtificialNeural Networks, IEEE Journal on selectedareas in Communications, Vol. 20, Number6, 2002, pp. 1-10.
Pavlos, F., Sofoklis, K, and George, K (2007).Enhanced Handover Per-formance inCellular Systems based on PositionLocation of the Mobile Terminals. Seminarpaper, Telecommunications Laboratory,National Technical University of Athens. 2-3.
Rappaport, T. S. (2002). Wireless Commu-nications,Second Edition, Pearson Publication, India,2002, Pp. 57-176.
Sharma, S. (2007). Wireless and CellularCommunications, Second Edition, S. K.
Kataria & Sons, New Delhi, 2007, pp. 20-96.
Stuber, G. L.(2001). Principles of MobileCommunication, Second Edition, KluwerAcademic Publishers, Boston, 2001, pp.39- 125.
SEIDEL S. ET AL., (1991). PATH LOSS, SCATTERINGAND MULTIPATH DELAY STATISTICS, IEEETRANSACTIONS ON VEHICULAR TECHNOLOGY,VOL.40, NO 4, PP. 721-730.

40
_____________________________________________________________________________________________________________________________________
MEASURING INFORMATION SECURITY AWARENESS EFFORTSIN SOCIAL NETWORKING SITES – A PROACTIVE APPROACH_____________________________________________________________________________________________________________________________________
J. O. OkesolaTASUED, Ijebu-Ode, Nigeria; andSchool of Computing, University of South Africa (UNISA)[email protected]
M. GroblerDPSS, CSIR, Pretoria, South Africa; andSchool of Computing, University of South Africa (UNISA)[email protected]
1.0 INTRODUCTIONMany experts agree that ISA is effective
while some others are of a different opinion(Veseli, 2011). Okesola (2014) in particular, criticisesthe effectiveness of Information SecurityAwareness (ISA) arguing that ISA has beenpromoted for many years as being fundamental toIS practices. His statements clarifies that only veryfew studies have been done regarding theeffectiveness and efficiency of ISA.
The importance of security awareness isactually being discussed by many authors andorganisations but very few empirical studies aredone, and none of these offers a technique that iseffective in measuring users’ behaviour in SocialNetwork Sites (SNSs) (Veseli, 2011). Similarly, veryfew experiments are done in the measurement ofthe effectiveness of the changes in humanbehaviour or attitude (Spice, 2007; Williams, 2007).Although recent research works (Albrechsten &Hovden 2010; Wolf, 2010) are already looking intothe effects of ISA efforts on SNSs, they havealways been focusing on phishing threats, and areknown for showing the effectiveness of phishingtests, class-room based training, e-mail basedtraining and web-based awareness material(Johnson, 2012).
Research has been exhausted in the realmof ISA, but literature still lacks proof of theeffectiveness of ISA methods from psychologicaltheories and they are still silent on thefundamental assumptions of these methods.However, Khan et al., (2011) evaluated theeffectiveness of different ISA tools and techniqueson the basis of psychological models and theories.They eventually succeeded in describing processesneeded to measure ISA in an organisation.
The recent report of ABC, (2013) worksubmitted in November 2012 classified all thesemethods as incident statistics approaches to
ABSTRACT
For Social Network Sites to determine the effectivenessof their Information Security Awareness (ISA) techniques,many measurement and evaluation techniques are now inplace to ensure controls are working as intended. Whilethese techniques are inexpensive, they are all incident-driven as they are based on the occurrence of incident(s).Additionally, they do not present a true reflection of ISAsince cyber-incidents are hardly reported. They aretherefore adjudged to be post-mortem and riskpermissive, the limitations that are inacceptable inindustries where incident tolerance level is low. Thispaper aims at employing a non-incident statisticapproach to measure ISA efforts. Using an object-oriented programming approach, PhP is employed as thecoding language with MySQL database engine at theback-end to develop sOcialistOnline – a Social NetworkSites (SNS) fully secured with multiple ISA techniques.Rather than evaluating the effectiveness of ISA efforts bysuccess of attacks or occurrence of an event, passwordscanning is implemented to proactively measure theeffects of ISA techniques in sOcialistOnline. Thus,measurement of ISA efforts is shifted from detective andcorrective to preventive and anticipatory paradigmswhich are the best forms of information securityapproach.
Key words: Incident-driven, information securityawareness, non-incident statistics approach, quiztemplates, sOcialistOnline

41
Johnson (2012), in his doctoral measureISA. They are adjudged to be incident statistics, sincethe measurement of their effectiveness is based onthe occurrence of an event or success of an attack.Therefore, putting in mind the goal of passwordscanners as a non-incident statistics technique, thisauthor chooses to develop a strong passwordscanner capable of cracking SNS passwords that ishashed with a more complex system.People generally do not see legitimate reasonsbehind the creation of password scanner/cracker.However, the problem is not the existence ofpassword crackers, but their frequent illegal use byfraudulent people for bad goals and objectives.When employed with good intentions, passwordscanners offer a valuable service to system and dataadministrators by alerting them of system or users’weak passwords (Taber, 2011).
2.0 RELATED WORKA wide form of completely different
strategies is being adopted to measure ISA efforts.However; organisations seem to find it difficult toimplement effective quantitative metrics (ENISA,2007). They tend to adopt different methods, bothquantitative and qualitative approaches, to measurethe effectiveness of their ISA activities. Nyabando,(2008) agrees that more extensive qualitative andquantitative studies are needed to understand thedisparities between awareness and practice.
In 2005, a prototype model was invented byKruger and Kearney, (2005) to measure ISAeffectiveness in an international gold miningcompany, based on knowledge, attitude andbehaviour (KAB). However, their work failed to studythe basic theory behind the model. Similarly, Hagen,Albrechtsen and Hovden, (2008) analysed responsesto research questions from 87 IS managers inNorwegian organisations. Furthermore, in a researchstudy concluded in September 2010, Albrechsten andHovden (2010) identified IS related discussion as atool effective enough to raise users’ awareness.
research work conducted at the Universityof Lagos in May 2012, argues that too much isexpected from the audience, undermining a factthat security processes can only be effective whenaudience have a good security support andappreciate security requirements. On this basisand by applying background training, Jagatic,Johnson, Jakobsson and Menczer, (2007) were ableto prove that it is very easy (through SNS inparticular) to capture huge amount of data foreffective phishing attacks. However, they attempted
(with no success) to measure the influence of socialcontext information on phishing attacks. Whatmakes their work different was that e-mails werespoofed to deceive users as if it was from friends inthe Social Networks (SNs), and at the end the totalnumber of victims to this phishing attack outweighedthe expectation (Jagatic, 2008).
Wolf, (2010) reported that there were someunconventional methods used to study and measureusers’ SA. One of the notable methods wasemployed by Dodge, Carver, and Ferguson, (2007),who used phishing e-mails to detect users that clickedon potentially malicious links in e-mails. Briggs,(2009), who described how software wasimplemented to examine network traffic forPersonally Identifiable Information (PII) that wasbeing transmitted unencrypted over a campusnetwork, made another attempt. Meister andBiermann, (2008), using similar methods, detailed theuse of a worm that was created to test the users’ability to detect phishing attempts in their research.Nagy and Pecho, (2009) tested Facebook users’ability to detect and measure phishing attacks byattempting to friend as many unknown people aspossible.
Research conducted by Briggs (2007)highlighted 12 different metrics as effective inmeasuring the success of ISA activities, all of whichare incident statistics driven. The most popularoverall is the measure of internal protection, wherepolicy breaches from audit report are being used as ameasure.
This is followed by the effectiveness andefficiency measure, where experience of therespondents on security incidents count a lot. Thecommon metrics include the quantity of incidentsresulted from human unsecured deeds and rootcause analysis of the most terrible incidents.
Figure 1: Data Gathering (own compilation)

42
Surveys and questionnaires are adjudgedto be the most popular measurement instrumentas evident by the large number of studies that usedthem, Bulgurcu, Cavusoglu and Benbasat,(2009)are the only authors who use authorobservation as part of the measurement. Theycombined surveys, interviews, case studies andobservations to form their analysis (Wolf, 2010).
While considering a non-incident statistic approachto measure ISA on SNSs, Okesola, (2014) in hisdoctoral research work, identified severalapplications and utility software presently availableto scan SNS’s password file, but with a limitation toonly the files that are hashed with less complexsystem such as MD5. These passwordscanners/crackers include but are not limited toFacebook Password Sniffer, John the Ripper,Password Decryptor, Google Password Decryptor,Password Security Scanner, PasswordFox, Sniffer,OperalPassView, Access PassView, Web PassView,and AsterWin IE. This limitation calls for the needfor a stronger password scanner to crack SNSpasswords hashed with a more complex system.
3.0 METHODOLOGYIn this study, quantitative research strategy isdeployed where data-gathering is primarilyfocused on collection of existing data alreadygathered by sOcialistOnline – a newly developedSocial Network Site – SNS (figure 1). These existingdata are relevant data from managementinformation systems such as users’ personal andconfidential data including photographs andpassword files. To ensure data collected from thestudy is treated as private and confidential, and tocomply with the ethics policy (http://www.unisa.edu.au/policies/codes/ethics/ethics.asp
) on research, the scanner is designed to displayonly the security information about passwordswithout actually showing the password itself (seefigure 2).
3.1 Developing the ScannerThis author consulted some existing
algorithm and expert knowledge to come up witha new scanner suitable enough for this researchpurposes only. Based on an exploratory approachusing an object oriented programming (OOP)methodology, the utility software is structured toscan and display security information of thepasswords (and not the password itself) stored onMicrosoft Outlook, Mozilla Firefox, and InternetExplorer and display password securityinformation, such as password strength.
This information is later used to determinethe strength of the passwords of the SNS’s userswithout necessarily seeing the passwordsthemselves.Some of the features of this newly developedpassword scanner are described as follows. System requirements: This scanner works on
Windows 2000 version and up to Windows 7. Applications supported: It was incident-ally
tested and found suitable to scan thepasswords of Internet Explorer 7.0 - 9.0,Internet Explorer 4.0 - 6.0, and Micro-softOutlook as well.
Known limitations: Only two limitations werenoticed: (1) once protected by a masterpassword, this scanner cannot scan the Firefoxpasswords; and (2) Windows passwords canonly be uncovered if the scanner is run withadministrator’s privileges.
Columns description: The scanner output has 9columns as displayed in figure 2 and describedas follows:

43
Figure 2: The Screen-print of the Password Scanner (own compilation)
User Name: The user name or UserID of theparticular password item.Uppercase: The total number of characters withuppercase (A - Z) in a password.Lowercase: The total number of characters withlowercase (a - z) in a password.Numeric: The total number of numerals (0 - 9) in apassword.Special: The total number of characters that arenon-alphanumeric in a password.Password Length: The total number of letters orcharacters in a password.Repeating: The total number of charactersrepeated in the password. For instance, if thepassword is cnbnckc, the repeating value will betwo since only c and n characters appear morethan once.Password Strength: This may be calculated basedon the total number of parameters including thecharacter type, the presence and the total numberof characters and repeating characters used in thepasswords. Each value appearing in this columndenotes the strength of the password, in line withthe classifications in table 1.
Table 1: Password Classification Table
Securityclasses
Sub-classes
Classinterv
al
Character composition
BAD Veryweak
1 – 5 Less than 8 characterslength, only alphabetsor numbers.
Weak 6 – 15 Only alphabets ornumbers but longerthan 7 characters.
GOOD Medium
16 – 29 Alphabets (lowercaseor uppercase) plusnumbers and longerthan 7 characters.
Strong 30 – 49 Uppercase, lowercaseplus numbers andlonger than 7characters.
Verystrong
50 andabove
Uppercase, lowercase,numbers, plus specialcharacters (#, $) andlonger than 7characters.

44
3.2 Password ClassificationFor this research exercise, a password is
classified as good or bad (table 1). In which case, apassword is said to be: Bad and guessable if its character combination
is weak or very weak; and Good if its character combination is medium,
strong, or very strong.Following this classification, data related
to the biographic details were captured andanalysed to generate a survey report. These datainclude Group, age, gender, tribe, country,qualifications, profession, and technologicaladvancement based on the user level of computerliteracy and proficiency.
3.3 Conducting the ScanningsOcialistOnline was developed and
system-tested in September 2011, but it was notmigrated to production stage until November 2011due to some Users Accep-tance Test (UAT) andsecurity challenges. The SNS was planned to runfor only 12 months (December 2011 – November2012) but because of low patronage owing tobeing new to SNSs users, it was left on productionstage until July 2013. Meanwhile, the passwordscanner has been developed and tested okay foruse since November 2012.
The sOcialistOnline password file wasdecrypted, downloaded and scanned into a flatdata file. All the users on the SNS were capturedbut bearing in mind that most people who join willnot remain active for privacy, social, and otherfactors (Okesola, 2014), the file was automaticallyreviewed to eliminate the non-active users. Thescanner statistically analyse the composi-tions ofthe active passwords to determine their strengthsand weaknesses as very weak, weak, medium,strong, and very strong.
4.0 FINDINGS AND DISCUSSIONThe result from the password scanning
exercise is summarised in table 2, where thenumbers of good and bad passwords are almost atratio 5:1 with bad password taking less than 20% ofthe total population size. As indicated in table 2and figure 3 as well, only 364 passwords
(representing 19%) of the population size of 1,903are bad passwords.
Table 2: Output from the Password ScannerPassword
ClassesGood Bad Population
Size
Very Weak 135 135
Weak 229 229
Medium 384 384
Strong 397 397
Very strong 858 758
TOTAL 1,539 364 1,903
Figure 3: Good vs Bad Password Combinations
This is an improvement on some pastrelated works of Briggs, (2009), Carnegie MellonUniversity (Spice, (2007), CISO (a large financeservice) German organisation (Williams, 2007), andKhan et al., (2011) where ISA efforts wereevaluated on the basis of post-mortem metrics.The latter in particular evaluated the effectivenessof various ISA tools and techniques on the basis ofpsychological models and theories, and succeededin describing processes needed to measure ISA inan organisation.
Despite the fact that the statisticsgenerated from this method are always of greatinterest to senior management, the approach maystill not be the most effective because it cannotgive a true reflection of ISA (Briggs, (2009). This isbecause security awareness is not the soledeterminant factor of incidents occurrence butalso the extent of the occurrence of attacks.

45
5.0 CONCLUSION AND RECOMMENDATIONThe major achievement here, which
remains the main focus of this research work, isthat the effectiveness of ISA efforts implementedon the SNS were successfully measured using anon-incident statistics technique. The implicationis that guessable password combinations could bediscovered before the occurrence of an event orsuccess of an attack.
Of recent, there have been several sitessuch as OnlineHashCrack.com (2013), Pendriveapps(2013), Stock and Barto (2013) offering to scanFacebook accounts, even at no cost. Some claimto scan using the expertise they gained in last fewyears, while others based their claims on their fullawareness of the existing loopholes of Facebookand some other popular SNSs. The same claims gofor Facebook password crackers and stealers. Thisauthor disagrees with these claims because theyare all based on the false assumption thatFacebook has a MD5 password that isindecipherable. Facebook do not use MD5 forpassword hashing; it uses more complex system(OnlineHashCrack.com 2013) just as it is insOcialistOnline.
The goal of the password scanning is toprovide a useful direct quantitative measure of theattitude and behaviour of SNSs’ users. Followingthe successful scan-ning of users’ password files,the proposed solution in this study analyses thestrength of individual passwords, using anautomated statistical approach. The number ofusers using easily guessable passwords is a keyindicator of effective ISA.
The stronger password scanner developedin this research is thereby recommended for use tomeasure the effectiveness of ISA efforts on theSNSs, as it is capable of cracking SNS passwordsthat is hashed with a more complex system thanMD5. However, it must not be used with a cleanobjective and not for bad goals and fraudulentintentions.
6.0 REFERENCESABC (2013). Measuring Informa-tion Security
Awareness Techniques; the Pros and theCoins. ABC Nig. Press, University ofMaiduguri, Nigeria
Albrechsten E. and Hovden J. (2010). Improving ISAand Behavior through Dialogue,
Participation, and Collective Reflection.An Interven-tion Study. Journal ofComputer Security, 29(4): 432-445.
Briggs, L. (2009). Locking Down Data at UNebraska. Available online: http://campustechnology.com/articles/2009/10/15/locking-down-data-at-unebraska.aspx. Date Retrieved:July 23, 2011.
Bulgurcu, B., Cavusoglu, H. and Benbasat, I. (2009).Effects of Indi-vidual and OrganisationBased Beliefs and the Moderating Role ofWork Experience on Insiders' GoodSecurity Behaviours. 2009 Proceedings ofIEEE Workshop on Software SecurityProcess, August 29-31. Vancouver, Canada.
Dodge, R. C., Carver, C. and Fergu-son, A. J. (2007).Phishing for User Security Awareness.Computers and Security, 26, 73-80
ENISA (2007). Information Security AwarenessInitiatives: Current Prac-tice andMeasurement of Success. AvailableOnline: http://www.itu.int/osg/csd/cybersecurity/WSIS/3rd_meeting_docs/contributions/enisa_measuring_awareness_final.pdf. Date Ret-rieved: May 18,2011
Hagen JM, Albrechtsen E, and Hovden J. (2008).Implementation and Effectiveness ofOrganisational Information SecurityMeasures. Information Manage.Computer Security, 16(4):377-397.
Jagatic, T.N., Johnson, M., Jakobs-son, M.,Menczer, F. (2007). Social Phishing.Communications of the ACM. Vol. 50(10)112-136, 2007.
Johnson, A. (2012). Social Network Settings areIneffective. Information andCommunication Journal, Depar-tment ofComputer Sciences, Univer-sity of Lagos,Nigeria. Vol. 12(3) 25-34.
Khan, B, Alghathbar, K.S, Nabi, S.I, and Khan, M.K.(2011). Effective-ness of InformationSecurity Aware-ness Methods Based onPsycho-logical Theories. African Journal ofBusiness Management Vol. 5(26).Available online: http://www.aca-demicjournals.org/ajbm/pdf/pdf2011/28Oct/Khan%20et%20al.pdf. Date retrieved:October 27, 2012.

46
Kruger, H. and Kearneyn (2005). Measuring ISAwareness: A West Africa Gold MiningEnvironment Case Study. A ProceedingsOf ISSA, Pretoria, South Africa. Availableonline: http://icsa.cs.up.ac.za/issa/2005/Proceedings/Full/018_Article.pdf. Date Retrieved: July 25, 2011.
Meister, E. and Biermann, E. (2008).Implementation of a Socially EngineeredWorm to Increase IS Awareness. ThirdInternational Con-ference on BroadbandCommuni-cations, Information Technologyand Biomedical Applications, Gauteng
Nagy, J. and Pecho, P. (2009). Social NetworksSecurity. The Third InternationalConference on Emerging SecurityInformation, Systems and Technologies,Greece. Date Retrieved: August 3, 2012
Nyabando, C. J., (2008). An Ana-lysis of PerceivedFaculty and Staff Computing BehavioursThat Protec-tor Expose Them or Others toIS Attacks. Doctoral Dissertation, EastTennessee State University. AvailableOnline: http://proquest.umi.com/pqdlink?did=1597602021&fmt=2&vtype=PQD&vinst=PROD&RQT=309&vname=PQD&TS=1316378955&clientid=79356.Date Ret-rieved: September 18, 2011.
Okesola, J.O (2014). Measuring InformationSecurity Awareness Effectiveness in SocialNetworking Sites – A Non-IncidentStatistics Approach. Ph.D. Thesis (UNPUB-LISHED), School of Computing, Universityof South Africa (UNISA).
OnlineHashCrack.com (2013). The Truth AboutFacebook Password Hacking. Availableonline: http://www.onlinehashcrack.com/how_to_crack_facebook_account_the_truth.php. DateRetrieved: March 5, 2013.
Pendriveapps (2013). Portable Password RecoveryCategory. Pendriveapps.com. Availableonline:http://www.pendriveapps.com/software/password-recovery/. Date Retr-ieved: June1, 2013.
Spice, B. (2007). Carnegie Mellon ResearchersFight Phishing Attacks With PhishingTactics. Available Online:http://www.cmu.edu/news/
archive/2007/october/oct2_phishing.shtml. Date Retrieved: December 21, 2012.
Stock and Barto (2013). Password Tools. DavidStock and Bill Barto Consulting. Availableonline: http://thedatalist.com/pages/Password_Tools.htm. Date Retrieved: April 15, 2013.
Taber, M. (2011). Maximum Security: A Hacker’sGuide to protecting Your Internet Site andNetwork. Macmillian ComputerPublishing. Available online: http://newdata.box.sk/bx/hacker/ch10/ch10.htm.Date Retrieved: April 16, 2013.
Veseli, I. (2011). Measuring the Effectiveness of ISAwareness Programme. Master Thesis,Master of Science in Information Security,Department of Computer Science andMedia Tech., Gjovic University College.Available online: http://brage.bibsys.no/hig/bitstream/URN:NBN:No-bibsys_brage_21083/1/Ilirjana%20veseli.pdf. Date Ret-rieved: June5, 2012.
Williams, A. (2007). The Ineffec-tiveness of UserAwareness Train-ing. Available Online:http://techbuddha.wordpress.com/2007/05/02/the-ineffectiveness-of-user-awarenesstraining/. Date Retrieved: March 3,2011.
Wolf M.J. (2010). Measuring ISA Programme.Master’s Thesis, Depar-tment of InformationSystems and Quantitative Analysis, University OfNebraska, Omaha.

47
_____________________________________________________________________________________________________________________________________
NIGERIA YOUTHS: MAJOR CONTRIBUTOR TO ICT TOOLS ORMAJOR CONSUMERS OF ICT?
_____________________________________________________________________________________________________________________________________
F.Y. OsisanwoDepartment of Computer Science, Babcock University,Ilishan-Remo, Ogun [email protected]
C. AjaegbuDepartment of Computer Science, Babcock University,Ilishan-Remo, Ogun [email protected]
O. AkandeDepartment of Computer Science, Babcock University,Ilishan-Remo, Ogun [email protected]
1.0 INTRODUCTIONComputer Science is about solving
problems using computer techniques. One of itsresultant effects on the environment is themarriage of Information and CommunicationTechnology (ICT). Infor-mation andCommunication Technology (ICT) is greatlytransforming the world, making the world a globalvillage. This is possible through the Internet andseveral internet-based applications such as socialmedia, news and information, entertain-ment,email services etc. These applica-tions are nowmore popular in Africa, especially in Nigeriathrough the wide spread of mobile devices. Also,these applications have enhanced the flow ofinformation, and youth transition across the globe.
According to 2013 news report by ministerof communication, thirty two million, five hundredand thirteen thousand, two hundred and sixty-one(32,513,261) Nigerians are accessing the Internetthrough telecommunications net-works, largerpercentage of whom are youth. Variousapplications or devices that are populating the ICTworld make youth interact more with ICT. Thus,Nigeria Youth should begin to think about how todevelop ICT tools that can solve problem in theirimmediate environment. In Nigeria, a Youth issomeone between the age of 18 to 40 and majorityare university students.
Normally, as users interact with ICT, theyconsume, modify, design, reconfigure, and canbring technological development. The result ofinteractions with ICT can be seen in some Youthfrom developed world. For example, MarkZuckerberg was 19 when he and his threeroommates in Harvard University designedFacebook. The software, originally calledFacemash, was written by Mark Zuckerberg. Hisinterest in Computer Science was built up by hisfather, who taught him basic programming. Hisfather later hired a software tutor for him. One ofhis passions is to use this medium to make Harvard
ABSTRACT
Information and Communication Technology (ICT) tools havebeen widely adopted by Nigeria youths; various tools havebeen integrated into their daily life, either forcommunication, research, networking, social activities or anyother purpose including academics. As much as these toolsare embraced by the youths, interest in inventing orcontributing to the existing technology is not high amongthem. This research takes a look at the rate of youth’s interestin contributing to the existing ICT tools. The study wasconducted in one of the Nigerian private universities andemployed the survey form of research where copies ofquestionnaire were used as the research tool. A stratifiedsampling technique was used across all the levels of theircomputer science department with a total population of 1030and a sample size of 3/5 was considered. The analysis of theresearch was carried out using Statistical Package for SocialScience (SPSS). SPSS was used to analyse the gathered data.The result showed that despite the exposure of our youth toICT at early age, their passion for ICT and desire to be knownfor an invention, they still fall majorly under the class ofconsumers of ICT rather than creators. This is a situation thatneeds to be addressed by government of Nigeria, educationalinstitutions, ICT based organisations as the youths are thefuture of any nation.
Keywords: Communication, InformationCommunication Technology, ICT tools, Nigeria Youth.

48
University Student more open. Through the site hisclassmates met to study a course and the teacherreported of recording the best grades that session(Wikipedia, 2014).
Drew Houston invented Dropbox as apersonal solution to USB flash drive which he oftenforgets at home. He was then an undergraduatestudent in MIT (Massuchest Institute ofTechnology). Dropbox as a cloud-based storagesystem, can help to share files and pdf that are toolarge for email attachment.
Google was created as a result ofcollaboration to write a program for a searchengine (initially called BackRub) by Larry Page, andSergey Brin who were graduate students ofComputer Science in Stanford University. TheCommon things among these inventors are; theywere driven by the desire to solve problem in theirimmediate environment using ICT, and they wereYouth, and they were Computer Science students(Wikipedia, 2014).
Nick D’Aloisio, a 17 year old Londonteenager, has recently become one of Britian’syoungest millionaires due to his invention of theapp ‘Summly’, an app that summaries news articlesfor the small screen, and was swiftly purchased byYahoo after initially being downloaded one milliontimes on Apple’s App store before Yahoo’spurchase. Yahoo bought the app for £30 million, astaggering figure that serves to highlight theincreasing value that the youth of today representsin the technological field. Thomas Goodenough, 12year old, holds the title of the youngest appinventor in his creation of Air Ambulance, an appthat allows virtual tours on air ambulances (Lucy,2012).
There is a clear gap in the market forinnovative youngsters who run their lives throughtechnology to prosper by using their creativity andexperience in technology. (Lucy, 2012). Hence,Africa youth, especially Nigerians should not onlybe consumers of ICT products but must start to beinnovators. For a country to improve her GlobalCompetitive Index (GCI), innovation is one of themajor areas of improvement. Nigeria Youth needsto move from the level of consumption into levelsthat can bring innovations to ICT. The adoption ofthis rule will transform them to be more innovativetechnologically thus leading them to be more ofcontributors rather than consumers.
This research takes a look at students’interest towards becoming contributors to ICT,their involvement, and their first contact with ICT.The research provided answer to the question ofwhether Nigeria youth are major contributors orconsumers of ICT. This helped to predict the trendof ICT in Nigeria and gave us insight towards thepossible solutions. The research employed the useof copies of questionnaire in order to ascertainstudents’ level of interest in using ICT to solveproblems in their immediate environment. Thedata gathered were analysed using SPSS(Statistical Package for Social Science).
1.2 Aim and ObjectivesThe aim of the research is to determine
the extent to which Nigerian youths have beenengrossed with IT in terms of creating and buildingICT tools (both hardware and software).Specific objective of the research are to: find out the level of ICT tool usage among
Nigerian youths examine the basis of youths interest in ICT and find out the percentage of youths who have
contributed to the development of ICT tools
1.3 Research QuestionThe following are the questions answered
by this research: To what extent do Nigerian youths regard ICT
courses or ICT related courses? What is the level of ICT tools usage among
Nigerian youths? What was the basis of youths’ interest in ICT? What is the percentage of youth’s contribution
to the development of ICT tools?
2.0 RELATED RESEARCH WORKSIn Carroll et al. (2002), this research work
tried to find out what young people want fromInformation and Communication Technology? Whysome technologies were adopted and othersrejected? What roles do mobile technologies playin their lives as they move from childhood towardadult world?The objective of the paper is to examine the youngpeople’s adoption of infor-mation andcommunication technologies in order to envisionthe design of innovative technologies.
The research employed a structured-casemethodological frame-work, where a combination

49
of methods was used to build understanding ofyoung people’s use of mobile technologies. Allthese were drawn from research methods fromvarious other disciplines; focus groups,questionnaires, participant observation, on-linediaries and scrapbooks were all used to collectdata and triangulate young people’s opinions andrecollections.
It was concluded in this research thatyoung people are adopting a lifestyle rather than atechnology perspective: they want technology toadd value to their lifestyles, satisfy their social andleisure needs and reinforce their group identity.
In Thulin (2005), this study explores howurban youth fit the use of information andcommunication technologies (ICT) into theireveryday lives.
The study is based on an in depth, two-wave panel study of young people living inGothenburg, Sweden, supplemen-ted by nationalICT-use survey data.
Results show that young people usecomputers for one and a half hours per day, andhalf of this time is spent online. Time spent on ICTuse is increasing, and ICT now encompasses abroader range of activities. The Internet is mainlyused to communicate with people already knownin ‘real life’. Contacts are both geo-graphically far-flung and very local. ICT use is found to generateadditional contacts and communication ratherthan replace telephone calls and travel.
In Johnson (2012), Federal Ministry ofCommunication Technology (2012) opined that 70%of Nigeria’s 167 million population is occupied byyouths from ages 18-35(in accordance to Nationalyouth policy) and globally they are recognised thatthey are greatest consumers of ICT content andcreators of ICT tools. The research suggested thefollowing to government in order to promote ICT: increased availability of broadband, institutional support of youth
entrepreneurship in ICT skills and capacity development.
In Cole (2008), the researcher opined thatmost of the social software technologies onlycreate room for student to be more of the webcontent consumers rather than web contentpublishers. Hence, the uniqueness of wikitechnology.
The aim of the study was to present to theeducational community the negative impact
encountered when the integration of wiki intoexisting teaching format is poorly designed andsupported.The specific objectives were: to take a review on the features of wiki and
suitable models of learning presented, to examine the cause of failed action research
experiment to integrate wiki into existingsystem.
The researcher employed a descriptiveform of research where an overview of a failedaction research was examined along with review oflearning theories and features/ characteristics ofwiki technology. Also case studies were presentedon the effect of integrating wiki into existingsystem.
The study showed that wiki has littleimpact on student engagement simply becauseparticipating students chose not to pose to thewiki.
3.0 RESEARCH METHODOLOGYTo achieve the above objectives, the
research examines the rate at which youth getinvolved with ICT tools for their different activities,their first contact with ICT, also examines the levelof students’ interest in being a contributor to ICTand how far the students have gone in using ICT tosolve problems in their immediate environment.
The research adopted an exploratorysurvey approach to examine issues discussedabove and report the investigated opinions of theyouth. An initial conceptual framework was carriedout, which informed the starting point, the scope,area of interest, participant, planning, collectingand analysing of data, and also reflection on thefindings. The process started with the selection ofa target case study of students of Science andTechnology in a University in South West Nigeriafor the survey. Questionnaires were administeredto the target participants, feedback gathered fromthe case study were collated and then analysed.The statistical tool employed for the analysis of thegathered data is SPSS. From the analysis,reflections were made on the implications of thegathered data.
3.1 The ScopeThe research focused mainly on ICT tools
which could be hardware or software, the targetparticipants were the students of computer science

50
department of the University, where the followingcourses were taken: Computer Science, ComputerInformation System and Computer Technology. Thetotal population of the department is 1030 where asampling size of 3/5 was considered. The studentfrom second year (200 level) to the fourth year (400level) were recruited on the basis that they aregetting grounded in the reality of their course ofstudy unlike the freshmen.
3.2 QuestionnaireThe survey was first reviewed by experts in
ICT before a final version was now administered tothe participant. A total number of 620 questionnaireswere produced and administered The survey containsfour sections:Section A: The demographic Information of the
participantsSection B: The section measuring passion and interest
in ICTSection C: he section measuring the desire to
continue with ICTSection D: The section examining how far the
participant has gone in building ICT tool.
4.0 FINDINGSThe collected data were analysed, this
enabled us to examine all the issue discussed. Out ofthe 620 questionnaire sent out 550 were returnedand the findings were drawn from that returnedquestionnaires. The findings were expressed below inform of a frequency table.
Section A: Course of StudyThere are three different courses of study in
the Computer Science department of the University.They are Computer Science, Computer InformationSystem and Computer Technology. Table 1 shows thepercentages of students in each option
Table 1: The three arms in computer science of theselected institution.
Frequency Percent ValidPercent
Valid CS 204 37.1 37.2CT 159 28.9 29.0CIS 185 33.6 33.8Total 548 99.6 100.0
Missing System 2 .4Total 550 100.0
(ii) Age Range
The majority age range of the participantsranges between ages 15 and 25 the table 2 showsvarious percentages of the participant age ranges
Table 2: The age range of youths in the computerscience department
Frequ-ency
Percent ValidPercent
Valid 15-25 526 95.6 96.526-35 16 2.9 3.036-45 3 .5 .6
Total 545 99.1 100.0MissingSystem
5 .9
Total 550 100.0
(iii) SexThe department consists of both male and
female students, but from the survey it wasdiscovered that there are more male students thanfemale. Table 3 shows the frequency andpercentages of each sex.
Table 3: This table showed the percentage ofgender selected at random
Frequ-ency
Percent ValidPercent
Valid Male 354 64.4 64.7Female 193 35.1 35.3Total 547 99.5 100.0
Missing System 3 .5Total 550 100.0
Section BThis section consists of various questions
that are used to measure interest and passion thatthe youth have in ICT and ICT tools. The sectionrevealed that, based on the fact that majority ofthe youth were exposed to ICT tools at tender age,many resources are made available for their usagevia the ICT tools, their interest in ICT usage hadbeen developed. Hence, the positive influence ontheir self choice of ICT course. This is furthershown and discussed in tables below:(i) Do you have passion for tech-nology/ICT
related courses?Table 4 shows that a greater percentage of ouryouth currently in an institution have passion forthe technology/ICT related courses they are takingpresently.

51
Tabe 4: Showing the percentage of youths havingpassion for technology/ ICT relatedcourses
Freq-uency
Percent ValidPercent
CumulativePercent
Valid Yes 416 58.3 76.1 76.1NotReally
113 15.8 20.7 96.7
No 18 2.5 3.3 100.0Total 547 76.6 100.0
Missing System 167 23.4Total 714 100.0
(ii) Was your passion for technology/ ICT achildhood desire?
Table 5 showed that though we have greaterpercentage of respondents that had a childhooddesire for Information Technology, there are alsogreater percent-age that did not considered ICTcourses as an option in their infancy.
Table 5: the percentage who had childhood desire forICT
Frequ-ency
Percent ValidPercent
Cumula-tive
PercentValid Yes 250 35.0 45.8 45.8
NotReally
191 26.8 35.0 80.8
No 105 14.7 19.2 100.0Total 546 76.5 100.0
Missing System 168 23.5Total 714 100.0
(ii) At what academic level were you exposedto ICT tools?
Table 6 showed that most of the exposure for ICTtools started from primary school, but theexposure was not enough to inspire or challengethe youths to be ICT tools creators rather thanconsumers.
Table 6: Showing level of exposure of the youthFrequ-ency
Percent ValidPercent
Valid Primary 243 44.2 44.8Secondary 228 41.5 42.0Tertiary 64 11.6 11.8Others 8 1.5 1.5Total 543 98.7 100.0
Missing System 7 1.3Total 550 100.0
(iii) Your Choice of ICT course was made by?
From table 7, it is important to allow the youths tomake decision of courses or carrier selection ontheir own without imposing courses or carrier
selection on them.Table 7: Showing who influenced the choice of
ICT courses
(iv) Are you finding your technology/ ICTrelated courses interesting?
Table 8 showed that some youths currentlyinvolved in technology/ ICT courses are not reallyfinding it interesting. This could be as a result of somany factors like choice of selection or thedirection of exposure the instructor(s) areembarking on.
Table 8: Showing level of interest of the youth in ICTFrequ-ency
Percent
ValidPercen
t
Cumula-tive
PercentValid Yes 268 37.5 49.5 49.5
NotReally
234 32.8 43.3 92.8
No 39 5.5 7.2 100.0Total 541 75.8 100.0
Missing System 173 24.2Total 714 100.0
(v) Are you regularly exposed totechnology/ICT and its tools in yourinstitution?
Table 9 showed that the level of exposure gottenby our youths to ICT tools is quite poor, mostimportant devices or tools that are relevant anduseful are either kept away from their usage or
Frequ-
ency
Per-cent
ValidPer-cent
Cumula-tive
Percent
Valid Self 410 57.4 76.2 76.2Parent 67 9.4 12.5 88.7Guardians 61 8.5 11.3 100.0Total 538 75.4 100.0
Missing System 176 24.6Total 714 100.0

52
there are no adequate hands in terms offacilitators or instructors to handle them.
Table 9: Shows level of exposure of students toICT tools
Frequ-ency
Percent ValidPercent
Cumula-tive
PercentValid Yes 198 27.7 36.1 36.1
Not Really 217 30.4 39.6 75.7No 133 18.6 24.3 100.0Total 548 76.8 100.0
Missing System 166 23.2Total 714 100.0
(vi) Do you enjoy working with ICT tools?
Question 7 analysed in Table 10 showed that thelevel of interest exhibited by our youth on ICT toolusage is quite encouraging.
Table 10: Showing the level of satisfac-tion of theyouth with ICT tools
Frequ-ency
Percent ValidPercent
Valid Yes 414 75.3 76.0NotReally
117 21.3 21.5
No 14 2.5 2.6Total 545 99.1 100.0
Missing System 5 .9Total 550 100.0
(vii) If yes, how often do you work with ICTtools?
Question 8 analysed on table 11, proved that ouryouths are serious consumers of ICT tools. Majority ofthen depends so much on the usage of this tools fortheir daily activity especially in relation to their study.
Table 11: Showing how often the ICT tools wereused by the youth
Frequ-ency
Per-cent
ValidPercent
Cumula-tive
PercentValid Seldom 235 32.9 45.9 45.9
Often 277 38.8 54.1 100.0Total 512 71.7 100.0
Missing System 202 28.3Total 714 100.0
Section CThis section consists of questions to
measure that based on the level of interest andnumber of years a youth has spent in the field, isthe youth still willing to continue and get rooted inthis field and to what extent does the youth wantto be involved with the ICT tools, is the youthinterested in inventing a tool for ICT or does theyouth prefer to be a consumer, all this wereanswered and reviewed in this section. Thecategories of questions asked in this section wereanswered based on levels of agreement, options ofStrongly Agreed, Agreed, indifferent, Disagree andstrongly disagreed were available for choice oneach question. They are further explained below intables.
(i) I enjoy reading books that aretechnology/ICT related
From the question, it was realized that 207 of theyouth which is 38 per cent of the entire populationhave interest in reading book on ICT while 201forming 36 per cent were indifferent about ICTbooks.
Table 12: This table showed the rate of youth’sinterest in reading technology/ICTrelated books.
Frequ-ency
Percent ValidPercent
Valid SA 93 16.9 17.1A 207 37.6 38.0N 201 36.5 36.9D 30 5.5 5.5SD 14 2.5 2.6Total 545 99.1 100.0
Missing System 5 .9Total 550 100.0
(ii) Do you browse the internet fortopics/articles that are related totechnology/ICT
From question 2, the rate at which our youthsbrowse the internet for technology /ICT relatedtopics in order to keep track of updates wasderived. It was observed that a higher percentagebrowse the internet rather than study book for ICTrelated topics.

53
Table 13: This table showed the rate at which ouryouths browse the internet fortechnology/ICT related topics
Frequ-ency
Per-cent
ValidPercent
Valid SA 163 29.6 30.1A 218 39.6 40.2N 121 22.0 22.3D 30 5.5 5.5SD 10 1.8 1.8Total 542 98.5 100.0
Missing System 8 1.5Total 550 100.0
(iii) I wish to design or invent an ICT tool(software or hardware) of my own
From the table, it showed that Nigerian youthshave the passion to design or invent ICT tools oftheir own, as 52 per cent strongly wish or desire toinvent a tool of their own, 23 per cent agreed, 14per cent were indifferent, only 9 per cent appearto be not interested in personal invention of ICTtools.
Table 14: Showing the desire to invent ICT toolsFrequ-ency
Per-cent
ValidPercen
t
Cumula-tive
PercentValid SA 287 40.2 52.7 52.7
A 128 17.9 23.5 76.1N 79 11.1 14.5 90.6D 23 3.2 4.2 94.9SD 28 3.9 5.1 100.0Total 545 76.3 100.0
Missing System 169 23.7Total 714 100.0
Section DThis section looks at how ready the youths
are to invent an ICT tool, also what they have doneor what they are working on in order to meet aneed or solve a problem in their environment. Thisis further discussed below.
(i) I want to be known for my owndesign/invention?
The first question in this section analysed on table15 showed that, Nigerian youths wish to be knownfor their own design rather than dwelling more onICT tools that have been invented by others.
Table 15: Percentage of those who wants to beknown for their design
Frequ-ency
Per-cent
ValidPercent
Cumula-tive
PercentValid To a
greatextent
317 44.4 59.8 59.8
To anextent
133 18.6 25.1 84.9
To aminimalextent
57 8.0 10.8 95.7
Not at all 23 3.2 4.3 100.0Total 530 74.2 100.0
Missing System 184 25.8Total 714 100.0
(ii) Have you discovered a problem in yourneighbourhood that you think you cansolve using IT?
Table 16 showed that our youths in their constantinteraction with the environment do not reallyfocus on discovering problems that could besolved with their ICT knowledge and skills. Aslarger percentage responded to not really, thougha close range affirmed that they have discovered aproblem to solve.
Table 16: Those who have discovered a problemFrequ-ency
Percent ValidPercent
Valid Yes 214 30.0 39.4Not Really 256 35.9 47.1No 73 10.2 13.5Total 543 76.1 100.0
Missing System 171 23.9Total 714 100.0
(iii) Have you designed any ICT tool(hardware/software) that has been used tosolve problem within your environment?
This last question analysed in Ttable 17 showedthat greater percentage of Nigerian youths aremajor consumers of ICT tools rather than creators.As only a few percentage, 16 percent havedesigned or invented a tool for ICT.

54
Table 17: Showing how many have designed orinvented an ICT tool.
Frequ-ency
Per-cent
ValidPercent
Cumu-lative
PercentValid Yes 88 12.3 16.0 16.0
NotReally
111 15.5 20.2 36.2
No 351 49.2 63.8 100.0Total 550 77.0 100.0
Missing System 164 23.0Total 714 100.0
5.0 REFLECTIONS ON THE FINDINGSThe study found out that:
Most of Nigerian youths undertakingtechnologic/ICT related course are beingmandated by their parent or guardian to takesuch as a carrier. Hence, the youths show lessinterest in these courses.
Also those that have interest in this courses lacksufficient encouragement in terms of exposureto this tools.
The extent of exposure being gotten by theyouths was not enough to drive them towardsdiscovering problems and building/inventingtools that could be used to solve such problems.
Nigerian youths are major consumers of ICTtools. This is because focus is more on learninghow to use rather than re-creating the created.
6.0 CONCLUSION/RECOM-MENDATIONIn conclusion, it is noted that despite the
exposure of youth and their involvement in the usageof ICT and its tools at an early age, their passion isdriven towards exploring more of the developedtools and becoming experts in the usage. They preferto be users rather than going the extra mile ofrecreating the created or adding more to the toolsthat are in existence. This is due to the fact that mostof them still find it difficult to identify problem in theirenvironment that can be solved via a tool they caninvent. Also for those who have ideas or who haveidentified a problem that they can solve, the majorchallenge is the lack of adequate resources andindebt understanding of how to take giant stride ofinventing or designing a tool that can solve theidentified problem. It is therefore conclu-ded thatNigeria youths of this day are major consumers of ICTtools and not creators of ICT tools.
In view of this, it is therefore recommendedthat there should be re-design of educationalcurriculum where youths should be exposed to ICTtool usage from their primary learning, so that anytime spent with ICT tools after then should tendtowards creating rather than solely depending onexisting ICT tools. Also subjects that treatselementary parts of electronics, programming,software design and hardware architecture should beintroduce into elementary schools with practicalincluded. Also it is important that NigerianUniversities should change their method of teachingto problem-driven approach. This will aid andencourage the students to discover unique problemsand how to go about solving them.
7.0 REFERENCESCarroll J. et al. 2002, Just what do the youth of today
want? Technology appropriation by youngpeople. In the proceedings of the 35th HawaiiInternational Conference on System Sciences.Hawaii
Cole M. 2008, Using Wiki technology to supportstudent engagement: Les-sons from thetrenches. retrieved fromwww.elsevier.com/locate/ compedu
Eva T. And Bertil V., 2005. Virtual Mobility Of UrbanYouth: ICT-Based Communication In Sweden.Journal of Economics and Social Geographypages 477 – 487
Glenda M. et al., 2010. The Youth Engagement withScience and Technology Survey: InformingPractice and Measuring Outcomes.Presented at NARST (National Association forResearch on Science Teaching) 2010 AnnualMeeting, Philadelphia, PA
Johnson O., 2012, Youth Development, ICT andNigeria’s Knowledge Economy 18th NigerianEconomy Summit (Ministry of Communi-cation Technology). Nigeria.
Lucy F., 2012. How Can the Youth of Today Contributeto Economic Progress via Technology? ThePositive newspaper Co. limited. UK.
Wikipedia 2014 History_of_Facebook retrieved fromhttp://en.wikipedia.org/wiki/History_of_Facebook on20/2/2014
Wikipedia 2014 History of Dropbox. Retrieved fromhttp://en.wikipedia.org/wiki/Dropbox_(service) as at 20/2/2014
Wikipedia 2014 History of Google retrieved fromhttp://en.wikipedia. org/wiki/History_of_Google asat 20/2/2014.

55
_____________________________________________________________________________________________________________________________________
Phishing E-mail Detection Mechanism Based on MiddlewareTechnology
____________________________________________________________________________________________________________________________________
A. A. OrunsoluDepartment of Computer Science, Moshood AbiolaPolytechnic, Abeokuta, [email protected]
A. S. SodiyaDepartment of Computer Science, Federal University ofAgriculture, Abeokuta, Nigeria
A. T. AkinwaleDepartment of Computer Science, Federal University ofAgriculture, Abeokuta, Nigeria
1.0 INTRODUCTIONThe rate of internet acceptability
continues to grow considering the widespreadadoption of electronic option for both formaland informal communication. However, thisscenario has presented some security challengesto the online community. These challengesreached all-time high with the advent of phishingattacks. Phishing is a serious security threat
whereby a phisher tries to trick unsuspectinginternet users into providing confidentialinformation (Dhamija et al. 2006). To achieve thismalicious goal, an attacker first sets up a fakewebsite that looks almost the same as thebenign target website. The URL of the fakewebsite is then sent to a large number of usersat random via e-mails, social networking sites orinstant messages. Unsuspecting users who clickon the link are directed to the fake website,where their personal information is unknowinglyleaked to the phishers. The success of thismalicious action has grave effect on both theunsuspecting users and online company’s brandreputation. It is interesting to note that thesuccess of phishing attacks depend largely on itssource of disseminating phishing messages.Phishers employ e-mail in most cases because alarge number of e-mail addresses could be easilyharvested from some online sources.
To respond to the phishing email threat,a large number of countermeasures have beendeveloped and deployed. Although, a number ofcurrent methods mitigate these threats fromgrowing, their effectiveness is still a subject offurther research. For instance, the server/client-side approaches employed in most worksstudied, had been recently criticized asinadequate. Ofuonye and Miller (2013) identifiedthe challenges of client-side method (e.g.browser plug-in, toolbars etc) to include the useof specific browser (e.g. spoofGuard on Mozilla),user intensive administration (configuration,installation and upgrade) and high browserexploits and vulnerabilities of over 79% (Turner,2008). The server filters is another popularalternative in most anti-phishing schemes whichsuffers from the challenges of trust and thirdparties involvement (e.g. SSL certificate, etc.).
The only viable alternative to challengesof client/server filter is the use of MiddlewareTechnology (MT), which has not beenextensively applied in anti-phishing design. Theprimary advantage of MT is that it leverages onthe benefits of software as a service model. Thatis, software solution or design remains externalto their system and is accessible and executableby a large numbers of individuals. In this work, a
ABSTRACT
In view of the widespread adoption of phishing email indeceiving unsuspected users to part with theirauthentication credentials , current countermeasureshave proved less efficient. In this work, a Middleware-Based Anti-Phishing E-Mail Scheme is presented. Theproposed scheme involves three processes: Registrationprocess, Scanning process and Decision process. Theregistration process involves a user choosing a username, a graphical based security question and the e-mailaddress (unique key) on which the middleware anti-phishing scheme will operate. The scanning process isactivated when a registered account receives an e-mailmessage. The results of scanning process inform theaction of the decision process, which classifies messageas phish or otherwise. The proposed solution ensure theanti-phishing service remains efficient as administrationis under the control of service provider and it does notrequire client-side scripts, plug-ins or external devices.
KEYWORDS: ANTI-PHISHING, E-MAIL, MIDDLEWARE,PASSWORDS, WEB SECURITY

56
Middleware-Based Anti-Phishing E-Mail Scheme(MBAPES) is presented. The proposed schemeinvolves three processes: Registra-tion process,Scanning process and Decision process. Theregistration process involves a user choosing auser name, a graphical based security questionand the e-mail address (unique key) on which themiddleware anti-phishing scheme will operate.The scanning process is activated when aregistered account receives an e-mail message.The results of the scanning process inform theaction of the decision process, which classifiesmessage as phish or otherwise.
The remainder of this paper is organized asfollows. In the next section, the motivation forthis work is discussed. In Section 3, relevantrelated works are discussed in detail. Section 4contains the methodology of the proposed anti-phishing solution and Section 5 summarizes ourconclusions.
1.1 MotivationPhishing scams have been receiving
extensive attention because such attacks havebeen growing in numbers and sophistications(Kirda and Kruegel. 2006). Phishing has becomea crippling problem for many of today’s internetusers. Despite innovations in preventativemeasures, phishing has evolved to become veryhard to detect. Determining whether a particularsite is a phishing site or not is difficult, causingmany inexperienced users to fall victim(Ferguson et al. 2012). Moreover, browservulnerability, poor understanding of internetsecurity, poor password culture and server sidevulnerability (e.g. injection attacks, URLobfuscations, XSS attacks) have left phisherswith wider freedoms to ravage the cybercommunity. Neverthe-less, anti-phishingdetection, defence and offence remain an areaof research owning to the following reasons: Phishing is a significant security threat to the
cyber community, a plague that causestremendous loss every year to bothexperienced and unwary internet users.
The popularity of social networking sitessuch as Facebook, Twitters etc. whereinstant electronic communica-tion presentsphishers the opportunity of embeddingmalicious links in e-chat (Aggarwal et al.2012).
The open source model of web pages makesit easy for attackers to create an exactreplica of a legitimate site (Han et al. 2012).Because such a replica can easily be created
with little cost and looks very convincing touser, many such fraudulent web sitescontinuously appear.
Phishing is a pervasive problem that will notdisappear in the near future, but will mostlikely become even more sophisticated(Baker et al., 2006).
The rationale behind the proposedMBAPES solution is simple. Humans have beenidentified as the weakest link in the electroniccommunication chain because of negligent,ignorance and poor understanding of securitycomplexity of the cyber environment. Mostphishing attacks exploit these vulnerabilities inelectronic communication. In the light of this, amiddleware scheme is proposed to block someof these vulnerabilities through an efficientscanning process that identifies securityloopholes in electronic communication. Theposition of MBAPES between the E-Mail WebServer and the client’s machine ensuresautomatic detection of phishing e-mail anddeployment of necessary corrective mechanism.This service “disarms” the threat of the phishingemail before their arrival at the client’s machine.
2.0 RELATED WORKSSome of the related works that aimed to
detect phishing e-mails was presented in thissection.
Olivo et al. (2011) proposed a techniquethat yielded the minimum set of relevantfeatures providing reliability, good performanceand flexibility to the phishing detection engine.The experiment-tal results reported in their workshowed that the proposed technique could beused to optimize the detection engine of theanti-phishing scheme.
Chen and Guo (2006) created a clientapproach based on five main features. Theproposed technique reached 96% of detectionrate. One advantage of their approach is that thelearning phase for the classifier is not necessary.However, if the phishing features change, theformula used in detection can fail. Anothernegative aspect of their work is the lack of a testdatabase with legitimate messages; therefore itis not possible to measure the false positiverates. Besides, the features are consideredisolated and no combination of them wasstudied.
Basnet et al. (2008) reported in theirwork that using 16 features. The authors’proposal, although using SVM, depends on manyfeatures and the identification of keywords in

57
the body of the e-mail message, which can makethe approach very slow during the detectionphase in real detection systems. The chosenkeywords are searched considering the financialsector. Although e-mail phishing historically hadbeen associated with such a sector, statisticsshowed that this kind of behavior is changingrecently, leading to targets as trading,government, etc.
Fette et al. (2007) used a technique thatinvolves machine learning with 10 features. Inthis approach the detection rate achieved 99.5%,when used in cooperation with an anti-Spamtool. Despite of the high classification rate, thistechnique needs 10 features, anti-Spam tool andquerying external sources (the WHOIS service)to discover the “age of a domain” of the e-mailsender or some URL in the e-mail body. Such anapproach may increase considerably the time toevaluate each message, derailing the proposal ina real SMTP gateway that receives a greatnumber of messages.
3.0 METHODOLOGYIn this section, the underlying
techniques, framework and algorithms of theproposed MBAPES are discussed in details. In thedesign of the proposed scheme, the followingare incorporated targeting both efficient andaccurate Anti-Phishing system: Accurate reports/decisions: The APS is
designed to have the capability toemphasize low false positives in order tominimize mistaking non-phishing URL asmalicious
Fine-grained classification: The pro-posedAPS is able to differentiate between phishinghosted on public services alongside non-phishing con-tent (e.g. injection of maliciouscode into benign websites)
Adaptable to feature evolution: The arms-race nature of phishing leads to everydayinnovation on the part of phishers’ efforts toevade detection. Thus, the APS requires theability to easily retrain to adapt to newfeatures to prevent Zero-Day Attack (ZDA).
Real-time Upgrade: The APS is designed tooperate as near-interactive real-timedetection service whose upgrade anddecision results should be incorporated intothe design without significant delays.
Toward the goal of the designconsiderations, a robust multi-stage midd-lewaredriven methodology is developed which can be
implemented as an anti-phishing protectivesecurity layer on email server and web servers toautomatically detect phishing messages anddeploy necessary corrective mechanism depend-ing on the severity of the attack.
3.1 Architecture of Middleware based Anti-Phishing e-Mail SchemeThe architecture of MBAPES is
presented in Figure 1. The architecture combinesthe merits of middleware technology astransparent service model, browser renderingapplications, large database processing usingMap Reduce, the power of natural languageprocessing, search engines and WHOIS to buildefficient phishing email detector. The superiorefficiency and accuracy of MBAPES stem fromthe following key features: Browser independent anti-phishing
techniques with support for HTTP and HTTPS Operating system independent approach Generic middleware architectural solu-tion
with stronger guarantees than browserplugins (can catch phish even if the browseris closed or not part of the communication)
Richer configurability and re-configur-abilityof anti-phishing services with no changes toWeb based Data Services (WDS)
Quality of security service manage-mentwith high support for customiz-abledeployment options.
The core components of the MBAPESarchitecture which captures the design goals andkey features highlighted in the opening sectionof the design methodology consists of: Registration process Scanning process Decision process
(a) Registration Process: Usually, theregistration process for the proposedmiddleware service involves the followingsteps. A user must choose a user name,select a graphical-based security questionand provide a unique email address. Theweakness of text-based security questioninformed our decision of using the graphicalbased security question. Such graphical-based security question makes theregistration more secure. Once the usercompletes this simple registration process,the Monitor Engine of the proposedMBAPES enlists the email address on its

58
“whitelist”. The whitelist contains thecredential of registered MBAPES users.
Figure 1: MBAPES Architecture and Work flowIn step (1) a phisher crafts a phishing emailand sent it to some harvested emailaddresses; in step (2) the routes the phishingemail through a Mail server; in step (3) if theemail address is registered on MBAPES, themonitor engine tracks the detail of themessage; in step (4) the content of the emailis scanned and in step (5) decision is madebased on the result of the scanning process;in step (6) a safe message arrives the client’smachine.
(b) Scanning Process: This is the core activity inthe whole detection process. In this stage,the scanning process scans all registeredelectronic-mail address for new mail bycooping through the “whitelist”. Thescanning process invokes the parser whichtokenizes the message using the algorithm 1.The parser scans for the most indicativefeatures that reveal the intention ofphishers’ action (e.g. embedment maliciousURL, violation of binding relationship etc.).
Algorithm 1: New Email Parsing AlgorithmInput: New E-mail messageOutput: Parsed E-mail messageAlgorithm:1. Extract e-mail from mail web server2. Text preprocessing
a. Tokenize text sentences into NamedEntity Recognition
b. Use FeatureNet to removes proper nounsand stop features
c. Construct tf-idf of each term
d. Generate features // Corresponding toFeature Generator//
e. Return the tf-idf terms as the termidentity
3. If has a text input keyfeature indicator,invoke Scannera. Check violation of binding relationship if
login form is found on preapproved siteb. Else Test login field with bogus datac. Label the transactiond. exit
4. ElseIF is a URL {preapproved sites,popular sites etc}a. Invoke URL checker using WHOISb. Compare term identity retrieved with
page under investigationc. If WHOIS.URL≠Page.URL then Label the
transactiond. exit
5. Return
Expectedly, the presence of login formon a webpage is characterized by the presenceof three properties i.e. Form tags, INPUT fieldsand login keyfeatures such as passfeature, PIN,ID etc. The INPUT fields usually hold user inputand login keyfeatures distinguish a login formfrom other types of forms. The scanner usesLatent Dirichlet Allocation due to its sensitivity tochanges in feature usage which make it good athandling synonyms. For instance, phishers canuse different feature patterns such as passcode,customer number etc. to hide from commonlogin key features. In addition, it can discoverthreatening theme in a message andintentionally misspelled features and conjoinedfeatures. The scanner consists of a customizedfilter that detect the presence of login form onthe original homepage, a user profile whichestablish a binding relationship between a userand a page, if a user has visited the page beforeand a PhishTester which identify the destinationwebsite and test with bogus credentials. Thealgorithm for the scanning process is presentedin algorithm 2.
Algorithm 2: Algorithm for scanning process

59
URL checker ()Input URL(s)
For int i=0; i<url(s).length;i++;if (url(i).contain in url database){return url okelse {
if (url(i).contain something closely similar)return url not ok }}
End URL checker ()The scanning interface of a typical email
message in MBAPES is shown in Figure 2.
Figure 2: E-mail scanning interface(c) Decision Process: The decision process
receives the results of the scanning processand deploys necessary corrective actionbased on the severity of the attacks. Thedecision process is a rule-based system thatranks attacks into three classes namely HighImpact Attack, Medium Impact Attack andLow Impact Attack. The response of thedecision process is based on the category ofattack. For instance, consider a decisionalgorithm that assign a threat score,
, to the ith email upon theoccurrence of the jth events in the scanningphase. The threat scores may qualitativelyidentify the threat level upon classification ascompromised if threatened if
, and unthreatened if . Thecomplete algorithm for decision process ispresented in algorithm 3.
Algorithm 3: Algorithm for Decision processInput: = scanned e-mail
Output: ts = threat score, rs = response typeBegin
If ( ) then stop
Elseif ( ) then
Replay (t.history and t.features)Compute t.impact = information Gain (IG)
If IG = 1 // high level phishDeploy HIR // high impact response
IF IG >0 .4 // middle level phishDeploy MIR // middle impact response
If IG < 0.4 // low level phishDeploy LIR // low impact response
End ifEnd if
End
4.0 CONCLUSIONThe goal of email phishing is to steal
user’s personal authenticating credentials, suchas account names, PIN, social security numberand passwords. Although there exists a numberof methods for detecting phishing scams andprotecting users from attacks, the trend ofphishing attacks continue to climb further. Mostphishing attacks exploit the vulnerabilities ofhuman element in the electronic communication

60
chain. In this paper, a middleware based schemeis presented to reduce the exploitation of humanvulnerabilities in electronic communication. Theproposed system offers a layer of securityservice that “disarms” phishing messages anddeploys necessary corrective mechanisms beforearriving at the user’s machine. We acknowledgethat user’s privacy concerns may constitutesome challenges to widespread adoption of thisapproach. However, recent trends in mobileapplications usage indicate that users placehigher premium on tools that ensures theirsecurity while offering efficient service.
5.0 REFERENCESAggarwaly, A., Rajadesingan, A., Kumaraguru, P.
2012. PhishAri: Automatic realtimephishing detec-tion on twitter. InSeventh IEEE APWG eCrime researcherssummit (eCRS). Las Croabas, PuertoRico, 22–25
Baker, E.M., Tedesco, J.C. and Baker, W.H. 2006.Consumer privacy and trust online: anexperimental ana-lysis of anti-phishingpromotional effects. Journal of WebsitePromo-tion, Vol. 2 Nos 1/2, pp. 89-113.
Basnet R, Mukkamala S and Sung A, 2008.Detection of phishing attacks: Amachine learning approach, SoftComputing Appli-cations in Industry, pp373–383.
Chen J and Guo C. 2006.Online detection andprevention of phishing attacks ,Communications and Networking inChina pp. 19–21.
Dhamija, R., J.D. Tygar, and M. Hearst. 2006.Why Phishing Works. In Proceedings ofACM Conference on Human Factors inComputing Systems (CHI2006), pp. 581-590.
Ferguson E, Weber J, and Hasan R. 2012. CloudBased Content Fetching: Using CloudInfrastructure to Obfuscate PhishingScam Analysis. IEEE FoSEC.
Fette I, Sadeh N and Tomasic A, . 2007. Learningto detect phishing e-mails , in:International World Wide WebConference, pp. 649–656.
Han W, Cao Y, Bertino E. and Yong J. 2012. Usingautomated individual white-list toprotect web digital identities. ExpertSystems with Applications.
Kirda E, Kruegel C. 2006. Protecting Usersagainst Phishing Attacks. The ComputerJournal; 49(5):554–61.
Ofuonye E and Miller J. 2013. Securing web-clients with instrumented code anddynamic runtime monitoring. Journal ofSystems and Software.
Olivo, K.C., Santin, A.O. and Oliveira, L.S. 2011.“Obtaining the threat model for e-mailphishing”, Applied Soft Computing.Elsevier Press.
Turner, D., 2008. Symantec Global InternetSecurity Threat Report Trends for July–December 07, Volume XII, April,http://eval.symantec.com/mktginfo/enterprise/white papers/b-whitepaper internetsecurity threat report xiii 04- 2008.en-us.pdf.

61
_____________________________________________________________________________________________________________________________________
SECURE FACE AUTHENTICATION USING VISUALCRYPTOGRAPHY
_____________________________________________________________________________________________________________________________________
S. O. AsakpaComputer Science Department, Federal Polytechnic, [email protected]
B. K. AleseComputer Science Department, Federal University ofTechnology, [email protected]
O. S. AdewaleComputer Science Department, Federal University ofTechnology, [email protected]
A. O. AdetunmbiComputer Science Department, Federal University ofTechnology, [email protected]
1.0 INTRODUCTIONIdentity theft is a growing concern in the
digital world. Traditional authentication methodssuch as passwords and identity documents arenot sufficient to combat identity theft or ensuresecurity. Such surrogate representations ofidentities can be easily forgotten, lost, guessed,stolen, or shared (Asakpa, 2010). Similarly, intraditional cryptosystems where userauthentication is based on possession of secretkeys, which could falls apart if the keys are notkept secret (for instance, keys shared with non-legitimate users). It follows that, in traditionalcryptosystems, keys can be forgotten, lost, orstolen and, thus, cannot provide non-repudiation, a very important goal ofcryptography (Meneze, 2006). As a result,reliably secure mechanisms are required toprotect data and information againstvulnerabilities like spoofing and unauthorizedaccess to computer resources. Biometricauthentication is a possible alternative.Biometric authenti-cation systems are anexample of technologies which are widelyaccepted in various applications such as inidentification based systems and access control,ID cards verification, banking operation, etc(Rahna, 2011; Rao, 2008).Biometrics is a science that uses uniquephysiological characteristics (such asfingerprints, iris, retina, face and hand geometry)or behavioural characteristics (such as voice,signatures, and keystrokes) for the purpose ofidentification and authentication (Rahna, 2011).Using biometric methods have significant adven-tages over traditional password authenticationsystems. As against pass-words based ortraditional cryptosystem authentications,biometrics cannot be forgotten, stolen orshared. A biometric system is howevervulnerable to two types of failures namely, denial
ABSTRACT
The main concern of this paper is to apply visualcryptography technique onto the area of biometricsauthentication using human face. By using biometrics,authentication is directly linked to the person, rather thanhis / her token or password. However, biometric issusceptible to certain vulnerabilities such ascircumvention, covert acquisition, collusion, coercion, etc.Visual cryptography is a kind of secret sharing schemewhere a secret image is encrypted into shares whichindependently disclose no information about the originalsecret image. The goal of this paper is to combinebiometrics with visual cryptography in order to overcomethe vulnerabilities in biometric systems. This can beachieved as follows. We divide an input face image intotwo shares with the help of visual cryptographic techniquekeeping one in the database in the form of a cipher-text(share) while the other is kept with the participant in theform of an ID card, this serves as a key (share) to revealingthe original image when these shadows are superimposedtogether. This combination of biometrics and visualcryptography is a promising technique for informationsecurity, as it offers a more secure way to authenticate andprotect personal identity.
KEYWORDS: BIOMETRICS, AUTHENTICATION, FACE,SECURITY, VISUAL CRYPTOGRAPHY

62
of service and intrusion. A denial of serviceoccurs when the system does not recognize alegitimate user (i.e. false rejection), while anintrusion refers to the scenario in which thesystem incorrectly identifies an impostor as anauthorized user, (i.e. false acceptance) (Asakpa,2010; Ross, 2011).A possible solution to these problems is a twolevel security measure that harnesses thestrengths of cryptography using a visual secretsharing scheme (VSSS) referred to as visualcryptography and biometrics together (Russ,2008).
This paper proposes the application ofvisual secret sharing scheme as a technique forachieving biometric authentication withemphasis on human face. The proposed systemcan be applied in various applications likebanking services, examination identity, airportverification, etc.
The rest of this paper is organized asfollows: sections 2.1, 2.2 and 2.3 consider secretsharing scheme, overview of visualcryptography, and application of visualcryptography to biometrics respectively. Section3 is a discussion of the proposed method. Theexperimental results and conclusions arepresented in sections 4 and 5.
2.0 LITERATURE REVIEW2.1 Secret Sharing Scheme
In modern cryptography, the security ofdata is fully dependent on the security of thekeys used. Most ciphers are public knowledge,what is not known is the key, once the key isrevealed we can easily encrypt and decrypt anymessage. The most secure key managementscheme keeps the key in a single, well guardedlocation (e.g. a computer, a human brain, or asafe). This approach is highly unreliable since asingle misfortune (e.g. a computer breakdown,sudden death, or sabotage) can make theinformation inaccessible (Shamir, 1979; Sonali,Kapil and Janhavi, 2013). An obvious solution is tokeep a multiple copies of the key at differentlocations, but this increases the danger ofsecurity breaches. A possible solution is todistribute the key among a group of people sothat no single individual has the key. This isknown as secret sharing scheme (Russ, 2008).
Therefore, a secret sharing scheme is amethod of distributing a secret, usually a key,among a group of users, requiring a cooperative
effort to determine the key, so the plaintext(message) can subsequently be decrypted.
It was discovered independently byGeorge Blakley and Adi Shamir in 1979 (Stinson,2006).
The general ideas behind “secret sharingscheme” are: Distribute a secret to n different
participants; Any group of t participants can reconstruct
the secret; Any t-1 or fewer participants cannot reveal
anything about the secret.
This is otherwise referred to as a (t, n)threshold scheme, meaning that the secret isdispersed into n overall pieces, with any t piecesbeing able to recreate the original secret.Therefore, in a secret sharing scheme, any shareby itself does not provide any information, buttogether they reveal the secret. An example:
One-time pad: the secret binary stringk = k1 k2k3... kn can be shared as
{x = x1x2 ...xn ; y = y1y2 ...yn }, where xi is randomand yi = ki XOR xi
No information about the secret will begained by looking at either the first share (S1) orthe second share (S2). We need to combine thetwo shares S1 and S2 in order reveal the secret:Secret = S1 XOR S2.
2.2 Visual CryptographyVisual cryptography is a special kind of
secret sharing scheme for hiding a secret imageinto a set of binary transparencies which seemlike random noise. Visual cryptography wasintroduced by Naor and Shamir (1995) atEUROCRYPT '94. It is used to encrypt writtenmaterial (printed text, handwritten notes,pictures, etc) in a perfectly secure way. Thedecoding can be done by the human visualsystem directly.
Visual cryptography uses a visual secretsharing scheme based on a (t, n) threshold
Figure 1:
Secret: 101101
S1:011011 S2:110110

63
framework, where n means a secret image willbe hidden in n transparencies, and t is that westack t or more than t transparencies toreconstruct the secret image. It is basically asecret sharing scheme extended for images.
For a set p of n participants, a secretimage s is encoded into n shadow images calledshares, where each participant in p receives oneshare. Certain qualified subset (t) of participantscan visually recover the secret image, but otherforbidden (t-1) set of participants have noinformation about the secret s.
A visual recovery for a set q ofparticipants consists of copying the shares ontotransparencies, then stacking them on aprojector.
Visual cryptography has somecharacteristics that serve as advantages: Complete security;
Robust method against the loss ofcompression and distortion because of theproperty of binary;
Does not need computer for decryption.
2.2.1 Threshold scheme share distributionGiven a secret message, the goal is to
generate n transparencies so that the originalmessage is visible if any k or more of them arestacked together, but totally invisible if fewerthan k transparencies are stacked together.Assuming that the message consists of acollection of black and white pixels and eachpixel is handled separately.
Each original pixel appears in n modifiedversion (shares), one for each transparency. Eachshare is a collection of m black and white sub-pixels, which are printed in close proximity toeach other so that the human visual systemaverages their individual black/whitecontributions.The resultant structure can be described by an nx m Boolean matrix S = [Sij] where Sij = 1 iff the jthsub-pixel in the ith transparency is black and Sij =0 iff the jth sub-pixel in the ith transparency iswhite (Hugo, 1993; Russ, 2008; Sreekumar,2009). It therefore follows that, a k out of nvisual secret sharing scheme consists of twocollections of n x m Boolean matrices C0 and C1,as shown in figure 2.
(White)
and
(Black)
A typical 2 out of 2 visual secret sharingscheme uses 2x2 array of 4 sub-pixels arrangedas follows in figure 3:
Any single share is a random choice oftwo black and two white sub-pixels, which looksmedium grey (Hugo, 1993; Russ, 2008;Sreekumar, 2009).
When two shares are stacked together,the result is either medium grey (whichrepresents white) or completely black (whichrepresents black). Figure 4 shows the sharescombinations.
Figure 4: Shares combinations and results
It is therefore important to note that athreshold scheme could either be a k out of k ork out of n.
In general, a typical visual cryptographicscheme (VCS) takes a secret image as input andoutputs shares that satisfy two conditions:
Figure 2: Matrices obtained by permuting thewhite and black columns of a pixel.
Figure 3: (2,2) VSSS various shares
0 11 0
1 00 1
Diagonal Shares
0 10 1
1 01 0
Vertical Shares
0 01 1
1 10 0
Horizontal Shares

64
1) any qualified subset of shares can recover thesecret image;
2) any forbidden subset of shares cannot obtainany information of the secret image other thanthe size of the secret image. Figure 5 shows atypical example of a (2, 2) VCS.
Figure 5: (2, 2) VCSIn this scheme, shares (a) and (b) are
distributed to two participants secretly, and eachparticipant cannot get any information about thesecret image, but after stacking their shares (a)and (b) together, the secret image (c) can berecovered visually by the participants.
2.3 Applications of Visual Crypto-graphy toBiometricsThe combination of biometrics and
visual cryptography is a promising informationsecurity technique which offers a two layersecurity platform for data and information. Thereare various applications of visual cryptography tobio-metrics with various degrees of successes.
Neha, Anuja, and Nikhita (2013) andRevenker, Anjum and Gandhare (2010)considered the application of visualcryptography to biometric templates of iris in adatabase. They provided a two-fold security tothe iris template using visual cryptography. Divyaand Surya (2012) explored the possibility of usingvisual cryptography for imparting privacy ofbiometric templates. Their contributionsincluded a methodology to protect the privacy ofpalm print images by decomposing an inputimage into two independent sheet images, suchthat the private palm print image can bereconstructed only when both sheets aresimultaneously available. Askari, Moloney andHeys (2011) proposed the application of visualcryptography to fingerprint templates. Thesystem works by comparing and matching theparticipant’s fingerprints with secret fingerprintimages that are derived from visual cryptographyalgorithm. Facial images are the most commonbiometric characteristic used by humans to make
a personal recognition, hence the idea to use thisbiometric in visual cryptography. This is anonintrusive method and is suitable for covertrecognition applications. Unlike the otherbiometric methods, the face is the only biometricfeature that could be used by human beingwithout the help of a machine, in order torecognize and authenticate a person. Faceverification involves extracting a feature setfrom a two-dimensional image of the user's faceand matching it with the template stored in adatabase. The most popular approaches to facerecognition are based on either: 1) the locationand shape of facial attributes such as eyes,eyebrows, nose, lips and chin, and their spatialrelationships, or 2) the overall (global) analysis ofthe face image that represents a face as aweighted combination of a number of canonicalfaces. It is questionable if a face itself is asufficient basis for recognizing a person from alarge number of identities with an extremelyhigh level of confidence. Facial recognitionsystem should be able to automatically detect aface in an image, extract its features and thenrecognize it from a general viewpoint (i.e., fromany pose) which is a rather difficult task.
3.0 THE PROPOSED SYSTEMThis section presents the methodology
for the proposed system. To authenticate theidentity of a participant of the system, thesystem administrator will take the image of faceof the participant. Then by applying suitablevisual cryptography scheme for the image, twoencrypted shares of the image are generated.One of these shares is kept in the system’sdatabase while the other share is given to theparticipant in the form of an ID card. When theuser authentication is required, the shares aresuperimposed for decryption and the decryptedimage is compared with the actual image of theparticipant. If there is a match, then theparticipant is authenticated. Therefore, it isimportant to note that there are two importantmodules for this system namely, enrollment andauthentication (Rahna, 2011; Rao 2008).
(a) Enrolment Module: The systemadministrator will collect the face image ofthe eligible participants who are consideredqualify to use the system. The enrolled faceimage is required to be processed so as toextract the essential features. This involvesthree major steps namely; acquisition, pre-
+ =
a b c

65
processing and feature extraction ashighlighted below:• Acquisition is the phase at which the face
image is captured for processing.• Pre-processing is the phase during which
common operations such asenhancement, normalization, filtering andbackground removal, etc are performedon the face image for easy processing.
• Feature extraction is the stage duringwhich principal components are extractedfor processing. In order to provideaccurate authentication of participants,the most discriminating informationpresent in the face image is extracted.
The resultant face image is subjected tovisual cryptographic algorithm that willgenerate two shares that will be dividedbetween the system’s database (stored) andthe participant (ID card), as earlier stated(Askari et al, 2011; Neha et al, 2013).
(b) Authentication Module: For authen-tication,participant will provide share in the form ofID card. System queries for thecorresponding share from the system’sdatabase. By stacking the two shares, theface image is reconstructed. This representsthe face template, A. Next, the participantface image is captured and subjected to thebasic tasks in the enrolment module, theresultant face image form the face template,B (Askari et al, 2011; Neha et al, 2013). Thenthese two feature templates, A and B arematched using Euclidean distance. Euclideandistance is the straight line distancebetween two pixels. Given an arbitraryinstance x described by the feature vector:
Where denotes the value of therth attribute of instance x. Then the distancebetween two instances and is defined
to be the Euclidean distance, d( , ):
If features, A and B match access is grantedotherwise the verification fails (Asakpa,2010). These two modules can be presentedin a diagram form as shown in figure 6.
4.0 EXPERIMENT AND RESULTThe result of the proposed experiment
is implemented in MATLAB 7.10 running onWindows 8 computer. Codes were written inMATLAB using the image processing toolbox.The size of each secret face image used is 256 x256 pixels. Shares A and B were generated. ShareA is stored in the database while share B is keptwith the subject. The two shares are required toretrieve the information, in this case, the faceimage. As it is shown in Figure 7, the face imageis encrypted into two shares. For decryption,shares A and B are stacked together toreconstruct the secret image. There is a loss ofresolution in the reconstructed image. There areseveral research works on how to restore theloss of resolution (Jin, 2003 and Young-Chang,2003). The enrollment and authentication for aface image is illustrated in figure 6.
Figure 6: The Proposed System Model
Figure 7: Example of a (2,2) Secret sharing scheme:(a) Secret face image, (b) Share A, (c)Share B, (d) Reconstructed Face Image
5.0 CONCLUSIONUsing biometric characteristics in
cryptography has significant advantages overtraditional cryptographic methods in the case ofauthentication. For instance, biometriccharacteristics of an individual are difficult tosteal, lose or forge. Even though biometricscome with its own challenges as highlighted inthe paper, to address such challenges, a two-level security is proposed in this paper. That is,the combination of biometrics and visualcryptography to ensure higher level of security.
In this paper, we discuss secret sharingscheme, a precursor to visual cryptography. Amethod is proposed based on the (2, 2) thresholdscheme to produce two shares that aredistributed between the participant and thesystem database. Authentication is achieved by
a d
c
b

66
comparing and matching the probe with thereconstructed face image.
It is recommended that future researchersmay consider a (t, n) threshold scheme such as(2, 3) at least. In such a situation, there are threeshares, two of which can conveniently recoverthe stored information. Though this may exposethe system to compromise but would havesolved the problem of a loss of share.
6.0 REFERENCESAsakpa, S.O. (2010) “Development of Face
Recognition System using PrincipalComponent Analysis,” Master degreethesis, Federal University of Technology,Akure, Nigeria.
Askari, N., Moloney, C. and Heys, H. M. (2011)“Application of Visual Cryptography toBiometric Aut-hentication”,Newfoundland Elec-trical and ComputerEngineering conference.
Blakley, G. R. (1979). “SafeguardingCryptographic Keys,” proceeding ofAFIPS National Computer Conference,vol. 48, pp. 313-317.
Divya, C and Surya (2012) “Visual Cryp-tographyusing Palm Print Based on DCTAlgorithm,” International Journal ofEmerging Technology and AdvancedEngineering, Vol. 2, Iss 10
Hugo Krawczyk (1993) “Secret Sharing MadeShort”, Advances in Cryptology,
CRYPTO ‘93 LNCS 773, pp. 136-146.
Jin, D. (2003) “Progressive color visualCryptography,” Master degree thesis,School of Computing, NationalUniversity of Singapore, Singapore.
Menezes, A.; Oorschot P. van and Vanstone, S.(2006) “Handbook of AppliedCryptography”, CRC Press, Inc.
Naor Moni and Shamir Adi (1995), “VisualCryptography,” Proc. the Advances inCryptology– Eurocrypt, pp. 1-12.
Neha Hajare, Anuja Borage, Nikhita Kamble,Supriya Shinde (2013) “BiometricTemplate Security Using VisualCryptography” International Journal ofEngine-ering Research and Applications(IJERA) Vol. 3, Issue 2, March -April 2013,pp.1320-1323
Rahna. P. Muhammed (2011) A Secured Approachto Visual Cryptographic BiometricTemplate ACEEE Int. J. on NetworkSecurity , Vol. 02, No. 03, July 2011
Rao, Y., Sukonkina, Y. Bhagwati, C. and Singh, U.(2008) “Fingerprint basedauthentication application using visualcryptography methods (improved idcard),” in Proc. IEEE Region 10 Conf.,pp.1–5.
Revenker, P., Anjum, A. and Gandhare, W. 2010)“Secure iris authenic-tion using visualcryptography,” Int. J. Comput. Sci.(IJCSIS), vol. 7, no. 3, pp. 217–221.
Ross, A. and Othman, A.A. (2011) “VisualCrptography for biometric privacy”,IEEE tran-sactions on informationforensics and security,Vol.6,No.1.
Russ Martin (2008) “Introduction to SecretSharing Schemes”
Shamir, A. (1979). “How to Share a Secret”,Communications of the ACM, Volume 22,Number 11, pp. 612-613.
Sonali Patil, Kapil Tajane, Janhavi Sirdeshpande(2013) “Secret Sharing Schemes forSecure Biometric Authentication”International Journal of Scientific &Engineering Research IJSER, Volume 4,Issue 6.
Sreekumar, A. (2009) “Secret Sharing Schemesusing Visual Cryp-tography”, PhD Thesis,Cochin University of Science andTechnology, India
Stinson, D. R. (2006) “Cryptography: Theory andPractice,” 2nd ed. CRC Press 2006.
2.0 YOUNG-CHANG, HOU (2003) “VISUALCRYPTOGRAPHY FOR COLOR IMAGES,”PATTERN RECOGNITION, VOL. 36, PP1619-1629.

67
_____________________________________________________________________________________________________________________________________
MOBILE TECHNOLOGIES: ADOPTING APPLICATION MODELFOR ECONOMIC PRODUCTIVITY IN NIGERIA
____________________________________________________________________________________________________________________________________
Babatunde B. OlofinDepartment of Computer Science, Federal PolytechnicNekede, PMB 1036, [email protected]
Clement J.C. AyatalumoDepartment of Computer Science, Akanu Ibiam FederalPolytechnic Unwana, PMB 1007, [email protected]
1.0 INTRODUCTIONThe information society is the world of
ongoing progress and tech-nologicalinnovations. It is enabled by the technologicaldevelopment and progress achieved in the areas
of information and communication technology.The informa-tion society is enabled bytechnology, but it is far more than just atechnology-driven society. It is a complex andmulti-disciplinary society driven by knowledge,innovations and development (Rupnik andKrisper, 2003). The information society is aservice-oriented society in which theeffectiveness of the individual and theorganisation as such depend on the ability toacquire the accurate information at the righttime and react according to the informationacquired. The convergence between severaltechnology sectors offers the opportunity forthe emergence of new services. One of the mostrepresentative characteristics of the informationsociety is the convergence between informationand communication technologies. Thedevelopment in mobile computing andtelecommunication led to the proliferation ofmobile phones, tablet computers, smartphones,and notebooks. Some of these consumerelectronic products, like notebooks are oftenpriced lower as compared to laptops anddesktop computers, since the target market forthese products are those living in the emergingmarkets. This made the Internet and computingmore accessible to people, especially inemerging markets and developing countrieswhere most of the world’s poor reside. Mobileapplications are the consequence and the resultof this development (Müller-Veerse, 2000).Mobile applications also represent demand ofthe information society. There are some lawsdetermining characteristics which endorse theimportance of mobile applications for theinformation society. Some of them are (Rupnikand Krisper, 2003): Metcalfe’s law, which defines the value of
the network proportional to the square ofthe number of nodes connected to thenetwork. Mobile applications represent ahigh potential for services in the informationsociety, due to the fact that there aresignificantly more mobile devices than the
ABSTRACT
Employees in Nigeria are faced with the demand forhigher productivity; this is compounded with the inabilityto access information on demand. Challenged with thisscenario, it is the views in this paper that the countryneeds to embrace mobile applications for a way out. Thefirst part of the paper reviewed mobile applications in thecontext of information society, define their scope andlimitations. In the second part classical mobile applicationmodel and context-aware mobile application model areintroduced. In order to show the potential of informationsupport in the state of mobility the paper discusses typesof mobile applications and emphasises the significance ofworkflow concept for mobile applications. In the finalpart, the paper establishes that developmentopportunities abound in mobile technologies andproposed a context-aware mobile application model thatwill support economic productivity in Nigeria, stating theimplications for it to come on board, as well as its impactson national development. Furthermore, it outlines somefactors that are vital to enable the country kick-start theprocess for its economic growth.
Keywords: context-awareness, entrepreneurship, mobileapplications, mobile business, social cohesion

68
number of computers connected to theInternet;
Information society requires access to thequalitative information for successfulmanagement. Mobile applications will alsoenable the access to the information in thestate of mobility, and will therefore make asignificant contribution to the informationaccess;
Employees are faced with the demand forhigher productivity. The ability to accessinformation and use applications in the stateof mobility will without doubt make acontribution to this area;
With ongoing emergence of jobs with director indirect demand for application use andinformation access mobile applications willrepresent a contribution in this area as well.
Mobile applications, therefore,represent the consequence and demand of theinformation society. They are un-disputedlyworth the full attention of infor-mation systemscientists and information system managers.
The paper discusses mobile appli-cationswith the emphasis on mobile application as anew context-aware application model. Thispaper introduces the scope of mobileapplications, classical and context-aware mobileapplication models, and overview of types ofmobile applications and emphasises the signi-ficance of workflow concept for mobileapplications.
2.0 MOBILE APPLICATIONSMobile application is a computer
program running on a mobile device. Nativearchitecture for mobile applications is three-tier(multi-tier in general) architecture and theexecution of mobile application is distributedover multiple layers: presentation layer,application layer and database layer. For thepurpose of this paper, a mobile device is anydevice connected to the Internet using anystandard wireless communication protocol; Palmor WAP-enabled mobile phones are mobiledevices, while a notebook connected to theInternet via wireless connection is, for thepurpose of this paper, not considered as amobile device (Tarasewich, Nickerson andWarenikin, 2002). The reason for the eliminationof the notebook as a mobile device is because itdoes not reflect the distinct characteristics andlimitations of mobile devices. Mobile phonesmanufacturers are coming closer to the PDAmanufacturers; they offer communicators with
combined functionality of PDA and mobile phone(Müller-Veerse, 2000).
According to (Varshney et al., 2000) thesize and some other characte-ristics of mobiledevices imply their limitations. They haverelatively little memory available for running ofapplications, their processors are not of thehighest performance, displays are relatively smalland the using of keypad is uncomfortable. Thegrowth in storage and processing capabilitiesand improvement of manipulation are importantobjectives of the development of mobile devices(Rupnik and Krisper, 2003). The limitations ofmobile devices are essential, because theydetermine the limitations of mobile applications.The limitations of mobile applications andmobility itself make the mobile application modeldistinct from other application models (Rupnikand Krisper, 2003).
2.1 The Scope of Mobile ApplicationsApplications perform five different
elementary functions within an infor-mationsystem: capturing, storing, retrieving,transforming and displaying (Alter, 1999). Due tothe limitations of mobile devices, mobileapplication cannot reach the same level ofefficiency at capturing and displaying as otherapplications. Nevertheless, lower levels ofefficiency at performing elementary functionsdoes not make mobile applications handicapped,because to reach the same level of efficiency asother applications is beyond the scope of theirpurpose.
The scope of mobile applications is toenable the use of applications and access to theimportant information and basic level of servicesin the state of mobility. Their scope is not toenable the same level of functionality as classicalapplications on notebooks or desktops. Theservices they offer and the functionality theyenable should be appropriate for mobility andthe needs of a mobile user. It must beemphasised that the mission of mobileapplications is to offer mobility-suitable, mobility-aware and mobility-adapted mobile services.Mobile applications must provide a basic level offunctionality, access to the importantinformation and the possibility to be informedabout exceptional, unexpected and otherunusual situations happening within anorganisation that one belongs. Mobileapplications signify the connection of a mobileuser with his organisation and its informationsystem (Rupnik and Krisper, 2003).

69
Mobile applications will cause anddemand business process reengineering. On theone hand, business processes will demandmobility, and on the other hand, mobility willenable different and also new businessprocesses. It is estimated that a largerpercentage of employees are going to be mobilein the future and that mobile application willrepresent a considerable contribution to theefficiency of information systems at supportingbusiness processes (Rupnik and Krisper, 2003).
The comparison of mobile applicationswith classical ICT applica-tions is unjustified andinappropriate (Spritersbach, 2001). Thelimitations of mobile applications, which areimplied by limitations of mobile devices andmobility itself, justify the research of mobileapplications as distinct application model(Rupnik, 2002) and offer a motivation for thispaper.
2.2 Classical and Context-AwareApplication ModelMobile applications must be developed
with mobility in mind (Hampe et al., 2000).Mobility is the main purpose of mobileapplications and demands a new functionality, anew philosophy and a new application model.Merely developing mobile applications assimplification of applications already availablewould not be of significant benefit to theinformation system and its mobile users.
2.2.1 Classical application model
There are two mobile applicationmodels. The first is a classical mobile applicationmodel, where a mobile application is started bythe users’ demand. The fact that the mobile userhas run a mobile application indicates his currentinformational needs. The classical mobileapplication model does not bring the highestpossible added value to the mobile user, becauseit assumes the perception of the mobile user:what information is essential at a particularmoment, and accordingly, which mobileapplication they should run in order to acquirethat information. It must not be under-estimated, because users will still need on-demand applications (Rupnik, and Krisper, 2003;and Hampe et al., 2000).
The introduction of a classical mobileapplication model has pointed to itsdisadvantage, implicitly revealed in thecharacteristics required from a new mobile
application model. The new mobile applicationmodel should move the focal point from anapplication being run by a mobile user ondemand to an application being triggered by anapplication server and passed on to a mobileuser based on the condition that depends oncurrent circumstances within the businesssystem and its information environment. Themain idea of new application model is context-awareness (Dey, 2000). Context is defined asimplicit information on: The situation a mobile user is currently
involved in. That is, a context of situationwhich is defined by the user’s location, socialsituation and physical environment;
Informational needs of a mobile user whichis determined by information systems’informational needs. This is defined as acontext of informational needs
Technical descriptions, which carry theinformation about the places where the user isusually present, the information about thetechnical characteristics of the users’ mobiledevice and the information on the current stateof the wireless network. This is defined as thecontext of technical descriptions.
All these components are required inorder to determine the context of a mobile user.Information on the current state of the wirelessnetwork, for example, determines the form inwhich an application can be passed on to theuser. In cases of wireless network overload, thesystem can pass on to the user an applicationwith ASCII interface instead of graphical userinterface (GUI). The context determines theinformation given to the user and the moment atwhich application is triggered and passed on to amobile device.2.2.2 Context-aware application model
Context-aware mobile application modelis the second model. Mobile application iscontext-aware if it uses the context fordetermination of the triggering moment and theforming of contents. That means it uses thecontext to provide information to the user. Theinformation is relevant to the user due to thecontext of informational needs, limited by thecontext of situation and affected by the contextof technical descriptions (Rupnik and Krisper,2003).
A context-aware mobile application model isbased on the aforementioned definition ofcontext-aware mobile applications. It eliminatesthe disadvantage of a classical mobile applicationmodel, because it enables the triggering moment

70
of application to be determined by the contextof informational needs and not only on the user’sdemand. Context-aware mobile applications willenable the following new functions: Confirming. The main idea of confir-ming is
to minimise the need for entering data,while using mobile application. Ourassumption is that, in many cases, data canbe pre-generated based on context, storedinto a database and then offered to a user asan option. Pre-generation is the creation ofappropriate set of data and can beimplemented using lists of values, or can bephysically pre-inserted into a database. Thefirst type of confirming is approving; usersmust either approve the only option ordisapprove it; while the second type ofconfirming is selecting, in which case, usersmust select one among multiple options(Hampe, Swatman and Swatman, 2000);
Messaging. Messaging will enable thebroadcasting of important information,mostly, to managers, and also, to otherindividuals within the information system,and in general as well (Müller-Veerse, 2000).There are at least two levels of messaging.Operational level messaging broadcastsinformation of the operational, non-strategiclevel. On the other hand, management levelmessaging broadcasts tactical and strategiclevel information, which enables decisionsupport. At any level, messages can betriggered either by time, or event based oncondition.
Confirming and messaging are new non-elementary functions typical for context-awaremobile applications. Confir-ming is, for example,only a special case of storing. Those functionsare not implemented only by mobileapplications; they can be implemented in anyother environment. But they bring a substantialbenefit and meaning, especially to a mobile user.Their main purpose is to enable the mobile userto do as much as possible with as few clicks aspossible.
The implementation of context-awaremobile applications covering all of context
components is a rather difficult task, whichdemands complex technolo-gical infrastructure,especially for the determination of the contextof situation. Sensors in buildings and localisationsoftware, for example, are needed for theimplementation of the context of situation (Dey,2000). On the other side, there are also complexand uncertain algorithms needed for theimplementation and determination of thecontext of situation. For that reason the focalpoint should be on the context of informationalneeds, at the present stage. The first phase inthe evolution of context-aware mobile applica-tions will be based on the context ofinformational needs and the context oftechnological descriptions.
3.0 MOBILE APPLICATIONS AS ADDEDAPPLICATION CHANNELMobile applications represent a niche
application model appropriate for specific roleswithin specific business processes. They will notprevail over other types of applications, i.e. webapplications and client/server applications.Mobile applications as primary application chan-nel would not bring substantial added value toevery user.
Application models presented in thispaper indicate that mobile applications aresimple applications with rather limitedfunctionality. They can, therefore, better serve asadditional application channels offering mobility-adapted and mobility-suitable services withinportals or information systems (Figure 1). Portalsrepresent primary application channels for userswhere they can personalise and customisemobile applications, i.e. the level of informationsupport while being mobile. Withinpersonalisation, users can set up different things:events and situations they want to be informedabout, transitions of business processes theywant to confirm or they want to be informedabout and classical applications they want to usewithin their mobile portal.

71
Figure 1:
Mobile Portal within a Portal as Additional Application Channel
The just introduced concept of mobile portalwithin a portal represents a platform forenabling the information support in traditionalworking environments and in the state ofmobility. This platform enables the broadcastingof information to the entire information systemenvironment: transaction processing support
and decision support. The area of decisionsupport will be the one who will benefit a lot,because the decision makers are often notpresent in their traditional working environmentand the ability to view information and confirmdecisions in the state of mobility will be veryimportant for some companies.
3.1 Types of Mobile ApplicationsFunctionalityThe new application models just
introduced offer the first criterion to make aclassification of types of mobile applications.Therefore, in this dimension, the two modelsdistinguish mobile applica-tions: classical mobile
applications model and context-aware mobileapplications model.
3.1.1 Mobile application functionalityThe second dimension is funct-ionality of
the application system. Application systemsperform three major types of functions withininformation system: information broadcastingsupport, transaction is based on an application
There are several types of traditional,non-mobile applications (Alter, 1999). For thediscussion about mobile applications, thefollowing are relevant: communication systems,transaction pro-cessing systems, managementapplication systems and decision supportsystems. SMS is part of the traditional mobileapplications side. It could also part of the newmodel, and implicitly it is, because in the context-aware model any messaging is conceptuallysimilar to SMS. Mobile e-mail is anothertraditional mobile application type. It can be
implemented in different ways, even thoughSMS service, according to estimations, will beone of the most used and popular mobileapplica-tions. Both of applications mentioned sofar belong to the information broadcastingsupport category.
Mobile transaction processingapplications are probably the most wantedmobile applications, because transaction supportis demanded in every area. Some simple andeven sophisticated applications of this kind arealready offered. One of the conditions for their

72
real era to come is the solution of the securityproblem, which is conceptually already solved,but not implemented in all mobile devices. Themost significant areas for a mobile user arebanking, shopping, broking reservations andeducation. Mobile applications for the areasmentioned are already offered (Müller-Veerse,2000), but very little for education.Decision support area will probably gain themost of all areas of functionality with theemergence of mobile applications. Managers andexecutives will have the opportunity to seeessential parameters of running business andmake decisions based on those parameters whilebeing mobile. Mobile management applicationsand mobile decision support systems oftraditional application model enable query-on-demand without combination with messaging.Transaction support is in the heart of allfunctionalities for the classical application model.This is not surprising, as it is in accordance withthe fact that to record facts was one of the mostimportant missions of application systems. Withthe new application model things are different,because the demand for mobility determinesinformation broadcasting as the corefunctionality. Mobile decision support systemswill mostly be based on messaging andconfirming as well. They will also keep query-on-demand capability, but their main potential is incontext-aware messaging capability. Mobiledecision support systems will be mostlymessaging oriented; there will also be someconfirming in cases when managers will have toconfirm some draft decisions made by theirsubordinates, and these will be triggered by thecontext.Various messaging systems designed for variouspurposes will play an important role in thefuture. In order to satisfy user’s needs and inorder to prosper, they will have to be locationdependent and personal profile dependent.Among other things, this will make mobileadvertising possible; that actually means one-to-one, location dependant and fully personalisedmarke-ting.
Furthermore, emerging 3G net-worksare the important prerequisite for theemergence of mobile applications (Economist,2003). Always-on is the precondition for theemergence and the success of mobileapplications and it can be achieved throughconnection to GSM (2.5G or 3G) networks.
3.1.2 Mobile commerce
The most important type of mobileapplications of the future is mobile commerceapplications. They will rep-resent a considerablepart of the mobile application market. Thegeneral name, mobile commerce applications,covers an extensive area of various mobileapplications sub-types which all have evidentcommercial component. There are three groupsof mobile application sub-types within mobilecommerce applica-tions.
In the first group, there are mobileapplications that are mostly transaction-supportoriented, but with noticeable informationbroadcast support as well. They enablemessaging and confirming with emphasis ontransaction support. With only transactionsupport, mobile applications of this group would,in fact, be mobile transaction processingapplications. Their contribution and the newvalue that they provide are in messaging, whichadds a dynamic component to transactionprocessing. The most typical mobile applicationsof this group are applications that supportmobile auctions, mobile broking and mobileadvertising.
The second group has strong emphasison transaction support with messaging andconfirming functions required. Mobile banking,mobile reservations and mobile shopping arerepresentatives of mobile applications of thisgroup. The main difference between the first andthe second group is in information broadcastingsupport. For the first group, the informationbroadcasting, with messaging function as itsimplementation, is the primary functionality.Transaction can only be a consequence of amessage delivered to the user. For the secondgroup, the transaction support is the primaryfunctionality, with messaging only as itssupportive function.
3.2 Workflow and Mobile ApplicationsWorkflow concept is very important for
mobile applications. It is concerned with theautomation of procedures, steps of businessprocesses, where data, documents, informationor tasks are passed between participantsaccording to a defined set of rules to achieve, orto contribute to, an overall business goal(Workflow Management Coalition, 1995).Workflow is defined as computerised facilitationor automation of a business process, in whole orpart. The ability to distribute tasks and invokemobile application at the right moment isparamount for implementing concepts of

73
messaging, confirming and accepting. In theworkflow framework, workflow engine isresponsible for invoking applications.
Between the areas of mobileapplications and workflow, there is a kind ofcoherence; for success of mobile applications ina way depends on workflow technology andworkflow technology will become moreimportant through expansion of mobileapplications.
3.3 Mobile Technology and Develop-mentOpportunitiesThe advent of mobile technology as part
of ICT in development initiatives has proven tobe a success as the rapid distribution of mobiletelephony has made it possible for poor peopleto have easy access to useful and interactiveinfor-mation (Silvia Masiero, 2013). For instance,in India, the total number of mobile phonesubscriptions reached 851.70 million in June 2011,among which 289.57 million came from ruralareas, with a higher percentage of increase thanthat in urban areas. The unexpected growth ofaffordability and coverage of mobile telephonyservices has increased its importance not just asa means of two way communication but that ofease-of-access to information as well.
Mobile phones are capable of muchmore than the exchange of information betweentwo people through calling or text messaging.Advanced models of mobile phones can take
photos, record video, receive local AM/FMstations radio frequencies, share and receivemultimedia and even connect to the Internet.These features make an even better device to aidin ICT for development projects.
According to International Tele-communication Union (ITU), mobilecommunications and technology has emerged asthe primary technology that will bridge in theleast developed countries. This trend can befurther supported by the rosy sales reports oftechnology companies selling these electronicdevices in emerging markets which includessome of the least developed countries.
Moreover, data from the ITU’sMeasuring the Information Society 2011 Reportshows that mobile phones and other mobiledevices are replacing computers and laptops inaccessing the Internet. Countries in Africa havealso recorded growth in using mobile phones toaccess the Internet. In Nigeria, for example, 77%of individuals aged 16 and above use their mobilephones to access the Internet as compared to amere 13% who use computers to go online (ITU,2011).
These developments and growth inmobile communication and its penetration indeveloping countries are expected to bridge thedigital divide between least-developed countriesand developed countries, although there are stillchallenges in making these services, the
affordable. For example, a study in Kenyaidentified innovation in mobile technologies fordevelopment in particular the success of M-PESAmobile banking (Silvia Masiero, 2013). M-PESA(M for mobile, PESA is Swahili for money) is amobile-phone based money transfer andmicrofinancing service for Safaricom andVodacom, the largest mobile network operatorsin Kenya and Tanzania (CommunicationsCommis-sion of Kenya, 2012). The study alsolooked at sectors like m-agriculture and m-healthwhere best practice is still to be achieved andhave high demand from Kenyan people.
The main lesson they learnt wasexemplified by M-PESA where they found thepresence of three factors required if mobiletechnology innovation is to be fostered indeveloping countries (Silvia Masiero, 2013): A creative private sector; A process coordinated by a govern-ment; Committed international donors.
They found demand for mobiletechnologies in Kenya present for health and
agriculture and found case studies of bestpractice in these fields (Silvia Masiero, 2013).They learnt that best practice in m-health seemsto depend on demand and on the governmentfacilitating innovation. Alternatively, they foundm-agriculture leaving more room forentrepreneurship in the private sector (SilviaMasiero, 2013).
3.4 Impact of Mobile Technologies inEconomic DevelopmentAccording to a study conducted in
Tanzania (Bhavni, Chiu, Janakiram, Silarszky,Bhatia, 2008) the use of mobile phones hasimpacted rural living in many ways. According tothe latest study conducted on mobile commerce,up to 78 percent of smartphone users areapplying their devices to the shopping decisionprocess for choosing the products that they willbuy. The study was conducted with participationof 400 users of both smartphones and socialmedia users in India, from among 4,000 total

74
participants. The study indicated that amongsmartphone using consumers 65 percent usetheir devices for buying from a retail store.Moreover, 81 percent of them often used socialmedia over those devices to obtain purchasingadvice before they actually buy the item beingconsidered. The mobile commerce study wasconducted in 10 different countries (Lambert,2013).
4.0 ADOPTING APPLICATION MODEL FORECONOMIC PRODUCTIVITY IN NIGERIASeveral authors have done research on
mobile application model for economicproductivity The research pointed out thatconsumers in the mobile commerce environmentare creating a fundamental shift in shopping asthey begin using that channel as their primarychoice on an increasing basis. It also indicatedthat even though there are some securityconcerns that continue to exist, online banking isalso on the rise and this will only help to boostthe popularity of shopping and transactions as awhole.
Employees in Nigeria are faced with thedemand for higher productivity; this iscompounded with the inability to accessinformation on demand. Challenged with thisscenario, it is the views in this paper that thecountry needs to embrace mobile applicationsfor a way out. It must be emphasised that themission of mobile applications is to offermobility-suitable, mobility-aware and mobility-adapted mobile services. The ability to accessinformation and use applications in the state ofmobility will without doubt make a contributionto this area.
A context-aware mobile applica-tionmodel that will provide the func-tionality foreconomic productivity in Nigeria is herebyproposed. The model will have functionalities formessaging, accepting and confirming withfeatures for information broadcasting support,transact-tion support and decision support.
In comparison with the context-awaremodel, the classical model is disadvantaged,because it lacks the potential context-sensitivityinherent in the new model selected, the basis ofwhich is that the new mobile application modelwill move the focal point from an applicationbeing run by a mobile user on demand alone toan application being triggered as well by an
application server and passed on to a mobileuser based on the condition that depends oncurrent circumstances within the businesssystem and its information environment.
As Nigeria is predominantly made up ofrural dwelling communities, this paper expectsthat deployment of mobile application willimpact on the nation’s economic productivity inmany ways: Easy Access to Information: Mobile phones
will enables users to access valuableinformation such as prices, arbitrage andmarket or trade opportunities which couldbetter prepare them for businesstransactions.
Transport Substitution: The improvement inthe information flows between the buyersand sellers make for a more effectivebartering of information without traveling.This is particularly significant in rural areaswhere traders need to travel to urban areassimply to check for demand and negotiateprices. Mobile phones eliminate the need formiddlemen and journeys as traders couldensure that demand for their products existsbefore leaving their rural homes;

75
Figure 2: Proposed Context-Aware Mobile Application ModelCourtesy: Academia.edu

76
Market Inefficiencies: The use of mobilephones can correct market inefficiencies,therefore regaining the balance in the supplymarket;
Disaster Relief: In cases of severe drought,floods, wars or weak economies, mobilephones can be used to keep in touch withone's home community. Mobile operatorshave proven to be incredibly helpful indisaster relief efforts by providingemergency-related communicationsinfrastructure;
Education and Health: Mobile services canbe used to spread locally generated andlocally relevant educa-tional and healthinformation;
Social Capital and Social Cohesion: Mobileservices will enable partici-pants to acttogether and pursue shared objectives bypromoting cooperation among socialnetworks;
Entrepreneurship and Job Search: Use ofmobile phones will reduce the cost ofrunning a business and, in some cases, thetechnology could even enable a user to startone.
4.1 The Implication of the MobileApplication Model
The adoption of the proposed mobileapplication model for economic productivity,fundamentally, will entail: Infrastructure: especially for deter-mination
of the context of situation; that will includeo sensors in buildings,o localisation software;
Mobile portal within a portal: this presentsa platform for enabling information supportin traditional ICT environment and in thestate of mobility. This platform will enablebroadcasting of information to the entireinformation system environ-ment,transaction processing and decision support;
Connectivity with GSM: especially 2.5G or 3Gbroadband network;
Business process reengineering: mobilitywill entail different and also new businessprocesses, as a larger percentage ofemployees are going to be mobile in thefuture; mobile application will thenrepresent a considerable contribution to the
efficiency of information systems atsupporting business processes.
As mobility is the main idea of mobileapplications it demands a new functionality, anew philosophy and a new application model.This paper views that developing mobileapplications as simplification of applicationsalready available would not be of significantbenefit to the information system and its mobileusers.
5.0 RECOMMENDATIONS ANDCONCLUSION
5.1 Effective Adoption of MobileApplicationThe country will have to embrace the
innovations brought about by use of mobiletechnologies in the various sectors of theeconomy. In view of the implications of themobile application and in order to kick-start thisprocess effectively in Nigeria, the followingenabling environments should be put in place: A creative private sector seizing the initiative
and acting upon a specific and wide demandfor innovation;
A process coordinated by a govern-mentthat is supportive;
Committed international donors sup-portingthe innovation across all phases.
5.2 ConclusionMobile applications are a novelty
introduced and enabled by the techno-logicalprogress in the information society. Theyrepresent the foundation for m-commerce,which is probably one of the most demandedservices by mobile users, and the widespreadacceptance of e-commerce. Mobile applicationsare accompanied by a new context-awareapplication model, which represents higher valueadded to the mobile user, because the contentand the triggering moment are based oncontext.
The paper highlighted that 3G networksare the important prerequisite for theemergence of mobile applications, and thesuccess of mobile applications can be achievedthrough connection to GSM (2.5G and 3G)networks. It is, therefore, evident that the futuresuccess and the widespread use of mobileapplications depend on possibility for mobiledevices to connect to these networks.

77
Context-aware mobile applicationsintroduced in the paper represent one of thecore challenges to the research area ofinformation systems development. There is agreat need and opportunity for a research areaof information systems development to takeadvantage of mobile applications
This paper has established thatdevelopment opportunities abound in mobiletechnologies and proposed a context-awaremobile application model that will supporteconomic productivity in Nigeria, stating theimplications for it to be put in place. It also hashighlighted significant impact the application willhave on national productivity and outlined somefactors that are important to enable the countrykick-start the process for its economic growth.
In today’s world, the speed of changesand emergence of novelties in the area oftechnology often overtake the science anddevelopment of methodologies to supportchanges. Mobile applications are example ofsuch overtaking. Infor-mation systemsdevelopment methodo-logies will have to adoptnew approaches, methods and techniques fordevelopment of context-aware mobileapplications with advanced functionality.
6.0 REFERENCESAlter, S., 1999. Information Systems: A
Management Perspective. TheBenjamin/Cummings PublishingCompany, Menlo Park.
Bhavni, Asheeta, Rowena Won-Wai Chiu,Subramaniam Janakiram, PeterSilarszky, Deepak Bhatia, 2008. The Roleof Mobile Phones in Sustainable RuralPoverty Reduction. The CommunicationInitiative Network and Partnershiphttp://www.comminit.com/ict-4-development/node/276367/feed-items.Retrieved June, 2008.
Communications Commission of Kenya, 2012. CCKReleases 2nd Quarter ICT Sector Statisticsfor 2011/ 2012.
Dey, K.A., 2000. Enabling the Use of Context inInteractive Applica-tions. ACM ExtendedAbstracts on Human Factors inComputing Systems, pp79-80.http://dl.acm.org/citation.cfm?id=633340 RetrievedMarch 10, 2014.
International Telecommunication Union, 2011.Measuring the Information Society.International Telecommunication Union,Place des Nations, Geneva.
Müller-Veerse, Falk, 2000. Mobile CommerceReport. Müller-Veerse Research Ltd,London. Available at:http://archiv.iwi.uni-hannover.de/lv/seminar_ss03/Dittel/Literaturlinks/Müller-Veerse/mcomreport. pdf.Retrieved January 16, 2014.
Economist, 2003. Mobile telecoms: The shunningof 3G. The Economist, Vol. 368, No. 8342,pp.81, 82.
Hampe, J.F., Swatman, P.M.C. and Swat-man,P.A., 2000. Mobile Electronic Commerce:reintermediation in the payment system.Proceedings of the 13th Bled ElectronicCommerce Conference, pp. 693–706.
Hars, A., El Sawy, O.A., Gosain, S., Hirt, S., Im, I.,Kang, D., Lee, Z. and Raven, A., 2000.Reengineering IS for the ElectronicEconomy, Journal of OrganizationalCompu-ting and Electronic Commerce,Vol. 10, No. 2, pp. 63-77.
Rupnik, R., 2002.Context-Aware MobileApplications Model and Deter-minationof Role of Mobile Applications withinInformation System« (in Slovene). PhD.Thesis, University of Ljubljana.
Rupnik, R., Bajec, M. and Krisper, M., 2003. TheRole of Mobile Appli-cations inUniversity Information Systems.Academia.edu. https://www.academia.edu/4255716/The_Role_of_Mobile_Applications_in_University_Information_Systems. RetrievedFebruary 15, 2014.
Silvia Masiero, 2013. Innovation and BestPractice in Mobile Technologies forDevelopment. Economic and PrivateSector Professional Evi-dence and AppliedKnowledge Services - Helpdesk Request.http://www.kiwanja.net/database/document/report_Innovation_mobile_technologies_for_development.pdf. RetrievedFebruary 15, 2013.
Spritersbach, J. 2000. Integrating ContextInformation
into Enterprise Applications for the MobileWorkforce - A Case Study. Proce-edingsof Workshop of Mobile Commerce at the

78
International Conference on MobileComputing and Networking, pp.55-59.
Tarasewich, P., Nickerson, R.C. and Warenikin,M., 2002. Issues in Mobile E-Commerce.Communi-ations of the Association forInfor-mation Systems. Vol. 8, Article 3.http://aisel.aisnet.org/cais/vol8/iss1/3.Retrieved February 15, 2014.
Varshney, U., Vetter, J.R. and Kalakota, R., 2000.Mobile Commerce: A New Frontier, IEEEComputer, Vol. 10 pp.32-38.
2.0 WORKFLOW MANAGEMENT COALITION1995. THE WORKFLOW REFERENCEMODEL. WORKFLOW MANAGEMENTCOALITION, WINCHESTER, UKHTTP://WWW.WFCM.ORG/STANDARDS/DOCS/TC003V11.PDF.RETRIEVED: FEBRUARY 15, 2014.

79
_____________________________________________________________________________________________________________________________________
ANALYSIS OF SMART VIDEO SURVEILLANCE SYSTEMS_____________________________________________________________________________________________________________________________________
Akintola K.G.Computer Science Department, Federal University ofTechnology Akure, Ondo State, Nigeria
Akinyokun O.C.Computer Science Department, Federal University ofTechnology Akure, Ondo State, Nigeria
Olabode O.Computer Science Department, Federal University ofTechnology Akure, Ondo State, Nigeria
Iwasokun G.B.Computer Science Department, Federal University ofTechnology Akure, Ondo State, Nigeria
1.0 INTRODUCTION1.1 Smart Systems
Smart systems are systems that use afeedback loop of data, which provides evidencefor informed decision-making. The system canmonitor, measure, analyze, communicate and
act, based on inform-ation captured fromsensors (Martyn et al., 2012).
1.2 Smart Video SystemsSurveillance involves object detection,
classification and monitoring within the scenewhile activity recognition involves the process ofrecognizing the actions performed by a person,such as walking, running, jumping, bending andso on. Also identity recognition involves theprocess of recognizing a person using someunique features such as face, fingerprint, gait,and so on. Video surveil-lance is a technologythat has been applied in many public and privateplaces such as banks, airports, highways,crowded areas for the purpose of security(Yigithan, 2004). In the beginning, video outputsare processed in real time by human operatorsand are usually stored for later for post-crimeinvestigations. However, it has been recognizedthat humans are inefficient at doing thisespecially now that we have a large number ofareas to be monitored simultaneously(Hampapur et al., 2005). In order to detectimportant events automatically from such anarray of cameras, assisting the human operatorswith identification of important events in videoby use of “smart” video surveillance systems is acritical requirement. Figure 1 presents a typicalvideo surveillance system.
Figure 1: A typical visual surveillance system
The terms Smart visual surveil-lance,intelligent video surveillance, video analytics,intelligent video and intelligent analytics are
ABSTRACT
This paper presents a review of currentdevelopments in smart video surveillance systems.We look at the existing surveillance systems in linewith their domains of application, theirarchitectural design, their support for multi-sensors,multi-cameral, video analysis, and quality of service.Their support for 3D visualization, data fusion, andmobility were also looked into. The Computer Visiontechniques applied to surveillance technologies arealso given. The current research issues supported bythese systems were also analyzed as well. Theobjective of this paper is to present the state of theart of visual systems for surveillance in the past andpresent with a view to understanding the currentresearch focus areas of these technologies and thechallenges ahead.
Keywords: smart, multi-sensor, multi-camera surveillance

80
typical names used to describe the concept ofapplying automated signal analysis and patternrecognition to video cameras and sensors, withthe goal of automatically extracting “usableinformation” from video and sensor streams(Russo, 2008)
Detection, tracking, and understandingof moving objects of interest in dynamic sceneshave been active research areas in computervision over the past decades. Intelligent visualsurveillance (IVS) refers to an automated visualmonitoring process that involves analysis andinterpretation of object behaviors, as well asobject detection and tracking, to understand thevisual events of the scene (Kim et al. 2010).
2.0 COMPUTER VISION TECHNI-QUES INSMART VISUAL SYSTEMS
2.1 Video AnalysisIn general, the tasks of video analysis
can be divided into that of fore-grounddetection, classification, tracking, identityrecognition, and activity recognition.Surveillance involves the detection, tracking andclassification of foreground objects in videoscenes, while Human identity recognitioninvolves the process of recognizing a personusing some unique features such as face,fingerprint, gait, and so on. Activity Recognitioninvolves the process of recognizing the actionsperformed by a person, such as walking, running,jumping, and bending and so on. The foregrounddetection subsystem detects the moving regionsin the scene, foreground classification attemptsto classify the moving object into the variousclasses they belong. Foreground tracking isconcerned with locating the position of themoving object from frame to frame within thescene. Foreground Identification tries torecognize the identity of the moving objects.Activity recognition attempts to recognize theaction taking by the moving objects in the sceneor detect if an action is normal or abnormal.
2.2 Object Detection in Smart VisualSystemsAccurate human segmentation in videos
is a necessary requirement for any surveillancesystem. The first task of a video analytics is todetect moving objects in the scene. Thisdetection is used in the later stages of the videoanalytics. There are many moving objectdetection mechanisms in the literature. Due to
the nature of different backgrounds- i.e. static,dynamic, and a quasi-stationary, motiondetection poses a difficult problem, anddifferent algorithms have been proposed in theliterature to work in different environments.Frequently used techniques for moving objectdetection are back-round subtraction,background statistical modeling, temporaldifferencing, optical flow and Hair like features.
Surveillance system needs objects to beidentified in the scene. In general video analyticsforeground detection can be classified by themethods used to detect the motion. Those thatuse models of the background and those thatmake use of temporal difference and finallythose that make use of the flow vectors ofmotion to estimate regions of motion. In thecase of background subtraction, a model of thebackground is obtained by using the firstbackground frame or by building statisticalmodel of the background using few first framesof the background. Motion is then detected bytaking the difference between the current frameand the background reference frame in a pixel-bypixel fashion. Temporal differencing makes useof the pixel wise differences between two orthree consecutive frames in an image sequenceto detect moving regions. This method is veryadaptive to dynamic science, but does a poor jobof extracting all the relevant pixels.
Optical flow based method uses flow vectors ofmoving objects over time to detect movingregions in an image sequence. The flowcomputation is computationally intensive andsensitive to noise and cannot be applied to realtime video without specialized hardware (Yigit-an., 2004).
2.3 Object Tracking in Smart Visual SystemsObject tracking can be defined as the
problem of estimating the trajectory of an objectin the image plane as it moves around a scene. Inother words, a tracker assigns consistent labelsto the tracked objects in different frames of avideo. Additionally, depending on the trackingdomain, a tracker can also provide object-centricinformation, such as orientation, area, or shapeof an object (Yilmaz et al., 2006). Object Trackingis an important task in many computer visionapplications including surveillance (Yang et al.,2005). The tracking of real world objects is achallenging task due to the presence of noise,

81
occlusion, clutter of objects of interest. A varietyof algorithms have been proposed in theliterature to tackle these problems.
According to Yang., (2005), trac-kingalgorithms can broadly be classified into twocategories Deterministic methods and stochasticmethods. Deterministic methods typically trackby performing an iterative search for the localmaxima of a similarity cost function between thetemplate image and the current image. The costfunction widely used is the sum of squareddifference (SSD) between the template and thecurrent image. In this regards, more robustsimilarity measures have been applied and themean-shift algorithm or other optimizationtechniques have been utilized to find the optimalsolution (Yang et al., 2005).
Model based tracking algorithmsincorporate a priori information about theobjects to develop representations such as skincolor, body blobs, silhouettes, kine-maticskeleton, while appearance based approachesapply recognition algorithms to learn the objectseither in some basis such as the eigenspace, or inkernel space (Yang et al., 2005).
The second category which is thestochastic methods, use the state space tomodel the underlying dynamics of the trackingsystem.
2.4 Human Identity Recognition in SmartVisual SystemsAutomatic recognition of people is a
challenging problem which has received muchattention during the recent years due to its manyapplications in different fields such as lawenforcement, security applications or videoindexing. Identifying human beings fromdistance in a surveil-lance scenario require non-cooperative subjects; hence the physiologicaland behavioral traits that can be used for thispurpose are face and gait of the individual.Face has always been one of the biometrics usesfor human identification. Although othermethods of identification such as fingerprints,iris scan can be used, but they cannot be suitablein a situation where non-copeartion is needed.Face recognition has always remain a majorfocus of research mainly because of its non-invasive nature and because it is people’sprimary method of person’s identification(Chellappa et al., 2003). Humans often use faces
to recognize individuals and advancements incomputing capability over the past few decadesnow enable similar recognitions automatically(Chellappa et al., 2003).
Human face localization or detection isoften the first step in video surveillanceapplication. Locating and tracking human faces isa prerequisite for face recognition and/or facialexpression analysis. In order to locate a humanface, the system needs to capture an imageusing a camera and a frame grabber to processthe image, extract important features and thenuse these features to locate the region of humanface in videos. Face recognition is a verychallenging problem and up to date, there is notechnique that provides a robust solution to allsituations and different applications that facerecognition may encounter (Chellappa et al.,2003).
Gait is a spatio-temporal pheno-menonthat typifies the motion charact-eristics of anindividual (Kale et al., 2002). Gait recognition isaimed to recognize human beings from distanceusing the way they walk (Bouchrika et al., 2008).Human gait recognition works from theobservation that an individual walking style isunique and can be used for identification. It isobserved that natural biometric systems fails intwo ways 1) failure to match in low resolutionimages 2) user co-operation to obtain accurateresults. These shortcomings might be a plus forusing gait for biometric purposes (Rani andArumugam 2010).
Many studies have shown that it ispossible to recognize people by the way theywalk (Imed et al., 2008). In kinesiology (humankinetics) the goal has been to understand humanmotion with applications in sports, medicine,elderly care and early detecting of movementdisorders (Harris et al., 2010). Analyzing humangait has found considerable interest in recentcomputer vision research (Katiyar et al., 2010).
Various Gait algorithms have beenproposed in literature to achieve betterrecognition results. They can be broadlyclassified as model-based and modelessalgorithms. The model-based approaches use abio-mechanical motivated approach, andinput/output modeling approaches while themodeless approaches use shape and motioninformation for gait analysis (Ding, 2008).
2.5 Activity Recognition in Videos

82
This section reviews the state-of-the-artmethods of action recognition in realistic,uncontrolled video data. The existing works isstructured into three categories: (a) Humanmodel based met-hods, which employ a full 3D(or 2D) model of human body parts, and actionrecognition is done using information on bodypart positioning as well as move-ments. (b)Holistic methods which use the knowledge aboutthe localization of humans in video andconsequently learn an action model thatcaptures characteristic global body movementswithout any notion of body parts. (c) Localfeature met-hods which are based on descriptorsof local regions in a video, no prior knowledgeabout human positioning nor of any of its limbs isgiven. A model-based approach employs akinematics model to represent the poses of bodyparts in each snapshot of body action. Therecognition algorithm first aligns the kinematicmodel to the observed body appearance in eachvideo frame and then codes the motion of thebody parts with the model transfor-mations(Chen et al 2008). Appearance-Based: AnAppearance based method use the appearanceproperties of each action frames withoutexplicitly representing the kinematics of thehuman body. A good example is templatematching, which is widely used as anappearance-based action recognition algorithme.g. (Bobick et al., 2001). In part-based method,the appear-ance of an actor is decomposed intoa set of small, local spatio-temporal compo-nents, and statistical models are applied to mapthe local components to actions.
3.0 REVIEW OF SMART VISUALSURVEILLANCE SYSTEMSThere have been several smart
surveillance systems reported in the literature.Many of such systems are depicted in Table 2.1.Haritaoglu (1998) presents a Real Time systemfor Detecting and Tracking people is presented.W4 is designed as real time visual surveillancesystem for detecting and tracking people andmonitoring their activities in an outdoorenvironment both day and night. It operates on amonocular grayscale video imagery or videoimagery from an infrared camera. W4 ismotivated by the desire to develop a peopletracking oriented system that can locate andtrack people especially during the night time. Theobjectives of developing the system are:
To construct a system to answer ques-tionsabout who is the there?, what is he doing?,people are doing and where is he? and whenwas the action?.
To track multiple people and their partsusing shape analysis.
The system can perform the following: Background modeling using frame dif-
ferencing. Object detection Object tracking Occlusion handling using region Mer-ging
and splitting Parts tracking using cardboard Algo-rithm.
The limitation of the system is that themodel used for body pose prediction is restrictedto upright position only and hence cannot detectpeople in other body poses. Also the systemcannot detect complex events. The W4 actuallyextends the first generation of surveillancesystems by providing for automatic detection ofobjects and actions in the system. This type ofsystems can be categorized as secondgeneration systems.
In Collins et al. (2001), the Archi-tectureof the Video Surveillance and Monitoring (VSAM)is presented. The Objective of the system is todevelop a single user monitoring system. Thearchitecture of VSAM consists of an operatorcontrol unit, several sensor pro-cessing units, agraphical user interface (GUI), and severalvisualization nodes. VSAM allows multiple(Operator Control Unit) OCU to be networkedtogether each controlling multiple (SPUS) SensorProcessing Units. Each OCU supports exactly oneGUI through which all users’ related commandand control information is passed. Datadissemination is not limited to a single userinterface, however but is also accessible througha series of visualization modes (VIS). Objectdetec-tion is performed by the sensor processingunits using adaptive background sub-tractionand three-frame differencing. This information issent to the operator central unit. That is, theoperator control unit receives the processeddata from the entire sensor processing unitsdistributed over the area of interest. Once theoperator control unit acquires results from thesensor-processing units, this information isintegrated with a site model and a database ofknown objects to infer information of interest tothe user (Collins et al., 2001).

83
CMUP
Figure 2: Schematic overview of the VSAM testbed system (Collims et al., 2001)The system schematic overview is
presented in figure 2 and consists of thefollowing: Sensor processing units (SPUS): The SPU
acts as an intelligent filter between a cameraand the VSAM network. Its function is toanalyze video imagery for the presence ofsignificant entitles or events and to transmitthat information symbolically to the OCU.The advantage of this arrangement allowsfor many different sensor modalities to beseamlessly integrated into the system. Alsoperforming as much video processing aspossible on the SPU reduces the bandwidthrequirements of the VSAM network. Fullvideo signals are not required fortransmission, only sym-bolic data extractedfrom video signals.
Operator Control Unit (OCU): The OCUaccepts video processing results from eachof the SPUs and integrates the informationwith a site model and a database of knownobjects to infer activities that are of interestto the user. This data is then sent to the GUIand other visualization nodes as output fromthe system.
GUI: The GUI currently consists of a map ofthe area, over laid with all object locations,sensor platform loca-tions, and sensor fieldof view. In addition a low bandwidth and thecompressed video stream from one of thesensors can be selected for real-time display.The GUI is also used for sensor suite testing.Through the interface, the operator can testindividual sensor units, as well as the entiretestbed sensor suite.
Visualization nodes are used for viewing the3D scene of the surveillance area. This alsosupports data fusion. Every observed objectis positioned in a 3D geodetic coordinatesystem using relocation.
The system is one of the pioneeredworks in third generation surveillance systems.
The systems allow many different sensors to co-operate and work together. Also there isefficient usage of bandwidth since only symbolicinformation is sent across the network. Butcomplex activity recognition is not supported bythe system.
In Georis et al. (2003) an IP-distributedcomputer-aided video-surveil-lance system ispresented. It is a surveil-lance architecture thatbasically consists of three components:Computers connected together through a typicalfast Ethernet network (100 Mbls). The variouscameras are plugged either in an acquisition cardin a PC or directly on the local network hub for IPcameras. It also consists of Human ComputerInterface (GUI) and storage space plugged intothe system. The overall advantage of thearchitecture is the flexibility offered androbustness in the presence of errors,transmission interrupt-tion.
In this work, a generic, flexible androbust intelligent real-time video surveil-lancesystem is presented. The proposed system is amulti-camera platform that is able to handledifferent standards of video inputs (composite,IP, IEEE1394). The system implementation isdistributed over a scalable computer clusterbased on Linux and IP network. Data flows aretransmitted between the different modulesusing multicast technology. Video flows arecompressed with the MPEG4 standard and theflow control is realized through a TCP-basedcommand network (e.g. for bandwidthoccupation control). The design of thearchitecture is optimized to display, compress,store and playback data and video flows in anefficient way. This platform also integratesadvanced video analysis tools, such as motiondetection, segmentation, tracking and neuralnetworks modules. The goal of these advancedtools is to provide help to operators by detectingevents of interest in visual scenes and store themwith appropriate descriptions. This indexation
SPUS OCUSiteSensorModelFusion
VISGUI

84
process allows one to rapidly browse throughhuge amounts of stored surveil-lance data andplay back only interesting sequences.
The major components of the physicalarchitecture are presented in Figure 1. Basically,the system is compos-ed of computersconnected together through a typical fastEthernet network (100/Mb/s). The variouscameras are plug-ged either on an acquisition
card on a PC or directly on the local network hubfor IP cameras. A human computer interface anda storage space are also plugged on this system.The main advantage of such architecture is theflexibility. The robust-ness of the overall systemis provided by the logical architecture. Itmanages the various problems that can arisesuch as a network packet loss and networktransmis-sion interruption.
Figure 2.10 Architecture of the Georis et al. (2003)
In Luca et al., (2003), a co-operativemulti-sensor system for face detection in videosurveillance applica-tions is presented. This workpresents an innovative architecture for multi-sensor video surveillance cameras. The use ofstatic and other active sensors both co-operatingto capture human faces and track it in a scene inreal-time is presented. The motivation is todevelop a system with enhanced capabilities onthe monitored environment and on activitieswhich take place in that environment. Thesystem aims to locate, detect and track humanfaces in complex outdoor scenes and capturefacial video shots. To achieve this aim, thesystem involves the use of video camera forimage acquisition. Features provided by thelower levels enable it to estimate 3-D positiondimensions of the detected objects tracked inthe scene. The system has the following layers ofinformation processing: Sensor Layer: Calibration of sensors,
positioning of cameras, collection of videodata.
Image processing Layer: This is used forvideo processing and manipulation.
Data fusion layer: Interaction strate-gies,Multi-camera calibration, and networking isachieved in this level.
The face tracker follows the face throughthe scene. The system performs well but themodel used for skin detection needsimprovement.
In Ko et al. (2004) Secure Internetexamination system based on video monitoringis presented. It is recognized that the use of theInternet for web-based teaching and learning isfast becoming a reality, however, since it isdifficult to verify the identity of the studentthrough a simple user ID and password on theclient side, the performance evaluation ofstudents through test and examination throughInternet is still a problem. To overcome thishurdle, a system using face biometric is adopted.The authors assert that as web-based learningtakes root, the use of the Internet for formal testand examination becomes an interestingchallenge. Since such test and examination canbe carried out anywhere, anytime, the problemof security is the main concern that needs to beovercome. For example, the student taking thetest may have correct ID and password, but may

85
be aided in the Web-test since they are far fromthe examiners. To solve this problem thisproblem, a camera installed on the clientcomputer captures the student’s face andposture at random intervals during the test.These captured images are stored in the serverfor the examiner to verify the identity of thestudent when there is doubt on his or heridentity or the circumstances under which thetest is taken. The problem with this system isthat it cannot provide real time alert to theexaminers during the test. It can only be used forlater after examination investigation.
In Hampapur et al. (2005), Smart VideoSurveillance: Exploring the concept of multi-scalespatio-temporal tracking is presented. Thisproject attempts to develop a surveillancesystem that spans multiple scales of space andtime. It is recognized that in the existingsurveillance systems, the componenttechnologies are evolving in isolation. To providecomprehensive non intrusive situationawareness, it is imperative to address thechallenges of multi-scale, spatio-temporaltracking. The work addresses these problems bythe use of active cameras, multiple objectmodels, and long-term pattern analysis toprovide comprehensive situation awareness.According to the authors, the objectives ofdeveloping the system are to solve some of thechallenges of surveillance systems such as: The Multi-scale challenge: This involves
acquisition of information at multiple scales.A security analyst who is monitoring a placeneeds to observe who the people are; whatthey are doing and expression on people’sfaces.
The contextual event detection chal-lenges:While detecting and tracking objects is acritical capability for smart surveillance, themost critical chal-lenge in video-basedsurveillance is interpreting the automaticanalysis data to detect events of interestsand identify trends.
The Large System development challenge:The challenge here deals with how to buildlarge-scale deployable systems. Theidentified challenges of deployment includeminimizing the cost of wiring, meeting theneed for automatic calibration of cameras
and automatic fault detection, anddeveloping system management tools.
To solve these challenges a multi-scalesolution is proposed. The system has a staticcamera which is used to capture a global view ofthe scene. Another camera, the pan-tilt-zoom(PTZ) camera is meant to obtain detailed or fine-scale information about objects of interest in thescene. The video from one static camera is usedto detect and track multiple objects in either twoor three dimensions. Additionally, the fixedcamera images can be used to extract additionalinformation about the objects at a coarse level;like object class (person, car, truck) or objectattributes (position of a person’s head, velocityof the car etc). The coarse-scale information isused as a basis to “focus the attention of the PTZcameras”. The information from the PTZ camerasis then used to perform fine-scale analysis. Thesystem performs object detect, then backgroundsubtraction and salient motion detection. A two-dimen-sional object tracking is also performed todevelop object trajectories over time by using acombination of the object’s appearance andmovement characteristics. The system inaddition is also able to perform face cataloguing,object structure analysis and movement patternanalysis. The pattern of movement and videoindex is generated which are stored in relationaldatabase for querying purposes. As the systemmonitors the scene, it generates the viewablevideo index which is stored in relational databaseagainst which queries may be implemented. Thelimitation of this system is that complex activityrecognition is not supported by the system.Bramberger et al. (2006) presents a SmartCamera for Traffic Surveillance. Smart camerasare obtained by incorporating advanced CMOSimage sensors with high-performance processorsinto an embedded system. A smart cameracombines video sensing, video processing andcommu-nication within a single device. The workreports on the prototype implementation of asmart camera for traffic surveillance. It capturesa video stream, computes traffic information andtransfers the compressed video stream and thetraffic information to a network node. The entiresmart camera is packed into a single cabinetwhich is typically mounted in tunnels and high-ways. The electrical power is either supplied by apower socket or by solar panels.

86
Figure 1: System architecture of the smart camera.
The video sensor represents the firststage in the smart camera’s overall data flow.The sensor captures incoming light andtransforms it into electrical signals that can betransferred to the processing unit. A CMOSsensor best fulfills the requirements for sensingin the smart camera Bramberger etal.(2006).These sensors feature a high dynamics due totheir logarithmic characteristics and provide on-chip ADCs and amplifiers. The first prototype ofthe smart camera is equipped with the LM-9618CMOS sensor from National Semiconductor.
The second stage in the overall dataflow is the processing unit. Due to the high-performance on-board image and videoprocessing the requirements on the computingperformance are very high. A rough estimationof 10 GIPS computing performance. Theseperformance requirements together with thevarious constraints of the embedded systemsolution are fulfilled with digital signalprocessors (DSP). The smart camera is equippedwith two TMS320DM642 DSPs from TexasInstruments running at 600 MHz. Both DSPs areloosely coupled via the Multichannel BufferedSerial Ports (McBSP), and each processor isconnected to its own local memory. The videosensor is connected via a FIFO memory with oneDSP to relax the timing between sensor and DSPBramberger etal. (2006). The image is thentransferred into the DSP’s external memory witha capacity between 8 MB and 256 MB.
The final stage of the smart camerarepresents the communication unit. Theprocessing unit transfers the data to the outputunit via a generic interface. This interface easesthe implementation of the different networkconnections such as Ethernet, wireless LAN and
GSM/GPRS. For the Ethernet network interfaceonly the physical-layer has to be added becausethe media-access control layer is alreadyimplemented on the DSP.
A second class of interfaces is alsomanaged by the communication unit. Flashes,pantilt-zoom heads (PTZ), and domes arecontrolled using the communication unit. Themoving parts (PTZ, dome) are typicallycontrolled using serial interfaces like RS232 andRS422. Additional in/outputs are also provided,e.g. to trigger flashes or snapshots.
Figure 5: Prototype architecture of the smartcamera including the CMOS imagesensor.
Figure 5 depicts the prototypearchitecture of the smart camera including theCMOS image sensor, the DSP-based processingunit and the Ethernet network connection. Thesystem has been applied in vehicle detection and

87
tracking and found very effective. However, thedevelopment of smart cameras is still at itsinfancy.
In Fleck (2006), A Distributed Network of smartcameras for Real –Time Tracking and itsvisualization in 3D is presented. In this project amulti-object tracking system is developed. Thelive visualization of tracking result is embeddedin a 3D model of the environment. The project ismotivated by the desire to develop a multitracking system that can be visualized in anembedded 3D model environment.
The system consists of multiple,networking enabled camera nodes, a servernode and a 3D visualization node. Each cameranode is implemented either by a smart camera orby a combination of one or multiple non-smartcameras. The server node acts as server for allthe camera nodes and concurrently as client forthe visualization node. It manages configu-rationand initialization of all camera nodes, collects theresulting tracking data and takes care of personhandover. The visualization node acts as a serverreceiving position, size and texture of eachobject currently tracked by any camera from theserver node. It embeds the ROI of each object.The system however does not support identityrecognition, complex activity recognition.
In Rangaswami et al., (2004), The SfinxVideo Surveillance System is presented. Thesystem is motivated by the desire to design asurveillance system that not only supports real-time monitoring and storage of the videostreams, but also performs video analysis andanswers semantic database queries. Theobjective of the system is to develop a systemwith several core components to process,transmit, and fuse video signals from multiplecameras. Also to mine unusual activities from thecollected trajectories and to index and storevideo information for effective viewing.
Cameras are mounted at the edges of asensor network to collect signals. When activitiesare detected, signals are compressed andtransfused to a server. The server fuses muti-sensor data and constructs spatio-temporaldescriptors to depict the captured activities. Theserver indexes and stores video signals with theirmeta-data on RAID storage. Users of the systemare alerted to unusual events and they canperform online queries and inspect video clips ofinterest. The Limitation of the system is that the
Architecture is designed but was notimplemented.
Reulke1 et al. (2007) presents TrafficSurveillance using Multi-Camera Detection andMulti-Target Tracking. It is recognized that non-intrusive video-detection for traffic flowobservation and surveillance is the primaryalternative to conventional inductive loopdetectors. Video Image Detection Systems(VIDS) can derive traffic parameters by means ofimage processing and pattern recognitionmethods. Existing VIDS emulate the inductiveloops. The project uses a trajectory basedrecognition algorithm to expand the commonapproach and to obtain new types ofinformation (e.g. queue length or erraticmovements). Different views of the same areaby more than one camera sensor is necessary,because of the typical limitations of singlecamera systems, resulting from the occlusioneffect of other cars, trees and traffic signs. Thetrajectories are derived from multi-targettracking. The fusion of object data from differentcameras is done using a tracking method.
The cameras are being used to monitoroverlapping or adjacent obser-vation areas. Withit the same road user can be observed usingdifferent cameras from different positions andangles. The objects of interest are identified fromthat image data by means of automatic imageprocessing methods. These image coordi-natesare then converted into a common worldcoordinate system in order to enable the objecttracking and data fusion. The tracking of a singleobject is realized using a Kalman-filter. Itestimates the state of an object for the timestamp of the following picture, thus allowing tocompare the estimated state and the observedobject data. They can be associated to the sameobject, if both are within a certain distance. Inorder to derivate the initial object state, directlyobservable features like position, colour and sizeof objects are compared in two successiveframes without any estimation process.Constraints like maxi-mum velocity or sizechange are defined in order to limit the numberof incorrect associations. The trajectory isfinalized when the object is leaving the observedarea. The trajectory is also finalized after aparticular number of misses. A distributedcooperative multi-camera system enables asignificant enlargement of the observation area

88
Jang et al. (2007) presents a wirelessnetwork-based tracking and monitoring ofconstruction materials on project sites. This workpresents a new prototype framework ofautomated trac-king and monitoring system forconstruction materials. It is based on a ZigBee-based system architecture using combinationtechniques of Radio Frequency (RF) andultrasound to improve positioning accuracy andcost benefit. It is recognized that computing andsensor network technologies provide potentialfor data acquisition and communication forautomation and improvement in processperformance. A new prototype framework ofautomated tracking and monitoring system thatwill address the needed shift from the time-andlabor-intensive legacy systems into sensor- andnetwork-based tracking and monitoring systemsfor construction materials is presented. Theresearch presents the design of tracking andmonitoring system architecture based onZigBee™ networks, named as Auto-matedMaterial TRACKing (AMTRACK). To implementthe ZigBee™-based tracking and monitoringsystem, the combination techniques of radiofrequency signal and ultrasound to improvepositioning accuracy and cost benefits wasproposed. In addition, feasibility analysis andapplication scenario was examined to presentthe possible deployment frame-work inconstruction. Jang et al. (2007).
ZigBee is emerging network tech-nologyand a wireless communication standard capableof realizing the ubi-quitous environment tosatisfy such requirements. ZigBee specificationtakes advantage of the IEEE 802.15.4 wirelessprotocols as communications method, andexpands on this with a flexible mesh network,wide range of applications, and interoperability.This work envisions the possible scenarioutilizing the ZigBee protocol in construction.ZigBee routers are placed at the location thatcan cover the entire laydown yard within theirtrigger ranges to detect the events associatedwith the movement of distributed smart tags. Inthis network topology, sensing data collected toeach of the routers is transmitted to the basestation, i.e. field office, along with the ad hocpath. Different smart tags are categorized,identified, and attached to the constructionmaterials according to the characteristics ofmaterial property and measurement type withinthe geometry of construction site. For example,
humidity sensor can be attached to the bulk of acement bag or a steel beam to sense the level ofhumidity in order to avoid the hardening orcorrosion caused by water in the humidenvironment.
Kousia et al., (2008) presents anautomated visual traffic monitoring andsurveillance through a network of distributedunits. It is recognized that robust and accuratedetection and tracking of moving objects hasalways been a complex problem especially in thecase of outdoor video surveillance systems. Thevisual tracking problem is particularly challengingdue to illumination or background changes,occlusions problems etc. The aim of the TRAVISproject was to determine whether the recentchanges in the field of Computer Vision can helpovercome these problems and develop a robusttraffic surveillance application Kousia et al.,(2008). The research presents two prototypes: Traffic control of aircraft parking areas
(APRON). This application focuses more onthe graphical display of the ground situationat the APRON. The system calculates theposition, velocity and direction of the targetsand it classifies them according to their type(car, man, long vehicle etc). Alerts aredisplayed for dangerous situations, such asspeeding. This information can be accessibleby the respective employees, even if theyare situated in a distant area, with no directeye-contact to the APRON. Kousia etal.,(2008)
Traffic control of tunnels at highways. Thefocus of this application is on the collectionof traffic statistics, such as speed and trafficloads per lane. It can also identify dangeroussituations, such as objects falling, animals ortraffic jams. These results can be sent totraffic surveillance centres or used toactivate road signs/warning lights. Kousia etal., (2008).
The proposed system consists of ascalable network of autonomous tracking units(ATUs) that use cameras to capture images,detect moving objects and provide results to acentral sensor data fusion server (SDF). The SDFserver is responsible for tracking and visualizingmoving objects in the scene as well as collectingstatistics and providing alerts for dangeroussituations. The system uses two modes ofoperation each supporting a different datafusion technique. Grid mode separates the

89
ground plane into cells and fuses neighboringobservations while map fusion mode warpsgrayscale images of foreground objects in orderto fuse them. Kousia et al. (2008).
The network architecture is based on awired or wireless TCP/IP connection as illustratedin Figure 2.9. These topologies can be combined
to produce a hybrid network of ATUs. Dependingon the available network bandwidth, imagescaptured from specific video sensors may also becoded and transmitted to the SDF server, toallow inspection by a human observer (e.g.traffic controller) Kousia et al. (2008).
Figure 2.8: Architecture of the proposed system. source Kousia et al., (2008).
Each ATU is a powerful processing unit(PC or embedded PC), which periodically obtainsframes from one or more video sensors. Thevideo sensors are standard CCTV cameras. Theyare also static (fixed field of view) and pre-calibrated. Each ATU consists of the followingmodules: Calibration module (off-line unit to calibrate
each video sensor). To obtain the exactposition of the targets in the real world, thecalibration of each camera is required, sothat any point can be converted from imagecoordi-nates (measured in pixels from thetop left corner of the image) to groundcoordinates and vice versa. A calib-rationtechnique, which is based on a 3x3homographic transformation and uses bothpoints and lines correspond-dences, wasused.
Background extraction and update module.Each ATU of the system supports severalrobust background extraction algorithms. Itconsists of foreground segmentationmodule,
Blob tracking module, Blob classifica-tionmoduleand finally a 3-D observa-tionextraction module. It uses the availablecamera calibration informa-tion to estimate
the accurate position of targets in the scene.Since the camera calibration is based onhomographies, an estimate for the positionof a target in the world coordinates can bedirectly determined from the centre of eachblob. The limitation of the system however isthat it does not support human identity andcomplex activity recognition.
Russo (2008) presents IBM SmartSurveillance Solution (SSS). According to theAuthor, the system was motivated by the desireto design a surveillance system that providescapability for real-time decision making and post-event correlation of people and activities. Theobjectives of developing the system are tocreate a system with real-time alerts and abilityto perform user-driven queries. SSS provides theunique capability to carry out efficient dataanalysis of video sequences, either in real-time orrecorded video.
The integral software component of SSSis IBM Smart Surveillance Analytics (SSA). All SSAfunctionality is Web-based, allowing virtually“anytime, any-where” access to both real-timeand historical event data from the system. TheSSA framework is comprised of two corecomponents: Smart Surveillance Engine (SSE).

90
Middleware for Large Scale Surveil-lance(MILS).
The Smart Surveillance Engine (SSE): VideoAnalysis Performed by the SSE in the firstitem in the data flow of the architecture ofthe SSS, The smart Surveillance Engine (SSE)processes the sensor data (typically form acamera) to generate real time alerts andgeneric event meta-data. The SmartSurveillance Engine (SSE) is designed toprocess one stream of video in real-time,extracting object meta-data and evaluatinguser defined alerts. The SSE uploadsmessages in XML format to the central datarepository while the Middleware for LargeScale Surveillance is used for datamanagement.
Object detection is achieved bybackground subtraction methodology. Thedetected objects are tracked throughout thefield of view of the camera. After, tracking,object classi-fication is used to determine ifobject belong to people or vehicles. Shapeand motion of the object are used to classifythe object. Tracked object are also classifiedusing their colour properties. Eight types ofalerts can currently be detected in thesystem. Motion detection, Directionalmotion , Standard object, Object removal,Trip move, Region alert, Camera moved,Camera motion stopped. Compound eventdetection such as a person leaving a buildingis also included in the system.
Middleware for Large Scale Surveil-lance(MILS): The MILLS provide data
management services needed to build alarge scale smart surveillance applicationand to enable extensive search capabilities.(MILS) provides the algorithm needed totake the event meta-data and map it intotables in a relational database. It alsoprovides event search activities, meta-dataman-agement, and user management andapplication development services. MILLSprovides analytical engine with the followingsupport functionalities via standard webservices interfaces using XML documents. Meta-data ingestion services; there are
web services calls which allow theengine to ingest events into the MILLSsystem. There are two categories ofingestion serviceso Index ingestion serviceso Event ingestion services
Schemata Management Services: Thereare web services which allow adeveloper to manage their own meta-data schemata. A developer can create anew schema or extend the base MILLSschema to accommodate the meta dataproduced by the analytical engine.
System Management Services: Theseservices provide a number of facilitiesneeded to manage a surveillance systemincluding:
o Camera management serviceso Engine management serviceso User management serviceso Content-based search services
Figure 2.6: IBM Smart Surveillance Systems Architecture

91
The Limitation of the system is that complexhuman actions and Identity recognition are notincluded in the system. Lo et al. (2003) presents anintelligent distributed surveillance system for publictransport. It is recognized that security and safetyare major concerns to the stake-holders of publictransport systems (i.e. passengers, staff, operating,companies, regulation, local authorities, andgovern-ment). Some of these concerns are basedon actual situations that threaten personal security.Lack of risk to personal security can affect thepatronage of public transport system becausepeople may prefer not to make a trip at alldepending on personal factors and the way inwhich environment factors affect each person. Loet al. (2003).
The motivation for the work is to develop atransport security system were safely and securitiesare safeguarded. Also to develop Automation thatdeals with large distributed environment. Theobject-ives of the system are: (a) to determinewhere pedestrians are in close proximity withvehicles (e.g. in platforms) or in situation that couldlead to dangerous condition e.g. (overcrowding),
and gener-ate alarms. (b) To detect,and preventanomalous anti-social or criminal behaviours e.g.intrusion to forbidden areas, pick pocketing,aggression, willful damage to equipment, rowdybehavior, unattended packages. To cope withdifferent, security and safety issues in publictransport, the system incorporates differentintelligent detection devices. The PRISMATICA isdesigned as a distributed system built upon aCORBA (common object request brokerArchitectures) Network, where each devices is astand alone Sub-system. The system consists of: Local camera network Wireless data/video/audio transmission system Intelligent camera system Audio surveillance system Contactless passcard system MIPSA (modular integrated pedestrian
surveillance ArchitectureThe limitation of the system is that no
identity recognition system is incorpo-rated.However, a true multi camera and distributedsurveillance system has been developed.
Figure 2.9 Architecture of GeNERIC surveillance system source: Benny et al. (2008).
Survonvorn (2008) presents a genericsoftware platform for real-time video surveillancesystem to support ongoing research in motiondetection, tracking and abnormal eventrecognition. The proposed system is a multi cameraplatform that is able to connect with differentstandard of video inputs from many manufacturers.The system supports video display, storage,searching and playing back.
The motivation for the system is todevelop a visual surveillance system that can workindependently with cameras devices and networkinfrastructure from many manufacturers. The aimand objective of the project is to design asurveillance system that support multi-cameras,and multi devices that can co-operate and worktogether in the same platform. It is also aimed todesign systems that support alert, video Storage,

92
video searching playback, object recognition andtracking.
Video acquisition is done using IP-cameras.A graphic user interface for viewing differentcameras from different manufacturers at a time isalso presented. The system is able to performmotion detection, object tracking and recognition.
Video encoding and storage, stores imagesequence when only having motions on the scene.Encoders starts encoding images after capturing amotion event and stop when new event is raised. Awindow media encoder (WME) is used to encodethe video data. The system has the limitation thatcomplex action recognition and identity recognitionare not incorporated.
Ratty (2008) presents a high levelarchitecture for a single point surveillance systems.It is based on distributed multi-sensor surveillancesystem. It comprises of an arbitrary amount ofsensors that collects readings from a singlelocation, which is the surveillance point. Eachsensor transmits its data to a session sensor whichhandles the connections among the components.The session sensor routes the crude sensorinformation to the logical decision making sensor.The logical decision making sensor automatically
deducts the situation at the surveillance pointbased on the received sensor information. Thelogical decision making sensor informs the securitymanager sensor of the situation at the surveillancepoint.
WU† et al. (2011) presents a Clustering-based motion understanding method for trafficvehicles. It is recognized by the authors that motionunderstanding is the classification process for time-varying data and vehicle motion understandingunder road traffic scene is a systematic researchwork. The work presents a clustering-based motionunder-standing framework for traffic vehicle. Thework first preprocesses the obtained trajectory,and then uses Fuzzy C Mean clustering to clusterthe preprocessed collection of trajectories and usesthe Hausdorff distance measure to classify thevehicle trajectory. On the basis of the correctclassification, understanding the behavior of thevehicle combined with the vehicle’s contextinformation is achieved. To verify the effectivenessof this method, this work uses violation-orientedtraffic incident behaviors in the experiment.Experimental results show that this method hasgood feasibility and robustness.
Summary of the existing smart systems reviewed
Author and year
Dom
ain
Mul
tisen
sor
3D v
isua
lizat
ion
Mul
ticam
era
Vide
o
Arc
hite
ctur
e an
dCo
mm
unic
atio
n
Vide
o A
naly
sis
QoS
Mob
ility
Dat
a Fu
sion
Haritaoglu (1998) PedestrianCollins et al. (2001) GenericlLo Benny et al. (2003) TransportLuca et al. (2003) Face RecognitionGeoris et al. (2008) GenericKo et al (2004) Examination
MonitoringHampapur et al. (2005) GenericBramberger et al. (2006) TrafficFleck (2006)Rangaswani et al. (2004) GenericReulke et al. (2007) Traffic flow
observationJang etal (2007) BuildingKousia et al. (2008) Aircraft packing
areasSuvonvorn (2008) GenericRaty 2008) GenericWu et al. (2011) Traffic
Table 2.1: A survey of some existing surveillance systems

93
4.0 CONCLUSIONIn this paper, efforts have been made to review
the existing smart visual systems for surveillance. We havediscussed the smart visual systems and computer visiontechniques used in such systems. Several systemsdeveloped in smart visual systems were also reviewed. Welearnt that no single generic system has been able tofunction in all areas of human needs. It was also observedthat identity recognition and complex human activityrecognition were not incorporated into many of theexisting systems. It is hoped that future technologies willincorporate these aspects into their developmentalefforts.
5.0 REFERENCESBouchrika I. and Nixon M.S. (2008). Gait Recognition by
Dynamic Cues IEEE 2008.Bobick A. F. and Johnson A.Y. (2001). Gait Recognition
Using Static, Activity-Specific Parameters, CVPR,2001, pp. 423-430
Chellappa R. A. and Roserfield (2003) .“Face recognition:A Literature Survey”. ACM Computing Surveys2003.
Chen, D., Wactlar, H., Chen, M., Gao, C., Bharucha A.,Hauptmann A (2008) Recognition of aggressivehuman behaviour using Binary Local MotionDescriptors 30th Annual International IEEEEngineering in Medicine and Biology (EMBC)conference August 20-24 2008.
Collins, R. T., Lipton, A. J., Fujiyoshi, H., & Kanade,T.(2000). A System for Video Recognitionhttp://www.computer.org/portal/web/csdl/doi/10.1109/CVPR.2008.4587634
Ding T. (2008). A robust Identification to Gait Recognition,2008 IEEE Conference on Computer Vision andPattern Surveillance and monitoring: VSAM finalreport. Technical report CMU-RI-TR-00-12,Robotics Institute, Carnegie Mellon University,May 2000.
Fleck S. et al. (2006). 3D Surveillance A DistributedNetwork of smart cameras for Real–TimeTracking and its visualization in 3D. Procee-dingsof the 2006 conference on computer vision andpattern recognition workshop (CVPRW’ 06)Washington DC, U.S.A.
Georis B., Desurmant X, Demaret D., Redureau S., DelaigleJ., Moeq B (2003) IP-distributed computer-aidedvideo-surveillance system Intelligent Distributedsystem workshop Lavon UK Feb., 26 2003.
Hampapur, A., Brown, L., Connell, J., Ekin, A., Haas, N., Lu,M., Merkl, H., Pankanti, S., Senior, A., Shu, C.-F.and Tian, Y.L. (2005) Smart Video Surveillance.IEEE Signal Processing Magazine, March 2005,pp. 38.51.
Haritaoglu I., David H., Larry S.D (1998) W4: Who? When?Where? What? A Real time system for detectingand tracking people International conference onface and gesture recognition April 14-16 1998Nara Japan
Harris G.F., and Smith P.A. (Editors). Human MotionAnalysis: Current Applications and FutureDirections. IEEE Press, 1996.
Jang W., and Skibniewski M.J. (2007). Wireless Network-Based Tracking and Monitoring on Project SitesConstruction Materials. The 9th internationalconference: Modern Building Materials,Structures and Techniques, May 16-18, 2007.
John D. Woodward Jnr, Christopher Horn,” Biometrics: ALook at Facial Recognition”. Virginia State CrimeCommission.
Katiyar R., Pathak V.K (2010) Clinical gait data analysisbased on Spatio-Temporal Features InternationalJournal of Computer Science and InformationSecurity, IJCSIS, Vol. 7 No. 2, February 2010, USA.ISSN 1947 5500.
Kim I.S., Choi H.S.,, Yi K.M.,, Choi J.Y.,, Kong S.G., (2010),International Journal of Control Automation andSystems Volume: 8, Issue: 5, Pages: 926-9392010.
Ko C., Cheng C.D (2004). Secure Internet examinationsystem based on video monitoring InternetResearch: Electronic Networking Applica-tionsand Policy Volume 14, No. 1 2004 48-61
Koutsia et al. (2008) Automated visual traffic monitoringand surveillance through a network ofdistributed units, the international Archives ofthe photogrametry, remote sensing and specialinformation sciences vol xxxvii part B3b Beijing2008.
Lo B. et al. (2003) intelligent distributed surveillancesystem for public tran-sport Symposium onIntelligent distributed system IEEE February2003v London UK.
Marchesotti L., Messina A., Marcenaro L. and Regazzoni C.(2003). A co-operative multi-sensor system forface detection in video surveillance Applications,Acta Automatica Sinica 2003 29(3) : 423-435
Martyn T. et al. (2012). Smart infra-structure: the future,Royal Academy of Engineering 3, Carton HouseTerrace London SW1Y 5DGwww.raeng.org.uk/smartin-frastructure.
Suvonvorn N. (2008). A Generic Visual SurveillanceSystem The sixth PSU Engineering conference 8-9 May 2008
Niu W., Jiao L., Han D’ Wang Y. (2003). Real time multi-person Tracking in video Surveillance Pacific RimMulti-media conference Singapore.

94
Rani P.M. and Arumugam (2010). An efficient GaitRecognition system for Human Identificationusing Modified ICA International journal ofcomputer science and infor-mation technology(IJCSIT) Vol. 2, No 1, February 2010.
Rangswami R., Dimitrijerc Z., Kakligian K., Chang E., Wang,Y., (2004) The Sfinx Video Surveillance System.,proceedings of the IEEE ICME Taipei Taiwan June2004.
Reulke R., Baver S., Doring T. and Meysel F., (2007) TrafficSurveil-lance Using Multi-Camera Detec-tion andMulti-Target Tracking, Proceeding of image andvision computing new Zealand 2007 pp 175-180Hamilton New Zealand
Russo S., (2008) Digital Video Surveil-lance: enhancingphysical security with analytic capabilities IBMGlobal Services February 2008.
Ratty T., (2008) High level Architecture for a singlelocation surveillance point. Proceedings of thethird International conference on wire-less andmobile communications, ICWMC’ 07.Gauadelonge, French Caribbean, 4-9 March 2007.
Wu J., Cul Z., Zhang Y. Chen J. (2011). A clustering-basedmotion under-standing method for trafficvehicle. Journal of Computational Informa-tionSystems 7: 9 (2011) 3039-3046 Available athttp://www. Jofcis.com.
Yang C., Duraiswami R. and Davis l., (2005) Fast MultipleTracking via Hierarchical particle Filter

95
__________________________________________________________________________________
TEXT TO SPEECH BASED APPLICATION FOR ENHANCED LEARNINGIN COMPUTER ASSISTED ENVIRONMENT
_____________________________________________________________________________________________________________________________________
O. OladipoCenter for Information Technology & Management, Yaba, College ofTechnology, Yaba, Lagos [email protected]
B. A. OkeCenter for Information Technology & Management, Yaba, College ofTechnology, Yaba, Lagos [email protected]
A. F. FalolaCenter for Information Technology & Management, Yaba, College ofTechnology, Yaba, Lagos, [email protected]
1.0 INTRODUCTIONThis The introduction of computer (ICT) into
learning has become a Global phenomenon; its effecton education cannot be over emphasized. Astechnology evolves so does our way of life evolveincluding the way learning is dispersed. In traditionallearning environment, the ratio of teachers to studentsis not directly proportional and not evenly distributed;students taught on a one-on-one basis tend to performbetter than when taught as a group. It is howeverexpensive and not feasible considering local economicstate of the country to have one teacher to onestudent scenario. Hence, the need for computerassisted learning.
It is equally important to note that, acomputer is nothing more than a tool, an aid to be usedor not, as the teacher thinks fit “(Farrington, 2010). Thecomputer provides a means of enhancing theeffectiveness of human natural talents and capabilities,it is useless without the human input and control butwhen “used properly they can be very effective indeed;enabling the individual to carry out task optimally(Kenning and Kenning, 2008). The role of computers inlearning is however to compliment the traditionalmode of teaching i.e. the chalk and blackboard, byproviding virtual means of impacting knowledge intostudents effectively.
Computer assisted learning is not a new field,as it is already been exploited and its application variesfrom language learning to complimenting classroomefforts. Computer shouldn’t be seen as an outsideinstrument rather as a part of the ecology of learningbecause it’s an integral aspect of education delivery inthe 21st century (Kern, 2006). The use of Computerassisted learning has moved from the input – control –feedback sequence to management of communi-cationin a learning environment which include variouscontexts such as text, audio, forums and video (Jane &Willis, 2008). All of us have at one point or the otherused a Computer Aided Learning system (CAL) system
ABSTRACT
The integration of information technology to life needs hasbeen globally accepted; education is however not anexception. The attainment of states’ educationalaspirations taking into cognizance the limitation of timeand available resources have made information technologya viable tool to create virtual platform for teaching andlearning. In light of the growing need for technology inlearning, this work developed a text to speech applicationthat can aid the learning process by augmenting thetraditional class method with an application that reads outlecture note on students system anywhere. The applicationdevelopment was in two phases, the web and windowdesktop application. The web application takes care of thestudent profile, display of course registration and selectionof course outline of choice. while the windows applicationreads out the selected course outline. The application isdeveloped using .NET framework. It was finallyrecommended that equivalent implementation designed towork on mobile device should be developed and furtheranalyze the critical factor that could affects thedeployments of such application in tertiary institutions.
KEYWORDS: TEXT TO SPEECH, APPLICATION,LEARNING, COMPUTER ASSISTED ENVIRONMENT.

96
unconsciously, a DVD player when used to play videotutorials or listen to audio as simple as it sounds, servesthe purpose of CAL. The focus of this research work isto develop a Text-To-Speech (TTS) based application toread out lecturer’s uploaded lecture note on students’system without the institution incurring the expense ofa speech server. The developed platform made itpossible for students to have their lectures’ notes in anaudible form even outside the four walls of theirclasses; which enhanced their understanding of thecourse and learning at large. The application developedwas deployed for testing at Yaba college ofTechnology, Center for Information Technology andManagement (CITM) and students opinions weresampled after interacting with the new systemdeveloped.
The remaining part of this paper is organizedas follow; Section 2 earns out a literature of variousexisting platforms. Section 3 explains the designmethodo-logy. Section 4 earns out the implement-tation and testing feedback while Section 5 concludesthe paper.
2.0 LITERATURE REVIEWText-To-Speech (TTS) technology in CAL
already exists but not commonly used. The traditionalCAL system outputs information on screen and userinteract using keyboard and mouse to pass in inputs.TTS is just one of the many different technologies thatcan be implemented in CAL, some of which are webtutorials, multimedia and chat. It is believed that it’snot the technology that makes CAL effective orineffective but ways in which the technology is used.It’s expedient to know the set of technology to merge,when to use them and the right learner to use thetechnology with, to achieve the effectiveness desired(Zhao, 2003). TTS technology is also referred to asspeech synthesis and there are quite a few applicationsalready in use, some of which are: the reading pen, thescreen reader, mobile Polaris office and some mobilephone applications. The reading pen can make printedtext audible by moving it line by line across the printedtext, while the screen reader is a program designed toread the text on the computer screen. Some mobilephone applications such as SMemo and TMemo havethe ability to convert pictures to text using opticalcharacter recognition (OCR) technology and speechsynthesis converts the text to speech.
It is necessary to know that in order to achieveoptimal efficiency in learning using computerizedenvironment, there is need for the appropriate mix of
technology for the right set of student. Text to speechis already in use in some CAL programs. However, theusage is limited due to high cost of implementation andresources required to have such application up andrunning. Benchmarking is a suggested way out of thelimitation, has it’s believed that once it can be proventhat TTS based application can provide the necessaryresult consistently, the resources can be invested in it(Necto, Batista and Klautau, 2012).
TTS are often deployed for the use by peoplewith reading problems, such as visually disabled ordyslexic people (Otaiba & Fuchs, 2006). Sinceeducational bodies do not provide special curriculumfor disabled students; they are required to have accessto the same curriculum as their peers withoutdisabilities, the incorpo-ration of TTS into learning willserve as a bridge to the gap created by their dis-ability.It is however of great importance to make textavailable beyond the pages of books and on chalk inother to supplement the learning process for bothpeople with and without disability because wordsheard are better understood than words read.
Figure 1: Existing TTS implementations
Students with reading disability can use any ofthese devices shown in figure 1 to read and acquireknowledge in the process (Zhao, 2003).
3.0 DESIGN METHODOLOGYThis paper presents the develop-ment of a
learning platform that imple-ments various classes ofthe TTS library of .NET framework to read out lecturesnotes made available by the lecturers. The system hastwo segments, the web applica-tion and windowsapplication which were developed using asp.net andvb.net respectively. The windows application wasdesigned to read out the lecture note selected by thestudent after login in the courseware portal. The

97
courseware portal is the web application which thestudent logs into to view available materials for theregistered courses in the current semester. MicrosoftSQL Server (Ms SQL SERVER) was used as databaseback end. The database housed the data uploaded bythe lecturers and students registration information(which include the courses registered and studentprofile). The database also housed the parameters thatdescribe the currently selected course outline to beread and earned it to the windows application(windows read out). This is achieved by storing thespecific system address and system name of therequesting client’s system (the system where thecourse outline was selected) and correspondingmaterial requested. This is picked up by the windowsread out to read aloud the materials corresponding tothe resident system.
3.1 Data CollectionStudents’ record, departments and courses
used to populate the developed application databasewas acquired from the Centre for informationtechnology and management (CITM) of Yaba College oftechnology. While the lecture notes were sourced fromthe internet. All the data collated were manually fedinto the database using the Microsoft SQL servermanagement studio. It should be noted that onlycomputer science ND 1 and HND 1 courses wereuploaded into the courseware for testing.
3.2 Database DocumentationThe database back end for this project used
Microsoft SQL Server (MSSQLSERVER) and it has seven(7) users’ tables namely; student password table(named as “Studpass”), Course outline table (named as“CosOutline”), various course table (named asCosTable), the current outlined table (named asCuroutline), Department table (named as Depts),Student profile view (named as StdproView) and thepublished registration table (named as PubReg). Figure2 and Figure 3 show the database diagram for theimplemented tables and various relation-ships. Figure 2shows ‘StdproView’ 1-N relationship which indicatesthat each matric number in ‘StdproView’ table havemany associated records in the ‘PubReg’ table. Therelationship that exist between ‘StdproView’ table andthe ‘StudPass’ is a 1-1 relationship which indicates thateach record in ‘StdproView’ table has an equivalentrecord in ‘StudPass’. Figure 3 shows the relationshipbetween ‘CosOutline’ and ‘CurOutline’. The tables areconnected using the topic outline (‘TopOutline’) field in
a 1-N relationship. This indicates that the ‘CurOutline’could have several ‘TopOutline’ in the ‘CosOutline’table.
Figure 2: Database diagram of Studpass, StdproViewand PubReg
Figure 3: Database Diagram for CosOut-line andCuroutline
3.3 System DesignThe entire system is represented in a flow
chart shown in figure 4. The students’ access to thecourseware portal is dependent on successfulauthentication against the student password table(‘Studpass’) in the database. The authentication is doneusing student Matriculation number and associatedpassword; on successful attempt, the student isredirected to the home page where ‘courseware’ linkcan be selected. Thereafter, the students’ registeredcourses for the current semester is displayed as in thepublished registration table (‘PubReg’). Selecting any ofthese courses would display the associated courseoutline from the course outline table (‘CosOutline’).Here the student can select an outline of choice toinitiate the windows application and read-out lecturenote. Figure 5 shows the various processes involved toread aloud a lecture note selected by the student (Theread-out part of the work was done by the windowsapplication).

98
Figure 4: Application Flow Chart
Figure 5: Block diagram for the read out part
4.0 SYSTEM IMPLEMENTATIONThe application developed was written and
compiled on Visual studio 2010 and deployed to behosted on an online server running InternetInformation Service version 6.0 (i.e. IIS 6.0 webserver). The outputs shown in figure 6 to 9 werevarious outputs at different instances while testing thedeveloped application. Figure 6 shows the homepageinterface which is the students’ dashboard that showsthe student’s full name, Matriculation number and ahyperlink to courseware; the homepage is shown aftersuccessful login.
Figure 6 : Student’s dashboard
Figure 7 was the course display interface. Thisinterface lists all the registered courses with respectivecourse unit(s) of the student who is currently logged in.Figure 8 displayed course outline for a selected course(‘COM113’) and a dialogue box shown to initiate thewindows application on selecting the course outlineshown. Figure 9 showed the output form that finallyreads the lecture note, highlighting the speakersinstalled on the local system, speech rate and differentcontrols available on the form (the restart readingbutton, stop reading button and start reading button).
Figure 7 : Course display interface
Figure 8 : Course outline display interface.

99
Figure 9 : Lecture note read-out interface4.1 System Testing and Feedback
The TTS application was tested in thecomputer laboratory of Yaba College of Technologyunder the supervision of selected Centre forInformation Techno-logy and Management (C.I.T.M)staff. The students were exposed to using thedeveloped application and in-turn rated the applicationbased on its effectiveness.
A total of 105 students were used in thesurvey. The testing was done in two different days. Theselection process was random and it was ensured thatvolunteers had basic knowledge of the functionalitiesand usage of a computer system. Each user was given aseparate username and password and was given theliberty to choose any course material to read.Assessment was based on comprehension and theiropinion of the application; if they would like it to beincorporated into their main course portal. Thestudents’ were told to rate the application on a scale 1-5 (ranging from poor to excellent). Table 1 and Table 2showed the summary of students’ responses based ontheir com-prehension and if they want it incorporatedinto the school’s portal (acceptability) respectively.
Table 1: Summary Based on Comprehension
Rating Scale for comprehension
1 2 3 4 5
Number ofstudents
0 0 12 58 35
Percentageof students(%)
0 0 11.43 55.24 33.33
Table 2: Responses for Acceptability
Options for the acceptabilitymeasure question
Yes No Indifferent
Number ofstudents in eachcategory
96 0 9
Percentage ofstudents (%)
91.43 0 8.57
The feedback from the student showed thatthe entire students indicated that they easilycomprehended any of the materials selected, as all of
them rated the application 3 and above (60% compre-hensive and above). This is shown in table 1.The surveyalso showed that more than 90% of the students werelooking forward to the implementation of the newsystem as it will improve the process of learning. This isshown in table 2. After the survey some of the studentswere interviewed and these were their comments: Iwould love to use the TTS system because it helpseliminate boredom, it requires less stress because fullconsciousness is not needed to listen, and it is alsoeasier to understand compared to the traditionalmethod of reading. They however had challengescoping with the speech rate which was adjusted forthem afterwards by selecting speech rate ‘-2’ and ‘-3’. Itis however fair to say that TTS system will add value tothe learning community by aiding the assimilation rateof students and making learning more fun.
5.0 CONCLUSIONThis research work has successfully developed
and described a Text-to-Speech teaching aid whichpresents an audio version of loaded course material.The survey carried out after testing the applicationshowed that the presented modality for teaching inthis research work will stimulate student interest,reduce boredom and add glamour to classes as well asprovide disabled with the necessary leverage to be atpar with students without disability. This to a largeextent demonstrate one of The potential benefits ofutilizing computer based technologies for teaching andrecommends that computer based teaching should beimplemented simultaneously with the traditionalmethod of teaching to maximize the process oflearning in our environment.
6.0 ACKNOWLEDGEMENTI acknowledgement the corporation of all
CITM, Yabatech staff for their availability during thetesting phase of this research work and more especiallythe Director, Dr. I.K. Oyeyinka for his support andremarkable guidance.
7.0 REFERENCESFarrington, B. (2010). “Perspectivesss for Computer
Based Learning of Lan-guages”. ComputerJournal of Modern Languages in Scotland, vol.21, no. 2, pp. 116-124.

100
Jane and Willis, D. (1998) Challenge and Change inLanguage Teaching. Macmillan PublishersLimited, Honk Kong.
Kenning, M. and Kenning, J. (2008) “ComputerAssisted Language Teaching Made Easy”.British Journal of Language Teaching, vol. 19,no. 3, pp. 119- 123.
Kern, R. (2006). "Perspectives on Technology inLearning and Teaching Languages". TESOLQUARTERLY, Vol. 40, No. 1, pp. 183-208.
Neto, N. Batista, P. and Klautau, A. (2012). "ACollaborative Frame-work for Speech-BasedComputer Accessibility with a Case Study forBrazilian Portuguese", Modern SpeechRecognition Approaches with Case Studies.Intech, India.
Otaiba, S. and Fuchs, D. (2006). Who are the youngchildren for whom best practices in readingare ineffective: An experimental andlongitudinal study. Journal of Learning Dis-abilities, 39(5), 414-431.
Zhao, Y. (2003). Recent developments in technologyand language learning: A Literature review and meta-analysis. CALICO Journal, 21(1), pp.7–27.
procee-dings of International Conference on ComputerVision - ICCV , pp. 212-219, 2005.
Yigithan D. (2004) Moving object detec-tion, trackingand classification for smart video surveillancea Masters thesis submitted to the departmentof computer engineering and the institute ofengineering and science of bilkent university.
Yilmaz A., Javed O. and Shah M. (2006). "ObjectTracking: A Survey", ACM Journal of ComputingSurveys, Dec. 2006.


