Embed Size (px)
Citation preview


Science and Technology of Fullerene Materials
Acce3ion For
NTIS CRA&I DTIC TAB Unannounced Justification
By Distribution /
i D D
Availability Cores —1
Dist
/W
Avail and/or Special
CTiC Qu-' ms

MATERIALS RESEARCH SOCIETY SYMPOSIUM PROCEEDINGS VOLUME 359
Science and Technology of Fullerene Materials
Symposium held November 28-December 2, 1994, Boston, Massachusetts, U.S.A.
EDITORS:
Patrick Bernier Universite de Montpellier
Montpellier, France
Donald S. Bethune IBM Almaden Research Center San Jose, California, U.S.A.
Long Y. Chiang National Taiwan University
Taipei, Taiwan
Thomas W. Ebbesen NEC Research Institute
Tsukuba, Japan
Robert M. Metzger University of Alabama
Tuscaloosa, Alabama, U.S.A.
John W. Mintmire Naval Research Laboratory Washington, D.C., U.S.A.
iMlRlsl MATERIALS RESEARCH SOCIETY
Pittsburgh, Pennsylvania

This work was supported in part by the Office of Naval Research under Grant Number N00014-95-1-0204. The United States Government has a royalty-free license throughout the world in all copyrightable material contained herein.
Effort sponsored by the Air Force Office of Scientific Research, Air Force Material Command, USAF, under F49620-95-1-0211. The U.S. Government is authorized to reproduce and distribute reprints for Governmental purposes notwithstanding any copyright notation thereon. The views and conclusions herein are those of the authors and should not be interpreted as necessarily representing the official policies or endorsements, either expressed or implied, of the Air Force Office of Scientific Research or the U.S. Government.
Single article reprints from this publication are available through University Microfilms Inc., 300 North Zeeb Road, Ann Arbor, Michigan 48106
CODEN: MRSPDH
Copyright 1995 by Materials Research Society. All rights reserved.
This book has been registered with Copyright Clearance Center, Inc. For further information, please contact the Copyright Clearance Center, Salem, Massachusetts.
Published by:
Materials Research Society 9800 McKnight Road Pittsburgh, Pennsylvania 15237 Telephone (412) 367-3003 Fax (412) 367-4373
Library of Congress Cataloging in Publication Data
Science and technology of fullerene materials : Symposium G, November 28- December 2, 1994 / edited by Patrick Bernier, Donald S. Bethune, Long Y. Chiang, Thomas W. Ebbesen, Robert M. Metzger, John W. Mintmire
p. cm.—(Materials Research Society symposium proceedings, ISSN 0272-9172 ; v. 359)
Includes bibliographical references and index. ISBN 1-55899-260-X 1. Fullerenes—Congresses. 2. Nanostructure materials—Congresses. 3. Thin
films—Congresses. 4. Fullerenes—Thermomechanical Properties—Congresses. I. Bernier, Patrick II. Bethune, Donald S. III. Chiang, Long Y. IV. Ebbesen, Thomas W. V. Metzger, Robert M. VI. Mintmire, John W. VII. President Enterprises Corporation VIII. Series: Materials Research Society symposium proceedings ; v. 359.
TA455.C3S35 1995 95-6755 620.1'93-dc20 CIP
Manufactured in the United States of America

Contents
PREFACE xiii
MATERIALS RESEARCH SOCIETY SYMPOSIUM PROCEEDINGS xv
PART I: SYNTHESIS, PRODUCTION, AND GROWTH MECHANISMS
»HIGHER FULLERENES: STRUCTURE AND PROPERTIES 3 Yohji Achiba, Koichi Kikuchi, Yuichi Aihara, Tomonari Wakabayashi, Yoko Miyake, and Masatsume Kainosho
PRODUCTION OF FULLERENES FROM SOLAR ENERGY 11 D. Laplaze, P. Bernier, L. Barbedette, G. Flamant, M. Lebrun, A. Brunelle, and S. Della-Negra
COMBUSTION SYNTHESIS OF FULLERENES 17 H. Richter, A. Fonseca, P.A. Thiry, J.M. Gilles, J.B. Nagy, and A.A. Lucas
REACTION CHAMBER AND CATHODE CONFIGURATIONS IN ARC PRODUCTION OF FULLERENES 23
E. Pasqualini, C. Podesta, A. Garcia, A. Rafael, S. Dengra, and M. Paulozzi
FORMATION OF NANOPARTICLES IN A CARBON ARC 29 S.A. Majetich, J.H. Scott, E.M. Brunsman, and M.E. McHenry
CHARACTERIZATION OF FERROMAGNETIC NANOPARTICLES PRODUCED BY A CARBON ARC 35
E.M. Brunsman, S. Anna, S.A. Majetich, and M.E. McHenry
MORPHOLOGY OF NANOPARTICLES AND FULLERENE BLACKS PRODUCED IN A CARBON ARC 41
John Henry J. Scott, S.A. Majetich, and S. Derrington
CRYSTALLINE BORON CARBIDE ENCAPSULATED INTO CARBON NANOCLUSTERS FROM ARC-DISCHARGE SOOT 47
Supapan Seraphin, Dan Zhou, and Jun Jiao
MORPHOLOGY OF NANOMETRIC BORON NITRIDE POWDERS PRODUCED BY LASER PYROLYSIS 53
F. Willaime, L. Boulanger, and M. Cauchetier
PART II: NANOTUBES
*FIELD EMISSION AND GROWTH OF FULLERENE NANOTUBES 61 Andrew G. Rinzler, Jason H. Hafner, Daniel T. Colbert, and Richard E. Smalley
EFFECTS OF CATALYST PROMOTERS ON THE GROWTH OF SINGLE-LAYER CARBON NANOTUBES 69
Ching-Hwa Kiang, William A. Goddard III, Robert Beyers, Jesse R. Salem, and Donald S. Bethune
HIGH YIELD CONVERSION OF CARBON NANOTUBES TO NANOSTRAWS AT MILD CONDITIONS ?5
Kuo Chu Hwang
*Invited Paper

NANOBUNDLES 81 Kiyoshi Yase, Nobutaka Tanigaki, Mutsumasa Kyotani, Motoo Yumura, Kunio Uchida, Satoshi Ohshima, Yasunori Kuriki, and Fumikazu Ikazaki
ATOMIC FORCE MICROSCOPY OF CARBON NANOTUBES AND NANOP ARTICLES 87
Ping Li and Klaus Sattler
BUCKYTUBE COLD FIELD EMITTER ARRAY CATHODE EXPERIMENTS 93 B.H. Fishbine, CJ. Miglionico, K.E. Hacke«, K.J. Hendricks, X.K. Wang, R.P.H. Chang, J.D. Shovlin, and M.E. Kordesch
NANOTUBE CARBON STRUCTURE TIPS-A SOURCE OF HIGH FIELD EMISSION OF ELECTRONS 99
Leonid A. Chernozatonskii, Yu.V. Gulyaev, Z.Ja. Kosakovskaja, N.I. Sinitsyn, G.V. Torgashov, E.A. Fedorov, Yu.F. Zakharchenko, and V.P. Val'chuk
STUDY OF ONION-LIKE CARBON (OLC) FORMATION FROM ULTRA DISPERSE DIAMOND (UDD) 105
Vladimir L. Kuznetsov, Andrey L. Chuvilin, Yurii V. Butenko, Igor Yu. Mal'kov, Anton K. Gutakovskii, Sergey V. Stankus, and Raschid A. Khairulin
INORGANIC FULLERENES OF MX, (M = W,Mo;X=S,Se) Ill R. Tenne, L. Margulis, Y. Feldman, and M. Homyonfer
PART III: ENDOHEDRAL FULLERENES
*ENDOHEDRAL METALLOFULLERENES: ISOLATION AND CHARACTERIZATION 123
H.C. Dorn, S. Stevenson, P. Burbank, Z. Sun, T. Glass, K. Harich, P.H.M. van Loosdrecht, R.D. Johnson, R. Beyers, J.R. Salem, M.S. de Vries, C.S. Yannoni, C.H. Kiang, and D.S. Bethune
ISOLATION AND CHARACTERIZATION OF TWO ESR-ACTIVE La@C8? ISOMERS 137
Kazunori Yamamoto, Hideyuki Funasaka, Takeshi Takahashi, Takeshi Akasaka, Toshiyasu Suzuki, and Yusei Maruyama
PART IV: THEORY AND MODELING
*INTER-CAGE ORBITAL INTERACTIONS IN [2 + 2] AND [4 + 4] DIMERS OF BUCKMINSTERFULLERENE 145
Shuichi Osawa and Eiji Osawa
STRUCTURE, STABILITY AND PROPERTIES OF COVALENT C34, C,0, AND C,2 CRYSTALS 157
G. Benedek, L. Colombo, B. Corona, E. Galvani, S. Sanguinetti, and S. Serra
SMALLER CARBON CLUSTERS: LINEAR, CYCLIC, POLYHEDRAL 163 Z. Slanina, S.-L. Lee, M. Smigel, J. Kurtz, and L. Adamowicz
CONSTRAINTS ON SMALL FULLERENE HELICES 169 Brett I. Dunlap
THE FULLERENE NEIGHBOURS 175 Z. Slanina, M.-L. Sun, S.-L. Lee, and L. Adamowicz
*Invited Paper

THE CRYSTALLOGRAPHIC MODELING OF C60 ORIENTATIONS IN A CUBIC LATTICE 181
Veniamin Sh. Shekhtman, Ruben A. Dilanyan, and Oksana G. Rybchenko
MOLECULAR FORM-FACTOR AND ANALYSIS OF DIFFRACTION PATTERN OF FULLERENE CRYSTALS 187
E.V. Shulakov, R.A. Dilanyan, O.G. Rybchenko, and V.Sh. Shekhtman
QUALITATIVE MODEL FOR FULLERENE FORMATION 193 Tanya Yu. Astakhova, Shagen A. Shaginyan, and George A. Vinogradov
MOLECULAR DYNAMICS SIMULATIONS OF HYPER VELOCITY BUCKMINSTERFULLERENE COLLISIONS 199
D.H. Robertson, D.W. Brenner, and C.T. White
ELECTRONIC STRUCTURE CALCULATIONS OF DEFECT C60 WITH ONE OR TWO VACANCIES 205
J.L. Morän-Löpez, J. Dorantes-DäVila, and J.M. Cabrera-Trujillo
CONTROLLING THE REACTIVITY OF C^ A THEORETICAL ANALYSIS OF THE ELECTRONIC STATES MODULATED BY SUBSTITUTIONAL CHEMISTRY 211
S.-H. Wang, M. Kashani, and S. Jansen
A MOLECULAR DYNAMICS INVESTIGATION OF C60-RARE GAS MIXTURES 217
Maria C. Abramo and C. Caccamo
ELECTRONIC ANGULAR MOMENTUM EFFECTS IN THE PHOTOPHYSICAL BEHAVIOR OF FULLERENES 221
S.M. Argentine and A.H. Francis
SEARCH FOR THE GROUND STATE OF C60B10 229 Keivan Esfarjani, Kaoru Ohno, and Yoshiyuki Kawazoe
MOLECULAR DYNAMICS STUDIES OF NANOTUBE GROWTH IN A CARBON ARC 235
C.J. Brabec, A. Maiti, C. Roland, and J. Bernholc
PROPERTIES OF NOVEL FULLERENE TUBULE STRUCTURES: A COMPUTATIONAL STUDY 241
Susan B. Sinnott, Carter T. White, and Donald W. Brenner
HREM LATTICE IMAGE SIMULATIONS OF CIRCULAR CROSS- SECTIONAL MULTISHELL CARBON NANOTUBES 247
S.L. Cullen, C.J. Morgan, C.B. Boothroyd, and C.J. Humphreys
THERMODYNAMIC PROPERTIES OF THE FCC MODIFICATION OF SOLID FULLERENE C60 253
V.l. Zubov, N.P. Tretiakov, J.N. Teixeira Rabelo, and J.F. Sanchez Ortiz
PARTV: ALKALI FULLERIDES
»FULLERENES UNDER PRESSURE STUDIED BY 13C-NMR 261 Pascale Auban-Senzier, R. Kerkoud, D. Jerome, F. Rachdi, and P. Bernier
*Invited Paper
VII

*FULLERENE SUPERCONDUCTORS: EFFECTS OF MOLECULAR ORIENTATION AND VALENCE 273
T. Yildirim, L. Barbedette, M. Kniaz, I.E. Fischer, C.L. Lin, N. Bykovetz, P.W. Stephens, P.E. Sulewski, and S.C. Erwin
SUPERCONDUCTIVITY AT 40K IN CESIUM DOPED C60 285 T.T.M. Palstra, O. Zhou, Y. Iwasa, P.E. Sulewski, R.M. Fleming, and B.R. Zegarski
EFFECT OF He PRESSURE ON THE SUPERCONDUCTING TRANSITION TEMPERATURES OF Na^CsC« AND (NH3)4NajCsCw 289
I.E. Schirber, W.R. Bayless, M.J. Rosseinsky, 0. Zhou, R.M. Fleming, D. Murphy, and I.E. Fischer
THE SUPERCONDUCTING ENERGY GAP OF Rb3C6„ AS MEASURED BY IR TRANSMISSION IN THIN FILMS 295
Daniel Koller, Michael C. Martin, and Laszlo Mihaly
HREELS STUDIES OF K C,0 THIN FILMS 301 G.P. Lopinski, M.G. Mitch, S.J. Chase, and I.S. Lannin
VIBRATIONAL AND ELECTRONIC PROPERTIES OF RbC60 THIN FILMS 307
G.P. Lopinski, M.G. Mitch, I.R. Fox, and I.S. Lannin
STRUCTURE SEQUENCE AND PHYSICAL PROPERTIES OF RUBIDIUM FULLERIDE CZ0Rbx 313
Mototada Kobayashi, Masao Fukuda, Yuichi Akahama, Haruki Kawamura, Yahachi Saito, and Hisanori Shinohara
Rb,C60: LINEAR POLYMER CHAINS AND DIMERS 319 Michael C. Martin, Daniel Koller, A. Rosenberg, C. Kendziora, and L. Mihaly
PART VI: POLYMERS AND CHEMICAL DERIVATIVES
MEDICAL APPLICATIONS OF WATER-SOLUBLE POLYHYDROXYLATED FULLERENE DERIVATIVES 327
Long Y. Chiang, Fung-Jou Lu, and law-Town Lin
POLYHYDROXYLATED C60 AS AN HYPERCROSS-LINKING AGENT 331 Long Y. Chiang, Lee Y. Wang, Rong-Shen Wu, and Kuo-Huang Hsieh
STRUCTURAL CHARACTERIZATION OF A POLYMER SUBSTITUTED FULLERENE (FLAGELLENE) BY SMALL ANGLE NEUTRON SCATTERING 335
K.A. Affholter, G.I. Bunick, I.M. Desimone, M.O. Hunt, Ir., Y.Z. Menceloglu, E.T. Samulski, and G.D. Wignall
LIGHT SCATTERING STUDY OF [60] FULLERENOL-BASED POLY(URETHANE-ETHER) STAR-SHAPED POLYMERS 341
Lee Y. Wang and Long Y. Chiang
LATTICE-TYPE POLYMERS FROM AN ADDUCT OF C60 AND 2-METHYLAZIRIDINE 347
A. Nigam, T. Shekharam, T.N. Bharadwaj, J. Giovanola, S.C. Narang, and R. Malhotra
*Invited Paper
VIII

EMBEDDING FULLERENES IN THIN SOL-GEL FILMS 351 Maurizio Prato, Michele Maggini, Gianfranco Scorrano, Giovanna Brusatin, Plinio Innocenzi, Massimo Guglielmi, Moreno Meneghetti, and Renato Bozio
FUNCTIONALIZATION OF C60 BY CYCLOADDITION REACTIONS 357
Stephen R. Wilson, Jingrong Cao, Qingyi Lu, Yunhui Wu, Nikolaos Kaprinidas, George Lem, Martin Saunders, Hugo A. Jimenez-Vasquez, and David I. Schuster
DISILENE ADDITION TO C™ 363 S.J. Jacobs, CM. Rohlfing, and P.A. Cahill
FULLERENES AS NANOSCALE "CONNECTORS" 369 Mark S. Meier, Douglas J. Rice, Craig Thomas, Vahid Majidi, Robert Pogue, and Magdalena Poplawska
PART VII: THIN FILMS AND DEPOSITION
»GEOMETRIC AND ELECTRONIC STRUCTURE OF FULLERENE FILM GROWTH AS A FUNCTION OF COVERAGE 375
B. Reihl
METAL FILM NUCLEATION AND GROWTH ON C60 INTERFACIAL LAYERS 387
A.F. Hebard, C.-B. Eom, R.C. Haddon, Julia M.»,Phillips, and J.H. Marshall
TEMPERATURE DEPENDENT ORIENTATIONAL EPITAXY OF C60 FILMS ON NOBLE METAL (111) SURFACES; Au, Ag AND Cu 393
A. Fartash
HETEROEPITAXIAL GROWTH OF EPITAXIAL C60-THIN FILMS ON MICA(OOl) 399
S. Henke, K.H. Thürer, S. Geier, B. Rauschenbach, and B. Stritzker
LOW TEMPERATURE FORMATION OF ß-S\C BY EPOSITION ON SILICON
S. Henke, B. Rauschenbach, and B. Stritzker C60-DEPOSITION ON SILICON 405
LOW TEMPERATURE INTERNAL FRICTION OF THIN FULLERENE FILMS 411
B.E. White, Jr., J.E. Freund, K.A. Topp, and R.O. Pohl
STRUCTURAL CHARACTERIZATION OF FULLERENE THIN FILMS FABRICATED BY ORGANIC MOLECULAR BEAM DEPOSITION 417
Kiyoshi Yase, Takuya Saraya, and Kazuhiro Kudo
MICRODIELECTRIC MEASUREMENTS OF PRISTINE AND MODIFIED THIN FULLERENE (Q0) FILMS 423
B. Pevzner, A.F. Hebard, R.C. Haddon, S.D. Senturia, and M.S. Dresselhaus
FRAGMENTATION OF C60 MOLECULES IN PARTIALLY IONIZED FULLERENE BEAM DEPOSITION 429
Zhong-Min Ren, Xia-Xing Xiong, Yuan-Cheng Du, Zhi-Feng Ying, Liang-Yao Chen, and Fu-Ming Li
*Invited Paper

DOPING OF C60 FILMS USING HIGH ENERGY BORON ION IMPLANTATION 433
Zhong-Min Ren, Yuan-Cheng Du, Xia-Xing Xiong, Zhi-Feng Ying, Fu-Ming Li, and Xing-Long Xu
THE EFFECTS OF MECHANICAL ALLOYING OF C60 WITH METALS (II): Al AND Mg 437
Xin-Yu Zhang, Rafael Q. Hidalgo, Richard J. Murphy, Robert S. Markiewicz, and Bill C. Giessen
STRUCTURE AND CONDUCTIVITY OF IODINE-DOPED C60
THIN FILMS 443 Jun Chen, Haiyan Zhang, Baoqiong Chen, Shaoqi Peng, Ning Ke, and S.P. Wong
PART VIII: SPECTROSCOPY OF FULLERENES
»NONLINEAR OPTICAL AND TRANSPORT PROPERTIES OF FULLERENE CRYSTALS 451
Hugh J. Byrne, Lidia Akselrod, Andreas T. Werner, Wolfgang K. Maser, Mathias Kaiser, Wolfgang W. Riihle, and Siegmar Roth
13C ISOTOPIC EFFECT ON THE RAMAN SPECTRUM AND STRUCTURE OF C60 FULLERENE 463
Pham V. Huong, Denis Jerome, Pascale Auban-Senzier, and Patrick Bernier
MICRO-FTIR AND THEORETICAL STUDY OF C60 SINGLE- CRYSTAL VIBRATIONAL MODES 469
G. Guizzetti, F. Marabelli, M. Patrini, M. Manfredini, P. Milani, G. Benedek, and S. Sanguinetti
STRUCTURAL AND ELECTRONIC PROPERTIES OF DAMAGED FULLERITE CRYSTALS 475
M. Manfredini, S. Serra, L. Colombo, and P. Milani
NANO AND MICROSTRUCTURE OF LASER DAMAGED FULLERITE SINGLE CRYSTAL 481
M. Manfredini and P. Milani
LASER AND OXYGEN INDUCED DAMAGE OF C,0 SINGLE CRYSTAL OBSERVED BY SCANNING ELECTRON MICROSCOPY 487
P. Milani and M. Manfredini
INTERMOLECULAR VIBRATIONS IN FULLERENE SYSTEMS 493 M.G. Mitch, G.P. Lopinski, and J.S. Lannin
13C NMR STUDY OF OXYGEN INTERCALATION IN C60 499 P. Bernier, I. Luk'yanchuk, Z. Belahmer, M. Ribet, and L. Firlej
THE EFFECT OF O, INTERCALATION ON THE ROTATIONAL DYNAMICS AND THE ORDERING TRANSITION OF C60 505
S.A. Myers, R.A. Assink, J.E. Schirber, and D.A. Loy
MEASUREMENT OF THE EXCITED-STATE MOLECULAR POLARIZABILITY OF C,0 511
N. Tang, R.W. Hellwarth, and J.P. Partanen
*Invited Paper

MULTIPHOTON IONIZATION MASS SPECTROSCOPY OF FULLERENES IN METHANE DIFFUSION FLAMES 517
H. Hepp, K. Siegmann, and K. Sattler
ANALYSIS OF A C60/TWELVE SOLVENT SURVEY FOR RED SHIFTING OF SPECTRA 523
D.M. Brandelik, D.G. McLean, and R.L. Sutherland
FLUORESCENCE OF CYCLIC ADDUCTS OF FULLERENE 529 Tsung-I Lin, Syh-Kun Lin, Lung-Lin Shiu, Kuo-Ming Chien, and Tien-Yau Luh
PART IX: STRUCTURE AND THERMODYNAMICS
NEUTRON SCATTERING STUDIES OF C6,H2 537 D.A. Neumann, J.E. Fischer, J.R.D. Copley, P.A. Heiney, J.J. Rush, R.M. Strongin, L. Brard, and Amos B. Smith III
CHARACTERIZATION OF C60 FULLERENE IN CARBON DISULFIDE SOLVENT USING INTERMEDIATE ANGLE NEUTRON SCATTERING 543
Steve Spooner, J.L. Zarestky, and K.A. Affholter
THERMAL CONDUCTIVITY OF C60 UNDER HIGH PRESSURE 549 O. Andersson, A. Soldatov, and B. Sundqvist
THERMOPHYSICAL PROPERTIES OF C70 UP TO 1 GPa 555 A. Lundin, A. Soldatov, and B. Sundqvist
THE BINARY PHASE DIAGRAM NAPHTHALENE-C6„ 561 Rafael Hidalgo-Quesada, Xin-Yu Zhang, and Bill C. Giessen
DIFFUSION SEPARATION OF FULLERENES IN SOLUTION 567 Alexander V. Eletskii, Michael V. Okun, and Eugene V. Stepanov
THERMODYNAMICS OF CO-EXISTING PHASES AT PHASE TRANSITIONS IN FULLERENES 573
Eugene V. Stepanov
AUTHOR INDEX 579
SUBJECT INDEX 583
XI

Preface
This volume contains the proceedings of the symposium "Science and Technology of Fullerene Materials," held at the 1994 MRS Fall Meeting in Boston from November 28 to December 2. This symposium was international in character, and was planned to provide a multidisciplinary discussion of all levels of fullerene-based materials science, with a special focus on new technological advances in the development and application of fullerenes and related materials.
The symposium comprised 21 invited talks and 113 contributed oral and poster presentations, broadly covering both experimental and theoretical results of the ongoing efforts to create, characterize, and find applications for fullerenes and related novel carbon materials. The diversity of conditions leading to fullerene formation was demonstrated by reports showing that flame production of fullerenes is quite practical, that a solar furnace can make fullerenes, and that fullerenes are prominent in certain regions of ordinary candle flames. Similarly, production of carbon nanotubes was reported not only in cathodic deposits, but also in flame soots, pyrolysis products of hydrocarbons, soot produced by laser vaporization of graphite, and in arc fullerene generators with added metal catalysts. Other nanotube papers focused on purification and on field emission from nanotube tips as a factor controlling the arc plasma during growth and a potentially useful phenomenon enabling fabrication of novel cold cathode field emitters. Fullerene-like particles and nanotubes based on non-carbon layer compounds such BN and MoS, and its analogs were reported. A session on endohedral fullerenes featured talks on isolation of reasonably large (10 mg) quantities of individual isomers of metal-atom-containing species and their characterization by a wide variety of techniques, and on the application of He NMR to follow the chemistry He-containing fullerenes. Theoretical efforts to understand the structural properties of fullerenes, nested fullerenes, and nanotubes were reported.
Several sessions focused on fullerenes as condensed phase films and solids. Trends in the occurrence of superconductivity in alkali-fullerides were summarized, and evidence for superconductivity at 40 K in pressure-stabilized CsjC^, was reported. A study of Rb-doped C70 compounds found no superconductivity, thus CM salts remain the only fullerene superconductors. There was considerable interest in C^ solids and films and their photoconductivity, epitaxial growth, optical properties, behavior at high photoexcitation levels, and photochemistry—particularly photopolymerization and photodimerization.
Perhaps the strongest advances towards practical applications of fullerenes were in the areas of fullerene chemistry, functionalization, and polymerization. A sample of a star- polymer consisting of C«, molecules linked three-dimensionally by poly(urethane ether) chains was passed through the audience during a talk discussing this novel elastomer. A wide variety of chemical derivatives of both C^ and C70 were described, and potential pharmacological applications such as HIV protease inhibitors or biological radical scavengers were suggested for some derivatives.
The symposium was extremely successful in eliciting a wide international response, with both participants and official sponsors of many nationalities. The nationalities of the contributors spanned over four continents, with contributions from the United States, Japan, Taiwan, The United Kingdom, France, Germany, Italy, Sweden, the People's Republic of China, India, nations of the former U.S.S.R., Argentina, Mexico, and other nations. Indeed, organizing a symposium of this size would not have been possible without wide international sponsorship. Hence, we are pleased to acknowledge the generous support of the following donors: President Enterprises Corp. (Taiwan), China Technical Consultants (Taiwan), Office of Naval Research (U.S.A.), Air Force Office of Scientific Research
Xlll

(U.S.A.), Pica (France), Rhöne-Poulenc (France), Igole He de France (France), Techno- Carbo (France), NEC Corp. (Japan), Tokyo Instruments (Japan), Toray Company (Japan), Hoechst (Germany), Digital Instruments (U.S.A.), Exxon (U.S.A.), MER Corp. (U.S.A.), Strem Chemicals (U.S.A.), and the Texas Center for Superconductivity (U.S.A.).
We thank all of the symposium participants for their role in making this meeting a success. We thank the authors included in this volume for their timely contributions, and the manuscript reviewers for their prompt and conscientious responses. Finally, we thank the officers and staff of the Materials Research Society for their efforts in planning both the symposium and this volume.
Patrick Bernier Donald S. Bethune Long Y. Chiang Thomas W. Ebbesen Robert M. Metzger John W. Mintmire
January 1995
XIV

MATERIALS RESEARCH SOCIETY SYMPOSIUM PROCEEDINGS
Volume 336—Amorphous Silicon Technology-1994, E.A. Schiff, A. Matsuda, M. Hack, M.J. Powell, A. Madan, 1994, ISBN: 1-55899-236-7
Volume 337—Advanced Metallization for Devices and Circuits—Science, Technology, and Manufacturability III, S.P. Murarka, K.N. Tu, A. Katz, K. Maex, 1994, ISBN: 1-55899-237-5
Volume 338— Materials Reliability in Microelectronics IV, P. Bargesen, W. Filter, J.E. Sanchez, Jr., K.P. Rodbell, J.C. Coburn, 1994, ISBN: 1-55899-238-3
Volume 339—Diamond, SiC and Nitride-Wide-Bandgap Semiconductors, C.H. Carter, Jr., G. Gildenblat, S. Nakamura, R.J. Nemanich, 1994, ISBN: 1-55899-239-1
Volume 340—Compound Semiconductor Epitaxy, C.W. Tu, L.A. Kolodziejski, V.R. McCrary, 1994, ISBN: 1-55899-240-5
Volume 341—Epitaxial Oxide Thin Films and Heterostructures, D.K. Fork, J.M. Phillips, R. Ramesh, R.M. Wolf, 1994, ISBN: 1-55899-241-3
Volume 342—Rapid Thermal and Integrated Processing III, J.J. Wortman, J.C. Gelpey, M.L. Green, S.R.J. Brueck, F. Roozeboom, 1994, ISBN: 1-55899-242-1
Volume 343— Polycrystalline Thin Films—Structure, Texture, Properties and Applications, M. Parker, K. Barmak, R. Sinclair, D.A. Smith, J. Floro, 1994, ISBN: 1-55899-243-X
Volume 344— Materials and Processes for Environmental Protection, C. Adkins, P.N. Gadgil, L.M. Quick, K.E. Voss, 1994, ISBN: 1-55899-244-8
Volume 345—Flat Panel Display Materials, J. Batey, A. Chiang, P. Holloway, 1994, ISBN: 1-55899-245-6
Volume 346—Better Ceramics Through Chemistry VI, C. Sanchez, M.L. Mecartney, C.J. Brinker, A. Cheetham, 1994, ISBN: 1-55899-246-4
Volume 347—Microwave Processing of Materials IV, M.F. Iskander, R.J. Lauf, W.H. Sutton, 1994, ISBN: 1-55899-247-2
Volume 348— Scintillator and Phosphor Materials, M.J. Weber, P. Lecoq, R.C. Ruchti, C. Woody, W.M. Yen, R.-Y. Zhu, 1994, ISBN: 1-55899-248-0
Volume 349—Novel Forms of Carbon II, C.L. Renschler, D. Cox, J. Pouch, Y. Achiba, 1994, ISBN: 1-55899-249-9
Volume 350— Intermetallic Matrix Composites III, J.A. Graves, R.R. Bowman, J.J. Lewandowski, 1994, ISBN: 1-55899-250-2
Volume 351—Molecularly Designed Ultrafine/Nanostructured Materials, K.E. Gonsalves, G.-M. Chow, T.D. Xiao, R.C. Cammarata, 1994, ISBN: 1-55899-251-0
Volume 352—Materials Issues in Art and Archaeology IV, P.B. Vandiver, J.R. Druzik, J.L Galvan Madrid, I.C. Freestone, G.S. Wheeler, 1995, ISBN: 1-55899-252-9
Volume 353—Scientific Basis for Nuclear Waste Management XVIII, T. Murakami, R.C. Ewing, 1995, ISBN: 1-55899-253-7
Volume 354—Beam-Solid Interactions for Materials Synthesis and Characterization, D.E. Luzzi, T.F. Heinz, M. Iwaki, D.C. Jacobson, 1995, ISBN: 1-55899-255-3
Volume 355— Evolution of Thin-Film and Surface Structure and Morphology, B.G. Demczyk, E.D. Williams, E. Garfunkel, B.M. Clemens, J.E. Cuomo, 1995, ISBN: 1-55899-256-1
Volume 356—Thin Films: Stresses and Mechanical Properties V, S.P. Baker, P. Borgesen, P.H. Townsend, C.A. Ross, C.A. Volkert, 1995, ISBN: 1-55899-257-X
Volume 357—Structure and Properties of Interfaces in Ceramics, D.A. Bonnell, U. Chowdhry, M. Riihle, 1995, ISBN: 1-55899-258-8

MATERIALS RESEARCH SOCIETY SYMPOSIUM PROCEEDINGS
Volume 358— Microcrystalline and Nanocrystalline Semiconductors, R.W. Collins, C.C. Tsai, M. Hirose, F. Koch, L. Brus, 1995, ISBN: 1-55899-259-6
Volume 359—Science and Technology of Fullerene Materials, P. Bernier, D.S. Bethune, L.Y. Chiang, T.W. Ebbesen, R.M. Metzger, J.W. Mintmire, 1995, ISBN: 1-55899-260-X
Volume 360—Materials for Smart Systems, E.P. George, S. Takahashi, S. Trolier- McKinstry, K. Uchino, M. Wun-Fogle, 1995, ISBN: 1-55899-261-8
Volume 361—Ferroelectric Thin Films IV, S.B. Desu, B.A. Tuttle, R. Ramesh, T. Shiosaki, 1995, ISBN: 1-55899-262-6
Volume 362—Grain-Size and Mechanical Properties—Fundamentals and Applications, N.J. Grant, R.W. Armstrong, M.A. Otooni, T.N. Baker, K. Ishizaki, 1995, ISBN: 1-55899-263-4
Volume 363— Chemical Vapor Deposition of Refractory Metals and Ceramics III, W.Y. Lee, B.M. Gallois, M.A. Pickering, 1995, ISBN: 1-55899-264-2
Volume 364— High-Temperature Ordered Intermetallic Alloys VI, J. Horton, I. Baker, S. Hanada, R.D. Noebe, D. Schwartz, 1995, ISBN: 1-55899-265-0
Volume 365— Ceramic Matrix Composites—Advanced High-Temperature Structural Materials, R.A. Lowden, J.R. Hellmann, M.K. Ferber, S.G. DiPietro, K.K. Chawla, 1995, ISBN: 1-55899-266-9
Volume 366—Dynamics in Small Confining Systems II, J.M. Drake, S.M. Troian, J. Klafter, R. Kopelman, 1995, ISBN: 1-55899-267-7
Volume 367—Fractal Aspects of Materials, F. Family, B. Sapoval, P. Meakin, R. Wool, 1995, ISBN: 1-55899-268-5
Volume 368—Synthesis and Properties of Advanced Catalytic Materials, E. Iglesia, P. Lednor, D. Nagaki, L. Thompson, 1995, ISBN: 1-55899-270-7
Volume 369—Solid State Ionics IV, G-A. Nazri, J-M. Tarascon, M. Schreiber, 1995, ISBN: 1-55899-271-5
Volume 370— Microstructure of Cement Based Systems/Bonding and Interfaces in Cementitious Materials, S. Diamond, S. Mindess, F.P. Glasser, L.W. Roberts, J.P. Skalny, L.D. Wakeley, 1995, ISBN: 1-55899-272-3
Volume 371—Advances in Porous Materials, S. Komarneni, D.M. Smith, J.S. Beck, 1995, ISBN: 1-55899-273-1
Volume 372—Hollow and Solid Spheres and Microspheres—Science and Technology Associated with their Fabrication and Application, M. Berg, T. Bernat, D.L. Wilcox, Sr., J.K. Cochran, Jr., D. Kellerman, 1995, ISBN: 1-55899-274-X
Volume 373—Microstructure of Irradiated Materials, I.M. Robertson, L.E. Rehn, S.J. Zinkle, W.J. Phythian, 1995, ISBN: 1-55899-275-8
Volume 374— Materials for Optical Limiting, R. Crane, K. Lewis, E.V. Stryland, M. Khoshnevisan, 1995, ISBN: 1-55899-276-6
Volume 375—Applications of Synchrotron Radiation Techniques to Materials Science II, L.J. Terminello, N.D. Shinn, G.E. Ice, K.L. D'Amico, D.L. Perry, 1995, ISBN: 1-55899-277-4
Volume 376—Neutron Scattering in Materials Science II, D.A. Neumann, T.P. Russell, B.J. Wuensch, 1995, ISBN: 1-55899-278-2
Prior Materials Research Society Symposium Proceedings available by contacting Materials Research Society

PARTI
Synthesis, Production, and Growth Mechanisms
HIGHER FULLERENES: STRUCTURE AND PROPERTIES
YOHJI ACHIBA, KOICHI KIKUCHI, YUICH! AIHARA, TOMONARI WAKABAYASHI, YOKO MIYAKE AND MASATSUME KAINOSHO
Department of Chemistry, Tokyo Metropolitan University, Hachioji, 192-03 Tokyo, Japan
ABSTRACT
The structures of higher fullerenes are described based on 13C NMR measurements of isolated and purified samples. The most interesting aspect deduced from the present structural work on the higher fullerenes up to C90 is that among 19 kinds of fullerenes with different sizes and isomers, 18 fullerenes commonly have at least one C2 symmetry axis in their molecular frame. Only one exception is C90 fullerene with a C1 symmetry. The spectral feature of UV/Visible absorption obtained for the HPLC-isolated C120 fullerene gives, on the other hand, a strong indication that the numbers of co-existing isomer of very large fullerenes are extremely limited, probably one or two. Considering the huge numbers of IPR-(isolated pentagon rule) satisfying isomer of C120 (10,774), these experimental evidences may suggest the presence of very strong selectivity for the formation of stable higher fullerenes, which, in turn, is closely associated with the unknown growth process of a fullerene cage network.
INTRODUCTION
Soon after the discovery of large-scale preparation of Ceo fullerene1, the presence of much larger all carbon molecules has been found and identified in carbon soot. From mass spectrometric characterization, it has been suggested that these all carbon molecules possess a similar molecular structure and property to (^0 and C70. Actually, soon later, several kinds of stable higher fullerenes were isolated and characterized by means of 13C NMR spectroscopy, revealing the presence of a cage structure with a five- and six-membered ring system2"5.
The studies of higher fullerenes, particularly those placed attention to the structure are very important to understand not only the general properties of a novel molecular system consisting of a five- and six membered ring network but also the unknown growth processes of fullerene networks. From mass spectrometric points of view, very large fullerenes up to over 1000 carbon atoms have been detected in the carbon raw soot or solvent extract^. However, the structural study of higher fullerenes has still been very limited , and C84 fullerene is the biggest size whose molecular structure was well identified. Among many intriguing aspects of the research of the higher fullerenes, of particular interest is what is the general feature of large fullerenes; is a spherical shape more preferable? or tube like structure?
Furthermore, very recent research has suggested that there exists many kinds of new fullerene family, in which single or multiple metal atoms are
3
Mat. Res. Soc. Symp. Proc. Vol. 359 ° 1995 Materials Research Society

thought to be trapped in the fullerene cages7. In the most of the cases of metallofullerene formation, the cages of higher fullerenes play an important role on the stabilization of metallofullerenes. In this sense, the structure and stability of C82 fullerene is particularly important8.
NMR CHARACTERIZATION OF C86, C88, and C90
By means of high performance liquid chromatography (HPLC), recent experimental efforts have enabled us to isolate and characterize the higher fullerenes up to C84. In the present work, we further extended the isolation and characterization task up to Cg0, including C86 and C88
9- For isolation of these higher fullerenes, the previous HPLC method was modified by using a two-stage HPLC system (one is size exclusion type (polystyrene/CS2) and the other one is adsorption (Cosmosil Buckyprep/toluene))10. As a result, we were safely able to obtain over 95 % purified samples of C86, C88 and Cgo. Furthermore, in the course of the present work, we found there exists the third stable isomer of C84 with a D2 symmetry which has not been identified so far.
'86
Fig. 1. 13C NMR spectrum of C86 fullerene in CS2 solution. Two isomers co-exist with about 4:1 fraction ratio.

In order to clarify the structure of Cs6, Css and Cg0 fullerenes, 13CNMR measurements were carried out in solution. The NMR spectra of Cs6 and Css showed 43 and 44 distinct lines, respectively, strongly indicating the presence of fullerene cages with a C2 symmetry as a major isomer. Figure 1 shows 13C NMR spectrum of C86 in CS2 solution. Among 43 NMR lines, two of them accidentally appear at the same chemical shifts. As a result, these two lines give twice in intensity as shown in Fig. 1. Furthermore, from the 13C NMR spectra, it was found that even after two-stage separation, the major fraction of C86 still contains at least one other minor isomer with the same symmetry, C2. The abundance of these two isomers is about 4:1.
The major fraction of C90 portion observed by the initial HPLC was further divided into three fractions after a recycle procedure with the same HPLC. 13C NMR spectra were measured for each fraction, separately. The 13C NMR spectra of these three fractions of Cg0 suggested that the first and third fractions consist of two isomers and the second one consists of a single isomer. As a conclusion, it was indicated that C90 fullerene possesses at least 5 different isomers, namely, one C2V, three C2 and one C1 symmetries. Here we note that the C2V-C90 isomer is different from the one predicted by recent thermodynamic consideration1112. According to the recent ab initio calculation on C90, the most stable isomer has C2 symmetry and the second one is C2v. However, the C2V-C90 recommended by the ab initio calculation should have 24 distinct lines among which 3 lines are a half in intensity. This is definitely not the present case, because, in Fig. 2, we can see 5 distinct lines with a half intensity. The most probable candidate for the observed C2V isomer is the one of no. 14 in ref. 11. Table 1 is a summary of molecular symmetries of all higher fullerenes examined so far.
Fig. 2. !3C NMR spectrum of C90 HPLC-fraction. Five weak lines (nos. 12, 19, 41, 67 and 70) are attributed to C2V-C90.

Table 1 Molecular symmetries of 19 different stable fullerenes
size symmetry of experimentally observed stable isomer
60(1)* |h
70 (1)* D5h 76 (2)* D2
78 (5)* Csv, C2v, D3 82 (9)' Q, 84 (24)* D2, D2d, D2 86 (29)* C2, Q> 88 (35)* C2 90 (46)* Q,, d, C2, Cgv, C2
* parentheses are the numbers of IPR-satisfying isomers
2D-13C NMR of C76, C78 AND C84: INADEQUATE ANALYSIS
In order to clarify the fullerene's networks in detail, we have performed 2D-J3CNMRwith use of 20 %^C enriched purified samples. After isolation of C76, C78 and C84 higher fullerenes by a high performance liquid chromatography (HPLC), "C NMR spectra were measured by Varian 500 MHz NMR in CS2 solution. In the present work, so called "INADEQUATE" method^ was used to determine the carbon connectivity of these higher fullerenes
Concerning the structure of C76 and C78, the previous 1 D-13C NMR data have unambiguously provided their topological structures2-5 The symmetries of these fullerenes are D2 for C76 and C2V, C2V, and D3 for C78
respectively. Fortunately, since C76 has only one IPR (isolated pentagon rule .where no adjacent pentagons are allowed in the network formation) satisfying candidate with D2 symmetry and also the three isomers of C78
have different numbers of 13C NMR lines from each other, we were safely able to determine the sets of NMR lines for each fullerene isomer. However since the 1D NMR could give only information on a molecular symmetry, it gave just topological information on the fullerene cages. Thus it has strongly been required to carry out 2D 13Q NMR study to understand much deeper chemical properties such as a correlation between a topological curvature (deviation from an ideal sp2 plane) and a quantity of chemical shift. Furthermore, although 1 D-13C NMR clearly showed the presence of two major isomers of C84 with D2 and D2d symmetries in the previous work, we were not able to distinguish an unique D2 isomer from other three D2
candidates. Thus, to deduce a final conclusion on the D2-isomer problem of Ca4, it has been crucial to carry out 2D 13Q NMR and to obtain a direct evidence of carbon connectivities. In order to distinguish a particular C2 from three C2-C82 fullerenes, 2D 13C NMR measurements on Cs2 is also very

important. First, we have measured 2D ™C NMR spectra of C76 and clarified the
connectivity of D2 network as shown in Fig. 3. The 19 NMR lines were, then, safely assigned by an INADEQUATE method. Furthermore, the resulting chemical shifts of the 19 NMR lines are plotted as a function of a distance, d, defined by a deviation from an ideal sp2 plane (similar value to POAV). As has been expected so faM3, it was found that the observed chemical shift and the curvature of cage surface seems to be well correlated with each other. The steeper network curvature gives the NMR line in the lower magnetic field, while the carbon atom sitting on the more plane surface appears in the higher magnetic field. Such a correlation was found to possess even for other higher fullerenes, C78 and Cs4.
From the present 2D 13C NMR study on Cs4, we were able to give a final conclusion on the structure of major D2 isomer. From analyzing the INADEQUATE data of C84, the structure of D2 (22) 1* and D2d(23)i4 was uniquely deduced as a major product. Here the notations of D2(22) or Ü2d(23) are the same to those used in ref. 14. This result is well consistent with the theoretical predictions published so far13.1s. but inconsistent with the prediction by oursie. However, it should also be pointed out that the newly observed third isomer has D2 symmetry and the most probable candidate for this isomer is D2(5)it, which has been suggested as one of the stable Cs4 by our fullerene growth models. The abundance of D2(5) comparing with D2(22) was about 1/5 - 1/8. It is quite interesting to note that the selective formation of D2(22) and D2tj(23) C84 isomers is actually consistent with the prediction by thermodynamic consideration15, but the formation of D2(5) is not. The latter situation is rather similar to the case found in the formation of C2V-C90 in the present work.
r3c] c76
16 14k
\ww VVVHWIW)
148 146 142 140 136 136 '"l ....|..M|U..|,
132 130 ppm
Fig. 3. 13C NMR spectrum of 20% 13C enriced C76. Insertion is the assignments of 19 NMRIines by INADEQUATE method.

Finally we briefly describe about 2D 13C NMR measurements of C82. We have also intended to apply an INADEQUATE to Ca2. Unfortunately, however, the measurement of INADEQUATE was not satisfied, mostly because of too many accidentally overlapping NMR lines to be resolved. Therefore, at moment we were not able to define a specific C2 isomer of Q32 among three G2 candidates. In the course of the present separation task of C82, we found the presence of the third isomer of G34 fullerene. For the purification of G32 in the present work, we used the two-stage HPLC in stead of previous single-stage purification. As a result, we found one additional fullerene component hidden in the major C82 fraction. The new component was found to be D2(5) C84 by both mass and isc NMR analyses. Comparing the present NMR data for newly purified C82 sample with the previous one3, the presence of C2v- and C3V-C82 isomers suggested in the previous report3 were safely ruled out. Therefore, we can conclude here that C82 has at least two isomers and both of them have C2 symmetry. There are no evidence revealing the formation of C82 isomers with C2V and Q3V symmetries. This new result is rather well consistent with the theoretical prediction on these C82 isomers in which those isomers with C2V and C3V symmetries are possibly reduced in their symmetries to C1 or Cs by Jahn-Teller distorsion. This conclusion, on the other hand, gives important information on the stability of single and multiple metal atoms encapsulated fullerenes with a C82 cage. Of particular interest is Sc3C82 case, because the equivalent 22 ESR lines of this molecule has been thought to be rationalized by assuming the presence of C82 fullerene with a three-hold rotational axis.
SEPARATION OF LARGE FULLERENES UP TO C120
In the course of the present work, we also intended to isolate much higher fullerenes up to C120. Unfortunately, however, at moment the isolation task of these higher fullerenes has not been completed yet. Each HPLC-separated fraction still contains at least two or three fullerenes with different sizes. Typical example of the HPLC-isolation of fullerenes with the size at around C110 are shown in Fig. 4. As can be indicated in the mass spectra of Fig. 4, the main peaks are followed by several neighboring-size fullerenes. The general trends of UV/Visible absorption spectra of the fraction at around C120 is also quite similar to those shown in Fig. 4. Although the separation is not completed, we can see at least one characteristic feature from this figure, i. e., there appear several distinct absorption band structures.
Considering the fact that C|20 fullerene has 10,774 distinct IPR- satisfying isomer candidates17, it is amazing that UV/Visible absorption feature of C120 is still of structure rich. This spectral characteristics may directly reflect the formation of very limited kinds of co-existing isomers in carbon soot. This, in turn, suggests the presence of a strong selectivity in fullerene growth process, and the driving force forming such a selectivity would not be a simple thermodynamics. Considering the fact that almost all stable fullerenes examined so far have at least one C2 symmetry component in their molecular frame, it is strongly suggested that very limited numbers of precursors with a C2 symmetry would play an essential role on the selectivity of fullerene cage structure. This final implication turns out the suggestion of an epitaxial growth model for the fullerene cage formation.

Ciio
Cll2
500 600 700 600 ' 900 1000 1100 WAVE LENGTH/nm
90 110 130 - NUMBER OF CARBON ATOMS
Fig. 4. Mass and absorption spectra of the HPLC-fractions at around Cno.
REFERENCES
1. W. Kratschmer, D. L. Lamb, K. Fostiropoulos, and D. R. Huffman, Nature, 347 354 (1 990).
2. R. Ettl, I. Chao, F. Diederich and R. L. Whetten, Nature, 353, 149 (1991). 3. F. Diederich, R. L Whetten, C. Thilgen, R. Ettl, I. Chao, and M. M. Alvarez,
Science, 254, 1768 (1991). 4. K. Kikuchi, N. Nakahara, T. Wakabayashi, S. Suzuki, H. Shiromaru, Y. Miyake,
K. Saito, I. Ikemoto, M. Kainosho, and Y. Achiba, Nature, 357, 142 (1992). 5. R. Taylor, G. J. Langley, T. J. S. Dennis, H. W. Kroto and D. R. M. Walton, J.
Chem. Soc. Chem. Commun., 1043 (1992). 6. For example, S. Maruyama, M. Y. Lee, R. E. Haufler, Y. Chai and R. E.
Smalley, Z. Phys., D19, 409 (1991). 7. See review, D. S. Bethune, R. D. Johnson, J. R. Salem, M. S. de Vries and C.
S. Yannoni, Nature, 366, 123 (1993). 8. K. Kikuchi, N. Nakahara, T. Wakabayashi, M. Honnda, H. Matsumiya, T.
Moriwaki, S. Suzuki, H. Shiromaru, K. Saito, I. Ikemoto and Y Achiba, Chem. Phys. Lett., 188, 177 (1992).
9. K. Kikuchi and Y Achiba, to be published. 10. K. Kikuchi, S. Suzuki, Y. Nakao, N. Nakahara, T. Wakabayashi, H. Shiromaru,
K. Saito, I. Ikemoto and Y Achiba, Chem. Phys. Lett., 216, 67 (1993). 11. R. L Murry and G. E. Scuseria, J. Phys. Chem., 98, 4212 (1994). 12 E. Osawa, private communication. 13. U. Schneider, S. Richard, M. M. Kappes and R. Ahlrichs, Chem. Phys. Lett.,
210, 165 (1993). 14. D. E. Manolopoulos and P. W. Fowler, J. Chem. Phys., 96, 7603 (1992). 15. B. L. Zhang, C.Z.Wang and K. M. Ho, J. Chem. Phys., 96, 7183 (1992). 16. T. Wakabayashi, H. Shiromaru, K. Kikuchi and Y Achiba, Chem. Phys. Lett.,
201, 470 (1993). 17. P. W. Fowler, S. J. Austin and D. E. Manolopoulos, in "Physics and
Chemistry of the Fullerenes" ed. by K. Prassides , Kluwer Academic Publishers 1994, p. 41.
PRODUCTION OF FULLERENES FROM SOLAR ENERGY
D LAPLAZB", P. BERNIER«), L. BARBEDETTE<2>, G. FLAMANT"', M. LEBRUN« A. BRUNELLE<4>, S. DELLA-NEGRA'4»
(l)Groupe de Dynamique des Phases Condensees, Universite de Montpellier II, F34095 Montpellier, France (2)Institut des Materiaux de Nantes, Universite de Nantes, F44087 Nantes, France (3)Institut de Science et de Genie des Materiaux et Precedes, BP5 Odeillo, F66125 Font-Romeu, France (4)Institut de Physique Nucleaire, Universite de Paris Sud, F91406 Orsay, France
ABSTRACT
The high intensity of solar radiation, obtained with the Odeillo (France) solar furnace facilities, is used to vaporize graphite in inert gas atmosphere. The soot obtained contains C60, C70 and other heavier fullerenes. We discuss the possibility of increasing the evaporation rate of graphite and the yield of soot with this technique. From our last experiments, we obtain a first estimate of the soluble fullerene yield Y ( greater than 12%) and we have shown that l3C enriched fullerenes can be easily produced by this process.
INTRODUCTION
In 1993, various research groups [1-3] have shown that it is possible to produce fullerenes in rarefied inert gas atmosphere, by direct vaporization of graphite in focused sunlight. In these first experiments, only a small amount of soot was collected, typically one or two milligrams per hour. This low production is mainly due to the very important radiative and conductive thermal losses of graphite. However this method presents substantial advantages: (i) the starting material can be an insulator such as graphite powder or mixed rod of graphite and other species, (ii) in theory, the evaporation temperature and sublimation rate can be adjusted by a convenient choice of the inert gas pressure and incident light flux if one finds the way to reduce thermal losses, (iii) the U-V radiation from direct sunlight is very small compared with plasma radiation of electrical arc at a temperature of 10,000 K and it seems that photochemical destruction of fullerenes is the main mechanism which prevents high yields of C60 . In this paper we explore the possibility of increasing the evaporation rate of graphite, and the effect of the inert gas. We describe the use of this procedure to produce derivatives of the fullerenes and particularly ' 3C enriched fullerenes.
EXPERIMENTAL DESIGN
We have used a 1.5 kW solar furnace of the Odeillo Institute as described in figure 1. The sunlight is collected by a flat tracking mirror Mp and is vertically reflected towards a parabolic mirror Ms ( diameter 1.5m, 0.65m focal length, aperture half angle a = 60°). For a direct solar flux around 850-900 W/m2, the focused power on the focal area which has a diameter close to 1.6 cm, can reach 1100W. Its radial distribution is shown on figure 2. The experimental chamber whose position can be adjusted so that the top of the target coincide with the focus, is schematically drawn on figure 3. The stand part R, surrounded by the Pyrex balloon flask S, is a water cooled brass cylinder which supports the target and cellulose filter to collect the soot.
11
Mat. Res. Soc. Symp. Proc.Vol. 359 °1995 Materials Research Society
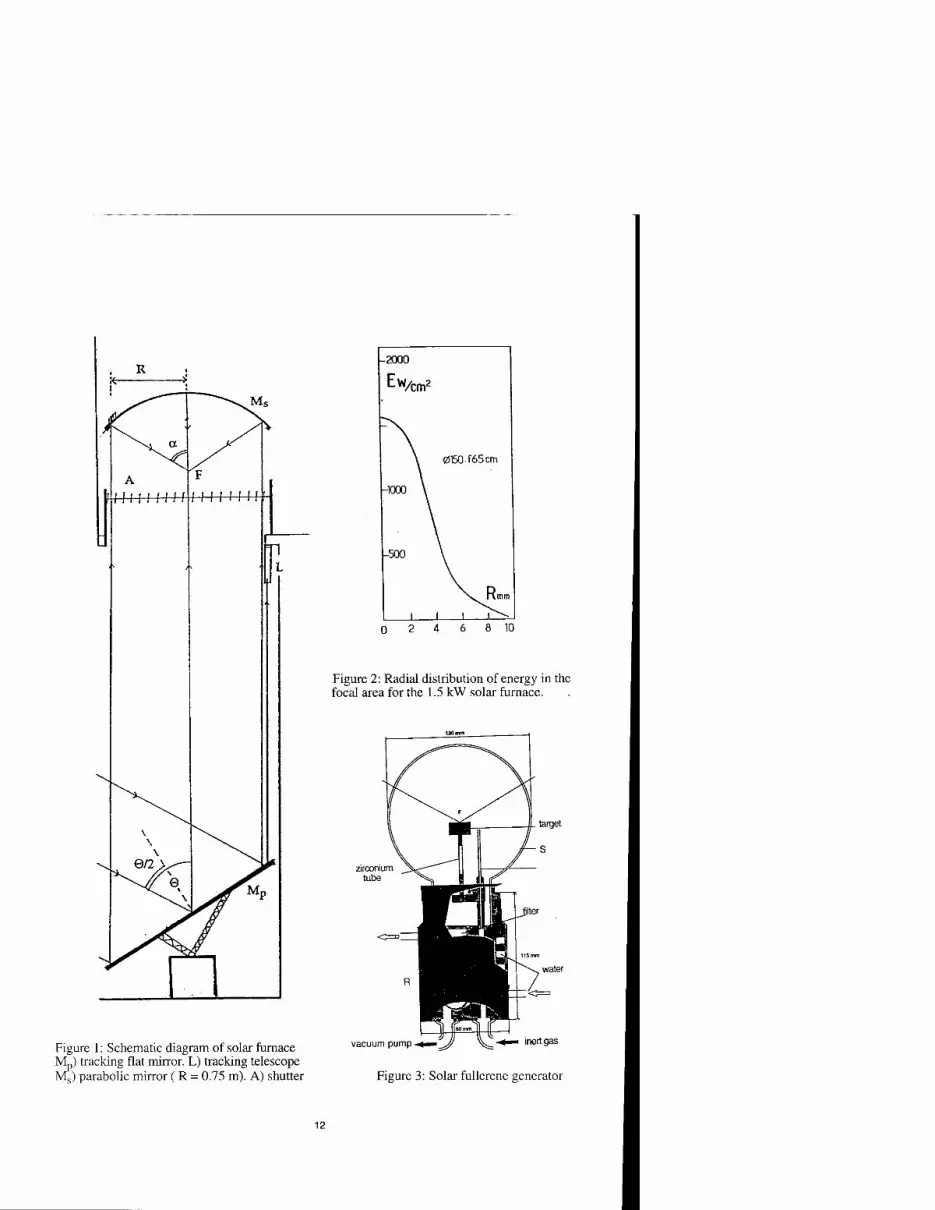
Figure 2: Radial distribution of energy in the focal area for the 1.5 kW solar furnace.
Figure 1: Schematic diagram of solar furnace M„) tracking flat mirror. L) tracking telescope Ms) parabolic mirror ( R = 0.75 m). A) shutter
vacuum pump
water
inert gas
Figure 3: Solar fullerene generator

The target can be a graphite rod or a graphite crucible filled with graphite powder. In all cases, it was fastened to the stand by a zirconium tube. This chamber was first evacuated to lO2 mb and purged and then swept by He or Ar gas during sublimation. The pressure could be varied from 10 to 150 mb.
EVAPORATION RATE
With this reactor, evaporation of graphite is possible and gives a small amount of soot which contains fullerenes, but two major difficulties arise: first, the evaporation rate is very small for a standard graphite rod; second, using He gas, the greater part of the soot is deposited on the balloon flask, restricting the duration of experiment.
This last problem can be solved by the use of Ar gas which, for the same pressure and same flow, sweeps the soot out of the chamber more efficiently than helium.
The small value of the evaporation rate is due to the high thermal conductivity k and high emissivity of graphite. According to the model of Abrahamson [4], the thermal balance of the front face of the graphite rod can be written:
e* - 7tr2aeTf4 + kicr2(dT/dz) = L (dm/dt) (1)
where O is the intercepted part of the incident flux, o the Stephan constant, r the radius of graphite rod and Tf the temperature of the front face. The latent heat of sublimation is designated by L and the evaporation rate by (dm/dt). In a steady state condition, the thermal equilibrium of a slice at the distance z from the top requires:
K7tr2(d2T/dz2) - 27irae(T4 -Tw4) - C = 0 (2)
where Tw is the temperature of surrounding walls and C the convection losses. Using this simple model, and neglecting the convection losses C, we can optimize the
value of r taking into account the radial distribution of energy in the focal area. The best results are found for r = 3mm (top surface S0 = 28.3 mm2) for this furnace, and taking Tw= 300K, the calculated front temperature Tf is around 2450 K. For this surface temperature and 10 mb inert gas pressure, the evaporation rate is very small.
In order to increase Tf and the evaporation rate, we must minimize or balance the heat losses. One possibility consists of changing the shape of the sample. Different tests have been carried out and the results are summarized in table I. We have also reported the calculated value of Tf deduced from the previous model. Accurate measurement of Tf with a pyrometer in the visible range is not possible on account of the scattered and reflected parts of the incident sunlight. In the IR range it is the balloon flask which alters the measurement. However, we can make an estimate of Tf using an experimental curve published by Abramhason [4] which gives a simple relation between the evaporation rate and the surface temperature . In case 2, we have made a cavity on the top of the rod to obtain black body effects. In case 3, the graphite rod is surrounded by a graphite pipe (diameter # 12 mm) which intercepts a part of solar flux and has a temperature (Tw) around 2500K at its top and reduces radiative losses. Finally, in case 4 we also reduce conductive effects (km2 coefficient) using graphite plates linked by a thin graphite rod and always surrounded by the graphite pipe. In this last case, the ablation rate is large enough to yield a colored solution of fullerenes in toluene after an half an hour experiment.
The differences between the two values of Tf in table I result from the approximations of the model. In case 1 we have not taken into account the part of incident light intercepted by the side of the rod; in case 3 we have used an average value for Tw and in the last case, the second term in equation (2) becomes more complex.
13

Table I: Variations of the front temperature Tf. Experimental conditions: pressure: 10 mb; Incident flux: 900 W/m2 ; top surface S0 = 28.3 mm2
Sample shape
Measured evaporation rate
(mg/hour)
Calculated Tf(K)
Estimate Tf(K)
1 1 5 2450 2700
2
M 23 2900
3
III 63 2750 2950
4
111 88 3100 3000
Another way to increase the sublimation rate consists of the use of graphite powder which has a poor thermal conductivity. The grain size must be large enough to prevent ejection of solid graphite particles and the diameter of the graphite crucible must be of the order of the focus area diameter. In this case, the trapping effect for radiation on the front surface and the reduction of conductive losses increase the front temperature and evaporation rate can reach 500 mg / hour under a pressure of 10 mb.
To increase again the evaporation rate it is necessary to reduce thermal losses from the side and back of the target and certainly to bring more energy to the sample.
We note that increasing the size of the parabolic mirror (and the focal length) can only increase the yield of soot but not the normalised evaporation rate (Kgm"2s"')- The concentration ratios of different furnaces of the Odeillo institute are essentially the same and reach the maximum possible value and the values of Tf are essentially a function of the energy density in the focal area.
RESULTS AND DISCUSSION
In all cases, the toluene-soluble part of the soot contains Cg0 and C70 , but the soot also consists in a large part of insoluble heavier fullerenes up to C23Q (Figure4). These analyses have been made by mass spectroscopy with a time of flight spectrometer equipped with an electrostatic mirror [5]. Desorption is achieved either with 252Cf for the toluene-soluble part or with nitrogen U-V laser for the soot.
First observations during this set of experiments show that the choice of the inert gas has important consequences. Under the same conditions (incident light flux and pressure) the yield of soot is larger with Ar than with He and the proportion of toluene-soluble product is greater with Ar. These observations are consistent with more efficiently flushing which keeps the balloon flask cleaner and sweeps the carbon vapor out of the irradiated zone. Variation of pressure seems to lead to variation of the soot composition but as variation of pressure induce variation of the evaporation rate, new experiments are necessary to specify these effects.
14

70000
60000
50000
jn 40000 H
" 30000 H
'60
"70
T0F23 I.P.N. Orsay
U.V. Laser Desorption
C2n" (AM = 24)
n—i—i—i—i—i—i—i—i—i—i—I—r—i—i—|—i—i i I i i r
3500 4000 4500 5000 5500 6000 6500 7000
Channels(5nsec/ch)
Figure 4: Mass spectrum of the soot. Experimental conditions: Target: graphite rod; inert gas: He; pressure: 10 mb; incident flux: 950 W/m2
30000
24000 -
18000
o o
12000
6000
0 47200
-/-M
W2Zl?K0naf ^f Desorption
C
<V
MA HJOJ dusters
90 % of Cg0T
m = 721.72 !M
P C = 1.1 4.0 11.0 % ^oo 5(000 51000 SSO» «000
10 % of C60+ m = 737.14
p ,3C = 28.6 %
i ^62
47400 47600 47800
Time of Flight (ns)
48000 48200
Figure 5: Mass spectrum of toluene-soluble part of the I3C enriched soot (b) and details of the isotopic distribution in C60 molecules (a). In spectrum (b), A1203 clusters come from sample holder (Mylar film covered with Al)
15

Using graphite powder under Ar with a pressure of 100 mb, the toluene-soluble part of the soot gives a solution which exhibits all the absorption bands of a Cgrj/Cyo mixture in the range 300-700 nm. Then, it is possible to deduce the concentration of solution from absorbance measurement and to obtain a first approximate value of Y. However as the yield of soot is still small this determination can not be very accurate. We think that Y is greater than 12% and can reach 20%.
Finally, the last set of tests we have done is related to the production of ' 3C enriched fullerenes. The starting material is a mixture (70%-30%) of natural graphite powder and of 99% pure 13C powder set in a graphite crucible partly filled with natural graphite powder. Evaporation has been made under a 100 mb Ar atmosphere and incident flux close to 900 W/m2. As the grain sizes of the two powders are not the same and as the mixture covers only the top part of crucible, we cannot hope to have a constant isotopic composition of carbon vapor during the experiment. Mass spectrometric analysis of the toluene-soluble part of the soot shows the presence of fullerenes from Cg0 to Cgg. Distribution of l3C in each kind of molecule is close to the distribution found for Cgrj which is reported on figure 5. With the classical assumption that isotopic distribution can be deduced from vapor composition by a binomial law, we find that our sample can be described as the result of clustering from a vapor mixture of four different compositions, respectively 1.1% (natural 13C abundance), 4%,11% and 29% of 13C.
This result points out one of the many advantages of the solar generation of fullerenes but other tests will be necessary to have a better knowledge of the relation between isotopic distribution in the molecules and the composition of the starting powder mixture.
CONCLUSION
The results of our experiments show some of the advantages of solar generation of fullerenes: (i) it is possible to adjust the evaporation temperature Tf (at this time in the range 2500-3000 K) and vary the evaporation rate. A better balance of thermal losses could increase again the yield of soot, (ii) 13C enriched fullerenes can be more easily produced than using electrical arc method.
At this time, we can produce a reasonable amount of fullerenes by vaporization of graphite in focused sunlight. These quantities are large enough to perform spectroscopic analysis and some other laboratory experiments which can help us to have a better knowledge of the processes occurring during the fullerene formation. Such informations and the reduction of thermal losses can lead to a greater efficiency. In the next months we will develop the production of ' 3C doped fullerenes and explore the possibility of production of endohedral molecules.
References
1. L.F.P. Chibante, A. Tess, J. Alford, M.D. Dierner, R.E. Smalley, J. Phys.Chem. 97, 8696, 1993. 2. C.L. Fields, D.H. Parker, J.R. Pitts, M.J. Hale, C. Bingham, A. Lewandosky, D.E. King, J. Phys. Chem. 97, 8701, 1993 3. D. Laplaze, P. Bernier, L. Barbedette, J.M. Lambert, G. Flamant, M. Lebrun, A. Brunelle, S. Della-Ngra, C.R. Acad Sei. Paris, 318,(serie II), 7"", 1994 4. J. Abrahamson, C. Davies, J. Stott, R. Ward, P; Wiles, Ind. Eng. Chem. Fundam., 19, 283, 1980 5. A. Brunelle, P. Chaurand, S. Della-Negra, Y. Le Beyec, P. Hakansson B.U.R. Sundquist, P. Bernier, N. Coustel, Proceeding of the 40th ASMS Conference on Mass Spectrometry and allied topics, Washington DC, May 1992, p 1482

COMBUSTION SYNTHESIS OF FULLERENES
H. Richter. A. Fonseca, P. A. Thiry, J. M. Gilles, J. B. Nagy and A. A. Lucas Institute for Studies in Interface Sciences Facultes Universitaires Notre-Dame de la Paix Rue de Bruxelles, 61 B-5000 Namur Belgium
ABSTRACT
The formation of fullerenes by combustion was investigated for nine benzene/ oxygen/argon flames, one acetylene/oxygen/argon- and one toluene/oxygen/argon flame burning at 75 mbar. The flame-generated soot was Soxhlet extracted with toluene and the extract analyzed by HPLC. It was shown that the C6o/C70 ratio depends on the percentage of argon in the fresh gas mixture, which is directly related to the flame temperature. The use of acetylene and toluene as combustible led also to the formation of fullerenes, the yield in the toluene flame being 3.71% of the generated soot, so that toluene represents a serious alternative to benzene for fullerene fabrication in flames.
INTRODUCTION
Since the discovery of fullerenes by Kroto and Smalley , and their first macroscopic production by means of the electric arc method (Krätschmer-Huffman) ' , the investigation of their physical and chemical properties has been rapid. These studies have shown potential application fields in material sciences, e. g. as superconductor , optical devices, batteries or catalysts , or in organic and pharmaceutical chemistry. Besides the " archetypes " Cm and C70
the existence of larger fullerenes such as C78, C84 up to C30o has also been shown ' ' .An eventual industrial use of fullerenes will require production on a larger scale. Owing to the problems of up-scaling" the existing fabrication methods, i. e. electric arc (Krätschmer- Huffman)2, 3 or carbon vaporization by pulsed lasers ' , fullerene production in sooting hydrocarbon flames is likely to become the preferred method for industrial production. In this work we describe the fullerene formation in low pressure flames using either acetylene, benzene, or toluene as combustible.
FULLERENE FORMATION IN SOOTING HYDROCARBON FLAMES
The formation of fullerenes in flames was shown relatively early through investigations of the soot formation mechanism in hydrocarbon flames. In fact the first evidence of fullerene ions in acetylene/oxygen/argon- and benzene/oxygen/argon flames was presented in 1987 by the Homann group in Darmstadt14. The first extraction of macroscopic amounts of fullerenes
17
Mat. Res. Soc. Symp. Proc. Vol. 359 ° 1995 Materials Research Society

from flame-generated soot was achieved in 1991 by the Howard group at MIT ' ' . Further investigations suggested corannulene (C2oH10) as a fullerene precursor . In order to explain the chemical formation mechanism the Homann group discussed the role of polycyclic aromatic hydrocarbons (PAH) and of growing soot particles . Recently they suggested a precursor/product relation between C60HX and C60 as well as between C70HX and C70 with 1 < x < 4 in naphthalene/oxygen/argon flames20. A complex chemical mechanism for fullerene formation in benzene/oxygen flames has been suggested by the Howard group ' .
EXPERIMENTAL AND RESULTS
Our experimental set-up uses a stainless steel combustion chamber in order to burn flat low pressure flames. It has been described elsewhere . The fullerene formation in benzene/oxygen/argon- and benzene/acetylene/oxygen/argon flames was reported previously as a function of the experimental conditions, i. e. the composition of the fresh gas mixture, its velocity and the pressure. The role of acetylene in the fullerene formation was discussed . In the present work nine benzene/oxygen/argon flames as well as one acetylene/oxygen/argon- and one toluene/oxygen/argon flame were investigated. The pressure was always maintained at 75 mbar. The flame-generated soot was Soxhlet extracted with toluene during 40 to 60 h. It was analyzed with a Millipore Waters HPLC system equipped with an UV/VIS detector operating at 350 nm and a Regis analytical Buckyclutcher I column (Trident-Tri-DNP, 250 x 4.6 mm). The identification and quantification of the fullerenes C60 and C70 was performed by means of external references, whilst their isolation was achieved by complexation with p-Bu<- calix[8]arene following the procedure described in the literature '" .
Benzene/oxygen/argon flames
Table I Experimental conditions of the benzene/oxygen/argon flames
Flame C/O %Ar v [cm s"1],
25°C
P [mbar] Time [min]
Bl 0.90 16.7 43.0 75 50 B2 1.12 17.0 42.4 75 40 B3 0.77 38.0 44.2 75 40 B4 0.87 38.2 43.9 75 45 B5 0.97 38.4 43.7 75 65 B6 1.07 38.6 43.5 75 40 B7 1.17 38.8 43.3 75 40 B8 0.84 58.7 45.0 75 70 B9 1.02 59.1 44.7 75 35
18

Nine benzene/oxygen/argon flames were investigated at a pressure of 75 mbar. The atomic C/O ratio was varied, respectively, for a percentage of argon in the fresh gas mixture varying from about 17% (Flames Bl and B2), to 38.0 to 38.8% (Flames B3 to B7) and to about 59% (Flames B8 and B9). The velocity of the fresh gas mixture was maintained nearly constant with values between 42.4 and 45.0 cm s" . Table I shows the experimental conditions of the investigated flames, while Table II summarizes the results, indicating the soot and the (C60 + C70) formation per hour, the percentage of (C60 + C70) in the soot, the percentage of carbon in the fresh gas mixture (as benzene) which was transformed to (C60 + C70) and the C60/C70 ratio. The comparison of flames B1 and B2 shows a great increase of the soot as well as of the fullerene formation, for higher atomic C/O-ratios. This evolution is in agreement with the results for flames B3 to B7. From observation of these results it is not possible to determine exactly the best atomic C/O-ratio in order to reach a maximal fullerene formation. Nevertheless, taking into account former results23 which show a decrease of fullerene formation for higher atomic C/O ratios while the soot formation still increases, the optimal value should not be very far from 1.20. The difference of the percentage of argon in the case of flames Bl to B7 does not influence the global soot and fullerene formation, but it is worth mentioning that the C60/C70 ratio is higher for lower argon concentrations. This phenomenon can be explained by the higher temperature in these flames. The results of flames B8 and B9 show a C70 formation which is more important than the C60 one, while the fullerene concentration in the soot remains small. This phenomenon is probably due to the smaller temperature which was insufficient for enabling fullerene formation in a large region of the flame.
Table II Results of the benzene/oxygen/argon flames
Flame soot [g h_1] (COO + C70)
[mgh" ]
%
(COO + C7o)
%ofC transformed
C6(/C7o
Bl 0.828 3.66 0.44 7.16 lO"4 1.36 B2 6.911 277.37 4.01 4.70 10-2 2.15 B3 0.000 0.00 - - - B4 0.028 0.04 0.14 1.06 10-5 1.00 B5 1.347 28.12 2.09 6.95 10-3 1.55 B6 4.120 107.32 2.61 2.49 10-2 1.42 B7 9.152 415.58 4.54 9.10 10-2 1.45 B8 0.027 0.18 0.65 7.18 10"5 0.92 B9 5.896 69.43 1.18 2.43 10-2 0.79
19

Comparison of different combustibles
The formation of fullerenes in the benzene/oxygen/argon flame B7 was compared with that occuring in an acetylene/oxygen/argon- and a toluene/oxygen/argon flame, the latter being also burnt at a pressure of 75 mbar. The investigation of an acetylene/oxygen/argon flame was prompted by the knowledge of the formation of fullerene ions and of polycyclic aromatic hydrocarbon (PAH) ions in such flames14, 26. The experimental conditions are shown in Table m, and the results are summarized in Table TV. In the case of flame Al it could be observed that a much higher atomic C/O-ratio was needed for the formation of soot. The percentage of argon in the fresh gas mixture had to be increased in order to avoid damaging by excessive heating the bored stainless steel plate of the burner surface. The high temperature of the flame could be responsible for the formation of a comparatively small amount of the usual fullerenes C60 and C70. The HPLC chromatogram indicates the formation of larger quantities of unidentified compounds. The comparison with the literature data allows us to estimate the presence of C60 and C70 oxides as well as of C60 and C70 isomers. This hypothesis may be confirmed by further measurements.
Table HI Comparison of different combustibles (experimental conditions)
Flame Combustible C/O %Ar v, 25 °C [cm s~l]
P [mbar] Time [min]
Al Acetylene 1.69 44.8 48.9 75 7 Tl Toluene 1.20 38.2 43.9 75 24 B7 Benzene 1.17 38.8 43.3 75 40
Table IV Comparison of different combustibles (results)
Flame soot feh-1]
(C60+C70) [mgh-1]
% (Q0+C70)
% of C transformed
C6C/C70
Al 1.096 7.64 0.68 2.19 IO-3 0.84 Tl 6.063 224.82 3.71 4.52 10-2 1.20 B7 9.152 415.58 4.54 9.10 IQ-2 1.45
Experimental conditions chosen for the toluene/oxygen/argon flame were close to those valid for the benzene/oxygen/argon flame B7. It can be observed that this toluene flame generates less soot. This fact could be explained by an abstraction of the methyl-group by collision followed by a fast oxidation of this group, which is certainly easier than the oxidation of aromatic systems. However, the most important result is the relatively high yield of fullerene formation in the toluene flame, considering only the carbon atoms in the aromatic cycle
20

(without the CH3-group) it reaches about 58% of the carbon transformation yield in the corresponding benzene/oxygen/argon flame. It can be expected that an increase of the pressure in the combustion chamber will increase the fullerene formation yield in toluene flames because the formation of phenyl-radicals (C6H5 ■) by collision will become still more probable than the H-abstraction at the methyl-group by other radicals. Phenyl-radicals should thus play an important role in the starting mechanism for fullerene formation.
CONCLUSIONS
In this work we have investigated the influence of the atomic C/O-ratio and of the percentage of argon in the fresh gas mixture, on the fullerene formation while keeping constant both the pressure in the combustion chamber and the velocity of the fresh gas mixture. Under these conditions a variation of the atomic C/O-ratio for a percentage of argon of about 17% or of 38 to 38.8% shows the same evolution of the soot and the fullerene formation, but the higher temperature in flames containing about 17% of argon leads to a higher C6o/C70 ratio. In flames containing about 59% of argon the temperature is not sufficient for the formation of fullerenes in a large region of the flame. The most interesting result is certainly the formation of 3.71% of (C60+C70) in the soot generated by a toluene/oxygen/argon flame. An increase of this yield should be possible by means of an optimization of the experimental conditions.
Acknowledgements
This work was supported by the Belgian National Programme of Interuniversity Research Projects initiated by the State Prime Minister Office (Federal Services for Scientific,' Technical and Cultural Affairs), and by the Wallonia Region.
REFERENCES
H. W. Kroto, J. R. Heath, S. C. O'Brien, R. F. Curl and R. E. Smalley, Nature 318, 162(1985). W. Krätschmer, L. D. Lamb, K. Fostiropoulos and D. R. Huffman, Nature 347, 354 (1990). W. Krätschmer, K. Fostiropoulos and D. R. Huffman, Chem. Phys. Lett. 170, 167 (1990). P.- M. Allemand, K. C. Khemani, A. Koch, F. Wudl, K. Holczer, S. Donovan, G. Grüner and J. D. Thompson, Science 253, 301 (1991). R. M. Baum, Chemical & Engineering News (C&EN), November 22 1993, p. 8. R. Taylor and D. R. M. Walton, Nature 363, 685 (1993). R. M. Baum, Chemical & Engineering News (C&EN), August 2 1993, p. 3. H. Shinohara, H. Sato, Y. Saito, M. Takayama, A. Izuoka and T. Sugawara, J. Phys. Chem. 95, 8449 (1991).
21

9 D. H. Parker, P. Würz, K. Chatterjee, K. R. Lykke, J. E. Hunt, M. J. Pellin, J. C. Hemminger, D. M. Gruen and L. M. Stock, J. Am. Chem. Soc. 113, 7499 (1991).
0 D. H. Parker, K. Chatterjee, P. Würz, K. R. Lykke, M. J. Pellin, L. M. Stock, and J. C. Hemminger, Carbon 30, 1167 1992). H. Richter, S. C. Emberson and A. Fonseca, Revue de 1'Institut Francais du Petrole 49, 413(1994).
2 Y. Chai, T. Guo, C. Jin, R. E. Haufler, L. P. F. Chibante, J. Fure, L. Wang, J. M. Alford and R. E. Smalley, J. Phys. Chem. 95, 7564 (1991).
3 L. P. F. Chibante, A. Thess, J. M. Alford, M. D. Diener and R. E. Smalley, J. Phys. Chem. 97,8696(1993).
4 Ph. Gerhardt, S. Löffler and K. H. Homann, Chem. Phys. Letters 137, 306 (1987). J. B. Howard, J. Th. McKinnon, Y. Makarovsky, A. L. Lafleur and M. E. Johnson, Nature 352, 139(1991). J. Th. Mac Kinnon, W. L. Bell and R. M. Barkley, Combustion and Flame 88, 102(1992).
J. B. Howard, J. Th. McKinnon, M. E. Johnson, Y. Makarovsky and A. L. Lafleur, J. Phys. Chem. 96, 6657 (1992).
8 A. L. Lafleur, J. B. Howard, J. A. Marr and T. Yadav, J. Phys. Chem. 97, 13539 (1993). Th. Baum, S. Löffler, Ph. Löffler, P. Weilmünster and K. H. Homann, Ber. Bunsenges. Phys. Chem. 96, 841 (1992).
20 M. Bachmann, J. Griesheimer and K. H. Homann, Chem. Phys. Letters 223, 506 (1994). 2' Ch. J. Pope, J. A. Marr and J. B. Howard, J. Phys. Chem. 97, 11001 (1993). " Ch. J. Pope and J. B. Howard, Twenty-fifth Symposium (International) on
Combustion; The Combustion Institute: Pittsburgh, 1994; in press. 23 H. Richter, A. Fonseca, S. C. Emberson, J.-M. Gilles, J. B. Nagy, P. A. Thiry, R. Caudano
and A. A. Lucas, submitted for publication. 24 T. Suzuki, K. Nakashima and S. Shinkai, Chemistry Letters, 699 (1994). 25 J. L. Atwood, G. A. Koutsantonis and C. L. Raston, Nature 368, 229 (1994). 26 Ph. Gerhardt and K. H. Homann, J. Phys. Chem. 94, 5381 (1990).
22

REACTION CHAMBER AND CATHODE CONFIGURATIONS IN ARC PRODUCTION OF FULLERENES.
E.PASQUALINI*, C.PODESTA", A.GARCIA", A.RAFAEL", S.DENGRA", M.PAULOZZI" *Dpto. Materiales. CAC. Comision Nacional de Energia Atomica. Av.Libertador 8250, (1429) Buenos Aires, Argentina. "Facultad de Ciencias Exactas y Naturales. UNBA.
ABSTRACT
The reaction chamber in the arc production of fullerenes was redesigned with a nozzle sur- rounding the decomposition zone to allow for clean collection of soot in a filtering cartridge. Quantitative analysis in the region of 300-430 nm in UV-visible spectra permits determination of the abundance of C60 and C70 in the soot. Calibrated curves of absorptivity for both pure ful- lerenes were employed. In equivalent conditions of current and pressure, electrographites of different origins have different decomposition rates and yields. A mechanism to interpret the cathodic deposit formation is proposed. Decomposition inside a closed cathodic cylinder yields 100% deposit.
INTRODUCTION
Many variables are involved in the kinetics of arc-synthesis of fullerenes by the Krätschmer- Huffman technique1. Different results are obtained depending on pressure, temperature, carbon and inert gas used2. Process variables such as current, gap distance, rate of decomposition, and dynamic or static flow, will in general affect the yields and proportions of fullerenes obtained3. Geometrical factors of chamber configurations, refrigerated walls, heat radiation, electrodes, and deposition zones will influence the conditions of formation of different species inside the reac- tor. Some of these aspects are correlated. Systematization of the influence and interdependence of these variables is necessary for the evaluation of a scale production of fullerenes, nanotubes and encapsulated materials.
REACTION CHAMBER
A reaction chamber (Fig.I) was designed for evacuation of the soot produced in the decom- position of graphite, towards a non heat irradiated zone. The outcoming soot from the arc de- composition of graphite electrodes was redirected by the flow of inert gas passing through a centered graphite nozzle that surrounds the high temperature zone. A mechanic pump forced the gas flow and soot towards a filtering cartridge. The flow of gas was controlled by a needle valve and maintained at a minimum value, so that no soot could go upwards. A small percenta- ge of soot is deposited in the interior wall of the nozzle. The rest of it was collected in the cel- lulose cartridge of the type used in soxhlet extractions (33 mm diameter, 100 mm height).
Many tests were carried out until, in similar conditions of pressure and current, the same yields as with the usual method were obtained. The interior diameter of the nozzle had to be at least 20 mm for 6.4 mm electrodes. The cathode support had a minimum interference with the flow of gas and soot.
After passing through the nozzle, the soot entered a refrigerated expansion tube of 30 mm diameter. The cooling in this zone prevented the carbonization of the cellulose cartridge. The recollection of soot using this reactor configuration resulted simpler and cleaner than in the usual ones.
23
Mat. Res. Soc. Symp. Proc. Vol. 359 e 1995 Materials Research Society

u IN SOOT SAMPLES
The way used to determine<xhe cuantity of C60
and C70 in a soot sample was by dissolution, filtration and quantitative analyses of UV-visible spectrum (Perkin Elmer, Lambda 3, Spectropho- tometer) of each sample4'5. Pure Chromatographie grade cyclohexane was used as solvent.
The kinetics of dissolution6'7 of C60 (99.9%) and C70 (98%) (MER Corporation) was deter- mined first. The dissolution process was follow- ed measuring the 328 and 378 nm peaks of C60 and C70, respectively, for different quantity of hours in an agitated bath at 30 °C. In the case of C60, 20 hours of agitation was needed for com- pletion of the dissolution. For C70, 3 hours of dissolution were enough. Simultaneously it was observed that pure C60 and C70 obeyed Beers law (linear dependence of absorbance with con- centration) up to at least 0.033 mg/ml, near satu- ration. The second step was to obtain calibrated absorptivity curves. A wavelength range between 300 and 430 nm was selected since the more pronounced differences between both materials were appreciated and repetitive in this region.
A deconvolution program with Lorentzian profiles reproduced the shape of both curves. In the case of C60 nine peaks were used. C70 was approximated with seven peaks (Table I). These two composed profiles were used to establish a linear correspondence between concentration and area beneath the spectrum after the computational intensity was adjusted. Background com- ing from other bands outside this region were taken into account adjusting a horizontal line and the tails of two Lorentzian peaks, situated one at left and the other one at right of the used zone (Fig.2). Confirmation better than 2% was checked using previously calibrated mixtures of C60 and C70, from pure C60 up to 30% C70.
Five milligrams of soot obtained in each of the decompositions with the reactor described were mixed with 25 ml of pure cyclohexane. Sufficient time was given for the dissolution of C60 and C70 before filtering. Once the spectrum of interest was obtained, intensities of C60 and C70 patterns were adjusted. Integration of the areas beneath each spectrum allowed the deter- mination of the quantity of C60 and C70 in the soot sample.
MM
Fig.l Decomposition zone and filtering cartridge.
GRAPHITE STRUCTURE INFLUENCE IN YIELDS
Usually, for the synthesis of fullerenes, spectrographic grade graphite is used. This precaution avoids the influence of impurities in the synthesis process. Electrographites of good purity can be obtained commercially, and much cheaper. To our surprise, big differences were observed in the velocity of decomposition and yields in the fullerenes obtained. A set of six electrographites of different origin with no impurity traces in X-ray diffraction patterns were selected to test their influence in the yields of fullerene synthesis. These electrographites had different grain and porous sizes, electrical and thermal properties, densities, etc.
24

Table I. Pattern peaks to simulate CM and C70 spectra.
T*SLE i »,» a, m Int. "~1
do 327.5 H.4 1.000 337.0 17.0 .284 348.0 10.0 .010 359.5 54.0 .239 380.0 S.O .020 391.0 S.O .028 397.0 2.0 .005 403.6 3.0 .047 408.0 4.0 .032
311.5 17.0 .264 329.5 19.0 .772 340.0 20.0 ^32 351.0 H.O .145 358.5 10.0 .411 377.3 13.4 1.000 383.0 22.0 .106
3WD10 3Tfl JX 34D 3SO 380 370 JU 3BD «O 410 «043fl
wave length (nm)
Fig.2 Deconvolution of UV-visible spectrum of a solution with 85% C60 and 15% C,0 adjusting patterns of CM', C70
2 and background3.
From each of the selected materials, including spectrographic grade, two electrodes of 5 mm diameter and 50 mm length were machined. All of the electrodes were decomposed in a 100 torr He pressure, 50 A dc current, 18/20 volt. Rates of decomposition varying from 1 to 5 mg/sec and yields of fullerenes between less than 2% and 10% were obtained. The proportions of C60/C70 was the same in all cases (84/16). A direct correlation was noticed between yield and decomposition velocity. The higher rates had the bigger yields of fullerenes obtained from the soot. During decomposition, different temperature gradients were seen in the various electrogra- phites. Those with higher rates of decomposition presented a pronounced temperature gradient, just in the extreme of the anode. The slower decomposition rates presented a uniform color throughout the whole length.
Since practically all the energy input is liberated in the arc discharge and 70% of it in the a- node8, it can be said that the thermal gradient act in opposite way to the thermal conductivity of the anode. In consequence, the temperature at the decomposition surface will be bigger in those graphites that have a bigger gradient. Therefore the rate of decomposition and yields of ful- lerenes, for this particular conditions, increases with the temperature at the anode surface.
The thermal conductivity can be associated with the heat flow present in the anode. The latter is influenced by various factors: the thermal conductivity of the anode, the emission of radiation from its surface to the surroundings, the temperature of electrode supports, the heat generated by electric resistance, etc9. Thermal conductivity of graphites depends on their porosity, crystal- lographic structure and orientation10. Looking at the X-ray diffraction patterns of the electrogra- phites, there is a general tendency for the more crystalline ones (bigger thermal conductivity) to give smaller yields.
CATHODIC DEPOSITS
In the decomposition process of graphite anodes, 25-55% in weight of the decomposed mate- rial is deposited in the cathode". To study the origin of this deposit a 15 mm interior diameter cylinder of dense graphite was installed surrounding the decomposition zone. Electrodes of spectrographic graphite 6.4 mm diameter were decomposed with a dc current of 50 amperes in a 500 torr He pressure12. Samples of the anode, the soot, deposit on the interior wall of the cylinder and the cathodic deposit were observed with a SEM and X-ray diffraction.
All of the soot had a fibrilar structure (Photo 1). Both the wall and cathode deposits had fibrils and spherical particles. In the wall deposit, fibrils were observed in the more distant and coldest zones. In the transition towards the hottest zones, the spheres began to appear (photo 2)
25

and became predominant (Photo 3). In this process of wall deposit formation, stopping the arc discharge is like quenching the situation in different stages of a heat treatment.The cathodic deposit was nearly half and half: fibrils (soot) and globules (spheres). The general aspect of the cathodic deposit is of a stratified structure". In the transition zone of the wall deposit it can be observed how bundles of fibers, by the action of heat radiation, fuse and collapse into spheres13. The same appearance is seen in different regions of the cathodic deposit. In the zones of glo- bular aspect, in the wall or in the cathode, a subsequent ripening is seen in the contribution of small globules aggregating to form bigger ones (photo 4).
The X-ray sequence (Fig.3) shows the initial graphite structure, the soot diffractogram and the mixed structures of wall and cathode deposits'4. The three last can be imagined as the evolution towards more graphitized structures, similar to the annealing of amorphous carbon at high tem- peratures10.
In view of the above description and interpretation, it can be said that the cathodic deposit is formed by the aggregation of soot and a subsequent annealing of it. The latter is due to the
40 60 80
Fig.3 X-ray spectra of electrographite', soot2, wall deposit3 and cathodic deposit4.
moving hot spot15 and heat radiation. The soot appearance usually is of a fibril type. When heated aditionally the fibrils can fuse and collapse assuming a spherical form. In this ripening effect, spheres can collapse together, forming bigger ones. Additionally, fibers can collapse into spheres.
The stratification appearance of the cathodic deposit is just a consequence of soot deposition and the movement of the hot spot fussing the soot in the cathode surface. The erratic movement of the hot spot is controlled towards fresh zones of soot deposition where soot accumulation decreases locally the electrode gap, increasing the electric field. Different geometrical configura- tions, specially of the anode, and soot movement in the gap, can generate a pattern of movem- ent of the hot spot, and in consequence, preferential zones of fibrils and globules.
Using a helium pressure of 100 torr, the fibers were less ubiquitous, but the general charac- teristics were similar. This interpretation of the evolution of the cathodic deposit can be cor- related with similar and higher magnification observations"'3.
26

To verify the interpretation of these results, anodes of 6.4 mm diameter were decomposed inside a cylinder closed at one extreme. The latter measured 10 mm inside diameter and 16 mm outside diameter. Its interior length was such that the inside volume was slightly larger than the volume of the anode to be decomposed. Using this design, no soot was liberated, and in a very stable regime, all of it was transformed in the previously described way. 100% cathodic deposit was obtained. This cathodic configuration seems to be appropriate for the production of encap- sulated materials.
Photo 1. Bundles of fibrils in soot. Photo 2. Collapsed or fused fibrils.
Photo 3. Transition zone. Spheres and fibrils. Photo 4. Collapse of spheres into bigger ones.
DISCUSSION
Various dozens of experiments were carried out to determine correlation and dependence between process variables. Many times, conclusions that were thought to be certain, had to be revised, and many of them, discarded. When comparing results, it is not sufficient to know that spectrographic grade graphite is used. From the experiments shown here, it can be concluded
27
that graphite properties will determine the maximum temperature at the anode. The same can be said of electrode supports and other boundary effects.
To know about the interdependence of electrode gap, velocity of decomposition, current den- sity, graphite structure and yield of fullerenes, more automated controls are needed. General tendencies observed in our decompositions gave better yields with: minimum current densities, alternate current or using He instead of Ar. Cathodic deposits can be avoided using alternate current. Slower decomposition rates -at similar power input- are obtained, because of heat eva- cuation through two electrodes instead of one. Electrodes, in consequence, are colder than the anode in direct current. Nothing can be said about the decomposition of amorphous carbon structures.
These kind of correlated circumstances such as crystallographic and defect structure, thermal and electrical conductivity, temperature gradients, temperature, velocity of decomposition, yi- elds, and others, are the explanation of why it is impossible to systematize experimental data from different authors.
Tests were also carried out trying to decompose graphite powder injected in the electrode gap with the aid of helium flow through hollow anodes. The residence time in the plasma wasn't sufficient to decompose fine powder. The intention was to obtain a continuous process with similar conditions of pressures and gas flow.
CONCLUSIONS
Redirectioning of gas phase soot towards a filtering cartridge simplifies the recollection and favors the design of smaller reactors. The quantity of C60 and C70 in soot samples could be determined from UV-visible spectra in the region 300-430 nm with an error less than 2%. In similar conditions of current, pressure, and boundary conditions, the maximum temperature at the anodic surface is related with the properties of the anode. The rate of decomposition is bigger for higher temperatures, and so is the yield of C60 and C70 fullerenes obtained. A cyli- ndrical geometry of the cathode, with the anode being decomposed in the inside, transforms all the soot produced in cathodic deposit. This result was obtained on the basis of a complete inter- pretation of the mechanism of formation of cathodic deposits.
REFERENCES
1. W.Krätschmer, L.Lamb, K.Fostiropoulos, D.Huffman. Nature 347, 354 (1990). 2. The Fullerenes, eds. H.Kroto, J.Fisher and D.Cox (Pergamon Press, 1993). 3. L.Lamb, D.Huffman. J. Phys. Chem. Solids, 54, N°12, 1635 (1993). 4. H.Willard, L.Merrit, Jr., J.Dean, F.Seile, Jr. Instrumental Methods of Analysis, 7th ed.,
Ch. 7 (Wadsworth Publishing Company, 1988). 5. J.Wright. Molecular Crystals (Cambridge University Press, 1987). 6. N.Sivaraman, R.Dhamodaran, I.Kaliappan, T.Srinivasan, P.V.Rao, C.Mathews. J. Org.
Chem. 57, 6077 (1992). 7. RRuoff, D.Tse, R.Malhotra, D.Lorents. J. Phys. Chem. 97, 3379 (1993). 8. Welding Handbook, 7th ed. 1, 52 (American Welding Society, 1981). 9. H.Carslaw and J.Jaeger. 2nd ed. Ch. 4.5, 140 (Oxford at the Clarendon Press, 1959).
10. Nuclear Graphite, ed. R.Nightingale (Academic Press, 1962). 11. S.Seraphin, D.Zhou and J.Jiao. Carbon 31, N°7, 1209 (1993). 12. S.Seraphin, D.Zhou, J.Jiao, J.Withers and R.Loutfy. Carbon 31, N°5, 685 (1993). 13. T.Ebbesen, H.Hiura, J.Fujita, Y.Ochiai, S.Matsui, K.Tanigaki. Chem. Phys. Lett. 209, 83
(1993). 14. O.Zhou, R.Fleming, D.Murphy, C.Chen, R.Haddon, A.Ramirez, S.Glarum. Science, 263,
1744, 25 March 1994. 15. M.Hoyaux. Arc Physics (Springer-Verlag, New York Inc., 1968).
28

FORMATION OF NANOPARTICLES IN A CARBON ARC
S. A. MAJETICH**, J. H. SCOTT*, E. M. BRUNSMAN*, AND M. E. MCHENRY** *Physics Department, Carnegie Mellon University, Pittsburgh, PA 15213-3890, **Materials Science and Engineering Department, Carnegie Mellon University, Pittsburgh, PA 15213-3890. $ Correspondence Author
ABSTRACT
Details of the carbon-coated nanoparticle growth mechanism are revealed by a comparison of product morphology and reactor parameters. Carbon-coated metal or metal carbide clusters nucleate in the gas phase, grow to characteristic sizes, and deposit on surfaces within the reactor. The surface temperature determines the crystallinity of the nanoparticles and the surrounding carbon. Tungsten carbide nanoparticles show that the carbon coating arises due to phase segregation when the nanoparticle has a lower melting point than that of graphite.
INTRODUCTION
Carbon-coated nanoparticles are made by the Huffman-Krätschmer process using an anode which contains both graphite and the nanoparticle precursor.'_5 Our group has focused particularly on nanoparticles with useful magnetic properties, and those which could be used to strengthen composite materials. If the potential applications are to be realized, however, it is critical both to establish advantages relative to existing materials, and also to develop efficient, economical means of producing large quantities. Knowledge of the nanoparticle formation mechanism is critical to establishing the requirements for large scale production. It is also interesting to compare and contrast the details of nanoparticle growth with those concerning fullerene and carbon nanotube formation.
Here we bring together existing experimental evidence and new results to postulate the details of carbon-coated nanoparticle formation. We focus on basic questions concerning nanoparticle growth, concentrating on the characteristics which make them desirable for various applications. The main advantages of nanoparticles made by the carbon arc process are: 1) their resistance to oxidation and hydrolysis,6 2) the abundance of particles in the 5-50 nm size range, 3) the ability to generate alloy nanoparticles,7 and 4) the ability to prepare high temperature metastable phases.8 The first of these advantages exists due to the carbon coating, the second depends on the details of cluster growth, the third arises from the microscopic homogeneity of the carbon arc, and the fourth due to the rapid quenching rate. Understanding the formation mechanism is therefore critical for engineering nanoparticles with desirable properties.
EXPERIMENTAL
The evidence for nanoparticle formation is obtained by studying the product morphology and relating it to different experimental parameters, rather than from direct examination of the growth process. Our understanding of the particle morphology arises mainly from transmission electron microscopy (TEM) images of the nanoparticles, which indicates their size, shape, and crystallinity. In addition, electron microdiffraction and x-ray powder diffraction yield
29
Mat. Res. Soc. Symp. Proc. Vol. 359 c 1995 Materials Research Society

information concerning the nanoparticle crystalline phases. Finally, energy dispersive spectroscopy (EDS) reveals the elements present.
Reactor parameters investigated here include the materials the particles are made from, the buffer gas pressure, and the temperature of the surface where the particles deposit. The bulk of data concerns either rare earth carbides or transition metals. The composite anode rods used in the carbon arc are either pure graphite drilled and packed with metal or metal oxide powders, or mixtures of graphite and metal or metal oxide powders formed into cylindrical rods, typically of 1/4 in. diameter. In some cases organic binders were used to solidify the powders. The grain size of the powder starting materials is on the order of tens of microns for most materials, and is never in the nanoparticle size regime. The typical conditions for preparing nanoparticles range from those optimized for the fullerenes (100 A DC current, 125 Torr He) to the higher pressure (500 Torr He) conditions which favor carbon nanotubes. Normally the helium is flowing through the reactor, but we have also tested static burning (without He flow) for quantitative analysis of the reactor products.
RESULTS AND DISCUSSION
Nanoparticles are found in all parts of the reactor, both on the walls and in different regions of the cathode deposit,9 demonstrating that the nanoparticles do not form only as liquid droplets on the high temperature cathode.10 Metal and metal carbide clusters form along with the fullerenes in the high density plasma. Collisions with the He buffer gas and other plasma species cause diffusion toward the reactor walls or to the cathode, where a deposit builds up. Nanotubes are observed in all regions of the cathode deposit but very rarely in material deposited on the reactor walls. The yield of carbon-coated nanoparticles can greatly exceed that of the fullerenes or nanotubes,11 suggesting less stringent conditions for their formation. Even under conditions when nanotubes are plentiful, encapsulation within the tubes is rare, indicating differences in the nanotube and nanoparticle growth mechanisms. The plasma which exists in a carbon arc is quite complex, and the addition of metal species complicates it further. However, many details of the growth process are revealed by studying the reactor products.
The starting materials are at a minimum broken into tiny clusters, and for many materials will be completely atomized in the carbon arc. Micron-sized starting materials are converted into nanoparticles, except at very high pressures (925 Torr), where micron-sized spherical Co particles were also observed, indicating some melting and resolidification. Metals are believed to be atomized, based on the rapid thermalization of hot electrons,12 but oxides may be broken into clusters.13 These clusters are small enough that when they react in the carbon vapor, no trace of residual oxide is detected.
The metal-to-carbon ratio in the composite rods can be related to the ratio in the products. Our composite rods (~4 g) were converted into nanoparticle-containing soot in times on the order of 1-2 minutes. Under static burn conditions with WO3 starting material, approximately 30 wt. % of the material recovered was from the reactor walls and 70% was from the cathode deposit which builds up in the DC carbon arc.14 With flowing helium and high metal abundance, the resulting soot has a higher metal-to-carbon ratio than would be predicted by the starting material.11 While we believe that the carbonaceous soot contains some metallic atoms outside of the nanoparticles, the fraction of these atoms is extremely small. Individual Co atoms would be paramagnetic, but SQUID magnetometry of Co nanoparticle-containing soot shows hysteretic behavior at low temperatures.1-11 Mass spectrometric characterization of the fraction extracted with CS2 indicated the presence of free Co in small amounts. This is also consistent with the miniscule (or in the case of Co undetectable) yields of endohedral fullerenes. ^
Carbon and metal carbide clusters of characteristic sizes grow in the plasma. The typical size is the same for particles found throughout the reactor. The shape of the cathode deposit suggests that the main growth region is defined by the diameter of the anode rod. Careful inspection of samples taken from the reactor walls (Fig. 1) reveals evidence of the formation
30

200 nm 150 nm
Fig. 1. a.) FCC Co nanoparticles embedded in amorphous carbon, typical of soot obtained from the walls of the reactor with 500 Torr He flowing, b.) E112O3 nanoparticles on the surface of amorphous carbon glubules, also from the reactor walls, but with 100 Torr of He.
mechanism. Most nanoparticles, such as those made of Co, embed within the carbon globules (Fig. la). However, in a few cases, such as Eu (Fig. lb), the nanoparticles remain at the surface. The lack of encapsulation for Eu and Sm has previously been correlated with the high vapor pressure of these metals, relative to other rare earth elements.16 Fig. lb shows that Eu- containing nanoparticles still form, but we postulate that this occurs in a cooler region of the reactor where the carbon has already formed separate particles. The unprotected Eu nanoparticles later oxidize when exposed to air. Powder from low abundance samples from the reactor walls shows amorphous carbon globules (typical size -0.1 |0,m) and smaller metal-
containing nanoparticles (typical size - 0.03 (J.m). With increasing Co abundance in the composite starting materials, the characteristic nanoparticle size does not change, but higher He pressure is required for encapsulation. This suggests that the clusters grow separately and then collide (Fig. 2), either in the gas phase or on the deposition surface. The similar characteristic size of carbon black particles obtained by rapid evaporation is insensitive to changes in buffer gas pressure over four orders of magnitude.17 This has been modeled in terms of nucleation in supersaturated vapor, followed by depletion of carbon atoms.17 Similar calculations for yield smaller characteristic cluster sizes for rapidly evaporated transition metals.
The phase and crystallinity is determined by the temperature of the surface where the nanoparticles are deposited. Particles found in the cathode deposit show higher crystallinity, particularly in their carbon coatings. We attribute this mainly to the high temperature annealing on the cathode surface (up to 3500 K),18 in contrast to the rapid quenching at the reactor walls (-25 °C). This is seen not only by transmission electron microscopy (TEM), but also in the comparison of x-ray diffraction (XRD) of wall soot and samples from the cathode deposit. In some cases, we have had difficulty detecting nanoparticle phases by XRD, even when the particles of a particular type are seen by TEM and EDS, or known to exist as particles based on magnetic hysteresis.
31

o
.0 Fig. 2. As time passes, clusters first nucleate in the supersaturated vapor, then carbon and metal-containing clusters grow to characteristic sizes, and finally composite particles are deposited on surfaces within the reactor.
The morphology of tungsten carbide nanoparticles reveals the formation mechanism for the carbon coating. Phase segregation as the liquid metal-carbon alloy droplet cools10 has been postulated as the cause (Fig. 3a), due to the significantly higher melting point of graphite, relative to most nanoparticle materials. However, a mechanism similar to that involved in
a.)
Fig. 3. a.) Phase segregation as an alloy liquid droplet cools, and b.) coating of a metal particle by reactive carbon species have both been suggested as the cause of the carbon coating.
32

catalyst poisoning (Fig. 3b) could also be responsible, whereby carbon atoms or ions adsorb, and at high enough density and temperature, they graphitize.19 To probe the actual mechanism, we selected a high melting point material, tungsten (mp 3410 °C), which would not be expected to undergo phase segregation. If the graphitic carbon coating was observed in the resulting nanoparticles, then the catalyst poisoning mechanism would have to be correct. We prepared nanoparticles starting a W:C atomic ratio of 1:10 to insure excess carbon was available for coating. X-ray diffraction of the product shows sharp peaks corresponding to a predominant W2C phase, and no indication of tungsten oxides. TEM shows that the tungsten carbide nanoparticles do not encapsulate (Fig. 4a), suggesting that the phase segregation mechanism is correct. This is supported by the formation of interior gaps within some rare earth dicarbide nanoparticles in the cathode deposit,2"4 which would be difficult to explain by the catalyst poisoning mechanism. A mechanism similar to catalyst poisoning is believed to increase the number of graphitic shells upon annealling, but that differs from the formation mechanism of the initial carbon coating. While unencapsulated tungsten carbide nanoparticles predominate, evidence of occasional splat quenching of liquid alloy droplets was also observed (Fig. 4b), suggesting that the nanoparticles may be solidified before deposition. We are fursuing this further.
150 nm
Fig. 4. a.) TEM of tungsten carbide nanoparticles (from the reactor walls, 500 Torr He, static) showing a lack of carbon encapsulation, b.) dendritic tungsten carbide structures from the same location.
CONCLUSIONS
In the modified Huffman-Krätschmer process, the starting materials are atomized or broken into tiny clusters which then react and grow into the resulting nanoparticles. Nanoparticle growth occurs in the gas phase, since nanoparticles are found through out the reactor. Virtually all of the metal is transformed into nanoparticles. Carbon and metal carbide clusters of characteristic sizes grow in the plasma. The boiling point of the metal determines where in the reactor the nanoparticles nucleate and grow. For high boiling point materials this occurs in the region where carbon clusters are molten, and encapsulation arises. The deposition surface temperature controls the degree of crystallinity of both the nanoparticles and the surrounding
33

carbon. The carbon coating is formed by phase segregation when the nanocrystal material has a significantly lower melting point than that of graphite.
ACKNOWLEDGEMENTS
S. A. M. and M. E. M. thank the NSF for support through NYI awards DMR-9258308 and DMR-9258450 , respectively. This work is also based (in part) upon work supported by the NSF under Grant No. ECD - 8907068. The assistance of the CMU SURG program, and the participation of the CMU Buckyball Project members have been invaluable.
REFERENCES
1. S. A. Majetich, J. O. Artman, M. E. McHenry, N. T. Nuhfer, and S. W. Staley, Phys. Rev B 48, 16845, (1993); M. E. McHenry, S. A. Majetich, M. De Graef, J. O. Artman, and S. W. Staley, Phys. Rev. B 49, 11358 (1994).
2. R.S. Ruoff, D.C. Lorents, B. Chan, R. Malhotra, and S. Subramoney, Science 259, 346, (1993).
3. M. Tomita, Y. Saito, and T. Hayashi, Jpn. J. Appl. Phys. 32, L280, (1993). 4. Y. Yoshida, Appl. Phys. Lett. 62, 3447 (1993). 5. S. Seraphin, D. Zhou, J. Jiao, M. A. Minke, S. Wang, T. Yadav, and J. C. Withers, Chem.
Phys. Lett. 217, 191 (1994). 6. M. Ladouceur, G. Lalande, D. Guay, J. P. Dodelet, L. Dignard-Bailey, M. L. Trudeau, and
R. Schulz, J. Electrochem. Soc. 140, 1974 (1993). 7. M. E. McHenry, Y. Nakamura, S. Kirkpatrick, F. Johnson, S. A. Majetich, and E. M.
Brunsman, in Fullerenes: Physics. Chemistry, and New Directions VI. eds. R. S. Ruoff and K. M. Kadish, The Electrochemical Society, Pennington, NJ. 1994, p. 1463.
8. S. Kirkpatrick, M. E. McHenry, M. DeGraef, P. A. Smith, Y. Nakamura, and D. E. Laughlin, E. M. Brunsman, J. H. Scott, S. A. Majetich, Acta Metallurgica (under review).
9. S. A. Majetich, J. H. Scott, E. M. Brunsman, M. E. McHenry, and N. T. Nuhfer, in Fullerenes: Physics. Chemistry, and New Directions VI. eds. R. S. Ruoff and K. M. Kadish, The Electrochemical Society, Pennington, NJ, 1994, p. 1448.
10. Y. Saito, T. Yoshikawa, M. Inagaki, M. Tomita, and T. Hayashi, Chem. Phys. Lett. 204, 277 (1993).
11. E. M. Brunsman, J. H. Scott, S. A. Majetich, and M. E. McHenry, Science and Technology of Fullerene Materials, Materials Research Society, Fall 1994, abstract G5.6.
12. R. W. Schoenlein, W. Z. Lin, J. G. Fujimoto, and G. L. Eesley, Phys. Rev. Lett. 58, 1680 (1987).
13. L. A. Bloomfield, Y. A. Yang, P. Xia, and A.L. Junkin, in Clusters and Cluster Assembled Materials. MRS Symp. Proc. 206, eds. R. S. Averback, J. Bernholc, and D. L. Nelson, 1991,p.l05.
14. A small amount of product was irretrievably lost because the walls of the copper reactor cannot be scraped clean without Cu contamination. Reactor cleaning between batches of different materials was therefore separate from sample collection.
15. Y. Chai, T. Guo, C. Jin, R. E. Haufler, L. P. F. Chibante, J. Fure, L. Wang, J. M. Alford, and R. E. Smalley, J. Phys. Chem. 95, 7564, (1991).
16. Y. Saito, M. Okuda, T. Yoshikawa, A. Kasuya, and Y. Nishina, J. Phys. Chem. 98, 6696 (1994).
17. G. W. Smith, 15th Biennial Conference on Carbon. June 22-23, 1981, Philadelphia, PA, American Carbon Society, p. 482
18. Y. Murooka and K. R. Hearne, J. Appl. Phys. 43, 2656 (1972). 19. P. E. Nolan, M. J. Schabel, and D. C. Lynch, Carbon 35, 1 (1994)
34

CHARACTERIZATION OF FERROMAGNETIC NANOPARTICLES PRODUCED BY A CARBON ARC
E. M. BRUNSMAN*, S. ANNA*, S. A. MAJETICH**, and M. E. MCHENRY** * Physics Department, Carnegie Mellon University, Pittsburgh, PA 15213-3890. ** Materials Science and Engineering Department, Carnegie Mellon University, Pittsburgh, PA 15213-3890. i Correspondence Author
ABSTRACT
The effect of increasing metal fraction on carbon arc nanoparticle production is examined for 10-50 weight percent cobalt starting materials. With 500 Torr of helium buffer gas, the carbon arc process yields carbon-coated FCC Co nanoparticles of similar sizes throughout this range. The saturation magnetization is believed to scale linearly with the relative abundance of Co. The variation in the coercivity with abundance is small compared to the dramatic changes which can arise from changes in the size of fine particles. The approach to magnetic saturation is more rapid in high abundance samples. This is attributed to interparticle interactions which align the easy axes when the nanoparticles crystallize within interconnected carbon shells. The switching field distribution as a function of Co abundance arises from both rotational barriers and from barriers due to the particle size distribution.
INTRODUCTION
The carbon arc process has been used to prepare fullerenes,1 endohedral fullerenes,2 carbon nanotubes,3 and giant fullerenes now called carbon-coated nanocrystals or nanoparticles.4 Our group has focussed on this last group of carbon arc products, particularly those made of magnetic materials. Paramagnetism has been observed in rare-earth (RE) carbide nanocrystals.5
Superparamagnetism was seen in elemental ferromagnet nanocrystals at room temperature, but are hysteretic below 160 K.6 In all previous studies of endohedral fullerenes and carbon coated nanoparticles, the abundance of metal relative to that of carbon is below ten weight percent in the starting materials.
Here we examine the effect of increasing the relative metal abundance. A process is developed enabling the abundance of cobalt metal precursor in the anode of the carbon arc to range from zero to fifty weight percent. Nanoparticles are generated as before, and then are characterized structurally to determine the effect on particle size, phase, and spacing. The magnetic properties of these particles are compared with those of bulk cobalt and those of isolated cobalt nanoparticles. The properties were then compared to the bulk Co values.
EXPERIMENTAL
Composite rods were used to study the effect of concentration on saturation magnetization in Co nanoparticles. The composite rods were made by first mixing dextrin and graphite in a 3:4 ratio by weight, and then combined with varying amounts of Co metal powder. A series of samples was prepared with Co concentrations of 10, 20, 30, 40, and 50 weight percent. The powder mixtures were individually packed into a mold and baked overnight at 300°C to drive off water vapor and harden the composite rods. They were then pressed out of the mold and baked a
35
Mat. Res. Soc. Symp. Proc. Vol. 359 e 1995 Materials Research Society

second time at 200°C immediately prior to use. To create a conductive pathway in the rod, current was passed briefly with the electrodes touching prior to the standard Huffman-Kratschmer carbon arc with a 1 mm gap. The 1/4 in. diameter composite rods were used as the anode in a DC carbon arc along with a 2 in. diameter graphite cathode. The rods were consumed at 100A and 30V. The He pressure was varied and found to affect the nanoparticle phase; the samples discussed here were made with a He pressure of 500 torr. Samples were obtained both with flowing helium, and under fixed helium pressure conditions. The material collected was a mixture of Co nanocrystals, amorphous and graphitic carbon, and fullerenes.
Samples were obtained by gently brushing the walls of the copper reactor. The powder was then ground with a mortar and pestle before structural characterization. X-ray diffraction (XRD) was obtained with a Rigaku diffractometer to determine the phases of carbon and cobalt, and to check for the presence of cobalt oxides. Transmission electron microscopy (TEM) with a JEOL 120 microscope was used to observe whether the cobalt formed fine particles, whether they were encased in carbon, and how the size distribution varied with relative abundance. TEM samples were prepared by dispersing the powder in methanol with the aid of ultrasound, and then drying a drop of this solution on an amphorous carbon-coated copper grid.
Magnetization data was obtained for the Co nanocrystals using a Quantum Design superconducting quantum interference device (SQUID) magnetometer. The samples were prepared by immobilizing a known weight of ground sample powder in epoxy. The magnetization data were corrected for the diamagnetic contributions arising from the carbon and epoxy. Because the nanoparticles are embedded in amorphous carbon before the epoxy is added, the mean separation between particles is not altered by this procedure, in contrast with studies of behavior as a function of the fine particle packing fraction.7 The magnetization as a function of applied field was determined for all samples between ±5T at 5K. From earlier work on low abundance Co samples,6 it was anticipated that all samples would show hysteretic rather than superparamagnetic behavior at this temperature.
RESULTS AND DISCUSSION
X-ray diffraction revealed the presence of graphite and FCC Co. The FCC Co phase is commonly found in fine particles and thin films. Under standard fullerene conditions (-100 Torr) at and above 30 wt. % Co, XRD indicated the presence of CoO and C03O4. However, no evidence of cobalt oxides or carbides was observed when the He buffer gas pressure was raised to 500 Torr, and all of the magnetic characterization was performed on purely FCC Co samples. The lack of Co oxides is attributed to the protective graphitic coating around the nanocrystal which prevents oxygen from reaching the cobalt, which was confirmed by transmission electron microscopy.8
While x-ray diffraction demonstrated that the cobalt phase was unaffected by increasing abundance, TEM showed that the cobalt remained in fine particle form. Co nanocrystals with graphitic shells surrounded by amphorous carbon were observed. As expected, the higher abundance Co samples had correspondingly less amphorous carbon associated with them, and the sample from the 50 wt.% Co composite rods appeared to be approaching the limit for complete carbon coating. These nanoparticles were comparable to our past samples from the reactor walls,6 in that no voids were observed in between the nanocrystal and its coating. No carbon nanotubes were observed. The size distribution varied little with varying abundance, so that higher abundance sanies contained more nanocrystals rather than larger particles. The median diameter was approximately 20 nm, with a FWHM of roughly 10 nm.
Fig. 1 shows magnetization versus field results for different abundance samples at 5K. Here the hysteretic behavior at low fields, which is discussed later, is obscured in order to focus on the differences in saturation behavior. For low abundance samples, a much stronger applied field is required to saturate the magnetization, relative to samples with larger nanoparticle fractions. This can be thought of in terms of magnetic dipole-dipole interactions among nanoparticles embedded in the same amorphous carbon grain. The number of nanocrystals per carbon grain increases with
36

1.0
0.5 10
s o.oj
-0.5
♦ ■
f—•—r
101 ' ^ T
-5 -3
"M
H(T) Fig. 1. Magnetization per gram of sample as a function of applied field at 5K for samples
made from 10 and 50 weight percent cobalt composite anodes.
increasing abundance. The nanocrystals within a carbon grain in the low abundance samples are far enough apart that the dipole-dipole interaction is minimal. When the particles solidify after formation, the crystallographic orientations of the different particles are randomly aligned. For single magnetic domain particles this means that the easy axis directions which reflect the direction of spontaneous magnetization are also randomly aligned. In order to saturate the magnetization, particles within a single grain must overcome different rotational barriers in order to align with the applied field. The spacing between nanocrystals decreases with increasing abundance and dipole-dipole interactions between nanoparticles within the same carbon cluster tend to align the individual moments, and therefore the easy axes, with one another.
Fig. 2 shows the saturation magnetization as a function of Co abundance. The straight line indicates the extrapolation between values of zero magnetization for zero Co increasing linearly with the weight percent Co to o0 = 162.5 emu/g for pure FCC Co (at OK).9 The first three experimental points agree well with the expected line. The 40 and 50 weight percent data points lie above their expected saturation values. This could be due to a paramagnetic contribution from isolated Co atoms, since the atomic moment is 3|iB/atom, higher than the bulk Co value of 2nB/atom. However, the shape of the magnetization curves for high abundance Co samples does not reflect the S-shaped Brillouin function expected for paramagnetism. The higher saturation magnetization is more likely due to preferential loss of the lighter carbon atoms in the flowing He environment used in preparing the higher abundance samples. This is supported by TEM and the observation that when static He conditions were used in our reactor for the low abundance samples the data came into line with the expected results. Because at saturation all atomic moments are in the same direction as the applied field, only deviations in the moment per atom would raise the measured value above the theoretical prediction. Based on Langevin function of high temperature Co nanoparticles,6 we believe the paramagnetic contribution is small and that the deviations reflect increased Co abundance in the carbon arc products under flowing helium conditions. Elemental analysis is underway to confirm this hypothesis.
Fig. 3 expands the low field axis to show typical hysteresis loops for different Co abundances. The coercivities, He, of our samples were found from the widths of the hysteresis loops. Our Hc data were scattered, with an average coercivity around 400 Oe, attributed to small variations in the size distributions among samples. Unlike the saturation magnetization, the
37
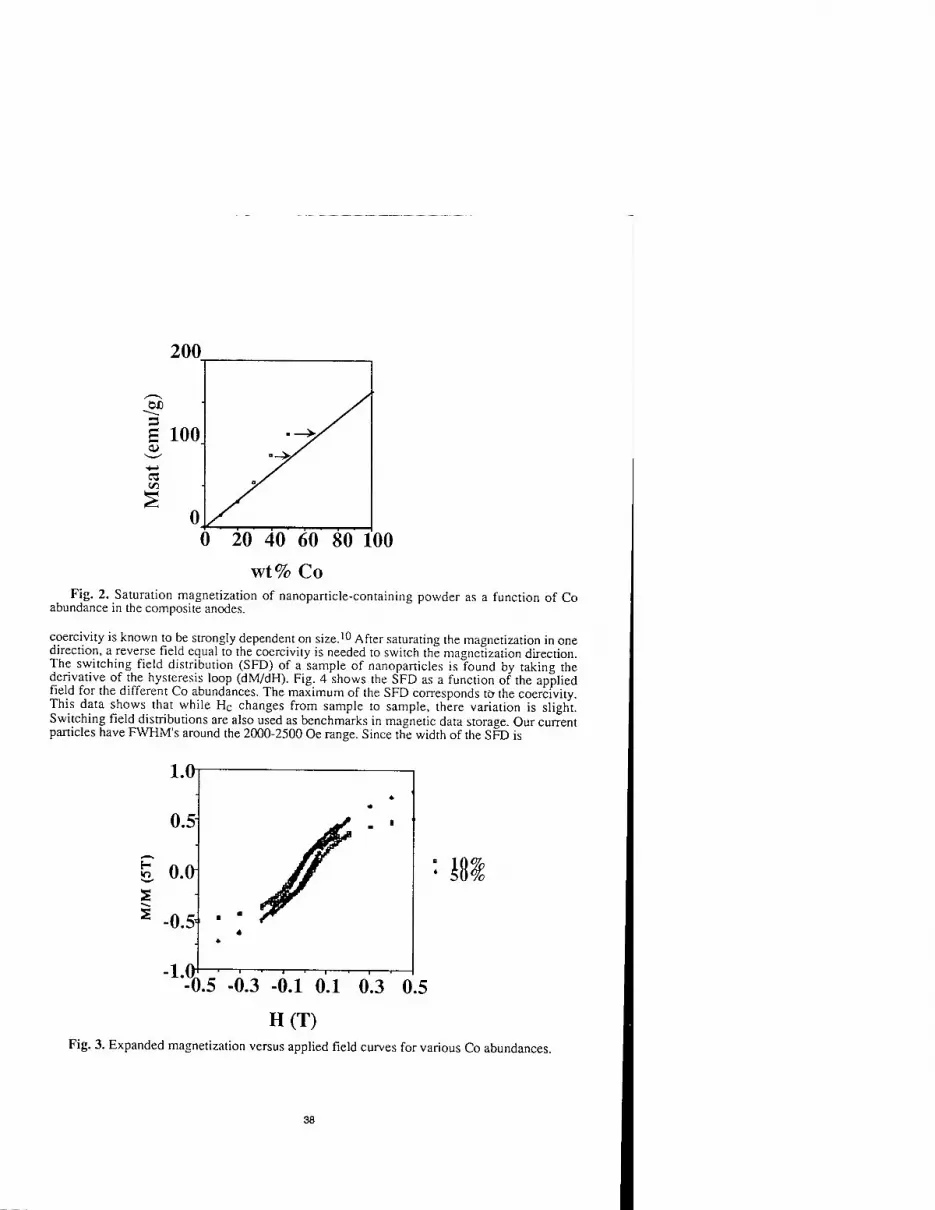
200
0 20 40 60 80 100
wt% Co Fig. 2. Saturation magnetization of nanoparticle-containing powder as a function of Co
abundance in the composite anodes.
coercivity is known to be strongly dependent on size.10 After saturating the magnetization in one direction, a reverse field equal to the coercivity is needed to switch the magnetization direction. The switching field distribution (SFD) of a sample of nanoparticles is found by taking the derivative of the hysteresis loop (dM/dH). Fig. 4 shows the SFD as a function of the applied field for the different Co abundances. The maximum of the SFD corresponds to- the coercivity. This data shows that while Hc changes from sample to sample, there variation is slight. Switching field distributions are also used as benchmarks in magnetic data storage. Our current panicles have FWHM's around the 2000-2500 Oe range. Since the width of the SFD is
-m
-0.5 -0.3 -0.1 0.1 0.3 0.5
H(T) Fig. 3. Expanded magnetization versus applied field curves for various Co abundances.
38

600
H it
1 X •a •^ s
50%
-0.1 0.1 H(T)
0.3
Fig. 4. Switching field distribution obtained from the derivative of the magnetization versus applied field curves for different Co nanoparticle abundances.
due to both the distribution of rotational barriers and nanoparticle size distribution. Higher abundance samples have more sharply peaked switching field distributions, but the full width at half maximum (FWHM) shows no significant trend. If particle alignment dominated the SFD, then a narrowing of the distribution of rotational barriers would be observed. We therefore believe that the particle size distribution predominates. In Table I we summarize the saturation magnetization, coercivity and FWHM of the switching field distribution for all our Co abundance samples.
Table I. Summary of Magnetic Properties for Various Co Abundances.
wt% Co Msat (emu/g) Hc (Oe) FWHM (Oe) 10 14.6 335 1240 20 31 528 2360 30 53 425 2550 40 86 474 1640 50 112 241 2470
CONCLUSIONS
The relative abundance of Co nanoparticles made in a carbon arc was varied, using composite starting materials with 10-50 weight percent Co. The resulting nanoparticles were the same phase and size, and they retained their carbon coating. The magnetic properties varied with relative abundance due to interactions between particles. Though the saturation magnetization is believed to depend only on the Co particle abundance, the approach to saturation was more gradual for samples with isolated particles. The behavior of high abundance samples can be explained by assuming that particles which lie close together in the carbon grains have similar crystallographic alignments due to magnetic dipole-dipole interactions when the particles form. The size distribution of particles generated in the carbon arc leads to rounding of the hysteresis curve and broadening of the switching field distribution.
39

ACKNOWLEDGEMENTS
S. A. M. and M. E. M. thank the NSF for support through NYI awards DMR-9258308 and DMR-9258450 , respectively. This work is also based (in part) upon work supported by the NSF under Grant No. ECD - 8907068. The assistance of the CMU SURG program, and the participation of the CMU Buckyball Project members have been invaluable.
REFERENCES
1. W. Kratschmer, L. D. Lamb, K. Fostiropoulos, and D. R. Huffman, Nature 347, 354 (1990).
2. R. D. Johnson, M. S. de Vries, J. Salem, and D. S. Bethune, Nature 355, 239 (1992). 3. S. Iijima, Nature 354, 57 (1991). 4. R.S. Ruoff, D.C. Lorents, B. Chan, R. Malhotra, and S. Subramoney, Science 259, 346,
(1993); M. Tomita, Y. Saito, and T. Hayashi, Jpn. J. Appl. Phys. 32, L280, (1993). 5. S. A. Majetich, J. O. Artman, M. E. McHenry, N. T. Nuhfer, and S. W. Staley, Phys
Rev. B 48, 16845, (1993). 6. M. E. McHenry, S. A. Majetich, M. De Graef, J. O. Artman, and S. W. Staley, Phys. Rev
B 49, 11358 (1994). 7. S. H. Liou and C. L. Chien, J. Appl. Phys. 63, 4240 (1988). 8. S. A. Majetich, J. H. Scott, E. M. Brunsman, and M. E. McHenry, Science and Technology
of Fullerene Materials, Materials Research Society, Fall 1994, abstract G3.8. 9. B. D. Cullity, Introduction to Magnetic Materials. Addison-Wesley, Reading, MA 1972 10. F. E. Luborsky, J. Appl. Phys. 32, 171S (1961).
40

MORPHOLOGY OF NANOPARTICLES AND FULLERENE BLACKS PRODUCED IN A CARBON ARC
JOHN HENRY J. SCOTT*, S. A. MAJETICH*#, AND S. DERRINGTON** ♦Department of Physics »♦Department of Materials Science and Engineering Carnegie Mellon University, Pittsburgh, PA 15213 # Author to whom correspondence should be addressed.
ABSTRACT
Using X-ray powder diffraction and transmission electron microscopy we examine the morphology and crystallographic structure of carbon-coated nanoparticles produced in a modified Huffman-Kratschmer carbon arc process. Graphite rods containing Ho were consumed in the arc and soots sampled from both the reactor walls and the inner core of the cathode deposit are compared. The inner core soot displays increased crystallinity and less amorphous carbon than wall-deposited soot, and nanoparticles in the inner core have more graphitic layers in the encapsulating shells, more gaps between the carbon coating and the core, and exhibit a greater degree of facetting than particles harvested from the reactor walls. These differences are interpreted as manifestations of the high temperature post-formation environment of the inner core of the cathode deposit.
INTRODUCTION
Since the discovery of carbon-coated nanoparticles by Ruoff and co-workers in 1993 [1], the field has aroused interest in several research groups already working with fullerene-derived materials. As the number of materials found to encapsulate grows, so does the richness of properties displayed by these species. To date, work has focused primarily on rare earth carbide [2-4] and transition metal [5] nanoparticles, but other metals and some alloys [6] have been studied. Novel properties displayed by these nanoencapsulates have led to their consideration for a wide variety of applications. The fine-particle magnetic behavior of these particles has drawn particular attention, and these materials are now being considered in areas traditionally dominated by iron oxides, such as magnetic toner for xerography, magnetic media for data storage, and ferrofluids for magnetic seals and bearings. Interest in these particles has even penetrated the biomedical community where it is hoped the carbon-coating may provide a biocompatible protective layer surrounding a magnetic core suitable for enhancing contrast in magnetic resonance imaging.
A detailed understanding of the growth mechanism of encapsulated nanoparticles is critical if we hope to overcome the barriers to their exploitation and bring the applications mentioned above to fruition. Crystallographic structure and soot morphology provide important clues about how these particles form and are encapsulated in the electric arc process, but the large number of interrelated parameters affecting particle nucleation and growth in the reactor often confuse the issue. Extraction of reliable conclusions from morphological observations is often difficult. This study examines both rare earth and transition metal nanoparticles and attempts to isolate the effect of location of deposition within the reactor on nanoparticle morphology and structure. The morphology of soots recovered from Ho-containing rods are examined with conventional and high resolution transmission electron microscopy (TEM), and their crystallographic structures are determined from X-ray powder diffraction (XRD). The effects of deposition location are revealed when the results of these characterizations are compared.
41
Mat. Res. Soc. Symp. Proc. Vol. 359 ° 1995 Materials Research Society

EXPERIMENTAL PROCEDURE
The nanoparticles produced in this study were collected from soot generated in a modified Huffman-Kratschmer carbon arc reactor. Our reactor consists of a cylindrical copper reaction vessel 15 cm in diameter and 30 cm in length. The upper electrode (anode) consisted of doped graphite rods 6.35 mm in diameter. A solid, cylindrical block of graphite 38 mm in diameter rested atop a water-cooled copper support structure and served as the cathode. The electric arc was energized by a DC welding power supply operated at 30 V and 100 A. The reactor was evacuated and backfilled with helium buffer gas several times before each burn to purge the reaction vessel of air. While the arc was energized, additional helium was flowed through the reactor at a pressure of 125 Torr. Cold tap water was used to cool both electrode support structures and the reactor vessel wall.
The doped graphite rods used in generating the soot were cast in brass molds from a mixture of graphite, either metal or metal oxide dopant powder, and dextrin, a large molecular weight sugar used as a binder. The molds were packed with a mixture of the above powders and heated in air to 300 °C for at least 6 hours to drive off moisture and allow the binder to set. When cool, the rods were extracted from the mold and baked a second time at 300 °C for 8 hours to ensure complete dryness. The rods produced in this casting process were 20 cm long and somewhat fragile, but mechanically sound enough to handle and burn.
X-ray powder diffraction was performed on the soot to determine the crystalline phases present and the degree of crystallinity of the carbon fraction of the sample. We used a Rigaku theta-theta diffractometer with a copper target excited at 25 kV, 30 mA and a single crystal silicon sample holder. A post-sample monochromator filtered out Kß but did not separate Kal from Ka2. Our goniometer step size was typically 0.05° and each angle was integrated for 5 seconds.
Transmission electron microscopy was performed to determine soot morphology and particle size distributions. When possible, electron microdiffraction patterns were obtained to supplement XRD patterns in structural identification. TEM samples were prepared by sonicating raw soot in HPLC-grade methanol for 30 minutes. The resulting suspension was pipetted onto a copper TEM grid coated with amorphous carbon and allowed to air dry. Conventional TEM was performed on a JEOL 120CX TEMSCAN microscope operated at 120 kV, while high resolution images were obtained using a JEOL 4000EX atomic resolution microscope operating at 4O0 kV.
RESULTS AND DISCUSSION
Consumption of doped graphite rods in the carbon arc produces two macroscopically distinct products. The first product, wall soot, is a fine, black, powdery residue that coats the reactor vessel walls and electrode support structures. The other reactor product is the cathode deposit (Fig. 1), which consists of a hard, thin, horizontal plate-like disc of carbonaceous material atop the surface of the cathode, and a tall pencil-like structure that grows vertically from the cathode toward the anode. Upon further inspection this pencil exhibits internal structure. The inner core of the cathode pencil is a soft, black powdery material known to be rich in nanotubes, nanoparticles, and pure-carbon nanopolyhedra. This inner core is surrounded by a hard, gray outer shell of carbonaceous material that often shows a lamellar morphology when examined microscopically [7].
X-ray powder diffraction was performed on soot sampled from both the reactor walls and the inner core of the cathode deposit (Fig. 2). The wall soot displays graphite peaks (G) as expected, but no holmium or holmium carbide peaks. However, because our diffractometer is insensitive to concentrations below 5 weight percent, we cannot conclude from the XRD that the wall soot does not contain holmium carbide nanoparticles. We confirmed this by directly testing the sensitivity of our instrument with finely divided aluminum powder. XRD of aluminum powder dispersed in pure carbon soot from the reactor (5 wt. % Al) showed no trace of aluminum in the diffraction pattern. Graphite peaks also appear in the XRD of the inner core soot, as does a peak at 53° (labeled C), which we have identified as a carbon peak because it appears in soots produced from pure graphite rods. The inner core pattern also contains holmium dicarbide peaks. In conjunction with evidence from TEM, these peaks are attributed to holmium
42

\ L-Z/ Cathode
Fig 1. Schematic of cathode deposit showing macroscopic morphology: (a) inner core; (b) carbonaceous outer shell; (c) carbonaceous disc or "pancake".
dicarbide nanoparticles. The peaks labeled with an asterisk do not match any of the known phases of holmium, holmium oxides, holmium carbides, carbon, or copper. The presence of such peaks and the absence of known strong reflections of some materials make interpretation of XRD results problematic. Although XRD remains a valuable technique for characterizing soots containing nanoparticles, the information it provides is limited and should be interpreted with care.
Conventional and high resolution TEM were performed on the same two soot samples to study their microscopic morphology and to confirm and supplement the structural information extracted from XRD. Figure 3 is a high resolution micrograph of holmium containing soot harvested from the reactor wall. Nanoparticles with graphitic carbon coatings roughly 20 nm in diameter can be seen embedded in amorphous carbon. In high resolution micrographs such as these the crystallinity of the carbide core is revealed and the c-axis d-spacing of graphite is clearly visible. Because the flux of nanoparticles from the cathode deposit to the walls is assumed small, the presence of particles in the wall soot implies either a gas-phase growth mechanism, or simultaneous surface growth on the walls and the cathode. Similarity in particle morphology and sizes in these two locations suggests the former mechanism (gas-phase growth) is more likely. The microscopic morphology of the pure carbon fraction of this soot also supports this growth model. Conventional TEM of wall soot reveals aciniform, pure-carbon structures very similar to those produced by the nucleation and post-aggregation mechanisms responsible for carbon black formation in gas-phase processes such as diffusion flame combustion [8].
High resolution micrographs of the inner core soot (Fig. 4) exhibit holmium carbide nanocrystals with a similar size distribution. These particles also consist of a crystalline core encapsulated by ordered, graphitic carbon shells. In this case, however, the particles are embedded in a much more graphitic matrix. The carbon surrounding the nanoparticles displays much longer-range order than in the wall soot samples, the number of graphitic shells around
43

700-1
600-
■a 500H
X> J3 400-
2£ c
i—i 200-1
100-
I I T 30 35 40 45
Two Theta (degrees) 50
' I ' ' 55
Fig. 2. X-ray diffraction pattern of holmium-containing soot. Upper trace is soot sampled from the inner core; lower trace is soot sampled from the reactor walls. The meanings of the peak labels are given in the text.
each metal core is larger, and the shells possess fewer defects. We believe this increased crystallinity is due to the higher temperature of the post-formation environment of the inner core nanocrystals, not a fundamental difference in their growth mechanism. The proximity of the inner core of the cathode deposit to the arc root allows for a slower cooling profile producing "annealed" or graphitized material instead of amorphous carbon. The effect of this additional graphitization is evident in the XRD (Fig. 2) as sharper, higher intensity graphite peaks in the inner core soot compared with wall-deposited soot.
A morphological trend related to the increased crystallinity is the greater frequency of facets in the inner core. This increased facetting is evident in both the nanoparticles and empty carbon nanopolyhedra. The facetting frequently exhibits the 120° angles characteristic of graphite, as well as some 90° facets. Since these facets appear in inner core samples produced from pure carbon anodes, they are likely a characteristic of carbon and not the metal carbide nanoparticles. Close inspection of Figure 4 also reveals the presence of gaps between the metal carbide core of the nanoparticle and the encapsulating shells. As can be seen from the micrograph, these gaps do not occur in every particle but are quite common in the inner core soot samples. In contrast, very few gaps are present in soots collected from the reactor walls. While the exact mechanism that produces these gaps is not known, the variation in the size of the gap (as a fraction of the associated nanoparticle's volume) from one particle to the next seems to indicate it is not merely a shrinkage-on-cooling process. Elucidation of this gap formation mechanism is one of many areas that will benefit from an improved nanoparticle growth model.
44

' , -.;»: ■*^?,j£? '15 nm '
Fig. 3. High resolution micrograph of Ho-containing soot sampled from the reactor wall.
JKäSafsäsä
Ei
'Mm
h 25 nm Fig. 4. High resolution micrograph of Ho-containing soot sampled from the inner core of the
cathode deposit.
45
CONCLUSIONS
Differences in morphology of nanoparticles deposited in various locations within the carbon arc reactor reflect the different cooling curves and post-formation environments experienced by those particles, and eventually provide clues about the growth mechanism and annealing processes that occur within the reactor. XRD and high resolution TEM of soots sampled from the reactor walls and the inner core of the cathode deposit reveal differences in the degree of crystallinity of these materials. Inner core carbon is generally much more graphitic and less amorphous than the carbon found in wall soot. Correspondingly, inner core nanoparticles are typically decorated with more encapsulating graphitic shells with fewer defects than their wall soot counterparts. Inner core nanoparticles also display more gaps and facets than wall soot samples. Further study of nanoparticle morphology will provide important data for improving existing growth models. Such improvements are critical if we wish to control and modify the growth of these particles and fully exploit their potential for applications.
ACKNOWLEDGMENTS
S.A.M. thanks the NSF for support through NYI award DMR-9258308 and grant ECD- 8907068. The authors also gratefully acknowledge the support of the CMU SURG program and the assistance of the CMU Buckyball Project.
REFERENCES
1. R. S. Ruoff, D. C. Lorents, B. Chan, R. Malhotra, and S. Subramoney, Science, 259, 346 (1993).
2. Y. Saito, M. Okuda, T. Yoshikawa, A. Kasuya, and Y. Nishina, J. Phys. Chem., 98, 6696 (1994).
3. B. Diggs, A. Zhou, C. Silva, S. Kirkpatrick, N. T. Nuhfer, M. E. McHenry, D. Petasis, S. A. Majetich, B. Brünett, J. O. Artman, S. W. Staley, J. Appl. Phys., 75, 5879 (1994).
4. S. A. Majetich, J. H. Scott, E. M. Brunsman, M. E. McHenry, N. T. Nuhfer in Fullerenes: Recent Advances in the Chemistry and Physics of Fullerenes and Related Materials, edited by Karl M. Kadish and Rodney S. Ruoff (Electrochemical Society Proceedings, 94-24, Pennington, NJ, 1994) pp. 1448-1461.
5. Y. Saito, T. Yoshikawa, M. Okuda, N. Fujimoto, S. Yamamuro, K. Wakoh, K. Sumiyama, K. Suzuki, A. Kasuya, Y. Nishina, J. Appl. Phys., 75, 134 (1994).
6. S. Kirkpatrick, M. McHenry, M. DeGraef, P. Smith, Y. Nakamura, D. Laughlin, E. Brunsman, J. H. Scott, S. Majetich, submitted to Acta Metallurgica.
7. S. Seraphin, D. Zhou, J. Jiao, Carbon, 31, 1212 (1993).
8. K. Kinoshita, Carbon: Electrochemical and Phvsicochemical Properties. (John Wiley and Sons, New York, 1988), p. 25.
46

CRYSTALLINE BORON CARBIDE ENCAPSULATED INTO CARBON NANOCLUSTERS FROM ARC-DISCHARGE SOOT
SUPAPAN SERAPHIN, DAN ZHOU, AND JUN JIAO Department of Materials Science and Engineering, University of Arizona, Tucson, AZ 85721
ABSTRACT
Using a boron-containing composite anode in an arc discharge, we found in the soot on the reactor walls graphitic multiwalled carbon clusters that contained boron carbide crystals, as identified by high resolution transmission electron microscopy (HRTEM), electron energy loss spectroscopy (EELS), and electron diffraction. The encapsulants are compounds of the lightest element that has yet been encapsulated, and the first of the non-metallic. The multiwalled graphitic cages partially encapsulating the boron compounds have rarely been observed in the soot of arc-discharge material produced from anodes not containing boron. We explain this exception by the known tendency of boron to catalyze graphitization.
INTRODUCTION
Successful synthesis of carbon nanoclusters in tubular form has enlarged the technological promise of the new allotropes of carbon [1]. Even more interest was stimulated when broad-based studies of carbon nanotubes showed that introduction of metals or their compounds into the arc-discharge process through composite anodes produced novel structures [2-5]. Some of the metals or their compounds were encapsulated into the hollow core of the carbon nanoclusters [6-9], promising the growth of nanowires, microcrystals of magnetic elements, and in general facilitating the study of small amounts of the encapsulants in the confined configuration of the nanotubes.
The list of the materials reported to be encapsulated was so far restricted to metals and their compounds, with Sc [10] the lightest element. Metals of the groups 3B (Sc, Y, La) [6-11] and group 5B (V, Nb, Ta) [12-13], the Lanthanide series (La, Ce, Pr, Nd, Gd, Dy, Ho, Er, and Lu) [6-7, 14-15], the iron group metals (Fe, Ni, and Co)[12, 16], as well as Zr [13], Mo, Mn [12], and Cu [17] comprise the list of encapsulants, most of them in the form of their carbides. Some of them (Fe, Ni, Co, Nd, Gd, Cu, Y) [2-4, 14, 17, 18] catalyze the formation and growth of single-walled nanotubes from the arc-discharge. Early laser-vaporization studies incorporated metal ions into molecular fullerenes [19-21]. However, no encapsulation into tubular structure has been observed for non-metallic elements or their compounds.
The location on which the carbonaceous material is deposited determines strongly the character of the deposit. Two locations are common for the retrieval: One, the cathodic slag at the terminus of the arc, where temperatures are believed to exceed 3000 C, and which is exposed to a dense ionic flux that is driven by a strong electric field; Two, in contrast, the soot at the walls of the reaction vessel that reflects a much cooler region, and which is exposed to a much diluted ionic flux, with only a weak electric field present. The different conditions of deposition in the two locations have resulted in significantly different types of carbonaceous deposits. In particular, it is not usual that graphitic multiwalled structures are observed in the soot, and encapsulation of the element utilized in the composite electrode has not been reported there. True, near spherical fullerenes have been reported in the soot, and star-patterned [14, 18] and string-of-beads shaped [5, 15] configurations were observed there, but none of the cage-like tubular structures with and without encapsulation that are predominantly present in the slag only.
We present here results showing that: 1) boron carbides can be encapsulated in cage-like multiwalled structures retrieved from
the soot, making these compounds of by far the lightest element ever encapsulated. A large percentage of closed polyhedra and tubular clusters in the soot contain boron carbide crystals. A portion of the soot appears as connected graphitic "ribbons" among the usual amorphous carbon.
47
Mat. Res. Soc. Symp. Proc. Vol. 359 e 1995 Materials Research Society

2) the spatial distribution of the deposit is strongly shifted in favor of deposition of multiwalled polyhedra and tubules containing boron carbides in the soot rather than in the slag. This is in contrast to the conventional arc discharge. The apparent effect of boron on the products of the arc discharge is in agreement with the strong enhancement of graphitization by the presence of boron in pyrolytic carbon observed before [22]. Apparently, this enhancement overcomes the more gentle process environment in the soot that does not stimulate the formation of multiwalled cages and encapsulation if no boron is present.
EXPERIMENTAL PROCEDURE
The samples were retrieved from the soot and the cathodic deposits of an arc-discharge sustained by 43 V at 70 amps dc. under a helium atmosphere of 550 Torr. The boron composite anode, of cylindrical shape of 0.64 cm diameter and 30 cm long, consisted of a homogeneous mixture of 17 wt.% pure boron powder and graphite cement. The cathode was a cylindrical graphite rod of 0.95 cm diameter and 3 cm long. The gap between the electrodes was maintained at approximately 1 mm. At the end of the deposition, the soot was collected from walls of the reactor vessel, and the cathodic deposit was broken off from the cathode. For the transmission electron microscopy (TEM) observation, the carbonaceous deposits were ground into powder and dispersed in ethanol. After sonicating for approximately five minutes, drops of the black suspension were deposited on a holey-carbon copper grid and the solvent allowed to evaporate. The samples were then examined in a Hitachi 8100 TEM at 200 keV. The chemical composition of the encapsulants was analyzed using the parallel detection electron energy loss spectrometer (PEELS) attached to the microscope. Electron diffraction patterns obtained with the electron images were used to determine the crystalline phase of the boron compounds in the samples.
RESULTS AND DISCUSSION
TEM observation of the soot prepared from the boron composite anode revealed a morphology never observed before in soot samples which normally consist of crystalline C60, C70 and amorphous carbon. In particular, the characteristic graphitic fringes of 0.34 nm spacing both in forms of connected networks or in polyhedra cages are normally absent. In contrast, the soot prepared from the boron composite anode contained in the soot numerous polyhedra clusters coated with graphitic carbon as shown in a low magnification TEM image in Fig.l. The particles
1 0 nm
:;■•' ■•;v Ä
ästpsSälsltä
Fig. 1 A low magnification TEM image of encapsulated polyhedra particles in the soot
48
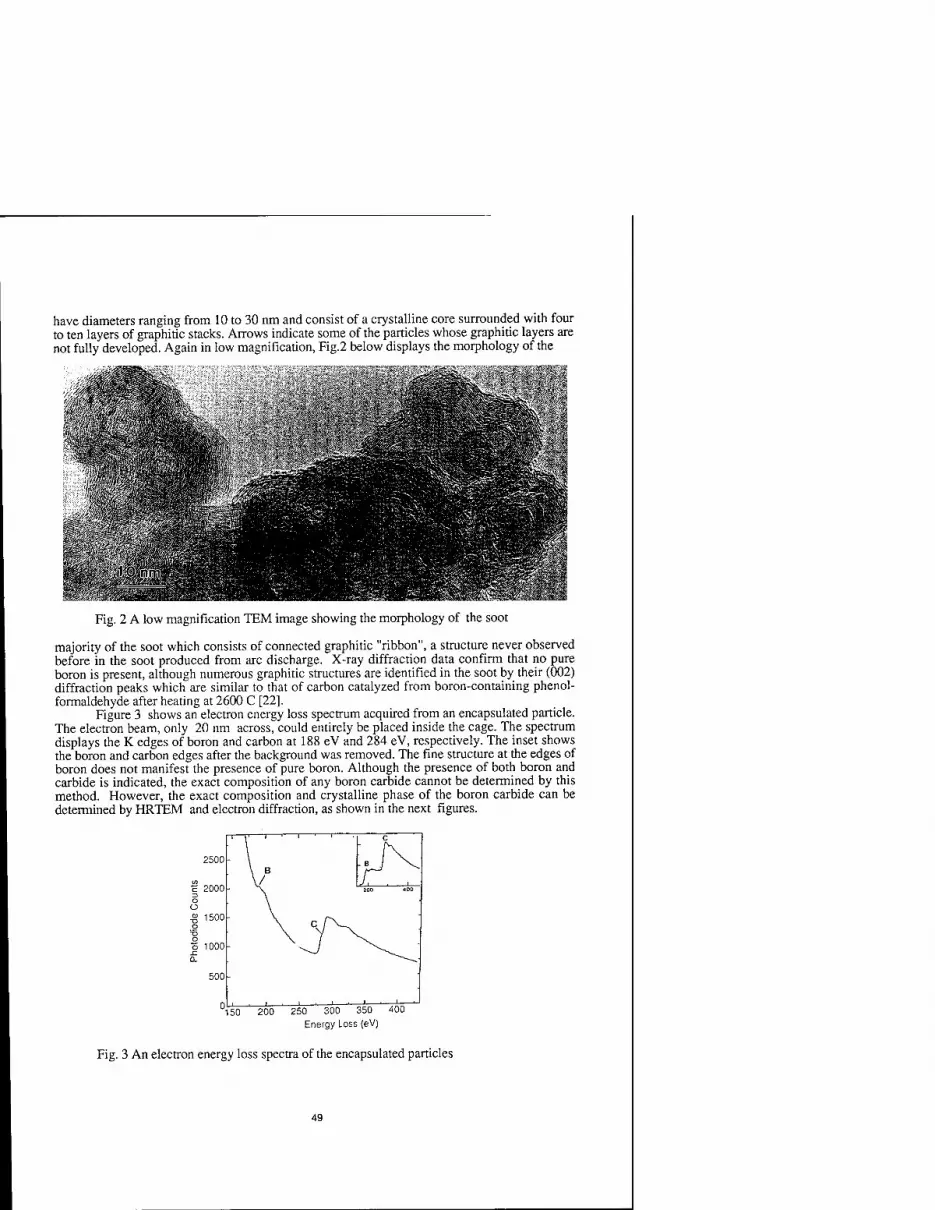
have diameters ranging from 10 to 30 nm and consist of a crystalline core surrounded with four to ten layers of graphitic stacks. Arrows indicate some of the particles whose graphitic layers are not fully developed. Again in low magnification, Fig.2 below displays the morphology of the
Bilk , A?s8Sss*i^wsSIIg§§&>.
Fig. 2 A low magnification TEM image showing the morphology of the soot
majority of the soot which consists of connected graphitic "ribbon", a structure never observed before in the soot produced from arc discharge. X-ray diffraction data confirm that no pure boron is present, although numerous graphitic structures are identified in the soot by their (002) diffraction peaks which are similar to that of carbon catalyzed from boron-containing phenol- formaldehyde after heating at 2600 C [22].
Figure 3 shows an electron energy loss spectrum acquired from an encapsulated particle. The electron beam, only 20 nm across, could entirely be placed inside the cage. The spectrum displays the K edges of boron and carbon at 188 eV and 284 eV, respectively. The inset shows the boron and carbon edges after the background was removed. The fine structure at the edges of boron does not manifest the presence of pure boron. Although the presence of both boron and carbide is indicated, the exact composition of any boron carbide cannot be determined by this method. However, the exact composition and crystalline phase of the boron carbide can be determined by HRTEM and electron diffraction, as shown in the next figures.
2500
2000
1500
o 1000
500
150 200 250 300 350 400
Energy Loss (eV)
Fig. 3 An electron energy loss spectra of the encapsulated particles
49

Figure 4 shows a high-resolution TEM image of a 18-nm diameter carbon nanotube, containing a crystalline particle in the hollow core. Notice that this image also demonstrates that an encaged polyhedral particle is attached to the nanotube, and the graphitic cages are not completed (indicated by arrows). Figure 5 shows a high-resolution TEM image of a 30-nm diameter hexagonal-shaped particle filled with a crystalline material. The measured lattice spacings of 0.372 nm and 0.409 nm under an angle of 54 degree labeled on the image match those of (012) and (003) planes of a boron carbide (B4C) crystal of hexagonal structure with
msgm
l^Ba^äBrans^^.^;-?^^7«;.v.;T'--1v-...-.v/.v .-.<.-■-,
Fig. 4 A high resolution TEM image of an encapsulated carbon nanotube
m ■'■'■.'Sfe •.•. •
: 5 nm
Fig. 5 A high resolution TEM image of an encapsulated graphitic cage
50

lattice parameters a=0.560 nm and c=1.212 nm [23]. Note that on all six sides of the graphitic cage the layers are aligned nearly parallel to the crystallographic planes of the boron carbide crystal. The image also illustrates that there are numerous particles (arrows) of about 5 nm in diameter that are coated with double layers of graphite.
Figure 6 shows a high-resolution TEM image of a 44-nm diameter graphitic cage filled with a boron carbide crystal. Again, as labeled on the image, three sets of the interplanar spacings of A=0.445 nm, B=0.372 nm, and C=0.235 nm under angles of 59 degree (between A and B) and 31 degree (between B and C), respectively, are in close agreement (3% experimental errors) with the calculated values of (101), (012), and (113) planes of a hexagonal B4C crystal. The selected area electron diffraction of a few of these particles can be indexed on the basis of the hexagonal structure of B4C, suggesting that the encapsulant is crystalline B4C.
Sfri'm
sK$5SI§!£o?£!».!&i
Fig. 6 A high resolution TEM image of an encapsulated graphitic cage and an electron diffraction pattern from the encapsulated particle
The strongly enhanced presence of graphitic structures in the soot where none are found without boron, confirms previous observations that boron accelerates the rate of graphitization [24-26]. These studies show that the activation energy for graphitization is essentially the same for boronated carbon as compared to boron-free carbon. However, the rate of graphitization is strongly enhanced for boronated carbons, due to an increase in the pre-exponential factor of the graphitization reaction [27].
CONCLUSIONS
We have investigated growth phenomena and encapsulation in the environment of an arc- discharge that contained boron resulting in an encapsulation of boron carbides into multiwalled carbon cages. Equally important, we observed a displacement of the usual growth phenomena from the cathodic slag to the soot, indicating that the known tendency of boron to catalyze graphitization overcomes the limitations of the process conditions existing in the soot without boron present. This suggests that multiwalled growth occurs in an equilibrium of process conditions in the reactor vessel on the one hand, and thermodynamic properties on the other. This equilibrium can apparently be shifted, and will emerge more clearly from detailed studies under way.
51

ACKNOWLEDGEMENTS
The authors acknowledge valuable discussions with J. C. Withers and B. Cort of MER Corp., Tucson, Arizona, and R. S. Ruoff of SRI International, Menlo Park, California. The research was supported by Grant No. DMR 921805 from the U.S. National Science Foundation.
REFERENCES
[I] T. W. Ebbesen and P. M. Ajayan, Nature 358, 220 (1992) [2] D. S. Bethune, C. H. Klang, M. S. de Vries, G. Gorman, R. Savoy, J. Vazquez, and R.
Beyers, Nature 363, 605 (1993) [3] S. Iijima and T. Ichihashi, Nature 363, 603 (1993) [4] S. Seraphin and D. Zhou, Appl. Phys. Lett. 64, 2087 (1994) [5] S. Seraphin, D. Zhou, J. Jiao, M. A. Minke, S. Wang, T. Yadav, and J. C. Withers
Chem. Phys. Lett. 217,191 (1994) [6] R. S. Ruoff, D. C. Lorents, B. Chan, R. Malhotra, and S. Subramoney, Science 259, 346
(1993) [7] M. Tomita, Y. Saito, and T. Hayashi, Jpn. J. Appl. Phys. 32, L280 (1993) [8] S. Seraphin, D. Zhou, J. Jiao, J. C. Withers, and R. Loutfy, Nature 362, 503 (1993) [9] S. Seraphin, D. Zhou, J. Jiao, J. C. Withers, and R. Loutfy, Appl. Phys. Lett. 63, 2073
(1993) [10] Y. Saito, M. Okuda, T. Yoshikawa, S. Bandow, S. Yamamuro, K. Wakoh, K. Sumiyama
and K. Suzuki, Jpn. J. Appl. Phys. 33, L186 (1994) [II] Y. Saito, T. Yoshikawa, M. Okuda, M. Okohchi, Y. Ando, A. Kasuya, and Y. Nishina
Chem. Phys. Lett. 209, 72 (1993) [12] S. Seraphin, J. Electrochemical Society, in: Proceedings of the Symposium on Recent
Advances in the Chemistry and Physics ofFullerenes and Related Materials, Vol. 94-24, eds. K. M. Kadish and R. S. Ruoff (The Electrochemical Society, INC.,1994) p.1433
[13] S. Bandow and Y. Saito, Jpn. J. Appl. Phys. 32, L1677 (1993) [14] S. Subramoney, R. S. Ruoff, D. C. Lorents, and R. Malhotra, Nature 366, 637 (1993) [15] Y. Saito, T. Yoshikawa, M. Okuda, N. Fujimoto, K. Sumiyama, K. Suzuki, A. Kasuya
and Y. Nishina, J. Phys. Solids 54, 1849 (1993) [16] S. Seraphin, S. Wang, D. Zhou, and J. Jiao, Chem. Phys. Lett. 228, 506 (1994) [17] X. Lin, X. K. Wang, V. P. Dravid, R. P. H. Chang, and J. B. Ketterson, Appl. Phys.
Lett. 64, 181 (1994) [18] D. Zhou, S. Seraphin, and S. Wang, Appl. Phys. Lett. 65, 1593 (1994) [19] J. R. Heath, S. C. O'Brien, Q. Zhang, Y. Liu, R. F. Curl, H. W. Kroto, F. K. Tittel, and
R. E. Smalley, J. Am. Chem. Soc. 107, 7779 (1985) [20] D. M. Cox, D. J. Trevor, K. C. Reichmann, and A. Kaldor, J. Am. Chem. Soc 108
2457 (1986) [21] T. Guo, C. Jin, and R. E. Smalley, J. Phys. Chem. 95, 4948 (1991) [22] A. Oya and S. Otani, Carbon 17, 131 (1979) [23] H. K. Clark, J. Am. Chem. Soc. 65, 2215 (1943) [24] D. B. Fischbach, in: Chemistry and Physics of Carbon, Vol 7, ed. P. L Walker
Jr.(Marcel Dekker, Inc., 1971) p. 86. [25] R. N. Katz and C. P. Gazzara, J. Mater. Sei. 3, 61 (1968) [26] J. A. Turnbull, M. S. Stagg, and W. T. Eeles, Carbon 3, 387 (1967) [27] H. N. Murty, D. L. Biederman, and E. Heintz, Fuel 56, 305 (1977)
52

MORPHOLOGY OF NANOMETRIC BORON NITRIDE POWDERS PRODUCED BY LASER PYROLYSIS
F. WHJLAIME*, L. BOULANGER* AND M. CAUCHETIER**
*Section de Recherches de Metallurgie Physique - Departement d'Etude du Comportement des Matenaux - Direction des Technologies Avancöes, Centre d'Etudes de Saclay, F-91191 Gif-sur- Yvette, France **Service des Photons, Atomes et Molecules - Departement de Recherches sur l'Etat Condense, les Atomes et les Molecules - Direction des Sciences de la Matiere, Centre d'Etudes de Saclay, F 91191 Gif-sur-Yvette, France
ABSTRACT
Ultrafine boron nitride powders were synthesized by laser driven reactions in BCI3-NH3 mixtures. The structure and morphology of the graphitic nanoparticles generated in this process were investigated by high-resolution electron microscopy. Polyhedral concentric shells (ranging in size from 30 nm to more than 100 nm) are a major constituent of the as-pyrolyzed powder. This onion-like configuration is very similar to that observed in carbon materials. After heat treatment at 1650°C under nitrogen atmosphere, plate-like particles with a few perfectly flat graphitic sheets (10 to 50 layer thick, 50 nm in diameter) are formed.
INTRODUCTION
Electron microscopy images of graphitized-carbon particles, with several polyhedral or nearly- spherical concentric shells, were available in 1980.1 These particles of less than 10 nm in diameter were formed within amorphous carbon films prepared by the arc-discharge method. Similar structures, also known as onions, russian dolls, and nested or multilayered fullerenes, were also observed for larger, hollow particles of carbon blacks.2-3 More recently, the production of COO in macroscopic quantities4 and the unexpected discovery of carbon nanotubes5 have stimulated much activity in the field of fullerenes and related carbon structures. Small polyhedral particles were shown to be formed on the anode of the carbon-arc apparatus6 or by heat treatment of the carbon soot7, whereas electron beam irradiation transforms the soot into concentric, nearly spherical shells8 that may attain 50 nm in diameter. The observation of these remarkable structures were limited to carbon materials until a variety of concentric polyhedral and cylindrical structures of layered nanoparticles were shown to exist also in MX2 materials (M=W, Mo; X=S, Se).9-10
Boron nitride (BN) is a III-V compound which is found in an hexagonal structure with strongly covalent (sp2) intralayer B-N bonds and weak, van der Waals, interlayer interactions. The close resemblance to graphite is illustrated in fig. 1. Based upon similarities between carbon and BN materials, fullerene-type geometries were suggested for BN clusters11, and the existence of boron nitride nanotubes was proposed12.
Fig. 1. Similarities between the layered structures of hexagonal boron-nitride (ÄBN) and graphite. The nearest-neighbour distances (dNN = 0.144 nm and 0.142 nm respectively) and the inter-layer spacings (c/2=0.33 nm and 0.335 nm respectively) are almost identical in both structures.
Ac£^£^2. -, r ^fp>, A
1 1 1 1 1 II 1
ÄBN »B°N • C Graphite
53
Mat. Res. Soc. Symp. Proc. Vol. 359 s 1995 Materials Research Society

In this paper, we describe the synthesis of an ultrafine boron nitride powder produced by CO2 laser pyrolysis, and the characterisation by high resolution electron microscopy (HREM) of the graphitic nanoparticles formed during this process.
POWDER SYNTHESIS
Boron nitride powders were synthesized via laser-driven gas-phase reactions, as described previously. «.14 The two gaseous precursors, NH3 and BCI3, were separately introduced in the beam of a high powered continuous wave CO2 laser, leading to the overall reaction:
BCI3 + NH3 -> BN + 3 HC1
An excess of NH3 reacts with HC1 to give NH4 Cl as by-product. In this process the two reactants which have absorption bands near the emission line of the CO2 laser (10.6 ^m) are rapidly heated by the laser beam. The resultant powders and by product gases are carried by a laminar flow of argon gas from the reaction chamber to a collection filter. The advantages of this innovative method is to produce high purity, chemically homogeneous, non-agglomerated, small diameter powders. The specific surface area of the present powders, as determined by BET measurements, can be as high as 200 m2/g, i.e. more than two orders of magnitude larger than for commercial BN powders."-!4
The powders were studied in the as-pyrolyzed state and after two-hour heat-treatments under nitrogen atmosphere at various temperatures (ranging from 1000°C to 1650°C).
TRANSMISSION ELECTRON MICROSCOPY RESULTS
The transmission electron microscope study was performed on a Philips CM20 twin operating at 200 kV. Electron diffraction patterns of the initial powder contain diffused rings indicating a high two-dimensional ordering within graphitic layers, and a low ordering between layers. After heat treatment at 1650°C, the three-dimensional ordering is increased, in particular the 11 rine splits into 110 and 112 reflections (see fig. 2).!5
110 112 11 004 10 002
Fig. 2. Transmission electron diffraction patterns of boron nitride powders.(a): As-synthesized state presenting a turbostratic structure.(b): Three-dimensional ordering towards the hexagonal structure after heat treatment at 1650°C under nitrogen atmosphere.
54

Concentric Shells
We have observed a very large variety of roughly spherical particles with graphitic layers parallel to the surface ranging in size from 30 nm to more than 100 nm (fig. 3). The closed nature of these structures and their roughly spherical shape is confirmed by tilting experiments. These particles are either nearly filled to the center, or hollow with a large void inside.
In the larger particles, the roughly spherical arrangement does not present a very high order between layers throughout the whole cross section, and the shells, possibly incomplete, are only nested over a few layers.
On the other hand, the smallest particles - 30-to-50 nm in diameter - are perfectly nested polyhedra. A hollow polyhedron with a thickness of 15-to-20 layers is presented in fig. 3.(b) & (c). The morphology of this particle, as schematized in fig 3.(d), corresponds exactly to the sketch proposed by Heidenreich et al. to describe carbon black particles. In these structures the layer planes are bending from one facet to another, i.e. there is a clear continuity between layers of adjacent facets rather than separate crystallites meeting at a grain boundary. Incomplete layers can also be observed either at the surface or forming edge dislocations within the structure. A further indication of the stability of these onions is given by the fact that they are still observed in the powder after heat treatment at temperatures as high as 1650°C.
Fig. 3. Transmission electron micrographs of boron nitride concentric shells, (a): Particle nearly filled to the center, obtained in the as-pyrolyzed powder, (b) Hollow particle, observed in the powder heated.at 1650°C. (c) Detail of an edge of the particle shown in (b). (d) Schematic representation of the particle shown in (b) and (c)
55

Platelets
The second typical morphology consists of a stacking of perfect, flat graphitic layers (see fig. 4). These particles have been observed in the powder after two-hour heat-treatment under nitrogen atmosphere at 1650°C, where they constitute the dominant growth form. These plate-like crystallites have a diameter of typically 50 nm and a thickness of 10-to-50 layers. According to the electron diffraction patterns, these crystallites have a three dimensional ordering close to the hexagonal structure. The energy of these ÄBN-platelets is further minimized by eliminating dangling bonds at the border of the layers. The closure is achieved by graphitic layers bent back so as to join pairs of layers (see fig. 4.(a)). These piles are also observed in the powders heated at temperatures as low as 1400°C, where they are less abundant and have more dangling bonds.
The stacking morphology is believed to be rather common in BN after heat treatment and independent of the initial powder, as suggested by previous observations showing analogous low magnification micrographs16.17. However the exact crystalline structure of these nanoparticles was not resolved by HREM in these previous studies. A similar but less organized arrangement of graphitic planes has been observed in the carbon-arc soot.18
Fig. 4. Boron nitride platelets formed in the powder after heat treatment at 1650°C. (a) High resolution electron micrograph of a platelet showing the high crystalline order, and bending of the layers at the extremity, (b) Low magnification image, (c) Schematic representation.
56

Search for BN tubules
We also searched for cylindrical structures. Contrary to what occurs in carbon and WS2 the nanotube configuration is not a common morphology in the present powders. However, a few elongated graphitic particles with the same number of lattice fringes on both sides of an empty core have been observed. The HREM micrograph presented in figure 5 can be interpreted as a tubular particle with a conical-shaped end, as described in carbon nanotubes.19 This particle was observed in the BN powder that obstructed the plunging tubing which leads to the collection chamber.14 It should also be mentioned that the spherical particles observed in this part of the powder have an uncommon hairy aspect.
Fig. 5. Transmission electron micrograph of an elongated particle, with graphitic layers parallel to the surface, observed in the powder collected in the obstructed part of the tubing leading to the collection chamber. It is believed to have a tubular form and a conical-shaped end.
CONCLUSIONS
We have presented a transmission electron microscope study of boron nitride powders produced by CO2 laser pyrolysis. A very large variety of concentric shelled nanoparticles have been observed. They are intermediate in size and degree of crystallinity between carbon blacks and particles observed in the carbon-arc soot. After thermal treatment under nitrogen atmosphere at temperatures ranging from 1400°C to 1650°C, plate-like nanoparticles are produced. The stability of these structures is confirmed by the fact that they remained unchanged for a period of several months.
The concentric shells observed in the present study give further evidence that the similarities between carbon and boron nitride materials may be extended to the nanometer scale. In this regard, the laser pyrolysis technique, with a yield of a few grams of ultrafine powder per hour, appears to be a very promising method to produce macroscopic quantities of various BN nanoparticles. Other morphologies, such as nanotubes or smaller concentric shells, may be expected to be formed by varying the experimental conditions, i.e. the flow rates, laser power, and irradiation geometry. Small BN clusters may also be searched for in the present powders.
57

ACKNOWLEDGEMENTS
The authors would like to thank Beatrice Andriot for her contribution to the transmission electron microscope observations.
REFERENCES:
1. S. Iijima, J. Cryst. Growth 50, 675 (1980). 2. R.D. Heidenreich, W.M. Hess and L.L. Ban, J. Appl. Cryst. 1, 1 (1968). 3. A. Oberlin, in Chemistry and Physics of Carbon, edited by P.A. Thrower (M. Dekker New York, 1989) 22, pp. 1-143. 4. W. Krätschmer, L. D. Lamb, K. Fostiropoulos and D. Huffman, Nature 347, 354 (1990) 5. S. Iijima, Nature 354, 56 (1991). 6. Y. Saito, T. Yoshikawa , M. Inagaki, M. Tomita and T. Hayashi, Chem. Phys. Letters 3-4, 277(1993). 7. W.A. De Heer and D. Ugarte, Chem. Phys. Letters 207, 480 (1993). 8. D. Ugarte, Nature 359, 707(1992). 9. R. Tenne, L. Margulis, M. Genut and G. Hodes, Nature 360, 444 (1992). 10. M. Hershfinkel, L.A. Gheber, V. Volterra, J.L. Hutchison, L. Margulis and R. Tenne, J. Am. Chem. Soc. 116, 1914 (1994). 11. F. Jensen and H. Tolfund, Chem. Phys. Letters 201, 89 (1993). 12. A. Rubio, J.L. Corkill and M.L. Cohen, Phys. Rev. B 49, 5081 (1994). 13. M. Luce, O. Croix, Y.D. Zhou, M. Cauchetier, M. Sapin and L. Boulanger,. in Euro- ceramics II, edited by G. Ziegler and H. Hausner (Deutsche Keramische Gesellschaft Köln Germany, 1993) pp. 233-238. 14. M.I. Baraton, L. Boulanger, M. Cauchetier, V. Lorenzelli, M. Luce, T. Merle, P Quintard and Y.H. Zhou, J. Eur. Ceram. Soc. 13, 371 (1994). 15. V.l. Chukalin, N.V. Chukanov, S.V. Gurov, V.N. Troitskii, N.E. Filatova, T.V. Rezchikova, and E.P. Domashneva, Sov. Powder Metall, and Met. Ceram. 27, 81 (1988).' 16. D.A. Lindquist, J.F. Janik, A.K. Datye and R.T. Payne, J. Am. Ceram. Soc. 74, 3126
17. T.S. Bartnitskaya, T.Y. Kosolapova, A.V. Kurdyumov, G.S. Oleinik and A N Pilyankevich, J. Less-Com. Metals 117, 253 (1986). 18. D. Ugarte, Chem. Phys. Letters 198, 596 (1992). 19. S. Iijima, P.M. Ajayan and T Ichihashi, Phys. Rev. Lett. 69, 3100 (1992).
58

PART II
Nanotubes
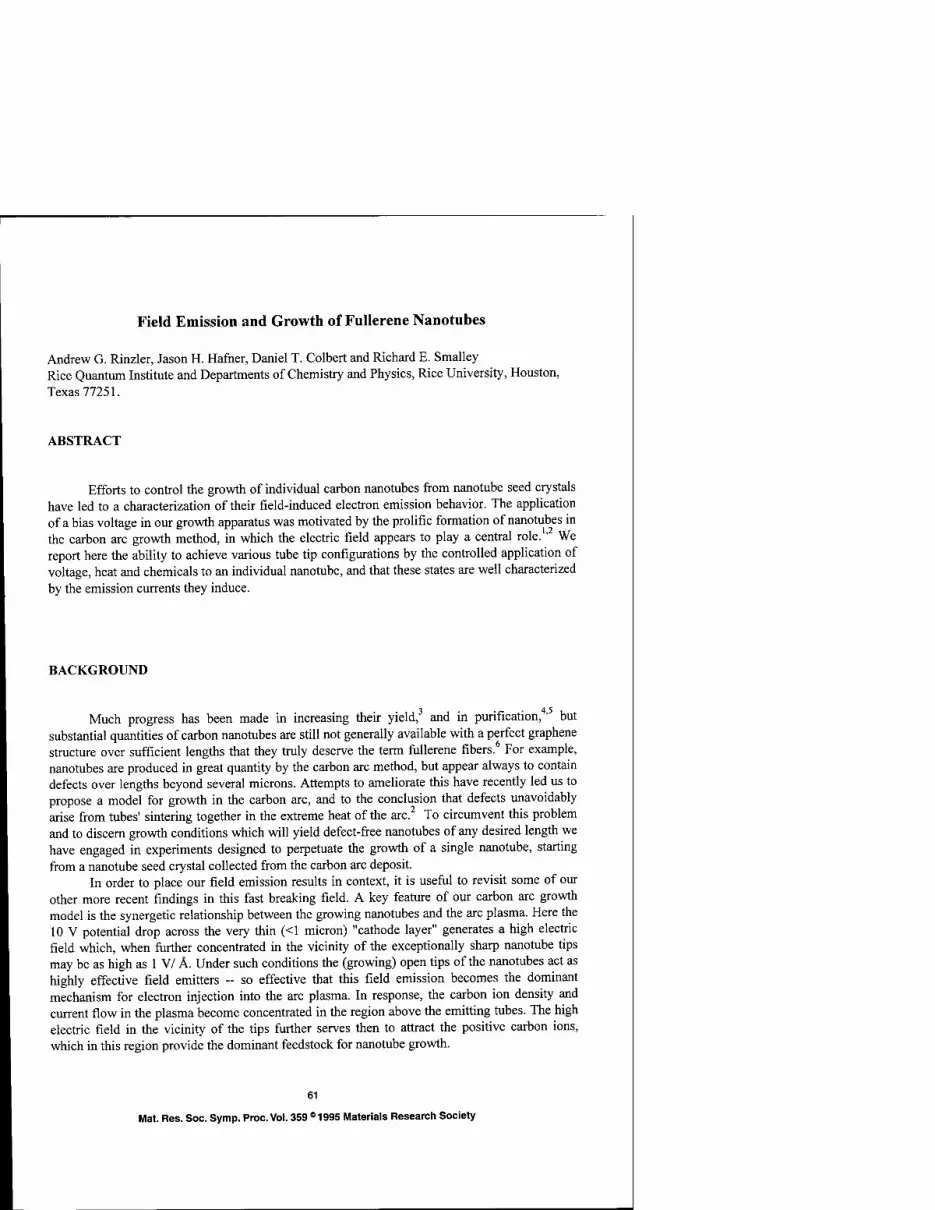
Field Emission and Growth of Fullerene Nanotubes
Andrew G. Rinzler, Jason H. Hafner, Daniel T. Colbert and Richard E. Smalley Rice Quantum Institute and Departments of Chemistry and Physics, Rice University, Houston, Texas 77251.
ABSTRACT
Efforts to control the growth of individual carbon nanotubes from nanotube seed crystals have led to a characterization of their field-induced electron emission behavior. The application of a bias voltage in our growth apparatus was motivated by the prolific formation of nanotubes in the carbon arc growth method, in which the electric field appears to play a central role. ' We report here the ability to achieve various tube tip configurations by the controlled application of voltage, heat and chemicals to an individual nanotube, and that these states are well characterized by the emission currents they induce.
BACKGROUND
Much progress has been made in increasing their yield, and in purification, ' but substantial quantities of carbon nanotubes are still not generally available with a perfect graphene structure over sufficient lengths that they truly deserve the term fullerene fibers. For example, nanotubes are produced in great quantity by the carbon arc method, but appear always to contain defects over lengths beyond several microns. Attempts to ameliorate this have recently led us to propose a model for growth in the carbon arc, and to the conclusion that defects unavoidably arise from tubes' sintering together in the extreme heat of the arc. To circumvent this problem and to discern growth conditions which will yield defect-free nanotubes of any desired length we have engaged in experiments designed to perpetuate the growth of a single nanotube, starting from a nanotube seed crystal collected from the carbon arc deposit.
In order to place our field emission results in context, it is useful to revisit some of our other more recent findings in this fast breaking field. A key feature of our carbon arc growth model is the synergetic relationship between the growing nanotubes and the arc plasma. Here the 10 V potential drop across the very thin (<1 micron) "cathode layer" generates a high electric field which, when further concentrated in the vicinity of the exceptionally sharp nanotube tips may be as high as 1 V/ Ä. Under such conditions the (growing) open tips of the nanotubes act as highly effective field emitters - so effective that this field emission becomes the dominant mechanism for electron injection into the arc plasma. In response, the carbon ion density and current flow in the plasma become concentrated in the region above the emitting tubes. The high electric field in the vicinity of the tips further serves then to attract the positive carbon ions, which in this region provide the dominant feedstock for nanotube growth.
61
Mat. Res. Soc. Symp. Proc. Vol. 359 ° 1995 Materials Research Society
We have previously maintained that the high electric field is also critical in preventing the growing end of the nanotube from closing off with a fullerene cap and thus terminating further growth. Calculations have indicated,7 however, that a field sufficient to keep a single walled nanotube open would be more than sufficient to break C-C bonds at the open tube end, leading to a wholesale field-evaporation of carbon from the tip. The question then remains what mechanism keeps the tubes from closing. Recently reported experiments from our group,8 in which nanotubes were discovered under conditions previously thought to exclude their growth, have shed new light on this question.
In these experiments, nanotubes were found in the same the laser-vaporization apparatus that produces high yields of spheroidal fullerenes. In order to rationalize nanotube growth at a temperature high enough (1200 C) to anneal closed spheroidal fullerenes, we were forced to invoke an intrinsic factor which inhibits the closure of a forming nanotube. We proposed that for a multilayer nucleating "prototube" the highly reactive and energetic dangling bonds at the growing open edges interact with one another, most likely with bridging atoms between adjacent layers. The incentive to eliminate dangling bonds by closing diminishes once they become partially deactivated in this way. For a multiwall nanotube, the open structure can be energetically lowered enough that the energetic barrier to closure allows lengthening if feedstock adds on a time scale rapid compared with the rate of closure. (By "open", we now mean the general case where the inner hole is open, rather than that each edge atom exposes dangling bonds.) In this regard, it is significant that we observed no single-layer nanotubes in the laser- vaporization apparatus, since the model predicts that any single-layer shell lacks the stabilizing interactions required to lengthen, and will readily anneal closed. The energy-lowering by the electric-field (roughly 2-3 eV for the fields in the arc), combined with the stabilization conferred by bridging species may now be sufficient to keep the tips open for growth in the arc.
These considerations prompted the application of an electric field to the nanotubes when mounted in our growth apparatus, leading to a study of field-emission as a diagnostic for the state of the nanotube growth site, its tip. Questions we may now address are: What is the precise nature of an "open" tip? How does an electric field affect the relative stabilities of open and closed tips? Can we know the state of the tube tip without subjecting it to a destructive test, allowing growth experiments to be performed under controlled conditions?
FIELD EMISSION OF NANOTUBES
We shall argue below that field-emission can be used to infer the configuration of a nanotube tip. Ideally, we would like to confirm our model tying the state of the nanotube tip to its emission behavior by directly imaging the tip in the TEM. Unfortunately, experimental circumstances conspire to make this difficult at present. In our growth apparatus, the length of a nanotube mounted on the supporting electrode must be sufficiently long to heat its tip to incandescence by a focused laser beam without illuminating the much larger electrode. For nanotubes which are too short scattering from the electrode makes it difficult to differentiate, with our imaging equipment, the image of the incandescing nanotube (even with filtering to reject the laser light). When a nanotube of this free-standing length (attached to an electrode) is mounted in a specially designed pallet in our TEM we have found that while the resolution is adequate to observe that we do indeed have a single nanotube at the tip (and can estimate its
62

diameter), it is not sufficient to permit resolution of the tube wall fringes necessary to judge the state of the tip. Since we routinely image the walls of nanotubes mounted on holey carbon grids, we at first suspected the problem was mechanical vibrations acting on the long, unsupported length of the electrode mounted tubes. Closer consideration, however, has led us to the conclusion that the limitation is more fundamental in that on the nanometer scale, thermal vibrations become significant.
Modeling the nanotube as a continuous beam of length / and Young's modulus Y, rigidly fixed at one end, one can calculate its deflection, Az, at the free end when subjected to a point force from elasticity theory.9 The energy required to displace the beam tip by a small displacement Az is AE = 37tYr4Az2/8/3, where r is the beam radius, and the area moment for a solid, cylindrical beam has been assumed. Setting the energy available for bending to kT by equipartition (the bending mode is doubly degenerate), and using the Young's modulus of Indium (a particularly stiff material; nanotubes are thought to be stiffer yet), Y=5.2xl0 N/m , a nanotube of radius 10 nm and length 10 microns is calculated to thermally deflect 26 nm at its tip at room temperature. This easily accounts for the observed lack of resolution in our electrode mounted nanotube TEM images. We are at present working to develop the techniques for reliably transferring a nanotube sample from an electrode to a TEM grid. Until such time our inferences concerning the various states of nanotube tips must rely on the evidence presented here.
Experimental
The electrode, to which the nanotubes are attached, consist of a short length (~4 mm) of a commercially available 8 micron diameter carbon fiber, one end of which has been attached by conductive silver paint to a small steel pallet for handling and mounting in our TEM, SEM or growth apparatus. Attachment of a nanotube to the free end of the carbon fiber proceeds as follows: a small piece of arc grown, purified boule2 is mounted on an X-Y-Z translation stage within the field of view of a high power (800 X) optical microscope set up for reflected dark field operation. Since individual nanotubes, and even bundles of adjacent nanotubes, are far smaller in diameter than the wavelengths of visible light it would hardly seem likely that these could be imaged by an optical system, however, for the component of the incident light polarized along the length of the tubes we have found them to be quite efficient scatterers and hence readily visible under these conditions. The boule will typically possess numerous bundles or "stalks" of nanotubes which stick out further than others. With its pallet attached to an opposing X-Y-Z translation stage the commercial carbon fiber is now maneuvered so that it is positioned adjacent to a selected stalk with several microns of overlap. The two are now brought into contact and the commercial fiber is withdrawn. Frequently, the van der Waals bonding of this stalk to the commercial fiber is sufficient to cause the stalk to go with the fiber, thus pulling out of the boule.
Often, the intensity of the light scattered from the stalk, now connected to the fiber, is seen to diminish in stages as one follows along its length to the free end. When the final stage at the tip of the stalk is exceptionally straight and barely visible, indicating it to be very thin, TEM images have confirmed that the stalk has tapered down to a single nanotube. The stalks range in lengths up to 60 microns with the average being -14 microns. In cases where the lengths of the free-traveling single nanotube at the tip are less than 5 microns the sample is rejected. The
63

typical sample we use has a single tube, free-travel length of ~8 microns although these have been as long as 15 microns. TEM images have shown their diameters to range from 10 to 30 nm. Figure 1 is an SEM image of the tip of a commercial fiber with nanotubes attached in this manner.
H ■
Figure 1. Scanning electron micrograph of nanotubes attached to a 8-micron diameter carbon fiber by van der Waals forces. At the site of attachment and for several microns beyond the end of the fiber, several nanotubes run together, terminating in a single tube for several microns.
The van Der Waals bonding to the carbon fiber is quite robust, easily surviving the transport and mounting in our various analytical tools. We attribute this to the relatively large planar graphitic sheets at the surface of the carbon fiber which permit the nanotubes to be in intimate van Der Waals contact for substantial lengths of the tubes. The carbon fibers have the additional advantage of being good electrical conductors, thus permitting electrical contact to the nanotubes.
64

The sample is mounted on a linear translation positioner in a vacuum chamber which is evacuated to a pressure of 4x10"7 Torr. An electrical vacuum feedthrough lead makes connection to the sample mount (electrically isolated from the positioner) from a high voltage DC power supply. A second electrical feedthrough lead connects to the opposing electrode which consists of an otherwise electrically isolated brass cup (~3 mm diam.) set ~ 1 mm from the nanotube. This connects the cup to electrical ground through a Keithley model 345 picoammeter which monitors the emitted electron current.
A 10 cm focal length lens mounted on a precision X-Y-Z translation stage focuses the 514.5 nm laser light of a CW Ar-ion laser to a 5 micron Gaussian spot at the tip of the nanotube. Visual monitoring of the tube is accomplished with a Microzoom II microscope fitted with a long working distance 50 X objective (N.A. 0.45) situated at right angles to both the nanotube long axis and the direction of the exciting beam. The scattered green light or incandescent radiated light image of the nanotube is observed using a Princeton Instruments back lit CCD camera sensitive out to 1 micron in the near infrared.
Results and Discussion
Figure 2 displays typical data of emission current as a function of applied voltage. Initially, the onset voltage (i.e., the bias voltage yielding the smallest detectable current, which in our apparatus is 0.1 pA) is high, here about -120 V (negative bias). We believe this state corresponds to a nanotube tip overcoated with an amorphous layer; such a blunt tip enhances the local electric field much less than one with sharper features. (In this figure, we have plotted for reference the Fowler-Norheim10 field-emission curves for metallic tips of various radii, assuming a work function of 5.0 eV.) After laser-heating the nanotube tip to 1000-2000 C for 1-2 minutes to desorb the overcoating, the emission onset falls to about -80 V (middle curves), and was found to be reproducible if the current was not taken above several nA. When sufficient bias voltage was applied to induce a current on the order of 1 uA, the onset dropped to about -65 V. With zero voltage, the tip was laser-annealed at 1000-2000 C for 1-2 minutes, and the intermediate emission onset of -80 V was recovered. We believe that the different emission onsets are characteristic of different states of the emitting tip: the -80 V onset corresponds to a closed tip, while the lower onset corresponds to an open tip whose sharper features enhance the local electric field. Included in the figure are emission data recorded the day after leaving the tip in the open state overnight. The onset potential of this state was then found to be -65 V as before, indicating its stability under vacuum. In summary, the voltage onset for emission depends on the history of the nanotube.
At emission currents of ~1 \iA and higher, the nanotube tip is seen to glow. In cases where a higher voltage is required to achieve currents of this scale (indicating a fatter tube tip) the nanotube has been observed to shorten at a rate of about 1 (i/min. and faster. In such cases the emitted light intensity increases substantially. We attribute this emitted light to radiation due to ohmic heating of the tip as electrons scatter off phonons in that region. That this light is confined to the tip we ascribe to differences between the tube walls and the tip as regards their respective electron-phonon interactions. The sudden increase in the emitted radiation observed when the nanotube is seen to shorten we attribute to the opening of a formerly closed tube which shortens due to field-desorption of its carbon walls. The increase in the light intensity derives
65

10'
^r=2.00nm, wf=5.0eV
^r=2.50nm, wf=5.0eV
. 'r=3.00nm, wf=5.0eV
, r=3.50nm, wf=5.0eV
, r=4.00nm, wf=5.0eV
/ T=4.50nm, wf=5.0eV
'r=5.00nm, wf=5.0eV
100 120 140 Fiber Potential (-volts)
160 180
Figure 2. Emission current vs. applied bias voltage for a single nanotube.
from heating of the tip by the violent recoil of atoms left behind as edge atoms are torn away by the field.
We can achieve the open tip state non-destructively by exposing the nanotube to 5 mTorr 02 at 500-1000 C for several minutes. Figure 3 shows the emission behavior prior to such oxidative opening. Shown is the field emission current at -83 V bias as a function of time, with the laser beam which heats the tube tip to -1000 C repeatedly blocked and then unblocked. That the emission current is substantially increased when the laser heating is in effect is readily understood as a simple thermal enhancement of this field induced emission. Figure 4, in contrast, shows the behavior under similar conditions for this nanotube after oxidative opening. Note that there continues to be a difference in the magnitude of the emission with the laser blocked and unblocked, however, the higher emitting state now pertains to when the laser is blocked!
66

10- Laser on
fry
< C
o
0.1
0.01 ¥
K^
w V 1 Laser off
jtr\A
1000„
<
"E CD
100-
6 io
1
Laser off
fW
Laser on
N-JL/
0 10 20 30 40"
0.001 -\ 1 1 1 1 1 1 1 r 0 40 80 120 160
Time (sec)
B
50
Time (sec) Figure 3. A) Preoxidation and B) Post oxidation two-state behavior in the emission current at a fixed bias voltage of -80 V as the sample is laser heated, and when the laser is blocked. The states are indicative of different tip configurations.
67

This behavior is made sensible within the following model: after an oxidative etch which opens a closed nanotube, the tip edge atoms rearrange to minimize their energy, tying up dangling bonds in various structures which bridge carbon atoms within and across the edges of the graphene sheets. The marriage of these bridging carbon atoms is frequently tenuous. So much so that under the influence of a strong applied electric field some of these structures break free to project long chains of carbon atoms out from the nanotube tip. Such a chain presents an atomically sharp feature to the field which further concentrates it resulting in a large enhancement in the emission current. This field enhancement is probably often sufficient to rip the chains from the tip, however, the remaining dangling bonds give rise to an energetically unfavorable tip structure. Consequently, rearrangements occur which result in new chain structures forming. A possible mechanism for this chain formation is the unzipping of atoms comprising the edge layers of a helical tube wall. In such a case the maximum number of chains which may be contributed by a single tube wall is precisely equal to its helicity. With laser heating the ability of these chains to remain attached to the tip is diminished so that as soon as such a chain begins to form it is ripped away. Consequently, without the field concentration effected by the long chains the field emission current diminishes to the lower value.
REFERENCES
' R.E. Smalley, Mater. Sei. Eng. B19, 1 (1993). 2 D.T. Colbert, etal., Science 266, 1218 (1994). 3 T.W. Ebbesen and P.M. Ajayan, Nature 358, 220 (1992). 4 K. Tanaka etal., Chem. Phys. Lett. 223, 65 (1994) s T.W. Ebbesen, P.M. Ajayan, H. Hiura, and K. Tanigaki, Nature 367, 519 (1994). 5 O. Zhou etal., Science 263, 1744 (1994). ' L Luo, P. Nordlander and R. E. Smalley, submitted to Phys. Rev. Lett. (1994). ä T. Guo etal., submitted to Nature (1994). !K.R. Symon, Mechanics, 3rd ed. (Addison-Wesley, Philippines, 1971), pp. 241-247. '° R.H. Fowler and L.W. Nordheim, Roy. Soc. Proc. A119, 173 (1928).

EFFECTS OF CATALYST PROMOTERS ON THE GROWTH OF SINGLE-LAYER CARBON NANOTUBES
CHING-HWA KIANGab, WILLIAM A. GODDARD III", ROBERT BEYERS', JESSE R. SALEM", AND DONALD S. BETHUNEa
"IBM Research Division, Almaden Research Center, San Jose, CA 95120 "Materials and Molecular Simulation Center, Beckman Institute, Division of Chemistry and Chemical Engineering, California Institute of Technology, Pasadena, CA 91125
ABSTRACT
The discovery of a catalytic route to the growth of single-layer carbon nanotubes suggests that it may be possible to produce these materials with better selectivity and in higher yield1,2. Increasing the production efficiency is essential for characterization and application of these materials. We have discovered several catalyst promoters, in particular S, Bi, and Pb, that greatly enhance the single-layer carbon nanotube yield, and extend the distribution of nanotube diameters to much larger sizes (> 3 nm). Co crystallites encapsulated in graphitic polyhedra also form abundantly when S, Bi, or W is present. Understanding these catalytic process is of substantial scientific and technological importance.
CARBON NANOTUBES
The term "carbon nanotube" generally refers to carbon with a cylindrical graphene structure. Multilayer carbon nanotubes are generally produced on the cathode tip deposit in an electric arc3. These nanotubes are typically composed of 2 to 50 layers of cylindrical shells, with tube diameters ranging from several to several tens of nm. Single-layer carbon nanotubes can be produced with or without a catalyst. Carbon can self-assemble into tubes without a catalyst by either hydrocarbon decomposition4 or carbon vapor condensation5 on a substrate surface. The yield is low and the nanotubes produced usually have more than one layer. On the other hand, catalytic synthesis of carbon nanotubes produces nanotubes exclusively with a single layer and in higher yields. Fe, Co, and Ni catalyze the growth of single-layer carbon nanotubes when co-vaporized with carbon in an arc1,2,6,7. The nanotubes produced have a very high aspect ratio (length to diameter), and have diameters from subnanometer to several nanometers and lengths from hundreds of nm to urn. Metals such as Y and Gd have also been shown to catalyze nanotube growth8,9. These tubes, however, are rooted on a metal carbide (or metal oxide) crystal, and have diameters ranging from 1 to 2 nm and lengths from 10 to 200 nm. This article focuses on the single-layer carbon nanotubes produced using Co catalyst, and the effects of certain catalyst promoters on the nanotube growth.
69
Mat. Res. Soc. Symp. Proc. Vol. 359 ® 1995 Materials Research Society

CATALYTIC SYNTHESIS OF SINGLE-LAYER CARBON NANOTUBES
We produce nanotubes with an electric arc, using a dc current of 95 A with a supply voltage of 25 V, under 300 to 500 Torr helium. The cathode is a 6 mm graphite rod, and the anode is a graphite rod cored at the center and filled with a mixture of C, Co, and additives such as S, Bi, Pb, and W. The metal concentration is 4 atomic % Co and an equal amount (in atomic %) of the additive is used. We sonicate the soot in ethanol and place drops of the solution containing suspended materials on a holey carbon grid for transmission electron microscopy (TEM) study.
EFFECTS OF CATALYST PROMOTERS
We found that S, Bi, and Pb enhance the single-layer carbon nanotube yield in the presence of Co, yet they do not catalyze tube growth when used without the catalyst. Therefore they behave as catalyst promoters. Figure la is a typical TEM image of the soot containing nanotubes, metal particles, fullerenes, and non-crystalline carbon. Bundles consisting of hundreds of single-layer nanotubes are frequently observed. The density of nanotubes is very high and large diameter (> 2 nm) single-layer nanotubes are abundant, as shown in Figure lb. High resolution TEM images show that Co particles encapsulated in graphitic polyhedra are produced in good yields with the use of S or Bi (see Figure 2)10.
SKV; )\ *lfi ', iMll > \Y,i t'l^H »vii'TÄ1!^ i it1 'AM ä
Käu-«:
I».«" il
IB nmf
m. I >$R ''%.«'.'.'"': 1 i'j£
LH>
Figure 1 Transmission electron micrograph of soot produced by vaporizing Co, Bi, and C by using an arc (see text). The large dark objects shown in the figure are pure Bi particles, and the smaller spots are fee Co crystals, as determined with energy dispersive spectroscopy (EDS) and high resolution TEM images.
70

IQ nm
^liäÄlltell
10 nm
Figure 2 Co crystals encapsulated in graphitic polyhedra, produced with (a) S and (b) Bi.
71

DISCUSSION
The nanotube diameter distribution has been modified by the promoters, as it contains tubes of sizes not observed when Co is used alone. We measured diameters of over 150 tubes for each sample from high resolution TEM micrographs, and the resulting histogram is shown in Figure 3. The ranges of the nanotube diameters are 1 to 4 nm, 1 to 5 nm, and 1 to 6 nm, for tubes produced using promoters Pb, Bi and S, respectively, compared to 1 to 2 nm when using Co alone.
CoPb
Figure 3 Histogram of nanotube diameter distribution of samples made from catalyst Co, Co+S, Co+Bi, and Co+Pb. The numbers of tube diameters measured were more than 150 for Co, 300 for Co+S, 150 Co+Bi, and 200 for Co+Pb. There is 10 % uncertainty in the measured diameters, and we expect larger fluctuations in diameters for tubes larger than 2 nm due to the radial deformation.
72

We have also tested another heavy metal, W, and found that it reduces the nanotube yield. Additionally, the tubes produced have diameters between 1 and 2 nm. To our surprise, however, W does enhance the graphitization of the carbon surrounding the Co crystallites, as shown in Figure 4.
10 nm
Figure 4 Co crystal encapsulated in layers of graphene sheets, produced with Co+W. The graphene layers seem to take the irregular shape of the Co particle, and there are several defects in the shell.
PROSPECT
The discovery of catalyst promoters provides a key to mass production of single-layer carbon nanotubes and metal encapsulated graphitic polyhedra. Nanotube properties and applications that depend on the diameter, such as electric conductivity11, hydrogen storage media12, and super strong materials may now be investigated. Catalytic production allows high efficiency and selectivity. Additional study of nanomaterials formed with various catalysts and promoters will help elucidate the growth dynamics, and many provide fundamental information that will further aid the development of potential applications.
73

REFERENCES
1. S. Iijima and T. Ichihashi, Nature 363, 603 (1993).
2. D. S. Bethune, C-H. Kiang, M. S. de Vries, G. Gorman, R. Savoy, J. Vazquez and R. Beyers, Nature 363, 605 (1993).
3. S. Iijima, Nature 354, 56 (1991).
4. M. Endo, K. Takeuchi, S. Igarashi, K. Kobori, M. Shiraishi, and H. W. Kroto, J. Phys. Chem. Solids 54, 1841 (1993).
5. M Ge and K Sattler, Science 260, 515 (1993).
6. Y. Saito, T. Yoshikawa, M. Okuda, M. Ohkohchi, M. Inagaki, Y. Ando, A. Kasuya and Y. Nishina, Chem. Phys. Lett. 209, 72 (1993).
7. S. Seraphin, in Recent Advances in the Chemistry and Physics of Fullerenes and Related Materials, edited by K. M. Kadish and R. S. Ruoff (Electrochemical Soc. Pennington, NJ, 1994).
8. S. Subramoney, R. S. Ruoff, D. C. Lorents, and R. Malhotra, Nature 366, 637 (1994).
9. D. Zhou, S. Seraphin and S. Wang, in Novel Forms of Carbon, (Mater. Res. Soc. Proc, San Francisco, CA 1994).
10. C.-H. Kiang, W. A. Goddard III, R. Beyers, J. R. Salem, and D. S. Bethune, J. Phys. Chem. 98, 6612 (1994).
U.R. Saito, M. Fujita, G. Dresselhaus, and M. S. Dresselhaus, Mater. Sei. Eng. B19, 185 (1993).
12. T. A. Bekkedahl and M.J. Heben (private communication).

High Yield Conversion of Carbon Nanotubes to Nanostraws at Mild Conditions
Kuo Chu Hwang, Department of Chemistry, National Tsing Hua University, Hsinchu, Taiwan, R. O. C.
ABSTRACT
Several oxidants were examined for their abilities in opening carbon nanotube end caps. Up to 91% of carbon nanotubes were found to have at least one open end when treated by 0.2 M KMnCV 10% H2SO4 or 0.2 M KMnOV 0.2 M CrC-3 aqueous solution at 100° C, 90 min. That is, -82% of carbon nanotubes was converted to "nanostraws". The morphologies of the processed carbon nanotubes reflect the relative strength of these oxidants. The mechanism of carbon nanotube end cap opening processes will be discussed.
INTRODUCTION
The discovery,1 and large scale synthesis2 of carbon nanotubes have initiated many theoretical and experimental studies on the physical and electronic properties of nanotubes. The internal hallow space of carbon nanotubes is expected to have special confinement effects on phase transition and low dimensional chemistry.4 To fill in substrates, the nanotube end caps have to be opened first. Carbon nanotubes were previously reported to have <1% cap opening upon treatment by melted lead at 400° C in the presence of O2,5 5-10% cap opening when heated with CO2 at 800° C,6 and -20% cap opening along with >90% weight loss, when heated in air at 800° C.7 The mechanisms of these carbon nanotube cap opening processes are not clear. We report herein that carbon nanotube end caps can be efficiently opened by several oxidants at mild conditions, namely in aqueous solution at 100°C, 90 min. The mechanism of the cap opening processes is most probably the conversion of C=C double bonds to vicinal diols followed by oxidative cleavage of vicinal diols.
EXPERIMENTAL
Multilayer carbon nanotubes were purchased from MER Corporation (Tucson, Arizona) with length distribution of 0.1-100 (xm and diameter range of 3-50 nm. In general, 2 mg of nanotubes was heated in 2 ml of 0.2 M oxidant(s)-aqueous solution at 100° C, 90 min with constant stirring. The processed nanotubes were separated from the solution by centrifugation, and washed by distillated water a few times to remove
75
Mat. Res. Soc. Symp. Proc.Vol. 359 s 1995 Materials Research Society

residual oxidants. In the case of formation of solid precipitates (such as Mn02 or OSO2) during the heating process, acidic ascorbate solution was added to the final solution to convert these solid oxides to the soluble ionic forms (Mn2+ or Os3+). The carbon nanotubes was then dispersed in methanol, and a few drop of the nanotube-methanol solution was added to a carbon thin film coated copper grid for transmission electron microscopy (TEM, Hitachi, model H-600-3, operated at 75 KV) measurements.
RESULTS AND DISCUSSIONS
The basic structure of graphene layers of carbon nanotubes is composed of 5- and 6-member rings and C=C double bonds.8 To cleave open the carbon nanotube end caps is to break the C=C double bonds. In literature, several oxidants (such as KMn049>10 and OsCU11) are commonly used to convert C=C double bonds to vicinal diols, and others (e.g., MnC>2,12 Cr03,13 IO4-,10 etc.) are known to be able to oxidatively cleave the C-C single bond of vicinal diols to generate two carbonyl groups (see equations 1 and 2 for examples of KMn04 and CrC>3). Combination of
--A^Os. O H,0 -J.OHOH H,0 -4^0H + M11O4 —- ] M/ ^^ 1 yH ^^\ (i)
■0-Mn = 0 --^OH 0_
VOH _ Hi0 -_\^0-Cr03H - H20 + H2Cr04
OH -7^ OH
V<K /c=0
CrVI0, »- (2) 0 " ) c=o
these two types of oxidants should be able to break a C=C double bond. Opening the end caps of carbon nanotubes, however, requires consecutive cleavage of many adjoining C=C double bonds of several graphene layers.14
Four different sets of oxidants were examined for their efficiencies on opening carbon nanotube end caps, and results listed in Table I. When treated by acidic KMn04 at 100° C, 90 min, -90 % of nanotube end caps were opened. As shown in Figure 1, most of nanotube end caps were cut open. One common distinguished feature is the much wider open ends
76

Table I. Oxidants, condition, and the percentage of carbon nanotube end cap opening.
Oxidants Condition % oi
100° C, 90 min 90 100° C, 90 min 91 100° C, 90 min 32 100° C, 90 min 75
% of cap opening3
1. 0.2 M KMnO4/10% H2S04
2. 0.2 M KMn04/ 0.2 M Cr03
3. 0.2 M KMn04/ 0.2 M NaI04
4. 0.03 M OsCb/ 1.2 M NaI04
a. The percentage is the ratio of the numbers of open vs. closed carbon nanotubes observed under TEM. The confidence limit is ±5%.
FIGURE 1 Carbon nanotubes processed by 0.2 M KMn04/ 10% H2S04 solution at 100° C, 90 min. The scale bar is 50 nm.
than the internal diameter. This indicates two important aspects: the entrance of oxidant solution into the internal hallow space and the preference of oxidative cleavage of the internal graphene layers at the end cap regions than the outer layers. The former confirms the recent prediction that low surface tension liquid can wet the carbon nanotube surface and be drawn into the internal hallow space of the open ended carbon nanotubes.15 The latter is consistent with previous conclusion that local strain is one of the major driving force for chemical reactions on fullerene graphene layer.16.17
Under acidic condition, large amount of Mn02 was generated via the reduction of Mn04-. The opening of carbon nanotube end caps should be considered as the combination effects of Mn04" and Mn02. In neutral KMn04 solution the formation of MnCh is significantly reduced and 0.2 M CrC>3 was added to take the role of Mn02. Surprisingly, -91% of carbon nanotube end caps was also found open (entry 2 of Table I). As shown in Figure 2 (a) and (b), the two nanotubes have both ends open. The open ends still have wider diameter than that of the inner part, similar to
77

m
FIGURE 2 (a) and (b) Carbon nanotubes processed by 0.2 M KMnC-4/ 0.2 M Cr03
solution at 100° C, 90 min. The scale bar is 50 nm.
b
FIGURE 3 (a) and (b) Carbon nanotubes processed by 0.2 M KMn04/ 0.2 M NaI04
solution at 100° C, 90 min. The scale bar is 50 nm.
those processed by the KMn04/H+ solution. One additional feature is the end cap region is slightly sharper than the middle part of the nanotubes. When NaIÜ4 was used instead of CrÜ3 (entry 3 of Table I), the percentage of end cap opening drops to -32% along with even sharper ends and relatively much smaller open ends (see Figure 3). This feature indicates the efficient oxidative cleavage of the outside graphene layers near the end cap regions before cleavage of the inner graphene layers. The result shows that a more powerful oxidant, namely NalCM relative to CrÜ3 and MnC>2, has less selectivity and will cleave outside graphene layers first instead of the inner graphene layers at the end caps, and thus lower percentage of cap opening.
The above three systems all utilize KMn04 to convert C=C double
78

'ifttBÜgfi-
^»^pytÄäij^^^»^:
FIGURE 4 Carbon nanotubes processed by 0.03 M OsCb/ 1.2 M NaIÜ4 solution at 100° C, 90 min. The scale bar is 50 nm.
bonds to vicinal diols before oxidative cleavage of vicinal diols. If the mechanism of carbon nanotube end cap opening follows what one expects above, replacing KMnÜ4 by OsÜ4 should also afford similar results. Combination of OSO4 (generated in-situ by oxidation of Os3+ by NaIÜ4) and NaIC>4 indeed causes opening of -75% of carbon nanotube end caps under our experimental condition (see entry 4 of Table I). The nanotubes processed in this way (see Figure 4) retain the sharp end feature as those in Figure 3, indicating preference in oxidative cleavage on outer graphene layers than the inner layers at the end cap regions.
CONCLUSION
Carbon nanotubes were efficiently converted to nanostraws (up to 82%) by several oxidant systems, such as the Mn04~/H+, Mn04"/Cr03 or IO4-, and OSO4/IO4- systems, at rather mild conditions (100° C aqueous solution). The mechanism of the nanotube end cap opening processes is most probably the conversion of C=C double bonds to vicinal diols, followed by oxidative cleavage of vicinal diols to ketones. Powerful oxidants (e.g., Mn04~/I04\ and OSO4/IO4-) have poor selectivity in cleaving the C=C double bonds located on the outer surface verse on the end caps. Consequently, low percentage of nanotube end cap opening and sharp ends of the processed nanotubes were observed. To achieve high yield conversion of carbon nanotubes to nanostraws, the use of a relatively mild oxidant (such as the Mn04"/H+ system) with prolonged heating time is probably a better strategy.
79

ACKNOWLEDGMENT The author is grateful for the financial support from the National Science Council of the Republic of China.
REFERENCES
1. S. Iijima, Nature 354, 56 (1991).
2. T. W. Ebbesen and P. M. Ajayan, Nature 358, 220 (1992). 3. J. W. Mintmire, B. I. Dunlap, C. T. White, Phys. Rev. Lett. 68, 631
(1992); N. Hamada, S. I. Sawada, A. Oskiyama, ibid. 68, 1579 (1992); R. Saito, M. Fujita, G. Dresselhaus, M. S. dresselhaus, Appl. Phys. Lett. 60, 2204 (1992).
4. P. Ball, Nature 361, 297 (1993).
5. P. M. Ajayan and S. Iijima, Nature 361, 333 (1993).
6. S. C. Tsang, P. J. F. Harris and M. L. H. Green, Nature 362, 520 (1993).
7. P. M. Ajayan, T. W. Ebbesen, T. Ichiharhi, S. Iijima, K. Tanigaki and H.
Hirua, Nature 362, 522 (1993).
8. S. Iijima, Nature 354, 56 (1991); S. Iijima, T. Ichihashi, Y. Ando, ibid,
356, 776 (1992).
9. W. A. Waters, Q. Rev. Chem. Soc 12, 277 (1958).
10. B. Sklarz, Q. Rev. Chem. Soc. 21, 3 (1967); H. Vorbrueggen and C.
Djerassi, J. Am. Chem. Soc. 84, 2990 (1962); F. D. Gunstone and P.
J. Sykes, J. Chem. Soc. 1962. 3058.
11. J. R. Henry and S. M. Weinreb, J. Org. Chem. 58, 4745 (1993); M.
Uskokovic, M. Gut, E. N. Trachtenderg, W. Klyne and R. I. Dorfman, J.
Am. Chem. Soc. 82, 4965 (1960); M. Schroder, Chem. Rev. 80, 187
(1980).
12. G. Ohloff and W. Giersch, Angew. Chem. Int. Ed. Engl. 12, 401 (1973).
13. D. F. Tavres and J. P. Borger, Canad. J. Chem. 44, 1323 (1966); J. Rocek
and F. H. Westheimer, J. Am. Chem. Soc. 84, 2241 (1962).
14 K. C. Hwang, J. Chem. Soc. Chem. Comm. (in press).
15. E. Dujardin, T. W. Ebbesen, H. Hiura and K. Tanigaki, Science 265,
1850 (1994).
16. R. C. Haddon Ace. Chem. Soc. 21, 243 (1988); Science 261, 1545
(1993). 17. J. M. Hawkins, A. Meyer, M. A. Solow, J. Am. Chem. Soc. 115, 7499
(1993); J. M. Hawkins, M. Nambu, A. Meyer, ibid. 116, 7642 (1994).
80

NANOBUNDLES
Kiyoshi YASE, Nobutaka TANIGAKI, Mutsumasa KYOTANI, Motoo YUMURA,
Kunio UCHIDA, Satoshi OHSHIMA, Yasunori KURIKI and Fumikazu IKAZAKI
National Institute of Materials and Chemical Research
1-1 Higashi, Tsukuba, Ibaraki 305, Japan
ABSTRACT
Fine molecular straw, carbon nanotube (NT) is aligned to form a bundle. The purified
NTs are mixed with a plastic polymer (polypropylene: PP) and extruded from a small die
with a diameter of 2 mm kept at 200°C. The threads of NT/PP blend are characterized by
small angle X-ray diffractometry and transmission electron microscope to confirm the
existence of nanobundle of NTs, which orient along the spinning direction.
INTRODUCTION
The stability and electronic properties of fine capillary carbon nanotubes (NTs) with a
diameter of 1 - 50 nm have received much attention [1,2]. Recently single-walled NTs have
been found in soot when a couple of carbon rods including Fe and Co were arc-discharged
in a helium atmosphere [3,4]. Although the caged carbon molecules, fullerene (C60), can be
extracted from the soot in toluene or hydrogen sulfide solution [5], there is no technique to
separate NTs from by-products such as graphite and amorphous carbon particles by diameter
and length. Moreover, it could be studied only by high resolution transmission electron
microscopy (HRTEM) [6].
We have applied to NTs known techniques to produce oriented carbon fibers with a
diameter between 10 and 100fim in conventional polymers. The procedure of fabricating the
spinning strands is schematically shown in Fig. 1. The NTs havelarge aspect ratio, the ratio
of length (1 - 20^m) to diameter (1 - 50 nm), from 20 to 2 x 10 4. So they should be
extruded with a moderate polymer from a die to arrange neatly side by side and to orient
parallel to the spinning direction. If the enough purified NTs were obtained, for example
several grams, bundles of NTs should be obtained.
81
Mat. Res. Soc. Symp. Proc. Vol. 359 ®1995 Materials Research Society

EXPERIMENTAL
A pair of C/Fe composite rod and carbon plate was set in a carbon cluster fabrication
instrument (Vacuum Metallurgical Co. Ltd., Type-3). The electrodes with a gap of 1 mm
were subjected to a DC voltage of 18 V under a He pressure of 500 Torr. The cathode plate
was slowly rotated during the experiment. The cathode deposits were continuously removed
from the plate surface. The crude materials obtained from the soot were dispersed in
methanol solution and mechanically treated to separate the NTs from by-products, such as
amorphous carbon particles and graphite: decantation, filtration, ultrasonic dispersion, or
ultracentrifugation according to previous work [7,8]. Then fibrous precipitates were oxidized
in an electric furnace at 800°C. Graphite-like by-products were burned out, and especially
graphite particles on and around NTs disappeared.
Purified NTs (0.3 g) were mixed with polypropylene (PP) (10 g) at 200°C. The
NT/PP blend was extruded from a die with a diameter of 2 mm to make a strand as shown in
Fig. 1.
(How to make "Nanobundle")
Nanotubes in Polypropylene
Randum Orientation
I Aligning to Extrusion Direction
Spinning Machine
Extrusion Strand
< 2 mm
(Cross Section of Nanobundle)
Cross Section of A Nanotube
Figure 1 Schematic illustration of the method to prepare the nanobundle
and its cross section.
82

The thick strings with a diameter of 1 mm were examined by a RIGAKU X-ray diffractometer (Cu Ka: A = 0.154 nm) equipped with a Laue camera and an imaging plate.
For the characterization by HRTEM, thin fibers of ca. 100fim were sandwiched between the
(001) planes of cleaved KBr single crystals. The KBr pellets were heated on a hot plate up to
100°C and pressed to less than 1 fim. A pair of KBr pellets were immersed into liquid
nitrogen to quench the structure of thin strands. The film on the KBr crystal was reinforced
by a vacuum-deposited carbon film and then separated from KBr on the water surface. The
segments of floated film were transferred on the Cu grids. The HRTEM observation was
carried on a Zeiss CEM-902 with an accelerating voltage of 80 kV.
RESULTS AND DISCUSSIONS
Figure 2 shows the lamellar structure characterized in the extruded threads of the
polymers. The wavy structure in the picture corresponds to the PP lamellae. The
longitudinal direction of the lamellae is normal to the spinning one, as indicated by the
arrow. The molecular orientation of PP and NTs could be confirmed by small angle X-ray
diffractometry. A pair of very strong reflection arcs and weak ones appear as shown in Fig.
3. Each arc corresponds to the intermolecular distance of oriented PP and the interplanar
spacing of graphite structure in multi-shell NTs, as indicated by arrows in the equatorial
cross section in Fig. 3 (b). These arcs are parallel each other and surely exist normal to the
extruding direction.
The single NT aligned along the spinning direction is shown in Fig.4. This is a multi-
shell NT with a diameter of 20 nm and a hollow of 3 nm. It exhibits an electron energy loss
spectrum (EELS) similar to that of graphite, as shown in Fig. 4 (b). There is a peak
corresponding to the Jt-Jt* excitation in the graphite structure at 280 eV. This is a good
agreement with known high resolution EELS [9] and X-ray absorption near-edge structure
data [7]. It proves the existence of oriented NTs in the spinning threads.
Figure 5 shows the bundles of NTs. There are 15 - 20 molecular straws aligned along
the extruding direction. Since the amount of NTs compared with plastic polymer is not long,
the bundles could not be frequently observed. Pure PP threads are transparent, but the
NT/PP blend is black. If enough NTs were mixed with PP, the electrical and optical
measurements of such nanobundles should be promising.
When the strands were embedded in a resin and cut by glass knife, even a diamond
knife, it resulted that only the part of polypropylene was cut. NTs tended to protrude from
the cutting plane. The method to observe the cross section of nanobundles is under
development.
83

M ^ I ~t i*i
Figure 2 Typical electron
micrograph of extruded polymer
thread. The spinning direction is
indicated by arrow.
EXTRUSTION
Figure 3 X-ray diffraction pattern of mm
the extruded thread of NT/PP blend.
The reflection arcs from oriented NT
and PP are indicated by arrows.
84

! 1.3E6-1 n l V» n s } 1.2E6
Ch
b
U '' l '' \
j LIES- """-. --
1.8E6 '--'• '--
/
9.0E5
26 i
a.B 277.5 295.0 312.5 eU 330.0
AE LIN
Figure 4 High resolution electron micrograph of single nanotube (a)
and its electron energy loss spectrum (b).
85
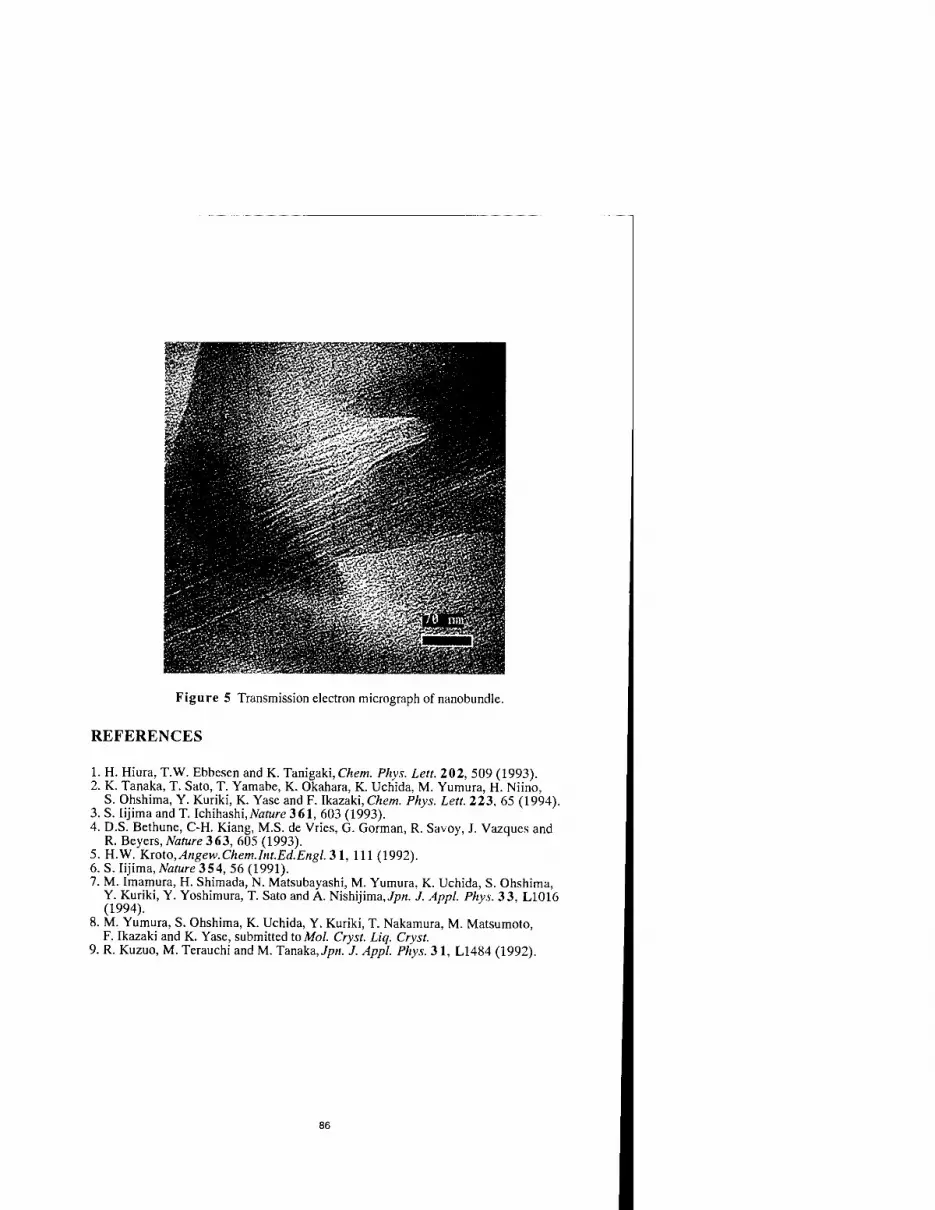
Figure 5 Transmission electron micrograph of nanobundle.
REFERENCES
1. H. Hiura, T.W. Ebbesen and K. Tanigaki, Chem. Phys. Lett. 202, 509 (1993). 2. K. Tanaka, T. Sato, T. Yamabe, K. Okahara, K. Uchida, M. Yumura, H. Niino,
S. Ohshima, Y. Kuriki, K. Yase and F. Ikazaki, Chem. Phys. Lett. 223, 65 (1994). 3. S. Iijima and T. Ichihashi,Nature 361, 603 (1993). 4. D.S. Bethune, C-H. Kiang, M.S. de Vries, G. Gorman, R. Savoy, J. Vazques and
R. Beyers, Nature 363, 605 (1993). 5. H.W. Kroto,Angew.Chem.Int.Ed.Engl. 31, 111 (1992). 6. S. Iijima, Nature 354, 56 (1991). 7. M. Imamura, H. Shimada, N. Matsubayashi, M. Yumura, K. Uchida, S. Ohshima,
Y. Kuriki, Y. Yoshimura, T. Sato and A. Nishijima,7p«. J. Anpl. Phys. 33, L1016 (1994).
8. M. Yumura, S. Ohshima, K. Uchida, Y. Kuriki, T. Nakamura, M. Matsumoto, F. Ikazaki and K. Yase, submitted to Mol. Cryst. Liq. Cryst.
9. R. Kuzuo, M. Terauchi and M. Tanaka, Jpn. J. Appl. Phys. 31, L1484 (1992).
86

ATOMIC FORCE MICROSCOPY OF CARBON NANOTUBES AND NANOPARTICLES
PING LI AND KLAUS SATTLER University of Hawaii, Department of Physics and Astronomy, Watanabe Hall, 2505 Correa Road, Honolulu, HI 96822.
ABSTRACT
Very hot carbon vapor was deposited on highly-oriented pyrolytic graphite (HOPG) and on sapphire substrates. Using atomic force microscopy, the obtained carbon structures are analyzed. It is found that carbon nanotubes and cones had formed on the graphite substrate but not on sapphire. Instead, spherical-type nanoparticles are analyzed on sapphire. A particle with double-conical shape is found on the graphite substrate. The two observed cone angles 19° and 60° are explained by perfect network closure of sectors of curled graphene sheets.
INTRODUCTION
Much interest has recently been focused on the physical and chemical properties of carbon cage structures. Various such materials, with fullerene- and graphene-type networks have been generated: C6o and higher fullerenes, nanotubes, nanocones, and others. We have recently shown that such structures form in the vapor phase and that the inhomogeneous conditions present in the arc discharge method (used commonly to produce carbon nanotubes) are not required for their growth. Carbon vapor, deposited onto highly-oriented pyrolytic graphite (HOPG), after being quenched at the substrate, can form individual multi-wall tubes [1], bundles of tubes [2], single- wall tubes [3], and cones [4].
The question arises if the substrate material has an effect on the type of structures produced from the quenched vapor. In fact, planar single-atom graphene layers have been produced on metal substrates [5,6]. Carbon grows epitaxially on diamond substrates forming diamond adparticles. Yet, diamond particles do not form on other kinds of substrates for a variety of reasons such as strain and formation of sp2 bonded carbon [7].
The fullerene C6o has the structure of a truncated icosahedron formed from twelve pentagons and twelve hexagons. Experimental evidence shows that the larger fullerene C70 has the D5h structure. This cluster can be constructed by orienting C6o along one of its C5 axes, and then inserting five new 6-membered rings by equatorially adding a planar ring of ten carbon atoms. By adding more of such rings, ellipsoidal structures (nanotubes) are formed, with a cross section diameter of ~7 Ä , which is roughly that of the diameter of C6o- Larger diameter single-wall tubes have different helicities. Single-wall tubes are the cores for multi-wall tubes with diameters of up to several hundred Angstroms. The bundles consist of muti-wall tubes which are tightly bound to each other. Atomic resolution has been achieved for multiwall tubes [1] and for single-wall tubes [3] using scanning tunneling microscopy (STM) and their helicities have been directly determined. The application of AFM may yield different results compared to STM because the two instruments respond differently to the local electronic properties of the investigated nanostructures.
In this paper we show AFM studies of carbon nanostructures being generated by deposition ont HOPG and on sapphire. We find nanotubes had formed on graphite but not on sapphire. Instead, nanoparticles of carbon with spherical structures are observed on sapphire.
EXPERIMENT
The samples were prepared by vapor deposition of carbon on highly-oriented pyrolytic graphite (HOPG) and on sapphire substrates in high vacuum. The graphite (grade-A HOPG) was freshly cleaved before the deposition. The HOPG surface was atomically flat and defect-free over
87
Mat. Res. Soc. Symp. Proc.Vol. 359 e 1995 Materials Research Society

micrometer dimensions. The sapphire surface was reasonably flat, with small surface features around 3 nm or less. The vapor was produced by resistively heating a carbon foil. After deposition, the samples were transferred to an AFM operated under ambient conditions.
A silicon nitride cantilever with a silicon nitride (integral) tip was used for the AFM. The microfabricated cantilever was wide-legged with a length of 100 microns and a spring constant of 0.6 N/m. Our AFM is based on detecting the cantilever deflection using an optical lever technique. The light beam from a laser diode is focussed on the cantilever and reflected off its back. The reflected beam is detected by a split photodetector diode. The AFM was operated in constant force mode with a force between the tip and the sample of the order of nano-Newtons. The images were taken with a scan frequency of 8.7 Hz.
RESULTS AND DISCUSSION
Fig. 1 shows an AFM image of a 40 nm diameter carbon nanotube on HOPG, and the cross section giving its cylindrical shape. The tube is located horizontally on the flat and uncovered graphite surface. The diameter of the tube is unusually large. The tube could either be a very wide multiwall tube with about 60 concentric graphene cylinders, or, a bundle where the individual tubes are not resolved. We have shown in ealier studies on assembled cluster structures that the AFM may not resolve low-energy grain boundaries while the STM does [8]. While both instuments are proximity probes often giving similar images of surfaces or adlayers, their imaging modes are entirely different. The STM probes the object by use of an electron current while the AFM by use of a force. While the STM is sensitive to the density of states at the Fermi level, the AFM responds to the total density of states. Low-energy grain boundaries occur for tighly bound nanoparticles and for nanotubes in bundles and they usually show little height corrugations between the grains or tubes.
Fig. 1 AFM Image of a 40 nm diameter carbon nanotube on HOPG (left) and cross sectional profile (right).
88

The AFM image in Fig. 2 shows another carbon nanostructure on HOPG. The object has the shape of a double-cone. It is about 250 nm long and on the average about 50 nm wide. The opening angles of the two connected cones are -19° and 60°. The 19° cones have been found in our earlier experiments of carbon nanostructures on graphite [3]. Its apex contains 5 pentagons in a fullerene-type network. The bulk of the cone is a single sheet of graphite with entirely hexagonal structure (Fig.2). It may be formed by curling a 7t/6 section of a planar graphene sheet and matching the structure at the closure line. There are five possible opening angles for perfect graphitic cones: 19.2°, 38.9°, 60.0°, 86.6°, and 123.6°. Two of these, 19.2° and 60.0°, are measured for the double-cone in Fig. 2.
Fig. 2. AFM image of an asymmetric double-cone on HOPG (topview above, side view on the right). The object is about 250 nm long and on the average about 50 nm wide. The two cone angles are 19.2° and 60.0°. The graphene network structure of the 19.2° cone is shown in a ball-and- stick model (mirror plane through A and B).
89

According to Euler's 5/6 network-closure theorem, the closed-cage object needs to contain 12 pentagons. The apex cap of the 19.2° cone contains 5 pentagons and the apex cap of the 60.0° cone contains 3 pentagons. This leaves 4 pentagons for the area where the two cones touch. In order for the double-cone to be rotationally symmetric about one line, these 4 pentagons would have to be equally distributed along the periphery where the two cones touch. The double-cone in Fig. 2 however is not symmetric about a common axis for the two cones. Therefore the 4 pentagons need to be arranged in an asymmetric way along the closure line, with 3 pentagons on one side and one pentagon on the other side. Such asymmetry may lift degeneracy of energy states reducing the free energy of the object.
In Fig. 3 we show a 660nm x 660nm AFM image of a sapphire substrate covered with carbon particles. The particles were growth from the quenched vapor. The sphere-like particles have diameters from 30 to 60 nm. The surface corrugation of the uncovered sapphire substrate is less than 1/10 of the particle diameters. Some of the particles appear elongated in the images. Surface profile measurements show that these are agglomerated spherical particles. A line defect on the substrate could explain the linear arrangement of some of the particles, aligned along the diagonal direction in the image. We compared the underlying substrate at both sides of the linear arrangement of particles but did not find a difference in height taking into account the resolution of
Fig. 3. 660nm x 660nm AFM image of carbon particles on a sapphire substrate.
our instrument and the surface roughness of the substrate. We conclude that the particles are either coupled in linear form or even very weak surface structures may have alignment effects on the adparticles.
As our vapor phase generation method favors carbon cage structures [1-4], the observed particles could well be giant fullerenes, either with single-wall or onion-type configurations. Giant fullerenes with diameters between 30 nm and 60 nm would have large facets made by slightly curved graphene sheets between the pentagon-containing areas which provide the main curvature for closure of the nets. The particles indeed are observed with very smooth surfaces, as obtained from our images from taking surface profiles.
Nucleation on a surface can be discussed in both thermodynamic and in atomistic terms. In vapor phase growth, atoms arrive from the vapor on the substrate. At high temperatures, the adatoms will only stay at the surface for a short time, the adsorption residence time. During this time they migrate over the surface with a diffusion coefficient determined by the diffusion energy Ed, the atomic vibrational frequency, and the surface repeat distance. The residence time is determined by the adsorption energy Ea. For different ratios of Ea/Ed, the adatoms will migrate
90

more or less on the substrate and encounter other atoms. Depending on the size of the binding energy between these atoms, and on their areal density, they will form small clusters, which may then grow to form larger clusters. In this island growth mode, the critical nucleus size is typically only a few atoms at most, and the larger clusters have a 3D form. On the other hand, 2D nucleation processes occur in layer growth. Carbon cluster growth on substrates is intermediate between 2D and 3D growth. The morphology of carbon cages is 3D, while the graphene and fullerene-type networks of the particles are 2D. Therefore neither the island growth nor the layer growth atomistic models can be fully applied to understand vapor phase growth of carbon cage structures on supports This issue will be discussed by us in more detail in forthcoming publications.
For carbon adatoms on HOPG there may be graphene layer growth in the first stages of particle formation initiated by the underlying honeycomb lattice. Small planar graphene clusters may form by epitaxial growth and then they may curl in order to saturate the surface dangling bonds to minimize their free energy. The curled sheets may then heal the defect structure at the closure line to become perfect graphitic tubes and.cones. If on the other hand, carbon vapor is deposited on sapphire, the growth is free from an adjustment to the substrate lattice due to a mismatch of the lattices of graphite and sapphire. Therefore spherical rather than tubular carbon structures are formed from quenching the vapor on sapphire.
In summary, we have produced various carbon cage structures on solid supports by deposition of carbon vapor. Using an atomic force microscope we found nanotubes on HOPG but not on sapphire substrates. Instead, more compact and mostly spherical-like carbon nanoparticles were found on sapphire. . ™™ nmzn-7,1 ■
Financial support from the National Science Foundation, Grant No. DMR-9106374 is gratefully acknowledged.
REFERENCES
1 M. Ge and K. Sattler, SCIENCE 260, 515 (1993) 2 M. Ge and K. Sattler, Appl. Phys. Lett. 64, 710 (1994) 3 M Ge and K. Sattler, Appl. Phys. Lett. 65, 2284 (1994) 4 Maohui Ge and Klaus Sattler, Chem. Phys.Lett. 220, 192-196 (1994) 5 R Vanselow, M. Braun, and J. H. Van der Merwe, Surf. Sei. 214, 197 (1989) 6 T. A. Land, T. Michely, R. J. Behm, J. C. Hemminger, and G. Comsa, Surf. Sei. 264,
261(1992)' 7 N Wada and S. A. Solin, Physica 105B, 353 (1981) 8 K. Sattler, G. Raina, M. Ge, J. Xhie, N. Venkateswaran, and D. Siegel, J. of Appl. Phys.
76, 546 (1994)
91

BUCKYTUBE COLD FIELD EMITTER ARRAY CATHODE EXPERIMENTS
B. H. FISHBINEt a, C. J. MIGLIONICO a, K. E. HACKETT3 , K. J. HENDRICKS a, X. K. WANG b, R. P. H. CHANG b, J. D. SHOVLIN c AND M. E. KORDESCH c
aPhillips Laboratory, Kirtland AFB NM 87117 bNorthwestern University, Evanston IL 60208 cOhio University, Athens OH 45701
ABSTRACT
We discuss experiments and theory directed towards the development of a buckytube cold field emitter array electron cathode.
INTRODUCTION
Our interest is to generate intense electron beams for high-power microwave devices using cold field electron emitters. Cold field emission provides electrons without generating plasma. Thus diode gap closure problems typically encountered in long-pulse (> 1 p.s) applications are avoided. There are also commercial applications for cold field emitters, particularly in flat screen displays.
The potential of carbon nanotubes for cold field emission is due to several exceptional measured or predicted properties: 1) Transmission electron microscopy (TEM) and scanning electron microscopy (SEM) have shown that nanotubes may have high aspect ratios (length/radius), permitting high field enhancement which reduces the anode-cathode potential difference required for field emission. This is particularly attractive for flat screen displays, and may be a consideration for intense electron beam cathodes as well. 2) The rigidity of some nanotubes is predicted to be ten times that of indium of comparable dimensions [1]. Also predicted is the inhibited introduction of impurities and defects into the nanotubes, offering the potential of great tensile strength [2]. This would reduce the possibility of emitter breakage due to tensile failure at high electrostatic pressures, or shock in rugged applications such as in fieldable microwave generators. 3) The conductivity of some nanotubes is predicted to be more than ten times that of copper [3]. 4) Single layer nanotubes in vacuum have survived for a day at temperatures higher than the melting point of copper [4]. 5) Buckybundle measurements have shown positive temperature coefficient of conductivity near room temperature and below (down to -10 K) [5]. These last three properties bode well for high emission current densities without emitter destruction by Joule heating [6]. 6) Finally, the one-dimensional electronic properties of nanotubes will result in emission behavior substantially different than that predicted by the Fowler-Nordheim equation for a three-dimensional conductor. Theoretical studies of 2-D quantum well field emitters have shown a lowering of work function which reduces required emission fields [7]. Discussions in the literature suggest using buckytubes as forms to fill with metals that would be quantum wires because buckytube diameters can be comparable to Fermi wavelengths. In fact, it has been predicted that some buckytubes will be one-dimensional metals without filling them [8]. Further, scanning tunneling spectroscopy of unfilled buckytubes has shown peaks in conductance associated with peaks in the densities of states resulting from one- dimensional electronic structure [9].
t National Research Council Associate
93
Mat. Res. Soc. Symp. Proc. Vol. 359 c 1995 Materials Research Society

BUCKYTUBE COLD FIELD EMITTER ARRAY CATHODE FABRICATION
At present we see two basic approaches to buckytube cathode fabrication based on two different buckytube fabrication methods: 1) condensation, onto a substrate, of carbon atoms produced by e-bearri evaporation of graphite [10], and 2) the common high-pressure arc- discharge buckytube fabrication process [11].
The e-beam evaporation technique can produce fairly uniform nanotubes with good alignment at any specified angle to the substrate, although nanotube separation distance cannot be controlled. The morphology of nanotubes produced by this method depends on the carbon atom pressure at the substrate [12]. This technique also produces nanotubes in thin films ideal for hardness and field emission tests. In this case the buckytube field emitting surface can be fabricated directly on the cathode substrate. In fact, cold field emission tests of this material have been performed [13]. To our knowledge, however, only Chernozatonskii has produced nanotubes by this method. And, to date, we have been unable to obtain samples of this material for our own field emission tests. Therefore we have concentrated on ways to make cathodes from arc-discharge-produced buckytubes. The material we have worked with most extensively was produced at Northwestern University with a "quiescent" arc-discharge and, most recently, using hydrogen instead of helium as the background gas.
Arc-discharge-produced carbon nanotubes present several challenges for field emission tests and cathode fabrication because nanotubes produced in this way require separation from each other and other nanoparticles. There is also the problem of aligning the nanotubes for a field emission cathode and attaching them to a conducting substrate.
Cathode Fabrication Plan
To provide context for what follows, we first present a way to fabricate a cold field emission cathode using arc-discharge-produced buckytubes.
First, purify and separate the buckytubes using oxidation or other purification methods. Then, sort buckytubes electrostatically or by other means, such as field flow fractionation, to provide some sort of uniformity. Place buckytubes selected for cathode fabrication in a dielectric solvent, for example, amyl acetate, with a small percentage of nitro-cellulose or other fixative. Place the buckytube solution on a substrate coated with low-melting point metal whose molten surface tension is low enough for capillary absorption into buckytubes [14]. Place the substrate with buckytube solution in an electrostatic field for buckytube alignment perpendicular to the plane of the substrate. The gravitational vector will be parallel to the electrostatic alignment field. When the amyl acetate or other solvent has evaporated, buckytubes will remain perpendicular to the substrate, fixed to it by the nitro-cellulose or other fixative. The thickness of the fixative layer will be perhaps 10% of the buckytube length so that differences in buckytube settling times are not important. Heat the substrate, "soldering" the buckytubes to the substrate by capillary absorption. If necessary, undesirable remnants of the fixative can then be removed, possibly by oxygen plasma or other methods.
Below we discuss experimental or theoretical developments related to implementing this cathode fabrication plan.
Oxidation Purification Experiments
Nanotube purification by oxidation has been successful, notably at Ebbesen's laboratory at NEC, Japan [15]. We have had limited success with purification efforts at Phillips Laboratory.
Nanotube oxidation experiments were performed at Phillips Lab by heating buckytube material on various substrates in an oven, following Ebbesen [15] and Ruoff [16]. The buckytubes used were produced at Northwestern University in a quiescent arc-discharge in hydrogen. In oxidation experiments the material was heated in ambient air with no attempt to maintain gas flow. Small quantities of buckytube material were placed on the substrate either dry (as received) or in solution, after vigorous ultrasonic dispersion. Oxidation times varied from 15
94

minutes to 1 1/2 hours. Oxidation temperatures varied from 600 to 800 C. The substrates used were: foil or sheet pieces of noble metals, including Au, Pt and Au/Pd; an AI2O3 boat; and a porcelain crucible. Crucible experiments were done with the crucible open or capped.
The most noticeable effects in oxidation experiments with noble metal substrates were thermal etching of the substrate and reaction of the nanotube material with the substrate. Catalytic reaction occurred in all cases: after oxidation the nanotube material often appeared transformed into long, rectangular forms, sometimes with angular end structure and sometimes etched within the interior, as shown in Figure la. The impression is that entire buckybundles or groups of buckybundles were "melted" into flattened, basically rectangular forms and then sometimes etched within the interior. In addition to this material, we very rarely saw what appeared to be isolated buckybundles, based on their high aspect ratio and dimensions, as shown in Figure lb. More commonly seen were regions of cubic crystals of carbon (determined by SEM elemental analysis), as shown in Figure lc. We have seen this cubic structure in many arc-discharge- produced buckytube samples [6] and suspect it is produced in the arc-discharge itself, along with buckytubes. We speculate that, just as oxidation removes the more reactive carbon structures, such as nanoparticles and nanotube end-caps, leaving the open-ended cylindrical bodies of the nanotubes, the cubic carbon forms are also less reactive and remain after oxidation. We believe these cubic forms may be diamond but cannot rule out other forms of carbon or metallic carbide crystals.
Nothing was seen after oxidation in the AI2O3 ceramic boat or open porcelain crucible experiments. The capped crucible experiment took much longer for complete oxidation to occur, that is for all the buckytube material to disappear. However, partial oxidation (removing the sample from the oven while some material still remained) yielded some results. The partially oxidized material was extensively examined using a field emission scanning electron microscope (FESEM), which provides the highest SEM resolution. Graphitic plates and nanoparticles seen in unoxidized material were not seen after partial oxidation. Only nanotube bundles and cubic carbon crystals remained, as shown in Figure Id. After an additional 15 minutes at temperature, complete oxidation of the remaining material occurred.
Despite these curious results, the hoped-for production of a large quantity of clean, isolated buckytubes or buckybundles suitable for electrostatic alignment or other experiments was not realized. We have found the oxidation purification technique very difficult to use. Once the buckytube material is at the temperature required for oxidation of nanoparticles, it is very easy to heat the purified nanotubes too long, resulting in total oxidation of the sample and no yield of purified nanotubes. We continue to investigate ways to purify nanotubes suitable for alignment or other experiments.
Electron Emission and Photoelectron Emission Microscopy of Buckytubes
Tests of a macroscopic field emission cathode made from arc-discharge-produced buckytubes are probably well in the future. Therefore we have studied microscopic buckytube field emission using a special microscope at Ohio University. This microscope electron-optically images electron emission sites. It can also be used to image photoelectric emission sites. The technique is called PhotoElectron Emission Microscopy, or PEEM [17]. The lateral resolution of this instrument is -100 nm. Specimen fields up to -50 kV/cm can be obtained. Experiments on microscopic buckytube field emission using this instrument are in progress.
Electrostatic Alignment and Manipulation of Buckytubes
We have developed theory for the alignment and manipulation of nanotubes using induced dipole moments. In Reference 18 we discuss alignment time, viscosity effects of the dielectric liquid in which the nanotubes are suspended and thermal agitation effects on alignment. We also discuss manipulation of nanotubes using the dielectrophoretic force F = V (p«E), where p is the induced dipole moment and E is the applied external field. We have also explored alignment mechanics with an analog of nanotubes -- pieces of Thornel 5.1 |im in diameter and 100-500 |im
95
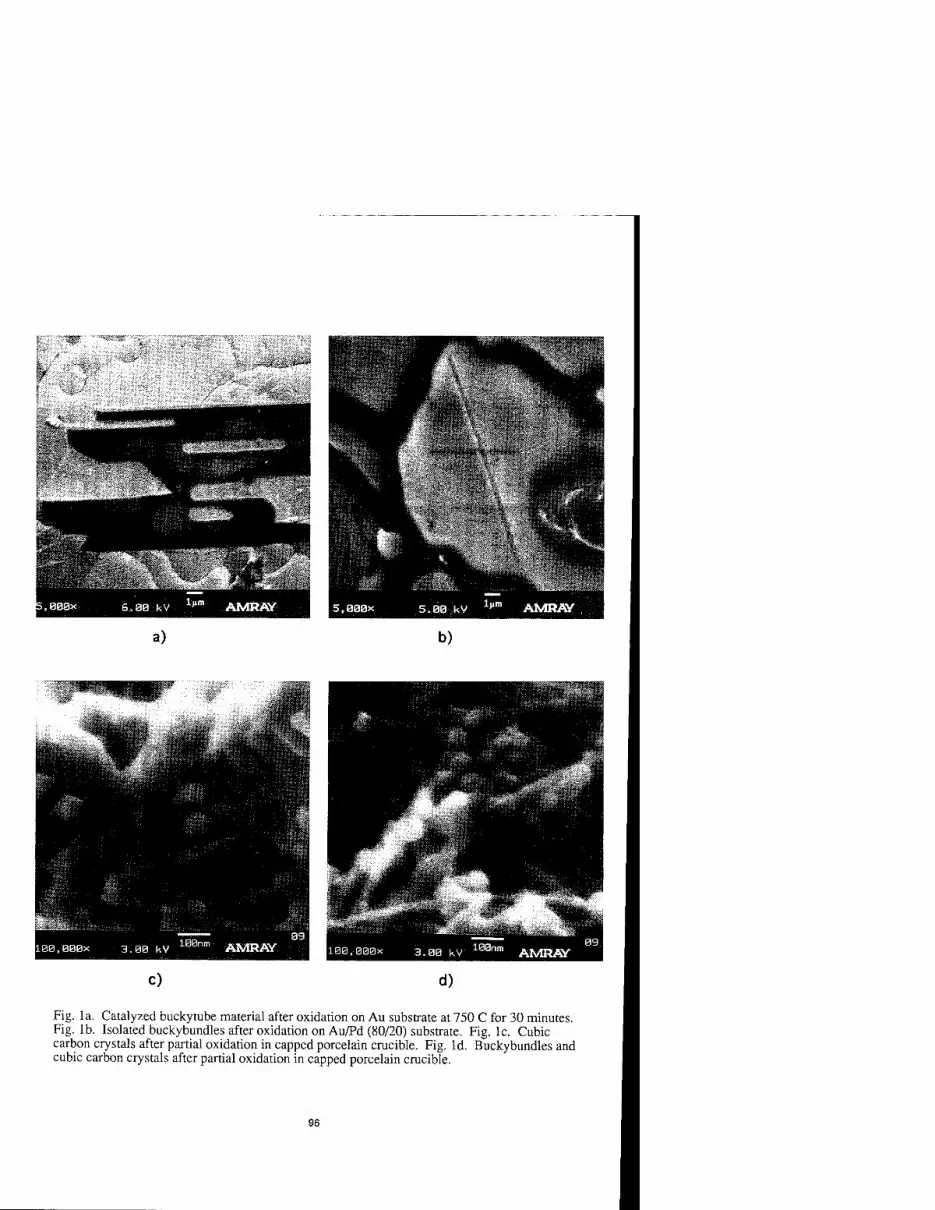
,000x S.00 kV AMRAY
a) b)
l00,000x 3.00 kv 100nm AMRAY
C) d)
Fig. la. Catalyzed buckytube material after oxidation on Au substrate at 750 C for 30 minutes. Fig. lb. Isolated buckybundles after oxidation on Au/Pd (80/20) substrate. Fig. lc. Cubic carbon crystals after partial oxidation in capped porcelain crucible. Fig. Id. Buckybundles and cubic carbon crystals after partial oxidation in capped porcelain crucible.
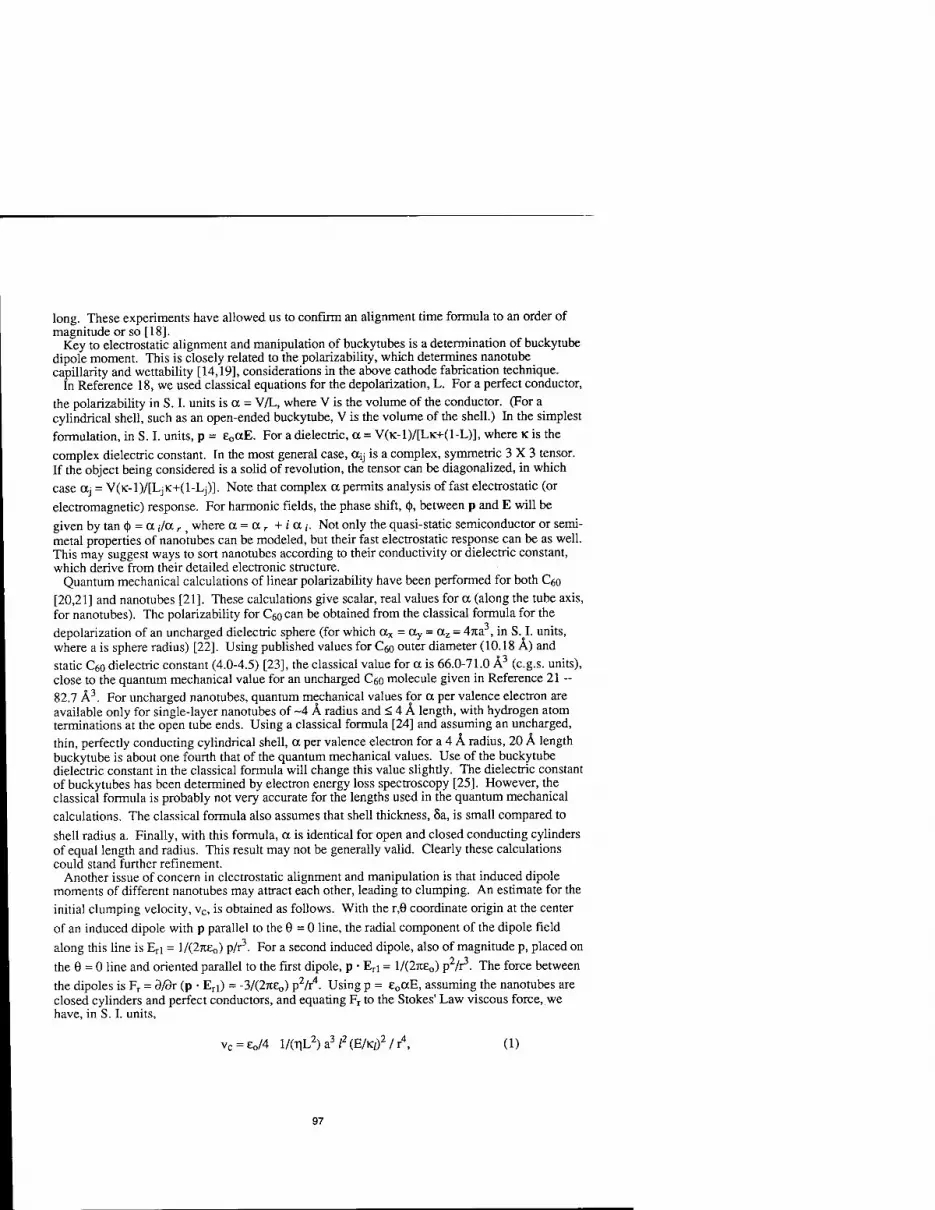
long. These experiments have allowed us to confirm an alignment time formula to an order of magnitude or so [18].
Key to electrostatic alignment and manipulation of buckytubes is a determination of buckytube dipole moment. This is closely related to the polarizability, which determines nanotube capillarity and wettability [14,19], considerations in the above cathode fabrication technique.
In Reference 18, we used classical equations for the depolarization, L. For a perfect conductor, the polarizability in S. I. units is a = V/L, where V is the volume of the conductor. (For a cylindrical shell, such as an open-ended buckytube, V is the volume of the shell.) In the simplest formulation, in S. I. units, p = e0aE. For a dielectric, a = V(K-1)/[LK+(1-L)], where K is the complex dielectric constant. In the most general case, OC;J is a complex, symmetric 3X3 tensor. If the object being considered is a solid of revolution, the tensor can be diagonalized, in which case aj = V(K-l)/[LjK+(l-Lj)]. Note that complex a permits analysis of fast electrostatic (or
electromagnetic) response. For harmonic fields, the phase shift, <|>, between p and E will be given by tan <|) = a ,7a r; where a = a r + i a ,-. Not only the quasi-static semiconductor or semi- metal properties of nanotubes can be modeled, but their fast electrostatic response can be as well. This may suggest ways to sort nanotubes according to their conductivity or dielectric constant, which derive from their detailed electronic structure.
Quantum mechanical calculations of linear polarizability have been performed for both Qo [20,21] and nanotubes [21]. These calculations give scalar, real values for a (along the tube axis, for nanotubes). The polarizability for COO can be obtained from the classical formula for the depolarization of an uncharged dielectric sphere (for which ax = ay = az = 47ta , in S. I. units, where a is sphere radius) [22]. Using published values for COO outer diameter (10.18 Ä) and static C60 dielectric constant (4.0-4.5) [23], the classical value for a is 66.0-71.0 Ä3 (c.g.s. units), close to the quantum mechanical value for an uncharged C6o molecule given in Reference 21 - 82.7 Ä3. For uncharged nanotubes, quantum mechanical values for a per valence electron are available only for single-layer nanotubes of ~4 Ä radius and < 4 Ä length, with hydrogen atom terminations at the open tube ends. Using a classical formula [24] and assuming an uncharged, thin, perfectly conducting cylindrical shell, a per valence electron for a 4 Ä radius, 20 Ä length buckytube is about one fourth that of the quantum mechanical values. Use of the buckytube dielectric constant in the classical formula will change this value slighdy. The dielectric constant of buckytubes has been determined by electron energy loss spectroscopy [25]. However, the classical formula is probably not very accurate for the lengths used in the quantum mechanical calculations. The classical formula also assumes that shell thickness, 8a, is small compared to shell radius a. Finally, with this formula, a is identical for open and closed conducting cylinders of equal length and radius. This result may not be generally valid. Clearly these calculations could stand further refinement.
Another issue of concern in electrostatic alignment and manipulation is that induced dipole moments of different nanotubes may attract each other, leading to clumping. An estimate for the initial clumping velocity, vc, is obtained as follows. With the r,6 coordinate origin at the center of an induced dipole with p parallel to the 6 = 0 line, the radial component of the dipole field
along this line is Eri = l/(27te0) p/r3. For a second induced dipole, also of magnitude p, placed on
the 6 = 0 line and oriented parallel to the first dipole, p • Erl = l/(27ie0) p2/:3. The force between
the dipoles is Fr = d/3r (p • Erl) = -3/(27tEo) p2/r4. Using p = E0aE, assuming the nanotubes are closed cylinders and perfect conductors, and equating Fr to the Stokes' Law viscous force, we have, in S. I. units,
vc = e0/4 l/(TiL2)a3/2(E/K,)2/r4, (1)
97

where a is the radius of the nanotubes, / is their length, r) is the viscosity of the liquid and K; is the liquid dielectric constant. In this estimate buoyant and gravitational forces are neglected.
As an example, we assume that in a completed cathode there are 10 emitters/cm, for an areal density of 10 emitters/cm . If we assume 1 ^/emitter, this will produce a macroscopic current density of 10 A/cm , a very respectable source for intense electron beams. A current of 1 p-A is well within the emission seen from individual Spindt gated field emitters. In this case the emitters will be placed on the substrate with a separation of 1 |im. We take r to be equal to this distance. For room temperature amyl acetate, T) ~ 10"3 N-s/m2. However, the addition of nitro-
cellulose drastically increases r\. We assume T) = 10 N-s/m . We also assume a nanotube with 10 nm radius and 100 nm length to obtain L. Using these values in Equation 1, as well as E = 1 kV/cm and K; = 1, we obtain vc = 7.5 X 10" nm/s. The clumping velocity should be so low that nanotubes do not move very much before the solvent evaporates and they are fixed to the substrate. Clearly there is much latitude in adjusting T|, L and so forth, to avoid clumping.
ACKNOWLEDGMENT
We wish to thank Dr. Charles Stein at Phillips Laboratory for suggestions, support and encouragement of this work, and TSGT Robert Robertson for digital image processing.
REFERENCES
1. G. Ovcmey, W. Zhong, D. Tomanek, Z. Phys. D 27,93 (1993). 2. M. S. Dresselhaus, Nature 358, 195 (1992). 3. R. A. Jishi, M. S. Dresselhaus, G. Dresselhaus, Phys. Rev. B 48,11385 (1993). 4. J. M. Lambert et al., Chem. Phys. Lett. 226, 364 (1994). 5. S. N. Song, X. K. Wang, R. P. H. Chang, J. B. Ketterson, Phys. Rev. Lett. 72,697 (1994) and L. Langer et al., J. Mater. Res. 9, 927 (1994). 6. B. H. Fishbine, C. J. Miglionico, K. E. Hackett, K. J. Hendricks, to appear in the proceedings of the Spring 1994 Materials Research Society meeting, San Francisco, paper T7.21. 7. V. G. Litovchenko and Y. V. Kryuchenko, J. Vac. Sei. Technol. B 11, 362 (1993). 8. N. Hamada, S.-I. Sawada, A. Oshiyama, Phys. Rev. Lett. 68, 1579 (1992). 9. C. H. Oik and J. P. Heremans, J. Mater. Res. 9,259 (1994). 10. Z. Ya. Kosakovskaya, L. A. Chernozatonskii, E. A. Fedorov, JETP Lett. 56,26 (1992) and L. A. Chernozatonskii, E. A. Fedorov, Z. Ja. Kosakovskaya, V. I. Panov, JETP Lett. 57, 35 (1993). 11. T. W. Ebbesen and P. M. Ajayan, Nature 358, 220 (1992). 12. L. A. Chernozatonskii, Z. Ja. Kosakovskaja, A. N. Kiselev, N.A. Kiselev, Chem. Phys. Lett. 228, 94 (1994). 13. L. A. Chernozatonskii el al., program of the Fall 1994 Materials Research Society meeting, Boston, paper G5.76. 14. E. Dujardin, T. W. Ebbesen, H. Hiura, K. Tanigaki, Science 265, 1850 (1994). 15. T. W. Ebbesen, P. M. Ajayan, H. Hiura, K. Tanigaki, Nature 367, 519 (1994). 16. R. S. Ruoff, private communication, 1994. 17. W. Engel, M. E. Kordesch, H. H. Rotermund, S. Kubala, A. von Oertzer, Ultramicroscopy 36, 148 (1991). 18. B. H. Fishbine, submitted to Science. 19. M. R. Pedcrson and J. Q. Broughton, Phys. Rev. Lett. 69,2689 (1992). 20. M. R. Pederson and A. A. Quong, Phys. Rev. B 46,13584 (1992). 21. A. A. Quong and M. R. Pederson, to appear in the proceedings of the Spring 1994 Materials Research Society meeting, San Francisco, paper T6.5. 22. W. K. H. Panofsky and M. Phillips, Classical Electricity and Magnetism. 2nd ed., Addison-Wesley, 1962, p. 85. 23. M. S. Dresselhaus, G. Dresselhaus, P. C. Eklund, J. Mater. Res. 8,2054 (1993). 24. F. Bchroozi et al., J. Appl. Phys. 68, 3688 (1990) and G. W. Crabtrce, Phys. Rev. B 16, 1117 (1977). 25. R. Kuzuo, M. Terauchi, M. Tanaka, Jpn. J. Appl. Phys. 31, L1484 (1992).
98

NANOTUBE CARBON STRUCTURE TIPS - A SOURCE OF HIGH FIELD EMISSION OF ELECTRONS
LEONID A. CHERNQZATONSKII*, Yu.VGUL.YAEV" ZJa. KOSAKQySKAJA** NI. SINITSYN/, G.V.TORGASHOV , EA. FEDOROV , YUF.
ZAKHARCHENKO , V.P. VAL'CHUK .institute of Chemical Physics, Moscow 117334, Russia
Institute of Radio Engineering and Electronics, Moscow 103907, Russia
ABSTACT
We present the finding of experiments of considerable field emission from the films consisting of nanotube carbon structures,on various substrates (Si, quartz, glassV density of emission current was up to 1-3 A/cmz while electric field was about 100 V/>im. The "reconstruction" and "inversion" of field emission have also been observed after current breakdown.
1. MATERIALS AND EXPERIMENTS
Goal of the work is to use tips of carbon nanotubes [1-4] as a source of field emission. We have chosen our films [2-5] as a material for this purpose. As scanning tunneling microscopy (STM) and high resolution electron microscopy (HREM) prove that they consist of tube-like carbon molecules - tubelenes aligned in one direction: A- tubelites - their structure includes single graphite layer tubules forming filaments - bundles 10-30 nm in diameter [2,3,5]; B-tubelites, including mostly multilayer graphite- like tubes 10-30 nm in diameter with conoid or dome-like caps [4]. Taking into account the high conductivity along nanotubes (about 100 S cm"1 [6]), and nm radii of their tips are rather small, we expected to obtain high microfields F=bE near them at sufficiently low values of the average field E as compared to known tip sources of field emission [7,8]. Naturally arrays organization of tips at the surface allows to get high density of electron current emission.
Carbon tubelite films have been obtained on substrates by electron beam evaporation of graphite in 10"i - 10"b Torr vacuum: A-tubelites have been placed on glass and quartz by directed carbon particle flows several times greater than those forming B-tubelites on Si substrates.. The films produced were 0.1-03 m thick. Texture of all tubelite films is oriented along the normal to the substrate surface. Diode structures usually worked in 10"" Torr vapium. Their emission ability remained at the same level while vacuum varied from 10"° to 10 Torr.
Fig.l shows characteristic structures of film surfaces (a,b - STM pictures): (a) A- tubelite consists of single layer tubes about 1 nm in diameter forming the filaments 10- 30 nm in diameter (see also HREM pictures [5]), having tips 2-10 nm in height [4]; B- tubelite surface is formed by conoid and dome-like tips of nanotubes about 10 nm in diameter and height forming the bundles [5] - (b) STM image, (c) HREM image (scale bar is 10 nm).
2. RESULTS AND DISCUSSION
Usually the dependence of emission current density J (A/cm2) on microscopic field F and work function <J> (eV) is well described by Fowler-Nordheim (F-N) low:
J = (15 x 10"6 F2 /O) x exp{-6.8xl07 O3/2 /F} (1)
99
Mat. Res. Soc. Symp. Proc. Vol. 359 ° 1995 Materials Research Society

Fig.i
a)
b)
c)
100

here the field F = b x E is enhanced due to a tip by a factor b over the average field E (V/cm), where d is a gap between electrodes one of which is a microtips field emitter.
Typical F-N characteristics of tubelite field emission are presented in Fig2. It is clear that they are fairly close to simitor characteristics of autoemission of new diamond-like films for which factor G = O3/2 /b (eV3/2)is in the range 0.05-0.06 [8]. If the formula (1) is used, then the work function value 3.5-4.5 eV for graphite gives an estimate of the coefficient of electric field growth b about or more than 100, which proves a high amount of nanodimension tips at the surface of analyzed films, i.e., it corresponds to their surface morphology in Fig.l. The emission current of A-t structure exceeds the value of B-t structure by nearly an order of magnitude under the small (E < 40 V//1 m) field; the maximum value of pre-breakdown current of investigated structures was up to 1-3 A/cm2 for A-tubelite, it was smaller for B-tibelite. This fact is connected probably with a great curvature of Art bundle tips and high interconnection of single- layer tubelenes due to covalent sp3 bonds between their high curvature cylinder surfaces similar to those in Cgo-barrelite [9]. On the contrary, B-tubelenes in a film should be bound by molecular forces through small parts of their surfaces and can be "torn out" by an electric field
Factor G value distribution and deviation from a straight line of some F-N characteristics - Fig.2 can be explained by "switching on" and "off" of tips of various types and various heights from the average level of a nanotube structure while working voltage is changed. Thus, for example, the parameter G for an A-tubelite is almost three times less than its value for a B-tubelite, which is naturally connected with the smaller curvature of caps of a multilayer tubelene. The smaller inclination of F-N curves of A-B mixture tubelites in minor electric fields can be a consequence of the fact Jhat a small quantity of tubelenes with sharp caps (initial parameter Gj =0.02 eV1-5) is present at the surface. Supposing that in the straight line region of a F-N characteristics tips of the same type are working, each tip giving current I0=Joso Qo " current density, described by formula (1), from the area s0 of a single tip), the number of "working" tips can,, be estimated: N=I/I0 and their density n=N/S. Using G values from Fig.2, so=5.10"i;' and 3.10"i2 cmz for A- and B- tubelenes with diameters of tip working spot 0.8 and 20 nm correspondingly and 0=3.5 eV, S=3.10"3cmz, we estimate n 105 cm"2 for typical A-tubelite samples and n 10v cm"z for B-tubelites.
Note, that work function for A-tubelenes should be less than the chosen value, and correspondingly the amplification parameter b is also smaller. But it does not cause a great deviation from the given estimates of n. F-N straight lines with the same factor G enable also to estimate the number of working tips "flying away" after diode breakdown. For example, after the first breakdown about 30% A-t tips (G= 0.029) "fly away", and more than 60% tips "fly away" from a B-t (G = 0.085) film.
A small quantity of working tips per square unit of the film (see n abowe) is obviously connected with its sufficiently divergent structure and correspondingly with heterogeneous height distribution of tips. The manufacturing of the films with more homogeneous in diameter and more closely packed tubelenes should cause substantially better emission characteristics in weaker electric fields far away from the breakdown, if their density of equally high tips will be, for example, 10n cm"z (i.e., one working tip per area 30 x 30 nm2) and JA-t, B-t = 5-5 x 10⁴, 2 x VF A/cmz for E = 50 V//t m.
Fig.2 shows F-N characteristics of diodes based on (r.) - single-layer tubelelite on a quartz (o - prebreakdown regime, iX - first breakdown field 900 V//im, G = 0.024,; (> and * - direct and inverse current regime after first breakdown,; x - inverse current regime after second breakdown); (b) - B-t emission (multilayer tubelenes on a Si substrate: o - prebreakdown and after first 500V/jum breakdown regimes, G = 0.085,1 direct and inverse regime after third breakdown, G[ = 0.020, Gf = 0.074) - B-A mixture on Cr-glass: ft - prebreakdown regime.G = 0.03; * - inverse current regime after first breakdown, G = O.03). Stroke lines - diamond-like films [8].
101

Fig.2a
10
E o
<
10
10
2.0 *10A6
2.5 (cm/volt)
4.0
Fig.2b
1 0 ~"-
>
10
1 0 -"-
2.5 3.0 (cm/volt)
4.0
102

We have observed also a recreation and inversion of autoelectron emission in some samples after breakdowns of current (see Fig2), when the emission current failed but reappeared several minutes after breakdown when greater voltage values were applied, or reappeared after a change of voltage polarity (as Mo electrode was a cathode). We believe that such a phenomenon is connected with the fact that tubelenes are torn ott the substrate when the tubelite film is heated during the diode operation (surface ot some substrates hasn't been specially purified before covering by a tubelite structure, i.e. it probably has a bad adhesion). Weak Van der Waals bonds between multilayer nanotubes [10] or single layer tube bundles could be destroyed by heating and due to a sufficiently great electric field in the diode gap (E > 1(P V/cm) Thus, torn off polarized tube-like molecules or separate carbon particles could "fly in high held to the surface of Mo anode and form tubelite on it - the process is similar to the growth ot tubes in arc discharge [10]. Such NFSC destruction is promoted by swelling of the film observed after heating to more than 100°C. Some fragments (10-30 ji m wide) take the form of zigzag branching "hangar", the film remaining stuck to the substrate between them - Fig3.
Fie3 micrograph of a sample of multi-layer nanotube film on Si after more than 100°C heating.
Such a picture seems to remind an "anchor" structure of a nematic crystal layer while heating [11]. Separation of the film from the substrate can be explained by Joules heating of the structure possessing a great difference in thermal expansion coefficients of the nanotube carbon structure and the substrate. After that the electric field is concentrated at the convex and still greater heating of the areas causes detachment ot carbon particles, including possibly separate parts of tubelenes - Fig. 3b. Note that a possibility of flight of nanotube molecules is confirmed also by facts of sudden change of current polarization during STM investigation of the surface of such samples with bad adhesion of nanotube films. It can be connected with pulling a tubelene out of a structure by a strong electric field and its sticking to the ST microscope edge.
Worse emission properties of reconstructed nanotube structures can be connected with a smaller number of tips on it as compared to the number of tips at the surface of the initial structure before the breakdown. We can explain the reconstruction phenomena by the fact that the breakdown tears off the tubelene caps also, and a
103

cloud of carbon particles is formed in a narrow gap between electrodes. Some particles stick to the Mo-electrode, while others return to the NFCS and form new tubelene tips.
3.CONCLUSIONS
We have observed for the first time a considerable field electron emission from the surface of carbon nanotube structures provided by the high concentration of electric field (b>100) at nanodimensional tips of such a structure. A high electron emission discovered in these structures gives a hope for wide applications of carbon nanotube molecules as nanodimensional cathodes and flat displays.
Such field concentration is particularly interesting for using carbon nanotube structures in investigation of electrochemical processes at its surface, and also for observation of high electrooptic and photoemission effects on it.
This work was carried out with the aid of grants No M41000 and RNP000 by International Sience Foundation.
REFERENCES
1. S. Iijima, T. Ichihashi, Y. Ando, Nature 356, 776 (1992). R.W.Wood, Phys.Rev. 5 (1897) 1.
2. ZJa. Kosakovskaja, LA. Chernozatonskii, EA.Fedorov, Pis'ma Zh. Eksp. Teor. Fiz. 56, 26 (1992) [JETP Lett. 56, 26 (1992)].
3. LA. Chernozatonskii, EA. Fedorov, ZJa. Kosakovskaja, V.l. Panov, S.V. Savinov, Pis'ma Zh. Eksp. Teor. Fiz. 57, 35 (1993) [JETP Lett. 57, 35 (1993)].
4. LA. Chernozatonskii, ZJa. Kosakovskaja, A.N. Kiselev, NA. Kiselev, Chem.Phys.Lett. 228, 94 (1994).
5. LA. Chernozatonskii, A.N. Kiselev, NA. Kiselev, ZJa. Kosakovskaja, presented at Phys. Lett, (unpublished).
6. T.W. Ebbesen and P.M. Ajayan, Nature, 358, 220 (1992).
7. CA. Spindt, et.al. JAppl.Phys. 47, 5248 (1976).
8. C. Xie, N. Kumar, C.B. Collins, TJ. Lee, H. Schmidt , S. Wagal, Proceedings of. 6 Int. Vacuum Microel. Conf., Newport, 162 (1993).
9. LA. Chernozatonskii, Chem.Phys.Lett. 209, 229 (1993).
10. R.S. Rouff, J. Tersoff, D.C. Lorents, S. Subramoney, B. Chan, Nature 364, 514 (1993).
11. J.S. Patel and H. Yokoyama, Nature 362, 82 (1992).
104

STUDY OF ONION-LIKE CARBON (OLC) FORMATION FROM ULTRA DISPERSE DIAMOND (UDD)
Vladimir L.Kuznetsov*, Andrey L.Chuvilin*, and Yurii V.Butenko*, Igor Yu.Mal'kov**, Anton K. Gutakovskii**, Sergey V. Stankus*** and Raschid A.Khairulin*** *Boreskov Institute of Catalysis, Novosibirsk, 630090, Russia; **Lavrentiev Institute of Hydrodynamics, Novosibirsk 630090, Russia; ***Institute of Thermophysics, Novosibirsk 630090, Russia.
ABSTRACT
Measurements of diamond bulk density change of carbon powder in the annealing of UDD to OLC (293-2400 K) was performed by irradiating the samples with a narrow beam of gamma quanta (137Cs gamma-ray source). The intermediates of UDD to OLC transformation were registered by high resolution TEM. The annealing products were also characterized by true density and specific area adsorption measurements. The structural rearrangement of UDD begins from the surface towards a crystal bulk. UDD annealing proceeds via particles composed of semi-spherical shells enclosed one-to-one with the rest of diamond core and quasi- spiral carbon shells. The influence of particle size on the temperature of UDD to OLC transformation was found.
INTRODUCTION
All the fullerene-related materials have been usually produced by condensation of carbon vapor in experiments involving the transient high-temperature regimes: pulsed laser heating[l]; electric arc [2]; resistive heating, flame production of soot and high frequency inductive heating method (see the references in [3,4]). However, Ugarte [5,6] discovered the curling and closure of graphitic networks of the soot taken from arc-eveporation experiment under the electron-beam irradiation into the multiple-shell spheres in condensed phase. Later it was shown [7] that a conventional microporous carbon could so be converted into onions by electron irradiation. Recently a new material containing the hollow nanometric carbon onions with from 2 to about 8 graphitic shells was produced by the heart treatment of pure carbon soot at 2250-2400°C [8]. We have found quasi-spherical particles with closed concentric graphite shells (OLC) among the high explosives detonation products UDD of the size 3.0-7.0 nm, graphite ribbons and amorphous carbon) [9]. This made us investigate the UDD annealing. We have shown that UDD annealing at the temperature higher than 1100°C leads to the formation of OLC [10,11]. Here we discuss the peculiarities of OLC formation from UDD.
EXPERIMENT
UDD (with average particle diameter, d=4.5 nm) has been isolated from the detonation soot (prepared by 50/50 trotyl/cyclotrimethylene-trinitraminine charges
105
Mat. Res. Soc. Symp. Proc. Vol. 359 e 1995 Materials Research Society

fired in the hermetical tank [9]) by the oxidative removal of nondiamond carbon with HCIO4. Synthetic diamond ASM 1/0 (average particle diameter d lOOOnm) was provided by the Institute of Superhard Materials (Kiev). UDD properties were described elsewhere [12]. UDD annealing was performed in a vacuum furnace (max T - 2400 K) equipped with a narrow beam gamma quanta !37Cs source and scintillation detector for registration of changes of bulk density. Experimental equipment and procedures have been described in details elsewhere [13,14]. Temperatures were measured with a tungsten-rhenium thermocouple. The micrographs of UDD and annealing products (AP) were obtained with transmission electron microscope (TEM) JEM- 4000 EX. The surface area of samples (Sa) was estimated from argon adsorption and desorption. Sa values were calculated from unit area of argon molecule adsorption over graphite. The true density of UDD and AP (pHe) was measured using Micrometrics Auto Picnometer-1320. Prior to density measurements, the samples were heated under vacuum at 300°C.
RESULTS AND DISCUSSION
Variation of bulk density with temperature for UDD, ASM and corresponding AP is presented in Fig.l (heating rate was 10 o/min). Arrows indicate the temperatures
pkg/ m3 pkg
A* * * - 1 14 m2/g -
3.49 kg/m Sa
3 ""He
• A . » . 580 -
1
& 560 - • . • • . .
^1123 '->
A
A Q)
2 540- 3
520-
* a
' '
500 -
^296 ^.3.07
1413 319 2.9
f\ 43 1 '. „ 2.08-
1603 . , 2149 368 A * . *-* A* 253 1802 "...
434 *••—:_ 2 14 * 2153
480 -
1 1 1 1 1 1 430 2.03
1 1 1 r1
1300
1200
1100
1000
900
600 1000 1400 1800 2200 T, K
Fig.l. Density change on diamond annealing, a) UDD; b) ASM.
106

of UDD vacuum treatment in separate experiments for the sample preparation for TEM study, surface area and true density measurements (see the numbers in Fig.l). It should be noted that in these experiments, the samples were heated at a desirable temperature for 1.5 h. For the samples heated at 1603 and 1802 K bulk density decreased within temperature exposition. So, in static conditions the conversion of UDD to AP was slightly higher than in dynamic experiments. Initial part of the curves (see Fig.l) with constant slope corresponds to the thermal expansion of diamonds. However in the case of UDD thermal expansion was accompanied by gas desorption from sample surface (weight loss - l-2wt%). UDD annealing begins at 1300 K. At TM600 K, annealing rate increased. ASM transformed to the AP at 1950-2000 K. Note that UDD transformation completes at the same temperature. TEM micrographs of the UDD annealing products treated at different temperatures are shown in Fig. 2. It is evident that the sample heated at 1123 K contains mostly untransformed UDD associates. The dark contrast lines corresponding to the (110) and (111) diamond planes (with the distance between them 0.2063 and 0.253 nm respectively [11]) were used to scale the magnification of TEM images. According to the bulk density measurements, TEM images of the sample heated at 1413 K contain a large variety of partially transformed UDD particles. Particles larger than 2.0-2.5 nm are covered with 2-5 highly defective curved graphite-like layers. Only the particles less than 2.0-2.5 nm in size have no diamond core. They have highly defective nested structures with 3-5 shells. The distance between the shells is close to 0.35 nm, i.e. typical for bulk graphite (d0o2=0.3354 nm). Annealing at 1603 K leads to further UDD transformation. Micrograph (Fig.2c) shows the coexistence of small highly defective OLC particles (2-4 nm), particles with diamond inner core covered by curved graphite shells and 8-15 nm diamond particles covered by few graphite-like scales. The closure of graphite-like shells is not completed, so particles composed of semi-spherical shells enclosed one-to-one and quasi-spiral carbon shells can be identified. The samples heated at 1803 (static experiment) and 2153 K contained no diamond particles. This is in good agreement with the data on bulk density and surface area measurements. However, some distinctions occur here. Thus, the sample heated at 2153 K contains more defective OLC particles, graphite-like ribbons and moreover oblong hollow carbon onions similar to those observed by Ugarte after heat treatment of pure carbon soot at 2400-2670 K [8]. The larger graphite structure (10-30 nm) were also observed. Among the UDD annealing products some polyhedron OLC particles with smooth edges and elongated particles with linked external graphite-like layers and closed quasi-spherical internal shells one can observed. The latter seem to be formed from UDD associates with a high number of contacts between initial particles. It should be noted that more perfect OLC was formed when we heated small quantities of UDD. Higher vacuum can be achieved in this case that makes the gas transfer reactions (1, 2) less intensive.
C02 + Ccurved > 2CO (1) 2CO —> Cgraphitic + C02 (2)
107

^>W'V u^>v\T'iÄ-■■*
Fig.2. TEM images of UDD annealing products (vacuum, 1.5 h.): a) 1413 K, b) 1603 K, c) 1802 K,d) 2153 K
108

Thus we can make the following conclusions: 1) The structural rearrangement of UDD under annealing conditions begins from the surface and proceeds towards the crystal bulk. 2) UDD annealing proceeds via particles composed of semispherical shells enclosed one-to-one with the rest of diamond core and quasi-spiral carbon shells. 3) UDD annealing to OLC proceeds easer for small particles (2-4 nm) rather than for large ones due to the higher surface energy of smaller particles. 4) Formation of OLC without hollow inner space proceeds at the the optimal temperature. Interesting observation was made for AP of ASM containing rather large diamond particles (~1000nm). Beside the large graphite particles, nanometric curved structures with tubular or conic form were observed (Fig. 3). The transformation of (111) diamond plane to (001) graphite one is accompanied by the shrinkage along the graphite network. At the same time, UDD annealing dramatically increases the distances between graphitic layers (from 0.2065 mn to ~0.35nm) and particle volume (compare the densities of graphite and diamond, 2.265 and 3.515 g/cm3, respectively). Hence, the number of surface carbon atoms of initial diamond particle is not sufficient to form the surface of graphitic particles and curved volcano-like or tubular structure can form. The observation of closed structures (OLC, nanotubes) have not limited to the carbon system. Stable structures with closed shells were found to occur in the layered semiconductor WS2 [15,16] and MoS2 [17]. So, such curling structure is likely to form in many layered compounds, and new forms of this compounds in nanoscale region of phase diagram with additional axis could be proposed. Fig.4 represents the form of proposed three-dimension phase diagram of carbon.
CM»-« w&iA
Liquid carbon
Fig.3. TEM image of ASM annealing product (vacuum, 1.5 h., 2149 K).
Fig. 4. Three dimensional phase diagram of carbon.
109

UDD production is well developed [18] and diamond particles of different dispersion can be prepared [19]. So the production of macroscopic quantities of material containing OLC can be elaborated. The further development of onion- carbon preparation technique and isolation of fractions with the narrow size distribution can provide a new family of carbon materials with unusual properties.
Acknowledgment. Support of our work by the International Science Foundation (grant RA2 000) is gratefully acknowledged. Authors would like to express their gratitude to V.M.Titov for fruitful discussion and support.
REFERENCES 1. H.W.Kroto, J.R.Heath, S.C.O'Brien, R.F.Curl and R.E.Smalley, Nature 318,
162 (1985). 2. W.Kratschmer, L.D.Lamb, K.Fostiropoulos and D.Huffman, Nature 347, 354
(1990). 3. Carbon 30 No 8 (1992), Special issue on fullerenes, Guest editor: H.Kroto. 4. D.H.Parker, K.Chatterjee, P.Wurz, K.R.Lykke, M.J.Pellin, L.M.Stock, and
J.C.Hemminger, Carbon 30, No.8, 1167 (1992). 5. D.Ugarte, Nature 359, 707 (1992). 6. D.Ugarte, Chem.Phys.Letters 207, 473 (1993). 7. PJ.F.Harris, European Microscopy and Analysis, Sept. 1994, 13. 8. W.Ade Heer and D.Ugarte, Chem.Phys.Letters 207, 480 (1993). 9. V.L.Kuznetsov, I.Yu.Mal'kov, A.L.Chuvilin, E.M.Moroz, V.N.Kolomiichuk,
Sh.K.Shaichutdinov, and Yu.V.Butenko, Carbon 32, 873 (1994). 10. I.Yu.Mal'kov, V.M.Titov, V.L.Kuznetsov, A.L.Chuvilin, Fizika Gorenia i
Vzryva (Russ.) 30, No 1, 130 (1994). 11.V.L.Kuznetsov, A.L.Chuvilin, Yu.V.Butenko, I.Yu.Mal'kov and V.M.Titov,
Chem.Phys.Lett. 222, 343 (1994). 12. V.L.Kuznetsov, M.N.Aleksandrov, I.V.Zagoruiko, A.L.Chuvilin, E.M.Moroz,
V.N.Kolomiichuk, VA.Likholobov, P.M.Brylyakov and G.V.Sacovich. Carbon 29, 665 (1991).
13. S.V.Stankus and R.A.Khairulin, Teplophizica Vysokikh Temperatur (in Russian) 30, 487 (1992)
14. S.V.Stankus and R.A.Khairulin, Russ. J.Engineering Thermphys. 1, 193 (1991). 15. M.Genat, LMargulis, G.Hodes, and R.Tenne, Thin Solid Films 217, 91
(1992). 16. R.Tenne, LMargulis, M.Genut, and G.Hodes, Nature 360, 444 (1992). 17. J.Moser, H.Liao, F.Levy, J.Phys. D. appl. Phys. 23, 624 (1990). 18. A.I.Lyamkin, E.A.Petrov, A.P.Ershov, G.V.Sacovich, A.M.Staver and V.M.Titov,
Dokl.Acad.Nauk SSSR 302, 611 (1988). 19. I.Yu.Mal'kov, Fizika Gorenia i Vsryva 27, No 5, 136 (1991).
110

Inorganic fullerenes of MX2 (M=W,Mo;X=S,Se)
R. Tenne*, L. Margulis*,Y. Feldman*, and M.Homyonfer*, 'Department of Materials and Interfaces, Weizmann Institute, Rehovot 76100, Israel.
Abstract
The gas-phase reaction between M0O3-X and H2S in a reducing atmosphere and at elevated temperatures (800° to 950°C) has been used to synthesize large quantities of an almost pure nested inorganic fullerenes (IFs) phase of M0S2. A uniform IF phase with a relatively narrow size distribution was obtained. The x-ray spectra of the different samples show that as the average size of the IF decreases the van der Waals gap along the c axis increases, largely because of the strain involved in folding of the lamella. Large amount of quite uniform nanotubes were obtained under modified preparation conditions.
In the second part of this work M0S2 nested fullerenes were grown on Ti and Nb and Mo oxide substrates. In one set of conditions hollow nested fullerenes of M0S2 were collected on a titanium oxide matrix, and analyzed by local area energy dispersive analysis. Under different flow conditions of the reacting gasses nested fullerenes with endohedral metal oxides were obtained and1 analyzed by electron diffraction.
Introduction
Although graphite is the most stable form of carbon under ambient conditions, graphite nanoclusters have been shown to be unstable against folding and close into fullerenes1, nested fullerenes2 and nanotubes3. It is believed4 that the main stimulus to form carbon fullerenes (CF) emanates from the large energy associated with the dangling covalent bonds of the peripheral carbon atoms in graphite nanoclusters. Recent theoretical work5 suggests that multilayer nested fullerenes are thermodynamically more stable than single layer fullerenes having the same number of carbon atoms. Although the growth conditions in most cases are far from equilibrium, some evidence in support of this theoretical work was obtained by careful annealing of amorphous carbon soot with the beam of a transmission electron microscope (TEM)6. Nanoclusters of layered metal dichalcogenide materials, such as WS2, were also recently shown7"9 to be unstable against folding and close upon themselves to form nested fullerene-like structures (also designated IFs) and nanotubes, which are similar to their carbon predecessors. Although the driving force in this case is not likely to be very different, the detailed structure of the IFs are quite different from that of the CFs, largely because of the different structures of graphite and layered dichalcogenides. In particular, the IFs are generally more faceted than the CFs8.9. In both the CF and IF, these folded, three dimensional fullerenes are characterized by topological point defects on the basal planes of the regular crystal structure10. However, the topological defects are much stronger in the IF structures.
111
Mat, Res. Soc. Symp. Proc. Vol. 359 e 1995 Materials Research Society

Because carbon fullerenes can be considered as a metastable form of carbon, it was suggested11 that the ideal growth conditions for CF could be provided through a gas phase reaction. In this case, each nanocluster is isolated in the reaction chamber and the only means for it to release its extra energy is through collisions with the noble carrier gas (He in most experiments). Development of a similar strategy for the IF would be desirable, but requires careful consideration and detailed knowledge of the phase equilibria in the reaction chamber. However, the choice of source materials for a gas phase reaction is fairly extensive. For example, preparation of M0S2 powders and films by the gas phase reaction between MoClx (X=3-5) and H2S12 or M0F6 and H2S13 has been demonstrated. Alternatively, pulsed laser evaporation14, metal organic chemical vapor deposition15, and so forth, can be used to form IF from the gas phase. In order to take advantage of the sublimation of M0O3-X at relatively low temperatures (>650°C), a reactor was built that allowed for a gas phase reaction between a stream of gaseous molybdenum suboxide and H2S. This reactor was used to prepare, reproducibly, a few milligrams of an almost pure IF phase in each run16. The production of copious amounts of IFs allowed, a systematic study of the properties of the IF, the initial results of which are also reported here. Furthermore, the analysis of the growth conditions provided some clues for the pathway to IF production. Minor changes in the reactor design resulted in the production of substantial amount of nanotubes of up to 5u.m in length and diameters of 10 to 20 nm.
In order to form M0S2 from H2S and M0O3 in a reducing atmosphere at elevated temperatures, the Mo-S-0 ternary phase diagram should be considered17. The following series of reactions are relevant for the growth of M0S2:
Mo03(s) + XH2(g) --> Mo03-X(g) + XH20(g) (1)
Mo03-X(g) +(1 -X)H2(g) +2H2S(g) --> MoS2(s) + (3-X)H20(g) (2)
Mo03(s) + 3H2(g) --> Mo(s)+3H20(g) (3)
Mo03-X(g) + 0 -X)H2(g) +XH2S(g) -> Mo02-XSx(s)+H20(g) (4)
Mo03-X(g) +3H2S(g) -> MoS3(s) + (3-X)H20(g) +XH2(g) (5)
MoS3(s) --> MoS2(s) + S(g) (6)
Nonstoichiometry commonly occurs in metaloxides, including the molybdenum compounds. One may also take advantage of the fact that some of the substoichiometric oxides are very volatile and sublime at temperatures as low as 650°C (reaction 1). However, if the reducing atmosphere is too strong, metallic molybdenum, which has an exceedingly low vapor pressure at these temperatures (reaction 3), occurs. On the other hand if the reducing atmosphere in the reactor is not sufficiently strong, oxi-sulfides of molybdenum with an orthorhombic structure are collected on the substrate (for example, reaction 4). Careful control of the reducing
112
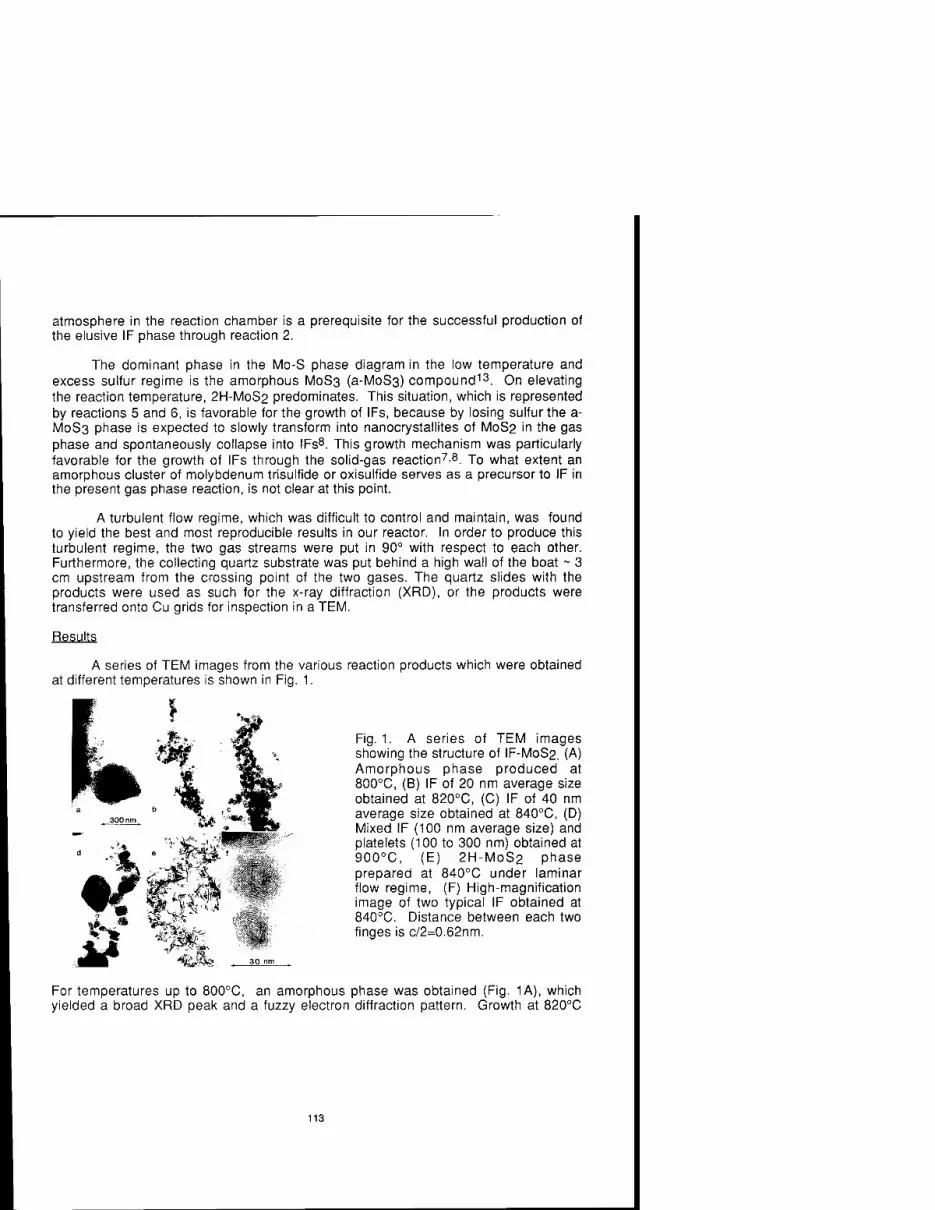
atmosphere in the reaction chamber is a prerequisite for the successful production of the elusive IF phase through reaction 2.
The dominant phase in the Mo-S phase diagram in the low temperature and excess sulfur regime is the amorphous M0S3 (a-MoS3) compound13. On elevating the reaction temperature, 2H-M0S2 predominates. This situation, which is represented by reactions 5 and 6, is favorable for the growth of IFs, because by losing sulfur the a- M0S3 phase is expected to slowly transform into nanocrystallites of M0S2 in the gas phase and spontaneously collapse into IFs8. This growth mechanism was particularly favorable for the growth of IFs through the solid-gas reaction7.8. To what extent an amorphous cluster of molybdenum trisulfide or oxisulfide serves as a precursor to IF in the present gas phase reaction, is not clear at this point.
A turbulent flow regime, which was difficult to control and maintain, was found to yield the best and most reproducible results in our reactor. In order to produce this turbulent regime, the two gas streams were put in 90° with respect to each other. Furthermore, the collecting quartz substrate was put behind a high wall of the boat ~ 3 cm upstream from the crossing point of the two gases. The quartz slides with the products were used as such for the x-ray diffraction (XRD), or the products were transferred onto Cu grids for inspection in a TEM.
Results
A series of TEM images from the various reaction products which were obtained at different temperatures is shown in Fig. 1.
Fig. 1. A series of TEM images showing the structure of IF-M0S2. (A) Amorphous phase produced at 800°C, (B) IF of 20 nm average size obtained at 820°C, (C) IF of 40 nm average size obtained at 840CC, (D) Mixed IF (100 nm average size) and platelets (100 to 300 nm) obtained at 900°C, (E) 2H-M0S2 phase prepared at 840°C under laminar flow regime, (F) High-magnification image of two typical IF obtained at 840°C. Distance between each two finges is c/2=0.62nm.
For temperatures up to 800°C, an amorphous phase was obtained (Fig. 1A), which yielded a broad XRD peak and a fuzzy electron diffraction pattern. Growth at 820CC
113

produced IFs ~ 20 nm in (external) diameter (Fig. 1B). The average size of the IFs increased with increasing reaction temperature. A typical example obtained at 840°C is shown in Fig. 1C. Here the average external diameter is ~ 40 nm. When the reaction was allowed to proceed for 2 hours instead of 1 hour, there was no noticeable change in the IF size distribution. This result suggests that the sizes and morphologies of the IF are determined during growth in the gas phase and that quasi-equilibrium conditions, prevail. At a growth temperature of 900°C, the external diameter of the IFs was 100 nm and the wall thickness was ~ 20 nm (Fig.lD). Platelets of 100 to 300 nm in size and above, belonging to the 2H-M0S2 polytype, start to appear at this temperature. If the temperature of the reactor is further increased, the fraction of the 2H- M0S2 predominates and becomes the sole phase at 950°C. In this case most of the crystallites were oriented with their <0001> axis perpendicular to the substrate18. Higher annealing temperatures yielded even larger crystallites of the same phase. The IFs represented the most prevalent phase in the film only under a specific turbulent flow regime. They were visible only very rarely in the laminar flow regime even at temperatures (840°C) where IFs predominate under turbulent flow regime (Fig. 1E). A high-resolution image of two IFs obtained at 840°C is shown in Fig. 1F.
The spacing between two adjacent layers in CF (c/2) and nanotubes was found to be somewhat larger than that of bulk graphite19. The lattice expansion was ascribed to strain relief in the folded structure. A similar mechanism for strain relief was expected to operate in the IFs. A series of XRD spectra for the various films prepared on quartz substrates is shown in Fig. 2. The scattering intensity of the thin films was very weak and, therefore, lengthy measurements were taken for each film. The (0002) peak position in the XRD pattern depended not only on temperature but also on the flow regime, as expected from the TEM results. The XRD pattern for the film prepared in the turbulent flow regime at temperatures between 800° to 900°C corresponded to the IF phase seen in TEM.
13.6 14 14.4 14.8 20
Fig. 2. Powder XRD spectrum taken from the phases obtained during the growth of M0S2 at (A) 840°C, (B) 900°C, and (C) 840°C under laminar flow conditions.
114

The sample prepared at 840°C showed an average expansion of 2% along the C axis (Fig. 2A) compared with the 2H phase (vertical line). The average size of the crystallites was calculated from the Debye-Scherrer formula to be 40 nm (see also Fig. 3C). Upon increasing the temperature to 900°C (Fig. 2B), the intensity of the peak increased and the shift from the peak position of the 2H phase decreased (see also Fig. 1E). The average size of the crystallites was 100 nm at this temperature, which suggests a reduced strain for the larger IF. The XRD spectrum of the specimen obtained within the laminar flow regime (Fig. 2C) at 840°C (see also Fig. 1E) corresponded to the 2H bulk phase. The low intensity and the large width of the peak suggested that the crystallites were very small. TEM observations showed that these crystallites were in the form of small platelets (15 nm). The XRD spectra of the samples which were heated to T>950°C corresponded to the bulk 2H phase, independent of the flow regime. The XRD results were consistent with the TEM observations and confirmed the growth of the IF phase. The increased van der Waals gap (c/2) of the IF suggests an easier intercalation of small alkali ions into the IF compared with the bulk 2H polytype.
When the nozzle of the exit gas mixture containing M0O3-X was made very narrow, substantial amounts of nanotubes was obtained (see Fig. 3A). The nanotubes, which were obtained in this way, are very uniform in shape (Fig. 3B): most of them contained between 5 to 10 layers of M0S2 and their length exceeded a few micrometers. The nanotubes were mixed with a separate phase consisiting of 2H- M0S2 platelets.
Fig. 3. (A) Assortment of nanotubes obtained by the gas-phase reaction of M0O3-X and H2S in a reducing atmosphere at 850°C. (B) High- magnification image of the arrowed tube. Distance between each two fringes is c/2=0.62nm.
30 nm
In the next series of experiments a "reactive" substrate was attempted as a collector of the nanocrystallites. Metal oxides, which may transform into sulfides in the reaction chamber were choosed. The premise of this excercise was that such
115

Substrates could trap the fullerenes and perhaps react with them to give interesting mixed phases of fullerenes and nanocrystallites. The synthesis of carbon fullerenes stuffed with metal20 and metal carbides21 has been largely demonstrated, recently. This development opens the field for many new applications. Similarly, encapsulation of metal, metal-oxides, and metal sulfides inside IF could provide a route for, e.g. the fabrication of solid-state junctions of < 10 nm in size, or mechanically reinforced solid lubricants. In this paper we reprot of our early experiments with this idea. Towards that goal a quartz substrate (collector), covered with an ultra- thin (10 nm) film of either Ti, Nb and Mo were provided. These substrates were oxidized either at ambient conditions or inside the reactor, before reaction started.
Fig.4. High resolution TEM of an IF collected from the gas phase. The core and the two locations on the rim were analyzed with selected area EDS and found to consist of M0S2. Bar is 10 nm.
Fig. 5. Digitized image of a region contaning M0S2 IFs which were collected on a Ti02 substrate: a. dark field image; b. Mo map; c. S map which were obtained by selected area EDS analysis (K-line). Bar is 10 nm.
116

Fig.4 shows a high resolution TEM image of a single M0S2 IF collected from the gas phase. Selected area energy dispersive X-ray analysis (EDS) with a an ultra-thin window, which was used in a scanning TEM mode, showed that the core and the rims (1,2) of the nanocrystallite of Fig. 4 have the same composition- i.e. M0S2. This is a further confirmation of our early study8 in which closed and hollow MoS2were reported.
Fig. 5 shows a high resolution mapping of a region in which a few M0S2 IFs were trapped on the Ti02 substrate. While Fig. 5a shows a dark field image of the region, Figs. 5b and c show the S and Mo (K lines) distribution in this speciemen. This image and a few others, some at even higher resolution, clearly indicated that the M0S2 IF constitute a definite separate phase on the Ti02 substrate. The Ti and O mapping showed a complementary pattern of these maps, i.e. the signals of both elements were very weak inside and very strong outside the IF.
v&\
■WHPVH „H
Fig. 6. TEM micrograph of TO2 (a) and Nb2Ü5 (b) encapsulted by M0S2 IFs. Bar is 10 nm.
Fig. 6 shows a typical encapsulation of T1O2 (a) and Nb20s (b) with a M0S2 IF. Similar patterns were observed for M0O3 substrate, which crystallites were encapsulated by M0S2 envelope of a few shells. The encapsulation of the oxides by the M0S2 fullerene was confirmed by selected erea EDS. The encapsulated phase was a rhombohedral oxide as confirmed by selected area electron diffraction of the core of one such composite nanocrystallite (Fig.7). This process will be further investigated in the future in order to achieve a better control over the encapsulation process, so that nanojunctions, e.g. between NbS2 core and M0S2 envelope, can be fabricated and tested. Previously Bursill22 consdiered this issue and found that NiSx
can be encapsulated by M0S2 fullerene.
117

Fig. 7. Electron diffraction of the core of the IF of Fig. 6a. The diffraction pattern agrees with that of a Ti02 lattice.
In conclusion, a major progress has been achieved with the synthesis of copious quantitities of IF with sizes ranging from a few nm and up to 100 nm in size. This allowes a systematic characterization of these new materials. Major effort is put into the fabrication and analysis of but the smallest IF, currently. Using high resolution transmission electronmicroscopy combined with a local area energy dispersive chemical analysis and selected area electron diffraction, the structure of M0S2 fullerenes and oxide encapsulted M0S2 fullerenes was confirmed.
Acknowledgment
We are grateful to E. Wasserman and D. Srolovitz for illuminating discussions on the content of the paper. We are indebted to Philips Electron Optics Application Laboratory (The Netherlands) and to M.T. Otten for the access to the selected area EDS/TEM set-up and for the measurements which make-up part of this work. R.T. acknowledges the support of the US-Israel binational science foundation, Grant No. 94-11-002, and the Israeli Ministry of Energy and Infrastructure, Grant No. 92-00175.
References
1. H. W. Kroto, J. R. O'Brien, J. R. Heath, R .F. Curl, R. E. Smalley, Nature, 318, 162 (1985).
2. S. lijima, J. Cryst. Growth , 50, 675 (1980). 3. S. lijima, Nature , 354, 56 (1991). 4. D. H. Robertson, D. W. Brenner, C. T. White, J. Phys. Chem., 96, 6133 (1992). 5. A. Maiti, C. J. Brabec, J. Bernholc, Phys. Rev. Lett.,70, 3023 (1993); J. P. Lu and
W. Yang, Phys. Rev. B , 49, 11421 (1994). 6. D. Ugarte, Nature, 359, 707 (1992), Eur. Phys. Lett, 22, 45 (1993). 7. R. Tenne, L Margulis, M. Genut, G. Hodes, Nature , 360, 444 (1992); 8. L. Margulis, G. Salitra, R. Tenne, M. Talianker, Nature , 365, 113 (1993). 9. M. Hershfinkel et al, J. Am. Chem. Soc, 116, 1914 (1994). 10. H. W. Kroto, Science, 242, 1139 (1988).
118

11. Q. L. Zhang et al, J. Phys. Chem., 90, 525 (1986); H. W. Kroto, Nature , 329, 529 (1987).
12. H. Arctowski, Z Anorg. Allgem. Chem., 8, 213 (1895); P. R. Bonneau, R. F. Jarvis Jr., R. B. Kaner, Nature, 349, 510 (1991); N. Imanishi, K. Kanamura, Z. Takehara, J. Electrochem. Soc, 139, 2082 (1992).
13. E. Furimsky and C.H. Amberg, Can. J. Chem., 53, 3567 (1975); W. L. Lee, T. M. Besmann, M. W. Stott, J. Mater. Res., 9,1474 (1994).
14. M. S. Donley, N. T. McDevitt, T. W. Hass, P. T. Murray, J. T. Grant, Thin Solid Films ,168, 335 (1989).
15. W. K. Hofmann, J. Mater. Sei., 23, 3981 (1988). 16. Y. Feldmann, E. Wasserman, D. Srolovitz, and R. Tenne, Science, in press. 17. The role of the hydrogen was considered here as a reducing agent, only. However,
hydrogen is known to intercalate into M0O3 [see, for example, S.P. Mehandru and A.B. Anderson, J. Am. Chem. Soc, 110, 2061 (1988)].
18. Typically, metal dichalcogenide films adopt this morphology when grown at these elevated temperatures. See, for example G. Salitra, G. Hodes, E. Klein, R. Tenne, Thin Solid Films , 245, 180 (1994).
19. Y. Saito, T. Yoshikawa, S. Bandow, M. Tomita, Phys. Rev. B , 48, 1907 (1993); Y. Yosida, Appl. Phys. Lett, 64, 3048 (1994); M. Li and J. M. Cowley, Ultramicroscopy 53 333 (1994).
20. P.M. Ajayan and S. lijima, Nature, 361, 333 (1993); E. Dujardin, T.W. Ebbesen, H. Hiura, and K. TanigAki, Science, 265, 1850 (1994).
21. R.S. Rouff et al., Science, 259, 346 (1992); M. Tomita, Y. Saito, and T. Hayashi, Jpn. J. Appl. Phys., 32, L280 (1993); S. Seraphin, D. Zhou, J. Jiao, J.C. Withers, and R. Loutfy, Nature, 362, 503 (1993).
22. Bursill, L, Intl. J. Modern Phys. B, 4, 2197 (1990).
119

PART III
Endohedral Fullerenes

ENDOHEDRAL METALLOFULLERENES: ISOLATION AND CHARACTERIZATION
H. C. DORN,* S. STEVENSON,* P. BURBANK,* Z. SUN,* T. GLASS,* K. HARICH, * P. H. M. VAN LOOSDRECHT + R. D. JOHNSON* R. BEYERS,^ J. R. SALEM + M. S. DE VRIES + C. S. YANNONI+ C. H. KIANG" AND D. S. BETHUNE+ ♦Department of Chemistry, Virginia Tech, Blacksburg, VA 24061-0212 +IBM Almaden Research Center, San Jose, CA 95120-6099 "Materials and Molecular Simulation Ctr., Beckman Institute, Caltech, Pasadena, CA 91125
INTRODUCTION
Since the initial discovery of fullerenes nearly a decade ago [1], material scientists have focused attention on the possibility of encapsulating one or more metal atoms inside these spheroidal carbon frames. The experimental realization of macroscopic quantities of endohedral metallofullerenes (Am@C2n, n=30-55) in the early 1990's has heightened interest in developing this new class of tunable materials with possible electronic and/or optical applications [2,3]. They have been characterized by a number of spectroscopic techniques, for example, scanning tunneling microscope [4,5], EXAFS [6,7] and x-ray diffraction and electron microscopy [8]. However, low production yields and purification difficulties have hampered the development of this new class of materials. The soluble product distribution usually consists of high levels of the empty-caged fullerenes CöO, C70, Cs4 and decreasing levels of the higher fullerenes, while the endohedral metallofullerene fraction usually constitutes less than 1% of the total soluble yield. Furthermore, the endohedral metallofullerene fraction consists of molecules with different numbers of metal atoms encapsulated (m=l-3), cage sizes (C2n) and isomers of the same mass (e.g., Er2@Cs2). The purification process is further complicated by the chemical reactivity of several endohedral metallofullerenes [9] in aerobic environments. For several years, we have been involved in a collaborative effort to develop methodology for detection, isolation, and characterization of endohedral metallofullerenes. The focus of the present study is on fullerenes encapsulating metals from Group Illb, (Sc@C2n, Y@C2n, and La@C2n) and the lanthanide series metal (Er@C2n).
PRODUCTION AND INITIAL SEPARATION PROCEDURES
The samples were produced by arc-burning cored carbon rods filled with mixtures of powdered carbon and pure metal or metal oxide. A Krätschmer-Huffman style fullerene generator [10] (I-100A, ~25V) was utilized to "burn" the rods and operated under a dynamic helium flow (-200 torr). Previous experiments have demonstrated that the yields and product distribution are relatively insensitive to the form in which the metal is introduced (metal, metal oxide, or carbide) [11]. However, the product distribution (and yield) is quite sensitive to the metal concentration. Monometal species dominate at low metal/carbon ratios whereas the di- and trimetal species dominate at high metal loadings (-3-4%). The fullerene containing soot was promptly extracted with cold CS2 or with Soxhlet extraction using refluxing toluene.
123
Mat. Res. Soc. Symp. Proc.Vol. 359 e 1995 Materials Research Society

After solvent removal in vacuo, the soluble fullerene and metallofullerene extract was washed with diethyl ether.
An automated HPLC apparatus [12] has been extensively employed in the initial purification stages (Fig. 1). The Q, C2 and C3, C4 columns function as load columns and the separation columns, respectively. Both polystyrene (Perkin-Elmer PL gel, 1000 and 500 A°, 250 x 10 mm columns in series) and Buckyclutcher (Regis, Trident-Tri-DNP, 250 x 10 mm columns in series) have been used for the initial separation. The separation protocol used for the erbium metallofullerene (Er@C2n) is typical and is described in more detail below. In a given automated sequence, injection of the soluble fullerene/metallofullerene extract (e.g., Erm@C2n> 5-7.5 ml, ~3 mg/ml) was separated with flow rates of 1 ml/min. (80/20, toluene/decalin mobile phase) and a 90 min recycle time. The low flow rates provide good separation with low solvent consumption. For a 24 hr period, an automated through-put in excess of 300 mg of the soluble metallofullerene extract can be achieved for the initial separation step.
XT <33 <ZI> ct> C32 CZ2
NLdUHH FRACTION COLLECTION
UV
Ca
LOAD
PUMP A
Figure 1. Automated HPLC Apparatus: Ci, C2 are the load columns and C3, C4 are the separation (polystyrene or Buckyclutcher) columns [12].
ENDOHEDRAL SCANDIUM METALLOFULLERENES
It is now well established [5, 11-15] that Scm@C2n extracts contain the paramagnetic Sc@C82 and Sc3@Cs2 species as well as numerous dimetal metallofullerenes (e.g., Sc2@C84). In addition, the usual empty-cage fullerenes (CöO, C70, C76, Cg4, etc.) dominate the soluble product profile. Although UV detection (260-400 nm) is commonly used to monitor metallofullerene separations, on-line electron paramagnetic resonance (HPLC-EPR) has the
124
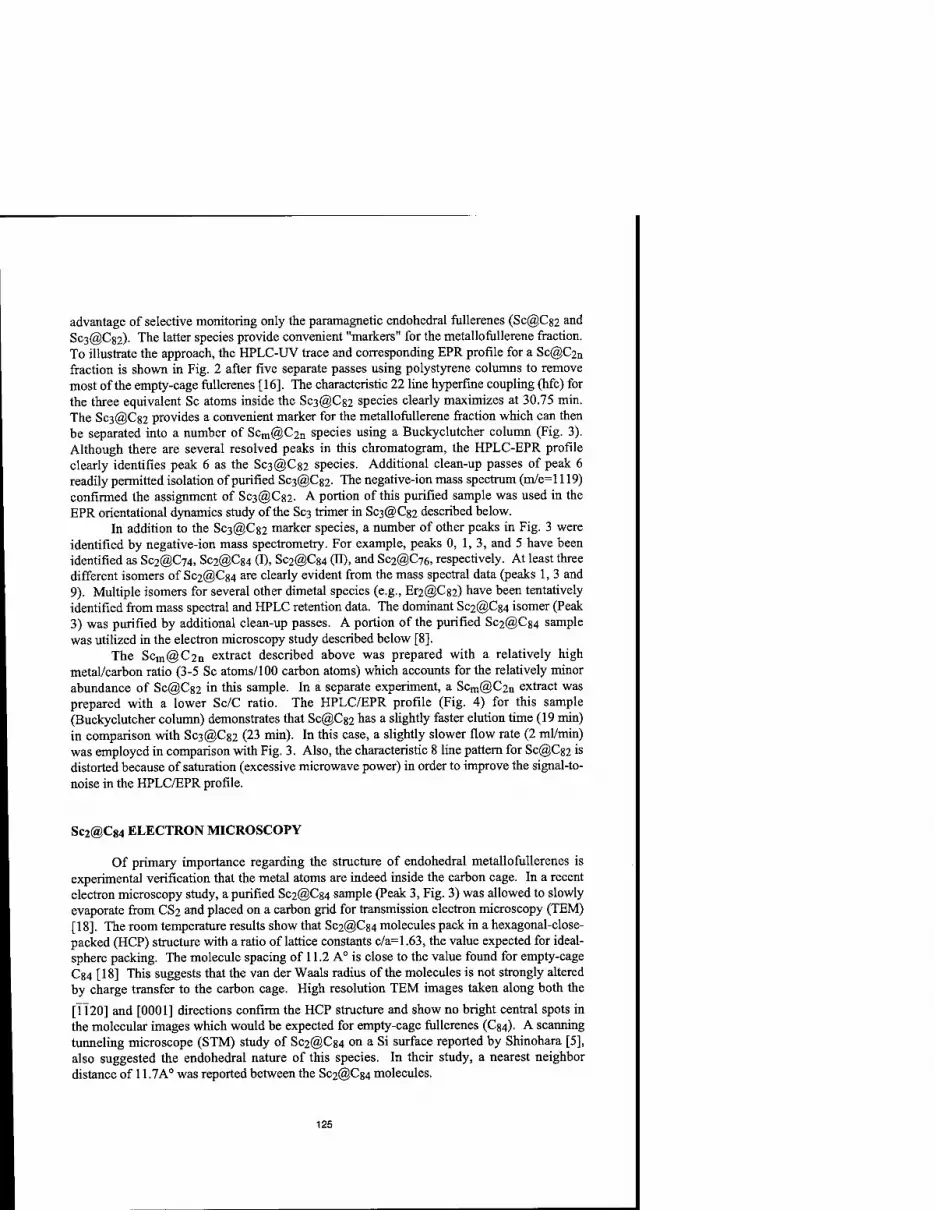
advantage of selective monitoring only the paramagnetic endohedral fullerenes (Sc@Cs2 and Sc3@C82)- The latter species provide convenient "markers" for the metallofullerene fraction. To illustrate the approach, the HPLC-UV trace and corresponding EPR profile for a Sc@C2n
fraction is shown in Fig. 2 after five separate passes using polystyrene columns to remove most of the empty-cage fullerenes [16]. The characteristic 22 line hyperfme coupling (hfc) for the three equivalent Sc atoms inside the Sc3@Cs2 species clearly maximizes at 30.75 min. The Sc3@C82 provides a convenient marker for the metallofullerene fraction which can then be separated into a number of Scm@C2n species using a Buckyclutcher column (Fig. 3). Although there are several resolved peaks in this chromatogram, the HPLC-EPR profile clearly identifies peak 6 as the Sc3@C82 species. Additional clean-up passes of peak 6 readily permitted isolation of purified Sc3@Cs2- The negative-ion mass spectrum (m/e=l 119) confirmed the assignment of Sc3@Cs2. A portion of this purified sample was used in the EPR orientational dynamics study of the Sc3 trimer in Sc3@C82 described below.
In addition to the Sc3@Cs2 marker species, a number of other peaks in Fig. 3 were identified by negative-ion mass spectrometry. For example, peaks 0, 1, 3, and 5 have been identified as Sc2@C74, Sc2@Cg4 (I), Sc2@C84 (II), and Sc2@C76, respectively. At least three different isomers of Sc2@Cs4 are clearly evident from the mass spectral data (peaks 1, 3 and 9). Multiple isomers for several other dimetal species (e.g., Er2@Cs2) have been tentatively identified from mass spectral and HPLC retention data. The dominant Sc2@Cs4 isomer (Peak 3) was purified by additional clean-up passes. A portion of the purified Sc2@Cs4 sample was utilized in the electron microscopy study described below [8].
The Scm@C2n extract described above was prepared with a relatively high metal/carbon ratio (3-5 Sc atoms/100 carbon atoms) which accounts for the relatively minor abundance of Sc@Cs2 in this sample. In a separate experiment, a Scm@C2n extract was prepared with a lower Sc/C ratio. The HPLC/EPR profile (Fig. 4) for this sample (Buckyclutcher column) demonstrates that Sc@Cs2 has a slightly faster elution time (19 min) in comparison with Sc3@Cs2 (23 min). In this case, a slightly slower flow rate (2 ml/min) was employed in comparison with Fig. 3. Also, the characteristic 8 line pattern for Sc@Cs2 is distorted because of saturation (excessive microwave power) in order to improve the signal-to- noise in the HPLC/EPR profile.
Sc2@C84 ELECTRON MICROSCOPY
Of primary importance regarding the structure of endohedral metallofullerenes is experimental verification that the metal atoms are indeed inside the carbon cage. In a recent electron microscopy study, a purified Sc2@C84 sample (Peak 3, Fig. 3) was allowed to slowly evaporate from CS>2 and placed on a carbon grid for transmission electron microscopy (TEM) [18]. The room temperature results show that Sc2@Cs4 molecules pack in a hexagonal-close- packed (HCP) structure with a ratio of lattice constants c/a=1.63, the value expected for ideal- sphere packing. The molecule spacing of 11.2 A0 is close to the value found for empty-cage C84 [18] This suggests that the van der Waals radius of the molecules is not strongly altered by charge transfer to the carbon cage. High resolution TEM images taken along both the
[1120] and [0001] directions confirm the HCP structure and show no bright central spots in the molecular images which would be expected for empty-cage fullerenes (C84). A scanning tunneling microscope (STM) study of Sc2@C84 on a Si surface reported by Shinohara [5], also suggested the endohedral nature of this species. In their study, a nearest neighbor distance of 11.7A° was reported between the Sc2@C84 molecules.
125

a) EPR ACTIVE REGION
b)
.# £■ / —^VVVW^M/VVVAA^^. ,„.„
(min) 0 S 10 IS 20 Z3 30 33 40 (mkj
Figure 2. (a) HPLC-UV trace (340 urn) for the fifth polystyrene pass, 410-|0.L injection
of the Sc@C2nEPR active fraction, 1 mL/min, and 80:20 degassed toluene/decalin. (b) On-
line HPLC-EPR profile, 9.55 GHz, 4 scans/file, and 20 s/sweep [16].
a) EPR ACTIVE
REGION
b) S«3@C82
Ed S
0 S 10 15 20 25 30 (min)
Figure 3. (a) HPLC-UV trace (340 nm), concentrated Sc3@Cg2 fraction after five
polystyrene passes, Buckyclutcher column, 250-|aL injection, 2.1 mL/min, and degassed 80:20 toluene/decalin; EPR-active region is
peak 6. (b) On-line HPLC-EPR stacked plot, 9.55 GHz, 3 scans/file, and 20 s/sweep [16],
126

Sc3@C82
LC-EPR Figure 4. On-line HPLC-EPR profile for Scm@C2n extract 2.0 ml/min,
degassed 80:20 toluene/decalin; EPR 9.55 GHz, 3 scans/file and 20 s/sweep.
ORIENTATIONAL DYNAMICS OF THE Sc3 TRIMER IN Sc3@C82: AN EPR STUDY
The highly anharmonic potential for the metal atoms in metallofullerenes leads to the expectation that these species will exhibit novel dynamical properties. Calculations have predicted new types of vibrations for endohedral fullerenes, with the encapsulted atoms rattling and rolling inside the cage. We have carried out a systematic study of the electron paramagnetic resonance (EPR) spectrum of Sc3@Cs2 for temperatures varying from 77 K to 333 K that gives new information about the dynamical behavior of this species [17]. The study was carried out on a purified sample of Sc3@Cs2 [16]. The EPR spectra show 22 hyperfine coupling split transitions with unusually large linewidths [18,19]. Figure 5a and 5b show two spectra taken at 193 K in decalin. The spectrum in Fig. 5a was obtained with the solvent supercooled, but still liquid. The spectrum in Fig. 5b was taken with the solvent frozen. In both cases, the data show that the three Sc ions are equivalent, and can be modeled using a simulation with equal isotropic hyperfine coupling to the three scandium nuclei. As the temperature falls, there is a strongly m-dependent broadening of the lines, with the linewidths increasing as -|m|. The effect of this broadening is evident in Fig. 5b. As shown in Figure 6, the linewidth has the qualitative temperature dependence expected for a paramagnetic species tumbling in solution due to Brownian motion: the linewidth increases at low temperatures due to insufficient averaging of the magnetic anisotropy by reorientational motions, whereas at high temperatures the linewidth increases due to the interactions between
127

3200 3250 3300 B (gauss)
Figure 5. EPR spectrum of Sc3@Cs2 in (a) fluid and (b) frozen decalin at T=193 K. Some of the nuclear magnetic quantum numbers of the states involved
in the transitions are indicated in (a). The dashed line is the envelope of a simulation of the fluid spectrum, (c) Simulation of the frozen spectrum.
the unpaired spin and the magnetic moment associated with rapid molecular rotation. However, the temperature dependence of the linewidth strongly deviates from that expected to result from the Brownian tumbling motion of the Cs2 cage (shown by the dashed line in Fig. 6): at high temperatures the observed linewidths are too large compared to the value expected for spin-rotation interaction due to cage reorientation, whereas at low temperatures (where the cage motion becomes very slow), the linewidths are much too small. Even in frozen decalin resolved hyperfine structure persists, indicating there still is rapid reorientational averaging. These results contrast sharply with those obtained for Sc@Cs2 by Kato et al., which seem to follow expectations for broadening due to cage rotation [20]. We were thus led to consider broadening due to motion of the Sc trimer within the fullerene cage. We postulated that the metal trimer can reorient by overcoming a barrier to rotation E, resulting in a correlation time for trimer reorientation proportional to exp(E/kT). The reorientation of the cage in the viscous solvent was assumed to be described by a second correlation time proportional to the viscosity and T"1 in the usual way. By thus considering both motion of the cage in solution
128

and of the Sc trimer within the cage, the data could be fit across the full measured temperature range, for both liquid and frozen solvent, as shown by the solid lines in Fig. 6. A small barrier to trimer reorientation (28 meV) is derived from the data. An additional consequence of the Sc3 reorientational motion is that the hyperfine coupling, a(hfc), will be modulated as the trimer moves. The observed hyperfine coupling will be an averaged value that will depend on the magnetic quantum number m and on the temperature. Indeed, a(hfc) varies with m and, as shown in Figure 7, has a strong temperature dependence - varying by 10% over the range from 100 to 325 K. This evidence of large amplitude motion strongly supports the notion of facile Sc trimer reorientation. The conclusion that the Sc metal trimer can move rapidly with respect to the cage lends support to the idea that the unusual structure of these species will lead to unusual linear and nonlinear polarizabilities and vibrational properties [21,22].
w
id so
a, a.
, 1 1 1 r—
Linewidth due to cage motion only
Fit including Sc„ motion
: I r 1
100 150 200 250 T (K)
300
Figure 6. Temperature dependence of the linewidth of the mi=+l/2 (see Fig. 1) EPR transitions for Sc3@Cs2 in frozen (filled circles) and fluid (open circles)
decalin. The solid lines are fits of a dynamical model.
Er2@C82 ISOMERS
In contrast with Scm@C2n, Ym@C2n, and Lam@C2n, erbium metallofullerene extracts are dominated by only Er@Cs2, Er2@Cg2 and smaller quantities of Er2@C84, as shown in the LD-TOF mass spectrum (Fig. 8). Isolation of Er2@Cs2 was accomplished in a four-stage automated Chromatographie procedure. The initial separation stage using two Buckyclutcher columns (250 x 10 mm) with a toluene/decalin (80/20) solvent system has been previously described vide supra. After a second automated pass using the same Chromatographie procedure, the enriched Er2@C82 fraction (Fig. 9) shows three major peaks I, II, and III
129
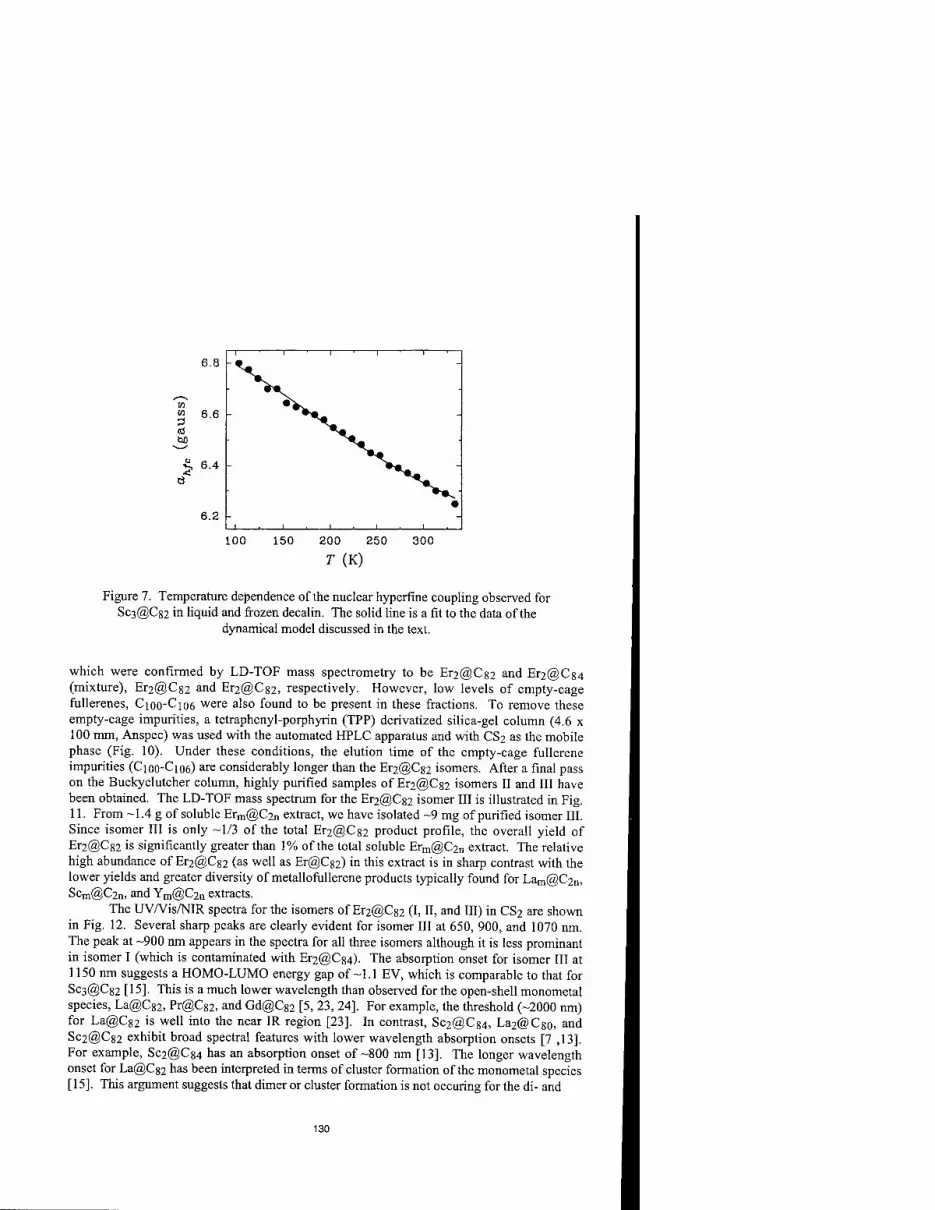
cd
100 150 200 250
T (K)
300
Figure 7. Temperature dependence of the nuclear hyperfine coupling observed for Sc3@C82 in liquid and frozen decalin. The solid line is a fit to the data of the
dynamical model discussed in the text.
which were confirmed by LD-TOF mass spectrometry to be Er2@Cs2 and Er2@Cs4 (mixture), Er2@C82 and Er2@Cs2, respectively. However, low levels of empty-cage fullerenes, C100-C106 were also found to be present in these fractions. To remove these empty-cage impurities, a tetraphenyl-porphyrin (TPP) derivatized silica-gel column (4.6 x 100 mm, Anspec) was used with the automated HPLC apparatus and with CS2 as the mobile phase (Fig. 10). Under these conditions, the elution time of the empty-cage fullerene impurities (C100-C106) are considerably longer than the Er2@C82 isomers. After a final pass on the Buckyclutcher column, highly purified samples of Er2@Cs2 isomers II and III have been obtained. The LD-TOF mass spectrum for the Er2@Cs2 isomer III is illustrated in Fig. 11. From -1.4 g of soluble Erm@C2n extract, we have isolated -9 mg of purified isomer III. Since isomer III is only -1/3 of the total Er2@C82 product profile, the overall yield of Er2@C82 is significantly greater than 1% of the total soluble Erm@C2n extract. The relative high abundance of Er2@Cs2 (as well as Er@Cs2) in this extract is in sharp contrast with the lower yields and greater diversity of metallofullerene products typically found for Lam@C2n, Scm@C2n, and Ym@C2n extracts.
The UV/Vis/NIR spectra for the isomers of Er2@Cs2 (I, II, and III) in CS2 are shown in Fig. 12. Several sharp peaks are clearly evident for isomer III at 650, 900, and 1070 nm. The peak at -900 nm appears in the spectra for all three isomers although it is less prominant in isomer I (which is contaminated with Er2@Cs4). The absorption onset for isomer III at 1150 nm suggests a HOMO-LUMO energy gap of -1.1 EV, which is comparable to that for Sc3@C82 [15]. This is a much lower wavelength than observed for the open-shell monometal species, La@Cs2, Pr@C82, and Gd@C82 [5, 23, 24]. For example, the threshold (-2000 nm) for La@C82 is well into the near IR region [23]. In contrast, Sc2@Cs4, La2@C8o, and Sc2@C82 exhibit broad spectral features with lower wavelength absorption onsets [7 ,13]. For example, Sc2@Cs4 has an absorption onset of-800 nm [13]. The longer wavelength onset for La@Cs2 has been interpreted in terms of cluster formation of the monometal species [15]. This argument suggests that dimer or cluster formation is not occuring for the di- and
130

a) c»c^ Er,@C..
Er@C„
IdUikuL JmartB^m
1000 1200 1400 1600 l!O0
MASS
b) C-SO t-70 ^71 ^-M
Er,@C8:
Er2@C82
0 10 10 30
TIME
Figure 8. (a) LD-TOF mass spectrum of Erm@C2n raw extract, (b) Erm@C2n stock solution chromatogram, 200 |J.L injection
(Buckyclutcher column), 1.2mL/min, toluene/decalin (80/20), and UV detection at
354 nm.
Figure 9. Chromatogram of Er2@Cs2 isomers I, II, and III. Buckyclutcher columns, 1.55 mL/min, toluen/decalin (80/20), and 340 nm
UV detection.
trimetal endohedral metallofullerene species. Further efforts to characterize the purified Er2@C82 isomers (e.g. by 13C NMR) are presently in progress.
TRENDS IN Am@C2n SEPARATIONS The quantities of endohedral metallofullerenes currently available still limit reactivity,
complexation, and intermolecular collisional studies of these species with other substrate molecules. However, Chromatographie stationary phases (e.g., Buckyclutcher and TPP) are known to provide a source of weak 7t-3t complexation with substrate aromatic systems. For example, the Buckyclutcher stationary phase consists of a tripodal 3,5-dinitrobenzoate ester phase which can function as a weak 7t-acidic group. We have carefully evaluated the Chromatographie retention behavior of a wide range of fullerenes (CöO-CIOO) and several endohedral metallofullerenes (Scm@C2n, Ym@C2n, Lam@C2n, and Erm@C2n)- The
131

Er2@C8:
Er2@CM C100-C106
Er^C*
L _ 1 ,lll,„. MASS MASS
Er2@C„
TIME Figure 10. HPLC-UV trace for Er2@C82
fractions obtained from initial Buckyclutcher separation (Figure 9). Chromatographie
conditions: TPP column, 1.0 mL/min CS2, and 340 nm UV detection.
MASS Figure 11. LD-TOF mass spectrum for
Er2@C82 Isomer III.
Chromatographie retention parameter, the capacity factor k', was determined for the Buckyclutcher and polystyrene stationary phases using the solvent system toluene/decalin (80/20). A capacity factor (log k') versus fullerene carbon number plot is illustrated in Fig. 13. As expected, the empty-cage fullerenes constitute a linear homologous series (slope=0.018) with log k' versus the number of carbons in the cage. For clarity, only the Am@C82 endohedral metallofullerenes are included in this figure. In all cases, the retention times of a given species were unambigously determined either by on-line HPLC-EPR and/or sample collection with off-line mass spectrometry. From a practical separation viewpoint, this plot is useful in determining which empty-cage fullerenes will co-elute with a given endohedral metallofullerene. For example, Sc3@Cs2 co-elutes with empty-cage fullerenes around of C112. In contrast, Y@Cg2 will be contaminated with empty-cage fullerenes centered at "-C104. From a viewpoint of understanding the weak K-% complexation interaction of the stationary phase and the endohedral metallofullerene, clearly Sc3@Cs2 is more strongly retained than any of the monometal species (Sc@Cg2, Y@C82 and La@Cg2>. As a group, the dimetal species (Sc2@C82, Y2@C82, La2@C82 and Er2@Cs2) have similar retention times, but are generally the most weakly retained endohedral metallofullerenes. There are obvious minor differences in the retention times of the various isomers (e.g., Er2@C82, isomers I, II and III), but the retention times of the dimetal species are not significantly influenced by which metal atoms are in the cage or isomer differences. A similar plot for the weaker complexing polystyrene stationary phase exhibits the same overall trends, with a much lower slope (slope=0.0088) for the linear plot of empty-cage fullerenes. In addition, significantly reduced k' values for the endohedral metallofullerenes were observed. The lack of significant Chromatographie
132

Abs
350 500 1000 1500
X (nm)
Figure 12. UV/Vis/NIR spectra for Er2@Cs2 Isomers I, II, and III.
log k' o.2
Figure 13. Chromatographie capacity factor (k') versus carbon cage number, ♦, (Buckyclutcher column, *, polystyrene column, 80/20 toluene/decalin mobile phase.
133

resolution of the individual endohedral species (e.g., small differences in k' for Sc3@Cs2 versus Sc@C82) on this Chromatographie phase clearly illustrates why these paramagnetic species served as ideal "markers" for the entire metallofullerene fraction under the conditions used in the earlier phases of this study, as described above.
CONCLUSION
This study illustrates the continued development of improved separation and detection (on-line EPR) methodology applicable to endohedral metallofullerenes. The characterization techniques (TEM, EPR, UV/Vis) provide a better understanding of the structure and dynamics (e.g., SC3 trimer) of these fascinating molecules. The preparation and isolation of purified Er2@Cs2 isomers in macroscopic quantities should ultimately provide new insight regarding the optical and electronic properties of these new materials.
ACKNOWLEDGEMENTS
We gratefully acknowledge stimulating discussions with Paul Kasai and Ray Kendrick. PvL gratefully acknowledges financial support by the Dutch Organization for Scientific Research (NWO) and the IBM Corporation. HCD gratefully acknowledges support from IBM Corporation and the Virginia Center for Innovative Technology. CHK gratefully acknowledges partial support by the NSF (ASC-9217368) and by the Materials and Molecular Simulation Center.
REFERENCES
1. H. W. Kroto, J. R. Heath, S. C. O'Brien, R. F. Curl and R. E. Smalley, Nature 218, 162 (1985).
2. D. S. Bethune, R. D. Johnson, J. R. Salem, M. S. de Vries and C. S. Yannoni, Nature 366, 123 (1993).
3. H. Schwarz, T. Weiske, D. K. Böhme and J. Hrusak, in Buckminsterfullerenes, eds. W. E. Billups and M. A. Ciufolini, VCH publishers, New York (1993), p. 257.
4. H.-D. Wang, Q. K. Xue, T. Hashizume, H. Shinohara, Y. Nishima and T. Sakurai, Phys. Rev. B 48, 15492(1993).
5. H. Shinohara, M. Kishida, T. Nakane, T. Kato, S. Bandow, Y. Saito, X-D. Wang, T. Hashizume and T. Sakurai, in Fullerenes: Recent Advances in the Chemistry and Physics of Fullerenes and Related Materials, (eds. Kadish, K. M. and Ruoff, R. S.), 1361-1381, (Electrochem. Soc.,NJ, 1994).
6. • C-H. Park, B. O. Wells, J. DiCarlo, Z-X. Shen, J. R. Salem, D. S. Bethune, C. S. Yannoni, R. D. Johnson, M. S. de Vries, C. Booth, F. Bridges and P. Pianetta, Chem. Phys. Lett. 213, 196 (1993).
7. K. Kikuchi, Y. Nakao, Y. Achiba, M. Nomura, in Fullerenes: Recent Advances in the Chemistry and Physics of Fullerenes and Related Materials, (eds. Kadish, K. M. and Ruoff, R. S.), 1300-1308, (Electrochem. Soc, NJ, 1994).
8. R. Beyers, C-H. Kiang, R. D. Johnson, J. R. Salem, M. S. de Vries, C. S. Yannoni, D. S. Bethune, H. C. Dorn, P. Burbank, K. Harich and S. Stevenson, Nature 370, 196 (1994).
134

9. S. Bandow, H. Kitagawa, T. Mitani, H. Inokuchi, Y. Saito, H. Yamaguchi, N. Hayashi, H. Sato and H. Shinohara,./. Phys. Chem. 96, 9609 (1992).
10. W. Krätschmer, L. D. Lamb, K. Fostiropoulos and D. R. Huffman, Nature 347, 354 (1990).
11. P. H. M. van Loosdrecht, R. D. Johnson, R. Beyers, J. R. Salem, M. S. de Vries, D. S. Bethune, P. Burbank, J. Haynes, T. Glass, S. Stevenson, H. C. Dorn, M. Boonman, P. J. M. van Bentum, G. Meijer, in Fullerenes: Recent Advances in the Chemistry and Physics ofFullerenes and Related Materials, (eds. Kadish, K. M. and Ruoff, R. S.), 1309-1319, (Electrochem. Soc.,NJ, 1994).
12. S. Stevenson, H. C. Dorn, P. Burbank, K. Harich, J. Haynes, C-H. Kiang, J. R. Salem, M. S. de Vries, P. H. M. van Loosdrecht, R. D. Johnson, C. S. Yannoni, D. S. Bethune, Anal. Chem. 66, 2675-2679 (1994).
13. H. Shinohara, H. Yamaguchi, H, N. Hayashi, H. Sato, M. Ohkohchi, Y. Ando and Y. Saito, J. Phys. Chem. 97, 4259-4261 (1993).
14. H. Shinohara, H. Sato, M. Ohkohchi, Y. Ando, T. Kodama, T. Shida, T. Kato and Y. Saito, Nature 357, 52-54 (1992).
15. H. Shinohara, M. Inakuma, N. Hayashi, H. Sato, Y. Saito, T. Kato and S. Bandow, J. Phys. Chem. 98, 8597-8599 (1994).
16. S. Stevenson, H. C. Dorn, P. Burbank, K. Harich, Z. Sun, C-H Kiang, J. R. Salem, M. S. de Vries, P. H. M. van Loosdrecht, R. D. Johnson and C. S. Yannoni, Anal. Chem. 66, 2680-2685 (1994).
17. P. Y. M. van Loosdrecht, R. D. Johnson, M. S. de Vries, D. S. Bethune, H. C. Dorn, P. Burbank and S. Stevenson, Phys. Rev. Lett. 23, 3415-3418.
18. H. Shinohara, H. Sato, M. Ohkohchi, Y. Ando, T. Kodama, T. Shida, T. Kato, and Y. Saito, Nature 357, 52-54 (1992).
19. C. S. Yannoni, M. Hoinkis, M. S. de Vries, D. S. Bethune, J. R. Salem, M. S. Crowder and R. D. Johnson, Science 256, 1191-1192 (1992).
20. T. Kato, S. Suzuki, K. Kikuchik and Y. Achiba, J. Phys. Chem. 97, 13425-13428 (1993). 21. P. P. Schmidt, B. I. Dunlap and C. T. White, J. Phys. Chem. 95, 10537-10541 (1991). 22. C. G. Joslin, J. Yang, C. G. Gray, S. Goldman and J. D. Poll, Chem. Phys. Lett. 208, 86-
92 (1993). 23. K. Kikuchi, S. Suzuki, Y. Nakao, N. Nakahara, T. Wakabayashi, H. Shiromaru, K. Saito,
I. Ikemoto and Y. Achiba, Chem. Phys. Lett. 216, 67-71 (1993). 24. K. Yamamoto, H. Funasaka, T. Takahashi and T. Akasaka, J. Phys. Chem. 98, 2008-2011
(1994).
135

ISOLATION AND CHARACTERIZATION OF TWO ESR-ACTIVE La«C,9
ISOMERS Kazunori Yamamoto, Hideyuki Funasaka* Takeshi Takahashi* Takeshi Akasaka, Toshiyasu Suzuki,*** and Yusei Maruyama*** *Nuclear Fuel Technology Development Division, Tokai Works, Power Reac- tor & Nuclear Fuel Development Corporation, Tokai, Ibaraki, 319-11, Japan
Department of Chemistry, University of Tsukuba, Tsukuba, 305, Japan Institute for Molecular Science, Myodaiji, Okazaki, 444, Japan
Abstract Two abundant ESR-active lantanofullerene species have been iso- lated with an efficient HPLC method. Each of isolated species was well identi- fied as a stable metallofullerene molecule. Both mass and ESR spectra con- firmed that they were La@Cg2 with 1.159-G and 0.836-G I39 La hyperfine splittings. Visible and near-IR absorption spectra, cyclic and differential pulse voltammograms, and C hyperfine splitting structures in ESR spectra for the samples showed features quite different from each other. Their differ- ences were discussed on the basis of their structures. Introduction
There has been a growing interest in the characterization of metal loful le- renes, especially ESR-active ones. As to paramagnetic lantharioful lerenes, two groups'"' independently succeeded in isolating the most abundant spe- cies of LaSCoo (denoted as La@Cjj2-A). It shows an electronic spectrum with low-energy absorptions as well as an ESR spectrum of eight equally- spaced octet lines with a 1.159-G ('La) hyperfine coupling. However, previous ESR measurement of lanthanofullerene mixtures showed another minor octet signal with a smaller hyperfine splitting of 0.836 G, whose origin was not ful ly characterized. In this study, we describe the first isola- tion and characterization of these two species, La@Cg2-A and La@Cg2 "B. Experimental section
Metal lofullerene soot was generated by evaporating metal-impregnated graphite rods using methods that have been described in detail. b Graphite rods (13-mm diameter) were drilled out (7-mm diameter) and filled with a mixture of Lao03, graphite powder, and prepowder asphalt (Showa Shell Co.) with a ratio of 3:5:2 by weight. Before use, the rod was cured at 300 C for 2 h and carbonized at 1000 C for 1 h in flowing nitrogen. The resulting rod was 1- 2 atom % lanthanum. The metal-jmpregnated graphite rod was used as the anode in a contact arc reactor3,5'" (Vacuum Metallurgical Co., UFP/SD1) at 250 A in a He (45 Torr) static atmosphere.
The resulting soot was collected and extracted for 48 h in 1,2.4-tr ichloro- benzene (TCB) using a Soxhlet extraction apparatus. The extracts were dis- solved in toluene prior to HPLC separation. The toluene solution of the extracts (5-mL injection volume) was separated using an HPLC system (Tosoh Co., HLC-8070) with a 2-(l-pyrenyl)ethylsilylated silica columrl (COSMOSIL 5PYE, 20-mm i.d., 250-mm length, Nacalai Tesque Co.) with toluene eluent (flow rate 10 mL/min) at 20 °C. In this HPLC separation process (330-nm UV detection), the peak due to La8Cg2-A was observed between the Cg4 + Cg6 and Cg8 peaks. By collecting the corresponding frac- tion, we obtained the pure La@Cg2-A species.
On the other hand, the minor octet signal for LaSC^ "B was absent in all the HPLC fractions in aerobic conditions. This is consistent with the previ- ously reported properties that La8Cg2-B is very reactive and air- sensitive/'3'4c For this reason, the isolation of LaSG^ -B has been achieved by manipulating our HPLC with an on-line degasser. A peak frac- tion containing a minor octet species and empty fullerenes (mostly <gg ) was eluted after a major La@Cg2-A at 20°C. Second-stage chromatography at 0°C separated La@Cg2-B from Cgg, due to the difference of their retention times
137
Mat. Res. Soc. Symp. Proc.Vol. 359 »1995 Materials Research Society

The isolated metal loful lerenes were analyzed using a Fourier-transform ion-cyclotron resonance (FT-ICR) mass spectrometer (Extrel FTMS-2000), equipped with a No laser for desorption and ionization. The fast atom bombardment (FAB) mass spectra of the isolated products were also meas- ured in a m-nitrobenzy 1 alcohol (m-NBA) matrix on a JMS-SX102A mass spectrometer (JEOL Co., Ltd.). The isomeric purification of La@(g2 was
confirmed by ESR spectra. Both isolated La@Cg2 were dissolved in TCB and degassed. ESR measurements were performed using a conventional X- band ESR spectrometer (Bruker ESP 300) at room temperature. Absorption spectra for LaSCgo were obtained by a 10-mm quartz cell with a Hitachi U- 3410 UV-vis-near-IR spectrometer. Carbon disulfide CCS; ) was used as a solvent. Results and Discussion
Figure la shows an HPLC profile of the crude extract of the fullerene soot redissolved in toluene. The most abundant fullerene in the mixture is CgQ (75% relative integrated intensity at 330 nm), followed by C™ (15%), G>g (1.5%), C78 (2.5%), Cg, + Cg. + Cg6 (4%), LaSC^-A (0.5%), and <gg
(0.5%). The scarcity of the metafioful lerenes in the extracts was seen in the chromatogram. The distribution of the hollow all-carbon fullerenes such as CQQ, CJQ. C^g, and Cyg resembles that in the extracts of pure carbon soot. When pure carbon electrodes were used for producing fullerenes, no peaks were observed between the Cg4 + Cgg and Cgg peaks. All of the peak as- signments have been performed by mass spectroscopic analyses of the corre- sponding fraction.
Figure lb shows an HPLC trace of the purified metal loful lerene, La@G>2 " A. From the HPLC profile of the crude extract shown in Figure la, the possi- ble slight contaminants were Cg^ and Cgg. An additional purification proce- dure resulted in empty-ful lerene-free La8Cg2 -A (99% maximum purity from relative integrated intensity of the HPLC trace) as shown in Figure lb. This fraction is yellow in a dilute solution and dark-yellow in a dense solution of toluene and TCB. Figure 2a shows the positive ion FT-ICR mass spectrum for this rechromatographed La@Cg2~A fraction. Molecular ion peaks ascribable to La@Cg2 are observed at 1123-1126 amu. The obtained ion intensity ratio agrees well with the 16C isotope distribution. For every mass spectral signal the isotope distribution is used as a criterion for the peak assignment. In Figure 2a, very weak peaks such as La@Cg0 and La@Cyg by successive & losses are accompanied with main La@Cg2 peaks. Essentially the same stability of metal loful ler enes with respect to fragmentation has been reported extensively with FT-ICR mass spectrometry.9 The all-carbon species such as c60' c70' C76' C78' C82' and C84 are not observed in the mass spectrum (Figure 2a). Besides some series of peaks arising from the m-NBA matrix, essentially the same mass spectral features were observed for the FAB mass spectra. The predominance of La8Cg2 among all-carbon fullerenes in Figure 2a is consistent with the HPLC profile shown in Figure lb. Mass spec- tra of the crude extract showed peaks ascribable to La@C (n = 74, 76, 80- 112); among them La@Cg2 was the most abundant. These results mean that the isolation of La@Cg2 from both empty fullerenes and other metal loful le- renes is successful in the present HPLC system.
Figure 3a shows the ESR spectrum of the isolated La@Cg2-A fraction, which is the same sample shown in Figures lb and 2a. Interestingly, the second octet signal with 0.839-G hyperfine splitting shown in crude extract is completely absent, and only the octet with 1.159-G hyperfine splitting is seen in the spectrum (Figure 3a). This indicates that the separation of a mole- cule exhibiting the most abundant octet signal is complete in the present HPLC process. From our measurement of the sample described above, this species has proved to be the most abundant paramagnetic lanthanoful lerene of La@Cg2
_A. For La@Cg2~A, the g value and hyperfine coupling constant
138

are identical in crude extract.3 From the mass and ESR spectra a s well as the HPLC profile for the purified La@Cg,-A (Figures lb, 2a, and 3a), we conclude that La@Cg2-A is surely isolated by our HPLC system.
On the other hand, the minor octet species with 0.836-G hyperfine splitting has almost the same retention time as that of Cgg at 20CC, which eluted after La@C82-A (see Figure la). Therefore, the species was obtained as a mixture with empty fullerenes in this separation stage. To obtain the minor octet species in pure form, rechromatography was performed at 0°C. In that condi- tion, the species eluted before Cgg. Isolated sample was thus obtained by collecting the corresponding fraction. The ESR spectrum of the sample (Figure 3b) shows one set of equally spaced octet lines with a 0.836-G hyper- fine splitting, which is also the same as that in crude extract. This octet signal was stable in a degassed solution for more than 1 year. The relative signal intensity remained unchanged in degassed 1,2,4-trichlorobenzene even at 200 C for 1 h. Note that no other octet signals appeared during the exper- iments. The positive ion FT-ICR mass spectrum of the sample indicates that it contains La8Cg2 alone as shown in Figure 2b. All-carbon fullerenes such as Cgg are absent in Figure 2b, which was also confirmed by FAB mass spec- trometry. Both the ESR spectrum and these mass spectral results conclude that it is a molecular species of La@Cg2 and surely an isomer of La@Cg2-A (i.e. La®C82-B). Pur should be""noted that tures from each other
ified La@Cg2-B is dark brown in toluene and TCB t both ESR spectra show different 13C hyperfine s-
It struc-
z
V-J VJ
C78
Cw+Cw
/ U@C«2-A
C»(-fLa@C«2-B)
La@C»-A
0 10 20 30 40 50 60 3360 3364 3368 3372 3376 RETENTION TIME (min.) [G]
Figure 1. (left) (a) An HPLC trace for the redissolved crude extract of the metallofullerene soot. Peaks due to empty fullerenes such as Cg0 , Gyp, Q,& , C7R, and C82 + Cg4 are prominent and out of scale. The La@Cg2-A peak (retention time 40 min) is seen between peaks of Cg4 + Cgg and Cgg. (b) A repeatedly isolated HPLC trace for La@Cg2-A. Figure 3. (right) ESR spectra of the isolated LaSC^ -A (a) and La@(g2 -B (b). Spin parameters obtained are as follows: La hyperfine coupling with 1.159 and 0.836 G, and AHpp = 0.154 and 0.165 G.
139

Figure 4 shows the electronic absorption specta for the isolated LaStgn ~A and La@Cg2_B. Both isomers have near-IR absorption bands down to 2300 nm due to their open-shell electronic structures. The spectral features are quite characteristic as compared, for example, with the corresponding empty Cg2 fullerene. As previously reported, the absorption spectrum of Cg2 continues down to 900 nm and shows absorption peaks at 580 and 680 nm. • The new absorption peaks at 637, 1010, and 1428nm are observed in the LaSCgo-A spectrum (Figure 4a). For La@Cg2~B, the new absorption peaks at %8, 1093, 1675 and 1800 nm are observed in Figure 4b.
The redox property of the LaSCon-B was measured by cyclic (CV) and differential pulse voltammograms (DPV). The CV shows one reversible oxida- tion and four reversible reductions (Ei 1/2, 1-197, -207, -1138, -1743, and -2146 mV vs Ag/AgNC>3 reference electrode) as well as an irreversible oxida- tion (+1352 mV by DPV) as shown in Figure 5. The DPV of La@Cg2-A is
100.0
La@C82-l
1200.0 1300.0
100.0-1
La@C82-A
1000.0 m/z
1100.0 1200.0 1300.0
Figure 2. FT-ICR mass spectra of LaSCg,-A (a) and LaOCg, -B (b) from 700 to 1300 amu and expanded views of the 1076-1142 a '" *XUU «""u """ BÄpanuea views 01 ine 1U/0-114Ü amu region: La@ c82 (1123 amu)' LaS^C^Co, (1124 amu), and La@I3CßC3n (1125 amu) are the main spectral peaks
140

presented for comparison.11 The following are the salient features: (1) The first oxidation potential shifts negatively by 143 mV relative to that of
-A rr ._ ... _„ , *c (2) Each of the isomers has a
La@Cg2~A. isomer
This is in is more sensitive to oxygen
small potential difference between the first oxidation and reduction (La@Cgo-A, 494 mV;11 LaeCg2-B, 404 mV). (3) By DPV, the peak current intensity of the second reduction (-1117 mV) is twice that of each of the redox peaks for La@Cg2-B. In contrast, La@Cg2-A shows two sequential one- electron reductions (-1084 and -1256 mV by DPV).11
For the present, the observed differences between two La@Cg2 isomers, such as 13C hyperfine structures in the ESR spectra, absorption spectra, and redox properties, could be attributed to the difference in (g2 cages. Indeed, Kikuchi et al. suggested from their 13C NMR measurement that their C;j2 sample consists of at least four cage isomers. For both isomers of LaeCoo. the electronic structure should be described as La3 (go experimentally6,13 and theoretically. From theoretical calculations, exohe- dral lanthanofullerene tends to have the electronic structure as La^+Cg2
2-.14 Another possibility might be that the La atom is in the same cage but at different positions, i.e., conformers of the same metal lo- fullerene. ' Based on the model calculations showing that such a less stable species isomerizes to a stable one with a barrier of 30 kcal/mol, the observed stability of La@Cg2-B might also exclude the latter possibility. The differences between two La@Cg2 isomers are still under study.
Acknowledgments This work was partly supported by the Japanese Ministry of Education, Science and Culture of Japan (Nos. 05233204 and 05233231). We express thanks to Mr. K. Sugiyama (PNC), K. Sakurai (Zuiho Sangyo Co.), T. Ishiguro (Genshiryoku Gijyutsu Co.), and Y. Kane (GGC) for their experimental help.
0.10M
1600 800 0 -800 -1600
E (mV) vs Ag/Ag N03
2400 50f7 1000 1500 2000 Wavelength (nm)
2500
Figure 4. (left) Visible and near-IR absorption spectra from 500 to 2500 nm for the isolated La@Cgo-A and La@Cg2-B in CS2 at room temperature. Figure 5. (right) Cyclic and differential pulse voltammograms of La@(g2
-B in 1,2-dichlorobenzene (a and b). The differential pulse volt ammo gram of La@C82-A (c) under the same conditions was presented for comparison.
141

References and Notes 1. For recent reviews on metal loful lerenes, see, e.g.: D. S. Bethune, R. D.
Johnson, J. R. Salem, M. S. de Vries, C. S. Yannoni, Nature 366. 123(1993). 2. K. Kikuchi. S. Suzuki, Y. Nakao, N. Nakahara, T. Wakabayashi, H.
Shiromaru, K. Saito, I. kemoto, Y. Achiba, Chem. Phvs. Lett. 215, 67(1993). 3. K. Yamaraoto, H. Funasaka, T. Takahashi, T. Akasaka, i. Phvs. Chem.
M. 2008(1994). 4.(a) M. Hoinkis, C. S. Yannoni, D. S. Bethune, J. R. Salem, R. D. Johnson, M.
S. Crowder, M. S. de Vries, Chem. Phvs. Lett. 198. 461(1992). (b) S. Suzuki, S. Kawata, H. Shiromaru, K. Yamauchi, K. Kikuchi, T. Kato,
Y. Achiba, i. Phvs. Chem. 2fi, 7159(1992). (c) S. Bandow, H. Kitagawa, T. Mitani. H. Inokuchi, Y. Saito, H. Yamaguchi,
N. Hayashi, H. Sato, H. Shinohara, J» Phvs. Chem. 25, 9609(1992). 5. Y. Chai, T. Guo, C. Jin, R. E. Haufler, L. P. F. Chibante, J. Fure, L. Wang,
J. M. Alford, R. E. Smalley, X Phvs. Chem. 25, 7564(1991). 6. R. D. Johnson, M. 'S. de Vries, J. Salem, D. S. Bethune, C. S. Yannoni,
Nature 155, 239(1992). 7. K. Kimata, K. Hosoya, T. Araki, N. Tanaka, i. Ore. Chem. 5S, 282(1993). 8. H. Shinohara, H. Sato, Y. Saito, A. Izuoka, T. Sugawara, H. Ito, T. Sakurai,
T. Matsuo, T. Rapid Comnum. Mass Spectrom. fi, 413(1992). 9. F. D. Wiess, J. L. Elkind, S. C. O'Brien, R. F. Curl, R. E. Smalley, i Am. Chem. Son. Hfi, 4464(1988).
10. K. Kikuchi, N. Nakahara, T. Wakabayashi, M. Honda, H. Matsumiya, T. Moriwaki. S. Suzuki, H. Shiromaru, K. Saito, K. Yamauchi, I. Ikemoto, Y. Achiba, Chem. Phvs. Lett. 188. 177(1992).
11. T. Suzuki, Y. Maruyama, T. Kato, K. Kikuchi, Y. Achiba, ^L Am, Chem. Son. JJL5, 11006(1993).
12. K. Kikuchi, N. Nakahara, T. Wakabayashi. S. Suzuki, H. Shiromaru, Y. Miyake, K. Saito, I. Ikemoto, M. Kainosho, Y. Achiba, Nature 357. 142(1992).
13. J. H. Weaver, Y. Chai, G. H. Kroll. C. Jin, T. R. Ohno, R. E. Haufler, T. Guo, J. M. Alford, J. Conceicao, L. P. F. Chibante, A. Jain, G. Palmer, R. E. Smalley,, CJISJL Phvs. Lett. 190. 460(1992).
14.(a) K. Laasonen, W. Andreoni, M. Parrinello, Science 252, 1916(1992). (b) S. Nagase, K. Kobayashi, T. Kato, Y. Achiba, Chem. Phvs. Lett. 201.
475(1993). (c) S. Nagase, K. Kobayashi, Chem. Phvs. Lett. 214. 57(1993). (d) D. M. Poirier, M. Knupfer, J. H. Weaver. W. Andreoni, K. Laasonen, M. Parrinello, D. S. Bethune, K. Kikuchi. Y. Achiba, Phvs. Rev. B_ 42 17403(1994).
15. C. S. Yannoni, H. R. Wendt, M. S. de Vries, R. L. Siemens, J. R. Salem, J. Lyerla, R. D. Johnson. M. Hoinkis, M. S. Crowder, C. A. Brown, D. S. Bethune, L. Taylor, D. Nguyen, P. Jedrzejewski, H. C. Dorn 52, 279(1993).
16. K. Yamamoto, H. Funasaka, T. Takahashi, T. Akasaka, T Maruyama i. Phvs. Chem. 2S,(1994) in press.
Svnth. Met.
Suzuki, Y.
142

PART IV
Theory and Modeling

INTER-CAGE ORBITAL INTERACTIONS IN [2+2] AND [4+4] DIMERS
OF BUCKMINSTERFULLERENE
SHUICHI OSAWA AND EIJIOSAWA*
Computational Chemistry Group, Department of Knowledge-Based Information Engineering,
Toyohashi University of Technology, Tempaku-cho, Toyohashi, Aichi-ken 441, Japan
ABSTRACT
Geometry optimization of [2+2]- and [4+4]-dimers of Q, by semiempirical AMI MO
method reveals usual length for the bridge bonds of the former but unusually long bonds for
the latter. Perturbational analysis of molecular orbitals confirm the presence of orbital
interaction through bond (OITB) between the cages in the [2+2] dimer but no interaction in the
[4+4] dimer. These results contradict with previous examples of OITB wherein elongation of
the mediating a bond is usually observed.
INTRODUCTION
Recent interests in the polymerization of buckminsterfullerene (C^)1 provide us with a
number of unsettled riddles.2 Above all, polymers have been only poorly characterized that
the mode of polymerization is still unclear.2" Even none of the dimers of C«, has been isolated
yet. In this work, we address to the latter problem, namely the reason why the Cm dimer has
been so elusive. We first thought of two explanations: either technical difficulties like
insolubility of C120 species and contamination of intractable impurities or high instability of
newly formed inter-cage bonds. We are interested in studying the second possibility by
computational means and report the results below.
Our anticipation that the newly formed, inter-dimer a bonds in the Cm dimers may be
weak, stems from seemingly ideal situation for the orbital interaction mrough-bond (OITB) at
the junction of the C60 dimer (A). OITB generally brings about anti-bonding character in the
mediating bridge bond.3,4 In view of the well-known enhancement of OITB by strain, which
must have been generated at the junction of C60 dimers, we expected that the bridge bond of C60
dimers must be abnormally long and weak.5,6
145
Mat. Res. Soc. Symp. Proc. Vol. 359 ° 1995 Materials Research Society

71, 7t* Tt, K*
-60
We consider in this work [2+2] (1) as well [4+4] dimers (2) of Cm.2t> Especially 1 has
been considered by many authors to be the most potential candidate for the initial product in
not only the photochemical but also thermal polymerizations of C^.1,2
hv
C120 (1)
hv
C120 (2)
1 (ö2h)
146

syn-2 (C2v)
anti-2 (C2ll)
COMPUTATIONAL METHOD
AMI7 in the MOPAC package8 is used for the HF/SCF MO calculations under NDDO
approximation. AMI accurately reproduces the observed structural parameters of C609 as well
as C70,10 and responds well to OITB." Convergence criteria in the SCF cycle is 10"4 kcal/molÄ
for the energy threshold and 10"2 kcal/molÄ for the energy gradient norm. All computations
have been carried out on Hewlett-Packard-Apollo DN10000, 9000/750 and Titan 2-800
workstations.
RESULTS AND DISCUSSION
We first optimized the geometries of 1 and 2 with AMI, expecting their pivot bonds to
show up unusually long. Contrary to our initial guess, however, the C1-C61 bond of 1 is of
normal length (1.546 Ä, Table I), but the other cyclobutane bond C1-C2 (1.603 Ä) is certainly
long.12 On the other hand, 2 has unexpectedly long bridge bonds (1.603 Ä).
The results are confusing and call for the OITB analysis. The most convenient diagnosis
147

Table I. Salient Features in the AMI-Optimized Geometries of C6,
Dimers (1 and 2) and Their Models (3 and 4)
co, deg"
r,Äd
117.8
1.546
143.2
1.603
128.2
1.581
136.5C
1.536c
a Not a stationary point because Csp3-Csp3-H angle is fixed. b Dihedral angle C5-C1-C4-C9, see 1 and 2.. c When the molecule is geometry-optimized without the constraint at
Csp3-Csp3-H, co becomes 132.4° and r 1.559 Ä.
" Bridge bond length: C1-C61 in 1, C 3-C 3 in 2, C1-C2 in 3 and 4.
for the OITB effect is to look into the ordering of occupied 7t orbitals.4,513 In order to facilitate
the analysis, we first use small models, 4a,4a',8a,8a'-dinaphthalene 3 and p,p'-dibenzene 4, for
1 and 2, respectively.14 4 has been used by Mislow and his students15 in an early study on the
effect of OITB on the length of mediating bond, but completely optimized structure of 4 had a
too small Csp3-Csp3-H angle compared to the corresponding Csp3-Csp3-Csp2 angle in 2, hence
this angle was fixed to the average value of syn- and anti-2 (133.5°) throughout the calculations
described below.
3 (D2h)
148

4 (D2t)
Let us classify MO's according to the mirror symmetric properties (1 for symmetric and
T for antisymmetric) regarding oxy, (f1 and ayz planes passing through the center of molecule.
Among eight bonding n MO's of 3, those which interact through the bridge a bonds C1-C2
(and C3-C4) must be symmetric with respect to a mirror plane an. MO's having 111, 1T1, Tl 1
and TT1 notations satisfy this condition. From Table II,16 the group-theoretical symmetry
notations of these orbitals are Ag, B,„, Blu and B3g, respectively. Of these, a pair of MO's
which differ only in the o*z index comprise the in-phase and out-of-phase combinations we are
looking for. Normally, the in-phase MO is lower in energy than the out-of-phase MO, to give
the so-called natural ordering in orbital energies: B2u>Ag and B3g>Blu. However, OITB
reverses the order due to mixing with anti-bonding orbitals and produces unnatural order
B,„<AgandB3g<Blü.17
Table II. Character Table of D,h Point Group
E C2Z C2y C2* i oxy
\ ' 1 1 1 1 1 1 1
A„ 1 1 1 1 T T T T
Bi8 ] 1 T T 1 1 T T
B,„ 1 1 T T T T 1 1
B2g T 1 T 1 T 1 T
B2U T 1 T T 1 T 1
B38 T T 1 1 T T 1
B3„ I T T 1 T 1 1 T
149

Figure 1. The a-n fragment analysis of orbital interactions between
two naphthalene moieties in the top and bottom of
dinaphthalene 3 (model of [2+2] Cm dimer 1).
AMI energy levels of the interacting MO's in 3 are shown in the center of Figure la.
The unnatural order, Blu>B3g and Ag>B,u attests to the operation of inter-cage interaction of
7t-orbitals through the bridge a bonds. This Figure includes the results of G-TT fragment
150

analysis,15 that uses n- (5) and o-fragments (6) of 3 to illustrate how the natural order seen in 5
is reversed due to the mixing with 0* MO's of 6.'8 In the n fragment, only the distances of
C-H bonds directing to the inside are optimized while keeping other structural parameters fixed
at those of the optimum geometry of 3. In the c fragment, only the carbon atoms are fixed at
the corresponding positions in 3. With these symmetry indices as the key reference, we were able to confirm the unnatural
order in the corresponding orbitals in 2 itself: Blu= -9.482, B3g= -9.495, A = -9.905, B, = -9.950
eV. Blu and B3g orbitals are HOMO and the second HOMO, respectively. The large number
of a MO's present in the small models prevent us from unambiguously detecting the contamination
of 7i* character into a orbitals of mediating bond, we can duly surmise that the mixing has
indeed occurred and weakened the mediating Csp3-Csp3 bond. In accordance with this surmise,
the calculated C1-C2 bond length of 3 is considerably long (1.581 Ä, Table I).
In the other model 4, the interacting Tt MO's must be symmetric with regard to not only
5.000
Constrained
o*
0.000 •
>
60 <D C W
-5.000
out of phase / 10.000
in phase
-isnno a
8
Figure 2. The a-n fragment analysis of orbital interactions
between two benzene moieties in the top and bottom
of dibenzene 4 (model of [4+4] C60 dimer 2).
151

oyz but also <fy. Hence we need to look at only the 111 and ill symmetric MO's, namely Ag
and B2u orbitals (Table II). Figure 2 illustrates the orbital interaction between a- and n-
fragments (7 and 8, respectively) of dibenzene 4. In this case, the B2u o* orbital of 7 does not
mix well with B2u n orbital of 8, its in-phase combination level being lowered only by 0.01 eV.
The observed ordering is natural (B2u>Ag, Fig. 2 center), hence there is no OITB in 4.19 In
accordance with this observation, the C1-C2 bond length of 4 is normal (Table I).
Let us apply this analysis to the two isomers of 2. Whereas the four occupied 7t-orbitaIs
in model 4 are grouped into two pairs, each having identical symmetry and energy, 2 does not
follow this pattern because of its lower symmetry (C,v and C2h). In other words, the condition
for 4 (Z)2h) molecule to enter into OITB, namely 'p-orbitals must be symmetric with respect to a
symmetry plane containing the mediating o bond' does not hold for 2. It is necessary to
compare the in-phase and out-of-phase combinations between two MO's having different phase
relation. With the aid of Table III,'6 we chose MO's having reduced notations A, and B2 as the
Table III. Character Tables of C2v and C2h Point Groups
C2v E C2(z) Sv(yz) sv(xz) c2h E C2(z) sh(xy) i
A, 1 1 l 1 \ 1 1 1 1 A2 1 1 T T Au 1 1 T T
B, 1 T 1 T B* 1 T T 1
B2 1 T T 1 Bu 1 T 1 T
152
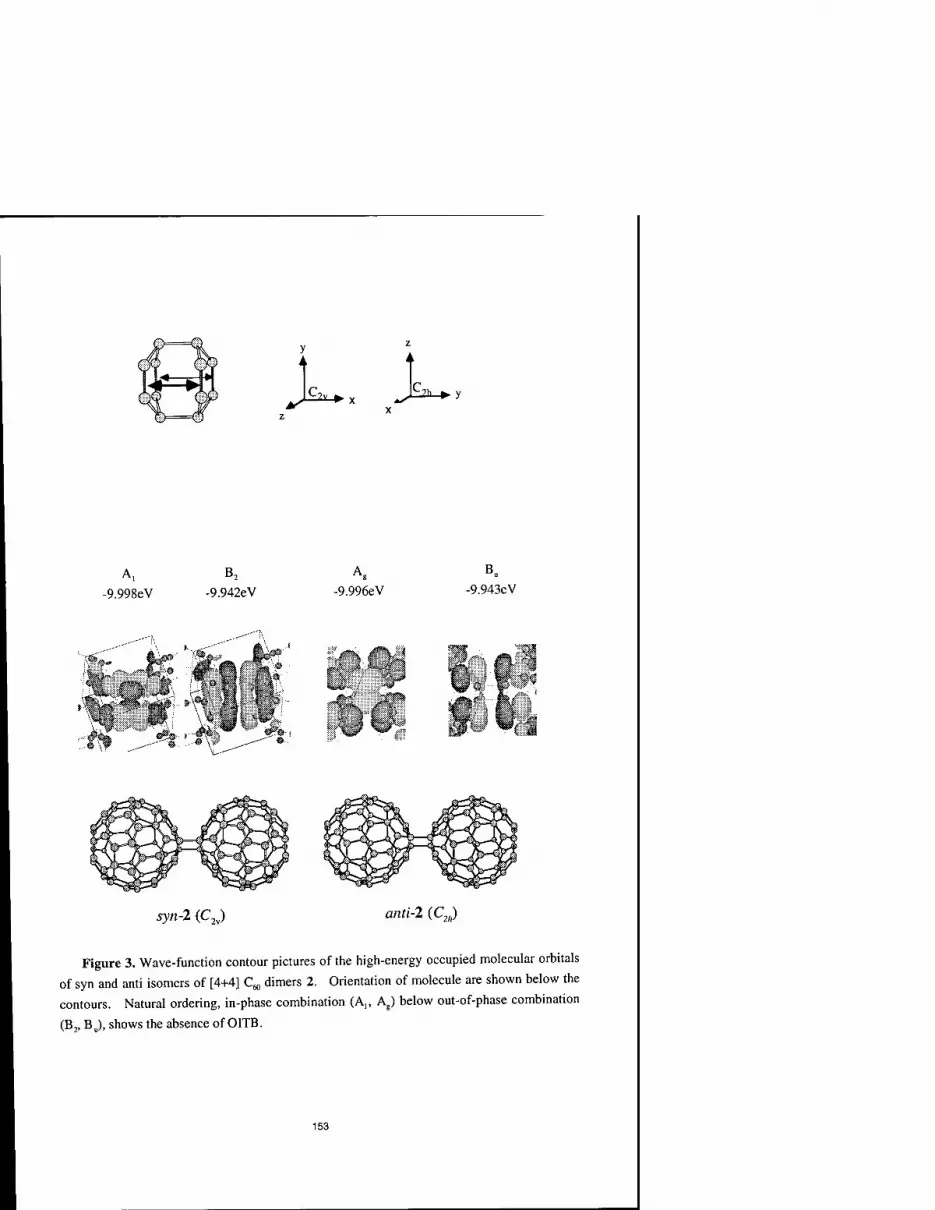
y 4
i2i_
z
:2k.
A, -9.998eV -9.942eV -9.996eV
Bu
-9.943eV
"W ft '
syn-2 (C2v) anri-2 (C,.)
Figure 3. Wave-function contour pictures of the high-energy occupied molecular orbitals
of syn and anti isomers of [4+4] Cm dimers 2. Orientation of molecule are shown below the
contours. Natural ordering, in-phase combination (A,, Ag) below out-of-phase combination
(B,, B0), shows the absence of OITB.
153

in-phase and out-of-phase combinations of syn-2 (C,v), respectively, and Ag and Bu as those of
anti-2 (C2h). Among great many MO's having these notations, those of the highest energy
levels are found in natural order and are shown in Fig. 3.
It has been clearly demonstrated above that the AMI-optimized lengths at the bridge
bonds of 1 and 2 are not affected by OITB, normal in 1 and abnormally long in 2, in complete
contradiction with the results of calculations on models 3 and 4, respectively. These results
mean that there is an extra feature in the C60 dimers, which is absent in their models, but is
responsible for overriding the OITB effect in the dimers. After several futile attempts, we
eventually established that the unusual valence angle deformations in these Cm dimers caused
by the fusion of rigid cage molecules are responsible for the failure of the OITB in elongating
the mediating bond. Detailsof the valence analysis will be described elsewhere.10
In conclusion, because the bridge bonds in the [2+2] C^ dimer 1 are of normal length, the
unsuccessful isolation of these dimers must be due to the well-recognized technical difficulties
commonly encountered in the isolation and purification of fullerenes. On the other hand, the
bridge bonds of [4+4] C60 dimer 2 should be long and weak, hence may not survive under the
polymerization conditions.10
ACKNOWLEDGEMENTS
This work was supported by a Grant-in-Aid for Scientific Research in Priority Areas (Carbon
Clusters), No. 05233107, from the Ministry of Education and Culture.
REFERENCES AND NOTES
(1) (a) R. D. Beck, C. Stoermer, C. Schulz, R. Michel, P. Weis, G. Bräuchle and M. M.
Kappes, J. Chem. Phys. 101, 3243 (1994). (b) .D. S. Cornett, I. J. Amster, M. A. Duncan,
A. M. Rao and P. C. Eklund, J. Phys. Chem., 97, 5036 (1993). (b) A. Manfredini, C. E.
Bottani and P. Milani, Chem. Phys. Lett. 226, 600 (1994). (c) A. M. Rao, P. Zhou, K.
Wang, G. T. Hager, J. M. Holden, Y. Wang, W.-T. Lee, X. Bi, P. C. Eklund, D. S. Cornett,
M. A. Duncan and I. J. Amster, Science, 259, 955 (1993). (d) P. W. Stephens, G. Bortel,
G. Faigel, M. Tegze, A. Janossy, S. Pekker, G. Oszlanyi and L. Forro, Nature, 370, 636
(1994). (e) N. Takahashi, H. Dock, N. Matsuzawa and M. Ata, J. Appl. Phys., 74, 5790
154

(1993). (f) C. Yeretzian, K. Hansen, F. Diederich and R. L. Whetten, Nature, 359, 44
(1992). (g) P. Zhou, Z.-H. Dong, A. M. Rao and P. C. Eklund, Chem. Phys. Lett., 211,
337 (1993).
(2) J. E. Fischer, Science , 264, 1548 (1994).
(2a) The only available information on the structure of cage junction in the Q, polymer is
based on the preliminary analysis of small angle x-ray scattering data by Stephens et al.u
(2b) A referee asked the reason why we did not calculate [2+4] C«, dimers, a rational product
from thermal reaction. When we started this work, only the photo-reactions were known.
Then, after thermal polymerization of C60 was reported, [2+4] dimer was calculated to be
70 to 90 kcal/mol more strained than the [2+2] dimer [N. Matsuzawa, M. Ata, D. A. Dixon
and G. fitzgerald, J. Phys. Chem., 98, 2555 (1994)]. Hence we decided to concentrate on
the [2+2] dimer for least for the moment. However, [2+4] dimer is interesting with regard
to the possibility of OITB, hence we plan to study this molecule by using the same
methodology as we used here. There is one other paper reporting on the computation of a
[2+4] cycloaddition product from two molecules of Cm [D. L. Strout, R. L. Murry, C. Xu,
W. C. Eckoff, G. K. Odom and G. E. Scuseria, Chem. Phys. Lett., 214 (1993)]. However,
judging from the structure depicted in this paper, we think that these authors meant a
product from double [2+2] reactions between 6/6 and 5/6 bonds.
(3) Also called a/n hyperconjugation.
(4) K. D. Jordan and M. N. Paddon-Row, Client Rev., 92,395 (1992).
(5) E.Osawa and K. Kanematsu, in "Molecular Structure and Energetics", Vol. 3, edited by J.
F. Liebman and A. Greenberg (VCH Publishers: N. Y. 1986), Chap. 7.
(6) D. A. Dougherty, C. S. Choi, G. Kaupp, A. B. Buda, J. Rudzinski and E.Osawa, 7. Chem.
Soc, Perkin Trans. 2 , 1063 (1986).
(7) M. J. S. Dewar, E. G. Zoebisch, E. F. Healy and J. J. P. Stewart, J. Am. Chem. Soc, 107,
3902 (1985).
(8) MOPAC version 6.01 by J. J. P. Stewart is obtained from the Japan Chemistry Program
Exchange, program No. P049. JCPE, c/o Japan Association for International Chemical
Information, Nakai Bldg., 6-25-4 Honkomagome, Bunkyo-ku, Tokyo 113. FAX 81-3-
5978-3600.
(9) (a) D. Bakowies and W. Thiel, J. Am. Chem. Soc, 113, 3704 (1991). (b) D. Bakowies, A.
Gelessus and W. Thiel, Chem. Phys. Lett., 197, 324 (1992).
(10) S. Osawa, E. Osawa and M. Harada, to be submitted for publication.
(11) E.Osawa, J. M. Rudzinski and Y. Xun, Struct. Chem., 1, 333 (1990).
(12) These and other computational results described herein are in reasonable agreement with
those recently reported by Scuseria's group [D. L. Strout, R. L. Murry, C. Xu, W. C.
155

Eckhoff, G. K. Odom and G. E. Scuseria, Chem. Phys. Lett., 214, 576 (1993)].
(13) See W. L. Jorgensen and L. Salem, "Organic Chemist's Book of Orbitals" (Academic
Press, New York, 1973), p. 253, 267-268, for examples of the unnatural ordering in p-benzyne,
6Ag(n+)>5B3u(nJ, and pyrazine, 6Ag(n+)>5Bl0(n_).
(14) Choice of small models is rationalized by the fact that changes in the structural parameters
and charge distribution that occur by the 1,2-addition to C^ are limited to the close vicinity
of the reaction site: (a) K. M. Creegan, J. L. Robbins, W. K. Robbins, J. M. Millar, R. D.
Sherwood, P. J. Tindall and D. M. Cox, /. Am. Chem. Soc, 114, 1103 (1992). (b) Y.
Elemes, S. K. Silverman, C. Sheu, M. Kao, C. S. Foote, M. M. Alvarez and R. L. Whetten,
Angew. Chem. Int. Ed. Engi, 31, 351 (1992). (c) J. M. Hawkins, T. A. Lewis, S. D.
Loren, A. Meyer, J. R. Heath, Y. Shibato and R. I. Saykally, J. Org. Chem., 55, 6250
(1992). (d) S. H. Hoke, Jr., J. Molstad, D. Dilettato, M. J. Jay, D. Carlson, B. Kahr and R.
G. Cooks, J. Org. Chem., 57, 5069 (1992). (e) K. Komatsu, Y. Murata, A. Miyabo, K.
Takeuchi and T. S. M. Wan, Fullerene Sei. TechnoL, 1, 231 (1993). (0 F. Okino, H.
Touhara, K. Seki, R. Mitsumoto, K. Shigematsu and Y. Achiba, Fullerene Sei. TechnoL, 1,
425 (1993). (g) M. Prado, T. Suzuki, H. Foroudian, Q. Li, K. Khemani, F. Wudl, J.
Leonetti, R. D. Little, T. White, B. Rickborn, S. Yamago and E. Nakamura, J. Am. Chem.
Soc, 115, 8479 (1993).
(15) D. A. Dougherty, H. B. Schlegel and K. Mislow, Tetrahedron, 34, 1441 (1978).
(16) E. A. Halevi, "Orbital Symmetry and Reaction Mechanism" (Springer-Verlag, Berlin, 1992).
(17) To be exact, the unnatural order occurs only when OITB dominates the orbital interaction through space (OITS).
(18) The a-Ti fragment analysis of 3 at the to value of 1 (117.8°) gives essentially the same
result as given in Figure 1, but the energy difference between the in-phase and out-of-phase
orbitals decreases. This change reflects the decreased orbital interaction through space for
small co's due to the increased distance between the top and bottom wings of naphthalene
ring.
(19) The constrained Csp3-Csp3-H angle in 4 is responsible for the vanished OITB, which exists in the unconstrained 4, ref. 15.
156

STRUCTURE, STABILITY AND PROPERTIES OF COVALENT C34, C20, AND C22 CRYSTALS
G. BENEDEK, L. COLOMBO, B. CORONA, E. GALVANI, S. SANGUINETTI, AND S. SERRA Dipartimento di Fisica, Universita' di Milano, via Celoria 16,1-20133 Milano (Italy)
ABSTRACT
Topological arguments indicate that an infinite number of covalent carbon crystals may exist with either diamond-like (sp3), graphitic-like (sp2)~ or mixed (sp3/sp2) bonding structure. We investigate the structural, elastic and electronic properties of three prototypical structure: C34, C20 and C22, respectively. All of them form a face-centered cubic lattice. Their properties have been calculated by both Montecarlo and molecular dynamics simulations based on the Tersoff potential. Both the sp3-bonded C34 and the sp2-bonded C20 are found to have a cohesive energy per atom very close to that of diamond. A comparison of elastic and electronic properties to those ones of diamond and graphite are also presented and discussed.
INTRODUCTION
Atomic-scale porous materials, molecular sieves and intercalation compounds constitute one of the prominent research areas in modern materials science [1]. Good mechanical properties, chemical inertness and easy interfacing are often demanded for solid membranes and the functional components of ionic devices. All of these properties could in principle be met by carbon-based materials. We undertook a theoretical search for novel fully covalent carbon crystals, in either the sp3 or sp2 or mixed sp3/sp2 bond configurations, which combine a large nanoscale porosity with high stability and good mechanical properties. In this brief report we describe a few basic examples of such hypothetical carbon crystals with a theoretical calculation of their stability, their elastic constants and electronic structure.
THE HOLLOW DIAMOND fcc-C34
With the aid of topological arguments we discovered three new infinite series of 4-fold coordinated (sp3 bonded) lattices having Nn(n+l)(2n+l)/3 carbon atoms per unit cell, where n is any natural number and N = 17 (face centered cubic lattices, Fd3m space group), 20 (hexagonal lattices, P6/mmm space group) and 23 (simple cubic lattices, Pm3n space group). They are formed by periodic arrays of fullerenic cavities so that we call them hollow diamonds (HDs).[2]-
In the first elements (n = 1) the fullerenic cavities are coalescing so as to form a periodic space filling with two or three kinds of polyhedra. The smallest HD, fcc-C34, is generated by two C28 and four C20 polyhedra per unit cell; hex-C40 is generated by two C26, two C24 and three C20 polyhedra per unit cell; sc-C46 is generated by six C24 and two C20 polyhedra per unit cell. As regards nanoporosity the cavities of fcc-C34 form a sort of tetrahedral zeohtic network; those of hex-C40 form a hexagonal array of parallel tubes (made of C24 cages) along the c-axis passing through an orthogonal non-intersecting stack of planar hexagonal labyrinths (made of C26 cages); those of sc-C46 form three orthogonal non-intersecting square arrays of tubes. The larger
157
Mat. Res. Soc. Symp. Proc.Vol. 359 81995 Materials Research Society

elements (n > 2) of each series are formed by the same arrays of fullerenes covalently interconnected by diamond-like structure. The three series tend to diamond for n going to infinity.
The positions of carbon atoms within the rombohedral unit cell of fcc-C34 are shown in Fig. 1 togheter with a portion of the crystal lattice. We have calculated the ground state energy of this crystal by means of a Monte-Carlo (MC) simulated annealing (SA) procedure. The carbon- carbon interaction has been modelled by the empyrical many-body Tersoff potential [3], which has been explicitly designed to treat carbon polymorphism. The process consisted of a high temperature equilibration from an initial hypothetical HD lattice (104 MC steps/atom at constant T = 1500 K), followed by a slow cooling to T = 0 at a rate of 2 x 10"4 K/MC step.
(a) fcc-C34
Fig.l - The rombohedral unit cell of fcc-C34 (a) and a portion of its crystal lattice (b).
The calculated T = 0 K density and cohesive energy, bulk modulus and elastic constants (the latter obtained by numerical derivation of the energy with respect to symmetrized lattice strains) are collected in Table I and compared to diamond. The cohesive energy per atom is only 140 meV less than for diamond. This result may appear somewhat surprising in view of the appreciable distorsion of the tetrahedral bonds. It is however consistent with recent density functional theory calculations of sc-Si46 whose total energy per atom is only 90 meV above that of ordinary fee silicon. [4] Also the density and the elastic constants are somewhat less than in diamond, but they compensate each other in giving sound velocities comparable or even larger (e.g., vT[lll] ) than in diamond. Similar properties have been found for hex-C40 and sc-C46 [3]. Needless to say HDs would comparatively low density.
have magnificent mechanical properties combined with a
158

diamond fee - C20 fee - C22 fee - C34
Energy (eV) -7.37 -7.36 -6.90 -7.23
Density 1 0.582 0.620 0.859
B (Mbar) 4.44 2.22 2.37 3.64
dl (Mbar) 10.9 5.7 5.7 10.3
C12 (Mbar) 1.2 0.5 0.7 0.3
c44 (Mbar) 6.4 3.5 2.2 4.8
Tab. I - Density, cohesive energy, bulk modulus and elastic constants of C34, C20 and C22
Insertion of metal ions into their cavities would probably increase their hardness above that of diamond.
THE CUBIC GRAPHITE fcc-C20
Various kinds of three-dimensional graphite-like (3-fold coordinated) crystals have been suggested in recent years, e.g., as a tiling of periodic surfaces (polybenzene [5] and plomber's nightmares [6]) or simpler forms like bct-4 and H-6 structures. [7] The latter, postulated as intermediates in the growth of diamond-like films [7], have large atomic rings and are often unstable towards the formation of smaller rings with partial or full conversion into some sp3
diamond-like structure. We have investigated a fully sp2-bonded fee carbon crystal with 20 atoms per unit cell (Fig. 2)
which we found to have a cohesive energy almost identical to that of graphite. We call this new (to our knowledge) fcc-C20 crystal a cubic graphite.
Fig.2 - The unit cell of fcc-C 20
159

We obtained the T = 0 equilibrium density, cohesive energy and elastic properties with the same potential used for HDs (Table I). In this case the SA strategy has been implemented through a molecular dynamics simulation consisting into two steps: (i) careful equilibration at 300 K during a constant-temperature simulation as long as 0.13 ns (the selected time step was lO"15 s); (ii) quenching down to zero temperature following an average cooling rate of 2.5 1012
K/s. For a graphite-like material it is important to know about its Fermi level EF and whether it retains any semimetallic character. To this aim we performed a tight-binding (TB) calculation of the electronic band structure of fcc-C20 within the two-center approximation, where only interactions up to the first next-neighbours have been considered. The TB parameters have been taken from Ref. [8] where suitable scaling laws for the variation of the TB hopping integrals against interatomic distance have been introduced. The calculated total density of states (DOS) is displayed in Fig. 3 togheter with s- and p-state contributions. The highest occupied state is located at the bottom of a narrow dip at almost zero DOS, which indicates also for fcc-C20 a semimetallic nature. However a very sharp DOS peak occurs just above Ep, which means that a moderate electron doping may induce some sort of instability towards a charge density wave or a superconducting state. The calculation of the graphite band structure with the same parametrization shows that EF of fcc-C2o is located 0.43 eV below that of graphite. This information, for this and other possible cubic graphites, combined with the knowledge of lithium intercalation ability may lead to the discovery of useful cathodic and anodic materials for solid state batteries. The cubic structure should permit extended and chemically stable interfaces with polymeric ionic conductors. With respect to graphite the most evident feature of fcc-C20 DOS is the narrowing of the 7t-band with the formation of two gaps below -0.2 eV and above 4.4 eV. This is due to the degeneracy of rc-states in the staggered sp2
bonding of the fcc-C20 structure as compared to the split 7t-states occurring in the eclipsed bonding of graphite.
Energy (eV) Energy (eV)
Fig. 3 - Total density of states (DOS) of C2p (left panel). The s- and p-state contributions are reported in the right,top and right,bottom panels, respectively.
THE MIXED sp2/sp3 STRUCTURE fcc-C22
The fcc-C20 presents tetrahedral cages (two per unit cell) suitable to bind a carbon atom in the center with a moderate distortion. This leads to the mixed sp2/sp3 structure fcc-C22 whose unit cell has 10 atoms with 4-fold and 12 atoms with 3-fold coordination (Fig. 4). The calculation of this systems, where sp2 and sp3 bonds are almost in the same proportion, is rather suggestive of the way the electronic properties change from graphite-like to diamond-like structures.
160

Fig.4 - The unit cell of fcc-C22
While the calculated elastic properties are similar to those of fcc-C2o, the cohesive energy (Table I) is rather low (about 7% less than that of diamond, graphite and fcc-C20).
The electronic DOS of fcc-C22 (Fig. 5) also shows important differences with respect to fcc- C2Q: the/? band is now split into subbands originating from 3-fold and 4-fold coordinated atoms,
3 (Ö
CO o Q
-ao -to
Energy (eV)
Fig. 5 - Total density of states (DOS) of fcc-C22 (bottom panel). The s- and p-state contributions and the DOS projected onto 3-fold and 4-fold coordinated atoms are shown in the middle and bottom smaller panels, respectively.
161

the former yielding two sharp peaks in the DOS at 0 eV and 4 eV, the latter two broader subbands around -3 eV and 6 eV. Now the highest occupied level occurs at the top of the narrow band around 0 eV, which is completely filled. The Fermi energy falls in the above gap and gives therefore an insulator. This shows that in a crystalline, highly symmetric structure a percentage as high as 54 % of sp2 bonds may not be enough to yield a semimetallic character
ACKNOWLEDGEMENT
This work was partially supported by the National Research Council (CNR) of Italy under Project "Crescita, caratterizzazione e proprieta' di strutture fullereniche". We greatly acknowledge P. Flukiger (CSCS, Switzerland) for computer graphics support.
REFERENCES
[1] D.W. Scaefer, MRS Bulletin XIX No.4, 14 (1994) [2] G. Benedek, E. Galvani, S. Sanguinetti and S. Serra, Phys. Rev. Lett, (to be published) [3] J. Tersoff, Phys. Rev. B 37, 6991 (1988); Phys. Rev. Lett. 61, 2879 (1989) [4] S. Saito and A. Oshiyama, Phys. Rev. B, in press [5] M. O'Keeffe, G.B. Adams and O. Sankey, Phys. Rev. Lett. 68, 2325 (1992) [6] D. Vanderbilt and J. Tersoff, Phys. Rev. Lett. 48, 511 (1992) [7] R. Riedel, Adv. Mater. 6, 549 (1994) [8] L. Goodwin, J. Phys.: Condens. Matter 3, 3869 (1991)
162

SMALLER CARBON CLUSTERS: LINEAR, CYCLIC, POLYHEDRAL
Z. SLANINA"*, S.-L. LEE", M. SMIGEL6, J. KURTZ0 AND L. ADAMOWICZ'* "Department of Chemistry, National Chung-Cheng University, Ming-Hsiung, Chia-Yi 621,
Taiwan 'Convex Computer Corporation, Richardson, TX 75083-3851, USA Tockheed Engineering and Science Corporation, P. O. Drawer MM, Las Cruces, NM
88004, USA ^Department of Chemistry, The University of Arizona, Tucson, AZ 85721, USA
ABSTRACT
The MP2 perturbation treatment with the 6-31G* basis set has been applied to linear, cyclic, arid polyhedral structures of Cn, n = 6-13, esp. to CJ2 in this report. While the linear and cyclic species can co-exist, polyhedral ones are too high in energy. Preliminary results on C8H (related to diffuse interstellar bands) are reported, too.
INTRODUCTION
Small carbon clusters C„ have been studied for several decades but still they are not well understood [1]. The studies moreover received a considerable impetus from the fullerene discovery and synthesis [2]. Experimental evidences of isomerism of the small carbon clusters [3-5] represent probably the most important event in their understanding during recent years. Computational effort has progressed [6-27] but some discrepancies still exist between theory and experiment and between various computations. Neverthe- less, existence of linear and cyclic species has been established, the linear even-numbered structures being in triplet electronic state.
At same stages both small carbon clusters and fullerenes have been suggested as potential candidates responsible for the astrophysical spectroscopic patterns known as [28,29] diffuse interstellar bands, this problem being closely related to the form in which carbon is present in the interstellar space. Very recently, however, a convincing experi- mental evidence has been supplied [30] that the diffuse bands could be generated by highly unsaturated hydrocarbons, e.g., CeH or CsH, which can be understood as simple deriva- tives of the carbon clusters themselves. This report thus presents results from on-going computations not only of carbon aggregates, especially C12, but also on CsH.
COMPUTATIONS
The computations were partly carried out with the Gaussian 90 [31] and partly with the Gaussian 92 [32] program packages. For the sake of consistency with the previous studies the standard 6-31G* basis set was applied and the electron correlation was treated through all-electron second order M0ller-Plesset (MP2=FULL) perturbation treatment. Open shell species were computed using the related unrestricted approach. The C12 and
On a leave of absence from the Academy of Sciences of the Czech Republic, Prague.
163
Mat. Res. Soc. Symp. Proc. Vol. 359 c 1995 Materials Research Society

Ci3 systems have however been treated with the frozen-core MP2 option (MP2=FC/6- 31G*). The geometry optimization was carried out in internal coordinates restricted to the smallest possible set of optimized variables. The energy gradient was constructed analytically, force-constant matrix numerically or analytically, depending on memory and software resources. Hence, it supplied a check of the types of the stationary points found and their vibrational spectra as well.
RESULTS AND DISCUSSION
Table I surveys the computed energetics for the linear and cyclic Cn clusters for n = 6 — 13. (In fact, some additional computations are needed, especially for the linear Cio, Cn, and C13 structures in order to clarify if we deal with real minimum-energy structures.) While the C7 and C9 cyclic structures are slightly higher in energy than the related linear forms, Cn cycle is located considerably below the corresponding linear structure, and the C13 cycle again closer, but still being the ground state. This fairly agrees with the findings from ion chromatography [3] where two well resolved peaks were found for n = 7 — 10, but not for n = 11 — 20. Entropy calculations, which are also in progress, can influence the stability interrelationships, especially at higher temperatures. As linear structures are typically favored [30] by this contribution, we could explain the very recent results [27] on infrared laser spectroscopy of the linear C13 through this factor.
The C12 system has received rather limited attention by now, and therefore we have studied it in a detail. Two clear minimum-energy structures have been established, the Dßh planar cycle and triplet linear species (Figure 1), the cycle being the system ground state (Table I). There are two types of bonds in the planar cycle (1.250 and 1.375 A) so that it is not obvious whether it is more cumulenic or rather acetylenic arrangement. We could however locate another cycle form, albeit non-planar, with a D%j, symmetry, in fact lower in energy than the linear form (Table I); its vibrational analysis is being performed (so that we may deal with a transition state for the planar ring interconversion). In the structure only six atoms are in a common plane, three are above, three below the plane (though by 0.07 A only). It resembles the situation with Cj, though the D2d structure is the global minimum for the system [22,24]. The C12 stoichiometry also allows for several interesting polyhedral forms, the icosahedron and truncated tetrahedron being most appealing. The icosahedron is composed from triangles only, it can hardly be a low-energy structure, and SCF convergency has been slow. However, we could optimize the structure of the truncated tetrahedron (four triangles, four hexagons - Figure 1) but it is high in energy (Table I). Hence, it confirms presumptions that for smaller clusters only linear and cyclic forms are relevant.
Figure 2 documents that the cyclic forms need not necessarily be monocycles. The unusual combination of a three- and ten-membered ring in Cn is not really exceptional though does not appear in C13. In fact, a similar motif can be seen in C9 and even C7, too. This feature is certainly worth of interest as Kim and Tomanek [34] discovered multi-cyclic structures in their molecular dynamic treatment of the fullerene melting.
Fulara et al. [30] reported very recently observations of the CnHm (6 < n < 12, m = 1,2) and demonstrated that their spectra could well explain the diffuse interstellar bands. We have tried computations on a member of the new series, CsH radical, its anion and cation, consistently within the MP2/6-31G* approach. Table II surveys of the computations. For both the anion and cation there is a quasi-linear local energy minimum. For the neutral species its form is strictly linear (its vibrational analysis being performed).
164
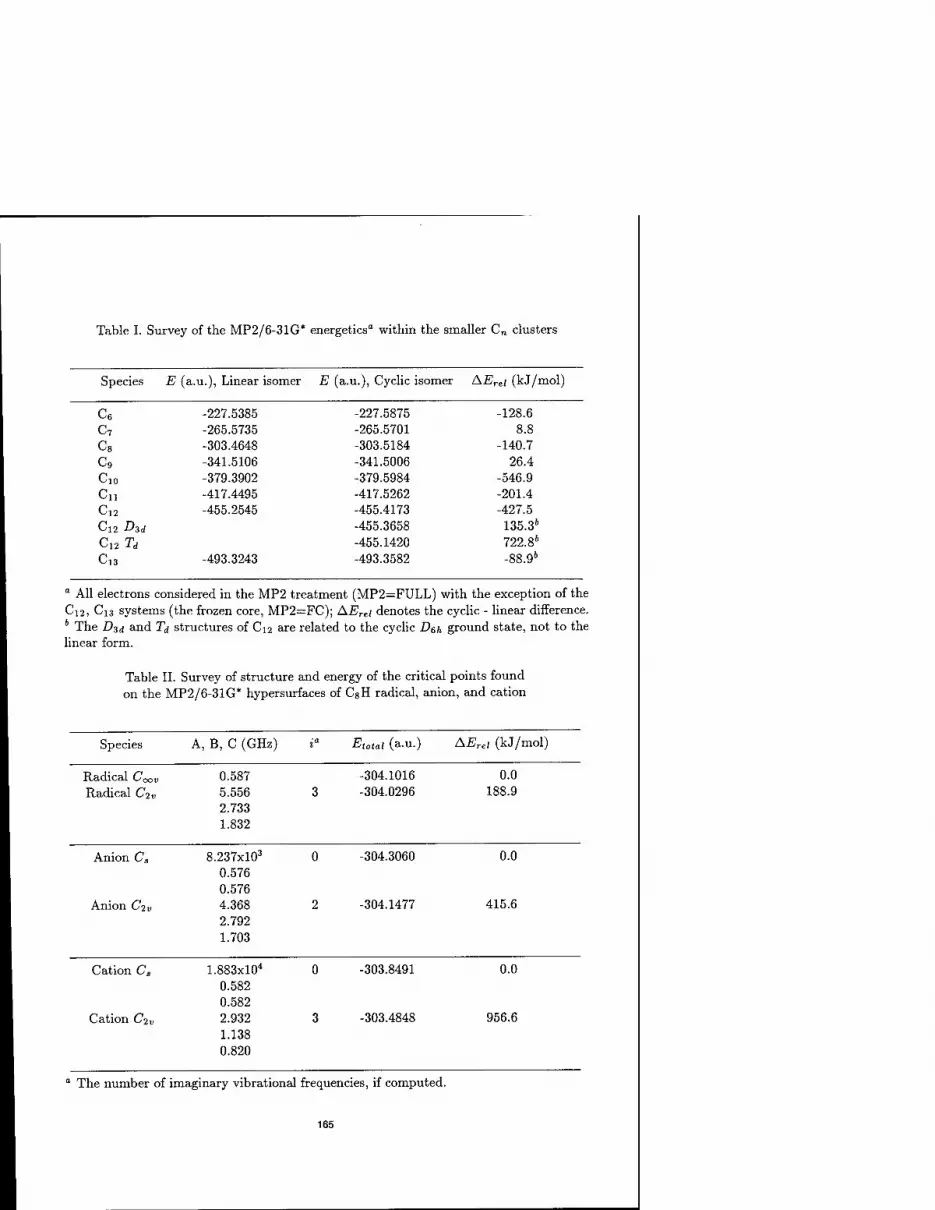
Table I. Survey of the MP2/6-31G* energetics" within the smaller C„ clusters
Species E (a.u.), Linear isomer E (a.u.), Cyclic isomer AE ret (kj/mol)
c6 -227.5385 -227.5875 -128.6
c7 -265.5735 -265.5701 8.8
c8 -303.4648 -303.5184 -140.7
c9 -341.5106 -341.5006 26.4
Cio -379.3902 -379.5984 -546.9
Cn -417.4495 -417.5262 -201.4
C12 -455.2545 -455.4173 -427.5
C12 Did -455.3658 135.36
C12 Td -455.1420 722.86
Cl3 -493.3243 -493.3582 -88.9*
" All electrons considered in the MP2 treatment (MP2=FULL) with the exception of the Ci2, Ci3 systems (the frozen core, MP2=FC); AErei denotes the cyclic - linear difference.
The Did and Td structures of C12 are related to the cyclic Df,h ground state, not to the linear form.
Table II. Survey of structure and energy of the critical points found on the MP2/6-31G* hypersurfaces of CgH radical, anion, and cation
Species A, B, C (GHz) ia Etotal (a.u.) AErel (kJ/mol)
Radical Coo« 0.587 -304.1016 0.0
Radical Civ 5.556 2.733 1.832
3 -304.0296 188.9
Anion Cs 8.237xl03
0.576 0.576
0 -304.3060 0.0
Anion C-iv 4.368 2.792 1.703
2 -304.1477 415.6
Cation Cs 1.883xl04
0.582 0.582
0 -303.8491 0.0
Cation Civ 2.932 1.138 0.820
3 -303.4848 956.6
The number of imaginary vibrational frequencies, if computed.
165

Figure 1. The MP2=FC/6-31G* optimized structures of C]2: planar cycle D6h, (bottom, right), non-planar cycle Da (bottom, left), linear D^ä triplet (top, right),
and polyhedral Td (top, left).
166

Figure 2. The MP2=FULL/6-3lG* optimized structure for the planar C2v cyclic Cn (top), and the MP2=FC/6-31G* optimized structure
for the planar C2v cyclic C13 (bottom)
167

The cyclic structures are out of question as they are too high in energy and they are not energy minima. The results correspond to our findings for the C6H species [26]. The MP2/6-31G* geometries will be used for computations of electronic spectra later on.
ACKNOWLEDGEMENT
Acknowledgement is made to the National Science Council, Taiwan, Republic of China, for support. The authors thank the National Center for High-Performance Com- puting in Hsinchu for computer time on the Convex C3840, and the Lawrence Livermore National Laboratory for computer time on the Cray Y-MP C90 and 2S, where a part of the computations was done.
REFERENCES
1. W. Weltner Jr. and R. J. van Zee, Chem. Rev. 89, 1713 (1989). 2. H. W. Kroto, A. W. Allaf, S. P. Balm, Chem. Rev. 91, 1213 (1991). 3. G. von Helden, M.-T. Hsu, P. R. Kemper and B. T. Bowers, J. Chem. Phys. 95, 3835 (1991). 4. D. Zajfman, H. Feldman, 0. Heber, D. Kella, D. Majer, Z. Vager, R. Naaman, Science 258,
1129(1992). 5. G. von Helden, P. R. Kemper, N. G. Gotts and M. T. Bowers, Science, 259, 1300, (1993). 6. K. Raghavachari, R. A. Whiteside, J. A. Pople, J. Chem. Phys. 85, 6623 (1986). 7. K. Raghavachari, J. S. Binkley, J. Chem. Phys. 87, 2191 (1987). 8. J. M. L. Martin, J. P. Francois, R. Gijbels, J. Chem. Phys. 90, 3403 (1989). 9. V. Parasuk and J. Almlöf, J. Chem. Phys. 91, 1137 (1989). 10. C. Liang, H. F. Schaefer III, J. Chem. Phys. 93, 8844 (1990). 11. J. M. L. Martin, J. P. Francois, R. Gijbels, J. Chem. Phys. 93, 8850 (1990). 12. W. Andreoni, D. Scharf, P. Giannozzi, Chem. Phys. Lett. 173, 449 (1990). 13. J. Kurtz, and L. Adamowicz, Astrophys. J. 370, 784 (1991). 14. J. M. L. Martin, J. P. Francois, R. Gijbels, J. Chem. Phys. 94, 3753 (1991). 15. J. M. L. Martin, J. P. Francois, R. Gijbels, J. Comput. Chem. 12, 52 (1991). 16. D. W. Ewing, Z. Phys. D, 19, 419 (1991). 17. Z. Slanina, J. M. Rudziriski, E. Osawa, Z. Phys. D, 19, 431 (1991). 18. J. M. L. Martin, J. P. Francois, R. Gijbels, J. Almlöf, Chem. Phys. Lett. 187, 367 (1991). 19. J. D. Watts and R. J. Bartlett, Chem. Phys. Lett. 190, 19 (1992). 20. V. Parasuk and J. Almlöf, Theor. Chem. Acta, 83, 227 (1992). 21. Z. Slanina, J. Kurtz, L. Adamowicz, Chem. Phys. Lett. 196, 208 (1992). 22. Z. Slanina, J. Kurtz, L. Adamowicz, Mol. Phys. 76, 387 (1992). 23. M. A. Nygren, L. G. M. Pettersson, Chem. Phys. Lett. 97, 6592 (1993). 24. Z. Slanina, S.-L. Lee, J.-P. Francois, J. Kurtz. L. Adamowicz, Chem. Phys. Lett. 223, 397
(1994).^ 25. Z. Slanina, S.-L. Lee, J.-P. Francois, J. Kurtz, L. Adamowicz, M. Smigel, Mol. Phvs. 81,
1489 (1994). 26. Z. Slanina, S.-L. Lee, M. Smigel, J. Kurtz, L. Adamowicz, Computations of Smaller Carbon
Aggregates, Proc. San Francisco 1994 Fullerene Symposium. 27. T. F. Giesen, A. van Orden, H. J. Hwang, R. S. Fellers, R. A. Provencal, and R. J. Saykally,
Science, 265, 756 (1994). 28. T. P. Snow, C. G. Seab, Astron. Astrophys. 213, 291 (1989). 29. H. W. Kroto, M. Jura, Astron. Astrophys. 263, 275 (1992). 30. J. Fulara, D. Lessen, P. Freivogel, J. P. Maier, Nature 366, 439 (1993). 31. M. J. Frisch, M. Head-Gordon, G. W. Trucks, J. B. Foresman, H. B. Schlegel, K.
Raghavachari, M. Robb, J. S. Binkley, C. Gonzalez, D. J. DeFrees, D. J. Fox, R. A. White- side, R. Seeger, C. F. Melius, J. Baker, R. L. Martin, L. R. Kahn, J. J. P. Stewart, S. Topiol, J. A. Pople, Gaussian 90, Revision I. (Gaussian, Inc. Pittsburgh, 1990).
32. M. J. Frisch, G. W. Trucks, M. Head-Gordon, P. M. W. Gill, M. W. Wong, J. B. Foresman, B. G. Johnson, H. B. Schlegel, M. A. Robb, E. S. Replogle, R. Gomperts, J. L.res, K. Raghavachari, J. S. Binkley, C. Gonzalez, R. L. Martin, D. J. Fox, D. J. DeFrees, J. Baker, J. J. P. Stewart, J. A. Pople, Gaussian 92, Revision C. (Gaussian, Inc. Pittsburgh, 1992).
33. Z. Slanina, Chem. Phys. Lett. 173, 164 (1990). 34. S. G. Kim and D. Tomänek, Phys. Rev. Lett. 72, 2418 (1994).
168

CONSTRAINTS ON SMALL FULLERENE HELICES
BRETT. I. DUNLAP Theoretical Chemistry Section, Code 6179, Naval Research Laboratory, Washington, DC 20375-3321
ABSTRACT
A single heptagon together with a single pentagon can join two graphene semitubules together at a 30° angle so that all carbon atoms are three-fold coordinated and all other carbon rings are hexagons. This bend connects tubules of complementary classes. A tubule class is the set of all tubules having the same helicity. A tubule class has a uniform density of radii, which is the number of different tubules in the class per unit change in tubule radius. The classes that are joined by a heptagon and pentagon have smallest members whose radii differ by a factor of y/Z. Thus tubule segments joined by a heptagon and pentagon cannot have exactly equal circumferences. There are only a finite number of twist angles allowed between sequential bends along a tubule. Pentagons and heptagons should be isolated and separated as far as possible. These requirements particularly constrain the bends and twists that can occur in the smallest tubules. These considerations favor long-range order along a helix, given a driving force for curling during the formation process.
INTRODUCTION
Since the discovery [1] and production [2] of the fullerenes many new nanoscale carbon structures have been proposed and observed. A fullerene is a graphene sheet that has been closed into a roughly spherical shape by including twelve pentagons in the otherwise hexagonal sp2 carbon network [3]. A fullerene can be cut in half and extended indefinitely by inserting bands of hexagons to form a tubule [4,5]. In the infinite limit, the caps can be ignored and the tubule considered to be a straight cylinder made entirely of hexagons having helical, rotational, and translational symmetry [6,7]. A tubule can be bent. If the bend is sufficiently large, the strain energy can be relieved through rebonding individual carbon atoms. By Euler's theorem the number of bonds between three-fold coordinated carbon atom is preserved if the total number of extra sides in all the polygons larger than hexagons equals the number of deficient sides in all the polygons smaller than hexagons. The minimal such transformation of a tubule is caused by a single heptagon and a single pentagon [8,9]. The optimal position of the pentagon is to supply positive curvature at the outside of the bend. The optimal position of the heptagon is to supply negative curvature at the inside of the bend.
In order to introduce the heptagon and pentagon, the helicity of an entire half of the tubule must be altered; the heptagon and pentagon can only connect tubules of compatible helicities [10]. Thus the helicities of every second tubule segment must be identical. Each tubule segment must have roughly the same diameter, because it costs energy to flatten the larger tubule to have an oval cross section. The heptagon and pentagon defects are located far apart on opposite sides of the tubule. The twist angle between successive tubule bends can only assume a finite number of values [11]. These constraints could drive the high regularity seen in nanoscale graphitic helices [12]. In fact a continuum model of differential creation rates has been described that would drive helix formation [13].
169
Mat. Res. Soc. Symp. Proc. Vol. 359 ° 1995 Materials Research Society

RESULTS AND DISCUSSION
The helicity of a tubule can be defined as the smallest angle that its circumference makes to any line of edge-sharing rows of hexagons on its surface. It is possible that tubules of different helicities could twist different amounts due to differences in electronic structure and differences in relative curvature of the three symmetry-inequivalent bonds. To be independent of twist angle, it is better to define the topological helicity as the minimal number of steps along one or two different rows of edge-sharing hexagons necessary to return to the same or another point on the circumference. This definition of helicity can be reduced to a set of two nonnegative numbers that have no common factors other than unity.
Tubules can be indicated by the lattice vector [L, M] of points on a graphene sheet that when rolled up to overlap create the tubule [14]. The set of all tubules of a given helicity are [711,717] where (i,j) is the helicity of the class and n is a positive integer. The axis of the rath member of each class is an ra-fold rotational axis, thus the tight-binding electronic structures of the members of each tubule class are related, neglecting the effects of curvature [7]. The members of a tubule class have uniformly spaced circumferences and radii. Thus each tubule class has a density of radii, which is the ratio of 3.4 A, an average turbostratic graphite layer spacing, to the radial increment between members of the tubule class [11]. The tubule classes with the largest density of radii are listed in Table I.
Table I. The density of radii ptj for each tubule class (i,j), which is the number of members in each class that have radii within 3.4 A of each other. The C-C bond distances are assumed to be 1.42Ä.
(M) Pij (*>j) Pij (hi) Pij
(1,0) 8.69 (5,2) 1.39 (6,5) 0.91 (1,1) 5.01 (6,1) 1.32 (9,1) 0.91 (2,1) 3.28 (5,3) 1.24 (7,4) 0.90 (3,1) 2.41 (7,1) 1.15 (8,3) 0.88 (3,2) 1.99 (5,4) 1.11 (9,2) 0.86 (4,1) 1.90 (7,2) 1.06 (7,5) 0.83 (5,1) 1.56 (8,1) 1.02 (10,1) 0.82 (4,3) 1.43 (7,3) 0.98 (7,6) 0.77
Thus it is impossible for multiwalled tubules to be composed entirely of one class of tubules for almost all possible helicities. It is impossible to construct multiwalled tubules of a single helicity using any class of tubule not listed in Table I. On the other hand, the sets of tubules [L+5ra, L+hn] and [3L+6n, 2L+4n] could form multiwalled tubules for any L and sequence in n with minimal distortion. By alternating the number of class members skipped between concentric tubules a few more of the classes listed in Table I might be used to construct multiwalled tubules having one helicity.
Fujita, et al, can project any capped tubule onto a honeycomb lattice by cutting it open in such a way as to permit a 60° wedge in each pentagon upon flattening [15]. In a different approach, one can design even more complicated 3-D fullerene-like objects using a flat sheet of hexagonal graph paper. The key is to imagine it locally pressed flat with a crease running through each defect just as one would proceed to iron the fullerene if it were a complicated garment [10]. A hexagon creased down its center leaves exactly three sides on either side of the crease. Therefore any crease through a hexagon can be represented by a straight
170

line through a hexagon that passes through its center. Any straight line through a hexagon can represent a crease that leaves a different number of sides of the hexagon to either side of the crease, however. A square, pentagon, heptagon and octagon creased in half through their centers have 2, 2 1/2, 3 1/2 and 4 sides to either side the crease, respectively. Thus in any hexagon of the graph paper one can draw any two straight lines meeting in the center at 30°. The 150° part of the hexagon could represent a creased pentagon because there are 2 1/2 sides on the circumference of that wedge, or the other 210° wedge, with 3 1/2 sides on its circumference, could represent a creased heptagon. Similarly, any two straight lines meeting at 60° could represent a creased square to one side or a creased octagon to the other. These straight lines, when continued out of the hexagons representing creased defects, represent creases through neighboring hexagons.
Two hexagons separated L steps down one row of abutting hexagons and M steps down a second row of abutting hexagons can be considered to lie on the parallel creases of a tubule whose axis and creases meet the line between the hexagons at 60°. This is because the cosine of 60° is one half, and the two creases bound a representation of the top half of the tubule segment. Segments of [18,9] and [20,5] are shown in Figure 1. This method of representation leads to precise 60° octagon-square junctions and precise 30° heptagon- pentagon junctions. The symmetry of the hexagonal lattice requires that octagon-square 60° junctions connect tubule segments of like helicity. The heptagon-pentagon 30° junctions connect tubule segments of the definite helicities (i,j) and (fc,Z) listed in Table II. Every second heptagon-pentagon junction, however, will also produce a tubule segment with the same helicity as the first. The n^-th and n^th members of these two tubule classes have n-ij/VSnkl 3s the ratios of their circumferences, assuming equal bond lengths [10]. Thus there must always be a small mismatch. Relatively small 3.9% and 1.0% circumference mismatches are associated with 9-5 and 12-7 junctions, respectively, to yield the average tubule-segement radii of the two segments listed in Table II.
These average radii increase very rapidly. If a multiwalled tubule junction has an inner tubule diameter of one nanometer, then the inner tubule must be made of achiral tubule segments, i.e., have only (1,0)-(1,1) junctions. Examination of the density of radii suggest that it is even more difficult for multiwalled heptagon-pentagon tubule bends to have constant helicities to either side of the bend. Perhaps the best chance is one or more repetitions of the achiral multiwalled tubule junctions [L^OHLj,.^] inside [ij + 9,0]- [L2 + 5, L2 + 5] inside [Lj + 18,0]-[£2 + 10, L2 + 10] inside [Lx + 26,0]-[L2 + 15, L2 + 15], for some integers Lx and £2, where 8.69 has been approximated as 8 2/3.
Representing out-of-plane tubule twists on a sheet of hexagonal graph paper is more challenging. It can be accomplished by noting that the angular displacement from one imaginary crease on a tubule to the other is 180° or ■K radians. This suggests representing out-of-plane rotation of imaginary creases by a translation perpendicular to the tubule axis, where the conversion of distance to out-of-plane angle is the same as that between the in- plane creases. Thus a perpendicular displacement of 21/35 of the distance between a pair of creases representing one side of a tubule junction can be taken to represent an angular twist of 2l7r/35 between the first pair of creases and a second pair of creases representing one side of the next tubule junction in Figure 1. If periodically repeated, these junctions would form a helix.
The number of allowed twist angles between the planes of the heptagon-pentagon junc- tions at the two ends of an undistorted tubule segment is finite. This is because the creases associated with the defects at both ends must go through hexagon centers in the connecting tubule segment or its imaginary extensions, indicated by the two dashed lines in Figure 1, if the connecting segment is too short. For this tubule segment the number of allowed
171

Figure 1. Bends and twists between [18,9] and [20,5] chiral tubule segments. Long, straight, solid lines represent creases of flattened tubule segments parallel to its axis going through the center of a heptagon or pentagon. The solid lines in the upper part of the figure represent creases that are twisted 2l7r/35 around the tubule segment. The other crease is displaced by an angle of n onto the back side of the tubule segment, which is unfolded in the figure. Short parallel line segments represent other allowed twist angles.
172
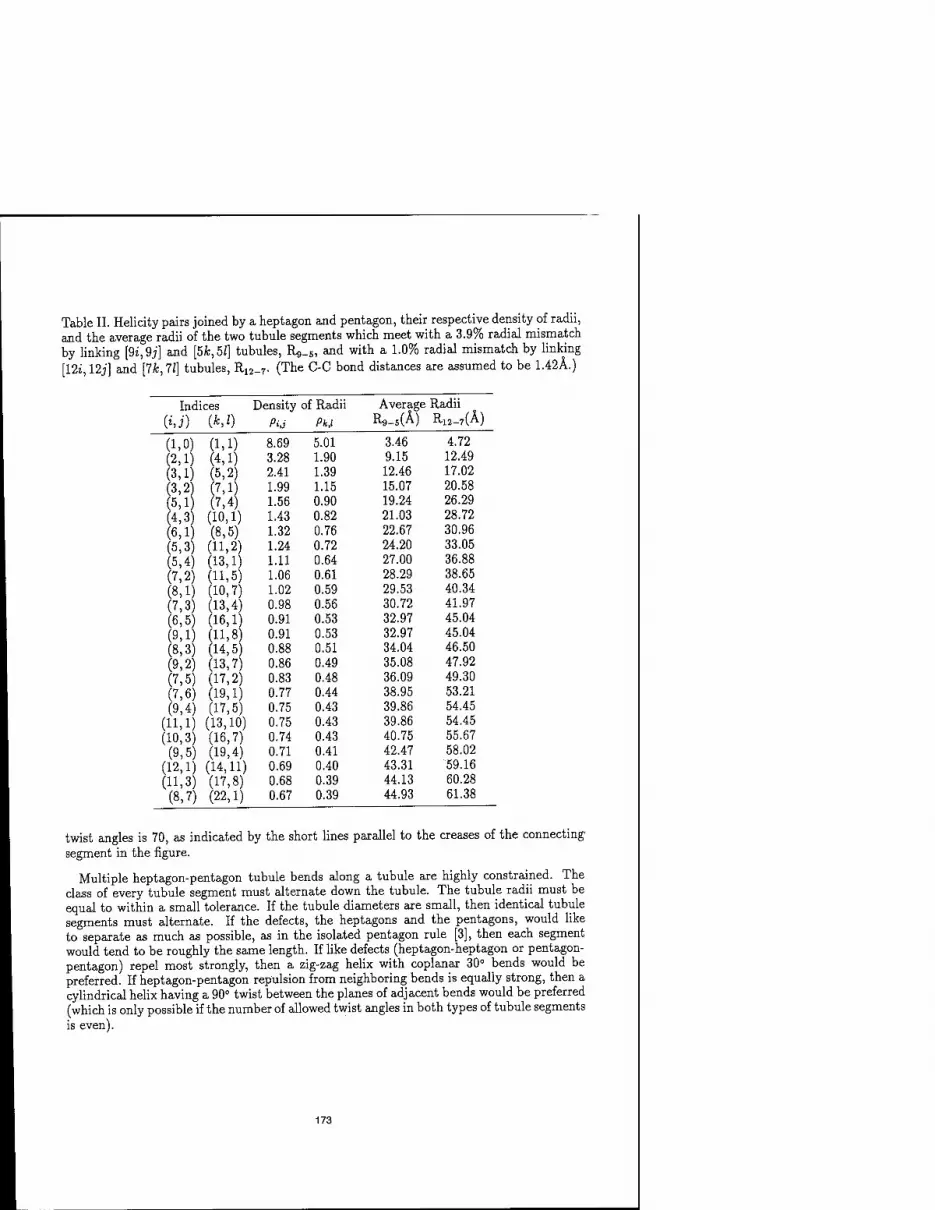
Table II. Helicity pairs joined by a heptagon and pentagon, their respective density of radii, and the average radii of the two tubule segments which meet with a 3.9% radial mismatch by linking [9*,9j] and [5k, 51] tubules, R<,_5, and with a 1.0% radial mismatch by linking [12i,12j] and [7k,7l] tubules, R12_7. (The C-C bond distances are assumed to be 1.42Ä.)
Indices Density of Radii Average Radii
(M) (M) Pi,j Pk,i R9-B(A) Rl2-7(A)
(1,0) (1,1) 8.69 5.01 3.46 4.72
(2,1) (4,1) 3.28 1.90 9.15 12.49
(3,1) (5,2) 2.41 1.39 12.46 17.02 (3,2) (5,1) n 1.99 1.15 15.07 20.58
1.56 0.90 19.24 26.29 (4,3) (10,1) 1.43 0.82 21.03 28.72
(6,1) (8,5) 1.32 0.76 22.67 30.96 (5,3) (11,2) 1.24 0.72 24.20 33.05 (5,4) (13,1) 1.11 0.64 27.00 36.88 (7,2) (11,5) 1.06 0.61 28.29 38.65
(8,1) (10,7) 1.02 0.59 29.53 40.34 (7,3) (13,4) 0.98 0.56 30.72 41.97 (6,5) (16,1) 0.91 0.53 32.97 45.04
(9,1) (11,8 0.91 0.53 32.97 45.04 (8,3) (14,5) 0.88 0.51 34.04 46.50 (9,2) (13,7) 0.86 0.49 35.08 47.92 (7,5) (17,2) 0.83 0.48 36.09 49.30 (7,6) (19,1) 0.77 0.44 38.95 53.21 (9,4) (17,5) 0.75 0.43 39.86 54.45
(11,1) (13,10) 0.75 0.43 39.86 54.45 (10,3) (16,7) 0.74 0.43 40.75 55.67 (9,5) (19,4) 0.71 0.41 42.47 58.02
(12,1) (14,11) 0.69 0.40 43.31 59.16 (11,3) (17,8) 0.68 0.39 44.13 60.28 (8,7) (22,1) 0.67 0.39 44.93 61.38
twist angles is 70, as indicated by the short lines parallel to the creases of the connecting' segment in the figure.
Multiple heptagon-pentagon tubule bends along a tubule are highly constrained. The class of every tubule segment must alternate down the tubule. The tubule radii must be equal to within a small tolerance. If the tubule diameters are small, then identical tubule segments must alternate. If the defects, the heptagons and the pentagons, would like to separate as much as possible, as in the isolated pentagon rule [3], then each segment would tend to be roughly the same length. If like defects (heptagon-heptagon or pentagon- pentagon) repel most strongly, then a zig-zag helix with coplanar 30° bends would be preferred. If heptagon-pentagon repulsion from neighboring bends is equally strong, then a cylindrical helix having a 90° twist between the planes of adjacent bends would be preferred (which is only possible if the number of allowed twist angles in both types of tubule segments
173

ACKNOWLEDGEMENT
This work was supported by the Office of Naval Research through the Naval Research Laboratory.
REFERENCES
[1] H.W. Kroto, J.R. Heath, S.C. O'Brien, R.F. Curl and R.E. Smalley,
[2.] W. Krätschmer, L.D. Lamb, K. Fostiropoulos, and D.R. Huffman, Nature 347, 354 (1990).
[3] H.W. Kroto, Nature 329, 529 (1987).
[4] S. Iijima, Nature (London) 354, 56 (1991).
[5] M.S. Dresselhaus, G. Dresselhaus, and R. Saito, Phys. Rev. B 45, 6234 (1992).
[6] J.W. Mintmire, B.I. Dunlap, and C.T. White, Phys. Rev. Lett. 68, 631 (1992).
[7] C.T. White, D.H. Robertson, and J.W. Mintmire, Phys. Rev. B 47, 5485 (1993).
[8] B.I. Dunlap, Phys. Rev. B 46, 1933 (1992).
[9] S. Iijima, RM. Ajayan, and T. Ichihashi, Phys. Rev. Lett. 69, 3100 (1992).
[10] B.I. Dunlap, Phys. Rev. B 49, 5643 (1994).
[11] B.I. Dunlap, Phys. Rev. B 50, 8134 (1994).
[12] X.B. Zhang, Z.F. Zhang, D. Bernaerts, G. Van Tendeloo, S. Amelinckx, J. Van Lan- druyt, V. Ivanov, J.B. Nagy, Ph. Lambin, and A.A. Lucas, Europhys. Lett. 27, 141 (1994).
[13] S. Amelinckx, X.B. Zhang, D. Bernaerts, X.F. Zhang, V. Ivanov, J.B. Nagy, Science 265 635 (1994).
[14] D.H. Robertson, D.W. Brenner, and J.W. Mintmire, Phys. Rev. B 45, 12592 (1992).
[15] M. Fujita, R. Saito, G. Dresselhaus, and M.S. Dresselhaus, Phys. Rev. B, 45, 12834 (1992).
174

THE FULLERENE NEIGHBOURS
Z. SLANINA", M.-L. SUN", S.-L. LEEa, AND L. ADAMOWICZ6
"Department of Chemistry, National Chung-Cheng University, Ming-Hsiung, Chia-Yi 621,
Taiwan 'Department of Chemistry, The University of Arizona, Tucson, AZ 85721, USA
ABSTRACT
Semiempirical quantum-chemical calculations are reported for the fullerenic struc-
tures C60, Si60, Ge60, N60; B36N24, B36P24, A136N24, A136P24; and various BnNn. A new route towards B/N clusters is considered, being based on squares and hexagons. The pat- tern always requires six squares. The route can produce species of similar or even higher stability comparing to the conventional pentagon/hexagon pattern. Four particular stoi- chiometries emerge from the available AMI computations: B12N12, B28N28, B36N36, and
B36N24.
INTRODUCTION
During formation of the C6o research [1-3], silicon aggregates have become [4-16] a natural subject of study, and there are mass-spectrometric evidences [10,17] of large charged silicon and even germanium clusters. Nitrogen aggregate N20 [18,19] has also attracted attention. The doped fullerenes containing boron, nitrogen, and other atoms [20- 34] represent another interesting class. The non-carbon species BnNm can be considered as a limiting case of the B/N doped fullerenes. In fact, three B30N30 isomers have been computed [24,25], but it is of course only a small fraction of all possibilities.
COMPUTATIONS
The computations were performed with the standard parametrizations of the AMI semiempirical quantum-chemical method [35] available in the SPARTAN program package [36]. The main part of the computations was done with this program implementation at an Iris/Silicon Graphics XZ4000 workstation (though some computations were also carried out with the MOPAC 5.0 [37] and GAUSSIAN 92 [38] program packages). The Ge60 cage was computed at the MNDO level. The full geometry optimizations were carried out using the analytical energy gradient, and vibrational analysis was performed numerically for selected cases. Only singlet electronic states were considered.
RESULTS AND DISCUSSION
Table I deals with the C6o, Si6o, Ge60, and N60 cages (Ge60 has a distorted structure, possibly owing to a (pseudo) Jahn-Teller effect, but it is not very different from the exact Ih symmetry - Figure 1). As different thermochemical reference states are involved, heats of formation cannot be directly applied and we use related heats of atomization instead.
On a leave of absence from the Academy of Sciences of the Czech Republic, Prague.
175
Mat. Res. Soc. Symp. Proc. Vol. 359 ° 1995 Materials Research Society

Table I. Formation and atomization heats" (kcal/mol) of Ceo, Sieo, Ge6o, and NO
Species AH"0
&H°: ^Kt 298.15,rel
C60, AMI 973.3 -9280 0 Si6o, AMI 1296 -5207 4073
Ge60, MNDO 2543 -2827 6453 N60, AMI 3243 -3537 5743
" The formation and atomization heat is denoted by the index / and at, respectively, both types of terms refer to the room temperature.
Figure 1. The MNDO optimized (near Ik) structure of Ge60.
176

The difference between Si6o and C6o in AJ?°(298 15 is by one order of magnitude larger than in AHj29a 15. The related separation between Ge60 and Si6o in the new terms is about two times larger. It suggests that, thermodynamically, creation of C6o is favored over Si60 or even Ge6o- It however does not take into account kinetic barriers. N6o is close to Ge60 in the scale. If we compare stabilities of the cages with respect to 30 diatomic molecules results are still more pronounced. C6o is located some 5514 kcal/mol below 30 C2 (AMI) but N60 is 2908 kcal/mole above 30 N2; clearly enough, the high stability of N2
manifests here. Let us note that the AMI HOMO-LUMO gap [39,40] is quite similar for C6o (6.7 eV) and N60 (7.7 eV); it seems that this stability measure would not be applicable here. Finally, Ik B6o is a Jahn-Teller case (as, e.g., h C2o)-
There is basically no experimental information on the B„Nm cluster thermochemistry, though some information for small aggregates can be derived from ab initio calculations [41-43]. Still, we can expect that B-N bonds bring larger stabilization comparing to B-B or N-N bonds. Based on this scheme, isomers with a larger number of the B-N bonds are considered. Figure 2 presents a Th symmetry structure of B36N24. If we check stabilities of other three related species (B36P24, A136N24, A136P24) it turns out that B36N24 is preferred by the atomization heat and the HOMO-LUMO gap as well (Table II).
Even if we limit our considerations to B-N modifications only, we should try some other ratios, for example: B24N36, B48N12, Bi2N48. The first one just requires a systematic B-N exchange in the B36N24 body. The AMI optimization yields an optimum structure of the Th symmetry but less stable in both the atomization heat and HOMO-LUMO gap. 56 and D2 symmetries can be computed for the other two cases. The AMI stationary points however turn out to be even less stable comparing to the ruled out B24N36.
The traditional fullerene pattern, pentagons and hexagons (5/6), always needs some B-B and/or N-N bonds owing to the five-membered rings. In order to eliminate the B-B and N-N bonds completely we have to deal with even-numbered rings only, which leads to a choice of squares and hexagons (4/6), and an equal number of B and N atoms. It can be derived that the number of the four-membered rings is always six.
Table III surveys the studied 4/6 clusters BnN„. It is a sample in which the dimension mostly increases with a step of (BN)4. Similar to the C„ series the heat of atomization per particle does not allow for a clear stability conclusion. However, the HOMO-LUMO gap points out three local maxima and thus, higher stability candidates - Bi2N12, B28N28, and B36N36 (all with a tetrahedral symmetry, see Figure 3). It seems that we need a certain degree of similarity in order to judge a relative stability of compounds with different stoichiometries from the HOMO-LUMO gaps [39,40], and the similarity concept is not fully understood yet. A comparison with the conventional 5/6 approach should be made. There are three MNDO isomers of B30N30 in Ref. 24. If we recompute our 4/6 structures at the MNDO level, our lowest structure falls about 100 kcal/mol below the best 5/6 structure [24]. This could have consequences even for the supposed B-N nanotubes [44].
Table III shows that the 4/6 route should not be significant for the pure fullerenes. For example the 4/6 D2 symmetry C6o, derived from the D2 B3oN30, is located more than 500 kcal/mol above the well established h structure. Apparently, in the pure carbon clusters there is no compensation for a destabilization owing to smaller four-membered rings. Although several stability candidates emerge from our computations, it is also clear that we need a more comprehensive stability measure. One option is to switch to equilibrium constants and to compute composition at plausible temperatures and pressures. This could be computationally feasible (before the matter can be settled by molecular dynamics
within sophisticated potential hypersurfaces).
177

Figure 2. The AMI Th structure of B36N24 (view along a two-fold rotational axis; •: B atoms).
Figure 3. The AMI Td structure of B36N36 (view along a three-fold rotational axis.
178

Table II. Basic AMI structure and energy parameters of X36Y24 species
Species Da AH" b AR" b HOMO-LUMO gap
(Ä) (kcal/mol) (kcal/mol) (eV)
Ceo 7.11 973.3 -9280.1 6.70 B36N24 7.48 -964.1 -8561.3 9.51 B36P24 9.64 -555.0 -7253.9 6.63 AI36N24 9.30 -1166.8 -6740.5 6.48 A136P24 11.8 170.8 -4504.6 5.79
" The longest inter-atomic distance found in the cage; it can be viewed as its diameter. 6 The formation and atomization heat is denoted by the index / and at, respectively, both types of terms refer to the room temperature.
Table III. The AMI energetics of B„Nm and Cn clusters
Species Symm. A TT° a
^n f,29S.15 A-"al,298.15/z HOMO-LUMO group ( kcal \ / kcal \
^ mol.atom ' gap (eV)
B4N4 Tt 219.2 -97.0 7.42 B8N8 SA 34.1 -122.2 8.08 Bi2N12 Th -238.4 -134.3 8.85 BisNie Td -428.1 -137.7 8.55 B20N20 c2 -569.6 -138.6 8.50 B24N24 54 -788.4 -140.8 8.66 B28N28 T -1013.3 -142.4 8.78 B30N30 c, -853.8 -138.6 6.48 B30N30 D3 -999.0 -141.0 8.38 B30N30 S6 -1003.2 -141.1 8.58 B32N32 Ci -1191.9 -143.0 8.70 B36N36 Td -1416.2 -144.0 8.91 B41N41 Cs -1663.7 -144.6 8.73
B36N24 Th -964.1 -142.7 9.51
COO h 973.3 -154.7 6.70 COO D2 1531.7 -145.4 5.18
a The formation and atomization heat is denoted by the index / and at, respectively, both types of terms refer to the room temperature. The atomization heat is divided by number of atoms in a cluster, z (z = n + m and z = n for the B/N and C clusters, respectively).
179

ACKNOWLEDGEMENT
Acknowledgement is made to the National Science Council, Taiwan, Republic of China, for support. The authors thank the National Center for High-Performance Com- puting in Hsinchu for computer time on the Convex C3840.
REFERENCES
1. R. F. Curl and R. E. Smalley, Science 242, 1017 (1988). 2. H. Kroto, Science, 242, 1139 (1988). 3. W. Weltner Jr. and R. J. van Zee, Chem. Rev. 89, 1713 (1989). 4. K. Raghavachari, J. Chem. Phys. 84, 5672 (1986). 5. S. Katircioglu and S. Erkoc, Chem. Phys. Lett. 184, 118 (1991). 6. D. A. Jelski, B. L. Swift, T. T. Rantala, X. Xia, T. F. George, J. Chem. Phys. 95, 8552
(1991). 7. M. F. Ja Jarrold, Science, 252, 1085 (1991). 8. T. Lange and T. P. Martin, Angew. Chem., Int. Ed. Engl., 31, 172 (1992). 9. C. Zybill, Angew. Chem., Int. Ed. Engl. 31, 173 (1992). 10. M. F. Jarrold and J. E. Bower, J. Chem. Phys., 96, 9180 (1992). 11. D. A. Jelski, J. R. Bowser, X. Xia, J. Gao, T. F. George, J. Cluster Sei. 4, 173 (1993). 12. S. Nagase, Pure Appl. Chem. 65, 675 (1993). 13. S. Nagase and K. Kobayashi, Fullerene Sei. Technol. 1, 299 (1993). 14. M. C. Piqueras, R. Crespo, E. Orti, F. Tomas, Chem. Phys. Lett. 213, 509 91993). 15. M. C. Piqueras, R. Crespo, E. Orti, F. Tomas, Synth. Met. 61, 155 (1993). 16. Z. Slanina, S.-L. Lee, K. Kobayashi, S. Nagase J. Mol. Struct. (THEOCHEM) 312, 175
(1994). 17. S. Sugano, Microcluster Physics, (Springer-Verlag, Berlin, 1991). 18. A. A. Bliznyuk, M. Shen, H. F. Schaefer III, Chem. Phys. Let. 198, 249 (1992) 19. C. Chen, K. C. Sun, L. H. Lu, J. Chin. Chem. Soc. 40, 199 (1993). 20. T. Guo, C. M. Jin, R. E. Smalley, J. Phys. Chem. 95, 4948 (1991). 21. W. N. Lipscomb and L. Massa, Inorg. Chem. 31, 2297 (1992). 23. S. J. La Placa, P. A. Roland, J. L. Wynne, Chem. Phys. Lett. 190, 162 (1992). 24. X. Xia, D. A. Jelski, J. R. Bowser, T. F. George, J. Am. Chem. Soc. 114, 6493 (1992). 25. J. R. Bowser, D. A. Jelski, T. F. George, Inorg. Chem. 31, 154 (1992). 26. F. Jensen and H. Toftlund, Chem. Phys. Lett. 201, 89 (1993). 27. A. C. Tang, Q. S. Li, C. W. Liu, J. Li, Chem. Phys. Lett. 201, 465 (1993). 28. T. Pradeep, V. Vijayakrishnan, A. K. Santra, C. N. R. Rao, J. Phys. Chem. 95, 10564
(1991). 29. C. N. R. Rao, T. Pradeep, R. Seshadri, A. Govindaraj, Ind. J. Chem. A 31, 27 (1992). 30. B.-C. Wang, L.-J. Yu, W.-J Wang, J. Chin. Chem. Soc. 40, 497 (1993). 31. I. W. Locke, A. D. Darwish, H. W. Kroto, K. Prassides, R. Taylor, D. R. M. Walton, Chem.
Phys. Lett. 225, 186 (1994). 32. E. C. Behrman, R. K. Foehrweiser, J. R. Myers, B. R. French and M. E. Zandler, Phys. Rev.
A 49, R1543 (1994). 33. E. Kaxiras, K. Jackson, M. R. Pederson, Chem. Phys. Lett. 225, 448 (1994). 34. L. B. Knight Jr., D. W. Hill, T. J. Kirk, C. A. Arrington, J. Phys. Chem. 96, 555 (1992). 35. M. J. S. Dewar, E. G. Zoebisch, E. F. Healy, J. J. P. Stewart, J. Am. Chem. Soc. 107, 107
(1985). 36. W. J. Hehre, L. D. Burke, A. J. Schusterman, SPARTAN, (Wavefunction, Inc., Irvine, 1993). 37. J. J. P. Stewart, MOPAC 5.0, (QCPE 455, Indiana University, 1990). 38. M. J. Frisch, G. W. Trucks, M. Head-Gordon, P. M. W. Gill, M. W. Wong, J. B. Foresman,
B. G. Johnson, H. B. Schlegel, M. A. Robb, E. S. Replogle, R. Gomperts, J. L. Andres, K. Raghavachari, J. S. Binkley, C. Gonzalez, R. L. Martin, D. J. Fox, D. J. Defrees, J. Baker, J. J. P. Stewart, J. A. Pople, GAUSSIAN 92, Revision C (Gaussian, Inc., Pittsburgh, 1992).
39. R. G. Pearson, Ace. Chem. Res. 26, 250 (1993). 40. R. G. Parr and Z.Zhou, Ace. Chem. Res. 26, 256 (1993). 41. Z. Slanina, J. M. L. Martin, J.-P. Francois, R. Gijbels, Chem. Phys. Lett. 201, 54 (1993). 42. Z. Slanina, J. M. L. Martin, J.-P. Francois, R. Gijbels, Chem. Phys. 178, 77 (1993). 43. J. M. L. Martin, Z. Slanina, J.-P. Francois, R. Gijbels, Mol. Phys. 82, 155 (1994). 44. A. Rubio, J. L. Corkill, M. L. Cohen, Phys. Rev. B 49, 5081 (1994).
180

THE CRYSTALLOGRAPHIC MODELING OF C60 ORIENTATIONS IN A CUBIC LATTICE
VENIAMIN SH. SHEKHTMAN, RUBEN A. DILANYAN , OKSANA G. RYBCHENKO Institute of Solid State Physics, Russian Academy of Sciences, Chernogolovka, Moscow district, 142432, Russia.
ABSTRACT
The symmetry conditions which rule the matching of a fulleren molecule's main axis in a translational lattice are considered. The full set of orientational states for the structure of fullerene are obtained. The different levels of correlations between symmetry axes of icosahedral molecule and cubic lattice are considered. This result used for analysis of orientational ordering models, including modulation structure and discrete orientational glass.
INTRODUCTION
The study of fullerene compounds puts forward a number of novel interesting problems in the spheres of crystallochemistry and material science. The orientational characteristics of molecules discussed in a set of works [1-4] require, in particular, special attention. One of the key problems here, to our opinion, is the analysis of unique topological situations which are associated with the coordination of a high-symmetry configuration of atoms with a translational lattice.
The given work considers the creation of the cubic Bravais lattices from the atomic designs belonged to the icosahedral system. The authors proceed from the fact that consistent application of basic notions for the modern theory of crystals (quasicrystals) is quite appropriate to the systematic study of orientational ordering of COO molecules.
MATCHING OF SYMMETRY AXES
We should begin with the statement that the icosahedral (Y) and cubic (C) point groups refer to the rank system of a complete group of the ball's symmetry. The the groups m3 and 23 are the subgroups of the both holohedral Y- and C-groups. According to the Curie principle the truncation may be put down as
m35om3m=m3, (1) which, in particular, preassigns a point symmetry for the structure of cubic COO
Tne geometrical analysis of (1) fully reproduces the picture of orientations of the icosahedral molecule in a cubic unit cell. It is significant that the Y-group consists often 3-fold and fifteen 2-fold axes, and the C- group - of 4 3-fold and 3 2-fold axes. Bearing this in mind the fulfillment of (1) coordinates the axes of the molecule's symmetry with those of the unit cell's symmetry:
(3-fold axes)Y II (111>C (2-fold axes>Y II <001>C (2)
181
Mat. Res. Soc. Symp. Proc. Vol. 359 • 1995 Materials Research Society

A 5-fold axes is not associated with any rational direction and according to [5]: (5-fold axis)Y || (ITO),
where x = (l+V5)/2. Thus four often 3-fold axes and three of fifteen 2-fold ones coincide with corresponding cubic axes.
Further on, the observation of (2) permits us to describe the indexes of directions and the interorientation of all the symmetry axes of a molecule's in the coordinate system of a cubic lattice. 3-FOLD AXES (Tj), Table 1. One often 3-fold axes (Ti0) coincides with the direction [11 l]c
and is not presented in the Table. The rest nine axes can be divided into two groups. The six axes (TjiTg) form the angle cq=70.53° with [111] and three axes (T7:To) - the angle a2
=41.81°. Besides the couples of directions (Tj, T4), (T2, T5), (T3, T6) form the angle <t>i =41.81° and the couples (T1; T6), (T2, T4), (T3, T5) - the angle <J>2 =70.5° . 2-FOLD AXES (Dj), Table 2. Fifteen 2-fold axes can be devided into the four groups. The six axes (DjiDö) form the angle ai=54.7° with [11 l]c; they are divided into the two triplets (D1:D3) and (D4:D6) of mutually orthogonal axes. The couples of directions (Di, D4), (D2, D5), and (D3, D6) form the angle <j>i= 36° and the couples (Dj, D6), (D2, D4), and (D3, D5) - <|>2 =60° . The 2-fold axes D7, Dg, and D9 are positioned in the plane perpendicular to [11 l]c- Each of these axes forms the angle <)>3=22.230 with the direction of <110>c type.
Table 1. Orientation of (3-fold)y axes in a cubic lattice.
N [u v w] a.degree 1 [-111] 2 [1-11] 3 [11-1] 4 [-U 0 T2U] 70.5 5 [x2u -u 0] 6 [0 T2U -U]
7 [T2
U U 0] 8 [0 T2u u] 41.8 9 [U 0 T2U]
Table 2. Orientation of (2-fold)Y
axes in a cubic lattice. N [u v w] a, degree
1 2 3 4 5 6
[0 0 1] [0 1 0] [0 0 1] [x2u TU -U]
[-U T2U TU]
[TU -U T2
U]
54.7
7 8 9
[TU U-T2
U]
[U -T2U TU]
[-T2U TU U]
90.0
10 11 12
[TU U T2
U]
[U T2U TU]
[T2U TU U]
20.9
13 14 15
[-TU U T2U]
[U T2U -TU]
[T2U -TU U]
69.1
5-FOLD AXES. Six 5-fold axes are grouped three at a time and with [11 l]c form the two angles: c<i=37.4° a2=79.2°.
The above description distinguishes two equally justified versions for a molecule's orientation atT10||[lll]C:
orientation (a)
Tlll[-1 1 l]c T2||[l -1 1]C T3||[l 1 -l]cDi||[l 0 0]C D2||[0 1 0]c D3||[0 0 l]c
182
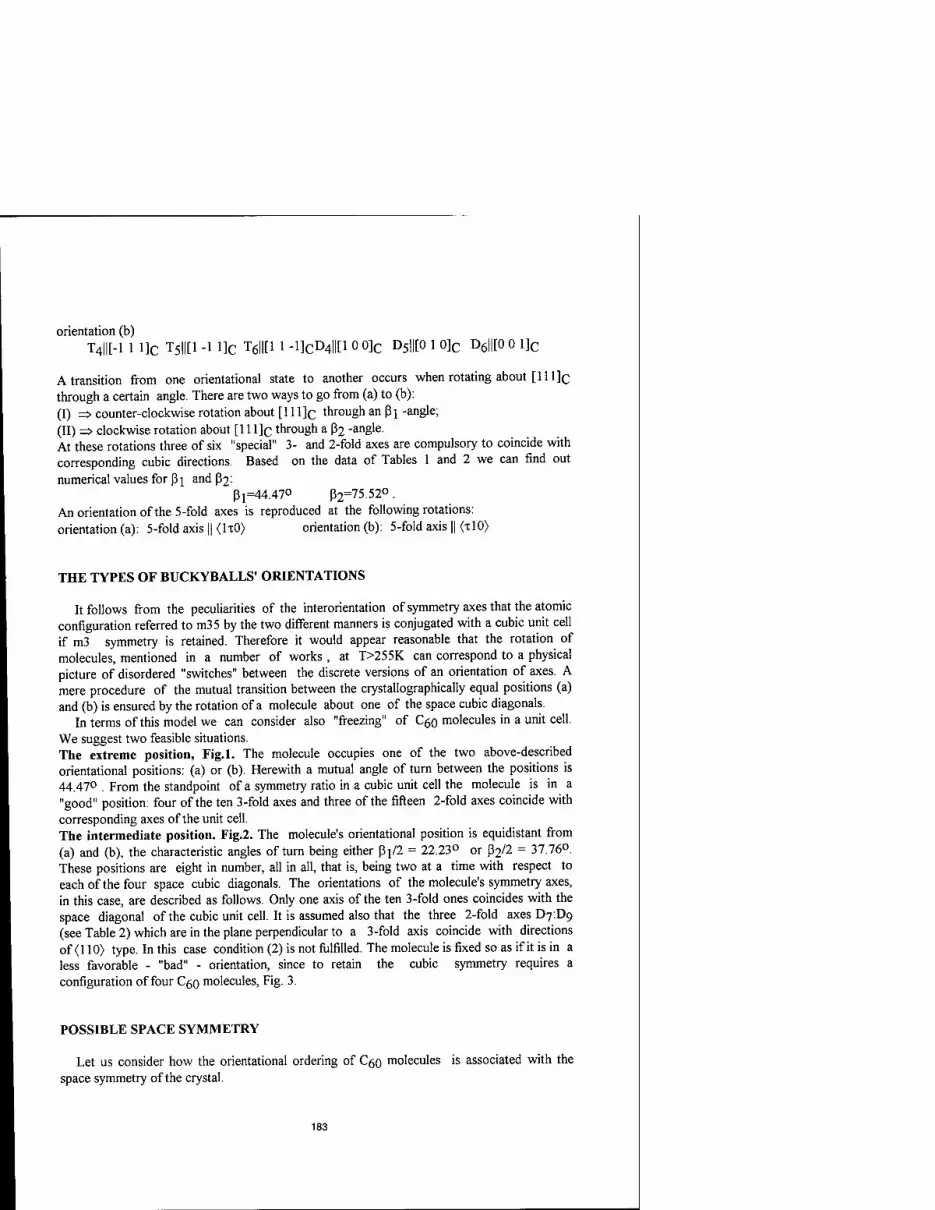
orientation (b) T4||[-l 1 l]c T5||[l -1 1]C T6I|[1 1 -1]CD4II[1 0 0]C D5||[0 1 0]C D6||[0 0 1]C
A transition from one orientational state to another occurs when rotating about [11 l]c through a certain angle. There are two ways to go from (a) to (b): (I) => counter-clockwise rotation about [11 l]c through an ßi -angle; (II) => clockwise rotation about [11 l]c through a ß2 -angle. At these rotations three of six "special" 3- and 2-fold axes are compulsory to coincide with corresponding cubic directions. Based on the data of Tables 1 and 2 we can find out numerical values for ßj and ß2:
ßl=44.47° ß2=75.52°. An orientation of the 5-fold axes is reproduced at the following rotations: orientation (a): 5-fold axis || (1x0) orientation (b): 5-fold axis || (xl0>
THE TYPES OF BUCKYBALLS' ORIENTATIONS
It follows from the peculiarities of the interorientation of symmetry axes that the atomic configuration referred to m35 by the two different manners is conjugated with a cubic unit cell if m3 symmetry is retained. Therefore it would appear reasonable that the rotation of molecules, mentioned in a number of works, at T>255K can correspond to a physical picture of disordered "switches" between the discrete versions of an orientation of axes. A mere procedure of the mutual transition between the crystallographically equal positions (a) and (b) is ensured by the rotation of a molecule about one of the space cubic diagonals.
In terms of this model we can consider also "freezing" of COO molecules in a unit cell. We suggest two feasible situations. The extreme position, Fig.l. The molecule occupies one of the two above-described orientational positions: (a) or (b). Herewith a mutual angle of turn between the positions is 44470 From the standpoint of a symmetry ratio in a cubic unit cell the molecule is in a "good" position: four of the ten 3-fold axes and three of the fifteen 2-fold axes coincide with corresponding axes of the unit cell. The intermediate position. Fig.2. The molecule's orientational position is equidistant from (a) and (b), the characteristic angles of turn being either ßj/2 = 22.23° or ß2/2 = 37.76°. These positions are eight in number, all in all, that is, being two at a time with respect to each of the four space cubic diagonals. The orientations of the molecule's symmetry axes, in this case, are described as follows. Only one axis of the ten 3-fold ones coincides with the space diagonal of the cubic unit cell. It is assumed also that the three 2-fold axes 07:09 (see Table 2) which are in the plane perpendicular to a 3-fold axis coincide with directions of < 110) type. In this case condition (2) is not fulfilled. The molecule is fixed so as if it is in a less favorable - "bad" - orientation, since to retain the cubic symmetry requires a configuration of four Cgo molecules, Fig. 3.
POSSIBLE SPACE SYMMETRY
Let us consider how the orientational ordering of COO molecules is associated with the space symmetry of the crystal.
183
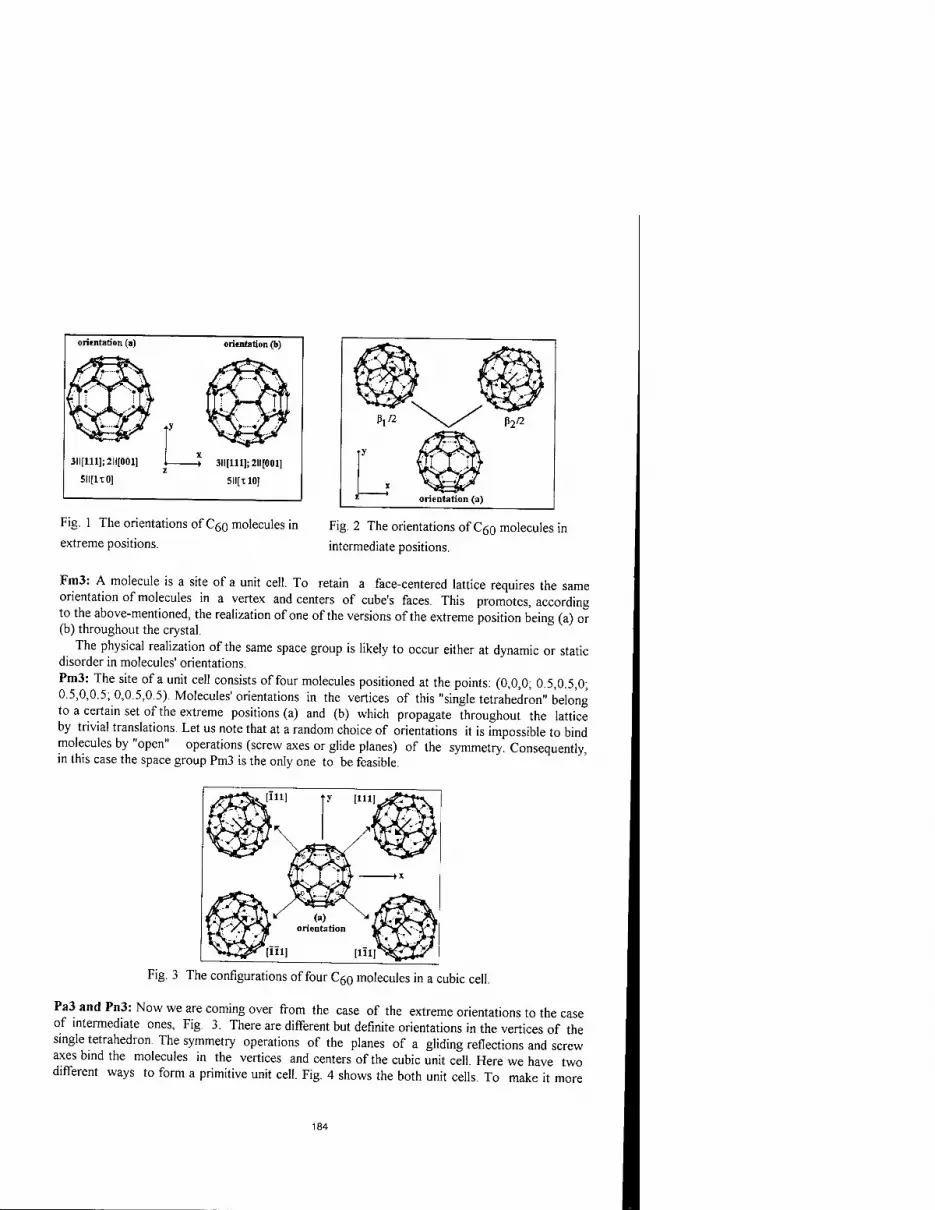
orientation (a) orientation (b)
/^ÖS. /jSt\\ ^rl^T* \v^* i^n V^^fi^T ilL^~\z4r Sik&r ■ y *2g^ 3II[111]; 211(001]
X
511(1x0] 5II[T 10]
Fig. 1 The orientations ofCöQ molecules in
extreme positions. Fig. 2 The orientations of COO molecules in
intermediate positions.
Fm3: A molecule is a site of a unit cell. To retain a face-centered lattice requires the same orientation of molecules in a vertex and centers of cube's faces. This promotes, according to the above-mentioned, the realization of one of the versions of the extreme position being (a) or (b) throughout the crystal.
The physical realization of the same space group is likely to occur either at dynamic or static disorder in molecules' orientations. Pm3: The site of a unit cell consists of four molecules positioned at the points: (0,0,0; 0.5,0.5,0; 0.5,0,0.5; 0,0.5,0.5). Molecules' orientations in the vertices of this "single tetrahedron" belong to a certain set of the extreme positions (a) and (b) which propagate throughout the lattice by trivial translations Let us note that at a random choice of orientations it is impossible to bind molecules by "open" operations (screw axes or glide planes) of the symmetry. Consequently, in this case the space group Pm3 is the only one to be feasible.
Fig. 3 The configurations of four Cßo molecules in a cubic cell.
Pa3 and Pn3: Now we are coming over from the case of the extreme orientations to the case of intermediate ones, Fig. 3. There are different but definite orientations in the vertices of the single tetrahedron. The symmetry operations of the planes of a gliding reflections and screw axes bind the molecules in the vertices and centers of the cubic unit cell. Here we have two different ways to form a primitive unit cell. Fig. 4 shows the both unit cells. To make it more
184

demonstrative we depicted the arrows instead of molecules. Each arrow denotes a direction from a hexagonal face to a pentagonal one, Fig. 3. As the figure shows the choice out of Pa3 and Pn3 is determined only by an interorientation of CöO
m the vertices of the single tetrahedron. Topologically the both ways of forming the unit cell are equally justified. R3m: Analyzing the ways of coordination of the symmetry axes in the previous section, we came across the case when an individual molecule was in the "bad" position, from the viewpoint of the cube's symmetry m3. Coming back to that situation let us note that at this type of a turn we can form a rhombohedral unit cell. In this case the molecule will appear in a "good" symmetry position. Here the 3-fold axes and three symmetry planes of a molecule and unit cell are coincident.
0-0-0 0-SKp 0 0 0 0 0 0 ®-©-0 ®-©-€>
Pa3 f Pn3
0-c6„ Fig. 4 Two different ways to form a primitiveunit cell.
WHAT ABOUT APERIODIC CRYSTALS
Thus, we can simulate the fullerene's crystalline structure by the orientational characteristics of CöO
m the lattice. Actually a type of ordering determines the space symmetry of a formed unit cell. More complicated designs are likely to occur prior to a complete orientational disorder. It should be noted, herewith, that a static disorder of molecules' orientations in lattice sites is specifically analogous to spin glass. It would be useful to define this novel hypothetical design as a descrete orientational glass, since the symmetry offers a restricted number of anticipated orientations.
The works [1,3,4] require, marked that the phase transition "dynamical orientational disorder => order" took place in a wide thermal interval. The given paper permits one to create the logical net of the transitions at which a degree of an orientational order grows. Such the unique kinds of a static disorder as the discrete orientational glass and long-period orientational modulations deserve a special experimental approach.
REFERENCES 1. O. Blaschko et.al, Phys. Rev. B, 48, p. 14638-14641, (1993). 2. W.I.F. David et.al. Nature , 353, p. 147-149, (1991). 3. JE. Fisher et.al, Phys. Rev. B, 47, p. 14614-14617, (1993). 4. H.A. Heiney , J. Phys. Chem. Solids, 53, p.1333-1352, (1992). 5. Th. Hahn, International Tables for Crystallography, A, Dordrecht/Boston/London,
Kluwer Academic Publishers, (1989).
185

MOLECULAR FORM-FACTOR AND
ANALYSIS OF DIFFRACTION PATTERN OF FULLERENE CRYSTALS
E. V. SHULAKOV, R. A. DILANYAN, O. G. RYBCHENKO, V. SH. SHEKHTMAN
Institute of Solid State Physics, Russian Academy of Sciences,
Chernogolovka, Moscow district, 142432, Russia.
ABSTRACT
COO molecules, in diffraction terms, is a quite novel object- covered by scattering points large
sphere (Ds0.5acub). The peculiarities of the diffraction distribution and its variation near the
order-disorder phase transition are defined from the buckybal's molecular form-factor, fmoi. The
comparison of calculated diffraction distributions and experimental data proved advantage of the
COO "jump rotation" model at middle and high temperatures.
INTRODUCTION
Based on diffraction data, we can state that the structural peculiarities of the fullerene family
bye the conceptions of the molecular Fourier Transforms earlier developed by Wrinch H. Lipson
andW. Cochran[l]. A molecule C60, as a node of the unit cell, bears an extraordinary design of scattering centers
on the rotation surface with diameter D = 0.704nm [2]. This fact gives rise to very peculiar
diffraction patterns which immediately reflect the orientational ordering and structural
transformations. This work is devoted to the above problem. We analyzed the Fourier-image molecule
and considered the superposition of the obtained picture with the Laue interference function.
RESULTS AND CONCLUSION
Let us clarify the notion of the molecular form-factor (MFF) [3] based on the traditional
approach to the problem on a small crystal scattering. We shall consider an individual molecule
as a structure element of the Bravais lattice. A scattering amplitude, attributed to one electron,
can be put down as follows:
187
Mat. Res. Soc. Symp. Proc. Vol. 359 ° 1995 Materials Research Society

M A = Zfnexp(2;zSrn):
where fn is the atomic factor of an n - atom, S - the scattering vector (S = 2Sin(6)A), M - a
number of atoms in the crystal. If the molecules are in the lattice then we can represent the
atom's coordinate as rn = rj + rm + rpm, where n is a serial number of a unit cell, m - a serial
number of a molecule in the unit cell, mp - a serial number of an atom in the molecule. Then,
approaching the problem traditionally, we may write down:
A = Xexp(2;zSrj)IFmexp(2/zSrm) j m
and distinguish the Laue interference function. MFF appears in the second factor, i.e. in the structure amplitude Fm, in an explicit form:
Fm = £ fpmexp(2 ;zSrpm). p
The study of the Fm properties, using C60 as an example, immediately reveals a
specific contribution of MFF to the intensity. Let us, first of all, consider the state of an
orientational disorder of the molecules or, to put it otherwise, the state of a rotating spherical
molecule. Then, a reasonable approximation must be a problem on scattering on a charged
spherical surface [2]. Taking a sphere's diameter as D = 0.5a, where a is the constant of a
cubic lattice, we obtain the Fourier-image shown in Fig. la. In this case MFF is approximated by the function:
Fm=60fcJo(^SD),
where fc - the carbon atomic factor, j0 - the zero order Bessel spherical function. The distribution
of MFF intensity normalized on (fc)2 is the spherical, fast dropped function of SD-parameter. We
can see the zero-points by SD = n and the series of maxima by SD * n+0.5 with amplitude
proportional l/(7tSD)2 (n= 1, 2, 3, ...). By usual for C60 values D/a * 0.5 the general condition
for special extinctions of intramolecular diffraction is:
h2+k2+l2 = 4n2 For FCC lattice that corresponds (2h 0 0), (4 4 2), (8 6 0) et al reflections.

(b)
^FF-C60
:-fold axis imax'D: 6
Fig.l The Fourier image of Cgo, (a) - disordering state, (b, c, d) - ordering state
( b - 2-fold axis direction, c - 3-fold axis direction, d - 5-fold axis direction).
189
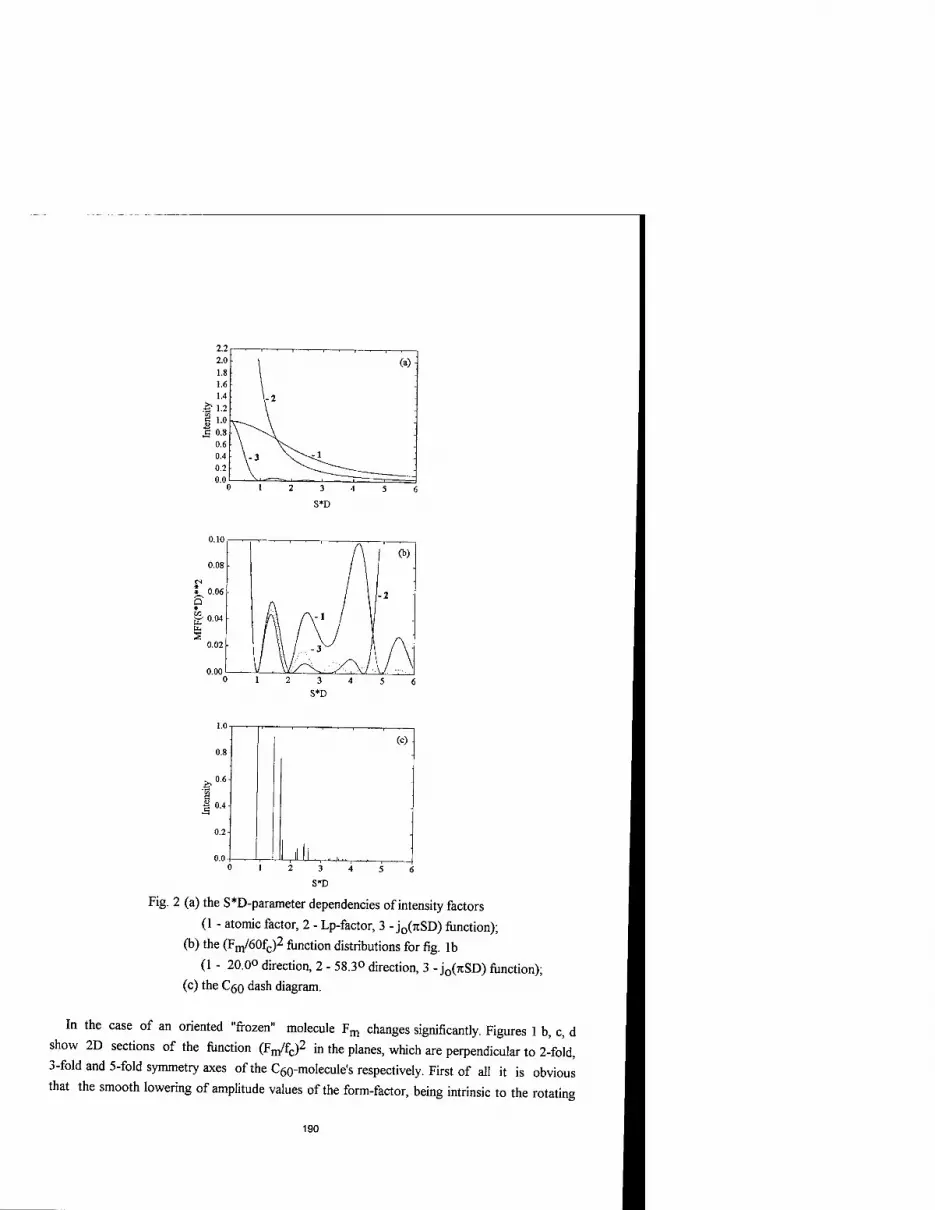
Fig. 2 (a) the S*D-parameter dependencies of intensity factors
(1 - atomic factor, 2 - Lp-factor, 3 - jo0iSD) function);
(b) the (Fm/60fc)2 function distributions for fig. lb
(1 - 20.0° direction, 2 - 58.3° direction, 3 - j0(7tSD) function); (c) the Cgo dash diagram.
In the case of an oriented "frozen" molecule Fm changes significantly. Figures 1 b, c, d
show 2D sections of the function (Fm/fc)2 in the planes, which are perpendicular to 2-fold,
3-fold and 5-fold symmetry axes of the C60-molecule's respectively. First of all it is obvious
that the smooth lowering of amplitude values of the form-factor, being intrinsic to the rotating
190

molecule, gets disturbed with an increase of the scattering vector, Fig.2. The Fourier image
of the oriented molecule exhibits quite an anisotropic picture, which contains local maxima.
Then, it is interesting that in the range up to first minima (SD < 1) the Fm for rotating and
oriented molecules are identical, fig. 2b. In the range 1< SD < 2 the differences between various
models are insignificant. However, by SD > 2 the difference increased drastically and instead
specific extinctions we can see at the same local maxima points of MFF.
Thus for diffraction pattern Fm is alone factor of intensity which is not monotonic lowered by
increased 9 - angle (fig. 2a). Therefore the precision diffraction measurements by highest SD are
adequate to problems of orientational ordering.
Experimentally it was important that a cubic-lattice period affects a lines' intensity in a
somewhat unusual manner. Indeed, in the relation D/a defines the Fm value and a molecule's
diameter remains essentially constant. Therefore, insignificant changes of a unit-cell parameter
are likely to shift a point site of the reciprocal lattice in the region of a local maximum. The
intensity of the given reflection, here, either increases or decreases. The diagram in Fig. 3
illustrates how the intensity 1220^111 and 1200^111 behaves at a change of a lattice period in
the interval 1.3-1.4 nm. The measurement of intensity's variations becomes a useful experimental
technique which permits us to appreciate temperature and pressure effects on the lattice
period. Hypothetical^ we can presuppose the situation in which a thermal effect counteracts
the Debye-Waller factor: decrease of a line's intensity at cooling, for example. It should be
also born in mind that the analysis of intensities also permits one to evaluate a content of
minor impurities affecting the lattice period.
1.37 1.38 1.39 1.40 1.41 1.42 1.43 1.44 1.45 1.46 1.47
Unit cell parameter, nm
Fig. 3 The 1220^111 and I200/'I111 intensities relation as function of unit cell parameter
(the value of ^(x/1111 is multiply by 100).
Thus, the shift of reciprocal-lattice sites over the relief of Fm distribution is the principal
factor which affects the intensity's values in the above-mentioned case. Here, for example, the
relation Ijjy/Ii u is the criterion for variations of the period a.
191
Another situation is important by analyzing of the orientational ordering. In such the case a
special stability of a profile of Fm near the zero and first maxima should be taken into account
and no matter whether the molecule is strictly oriented or rotates. As is seen from figures 2b
and 2c, the intensity of reflection (111) on the "slope" of the zero maximum can serve as a
good reference point for reflections available in the range of noticeable variations of Fm
at reorientation. This means that the comparison of intensities Ihkl^l 11 facilitates the choice of
an ordering model or the observation of molecular orientational states.
Thus, the proposed approach to the analysis of the molecule's diffraction picture, based on
the superposition of MFF (as a function of the scattering vector of a reciprocal state) and
the Laue interference function, appears useful even when solving the problem on an orientational
order. For example, on diffraction pattern of C60 by T = 300K [2] the reflection evidences by
SD > 3.5 seems much higher then it is possible for orientational disordering model. On our
opinion that is a evidence of processes of jump rotation between hard orientation positions.
REFERENCES
1. H. Lipson, W.Cochran, The determination of crystal structures, London, G.Bell and sons LTD, (1953).
2. P.A. Heiney, J. Phys. Chem. Solids, 53, pp. 1333-1352.
3. B. K. Vainshtain, The X-ray diffraction on chain molecules, Moscow,
USSR Academy of Sciences, (1963).
192

QUALITATIVE MODEL FOR FULLERENE FORMATION+
TANYA YU. ASTAKHOVA, SHAGEN A.SHAGINYAN, GEORGE A.VINOGRADOV Institute of Chemical Physics, Russian Acad.Sci., Ul.Kosygina 4, Moscow 117334, Russia
ABSTRACT
A new mechanism of fullerene formation is presented. The "gas-liquid" transition in the expanding flux of carbon atoms is considered as a necessary initial stage. The transition is not terminated at the liquid phase formation as the more powerful processes of network formation predominate. The process of clusters formation starts with the transformation of three-contact structures to stable two-dimensional networks and is governed by the carbon atoms specificity: three-functionality and high rate of chemical reactions. The resulting network is a flat hexagonal lattice with pentagonal "defects" bending the surface, the free energy minimum structures being fullerenes.
INTRODUCTION
Fullerenes are carbon clusters C20+2711 (n = 0,2,3...) with the convex closed cage polygon structures of 12 pentagons and n hexagons. As a rule, fullerenes have point sym- metry groups, belonging to subgroups of icosahedral symmetry group [1]. Microscopically, fullerenes are characterized by surface density of pentagons and microexchange energy of two neighboring faces.
There are two main methods of fullerenes production with a quantitative yield: one is a resistive heating or the similar arc discharge method [2]; the other is a continuous or impulse laser irradiation of carbon containing materials [3]. In both methods carbon atoms are evaporated and expanding flux of carbon atoms is formed. With arc discharge method the absolute yield and distribution function over masses depend strongly on the arc parameters (current strength, interelectrode distance).
A necessary condition for a rather high fullerenes yield is the presence of a buffer gas (It is standard practice to use helium (He)). There is an extreme dependence of the yield on helium pressure with maximum at ~100 Torr. Pressure variation causes changes in a relative distribution over isomers yield [4]. Apparently, strong electric and magnetic fields of an arc or laser, and light irradiation influence on the fullerenes yield.
+ this work is partially supported by ISTC under grant # 079
193
Mat. Res. Soc. Symp. Proc. Vol. 359 s 1995 Materials Research Society

Thus, the necessary experimental conditions of fullerenes formation are: 1) high initial temperature and pressure of carbon vapour; 2) a presence of a buffer gas - one atomic gas with high ionization potential; 3) fast expansion of carbon vapour into the buffer gas. The thermalization rate at the expense of the buffer gas is treated to be rather high to maintain
a quasi-equilibrium state of the system. Structures observed in mass-spectra were investigated using the ion drift mobility tech-
nique [5]. It was supposed that at the early stage of the evolution monocyclic polyyne clusters are formed. Joining, they form bi- and multycycles. When the number of atoms in a cluster achieves ~40, then a spheroidal structure (and fullerenes finally) is possible.
Still, the microscopic mechanism of fullerene formation is an unresolved problem. There are several hypotheses: 1) "fullerene road" [6]; 2) "pentagon road" [7]; 3) spirocyclization [8]; 4) fullerene formation from precursor clusters of special types [9]. (On mechanisms of fullerenes formation see reviews in [10]). All the models include a stage of sequential addition of small (or middle) clusters to structures formed before.
Fullerene formation from the atomic carbon was also simulated by molecular dynam- ics methods. Special time-dependent spheroidal boundary conditions accompanied with cooling gives the best results (in a sense of final structure) [11].
In the present work an alternative two-step mechanism of fullerene formation is pro- posed.
MECHANISM OF FULLERENE FORMATION
General features of nuclei formation from carbon vapour
After evaporation an oversaturated carbon vapour is supposed to be formed. Therefore, "gas-liquid" phase transition is the necessary stage of the process. However, a liquid carbon droplets are never formed as the result of the transition. A more powerful chemical tendency of network formation is engaged into the process further.
First order "gas-liquid" phase transition can occur in two different mechanisms: nucle- ation and spinodal decomposition. Having no of information which mechanism is realized, both of them are briefly discussed.
Some estimations of nuclei sizes and formation times, assuming the nucleation mecha- nism are given below. The work of formation of a nucleus consisting of i- particles (carbon atoms) is described [12] by
A, = as, + Vi{p" - p') - (//' - li')n, (1)
where s; and u,- are surface area and volume of a i-particle nucleus, a is a surface tension, fi and p are chemical potential and pressure, a double prime refers to a gas phase and single prime - to a liquid phase. The probability of the nucleus formation depends on oversaturation degree as iw,- ~ exp(—Ai/kßT). A unit-volume frequency of nucleus forma- tion J, = NBwt, where N is the number of particles of the initial phase (carbon vapour)
194
per unit volume, B is a kinematic coefficient (introduced by Volmer [13]). B means the unit-volume number of atoms collisions in a unit time, it being estimated qualitatively
only. The initial stage of nucleus growth is described by the Kramers-Fokker-Planck equation
[14]. The growth of the nucleus radius against time is R't1/3 or i1/2 depending on the theoretical model used, the volume growth is of t or t3/2 proportional, correspondingly. In the case of non-stationary expanding carbon vapour such estimations are not available. The rate of an increase in the system volume is one of the limiting factors for a nucleus size (in any model the rate of nuclei growth is ~f" (a < 3/2), whereas the rate of expansion is ~ t2). Nucleus growth is also retarded by chemical processes of network formation.
Let the oversaturation degree be such, that the system is within an unstable spinodal region. Then, at the initial stage of spinodal decomposition inhomogeneities spontaneously grow from a distribution over scales of thermal fluctuation. The characteristic size of inhomogeneities is of the order of Cahn mode \c [15]. At the initial stage, nuclei grow exponentially n(t) = n0exp(R(k)t), where R(k) is an amplification factor (the rate of diffusive growth of inhomogeneities with wave number k). It is determined in [12]
R(k)=r,dk2(l-ßk2) (2)
where ß = \xjd - 771/7, d is determinant of stability, changing its sign on spinodal, y, is a coefficient determined by the heat capacity and isothermal compressibility, 77 is the coefficient of thermal conductivity, v is the coefficient of volume viscosity, and 7 is a constant. All the values are for carbon vapour. A nucleus size is determined by the Ac corresponding to the maximum amplification factor (2) R0 = 2y/2ir/'\fß- The theory predicts a "gas-liquid" phase separation on the time scale of picoseconds [14].
Network formation stage of the evolution
As a result of "gas-liquid" phase transition nuclei of about several dozen carbon atoms are formed. Mechanical degrees of freedom are thermalized by a buffer gas. The temper- ature is high enough for the system to be in a quasi-liquid state. On cooling the system more stable physical and chemical bonds are formed.
Up to now the ground state energy calculated by the quantum chemistry methods was one of the main reasons determine a preferable structure (linear chain, mono-,bi- or multicycle) [16]. In the case of small carbon clusters, the most dominant structures are linear chains. For 20 < N < 30, a type of the most preferable structure is not yet clear. For N > 30 and up to several hundred atoms, a preferable structure is a fullerene. The ground- state energies were calculated at low temperatures. However, a great role of entropy at high temperatures can change a structure type essentially.
In the present work another approach is proposed. Due to high temperature at the first stage the structures of three-functional Cayley tree type are formed with high rate, because just these singly connected structures have the highest possible entropy. Structures of Cayley tree type have been already considered as initial configurations to explain "magic
195
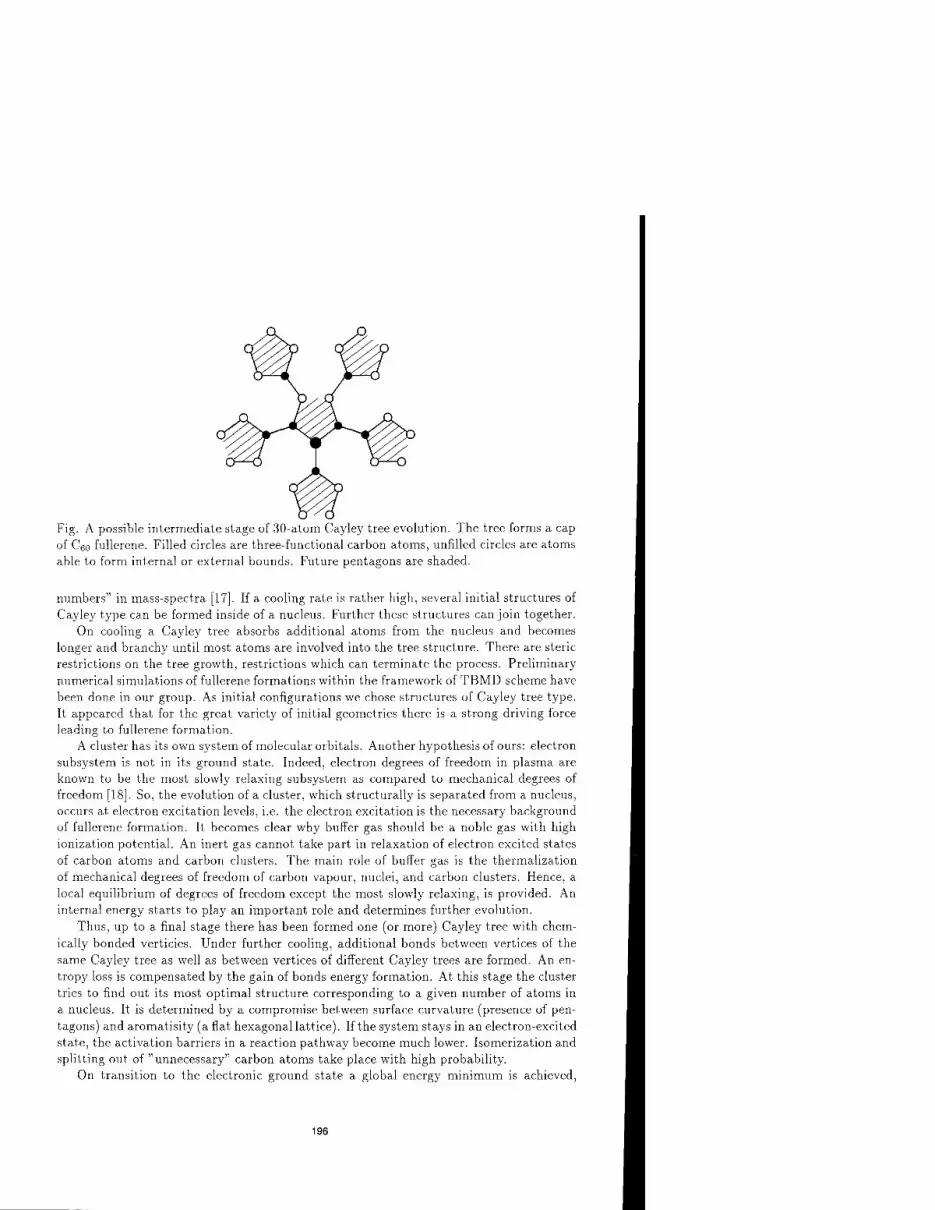
Fig. A possible intermediate stage of 30-atom Cayley tree evolution. The tree forms a cap of C6o fullerene. Filled circles are three-functional carbon atoms, unfilled circles are atoms able to form internal or external bounds. Future pentagons are shaded.
numbers" in mass-spectra [17]. If a cooling rate is rather high, several initial structures of Cayley type can be formed inside of a nucleus. Further these structures can join together.
On cooling a Cayley tree absorbs additional atoms from the nucleus and becomes longer and branchy until most atoms are involved into the tree structure. There are steric restrictions on the tree growth, restrictions which can terminate the process. Preliminary numerical simulations of fullerene formations within the framework of TBMD scheme have been done in our group. As initial configurations we chose structures of Cayley tree type. It appeared that for the great variety of initial geometries there is a strong driving force leading to fullerene formation.
A cluster has its own system of molecular Orbitals. Another hypothesis of ours: electron subsystem is not in its ground state. Indeed, electron degrees of freedom in plasma are known to be the most slowly relaxing subsystem as compared to mechanical degrees of freedom [18]. So, the evolution of a cluster, which structurally is separated from a nucleus, occurs at electron excitation levels, i.e. the electron excitation is the necessary background of fullerene formation. It becomes clear why buffer gas should be a noble gas with high ionization potential. An inert gas cannot take part in relaxation of electron excited states of carbon atoms and carbon clusters. The main role of buffer gas is the thermalization of mechanical degrees of freedom of carbon vapour, nuclei, and carbon clusters. Hence, a local equilibrium of degrees of freedom except the most slowly relaxing, is provided. An internal energy starts to play an important role and determines further evolution.
Thus, up to a final stage there has been formed one (or more) Cayley tree with chem- ically bonded verticies. Under further cooling, additional bonds between vertices of the same Cayley tree as well as between vertices of different Cayley trees are formed. An en- tropy loss is compensated by the gain of bonds energy formation. At this stage the cluster tries to find out its most optimal structure corresponding to a given number of atoms in a nucleus. It is determined by a compromise between surface curvature (presence of pen- tagons) and aromatisity (a flat hexagonal lattice). If the system stays in an electron-excited state, the activation barriers in a reaction pathway become much lower. Isomerization and splitting out of "unnecessary" carbon atoms take place with high probability.
On transition to the electronic ground state a global energy minimum is achieved,
196

topology being preserved and geometry being fixed. Such a transition can be described as -K -bond formation in the lattice of cr-bonds. The problem of a heat take-off arises as a result of fast energy liberation. The most efficient channel of energy dissipation is the vibrational irradiation of electron-excited system, any other dissipative channels are
auxiliary. The spheroidal form of nuclei is the same as the form of a final structure (fullerene),
playing an important organizing role [11]. Cooling from the surface, a nucleus is frozen into surface structures of Cayley tree type and grows at the expense of volume diffusion. In this way fullerene "caps" can be formed (see accompanying Fig.).
Different fullerene isomers can be produced with the number of atoms in a nucleus and mutual orientation of "caps". If a foreign atom should be located inside the nucleus, it can be trapped inside the final cage structure and can form endo-complexes.
In an initial distribution over nuclei sizes some of them can be unfavorable for fullereni or other stable carbon clusters formation. The nuclei of 20-30 carbons atoms belong to this size range. Apparently, these nuclei decay into the smaller and more stable clusters
and make no contribution to the observed mass-spectra.
CONCLUSIONS
The proposed mechanism of fullerene formation consists of two main stages. At the first stage, liquid nuclei are formed from the oversaturated vapour by the first order "gas- liquid" phase transition either by nucleation mechanism or by spinodal decomposition. The transition details should be clarified. Nuclei sizes are restricted both by the expansion of carbon vapour flux and by internal structuration tendencies. Isolation of nuclei from carbon vapour determines further distribution over mass-spectra of products. (Certainly, there are nuclei and a residual gas of carbon atoms that cannot evolve to fullerenes and
produce soot.) Due to the high rate of chemical reactions at high temperature and density combined
with to the intensive cooling, the second stage of evolution starts very rapidly: structural processes take place inside the nuclei. The processes resemble the "liquid-solid state" transition. On the other hand, the processes are rather specific as two dimensional (2D) connectivity phase is formed. Gas-liquid nuclei interface can play a role of boundary con- ditions for the formation of 2D structures. The spheroidal form of a nucleus can determine
further structures as well. A structuration process inside the nucleus starts with formation of topological struc-
tures of Cayley tree types. Under further cooling the internal energy becomes a driving force for the evolution, and additional bonds between vertices of the same tree as well as between vertices of different trees are formed. The process is determined by both kinetic (cooling rate) and thermodynamic factors (entropy and aromaticity concurrence). A grate energy revealed under bonds formation dissipates by radiation deactivation of vibrational degrees of freedom. The final stage involves a fixation of geometry of a chosen structure at the expense of 7r-bonds formation between carbon atoms, with the transition to the
electronic ground state. Here, several hypothesis have been proposed: 1) nucleus formation as the first order
phase transition of "gas-liquid" type; 2) formation of 2D connectivity inside the nucleus; 3) closing of 2D surface into closed structure; 4) electron-excited reaction pathway.
197
With the framework of proposed mechanism, the role of different experimental con- trolling parameters becomes more clear. Namely, a source should be powerful enough to maintain oversaturation and expansion of carbon vapour. Buffer gas thermalizes mechan- ical degrees of freedom and it should be a noble gas with high ionization potential.
To test the proposed mechanism several'experiments can be carried out. In an acoustic spectrum some high-frequency singularities can be observed due to characteristic "noise" of nuclei at the "gas-liquid" transition. There can be observed a certain coherence of optical irradiation caused by cooperative character of transition into electronic ground state. It seems to be useful to try structures of Cayley tree type as candidates for the intermediate structures observed in experiments on the ion drift mobilities.
There is a question of general interest: whether fullerenes form their own thermody- namically equilibrium phase, i.e. whether there is a site on the carbon phase diagram for fullerenes or they are metastable (kinetically "frozen") phase. The answer is unknown yet.
REFERENCES
1. D.E.Manolopoulos, P.W.Fowler, J.Chem.Phys., 96, 7603 (1992) 2. W.Krätschmer, L.D.Lamb, K.Fostiropoulos, D.R.Huffman, Nature (London) 347, 354 (1990)
3. H.W.Kroto, J.R.Heath, S.C.O'Brien, R.F.Curl, R.E.Smalley, Nature 318, 162 (1985). 4. T.Wakabayashi, K.Kikuchi, S.Suzuki, H.Shiromaru, Y.Achiba, J.Phys.Chem. 98, 3090 (1994).
5. G.Von Helden, M.-T.Hsu, P.R.Kemper, M.T.Bowers, J.Chem.Phys. 95, 3835 (1991); G.Von Helden, N.G.Gotts, P.R.Kemper, M.T.Bowers, Nature (London) 363, 60 (1993); J.M.Hunter, J.L.Fye, E.J.Roskamp, M.F.Jarrold, J.Phys.Chem. 98, 1810 (1994). 6. J.R.Heath, in Fullerenes: Synthesis, Properties, and Chemistry of Large Carbon Clusters (Am.Chem.Soc, Washington, D.C., 1991). 7. R.E.Smalley, Accnts.Chem.Res. 25, 98 (1992); J.R.Heath, S.C.O'Brien, R.F.Curl, H.W.Kroto, R.E.Smalley, Comments Cond.Matter. Phys. 13, 119 (1987). 8. H.W.Kroto, D.R.W.Walton, Phil.Trans.R.Soc.Lond.A. 343, 103 (1993). 9. A.Goeres, E.Sedlmayr, Chem.Phys.Lett. 184, 310 (1991); T.Wakabayashi, Y.Achiba, Chem.Phys.Lett. 190, 465 (1992).
10. R.F.Curl, Phil.Trans. R.Soc.Lond.A. 343, 19 (1993); H.Schwarz, Angew.Chem., Int.Ed.Engl. 32, 1412 (1993). 11. C.H.Xu, C.Z.Wang, C.T.Chan, and K.M.Ho, Phys.Rev.B47, 9878 (1993). 12. A.Z.Patashinsky, I.S.Yacub, JETP 73, 1954 (1977) (Russian); V.P.Skripov, A.V.Skripov, Usp.Fiz.Nauk 128, 193 (1979) (Russian). 13. M.Volmer, The Kinetics of the New Phase Formation ( "Nuaka", Moscow, 1986) (Russian).
14. S.W.Koch, Dynamics of First-Order Phase Transitions in Equilibrium and Nonequi- librium Systems. Lecture Notes in Physics 207, (Springer-Verlag. Berlin, 1984). 15. J.W.Cahn, J.E.Hilliard, J.Chem.Phys. 28, 258 (1958); 31, 668 (1959). 16. W.Welter, R.J.van Zee, Chem.Rev. 89, 1713 (1989). 17. J.A.Van Vechten, D.A.Keszler, Phys.Rev.B36, 4570 (1987). 18. A.I.Osipov, A.V.Uvarov, Usp.Fiz.Nauk 162, 1 (1992) (Russian).
198

MOLECULAR DYNAMICS SIMULATIONS OF HYPERVELOCITY BUCKMINSTERFULLERENE COLLISIONS
D.H. ROBERTSON^ D.W. BRENNER, AND C.T. WHITE Theoretical Chemistry Section, Naval Research Laboratory, Washington, DC 20375
ABSTRACT
Molecular dynamics simulations of high-energy collisions between various combinations of Ceo and C70 fullerenes were performed to calculate the threshold for molecular fusion of these clusters as a function of the center-of-mass collision energy. For collision ener- gies below 90 eV, only non-reacting collisions occurred with no observation of any fusion. However, at higher collision energies molecular fusion of the colliding clusters was observed with the fusion probability approaching 1 by 160 eV collision energy. The non-fusing, re- bounding collisions showed deeply inelastic behavior with the loss of translational energy to internal energy varying from 50 to 70 percent.
INTRODUCTION
One remarkable property of Ceo has been its observed ability to survive violent short-time hypervelocity impacts with surfaces without chemically reacting [1-4]. However, recently Campbell et al. have performed experimental studies of C6o cluster collisions and have found evidence for the fusion of fullerene clusters at sufficiently high collision impact energies [5]. Their experiments indicate that the barrier for fusion must lie below 200 eV. In a re- lated molecular dynamics (MD) study, Seifert and Schmidt, performed two simulations of Ceo cluster collisions with initial temperatures of 0 K and impact energies of 150 eV and 500 eV[6]. For their simulations the 150 eV trajectory showed no fusion while the 500 eV trajectory showed fusion immediately followed by fragmentation. An earlier paper by Bal- lone and Milani performed MD simulations on C5g/C59, Csg/C6o, and C6o/C6o collisions at very low collision energies (approximately 1/3 eV) and only observed fusion in collisions between the more reactive C59 clusters at these low impact energies [10]. In this paper we report results of extensive molecular dynamics simulations of high energy collisions between combinations of C6o and C70 clusters to study the threshold for molecular fusion [8]. These simulations show that cluster collisions with a zero impact parameter show a 50% prob- ability for fusion at 120-130 eV collision energies in accord with the experimental results and MD studies using tight-binding methods [9].
MODEL AND METHOD
The fullerene clusters are modeled using a bond-order type empirical hydrocarbon potential [10] which accurately predicts the bonding and energetics of solid diamond lat- tices and graphite sheets, as well as hydrocarbon molecules, while still allowing reactions to occur. The ability of this potential energy surface to allow reactions is crucial for these simulations to allow for possible fusion and/or fragmentation of the colliding clusters. This potential has previously been shown to provide a good model for a wide variety of prop- erties of fullerenes and related structures [4,11-14], including simulations of the collision of COO with a hydrogen-terminated diamond (111) surface [4]. This potential has also been used in a series of friction simulations involving diamond surfaces [15-17].
199
Mat. Res. Soc. Symp. Proc. Vol. 359 c 1995 Materials Research Society

The constant energy MD simulations are performed by integrating Newton's equation of motion with an accurate high-order Nordsieck predictor-corrector method [18]. The clusters are equilibrated at an internal temperature of 750 K to match conditions similar to exper- imental studies. The initial conditions for a given trajectory are generated by randomly rotating the clusters, placing them 2 nm apart and then giving each cluster a center-of-mass velocity towards each other to generate the required impact energy. Most of the simulations were performed with an impact parameter of zero, i.e. headon collisions. These trajectories were then followed for 2 ps, after which time the trajectories were classified as to whether or not the clusters had fused. If the clusters did not fuse then the loss of translational energy to internal energy was calculated to obtain the degree of elasticity exhibited by the cluster collision. These simulations were performed for collisions between combinations of C6o and C70 clusters at impact energies of 50 to 180 eV.
RESULTS
The results for the simulations involving collisions with zero impact parameter are sum- marized in Figure 1.
100 -1 1 1 1—
% Fused % Elastic
^60/^80
^60/^70
C70/C70
100 120 140 Collision Energy (eV)
160
Figure 1. Plots of the percentage of zero-impact-parameter trajectories result- ing in molecular fusion are plotted by the solid lines and the relative amounts of translational energy retained after these collision are plotted by the dashed lines for Ceo/Ceo, C60/C70 and C70/C70 collisions plotted as circles, x's, and squares, respectively.
200

Each point in Figure 1 represents the results from a hundred trajectories with random initial orientations of the colliding clusters. The solid lines represent the observed probability for fusion obtained from the one hundred trajectories. The dashed lines represent the percentage of the initial translational energy that was retained by the rebounding clusters for the trajectories that did not undergo molecular fusion (degree of elasticity). For the Ceo/Ceo collisions, plotted as the circles, molecular fusion began occurring in collisions with 90 eV center of mass collision energy. By 160 eV the probability of fusion for the collisions was unity. The average amount of translational energy retained after collision of non-fusing trajectories decreases as the collision energy increases. The percentage of retained translational energy deceases from 48.5% for 50 eV collisions down to 25.5% for 150 eV trajectories which shows the highly inelastic nature of these cluster collisions.
Snapshots of the collision process are presented in Figure 2 for three of the C6o/C6o trajectories.
Figure 2. Snapshots of three Ceo/Coo trajectories at zero impact parameter with impact energies from top to bottom of 120 eV, 120 eV, and 150 eV, respectively. The times from left to right are 0.1, 0.25, and 0.5 ps for the top panel, and 0.1, 0.25, and 2.0 ps for the middle and bottom panels.
The top panel in Figure 2 depicts the results from an 120 eV collision trajectory at times of 0.1, 0.25, and 0.5 ps, from left to right. In this trajectory the colliding clusters undergo extreme distortion at maximum compression but do not fuse. They rebound inelastically with much of the translational energy transformed into internal energy of the rebounding clusters (as seen by the distorted shapes after collision). The middle and bottom panels in Figure 2 depict totally inelastic trajectories showing molecular fusion for collision energies of 120 and 150 eV, respectively, at simulation times of 0.1, 0.25, and 2.0 ps, from left
201

to right. In these collisions at maximum compression, intercluster bonding occurs which inhibits the clusters from cleanly rebounding allowing the clusters to remain fused together. The major difference between the 120 eV and 150 eV collisions is the degree of bonding between clusters and the resulting disruption of the individual clusters. For the 120 eV molecular fusion, the original clusters, for the most part, retain their individual identities with only a few intercluster bonds. For the higher energy 150 eV collision numerous bonding occurs between the clusters with major disruption of individual cluster bonding topologies. After fusion these combined clusters could possibly anneal to more stable larger fullerene configurations.
The trajectory results for the C6o/C7o and C70/C70 show similar behavior to the C6o/C6o results. As seen in Figure 1, the fusion probability curves are shifted to higher energies for the higher mass cluster collisions. This might be due in part to these higher mass clusters having lower collision velocities for the same translational energy. The degree of elasticity of these higher mass cluster collisions shows similar trends as the lower mass collisions. Therefore, the behavior of these C6o and C70 cluster collisions show similar fusion behavior at zero impact parameter regardless of whether the colliding clusters is the spherical C6o or the more elongated C70.
The dependence of the fusion probability on the impact parameter for 120 and 150 eV C60/C60 and C70/C70 collisions is plotted in Figure 3.
100
Impact Parameter
Figure 3. Probability for molecular fusion as a function of the impact param- eter (Angstroms) for 150 eV and 120 eV impact energies, plotted as solid and dashed lines, respectively, for C6o/C6o and C70/C70 cluster collisions plotted as circles and squares, respectively.
202

Overall, all cross sections decrease with increasing impact parameters. However, for larger values of the impact parameter the cross section of the C70/C70 collisions decrease more slowly than the corresponding ones for the Coo/Ceo consistent with the larger size of the C70 clusters.
CONCLUSIONS
These MD simulations using a reactive hydrocarbon potential are able to simulate the molecular fusion of COO clusters observed in experimental studies. These simulations show a greater than 0.5 probability for molecular fusion at a collision energy of 120-130 eV. This is consistent with the experimental results which predict that the threshold for molecular fusion is below 200 eV. The threshold shifts to slightly higher impact energy for collisions involving C70. The non-fusing collisions show highly inelastic behavior with the amount of translational energy lost to internal energy varying from 50 to 75% for impact energies of 50 eV to 150 eV. The cross sections for fusion in C70/C70 show a larger fusion probability at higher impact parameters than the Ceo/Ceo collisions in accord with the larger size of the C70 over the Ceo- These simulations support the experimental observation of the molecular fusion of colliding Ceo clusters at sufficiently high center-of-mass impact energies and place the onset of molecular fusion for zero impact parameter at around 90 eV.
ACKNOWLEDGEMENTS
D. H. R. acknowledges a NRC-NRL Postdoctoral Research Associateship. This work was supported by ONR through the Naval Research Laboratory and the ONR Physics Division (contract # N00014-94-WX-23009).
REFERENCES
[f] Permanent address: Department of Chemistry, 402 Is?. Blackford St., Indiana Univer- sity-Purdue University at Indianapolis, Indianapolis, IN 46202.
[1] R.D. Beck, P. St.John, M.M. Alvarez, F. Diederich, and R. Whetten, J. Phys. Chem. 95, 8402 1991.
[2] S.W. McElvany, M.M. Ross, and J.H. Callahan, Mater. Res. Soc, Symp. Proc. 286, 697 (1991).
[3] H.-G. Busmann, Th. Lill, and I. V. Hertel, Chem. Phys. Lett. 187, 459 (1991).
[4] R.C. Mowrey, D.W. Brenner, B.I. Dunlap, J.W. Mintmire, and C.T. White, J. Phys. Chem. 95, 7138 (1991).
[5] E.E.B. Campbell, V. Schyja, R. Ehlich, and I.V. Hertel, Phys. Rev. Lett, 70, 263 (1993).
[6] G. Seifert and R. Schmidt, Clusters and Fullerenes, edited by V. Kumar, T.P. Martin, and E. Tosatti (World Scientific, Singapore, 1992).
[7] P. Ballone and P. Milani, Z. Phys. D 19, 439 (1991).
[8] D.H. Robertson, D.W. Brenner, and C.T. White, submitted for publication.
[9] B.I. Zhang, C.Z. Wang, C.T. Chan, and K.M. Ho J. Chem. Phys. 97, 3134 (1993).
203

[10] D.W. Brenner, Phys. Rev. B 42, 9458 (1990).
[11] B.I. Dvmlap, D. W. Brenner, J.W. Mintmire, R.C. Mowrey, and CT. White J. Phys. Chem. 1991, 95, 5763.
[12] D.H. Robertson, D.W Brenner, and J.W. Mintmire, Phys. Rev. B 45, 12592 (1992).
[13] D.H. Robertson, D.W. Brenner, and CT. White, J. Phys. Chem. 96, 6133 (1992).
[14] CT. White, J.W. Mintmire, R.C. Mowrey, D.W. Brenner, D.H. Robertson, J.A. Har- rison, and B.I. Dunlap, Buckminsterfullerenes edited by W.E. Billups and M. Cuifolini (VHF Publishers inc., New York, 1993), Ch.6.
[15] J.A. Harrison, CT. White, R.J. Colton, and D.W. Brenner, Phys. Rev. B 46, 9700 (1992).
[16] J.A. Harrison, CT. White, R.J. Colton, and D.W. Brenner, J. Phys. Chem. 97, 6573 (1993).
[17] J.A. Harrison, CT. White, R.J. Colton, and D.W. Brenner, MRS Bulletin 18, 50 (1993).
[18] C.W. Gear, Numerical Initial Value Problems in Ordinary Differential Equations (Prentice-Hall: Englewood Cliffs, 1971) p. 148.
204

ELECTRONIC STRUCTURE CALCULATIONS OF DEFECT C60
WITH ONE OR TWO VACANCIES
J.L. MORÄN-LÖPEZ*, J. DORANTES-DÄVILA* AND J.M. CABRERA-TRUJILLO" * Institute) de Fisica, "Manuel Sandoval Vallarta", Universidad de San Luis Potosi, Alvaro Obregön 64, 78000 San Luis Potosi, Mexico ** Facultad de Ciencias, Universidad de San Luis Potosi, Alvaro Obregön 64, 78000 San Luis Potosi, Mexico
ABSTRACT
The electronic properties of defect C6o with one or two vacancies, are calculated by using a Hubbard-like Hamiltonian for sp-electrons in the unrestricted Hartree-Fock ap- proximation. Results are given for the cohesive energy and local charge distribution of the different non-equivalent sites. These results might support a possible mechanism to encapsulate atoms in the internal cavities of C6o- This mechanism involves the production of C60 molecules with two carbon isotopes ^C and BC (A, B = 12,13,14). The molecules ^Csg^Ci and -4C58SC2 are separated from the total production and collected in a chamber under partial pressure of the element to be inserted.
INTRODUCTION
One of the most promising applications of fullerenes is the possibility to encapsulate el- ements in their cavities. The endohedral fullerenes, A@C60, could be used as drug-delivery agents, for example. This potential application was recognized almost simultaneously to the discovery[l] of C6o when the endohedral fullerene La@C6o was detected[2]. The early finding lead to the optimistic conclusion that one could insert in the hollow cages almost any element or molecule. However, that was not the case, as it turned out to be very difficult to encapsulate elements into the fullerenes.
A proposal to get important quantities of endohedral complexes was to generate the fullerenes by arc discharge in the presence of the element to be inserted, either in the form of gas or as a part of the electrodes[3]. As the fullerene is formed there is chance that the foreign atom will be trapped. It has been shown[4] that this process leads to the formation of He@C60 but in small quantities (1 in 880,000).
Other atempt for the production of endohedral systems was to accelerate ionized fullerenes and impact them with the target atoms in the gas phase. The "slip" energy required to get the foreign atom through one of the fullerene rings has been estimated[5] to be of the order of 10 eV for He. Larger energies[6] are needed (~ 10 - 20 eV) in the case of Ne. However, due to the large collision energies, this process produces unstable complexes. For example C6oNe+ boils out ejecting C2 molecules. Limited quantities of Li@C6o, Na@C60, and K@C60 have been also obtained by ion implantation[7].
More recently, the production of endohedral fullerenes has been improved [4]. It has been possible to insert He and Ne by heating C6o soot under the atmosphere of those elements at temperatures ~ 600 °C. By this process one can obtain, in the case of He@C6o, quantities of 1 in 650,000. It is assumed that the heating process distorts the C-C bonds and opens temporarily a "window" in the cage. A recent calculation[8] supports this
205
Mat. Res. Soc. Symp. Proc. Vol. 359 e 1995 Materials Research Society

mechanism. By means of ab initio calculations it has been concluded that by opening a C-C bond 9- and 10-membered rings are created with a relative small cost in energy. Murry and Scuseria find a minimum in the triplet C6o potential energy surface with the single C-C bond opened to 2.48 Ä.
Here, we propose a mechanism that complements the idea that one can open a tempo- rary gate on the fullerene surface to introduce atoms into the hollow cages, which may lead to a larger production of endohedral complexes. The central idea is to excite selectively only one or two carbon atoms in order to build up the gate with the stretched bonds. The mechanism is the following: a preliminary step consists in the production of fullerenes containing two carbon isotopes, AC60-N
BCN. By mass spectroscopy one can separate the molecules containing one or two atoms of the same isotope. The next step is to collect the particular set of molecules in a chamber containing the element to be inserted in the gas phase. The minority isotopes are then selectively excited by laser irradiation which results in the deformation of the C-C bonds. The stretched bonds build up a "gate" or "window" that may allow the gas atoms to get into the hollow cages. Depending on the size of the atom to be inserted, it might be necessary to use fullerenes with one or two neighbor isotope atoms. In the case of two isotope atoms the probalility that those are nearest neighbors in the molecule is 3/59, i.e., ~ 5%
In contrast to the process of heating the whole molecule, in which all the bonds are distorted allowing the atoms to get in and out, the selective excitation mechanism has the advantage that only a reduced number of bonds are stretched and the probability that the enclosed atoms escape is much smaller. Furthermore, other advantage is that it may be possible to insert atoms at a much lower temperatures than 600 °C. Thus, one can presumibly introduce a larger variety of atoms and molecules.
In order to provide a support of the above mechanism we present results of the elec- tronic properties of defect C6o with one or two vacancies. A more detailed account of our calculations will be published elsewhere[9].
THEORETICAL MODEL
To determine the electronic properties of these complex systems, we consider a re- alistic sp-band model Hamiltonian including intra-atomic Coulomb interactions in the unrestricted Hartree-Fock approximation. In the usual notation it is given by
H = Hd + Ha (1)
where Hei includes the electron-electron and electron-core interactions, and Hcorc describes the core-core interactions.
Hd = 5^ siaa hiaa + Y,ff aL Cjß* (2)
where <°. refer to the hopping integrals between sites i and j and orbitals a and ß (a,ß = s,Px,Py,Pz), and the energy levels are
ßa' (3)
206

In Eq. (3), s°ia stand for the orbital energy-levels of the element at site i. The second term takes into account the level shifts due to the redistribution of the electronic charge and the resulting intra-atomic Coulomb interactions. Av$a = U0„ — v^a, where v$a = (w0ff) is the average electronic occupation of the spin orbital ißa, and i/^a the corresponding average occupation in the solution of the bulk. Finally, the last term in Eq. (3) takes into account the environment dependent energy-level shifts due to non-orthogonality effects (overlap interactions)[10,ll] and to the crystal-field potential of the neighboring atoms,[12] which are approximately proportional to the local coordination number «,-. The repulsive interactions between cores are calculated from
Hem = iY<r*R*-*°)l*<, (4) 2 2^
where the parameters A and p are fitted to the bulk equilibrium condition and compress- ibility modulus.
The number of electrons
va{i) = <?M) + (?W (5J
at site i and orbital a are determined self-consistently by requiring
PiQa(e) de . (6) ■OO
The local density of states (DOS) p,-Qff(e) = (-l/^)Im{Giaa,iaa(s)} is determined by cal- culating the local Green's functions GiaCtiaa(e) by means of the recursion method[13]. The number of levels M of the continued fraction expansion of Giaa^aa is chosen large enough so that the physical results become independent of M[14]. Notice that spin-charge transfer between atoms and orbitals having different local environments may occur.
The cohesive energy per cluster atom is given by
Ecoh{n) = Eband(l) - Ebarld(n) - ER (7)
where Eband{n) refers to the electronic sp-band contribution per atom,
EiaU") = " E /'' ep^£)d£ ~ Ed< (8) n ,=i J°°
Note that the estimated energy cost to form e.g. C59 from C6o, would be 60Ecoh(60) - 59Ecoh(59).
RESULTS AND DISCUSSION
The parameters used in the calculations are determined as follows. The hopping integrals t"3 between atoms of the same element are fitted to band-structure calculations [15]. We neglect the differences between s and p Coulomb integrals (i.e., Uss = Usp = Uvv) The absolute value of UJV{C)= 1.00 eV is obtained by fitting to the ionization potential of the atom. The orbital dependent constants Qa are given as the difference between the
207

bare energy levels (i.e., excluding Coulomb shifts) of the isolated atom and the bulk. In this way we obtain, ßs = Qv = 0.697 eV.
The geometries correspond to the extreme case where one or two vacances are removed. In molecules with two adjacent vacancies, there are two cases, depending if the atoms were part of a bond between two hexagons Cg8 or between a pentagon and an hexagon Cf8.
The self-consistent local densities of states were calculated at the varios inequivalent sites in the defect molecules. In Table I the charge distribution in the defect molecule C59 at the various non-equivalent sites is given. The sites denoted 1, 2 and 3 correspond to the 11-membered ring. One notices important differences between the three sites. There is large accumulation of charge at the sites 1 that form the "mouth" of the gate. This may attract positive ions into the cavity.
The results for the charge distribution in the C\s and C|8 molecules are given in Table II. Here we give the local charge only at the sites that form the 12- and 13-membered rings. The gates in these cases are obviously larger than the one in C59 and with different topologies. The case of C\& is more symmetric and therefore is more stable than the Cij8
molecule. From Tables I and II we see that the largest excess of electrons occurs at sites 1 of the Cjg.
We calculated also the energy of cohesion of these defective molecules. The values obtained are 6.957, 6.935, and 6.933 eV/atom for C59, C£8, and C^, respectively. These values are not too different from the perfect C60 (7.03 eV/atom). These results give also information about the energy of formation for each molecule from C6o- The results for the energy of formation for C59, Cj8 and C2
5S are 11.34, 19.57 and 19.68 eV respectively. These values are physically expected, since this energy would be approximately the number bonds times the C-C bond energy. When we compare to the 10 eV necessary to implant He atoms through the fullerene rings, we conclude that the selective excitation is a more promising mechanism. Although our calculation was restricted to the ideal case in which the atoms in the defect fullerenes were frozen to the positions of the perfect molecule and the isotope atoms were completely removed, we expect that a more realistic calculation with distorted atomic possitions will not differ significantly from our results.
TABLE I The number of s, p and total number of electrons i/a(i) at various inequivalent sites i of the defect molecule Csg.
P Total
"«(1) va(2) ^(3) "a(4)
1.5835 1.2189 1.2231 1.2371 3.0554 2.7443 2.6604 2.6604 4.6389 3.9632 3.9972 3.8975
208

TABLE II The number of s, p and total number of electrons vji) at various inequivalent sites i of the defect molecule Cgg and Cj8.
a *«(!) "a(2) fa(3) "«(4) Va&) ua(6)
s
Total
1.5859 3.1298 4.7155
1.2334 2.7487 3.9821
1.2212 2.7629 3.9725
s
Total
1.5131 3.0733 4.6564
1.6201 2.9616 4.5817
1.2096 2.8000 4.0096
1.2281 2.7210 3.9491
1.2238 2.7632 3.9870
1.2206 2.7437 3.9643
SUMMARY
In conclusion, we have proposed a mechanism for the macroscopic production of en- dohedral fullerenes. We support the previos idea[4] to get the foreign atoms into the hollow cages by distorting the fullerene surface. In contrast to heating the whole molecule, we suggest to excite selectively only some of the atoms. This mechanism may lead the insertion of atoms or molecules at low temperatures. The theoretical calculation of the electronic structure of defect fullerenes supports our proposal. Furthermore, here we have restricted our discussion to C6o but the same idea applies to larger fullerenes. Results for the electronic properties of C6o in which the radial coordinates of one or two carbon atoms are modified, will be published elsewhere.
ACKNOWLEDGEMENTS. Illustrative discussions with K.H. Bennemann, J.M. Sanchez, L. Wöste and F. Aguilera-Granja are gratefully acknowledged. This work was supported in part by Consejo Nacional de Ciencia y Tecnologia (Mexico) through Grants C90-07-0383 and 1774-E9210.
REFERENCES
1. H. W. Kroto, J. R. Heath, S. C. O'Brien, R. F. Curl, and R E. Smalley, Nature 318, 162 (1985).
2. J. R. Heath, S. C. O'Brien, Q. Zhang, Y. Liu, R F. Curl, H. W. Kroto, E. K. Tittel, and R. E. Smalley, J. Am. Chem. Soc. 107, 7779 (1985).
3. K. H. Bennemann (private communication). 4. M. Saunders, H. A. Jimenez-Vazquez, R. J. Cross, and R. J. Poreda, Science 259,
1428 (1991). 5. T. Weiske, D. K. Böhme, J. Hrusak, W. Krätschmer, and H. Schwarz, Angew. Chem.
Int. Ed. Engl. 30, 844 (1991). 6. Z. Wan, J. F. Christian, and S. L. Anderson, J. Chem. Phys. 96, 3344 (1992).
209

7. Z. Wan, J. F. Christian, Y. Basir, and S. L. Anderson, J. Chem. Phys. 99, 5858 (1993).various of the inequivalent sites in
8. R. L. Murry and G. E. Scuseira, Science 263, 791 (1994). 9. J. L. Morän-Lopez, J.M. Cabrera-Trujillo, and Dorantes-Dävila, submitted to Chem.
Phys. Lett. 10. J. Dorantes-Dävila, A. Vega and G.M. Pastor, Phys. Rev. B47, 12995 (1993). 11. W.A. Harrison, Electronic Structure and the Properties of Solids (Freeman, San
Francisco, 1980); M. van Schilfgaarde and W.A. Harrison, Phys. Rev. B 33, 2653 (1986).
12. G.M. Pastor, J. Dorantes-Dävila and K.H. Bennemann, Chem. Phys. Lett. 148, 459 (1988).
13. R. Haydock, in Solid State Physics, (Academic Press, London, 1980), Vol. 35, p. 215.
14. A. Vega, L.C. Balbäs, J. Dorantes-Dävila and G.M. Pastor, Phys. Rev. B47, 4742 (1993).
15. D. A. Papaconstantopoulos in Handbook of the Band Structue of Elemental Solids, (Plenum Press, New York, 1986).
210

CONTROLLING THE REACTIVITY OF C„: A THEORETICAL ANALYSIS OF THE ELECTRONIC STATES MODULATED BY SUBSTITUTIONAL CHEMISTRY
S.-H. Wang. M. Kashani, S. Jansen* Department of Chemistry, Temple University, Phila. PA, 19122
ABSTRACT The availability of large amounts of Buckminsterfullerene has allowed a plethora of
experimental investigations on fullerenes. The chemical and physical studies have focussed on synthesis, isomerism, magnetism, spectroscopy and high temperature superconductivity in doped materials. The chemical reactivities of fullerenes have been defined and most of the studies are dominated by CM isomers. Some of the observed activities of fullerenes parallel tose of alkeaes. In our previous studies, the reactivity of the 6-6' bond with respect to «to- addition was described. Current studies have exploited the olefinic nature of the 6-6' bond and analyzed the effect of the addition on-Cluster stability and frontier character. In this work, we describe the mechanisms of simple substitution and analyze stability and orbital effects for the addition chemistry of C«, with multiple species. Evolving changes in orbital frontier character are analyzed with respect to site directed chemistry exhibited by CM.
INTRODUCTION The availability of large quantities of fullerenes has aroused increasing research m die cage
chemistry of CM'. Multiple endo- and exo- hedrally substituted fullerenes have been prepared2-* In most of these objectives definite patterns in reactivity and regie-chemistry have been observed". For example, metal substitution occurs at the 6-6' site, promoted or stabilized by back bonding*, while other substitution*! chemistry is more complex. In the present work, the electronic effects induced by substitution are analyzed yielding information about the evolution of the frontier chemistry during the course of the addition. For addition, the stability of the isomers is described in terms of seemingly competing effects: frontier orbital chemistry and fullerene cage stability. Here, we describe electronic effects and stability factors that drive the regiochemistry for a variety of groups ranging from simple halogens, to nitro and amine groups to perhalomethyl substituents. The analysis of the frontier orbital character"' and isomer preference information"'11 proves very important for analysis of reaction chemistry and spectral characterization of fullerene materials.
COMPUTATIONAL METHOD AND MODELS The CJO geometry utilized in the calculations was obtained from X-ray crystallographic
data'. The structures of the substituted species were obtained from molecular mechanics optimization using the MM2 force field. Four possible substitutional sites were analyzed as shown in Figure 1. These include 1-3 (meta), 1-4 (para), 1-2 (ortho, 5-6 and 6-6* sites). The 5-6' and 6-6' sites are distinct due to the threefold symmetry observed in the icosohedron.
Figure 1. Two types of bonds of C«.
211
Mat. Res. Soc. Symp. Proc. Vol. 359 e 1995 Materials Research Society

The electronic structure calculations have relied on applications of the extended Hückel method has already demonstrated utility in describing hydrocarbon and CM chemistry'10. The method developed by Hoffmann et alM. describes relative energy trends extremely well and gives an excellent illustration of covalent bonding in molecules and clusters.
RESULTS AND DISCUSSION (a) Hydrogenation and Halogenation
In this study, it has been determined mat frontier orbital chemistry is not always the critical factor in driving the substitutional chemistry of Cu. In the case of fluorine substitution the orbital energies of the substituent and frontier Ca levels we mismatched resardless of
the addition mechanism. For atomic fluorine, the 2p states are considerably lower in energy than the hlf or tu levels of C*. Similarly, the LUMO of F, though compatible in energy with the HOMO states of CM is o-antibonding. Moderate electron transfer will activate the F-F bond and promote dissociation giving atomic adducts for addition.The C-F bonds that "eventually" form do so at the expense of bonding in the cage as the bonding states of CM are destabilized by the interaction with the F states of low energy. Therefore the greater stability is observed when the 6-6' olefinic linkage is preserved and the average C-C bond order is maintained. The stabilization energies are given in Table I.
Table I. Stabilization energy(eV) of X.C«,, i=l, 2 and X=H, F, and Br.
(a) (b) (a) (b) (a) (b) HC«, +2.71 -1.25 FC« +2.98 +2.43 BrC„ +2.38 +1.32 ^„(56') -1.36 -2.81 ^„(560 +1.03 +0.67 Br.C^SÖ1) +7.86 +6.18 H2CM(660 -0.35 -2.56 FjC^Ö1) +3.27 +2.41 BT2C^6e) +11.31 +8.78 H2C„(m) -0.88 -1.74 FjC^m) +5.22 +4.96 Br2CM(m) +4.71 +2.58 ^„(p) -1.98 -2.21 V£Jp) +3.30 *hCJp) +1.40 +0.95
(a) molecular (b) free radical addition patterns.
For bromination a different trajectory can be envisaged. The LUMO of Br2 is antibonding, however it is not likely to be populated through interaction with Ca. Instead, the HOMO states are likely to interact with the LUMO of C«. The HOMO of Br2 is K-antibonding and thus transfer of electrons to the LUMO of Ca offers greater stability in the Br3 unit This destabilizes the fullerene by populating states mat are antibonding across the 6-6' linkage. Therefore, the total energy of the complex formed depends on C-C framework bonding, Br-C bonding and Br-Br residual interation. These orbital interaction are shown in Figure 2.
These arguments presuppose molecular addition, however in the case of both fluorine and bromine free radical addition is a common addition motif. Thus we can consider the addition of two addendum as a sequential process probing the site directive nature of the halogen. Mono- addition of either fluorine or bromine affects the frontier states similarly. There is a concentration of orbital density at the para and meta position, although to a lesser degree for meta, upon the single atom substitution while the 5-6' or 6-6' site is nearly noded. Thus the frontier chemistry suggests that initial substitution should be para directing for either F or Br. In the case of F the extreme localization affects cluster stability and thus produces the least stable addition isomer. While in the case of Br the fullerene cage is less destabilized with the para site favored. These effects are shown for Br in Figure 3. The arguments for hydrogen are similar however the orbital effects are not so extremely. Electronic structure analysis suggest that all addition isomers considered in this study possess reasonable inherent stability and thus a distribution of products
212

are expected. F ft WF.C. c.
-5
1 > ■ 10
I LUMO ' . -' , ' ' ,'■'
' 1
----?- HC
4
■ IS
1
1 1
/ ,' t '
1 * } / ,-- 'HOMO
' --~ 2 '■'*■— i
HOMO »_--
M> -UJMO
II »■■
«S-BtjC.
Figure 2. Energy diagram for halogenation of Cj,
BlC„ B'iC^m) Br^lp) Br.C^o. 6-*1) BrjCJo. MT c. -9.0.
2 1 1 1 1
2' . 3 LUMO
10.0-
1"- - _ 1 v '
' 1 /
\ \
\ \ > \ / x
f v 1 , 1 t
u.o 3 =! «
1 2 i,' ' 5 HOMO
— 1 1 1 M 1
HI9 ■* 5< l ij 5
5
' 1 -■2
-12.0 ■ —' HB 2 -- — i
1 ■
■ ■' "2 *~3
4
Figure 3. Energy diagram of C60 and its brominated adducts. *: orbital not completely filled; arabic number: degeneracy of states.
(b) N02 and NH2 Addition The addition of N02 and NIL, have been analyzed as well. Table II and III shows the
energies for the fullerene addition products and gives an assessment of changes in frontier orbital character. In the case of amine addition, the 6-6' isomer appears to be the most stable. Here, the steric interaction of hydrogen is minimal and at this limit of interaction, population of the LUMO states of CM appears minimal. Thus the C-N interaction can occur without significant loss of cluster stability.
213

Table n. Energies for Di-Addtion of NH,
Isomer Total Energy (EH,eV)
HOMO (eV) LUMO (eV) Total Energy (MM, kcal/mol)
5-6' -4498.59 -10.17 -1011 48336
6-6' -4499.65 -10.70 -9 89 482.65
meta -4498.14 -10.25 -1015 487.40
para -449859 -10.50 -9 89 488.29
Table m. Energies for Di-addition of NO,.
Isomer Total Energy (EH)
HOMO (eV) LUMO (eV) Total Energy (MM2)
5-6' -4939.95 -11.10 -1073 459.34
6-6' -4940.05 -11.07 -10.85 46062
meta -4939.05 -10.92 -10.75 460.02
para -4939.31 -11.02 -10.87 460.72
The situation for N02 addition is somewhat different. Strong interaction occurs between the oxygen species of the nitro addenda and thus a more "rigid" structure is found by MM geometry optimization. In the case of the amine addenda, some rotation freedom is observed.
For the nitro- addition, both 5-6' and 6-6' sites possess nearly the same stability. In all cases, the antibonding LUMO states of Ca are involved in the addition process. This suggests that the bonding between carbon and nitrogen is sizeable and only minor perturbations are seen in carbon-carbon cluster bonding. The HOMO-LUMO gap traces the energy trends of the cluster as anticipated. Variances in the MM energies compared with those obtained from EH are due to steric effects induced by rotation freedom. A complete dynamics minimization should prove interesting in defining the lowest energy structure for these materials.
(c) Methylation and Perhalomethylation The data for the isomer preference for methylation and perhalomethylation are given in Table IV and Table V. Isomer stabilities can be understood in terms of the MM, EH energies and HOMO-LUMO splitting energies. From these data it can be seen that the 6-6' site is favored for methyl- or perfluoro- methyl substitution. In the case of perbromo substitution, steric interaction of Br on adjacent carbon sites induce severe instability in the fullerene derivative. Here, 1-3 and 1-4 isomers showed similar stabilities.

Table IV. Energy for methylation.
Addition Isomer Methylation
TOTAL ENERGY (eV.
MM+ Kcal/ mole
HOMO eV. LUMO eV.
CMCH3 -4329.93 358.50 -10.23 -9.86
C60(CH3)2 6-6 -4427.59 499.41 -9.88 -9.77
C«,(CH3)2 5-6' -4427.39 429.29 -10.25 -10.10
C«,(CH3)2 1-3 -4426.98 436.49 -10.23 -9.98
C^CH,), 1-4 -4426.85 434.90 -10.35 -9.84
Table V. Energy for perhalomethylation.
Addition Isomer Perhalo- methylation
LgoCx^
C60(CF3)2 6-6
C„(CF3), 5-6'
C«,(CF3), 1-3
QoCCF,), 1-4
Ca.CBrj
C«,(CBr3)2 1-3
CJ.CBT& 1-4
TOTAL ENERGY (eV.
-4329.74
-4428.28
-4428.16
-4427.35
-4427.40
-4330.90
^»429.38
-4427.76
MM+ Kcal/ mole
378.69
667.01
466.60
418.25
504.68
400.40
484.054
437.51
HOMO eV.
-10.26
-9.88
-10.31
-10.31
-10.41
-10.35
-10.47
-10.39
LUMO eV.
-9.86
-9.77
-10.14
-10.00
-9.86
-9.86
-10.23
-9.87
CONCLUSION A complete description of the reaction trajectory has been developed for these additions,
however owing to the limited space and scope of the proceedings it can not be included here. In these work the "trajectory" is described for simple addition species, H, F and Br and the energy preferences are described for the more complex addenda. In the hydrogenation and halogenation study, site directed chemistry does occur when the frontier orbital energy is compatible with that of the addition species. The lowest energy structures obtained appear to be those in which cluster bonding is maintained.
In this work further comparison of the 5-6' and 6-6' linkage with respect to cage chemistry has demonstrated that the unique bond character is critical in defining chemical reactivity.
ACKNOWLEDGEMENT
The authors gratefully acknowledge financial support for this work from AFOSR, grant #
F49620-93-1-0018 and the Sun Oil for support of this work.
215

REFERENCE 1. W. Krätschmer, D. L. Lamb, K. Fostiropoulos, D. R. Huffman, Nature, 347, 354 (1990). 2. N. Matsuzawa, T. Fukunaga, D. A. Dixon, J. Phys. Chem., 96, 10747 (1992) and references therein. 3. (a) P. J. Fagan, B. Chase, J. C. Calabrese, D. A. Dixon, R. Harlow, P. J. Krusic, N. Matsuzawa, F. N. Tebbe, D. L. Thorn, E. Wasserman, p. 75, (b) Olah, G. A.; Bucsi, I.; Aniszfeld, R.; Prakash, G. A. S. p. 65 in The Fullerenes. Edited by Harold W. Kroto, John, E. Fisher and David E. Cox (Pergamon Press: New York, 1993), and references therein. 4. (a) J. M. Hawkins, A. Meyer, T. A. Lewis, Loren, S. (b) F. Wudl, A. Hirsch, C. K. Khemani, T. Suzuki, P.-M. Allemand, A. Koch, H. Eckert, G. Srdanov, H. M. Webb, (c) P. J. Fagan, J. C. Calabrese, B. Malone, in Fullerenes. Edited by George S. Hammond and Valerie J. Kuck(ACS symposium series 481, Washington, D. C, 1992) and references therein. 5. A. Hirsch, I. Lamparth, H. R. Karfunkel, Angew. Chem. Int. Ed. Engl, 33, 437(1994). 6. R. Seshadri, A. Govindaraj, R. Nagarajan, R. Pradeep, C. N. R. Rao, Tetrahedral Lett. 33, 2069(1992). 7. R. Taylor, G. J. Langley, A. K. Brisdon, J. H. Holloway, E. G Hpoe, H. W. Kroto, D. R. M. Walton, J. Chem. Soc, Chem. Commun., 875(1993). 8. P. R. Birkett, P. B. Hitchcock, H. W. Kroto, R. Taylor, D. R. M. Walton, Nature, 357, 479. (1992). 9. F. Chen, D. Singh, S. A. Jansen, J. Phys. Chem., 97, 10958(1993). 10. F. Wudl, in Buckminsterfullerenes. Edited by W. Edward Billups and Marco A. Ciufolini, (VCH: New York, 1993), chap. 13. 11. D. A. Dixon, N. Matsuzawa, T. Fukunaga, F. N. Tebbe, J. Phys. Chem., 96, 6107(1992) and references therein. 12. N. Matsuzawa, D. A. Dixon, P. J. Krusic, / Phys. Chem., 96, 8317(1992) and references therein. 13. F. N. Tebbe, R. L. Harlow, D. B. Chase, D. L. Thorn, G. C. Campbell, Jr., J. C. Calabrese, N. Herron, R. J. Young, Jr., E. Wasserman, Science, 256, 822(1992). 14. (a) R. Hoffmann. /. Chem. Phys. 39, 1397(1963). (b) R. Hoffmann., W. M. Lipsomb, J. Chem. Phys. 36, 3179; 37, 2872(1962).
216

A MOLECULAR DYNAMICS INVESTIGATION OF C60-RARE GAS MIXTURES
MARIA C. ABRAMO AND C.CACCAMO Dipartimento di Fisica, Sez. Teorica, Universita' di Messina, C.P.50 , 98166 S.Agata di Messina, Italy
ABSTRACT: Mixtures of krypton atoms and Cg0, modelled in terms of rigid spherical molecules, are investigated at T ~1800K through classical Molecular Dynamics. The two species do not tend to mix for low to moderate concentrations of krypton, and solid clusters of CgQ tend to be stable. Possible implications of these results are shortly discussed.
It is known that Cg0 molecules were discovered1, and the solid phase of
this same fullerene obtained2, after vaporizing graphite layers or rods, in a helium gas atmosphere; it was also found that helium pressure played a crucial role in the formation of the CgQ molecule
Possible aggregation of fullerene molecules, once formed in the high temperature gaseous phase surrounding, e.g., the electrodes of a carbon-arc, could also be of interest.
This study is an attempt to investigate, through a simple potential modelization and a fully microscopic approach, the role that an inert gas can play in mixture with CgQ at high temperature.
Specifically, we report constant volume Molecular Dynamics (MD) investigation of mixtures of krypton atoms and CgQ molecules for different concentrations of Kr. The temperature T~1800K, and the particle density (see below) at which we perform our simulations for the mixture, should be those typical of hot fluid pure Cg0, according to recently determined phase diagrams of model CgQ
Rare gas particles interact through the well known Lennard-Jones (LJ) potential, while Cg0 molecules are assumed to interact through a spherically averaged potential due to Girifalco5, previously adopted in refs. (6,7). The interaction between Cg0 and Kr atoms is modeled in the form of an integrated LJ potential due to Breton et at.
Two Kr concentrations c were investigated : c=0.3 and c=0.5. The particle density was fixed in terms of the reduced density p = P^T"]lir+PQß()a'C60' wnere
p., , pCg„ are the Kr and Cg0 number density of particles, respectively; <rK
r=3.5 A is the repulsive parameter entering the LJ Kr-Kr potential (and roughly corresponding to the Kr diameter), and <rCg0=7.1 A is the diameter of the Cp0 molecule5. All results reported below have been obtained for p*=0.34, but simulations at higher reduced densities have also been performed . -.r
The MD simulations were performed with a time step of 0.5 x 10 ' s. After 10000 equilibration time steps (corresponding to 50 ps), averages were cumulated over further 5000 time steps (25 ps). Each run was started by placing Cg0 and Kr particles on a fee lattice, according to configurations which we visualize through the projections of the particle positions on the coordinate planes xy , xz, yz , as shown in figs. 1 and 2.
It appears that Kr atoms were initially confined into a slice of the basic simulation box, parallel to the yz plane; this slice was delimited by two adiacent Cg0 slices. The replicae of the box will then generate a sort of 'wafer' arrangement with Cg0 and Kr blocks interleaved.
Wc can see by comparing top with bottom projections in fig. 1, that at
217
Mat. Res. Soc. Symp. Proc. Vol. 359 ° 1995 Materials Research Society

c=0.3 only a small number of Kr molecules is able to penetrate 'slices', and viceversa. (Full equilibration of our final MD is ensured by the behavior of thermodynamic quantities).
the C60 configuration
i ■ -j- m i-MVTL. ■ v > M^-»-r-»-. -a-.-o
O O OO O O a , • * > i o q o o bo' •'■■ • • ii -OOOOOOa « a O OOOOOOa a *|i
V°-oooooo' •••^i OOOOOOa • a «I
OOOOOOa a • <i
O O O O O o[ a • a '<>
OOOOOOaaali
-fW-'-WT» ■ 0-«-Q •-&-. » T-»-.-a
O O O O O o'_ a a a
OOOOOOj'aaa
OOOOOO;» a a
OO OOOOa a *
OOOOOOa a a
OOOOOOaaa
O0OOOO:aaa
OOOOOOaaa
y »
1 > £» & O
o o o *PL*T5-5
« o <, oY.\V9
Fig.l: TOE: projections onto iy and zz planes of the initial MD configuration at c=0.3,T ~1800K and p =0.34. Bottom:same projections as top taken after 75 ps simulation. Circles:Cßn; full dotsrKr. bU
O O O O
%%&: r$>tj
Fig.2: same legend, temperature and density as fig.l but for c=0.5
A substantially different result is obtained at c=0.5, by keeping T and p*
218

the same as in the c=0.3 case. This appears from fig. 2 where an effective mixing of the two species is visible at the end of the MD run.
A further insight into the effect of Kr concentration is offered by fig. 3 where the Cg0-Cg0 radial distribution function (rdf) is displayed. It appears that as soon as the Kr concentration is increased, by starting
from the pure CgQ case up to c=0.3, the rdf progressively transforms from a liquid-like to a solid-like pattern. Then, at c=0.4 a sudden change takes place, and the CgQ rdf turns to liquid-like behavior.
o
3.5
Fig.3: Radial distribution function of Cgp les for CgQ-Kr mixtures at different centrations, T~1800K and p*=0.34.
The mean square displacements, not reported here, confirm the above picture. Ve find that until the two species do not mix with each other, the Cg0 movements tend to be frozen, with Kr atoms flowing extremely fast within their confining slice; their diffusion coefficient DKr> 10 cm s is actually typical of a gas phase. Then, as soon as mixing takes place at c=0.5, the Kr diffusivity drops substantially to less than 10 cm s while, by converse, CgQ diffusivity increases .
These results show that clusterization of CgQ molecules in a solid-like arrangement might be favored by mixing them to moderate amounts ( c*:20.3) of a inert gas. Obviously, since C( 60 is produced in an inert gas (helium) atmosphere, the global concentration "of the latter will be much greater than c~0.3. However, the relative abundance of carbon and helium species could be considerably different in the immediate neighbourhood of the arc. In the light öf the above results, the mixing properties of CgQ-rare gas systems in such a restricted zone might deserve further investigation.
References
1) H.V.Kroto, J.R.Heath, S.C.O'Brien, R.F.Curl, R.E.Smalley, Nature 318 ,162 (1985).
219

2) W.Kratschmer,L.D.Lamb, K.Fostiropulos and D.R.Huffman, Nature 347, 354 (1990).
3) R.F.Curl and R.E.Smalley, Scientific American Oct. 91, p. 32.
4) D.R. Huff man, Physics Today Nov. 1991, p. 22. 5) L.A.Girifalco, J.Phys.Chem.96, 858 (1992). 6) A.Cheng, M.L.Klein and C.Caccamo, Phys.Rev.
Lett. 71, 1200 (1993). 7) M.H.J.Hagen, E.J.Meijer,G.C.A.M.Mooij,D.Frenkel
and H.N.Lekkerkerker, Nature 365, 425 (1993). 8) J.Breton, J.Gonzales-Platas and G.Girardet,
J.Chem.Phys. 99, 4036 (1993).
220

ELECTRONIC ANGULAR MOMENTUM EFFECTS IN THE PHOTOPHYSICAL BEHAVIOR OF FULLERENES
S. M. Argentine and A. H. Francis Department of Chemistry, University of Michigan, Ann Arbor, MI 48109-1055
ABSTRACT
The intensity of the electronic origin in the emission spectrum of C70 exhibits a strong solvent sensitivity. The intensity of this peak increases relative to the vibronic features as the dielectric constant of the solvent increases. This solvent dependence is explained by an extension of Platt's Perimeter Free Electron Orbital model. The fullerenes, in particular CQQ and C70, possess a nearly spherical symmetry that gives rise to the presence of significant electronic orbital angular momentum. The unexpected spectral sensitivity is shown to arise from quenching of the electronic angular momentum by the solvent environment.
INTRODUCTION
Several groups have examined the fluorescence of C70 [1-8]. The reported fluorescence spectra show significant vibronic intensity differences that are dependent on the solvent. The room temperature spectra reported by Williams and Verhoeven [2] and Sun and Bunker [3] reveal dramatic intensity differences between the origin and the first vibronic feature in hexane, benzene, toluene, and dichloromethane. Palewska et al [4] noted the pronounced difference in intensity between a vibronic feature of their fluorescence spectrum taken in n-hexane at 77K and the same band in Arbogast and Foote's [5] fluorescence spectrum taken in 3:1 MCH/3-methylpentane glass at the same temperature.
The solvent-dependent behavior of the C70 emission is easier to study in phosphorescence rather than fluorescence simply because the fluorescence structure broadens in solvents of increasing dielectric constant and the phosphorescence remains well-resolved. We have observed a giant solvent-induced intensity change in the phosphorescence of C70; the relative intensity of the 0-0 transition increases dramatically as the dielectric constant of the solvent increases. We have been able to understand this behavior by extending Platt's Perimeter Free Electron Orbital (PFEO) model, originally developed to describe the photophysical behavior of planar aromatic cata-condensed hydrocarbons (general formula: C4n+2H2n+4) PL Platt's model successfully explains the characteristically weak intensity of the absorbance origin of these symmetric molecules in terms of their intrinsic forbiddeness by selection rules based on the conservation of orbital angular momentum. Angular momentum is a good quantum number only for the most symmetric molecules. Certainly the fullerenes fall into this category. Cgo and C70 in particular possess a nearly spherical symmetry that gives rise to the presence of significant angular momentum. The unexpected spectral sensitivity we have observed is shown to arise from environmental induced quenching of the electronic angular momentum, similar to the angular momentum quenching that occurs when substituents are added to cata-condensed hydrocarbons.
221
Mat. Res. Soc. Symp. Proc.Vol. 359 e 1995 Materials Research Society

EXPERIMENTAL SECTION
Spectrophotometric grade toluene, methylcyclohexane (MCH), and iodoethane were used to prepare lO'^M solutions of C70- The solutions were degassed in quartz tubes by several freeze-evacuate-thaw cycles and sealed under vacuum. Photoluminescence (PL) spectra of the glassy solutions were recorded at 77K in a Janis 10DT cryostat with a cold flow of N2 gas or by direct immersion in the cryogenic liquid.
PL spectra were obtained by employing broad-band excitation into the weak, long wavelength absorption band of C70 using a high-pressure 1-kW xenon arc lamp and a Q1SO4 solution filter that transmits between 29400 and 18300 cm"*. The luminescence was passed through a Coming 2-63 glass filter to remove scattered excitation wavelengths and then dispersed by a 1/4-meter Acton Research Corporation scanning monochromator. The phosphorescence was detected with a cooled, red-sensitivity enhanced, Hamamatsu R1767 photomultiplier tube.
RESULTS AND DISCUSSION
Figure 1 illustrates the phosphorescence of C70 at 77K in MCH, toluene and 3:1 MCH/iodoethane. We have designated the peak at 12404 cnr* (peak B) as the origin of the phosphorescence system rather than the highest-energy peak at 12659 cm"l (peak A) because peak A is strongly temperature dependent As the temperature is decreased below 77K, the
a .2
13000 12000 11000
wavenumber(cm-l)
Figure 1. PL spectra of C70 in a) MCH glass at 77K, b) toluene glass at 77K, c) 3:1 MCHyiodoethane glass at 4K
222

intensity of peak A decreases while the intensity of all other peaks in the phosphorescence system increases. We therefore conclude that this emission arises from a different state and assign peak B as the 0-0 transition of the phosphorescence [10]. The ratio of the integrated area of the 0-0 transition (peak B) to peak C is clearly dependent on solvent. The ratio increases by an order of magnitude as the dielectric constant of the solvent increases from 2.02 in MCH to 7.82 in iodoethane, revealing a giant solvent dependence in the emission of C70 Similar solvent- dependent behavior is known to occur for pyrene [11], although the magnitude of the effect is considerably smaller.
This increase in intensity of the weak origin as the C70 solute is perturbed by an increasingly polar solvent is similar to the intensity behavior of the origin in the long-wavelength absorption spectra of aromatic hydrocarbons. The weak absorbance origin of these molecules typically becomes more intense when substituent groups are added. For example, the origin of toluene is much more intense than the origin of benzene [12]. Perturbations of the molecule by solvent or by chemical substitution have been predicted to produce effects that are qualitatively similar, but quantitatively different [13]. For example, the intensity of the origin of pyrene increases dramatically when the dielectric of the solvent increases [ 11 ] or when an ethyl substituent is added [14]. Plan's PFEO model successfully explains the characteristic transitions of both cata-condensed and peri-condensed hydrocarbons.
Platt's Perimeter Free Electron Orbital Model
Platt first proposed a perimeter model for cata-condensed hydrocarbons in 1949. The K
electrons are treated as particles on a circle whose circumference is equal to the perimeter of the hydrocarbon in question. The resulting Schrodinger equation is that of a plane rotor whose solutions are well-known:
E =qlfil2l (1)
where q is the orbital ring quantum number and / is the moment of inertia. Angular momentum is well-defined in this circular system and leads to the selection rule |A^| = 1- As shown in Figure 2,
all energy levels except the lowest are two-fold degenerate, corresponding to angular momentum states equal in magnitude but opposite in sign. The q=Q level is singly degenerate because the angular momentum of this molecular orbital is zero. For aromatic cata-condensed hydrocarbons, the number of pi-electrons is 4n+2, where n is the number of rings. The HOMO is therefore filled and has q=n. The total ring quantum number Q is the sum of the individual angular momenta and is necessarily zero for the ground state. States with Q=0 are designated as A states in the Platt notation. When an electron is promoted to the next higher energy level, the total ring quantum number is Q=(n+1) + n = 1 or 2n+l, resulting in 8 possible states: ^1^, 1'3Lb, 1>3 Ba, ^Bf,. In Platt's notation, the B states correspond to Q=l and the L states correspond to Q=2n+1. The a, b designations arise from introduction of the periodic potential of the carbon skeleton, which splits the two-fold degeneracy of the states. According to Hund's rule for partially filled orbitals, states of high Q lie lower in energy than states of low Q. Thus, for highly symmetric aromatic cata-condensed hydrocarbons the HOMO-LUMO transition is from an A state to an L state, and the transition is angular momentum forbidden since AQ=2n+l. A characteristically weak 0-0 transition is observed for these molecules even though the transitions are orbitally allowed. Platt's model is only valid for molecules of nearly circular (highly symmetric) symmetry; when a
223
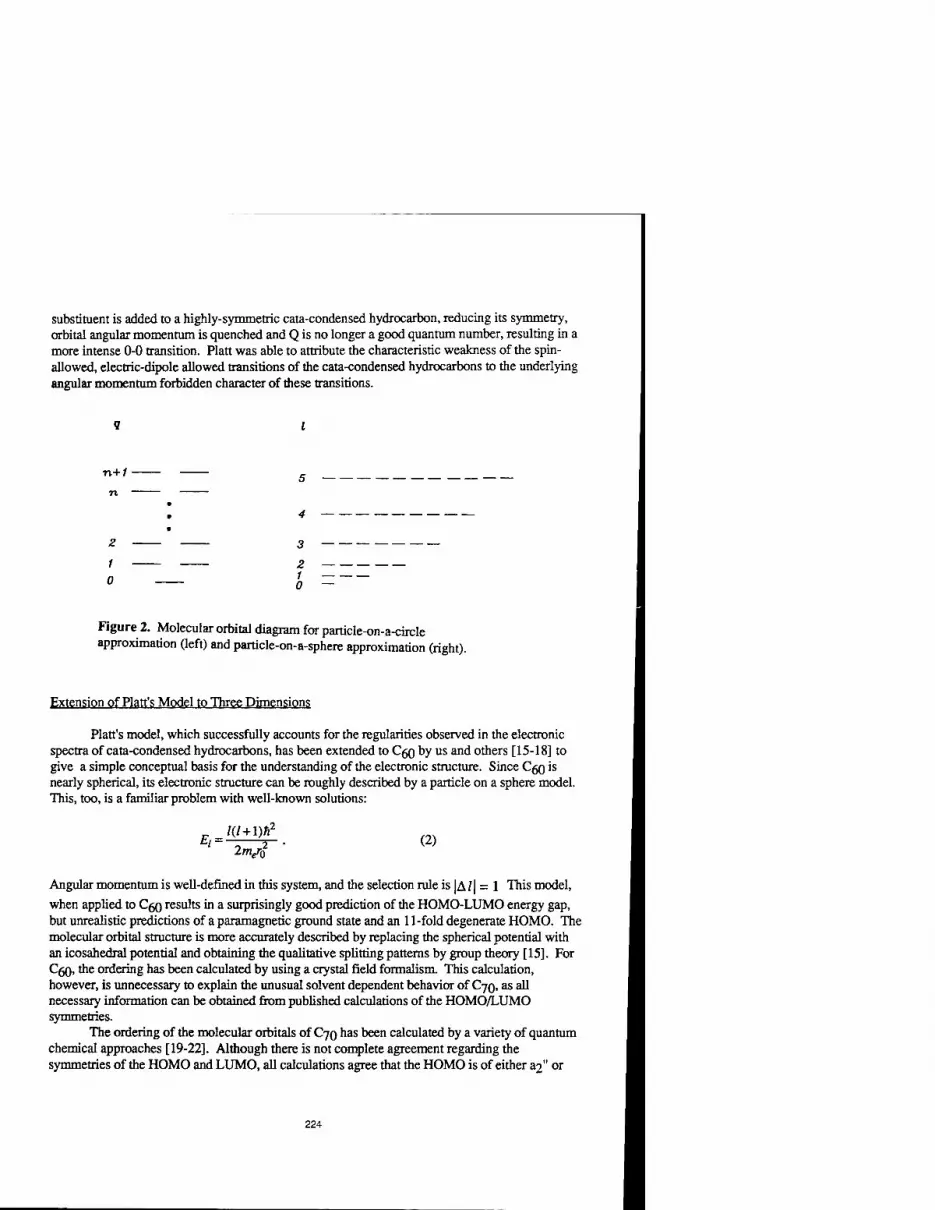
substituent is added to a highly-symmetric cata-condensed hydrocarbon, reducing its symmetry, orbital angular momentum is quenched and Q is no longer a good quantum number, resulting in a more intense 0-0 transition. Platt was able to attribute the characteristic weakness of the spin- allowed, electric-dipole allowed transitions of the cata-condensed hydrocarbons to the underlying angular momentum forbidden character of these transitions.
m
9
• „
/ 0 / —
o — —
Figure 2. Molecular orbital diagram for particle-on-a-circle approximation (left) and particle-on-a-sphere approximation (right).
Extension of Platt's Model to Three Dimensions
Plan's model, which successfully accounts for the regularities observed in the electronic spectra of cata-condensed hydrocarbons, has been extended to Cßo by us and others [15-18] to give a simple conceptual basis for the understanding of the electronic structure. Since C50 is nearly spherical, its electronic structure can be roughly described by a particle on a sphere model. This, too, is a familiar problem with well-known solutions:
£; = lil+\)n2
(2)
Angular momentum is well-defined in this system, and the selection rule is |A/| = 1 This model,
when applied to C50 results in a surprisingly good prediction of the HOMO-LUMO energy gap, but unrealistic predictions of a paramagnetic ground state and an 11-fold degenerate HOMO. The molecular orbital structure is more accurately described by replacing the spherical potential with an icosahedral potential and obtaining the qualitative splitting patterns by group theory [15]. For Cgrj, the ordering has been calculated by using a crystal field formalism. This calculation, however, is unnecessary to explain the unusual solvent dependent behavior of C70, as all necessary information can be obtained from published calculations of the HOMO/LUMO symmetries.
The ordering of the molecular orbitals of C70 has been calculated by a variety of quantum chemical approaches [19-22]. Although there is not complete agreement regarding the symmetries of the HOMO and LUMO, all calculations agree that the HOMO is of either a2" or
224

e2" symmetry and the LUMO is of either ei" or aj" symmetry. The important information from these calculations is that both the HOMO and LUMO are of double prime symmetry. From these symmetries, we can deduce the angular momentum origin of these orbitals in the particle-on-a- sphere model. Odd angular momentum molecular orbitals in a spherical potential split into molecular orbitals of double-prime symmetry and even angular momentum molecular orbitals split into molecular orbitals of single-prime symmetry. The HOMO and LUMO, therefore, must originate from states of the same angular momentum or from angular momentum states that differ by an even integer. According to Platt's model, the HOMO-LUMO transition is angular momentum forbidden since AL (corresponding to AQ in the Platt notation) is either zero or two. The observed solvent-dependent behavior can be explained in terms the predicted angular momentum forbiddeness.
Just as Platt's model works best for molecules with small departures from circular symmetry, the model we propose should work best for molecules with small departures from spherical symmetry. Since the HOMO-LUMO transitions for Cgo and C70 are forbidden by angular momentum selection rules, the HOMO-LUMO transitions for both molecules are expected to be weak. Indeed, the absorbance spectra indicate weak electronic origins for both molecules; and the origin for CgQ is much weaker than that for C70, as expected. Further reduction of the symmetry of C70 would result in additional relaxing of the angular momentum selection rules and increased intensity of the HOMO-LUMO transition.
The HOMO-LUMO transition in the phosphorescence of C70 is symmetry allowed but spin forbidden. The change in spin explains the weakness of the entire phosphorescence spectrum. It does not, however, explain why only the origin of this system is weak in solvents with small dielectric constants. It appears that the 0-0 transition is forbidden for C70 in MCH but becomes more allowed as solvents with larger dielectric constants are used. This observation can be adequately explained by relaxation of the angular momentum selection rules as the dielectric constant of the solvent increases. To relax the angular momentum selection rules, we need only perturb the D^ symmetry of €70- We can imagine two ways the solvent may effect a symmetry reduction: 1) by inducing solute association or clustering, or 2) by asymmetric packing of the solvent around the individual C70 molecules.
Cluster Formation
Recent investigations of the optical absorption spectra and the classical light scattering behavior of room temperature CgQ and C70 solutions have suggested that these species associate in solution to form weakly bound clusters [22-25]. Laser light scattering studies of Cgg hi benzene solution at room temperature indicate that Cgo aggregates in 10" 3 M solutions. This concentration exceeds the concentrations of the solutions used in our experiments by two orders of magnitude. Evidence for C70 cluster formation is not as convincing. An abrupt change in the absorption spectrum of C70 in a toluene/acetonitrile solution as the volume fraction of acetonitrile increases above about 0.6 has been attributed to C70 cluster formation. It seems, however, that charge transfer is an equally likely explanation for the observed red-shift of the absorbance spectra.
We would expect C70 clusters to produce a diffuse spectrum and to shift the entire luminescence spectrum to longer wavelengths. We have not observed these features in our own spectra and have therefore discarded increasing cluster formation in different solvents as the cause of the solvent-dependent intensity of the origin.
225

Asymmetrie Solvent Packing
In vitreous, frozen matrices, the effects of solvent interactions in the Cgo and C70 spectra are revealed through both inhomogeneous broadening and intensity changes of various spectral features. Solvent effects upon linewidth produce inhomogeneous linewidths on the order of 50 cm-1 in the phosphorescence spectrum of C7Q. The effect of the solvation environment upon intensity is expected to be pronounced only for those spectral features that are associated with forbidden transitions. Increasing the polarity of the solvent increases the magnitude of the solute/solvent interaction. The increased intensity of the solvent induced Platt forbidden transitions is associated with static, highly selective solvent environments in the vitreous frozen solvent We interpret the phosphorescence spectrum as arising from the superposition of two sub-spectra: an angular momentum forbidden spectrum with weak vibrational structure and a vibronically induced spectrum involving asymmetric vibrational modes. The two sub-spectra gain intensity from different types of asymmetric distortion. The angular momentum forbidden spectrum gains intensity from the solvent distorted electronic environment and the vibronic spectrum gains intensity from nuclear distortion of the C70 molecule. The decomposition of the spectrum into the angular momentum forbidden transition and the vibronically allowed transition is shown in figure 3.
Platt Forbidden1
Vibronically allowed
Spectrum observed
Figure 3. Interpretation of observed C70 emission spectrum. A) angular momentum forbidden transition, B) vibronically allowed transition.
CONCLUSION
The increase in intensity of the electronic origin in of C70 with solvents of increasing dielectric constant have been explained by an extension of the Platt model. This model predicts that the
226
HOMO-LUMO transition is forbidden by angular momentum selection rules. As the symmetry of C70 is reduced by asymmetric packing of the solvent, the angular momentum selection rules are quenched and the intensity of the purely electronic transition increases.
References 1. E. Shin, J. Park, M. Lee, D. Kim, Y.D. Suh, S.I. Yang, S.M. Jin, S.K. Kim, Chem. Phys. Lett. 209,427(1993). 2. R.M. Williams, J.W. Verhoeven, Chem. Phys. Lett. 194, 446 (1992). 3. Y.-P. Sun, C.E. Bunker, J. Phys. Chem. 97, 6770 (1993). 4. K. Palewska, J. Sworakowski, H. Chojnacki, E. Meister, U.P. Wild, J. Phys. Chem 97, 12167 (1993). 5. J.W. Arbogast, C.S. Foote, /. Am. Chem. Soc. 113, 8886 (1991). 6. J. Catalan, J. Elguero, /. Am. Chem. Soc. 115, 9249 (1993). 7. D. Kim, M. Lee, /. Am. Chem. Soc. 114, 4429 (1992). 8. Y. Wang, /. Phys. Chem. 96,764 (1992). 9. J. R. Platt, J. Chem. Phys. 17, 484 (1949). 10. S.M. Argentine, A.H. Francis, C.-C. Chen, CM. Lieber, J.S. Siegel, J. Phys. Chem. 98, 7350 (1994). 11. P. Lianos, S. Georghiou, Photochem. Photobiol. 30, 355 (1979). 12.1. B. Berlman, Handbook of Fluorescence Spectra of Aromatic Molecules. 2nd ed. (Academic Press, New York, 1971). p. 40. 13. J. R. Platt, /. Opt. Soc. Am. 43, 252 (1953). 14. F.W. Langklide, E.W. Thulstrup, J. Michl, J. Chem. Phys. 78, 3372 (1983). 15. M.R. Savina, L.L. Lohr, A.H. Francis, Chem. Phys. Lett. 205, 200 (1993). 16. G.A. Gallup, Chem .Phys. Lett. 187, 187 (1991). 17. D.W. Ball, J. Chem. Ed. 71, 463 (1994). 18. F. Rioux, J. Chem. Ed. 71 464 (1994). 19. J. Baker, P.W. Fowler, P. Lazzeretti, M. Malagoli, R. Zanasi, Chem. Phys. Lett. 184, 182 (1991). 20. W. Andreoni, F. Gygi, M. Parrinello, Chem. Phys. Lett. 189, 241 (1992). 21. G.E. Scuseria, Chem. Phys. Lett. 180, 451 (1991). 22. J. Shumwat, S. Satpathy, Chem. Phys. Lett. 211, 595 (1993). 23. Y.-P. Sun, C.E. Bunker, Nature 365, 398 (1993). 24. Ying, Q., J. Maracek, b. Chu, Chem. Phys. Lett. 219, 214 (1994). 25. T.P. Martin, U. Naher, H. Schaber, U. Zimmerman, Phys. Rev. Lett. 70, 3079 (1993).
227

SEARCH FOR THE GROUND STATE OF C6oBio
Keivan Esfarjani, Kaoru Ohno and Yoshiyuki Kawazoe Institute for Materials Research, Tohoku University, Sendai 980-77, Japan
ABSTRACT
Recent experimental discovery of C60B10 has motivated the present search for the possible atomic structures of this system. We have already studied the electronic properties of CssBN within the density functional theory, and are interested in the effects of other substitutions of carbon atoms by boron and nitrogen in fullerenes. In our all-electron calculation, we adopt the mixed-basis approach in which Is and 2p Orbitals in addition to about 3000 plane waves are included. The total energy and the band gap of many possible configurations are calculated in order to predict the most stable structure of this system. The density of states is presented as well for the ground state configuration.
INTRODUCTION
The discovery of fullerenes as fundamentally new stable structures of carbon clusters'1' has stimulated much interest in the existence of similar type of clusters constructed with differ- ent species. For example, by laser vaporization supersonic cluster beam studies, Guo et al.' ' suggested that several carbon atoms in Ceo were replaced by boron atoms, forming Cso-nBn • Miyamoto et al.'3' and Esfarjani et al.'4' calculated the electronic structures of hypothetical fee C59B and C58BN , respectively. In the first case it was found that there is an acceptor level due to the boron atom in the band gap of C59B which has an open shell structure. In the second case, for N and B far from each other, a donor as well as an acceptor level were found in the gap, whereas for N nearest neighbor to B, very similar properties to COO were discovered (i.e. same band gap with no donor nor acceptor levels). The structure was closed-shell and therefore stable. Recently, we were informed'5' of the synthesis of a new doped fullerene, namely C60B10 for which no structural data was available. We have therefore performed electronic structure calculations for several possible structures to find the most stable one.
Going from one structure to another requires breaking many bonds: typically to form an isomer of Ceo with two neighboring pentagons, one needs to overcome an energy barrier of about 7 eV'6'. The energy required to break only one bond is at least 3 eV and that corresponds to a temperature of 33,000 K! This temperature being much higher than the experimental temperature at which these molecules are formed, there can not be an activated transition from one structure to another of lower energy. Therefore, both structures can a priori be formed and would be thermodynamically stable; however their kinetic stability would depend on other parameters such as the band gap. Since the energy barrier between these structures is very high, a molecular dynamics simulation would not be able to predict systematically the lowest energy structure. Accordingly, one can find many metastable states, i.e. local minima in each class of considered structures (i.e. the minimum would depend on the starting point, and would have a similar geometric structure to it.)
In this study, we concentrate on the search of local or global minima which are kinetically stable structures. Any metastable state (i.e. local minima with higher energy) is possible provided that it does not react chemically with other elements, or in other words, has a fairly
229
Mat. Res. Soc. Symp. Proc. Vol. 359 ° 1995 Materials Research Society

large gap so that it can be produced in an isolated form. So, in what follows, one criterion for stability would be clusters with a "large" gap.
Within each class of considered structure, a classical MD simulation would allow us to find roughly the relaxed position of the atoms. We have performed such relaxation by using the Cerius2 software package'7). The energy function of this package includes terms such as : Van der Waals (VdW) and electrostatic interactions in addition to terms describing bond-stretching, angle-bending and torsions. The constants coming in each term are looked up in a table depending on the elements involved. Once the relaxed positions are found by this means, we proceed to the ab-initio total-energy calculation and compare the energies and the gaps of the considered structures.
The possible structures for CöOBIO can be classified into 2 large categories. Here we are considering the most likely configurations having a cage-like structure. The first category includes structures like C70 and its isomers in which 10 carbons of the cage are substituted by borons, and the second a Ceo cage with 10 borons inside or outside the cage.
We will first use some general criteria to rule out many possibilities. One is in search of a configuration where the energy is least. Therefore, one has to minimize the number of dangling bonds since the energy gained by forming a bond in the case of B or C is at least about 3 eV. In the case of polar bonds between B and C because of the difference in their electronegativity, some transfer of charge will take place and will result in an electrostatic interaction between the "residual electron" on C and the "hole" on B. Because of the existence of the two types of charge, a configuration with a higher number of C-B bonds and a lower number of B-B and C-C bonds is favored. The VdW interaction must also be minimized. In the case of Bio inside the COO cage for example there is a strong repulsion between the electronic clouds of the carbon and the boron clusters which will give rise to a relatively high local minimum energy state. The configurations in which there is a B-B bond passing through the spherical cage would be eliminated because of the large VdW repulsion. Other considerations include keeping the bond lengths and the angles between the bonds near their "equilibrium value"; both these terms are quadratic in their respective variables.
METHODOLOGY
Our ab-initio electronic-structure program is based on the mixed-basis approach in which the basis functions are Slater orbitals as well as plane waves. The exchange and correlations are represented in a local density approximation (LDA) by the Xa formula. This is an all-electron calculation in which we use Is, 2px, 2py and 2p, Slater orbitals for each atom in addition to 2,891 plane waves in a super cell of 13 Ahaving 128 x 128 x 128 mesh points. This method has been successfully used for fullerenes, for more details about the method, the reader can consult references in (8).
The configurations we have considered are presented below. All the structural minimizations are done with Cerius2. The total energies and the band gaps are however calculated by using our own ab-initio method.
1- Ceo with 10 borons inside the cage: When we carry out classical MD simulation for this structure, we assume VdW bonding between boron and carbon atoms; otherwise a carbon atom would have an sp3 hybridization which would deflate the cage structure of COO ■ The 10 borons form then a compact structure. We considered the 2 following forms:
a- two pentagons with their planes parallel to each other; but one is rotated by ir/5 with respect to the other ( the point group would be D5.)
b- two pyramids of square bases parallel to each other where one is rotated with respect to
230

Table I: Energy(calculated by Cerius3) and symmetry of the proposed structures for CeoBio
Structure 1-a 1-b 2-a 2-b 2-c 3-a 3-b 3-c
Symmetry D5 - C2 - - D5h C5 D5
Energy (kcal/mol) 3850 3972 980 1003 978 926 941 874
LDA Energy(eV) -1071.3 - - - - -1070.3 -1070.7 -1072.0
LDA gap(eV) 0.12 - - - - 0.04 0.05 0.9
the other by an angle of ir/4 ( the point group would be D4.) 2- C60 with 10 borons outside:
In this case in principle it is possible to include covalent bonding between B and C, the form of the cage would be only slightly changed. It turns out however that the energies are much higher if we connect borons to the cage, because it will cost much energy to deform the cage. So all the considered structures in this category interact with the Ceo cage via VdW interactions.
a- The 10 borons form 2 connected hexagonal rings and face two hexagons of COO • b- Same as case a but instead of two hexagons, we consider a ring. c- Same as case a but instead of two hexagons, we consider an open chain. 3- C70 structure with 10 carbons substituted by 10 borons. In this case, we assume the 3
following forms: a- 10 borons on the belt b- 10 borons on the top part of the cage c- 10 borons dispersed on the rings above and below the belt in a symmetric way so as to
keep them as far as possible away from each other. A C70 isomer was also considered for the sake of completeness. These isomers which have
pairs of edge-sharing pentagons are believed however not to be stable because the mentioned edge is chemically active and that makes their existence in isolated form very unlikely. If we replace the two carbons of the edge by borons, the n bonds would disappear and we can gain some of the energy stored in the angles, but the bond lengths with B being longer, we lose much bond-length
energy. The structure of the case 3-c is displayed in Fig.l; the energies calculated by Cerius and
LDA are in Table I.
Figure 1: Atomic configuration of the structure with highest LDA gap and lowest total energy
RESULTS AND DISCUSSION
The experimental evidence for the structure C60B10 comes from mass-spectral analysis'5'. It does not therefore mean that the obtained structure can be isolated, or in other words, that it is
231
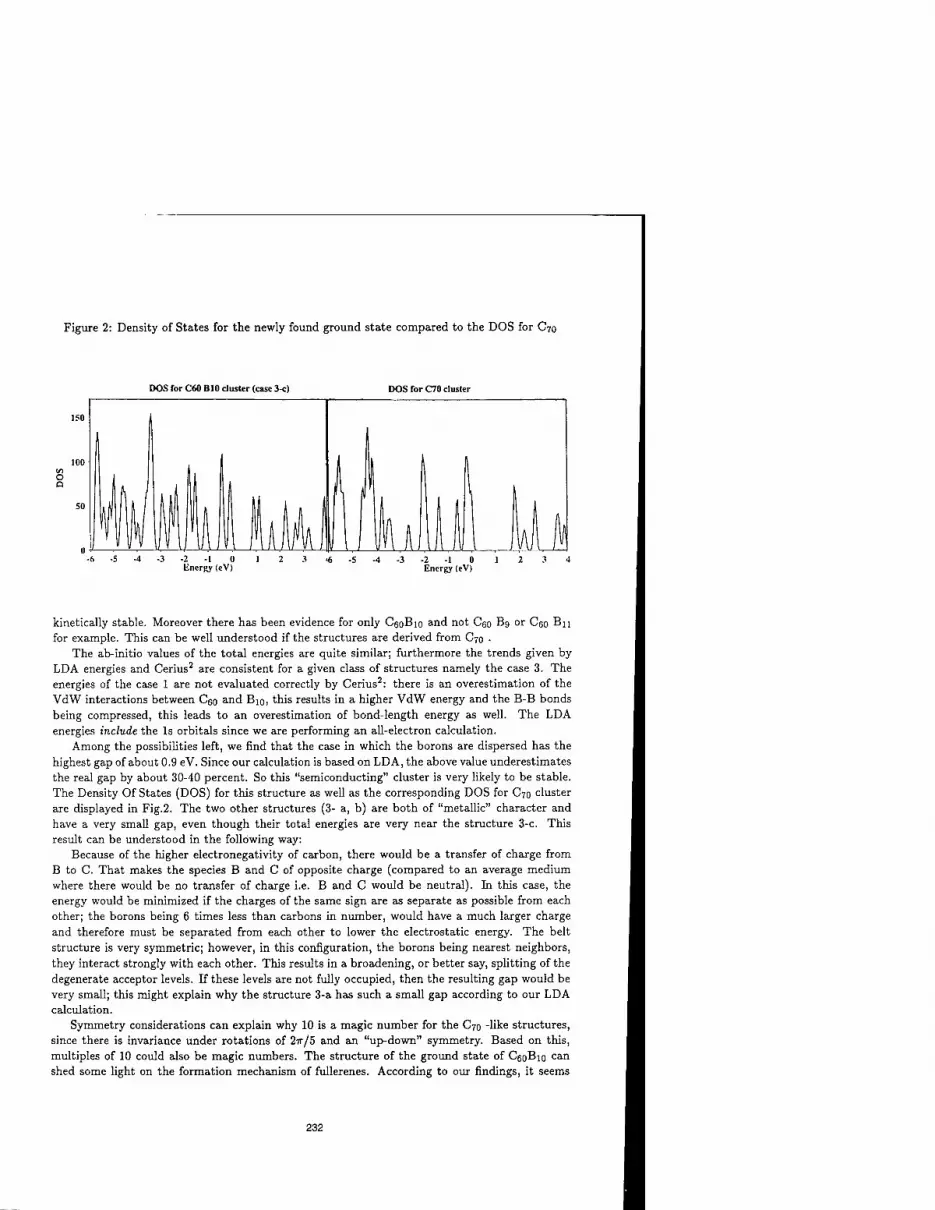
Figure 2: Density of States for the newly found ground state compared to the DOS for C70
DOS for C60 BIO cluster (case 3-c) DOS for C70 cluster
kinetically stable. Moreover there has been evidence for only C60B10 and not Ceo Bg or Cro Bn for example. This can be well understood if the structures are derived from C70 .
The ab-initio values of the total energies are quite similar; furthermore the trends given by LDA energies and Cerius2 are consistent for a given class of structures namely the case 3. The energies of the case 1 are not evaluated correctly by Cerius2: there is an overestimation of the VdW interactions between C60 and Bio, this results in a higher VdW energy and the B-B bonds being compressed, this leads to an overestimation of bond-length energy as well. The LDA energies include the Is orbitals since we are performing an all-electron calculation.
Among the possibilities left, we find that the case in which the borons are dispersed has the highest gap of about 0.9 eV. Since our calculation is based on LDA, the above value underestimates the real gap by about 30-40 percent. So this "semiconducting" cluster is very likely to be stable. The Density Of States (DOS) for this structure as well as the corresponding DOS for C70 cluster are displayed in Fig.2. The two other structures (3- a, b) are both of "metallic" character and have a very small gap, even though their total energies are very near the structure 3-c. This result can be understood in the following way:
Because of the higher electronegativity of carbon, there would be a transfer of charge from B to C. That makes the species B and C of opposite charge (compared to an average medium where there would be no transfer of charge i.e. B and C would be neutral). In this case, the energy would be minimized if the charges of the same sign are as separate as possible from each other; the borons being 6 times less than carbons in number, would have a much larger charge and therefore must be separated from each other to lower the electrostatic energy. The belt structure is very symmetric; however, in this configuration, the borons being nearest neighbors, they interact strongly with each other. This results in a broadening, or better say, splitting of the degenerate acceptor levels. If these levels are not fully occupied, then the resulting gap would be very small; this might explain why the structure 3-a has such a small gap according to our LDA calculation.
Symmetry considerations can explain why 10 is a magic number for the C70 -like structures, since there is invariance under rotations of 27r/5 and an "up-down" symmetry. Based on this, multiples of 10 could also be magic numbers. The structure of the ground state of CeoBio can shed some light on the formation mechanism of fullerenes. According to our findings, it seems
232

that the process of formation starts from the bottom and the top of the cage where a pentagon is at the center. As soon as such pentagon is formed, the building of the curved surface (cup shape C20) can follow almost automatically. Furthermore the borons depositing at the boundaries allow even a larger curvature, since they do not have any 7r electrons. Any two such half-spheres can then combine to form a full cage. To confirm experimentally the present findings, studies such as NMR to get some information on bond lengths, and diffraction to learn about the symmetry properties of the given cluster would be necessary.
CONCLUDING REMARKS
In this report, using all-electron mixed-basis calculation and the LDA, we found one possible configuration which is relatively stable kinetically and thermodynamically; and that is consistent with experimental findings.
In this structure the borons atoms are dispersed around the belt but are not neighbor to each other; its symmetry group is D5. The carbons on the belt are joint then by double bonds, although there is a slight distorsion which tilts them. This structure is chiral (but both left handed and right handed structures can exist) and therefore there can be ways of testing their existence experimentally by looking at the change in the polarization of incident photons for example. The LDA band gap of about 0.9 eV makes this cluster quite stable, so there should be the possibility of producing and isolating it, in which case, one may be able to grow semiconductors of relatively small gap out of it. We further predict that the cohesive energy of the resulting solid could be larger than C70 in which the molecules are bound by VdW interactions.
ACKNOWLEDGMENTS
We are very grateful to all the members of the computer-science group of IMR for valuable discussions and assistance in using the HITAC S-3800 supercomputing system. We also wish to thank Marcel Sluiter, Manabu Takahashi and Prof. Osawa for their fruitful discussions. This work is partially supported by the Grant-in-Aid for Science Research on Priority Areas "Carbon Microclusters" from the Ministry of Education, Science and Culture.
REFERENCES
1. R. F. Curl and R. E. Smalley, Science 242 (1988) 1017; H. W. Kroto et al., Nature 318 (1991) 162.
2. T. Guo, C. Jin and R. E. Smalley, J. Phys. Chem. 95. (1991) 4948
3. Y. Miyamoto, N. Hamada, A. Oshiyama, S. Saito, Phys. Rev. B 46 (1992) 1749.
4. K. Esfarjani, K. Ohno and Y. Kawazoe, MRS proceedings (spring 94) , and Phys. Rev. B (To appear in December 15 1994).
5. Robert Compton and Charles Ying (private communication).
6. R. L. Murry, D. L. Strout, G. K. Odom and G. E. Scuseria, Nature 366 (1993) 665.
7. Cerius2 is a software package produced by Molecular Simulations Inc.(1994).
8. Y. Kawazoe, H. Kamiyama, Y. Maruyama and K. Ohno, Jpn. J. Appl. Phys. 32 (1993) 1433; B.-L. Gu, Y. Maruyama, J.-Z. Yu, K. Ohno and Y. Kawazoe, Phys. Rev. B 49 (1994) 16202.
233

MOLECULAR DYNAMICS STUDIES OF NANOTUBE GROWTH IN A CARBON ARC
C. J. BRABEC, A. MAITI, C. ROLAND, AND J. BERNHOLC Department of Physics, N.C. State Univ., Raleigh, NC 27695-8202.
ABSTRACT
It has been shown experimentally that the growth of carbon nanotubes in an arc discharge is open-ended. This is surprising, because dangling bonds at the end of open tubes make the closed tube geometry more favorable energetically. Recently, it has been proposed that the large electric fields present at the tip of tube is the critical factor that keeps the tube open. We have studied the effects of the electric field on the growth of the nanotubes via ab initio molecular dynamics simulations. Surprisingly, it is found that the electric field cannot play a significant role in keeping the tubes open, implying that some other mechanism must be important. Extensive studies of the energetics and simulations of the growth of tubes were performed using a three- body Tersoff-Brenner potential. Our results show that there exists a critical diameter of ~ 3 nm above which a defect-free growth of a straight tubule is possible. Narrower tubes stabilize configurations with adjacent pentagons that lead to tube-closure and termination of the growth. This explains the absence of tube narrower than 2.2 nm in arc discharge experiments.
INTRODUCTION
The recent discovery of graphitic nanotubes in an arc discharge [1-3] has aroused much interest in the scientific community, due to their unusual structural and electronic properties. Experimental and theoretical studies show that nanotubes are potential candidates for wires of very high tensile strength, and that they exhibit interesting material characteristics as composites, catalysts, molecular straws and switches [4-7]. Recent experiments, utilizing metal catalysts [8] or plasma-decomposition of benzene [9], have led to the synthesis of nanotubes ranging from 1 to 200 (im.
In an arc discharge, bundles of nanotubes with diameters ranging from 2 to 20 nm grow at the graphite cathode in an inert gas atmosphere [1-3]. Because they form under highly non- equilibrium conditions, determining their growth mechanisms is a problem of considerable complexity. While it was initially believed that the tubes grow through the addition of atoms to the caps of closed tubes [10], recent experiments show that the growth of these tubes is open- ended [3]. This is quite surprising, because the presence of dangling bonds at the end of an open tube should favor the closed tube geometry. It has been proposed that the high electric field (E- field) present at the tip of the nanotube is the critical factor that prevents it from closing [11].
In this paper, we present results of an extensive theoretical study on the growth of carbon nanotubes in an arc discharge. Surprisingly, an unrealistically long critical tube length is required before the E-field alone can stabilize the growth of open tubes. Examination of the low-energy structures formed upon atomic depositions shows that tube closure is seeded by the formation of adjacent pentagon structures. Their formation is energetically favorable only for tubes narrower than a critical diameter, estimated to be ~ 3 nm. Wider tubes stabilize the formation of all- hexagonal structures, thereby allowing for continued growth. These results shed light on the mechanisms of non-catalytic growth of nanotubes, and explain the absence of narrow tubes in the arc discharge growth. We identify the specific mechanisms of adatom addition and motion and show by explicit molecular dynamics simulations that the growth of a straight helical tube can be achieved without a strong external field, provided that the tube is sufficiently wide.
235
Mat. Res. Soc. Symp. Proc. Vol. 359 ° 1995 Materials Research Society

ROLE OF THE ELECTRIC FIELD
To assess the role of the E-field, we solved the Laplace equation for the arc discharge geometry [12]. The effect of the E-field on the tips of carbon nanotubes was investigated using ab initio molecular dynamics [13]. The carbon atoms were represented by a soft core pseudopotential [14] that reproduces the structural properties of diamond and graphite. The effect of the external E-field was incorporated by an additional external energy term in the local density functional. Tips of both open and closed tubes with 0.7 run diameter were constructed. The small rube diameter was chosen in order to maximize the effects of the E-field and to minimize the computational cost. For the open tube-tip, six layers of an armchair tube (known to be metallic [7,15]) were used, while the closed tube-tip was constructed by replacing the top three layers of the open tip by a hemispherical cap of Qo- The tube-tips were about a diameter long, since the differences in induced charge between the open and closed tube-tips occur only in this range. A 26 Ry kinetic energy cutoff was used in the calculations, which corresponds to about 36,000 plane waves. The supercell included a vacuum region 0.7 nm wide in all cartesian directions, so ar "-> effectively isolate the tube-tip from its periodic images.
Both tube-tips were atomically relaxed in the absence of the E-field. It was found that the presence of dangling bonds at the open tube-tip favors the closed tube structure by 1.6 eV/dangling bond. As the E-field is turned on, the energy difference between the open and closed tubes decreases slowly. In order to present the best case scenario for the positive role of the E- field in enhancing open-ended growth, we compared the energy of the open tube in the E-field to that of the closed tube in zero field. The open tip was fully relaxed in E-fields characteristic of several different tube-lengths. The field at the tube-tip increases linearly as a function of the tube- length L, thereby increasing the electrostatic energy. For the 0.7 nm diameter buckytube, the E- field energetically favors the open tube geometry only for L > Lcriticai ~ 49 nm, which corresponds to a tip field of ~ 1.7 V/Ä. Since E,ip for a given L decreases with increasing tube diameter, wider nanotubes will have an even larger LcritiCai. However, thermionic and field emission are expected to occur at field-strengths smaller than 1 V/Ä [16,17], so that the crossover field is unattainable in practice. We therefore conclude that the E-field cannot be responsible for keeping the tubes open during growth.
LOW ENERGY STRUCTURES
With the E-field ruled out, open-ended growth must be due to other conditions in the arc discharge apparatus. The idea that hydrogen atoms temporarily saturate the dangling bonds and keep the tube open is attractive but highly improbable [11], due to the almost complete exclusion of H in the arc discharge experiments [1-3]. The presence of a thermal or concentration gradient of sufficient magnitude at the tube-tip can also be ruled out [11]. This naturally leads to a model based on local stability of open-ended structures in the accessible configuration space of the nanotubes.
In order to explore the relative stability of the various adatom structures, total energy calculations were performed using classical three-body interatomic potentials of Tersoff s form [18] with parameters due to Brenner [19]. A number of all-hexagon open tubes of varying diameters and helicities were constructed. Carbon atoms, dimers and trimers were deposited at various orientations on different parts of the open edges. The resulting structures were relaxed by the conjugate gradients method. The most important structures are the ones that form at a "step edge," where a row of hexagons terminates at the tube-tip.
For a dimer deposit there are two competing low energy structures, a hexagon and a 5-5 pair at a step edge. The 5-5 pair stabilizes one more dangling bond than the hexagon, but leads to a highly curved structure with a large strain energy. It is energetically favorable only for narrow, highly curved tubes. The hexagons, which lead to open growth, are energetically favored for less
236

curved, large diameter tubes. Other structures, such as a pentagon forming away from a step edge, or a pentagon and a dangling bond at a step edge, are energetically unfavorable, costing ~ 2 eV each. Trimers also insert themselves preferably at the edges of steps: 5-5-5, 5-6 and 6-5 are the lowest energy structures for very narrow tubes, with the 5-5-5 being the most stable energetically. As the tube-diameter increases, the 5-5-5 becomes unfavorable due to a large strain energy, and the 5-6 and 6-5 become the lowest energy structures. The formation of heptagons at the step edge is energetically unfavorable, both due to strain energy and the presence of additional dangling bonds (energy-cost > 1.7 eV).
The presence of a 5-5 or a 5-5-5 structure at a step edge leads to a highly curved tip that results in tube closure after further depositions. Our calculations thus suggest that narrow tubes cannot grow for long, due to the formation of structures with adjacent pentagons that act as seeds for tube-closure. However, tubes wider than ~ 3 nm stabilize structures with either hexagons or hexagons and isolated (exposed) pentagons at the step edges. The isolated pentagons are converted back to hexagons by additional deposits, and open-ended growth can continue. We should caution that although the Tersoff-Brenner potential gives reliable estimates for the elastic constants of graphite and nanotubes [20], we expect some differences between our calculated crossover (~ 3 nm) and that observed experimentally (~ 2.2 nm, see Ref. [1]) due to a wide range of possible helicities and the presence of nearby tubes and bundles in the experiments.
MOLECULAR DYNAMICS SIMULATIONS
In our molecular dynamics simulations, carbon atoms were also modeled with the three-body Tersoff-Brenner potential. A number of all-hexagon open tubes with varying diameters and helicities (m, n2), in the notation of Saito et al. [7], were constructed. A tube-length of approximately 12 A was used for all simulations. The tube tip was kept at a relatively high temperature of 3000 K, in order to simulate the high experimental temperatures of the cathode in the arc discharge apparatus. The electric field at the tube-tip is assumed to focus incoming carbon ions on the tube-tip. In the simulations, this effect was modeled by using a wide range of initial energies for the ions incident upon the tube-tip. Thus, singly charged carbon ions were aimed at random positions of the tip and given initial kinetic energies between 1-8 eV.
Carbon ions in our computer experiments were deposited at the rate of about one per 0.3 ns per unit nanometer length of the tube edge. Although this deposition rate is considerably higher than the estimated experimental value of about one per 10M04 ns, it is mandated by the extensive computer requirements of the simulations. However, as discussed below, the annealing of defect structures takes place on timescales of ~ 10-100 ps. Therefore, the important annealing and thermalization phenomena that occur in actual experiments can be studied even at this high deposition rate.
In all the simulations the incident ions were found to either: (a) insert into a ring close to where they strike the tube tip, or (b) form a new ring at a step edge, where a row of hexagons terminate at the tube-tip. For example, a carbon atom depositing on an all-hexagonal helical tube either forms a heptagon by inserting itself into one of the existing hexagons, or forms a pentagon at a step edge. Similarly, an atom depositing on an existing pentagon inserts itself to form a hexagon. Such insertion happens, regardless of the energy of the incoming ion, because of large thermal vibrations at the tube tip. Once the structures form, the heptagonal and pentagonal rings migrate along the step by a series of single bond switches, each occurring on a time-scale of 10-100 ps. There are two different ways in which a pentagon is found to migrate: (a) via single ring migration, in which a pentagon and an adjoining hexagon are swapped by means of a single bond switch; or (b) via double ring migration, in which a hexagon pair adjacent to an isolated pentagon gets converted into a heptagon-pentagon pair, with the heptagon adjoining the original pentagon. This conversion occurs through a single bond switch, and is induced by the local curvature generated by the pentagon's presence. The heptagon then annihilates the originally isolated
237

pentagon by another bond switch to form a pair of hexagons, leaving a pentagon that has effectively migrated two units from its initial position. Heptagonal rings are also observed to migrate by mechanisms similar to pentagon migration.
For the straight defect-free growth of a graphitic nanotube, it is necessary to maintain an all- hexagonal structure, with possibly a few isolated pentagons which get converted to hexagons upon additional deposits. However, heptagons do form when deposited atoms insert into existing hexagons. In reviewing the MD simulations, we have categorized the various ways in which the heptagons and pentagons anneal out to form a hexagonal structure. The basic processes fall into one of the following categories: (a) a heptagon migrates to a step edge and breaks up into a hexagon and a pentagon; (b) a heptagon "annihilates" a pentagon to form a hexagon pair; (c) a pentagon converts to a hexagon by a direct insertion of a deposited atom; (d) a pentagon pair at a step edge "fuses" together into a single hexagon. Processes (b) and (c) do not depend on the proximity of a step edge. Pentagons at a step edge can either: (a) migrate inward into the step; or (b) swap with the adjoining hexagon of the lower terrace, thus effectively migrating to the lower terrace. The above processes ensure the growth of helical, all-hexagonal structures with net additions of hexagons at the step edges, provided there are only single steps. At a double step edge, the simulations show that the heptagon swaps with the lower adjoining hexagon through a single bond switch, and then breaks up into a hexagon-pentagon pair at the lower step edge. The net addition of atoms therefore occurs first at the lower step edge so that the helicity of the tube is always maintained.
Figure 1: Snapshots from the growth simulation of the 6.0 nm tube: (a - f) illustrate the growth mechanisms observed on a small section of the tube tip. See text.
Figure 1 depicts snapshots of a specific growth simulation of a step edge on a 6 nm diameter tube with helicity (59, 27). The initial all-hexagonal structure, shown in Fig. la, remains stable with almost no bond switches, even at our high simulation temperatures. The first atom inserted itself to form a heptagon at the step edge (Fig. lb). The heptagon quickly broke up into a hexagon and a pentagon, with the pentagon at the step edge (Fig. lc). The pentagon then swapped with its adjacent hexagon and migrated one ring away from the step edge (Fig. Id). A second deposit inserted into the hexagon at the step edge to form a heptagon (Fig. le). This heptagon then annihilated with the migrated pentagon to form a pair of hexagons, thus resulting in an all- hexagonal structure (Fig. If).
This behavior is to be contrasted with the growth on narrow tubes. Figure 2 shows similar snapshots of growth for a tube of diameter 1.5 nm and helicity (16, 5). In this case, the initial all-
238

Figure 2: Snapshots from the growth simulation of the 1.5 nm tube: (a - d) show that the growth process rapidly leads to closure in narrow tubes; (e - f) Top and side views of the disordered cap formed by the attempted growth on a closed tube tip. See text.
hexagonal structure (Fig. 2a) is unstable and hexagons at step edges quickly degenerate into pentagon-pairs upon annealing. The pentagons, once formed (Fig. 2b), migrate along the open edge but never get converted back into hexagons through annihilation with heptagons. They introduce a large amount of curvature at the tube-tip, so that the tube begins to close with additional deposits (Fig. 2c). Figure 2d shows the closed tube after a simulation time of 6.6 ns with a net addition of 18 atoms. To test the suggestion of Endo et al. [10] that growth may take place through the incorporation of atoms into the caps of closed tubes, we have continued deposition even after the tube closed. Top and side views of the resulting geometry after 16.4 ns, during which 68 atoms were deposited, are shown in Figs. 2 e-f Clearly, deposition after closure has led to a very disordered cap at the tip. Open-ended tubes are therefore necessary for uniform nanotube growth.
The contrasting behavior between wide and narrow tubes as observed in our molecular dynamics simulations is in agreement with the energy arguments, which demonstrate the existence of a critical diameter, estimated to be ~ 3 nm. For tubes larger than this critical diameter, structures with only hexagons and possibly isolated pentagons, which get converted to hexagons upon growth, are energetically stable. For narrower tubes, the all-hexagonal structures are highly strained and structures involving adjacent pentagonal rings are energetically favored. Since all- hexagonal structures are necessary for a defect-free growth, and since stable pentagons lead to the formation of a cap, we conclude that tubes wider than the critical diameter should grow straight, while the narrower ones should close.
So far, all the discussion has been confined to the deposition of carbon atoms only. Larger carbon clusters, i.e., dimers, trimers and possibly even bigger clusters, are also expected to be present in the carbon soot formed in the dc-arc discharge. Our molecular dynamics simulations with singly charged dimers and trimers agree with the scenario described above: narrow tubes close while wider tubes grow with further depositions. However, unlike single atom deposits, such clusters create many more defects (both planar and non-planar) upon deposition, which take
239

a much longer time to anneal out. Since experimental annealing times are about three to four orders of magnitude larger than what can be achieved in current computer simulations, it is likely that these structures would still anneal during growth. We therefore expect no qualitative changes in the growth picture derived from the carbon atom simulations. Obviously, this does not apply to very large fullerene fragments, which can lead to closure of wide tubes.
In summary, we have carried out extensive molecular dynamics simulations of the growth of carbon nanotubes and identified the key kinetic processes involved. Wide helical tubes are found to grow by the net addition of hexagons at the step edges. This addition occurs when various non-hexagonal structures (pentagons and heptagons) that form initially by insertion into the existing rings combine and annihilate to give an all-hexagonal structure. A hexagonal structure, once formed, is found to be very stable against bond-switching processes even at high temperatures. At the top of a double step edge, heptagons are found to roll down to the lower step edge, thus maintaining the helicity of the tube. Narrow tubes stabilize pentagons that do not get converted back to hexagons. The pentagons give rise to a curved geometry at the tube-tip, and the tube closes with additional deposits.
This work was supported by the Office of Naval Research, Grant No. N00014-91-J-1516.
REFERENCES
1. S. Iijima, Nature (London) 354, 56 (1991). 2. T. W. Ebbeson and P. M. Ajayan, Nature (London) 358, 220 (1992). 3. S. Iijima, P. M. Ajayan, and I. Ichihashi, Phys. Rev. Lett. 69, 3100 (1992). 4. P. Calvert, Nature (London) 357, 365 (1992). 5. P. Ross, Sei. Am. 265, No. 6, 16 (1991). 6. J. Broughton and M. Pederson, Phys. Rev. Lett. 69, 2689 (1992). 7. N. Hamada, S. Sawada, and A. Oshiyama, Phys. Rev. Lett. 68, 1579 (1992); J. W. Mintmire,
B. I. Dunlap, and C. T. White, Phys. Rev. Lett. 68, 631 (1992); R. Saito, M. Fujita, G. Dresselhaus, and M. S. Dresselhaus, Appl. Phys. Lett. 60, 2204 (1992).
8. D. S. Bethune, C. H. Kiang, M. S. de Vries, G. Gorman, R. Savoy, J. Vazquez, and R. Beyers, Nature (London) 363, 605 (1993); S. Seraphin and D. Zhou (to be published).
9. N. Hatta and K. Murata, Chem. Phys. Lett. 217, 398 (1994). 10. M. Endo and H. W. Kroto, J. Phys. Chem. 96, 6941 (1992); R. Saito, G. Dresselhaus, and
M. S. Dresselhaus, Chem. Phys. Lett. 195, 537 (1992). 11. RE. Smalley, Mater. Sei. Eng. B 19, 1 (1993). 12. A. Maiti, C. J. Brabec, C. M. Roland, and J. Bernholc, Phys. Rev. Lett. 73, 2468 (1994). 13. R. Car and M. Parrinello, Phys. Rev. Lett. 66, 2633 (1991). 14. G. Li and S. Rabii (to be published). 15. S. N. Song, X. K. Wang, R. P. H. Chang, and J. B. Ketterson, Phys. Rev. Lett. 72, 697
(1994). 16. J.D. Cobine, Gaseous Conductors (Dover Publications, Inc., New York, 1958), pp. 300-307. 17. P. Norlander (private communication). 18. J. Tersoff, Phys. Rev. Lett. 56, 632 (1986); 61, 2879 (1988); Phys. Rev. B 37, 6991 (1988). 19. D. W. Brenner, Phys. Rev. B 42, 9458 (1990). 20. D. H. Robertson, D. W. Brenner, and J. W. Mintmire, Phys. Rev. B 45, 12592 (1992).
240

PROPERTIES OF NOVEL FULLERENE TUBULE STRUCTURES: A COMPUTATIONAL STUDY
SUSAN B. SINNOTT*, CARTER T. WHITE* AND DONALD W. BRENNER** *Naval Research Laboratory, Surface Chemistry Branch, Code 6170, Washington, DC 20375- 5342, "Department of Materials Science and Engineering, North Carolina State University, Raleigh, NC 27695-7907
ABSTRACT
Theoretical Young's moduli have been estimated for several fullerene carbon tubule fibers along the tubule axis. These results indicate that carbon fibers composed of nested tubules could have a modulus nearly 1.4 times that of a conventional graphite whisker. The results also indicate that the modulus of the tubule fiber can be further increased by decreasing the distance between the close-packed tubules in the fiber. This is true for both nested and single-shell tubules, but is only significant for the latter. Taking advantage of this property of single-shell tubules, we have examined a hypothetical tubule-diamond composite that, if it could be produced, would yield a modulus greater than diamond while at the same time stabilizing the fiber against shear distortions.
INTRODUCTION
Since their discovery by Iijima in 1991', fullerene tubules have been targeted as potential building blocks for materials with a wide variety of new and novel properties. Electronic structure calculations2'3'4'5, for example, have shown that the band gap for individual tubules depends strongly on their helical structure and radius, with predicted conductivities ranging continuously from insulating to metallic. This suggests that carbon-based molecular wires with a range of electronic properties could be produced using tubules with carefully tailored structures. Other calculations6,7,8
have examined the elastic properties of individual tubules and tubule crystals, with predictions of high strengths7 and anomalous bulk moduli8. Still other calculations9 have suggested that tubules may act as molecular straws, providing nanometer-scale sieves for collecting and studying liquids at very small scales. With these predictions of new materials with unique properties, it is no wonder that fullerene tubules have been heralded as appropriate 'synthetic targets of the 1990's'10.
In this paper we explore the potential for fullerene tubules to yield new light-weight materials with high Young's moduli. The structure we examine, which is a natural one for this system, is a carbon fiber composed of tubules with their axes aligned. The calculations reported in this paper are restricted to Young's moduli in the direction of the tubule axis for fibers consisting of both close-packed individual and nested tubules. Based on a simple analysis, we show that fibers of this type can have large Young's moduli exceeding those of more traditional carbon whiskers provided that either the packing of individual tubules is very tight, or structures composed of nested tubules are used. We also suggest a novel diamond-tubule composite that may be able to maintain the very tight packing of tubules needed to achieve fiber moduli rivaling that of diamond, and at the same time provide resistance to shear for the tubule-based fibers.
241
Mat. Res. Soc. Symp. Proc. Vol. 359 e 1995 Materials Research Society

ANALYSIS OF YOUNG'S MODULI FOR TUBULE-BASED FIBERS
For simplicity, we begin by assuming a fiber with an infinite thickness composed of identical tubules. In this case, Young's modulus Y is given as
3 E . T Y . = *A*L (i) axis T \XJ de2
where d2E/de2 is the second derivative of energy with respect to strain along the tubule axis, L is the number of atoms per tubule per unit length, and A is the number of tubules per unit area perpendicular to the fiber axis. The function A depends on the tubule radius and inter-tubule distance. If cylindrical tubules are assumed (see Ref. 6 for a discussion of this assumption), A is given as
* 0-9
7r(Rt + Rvdw/2)2
where Rc is the tubule radius, Rvdw is the distance between tubules, and 0.9 is the packing fraction for a two-dimensional hexagonal lattice.
In general L is a function of both tubule radius and helical structure. To simplify this analysis, we assume that each tubule is either the serpentine or sawtooth structure (see Ref. 8 for the definition of these structures), and that the tubule radius is a nondiscrete variable. With these assumptions, L can be written as a function of tubule radius as
87iRt
3^3d2 (3)
where d is the nearest-neighbor carbon-carbon distance. Combining Eqs. (1), (2), and (3) yields
a2E 0.9* 8Rt Y.„, = x__ (4) axis
3e2 3\/3d2(Rt + Rvdw/2)2
Shown in Fig. 1 is the Young's modulus from Eq. (4) versus the inter-tubule distance Rvdw for several tubule radii. These curves were generated assuming the in-plane graphite value of 58.2 eV/atom (calculated as cl 1 for graphite divided by its density8) for 32E/3e2 independent of tubule radius. Also shown as the dashed lines are moduli for diamond in the (111) direction as well as ideal graphite, a graphite whisker and a silicon nitride whisker. If the tubules close-pack in the fiber at the interplanar graphite spacing of 3.35 Ä, a tubule radius of approximately 5 Ä is needed to match the modulus of a graphite whisker"; this is within the range of tubule radii that have been observed12.
242

15
U1
O
(Z5
"öfl
o
10
1 1 i 1 1 1 1 I 1 1 1 [ 1 i i i i
_ -
- ^\Rt=2Ä - - -
— —
- --__R=5Ä
^^=
- Rt=10Ä -
_ Rt = 2ÖA _
1 1 i i 1 i i i i 1 i i i i 1 1 1 1 1
Diamond (111)
Ideal Graphite
Graphite
Whisker
Si3N4
Whisker
2 2.5 3 3.5 4
Tubule-Tubule Distance (1) Figure 1: Young's modulus versus the inter-tubule distance for several tubule radii. Note that for small radii, decreasing the tubule-tubule distance significantly increases the Young's modulus.
We also note that to produce tubule fibers with moduli greater than diamond (111), the inter-tubule distance must be significantly smaller than the interplanar spacing in graphite even forvery small radius tubules.
This analysis can also be used to examine whether nested structures, where tubules grow around tubules, can be packed to yield high-moduli carbon fibers. Assuming a distance between shells equal to the graphite inter-planer spacing of 3.35 Ä, the limit of a single nested structure with an infinite number of shells yields a modulus equal to that of ideal graphite. A tubule fiber of this kind, however, would most likely be made of many close-packed nests. In this case, the modulus in the limit of an infinite number of shells in each of these nests would be the ideal graphite modulus times the two-dimensional packing fraction for close packed circles. This yields a value for Young's modulus along the fiber axis of approximately 9.6 Mbar.
For fibers composed of nested tubules with a finite number of shells, Eq. (4) for Young's modulus along the fiber axis can be generalized to:
0.9x8
3\Z3d2(Ri, 2 (
32E
►(Nshell-i)Rnest+Rvdw
/2) 2"=1 de ).<*■„ + (a-1)**) (5)
243

15.0
CO
O
Ö
o
10.0
5.0
Diamond (111)
Single Infinite Nest
Graphite Whisker
Whisker
5 10 15 Number of Shells
Figure 2: Young's modulus for the nested tubules versus the number of shells for various inner tubule radii.
nested structure, R^ is the distance between individual tubules within each nest, R^m is the distance between separate nested structures, d is the carbon-carbon nearest-neighbor distance within the tubule, and (32E/5e2)n is the second derivative of energy with respect to strain for each tubule in the nest. Shown in Fig. 2 are values of Y^ versus the number of shells for various values of the inner tubule radius. In this plot, the inter-planar graphite distance of 3.35 Ä has been used for Rvdw and R^, and the same values for d and d2E/de2 are used as above. In each case the modulus converges fairly rapidly to the limiting value of 9.6 Mbar.
It is worth noting that decreasing the distance between nested structures Rvdw, which could be achieved by applying pressure to a fiber in the plane of the tubule axes, would only increase the modulus by a few percent at best for nests with more than a few shells. This behavior differs from the individual tubule structure discussed above, where decreasing the distance between tubules can produce profound changes in modulus along the fiber axis, as apparent in Fig. 1.
DIAMOND-TUBULE COMPOSITES
How to take advantage of the significant increase in the Young's modulus that is possible by decreasing the distance between single tubules in a fullerene fiber is not clear. It is also not clear
244

iiiiiniiiiiniiiiiniiiiinitffiinii iiiiiiiiiiiiiiiiiiiiiiiiiiiiiiiiiiiii iiiiiiiiiiiiiiiiiiiiiiiiiiiiiiiiiiiiii
/ASTAT ITATAT.1 TA 'ATtTA' ATA^T*": ATA»ATA»A !«TAT. TA 'ATATA'' ATA^T^ATATATATAT-.VA^TAT TATA' ATAT»T'r ATATATATATi'A>iTAT .TATATi JjL \v*r ATATATATATV'A^TAT »TATAT, TA' 'ATATA' A» .▼ATATi'A'iTAT^ATA^TA'ATATA'ArA^T^ATA !▼*▼. iTATATi TA 'ATATA' ATA^T*': ATATATATATIV, TI TA' 'ATATA' ATA^T>T ATATATATAT^VA'^TAT ITA' A,ATA>T>TATATATATATi'A>^TATlTATATJTX'AT ^ATATATATATV»AVTAT »TATATI TA' 'A^ATA' ATAV AT^'A^TAT »TATAT, TA 'ATATA' ATA^TATATATAT T, ITATAT. TA' 'ATATA' ATAV»»TATATA*ATAT:.»A»^ A' 'ATATA' ATAT»T*TATATATATATirA*.LTAT »TATAT TA"»T>'ATATATATATi*A»,:TAT»TATATlTA''ATATA'1
a) b)
Figure 3: Illustration of the tubule-diamond composite. Grey denotes carbon-carbon bonds, white denotes hydrogen-carbon bonds, a) Side view; b) Top view.
how to stabilize a fullerene-based fiber against shear, where the presumably weak inter-tubule forces would allow tubules to slide by one another with little resistance. In this section we propose a hypothetical tubule-diamond composite that, if it could be produced, would yield a Young's modulus that exceeds that of diamond, and would stabilize a tubule-based fiber against shear.
Each atom on a diamond (111) surface has six surrounding atoms at a distance equal to the second neighbor position in bulk diamond, 2.52 Ä. These six atoms, which form a hexagon, can be used as a template for building a sawtooth tubule normal to the surface, where the mismatch in radius between this tubule and the one with atoms at the graphite neighbor distance would be less than 2.5 %. Furthermore, the sp3 radical orbitals associated with the atoms on the diamond (111) surface are directed normal to the surface and therefore would overlap strongly with those associated with the atoms at the end of the sawtooth tubule. The strong bonds formed by this overlap combined with the close lattice match between the two structures suggests that this tubule could be strongly chemisorbed to the diamond surface.
We further note that a close-packed hexagonal array of these tubules chemisorbed to a diamond (111) surface can be formed as illustrated in Fig. 3. This arrangement yields a tubule packing in the plane of the diamond surface of 38.455 Ä2/tubule. Using Eq. (4), this structure would produce a Young's modulus of 13.2 Mbar in the limit of infinitely long tubules, a value that exceeds that of diamond in the (111) direction by 3.4% at a density of about 80% of diamond. Furthermore, the diamond substrate would help keep the tubules from sliding past one another, stabilizing the fiber against shear. Thus it appears that a tubule-diamond composite such as this might provide a new light-weight, high-modulus material that could be an alternative to more conventional carbon-based
composites. It is important to note that, while this composite shows promising characteristics, there
remain serious questions about it. For example, there is the formidable question of how such a composite might be manufactured. It is also not clear that tubules packed at this close distance (approximately 2.1 Ä apart) will retain their strong sp2 bonding character. With atomic rehybridization, chemical forces stronger than those normally associated with van der Waals interactions might exist between the tubules that could affect the composite structure and properties.
245

Finally, previous calculations8 have shown that tubules with radii of 2.45 Ä, such as those in the composite, are strained structures, with a strain energy of 0.2-0.3 eV/atom. Clearly much more needs to accomplished before such a structure could become reality.
SUMMARY
Theoretical Young's moduli along the fiber axis have been estimated for several different structures of fullerene tubule-based carbon fibers. Our results indicate that fibers composed of nested tubules could have a modulus almost 1.4 times that of a conventional graphite whisker. In addition, by decreasing the distance between close-packed tubules, the modulus can be caused to increase even further. This is seen for both nested and single-shell tubules, but is only significant for the latter. We also examined a hypothetical tubule-diamond composite that, if it could be produced, would yield a modulus greater than diamond while at the same time stabilizing the tubule fibers against shear distortions.
ACKNOWLEDGMENTS
This work was partially supported by the Office of Naval Research under Contract No. (N00014-94-WX-23024). The authors thank Dr. John Mintmire, Dr. Frederick Streitz and Dr. Tom Hare for many helpful discussions. S.B.S. acknowledges support from a National Research Council/Naval Research Laboratory Postdoctoral Associateship.
REFERENCES
1. S.Iijima, Nature 354, 56(1991). 2. J. W. Mintmire, B. I. Dunlap and C. T. White, Phys. Rev. Lett. 68, 631 (1992). 3. C. T. White, D. H. Robertson and J. W. Mintmire, Phys. Rev. B 47, 5485 (1993). 4. N. Hamada, S. Sawada and A. Oshiyama, Phys. Rev. Lett. 68, 1579 (1992). 5. R. Saito, G. Dresselhaus and M. S. Dresselhaus, Phys. Rev. B 46, 1804 (1992). 6. J. Tersoff and R. S. Ruoff, Phys. Rev. Lett. 73, 676 (1994). 7. G. Overney, W. Zhong and D. Tomanek, Z. Phys. D 27, 93 (1993). 8. D. H. Robertson, D. W. Brenner and J. W. Mintmire, Phys. Rev. B 45, 12592 (1992). 9. M. R. Pederson and J. Q. Broughton, Phys. Rev. Lett. 69, 2689 (1992). 10. J. W. Mintmire, D. H. Robertson and C. T. White, J. Phys. Chem. Solids 54, 1835 (1993). 11. D. R. Askeland, The Science and Engineering of Materials, 3rd ed. (PWS Publishing,
Boston, 1994). 12. S. Iijima and T. Ichihashi, Nature 363, 603 (1993); D. S. Bethane, C. H. Klang, M. S.
deVries, G. Gorman, R. Savoy, J. Vazquez and R. Beyers, Nature 363, 605 (1993).
246

HREM LATTICE IMAGE SIMULATIONS OF CIRCULAR CROSS-SECTIONAL MULTISHELL CARBON NANOTUBES.
S. L. CULLEN, C.J. MORGAN, C.B. BOOTHROYD AND C.J. HUMPHREYS Department of Materials Science and Metallurgy, Pembroke St., Cambridge, CB2 3QZ, U.K.
INTRODUCTION
In recent years there has been much interest in a newly found member of the fullerene family, carbon nanotubes. As a result of the small dimensions of these structures much of the structural investigation has involved the use of HREM images of the tubes1"3. From these images it has been proposed that the idealised structure of a carbon nanotube comprises closed cylindrical coaxial shells of graphite in which each shell may have its own unique helical pitch due to the numerous ways in which a sheet of graphite may be rolled to form a cylinder. We have previously discussed HREM image simulations of the {100} fringes at the centre of nanotubes which assumed that the top and bottom faces of the tube were parallel4. In this paper attention is focused on image simulations for complete ideal tubes of circular cross-section in order to elucidate further the structure of the tubes. However, due to the complexity and large range of possible configurations and orientations of the tubes, we have not attempted to match the simulations to a particular tube. Instead we have chosen one representative structure and have varied the parameters of the tube in order to observe the effects on the image of the stacking of the shells relative to each other, tilt of the tube along the long axis and helical pitch of the shells. Features which occur in the simulations are compared qualitatively to experimental images.
IMAGE SIMULATIONS
Computer models of the tube structures were created by a series of computer programs in order that simulated images could be calculated using a multislice algorithm5. The steps involved in calculating the computer models are as follows: first a list of atom co-ordinates are generated describing an individual flat sheet of graphitic carbon; next, additional layers are generated by a matrix operation which defines a translation and a rotation about the normal to the sheet, such that the perpendicular spacing between the sheets is equal to the desired separation of the shells in the finished tube model; a further matrix operation is then carried out to bend the layers around one common axis such that the atomic separations measured along the circumference are the same as those in the flat sheet and at this stage any general rotation about the axis may be specified to set the tube in the desired orientation; finally slices are taken through the structure perpendicular to the beam direction and the atom coordinates are fed into the multislice calculation.
When assembling models of tubes it is necessary to ensure the continuity of the carbon atoms around the tube circumference. This criterion restricts the combinations of helical pitch and tube radii which may be used. Additionally since the tube is only periodic along the length, large empty 'buffer' regions must be included between the side of the tube and the edge of the slice supercel to prevent intensity wrapping around from one edge of the slice to the other. In the case of helical tubes the period along the length may be many times longer than the radius of the tube and in these cases the slices will not contain a full period due to constraints on processing time. However by ensuring that the slices are large in the length direction spurious effects arising from the discontinuities in period are confined to the edges of the simulated images.
For the purposes of the image simulations a basic tube was defined consisting of five shells with zero helical pitch, an outer radius of 3.025nm and perfect graphitic stacking in the flat sheets prior to curving them about the tube axis. We have defined a tube as having zero helical pitch when the longitudinal axis lies parallel to the [100] direction in the graphite sheet. This tube represents a
247
Mat. Res. Soc. Symp. Proc. Vol. 359 e 1995 Materials Research Society

single ideal structure; derivations from this ideal structure were considered by the introduction of sample tilt, random relative translations of adjacent shells and the introduction of a helical pitch to the tube.
All image simulations were carried using the Cerius multislice HREM image simulation package6. Each tube was divided into 40 slices which in the case of the non-helical tubes gave a slice 0.1625nm deep, 7.5nm across the width of the tube and 0.426nm along the length of the tube. In helical tubes the dimension of the slices along the length of the tube was increased.
The projected potential of the basic tube is shown in figure la along with two images from a focal series of images simulated for a JEOL 4000EX (Cs=lmm).
Figure 1 Simulations of the basic tube; (a) projected potential, (b) Scherzer defocus (-38.47nm), (c) Overfocus (36.53nm). Only half of the calculated image is shown.
Comparison of the Scherzer image (figure lb) with the projected potential reveals that, as expected, at the edge of the tube where the electron beam is parallel to the graphitic planes the (002) graphitic planes are visible as five dark fringes. Superimposed on these fringes are the projected positions of bent columns of carbon atom pairs. However the positions of the dark fringes are closer to the tube axis than expected from the diameters of the 5 carbon layers forming the tubes. A simple model describing this shift predicts that the maximum atomic density of a cylinder of carbon atoms in projection is approximately an atomic radius from the edge of the cylinder.
At the exact centre of the tubes the electron beam is normal to the graphitic planes and hence fringes ~2.1nm apart are observed which correspond to the {100) planes in graphite. It can be seen that these {100} fringes have a much lower contrast than the (002) fringes at the edge of the tube. This is partly due to the stronger intensity of the diffracted beam associated with the (002) planes but is mainly due to the increased density of scattering centres at the side of the tubes compared to the centre of the tubes. As we move away from the centre of the tube in the radial direction there is a decrease in the {100} fringe contrast; the projection of the atoms in the tube changes as the curvature of the planes increases. Clearly for the inner shells, where the curvature effects are most pronounced, the changes in contrast will increase most rapidly. However it is interesting to note that the change in contrast is not large and that in general the simulated images appear as a cross section through the centre of the tube with a sudden change in contrast between the central {100} fringes and the edge (002) fringes. Figure lc demonstrates the dangers in interpreting HREM images of tubes as structure images; at certain values of overfocus the impression of six graphitic layers in the image is created.
In the basic tube the stacking has been defined as graphitic at one point on the tube's circumference and in figure 1 this point is on the far left of the simulation. However, the stacking will change as one goes around the circumference so that as we rotate the tube about its axis subtle variations in the image will result from the variations in stacking sequence. In particular, there will
248

be unique cases where the graphitic stacking sequence lies at the top or bottom of the tube and the simulated image for such a situation at Scherzer defocus is shown in figure 2. In general, it is found that as the tube is rotated about its axis the image remains remarkably similar to figure 1 but that there is a maximum in the (100} fringe contrast when the tube is rotated to the position in figure 2.
An alternative to the graphitic stacking is to introduce random translational relationships between the layers in the direction of the tube axis. This is adding a further degree of disorder to that already present due to the impossibility of maintaining graphitic stacking around the circumference of the multishell tube. A typical simulated image at Scherzer defocus is shown in figure 3 for a tube with random stacking. As expected, the (100) fringes have the same periodicity as in figure lb but the fringe contrast is greatly reduced in comparison to the basic tube since atoms from different sheets no longer project as columns.
In general, for a non-helical ideal tube, the stacking sequence can never be described as truly graphitic except in certain positions around the circumference. However, the energetically favourable stacking sequence is that of perfect graphitic stacking and in a real tube there is experimental evidence to suggest that graphitic stacking may be achieved over large sections of the tube circumference when the tube cross-section is polygonal rather than circular'.
**+**♦'
«st. * * * * <f
nfiem * * # # '
Figure 2 Simulated image of the basic tube at Scherzer defocus and with graphitic stacking
of the shells at the top of the tube.
Figure 3 Simulated image of the basic tube at Scherzer defocus with random translations
between the shells along the length of the tube.
When imaging nanotubes in the electron microscope it is not usual for the tube axis to be exactly perpendicular to the electron beam. This is observed in HREM experimental images as a variation in focus along the length of the tube. Hence tilt along the axis is introduced into the simulations to produce a more realistic description of the expected image.
The effect of tilt is demonstrated clearly in figure 4 which shows the simulated image at Scherzer defocus for the same tube as was used for figure 1 tilted by 50mrad along its length. In comparison to the untilted case there is a loss of contrast in the centre of the tube since the atoms are no longer projected as columns of atoms. In conjunction with this a smearing out of the atomic positions in the (002) planes is observed. Clearly, such effects will not be observed for the tube in which the shells have translational disorder in the axial direction. At larger angles of tilt stronger contrast will be observed as we approach a tilt in which coincidence of atomic positions in projection occurs. In addition curvature of the {100} planes occurs due to the angle of projection. Larger angles of tilt, for which the multislice approximation is poor, could be simulated in the images by creating a tilted tube which is subsequently sliced.
Figure 4 Simulated image of the basic tube tilted 50mrad along the length of the tube.
249

Initially the effect on the simulated image of introducing a helical angle is demonstrated on a single graphitic shell . In this case the helical angle is -6° and, as discussed above, the radius of the shell is linked to the helical angle to ensure continuity of the shell around the circumference.
In the simulated image of the helical tube (figure 5) it may be observed that the projection of the edge of the tube has far greater contrast than the pattern of fringes in the centre of the tube as previously noted. However, there is little {100} contrast superimposed on this fringe as the rows of atoms which comprise the plane are not now parallel to the electron beam.
In the centre of the image the {100} fringe pattern is replaced by a pattern of moire fringes which repeats periodically along the length and appears to have a mirror plane along the axis of the tube. If it is assumed that the pattern in the image results simply from the projection of the whole tube structure (i.e. the position of the atoms through the thickness of the structure is ignored) then it may be shown that the moire fringe pattern, which results from two overlaid sheets of graphite rotated relative to each other, maintains the symmetry of the graphitic sheets, but that the longitudinal period varies with the helical angle and the radius of the tube. This implies the existence of a mirror plane parallel with the length of the tube but the curvature of the tube results in a breakdown of medium and long range symmetry across the width of the tube and true mirror symmetry will only occur when the projection of a mirror plane coincides with the tube axis. Whilst the projection of the tube may exhibit mirror symmetry, in real space the tube itself does not exhibit mirror symmetry since the atoms lie at different positions through the tube thickness. As we move away in the radial direction from the centre of the simulation the symmetry of the moire fringes breaks down due to curvature of the graphitic planes.
For multiple shell tubes where each shell has a different helical pitch the longitudinal pitch will be the lowest common multiple of the longitudinal periods for each individual shell. The simulated image at Scherzer defocus for such a tube is shown in figure 6. As the longitudinal period in this case is longer than the length of the slice, only a portion of the repeat pattern is seen. Spurious contrast effects from the edge of the slice due to the periodic discontinuities have been removed to avoid confusion. In principle it would be possible to show the total longitudinal repeat in the simulation for the tube of figure 6, but in practice the time for the calculation is prohibitive. As for the single shell tubes, it is expected that detail on the (002) fringes will be lost. However in certain instances it is possible that some structure is seen as is the case for the inner fringes in figure 6. Such structure occurs when the helical angle results in rows of atoms appearing parallel to the electron beam and is visible if the projected thickness of the tube is small enough to prevent excessive broadening of features in the simulated images. Clearly shells of smaller radii allow greater tolerance in the angle of inclination of these columns before they start to overlap in projection.
"'HBP mm *1« IIHHI SI™»»
3R*Riar:3&
Figure 5 Simulated image at Scherzer defocus of a single shell helical tube of -6°
W^W'^iC^M
* f I»
- -. * It ■ *: §• ' (*V
Figure 6 Simulated image at Scherzer defocus of a multi-shell helical tube.
250

Tilt in the images is calculated in the multislice method by shifting each slice a certain distance laterally relative to the adjacent slices. Hence, for non-periodic slices along the length, artefacts will result as the angle increases and therefore in the simulations of helical tubes the tilt was restricted to relatively low values (~70mrad) to avoid such artefacts in the image. The effect of tilt is a shift along the length of the periodic repeat in the moire pattern and a slight compression of the pattern in the axial direction.
A further point to note about simulations of carbon nanotubes is that, due to the low atomic scattering factor of carbon and the relatively small thickness of the tubes, the dynamical scattering effects associated with the tubes are very small. As a consequence, the images produced when the whole tube is projected as one slice are almost identical to those produced when the tube is subdivided into 40 slices. In these calculations we have subdivided the tubes but it may be a reasonable approximation to use one slice to reduce processing time in certain circumstances.
EXPERIMENTAL IMAGES
The carbon nanotubes used in this work were produced by the Materials and Electrochemical Research Corporation, Tucson, Arizona. HREM images of the nanotubes were obtained on a JEOL 4000EX TEM at 400keV. The tubes are extremely beam sensitive8 and so images were taken quickly, after adjustment on an adjacent part of the specimen. The radiation sensitivity of the tubes, coupled with their small dimensions, makes accurate tilting of the tubes difficult.
The experimental images show many variations in detailed structure but structure is observed that is qualitatively similar to that calculated in the simulated images. Figure 7 shows a small section of the central region of a 28 shell tube with an outer diameter of ~24nm and an inner diameter of ~4.5nm. This tube is significantly larger than any of those used in the simulations, but it can be observed the {100} fringes at the centre of the tube exhibit hexagonal symmetry as was observed for the image simulations of a non-helical tube. This suggests that in this tube most, if not all, of the layers have zero helical pitch. It should be noted that the qualitative form of the contrast in the central region of the tube does not depend critically on the tube cross-section, but depends simply on the presence of approximately parallel opposite faces. From the simulations, for a circular cross-section tube, we expect to see a variation in the contrast of the {100} fringes in the radial direction but in figure 7 no such variation is seen. This may suggest that the tube in figure 7 has a polygonal cross section but as was noted for the simulation of the basic tube the change in contrast of the {100} fringes with curvature is small and hence in practice these fringes may not be visible.
Figure 7 (a) Experimental image of the {100} fringes of a carbon nanotube showing hexagonal symmetry as indicated (b) power spectrum of this central region of the tube.
In the case of a multishell helical tube it is expected from the simulated images that a moire fringe pattern of a given period would result. In practice, the longitudinal repeat distance will typically be expected to be large and any distortion or defect in the tube occurring over a comparable or shorter distance will cause a breakdown in this longitudinal image symmetry. In figure 8 an 18 shell tube is shown but in this case the hexagonal symmetry of the {100} fringes is replaced by a complicated pattern which shows some elements of symmetry. This is consistent with a tube having multiple helical angles in the different shells. Calculations of the power spectra
251

for the centre of the two experimental tubes discussed are consistent with the conclusions that the first tube is non-helical whilst the second has multiple helical angles.
nmm< n _ ^^';^T/fcl?l'Jl_!T'1^y#'|^'L-l^lfl|Ti^Lrt^^^»^■*iuT»1^Jl^■'^JPJ» *'.. Figure 8 (a) Experimental image of the centre of a carbon nanotube in which the contrast of the
central region suggests that the tube is helical, (b) power spectrum of the boxed region.
CONCLUSIONS
We have calculated HREM image simulations of idealised complete multishell carbon nanotubes and shown that for a non-helical tube the resultant image comprises fringes corresponding to the (002) planes at the edge of the image and hexagonal fringes corresponding to the {100} planes at the centre of the tube on which the effects of curvature of the planes of graphite are observed. It has been noted that the centre of the atoms in the structure do not correspond to the points of maximum contrast in the simulated images but are offset towards the tube axis by a distance equal to an atomic radius. In addition we have observed that at high values of overfocus the simulated image has the appearance of extra shells. Variations in the stacking of the tubes results in a change in the contrast of the tubes; the strongest contrast for the {100} fringes is observed in the case of perfect graphitic stacking in the planes perpendicular to the electron beam. Similarly tilts along the length of the tube cause a decrease in the contrast levels of the image as compared to the untilted case. There is evidence to suggest that such non-helical tubes may exist from the observation of hexagonal patterns of {100} fringes at the centre of experimental images of tubes but it is equally possible that these fringes may result from oppositenarallel faces of a polygonal tube. The observation of such polygonal tubes has been reported'based on images showing asymmetrical (002) fringe contrast and we have also observed non-symmetrical images of tubes in some cases. Hence in future work we shall calculate the image simulations for the faces of a polygonal tube. It seems probable that the true cross-section lies somewhere between a perfectly circular cross section and a polygonal cross-section with very sharp corners.
For helical tubes it is observed from the simulations that a moire fringe pattern occurs at the centre of the tube with a characteristic longitudinal repeat distance. For a single shell tube this repeat distance is dependent on the helical pitch and radius of that particular tube and for multiple shell tubes the repeat distance will be the lowest common multiple of the individual repeat distances for the shells in that tube. In experimental images the moire fringe pattern is indiscernible since the structure of the tubes is not perfect over large distances.
REFERENCES
1. S. Iijima, Nature 354, 56 (1991). 2. X.F. Zhang et al., J. Cryst. Growth 130, 368 (1993). 3. Y. Saito et al., Chem. Phys. Lett. 204, 277 (1993). 4. S.L. Cullen et al., Ultramicroscopy (in press). 5. J.M. Cowley and A.F. Moodie, Acta. Cryst. 10, 609 (1957). 6. Cerius version 3.2 (Molecular Simulations Inc.) 7. M. Liu and J.M. Cowley, Ultramicroscopy 53, 333 (1994). 8. S.L. Cullen et al., Inst. Phys. Conf. Ser. 138, 79 (1993).
252
THERMODYNAMIC PROPERTIES OF THE FCC MODIFICATION OF SOLID FULLERENE C60
V.I.ZUBOV*+, N.P.TRETIAKOV*+, J.N.TEIXEIRA RABELO* AND J.F.SANCHEZ ORTIZ+
"Universidade Federal de Goiäs, Depto Ffsica, 74001-970, Goiänia, GO, Brazil + Peoples' Friendship University, Moscow, Russia
ABSTRACT
We have applied the correlative method of unsymmetrized self-consistent field to study thermodynamic properties of the FCC phase of solid fullerene C60 which is stable at T>261 K. We have calculated the temperature dependences of the intermolecular distance, cohesive energy, bulk moduli, thermal expansion coefficient, elastic constants and sound velocities. The central intermolecular potential of Girifalco and its approximation by Yakub have been used. We have infered the crucial role of anharmonicity of lattice vibrations at high temperatures. It has been noted also that unlike other Van der Waals crystals, for the considered modification of C60 the quantum effects are small at any temperature. Our results agree closely with available experimental data. Some properties near the spinodal point are discussed.
INTRODUCTION
This paper is devoted to calculations of thermodynamic properties of the FCC modification of solid fullerene C60 whose molecules possessing the maximum cohesive energy per atom are the most widespread '. It is known 2'3 that at low pressures and temperatures, this fullerene has the crystal lattice made up of four SC sublattices which differ from one another by molecular orientation. At high temperatures it possesses the FCC lattice with molecules rotating rather freely 2- 4. Under normal pressure, the phase transition occurs at 261.4 K 2. This is at once a polymorphic transition and an orientational order-disorder transition which sometimes is refered to as orientational melting. New phases of solid C60 have been observed under high pressures 5" 8. So, it can be said that two types of polymorphism are inherent in fullerenes: polymorphism due to temperature variation and due to variation in pressure9. Note also that in terms of position of molecular centers, the first transition in solid C60 can be treated as isomorphic transition underlining thereby its pure orientational nature.
Here we study properties of the orientationally disordered FCC phase of fullerene C60 at normal pressure. To do this we use the correlative method of unsymmetrized self-consistent field (CUSF) 10"16 which takes into account a strong anharmonicity of lattice vibrations.
METHOD
The CUSF allows investigations to be made of thermodynamic properties of various materials whose interatomic or intermolecular forces are known. Its zeroth approximation can hold the main anharmonic terms. Usually, the terms of the fifth and higher orders remain small up to the melting temperatures. In this case, the zeroth approximation of CUSF gives the following expression for the Helmholtz free energy of a cubic strongly anharmonic crystal
253
Mat. Res. Soc. Symp. Proc. Vol. 359 @ 1995 Materials Research Society

2 24 X 4 ex
-ein[(i^)^Dls(X*-p)} . m fc«K. -1'5 6X l1'
Here NKg /2 is its static part, m the molecular mass,
x-^-kr ■ (2)
K2 and K4 are isotropic parts of the second- and fourth-order force coefficients, ß(X) is a solution of the transcendental equation
ß - 3X g- (3)
where Dv are the parabolic cylinder functions. In the case of pairwize forces with the intermolecular potential $(r),
K21 -Ea,ov2>(|r[)LA-Ä; 1-0,1,2,.. (4)
where Ä is the lattice matrix and n are integer-component vectors. CUSF enables one also to include many-body forces into the zeroth approximation ".
From (1) and (3) follows the equation of state under hydrostatic pressure
°.-_£. r 1 dK°, ße d*2, (3-ß)9 dJS " 3v 2 da* IK da * 4K, da (5)
(a is the nearest-neighbour distance and v (a) = V / N the volume of the unit cell) and for the lattice part of the internal energy
o N (9*3)6, "2 [ ° 2 ] • (6)
Differentiating (1), (5) and (6) with respect to 8, v (or a) and components of the strain tensor, all thermodynamic functions for a cubic strongly anharmonic crystal are derived "•14,16.
Higher anharmonicities (fifth and sixth) are taken into account using the perturbation theory n- ". CUSF allows quantum effects to be included as well'". However, for C60 the de Boer parameter 17 is
A - 2n>i/Ov/m? * 3.1x1er3 (7)
254

where o is the point in which 0(a) = 0 and e is the depth of the potential well18. Because of this, even at the SC - FCC transition temperature T, = 261.4 K,
(A/r;)2 - {sh/kTt)2 * l.Sxicr3 (8)
and hence, quantum corrections to lattice properties of the FCC phase of C60 are negligible in all its diagram of state.
INTERATOMIC INTERACTIONS IN SOLID Cm
In general, the interaction between two fullerene molecules can be represented as the sum of the interactions between all the carbon atoms of one molecule and those of the other 18 and also between effective charges of their electron bonds 19. Thus, intermolecular forces in fullerenes are noncentral, this provides the orientational order in the low-temperature phase. However, in the high-temperature modification as well as in the gas phase, the molecules rotate very rapidly, then they can be averaged over molecular orientations.
Considering each C60 molecule as if it were a sphere with a surface consisting of a constant density of carbon atoms and using the (12-6) Lennard-Jones potential for C-C interactions, Girifalco has obtained the intermolecular potential18
where s = r/2a, a = 3.55 Ä, a = 7.494 x 10¹⁴ erg, p = 1.359 x 10"1S erg. This function has a minimum point r0 = 10.06 Ä and the depth of the well e/k = 3187.6 K. It is satisfactory for the FCC phase of Cm at all but properties related to intrinstic molecular degrees of freedom. Mrs. Yakub 20 has approximated the Girifalco potential (9) to a more simple Lennard-Jones type function
0y(r) - J-[9(iV3- 43(iV] (10) Y 34 r r
with r0 = 10.04 Ä and e/k = 3218 K. In our calculations we use these potentials.
RESULTS AND DISCUSSIONS
Some detail of computation by CUSF has been outlined recently15' 16,21. The equation of state (5) with corrections13,14 has been solved for the FCC phase of C60 at normal pressure. At T<TS
, it has two roots a, (T) < a2 (T) with the lower root representing the stable thermodynamic state (3P/aV)T < 0 and the upper one being absolutely unstable (eP/5V)T > 0. The temperature Ts
at which a[ = a2 and (3P/3V)T = 0 is the point of loss of stability (the spinodal point) of the given phase, and at T > Ts its equation of state has no real roots. Potentials (9) and (10) lead to Ts
» 1915 K and 1834 K , respectively. Here we have calculated thermodynamic properties of solid C60 along the lower branch of the
normal isobar. In Table I are listed our results obtained using the Girifalco potential: the nearest neighbours distance a (= ai (T)), the thermal expansion coefficient a = (1/a) (da/ 3T)P
the density p , the cohesive energy Uc , the isochoric and isobaric specific heats Cv and CP
255

Table I. Calculated properties of the FCC phase of C60: nearest neighbours distance a = 10 + a' (Ä) , thermal expansion coefficient a (105 K"1), density p (g/cm3 ), cohesive energy Uc
(cal/mole), specific/ heats Cv , CP (cal/mole K), Grüneisen parameter y, elastic properties BT , Bs
> C„PT, C„p
s, 8T , 6S (kbar), anisotropy A, sound velocities v,, vt (m/s)
T 261.4 400 600 800 1000 1200 1400 1600 1800
a' 0.067 0.083 0.106 0.132 0.161 0.194 0.233 0.282 0.355
1 0.2 3 4
1.071 1.090 1.255 1.070
1.127 1.151 1.338 1.125
1.224 1.256 1.664 1.159
1.349 1.394 2.331 1.193
1.514 1.581 6.844 1.227
1.747 1.852
1.261
2.107 2.296
1.295
2.770 3.220
1.329
4.738 8.729
1.363
P 1.659 1.651 1.639 1.627 1.613 1.597 1.579 1.557 1.524
u. 40756 40312 39639 38919 38138 37277 36297 35126 33523
Cv 8.713 8.617 8.481 8.351 8.226 8.103 7.978 7.841 7.670
a 9.107 9.232 9.439 9.702 10.05 10.52 11.25 12.55 16.29
BT 140.4 128.8 112.8 97.44 82.63 68.12 53.61 38.50 20.97
BR 146.7 138.0 125.5 113.2 100.9 88.47 75.58 61.61 44.54
Y 8.18 8.06 7.91 7.77 7.64 7.51 7.40 7.28 7.19
CT 218.8 206.2 188.7 171.5 154.5 137.2 119.0 98.96 73.70
CT 101.2 90.07 74.82 60.39 46.69 33.58 20.88 8.26 -5.41
c^ 111.7 105.4 96.29 86.92 77.08 66.47 54.67 40.83 22.47
0s 225.1 215.4 201.4 187.3 172.8 157.5 141.0 122.1 97.27
107.6 99.26 87.56 76.15 64.97 53.93 42.85 31.37 18.16
ÖT 10.47 15.33 21.47 26.53 30.38 32.89 33.78 32.57 27.88
8, 4.13 6.14 8.72 10.77 12.10 12.54 11.81 9.46 4.31
A 1.90 1.81 1.69 1.56 1.43 1.28 1.11 0.90 0.57
vi 3684 3612 3505 3393 3273 3140 2988 2800 2526
v. 2595 2527 2423 2311 2186 2040 1861 1620 1214
1, 2 - the potentials of Girifalco and Yakub, respectively, with a strong anharmonicity; 3 harmonic approximation; 4 - weak anharmonicity approximation
quasi ■
256

(more exactly, their lattice and rotational parts), the isothermal and isobaric bulk moduli BT and Bs , the Grüneisen parameter y = 3VccBT / Cv' where Cv' is the lattice part of Cv , the isothermal and adiabatic elastic constants C„P
T and C„ps , the deviations from the Cauchy relations
8T = Q, - C12T and 8S = C« - C12
s, the anisotropy A = 2C« / (Cn - C12) and the longitudinal and transversal sound velocities in the [100] direction v, and v, . For a we also show values computed using the Yakub potential and results of the quasi-harmonic approximation (ß = 3 in (5) and without corrections) and those of the weak anharmonicity approximation in which the Heimholte free energy is expressed as a power series of the temperature up to quadratic terms.
One can see that taking into account strong anharmonicity, both potentials (9) and (10) yield very close results except in the vicinity of the spinodal point. They provide a good fit to experimental data for the lattice parameter available up to 1200 K22, for the cohesive energy 1.739 eV23 and for the isothermal bulk modulus 143.2 kbar24 measured at 707 K and room temperature, respectively. Meanwile, the quasi-harmonic and weak anharmonicity approximations fail at high temperatures, especially the former which gives Ts
qh = 1053 K for the spinodal point, whereas the FCC phase of solid C60 is observed at higher temperatures22 . This demonstrates a crucial role of anharmonic effects above about a half of the melting temperature Tm which we have estimated21 at 1400 K.
By and large, lattice thermodynamic properties of the FCC phase of C60 behave much as those of a typical Van der Waals crystal. However, total values of properties depend on the intrarmolecular degrees of freedom which we do not consider here. This is most pronounced at specific heats. Because of this a difference between measured and calculated values of CP can be attributed to intramolecular vibrations. Great values of the Grüneisen parameter are due to very short-range character of intermolecular forces. This parameter is known to increase25 with indices m and n of the Lennard-Jones type potential, and for C60 m = 9, n = 43 (10). At the spinodal point Ts , the isothermal bulk modulus goes to zero whereas the thermal expansion coefficient and the isobaric specific heats tend to infinity. Unlike familiar Van der Waals crystals, in the vicinity of Ts there is a sharp decrease in C44 .
In conclusion we note that thermodynamic properties of solid C60 are dependent also on many- body interactions and on lattice defects, especially on vacancies whose contribution can be appreciable in the vicinity of Tm . The CUSF enables one to take them into account11,26.
REFERENCES
1. The Fullerenes , edited by H.W.Kroto, J.E.Fisher & D.E.Cox (Pergamon Press, Oxford - New York, 1993).
2. R.Sachidanandam and A.B.Harris, Phys. Rev. Lett. 67, 1467 (1991). 3. J.de Bruijn, A.Dworkin, H.Szwar, J.Godard, R.Ceolin, C.Fabre and A.Rassat, Europhys.
Lett. 24, 551 (1993). 4. P.A.Heiney, J.E.Fisher, A.R.McGie, W.J.Romanow, A.Denenstein, J.P.McCauley,
A.B.Smith and D.E.Cox, Phys. Rev. Lett. 66, 2911 (1991). 5. J.H.Nguyen, M.B.Kruger and R.Jeanloz, Solid State Commun. 88, 719 (1993). 6. V.Blank, M.Popov, S.Buga, V.Davydov, V.N.Denisov, A.N.Ivlev, B.N.Martin,
V.Agafonov and R.Ceolin, Phys. Lett. A 188, 281 (1994). 7. J.L.Hodeau, J.M.Tonnere, B.Bouchet-Fabre, M.Nunez Regueiro, JJ.Capponi and
M.Perroux, Phys. Rev. B 50, 10311 (1994). 8. I.O.Bashkin, V.I.Rashchupkin, A.F.Gurov, A.P.Moravsky, D.G.Rybchenko,
257
N.P.Kobelev, Ya.M.Soifer and E.G.Ponyatovsky, J.Phys. Condens. Matter 6, 7491 (1994).
9. N.N.Sirota, Crystal Res. Technol. 17, 661 (1982); 22, 1343 (1987). 10. V.I.Zubov and Ya.P.Terletsky, Ann. Phys. (Leipzig) 24, 97 (1970). 11. V.I.Zubov, Ann. Phys. (Leipzig) 31, 33 (1974). 12. V.I.Zubov, Phys. Stat. Sol. (b) 72, 71, 83 (1975). 13. V.I.Zubov, Phys.Stat. Sol. (b) 87, 385 (1978); 88, 43 (1978). 14. V.I.Yukalov and V.I.Zubov, Fortschr. Phys. 31, 627 (1983). 15. J.F.Sanchez Ortiz, N.P.Tretyakov and V.I.Zubov, Phys. Stat. Sol. (b) 181, K7 (1994). 16. V.I.Zubov, J.F.Sanchez Ortiz, N.P.Tretiakov and A.E.Yusef, Int. J. Mod. Phys, in print. 17. J.de Boer, Physica 14, 139 (1948). 18. L.A.Girifalco, J.Phys. Chem. 96, 858 (1992). 19. X.-P.Li, J.P.Lu and R.M.Martin, Phys. Rev. B 46, 4301 (1992). 20. L.N.Yakub, Fiz. Nizk. Temp. 19, 726 (1993), in Russian. 21. V.I.Zubov, N.P.Tretiakov, J.N.Teixeira Rabelo and J.F.Sanchez Ortiz, Phys. Lett. A
194, 223 (1994). 22. J.E.Fisher and P.A Heiney, J.Phys. Chem. Solids (1993). 23. C.Pan, M.P.Sampson, Y.Chai, R.H.Hange and J.L.Margrave, J. Phys. Chem. 95, 2944
(1991). 24. J.E.Fisher, P.A.Heiney, A.R.McGie, W.J.Romanow, A.M.Denenstein, J.P.McCauley
and A.B.Smith, Science 252, 1288 (1991). 25. G.Leibfried and W.Ludwig, Theory of Anharmonic Effects in Crystals (Academic Press
Inc., New York - London, 1961). 26. V.I.Zubov, Phys. Stat. Sol. (b) 101, 95 (1980).
258

PARTY
Alkali Füllendes

FULLERENES UNDER PRESSURE STUDIED BY 13C-NMR
PASCALE AUBAN-SENZIER *, R. KERKOUD *, D. JEROME *, F. RACHDI ** AND P. BERNIER ** * Laboratoire de Physique des Solides (associe au CNRS), Universite Paris-Sud, 91405 Or- say, France ** Groupe de Dynamique des Phases Condensees, Universite des Sciences et Techniques du Languedoc, 34060 Montpellier, France
ABSTRACT
High pressure is an important parameter for the study of C60 and doped fullerenes as these molecular crystals are very compressible. 13C-NMR experiments under pressure in Ä3C60 have given access to the determination of the 13C Knight shift and the chemical shift of this superconducting compound. These NMR data do not reveal significant effects of Coulomb correlations in A'3C
TGO and support a pairing mechanism for superconductivity
mediated by intramolecular vibrations. We report also a 13C-NMR investigation of Rb4C60 under pressure and temperature.
The temperature dependence of the spin-lattice relaxation rate clearly shows, under pres- sure, the increase of a linear contribution which gradually substitutes to the exponential behaviour present at ambient pressure. The activated relaxation is attributed to intrinsic spin excitations through the direct Jahn-Teller gap whereas the closing of a small indirect gap under pressure gives rise to a semimetal and a Korringa like relaxation.
INTRODUCTION
Molecular solids such as fullerenes compounds, Ceo and AxCgo (where A is an alkali atom), are characterized by strong intra C60 covalent bonding together with weak inter- molecular Van der Waals bonding. This explains the high compressibility measured on Ceo (A'„ RS 5.5 ■ 10~'i(kbar)~1) [1] and the slightly lower value measured on K3Ceo (Kv ss 3.57 ■ i0~3(kbar)~1) [2] where the C60 lattice is stiffened by the intercalation of alkali atoms. By reducing intermolecular distances, the application of pressure is expected to play a sig- nificant role either on molecular dynamics or on electronic properties (namely the band structure, the density of states at the Fermi level, N(Ep-), and the superconducting transi- tion. Tc) of these materials. It has been proved, for instance, by the experimental relation existing between Tc and the lattice constant obtained through the study of a series of isostructural superconducting compounds with composition Az-xBxCeo (where A and B are Na, K, Rb, Cs) [3] [4] and also through the variation of the lattice constant under- pressure [2] [5].
The NMR technique is well adapted to study these two aspects and allows to work on air sensitive powders. In pure C6Ü,
13C-NMR properties, spin-lattice relaxation time, Tj, and spectral shapes, are dominated by molecular reorientations and structural properties.
261
Mat. Res. Soc. Symp. Proc. Vol. 359 c 1995 Materials Research Society

This has allowed us to determine thermodynamic data such as the enthalpies and volumes of activation in the two structural phases of Ceo [6]- On the other hand, NMR data are also correlated to the electronic properties of doped fullerenes AxCeo [7].
When alkali atoms are intercalated in the interstitial sites of the face centered cubic (fee) structure of C60 in order to form AxCeo compounds, up to six electrons can occupy the threefold-degenerate lowest unoccupied molecular Orbitals (LUMO), tlu. The stoichiometry x=3 retains the fee structure of C60 and leads to metallic and superconducting compounds. The stoichiometry x=4 adopts the less compact body centered tetragonal (bet) structure [3] and leads to semiconducting compounds although a metallic behaviour should be expected from a partial band filling [8]. Finally, A6C60 compounds are insulating in agreement with the complete filling of the tlu LUMO level. These properties have been established mainly by photoemission studies [9], [10] and resistivity measurements on thin films [11][12].
Moreover, the 13C-NMR properties of A3Ceo and A|C6o are still not well understood. The position of the isotropic 13C lines are, in both compounds, paramagnetically shifted from the neutral C60 one, in spite of the presence of a Knight shift only for A3Ceo and the T\ value measured in Rb4C'eo at room temperature is shorter (tu 0.1s) than in metallic compounds
/V3C60 and Rb3Ceo (0.3s and 0.2s respectively). We present here 13C-NMR experiments under pressure on A'3(76o and Rb4Ceo samples.
We have investigated the metallic state of K3C60 via the pressure dependence of the spin- lattice relaxation rate, T-,"1, and of the 13C line shift in order to determine the actual value of the Knight shift, K. Effectively, both T^1 and K are correlated to N(EF) which can be varied by the application of pressure via the bandwidth of the material.
In Rb4C60, an exponential temperature dependence of T{1 is observed at ambient pres- sure which we have attributed to the intrinsic spin excitations. The growth of a linear contribution to T4
X takes place under pressure, coexisting with the exponential term. This feature is interpreted as a transition from a semiconducting to a semimetallic phase induced by the changes in band dispersion under pressure.
13C-NMR experiments were performed on different powdered samples all made from Cay isotopically 13C enriched up to 10af.% and in different magnetic fields: B0 = 3T
(33MHz) for 7\~l measurements in K3C60 , B0 = 9.3T (WOMHz, with high resolution) for the line shift determination in A'3C60 and ambient pressure experiments on Rb4C6o and finally Ba = 8T (86MHz) for Tf1 experiments on Rb4Cea under pressure. The high pres- sure, transmitted by isopentane, was supplied by a double stage equipment (with an in-situ intensifier ratio x 4) for both experiments up to \3kbav. The Be-Cu pressure cell could be cooled down to liquid Helium temperature by a continuous flow cryostat.
13C KNIGHT SHIFT IN THE METALLIC COMPOUND K3C6o
Tf1 measurements were performed on A'3C6o powder containing less than 5mo/.% of unreacted neutral Ceo whereas for 13C-Knight shift measurements, the sample included around 50 mo/.% of neutral Ceo used as a magnetic field marker. Figure 1 shows the pressure dependence of (7\ T)~l as measured on the C6o -poor sample at room temperature (V) and 80K (T) (from [13]) and on the Ceo -riched sample at room temperature (o) (from [14]). At ambient pressure, a large amplitude of variation between 300 and 80K is observed. Extrinsic relaxation channels are actually provided by molecular reorientations
262

0.010 -
E-"
0.008, r
0.006
—1—1—1—1—1 1 1 —t" ' 1 '
K3C60
1
o •
o
o $ V f V
•
o ▼ -
o
. r . i . I .
O O
i . i 1 0.004 0 2 4 6 8 10 12
Pressure (kbar)
Figure 1: Temperature dependence of (Ti T)_1 on K3Ceo at ambient pressure.
in the pressure region 0 — 5kbar, as it was observed at ambient pressure around 230K [15]. The temperature of the peak observed on Tf1 increases with increasing pressure and is finally shifted above room temperature for P ss 5kbar. The remaining variation could be explained by thermal contraction effects . Above 5kbar, the difference between the results obtained on the two samples increases with pressure. As a matter of facts, spin diffusion between the two 13C spin species from C60 and A'3C6o phases is important when a large amount of Ceo is present in the sample, due to the progressive overlap of the spectra. T{~ in Ceo is always smaller than in K3Ceo which tends to decrease the measured values in the Ceo -riched sample. This is the reason why we think that the results obtained on the Ceo -poor sample above bkbar are intrinsic and correspond to the electronic contribution to the relaxation. Actually, in this pressure region, the Korringa law, (Ti T)_1 = Cst(T), characteristic of a metallic state, is well followed. The quantity (Ti T)_1 which slightly decreases with pressure, is proportional to N(Ep)2 whatever is the origin of the relaxation (hyperfine contact or dipolar) [16].
263

1.7
1.6
I
H 1.5
1.4 -
1.3 32 34 36 38 40 42 44
Frequency shift ö (ppna)/C_-° 60
Figure 2: Relation between the Cg0 electronic relaxation rate and the resonance frequency
shift 6 relative to C°0, measured at different pressures, plotted as T]~ versus <5, yielding the actual Knight shift K. Insert: Room temperature pressure dependence of the resonance frequency shift 8 of the 13C - CgQ line relative to the Cg0 one in the C6o-riched A'3C6o sample. A typical error bar (iiO.lppm) is shown.
A second NMR signature of a metallic state is the presence of a Knight shift, usually decomposed in an scalar (isotropic) part which gives raise to a shift of the NMR line and a dipolar (anisotropic) part which leads to the broadening of this line. In A3C60 compounds. it has been proved that T{1 and therefore the Knight shift are mainly of dipolar origin [16] implying that the isotropic shift should be small. What we measure here is a site and powder average of this scalar shift (noted K hereafter). However, the position of the NMR line is also determined by a chemical shift, which not only depends on the C60 molecule but also on the electronic charge it holds. As a consequence, the origin of K in A'3C6o is unknown. However, K is proportional to N(Ep) and is the only part of the frequency shift to be affected by pressure. As mentioned above, the electronic component of the relaxation
264

rate Tj1 is proportional to N(EF)2 and we can therefore correlate the pressure dependences
of both K and T^1 in order to determine the origin of K. The frequency shift 6, of the C|0~ line relative to the C^, one taken as a reference, was
measured at room temperature as a function of pressure, up to 8kbar (insert of Figure 2), from the relative position of the maxima of the two peaks. A linear pressure dependence is observed with a slope d8 /dP « -0.73ppm/kbar. K is related to this shift 6 by K(P) = 6(P) - S0. In order to determine <50 we used the pressure dependence of the electronic component of T{1 measured, between 5 and 12kbar on the C60 -poor sample at room temperature
(figure 1). Figure 2 shows the proportionality relation between 6 and Tj when the pressure is varied up to \2kbar. The extrapolation of the line position corresponding to zero relaxation rate gives 80 = -18 ± 4ppm, from which is deduced the actual Knight shift at P = \bar, K = 61 ± 4ppm. It decreases by as 7ppm i.e. 11 ± 1.5% under lOkbar while at the same time, the electronic contribution to Tf1 drops by 21.5 ± 3%. These results compare very well with the extended Hiickel band structure calculations [17] leading to a 11% reduction of N(EF) taking a lattice parameter reduction of 1.2% [2]. NMR data under pressure can be therefore understood within a weak Coulomb interaction model. However, this result cannot explain the large enhancement of ESR [18] and SQUID susceptibility [19]
as compared to band calculations [20]. N(EF) is also related to the superconducting transition temperature Tc. If we apply
directly the BCS relation Tc ~ üph e-ll{N{EF)v\ the pressure dependence of both Tc and
N(EF) (via K or (TiT)~1/2) can give us a rough estimate of the phonon frequency Qph and of the electron-phonon coupling constant A = N(EF)V. By plotting ln(Tc(P)) (from [21] [22]) versus l/K(P), we have found ftpk as 600A' and A « 0.3 which supports the essential role played by intramolecular phonon modes in the superconductivity of these materials.
Our Knight shift value is also compatible with the 13C-C%0 resonance in Rb3C60 observed at 195 ppm/ TMS by MAS-NMR technique at 5T [23]. The difference of 9ppm between the two compounds may be ascribed only to an increase of the Knight shift as the chemical shift is fixed by the charge density on the C60 molecule. This is in agreement with the larger N(EF) (and the higher Tc) found in Rb3C60 ■ Finally, the chemical shift of C& (125 ppm/ TMS) deduced from K shows that the C^ species is 18ppm more diamagnetic than the neutral molecule which could be due to anomalous paramagnetic ring currents in
neutral Ceo [24].
SEMICONDUCTOR TO SEMIMETAL TRANSITION IN Rb4C60
These experiments were performed on Rb4C60 powder containing around 15 mo/.% of insulating Rb6C60 which was the only parasitic phase in the sample.
A Jahn-Teller distorsion seems to be responsible for the splitting of the tlu manifold leading to a small gap in the band structure of A4C60 compounds already observed in Raman [25] and magnetic susceptibility [26] measurements. This Jahn-Teller gap can be also evaluated from NMR relaxation data. At ambient pressure, the temperature dependence of Tf1 in Rb^Ceo (reported in figure 3) is much steeper than the linear variation observed in metals, as already mentioned for A'4C60 [27] and Rb4C60 [28]. Effectively, a plot of InlT^1) versus 1/T reveals, at T > 100Ä', an activated regime with the activation energy: Ea = 739Ä' (insert of figure 3) which is indeed close to the activation energy of the spin
265

susceptibility (m 600A') [26] and of the NMR Tf1 measured in A4C6( 550A') [27]. The low temperature behaviour (60A' < T < 100Ä') is consistent with an activated regime characterised by a lower activation energy (A(, < 100A'), however the experimental accuracy does not allow to rule out unambiguously a power law dependence. Nevertheless, it is clear that the temperature dependence of T^1 is still sharper than a Korringa law.
12
10 ■
8 -
6 ■
a
P=lbar
Rb4C60 /£
P=lbar
To
0 S 10 15 20
1000A (K_1)
P=12kbar
100 200 300
TEMPERATURE (K)
Figure 3: Temperature dependence of the 13C-NMR spin-lattice relaxation rate, T^1 on Rb4Cßo at P—lbar, 8kbar and 12kbar. The dashed line is the fit of experimental points to equation 1 . The continuous lines are the fit of experimental points to equation 2. The insert shows the ambient pressure results plotted as ln(T{1) versus 1000/T.
With increasing pressure at room temperature, Tj-1 strongly decreases with increasing pressure. At the same time, the amount of the temperature dependence of Tf1 decreases with increasing pressure. This dependence becomes almost linear under \2kbar (see figure 3).
At ambient pressure, no evidence of a non electronic contribution to the spin-lattice relaxation, due to molecular reorientations, could be observed up to 350K in Rb4C60, at
266

variance with the K4C6o compound for which a peak in Tf1 (T) was observed around 300K [27]. Although we cannot completely rule out the presence of this peak in Rb4Cao from our experimental data, we guess that this additional contribution to Tj-1, if it is also present in Rb doped compounds, could be shifted above room temperature because of the size difference between K and Rb atoms. Moreover, a further slowing down of the motions in Rb4C6o , together with an increase of the peak temperature on TV"1 (T), is expected to occur under pressure. Therefore, we may be fairly confident that the spin-lattice relaxation rate
presented in figure 3 is governed by electronic excitations. The simplest interpretation for an activated relaxation rate is the excitations of electron-
hole pairs through a band gap. More precisely, if we assume that the relaxation is caused by thermally activated intrinsic carriers, in a semiconducting regime, this contribution is
found as [29]:
r^ = ^)2©>(iW-^)) (U where t is the bandwidth and 6 is the smallest indirect gap between occupied and unoc- cupied subbands of the tlu manifold. As seen by figure 3 (dashed line), the quality of the fit of experimental data at lbar with equation (1) is not good enough, especially at low temperature (T < 200Ä") where the measured Tx are longer than the ones expected from equation (1). The choice of delocalized band carriers may not be appropriate. Alternatively, the NMR relaxation may be provided by localized paramagnetic centers. The activated be- haviour observed down to about 120 K shows that these centers should be intrinsic. In principle those can be localized electrons, holes or triplet electron excited states on the C6o molecule. However, energy considerations are in favour of triplet excitons [29].
Under pressure, the large activation energy Ea decreases, whereas the low temperature contribution becomes a linear one growing with pressure. Therefore, the temperature de- pendence of rx
_1 under pressure (figure 3) can be modeled by a law of the type:
l/r1=aexp(-^) + 6T (2)
The low temperature behaviour at ambient pressure and the coexistence of linear and acti- vated regimes under pressure, suggested us the presence of a small indirect gap in the band structure besides the direct Jahn-Teller gap. Therefore, the excitation of electron-hole pairs through this indirect gap could provide a second channel of relaxation. At ambient pres- sure, the low yield of the relaxation via free electrons makes this channel efficient only at low temperatures whereas the localized states provide the most efficient relaxation, above 100K in spite of their higher activation energy (Ea = 739A', A « 130meV). The first chan- nel of relaxation in (2), from now on called T~}ir, requires the excitation of paramagnetic centers through the direct Jahn-Teller gap A = 2Ea, presumably at the T point of the Brillouin zone. The linear term in (2) can be related to a nuclear relaxation channel from a degenerate electron gas (i.e. a Korringa like relaxation) which appears when the small indirect gap 6 = 2Eb closes. We shall note it T^nd. Table 1 gives the parameters a, Ea and b in equation (2) at lbar, Skbar and \2kbar. The fits obtained with these parameters are
reported in figure 3 (full lines). For the NMR relaxation by the localized triplet electronic states the relaxation rate
rfj.v can be written as for paramagnetic impurities [30], with the thermally activated
concentration defined by Boltzman statistics:
267

Pressure a Ea b r, N(EF)
kbar s-1 K (sAT1 10~14s (eV'.spin .mol .)~l
0.001 111 739 0 23 0
8 16.9 529 0.0038 3.5 6.7
12 4.26 333 0.0052 0.9 7.8
Table 1: Parameters extracted from the fit of 7\ l (T) by the law aexp(-^f) + bT and the correlation time, TS, and the density of states at the Fermi level, N(EF) from equations (3) and (4).
K ■ exp(- ' kT (3)
where TS is the relaxation time of the paramagnetic moments themselves and A is the hyperfine coupling constant. From the preexponential factors of the activated contribution to T{~ (a parameter in table 1), we have deduced the characteristic correlation times rs
for the different pressures, which are also reported in table 1. rs strongly decreases under pressure but remains shorter than the usual characteristic times of the spin-lattice relaxation of paramagnetic impurities: « 10"6 4-10~12 s at room temperature [30]. As seen from table 1, the activation energy Ea for the direct process, which is an intramolecular property, is however strongly depressed under pressure but does not disappear when the indirect band gap closes. This feature can be understood in terms of a screening of the Jahn-Teller effect by excited carriers in the indirect gap band structure.
We attribute the second contribution, T^Jnd, to band carriers. Both the valence and conduction bands are expected to broaden under pressure at a rate which can be estimated from the NMR study of A'3C60 under pressure to 2meV ■ kbar~l [14]. Therefore, we can infer that a pressure less than bkbar should be large enough to close the indirect gap < 20meV assuming that there is no significative difference in lattice compressibility between AsCeo and AjCeo • According to table 1, the existence of a linear term in the temperature dependence of T^1 at 8 and 12kbar may be the signature for a finite density of states at the Fermi level, N(EF). Therefore a semiconducting to semimetal transition should arise below 8kbar leading to a Korringa type relaxation for T{lni. We could not detect any visible paramagnetic shift of the NMR line due to the isotropic part of the Knight shift. However, this contribution could be small if the main contribution to the Knight shift is of dipolar origin as for A3C6o compounds [16].
In the metallic regime, the relaxation caused by the band carriers, T^lnd, is given by
A^2
?£„,, = *Ä ( £ ) N(EFfkT (4)
268

For the numerical estimates, the hyperfine coupling constant, A, was obtained from the Korringa type relation (equation (4)) which is well obeyed by T{x in Rb3Ceo between 30 and 100K. Using N(EF) = 10.5 states/(eV.spin.molecule) deduced from LDA calculations [16] and (T^X)-1 = 9.5 ■ 10~3(A'.s)_1 from previous measurements, we have obtained A = 2.32 ■ 10~27 J. We have made the assumption that the same value for the hyperfine coupling constant can be used in both Rb3C60 and Rb4C60 , whatever is the nature of the relaxation. Using equation (4) and the b parameter in table 1, we have extracted N(EF) for the different
pressures which are also reported in table 1. The linear contribution to Tj"1 observed above Skbar gives a finite density of states at
the Fermi level increasing with pressure. At P = \2kbar, the temperature dependence of Ti1 is dominated by the Korringa channel and the derived value of N(EF) is only slightly lower than the value obtained in A3Ceo compounds undergoing a superconducting tran- sition. Therefore, a search for superconductivity has been made in Rb4C6o under 15 and Wkbar using the ac susceptibility method. We have been able to detect the superconducting transition ascribed to a minority phase (« 10%) of Rb3C60 {Tc = 14.5Ä" at P = lbkbar and Tc = 20K at P = lOkbar) contained in the Rb4C60 sample, but no other transition could be detected down to 0.39K. One of the reasons may be the following. In spite of similar values of the density of states at the Fermi level for A'3C6o at ambient pressure and for Rb4Ceo at P = I2kbar, they have different origins. In A'3C6o, the density of states is related to the metallic Fermi surface, while in Rb4C60 the density of states derived from the NMR data at high pressure is indeed a summation over the several band structure valleys. Therefore the density of states of an individual valley may be too small to stabilize superconductivity
in the investigated temperature domain.
CONCLUSION
In the metallic compound K3C6o , we have used the proportionality between T{~ and the Knight shift (K) and their pressure variation at room temperature to determine the actual value of K (61ppm under ambient conditions). From this value, we could deduce the Knight shift of Rb3C60 (70ppm) and the chemical shift of the C^ species (125ppm /TMS). Furthermore, these results are in favour of weak electron correlations in K3C60 and of superconducting pairing via the intramolecular phonon modes.
In the semiconducting compound Rb4C6u, NMR experiments confirm the essential role played by the Jahn-Teller distorsion. Assuming that the dominant activated NMR relax- ation observed at lbar is provided by localized paramagnetic centers, we can estimate the Jahn-Teller splitting as EJT « 130meV. The band structure evolves from a narrow indi- rect gap semiconductor at ambient pressure to a semimetallic material under pressure. The linear contribution to T^1 observed above Skbar gives a finite density of states at the Fermi level increasing with pressure. However, in spite of similar values of the density of states at the Fermi level for K3Cm at ambient pressure and for Rb4C60 at P = I2kbar, we did not detect any superconductivity in the last compound up to 15kbar above 0.4K.
Acknowledgements: This work has been supported by the CNRS contract: GDR 1019 on C60. We thank M. Nardone for technical help in high pressure experiments.
269

References
[1] S.J. Duclos, K. Blister, R.C. Haddon, A.R. Kortan, and F.A. Thiel, Nature, 351, 380, (1991).
[2] 0. Zhou, G.B.M. Vaughan, Q. Zhu, J.E. Fischer, P.A. Heiney, N. Coustel, J.P. Mc- Cauley Jr, and A.B. Smith III, Science, 255, 833, (1992).
[3] R.M. Fleming, A.P. Ramirez, M.J. Rosseinsky, D.W. Murphy, R.C. Haddon, S.M. Zahurak, and A.V. Makhija, Nature, 352, 787, (1991).
[4] K. Tanigaki, I. Hirosawa, T.W. Ebessen, J. Mizuki, Y. Shimakawa, Y. Kubo, J.S. Tsai, and S. Kuroshima, Nature, 356, 419, (1992).
[5] G. Spam, J.D. Thompson, R.L. Whetten, S.-M. Huang, R.B. Kaner, F. Diederich andG. Grüner, and K. Holczer, Phys. Rev. Lett., 68, 1228, (1992).
[6] R. Kerkoud, P. Auban-Senzier, J. Godard, D. Jerome, J.-M. Lambert, and P. Bernier, Adv. Mater., 6, 782, (1994).
[7] R. Tycko, G. Dabbagh, M.J. Rosseinsky, D.W. Murphy, A.P. Ramirez, and R.M. Fleming, Phys. Rev. Lett., 68, 1912, (1992).
[8] S.C. Erwin, in Buckminsterfullerenes. W.E.Billups and M.A. Ciufolini Eds. (VCH Publishers, New York, 1992).
[9] P.J. Benning, D.M. Poirier, T.R. Ohno, Y. Chen, M.B. Jost, F. Stepniak, G.H. Kroll, J.H. Weaver, J. Fure, and R.E. Smalley, Phys. Rev. B, 45, 6899, (1992).
[10] M.de Seta and F. Evangelisti, Phys. Rev. Lett., 71, 2477, (1993).
[11] F. Stepniak, P.J. Benning, D.M. Poirier, and J.H. Weaver, Phys. Rev. B, 48, 1899, (1993).
[12] R.C. Haddon, A.S. Perel, R.C. Morris. S.-H. Chang, A.T. Fiory, A.F. Hebard, T.T.M. Palstra, and G.P. Kochanski, Chem. Phys. Lett., 218, 100, (1994).
[13] G. Quirion, C. Bourbonnais, E. Barthel, P. Auban, D. Jerome, J.M. Lambert, A. Za- hab, P. Bernier, J.M. Fabre, and A. Rassat, Europhys. Lett., 21, 233, (1993).
[14] R. Kerkoud, P. Auban-Senzier, D. Jerome, J.M. Lambert, A. Zahab, and P. Bernier, Europhys. Lett., 25, 379, (1994).
[15] Y. Yoshinari, H. Alloul, G. Kriza, and K. Holczer. Phys. Rev. Lett., 71, 2413, (1993).
[16] V.P. Antropov, I.I. Mazin, O.K. Andersen, A.I. Liechtenstein, and 0. Jepsen. Phys. Rev. B, 47, 12373, (1993).
[17] S. Saito and A. Oshiyama, Phys. Rev. Lett., 66, 2637, (1991).
[18] A. Janossy, O. Chauvet, S. Pekker, J.R. Cooper, and L. Forro, Phys. Rev. Lett., 71, 1091, (1993).
270

[19] A.P. Ramirez, M.J. Rosseinsky, D.W. Murphy, and R.C. Haddon, Phys. Rev. Lett.,
69, 1687, (1992).
[20] S.C. Erwin and W.E. Pickett, Science, 254, 842, (1991).
[21] G. Sparn, J.D. Thompson, S.-M. Huang, R.B. Kaner, F. Diederich, R.L. Whetten, G. Grüner, and K. Holczer, Science, 252, 1829, (1992).
[22] J.E. Schirber, D.L. Overmyer, H.H. Wang, J.M. Williams, K.D. Carlson, A.M. Kini,
U. Welp, and W.-K. Kwok, Physica C, 178, 137, (1991).
[23] J. Reichenbach, F. Rachdi, I. Luk'yanchuk, M. Ribet, G. Zimmer, and M. Mehring, to
be published in J. Phys. Chem.
[24] A. Pasquarello, M. Schlüter, and R.C. Haddon, Phys. Rev. A, 47, 1783, (1993).
[25] G. Ruani, P. Guptasarma, C. Taliani, and J. Fischer, presented at MS-HTSC IV,
Grenoble (1994), to be published in Physica C.
[26] I. Luk'yanchuk, N. Kirova, F. Rachdi, C. Goze, M. Molinie, and M. Mehring, to be
published in Phys. Rev. B, rapid comm.
[27] G. Zimmer, M. Heimle, M. Mehring, and F. Rachdi, Europhys. Lett., 27, 543, (1994).
[28] R. Tycko, J. Phys. Chem. Solids, 54, 1713, (1993).
[29] R. Kerkoud, P. Auban-Senzier, D. Jerome, S. Brazovskii, I. Luk'yanchuk, N. Kirova,
F. Rachdi and C. Goze, submitted to J. Phys. Chem. Solids.
[30] A. Abragam and B. Bleaney, in Electron Paramagnetic Resonance of Transition ions,
(Oxford, 1970). "
271

FULLERENE SUPERCONDUCTORS: EFFECTS OF MOLECULAR ORIENTATION AND VALENCE
T. YILDIRIM«2', L. BARBEDETTE<2'*>, K. KNIAZ«, J. E. FISCHER« C. L. LIN«, N. BYKOVETZ«, P. W. STEPHENS'4', P. E. SULEWSKI« and S. C. ERWIN*6» «National Institute of Standards and Technology, Gaithersburg MD 20899 «University of Pennsylvania, Philadelphia, PA 19104 «Temple University, Philadelphia PA 19122 «State University of New York, Stony Brook NY 11794 «AT&T Bell Labs, Murray Hill NJ 07974 «Naval Research Laboratory, Washington DC 20375
ABSTRACT
We report results of high-resolution x-ray diffraction, dc magnetometry and Raman scattering on the quaternary alkali and ternary mixed alkali-alkaline earth fullerene com-
pounds NajRbzCsi-zCso (0 < x < 1) and Rb3-sBa5C6o {6 ~ 0.4 and 2.0). These have the same cubic space lattices as K3C60 and Rb3C6o; however the former exhibit long-range orientational correlations with Pa3 symmetry and the latter have N > 3 delocalized elec- trons per molecule. We show that the dependence of Tc on lattice constant is much steeper for the ordered as compared to the merohedrally disordered phases with N = 3, and that within the constraint of cubic symmetry Tc decreases significantly with increasing N > 3,
in disagreement with some theoretical predictions.
INTRODUCTION
The properties of solid C6o have been extensively studied, but our understanding of doping effects on electronic properties remains limited. In particular, it is still unclear why only a few of the C6o intercalation compounds are metallic and/or superconducting, while one-electron band structure calculations suggest that such behavior should be the rule rather than the exception. All the known alkali metal-doped fullerene superconductors are cubic at Tc, contain 3 ions per molecule which singly occupy the tetrahedral and octahedral voids, and consist of Cgo3 tri-anions according to the positions of the Ag Raman lines. Fur- thermore, until recently, all of them exhibited merohedral disorder in which the molecules are locked at random into one of two energetically degenerate "standard orientations" [1], We discovered that the key to overcoming this disorder was to intercalate the smaller Na+
into the tetrahedral sites, then tune the properties by choosing different octahedral ions (including vacancies) [2,3]. This led to the discovery that Na2RbC6o is an orientationally- ordered superconductor and provided a new clue to the origin of its anomalously low Tc, 3.5 K as opposed to the ~ 12 K expected on the basis of its lattice constant [4]. In the first part of this paper we describe experiments on a series of orientationally-ordered quaternary superconductors Na2RbzCsi_IC6o from which we establish a much steeper dependence of Tc
on lattice constant than the dependence previously found for the merohedrally-disordered
phases [5].
273
Mat. Res. Soc. Symp. Proc. Vol. 359 ° 1995 Materials Research Society

Another important variable is the average molecular valence. None of the alkali com- pounds with N / 3 electrons per COO superconduct, while one-electron models predict that they should at least be metallic. Up to now it has been impossible to definitively resolve this mystery, because the non-metallic phases with N ^ 3 are at the same time not isostruc- tural with the superconducting ones. Thus their non-metallic nature could be attributed to Fermi surface instabilities associated with anisotropic lattices [6]. We have succeeded in separating the structural and molecular valence variables by preparing and studying mixed alkali-alkaline earth compounds A3_sAE«C6o (A = Na, K, Rb, Cs and AE = Ca, Sr, Ba) which retain the fee structure with 3 ions/molecule but with N in the range 3 - 5. These efforts are in an early stage but have already yielded important results. In particular, we find that Tc is indeed optimized at or very near 3 electrons/C6o, decreasing rapidly for
N > 3.
EFFECT OF ORIENTATIONAL ORDER
The establishment of the "universal" relation between Tc and a for the merohedrally- disordered phases (space group Fm3m) was based initially on Tc(a) data for pseudobinary solid solutions K^Rb^Ceo and Rb^Csi-xCeo [4]. Similar data for orientationally-ordered Na2RbICsi_IC6o (ground state space group Pa3) yields a much steeper Tc(a) dependence. This not only provides a correct explanation for the anomalously low Tc of Na2RbCeo but also implies the possibility of much larger gains in Tc if one can achieve only slight increases
in a. The orientational state of the C6o molecules in fullerene intercalation compounds is
controlled mainly by the size of the tetrahedral ion. Large ions (K+, Rb+) favor the two "standard orientations" which minimize the alkali-fullerene repulsive overlap. This
interaction is negligible for Na+, and there is no frustration between the Na+ - C^0n Coulomb
attraction and the purely intermolecular interactions, resulting in the same orientationally- ordered ground state as occurs in C6o itself [7]. Thus we found that Na^Ceo, 1 < x < 3, exhibits the ordered Pa3 ground state [2]. Given the much larger octahedral void volume, it was not surprising to find that the ternary superconductors Na2RbC60 [3] and Na2CsC6o [8] behaved similarly, since these compounds exhibit a high degree of chemical ordering in which the larger ions are confined to octahedral sites [9]. We reasoned that mixing Rb and Cs on the octahedral sites would have no effect on the orientational state, thus providing a chemical tuning method to probe in detail the Tc(a) correlation in orientationally ordered
Pa3 phases. Quaternary solid solutions Na2RbICsi_IC6o were prepared in two steps by direct reac-
tion of COO and alkali metals in swaged evacuated copper tubes. By mixing appropriate fractions of the ternaries and annealing at 400-450° for a month with several intermediate regrindings, we obtained single phase quaternaries with nominal x = 0.25, 0.50 and 0.75. Note that the accuracy on x (which we conservatively estimate to be ± 0.1) is unimportant for what follows since any proportion of Na2RbC6o and Na2CsC6o yields a solid solution and x drops out when Tc(x) and a(x) from the same sample are combined to give Tc(a).
Synchrotron X-ray powder diffraction at 300 K revealed mixtures of simple cubic and face-centered cubic lattices with slightly different a's for all 5 samples. This mixture is clearly associated with orientational order-disorder transitions rather than chemical phase separation, as proved in Figure 1. Single phase behavior is observed both above and below 300 K, consistent with a transition on heating from Pa3 to Fm3m accompanied by a jump
274

1000
900
800
£ 700 S3 Z e 600
$ 50° as
* 400
300
200 ■
1 1 1
Na2Rbo.5cso.5c60 ft
1
M FM3M / \
/ \ / \ 375K -
¥^^M****(620) *H»«rt "**^ (533)/****
" A^ yv. 299K
_yr 1 1 \ZrW*T | 1 ^* "*■****"*"
*t PA3 / \ 250K ■
, (620) (621) (541) , (533) ***&*&*'.
2.75 3.00 2.80 2.85 2.90 2.95 Q (INVERSE ANGSTROMS)
Figure 1: Synchrotron x-ray powder diffraction data and Gaussian fits for Na2Rbo.5Cso.5C60 at the indicated temperatures. The two-phase behavior observed near room temperature is clearly associated with the finite width of the orientational ordering transition Fm3m —► Pa3 on cooling.
0.04
~ -0.04 E a
^ -0.08 E S, s -0.12
-0.16
-0.20 0.0 6.0 9.0 12.0 15.0 18.0
T(K)
Figure 2: Magnetic shielding of the superconducting quaternaries Na2RbICsi_IC6o with 0 < x < 1 (measuring field 10 gauss). Note especially the strong increase in Tc with decreasing x. Inset: 300 K lattice parameters vs. x for Pa3 and Fm3m fractions; the solid lines are linear
fits.
275

in lattice constant of about 0.05 Ä, just as in pure COO but with a higher transition temper- ature. Fitting the high angle portions of the 300 K two-phase profiles gives the respective a's which are plotted in the inset to Figure 2. The lattice constant decreases linearly with x, confirming the solid solution behavior. The main part of Figure 2 shows zero-field-cooled DC SQUID results, from which we deduce Tc's of 11.7 K, 9.4 K, 8.4 K, 5.2 K and 3.4 K (all ± 0.4 K) as x increases from 0 to 1 in 0.25 increments. In Figure 3 we plot Tc vs. the 300 K Pa3 lattice constant for the ordered quaternaries (solid squares) along with Tc vs. 300 K Fm3m lattice constant for the disordered ternaries [4] (open squares) and binaries [10] (open triangles and filled circles). The former dependence is clearly much steeper than the latter, the crossover occurring at a ~ 14.135 A (Tc ~ 15 K).
40
30
* 20
10
A Rb3C60 vs. P • K3 CM vs. P ° M.MV.C«, 1 Atm ■ this work
13.7 13.9 14.1 14.3 14.5 Lattice Parameter (A°)
14.7
Figure 3: Tc versus a for Fm3m [4, 10] and Pa3-ordered superconductors (this work). Solid curves are fits to McMillan's formula using a linear dependence of N(Ejr) on the intermolecular distance; only the parameters describing N(E/r) vs. a differ in the fits to the two families of materials. The slope of the Pa3 curve is much larger than the Fm3m one, indicating that a small increase in a without destroying PaZ ordering should cause Tc to increase very rapidly. The dotted line represents the results of Ref. 11 (see text).
Mizuki et al. used a different method to study the same problem [11]; their results are represented by the dotted line in Fig. 3. Using a laboratory x-ray diffractometer, they obtained a = 14.025 A for Na2RbC6o, considerably smaller than our value 14.097 Ä. As a consequence, our Tc vs. a dependence is much steeper than theirs; linear approximations give roughly 280 K/Ä and 90 K/Ä respectively. Mizuki et al. attempted to obtain inter- mediate data points by measuring Tc vs. pressure on Na2CsC6o and converting to Tc vs. a using the published compressibility of K3Ceo [10]. The points thus obtained indeed fall on their dotted line, but this is fortuitous. We and they now agree that the correct Na2RbC6o lattice constant is 14.096(10) A [12], such that the pressure-derived points no longer fall on the line defined by the end-members at 1 atm. We further believe that there are two poten- tial problems with the pressure method which explain why the pressure-derived points do not in fact lie on the correct line. The first problem is the likelihood of a pressure-induced symmetry-lowering distortion, which we in fact observe below 0.6 GPa at 300 K for all
276

compounds containing tetrahedral Na (explicitly including Na2CsC6o) [13]. If the same pressure-induced distortion occurs at low temperature, the Mizuki et al. correlation does not apply to an isostructural sequence, as ours clearly does. The second problem is that there is no reason a priori for the compressibility of Na2CsC6o to be the same as that of
K3Ceo- The difference between the two results is of more than quantitative interest. If one
ignores the high-pressure data for K3C6o and Rb3C6o (Fm3m with a < 14.1 Ä), one could argue that the dotted line for Pa3 joins the Fm3m curve at ~ 14.2 Ä, resulting in a single universal curve with negative rather than positive curvature. This would imply that Tc has saturated with increasing a [14]. On the other hand, the much steeper Tc vs. a dependence found in the present experiments has clear implications for further gains in Tc if one can stabilize an orientationally-ordered structure with only a slight increase in lattice constant.
EFFECT OF MOLECULAR VALENCE
The radii of AE+2 ions dovetail nicely with those of A+: Ba+2 lies between K+ and Rb+, while Sr+2 and Ca+2 lie between Na+ and K+. Thus the prospect for chemically-ordered mixed alkali-alkaline earth phases with 3 ions but N ^ 3 electrons per molecule is good. We have prepared and studied such compounds, A3_5AE5C6o, with A = Na, K, Rb or Cs and AE = Ca, Sr or Ba. These syntheses are very difficult due to the low vapor pressures of the alkaline earths. Furthermore, since the miscibility of alkali and alkaline earths in C6o lattices is completely unknown, many trials were required to obtain samples with identifiable mixed phases. We were faced with two choices: low-temperature solution reactions (e.g. using metal-ammonia solutions) which ensure fast mixing at the atomic/molecular level at the risk of obtaining metastable phases or phase mixtures; or high-temperature reactions which rely on vapor transport but which at least should yield reproducible equilibrium products. We have chosen the latter strategy, and we report preliminary results for (Rb,Ba) phases with 6 ~ 0.4 and 2.0. These were obtained by reacting Ceo with the azides RbN3 and BaN6 in swaged evacuated OFHC copper tubes. In a first step the azides were decomposed at appropriate temperatures, then the tubes were opened in the glove box and complete decomposition verified by weight loss of the reactants. The raw product was ground and re-sealed in a second evacuated OFHC tube and annealed at 400 - 500 °C for several weeks.
Figure 4 shows a Rietveld refinement of synchrotron powder x-ray data for a sample of nominal composition RbBa2Ceo- The majority phase is identified from the refined pa- rameters as RbBa2C6o, with lattice constant 14.21 A and essentially perfect chemical order (tetrahedral Ba, octahedral Rb). The lattice constant is slightly smaller than that of K3C60 while the radius of Ba+2 is 0.02 Ä larger than that of K+. We attribute this inverse rela- tion to an additional compressive (Coulomb) effect of the doubly-charged tetrahedral ions. Equally good refinements were obtained with Fm3m and Fm3 space groups. There is a second phase, ~ 10 vol.%, which we identify as Ba3C6o in the A15 structure [15], as well as a trace amount of a third phase which we have been unable to identify as yet. The latter accounts for most of the error profile, the refinement for the two dominant phases being
otherwise excellent. Raman scattering spectra in the region of the A3(2) "theta-pinch" mode (Figure 5)
exhibit a strong line at 1434 cm-1 and a weaker one at 1456 cm-1. The 35 cm-1 redshift of the former relative to neutral COO is consistent with pentavalent ions [16] which in turn is consistent with the stoichiometry of the majority phase assuming complete charge transfer
277

w 5 o
> CO
CC i
x \J
A u LLJ 1 1 , , l i, j i i
i1 i ... _ -mv . ..- . . ^ 1
10 15 20 25
, „ , „ , , . ., . i. ... \V • .1 • •• . M V.1,. ,. M ,.,'.,. M ,.,
25 55 35 45 2 theta (degree)
Figure 4: Two-phase Rietveld refinement of 300 K synchrotron x-ray data for RbBa2C6o- The heavy and light tick marks indicate allowed reflections for the fee RbBa2C6o (majority) and bec (A-15 structure) Ba3C6o (minority) components respectively.
8000
7500
7000
S3 6500
S 6000
S 5500
5000
4500
4000
1434.1 cm
W®t+&l&+
1380
■1-
1420 1460 WAVENUMBERS
1500
Figure 5: Raman scattering spectra (2 mW of 5145 Ä excitation on a 1 mm quartz x-ray
capillary) in the region of the As(2) theta-pinch mode for RbBa2C60 powder at 300 K. Symbols
are the experimental points and the solid curve is a fit to two Lorentzians at 1434.1 and 1456.4
cm-1 respectively. The fitted widths are equal to the 10 cm-1 resolution. The dashed curve is a
hypothetical Lorentzian for trivalent COO [16].
278

from both metals. The origin of the second Raman line is not known at this stage. The most important result from this sample is the absence of superconductivity. The DC
SQUID data place a conservative upper bound of 2% on the 2 K shielding fraction with our typical conditions (1 mg. sample, p ~ 2 g/cm3, 50 G field). Thus we have the first example of a compound which is in every way isostructural with known all-alkali superconductors but which does not superconduct above 2 K. The universal curve for Fm3m superconductors (Figure 3) would predict a Tc of about 17 K for the majority phase in this sample if the
fullerenes were trivalent. A second sample of global composition Rb2BaC6o yielded a mixture of two fee structures
plus the same trace third phase observed in RbBa2C6o, as shown in Figure 6. A two-phase refinement neglecting the trace phase resulted in a 2.05:1.0 admixture of Rb3_äBaäC6o (lattice constant 14.43 Ä at 300 K) and the same RbBa2C6o structure described above. Neglecting the unknown trace third phase, we first estimated 8 to be ~ 0.5 from the
nominal stoichiometry and the decomposition reaction
Rb2BaC60 -> 2/3 Rb2.5Bao.5C6o + 1/3 RbBa2C60.
With this as a starting point, we refined 8 and obtained a value 0.34, in reasonable agreement with the above. However, the R-factor in the refinement is rather insensitive to 8, such that fixing it at the 0.5 value implied by the decomposition reaction has little effect on the
quality of the fit. Hence we conclude that 0.3 < 8 < 0.5. Some more definite conclusions can be obtained from the refinement. The octahedral
sites in both compounds are occupied entirely by the larger Rb+ ion (1.48 Ä radius), while the tetrahedral sites are all Ba-occupied in RbBa2C60 but randomly occupied by a 3:1 mixture of Rb and Ba in Rb3_{Ba5C6o- Perhaps as a consequence of this chemical disorder on the tetrahedral site sublattice, the diffraction peaks of Rb3_sBa5C60 are considerably
broader than those of RbBa2Ceo- Figure 7 shows the Raman data for this sample. Here we see only one peak in the A3(2)
region, at 1444 cm-1. Shown for reference is a hypothetical Lorentzian at the expected position for Cg0
3 ions. There is a significant redshift, consistent with ~ 3.4 electrons per molecule, i.e. essentially complete electron transfer from 2.5 Rb's and 0.5 Ba's per molecule. Note that the fit to a single Lorentzian is quite acceptable; in particular we were unable to improve the fit by including a contribution from RbBa2C60 at 1434 cm"1 (Figure 5). We assume for now that the absence of such a contribution is due to different Raman cross-sections, and conclude that the majority Rb3_5Ba,sC6o phase in this sample consists of molecules with average valence 3.4 ± 0.1.
Finally we show in Figure 8 the results of DC SQUID magnetometry. There is a well- defined superconducting onset at 24 K; similar measurements on pure-phase Rb3C6o powder typically show onsets at 29 K. Since the RbBa2C6o component of this sample does not superconduct, we attribute the 16 % shielding fraction averaged over the sample to the ~ 66% (molar or volume) fraction of Rb3_$Ba5C6o as deduced from the x-ray analysis. The shielding fraction for this phase is thus ~ 25%, and therefore the ~ 5 K depression of Tc
relative to Rb3Ceo is in all likelihood a result of tuning the electron number away from N = 3 as opposed to a morphological effect. We conclude that Tc drops rather rapidly as the electron number increases beyond 3 per molecule. A similar result was obtained for K3_sBasC6o with 8 ~ 0.2, in which a Tc of 16 K was found, ~ 3 K lower than that of K3Ceo-
279

35 2 theta (degree)
Figure 6: Two-phase Rietveld refinement of 300 K synchrotron x-ray data for "Rb2BaC6o"- The light and heavy tick marks indicate allowed reflections for the Rb3_$Ba$C6o and RbBa2C6o components respectively.
250 -i r-
1443.7 cm
1410 1420 1430 1440 1450 WAVENUMBERS
1460 1470 1480
Figure 7: Raman scattering spectra (1 mW of 5145 Ä excitation on a 1 mm quartz x-ray capillary) in the region of the A5(2) theta-pinch mode for nominal "Rb2BaC6o" powder at 300 K. Symbols are the experimental points, the solid curve is a fit to a Lorentzian at 1443.7 cm-1
and the dashed curve is a hypothetical Lorentzian for trivalent Ceo- We identify this line with the majority Rb3_4Ba{C6o phase, molecular valence = 3 + S ~ 3.4.
280

0.1
0.05
<! 0 Bi O g-0.05
m
I"0-1 P-0.15
-0.2 -
Q -0.25
-0.3 -
-0.35
1 —1
• 'Rb2BaC60'
1 —i 1 r'
Rb3C60
1 « ♦ * □
FC
- D
E
- a
□
'
• B
- .° -
^°° ZFC
10 15 20 25 TEMPERATURE (K)
30 35
Figure 8: DC magnetization of a mixed-phase sample with global composition Rb2BaC6o, measured with 50 gauss field and increasing temperature. Field-cooled and zero-field cooled curves are displayed with different symbols. The superconducting onset is found at 24 K, significantly
below that of Rb3C6o, which we attribute to Rb3_$Ba«C6o with S ~ 0.4.
BARIUM-CARBON INTERACTIONS
At this point one has to examine the presumption that Ba will exist as a divalent ion when intercalated into solid C60- This is especially significant given our knowledge of the intercalated graphite analog. Band structure calculations [17], core level XPS spectroscopy [18] and structural properties [19] of the stage 1 compound BaC6 all indicate that only ~ 1 of the 6s2 valence electrons becomes a delocalized ir charge carrier. The remainder hybridize with normally empty bd states (which lie only 1.2 eV above the occupied 6s in atomic Ba), and thus remain localized as part of the Ba "ion core". The strength of the Ba- C interaction depends on the Ba-C distance, which in BaC6 is 3.05 Ä, coordination number 12. In contrast, tetrahedral Ba in superconducting Rb3_sBaäC60 has 24 nearest Ba-C pairs at 3.31 Ä separation. Despite the twofold greater coordination, the Ba-C interaction is now weak enough that 5rf-6s hybridization is negligible, and the position of the A3(2) mode is consistent with ~ 2 electrons transferred per Ba. Simple energetic considerations also show that Ba+2 is favored over Ba+ if orbital hybridization is negligible. The difference in total
energy, AEt, between the electronic configurations Rb+BaJ2Cgo5
written as
AEt = [£(Ce05) - £(C60
3)] + 2 [£(Ba+2) - £(Ba+)] + AEM*A, (1)
where Ai?Mad is the difference in Madelung energy for the two configurations. The first and second bracketed terms are both positive, but the energy gain from the Madelung contribution is sufficient to overcome this cost. The resulting AEt=—7.7 eV strongly favors a configuration with divalent Ba. The same conclusions apply to fee RbBa2Ceo-
281

First-principles electronic-structure calculations confirm part of this scenario in detail. We have carried out self-consistent density-functional calculations for orientationally or- dered RbBa2C6o within the local-density approximation, using an all-electron method de- scribed in detail elsewhere [20]. The results are largely similar to those for the binary alkali füllendes, with some modifications. The t\u conduction band is almost purely C p-like, with Rb and Ba admixtures at only the 4% level, similar to the alkali füllendes. The calculated t\u density of states is shown in Fig. 9(a). The width and shape strongly resemble the corresponding curve for the alkali füllendes, although the gap between the tlu and the next higher manifold (tlg) is approximately 0.3 eV for K3C6o while this gap nearly closes for RbBa2C60.
-0.50 -0.25 0.00 Energy (eV)
0.25 -0.50 -0.25 0.00 Energy (eV)
0.25
Figure 9: Theoretical density of states (both spins combined) for the tlu conduction band in (a) orientationally ordered RbBa2C6o, and (b) merohedrally disordered K3C6o. The Fermi level is the energy zero for both plots, and has been shifted in (b) to correspond to five conduction electrons.
With five electrons in the tiu manifold, the Fermi level falls on a peak in the density of states, with N(EF) = l3-5 states/eV. This is nearly identical to the result for ordered K3C6o (13.2 states/eV) and, taken at face value, suggests a comparable Tc, strongly at odds with our upper bound of 2 K. A likely resolution lies in the probability that RbBa2C60 is merohedrally disordered; its lattice constant is considerably smaller than that of RbK2C60, and R(Ba^J) in the former slightly exceeds R{Kfet) in the latter. The effect of such disorder on the electronic spectrum has been studied earlier [21,22], and is shown in Fig. 9(b) for the case of K3C6o- Although the disorder washes out most of the sharp structure, a strong energy dependence remains, with N(EF) dropping by roughly 30% as the filling increases from three electrons to five. The corresponding drop in Tc is difficult to predict reliably, but we estimate it to be almost an order of magnitude; this is essentially consistent with our finding of no superconductivity above 2 K. We caution, however, that this scenario also predicts Tc to increase for N < 3 electrons per molecule, while to date there is no evidence for this effect.
282
SUMMARY AND CONCLUSIONS
The elucidation of structure-property relationships in new materials is generally facili- tated by the ability to synthesize new compounds with controlled variations in structural or chemical parameters. The first such example in fullerene superconductors was the tuning of Tc by varying the radius of the tetrahedral ions [4]. We have presented two more examples, in which new families of compounds were synthesized by design to isolate and study the ef-
fects of molecular orientation and valence. From the quaternary series Na2RbiCsi_iC60 we find that Tc increases much more rapidly with increasing lattice constant for orientationally- ordered structures than for merohedrally-disordered ones, indicating thereby possible fruit- ful directions for further enhancements of Tc. Preliminary results from mixed alkali-alkaline earth compounds (Rb,Ba)C60 indicate that there is indeed something special about triva- lent molecular ions, Tc dropping by ~ 20% at 3.4 electrons per molecule and by at least 93% at 5 electrons per molecule. A similar exploration of the N < 3 regime is hampered by the limited solubility of A vacancies in A3C60 [23]. It is however interesting to note that the unpaired electrons in the fee phases of AC«, (A = K, Rb or Cs) appear to be localized
[24]. The data presented here are in disagreement with a number of theoretical results based
on strong electron correlations. Lof et al. predicted that any non-integer valence should yield superconductivity [25], while we find that Tc is strongly depressed as N increases beyond 3. Lu suggests that superconductivity is possible at x = 3 for some range of Hubbard parameters [26]. Chakravarty et al. proposed a theory in which correlation effects within single molecules play a central role. They predicted that Tc should peak when there are (approximately) an odd number of electrons per molecule [27], which disagrees with the observed absence of superconductivity in pentavalent RbBa2C6o- Finally, Sarker obtained a Hartree-Fock phase diagram for a Hubbard model on the fee lattice and predicted that Tc reaches a minimum slightly above 3 electrons/molecule but increases very rapidly on either side of the minimum [28], again in disagreement with our experimental findings.
The ability to "separate the variables" at the synthetic level should continue to con- tribute to a global understanding of the electronic structure of doped füllendes, which for
the moment remains rudimentary.
This research was supported by the National Science Foundation MRL Program un- der Grant No. DMR91-20668 and by the Department of Energy, DE-FC02-86ER45254 (Penn); by NSF Grant No. DMR92-02528 (SUNY); by DOE Grant DE-FG02-86ER45231 (The SUNY X3 Beamline); and by DOE DEAC02-76CH00016 (the National Synchrotron Light Source at Brookhaven). We gratefully acknowledge the assistance of G. Bendele, R.
Dinnebier and Q. Zhu in some of the x-ray measurements.
* Current address: Institut des Materiaux de Nantes, 44072 Nantes Cedex 03, France.
283
REFERENCES
[1] P. W. Stephens, L. Mihaly, P. L. Lee, R. L. Whetten, S-M. Huang, R. B. Kaner, F. Diederich and K. Holczer, Nature 351, 632 (1991).
[2] T. Yildirim, J. E. Fischer, A. B. Harris, P. W. Stephens, D. Liu, L. Brard, R. M. Strongin and A. B. Smith III, Phys. Rev. Lett. 71, 1383 (1993).
[3] K. Kniaz, J. E. Fischer, Q. Zhu, M. J. Rosseinsky, 0. Zhou and D. W. Murphy, Solid State Commun. 88, 47 (1993).
[4] R. M. Fleming, A. P. Ramirez, M. J. Rosseinsky, D. W. Murphy, R. C. Haddon, S. M. Zahurak and A. V. Makhija, Nature 352, 787 (1991).
[5] T. Yildirim, J. E. Fischer, R. Dinnebier, P. W. Stephens and C. L. Lin, Solid State Comm. (in press).
[6] S. C. Erwin and C. Bruder, Physica B199-200, 600 (1994). [7] T. Yildirim, S. Hong, A. B. Harris and E. J. Mele, Phys. Rev. B 48, 12262 (1993). [8] K. Prassides, C. Christides, I.M. Thomas, J. Mizuki, K. Tanigaki, I. Horosawa and T.
W. Ebbesen, Science 263, 950 (1994).
[9] I. Hirosawa, J. Mizuki, K. Tanigaki and H. Kimura, Solid State Comm. 89, 55 (1994). [10] O. Zhou, G. B. M. Vaughan, Q. Zhu, J. E. Fischer, P. A. Heiney, N. Coustel, John P.
McCauley Jr. and A. B. Smith III, Science 255, 833 (1992). [11] J. Mizuki, M. Takai, H. Takahashi, N. Mori, K. Tanigaki, I. Horosawa and K. Prassides,
Phys. Rev. B50, 3466 (1994). [12] K. Prassides (private communication).
[13] J. E. Schirber, D. L. Overmyer, W. R. Bayless, M. J. Rosseinsky, D. W. Murphy, Q. Zhu, 0. Zhou, K. Kniaz and J. E. Fischer, J. Phys. Chem. Solids. 54, 1427 (1993).
[14] K. Tanigaki, in Recent Advances in the Chemistry and Physics of Fullerenes, edited by K. M. Kadish and R. S. Ruoff (Electrochemical Society, Princeton NJ 1994) p. 546.
[15] A. R. Kortan, N. Kopylov, R. M. Fleming, O. Zhou, F. A. Theil, R. C. Haddon and K. M. Rabe, Phys. Rev. B 47, 13070 (1993).
[16] H. Kuzmany, M. Matus and B. Burger, Adv. Mater. 6, 731 (1994). [17] N. A. W. Holzwarth, D. P. DiVincenco, R. C. Tatar and S. Rabii, Int. J. Quantum
Chem. 23, 1223 (1983).
[18] M. E Preil, J. E. Fischer, S. B. DiCenzo and G. K. Wertheim, Phys. Rev. B 30, 3536 (1984).
[19] J. E. Fischer, H. J. Kim and V. B. Cajipe, Phys. Rev. B 36, 4449 (1987). Phys. Rev. B 49, 7620 (1994).
[20] S.C. Erwin and M.R. Pederson, Phys. Rev. Lett. 67, 1610 (1991). [21] M.P. Gelfand and J.P. Lu, Phys. Rev. Lett. 68, 1050 (1992). [22] S.C. Erwin and E.J. Mele, Phys. Rev. B 50 5689 (1994).
[23] Q. Zhu, J. E. Fischer and D. E. Cox, in Springer Series in Solid State Sciences 117, 168 (1994).
[24] A. Jänossy, O. Chauvet, S. Pekker, J. R. Cooper and L. Forrö, Phys. Rev Lett 71 1091 (1993).
[25] R. W. Lof, M. A. van Veenendal, B. Koopmans, H. T. Jonkman and G. A. Sawatzky, Phys. Rev. Lett. 68, 3924 (1992).
[26] J.-P. Lu, Phys. Rev. B 49, 5687 (1994).
[27] S. Chakravarty, M. P. Gelfand and S. Kivelson, Science 254, 270 (1991) [28] S. K. Sarker, Phys. Rev. B (in press).
284
SUPERCONDUCTIVITY AT 40K IN CESIUM DOPED C60
T.T.M. PALSTRA, O. ZHOU, Y. IWASA,* P.E. SULEWSKI, R.M. FLEMING, and B.R.
ZEGARSKI
AT&T Bell Laboratories, Murray Hill, New Jersey 07974
* Japan Institute of Science and Technology, Ishikawa 923-12, Japan
ABSTRACT
We report superconductivity in Cs3C6o at 40K using ac susceptibility measurements under
hydrostatic conditions up to 15 kbar. Cs3C6u was prepared by reaction of C« with Cs in
liquid ammonia, followed by heating at 150°C. This route circumvents formation of the
energetically more stable CsiC60 and Cs4C6o phases. We have studied the synthesis and
phase formation by measuring the symmetric Ag pentagonal pinch mode of C(,o using Raman
spectroscopy. Whereas Raman spectroscopy indicates homogeneous charge transfer of three
electrons, x-ray diffraction indicates two phases other than the commonly observed fee
structure. This superconducting transition temperature is considerably higher than for known
doped Cßo compounds and intermetallic compounds.
Introduction
While in most superconductors Tc is almost impossible to predict, it turns out that for
A3C60 there are simple guidelines. Since the relevant high frequency phonons are
intramolecular modes and almost unaffected by the alkali doping, Tc is determined by the band
width. The band width can be decreased by reducing the wavefunction overlap, and a higher
N(Ep) can be obtained by expanding the lattice. In fact, this results in a monotonic relation
between Tc and the fee lattice parameter. This relationship can be verified by two methods:
first by plotting Tc versus lattice parameter for the various fee A3C6o compounds, and second
by applying hydrostatic pressure and shrinking the lattice uniformly. It turns out that both
methods yield an identical Tc for a given lattice parameter, emphasizing the passive role the
alkali ions have for the electronic properties. Various attempts have been reported to
synthesize CS3C60.'1' since it is the obvious candidate to expand the crystal lattice from the
present highest TC = 33K in Cs2RbC60.[21 We will show that it is essential to use a low
temperature synthesis route, since already at 200CC the phase segregates in the energetically
favorable compounds Cs] C«> and Cs4C60- CS3CGO already exists at ambient pressure albeit
not in the common fee structure. Hydrostatic pressures are required to raise superconductivity
to 40K, but without the formation of fee Cs3C6o- This increases the superconducting
transition temperature by 25% from previous results on A3C60. and is almost a factor of two
higher than for any intermetallic compound.
285
Mat. Res. Soc. Symp. Proc. Vol. 359 s 1995 Materials Research Society

Experimental Results
We used the following method to synthesize Cs3C6o- Cs metal and C6o powder in a
stoichiometric ratio of 3:1 were cooled in an evacuated flask by a dry-ice/isopropanol slush.
Anhydrous NH3 was condensed onto the Cs/C6o mixture through a vacuum line. The C6o
powder completely dissolved in the liquid NH3, indicating charge transfer from Cs to C60-
(Pristine C6o is insoluble in liquid NH3). After about half an hour, NH3 was evaporated from
the solution by heating up the flask to 150°C under vacuum, conditions sufficient to remove
NH3 from NH3 K3 C6o- All the evolving gas is condensable in a liquid nitrogen trap, hence no
measurable H2 is evolved during the reaction. Heating was stopped when no more NH3
evolved from the flask.
Figure 1 shows the ac susceptibility of Cs3C60 at hydrostatic pressures between 0 and 15
kbar. The pressure cell is a clamp-type cell, described elesewhere, using mineral oil as
pressure medium.' ' ac susceptibility was measured using a primary coil generating -0.1 Oe at
88 Hz, and two counterwound secondary coils. We used a Pb chip for pressure calibration.
Since the samples react with water and oxygen in air, we avoided any exposure to the ambient.
The ac susceptibility measurements are non hysteretic with temperature, or pressure cycling.
Figure 1 shows that hydrostatic pressures are needed to observe superconductivity at 40K. At
residual pressure only a small superconducting signature is observed near 18K, which increases
and shifts to 40K upon applying pressure. The susceptibility at 4K has a value of
-8xl0~4emu/cm3, comparable to the early results on K3C60 andR^C^. For the fullerene
superconductors the particle size is often smaller than the magnetic penetration depth
X~0.4\im. For uncoupled grains with typical size D, the superconducting signal has a
magnitude that depends on the ratio x=DA.'4) The Meissner state has a magnetic susceptibility 1 x^ 1 2
X = - ^r T^- for D < A., and % = - —- (1 )3 for D > X.. The typical particle size is usually o
larger than the x-ray coherence length of -300 A, but presumably somewhat smaller than that
of sintered material of ~lu.m. Using a particle size of 0.5nm, we obtain a superconducting
volume fraction of -25%. The weak Josephson coupling between the grains may be enhanced
by the two-phase nature of the material.
Whereas Raman spectroscopy indicates that we successfully synthesized Cs3C60, x-ray
diffraction shows a more complicated situation. X-ray diffraction was performed using 0.6911 o
A monochromatic synchrotron x-ray radiation and a linear detector. Atmospheric pressure data
were taken on a sample in a sealed glass capillary and the 11 kbar and 26 kbar patterns were
taken on a sample of the same batch in a diamond anvil cell. The 1 bar x-ray pattern cannot be
indexed as from a single phase sample. The presence of fee Cs3C6n is ruled out from peak
positions and intensity calculations. We have indexed the pattern as a two-phase mixture of a
cubic A15 and a body-centered tetragonal (bet) structure, with lattice parameters of a = 11.770
286

CS3C60_2 1
0
-1
-2
-3
1-4
--5 3. u
-7
-8
-9
-10
Figure 1
CS3C60 empty
I p(kbar). 0.1
!// I
/CS3C60 K3C1 3<~>60
0.4 0.6 0.8 1.0 1.2 ■ I i I T/Tel i I
10 20 30 40 50 T(K)
Temperature dependence of the ac susceptibility of CsjC^n under hydrostatic pressures up to 14.3 kbar. The arrows indicate the onset of the superconducting transition. The inset shows a blow-up of the transition comparing the ac susceptibility versus reduced temperature of CS3 C60 at 14.3 kbar with the transition of K3 Cgn at ambient pressure.
287

A for the A15 phase and a =12.057 and c = 11.432 A for the bet phase. The unit cell volumes
for the cubic and tetragonal phase are 815.3 and 830.9 A3/C6o> and are essentially the same as
that of the bec Cs6C6oI5) and the bet Cs4C60 phase, respectively. For comparison, K3C60
and Rb3 C60 have a unit cell volume of 722 and 744 A3 per C^ at 1 bar, respectively. Band
structure calculations have reported a Tc of 47.4K[6] and 70K[7] for fee Cs3C60, based on a
unit cell volume of 810 and 767A3 per Cgo> respectively.
Discussion
Our measurements show that for pressures lower than 12 kbar Tc increases with pressure.
This is contrary to what one would expect, based on the broadening of the band when applying
pressure. As possible expanations we suggest the vicinity or even crossing of the Mott limit
when applying pressure, or suppression of phase fluctuations by hydrostatic pressure. More
characterization of the magnetic state of Cs3C60 at ambient pressure is required to settle this
issue.
While our present result enhances Tc to a record level of 40K for conventional electron-
phonon coupling superconductors, it may be evident that the limits can be pushed further.
Firstly, Tc can still be limited by phase fluctuations, which could be suppressed by other
synthetic routes. Secondly, hydrostatic pressure to stabilize a phase can usually be supplanted
by chemical modifications. While Tc is limited to 12K in the simple cubic Pa3 structure,'81 and
to 33K in the fee structure, higher Tc's than the present result of 40K may be achieved in other
fullerene based compounds.
ACKNOWLEDGEMENTS. We acknowledge stimulating discussions with B. Batlogg, R.C.
Haddon, and D.W. Murphy. One of us (Y.I.) acknowledges G.A. Thomas and A.F. Hebard for
their hospitality and stimulating discussions.
REFERENCES
1. S.P. Kelty et al. Nature 352, 223-225 (1991).
2. K. Tanigaki et al. Nature 352,222-225 (1991).
3. J.D. Thompson, Rev. Sei. Instrum. 55, 231-234 (1984).
4. D. Shoenberg, Proc.Roy.Soc. (London) A175, 49 (1940).
5. O. Zhou et al. Nature 351,462-464 (1991).
6. D.L. Novikov et al. Physica C191, 399-408 (1992).
7. M.-Z. Huang et al. Phys.Rev.B 46, 6572-6577 (1992).
8. K. Prassides et al. Science 263, 950-954 (1994).
288

EFFECT OF He PRESSURE ON THE SUPERCONDUCTING TRANSITION TEMPERATURES OF Na2CsC6o AND
(NH3)4Na2CsC6o
IE. SCHIRBER,* W.R. BAYLESS*, M.J. ROSSEINSKY**, O. ZHOU**, R.M. FLEMING**, D. MURPHY**, J.E. FISCHER*** *Sandia National Laboratories, Albuquerque, NM 87185-0345 **AT&T Bell Laboratories, Murray Hill, NJ 07974 ***University of Pennsylvania., Philadelphia, PA 19104-6272
ABSTRACT
The Na based mixed alkali doped C6o superconductors show anomalous behavior with respect to the "universal" superconducting transition temperature Tc vs lattice constant a„ relation followed by most of the fee A3C6o superconductors. We have measured dTc/dP for Na2CsC6o and (NH3)4Na2CsC6o using solid He as the pressure medium to ~ 6 kbar finding dTc/dP equal to -0.8±(0.01) K/kbar and -1.0(±0.1) K/kbar for Na2CsC60
and Na2(NH3)4C6o respectively. Our value for Na2CsC6o differs markedly from that obtained by Mizuki et al of about -1.3 K7kbar. However, using N2 or Ar, we obtain values for dTVdP in substantial agreement with Mizuki et al who used fluorinert to generate their pressure. This work emphasizes the need for compressibility measurements with the same pressure medium in the appropriate temperature range so that meaningful comparisons can be made between various pressure measurements and models which are based on lattice spacing.
Introduction
Much has been made of the simple relation between the lattice constant and the superconducting transition temperature, Tc, of the alkali metal doped, A3C6o superconductors. Pressure studies as well as comparison of results for members of the A3C6o family gave rise to the picture2 shown in Figure 1. Theoretical models involving only inter and intra COO interactions have been able to describe this Tc vs lattice constant behavior, essentially neglecting any details of the alkali intercolate.3'4 We have shown5'6 that this simple picture can break down if substantially more than the three electrons are transferred as in the alkali superconductors A3C6o- For example, Ca5C6o and Yb3C6o have qualitatively different dependencies on lattice constant or pressure (opposite sign and nearly a factor often in magnitude). In retrospect this is probably not surprising because with the A3C6o, three electrons are donated, half filling the first unoccupied Tiu band above the C6o gap. The Ca5 and Yb3 can donate sufficient electrons to completely fill the ti„ band and partially fill the next higher T[g band. The density of states of the Tig band evidently has a much different volume dependence thattthat of the ti„.
289
Mat. Res. Soc. Symp. Proc. Vol. 359 c 1995 Materials Research Society

13.7 13.9 14.1 14.3 14.5
Lattice constant (A)
14.7
Figure 1 Tc vs lattice constant for various A3C60 materials (from reference 2), recent data indicate that the Na2Rb-Na2Cs is even steeper.
There are however further deviations from the simplest lattice constant vs Tc picture even within the A3C6o case when the mixed alkali members involving Na are considered. Na2RbC6o falls considerably off the curve as shown in Fig. 1 while Na2CsC60 is more or less in line. This would indicate that a considerably greater negative pressure effect would be seen and indeed Mizuki et al7 observe a 50% greater negative pressure derivative for Na2CsC60 than for the nearby (in lattice parameter) A3C6o superconductors. They and Yildirim et al8 attribute this to the fact that Na2CsC60 and Na2RbC6o are simple cubic rather than the usual fee structure. Our preliminary pressure measurements of Tcfor Na2CsC60 gave essentially the "right" value for dTc/dP in line with the fee A3C6o materials. In this report, we present new pressure studies of Na2(NH3)4CsC6o and Na2CsC6o using He and other gases as pressure media in an effort to understand these seemingly disparate results.
Experimental
Samples of (NH3)4Na2CsC60 were prepared as described earlier.9 Briefly fee Na2CsC60
was exposed to NH3 gas at room temperature for 1 - 2 days, sealed and annealed for 1 day at 100° C. The resultant material is fee with a lattice constant of 14.473 A and a Tc value of 29.6 K. For the pressure measurements, an if technique described earlier10 in which a coil is wound around the capillary containing the superconducting powders is used. This if technique detects the onset of diamagnetism and has been shown on many samples to coincide with the onset observed on the identical samples using a SQUID magnetometer. The capillary is broken under
290

He in the pressure cell so as to expose the material to the gaseous pressure medium. A chip Nb is affixed to the capillary to provide an internal calibration of the carbon glass thermometer which is attached to the exterior of the pressure vessel. Nb has a completely negligible pressure derivative for our purposes so is ideal for this purpose. Pressures to 5 kbar were used to determine dTc/dP = -1 0±0.15 K/kbar for (NHs^Na^sCeo as shown in Fig. 2.
(NH3)4Na2CsC60
Pressure in kbar
Figure 2 Effect of pressure on the superconducting transition temperature of (NH3)4Na2CsC6o.
The identical techniques were employed for the study of dTc/dP of Na2CsC6o- As noted above, our initial results using He as the pressure medium gave a value of dTc/dP = -0.8(±0.1) K/kbar which is near the usual 1U2 value obtained for the fee A3C6o materials. However it is too small a derivative to be reconciled with the line connecting Na2RbC6o and Na2CsC60 in Fig. 1 and is much smaller than the value of-1.25 K/kbar obtained by Mizuki et al7
using fluorinert as the pressure medium. We have observed similar differences with various pressure media in a study13 of the pressure dependence of the orientational ordering in C6o. With He, the interpenetration of the lattice resulted in a 30 - 40% smaller derivative than with N2 or pentane which presumably can penetrate much less easily.
In order to investigate our suspicion that with a small atom like Na we might have a similar penetration of the lattice with our He pressure medium, pressure measurements were made on the same sample under identical conditions except that the pressure transmitting gas was changed from He to N2 to Ar. The situation is complicated here because the pressure media are freezing at very different temperatures which results in a loss of pressure experienced by the sample at low temperature depending upon the relative thermal expansivities of the pressure medium, the sample and the pressure vessel. At 5 kbar, He freezes at 40 K, N2 at 130 K and Ar
291

at 180 K. We therefore employed an internal pressure gauge consisting of a chip of high purity Sn which has a dTc/dP = -0.05 K/kbar. Our results for the pressure dependence of Tc for Na2CsC6o using He as the pressure medium are shown in Fig. 3 and give dTc/dP = -0.8(+0.1) K/kbar. Applying a 5 kbar pressure of either Ar or N2 room temperature results in a pressure near 3.1 kbar at liquid He temperature and gives a value of Tc of near 7 K (shown as an X in Fig. 3). The fact that 5 kbar applied pressure at room temperature results in the same low temperature for N2 and Ar stems from the effect of a volume change in N2 accompanying a solid-solid phase transition14 compensating for the higher melting point of N2 with respect to Ar.
Na.CsC,
Figure 3 Effect of pressure on the superconducting transition temperature of Na2CsC6o. The solid squares were obtained using He as the pressure transmitting medium and are numbered in the order in which they were taken. The point near 3 kbar and 7 K was obtained with both N2
and Ar as the pressure medium.
Results and Discussion
We find that (NH3)4Na2CsC6o is stable under pressure cycling in the He to 5 kbar and has a pressure dependence of Tc completely in line with its position on the Tc vs lattice constant curve (see Fig. 1). Therefore, the expansion of the lattice by substitution of (NH3)4Na+ for Na+ in the octahedral sites expands the lattice moving Tc up to 29.5 K and pressure moves Tc back down following the simple picture quite nicely.
292

Our results for the pressure dependence of Tc for Na2CsC6o differ markedly with pressure medium. With He, dT/dP = -0.8 K/kbar while with N2 or Ar the value is -1.2 K/kbar in excellent agreement with the results of Mizuki et al7 who used fluorinert as the medium. Quite clearly we have the situation observed earlier in pure C6o where the He interpenetrates the lattice so that the compressibility is reduced over that where the pressure medium is excluded as is of course the usual situation. This does not occur to a very large extent in any of the A3C6o superconductors except those containing Na, presumably because K, Rb and Cs have sufficiently large atomic radii so that the He cannot penetrate the lattice.
These results then remove the apparent disagreement between our He pressure results and those of Mizuki et al7 (and with our N2 and Ar results). The larger pressure derivatives for the Na containing superconductors and for the apparent misplacement of Na2RbC6o on the Tc vs lattice constant curve would appear to stem from the fact that the Na materials are simple cubic rather than fee as discussed by Mizuki et al7 and by Yildirim et al.8 Our results emphasize the need for accurate compressibility measurements for these systems. The compressibilities must be determined using the same pressure medium as the particular parameter studied under pressure and be in the same orientational ordered structure so as to arrive at the correct volume dependence which is what can be compared with theory. This caution is now obviously valid with He for pure Coo and Na containing A3C6o but may be true to varying degrees with other pressure media in some of these doped COO materials.
Work at Sandia sponsored by the US DOE under contract DE-AC04-94AL85000.
References
1. A. P. Ramirez, Superconductivity Review I, 1(1994).
2. K. Prassides, C. Christides, I. M. Thomas, J. Mizuki, K. Tanigaki, I. Hirosawa and T. B. Ebbesen, Science 263, 950(1994).
3. M. Schlüter, M. Lannoo, M. Needels, G. Baraff and D. Tomanek, Phys Rev Lett. 68, 526(1992).
4. C. M. Varma, J. Zaanen and K. Raghavachari, Science 254, 989(1991).
5. J. E. Schirber, W. R Bayless, A. R. Körten and N. Kopylov, Physica C 20, 190(1993).
6. J. E. Schirber, W. R Bayless, A. R. Körten, M. J. Rosseinsky, E. Ozdas, O. Zhou, R. M. Fleming, D. Murphy and J. E. Fischer, Proc. 185 Mtg Electrochem. Soc, May 1994.
7. J. Mizuki, M. Takai, H. Takahashi, N. Mori, K. Tanigaki, I. Herosawa and K. Prassides, Phys Rev B 50, 3466(1994).
8. T. Yildirim, J. E. Fischer, R. Dinnebier, P. W. Stephens and C. L. Lin, Solid State Comm.
293

9. O. Zhou, R. M. Fleming, D. W. Murphy, M. J. Rosseinsky, A. P. Ramirez, R. B. Van Dover and R. C. Haddon, Nature 362, 433(1993).
10. L. R. Azevedo, J. E. Schirber, J. M. Williams, M. Beno and D. R. Stephens, Phys Rev B 30, 1370(1984).
11. JE. Schirber, D. L. Overmyer, H. Wang, J. Williams, K. D. Carlson, A. Kini, M. Pellin and W. K. Kwok, Physica C 178, 137(1991).
12. G. Sparn, J. D. Thompson, S. Huang, R. Kaner, F. Diederish, R. Whetten, G. Grüner and K... Holczer, Science 252, 1829(1991).
13. G. A. Samara, L. V, Hansen, R. A. Assink, B. Morosin and J. E. Schirber, Phys Rev Letters 67, 3136(1991.
14. C. A. Swenson, J Chem Phys. 23, 1963(1955).
294

THE SUPERCONDUCTING ENERGY GAP OF Rb3C60 AS MEASURED BY IR TRANSMISSION IN THIN FILMS.
DANIEL KOLLER, MICHAEL C. MARTIN, and LASZLO MIHALY,
Department of Physics, SUNY at Stony Brook.
Abstract The superconducting energy gap of Rb3C6o has been measured by infrared transmission
through a thin film. Resistivity measurements on the same samples in situ indicate a tran- sition to superconductivity at the expected temperature, ~30K, with distinct gap features appearing in the transmission below this temperature. The results are interpreted in terms
of the BCS theory.
Introduction At temperatures below the critical temperature, Tc, most of the known superconductors
develop a well defined gap in the electronic density of states. In the weak-coupling BCS theory, the zero temperature gap is expected to have a value 2A = 3.5kBTc- For strong electron-phonon coupling, a gap value exceeding 3.5 kBTc is expected. Accurate measure- ments of the temperature dependence of the gap can answer fundamental questions about
the nature of a superconductor.
Measurements of the gap in Rb3C6o have already been carried out by other groups, each reporting a different value for 2A ranging from 2 to 5.2kBTc. [1, 2, 3]. The great disparity in reported values further stresses the need for an accurate and reliable measurement of the energy gap. The most recent and most accurate measurements to date are those of Degiorgi et al. , carried out in a reflecting geometry on both polycrystalline pellets [4, 5] and single crystals [6]. It is to their results that the work presented here is best compared.
Measurement of the Gap
The Rb3C6o sample measured in this experiment was prepared in a special glass sample chamber designed for infrared (IR) transmission measurements on thin films [7]. The cham- ber is made of Pyrex glass with two silicon windows sealed to opposite ends of a 1cm high cylindrical sample area. One of the two windows serves as a C6o substrate and four leads patterned on it allow in-situ resistivity measurements. C6ois evaporated under high vacuum onto the substrate and an alkali-metal film, in this case Rb, is deposited in an appendage to the sample space. The chamber is then sealed off, preventing further contamination from the vacuum system and allowing the alkali metal to getter any remaining contaminants.
295
Mat. Res. Soc. Symp. Proc. Vol. 359 c 1995 Materials Research Society

Rb3C 60 Thin Film Spectra (below Tc)
Rb3C60 Spectra ratioed to 35K 100 and 700 cm"1 data combined
30 KA SamPle 73' BNL APril '94
1 fu Order of traces ^6 6.4, 10 K
15K 20 K
o y ' 25, 30 K 05 . in 4 IVJ E '\ CO 6.4 K... V^
1- 2
£
O 03 Q. CO
CO
CO
cr
1.4 6.4,10 KA
15 K r\\ ■
1.2 |20K\V
/// 25 j£^-~-^^ ^. 1
0.8 ■
0.6 Sample 73, BNL April '94"
100 200 300 400 500 600
Wave number (cm1)
20 100 200 300 Wave number (cm1)
400
Figure 1. The raw data, for the 40 — 700em-1 Figure 2. Ratios of the superconducting spectra
region, below Tc. A distinct gap feature ap- to the normal-state spectrum for RbßCeo- Com- pears below 30 K. pare to the fits shown in Figure 3.
To dope the Ceo > the appendage is warmed in an oil bath to increase the alkali metal's vapor pressure and force the metal to migrate towards the Ceo film. Doping is monitored in-situ by observing the behavior of the Fi„(4) vibrational mode which is known to be a sensitive indicator of the doping state of C6o [8]. The sample prepared for this study was doped to a nominal composition of Rb3Ceo and the alkali metal appendage was removed from the chamber to prevent further doping during subsequent measurements. Resistivity measurements during cool-down indicate a superconducting transition at 30K (90% point).
The far-IR data were obtained with the sample chamber mounted on the cold finger of a liquid helium flow cryostat. The sample was well wrapped with oxygen free copper tape and affixed with GE varnish to insure good thermal contact with the cold finger. Temperature was measured to within ±1K using a silicon diode sensor. The cryostat in turn was placed at the beam focus of a Nicolet 20SX FTIR spectrometer, at the U4-IR beam-line of the National Synchrotron Light Source at Brookhaven National Laboratory.
IR spectra were measured in two steps with band pass filters covering the 20 — 110cm-1
and 40 — 700cm-1 frequency ranges and later merged into a single data set covering the full range. The 700 cm-1data are shown in Figure 1. Background spectra were obtained on an identical and similarly mounted reference chamber, free of Ceo , at all of the temperatures sampled during the course of the experiment. Note that the chamber used to obtain the background is similar but not identical to the actual sample chamber used, resulting in some additional features in the IR spectra.
296
Analysis
The traditional approach to analyzing IR transmission data in search of the energy gap is to obtain ratios of the superconducting spectral data to the normal state spectrum just above Tc, as first carried out by Glover and Tinkham in 1956 [9]. Only features caused by the superconducting transition will survive the ratio. Shown in Figure 2 are such ratios for Rb3C6o at the various temperatures measured. The most notable feature in the curves is the strong temperature dependent peak which, according to BCS theory, is expected to appear just above the gap. As T approaches Tc, the peak is reduced in amplitude, broadened, and shifted to lower frequencies following the temperature dependence of the gap . Note that for all temperatures, the transmission ratios extrapolate zero at low frequency, due to the
infinite DC conductivity of the superconductor.
The transmission just above Tc, at 35 K, was fit with a simple Drude model conduc- tivity, with plasma frequency, UJV =~ 7000cm_1and relaxation rate, \ =~ 5200cm"1. The resistivity, p=\ = 6.31 x 10~3O-cm, as obtained from the fit, is in rough agreement with other measurements on granular Rb3C6o films[10]. Note that with these parameters, all the data fall in the LO < \ range, so \ and up cannot be independently determined. Only
aDC = ^ influences the fits.
In the superconducting state, an algorithm developed by Brandt was used to model the conductivity for a superconductor with an arbitrary scattering rate[ll]. The conductivities were then utilized to obtain transmissions for both the superconducting and normal states. To derive reasonable fits, it was necessary to assume only a fraction of the sample was actually superconducting. This "superconducting fraction" was treated very simplistically in that the normal and superconducting contributions to the IR transmission were just averaged together. Sample thickness, 1/im, relaxation rate, £, and conductivity were held fixed at the experimentally established values while A and the superconducting fraction were free parameters. Best fits were obtained for a superconducting fraction falling slowly from a low temperature value of ~ 30% to 17% at 20K, and finally ~ 4% at 25K. The fits are shown in Figure 3 at temperatures corresponding to those of the measured spectra, and calculated using the film parameters discussed above. Note the good agreement between the calculated curves, and the data of Figure 2, except at very low frequencies where the fits deviate from the data due to the simple model used.
Error bars were established by allowing the fixed parameters, particularly the DC con- ductivity, to vary until the fit began to deteriorate. A was found to be relatively insensitive to the changes, yielding an uncertainty of ±3cm-1in A for the low temperature points.
The 25 K data were anomalously broadened and no adjustment of the fitting parameters could broaden the calculated features sufficiently to match the data. It is likely a range of Tc's exist in the sample, an effect which is enhanced for ^- < 1, and which is supported by the low superconducting fraction, indicating that at 25 K, a large part of the sample is above or near Tc- A was chosen to place the calculated peak squarely in the middle of the observed bulge, with the superconducting fraction adjusted to match the peak heights. A can be varied by ~ ±5cm_1 and still fit within the observed values, thus defining the
uncertainty for the 25 K data point.
297

BCS Fits using Rb3C60 thin film parameters
1.4
£1.2 (n c a H 1 "a CD
«0.8
0.6-
20
0.21 Tc/- \ 0.33 Tc
1 ■ 1
'. 0.5 Tc L
0.67 Tc/ 2AT « 1
(dirty limit)
JlSL!&Jc~~~~
yj Superconducting Fraction
T Fract.(%) J 6 30
10 30 15 25 20 17 25 4
100 200 300 Wave number (cm'1)
400
Rb3C60 thin film 2A by IR Transmission
15| } 1120
10
> E
< CM
Sample 73, BNL April'94
2A(6.4K) = 10.7meV= 4.1 kBTc
H 2A(T) BCS-
8T =+1K
10 20 T(K)
30
100
80
60 I
40 < CM
40
20
0
Figure 3. Ratios of the superconducting Figure 4. Temperature dependence of the su- spectra to the normal-state spectrum as calcu- perconducting energy gap as obtained from the lated from the BCS theory, using parameters of data, the Rb3C6o thin film.
Conclusions
The results are neatly summarized in the final figure (Figure 4). The temperature dependence of the energy gap as obtained from the data is shown, along with a calculated BCS temperature dependence scaled to the experimental value at 6.4 K. There are two main points of which to take note. First, the data at 6.4 K is assumed to lie at sufficiently low temperature to be taken as the T=0 value. 2A(0) is then found to be 4.1 ± 0.3 kBTc. This is in sharp disagreement with the value of 5.2 ± 0.3 kBT<7 of Zhang, Chen and Lieber [3], but falls within the range of 3 - 5kBTc specified by Rotter et al. [1]. Though still indicative of strong electron-phonon coupling, the current result is in much better agreement with the most recent reflectivity measurements by Degiorgi et al. on pressed pellets (2A = 2.98,3.6 kBTc for Rb3 and K3C60 respectively) [4] and single crystals ((2A = 3.44,3.45 kBTe for Rb3 and K3C60 respectively) [6].
The second significant feature is that the temperature dependence of the gap follows a BCS behavior, well within the established error bars. This is in contrast with the only other IR-derived temperature dependence reported from data for A3C6o, that of Degiorgi et al. [6]. Those results indicate a much flatter temperature dependence for the Rb3C6o and K3C6o single crystals studied.
298

At the time of this writing, the results presented here are the only IR transmission measurements mapping out the temperature dependence of the superconducting energy gap, A. Several previous measurements have been plagued with what the authors believe to be a spread in TVs [2, 6]. Our samples were not of pure phase either, but the data presented here were fit with a very simple model and the need to invoke a distribution of Tc's only becomes apparent at a relatively high temperature, T= 25K. This points to a comparatively good sample from which reliable information may be gained. With 2A = 4.1 ± 0.3kBTc, the lower extreme of the measurement approaches the BCS limit of 2A = 3.53ksTc- In addition, the BCS-like temperature dependence adds further support to the conclusion that
A3C6o is indeed a BCS superconductor.
A cknowledgment s
We offer many thanks to G.P. Williams and G.L. Carr for valuable discussions and for assis- tance in the measurements at the NSLS. Support was provided by NSF Grant DMR9202528 and the work at the NSLS is supported by the Department of Energy under contract #DE-
AC02-76CH00016.
References
[1] Rotter, L.D., et al., Nature, 355, 532 (1992).
[2] Fitzgerald, S.A., et al. , Phys. Rev. B, 45, 10165 (1992).
[3] Zhang, Z., et al. , Science, 254, 1619 (1991); Nature, 353, 333 (1991).
[4] Degiorgi, L., et al. Phys Rev. B, 49, 7012 (1994).
[5] Degiorgi, L., et al., Phys. Rev. Lett., 69, 2987 (1992).
[6] Degiorgi, L., et al. , Nature, 369, 541 (1994).
[7] Daniel Koller, Michael C. Martin, L. Mihaly, Rev. Sei. Instru., 65, 760 (1994).
[8] Martin, M.C., Koller, D., Mihaly, L., Phys. Rev. B. 47, 14607 (1993). Correction in
Phys. Rev. B, 50, 6538 (1994).
[9] Glover, R.E.,111, Tinkham, M., Phys. Rev., 104, 844 (1956); Phys. Rev., 108, 243
(1957).
[10] Palstra, T.T.M., et al. , Phys. Rev. Lett., 68, 1054 (1992).
[11] Brandt, E.H., Bauer, M., Sieder, E., Genzel, L., Infrared Reflectivity of Superconduc- tors with Arbitrary Purity, Proceedings of the USSR-FRG Bilateral Seminar "Investi- gation of High Temperature Superconductors - Modern Spectroscopic and Microscopic
Methods.", Oct. 30 - Nov. 5, 1989, Tallinn, USSR.
299

HREELS Studies of KXC60 Thin Films
G.P. Lopinski, M.G. Mitch, S.J. Chase and J.S. Lannin Dept. of Physics, Penn State University, University Park, PA 16802
Abstract
High resolution electron energy loss spectroscopy has been used to investigate the vibra- tional and electronic excitations of single-phase, crystalline AxC6o films. Substantial changes in intramolecular mode frequencies and intensities with alkali concentration arise from charge transfer effects as well as free carrier screening. For x=4, splitting of the <i„ band is observed, resulting in an insulating phase with an estimated gap of 0.3-0.4eV. Screening in the x=3 phase results in enhanced surface sensitivity and deviations from bulk stoichiometry at the surface of metallic films are observed.
Introduction
The electronic and vibrational properties of alkali-metal doped fullerenes (A^Ceo) have attracted considerable interest largely due to the occurrence of superconductivity in x=3 compounds. These materials also exhibit interesting metal-insulator transitions which are not yet fully understood. Of particular concern are the x=4 and x=l phases which are predicted to be metallic by band theory arguments but exhibit insulating behavior [1, 2]. Both electron correlation and disorder effects have been invoked in order to explain the non-metallic behavior of these compounds. Electron energy loss spectroscopy in transmission (T- EELS) has been used to determine the optical constants of the alkali füllendes over a wide energy range [3]. High resolution EELS (HREELS) utilizes considerably lower energy electrons in reflection and offers additional capabilities for the study of these materials. In particular, the higher resolution permits study of intra and intermolecular vibrational modes and of low-lying electronic transitions, while the short penetration depth of low energy electrons offers the possibility of surface sensitivity. HREELS has been used previously to study undoped C6o [4, 5, 6] as well as coadsorption of C6o and alkali-metals in monolayer films [7, 8]. In this paper we present HREELS results for single phase multilayer (~ 200A) K^Ceo films, including the x=4
phase not previously studied by T-EELS.
Experimental Samples were prepared and measured in-situ in a multi-chamber UHV system equipped with Raman scattering, low energy electron diffraction (LEED) and photoemission in addition to the HREELS spectrometer. Epitaxial films of C60 were grown by evaporation onto a clean Cu(lll) substrate. Alkali-metal doping of these films was carried out by evaporation from thoroughly de-gassed com- mercial SAES getter sources. The stoichiometry and phase behavior of the films was monitored with Raman scattering through the frequency of the Ag(2) pentagonal pinch mode which is sen- sitive to the local alkali concentration. A single narrow Ag(2) mode was used as the criterion for obtaining a single phase film. LEED confirmed that the films retained their crystalhnity upon doping. The x=3 phase exhibited a hexagonal LEED pattern as expected from an fcc(lll) surface. At 300K the spots were brighter than those from the undoped C6o film, reflecting freezing out of molecular rotations and the resulting reduction of thermal attenuation. Upon formation of the bcc x=6 phase the LEED pattern deteriorated, with the observed spots consistent with the expected
301
Mat. Res. Soc. Symp. Proc. Vol. 359 e 1995 Materials Research Society

in c
2.5
Energy Loss (cm )
Figure 1: EELS spectra for KrC6o in the region of electronic losses, multiplied relative to the elastic peak as indicated; a) x=0 (x400), b) x=3 (x20), c) x=4 (x40), d) x=6 (x60). Spectra were taken in the specular geometry except for b) which was 10° off-specular.
bcc(llO) orientation. Single phase x=4 films are not observed for doping at room temperature but can be produced by distillation [9]. Annealing x=6 films above 350C was found to produce an x=4 film according to Raman scattering. Only very dim, broad LEED spots were observed from this phase. An LK2000 spectrometer with rotatable analyzer was employed for the HREELS studies. The angle of incidence is fixed at 60° from normal. Incident energies were varied in the range of 2-10eV with typical resolutions (FWHM of the elastic beam) of 7meV for vibrational studies and 20meV for electronic losses.
Results and Discussion
Figure 1 shows EELS spectra for K^CöO in the range of low energy electronic transitions. For undoped C6o> a clear gap in the electronic excitations is observed with an onset of transitions at ~ 1.8eV as reported previously in HREELS [4, 7]. The peak at 2.2eV is assigned to the dipole- forbidden /iu(HOMO) to ii„(LUMO) transitions. In contrast, the hu — t\u separation determined from peaks in photoemission and inverse photoemission spectra is in the range of 3.5-3.7eV [10, 11]. This difference can be attributed to final state effects associated with electron correlation.
In x=3, the gap disappears with an intense peak emerging at 0.45meV. A similar feature has also been observed around 0.55meV in T-EELS and can be assigned to a plasmon of the t\u electrons, the shift arising from the different response functions of the two techniques. This plasmon has a rather large width (~ 0.35meV), implying significant damping of this mode. By changing the scattering conditions to suppress the dipole-active plasmon feature, a continuum of electronic transitions extending to low energies has also been observed. This continuum appears as a tail on the elastic peak and extends out to ~ 0.75eV. Bandstructure calculations for K3C60 indicate the possibility of low-lying (k~0) transitions within the tlu band [12], which can account for this feature. Similar low-
302

(0
300 600 900 1200 1500 -1,
Energy Loss (cm ) Figure 2: HREELS vibrational spectra for KxC6o at the incident energies noted and normalized to the elastic peak; a) x=0 (2.9eV), b) x=3 (2.9eV), c) x=4 (6.5eV), d) x=6 (6.7eV).
lying interband transitions have been observed in EELS studies of graphite [13]. These interband transitions also provide a decay channel for the plasmon mode, in contrast to an ideal free electron metal in which there are no low energy k=0 transitions available. The plasmon feature dominates the spectrum in the specular geometry (see Fig. 3) but for small off-specular angles, as in Fig. 1, additional features at leV and 1.3eV are observed and can be assigned to ii„ - hg and hu - <lu
transitions respectively. For the insulating x=6 phase a gap reappears, although the scattering intensity does not go
to zero as in the case of x=0 due to an intense multiphonon background. Subtraction of this background leads to a gap estimate of 0.6-0.7eV for this phase. A strong peak is observed at 1.25eV due to the dipole-active t\u - tlg transitions. In the x=4 phase, this feature is shifted down to 1.05eV and is considerably narrower. In addition, new features are observed at 0.6eV and 1.7eV which can be understood in terms of splitting of the ^„-derived band. Denoting the occupied and unoccupied portions of this band as tlu and t'lu respectively, these features can be assigned to <i„ - t[u (0.6eV) and hu - t'lu (1.7eV) transitions. Subtraction of the multiphonon background leads to a gap estimate of 0.3-0.4eV for x=4, consistent with optical results for this phase [14]. This splitting of the «ltl band could result from electron correlation effects [15] or a charge density wave
instability [16]. HREELS has also been used to observe the inter and intramolecular vibrations in KXC60 as
shown in Fig. 2. For the undoped material the spectrum is dominated by the four IR active modes of C6o, and is similar to spectra reported previously for films grown on GaSe and GeS [5, 6]. The intense peak at 550cm-1 consists of both the Ti„(l) and Ti„(2) modes which are resolved in higher resolution spectra. Although low energy electrons have a short penetration depth, HREELS remotely couples to vibrations substantial distances into insulating films through the long-range dipole scattering mechanism. In the absence of screening, the distance over which an electron of energy JE; can couple to the vibrations of the film is proportional to y/El/Ei0SS. For undoped C&j,
303

the dependence of the lowest frequency IR mode intensity on film thickness confirms the effective probe depth for this mode is on the order of lOOA (for 3eV incident energy), in rough agreement with the predictions of dipole scattering theory.
Upon doping, large changes in the intensity and frequencies of the intramolecular modes are observed. For the insulating x=4 and x=6 films additional strong features appear on both the Stokes and anti-Stokes side of the elastic peak due to Fuchs-Kliewer modes derived from alkali-C6o intermolecular vibrations, discussed in detail elsewhere [17]. These modes give rise to an intense multiphonon background extending into the intramolecular region. The x=3 vibrations also appear superimposed on a large background, in this case arising from the ilu interband transitions and the low frequency wing of the plasmon discussed previously. As in IR studies of the doped phases [18, 19, 20], the T]u(l) and T\u(4) vibrations are observed to shift considerably in the doped phases while the other IR-active modes do not shift. The arrows in Fig. 2 denote the IR frequencies for x=0 and 6, which are in good agreement with the HREELS data. These shifts are due to charge transfer from the alkali-metal atoms and have been described theoretically by the "charged-phonon" mechanism [21]. Enhancements of the oscillator strengths of the IR active modes are also predicted in this model [21]. For x=6, large increases of 80 and 30 times relative to x=0 are reported for the Tlu(4) and Tlu(2) modes, respectively[18, 19]. Enhancement of the T\U(A) mode is also observed in Fig. 2, although only by a factor of 25. However, in contrast to the monotonic increase of intensity with doping reported in the IR measurements, the observed intensity dependence is more complicated in the present experiments. For example, the T\u(2) mode intensity is reduced in x=3 before increasing again in x=6.
To understand the observed intensity dependence it is helpful to consider the following model dielectric function for A^CöO in the infrared;
«(«■o^ + E-r^ r^-r . uf — W* — IW/i U(U> — l~1-p),
where the <j; and p,- are the resonance frequencies and oscillator strengths of the four dipole-active modes and UJV is the plasmon frequency. The dramatic reduction in the intensities of the two lowest frequency modes in the x=3 phase can be explained by the addition of the plasmon term which screens out vibrational contributions to the HREELS response function (Im(l/(c(u>) + 1))). Alternatively stated, free carrier screening limits the effective probe depth leading to the reduced intensities in this phase. A similar effect has been noted in HREELS studies of alkali-metal doped WO3 [22]. For the highest frequency Tiu(4) mode the introduction of screening has a smaller effect since the effective probe depth is smaller to begin with and is counteracted by the strong enhancement in the oscillator strength. In the insulating x=6 phase, the plasmon term is negligible and the probe depth and mode intensities increase. The intensity dependence observed in HREELS can therefore be described by these two effects; the enhancement of the oscillator strengths upon doping and variations in the screening response of the various phases.
For x=4 the mode intensities are similar to x=6, indicating the lack of significant screening and consistent with the absence of states at Ef in photoemission from this sample. Estimating the density of thermally generated carriers from the 0.3eV gap reported above yields a plasmon frequency of ~ 2meV which may contribute to the broadening of the elastic peak observed in this phase. The spectrum for x=4 phase also exhibits increased scattering in the 650-800cro-1 range relative to x=6. Considerably weaker scattering in this region is also observed for the undoped film. This is in the frequency range of the Raman active -ffs(3) and Hg(A) modes as well as several optically silent modes observed in neutron scattering [23, 24]. Increased intensity of non-dipole modes in the specular HREELS spectrum is an indication of disorder and is consistent with the observed deterioration of the LEED pattern.
Since free carrier screening reduces the probe depth in x=3, the HREELS response from this phase will originate from the near surface region and will reflect the stoichiometry there. The
304

0.2 0.4 0.6
Energy Loss (eV)
Figure 3: Specular HREELS spectra for small variations in K doping near x=3. The indicated stoichiometries are estimates based on dosing time.
surface stoichiometry of alkali füllendes has been of some interest [25] due to its implications for the interpretation of ultraviolet photoemission experiments which are inherently surface sensitive. The <i„ plasmon energy is used to monitor the alkali concentration since it is proportional to the square root of carrier density. Fig. 3 illustrates the effect of slowly adding K to a sample that was indicated to be single phase x=3 by Raman scattering. Initially, the plasmon is observed at 0.37eV and the T\u(4) IR mode is at 1425 cm'1. This indicates significant underdoping at the surface. With further K doping the plasmon shifts up in frequency as the carrier density increases, while the Tlu(4) mode shifts downward. Transition to an insulating state at the surface is observed in the final spectrum (x ~ 3.3) with the damping of the plasmon feature. The Ti„(4) mode has also shifted to 1365 cm-1, characteristic of the x=4 phase. The t\u - t\g (1.05eV) and *i„ - t[u
(0.6eV) transitions associated with this phase also begin to emerge. The nucleation of the x=4 phase is accompanied by a deterioration of the LEED pattern reflecting the transition from fee to bet phases. Raman scattering on this sample remained characteristic of single phase x=3 indicating that the x=4 phase was confined to the near surface region.
Summary
In conclusion, HREELS has been used to observe low energy electronic excitations and inter and intramolecular phonons of KrC6o films. High resolution studies of electronic losses has revealed shifting of the tlu - tig interband transitions to higher energy with increasing occupation of the <i„ band. For x=4 the t\u band is observed to split resulting in an insulating state with a gap of 0.3-0.4eV. The intramolecular mode intensities were found to be sensitive to free carrier screening effects. Variations in these intensities can be understood in terms of the combination of screening and the previously observed oscillator strength enhancement. In the metallic x=3 phase, free carrier screening reduces the effective probing depth of HREELS, resulting in surface sensitivity.
305

Deviations from bulk stoichiometry are observed at the surface of metallic films. Further HREELS investigations of alkali füllendes promise to aid in the understanding of these interesting compounds.
Acknowledgements
This work was supported by USDOE Grant DE-FG02-84ER45095.
References
[1] F. Stepniak, P.J. Benning, D.M. Poirier, and J.H. Weaver, Phys. Rev. B48, 1899 (1993).
[2] P.J. Benning, F. Stepniak, and J.H. Weaver, Phys. Rev. B48, 9086 (1993).
[3] E. Sohmen and J. Fink, Phys. Rev. B47, 14532 (1993).
[4] G. Gensterbium et al., Phys. Rev. Lett. 67, 2171 (1991).
[5] G. Gensterbium et al., J. Phys. Chem. Solids 53, 1427 (1992).
[6] G. Gensterbium et al., Appl. Phys. A56, 175 (1993).
[7] S. Modesti, S. Cerasari, and P. Rudolf, Phys. Rev. Lett. 71, 2469 (1993).
[8] L.Q. Jiang and B.E. Koel, Phys. Rev. Lett. 72, 140 (1994).
[9] D.M. Poirier, Appl. Phys. Lett. 64, 1356 (1994).
[10] P.J. Benning et al., Phys. Rev. B45, 6899 (1992).
[11] R.W. Lof, M.A. van Veenendaal, B. Koopmans, H.T. Jonkman, and G.A. Sawatzky, Phys. Rev. Lett. 68, 3924 (1992).
[12] S.C. Erwin in Buckminsterfullerenes. eds. W.E. Billups and M.A. Ciufolini (VCH, New York, 1992).
[13] R.E. Palmer, J.F. Annett, and R.F. Willis, Phys. Rev. Lett. 58, 2490 (1987).
[14] Y. Iwasa et al., J. Phys. Chem. Solids 54, 1795 (1993).
[15] P.J. Benning et al., Phys. Rev. 47, 13843 (1993).
[16] S.C. Erwin and C. Bruder, Physica B 199-200, 600 (1994).
[17] M.G. Mitch, G.P. Lopinski, S.J. Chase, and J.S. Lannin, Phys. Rev. B, to be published.
[18] M.C. Martin, D.Koller, and L. Mihaly, Phys. Rev. B47, 14607 (1993).
[19] K.J. Fu et. al, Phys. Rev. B46, 1937 (1992).
[20] T. Pichler, M. Matus, and H. Kuzmany, Solid State Commun. 86, 221 (1993).
[21] M.J. Rice and H.Y. Choi, Phys. Rev. B45, 10173 (1992).
[22] P.A. Cox, M.D. Hill, F. Peplinskii, and R.G. Egdell, Surf. Sei. 141, 13 (1984).
[23] C. Coulombeau et al., C.R. Acad. Sei. Paris 313, 1387 (1991).
[24] K. Prassides et al., Chem. Phys. Lett. 187, 455 (1991).
[25] G.K. Wertheim, D.N.E. Buchanan, E.E. Chaban, and J.E. Rowe, Solid State Commun. 83, 785 (1992).
306

Vibrational and Electronic Properties of RbCöo Thin Films
G.P. Lopinski, M.G. Mitch, J.R. Fox, and J.S. Lannin Dept. of Physics, Perm State University, University Park, PA 16802
Abstract
In situ Raman scattering, UPS and HREELS measurements have been used to study the fee to orthorhombic phase transition in RbCöo thin films. Large changes in the Raman spectra are interpreted in terms of increased interfullerene coupling in the orthorhombic phase. However, the data do not support the proposed polymer model for this phase. Photoemission measurements indicate only small differences in the electronic states between the two phases in contrast with photopolymerized COO where additional states are observed. Low energy metallic-like excitations and screening of intramolecular vibrations are observed in HREELS.
Introduction
RbCeo has been shown to exhibit several different phases with intriguing electronic and magnetic properties. At high temperatures this compound assumes an fee structure, with the A+ ions occupying octahedral sites[l]. Below ~420K there is a transition to an orthorhombic (o) phase, involving an unusually small (9.12Ä) distance between neighboring C6o molecules [2]. Rietveld refinement of x-ray diffraction data for this phase has suggested a model involving distortion of the icosohedral symmetry of the molecule and the formation of interfullerene bonds resulting in chains of linked molecules [3]. Formation of this polymeric structure has been suggested to involve a [2+2] cycloaddition reaction, as in the case of photoinduced polymerization in undoped C6o [4]. The magnetic properties of this phase have been interpreted in terms of a Id metal, unstable to the formation of a spin density wave below 50K [2]. Band theory considerations predict RbCöo to be metallic. Transport measurements, however, have demonstrated insulating behavior, suggestive of disorder induced localization [5, 6].
In this paper we report results of a multi-technique study of electronic and vibrational properties of fee and o-RbC6o- Substantial changes are observed in the Raman spectra of the two phases and interpreted in terms of enhanced interfullerene coupling in the orthorhombic phase. Photoemission and HREELS measurements indicate metallic-like behavior for both fee and orthorhombic phases, with only small changes in the electronic states associated with the transition. Comparison of both the vibrational and electronic states of o-RbC6o to that of photopolymerized C6o suggest weaker interactions in the former and do not support the proposed polymer model of the orthorhombic phase.
Experimental
Samples were prepared and measured in-situ under UHV conditions. Epitaxial COO films with thick- nesses in the range of 400-600Ä were grown on a Cu(lll) substrate. LEED patterns were observed both before and after doping, confirming that the films were crystalline with a (111) orientation. Rb doping was carried out by evaporation from well degassed SAES getter sources followed by anneal- ing above 550K. Sample stoichiometry and phase behavior were monitored with Raman scattering. The observation of a single sharp Ag(2) mode at 1458cm-1 at elevated temperatures (~ 460Ä') indicated formation of RbCeo [7]- The orthorhombic phase was obtained by slow cooling to 300K
307
Mat. Res. Soc. Symp. Proc. Vol. 359 e1995 Materials Research Society

(0 c
300 600 900
Raman Shift (cm )
1200 1,
1500
Figure 1: Unpolarized (HU) Raman spectra for a) fcc-RbC6o (455K) b) o-RbC6o (240K) and c) photopolymerized Cßo (300K).
at a rate of ~ 50K/hr. Films of photopolymerized Ü60 were made by rastering a 514.5nm laser beam (~ 10kW/cm2) over an undoped film. The polymerization was judged to be complete when the Ag(2) mode was shifted fully to 1459cm"1 [4]. A Spex Triplemate with an ITT Mepsicron multichannel detector and 514.5nm excitation were used in the Raman measurements. Ultraviolet photoemission (UPS) was carried out with 21.2 eV photons using a VSW HA1000 hemispherical analyzer with 200meV resolution. The Fermi energy was determined by reference to an in-situ sput- ter deposited Ag film. An LK2000 spectrometer was used for the HREELS measurements. Typical resolution (FWHM of the elastic peak) was 7meV for vibrational measurements and 20meV for electronic losses.
Results and Discussion
Unpolarized (HU) Raman spectra for both the fee and orthorhombic phases of RbCeo are shown in Fig. 1. The high temperature spectrum is similar to that observed previously for KC6o[8], which also has the fee structure at elevated temperatures. The ten Raman active modes (8Hg + 2Ag) of the molecule exhibit the largest intensities with several of the modes softened slightly from their x=0 values. Also apparent is significant intensity from modes not Raman active for an isolated molecule. This is a consequence of intermolecular interactions and disorder. For Ceo molecules in an fee lattice, all even parity (gerade) modes acquire Raman activity [9]. The weak intensity of these induced modes in the fee spectrum suggests intermolecular interactions are weak. The observation of odd (ungerade) modes in the spectrum, such as the 343cm-1 (T2„(l)) and 738cm-1 (Gu(2)) modes require a loss of inversion symmetry. The inversion symmetry of the C6o lattice is lifted by orientational or alkali site disorder. Since NMR indicates the molecules are rotating rapidly in the fee phase [10], alkali metal site disorder must be responsible for the induced mode scattering in this phase. Additional evidence for the presence of this type of disorder is the observation of
308

low frequency Raman scattering from Rb-C6o vibrations which will be reported elsewhere [11]. Since the octahedral site has inversion symmetry this mode is Raman forbidden. Observation of octahedral site vibrations in the Raman spectrum implies disorder such as local variations in site occupancy or static displacements of the metal atoms from the high symmetry positions.
Upon formation of the orthorhombic phase the Raman spectrum changes significantly with a large increase in scattering from the induced modes. The most dramatic increase is in the 343 cm-1 peak which becomes as intense as the Raman-active Hs(l) mode. In addition several other ungerade modes take on appreciable intensity including the IR-active (Tlu(3)) and (Ti„(4)) modes. Detailed analysis reveals splittings of these modes in agreement with previous IR studies of this phase [12]. The Hg(l) mode also exhibits a clearly resolved splitting of 14cm-1.
The observation of splittings and increased intensity of induced modes suggests enhanced in- termolecular interactions, consistent with the reduced interball distance in this phase. In contrast, the low frequency intermolecular vibrations exhibit little change through the transition [11]. This implies changes in alkali-Ceo coupling are small and an additional mechanism is required to ac- count for the large increase in ungerade mode scattering in the low temperature phase. Since NMR indicates the molecules stop rotating below the transition [10], this phase may involve merohedral disorder. Increased interfullerene coupling between orientationally inequivalent molecules in the low temperature phase can account for the observed changes in the Raman spectrum. The strong increase in ungerade mode scattering in the low temperature phase appears to be inconsistent with the proposed polymer model of this phase [3], which maintains inversion symmetry.
Also shown in Fig. 1 is the Raman spectrum for a photopolymerized C60 film, similar to that reported previously [4]. Light irradiation is proposed to result in intermolecular linkages through a [2+2] cycloaddition mechanism. Similar linkages have been proposed in the polymer model of o-RbC6o [3, 13], motivating the comparison. Immediately apparent is the suppression of the low frequency radial Raman modes such as the Ag(l) and Hg(l) in the photopolymer, an effect not observed in the orthorhombic phase. The most intense Ag{2) mode is observed to shift downwards by 9cm-1 upon photoinduced polymerization, whereas little shift of this mode is observed through the fee to orthorhombic transition. Polarization measurements for this mode also indicate significantly greater perturbations of the molecular symmetry for the photopolymer than for either of the RbC6o phases [11]. Furthermore, the Hg(\) splittings are considerably different in the two phases with the photopolymer exhibiting three components, in rough agreement with theoretical calculations for linked C6o dimers [14]. This calculation also predicts a splitting of 26cm-1 for an infinite chain polymer, considerably larger than observed in the orthorhombic phase.
Changes in intermolecular coupling in the orthorhombic phase can be expected to influence the electronic states. Theoretical calculations for both linked dimers and polymer chains indicate the formation of additional states between those of the pristine film [14]. Figure 2 illustrates UPS spectra for the two x=l phases along with spectra from the undoped sample and the photopolymer. The occupied C6o bands are observed to shift down and broaden upon doping with a portion of the LUMO-derived band shifting below the Fermi energy. In general, the UPS spectra are rather similar for the two RbC60 phases. The HOMO and HOMO-1 bands are seen to be broadened slightly in the orthorhombic phase as can be seen most clearly by comparing the depth of the minimum between these features. This is consistent with increased interfullerene coupling which should result in greater overlap of states on adjacent molecules leading to broader bands. Larger differences appear upon polymerization of the undoped film. In particular, a new state is observed 2eV below the HOMO, in agreement with a previous report [15].
Small differences in the LUMO-derived band are also observed as seen in the inset of Fig. 2. Metallic-like behavior is observed in both phases with a finite density of states at the Fermi energy, N(Ej). For both phases the width of this band, however, is considerably broader than the 0.15eV predicted by bandstructure calculations for the fee phase [16]. With the choice of normalization for this figure (equal HOMO intensities), the area under the LUMO band and N(Ef) are observed to
309

*m c o c
6 4 2 0 Binding Energy (eV)
Figure 2: UPS spectra for a) undoped C60, b) photopolymerized C60, c)o - RbC60 at 300K and d) fee - RbCao at 460K, normalized by the HOMO peak heights. The inset shows the LUMO band for the two RbC6o phases.
increase in the orthorhombic phase. In contrast to the behavior of the deeper bands discussed above, the LUMO narrows in the orthorhombic phase, contrary to expectations for increased wavefunction overlap due to increased interactions. Similar asymmetric broadening away from E; has previously been observed for a Rb-doped C60 sample with a stoichiometry near x=l and interpreted in terms of electron correlation effects [6]. Within this framework changes in the LUMO band shape suggests a greater importance of correlation in the fee phase, in agreement with NMR results [10]. Recent studies of superconductivity in orientationally ordered ternary füllendes suggest orientational effects may also play an important role in determining N(Ef) and the LUMO band shape [17].
High resolution electron energy loss spectroscopy (HREELS) has also been used to probe low energy vibrational and electronic excitations of the RbC60 phases. Figure 3 compares HREELS spectra for undoped C60 and o-RbC60. The undoped film exhibits sharp (resolution-limited) modes due to intramolecular vibrations, the most intense modes corresponding to the four IR- active modes. For RbC6o no vibrational peaks are observed, instead there is a large increase in the back- ground appearing as a tail on the elastic peak. Similar attenuation of vibrational mode intensities has been observed in HREELS studies of K3C60 and has been discussed in terms of free carrier screening [18]. While in insulating materials electrons couple remotely to vibrational modes sub- stantial distances (~ 100A)into the film, in the presence of carriers this effective probe depth is limited by the screening length. Since the Thomas- Fermi screening length is estimated to be considerably smaller than the diameter of a single C60 molecule, the observed intensities should be strongly attenuated, as observed. In addition to the screening effect, the large low energy background will hinder observation of weak vibrational features.
The large background in the vibrational region extends out to 1.0 eV as shown in the lower resolution spectrum in the inset of Fig. 3. This background can be attributed to intraband transitions within the LUMO-derived band as well as excitation of charge carrier plasmons. By
310
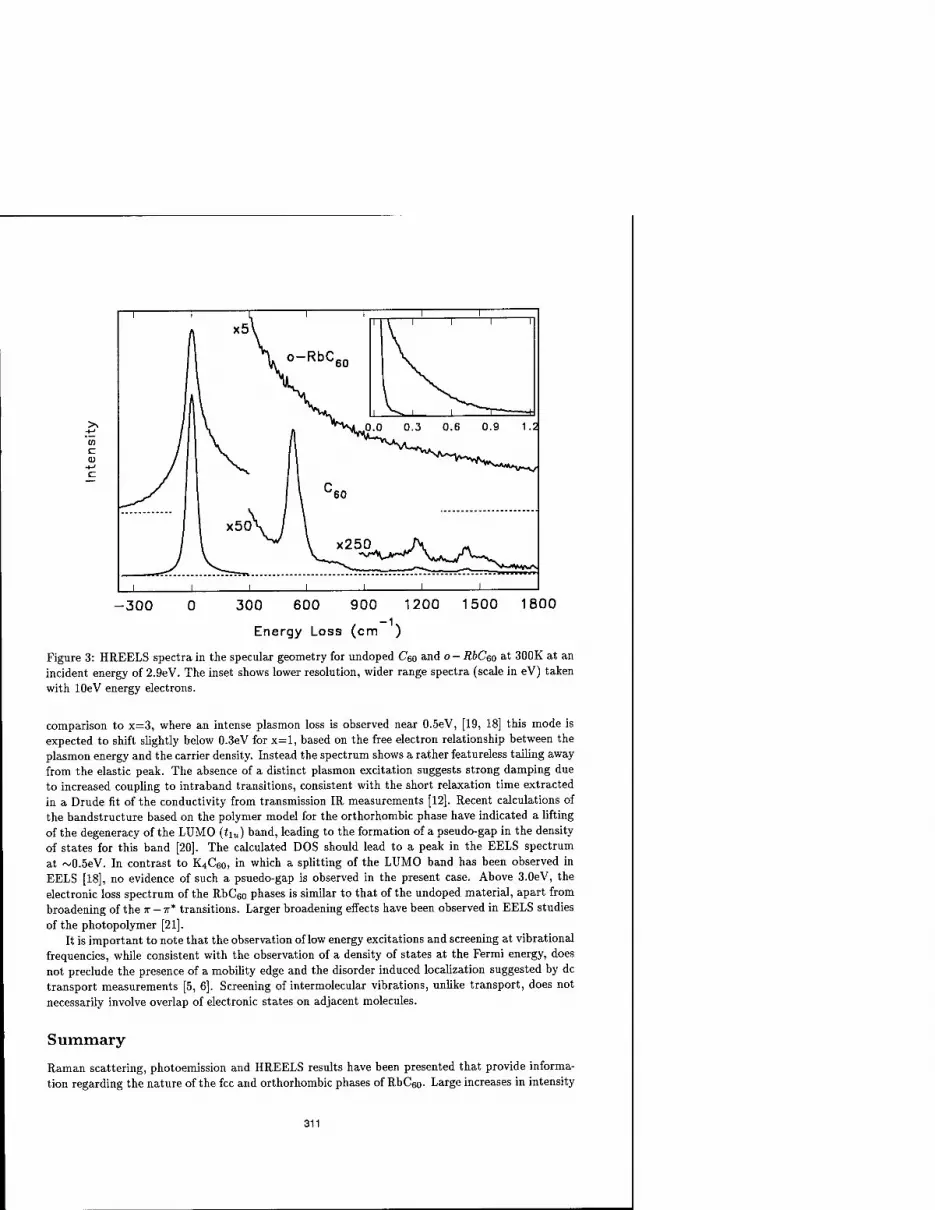
-300 300 600 900 1200 1500 1800 -1,
Energy Loss (cm )
Figure 3: HREELS spectra in the specular geometry for undoped C6o and o-RbCeo at 300K at an incident energy of 2.9eV. The inset shows lower resolution, wider range spectra (scale in eV) taken with lOeV energy electrons.
comparison to x=3, where an intense plasmon loss is observed near 0.5eV, [19, 18] this mode is expected to shift slightly below 0.3eV for x=l, based on the free electron relationship between the plasmon energy and the carrier density. Instead the spectrum shows a rather featureless tailing away from the elastic peak. The absence of a distinct plasmon excitation suggests strong damping due to increased coupling to intraband transitions, consistent with the short relaxation time extracted in a Drude fit of the conductivity from transmission IB, measurements [12]. Recent calculations of the bandstructure based on the polymer model for the orthorhombic phase have indicated a lifting of the degeneracy of the LUMO (ii„) band, leading to the formation of a pseudo-gap in the density of states for this band [20]. The calculated DOS should lead to a peak in the EELS spectrum at ~0.5eV. In contrast to K4C60, in which a splitting of the LUMO band has been observed in EELS [18], no evidence of such a psuedo-gap is observed in the present case. Above 3.0eV, the electronic loss spectrum of the RbC6o phases is similar to that of the undoped material, apart from broadening of the IT - 7r* transitions. Larger broadening effects have been observed in EELS studies of the photopolymer [21].
It is important to note that the observation of low energy excitations and screening at vibrational frequencies, while consistent with the observation of a density of states at the Fermi energy, does not preclude the presence of a mobility edge and the disorder induced localization suggested by dc transport measurements [5, 6]. Screening of intermolecular vibrations, unlike transport, does not necessarily involve overlap of electronic states on adjacent molecules.
Summary
Raman scattering, photoemission and HREELS results have been presented that provide informa- tion regarding the nature of the fee and orthorhombic phases of RbC6o- Large increases in intensity
311

of Raman scattering from ungerade modes in the orthorhombic phase are attributed to enhanced intermolecular interactions in the presence of merohedral disorder. Comparison of both Raman and photoemission spectra for this phase with the photopolymer indicates that the C6o-C6o inter- actions are weaker in the present case and argues against the formation of intermolecular bonds. Photoemission and HREELS exhibit metallic-like behavior for both phases, with only small changes associated with the phase transition. The orientational and alkali-metal site disorder indicated by the Raman results may support the hypothesis of disorder induced localization proposed to account for the non-metallic transport behavior of RbC6o[6].
Acknowledgements
This work was supported by USDOE Grant DE-FG02-84ER45095.
References
[10:
in
[12;
[13;
[w:
[is:
[ie:
[17
[18
[19
[20:
[21
Q. Zhu et al., Phys. Rev. B47, 2724, (1993).
0. Chauvet et al., Phys. Rev. Lett. 72, 2721, (1994).
P.W. Stephens et al., Nature 370, 636, (1994).
A. M. Rao et al., Science 259, 955, (1993).
F. Stepniak, P.J. Benning, D.M. Poirier, and J.H. Weaver, Phys. Rev. B48, 1899, (1993).
P.J. Benning, F. Stepniak, and J.H. Weaver, Phys. Rev. B48, 9086, (1993).
J. Winter and H. Kuzmany, Solid State Commun. 84, 935, (1992).
M.G. Mitch and J.S. Lannin, J. Phys. Chem. Solids 54, 1801, (1993).
G. Dresselhaus, M.S. Dresselhaus, and P.C. Eklund, Phys. Rev. B45, 6923, (1992).
R. Tycko, G. Dabbagh, D.W. Murphy, Q. Zhu, and J.E. Fisher, Phys. Rev. B48, 9097, (1993).
G.P. Lopinski, M.G. Mitch, J.R. Fox, and J.S. Lannin, (to be published).
M.C. Martin, D. Koller, X. Du, P.W. Stephens, and L. Mihaly, Phys. Rev. B49, 10818, (1994).
S. Pekker, L. Forro, L. Mihaly, and A. Janossy, Solid State Commun. 90, 349, (1994).
G.B. Adams, J.B. Page, O.F. Sankey, and M. O'Keeffe, Phys. Rev. B, in press.
B.S. Itchkawitz, T. Schedel-Niedrig, A.M. Bradshaw, and M.N. Kabler, Bull. Am. Phys. Soc. 39, 681, (1994).
S. Satpathy et al., Phys. Rev., B46, 1773, (1992).
T. Yildirim, J.E. Fischer, R. Dinnebier, P.W. Stephens, and C.L. Lin, (to be published).
G.P. Lopinski, M.G. Mitch, S.J. Chase, and J.S. Lannin, MRS Proceedings, this volume.
E. Sohmen and J. Fink, Phys. Rev. B47, 14532, (1993).
S.C. Erwin, G.V. Krishna, and E.J. Mele, (to be published).
G.P. Lopinski, J.R. Fox, and J.S. Lannin, (to be published).
312

STRUCTURE SEQUENCE AND PHYSICAL PROPERTIES OF RUBIDIUM FULLERIDE C70Rb,,
MOTOTADA KOBAYASHI*, MASAO FUKUDA*, YUICHI AKAHAMA*, HARUKI KAWAMURA*, YAHACHI SAITO** AND HISANORI SHINOHARA*** »Department of Material Science, Himeji Institute of Technology, Kamigohri 678-12, Japan **Department of Electrical Engineering, Mie University, Tsu 514, Japan **»Department of Chemistry, Nagoya University, Nagoya 464, Japan
ABSTRACT
A structure sequence of doped fee, bet, bec and Rb-saturated fee phases was observed in C^Rb, with increasing Rb concentration using x-ray-diffraction measurements. The composition of the"Rb-saturated phase was estimated to be C70Rb94±04 from a weight measurement. A model for the structure of C7QRb9 is proposed. Superconductivity in each phase was checked using ac magnetic-susceptibility measurements. All these phases were nonsuperconducting down to 1.3 K.
INTRODUCTION
Since the discovery of superconductivity in CJS^ by Hebard et al.1, many attempts to dope a wide variety of atoms or molecules into C^ have been made. The next larger fullerene, C70, has an ellipsoidal shape. As for the structure of Alkali Fulleride C70MX (M=alkali metal), potassium fulleride CJK, prepared from fee C70 has four doped phases , namely the fee phase at x=3, the bet phase at x=4, the bec at x=6 and the K-saturated fee phase at x=9. 2 C70Csx also had Cs-saturated fee phase at x=9. 3 The presence of the M-saturated fee phase at x=9 seems to characterize alkali metal fullerides C70MX. However, it had not been reported in recent studies of high-energy electron-energy-loss spectroscopy, "Ramanspectroscopy,5 dark conductivity and photoconductivity6 and photoelectron spectroscopy.7 Bulk superconductivity in C^M, has not been reported except an appearance of a small diamagnetism in C70KX which resulted from C^ impurity by Imaeda et al.8 and doped rhombohedral phase by the present authors.2
Here we report a series of x-ray-diffraction and ac magnetic-susceptibility experiments for C70Rb5. The present study can elucidate the growth and disappearance processes of doped phases" by heating C70 and Rb metal in a Pyrex glass tube. The superconductivity was checked for each phase.
EXPERIMENTS
The starting materials were purified C7p powdered crystals extracted with toluene and rubidium metal (99.5 % purity). Sample purity was checked by high performance liquid chromatography (HPLC: JAIL LC-908-C60) at 373 nm, and found to be greater than 99 % with respect to other fullerenes. The C70was washed using THF(tetrahydrofuran) and
heated at 300*0 for 6 h under a vacuum of the order of 103 Torr to remove the solvent. Figurel shows T-shaped Pyrex glass tubes with a capillary used for c70 ^ <b) the reaction. Cell (a) was used for reaction followed 70
by annealing and (b) was for stoichiometric reaction. FIG. 1. Sample cell for (a)reaction The C70 fine powders and excess distilled Rb metal followed by annealing, were set on each side of the cell and then evacuated. (b)stoichiometric reaction.
/T777J)
313
Mat. Res. Soc. Symp. Proc. Vol. 359 ° 1995 Materials Research Society

The cell was sealed off after the introduction of about fifty Torr of He gas for heat exchange. The reactions were performed at 220°C. After reacted for prescribed time, the specimen was sealed off from Rb metal and annealed to obtain homogeneous compound. For stoichiometric reaction, one of the two C70 was transferred to the other end of the cell and reacted with Rb metal until a Rb-saturated phase formed. Then the specimen was transferred back and mixed with the other pristine C70 after checking the structure by x-ray-diffraction measurement. This mixed specimen was annealed for long time to obtain homogeneous compound. A standard ac mutual inductance bridge with phase-sensitive detection was used for magnetic-susceptibility measurements. A frequency of 199 Hz and a measuring field of 1.10 Oe were used. The x-ray-diffraction analysis was performed by a system equipped with an 18-kW rotating molybdenum anode as the x-ray generator and an imaging plate(IP, MAC Science, DIP100) as the detector.
RESULTS AND DISCUSSIONS
The reaction time dependence of the x-ray-diffraction profile for C70Rbx reacted at 220°C is shown in Fig.2. The starting C70 has an fee structure with the lattice constant of a= 14.92 Ä. At 6h reaction intensity of the peak (220) fairly decreased with respect to the (111) or (311)
1 6 11 2 9 (deg.)
FIG.2. Reaction time dependence of the x-ray diffraction profile for C70Rbx
reacted at 220t Oh shows starting.
n o
c
6 11 2 6 (deg.)
16 21 MoKa
FIG.3. Annealing time dependence of the x-ray-diffraction profile for C70Rbx
reacted at 220°C 4h. Solid circles show peaks from the rubidium-saturated fee phase, (a) is just after the reaction and the annealing times are (b)5h, (c)24h and (d)48h. + symbols indicate unidentified peaks.
314

J3
O
en c
I i i £ bec
s „~s a=12.11A
I up |)l *3 d
MW» wW
LiA t W A«i
•
1 h AÄ HI A* a
p 1 1
6 11 2 9 (deg.)
16 MoKa
21
peak. This may suggest the existence of another fee phase. At 14 h reaction, this specimens finally adopted an fee structure with a fairly large lattice constant of 15.97 A. It is noted that this fee phase did not change after 48 h reaction at 300 °C. This fee phase was a Rb-saturated one. The composition of this phase was estimated to be C70Rb94±04 from a weight measurement in an inert gas. Any other remarkable peaks from another phase were not recognized.
Figure 3 shows the annealing time dependence of the x-ray-diffraction profile for C 70Rbx. Annealing was done at 300 °C after a reaction at 220°C for 4h. The x-ray-diffraction profile of the specimens just after the reaction can be assigned to a mixture of the starting fee and the Rb-saturated fee structures. C70Rb9 phase seemed to form near surface. After a 5 h annealing, a bet structure with the lattice constant of a= 12.67 Ä and c= 11.21 A was obtained. This shows the diffusion of Rb metal inside C70. At 24 h annealing, an fee structure with slightly changed peak intensities grew. This was interpreted as a further diffusion of Rb metal into C70. TheRb density of this fee phase was considered to be lower than that of the bet phase. After 48 h annealing, the relative peak intensities were further changed and the structure was assigned to an fee one with a=14.71 A. A slight amount of the bet phase still remained.
Figure 4 shows the annealing time dependence of the X-ray diffraction profile for C70Rbx reacted at 220^ 6h. For 6 h reaction sample, fairly large amount of the Rb-saturated fee phase was mixed with the starting fee phase. After a 48 h annealing, the profile can be assigned as a bee structure with a lattice constant of 12.11A. In the course of the annealing, this bee phase fairly grew after 5 h annealing.
The diffraction intensity of an (hkl) peak is described by the formula,
I(likl)=AP,M I I/c,exp{2 7ti(xi/i+)'ifc+zi/)}+i:/dexp{27ri(^j/!+yjfc+z/)} I2, (1)
where Ph and M are the Lorentz-polarization factor and the multiplicity of the peak, respectively. A is a constant, and/d is the Rb atomic scattering factor. nc and ndare the numbers of C70 and Rb atoms in a unit cell, respectively. We use the simple model that C70 molecules are freely rotating. Their molecular form factor, fc\ can be written as
FIG.4. Annealing time dependence of the x-ray diffraction profile for C7JRb, reacted at 220°C 6h. Solid circles show peaks from the Rb-saturated fee phase, (a) is just after the reaction and the annealing times are (b)5h, (c)24h and (d)48h. + symbols indicate unidentified
peaks.
/c-/c^nks>n( qrk)l( qrj, (2)
where fc is the carbon atomic scattering factor and «k means the number of carbon atoms at different radii, rk, and rk= ai?k, respectively. There are 10 atoms at a radius Rk of 4.173 A, 10 at 4.029 A, 20 at 3.876 A, 20 at 3.663 A, 10 at 3.565 A, following the atomic coordinates
315

\ /
H-'
/' \
1 6 11 16
2 9 (deg.) MoKa
21
FIG.5. Schematic drawing of structure for C^jRb,. Large cube show the fee lattice of C70 molecule. Solid and open circles represent Rb atoms in O-site. Open rectangles represent Rb atoms in T-site.
FiG.6. X-ray diffraction profile for C^b,. (a) and (b) represent the calculated and the observed profiles,respectively.
calculated by Baker et al.9 The parameter a represents the elongation of the radii due to the charge transfer from Rb to C70. The Debye-Waller temperature factor is disregarded. The reliability factor, R, is defined as follows:
fclOOZ I 1^ I IZI^,
Twenty-three peaks were used in the calculation. The structure sequence of the doped-fee, the
were quite similar to that for the C^K, case. The relative peak intensity for the Rb-saturated
phase is quite similar to that for C70K,. Actually, the composition of this phase was estimated to be C70Rb94±04 from a weight measurement. Figure 5 shows the structure model for C70Rb9. In analogy with C^ case, the coordinates of four Rb atoms in T-sites were fixed at (0.75, 0.25, 0.25) and its equivalent positions. Eight Rb atoms are assumed to be accommodated in the O-site of a small cubic shape. Four Rb atoms at the diagonally opposite sites of the small cube were moved along the diagonal lines and the positions of the other four Rb atoms were adjusted on the lines. The best fit was obtained with typical Rb coordinates of (0.348, 0.348, 0.348) and (0.604, 0.396, 0.396).
(3)
bet, the bec and the metal-saturated fee phases
2 c
i i i
o
'in c a> c
1 6 11 16 21 2 9 (deg.) MoKa
FIG.7 X-ray diffraction profile for stoichiometric compound C70Rb3. Solid triangles show peaks from the bet phase. + symbols indicate unidentified peaks.
316

fee a=14.92A
—»• fee a=14.7lA
—► X -*
bet a=12.67A c=11.21 A
—»- bee a=12.11 A -*
fee a=15.97A
x=0 x=l x=3 x=4 x=6 x=9
FIG.8. Structure sequence in C70Rbx.
The R factor is 12.2 at a = 1.022. These Rb coordinates give the bond lengths between the Rb atom and C70 as 6.53 and 6.74 A, respectively. The length between C70 and the Rb atom in the T-site is 6.92 Ä. Each Rb atom in C70Rb9 is regarded to be ionized and aligned on the surface of the C70 molecules.
In order to obtain C70Rb3, the stoichiometric reaction was performed by annealing a mixture of C70 and C70Rb9 with a molar ratio of 2 to 1. The special precaution was taken for removing excess Rb metal from the surface of C70Rb9. The x-ray diffraction profile for this specimen after annealing at 450°C for 300 h was shown in Fig.7. The major phase is the fee one with a= 14.71 A and the bet phase was mixed with it. This result shows an absence of an x=3 phase. The fee phase with a=14.71 A must be an x=l or x=2 phase. It is natural that Rb atom was first accomodated in O-site , because it has larger space than T-site. The C70Rb, which has one Rb atom in O-site is x=l. Further, rough intensity calculation using free rotation model agreed with this profile qualitatively. Therefore this fee phase is concluded to be the x=l one. This profile was not changed by cooling specimens rapidly from 450t to liquid nitrogen temperature. Fig.8 shows the structure sequence in C70Rbx.
Superconductivity was checked using ac magnetic-susceptibility measurements. The specimens did not show a superconducting transition down to 1.3 K at any doping levels within a volume fraction of 0.1 %.
SUMMARY
In summary, the structure sequence of the doped fcc(x=l), the bct(x=4), the bcc(x=6) and the Rb-saturated fcc(x=9) phases was observed in C70Rbx with increasing Rb concentration. All these phases were not superconducting down to 1.3 K. A model for the structure of C70Rb9 is proposed.
ACKNOWLEDGMENTS
This work was partly supported by a Grant-in-Aid for Scientific Research on Priority Areas from the Ministry of Education, Science and Culture.
1. A.F.Hebard, M.J.Rosseinsky, R.C.Haddon, D.W.Murphy, S.H.Glarum, T.T.M.Palstra, A.P.Ramirez, and A.R.Kortan, Nature 350,600 (1991).
2. M.Kobayashi, Y.Akahama, H.Kawamura, H.Shinohara, H.Sato and Y.Saito, Phys. Rev. B, 48, 16877(1993).
3. M.Kobayashi, Y.Akahama, H.Kawamura, H.Shinohara, H.Sato and Y.Saito, Fullerene Sei. Tech. 1, 449(1993).
4 E.Sohmen and J.Fink, Phys. Rev. B, 47, 14532 (1993).
317

5. Kai-An Wang, Ping Zhou, A.M.Rao, P.C.Eklund, R.A.Jishi, and M.S.Dresselhaus, Phys. Rev. B,48, 3501(1993).
6. M.Hosoya, K.Ichimura, Z.H.Wang, G.Dresselhaus, M.S.Dresselhaus, and P.C.Eklund, Phys. Rev. B, 49, 4981(1994).
7. M.Knupfer, D.M.Poirier, and J.H.Weaver, Phys. Rev. B, 49, 8464 (1994). 8. K.Imaeda, K.Yakushi, H.Inokuchi, K.Kikuchi, I.Ikemoto, S.Suzuki, and Y.Achiba, Solid State
Commun. 84, 1019(1992). 9.J.Baker, P.W.FowIer, P.Luzzeretti, M.Malogoli, and R.Zanasi, Chem. Phys. Lett. 184, 182
(1991).
318

RbiC60: LINEAR POLYMER CHAINS AND DIMERS MICHAEL C, MARTIN*, DANIEL KOLLER*, A. ROSENBERG1, C. KENDZIORA»,
AND L. MIHALYt TDepartment of Physics, SUNY at Stony Brook, Stony Brook, NY 11794-3800 *Code 6650, Naval Research Laboratory, Washington, DC 20375
ABSTRACT
The infrared- and Raman-active vibrational modes of C6o were measured in the various structural states of Rr^Ceo- According to earlier studies, RlnCeo has an fee structure at temperatures above ~ 100°C, a linear chain polymer orthorhombic structure when slowly cooled, and an as yet undetermined structure when very rapidly cooled ("quenched"). We show that the spectra obtained in the polymer state are consistent with each C6o molecule having bonds to two diametrically opposite neighbors. In the quenched state, we find evidence for further symmetry breaking, implying a lower symmetry structure than the polymer state. The spectroscopic data of the quenched phase are shown to be consistent
with Rb2(C6o)2, a dimerization of COO-
INTRODUCTION
A^eo was not discovered [1] until well after the other phases of alkali intercalated C6o were known, and it was found to undergo a number of structural and electronic phase transitions.[1, 2, 3, 4, 5, 6, 7, 8] The existence of a phase consisting of linear polymer chains,[8] which is stable in air,[9, 10] has stimulated recent interest in this material and
could help in developing applications for alkali-doped fullerenes. At high temperatures ( > 100°C), RbiCso has an fee rocksalt structure [4] and is
electrically conducting.[2, 3, 5, 6] When slowly cooled, the specimen undergoes a first-order phase transition to an orthorhombic phase, [7] forming linear chains of C6o molecules along the a direction (the face-diagonal direction of the fee phase).[8] These chains have been proposed to be [2 + 2] cycloaddition C60 polymers.[11] When RbiC6o samples are cooled extremely rapidly from the fee phase to below ~ 0°C a metastable phase is produced.[3, 6] This "quenched" phase is insulating [6] and relaxes back to the stable polymer chain phase, with a strongly temperature dependent timescale.[3, 6] Dimers forming from [2 + 2] cycloaddition or a single bond between two free radical C6o molecules have been suggested as a possible structure. [12] Recent x-ray scattering structural studies confirm a dimerized structure, but are unable to determine the exact bonding between the fullerene molecules [13]. Vibrational spectroscopy can help determine the symmetry of the C6o molecules in this quenched phase by observing which vibrational modes are infrared- (IR) or Raman-active.
In this paper we show that the IR and Raman vibrational spectra of the slowly cooled and quenched states are indeed consistent with polymerized and dimerized C6o structures, respectively. [14] Using this C6o dimer picture, we are able to show that many of the char-
acteristic properties of this phase are understood.
EXPERIMENTAL
The C6o films used for the present study were evaporated and doped in vacuum-sealed pyrex sample chambers described in detail previously.[15] Si substrates were utilized for the
319
Mat. Res. Soc. Symp. Proc. Vol. 359 ° 1995 Materials Research Society

IR measurements, and MgO substrates were used for the Raman measurements. During doping, IR spectra obtained in situ were used to monitor the stoichiometry of all samples by measuring the position of the Flu(4) vibrational mode.[16, 17] Once RbxC6o samples with the majority phase x = 1 were produced, these rugged, portable chambers allowed a number of measurements under a variety of thermal conditions. A copper block with a heater resistor and thermocouple was attached to each chamber in order to regulate and measure the sample temperature by means of a temperature controller. Quenching was accomplished by pouring liquid nitrogen directly on the sample chambers. Typically, the sample temperature dropped from 125°C to -200°C in approximately 30 seconds.
IR spectra were obtained at 2cm-1 resolution on a Bomem MB-155 Fourier transform spectrometer and ratioed to spectra of the empty sample chamber at the same temperature. Raman spectroscopy was performed using the 514.5nm Ar+ laser line and a Dilor XY triple monochromator with a CCD detector at a resolution of ~ 5cm-1; care was taken to use low laser powers and to monitor the Ag(2) mode when the sample was in a temperature range where photoinduced effects (photopolymerization or photoexcitation) of C6o have been observed [18] (the Raman-active As(2) mode shifts when C6o becomes photopolymerized or photoexcited).
RESULTS
The IR transmission spectra obtained for all structures are presented in Figure 1. The fee data (lowest curve) reveal only the four ^„-derived vibrational modes, as labeled. The -Fi„(4) mode shows small amounts of pure C60 and Rb6C6o , labeled x = 0 and x = 6 respectively, in the mostly RbjCiso sample (the F]u(4) absorption of the x = 6 compound appears large in Fig. 1 only because the mode in the x = 6 material is much stronger than in other stoichiometries [16, 17]). The approximate center positions (in cm"1) of all observed absorptions of the slow-cooled (middle curve) and quenched (top curve) states are labeled in the figure. Note that the overall transmission of the quenched phase is very different from those of the fee and polymerized phases (the fee and polymerized phases are electrically conducting and have low transmissions, while the quenched phase is insulating and has a high transmission [6]). For easier comparison, the IR spectra have been scaled such that the vibrational absorptions due to small amounts of other stoichiometric phases (labeled x = 0 and x = 6 in Fig. 1) appear approximately equal in magnitude. Since the strengths of these "impurity" modes should be independent of the state of the predominant RbiC6o in any given sample, this scaling allows meaningful visual comparisons of the modes seen in each phase.
We present the Raman spectra for all three states in Figure 2. The bottom panel shows the fee phase spectrum with the ten known Raman vibrational modes of C60 labeled; these appear unchanged from the pure C6o vibrations (while the sample is known to be majority x = 1 phased by IR spectroscopy, this Raman spectrum is probably dominated by a surface layer of the x = 0 "impurity" phase). The middle panel displays the spectrum of the polymerized state, with modes that are not seen in the fee state labeled. Inset to this panel is a drawing of the fullerenes in their polymer structure (the full orthorhombic Rb^o structure is shown in Ref. [8]). The top panel displays the spectrum of the quenched phase, with one of the proposed fullerene dimers (the [2 + 2] cycloaddition possibility) shown in the inset.
320

F1u(2) F,„(1)
600 800 1000 1200 1400 1600 Wave number (cm" )
Figure 1. Infrared transmission spectra of a RbiCöo sample at several temperatures in the energy range covering nearly all COO vibrational modes. The bottom curve is the spectrum of the fee (high temperature) phase of the sample. The middle curve was obtained by slowly cooling the sample from its fee state to the polymer state. The top spectrum was measured after the sample was rapidly cooled from high temperature to the new "quenched" state. Backgrounds have been subtracted and the three spectra have been scaled to aid visual comparison. The center position of each observed mode is annotated beneath the respective spectral line. Small vertical lines above the figure indicate the positions of the Raman-active Ag and Hg vibrations of pure Ceo-
DISCUSSION
We begin the discussion with the polymer chain structured state (drawn in the inset to the middle panel of Fig. 2). A drastic change in molecular environment occurs when the samples go through the first-order phase transition from the high temperature rocksalt structure, where the Ceo molecules are only bound by Van der Waals forces, to the polymer state where hexagon-hexagon (6-6) bonds on the COO cages are broken and bonds between neighboring fullerenes are formed. This change can be phrased in group theoretical terms as a symmetry lowering from the highly symmetric //, icosohedral Ceo structure to the much less symmetric D2h group of the polymer. Since the center of inversion site symmetry is preserved, the Raman and IR measurements remain strictly complementary. Applying the D2h site symmetry to the fullerene molecule, one expects all the ungerade (antisymmetric)
321

500 1000 Raman shift (cm" )
Figure 2. Raman spectra of a RbiCeo sample in its fee structure (bottom panel), its polymer state (middle), and its "quenched" state (top). The respective temperatures are indicated on the curves. The 10 Raman-active modes of pure C6o are labeled in the bottom panel; the frequencies of newly activated modes are labeled for the quenched and polymer state spectra in the upper two panels. Inset sketches represent the dimer and polymer structures of the C6o molecules in the
quenched and slow-cooled states of Rbj Ceo , respectively.
vibrations to become IR-active and similarly all the gerade (symmetric) modes to become Raman-active. Thus, the number of IR- and Raman-active modes will be greatly increased over fullerene compounds with no C6o-C6o bonds (such as the fee phase of RbiCeo)-
In agreement with this prediction, the RbjCso polymer IR spectrum in Figure 1 indeed reveals at least 12 absorptions, in addition to the four /^„-derived modes, which must have ungerade symmetry. Analogously, the Raman spectrum of this phase (middle panel of Fig. 2) also reveals many newly Raman-active vibrations which must be gerade modes. Since the parity of these modes is determined, these results can help to sort out the symmetries of IR- and Raman-forbidden vibrational modes of pure C60 seen in previous measurements. [19,
20, 21] In the polymer state, in addition to the appearance of these new modes, the Fiu(3) mode
at 1182cm"1 splits into two modes at 1183 and 1197cm-1, and the Flu(A) mode at 1395cm-1
splits into modes at 1388 and 1407cm-1 . The Flu vibrations are three-fold degenerate with motions along the translational axes (x, y, and z); polymerization breaks this degeneracy and a split mode is observed. An alternate explanation for these splittings has been offered
322

by Pederson and Quong [22]: a mixing occurs between the z-rows of the nearly degenerate G„(6) and Fi„(4) states, creating a perturbed IR-active mode, and similarly the i*i„(3) state mixes with the i*2U(4) and Hu(5) modes of their theoretical model. Either explanation is consistent with both the existence of the polymer state and the spectroscopic data.
Turning to the IR and Raman spectra of the quenched phase (top curves of Fig. 1 and Fig. 2, respectively), we note a number of differences relative to the polymer phase. First, many more vibrational absorptions are seen to have become IR-active (at least 25 in addition to the four Fi„-derived modes, as compared to 12 new modes in the polymer state). Similarly, the Raman spectrum of this quenched state shows several more vibrational modes than are observed in the polymer state. Second, the Fiu(3) and -Fi„(4) vibrational modes are again observed to split, but less than in the polymer case: the splittings are 9cm_1
for the Fi„(3) line and 6cm""1 for the -Pi«(4) line in the quenched phase, compared to the polymer state splittings of 14 and 19cm_1 , respectively. These observations indicate that a new and different type of symmetry breaking is occurring.
We compare our data to modes expected in the proposed quenched state structure [12] composed of Ceo dimers, Rb2(Ceo)2- A simple sketch of two fullerene molecules in such a dimerized state is shown in the inset to the top panel of Figure 2. The exact type of bond between the two CöO balls will have to be determined by further structural measurements but will not affect the present results. This dimerized state has even lower site symmetry than the polymer state: the center of inversion is no longer at the center of a Ceo molecule. Other short oligomers (such as three or four Ceo molecules bonded together) would have a similar symmetry-breaking, but only for the balls on the ends, therefore the intensity of modes arising from such oligomers would be less than from dimers. With the loss of then center of inversion, group theory then predicts that all gerade and ungerade vibrations will be both IR- and Raman-active in the quenched state.
To test this prediction, above Figure 1 we have placed vertical lines at the positions of the Raman-active Ag and Hg modes of pure Ceo which fall within our measurement range. Previous measurements have shown that most vibrational modes of Ceo soften upon doping with alkali metals.[23, 16, 24, 17] We indeed observe modes in the IR spectra of the quenched phase that are not IR-active in the polymer phase at energies just below the ideal Ag and Hg energies, in agreement with Raman studies of AiCeo [23] (although it is unclear which state of RbjCeo was measured in that study). Likewise, F\u modes appear in the Raman spectrum of the quenched phase (top curve of Fig. 2 at 527, 566cm-1) but not in the polymer state Raman spectrum. These observations strongly suggest that the center of inversion symmetry is broken in the quenched state, in agreement with the dimerization picture.
The dimer picture is in qualitative agreement with the smaller observed splittings of the Fiu(3) and i*iu(4) modes. Since each fullerene is altered only on one side when dimerized, as opposed to two sides when polymerized, the perturbation to the Ceo eigenmodes will be smaller. The insulating nature of this quenched state can also be understood to be due to dimerization. The LUMO (lowest unoccupied molecular orbital) in the uncharged dimer is derived from a splitting of the triply degenerate 11„ electronic orbital of pure Ceo into a singly degenerate lowest unoccupied orbital and higher energy orbitals. The two electrons donated by the two Rb atoms per dimer fill this lowest orbital and a true band insulator is formed. In this state the magnetic susceptibility is small, as observed by Janossy et al..[3] Breaking the dimer apart (e.g., by warming) results in a partially filled band, namely the
conducting RbjCeo fee state.
323

CONCLUSION
To conclude, vibrational spectroscopy on RbtCeo has provided strong evidence for novel structures in what has already been shown to be an intriguing fullerene compound. We propose that the quenched phase is composed of Rb2(C60)2 dimers and have shown that this structure is consistent with the IR and Raman data. Finally, many silent modes of pure COO, which become activated in either low temperature state of RbiCöo, are classified as having gerade or ungerade symmetry.
We thank D.B. Chrisey for providing the MgO substrates, and B.V. Shanabrook and D.G. Gammon for allowing us to use their Raman apparatus. The work at Stony Brook has been supported by NSF grant DMR 9202528.
REFERENCES
I] J. Winter and H. Kuzmany, Solid State Commun. 84, 935 (1992). 2] D.M. Poirier et al, Phys. Rev. B 47, 9870 (1993). 3] A. Jänossy et al., Phys. Rev. Lett. 71, 1091 (1993). 4] Q. Zhu et al, Phys. Rev. B 47, 13 948 (1993). 5] R. Tycko et al, Phys. Rev. B 48, 9097 (1993). 6] M.C. Martin et al, Phys. Rev. B 49, 10 818 (1994). 7] O. Chauvet et al, Phys. Rev. Lett. 72, 2721 (1994). 8] P.W. Stephens et al, Nature 370, 636 (1994). 9] D. Koller et al, Submitted to Appl. Phys. Lett. 10] S. Pekker et al, Science 265, 1077 (1994). II] S. Pekker et al, Solid State Commun. 90, 349 (1994). 12] S. Pekker et al, private communication. 13] Q. Zhu et al, unpublished. 14] M.C. Martin et al, Phys. Rev. B to appear Feb. I 1995. 15] D. Koller et al, Rev. Sei. Instrum. 65, 760 (1994). 16] M.C. Martin et al, Phys. Rev. B 47, 14 607 (1993); 50, 6538 (1994). 17] M.J. Rice and H.Y. Choi, Phys. Rev. B 45, 10 173 (1992). 18] A.M. Rao et al, Science 259, 955 (1993); P.H.M. van Loosdrecht et al, Chem. Phys. Lett.
205, 191 (1993). 19] M.C. Martin et al, Phys. Rev. B 50, 173 (1994). 20] C. Coulombeau et al, J. Phys. Chem. 986, 22 (1992); G. Gensterbium et al, Phys. Rev. Lett. 67, 2171 (1991). 21] Z.-H. Dong et al, Phys. Rev. B 48, 2862 (1993); K.-A. Wang et al, Phys. Rev. B 48, 11
375 (1993). 22] M.R. Pederson and A.A. Quong, unpublished.
23] M.G. Mitch et al, Phys. Rev. Lett. 68, 883 (1992); S.J. Duclos et al, Science 254, 1625 1991); P. Zhou et al, Phys. Rev. B 48, 8412 (1993). 24] T. Pichler et al, Condens. Matter Commun. 1, 21 (1993); K.-J. Fu et al, Phys. Rev. B 46,
1937 (1992).
324

PART VI
Polymers and Chemical Derivatives

MEDICAL APPLICATIONS OF WATER-SOLUBLE POLYHYDROXYLATED
FULLERENE DERIVATIVES
LONG Y. CHIANG Center for Condensed Matter Sciences, National Taiwan University, Taipei, Taiwan
FUNG-JOU LU Department of Biochemistry, College of Medicine, National Taiwan University, Taipei, Taiwan
JAW-TOWN LIN Department of Internal Medicine, College of Medicine, National Taiwan University, Taipei,Taiwan
ABSTRACT The promising positive results in reducing Superoxide free radicals (O2"), generated by in-
vitro xanthine and xanthine oxidase, have been demonstrated in the evaluation of potential uses of novel water-soluble [60] fullerenols as free radical scavengers. Observation reveals the inherent application of fullerenols in a wide range of medical and clinical areas as preventive alternatives for a long-term medical treatment.
Conjugated olefins in the structure of [60] fullerene and its analog molecules were found
to be extraordinarily susceptible to the attack of a variety of chemical reagents.1 Particularly,
they exhibit high reactivity toward additions of organic radicals.2 The reactivity is, presumably,
correlated to the intrinsically large electronegativity of C60 molecules. Upon chemical
functionalization on C60 with multiple electron-releasing groups, the electronegativity of
resulting fullerene derivatives decreases significantly. The decrease corresponds to the reduction
of their chemical response toward radical additions. One example was given by
polyhydroxylated fullerene derivatives (fullerenols l).3"5 The reduced chemical reactivity of
remaining conjugated olefinic moieties in 1 certainly diminishes the potential biological toxicity
of Cßo molecules. Combination of the moderate electron affinity of fullerenol and its allylic
hydroxy functional groups makes fullerenol a suitable candidate for application as free radical
remover or water-soluble antioxidant in the biological system. In this regard, evidences have
shown that an increasing variety of toxic injuries and diseases has been linked to free radical-
mediated disturbances. An excess of reactive free radical species resulted from the unbalanced
enzymatic metabolism often causes the serious tissue damage via changes of nucleic acid,
nucleotide, enzyme, and covalent bonding, damages of membrane (lipid peroxidation) and
protein, and modifications of receptor. In our early effort to study potential uses of water-
soluble fullerenols as free radical scavengers has shown promising positive results, such as in
reducing the free radical (superoxide radical) concentration in the diseased blood and inhibiting
the growth of abnormal or ailing cells, which supported our hypothesis.6 In this paper, we
demonstrate the utilization of water-soluble fullerenols as a free-radical scavenger for the
absorption of superoxide radicals (O2") generated by in-vitro xanthine and xanthine oxidase.
327
Mat. Res. Soc. Symp. Proc. Vol. 359 c 1995 Materials Research Society

Results exemplified the potential uses of functionalized fullerene derivatives in the biochemical
or medical related applications.7'8
HN-\-N.v I || > + 202 + 2H20
H H
Xanthine Oxidase
I || >=0 + 20,"- + 2H+
CK N ü H H
+ Oo"-
Scheme 1 Water-soluble fullerenols 1 used in this study were synthesized by a sequence of reactions
involving the electrophilic attack of nitronium tetrafluoroborate on fullerenes in the presence of
organocarboxylic acids as a key-step of reaction.9 Structurally, fullerenol 1 was found to
consist of 18-20 hydroxy groups, on average, and several hemiketal moieties.10 Aside from its
desirable water solubility, conjugated diols and v;c-diols in 1 are potentially good ligands for
coordination or binding on enzyme surfaces. To evaluate and determine the potential influence
of these diols on the enzymatic activity of xanthine oxidase, we carried out the fullerenol
concentration dependent study of the uric acid production by xanthine oxidase. The conversion
of xanthine 2 to uric acid 3 can be detected by the specific optical absorption of uric acid at 290
nm as shown in Scheme 1. Experimentally, the optical absorbance at the constant wavelength
of 290 nm was measured on an aqueous solution suspended with a proper amount of xanthine
and xanthine oxidase. Upon the addition of fullerenol, at various final concentration (from 10 to 50 (ig/ml), into the aqueous solution, the relative optical intensity of uric acid was observed
to remain nearly constant as shown in Figure 1. Results clearly indicated that fullerenols gave
no enzymatic inhibition on xanthine oxidase.
To monitor unstable trace amount of Superoxide radicals in aqueous solution, a
chemiluminescence technique was applied with lucigenin (bis-N-methylacridinium nitrate) 4 as
a chemiluminigenic probe for enhancing the delectability of Superoxide. In this method, bis-
cationic lucigenin salt was first reduced electronically by enzyme to give the corresponding
cation-radical of lucigenin. The subsequent reaction of lucigeninic cation radical with
Superoxide radical afforded JV-mefhylacridone 5 in a electronically excited state, which relaxed
328

back to its ground state resulting the emission of a photon, as shown in Scheme 1. Therefore,
the intensity of lucigenin-derived chemiluminescence can be correlated to the relative quantity of
Superoxide radical in solution. As a result, we observed systematic decrease in intensity of
chemiluminescence upon the addition of fullerenols in increasing concentration as shown in
Figure 2. The data clearly indicated the excellent efficiency of fullerenol in eliminating
Superoxide radical species generated by xanthine/xanthine oxidase. At an applied fullerenol
concentration level of 50 (ig/ml, a value of approximately 80% radical scavenging efficiency
was obtained.
0.40 - K i . c
0.35 - t Xanthine/Xanthine Oxidase
O
CO n o m n CO
0.30 -
0.25 -
in Aqueous Solution
£ c o a>
Q O
0.20 -
0.15 -
0.10 -
0.05 -
0.00 - I ! I I I
10 20 30 40 50 60
C60 final concentration (ug/ml)
Figure 1: The fullerenol concentration dependent of the optical absorbance of uric acid at a constant wavelength of 290 nm in an aqueous solution of xanthine and xanthine oxidase.
In conclusion, the observed free-radical absorbing activity of water-soluble fullerenols at
the enzymatic sites reveals the potential utilization of these molecules as free-radical scavenger in
medical applications. Superoxide radical, produced by one-electron reduction of O2, is an
highly reactive oxygen intermediate. The excessive production of Superoxide and other free
radicals in the unbalanced metabolism of biological system can cause oxidative destruction and
degradation of lipids and other biochemical components in cells and tissues. Systematic removal
of these radicals by fullerenols should provide a significant preventive therapy for medical
diseases. Therefore, our observation reveals the inherent application of fullerenols in a wide
range of medical and clinical areas as preventive alternatives for a long-term medical treatment.
Acknowledgment. This work was supported by the National Science Council of
Republic of China under grant no. NSC 83-0208-M-002-018 and NSC 84-2621-B-002-014Z.
329

7.e+5
2.e+5 -
1.e+5
Oe+0
0 10 20 30 40 50 60
C60 final concentration (ug/ml)
Figure 2: The fullerenol concentration dependent of the intensity of lucigenin-derived chemiluminescence in an aqueous solution of xanthine and xanthine oxidase.
References
(1) For review of fullerene functionalization chemistry see: Taylor, R.; Walton, D. R. M. Nature 1993, 363, 685.
(2) Krusic, P. J.; Wasserman, E.; Keizer, P. N.; Morton, J. R.; Preston, K. F. Science
1991,254, 1183.
(3) Chiang, L. Y.; Swirczewski, J. W.; Hsu, C. S.; Chowdhury, S. K.; Cameron, S.;
Creegan, K. J. Chem. Soc, Chem. Commun. 1992, 1791.
(4) Chiang, L. Y.; Wang, L. Y.; Swirczewski, J. W.; Soled, S.; Cameron, S. /. Org. Chem.
1994, 59, 3960.
(5) Chiang, L. Y.; Upasani, R. B.; Swirczewski, J. W. U.S. Patent 5,177,248, 1993; U.S.
Patent 5,294,732, 1994.
(6) Chiang, L. Y.; Lu, F. J.; Lin, J. T. to be published.
(7) Friedman, S. H.; DeCamp, D. L.; Sijbesma, R. P.; Srdanov, G.; Wudl, F.; Kenyon, G.
L. J. Am. Chem. Soc. 1993, 115, 6506.
(8) Tokuyama, H.; Yamago, S.; Nakamura, E. J. Am. Chem. Soc. 1993,115, 7918.
(9) Chiang, L. Y.; Upasani, R. B.; Swirczewski, J. W. J. Am. Chem. Soc. 1992, 114,
10154.
(10) Chiang, L. Y.; Upasani, R. B.; Swirczewski, J. W.; Soled, S. J. Am. Chem. Soc.
1993, 115, 5453.
330

POLYHYDROXYLATED C6n AS AN HYPERCROSS-LINKING AGENT
LONG Y. CHIANG* AND LEE Y. WANG Center for Condensed Matter Sciences, National Taiwan University, Taipei, Taiwan
RONG-SHEN WU AND KUO-HUANG HSIEH Department of Chemical Engineering, National Taiwan University, Taipei, Taiwan
ABSTRACT Polyhydroxylated fullerene derivatives (fullerenols) were utilized as an efficient
hypercross-linking agent for the synthesis of elastic poly(tetramethylene oxide)-based polyurethane networks with excellent thermal mechanical properties. Polyhydroxylated fullerenes were synthesized from the hydrolysis of polycyclosulfated fullerene derivatives in the presence of water at 85-90 °C or in aqueous NaOH solution at ambient temperature.
Fullerene molecules possessing unusual conjugated molecular orbitals are susceptible to
chemical reactions with a variety of nucleophilic, electrophilic, organo-radical, enophilic and
halogenation reagents.1-4 These extensively explored functionalization chemistry become
essential means in the design of multiple-step synthetic pathways for the preparation of fullerene
derived functional intermediates. That interested chemists in exploring the utility of functional
fullerenes derivatives in molecular and polymeric materials applications. Polar fullerene
derivatives, such as water-soluble fullerenols5-6 containing multiple hydroxy functional groups,
have been prepared primarily by a sequence of reactions initiated by either the electrophilic
reagent7-8 or the oxidative nucleophilic reagent.9 A feasible synthetic methodology using the
former reagent involved the electrophilic attack of cationic nitronium ions on olefinic moieties of
fullerene molecules, forming the carbocationic nitronium-C60 intermediate, prior to the
replacement of resulting nitro addends by weak nucleophiles. The latter reagent was used to
initiate the direct one-electron oxidation of fullerene molecules in strong acids, followed by the
nucleophilic attack of the counter anion on the resulting carbocationic Cßo radical in the reaction
medium. Fullerenol synthesized by these two independent approaches showed distinguishable
difference in its molecular structure and stability in acid. The electrophilic synthesis was
frequently complicated by the proposed fullerene-oxide rearrangement as a part of the overall
reaction mechanism that resulted in the formation of hemiketal substructure in the fullerene cage
skeleton in addition to hydroxy addends.10 Whereas the stepwise oxidative nucleophilic
synthesis afforded polycyclosulfated C6o derivatives9 as highly hydrolyzable11 precursors. This
reaction process involved no fullerene-oxide intermediates. Therefore, immediate hydrolysis of
polycyclosulfated COO derivatives gave the corresponding fullerenols 1, containing no hemiketal
and enol-ether structures. Owing to plural reactive hydroxy functions covalently attached and
randomly distributed on the molecular surface of the Cßo cage, fullerenols have the capability to
create high-density cross-linking in the fabrication of polymer matrix, or composite materials.
331
Mat. Res. Soc. Symp. Proc. Vol. 359 ® 1995 Materials Research Society

Here we report the use of polyhydroxylated COO derivatives as reagents for the high-density
crosslinking of polyether-based polyurethane, forming polymer networks which exhibit
excellent tensile strength and thermal mechanical properties. Their physical properties were
compared with those of polyether polyurethanes crosslinked by tri(2-hydroxyefhyl)methane.
"HO' J,H OH 2) CH3OH
1
one Scheme I
The chemical reactivity of tertiary fullerenolic hydroxy groups was investigated with
various reagents. They were found to be moderately reactive upon contact with isocyanate
functions, forming the corresponding urethane moieties. Therefore, the synthetic study was
carried out by the treatment of fullerenol 1, C60(OH)io-i2>9 with diisocyanated urethane
polyether prepolymer 2 (1.0 equiv. of NCO group to each OH group of fullerenol) in a mixture
of anhydrous THF and DMF (3 : 1) at 60 °C under N2 for 16 h. Diisocyanated prepolymer 2
was prepared by treating poly(tetramethylene oxide) glycol (PTMO) with 4,4'-methane diphenyl
diisocyanate (MDI, 2.0 equiv.) in CDCI3 at 60 °C under N2. The average molecular weight of
poly(tetramethylene oxide) glycol used was determined to be Mn 2 000 and Mw 4 500 with a
polydispersity of 2.25, which were calibrated by PTMO standards. Prior to the isocyanate-
hydroxy condensation reaction, fullerenol was dried under vacuum at 60 °C for 24 h. Complete
removal of residual water from the reaction medium was accomplished by further treatment of
the fullerenol-containing DMF-THF solution with dried molecular sieves (4 A) for at least 2
days. Reaction progress was monitored by the decrease in intensity of the hydroxy IR
absorption band at 3480 cm-1, until a minimum was reached. Gradual gel formation was
observed during the first few hours of reaction. At the end of reaction, unconverted isocyanate
332

functions were quenched by methanol with assistance of the ultrasonic treatment. After the
evaporation of solvent and the subsequent drying in vacuum, products of the corresponding
[60]-fullerenol cross-linked poly(urethane-ether) 3 were isolated as a thick free-standing film.
As predicted, the IR spectrum of the fullerenol cross-linked polyurethane product 3
showed the disappearance of a band around 2272 cm-1 corresponding to the absorption of
isocyanate NCO groups. It also showed the large decrease in the intensity of hydroxy
absorption bands centred at 3550 cnr1 compared to that of fullerenol 1. The conversion of
isocyanate functions into urethanes was evident through the observation of IR bands at 3300
cm-1 and 1733 cnr1 (strong) corresponding to the urethanic NH and carbonyl absorptions,
respectively. Elucidation of the chemical structure of polyurethane network 3 was carried out
by quenching residual isocyanate groups in the polymerization mixture with 2,2'-
dichloroethanol instead of methanol. In this case, the corresponding terminally chlorinated
network 3 was obtained. The structural characterization of 3 was performed by means of
various spectroscopic measurements and elemental analysis: the number of poly(urethane-ether)
chains covalently attached on each fullerenol cage was estimated to be six (on average) where
five of them were interconnected with the another fullerenol molecule.
Highly cross-linked poly(urethane-ether) 3 exhibits attractive thermal behaviours at low
temperatures. To facilitate the relationship correlation between the structure of network 3 and
its physical properties, the linear polymer analog of 3, bis(l-dodecanoxy) poly(urethane-ether)
4, was synthesized from the reaction of 1-dodecanol (2.0 equiv.) with the diisocyanate
prepolymer 2 at 60 °C under N2. Interestingly, we found that incorporation of fullerenol to
cross-link the poly(tetramethylene oxide) urethane does not alter much the nature of glass
transition of each individual poly(tetramethylene oxide) urethane chain in the resulting matrix.
As shown in the DSC profiles, the glass transition temperature of 3 was found to be -70 °C in
the similar temperature range as that of 4 (-71 °C). Both thermal transitions at 7 °C (18.3 J/g)
and -34 °C (7.8 I/g) upon heating, corresponding to the chain softening temperature and the
recrystallization temperature of poly(tetramethylene oxide) urethane moieties in 3, respectively,
were detected to be lower than those of 4 at 22 °C (45.3 J/g) and -25 °C (45.0 J/g),
respectively. These data implied that each poly(tetramethylene oxide) urethane chain covalently
interconnected on COO molecules in network 3 tends to behave individually upon variation of
temperature at low temperatures. When the temperature is increased gradually above its glass
transition the effect of cross-linking becomes significant. The cross-linking sufficiently reduces
the tight packing inside (chain folding) and among poly(tetramethylene oxide) urethane chains
making them meltable (softening) at a lower temperature.
Thermal mechanical properties of 3 was studied using a flat-point probe under a constant
force of 0.05N. An increase of the positive dimensional change of the polymer film more than
its linear temperature-dependent thermal expansion was observed at a onset temperature of -70
333

°C, consistent with the glass transition temperature of 3. The rate of the dimensional increase
of polymer was then largely suppressed when the temperature reached the recrystallization
transition at -34 °C. As anticipated, the poly(tetramethylene oxide) urethane chain softening
transition at 7 °C induced a sharp increase in the polymer dimension. It was subsequently
followed by the linear thermal expansion at higher temperatures. The rate of increase of the
polymer dimension in this temperature region is apparently higher than that in the lower
temperature region (< 7 °C). Furthermore, thermal penetration by the pressurized probe on the
polymer film was not observed until the heating temperature above 190 °C was reached. At that
temperature, a rapid decline of the polymer film dimension indicated the mechanical failure of
polymer at this thermal transition, which was undetectable in DSC measurements.
In conclusion, we have demonstrated the synthesis of the first poly(urethane-ether)
network system, hypercross-linked by polyhydroxylated fullerene derivatives. These polymer
networks can be utilized as reinforced elastomers which exhibit interesting thermal behaviours at
low temperatures around the glass transition, good tensile strength (>7 MPa) and elongation
(580%) at ambient temperatures, and excellent mechanical thermal stability at high temperatures,
comparing to that of the parent linear poly(tetramethylene oxide)-based polyurethane.
Acknowledgment. This work was supported by the National Science Council of Republic of
China under the grant no. NSC 83-0208-M-002-018.
References
(1) For review see: Taylor, R.; Walton, D. R. M. Nature 1993, 363, 685.
(2) Hirsch, A.; Li, Q.; Wudl, F. Angew. Chem., Int. Ed. Engl. 1991, 30, 1309.
(3) Hirsch, A.; Soi, A.; Karfunkel, H. R. Angew. Chem., Int. Ed. Engl.. 1992, 31, 766.
(4) Krusic, P. J.; Wasserman, E.; Keizer, P. N.; Morton, J. R.; Preston, K. F. Science
1991,254, 1183.
(5) Chiang, L. Y.; Upasani, R. B.; Swirczewski, J. W. U. S. Patent 5,177,248, 1993.
(6) Chiang, L. Y.; Upasani, R. B.; Swirczewski, J. W. U.S. Patent 5,294,732, 1994. (7) Chiang, L. Y.; Swirczewski, J. W.; Hsu, C. S.; Chowdhury, S. K.; Cameron, S,
Creegan, K. /. Chem. Soc, Chem. Commun. 1992, 1791.
(8) Chiang, L. Y.; Upasani, R. B.; Swirczewski, J. W. J. Am. Chem. Soc. 1992, 114,
10154.
(9) Chiang, L. Y.; Wang, L. Y.; Swirczewski, J. W.; Soled, S.; Cameron, S. J. Org. Chem.
1994, 59, 3960.
(10) Chiang, L. Y.; Upasani, R. B.; Swirczewski, J. W.; Soled, S. J. Am. Chem. Soc.
1993, 115, 5453.
(11) Deacon, T.; Steltner, A.; Williams, A. J. Chem. Soc, Perkin II 1975, 1778.
334

STRUCTURAL CHARACTERIZATION OF A POLYMER SUBSTITUTED FULLERENE (FLAGELLENE) BY SMALL ANGLE NEUTRON SCATTERING
K.A. AFFHOLTER', GJ. BUNICK", J.M. DESIMONE"*, M.O. HUNT, JR."*, Y.Z. MENCELOGLU*", E.T. SAMULSKI"* and G.D. WIGNALL' "Solid State and "Biology Division, Oak Ridge National Laboratory, Oak Ridge, TN 37831 '"Department of Chemistry, University of North Carolina, Chapel Hill, NC 27599
ABSTRACT
Small-angle neutron scattering (SANS) can structurally characterize fullerenes1 in solvents with strong SANS contrast (e.g. CS^. Deuterated solvents (e.g. toluene-d8) have a high scattering length density (SLD), which is close to that of C60 and C70 moieties. Hence, there is virtually no SANS contrast with the solvent and these particles are practically "invisible" in such media. On the other hand, the negative scattering length of hydrogen means that the SLD of H'-containing materials is much lower, so they have strong contrast with toluene-ds. Thus, SANS makes it possible to study the size and shapes of modified buckyballs such as the polymer-substituted fullerenes, or flagellenes2. These consist of C60 cores to which 1-4 polystyrene chains (with a molecular weight, MW = 2000) are attached. The extrapolated cross section at zero angle of scatter [dE/dfi(0)] is a function of the number of pendant chains, so SANS can be used to assess the number of "arms" which are covalently attached to the fullerene "sphere". Close agreement (±4%) between the measured and calculated values of dE/dQ(0) along with independent estimates of the radius of gyration (Rg) and second virial coefficient (A2) for a calibration linear polystyrene sample serves as a cross check on the validity of this methodology.
INTRODUCTION
The synthesis of a new class of fullerene adducts, described as "flagellenes," has recently been reported2. These molecules are comprised of several flexible polymer chains covalently attached to a fullerene "sphere" and have topologies similar to flagellata, or unicellular protozoa with snake-like appendages2. Similarly, the technique of small-angle neutron scattering (SANS) has recently been applied to characterize fullerenes1, and here we report the application of this technique for the structural characterization of a flagellene with the formula C60(PS)f, where 1 < f < 5.
The present C60(PS)f adducts consist of mixtures of flagellenes with different degrees of substitution (f) on the C60 core, though other 3-dimensional nanostructural architectures can also be envisioned. For example, reactions using polymer dicarbanions would be expected to yield networks having fullerene "crosslinkages", and the substitution of carbon nanotubes in place of fullerenes may yield novel, compatibilized reinforcements for polymer matrices. For each of these synthetic possibilities, the SANS technique is appropriate for the structural characterization of the individual molecules and solid state morphology of the resulting materials.
335
Mat. Res. Soc. Symp. Proc. Vol. 359 e 1995 Materials Research Society

EXPERIMENTAL
Approximately 20 mg of fraction number 1 (believed initially2 to contain mainly adducts with f = 3 and f = 4 arms, each with Mn = 1925 and Mw/Mn - 1.08) and 40 mg of polystyrene (MW 1925, Mw/Mn ~ 1.08) were dissolved in approximately 2 ml of toluene-dg (99+% purity), and contained in quartz cells. After each SANS experiment the samples were diluted by removing a fraction of the flagellene and the polystyrene from the quartz cells and replacing that amount with toluene-dg. All additions of toluene-d8 and transfer of material were performed with disposable glass pasteur pipets to avoid contamination of the sample with toluene-soluble organic material, which occurs when using plastic syringes.
The experiments were performed on the W. C. Koehler 30m SANS facility at the Oak Ridge National Laboratory3. The neutron wavelength was 4.75Ä (AX/X - 5%) and the beam was transported to a distance of 3.5m from the sample by means of moveable neutron guides. The beam was collimated by cadmium slits at the sample (1.6 cm dia.) and source (3.2 x 3.6 cm2) and the sample-detector distance was 3.1m. The detector was a 64 x 64 cm2
proportional counter with element size — 1 cm2. The transmission of the sample was measured in a separate experiment as described
previously1'4. Measurements were performed at room temperature (T = 23°C) and typical values of the empty quartz cell and sample transmissions were T=0.95 and T=0.68 respectively for a 5 mm path length. Run times were 1-4 hrs and the data were corrected on an element-by-element basis for the detector efficiency, instrumental (beam-blocked) background and the scattering from the quartz cell filled with toluene-d8. The corrected data were radially (azimuthally) averaged to give a range of momentum transfer 0.05 < Q < 0.18 A'1, where Q = 4-?rsin9/X, X = 4.75Ä is the wavelength and 29 is the angle of scatter. The net intensities were converted to an absolute (+ 4%) differential cross section per unit sample volume [dE/d(](Q) in units of cm1] by comparison with pre-calibrated secondary standards, based on the measurement of beam flux, vanadium incoherent cross section, the scattering from water and other reference materials5.
RESULTS AND DISCUSSION
In general, the differential scattering cross section of an homogenous particle or molecule [dE/dO(Q)] per unit solid angle per unit sample volume (in units of cm1), is '
d£(Q) = dE(0) P(Q) (1) dn dn
where P(Q) is the form factor describing the shape of the scattering entity [P(0) =1]. For solid or hollow spheres, P(Q) is represented by Bessel functions6, whereas for a star molecule with f-arms, P(Q) is given by7
P(Q) =—, (u-f (1-exp(-u/f) ) +li±Z±L (i-exp(u/f)2) ) 2 (2)
where u = (Q2Rg2f2)/(3f -2) and Rg is the radius of gyration [i.e. the root-mean-square
(r.m.s.) distance of all scattering elements from the center of gravity].
336

For particles suspended in a solvent medium, the (Q = 0) cross section is given1 by
dE(0) = N>p - p,)2Vp2 (3)
dfl
where pp and p, are the scattering length densities (SLDs) of the particle and solvent respectively, Np is the number of particles per unit volume and Vp is the particle volume. Equation (3) is based on the assumption that the particles scatter independently and hence is valid only in the dilute solution limit, typically where NpVp < 0.05.
Where the particle consists of two components (e.g., fullerene core and attached pendant chains), equation (3) is modified to
dS da (0) *ppi^(Pi Ps>]2 (4)
where the summation runs over the SLDs (p) and volumes (v) of the two components (fullerene and pendant chains in the case of flagellenes). Equation (4) reduces to equation (3) in the case of a 1-component homogenous particle or a system of two components, one of which has a SLD equal to that of the solvent6.
According to equation (4), the Q = 0 extrapolated cross section is proportional to Np or alternatively to the concentration, c = Np MJA^, where Ao is Avogadro's number. In the case where there are significant particle-solvent interactions, equation (4) is modified8 to
dS du (0)
CA (5)
where A2 is the second virial coefficient, which indicates whether a polymer chain swells or contracts in the presence of a solvent. In general, the second virial coefficient is a decreasing function of the (weight averaged) molecular weight, Mw. A2(MJ can be empirically described by A2 ~ M.-1, with 5 = 0.3 in various systems'.
Figs. (1) and (2) show typical SANS data sets for the polystyrene calibration sample, and the flagellene fraction 1.
0.2
-
i i i 1 1 1 II 1
D^TWjjn 1-2.0 •
0.1
- •
n , , 1 , 1 1 1 1 1 1 i
0.05 0.1 0.15 l
Q(A"1) dz 5n(Q) vs Q for 24.1 mg/ml of Polystyrene
(Mw - 2080; Mw / Mn = 1.08) In Toluene - da
Figure 1
jjjj(Q) versus Q for 13.3 mg/ml of Flagellene In Tduene-ds
Figure 2
337

Equation (2) reduces to the well known Debye formula" for a linear chain (f = 2) and the polystyrene data, fig. (1), were fit with only dE/dfi(0) and Rg as variables. Although the flat background (— 0.05 cm"1) due to the toluene-d8 solvent is removed by subtracting the scattering of a "blank" solvent run, there remains a small (flat) incoherent background due to the (wavelength dependent10) incoherent cross section of the protons [^(X) = 90 x 10"24 cm2
at X = 4.75Ä, or amc ~ 90 barns] in the pendant polystyrene chains. This was estimated in two different ways: firstly, by calculating the total H1 incoherent cross section per unit solid angle (e.g. NHain(./4Tr), where NH is the number of protons per unit volume. For the polystyrene sample with ~ 10 mg/ml, this gave a background of — 3.3 x 10"3 cm"1. Secondly, the background was scaled from the measured scattering of a solid protonated polystyrene (PSH) sample5 (~ 0.6 cm1, at X = 4.75Ä) via the proton density (NH). It is well known that there is an appreciable amount of multiple scattering in protonated polymer blanks11 because of the higher proton density in the solid sample. However, a correction5 for this effect led to an estimate (~ 2.9 x 10"3 cm1) in good agreement with the previous approximation. Such corrections were calculated and subtracted from the data at all concentrations by the two different methods and were consistent to within ± 5 x 10"4 cm1.
Plotting c"'dE/dO(0) versus concentration (c) for the polystyrene calibration sample and extrapolating to c = 0 gives c'dE/dfi(0) = 0.055 crt^gnv1, compared to 0.057 cm2gm', calculated via equation (3) and the GPC molecular weight. The slope is negative and leads to A2 ~ 18 x 104 cm3gm"2mol. There is a dearth of measurements of the second virial coefficient for polystyrene in toluene at such small molecular weights, and most studies have been undertaken on molecules with higher mass. For example, Rahlwes12 used light scattering (LS) to measure A2 = 2.2 x 10"* cm3 gm"2 mol at Mw = 2.95 x 10⁶ and scaling to Mw ~ 2 x 1Ö3 (A2 - Mw"6; 8 -0.3) leads to an estimate of A2 = 19.6 x 104 cm3 gm2 mol. The only direct measurements that we are aware of are those of Huber et al.13 (who measured 3 points by SANS) and Zhang et al.14, who measured 5 points via LS in the range 1.2 < 10'3MW < 4.0. However, osmometry measurements13 give grossly different estimates. As the SANS and LS measurements are in agreement with data scaled from higher mass, we have therefore taken these 8 points and fit them with an empirical scaling relationship A2 ~ 24.2MW"°-34 x 10"3 cm3 gm"2 mol. This leads to A2 = 18 x W4 cm3 gm"2 mol for Mw = 2080, in good agreement with the SANS result.
The average radius of gyration of the 3 highest concentration samples [via fitting a Debye coil as in Fig. (1)] is R,, = 12.5Ä, and Zimm fits in the Q-range 0.019 <Q < 0.085Ä"1 lead to 12.8Ä. It is well known that the Zimm analysis is valid only in the limit QRg « 1 and when this is exceeded, the procedure overestimates both Rg and dE/dO(0). Ullman15 has estimated numerical corrections for this effect as a function of QR^ and QRgmin and after these were applied, the Debye-fit and Zimm (12.2 + 0.5)Ä values are in agreement within the experimental error. These may be compared with Rg = 10.1Ä extrapolated from the 3 SANS data points of Huber et al13. We are unaware of any other measurements of the chain dimensions of polystyrene in toluene in this Mw range, though for such short chains containing only ~ 20 segments, the swelling in a good solvent should be negligible. The unperturbed dimensions for polystyrene have been measured several times in the melt and in e-solvents and may be summarized11 as Rgvv = (0.27 ± 0.005)MW
05, where RjW and Mw refer to weight-averaged quantities. After a slight polydispersity correction (~ 4%), this leads to 12.7 + 0.2Ä, which is close to the (z-averaged) dimension measured in this work. It is hard to see how the radius in toluene could be smaller13 than the melt dimensions, and accordingly we have assumed that the chains are unperturbed.
338

Plotting c''dE/dQ(0) versus concentration (c) for the flagellene fraction 1 and extrapolating to c = 0, gives the average number of pendant chains f = 3.2, via equation 2. The slope is again slightly negative, and leads to an estimate of A2 = (8.5 ± 5) x 104 cm3 gm"2 mol, ^ compared to a value of 12 x 10"4 cm3 gm"2 mol, extrapolated from the SANS and LS data1 ■ for linear PS chains. We believe that the difference is within the experimental and systematic errors.
The latter arise because of the expression used to fit the data, as a flagellene contains a fullerene, which is not accounted for in the model of a star shaped polymer molecule [equation (2)]. Although the contribution of this component is subtracted from the Q = 0 cross section [via equation (4)], this limitation may be the cause of the slight differences in the shapes of the measured and fitted scattering at finite Q [e.g. fig. (2)]. We are currently unaware of any better formulae that have been developed for such unique systems though the data were also extrapolated to (Q = 0) via the well know Zimm approximation as a cross check. This led to very similar results (+ 2%) for d£/dO(0) and Rg.
The Zimm and Debye-fit radii of gyration (averaged over the 3 highest concentrations) for the flagellene fraction 1 are 23.1/23.4Ä, after the former have been corrected15 for the finite range of QRg. For linear chains with a length equivalent to 3.2 arms one would expect an R - 23.4Ä, assuming that the chains are unperturbed. As the fullerene core contributes insignificantly to the average Rg in view of the low contrast, the measured Rg is determined almost completely by the pendant chains.
The radius of gyration of an f-arm star Rg0 has been calculated by Benoit16 on the assumption of a Gaussian distribution of chain elements, Rg0 = [(3f-2)/f2]°-5Rg, where Rg, is the radius of a linear chain with the same number of segments. For f = 3.2 this leads to Rg0 = 20.2Ä respectively. Boothroyd and Ball17 have modeled the conformational properties of star molecules unperturbed by excluded volume effects and shown that the nonideal behavior in the neighborhood of the branch point may be simulated via a spherical exclusion zone, whose radius (r0) is independent of the total number of segments. The calculated Rg is given by
Rg - Rg0 + 1.075 r0 [(3f-2)/6ff5 (6)
The concept of pendant chains originating from an impenetrable sphere seems particularly appropriate for flagellenes as long as the radius of the core r0 - 4Ä is smaller than the individual chain Rg. For f = 3.2 and r0 ~ 4Ä, equation (6) predicts a difference of 2.7Ä between the measured Rg = 23.25Ä (Zimm/Debye average) and the calculated Rg0 = 20.2A, and thus the perturbation of the chain trajectory seems to be well accounted for by this model.
SANS appears to be a promising technique for characterizing fullerenes and their derivatives. By adjusting the contrast of the constituents with respect to the solvent, a particular component can be highlighted for structural characterization. The fact that SANS methodology can be successfully applied on such small length scale, involving as few as 60- 70 atoms1, gives reasonable expectation that the SANS technique will continue to be useful when applied to higher fullerenes and their derivatives.
339

ACKNOWLEDGEMENTS
The authors are grateful to A. T. Boothroyd, S. J. Henderson and J. D. Londono for helpful discussions. The research was sponsored by the Division of Materials Science, U. S. Department of Energy (USDOE) and the Laboratory Directed Research and Development Program of Oak Ridge National Laboratory, managed for the USDOE under contract No. DE-AC05-840R21400 with Martin Marietta Energy Systems Inc, and was also supported in part by the Wright Patterson Materials Lab under Air Force Prime Contract F3361-90-C- 5813, a NSF Young Investigator Award (J.M.D.), and the UNC Department of Chemistry.
REFERENCES
1. K.A. Affholter, SJ. Henderson, G.D. Wignall, G.J. Bunick, R.E. Haufler and R.N. Compton, J. Chem. Phys. 99, 9224 (1993).
2 . E.T. Samulski, J.M. DeSimone, M.O. Hunt, Jr., Y.Z. Menceloglu, R.C. Jarnagin, G.A. York, K.B. Labat and H. Wang, Chemistry of Materials 4, 1153 (1992).
3. W.C. Koehler, Physic (Utrecht) 137B, 320 (1986). 4. W.S. Dubner, J.M. Schultz and G.D. Wignall, J. Appl. Cryst. 23, 469 (1990). 5. G.D. Wignall and F.S. Bates, J. Appl. Cryst. 20, 28 (1986)]. 6. G.D. Wignall, V. Ramakrishnan, M. Linne, A. Klein, L. Sperling, M. Wai, R. Gelman,
M. Fatica, R. Hoerl, L. Fisher, S. Melpolder, and J. O'Reilly, J. Molecular Crystals and Liquid Crystals 180A, 25 (1990).
7. E.F. Cassassa and G.C.J. Berry, J. Polym. Sei., Part A2, 4, 881 (1966). 8- Neutron, X-Ray and Light Scattering, edited by P. Lindner and T. Zemb, North-Holland
Delta Series, (Elsevier Science Publishers, New York, 1991). 9. H. Fujita, in Polymer Solutions, (Elsevier Science Publishers, Amsterdam, 1990), p.44. 10. G.D. Wignall, "Neutron and X-Ray Scattering", Polymer Properties Handbook, ed. J. E.
Mark, American Institute of Physics, in press. 11. G.D. Wignall, in The Physical Properties of Polymers, edited by J E Mark (ACS
Books, 1993), p. 313. 12. D. Rahlwes, Ph.D. thesis, University of Mainz (1974), quoted in Small Angle X-ray
Scattering, edited by O. Glatter and O. Kratky, (Academic Press, London, 1982), p. 389. 13. K. Huber, S. Bantle, P. Lutz and W. Burchard, Macromolecules 18, 1461 (1985). 14. L. Zhang, D. Qui and R. Qian, Polym. J. 17, 757 (1985). 15. R. Ullman, J. Polym. Sei., Polym. Lett. Ed. 21, 521 (1983); 23, 1477 (1984) 16. H. Benoit, J. Polym. Sei. 11, 506 (1953). 17. A.T. Boothroyd and R.C. Ball, Macromolecules 23, 1729 (1990).
340

LIGHT SCATTERING STUDY OF [60] FULLERENOL-BASED POLY(URETHANE-ETHER) STAR-SHAPED POLYMERS
LEE Y. WANG* AND LONG Y. CHIANG Center for Condensed Matter Sciences, National Taiwan University, Taipei,
Taiwan
ABSTRACT The dynamic behavior of the fullerenol-based polyurethane star-shaped
polymer and its analog model stars, containing three or four polymer arms, was investigated in toluene solution by dynamic light scattering measurements. In these systems, the diffusion coefficients clearly showed no angular dependence. In the case of study in dilute solution, all three star polyurethanes were found to possess higher mobility than that of the corresponding linear polyurethane with a similar molecular weight. Furthermore, the conformation of anchoring polymer chains was characterized by the hydrodynamic shrinking factor and compared with the Gaussian model. Results suggested that the polymer arms in the fullerene- based star-polymer were uniformly distributed around the central C60 cage.
INTRODUCTION Star-shaped polymers have been a subject of increasing interest from both
the theoretical and technological points of view [1-5]. Due to the peculiar structure
and properties, they have been used in a wide range of industrial applications [6,
7], such as adhesives [8]. Moreover, the study of the dynamic and the
conformational properties [9-15] of star polymers have led to a better understanding of the relationship between the macroscopic behavior of polymers
and their molecular architecture. Conventionally, the central core of star polymer consists of a polyfunctional
small molecule or particle. The increasing availability of spherically shaped C60
molecules, which were extracted and isolated from carbon soot in the electrical
arc-discharge process of graphite, allows the prospective design of the truly three-
dimensional star-like polymers utilizing the C60 cage as a molecular core.
Recently, we have successfully functionalized COO molecules and, subsequently, synthesized [60] fullerene-based poly(urethane-ether) star-polymers in a fairly
narrow distribution of molecular weight [16]. Since the dynamic light scattering
measurement is an important experimental method for probing dynamics of
polymers over a wide range of length and time-scale, it is most appropriate for this
investigation. Thus, the mobility and the molecular size of 3-, 4-, and 6-armed,
341
Mat. Res. Soc. Symp. Proc. Vol. 359 ® 1995 Materials Research Society

nearly monodispersed polyurethane star molecules in dilute solution were
obtained by light scattering. Difference in behavior between star and linear analog
polymers are discussed in relation to the Gaussian model.
EXPERIMENTAL PROCEDURES
Synthesis of fullerene-based polyurethane stars was performed by the
condensation reaction of diisocyanate-capped prepolymer with fullerenol. The
detailed procedures were described elsewhere [16]. For the purpose of
comparison, two polyurethane model stars with 3 or 4 polymer arms were also
prepared by the similar experimental procedure from 1.1.1-tris(hydroxymethyl)-
ethane or pentaerythritol, respectively. The molecular weight distribution of all
polyurethane stars and their constituent arms was determined by gel permeation
chromatography (GPC) using a Waters 600MS liquid chromatography instrument,
equipped with three interconnected ultrastyragel columns having a porosity range
from 100 to 106 Ä. Toluene was utilized as the carrier solvent and the flow rate was 1 ml per min.
Dynamic light scattering (DLS) measurements were performed with a Spectra Physics (Model 168) argon-ion laser, at the wavelength A = 514.5 nm, mounted on
a vibration isolation table. The sample cell was a cylindrical quartz cell with a
diameter of 1 inch, which was placed in the center of a refractive index matching
bath with toluene as the liquid medium. The sample compartment was
thermostated at 25.0 °C by an external circulating Hotech water thermostat. The intensity of the scattered light, emitting through a pinhole of 150 \im in diameter,
was augmented by a photomultiplier and evaluated by a Malvern Model 7032
correlator. The first 240 channels in the correlator were used for the time
correlation function. The experimental baseline was ascertained from the number
average of the scattered intensity collected in the last 16 channels, which were
delayed by 1024 sample times. Data points were accepted only when the
calculated baseline, determined from the number of laser pulses sent to the
autocorrelator in the course of the experiment, and the experimental baseline
agreed each other within 1 part in a thousand. Sample solutions were prepared by
dissolving the vacuum-dried polymers in toluene under stirring for 1 day at ambient
temperature. Toluene used was freshly distilled over CaH2. All solutions were then carefully filtered through a Teflon membrane of 0.2 |j,m pore size and
equilibrated for at least 2 hrs prior to the measurement.
342

RESULTS AND DISCUSSION
The molecular weight distribution of multi-armed polyurethane stars and their
precursors are given in Table I. The average number of anchored polymer arms
per molecule of the resulting star-polymer was calculated from the ratio of average
molecular weight between the star-product and its precursor polymer. These data
showed that the number of arms in model stars prepared from tri- and tetra-
hydroxylated molecules are in good agreement with the theoretical value of 3 and
4, respectively. In the case of fullerenol-based star-polymers, it fitted best with six
polyurethane arms, on average, chemically bonded on the Cßo cage even though
fullerenol itself contains an estimated 12 hydroxy groups on average. Most
significantly, the polydispersity (1.45) of fullerene-based star polyurethane is
notably narrower than that of the parent polymer precursor (2.11). The sole possibility to increase the number of polymer arms randomly bonded in a star-
shaped polymer without seriously broadening the polydispersity is to restrict the
number of polymer arms in a fairly narrow distribution. Similar phenomena were
also observed in the case of the 3- and 4-armed stars.
Table I
Molecular characteristics of PU star-polymers
Mn (x10-3)
Mw
(X10-3)
Mwl Mn f
(from Mn)
f
(from Mw)
PU precursor 2.6 5.5 2.10
triol-based star 9.3 15.2 1.64 3.6 2.8
tetraol-based star 12.6 20.3 1.60 4.8 3.7
fullerenol-based star 18.0 26.0 1.45 6.9 4.8
In our homodyne DLS experiments, the autocorrelation function of the scattered
intensity C(t) was analyzed by the cumulant method [17], where BL is the baseline
In [C(t) - BL]i/2 = 1 - r-i t + (r212)/2 ■ (1)
and f is the decay time. Ty and T2 are the first and second cumulants, respectively.
The second cumulant characterizes the deviation from a single exponential decay
due, for example, to polydispersity and long-range interactions. In all systems of star-polymers, the coefficient F2 is small compared to r?. It again states the
characteristic of a narrow polydispersity of prepared star-polymers.
343

Assuming that the scattered light is due to concentration fluctuations, the
average translational diffusion coefficient D of the scattering objects is obtained from
D = ryq2 (2)
with
q = {AKIX) sin (9/2) (3)
Where A is the wavelength of the incident light in medium and 0 the scattering
angle. For all investigated systems, the diffusion coefficients obtained have no
apparent angular dependence as shown in Figure 1. Therefore, the data presented in this paper were calculated from measurements acquired at 9= 90°.
Figure 2 showed that the mobility of stars decreases upon the increase of the
number of polymer arms in a closely related chemical structure. It can be
interpreted as the increase of friction between polymers in solution resulting from
the additionally bonded polymer arms. Meanwhile, all star-polymers were
observed in higher mobility than that of the corresponding linear polymers in a
similar molecular weight.
10
- 9.5
■Sg 9
8.5 8 8 S u
o t» 7.5
.3 7
6.5 6
- 1_ 0
: 0
E
\ •
z 0
- • linear \ 0 star •
: 1 I 1 1 i i
50 100
Scattering angle
150 12 3 4 5 6 7 Number of arms (f)
Figure 1. Diffusion coefficients of fullerene-based polyurethane star- polymers in toluene at 25 °C as a function of the scattering angle.
Figure 2. Diffusion coefficients of (o) f-stars and (•) linear PU polymers in a similar molecuJar weight range.
The comparison of conformational properties of star-polymers and the
corresponding linear polymers in a similar molecular weight range is usually made
by means of the shrinking factor h defined by
344

h = Rh, branch / Rh, linear (4)
Where Rh is the hydrodynamic radius of polymer. In the Gaussian model, each
polymer chain behaves as random walk in solution and is unperturbed by the
presence of other polymer arms attached onto the same core. According to
the derivation defined by Stockmayer and Fixman [18], the h factor is related to the
number of arms f of the star by the equation
n = f1/2/[2-f + 2l/2(f-1)] (5)
Equation (5) predicts that the h factor always has values smaller than unity when f
is greater than 2. To study the conformation of star polymer, the hydrodynamic
radius Rh of polymer was obtained from its translational diffusion coefficient,
according to the Stockes-Einstein relationship:
D = kT/(6 7tTi0Rh) (6)
Where k is the Boltzmann constant, and r\0 is the solvent viscosity. l.l
0 2 4 6 8 Number of arms (f)
Figure 3. The shrinking factor/? as a function of the number of arms /. The continuous line represents the Gaussian Model. The solid circle is the adjusted data for the fullerenol-based star.
The h value of three star-polymers and the theoretical curve from equation (5)
are shown in Figure 3. A good agreement of the experimental h values with the
theoretical predication for both 3- and 4-armed stars was obtained. Similar results
have also been reported for polystyrene in cyclohexane [19, 20]. In the case of the
fullerene-based star-polymer, the h value indicated some deviations from the theoretical prediction, tending a larger value. However, the diameter of fullerene cage, which is about 10 A, is considerably larger than that of the central core of
both 3- and 4-armed stars, with a single carbon atom as a branching center. When
345

the radius of fullerenol was subtracted from the measured hydrodynamic radius,
the adjusted data point was found to fit well with the theoretical line. Therefore, we
concluded that polymer chains of all three polyurethane star-polymers in dilute
solution can be described by the assumption of random walk. The polymer arms
chemically bounded to the fullerene cage are uniformly distributed to minimize
steric repulsions between each individual arms. Results also suggested that the
limitation of six anchored polyurethane arms on each fullerenol molecule may be due, primarily, to the steric effect as well.
ACKNOWLEDGMENT. This work was supported by the National Science Council of Republic of China under the grant no. NSC 84-2113-M-002-029.
REFERENCES 1. G.S. Grest, Macromolecules 27, 3493 (1994).
2. L.L. Zhou, P.M. Toporowski, J. Roovers, US Patent 5,276,110 (1994). 3. J. Roovers, P. Toporowski, Macromolecules 22, 1897 (1989).
4. W.D. Dozier, J.S. Huang, L.J. Fetters, Macromolecules 24, 2810 (1991).
5. B.J. Bauer, N. Hadjichristidis, L.J. Fetters, J.E.L Roovers, J. Am. Chem. Soc. 102, 2410 (1980).
6. J. A. Antonelli, C. Scopazzi, US Patent 5,310,807 (1994). 7. J.L. White, Rubber Chem. Technol. 42, 257 (1969).
8. J.R. Haws, R.F. Wright, In "Handbook of Thermoplastic Elastomers," B.M. Walker Ed., Reinhold, New York (1979).
9. D. Richter, B. Farago, Macromolecules 23, 1845 (1990). 10. T.M. Birshtein, E.B. Zhulina, Polymer 25, 1453 (1984).
11. W. Burchard, M. Schmidt, W.H. Stockmayer, Macromolecules 13, 580 (1980).
12. K. Huber, S. Bantle, W. Burchard, L.J. Fetters, Macromolecules 19, 1404 (1986).
13. M. Guenza, A. Perico, TRIP 2(2), 56 (1994).
14. K.R. Shull, E.J. Kramer, L.J. Fetters, Nature 345, 790 (1990).
15. D. Richter, B. Stuhn, B. Ewen, D. Nerger, Phys. Rev. Lett. 58(23). 2462 (1987).
16. L.Y. Chiang, L.Y. Wang, S.M. Tseng, K.H. Hsieh, J. Chem. Soc. Chem. Commun., in press (1995).
17. D.E. Koppel, J. Chem. Phys. 57, 4814 (1972).
18. W.H. Stockmayer, M. Fixman, Ann. N.Y. Acad. Sei. 57, 334 (1953).
19. J.E.L. Roovers, S. Bywater, Macromolecules 7, 443 (1974).
20. K. Huber, W. Burchard, L.J. Fetters, Macromolecules 17, 541 (1984).
346

LATTICE-TYPE POLYMERS FROM AN ADDUCT OF C60 AND 2-METHYLAZIRIDINE
A. NIGAM, T. SHEKHARAM, T. N. BHARADWAJ, J. GIOVANOLA, S. C. NARANG AND R. MALHOTRA. Chemistry and Molecular Physics Laboratory, SRI International, 333 Ravenswood Avenue, Menlo Park, California, 94025, USA.
ABSTRACT
A one to ten adduct of Cßo and 2-methylaziridine was prepared and copolymerized with Novolac, Epon and Bisphenol A to obtain three dimensional polymers containing Qo with low coefficients of friction and good wear properties, which bode well for their potential use as solid lubricants.
INTRODUCTION
The isolation1 of COO as a stable allotrope of carbon and its subsequent synthesis2 in macroscopic amounts generated lot of interest among chemists all over the world. Its soccer ball like structure and high electron affinity prompted several research groups3 to develop new chemistry for its functionalization. Along with the development of its chemistry, several different polymers incorporating COO
nave been reported.4 Amato et al.5 have proposed that polymers of COO could be of two different structural kinds: (i) pearl necklace, in which the COO
unit is a P31* of
the polymer chain; and (ii) charm bracelet, in which the fullerene unit is pendant to the polymer chain. Later Taylor and Walton3b have proposed a lattice-type polymer, which is a two- or three- dimensional variant of the pearl necklace polymers. Herein we report a simple synthesis of an adduct of 2-methylaziridine and Cßo and preparation of lattice-type polymers from the adduct
PREPARATION AND CHARACTERIZATION OF AZIRIDINE ADDUCT
Prompted by the work of Wucü3*1 and coworkers showing the facile addition of amines to Qo, we investigated the addition of 2-methylaziridine to CöO- Cta" motivation behind this study was the recognition that aziridine moieties would allow incorporation of the COO
cage mt0 a variety of polymers. Typically the adduct was synthesized by stirring Cßo in dry benzene with an excess of freshly distilled 2-methylaziridine for several days. Initially the reaction mixture was purple colored and had excess Qo particles suspended in it. As the reaction progressed the mixture became dark brown and finally turned into a very clear reddish brown homogenous solution. Upon evaporation of the solvent the adduct 1 was left as a shining dark brown colored solid. (For the sake of clarity only one methylaziridine ring is shown in the following equation, although the adduct on average has ten such rings.)
H N
/ \ (30 eq.)
Benzene, room temperature several days
1 Suspension in purple solution Clear brown solution (^
347
Mat. Res. Soc. Symp. Proc. Vol. 359 e1995 Materials Research Society

Unlike the starting COO, the adduct was readily soluble in chloroform, tetrahydrofuran, benzene and toluene. The weight gain observed in the reaction (72.5%) suggests the formation of a one to ten adduct of COO
to methylaziridine viz., C6o(C3H7N)io. The elemental analysis is also consistent with the addition of ten aziridine rings. The calculated values ( C, 83.69%; H, 5.46%; N, 10.84%) are in close agreement with those found (C,82.96% ; H,5.48%; N,l 1.56%). Though a mixture of products with varying number of methylaziridine rings added to Ceo were expected, the HPLC of the crude reaction product on dinitroanilinopropyl phase with 1:1 toluene and hexane exhibited essentially a single peak.6 The t'I'IK. spectrum of the adduct was dominated by peaks due to the aziridine rings such as at 1443 and 1396 cm~l due to CH2 deformations, at 1238 cnr1
due to asymmetric ring deformations, and at 1054 cm" * due to C-N stretch. Though the proton NMR showed only broad peaks at the expected chemical shifts, the 13C NMR showed sharp lines due both to the aziridine rings and to the Qo nucleus. Mass spectrometric analysis of the adduct by FABMS and by surface analysis by laser ionization (SALI) gave peaks at 777, 834,891 and 948 Da corresponding to the addition of one to four aziridine units to COO- AS with many other addition products of fullerene mass spectral analysis is accompanied by substantial fragmentation and peaks due to Qo with five and more aziridine units were not seen. In addition to the peaks mentioned, there was a prominent peak at 720 Da corresponding to Cßo- Since there was no unconverted C^p in the reaction product, the peak at 720 Da is due to a fragment of the adduct and its presence indicates that the overall cage structure of COO has been preserved.
POLYMERS WITH THE AZIRIDINE ADDUCT
Since the aziridine rings are very susceptible towards nucleophilic addition it should be possible to crosslink phenolic compounds like Novolac or Bisphenol A and epoxides like Epon 828 with 1. Several polymers were prepared with these materials by heat curing them with varying amounts of the adduct (Table). The thermal stability of the resulting polymers was assessed by thermogravimetric analysis. As can be seen from the table a prepolymer like Novolac loses 57% of its weight when heated to 400°C in Ar atmosphere. When the same Novolac is cured with the adduct 1 in the ratio 2:1, it loses only 26% of its weight under the same conditions.
Though the weight loss in case of Epon 828 and Bisphenol A can not be compared with the polymers since they are only monomers, the TGA data clearly shows the thermal stability of these polymers. The effect of the amount of the adduct on the thermal stability of the polymer is illustrated by the epon polymers. Whereas a 10:1 ratio of epon and adduct gives a polymer which loses 65% of its weight by heating to 400°C , 6:1 and 2:1 polymers lose only 42 and 18% of their weight under similar conditions.
To study the friction and wear behavior of the polymers, thin films were made by spin coating a very concentrated DMF/toluene solution of the reactants onto small quartz discs and heat curing them in a hot air oven. All the films were brown colored, transparent and on a pencil scale were very hard(generally >9H). The friction and wear behavior studies were made using a pin on disc arrangement using a tilted, beveled, flat bottom silicon nitride pin sliding on the coated quartz disc.
Novolac and Epon 828 resins containing high concentration of the adduct (2:1) gave films of low friction coefficient of .1 5 -.2 0 comparable to that of wet graphite. We have also observed indication that a coating in the process of breaking down during the sliding friction test regenerated itself. This ability to regenerate the interface film is a characteristic feature of good solid lubricants such as graphite or molybdenum disulfide. Films made with lower concentration of the adduct initially gave a friction coefficient of J 5 to.2 0, but rapidly degrade to 0.50 in a matter of seconds. Films made of Bisphenol A also wore off rapidly even with high concentration of the Qo methylaziridine adduct.
348

Table: Thermal and mechanical properties of polymers with C6o-2-methylaziridine adduct
Polymer Sample Curing Conditions % Wt loss at
400°C
Coefficient of Friction
Resin Resin:Adduct Temp, °C Time, hrs
Novolac 180 18 57 0.20=>0.35
Novolac (10:1) 180 18 30 0.15=>0.40
Novolac (6:1) 180 18 28 0.20=>0.45
Novolac (2:1) 180 18 26 0.15
Epon 828 - - 95 -
Epon 828 (10:1) 200 18 65 0.35=>0.60
Epon 828 (6:1) 200 18 42 0.15=>0.50
Epon 828 (2:1) 200 18 18 0.15 to 0.20
Bisphenol A - - 98 -
Bisphenol A (1:1) 200 18 3 0.30=>0.55
# X=>Y means the initial friction coefficient of X deteriorates to Y.
EXPERIMENTAL:
Synthesis of C6o- 2 methylaziridine adduct: To a suspension of 400 mg of COO i« 20 mL of dry benzene was added 1 mL(excess) of 2-methylaziridine under argon atmosphere and stirred at room temperature for 4 days. The initially violet colored heterogeneous reaction mixture becomes dark brown as the reaction proceeds and becomes very clear deep reddish brown solution by the end of the reaction. Upon removal of solvent and excess aziridine under reduced pressure 691 mg of the adduct (1) was obtained as a shining dark brown colored solid (MP: 204°C, as seen from DSC).
Elemental Analysis: Calculated for C6o(C3H7N)10 : C, 83.69; H, 5.46; N, 10.84. Found: C, 82.96; H, 5.48; N, 11.56. FTIR (KBr): cm"1: 1443, 1396,1364 (CH2def), 1238 (asymmetric ring def), 1054 (C-N str). lK NMR (CDCI3, 300MHz) 8: Two broad peaks at 1.2 and 2.0 for 5 and 2 H respectively. ßC NMR (benzene-do containing 0.035M Cr(acac)3,75 MHz) 5: 18.3 br (N-CH2), 21.6 (C.-CH3), 34.0 (Ceo £H), 34.5 (CH3), 34.4 (Qnfi-N), 142 to 152 several peaks due to COO nucleus. UV (CHCI3): A sharp absorption at 300 nm and a shoulder at 410 ran. SALI( Surface Analysis by Laser Ionization): 777 [C6o(C3H7N)i], 834 [C60(C3H7N)2], 891 [C6o(C3H7N)3], 948 [C6o(C3H7N)4].
Representative procedure for preparation of polymers from the of C<;o-2- methylaziridine adduct: Novolac (100 mg) was dissolved in 0.5 mL of N,N- dimethylformamide in a small sample vial. In another sample vial C^o-methylaziridine adduct (10 mg) was taken and dissolved in 0.25 mL toluene. This solution is added to the novolac solution
349

and mixed well. The resulting solution is then spin coated on to a one inch diameter quartz disc and heated in hot air oven at 180°C overnight to get a brown colored film on the quartz disc.
ACKNOWLEDGMENT
This work was conducted under the program :"Advanced Chemical Processing Technology," consigned to ACTA from New Energy and Industrial Science and Technology Frontier Program enforced by the agency of Industrial Science and Technology, the ministry of International Trade and Industry (MITI), JAPAN.
REFERENCES
1 H.W. Kroto, J.R. Heath, S.C. O'Brien, R.F. Curl, R.E. Smalley, Nature 318, 162 (1985).
2 W. Krätschmer, L.D. Lamb, K. Fostiropoulos, D.R. Huffman, Nature 347, 354 (1990).
3 For reviews on chemistry of fullerene see: a) G.A. Olah, I. Busci, R. Aniszfeld, G.K. Suryaprakash, Carbon 30, 1203 (1992); b) R. Taylor and D.R.M. Walton Nature 363, 685 (1993); c) F. Diedrich, L. Isaacs, D. Philip, Chemical Society Reviews 243 (1994); d) Fullerenes: Synthesis, Properties and Chemistry of Large Carbon Clusters G. Hammond and V.J. Kuck Eds., ACS Symposium Series 481; American Chemical Society, Washington DC, 1992. S
4 For polymers incorporating C<50 see: a) E.T. Samulski, J.M. Desimone, M.O. Hunt, Y.Z. Menceloglu, R.C. Jarnagin, G.A. York, K.B. Labat, H. Wang, Chem. Mater . 4, 1153 (1992); b) A.O. Patil, G.W. Schriver, B. Cartensen, R.D. Lundberg, Polym Bull 30, 187 (1993); c) D.E. Bergbreiter and H.N. Gray, J. Chem. Soc, Chem. Commun. 645 (1993); d) S. Shi, K.C. Khemani, C. Li, F. Wudl, J. Am. Chem. Soc 114, 10656 (1992); e) K.L. Wooley, C.J. Hawker, J.M.J. Frechet, F. Wudl, G. Sradanov, S. Shi, C. Li, M. Kao, J. Am. Chem. Soc. 115, 9836 (1993).
5 I. Amato, Science 254, 30 (1991).
6 D.S. Tse, R.S. Ruoff, D.C. Lorents, R. Malhotra, "Preparative and Semipreparative HPLC of Fullerenes on Silica-Bonded Dinitroanilinopropyl Phase," in Fullerenes: Recent Advances in the Chemistry and Physics of Fullerenes and Related Materials, K.M. Kadish and R.S. Ruoff Eds., The Electrochemical Society Inc., Pennington, New Jersey, p.191 (1994).
350

EMBEDDING FULLERENES IN THIN SOL-GEL FILMS
MAURIZIO PRATO*, MICHELE MAGGINI,** GIANFRANCO SCORRANO,**
GIOVANNA BRUSATIN,*** PLINIO INNOCENZI,*** MASSIMO GUGLIELMI,***
MORENO MENEGHETTI,**** RENATO BOZIO****
*Dipartimento di Scienze Farmaceutiche, Universitä di Trieste, Piazzale Europa 1, 34127
Trieste, Italy **Centro Meccanismi di Reazioni Organiche del CNR, Dipartimento di Chimica Organica, Via
Marzolo 1, 35131 Padova, Italy
***Dipartimento di Ingegneria Meccanica, Settore Materiali, Via Marzolo 9, 35131 Padova,
Italy
****Dipartimento di Chimica Fisica, Universitä di Padova, Via Loredan 2, 35131 Padova, Italy
ABSTRACT
Fullerene COO can be considered an interesting molecule for the preparation of new materials
with attractive optical properties. In the present work we report the preparation of sol-gel
derived, glass-like materials containing COO and a COO derivative prepared by 1,3-dipolar
cycloadditions of azomethine ylides to COO- The optical characterisation of the films confirms
the presence of COO and its derivative, in the glass matrix.
The properties of buckminsterfullerene (COO) [1,2] have attracted much interest, in the last
few years, in materials science and technology [3-6]. Among the most notable features of COO,
are its optical properties [7,8], which make this molecule interesting from the point of view of
non-linear optical materials [9], as is shown, for example, in optical limiting experiments [10]. The most promising materials for optical limiting are in fact those which, owing to excited
state absorption, the transmittance decreases with increasing laser fluence [11].
For such applications it would be desirable to include COO by simple method in thin films
with waveguiding properties and good resistance against environmental degradation.
These requirements can be satisfied by using composite systems. In this respect, the sol-gel
processing is an attractive possibility, mainly due to the relatively low temperatures at which
inorganic or hybrid organic-inorganic glasses can be prepared [12].
The homogeneous inclusion of organic molecules in a sol-gel matrix requires the solubility
of the compound in a solvent suitable for sol-gel processing. The best thing would be to use a
351
Mat. Res. Soc. Symp. Proc.Vol. 359 e1995 Materials Research Society

single common solvent for the three main species, i.e. alkoxide, water and the organic
compound, but it is also possible to use a specific solvent for the organic species. In the last
case, however, the solution containing this species, must dissolve, at least partially, in the sol
and has to be compatible with the gelation process.
It is known that COO shows very poor solubility in any solvent, except aromatic and
especially halogenated aromatic solvents [13]. Among the possible solvents, we decided to use
monochlorobenzene (MCB) because of its relatively low boiling point (132 °C).
In order to check the possibility to deposit films with a sol-gel solution containing MCB, we
prepared a sol with molar ratios of tetraethoxysilane (TEOS)/H20/HCl/EtOH/MCB =
1/2/0.01/6/3.5 . Using the fresh solution no transparent coating could be obtained. Instead,
good results were obtained by adding MCB to a TEOS sol refluxed at 80°C for 10 hours.
In order to understand this different behavior, it is important to remember that during the
deposition process of a film, substantial evaporation of solvents occurs prior to gelation.
However, due to the higher boiling points of MCB and water with respect to ethanol, the liquid
film becomes more and more rich in the first two, which are mutually insoluble. Thus phase
separation may occur, affecting the gel microstructure upon gelation so that the film becomes
highly porous. This can be limited or avoided by increasing the gelation rate or by bringing the
system close to the gel point before the deposition step, as it results by refluxing.
Using this approach a COO magenta colored solution with a Cßo /SiÜ2 molar ratio of 1.4x10- 4 was obtained. Transparent films about 350 nm thick were deposited by spinning (2000 rpm)
on soda-lime and silica glass substrates. The Cßo concentration in the film, however, was too
low to observe in the UV-Vis spectra clear signatures of the electronic transitions with high
oscillator strength observed at 328.4 nm and 256.6 nm in n-hexane solution [14]. However,
we have verified that in the spectra of gel powder (obtained under the same conditions) these
transitions can be observed as bands with very low intensity at about 330 nm and 257 nm,
confirming that COO was present in the sol-gel matrix (see fig. 1).
Thicker films could not be prepared from this solution even using the multilayer technique,
due to spontaneous cracking during drying. It is known that thicker films can be obtained by
using a sol modified by partial or total substitution of TEOS with methyltriethoxysilane
(MTES) [15]. A solution with molar ratios TEOS/MTES/H20/HCl = 2/3/17/0.03 was prepared
and mixed with COO in MCB. However, the maximum Cßo /Si02 ratio which yielded transparent films was 6xl0"5. A thickness of about 1.5 |i.m could be obtained by depositing
four layers, but again the concentration was too low to observe in the UV-vis spectra clear sign
of the presence of COO-
A critical factor in the above experiments was the use of MCB as a solvent for COO-
Derivatives of COO can be soluble in solvent which are more appropriate for the preparation of
the sol-gel and since THF is a good solvent for both the alkoxide and water, we have prepared
fulleropyrrolidine 2, which is soluble in this solvent.
352

"i 1 1 1 1 1 ' r 210 310 410 510 610
Wavelenght (nm)
Figure 1 UV-Vis spectra of sol-gel silica matrix (solid line) and COO in sol-gel matrix (dotted
line) dispersed in KBr.
Compound 2 was prepared by allowing 3,4-dibenzyloxy benzaldehyde, N-methyl glycine
and Cfjo to react in refluxing toluene. Condensation of the amino acid with the aldehyde and
subsequent decarboxylation yields the highly reactive 1,3-dipole 1 which adds to Cßo giving
the fulleropyrrolidine 2. The reaction proceeded smoothly in about 10 hours, affording 2 in
30% yield (80% based on COO conversion) [16].
CHsNHCHaCOOH +
OCH,Ph
PhCH20 0
PhCH20—<v ^-C-H
PhCH2OH\ },
-C02 -H20
CH,
"CH9
353

The UV-Vis spectrum of compound 2, reported in fig.2, shows that only some changes
with respect to COO can be observed. In particular, there is a difference in the relative intensity
of the main electronic transitions and a splitting of that at about 330 nm. This shows that the
electronic structure of fulleropyrrolidine 2 is not strongly perturbed with respect to that of COO-
2.50 m c 3 2.00 &> m .n 1 50 05
CD O r 1.00 m n i_ o
0.50 <
0.00-1 1 r- r r 200 300 400 500 600 700 800
Wavelength (nm)
Figure 2 UV-Vis spectra of 2 (solid line) and Cßo (dotted line) in cyclohexane.
With compound 2 we have not found problems in obtaining transparent films also using the
organically modified sol. The achievable concentration of 2 in the gel was limited by its
solubility in the sol and the maximum sol dilution to get reasonable film thickness. A molar
ratio between fulleropyrrolidine 2/Si02 = lxlO3 was obtained, but the solution was unstable.
A dilution by a factor of 2 gave a more stable solution, from which slightly brownish coloured
films were deposited. The thickness of a single layer was about 400 nm, but multilayer
deposition was possible up to 5-6 layers. The UV-Vis spectra shown in fig. 3 is that of a film
of about 800 nm thickness.
We have shown that COO and a COO derivative can be conveniently included in thin films
obtained by the sol-gel method. However, because of its solubility in THF, the
fulleropyrrolidine 2 results to be more appropriate for obtaining better films with higher
concentration. Experiments are now in progress to verify the optical limiting properties of these
new hybrid materials.
354

Wavelenght (nm)
Figure 3 UV-Vis spectrum of 2 in sol-gel film on silica slice heat-treated at 200 °C
REFERENCES
[1]. H. W. Kroto, J. R. Heath, S. C. O'Brien, R. F. Curl, R. E. Smalley, Nature, 1985,
318, 162.
[2]. W. Krätschmer, L. D. Lamb, K. Fostiropoulos, D. R. Huffman, Nature, 1990, 347,
354.
[3]. Ace. Chem. Res., 1992, 25, (Special issue on buckminsterfullerene).
[4]. Fullerenes: Synthesis, Properties and Chemistry of Large Carbon Clusters, (Eds.: G.
S. Hammond, V. J. Kuck), American Chemical Society, Washington, DC, 1992.
[5]. The Fullerenes, (Eds.: H. W. Kroto, J. E. Fischer, D. E. Cox), Pergamon, Oxford,
UK, 1993.
[6]. Buckminsterfullerenes, (Eds.: W. E. Billups, M. A. Ciufolini), VCH, New York,
1993.
[7]. J. W. Arbogast, A. P. Darmanian, C. S. Foote, Y. Rubin, F. N. Diederich, M. M.
Alvarez, S. J. Anz, R. L. Whetten, J. Phys. Chem, 1991, 95, 11.
[8]. Y. Wang, Nature, 1992, 356, 585.
355

[9]. F. Kajzar, C. Taliani, R. Danieli, S. Rossini, R. Zamboni, Chem. Phys. Lett, 1994, 277,418.
[10]. L. W. Tutt, A. Kost, Nature, 1992, 356, 225.
[11] P. A. Miles, Appl. Opt., 1994, 33, 6965.
[12]. L. L. Hench, J. West, Chem. Rev, 1990, 90, 33.
[13]. R. S. Ruoff, D. S. Tse, R. Malhotra, D. C. Lorents, J. Phys. Chem., 1993, 97,
3379.
[14]. S. Leach, M. Vervloet, A. Despres, E. Breheret, J. P. Hare, T. J. Dennis, H. W.
Kroto, R. Taylor, D. R. M. Walton, J. Chem. Phys., 1992,160, 451.
[15]. P. Innocenzi, M. O. Abdirashid, M. Guglielmi, 7. Sol-Gel Sei. Techn., 1994, 3, 47.
[16]. M. Maggini, G. Scorrano, M. Prato, J. Am. Chem. Soc., 1993, 775, 9798.
356

FUNCTIONALIZATION OF C«, BY CYCLOADDITION REACTIONS
STEPHEN R. WILSON", JINGRONG CAOa, QINGYI LUa, YUNHUI WU\ NIKOLAOS KAPRINIDASa,GEORGE LEMa, MARTIN SAUNDERSb, HUGO A. JIMENEZ-VASQUEZ\ DAVID I. SCHUSTER"
"Department of Chemistry, New York University, New York, NY 10003 bDepartment of Chemistry, Yale University, New Haven, CT 06520
ABSTRACT Functionalization of C6o has been achieved by [2+2] photocycloaddition reactions of enones
and [2+4] cycloaddition reactions of dienes, the course of these reactions can be followed using electrospray mass spectrometry using a special tagging reagent. Using tagged C6o it was shown that eis and trans cycloadducts are formed from ketones such as 3-methylcyclohexenone. We have also employed the new technique of 3He NMR spectrometry. 3He is an NMR-active nucleus. Fullerenes containing an endohedral 3He atom can be examined by NMR to obtain structural information and potentially determine isomer distributions. Examples, of helium spectra of fullerene hydrides are presented.
INTRODUCTION Over the last several years, fullerenes (C6o) have been one of the most vigorously studied
areas of chemistry. Work on fullerenes account for more that half the papers cited in all of chemistry over the last 3 years [1]. The chemical synthesis of derivatives of C60 is now becoming more-or-less routine. It is possible to prepare derivatives of C6o using many type of reactions and particularly cycloaddition processes. C60 behaves as an electron-deficient olefin towards many types of reagents and undergoes, for example, [2+2], [2+3], and [2+4] cycloadditions [2]. For example, the photocycloaddition of enones to C6o is an excellent method for derivatization (equation 1) [3].
(eq1)
The synthesis of derivatives is readily followed by electrospray MS. Electrospray is a solution MS technique whose major requirement is that ions already exist in solution. Thus the application of electrospray MS to fullererenes requires a method for making the uncharged fullerene derivatives visible (chargeable). We have found that tagging of fullerenes with the diazo-crown reagent 1 allows ready analysis of fullerene products [4].
c
357
Mat. Res. Soc. Symp. Proc. Vol. 359 s 1995 Materials Research Society

The analysis of fullerene derivatives therefore involves the reaction of 1 with the compound of interest in benzene, followed by addition of KOAc or NaOAc in methanol. Electrospray of this solution produces a very clean spectrum containing ions due to complexation of the crown ether group with Na+ or K+.
MXK+
MK+
juU*r 4M
MX,K*
MX-.K+
iy I »t If Hi i)lll,i,l)
MX4K+
u.
MX5K+
MX6K+
MX7K+
198« UN 1289 UN 14M UN 1(99 17» 1119 »99 ItU ra/z
Figure 1. Electrospray MS spectrum of enone photoproducts in equation 1 (cf. reference 3 ).
Electrospray MS of the tagged reaction mixture from equation 1 in benzene/methanol containing KOAc shows the [2+2]-photocycloaddition of multiple units of 3- methylcyclohexenone to C6o (Figure 1). Of course, mass spectrometry only detects compounds differing in mass. While the electrospray MS method is excellent for identification of adducts of C6o, it cannot distinguish isomers. The multiple enone additions to C6o, while giving many different isomers, give only one peak in the electrospray MS spectrum.
HELIUM NMR Thus we have begun exploring the new technique of helium-3 NMR for identifying C6o
isomeric derivatives. One unique aspect of the soccer-ball shaped C6o molecule that had been recognized since its discovery in 1985 was the potential for trapping an atom inside the carbon cage [5]. Work on these so-called endocyclic compounds has been a major focus of research. Preparation and isolation of compounds, termed metallofullerenes and having the nomenclature M@C60, is difficult and only very small quantities have thus far been characterized. A potentially more interesting development in this area involves filling C60 with inert gases and particularly with an isotope of helium~3He [6]. This isotope, available in quantity relatively cheaply via decay of tritium, is NMR active, i.e. has a spin of 1/2, resonates at 381 MHz, and has NMR sensitivity similar to 'H. Thus, 3He NMR spectrometry can be used to examine fullerene structure [7].
Earlier this year, only one 3He NMR line was known, the signal for gaseous 3He - there were no helium compounds [6]. The discovery of 3He@C6o and its relative 3He@C70 suddenly opens a whole new field of helium molecule chemistry and 3He NMR spectroscopy. We were able to obtain a sample of He@C6o and carry out several chemical reactions. We have produced two of the first isomeric helium compounds, eis and trans 3He@C6o -enones (Figure 2).
One can observed distinct chemical shifts for the new helium compound isomers (relative to gaseous helium and 3He@C6o). For example, the 3He@C6o -enone in Figure 2 is a 60/40 mixture of cis/trans isomers and the intensities of helium NMR peaks at -9.28 and -9.34 ppm are also in a 60/40 ratio. The helium atom inside the C6o framework is surrounded by the C6o Jt- electron system. It appears that the chemical shift of the 3He signal is related to the it -electron system and indeed appears to be a very sensitive probe for its constitution.
358

CH3
hv
benzene
3He@C 6 0
-9.28 (3He@C60-'-ketone)
« -9.54 (3He@C60-c-ketone)
i 1 1 1 1 1 1 r——« 1 1 1 1 1 « i -5.0 -6.0 -7.0 -8.0 -9.0 -10.0 -ii.O
PPH
Figure 2. Helium-3 NMR of eis and trans 3He@C60 -enone adducts (the reference is gaseous 3He at 0 ppra.)
STUDIES OF FULLERENE HYDRIDES Of particular interest in materials science are fullerene hydrides as potential stable hydrogen
sources in fuel cells [8]. One of the first reactions of C6o reported was Birch reduction to C6oH36
and its conversion back to C6o- Using this chemistry hydrogen might be stored in a solid form.
+H, -60 *-
H, -60 "3«
We have recently been examining methods for synthesis and structure determination of such fullerene hydrides [9]. In 1993, Cahill reported the characterization of the simplest fullerene hydride C6oH2 [10]. This hydrocarbon was prepared by hydroboration/protonation of C6o- Other workers have reported alternative processes including transfer hydrogenation, hydrozirconation, dissolving metal reduction, and diimide reduction.
Since initial reports described the difficulty in obtaining good mass spectral characterization of fullerene hydrides such as C6oH2, we wished to examine the application of electrospray MS to this problem. Reduction of one double bond in C6o using the Cahill procedure was tricky and in our hands lead to less than 10% yield of C6oH2. The separation of C6oH2 from unreacted C60 was also quite tedious.
The search for a better synthetic method lead us to modify the diimide method of Taylor [11]. Thermal, rather that oxidative generation of diimide gives a very clean conversion of C6o to C6oH2.
359

\/° thermolysis
11 Cf
toluene
We were able to prepare C6oH2 in 30% yield by this method. Separation of C6oH2 by Buckyclutcher HPLC lead to homogeneous material. Proton NMR shows a singlet at 5.88 ppm (C6D6). Electrospray MS of C6oH2 (tagged) shows only a molecular ion at the expected m/e = 1441. If 3He@ COO is subject to the Cahill reduction conditions 3He@C6oH2 is produced. Our 3He NMR spectrum is shown in Figure 3A. The signal for 3He@C6oH2 shows a shift upfield to -9.663 ppm relative to 3He@ C6o at -6.345 ppm.
toluene reflux
-30% yield Even more interesting is the prospect for investigation of isomeric addends around the sphere.
The substitution of C6o with more than one group leads to the possible formation of as many as 8 bis-adducts. Several studies of the isomer distribution for C6o products have appeared. Hawkins discusses the preparation of bis-osmylated derivatives [12 ], Hirsch described the isolation of 7 of the 8 possible isomers [13]. Cahill reported hydrogenation of C6o to CöOHI and identification of several of the isomers in Figure 4 [14]. are 8 possible isomers.
When two double bonds are reduced in He@ C6o there
CgoHo C60H4
Reduction of He@C6o with excess diimide leads to formation of C60H4 is substantial amount. Electrospray MS confirmed the formula and proton NMR was consistent with formation of at least 6 isomers. The 3He NMR spectrum of the reaction mixture is shown in Figure 3B. Clearly, 3He@C6oH2 is observed at -9.663 ppm and 6 signals due to 3He@C6oH4in the region -10.3 to - 12.8 ppm are observed, indicating at least 6 isomers are formed (note, the signal at 12.8 is actually two peaks of equal intensity). Data already available suggests that 3He "feels" the n-system (ring currents, etc.) and its chemical shift will be quite diagnostic for identification of isomer distribution. We expect that 3He NMR will be extraordinarily useful for the assignment of the substitution pattern around the C6o sphere in multiply substituted fullerene derivatives.
360

Figure 3A: The NMR spectrum for 3He@C6oH2 produced by hydroboration. Signal at - 6.345 ppra is C6o and at.-9.663 ppm is 3He@C6oH2. (relative to gaseous 3He at 0 ppm.)
Figure 3B: The 3He NMR spectrum of the reaction mixture produced by diimide reduction (excess) of 3He@C6o. The signal at -6.345 ppm is C6o, at -9.663 ppm is 3He@C6oH2 and in the region -10.3 to -12.8 ppm 6 signals due to 3He@C6oFIiare observed (-10.30, - 10.81, -11.26, -11.56, -12.75, -12.79 ppm.) (relative to gaseous 3He at 0 ppm.)
'He
3He@C60H2
B
3He@C( 60
3He@Cß0H(i isomers
tWpAiWMW«^^
i i • ■ ■ ■ ■ i i ,-..-,—.. i... |..—.... | ,..,,.
5.00 -8.00 -10.00 -12.00 -14.00 -16.00 -IB.CO -20.00 -22.00 -t
3He@C60
A
'HeOCeoHj
wWHty»kW^ 0.0
■!■'■" -5.00 -15.00
PPM
T -20.00 -25
361

REFERENCES
1. "So Far Fullerene Studies Dominate Chemical Citations in the 1990's," The
Scientist, Oct 31, 1994, p 14.
2. (a) "Buckminsterfullerene," W.E. Billups, M.A. Cuifolini, eds, VCH Publishing
Co., NY 1993.
(b) "Fullerenes," K.M. Kadish, R.S. Ruoff, Electrochemical Society, Pennington,
NJ 1994.
3. S.R. Wilson, N. Kaprinidis, Y. Wu, D.I. Schuster, J. Amer. Chem Soc, 115,
10334 (1993)
4. S.R. Wilson and Y. Wu, J. C. S. Chem. Commun, 1993, 784.
5 H.W. Kroto, J.R. Heath, S.C. O'Brien, R.F. Curl, R.E. Smalley, Nature, 318, 162
(1985).
6. M. Saunders, H.A. Jimenez-Vasquez, R.J. Cross, and R.J. Poreda, Science, 259,
1428 (1993).
7. M. Saunders, H.A. Jimenez-Vasquez, R.J. Cross, S. Mroczkowski, D.I. Freedberg
and F.A.L. Anet, Nature, 367, 256-258 (1994)
8. S. Kartha and P. Grimes, Phys. Today, 1994. 54.
9. H. Zhao, PhD thesis, New York University, 1994.
10. C.C. Henderson and P.A. Cahill, Science, 259 1885 (1993).
11 A.G. Avent, A.D. Darwish, D.K. Heimbach, H.W. Kroto, M.F. Meidine, J.P.
Parsons, C. Remars, R. Roers, O. Ohashi, R. Taylor, D.R.M. Walton, J. C S.
Perkin Trans 2, 1994. 15.
12. J.M. Hawkins, A. Meyer, T.A. Lewis, U. Bunz, R. Nunlist, G.E. Ball, T.W.
Ebbeson, K. Tanigaki, J Amer Chem Soc, 114, 7954 (1992).
13. A Hirsch. I. Lamparth, H.R. Karfunkel, Angew Chem Int Ed Engl, 33, 437 (1994).
14. C.C. Henderson, CM. Rohlfing, R.A. Assink, and P.A. Cahill, Angew Chem Int
Ed Engl, 33, 786 (1994).
362

Disilene Addition to C70
S. J. JACOBS,* C. M. ROHLFING** and P. A. CAHILL* *Sandia National Laboratories, Albuquerque, NM 87185-0368 **Sandia National Laboratories, Livermore, CA, 94551-0969
ABSTRACT
Semiempirical and ab initio Hartree Fock computational results indicate that the highly reactive dienophile tetramethyldisilene, Me2Si=SiMe2, is an excellent candidate for a novel functionalization of the equator of C70 via a [2+4] cycloaddition to the 21, 22, 23, 42 carbons. Thermal or photochemical generation of tetramethyldisilene in the presence of C70 results in similar complex mixtures in which the major product appears to be that of [2+2] cycloaddition to the 7,8 carbons of C70. A minor product clearly results from [2+2] cycloaddition to the 1,9 carbons. Both of these products are hydrolytically unstable and are converted nonspecifically to mixtures of 1,9- and 7,8-C7oH2 which are also present in HPLC traces of the reaction mixtures.
INTRODUCTION
The chemistry of C70 has to a large measure paralleled that of COO- C7o's lower symmetry gives rise to several possible products, in contrast to the single product often found in additions to COO- In some cases the chemo- or regioisomers can be equilibrated to yield differential free
Figure 1. C70 nomenclature. Addition to the 21,42 positions is predicted to be favorable, but only additions to the 1,9 and 7,8 positions has so far been observed.
363
Mat. Res. Soc. Symp. Proc. Vol. 359 e 1995 Materials Research Society

energies of formation that yield insight into the fundamental chemical nature of C70.1 A unique low energy addition pattern — addition to the 21,42 carbons of C70 — was first identified by semiempirical calculations on C70H2 and verified by ab initio Hartree-Fock methods.2 This addition pattern is 1,4 across a 6-ring that spans the equator of C70 as is shown in Figure 1. However, it is perhaps best described as addition to one carbon in each hemisphere of C-JQ.
These calculations on C70H2 prompted the search for methods to functionalize the equatorial region of C70 chemoselectivefy with applications to both materials and pharmaceuticals. Because the energy of the 21,42 isomer of C70H2 is estimated to lie 4.5 kcal/mol higher in energy than the lowest energy 1,9-isomer, [2+4] cycloadditions to C70 were proposed as the most direct route to functionalization of the C70 equatorial region. There are many examples of fullerenes reacting as the 2-atom reagent in cycloadditions; this would be the first example of a fullerene reacting as the 4-atom component.
SEMIEMPIRICAL CALCULATIONS
A series of semiempirical calculations were undertaken in order to focus the experimental program. The MNDO/PM33 heats of reaction of C70 with common dienophiles to yield 21,42- addended C70 [2+4] cycloaddition products are presented in Table 1. With the exception of benzyne, none of the products containing only first row atoms was significantly thermodynamically stable with respect to cycloreversion. The final geometries clearly show high
Table 1. Results of semiempirical calculations on [2+4] cycloadditions to C7o's 21,42 carbons
Ene Component AHf(C70) AHf(Ene) Sum Sum AAHf kcal/mol kcal/mol (Reagents) (Product) kcal/mol
Ethylene 884.17 16.61 900.78 908.67 7.90 Acetylene 884.17 50.69 934.86 950.67 15.82 2-Butyne 884.17 29.77 913.94 930.42 16.48 Maleic anhydride 884.17 -90.08 794.09 806.55 12.46 DMAI> 884.17 -107.87 776.30 794.48 18.19 DEADb 884.17 -128.36 755.81 794.41 38.60 HF2BC 884.17 -253.66 630.51 643.67 13.16 Benzyne 884.17 129.89 1014.1 954.32 -59.74 Fumaronitrile 884.17 85.99 970.16 990.69 20.53 Cyclobutene 884.17 37.67 921.84 922.41 0.57
Corrected GiH6d 933.03 12.19 Dicyanoacetylene 884.17 127.99 1012.20 1026.8 14.69 trans-1,2-C2H2F2 884.17 -71.52 812.65 825.98 13.33 S-acetaldehyde 884.17 29.17 913.34 908.15 -5.19 cyclo-C3F4 884.17 -102.48 781.69 779.04 -2.65 MeOOCOMe 884.17 -9.66 874.51 877.32 2.81 Cyclopropene 884.17 68.17 952.34 949.04 -3.30 H2Si=SiH2
e 884.17 56.81 940.98 865.36 -75.62
aDimethylacetylene dicarboxylate bDiethylazo dicarboxylate cHexafluoro-2-butyne dHand corrected for relatively poor calculated value of cyclobutene vs. cyclobutane eAccuracy of disilene heat of formation is not known
364

bond strain in the products which can be attributed to C7o's rigid framework which does not accommodate the short bonds that result from the cycloaddition of dienophiles with first row elements. , „ . j , , . ,,
In contrast, the cycloaddition of disilenes, R2Si=SiR2, with C70 is predicted to be highly exothermic. Although the exact heat of formation of the disilene may be poorly estimated by semiempirical calculations, the exothermicity of the reaction is assured. The thermodynamic stability of the product can be ascribed to two factors: the relatively high energy of the disilene dienophile and the long Si-Si bond in the final product that does not require significant conformational changes in the C70 framework upon cycloaddition.
A more complete analysis of cycloadditions of disilene, H2Si=SiH2, to C70 is presented in Table 2. The product of [2+2] cycloaddition of disilene to the 7,8 carbons of C70 is the lowest energy isomer at a semiempirical level; however, other products of [2+2] and [2+4] addition are only slightly higher in energy.
Table 2. Heats of reaction (MNDO/PM3) and relative energies of isomers (HF/3-21G*) of S12H4 with C70. All geometries fully optimized, energies in kcal/mol.
Addended Cycloaddition AHf(PM3) AAHf Relative AE R(Si-Si) A Carbons kcal/mol kcal/mol3 HF/3-21G* HF/3-21G*
23,40 [2 + 4] 911.75 -29.23 8,23 [2 + 4] 888.19 -52.79 6,9 [2 + 4] 882.13 -58.85 21,40 [2 + 2] 879.99 -60.99 1,7 [2 + 4] 878.14 -62.84 21,22 [2 + 2] 869.28 -71.70 10.6 2.322 21,42 [2 + 4] 865.36 -75.62 0 2.402
1,9 [2 + 2] 863.31 -77.67 3.3 2.322 7,8 [2 + 2] 862.24 -78.74 4.1 2.322
aßased on AHKC70) = 884.17 and AHr(Si2H4) = 56.81 kcal/mol.
AB INITIO-HARTREE FOCK CALCULATIONS
The four lowest energy isomers of C7oSi2H4 were then chosen as candidates for further investigation using ab initio methods with the GAUSSIAN 92 series of programs.5 For computational convenience, the methyl groups (used in the experimental work, see below) were replaced by hydrogens. Complete geometry optimizations were performed at the Hartree-Fock (HF) level using the 3-2 IG* basis set, which contains one set of spherical harmonic d functions on each silicon. A summary of the ab initio results is given in Table 2.
These calculations indicate that the most stable product from cycloaddition of a disilene with C70 is that from [2+4] addition across the C70 equator. Semiempirical and ab initio calculations suggest different energy orderings; however, semiempirical calculations are known to be less reliable in predicting isomer energy orderings in fullerenes.1-4 Therefore, the thermodynamically most stable product from disilene addition is predicted be the 21,42-isomer.
The Si-Si bond lengths in the other three isomers are identical, and somewhat shorter than the HF/3-21G* optimized bond length of 2.352 Ä in eclipsed Si2H6. These isomers probably lie higher in energy due to this close proximity of the silicons, which in turn is due to the rigid nature of the addition. The 21,42 isomer has a favorable Si-Si interaction distance, due to the accommodating nature of this type of addition.
RESULTS AND DISCUSSION
Although a facile route to disilene, Si2H4, is not available, tetramethyldisilene can be generated from thermolysis or photolysis of its biphenyl adduct, 2,3-disila-l-phenyl-2,2,3,3-tetramethyl-
365
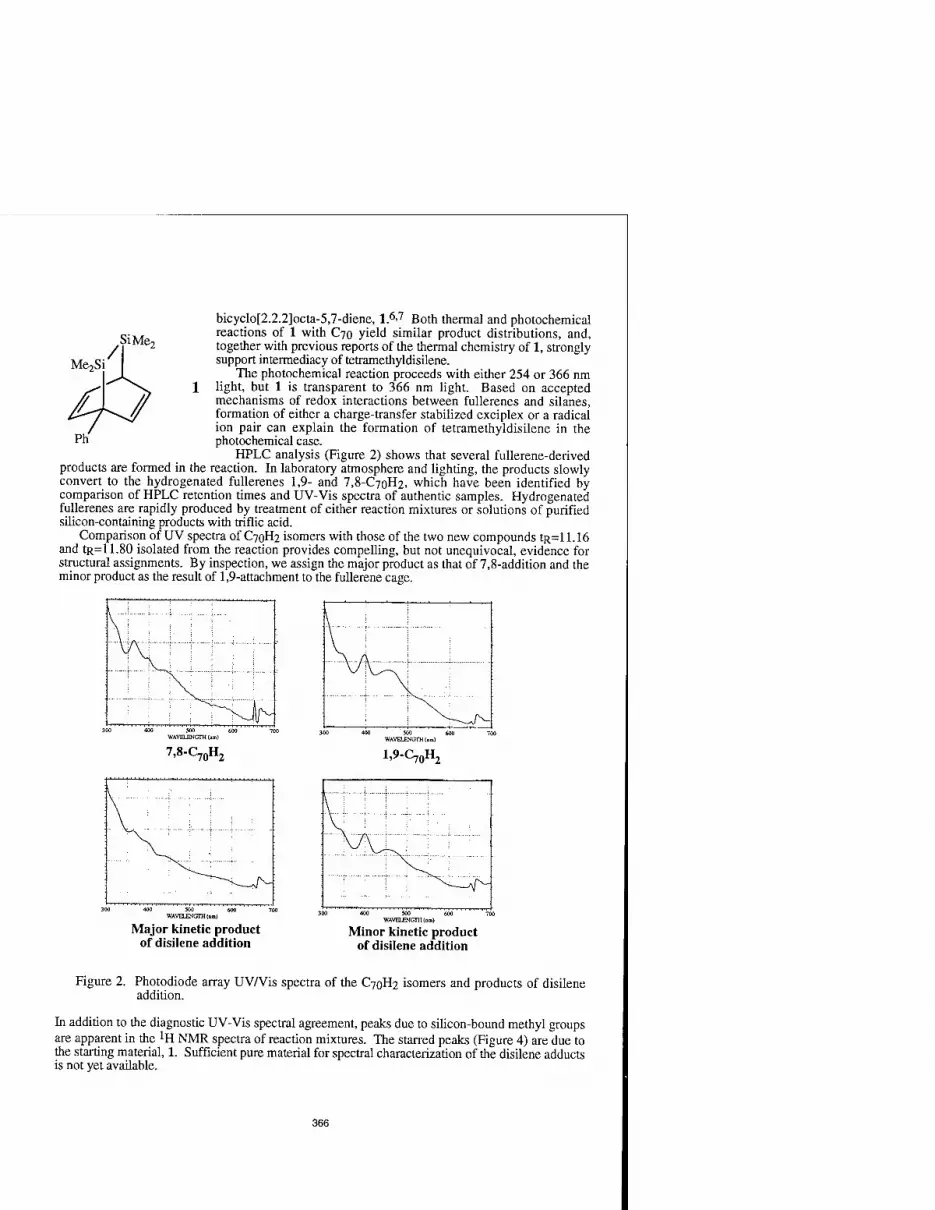
Si Me-,
Me2Si
bicyclo[2.2.2]octa-5,7-diene, 1.6>7 Both thermal and photochemical reactions of 1 with C70 yield similar product distributions, and, together with previous reports of the thermal chemistry of 1, strongly support intermediacy of tetramethyldisilene.
The photochemical reaction proceeds with either 254 or 366 nm 1 light, but 1 is transparent to 366 nm light. Based on accepted
mechanisms of redox interactions between fullerenes and silanes, formation of either a charge-transfer stabilized exciplex or a radical ion pair can explain the formation of tetramethyldisilene in the photochemical case.
HPLC analysis (Figure 2) shows that several fullerene-derived products are formed in the reaction. In laboratory atmosphere and lighting, the products slowly convert to the hydrogenated fullerenes 1,9- and 7,8-C7oH2, which have been identified by comparison of HPLC retention times and UV-Vis spectra of authentic samples. Hydrogenated fullerenes are rapidly produced by treatment of either reaction mixtures or solutions of purified silicon-containing products with triflic acid.
Comparison of UV spectra of C70H2 isomers with those of the two new compounds tR=l 1.16 and tR= 11.80 isolated from the reaction provides compelling, but not unequivocal, evidence for structural assignments. By inspection, we assign the major product as that of 7,8-addition and the minor product as the result of 1,9-attachment to the fullerene cage.
WAVELENGTH (am)
7,8-C7flH2
WAVELENGTH (nm)
1,9-0^2
WAVELENGTH (nm)
Major kinetic product of disilene addition
WAVELENGTH (nm)
Minor kinetic product of disilene addition
Figure 2. Photodiode array UV/Vis spectra of the C70H2 isomers and products of disilene addition.
In addition to the diagnostic UV-Vis spectral agreement, peaks due to silicon-bound methyl groups are apparent in the *H NMR spectra of reaction mixtures. The starred peaks (Figure 4) are due to the starting material, 1. Sufficient pure material for spectral characterization of the disilene adducts is not yet available.
366

EXPERIMENTAL
Thermal reaction. A solution of 2,3-disila-l-phenyl-2,2,3,3-tetramethylbicyclo[2.2.2]octa-5,7- diene (10 mg) and C70 (4 mg) in toluene (6 ml) was placed in a Teflon-valve-sealed glass reaction tube (KONTES 218710-0050) and subjected to three freeze-pump-thaw degassing cycles. The mixture was heated in a 265 °C sand bath for 9 hours. HPLC analysis of the reaction mixture (Figure 3(a); 4.6 x 250 mm Buckyclutcher I column, 3:2 toluene:hexane mobile phase, 2.25 ml/min flow rate) revealed 30% consumption of C70 and a product distribution similar to that obtained by photolysis. A precipitate was not obtained. Photochemical reaction. A solution of 2,3-disila-l-phenyl-2,2,3,3-tetramethylbicyclo[2.2.2]octa- 5,7-diene, 1, (26 mg) and C70 (9 mg) in toluene (10 ml) was placed in a Teflon-valve-sealed glass reaction tube (KONTES 218710-0050) and subjected to three freeze-pump-thaw degassing cycles. The mixture was irradiated in a Rayonet photochemical reactor (254 nm) for 2.5 hours. HPLC analysis of the reaction mixture (Figure 3(b); 4.6 x 250 mm Buckyclutcher I column, 3:2 toluene:hexane mobile phase, 2.25 ml/min flow rate) revealed 90% consumption of C70 and formation of several products. Products were isolated by preparative HPLC (10 mm x 250 mm Buckyclutcher I column, 3:2 toluene:hexane mobile phase, 4.5 ml/min flow rate). With 366 nm radiation, the reaction proceeds at a lower rate, but gives a similar product distribution. Reaction product aping. After one week with normal exposure to room light and laboratory atmosphere, HPLC analysis (Figure 3(c); 4.6 x 250 mm Buckyclutcher I column, 3:2 toluene:hexane mobile phase, 2.25 ml/min flow rate) showed the product mixtures had changed significantly . By comparison with authentic samples (retention time and UV-Vis spectra), the compounds present were identified as C70, L9-C70H2, and 7,8-C7oH.2.
(a)
(c)
UM VH
Reaction of maior product with triflic acid. The major product of disilene addition (tR 11.16 min) was separated by HPLC and 2 ml
of this HPLC fraction was treated with two drops of triflic acid. After two minutes, the mixture was quenched with aqueous NaOAc.
Fi p„rP 3 HPT C analvses HPLC ^^sis of this samPle (Figure 3(d\™ Figure 3. HPLC analyses. mm x 25Q mm Buckyclutcher j colUmn, 3:2
toluene:hexane mobile phase, 4.5 ml/min flow rate) showed complete disappearance of the disilene adduct. Three of the four products of reaction with triflic acid were identified as C70, 1,9- and 7,8-C7nH2. A new compound (tg=12.67 min, cf. Figure 3(c)) is also present, but disappears upon standing.
367

Figure 4. lH NMR spectrum of photochemical reaction products.
I ~*»md u Jj LA
CONCLUSIONS
Ab initio Hartree-Fock calculations suggest that the lowest energy product of a disilene with C70 is that resulting from [2+4] cycloaddition to yield a 21,42- addended product. The major product resulting from either photochemical or thermal decomposition of 1 in the presence of C70 is best interpreted as that from reaction at the 7,8 carbons, though reaction at the 21,42 carbons cannot be ruled out. This result is consistent with the high reactivity and high electron density of the 7,8 bond. Evidence for additions to or across the equator of C70 is not yet unequivocal.8 The present results highlight the importance of kinetic considerations in f unctionalizations of the equator ofC7o.
ACKNOWLEDGMENTS
This work was supported by the U.S. Department of Energy through the Laboratory Directed Research and Development program under contract number DE-AC04-94AL85000. Technical discussions with C. C. Henderson and D. R. Wheeler have been greatly appreciated.
REFERENCES
1. C. C. Henderson, C. M. Rohlfing, K. T. Gillen and P. A. Cahill, Science 264, 397 (1994). 2. C. C. Henderson, C. M. Rohlfing and P. A. Cahill, Chem. Phys. Lett. 213, 383 (1993). 3. J. J. P. Stewart, J. Comput. Chem. 10, 209 (1989); 10, 221 (1989). 4. C. C. Henderson, C. M. Rohlfing, R. A. Assink and P. A. Cahill, Angew. Chem. Int. Ed.
Engl., 33, 786 (1994). 5. GAUSSIAN 92, M. J. Frisch, G. W. Trucks, M. Head-Gordon, P. M. W. Gill, M. W.
Wong, J. B. Foresman, B. G. Johnson, H. B. Schlegel, M. A. Robb, E. S. Repogle, R. Gomberts, J. L. Andres, K. Raghavachari, J. S. Binkley, C. Gonzales, R. L. Martin, D. J. Fox, D. j. DeFrees, J. Baker, J. J. P. Stewart, and J. A. Pople, Gaussian, Inc., Pittsburgh, PA, 1992.
6. D. N. Roark and G. J. D. Peddle, J. Am. Chem. Soc. 94, 5837 (1972). 7. D. N. Roark, PhD thesis, University of Alberta, 1970. 8. Ando et al. suggest that the photochemical addition of a cyclotrisilane with C70 yields a product
from reaction at the equatorial or "e" layer of C70. [T. Akasaka, E. Mitsushida, W. Ando, K. Kobayashi, and S. Nagase, J. Am. Chem. Soc. 116, 2627 (1994)] Our analysis of the published data suggests that their product is more likely that of addition to the 7,8 carbons, or possibly to the 21,42 carbons. The NMR evidence is not conclusive and the UV-Vis spectra of their product is essentially identical to that of 7,8-C7oH2.
368

FULLERENES AS NANOSCALE"CONNECTORS"
Mark S. Meier,* Douglas J. Rice, Craig Thomas, Vahid Majidi, and Robert Pogue, Department of Chemistry, University of Kentucky, Lexington, KY 40506-0055
Magdalena Poplawska, Faculty of Chemistry, Warsaw Technical University (Politechnika), 00- 664 Warszawa, Noakowskiego 3, Poland
ABSTRACT
The construction of nanoscale devices is a potentially important area of technology. Efforts in this area of chemistry have largely concentrated on the preparation of rigid organic molecules for use as spacers.1 These compounds are used to separate electronically active units, usually metal complexes, by defined distances.
We have been investigating the use of fullerenes as connectors in the construction of these extended assemblies. In this paper we will present our results on the preparation of these compounds, including discussions of the regiochemistry of the second addition of a nitrile oxide to a fullerene isoxazoline.
INTRODUCTION
Molecular electronic devices are usually envisioned as 3-dimensional assemblies of electroactive units separated by a well-defined length by some rigid structure that can function as a "wire," as shown in Figure 1.
Figure 1. An assembly of "connectors" and rigid "spacers."
Efforts in this area of chemistry have largely concentrated on the preparation of rigid organic molecules for use as spacers. These compounds are used to separate electronically active units by defined distances. This has presented a special challenge to organic chemists, as the majority of organic molecules are conformationally mobile. A variety of rigid organic molecules have been developed for these purposes, including "ladderanes"2 and "propellanes."1
Relatively little interest has been placed in organic structures that can function as the "connector" unit in a nanoscale device. The essential characteristics required for these units are that they be electroactive and that they allow for the attachment of a number of spacer units. For a well-defined structure to be constructed, attachment of spacer units in a linear arrangement and at a specific angle (presumably 90°) is required.
369
Mat. Res. Soc. Symp. Proc. Vol. 359 ° 1995 Materials Research Society

Octahedral metal complexes are most often the species seen as potentially filling the role of a "connector." Many of these species are electroactive, and linear and right-angle bend attachments are conceivable. There are few organic species other than fullerenes that can meet these requirements. Fullerenes have a number of redox states that are accessible in a reasonable potential window, and with 30 double bonds available for attachment of spacers, a number of different angles of attachment are possible.
RESULTS
We have investigated methods for controlling the regiochemistry of addition of a second equivalent of nitrile oxide to a fullerene isoxazoline. These fullerene derivatives, such as 1 are readily prepared and isolated.3,4i 5 Diadducts 2 could in principle be formed in a 180 ° or 90° fashion (below). The heterocycle is unsymmetrical, which imposes questions not only of regiochemistry (which bond is attacked in the second addition) by also the orientation of the new heterocycle.
N-o
2 (linear connection) 2 (right angle connection)
Diadducts 2 are produced in the course of the addition of benzonitrile oxide to C(,Q. A typical reaction produces similar amounts of 2 as the monoadduct 1. The diadduct band appears as a single, nearly Gaussian-shaped band upon chromatography by GPC in toluene, but is a mixture of isomers. This is clearly shown in Figure 2, a Cis-reversed phase chromatogram in 40% CH2Cl2/60% CH3CN. Photodiode array detection clearly shows approximately 8 different isomeric species.
Figure 2. Isomer Distribution of Q50 - PhCNO Diadducts (2). Conditions: 60% CH3CN 40% CH2CI2 mobile phase (1 mL/min), 10 cm Waters Nova-pak Cis reversed phase HPLC cartridge, photodiode array detection.
370

This experiment revealed that there appears to be one predominate isomer within the limits of Ci8 HPLC resolution. We elected to attempt thermal equilibration of the mixture in the hopes that one isomer would be thermodynamically preferred over the others. For this experiment to be successful, it is necessary for the addition of the nitrile oxide to COO to be reversible. We have two pieces of data that suggest that this is the case. First, TGA analysis of 1 shows a loss of 13% of the mass of the sample between ca. 280 °C and 400 °C. This mass loss corresponds well to the loss of the nitrile oxide moiety from 1. Second, laser-desorption time-of-flight mass spectrometry (LD-TOF) of 1 in the presence of excess COO and C70 (added as calibration standards) showed ions that corresponded to C7o(PhCNO). We have interpreted this result as suggesting that at high temperatures a 1,3-dipolar cycloreversion occurs, regenerating the nitrile oxide. The nitrile oxide then undergoes addition to either COO in the sample (regenerating starting material) or to C70, producing the new species that is detected.
Thermal equilibration of the mixture of diadducts at 280 °C in a sealed tube under vacuum resulted in the production of a mixture of unidentified compounds, some insoluble carbon char, and a good deal of COO- Under appropriate conditions, using stilbene as both a solvent and a trap for the nitrile oxide, we were able to capture the nitrile oxide moiety in 50% yield. This indicates that thermal decomposition of 1 and 2 proceeds by cycloreversion, but that recapture of the nitrile oxide is not efficient.
The question of a thermodynamic and a kinetic isomer can also be addressed by carrying out the addition of the nitrile oxide to COO under low temperature and under high temperature conditions. We have carried out the addition of benzonitrile oxide to COO at -78 °C and at 110 °C in toluene solution. In the low temperature case, the reaction mixture was treated with stilbene in order to remove any unreacted nitrile oxide before the mixture was allowed to warm to room temperature. This ensures that the isomeric mixture reflected the mixture formed at low temperature.
a)
10.00 11.00 12.00 13.00 14.00 15.00 16.00 17.00 18 10.00 11.00 12.00 13.00 H.O
Figure 3. a) Low temperature and b) high temperature addition of PhCNO to COO in toluene. Chromatographie conditions are given in the caption for Figure 2.
CONCLUSIONS
The chromatograms shown in Figure 3 show that there is clearly a difference in the mixture of isomers formed at low temperature and the mixture formed at high temperatures. While we can not demonstrate that the major bands are composed of single isomers at this time, it is clear that there is a dramatic simplification of the isomeric mixture at high temperatures. It is also
371

clear from examination of the low temperature mixture and the room temperature mixture that addition of nitrile oxides to C6o at room temperature is under kinetic control. We are pushing this reaction to higher temperatures by using higher-boiling solvents, and we believe that a relatively simple isomeric mixture can be produced.
Acknowledgments
The authors wish to thank the University of Kentucky, the National Science Foundation (Grants CHE 9404704, EHR-91-08764 and DE-FG02-91ER75657), and NSF REU Program (Grant CHE-9000653) for support of this research.
References
1. P. Kaszynski, A. C. Friedli, J. Michl, J. Am. Chem. Soc. 114, 601 (1992).
2. R. N. Warrener, G. Abbenante, C. H. L. Kennard, J. Am. Chem. Soc. 116, 3645 (1994).
3. M. S. Meier, M. Poplawska, J. Org. Chem. 58, 4524 (1993).
4 MS Meier, M. Poplawska, A. L. Compton, J. Shaw, J. P. Selegue, T. F. Guarr, J. Am. Chem. Soc. 116, 7044 (1994).
5 H. Irngartinger, C.-M. Köhler, U. Huber-Patz, W. Krätschmer, Chem. Ber. 127, 581 (1994).
372

PART VII
Thin Films and Deposition

GEOMETRIC AND ELECTRONIC STRUCTURE OF FULLERENE FILM GROWTH AS A FUNCTION OF COVERAGE
B. REIHL IBM Research Division, Zurich Research Laboratory, 8803 Riischlikon, Switzerland
ABSTRACT
We have employed scanning tunneling microscopy at room and low temperature, i.e. 300, 50, and 5 K, to study the epitaxy and growth of fullerene films on the noble-metal surfaces Ag(110) and Au(110). Initial island growth occurs on terrace sites away from substrate step edges. Particularly at low temperatures where the rotational and vibrational movements of the fullerene molecules are frozen in, different intra-molecular topographic patterns become visible in ordered films, which are characteristic of particular adsorption sites. Complementary tunneling spectroscopy and direct and inverse photoemission measurements reveal distinct differences between the first adsorbed monolayer and additional fullerene layers indicating differences in bonding and charge transfer. Our results are compared to theoretical calculations.
INTRODUCTION
The development of a new and inexpensive technique [1] for the mass production of COO
molecules has prompted an intense research activity to explore the novel properties of this new form of solid carbon. The cage-like arrangement of 60 carbon atoms on equivalent sites to form a soccer-ball (named fullerene), which again condenses on fee lattices site to build up a solid called fullerite, is established by now [2]. An extra impetus came from the discovery of a new kind of high-Tc superconductivity in alkali-doped fullerite [3]. Its understanding requires a detailed knowledge of the electronic structure and correlation effects involved. Consequently there exists a great body of experimental and theoretical papers [4-18] dealing with the energy positions of the highest-occupied and lowest-unoccupied molecular orbitals, the resulting HOMO-LUMO gap, and the changes induced by alkali-metal doping. We mention in particular that the electronic properties of KxC6o can be varied from semiconducting (x = 0), to metallic/superconducting (x = 3), to insulating (x = 6) by controlling the doping level of the alkali metal [4,5].
Although it seems to be obvious, there exist few detailed investigations on the interplay of the geometric and electronic properties of fullerite formation. In many cases fullerite is formed by growing films of COO on metal or semiconductor substrate surfaces. Hence, interfacial epitaxy, possible charge transfer, and different adsorption phases play a crucial role and determine the electronic and geometric properties of the first layers of the fullerene film. Here I summarize our findings of C6o adsorption on the clean Ag(110), Au(l 10)1x2, and Si(100)2xl surfaces employing the techniques of scanning tunneling microscopy (STM), tunneling spectroscopy, photon-emission with the STM, and direct and inverse photoemission. For more details I refer the interested reader to our original publications [19-26]. There are many articles and books which describe the various techniques used by us in general terms. Their references may also be found in the original papers [19-26].
375
Mat. Res. Soc. Symp. Proc. Vol. 359 • 1995 Materials Research Society

FULLERENE FILM GROWTH ON Ag(llO)
Geometric Properties
We have used an STM, originally developed [27] for low-temperature work, to investigate the adsorption of Cm on the clean Ag(llO) surface at room temperature. Details of the experimental set-up and the preparation of the clean and fullerene-covered silver surface are described in ref. [26]. In short, Cm was deposited onto the Ag(llO) surface by in vacuo sublimation onto a room-temperature substrate. A quartz crystal oscillator was used to control the sublimation rate at ~ 0.1 Ä s"'. Annealing at 650 K for 5-10 minutes produced an ordered COO overlayer as observed by STM and/or low-energy electron diffraction (LEED).
Figure 1(a) shows an STM topograph for about 0.6 monolayers (ML) Cm on Ag(110). In contrast to the behavior of Cm on Cu(l 11) [28] and Ag(lll) [29], the fullerene molecules nucleate in two-dimensional (2D) islands on the terraces and not on the step edges. The STM topograph of a coverage of 0.9 ML is presented in Fig. 1(b), in which large platelets of ordered C6o are observed. In the regions of the bare substrate a high density of Ag steps appears, indicating the retreat of substrate steps under the influence of the advancing edge of a growing fullerene island. This step bunching along with the Ag material transport involved already provides evidence for the strong interaction of Cm with the apparently open-structured noble-metal (110) surface at monolayer coverage.
Fig. 1: (a) STM topograph (~ 4000 x 4000 A2) of about 0.6 ML C» on Ag(l 10) showing 2D island formation on terrace sites away from the step edges of the sub- strate; (b) STM topograph (~ 2000 x 2000 Ä2) of a coverage of about 0.9 ML Cw with well-ordered platelets of C«> and a high-density of substrate steps in- between. From ref. [26].
Zooming into one Cm island seems to re- veal an fcc(lll) structure, as expected from fullerene adsorption on noble-metal (111) sur- faces, cf. Fig. 2. However, closer examination shows a significant distortion from a (111) packing arrangement. This becomes most evident in the power spectrum, i.e. the square of the Fourier transform of the surface, shown in the inset of Fig. 2. It corresponds to a LEED pattern which reveals the same findings (not shown): The aspect ratio of the centered rectangle in the inset is V2 as expected for a fcc(HO) surface atom arrangement. In other words the substrate structure changes the fullerene monolayer structure from normally (111) to (110). Additional coverage of Cm keeps the rectangular shape of the island growth with no signs of a return to a
376

close-packed growth mode, as could be expected and be proven by the observation of triangular or hexagonal fullerene islands. On the contrary, the twofold rotational symmetry imposed by the substrate onto the first C6o layer is maintained in the subsequent layers, thus the fullerene crystal grows epitaxially on Ag(l 10).
To derive the arrangement of the COO
molecules with respect to the silver substrate, several parameters and constraints have to be
Fig. 2: STM topograph (~ 200 x 200 Ä2) of a region at monolayer Ceo coverage. The crystallographic direc- tions of the substrate are shown. The inset represents the power spectrum with the clear distortion from hexagonal symmetry towards fcc(l 10). From ref. [26].
taken in account. The lattice matching of C6o is strongly determined by the intermolecular spacing and symmetry it is adopting in the bulk [10,25,28,29]. From total-energy calculations it is also known that the number of inequivalent adsorption sites of the substrate should be minimized. From the four possible (110) arrangements of C60 on Ag(110) shown in Fig. 3, (a) and (b) provide different adsorption sites, (c) compresses the nearest-neighbor C6o distance S™ by 20% as compared to the fullerite value of 10.04 Ä, only (d) has the correct azimuthal orien- tation (cf. Fig. 2), the proper nearest-neighbor C6o distance of the bulk value (within 0.2%), and equivalent adsorption sites. Fig. 3(d) repre- sents a Ag(l 10)c(4x4)C6o surface structure.
Fig. 3: Schematic diagram showing four different possible packing arrangements of C» on Ag(110) as suggested by a perfect lattice matching between the Ag(110) surface and fullerite along the [001] direction. The small circles represent Ag atoms and the large circles C«, molecules. S„„ is the nearest-neighbor distance. The direction vectors refer to the substrate.
Electronic Properties
o o o o
C60-Ag (110)
-» -oi-o-' o Jo
° ° 14 mi
o\oTo/o/ir~3\o\bi6/o
«go'"coo
g/o o/ojoV
(<=) (d)
[110] Evidently, there is a strong interaction of
the Ceo monolayer with the Ag(l 10) surface, as manifested in the silver step bundling with increasing C6o island growth, and vice versa by the substrate-induced (110) growth mode, which is different from the normal (111) growth mode. Such a strong interaction is expected to show up also in the electronic structure of the CM film One way to look at the electronic structure is by means of the STM performing tunneling spectroscopy, i.e. measuring the normalized conductance (dIldV)/(I/V) as a function of tip- sample voltage V. This provides a local view of the electronic structure and works in particular well, when s,p electrons play a major role, as they are the ones contributing to the tunneling current. The established methods for electronic-structure investigations are direct- and inverse-
377

photoemission spectroscopy, which can sample s, p, d, and f electrons plus change the probing depth by tuning the photon energy, but which are spatially averaging. In the following I present our results for Ag(l 10)c(4x4)C60 as obtained by both techniques.
Tunneling spectroscopy performed on C6o monolayer and multilayer covered Ag(llO) surfaces are shown in Fig. 4. The clean Ag(llO) curve (a) exhibits metallic behavior as expected. The 1-ML curve (b) exhibits features A' and B' in the unoccupied electronic regime and C in the occupied regime, which > apparendy shift away from zero energy for the § multilayer curve (c). Measurements for multi- | layer coverages are subject to instabilities, but the shifts observed are consistent with our observations in photoemission (see below).
Fig. 4: Tunneling spectroscopy curves from (a) clean Ag(llO), (b) Ag(110)c(4x4)C6o , and (c) multilayer C«, onAg(110).Fromref. [26].
-2-10 1 2
Energy (eV)
The electronic structure of fullerene films has been studied by direct (ultraviolet) and inverse photoemission spectroscopy [4,5,8,13], UPS and IPS, respectively, but other techniques have also been applied to measure the energy position of the HOMO and/or determine the gap of solid C6o, e.g., C Is core-hole excitation [6-8], electron energy loss spectroscopy (EELS) [9], scanning tunneling spectroscopy [10,11], and microwave conductivity [12]. In all cases solid C6o was prepared by sublimation on polycrystalline metal films [4,5,8], on Si(100) wafers [9,13], or cleaved GaAs(l 10) [5,6,8] without much further characterization except for the thickness of the COO adsorbate layer. As a consequence the experimentally obtained values for the energy positions of the HOMO- and LUMO-derived bands and the corresponding band gap Eg differ substantially, see Table I for an illustrative summary.
The symmetry characters of the HOMO (hu) and LUMO (tu) do not allow direct optical transitions [16]. Hence, the origin of the loss features in EELS [9] and C Is core excitation [6-8] and their relation to the band gap is subject of interpretations and calculations. We have now prepared G» films on Ag(l 10) in the same manner as described above, and performed UPS and IPS measurements at
Fig. 5: Direct and inverse photoemission spectra Cm on Ag(110) as a function of monolayer coverage. Also given are the workfunction changes A<& with respect to the clean surface.
-4 -2 E,, EF 2 4
ENERGY (eV)
hi) = 21.2 eV and 9.5 eV, respectively, as a function of C6o monolayer coverage at room tem- perature [30]. Fig. 5 shows the clean-silver spectra at the bottom, which are dominated by the occupied silver 3d bands between -4 and -8 eV. The 1-ML spectra reveal the characteris- tic[4,5,8,13] five-peak structure of the occupied regime and the four unoccupied spectral peaks
378

Table I.
Method E8
(eV)
hu-tu
(eV)
Specimen Ref.
UPS/IPS 2.5 3.5 100 Ä film on poly Au 4
UPS/IPS 2.6 3.7 30 Ä films on GaAs(l 10) and poly Ti 5
UPS/IPS 2.3 3.5 3-6 ML on Si( 100) 13
UPS/IPS C Is core
2.2 3.7 2-6 ML on poly Bi, Mg, Cr, Au andGaAs(llO)
8
UPS/IPS 1.7 3.2 1 ML on poly Au 8
C 1s core — 1.9 thick films on GaAs and InP(l 10) 6
EELS — 1.5 60ÄfilmonSi(100) 9
STS/UPS 2.3 3.8 >lMLonAu(100) 10
STS ... 0.9 lMLonSi(100)2xl 11
Microwave 1.9 powder 12
UPS/IPS 2.2 1.1
3.1 2.0
>2MLonAg(110) lMLonAg(HO)
this work
UPS/IPS 2.0±0.2 3.810.2 >2MLonSi(100)2xl this
work
with the HOMO and LUMO peaks, respectively, closest to the silver Fermi level, EF. However, in contrast to the literature the LUMO spectral feature crosses EF rendering the ordered 1-ML C6o metallic. With the deposition of the 2nd monolayer additional features occur in the spectra (cf. Fig. 5). With the help of the multilayer spectra (top curves) the 2-ML spectra can be interpreted as superposition of a 1-ML spectrum and a 2nd-layer spectrum shifted by - 0.9 eV for the unoccupied states and - 0.2 eV for the occupied states away from the Fermi level, respectively. The multilayer spectra are then dominated by these shifted peaks with a clear semiconducting signature, as they are known in the literature. Also shown in Fig. 5 are the
379

workfunction changes with respect to the clean surface: after an initial increase of 0.40 eV, the workfunction practically stays constant within ±0.05 eV.
The opposite energetic shifts of the occupied and unoccupied molecular levels reveal the me- tallic image-charge screening in the photoemission final states [31]. In an initial-state picture the energy position of the adsorbed molecule is pinned to the vacuum level, hence as a function of coverage it changes simultaneously for, e.g., the HOMO and LUMO as: E2„d ML = E,a ML + A* in contrast to our observation in Fig. 5 with no further workfunction changes after the lst-ML deposition. On the other hand, the final-state picture yields E^red = Eiailiai + Ere,ax , where Ereiax = Eii,ttaiScrK0 + 'Emw,xr<xn + (-e /4z) takes into account the intra- and intermolecular screening energies and the image-charge screening term. The image charge is induced in the silver surface by the positive (negative) C60 ion, with the screening energy depending on the average distance z of the photo-ionized (electron-added in case of IPS) molecule to the image plane of the surface. This naturally explains the coverage dependence and the opposite shifts observed for the UPS and IPS features in Fig. 5. Our findings are in agreement with valence-band photoemission and C Is core-hole absorption of C60 on Au(l 10) and their interpretation [32].
As a test we have also deposited C60 on Si(100) wafers and measured the analogous UPS and IPS curves as a function of coverage (not shown here; see Table I). In accordance with our interpretation above we do not observe any shifts of the HOMO and LUMO, as we do not expect any metallic image-charge screening for the Si(100) surface. Now it is evident why the literature values of the energy positions of the C60 HOMO and LUMO and the corresponding gaps differ so much: there is a coverage dependence, a substrate dependence (metallic or semiconducting), and a dependence on the experimental technique applied, as each technique implies a different relaxation energy. The last two rows of Table I summarizes our values for the CM monolayer and multilayer on Ag(l 10) and Si(100).
Band-Structure Aspects
It has become clear from the STM results and the photoemission measurements that the tX first monolayer of Cso interacts strongly with § the Ag(110) surface, while the bonding of si additional C6o layers is much weaker. This 2. suggests that the rotational movement of the £: single CM molecules present in fullerite at room jg temperature [2] is "frozen in" for the 1st £ monolayer owing to its strong interaction with « Ag(110). Hence energy-band formation becomes feasible, as it has been observed [33] for 1 ML of COO on GeS(OOl) by angle- resolved IPS. We have performed both angle- resolved UPS (not shown here) and inverse photoemission along the [001] (see Fig. 6) and [110] azimuths. In neither case do we discern
C60/Ag(iio)
■ 9=30°
25°
20°
15°
10°
5°
0°
hu = 9.5 eV
Ep=0 1 2 3 4 5 6 7
ENERGY (eV)
8 9
Fig. 6: Angle-resolved inverse photoemission spectroscopy of Ag(l 10)c(4x4)C6o at hv = 9.5 eV as a function of polar angle 9 along the substrate [001] direction at room temperature. There is no energy dispersion.
380

any energy dispersion, i.e. a shift of a spectral feature with polar angle. This may mean that the rotational and/or vibrational movements of the C6o molecules on the Ag(llO) are still present in contrast to the C60 / GeS(OOl) case [33]. A different interpretation bears on the recent calculation [34] of the electronic structure of fee Cm with different molecular orientations, which shows a strongly changing band structure when the molecules are tilted. For the angle-resolved photoemission experiments this suggests an averaging over several molecular orientations, hence masking any band dispersion effects. These findings go along with normal-incidence IPS measurements [35] which did not reveal any dispersion effects along the [111] direction either.
LOW-TEMPERATURE STM AND FULLERENE FILM GROWTH ON Au(llO)
Internal Structure of Cm Molecules
As I have discussed, the rotational movement of the CM molecules at room temperature prevents the study of the energy bands of fullerite. Besides the possibility to "fix" the molecules by chemical bonding, there is the alternative to freeze the rotation by cooling below 90 K [2]. In particular, when any internal structure of the C6o molecules shall be resolved by STM, this is the only way to go, although - as we shall see below - occasionally singular do molecules bonded chemically did indeed reveal internal structure in STM topographs at room temperature. We have designed and built a low-temperature ultrahigh vacuum STM to work at 5 and 50 K, which allows fast in situ sample and tip exchange. Its details are described elsewhere [24,27]. We note in passing that the STM manufacturer OMICRON has obtained a license to build and sell our low-temperature UHV STM.
Since the discovery of C60 there have been several attempts to image them with the STM. With a nominal diameter of the C6o sphere of 7 Ä it is clear that STM should resolve an intramolecular structure of the C60 molecule, and this has been the subject of several publications [29, 36-42]. The images observed fall into two classes: (i) in refs. [29,36,37] ordered layers of C6o were prepared and images of parallel elongated lobes could be resolved in each fullerene molecule; (ii) in refs. [38-42] internal structure could at least partly be resolved.
Generally, for molecular (carbon) species an interpretation of constant-current STM images is difficult: It is known that STM of graphite, another form of solid carbon, produces images with an unexpectedly high corrugation and a symmetry different from the symmetry of the surface layer. This has been attributed to forces arising from the coupling between STM tip and sample, which induce distortions of the graphite image [43]. Theoretical investigations [44] of STM images of benzene rings adsorbed on different substrates demonstrated that the images depend on the details of the substrate-molecule interaction and the tunnel parameters applied. Hence, force and electronic effects in STM may produce modifications of the C6Q image as compared to an "expected" image based on a simplistic ball-stick model. Recently, such effects were included in the calculations [45] of STM topographs from C6o molecules in different orientations on a Au(l 10) surface to explain the results presented below.
Material transfer between tip and sample may lead to topographic artifacts in STM. Thus, a realistic discussion of internal features in STM images of C6o needs to consider possible artifacts caused by a complex tip structure, e.g., a double tip or a tip with Cm molecules attached to it. Images of fullerene molecules with three or four lobes all oriented along the same direction might reflect such examples. On the other hand, we have as in ref. [42] observed lobes and centered hexagons simultaneously in singular molecules of disordered Ceo layers [46], but only
381

(b)
'V t¥^-&^ 1 "**L
^WrfvJ
■■vT
the confirmation of the same topographs in well-ordered do layers gives us confidence in our data.
On ordered, unordered, first and second monolayers of C6o on Au(llO) we repeatedly observed eight major types of internal structure within individual C6o molecular images. The first set of four different molecular images appear within a topograph obtained from an ordered second layer of C6o molecules on the Au(l 10) surface at 50 K. It was frequently also observed for the first layer. We are going to use this topograph to define the surface unit cell and denote the individual internal-structure patterns. For that we show two identical STM topographs in Fig. 7 (a,b) representing an area of 65 Ä x 65 Ä. The left image is displayed as measured and image-processed. We use the identical right topograph to emphasize the higher-lying zigzag chain (solid line) and the lower-lying zigzag chain of fullerene molecules (dashed line). In addition, we have drawn a surface unit cell which for the ordered hexagonal C6o adsorbate layer is diamond- shaped and contains 4 molecules denoted I, II, III, and IV. In the lower left part of Fig. 7 (b) we have marked two cross-sectional profile lines along A-B and C-D across the four different molecular images, which are shown in Fig. 7(c). It becomes evident that molecules I and II of the solid zigzag chain are higher than molecules III and IV from the dashed zigzag chain. This up and down of the molecular 0 10 2o 30 w
POSITION (X)
Fig. 7: 65 A x 65 Ä constant-current (Vtip = -1.1 V, It = 1.6 nA) STM topograph at 50 K of a Au(110) surface covered with an ordered bilayer of Cm . Left (a) and right (b) images are identical. Image (b) contains some guides to the eye (see text). The two cross-sectional profiles A-B and C-D are shown (c) and reveal the apparent height and shape of the four types of patterns. From ref. [19].
zigzag chains and their height difference is more pronounced for the first adsorbed COO layer and reflects the underlying highly corrugated Au(110) surface. Details of this COO induced re- organization of the reconstructed Au(l 10)1x2 surface are presented and discussed in ref. [25].
The solid zigzag chain with molecules I and II reveals internal structure within the images, respectively, while the lower-lying zigzag chain with molecules III and IV appears less crisp. We have selected 6 to 7 individual images of type I to IV from Fig. 7 (b) and obtained averaged images for each type using autocorrelation. The results are displayed in Fig. 8 in the same arrangement as in the surface unit cell of the ordered hexagonal COO layer on Au(110). Fig. 8 confirms our observation made in Fig. 7 (b): the molecular image I contains a hexagonal structure with a bright spot in the center, whereas image II resembles a pentagon with the lower left corner slightly diffuse or tilted down. Both patterns have recently been reported for an unordered C6o layer on Au(l 11) at 4.5 K [42].
A-B 1.0
A A ■ 05 A/ ' \ \ A-
7 E\/ m\ /M / A- 0 ./ V V. ' v. / V
-<
1.0 c D
0.5 j I \ f I \ / E\ / n \"
0 ■l , l" , , ■" , -
382

Fig. 8: Schematic drawing of the unit cell of Fig. 7 with the four C» images after selection, autocorrelation, and summation of several individual structures of Fig. 7(a). The solid lines represent guides to the eyes and suggest hexagonal (I and IV) and pentagonal (II and III) structures. From ref. [19].
After the averaging, images III and IV which belong to the lower-lying zigzag chain of COO
molecules, also seem to reveal some intramolecular structure in Fig. 8. Image III may be associated with the pentagonal structure, while image IV possibly exhibits evidence for another hexagonal structure with an additional spot in its center. If this observation holds true, it implies that along a straight line in Fig. 7 as, e.g., the cross-section A-B, two hexagonal structures are followed by two pentagonal structures and vice versa. Finally we notice in both cross-sections A-B and C-D of Fig. 7 (c) that the additional center spots of the hexagons appear as relatively sharp features in molecule I with the hexagonal corner spots producing weak shoulders. Here again, the observation of two different intramolecular structures in the same topograph indicates that tip artifacts are unlikely.
In Fig. 9(a,b) we present another frequently observed STM topograph of an ordered C6o monolayer on Au(llO). Both images 9(a) and 9(b) originate from identical measurements, their difference being due to an image processing with an enhanced high-pass filtering for Fig. 9(a). As a result of this filtering the additional C<x> molecule present in the lower right corner becomes less visible. In contrast to Fig. 7 the high- and low-lying Cm zigzag chains oriented along the [110] direction of the Au(l 10) surface are very pronounced. The larger difference between the high- and low-lying zigzag chains is also evident in the cross-sectional profile along E-F in Fig. 9(c). It reflects the highly corrugated Au(110) surface underneath and is more pronounced for the first monolayer as in Fig. 9 than for the bilayer in Fig. 7.
Profile E-F also denotes the four different molecules F, IF, III', and IV along with their position in the diamond-shape unit cell of Fig. 7(b). The notation is analogous to Fig. 7(b) except for the prime which takes care of their different shapes. The second profile G-H (Fig. 9c) reveals interesting details. Molecules F (analogous profile not shown) and IF of the high-lying chain have a three-lobe structure as already visible in Figs. 9(a,b), while the low-lying molecules III' and IV appear rather structureless. We have chosen profile G-H to cut through a single additional C6o molecule (denoted ad-C6o in Fig. 9c). Its apparent height difference may be due to a defect underneath.
Images I' and IF consist of three lobes per molecule with a higher central lobe as can be seen from the cross-sectional profile G-H in Fig. 9(c). The distance between two adjacent lobes is
383

SSsSv*
about 3.5 Ä resulting in a total distance between two outer lobes of 7 Ä. Moreover, the profile of Fig. 9(c) (and others not shown) reveal that for molecules F and II' the center lobe is 0.3 Ä higher than the left lobe which is again 0.3 Ä higher than the right one. Close inspection of these lobes reveals two distinct orientations. All type-I' molecules have an oblique lobe orientation, whereas all type-IF molecules exhibit a center lobe with a slightly tilted orientation. At the bottom right corner of Fig. 9(a) the lobe orientation of the molecules around the defect (ad-C6o) is unchanged, therefore tip artifacts can again be considered as unlikely. The internal structure of ad-C6o is again different. Two lobes are on its top, which can also be seen in profile G-H of Fig. 9(c), suggesting a fourfold symmetry.
Hexagons and pentagons are natural structures of the C6o molecule and therefore not unexpected to find in some of our STM images. However, all observed structures have features which cannot be explained by a simple top view of a ball-stick model of a C6o molecule, in which the carbon atoms sit in the corners of (possibly tilted) hexagons or pentagons. While the weaker fifth corner spots of the pentagonal images II and II' may reflect
1.5 E-F
1.0 / I
0.5
~ 0 m * §1.5
/ H / r \
^ E' U I
10 G-H
A /ad-C60\ 0.5
0 / H' V/H'V / I' w
II'V -
20 30
POSITION (Ä)
Fig. 9: 65 A x 65 A constant-current (Vtip = -2.4 V, It = 0.8 nA) STM topograph at 50 K of a Au(l 10) surface covered with an ordered monolayer of C«> showing high- and low-lying Cm zigzag chains. Two cross-sectional profiles E-F and G-H give the apparent heights of the four types of molecules in (c). Profile G-H clearly displays the three-lobe structure of image II' and features a single additional C«) molecule denoted ad-C«). From ref. [22].
the tilting of the whole molecule on the corrugated substrate, the additional bright spot in the centers of the hexagonal structures I and IV can by no means be associated with a carbon atom.
Another observation deals with the size of the individual molecules (Figs. 7c and 9c). Ball- stick-type top hexagons and pentagons have about 1/3 the diameter of the whole C6o molecule, i.e. about 2 Ä [2]. However, the full width at half maximum in the profiles (Figs. 7 and 9) gives about 6.5 Ä. Therefore, the hexagonal and pentagonal images observed in Figs. 7 are too big to be associated with the on-top hexa- and pentagons of a ball-stick model with single carbon atoms sitting in their corners. The above size argument instead suggests to associate the bright spots in Fig. 8 with the hexa- and pentagonal rings themselves.
Spatially Resolved Fluorescence of Cm Molecules
Now we discuss the spatial resolution of photon emission from COO molecules. In hexagonal arrays of C6o we observe strongest fluorescence when the tip of an STM is centered above an individual molecule. Photons (1.5<hv<6eV) were collected with a low /-number lens
384
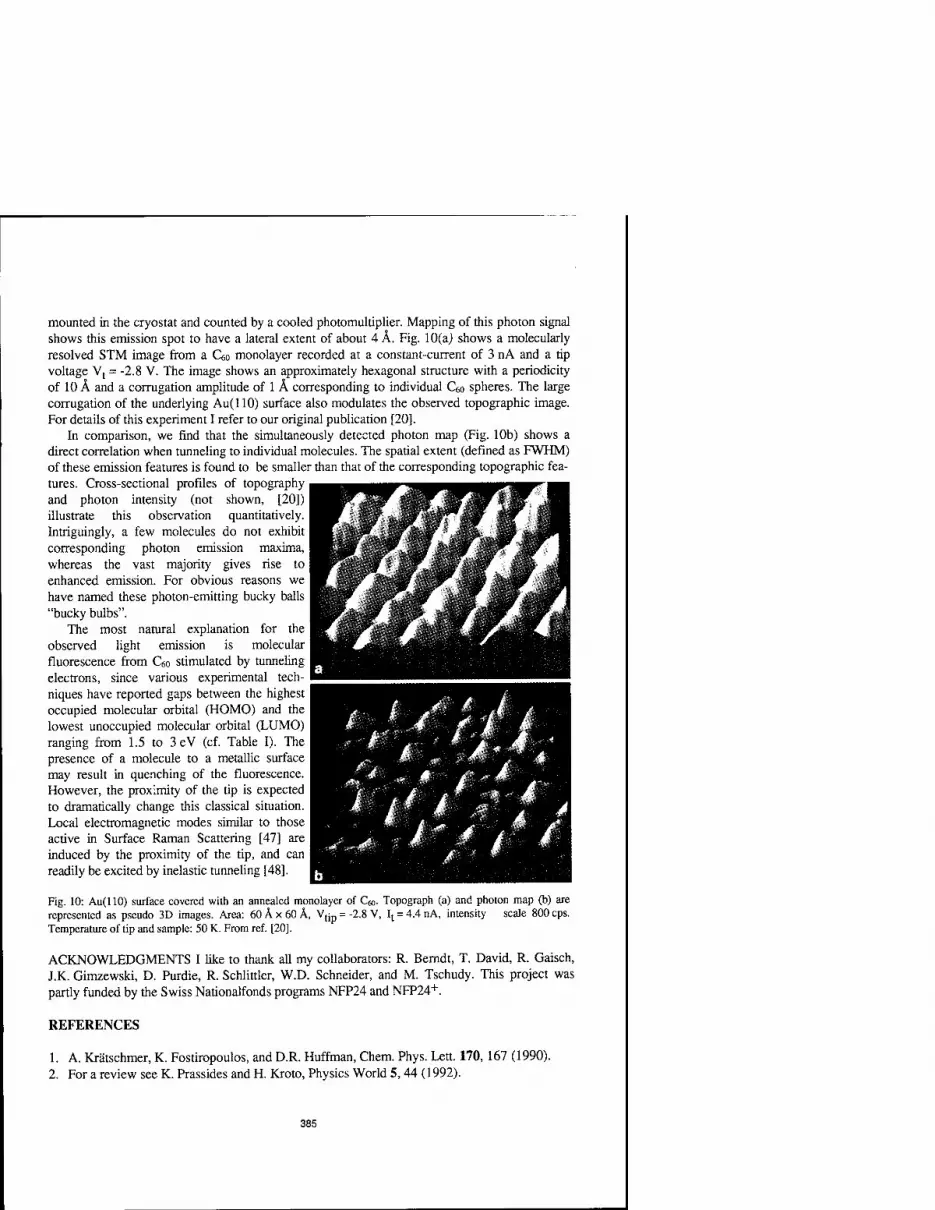
mounted in the cryostat and counted by a cooled photomultiplier. Mapping of this photon signal shows this emission spot to have a lateral extent of about 4 Ä. Fig. 10(a) shows a molecularly resolved STM image from a C6o monolayer recorded at a constant-current of 3 nA and a tip voltage Vt = -2.8 V. The image shows an approximately hexagonal structure with a periodicity of 10 Ä and a corrugation amplitude of 1 Ä corresponding to individual COO spheres. The large corrugation of the underlying Au(110) surface also modulates the observed topographic image. For details of this experiment I refer to our original publication [20].
In comparison, we find that the simultaneously detected photon map (Fig. 10b) shows a direct correlation when tunneling to individual molecules. The spatial extent (defined as FWHM) of these emission features is found to be smaller than that of the corresponding topographic fea- tures. Cross-sectional profiles of topography , and photon intensity (not shown, [20]) | illustrate this observation quantitatively. Intriguingly, a few molecules do not exhibit I corresponding photon emission maxima, whereas the vast majority gives rise to enhanced emission. For obvious reasons we have named these photon-emitting bucky balls "bucky bulbs".
The most natural explanation for the observed light emission is molecular | fluorescence from C6o stimulated by tunneling electrons, since various experimental tech- niques have reported gaps between the highest occupied molecular orbital (HOMO) and the lowest unoccupied molecular orbital (LUMO) ranging from 1.5 to 3 eV (cf. Table I). The presence of a molecule to a metallic surface may result in quenching of the fluorescence. However, the proximity of the tip is expected to dramatically change this classical situation. Local electromagnetic modes similar to those active in Surface Raman Scattering [47] are | induced by the proximity of the tip, and can readily be excited by inelastic tunneling [48].
Fig. 10: Au(110) surface covered with an annealed monolayer of Cm. Topograph (a) and photon map (b) are represented as pseudo 3D images. Area: 60 Ä x 60 Ä, Temperature of tip and sample: 50 K. From ref. [20].
"tip - -2.8 V, I, = 4.4 nA, intensity scale 800 cps.
ACKNOWLEDGMENTS I like to thank all my collaborators: R. Berndt, T. David, R. Gaisch, J.K. Gimzewski, D. Purdie, R. Schüttler, W.D. Schneider, and M. Tschudy. This project was partly funded by the Swiss Nationalfonds programs NFP24 and NFP24+.
REFERENCES
1. A. Krätschmer, K. Fostiropoulos, and D.R. Huffman, Chem. Phys. Lett. 170, 167 (1990). 2. For a review see K. Prassides and H. Kroto, Physics World 5, 44 (1992).
385
3. For a review see A.F. Hebard, Physica B 197, 544 (1994). 4. T. Takahashi, et al, Phys. Rev. Lett. 68, 1232 (1992). 5. P.J. Benning, et al, Phys. Rev. B 45, 6899 (1992). 6. J.H. Weaver, et al, Phys. Rev. Lett. 66, 1741 (1991). 7. S.C. Wu, era/., Phys. Rev. B 47, 13830(1993). 8. T.R. Ohno, et al., Phys. Rev. B 44, 13747 (1991). 9. G. Gensterbium, et al, Phys. Rev. Lett. 67, 2171 (1991). 10. Y. Kuk, et al., Phys. Rev. Lett. 70, 1948 (1993). ll.X.-D. Wang, etal., Phys. Rev. B 47, 15923 (1993). 12. T. Rabenau, A. Simon, R.K. Kremer, and E. Sohmen, Z. Phys. B 90, 69 (1993). 13. R.W. Lof, et al., Phys. Rev. Lett. 68, 3924 (1992). 14. S. Saito and A. Oshiyama, Phys. Rev. Lett. 66, 2637 (1991). 15. S.C. Erwin and M.R. Pederson, Phys. Rev. Lett. 67, 1610 (1991). 16. S.J. Woo, E. Kim, and Y.H. Lee, Phys. Rev. B 47, 6721 (1993). 17. N. Troullier and J.L. Martins, Phys. Rev. B 46, 1754 (1992). 18.E.L. Shirley and S.G. Louie, Phys. Rev. Lett. 71, 133 (1993). 19. R. Gaisch, et al., Appl. Phys. A 57, 207 (1993). 20. R. Berndt, et al, Appl. Phys. A 57, 513 (1993). 21. R. Berndt, et al., SCIENCE 262, 1425 (1993). 22. R. Gaisch, etal, J. Vac. Sei. Technol. B 12, 2153 (1994). 23. R. Berndt, et al., Surf. Sei. 307-309, 1033 (1994). 24. B. Reihl, et al, Physica B 197, 64 (1994). 25. J.K. Gimzewski, S. Modesti, and R.R. Schüttler, Phys. Rev. Lett. 72, 1036 (1994). 26.T. David, etal, Phys. Rev. B 50, 5810 (1994). 27. R. Gaisch, et al, Ultramicroscopy 42-44, 1621 (1992). 28. K. Motai, et al, Jpn. J. Appl. Phys. 32, L450 (1993). 29. E.I. Altman and RJ. Colton, Surf. Sei. 295, 13 (1993). 30. D. Purdie, H. Bemhoff, and B. Reihl (unpublished). 31. K. Horn, K.H. Frank, J.A. Wilder, and B. Reihl, Phys. Rev. Lett. 57, 1064 (1986). 32. A.J. Maxwell, et al., Phys. Rev. B 49, 10717 (1994). 33. J.M. Debever, etal, Phys. Rev. B 46, 15602 (1992). 34. B.-L. Gu, et al., Phys. Rev. B 49, 16202 (1994). 35. M.B. Jost, et al, Phys. Rev. B 44, 1966 (1991). 36. Y.Z. Li, et al, Phys. Rev. B 47, 10867 (1993). 37.X.-D. Wang, etal, Phys. Rev. B 47, 15923 (1993). 38. S. Howells, et al, Surf. Sei. 274, 141 (1992). 39. T. Chen, et al, J. Vac. Sei. Technol. B 9, 2461 (1991). 40. H.P. Lang, et al, Europhys. Lett. 18, 29 (1992). 41. T. Hashizume, et al, Jpn. J. Appl. Phys. 31, L880 (1992). 42. S. Behler, et al, Z. Phys. B 91, 1 (1993). 43. J. Tersoff and N.D. Lang, Phys. Rev. Lett. 65, 1132 (1990). 44. A.J. Fisher and P.E. Blöchl, Phys. Rev. Lett. 70, 3263 (1993). 45. C. Chavy, C. Joachim, and A. Altibelli, Chem. Phys. Lett. 214, 569 (1993). 46. R. Gaisch, Ph.D. Thesis, University of Lausanne, Switzerland, 1994 (unpublished). 47. A. Otto, et al, J. Phys.: Condens. Matter 4, 1143 (1992). 48. R. Berndt, J.K. Gimzewski, and P. Johansson, Phys. Rev. Lett. 67, 3796 (1991).
386
METAL FILM NUCLEATION AND GROWTH ON C60 INTERFACIAL LAYERS
A. F. HEBARD, C. -B. EOM\ R. C. HADDON, JULIA M. PHILLIPS and J. H. MARSHALL AT&T Bell Laboratories, 600 Mountain Avenue, Murray Hill, NY 07974 * Department of Materials Science and Mechanical Engineering, Duke University, Durham, NC 27708
ABSTRACT
The effect that the presence or absence of interfacial Cßo layers has on the nucleation and subsequent growth of overlying thin metal films has been studied using in situ resistivity meas- urements. Comparisons are made for Al and Cu films grown on quartz and yttria stabilized zir- conia (YSZ) substrates. Our results indicate that electron donation across M/CöO (M=A1, Cu) interfaces reduces the percolation threshold for conductivity while simultaneously giving rise to an increased resistance in the metal due to electron depletion. Additional physical processes that are taken into account include the effect of different interfacial energies at the M/Cßo and M/substrate boundaries and the effect of substrate tunneling between percolating metallic islands during the initial stages of film growth.
INTRODUCTION
The ease with which Cgo films can be grown by vapor sublimationfl] has stimulated significant research activity focused on understanding the remarkable properties of this unusual molecular solid. Not only does COO act as host to a variety of intercalants ranging across the periodic table from the alkali metals to the halogens but, in the pristine state, it also has novel optical and structural properties [2]. Many of the most interesting properties of Cgo films are a direct result of the strong electron affinity of the isolated molecule. Thus, for example, at two- dimensional interfaces between C^ and an underlying metal or a semiconducting substrate, charge transfer across the interface and into the C^o determines the strength of the Cßo/substrate interaction and hence the growth morphology of the overlying C6o-
The evidence for charge transfer at planar Coo-metal interfaces in which COO is the overlying layer is verified, for example, by photoemission spectroscopy for Au(110)[3], Cu[4], and a variety of metals including Ag, Mg, Cr, and Bi[5], and by surface enhanced Raman scattering for Au, Ag, and Cu[6]. Similar considerations hold for the reverse situation in which C(,o is the underlying material. For example, photoemission and inverse photoemission studies of various metals [Ti, Cr, Au, La, and In] condensed on COO show appreciable charge transfer and chemical bonding of the COO molecules with the metal substrate[7].
A large amount of charge transfer corresponds to a strong COO -substrate interaction and can be unfavorable to the van der Waals epitaxy found on substrates with more inert surfaces[8]. A recent example of this has been found in X-ray diffraction analysis of C go films grown on both hydrogen-terminated and slightly oxidized Si substrates[9]. In the former case, the weak interac- tion between the COO molecules and the inert Si surface (physisorption) gives rise to 1000A- thick films having a high degree of (111) texture whereas in the latter case (oxidized Si) the stronger C go-substrate bonding (chemisorption) frustrates positional order m the first few mono- layers and gives rise to an amorphous structure in similarly prepared 1000 A-thick films.
387
Mat. Res. Soc. Symp. Proc. Vol. 359® 1995 Materials Research Society

In this paper we use in situ resistivity measurements during deposition of the metals Al and Cu to study the metal/C60 interface. If C6o is used to precoat a substrate, then the percolation threshold for conduction is sharply reduced compared to identically prepared films on the same substrate but without the C60 precoat. We infer from these data that interfacial charge transfer has a pronounced effect on the electrical transport of thin metal films in contact with Cßo- In addition, a distinct increase in resistance occurs when Al and Cu films are covered by a mono- layer of COO, an effect which we believe arises from the donation of electrons into the C6o from the underlying metal.
EXPERIMENTAL
A stainless steel vacuum chamber with a base pressure of 5xlO~8 Torr was used for the preparation of the thin-film samples. Temperature-controlled resistively-heated boron nitride sources were configured as shown in Fig. 1. Each source can be independently shuttered and the flux of evaporant separately measured with quartz-crystal microbalance monitors. Not shown is the main shutter which covers the sample and is only opened after targeted deposition rates have been established and stabilized. Thicknesses for each evaporant were calibrated in separate runs using optical profilomerry.
Cu substrate block
substrate- r-E
crystal monitor.
shutters
Fig. 1: Schematic of evaporation sources, shutters, thickness monitors, and substrate holder used in the deposition of metal/C^o multilayers.
388
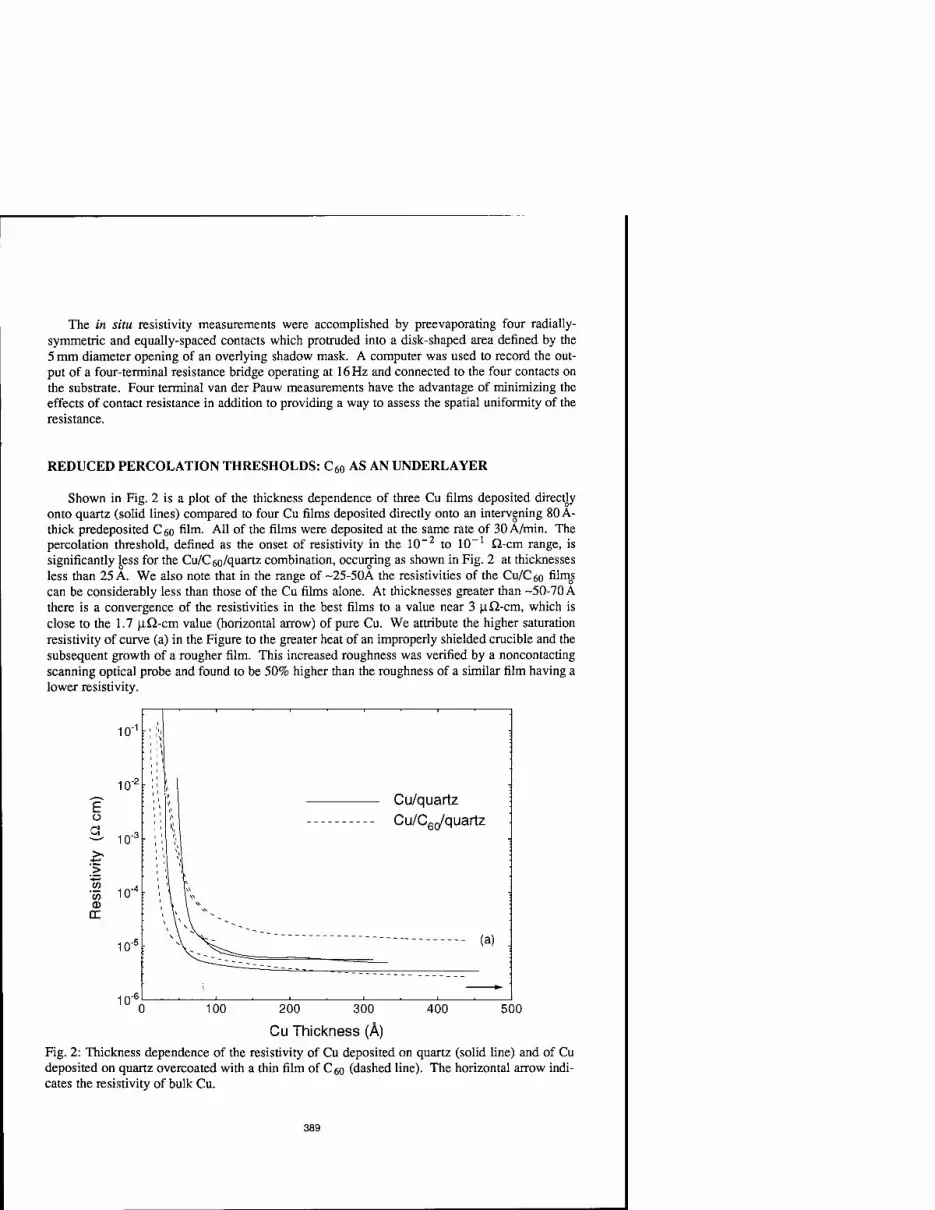
The in situ resistivity measurements were accomplished by preevaporating four radially- symmetric and equally-spaced contacts which protruded into a disk-shaped area defined by the 5 mm diameter opening of an overlying shadow mask. A computer was used to record the out- put of a four-terminal resistance bridge operating at 16 Hz and connected to the four contacts on the substrate. Four terminal van der Pauw measurements have the advantage of minimizing the effects of contact resistance in addition to providing a way to assess the spatial uniformity of the resistance.
REDUCED PERCOLATION THRESHOLDS: C60 AS AN UNDERLAYER
Shown in Fig. 2 is a plot of the thickness dependence of three Cu films deposited directly onto quartz (solid lines) compared to four Cu films deposited directly onto an intervening 80 A- thick predeposited C 6o film- All of the films were deposited at the same rate of 30 A/min. The percolation threshold, defined as the onset of resistivity in the 10 to 10 fl-cm range, is significantly less for the Cu/C6o/quartz combination, occurring as shown in Fig. 2 at thicknesses less than 25 A. We also note that in the range of -25-50A the resistivities of the CU/CöO filmos can be considerably less than those of the Cu films alone. At thicknesses greater than -50-70 A there is a convergence of the resistivities in the best films to a value near 3 |ifi-cm, which is close to the 1.7 (iQ-cm value (horizontal arrow) of pure Cu. We attribute the higher saturation resistivity of curve (a) in the Figure to the greater heat of an improperly shielded crucible and the subsequent growth of a rougher film. This increased roughness was verified by a noncontacting scanning optical probe and found to be 50% higher than the roughness of a similar film having a lower resistivity.
10"
10"'
E o
1 , SI 10"3
>. 1 '
+—>
> , 1
1 1
io-4 ■ 1
0 ( rr i
10"!
10"'
Cu/quartz Cu/C60/quartz
(a)
100 200 300 400 500
Cu Thickness (A) Fig. 2: Thickness dependence of the resistivity of Cu deposited on quartz (solid line) and of Cu deposited on quartz overcoated with a thin film of COO (dashed line). The horizontal arrow indi- cates the resistivity of bulk Cu.
389

Similar results to those for Cu have been found in an earlier study of Al deposited on yttria stabilized zirconia (YSZ) substrates[10]. These data are plotted in Fig. 3. Here, as in the Cu case, there is a considerably reduced percolation threshold for conductivity when the C60 under- layer is present.
Possible explanations for the observed behavior are illustrated in the schematic of Fig. 4. When a metal is deposited on a typical substrate, the initial growth stage depicted in panel (a) comprises isolated islands which are below the percolation threshold. If a C60 underlayer is present, however, then there are three scenarios, depicted in panels (b)-(d), which can lead to a reduced percolation threshold. These are respectively: (1) a modified interfacial energy which reduces the adatom mobility while increasing the density of island nucleation sites thus giving a smoother layer-by-layer growth habit [panel (b)], (2) increased substrate tunneling which pro- vides electrical connections between the otherwise isolated islands [panel (c)], and (3) charge donation from the metallic islands into the C60 which, by partially filling the tlu LUMO (lowest unoccupied molecular orbital) of the underlying C60 molecules, induces conductivity into an otherwise insulating substrate and hence electrical connections between the islands [panel (d)]. This charge donation may be accompanied by diffusion of some metal atoms into the C60[10].
40 60
Al Thickness (A)
80 100
Fig. 3: Thickness dependence of the resistivity of Al deposited on yttria stabilized zirconia (YSZ, solid line) and of Al deposited on YSZ overcoated with a thin film of C60 (dashed line). The horizontal arrow indicates the resistivity of bulk Al.
390

If modified interfacial energies [panel (b)] are responsible for the reduced percolation thres- holds, then one would expect that the resistivities of the M/C6o samples would for all thicknesses be less than the resistivities of the M samples without the C6o- Such behavior is not seen in the data of Figs. 2 and 3 where the crossover of the dashed and solid lines indicates that, for some restricted range of thicknesses greater than the threshold thickness for percolation, the M/C60 samples have a noticeably greater resistivity than the M samples. This behavior is con- sistent with the notion that the metal from which the charge has been donated into the C60 dur- ing the initial stages of growth [panel (d)] must, because of its depleted electrons, have a higher resistance when the percolation threshold is exceeded and the film is continuous than it would had the C 6o not been present.
DISCUSSION
In earlier work on charge transfer at Al/C6o interfaces [10] it was found that the resistance of metallic continuous Al films shows a pronounced increase when the films are covered with a monolayer of C6o- The increase in resistance ceases when the coverage exceeds approximately one monolayer. The relative change in sheet resistance, &RIR, for 10 films was found to be -3.6% and was attributed to a transfer of six electrons to each C6o molecule. The preliminary results on the Cu films reported hereoshow a similar phenomenology but with a nominal SR/R for comparable thickness films (100 A) at a somewhat smaller value of -2%. Using the argu- ments of Ref. 10, stress, diffusion, and surface scattering effects can be excluded as the cause.
(a) metal
(b)
0 <C substrate
(c) (d)
Fig. 4: Schematic showing various metal film growth scenarios: (a) agglomerated metallic islands in electrical isolation, (b) layer-by-layer coverage of a C6o substrate with a uniformly thick metallic film, (c) agglomerated metallic islands in spatial isolation but electrically con- nected because of lowered tunnel barriers associated with the underlying COO substrate, and (d) agglomerated metallic islands in spatial isolation but electrically connected because of charge donation into the C60. This charge donation may or may not be accompanied by diffusion of metal atoms into the Cw
391

The work reported here and elsewhere[10,ll] illustrates the profound and somewhat surpris- ing effects on electronic transport that occur when metal films are in close proximity to C^o interfacial layers. As thin film metalizations are important for much of technology, it is not inconceivable that the use of COO interfacial layers to obtain greater conductivity in ultra thin metal films may find a unique niche in applications. Further work however is needed to address some obvious questions. For example, it is not known how film microstructure and topography are affected by the presence of the C60 layers. Such microstructural details, some of which have already been inferred from electronic structure studies (photoemission and inverse photoemis- sion) of various metals condensed on COO[7], would be expected to be unique for different metals and metal combinations.
[I] W. Krätschmer, L. D. Lamb, K. Fostiropoulis, and D. R. Huffman, Nature 347, 354 (1990). [2] For reviews, see A. F. Hebard, Annu. Rev. Mater. Sei. 23, 159 (1993); J. Weaver and D. M. Poirier, Solid State Physics 48 (ed. by H. Ehrenreich and F. Spaepen, Academic Press, 1994) p. 1. [3] Y. Kuk, D. K. Kim, Y. D. Suh, K. H. Park, H. P. Noh, S. J. Oh, and S. K. Kim, Phys. Rev. Lett. 70, 1948 (1993). [4] J. E. Rowe, P. Rudolf, L. H. Tjeng, R. A. Malic, G. Meigs, and C. T. Chen, Int. J. Mod. Phys. B6, 3909 (1992). [5] T. R. Ohno, Y. Chen, S. E. Harvey, G. H. Kroll, J. H. Weaver, R. E. Haufler, R. E. Smalley, Phys. Rev. B44, 13747 (1991). [6] S. J. Chase, W. S. Bacsa, M. G. Mitch, L. J. Pilione, and J. S. Lannin, Phys. Rev. B46, 7873 (1992). [7] T. R. Ohno, Y. Chen, S. E. Harvey, G. H. Kroll, P. J. Benning, J. H. Weaver, L. P. F. Chi- bante, R. E. Smalley, Phys. Rev. B47, 2389 (1993). [8] G. Gensterblum, L. -M. Yu, J. -J. Pireaux, P. A. Thiry, R. Caudano, J. -M. Themlin, S. Bouz- idi, F. Coletti, and J. -M. Debever, Appl. Phys. A56, 175 (1993). [9] A. F. Hebard, O. Zhou, Q. Zhong, R. M. Fleming, R. C. Haddon, Thin Solid Films (in press). [10] A. F. Hebard, C. B. Eom, Y. Iwasa, K. B. Lyons, G. A. Thomas, D. H. Rapkine, R. M. Fleming, R. C. Haddon, Julia M. Phillips, J. H. Marshall, R. H. Eick, Phys. Rev. B (in press). [II] W. Zhao, K. Luo, J. Chen, J. Zhang, C. Li, D. Yin, Z. Gu, X. Zhou, Z. Jin, Sol. State Com- mun. 83, 853 (1992).
392

TEMPERATURE DEPENDENT ORIENTATIONAL EPITAXY OF C6o FILMS ON NOBLE METAL (111) SURFACES; Au, Ag AND Cu
A. Fartash Department of Physics and Texas Center for Superconductivity, University of Houston, Houston, Texas 77204-5932
ABSTRACT
High quality COO films are grown on surfaces of (111) oriented noble metal substrates (i.e., Au, Ag, and Cu) by using a molecular beam deposition method. The structures of these films are compared with each other on substrates that are prepared to have similar in-plane mosaic widths (~1.25°) as determined by their x-ray diffraction scans. The in-plane structures of these films are studied for substrate temperatures ranging from ~110 to 290°C. Although most materials grow in high symmetry small-lattice-mismatch in-plane orientations, COO films (depending on their growth temperatures) grow in orientations that are poorly lattice matched with their Au( 111) and Ag( 111) substrates. In these orientations, COO structures can be lattice matched only over large unit cells, forming "long-period" structures. These "long-period" structures coexist with or predominate "commensurate" structures that are almost perfectly lattice matched on these substrates. On Au(l 11) substrates, a structural transition is observed between two distinct long-period structures (at Tc ~150°C). Although Au and Ag have similar lattice spacings, this transition is absent on Ag( 111) substrates. The question of orientational epitaxy for C«) layers is examined in the context of several well-known systems in condensed matter physics.
INTRODUCTION
The physical properties of C60 layers in contact with noble metal surfaces are influenced because of electron affinity of these layers [1] resulting in charge transfer across their common interfaces such that these layers bind more strongly to these metallic surfaces than to their own layers away from interface. The strengths of these interactions can be described in terms of desorption temperatures of these layers. On Au(l 11) and Ag(l 11) surfaces, C<so molecules desorb at temperatures of about 200°C higher than CöO-CöO desorption temperature (-500 vs. 300°C) [2]. Due to their strong interactions with their substrates, the first adsorbed COO layers form extended single-monolayer-thick layers, coating the entire surfaces of noble metal substrates. STM (scanning tunneling microscopy) studies have shown that first layers initiate their growth at the steps of their substrate terraces [2]. These studies (at room temperature) have also shown that second layers begin their growth only after completion of the growth of the first layers. The first layers domains do not reorient, serving as rigid substrates for second layers to grow. In this work, the growth and structural properties of COO multilayers are discussed, probing these structures with x-ray diffraction. The structural evolution of in-plane mosaic structures of COO films is examined as a function of temperature (i.e., the temperature dependence of orientational epitaxy) [3]. More emphasis is placed on COO structures grown on Au and Ag surfaces, and these structures are compared with each other. Au and Ag have similar bulk lattice spacings, and because of their inert surfaces, they are more resistant (during film growth) to contamination than Cu. An important dis- tinction between (111) surfaces of Au and Ag substrates is that Au( 111) reconstructs into a long- range herringbone surface structure, described by a 23 x v3 unit cell. On Au( 111) surfaces, an in- plane structural transition between two distinct long-period CöOÜ 11) structures is observed, at Tc ~150°C [3]. This structural transition is absent on Ag(lll) surfaces, indicating a delicate balance between the forces at interface; controlling the reconstruction of the surface of the Au substrate, as well as the in-plane epitaxial orientations of COO layers. Above Tc, the COO structures on both Au and Ag substrates are similar to each other. On Cu(l 11) substrates, the in-plane orientations are oriented in two distinct orientations. The lattice mismatches in these orientations are ~2 and 3%. Although Cu(l 11) does not reconstruct, it is more reactive than Au and Ag substrates, and is thus more susceptible to contamination during film growth.
393
Mat. Res. Soc. Symp. Proc. Vol. 359 ° 1995 Materials Research Society
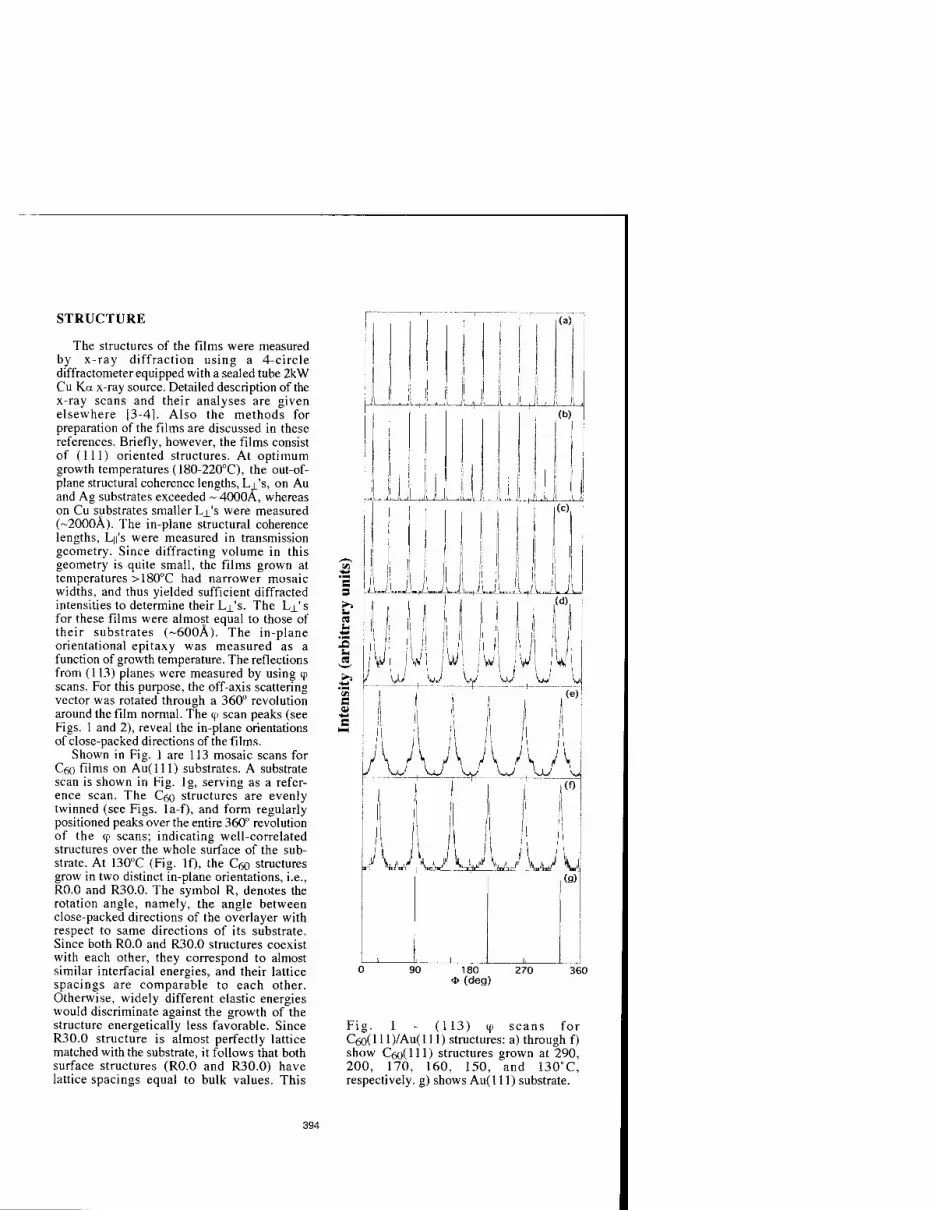
STRUCTURE
The structures of the films were measured by x-ray diffraction using a 4-circle diffractometer equipped with a sealed tube 2kW Cu Ka x-ray source. Detailed description of the x-ray scans and their analyses are given elsewhere [3-4]. Also the methods for preparation of the films are discussed in these references. Briefly, however, the films consist of (111) oriented structures. At optimum growth temperatures (180-220°C), the out-of- plane structural coherence lengths, Li's, on Au and Ag substrates exceeded ~ 4000A, whereas on Cu substrates smaller L^'s were measured (~2000A). The in-plane structural coherence lengths, L||'s were measured in transmission geometry. Since diffracting volume in this geometry is quite small, the films grown at temperatures >180°C had narrower mosaic widths, and thus yielded sufficient diffracted intensities to determine their Lx's. The Lj_' s for these films were almost equal to those of their substrates (-600Ä). The in-plane orientational epitaxy was measured as a function of growth temperature. The reflections from (113) planes were measured by using ip scans. For this purpose, the off-axis scattering vector was rotated through a 360° revolution around the film normal. The <p scan peaks (see Figs. 1 and 2), reveal the in-plane orientations of close-packed directions of the films.
Shown in Fig. 1 are 113 mosaic scans for COO films on Au(lll) substrates. A substrate scan is shown in Fig. lg, serving as a refer- ence scan. The Cgo structures are evenly twinned (see Figs, la-f), and form regularly positioned peaks over the entire 360° revolution of the (p scans; indicating well-correlated structures over the whole surface of the sub- strate. At 130°C (Fig. If), the C«) structures grow in two distinct in-plane orientations, i.e., RO.O and R30.0. The symbol R, denotes the rotation angle, namely, the angle between close-packed directions of the overlayer with respect to same directions of its substrate. Since both RO.O and R30.0 structures coexist with each other, they correspond to almost similar interfacial energies, and their lattice spacings are comparable to each other. Otherwise, widely different elastic energies would discriminate against the growth of the structure energetically less favorable. Since R30.0 structure is almost perfectly lattice matched with the substrate, it follows that both surface structures (RO.O and R30.0) have lattice spacings equal to bulk values. This
s
& ii _y t_y____jy y jy __L
B
i_W+W.W_L;/ u ,te)
90 180 270 360 <J> (deg)
Fig. 1 - (113) cp scans for C<5o(lll)/Au(lll) structures: a) through f) show C6o(Hl) structures grown at 290, 200, 170, 160, 150, and 130°C, respectively, g) shows Au(l 11) substrate.
394

conclusion is consistent with the findings of a recent STM study [2], showing the lattice spacings of these structures are equal to bulk values— in spite of the fact, the RO.O structure (the in-phase structure) is poorly lattice matched with the substrate (~13% lattice mis- match). With increasing substrate temperature, as shown in Figs, lc - If, the RO.O structure undergoes a transition to another poorly lattice matched structure (4% mismatch). The new structure is approximately oriented at -R12.9, and it can be lattice matched with the substrate only over a large unit cell, and because of the size of the unit cell it will be referred to as a "long-period" structure. At ~170°C the transition is complete, and at higher temperatures (up to 300°C) a mixture of long- period and commensurate structures is observed (see Figs, la and lb). At these temperatures since both surface structures coexist with each other, the long-period lattice spacings are almost equal to bulk values (using similar arguments above).
Shown in Fig. 2, are 113 cp scans for C<5o(l 11)/Ag(ll 1) films. A cp scan for a typical Ag(lll) substrate is shown in Fig 2d. The C6o(l 11) overlayers consist of evenly twinned structures. These structures are studied from 110 to 290°C, over the same temperature range the films on Au(l 11) substrates were studied. No structural transition on Ag(lll) is ob- served. The overlayers on Ag( 111) substrates
14.0
a> i3.o
DC
— 1 1
A Smooth
- D Rough
□
A
,-B' ..^'
D,' a i
(a) "
B S
•- A i.
•5- J e 01
ll 1 , 1
1 I! i ,11 , i i ll II ,, !
(a);
1 1 I il '
! 1. I.I 1 i ; 1 JLJLJUL idm ü
II w Ulli
I 1 i II ! , 1 ! ill I I
II HI lil i
i i
Ml
! 1 (c) il \
i 1! i !!i! i! I 1 \\ ! 1
lyUvl'lJ1
! L_
!(d)
90 180 270 <P (deg)
360
Fig. 2 - (113) ip scans for C6o(lll)/Ag(111) structures: (a), (b), and (c) show C6o(Hl) structures grown at 260, 200, and 120°C, respectively, (d) shows Ag(l 11) substrate.
Fig. 3 - In-plane orientations of long- period structures: R is the angle between the close-packed directions of long-period
structures and <ll0> directions of their Ag(lll) substrates. The in-plane close- packed directions of the commensurate structures are temperature independent, and oriented at 30.0° with respect to
<110> directions of their Ag(lll) substrates. The lines are drawn to guide the eyes.
395

consist of in-plane structures that are very similar to structures observed on Au(lll) — at temperatures higher than Tc. These structures consist of long-period and commensurate structures coexisting with each other over the entire temperature range of the study (from 120 to 270°C). At high temperatures T ~ 250°C (see Fig. 2a), the long-period structures predominate over R30.0 (commensurate) structures.
Shown in Figs. 3a and 3b are the in-plane positions for the centers of the long-period peaks measured at half maximum height plotted vs. the substrate temperature. The in-phase (R0.0) and commensurate (R30.0) peaks do not reorient with temperature, but long-period peaks coexisting with these structures show in-plane orientational dependence. In Fig. 3a, the peak positions (at temperatures above Tc) are shown for structures grown on Au(lll) substrates, for two different substrate surface topographies. The substrates are labeled as "smooth" and "rough," according to FWHM's of their 111 rocking curves. Different FWHM's (~ 0.26 and 0.5°) signify different vicinal surface roughnesses. For the "rough" surface (see Fig. 3a), a slight difference in orientational epitaxy (~ 0.5) is observed. For Ag(lll) substrates, the FWHM of 111 rocking- curves measured -0.26°, and on these substrates (see Fig. 3b), the long-period orientations also varied with temperature (see Fig. 3b). On Cu(lll) substrates, two in-plane orientations were observed, oriented at RO.O and R30.0 orientations, with lattice mismatches of ~2 and 3%, respectively. The in-plane orientations of these structures showed no dependence on temperature.
DISCUSSION
The question of orientational epitaxy for a two-dimensional layer has been studied in the literature in the context of several well-known examples [5-9]: 1) A system consisting of an adsorbate overlayer on the surface of a rigid solid substrate—the overlayer usually orients in high symmetry orientations with respect to the structure of the substrate [5]. This orientation is determined by minimizing the overlayer/sub- strate lattice mismatch, as well as the area of their common coincident site unit cell. The con- cept of "coincident site lattice" (CSL) by which orientational epitaxy is determined, is based on geometrical considerations. An imaginary plane is drawn parallel to the interface, and lattices on both sides of the interface are projected onto this plane forming a coincident structure (see Fig. 4a). In specific orientations, coincident points are formed between projections of the two lattices. Fig. 4a shows coincident points (solid circles) for a one-dimensional system. In this example, the smallest commensurate overlayer unit cell consists of two atoms, and the unit cell is thus a second order unit cell. The order of the unit cell is determined based on the number of the atoms in the unit cell. If the order is infinite, the overlayer atoms form an incommensurate structure [10]. 2) Chemisorbed adsorbate layers can induce substrate surface reconstruction, resulting in formation of high order or incommensurate surface structures [6]. Since in chemisorption process the electronic structures of the bonding partners (adsorbate/substrate) are strongly perturbed, usually new hybrid orbitals form.
(a)
(b)
_ooooooo_ oooooooooooo
Fig. 4 - a) One dimensional lattice forming a coincident unit cell with the lattice of its substrate, b) A domain wall is created because of a lattice mismatch between the overlayer and its substrate, cp is the positional phase function; showing the positions of the overlayer atoms with respect to their substrate potential minima, c) Graphite intercalation compounds consist of intercalant and graphite layers. The domain walls in the intercalant layer form a hexagonal mesh structure.
396

If the bondings have ionic character there may be charge transfer from one partner to another. 3) Physisorbed systems consist of weakly adsorbed layers such as rare gases on graphite or on metal surfaces [7-8]. These systems are prone to formation of domain walls — these domain walls influence their orientational epitaxy. A linear atomic chain is shown in Fig. 4b, subject to a periodic background potential. <p(x), is the positional phase function, showing the positions of the atoms relative to their substrate potential minima. The step-like behavior in q> (forming a domain wall), signifies a rapid change in periodicity of the atoms in the chain. <p unpins when periodicity of the overlayer differs from that of its substrate (at the center of the chain, see Fig. 4b). In regions that are commensurate, <p is pinned to the periodicity of the substrate, and remains unchanged in these regions. 4) In "graphite intercalated compounds" (GIC's), using similar domain wall ideas, the orientational epitaxy of the intercalant layers is described in terms of formation of domain walls (or discommensurations) in the intercalant layers [9]. Shown in Fig. 4c, is the top-view of an intercalant layer. The periodic regions in these intercalant layers are separated from each other by domain walls that form a hexagonal mesh structure. The domain walls influence the in-plane orientations of the intercalant layers with respect to orientations of their host graphite layers.
In R30.0 orientation C6o( HI) layers are almost perfectly commensurate with Ag( 111), and (non-reconstructed) Au(l 11) substrates, but they grow (as discussed above) in orientations with lower symmetry than commensurate R30.0 orientation. In these orientations large CSL unit cells are required to lattice match the COOOH) layers to their substrates, thus forming long-penod structures. Physically, however, it is difficult to understand why growth in these orientations is chosen over geometrically commensurate high symmetry orientations.
Orientational epitaxy is often discussed in terms of a simple model, i.e., Frenkel-Kontorova (FK) model [7]. The physical properties of rare gases on metals, for instance, are quite well understood in terms of this model [7-8]. The FK model is shown in Fig. 5, consisting of a linear chain of atoms. The chain is interconnected with harmonic springs, and is subject to a periodic background potential, V (due to substrate). As shown in Fig. 5, the phase diagram for the model consists of a large first order commensurate region (on the left), and smaller regions corresponding to higher orders of commensuration [8]. The dark areas correspond to orders of commensuration
higher than 10. w02 and C are proportional to V, and the spring constant of the springs,
respectively. The phase diagram shows that first order commensuration is favored for strong substrate potentials, and small lattice mismatches. Higher orders of commensuration are favored for systems that weakly interact with their substrates (such as rare gases on graphite or on
Fig. 5 - a) Frenkel-Kontorova (FK) model for a one-dimensional lattice, b) Phase diagram for the FK model (Ref. 8). b/a is lattice mismatch,
and Vtol/C is proportional to the ratio of the strengths of interactions of the atoms (in the chain) with their substrate vs. their interactions with each other through the springs.
(a) mmmm V oc »>„
(b)
Order = I
- ii - Order > 10 / m A
1 X ^^ /fv/7 Jv
o.o JLJL ± -L -1 z. i 10 8 6 4 3 5 2
a/b
397
metals [71), which lie close to the x-axis of the phase diagram. The GIC's, on the other hand, involve strong interactions between their layers. Although GIC's are fairly complicated systems to mimic their interactions in terms of a simple model such as the FK model, roughly speaking, certain structural features in these systems can be attributed to structural competitions due to large differences between periodicities of the intercalant and their bounding rigid honeycomb graphite layers, and can be understood using the FK model.
In spite of its simplicity, the FK model has been very useful to account for the structures of a variety of systems whose properties are determined as a result of structural competitions due to differences in periodicities of dissimilar structures of which these systems are composed. Given the strengths of interactions between COO molecules vs. interactions of these molecules with their
noble metal substrates, one may estimate ~1< Vcojj/C < ~2. Using the FK phase diagram (see Fig. 5), the CgoC HI) layers are expected to form first order commensurate structures, given CöoClll) structures can be lattice matched in small lattice mismatch orientations on their noble metal substrates (see Fig. 5). The fact these layers grow in other orientations than commensurate orientation (i.e., Ag(l 1 i) substrates), indicates that interactions that determine the orientational epitaxy of C^o layers supersede the constraints in geometry and structural competitions due to differences in periodicity.
CONCLUSION
On noble metal substrates CöOU 11) layers grow in two distinct in-plane orientations. Although on Ag(lll) substrates these layers are almost perfectly commensurate in R30.0 orientation, they grow in lower symmetry orientations, forming layers with ~4 % lattice mismatch. On Au(l 11), for temperatures T > Tc ~150°C, the structures are similar to structures on Ag( 111). For T< Tc, the in-plane structures consist of R30.0 and in-phase (R0.0) structures. These structures coexist with each other. On Cu(lll) substrates the in-plane orientations can be described using CSL arguments.
The question of orientational epitaxy was discussed in the context of four different well-known systems. Since Cfio layers interact strongly with their metallic substrates, some similarities may exist between structural properties of these layers, and layers in other systems subject to strong interactions — such as intercalant layers in GIC's, and chemisorbed layers on metallic surfaces. In the former case, domain walls (discommensurations) influence the orientational epitaxy, and in the latter case, the adsorbates modify (or reconstruct) the structure of their substrate surfaces forming high order commensurate and incommensurate overlayers.
ACKNOWLEDGMENT
This work was supported by the State of Texas through TCSUH.
REFERENCES
1. S. Modesti, S. Cerasari, and P. Rudolf, Phys. Rev. Lett. 7 1, 2469 (1993). 2. E. I. Altman, and R. J. Colton, Surf. Sei. 295, 13 (1993). 3. A. Fartash, Phys. Rev. B (to be published). 4. A. Fartash, Appl. Phys. Lett. 64, 1877 (1994). 5. A. Zur and T. C. McGill, J. Appl. Phys. 55, 378 (1984). 6. T. Janssen and A. Janner, Adv. Phys. 36, 518 (1987). 7. P. Bak, Rep. Prog. Phys. 45, 587 (1982). 8. S. Aubry, in Solitons in Condensed Matter Physics, eds. A. R. Bishop and T. Schneider
Springer, Berlin, (1978), p. 264. 9. S. C. Moss, and R. Moret, Graphite Intercalation Compounds I, eds. H. Zabel and S. A.
Solin, Springer Series in Materials Science, Vol. 14, Berlin (1990), p. 4. 10. S. C. Ying, Phys. Rev. B 3, 4160 (1971).
398

HETEROEPITAXIAL GROWTH OF EPITAXIAL Ca-TfflN FILMS ON MICA(001) S. Henke, K. H. ThUrer, S. Geier, B. Rauschenbach, B. Stritzker, Institut für Physik, Universität Augsburg, D-86135 Augsburg
ABSTRACT
On mica(OOl) thin CW-films are deposited by thermal evaporation at substrate temperatures from room temperature up to 225°C. The dependence of the structure and the epitaxial alignment of the thin Ceo-films on mica(OOl) on the substrate temperature and the film thickness up to 1.3 um at a well-defined deposition rate (0.008 nm/s) is investigated by atomic force microscopy and X-ray diffractioa The shape and the size of the Qo-islands, which have an influence on the film quality at larger film thicknesses, are sensitively dependent on the substrate temperature. At a film thickness of 200 nm the increase of the substrate temperature up to 225°C leads to smooth, completely coalesced epitaxial Qo-thin films characterized by a roughness smaller than 1.5 nm, a mosaic spread ACD of 0.1° and an azimuthal alignment A* of 0.45°.
INTRODUCTION
There is a considerable scientific and technical interest in the growth and structure of epitaxial fullerene thin films. The mechanisms of the growth of the well-known fullerene Ceo should be representative for other fullerenes as C70 or CM and applicable to the growth of well-oriented doped fullerene films via coevaporation and the growth of fullerene precursors for diamond films. The growth of (lll)-oriented epitaxial Ceo-thin films has been observed previously using mica(OOl) as a substrate [1,2]. Atomic force microscopy studies [3] have demonstrated that film growth starts with isolated islands. Once the surface has been completely covered, a subsequent layer-by-layer growth has been observed. The quality of the epitaxial alignment of the thin Ceo-films on mica(OOl) is sensitively dependent on the sublimation method using different deposition rates (hot-wall-method [4], effusion cell [5], thermal evaporation [6]) and strongly falls off by an increase of the film thickness up to some (im.
It is the purpose of this paper to illustrate the dependence of the structure and the epitaxial alignment of the thin Ceo-films on mica(OOl) on the substrate temperature and the film thickness at a well-defined deposition rate. The deposition rate of 0.008 nm/s has been kept constant, which results in a good epitaxial alignment of the Cw-crystals on mica(OOl) [7]. Furthermore, the influence of the substrate temperature and the film thickness on the structure and topography of the Ceo-films is investigated.
EXPERIMENTAL
For sublimation Ceo-microcrystalline powders synthesized with a purity of 99.9% and a resistive Ta-crucible were used. Under sublimation conditions the base pressure was in the range of 10"6 Torr. The distance between the Ta-heater and the substrate holder was about 8 cm. The film thickness was measured by a water cooled quartz microbalance thickness monitor placed directly beside the substrate holder. The substrate temperature was varied from room temperature (RT) up to 225°C and the thickness of the films from 10 nm up to 1300 nm. The mica (001)- substrates are of muscovite-lM type and the mosaic spread of the (001) Bragg-reflection has a
399
Mat. Res. Soc. Symp. Proc.Vol. 359 ®1995 Materials Research Society

full width at half maximum (FWHM) of 0.1°. The mica-substrates were cleaved on air and then preheated in vacuum for decontamination at a substrate temperature of 200°C for 12 hours.
The thickness of the films was measured by glanzing-angle-X-ray-diffraction measurements and by a surface profiler. The characterization of the film topography was performed by an atomic force microscope (AFM) operating in air. Qo-films starting from film thicknesses greater than 100 nm were additionally characterized with a four-circle X-ray diffraction goniometer. Because of the low scattering cross section of the Cso-molecules and the low thickness of the Ceo-films the (lll)-reflection of Cm has been chosen for the X-ray diffraction measurements. The FWHM of the rocking curves and the <(>-scans are a measure for the tilt (mosaic spread Aa>) and the twist (spread of the azimthal alignment A*) of the crystallites in the Ceo-fllms, respectively. A detailed description of the experimental parameters can be found in Ref. [7,8].
RESULTS AND DISCUSSION
From Fig. la and lb Aoo-values of 0.1° and AO-values of 0.45° can be determined (resolution in AO is 0.3°) at a substrate temperature of 225°C and a film thickness of 200 nm, which are the optimal values for the constant deposition rate. The dependence of the quality of the (lll)-oriented Qo-crystals on the substrate temperature is summarized in Fig. 2a and 2b for a constant film thickness of 200 nm. It is noticed, that the mosaic spread Am of the £»-(11 l)-reflections and the spread of the azimuthal alignment A«I> obviously decrease with increasing substrate temperature. The temperature dependence of the rocking curve is in contrast to the one measured at a higher deposition rate of 0.05 nm/s [6], where Am runs through a minimum of 0.2° at 150°C substrate temperature and increases up
25000- I O 20000 - 1
c =3 o o ^ 15000 -
C/3 = S 10000-
<> 5000- A
0- —• v, 1 1
-1.5 -1.0 -0.5 0.0 0.5 1.0
Omega (degrees)
(a) (b)
Fig. 1: Rocking curve (a) and *-scan (b) of the sample atthe(lll)-reflectionofC6o at the substrate temperature of 225°C.
400

~l 1 1 1 1 r- 80 100 120 140 160 180 200 220 240
Substrate temperature (°C)
(a)
-i—i—i—i—i—i-
80 100 120 140 160 180 200 220 240
Substrate temperature (°C)
(b)
Fig. 2: The FWHM of the rocking curves (a) and the curves resulting from <&-scans (b) as a fiinction of the substrate temperature. (The FWHM in <& is a measure for the azimuthal alignment.)
(a) (b) (c)
Fig. 3: (11 l)-pole figures of deposited C6o-films with film thicknesses of 100 nm (a) and 200 nm (b) for a substrate temperature of 150°C and of 100 nm for a substrate temperature of 200°C (c).
401

to 0.5° at 200°C due to the renewed generation of (311)-oriented C«rcrystals which prevents a better alignment. This behaviour correlates with the observation that the epitaxial Ceo-film growth is changed to non-oriented growth [9] at the substrate temperature of 230°C and for a further increase of the deposition rate up to 0.1 nm/s. The roughness of the films decreases with increasing substrate temperature and can be determined to be lower than 1.5 nm at a substrate temperature of 225°C by atomic force microscopy.
In Fig. 3 (a) - (c) (11 l)-pole figures are shown at film thicknesses of 100 nm (a) and of 200 nm (b) for a substrate temperature of 150°C and at the film thickness of 100 nm (c) for a substrate temperature of 200°C. As shown recently [7], the (lll)-oriented epitaxial Cargrowth on mica(OOl) is dominated by two independent and equivalent CWcrystal grain alignments (type A and type B). The nearly sixfold symmetry of the mica(001)-substrate surface offers the threefold fcc-(lll)-oriented Qo- crystal grains two equivalent crystal alignments. In Fig. 3a the strong type A and type B crystal grain alignments of the Carcrystals at the polar angle % = 70.5° are visible. Furthermore twins generated by 60°-rotations about the <11 Indirections at % = 38° and % = 56° and a slight fibre texture at % = 48° and x = 79° generated by (311)- or (331)-orientations of the Qo-crystal are evident. With increasing film thickness the twins and the fibre texture vanish and the alignment of the type A and B grains remains (Fig. 3b). A fibre texture cannot be observed for a substrate temperature of 200°C at a comparable film thickness (Fig. 3c).
The FWHM regarding the azimuthal alignment, A<I>, for type A and type B reflections and the corresponding FWHM- values of the mosaic spread, ACD, are summarized in the following table as a function of the thickness df of the films up to 1.3 |xm for both substrate temperatures Ts= 150°C and Ts
= 200°C. The plotted A*-values are the mean AO-values of both type A and type B reflections.
Ts
(°C) 150 200
df
(nm) 100 200 100 200 500 1000 1300
A*
(°) Aoo
(°)
1.60 1.00 0.67 0.67 0.76±0.10 0.80±0.15 0.84±0.2
0.18 0.18 0.15 0.15 0.20±0.05 0.25±0.10 0.55±0.4
At the substrate temperature of 150°C an increasing film thickness has no influence on the mosaic spread of the (lll)-oriented epitaxial Carcrystals, but leads to an improvement of the azimuthal alignment of the Carcrystals. At the higher substrate temperature of 200°C the mosaic spread and the azimuthal alignment of the (lll)-oriented Carcrystals are independent of the increase of the film thickness up to 200 nm. The orientation of the thin films seems to be determined during the first stages of film growth. On an average an increase of the film thickness up to 1.3 Lim results in the deterioration of the values of the mosaic spread and the azimuthal alignment. In additional (11 l)-pole figures no growth of first order twins up to 1.3 u,m is observed. The mean deviation of ACü and A<6 increases with the film thickness. Due to the high film thicknesses a long time for deposition is necessary. A slight instability of the source can result in a change of the deposition rate, which is a very sensitive parameter for the Qo-growth. This argument is confirmed by the fact that Aco deviates more strongly from the optimal values than A<& (see table), which appears, if the deposition rate is changed.
402

An early stage of the epitaxial growth of Ceo-fflms on mica(OOl) is illustrated in Fig. 4 for the substrate temperature of 150°C (a) and 200°C (b). The thin films are in the stage of island-growth [10]. The average height of the islands can be determined to 10 nm (a) and 20 nm (b). It is not possible to compare the growth stages at the same film thickness for both substrate temperatures, because island-coalescence at 150°C is more pronounced. At the substrate temperature of 150°C the average lateral expansion of the islands is 150 nm, the ledges of the single islands are irregular formed and no orientational relationship between the substrate and the islands is observable. As a consequence, at higher film thicknesses many grain boundaries exist which can act as energetical sink for new nuclei during the further film growth and are responsible for the fibre texture observed at 100 nm film thickness.
WS&
(a)
Fig. 4: The influence of the substrate temperature of 150°C (a) and 200°C (b) on the topography of the CM-islands measured by AFM
The topography of the islands is obviously different for the substrate temperature of 200°C. The mean size of the C«>-islands varies between 300 nm and 550 nm, the hexagonal shape of all islands is easly to observe. The single ledges of the hexagonal structure of the different CM- islands are parallel oriented to each other. The number of the Ceo-islands is smaller and the mean size of the islands is distinctly larger at the substrate temperature of 200°C than at 150°C. The alignment of the islands during the initial stage of growth deduced from the topography of the very thin films agrees with the results of the pole figure measurements on films grown to higher thicknesses.
This post-nucleation growth is well-known for deposition of metal films on mica (see e.g. ref. [11]) and has been described as the so-called liquid-like-coalescence [12]. The mechanism of the liquid-like-coalescence is characterized (1.) by a continous decrease in the number of islands per unit area and (2.) by an increase of the average island size. Moreover, this process is coupled with a reduction of the surface energy (surface tension) and results in the formation of a greater amount of large and equiaxed islands. Consequently, a preferred two-dimensional growth of the islands and an epitaxial alignment between the CM-islands and the mica(001)-substrate could be observed [8]. The consequence is a reduced number of grain boundaries. Further it can be shown
403

that the ledges of the islands are sharp and are not rounded up during the coalescence process. A detailed description of the heteroepitaxial growth process is given in Ref. [8].
SUMMARY
Thin Ceo-films are deposited on mica(OOl) by thermal evaporation at substrate temperatures between room temperature and 225°C. The dependence of the structure and the epitaxial alignment of the thin Ceo-films on mica(OOl) on the substrate temperature and the film thicknesses up to 1.3 |i.m at a well-defined deposition rate (0.008 nm/s) is investigated by atomic force microscopy and X-ray diffraction.
By (lll)-C«) pole figures it can be demonstrated that the nucleation process on mica(OOl) is determined by two independent and equivalent Qo-crystal grain orientations. Above a critical film thickness the variation of the substrate temperature up to 225°C leads to smooth, completely coalesced epitaxial Qo-thin films characterized by an average roughness smaller than 1.5 nm, a mosaic spread of A© = 0.1° and an azimuthal alignment of AO = 0.45°. For comparable film thicknesses the formation and loss of defect structures depend on the substrate temperature. During the island growth (Volmer- Weber-mode) the growth process is extremely sensitive on the deposition parameters as e. g. the substrate temperature. In early coalescence stages the formation of twins may be observed. The number of twinned particles decreases as the growth continues.
ACKNOWLEDGMENTS
The authors are indebted to Hoechst AG, Frankfurt, for providing Qo-materiaL
REFERENCES
[I] D. Schmicker, S. Schmidt, J. G. Skofronick, J. P. Toennies, and R. Vollmer, Phys. Rev. B 44, 10995 (1991)
[2] W. Krakow, N. M. Rivera, R. A Roy, R. S. Ruoff, J. J. Cuomo, AppL Phys. A 56,185 (1993) [3] H. G. Busmann, R. Riss, H. Gaber, I. V. Hertel, Surf. Sei. 289,381 (1993) [4] J. E. Fischer, E. Werwa, P. A Heiney, AppL Phys. A 56,193 (1993) [5] A. Faratash, Appl. Phys. Lett. 64, 1877(1994) [6] S. Henke, K. H. Thiirer, J. K. N. Lindner, B. Rauschenbach, B. Stritzker, J. AppL Phys. 76,
3337 (1994) [7] S. Henke, K. H. Thiirer, S. Geier, B. Rauschenbach, B. Stritzker, AppL Phys. A in press [8] S. Henke, K. H. Thiirer, B. Rauschenbach, B. Stritzker, in preparation [9] H. Gaber, AppL Phys. Lett. 65,378 (1994) [10] M. Volmer, Kinetik der Phasenbildung, Steinkopf, Dresden 1939 [II] A A Baski, H. Fuchs, Surf. ScL 313,275 (1994) [12] D. W. Pashley, Materials Science and Technology, VoL 15, Processing of Metals and Alloys,
VoL ed.: R. W. Cahn, VCH-Verlagsgesellschaft, Weinheim, 1991
404

LOW TEMPERATURE FORMATION OF ß-SiC BY Cso-DEPOSITION ON SILICON
S. Henke, B. Rauschenbach, and B. Stritzker Institut für Physik, Universität Augsburg, D-86135 Augsburg, Germany
ABSTRACT
By deposition of Ceo on silicon at moderate temperatures (800°C ... 900CC) the formation of thin epitaxial ß-SiC-films on Si could be proved. Ceo -molecules were deposited onto Si(001) and Si(l 11) in high-vacuum at constant deposition rates for some hours. The thickness and the composition of the formed layers are determined by Rutherford-Backscattering (RBS). The thickness of the layers varied between about 50nm and 200nm in dependence of the deposition parameters. From the shape of the RBS-spectra only ß-SiC can be identified. SiC-grains with a mean size of about 500 nm have been observed by atomic force microscopy (AFM). X-ray diffraction (XRD) pole figure measurements demonstrate the heteroepitaxial growth of ß-SiC on Si. It can be shown by XRD that only the cubic structure (ß-SiC) of the different polytypes of SiC was formed during the carbonization process. The formation of growth defects (twins) can be observed.
INTRODUCTION
Epitaxial SiC-layers on silicon have attracted much interest for applications in optoelectronic and electronic devices to operate at high frequencies, high temperatures and high powers. In particular, ß-SiC has wide band gap (2.2 eV) and high electron mobility (1000 cmWs) at room temperature, an electron saturation velocity of more than 2 * 107 cm/s, a breakdown voltage of about 3 * 106 V/cm and a very high operating temperature of 1250 K [1,2]. However, high purity and high quality SiC-layers on Si wafers are not commercially available in size above 2 inch.
Silicon carbide is a closed-packed material which exhibit a one-dimensional polytypism. The different SiC polytypes are characterized by differences in the stacking sequences of the tetrahedrally bonded Si-C Mayers. Different polytypic forms of either hexagonal, rhombohedral or cubic symmetry were found ( see e.g. ref. [3]). The cubic structure exists only as 3C-SiC, termed ß-SiC (zinc blende type), whereas the hexagonal polytypes are collectively termed as a-SiC (e. g. 6H-SiC, wurtzite type). It is ß-SiC which is attractive for optoelectronic and electronic applications.
Several techniques, the low and atmospheric pressure CVD, the gas-source molecular beam epitaxy (GSMBE) and the plasma-enhanced CVD have been successfully used to produce ß-SiC layers on silicoa The high growth temperatures (> 1000°C... 1300°C) result in high tensile stress because of the 20 per cent lattice mismatch between SiC and SL Due to the difference in thermal expansion coefficients between Si and SiC crystalline lattice defects are generated when cooled down. The defects and the strain in heteroepitaxial films degrade the carrier mobility, increase the junction leakage current and are incompatible with the VLSI processing.
Recently, Hamza et aL [4] have proposed a technique to produce silicon carbide films on oriented Si-substrates via Ceo precursors at temperatures between 950 and 1250 K. Silicon carbide films have been grown with very high growth rates and up to thicknesses greater than 1 (xra Recently the preferred orientation of ß-SiC, grown on Si(001) and Si(lll) with a modified technique, has been shown [5]. Based on the results obtained by the characterization of the epitaxial growth of Cso on mica [6] new aspects of the synthesis and growth of cubic ß-SiC using Ceo-carbonization of silicon at moderate temperatures between 800°C and 900°C are presented in this paper.
405
Mat. Res. Soc. Symp. Proc. Vol. 359 e 1995 Materials Research Society

quartz monitor
Shutter
^ i Kni ceE
Fig. 1: Schematical view of the evaporation chamber
Ta-heatewitfa EXPERIMENTAL Sl=SUbstrate In Fig. I a schematical view of
the evaporation apparatus is shown. The distance between the substrate holder and the Knudsen cell is adjusted to nearly 8 cm. Before starting the sublimation process the Knudsen cell filled with Cm- powder of 99.9% purity was heated up to nearly 400°C in vacuum. The Ta-heater onto which the silicon substrates were fixed was heated up to nearly 1000CC in vacuum for less than four hours. Under these conditions the base pressure was in the range of IGT7 Torr. In this process step the native silicon oxides, which prevent a reaction of the sublimed Ceo-molecules with the
silicon surface, were removed. When the deposition rate was kept constant and
the preheating process was finished, the shutter in front of the substrate holder was removed and the substrate temperature was lowered to a value between 800°C and 900°C, simultaneously. The deposition rate was measured by the quartz monitor. The time for deposition ranged between 5 and 18 hours at a constant deposition rate of 0.01 nm/s. The heating of the silicon substrate was stopped, immediately after finishing the deposition process.
The thin films were characterized by Rutherford-Backscattering (RBS), atomic force microscoppy (AFM) and X-ray diffraction (XRD). The carbon and silicon concentrations depth profiles of the formed layers were analyzed by RBS. The following parameters for the RBS- measurements were chosen: He+Mons with a total energy of 3 MeV, a current of 30 nA and the detector angle 0 = 170°. The topography of the surface of the formed layer was investigated by AFM in air. To investigate the orientational alignment between the thin film and the substrate X- ray diffraction measurements with a four-circle goniometer were performed. {lll}-pole figures were measured with 2c-step width both in polar direction % and in azimuthal direction «&. The determination of the full width at half maximum (FWHM) of different pole density maxima in polar and azimuthal directions, A% and A<&, was done at smaller step widths with a resolution in A% of 1.6° and in A* of 0.3°, respectively.
RESULTS AND DISCUSSION
Information about the carbon-silicon reaction and interdiffusion phenomena as obtained by RBS is illustrated in Fig. 2a-c. There different energy spectra are compared for samples after C«>- carbonization at different temperatures of the Si(001)-substrate for 15 hours. Fig. 2a shows the backscattering yields of silicon after Ceo-carbonization at 850°C compared with the corresponding random backscattering spectrum of Si(001) after annealing at 1000°C for 1 hour in high vacuum in order to remove the oxides before carbonization (reference spectrum). In comparison to the reference spectrum the Si-spectrum after carbonization at 850°C is characterized by decrease of the high energy Si-edge. The spectrum exhibits the presence of a continuous layer in the near-
406

Energy (MeV) 1.45 1.50 1.55 1.60 1.65 1.70 1.75
Energy (MeV) 1.45 1.50 1.55 1.60 1.65 1.70 1.75
r
900 Channel
1000
(a)
Energy (MeV) 1.55 1.60 1.65 1.70 1.75
(b)
Fig. 2: RBS-spectra of a Si(100) substrate onto which Cöo-molecules were deposited for 15 hours at a substrate temperature of about 850°C (a) and at a substrate temperature lower than 850°C (b). In Fig. 2(c) the spectrum (a) is compared with a simulation done by RUMP. The RBS-spectra of Fig. 2 (a) and Fig. 2 (b) are compared with the RBS-spectra of a Si(100) substrate preheated at 1000°C in vacuum .
1000
(c)
surface region of silicon (plateau) and a parabolic increase of the Si-backscattering yield with increasing depth. This behaviour corresponds to the interdiffusion of carbon and silicon and the formation of silicon carbides. Fig. 2b illustrates the influence of a smaller temperature of the silicon substrate during Coo-carbonization. Also in this case the same amount of COO has been deposited. When the temperature of the substrate is smaller than 850°C, then a formation of the concentration plateau could not be observed.
The evaluation of the RBS data was performed with the computer code RUMP [7]. An example is given in Fig. 2c. In this case, the backscattering spectrum of silicon after Cm- carbonization at 850°C for 15 hours (obtained from Fig. 2a) was evaluated (smoothed line in Fig
407

&';*".*•'. *"* Sim'\.♦•'■''-*'• - <.'■ \ ■■■v\ •; i
Fig. 3: AFM micrograph of a formed SiC-layer on SKOODbyC«, carbonization at about 850°C (scan area: 10 * 10 um2)
2c). The plateau of the composition can be clearly seen and corresponds to the stoichiometric phase SiC with a thickness of about 120 nm. On the low-energy edge of the plateau the parabolic increase of the Si-backscattering yield was fitted using a least squares method to the
complementary errror function. In a rough approximation the diffusion coefficient of carbon at 850° C was determined to 2* 10"15 cm2/s [5].
A view on the surface of a SiC-layer grown on Si(001) at a substrate temperature of nearly 850°C for 15 hours is shown in Fig. 3. In the figure an area of 10 * 10 ixm2 is illustrated. The reaction of the incoming Coo-molecules with the silicon surface changed obviously the silicon surface topography. The grains have a mean size of 0.5 (xm and the
shape of the grains is rounded. The SiC- grains are arranged on top of each other in the form of terracces. The height difference
Fig. 4. {Ill}- pole figure of a thin SiC- film on silicon(lll) evaporated at a substrate temperature of about 850°C for 15 hours.
408
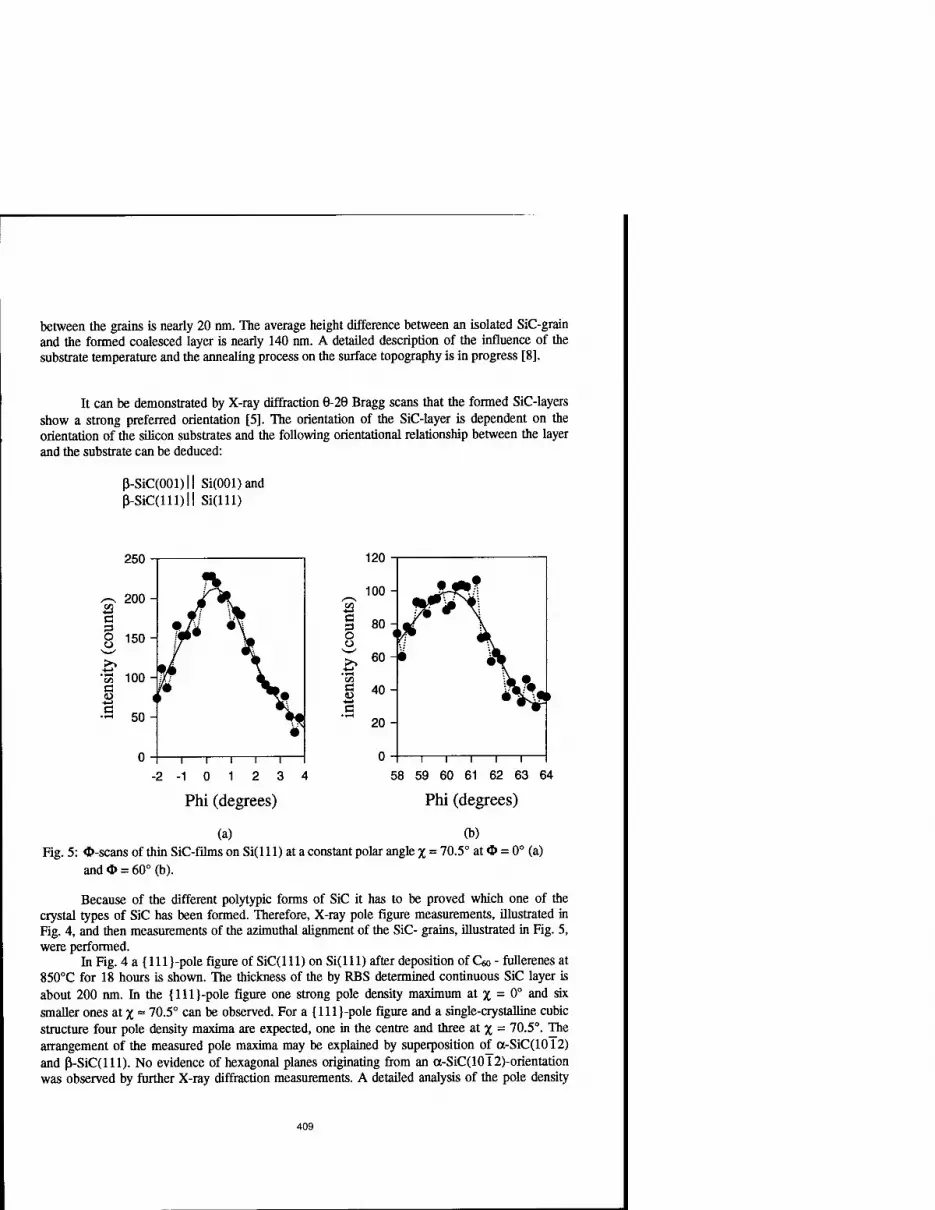
between the grains is nearly 20 nm. The average height difference between an isolated SiC-grain and the formed coalesced layer is nearly 140 nm. A detailed description of the influence of the substrate temperature and the annealing process on the surface topography is in progress [8].
It can be demonstrated by X-ray diffraction 6-29 Bragg scans that the formed SiC-layers show a strong preferred orientation [5]. The orientation of the SiC-layer is dependent on the orientation of the silicon substrates and the following orientational relationship between the layer and the substrate can be deduced:
ß-SiC(001)ll Si(001)and ß-SiC(lll)ll Si(lll)
250 120
100-
c o o
g
Phi (degrees)
(a)
i 1 1 1 r 58 59 60 61 62 63 64
Phi(degrees)
Fig. 5: *-scans of thin SiC-films on Si(l 11) at a constant polar angle % ■■ and * = 60° (b).
(b) :70.5°at* = 0°(a)
Because of the different polytypic forms of SiC it has to be proved which one of the crystal types of SiC has been formed. Therefore, X-ray pole figure measurements, illustrated in Fig. 4, and then measurements of the azimuthal alignment of the SiC- grains, illustrated in Fig. 5, were performed.
In Fig. 4 a {111 }-pole figure of SiC(lll) on Si(l 11) after deposition of Ceo - fullerenes at 850°C for 18 hours is shown. The thickness of the by RBS determined continuous SiC layer is about 200 nm. In the {lll}-pole figure one strong pole density maximum at % = 0° and six smaller ones at % ~ 70.5° can be observed. For a {lll}-pole figure and a single-crystalline cubic structure four pole density maxima are expected, one in the centre and three at % = 70.5°. The arrangement of the measured pole maxima may be explained by superposition of a-SiC(1012) and ß-SiC(lll). No evidence of hexagonal planes originating from an a-SiC(1012)-orientation was observed by further X-ray diffraction measurements. A detailed analysis of the pole density
409
maxima on the outer ring (% = 70.5°) is shown in Figs. 5a and 5b, e. g. at <|> = 0° and $ = 60°. The intensity of the pole density maximum at <)> = 0° is more than 2 times higher than at <J> = 60°. The intensity of these maxima has to be the same, if the pole density distribution would originate from an a-SiC polytype. Therefore it can be concluded that the main peaks in the pole figure are results from the diffracted intensities of lattice planes of the cubic ß-SiC grains. The weaker pole density maxima in Fig. 5b result from ß-SiC(lll) grains which are rotated by 60° about the surface normal and can be attributed to twins. A similar analysis can be carried out for ß-SiC(OOl) layers on Si(001), which also demonstrate that only the cubic structure is formed during the formation process [5].
CONCLUSION
In conclusion, epitaxial ß-SiC layers have been prepared on silicon by Ceo - carbonization at moderate temperatures ( 800 ... 900°C ). The layers were analyzed by RBS, AFM and XRD. The formation of silicon carbides is characterized by an interdiffusion process of carbon and silicon. Continuous layers could be produced with thicknesses up to 0.2 p.m. A decrease of the substrate temperature below to about 850°C does not result in the formation of continuous SiC-layers. At a temperature of about 850°C the carbon diffusion coefficient was determined to about 10 cm%. The reaction of the incoming Ceo-molecules has changed the surface topography of the silicon substrate. Using AFM grains with a mean diameter of about 500 nm have been observed. X-ray diffraction texture measurements exhibit a preferential orientation of the ß-SiC crystallites. Besides these epitaxial orientations other pole density maxima could be detected which are attributed to twins. More extended studies on the dependence of structure, topography and composition of epitaxial silicon carbide layers formed by Ceo-carbonization of silicon on the conditions of deposition are in progress.
ACKNOWLEDGEMENTS
The authors are indebted to Hoechst AG, Frankfurt, for providing Qo powder and M. Philipp for assistence.
REFERENCES
[1] D. K. Ferry, Phys. Rev. B 12,2361 (1975) [2] H. Morcoc, S. Suite, G. B. Gao, M. E. Lin, B. Svederlov and M. Burns, J. AppL Phys.
76,1363 (1994) [3] A Adamiano, in Silicon Carbide, R. C. Marshall, J. W. Faust and C. E. Ryan (Eds), Univ.
South Carolina Press, Columbia, 1974, p. 179 [4] A V. Hamza, M. Balooch and M. Moalem, Surf. ScL 317, LI 129 (1994) [5] S.Henke, B.Stritzker and B.Rauschenbach, submitted to AppL Phys. Lett. [6] S.Henke, K.H.Thiirer, J.K.N.Lindner, B.Rauschenbach and B.Stritzker, J. AppL Phys. 76,
3337 (1994); S.Henke, K.H.Thiirer, S.Geier, B.Rauschenbach and B.Stritzker, AppL Phys. A (in press)
[7] LRDoolittie, NucL Instr. Meth. B9,344 (1985) [8] S. Henke, M. Philipp, B. Stritzker and B. Rauschenbach, to be published.
410

LOW TEMPERATURE INTERNAL FRICTION OF THIN FULLERENE FILMS
B. E. WHITE JR., J. E. FREUND, K. A. TOPP, AND R. O. POHL Laboratory of Atomic and Solid State Physics, Cornell University, Ithaca, NY 14853-2501
ABSTRACT
The lattice vibrations of crystalline solids are generally described by traveling elastic waves. However, the vibrations of fullerene solids are expected to be quite different from typical crystalline solids because of the large molecular mass. In fact, based on measurements of thermal conductivity and specific heat, it appears that the vibrations of compacted fullerene solids are best described as localized. Only below a few Kelvin has evidence for elastic waves been found in these solids where they exist along with the localized tunneling states that are characteristic of amorphous solids. In order to verify the existence of these tunneling defects, the low temperature internal friction of thin fullerene films deposited on a silicon substrate has been measured. Fullerene films were prepared under a variety of conditions with substrate temperatures ranging from 300 K to 500 K. Film grain sizes were characterized using atomic force microscopy, as well as, scanning tunneling microscopy. Grain sizes were found to range between 100 nm and 400 nm. We find that while localized tunneling defects appear to be present in these films, they do not appear to be intrinsic to the fullerene solid. Instead, the tunneling states may be the result of residual disorder that is present in the grain boundaries of the solids.
INTRODUCTION
The first model of lattice vibrations of solids was proposed in 1907 by Einstein , who applied the quantum concept to the mechanical motion of individual atoms in a crystal lattice that he assumed to be vibrating with random phases. He subsequently found that this model was inadequate, its most drastic shortcoming being that it led to a thermal conductivity that disagreed with the observation on crystals both in magnitude and in temperature dependence. This disagreement was removed by Debye3 and by Born and von Karman , who demonstrated that in crystalline solids the atoms vibrate collectively as elastic waves. This picture has been tested extensively and is now generally accepted. Exceptions have been noted, however. In amorphous solids and certain disordered materials, for example, the thermal conductivity above ~50 K can be well described with Einstein's picture.5,6 Also, in some crystalline polymeric solids, the specific heat has been shown to be well described over a wide temperature range with a set of Einstein modes consisting of vibrational motions of certain molecular units. However, in crystal lattices of simple atomic constituents, the model of collective motion has always been found to be correct.
Recently, workers in our group have published measurements of the thermal conductivity and specific heat of compacted fullerene solids produced by compressing commercially available C60/C70 powder in a pellet press at 3000 atm.8 Their results indicated that the specific heat and thermal conductivity of these solids could be quantitatively described using Einstein's model above 4 K, indicating that the lattice vibrations in these solids are predominantly localized. In fact, only at temperatures below 4 K was evidence of elastic waves found. Here the lattice vibrations appear to consist not only of elastic plane waves but also the tunneling states that are characteristic of all amorphous solids.9 However, because these tunneling states could have resulted from disorder introduced during compaction or by impurities present in the starting powder (e.g. toluene), it was not clear that the measured low temperature properties were intrinsic to fullerenes.
Internal friction measurements are particularly useful for examining the tunneling states that exist in amorphous solids. While the information that is obtained from these measurements is essentially equivalent to that found from the low temperature thermal conductivity , the internal friction, in this temperature range ( < 1 K) is much less sensitive to problems associated with
411
Mat. Res. Soc. Symp. Proc. Vol. 359 e 1995 Materials Research Society

phonon scattering by grain boundaries. We have sought to verify the existence of tunneling states that are intrinsic to fullerene solids by performing internal friction measurements on thin fullerene films, where the disorder due to compaction should be removed. In addition, because the films are prepared at elevated substrate temperatures, problems associated with impurities in the starting powder should be minimized. Below we present the results of these measurements, as well as, results obtained from characterization of the thin films using scanning tunneling microscopy (STM) and atomic force microscopy (AFM). Results of internal friction measurements performed on the compacted fullerene solids are also presented.
EXPERIMENTAL DETAILS
Thin Film Preparation and Characterization
Thin fullerene films were produced by sublimation of commercially available C60/C70 powder. The sublimation chamber consisted of a turbo pumped, Pyrex "double tough" glass tube. The chamber's base pressure was limited by the use of Viton O-rings to lxlO"7 mbar after one day of pumping. The sublimation stage was a small stainless steel furnace which contained a small orifice that could be filled with C60/C70 powder. Heat to the furnace was provided by 3 mil tungsten wire. The sample stage consisted of a small aluminum block which could also be heated to a temperature of 250 °C.
In order to verify that the deposited fullerene films were indeed crystalline, a Nanoscope in operating in the STM mode was used to characterize the films. These films were deposited on substrates that consisted of 110 nm gold films sputtered on mica platelets which were held at 250 °C. The fullerene films were deposited at a rate of 0.02 Ä sec-1 which was achieved with a furnace
temperature of 430 °C. The thickness of these fullerene films ranged from submonolayer coverage to 30 monolayers.
Our first images were obtained on films with submonolayer coverage, which were deposited on substrates held at room temperature. They showed spherical protrusions with a diameter of 0.7 ± 0.1 nm, which we interpreted as COO molecules. The arrangement of the molecules was best
described as disordered. Films that were deposited at a substrate temperature of 200 °C showed much more order, with the fullerene molecules being hexagonally arranged in crystalline domains with diameters of 30 nm and nearest neighbor distances of 1.00±.02 nm. These domain sizes were probably limited by the width of terraces that were present on the underlying gold structure. It is interesting to note that in some images, molecules with diameters of 0.8 ± 0.1 nm could be seen. Their heights appeared to be 0.1 + 0.05 nm above the average height of the other molecules. Because of this small additional height, we could exclude the possibility that these features were caused by a second layer of COO molecules. We, instead, attributed these features to molecules of C70. In several images, the number of these protrusions were counted and it was determined that the number of protrusions was about 13% of the total number of molecules, in good agreement with the 15% natural abundance of C70 present in the starting powder. Also, in many of the images the C70 molecules exhibited an internal structure. While an imaging artifact could not be excluded, a likely explanation for this structure would be the absence of rotation of the C70 molecule.
Unfortunately, internal friction measurements could not be obtained on films as thin as those that were characterized by STM. Thus, atomic force microscopy was also used to study the topographic and morphological structures of the fullerene films deposited on double side polished, <100> silicon wafers. An AFM is ideal for these studies since it allows examination of the surface topography at scales ranging from nanometers to micrometers. Furthermore, in contrast to the STM, the AFM allows imaging of thicker films of non conducting materials.
The AFM work was also carried out using the Nanoscope HI operating in both the constant force mode as well as tapping mode. Measurements made in the constant force mode revealed
412

0 50 100 150 200 250 Substrate Temperature / C
Figure 1 The grain size of C60/C70 films as a function substrate temperature. The grain sizes were determined using Atomic Force Microscopy. The substrates were double side polished <100> silicon wafers
several interesting features. The fullerene films usually exhibited a granular structure with grains of varying shapes. Grain sizes of films that were deposited at 200 °C on a silicon substrate are ofthe order of 200 nm to 300 ran in diameter. These measurements were repeated on films prepared from pure COO as well as C60/C70 No significant effect on grain size or shape could be observed. Tapping mode images of the fullerene films did not provide additional information on grain sizes or height variations, however, the images seemed to reveal more clearly the shapes of the grains themselves.
In order to investigate the dependence of grain size on substrate temperature, four samples were prepared at substrate temperatures of 23 °C, 77 °C, 132 °C, and 200 °C and evaporation rates of 0.02 Ä sec"1. The thickness of the film in each case was 50 nm. The results are shown in figure 1. As expected, the grain size increased from 120 nm at the lowest substrate temperature to 395 nm at a substrate temperature of 132 °C. However, for the sample whose substrate
temperature was 200 °C, the grain size decreased to a value of 325 nm.
Compacted Solid Preparation
C60/C70 compacted solids were produced by compressing the as received powder in a pellet press at 3000 arm, which resulted in pellets of a strength comparable to that of soft pencil graphite. This procedure enabled us to prepare samples of sufficient size to perform internal friction measurements. Their mass density p = 1.54 g cm"3 (+10%) was close to the theoretical density (ptheor = 1-676 g cm"3) of the face-centered-cubic (fee) lattice. From Debye-Scherrer x-ray diffraction measurements, an fee lattice constant of a = 14.1 ± 0.1 Ä was determined, which was near the accepted value for pure COO (a60 = 14.186 Ä).
Internal Friction Measurements
413

Internal friction measurements of thin fullerene films were carried out using a technique developed in our group. The technique utilizes a substrate in the shape of a double paddle oscillator. The oscillator is produced from 0.3 mm, ultra high purity, <100> silicon wafers. The oscillator is operated in the so called antisymmetric mode to minimize clamping losses. The bare oscillator has a background internal friction of 3xl0"8 at 4 K and a resonant frequency of 5.3 kHz. The internal friction of a thin film can be determined by depositing a thin film onto the oscillator and measuring the change in its internal friction caused by application of the film.
A 650 nm, thin fullerene film was deposited onto one of these oscillators which was held at a temperature of 200 °C (hereafter, this film is referred to as the "well prepared film"). The grain size of the film was measured by AFM and determined to be approximately 300 nm, in agreement with measurements mentioned above. In addition, a thin film was also deposited onto an oscillator held at room temperature in a conventional thermal evaporator (hereafter known as the "poorly prepared film"). The evaporation rate for this sample was 20 Ä sec-1 with an ultimate film thickness of 500 nm. The internal friction measurements were carried out in a pumped He3 cryostat between temperatures of 0.5 K and 120 K and a He3/He4 dilution refrigerator between 0.070 K and 1.5 K.
Internal friction measurements on the compacted solid were performed using a compound oscillator which consisted of a quartz transducer and the compacted solid.11 The compacted solid was glued to the transducer using Stycast 2850 epoxy. The length of the sample was chosen in such a manner as to minimize the effect of the epoxy on the internal friction. These measurements were carried out in an insertible cryostat between 1.2 K and 300 K and in a He3/He4 dilution refrigerator between 0.060 K and 1.5 K. Internal friction measurements were performed on compacted solids in the as prepared state at a frequency of 85 kHz. In addition, internal friction measurements at a frequency of 125 kHz were also performed on solids that were vacuum annealed at temperatures of 200 CC in an attempt to remove any residual solvent remaining in the powder.
RESULTS
The results of the internal friction measurements on the two thin films are shown in figure 2a. Both films show a large peak in the internal friction at a temperature of approximately 100 K, which may be associated with the formation of an orientational glass state. This is followed by a sharp decrease which eventually develops into a temperature independent damping at temperatures below 4 K. The magnitude of this damping is dependent upon the method of film preparation, with the magnitude of the "well prepared film" being 2xl0-5 while the magnitude of the "poorly prepared film" is 1.4xl0"4. Measurements on the "well prepared film" were extended to lower temperatures where the damping begins to decrease, again, at temperatures below 200 mK.
The results for the compacted solids are quite similar, as is shown in figure 2b. The large peak at around 100 K appears to be masked by an additional peak at approximately 180 K. Again, the internal friction drops of quickly below the peak eventually developing a flat, temperature independent damping which depends on the method of sample preparation. For the as prepared solid, the magnitude of this damping is 1.9xl0-4, while the vacuum baked solid has damping of 7.6xl0"5. The internal friction of both solids then begins to decrease at temperatures below 500 mK.
DISCUSSION
The low temperature internal friction of all amorphous solids is very similar to that of a-SiC>2 which is shown for purposes of comparison in figure 2a. The internal friction of these solids can generally be broken into two regions. At temperatures above a characteristic temperature, which depends on the measuring frequency, the internal friction is temperature independent with a
414

IQ'1
10"'
! (a)
10 -
Q1
io-4^
10';
10<
m, 1—n-rrmj—
■- 500nmC6,>C70 •
650nmC60\C70
10"z 10"1 10° 101 102
Temperature / K 10'
IQ"1
10"
io-3
Q-1
i<r
io-;
io-(
(Vacuum baked)
IO'2 10"1 10° IO1 102
Temperature / K IO3
Figure 2 (a) The internal friction of thin fullerene films. The 500 nm film was prepared by sublimation of C60/C70 powder at a rate of 20 Ä sec"1 onto a substrate held at room temperature. The 650 nm film was prepared by sublimation of C60/C70 powder at a rate of 0.02 Ä sec-1 onto a
substrate held at a temperature of 200 °C. (b) The internal friction of two compacted C60/C70 solids. One solid was vacuum baked at a temperature of 200 °C in an attempt to remove residual impurities.
magnitude between 10"4 and 10"3. This is known as the plateau region. Below this characteristic temperature, the internal friction begins to slowly decrease, eventually falling off like T3. This characteristic internal friction is believed to be caused by the interaction of sound waves with lowenergy excitations that are due to some tunneling entity. Moreover, the magnitude of the internal friction in the plateau region is directly proportional to the density of tunneling states.
As can be seen in figure 2a, the low temperature internal friction of the "poorly prepared film" is very similar to that found in amorphous solids both in temperature dependence and magnitude. The internal friction of the "well prepared film" is also similar to that of amorphous solids but only in its temperature dependence. We are thus forced to conclude that the tunneling states that are characteristic of amorphous solids are present in these films. However, because the magnitude of the damping in the plateau region is dependent on the method of sample preparation, it appears that these tunneling states are not intrinsic to the fullerene solid. This is illustrated further by the results for the internal friction obtained on the compacted solids, where again the magnitude of the damping in the plateau region depends on the method of preparation.
The origin of the apparently extrinsic tunneling states remains a mystery. Conceivably, it is possible for the tunneling states to be caused by the presence of the C70 molecules. However, we have performed preliminary internal friction measurements on thin films prepared from pure COO and similar results to those mentioned above for the "well prepared film" have been found. These results are somewhat tenuous because of the inability of the pure Cßo films to survive the thermal cycling between 1 K and room temperature.
Another possible explanation for the extrinsic tunneling states is the residual disorder that is present in the grain boundaries of the thin films and compacted solids. Since this affect should become smaller as the grain sizes increase, we would expect that the internal friction of the "well prepared film" would be smaller than in the "poorly prepared film," as is the case. This effect can
415

be easily verified by correlating the magnitude of the internal friction in the plateau region with the measured grain size. Unfortunately, measurements of the grain size of the "poorly prepared film" were not performed. However, we can still infer an expected effect from our study of the grain size present in the "well prepared films" as a function of substrate temperature. As can be seen in figure 1, the grain size of the "well prepared films" is approximately a factor of three smaller for thin films which are deposited at room temperature when compared to those deposited at 200 °C. Thus, if the extrinsic tunneling states are due to disorder present in the grain boundaries, the magnitude of the internal friction in the plateau region should be a factor of three larger for a film deposited at room temperature. This is in good agreement with the measured factor of five difference in the "well prepared film" and the "poorly prepared film."
CONCLUSIONS
In order to verify the existence of tunneling states in fullerene solids, the low temperature internal friction of thin fullerene films deposited on silicon substrates has been measured. In addition, the internal friction of compacted fullerene solids has also been measured. We find that the tunneling states that are characteristic of amorphous solids are present in both the thin film as well as the compacted solid. However, these tunneling states do not appear to be intrinsic to the fullerene solid. Instead, the tunneling states may be the result of residual disorder that is present in the grain boundaries of these solids.
ACKNOWLEDGEMENTS
This work was supported by the National Science Foundation, grant no. DMR-91-15981, the Materials Science Center at Cornell University, the Semiconductor Research Corporation, grant no. 92/SC/069, and the U.S. Department of Education Graduate Fellowship Program in Materials Science, grant no. P200A10148.
REFERENCES
'A. Einstein, Ann. Phys. 22, 180 (1907). 2A. Einstein, Ann. Phys. 35, 679 (1911). 3P. Debye, Ann. Phys. 39, 789 (1912). 4M. Born and Th. Von Karman, Phys. Z. 13, 297 (1912). 5D.G. Cahill and R.O. Pohl, Solid State Commun. 70, 927 (1989). 6D.G. Cahill, S.K. Watson, and R.O. Pohl, Phys. Rev. B 46, 6131 (1992). 7M. Meissner, A. Tausend, and D. Wobig, Phys. Status Solidi A 49, 59 (1978). 8J.R. Olson, K.A. Topp, and R.O. Pohl, Science 259, 1145 (1993). For a review see Amorphous Solids: Low Temperature Properties, edited by W.A. Phillips
(Springer, Berlin, 1981). 1 B.E. White, Jr. and R.O. Pohl, in Thin Films: Stresses and Mechanical Properties V, Eds., S. P. Baker, P. B. Borgesen, P. H. Townsend, C. A. Ross, and C. A. Volkert, MRS Symposia Proceedings No. 356 (Materials Research Society, Pittsburgh, PA, 1995), in press. nD.G. Cahill and J.E. Van Cleve, Rev. Sei. Instrum. 60, 2706 (1989).
416
STRUCTURAL CHARACTERIZATION OF FULLERENE THIN FILMS FABRICATED BY
ORGANIC MOLECULAR BEAM DEPOSITION
Kiyoshi YASE, Takuya SARAYA* and Kazuhiro KUDO* National Institute of Materials and Chemical Research,
1-1 Higashi, Tsukuba, Ibaraki 305, Japan * Department of Engineering, Chiba University,
1-33 Yayoi-cho, Inage-ku, Chiba 263, Japan
ABSTRACT
Fullerene C60 thin solid films have been fabricated on the (001) surfaces of alkali halides (NaCl, KC1 and KBr) and muscovite by organic molecular beam
deposition (OMBD) technique. Pure C60 powder was sublimated from the pre- cisely temperature-controlled K-cell at low pressure (10 "7 Torr) and deposited onto the substrates kept in the range 125 - 300 °C. Increasing both the tempera- ture of K-cell and the substrate temperature, fine crystals grow with different size, shape and distance between neighbors. The dependence of the size and density of island crystals on the deposition conditions revealed the mechanism of crystal growth and the effect of interaction between molecules and substrate
surface.
INTRODUCTION
Polycrystalline fullerene C60 thin films have been intensively investigated [1-4]. In order to understand the physical and electrical properties of thin films, it is necessary to fabricate films with controlled structure and well characterized defects and dislocations. However there are less works in the field with respect to
crystal growth of the thin films [5-7]. In the field of semiconductors such as Si and GaAs, the molecular beam epitaxy (MBE) technique has been applied to
prepare the high quality thin films [8,9]. This technique is also promising alter-
native to fabricate organic films, although it just started [10]. We have already investigated the formation mechanism of thin films from
the thermodynamic point of view for several materials; long chain compound (Calcium stearate) [11,12], charge transfer complex (TTF-TCNQ) [13,14], organic dye (Alq3) [15] as well as C60 [16,17]. It is well known that the mole-
cular structure drastically affected the growth mechanism with respect to the substrate, especially for epitaxial growth. The nucleation and crystal growth
417
Mat. Res. Soc. Symp. Proc. Vol. 359 ° 1995 Materials Research Society

depend on the interaction between molecules, and between molecules and sub- strate surface. If the numerical analysis were successively and systematically done, it should promote the fabrication of epitaxially grown thin crystals of functional organic materials.
EXPERIMENTAL
C60 powder (purity 99.97 %) was purchased from Vacuum Metallurgical Co. Ltd. and used without any further purification. The Knudsen cell containing
C60 (diameter 10 mm and height 80 mm) has been connected to a temperature controller operating in the range 300 - 550 °C at pressure of 1 x 10 ~7 Torr. The
substrates have been air-cleaved along the (001) surfaces for alkali halides such as
NaCl, KC1 and KBr, and muscovite. Prior to deposition the substrates are backed at 300 °C for 1 hour under vacuum. Deposition has been performed at various substrate temperatures and for different deposition times in the range 125 - 300 °C and 1 min - 16 hours, respectively. After deposition the samples pick out from the vacuum chamber for observation of the morphology. The thin films on the substrates have been reinforced by vacuum-deposited carbon film with a thickness of 3 - 5 nm, then stripped off from the substrates on the surface of distilled water and transferred onto Cu grids. The morphological observation was carried out using Zeiss CEM-902 with an accelerating voltage of 80 kV. To
emphasize the image contrast the inelastically scattered electrons with AE = 50 eV and the energy width of 20 eV were employed in recording the pictures [18].
RESULTS AND DISCUSSION
Figures 1 and 2 are transmission electron micrographs of thin films formed on the (001) surfaces of NaCl (a), KC1 (b), KBr (c) and muscovite (d),
respectively. The deposition conditions have been as follows: the temperature of K-cell (Tf) and substrates (Ts), and the deposition time (f) were 500 °C, 125 °C and 10 min for Fig. 1 and 450 °C, 200 °C and 10 min for Fig. 2.
In the previous work [19], the evaporation rate (J : molecules/m 2«sec) was evaluated by thermogravimetry: J = 10 20 molecules/m 2«sec for Tf = 500 °C, 10 19 for 450 °C, and 10 18 for 300 °C. The shape of K-cell, the ratio of radius to length, leads to the Clausing factor (K ) of 0.2. It means that 20 % of the sublimated molecules can spout from the top of K-cell. If uniform sublimation occurred from the bottom of K-cell, the effective molecular flux (Jeff) can be
calculated as follows:
418

Figure 1 Transmission electron micrographs of C60 films formed on NaCl
(a), KC1 (b), KBr (c) and muscovite (d). The tem- peratures of K-cell and substrates are 500 °C and 125 °C, respectively.
Figure 2 Transmission
electron micrographs of C60 films formed on NaCl (a), KC1 (b), KBr (c) and muscovite (d). The tem- peratures of K-cell and substrates are 450 °C and
200 °C, respectively.
419

Jeff =J'K' cos (3°) • (1 x 10 -2 (m)) 2 / (jt • (20 x 10 -2(m)) 2 )
= 1.5 x 10⁻⁴.;
= 10 -4 to 10-6 molecules/nm 2«sec.
According to the geometrical characteristic of the deposition system, the distance between K-cell to the substrate (20 cm) and the size of substrate (10 x 10 mm 2),
the prospective solid angle is 3 °. When the deposition was carried out at Tf = 500 °C, Ts = 125 °C and t = 10 min, averaged film thickness was 10 nm. Since the size of fullerene molecule is 1 nm in diameter, the sticking coefficient should be ca. 0.5. In this experiment the re-evaporation of C60 molecules has been neglected.
The shape of nano-crystals strongly depended on the kinds of substrate. Indeed, C60 tended to form dendrites on the surface on alkali halides whereas it formed cap-shape crystals on muscovite. The size of nano-crystals also depended
on Tf. Increasing Tf, nano-crystal dimension tended to increase and the distance between islands decreased. Especially above 450 °C molecules on alkali halide
formed dendrites. It means that at higher Tf so many molecules existed on the substrate to reach easily to the stable crystals. The deposition condition during film growth should be optimized.
To evaluate the diffusion length of C60 molecules on the substrate surface, the dependence of crystal size and distance between adjacent nano-crystals versus the temperature of substrate (Ts) was examined at constant Tf = 450 °C. Figure 3 shows the dependence of crystal size (a) and distance between the adjacent islands
(b) versus Ts. Increasing Ts might activate the migration of molecules on the substrate surface to lead the formation of larger crystals (100 - 600 nm) and the longer diffusion length (200 nm - 2.5 ftm). Because no molecules between islands could be observed, molecules are except to diffuse from the landing position to the edge of mere stable nano-crystals. This confirms that the crystal size and the distance can be considered as the growth rate (vgrowth) and the diffusion
velocity (vdiff) on the substrate. So the dependence of vgrowth and vrfiffon the inverse of Ts leads the activation energy for crystal growth (A Egrowth) and surface migration (A Ediff) of fullerene molecules as follows:
v = A • exp (- A EI RT),
where A is a pre-exponential factor and R is a gas constant (8.31 J / mol • K). From the experimental data, A Egrowth and A Ediff have been estimated for
alkali halides and muscovite; 6-11 and 10 - 14 kJ/mol, respectively. Those values are ca. 1/20 compared with the sublimation energy for C60 (220 kJ/mol). In the
420

a)
£ e
N
800
600 -
400 -
W3
>» 200 -
u 0
T T --©"Nad —^ KCI - •- • KBr - -X" -Muscovite
-X
100 150
«.* •
->■©-
cöt:
200 250
Ts (°C) 300 350
b) 3000
g 2500 -
e ^ 2000 -
Ö 1500 - « K 1000 -
500 -
0 I— 100
•
—i r
Si
150 200 250
Ts (°C) 300 350
Figure 3 Dependence of crystal size (a) and distance between adjacent nano- crystals (b) on the substrate temperatures. The temperature of K-cell was maintained at 450 CC.
421

cases of Calcium stearate and Alq3 it was 87 and 44 kJ/mol, and 27 and 10 kJ/mol
on alkali halide, respectively. They have the enthalpy for fusion of 70 and 140 kJ/mol, respectively. Still we have to confirm how C60 molecules interact both with each other and between molecules and substrate by weak van der Waals force.
REFERENCES
1. H.W.Kroto, Angew.Chem.Int.Ed.Engl. 31, 111 (1992). 2. R.S.Averback et al. (Eds.), Cluster and Cluster-Assembled Materials (MRS Symposia Proa, No.206), Materials Research Society, Pittsburg, 1991. 3. H.W.Kroto. et al. (Eds.), The Fullerenes. Pergamon, 1993. 4. D.Koruga, et al. (Eds.), Fullerene C60: History, Physics, Nanobiology, Nanotechnology, Elsevier, 1993. 5. T.Ichihashi, K.Tanigaki, T.W.Ebbesen, S.Kuroshima and S.Iijima, Chem. Phy s.Lett. 190, 179(1992). 6. K.Tanigaki, T.Ichihashi. T.W.Ebbesen. S.Kuroshima, S.Iijima, H.Hiura and H.Takahashi, MRS Symp.Proc. 247,321 (1992). 7. M.Sakurai, H.Tada, K.Saiki, A.Koma, H.Funasaka and Y.Kishimoto, Chem. Phys.Lett. 208, 425 (1993). 8. J.H.Neave and B.A.Joyce, Appl.Phys. A31, 1 (1983). 9. M.Baskes, M.Daw, B.Dodson and S.Foiles. MRS Bulletin, Feb.. p.28 (1988). 10. M. Hara, H.Sasabe, A.Yamada and A.F.Garito, Jpn.J.Appl.Phys. 28, L306 (1989). 11. K.Yase, M.Yamanaka, K.Mimura, K.Inaoka and K.Sato. Appl.Surf.Sci. 75, 228(1994). 12. K.Yase, M.Yamanaka, K.Mimura, S.Ueno and K.Sato, Thin Solid Films 243, 389(1994). 13. K.Yase, N.Araand A.Kawazu, Mol.Cryst.Liq.Cryst. 247, 185 (1994). 14. N.Ara-Kato, K.Yase, H.Shigekawa, M.Yashimura and A.Kawazu, Proc. ICSM'94 (1994). 15. K.Yase. S.Sumimoto, H.Matsuda and M.Kato, Mol.Cryst.Liq.Cryst. in press. 16. K.Yase, N.Ara. S.Kazaoui, N.Minami, T.Suzuki and A.Kawazu, Adv.Mat. '93, IIB Trans.Mat.Res.Soc.Jpn., 14B, 1235 (1994). 17. K.Yase, N.Ara, S.Kazaoui, N.Minami, and A.Kawazu, Mol.Cryst.Liq. Cryst. 247, 179(1994). 18. L.Reimer, Transmission Electron Microscopy -Physics of Image Formation and Microanalysis-, Springer-Verlag (Berlin, Heidelberg) (1989). 19. K.Yase, Y.Takahashi, N.Ara-Kato and A.Kawazu, Jpn.J.Appl.Phys., 34, (1995) in press.
422

MICRODIELECTRIC MEASUREMENTS OF PRISTINE AND MODIFIED THIN FULLERENE (C60) FILMS
B. Pevznert, A. F. Hebard*, R. C. Haddon*, S. D. Senturiat, and M. S. DresselhausT +
tDept. of Electrical Engineering and Computer Science, MIT, Cambridge, MA 02139
tüept. of Physics, MIT, Cambridge, MA 02139 •AT&T Bell Laboratories, Murray Hill, NJ 07974
ABSTRACT As developed by Senturia and co-workers [1], microdielectrometry is a technique for mea- suring complex permittivity utilizing microfabrication technology to incorporate both the interdigital sensing electrodes and associated circuitry on the same microchip. By covering a microdielectrometer chip with a thin layer of C6o, it is possible to dynamically monitor the film's frequency response and dielectric properties as a function of doping with selected gases and other species.
It is known that solid C6o has a substantial amount of interstitial volume. The presence of mobile ions in these spaces compromises the breakdown voltage and makes pure C6o unsuitable for applications requiring high-quality dielectric films. However, various immobile ions or neutral species (e.g. oxygen) can be made to fill the interstitial volume, changing the characteristics of the C6o films and, in some cases, improving the dielectric properties. In-situ microdielectric measurements of pristine and modified C60 films were performed for frequencies ranging from 0.005 Hz to 100 kHz. Based on the low-frequency behavior of the dielectric constant, a model is proposed for the mechanism of oxygen diffusion into the interstitial spaces of the fullerene material.
INTRODUCTION Since the discovery by Krätschmer et al. [2] of the method for bulk synthesis of fullerene C6o, the complex dielectric function e(w) = e1{iii) + ie2(u) of solid C60 films has been studied over a broad frequency range using a wide variety of techniques [3, 4, 5, 6, 7, 8]. Figure 1 presents a summary of experimental data reported for the real ei(u>) and imaginary t2(io) parts of the dielectric function at 300 K over the entire optical frequency range from the infrared through the ultraviolet.
In Fig. 1, the features in the optical dielectric function below ~0.3eV are due to molec- ular vibrations, and can be associated with the four strong first-order Flu intramolecular modes (at 526, 576, 1183, and 1428 cm-1) and two strong combination (u>i + w2) modes (at 1539 cm-1 and 2328 cm-1) first observed by Krätschmer et al.[2] from measurements of the infrared absorption spectrum of a C6o film- Transmission experiments carried out on thicker (~2-3 /im) films reveal numerous (~100) additional features attributed to other in- tramolecular combination modes [9], which also enter into e(w). The IR peaks in Fig. 1 have been successfully fit [10] to the standard Drude-Lorentz model [11], in which the complex dielectric function e(u>) is given by the sum of contributions from a background core real constant «„, a Drude (or free carrier) term eDrude(w) and a phonon term ephonon(^) [10].
As the absorption edge of C6o solid has been determined to be ~1.5 eV [12], the structure in e(u>) in the visible-UV range below ~7 eV (see Fig. 1) is primarily of electronic origin, and may be assigned to electronic transitions between carbon 7r (bonding) and 7r* (antibonding) electron states. The data in this range were obtained by Ren et al. [5] for films vacuum deposited on Si(100) using variable angle spectroscopic ellipsometry (VASE), and by Wang et al. [6] on films deposited on quartz (Suprasil) from near-normal-incidence reflection and transmission experiments. The four broad peaks in this range (at 2.7, 3.6, 4.6, and 5.6 eV [5, 6]) are identified with dipole-allowed electronic transitions, and can also be described by a
423
Mat. Res. Soc. Symp. Proc. Vol. 359 e1995 Materials Research Society

6
2 -Vr
infrared
52fcm" 1183cm"' 1423cm'1
Al
x5
539cm"'
I i,
10"1 10,E
excitation frequency (Hz) 10,B
Figure 1: Summary of real ei(u>) and imaginary e2(^) parts of the dielectric function for C6o vacuum-sublimed solid films at room temperature over all optical frequencies. The data between 0.05 and 0.5 eV (mid- to near-infrared) were collected using the Fourier transform infrared (FTIR) transmission technique [7]. The vis-UV range was investigated by variable angle spectroscopic ellipsometry (VASE) [5] and near-normal-incidence reflection and trans- mission experiments [6]. UV data above ~7eV were obtained using electron energy loss spectroscopy (EELS) [8] by Kramers-Kronig analysis of the EELS loss function (inset). The arrow at the left axis points to ti = 4.4, the observed low frequency value of the dielectric constant [3].
sum of Lorentz oscillators [5, 6, 13]. In this case, each oscillator function corresponds to a transition between narrow electronic energy bands derived from C6o molecular orbit als. The success of the Lorentz oscillator fits at both infrared and vis-UV frequencies suggests the strong molecular character of the Ceo solid.
To obtain the dielectric function e(u>) in the UV range above ~7 eV not easily accessible by optical techniques, the electron energy loss spectroscopy (EELS) has been successfully employed [8, 14]. In the inset to Fig. 1, the two dominant peaks in the frequency dependence of the EELS loss function Im[-l/e(t«;)] for small momentum transfer (q = 0.1 Ä-1) occur at ~6 eV for the 7r-plasmon and an even more prominent peak at ~26 eV is observed for the ■K + a-plasmon. The shoulders between ~8 and ~25 eV have been attributed to transitions between bonding a and antibonding <r* levels, and partially also to mixed 7r — <r* or a — 7r* transitions [8]. Through the Kramers-Kronig analysis, these, as well as other less pronounced details of the EELS loss spectrum, enter into the complex dielectric function e(u>) as features between 7eV and 40 eV. It is encouraging that the peak positions in e2(o;) (at 7.7, 8.9, 10.0, and 12.2 eV) obtained by analyzing the EELS data are in agreement with the optical UV results reported by Kelly et ah [13] using a synchrotron radiation ellipsometer. The higher energy feature at 21.5 eV may be associated with the giant optical absorption that was detected around 21 eV in the gas phase of both C6o and C70, via photoionization spectroscopy using synchrotron radiation [15]. Not shown on Fig. 1 are the results of XPS and UPS experiments at higher frequencies (~300eV) probing the core electrons of C60 solid and thus giving rise to the core dielectric constant £„.
From Fig. 1, it is clear that, as we move towards lower and lower frequencies, for every loss process represented by a peak in the e2(üj), there is a rise (sometimes accompanied by a small oscillation) in ei(o>), as prescribed by the Kramers-Kronig relations. As we move below 1013Hz, all electrons and most phonons have already responded, and ei(w) is approaching

its DC value. The small difference between ei(1013Hz) « 3.9 [6] and ei(106Hz) « 4.4 [3] (shown by an arrow in Fig. 1) is probably due to the losses associated with COO molecules rapidly rotating at room temperature (T > T0i) at ~109Hz, as evidenced by the NMR[16], ultrasound attenuation [17], and other experiments in this frequency range.
From the Kramers-Kronig relations, it follows for the case of zero frequency:
iJ» U T Jo
This tells us that the DC dielectric constant e^O) includes all contributions from the higher frequency loss processes, and is proportional to the area under the e2(w) curve plotted on a logarithmic scale [18]. In this paper, we report measurements of the dielectric function of C6o thin films for frequencies below 105Hz, where new, previously unreported, polarization mechanisms come into play.
EXPERIMENTAL
The conventional way for making low frequency (below ~lMHz) measurements of the di- electric properties of solids is to place a sample between closely spaced parallel conducting plates, and to monitor the AC equivalent capacitance C{w) and dissipation factor D(u>) of the resulting capacitor. The capacitance is proportional to the real part of the relative di- electric function C(v) = ei(w)e0A/d, where A is the cross sectional area of the capacitor, d is the separation between the plates, and e0 = 8.85 X 10"12 F/m is the absolute permittivity of free space. The dissipation factor (also known as the loss tangent) D(u) = e2{w)/'ei(w) can then be used to extract the imaginary part of the dielectric function e2(u>). Clearly, the calibration of the measurement will be affected if the plate spacing d changes in the course of the measurements, as it will, for instance, at the Cßo phase transition point Toi ~ 260 K, or during intercalation of oxygen and other species into the interstitial spaces of Ceo solid.
To avoid this problem, we have used the microdielectrometry technique developed by Senturia and co-workers [1, 19, 20] to measure dielectric properties of C60 at low frequencies. Instead of using a parallel plate geometry, both electrodes used in the microdielectric mea- surement are placed on the same surface of an integrated circuit (see Fig. 2), and the medium to be studied (C6o film) is placed over the electrodes by thermal sublimation in vacuum, as described by Hebard et al. [3]. The comb electrodes in Fig. 2, in contrast to parallel plates, provide a fixed calibration for both e^ and e2, because electrode size and spacing remain constant even when the sample itself is changing. However, the interdigitated electrode ge- ometry is less efficient than parallel plates in terms of coupling the electric field through the sample medium. To increase the signal to an easily measurable level, some microdielec- trometer sensors provide amplification in the form of an integrated field-effect transistor, whose gate electrode is one of the two interdigitated electrodes (called the floating gate; see Fig. 2). To compensate for the transistor amplification factor, which would require a complex calibration procedure at each operating temperature, a second identical field-effect transistor is simultaneously fabricated on the same integrated circuit. The second field-effect transistor serves as a reference in a differential feedback circuit, the details of which have been published elsewhere [21]. The net effect of the two-transistor plus feedback circuit com- bination is that when a sinusoidal signal is applied to the driven electrode, the corresponding sinusoidally varying voltage that appears on the floating gate can be measured independent of the transistor amplification factor. This floating-gate voltage has an amplitude and phase relative to the drive signal that depends on the geometry of the device and on the dielectric properties of the sample medium. The fact that the sensing electrode is electrically floating, combined with the proximity of the amplifier to that electrode, means that a good signal- to-noise ratio can be achieved at very low frequencies (down to ~10-3 Hz). As the device geometry is both stable and reproducible, the task of calibrating the measurement reduces to
425

Driven Gate pG)
Ü
Figure 2: (a) Schematic view of active portion of microdielectrometer sensor chip. CFT refers to "floating-gate charge-flow transistor," of which the microdielectrometer is an example, (b) Schematic cross-section through the electrode region (AA') showing interdigitated driven and floating gate electrodes, and the electric field coupling them through the dielectric (C6o) sample. [19]
relating the measured amplitude and phase for a particular device geometry to the specific values of t\ and e2 for the sample.
C6o films (~l-2/mi thick, as measured with a Dektak 8000 profilometer) were deposited on microdielectric sensors by vacuum sublimation, as described elsewhere [3]. A microdielectric sensor with 1/tm inter-electrode spacing and lm meander length (see Fig. 2) was used. After the deposition, the films were taken out in the air, and their dielectric functions were measured as a function of oxygen diffusion using the Eumetric System II Microdielectrometer apparatus (Micromet Instruments, Newton, MA).
RESULTS AND DISCUSSION
In Fig. 3, we show the evolution of the dielectric properties of a 1.88/im thick Ceo film as a function of exposure to the ambient environment at room temperature. The uppermost dotted line represents the measurement taken within the first minute of exposure. Clearly, in an oxygen-free Ceo sample, the DC dielectric constant is dominated by conduction, as the conductivity of oxygen-free Ceo films at room temperature is ~10~8 S-cm-1 [22]. However, in polycrystalline films, oxygen rapidly diffuses into the grain boundaries isolating Ceo grains (crystallites) one from another and thus quenching the conductivity, reducing it by seven orders of magnitude within a few hours of exposure. (A similar rapid quenching of the photoconductivity by oxygen in Ceo films has been recently reported by Minami et al. [23]). The increased resistivity due to oxygen causes both the polarization and loss (decaying dotted curves in Fig. 3) to decrease dramatically within 13 hours (see inset to the Fig. 3(b)).
The big loss peak accompanied by a polarization increase re-appears again after 13 hours of exposure (solid lines in Fig. 3), signaling another increase in sample conduction. We have linked this effect to an increase in ambient relative humidity from ~35% to ~60%. With increased humidity, the moisture condenses on the surface of the sample, "shorting out" the electric field lines of the microdielectric sensor (Fig. 2(b)). This underscores the importance of making the sample thick enough (at least on the order of the inter-electrode spacing) when using the microdielectrometry technique.
As the humidity decreases back to its initial value (~35%) during the 28-45 hours of
426

Figure 3: Frequency dependence of the real (a) and imaginary (b) parts of the dielectric function of a C6o polycrys- talline film plotted on a log-linear scale, and the loss tangent (c) plotted on a log-log scale. The initial decrease in loss and polarization due to quenching of the conduction by inter-grain oxygen is shown by the dotted lines. The solid lines and the inset to plot (b) show the development and decay of the loss peak due to the surface moisture (see text). As the humidity decreases back to its initial value (~35%) during hours 28- 45 of exposure (inset), the conduction- related loss decreases as well, and then disappears completely, leaving behind the Debye-like dielectric loss peak at ~30 Hz, corresponding to the lowest so- lid line.
10~1 10° 101 102 10J
log frequency (Hz)
exposure (inset to Fig. 3(b)), the conduction-related loss decreases as well, and then disap- pears completely, leaving behind a Debye-like dielectric loss peak at ~30 Hz (the lowest solid line in Fig. 3(b,c)). The origin of this peak is identified with the presence of oxygen (O2) molecules occupying the octahedral interstitial spaces of the Cßo solid. It has been observed previously in NMR experiments [24] that oxygen diffuses into the octahedral sites of the Ceo fee lattice. Up to six 02 molecules can diffuse into as many octahedral sites surrounding each Ceo ball [24].
A small amount of charge transfer between the oxygen and Cßo molecules gives rise to the electrical dipoles, which can be aligned by the applied AC (low frequency) electric field. Because of the large size of the CöO molecule, only a small amount of charge transfer is required for creating a significant dipole moment, resulting in a big increase in polarization. As the bottom curve in Fig. 3(a) shows, the oxygen-induced dipole moment is responsible for increasing the real part of the dielectric constant from ~4.5 at 1kHz to ~7.0 at lOmHz. From charge image calculations, we estimate that, for one C60-O2 pair, only ~0.04ge needs to be transferred in order to account for this increase, where q^ is the elementary charge on an electron. From the dielectric loss peak position (the bottom curve in Fig. 3(c)), an interstitial diffusion constant for oxygen at room temperature D = Pf is estimated to be ~10~13cm2sec_1, where / = 30 Hz is the frequency of the loss peak, and I is the distance between two neighboring octahedral sites.
Regardless of the oxygen content, the relative permittivity tx of CöO films measured with microdielectrometry at 105 Hz is in close agreement with €i(105 Hz) m 4.4 determined by Hebard et al. [3] from the capacitance measurements of M/C6u/M (M=metal) tri-layer structures.
427

CONCLUSIONS
We used microdielectrometry to measure the frequency and temperature dependence of the low frequency dielectric function e(ui) of thin C6o films. We found that oxygen rapidly diffuses into the grain boundaries of the COO polycrystalline film, increasing its resistivity by about seven orders of magnitude. Water, on the contrary, does not penetrate into the bulk of Ceo solid, and the increase in conduction resulting from its presence on the surface of a Cßo film is fully reversible. In order to explain the Debye-like dielectric loss peak and the accompanying increase in polarization observed at ~30Hz, a small charge transfer is inferred between the C6o and 02 molecules which occupy interstitial spaces of the C6o solid.
We conclude that the dielectric and, especially, microdielectric spectroscopy can be used to assess the content of oxygen or other impurities in the interstitial spaces of COO solid. We are currently using this technique to ascertain the effect of various intercalants on the dielectric properties of C6o films.
Acknowledgments The MIT authors gratefully acknowledge financial support from NSF grant #DMR92-01878. We are also thankful to Dr. Huan Lee of Micromet Instruments (Newton, MA) for valuable help, and to R. H. Eick of AT&T Bell Labs for technical assistance.
References [1] S. D. Senturia and S. L. Garverick, Method and Apparatus for Microdielectrometry,
U.S. Patent No. 4,423,371, Dec. 27, 1983. [2] W. Krätschmer et al, Nature 347, 354 (1990). [3] A. F. Hebard et al, Appl. Phys. Lett. 59, 2109 (1991). [4] G. B. Alers et al, Science 257, 511 (1992). [5] S. L. Ren et al, Appl. Phys. Lett. 59, 2678 (1991). [6] Y. Wang et al, Phys. Rev. B 45, 14396 (1992). [7] A. M. Rao et al, Science 259, 955 (1993). [8] E. Sohmen, J. Fink, and W. Krätschmer, Z. Phys. B 86, 87 (1992). [9] K. A. Wang et al, Phys. Rev. B 48, 11375 (1993).
[10] P. C. Eklund et al, in Thin Solid Films, edited by D. M. Gruen (World Scientific Publishing Co. Ltd., Singapore, 1995).
[11] F. Wooten, Optical Properties of Solids (Academic, New York, 1972). [12] S. Saito and A. Oshiyama, Phys. Rev. Lett. 66, 2637 (1991). [13] M. K. Kelly et al, Phys. Rev. B 46, 4963 (1992). [14] A. Lucas et al, Phys. Rev. B 45, 13694 (1992). [15] I. V. Hertel et al, Phys. Rev. Lett. 68, 784 (1992). [16] C. S. Yannoni et al, J. Phys. Chem. 95, 9 (1991). [17] X. D. Shi et al, Phys. Rev. Lett. 68, 827 (1992). [18] A. K. Jonscher, Dielectric Relaxation in Solids (Chelsea Dielectrics Press, London, 1983). [19] S. D. Senturia, J. N. F. Sheppard, H. L. Lee, and D. R. Day, J. Adhesion 15, 69 (1982). [20] N. F. Sheppard, D. R. Day, H. L. Lee, and S. D. Senturia, Sensors and Actuators 2, 263 (1982). [21] S. L. Garverick and S. D. Senturia, IEEE Trans, on Electron Devices ED-29, 90 (1982). [22] K. Hoshimono et al., Jpn. J. of Appl. Phys. 32, L1070 (1993). [23] N. Minami and M. Sato, Synthetic Metals 56, 3092 (1993). [24] R. A. Assink et al, J. of Mater. Res. 7, 2136 (1992).
428

FRAGMENTATION OF Ca MOLECULES IN PARTIALLY IONIZED FULLERENE BEAM DEPOSITION
ZHONG-MINREN, XIA-XINGXIONG, YUAN-CHENGDU, ZHI-FENGYING,LIANG-YAO CHEN and FU-MING LI Department of Physics, Fudan University, Shanghai,200433, P.R.China
ABSTRACT
CM films have been deposited using a partially ionized cluster beam deposition (PIBD) technique. The experimental results show that as V, exceeds about 400 V almost all the C«, molecules fragmentate at collision with the substrate and the obtained films turn to be amorphous carbon layers at elevated V„ indicated by measurements of Raman spectra, X-ray diffraction, and ellipsometry.
INTRODUCTIONS
Several deposition methods have been used such as molecular epitaxial beam (MBE)[1,2,3], conventional evaporation of a benzene solution[4], sublimation in vacuum[5] and pulsed laser deposition[6] to deposite C^ films on various kinds of substrates. Recently ionized fullerene beam deposition, which was proposed by Gaber[7] and Busmann[8], has been used to produce a Cm film with a hard amorphous carbon coatings on the relatively soft fullerite layer to protect the C«, film from contamination diffusion, such as oxygen, as exposed to the atmosphere. In our experimental set-up of partially ionized beam deposition (PIBD) which has been described
previously[9],a Ca beam, being evaporated from a crucible with a small nozzle on its top, is partially ionized by an electron impact and then accelerated by an acceleration field V, towards the substrate where films are deposited.
EXPERIMENTAL
The crucible charged with CM powder with a purity of 99% is kept at 200 C for 1 hour by thermal radiation of a filament around it to eliminate any high pressure contaminations from the C«, material before deposition. Then the crucible is heated up to 450 C[14] to start the deposition process. The ionization current is 30 mA for all film-deposition processes. The substrate which is kept at room temperature during deposition, is 300 mm away from the source. Si(lll) substrates are chemically cleaned to remove impurities on the surface and native oxide layer. The depositing rate is about 10A min for all the films, and Cw films have the same thicknesses of about 3000Ä.
RESULTS AND DISCUSSIONS
Raman spectra of deposited films are shown in fig. 1 corresponding to different deposition conditions:
429
Mat. Res. Soc. Symp. Proc. Vol. 359 ® 1995 Materials Research Society

•H 01 c 0) +> c
1100 1200 1300 1400 1500 1600 1700
Raman Shift (1/cm)
Figure 1. Raman spectra for fullerenes films deposited using PIBD under: (a) V, = 0V, (b) V, = 200 V, (c) V, = 400 V and (d) Vm = 6000V, respectively.
(a) V, = 0V, (b) V, = 200V, (c) V, = 400V and (d) V. = 6000V, respectively. In Fig.l(a), only one strong and sharp peak at about 1470 cm"', which is the characteristic of C«, molecules, could be found, implying that the obtained film consists only consisted of C«, molecules without any other forms of carbon allotropes. As V, increases from 200 to 400 V, deposition results in a decrease of the Raman lines of C^, as shown in Fig. 1 (b) and (c). The decrease of the 1470 cm"1 peak for (b) and (c) indicates that part of Cw molecules are broken in deposited films and that elevated V, results in higher amount of broken CM soccer-balls in obtained films. When V, increases to 6000 V, as shown in Fig.l (d), the deposition results in disappear of C^, peaks and introduces a broad, asymmetric peak between 1000 and 1700 cm'1, which is the characteristic of amorphous carbon structures[8]. The results of Raman spectra suggest that although only a little part of C^ beam is ionized owning to low ionization efficiency under the experimental conditions proposed here, the acceleration field does have great effects on deposited films. CM soccer-balls will be broken as accelerating voltage V, exceeds about 200 V, and at higher V„ the obtained films contain higher fraction of amorphous carbon structures despite a certain fraction of volume remains the original fullerenes undestroyed.
The results of XRD measurements [9] indicate that applying of accelerating voltage during CM
deposition process alters the crystal properties of the obtained films, and the structures of the deposited films become totally amorphous when V, exceeds about 400V, fitting the results of Raman analyses.
The obtained C^ films are also sent for ellipsometry analyses to measure the real and image value, £! and C 2, of the complex dielectric function C =£, + i£ 2 as shown in Fig.2 (a) and (b) respectively.
430

U)
0 .0 (a)
P (A) 0 V
6.3 /~\ (B) 200 V \ (c) 400 V \ (D) 2500 V
3.8 / \(A) ,(B)\
1'.$*-^" '""■••\ _-^--—
1.3
1 .?.
^4ci ,f^C ■^
1 1 1 1 < > '
2.0 2.5 3.0 energy lev)
(A) 0 V (B) 200V <c> 400 V (D) 2500 V
3.5
1.5, 2.0 2.5 3.0 3.5
energy (ev) Figure 2. Ellipsometry results for fullerenesfilms deposited using PIBD under differentaccelerating fields: V. = 0,200, 400, and 2S00 V respectively. Figure (a) and (b) illustrate real and Image value, £1 and £„ of the complex dielectric function £ =£, + (£2 of obtained films.
The £ t peak in (a) and £ 2 valley in (b) at about 1.8 eV for Cg, film corresponding to V, = 0V suggest the semiconductor nature of CM films with band-gap about 1.8 eV, similar to those predicted by theoretical calculations[10]and experimental analyses[10,ll]. At elevated accelerating voltages V„ the ellipsometry of obtained films result in disappear of peaks and valleys in the region from 1.5 to 3.5 eV, and the curves in both (a) and (b) become more flat. The obtained films turn to be conductor as V, exceeds about 400 eV, probably due to the formation of amorphous carbon layers in the deposited films caused by broken of CM soccer-balls by applied accelerating field.
The breaking of Cm molecules could possibly happen in two ways: accelerated ionized C«, molecules
431

will be broken at collision with the substrate and neutral CM molecules deposited on the substrate will be broken upon collision with accelerated Cg, ions reaching the substrate. Under low accelerating fields, such as V, < 200V, ionized C^ are possibly broken into fragments at collision with the substrate, but the neutral C«, molecules already accumulated on the substrate remain undestoryed. On the other hand, under higher accelertaing fields, such as V,> 400V, the neutral CM molecules will probably be broken at collision with the arriving accelerated C«, ions, resulting in amorphous carbon films with conductor nature. The experimental results agree with those performed previously[9] and illustrate detailed features for the deposition process of C^, films using ionized fullerenes beam deposition technique[ll].
CONCLUSIONS
The analyses conducted in our experiments show that, in the partially ionized beam deposition (PIBD) proposed here, C«, soccer-balls are broken into fragments as a result of applying an accelerating voltage over about 200 V, while those obtained films deposited with about V,<65 V remain almost undestroyed.
REFERENCES
[I] W.M.Tong, D.A.A.Ohiderg, H.K.You, R.S.Williams, S.J.Anz, M.MAlvarez, R.I.Whetten, Y.Rubin and F.N.Dieterich, J.Phys.Chem., 95(1991) 4709 [2] S.Folsch, T.Maruno, A.Yamashita and Hayashi, Appl.Phys.Lett.,62(21)(1993)2643 [3] J.ADura, P.M.Pippenger, N.J.Halas, X.Z.Xiong, P.CChow and S.C.Moss, Appl.Phys.Lett. 63(25) (1993)3443 [4] J.L.Wragg, J.E.Chamderlain, H.W.White, W.Kratchmer, D.R.Huffman, Nature, 348(1990) 623 [5] Y.Z.Li, J.GPatrin, M.Chander, J.H.Weaver, L.P.F.Chibante, R.E.SmaUey, Science, 252(1991) 547 [6] M.Yoshimoto, T.Arakane, T.Asakawa, K.Horiguchi, K.Hirai and H.Koinuma, Jpn.J.Appl.Phys.,32 (1993) L-1081 [7] H.Gaber, H.G.Busmann, R.Hiss, I.V.Hertel, H.Romberg, J.Fink, F.Bruder and R.Brenn, J.Phys.Chem. 97 (1993) 8244 [8] H.G.Busmann, H.Gaber, HStrasser and I.V.Hertel, Appl.Phys.Lett. 64(1) (1994) 43 [9] Z.M.Ren, Z.F.Ying, X.X.Xiong, M.Q.He, Y.F.Li, F.M.Li and Y.C.Du, J.Phys.D, 27 1499(1994) [10] T.Pichler, M.Matus, J.Kurti, and H.Kuzmany, Solid State Comm., 81,(1992) 859 [II] Y.Saito, H.Shinohara, M.Kato, H.Nagashima, M.Ohkohchi and Y.Ando, Chem.Phys.Lett. 189, (1992)236
432

DOPING OF CM FILMS USING HIGH ENERGY BORON ION IMPLANTATION
ZHONG-MINREN',YUAN-CHENGDU",XIA-XINGXIONG',ZHI-FENGYING',FU-MINGLl', andXING-LONGXU" 'Department of Physics, Fudan University, Shanghai,200433, P.R.China "Shanghai Institute of Metallurgy, Academia Sinica
ABSTRACT
CM films, which are deposited by partially ionized beam deposition (PIBD), are doped by 100 keV boron ion implantation at dose ranging from 3 *1014 to 1*10" cm2. The implantation process has been studied using Fourier transform infrared spectroscopy (FTIR), Raman spectra and X-ray diffraction (XRD) analyses. Almost all C& soccer-balls in the doped region in the films are found to be broken at dose of 1*1016 cm2, while at dose less than 6*1014 cm2 a few CM molecules remain undestroyed and maintain the original structural properties.
^INTRODUCTIONS
The discovery of superconductivityat 18 K in potassium-doped QJ1] films has stimulated detailed investigations on doping of fullerenes, in theoretical and experimental aspects [2,3]. Alkali and alkali earth metals have been used for doping of fullerenes by several methods[l-3]. Chemical vapor doping of CM is commonly used in which fullerenes powder with a few dopant are annealed in a closed environment. Kastner[4,5] proposed a new kind of doing method using high-energy (30keV) K+ beam implantation to overcome the instability of doped films as exposed to atmosphere in which oxygen could possibly be incorporated into the films to change the desirable properties resulted from doping treatment. During the ion implantation process, an amorphous surface layer is formed while fullerenes molecules beyond this layer remain undestroyed[4,5].
In this paper, in an alterative way, fullerenes films are doped by boron species using high energy (lOOke V) B + beam with dose ranging from 3 * 10M to 1 * 1016 cm2. Since boron ions are relatively small as compared to many other species usually used for doping technique such as K+, Ba+ and Cs+, the ion-induced damages in doped films should be less. Studies of B-doped fullerenes films could be useful to investigate the possibility and to find appropriate experimental conditions for ion-implantation doping in CM films.
2. EXPERIMENTS
Qo films are deposited by partially ionized beam deposition[6]. FTIR measurements are carried on FT-IR Spectrometer of Model IFS 113V. The Raman spectroscopy is carried out on a Spex-1403 Raman Spectrometer with an Ar+ laser at lOOmW output at 5145Ä. The XRD is performed on Siemens D500 with Cu Ktt radiation.
433
Mat. Res. Soc. Symp. Proc. Vol. 359 e 1995 Materials Research Society

3. RESULTS AND DISCUSSIONS
TRIM calculation is used to estimate the depth distributionof boron species in the doped fullerenes film and the damages caused. The average depth range for B species is about 3500 A, while the largest depth is about 4700 Ä. B-content is found to distribute mostly in the region from 3000 to 4500 Ä. The depth prof ile for vacancy shows ahighdamage level in this same region. TRIM calcula tionsgave good agreements with experimental results in the investigationof doping of fullerenes films by high energy K+beams[4,5],exhibitinggood estimation of the depth profileof doping species in the resultingfilms. According to this analysis, fullerene films with thickness of 5000 Ä deposited by PIBD are used for B-doping in our experiments.
Infrared spectra and Raman spectra are approved to be good methods to characterize fullerenes materials, also in good agreement with theoretical predictions. Fig. 1(a) gives FTIR pattern for the undoped film, while Fig.l (b), (c), (d) and (e) illustratethe resultsfor doped films at dif ferentB+ion doses correspondingto 3*1014$*1014J.*101?ind 1*1016 cm2,respectively.It is obvious thatas the dose increases from (b) 3*10 To (e) l*101H;m" ,the doped film turn to be more amorphous and the Cgn molecular structuresturn to be more badly damaged. Fig.l(d) and(e) are very similar,showinghardly any Cgflpharacteristlcsjndicatingthatalmost all the Cg(jiiolecules have been destroyed, while Fig.l(b) and (c) keep some Cgopeaks suggesting a certain fraction of Cgpnolecules undestroyed. The strong IR peak at about 750 cm which appears in every figure except (a) for undoped film is probably related to boron carbide or boron fullerite structures. The peaks at 1330 and 1590 cm form very strong hills in Fig.l(d) and (e) and their intensities increase with the implantation dose, showing amorphous carbon structuresin doped films. The peak at about 1720 cm in Fig.l(b) disappears in other films doped by elevated doses, probably correspondingto boron-fullerenestructureon the films' surfaces which need to be explored further. The FTIR results, especially (d) and (e), shown that the boron species reach the depth of about 5000 Ä and they distributesalmost all along the depth of the starting Cgofilms.
The Raman analysisindicates that most of the Cgomolecules in the doped film are destroyed by the implanted ions despite thata partial volume of the doped film contalnsCßcmolecules in their original forms. The Raman resultsalso suggest that a higher implantation dose results in higher damages in the doped films, justthe same as those indicated by FTIR measurements.Taking the resultsof FTIR, Raman and TRIM calculations into consideration, also considering that Raman spectra reflect the information of the surface layers of tested films, the undestroyed Cgnmolecules seem to distribute predominantly in the region near the surface (probably within 4000 A) of the films.
In the XRD measurements, undoped Cgofilm has a closed-packed structurewith assignmentsof (100), (110) and (112)[6].The film being doped by dose 3*1014cm"2 maintains a small crystal orientationat assignment(HO), while other films being doped by elevated doses have no XRD peaks, showing amorphous structures. The disappear of orientation for crystal Cgn films under high implantationdoses suggest that boron species reach all along the depth of the 5000Ä film and cause high density of damages.
434

w o 2 <
£ 03 2 <
TTr^i
2000 1600 1200 800 400
WAVENUMBERS (cm"1) Fig.l. FTIR spectra for fullerene» films doped by 100 keV B+ beam at different doses: (a) undoped, (b) 3*10", (c) 6*1014, (d) 1*10" and (e) 1*10"W respectively.
435

The XRD analyses suggest that part of the obtained fullerene film doped by low implantation doses maintains the original crystal structure of PIBD-synthesized C«, films, not only the c60 molecules. At higher implantation doses, the crystal structures are all damaged although there are still Ca molecules undestroyed in the doped films, as previouslyindicated by Raman spectra. The doped fullerenes films with certain crystal orientations should be useful for further applications and experimental
investigations. Although high energy ion implantation is a complex process which will cause damages in the doped
fullerenes films, a certain amount of Ca molecules keep undestroyed and even maintain the original crystal structures under doping condition of 100 keV B+. The experimental results propose a low dose (less than 3*1014 cm"2 or so) at the implantation energy used here. The chemical states of doped films, such as whether B species are incorporated into the C«, soccer-balls or just stay in the films
individually, are remained unsolved.
4.CONCLUSIONS
C« films are doped by boron ions using high energy (100 keV) implantation. Analyses for doped films by different doses show that obtained films turn to be more amorphous as ion dose is elevated. A certain fraction volume of doped films contains original C«, molecules and even original crystal structures under low implantation doses (probably less than 3*10" cmn'2), while high implantation doses (larger than 6*10" cm'2) just result in amorphous films with a small amount of C«, molecules
undestroyed.
REFERENCES:
[l]A.F.Hebard,M.J.Rosseinsky,R.C.Haddon,D.W.Murphy,S.H.Glarum,T.T.M.Palstra,A.P.Ramirez
and A.R.Kortan, Nature, 350 600(1991) [2] P.J.Benning, J.L.Martins, J.H.Weaver, L.P.F.Chibante and R.E.Smalley, Science, 1417(1991) [3] R.C.Haddon, AF.Hebard, M.J.Rosseinsky, D.W.Murphy, SJ.Duclos, K.B.Lyons, B.Miller, J.M.Rosamilia, R.M.Fleming, AR.Kortan, S.H.Glarum, A.V.Makhija, AJ.Muller, R.H.Eick, S.M.Zahurak, R.Tycko, G.Dabbagh and F.A.Thiel, Nature 350 (1991)320 [4] J.Kastner, H.Kuzmany, L.Palmetshofer, P.Bauer and G.Stingeder, Nucl.Instr.and Meth. B80 81
1456(1993) [5] J.Kastner, L.Palmetshofer, P.Bauer, G.Stingeder and H.Kuzmany, IWEP NM 93, to be published
in Springer Series in Solid State Sciences [6] Z.M.Ren, Z.F.Ying, X.X.Xiong, M.Q.He, Y.F.Li, F.M.Li and Y.C.Du, J.Phys.D, 27 1499(1994)
436

THE EFFECTS OF MECHANICAL ALLOYING OF C60 WITH METALS (II): AlANDMg.
XIN-YU ZHANGad, RAFAEL Q. HIDALGOad, RICHARD J. MURPHYb, ROBERT S. MARKIEWICZcd AND BILL C. GIESSENad
"Department of Chemistry, 'Mechanical Engineering Department, cDepartment of Physics, dBarnett Institute of Chemical Analysis and Materials Science, Northeastern University, 360 Huntington Avenue, Boston, MA 02115, USA
ABSTRACT
C6o has been subjected to multiple micro-alloying passes by co-rolling together with Al and Mg. Complete amorphization has been found in samples of C6o with Al. However, the structural changes in the C6o/Mg combination were more complex. Here, a chemical reaction occurred during which the C6o molecules were apparently broken up into amorphous carbon-like materials, while a Mg-containing oxidation reaction product formed.
INTRODUCTION
Interest in the chemical and physical properties of fullerenes has continued to grow, following their synthesis in macroscopic amounts [1] and the reports of superconductivity of doped fullerenes. [2] Much effort has been put into intercalating metals or other species into the C lattice, [3,4] while there is also a report on the dispersion of fullerenes in metals. [5] In a previous study of mechanically alloyed metal-fullerene combinations, [6] (of which the present report is a continuation), we have observed major crystal structural changes in mixed C60/C70
fullerenes co-rolled with several transition metals and Al in multiple micro-alloying passes. In the present work, we have studied phase formation in pure C60 co-rolled with Al and Mg, with a strong focus on the C60-Mg combination. The stability and reactivity of C60 exposed to this processing method were explored.
EXPERIMENTAL METHODS
The preparation technique used in this study consisted of cold rolling metal-fullerene sandwich structures, as described in detail in our previous report. [6] This method had been found to be effective in producing metastable alloying effects in metal-metal combinations. [7,8] The fullerenes used were C60 (99.9%) obtained from MER Corp.; 99.9+% metal foils (Al and Mg) were obtained from Alfa/AESAR. Samples were examined at various stages of the multiple rolling process by X-ray diffraction (XRD) on a Siemens D-5000 diffractometer (Cu-Ka radiation) with pole figure attachment.
437
Mat. Res. Soc. Symp. Proc. Vol. 359 e 1995 Materials Research Society

RESULTS
CöOIAI : The XRD pattern of pure C60 before rolling is shown for comparison in Fig. 1 (a). Fig. 1 (b) shows the XRD pattern of C60 co-rolled with Al in six deformation passes. All C60 peaks have broadened, indicating progressive grain refinement (see [6]); also, incipient (110) rolling texture formation [6] is evidenced by the enhanced intensity of the (220) reflection at 20 -17.8°. Furthermore, a broad background appears, indicating the formation of an amorphous phase. The sample was cold-rolled further; Fig. 1(c) shows its XRD pattern after 8 deformation passes. The peaks due to grain-refined (but still crystalline) C6o have now disappeared; instead, three broad maxima (at 20 -9.5, 19 and 30°) are now clearly visible, indicating the formation of amorphous C .
Fig. l.(a): XRD pattern (Cu-Ka radiation) of pure C«o solid before rolling.
Fig. 1(b): XRD pattern of C60 co- rolled with Al for 6 deformation passes. All C6o peaks broaden, indicating progressive grain refinement; there is incipient amorphous phase formation, shown by broad peaks (see Fig. lc).
Fig. 1(c): XRD pattern of COO co- rolled with Al for 8 deformation passes. Three broad maxima indicate complete formation of amorphous COO-
Fig. 1(d): Calculated hypothetical XRD pattern of Ceo modelled as hard-sphere fluid by rescaling the XRD pattern of a liquid metal (Cd).
HI a
3 220
1
■> - 1 1 ) i ^ _A \_
438
To derive a radial distribution function from these broad diffraction maxima in the conventional manner, a Fourier transform should be performed. However, with the present data and in view of the clipped appearance of the important first broad diffraction maximum (which has been cut off at 20 ~11.2° by the zero of the Bessel function form factor [6] for the orientation- averaged C molecules), this approach had not been considered practical. [6] We therefore had limited ourselves to modeling the diffraction pattern by a simple, reverse approach in which the molecular dimension of C60 was used to rescale the k-values of the known interference function of an elemental amorphous metal (used as a model for a substance of spherical particles); this pattern was then modulated with the square of the appropriate first-order Bessel function to account for the form factor of COO-
Fig. 1 (d) shows an interference function for amorphous COO calculated by that approach, using the interference function data for liquid Cd. [9] The three calculated, broad peaks fit the three broad diffraction maxima in our present pattern [Fig. 1(c)] very well; in fact, in the present work (using pure C6o) there is better agreement of the calculated pattern with the observed one than with the pattern found for the amorphized C6o/C7o mixture studied in Ref. 6. In that work, the observed first broad maximum was more displaced from the calculated one in Fig. 1(d) than in the present work; this displacement (to lower k values) could have been caused by the presence of C70 in the amorphous CJClf) mixture. [6] The obvious intensity difference of the first peaks in Fig. 1(c) and Fig. 1(d) could be due to a vestige of the texture effect mentioned above which affects the relative heights of the broadened reflections of the fine-crystalline C6o that is present in the earlier deformation stages. [6]
C«i-Mg: Fig. 2 shows XRD patterns for C6o co-rolled with Mg. Fig. 2(a) presents the pattern of a C -Mg combination after four deformation passes. Here, as in the C6o-Al pattern (Fig. lb), peak broadening caused by particle-size decrease and (110)-texture enhancement of the (220) reflection are seen. In Fig. 2(b) which shows the XRD pattern of a Cöo-Mg sample after 6 deformation passes, a new peak appears at 20 -18.5°. Further rolling passes of this sample caused the total disappearance of the COO peaks and increasing formation of the new phase [Fig. 2 (c)]. While initially only the peak at 20 -18.5° became visible, with further processing other broadened peaks appeared (at 38.1, 50.9, 58.9, 62.3°). Finally, both the Mg and the Cßo peaks had disappeared and only the new phase was visible by XRD. The new phases pattern could be indexed as trigonal and was identified as that of Mg(OH)2, although some minor discrepancies in the lattice parameters remained. This was indeed a surprising result.
In order to understand this unexpected finding, additional experiments were performed. First, pure Mg was repeatedly rolled, following the same preparation procedure and with the same number of deformation passes as for the C6o-Mg sample. The XRD pattern of the product (Fig. 3) shows no Mg(OH)2 to have formed; only the pattern of pure Mg is visible. This indicates that C6o must have played a role in the formation of the hydroxide and that there was an interaction between C6o, Mg, atmospheric oxygen (and/or surface oxide), and atmospheric water. This catalytic effect of COO and the complete disappearance of its XRD peaks (Fig. 2(c)) lead us to suspect that the C6o molecular cage might have been broken up. The following experiments were performed to prove this assumption and to determine the nature of the products.
Solubility Study: Both a Cöo-Mg co-rolled sample (designated sample A) not yet showing the Mg(OH)2 formation (that becomes noticeable after > 4 deformation passes) and a second sample (designated sample B) showing complete Mg(OH)2 formation (after 8 deformation passes) were prepared and put into toluene solution. The solution over sample A showed the typical purple color of dissolved C6o while the solvent over sample B showed no color and no sign of dissolution.
439

Fig. 2(a): XRD pattern of C6o co- rolled with Mg for 4 deformation passes. CöO peaks are broadening.
Fig. 2(b): XRD pattern of C60 co- rolled with Mg for 6 deformation passes. A new peak at -18.5° appears, indicating formation of a new phase by interaction between COO
and Mg upon rolling.
Fig. 2(c): XRD pattern of do co- rolled with Mg for 8 deformation passes. COO and Mg peaks have disappeared. New phase was indexed as Mg(OH)2.
Note: Mg.
Peaks marked "X' are due to
^—
u_
*.,*—'V
Fig. 3: XRD pattern of pure Mg rolled following the same preparation procedures and same number of deformation passes as the Cöo/Mg combination sample (Fig. 2.c). There is no Mg(OH)2 formation.
,_ J .1 . \
Transmission Electron Microscopy: Upon immersion in dilute HC1 solution, sample B partially dissolved. The undissolved, blackish residue was collected and inspected by TEM. Fig. 4 shows a TEM micrograph and the selected area electron diffraction pattern (inset) of this sample. Both results are compatible with the presence of an unidentified form of amorphous carbon, with traces of magnesium chloride.
440

Fig. 4: TEM micrograph of undissolved residue collected after dissolving C6o-Mg sample (8 deformation passes) in Hcl. The inset is TEM-SAD pattern of the same region, showing amorphous rings, identifying amorphous carbon material to be present.
Raman Spectra: Raman spectra of liquids from sample A and sample B were taken, using the 514.5 nm Ar laser line. The spectrum from sample A shows the typical C6o feature (a peak at a Raman shift of 1470 cm"1) while the spectrum from sample B shows no such feature.
Elemental Analysis: There was -17 mass pet. of C in sample B. Since this carbon was not present as C6o (as shown by the dissolution and Raman data discussed above), COO molecules must have broken up during the rolling process with Mg. However, the mechanisms for the break-up of C6o and formation of Mg(OH)2 are still in question.
DISCUSSION
Cfin-Al: The gradual break-up of the fullerene structure and its ultimate amorphization under the mechanical stresses present in this procedure can be followed well in this system. There was no reaction of Al with C6o, although the rolling process promotes breaking up of the protective AI2O3 and there is a stable carbide, AI4C3. [10]
Cfin-Mg: From the data it is clear that Mg(OH)2 formed by oxidation of Mg, followed by absorption of moisture from the air. What was the role of C6o during cold-rolling in catalyzing the formation of Mg(OH)2? Breaking-up of C6o may have lead to formation of a metastable magnesium carbide (Mg does not form a stable carbide [10,11]) or, considering the presence of oxygen, of magnesium carbonate; with moisture, the carbide would hydrolyze to the hydroxide and acetylene.
Another possible path is via the transient ionic intercalation of Mg into (amorphous) COO"
as Mg2+, where n can be as large as 5; [12] this process would also have produced a reactive intermediate for hydroxide formation. In either case, oxygen plays a major role in such processes, as also reported elsewhere. [13]
Formation of a metastable metal carbide from fullerene by mechanical alloying as described would be an interesting result since it would confirm the theoretical possibility that the
441

excess free energy of C6o (compared to graphite) and the energy of cold work stored during rolling can be used to prepare metastable carbides not otherwise in the accessible solid state.
It should also be mentioned that we have observed a catalytic effect of a dicarboxylic acid promoting formation of magnesium hydroxide similar to that of C6o in a parallel experiment. [14] In any case, further studies on the structure and reaction behavior of C6o with metals, as promoted by mechanical alloying, are needed and are in progress.
ACKNOWLEDGMENTS:
We thank Dr. Simon Foner and Dr. Shahin Pourahimi of the Francis Bitter Magnet Laboratory at M.I.T. for permission to use the rolling facilities there and Mr. Y.Z. Lu of the Materials Research Laboratory at Harvard University for assistance. We gratefully acknowledge partial support of the fullerene study by General Electric Research Laboratory, Schenectady, NY. Publication No. 631 from the Barnett Institute of Chemical Analysis and Materials Science.
REFERENCES
1. W. Krätschmer, L.D. Lamb, K. Fostiropoulos and D.R. Huffman, Nature 347 354 (1990).
2. A.F. Hebard, M.J. Rosseinsky, R.C. Haddon, D.W. Murphy, S.H. Glarum, T.T.M. Palstra, A.P. Ramirez, and AR. Kortan, Nature, 350, 600 (1991).
3. K. Tanigaki, Nature, 352, 222 (1991). 4. Q. Zhu, D.E. Cox, J.E. Fischer, K. Kniaz, A.R. McGhie and O. Zhou, Nature 355 712
(1992). 5. E.V. Barrera, J. Sims, D.L. Callahan, V. Provenzano, J. Milliken and R.L. Holtz, J. Mater.
Res., 9, 2662 (1994). 6. X.-Y. Zhang, R.Q. Hidalgo, R.J. Murphy, R.S. Markiewicz, B.C. Giessen, in Fullerenes:
Recent Advances in the Chemistry and Physics of Fullerenes and Related Materials, edited by K.M. Kadish and R.S. Ruoff, Electrochemical Society Proceedings Vol 94-24 623 (1994).
7. A.R. Yavari, P.J. Desre, and T. Benameur, Phys. Rev. Lett., 68, 2235 (1992). 8. M. Atzman, K.M. Unruh, and W.L. Johnson, J. Appl. Phys., 58, 3865 (1985). 9. C.N.J. Wagner, in Liquid Metals: Chemistry and Physics, edited by S.Z. Beer, Marcel
Dekker, Inc., New York, p. 257, (1972). 10. T.B. Massalski, Binary Alloy Phase Diagrams. 2nd ed. (ASM International, Materials
Park, OH, 1990). 11. F. Irmann, Helv. Chim. Acta, 31, 1584-1602 (1948). 12. S. Huang, C. Yang, X. Yu, in Novel Forms of Carbon II. edited by C.L. Renschler, D.M.
Cox, JJ. Pouch and Y. Achiba, Mater. Res. Soc. Proc. 349, Pittsburgh PA 1994 pp 363-369.
13. GJ. Snyder, A. Simon and M.R. Beasley, in Fullerenes: Recent Advances in the Chemistry and Physics of Fullerenes and Related Materials, edited by K.M. Kadish and R.S. Ruoff, Electrochemical Society Proceedings, Vol. 94-24, 614 (1994).
14. R. Hidalgo-Quesada, X.-Y. Zhang, B.C. Giessen, unpublished results.
442

STRUCTURE AND CONDUCTIVITY OF IODINE-DOPED C60 THIN FILMS
JUN CHEN*, HAIYAN ZHANG*, BAOQIONG CHEN*, SHAOQI PENG*, NING KE**, S.P. WONG** *Department of Physics, Zhongshan University, Guangzhou, China »»Department of Electronic Engineering, The Chinese University of Hong Kong, Hong Kong
ABSTRACT
We report here the results of our study on the properties of iodine-doped C60 thin films by IR and optical absorption, X-ray diffraction, and electrical conductivity measurements. The results show that there is no apparent structural change in the iodine-doped samples at room temperature in comparison with that of the undoped films. However, in the electrical conductivity measurements, an increase of more that one order of magnitude in the room temperature conductivity has been observed in the iodine-doped samples. In addition, while the conductivity of the undoped films shows thermally activated temperature dependence, the conductivity of the iodine-doped films was found to be constant over a fairly wide temperature range (from 20°C to 70°C) exhibiting a metallic feature.
INTRODUCTION
Since the discovery by Kratschmer and coworkers of an efficient laboratory method [1] for producing "macroscopic" quantities of buckministerfullerene C60, knowledge of the molecular and solid state C60 has advanced rapidly. Many fullerene-derived solid phases have been synthesized with novel properties and potential applications. Among the various intercalation compounds, the synthesis and the study of the composition and phase equilibria of alkali-metal-doped fulleride have drawn most of the attention, mainly because of the occurrence of superconductivity in these systems [2-4].
In practice, due to the extreme sensitivity to oxidation, the alkali-metal-doped compounds are unstable in air, and most measurements of the superconductivity properties were necessarily made with samples either prepared in-situ or encapsulated in an inert gas environment. In contrast to the case of electron doping with alkali metals, possible hole doping in the fullerenes with halogen atoms appears to be another viable direction for searching new carbon-superconductor.
Several attempts to dope the fullerenes with elements such as bromine and iodine have been reported [5-7]. On the other hand, Miyamoto et al [8] have theoretically investigated the possibility of halogen doping in solid buckministerfullerene C60, assuming that the face-centered cubic lattice structure is unchanged by doping. They found by first principles total-energy calculations that the bromine atoms are exothermically incorporated into solid C60, but that hole injection in the valence band of the pristine Cm is not achieved. They also showed that new bands consisting mainly of the bromine 4p orbitals appear in the midgap of C60 and as the uppermost band of these midgap states is half-filled, they lead to metallic features.
In this work, we shall report the results of our study on the properties of iodine-doped C60
thin films by IR and optical absorption, X-ray diffraction, and electrical conductivity
443
Mat. Res. Soc. Symp. Proc. Vol. 359 c 1995 Materials Research Society

measurements. The electrical results will be discussed in relation to the theoretical calculations of Miyamoto et al [8].
EXPERIMENTAL
The starting material was made by conventional AC arc discharge method. C60 films was evaporated onto quartz and silicon substrates in high vacuum chamber at 450°C. The thickness of the films is about 0.2-0.5/xm. The doping was performed by placing the films in a glass vial and exposed them to iodine vapor at room temperature for a few hundred hours. After this process, the color of the films was obviously changed from yellow brown to red brown and optical absorption was measured on a DU-8B spectrophotometer. FT-IR spectra and X-ray diffraction results of these samples were obtained on a NICOLET 5DX FT-IR spectrometer and a D/max-3A X-ray diffractometer respectively. Aluminum electrodes with a gap of 1 mm were evaporated onto the films for conductivity measurements. The temperature dependence of the conductivity was measured in a dark vacuum chamber over the temperature range from 20"C to 120°C with an incremental step of 5°C.
RESULTS AND DISCUSSION
The X-ray diffraction result of the initial C60 thin film sample and that of the sample after 100 hr exposure to iodine vapor are shown in Fig. la and lb respectively. It is seen that except for a slight decline in crystallinity, which may be due to a surface absorption of I2 on C60 thin films, no structural change appears to have occurred. The infrared spectra measured for the initial and the doped C«, thin films are shown in Fig. 2. Again there is no apparent difference observed in the spectra. It seems therefore reasonable to assume that the closed-packed planes of the fee structure are preserved and that the iodine atoms are placed between these planes.
600
Q 400 * O U 200 tZ)
as o a. 600 tzi H g 400 o u
200
I j ' I t i ' t i i i i t i i i i t ■ .,.<■■■.,,.■,■.
r\ "■*' ' ' »■■*■*■■*■■■' * ■ «-i-«-»-i-»~i~t-j.i >.*.i ■ * ■
5 15 25 35 45 55
29 Fig. 1 X-ray diffraction pattern of (a) undoped C60 thin film sample and (b) the C60 sample
after 100 hr exposure to iodine vapor.
444
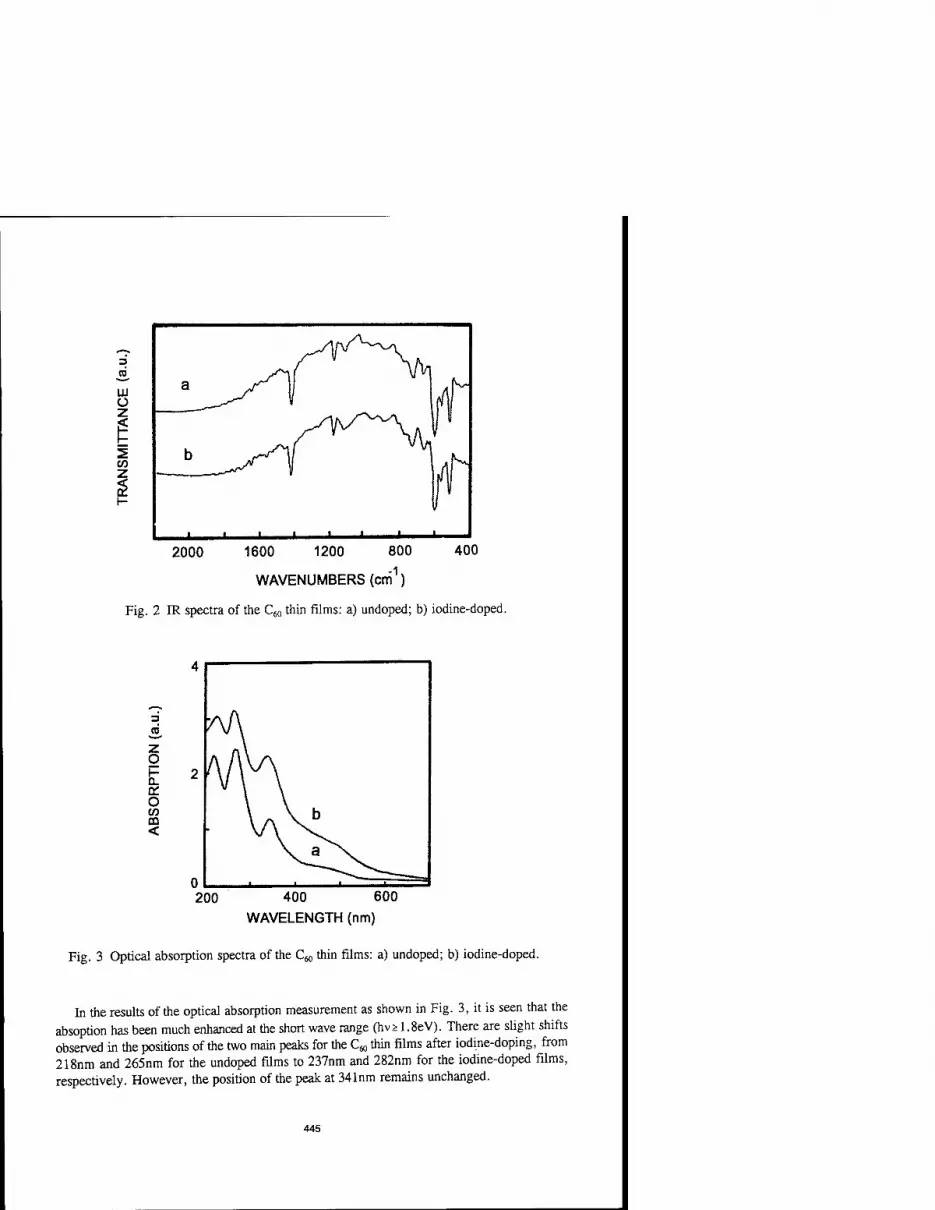
3 d 111 O Z
CO z
WAVENUMBERS (cm )
Fig. 2 IR spectra of the C60 thin films: a) undoped; b) iodine-doped.
z o H Q. en o to CO <
200 400 600 WAVELENGTH (nm)
Fig. 3 Optical absorption spectra of the C60 thin films: a) undoped; b) iodine-doped.
In the results of the optical absorption measurement as shown in Fig. 3, it is seen that the absoption has been much enhanced at the short wave range (hv>1.8eV). There are slight shifts observed in the positions of the two main peaks for the Cw thin films after iodine-doping, from 218nm and 265nm for the undoped films to 237nm and 282nm for the iodine-doped films, respectively. However, the position of the peak at 341nm remains unchanged.
445

10
_ 10
q
Q -13 10 ■"
10
O C G O
2.8 3.0 3.2 3.4
1000AT(K") Fig. 4 The dark electrical conductivity, o, versus reciprocal temperature of the C60 thin films:
a) undoped; b) iodine-doped.
Figure 4 shows the results for the temperature dependence of the electrical conductivity. For the undoped film, the room temperature conductivity oRT is about 10"13 (Qcm)"1. After doping, an increase of more than one order of magnitude in oRT has been observed. It is also worthy to note that unlike the thermally activated temperature dependence of conductivity observed in the undoped Cm films, the conductivity of the iodine-doped films remains constant over a fairly wide temperature range (from 20°C to 70°C) after which it rises with increasing temperature again. We believe that the occurrence of such a constant conductivity temperature range in the iodine-doped samples is an indication of the metallic feature in support of the theoretical results of Miyamoto et al [8] who performed total-energy band structure calculations for bromine-doped CM. The high electronegativity of C60 hinders acceptor doping. According to Miyamoto et al [8], the halogen doping does not create holes in the valence band of the pristine C60 but instead, three new bands consisting mainly of Br 4p orbitals appear in the original energy gap regardless of the sites at which the Br atoms are placed. The lower two bands are occupied completely and the uppermost is half-filled, resulting in the metallic feature of the midgap states. The full widths of these bands are 0.1 eV for Br atoms at the octahedral sites and 0.25 eV for those at the tetrahedral sites, respectively, and the width of the single half-filled band is less than those. Since iodine is not likely to have a higher electronegativity than bromine, similar results are expected for iodine-doped C^. The results of the conductivity measurements of the present work seem to be consistent with their calculation for Br-doped
CONCLUSION
In the present study of iodine-doped C«, thin films, we have shown that there is no apparent structural change in the doped samples in comparison with that of the undoped sample.
446

However, the room temperature electrical conductivity of the doped sample has increased by more than one order of magnitude compared with the undoped sample. Moreover, the conductivity of the iodine-doped sample was found to remain constant over the temperature range from 20°C to 70°C exhibiting a metallic feature. This metallic feature is consistent with the prediction of the theoretical calculation by Miyamoto et al [8] for Br-doped C60.
ACKNOWLEDGEMENT
This work is supported by the Establishment Foundation of Key Discipline by the Higher Education Bureau of Guangdong Province, China and Croucher Foundation, Hong Kong.
REFERENCES
[1] W. Kratschmer, L.D. Lamb, K. Fostiropoulos, and D.R. Huffman, Nature 347, 354 (1990).
[2] A.F. Hebard, M.J. Rosseinsky, R.C. Haddon, D.W. Murphy, S.H. Glarum, T.T.M. Palstra, A.P. Ramirez and A.R. Kortan, Nature 350, 600 (1991).
[3] M.F. Rosseinsky, A.P. Ramirez, S.H. Glarum, D.W. Murphy, R.C. Haddon, A.F. Hebard, T.T.M. Palstra, A.R. Kortan, S.M. Zahurakand A.V. Makhija, Phys. Rev. Lett. 66, 2830 (1991).
[4] K. Holczer, O. Klein, S.M. Huang, R.B. Kaner, K.J. Fu, R.L. Whetten and F. Diednch, Science 252, 1154(1991).
[5] Hisashi Sekine, Hiroshi Maeda, Michio Kosuge, Yoshiaki Tanaka and Madoka Yokumoto, J. Appl. Phys. 72, 5448 (1992).
[6] Th. Zenner, H. Zabel, J. Phys. Chem. 94, 8690 (1993). [7] L.W. Song, K.T. Fredett, D.D.L. Chung and Y.H. Kao, Solid State Commun. 87, 387
(1993). [8] Yoshiyuki Miyamoto, Atsushi Oshiyama and Susumu Saito, Solid State Commun. 82, 437
(1992).
447

PART VIII
Spectroscopy of Fullerenes

NONLINEAR OPTICAL AND TRANSPORT PROPERTIES OF FULLERENE CRYSTALS
HUGH J. BYRNE, LIDIA AKSELROD, ANDREAS T. WERNER, WOLFGANG K. MASER, MATHIAS KAISER, WOLFGANG W. RÜHLE, AND SIEGMAR ROTH. Max-Planck-Institut für Festkörperforschung, Heisenbergstrasse 1, 70569-Stuttgart, Germany
ABSTRACT
Picosecond time resolved photoluminescence and photoconductivity measurements are performed to investigate the influence of high intensity illumination on the properties of Fullerene crystals. A highly nonlinear dependence of both the photoluminescence characteristics and the photoconductive response of the fullerenes is seen and temperature dependent measurements indicate that the nonlinear processes are associated with an insulator- metal-like phase transition in the material, and thus that the electronic properties of the excited state are dramatically altered at high excited state densities. The observed behaviour is compared and contrasted to the changes in the optical properties upon photochemical modification of the pristine material via Raman spectroscopy. Application of a simple phenomenological model to calculate the contribution of intermolecular exchange and correlation energies in the excited state supports the proposal that the observed phenomena originate from a Mott-like phase transition. A further manifestation of this behaviour is the emergence of a broadband electroluminescent emission above a critical injection current density.
INTRODUCTION
As fully conjugated, molecular organic systems, the fullerenes have attracted much attention for their potential applications as optical and, indeed, nonlinear optical materials1. Since they have become available in sizeable quantities, extensive investigations of their optical properties have been conducted, leading to the conclusion their molecular symmetry is a determining feature. The HOMO-LUMO transition is optically forbidden due to symmetry selection rules, becoming weakly allowed in solution through symmetry breaking interactions2. Upon excitation, radiative relaxation is equally forbidden and the first excited singlet state decays predominantly via intersystem crossing, on a timescale of -lnsec, to the triplet state which is long lived3. The effects of symmetry are similarly manifest in the vibrational spectroscopy of molecular fullerenes. The 174 degrees of vibrational freedom are reduced to 46 vibrational frequencies due to the icosahedral symmetry, of which 32 are silent4.
Although an understanding of the spectroscopic properties of molecular fullerenes was rapidly established, those of the solid state appear more complex. The speculation which has been directed towards the influence of packing on both the orbital symmetry and the intermolecular interaction has been fuelled by the variety of apparently conflicting results. Whereas band structure calculations have predicted an energy gap as low as 1.3eV5, the lowest energy, forbidden transition has been determined to lie at 1.85eV6, remarkably similar to the HOMO-LUMO separation in molecular fullerenes2. The vibrational spectrum is similarly unperturbed by the solid state environment7. The observation of fluorescence in the solid is a
451
Mat. Res. Soc. Symp. Proc. Vol. 359 ® 1995 Materials Research Society

departure from observations in solution, but its low efficiency, coupled with its 1.2nsec decay time8 are consistent with a rapid and efficient intersystem crossing from a molecular singlet to the triplet, as in solution. Indeed, such long lived triplets have been observed in ESR measurements and their ODMR measurements associate them with the fluorescence emission9-10. These triplets, however, were concluded to be delocalised over more than one molecule and, to add to the debate, the fluorescence has been associated with traps or defect states11. Transient excited state absorption measurements, which in solution clearly the evolution of the long lived triplet from the excited singlet on a timescale of -lnsec, show a spectrum in the solid state which can not be correlated with either the molecular singlet or triplet, and which, over its lifetime, (>200nsec), shows no spectral evolution12 and notably, no evidence of a species which decays on a nanosecond timescale. A proposal which may reconcile such conflicting results is that, whereas vacancies, defects and possibly surface molecules exhibit properties which may be associated with molecular fullerenes, excitation of the bulk material leads to the formation of a self-trapped exciton12. What is clear is that the spectroscopic properties of fullerenes in the solid state are extremely sensitive to crystal packing, as further illustrated by pressure dependant studies13 and the effect of thermal annealing14, and in particular on the local environment. The observation of fluorescence from so-called defect states demonstrates that any break in symmetry of the local environment has a profound effect on the optical properties of the molecule in the solid state. In this paper, we report on the dependence of the optical and electronic properties of solid state fullerenes on the local excited state population density and show how density dependent electronic interactions can give rise to interesting phenomena such as electroluminescent emission.
FULLERENES UNDER HIGH EXCITATION DENSITIES
Photoluminescence
The weak luminescence output which is observable upon resonant optical pumping of solid state fullerenes has a spectral width and vibronic structure which can be correlated with that of the absorption spectrum of Cgo solutions8-15. The temporal decay of 1.2nsec at 10K, is remarkably similar to that of the molecular first excited singlet via intersystem crossing to the long lived triplet suggesting that the excited state in the solid is molecular in nature. However, Feldmann et al. have shown that the fluorescence can be assigned to X-traps11, leading to the conclusion that Cgo is not luminescent in the bulk solid.
It should be noted that the measurements described above were performed at low intensities. On increasing the input intensity, a dramatic change in the low temperature photoluminescence spectrum is observable. Figure 1 shows the evolution of the spectrum over the range 30 Wcm~2 to 1 kWcm~2. The spectral evolution is accompanied by a broadening of the spectrum and a dramatic increase in the luminescence output. Investigations of the temporal decay of the emission indicate that the spectral changes may be associated with the emergence of a long lived emission component8. The magnitude of the longlived component increases with the cube of the average input power, in the range 175 Wcnr^to 1 kWcm~2 as shown in figure 2. Furthermore, within the time window of the measurement (0-10 nsec; see8-16 for details), the decay time of the long lived component, extracted from a fit to a single exponential decay, is seen to increase with intensity, with an exponent between two and three, as is shown in figure 3. The intensity onset of this behaviour appears to be a threshold value and varies with position on the sample by a factor of the order of two.
452

1.2 1.3 1.4 1.5 1.6 1.7 1.1 Energy [eV]
Fig. 1: Luminescence Spectra of Cgo Crystal with increasing illumination from 0.1 (solid), 0.5 (dashed), and 3.0 mW (dotted)
10" 10' 10' Input Power [mW]
Fig. 2: Dependence of the long lived luminescence component on intensity.
1000
Intensity (Wem
Fig. 3: Dependence of the emission lifetime of the long lived component on intensity
The features of the observed behaviour, including the nonlinear evolution of the emission spectrum, a continuous, nonlinear increase in the luminescence efficiency as well as lifetime, may not easily be accounted for by a model system based on static energy levels. The apparent existence of a threshold intensity for this behaviour is indicative of the requirement of a critical excited state density. The use of the term threshold is provoked by the observation that, on the emergence of the long lived, spectrally shifted luminescence, the short lived component saturates and remains constant with increasing intensities8. If this short lived component is attributed to traps or surface molecules, then the long lived luminescence emerges only once the decay rate through such channels has been saturated. The fact that no nonlinear evolution of the spectrum is observable in films, which are polycrystalline with grain size typically of order
453

50nm17, is an indication of the competition between such decay channels and the build up of a critical excited state density.
Transport Properties
The behaviour observed in the photoluminescence of Cgy under high intensity illumination is a strong departure from the intramolecular processes observable in solution and, in order to further investigate this phenomenon, the transport properties of the system under high level illumination were investigated. Under low intensity illumination, the photoconductive response of fullerene crystals is linear in intensity18 and the temperature dependence shows the transport process to be thermally activated, characteristic of a molecular insulator or semiconductor. At elevated intensities, the intensity dependence of the photoconductive response initially reduces to a square root dependence due to the contribution of bimolecular recombination processes19. This square root dependence is therefore the first indication of the onset of the interaction of neighbouring excited balls. As is shown in figure 4 this square root dependence is transformed to a cubic dependence upon further increase in intensity from 3Wcnr2 to 300Wcnr2. The onset of the cubic dependence of the photoconductive response coincides with the visible onset of the nonlinear photoemission process described above and the nonlinear behaviour of the transport properties may, therefore, be associated with the nonlinearity in the optical properties.
1 10 100 1000 Input Power [mtf]
4 5 6 7 8 9 10 1000/T [K ]
Figure 4; Intensity dependence of the photo- current in fullerene crystal.
Figure 5: Temperature dependence of the photoconductive response, (a) low and (b) high illumination conditions.
The increase of the photoconductive response over two orders of magnitude seen in figure 4 is indicative of a dramatic change in the nature of the photoconductive state. In order to probe the nature of this highly excited state, the temperature dependence of the photoconductive response of highly excited fullerene was monitored. In figure 5(b), the temperature dependence of a crystal illuminated with 300 Wcm~2 average intensity, an intensity just above the threshold intensity, is compared to that of the same crystal illuminated with 3 Wcm~2 (figure 5(a)). The measurement was performed by sweeping the temperature
454

and monitoring the high and low intensity response at each temperature. At each point, adjustment of the laser spot on the sample was performed to optimise the response. Whereas the low intensity photoconductive response decreases by three orders of magnitude over the temperature range measured, the high intensity response remains constant within an order of magnitude. Such a temperature independence of the conductivity may be characteristic of a metallic-like behaviour and a Mott-like insulator to metal transition is inferred.
Raman Spectroscopv
In the interpretation of optically induced phenomena in fullerenes, it is important to note that Cgo in the solid-state has been observed to be photochemically unstable above the phase transition of 249K20. In resonant-Raman spectroscopy, the photochemical transformation is manifest as a softening by 10cm-1 and a loss of oscillator strength of the Raman modes. This is most clearly observed by investigating the strongest Cgo Raman vibration, the Ag pentagonal pinch mode positioned at 1468cm"1 21. The source of the softening has been identified as a photopolymerisation via a 2+2 cycloaddition21. The situation is eased, however, by the nature of the temperature dependence of the process. At low temperatures, the lack of rotational freedom prevents the molecule aligning a double bond with a double bond of its next nearest neighbour, inhibiting photopolymerisation22. Furthermore, at temperatures >~450K, the thermal energy is sufficient to prohibit polymerisation as well as to decompose already polymerised material23. Therefore, the photochemical instability of the material is only of concern within a limited temperature regime. Nevertheless, it is informative to compare and contrast the nature of such processes to those observed at high excitation densities.
Measurements were performed on crystals at 20K using the 514 line of an Ar+ ion laser and spectra were recorded using a Dilor X-Y spectrometer. At low powers (3mW) the Ag
pentagonal pinch mode was observed to be stably positioned at 1469cm-1. With increasing intensities, however, the mode positioning begins to shift to lower frequencies. Figure 6 shows the power dependence of the mode positioning. The power dependent shifting is continuous and nonlinear with an exponent of order 2-3. Such a power dependence has previously been reported in fullerenes at room temperature, in a sample which proved to be stable against photopolymerisation24. The mode shifting is accompanied by the nonlinear emergence of a strong background luminescence and therefore may be associated with the nonlinear behaviour described above. The process is furthermore characterised by a strong, nonlinear increase in the Raman scattering cross-section, the nonlinearity being of order three, as shown in figure 7. The observed behaviour is rather different to that which is observed upon photochemical transformation of the material. Most notably the process is reversible, the original mode positioning being recovered upon a return to low intensities. Notable also is the continuous nature of the shift as well as the dramatic increase in the Raman intensity.
Upon phototransformation of the fullerenes a single mode frequency emerges with significantly lower Raman intensity than the pristine material. An interesting comparison to the observed intensity dependence of the Raman scattering of the pristine material is that of the photopolymerised material25. In material which has been already exposed to light, the low intensity mode positioning is 1459cm"1. This mode positioning is seen to be stable up to what appears to be a threshold power density, whereupon it shifts abruptly to -1463cm"1. The abrupt spectral shift is accompanied by a dramatic and abrupt increase in both the Raman intensity and the background luminescence. Upon reduction of intensity, the original, 1469cm"1 mode positioning is attained. Prolonged illumination causes a decay of this feature and the re-
455

emergence of the 1458cm-1 mode, i.e. polymerisation, and the entire procedure may be cycled. The process has been interpreted as a photoinduced de-polymerisation25. Of importance to the discussion here, the characteristics of the intermediate state at high intensities, including the fact that it reverses to the pristine material at reduced intensities, are similar to those of the state which evolves continuously in the pristine material at low temperatures, indicating that this state is inherent to Cgo at high intensities.
0 10 20 30 40 50 60 70
Input Power[mW]
Fig. 6: Intensity dependence of the mode positioning in Cgo crystal at 20K
10" 10' 10'
Input Intensity[mW]
Fig. 7: Intensity dependence of the integrated Raman intensity
In a bond polarisability model of the Raman spectrum of C^26, it was illustrated that the polarisability constants, and therefore the Raman intensities, or oscillator strengths, are dominated by those of the ^-conjugated double bonds. In contrast, the force-constant is determined by n and a-bonds. However, since the a-bonds are considerably stronger, disturbances to the 7t-system result in only moderate perturbation to the force constant. In the Raman spectrum, this should manifest itself as wavenumber shifts within a very small spectral region. In the case of the phototransformation of fullerenes, which dominates at room temperature and moderate intensities21'22-27, an irreversible mode softening by 10cm"1 and a significant loss of oscillator strength are observed. The spectral softening is indicative of a loss of rc-electron contribution to the force constant. The reduced oscillator strength of the photopolymer mode implies a reduced polarisability of the 7t-system. The proposed and commonly accepted interpretation of the process is that of the formation of an intermolecular 7t-bond via a 2+2 cycloaddition21, essentially a photochemical polymerisation reaction. That the Raman spectrum of the photoproduct predominantly retains a molecular character may be understood by the observation that the addition process is constrained by the lattice interactions and equilibrium bond formation is inhibited28. The result is a weak chemically bonding interaction which acts as an intermolecular perturbation to the 7t-system. The minimal extent of the perturbation may be gauged by the similarity of the optical absorption spectra of the photopolymer and the pristine material. The process is furthermore reversible upon heating to temperatures starting at ~100°C29.
The 2+2 cycloaddition reaction is forbidden in the ground state and is facilitated only through the change in orbital symmetry which is affected by the optical absorption30. The
456

photochemical polymerisation of Cgn has been shown to exhibit a linear-intensity dependence, implying a behaviour that requires a single excited state in the local environment27, consistent with elementary symmetry considerations governing photochemical interactions. Through the same considerations, the cycloaddition of two neighbouring excited states is forbidden. Therefore the reversal of the photochemical polymerisation at elevated intensities is not surprising. The behaviour is characterised by the re-emergence of the Raman spectrum of the pristine material upon returning to low intensities. The abrupt nature of the reverse process indicates that it requires multi-photon excitation, which yields a high density of excited states which no longer interact chemically.
The characteristics of the Raman spectrum in the high excitation density regime, in both cases, are distinct from those of both the pristine material and the photoproduct. The mode positioning is softened with respect to that of Cgn, but notably the oscillator strength is considerably larger than that of the photoproduct. The characteristics of the changes are consistent with a loss of 71-character from the molecular vibration, but an increased polarisability or delocalisation. The manifestation of the spectral changes only at high intensities implies a dependency on a threshold excitation density which, for the case of depolymerisation, must be in the regime where next nearest neighbours are excited. The continuity of the mode shifting in the intensity dependent evolution of the spectrum of the pristine material indicates that its origin is not in a single molecular species nor in a bonding between two molecules, but that the perturbation varies continuously, dependent on excitation density. The process is reversible implying that it is photophysical in origin and points towards the concept of a co-operative electronic interaction at high excitation densities. Such a state may be reached at low temperatures, where photopolymerisation is inhibited, or, viewing the depolymerisation process as due to the excitation of the nonbonding state between the molecules, also at room temperatures. In this sense the photochemical polymerisation process does not compete with the photophysics at high intensities but merely presents an intermediate at room temperatures. The state of the material is predominantly unperturbed in either case, the differences lying in the nature and degree of the intermolecular 7t-electron interactions.
MANY BODY PROCESSES IN FULLERENES
The effects exhibited by fullerenes under high intensity illumination point towards a departure from the molecular like behaviour of the weakly excited state through the influence of the interaction of molecules in the excited state. Such many body processes have been extensively investigated in inorganic semiconductors31. Although the fundamental excitations are Coulomb bound as excitons, at high concentrations the interaction of excitons becomes significant and leads for example to the formation of biexcitonic molecules in direct band-gap materials32. Perhaps the most dramatic effects are exhibited by indirect band-gap materials, in which optical excitations have been observed to exist in the form of electron-hole plasmas or liquids33. The most extensive investigations have been carried out on germanium and silicon. In both materials, high intensity illumination leads to the emergence of a photoluminescence emission which is red shifted with respect to that of the free exciton34-35. As in the case of fullerenes, the dependence of the emission intensity on excitation intensity has been shown to be cubic in both materials36-37 eliminating biexcitonic molecules as its origin. The decay kinetics of the red-shifted emission was shown by Westervelt et al. to be highly nonexponential, the decay rate increasing with time38. Further nonlinear behaviour was observed in the photoconductive response of Ge at high excitation densities39. Although not
457

considered in the original work, a cubic dependence of the photocurrent above threshold fits well to the data and the similarities to the behaviour described in figure 4 are remarkable.
Clearly, the manifestations of many body phenomena in the highly excited states of indirect semiconductors are comparable to the nonlinear phenomena exhibited by fullerenes. In the model proposed by Mott, as the density of excitons is increased, the electron-hole interaction is considered screened by a plasma environment until, at a critical density (nc~0.01 /a^), they cease to exist. Indirect band gap semiconductors are particularly amenable to the production of the high densities required due to the long excited state lifetimes which result from the forbidden nature of the radiative transitions. In the supra-Mott regime, exchange and correlation energies become important and at high excitation densities, exchange/correlation energies can dominate over the exciton binding energy, resulting in the formation of an electron-hole plasma. Furthermore, the ground state energy of the system, Eg(n), has a minimum at an equilibrium density n0 for T= 0 K, at which a liquid form which is stable with respect to decay into excitons or an electron-hole plasma exists, if Eg(n0) is less than the binding energy of the free exciton, Ex. The proposal by Keldysh40 that the dominance of Exc can lead to the formation of a constant density condensate, has been substantiated by the nonlinear phenomena observed in indirect semiconductors at low temperatures and is currently widely accepted.
The similarities of the properties of the highly excited state to those of Ge and Si at low temperatures (<4 K) prompt an evaluation of the contribution of correlation and exchange energies in fullerenes. The "exciton" binding energy in fullerenes is ~0.7 eV41. Band calculations of fullerenes in the solid state yield effective masses of the electron and hole to be 1.41 and 1.1, respectively42, corresponding to a reduced mass u= 0.65. The exciton Bohr radius is given by aQ=h2E/ue2, where s is the dielectric constant. Taking s = 4.343, the resultant value of a^O.35 nm is consistent with the dimensions of a molecularly localised excited state, analogous to a Frenkel exciton in inorganic semiconductors. The exciton binding energy, given by
e2 x SiieQenQ
may be calculated to be -0.5 eV and is consistent with the separation of the exciton transition and the first solid state feature, or bandgap, in fullerenes41-17.
In such a system, the critical, or so-called Mott density, at which the exciton binding energy becomes screened is given by44
ncao3~(0.25)3~10-2 (2)
and may be calculated to be -1.4x10^0 cm"-*. The molecular density is -3.6x10^0 cm"3, and so this corresponds to an excitation density of -40%. Both the exchange and correlation energies are strongly dependent on band structure and anisotropy, but it has been shown that their sum is largely independent, enabling a universal description of their contribution in the form4^,
458

Exc(rs) _a+bro
" c+drs+rs2 (3)
where a=-4.8316, b=-5.0879, c=0.0152 and d=3.0426. rs is the mean distance between excitations. Using the parameters above, the exchange-correlation energy may be calculated as a function of excitation density, and is plotted in figure 8. At a density of 1.4 x 1020 cm"3, Exc increases above that of the exciton binding energy and, at a density of 4x1O2^ cm~3, the excess energy has a value of 150 meV.
10
>
60 u <D C
W
10
1 1 - -
s'-
E ex ■
■
■
xc/
10"
-3. Density (cm
Fig.8; Plot of the sum of exchange and correlation energies as a function of excitation density.
Comparison of the exchange and correlation energies at high excitation densities to the low intensity molecularly localised energies therefore supports the existence of a Mott-like transition at a critical density of ~lx 1020cm~3 and the increasing prevalence of Exc can result in an energy shift of 150meV, consistent with that observed in the photoluminescence of fullerenes at high intensities. Such a calculation, combined with a comparison of the cubic dependence of both the photoluminescence output and the photocurrent, in fullerenes and both Ge and Si, strongly supports the proposition that the nonlinearities observed are governed by similar interactions.
ELECTROLUMINESCENCE IN FULLERENE CRYSTALS
A further manifestation of the highly nonlinear optical and transport properties of fullerenes is the electroluminescent emission observable upon application of an injection current above a critical value46. COO crystals of dimensions ~200x200x200um3 were mounted using CuBe-springs, or silver paste on a substrate with two gold strip lines. The crystal was
459

therefore symmetrically contacted. All processing was performed under inert atmosphere, and the sample was mounted in a cryostat to allow temperature control down to liquid nitrogen temperature. A dc voltage was provided by a Keithley voltage source.
Figure 9 shows the current/voltage and the intensity/voltage characteristics. Below a voltage of ~10V no light emission can be detected and the current increases approximately linearly with the field. Increasing the voltage above this point, however, results in the abrupt turn-on of light emission. The emission has a broad distribution, as shown in figure 10, which is comparable to the photoluminescence observed from fullerene crystals at high excitation densities. The luminescence intensity increases highly nonlinearly with the current above the threshold and the current-voltage characteristics become somewhat nonlinear. The requirement of a critical current density is further support of the proposition that the nonlinearities observed stem from an excited state phase transition at a critical excited state density.
Volta / V Fig. 9: Current/Voltage (circles) and Intensity/Voltage (squares) characteristics of an electroluminescent crystal
c
.a id
400
1 1 1 1
300 I 200 \
100
0 /ill! . 1 \l
400 600 BOO 1000 1200
Wavelength (nm) Fig. 10: Emission Spectrum of an electro- luminescent fullerene crystal.
CONCLUSIONS
The task of unravelling the complexities of the optical and electronic properties of fullerenes in the solid state has proven to be far from trivial. Their sensitivity to external influences such as oxygen and illumination is well established. A more complete understanding of their sensitivity to local crystalline environment and structure is developing. Although comparison of the positioning of the lowest energy transition in solution and solid indicates a minimum perturbation by the solid state environment, the photochemical instability of the material indicates the existence of a significant interaction upon excitation. The results outlined here suggest that this interaction increases with increasing excitation density. The resultant state, which is distinguishable from the photochemical product, results from excited state density dependent electronic interactions, similar to the case of indirect bandgap semiconductors. The excited state interactions lead to dramatic changes in the optical and electronic properties of the material. The emerging picture of fullerenes is that of a material which is finely balanced between weak intermolecular interactions in the ground state and strong interactions between excited state. A demonstration of how this fine balance may be
460

exploited is apparent in the observation of a strong, broadband electroluminescent emission from fullerene crystals.
REFERENCES
1. L.W. Tutt and A. Kost, Nature, 356, 225( 1992). 2. S. Leach, M. Vervloet, A. Despres, E. Breheret, J.P. Hare, T.J. Dennis, H.W. Kroto, R.
Taylor, and D.R.M. Walton.Chem. Phys., 160, 451 (1992) 3. T.W. Ebbesen, K. Tanigaki and S. Kuroshima, Chem. Phys. Lett., 181, 501(1991). 4. D.S. Bethune, G. Meijer, W.C. Tang, H.J. Rosen, W.G. Golden, H. Seki, C.A. Brown
and M.S. de Vries, Chem. Phys. Lett., 179, 181 (1991). 5. W.Y. Ching, M.-Z. Huang, Y.-N. Xu, W.G. Harter and F.T. Chan, Phys. Rev. Lett., 67,
2045 (1991). 6. R. Zamboni, M. Muchini, R. Danieli, C. Taliani, H. Mohn, W. Müller and H.-U. ter
Meer, to be published in the proceedings of the SPIE symposium on "Fullerenes and Photonics", San Diego, July 1994.
7. P.C. Eklund, Z.-H. Dong, Y. Wang, M.J. Holden, K.A. Wang, P. Zhou, A.M. Rao, G. Dresselhaus and M.S. Dresselhaus, in Electronic Propertiesof Fullerenes. edited by H. Kuzmany, J. Fink, M. Mehring and S. Roth (Springer Series in Solid State Sciences 117, Springer Verlag, Heidelberg 1993) p. 413.
8. H.J. Byrne, W. Maser, W.W. Rühle, A. Mittelbach, W. Hönle, H.G. von Schnering, B. Movaghar, S. Roth, Chem. Phys. Lett. 204, 461 (1993)
9. E.J.J. Groenen, O.G. Poloektov, M. Matsushita, J. Schmidt, J.H. van der Waals, Chem. Phys. Lett., 197, 314 (1992)
10. E.J.J. Groenen and J. Schmidt, in Progress in Fullerene Research. pp397, edited by H. Kuzmany, J. Fink, M. Mehring and S. Roth (World Scientific Publishing, Singapore 1994).
11. J. Feldmann, W. Guß, E.O. Göbel, C. Taliani, H. Mohn, W. Müller and H.-U. ter Meer, in Progress in Fullerene Research. pp416, edited by H. Kuzmany, J. Fink, M. Mehring and S. Roth (World Scientific Publishing, Singapore 1994).
12. T.W.Ebbesen, Y. Mochizuki, K. Tanigaki and H. Hiura, Europhys. Lett., 25, 503, (1994). 13. D.W. Snoke, K. Syassen and A. Mittelbach, Phys. Rev., B47, 4146 (1993) 14. L. Akselrod, H.J. Byrne, T.E. Sutto and S. Roth, Chem. Phys. Lett., submitted. 15. C. Reber, L. Yee, J. McKiernan, J.I. Zink, R.S. Williams, W.M. Tong, D.A.A. Ohlberg,
R.L. Whetten and F. Diederich, J. Phys. Chem., 95, 2127 (1991). 16. H.J. Byrne, W.K. Maser, W.W. Rühle, A. Mittelbach and S. Roth, Appl. Phys. A56, 235
(1993). 17. L. Akselrod, H.J. Byrne, J. Callaghan, A. Mittelbach and S. Roth, in Electronic Properties
of Fullerenes. edited by H. Kuzmany, J. Fink, M. Mehring and S. Roth (Springer Series in Solid State Sciences 117, Springer Verlag, Heidelberg 1993) p. 219.
18. M. Kaiser, PhD. Thesis, Univ. of Karlsruhe, Germany (1993) 19. H. Yonehara and C. Pac, Appl. Phys. Lett., 61, 575 (1992). 20. P. Zhou, A.M. Rao, K.-A. Wang, J.D. Robertson, C. Eloi, M.S. Meier, S.L. Ren, X.-X.
Bi and P.C. Eklund, Appl. Phys. Lett., 60, 2871 (1992) 21. L. Akselrod, H.J. Byrne, C. Thomsen, A. Mittelbach and S. Roth, Chem. Phys. Lett.,
212, 384 (1993)
461

22 P. Zhou, Z.-H. Dong, A.M. Rao, and P.C. Eklund, Chem. Phys. Lett., 211, 337 (1993) 23. H. Kuzmany, M. Matus, T. Pichler, and J. Winter, in the Proceedings NATO ARW on
Physics and Chemistry of Fullerenes, NATO ASI-C series, (Crete 1993). 24. H.J. Byrne, L. Akselrod, C. Thomsen, A. Mittelbach and S. Roth, Appl. Phys., A57
299 (1993) 25. L. Akselrod, H.J. Byrne, C. Thomsen and S. Roth, Chem. Phys. Lett., 215, 131 (1993). 26 D.W. Snoke and M. Cardona, Solid State Commun., 87,121 (1993). 27. Y. Wang, J.M. Holden, Z.-H. Dong, Xiang-Xin Bi, and P.C. Eklund, Chem. Phys
Lett., 211,341 (1993). 28. A.M. Rao, Ping Zhou, Kai-An Wang, G.T. Hager, J.M. Holden, Ying Wang, W.-T.
Lee, Xiang-Xin Bi, P.C. Eklund, D.S. Cornett, M.A. Duncan, I.J. Amster, Science 259, 955 (1993).
29. Y. Wang, J.M. Holden, Xiang-Xin Bi, and P.C. Eklund, Chem. Phys. Lett., 217 413 (1994).
30. K. Venkatesan and V. Ramamurthy, Photochemistry in Organized and Constrained Media. ppl33 (VCH, New York, 1991).
31. See for example Physics of Highly Excited States in Solids, edited by M. Ueta and Y. Nishina., (Lecture Notes in Physics vol. 57, Springer Verlag, Heidelberg 1976).
32. H. Souma, T. Goto, T. Ohta and M. Ueta, J. Phys. Soc. Japan, 29, 697 (1970). 33. Electron-Hole Droplets in Semiconductors, edited by CD. Jeffries and L.V. Keldish,
(North Holland, Amsterdam 1983) 34. G.A. Thomas, A. Frova, J.C. Hensel, R.E. Miller and P.E. Lee, Phys. Rev B13 1692
(1976). 35. R.B. Hammond, T.C. McGill and J.W. Mayer, Phys. Rev. B13, 3566 (1976). 36. A. Kaminskii, YA Pokrovskii and N. Alkeev, Zh. eksper. teor. Fiz., 59,1937 (1970). 37. YA. Pokrovskii, phys. stat. sol. (a), 11, 385 (1972). 38. R.M. Westervelt, T.K. Lo, J.L. Staehli and CD. Jeffries, Phys. Rev. Lett., 32, 1051
(1974). 39. M. Glicksman, M.N. Gurnee and J.R. Meyer, in (42), pp219. 40 L. Keldysh, Proc. DC. Internat. Conf. Phys. Semicond., Moscow 1968, ppl307. 41 R.W. Lof, M.A. van Veenendaal, B. Koopmans, H.T. Jonkman and G.A. Sawatsky, Phys
Rev. Lett., 68, 3924(1992). 42. W.Y. Ching, M.-Z. Huang, Y.-N Xu, W.G. Harter and F.T. Chan, Phys. Rev. Lett 67
2045 (1992). 43. M.K. Kelly, P.Etchegoin, D. Fuchs, W. Krätschmer and K. Fostiropoulus, Phys Rev
B46, 4963 (1992). 44. N.F. Mott, Metal-Insulator Transitions (Taylor and Francis Ltd. 1974) 45. P. Vashista and R.K. Kalia, Phys. Rev. B25, 6492 (1982). 46. AT. Werner, J. Anders, H.J. Byrne, W.K. Maser, M. Kaiser, A. Mittelbach and S. Roth
Appl. Phys. A57, 157 (1993).
462
13C 1S0T0PIC EFFECT ON THE RAMAN SPECTRUM AND STRUCTURE OF C6o FULLERENE
Pham V HUONG*, Denis JEROME**, Pascale AUBAN-SENZIER** and Patrick BERNLER***. *Laboratoire de Spectroscopie Moleculaire et Cristalline, Universite Bordeaux I, 351 cours Liberation, 33405 Talence, France - Fax 33-56 84 84 02 **Laboratoire de Physique des Solides, Universite Paris-Sud, bat. 510, 91405 Orsay, France ***G.D.P.O, Universite Montpellier H, 34095 Montpellier, France
ABSTRACT
The Raman spectrum ofl^C enriched CßO samples is recorded and analyzed in comparison with that of undoped 12C60- Comparison with the isotopic effect in diamond and in other infinite solid networks is also made.
A frequency shift depending on the amount of 13C is observed for the C=C stretching vibration, without any splitting. This effect is unusual and is a proof that the C = C is not localized and its double bond character is not isolated but strongly coupled with other bonds in the cage. If the CC bond was independent as in small or non-spherical molecules such as organic compounds, an isotopic effect ofAv ^ 30 cm-1 for 12C=13C and &\ = 60 cm-' for 13C = "C could be expected and a splitting could appear in the case of uncompleted 13C substitution and variable relative intensities could be observed. It is not the case of!3Ceo-
In isotopic CßO, all C = C vibrations in the spherical network are strongly coupled ; an average isotopic mass must be considered for the randomly distributed isotopic atoms in the material to interpret the experimental result. CßO has thus more solid than molecule behavior.
1. INTRODUCTION
The carbon structures are known to be generally infinite or of undetermined size. Carbon 60 fullerene is the first carbone molecule found with a limited formula unit. The C60 molecules are often agglomerated in the solid state, but they can be isolated in very dilute solution in relatively inert solvent such as carbon disulfide.
The truncated icosahedral structure of an isolated COO fullerene molecule is a cage limited by 60 [V - VI] bonds, common to pentagons and hexagons, and 30 [VI - VII bonds joining by their intermediary hexagons to hexagons. These CC bonds are believed to be different and their bond lengths have been evaluated to be 1.47 Ä and 1.41 Ä repectively. These values are in agreement with the partial double bond characters of these chemical bonds [1] and explain the appearance of CC stretching vibration frequency around 1465 cm1 in the Raman spectrum of C60-
This C = C double bond vibrational frequency is lower than that observed around 1600 cm-1 in smaller molecules such as organic compounds, but higher than the CC stretching frequency 1331 cm-i in diamond.
It is well known that in small or non-spherical molecules, the C = C vibration is mostly localized on the CC bond itself, while in infinite system such as diamond, the observed frequency represents the movement in the whole solid network. It seems to be interesting to know the behaviour of the CC vibration in
463
Mat. Res. Soc. Symp. Proc. Vol. 359 e 1995 Materials Research Society

the fullerene structure. One of the convenient methods to investigate this behaviour is to study the isotope effect.
In this paper we present our results concerning the effect of 13C on the Raman spectrum of COO fullerene. The analysis will be helped by comparison with the !3C isotopic effects on common organic molecules and on diamond.
2. EXPERIMENT
13C enriched CßO samples were prepared. Partial composition was found.
The Raman spectra of pure COO and 13C enriched COO were recorded on a DILOR Omar spectrometer, coupled with an optical microscope and a multichannel detector (both Silicon photodiodes and CCD). The ion Argon laser source used was a Spectra Physics model 2036 emitting at 514.5 nm.
3. RESULTS AND DISCUSSION
The Raman spectrum of a C60 sample partially substituted by 13C is reproduced on figures 1 and 2, in comparison with that of pure COO [2].
The absence of characteristic Raman band corresponding to C70 indicates that the sample is free of all higher fullerene than C60-
1500 1475 1450 1425 WAVENUMBER (CM-1)
1400
Fig. 1 - Raman spectra (partial) of Ceo and '3C enriched (8%) Ceo-
A frequency shift is observed by isotopic substitution especially for the curvilinear C = C stretching vibration around 1465 cm-i ; smaller shifts are also recorded for other vibrations. Nevertheless, the effect is not similar to that usually observed for small and non-spherical molecules, such as organic compounds. One can remember that in a partial substitution of Carbon 12C by carbon 13C in these systems, three CC bonds can occur : 12C-12C, 12C-13C and 13C-13C. When the vibration is localized on the bond, without coupling with the surrounding bonds, the harmonic approximation [3] can give the value of the
464

vibrational frequency of an isolated oscillator A-B in function of their masses HIA and mg:
where k is the force constant and p the reduced mass of the oscillator :
1 1 — + — m. m„
(1)
(2)
For a C = C streching frequency around 1500 cm-l, the isotopic effect on 12C-13C and on 13C-13C will provoke a lowering shift of 30 and 60 cm-l respectively, compared to that of undoped oscillator. That is effectively and generally observed for small or non spherical molecules such as common organic substances.
Furthermore, the relative intensity observed for the Raman or infrared band at those positions can help to determine the composition and amount of the isotopic species in the material.
For diamond [4] as well as for other infinite solid networks such as germanium [5-7], the isotopic effect is quite different than that recorded for small and non spherical molecules.
For totally 13C diamond, the triply degenerate F2g Raman mode, in the simple harmonic approximation, could appear at 1281 cm-l compared to 1332 cm-l in pure 12C diamond [8, 9], while experimentally these phonons are observed at 1285 and 1332 cm-l respectively [4]. Some more sophisticated calculations [10-13], including anharmonicity and zero-point motion of the interatomic forces, the gap between experimental and calculated frequencies can be reduced.
Nevertheless, when the 13C is uncomplete in diamond, no band appears at these two frequencies but at intermediary positions [4]. This is assigned to the
in
C60(8%13C)
c (
o> If
r» r-N
1 ; 1 1- | 1 i
800 600 400 200 .-1, WAVENUMBER (CM ')
Fig. 2 - Raman spectra of 8% 13C enriched Cgo (low frequency range).
465

effects of isotopic disorder and many models applied for the random by distribution of isotopes in the solid lattices have been made [10-14] to interpret the experimental results.
For partially 13C doped COO fullerene, the observed Raman bands are not located at positions expected [15] for pure 12C60 and pure 13C60. nor at frequency expected for 12C-13C. So, no similarity with small or non-spherical molecules is seen. The experimental result is, in the other hand, very parallel to that of diamond.
Without making sophisticated calculations, we can again use the harmonic approximation.
From equations (1) and (2):
1 J( ' i = —.k .1 — 2n \ m.
+ 1
In pure isotopic species,
'■ 2n\
= -L(
l k X 2 Ü
M.2 with Mi2 = 12
— )5 withM]3 = 13 M.3
In partially isotopic fullerene, the isotopic effect is distributed all over the spherical network and the isotope carbons I3C are distributed randomly. The above results show that there are no local vibrations.
We assume, as in the case of diamond, that the average isotopic mass M can be used in place of MA and MB, and thus the frequency co will become
By logarithmic derivation:
00 = W2k_w
2nV M 7
1 dM
~ ~ 2 M
and when converted to definite quantities :
Ad)
0)
1 AM
2 M (3)
In this equation, the relative frequency shift is directly correlated with the relative change in the isotopic mass of the material.
Applied for our experiment, with 8% of '3C in COO network, the calculated shift in the wavenumber is within 1 % compred to the value found experimentally.
Of course, if one takes into account the anharmonicity and other factors, closer fitting could be found for both the frequency and band-width.
466

4. CONCLUSION
Partial isotopic ]3C fullerene Cßo is prepared and studied by Raman spectroscopy. The isotopic effect is quite different than that observed for small or non spherical isolated molecules but similar to that recorded in infinite solid lattices such as diamond. As all C = C vibrations in the spherical network are strongly coupled, an average isotopic mass must be considered for the randomly distributed isotopic atoms in the material to interpret the experimental result.
REFERENCES
1. P. V. Huong, Mat. Letters 14, 80 (1992). 2. P. V. Huong, J. Mol. Struct. 292, 81 (1993). 3. P. V. Huong in "Analytical Raman Spectroscopy ",
J.Grasselli & B. Bulkin Eds, Wiley, New-York, 1991, p.397. 4. K. C. Hass, M. A. Tamor, T. R. Anthony and W. F. Banholzer,
Physical Rev. B 44,12046 (1991). 5. H. D. Fuchs, P. Etchegoin, M. Cardona, K. Itoh and E. E. Haller,
Phys. Rev. Lett. 70,1715 (1993). 6. H. D. Fuchs, C. H. Grein, R. I. Devlen, U. Kuhl and M. Cardona,
Physical Rev. B 44, 8633 (1991). 7. P. Etchegoin, H. D. Fuchs, J. Weber, M. Cardona, L. Pintschovius, N. Pyka,
K. Itoh and E. E. Haller, Physical Rev. B 48,12661 (1993). 8. P. V. Huong, Diamond and Related Mat. 1, 33 (1991). 9. P. V. Huong, B. Marcus, M. Mermoux, D. K. Veirs, G. M. Rosenblatt,
Diamond and Related Mat. Bl, 869 (1992). 10. A. T. Collins, S. C. Lawson, G. Davies and H. Kanda,
Phys. Rev. Lett. 65, 891 (1990). 11. P. Pavone, K. Karch, O. Schutt, W. Windl, D. Strauch, P. Giannozzi and
S. Baroni, Physical Rev. B 45, 3156 (1993). 12. A. K. Ramdas, S. Rodriguez, M. Grimsditch, T. R. Anthony and
W. F. Banholzer, Phys. Rev. Lett. 76,189 (1993). 13. J. Spitzer, P. Etchegoin, M. Cardona, T. R. Anthony and W. F. Banholzer,
Solid State Commun. 88, 509 (1993). 14. J. Lefranc, ICSM Conference, Göteborg, Sweden, 1992. 15. P. V. Huong, Solid State Comm. 88 , 23 (1993).
467

MICRO-FTIR AND THEORETICAL STUDY OF C60 SINGLE-CRYSTAL VIBRATIONAL MODES
G. GUIZZETTP, F. MARABELLI*, M. PATRINI*, M. MANFREDINIot, P. MILANIot, G. BENEDEK0 and S. SANGUINETTI" *Dipartimento di Fisica "A. Volta", Universita di Pavia, Via Bassi 6, 1-27100 Pavia, Italy "Dipartimento di Fisica and +INFN, Universita di Milano, Via Celoria 16,1-20133 Milano, Italy
ABSTRACT
Reflectance (R) and trasmittance (T) of Ceo single-crystals have been measured in the 400- 5000 cm-1 range, at room temperature, by using micro-Fourier transform IR spectroscopy. The frequencies of the peaks, appearing in both R and T spectra, are compared with the IR active ones calculated for the simple cubic structure with the bond charge model. It appears that all modes which are expected from symmetry arguments to give a dipole activity are actually observed and the corresponding frequencies are in good agreement with the experimental findings.
INTRODUCTION
The main problem addressed in the vibrational properties of Ceo is related to the crossover from the molecular behavior of an isolated cluster to the dynamics of atoms in the solid fee Ceo phase (fullerite). Group analysis has been applied to investigate the IR activation in the crystal of silent modes in the icosahedral symmetry of the molecule [1]. The overtones of the fundamental frequencies have been taken into account to explain the very rich collection of structures observed in the only (at our knowledge) published spectrum of single crystalline Ceo [2,3]. The aim of the present paper is to confirm and extend with two independent measurements (R and T) the experimental results of Ref. 2 and to approach theoretically the problem using a model which can account for both intramolecular and intermolecular interactions in the crystalline environment.
EXPERIMENT
Fullerene was produced by standard contact-arc method and subsequent purification of the raw soot by Sohxlet extraction. Pure Ceo was then obtained by liquid chromatography and tested by IR and UV spectroscopy. The Ceo powder was put into a gold crucible and then degassed in an open quartz tube under dynamic vacuum for two days to remove the solvent. Finally the tube was placed in a horizontal furnace with two temperature zones. The temperature in the crucible region was kept at 550 °C and a helium flux was maintained in the tube during the growth process. After 72 h small crystals of several tenths of millimeter were collected at the end of the tube. X-ray diffraction performed on the crystals showed very narrow peaks and no traces of contaminants, with pattern corresponding to an fee structure, in good agreement with previous works [4]. The measured crystals presented several plane facets with good optical quality and with linear dimensions of about 50 (ira.
The optical and crystalline quality was also confirmed by the ti spectrum obtained from spectroscopic ellipsometry [5,6]; it displayed higher and sharper peaks with respect to
469
Mat. Res. Soc. Symp. Proc. Vol. 359 c 1995 Materials Research Society

soirepaijs^
a
"3b .S
u CO
E ft o
JO
c > CT3
o 1) Q, v: <u o c 2 o 4>
u T3 a ca <u o c «
X)
X) <
3
aoireqjosqv
470

polycrystalline films; moreover it allowed to carefully determine the optical gap at 2.3 eV and evidenced structures at lower energies attributed to Frenkel-type molecular excitons.
Transmittance measurements were performed at room temperature in the wave number range from 500 to 5000 cm-1 using a Bruker IR microscope coupled with a FTIR spec- trometer 113v. The minimal diameter of the spot was 20 /im. Reflectance at near-normal incidence was measured with the same apparatus, using a gold mirror as reference. A globar source with a liquid-nitrogen cooled mercury cadmium telluride and a KBr beam splitter was used. Instrumental resolution was 4 cm-1 giving about ± 1 cm-1 uncertainty in the peak position. To improve the signal to noise ratio more than 500 scans were accumulated for each spectrum.
RESULTS AND DISCUSSION
Absorbance (A) and reflectance (R) spectra from 500 to 3000 cm-1 are shown in Fig.l. The absorbance is calculated by A = -log T, where T is the measured transmittance.
Above 3000 cm-1 no significant structures were observed; however interference fringes were clearly evident in both A and R spectra, from which, by assuming a FIR refractive index n=2.1 [4], an average sample thickness of 50 fim was estimated.
We can so obtain a value of the absorption coefficient a= 420 cm-1 and then e2 = na/2nv =0.12 in correspondence to one of the strongest peaks at 1177 cm-1. We note that A and R spectra of Ceo show several corresponding structures, indicating they are not due to spurious signals or sample impurities. Maxima in A generally correspond to minima in R because ei in correspondence of the absorption peaks is essentially structureless and the relevant contribution comes from the e2 structures, which are effective in reducing the reflectance value to the reflectivity of the front surface of the sample.
The absorption spectrum extends to « 3000 cm-1, well beyond the frequency max- imum of the isolated Ceo molecule, thus encompassing two-phonon absorption. The two phonon absorption is also responsible for the presence in the spectrum of overtones and combinations of the fundamental frequencies which can account for a consistent part of the observed peaks. A careful analysis of the absorption spectrum of solid CöO has been performed by Bowmar et al. [2,3] (Fig. 2), who have attributed, by symmetry arguments and a comparison with Raman and inelastic neutron scattering spectra, the spectral IR absorption lines to fundamental vibrations, combinations and overtones.
Our analysis is based on a bond-charge model (BCM) calculation [7,8] of the infra- red active spectrum for both the high-temperature fee phase (one molecule per unit cell) and the low temperature sc phase (four molecules per unit cell). Most modes which are activated in the sc phase by folding are almost degenerate with the corresponding zone- center modes of the fee phase. Only the A2tl mode at 1343 cm-1, inactive in the fee phase, is activated in the sc phase. Actually there is a weak esperimental feature at this frequency, which indicates the sc phase as an appropriate model. Bowmar et al. [2] suggest that the presence of oxygen hinders the molecular rotations yielding an effective sc phase also at room temperature. Our analysis, however, gives no direct evidence of C-0 or 0-0 bonds; thus the apparent sc character argued from experiment may be attributed to some residual correlation between molecular free rotations.
The cubic symmetry group of the crystal lifts some of the degeneracies and splits the vibrational modes of the isolated C6o molecule (I& symmetry group). The resulting IR active vibrational modes are now all those with an odd parity in the isolated molecule [1].
The phonon spectrum of the sc-Ceo lattice has been calculated within the BCM ap- proach. The model is based upon a representation of the valence electronic density by means of massless point charges (bond charges) and massive ions. The crystalline environment has been accounted for by means of a nearest-neighbours force constant [9].
Fig.2 shows the BCM calculated dipole active modes compared with the experiment.
471

(Sjiun ÄJBJJiqjB) S3IJTSU3JUI ^i
C o S3 C
X> E 03 o
"O o c
03 01
1> -a to
C o
-t—»
CU > o
C 03
•i tD n
JO iß ID i-l <i>
r- o X)
E o VJ
„i^ T3 J=
CD
"03
E 5
i- u 03
<i) n> rs: a. o x> >> vs
o H >> o s 3 C >
o Q.
(U c
■a c 03
u CO tu .s
£ TD m .3
1) tu .3 03 03
-a ■■—' ^—'' V3
F= tu H 3 o J-.
c 3 tu O
O 3 <+-!
a, er tu
O <U <*H
o "1 o >o C c >.
E tu E c 03 II)
X C .3 tu «y (i) 03 o
<N tD J-< 3 OJD
472

An accurate calculation of the relative intensity taking into account long-range coulomb interactions is in progress. The features of the spectrum are pretty well described. It appears that the main structures in the range 600-1100 cm-1 and over 1500 cm-1 are due to modes activated by the crystalline environment. A notable exception is the observed structure at about 1100 cm-1 which is here associated with theoretical modes located 100 cm-1 below. The presence in the spectrum of overtones and combinations of fundamental vibrations can account for the structures not predicted by the BCM calculation.
As final note, the bond charge model appears to give a reliable description of the IR active modes and should be applicable to the spectroscopic analysis of more complex fullerenic structures.
ACKNOWLEDGEMENTS
This work was partially supported by Istituto Nazionale di Fisica Nucleare and by Gruppo Nazionale di Struttura della Materia del C.N.R. through project: "Crescita, carat- terizzazione e proprietä di strutture fullereniche".
REFERENCES
1. G. Dresselhaus, M.S. Dresselhaus and RC. Eklund, Phys. Rev. B 45, 6923 (1992). 2. P. Bowmar, M. Kurmoo, M.A. Green, F.L..Pratt, W. Hayes, P. Day, K. Kikuchi, J.
Phys. C 5, 2739 (1993). 3. P. Bowmar, W. Hayes, M. Kurmoo, P.A.Pattenden, M.A. Green, P. Day, K. Kikuchi,
J. Phys. C 6, 3161 (1994). 4. P.A. Heiney, J. Phys. Chem. Solids 53, 1333 (1992). 5. P. Milani, M. Manfredini, G. Guizzetti, F. Marabelli, M. Patrini, Solid State Commun.
90, 639 (1994). 6. M. Patrini, F. Marabelli, G. Guizzetti, M. Manfredini, C. Castoldi, P. Milani, in Recent
advances in the chemistry and physics of fullerenes and related materials ed. by K.M. Kadish and R.S. Ruoff, The Electrochem. Soc. Inc. (Pennington, N.J.), 1994.
7. G. Onida and G. Benedek, Europhys. Lett. 18, 403 (1992). 8. S. Sanguinetti, G. Benedek, M. Righetti and G. Onida, Phys. Rev. B 50, 6743 (1994). 9. G. Benedek and G. Onida, in Fullerenes: Status and Perspectives ed. by G. Ruani,
C. Taliani and R. Zamboni, Word Scientific (Singapore), 1992.
473

STRUCTURAL AND ELECTRONIC PROPERTIES OF DAMAGED FULLERITE CRYSTALS
M. MANFREDINI, S. SERRA, L. COLOMBO, P. MILANI Dipartimento di Fisica, Universita' di Milano, via Celoria 16,1-20133 Milano (Italy)
ABSTRACT
A structural tranfsormation of C60 crystals has been induced by high fluence laser irradiation under various chemical environments. The role of oxygen in driving fullerene cage opening reactions is investigated. The resulting material, showing features typical of low density amorphous carbon, has been characterized by Raman spectroscopy. In order to provide an atomistic model of the damaged sample, we have simulated the irradiation process by a tight binding molecular dynamics calculation on a 240-atoms system. We have carefully investigated the structural and electronic properties. In particular, the short- and medium-range features have been related to the cage opening, which is here modeled as a sequence of bond breakings.
INTRODUCTION
Although C60 is industrially being produced, the microscopic mechanisms underlying the formation and the fragmentation of fullerenes are still poorly understood. Another important issue for the production of fullerite-based devices is the stability of C60 under different chemical environments and excitations [1]. In particular it has been shown that oxygen weakens the stability of C60 cage and, under moderate heating of the system, it can induce cage opening reactions and subsequent coalescence [2,3]. Several studies have been reported on the modifications of fullerite induced by intense laser irradiation under different chemical environments [3, 4,5].
The material resulting from fullerite degradation has characters typical of amorphous carbon together with more exotic properties such as very low density. In order to get a better understanding of the disruption and coalescence processes resulting in the amorphous phase we have characterized the amorphous material by Raman spectroscopy and performed a simulation of the coalescence of fullerenes.
EXPERIMENTS
Details on the preparation of the sample and on the experimental apparatus have been given elsewhere [3]. Briefly the 514.5 line of an Argon ion laser, focalized on a spot of 15 micron, was used to induce the transformation and as a Raman probe. It should be noted that we deliberately exposed the samples to power densities much greater than those reported in the literature for the study of "unperturbed" fullerite [6]. However these power densities are orders of magnitude lower than those used for photofragmentation of C60 in molecular beams [7], The cage opening of fullerenes is thus caused by a chemical reaction instead of a multiphoton induced fragmentation.
475
Mat. Res. Soc. Symp. Proc. Vol. 359° 1995 Materials Research Society

In fig.l we show a Raman spectrum of fullerite irradiated for 10 min. at 4000 W/cm2. Two broad features peaked around 1400 cm-1 (D band) and around 1600 cm-1 (G band) are present together with a narrow peak around 1470 cm"1. The D band and the G band are typical of amorphous carbon: their intensity , position and width depend on the nanostructure of the material [8]. In particular we have observed that under prolonged laser irradiation the G band shifts toward lower energies indicating an annealing of the a-C microcrystallites. It has been suggested that the amorphous phase may be reminiscent of the pristine fullerene clusters[4], moreover we observe that C60 structure (the 1470 cm"1 pentagonal pinch mode) are still detectable in our irradiated sample, although shifted and broadened.
This indicates that islands of intact C60 are embedded or interacting with the a-C matrix. In order to verify this hypothesis and corroborate the experimental findings, we have undertaken a numerical simulation aimed to describe the coalescence of fullerene units. The numerical results will be presented in the next Section.
40-
„ i i-' % 3 30- <
55 20- c B c
10-
%W^" "t\.
-W- V* '■s
:■*$
1300 1400 1500 1600 1700
Frequency shift [cm"1]
Fig. 1. Multiple lorenzian fit of a Raman spectra (514.5 nm excitation) obtained on C60 single crystal after one hour irradiation in air with 4200 W/cm2. Amorphous carbon lines coexist together with C60 pentagonal pinch mode.
THEORY
The damaging of the fullerite crystal has been modeled through a large-scale simulation based on the tight-binding molecular dynamics (TBMD) scheme. As for the carbon-carbon interactions, we have developed a novel interatomic potential which has been fitted to the cohesive energy curves of graphite, diamond and linear chain. We have selected such a set of structures in order to give our TBMD scheme the transferability needed to manage two-, three- and four-fold coordinated structures. At variance with other TBMD parametrizations available for carbon-based materials, [9,10] we have introduced a contribution to the short-range repulsive potential which explicitely depends on the local coordination of each atom in the simulation box. This feature is aimed to mimic the peculiar chemistry of the C-C bond. A better description of the present TBMD model and fitting procedure has been presented elsewhere. [11]
476

The fee Merite crystal has been reproduced by a cubic periodically-repeated cell containing 240 atoms, initially positioned on four different buckyballs. The equation of motions have been integrated with the velocity-Verlet algorithm and a time step as small as 0.5 10"15 s was used during constant-temperature, constant-volume simulations. The density of the system was fixed to 1.68 g/cm3.
The cage opening reactions induced by oxygen (see previous Section) have been modeled by an ad hoc bond breaking procedure. In fact, the full simulations consisted in three different steps, illustrated in Fig. 2: (i) a fee crystal was initially created (left panel); (ii) a number of bonds were broken (middle panel); (iii) a final annealing cycle was applied to the system and the resulting structure (right panel) was characterized.
T=2000 K (sample a)
ideal positions bond-breaking after annealing
Fig. 2 - Evolution of the fee damaged structure. The left, middle and right panels correspond to snapshots taken at the beginning of the simulation, after the bond breaking procedure and after the annealing cycle, respectively. In this case 15% of the carbon-carbon bonds belonging to pentagons were broken.
In all of the numerical experiments presented here, we have broken only those bonds belonging to pentagons. However, the number of broken bonds has been varied from 15% to 20%. The two resulting systems will be hereafter referred to as sample a and b, respectively.
The annealing cycle consisted of a short heating process at 5000 K (just 200 time steps) and a much more careful equilibration at 2000 K (5000 time steps). The system properties have been finally measured for 2000 time steps. Despite the semi-empirical character of the present TBMD scheme, the resulting computational workload was quite large, mainly because of the high number of particles present in the simulation box.
The global structural properties of the two damaged fullerite crystals are reported in Fig. 3 where the particle-particle correlation function g(r) is shown (full line). For sake of comparison, we also report the g(r) of amorphous carbon (a-C) at the same density. The 216-atom a-C sample was obtained by quenching from the melt.[11]
477

<ä
6
4
2
0
6
4
2 h
0 0.5 1 1.5 2 2.5 3 3.5 4 4.5 5 5.5
distance ( Ä )
Fig. 3 - Particle-particle correlation function g(r) of two damaged fullerite crystals (full line). The corresponding g(r) of low-density amorphous carbon is reported as well (dashed line).
It is clear from Fig. 3 that the damaged fullerites are quite similar to an amorphous network, thus confirming the experimental findings. On the other hand, it is also evident from Fig.2 (right panel) that C60-like structures can still be found in the systems. The main difference between sample a and b is the closer similarirty of the latter to a-C. This result is obviously related to the higher number of broken bonds created before annealing and enforces the picture according to which cage opening reactions could drive a crystal-to-amorphous transition.
A better characterization of the short-range structural properties comes from the calculation of the ring statistics [12] and local atomic coordination. We have found that cage opening and subsequent annealing favour the formation of rings with a number of atoms higher than 5 or 6. In particular, a sizeable amount of 7-atom and 8-atom rings were measured in both samples a and b. The formation of such complex closed structure gives rise to the creation of bridges connecting neighbouring buckyballs (see Fig. 2, right panel). In Fig. 4 we report the quantitative ring statistics where a bond cutoff of 2.1 Ä has been selected for numbering the rings. A larger percentage of broken bonds is reflected in sample b by the occurrence of rings with a number of members up to 12. It is worth noticing that a qualitatively different behaviour was found by Wang et dl. [13] for low-density amorphous carbon. In that case, graphitic-like fragments consisting of 5-,6- or 7- member rings were measured, while no evidence of larger rings and/or bridge structures was found.
478

d
s-, CD
e
80
70
60
50
40
30
20
10
0
sample a
-+H I I I I
sample b
i i Ii i i i I i T1
0 10 468 10 02468
number of members Fig. 4 - Ring statistics for sample a (left) and b (right) after bond breaking and annealing.
We finally come to the electronic structure of the damaged fullerites. Since the TBMD scheme allows for the calculation of the single-particle energy levels on-the-flight during the simulation, we have recorded the total density of states (DOS) of both samples. The results are shown in Fig. 5. The first important qualitative feature of the displayed DOS is that the separation of the s- like and p-like bands is lost, as consequence of the structural disorder. Nevertheless, there is a clear pseudo-gap occurring at the Fermi level, i.e. just above 0 eV. This behaviour is quite similar to that one observed theoretically for a-C [13] and experimentally for evaporated a-C films [14] and should be considered as a common feature of most of the low-density disordered carbon systems.
o Q
20
15
10
-20 0 20 energy ( eV )
Fig. 5 - Total electronic density of states (DOS) for sample a (full line) and b (dashed line) after bond breaking and annealing.
479

ACKNOWLEDGEMENTS
This work was partially supported by the National Research Council (CNR) of Italy under Project "Crescita, caratterizzazione e proprieta" di strutture fullereniche". We greatly acknowledge Prof. G. Benedek (Milano) for a critical reading of the manuscript.
REFERENCES
[I] H. Werner, J. Bloecker, U. Goebel, B. Henschke, W. Bensch and R. Schloegl, Angew. Chem. 31, 868 (1992) [2] A. Ito, T. Morikawa, and T. Takahashi, Chem. Phys. Lett. 211, 333 (1993) [3] M. Manfredini, C.E. Bottani, and P. Milani, Chem. Phys. Lett. 226, 600 (1994); ibid, this volume [4] F. Meinardi, A. Paleari, M. Manfredini, and P. Milani, Solid State Commun., in press. [5] M. Manfredini, and P. Milani, Appl. Phys. Lett., to be published. [6] M. matus, and H. Kuzmany, Appl. Phys. A56, 241 (1993) [7] P. Würz, and K. Lykke, J. Phys. Chem. 96, 3332 (1992) [8] B.S. Elman, M.S. Dresselhaus, G. Dresselhaus, E.W. Maby, and H. Mazurek, Phys. Rev. B24, 1027 (1981), and references therein. [9] L. Goodwin, J. Phys.: Condens. Matter 3, 3869 (1991) [10] C.H. Xu, C.Z. Wang, C.T. Chan and K.M. Ho, J. Phys.: Condens. Matter 4, 6047 (1992) [II] S. Serra, C. Molteni, L. Colombo and L. Miglio, submitted for publication [12] D.S. Franzblau, Phys. Rev. B44, 4925 (1991) [13] C.Z. Wang, K.M. Ho and C.T. Chan, Phys. Rev. Lett. 70, 611 (1993) [14] D. Wesner et ah, Phys. Rev. B28, 2152 (1983)
480
Nano and micro structure of laser damaged fullerite single crystal
M. MANFREDINI and P. MILANI Universitä di Milano, Dipartimento di Fisica, via Celoria 16, 20133 Milano, Italy.
ABSTRACT
We have studied the nano and micro structure of the product resulting from high fluence laser irradiation of Cw, single crystal. Raman spectra reveal that, in the presence of oxygen, amorphous carbon (a-C) is formed. The laser heating of the sample promotes fullerene oxidation and cage opening reactions: the new carbon phase is originated by the coalescence of C(-,() fragments. The irradiance threshold for a-C formation is discussed. Brillouin spectroscopy shows that the acoustic properties of the irradiated material are typical of a higly porous material similar to carbon aerogels. Under irradiation in an inert environment CM) degradation is not observed, even for high power densities.
INTRODUCTION
Several investigations on solid CM) have shown that the fullerene reactivity is strongly affected by photon exposure 1_4. Visible laser irradiation experiments indicate that oxidation, polymerization, photodissociation and cage opening reactions may take place depending on the chemical environment where laser irradiation occurs '■•*. In particular the interaction with 02
promotes the opening of the fullerene cage and subsequently the coalescence of the clusters 5-6. This can be used to favour encapsulation processes or selective etching of fullerene structure 7
with a moderate heating of the sample. In contrast, fragmentation of CM) in non oxidative conditions requires a transfer of a huge amount of energy to the cluster 8. The presence of amorphous carbon has also been reported when fullerite undergoes ion bombardment 9 or is compressed under high static pressure 1(). In order to better understand this amorphous phase we characterized the material resulting from laser irradiation of solid Cf,0 with different laser fluence, exposure time and chemical environment with Raman and Brillouin spectroscopy.
RESULTS AND DISCUSSION
Details on the preparation and characterization of fullerite single crystals are reported elsewhere ''. Unpolarized Raman and Brillouin spectra were recorded at room temperature in a backscattering geometry using respectivaly an I.S.A. Jobin-Yvon triple grating spectrometer and a 3 + 3 passes tandem interferometer actively stabilised. The 514.5 nm line of an Argon ion laser, focalised on a spot of 15 urn of diameter, was used to induce the transformations and as a Raman and Brillouin probe.
481
Mat. Res. Soc. Symp. Proc. Vol. 359 s 1995 Materials Research Society

250- 1.J 200- ■U^^' ,y\ ■ '"-i-,_.
3 <
i itensity
o
1
i ill -i 1180
100-
-
50-
0- i > i i ■ i "' -
1300 1400 1500 1600 1700
Frequency shift [cm"1 ]
Fig 1. Raman spectra of C60 single crystal collected in air after ten minutes irradiance at 240 W/cm2, 1180 W/cm2, 4000 W/cm2. The inset shows a multiple lorenzian fit near the C6u
pentagonal pinch mode.
Fig. 1 shows Raman spectra collected at different incident power after ten minutes of irradiation in air; the inset shows a lorenzian fit near the C60 pentagonal pinch mode. Between 200 W/cm2 and 650 W/cm2 the 1469 cm-1 and the 1459 cm_i lines coexist; the first line corresponds to the pentagonal pinch mode while the second originates from polymeric units 3-4. Increasing the power above 650 W/cm2 the Raman lines of the photopolymerised C60 disappear and the pentagonal pinch mode is shifted to 1464 cm"1. A similar shift has been observed in Raman spectra collected at high temperature 12, and it may be due to a local laser heating of the sample. For power densities higher than 1800 W/cm2 broad features typical of amorphous carbon (a-C) appear in the Raman spectra: in the spectrum of Fig 1 taken at 4000 W/cm2 two bands at 1600 cm"1 (G-band) and 1400 cm"1 (D-bands) are clearly visible. The C60 pentagonal pinch mode is still detectable, although broadened and shifted; these features are probably due to intact C60 units or small islands interacting with the surrounding amorphous material.
To elucidate the role of oxygen in cage opening reactions and coalescence to form a-C, we performed mesurments at high incident power under inert atmosphere; no Raman lines typical of a-C are detected, even after long irradiation times at high fluences (Fig. 2).
482

200
=> 150 <
w 100 CD
50-
0
150
< 100
CO c ~ 50
(a) After 1 min.
\%>»t Helium
^##0* A ... Air / l^Mt^^Xl«,»,
0
After 10 min. (b)
Helium ^^^«hi^h
tjgg»- 1300 1400 1500 1600 1700
Frequency shift [cm"1 ]
Fig. 2. Raman spectra of C60 single crystal obtained after one minute (a) and ten minutes (b) irradiation in air and in helium.
This confirms that oxygen is responsible for the degradation of fullerite under intense flux of photons. Recent experiments performed on fullerite thin films with different transmittance (different thickness and substrate) have shown that the laser induced Oxydation of C6u is due to local heating and it is not an electronic effect as in photopolymerization 13.
Energy dispersive X-ray (EDX) spectroscopy of the irradiated surface reveal that, for power densities higher than 1800 W/cm2 (threshold for a-C formation), the oxygen to carbon ratio greatly increases 7; thus oxygen not only catalyses the fullerene cage breaking but reacts with the fragments producing a material with an a-C nanostructure associated with carbonyl complexes 14.
483

400
1 i > i ' i ' i ' i ' i • i
-8 -6 -4 -2 0 2 4 6 8
-
i
(b)
i ■
ij
1 1 1 i ill
1
I 1
l,
III - £ if !| \ \ W 1 <m | f|!
i i i i ■ i i i i i i i i i i
-8-6-4-202468
Brillouin shift [GHz] Fig 3. Brillouin spectra of Cgo single crystal obtained (a) in air, (b) in vacuum after irradiation in air. The spectra have been recorded using a 514.5 nm excitation with an intensity of 4200 W/cm2 for 4000 s.
On this new carbon phase we performed Brillouin scattering spectroscopy 5: the spectrum reported in Fig 3 a, collected with an incident power of 4200 W/cm2, shows a Brillouin doublet at 2.7 GHz. From this shift we calculate a sound velocity (between 280 and 700 m/s) which is substantially lower than the values reported in the literature for solid Cg(). This very low sound velocity suggests a material with a high fraction of voids. Similar Brillouin doublets have been observed in carbon aerogels 15-16 which are materials with extraordinarily high porosity and low density. Fig. 3b shows a spectrum obtained in vacuum after irradiation in air; the Brillouin doublet shifts to higher energy. A similar anomalous dependence from pressure has also been observed in aerogels 16.
CONCLUSIONS
From all these observations we can conclude that, under laser heating, oxygen weakens the stability of fiillerenes which break and coalesce to form a porous material rich of carbonyl complexes and with a nano structure typical of amorphous carbon 17. The acoustic properties of this material are typical of a low density spongy structure similar to carbon aerogels. Raman spectra suggest that the a-C carbon phase is reminescent of the pristine fullerene cluster and that
484

some CöO units survive, embedded in the amorphous matrix. Under inert atmosphere C<;o retains its structure even for long irradiation at considerably high power densities.
Acknowledgements
We thank C. E. Bottani for clarifying discussions and C. Castoldi, A. Mantegazza and G. Fattori for expert technical support. This work was partially supported by Istituto Nazionale di Fisica Nucleare, Progetto speciale "Crescita, caratterizzazione e proprietä di strutture fullereniche " del CNR and Progetto finalizzato Materiali Speciali per tecnologie avanzate del CNR.
REFERENCES
1. A. Ito, T. Morikawa and T. Takahashi, Chem. Phys. Letters, 211, 333 (1993). 2. G.H. Kroll, P.J. Benning, Y. Chen, TR. Ohno, J.H. Weaver, L.P.F. Chibante and
RE. Smalley, Chem. Phys. Letters, 181, 112 (1991). 3. P. Zhou, A.M. Rao, K. Wang, J.D. Robertson, C. Eloi, M.S. Meier, S.L. Ren, X. Bi and
P.C. Eklund, Appl. Phys. Letters, 60, 2871 (1992). 4. A.M. Rao, P. Zhou, K. Wang, G.T. Hager, J.M. Holden, Y. Wang, W.T. Lee, X. Bi,
P.C. Eklund, D.S. Cornett, M.A. Duncan and I.J. Amster, Science, 259, 955 (1993). 5. M. Manfredini, C.E. Bottani and P. Milani, Chem. Phys. Lett., 226, 600 (1994), and
references therein. 6. F. Meinardi, A. Paleari, M. Manfredini and P. Milani, Solid State Commun., in press. 7. M. Manfredini and P. Milani, Appl. Phys. Lett., to be published; in this MRS proceedings. 8. P. Wurtz and K.R Lykke, J. Phys Chem., 96, 10129 (1992). 9. J. Kastner, H. Kuzmany and L. Palmsthofer, Appl. Phys. Lett., 65, 543 (1994).
10. C.S. Yoo and W.J. Nellis, Chem. Phys. Lett., 198, 379 (1992). U.M. Patrini, F. Marabelli, G. Guizzetti, C. Castoldi, M. Manfredini and P. Milani, in Recent
advances in the chemistry and physics offullerenes and related materials, edited by K.M. Kadish and R.S. Ruoff (The Electochemical Society, Pennington, N.J.,1994) p. 632.
12. Y. Hamanaka, S. Nakashima, M. Hangyo, H. Shinohara and Y. Saito, Phys. Rev. B, 48, 8510(1993).
13. P. Milani and M. Manfredini, J. Chem. Phys., submitted. 14. R.C. Bansal, T.L. Dhami and S. Parkash, Carbon, 15, 157 (1977). 15. R. W. Pekala and C.T. Alviso in Novel forms of carbon, edited by C.L. Renschier, J.J. Pouch
and D.M. Cox (Mater. Res. Soc. Proc. 270, Pittsburgh, PA, 1992) pp. 3-14. 16. P. Xhonneux, E. Courtens, J. Pelous and R. Vacher, Europhys. Letters 10, 733 (1989). 17. M. Manfredini, S. Serra, L. Colombo and P. Milani, in this MRS proceedings.
485

Laser and oxygen induced damage of C60 single crystal observed by scanning electron microscopy
P. MILANI and M. MANFREDINI Universitä di Milano, Dipartimento di Fisica, via Celoria 16, 20133 Milano, Italy.
ABSTRACT
Modifications induced by laser heating of C60 single crystal are examined by scanning electron microscopy (SEM). The fullerite surface is etched in the presence of oxygen, whereas no substantial change is observed under inert atmosphere. The formation of three dimensional micro-structures is observed depending on laser annealing conditions. Energy dispersive X-ray (EDX) spectroscopy shows that oxygen concentration substantially increases in the irradiated regions.
INTRODUCTION
Since the production of macroscopic amounts of Cgo, the study of its solid state properties showed that the concept of "pure" fullerite must be considered with some caution. Solid Cg0
should not be considered as an inert van der Waals molecular crystal, but as a solid with a complex reaction behaviour '. In particular the modification of solid C60 in presence of oxygen has been extensively studied with particular attention to the reactivity of fullerens upon heating and with respect to photoinduced oxidation 2";\ It has also been shown that C(-)0 and related structures, such as nanotubes 6, have an enhanced reactivity towards oxygen compared to other forms of carbon. This can be attributed to the presence of conformational strain in fullerenes 7.
Laser irradiation of fullerite single crystal under oxidative conditions causes the opening of the cage and the coalesce of the fragments to form a new carbon phase. The structure of this carbon based material has been investigated by Raman and Brillouin spectroscopy 8_1°. In this paper we present a SEM and EDX study of the morphology of the material resulting from the etching of the crystal surface 11.
RESULTS AND DISCUSSION
Fullerite single crystals were produced by sublimation of pure C50 powder in a helium flow furnace n. The high quality of the FCC single crystals has been tested by X-ray diffraction, ellipsometric spectroscopy, FTIR spectroscopy 13. The irradiation source was an argon ion laser oscillating single longitudinal mode at 514.5 nm wavelength, focalised on a spot of about 15 p.m diameter.
487
Mat. Res. Soc. Symp. Proc. Vol. 359 e 1995 Materials Research Society

20|j.m
(b)
Fig. 1. SEM picture of a (111) C60 crystal surface after exposure to a laser intensity of 4200 W/cm2 for one hour, (a) in air, (b) in helium. The inset in (a) show a particular of a spongy structure inside the crater.
488

SEM micrographs have been recorded using a Cambridge Stereoscan 360 scanning electron microscope, EDX analysis was performed with a LINK AN 10/25 system using a LZ5 detector.
Fig. 1 shows micrographs of the fullerite crystal surface irradiated with a power density of 4200 W/cm2 respectively in air (a) and in helium (b). While in helium no substantial modification of the surface is visible (cracks are due to local heating), in air a hole with a diameter of about 15 urn is formed. The threshold for surface etching is roughly at 3200 W/cm2. The wall of the crater shows a morphology different to the pristine solid; in the inset of Fig. 1 a a spongy material, based on fibrous bundles, is visible. By cleaving the irradiated crystal we were able to isolate an intact crater (Fig. 2). The hollow cone is the fingerprint of the laser spot, the wall is about one micron thick and it is formed by a material of higher toughness than the sorrounding fullerite crystal.
To achieve a better understanding of the role of oxygen we performed EDX analysis. Spectra collected respectively on a fresh surface and on the wall of a crater, show that oxygen to carbon ratio greatly increases for the etched material (from * 0.1 to» 1) indicating that oxygen acts not only as a catalyst but is also present in the material.
10 urn
Fig. 2. SEM Picture of a hollow cone extracted by cleavage from the Cgo crystal. The cone is the fingerprint of the laser spot. The fee cleavage planes are visible.
The laser heating of the crystal in the presence of oxygen promotes cage opening reactions and the fragments react to form amorphous carbon or other more complicated carbon and oxygen compounds 14>15. This process continues until a layer of new material is formed on the wall of the crater, preventing oxygen from reacting with fresh C60, infact, once formed, the cone does not grow further even under laser irradiation. The formation of this material requires specific conditions and depends also from the laser exposure time. In Fig. 3 the effect of a rapid etching of the laser across the crystal surface is shown: a groove is formed with walls morphologically different from those of the craters, probably due to a lack of annealing of the etched material.
489

5 um
Fig. 3. SEM picture of the irradiated (111) crystal surface and a particular of the groove made by a laser scan of few seconds with a power density of 4200 W/cm2 in the presence of oxygen.
CONCLUSIONS
We have shown that laser heating of solid C60 under oxidative conditions produces a local surface etching, whereas this effect is not observed under an inert atmosphere. The structure of the resulting material is based on amorphous carbon nanoparticles bonded with carbonyl groups. The mechanism is complex, involving the formation of carbonyl complexes, chemisorbed in the amorphous carbon network and the annealing of Cg(, fragments. Different regimes occur depending on laser exposure and reaction kinetics. The details of the chemical mechanism are per se interesting and can provide informations about oxidation processes in fullerene and more generally in other forms of carbon.
The resulting material shows similiarities with porous carbons and may belong to the class of systems with periodic or random structures such as schwartzites 16. Three dimensional structures (hollow cones) can be formed by prolunged laser irradiation of fullerite. This can be relevant for the development of fullerite lithography techniques and for the creation of carbon based microstructures.
Acknowledgements
We thank P. Cavallotti and D. Picenoni for clarifying discussions and expert technical support with the electron microscope. This work was partially supported by Istituto Nazionale di Fisica
490

Nucleare and Progetto speciale "Crescita, caratterizzazione e proprietä di strutture fullereniche" del CNR.
REFERENCES
1. W. Bensch, H. Werner, M. Bartl and R. Schlogl, J. Chem. Soc. Faraday Trans., 90, 2791 (1994).
2. H.S. Chen, AR Kortan, R.C. Haddon, ML. Kaplan, C.H. Chen, A.M. Mujsce, H. Chou, and D.A. Fleming, Appl. Phys. Lett., 59, 2956 (1991).
3. J.H. Weaver and D.M. Poirier, Solid State Physics vol. 48, edited by H. Ehrenreich and F. Spaepen (Academic, San Diego, 1994) pp. 56-60, and references therein.
4. GH. Kroll, P.J. Benning, Y. Chen, T.R. Ohno, J.H. Weaver, L.P.F. Chibante, and RE. Smalley, Chem. Phys. Lett., 181, 112 (1991).
5. A. Ito, T. Morikawa, and T. Takahashi, Chem. Phys. Lett., 211, 333 (1993). 6. S.C. Tsang, P.T.F. Harris and M.L.H. Green, Nature, 362, 520 (1993); P.M. Ajayan,
T.W. Ebbesen, T. Ichihashi, S. lijima, K. Tanigaki and H. Hiura, ibid., 362, 522 (1993). 7. J.D. Saxby, S.P. Chatfield, A.J. Palmisano, A.M. Vassallo, MA. Wilson and L.S.K. Pang,
J.Phys. Chem, 96, 17(1992). 8. M. Manfredini, C.E. Bottani, P. Milani, Chem. Phys. Lett., 226, 600 (1994). 9. F. Meinardi, A. Paleari, M. Manfredini, P. Milani, Solid State Commun., in press.
10. M. Manfredini and P. Milani, in this MRS proceedings. U.M. Manfredini and P. Milani, Appl. Phys. Lett., to be published. 12. M. Patrini, F. Marabelli, G. Guizzetti, C. Castoldi, M. Manfredini and P. Milani, in Recent
advances in the chemistry and physics offullerenes and related materials, edited by K.M. Kadish and R.S. Ruoff(The Electochemical Society, Pennington, N.J.,1994) p. 632.
13. G. Guizzetti, F. Marabelli, M. Patrini, M. Manfredini, P. Milani, S. Sanguinetti and G. Benedek, in this MRS proceedings.
14. H. Werner et al., Chem. Phys. Lett., 194, 62 (1992). 15. M. Manfredini, S. Serra, L. Colombo and P. Milani, in this MRS proceedings. 16. S.C. Tseng, P.J.F. Harry, J.B. Claridge and M.L.H. Green, J. Chem. Soc, Chem.
Commun., 1519(1993).
491
INTERMOLECULAR VIBRATIONS IN FULLERENE SYSTEMS
M.G. Mitch+, G.P. Lopinski and J.S. Lannin Department of Physics Penn State University University Park, PA 16801
ABSTRACT
Intermolecular vibrations in a variety of fullerene systems are reported that provide information on C60-C60 and alkali-metal - C60 interactions and disorder effects. Low frequency Raman scattering in laser polymerized C60 films are shown to exhibit additional modes not reported for bulk materials. This result is consistent with recent dimer calculations. Raman scattering and HREELS measurements are shown to provide complementary information on alkali-metal motions in K3C60. In FCC Na<,C6o both octahedral site disorder effects and reduced Na-C bond lengths account for changes in the Raman spectrum relative to Na3C60.
INTRODUCTION
The low frequency intermolecular dynamics of fullerene materials has not been extensively studied, in contrast to the intramolecular regime. For Raman studies this is consequence of the relatively weak scattering due to weak modulation of the ir-ir*, C60 derived states for alkali-metal or fullerene molecule displacements [1]. In addition, inelastic neutron scattering which are limited to bulk samples, emphasizes librational and acoustic mode behavior [2,3]. As such, basic questions exist in the intermolecular regime regarding alkali-metal - C60 interactions as well as QQ-QO coupling in laser polymerized pure C60. In polymerized systems different behavior has been observed in the intermolecular scattering for bulk [4] and ultrathin films. [5] Recent dimer and infinite chain model calculations have also suggested additional modes than that observed in bulk studies [6].
In thin films Raman scattering and high resolution electron energy loss spectroscopy (HREELS) methods provide a means of obtaining information regarding intermolecular coupling. As will be shown here, these methods are complementary as they couple to phonon induced fluctuations in the electronic states in different ways. For ordered systems this is difference understood as due to the dipole character of HREELS which is similar to that of infrared absorption. As noted in previous Raman scattering studies of intermolecular modes of A3C60, structural disorder plays, however, a significant role [1,7]. The present work and more extensive studies on both ordered and disordered fullerenes further emphasize disorder effects.
EXPERIMENT
Thin films of C60 and AXC60 where prepared and studied in situ in UHV, as discussed elsewhere [8]. In situ Raman scattering of polycrystalline and epitaxial films deposited on Cu(lll) single crystals employed multichannel detection with a Spex Triplemate spectroscope with 514.5nm laser excitation. HREELS measurements on epitaxial films of K3C60 employed an LK 2000 instrument with incident electron energies of 2.5eV. Laser polymerization of C60
films deposited on Cu(lll) was obtained at 300K, using a 514.5 Ar ion line with a cylindrical lens focused a power density of ~ 200W/cm2. The shift of the Ag(2) mode was used to confirm full polymerization [4].
493
Mat. Res. Soc. Symp. Proc. Vol. 359 ® 1995 Materials Research Society

RESULTS AND DISCUSSION
Shown in Fig. 1 is the intermolecular Raman spectrum of laser polymerized C60. The intramolecular spectrum was found to be similar to that obtained on bulk powders [4] with an Ag(2) mode at 1459cm1 and a lower frequency splitting of the Hg(l) mode of 12cm1. However, the low frequency intermolecular scattering exhibits additional detail not previously observed in bulk material. In contrast to the major peak at — 115cm"1 noted previously, weaker features are observed in a broader band centered at ~90cm"' and a feature at - 140cm"1. Recent theoretical calculations for polymerized dimers of C60 have predicted Raman active modes at -69cm"1, 111cm"1 and 123cm"1 [6]. Previous evidence for the lowest frequency band was noted in temperature dependent studies of ultrathin polymerized C60 films deposited on Si02 [5]. These studies indicated changes in the relative intensity of the two lowest peaks with temperature. Variations in the relative intensity of the 90cm"1 band with thickness have also been observed. The intermolecular spectra, as well as the splitting of the Hg(l) modes, support a dimer rather than an extended chain model for laser polymerized fullerenes. However, given the variations in the intensity of the lowest frequency peak, it is possible that other linked C60 cluster structures, such as linear and nonlinear trimers or larger units may occur. STM measurements of electron beam induced polymerized C60 exhibit larger unresolved clusters [9].
u
60 90 120 150
Raman Shift (cm )
Fig. 1 Intermolecular Raman spectrum of laser polymerized C60 (lower); the upper figure is background subtracted.
the intermolecular modes in K3C60 In contrast to polymerized C60 modes, Fig. 2 shows obtained from Raman scattering on polycrystalline films and HREELS measurements on epitaxial films. The Raman and HREELS resolutions were 6cm"1 and 45cm1, respectively. The latter width is determined by a combination of spectrometer resolution and apparent surface roughness
494

effects that vary with alkali-metal composition. The spectra shown were obtained after background subtraction of stray light and HREELS backgrounds discussed in more detail elsewhere [8]. As noted previously, the broad form of the Raman spectrum is due to disorder induced scattering. The spectrum is thus related to a Raman coupling parameter weighted density of states [1,7]. The HREELS spectrum peaks at considerably lower frequency than the Raman results. The latter has been related to the motion of K atoms at tetrahedral sites, while the former to K atoms at octahedral sites. The large difference in these frequencies is a
Frequency (cm )
Fig. 2 Comparison of HREELS (dashed) and Raman (solid) 300K spectra, background subtracted and normalized to a 1:2 area ratio.
consequence of the considerably greater K - C distance for octahedral versus tetrahedral sites. The relative areas of 2:1 for the Raman and HREELS spectral bands chosen for Fig. 2 correspond to the ratio of such sites in K3C60. Although inelastic neutron scattering has been performed on K3C60, the spectra do not resolve the octahedral peak obtained from HREELS [3]. This is attributed to overlap of acoustic modes and the 3.3 times larger neutron cross section for C than K.
An analysis of the modes of K3C60 indicate dipole activity for K motions in tetrahedral sites with Tlu symmetry. The absence of such scattering in the present study suggests weak coupling to these modes. In contrast to the disorder induced Raman spectrum, the HREELS response in the epitaxial K3C60 film is associated with a q = 0 dipole response. The observed broad band width is attributed to K site disorder. This is likely to arise from displacements of K from
495

ordered octahedral sites in the thin film or near its surface. The absence of observable Raman scattering from epitaxially ordered films demonstrates weak coupling to q = 0 allowed, Tlg
tetrahedral modes. The polycrystalline Raman spectrum shown is thus interpreted as resulting from tetrahedral site disorder that arises from K site displacements. While some degree of nonstoichiometry could introduce local disorder, limited studies of polycrystalline samples of different compositions did not remove the observed scattering. While the q = 0 response for HREELS does not formally yield the density of states for octahedral sites, the expected narrow dispersion of the bands [10] implies that the spectrum is a reasonable first order approximation to a weighted density of states.
Disorder is found to play a significant in the intermolecular Raman scattering and HREELS spectra of other fullerene systems, such as A,C60 and A4C60 [8]. For K6C60 and Rb6C60 systems, however, the spectra primarily reflect q = 0 scattering [11]. Recent polarized and depolarized Raman measurements have provided additional details on mode assignments than previously noted. In contrast to these BCC structures, Na^Qo exists in an FCC structure in which four atoms are displaced from the octahedral site center [12]. Shown in Fig. 3 are the HU Raman spectra along with the estimated stray light for NajQo and Na3C60. Figure 4 indicates a comparison of the background subtracted spectra normalized to the same area of convenience. The broad character of both spectra is consistent with disorder induced scattering reflected a weighted density of states. As noted previously, the peak in the Na-jC^ spectrum scales with alkali-metal mass relative to that of Kfi«, and Rb3C60 [1]. The Na6C60 spectrum exhibits, in contrast, a low frequency peak at ~ 100cm"1 and a peak and shoulder at ~ 149cm"1 and 179cm"1, respectively. The latter two features define a quite broad band whose mean frequency is considerably greater than that of Na3C60.
Theoretical modeling of Na^C^ has suggested a structure with shorter Na-C bond lengths for the octahedrally displaced atoms than the tetrahedral sites [13]. This contrasts with the substantially smaller tetrahedral than octahedral distances in A3C60 systems. The theoretical
m c
VI 1 1 1 1 —1—
VV. x 3/4
'""■•^^
—i 1 i i i i
75 100 125 150 175 200 -1,
Raman shift (cm )
Fig. 3 Comparison of the intermolecular Raman spectra at 300K of Na3C60 and Na^Q, Dashed lines indicate background estimates.
496

analysis also suggests that the Na atoms do not form metal-like clusters, as had been suggested, but have local, conventional ionic bonding. This bonding, with increased charge transfer to Cso
relative to Na3C60, results in the substantial increase in mean frequency in Na^C«,. Similar shifts have been noted in the BCC structures of K«C60 and Rb6C60. Structural studies have demonstrated that the displaced octahedral sites of the FCC structure may be populated for value of x > 6 in NajCöo. This will allow for additional dynamical studies of alkali-metal octahedral site disorder and charge transfer effects. Preliminary intramolecular Raman measurements [14] suggest charge transfer for up to x = 8, suggesting further studies of the intermolecular Raman spectra.
to c a;
Raman shift (cm )
Fig. 4 Comparison of the background subtracted Raman spectra of Na3C60 and NasQo of Fig. 3 normalized to the same area.
CONCLUSIONS
The present results have emphasized the value of intermolecular Raman scattering and HREELS for obtaining information about A-C interactions and the influence of disorder in a variety of different systems. For laser polymerized C60 the Raman spectra have noted additional modes required in a dimer model. Questions still exist here regarding possible larger cluster units that might occur. Further modeling would be useful here. For K3C60 Raman and HREELS spectra have allowed an estimate of the phonon density of states for K optic modes. In the NaxC60 system differences between x = 3 and x =6 have been obtained and related to increased charge transfer and octahedral disorder effects. These results will be useful for a deeper understanding of these interactions and future theoretical analysis of the lattice dynamics of fullerene materials.
497

ACKNOWLEDGEMENTS
This work was supported by USDOE Grant DE-FG02-84ER45095. We wish to thank Jon Fox for experimental assistance in the laser polymerization of C60.
+ Current Address: NIST, Ionizing Radiation Division, Gaithersburg, MD 20899.
REFERENCES
1. M.G. Mitch and J.S. Lannin, Phys. Rev. B 48, 16192 (1993). 2. B. Renker et al., Z. Phys. B92, 451 (1993). 3. D.A. Neumann et al., J. Phys. Chem. Solids, 54, 1699 (1993). 4. A.M. Rao et al., Science 259, 955 (1993). 5. W.S. Bacsa and J.S. Lannin, J. Elect. Spect. 64/65, 893 (1993). 6. G.B. Adams, J.B. Page, O.F. Sankey, M. O'Keeffe, Phys. Rev. B (in press). 7. M.G. Mitch and J.S. Lannin, J. Phys. Chem. Solids, 54, 1801 (1993). 8. M.G. Mitch, G. Lopinski, S.J.Chase and J.S. Lannin, Phys. Rev. B (to be published). 9. Y.B.Zhao, D.M. Poirer, R.J. Pechman and J.H. Weaver, Appl. Phys. Lett. 64, 577 (1994).
10. Y. Wang, D. Tomanek and G.F. Bertsch, Phys. Rev. B47, 6711 (1993). 11. V.N. Denisov et al., in "Electronic Properties of Fullerenes", ed. H. Kuzmany (Springer
Verlag, Berlin, 1993) p.267. 12. T. Yildirim et al., Nature 360, 568 (1992). 13. W. Andreoni, P. Giannozzi and M. Parrinello, Phys. Rev. Lett. 72, 848 (1994). 14. M. G. Mitch, G. Lopinski, J. Fox and J.S. Lannin (to be published).
498

13C NMR STUDY OF OXYGEN INTERCALATION IN C •60
P.BERNIER, I. LUK'YANCHUK, Z. BELAHMER, M. RIBET, L. FIRLEJ Groupe de Dynamique des Phases Condensees, Universite de Montpellier II, Place.E.Bataillon, 34095 Montpellier Cedex 05, France
ABSTRACT
High resolution 13C NMR has been used to investigate the properties of solid C60 after intercalation of molecular oxygen, which does not induce charge transfer with the host molecules. We show that, via the magnetic characteristics of the intercalant, information can be gained on its position and movement in the structure. In particular, molecular oxygen is found to occupy the middle of the octahedral site in the fee structure of solid Cgrj-
INTRODUCTION
COO under its molecular or solid form, is an ideal system for 13C NMR investigation. All carbons on the molecule are equivalent, yielding a unique resonance at 143.6 ppm from the TMS reference, characteristic of an aromatic system [1]. Also, due to the Van der Waals nature of the solid, intermolecular interactions are very weak and the resonance in the solid is similar to that in solution [2]. Such a situation is particularly interesting as any change on the ball itself (substitution, addition) or any chemical intercalation in the fee structure of the solid, yielding charge transfer, will be easily detected by 13C NMR. For instance the AnCgo phases (with A = K, Rb and n = 1,3,4 and 6) have been extensively studied as the 13C resonance of these compounds is shifted compared to pure COO.
in the ranSe 150-200 ppm [3]. For n = 3 the shift is a combination of Knight shift, characteristic of a metallic behaviour, and of chemical shift whose contribution can be estimated experimentally. For n = 6 which gives an insulating phase, the shift is essentially of chemical origin. For the other phases n = 1 and 4 the situation is not so clearly understood.
A simple situation is observed when the intercalant does not induce charge transfer with the host molecules. In this case the measured shift for the 13C resonance is a chemical shift modified by contributions from the (weak) environmental disturbances. A typical case is Cgrj intercalated with oxygen. As first shown by Assink et al [4], by submitting Cgo powder to a high pressure of oxygen, this species easily diffuses into the octahedral sites of the fee structure. Due to the paramagnetic nature of the molecule, the contact interaction between the K and oxygen orbitals produces a small shift whose amplitude is proportional to the magnetization (Curie law). This effect is additive and the shift corresponding to three oxygens will be three times that produced by one. Assink et al have also shown that the relaxation time of those Cßo surrounded by one or more oxygen is considerably decreased compared with pure C50 [4]. More recently, Belahmer et al have shown [5] that all these effects occur even if only ambient conditions (room air pressure and temperature) are imposed on the system. In this paper we present a new study of the effect of oxygen, in which we consider the dipole-dipole interaction between the '3C nuclear and O2 magnetic moments.
EXPERIMENTAL
Fullerene Cßo nas been obtained using the standard electric arc procedure, followed by chromatography, yielding a 99.9% pure sample. The whole batch has been kept in air and in the dark for a period of at least four months prior to any measurement. We expect that in this case
499
Mat. Res. Soc. Symp. Proc. Vol. 359 • 1995 Materials Research Society

diffusion of gaseous species such as oxygen or nitrogen has reached an equilibrium regime. In some cases a 9% 13C enriched sample has been used in order to improve the NMR signal to noise ratio
13c NMR spectra of powdered highly crystalline samples were recorded on a Bruker CXP200 or ASX200 spectrometer working at 50.3 MHz. Magic angle spinning (MAS with a rotational frequency from 0.1 to 6kHz) has been necessary to obtain high resolution and sensitivity. The chemical shifts are referred to the classical reference TMS.
Variable temperature (in the range 220 to 350K) with the high resolution conditions has been obtained using a cold or hot bearing gas flow.
RESULTS AND DISCUSSION
Figure 1 presents the spectrum obtained at room temperature and ambient air pressure with MAS (at 4 kHz) for the 9% ^C enriched sample. In addition to the expected resonance at 143.6 ppm due to Cgg molecules in a perfect fee environment, we observe five weak resonances whose positions are multiples of + 0.7 ppm from the main resonance. By reference to the work performed by Assink et al. [4] it is clear that these resonances correspond to the various cases of oxygen occupancy in the six octahedral sites around each COO molecule (Figure 2). Note that in our case we do not observe the sixth line which is probably too weak. The first resonance close to the main line then corresponds to only one oxygen surrounding one C50. It must be noticed that the intensity of these lines is rapidly decreasing, the smallest (fifth) one corresponding to less than 0.005 % of the total spectrum.
X20
AA*V*'^*^W,^V^
SV^'^
l'^^MV»Ki
149 148 147 146 145 144 143 —1
142
5 (ppm)
Figure 1. 13C NMR spectrum of Cgo powder contaminated with oxygen in ambient conditions. The intensity of the main line at 143.6 ppm is artificially decreased by reference to the other lines, as the cycle time is very short (1.5 s) compared to its relaxation time (at least 100 s).
500

These lines, which represent the isotropic part of the total spectrum, are shifted due to the paramagnetic nature of the oxygen molecule [4]. This shift is then directly proportional to the oxygen magnetic moment, to the inverse temperature and to the number of oxygens (with a maximum of 6) first neighbors of a given Cßo molecule.
More information can be gained by studying the anisotropic spectrum obtained with no MAS. Figure 3(a) presents the spectrum obtained with such a condition on the same sample as above. A superposition of two components is observed:
i) a symmetric line centered at 143.6 ppm, with a width of roughly 3 ppm, which correspond to C60 molecules not surrounded by any oxygen molecule;
ii) an anisotropic spectrum which expands from 125 ppm to 175 ppm and corresponds to C60
molecules surrounded by only one oxygen. In effect, taking into account the intensities of the various isotropic resonances (Fig.l), it is expected that the anisotropic spectrum corresponding to two or more oxygens would be extremely weak. We also note that using a very low spinning frequency (MAS) of the sample (Fig.3(b)), all the observed spinning side bands correspond to the isotropic resonance of the "one oxygen" case, and the envelope of the set of side-bands reproduces the static spectrum of Figure 3(a) as expected from the theory [6].
Figure 2. Schematic representation of the six sites of octahedral symmetry (noted A, B, C, D, E and F) around one Cgg molecule in the fee structure.
The origin of the anisotropic spectrum is the dipolar interaction between the oxygen and l^C nuclear magnetic moments. Two limiting situations have to be considered: the inter-moments vector can be parallel or perpendicular to the external magnetic field. In the first case the shift is paramagnetic, while in the second the shift is diamagnetic. The correponding resonances have intensities in the ratio 1 to 2 respectively as there are four sites of octahedral symmetry in the perpendicular (diamagnetic) situation around one Cgo but only two in the parallel (paramagnetic) situation. Then the powder pattern spectrum has the shape as shown on Figure 3.
On a quantitative basis, one can considerably simplify the expression for the extent of anisotropy A if we assume that the Cßo molecules still continue to rotate very fast compared with the Larmor frequency. In this case we can approximate the average distance between one O2 and one 13c on a C60 to the distance with its center L. In this case the expression for A, obtained from the dipole-dipole interaction formula, takes the form:
A = 8nB2/kBTL3
501

where p.g is the Bohr magneton, kg the Boltzmann constant and where the temperature T dependence comes from that of the oxygen magnetization. Fig 4 shows that this temperature dependence is correctly observed at least in the range 240 to 340 K. Note that a drop of A is clearly observed at a temperature close to the first order transition temperature Tc = 260 K [7].
120 100 180 160 140 5 (ppm)
Figure 3. I3C NMR of the sample of figure 1 a) Static spectrum obtained with no MAS showing the superposition of the two lines. b) Same conditions, but obtained with a low frequency MAS of 116 Hz.
From the expression above with A = 48 ppm at T = 300K, one obtains L = 7 Ä (with 4% accuracy). We then conclude that the oxygen molecule stays right in the middle of the octahedral site in the fee structure.
With L being half the lattice parameter of the fee structure, we can imagine that the small drop of A at 260 K could be due to the experimentally observed contraction of the lattice at the transition [7]. Nevertheless this contraction induces a variation of the lattice parameter smaller than 0.2% , which cannot account for the measured 16% drop of A at 260 K. We then have to question the validity of our starting assumption concerning the average distance between O2 and one 13C spin. The fact that at temperatures lower than 260 K the rotation of the Cßo molecules is no longer isotropic probably implies a more sophisticated calculation of this distance. Such an attempt is in progress.
The "two oxygens" case is more delicate to study. If the isotropic part of the spectrum is easy to detect at 1.4 ppm from the main line (Figure 1), the anisotropic spectrum cannot be obtained
502

75
a ex ex
50
25
Y* /
/
/ / y
// //
y X
0 0.88 1.76 2.64 3.52 4.4
1000/T [s1] Figure 4. Variation of A (defined as the distance in ppm between the two sides of the anisotropic spectrum such as presented in Figure 3) versus the inverse temperature, showing the linear dependence and the slight drop close to T = 260 K.
directly as it was the case for one oxygen. The main reason is the very weak signal to noise ratio as a result of the small number of Cßo molecules surrounded by two oxygens and the increasing width of the anisotropic spectrum. The only way to get some information on the shape of the spectrum is to record the High Resolution spectrum with enough spinning side bands to be able to study their envelope. In this case and using standard models [6], we can compare the experimental spinning side bands amplitudes with the theoretical predictions.
Figure 5. Amplitudes of the spinning side bands correspondind to the "two oxygens per C60" case. We compare the experimental data with the predictions of theory (full line). The two component spectra (dashed lines) correspond to the two situations described in the text.
The calculation of the shape of the spectrum uses the same assumptions than above: the Cßo
503

balls are supposed to rotate freely at room temperature and the molecular oxygen lies in the octahedral sites only. Then we have to consider two cases: the two oxygens are along the same axis going through the COO center (A and B for instance on Figure 2) or they are on perpendicular axis (A and C, D, E or F on Figure 2). The corresponding powder pattern shape has an extent over more than 90 ppm and presents two well defined maxima as shown on Figure 5. On the same figure are also presented the experimental amplitudes of the spinning side bands (the accuracy is not better than 30% in this case) as obtained after a long accumulation and using a low spinning frequency (400 Hz). Taking into account the extent of the spectrum and the poor signal over noise ratio we consider that there is a reasonable agreement with the predicted spectrum.
CONCLUSION
In conclusion, using l3C standard and high resolution NMR, we have shown that the presence of oxygen in solid Cgrj, in equilibrium with ambient air pressure can be easily detected. The molecular oxygen sits exactly in the middle of the octahedral sites of the fee structure. The case of one oxygen per C60 can be analyzed quite accurately, leading to the conclusion that the presence of molecular oxygen does not affect significantly the thermodynamical properties of solid Cgo- which contredict previous conclusions concerning the rotation hindrance by the presence of intercalated oxygen [5].
ACKNOWLEDGMENTS
The Groupe de Dynamique des Phases Condensees is an Unite de Recherche Associee au CNRS n° 233. We thank J.E.Fischer for stimulating discussions. We thank also the Groupe de Recherche 1019 of CNRS for financial support.
REFERENCES
1. R. Taylor, J.P. Hare, A.K. Abdul-Sada, H.W. Kroto, J.Chem.Soc, Chem.Comm., 20, 1423(1990).
2. C.S. Yannoni, R.D. Johnson, G. Meijer, D.S. Bethune, J.R. Salem, J.Phys.Cem., 95, 9 (1991).
3. R. Tycko et al, Phys.Rev.Lett., 68, 1912 (1992). R. Tycko et al, Phys.Rev., 48, 9097 (1993). G. Zimmer et al, Europhysics Lett., 24, 59 (1993). F. Rachdi et al, Solid St.Comm., 87, 547 (1993). P. Bernier et al, Springer Series in Sol.St.Sci., 117, 348 (1993).
4. R.A. Assink et al, in Novel Forms of Carbon, edited by C.L. Renschier, J.J. Pouch and D.M. Cox, MRS Symposia Proceedings No. 270 (Mater. Res. Soc, Pittsburgh, 1992) p. 255.
5. Z. Belahmer et al, Phys.Rev., 47,15980 (1993). 6. M. Mehring, in High Resolution NMR in Solids. 2nd ed.(Springer-Verlag, Berlin, 1983). 7. A. Dworkin et al, C.R.Acad.Sci.Paris, 312, 979 (1991).
P. Heiney et al, Phys.Rev.Lett., 66, 2911 (1991).
504

THE EFFECT OF 02 INTERCALATION ON THE ROTATIONAL DYNAMICS AND THE ORDERING TRANSITION OF C6o,
S. A. Myers, R. A. Assink, J. E. Schirber, and D. A. Loy Sandia National Laboratories, Albuquerque, NM 87185-0367
ABSTRACT
We have used 13C magic-angle spinning (MAS) nuclear magnetic resonance (NMR) to characterize the structure and rotational dynamics of C6o containing oxygen molecules located in the interstitial sites of the fee lattice. Under normal conditions, a narrow peak at 143.7 ppm is observed for Cßn. When exposed to oxygen at moderate pressures, several additional resonances appear in the 13C MAS NMR spectrum. These secondary resonances are shifted downfield from the main peak at 143.7 ppm and are due to the Fermi-contact interaction of the paramagnetic oxygen molecules with the 13C nuclear spins. The presence of oxygen depresses the orientational ordering transition by ca. 20 K as observed by DSC. The spin-lattice relaxation time (TO of each secondary peak shows a minimum near the ordering transition, indicating that this transition is not dependent on the number of oxygen molecules surrounding an individual COO molecule. The Tj due to paramagnetic relaxation, normalized by the number of surrounding oxygen molecules, is constant. This observation demonstrates that within a given sample, the dynamics of CM molecules are independent of the number of surrounding oxygen molecules.
INTRODUCTION
Small molecules such as oxygen and hydrogen diffuse readily into the octahedral interstitial sites of the fee lattice of COO [!]• The presence of interstitial species was found to affect the orientational phase transition of COO as measured by thermal methods [2,3]. In this paper we investigate the effects of intercalated oxygen molecules on the dynamics and phase transition of solid C60-
The rotational dynamics and the associated orientational phase transition of pure COO in the solid state have been the subject of considerable interest. The primary tool for probing the rotational dynamics of COO has been 13C nuclear magnetic resonance spectroscopy (NMR). Studies of pure C6o have recently been reviewed by Johnson, Bethune and Yannoni [4]. Intercalated oxygen causes a downfield shift of the 13C resonance of C60 due to the Fermi-contact interaction between paramagnetic oxygen molecules and the carbon atoms of adjacent COO molecules. Thus, we observe individual resonances for COO molecules surrounded by various numbers of oxygen molecules. Characterization of the relaxation properties of these resonances enables us to study the dynamics of the COO molecule as a function of the number of surrounding oxygens.
The behavior of the total sample is dependent on the loading level of oxygen. However, for a sample with a given loading level, no difference in the dynamics is observed for C^o molecules surrounded by 1 to 5 oxygen molecules. These observations emphasize the fact that the dynamics and phase transition are cooperative phenomena dependent on the overall rather than local state of the system.
This work is supported by the United States Department of Energy under Contract DE-AC04- 94AL85000.
505
Mat. Res. Soc. Symp. Proc. Vol. 359 ° 1995 Materials Research Society

RESULTS AND DISCUSSION
Figure 1 shows the 13C solid state spectrum of COO exposed to 1 kbar of oxygen for 48 hours. The spectrum was recorded at 100.1 MHz on a Bruker AMX-400 using direct polarization and MAS at 6 kHz. Although the relaxation time of the unloaded C60 is approximately 28 s at 298 K and 9.4 Tesla, the relaxation times of all of the resonances of the loaded sample are considerably shorter. A delay time of 60 s between each of the 32 pulses allowed for the complete recovery of the magnetization and results in a quantitative spectrum. The resonance at 143.7 ppm corresponds to COO without any oxygen molecules in the surrounding octahedral sites. As each of the six surrounding sites are occupied, the resonance undergoes a Fermi-contact shift of 0.7 ppm downfield [5]. The seven resonances correspond to n = 0 to 6 of the octahedral sites being occupied by an oxygen molecule. The distinct resonances permit the investigation of the magnetic relaxation behavior of COO surrounded by 0 to 6 oxygen molecules.
143.7 ppm
T—r T—|—i—i—r 150
—|—i—i—i—i—|—i—r 145 140
-1-1 155 150 145 140 130 ppm
Figure 1. 13C MAS NMR spectrum of C6o exposed to oxygen at 1 kbar for 48 hrs. vI0t is 6 kHz.
Since the relaxation of the 13C resonances is dominated by the interstitial paramagnetic oxygen molecules, we first wish to establish that the relaxation still reflects the dynamic behavior of the Cßo molecule rather than the spin properties of the oxygen. A paramagnetic species interacts with nuclear dipoles by two mechanisms: (1) direct dipole-dipole coupling and (2) hyperfine exchange coupling via the Fermi-contact interaction [5,6]. These interactions are modulated by the electron spin relaxation time and the rotational correlation time of the COO molecule. Figure 2 shows the relaxation times of resonances corresponding to COO surrounded by various numbers of oxygen molecules. The relaxation times of the n = 1 to 5 resonances were measured by an inversion recovery sequence using a delay time of 5 s and 16 scans. The n = 6 resonance was too small to be analyzed accurately. Each of the measured relaxation times undergoes a transition between 230 and 250 K. This is the same region that differential calorimetry shows a transition for oxygen loaded COO [2]. These observations demonstrate that the rotational dynamics of the sample are controlling the 13C magnetic relaxation behavior of the secondary resonances.
506

200
• C60(l) ■ C60(2) ♦ C60(3) k C60(4) w C60(5)
I
• i • «1
150
T (ms) 100 •
• • ■ ■ ■
50
n
■
1 ■ ■
t ♦
A r
i
A V
1
A
1
175 200 225 250
Temp(K)
275 300 325
Figure 2. Variable-temperature 13C spin-lattice (Ti) relaxation exposed to oxygen.
times for Cäo
The relaxation time transitions are depressed from the normal 257 K to somewhere between 230 and 250 K for the secondary resonances. This measurement is difficult to perform however, and further experiments are needed to narrow the temperature range over which the various relaxation times undergo a transition. There is an additional complication with this experiment. These measurements can tell us if the transition for each of the COO molecules occurs at the same temperature, but it cannot tell us if the rotational dynamics of the various COO molecules are the same at a given temperature. It is possible to imagine that the various COO molecules rotate at different rates, depending on the number of surrounding oxygens, but still undergo a phase transition at the same temperature. To address this question, the absolute values of the relaxation times for the COO molecules surrounded by distinct numbers of oxygens were analyzed.
Since the relaxation time reflects the rotational dynamics of the C«) molecule, the relaxation time contribution from a paramagnetic species can be written as:
1/Ti = nCxe
where n is the number of surrounding oxygen molecules, Xe is the reorientational correlation time and C is constant incorporating dipole-dipole and hyperfine interaction parameters [5,6]. The quantity 1/Ti, the relaxation rate, divided by n should be directly proportional to the reorientational correlation time for C^ surrounded by n=l to 5 oxygens. Figure 3 shows 1/nT] versus n for temperatures above and below the transition. Within experimental error this quantity is constant. Thus the reorientational correlation time does not appear to be dependent on the number of surrounding oxygens in a given sample of COO-
507

15
10
l/nT(s')
5 -
• 250K| ■ 230K| 1 1 1 1
- ■ ■ ■ ■ ■ -
- •
i
• •
i
• • -
0 12 3 4 5 6
n (number of surrounding oxygens)
Figure 3. Reorientational correlation times for C6o surrounded by n=l-5 oxygen molecules.
We have also examined the effect of oxygen on the spinning side bands of the various resonances of oxygen loaded COO- Belahmer et al. [7] used slow speed spinning to accentuate the differences in spinning side band (ssb) intensities. Figure 4 shows the slow speed spinning spectrum of a COO sample which has been exposed to oxygen. The ssbs of the resonances corresponding to COO surrounded by various number of oxygen have greater relative intensity than the ssb of the primary resonance corresponding to COO surrounded by no oxygen.
If ssb intensity reflects a greater "static" nature of the C6o> this result would imply that intercalated oxygen reduces the rotational mobility of the surrounding Cßo molecules. A reduction in mobility is usually associated with an increase in the temperature of the corresponding phase transition, however, while we observe a decrease in the temperature of this transition. We believe that alternative factors which could cause an increase in ssb intensities need to be explored. The direct dipole-dipole interaction as well as the Fermi-contact interaction can obviously give rise to increased linewidths under conditions in which these interactions are only partially averaged. For example, in rigid solids the broadening due to paramagnetic impurities is so great as to make the nuclei near such an impurity unobservable [8]. Even in the liquid state, paramagnetic impurities give rise to Curie spin line broadening caused by motional modulation of the dipole-dipole interaction [9].
CONCLUSIONS
We have found that oxygen incorporated into the COO lattice lowers the orientation transition of the sample in agreement with previous thermal experiments. The number of oxygens surrounding a COO in a given sample does not affect the dynamics of the observed COO- The dynamics and orientational phase transitions of COO are cooperative phenomena which depend on average rather than local loading factors.
508

r T
_J"JWL
143.7 ppm
LJI_JL_^ I ■ i • i i i ' i ' i ■ i ' i'
190 180 170 160 150 140 130 120 110 100 Figure 4. 13C slow speed MAS NMR spectrum of Qo exposed to oxygen at 1
kbar for 48 hrs. vrot is 1 kHz.
| ppm
REFERENCES
1 R. A. Assink, J. E. Schirber, D. A. Loy, B. Morosin, and G. A. Carlson, J. Mater. Res. 7, 2136 (1992).
2. J. E. Schirber, R. A. Assink, G. A. Samara, B. Morosin and D. A. Loy, Phys. Rev. B (in press).
3 G. A. Samara, L. V. Hansen, R. A. Assink, B. Morosin, J. E. Schirber, and D. A. Loy, Phys. Rev. B 47,4756 (1993).
4. R. D. Johnson, D. S. Bethune, and C. S. Yannoni, Ace. Chem. Res. 25, 169 (1992).
5. J. P. Jesson, in The Paramagnetic Shift, edited by G. N. La Mar, W. DeW. Horrocks, J., and R. H. Holm (Academic Press, New York, 1973), pp. 1-52.
6. A. Carrington and A. D. McLachlan, Introduction to Magnetic Resonance (Harper & Row, New York, 1967).
7. Z. Belahmer, P. Bernier, L. Firlej, J. M. Lambert, and M. Ribet, Phys. Rev. B., 47, 15980 (1993).
8. F. Dereux, J. P. Boilot, F. Chaput, and B. Sapoval, Phys. Rev. Lett. 65, 614 (1990).
9. J. D. Satterlee, in Annual Reports on NMR Spectroscopy, Vol. 17 (Academic Press Inc., London, 1986) pp. 149.
509

MEASUREMENT OF THE EXCITED-STATE MOLECULAR POLARIZABILITY OFC60
N. TANG,* R. W. HELLWARTH, AND J. P. PARTANEN Department of Physics and Electrical Engineering, University of Southern California, Los Angeles, CA 90089-0484.
*Current address: 3005 P St., Ste.l, WL/MLPJ, Bldg. 651, Area B, WPAFB, OH 45433.
ABSTRACT
We use -30 ps pulses at 532 nm to measure the complex excited-state molecular
polarizability ae in a C60/benzene solution. We determine the imaginary part of ae by measuring the excited-state absorption cross-section in a pump-probe experiment. In a degenerate-four-wave-mixing (DFWM) experiment, we find that in delayed probing of the complex index gratings formed by -30 ps pulses, the thermal and the excited-state polarizability changes both contribute to these transient gratings.
INTRODUCTION
The most natural parameter characterizing the complete excited-state linear optical
property is the complex excited-state linear molecular polarizability oce, whose imaginary part is related to the absorption cross-section while the real part is responsible for the refractive behavior. It is believed that excited singlet C60 molecules go through intersystem crossing to the lowest triplet state in a fraction of a nanosecond (up to about 1 ns depending on the preparation), where they stay for tens of microseconds before decaying back to the ground state.1' 2 In an earlier paper, we did not observe difference in the absorption cross-section between the excited singlet and the lowest triplet state in a pump-probe experiment.3 We reported the excited-state absorption cross-section at 532nm to be
oe = (12.3 ± 0.8) x 10~18 cm2, which agrees well with the literature value.2 We also determined
the ground state absorption cross-section at 532 nm to be og =(3.5±0.3)xl0~18cm2. In this
paper we try to determine the complete complex excited-state molecular polarizability cte by adding the information extracted from a degenerate-four-wave-mixing (DFWM) experiment.
The linear polarizability of the excited-state contributes to the third order nonlinearity due to the fact that molecules must first be promoted to the excited-state. However promoting molecules to the excited-state by absorption inevitably dumps energy into the sample. In a typical DFWM experiment with parallel polarized laser pulses, there are usually contributions in the DFWM signal from thermal and acoustic origin due to the hydrodynamic process following the absorption. This process can be described by the Navier-Stokes equations, which have solutions in close form under certain circumstances.4 At the same time, the spatially periodic population of the excited-state molecules modifies the dielectric constant,
511
Mat. Res. Soc. Symp. Proc.Vol. 359 e 1995 Materials Research Society

which in turn contributes to the DFWM signal. In the following we incorporate both excited- state and hydrodynamic contributions into our theory.
EXPERIMENT AND THEORY
We obtain 99.5% pure Cßo powder from MER Corporation (Tucson, Arizona) and use it as is. The benzene solvent is spectrophotometry grade from J. T. Baker Inc. (Phillipsburg, New Jersey). A 0.47g/l solution is placed in a 1 mm spectrophotometer cell for our DFWM experiment. Details of the DFWM experimental arrangement can be found elsewhere.5 The laser pulses used are at 532 nm with a pulse duration of~30 ps.
We first study the hydrodynamic process associated with the absorption of energy in a DFWM experiment. We assume that our pulse duration 8/ is short compared to the time required to reach local thermal equilibrium and that the initial temperature is spatially modulated. At times longer than the laser pulse width, we can solve the Navier-Stokes
equations and derive a time dependent quantity %f for the hydrodynamic process that is the
equivalent of the electronic/nuclear x<3) (defined by P{3) = 6%(3)EFE*PEB in the complex
formulation for the amplitude of the DFWM polarization P(3) of an isotropic medium) 6
X? =X%[e-Dkl'+(yRn-l)e-rk2'cos(nt)], (1)
L.(3)_»fai-7o)&ra» 96TZ
2POCVJL [dT *M> - „, 2„ _ ... UT I • (2)
Here D is a quantity related to the thermal conductivity K, the specific heat at constant
pressure cp, and the equilibrium density p0 by D = K / p0cp; k is the grating vector; y = cp I cv
is the ratio between the specific heat at constant pressure and that at constant volume;
R" SI 3T J / ST is the rati° between the temPerature derivative of the refractive index
at constant density and that at constant pressure; T = -[—(—+0 + (y-l)D], where i\ and •^ Po ->
C, are the shear and bulk viscosity, respectively; Q. is the acoustic frequency; ns is the solvent
refractive index; c is the speed of light in vacuum; T0 is the low intensity transmission of the sample; and L is the sample thickness. One can easily identify the two components in (1): the first term represents the thermal grating that decays only through thermal conductivity; the second term describes mainly the acoustic wave damping process.
To add the effect of the excited-state grating, we need to distinguish two different time ranges: (a) from the end of the writing pulses to a few hundred picoseconds (mainly singlet), and (b) from about one nanosecond to microseconds (mainly triplet). We make use of the Lorentz-Lorenz relation,
512

4 -1
-I f2
ne2 -1
:^(Nsas+Ngag), (3)
and -^—^ = ^[Nsas + (Ng-Ne)ceg+Neae). (4) ne+2 3
Here we use ng and ne to represent the complex refractive index before and after the writing
pulses reach the sample. The N's are the number density in cm"3 and the a's are the complex molecular polarizability in cm3. The subscripts s, g and e in N's and a's represent the solvent, the ground state C60 and the excited-state C60. Under small perturbation, (3) and (4) can be combined to give the change in the dielectric constant Ae as
Ae^2-H2=^(«2+2)2JVe(ac-cg. (5)
n—T *\FF Here the excited-state number density Ne in the non-depletion regime is Ne =—— ,
hvL (this is true since we only excite a few percent of the total C60 at most) with F being the writing beam fluence and e =1 in case (a) or the intersystem crossing efficiency in case (b).
We can derive a term xi? e"T similar to %f> for the effect of the excited-state grating
(assuming ng=ni.) with
(3, ws(w2+2)2(l-r0)c5ffi. , ,„ Y
(J' =-£ii — — (ae-a„). (6)
Here T is the lifetime of the excited singlet in case (a) or that of the lowest triplet in case (b).
Considering only a fraction ty of the absorbed energy goes into driving the
hydrodynamic process, we can now combine %^e~'lx and %f to write a quantity %; whose
square is proportional to the DFWM signal
3C!3) = X$[^~"T +4*"*"' +4>(Y3, -I)*""2' cos(Q0], (7)
, . %fj 2:r(n2+2)2e'Yp0cv where A-~m= A \ (««-«<?)■ (8)
513

Q
O 2 4 6 8 10 Backward delay (ns)
5= -100 -50 0 50 100 160
o Backward delay (ps)
Fig. 1. DFWM signal for the case of a 16.8° internal angle between the writing beams, (a) Time range containing triplet grating is shown. The solid line helps to guide the eyes, (b) At times around the three-beam-overlap where triplet grating is yet to develop.
RESULTS AND DISCUSSIONS
Fig. 1 presents the data from a typical DFWM experiment. Each data point here is an average of-20 pulses. Fig. 1(b) shows the data in the time range where case (a) applies, while data in Fig. 1(a) can be combined with those of Fig. 1(b) to extract the information of the triplet.
Solid C60 has a number density of 1.38xl021c/n3 and a refractive index of 2.1 at 532 nm.7 Combining with our cross-section measurement, we calculate the ground state C60
molecular polarizability to be ag = (92.1 + 2.2z) x 10"24cm3. The uncertainty for the real part is
estimated to be -1% while that of the imaginary part is -10% from our ground state absorption cross-section measurement. It is generally believed that interactions between adjacent C60 molecules are small even in a crystalline structure. This makes us believe that the refractive behavior from the solid should closely resemble that of the individual molecules.
514

The imaginary part of the molecular polarizability relates to the absorption cross- section by
9nsc
4n2v(n2s+2Y
Im(a.-cg= „Jj.^fr.-<*,)• (9)
The absorption cross-sections from our pump-probe experiment result in a value
Im(ae) = (ll.l±7%)xl0~24cm3, which is the same for both excited singlet and the lowest
triplet.
Table I. Physical constants of benzene around 20°C. Digits in parentheses give the uncertainty in last digit.
K (Wlm-K) p„(g/cm3) CpVlg-K) Refractive index at 532 nm
0.145(3)a 0.8787b 1.73(2)c 1.50d
a (10~3//C) ß (10~10/ Pa) 11 (W^Pa i) -,O-<(|);K-.,
1.24(5)e 9.5(1)1 6.3(2)g 6.5(l)h
1 'L class
r (xl0-5m2/s) at 5 MHz
vs(m/s)
1001 4.971 1310)
a Average value of Refs.8, 9, 10. b Calculated from the formula and data given in Ref. 11. c Average value of Refs. 8, 9, 11. d From Sellmeier formulas in Ref. 6. e Volume expansion coefficient. Estimated from data in Refs. 9,11. f Isothermal compressibility. Estimated from data in Refs. 8,11,12. g Shear viscosity. Estimated from references 8, 9, 12, 13. h References 6, 11, 12. i.FromRefs. 12, 14. j Data from Ref. 12 at 5 MHz.
We summarize in Table I some of the important physical constants of solvent benzene
in the literature. From the relation v, =(y/p0ß) we calculate a y value of 1.46, with an
uncertainty estimated to be less than a few percents. From the thermodynamic identity
cv=cp-ra2/p0ß, we obtain cv =(1.19+.07)J/g-A: and a y value of 1.45±0.10 at our
sample temperature of around 22°C by using the parameters in Table I. We thus establish a y value of 1.45+0.10.
515

Upon close examination of (7) and our DFWM data, we realize that in order to
determine the real part of A (which is directly related to the real part of ae) we need to
determine either <j) or Rn. The parameter <|> is one that we do not have information of.
However Rn for benzene, although not available in the literature, can be experimentally measured. We are in the process of determining this parameter.
CONCLUSION
We formulate the complete description to determine both the excited singlet and the lowest triplet molecular polarizability by incorporating both excited-state grating and the
hydrodynamic contributions in a DFWM experiment. The imaginary part of ae is obtained by
measuring the absorption cross-section. Determination of the real part of ac is in progress.
ACKNOWLEDGMENT
This work is supported by the U. S. Air Force Office of Scientific Research under Grant No. F49620-94-1-0139. One of us (N. T.) would like to acknowledge support from National Research Council-Air Force Wright Laboratory.
REFERENCES
1. T. W. Ebbesen, K. Tanigaki, and S. Kuroshima, Chem. Phys. Lett. 181, 501 (1991). 2. Y. Kajii, T. Nakagawa, S. Suzuki, Y. Achiba, K. Obi, and K. Shibuya, Chem. Phys. Lett.
181, 100(1991). 3. N. Tang, H. Guan, J. P. Partanen, and R. W. Hellwarth, SPIE Proc. Vol. 2143, 272 ( a
numerical error is corrected, see Ref.4). 4. N. Tang, Ph. D. Dissertation, University of Southern California, August 1994. 5. N. Tang, J. P. Partanen, R. W. Hellwarth, and R. J. Knize, Phys. Rev. B 48, 8404 (1993). 6. R. W. Hellwarth, Prog. Quantum. Electron. 5, 1 (1977). 7. S. L. Ren, Y. Wang, A. M. Rao, E. McRae, J. M. Holden, T. Hager, K. Wang, W. T. Lee,
H. F. Ni, J. Selegue, and P. C. Eklund, Appl. Phys. Lett. 59, 2678 (1991). 8. CRC Handbook of Chemistry and Physics (CRC Press, Boca Raton, 1993). 9. N. B. Vargaftik, Handbook of Physical Properties of Liquids and Gases (Hemisphere
Publishing Corporation, Washington, 1983). 10. N. B. Vargaftik, L. P. Filippov, A. A. Tarzimanov, and E. E. Totskii, Handbook of
Thermal Conductivity of Liquids and Gases (CRC Press, Boca Raton, 1993). 11. International Critical Tables of Numerical Data, Physics, Chemistry and Technology
(McGraw-Hill, New York, 1928) 12. American Institute of Physics Handbook (McGraw-Hill, New York, 1963). 13. D. S. Viswanath, and G. Natarajan, Data Book on the Viscosity of Liquids (Hemisphere
Publishing Corporation, New York, 1989). 14. A. B. Bhatia, Ultrasonic Absorption (Oxford University Press, London, 1967).
516

MULTIPHOTON IONIZATION MASS SPECTROSCOPY OF FULLERENES IN METHANE DIFFUSION FLAMES
H. HEPP*, K. SIEGMANN,* AND K. SATTLER** *Laboratory for Solid State Physics, Swiss Federal Institute of Technology (ETH),
CH-8093 Zuerich, Switzerland **Department of Physics and Astronomy, University of Hawaii, Honolulu, HI
ABSTRACT
Multiphoton ionization time-of-flight mass spectrosocopy is used as an on-line technique to investigate polycyclic aromatic hydrocarbons (PAH) and fullerenes in atmospheric pressure flames. We have recorded height profiles of neutral PAH and fullerenes in methane/argon diffusion flames. Fullerenes ranging from C32 to at least C150 are found in a region where PAH concentration starts to decrease. Uniformity of the profiles indicates that the fullerenes do not grow from smaller to larger ones. The influence of the amount of argon additive is discussed.
INTRODUCTION
Nucleation and growth of carbon clusters at high temperature is a unique process which is usually not observed with other cluster materials. A famous example for this process is the production of macroscopic quantities of fullerenes by graphite vaporization *. Soot formation in flames is an even more familiar phenomenon of high temperature carbon growth. Although mostly carbon-hydrogen compounds are found in the complex machinery of flames, the possibility of fullerene formation in flames has been suggested^ already shortly after the discovery of this modification of carbon.
The first fingerprints of fullerenes in flames were observed by mass spectrometry of their ions probed from low-pressure premixed benzene/oxygen and acetylene/oxygen flames^A Later, also the corresponding neutral species were measured in these flames by multiphoton ionization mass spectrometry5. More evidence of the presence of fullerenes in this type of flame has been provided by Howard and coworkers using solvent extraction and spectroscopic techniques^. They have further shown that the amount of COO and C70 formed in the flame is substantial and can be varied over a wide range by changing the burning conditions^. Hence, flame based fullerene synthesis may become interesting for production. Recently, mass spectra of fullerene ions have been obtained also from low-pressure premixed naphthalene/oxygen/argon flames^.
To our knowledge, fullerenes had not yet been detected in diffusion flames. It had been conjectured that diffusion flames give higher yields of fullerenes then premixed flames'?. Malhotra and Ross^ studied soot sampled from an open butane flame using field ionization mass spectrometry but found no peaks corresponding to fullerenes.
We have investigated a methane/argon diffusion flame at atmospheric pressure by on-line multiphoton ionization time-of-flight mass spectroscopy. Neutral molecular flame species are extracted using a narrow quartz glass capillary. In this way, we have measured high-resolution profiles of the species concentrations across the flame. Low laser intensity at a wavelength of
517
Mat. Res. Soc. Symp. Proc. Vol. 359 e 1995 Materials Research Society

250 nm was suitable for ionization of polycyclic aromatic hydrocarbons (PAH). The profiles have well reflected the growth of PAH in diffusion names1". Switching to higher laser intensities at a wavelength of 308 nm, it became indeed possible to measure height profiles of fullerenes in this flame1'. These profiles are qualitatively very different from those in low- pressure premixed flames.
The mechanism of fullerenc formation in flames is not yet sufficiently understood. It has been shown that there is a possible path to fullerene synthesis by combining PAH growth mechanisms with cage closing via H2 elimination and intramolecular rearrangements'2. Besides models of gas phase synthesis, also heterogeneous fullerene formation has been proposed^. Young soot particles might act as reactors for fullerenes. Our height profiles indicate that such a heterogeneous formation path is probable for the fullerenes in our diffusion flames.
EXPERIMENTAL
Coannular laminar diffusion flame under atmospheric pressure conditions were studied. The fuel was methane diluted with different amounts of argon to reduce flame luminosity and the clogging of the probe. Our burnei'l">'3 consists of two concentric tubes of 12 mm and 102 mm i.d., with the fuel flowing through the central tube and air through the outer duct. The air flow is adjusted to optimal stabilization of the flame. The visible flame height is set to 70 mm.
Fig.l shows the principle of our custom-designed inlet system that transfers combustion gases from atmospheric pressure to the high vacuum chamber of a time-of-flight mass spectrometer (TOF-MS). Slight underpressure, Ap = -20 mbar is applied to suck combustion gases through a quartz probe (0.5 mm i.d.) where they are immediately diluted (ca. 1:10) and cooled with clean air in order to quench further reactions. The mixture is guided by a 7 mm steel tube to the TOF-MS.
Figure 1: To Pump ♦
Solenoid Actuated ^S Quartz Glass Probe Valve'
►Ap = —20 mbar
Argon Gas for Dilution
Fig. 1: Sketch of the inlet system for the transfer of combustion products to the time-of-flight mass spectrometer.
518

The entrance to the first chamber of the TOF-MS14 is formed by a nozzle equipped with a solenoid actuated valve lo generate a pulsed supersonic jet. This molecular beam passes a skimmer and is ionized by an XeCl excimer laser at a wavelength of 308 nm. Optionally, an excimer-pumped frequency-doubled dye laser at a wavelength of 250 nm can be used for 2-photon ionizalion of PAH. Species with a higher ionization threshold such as acetylene can
be ionized by electron impact. The flight tube is equipped with a gridless reflector for energy compensation. The flight
path is 1.7 m in length. The ions are detected by a dual channel-plate system connected to a 200 MHz 10 bit transient recorder. System control and acquisition are carried out by a 32 bit Motorola 68020 microprocessor based data system. We have recorded timc-of-flighi spectra adding up 100 ionization-detection cycles. The electric potentials of the ion optics allow only neutral molecules to enter. Hence, ions from the flame are not measured with our setup.
The burner is mounted on a linear drive to vary the position of the quartz probe in the name. The sampling height above the burner can be adjusted with an accuracy of less than 0.1 mm. Time-of-flight spectra have been recorded along the middle axis of the flame. We
compare the integral over a mass peak from different heights above the burner. The resulting profile reflects the variations in concentration throughout the flame.
RESULTS AND DISCUSSION
A typical mass spectrum from the fullerene-rich part of the flame is shown in fig.2. There are two distinct mass regions. In the lower one, we find narrow peaks corresponding to PAH as well as hydrocarbon and all-carbon fragments. The spectrum is taken at relatively high laser intensity (1 MW / cm2) in order to maximize the fullcrene signal. Above about 380 amu (m(C32) =384 amu) the distinct pattern of broad fullerene peaks separated by 24 amu becomes apparent. The broadening is due to delayed ionizalion5>14,15 The most prominent fullerene peaks are CßO. C70 and C50 C62 is particularly small. The signal intensity decreases slowly for larger fullerenes, the largest one shown in this figure is C124. We do not observe any doubly charged fullerenes.
Figure 2:
600 800 1000 Mass [amu]
Fig.2: Typical mass spectrum in the fullerene-rich part of the flame (CH4 / Ar (1/0.54), Height above the burner: 55 mm).
519

Figure3:
Ä-1-
0.5 -
Fig.3 displays height profiles in fiames ol" two different methane/argon mixtures. The distributions of PAH, represented here by C13H8 and of fullerenes such as COO are different both in shape and location. The PAH profiles are approximately bell-shaped, the decay of the concentration being usually steeper than the rise. In general, larger PAH exhibit more narrow distributions that culminate higher in the flames than smaller ones. This is discussed in detail elsewhere 10
The most striking feature of the fullerene profiles in these flames is that all fullerenes show the same spatial distribution, i.e. their normalized concentration profiles are in perfect confor- mity. Hence, there is no sign that larger fullerenes grow from smaller ones or that a certain subclass of fullerenes is preferentially formed in one part of the flame. Growth and destruction of fullerenes occur for all fullerenes in parallel. This is in contrast to low-pressure premixed flames where the profiles e.g. of C44, C50, COO
and C70 display the same general features but can be well distinguished from each other4>5. Yet, also in those flames, the profiles do not indicate that smaller fullerenes grow to larger ones.
■o N
E o z
0.0
1.0
-a) Methane/Argon (1/1.2) j^ ft ^60
C-i3H8 / /
1 1
\l
I 0.5 to E o z
0.0
- b) CH4/Ar (1/0.8) /-^l °"q ft
Vtr I Ceo
C 2 H 2 / P A I
/C-|3H8/ / lu
\z.^.^J. 10 20 30 40 50 60 70
Height above the Burner [mm]
Fig.3: Normalized concentration profiles in flames of two different methane/argon mixtures.
All PAH profiles investigated (up to a mass of 472 amu) culminate below the fullerene profile. As discussed in^O, the depletion of acetylene marks an upper limit to the PAH profiles. The dashed curve in the lower half of fig.3 represents the acetylene concentration. The steep decreasing flank of the fullerene profile is found precisely where the acetylene is depleted. Probably, at this height above the burner, oxidation becomes very efficient.
520

The fullerene profile rises in two steps. The first one is found in the upper region of the increase of most PAH concentrations. The second step is coincident with the decrease of PAH of about the size of C13H8. For all the PAH, we observed only simple rise and decay behavior in our previous experiments 10. Hence, the bimodal profile of the fullerenes indicates that there is not only one path leading from certain gas phase PAH to fullerenes. We do not yet have data on the soot particle distributions under these conditions. It is possible that the second increase of the fullerenes is due to enhanced fullerene formation in or on the surface of soot particles'*. This would be in accordance with the observation of Homann and coworkers that there are two regions of fullerene formation in premixed acetylene flames, one in the soot-free part of the flame and a second region of higher fullerene concentration in the presence of soon-.
The effect of changing the fuel dilution is also shown in fig.3. If we increase the amount of argon additive from 300 to 500 ml/min, keeping the methane flow rate constant, the height of the visible flame does not change. The flame gets slightly less luminous. The profile of C13H8 as well as the fullerene profile shift to a larger height above the burner and become more narrow. The same effect has been observed for other PAHl°
Our experiments show that 5 eV photons (250 nm) are much better suited for PAH ionization than 4 eV photons (308 nm). At 308 nm, enhancement of PAH ionization by increasing the laser power is limited by strong fragmentation. This fragmentation can affect the height profiles if the mass peak under investigation corresponds to fragments of larger molecules. Thus, we studied the influence of the laser power on our spectra and profiles.
The peak at 166 amu, C13H8, represents an exception among the PAH. Its great intensity, compared to ionizaton at 250 nm, indicates resonant ionization at 308 nm. Varying the laser power over a wide range changes the 165 amu / 166 amu peak intensity ratio but does not affect the shape of the C13H8 height profile. As expected, it is in conformity with the profile of C13H8 that we obtained ionizing at a wavelength of 250 nm.
Rather high laser power is required to ionize fullerenes for these photon energies5.15. The shape of the fullerene profile does not depend on the laser power for intensities in the range where fullerene mass spectra can be obtained.
ACKNOWLEDGEMENTS
We wish to thank H.C. Siegmann and H. Burtscher for helpful discussion.
521

REFERENCES
1. W. Krätschmer, L.D.Lamb, K. Fostiropoulos, and D. R. Huffman, Nature 347, 354 (1990).
2. Q.L. Zhang, S.C. O'Brien, J.R. Heath, Y. Liu, R.F. Curl, H.W. Kroto, and R.E.Smalley, J. Phys. Chem. 90, 525 (1986).
3. Ph. Gerhardt, S. Löffler, and K.H. Homann, Chem. Phys. Lett. 137, 306 (1987).
4. Th. Baum, S. Löffler, Ph. Loftier, P. Weilmünster, and K.H. Homann, Ber. Bunsen-Ges. Phys. Chem. 96, 841, (1992).
5. J. Ahrens, R. Kovacs, E.A. Shafranovskii, and K.H. Homann, Ber. Bunsen-Ges. Phys. Chem. 98, 265, (1994).
6. J.B. Howard, J.T. McKinnon, Y. Makarovsky, A.L. Lafleur, and M.E. Johnson, Nature 352, 139 (1991); J. Phys. Chem. 96, 6657 (1992).
7. J.B. Howard, Twenty-Fourth Symposium (International) on Combustion; The Combustion Institute: Pittsburgh 1992, p 933.
8. M. Bachmann, J. Griqsheimer, K.H. Homann, Chem. Phys. Lett. 223, 506 (1994).
9. R. Malhotra, and D.S. Ross, J. Phys. Cham., 95, 4599 (1991).
10. H. Hcpp, K. Siegmann, and K. Sattler, submitted to Chem. Phys. Lett..
11. K. Siegmann, H. Hepp, and K. Sattler, Surface Review and Letters, in print.
12. C.J. Pope, J.A. Marr, and J.B. Howard, J. Phys. Chem. 97, 11001 (1993).
13.H. Burtscher, D. Matter, and H.C. Siegmann, Atmospheric Environment 27A, 1255 (1993).
14. M. Loepfe, H. C. Siegmann, and K. Sattler, Z. Phys. D -Atoms, Molecules and Clusters- 26, S 311-313 (1993).
15. E.E.B. Campbell, G. Ulmer, and I.V. Hertel, Phys. Rev. Lett. 67, 1986 (1991).
16. K. Siegmann, H. Hepp, and K. Sattler, submitted to Ber. Bunsen-Ges. Phys. Chem..
522
ANALYSIS OF A C6o/TWELVE SOLVENT SURVEY FOR RED SHIFTING OF SPECTRA
D. M. BRANDELIK*, D. G. MCLEAN*, R. L. SUTHERLAND* * Science Applications International Corporation, Dayton ,OH.
ABSTRACT
A survey of solvents with a wide variation of solubility for COO and a broad variation in dielectric constant was investigated for possible red shifting of the linear absorbance spectra. Initial analysis shows that very small shifts are achieved. Molar extinction spectra were measured for Cßo in each solvent in both the standard mode and with an integrating sphere. Comparison of the two methods has shown strong scattering effects. The UV-vis spectra revealed some broadening in the bands and in some cases supression of strong Cßo bands. Fluorescence spectra also show broadening of bands and new fluorescence minima in some solvents indicating formation of complexes between the Cßo and those solvents that contain nitrogen.
INTRODUCTION
Solubility of CöO in many classes of solvents has been studied using HPLC as a method of determining the solubility limit.1 We have studied the photoluminescence and fluoroescence of Cßo in a variety of solvent solutions 2>3. Interest in redshifting the spectra has motivated this research.to extend the optical limiter range to the NIR. This study explores twelve solvents using UV spectroscopy and fluorescence to determine the solvent effects on spectra shifting. Measurement of an accurate molar extinction coefficient was achieved using an integrating sphere and carefully prepared concentrations of the solutions. Indications of complex formation were seen in many of the solvents containing nitrogen.
RESULTS AND DISCUSSION
Experimental
All solvents used in this study were obtained in the highest purity available and used as received from Aldrich. Solvents were chosen from the literature1 to have a wide range of dielectric constants. Cßo was obtained in 99.99% purity from MER Corp. and used as received. Samples were desired at the solubility limit in each solvent since the fluorescence signal of Cßo is very small. Each sample was weighed in the literature solubility limit amount on a six place balance into a preweighed precleaned vial with a teflon lined cap. Solvents were measured with a glass syringe into the vial which was then sealed to prevent random evaporation of the solvent. The samples were sonicated four times with an ultrasonic bath for five minutes, with five minute rest intervals to avoid overheating the samples. The mixtures were sealed in foil to protect them from light and then allowed to sit for 48 hours at room temperature. To avoid floating agglomerates in the solution and to remove any inert column material, each sample was filtered with a preweighed .2 (xm pore size PTFE filter and loaded into precleaned 1cm quartz cuvettes. By drying and reweighing the filter and original vial with the undissolved COO and inert material, the actual amount of dissolved Cßo was determined. From this value the molarity at saturation was obtained.
Table 1 lists the solvents, calculated molarity, measured mg/ml at saturation, and the molar extinctions of the solutions at 694 nm.The calculated mg/ml solubility limit obtained is, in all cases, less than that obtained from the literature.1 Correlation to literature values ranges from 23 to 97%. Sources of error include the weighing error in the vial and filter, inert column packing material from the purification of Cßo and the syringe measurement error. Possible sources of the lower values include differences in the method of measurement and error bars on the
523
Mat. Res. Soc. Symp. Proc. Vol. 359 e 1995 Materials Research Society

material from the purification of CßO and the syringe measurement error. Possible sources of the lower values include differences in the method of measurement and error bars on the measurements. Reference 1 samples were filtered with a .45 (lm filter and diluted several times to meet the test range of the HPLC column. Their measured solubilites were within 10% error. The dilutions may have introduced solvent evaporation. Concentrated solutions may contain agglomerates which will vary the concentration of each HPLC sample.
Table I. Molar Extinctions and Molarity of Cßo Solvent Solutions at Saturation
Solvent Dielectric Constant
fel)
Molarity of Qo
[M]
mg/ml; % of (lit.); (lit.)
mg/ml measured
Molar Extinction
(Em) @ 694 nm
tetrachloroethane (TCE) 2.46 2.64 x 10"3 1.4; 97.1 1.36 257.9 trichloroethylene (TCE1) 3.40 1.88 x 10⁻³ 5.3; 36.0 1.91 100.21 decalins (DEC) 2.20 4.48 x 10⁻³ 4.6; 70.2 3.23 928.37 toluene TOL) 2.44 2.21 x 10⁻³ 2.8; 56.8 1.59 38.50 chlorobenzene (CB) 5.71 5.46 x 10⁻³ 7.0; 35.7 2.50 810.66 dichlorobenzene (DCB) 9.93 6.52 x 10-3* 27; * 4.70 606.22 1-chloro-naphthalene (CHN)
5.00 6.51 x 10-3* 51.0; * 4.72 49.18
N,N-diethylaniline (DEA)
7.76 x 10⁻⁵* • >1 3163.7
benzonitrile (BZN) 25.60 3.33 x 10⁻⁴ 0.41; 58.5 .24 1391.80 nitrobenzene (NB) 35.74 8.47 x 10"4 0.8; 76.3 .61 378.12 N-methyl-pyrrolidone (NMP)
2.85 x 10⁻⁴ 0.89; 23.0 .205 4423.2
pyridine (PY) 12.30 5.20 x 10⁻⁴ 0.89; 42.7 .38 613.70 * These solutions are not at saturation.
Examining the results in Table I by solvent class, we can see that TCE and TCE1 show an increase in e<] and a decrease in the solubility limit and em , for chlorine substituted alkanes and alkenes. DEC and TOL are two ring unconjugated vs one ring methylsubstituted conjugated systems. Again, £d increases, slightly, and solubility decreases two fold, but the em decreases by a factor of 24.
In chlorosubstituted single ring and double ring conjugated solvents; (CB.DCB, and CHN); £d increases for two chlorines on a single ring, but decreases with a single chlorine on a double ring. Th measured solubility nearly doubles with a second chlorine on a single ring, but very little increase is seen with a second ring. A decrease of 25% is seen for em with the addition of a second chlorine on the single ring, and a dramatic 6.5 decrease with the second ring.
A wide variety of nitrogen containing compounds were included in the study. For NB and PY Ed decreases by a factor of three, and the solubility by one-half; however Em doubles. Py's nitrogen contributes to the n electron structure while the NB nitrogen detracts. NMP, BZN, and DEA were compared for solubility. DEA has a reasonably large solubility compared to NMP and BZN. DEA also has functional groups which donate electron density to the ring, while NMP and BZN have functional groups which detract from ring electron density. Increasing £m is seen for BZN, DEA, and NMP.
UV and fluorescence spectra comparisons were analyzed for changes in the spectral features compared toluene solutions. Figure 1 shows the Uv absorbance spectra. Red shifting of the spectra relative to that in toluene is minimal in all the solutions, with a maximum shift of 5 nm for the 540 nm and 600 nm bands overall. The shape of the spectra was not changed much for TCE, TCE1 and DEC. More changes are seen due to solubility limits for CB,DCB, and CHN. The most changes in the spectra are seen for NMP, BZN, NB, PY, and DEA. A slight
524

broadening is seen in NB, with a strong broadening effect in PY, BZN, and DEA. The NMP solution shows a strong supression of the Cßo bands. This broadening and supression of bands may be caused by the formation of complexes.
7-
6-
i i i
4-
3- 1
DEC TCE TCE1 TOL
-
2-
1 -
1 /so
- i i 'i"'-
5-
4-
i fr ••] ' ' i S
1 1 i ~r
-
3-
2-
C8 DCB an TOL
1 -
0- n I I
400 500 600 700 800 900 10001100 nm
400 500 600 700 800 900 10001100 nm
400 500 600 700 800 900 1000 1100 nm
Figure 1. UV absorbance plots of COO solutions showing spectral broadening and minimal red shifting.
Plots of the fluorescence and integrated and on-axis em are shown in Figures 2 and 3 Comparison of fluorescence scans in Figure 2 show relatively small changes in spectral shape as compared to COO in toluene,4 for TCE, TCE1, CB, DEC, DCB, and NB. The em was calculated from UV absorbance measured on-axis and with an integrating sphere. The integrating sphere (IS) measurement gives the truest measure of the em that would determine the nonlinear absorption. Normally the IS measurements are less than the on-axis signal, but TCE1, toluene, and TCE produce scattering in the 700 to 900 nm range. For the others, the scattering is difficult to determine. Triethyl amine is included in Figure 3, but was not a true solution and was not further analyzed in this study. The broadening of the fluorescence spectra in the nitrogen solvents NMP, and DEA are seen, with very little scattering effects. PY and BZN cause less change, again with small scattering effects. NB has uncertain scattering effects due to low signal in the 700-900 nm range. The broadening seen in all of these solvents indicates additional absorbance resonances from new species which are not present in the neat solvents. Possible explanation of the new species may be complex formation, which is known to occur with aliphatic and aromatic amines.5
525

400" ' ' '5Ö0 ' 6Ö0 "7Ö0' 'SÖO' ' 900' 1W
Wavelength (nm)
900' ' ' 1000
2 15l
8
400 500 600 700 S00 900 1000
Wavelength (nin)
'900' ' ' "ld<
Figure 2. The molar extinction coefficient and fluorescence spectra of seven Q,Q solutions in different solvents as indicated on each plot.
526

soo' eoo' 760' soo
Wavelenglli(nin)
600' 700 800
Wavelength (mil)
Dietliylaiiiline
'760" ' ' '800
Wavelength (rim)
900 1000 '760' ' ' 8C
Wavelength (tim)
Figure 3. The molar extinction and fluorescence spectra of six solvents producing the largest effects on Cßo-
CONCLUSION
We have studied the solubility and molar extinction coefficients for a variety of solvent classes and found the largest increase in em with DEC, CB, DEA, and NMP. The solubility increases most in CHN, DCB, and DEC. Molar extinction coefficients were determined from UV spectra taken both on-axis and with the integrating sphere and showed significant scattering effects in the 700- 900 nm range. Broadening in UV and fluorescence spectra was seen in nitrogen containing solvents, indicating complex formation. DEA and other aromatic amines have been shown to form complexes with CöO-
6 An expanded study of other solvents is underway. The nitrogen
527

containing solvents were studied for complex formation and nonlinear absorption, and reported on in the optical limiting symposium in this conference.7 DMB.DGM.and RLS gratefully acknowledge the support of this work by the Materials Laboratory, WL/WPAFB Ohio, under USAF contract F33615-90-5911.
REFERENCES
1. R. S. Ruoff, Doris S. Tse, Ripudaman Malhotra, and Donald C. Lorents, J. Phys. Chem., 97, 3379 (1993).
2. D. G. McLean, D. M. Brandelik, M. C. Brant, R. L. Sutherland, P. A. Fleitz, SPIE.2143, 263 (1994).
3. D. G. McLean, D. M. Brandelik, R. L. Sutherland, M. C. Brant, P. A. Fleitz, SPIE, 2229, 68 (1994).
4. D. Kim, M. Lee, Y.D.Suh and S. K\ Kim, J. Am, Chem. Soc. 114, 4429, (1992).'
5. D. K. Palit, H. N. Ghosh, H. Pal, A. V. Sapre, J. P. Mittal, R. Seshadri, C. N. R. Rao, Chem. Phys. Lett., 198, 113 (1992).
6. J. V. Casper, Y. Wang, Chem. Phys. Lett., 218, 221 (1994).
7. D.M.Brandelik, D.G.McLean, M. C. Brant, R. L. Sutherland, L.Frock, R. L. Crane, MRS Fall Symposium on Optical Limiting, in press, (1994).
528

FLUORESCENCE OF CYCLIC ADDUCTS OF FULLERENE
TSUNG-I LIN, SYH-KUN LIN, LUNG-LIN SHIU, KUO-MING CfflEN, AND TIEN-YAU LUH Department of Chemistry, National Taiwan University, Taipei 106, Taiwan, Republic of China
ABSTRACT
Five cyclic adducts C^C^, C60C5H6, C60NHCO2, C60NCO2Et, and C60CHCO2Et have been synthesized and their absorption and fluorescence spectral properties investigated and compared with those of the parent. Breaking the structural symmetry of C60 apparently resulted in enhancing the quantum yield two to three-folds in some adducts and thus made fluorescence much easier to be measured at room temperature. New absorption bands and altered fluorescence spectra were observed in the adducts. The Stokes' shifts of the adducts were small, about 4-5 nm, compared to 68 nm for the parent compound. All the adducts exhibited a single fluorescence lifetime about the same as C60 (ca. 1.3 ns). Aliphatic solvents had little influence on the absorption or fluorescence spectral profile except on the molar absorptivity whereas aromatic and polar solvents strongly interacted with the adducts causing a peak broadening effect.
INTRODUCTION
The electronic absorption and fluorescence properties of C60 and related compounds are valuable to a fundamental understanding of the electro-optical and photochemical properties of fullerene molecules. The absorption spectra of C60 under various conditions (e.g., solid film, in different solvents or temperature) have been characterized.1 However, luminescence properties of C60 have only been studied mostly at low temperature.2 Because of the very low fluorescence quantum yield (ca. 2 x KM), the fluorescence spectra of fullerene in high resolution at room temperature has only been reported recently.3 The lifetime was found to be ca. 1.2 ns for C60. In the present investigation, we studied the absorption properties of C60 and five adducts and observed that all six compounds fluoresced at room temperature. Presumably, because the modification reduced the symmetry of the fullerene structure from Ca to C2v or Cs, and converted some vibronic-forbidden states to the allowed states, increasing their populations and transition probabilities. The absorption, excitation, and emission spectra, quantum yields, and lifetimes of these compounds in various solvents were examined. The results presented here may provide a better understanding of the factors, e.g. structure moieties and solvent interaction, that might affect and favor the fluorescence emission of fullerene compounds at room temperature.
EXPERIMENTAL
C60 (I, 99.5%, MER Corp.) was used without further purification. The adducts (Fig. 1) C60C4H6 (II), C60C5H6 (HI), C60NHCO2 (IV), C60NCO2Et (V), and C60CHCO2Et (VI) were synthesized according to the published procedures and purified on Buckyclutcher I columns (Regis Chem.) by using the HPLC method.4 All solvents used were of reagent or spectroscopic grade. The purity of all fullerene adducts used for the spectroscopic work was double-checked
529
Mat. Res. Soc. Symp. Proc.Vol. 359 "1995 Materials Research Society

by using 13C-NMR and mass spectrometry. UV-vis absorption spectra were measured in a scanning spectrophotometer (Hitachi U-2000). The fluorescence excitation and emission spectra of the fullerene adducts were measured in a scanning luminescence spectrometer (SLM-Aminco AB2). The fluorescence lifetime was measured in a time-correlated single-photon counting spectrofluorometer (Edinburgh Instrument FL-900). The excitation wavelength was 335 nm and fluorescence was measured at the emission maxima with an extended red-wavelength photomultiplier (Hamamatsu R955) that was cooled to improve the signal-to-noise ratio. Fluorescence lifetimes were extracted from the composite single-photon counting decay curve by the deconvolution technique using a nonlinear least-squares curve fit method. Routinely, the decay curves were fitted with one to three exponentials and the goodness of fit was judged by weighted residual and x2-squares analyses. Employing the deconvolution technique provided the time resolution to 0.1 ns.
C60 (I) C6oC4H6 (M) C60C5H6 (III)
N —C02Et CO,Et
C60NHCO2 (IV) Cs0NCO2Et (V) C60CHCO2Et (VI)
Fig. 1. Structures of the fullerene compounds.
RESULTS AND DISCUSSION
Absorption spectral properties As shown in Fig. 2A, all fullerene compounds exhibit strong UV absorption peaks (for I, log s = 5.07, 5.12, and 4.61 M"1 cm-1 respectively at 211, 256, and 328 nm). In addition, weak multiple peaks appear in the visible region (Fig. 2B-D). The spectra of the adducts are similar to the parent compound in the UV region but distinctly different in the visible region. In the 400-450 nm region, all except IV have maxima at 402-408 nm but the adducts exhibit a second distinct peak in the 419-431 nm region (whereas C60 has two very little peaks). These bands correspond to the S0 --> Sn transitions. Another noticeable difference is in the 450-700 nm region; the parent C60 has distinct fine structures: multiple pairs of peak-
530

shoulder appear at 537-541 mn, 560-569 nm, 592-598 mn, and 621 nm; but these bands are obscured in all adducts. In the three-ring adducts, prominent but broad bands (for V at 491 nm, for VI at 462 nm) appear in the 450-490 nm region. In addition, the adducts exhibit several additional new peaks and shoulders; most noticeably, a doublet structure is present around 702 nm for II and HI (Fig. 2B, inset for II), but is blue-shifted for IV-VI. The vibronic peak-to-peak energy differences (Su) are about 250-1550 cm-1. These values are in general agreement with the calculated values reported in the literature and those found in the solid film of C60. From the group symmetry consideration, among various electronic states, only transitions to >Tlu states are optically allowed from the >Ag ground state of C60.5 In the 450-750 nm region, the broad absorption band corresponds to the forbidden state of S0 --> S, transition. The observed multiple vibrational structural features are the results of the Herzberg-Teller coupling.5 The modification to C60 with a side ring reducs its symmetry from Ih to C2v or Cs. Thus, the number of degeneracy was decreased, presumably, allowing more vibronic couplings to occur but with decreasing oscillator strength. Judged by the small absorption extinction coefficient in the 450-700 nm region observed in the parent and adducts, it seems that there is no conversion of electronic- forbidden to allowed states due to chemical derivatization. The alternations in the visible region were vibronic-related, as expected.
400 500 600 700
wavelength (nm)
400 500 600 700
wavelength (nm)
Fig. 2. UV and visible absorption spectra of the fullerene compounds inMeCy. (A) 1.0x JO-3M; (B)-(D) 5.0x J0~5M; inset, II(saturated, ca. J.Ox lfr4M). The absorbance scales in (B)-(D) are magnified JO times.
531

Fluorescence spectral properties The fluorescence emission spectra of fiillerene compounds are shown in Fig. 3. The main features observed in the fluorescence emission spectra of C60 are multiple peaks in the 686-762 nm region and three spectral shoulders in the 620-677 nm region. Notice that the three minor spectral shoulders appeared in the 620-677 nm region are similar to those previously reported.3 The vibronic bands above 689 nm are spaced about 179- 438 cm-1 apart. These values are in good agreement with those obtained by others in the solid film using luminescence and Raman spectral techniques.2-5 On the other hand, the band distances between the first three emission bands (below 689 nm) are ca. 770 and 410 cm1. No cor- responding Raman bands could be found in the literature. The fluorescence emission spectra of the five-ring adducts (D-IV) are similar and almost identical for El and HI. The emission maxima of IV-VI are-blue shifted compared to II and m. Notice that the spectra in Fig. 3 are uncorrected (to best contrast their differeneces in fluorescence intensity), these spectra would appear much more differently if nonlinearity in the detector response is corrected (as in Fig. 4). The emission spectra of all fiillerene adducts maintained the same spectral characteristics independent of the excitation wavelength used. Also, lowering temperature to -25°C did not alter the emission spectral profile significantly. Derivatization also substantially increases the fluorescence of the adducts (except V).
600 650 700 750 780
wavelength (nm)
600 650 700 750 780
wavelength (nm)
-tfehtött*
0.15-
I VI D
o.io-
- 0.05- Xwi,
0 600 650 700 750 780
wavelength (nm)
600 650 700 750 780
wavelength (nm)
Fig. 3. Uncorrected fluorescence emission spectra (average of four scans) of fiillerene compounds (l.Ox lfr5M) in MeCy at 25°C. Excitation wavelength, 328 nm; scanning speed, 0.2 or 0.4 nm/s.
532

Spectral Mirror Image of Absorption and Fluorescence and Assignment of the 0-0 Transition Band. The conventional wavelength plots are converted to wavenumber plots (Fig. 4) to show a general good spectral mirror images between the absorption and fluorescence spectra in the wavenumber region measured from 12800-15700 cm-1 (637-780 nm). The 0-0 transitions are assigned to the absorption and emission bands with the shortest wavenumber and the Stokes' shifts are calculated. The adducts have small Stokes' shifts (ca. 90-160 cm1), compared to the parent (ca. 1600 cm1).
wavelength (nm)
700 600
wavelength (nm) 750 700 650
13000 14000 15000
wavenumber (cm-1)
14000 15000
wavenumber (cm-1)
Fig. 4. Mirror images of the absorption and emission spectra of the fullerene compounds in MeCy. Smooth and wavy curves respectively are the absorption and corrected emission spectra (in the 600-780 nm region) replotted in wavenumber.
Solvent Effect and Fluorescence Quantum Yield The effects of the aliphatic solvents pentane, methylcyclohexane (MeCy), and decalin (decahydronaphthalene); the aromatic solvents benzene and toluene; and chloroform on the absorption and fluorescence properties of fullerene compounds were investigated. Except in the 600-780 nm region, the spectral shape of fullerene compounds, in general, was not affected by the solvents. However, the extinction coefficient was solvent-dependent. In aliphatic solvents, the fluorescence emission spectral profiles of fullerene compounds was unaffected by the solvents. On the other hand, in chloroform and aromatic solvents, the fine details of the absorption and emission spectra disappeared and the peaks were red-shifted and broaden considerably. For example, the emissions of II at 707, 719, and 727 nm in MeCy were broaden by benzene and appeared as one band at 718 nm. Similarly, the emissions of C60 at 689, 700, and 714 nm in MeCy became a broad band at 702 nm in benzene. However,
533

good correlation in spectral mirror image was still maintained in these solvents. The fluorescence quantum yields of the Merene compounds were also determined in various solvents by a comparative method using quinine bisulfate (5.4 x 10⁸Min 0.1 N sulfuric acid) as the standard (a quantum yield of 0.56 was assumed). The quantum yield of C60 varied in different solvents from 0.9 x 10"> to 2.2 x 10⁻⁴ with an average of about (1.45 ± 0.5) x 10"4, in good agreement with the recent literature values.2 Except V all adducts have quantum yields two to three-fold higher than
the parent.
Fluorescence Lifetime. Fluorescence lifetimes of Merene compounds in the various solvents were determined by using the time-correlated single-photon counting technique. Because of the very low fluorescence quantum yield of these compounds, a long acquisition time was necessary for collecting sufficient and reliable data, typically 1-2 h. even under optimal conditions. Due to the long data-collecting time, some background photon counts (2-20 counts) appeared in the long time channels. Without subtracting the background signals, the fluorescence decay curve shows two exponential decay components, a shorter lifetime component of 1.1-1.6 ns and a longer lifetime component of 6-8 ns. The shorter lifetime is the major component accounting for about 76-94% (depending on the solvent) of the fluorescence. If the background signals from the solvent were subtracted from the decay curve of the fullerene compounds, deconvolution analysis showed only a single fluorescence lifetime. The lifetime of all six compounds are approximately the same.
Grant support by the National Science Council of the Republic of China (Taiwan) is gratefully acknowledged.
References
1. W. Kratschmer, L.D. Lamb, K. Fostiropoulos, D.R. Huffman, Nature, 347,354(1990); H. Ajie, M M Alvarez S J Anz, R.D. Beck, F. Diederich, K. Fostiropoulos, D.R. Huffman, W. Kratschmer, Y. Rubin, K.E. Schriver, D. Sensharma, R.L. Whetten, J. Phys. Chem. 94, 8630, (1990); J.W. Aibogast, A.P. Darmanyan C S Foote, Y. Rubin, F.N. Diederich, M. M. Alvarez, S.J. Anz, R.J. Whetten, ibid... 95, 11 (1991); J.P.' Hare, H.W. Kroto, R. Taylor, Chem. Phys. Lett. 177,394(1991); T.W. Ebbesen, K. Tanigaki,
S. Kuroshima, ibid., 181, 501 (1991). 2 Y Wang, J. Phys. Chem. 96,764(1992); Y. Zeng, L. Biczok. H. Linschitz, ibid.. 96, 5237 (1992);
C Reber, L. Yee, J. McKiernan, J.I. Zink, R.S. Williams, W.M. Tong, D.A.A. Ohlberg, R.L. Whetten, F. Diederich, ibid., 95, 2127 (1991); S.P. Sibley, S.M. Argentine, A.H. Francis, Chem. Phys. Lett. 188, 187 (1992)' D.S. Bethune, G. Meijer, W.C. Tang, H.J. Rosen, ibid. 174, 219 (1990)
3 JW Arbogast and C.S. Foote, J. Am. Chem. Soc. 113, 8886 (1991); D. Kim and M. Lee, ibid, 114, 4429 (1992); Y.P. Sun, P. Wang, N.B. Hamilton, ibid., 115, 6378 (1993); J.Catalan and J. Elguero, ibid., 115, 9249(1993)' RM Williamsand J.W. Verhoeven, Chem. Phys. Lett. 194,446(1992).
4 L -L Shiu T -I Lin, S.M. Peng, G.R. Her, D.D. Ju, S.K. Lin, J.H. Hwang, C.Y. Mou, T.Y. Luh, ./. Chem. Soc. Chem Commun., 1994, 647; M. Tsuda, T. Ishida, T. Nogami, S. Kurono, M. Ohashi, ibid., 1993, 1296; V M Rotello, J.B. Howard, T. Yadav, M.M. Conn, E. Viani, L.M. Giovane, A.L. Lafleur, Tetrahedron Lett. 34, 1561 (1993); F. Wudl, Ace. Chem. Res. 25, 157 (1992); L. Isaacs, A. Wehrsig, F. Diederich, ffelv. Chim Ada 76 1231 (1993); T.-Y Luh, Mater. Res. Soc. 1992 Fall Meeting, Boston. Mass.; T. Ishida, K Tanaka T Nogami, Chem. Lett. 1994, 561; C.J. Welch, W.H. Firkle, J. Chromatogr. 609, 89 (1992).
5. G. Marconi andP.R. Salvi, Chem. Phys. Lett. 202, 335 (1993); K. Yabanaand G.F. Bertsch, ibid., 197, 32 (1992); G.A. Heath, J.E. McGrady, R.L. Martin, J. Chem. Soc. Chem. Commun. 1992, 1272.
534

PART IX
Structure and Thermodynamics

NEUTRON SCATTERING STUDIES OF C61H2
D. A. NEUMANN1, J. E. FISCHER
2, J. R. D. COPLEY
1, P. A. HEINEY
2, J. J. RUSH
1,
R. M. STRONGIN2, L. BRARD
2, AND AMOS B. SMITH III2
1 National Institute of Standards and Technology, Gaithersburg, Maryland 20899 2 University of Pennsylvania, Philadelphia, Pennsylvania 19104
ABSTRACT
We report neutron diffraction measurements of orientational ordering, and inelastic neu- tron scattering measurements of the inter- and intra-molecular excitations, for the 6:5 an- nulene isomer (Cs symmetry) of C6iH2. We confirm previous x-ray measurements^] which have shown that above 290K this isomer has an fee structure, with the molecules orienta- tionally disordered such that the methylene groups preferentially occupy "octahedral" sites. Below 290K, the diffraction pattern can be indexed on a simple cubic lattice, in direct anal- ogy with the orientational ordering transition of C6o- The observed low energy dynamics reflect this behavior. A peak corresponding to molecular librations is observed below the transition, at ~2.5meV, while above the transition the peak collapses into a quasielastic line characteristic of rotational diffusion. The intramolecular spectra show several pronounced peaks. The assignments of these modes are discussed.
INTRODUCTION
It is well known that COO undergoes a first order transition, at ~260K, from a low temperature orientationally ordered simple cubic phase to a high temperature disordered fee phase. [2] Modifications to the C6o molecule that distort its nearly spherical shape can be expected to affect the molecular rotational potential and the associated orientational order-disorder phase transition. In fact studies on compounds obtained by adding rather large groups to the fullerene cage show that these molecules remain orientationally ordered at room temperature and probably remain so on heating until they eventually decompose. On the other hand the small pertubation introduced by adding a single oxygen atom, to form C6o0, merely increases the transition temperature by ~20K.[3]. Lommen et ah have recently reported a combined x-ray diffraction and differential scanning calorimetry study of the 6:5 annulene isomer of C6iH2 and have shown that an orientational order-disorder transition occurs at ~290K.[1] This isomer has a 9-membered carbon ring derived from a pentagon and hexagon with the carbon of the CH2 group bridging what had been the shared bond between the pentagon and hexagon. Since previously reported neutron scattering measurements on powder samples of C6o revealed considerable information, particularly regarding the rotational potential sensed by molecules as they change their orientations,[4] a series of measurements has been undertaken on C6iH2 and its deuterated analog.
EXPERIMENTAL PROCEDURES
The sample was prepared following procedures described in detail elsewhere. [1, 5] All neutron scattering measurements were made at NIST. The powder diffraction measure- ments were performed using the 32-detector BT1 instrument with a wavelength of ~1.54A obtained by diffraction from a Cu(311) monochromator.[6] The low energy transfer inelastic scattering results were obtained using two different instruments. Some of the measurements were performed with the BT4 spectrometer operated in triple-axis mode with a Cu(220)
537
Mat. Res. Soc. Symp. Proc. Vol. 359 ° 1995 Materials Research Society
monochromator, a PG(004) analyzer, a graphite filter, and collimations chosen to give an energy resolution of ~1.05meV for elastic scattering. Other low energy transfer results were obtained using the Fermi chopper spectrometer (FCS).[7] In this case the incident wave- length was ~4.264A, yielding an energy resolution of ~0.16meV at the elastic position. The intramolecular vibrational density of states measurements were made using the BT4 spec- trometer operated as a filter analyzer spectrometer. The spectra presented in this paper were obtained using the Cu (220) monochromator and a Be filter analyzer. The calculated resolution varied from ~3.8meV at 40meV to ~16meV at 200meV energy transfer. Higher resolution spectra were obtained using a Be-graphite composite filter.
DIFFRACTION
Neutron diffraction patterns for C6iD2, obtained using the BT1 spectrometer, are shown in Fig. 1. The intense peaks above ~40° are due to the Al sample container. At 310K, which is above the transition temperature, the pattern indexes to a face centered cubic lattice in analogy with high temperature COO (space group Fm3m). The substantial diffuse scattering at ~50° and ~90° can be well described by assuming that all molecular orientations are equally probable and that there are no correlations between the orientations of adjacent molecules. Of course the situation must be more complicated than this. In fact, recent x-ray diffraction[l] and quasielastic neutron scattering[8] results suggest that the methylene groups preferentially occupy "octahedral" sites. This is not particularly surprising since the "octahedral" site is the largest space available in the crystal structure, and is easily large enough to accomodate a methylene group. This preference for certain orientations should lead to anisotropic diffuse scattering which could be observed using a single crystal
of C6iDj.[9] At low temperatures the powder diffraction pattern (Fig. 1) can be indexed to a simple
cubic lattice in analogy with the low temperature phase of Ceo (space group Po3). In fact if the Ceo moiety in C6iD2 molecule adopts the same orientation as the more populated molecular orientation in pristine COO,[10] the methylene group can actually be accomodated in the "octahedral" site, causing little change in the C-C interactions responsible for the orientational ordering in COO- It is also important to note that substantial diffuse scattering remains below the transition, presumably due to residual orientational disorder. Lommen et al.[l] found it necessary to include orientational disorder, of the type observed in Ceo[10], in order to adequately describe the intensities observed in their x-ray diffraction measurements. In this regard, it is interesting to point out that the C6iD2 molecule, unlike the Ceo molecule, does not have a 3-fold axis so that there must either be sufficient orientational disorder to produce such an axis, or the symmetry of the lattice must actually be lower than cubic. Because neutron diffraction tends to be more sensitive to details of the molecular orientations than does x-ray diffraction, we are currently in the process of analyzing the C61D2 diffraction data in greater detail. Data have also been collected for C61H2 since the difference in the scattering lengths of H and D may make it possible to locate the methylene groups with confidence.
ROTATIONAL DYNAMICS
The orientational order-disorder transition in C6iH2 also manifests itself in scattering associated with the rotational dynamics (Fig. 2). Above the transition there is a broad quasielastic feature centered at zero energy. This type of scattering is known to be char-
538

<Z)
C o U
4000
0 20 40 60 80 100 120 4000 i i i i | i i i |
3000
2000 -
1000
0 Vjl UJUw
T i i i i i i i i i i
10K
■ ■ ' K^L i*
■ i ■
0 20 40 60 80 100 Scattering Angle (deg)
120
Figure 1. Neutron powder diffraction patterns of C6iD2 above and below the orientational order-disorder transition at 290K. These data were collected with a wavelength of 1.54Ä. The intense peaks above ~40° are due to the aluminum sample container.
539

acteristic of rapid diffusive motion[4, 8], suggesting that the orientational disorder in the high temperature phase is dynamic. At 200K the scattering is dramatically different. The observed inelastic peaks, centered at ~2.5meV, can be assigned to molecular librations in the orientational potential responsible for securing the low-temperature structure. The mea- sured dependence of the integrated intensity of this low energy scattering on the wavevector transfer Q, both above and below the transition temperature, confirms that the scattering shown in Fig. 2 is indeed associated with rotational rather than translational molecular motions. [4]
Librational energies in C6iH2 are slightly higher than those in C6o (Fig. 3). This is consistent with the higher orientational ordering transition temperature (290K for C6iH2, 260K for COO). The peaks are also much broader in C6iH2, possibly reflecting a more anisotropic orientational potential. This is reasonable, given the anisotropy of the molecule due to the added methylene group. The additional broadening may in fact have nothing to do with the lowered molecular symmetry and may simply be a consequence of anisotropies in the rotational phonon dispersion surfaces. Single crystal measurements should again be able to resolve this question. We have determined the temperature dependence of the energies and widths of the librational peaks by fitting each measured peak to a Lorentzian lineshape convoluted with the instrumental resolution. The results show that the librational peaks soften and broaden as the orientational order-disorder transition temperature is approached. This is very similar to the behavior seen in pristine Ceo-[4]
INTRAMOLECULAR MODES
The measured vibrational density of states for C6iH2 is shown in Fig. 4. Because the scattering cross section of H is more than an order of magnitude larger than that of C, modes involving significant motion of H atoms are emphasized. Comparing the CeiH2 spectrum with spectra for C6iD2 and C6o, we have determined that the modes at 37.8, 130, 152, and 180meV include substantial contributions from hydrogen atoms. We assign these peaks as a rocking mode of the entire methylene group in the mirror plane of the molecule, a twisting mode of the methylene group in which the C is essentially stationary and the H's are displaced perpendicular to the mirror plane, a wagging mode in which all atoms are displaced perpendicular to the mirror plane with the motion of the C out of phase with the motion of the H's, and a H-C-H bending mode in which the H displacements are in the mirror plane and out-of-phase with each other, respectively. In a recent infrared study Cardini et al.[11] assigned peaks at 37.7, 112.7, 152.5, and 178.3meV respectively to the modes of the methylene group. The energies of 3 of these 4 peaks are in excellent agreement with the energies of the peaks we identify as being due to modes involving relatively large displacements of H atoms. The most probable explanation for the lone discrepancy is that the mode observed at 112.7meV in the infrared spectrum is actually a shoulder on the very broad peak due to the methylene twisting mode which is centered at ~130meV (Fig. 4). The peaks observed between 40 and lOOmeV are largely unchanged from those seen in C60. Detailed assignments are difficult because each of these peaks is due to multiple modes of the Ceo framework.
Since the inelastic neutron scattering cross section only depends on the known scattering cross sections of the atoms, and on the energies and eigenvectors of the modes, we can gain further confidence in these assignments by directly comparing the results of dynamical calculations with the measured spectrum. The solid line in Fig. 4 represents a spectrum calculated with the program MOPAC using the AMI Hamiltonian,[12] convoluted with the
540

0.04 I I I | I I I | I I I | I l[\4 I I
°-03 - 350K 3 a 0.02
^ 0.01 h 0.00
^ 0.03 3 a 0.02
^ 0.01 0.00
-H -m - 200K
nlml LUJJ
400
300 -
c O U
-8-4 0 4 Energy (meV)
-8 -6 -4-2 0 2 Energy (meV)
Figure 2. (Left) Q-integrated plots of S(Q,w) for C6iH2 at 200K and 350K, obtained using the Fermi Chopper Spectrometer.
Figure 3. (Right) A representative inelastic scattering spectrum for C6iH2 compared with a similar spectrum for C6o- The data were collected at Q « 5.6Ä"1 using the BT4 triple axis spectrometer. The data for C6iH2 has been vertically offset by 100 counts.
900
c o U
600 -
300 -
0 0 50 100
Energy (meV) 200
Figure 4. The spectrum of internal modes in C6iH2 at 10K, measured with the BT4 spec- trometer operated as a filter analyzer spectrometer. The solid line represents the spectrum
calculated using the AMI Hamiltonian.
541

known instrumental resolution. The only adjustable parameters are an overall intensity scale and an average displacement of the atoms due to the lattice modes, assumed to be 0.1Ä in our calculations. Below ~100meV there appears to be a one to one correspondence between peaks in the calculated and measured spectra. The principal problem is that the calculation somewhat overestimates the energies. The sharp peak at 40.1meV in the calculation is the methylene rocking mode, confirming the assignment of the peak observed at 37.8meV. Above 100 meV the situation is less satisfactory. In this region, the strongest peaks in the calculation are at 129.1, 130.3 (the methylene twisting mode), 160.6 (the methylene wag mode) , and 175.7meV (the H-C-H bending mode) . The main problem is that the peaks at 129.1 and 130.3meV are too close together and have too much intensity as compared with the peak at 160.6meV. Work to resolve these discrepancies is in progress.
SUMMARY
We have presented preliminary results of a wide variety of neutron scattering mea- surements on the 6:5 annulene isomer of C6iH2. The diffraction and low energy inelastic scattering results show that the basic physics of these systems is the same, though the rotational barrier is a little higher in C6iH2 than in Ceo- This is because the methylene group is readily accomodated in the relatively large "octahedral" interstitial site, allowing the C-C interactions that are responsible for the orientational properties of Cßo to dominate the orientational properties of C61H2 as well. This raises two interesting questions. "For the 6:5 annulene isomer, how large does the added group have to be to significantly disrupt the orientational properties?" "Since the methylene group cannot be accomodated into the 'octahedral' site if the 6:6 cyclopropane isomer of C61H2 adopts the same low temperature structure, does it have different orientational properties?" We are currently attempting to address these questions.
REFERENCES
[I] A.N. Lommen, P.A. Heiney, G.B.M. Vaughan, P.W. Stephens, D. Liu, D. Li, A.L. Smith, A.R. McGhie, R.M. Strongin, L. Brard, and A.B. Smith III, Phys. Rev. B49, 12572 (1994).
[2] P.A. Heiney, J.E. Fischer, A.R. McGhie, W.J. Romanow, A.M. Denenstein, J.P. Mc- Cauley, Jr., A.B. Smith III, and D.E. Cox, Phys. Rev. Lett. 66, 2911 (1991).
[3] G.B.M. Vaughan, P.A. Heiney, D.E. Cox, A.R. McGhie, D.R. Jones, R.M. Strongin, M.A. Cichy, and A.B. Smith III, Chem. Phys. 168, 185 (1992).
[4] J.R.D. Copley, D.A. Neumann, R.L. Cappelletti, and W.A. Kamitakahara, J. Phys. Chem. Solids 53, 1353 (1992).
[5] T. Suzuki, Q. Li, K.C. Khemani, and F. Wudl, J. Am. Chem. Soc. 114, 7301 (1992). [6] J.K. Stalick, these proceedings. [7] J.R.D. Copley and T.J. Udovic, J. Res. NIST 98, 71 (1993). [8] M. Ricco, L. Cristofolini, G. Viola, and E. Dalcanale, J. Phys. Chem. Solids 54, 1487
(1993). [9] R. Moret, S. Ravy, and J.-M. Godard, J. Phys. I France 2, 1699 (1992). [10] W.I.F. David, R.M. Ibberson, T.J.S. Dennis, J.P. Hare, and K. Prassides, Europhys.
Lett. 18, 219 (1992). [II] G. Cardini, R. Bini, P.R. Salvi, V. Schettino, M.L. Klein, R.M. Strongin, L. Brard, and
A.B. Smith III, J. Phys. Chem. 98, 9966 (1994). [12] M.J.S. Dewar, E.G. Zoebisch, E.F. Healy, and J.P. Stewart, J. Am. Chem. Soc. 107,
3902 (1985).
542

CHARACTERIZATION OF C60 FULLERENE IN CARBON DISULFIDE SOLVENT USING INTERMEDIATE ANGLE NEUTRON SCATTERING
STEVE SPOONER*, J. L. ZARESTKY** and K. A. AFFHOLTER*
*Oak Ridge National Laboratory, Oak Ridge, TN 37831 **Ames Laboratory and Department of Physics and Astronomy, Iowa State University, Ames, IA 50011
ABSTRACT
In recent characterization of fullerenes by small angle neutron scattering use was made of the Guinier scattering regime to determine the radius of gyration of the fullerene molecules. In the present work the HB-1A spectrometer at the High Flux Isotope Reactor at Oak Ridge National Laboratory was used to measure the scattering from COO in CS2 solvent. The scattering covers a range which includes scattering intensity oscillations associated with the C60 shell structure. These oscillations are used to measure the COO molecule size. Assumption of a carbon shell radius of 3.57Ä fits the scattering minima. This radius and the assumption of a solvent cavity radius of 5.93 Ä gives a good fit to the whole scattering range. However, modeling to remove a remaining scattering intensity discrepancy at low angles requires the addition of a small solvent density excess near the COO molecule.
INTRODUCTION
Small angle neutron scatttering (SANS) has been used successfully for the characterization of COO and C70 dissolved in carbon disulfide [1]. At saturation the COO molecular density is small which appears to ensure that intermolecular interaction is minimal. The scattering from Cßo can be represented as the superposition of intensities from independent molecule/solvent scattering cells. The observation of COO scattering in CS2 solvent is favored by the lack of hydrogen scattering, the low neutron attenuation and the low scattering density of the solvent. SANS data from conventional instruments lie in the range of the Guinier scattering regime in which the scattering takes a simple Gaussian form - the plot of the log intensity versus the squared scattering angle is a straight line. The Guinier radius obtained from the slope of such a plot characterizes the size of the COO
molecule in an appropriate solvent cavity and was found to be 3.82 (0.05) A. This result differs from the expected COO sphere radius possibly because of the solvent scattering effects. In the present scattering measurements the range of scattering angle (momentum transfer) was extended well beyond the Guinier regime. By so extending the scattering data diffraction from the Cßo sphere could be observed with less interference from solvent scattering and a more detailed view of the solvent scattering could be obtained.
EXPERIMENT
Although the scattering from C60 is small, the scattering properties of the solvent favor the scattering experiment; there is no hydrogen incoherent scattering and the neutron attenuation in CS2 is small. A large sample can be used to compensate for
543
Mat. Res. Soc. Symp. Proc. Vol. 359 ° 1995 Materials Research Society

the small scattering cross section. COO (99.98% pure) was supplied by MER Corporation (Tucson, Ariz.). Solutions made with reagent grade (99.98%) CS2 were made with nominal concentration of 8 mg/ml which assured a saturated condition.
The scattering experiments were performed on the Ames Laboratory triple-axis spectrometer at HB-1A at the High Flux Isotope Reactor (HFIR). The wavelength was 2.357 Ä obtained from a double-crystal graphite monochromator. The energy analyzer was set for elastic scattering. 0.25° Soller slits before and after the scattering sample provided good angular resolution. Measurements were made from 5° to 45° two theta. A quartz holder having a 65 mm length and an inside diameter of 25 mm was topped with a vapor tight screw cap. Cadmium shielded the top and bottom of the holder. Transmission measurements showed no measurable difference between the solvent and solution. The solvent scattering was directly subtracted from the solution scattering. Multiple-scattering from the solvent is expected to be the same in the solution and pure solvent and is therefore eliminated by subtraction.
SCATTERING RESULTS AND ANALYSIS
The scattering data for solvent and solution are dominated by the broad peak from quartz and CS2. Because the diffraction interferences for C60 occur in this range, long data collection times were used to achieve the needed counting statistics. Figure 1 shows the scattering data and the scattering remaining after subtraction. The smallest angle data overlaps the conventional SANS data; the Guinier radius obtained from Figure 2 agrees well with the SANS results. The scattering intensity was calculated from I(Q) = Constant x F(Q)2 where Q is the scattering momentum transfer, given by 4jtsin(6)/A., with 20 the scattering angle and X the neutron wavelength, the constant is proportional to the molecule number density, and F(Q) is the structure factor. The SANS results [1] showed that scattering from COO solutions is proportional to solution concentration which is consistant with the absence of intermolecular interference. In that case the structure factor for the whole sample is taken to be the sum of the structure factors for spatially independent cells containing a COO molecule which is surrounded by CS2 solvent. For each cell the structure factor is equal to the sum of structure factor for the carbon molecule and the structure factor for the solvent. The COO structure factor is given exactly by an expression for the spherical average of the structure factor of an atom cluster characterized by the set of radii to each atom in the cluster from the center of the molecule [2]. A single radius is used in the present calculation. The structure factor for the solvent is obtained from the Fourier transform of the solvent density. The solvent structure is simply represented by a spherical region from which the solvent molecules are excluded and which contains the Cßo molecule. The calculation is made in two parts; (a) an integration from zero to the cavity boundary entering as negative and (b) the integration of the uniform solvent density from zero to "infinity" which contributes scattering at inaccessibly small angles [3].
F(Q)=60 bc sin(QRb)/(QRb)-pS 4TC Rh3 (sin(QRh)-QRhcos(QRh))/(QRh)3 (1)
where be is the carbon scattering length (0.6646 10~12 cm)/ R^ [S the carbon atom radius, ps is the neutron scattering density for the solvent, and Rh is the solvent
544

cavity radius. The solvent scattering density, ps, was calculated from the solvent density, molecular weight and the molecular neutron scattering length (1.234 10~12
cm) and equals 0.0123 1010 cm"2.
280000 c
260000 ^ 0) Q-40000
£ 20000 ■■■■■^4 J f t
o c _ 0
0.0 0.5 1.0 1.5 2.0 2.5
Momentum Transfer, (Ä"1)
Figure 1. Scattering data for the C60 solution and the CS2 solvent are shown with the difference between the two curves. The counting statistics errors are smaller than the difference intensities at large Q.
10.70
10.60
-10.50
c 10.40
10.20 J + 0.00 0.02 0.04 0.06 0.08 0.10 0.12
Q2
Figure 2. The present data overlap the SANS data range indicated by the arrows on the Q^-axis. The Guinier radius is 3.83Ä in good agreement with the SANS result for
A third term in the structure factor was added to represent the interaction of the solvent and COO molecule. The density of the solvent was "dressed" by a term added to the structure factor,
Ap =pd exp(-b R2), for R>Rh (2) where pa is a solvent density increment which is positive for a solvent-molecule attraction and negative for repulsion and b is a reciprocal squared interaction length. This scattering amplitude term was calculated in two parts; (a) the definite integral
3000 'E u ©
0.015
2000 O
0.012
1000° ^ -h 0.009
0 2 >.
3 -100«
o Q
0.006
Ol 0.003 -2000
-3000 0.000
0 0.5 1 1.5 2 2.5
Momentum Transfer, Q(A"1)
0 5 10 15 20 25 30
Distance from Cc. Center, A
Figure 3. The continuous curves show the 5- Figure 4. The solvent scattering density parameter fit to the scattering data (left scale). model resulting from the refinement shows The differences between fit and data (right scale) a small excess near the cavity edge, are shown with error bars from the counting statistics .
545

from zero to infinity equal to (71/b)3/2 exp(-Q2/4b) and (b) numerical integration from zero to Rh which enters as negative for positive pa- The scattering model was fit to the scattering data by non-linear least squares calculation with five parameters; a proportionality constant, Rb, the molecule radius and Rh, the cavity radius, pa, the solvent scattering density "dressing" and b, the interaction parameter. The solvent molecule neutron scattering length density given as ps in Eq. (1) is held constant at the value of 0.0123 1010 cm"2.
DISCUSSION
The refined fit to the scattering data is shown in Figure 3. There are oscillations in the difference with an amplitude of 2 to 4 times the statistical error. Table I gives the values of the model parameters along with the estimates of precision calculated from the covariant matrix for the least squares fit. The Cßo molecule radius, Rh, is larger than the values given by crystallographic analysis of solid powders (3.53 Ä) [4]. The solvent hole is larger than that estimated by use of van der Waals radii (5.02 A). The solvent model calculated from Rh, ps and b is shown in Figure 4.
Table I. Refinement Parameters Parameter
Constant
Rb Rh
Pd
b
Value 48.5
3.571Ä 5.93 A
O.OOllxlO"10
cm-2
0.013Ä"2
Precision 1
0.016Ä 0.093Ä
0.0003xlCT10
cm-2
0.0024Ä'2
The positive "dressing" of the solvent suggests a small attractive interaction with an "interaction" distance of about 9 Ä. However, the solvent "dressing" improves the fit only at low angles and does not affect the scattering in the angle range where the Cgo structure oscillations are important. Figure 5 shows the calculated intensity with and without the "dressing". Intensity differences are seen for Q up to 0.8 A-1.
50000
0) 40000 c 0)
30000
0 0.5 1 1.5 2 2.5
Momentum Transfer, Q
Figure 5. The scattering model with and without the solvent "dressing" differs only at small Q. The difference between the two models is amplified by 5 shows a dip at Q=0.04.
2000
-2000 0 0.5 1 1.5 2 2.5
Momentum Transfer, Q
Figure 6. The two differences between the model and data for the three (open) and five (closed) parameter fit display a shift at larger Q and significant improvement at low Q for the "dressed" solvent.

The scattering model using Rb and Rh alone gives a good fit. The improvement in the fit with a "dressed" solvent and allowing refinement of Rb and Rh is subtle. Figure 6 plots the differences between data and models on a common scale to show the nature of the refinement. There is an improved fitting in the small angle range and the region of oscillations at large Q. A slightly larger Rb is the principal factor improving the large Q scattering.
SUMMARY
The recent characterization of C60 in CS2 solvent by SANS resulted in the determination of a Guinier radius of 3.85 Ä which was shown to be consistent with a carbon shell radius (Rb) of 3.70 Ä and a solvent exclusion radius (Rh) of 5.02 Ä. The present data was fit with a model with Rb=3.571 Ä and Rh=5.930 Ä and the incorporation of a solvent "dressing" effect. The intensity oscillations at large Q lead to a relatively direct measure the Rb size and the solvent "dressing" appears to be essential in achieving a good fit of data at smallest Q. The improvement in fitting with the amplified model is subtle. An improved fit suggests that an attractive interaction between the COO molecule and the solvent may be operative.
ACKNOWLEDGMENTS
Oak Ridge National Laboratory is managed by Martin Marietta Energy Systems, Inc., under contract DE-AC05-84OR21400 for the U. S. Department of Energy. Ames Laboratory is operated by Iowa State University for the U. S. Department of Energy under Contract No. W-7405-Eng-82. The authors wish to thank their colleagues Peng Cheng Dai and Lee Robertson for the very helpful discussions on modeling and scattering calculations.
REFERENCES
1. K. A. Affholter, S. J. Henderson, G. D. Wignall, G. J. Bunick, R. E. Haufler, and R. N. Compton, J. Chem. Phys., 99, 9224 (1993).
2. F. Betts and A. Bienenstock, J. Appl. Phys., 43, 4591 (1972).
3. A. Guinier and G. Fournet, Small Angle Scattering of X-Rays, translated by C. B. Walker, (John Wiley, New York, 1955), pp. 5-82.
4. A. K. Soper, W.I.F. David, D. S. Sivia, T. J. S. Dennis, J. P. Hare and K. Prassides, J. Phys.: Condens. Matter, 4, 6097 (1992).
547

THERMAL CONDUCTIVITY OF C60 UNDER HIGH PRESSURE
0. ANDERSSON, A. SOLDATOV, AND B. SUNDQVIST Department of Experimental Physics, Umeä University, S-90187 Umeä, Sweden
ABSTRACT
We have measured the thermal conductivity X of highly pure polycrystalline Cgo in the range 50 to 300 K under pressures up to 1 GPa. The results are discussed in terms of the lattice structure and dynamics. In particular, we discuss the phase diagram as delineated by anomalies observed in X and Cp at the f.c.c.-to-s.c. transition at 260 K and the glass transition at Tg = 90 K, and also the effect on X of the orientational motion in the s.c. phase. The results are found to be compatible with p-T phase diagram recently suggested by us.
INTRODUCTION
Many properties of Buckminsterfullerene, C60, have been extensively studied as functions of both temperature, T, and pressure, p. The crystal structure and dynamics are now well known as functions of T at normal pressure1-2 and the high-p phase diagram has also been carefully mapped near and above room temperature3. However, few studies have been carried out under pressure at low T, and little information is available on phases and structures in this range. Compressibility data4 for Cg0 have recently been obtained at this laboratory at temperatures down to 152 K, and combining those data with literature data for the structure5 under pressure we have predicted6
the existence of an orientationally ordered phase at sufficiently high pressure. Although the actual crystal structure(s) of a material can only be found by x-ray or neutron
diffraction experiments, the phase diagram can often be mapped more easily by finding the phase boundaries by other means. In particular, measurements of the thermal or electrical transport properties are often used for this purpose, since these properties are continuous functions of T and/or p within each phase but often change more or less discontinuously on going from one crystal phase to another. Such measurements can also provide information on structural order or disorder. We have therefore measured for the first time the thermal conductivity X of C60 at high pressure to obtain more information on the phase diagram and, indirectly, on the lattice structure and dynamics. From the measured data we find the p dependence of the glass transition tempera- ture T„ and also a very interesting and unexpected relaxation behaviour near Tg under pressure.
EXPERIMENTAL DETAILS
We used the hot-wire method7 to measure simultaneously X and the heat capacity per unit volume, pcp, where p is the density. The probe was a 0.1 mm in diameter Ni wire, surrounded by the material investigated and heated by short power pulses. X and pcp were then obtained by fitting a theoretical expression to the measured data for T vs. time. The estimated inaccuracy in X
Permanent address: Institute for Low Temperature Physics and Engineering, Ukrainian Academy of Sciences, Kharkov, Ukraine.
549
Mat. Res. Soc. Symp. Proc. Vol. 359 e 1995 Materials Research Society

was less than ±2% above 200 K but increased to ±4% at 40 K. The C60 specimen was identical to that used in our recent compressibility study4. It was supplied by Term USA, Berkley, CA, and had a stated purity >99.9%. The sample was loaded into the pressure cell in dry argon and the cell was then mounted in a piston-cylinder device described elsewhere8. The temperature was varied by cooling the pressure vessel with a closed cycle helium refrigerator and p was calculated as load/area with an empirical correction for friction.
EXPERIMENTAL RESULTS AND DISCUSSION
Figure 1 shows our experimental data for X as a function of T at several pressures in the range 0.1 to 1 GPa. Except at 0.3 GPa, the data shown were obtained during cooling of the sample at approximately constant pressure. The T dependence of X is unusually weak for a crystalline material, reflecting a large amount of disorder in the crystal. Since we concentrate the discussion below on the information obtained from these data on the phase diagram and the molecular dynamics, we repeat here some general features of the lattice structure and dynamics of C60.
At room temperature, C60 has a face-centred cubic (fee.) structure. Because of the weak intermolecular interactions the almost spherical molecules are free to rotate, and the material is thus an orientationally disordered or plastic crystal, with translational order of molecular centres but no orientational order. A transition from the fee. phase to a phase with a simple cubic (s.c.) structure occurs at 260 K at atmospheric pressure. In the low-T phase, orientational disorder is
U ,, U I
(0.1) 0.20 h J—^
in"'«i -"iVi i ■■■,...
T(K)
Figure 1. Thermal conductivity of C60 as a function of T at the pressures (in GPa) indicated.
550

still present but to a smaller extent than in the fee. phase. In the standard model1-9 for C60, the molecules jump between two orientations with an energy difference of about 10 meV separated by an energy barrier roughly 250 meV high. With decreasing T the number of molecules occupying low-energy state increases, until at 90 K the ordering process stops and the remaining disorder freezes in. The resulting orientationally disordered state is referred to as a glassy crystal and the transition associated with it is as a glassy crystal transition2-10.
The thermal conductivity of C60 has previously been studied at atmospheric pressure11-15
only. Yu and co-workers11'12 studied a single crystal and found that X was almost independent of T in the fee. phase, in agreement with what is found for other orientationally disordered phases16. The results for the s.c. phase were also "normal", i.e. similar to those expected for ordered crystals. However, the results also showed evidence for the glassy crystal transition at 90 K, indicated by a sharp change in dXJdT at 90 K and a time dependence of X below. These results are all consistent with the structural model described above. Other investigators13"15 have studied polycrystalline C60, in one case15 containing a substantial amount (15%) of C70. Both studies showed13-15 X to be almost independent of T in the fee. phase, in agreement with the single crystal data, but the magnitudes of X were smaller by factors of two13-14 and four15, respectively. Data for the s.c. phase were recorded only for the C60/C70 mixture15 and exhibited a glass-like T dependence for X (positive dA7dT) in contrast with the approximate T-1 dependence obtained for the single crystal. No evidence was observed for a fc.c.-»s.c. transition or a glass transition.
A comparison with literature data shows that our data for polycrystalline "pure" C60 lie in between those for single crystal material and those for less pure material. We note a clear effect of the f.c.c.-»s.c. transition at the lowest pressure in the form of a sharp change in slope at 280 K. In the s.c. phase, dX/dT < 0 near the transition, while in the fee. phase X is almost indepen- dent of T. The transition could also be detected as a peak in pcp(T) at 0.1 GPa near 270 K. The exact transition temperature depends on how it is defined: The maxima in pcp give transition temperatures of 265 K and 275 K at 0.12 and 0.2 GPa, respectively, while the changes in slope for X occur 10 K higher. The calculated slope of the transition line is 120 K GPa-1, which is within the range found in other investigations3-4. Finally, this transition was also observed in an isothermal measurement of the p dependence of A. at 294 K where dX/dP increased at about 0.3 GPa, in good agreement with the transition pressure previously observed4 for this sample. In the fee phase X has a weaker pressure dependence than in the s.c. phase but both phases show the usual16 linear increase of X with p. From dXJdp and the compressibility4 we calculate the density dependence of X as the Bridgman parameter g = (dinJLId\np)T. At 294 K, g = 5.5 and 9.5 for the fee and s.c. phases, respectively, while at 150 K we find g = 8.7 for the s.c. phase. In general, orientationally disordered phases show16 values for g in the range 4 < g < 7, whereas ordered crystals usually have 6 < g < 9. For both phases, the density dependencies of X thus fall within the range expected for C60.
For our specimen, X depends weakly on T between 70 K and 200 K. Ordered single crystals, including C60, usually show X oc T-1 near and above the Debye temperature, which for C60 is between17-18 40 and 70 K. The deviations from the T-1 behaviour, particularly below 200 K, are probably caused by a substantial amount of structural disorder in our sample, since defects tend to decrease19 the exponent ß in X oc T-P. However, we also find that X(J) cannot be fitted to a simple phonon model, and we are now investigating whether this is due to a temperature dependent point defect density (to be discussed briefly below), to the presence of an amorphous phase created by non-hydrostatic stress, to extra scattering mechanisms, or to a parallel heat transport by, for example, librons. This subject will be discussed further in a future publication.
551

The hot-wire method has been used previously to detect glass transitions in many materials16
since pcp and X usually show characteristic anomalies at T„ where the structural relaxation associated with the transition causes a pronounced effect on the temperature rise of the wire. Since C(,Q is considered an extremely "strong" glass former2-20 we should expect only small anomalies in X at Tg. This is also the case, and we show in Fig. 2 some typical glass-transition anomalies. Although these are small, so is the scatter in the data and we can usually define Tg
from the discontinuities in dX/dT. From such data we have mapped the increase of T„ with p from about 0.07 GPa and up to 1 GPa. However, at some pressures, notably in the range 0.1 - 0.3 GPa and at 0.8 GPa and above, the anomalies were small and could not always be detected with certainty. We return to this question below. Tg, as defined in this way, increased with p at a rate of 62 K GPa-1 and extrapolated to approximately 90 K at p = 0, as shown in the phase diagram in Figure 3. The slope dTg/dp can be estimated theoretically from21
dTg/dp = TgVgAa/Acp, (1)
where Aa and Acp are the changes in the volume thermal expansivity and heat capacity at T„, respectively. C60 is unusual in that a is larger below Tg than above22, resulting in a predicted negative slope dT./dP= -130 K GPa-1, in contrast to the positive slope observed experimentally.
T(K) 200
Figure 2. Thermal conductivity of C^Q vs. T, showing two types of glass transition anomalies: Arrows pointing upwards indicate "standard" anomalies found when cooling and heating at the same p, while arrows pointing downwards indicate the "hump" anomalies discussed in the text. One curve at 0.1 GPa has been shifted vertically to avoid overlap.
552

Another interesting effect is shown in several curves in Fig. 2: If we cool the sample into the glassy phase at a certain pressure and then change p at T < Tg, we preserve an equilibrium orientational structure characteristic of the initial pressure. On reheating, the frozen-in structure will relax towards a new equilibrium as we approach T„ from below. This relaxation gives rise to a "hump" in the measured X, probably because the heat pulse energy is absorbed by molecules relaxing across the orientational barrier. Surprisingly, this relaxation anomaly, which must be connected with pentagon-to-hexagon reorientation, seems not to be connected with the glass transition anomaly as defined above: The temperature Tr at which the "hump" anomaly occurs has a much weaker pressure dependence dTr/dp = 12 K GPa-1 and at high p both types of anomalies can thus be observed in the same experiment, as shown in Fig. 2. We have plotted the p dependence of Tr, here defined as the temperature at which X has a maximum, in Fig. 3.
One possible reason for the difference between theoretical and experimental values for dTg/dp is the orientational structure of the s.c. phase. As mentioned above, molecules have two possible orientations: At p = 0, a molecule in the lowest energy state is rotated such that a pentagon faces a double bond on its neighbors, while in the higher energy state a hexagon faces a double bond. Since the hexagon orientation has a smaller volume and the molecular orientations change with both9 T and5 p, the pentagon-to-hexagon reorientation has strong effects on both the compressi- bility4 and the thermal expansion2'22. Using literature data9 for the T dependence of the pentagon fraction and the molecular volumes we can correct the thermal expansion to constant pentagon fraction. It is then found to be larger above T„ than below, giving a theoretical dTg/dp = + 23 K GPa-1, which has the correct sign but is smaller than the experimental value.
300-
200-
0
_ ' ' ' 1 . fee.
i IL- U-H 1 1 1 1 ' 1 ' 1 1 _
s.c. -
D _
--♦-
S- --•-
-J- --%- --fl- --*--' —*i
, , i i i i i 1 1 1 1 1 1 1 1 1 1
100 =-»-
0 0.2 0.8 1.0 0.4 0.6 P (GPa)
Figure 3. Simplified phase diagram for C60 at low T. Dots denote the rotational transition at high T and the position of the "hump" anomalies near 90 K discussed in text. Squares denote the glass transition anomalies observed, on cooling (open symbols) and on heating (filled). Lines have been fitted to the data. Note that the definition of Tr has been changed in comparison with the corres- ponding diagram in Ref. 6; also, for clarity we do not show the phase boundary for the "hexagon oriented" phase suggested in Ref. 6.
553

The pentagon-hexagon reorientation model also explains why no glass transition is clearly observed near 0.2 GPa and above 0.8 GPa. The smaller molecular volume9 of the hexagon orientation makes it the more stable at high p, and the fraction of pentagon oriented molecules thus decreases5 approximately linearly with increasing p. At 0.19 GPa the two orientations are equally probable, implying that they also have identical energies. By analogy with the residual resistivity of concentrated alloys23 we expect that to a first approximation phonon scattering due to orientational disorder would be proportional to C(l-C), where C is the fraction of pentagon oriented molecules. Since the energies of the two orientations are almost equal near 0.2 GPa, C must be close to 0.5 at all T and we would expect only a very small anomaly in X at Tg. If we extrapolate the measured fraction5 of pentagon oriented molecules to higher pressures we find6
that C becomes zero near 0.7 GPa at 150 K. We then expect that the glass transition anomaly should vanish since there is only one orientational state. The model agrees quite well with our data: We see only very small traces of a "standard" glass transition type anomaly in X near 0.2 GPa and above 0.7 GPa.
Acknowledgements: This work was financially supported by the Swedish Natural Science Research Council (NFR), the Swedish Research Council for Engineering Sciences (TFR) and the Swedish Institute.
References:
1. J.D. Axe, S.C. Moss and DA. Neumann, in Solid State Physics, edited by H. Ehrenreich and F. Spaepen (Academic Press, New York, 1994), Vol 48, p. 150.
2. C. Meingast and F. Gugenberger, Mod. Phys. Lett. B 7, 1703 (1993). 3. G.A Samara et al., Phys Rev B 47, 4756 (1993). 4. A. Lundin and B. Sundqvist, Europhys. Lett. 27, 463 (1994). 5. W.I.F. David and R.M. Ibberson, J. Phys. Condens. Matter 5, 7923 (1993). 6. B. Sundqvist, O. Andersson, A. Lundin, A. Soldatov, Solid State Commun. 93, 109 (1995). 7. B. Häkansson, P. Andersson and G. Bäckström, Rev. Sei. Instrum. 59, 2269 (1988). 8. O. Andersson, B. Sundqvist and G. Bäckström, High Pressure Research 10, 599 (1992). 9. W.I.F. David et al., Europhys. Lett. 18, 219 (1992).
10. T. Matsuo et al., Solid State Commun. 83, 711 (1992). 11. R.C Yu et al., Phys. Rev. Lett. 68, 2050 (1992). 12. N.H. Tea et al., Appl. Phys. A 56, 219 (1993). 13. D.P.H. Hasselman, K.Y. Donaldson, J.C. Withers, and R.O. Loutfy, Carbon 31, 996 (1993). 14. J.C. Withers, R.O. Loutfy, K.Y. Donaldson, and D.P.H. Hasselman, J. Am. Ceram. Soc. 76,
754 (1993). 15. JR. Olson, K.A. Topp and R.O. Pohl, Science 259, 1145 (1993). 16. R.G Ross, P. Andersson, B. Sundqvist and G. Bäckström, Rep. Progr. Phys. 47, 1347
(1984). 17. T. Atake et al., Chem. Phys. Lett. 196, 321 (1992). 18. W.P. Beyermann et al., Phys. Rev. Lett. 68, 2046 (1992); 69, 2737 (1992). 19. B.M. Andersson, B. Sundqvist, J. Niska, and B. Loberg, Phys. Rev. B 49, 4189 (1994). 20. CA. Angell, J. Non-Crystalline Solids 131-133, 13 (1991). 21. J. Jackie, Rep. Progr. Phys. 49, 171 (1986). 22. F. Gugenberger et al., Phys. Rev. Lett. 69, 3774 (1992). 23. J.M. Ziman, Electrons and Phonems (Oxford University Press, Oxford 1960) p. 337.
554

THERMOPHYSICAL PROPERTIES OF C70 UP TO 1 GPa
A. LUNDIN, A. SOLDATOV*, AND B. SUNDQVIST Department of Experimental Physics, Umeä University, S-90187 Umeä, Sweden
ABSTRACT
We have measured the thermal conductivity X and the compressibility of highly pure C70 in the range 90 to 450 K under pressures up to 1.2 GPa. Our results for the thermal conductivity indicate molecular rotation in C70 above 280 K at zero pressure. The phase boundary for the rotationally disordered phase has an approximate slope dT/dp = 75 K GPa"1. The bulk modulus B increases linearly with increasing p above 0.1 GPa, with an extrapolated zero pressure value at 296 K of B(0) = 8.3 GPa. Unexpected anomalies are found in both B and X near 100 MPa, and we tentatively suggest that orientational ordering is responsible.
INTRODUCTION
Most physical properties of C60 are now fairly well known1 as functions of temperature T, and the effects of pressure p on the structure and other properties have also been extensively studied such that the p-T phase diagram is known over quite wide ranges in p and T. A large variety of interesting structural and dynamic features have been observed and the study of C^Q has turned out to be an unusually fruitful field in solid state physics and chemistry. However, the properties of other fullerenes are much less known. This is probably largely due to the fact that the higher fullerenes are much more difficult to produce in pure form, but it also seems that these materials show an even more complicated behaviour vs. T and p than CöQ. Talcing the second lightest fullerene, C70, as an example, the true zero-pressure structural and dynamic properties are still hotly debated, and different groups have found different lattice structures and phase transition temperatures even for seemingly well defined, highly pure samples.
We have recently measured the compressibility2 and thermal conductivity3 of nominally 99.9 % pure C60 up to about 1 GPa and at temperatures between 50 and 340 K. While the data obtained were interesting and important in themselves, an even more interesting result was that they enabled us to map the phase diagram in surprising detail over the p-T range investigated4. Using literature data for the orientational structure we could explain both the presence of anoma- lies in the compressibility and the absence of glass transition anomalies in the thermal conductivi- ty in certain pressure ranges, as well as a surprisingly small bulk modulus in the s.c. phase.
Having thus found that studies of thermophysical properties can give important information on the phase diagrams of fullerenes we have applied the same methods to C70, and we present preliminary results below. The magnitudes of the bulk modulus and the thermal conductivity of C70 are similar to those for COO,
as might be expected. The thermal conductivity is quite sensitive to rotational disorder and we can thus map the p-T phase boundary for molecular rotation in C70, which is believed to coincide with the transformation from a room-temperature phase, probably with a mainly rhombohedral structure, to a low-T phase with a lower symmetry.
Permanent address: Institute for Low Temperature Physics and Engineering, Ukrainian Academy of Sciences, Kharkov, Ukraine.
555
Mat. Res. Soc. Symp. Proc. Vol. 359 e 1995 Materials Research Society

EXPERIMENTAL DETAILS
The material investigated was obtained from Term USA Ltd, Berkeley, CA and had a stated purity of 99.8% (referred to fullerene purity). The specimen was first heat treated at 650 K and 10"2 torr before the experiment to remove solvents, and a Raman test indicated less than 0.1% solvent in the sample used. About 2.2 g of powder was compacted around a Ni hot-wire probe in a toroidal groove in a Teflon pressure cell under an atmosphere of dry Ar, and the closed cell was mounted in a piston-and-cylinder high pressure device which could be heated electrically or cooled by freon or liquid nitrogen. The thermal conductivity was measured using the hot-wire method5 with an estimated error of ±2% near room temperature, increasing to +4% at the lowest T. This method also gives data for the specific heat per unit volume, pcp, where p is the density, although with lower accuracy. After these studies 1.9 g of the sample was transferred to an indium capsule, again under Ar, and mounted in a piston-and-cylinder pVT apparatus6.
EXPERIMENTAL RESULTS
Thermal conductivity and specific heat capacity
We show in Figure 1 data for the thermal conductivity X versus T at some selected pressures. The data are similar to those found3 for polycrystalline Cgo in terms of both magnitude and the general behaviour versus T: Above room temperature (RT) X is almost independent of T with a small positive or negative slope, in agreement with the behaviour found previously for both single crystal7»8 and polycrystalline3-9'10 C60 and C70 in the plastic (rotationally disordered) phases. Near RT there is a break in the slope dX/dT and below this we see a behaviour similar to that of
1
E
0.13
0.12
0.11
0.10
0.09
j i i i | J i i i | i i i i | i i i i | i i i i.
V 0.3 GPJH
\ ^""0.1 GPäp
i i i i I i i i i I i i i i I i i i i I i i i
0 100 200 300 400 500
T(K)
Figure 1. Thermal conductivity of C70 as a function of T at the pressures indicated.
556

CO
o
1.7x10c
1.5x10c
1.3x10⁶h
°- 1.1x10 -
0.9x10°
I I I I I I I I I I I I I I I I I I. I
- * — — P=0.08 GPa .„•/' -
w^' W'' ." »* - ,v
"*\\> ,+* » — — •m _
..-' — J*f — .#' - •*» — V-
I i i I i i i i I i i i i I i i i i ~ 200 250 300 350 400
T(K)
Figure 2. Specific heat capacity per unit volume (pep) versus T for C70 at 0.08 GPa.
single crystal8 material, with a negative dA/dT down to a peak in X near 200 K. Below this T X starts to decrease, presumably because of strong defect and grain boundary scattering. The fact that this peak occurs at such a high temperature indicates very small grains and a high defect den- sity in our specimen. Since a T independent X indicates a T independent phonon mean free path, which is typical for strongly disordered solids, we attribute the constant high-T X to molecular rotation, in analogy with the behaviour in the rotationally disordered high-T phase of Cgo- The rotational transition in Cgo is also connected with an anomaly in both1' p and12 Cp, and we show in Figure 2 data for pcp for C70 at 0.08 GPa. Although these data have a low accuracy it is obvious that there is a peak in pep at the same T as the change in slope in X.
We have also carried out an isothermal measurement of X versus pressure at 298 K. X in- creases with p, as expected. Interestingly, we observe a decrease in the pressure slope dX/dp near 100 MPa. Below this, we find a very high dln^/dp =1.51 GPa"1, while above 300 MPa dlnX/dp = 0.56 GPa-1. The large low-p slope was observed on both decreasing and increasing p and is probably not associated with the rotational transformation discussed above, which we believe may be connected instead with another, smaller, plateau type anomaly between 0.2 and 0.25 GPa.
Compressibility
Figure 3 shows the relative volume V/V0 versus p at 296 K, where V0 is the volume at zero pressure. The volume decreases smoothly with p except for an unusually rapid decrease with increasing pressure below 100 MPa. This is shown better in Figure 4 which shows the bulk modulus B, calculated between each consecutive pair of experimental points of V/V0, vs. p. This effect is probably not due to trapped gases or an initial compaction of the powder used: No data were taken during the very first pressure cycle as the powder was compressed into a solid lump, and after the experiment the material was found to be very hard and dense with no apparent
557

1.00
0.98
o >
0.96
^ 0.94
A
0.92-
0.90
i 1 1 1 r T 1 1 1 r
T = 296 K V X V
i i i i i i i i i i i
0 0.2 0.4 0.6 0.8 1.0 1.2
P (GPa)
Figure 3. Relative volume V/V0 of C70 as a function of p at 296 K.
CO Q_ O m
30
20-
10-
0
1 1 1 1 I 1
- T = 296K
1 it
, ,
,
~1-—"H^
□ ",1,1,1
1 1 1 1 1 1 1 1
0 0.2 0.4 0.6 0.8 1.0
p (GPa)
Figure 4. Bulk modulus B as a function of p for C70 at 296 K.
558

185 13.1 14.5 296 8.3 14.7 344 8.15 14.1
Table I: Bulk modulus of C70 vs. T. B(0) has been extrapolated to p = 0 as described in the text.
T (K) B(Q-) (GPa) B' Phase
Low-temperature (monoclinic?) Room-temperature (rhombohedral?) Room-temperature (rhombohedral?)
porosity. If gases were present the effect would have been limited to a very much smaller range in p since the gas would have been compressed to 1% of its initial volume already at 10 MPa. Also, no such effect was observed in our measurements2 on C50 which were carried out using the same equipment and an identical procedure. Measurements were carried out at several other tempera- tures in the range 150 to 363 K, and a low-p anomaly was also observed near 100 MPa at 343 K. At higher (363 K) and lower (< 236 K) T no such anomaly could be observed.
Between 0.1 and 1 GPa B is a linear function of p, and in this range we have fitted linear functions of p to the data to find B(0), the extrapolated zero-pressure value, and B' = dB/dp. We present in Table I data for B(0) and B' at selected temperatures. The fitted data for B(0) and B' are similar to those found by us2 for C60, and B(0) also agrees well with the value 11 GPa found by Kawamura et al.13 for rhombohedral C70 up to 1.5 GPa. Christides et al.14 report B(0) = 25 GPa. However, their data for V(p)/V(0) are strongly non-linear in p, and fitting a straight line to the data for p < 1 GPa gives B * 10.5 GPa, close to our result.
DISCUSSION AND CONCLUSIONS
The crystal structure of C70 is not well known even at atmospheric pressure. Molecular dyna- mics simulations by Sprik15 et al. suggest that the stable high-T structure should be fee, with free molecular rotation as in the fee. phase of Cgo- This is verified by experiments, which usually show13'14-16"18 that C70 transforms with decreasing T, first near 335 K into a rhombohedral (rh) structure with molecular rotation around the axis which is oriented along the {111) direction, then near 280 K into a monoclinic (mc) low-T phase, presumably with hopping between a number of molecular orientations as in the low-T phase of C(,Q. Indications of a glass transition have been reported18 near 50 K, and many other structures have been observed with different transition temperatures in different specimens, and often very large hysteresis in T. We interprete our results in terms of this standard model, although x-ray studies of our sample at RT after the experiments indicate an appreciable amount of disordered metastable fee structure.
We identify the anomalies observed in dÄ/dT (Fig. 1) with the the mc-to-rh transformation, since they are observed at temperatures close to those found for this transition in other experi- ments. Anomalies in X of this type are usually observed at transformations into rotationally disordered phases. A constant X is a sign of extreme disorder with a mean free phonon path comparable with the intermolecular distance, and usually indicates either an amorphous (glassy) structure or that the molecules are rotating. For Cgo, the anomaly in X near 260 K signals onset of free (3-D) rotation, but similar anomalies have been found also at the onset of uniaxial rotation of linear molecules19 and we conclude that in C70 the anomalies in X signal the onset of uniaxial molecular rotation. For single crystal7'8 Cgo and C70 a step change is always found in X, but such a feature is not observed for our more disordered, polycrystalline materials3. For disordered materials the peak in Cp is also smeared over a large range in T (Fig. 2) instead of sharp, and we speculate that these features are connected and indicate that either a residual rotational move-
559

ment is possible below the main transformation temperature, slowly dying out with decreasing T, or that low-T orientational fluctuations can be excited in disordered materials. We note that a recent20 muon study concluded that rotational movement is possible in C70 even down to 73 K. We find a phase boundary slope of about 75 K GPa"1, in reasonable agreement with the values 53 to 84 K GPa"1 given by Ramasesha et al.21. We do not observe any clear anomaly that could be ascribed to the f.c.c.-rh transition, as might be expected from the high zero-pressure transition temperature 335 K and the large reported phase boundary slope13 of 300 K GPa"1.
Both the compression data and the thermal conductivity data indicate the presence of an anomaly at RT near 100 MPa, at which the lattice becomes stiffer and dX/dp smaller. A similar compressibility anomaly has been reported by Christides et al.14 at a significantly higher pressure near 1 GPa, and the presence of a transition at this pressure is verified by spectroscopic studies22. However, we see no connection between this high-p transition and our low-p anomalies but speculate instead that the present anomalies may be caused by orientational ordering. When we cool the sample from the fee. phase into the rh phase some material remains in a disordered fee. structure, as shown by our diffraction results. Compressing the material might then induce a continuous reorientation of the molecules along the {111) axis which should give a rapid increase in X and a rapid drop in volume with increasing p, in agreement with the effects observed.
Acknowledgements: This work was financially supported by the Swedish Natural Science Research Council (NFR) and the Swedish Research Council for Engineering Sciences (TFR). A.S. also gratefully acknowledges financial support from the Swedish Institute.
References:
1. See, for example, reviews in Solid State Physics, edited by H. Ehrenreich and F. Spaepen (Academic Press, New York, 1994), Vol 48.
2. A. Lundin and B. Sundqvist, Europhys. Lett. 27, 463 (1994). 3. O. Andersson, A. Soldatov, and B. Sundqvist, these Proceedings (1995). 4. B. Sundqvist, O. Andersson, A. Lundin, and A. Soldatov, Solid State Commun. 93, 109
(1995). 5. B. Häkansson, P. Andersson and G. Bäckström, Rev. Sei. Instrum. 59, 2269 (1988). 6. A. Lundin, G Bäckström, and B. Sundqvist, High Pressure Res. (in press). 7. RC. Yu et al., Phys. Rev. Lett. 68, 2050 (1992). 8. N.H. Tea et al., Appl. Phys. A 56, 219 (1993). 9. J.C. Withers et al., J. Am. Ceram. Soc. 76, 754 (1993).
10. D.P.H. Hasselman, K.Y. Donaldson, J.C. Withers, and R.O. Loutfy, Carbon 31, 996 (1993). 11. F. Gugenberger et al., Phys. Rev. Lett. 69, 3774 (1992). 12. T. Matsuo et al., Solid State Commun. 83, 711 (1992). 13. H. Kawamura et al., J. Phys. Chem. Solids 54, 1675 (1993). 14. C. Christides, IM. Thomas, T.J.S. Dennis, and K. Prassides, Europhys. Lett. 22, 611 (1993) 15. M. Sprik, A. Cheng, and ML. Klein, Phys. Rev. Lett. 69, 1660 (1992). 16. G. van Tendeloo et al., Europhys. Lett. 21, 329 (1993). 17. G.B.M. Vaughan, Chem. Phys. 178, 599 (1993). 18. E. Grivei et al., Phys. Rev. B 47, 1705 (1993). 19. H. Forsman and P. Andersson, J. Chem. Phys. 80, 2804 (1984). 20. T.J.S. Dennis et al., J. Phys. Chem. 97, 8553 (1993). 21. S.K. Ramasesha et al., Chem. Phys. Lett. 220, 203 (1994). 22. AK. Sood et al., Philos. Mag. 70, 347 (1994).
560

THE BINARY PHASE DIAGRAM NAPHTHALENE-Cso
RAFAEL HIDALGO-OUESADA XIN-YU ZHANG and BILL C. GIESSEN, Chemistry Department and Barnett Institute of Chemical Analysis and Materials Science, Northeastern University, 360 Huntington Avenue, Boston, MA 02115, USA
ABSTRACT
Molten naphthalene has considerable solubility for C6o (~5 • 10'3 in mole fraction) making it a potential solvent for fiillerenes; the phase diagram is therefore important. It was also of interest to study whether C« displays the same anomalous solubility behavior in naphthalene as in hexane, CS2, and toluene, where the solubility increases with temperature up to a maximum near room temperature and decreases subsequently.
The naphthalene-Cco eutectic temperature was determined by DSC; the solubility of C6o in the liquid solution up to -180 °C was derived by UV spectrophotometry and found to decrease monotonically with increasing temperature from a mole fraction of 5 ■ 10" at the eutectic (-79.5 °C) to 1.5 • 10"3 at 165 °C; thus, it shows a higher-temperature C6o solubility decrease (with increasing temperature) analogous to the other solutions, while a potential lower- temperature solubility increase (with increasing temperature) is masked by the eutectic. A binary phase diagram based on these data is proposed.
INTRODUCTION
Since the discovery of a method to produce fiillerenes in larger amounts, [1] thei. solubilities in organic solvents have been a common research subject. Also, there are many studies aimed at better methods for the extraction of fiillerenes from soot and their improved separation from each other.
In these solvents, C6o presents an anomalous solubility behavior [2] that has not been fully explained, although recent efforts have been made to resolve this issue. [3, 4] Several solvent parameters have been examined and correlated to the solubility of C6o in many solvents [5] to determine which of these factors are essential for high solubility, but these correlations often show exceptions. [6] In general, solubilities (expressed as mole fractions) are low. Due to these low solubilities, the details of the deviation from ideality are not known; only general stability trends have been established. [5] In particular, it is known that the better solvents are aromatic compounds, with methyl-naphthalene and chloro-naphtalene having the highest solubilities.
It appears that the field is still open to seeking new solvent alternatives that may be useful or at least can give more information about the behavior of the fiillerenes in solution. One alternative that has not yet been explored is the use of aromatic fiised-ring compounds in the series naphthalene, anthracene, phenantrene, tetracene, etc. These compounds are solids at room temperature and have to be melted to be able to dissolve fiillerenes, but they allow solubility measurements to be made at higher temperatures than solvents liquid at room temperature. We present here the first of these studies, in which naphthalene (NP) was used as a solvent for C60 and in which a T-x phase diagram at P = 1 atm. is proposed for this binary mixture.
561
Mai. Res. Soc. Symp. Proc. Vol. 359 ° 1995 Materials Research Society

EXPERIMENTAL PROCEDURES AND DATA EVALUATION
Solubility Study: The solubility of C60 in the liquid NP-C6o solution over the temperature range from -80 to -180 °C was measured by UV spectrophotometry at a wavelength of 335 nm in a double beam spectrophotometer (PERKTN-ELMER LAMBDA 4B) after freezing and dissolving the saturated NP-C«0 mixtures in toluene (FISHER). Saturated liquid samples were prepared as follows: A small H-cell was immersed in a bath held at constant temperatures by various boiling liquids. In one arm of the cell, a molten mixture of 2.00 g NP and 100 mg C60
acted as the source of saturated solutions at each measurement temperature. After one hour in the bath, a part of the saturated solution was forced to pass through the fritted disk to the other arm of the cell, thus separating it from undissolved C«0. Next, a sample of the saturated liquid was taken up with a Pasteur pipette and was allowed to solidify rapidly. The pipette is broken and 1 or 2 subsamples of -50 mg were weighed and dissolved in 50 mL of toluene. From a Beer's law plot the concentration of C60 in the toluene solution could then be determined, yielding the mass of C«, in the subsample and allowing the mole fraction of C« in the saturated liquid to be calculated. This process was repeated for each measurement temperature.
Spectrophotometry: The UV spectrophotometric analysis of the C60 content of the NP-Cso solutions dissolved in toluene was done at 335 nm because at this wavelength C60 absorbs strongly but naphthalene does not, as shown by their respective absorption spectra (Figure 1 a and b). The Beer's law plot of C60 solutions in toluene was found to display very good linearity (Fig. 2), yielding a molar extinction coefficient of-5.7' 104 L morW. This value is lower than a reported one of 6.7 ■ 104; [7] however, the discrepancy does not affect the calibrated concentrations reported here. Based on the estimated spectrometric error, maximum uncertainties in the reported mole fractions are of the order of ± 2%, but the reproducibility between different samples is 80%; the temperatures were constant to within ±1 °C, with the exception of the measurement at 182 "C, which fluctuated by ±5 °C, since a temperature controlled mineral oil bath was used here instead of a boiling liquid as the thermal bath.
Differential Scanning Calorimetrv (DSC): The NP-C60 eutectic temperature was determined by DSC of premelted samples made from naphthalene (ALDRICH, 99.5%) and C60
(MER, 99.9%) placed in sealed aluminum pans. Thermograms were recorded on a Perkin-Elmer DSC-7 in argon at a heating rate of 2.5 °C/min in the range of 57 to 87 °C; temperatures were calibrated with the melting point of indium. Compositions up to mole fractions of COO X(C6O) = 4 ' 10" were studied.
Phase Diagram NP-CM: The phase diagram was constructed using the solubilities determined as described, the eutectic temperature, and literature data for the melting point and the normal boiling point of naphthalene [8] and sublimation of C60. [3]
Figure la,b: Absorption spectra of a) C«> in toluene; b) Naphthalene in toluene.
562

Figure 2: Beer's law plot for COO in toluene at \ = 335 nm.
RESULTS
Solubility Data by Spectrophotometrv: The measured C6o solubility curve is shown in Fig. 3; it is monotonic and retrograde (i.e., showing decreasing solubility of COO at increasing temperature).
The lowest temperature at which a liquid solution could be retained is the eutectic temperature TE -79.5 °C (see below). The do solubility curve and TE define the eutectic composition XE ~(5 ± 1)' 10"3. The lowest CM solubility measured is x = 1.5 ' 10'3 at 182 °C.
We comment briefly on the equilibration times used. As stated, liquid solubilities were measured after one hour of thermal equilibration. Some authors [5] consider 4 hours as still insufficient to reach solubility equilibrium and prefer times as long as 24 hours, but this was usually for work at lower temperatures than the ones required here for NP melts. Since severe thermal degradation of COO solutions with increasing time and temperatures have been reported, [9] we have limited the dissolution time used here to one hour. However, to improve the speed of dissolution the mixtures were stirred with a microstirring bar; also, the small dimensions of our H-cell facilitate thermal equilibration of the cell contents with the surrounding bath.
DSC Data: At all compositions between x = 6 ' 10"3 and 40 ■ 10"3, heating curves showed only a single endotherm at 79.5 ±.2 °C; this value was taken to be the eutectic temperature and yielded a maximum melting point depression of NP by C60 of AT = 1.0 +0.2 °C at the eutectic composition. At lower C«o content, (e.g., x = 4 ' 10"3), the decreasing amount of eutectic makes the temperature measurement unreliable.
563

Vc
Figure 3: Solubility curve for Cso in naphthalene-Coo liquid.
To observe AT values for hypoeutectic compositions, heating curves are undesirable since the thermal tail of the eutectic endotherm tends to mask the endotherm due to the melting of residual NP. Instead, cooling curves would have been appropriate to detect the primary crystallization of NP preceding eutectic solidification. Unfortunately, the NP-CöO melts show gross su percooling (up to 15 °C) which could not be prevented in the DSC environment by any means attempted (providing nucleation sites, etc.); this valuable technique was therefore not applicable and the primary crystallization curve of NP (i.e., the solubilities of NP in the melt as a function of temperature) could therefore only be approximated as a straight line using the eutectic T and x values.
The T-x Phase Diagram: A schematic, proposed diagram for the system NP-CöO at 1 atm is presented in Figure 4. It is not drawn at scale in order to show all of its features. The equilibrium phases stable at particular temperatures and compositions are marked. C6o was assumed to sublime at 1 atm, since its melting point (at elevated pressure) had been predicted to lie above 1200 K. [3] The proposed liquid-vapor curve and the boiling point increase of NP upon adding COO take into account the positive deviations from Raoult's law expected for solute- solvent intermolecular forces weaker than solute-solute or solvent-solvent forces, suggested also by small condensed phase solubilities. The solid solubility of C6o in NP was not determined but can be assumed to be negligible, based on the incompatibility of the molecular shapes and the resulting positive enthalpy of solid solution formation.
DISCUSSION
Cm Solubility Curve: The observed retrograde, highly non-ideal change of the C6o solubility in naphthalene with temperature shows the same qualitative behavior as the solubility of C6o in toluene, CS2 and hexane reported by Ruoff et al. [2] in the high temperature regime. Direct
564

900 Vapor
k
Liquid * Vapor
Liquid + C
8051^
Liquid
Liquid ^Naphthalene C + Naphthalene
■VMr
Figure 4: Proposed T-x phase diagram for the binary system naphthalene-Coo-
comparison of the present data with the master solubility curve of RuofF et al. is not possible because of the higher solubilities and melting temperatures in the present system compared to their lower-melting, lower-solubility solvents; however, the explanation suggested for the retrograde effect (increasing self-association of Gso with increasing temperature) assumed for the other systems [2-4] is probably valid for NP-C6o also.
The higher solvent freezing point of NP compared to those of toluene, CS2 etc., precludes observation of a possible transition to a "prograde" (i.e., non-retrograde) solubility curve of COO
at a lower temperature, as observed for the other solvents. [2] Evaluation of thermodynamic quantities such as the enthalpy of solution of COO would be premature at the present.
NP as a Solvent for Cm: The maximum solubility of COO in naphthalene attained at the eutectic is high compared to that in many other solvents, showing a potential for naphthalene as a C60 solvent, although a direct comparison with good C«0 solvents such as methyl naphthalene and chloronaphthalene is not possible because solubilities in these media are reported at different temperatures (25-30 °C vs 80 °C in naphthalene). NP as a potential solvent for COO presents the advantage of being easily removed from Qo by differential sublimation. Recycling of solvents has
565

been considered as one of the features necessary to lower costs of larger-scale ftillerene production. [10]
Other potential solvents to study are anthracene and phenantrene; the UV analyses for these substances can be done by a methodology similar to that described here. Also, it would be interesting to measure the solubilities of C70 in NP to gain more insight into the general solubility behavior of the flillerenes.
ACKNOWLEDGMENT
We are deeply thankful to Dr. A. Sentissi (Endocon, Inc., S. Walpole, MA) for allowing us to use his DSC equipment, and to Mr. Ruben Martinez for his kind assistance in its use. We acknowledge conversations with Prof. L. Khundkar.
Communication No. 632 from the Barnett Institute.
REFERENCES
1. W. Krätschmer, L.D. Lamb, K. Fostiropoulos and DR. Huffman, Nature, 347, 354 (1990).
2. R.S. Ruoff, R. Mahlotra, D.L. Huestis, D.S. Tse and DC. Lorents, Nature, 362, 140(1993).
3. A.L. Smith, D. Li, B. King and G. Zimmerman, in Fullerenes: Recent Advances in the Chemistry and Physics of Fullerenes and Related Materials, edited by K.M. Kadish and R.S. Ruoff (Electrochemical Society Proceedings, 94-24, NJ, 1994) p. 443.
4. V.N. Bezmelnitzyn, A.V. Elotskii, B.M. Smirnov and E.V. Stepanov, in Fullerenes: Recent Advances in the Chemistry and Physics of Fullerenes and Related Materials, edited by K.M. Kadish and R.S. Ruoff (Electrochemical Society Proceedings, 94-24, NJ, 1994) p. 1526.
5. R.S. Ruoff, D.S. Tse, R. Mahlotra and DC. Lorents, J. Phys. Chem., 97, 3379 (1993). 6. N. Sivaraman et al., in Fullerenes: Recent Advances in the Chemistry and Physics of
Fullerenes and Related Materials, edited by K. M. Kadish and R.S. Ruoff (Electrochemical Society Proceedings, 94-24, NJ, 1994) p. 156.
7. F. D'Souza et al., in Fullerenes: Recent Advances in the Chemistry and Physics of Fullerenes and Related Materials, edited by K.M. Kadish and R.S. Ruoff (Electrochemical Society Proceedings, 94-24, NJ, 1994) p. 774.
8. CRC. Handbook of Chemistry and Physics. 74th ed., edited by DL. Lide (CRC. Press, Boca Raton, FL, 1993-1994) p. 3-327.
9. L.P.F. Chibante, C. Pan, M. Pierson, RE. Haufler and D. Heymann, Carbon, 31, 185 (1993).
10. T. Yadov, in Fullerenes: Recent Advances in the Chemistry and Physics of Fullerenes and Related Materials, edited by K.M. Kadish and R.S. Ruoff (Electrochemical Society Proceedings, 94-24, NJ, 1994) p. 120.
566

DIFFUSION SEPARATION OF FULLERENES IN SOLUTION
Alexander V. Eletskii, Michael V. Okun and Eugene V. Stepanöv* Russian Research Center "Kurchatov Institute ", Kurchatov Sq. 1, Moscow 123182, Russia
ABSTRACT
The diffusion of fullerenes in solution is studied taking into account the recently established fact of the formation of clusters containing some number of aggregated fullerene molecules. Based on a droplet model of a cluster, the distribution function of fullerene clusters by size is ob- tained for various concentrations of solution. It is shown that dissolved fullerene is present mainly in the form of clusters at saturation conditions, but the contribution of clusters decreases as con- centration drops down. Since the diffusion mobility of clusters is much less than that of molecules, it leads to the dependence of an effective diffusion coefficient on concentration, which is com- puted for the case of fullerene COO- The feasibility of the use of this dependence as a basis for a diffusion method of the separation and enrichment of the fullerene extract with a small addition of higher fullerenes is analyzed. Possible schemes for enrichment are discussed.
INTRODUCTION
An exciting interest in the study of the behavior of fullerenes in solution is mainly due to the wide use of methods for the preparation, separation and purification of fullerenes based upon the application of organic solvents[l-4]. Besides, this interest is stimulated by much of extraordinary physical and chemical properties revealed by fullerenes in solution. So, the temperature depend- ence of the C6o solubility in some solvents proved to be non-monotone with a maximum at about 280 K [5]. The optical spectra of C70 dissolved in the mixture of toluene and acetonitrile dramati- cally depend on the percentage composition of the mixture undergoing a sharp transformation at the acetonitrile concentration around 60% [6]. The dependence of the non-linear optical suscep- tibility of C6o dissolved in benzene on the COO concentration also significantly changes its character at concentration approaching to saturation [7]. All these facts are explained by the phenomenon of the formation of clusters containing some number of fullerene molecules [8,9]. Recently the clus- ters of C60 in benzene solution were directly observed by the light scattering method [10].
A thermodynamic approach to the analysis of fullerene clustering in solution utilizing a droplet model of a cluster is developed in [8,9]. As shown in those studies, a droplet model enables to arrive at a satisfactory description of the experimental data on the temperature dependence of the COO solubility, the change of its slope from ascending to a descending one near 280 K being con- nected with an orientational phase transition in the bulk solid phase of COO-
The fact of existence of fullerenes in solution in the form of clusters whose average size de- pends on the fullerene concentration suggests that the fullerene diffusion coefficient also depends on concentration. Indeed, in a very dilute solution, clusters are almost absent, and the diffusion coefficient is determined by an appropriate value for individual molecules of fullerene. As concen- tration rises, the average size of clusters increases as well, hence the diffusion coefficient has to drop down. In the present study, the dependence of the diffusion coefficient of fullerene COO in solutions on its concentration allowing for the cluster formation is obtained. In doing this, for cal- culation of the fullerene cluster distribution function we invoke the droplet model developed pre- viously [8,9] and use the energetic parameters of the fullerene interaction within a cluster deter- mined on that basis. The diffusion of fullerenes and the fullerene clusters is considered as a diffu-
567
Mat. Res. Soc. Symp. Proc. Vol. 359 °1995 Materials Research Society

sion of a brownian particle, which proved to be in a quite good agreement with the experimental data on the COO diffusion coefficient in various solvents [11-14].
The concentration dependence of the diffusion coefficient determined below can be applied to elaborate a diffusion method for the separation and enrichment of two kinds of dissolved fullerenes provided their concentrations significantly differ from each other. In this case, that fullerene which is a small addition in solution and therefore does not form clusters has to spread with higher diffusion coefficient than the fullerene whose concentration is close to saturation and which is present in solution in the form of large clusters. The feasibility of a diffusion enrichment for fullerenes in solution is analyzed by numerical solving a diffusion problem with regard to the concentration dependence of the diffusion coefficient. It is shown, that the highest enrichment factor is attained with the use of a non-stationary scheme of separation.
THEORY
A standard statistical approach to calculating the fullerene cluster distribution function over the number n of constituent molecules in saturated solution is based upon a droplet model of a cluster [8,9,15,16]. By this model (valid for n » 1 ) an expression for the partial concentration c„ of «-molecule clusters can be presented with an exponential accuracy in the following form:
cn=gnexp[(-An + Bn2,3)/T] (1)
Here, the parameter^ refers to a difference in the thermodynamic specific energies of the interac- tion of the fullerene molecule with its surroundings in the bulk solid phase and within a cluster, and the parameter B is a similar difference in energies for molecules placed on the cluster's sur- face, g„ is the statistical weight of the cluster of the size n. As follows from the normalizing con- dition, the value A > 0 ; the role of clusters is significant at B > 0[9].
For unsaturated solution, the distribution function can be evaluated by requiring that the chemical potential of fullerene [i„ at equilibrium has to be the same for clusters of any size:
Hn = G„ + rinc„ = const (2)
(G„ is the specific Gibbs energy of fullerene in a cluster of n-th size). The constant in (2) depends on a total concentration and has to be equal to the chemical potential of solid fullerene at satura- tion. Thus one can express the distribution function in terms of the above defined parameters A and B as:
cnccIexp[(-An + Bn2,3)/T] (3)
where the parameter X is determined by the normalization equation:
C = C02>Xexr| f J (4)
C is the total concentration of fullerenes in solution, and C0 is a pre-exponential constant calcu- lated through the value of solubility.
The diffusion coefficient D is defined by a standard expression:
J = -DVC (5)
568

I I I I I I I I I I I I I I I I I I I I I M I I I I I I
0 10 20 30 the number of molecules per cluster
15-
E12-
-| 1 1 1 1 1 r 10-6 10-5 10-4 10-3 10-2 1Q-1 100
c/csa(
Fig.l. The change of the distribution function Fig.2. The dependence of the diffusion coeffi- of fullerene clusters by size with the variation cient on concentration computed for fullerene of the total concentration C/Csat: A - 1; B - 0.3; C6o in toluene at room temperature. C - 0.1; D - 0.01, for C6o dissolved in toluene (temperature 350 K).
where J is a flow of substance in solution caused by the concentration gradient. On the other hand, taking into account clustering fullerenes, the expression (5) can be written as a sum of the partial fluxes J„ of the «-molecule clusters:
•/ = !>„ = -2>„VKC„ (6)
every partial flux being characterized by its diffusion coefficient D„ respectively. With a droplet model, one can evaluate the diffusion coefficient of a cluster of size n» 1 using classical Stokes- Einstein relation:
Dn = kTldnnrn (7)
where ju is the dynamical viscosity of solvent, r„ =c nm is an effective radius of a cluster. Then given the requirement of a local thermodynamic equilibrium, for c„ in (6) one should use the dis- tribution function in the form (3), and comparing the result of the substitution with a definition (5) we arrive at:
D = EL
J^r,5l3X^exp[(-An + Bn2,3)/T] n=\ .
fy;Texp[(--i4n + AiM)/71 (8)
569

This, in combination with equations (4) and (7), represents a sought expression for the concentra- tion dependence of the diffusion coefficient for fullerenes (D0 is the diffusion coefficient for indi- vidual molecules, which is approached by the value of D in the limit of a very dilute solution).
RESULTS AND DISCUSSION
The distribution function of the fullerene clusters by size computed by evaluating (3) with solving equation (4) at various concentrations of fullerene C60 in toluene is shown in Fig. 1. In calculation, we used the values of the parameters A = 320 K and B = 970 K obtained previously [8,9] as a result of fitting the theoretical dependence of the C6o solubility in toluene to experimen- tal data [5]. It is seen that the average size of clusters decreases as concentration drops, and at concentration around 1% of the saturation value, clusters are practically absent. This indicates the significant dependence of the fullerene diffusion coefficient in toluene on concentration. The re- sults of computing this dependence on the basis of expressions (4),(8) are presented in Fig. 2. Thus the formation of clusters in solution close to saturation causes the diffusion coefficient to lower by approximately 30% in comparison with the value for individual molecules.
Let us consider the feasibility of the use of the above concentration dependence of the diffu- sion coefficient as a basis of a diffusion method for the enrichment of the mixture of two kinds of fullerenes in solution. If their concentrations are significantly different, the diffusion coefficient of a minor component has to be higher than that of a major one. Evidently, it gives rise to their sepa- ration upon spreading out. To model such an effect, let us analyze one-dimensional non-stationary diffusion from a flat layer of the fullerene extract. Assume that the extract is composed of a main component (labeled 1 below) and a small addition (labeled 2). The small addition is considered to form no clusters in solution, and characterized by the diffusion coefficient D2 appropriate to indi- vidual molecules. The diffusion coefficient of the prevailing component D,(Ci) depends on con- centration, and is less than that for individual molecules because of the possibility of clustering. Thus the diffusion equations for the components in solution take the form:
dC2 &C2
with conditions:
C,(x = 0) = (C1)ra,; C,(x = =°) = 0; C,(r = 0) = 0; C2(x = 0) = C2°; C2(x = oo) = 0; C2(t = 0) = 0;
where C° « (C,)„, as assumed. Both equations (9),(10) have automodelling solutions depending
on a common variable z = xl 4t. The latter is a standard diffusion equation with the solution:
C2 = C2°[l-erf(x/2VZv)]; (11)
but the former taking into account the concentration dependence Di(C,) given by expression (8) calls for numerical solving.
The obtained results of the numerical computing the spatial and temporary distributions of the components in solution expressed in terms of the dependencies of their relative concentrations C[(x,t) = Q(x, t) ICt{x = 0) on the automodelling variable are presented in Fig. 3. The enrichment factor defined as
570

c <u E sz o 'l c:
Fig. 3. The distributions of rela- tive concentrations computed for fullerene COO (the curve B) and a small addition of a higher fullere- ne (A) both diffusing in solution from the surface of the solid fulle- rene extract. The curve C repre- sents the enrichment factor.
/?(xj) = C2(x,t)/Cl(x,t); (12)
is plotted as well. In computation, we neglected insignificant difference between the diffusion coefficients of the individual molecules of two considered kinds of fullerenes, thereby having as- sumed the value ofD,(C,) in the limit of a very dilute solution C, -> 0 being coincided with D2. This difference caused by some distinction in molecular size for various fullerenes is of around several percent, which evidently does not exceed the accuracy of the droplet model involved.
As seen from the presented data, the fullerene enrichment factor attains its maximum value T]max at some distance xmax dependent on time. But the value rfmax itself is not changed with time by virtue of the automodelling character of the solutions of equations (9),(10). One can see the maximum enrichment rjmax ~ 25 is quite large, and it seems to be perspective to utilize such an ef- fect for the separation and enrichment of higher fullerenes from the fullerene extract.
To conceive feasible ways for the diffusion enrichment, it is worthwhile to use a wealth of ex- perience gained with developing the isotope separation technology [17,18]. Firstly let us consider a scheme based on a non-stationary diffusion. Suppose a volume filled with solvent is divided by a porous partition which does not prevent the diffusion of dissolved fullerenes but hinders convec- tive transfer between two parts of the volume. The solid extract of fullerenes (for example, C6o) containing a small addition of a higher fullerene is placed on the bottom of one of the volume parts, and thereby saturates the solution. As fullerenes diffuse through the porous partition of a finite thickness, the second parts of the volume are filled with fullerenes in proportion determined by the diffusion dynamics considered above. When the time corresponding to the maximum value of enrichment at given geometry of the device has elapsed, the second part should be emptied. Such a way yields a transient enrichment of the fullerene extract in relation to a small addition.
In practice, a stationary regime of the enrichment can turn out to be more convenient For this case, an elementary separation cell should also consist of two volumes divided by a porous parti- tion. The original solution of two kinds of fullerenes is supposed to be slowly pumped through one of these volumes Similarly, pure solvent is to move through the second volume in the oppo- site direction. Owing to diffusion through the porous partition, the solution in the second volume is to be enriched in respect to the small addition. In this case, the maximum enrichment factor cor-
571

responds to the relation of the diffusion coefficients of the small addition to that of the main com- ponent. Since this relation computed above is no more than 2 (see Fig. 2), for the enrichment factor to be significant, a multi-step scheme should be used. Then the net enrichment factor is ex- pressed through that for a unit cell 770 and the number of cells was J= 77™ [17,18],
Finally, it should be noted that the diffusion methods considered here are supposed to be most effective for the enrichment of a minor component from a tiny concentration up to approximately ten percent of the saturation value. In this range, we deal with appreciable difference in the diffu- sion coefficients of components caused by the crucial distinction of their distribution functions by size in solution. Besides, these methods can also be applied for the purification of C6o from an addition of higher fullerenes usually presented in the fullerene extract.
CONCLUSIONS
The tendency of fullerenes to form clusters in solution reflects on a character of the diffusion of fullerenes and is responsible for the concentration dependency of the diffusion coefficient. This dependence is computed on the basis of a droplet model of a cluster which showed itself to advan- tage when being employed to explain the temperature dependence of the fullerene solubility [8,9]. The concentration dependence of the diffusion coefficient determined here can be utilized as a ba- sis for the diffusion methods of the enrichment of fullerenes in solution. Such methods are sup- posed to be effective enough for the enrichments of solution containing a small addition of higher fullerenes along with do-
ACKNOWLEDGMENTS
The present work was supported in part by Russian Basic Research Foundation (the grant number 94-02-03433), and by the Programm 'Fullerenes and atomic clusters" under Project No. 2 "Soot".
REFERENCES
1. W. Kratchmer, L.D. Lamb, K. Fostiropoulos et al., Nature, 347, 354 (1990). 2. F. Diederich and R.L. Whetten, Ace. Chem. Res., 25, 119 (1992). 3. R. Taylor, J.P. Hare, H.W. Kroto et al, J. Chem. Soc. Chem. Comm., p. 1423 (1990). 4. A.V. Eletskii and B.M. Smirnov, Sov. Phys. - Uspekhi (Engl.Transl.), 163 (2), 33 (1993). 5. R.S. Ruoff, D.S. Tse, R. Malhotra et al., Nature, 361, 140 (1993). 6. J.P. Sun and C.E. Bunker, Nature, 365, 398 (1993). 7. W.J. Blau, HJ. Byrne, DJ. Carchin et al., Phys. Rev. Lett, 67, 1493 (1991). 8. V.N. Bezmelnitsin, A.V. Eletskii and E.V. Stepanov, J. Phys. Chem., 98, 6665 (1994). 9. V.N. Bezmelnitsin, A.V. Eletskii, B.M. Smirnov et al., in Fullerenes, ed. by K.M. Kadish and
R.S. Ruoff (Electrochem. Soc. Proc. 94-24, Pennington, NJ, 1994), pp. 1526-1532. 10. Q. Ying, J. Marecek and B. Chu, Chem. Phys. Lett., 219, 214 (1994). 11. D. Dubois, G. Moninot, W. Kutner et al., J. Phys. Chem., 96, 7137 (1992). 12. R Haseimeir, M. Holz, M.M. Kappes et al., Ber. Bunsenges. Phys. Chem., 98, 878 (1994). 13. T. Kato, K. Kikuchi, Y. Achiba, J. Phys. Chem., 97, 10251 (1993). 14. S. Ramos, J. Phys. Chem., 98, 4188 (1994). 15. Ya.I. Frenkel, Kinetic Theory of Liquids, (Nauka, Moscow, 1975; also Engl. Transl. by Pergamon Press) 16. B.M. Smirnov, Sov. Phys. - Uspekhi (Engl. Transl.), 162 (1), 119 (1993); 163 (10), 29 (1993). 17. E.V. Shpolskii, Atomic Physics, v. 1, (Nauka, Moscow, 1984). 18. B.M. Andreev, Ya. D. Zelvenskii and L.G. Katalnikov, The separation of stable isotopes by physico-chemical
methods (Energoatomizdat, Moscow, 1982).
572

THERMODYNAMICS OF CO-EXISTING PHASES AT PHASE TRANSITIONS IN FULLERENES
Eugene V. Stepanov Russian Research Center "Kurchatov Institute ", Kurchatov Sq. 1, Moscow 123182, Russia
ABSTRACT
A thermodynamic model describing the co-existence of phases at orientational phase transition in solid fullerenes is developed. It is shown that for such a transition in fullerene COO characterized by the comparatively low enthalpy, heterophase fluctuations can lead to the wide temperature re- gion of the phase co-existence within about 30 K below the 260 K transition point, and mainly determine the anomalies of thermodynamic characteristics observed within that region. By com- parison of the theoretical dependence obtained on this basis with the experimental data on the x- ray diffraction and heat capacity measurements for COO, the energetical characteristics of the het- erophase cluster formation are evaluated. The relative contribution of homophase and heterophase fluctuations to breaking the orientational order is discussed.
INTRODUCTION
The processes of orientational ordering in solid fullerenes and the ensuing rearrangement of a crystal lattice are the matter of significant interest at the present time [1-5]. Physical properties of such crystals built of so many-atomic and highly symmetric molecules as fullerenes are closely connected with the orientational interaction as well as with the character of their vibrational, rota- tional and librational movement allowed by the symmetry of the crystal structure. So, solid fullere- ne Ceo proved to be constructed of freely rotating molecules arranged in a fee structure at room temperature. On cooling down to Tc = 260 K the rotation freezes, which results in re-ordering the lattice to a sc structure with four fullerene molecules in an elementary cell (the symmetry Pa2). The data of the numerous experimental studies [1, 6-11] of this phenomenon involving a great variety of tecniques have shown that is a first-order phase transition with the latent heat of 1.7 kcal/mol and the specific volume change of about 1%. The studies of orientational ordering in solid C7o revealed the similar but much more complicated picture of the sequence of the phase transitions in the range from 260 K to 360 K, which probably is due to nonequivalent rotation around various axes freezing at different temperatures [4,12].
At the same time, the experiments cited above also show a number of distinctive peculiarities for the phase transitions in fullerenes. The main of them consists in the wide temperature region below the transition point where the structure of the low-temperature phase is not homogeneous. So, the x-ray diffraction study [7] of the sc phase of C60 displayed that the relative fraction of re- flections pertinent to Pa 3 symmetry began to decrease monotonically from unity at approximately 200 K, i.e. far below the transition point, down to about 60% at 260 K then falling to zero. Simi- lar results indicating that the sc phase in do can not be considered as pure above 200 K have been obtained by infrared spectroscopy [10]. Both x-ray and neutron diffraction experiments performed in [8] have clearly revealed the co-existence of phases within 10 K below Tc. Lastly, numerous calorimetric measurements (for example, see [6,9,12,14]) exibit the k-shape of the heat capacity curve around the transition point being of about 20 + 40 K width. Data on the thermal expansion coefficient [11] as well as on low-frequency speed of sound [13] show the similar width of the anomaly of these parameters near 7^.
573
Mat. Res. Soc. Symp. Proc. Vol. 359 ®1995 Materials Research Society

One of the possible ways to explain the mentioned phenomena is to suppose that the part of fullerene molecules violate the most energetically profitable orientation and occupy the exited levels which correspond to other local energetical minima permitted by molecular symmetry. The appreciable population of such levels for fullerenes can be attained due to the large statistical weight caused by both the diversity of possible configurations and the libration spectrum close to continuos for a heavy fullerene molecule. A thermodynamic model utilizing such a way has been developed recently in [3].
In the present study, we approach the problem from the another hand, focusing attention on heterophase fluctuations. As well-known [15-18], heterophase fluctuations are inherent for the phase transitions of a first order, but usually reveal themselves in a very narrow temperature re- gion near TQ dependent on the latent heat of the transition. Since the latent heat for fullerene or- dering is distinctively small, the heterophase fluctuations can result in the formation the clusters of the disordered phase far below Tc and thus be reponsible for the X-shape behavior of the thermo- dynamic functions. This approach underlies the thermodynamic model of co-existing phases in the vicinity of the ordering point developed here. To estimate the actual role of heterophase fluctua- tions in fullerenes, wc apply the model to processing experimental data on the C6o heat capacity and the direct measurements of relative fraction of the ordered phase below Tc [7,8] It is shown here that the data taken from different experimental studies are discribed by the same energetical parameters of the disordered cluster formation. The obtained energetical parameters we apply to evaluate the heterophase cluster distribution function by size, and thereby compare the contribu- tion of the clusters with that of the single disordered molecules in the body of the low temperature phase. Thus we arrive at the significant thermodynamic gain for the system to form heterophase clusters of about 10-15 molecules within the temperature range of approximately 30 K below the 260 K transition point for solid fullerene C6o.
MODEL
To derive the probability of heterophase cluster formation, we follow a standard statistical ap- proach for a closed system[15-17,19], but should make some modifications to the classical theory with regard to the wide temperature range as well as the asymmetry of the phase co-existence ob- served in the above c;ted experiments for fullerenes. To represent the main items of the model, let us consider a closed system of A'molecules from which NA belong to one phase, and the remain- der is distributed over the clusters of another phase, the number of clusters containing / molecules being Ni. Provided the clusters do not interact with each other, the total Gibbs energy G of the system has the form:
G = Niq>A + Y,Nlg{l,T)+T{NA\nfA+Y,Nl\nfl) (1) i i
where <pA, <pB are the chemical potentials of the host and fluctuation phases, respectively, g(l, 7) is the Gibbs energy of the cluster of size /, /., = NA I M\ f, = N, / M, and A4 = NA +^N,. Vary- ing (1) with taking into account the conservation of the total number of molecules as well as the set of balance conditions 5NA : 8M-; : öW, = 1 : 1 : (-1), one can obtain:
/, = (/,)'exp[-g(/,D/r] (2)
In line with the concept of heterophase fluctuations, we consider the clusters as compact and being far from the percolation threshold. This allows us to utilize a well-known droplet model [15-18] for a cluster to specify the form of the dependency g(/, 7):
574

g(l, T) = ApAB(T)l+a(T)lln+comt (3)
Here, A<pAB(T) is the difference in chemical potentials for the phases under consideration, and cc(7) is a surface term expressing the difference in specific Gibbs energies for molecules placed on the surface and within a cluster. The constant in expression (3) results in a pre-exponential factor for the distribution function (2), and can also be treated as independent on temperature with an exponential precision of the droplet model.
The above consideration is valid for both situations either the heterophase fluctuations of the high-temperature phase present in the body of the low-temperature phase below T^ or vice versa. Thus we can apply this approach to determine the behavior of thermodynamic functions as well as the relative fractions of phases on both sides of the transition points, expanding energetical pa- rameters in expression (3) near Tc. The volume term in (3) vanishes in the point of the phase transition, so the expansion begins from a linear term:
A<pAB(T) = Ae+.., e = \(Tc-T)/T\; (4)
where X is the latent heat of the transition. Using the same order of accuracy, we should also ex- pand the surface term:
Ci.(T) = b + cs+...; (5)
where the parameter b, as is easy to understand, is the same on both sides of the transition point, but the value of c corresponding to the difference of the cluster's surface and volume specific en- tropies is discontinuous at Tc. Making the simplest and most evident assumption that the specific energetical characteristics of a molecule placed on the interface between two phases are not changed at Tc, we can link the discontinuous values of c by the relation:
c(T^+Tc) = -c(T^>-Tc)-A, (6)
This relation brings an asymmetry in the model distribution function (2),(3) with respect to Tc. Thus for the sought equilibrium distribution of heterophase clusters near the phase transition point we obtain:
/,=</(/,)' exp[-/?(/,r)/ T\\ (?)
ß(l,T) = (Äl+clm)s+blm
where the value of/A for every temperature T\s determined by the normalization procedure:
l-/i=?ZC/"J'e*p[-/*(/,7yr|; (8) ;=i
Then the relative concentration cB of molecules occuring in the constitution of clusters is deter- mined from the expression:
i=i • i=i CeAh+HlfA Ulf,: &
The change of the heat capacity due to the appearance of heterophase fluctuations can be found by the standard way [19] using the magnitude of Gibbs energy G. With the distribution function (2), the expression (1) gives:
575

1.2
1.0
0.8
0.6-
0.4
0.2-
150 |"|"' I ' ' '
200 250 temperature, K
300
Fig. 1. The relative fraction of the ordered phase of Ceo in dependence on temperature by data [7] (circles) and [8] (squares). The solid line repre- sent the model results.
200 280 220 240 260 temperature, K
Fig. 2. The anomaly in the Cm heat capac- ity around the orientational transition point by data [14]. The solid line shows the de- pendence resulted from the model.
G = N{<pA + T\nfA); (10)
where the first term represents undisturbed value of the Gibbs energy of the crystal. Performing the differentiation of the second term, for the disturbance of the heat capacity CP(T) we arrive at the next set of equations:
Cp('f)T2[l+/-' Ulf,] = H\T)+f-'Zlß (A T) -/?/(/, T) - lH(T)ff,
H(T)[\+/-' Z/f,l=/;' Zlß (/, T) - ß>{i, r>]/, (ii)
which, together with normalizing equation (8), determine the temperature dependence CP(T) in the vicinity of the transition point.
RESULTS AND DISCUSSION
Let us apply the developed model to describe experimental data on the heat capacity anomaly as well as direct measurements of the fraction of the ordered phase for solid fullerene COO- TO
avoid possible errors related to the finite rate of a calorimetric scan, we used the most precise ex- periments [14] wherein the temperature was varied with the rate of 0.3 K/hour. It should be noted that although those experiments revealed a strong hysteresis of the values of the C6o heat capacity in respect of heating and cooling which probably is not connected with heterophase fluctuations, the shape of the curves in the region of 220 -*■ 270 K is the same. Also, we took data on the x-ray diffraction measurements of the integrated intensity of reflections pertinent to the sc phase of COO
presented in [7,8]. The theoretical dependencies were computed by simultaneous solving the equations (11) and (8) with exponent (7), and also taking into account the relation (6). The ener- getical characteristics b and c was sought to achieve the best fit to all experimental data under consideration. The best accordance with the data was attained at b = 0.02 and c = 0.3 kcal/mol. The dependencies computed at these parameters are plotted in Fig. 1,2 together with the experi- mental values. Thus the thermodynamic potential of the Cm disordered clusters
576

Fjg.3. The distribution functions of heterophase clusters by size at various temperatures for solid fullerene C^-
10 20 30 the number of molecules per cluster
is mainly determined by the volume term in (7) including the latent heat of the ordering transition X = 1.7 kkal/mol, and the surface energy provides only with a small correction in this case.
The distributions of molecules of the disordered phase over clusters calculated with the ob- tained parameters b and c are presented in Fig. 3 for various temperatures. We see the relative contrinution of clusters is significant beginning from the transition point down to approximately 230 K. Below this temperature the role of heterophase clusters proves to be negligible.
Thus the presented model enables to evaluate the role of heterophase fluctuations at orien- tetional phase transitions in fullerenes and to develop the computational methods for selecting the contribution of heterophase fluctuations from the observed pattern of anomalies in thermody- namic functions. This can also be applied to the study of the orientational freezing in higher fullerenes where the observed picture of phase transitions is much more complicated than in C50.
ACKNOWLEDGMENTS
The author is grateful to Prof. A.V. Eletskii for useful discussions. The work was supported by Russian Basic Reserch Foundation, and by the Programm "Fullerenes and atomic clusters" under Project No. 2 "Soot".
REFERENCES
1. P.A. Heiney, J. Phys. Chera. Solids, S3,1333 (1992). 2. A.F. Hebard, Annu. Rev. Mater. Sei., 23,159 (1993). 3. R. Saito, G. Dresselhaus, M.S. Dresselhaus, Phys. Rev. B, 49,2143 (1994). 4. G.B.M. Vaughan, P.A. Heiney, D.E. Cox et al.,Chem. Phys., 178, 599 (1993). 5. AV. Eletskii and B.M. Smimov, Sov. Phys. - Uspekhi (EngLTransl.), 163 (2), 33 (1993). 6. J.S. Tse, D.D. Klug, D.A Wilkinson et al., Chera. Phys. Lett, 183, 387 (1991). 7. H. Kasatani, H. Terauchi, Y. Hamanaka et al., Phys.Rev. B, 47, 4022 (1993). 8. P.AH. Heiney, G.B.M Vaughan, J.E. Fisher et al., Phys. Rev. B, 45,4544 (1993) 9. G.A Samara, L.V. Hansen, R.A Assink et al., Phys. Rev. B, 47,4756 (1993). 10. Y. Harada, T. Ohyama, E. Otsuka et al., J. Phys. Soc. Jap., 62 (5), 1427 (1993). 11. F. Gugenberger, R. Heid, C. Meingast et al., Phys. Rev. Lett, 69, 3774 (1992). 12 AR. McGhie, J.E. Fisher, P.A Heiney et al., Phys. Rev. B, 49, 12614 (1994). 13. W. Schranz, A Fuit, P. Dolinar et al., Phys. Rev. Lett, 71,1561 (1993). 14. E. Grivei, M. Cassart, J.-P. Issi et al., Phys. Rev. B, 48, 8514 (1993). 15. Ya.L Frenkel, Kinetic Theory of Liquids, (Nauka, Moscow, 1975; also Engl. Transl. by Pergaraon Press) 16. AR. Ubbelohde, The Molten State of Matter, (Wiley, New York, 1978). 17. V.L Yukalov, Phys. Rep., 208 (6), 397 (1991). 18. A.D. Bruce, R.A Cowley, Structural Phase Transitions, (Taylor & Francis Ltd., London, 1981). 19. L.D. Landau, E.M. Lifshitz, Statistical Physics, (Pergamon Press, Oxford, 1977).
577

Author Index
Abramo, Maria C, 217 Achiba, Yohji, 3 Adamowicz, L., 163, 175 Affholter, K.A., 335, 543 Aihara, Yuichi, 3 Akahama, Yuichi, 313 Akasaka, Takeshi, 137 Akselrod, Lidia, 451 Andersson, O., 549 Anna, S., 35 Argentine, S.M., 221 Assink, R.A., 505 Astakhova, Tanya Yu., 193 Auban-Senzier, Pascale, 261, 463
Barbedette, L., 11, 273 Bayless, W.R., 289 Belahmer, Z., 499 Benedek, G., 157, 469 Bernholc, J., 235 Bernier, Patrick, 11, 261, 463, 499 Bethune, Donald S., 69, 123 Beyers, Robert, 69, 123 Bharadwaj, T.N., 347 Boothroyd, C.B., 247 Boulanger, L., 53 Bozio, Renato, 351 Brabec, C.J., 235 Brandelik, D.M., 523 Brard, L., 537 Brenner, Donald W., 199, 241 Brunelle, A., 11 Brunsman, E.M., 29, 35 Brusatin, Giovanna, 351 Bunick, G.J., 335 Burbank, P., 123 Butenko, Yurii V., 105 Bykovetz, N., 273 Byrne, Hugh J., 451
Cabrera-Trujillo, J.M., 205 Caccamo, C., 217 Cahill, P.A., 363 Cao, Jingrong, 357 Cauchetier, M., 53 Chang, R.P.H., 93 Chase, S.J., 301 Chen, Baoqiong, 443 Chen, Jun, 443 Chen, Liang-Yao, 429 Chernozatonskii, Leonid A., 99 Chiang, Long Y., 327, 331, 341 Chien, Kuo-Ming, 529 Chuvilin, Andrey L., 105 Colbert, Daniel T., 61 Colombo, L., 157, 475 Copley, J.R.D., 537 Corona, B., 157 Cullen, S.L., 247
Della-Negra, S., 11 Dengra, S., 23 Derrington, S., 41 Desimone, J.M., 335 de Vries, M.S., 123 Dilanyan, Ruben A., 181, 187 Dorantes-Dävila, J., 205 Dorn, H.C., 123 Dresselhaus, M.S., 423 Du, Yuan-Cheng, 429, 433 Dunlap, Brett I., 169
Eletskii, Alexander V., 567 Eom, C.-B., 387 Erwin, S.C., 273 Esfarjani, Keivan, 229
Fartash, A., 393 Fedorov, E.A., 99 Feldman, Y., Ill Firlej, L., 499 Fischer, J.E., 273, 289, 537 Fishbine, B.H., 93 Flamant, G., 11 Fleming, R.M., 285, 289 Fonseca, A., 17 Fox, J.R., 307 Francis, A.H., 221 Freund, J.E., 411 Fukuda, Masao, 313 Funasaka, Hideyuki, 137
Galvani, E., 157 Garcfa, A., 23 Geier, S., 399 Giessen, Bill C, 437, 561 Gilles, J.M., 17 Giovanola, J., 347 Glass, T., 123 Goddard III, William A., 69 Guglielmi, Massimo, 351 Guizzetti, G., 469 Gulyaev, Yu.V., 99 Gutakovskii, Anton K., 105
Hackett, K.E., 93 Haddon, R.C., 387, 423 Hafner, Jason H., 61 Harich, K., 123 Hebard, A.F., 387, 423 Heiney, P.A., 537 Hellwarth, R.W., 511 Hendricks, K.J., 93 Henke, S., 399, 405 Hepp, H., 517 Hidalgo-Quesada, Rafael, 437, 561 Homyonfer, M., Ill Hsieh, Kuo-Huang, 331 Humphreys, C.J., 247
579

Hunt, Jr., M.O., 335 Huong, Pham V., 463 Hwang, Kuo Chu, 75
Ikazaki, Fumikazu, 81 Innocenzi, Plinio, 351 Iwasa, Y., 285
Jacobs, S.J., 363 Jansen, S., 211 Jerome, Denis, 261, 463 Jiao, Jun, 47 Jimenez-Vasquez, Hugo A., 357 Johnson, R.D., 123
Kainosho, Masatsume, 3 Kaiser, Mathias, 451 Kaprinidas, Nikolaos, 357 Kashani, M., 211 Kawamura, Haruki, 313 Kawazoe, Yoshiyuki, 229 Ke, Ning, 443 Kendziora, C, 319 Kerkoud, R., 261 Khairulin, Raschid A., 105 Kiang, Ching-Hwa, 69, 123 Kikuchi, Koichi, 3 Kniaz, M., 273 Kobayashi, Mototada, 313 Koller, Daniel, 295, 319 Kordesch, M.E., 93 Kosakovskaja, Z.Ja., 99 Kudo, Kazuhiro, 417 Kuriki, Yasunori, 81 Kurtz, J., 163 Kuznetsov, Vladimir L., 105 Kyotani, Mutsumasa, 81
Lannin, J.S., 301, 307, 493 Laplaze, D., 11 Lebrun, M., 11 Lee, S.-L., 163, 175 Lern, George, 357 Li, Fu-Mine, 429, 433 Li, Ping, 87 Lin, C.L., 273 Lin, Jaw-Town, 327 Lin, Syh-Kun, 529 Lin, Tsung-I, 529 Lopinski, G.P., 301, 307, 493 Loy, D.A., 505 Lu, Fung-Jou, 327 Lu, Qingyi, 357 Lucas, A.A., 17 Luh, Tien-Yau, 529 Luk'yanchuk, I., 499 Lundin, A., 555
Maggini, Michele, 351 Maiti, A., 235 Majetich, S.A., 29, 35, 41 Majidi, Vahid, 369 Mal'kov, Igor Yu., 105
Malhotra, R., 347 Manfredini, M., 469, 475, 481, 487 Marabelli, F., 469 Margulis, L., Ill Markiewicz, Robert S., 437 Marshall, J.H., 387 Martin, Michael C, 295, 319 Maruyama, Yusei, 137 Maser, Wolfgang K., 451 McHenry, M.E., 29, 35 McLean, D.G., 523 Meier, Mark S., 369 Menceloglu, Y.Z., 335 Meneghetti, Moreno, 351 Miglionico, C.J., 93 Mihaly, Laszlo, 295, 319 Milani, P., 469, 475, 481, 487 Mitch, M.G., 301, 307, 493 Miyake, Yoko, 3 Morän-Löpez, J.L., 205 Morgan, C.J., 247 Murphy, D., 289 Murphy, Richard J., 437 Myers, S.A., 505
Nagy, J.B., 17 Narang, S.C., 347 Neumann, D.A., 537 Nigam, A., 347
Ohno, Kaoru, 229 Ohshima, Satoshi, 81 Okun, Michael V., 567 Ösawa, Eiji, 145 Osawa, Shiiichi, 145
Palstra, T.T.M., 285 Partanen, J.P., 511 Pasqualini, E., 23 Patrini, M., 469 Paulozzi, M., 23 Peng, Shaoqi, 443 Pevzner, B., 423 Phillips, Julia M., 387 Podesta, C., 23 Pogue, Robert, 369 Pohl, R.O., 411 Poplawska, Magdalena, 369 Prato, Maurizio, 351
Rachdi, F., 261 Rafael, A., 23 Rauschenbach, B., 399, 405 Reihl, B., 375 Ren, Zhong-Min, 429, 433 Ribet, M., 499 Rice, Douglas J., 369 Richter, H., 17 Rinzler, Andrew G., 61 Robertson, D.H., 199 Rohlfing, CM., 363 Roland, C., 235 Rosenberg, A., 319
580

Rosseinsky, M.J., 289 Roth, Siegmar, 451 Rühle, Wolfgang W., 451 Rush, J.J., 537 Rybchenko, Oksana G., 181, 187
Saito, Yahachi, 313 Salem, Jesse R., 69, 123 Samulski, E.T., 335 Sanchez Ortiz, J.F., 253 Sanguinetti, S., 157, 469 Saraya, Takuya, 417 Sattler, Klaus, 87, 517 Saunders, Martin, 357 Schirber, J.E., 289, 505 Schuster, David I., 357 Scorrano, Gianfranco, 351 Scott, John Henry J., 29, 41 Senturia, S.D., 423 Seraphin, Supapan, 47 Serra, S., 157, 475 Shaginyan, Shagen A., 193 Shekharam, T., 347 Shekhtman, Veniamin Sh., 181, 187 Shinohara, Hisanori, 313 Shiu, Lung-Lin, 529 Shovlin, J.D., 93 Shulakov, E.V., 187 Siegmann, K., 517 Sinitsyn, N.I., 99 Sinnott, Susan B., 241 Slanina, Z., 163, 175 Smalley, Richard E., 61 Smigel, M., 163 Smith III, Amos B., 537 Soldatov, A., 549, 555 Spooner, Steve, 543 Stankus, Sergey V., 105 Stepanov, Eugene V., 567, 573 Stephens, P.W., 273 Stevenson, S., 123 Stritzker, B., 399, 405 Strongin, R.M., 537 Sulewski, P.E., 273, 285 Sun, M.-L., 175 Sun, Z., 123 Sundqvist, B., 549, 555 Sutherland, R.L., 523 Suzuki, Toshiyasu, 137
Takahashi, Takeshi, 137 Tang, N., 511 Tanigaki, Nobutaka, 81 Teixeira Rabelo, J.N., 253 Tenne, R., Ill Thiry, P.A., 17 Thomas, Craig, 369 Thürer, K.H., 399 Topp, K.A., 411 Torgashov, G.V., 99 Tretiakov, N.P., 253
Uchida, Kunio, 81
Val'chuk, V.P., 99 van Loosdrecht, P.H.M., 123 Vinogradov, George A., 193
Wakabayashi, Tomonari, 3 Wang, Lee Y., 331, 341 Wang, S.-H., 211 Wang, X.K., 93 Werner, Andreas T., 451 White, Jr., B.E., 411 White, Carter T., 199, 241 Wignall, G.D., 335 Willaime, F., 53 Wilson, Stephen R., 357 Wong, S.P., 443 Wu, Rong-Shen, 331 Wu, Yunhui, 357
Xiong, Xia-Xing, 429, 433 Xu, Xing-Long, 433
Yamamoto, Kazunori, 137 Yannoni, C.S., 123 Yase, Kiyoshi, 81, 417 Yildirim, T., 273 Ying, Zhi-Feng, 429, 433 Yumura, Motoo, 81
Zakharchenko, Yu.F., 99 Zarestky, J.L., 543 Zegarski, B.R., 285 Zhang, Haiyan, 443 Zhang, Xin-Yu, 437, 561 Zhou, Dan, 47 Zhou, O., 285, 289 Zubov, V.l., 253
581

Subject Index
ab initio Hartree-Fock, 363 molecular dynamics, 230
absorption, 523 cross-section, 511 spectroscopy, 529
ac magnetic susceptibility, 313 acetylene, 17 Al films, 387 alkali-metal doped fullerene (\C^), 301 AMI molecular orbital method, 145, 175 amorphization, 437 amorphous
carbon, 481 solids, 411
annealing, 105 atomic force microscopy, 87, 405
beam deposition, 417, 429, 433 benzene, 17 Bisphenol, 3, 347 bond charge model, 467 bonding, 544 boron
carbide, 47 nitride, 53, 175, 229
Brillouin spectroscopy, 481, 487
enriched C6„, 436 fullerenes, 11
Knight shift, 261 NMR, 261, 499, 505
C8H, 163 C«^ •• ^ deposition, 405
rare gas mixtures, 217 thin films, 375, 399, 417, 423, 433, 443
C60Bio- 223 61 2»
C70, 363 C70Rbx, 313
cage opening reaction, 475 carbon
arc growth, 23, 29, 35, 41, 47, 61 atom substitution, 229 clusters, 47, 163, 517 disulfide solvent, 543 nanotube, 61, 69, 75, 81, 87, 93, 99, 169,
235, 241, 247 shell radius, 543
catalyst promoters, 69 catalytic
effect, 437 graphitization, 47
cathode emitter, 93
charge transfer, 375, 499 clusters, 193, 567 cobalt, 35 cohesive energy, 205, 253 cold field emission, 93 complex formation, 523 compressibility, 555 concentric shells, 53 connectors, 369 correlative method, 253 covalent rullerene crystals, 157 crystal growth, 417 Cu films, 387 cubic point group, 181 cyclic adduct, 529 cycloaddition, 351, 357, 363, 529
defect structures, 205 degenerate four-wave mixing (DFWM), 511 density-functional theory, 229 diadducts, 369 diamond, 105 dielectric properties, 423 diffraction pattern, 187 diffusion, 567 dimers of C60, [2 + 2] and [4 + 4], 145 1,3-dipoIar cycloadditions, 351 dynamic light scattering measurements, 341
elastic properties, 157, 241, 253 electric field, 61, 235 electrical conductivity, 443 electroluminescence, 451 electron
energy loss spectroscopy (EELS), 47, 301, 307, 493
spin resonance (ESR), 137 electronic
angular momentum, 221 excitations, 301 properties,. 157, 423, 475 structure, 205, 363, 375
ellipsometry, 429 endohedral
fullerene, 23 metallofullerene, 123, 137 metal-oxide, 111
enrichment, fullerene, 567 epitaxial alignment, 399 epitaxy, 375 Epon, 347 eutectic, 561 excited state polarizability, 511 extended Hiickel method, 211
ferromagnetic nanoparticles, 35 field emission, 61, 93, 99
583

film Jahn-Teller gap, 261 growth, 375, 387, 393 quality, 399 kinetic isomer, 369
flagellenes, 335 flame growth, 17, 517 laser fluorescence, 221, 523 desorption time-of-flight mass spectrometry
lifetime, 529 (LD-TOF), 369 spectroscopy, 529 heating, 475, 481, 487
Fourier(-) pyrolysis, 53 imaging, 187 Laue interference, 187 transform infrared spectroscopy (FTIR), light-weight, high-modulus materials, 241
433, 469 localized tunneling states, 411 free long-period structures, 393
carrier screening, 301 low temperature internal friction, 411 radical scavengers, 327 luminescence, 451
friction, 347 fullerene mass spectroscopy, 517
fibers, 61 mechanical alloy with metal, 437 hydrides, 357 methylation, 211 isoxazoline, 369 2-methylaziridine, 347
fullerenol, 327, 331, 341 mica (001), 399 fullerite crystal, 475, 481 MM2 force field, 211
molar extinction coefficient, 523 gas- molecular
liquid transition, 193 dynamics simulations, 157, 199, 217, 235 phase reaction, 111 excitations, 537
Ge60, 175 librations, 537 glass mechanics, 211
matrix, 351 morphology, 29 transition, 549
grain refinement, 437 N60, 175 growth mechanisms, 29, 193, 235 Na3C60, 493
Na6C60, 493 halogenation, 211 nanobundle, 81 3He NMR, 357 nanoparticles, 29, 35, 41, 53, 87 heteroepitaxial growth, 399 nanostraw, 75 heterophase fluctuations, 573 nanotube high carbon, 61, 69, 75, 81, 87, 93, 99, 169, 235,
pressure, 549, 555 241, 247 resolution class, 169
electron microscopy (HREM), 247 connections, 169 transmission electron microscopy end-cap opening, 75
(HRTEM), 47 inorganic, 111 hydrogenation, 211 naphthalene-C6(1 solution, 561 hydrostatic pressure, 285 network formation, 193 hypervelocity collisions, 199 neutron scattering, 335, 537, 543
nitrile oxide, 369 icosahedral point group, 181 noble-metal substrates, 393 image simulations, 247 nonlinear interactions, 451 index gratings, 511 Novolac, 347 inelastic behavior, 199 nuclear magnetic resonance (NMR), 261, 357, infrared (IR) 499, 505
spectroscopy, 319 nucleation, 387 transmission, 295
inorganic fullerene, 111 onion-like carbon, 105 interfacial layers, 387 optical properties, 351, 451 intermolecular vibrations, 493 orbital internal friction, 411 frontier states, 211 inverse photoemission, 375 interaction through bond, 145 iodine-doped C60, 443 order-disorder phase transition, 537 isolated pentagon rule, 3 isomer, 3
organic molecular beam deposition, 417
isotopic effect, 463
584

orientational epitaxy, 393 order, 273 ordering, 181, 537 phase transition, 573 states, 181
orthorhombic phase, 307 oxidants, 75 oxidation, 481, 487 oxygen intercalation, 423, 499, 505
p-T phase diagram, 549 paramagnetic lanthanofullerene, 137 percolation threshold, 387 perhalomethylation, 211 phase
coexistence, 573 diagram, 555
of naphthalene-C60, 561 phosphorescence, 221 photoconductivity, 451 photoemission, 221 photoinduced oxidation, 487 photopolymerized C«0, 307, 493 polycyclic aromatic hydrocarbons, 517 polycyclosulfated C60 derivatives, 331 polyhedral structures, 163 polyhydroxylated fullerene derivatives
(fullerenols), 327, 331 polymer-substituted fullerene, 335 polymerization, 341, 347 polymerized C60, 319 polyurethane networks, 331 porous material, 481 pressure, 261, 289, 555 production, 11, 17 pump-probe experiment, 511
quantitative analysis, 23
Raman spectroscopy, 273, 285, 307, 319, 429, 433, 451, 463, 475, 481, 487, 493
RbC60 thin films, 307 reflectance, 469 rotational dynamics, 505
scanning electron microscopy (SEM), 487 tunneling microscopy (STM), 375
semiempirical electronic structure, 145, 175, 363 separation, 567 Si«„, 175 silicon carbide formation, 405 simulations, molecular dynamics, 157, 199, 217,
235 single-layer nanotube, 69 small-angle neutron scattering (SANS), 335 solar radiation, 11
sol-gel films, 351 solubility behavior, 561 solution, 567 solvent, 523, 529, 543
cavity radius, 543 density excess, 543 dependence, 221
spectral red shift, 523 star-shaped polymer, 341 structural properties, 157, 417, 475 structure, 3, 393
sequence, 313 substrate temperature, 399 superconducting transition temperature, 285, 289 superconductivity, 261, 273, 285, 289, 295 Superoxide free radicals, 327 surface topography, 375 symmetry, 3, 181
breaking, 319 synthesis, 17
temperature dependence, 393 tetramethyldisilene, 363 texture formation, 437 thermal
conductivity, 549, 555 equilibration, 369
thermodynamic model, 573 properties, 253
thin film(s), 295, 351 fullerene films, 393, 411 metal films, 387
tips, 99 toluene, 17 transmission electron microscopy (TEM), 41, 81 transmittance, 469
ultra-disperse diamond, 105 ultraviolet(-)
photoemission spectroscopy (UPS), 307 spectroscopy (UV), 561 visible spectra, 23
up-scaling, 17
vibrational excitations, 301 modes, 469
wear properties, 347
xanthine and xanthine oxidase, 327 x-ray
diffraction (XRD), 273, 285, 313, 405, 437 powder diffraction, 41
Young's modulus, 241
585


![Synthesis and photophysical properties of ruthenocene-[60]fullerene dyads](https://img.dokumen.tips/doc/110x75/63238cbe48d448ffa006b9fd/synthesis-and-photophysical-properties-of-ruthenocene-60fullerene-dyads.jpg)


![Synthesis and Properties of Isoxazolo[60]fullerene−Donor Dyads †](https://img.dokumen.tips/doc/110x75/636160711bb572d28603669d/synthesis-and-properties-of-isoxazolo60fullerenedonor-dyads-.jpg)


