Embed Size (px)
Citation preview

1
Instituto Tecnológico y de Estudios Superiores de Monterrey
Campus Monterrey
School of Engineering and Sciences
Lab-scale modular platform to study coiled-flow inverters (CFI) as candidates for continuous-flow photoreactor units: A case study based on
the oxidative degradation of fluorescein induced by visible light in the presence of ZnO-APTMS-Au micro/nano-particles in aqueous suspension
A thesis presented by
Chinmay Pramodkumar Tiwari
Submitted to the School of Engineering and Sciences
in partial fulfillment of the requirements for the degree of
Master of Science
In
Nanotechnology
Monterrey Nuevo León, December 4th, 2020

4
Dedication
To my parents and my brother, who have always believed in me irrespective of the situation. Mummy, Papa you always have taught us about this noble Sanskrit verse
from Bhagavad Gita -
“कर्मणे्यवाधिकारसे्त र्ा फलेषु कदाचन । र्ा कर्मफलहेतुरु्मर्ाम ते संगोऽस्त्वकर्मधि ॥ “
and told us to believe in performing duty sincerely without expectations of the outcomes, that has strongly motivated me to get going.

5
Acknowledgements
I would heartily thank my advisor Dr. Alan Aguirre Soto, for his constant guidance and support over the time while working. He cheered me when everything went well and continuously motivated me to get going whenever I felt low. He was always there as a mentor and a friend with whom I had a wide range of discussions whenever need be. His sociable nature always welcomed a wide range of intellectual discussions without any hesitations, which I have always cherished and look forward to having more in the coming future. His role in my development has been a special one, and I am truly indebted to him forever for being such a great mentor and look forward to learning under his guidance in the future also.
I would especially like to thank Prof. K.D.P Nigam, who played his role as a mentor monitoring my progress over time and give suggestions whenever need be.
I am also grateful to meet MSc Fernando Delgado Licona, Dr. Enrique A. López Guajardo, Dr. Sara Nunez Correa, and Dr. Alejandro Montesinos for allowing collaborating on projects and allowing to work with them. Working with such excellent researchers and friends had an indelible impact on me, and the learnings from experience will surely guide me for my future professional growth and becoming a better person.
I am also grateful to all the faculty members who taught me over time. Their support and advice were useful and appreciated. I could not imagine having better advisors, better committee members, teachers, and I am truly privileged to have learn under them. I want to dedicate the following Sanskrit verse to my advisors, mentors, and all faculty members seeking their blessings.
गुरुर्ब्मह्मा गु्ररुधवमषु्ुः गुरुदेवो र्हेश्वरुः । गुरुुः साक्षात् परं र्ब्ह्म तसै्म श्री गुरवे नर्ुः ॥
I would like to especially thank Dr. Gaurav Chauhan, Dr. Apurv Chaitanya, Gargi, Didi, Dr. Jogender Singh, and Dr. Hafiz Iqbal for their help over time and always making me feel like at home.
All my friends were the backbone throughout my stay away from my family, and I could not imagine myself without them.
(Aida, Fernando, and his family, Daniel, Kendra, Cynthia, Luis, Valeria, Martin, Pedro, Osamu, Maria, Niloufar, Zeinab, all my friends from India and many others)
Without the financial support of Tecnologico de Monterrey and CONACyT, this work would have never been possible.
6
Lab-scale modular platform to study coiled-flow inverters (CFI) as candidates for continuous-flow photoreactor units: A case study
based on the oxidative degradation of fluorescein induced by visible light in the presence of ZnO-APTMS-Au micro/nano-particles in
aqueous suspension
by
Chinmay Pramodkumar Tiwari
Abstract Visible light-driven continuous-flow photochemistry has gained widespread recognition lately and is employed in many innovatively designed photoreactors. Out of the two main categories, slurry reactors are found to have a better reputation in terms of achieving competitive photon efficiencies when compared to immobilized catalyst type reactor designs. However, several obstacles had stalled the broad-scale implementation of this beneficial process. A few of the main imminent challenges include combating light attenuation by better mixing in continuous-flow of the suspension to allow the use of the higher photocatalyst content and require lower photon consumption. Also, the difficulties in the fabrication of intricate glass-based photoreactor designs are one of the significant challenges. An inherently better-designed reactor which deals with the common problems of conventional photoreactors is required. This thesis presents a flexible platform to study photoreactors, where a coiled flow inverter—a well-established static mixer design— is used as a micro/milli-fluidic device. The CFI is incorporated as a photoreactor for the first time for a continuous flow photodegradation study of an organic model pollutant, fluorescein, with ZnO catalyst functionalized with APTMS and Au nanoparticles to make it visible-light absorptive. Flow inversions leading to chaotic advection occurring in the CFI combats light attenuation. Due to superlative mixing coupled with a highly efficient visible light source, our photo-CFI stands to be in top slurry reactor designs as per the recently established PSTY benchmark, valued at 2.97×10⁻² (m3 treated water day-1 m-
3 reactor kW-1). A brief study on the uni- and multi-axial light arrangement for complex geometries was used to analyze the effect of geometry/lighting arrangement and ensure uniform irradiation of the photo-CFI. A discussion of dye-degradation products surface interaction with photocatalyst was carried out to analyze possible explanations for an observed destabilization of the suspension during reaction, leading to depositions in the reactor. SLA based additive manufacturing is tested and projected to be a superior alternative for rapid prototyping of intricate transparent photoreactor designs in lieu of conventional glass blowing techniques of complex geometries such as those required for static mixers like the photo-CFI.
7
List of Figures Figure 1. 1 Typical bandgap energies of some MOS presented and relationship between their band gap and wavelength (figure adapted from Riente et al.72) ................................................................................. 25 Figure 1. 2 Relation of Distance into the medium and Mixing with % Transmittance ................................ 29 Figure 1. 3 Plot of PSTY vs STY for various designs, highlighting the top three designs in Slurry and Immobilized reactor category ...................................................................................................................... 36 Figure 1. 4 Schematic of photocatalytic membrane reactor system with visualization of crossflow ceramic membrane (Image adapted from Benotti et al.38,Llorca et al.,64) ................................................................ 37 Figure 1. 5 Schematic of continuous magnetic stirred tank reactor (Image adapted from Vela et al.39) ... 39 Figure 1. 6 CFI in the categorization of Micromixers (Image adapted from Vural Gürsel et al. 65) along with the visualization of flow inversion due to bending in a coil (Image adapted from Vashisth,S et al.66) 40 Figure 1. 7 Schematic image along with the picture of the photocatalytic reactor and also a visualization of flow and light propagation through the reactor (Image adapted from Claes et al.49) .............................. 43 Figure 1. 8 (a) Schematic of experimental apparatus along with the lamp arrangements used for the study (Image adapted from Yatmaz et al. 50) (b) Comparison of bubbles sizes formed in gas-liquid photochemical SDR system with the RPM pointing towards the effective mass transfer (Image adapted from Chaudhuri et al. 71) .............................................................................................................................. 45 Figure 1. 9 Experimental set up for PBR (Image adapted from Vaiano et al.51) ........................................ 48
Figure 2. 1 Lighting configurations for photoreactors. a) Batch photoreactor, b) Continuous-flow photoreactor, c) Micro-photoreactor, and d) Coiled-flow inverter presented herein. .................................. 63 Figure 2. 2 Modular platform for the study of coiled-flow inverters (CFI’s) as photoreactors, continuous-flow set-up, platform dimensions and model CFI specifications. ................................................................ 67 Figure 2. 3 Fluorescence imaging for the visualization of spatial gradients in irradiance on the outer surface of the photo-CFI. Image analysis shown in red scale for each photograph. .................................. 72 Figure 2. 4 a) Wide-angle visible-light LED source; b) Measurements of visible-light intensity at different locations inside the reaction chamber for uniaxial top-down irradiation. .................................................... 75 Figure 2. 5 Degradation of fluorescein induced by visible light in the presence of ZnO-APTMS-Au. a) Decay of fluorescence emission as a result of fluorescein degradation. b) Normalized decay in the concentration of the fluorescein model contaminant as a function of time. c) Proposed mechanism for the photoinduced production of reactive oxygen species (ROS) from ZnO-APTMS-Au nanoparticle. ............ 77
Figure 3. 1 Proposed mechanism (equations below) for photocatalytic degradation of fluorescein induced by visible-light in presence of ZnO-APTMS-Au particles where charge separation drives the formation of reactive oxygen species, highlighting the proposed role of the binding of the model contaminant to the photocatalyst surface and associated destabilization of the suspension. .................................................. 90 Figure 3. 2 a) Representation of fluid mixing and flow inversion b) Observed sedimentation initially versus towards the end of photodegradation reaction c) Representative figure (inspired by Kurt et al.15) for single-particle (in red star shape) tracking with high-speed camera (200 fps) for analyzing the radial movement in helical coil tube with respect to time. The inner wall region (marked ‘-‘) and the outer wall region (marked ‘+’) of the tube are separated by the dotted line. Fc indicates the direction of the centrifugal force that is perpendicular to the flow direction. ................................................................................................... 93 Figure 3. 3 FTIR spectra comparison for ZnO (commercial), ZnO_APTMS_Au (Before degradation) and ZnO_APTMS_Au (After degradation) indicating variation in peaks ............................................................ 97 Figure 3. 4 a. Incongruity in linear fit for pseudo first order ln(F/F0) vs. t curve for degradation curve and control experiments (F=Concentration in mol/lit of fluorescein at time t, F0=Initial fluorescein concentration in mol/lit) b. Pseudo second order fit 1/F (lit/mol) vs t (time) for degradation curve and control experiments c. Pseudo second order linear plots [1/F (lit/mol) vs t (time)] with varying kinetics at different time intervals for dye degradation using ZnO-APTMS-Au as photocatalyst d. UV-VIS spectra for fluorescein degradation with respect to time [consisting of both Fl (~521nm) and FL anion dimer peak (~551 nm)] ....................... 99
8
Figure 3. 5 Previously proposed mechanism for the complete degradation of Xanthene dyes, e.g. fluorescein from observations by Yu et al.17,Ou et al.18, and He et al.24 ................................................... 104
Figure 4. 1 Visualization of the superiority of SLA over FDM .................................................................. 116 Figure 4. 2 Explanation of XY-plane resolution and Z- resolution for Formlabs Form 2 .......................... 120 Figure 4. 3 Effect of surface roughness on light scattering ...................................................................... 123 Figure 4. 4 a) Qualitative and b) Quantitative difference between Unprocessed and Post-processed printed parts (preliminary experiments) .................................................................................................... 126 Figure 4. 5 Relationship between optical scattering (TIS) and surface roughness (RMS) (at 𝜃𝑖 =60, 𝜆 =450 𝑛𝑚, R0 =0.2, T=0.8, A=0).................................................................................................................... 128
Figure S 1 FTIR spectrum of the ZnO functionalized with APTMS. ......................................................... 139 Figure S 2 UV-vis spectra of aqueous ZnO-APTMS-Au/Fluorescein solutions with fluorescein concentrations of 10 μM and 1 μM. ........................................................................................................... 140 Figure S 3 Blueprints of: a) Front and back panels; b) Side panels; c) Top panel (light source inlet) and d) Base panel (for the reaction chamber and monitoring chamber. .............................................................. 141 Figure S 4 Different views of the modular photocatalytic platform with CFI. ........................................... 141 Figure S 5 Sedimentation and deposition of the catalyst at flow rates below 80 mL/min. ....................... 142 Figure S 6 Orange tint on CFI wall due to the formed by-product and low degradation. ......................... 142 Figure S 7 Algorithm for the design and operation of the continuous photocatalytic platform ................. 143

9
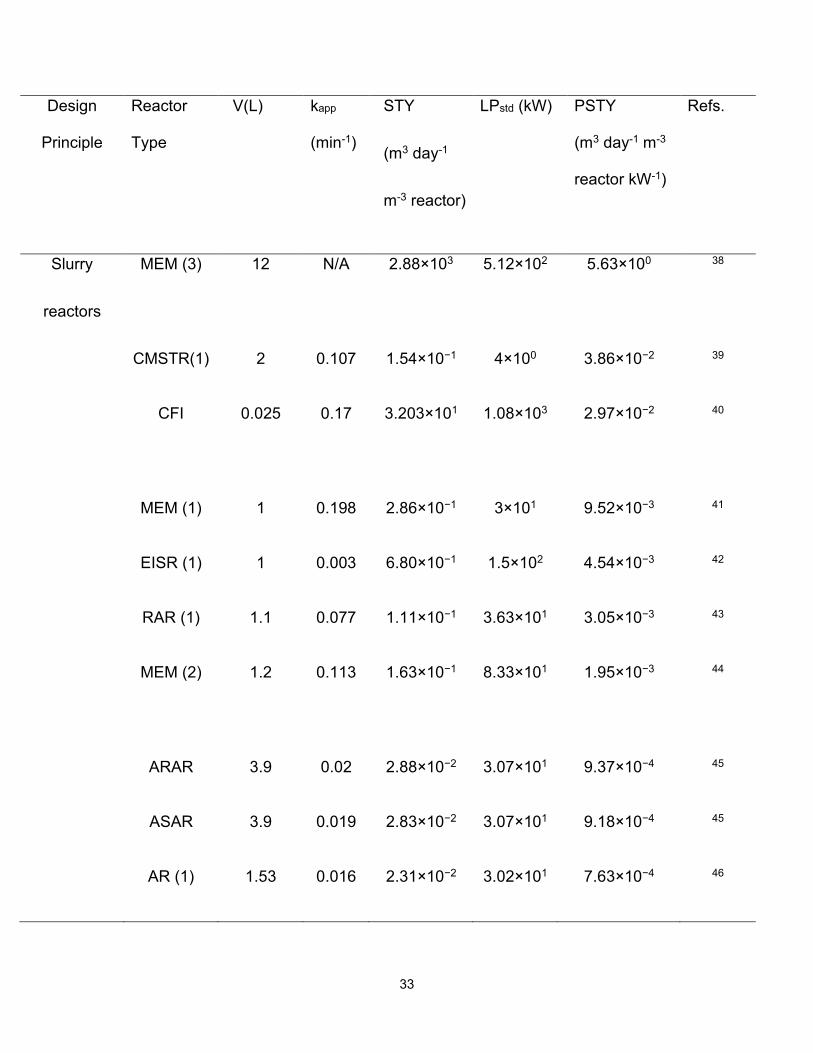
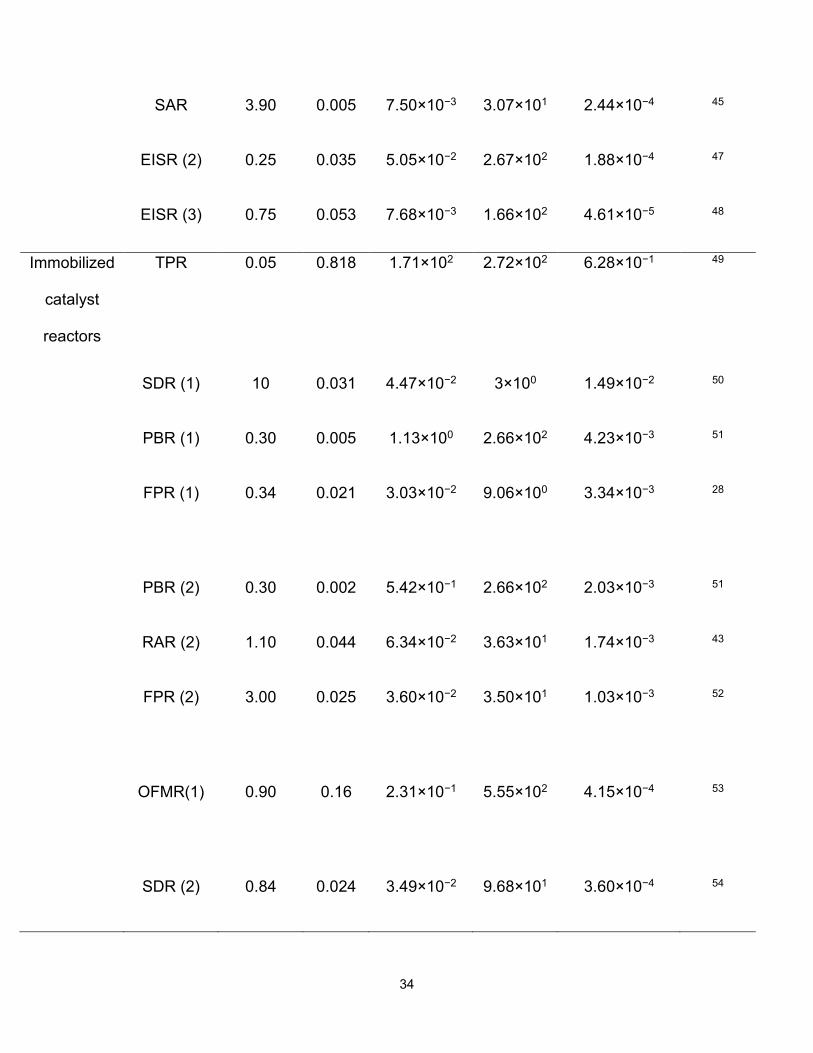
List of Tables Table 1. 1 Bond dissociation energies for organic molecule bonds (adapted from Blanksby et al.8) ........ 15 Table 1. 2 The comparison between various designs of photocatalytic reactors with respect to their PSTY values .......................................................................................................................................................... 32
Table 3. 1 Rate constant values for various phases with respect to time intervals .................................. 101
Table 4. 1 Comparison of various techniques for transparent fluidic devices fabrication ........................ 114
10
Contents
Abstract ........................................................................................................................ 6 List of Figures .............................................................................................................. 7 List of Tables ................................................................................................................ 9 1. Introduction ............................................................................................................ 13
1.1 Context and Problem Statement ....................................................................... 13 1.2 Hypothesis ........................................................................................................ 18 1.3 Research Objective .......................................................................................... 18 1.4 Thesis Overview ............................................................................................... 19 1.5 Theory and State of the Art ............................................................................... 20
1.5.1 Concepts of Photochemistry and Photochemical engineering .................... 22 1.5.1.1 Quantum efficiency............................................................................... 22 1.5.1.2 Photonic efficiency ............................................................................... 22 1.5.1.3 Apparent reaction rate .......................................................................... 22 1.5.1.4 Molar absorptivity ................................................................................. 23 1.5.1.5 Pathlength ............................................................................................ 24 1.5.1.6 Excited States ...................................................................................... 24 1.5.1.7 Photoinduced electron transfer (PET) .................................................. 24 1.5.1.8 Fluorescence ........................................................................................ 24 1.5.1.9 Metal oxide Semi-Conductor (MOS) Photocatalysis ............................ 24 1.5.1.10 Space Time ........................................................................................ 25 1.5.1.11 Static Mixers ....................................................................................... 26 1.5.1.12 Residence time .................................................................................. 26 1.5.1.13 Reynolds number (Re) ....................................................................... 26 1.5.1.14 Dean number (De).............................................................................. 27 1.5.1.15 Damköhler number (Da) ..................................................................... 27 1.5.1.16 Photocatalytic space-time yield (PSTY) ............................................. 27
1.5.2 Common obstacles and possible solutions in Photocatalytic systems........ 29 1.5.2.1 Light Attenuation and Homogeneity ..................................................... 29 1.5.2.2 Mixing ................................................................................................... 30 1.5.2.3 Low productivity ................................................................................... 30
11
1.5.2.4 Photocatalyst separation/recovery ....................................................... 31 1.5.2.5 Efficiencies/Effectivity of light sources used ......................................... 32
1.5.3 Highly effective designs as per PSTY for slurry and immobilized catalyst reactors ............................................................................................................... 35
1.5.3.1 Slurry reactors ...................................................................................... 36 1.5.3.2 Immobilized catalyst reactors ............................................................... 41
1.6 CONCLUSIONS ............................................................................................... 49 2. Shining light on the coiled-flow inverter – Continuous-flow photochemistry in a static mixer .......................................................................................................................... 61
2.1 INTRODUCTION .............................................................................................. 62 2.2 MATERIALS AND METHODS .......................................................................... 65
2.2.1 Materials ..................................................................................................... 65 2.2.1.1 Chemicals ............................................................................................ 65 2.2.1.2 Materials for the construction of the modular fluidic platform ............... 65 2.2.1.3 Light sources, on-line spectrophotometer, and power meter ................ 65
2.2.2 Methods ...................................................................................................... 66 2.2.2.1 Synthesis of ZnO-based visible-light photocatalyst .............................. 66 2.2.2.2 Spectroscopic characterization of photocatalyst nanoparticles ............ 66 2.2.2.3 Preparation of the ZnO-APTMS-AU/Fluorescein solution .................... 66 2.2.2.4 Fabrication of the customizable modular platform ................................ 68 2.2.2.5 Hydrodynamics control tests ................................................................ 68 2.2.2.6 Reactor cleaning protocol ..................................................................... 69 2.2.2.7 Multiaxial irradiation test ....................................................................... 69
2.3 RESULTS AND DISCUSSION ......................................................................... 70 2.3.1 Coiled-flow inverters for photochemical reactions ...................................... 70 2.3.2 Visualization of spatial gradients using fluorescence imaging .................... 72 2.3.3. Single source wide-angle lighting configuration with reflective surfaces .... 73 2.3.4 Photodegradation of fluorescein by ZnO-APTMS-Au nanoparticles in CFI 75 2.3.5 Photochemical Space-Time Yield with a “Photo-CFI” ................................. 79
2.4 CONCLUSIONS ............................................................................................... 80 3. Reaction-induced destabilization of aqueous suspensions of ZnO-APTMS-Au microparticles during photocatalytic degradation of fluorescein in Coiled-flow Inverter ................................................................................................................................... 86
12
3.1 INTRODUCTION .............................................................................................. 87 3.2 MATERIALS AND METHODS .......................................................................... 91 3.3 RESULTS AND DISCUSSION ......................................................................... 91
3.3.1 Destabilization of ZnO-APTMS-Zu aqueous suspension in photo-CFI ....... 91 3.3.2 Dye-particle interactions ............................................................................. 94 3.3.3 Reaction kinetics ........................................................................................ 98 3.3.4 Changes in the dynamics of the solution-surface interface ...................... 105
3.4 Conclusions .................................................................................................... 106 4. Towards glass-like transparency in SLA 3d-printed hollow parts for fluidic devices ................................................................................................................................. 112
4.1 INTRODUCTION ............................................................................................ 113 4.2 MATERIALS AND METHODS ........................................................................ 116
4.2.1 Materials ................................................................................................... 116 4.2.2 Methods .................................................................................................... 117
4.2.2.1 Standard post-processing steps ......................................................... 117 4.2.2.2 Transparency evaluation .................................................................... 118
4.3 RESULTS AND DISCUSSION ....................................................................... 118 4.3.1 Transparency of 3D printed objects using the standard procedure .......... 118
4.3.1.1 Impact of geometrical orientation and supports features .................... 118 4.3.1.2 Impact of washing protocol ................................................................. 120 4.3.1.3 Impact of post-curing and thermal treatment ...................................... 121
4.3.2 Improving the standard transparency with additional surface treatments . 122 4.3.3 The fundamental explanation behind the observation (Surface roughness) .......................................................................................................................... 126
4.4 CONCLUSIONS ............................................................................................. 128 5. Summary and Future Work .................................................................................. 134
5.1 Summary ........................................................................................................ 134 5.2 Future work ..................................................................................................... 135
Appendix A: Nomenclature ...................................................................................... 137 Appendix B: Supplementary Information for Chapter 2 ............................................ 139 Appendix C: Published Work ................................................................................... 144
13
Chapter 1
1. Introduction 1.1 Context and Problem Statement
From the genesis of the industrial revolution, as technology advanced and people
started using fossil fuels, air/water pollution have slowly become one of the grave issues
faced by humanity today. As of present, there is no sign of the proper damage control. Air
pollution-related premature deaths account for 7 million people, and water pollution-
related deaths, explicitly diarrheal deaths, account for close to 1 million as per reports
from the World Health Organization. Many diseases are caused by water and air pollution,
namely cholera, diarrhea, typhoid, hyperreactive airway diseases like rhinosinusitis,
allergic rhinitis, pharyngitis, and sometimes leading to asthma, are becoming very
common.1 Apart from developing new technologies to make inherently safer processes
which are less/non-polluting, it is also necessary to be less reliant on the conventional/
non-renewable sources of energy. Strong emphasize should be laid on the usage of
sustainable renewable energy sources to curb down the generation of pollutants by
developing techniques following principles of green chemistry.
One such perennial energy source is the Sun, and the functioning of our planet and
the living entities in it directly or indirectly depend on the effect of sunlight, which has
played a significant role in day-to-day processes and the evolution of life forms. During
the brink of the industrial revolution, one of the other exciting fields based on the sunlight
and chemical interactions, i.e., photochemistry, was found and paving its way.
The contribution of photochemistry to basic research since its inception is
undeniable— from peering into the nature of molecular orbitals to elucidating the
14
interactions between photons and matter. Nevertheless, it took several decades for some
photochemical processes to permeate into industrial applications, such as the light-
induced polymerization of coatings,2 sealants and adhesives,3 the lithographic
reproduction of digital patterns for electronics,4 and the synthesis of intermediate to final
chemical products5 (solvents, polymers, specialties, and pharmaceuticals). While the
advantages provided by light have been exploited in these applications— namely
spatiotemporal control of chemical reactions, access to free radical chemistry, and access
to otherwise unavailable isomers—, their development and adoption have generally been
halted by the challenge of engineering appropriate reaction systems that can compete
with thermal-activated chemical processes in terms of efficiency and productivity.6 This
advantage explains why most of these examples rely on free radical chemistry, leveraging
its chain reaction nature to counteract photon generation and transfer's compounded
efficiency drawbacks. Additionally, some of the final products' relatively high cost may
balance out the added expense that comes from the photonic activation.
Today, as efficiency has become a central topic in virtually every aspect of
engineering and science, an ever-expanding plethora of high-efficiency light sources,
chemical processing operations, and materials are being developed. This has lowered
the hurdle for the adoption of light-induced chemical processes for industrial applications
on large scales. Besides, the associated societal strive for more stringent environmental
regulations to battle some of the initial consequences of climate change have further
fueled research and development of lower-carbon footprint chemical processes.
However, it remains challenging to translate novel photochemical processes from basic
research or small-scale to large-scale implementation.
15
Photochemical processes are generally integrated by a light source, a reaction
medium, and a reactor. The light sources can be divided into natural (sunlight) or artificial,
where the goal in terms of a “net-zero” chemical process is to harness the energy from
the Sun directly. However, artificial light sources are increasingly becoming more and
more efficient, mainly driven by the success of light-emitting diodes' (LED’s). High-
efficiency light sources have been paramount in lowering the barrier for adopting some
photochemical processes, given that it provides a solution to the intermittency of natural
light. The light sources can then be further classified in terms of their wavelength range.
Monochromatic light sources are seldom preferred. Polychromatic light sources with an
emission ranging from the UV (100-380 nm) to the visible range (380-780 nm) of the
electromagnetic spectrum are most common. Industrially, the use of UV light has been
more broadly adopted since at least the 1970’s.7That is mostly related to the access to
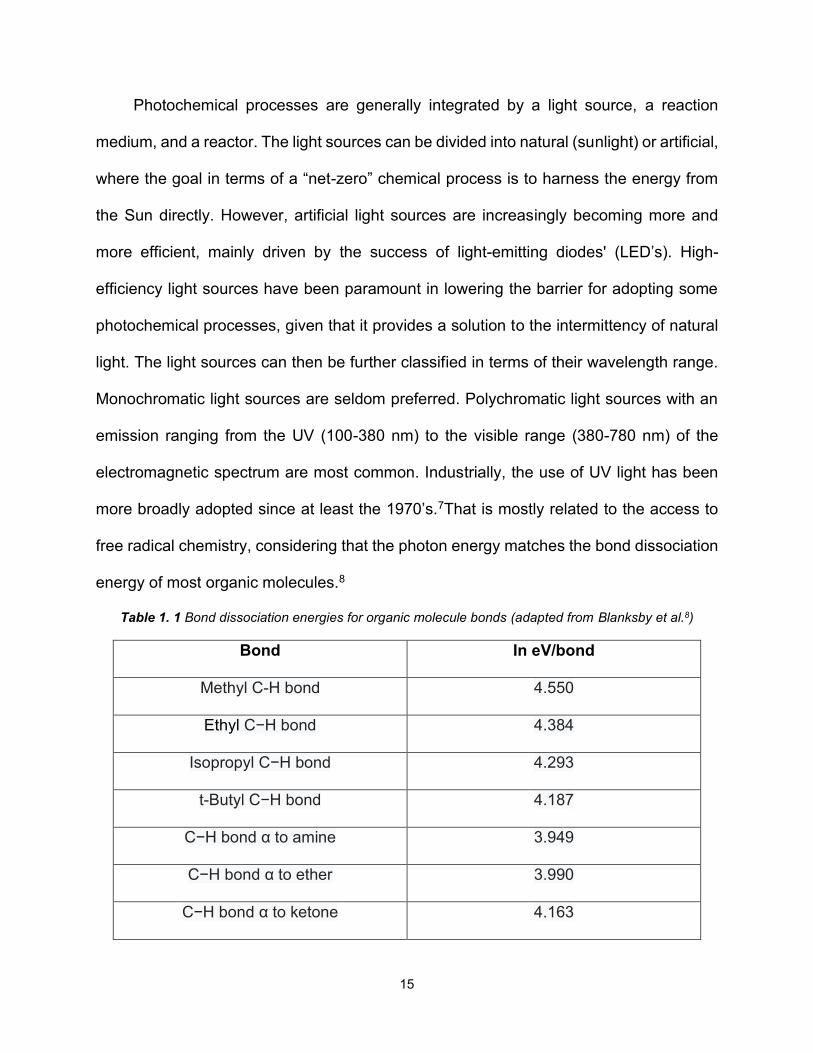
free radical chemistry, considering that the photon energy matches the bond dissociation
energy of most organic molecules.8
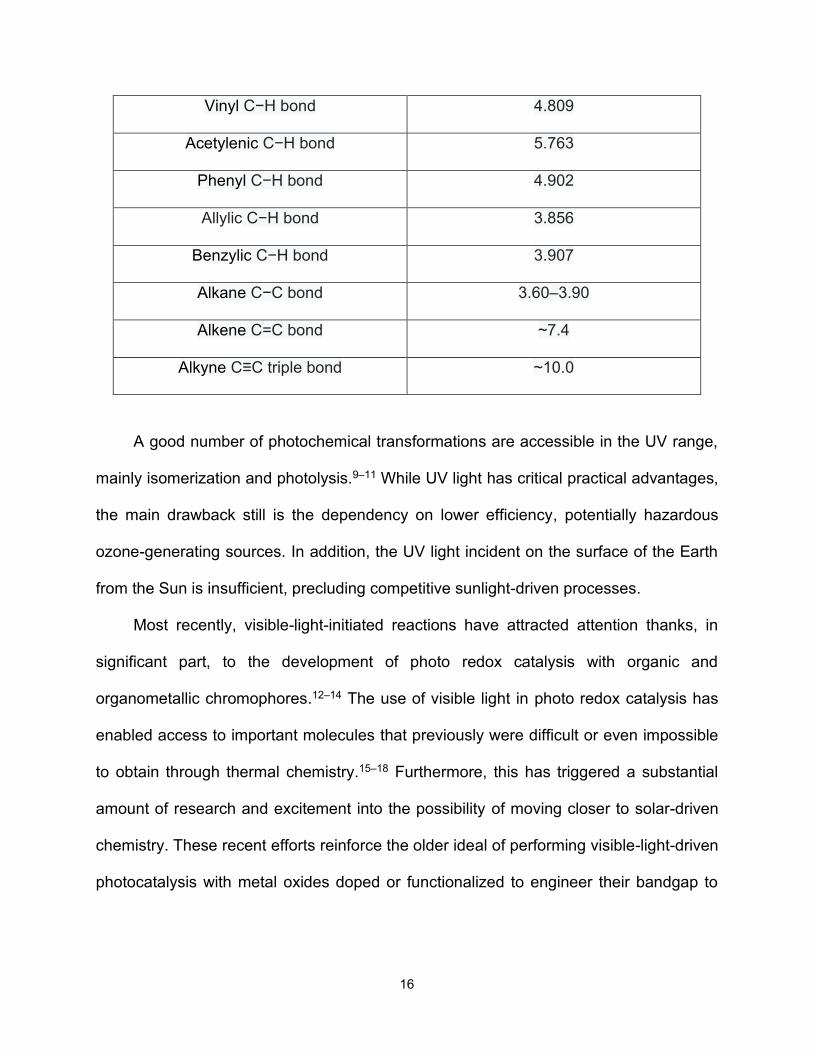
Table 1. 1 Bond dissociation energies for organic molecule bonds (adapted from Blanksby et al.8)
Bond In eV/bond
Methyl C-H bond 4.550
Ethyl C−H bond 4.384
Isopropyl C−H bond 4.293
t-Butyl C−H bond 4.187
C−H bond α to amine 3.949
C−H bond α to ether 3.990
C−H bond α to ketone 4.163
16
Vinyl C−H bond 4.809
Acetylenic C−H bond 5.763
Phenyl C−H bond 4.902
Allylic C−H bond 3.856
Benzylic C−H bond 3.907
Alkane C−C bond 3.60–3.90
Alkene C=C bond ~7.4
Alkyne C≡C triple bond ~10.0
A good number of photochemical transformations are accessible in the UV range,
mainly isomerization and photolysis.9–11 While UV light has critical practical advantages,
the main drawback still is the dependency on lower efficiency, potentially hazardous
ozone-generating sources. In addition, the UV light incident on the surface of the Earth
from the Sun is insufficient, precluding competitive sunlight-driven processes.
Most recently, visible-light-initiated reactions have attracted attention thanks, in
significant part, to the development of photo redox catalysis with organic and
organometallic chromophores.12–14 The use of visible light in photo redox catalysis has
enabled access to important molecules that previously were difficult or even impossible
to obtain through thermal chemistry.15–18 Furthermore, this has triggered a substantial
amount of research and excitement into the possibility of moving closer to solar-driven
chemistry. These recent efforts reinforce the older ideal of performing visible-light-driven
photocatalysis with metal oxides doped or functionalized to engineer their bandgap to
17
harness lower energy photons. Our primary focus is on photoreactors and photocatalysts
compatible with visible-light photochemistry.
The reactor design and materials are analyzed for some of the photochemical
processes with the highest efficiencies. The effect of reactor design on efficiency has
arguably received the most attention from researchers in the field. The latter stems
arguably from the growing interest in photochemistry from researchers working in process
engineering and intensification. Hence, a substantial fraction of the latest reports on the
topic delves into the hydrodynamics analysis and the photon transfer as a function of
reactor geometry.19,20 Experiments and simulations have been utilized in several
instances to investigate how these aspects impact the overall efficiency of the process.21
Importantly, this needs to be done for standard photocatalysts and formulations to isolate
the reactor architecture's effect. Therefore, the connection to the intricacies of
photochemistry are often lost. The success of continuous-flow processes for the
intensification of thermal reactors and separations units has also contributed to the higher
focus on reactor design. Microreactors have been previously reviewed more extensively,
and the productivity is generally more difficult to increase with such low volumes even if
operating under continuous flow. Photoreactors are available in varying volumes, but
reactor designs operating with volumes of milli-liters or higher should be given more
attention solely due to their higher productivity while keeping the advantages of
microreactors intact in terms of conversions versus photon utilization. The materials used
for photoreactor construction remain generally overlooked.22,23 Fabrication of complex
geometries at different scales poses a fair deal of complexities and increases the cost.
18
We will briefly comment on the opportunities to explore materials science and engineering
for photochemical process design.
1.2 Hypothesis
There have been numerous photocatalytic studies operated in relatively simpler
photoreactors' designs in both continuous and batch mode, some being effective and
others not due to the limitations in their inherent design. Our hypothesis is based on these
studies as we aim to work with a novel complex static mixer design - a coiled flow inverter
for continuous flow photochemistry. It has been proven to be a highly efficient reactor for
multiple types of reactions owing to its superlative mixing by eddy generation. Suppose
this superior design of reactor is operated with a visible light absorptive catalyst and
complemented by a custom-made platform with a reflective surface. In that case, the
photon efficiencies of the overall system should be significantly high as the reactor's
design directly combats the problems of light attenuation by mixing and relatively higher
productivity as operated at milli-scale. We also aim to use a highly efficient visible LED
light source for driving our reaction, thereby operating the process at higher photonic and
electrical efficiencies. We also hypothesize the usage of the SLA additive manufacturing
technique for rapid prototyping of geometrically complex photoreactors, such as the CFI,
by achieving higher transmissions equivalent/close to transparent materials.
1.3 Research Objective
Our long-term goal is to aid in adopting continuous-flow photochemical processes
as a greener, safer, and more efficient alternative to thermally driven chemical processes.
It shall be achieved by having more flexibility in operations, by incorporating specifically
19
tailored photocatalytic micro/milli-fluidic platforms and employing additive manufacturing
technology.
1.3.1 Specific Objectives
With that in mind, we deal with the following specific objectives:
1) Scrutinizing the efficiency of a coiled flow inverter (CFI - static mixer) as a
photoreactor in a highly flexible custom-made micro/milli-fluidic platform under
visible light as a driving force. Functionalizing the metal oxide for making an
effective visible light absorptive photocatalyst, to be characterized and utilized for
the photo-degradation of a model pollutant, fluorescein. Implementation of online
monitoring with fluorescence spectrometry for the reaction. Identification of a close
to ideal light arrangement for CFI (relatively a complex design). Comparison of a
CFI with other designs of photoreactors on a recently established metric (PSTY)
for its efficiency.
2) Discussion of the possible interactions with the photocatalyst surface
leading to any instabilities in the system.
3) To evaluate the usage of SLA 3d printing technique for making glass like
transparent micro/milli-fluidics which can be utilized for rapid prototyping of various
complex designs. Identify effect of different post-processing techniques on the
subject.
1.4 Thesis Overview
20
This document has been divided into different chapters, of which the summary is
described below:
Chapter 2 presents the study of continuous flow photochemistry (photodegradation)
in a coiled flow inverter design (static mixer) carried out on a milli-fluidic platform for
effective light utilization and achieving higher photon efficiencies.
Chapter 3 presents the continuation of the study carried out in chapter 2. It
emphasizes more on the different possibilities of model pollutant-photocatalyst interaction
during the photodegradation leading to the settling of photocatalyst
Chapter 4 discusses the insights for achieving transparency in SLA 3d printed
micro/milli-fluidics devices, complementing the study's preliminary results (yet not
completed.)
Chapter 5 presents a summary of the key findings throughout the thesis work
conducted and future direction and scope.
1.5 Theory and State of the Art
Here, in the state-of-the-art, photoreactor design is discussed as a mean to bring
attention to some of the most challenging aspects precluding the adoption of
photochemical processes, namely efficiency and productivity. We aim at complementing
previous reviews on the subject by highlighting undermentioned aspects, such as the
consideration of the photochemistry in addition to the hydrodynamic and irradiation
schemes.6,24,25 The majority of the present exemplary photoreactors were found to be
proposed for the photo-oxidative degradation of organic molecules using semiconductor
photocatalysis. The latter stems primarily from the older age of metal oxide photocatalysis
21
as compared to photo redox catalysis and the principle that chain reactions are both
thermodynamically and kinetically favorable, which aids the productivity of the overall
process.
The reaction mediums that are covered in the discussion in this section are mostly
multiphase. Given that most photoreactors were developed primarily for semiconductor
photocatalysis, the media is inherently a combination of at least two distinct phases,
typically liquid-solid. Reactors of this sort are now dominantly operated in a continuous
flow to sustain competitive productivities (throughout) with low working volumes to exploit
the principle of process intensification by down-scaling. From this point of view, the
reactors may be classified in terms of whether the solid phase (photocatalyst) is
immobilized or suspended in the reacting medium. Previous papers have reviewed the
effect of catalyst immobilization for some of the most common metal oxides. However,
the analysis has heavily centered around the hydro- and photon dynamics effects, without
much connection to the complex heterogeneous chemistry occurring at the catalyst
surface. Slurry flow reactors where an aqueous suspension of the photocatalyst is
continuously irradiated has been documented to provide substantial benefits in terms of
efficiency. This observation is analyzed herein to connect the hydro- and photon
dynamics with the complexity of the Langmuir-Hinshelwood type reaction mechanisms,
where many questions remain around the interaction between the organic molecules and
the photocatalysts.
A unique comparative paradigm must be there for an evaluative study of various
designs of photocatalytic reactors. A few criteria which have been employed more often
in the past studies are useful and serve the purpose to a certain extent, but they can't be
22
termed flawless. Certain limitations aren't considered in those criteria.6,24 In section 1.5.1,
are mentioned the definitions from the literature related to photochemistry and
photochemical engineering which are widely used in the field and some of them are going
to be useful in the current work in the chapters 2,3 and 4. A brief overview of the specific
formulation that has been used to benchmark the latest photoreactors is also included.
1.5.1 Concepts of Photochemistry and Photochemical engineering
1.5.1.1 Quantum efficiency
One of the elementary criteria used for the comparison of the photochemical reactor
designs is the quantum yield 𝛷. It is defined as the number of events of interest occurring
per photon absorbed by the system.3 It can be expressed as below:
𝛷 [𝑚𝑜𝑙
𝑒𝑖𝑛𝑠𝑡𝑒𝑖𝑛] =
𝑛𝑢𝑚𝑏𝑒𝑟 𝑜𝑓 𝑟𝑒𝑎𝑐𝑡𝑎𝑛𝑡 𝑐𝑜𝑛𝑠𝑢𝑚𝑒𝑑 𝑜𝑟 𝑝𝑟𝑜𝑑𝑢𝑐𝑡 𝑓𝑜𝑟𝑚𝑒𝑑 [𝑚𝑜𝑙]𝑎𝑚𝑜𝑢𝑛𝑡 𝑜𝑓 𝑝ℎ𝑜𝑡𝑜𝑛𝑠 𝑎𝑏𝑠𝑜𝑟𝑏𝑒𝑑 [𝑒𝑖𝑛𝑠𝑡𝑒𝑖𝑛]
1.5.1.2 Photonic efficiency
Other one being photonic efficiency. It's expressed by,
Ep= 𝑅𝐴
× 𝑧 × 100 (1)
where 𝑧 refers to the number of transferred electrons per target molecule for degradation,
R refers to the reaction rate in (mol L-1 s-1), 𝐴 refers to photon flux (mol L-1 s-1) and Ep
being the photonic efficiency (dimensionless). Quantum yield mainly exhibits the
efficiency of reactor design for light utilization.24,26,27
1.5.1.3 Apparent reaction rate
23
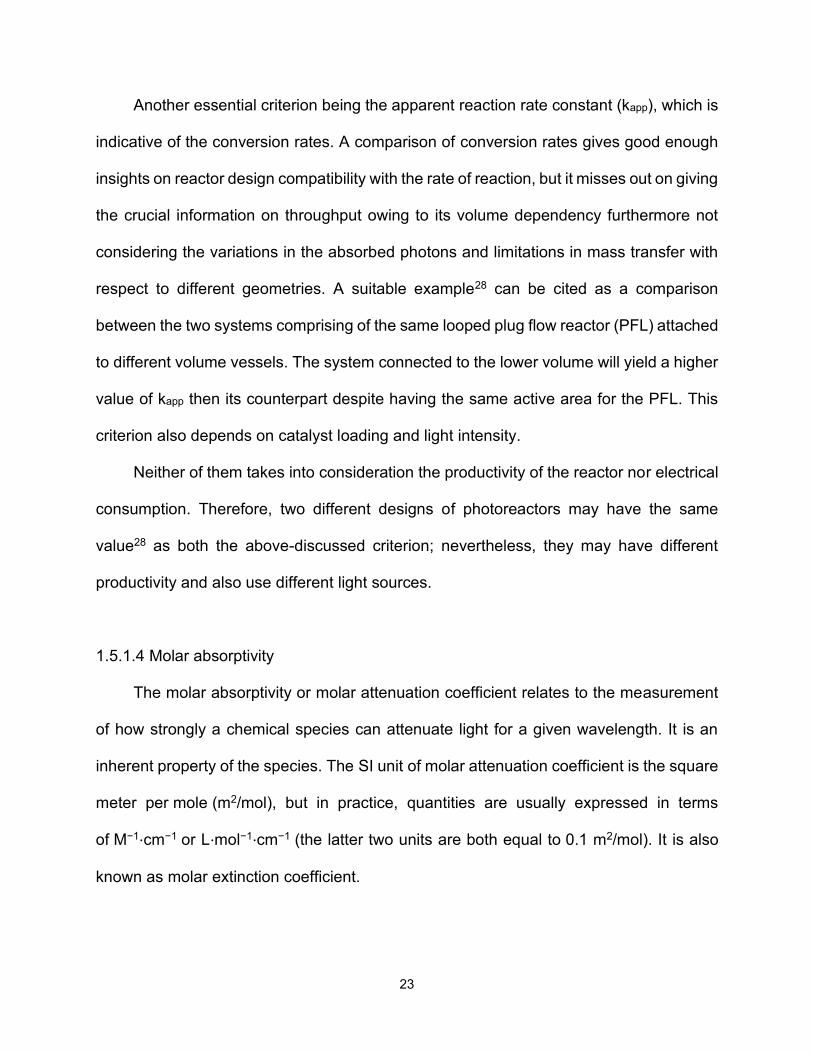
Another essential criterion being the apparent reaction rate constant (kapp), which is
indicative of the conversion rates. A comparison of conversion rates gives good enough
insights on reactor design compatibility with the rate of reaction, but it misses out on giving
the crucial information on throughput owing to its volume dependency furthermore not
considering the variations in the absorbed photons and limitations in mass transfer with
respect to different geometries. A suitable example28 can be cited as a comparison
between the two systems comprising of the same looped plug flow reactor (PFL) attached
to different volume vessels. The system connected to the lower volume will yield a higher
value of kapp then its counterpart despite having the same active area for the PFL. This
criterion also depends on catalyst loading and light intensity.
Neither of them takes into consideration the productivity of the reactor nor electrical
consumption. Therefore, two different designs of photoreactors may have the same
value28 as both the above-discussed criterion; nevertheless, they may have different
productivity and also use different light sources.
1.5.1.4 Molar absorptivity
The molar absorptivity or molar attenuation coefficient relates to the measurement
of how strongly a chemical species can attenuate light for a given wavelength. It is an
inherent property of the species. The SI unit of molar attenuation coefficient is the square
meter per mole (m2/mol), but in practice, quantities are usually expressed in terms
of M−1⋅cm−1 or L⋅mol−1⋅cm−1 (the latter two units are both equal to 0.1 m2/mol). It is also
known as molar extinction coefficient.
24
1.5.1.5 Pathlength
The optical path length is given by the product of the geometric length (in m) of
the path followed by light through a given system, and the refractive index of
the medium through which it propagates.
1.5.1.6 Excited States
An excited state of a system (as in atoms, molecules, or nucleus) is any quantum
state of the system that has a higher energy as compared to the ground state (also
knowns as absolute minimum energy state). Excitation relates to an elevation in the
energy above the baseline energy state.
1.5.1.7 Photoinduced electron transfer (PET)
An excited state generated by high energy photon absorption leading to an electron
transfer process in which excited electron is transferred from the donor to acceptor is
known as photoinduced electron transfer (PET). Charge separation (redox reaction)
generated from PET leads to initiation of many chemical transformations.
1.5.1.8 Fluorescence
When the electromagnetic radiation is absorbed by a substance, it emits the lower
energy radiation. This emission of lower energy wavelength (light) is known as
Fluorescence and it belongs to the category of luminescence.
1.5.1.9 Metal oxide Semi-Conductor (MOS) Photocatalysis
25
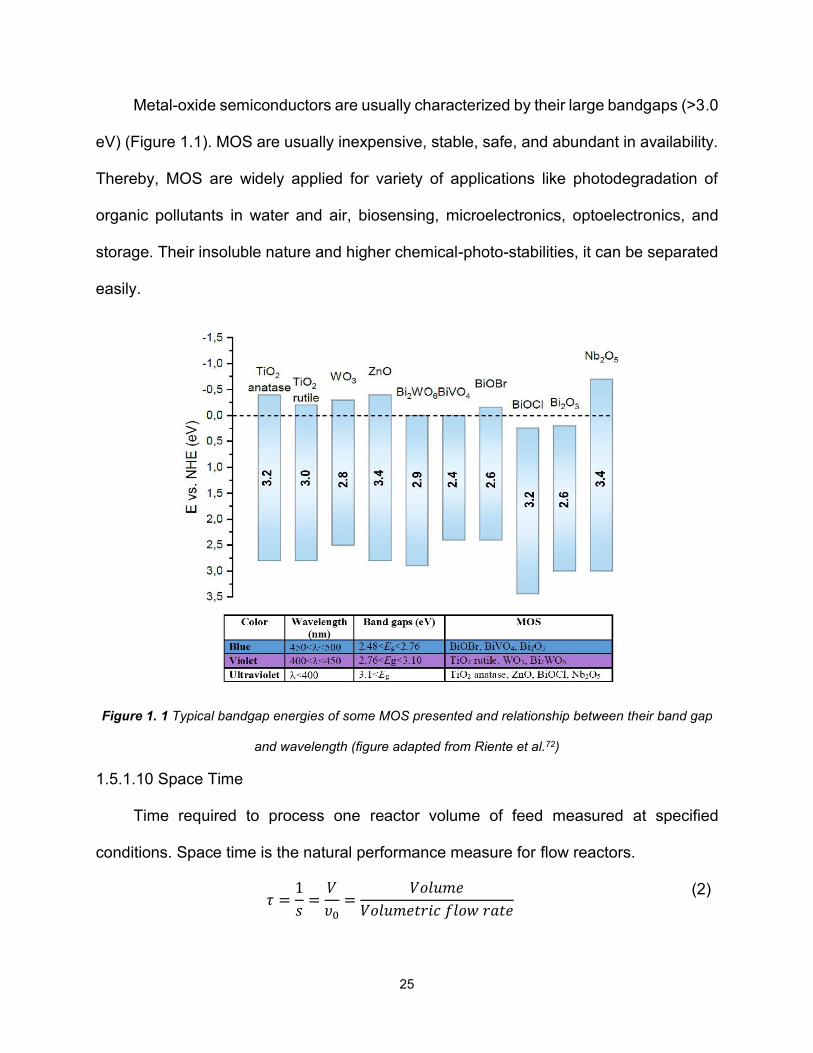
Metal-oxide semiconductors are usually characterized by their large bandgaps (>3.0
eV) (Figure 1.1). MOS are usually inexpensive, stable, safe, and abundant in availability.
Thereby, MOS are widely applied for variety of applications like photodegradation of
organic pollutants in water and air, biosensing, microelectronics, optoelectronics, and
storage. Their insoluble nature and higher chemical-photo-stabilities, it can be separated
easily.
Figure 1. 1 Typical bandgap energies of some MOS presented and relationship between their band gap
and wavelength (figure adapted from Riente et al.72)
1.5.1.10 Space Time
Time required to process one reactor volume of feed measured at specified
conditions. Space time is the natural performance measure for flow reactors.
𝜏 =1𝑠
=𝑉𝜐0
=𝑉𝑜𝑙𝑢𝑚𝑒
𝑉𝑜𝑙𝑢𝑚𝑒𝑡𝑟𝑖𝑐 𝑓𝑙𝑜𝑤 𝑟𝑎𝑡𝑒 (2)
26
1.5.1.11 Static Mixers
A precision engineered device for the continuous mixing of fluid flow passing through
it without any moving parts is known as static mixer. Generally static mixers are employed
for liquid mixing, but the mixture of gas streams and multiphase systems can also be
carried out.
1.5.1.12 Residence time
The total time spent by the fluidic element flowing inside a reactor volume is known
as residence time. The residence time of a set of fluidic elements is measured in terms
of the frequency distribution of the residence time in the set which is known as residence
time distribution (RTD), or in terms of its average, known as mean residence time.
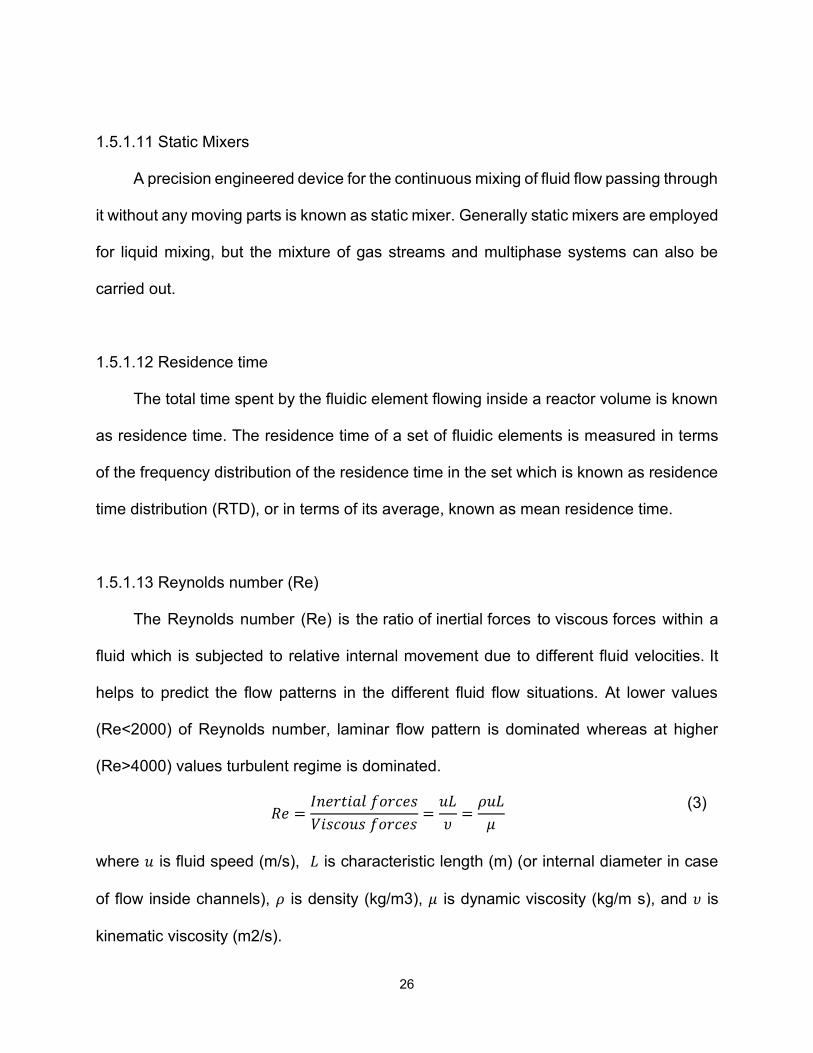
1.5.1.13 Reynolds number (Re)
The Reynolds number (Re) is the ratio of inertial forces to viscous forces within a
fluid which is subjected to relative internal movement due to different fluid velocities. It
helps to predict the flow patterns in the different fluid flow situations. At lower values
(Re<2000) of Reynolds number, laminar flow pattern is dominated whereas at higher
(Re>4000) values turbulent regime is dominated.
𝑅𝑒 =𝐼𝑛𝑒𝑟𝑡𝑖𝑎𝑙 𝑓𝑜𝑟𝑐𝑒𝑠𝑉𝑖𝑠𝑐𝑜𝑢𝑠 𝑓𝑜𝑟𝑐𝑒𝑠
=𝑢𝐿𝜐
=𝜌𝑢𝐿
𝜇 (3)
where 𝑢 is fluid speed (m/s), 𝐿 is characteristic length (m) (or internal diameter in case
of flow inside channels), 𝜌 is density (kg/m3), 𝜇 is dynamic viscosity (kg/m s), and 𝜐 is
kinematic viscosity (m2/s).
27
1.5.1.14 Dean number (De)
The Dean number (De) is a dimensionless group in the fluid mechanics, which
specifically occurs while studying the flow patterns in the curved channels. It is given by,
𝐷𝑒 = 𝑅𝑒√𝐷
2𝑅𝑐
(4)
where 𝑅𝑒 is Reynolds number, 𝐷 is diameter of the channel, and 𝑅𝑐 is the radius of the
curvature of the curved channel.
1.5.1.15 Damköhler number (Da)
The Damköhler numbers (Da) are dimensionless numbers used to relate the
timescales of chemical reactions with the timescales of transport phenomena occurring
in the system. We will define one of them for reacting system which consists of interphase
mass transport, second Damköhler number 𝐷𝑎|| which is given by,
𝐷𝑎||= 𝑅𝑒𝑎𝑐𝑡𝑖𝑜𝑛 𝑟𝑎𝑡𝑒
𝐷𝑖𝑓𝑓𝑢𝑠𝑖𝑜𝑛 𝑟𝑎𝑡𝑒=𝑇𝑖𝑚𝑒𝑑𝑖𝑓𝑓𝑢𝑠𝑖𝑜𝑛𝑇𝑖𝑚𝑒𝑟𝑒𝑎𝑐𝑡𝑖𝑜𝑛
(5)
1.5.1.16 Photocatalytic space-time yield (PSTY)
A new criterion of photocatalytic space-time yield (PSTY) was developed recently
by researchers24, taking into consideration the parameters discussed (1.5.1.1- 1.5.1.3)
and adding the missing components by relating lamp power with the reactor design
efficiency. PSTY is defined by the ratio of space-time yield (STY) to the power consumed
(Lamp Power-LP in kW).
28
STY can be found by the inverse of residence time (𝜏 in s-1) of the fluid in the reactor.
For a reactor in a loop, a continuous stirred tank reactor (CSTR) model equation is used
to predict the outlet concentration (CA) in mmol L-1. For plug flow, photocatalytic reactors
STY is given differently as per equation (4) below. Pseudo-first order rate constant (k) for
the reaction is determined by fitting a straight line for a plot of [ ln (CA/CA0) vs. t] (time)
and getting the slope for the same. Lamp power is scaled to the value enough for
illuminating 1 m3 of the reactor volume, as seen in equation (5). LPstd refers to
standardized lamp power (kW), P is the power of light source used in an experimental
setup in (kW), and V refers to experimental reaction medium volume (m3).
𝐶𝐴 =𝐶𝐴0
1 + 𝑘𝜏
(CSTR)
(6)
𝜏 =
𝐶𝐴0𝐶𝐴
− 1
𝑘
(Residence Time)
(7)
STYcstr= 1𝜏
= 𝑘𝐶𝐴0𝐶𝐴
−1
(Space-time yield-CSTR)
(8)
STYpfr= 1𝜏
= 𝑘
𝑙𝑛 (𝐶𝐴0𝐶𝐴
)
(Space-time yield-PFR)
(9)
LPstd= 𝑃 × 1 𝑚3
𝑉𝑟
(Lamp Power)
(10)
29
PSTY= STYLPstd
(11)
1.5.2 Common obstacles and possible solutions in Photocatalytic systems
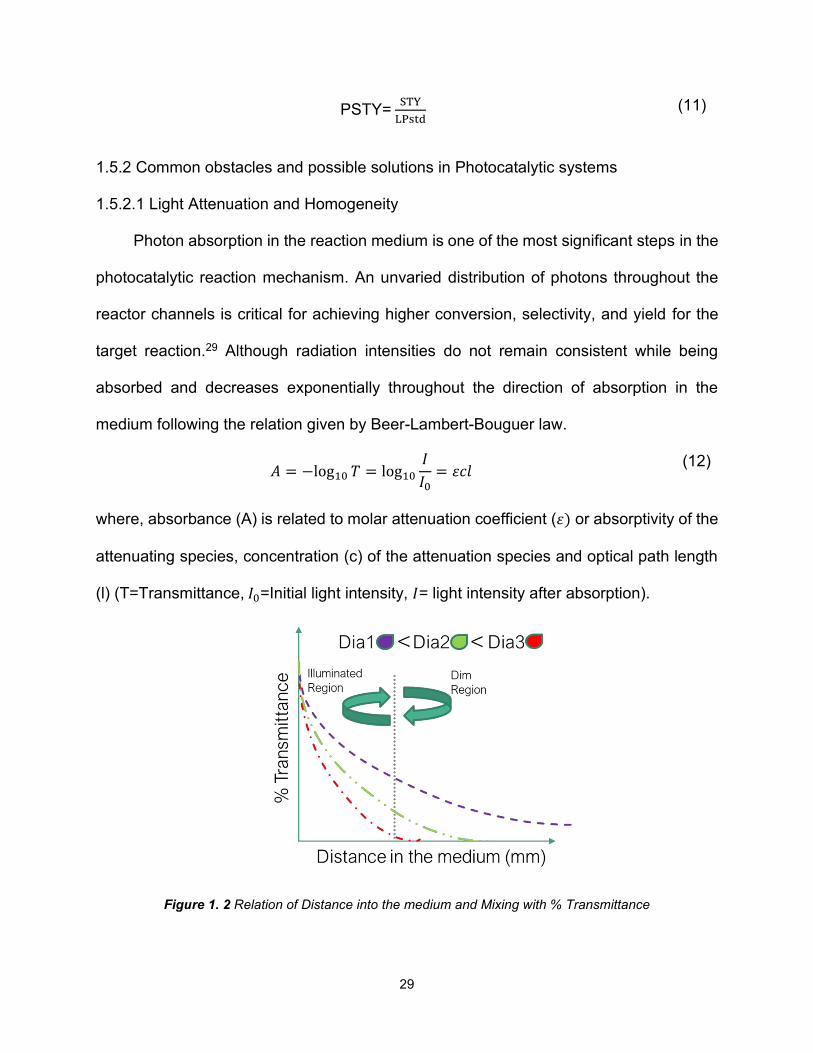
1.5.2.1 Light Attenuation and Homogeneity
Photon absorption in the reaction medium is one of the most significant steps in the
photocatalytic reaction mechanism. An unvaried distribution of photons throughout the
reactor channels is critical for achieving higher conversion, selectivity, and yield for the
target reaction.29 Although radiation intensities do not remain consistent while being
absorbed and decreases exponentially throughout the direction of absorption in the
medium following the relation given by Beer-Lambert-Bouguer law.
𝐴 = −log10 𝑇 = log10𝐼𝐼0
= 𝜀𝑐𝑙 (12)
where, absorbance (A) is related to molar attenuation coefficient (𝜀) or absorptivity of the
attenuating species, concentration (c) of the attenuation species and optical path length
(l) (T=Transmittance, 𝐼0=Initial light intensity, 𝐼= light intensity after absorption).
Figure 1. 2 Relation of Distance into the medium and Mixing with % Transmittance
30
The relation of transmittance and the varying channel diameters can be visualized
in the Figure 1.2. With an increase in the diameter of the channels, light intensity
decreases swiftly towards the center of the reactor.29 Thus, lower diameter channels
seem to be effective against the problem of light attenuation.30 It is expected all photons
to get absorbed and participate in reaction initiation, but in reality, not all of them are to
end-up initiating the reaction. Light homogeneity is also one of the critical parameters,17
which is taken into consideration for achieving the best PSTY and higher conversions for
the overall photoreaction system.
1.5.2.2 Mixing
Mixing plays a paramount role in any chemical reaction; the same is the case for
photocatalytic reactions. Mixing helps in eradicating confined concentration gradients as
seen in Figure 1.1, leading to the increase in the selectivity of products in wide range of
reactor systems, especially in small scale reactors.31 Mixing in the case of the laminar
region, i.e., layer on layer flow, which happens in micro- and milli-channels, is diffusion
controlled. Smaller the diameter of the channels quicker, the uniformity in concentration
can be reached and vice-versa. Therefore, micro- and milli-mixers are helpful for micro-
and milli-small scale systems to improve the mixing time and to make the process more
efficient.32,33
1.5.2.3 Low productivity
Since the inception of the idea behind photochemical reactions, chemists have been
employing the milli/centi-scale (ID > 1 cm) batch reactor systems where they were facing
31
problems with the decrease in light intensities owing to limitations of Beer-Lambert law.
The best possible solution to the problem mentioned above was scaling down to micro-
scale processes (ID < 1mm). Although micro-scale processes allow higher and
homogenized photon flux, higher conversions, shorter reaction times, improved
heat/mass transfers, and lesser unwanted side-product generation, they also undergo
with the problem of lower throughputs.
There have been some studies in numbering up34,35 the microscale photoreactor
systems, which are still not being capable enough to compete with the existing large-
scale processes for the same end applications due to extremely less throughput per day.
Milli-scale continuous processes can be a real viable option in terms of productivity, and
the problems faced by larger reactors can be solved by the selection of suitable designs
like a static mixer36 which reduces the light attenuation problem by swirling liquid to the
well-lit zone and continue the same until the outlet.
1.5.2.4 Photocatalyst separation/recovery
Photocatalytic systems are either homogeneous or heterogeneous. Either of them
uses photocatalysts, which are in solid or liquid form, but they are supposed to be
recovered and replenished after every intended reaction. This recovery issue is one of
the critical challenges coming against photocatalysis to make it functionally large scale,
as many photocatalysts contain costly noble metal particles or metallic compounds (e.g.,
Pt, Au, Ag, Ru, and others). Novel separation methods are to be implemented for
recovering and activating the catalyst for a new reaction, as reported in some studies37
like usage of magnetic nanoparticles. Overall, it is complicated for continuous flow
32
photochemical processes owing to their small sizes, and this field of separation/recovery
needs to be focused more for achieving an efficient methodology for the same.
1.5.2.5 Efficiencies/Effectivity of light sources used
Historically low/medium pressure mercury discharge-based UV light sources and
incandescent halogen light sources have played an important role at the core of
photochemistry-based applications. UV spectrum is highly effective when compared to
visible spectrum purely owing to its higher energy potential comparatively. Solar spectrum
also consists of UV but its only 3~5% of the total spectrum whereas 42~43% is visible
and the rest in infrared. Although the above mentioned conventional light sources are well
assimilated by the market, still they have drawbacks of using toxic materials, high voltage
requirements along with higher ignition pulses, thereby making it less adaptable. Newer
technologies like LEDs utilize inherently safer materials along with lower operating
voltages and comparatively smaller dimensions making it highly flexible and less frail.
One of the other biggest challenge with the older conventional light sources is their nearly
fixed or less tunable radiant power (in W/cm2), which is not the case for LEDs, where it is
quite easy to control/vary and achieve the high values of radiant power with the current.
Thus, LEDs can be costly for initial investments but give flexibility with various complex
geometries; high radiant power and smaller form factor can be helpful in making of highly
efficient and versatile photocatalytic reactor systems.
Table 1. 2 The comparison between various designs of photocatalytic reactors with respect to their PSTY
values
33
Design
Principle
Reactor
Type
V(L)
kapp
(min-1)
STY
(m3 day-1
m-3 reactor)
LPstd (kW)
PSTY
(m3 day-1 m-3
reactor kW-1)
Refs.
Slurry
reactors
MEM (3) 12 N/A 2.88×10³ 5.12×10² 5.63×100 38
CMSTR(1) 2 0.107 1.54×10⁻¹ 4×100 3.86×10⁻² 39
CFI 0.025 0.17
3.203×101
1.08×10³
2.97×10⁻² 40
MEM (1) 1 0.198 2.86×10⁻¹ 3×101 9.52×10⁻³ 41
EISR (1) 1 0.003 6.80×10⁻¹ 1.5×10² 4.54×10⁻³ 42
RAR (1) 1.1 0.077 1.11×10⁻¹ 3.63×101 3.05×10⁻³ 43
MEM (2)
1.2 0.113 1.63×10⁻¹ 8.33×101 1.95×10⁻³ 44
ARAR 3.9 0.02 2.88×10⁻² 3.07×101 9.37×10⁻⁴ 45
ASAR 3.9 0.019 2.83×10⁻² 3.07×101 9.18×10⁻⁴ 45
AR (1) 1.53 0.016 2.31×10⁻² 3.02×101 7.63×10⁻⁴ 46
34
SAR 3.90 0.005 7.50×10⁻³ 3.07×101 2.44×10⁻⁴ 45
EISR (2) 0.25 0.035 5.05×10⁻² 2.67×10² 1.88×10⁻⁴ 47
EISR (3) 0.75 0.053 7.68×10⁻³ 1.66×10² 4.61×10⁻⁵ 48
Immobilized
catalyst
reactors
TPR 0.05 0.818 1.71×10² 2.72×10² 6.28×10⁻¹ 49
SDR (1) 10 0.031 4.47×10⁻² 3×100 1.49×10⁻² 50
PBR (1) 0.30 0.005 1.13×100 2.66×10² 4.23×10⁻³ 51
FPR (1) 0.34 0.021 3.03×10⁻² 9.06×100
3.34×10⁻³ 28
PBR (2) 0.30 0.002 5.42×10⁻¹ 2.66×10² 2.03×10⁻³ 51
RAR (2) 1.10 0.044 6.34×10⁻² 3.63×101 1.74×10⁻³ 43
FPR (2) 3.00 0.025 3.60×10⁻² 3.50×101 1.03×10⁻³
52
OFMR(1) 0.90 0.16 2.31×10⁻¹ 5.55×10² 4.15×10⁻⁴
53
SDR (2) 0.84 0.024 3.49×10⁻² 9.68×101 3.60×10⁻⁴ 54
35
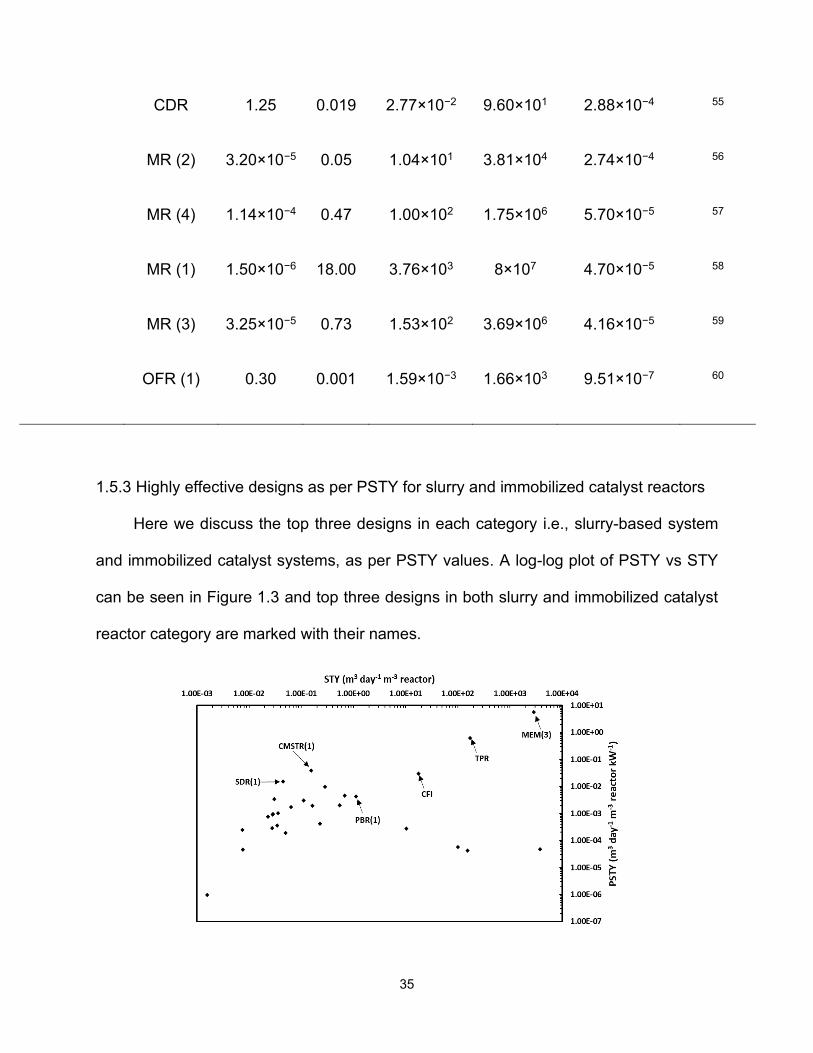
CDR 1.25 0.019 2.77×10⁻² 9.60×101 2.88×10⁻⁴ 55
MR (2) 3.20×10⁻⁵ 0.05 1.04×101 3.81×10⁴ 2.74×10⁻⁴ 56
MR (4) 1.14×10⁻⁴ 0.47 1.00×10² 1.75×10⁶ 5.70×10⁻⁵ 57
MR (1) 1.50×10⁻⁶ 18.00 3.76×10³ 8×10⁷ 4.70×10⁻⁵ 58
MR (3) 3.25×10⁻⁵ 0.73 1.53×10² 3.69×10⁶ 4.16×10⁻⁵ 59
OFR (1) 0.30 0.001 1.59×10⁻³ 1.66×10³ 9.51×10⁻⁷ 60
1.5.3 Highly effective designs as per PSTY for slurry and immobilized catalyst reactors
Here we discuss the top three designs in each category i.e., slurry-based system
and immobilized catalyst systems, as per PSTY values. A log-log plot of PSTY vs STY
can be seen in Figure 1.3 and top three designs in both slurry and immobilized catalyst
reactor category are marked with their names.

36
Figure 1. 3 Plot of PSTY vs STY for various designs, highlighting the top three designs in Slurry and
Immobilized reactor category
1.5.3.1 Slurry reactors
1.5.3.1.1 Photocatalytic membrane reactor (MEM)
A membrane has been employed for many applications such as, in purification or
separation processes like dialysis,61 carrying out reactions by providing huge surface area
as in zeolites,62 and is also modified to assign custom properties like photoactivity,63 which
justifies there have been lot of experimentation employing membranes for the various
systems.
The MEM pilot reactor technology38 patented by Photo-CatTM system discussed
here employs membrane as a filter/separator unit, which is aimed for catalyst recovery
and recycles it back to the reactor inlet like a purge line.
As can be seen in the figure 1.4, the system consists of prefiltration units, having
bag/cartridge filters with a nominal pore size of 10µm. The geometry employed in this
case is thin-film reactor (exact image not available due to patented technology), which is
adjoined with more significant mixing owing to plug flow pattern, a containment sleeve,
and UV light source (185~254 nm) arrangement. There is a catalyst recovery unit
comprising of the crossflow ceramic membrane, which selectively stops TiO2 nanoparticle
photocatalyst, while allowing the water to pass through the membrane. To prevent
clogging of the membrane, after every 60s a backflush is carried out, which carries
catalyst again to the entry of the reactor via the recycle line as seen in the schematic. The
pattern of recycling, and reuse of photocatalyst along with better mixing makes this
combination one of the best in slurry reactors as it checks all the necessary requirements.
37
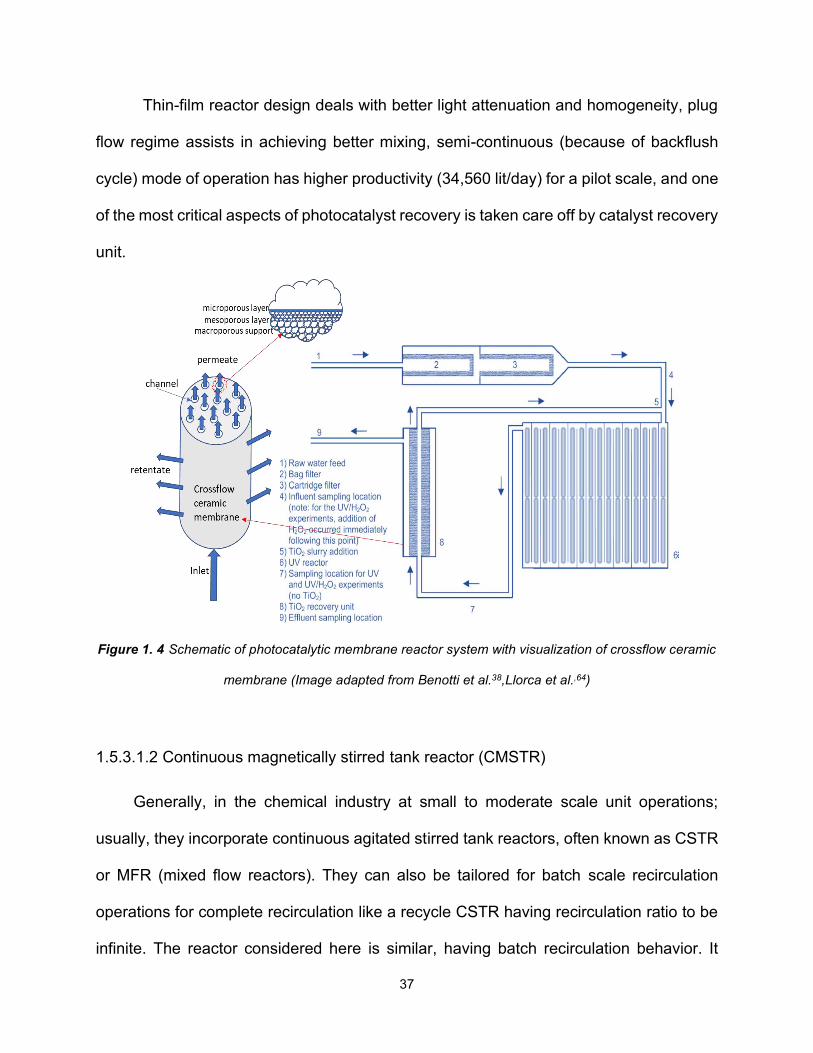
Thin-film reactor design deals with better light attenuation and homogeneity, plug
flow regime assists in achieving better mixing, semi-continuous (because of backflush
cycle) mode of operation has higher productivity (34,560 lit/day) for a pilot scale, and one
of the most critical aspects of photocatalyst recovery is taken care off by catalyst recovery
unit.
Figure 1. 4 Schematic of photocatalytic membrane reactor system with visualization of crossflow ceramic
membrane (Image adapted from Benotti et al.38,Llorca et al.,64)
1.5.3.1.2 Continuous magnetically stirred tank reactor (CMSTR)
Generally, in the chemical industry at small to moderate scale unit operations;
usually, they incorporate continuous agitated stirred tank reactors, often known as CSTR
or MFR (mixed flow reactors). They can also be tailored for batch scale recirculation
operations for complete recirculation like a recycle CSTR having recirculation ratio to be
infinite. The reactor considered here is similar, having batch recirculation behavior. It
38
comprised of a cylindrical glass structure comprising of magnetic stirrer and equipped
with a low-pressure UV light source at the center of the container, jacketed by a protective
glass for avoiding contact from water. As the light source is at the center of the container,
almost all of the volume of the liquid is irradiated uniformly, keeping light intensity to be
reasonably high for the given study at 10 mW/cm2 and spectral emission at 366nm.
Photon flux was controlled by portable photo radiometer arrangement attached to the
glass wall.39
Highlights of this design are special provision of bubbling air into the liquid system
after every 10 mins, which avoids oxygen deprivation and aids in the generation of
reactive oxygen species (ROS) (i.e., hydroxyl/superoxide/peroxide radicals) and ceases
the recombination of separated electrons with the generated holes. Oxygen works as an
electron dumping ground for photodegradation processes. While stirring aids in keeping
uniformity in the suspension, a water-cooling jacket helps to keep uniformity in
temperature throughout the process run (can be visualized in Figure 1.5). This unique yet
straightforward stirred tank design tackles the problems by providing homogeneity in light
distribution by its annular centric design and takes care of oxygen nourishment in the
recirculated liquid for the generation of ROS along with better mixing.
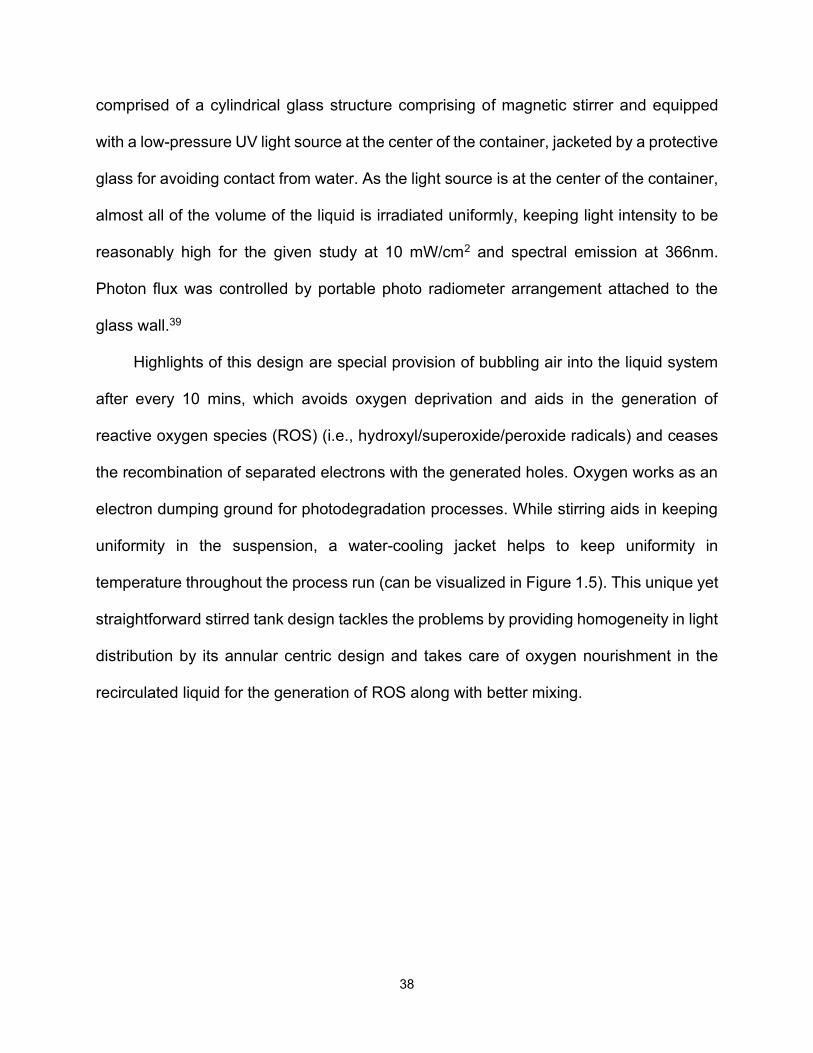
39
Figure 1. 5 Schematic of continuous magnetic stirred tank reactor (Image adapted from Vela et al.39)
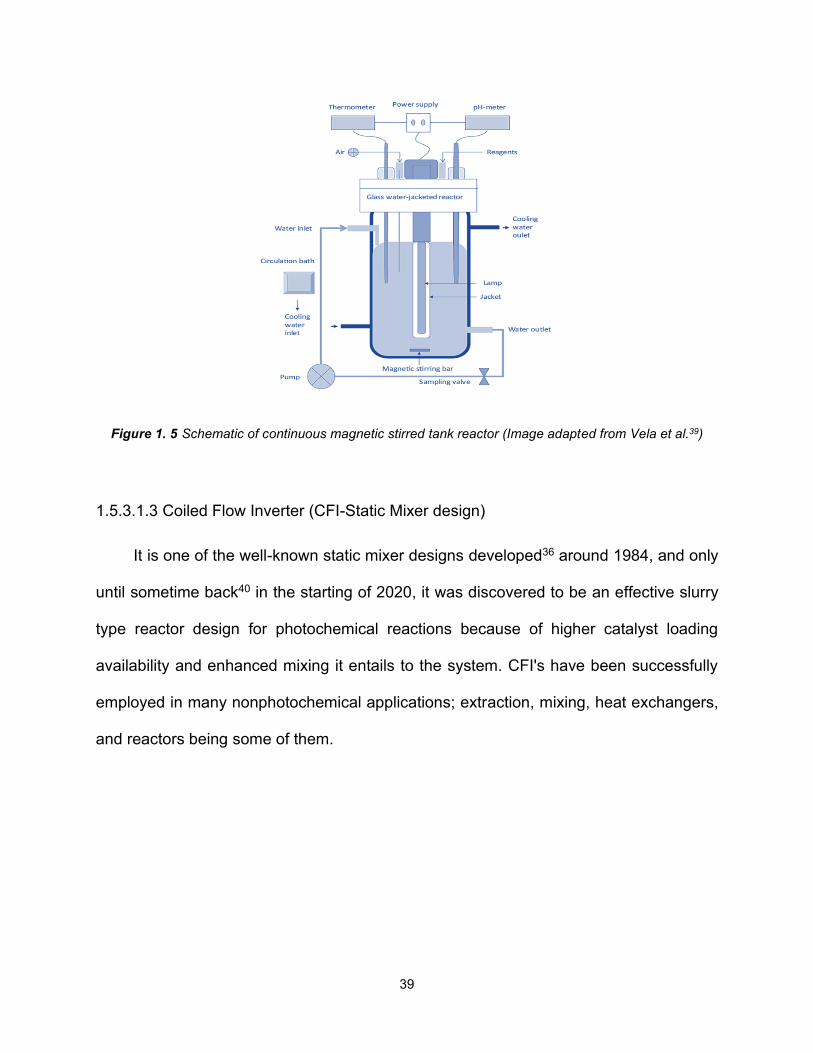
1.5.3.1.3 Coiled Flow Inverter (CFI-Static Mixer design)
It is one of the well-known static mixer designs developed36 around 1984, and only
until sometime back40 in the starting of 2020, it was discovered to be an effective slurry
type reactor design for photochemical reactions because of higher catalyst loading
availability and enhanced mixing it entails to the system. CFI's have been successfully
employed in many nonphotochemical applications; extraction, mixing, heat exchangers,
and reactors being some of them.
40
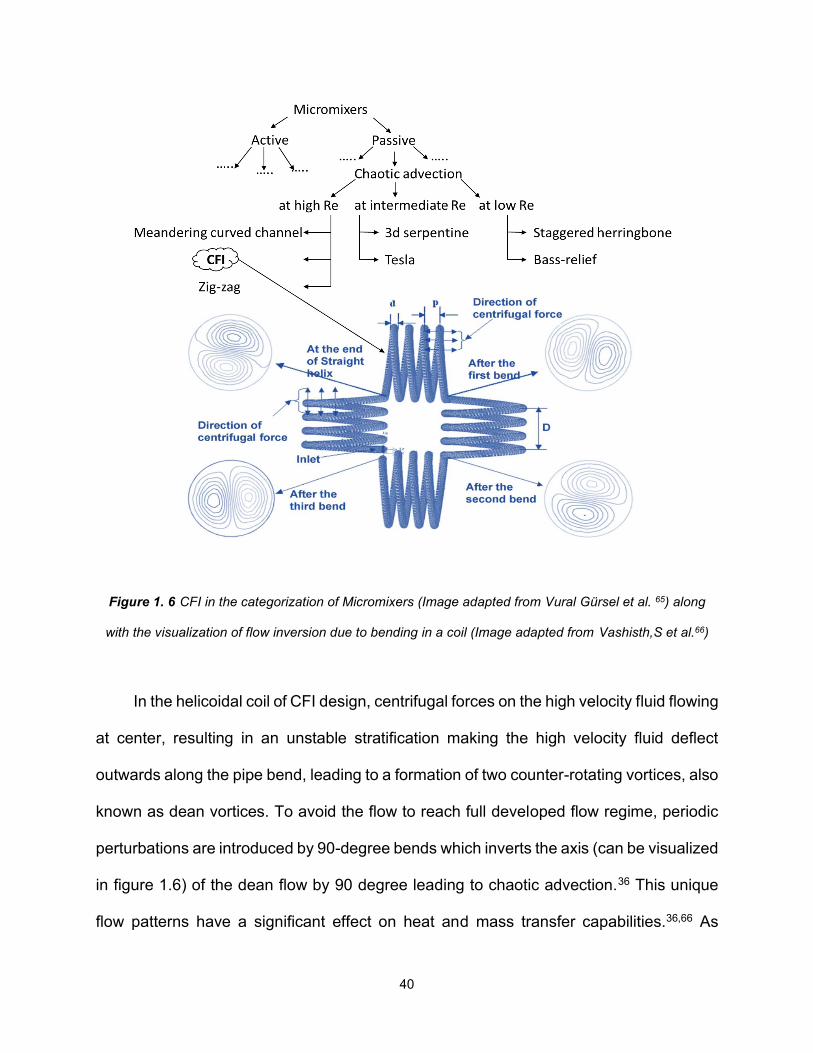
Figure 1. 6 CFI in the categorization of Micromixers (Image adapted from Vural Gürsel et al. 65) along
with the visualization of flow inversion due to bending in a coil (Image adapted from Vashisth,S et al.66)
In the helicoidal coil of CFI design, centrifugal forces on the high velocity fluid flowing
at center, resulting in an unstable stratification making the high velocity fluid deflect
outwards along the pipe bend, leading to a formation of two counter-rotating vortices, also
known as dean vortices. To avoid the flow to reach full developed flow regime, periodic
perturbations are introduced by 90-degree bends which inverts the axis (can be visualized
in figure 1.6) of the dean flow by 90 degree leading to chaotic advection.36 This unique
flow patterns have a significant effect on heat and mass transfer capabilities.36,66 As
41
discussed by Saxena et al.36, bringing abrupt changes in the direction of centrifugal forces
(in helical coils with bends) are more effective in narrowing down the residence time
distribution (RTD) in the system than the gradual changes (in helical coils without bends).
Although, it is worth noticing that RTD is sensitive to the number of parameters, namely,
the number of bends, the spacing between bends, the angle between different arms of
the helix, and dean number.36
It's a daunting task to irradiate the CFI design uniformly.40 A proper arrangement of
the light source is necessary to avoid any power wastage and getting the best
homogeneity with a highly efficient light source. Overall, this design tackles the problem
of mixing and productivity because of its inherent design, which can process higher
throughputs of fluids, although it needs to be coupled with a catalyst recovery system and
optimum flow rates for avoiding settling of catalyst for making it highly efficient, as will be
discussed later.
1.5.3.2 Immobilized catalyst reactors
1.5.3.2.1 Translucent packed bed reactor
Many studies on immobilized catalyst reactors for various applications ranging from
chemical synthesis to toxic/waste chemical degradation over a range of immobilized
catalysts (enzymes/metal oxides).67–70 The reactor design taken into consideration for this
discussion is unique where the main highlight was scale up of the design equivalent to
the multiple microreactors in lieu of the numbering up strategy, thereby enhancing the
surface area of the reaction and achieve mixing by flow distribution. It can be seen in the
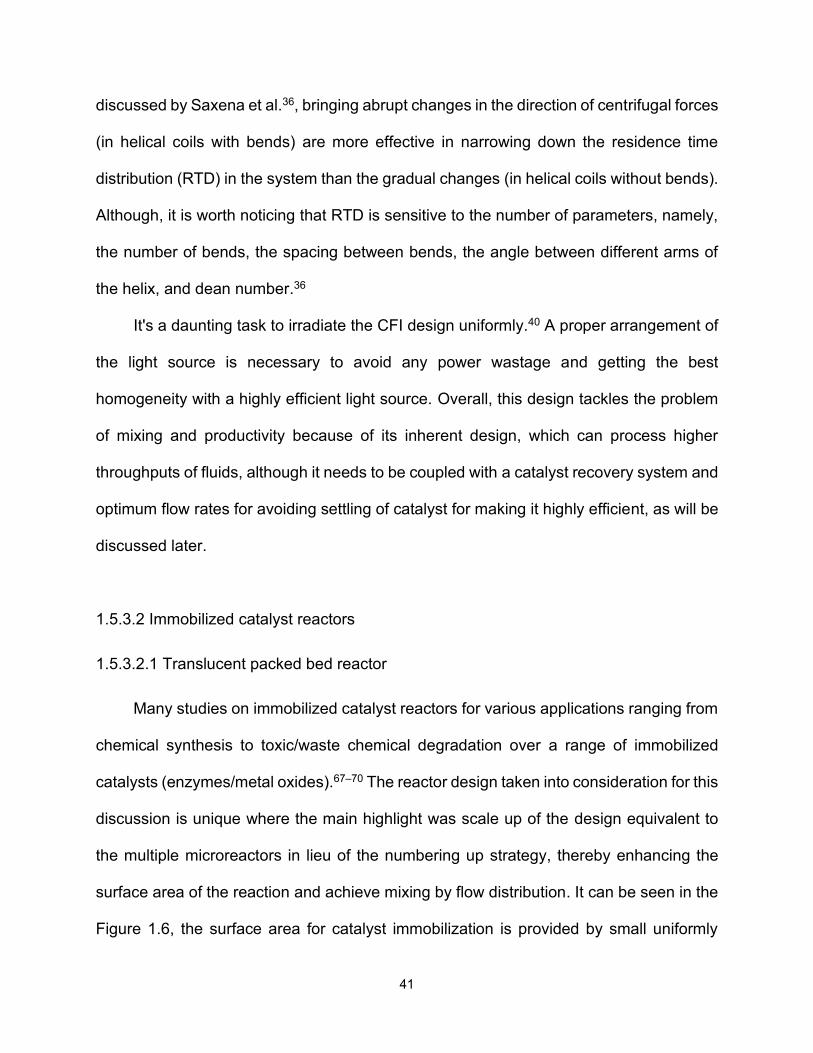
Figure 1.6, the surface area for catalyst immobilization is provided by small uniformly
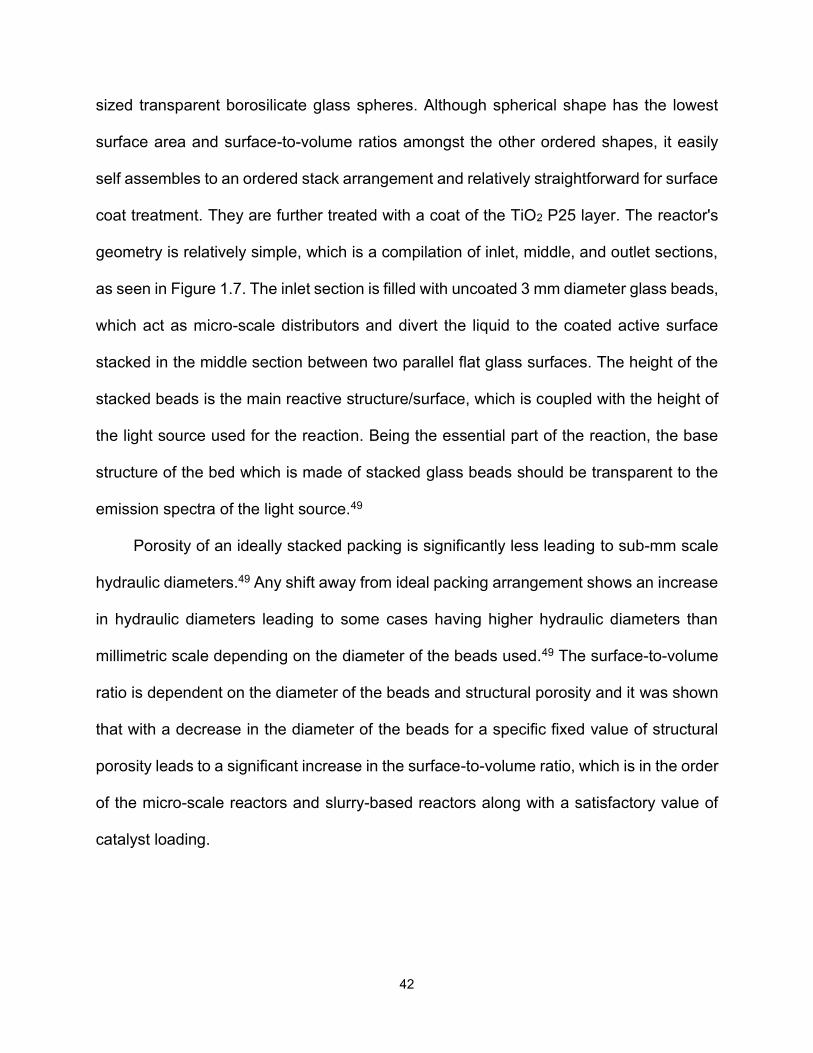
42
sized transparent borosilicate glass spheres. Although spherical shape has the lowest
surface area and surface-to-volume ratios amongst the other ordered shapes, it easily
self assembles to an ordered stack arrangement and relatively straightforward for surface
coat treatment. They are further treated with a coat of the TiO2 P25 layer. The reactor's
geometry is relatively simple, which is a compilation of inlet, middle, and outlet sections,
as seen in Figure 1.7. The inlet section is filled with uncoated 3 mm diameter glass beads,
which act as micro-scale distributors and divert the liquid to the coated active surface
stacked in the middle section between two parallel flat glass surfaces. The height of the
stacked beads is the main reactive structure/surface, which is coupled with the height of
the light source used for the reaction. Being the essential part of the reaction, the base
structure of the bed which is made of stacked glass beads should be transparent to the
emission spectra of the light source.49
Porosity of an ideally stacked packing is significantly less leading to sub-mm scale
hydraulic diameters.49 Any shift away from ideal packing arrangement shows an increase
in hydraulic diameters leading to some cases having higher hydraulic diameters than
millimetric scale depending on the diameter of the beads used.49 The surface-to-volume
ratio is dependent on the diameter of the beads and structural porosity and it was shown
that with a decrease in the diameter of the beads for a specific fixed value of structural
porosity leads to a significant increase in the surface-to-volume ratio, which is in the order
of the micro-scale reactors and slurry-based reactors along with a satisfactory value of
catalyst loading.
43
Figure 1. 7 Schematic image along with the picture of the photocatalytic reactor and also a visualization
of flow and light propagation through the reactor (Image adapted from Claes et al.49)
In actual measurements for the reactor, the porosity was found to be a little higher
than the ideal but lesser than the random stacking signifying the mix of structured and
random stacking arrangements. Ignoring the wall (surface) effects the mean hydraulic
diameter was found to be below the millimeter scale, thus satisfactorily comparing TPR
against an array of microchannels. But, the values of catalyst loading were found to be
lesser than theoretical load because of losses.49
This reactor design clearly checks all the problems and target them by its inherent
design in the immobilized category. Flat surface design with transparent base structure
targets the problem of uniform light distribution and homogeneity; mixing is enhanced by
arrays of microchannels where the liquid is flowing in the criss/cross pattern instead of a
smooth straight flow. Although it behaves like a microscale reactor, it can be scaled to a
larger design with a very high effective conversion, which can possibly solve the problem
44
of throughputs, but it doesn't deal with the catalyst recovery problem inherently in the
design.
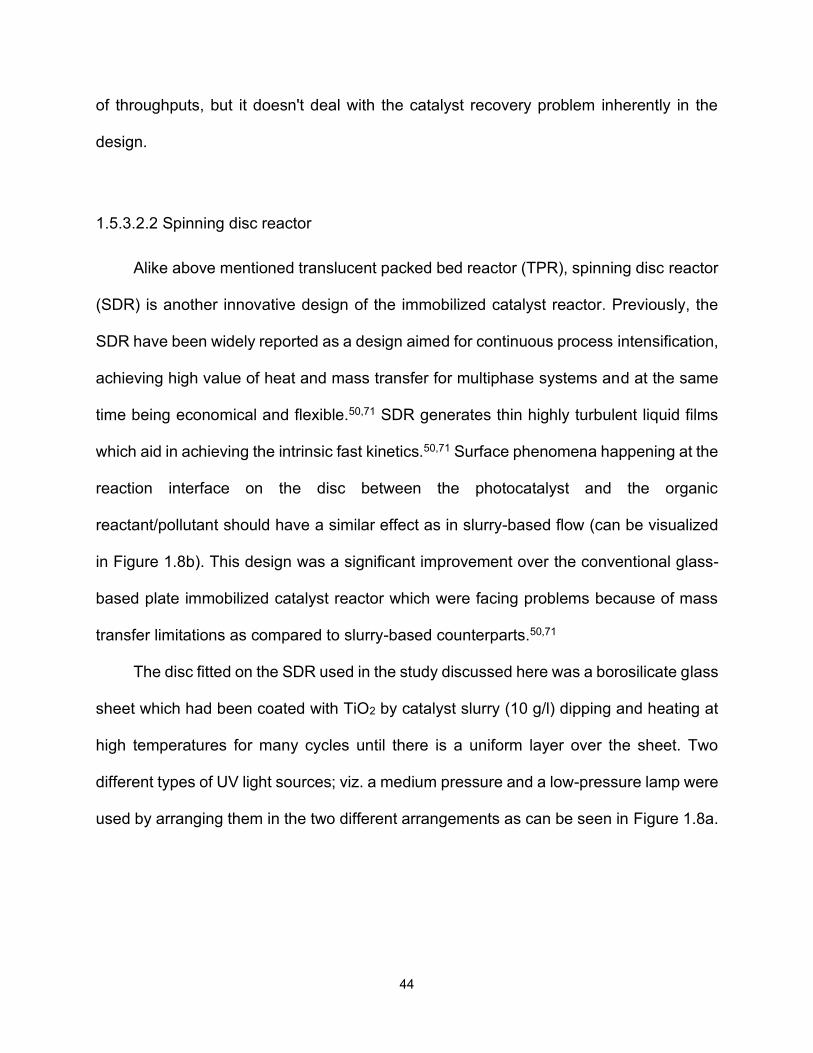
1.5.3.2.2 Spinning disc reactor
Alike above mentioned translucent packed bed reactor (TPR), spinning disc reactor
(SDR) is another innovative design of the immobilized catalyst reactor. Previously, the
SDR have been widely reported as a design aimed for continuous process intensification,
achieving high value of heat and mass transfer for multiphase systems and at the same
time being economical and flexible.50,71 SDR generates thin highly turbulent liquid films
which aid in achieving the intrinsic fast kinetics.50,71 Surface phenomena happening at the
reaction interface on the disc between the photocatalyst and the organic
reactant/pollutant should have a similar effect as in slurry-based flow (can be visualized
in Figure 1.8b). This design was a significant improvement over the conventional glass-
based plate immobilized catalyst reactor which were facing problems because of mass
transfer limitations as compared to slurry-based counterparts.50,71
The disc fitted on the SDR used in the study discussed here was a borosilicate glass
sheet which had been coated with TiO2 by catalyst slurry (10 g/l) dipping and heating at
high temperatures for many cycles until there is a uniform layer over the sheet. Two
different types of UV light sources; viz. a medium pressure and a low-pressure lamp were
used by arranging them in the two different arrangements as can be seen in Figure 1.8a.
45
Figure 1. 8 (a) Schematic of experimental apparatus along with the lamp arrangements used for the
study (Image adapted from Yatmaz et al. 50) (b) Comparison of bubbles sizes formed in gas-liquid
photochemical SDR system with the RPM pointing towards the effective mass transfer (Image adapted
from Chaudhuri et al. 71)
In this study it was highlighted that low-pressure lamps yielded better results as
compared to the medium pressure ones which was cross-checked with other controls.
The catalyst coating techniques needs to be modified to work better with the borosilicate
glass surface. One of the main conclusions is about the lesser impact of mass transfer
46
rate of organic reactant/pollutant over the rate of degradation, all due to the turbulence of
the film produced by the SDR.
1.5.3.2.3 Packed bed reactor
Packed bed reactor design is similar to the TPR (as discussed in section 1.5.3.2.1)
and in fact the TPR concept is an improved adaptation of the PBR. The study in
consideration specifically discusses the industrial usage of photocatalytic processes
focused on wastewater purification able to work with both sunlight and artificial light. The
reactor design thought for it was to be a continuous catalytic fixed bed type. The optimal
design was found after extensive CFD model simulation study for fluid dynamics and for
light distribution inside the photoreactors. Earlier photocatalysts were used in slurry phase
mainly because they provided high surface area for reactions but reaction in these phases
had their drawbacks mainly for time consumption for the separation of the photocatalyst
after the completion of the process.51 Particle aggregation in the flow because of high
photocatalyst concentration and their usage in the continuous flow processes is one of
the other challenges faced. To prevent these problems immobilized photocatalytic
reactors are suggested as photocatalyst is preserved for a longer time interval, although
their efficiency is lesser than slurry phase photoreactors. The design has to be done
taking into consideration for the fluid flow across the bed to be a plug flow and to avoid
any dead zones or recirculation.51
Performances of the photoreactor depends mainly on light source and its distribution
inside the reactor, therefore specific conditions should be fulfilled. But precise
understanding of the radiation field is a complex task and specifically models dealing with
47
light behavior in heterogeneous media are very less. Specific to photochemical reaction
engineering, local volumetric rate of photon absorption (LVRPA) is of major interest which
has been only indirectly found by radiative transfer equations (RTE) and its accurate
determination is important because of nonreliability of data found by other techniques.30
Light intensity calculation around the source to a certain distance is only possible
practically, so to reconstruct radiation field from the data is problematic. Helmholtz
equation was used for modelling photon distribution in the reaction zone for the first time
ever.51
Structured photocatalyst catalyst bed was manufactured by dip coating technique
by immobilizing N-doped TiO2 on Pyrex spheres of diameter 4.3 mm.51 The reactor’s
design is chosen such that it absorbs maximum irradiance from the source. A flat-plate
annular geometry is scalable and can be relatively easier in usage with direct sunlight,
therefore providing one of the best configurations for visible light metal oxide
photocatalysts.51,72 The major benefits of this design are its lack of any recirculation or
dead zones and approaching plug flow, its capacity to operate under various flow rates
and ability to get easily integrated with the illumination system in order to get maximum
model simplicity.
The fluid dynamics were modelled by using COMSOL Multiphysics software and it
was assumed that the bed has a constant porosity, the fluid is incompressible and
isothermal conditions. The flow inside the custom designed reactor was supposed to be
plug flow and the model results suffices the assumptions behind the design of the reactor.
Radiative transfer model used Helmholtz equation for photons distribution and clearly
indicated that light intensity was accumulated in the core of the reactor.
48
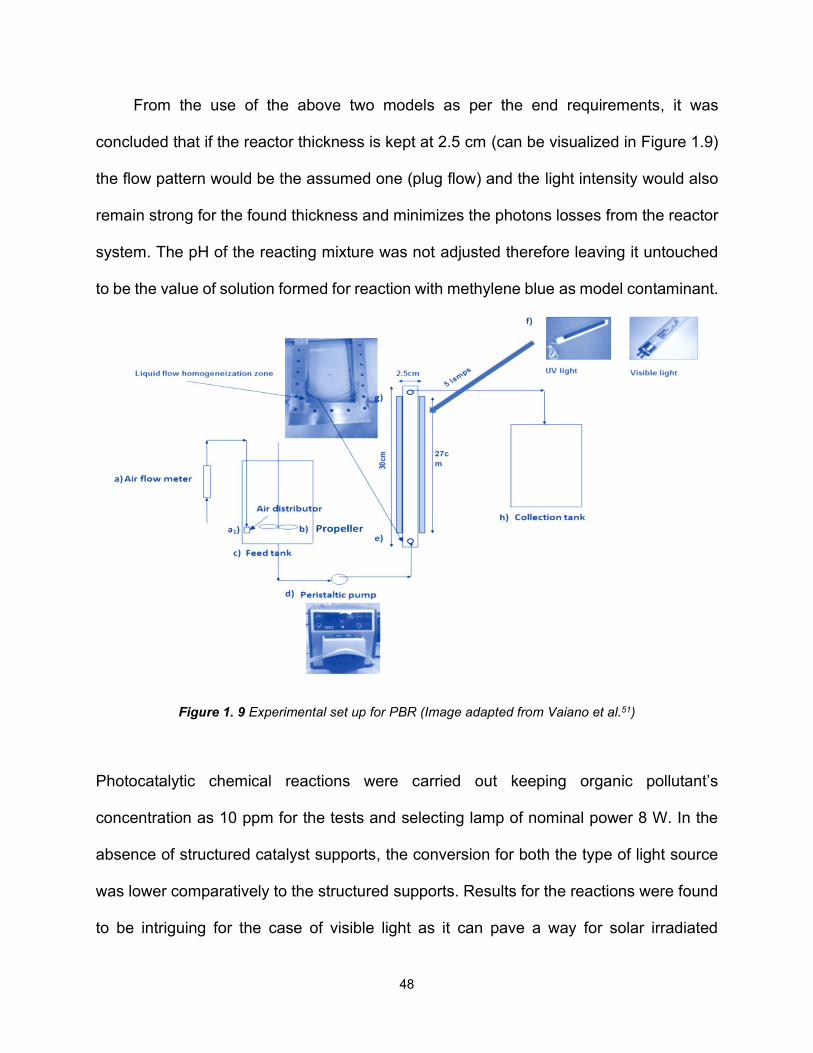
From the use of the above two models as per the end requirements, it was
concluded that if the reactor thickness is kept at 2.5 cm (can be visualized in Figure 1.9)
the flow pattern would be the assumed one (plug flow) and the light intensity would also
remain strong for the found thickness and minimizes the photons losses from the reactor
system. The pH of the reacting mixture was not adjusted therefore leaving it untouched
to be the value of solution formed for reaction with methylene blue as model contaminant.
Figure 1. 9 Experimental set up for PBR (Image adapted from Vaiano et al.51)
Photocatalytic chemical reactions were carried out keeping organic pollutant’s
concentration as 10 ppm for the tests and selecting lamp of nominal power 8 W. In the
absence of structured catalyst supports, the conversion for both the type of light source
was lower comparatively to the structured supports. Results for the reactions were found
to be intriguing for the case of visible light as it can pave a way for solar irradiated
49
photoreactor for water treatment. Important takeaway from this study is the strong
dependency of fluid dynamic conditions with the design of continuous photoreactor and
the adsorption properties of photocatalysts.
1.6 CONCLUSIONS
Photoreactor efficiency depends on many factors, as discussed, and a better
photoreactor design can be obtained if it is inherently designed to compensate for all
discussed bottlenecks. Although there are many parameters for photoreactor efficiency
comparison, recently found metric – PSTY seems to have an edge because of the
inclusion of reactor kinetics (from space-time yield) and monitoring the lamp power
efficiency. As per the PSTY values, the slurry designed reactors outperform the
immobilized catalyst type for the set of studies considered from the literature.
Furthermore, the perfect combination of an efficient reactor design coupled with the
proper light arrangements is necessary to achieve higher values of PSTY.
References
(1) Manisalidis, I.; Stavropoulou, E.; Stavropoulos, A.; Bezirtzoglou, E. Environmental
and Health Impacts of Air Pollution: A Review. Frontiers in Public Health. 2020.
https://doi.org/10.3389/fpubh.2020.00014.
(2) Moussa, K.; Decker, C. Light‐induced Polymerization of New Highly Reactive
Acrylic Monomers. Journal of Polymer Science Part A: Polymer Chemistry 1993.
https://doi.org/10.1002/pola.1993.080310903.
(3) Decker, C. Light-Induced Crosslinking Polymerization. Polymer International
50
2002. https://doi.org/10.1002/pi.821.
(4) Chen, F. H.; Pathreeker, S.; Biria, S.; Hosein, I. D. Synthesis of Micropillar Arrays
via Photopolymerization: An in Situ Study of Light-Induced Formation, Growth
Kinetics, and the Influence of Oxygen Inhibition. Macromolecules 2017.
https://doi.org/10.1021/acs.macromol.7b01274.
(5) Yasu, Y.; Koike, T.; Akita, M. Visible-Light-Induced Synthesis of a Variety of
Trifluoromethylated Alkenes from Potassium Vinyltrifluoroborates by Photoredox
Catalysis. Chemical Communications 2013. https://doi.org/10.1039/c3cc39235j.
(6) Loubière, K.; Oelgemöller, M.; Aillet, T.; Dechy-Cabaret, O.; Prat, L. Continuous-
Flow Photochemistry: A Need for Chemical Engineering. Chemical Engineering
and Processing - Process Intensification 2016.
https://doi.org/10.1016/j.cep.2016.02.008.
(7) Reed, N. G. The History of Ultraviolet Germicidal Irradiation for Air Disinfection.
Public Health Reports. 2010. https://doi.org/10.1177/003335491012500105.
(8) Blanksby, S. J.; Ellison, G. B. Bond Dissociation Energies of Organic Molecules.
Accounts of Chemical Research 2003. https://doi.org/10.1021/ar020230d.
(9) Su, Y.; Straathof, N. J. W.; Hessel, V.; Noël, T. Photochemical Transformations
Accelerated in Continuous-Flow Reactors: Basic Concepts and Applications.
Chemistry - A European Journal. 2014. https://doi.org/10.1002/chem.201400283.
(10) Zimmerman, G.; Chow, L. yung; Paik, U. jin. The Photochemical Isomerization of
Azobenzene. Journal of the American Chemical Society 1958.
51
https://doi.org/10.1021/ja01547a010.
(11) Henry, K. M.; Donahue, N. M. Photochemical Aging of α-Pinene Secondary
Organic Aerosol: Effects of OH Radical Sources and Photolysis. Journal of
Physical Chemistry A 2012. https://doi.org/10.1021/jp210288s.
(12) Condie, A. G.; González-Gómez, J. C.; Stephenson, C. R. J. Visible-Light
Photoredox Catalysis: Aza-Henry Reactions via C-H Functionalization. Journal of
the American Chemical Society 2010. https://doi.org/10.1021/ja909145y.
(13) Xuan, J.; Xiao, W. J. Visible-Light Photoredox Catalysis. Angewandte Chemie -
International Edition 2012, 51 (28), 6828–6838.
https://doi.org/10.1002/anie.201200223.
(14) Koike, T.; Akita, M. Visible-Light-Induced Photoredox Catalysis: An Easy Access
to Green Radical Chemistry. Synlett 2013. https://doi.org/10.1055/s-0033-
1339874.
(15) Prier, C. K.; Rankic, D. A.; MacMillan, D. W. C. Visible Light Photoredox Catalysis
with Transition Metal Complexes: Applications in Organic Synthesis. Chemical
Reviews. 2013. https://doi.org/10.1021/cr300503r.
(16) Yoon, T. P.; Ischay, M. A.; Du, J. Visible Light Photocatalysis as a Greener
Approach to Photochemical Synthesis. Nature Chemistry 2010.
https://doi.org/10.1038/nchem.687.
(17) Sambiagio, C.; Noël, T. Flow Photochemistry: Shine Some Light on Those Tubes!
Trends in Chemistry. 2019. https://doi.org/10.1016/j.trechm.2019.09.003.
52
(18) Lang, X.; Zhao, J.; Chen, X. Cooperative Photoredox Catalysis. Chemical Society
Reviews. 2016. https://doi.org/10.1039/c5cs00659g.
(19) Ruiz-Soto, A.; Barraza-Jiménez, D.; Hurtado-Macias, A.; Iliana Torres-Herrera, S.;
Omar Ríos-Orozco, C.; López-Guzmán, M.; Marcela Coria-Quiñones, E.;
Armando Olvera-Corral, R.; Alberto Flores-Hidalgo, M. Hydrodynamic Analysis
on a Photocatalytic Reactor Using ANSYS Fluent ® . In Computational Fluid
Dynamics Simulations; 2020. https://doi.org/10.5772/intechopen.89782.
(20) Roibu, A.; Van Gerven, T.; Kuhn, S. Photon Transport and Hydrodynamics in
Gas-Liquid Flows Part 1: Characterization of Taylor Flow in a Photo Microreactor.
ChemPhotoChem 2020. https://doi.org/10.1002/cptc.202000065.
(21) Marugán, J.; Van Grieken, R.; Pablos, C.; Adán, C.; Timmers, R. Determination of
Photochemical, Electrochemical and Photoelectrochemical Efficiencies in a
Photoelectrocatalytic Reactor. International Journal of Chemical Reactor
Engineering 2013. https://doi.org/10.1515/ijcre-2012-0014.
(22) Braham, R. J.; Harris, A. T. Review of Major Design and Scale-up Considerations
for Solar Photocatalytic Reactors. Industrial and Engineering Chemistry
Research. 2009. https://doi.org/10.1021/ie900859z.
(23) Marugán, J.; López-Muñoz, M. J.; Fernández-Ibáñez, P.; Malato, S. Solar
Photocatalysis: Fundamentals, Reactors and Applications. In RSC Energy and
Environment Series; 2016. https://doi.org/10.1039/9781782627104-00092.
(24) Leblebici, M. E.; Stefanidis, G. D.; Van Gerven, T. Comparison of Photocatalytic
Space-Time Yields of 12 Reactor Designs for Wastewater Treatment. Chemical
53
Engineering and Processing: Process Intensification 2015, 97, 106–111.
https://doi.org/10.1016/j.cep.2015.09.009.
(25) Cassano, A. E.; Martín, C. A.; Brandi, R. J.; Alfano, O. M. Photoreactor Analysis
and Design: Fundamentals and Applications. Industrial and Engineering
Chemistry Research 1995. https://doi.org/10.1021/ie00046a001.
(26) Du, Y.; Rabani, J. The Measure of TiO2 Photocatalytic Efficiency and the
Comparison of Different Photocatalytic Titania. Journal of Physical Chemistry B
2003. https://doi.org/10.1021/jp035491z.
(27) Xiong, P.; Hu, J. Degradation of Acetaminophen by UVA/LED/TiO 2 Process.
Separation and Purification Technology 2012.
https://doi.org/10.1016/j.seppur.2011.11.012.
(28) Leblebici, M. E.; Rongé, J.; Martens, J. A.; Stefanidis, G. D.; Van Gerven, T.
Computational Modelling of a Photocatalytic UV-LED Reactor with Internal Mass
and Photon Transfer Consideration. Chemical Engineering Journal 2015.
https://doi.org/10.1016/j.cej.2014.12.013.
(29) Cambié, D.; Bottecchia, C.; Straathof, N. J. W.; Hessel, V.; Noël, T. Applications
of Continuous-Flow Photochemistry in Organic Synthesis, Material Science, and
Water Treatment. Chemical Reviews 2016, 116 (17), 10276–10341.
https://doi.org/10.1021/acs.chemrev.5b00707.
(30) Su, Y.; Straathof, N. J. W.; Hessel, V.; Noël, T. Photochemical Transformations
Accelerated in Continuous-Flow Reactors: Basic Concepts and Applications.
Chemistry - A European Journal. Wiley-VCH Verlag August 18, 2014, pp 10562–
54
10589. https://doi.org/10.1002/chem.201400283.
(31) Yoshida, J. I.; Nagaki, A.; Iwasaki, T.; Suga, S. Enhancement of Chemical
Selectivity by Microreactors. Chemical Engineering and Technology 2005.
https://doi.org/10.1002/ceat.200407127.
(32) Hessel, V.; Löwe, H.; Schönfeld, F. Micromixers - A Review on Passive and
Active Mixing Principles. In Chemical Engineering Science; 2005.
https://doi.org/10.1016/j.ces.2004.11.033.
(33) Falk, L.; Commenge, J. M. Performance Comparison of Micromixers. Chemical
Engineering Science 2010. https://doi.org/10.1016/j.ces.2009.05.045.
(34) Numbering-up, P.; Zhao, F.; Cambie, D.; Janse, J.; Wieland, E. W.; Kuijpers, K. P.
L.; Hessel, V.; Debije, M. G.; Noe, T. Scale-up of a Luminescent Solar
Concentrator-Based Photomicroreactor via Numbering-Up. 2018, 4–11.
https://doi.org/10.1021/acssuschemeng.7b02687.
(35) de Sá, D. S.; Vasconcelos, L. E.; de Souza, J. R.; Marinkovic, B. A.; Del Rosso,
T.; Fulvio, D.; Maza, D.; Massi, A.; Pandoli, O. Intensification of Photocatalytic
Degradation of Organic Dyes and Phenol by Scale-up and Numbering-up of
Meso- and Microfluidic TiO2 Reactors for Wastewater Treatment. Journal of
Photochemistry and Photobiology A: Chemistry 2018.
https://doi.org/10.1016/j.jphotochem.2018.05.020.
(36) Saxena, A. K.; Nigam, K. D. P. Coiled Configuration for Flow Inversion and Its
Effect on Residence Time Distribution. AIChE Journal 1984, 30 (3), 363–368.
https://doi.org/10.1002/aic.690300303.
55
(37) Beydoun, D.; Amal, R.; Scott, J.; Low, G.; McEvoy, S. Studies on the
Mineralization and Separation Efficiencies of a Magnetic Photocatalyst. Chemical
Engineering and Technology 2001. https://doi.org/10.1002/1521-
4125(200107)24:7<745::AID-CEAT745>3.0.CO;2-D.
(38) Benotti, M. J.; Stanford, B. D.; Wert, E. C.; Snyder, S. A. Evaluation of a
Photocatalytic Reactor Membrane Pilot System for the Removal of
Pharmaceuticals and Endocrine Disrupting Compounds from Water. Water
Research 2009. https://doi.org/10.1016/j.watres.2008.12.049.
(39) Vela, N.; Fenoll, J.; Garrido, I.; Navarro, G.; Gambín, M.; Navarro, S.
Photocatalytic Mitigation of Triazinone Herbicide Residues Using Titanium
Dioxide in Slurry Photoreactor. Catalysis Today 2015.
https://doi.org/10.1016/j.cattod.2014.12.011.
(40) Tiwari, C. P.; Delgado-Licona, F.; Valencia-Llompart, M.; Nuñez-Correa, S.;
Nigam, K. D. P.; Montesinos-Castellanos, A.; López-Guajardo, E. A.; Aguirre-
Soto, A. Shining Light on the Coiled-Flow Inverter - Continuous-Flow
Photochemistry in a Static Mixer. Industrial and Engineering Chemistry Research
2020. https://doi.org/10.1021/acs.iecr.9b05008.
(41) Laohaprapanon, S.; Matahum, J.; Tayo, L.; You, S. J. Photodegradation of
Reactive Black 5 in a ZnO/UV Slurry Membrane Reactor. Journal of the Taiwan
Institute of Chemical Engineers 2015. https://doi.org/10.1016/j.jtice.2014.11.017.
(42) Manassero, A.; Satuf, M. L.; Alfano, O. M. Photocatalytic Reactors with
Suspended and Immobilized TiO2: Comparative Efficiency Evaluation. Chemical
56
Engineering Journal 2017, 326, 29–36. https://doi.org/10.1016/j.cej.2017.05.087.
(43) Mittal, S.; Tezduyar, T. E. Comment on “Experimental Investigation of Taylor
Vortex Photocatalytic Reactor for Water Purification.” Chemical Engineering
Science. 2018. https://doi.org/10.1016/j.ces.2017.11.014.
(44) Jiang, H.; Zhang, G.; Huang, T.; Chen, J.; Wang, Q.; Meng, Q. Photocatalytic
Membrane Reactor for Degradation of Acid Red B Wastewater. Chemical
Engineering Journal 2010. https://doi.org/10.1016/j.cej.2009.04.011.
(45) Subramanian, M.; Kannan, A. Photocatalytic Degradation of Phenol in a Rotating
Annular Reactor. Chemical Engineering Science 2010.
https://doi.org/10.1016/j.ces.2010.01.004.
(46) Chen, H. W.; Ku, Y.; Irawan, A. Photodecomposition of O-Cresol by UV-LED/TiO2
Process with Controlled Periodic Illumination. Chemosphere 2007.
https://doi.org/10.1016/j.chemosphere.2007.04.051.
(47) Casado, C.; Timmers, R.; Sergejevs, A.; Clarke, C. T.; Allsopp, D. W. E.; Bowen,
C. R.; van Grieken, R.; Marugán, J. Design and Validation of a LED-Based High
Intensity Photocatalytic Reactor for Quantifying Activity Measurements. Chemical
Engineering Journal 2017, 327, 1043–1055.
https://doi.org/10.1016/j.cej.2017.06.167.
(48) Lachheb, H.; Puzenat, E.; Houas, A.; Ksibi, M.; Elaloui, E.; Guillard, C.;
Herrmann, J. M. Photocatalytic Degradation of Various Types of Dyes (Alizarin S,
Crocein Orange G, Methyl Red, Congo Red, Methylene Blue) in Water by UV-
Irradiated Titania. Applied Catalysis B: Environmental 2002.
57
https://doi.org/10.1016/S0926-3373(02)00078-4.
(49) Claes, T.; Dilissen, A.; Leblebici, M. E.; Van Gerven, T. Translucent Packed Bed
Structures for High Throughput Photocatalytic Reactors. Chemical Engineering
Journal 2019, 361 (December 2018), 725–735.
https://doi.org/10.1016/j.cej.2018.12.107.
(50) Yatmaz, H. C.; Wallis, C.; Howarth, C. R. The Spinning Disc Reactor - Studies on
a Novel TiO2 Photocatalytic Reactor. Chemosphere 2001.
https://doi.org/10.1016/S0045-6535(00)00088-6.
(51) Vaiano, V.; Sacco, O.; Pisano, D.; Sannino, D.; Ciambelli, P. From the Design to
the Development of a Continuous Fixed Bed Photoreactor for Photocatalytic
Degradation of Organic Pollutants in Wastewater. Chemical Engineering Science
2015. https://doi.org/10.1016/j.ces.2015.06.023.
(52) Vezzoli, M.; Farrell, T.; Baker, A.; Psaltis, S.; Martens, W. N.; Bell, J. M. Optimal
Catalyst Thickness in Titanium Dioxide Fixed Film Reactors: Mathematical
Modelling and Experimental Validation. Chemical Engineering Journal 2013, 234,
57–65. https://doi.org/10.1016/j.cej.2013.08.049.
(53) Lin, H.; Valsaraj, K. T. Development of an Optical Fiber Monolith Reactor for
Photocatalytic Wastewater Treatment. Journal of Applied Electrochemistry 2005.
https://doi.org/10.1007/s10800-005-1364-x.
(54) Hamill, N. A.; Weatherley, L. R.; Hardacre, C. Use of a Batch Rotating
Photocatalytic Contactor for the Degradation of Organic Pollutants in Wastewater.
Applied Catalysis B: Environmental 2001. https://doi.org/10.1016/S0926-
58
3373(00)00219-8.
(55) Zhang, Z.; Meunier, S. M.; Gamage, J.; Duvnjak, Z. Design and Characterization
of a Novel Rotating Corrugated Drum Reactor for Wastewater Treatment.
International Journal of Photoenergy 2010. https://doi.org/10.1155/2010/146743.
(56) Gorges, R.; Meyer, S.; Kreisel, G. Photocatalysis in Microreactors. Journal of
Photochemistry and Photobiology A: Chemistry 2004.
https://doi.org/10.1016/j.jphotochem.2004.04.004.
(57) Lin, C.; Liu, M.; Yang, Z. Performance of a Metal Ion-Doped Titania-Coated
Planar Photocatalytic Microreactor. Chemical Engineering and Technology 2016,
39 (1), 88–96. https://doi.org/10.1002/ceat.201400776.
(58) Visan, A.; Rafieian, D.; Ogieglo, W.; Lammertink, R. G. H. Modeling Intrinsic
Kinetics in Immobilized Photocatalytic Microreactors. Applied Catalysis B:
Environmental 2014, 150–151, 93–100.
https://doi.org/10.1016/j.apcatb.2013.12.003.
(59) Aran, H. C.; Salamon, D.; Rijnaarts, T.; Mul, G.; Wessling, M.; Lammertink, R. G.
H. Porous Photocatalytic Membrane Microreactor (P2M2): A New Reactor
Concept for Photochemistry. Journal of Photochemistry and Photobiology A:
Chemistry 2011. https://doi.org/10.1016/j.jphotochem.2011.09.022.
(60) Danion, A.; Disdier, J.; Guillard, C.; Jaffrezic-Renault, N. Malic Acid Photocatalytic
Degradation Using a TiO2-Coated Optical Fiber Reactor. Journal of
Photochemistry and Photobiology A: Chemistry 2007.
https://doi.org/10.1016/j.jphotochem.2007.03.022.
59
(61) Verresen, L.; Fink, E.; Lemke, H. D.; Vanrenterghem, Y. Bradykinin Is a Mediator
of Anaphylactoid Reactions during Hemodialysis with AN69 Membranes. Kidney
International 1994. https://doi.org/10.1038/ki.1994.195.
(62) Tanaka, K.; Yoshikawa, R.; Ying, C.; Kita, H.; Okamoto, K. I. Application of Zeolite
Membranes to Esterification Reactions. In Catalysis Today; 2001.
https://doi.org/10.1016/S0920-5861(01)00271-1.
(63) Fischer, K.; Grimm, M.; Meyers, J.; Dietrich, C.; Gläser, R.; Schulze, A.
Photoactive Microfiltration Membranes via Directed Synthesis of TiO2
Nanoparticles on the Polymer Surface for Removal of Drugs from Water. Journal
of Membrane Science 2015. https://doi.org/10.1016/j.memsci.2015.01.009.
(64) Llorca, J. Monolithic Reactor. In Encyclopedia of Membranes; 2015.
https://doi.org/10.1007/978-3-642-40872-4_2203-1.
(65) Vural Gürsel, I.; Kurt, S. K.; Aalders, J.; Wang, Q.; Noël, T.; Nigam, K. D. P.;
Kockmann, N.; Hessel, V. Utilization of Milli-Scale Coiled Flow Inverter in
Combination with Phase Separator for Continuous Flow Liquid-Liquid Extraction
Processes. Chemical Engineering Journal 2016.
https://doi.org/10.1016/j.cej.2015.08.028.
(66) Vashisth, S.; Nigam, K. D. P. Experimental Investigation of Void Fraction and
Flow Patterns in Coiled Flow Inverter. Chemical Engineering and Processing:
Process Intensification 2008. https://doi.org/10.1016/j.cep.2007.04.008.
(67) Puglisi, A.; Benaglia, M.; Chiroli, V. Stereoselective Organic Reactions Promoted
by Immobilized Chiral Catalysts in Continuous Flow Systems. Green Chemistry.
60
2013. https://doi.org/10.1039/c3gc40195b.
(68) Damodar, R. A.; Jagannathan, K.; Swaminathan, T. Decolourization of Reactive
Dyes by Thin Film Immobilized Surface Photoreactor Using Solar Irradiation.
Solar Energy 2007. https://doi.org/10.1016/j.solener.2006.07.001.
(69) Souzanchi, S.; Vahabzadeh, F.; Fazel, S.; Hosseini, S. N. Performance of an
Annular Sieve-Plate Column Photoreactor Using Immobilized TiO2 on Stainless
Steel Support for Phenol Degradation. Chemical Engineering Journal 2013.
https://doi.org/10.1016/j.cej.2013.02.123.
(70) Mosbach, K. Immobilized Enzymes. Trends in Biochemical Sciences 1980.
https://doi.org/10.1016/S0968-0004(80)80065-X.
(71) Chaudhuri, A.; Kuijpers, K. P. L.; Hendrix, R. B. J.; Shivaprasad, P.; Hacking, J.
A.; Emanuelsson, E. A. C.; Noël, T.; van der Schaaf, J. Process Intensification of
a Photochemical Oxidation Reaction Using a Rotor-Stator Spinning Disk Reactor:
A Strategy for Scale Up. Chemical Engineering Journal 2020.
https://doi.org/10.1016/j.cej.2020.125875.
(72) Riente, P.; Noël, T. Application of Metal Oxide Semiconductors in Light-Driven
Organic Transformations. Catalysis Science and Technology. 2019.
https://doi.org/10.1039/c9cy01170f.
61
Chapter 2 2. Shining light on the coiled-flow inverter – Continuous-flow photochemistry in a static mixer
ABSTRACT
We present the use of a coiled-flow inverter (CFI) for continuous-flow
photochemistry at competitive photon efficiencies. The static mixer is placed inside a
reaction chamber, while a dark adjacent chamber allows for orthogonal online reaction
monitoring via fluorescence spectroscopy. The study of the aqueous visible-light induced
degradation of fluorescein with ZnO-APTMS-Au photocatalyst showcases the challenge
of uniformly irradiating photoreactors with non-planar surfaces. Fluorescence imaging is
introduced as a simple method to visualize spatial gradients in the irradiance at the outer
surface of such complex photoreactor geometries, allowing the analysis of photoreactor
efficiency as a function of lighting configuration. We compared uniaxial and multiaxial
lighting configurations and discuss the challenges associated with attaining uniform
irradiance distribution of incident light on coiled-flow inverters, where chaotic advection
combats light attenuation. A first calculation of the photochemical space-time yield
(PSTY) for a “photo-CFI” is presented and contrasted with other photoreactor designs.
This chapter is based on:
Chinmay P. Tiwari, Fernando Delgado-Licona, María Valencia-Llompart, Sara Nuñez-Correa, Krishna D.P. Nigam, Alejandro Montesinos-Castellanos, Enrique A. López-Guajardo, and Alan Aguirre-Soto Industrial & Engineering Chemistry Research 2020 59 (9), 3865-3872 DOI: 10.1021/acs.iecr.9b05008
62
2.1 INTRODUCTION
Given the increasing interest on continuous-flow photochemistry,1 it was recently
identified that static mixers, such as the coiled-flow inverter (CFI), could increase efficiencies
by allowing the use of higher catalyst (chromophore) loadings without hampering mass and
photon transfer.2 However, it was immediately recognized that a major obstacle precluding the
use of static mixers for photochemical reactions is to uniformly irradiate their complex 3D
geometries. No reports were found on the study of irradiation uniformity as a function of lighting
configuration of static mixers as photoreactors. Here, we designed a platform to analyze the
efficiency of static mixers as a function of irradiation and hydrodynamic parameters for
continuous-flow photochemistry.
The relatively low efficiencies and productivities of light-triggered processes are
hindering their broad implementation as safe, “soft”, and sustainable chemical routes for
organic synthesis, materials chemistry, and air and water treatment.3,4 In batch
configurations, the reaction timescales are still in the order of hours to days, where
significant inefficiencies in heat, mass and photon transfer rates are present.5 Flow
chemistry has addressed the limitations of batch photoreactors by reducing the
characteristic length scale of the reaction vessel, where small diameter transparent or
semi-transparent tubing is coiled around commercial light sources with high curvature
ratios.6 The small length scales used in continuous-flow significantly enhance the mass
transfer and photon absorption efficiencies. Albeit, the importance of mixing under the
laminar flow regime at these scales is seldom considered in the design. Hence, the
residence times necessary to achieve relevant efficiencies and productivities remains
high. As a result, concentrations, flow rates, reactor length and light intensity need to be
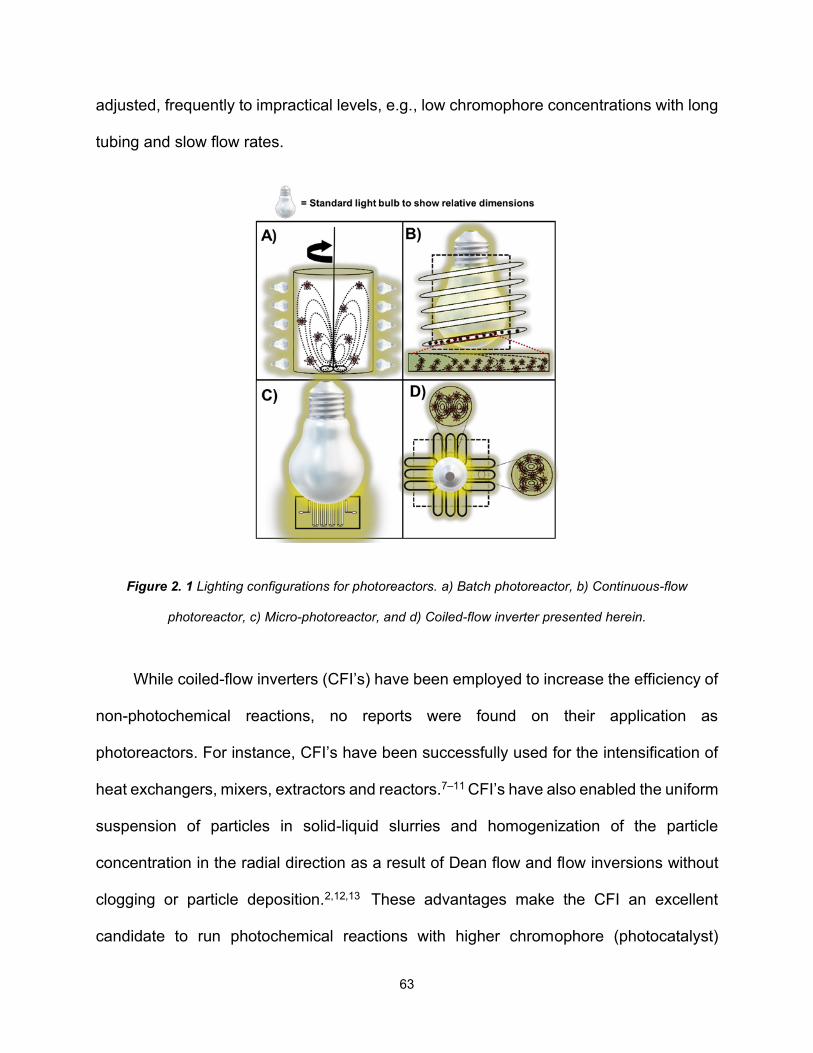
63
adjusted, frequently to impractical levels, e.g., low chromophore concentrations with long
tubing and slow flow rates.
Figure 2. 1 Lighting configurations for photoreactors. a) Batch photoreactor, b) Continuous-flow
photoreactor, c) Micro-photoreactor, and d) Coiled-flow inverter presented herein.
While coiled-flow inverters (CFI’s) have been employed to increase the efficiency of
non-photochemical reactions, no reports were found on their application as
photoreactors. For instance, CFI’s have been successfully used for the intensification of
heat exchangers, mixers, extractors and reactors.7–11 CFI’s have also enabled the uniform
suspension of particles in solid-liquid slurries and homogenization of the particle
concentration in the radial direction as a result of Dean flow and flow inversions without
clogging or particle deposition.2,12,13 These advantages make the CFI an excellent
candidate to run photochemical reactions with higher chromophore (photocatalyst)
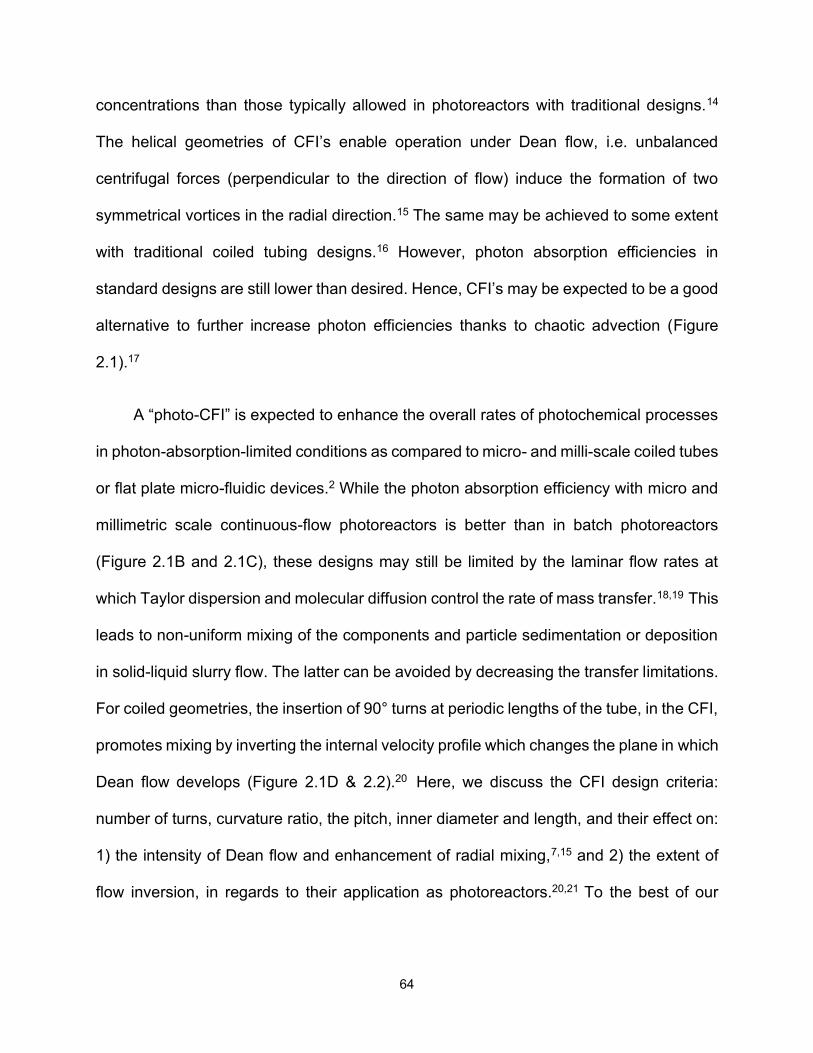
64
concentrations than those typically allowed in photoreactors with traditional designs.14
The helical geometries of CFI’s enable operation under Dean flow, i.e. unbalanced
centrifugal forces (perpendicular to the direction of flow) induce the formation of two
symmetrical vortices in the radial direction.15 The same may be achieved to some extent
with traditional coiled tubing designs.16 However, photon absorption efficiencies in
standard designs are still lower than desired. Hence, CFI’s may be expected to be a good
alternative to further increase photon efficiencies thanks to chaotic advection (Figure
2.1).17
A “photo-CFI” is expected to enhance the overall rates of photochemical processes
in photon-absorption-limited conditions as compared to micro- and milli-scale coiled tubes
or flat plate micro-fluidic devices.2 While the photon absorption efficiency with micro and
millimetric scale continuous-flow photoreactors is better than in batch photoreactors
(Figure 2.1B and 2.1C), these designs may still be limited by the laminar flow rates at
which Taylor dispersion and molecular diffusion control the rate of mass transfer.18,19 This
leads to non-uniform mixing of the components and particle sedimentation or deposition
in solid-liquid slurry flow. The latter can be avoided by decreasing the transfer limitations.
For coiled geometries, the insertion of 90° turns at periodic lengths of the tube, in the CFI,
promotes mixing by inverting the internal velocity profile which changes the plane in which
Dean flow develops (Figure 2.1D & 2.2).20 Here, we discuss the CFI design criteria:
number of turns, curvature ratio, the pitch, inner diameter and length, and their effect on:
1) the intensity of Dean flow and enhancement of radial mixing,7,15 and 2) the extent of
flow inversion, in regards to their application as photoreactors.20,21 To the best of our
65
knowledge, this is the first report of the intensification of a photochemical process with a
CFI.22
2.2 MATERIALS AND METHODS
2.2.1 Materials
2.2.1.1 Chemicals
Gold(III)chloride trihydrate (HAuCl4‧3H2O, 99.9%, Sigma Aldrich),
tetrakis(hydroxymethyl) phosphonium chloride solution (THPC, 80% wt. Sigma Aldrich),
distilled water and sodium hydroxide (NaOH, flakes, 99%, Sigma Aldrich), commercial-
grade zinc oxide (ZnO, 99.6%, J.T.Baker ACS), (3-aminopropyl)trimethoxysilane
(APTMS, 97%, Sigma Aldrich), a 1% w/v fluorescein stock solution (Desarrollo de
Especialidades Quimicas), ethanol (C2H6O, 96°, HYCEL) and toluene (C6H5CH3, 99.8%,
Sigma Aldrich) were used as received.
2.2.1.2 Materials for the construction of the modular fluidic platform
The reactor module was built using 5.5 mm thick medium-density fiberboards
(Trupan MDF, Arauco), while a mirror-like vinyl film (85% IR rejection; 99% UV rejection;
20% of visible light transmittance (VLT), Rabbittgoo, Globegou) was used as the reflective
surface of the reaction chamber. PVC fittings used in the system comprised of ball valves
(CFT-W003, SERVIMATIC), tee connector (CFT-W235, SERVIMATIC) and 90° elbow
connector (CFT-W231, SERVIMATIC). Silicon tubing (5/16” OD, THERMO SCIENTIFIC)
was used for the peristaltic pump (Watson 120s) connection, while PTFE tubing was used
for fitting connections.
2.2.1.3 Light sources, on-line spectrophotometer, and power meter
66
A commercial visible light (400-700 nm) LED (Sansi-A21) of 27 W and 4,000 lumens
with a spectral temperature of 5000K was used for the photoreactions. The “Spark Vis”
(Ocean Optics) system was utilized as an on-line fluorescence sensor. The system was
composed of a 470 LED as excitation source at 90˚ from a CCD detector. Reaction data
acquisition was programmed on the Ocean View software (Ocean Optics) with spectral
collection parameters adjusted for every experiment depending on the initial photon
counts. An Ophir Vega (P/N7Z01560-Ophir Photonics Product) handheld power meter
was used for intensity measurements.
2.2.2 Methods
2.2.2.1 Synthesis of ZnO-based visible-light photocatalyst
ZnO-APTMS nanoparticles were prepared based on the reported protocol.23,24 Gold
nanoparticles were synthesized following a previously reported procedure.25
2.2.2.2 Spectroscopic characterization of photocatalyst nanoparticles
Fourier-transform infrared spectroscopy (FTIR) spectra of the ZnO-APTMS particles
(Supplemental Information Figure S1 in Appendix B) were recorded using a Perkin Elmer,
Frontier spectrometer at a range of 4,000 to 400 cm-1 and a resolution of 1 cm-1. UV-Vis
absorbance spectra (200 nm-750 nm) of ZnO and ZnO-APTMS-Au particles
(Supplemental Information Figure S2 in appendix B) were recorded using a Perkin Elmer
Lambda 365 spectrophotometer to confirm successful functionalization of the ZnO
particles with APTMS and the gold nanoparticles.
2.2.2.3 Preparation of the ZnO-APTMS-AU/Fluorescein solution
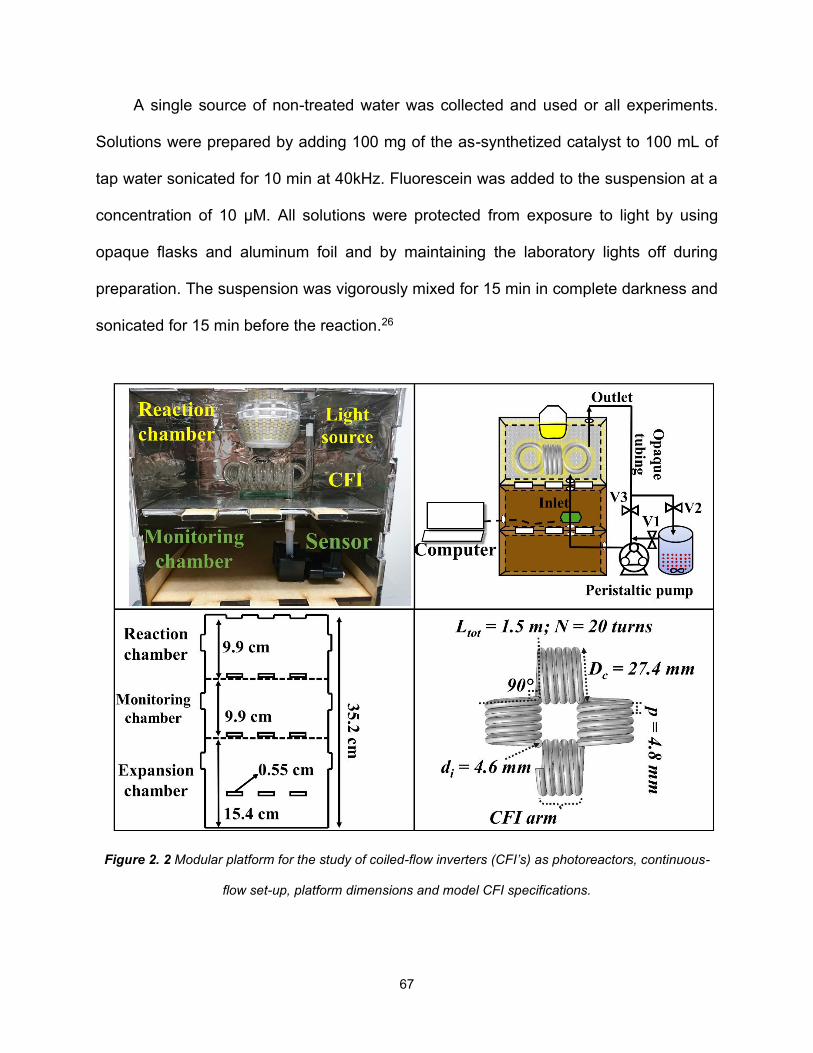
67
A single source of non-treated water was collected and used or all experiments.
Solutions were prepared by adding 100 mg of the as-synthetized catalyst to 100 mL of
tap water sonicated for 10 min at 40kHz. Fluorescein was added to the suspension at a
concentration of 10 µM. All solutions were protected from exposure to light by using
opaque flasks and aluminum foil and by maintaining the laboratory lights off during
preparation. The suspension was vigorously mixed for 15 min in complete darkness and
sonicated for 15 min before the reaction.26
Figure 2. 2 Modular platform for the study of coiled-flow inverters (CFI’s) as photoreactors, continuous-
flow set-up, platform dimensions and model CFI specifications.
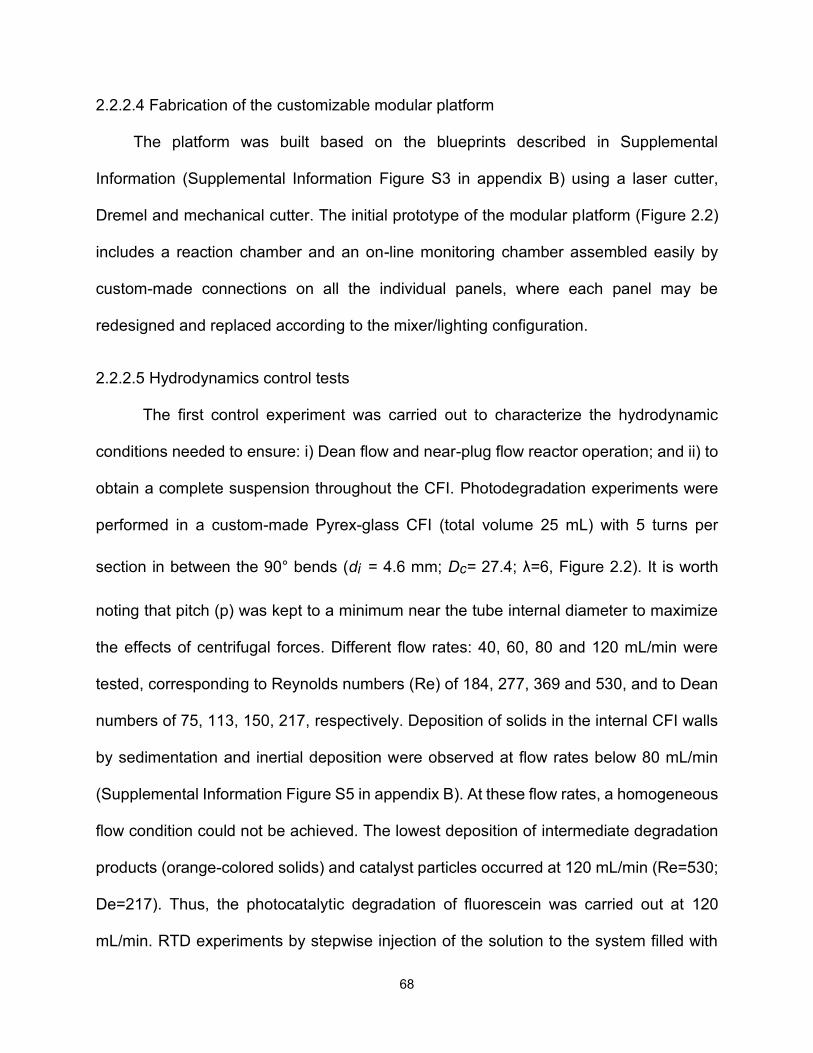
68
2.2.2.4 Fabrication of the customizable modular platform
The platform was built based on the blueprints described in Supplemental
Information (Supplemental Information Figure S3 in appendix B) using a laser cutter,
Dremel and mechanical cutter. The initial prototype of the modular platform (Figure 2.2)
includes a reaction chamber and an on-line monitoring chamber assembled easily by
custom-made connections on all the individual panels, where each panel may be
redesigned and replaced according to the mixer/lighting configuration.
2.2.2.5 Hydrodynamics control tests
The first control experiment was carried out to characterize the hydrodynamic
conditions needed to ensure: i) Dean flow and near-plug flow reactor operation; and ii) to
obtain a complete suspension throughout the CFI. Photodegradation experiments were
performed in a custom-made Pyrex-glass CFI (total volume 25 mL) with 5 turns per
section in between the 90° bends (di = 4.6 mm; Dc= 27.4; λ=6, Figure 2.2). It is worth
noting that pitch (p) was kept to a minimum near the tube internal diameter to maximize
the effects of centrifugal forces. Different flow rates: 40, 60, 80 and 120 mL/min were
tested, corresponding to Reynolds numbers (Re) of 184, 277, 369 and 530, and to Dean
numbers of 75, 113, 150, 217, respectively. Deposition of solids in the internal CFI walls
by sedimentation and inertial deposition were observed at flow rates below 80 mL/min
(Supplemental Information Figure S5 in appendix B). At these flow rates, a homogeneous
flow condition could not be achieved. The lowest deposition of intermediate degradation
products (orange-colored solids) and catalyst particles occurred at 120 mL/min (Re=530;
De=217). Thus, the photocatalytic degradation of fluorescein was carried out at 120
mL/min. RTD experiments by stepwise injection of the solution to the system filled with
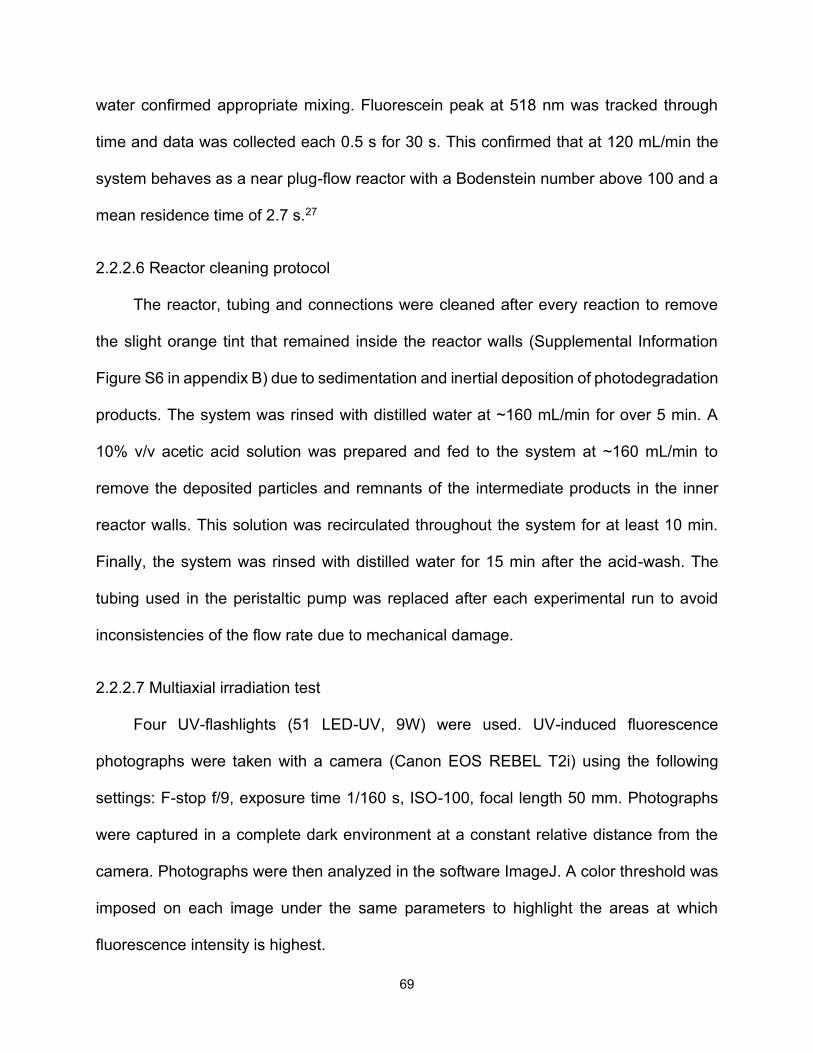
69
water confirmed appropriate mixing. Fluorescein peak at 518 nm was tracked through
time and data was collected each 0.5 s for 30 s. This confirmed that at 120 mL/min the
system behaves as a near plug-flow reactor with a Bodenstein number above 100 and a
mean residence time of 2.7 s.27
2.2.2.6 Reactor cleaning protocol
The reactor, tubing and connections were cleaned after every reaction to remove
the slight orange tint that remained inside the reactor walls (Supplemental Information
Figure S6 in appendix B) due to sedimentation and inertial deposition of photodegradation
products. The system was rinsed with distilled water at ~160 mL/min for over 5 min. A
10% v/v acetic acid solution was prepared and fed to the system at ~160 mL/min to
remove the deposited particles and remnants of the intermediate products in the inner
reactor walls. This solution was recirculated throughout the system for at least 10 min.
Finally, the system was rinsed with distilled water for 15 min after the acid-wash. The
tubing used in the peristaltic pump was replaced after each experimental run to avoid
inconsistencies of the flow rate due to mechanical damage.
2.2.2.7 Multiaxial irradiation test
Four UV-flashlights (51 LED-UV, 9W) were used. UV-induced fluorescence
photographs were taken with a camera (Canon EOS REBEL T2i) using the following
settings: F-stop f/9, exposure time 1/160 s, ISO-100, focal length 50 mm. Photographs
were captured in a complete dark environment at a constant relative distance from the
camera. Photographs were then analyzed in the software ImageJ. A color threshold was
imposed on each image under the same parameters to highlight the areas at which
fluorescence intensity is highest.
70
2.3 RESULTS AND DISCUSSION
2.3.1 Coiled-flow inverters for photochemical reactions
As identified by Heggo and Ookawara, the most important challenge halting the use
of CFI’s for photochemical reactions is uniformly irradiating their bent helicoidal
geometries.2 No reports were found on their use as photoreactors. The importance of
irradiance distribution was recently discussed for the case of micro-structured
photoreactors, quasi 2D.28 It was pointed out that irradiance modelling may be employed
to study spatial gradients in photon density on photoreactors, but that it has been
identified that models still lack accuracy for complex irradiation systems. On the other
hand, actinometry can provide an idea of the intensity inside the CFI.28 Nevertheless,
these values would not give information on the spatial distribution of the light intensity on
the CFI surface. An excellent analysis by near-field goniometry allowed the mapping of
irradiance uniformity inside microchannels illuminated by series of LED chips. This
demonstrated that even for relatively easy-to-irradiate flat-plate microreactors attention
must be paid to the distribution of the radiant flux as a function of position and viewing
angle of the light sources. For millimetric reactors with complex 3D geometries like the
CFI, it can only be expected that achieving uniform light distribution becomes increasingly
complicated while maintaining practical light intensity and energy efficiency values.
Considering the periodically bent coiled segments in a CFI, an initial idea to
incorporate uniform lighting to this class of static mixers was to irradiate from the center
of the coiled segments with either a bendable cylindrical light source or several smaller
straight cylindrical lamps. This approach stems naturally from the typical lighting
configurations where the tubing is coiled around the light source. A report was found on
71
the idea of irradiating a CFI with a cylindrical UV lamp from the center of coiled sections,
but it lacks full details on the results, experimental details and performance of this
system.29 One limitation we foresee with such an approach is that it is limited to cylindrical
light sources that fit inside the CFI sections, which appears to be impractical and
expensive to implement for multiple static mixer designs of various sizes and designs.
Hence, the option of irradiating each section of the CFI’s with a cylindrical lamp was not
explored.
We decided to build a platform where the CFI can be irradiated from the outside
from multiple angles and distances to the outer surfaces of the helices. With this approach
the CFI can be irradiated from a distance so that variations in light intensity are minimized,
where the distance from the light source to the reactor surface can obviously achieve a
reasonably uniform irradiation. However, as the light source is separated from the static
mixer the irradiance decreases dramatically (inverse square law), thus requiring high
energy-consumption light sources to operate the reactor at competitive reaction rates.
Additionally, if the CFI’s are irradiated from a single axis, the incident photon flux on the
furthermost face will be undoubtedly be lower than on the nearest face. As a result, it
appeared that uniform irradiation of CFI’s may only be achieved at practically relevant
intensities by enclosing the static mixers inside a chamber with reflective walls or by using
multiple light sources in tandem.
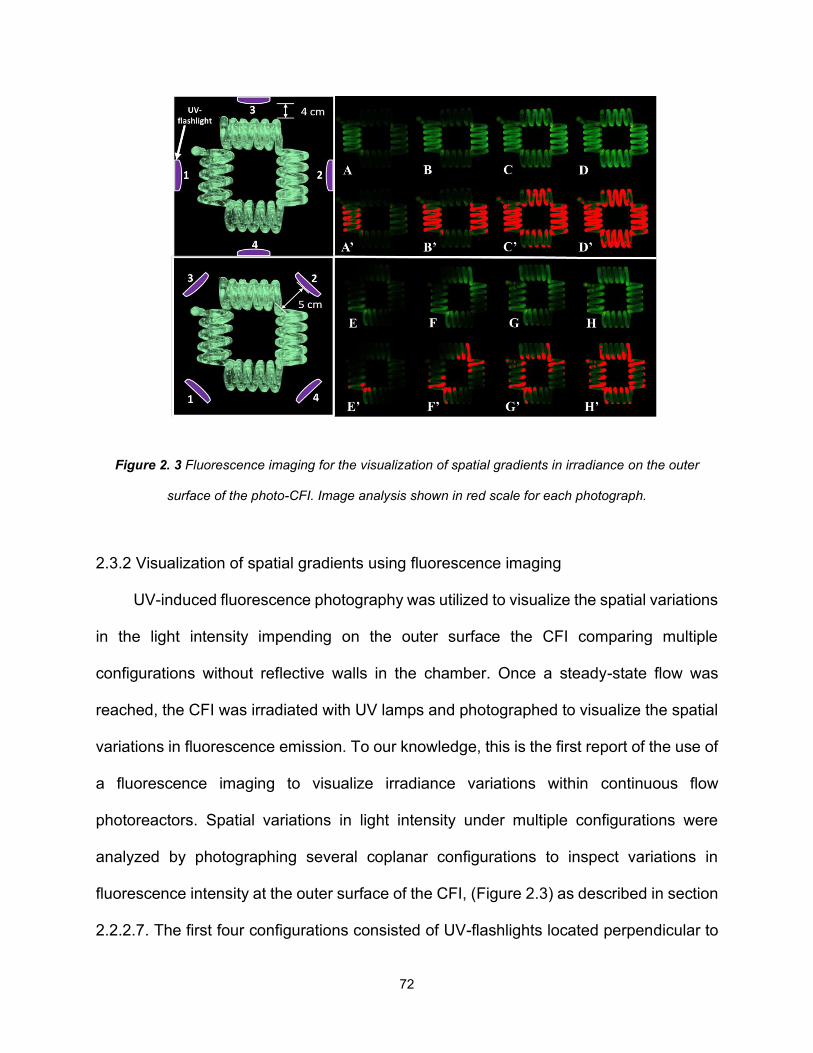
72
Figure 2. 3 Fluorescence imaging for the visualization of spatial gradients in irradiance on the outer
surface of the photo-CFI. Image analysis shown in red scale for each photograph.
2.3.2 Visualization of spatial gradients using fluorescence imaging
UV-induced fluorescence photography was utilized to visualize the spatial variations
in the light intensity impending on the outer surface the CFI comparing multiple
configurations without reflective walls in the chamber. Once a steady-state flow was
reached, the CFI was irradiated with UV lamps and photographed to visualize the spatial
variations in fluorescence emission. To our knowledge, this is the first report of the use of
a fluorescence imaging to visualize irradiance variations within continuous flow
photoreactors. Spatial variations in light intensity under multiple configurations were
analyzed by photographing several coplanar configurations to inspect variations in
fluorescence intensity at the outer surface of the CFI, (Figure 2.3) as described in section
2.2.2.7. The first four configurations consisted of UV-flashlights located perpendicular to
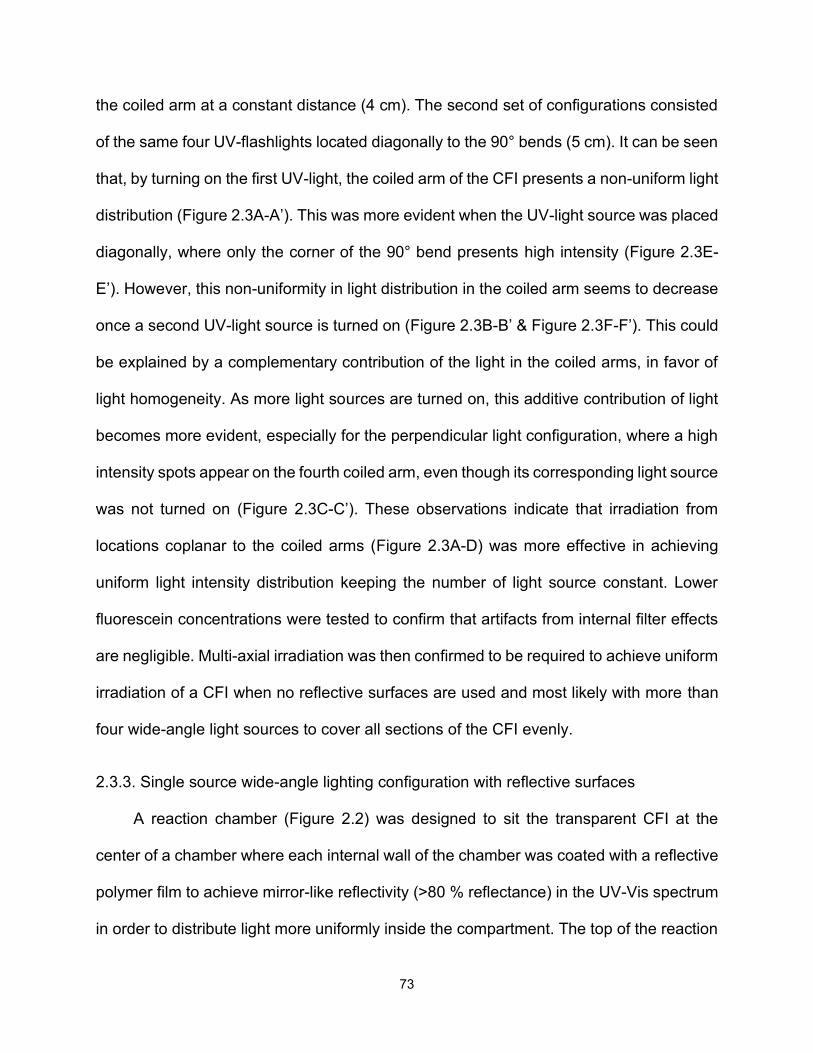
73
the coiled arm at a constant distance (4 cm). The second set of configurations consisted
of the same four UV-flashlights located diagonally to the 90° bends (5 cm). It can be seen
that, by turning on the first UV-light, the coiled arm of the CFI presents a non-uniform light
distribution (Figure 2.3A-A’). This was more evident when the UV-light source was placed
diagonally, where only the corner of the 90° bend presents high intensity (Figure 2.3E-
E’). However, this non-uniformity in light distribution in the coiled arm seems to decrease
once a second UV-light source is turned on (Figure 2.3B-B’ & Figure 2.3F-F’). This could
be explained by a complementary contribution of the light in the coiled arms, in favor of
light homogeneity. As more light sources are turned on, this additive contribution of light
becomes more evident, especially for the perpendicular light configuration, where a high
intensity spots appear on the fourth coiled arm, even though its corresponding light source
was not turned on (Figure 2.3C-C’). These observations indicate that irradiation from
locations coplanar to the coiled arms (Figure 2.3A-D) was more effective in achieving
uniform light intensity distribution keeping the number of light source constant. Lower
fluorescein concentrations were tested to confirm that artifacts from internal filter effects
are negligible. Multi-axial irradiation was then confirmed to be required to achieve uniform
irradiation of a CFI when no reflective surfaces are used and most likely with more than
four wide-angle light sources to cover all sections of the CFI evenly.
2.3.3. Single source wide-angle lighting configuration with reflective surfaces
A reaction chamber (Figure 2.2) was designed to sit the transparent CFI at the
center of a chamber where each internal wall of the chamber was coated with a reflective
polymer film to achieve mirror-like reflectivity (>80 % reflectance) in the UV-Vis spectrum
in order to distribute light more uniformly inside the compartment. The top of the reaction
74
chamber was perforated at the center to embed the light source from the top wall for
irradiation from a wide-angle single source. Photographs are shown in Supplemental
Information, Figure S4 in appendix B.
To quantitatively assess the irradiance uniformity of visible light with a single light
source, we mapped the light fluence inside the reaction module with a photo-thermal
sensor. The wide-angle LED (400-700 nm) source consisted of multiple chips in a radial
array (Figure 2.4A) to maximize irradiation in the CFI coils. We placed handheld power
meter at different positions inside the reaction chamber to analyze variations in the
intensity distribution along the plane normal to the irradiation axis. Results of light intensity
at each point are shown in Figure 2.4B. The intensity is slightly higher as we move from
the center of the reaction chamber to the outer walls. For the case of the CFI, the lower
intensity (4.3 mW) in the center of the reaction volume is not a problem as there is no
reaction volume directly underneath the light source. Furthermore, the reflective surfaces
appear to mitigate these variations, thus improving the uniformity of the light intensity.
The average intensity in the horizontal plane of the reaction chamber was determined to
be 12.82 mW for the case of uniaxial irradiation from the wide viewing angle LED chips.
The latter indicates that reflective surfaces may be enough to distribute a sufficiently high
photon density on the CFI even with a single source. A single source lighting configuration
with a distance-to-light-source between 1-5 centimeters appears to yield uniform intensity
distribution at relevant power densities if inside a chamber with reflective walls. We can
conclude that the biggest contribution in uniformly distributing light intensity on the outer
surface of the CFI came not from multiaxial irradiation but from the use of the reflective
surface inside the reaction chamber with at least one wide-angle light source.
75
Figure 2. 4 a) Wide-angle visible-light LED source; b) Measurements of visible-light intensity at different
locations inside the reaction chamber for uniaxial top-down irradiation.
2.3.4 Photodegradation of fluorescein by ZnO-APTMS-Au nanoparticles in CFI
Employing the single source lighting configuration inside the chamber with reflective
walls, we selected a photochemical reaction for wastewater treatment primarily because
of available efficiency and productivity benchmarks for various photoreactor and lighting
configurations.3,30 Fluorescein (FL) was chosen as model contaminant due to its relatively
high fluorescence and low electron-transfer quantum yields as compared to other
common model contaminants such as methylene blue or eosin Y. Specifically, the light-
induced degradation of fluorescein with ZnO-APTMS-Au photocatalyst was selected
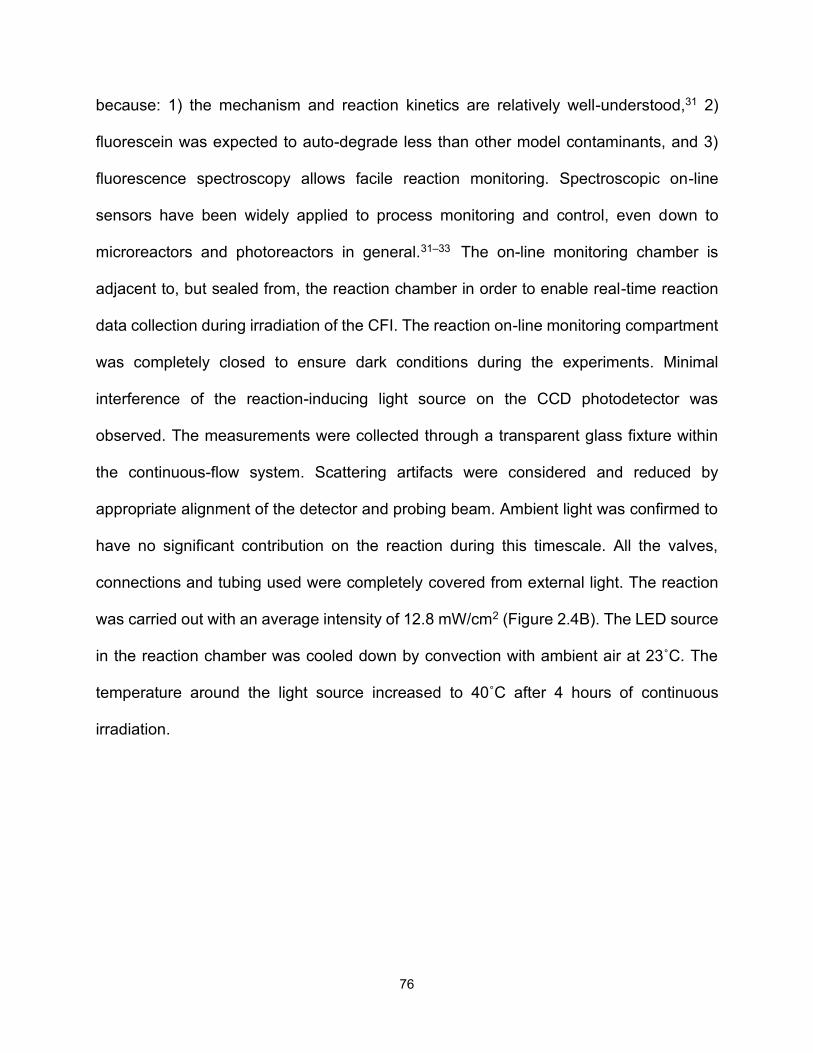
76
because: 1) the mechanism and reaction kinetics are relatively well-understood,31 2)
fluorescein was expected to auto-degrade less than other model contaminants, and 3)
fluorescence spectroscopy allows facile reaction monitoring. Spectroscopic on-line
sensors have been widely applied to process monitoring and control, even down to
microreactors and photoreactors in general.31–33 The on-line monitoring chamber is
adjacent to, but sealed from, the reaction chamber in order to enable real-time reaction
data collection during irradiation of the CFI. The reaction on-line monitoring compartment
was completely closed to ensure dark conditions during the experiments. Minimal
interference of the reaction-inducing light source on the CCD photodetector was
observed. The measurements were collected through a transparent glass fixture within
the continuous-flow system. Scattering artifacts were considered and reduced by
appropriate alignment of the detector and probing beam. Ambient light was confirmed to
have no significant contribution on the reaction during this timescale. All the valves,
connections and tubing used were completely covered from external light. The reaction
was carried out with an average intensity of 12.8 mW/cm2 (Figure 2.4B). The LED source
in the reaction chamber was cooled down by convection with ambient air at 23˚C. The
temperature around the light source increased to 40˚C after 4 hours of continuous
irradiation.
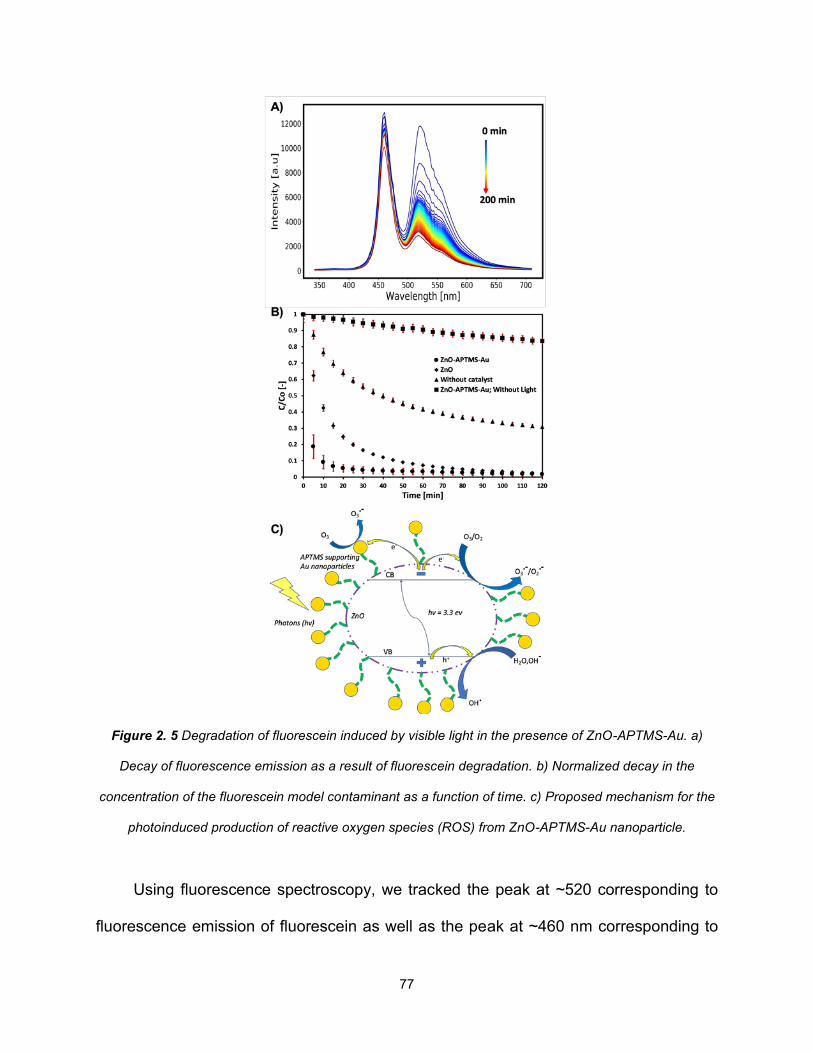
77
Figure 2. 5 Degradation of fluorescein induced by visible light in the presence of ZnO-APTMS-Au. a)
Decay of fluorescence emission as a result of fluorescein degradation. b) Normalized decay in the
concentration of the fluorescein model contaminant as a function of time. c) Proposed mechanism for the
photoinduced production of reactive oxygen species (ROS) from ZnO-APTMS-Au nanoparticle.
Using fluorescence spectroscopy, we tracked the peak at ~520 corresponding to
fluorescence emission of fluorescein as well as the peak at ~460 nm corresponding to
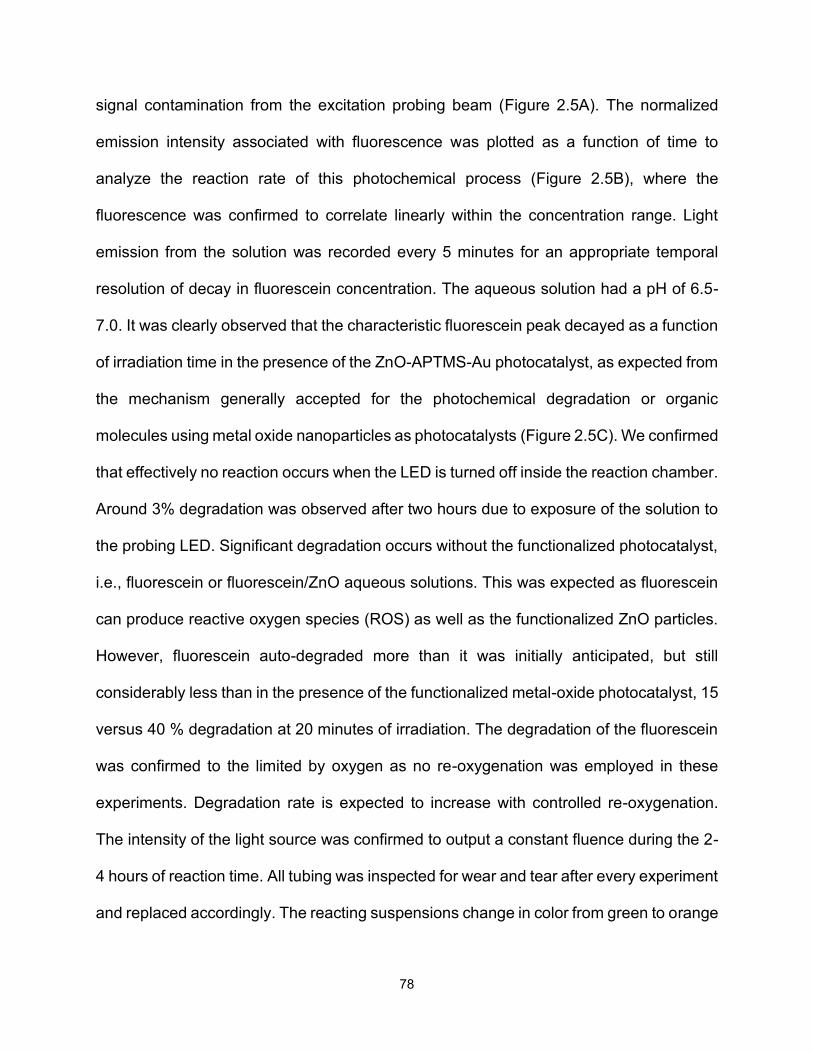
78
signal contamination from the excitation probing beam (Figure 2.5A). The normalized
emission intensity associated with fluorescence was plotted as a function of time to
analyze the reaction rate of this photochemical process (Figure 2.5B), where the
fluorescence was confirmed to correlate linearly within the concentration range. Light
emission from the solution was recorded every 5 minutes for an appropriate temporal
resolution of decay in fluorescein concentration. The aqueous solution had a pH of 6.5-
7.0. It was clearly observed that the characteristic fluorescein peak decayed as a function
of irradiation time in the presence of the ZnO-APTMS-Au photocatalyst, as expected from
the mechanism generally accepted for the photochemical degradation or organic
molecules using metal oxide nanoparticles as photocatalysts (Figure 2.5C). We confirmed
that effectively no reaction occurs when the LED is turned off inside the reaction chamber.
Around 3% degradation was observed after two hours due to exposure of the solution to
the probing LED. Significant degradation occurs without the functionalized photocatalyst,
i.e., fluorescein or fluorescein/ZnO aqueous solutions. This was expected as fluorescein
can produce reactive oxygen species (ROS) as well as the functionalized ZnO particles.
However, fluorescein auto-degraded more than it was initially anticipated, but still
considerably less than in the presence of the functionalized metal-oxide photocatalyst, 15
versus 40 % degradation at 20 minutes of irradiation. The degradation of the fluorescein
was confirmed to the limited by oxygen as no re-oxygenation was employed in these
experiments. Degradation rate is expected to increase with controlled re-oxygenation.
The intensity of the light source was confirmed to output a constant fluence during the 2-
4 hours of reaction time. All tubing was inspected for wear and tear after every experiment
and replaced accordingly. The reacting suspensions change in color from green to orange
79
and then to colorless as full degradation of the fluorescein was accomplished within 4-6
hours of irradiation in the presence of ZnO-APTMS-Au. The peak associated with the
excitation beam is due to light scattering and internal reflection through the solution filled
tubing segment for the analysis. This peak served as internal standard. Relatively small
variations in the LED-related emission peak were observed during the experiments.
2.3.5 Photochemical Space-Time Yield with a “Photo-CFI”
A standardized Photochemical Space-Time Yield (PSTY) was computed following
the procedure discussed in by Leblebici et al.3 in order to properly compare the
performance of the CFI photoreactor with other systems for water treatment. A pseudo-
first order rate equation (eq. 1) was fitted to the concentration data in order to obtain an
apparent reaction rate (kapp) constant that encompasses the reaction kinetics and mass
transfer effects on the catalyst surface. The standardized space-time yield (STY, eq. 2)
was computed by considering the total volume of water treated (Vw) in a determined
reactor volume (Vr). It is worth mentioning that the degradation system is modeled as a
continuous stirred tank reactor since the recycling ratio (R=Qr/Qw) is equal to 1 as it is a
fully-closed system. The PSTY (eq. 3) is computed from the standardized lamp power
(LP, eq. 4) that considers the scaled power of the light source (P) needed to irradiate 1
m3 of reactor by the volume of the reactor used.
−𝑟𝑜𝑏𝑠 = 𝑘𝑎𝑝𝑝𝐶 (1)
𝑆𝑇𝑌 =𝑘𝑎𝑝𝑝
𝐶0𝐶 + 1
×Vw
Vr
(2)
80
𝑃𝑆𝑇𝑌 =𝑆𝑇𝑌LP
(3)
𝐿𝑃 = 𝑃 ×1 𝑚3
Vr
(4)
From this analysis, we estimate the PSTY to be 2.97x10⁻² [m3 water treated/(m3
reactor*day*kW] using a lamp power of 27 W for the reactor volume of 25 mL and based
on the reaction kinetics obtained from fluorescence spectroscopy. With this analysis the
photon efficiency of static mixers can be compared with other configurations. The
obtained PSTY in the CFI 2.75 times higher than that obtained in a photocatalytic micro-
reactor and 2 times higher than a spinning disk photoreactor confirming that the
combination of Dean flow and flow inversions could enhance photon absorption.
2.4 CONCLUSIONS
We reported a versatile experimental setup that enables the study of static mixers
like the CFI as continuous-flow photoreactors, showcasing the importance of uniform
irradiation of such complex 3D geometries. We introduced the use of fluorescence
emission as a method to visualize spatial variations in irradiance on millimetric static
mixers. From our observation we can conclude that the use of reflective surfaces around
the CFI appears to be the most cost-effective way to ensure uniform irradiation on the
outer surface of the CFI. The use of on-line spectroscopic monitoring allowed for the real-
time analysis of the reaction rates to study the photooxidative degradation of fluorescein
in water in the presence of ZnO-APTMS-Au as model photochemical reaction. Lastly, the
case study discussed herein helped confirm that CFI’s can yield promising photon
81
efficiencies, as measured by the photochemical space time yield, when uniform irradiation
of the complex CFI geometry is achieved.
REFERENCES
(1) Su, Y.; Straathof, N. J. W.; Hessel, V.; Noël, T. Photochemical Transformations
Accelerated in Continuous-Flow Reactors: Basic Concepts and Applications.
Chem. - A Eur. J. 2014, 20 (34), 10562–10589.
(2) Heggo, D.; Ookawara, S. Multiphase Photocatalytic Microreactors. Chem. Eng. Sci.
2017, 169, 67–77.
(3) Leblebici, M. E.; Stefanidis, G. D.; Van Gerven, T. Comparison of Photocatalytic
Space-Time Yields of 12 Reactor Designs for Wastewater Treatment. Chem. Eng.
Process. Process Intensif. 2015, 97, 106–111.
(4) Cambié, D.; Bottecchia, C.; Straathof, N. J. W.; Hessel, V.; Noël, T. Applications of
Continuous-Flow Photochemistry in Organic Synthesis, Material Science, and
Water Treatment. Chem. Rev. 2016, 116 (17), 10276–10341.
(5) Loubière, K.; Oelgemöller, M.; Aillet, T.; Dechy-Cabaret, O.; Prat, L. Continuous-
Flow Photochemistry: A Need for Chemical Engineering. Chem. Eng. Process.
Process Intensif. 2016, 104, 120–132.
(6) Coley, C. W.; Abolhasani, M.; Lin, H.; Jensen, K. F. Material-Efficient Microfluidic
Platform for Exploratory Studies of Visible-Light Photoredox Catalysis. Angew.
Chemie Int. Ed. 2017, 56 (33), 9847–9850.
(7) Vural Gürsel, I.; Kurt, S. K.; Aalders, J.; Wang, Q.; Noël, T.; Nigam, K. D. P.;
Kockmann, N.; Hessel, V. Utilization of Milli-Scale Coiled Flow Inverter in
Combination with Phase Separator for Continuous Flow Liquid–Liquid Extraction
82
Processes. Chem. Eng. J. 2016, 283, 855–868.
(8) Singh, J.; Nigam, K. D. P. Pilot Plant Study for Effective Heat Transfer Area of
Coiled Flow Inverter. Chem. Eng. Process. Process Intensif. 2016, 102, 219–228.
(9) Mridha, M.; Nigam, K. D. P. Coiled Flow Inverter as an Inline Mixer. Chem. Eng.
Sci. 2008, 63 (6), 1724–1732.
(10) López-Guajardo, E. A.; Garza-Cantú, G. M.; Marques-Camarena, A.; Ortiz-Nadal,
E.; Nigam, K. D. P.; Montesinos-Castellanos, A. Liquid–Liquid Flow Pattern
Visualization and Mapping in a Millimetric Size Coiled Tube. Ind. Eng. Chem. Res.
2019, 58 (2), 1075–1086.
(11) Hohmann, L.; Greinert, T.; Mierka, O.; Turek, S.; Schembecker, G.; Bayraktar, E.;
Wohlgemuth, K.; Kockmann, N. Analysis of Crystal Size Dispersion Effects in a
Continuous Coiled Tubular Crystallizer: Experiments and Modeling. Cryst. Growth
Des. 2018, 18 (3), 1459–1473.
(12) Kurt, S. K.; Akhtar, M.; Nigam, K. D. P.; Kockmann, N. Continuous Reactive
Precipitation in a Coiled Flow Inverter: Inert Particle Tracking, Modular Design, and
Production of Uniform CaCO 3 Particles. Ind. Eng. Chem. Res. 2017, 56 (39),
11320–11335.
(13) Hohmann, L.; Schmalenberg, M.; Prasanna, M.; Matuschek, M.; Kockmann, N.
Suspension Flow Behavior and Particle Residence Time Distribution in Helical
Tube Devices. Chem. Eng. J. 2019, 360, 1371–1389.
(14) Lee, K. M.; Lai, C. W.; Ngai, K. S.; Juan, J. C. Recent Developments of Zinc Oxide
Based Photocatalyst in Water Treatment Technology: A Review. Water Res. 2016,
88, 428–448.

83
(15) Dean, W. R. Fluid Motion in a Curved Channel. Proc. R. Soc. A Math. Phys. Eng.
Sci. 1928, 121 (787), 402–420.
(16) Kurt, S. K.; Gelhausen, M. G.; Kockmann, N. Axial Dispersion and Heat Transfer in
a Milli/Microstructured Coiled Flow Inverter for Narrow Residence Time Distribution
at Laminar Flow. Chem. Eng. Technol. 2015, 38 (7), 1122–1130.
(17) Kumar, V.; Paraschivoiu, M.; Nigam, K. D. P. Single-Phase Fluid Flow and Mixing
in Microchannels. Chem. Eng. Sci. 2011, 66 (7), 1329–1373.
(18) Sharma, L.; Nigam, K. D. P.; Roy, S. Axial Dispersion in Single and Multiphase
Flows in Coiled Geometries: Radioactive Particle Tracking Experiments. Chem.
Eng. Sci. 2017, 157, 116–126.
(19) Ruiz-Ruiz, F.; López-Guajardo, E.; Vázquez-Villegas, P.; del Angel-Chong, M. E.;
Nigam, K. D. P.; Willson, R. C.; Rito-Palomares, M. Continuous Aqueous Two-
Phase Extraction of Microalgal C-Phycocyanin Using a Coiled Flow Inverter. Chem.
Eng. Process. - Process Intensif. 2019, 142, 107554.
(20) Saxena, A. K.; Nigam, K. D. P. Coiled Configuration for Flow Inversion and Its Effect
on Residence Time Distribution. AIChE J. 1984, 30 (3), 363–368.
(21) Mandal, M. M.; Aggarwal, P.; Nigam, K. D. P. Liquid–Liquid Mixing in Coiled Flow
Inverter. Ind. Eng. Chem. Res. 2011, 50 (23), 13230–13235.
(22) Van Gerven, T.; Mul, G.; Moulijn, J.; Stankiewicz, A. A Review of Intensification of
Photocatalytic Processes. Chem. Eng. Process. Process Intensif. 2007, 46 (9),
781–789.
(23) Mhd Haniffa, M. A. C.; Ching, Y. C.; Chuah, C. H.; Ching, K. Y.; Liou, N.-S.
Synergistic Effect of (3-Aminopropyl)Trimethoxysilane Treated ZnO and Corundum
84
Nanoparticles under UV-Irradiation on UV-Cutoff and IR-Absorption Spectra of
Acrylic Polyurethane Based Nanocomposite Coating. Polym. Degrad. Stab. 2019,
159, 205–216.
(24) Wei, J.; Ji, G.; Zhang, C.; Yan, L.; Luo, Q.; Wang, C.; Chen, Q.; Yang, J.; Chen, L.;
Ma, C.-Q. Silane-Capped ZnO Nanoparticles for Use as the Electron Transport
Layer in Inverted Organic Solar Cells. ACS Nano 2018, 12 (6), 5518–5529.
(25) Hueso, J. L.; Sebastián, V.; Mayoral, Á.; Usón, L.; Arruebo, M.; Santamaría, J.
Beyond Gold: Rediscovering Tetrakis-(Hydroxymethyl)-Phosphonium Chloride
(THPC) as an Effective Agent for the Synthesis of Ultra-Small Noble Metal
Nanoparticles and Pt-Containing Nanoalloys. RSC Adv. 2013, 3 (26), 10427.
(26) Zhang, D.; Zeng, F. Visible Light-Activated Cadmium-Doped ZnO Nanostructured
Photocatalyst for the Treatment of Methylene Blue Dye. J. Mater. Sci. 2012, 47 (5),
2155–2161.
(27) Klutz, S.; Kurt, S. K.; Lobedann, M.; Kockmann, N. Narrow Residence Time
Distribution in Tubular Reactor Concept for Reynolds Number Range of 10–100.
Chem. Eng. Res. Des. 2015, 95, 22–33.
(28) Roibu, A.; Morthala, R. B.; Leblebici, M. E.; Koziej, D.; Van Gerven, T.; Kuhn, S.
Design and Characterization of Visible-Light LED Sources for Microstructured
Photoreactors. React. Chem. Eng. 2018, 3 (6), 849–865.
(29) Ong, H. Y. Introduction to Coiled Flow Inverter (CFI) Photocatalytic Reactor
https://www.slideshare.net/HuiYangOng/introduction-to-coiled-flow-inverter-cfi-
photocatalytic-reactor (accessed May 10, 2019).
(30) Leblebici, M. E.; Van den Bogaert, B.; Stefanidis, G. D.; Van Gerven, T. Efficiency
85
vs. Productivity in Photoreactors, a Case Study on Photochemical Separation of
Eu. Chem. Eng. J. 2017, 310, 240–248.
(31) Muñoz-Batista, M. J.; Ballari, M. M.; Kubacka, A.; Alfano, O. M.; Fernández-García,
M. Braiding Kinetics and Spectroscopy in Photo-Catalysis: The Spectro-Kinetic
Approach. Chemical Society Reviews. 2019.
(32) Reizman, B. J.; Jensen, K. F. An Automated Continuous-Flow Platform for the
Estimation of Multistep Reaction Kinetics. Org. Process Res. Dev. 2012, 16 (11),
1770–1782.
(33) Lu, H.; Schmidt, M. A.; Jensen, K. F. Photochemical Reactions and On-Line UV
Detection in Microfabricated Reactors. Lab Chip 2001, 1 (1), 22.
86
Chapter 3 3. Reaction-induced destabilization of aqueous suspensions of ZnO-APTMS-Au microparticles during photocatalytic degradation of fluorescein in Coiled-flow Inverter
ABSTRACT
The photocatalytic degradation of organic molecules has come a long way since the
birth of semiconductor catalysis to today's implementation in air and water purification. To
increase the efficiency of these systems, promising materials have come from
Nanotechnology, while interesting photoreactor designs and multiphase flow strategies
have been reported from the Process Intensification standpoint. Continuous-flow
photochemistry in slurry flow of suspended photocatalytic particles in a coiled flow inverter
(CFI) yields competitive photon-efficiencies. However, the destabilization of the
suspension during the reaction remains a pervasive and generally unmentioned issue
commonly addressed by operating at higher flow rates. However, a CFI has an upper flow
rate limit to exploit its benefits, which means that alternative methods are required.
Therefore, we investigated the link between the kinetics of the visible-light induced
degradation of fluorescein and the disruption of the suspension of photocatalytic ZnO-
APTMS-Au particles in a CFI in order to spark ideas to prevent suspension destabilization
via other (e.g., chemical) means.
This chapter is based on:
This article is about to be submitted shortly
87
3.1 INTRODUCTION
The use of photochemical reactors has gained prominence lately and has been
explored for a broad range of applications, including air and water treatment,1 fine
chemical synthesis (e.g. pharmaceuticals),2 and water-splitting for hydrogen production.3
Photoreactors are looked upon as a safer and more sustainable alternative to heat-driven
processes. However, batch photoreactors generally suffer from low overall efficiencies
and slower reaction rates due, mainly due to light attenuation. The latter has been tackled
quite successfully by continuous-flow photochemistry thanks to the same principle, i.e.
enhancement of transfer rates, used in the intensification of thermal processes with micro-
and milli-fluidics.4 Mixing is crucial to attain optimum efficiencies in numerous
photochemical reactions, where photon diffusion barriers are often important. In-line static
mixers, e.g. coiled flow inverter (CFI), have been reported as reaction and separation
units providing substantial contributions against transport barriers; for instance, in
micro/milli-scale devices for heterogeneous reactions under laminar flow, making the CFI
a promising tool for process intensification.5–7
The advantages provided by a CFI stem from the utilization of centrifugal forces
generated within helical coiled sections that are linked by equidistant 90° bents.8 The
straight helical sections cause chaotic mixing at a cross-sectional plane, and the sudden
90° bends help in attaining complete flow inversion to prevent flow development, as
visualized in Figure 3.2a. The fluid flow in the curved path experiences complex
secondary flow vortices in a plane normal to the primary flow direction. This secondary
flow pattern arises due to the difference in centrifugal forces experienced by different
regions of fluid at different axial velocities. The centrifugal forces tend to be always
88
orthogonal to the axis of the helical coil, and after every bend there is a directional change
in the centrifugal force pattern given by the angle of the bend. D-shaped velocity contours
are created (Figure 3.2a), which are inverted after every bend directing towards the
centrifugal force’s direction. Therefore, the CFI is claimed to have at least a double
contribution towards intensifying the convective transfer processes.5,8
Earlier, we introduced the idea of a “photo-CFI” as an efficient photoreactor
alternative capable of attaining competitive photocatalytic space-time yields (PSTY) by
counteracting the detrimental effect of light attenuation.4 Although, achieving uniform
distribution of the irradiance on the photo-CFI may be challenging due to the relatively
complex non-planar geometry, the photo-CFI still appears to provide an overall positive
outcome. In that study, we functionalized commercialized ZnO microparticles with
APTMS to graft gold nanoparticles on the metal oxide via surface electrostatic interactions
(adsorption) forming a Schottky barrier as the two materials interact with each other. Gold
nanoparticles are proven to exhibit strong light absorption in the visible spectrum which
derives from the coupling of the electronic resonance oscillations with the electromagnetic
waves,9 i.e. localized surface plasmon resonance (SPR). Combination of two materials
having closer work functions (ZnO~5.2 eV, Au~5.0 eV) aids in easier transfer of electrons
from the lower work function material to the higher work function material (i.e. from Au to
ZnO), therefore modifying the absorption band spectra to yield a micro-composite
sensitive to the visible spectrum.9,10 APTMS functionalization also helps in prevent the
metal oxide catalyst from its natural tendency to agglomerate (aggregate),11 where the
latter may lower the surface area of the catalyst for photodegradation reaction. While the
functionalization was not originally intended to avoid particle aggregation, it may have this
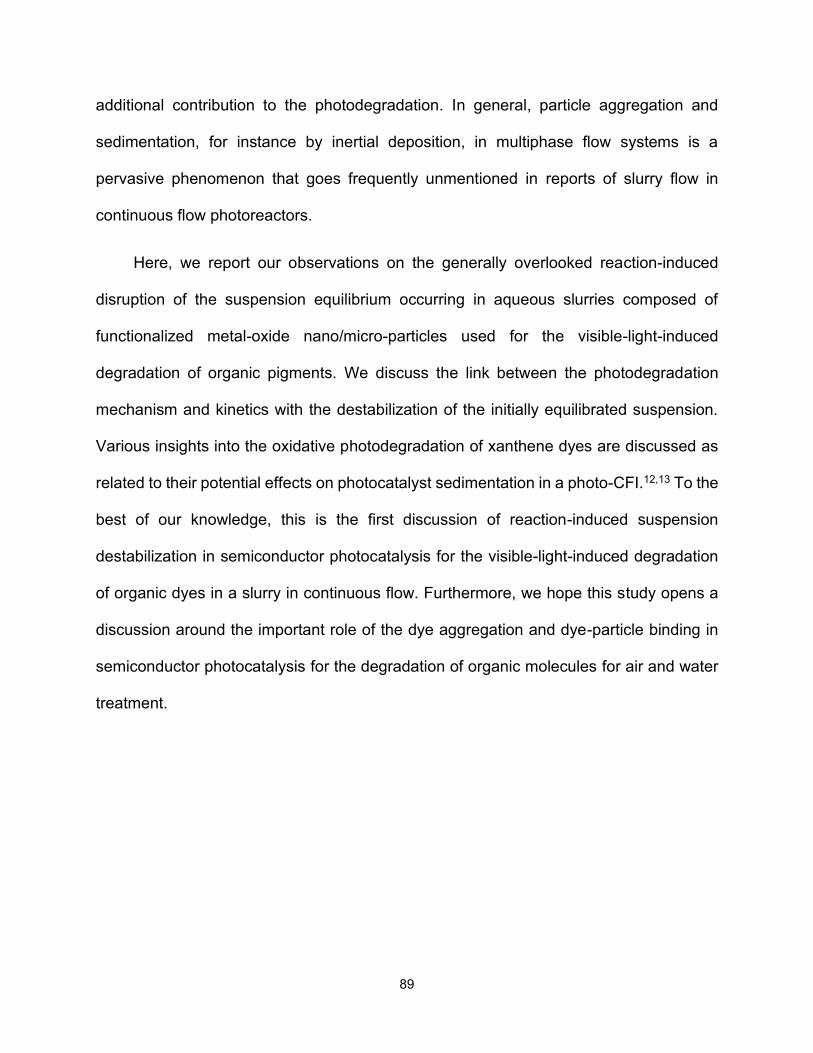
89
additional contribution to the photodegradation. In general, particle aggregation and
sedimentation, for instance by inertial deposition, in multiphase flow systems is a
pervasive phenomenon that goes frequently unmentioned in reports of slurry flow in
continuous flow photoreactors.
Here, we report our observations on the generally overlooked reaction-induced
disruption of the suspension equilibrium occurring in aqueous slurries composed of
functionalized metal-oxide nano/micro-particles used for the visible-light-induced
degradation of organic pigments. We discuss the link between the photodegradation
mechanism and kinetics with the destabilization of the initially equilibrated suspension.
Various insights into the oxidative photodegradation of xanthene dyes are discussed as
related to their potential effects on photocatalyst sedimentation in a photo-CFI.12,13 To the
best of our knowledge, this is the first discussion of reaction-induced suspension
destabilization in semiconductor photocatalysis for the visible-light-induced degradation
of organic dyes in a slurry in continuous flow. Furthermore, we hope this study opens a
discussion around the important role of the dye aggregation and dye-particle binding in
semiconductor photocatalysis for the degradation of organic molecules for air and water
treatment.
90
Figure 3. 1 Proposed mechanism (equations below) for photocatalytic degradation of fluorescein induced
by visible-light in presence of ZnO-APTMS-Au particles where charge separation drives the formation of
reactive oxygen species, highlighting the proposed role of the binding of the model contaminant to the
photocatalyst surface and associated destabilization of the suspension.
ZnO-APTMS/Au + hν (visible) → ZnO-APTMS/Au *(e-) (1)
ZnO-APTMS/Au *(e-) → ZnO-APTMS/Au (e-CB) (2)
ZnO-APTMS/Au (e-CB) + O2(ads) → O2.- (3)
O2.- + 2H+ → 2OH. (4)
O2.- + H+ → HOO. + ZnO-APTMS/Au (e-CB) → HO2. + H+ → H2O2 (5)
H2O2 + O2.- → OHads. + OH. + O2 (6)
91
H2O2 + ZnO-APTMS/Au (e-CB) → OHads. + OH- (7)
hVB+ + H2O → H2O+ → OHfree. + H+ (8)
hVB+ + OHads- → OHads. (9)
OHads. + O2.- + Fluorescein dye → Degradation products (10)
3.2 MATERIALS AND METHODS
Materials and methods are the same as those mentioned in chapter 2-section 2.
3.3 RESULTS AND DISCUSSION
3.3.1 Destabilization of ZnO-APTMS-Zu aqueous suspension in photo-CFI
CFI has been widely known to impart better mixing due to Dean vortices in the
transverse plane of coiled tubes. These vortices are existent because of the applied
centrifugal forces (visualized in figure 3.2a) on the fluid flowing in the curved tube. Kurt
identified the behavior of particle flow in a laminar heterogeneous system.15 As the CFI
has a complex geometry and due to the limited optical observation techniques for intricate
designs, Kurt and his team did particle tracking on a helically coiled tube devoid of bends,
in lieu of a straight section of the CFI. The radial movement of one of the particles in
consideration was tracked down for different time intervals. From the centerline, the inner
wall was denoted as ‘–‘, and the outer wall was denoted to be ‘+’, as can be seen in Figure
3.2c. The particle which is initially towards the inner wall (negative position) at t = 0 s is
clearly seen to cross the centerline and move towards the outer wall with the increment
in time along the flow direction because of the centrifugal force. In general, they observed
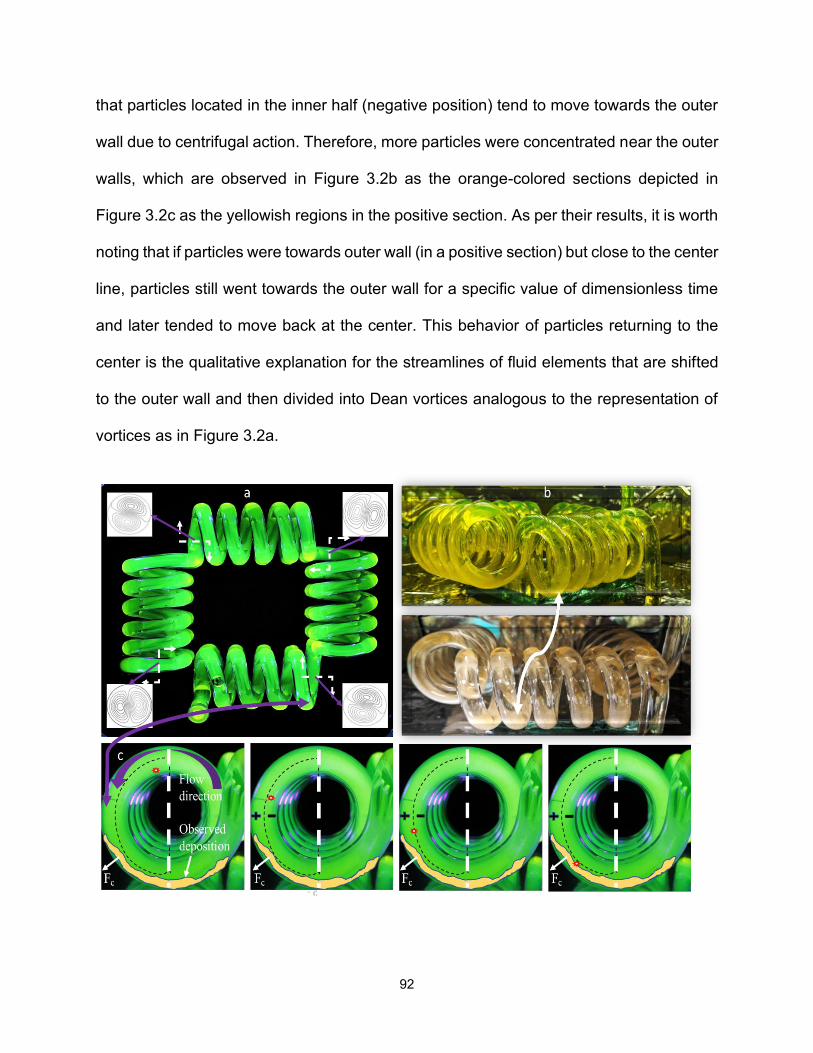
92
that particles located in the inner half (negative position) tend to move towards the outer
wall due to centrifugal action. Therefore, more particles were concentrated near the outer
walls, which are observed in Figure 3.2b as the orange-colored sections depicted in
Figure 3.2c as the yellowish regions in the positive section. As per their results, it is worth
noting that if particles were towards outer wall (in a positive section) but close to the center
line, particles still went towards the outer wall for a specific value of dimensionless time
and later tended to move back at the center. This behavior of particles returning to the
center is the qualitative explanation for the streamlines of fluid elements that are shifted
to the outer wall and then divided into Dean vortices analogous to the representation of
vortices as in Figure 3.2a.
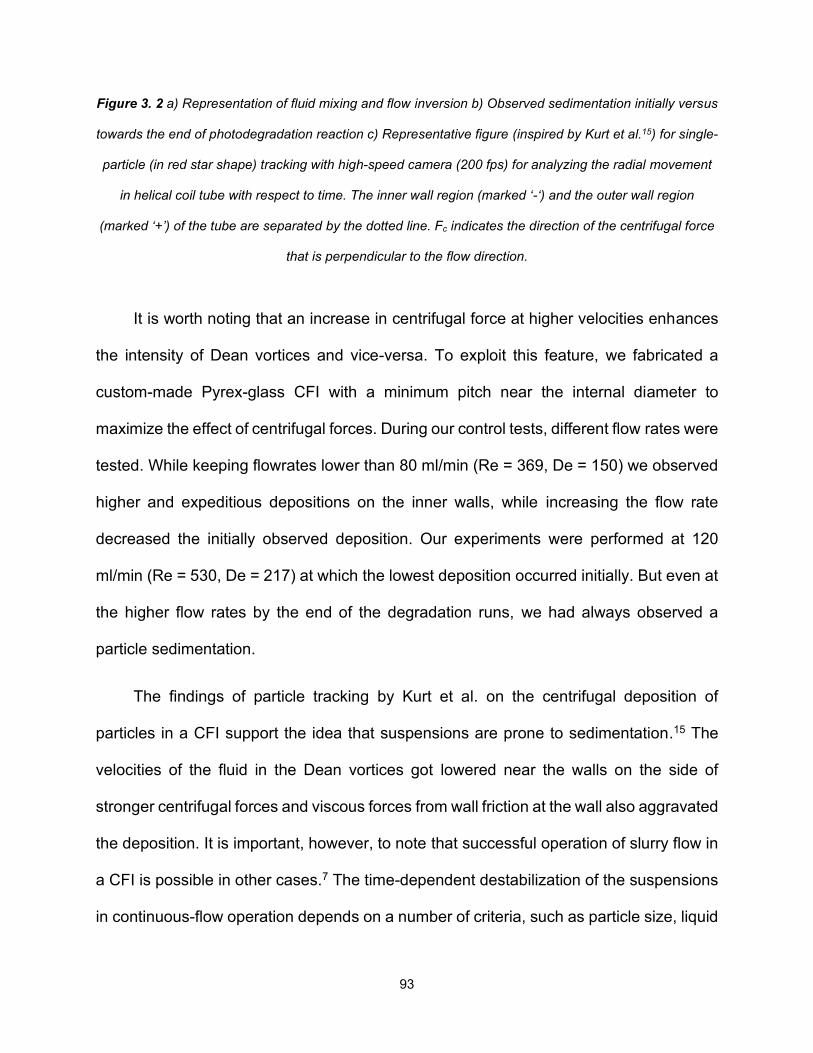
93
Figure 3. 2 a) Representation of fluid mixing and flow inversion b) Observed sedimentation initially versus
towards the end of photodegradation reaction c) Representative figure (inspired by Kurt et al.15) for single-
particle (in red star shape) tracking with high-speed camera (200 fps) for analyzing the radial movement
in helical coil tube with respect to time. The inner wall region (marked ‘-‘) and the outer wall region
(marked ‘+’) of the tube are separated by the dotted line. Fc indicates the direction of the centrifugal force
that is perpendicular to the flow direction.
It is worth noting that an increase in centrifugal force at higher velocities enhances
the intensity of Dean vortices and vice-versa. To exploit this feature, we fabricated a
custom-made Pyrex-glass CFI with a minimum pitch near the internal diameter to
maximize the effect of centrifugal forces. During our control tests, different flow rates were
tested. While keeping flowrates lower than 80 ml/min (Re = 369, De = 150) we observed
higher and expeditious depositions on the inner walls, while increasing the flow rate
decreased the initially observed deposition. Our experiments were performed at 120
ml/min (Re = 530, De = 217) at which the lowest deposition occurred initially. But even at
the higher flow rates by the end of the degradation runs, we had always observed a
particle sedimentation.
The findings of particle tracking by Kurt et al. on the centrifugal deposition of
particles in a CFI support the idea that suspensions are prone to sedimentation.15 The
velocities of the fluid in the Dean vortices got lowered near the walls on the side of
stronger centrifugal forces and viscous forces from wall friction at the wall also aggravated
the deposition. It is important, however, to note that successful operation of slurry flow in
a CFI is possible in other cases.7 The time-dependent destabilization of the suspensions
in continuous-flow operation depends on a number of criteria, such as particle size, liquid
94
phase, concentrations (loadings) and flow rates. The interesting aspect is the connection
of this phenomenon with the dye-particle interactions that seem to exacerbate the natural
tendency of the particles to sediment.
3.3.2 Dye-particle interactions
Another central point to consider regarding the deposition is the “poisoning” of the
photocatalyst by the adsorption of either degraded products or by-products or dye that is
used as a model contaminant on the catalyst surface. The activity of the catalyst usually
decreases while promoting the reactions, and that drop can be rapid or slow, but the
regeneration of the catalyst active sites is necessary to gain the activity. Catalyst can
mainly be deactivated by two possible routes: physisorption and chemisorption. Out of
various decay mechanisms, namely – 1) Parallel deactivation, 2) Series deactivation, 3)
Side-by-side deactivation, and 4) Independent deactivation, only the first three types are
relevant to the photocatalysis as it generally doesn’t involve higher temperatures.16
Parallel deactivation refers to the side by-products formed which may deposit on the
catalyst surface and make it inactive, series deactivation refers to the decomposition of
the above-mentioned side by-products into secondary materials which may get deposited
on the catalyst surface, and side-by-side decomposition refers to the impurity already
present in the feed which might clog the catalyst.16
In our case, we used fluorescein dye as a model pollutant in water in the presence
of ZnO-APTMS-Au photocatalyst. Fluorescein is an anionic dye of the xanthene family
and its degradation is supposed to follow all the pathways, including parallel, series, and
side-by-side deactivation.17–19 In theory, the photocatalyst should completely mineralize
the organic dye molecule into carbon dioxide and water, but that is rarely bound to happen
95
in short intervals because of the limitations of the activity of catalysts. Physisorption
affecting the catalyst activity can only happen by two different pathways, namely: 1) dye
adsorbed into the porous catalyst structure and 2) degradation by-products adsorbed on
the catalyst surface.
Recently Chan et al.20 did a similar study for photocatalytic degradation of an organic
dye molecule (methylene blue) in the presence of TiO2 catalyst. Their findings were quite
interesting and relatable to our setup as we were also dealing with an organic dye
molecule and a semiconductor photocatalyst. They observed slowing down of the activity
of their photocatalyst after the first 20 minutes from the start of the reaction and did
individual experimentation for proving their hypothesis of the existence of both the two
physisorption pathways. To check the effects of photocatalytic reaction on catalyst
separately, they carried out control experiments for adsorption and photocatalytic reaction
separately on their TiO2 catalyst, which was white before any of the studies, later turning
to a pale blue color and finally turning to a dark blue/violet color. Elemental analysis (%C,
%H, %N , %S) was necessary to confirm the presence of organic residues after the
reaction; where their findings were quite in line with their hypothesis, observing a
significant increase over base values in %C and %N after the photocatalytic experiments.
This significant increase in %C and %N after photodegradation as compared to the pre-
photodegradation experiments justifies the synergy between poisoning/adsorption and
the photocatalysis. They also performed an X-ray photoelectron spectroscopy (XPS)
study, and the results further substantiated their findings. Before any experiments a
carbon signal was detected, which might be because of naturally adsorbed carbon on the
surface; however, there was no presence of nitrogen (%N) & sulfur (%S), which only was
96
observed after their other control experimentation, strongly implying the presence of
organic products from methylene blue degradation. Moreover, there was a decrease in
the C-C binding energy, which was close to the range of Ti-C binding energy. They also
found the reduction in binding energy for Ti 2p3/2 and 2p1/2 when compared to the same
for the pure catalyst after control experiments, which strongly confirms some change in
the chemical environment on the TiO2 surface (chemisorption). Elemental analysis and
XPS both collectively corroborated that chemical shift might be related to the increase in
carbon content on the surface. This increased carbon content solely relates to the organic
dye degradation leading to the appearance of the metal-carbon bonding on the catalyst.
There have been other similar studies for air and water treatment by Abou Saoud et al.,
Ranjith et al., and Bardhan et al. where they observed poisoning/surface interaction on
the catalyst by using other spectroscopic techniques, cyclic photocatalytic oxidation, and
thermodynamic analysis.1,2,21
In the case of the aqueous degradation of fluorescein by ZnO-APTMS-Au particles,
we observed and obtained results in agreement with the observations of Chang and
coworkers, described in the previous paragraph. Fluorescein appears to have orange-
dark red color when in powdered form, while a bright green color in aqueous solution. We
observed the orange-colored deposits at the end of our experiments, which were
inexistent while the initial time of the experimentation and it can be related to the findings
by Chan et al.20 It may be reasonably expected that those orange deposits are due to
fluorescein adsorbed on the surface along with the degradation by-products.
Complementing to Chan’s findings, our claim is strengthened by ATR-FTIR analysis of
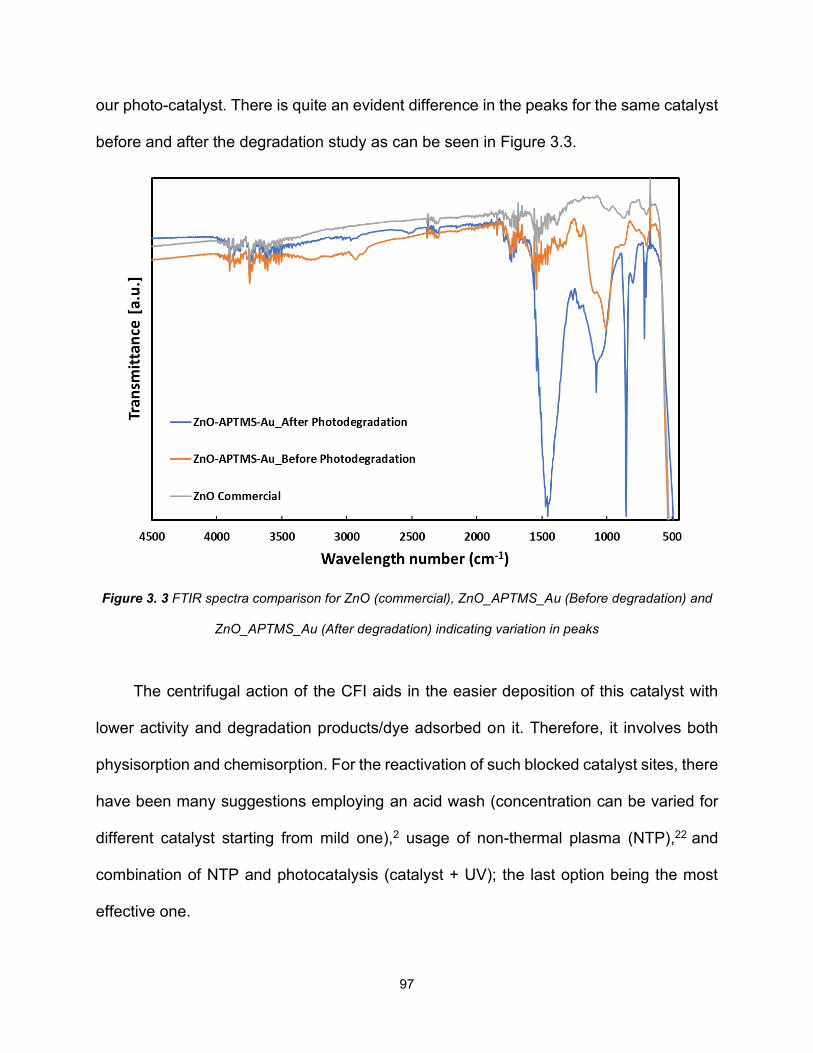
97
our photo-catalyst. There is quite an evident difference in the peaks for the same catalyst
before and after the degradation study as can be seen in Figure 3.3.
Figure 3. 3 FTIR spectra comparison for ZnO (commercial), ZnO_APTMS_Au (Before degradation) and
ZnO_APTMS_Au (After degradation) indicating variation in peaks
The centrifugal action of the CFI aids in the easier deposition of this catalyst with
lower activity and degradation products/dye adsorbed on it. Therefore, it involves both
physisorption and chemisorption. For the reactivation of such blocked catalyst sites, there
have been many suggestions employing an acid wash (concentration can be varied for
different catalyst starting from mild one),2 usage of non-thermal plasma (NTP),22 and
combination of NTP and photocatalysis (catalyst + UV); the last option being the most
effective one.
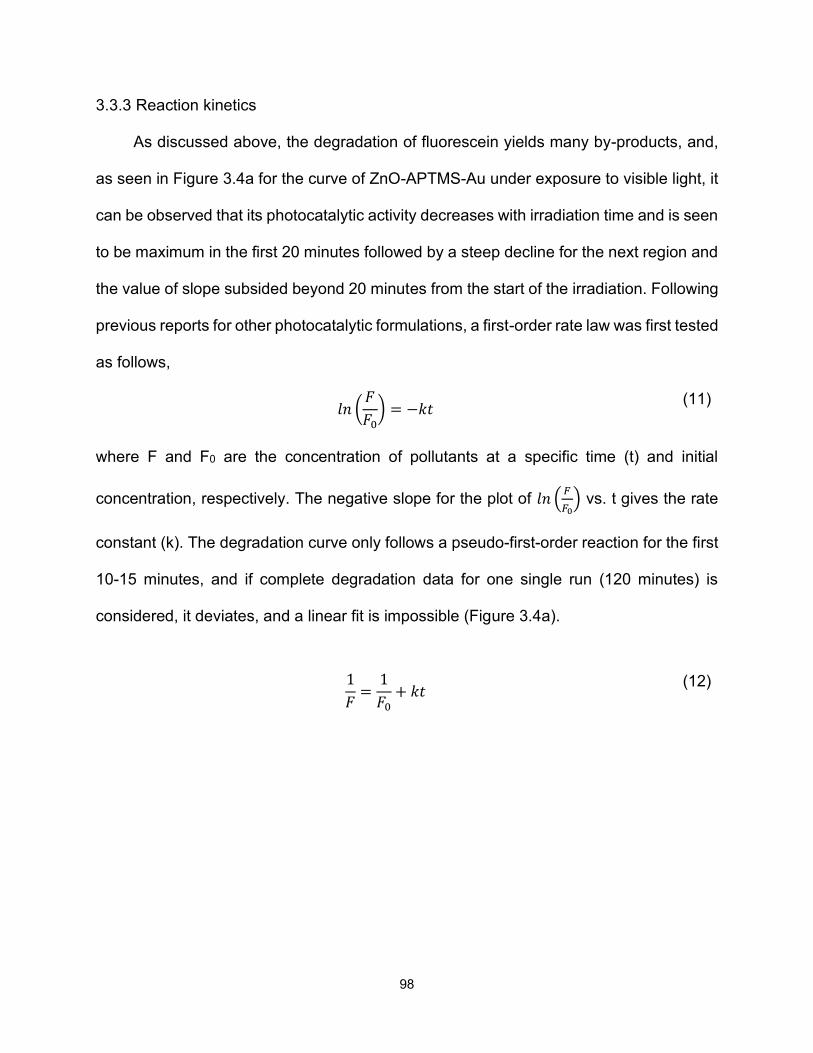
98
3.3.3 Reaction kinetics
As discussed above, the degradation of fluorescein yields many by-products, and,
as seen in Figure 3.4a for the curve of ZnO-APTMS-Au under exposure to visible light, it
can be observed that its photocatalytic activity decreases with irradiation time and is seen
to be maximum in the first 20 minutes followed by a steep decline for the next region and
the value of slope subsided beyond 20 minutes from the start of the irradiation. Following
previous reports for other photocatalytic formulations, a first-order rate law was first tested
as follows,
𝑙𝑛 (𝐹𝐹0
) = −𝑘𝑡 (11)
where F and F0 are the concentration of pollutants at a specific time (t) and initial
concentration, respectively. The negative slope for the plot of 𝑙𝑛 ( 𝐹𝐹0
) vs. t gives the rate
constant (k). The degradation curve only follows a pseudo-first-order reaction for the first
10-15 minutes, and if complete degradation data for one single run (120 minutes) is
considered, it deviates, and a linear fit is impossible (Figure 3.4a).
1𝐹
=1𝐹0
+ 𝑘𝑡 (12)
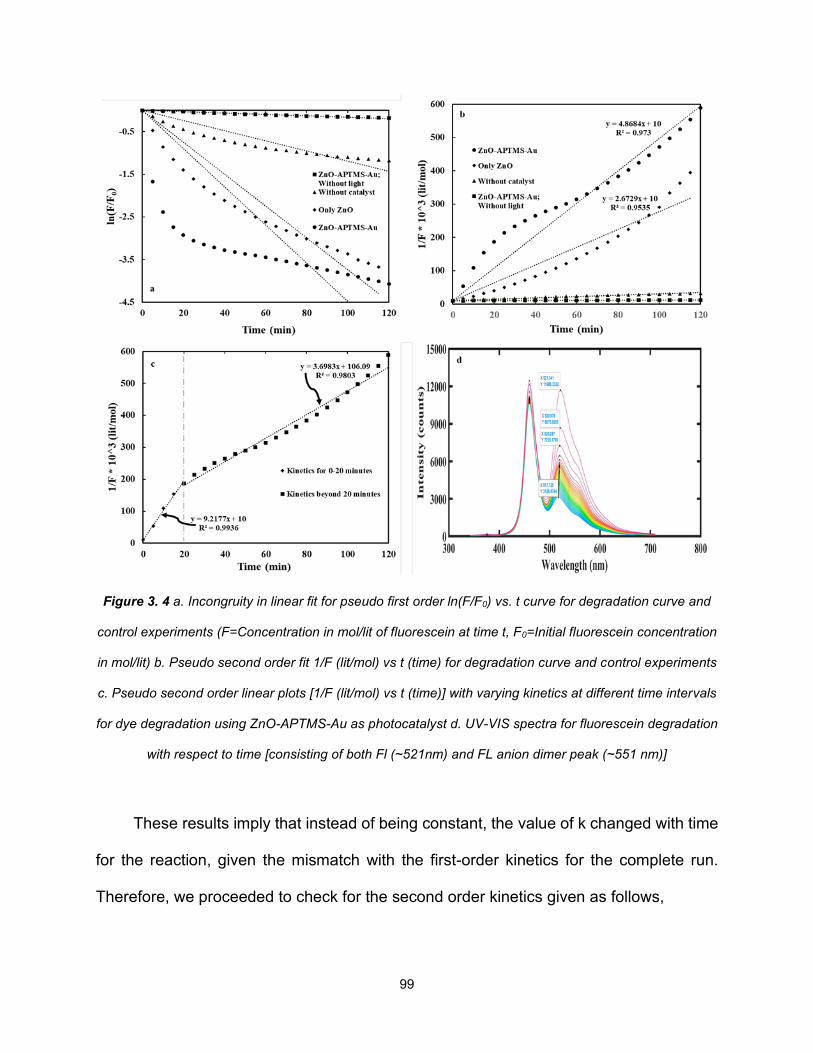
99
Figure 3. 4 a. Incongruity in linear fit for pseudo first order ln(F/F0) vs. t curve for degradation curve and
control experiments (F=Concentration in mol/lit of fluorescein at time t, F0=Initial fluorescein concentration
in mol/lit) b. Pseudo second order fit 1/F (lit/mol) vs t (time) for degradation curve and control experiments
c. Pseudo second order linear plots [1/F (lit/mol) vs t (time)] with varying kinetics at different time intervals
for dye degradation using ZnO-APTMS-Au as photocatalyst d. UV-VIS spectra for fluorescein degradation
with respect to time [consisting of both Fl (~521nm) and FL anion dimer peak (~551 nm)]
These results imply that instead of being constant, the value of k changed with time
for the reaction, given the mismatch with the first-order kinetics for the complete run.
Therefore, we proceeded to check for the second order kinetics given as follows,
100
where F and F0 are same as mentioned above for the first order equation. In Figure 3.4b
it is clearly evident that the reaction system closely fits a 2nd order kinetic model, although
initially there is a little non-conformity which is evident from the concavity of the curve with
respect to the fitting, which instead should have been similar to straight line throughout
the entire irradiation time. Following the nature of the curve and the observations by
Alvarez et al., time-based changes for the second order kinetics was followed. From the
values of the slope for the different interval of the curve, we observe values of k, which
can be seen in the Figure 3.4c and values are in Table 3.1. It is worth noting that
decreasing values of k suggest that the photoactivity of the particles decreases, which
might stem from the poisoning of the catalyst.
One of the dimensionless number-Damköhler number (𝐷𝑎||) which relates to the
reaction rate and diffusion rate might be useful for explanation for the high reaction rate
for the first 20 minutes of the reaction. During first 20 minutes the kinetics might be
reaction controlled and over the time because of the generation of the degradation
products and poisoning of catalyst, reaction might transform to diffusion controlled. More
analysis on this is needed but, it definitely seems to show probable explanation behind
the rate of kinetics.
The photodegradation was performed in a continuous-flow closed loop like a
complete recycle and the decline in the rate constant k (photoactivity) over time seems to
be attributed to the dissolved oxygen concentration in the loop relating it to the
observations by Alvarez et al. for Oxic and anoxic degradation of Eosin-Y. We didn’t
include reoxygenation/continuous oxygenation for the loop, so as time proceeds
dissolved ground state oxygen on photo excitation forms different intermediates [peroxide
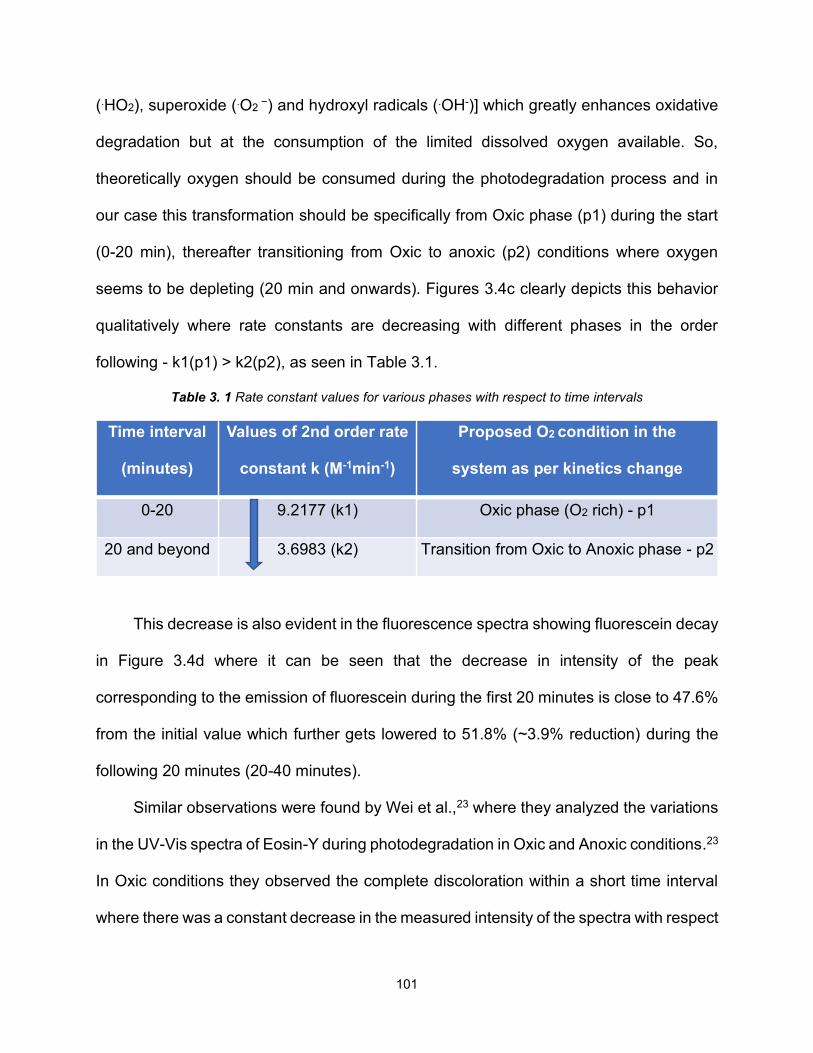
101
(.HO2), superoxide (.O2 −) and hydroxyl radicals (.OH-)] which greatly enhances oxidative
degradation but at the consumption of the limited dissolved oxygen available. So,
theoretically oxygen should be consumed during the photodegradation process and in
our case this transformation should be specifically from Oxic phase (p1) during the start
(0-20 min), thereafter transitioning from Oxic to anoxic (p2) conditions where oxygen
seems to be depleting (20 min and onwards). Figures 3.4c clearly depicts this behavior
qualitatively where rate constants are decreasing with different phases in the order
following - k1(p1) > k2(p2), as seen in Table 3.1.
Table 3. 1 Rate constant values for various phases with respect to time intervals
Time interval
(minutes) Values of 2nd order rate
constant k (M-1min-1)
Proposed O2 condition in the
system as per kinetics change
0-20 9.2177 (k1) Oxic phase (O2 rich) - p1
20 and beyond 3.6983 (k2) Transition from Oxic to Anoxic phase - p2
This decrease is also evident in the fluorescence spectra showing fluorescein decay
in Figure 3.4d where it can be seen that the decrease in intensity of the peak
corresponding to the emission of fluorescein during the first 20 minutes is close to 47.6%
from the initial value which further gets lowered to 51.8% (~3.9% reduction) during the
following 20 minutes (20-40 minutes).
Similar observations were found by Wei et al.,23 where they analyzed the variations
in the UV-Vis spectra of Eosin-Y during photodegradation in Oxic and Anoxic conditions.23
In Oxic conditions they observed the complete discoloration within a short time interval
where there was a constant decrease in the measured intensity of the spectra with respect
102
to time till the end of measurements, being indicative of simple degradation whereas that
was not the case for Anoxic conditions. Under the same set of operating parameters, the
degradation didn’t finish completely within the same time interval. It was comparatively
more sluggish because of oxygen depletion which would have then helped in making
more active radicals achieving quicker oxidative degradation, as in Oxic conditions. For
Eosin-Y’s degradation, brominated fluorescein, debromination is the first step which is
very slow for anoxic environment and faster for Oxic environment which is not the case
for us as fluorescein is already a chromophore devoid of any halogen atom. Thus,
fluorescein can be directly broken into anion (FL1) which further gives FL2, FL3 and FL4
molecules, which still have the fluorophore intact. Beyond FL4 molecule chromophore
breakdown happens as per literature to form other smaller ringed molecules as can be
seen in Figure 3.5.17,18,24 If the Oxic environment persists, ring cleavage happens leading
to smaller organic chained molecules which further degrade to carbon-dioxide and water
molecules. However, in our case, the system transitioned from Oxic environment to near
Anoxic conditions, which slows down the full degradation of the model contaminant.
Moreover, in Figure 3.4d, there are some variations in the fluorescence intensity
signals of the light source used (peak on the left side, which is supposed to be constant
throughout). These variations are expected to be attributed to the live changes happening
in the heterogeneous system (possibly poisoning and aggregation of MO photocatalyst)
while the reaction is still proceeding and are based on surface scattering phenomena.
These observations are in-line with our previous observations. While filling the reaction
system with the solution we observed fluctuations in the intensity of the peak from the
emission of excitation light source when air bubbles were passing through in front of the

103
sensor. The latter strengthens our assumption of catalyst surface modification during the
ongoing degradation process. This behavior suggests the presence of other by-products
present in the system, some of them being chromophores- FL1/FL2/FL3/FL4, imparting
the orange shade to the particles. These by-products may possibly change the dynamics
(zeta potential, pH, and other thermodynamics) of the system, thereby aggravating the
photocatalyst poisoning leading to deposition coupled by centrifugal action of the reactor.
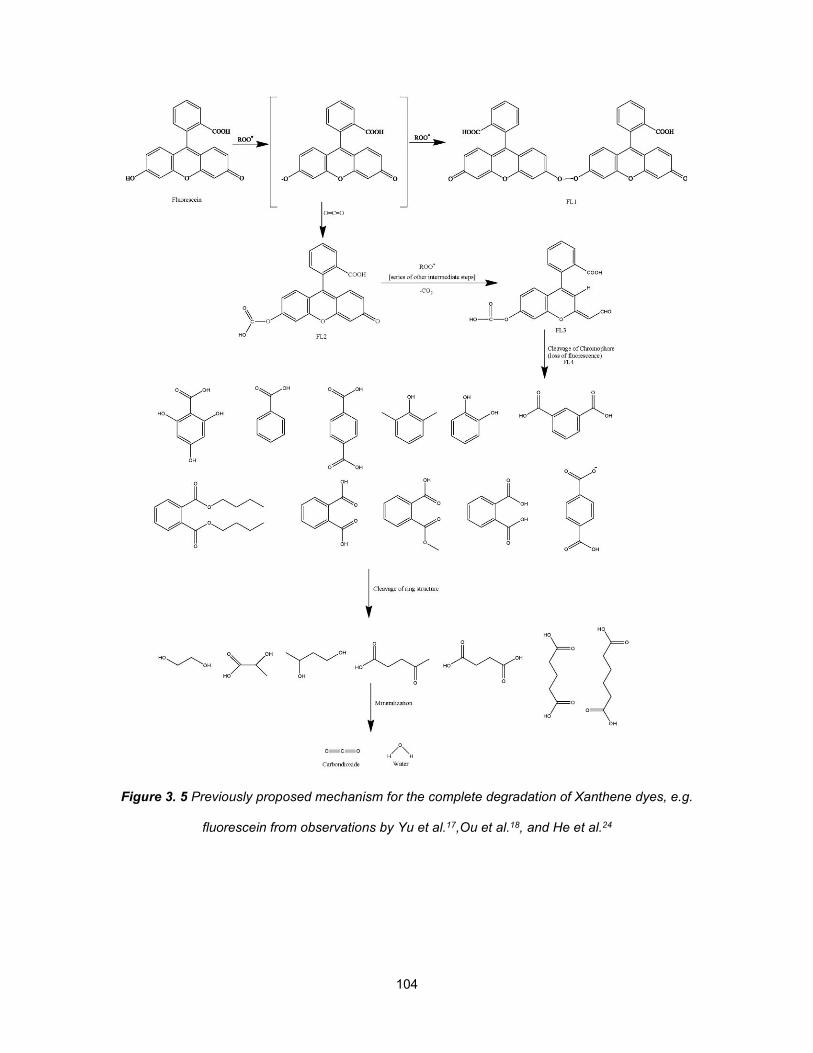
104
Figure 3. 5 Previously proposed mechanism for the complete degradation of Xanthene dyes, e.g.
fluorescein from observations by Yu et al.17,Ou et al.18, and He et al.24
105
3.3.4 Changes in the dynamics of the solution-surface interface
As discussed in the introduction, our intention for functionalizing ZnO with APTMS
was to allow the non-covalent grafting of gold nanoparticles on the metal oxide (MO)
surface via electrostatic interactions for improving visible spectrum absorptivity.
Functionalization also helped avoid the aggregation of MO particles by a steric
stabilization mechanism and impart more stability to the photocatalyst in the suspension.
It was later found from the literature that, if not functionalized, extensive aggregates may
lead to the genesis of an inapt surface interface between the photoactive layer and the
surrounding aqueous environment. This inapt surface interface formation reduces the
active surface area of the catalyst even before the start of the reaction. APTMS capping
over ZnO also promotes the photoluminescence intensity indicative of a reduction in
luminescence quenching, which indicates slower hole-electron pair recombination in the
catalyst. Moreover, the charge transfer properties (i.e., electron motilities) of the APTMS
capped ZnO was found to be similar to pristine ZnO.11 Those studies also found ZnO to
have a lower current density than APTMS capped MO, implying a higher density of
electron traps in the pristine ZnO, which is not suitable for efficient charge transfers.
Therefore, APTMS capping over ZnO microparticles is incredibly beneficial, as studied by
Wei et al.11
Capping of APTMS (3:1 proportion of hydrophobic alkyl moieties to hydrophilic
amine moieties) turns ZnO more hydrophobic in nature along with increased absorptivity
of nonpolar molecules on its surface. Zeta potential is changed by the functionalization of
ZnO turning from positive (earlier) to a negative value (later), as reported earlier by Wei
et al.11 The particles with a positive zeta potential will bind to negatively charged surface
106
and vice versa and therefore ZnO can adsorb the fluorescein anion (also stated by
Bardhan et al.21 but fluorescein anion should not get bounded to the ZnO with APTMS by
same extent because of repulsion of surface charges. The magnitude of the zeta potential
gives insights about the particle stability, higher the magnitude higher the stability.
Dispersions having values less than +25mV and greater than -25mV will eventually tend
to agglomerate due to particle-particle interactions (including Van der Waals interaction,
hydrophobic interactions and hydrogen bonding).25,26 The density of charge on the
particles is not constant and has dependency on the pH.
It is worth noting that APTMS capped particles did not show large scale
sedimentation during the start of the experiment. We expect the same pattern for zeta
potential values for our functionalized photocatalyst as observed by Chan and his team.20
Namely, a higher negative value before the reaction and then as the reaction proceeds
to form other degradation products the magnitude of the zeta potential values decreases
and therefore clearly indicates changes on the surface during the ongoing reaction. As
seen in Figure 3.5, for complete degradation of xanthene dyes, we expect some of those
nonpolar/cationic by-product molecules to adhere to the photocatalyst surface during the
reaction (a possible explanation for coloration of the catalyst) and therefore leading to a
decrease in the zeta potentials which further leads to the instability of the heterogeneous
suspension.
3.4 Conclusions
In this study, we investigated the destabilization of the suspension equilibrium of an
initially equilibrated aqueous suspension of ZnO-APTMS-Au microparticles in connection
107
to the oxidative photodegradation of fluorescein induced by visible light. We observed
evidence of metal-enhanced fluorescence (MEF) before irradiation, which supports an
initial binding of the model contaminant to the photocatalyst. During irradiation, the
suspension equilibrium was disrupted as seen by the accumulation of particles at the
bottom of the CFI helical coiled sections. The crashing of the suspension equilibrium
correlated with the appearance of an orange color in the suspension, which is indicative
of intermediate fluorescein degradation products. Suspension destabilization only
occurred when fluorescein was degraded. The kinetics of fluorescein photodegradation
appear to follow pseudo-second order kinetics, which may be at least in part associated
with the sedimentation of the particles. These observations suggest that prevention of an
initial binding between the organic dye and the photocatalytic particles may be required
to prevent suspension destabilization and allow the use of a photo-CFI for photoreactions
in slurry flow at optimum flow rates.
References
(1) Abou Saoud, W.; Assadi, A. A.; Guiza, M.; Bouzaza, A.; Aboussaoud, W.;
Ouederni, A.; Soutrel, I.; Wolbert, D.; Rtimi, S. Study of Synergetic Effect,
Catalytic Poisoning and Regeneration Using Dielectric Barrier Discharge and
Photocatalysis in a Continuous Reactor: Abatement of Pollutants in Air Mixture
System. Applied Catalysis B: Environmental 2017, 213, 53–61.
https://doi.org/10.1016/j.apcatb.2017.05.012.
(2) Ranjith, K. S.; Rajendra Kumar, R. T. Regeneration of an Efficient, Solar Active
Hierarchical ZnO Flower Photocatalyst for Repeatable Usage: Controlled
Desorption of Poisoned Species from Active Catalytic Sites. RSC Advances 2017,
108
7 (9), 4983–4992. https://doi.org/10.1039/c6ra27380g.
(3) Godin, R.; Wang, Y.; Zwijnenburg, M. A.; Tang, J.; Durrant, J. R. Time-Resolved
Spectroscopic Investigation of Charge Trapping in Carbon Nitrides Photocatalysts
for Hydrogen Generation. Journal of the American Chemical Society 2017.
https://doi.org/10.1021/jacs.7b01547.
(4) Tiwari, C. P.; Delgado-Licona, F.; Valencia-Llompart, M.; Nuñez-Correa, S.;
Nigam, K. D. P.; Montesinos-Castellanos, A.; López-Guajardo, E. A.; Aguirre-
Soto, A. Shining Light on the Coiled-Flow Inverter - Continuous-Flow
Photochemistry in a Static Mixer. Industrial and Engineering Chemistry Research
2020. https://doi.org/10.1021/acs.iecr.9b05008.
(5) Soni, S.; Sharma, L.; Meena, P.; Roy, S.; Nigam, K. D. P. Compact Coiled Flow
Inverter for Process Intensification. Chemical Engineering Science 2019.
https://doi.org/10.1016/j.ces.2018.09.008.
(6) López-Guajardo, E.; Ortiz-Nadal, E.; Montesinos-Castellanos, A.; Nigam, K. D. P.
Coiled Flow Inverter as a Novel Alternative for the Intensification of a Liquid-Liquid
Reaction. Chemical Engineering Science 2017.
https://doi.org/10.1016/j.ces.2017.01.016.
(7) Ruiz-Ruiz, F.; López-Guajardo, E.; Vázquez-Villegas, P.; del Angel-Chong, M. E.;
Nigam, K. D. P.; Willson, R. C.; Rito-Palomares, M. Continuous Aqueous Two-
Phase Extraction of Microalgal C-Phycocyanin Using a Coiled Flow Inverter.
Chemical Engineering and Processing - Process Intensification 2019.
https://doi.org/10.1016/j.cep.2019.107554.
(8) Saxena, A. K.; Nigam, K. D. P. Coiled Configuration for Flow Inversion and Its
109
Effect on Residence Time Distribution. AIChE Journal 1984.
https://doi.org/10.1002/aic.690300303.
(9) Fageria, P.; Gangopadhyay, S.; Pande, S. Synthesis of ZnO/Au and ZnO/Ag
Nanoparticles and Their Photocatalytic Application Using UV and Visible Light.
RSC Advances 2014. https://doi.org/10.1039/c4ra03158j.
(10) Tsukamoto, D.; Shiraishi, Y.; Sugano, Y.; Ichikawa, S.; Tanaka, S.; Hirai, T. Gold
Nanoparticles Located at the Interface of Anatase/Rutile TiO 2 Particles as Active
Plasmonic Photocatalysts for Aerobic Oxidation. Journal of the American
Chemical Society 2012. https://doi.org/10.1021/ja2120647.
(11) Wei, J.; Ji, G.; Zhang, C.; Yan, L.; Luo, Q.; Wang, C.; Chen, Q.; Yang, J.; Chen,
L.; Ma, C. Q. Silane-Capped ZnO Nanoparticles for Use as the Electron Transport
Layer in Inverted Organic Solar Cells. ACS Nano 2018, 12 (6), 5518–5529.
https://doi.org/10.1021/acsnano.8b01178.
(12) Qian, R.; Zong, H.; Schneider, J.; Zhou, G.; Zhao, T.; Li, Y.; Yang, J.;
Bahnemann, D. W.; Pan, J. H. Charge Carrier Trapping, Recombination and
Transfer during TiO2 Photocatalysis: An Overview. Catalysis Today 2019.
https://doi.org/10.1016/j.cattod.2018.10.053.
(13) Luan, J.; Ma, K.; Wang, S.; Hu, Z.; Li, Y.; Pan, B. Research on Photocatalytic
Degradation Pathway and Degradation Mechanisms of Organics. Current Organic
Chemistry 2010. https://doi.org/10.2174/138527210790963403.
(14) Klutz, S.; Kurt, S. K.; Lobedann, M.; Kockmann, N. Narrow Residence Time
Distribution in Tubular Reactor Concept for Reynolds Number Range of 10–100.
Chemical Engineering Research and Design 2015, 95, 22–33.
110
https://doi.org/10.1016/j.cherd.2015.01.003.
(15) Kurt, S. K.; Akhtar, M.; Nigam, K. D. P.; Kockmann, N. Continuous Reactive
Precipitation in a Coiled Flow Inverter: Inert Particle Tracking, Modular Design,
and Production of Uniform CaCO3 Particles. Industrial and Engineering Chemistry
Research 2017. https://doi.org/10.1021/acs.iecr.7b02240.
(16) Levenspiel, O. Chemical Reaction Engineering O. Levenspiel; 1999.
(17) Yu, K.; Yang, S.; He, H.; Sun, C.; Gu, C.; Ju, Y. Visible Light-Driven
Photocatalytic Degradation of Rhodamine B over NaBiO3: Pathways and
Mechanism. Journal of Physical Chemistry A 2009.
https://doi.org/10.1021/jp905173e.
(18) Ou, B.; Hampsch-Woodill, M.; Prior, R. L. Development and Validation of an
Improved Oxygen Radical Absorbance Capacity Assay Using Fluorescein as the
Fluorescent Probe. Journal of Agricultural and Food Chemistry 2001.
https://doi.org/10.1021/jf010586o.
(19) Vinu, R.; Polisetti, S.; Madras, G. Dye Sensitized Visible Light Degradation of
Phenolic Compounds. Chemical Engineering Journal 2010, 165 (3), 784–797.
https://doi.org/10.1016/j.cej.2010.10.018.
(20) Chan, K. L.; Lin, W. H.; Chen, F. J.; Yang, M. H.; Jiang, C. H.; Lee, C. Y.; Chiu, H.
T.; Lee, C. Y. Photocatalytic Performance of Bipyramidal Anatase TiO2 toward
the Degradation Organic Dyes and Its Catalyst Poisoning Effect. Reaction
Kinetics, Mechanisms and Catalysis 2020, 130 (1), 531–546.
https://doi.org/10.1007/s11144-020-01759-y.
(21) Bardhan, M.; Mandal, G.; Ganguly, T. Interaction and Photodegradation
111
Characteristics of Fluorescein Dye in Presence of Zno Nanoparticles. Journal of
Nanoscience and Nanotechnology 2011, 11 (4), 3418–3426.
https://doi.org/10.1166/jnn.2011.3741.
(22) Zadi, T.; Azizi, M.; Nasrallah, N.; Bouzaza, A.; Maachi, R.; Wolbert, D.; Rtimi, S.;
Assadi, A. A. Indoor Air Treatment of Refrigerated Food Chambers with
Synergetic Association between Cold Plasma and Photocatalysis: Process
Performance and Photocatalytic Poisoning. Chemical Engineering Journal 2020,
382 (September), 122951. https://doi.org/10.1016/j.cej.2019.122951.
(23) Alvarez-Martin, A.; Trashin, S.; Cuykx, M.; Covaci, A.; De Wael, K.; Janssens, K.
Photodegradation Mechanisms and Kinetics of Eosin-Y in Oxic and Anoxic
Conditions. Dyes and Pigments 2017, 145 (2017), 376–384.
https://doi.org/10.1016/j.dyepig.2017.06.031.
(24) He, Z.; Sun, C.; Yang, S.; Ding, Y.; He, H.; Wang, Z. Photocatalytic Degradation
of Rhodamine B by Bi2WO6 with Electron Accepting Agent under Microwave
Irradiation: Mechanism and Pathway. Journal of Hazardous Materials 2009.
https://doi.org/10.1016/j.jhazmat.2008.06.047.
(25) Kumar, A.; Dixit, C. K. Methods for Characterization of Nanoparticles. In
Advances in Nanomedicine for the Delivery of Therapeutic Nucleic Acids; 2017.
https://doi.org/10.1016/B978-0-08-100557-6.00003-1.
(26) Selvamani, V. Stability Studies on Nanomaterials Used in Drugs. In
Characterization and Biology of Nanomaterials for Drug Delivery: Nanoscience
and Nanotechnology in Drug Delivery; 2018. https://doi.org/10.1016/B978-0-12-
814031-4.00015-5.
112
Chapter 4
4. Towards glass-like transparency in SLA 3d-printed hollow parts for fluidic devices ABSTRACT
Additive manufacturing has tremendously increased in its application and its
development. A wide range of materials are now available for prototyping, consumer
products, medical devices, tools, and microfluidic devices. Stereolithography is arguably
one of the most advantageous methods to create 3D structures from polymer materials.
When a transparent 3D printed part is needed, it is accepted that the post-processing of
clear resin-based parts is the main obstacle. Glass-like 3D printed polymer-based
materials are expected to have a broad range of applications. However, the development
of transparent final 3D-printed parts is still very limited to a few reports that don't
thoroughly explain the details on how to achieve glass-like transparency for optical and
microfluidics applications. Here, we aim at providing the first quantitative analysis of the
effect of the post-processing steps on the optical transmittance of visible light through 3D
printed objects. We used transmission spectroscopy to show the evolution of translucency
with respect to the degree of sanding, application of clear coat, application of additional
resin layer, and Post-curing treatment conditions. We found that the most impactful
treatment to increase transparency was the application of a transparent surface coating
which may consist of commercial acrylic coats or clear resin layer that is UV-cured. We
hope that these findings help in developing better materials and post-processing
techniques for the fabrication of complex 3D printed geometries with glass-like
transparency for photoreactors and other applications.
(This study is ongoing and not concluded yet)
113
4.1 INTRODUCTION
Often synchronously used terminologies; additive manufacturing and 3d printing
technology have been revolutionizing global manufacturing by getting sizeable, agile, and
more robust since its inception and sheathing almost every aspect of human life1 including
fields of nuclear technology,2,3 space exploration,4–6 intrabody surgery/biological
applications,7–10 textiles,11 electronics,12,13 optics,14–16 and chemical reactions.17–20
Applications like optics and photochemical reactors deal with the UV-Vis spectrum,
allowing light to pass through and, therefore, should transmit highly in that range. High
transmission leads to the full utilization of light energy in the case of photochemical
reactions and increases the reliability of optical applications. Additive manufacturing,
specifically 3d printing, owing to its capabilities of rapid prototyping, can solve all the
complexities of achieving intricate transparent designs. However, it is necessary to note
that additional processing is mandatory to achieve the highest quality transparent
products with the present technology.
Currently, there are various methods of fabrication, engaging a wide variety of
materials used to achieve transparency, which is the key to have high transmission.
Industry uses glass as the most common material owing to its transparency for the optical
applications and for the fabrication of photoreactor systems to achieve higher efficiencies.
Transparency helps in achieving online fluorescence spectroscopy, used for sensing in
certain photoreactor setups for water treatment applications,21,22 which can only be done
because of transparency. Polydimethylsiloxane (PDMS) based devices are fabricated for
microfluidic and MEMS applications,23 which have optical transparency over a wide range
of wavelengths making online microscopy and sensing viable.24 Transparent acrylic-
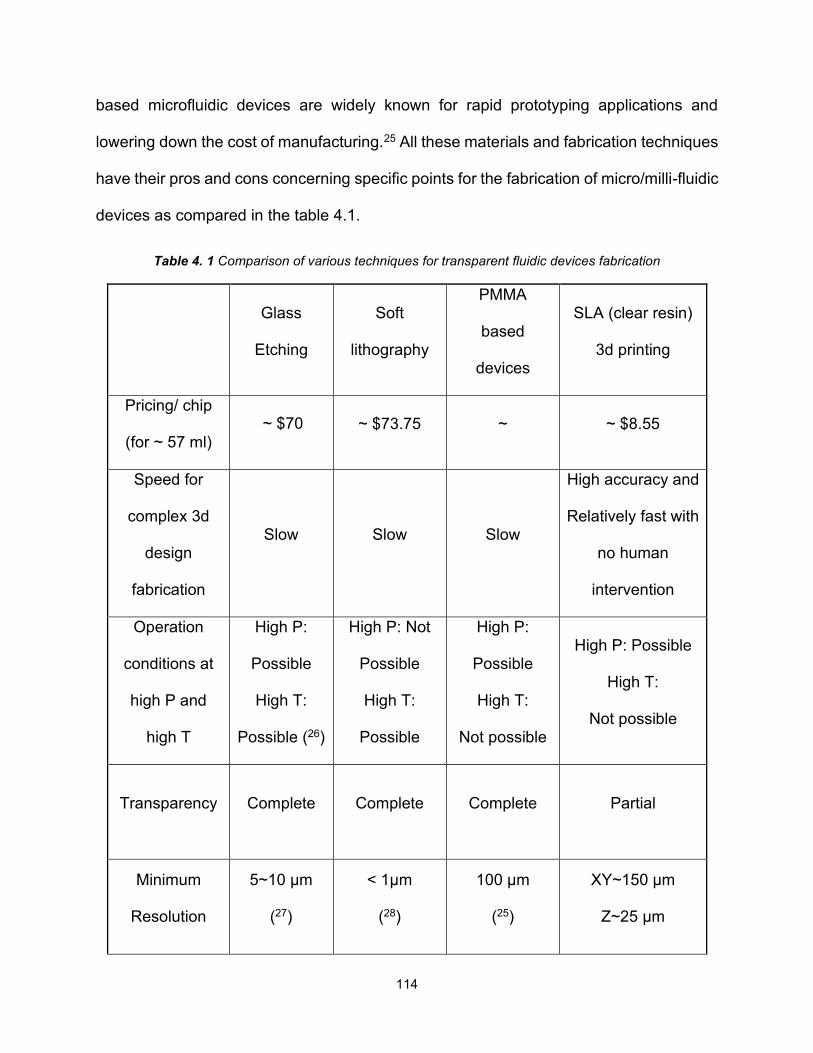
114
based microfluidic devices are widely known for rapid prototyping applications and
lowering down the cost of manufacturing.25 All these materials and fabrication techniques
have their pros and cons concerning specific points for the fabrication of micro/milli-fluidic
devices as compared in the table 4.1.
Table 4. 1 Comparison of various techniques for transparent fluidic devices fabrication
Glass
Etching
Soft
lithography
PMMA
based
devices
SLA (clear resin)
3d printing
Pricing/ chip
(for ~ 57 ml) ~ $70 ~ $73.75 ~ ~ $8.55
Speed for
complex 3d
design
fabrication
Slow Slow Slow
High accuracy and
Relatively fast with
no human
intervention
Operation
conditions at
high P and
high T
High P:
Possible
High T:
Possible (26)
High P: Not
Possible
High T:
Possible
High P:
Possible
High T:
Not possible
High P: Possible
High T:
Not possible
Transparency Complete Complete Complete Partial
Minimum
Resolution
5~10 µm
(27)
< 1µm
(28)
100 µm
(25)
XY~150 µm
Z~25 µm
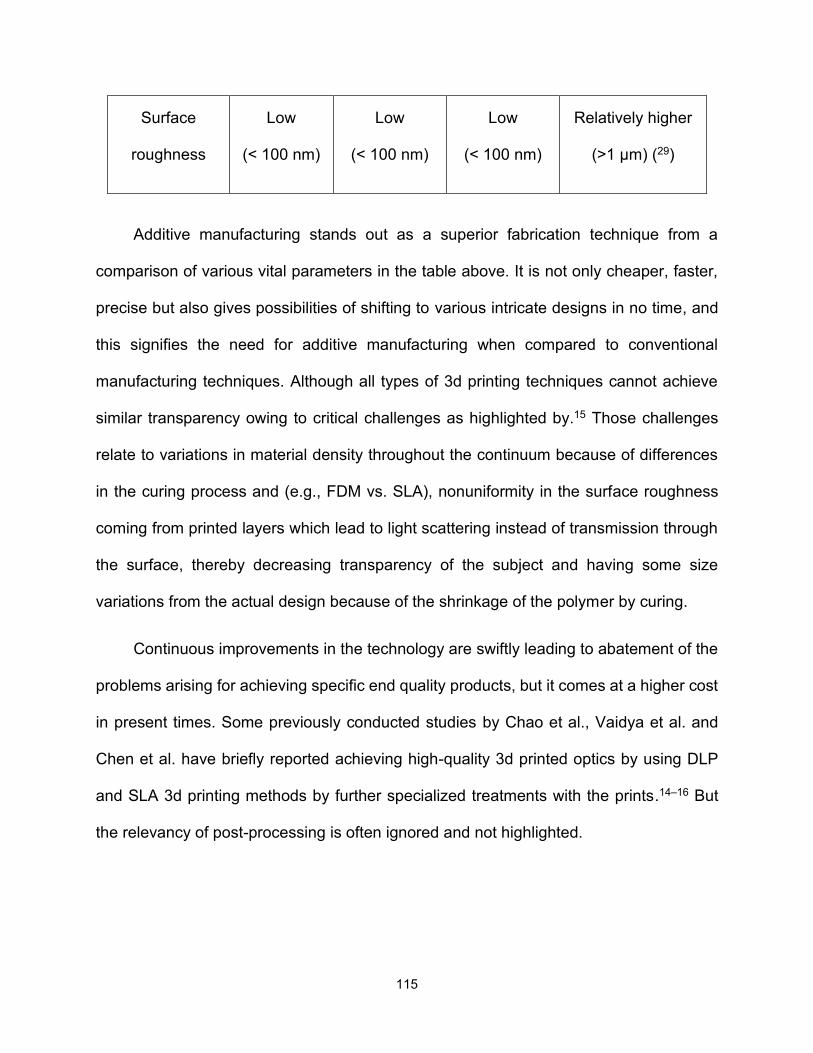
115
Surface
roughness
Low
(< 100 nm)
Low
(< 100 nm)
Low
(< 100 nm)
Relatively higher
(>1 µm) (29)
Additive manufacturing stands out as a superior fabrication technique from a
comparison of various vital parameters in the table above. It is not only cheaper, faster,
precise but also gives possibilities of shifting to various intricate designs in no time, and
this signifies the need for additive manufacturing when compared to conventional
manufacturing techniques. Although all types of 3d printing techniques cannot achieve
similar transparency owing to critical challenges as highlighted by.15 Those challenges
relate to variations in material density throughout the continuum because of differences
in the curing process and (e.g., FDM vs. SLA), nonuniformity in the surface roughness
coming from printed layers which lead to light scattering instead of transmission through
the surface, thereby decreasing transparency of the subject and having some size
variations from the actual design because of the shrinkage of the polymer by curing.
Continuous improvements in the technology are swiftly leading to abatement of the
problems arising for achieving specific end quality products, but it comes at a higher cost
in present times. Some previously conducted studies by Chao et al., Vaidya et al. and
Chen et al. have briefly reported achieving high-quality 3d printed optics by using DLP
and SLA 3d printing methods by further specialized treatments with the prints.14–16 But
the relevancy of post-processing is often ignored and not highlighted.
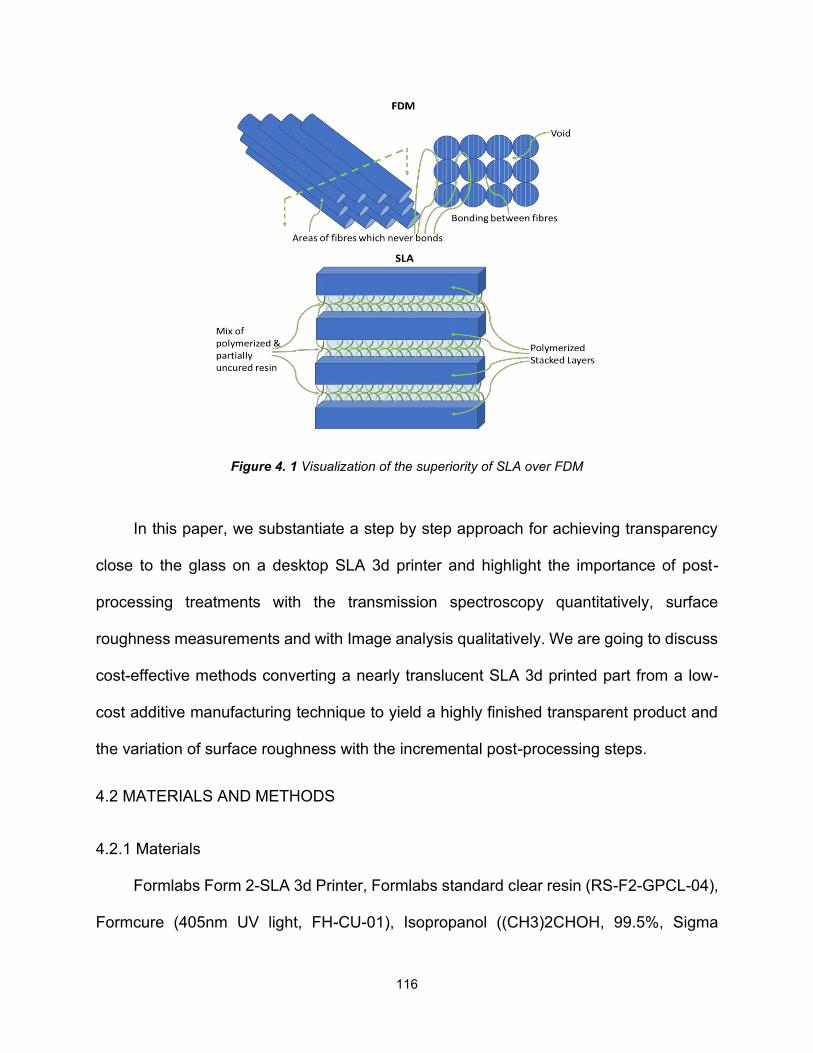
116
Figure 4. 1 Visualization of the superiority of SLA over FDM
In this paper, we substantiate a step by step approach for achieving transparency
close to the glass on a desktop SLA 3d printer and highlight the importance of post-
processing treatments with the transmission spectroscopy quantitatively, surface
roughness measurements and with Image analysis qualitatively. We are going to discuss
cost-effective methods converting a nearly translucent SLA 3d printed part from a low-
cost additive manufacturing technique to yield a highly finished transparent product and
the variation of surface roughness with the incremental post-processing steps.
4.2 MATERIALS AND METHODS
4.2.1 Materials
Formlabs Form 2-SLA 3d Printer, Formlabs standard clear resin (RS-F2-GPCL-04),
Formcure (405nm UV light, FH-CU-01), Isopropanol ((CH3)2CHOH, 99.5%, Sigma
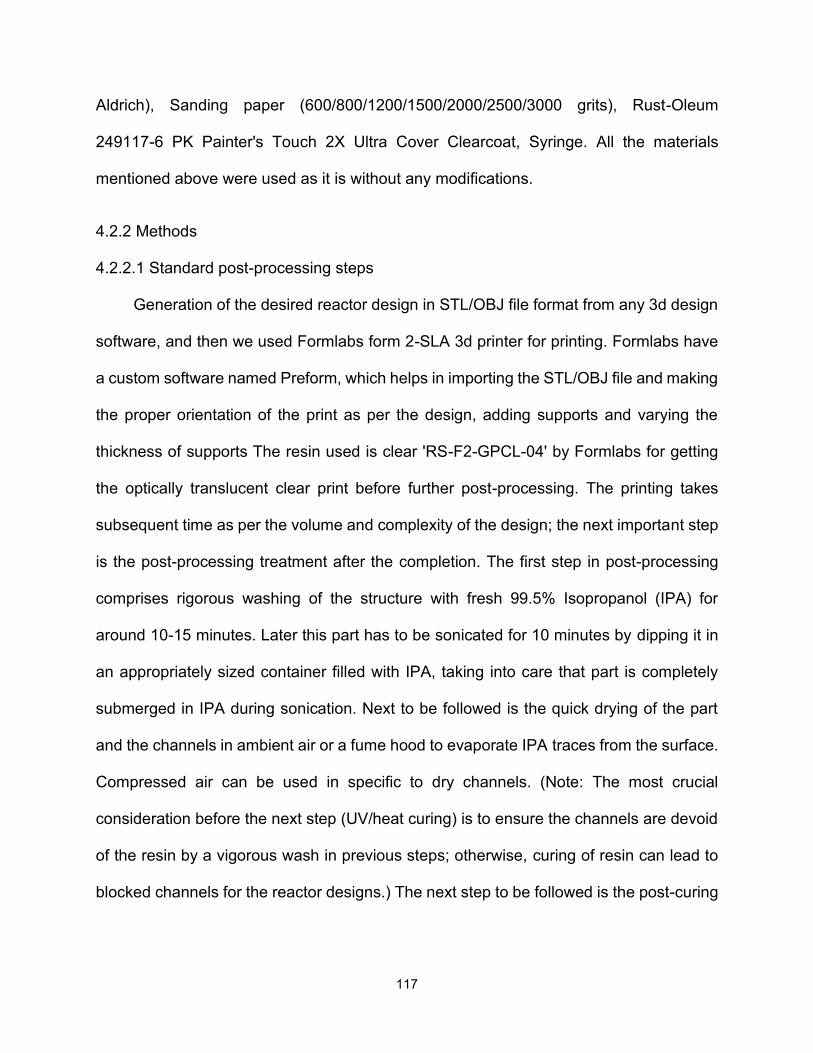
117
Aldrich), Sanding paper (600/800/1200/1500/2000/2500/3000 grits), Rust-Oleum
249117-6 PK Painter's Touch 2X Ultra Cover Clearcoat, Syringe. All the materials
mentioned above were used as it is without any modifications.
4.2.2 Methods
4.2.2.1 Standard post-processing steps
Generation of the desired reactor design in STL/OBJ file format from any 3d design
software, and then we used Formlabs form 2-SLA 3d printer for printing. Formlabs have
a custom software named Preform, which helps in importing the STL/OBJ file and making
the proper orientation of the print as per the design, adding supports and varying the
thickness of supports The resin used is clear 'RS-F2-GPCL-04' by Formlabs for getting
the optically translucent clear print before further post-processing. The printing takes
subsequent time as per the volume and complexity of the design; the next important step
is the post-processing treatment after the completion. The first step in post-processing
comprises rigorous washing of the structure with fresh 99.5% Isopropanol (IPA) for
around 10-15 minutes. Later this part has to be sonicated for 10 minutes by dipping it in
an appropriately sized container filled with IPA, taking into care that part is completely
submerged in IPA during sonication. Next to be followed is the quick drying of the part
and the channels in ambient air or a fume hood to evaporate IPA traces from the surface.
Compressed air can be used in specific to dry channels. (Note: The most crucial
consideration before the next step (UV/heat curing) is to ensure the channels are devoid
of the resin by a vigorous wash in previous steps; otherwise, curing of resin can lead to
blocked channels for the reactor designs.) The next step to be followed is the post-curing
118
of the washed product in UV light (405 nm) to give robustness and high performance to
the material.
4.2.2.2 Transparency evaluation
For evaluating the extent of transparency qualitatively, transmission spectroscopy
analysis was performed for the 3d printed samples with a different surface finish (Figure
4.4b). Five structures designed to have outer dimensions like a standard cuvette
(12.5mm*12.5mm*45mm) were printed in Formlabs form 2-3d printer with clear resin in
one batch. One of them being treated with normal post-treatment processing without any
surface modification, a second one followed with an extra wet sanding process over
normal post-treatment, the third one followed with a surface coat by rust oleum over
previous treatments and fourth one being coated with clear resin (supplied by Formlabs)
and cured in Formcure (UV + heat) instead of rust oleum over other post-treatments,
whereas one of them being an extra backup for surface coating .
The Ocean Optics system (QE Pro series detector) was utilized for transmission
detection. The system was composed of back-thinned, TE Cooled, 1044 x 64 element
(cross-check) CCD array detector and halogen light source as excitation source at 180°
from the detector. Transmission data acquisition was programmed on the Ocean View
software (Ocean Optics) with spectral collection parameters adjusted once and thereafter
maintained to be constant for all the readings with different surface treatments.
4.3 RESULTS AND DISCUSSION
4.3.1 Transparency of 3D printed objects using the standard procedure
4.3.1.1 Impact of geometrical orientation and supports features
119
One of the critical observations is the inconsistency in the printing of complex non-
straight design geometries with channels having lower cross-sectional dimensions, i.e.,
of the order ≤ 1mm in diameter.
The success and accuracy of SLA 3d printing for various shapes and sized channels
depend on the XY-plane resolution, and Z-axis resolution, which affects in achieving
accurate cross-sectional shapes and layer thickness. The XY-plane resolution refers to
minimum resolution/gap/distance between two surfaces on XY-plane and is of high
importance being solely dependent on curing laser point diameter, which is unique for
any SLA 3d printer, at 140 microns for Formlabs Form 2. Analogically, the Z-axis refers
to the thickness of the layer cured at one time by the same laser, here being 25 microns
layer thickness for the same printer.
Minimum possible XY-plane resolution for Formlabs Form 2 would be equivalent to
140 microns theoretically producing rounded surface devoid of 90° angles, unlike DLP
3d printing, which creates volumetric pixeled surface if checked microscopically. The
variations/failures of a unique design having microchannels for a final print can be
discerned by having variations in the orientation of the design on the build platform and
selecting the best possible orientation with the least deformations in the printed design in
contrast to the original design.
Thus, there are two main parameters involved that hinder getting lower dimensioned
channels, namely XY-plane resolution, and orientation angle.
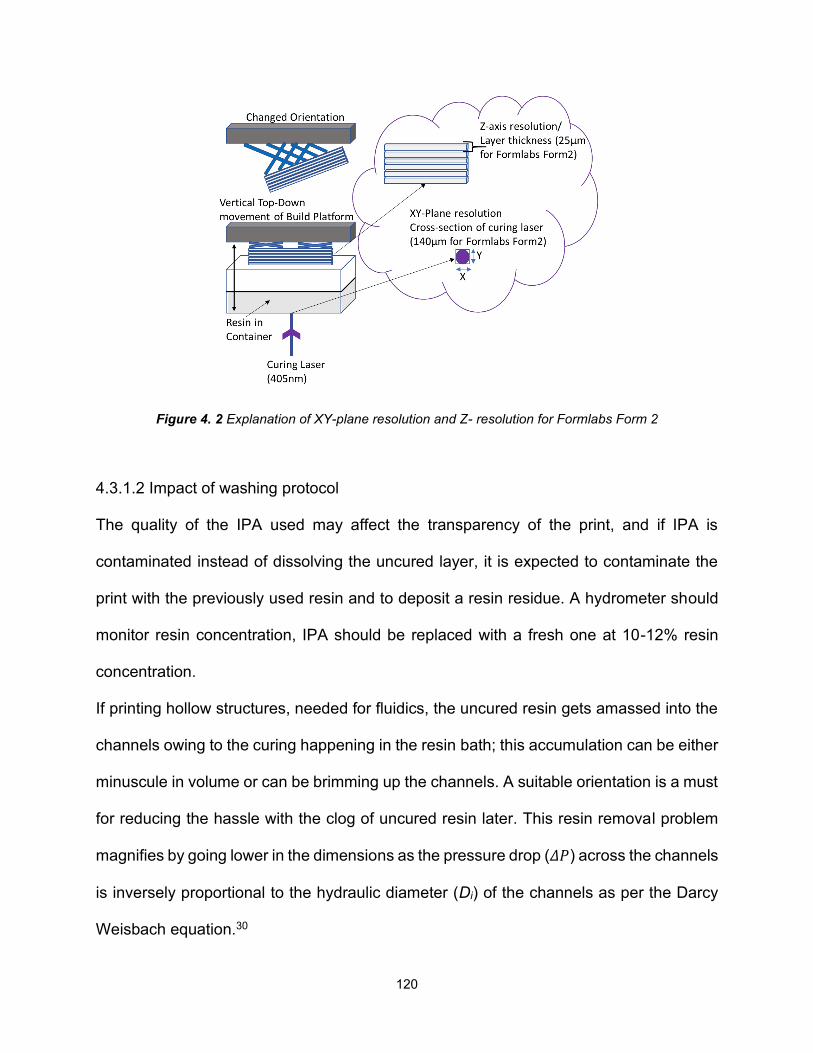
120
Figure 4. 2 Explanation of XY-plane resolution and Z- resolution for Formlabs Form 2
4.3.1.2 Impact of washing protocol
The quality of the IPA used may affect the transparency of the print, and if IPA is
contaminated instead of dissolving the uncured layer, it is expected to contaminate the
print with the previously used resin and to deposit a resin residue. A hydrometer should
monitor resin concentration, IPA should be replaced with a fresh one at 10-12% resin
concentration.
If printing hollow structures, needed for fluidics, the uncured resin gets amassed into the
channels owing to the curing happening in the resin bath; this accumulation can be either
minuscule in volume or can be brimming up the channels. A suitable orientation is a must
for reducing the hassle with the clog of uncured resin later. This resin removal problem
magnifies by going lower in the dimensions as the pressure drop (𝛥𝑃) across the channels
is inversely proportional to the hydraulic diameter (Di) of the channels as per the Darcy
Weisbach equation.30
121
𝜟𝑷𝜶𝟏
𝑫𝒊 (1)
More extended periods of IPA bath don't help in this specific situation to dilate the
resin in channels; instead, over-washing may affect the mechanical properties of the
cured subject. The same observations are also reported by some previous studies using
the Form 2 SLA 3d-printer, where, on lowering dimensions arises the problem related to
skin friction making it more challenging to impel viscous resin from the straight tubular
channels. Thus, making reliance on specialized syringe or attachments for smoother
removal from straight channels until 1mm of diameter.
This wash tends to dilute excess uncured resin present on the surface and cease
its curing from ambient light. Next step of sonication not only aids in eliminating any
unwashed viscid resin layers on the surface but also in ousting and solvating the remnant
uncured resin in the channeled prints. It is worth noting that if the channel dimensions are
below 1.5 mm in dimensions, best practice would be to clear the channels with the syringe
immediately after taking out from the printer and flushing it profusely until there are no
visual traces of any liquid resin left in the channels. Impact of post-curing and thermal
treatment
4.3.1.3 Impact of post-curing and thermal treatment
When the part is taken out from the printer, cured print, unlike the resin, does have
a continuous molecular structure, although further UV exposure is necessary for some
sprouting unreacted groups, which can further be cross-linked to bring it to an end.
122
Although UV post-curing is recommended for imparting relatively higher mechanical
strength, it is not mandatory with the Formlabs clear resin. It has also been observed,
post-curing in UV confer a slight yellowish tint to the transparent subject. The yellowish
tint is speculated to be happening because of the photo-initiator's degradation and
becomes intense amidst more exposure of UV light then recommendations if using
Formcure apparatus. If a high-intensity UV lamp is used, then even short-term exposure
can cause intense yellowing of the subject.
Natural sunlight has the capability of post-curing due to its broad spectral emissions,
but time and effectiveness of curing vary as per local atmospheric conditions.
The temperature of the curing also plays a vital role in increasing the rate of cross-
linking and terminating the leftover unlinked groups. The recommendation when using a
Formlabs 3d printer while working with transparent resin is to cure the subject at 60 °C
for 15 min in their custom Formcure, although it is not limited to that. Various custom build
options employing similar kinds of arrangements can be incorporated for getting
equivalent results.
4.3.2 Improving the standard transparency with additional surface treatments
The next step after the post-curing steps in UV is to impart a surface finish (i.e.,
lowering surface roughness) by various smoothening techniques available and abolish
the various vertical/horizontal lay patterns on the prints to decrease the degree of
scattering of light.
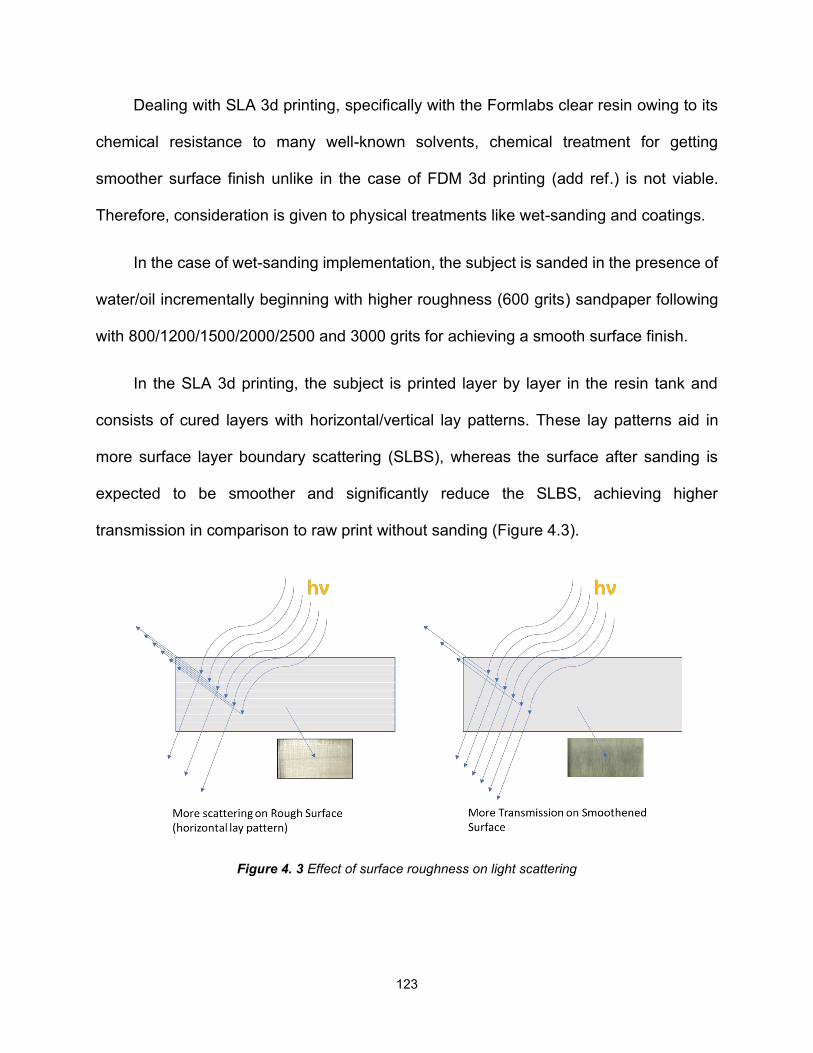
123
Dealing with SLA 3d printing, specifically with the Formlabs clear resin owing to its
chemical resistance to many well-known solvents, chemical treatment for getting
smoother surface finish unlike in the case of FDM 3d printing (add ref.) is not viable.
Therefore, consideration is given to physical treatments like wet-sanding and coatings.
In the case of wet-sanding implementation, the subject is sanded in the presence of
water/oil incrementally beginning with higher roughness (600 grits) sandpaper following
with 800/1200/1500/2000/2500 and 3000 grits for achieving a smooth surface finish.
In the SLA 3d printing, the subject is printed layer by layer in the resin tank and
consists of cured layers with horizontal/vertical lay patterns. These lay patterns aid in
more surface layer boundary scattering (SLBS), whereas the surface after sanding is
expected to be smoother and significantly reduce the SLBS, achieving higher
transmission in comparison to raw print without sanding (Figure 4.3).
Figure 4. 3 Effect of surface roughness on light scattering
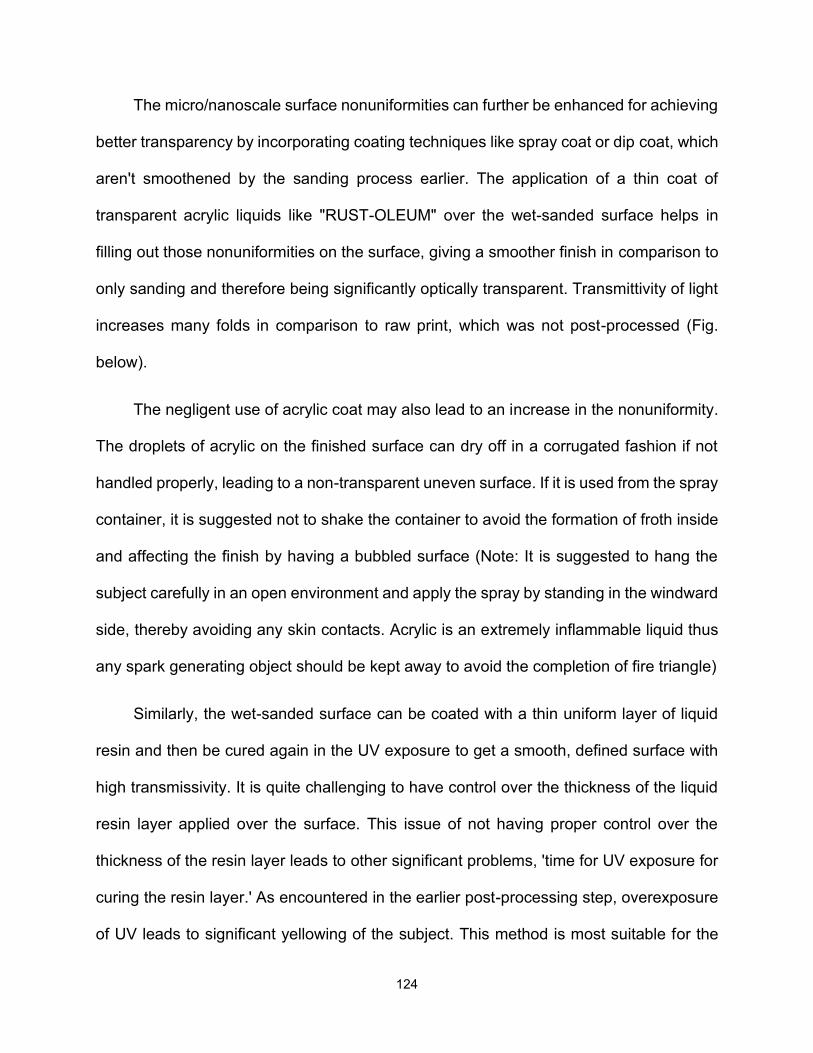
124
The micro/nanoscale surface nonuniformities can further be enhanced for achieving
better transparency by incorporating coating techniques like spray coat or dip coat, which
aren't smoothened by the sanding process earlier. The application of a thin coat of
transparent acrylic liquids like "RUST-OLEUM" over the wet-sanded surface helps in
filling out those nonuniformities on the surface, giving a smoother finish in comparison to
only sanding and therefore being significantly optically transparent. Transmittivity of light
increases many folds in comparison to raw print, which was not post-processed (Fig.
below).
The negligent use of acrylic coat may also lead to an increase in the nonuniformity.
The droplets of acrylic on the finished surface can dry off in a corrugated fashion if not
handled properly, leading to a non-transparent uneven surface. If it is used from the spray
container, it is suggested not to shake the container to avoid the formation of froth inside
and affecting the finish by having a bubbled surface (Note: It is suggested to hang the
subject carefully in an open environment and apply the spray by standing in the windward
side, thereby avoiding any skin contacts. Acrylic is an extremely inflammable liquid thus
any spark generating object should be kept away to avoid the completion of fire triangle)
Similarly, the wet-sanded surface can be coated with a thin uniform layer of liquid
resin and then be cured again in the UV exposure to get a smooth, defined surface with
high transmissivity. It is quite challenging to have control over the thickness of the liquid
resin layer applied over the surface. This issue of not having proper control over the
thickness of the resin layer leads to other significant problems, 'time for UV exposure for
curing the resin layer.' As encountered in the earlier post-processing step, overexposure
of UV leads to significant yellowing of the subject. This method is most suitable for the

125
flat/straight surfaces and definitely should be avoided for the concave natured surfaces
as it might add more thickness to the original surface finish and also changing the final
shape. It is also challenging to make UV exposures side by side carefully without
damaging the cured surface and also curing the surface with liquid resin completely.
In the figure 4.4 %transmission vs wavelength quantitative measurements, a
competitive comparison between various treatments was done with respect to a quartz
cuvette as a benchmark which has on average transmission above 90%. The test
subjects having no surface enhancements were found to have minimal transmission
through them which can be seen in the plot as the lowest measurements spanning from
~440nm and onwards to infrared at less than 5% transmission. After wet sanding process,
the % transmission was seen to have a marginal increase on the same range (440nm to
IR) as can be seen in the second lowest measurements in the graph. A significant rise in
%transmission was found by surface coat treatment by rust oleum/ resin coat. It was
interesting to have similar values of % transmission values for both of which was close to
45% at 440 nm, rising to 60% at 630 nm and reaching highest to around 78% in near IR
region.
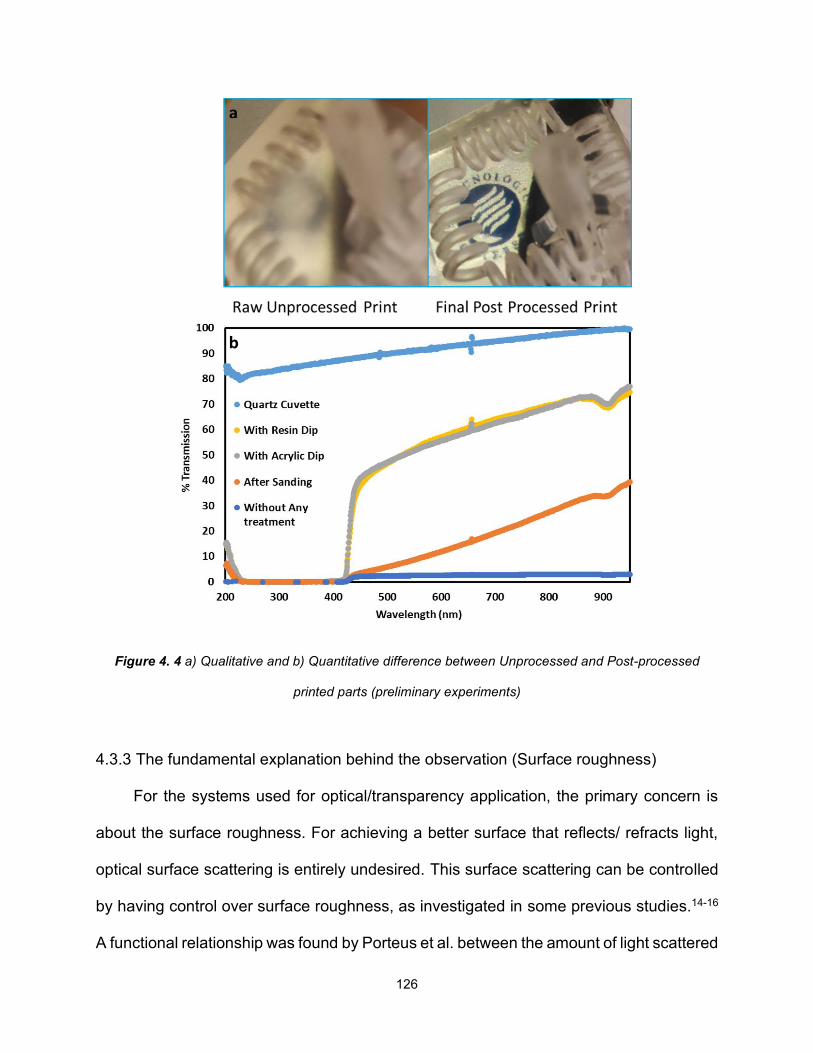
126
Figure 4. 4 a) Qualitative and b) Quantitative difference between Unprocessed and Post-processed
printed parts (preliminary experiments)
4.3.3 The fundamental explanation behind the observation (Surface roughness)
For the systems used for optical/transparency application, the primary concern is
about the surface roughness. For achieving a better surface that reflects/ refracts light,
optical surface scattering is entirely undesired. This surface scattering can be controlled
by having control over surface roughness, as investigated in some previous studies.14-16
A functional relationship was found by Porteus et al. between the amount of light scattered
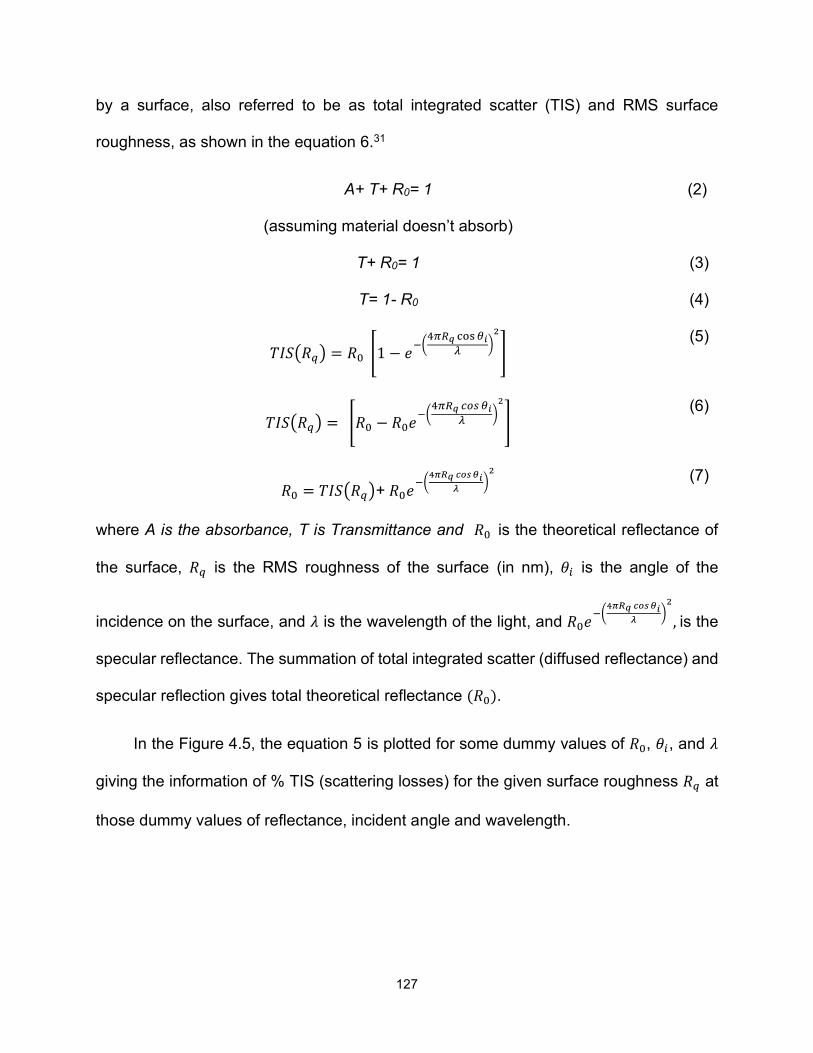
127
by a surface, also referred to be as total integrated scatter (TIS) and RMS surface
roughness, as shown in the equation 6.31
A+ T+ R0= 1
(assuming material doesn’t absorb)
(2)
T+ R0= 1 (3)
T= 1- R0 (4)
𝑇𝐼𝑆(𝑅𝑞) = 𝑅0 [1 − 𝑒−(4𝜋𝑅𝑞 cos 𝜃𝑖
𝜆 )2
] (5)
𝑇𝐼𝑆(𝑅𝑞) = [𝑅0 − 𝑅0𝑒−(4𝜋𝑅𝑞 𝑐𝑜𝑠 𝜃𝑖
𝜆 )2
] (6)
𝑅0 = 𝑇𝐼𝑆(𝑅𝑞)+ 𝑅0𝑒−(4𝜋𝑅𝑞 𝑐𝑜𝑠 𝜃𝑖
𝜆 )2
(7)
where A is the absorbance, T is Transmittance and 𝑅0 is the theoretical reflectance of
the surface, 𝑅𝑞 is the RMS roughness of the surface (in nm), 𝜃𝑖 is the angle of the
incidence on the surface, and 𝜆 is the wavelength of the light, and 𝑅0𝑒−(4𝜋𝑅𝑞 𝑐𝑜𝑠 𝜃𝑖
𝜆 )2
, is the
specular reflectance. The summation of total integrated scatter (diffused reflectance) and
specular reflection gives total theoretical reflectance (𝑅0).
In the Figure 4.5, the equation 5 is plotted for some dummy values of 𝑅0, 𝜃𝑖, and 𝜆
giving the information of % TIS (scattering losses) for the given surface roughness 𝑅𝑞 at
those dummy values of reflectance, incident angle and wavelength.
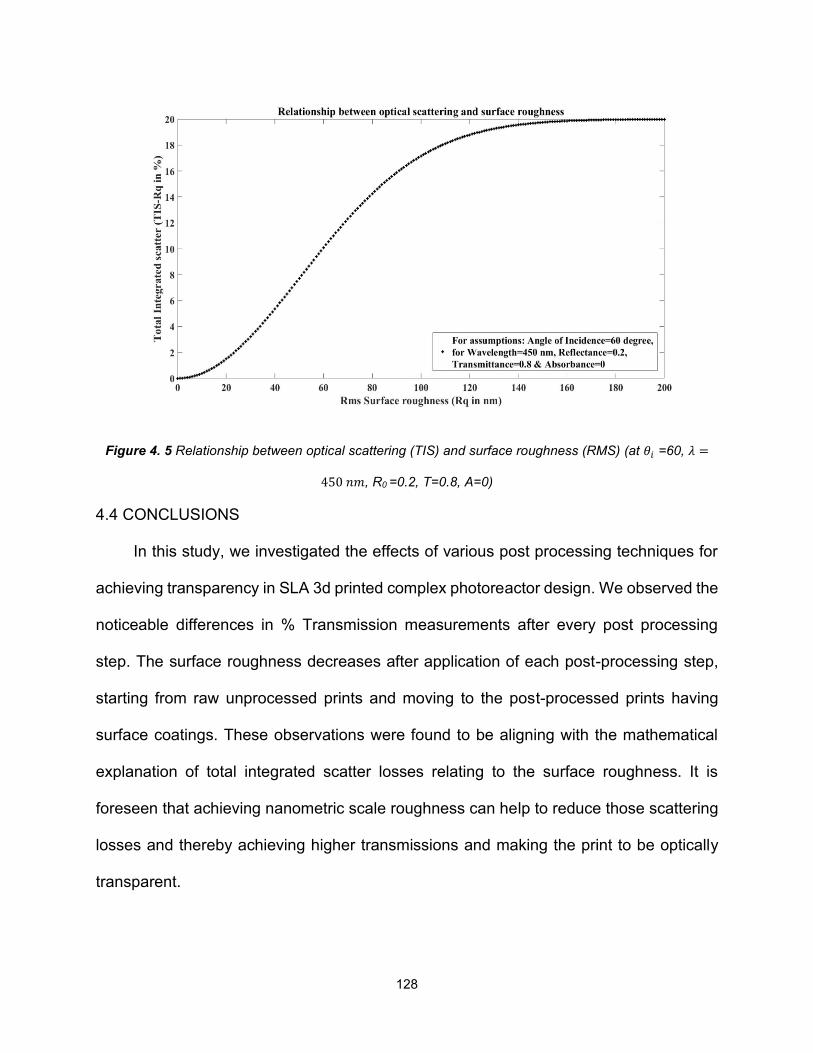
128
Figure 4. 5 Relationship between optical scattering (TIS) and surface roughness (RMS) (at 𝜃𝑖 =60, 𝜆 =
450 𝑛𝑚, R0 =0.2, T=0.8, A=0)
4.4 CONCLUSIONS
In this study, we investigated the effects of various post processing techniques for
achieving transparency in SLA 3d printed complex photoreactor design. We observed the
noticeable differences in % Transmission measurements after every post processing
step. The surface roughness decreases after application of each post-processing step,
starting from raw unprocessed prints and moving to the post-processed prints having
surface coatings. These observations were found to be aligning with the mathematical
explanation of total integrated scatter losses relating to the surface roughness. It is
foreseen that achieving nanometric scale roughness can help to reduce those scattering
losses and thereby achieving higher transmissions and making the print to be optically
transparent.
129
REFERENCES
(1) Zastrow, M. 3D Printing Gets Bigger, Faster and Stronger. Nature. 2020.
https://doi.org/10.1038/d41586-020-00271-6.
(2) Terrani, K.; Jolly, B.; Trammell, M. 3D Printing of High-Purity Silicon Carbide.
Journal of the American Ceramic Society 2020.
https://doi.org/10.1111/jace.16888.
(3) Gelis, A. V.; Kozak, P.; Breshears, A. T.; Brown, M. A.; Launiere, C.; Campbell, E.
L.; Hall, G. B.; Levitskaia, T. G.; Holfeltz, V. E.; Lumetta, G. J. Closing the Nuclear
Fuel Cycle with a Simplified Minor Actinide Lanthanide Separation Process
(ALSEP) and Additive Manufacturing. Scientific Reports 2019.
https://doi.org/10.1038/s41598-019-48619-x.
(4) Wong, J. Y.; Pfahnl, A. C. 3D Printed Surgical Instruments Evaluated by a
Simulated Crew of a Mars Mission. Aerospace Medicine and Human Performance
2016. https://doi.org/10.3357/AMHP.4281.2016.
(5) Wong, J. Y.; Pfahnl, A. C. 3D Printing of Surgical Instruments for Long-Duration
Space Missions. Aviation Space and Environmental Medicine 2014.
https://doi.org/10.3357/ASEM.3898.2014.
(6) Leach, N. 3D Printing in Space. Architectural Design 2014.
https://doi.org/10.1002/ad.1840.
(7) Noor, N.; Shapira, A.; Edri, R.; Gal, I.; Wertheim, L.; Dvir, T. 3D Printing of
Personalized Thick and Perfusable Cardiac Patches and Hearts. Advanced
130
Science 2019. https://doi.org/10.1002/advs.201900344.
(8) Noor, N.; Shapira, A.; Edri, R.; Gal, I.; Wertheim, L.; Dvir, T. Tissue Engineering:
3D Printing of Personalized Thick and Perfusable Cardiac Patches and Hearts
(Adv. Sci. 11/2019). Advanced Science 2019.
https://doi.org/10.1002/advs.201970066.
(9) Murphy, S. V.; De Coppi, P.; Atala, A. Opportunities and Challenges of
Translational 3D Bioprinting. Nature Biomedical Engineering. 2020.
https://doi.org/10.1038/s41551-019-0471-7.
(10) Murphy, S. V.; Atala, A. 3D Bioprinting of Tissues and Organs. Nature
Biotechnology. 2014. https://doi.org/10.1038/nbt.2958.
(11) Chatterjee, K.; Ghosh, T. K. 3D Printing of Textiles: Potential Roadmap to Printing
with Fibers. Advanced Materials. 2020. https://doi.org/10.1002/adma.201902086.
(12) Valentine, A. D.; Busbee, T. A.; Boley, J. W.; Raney, J. R.; Chortos, A.; Kotikian,
A.; Berrigan, J. D.; Durstock, M. F.; Lewis, J. A. Hybrid 3D Printing of Soft
Electronics. Advanced Materials 2017. https://doi.org/10.1002/adma.201703817.
(13) Wales, D. J.; Cao, Q.; Kastner, K.; Karjalainen, E.; Newton, G. N.; Sans, V. 3D-
Printable Photochromic Molecular Materials for Reversible Information Storage.
Advanced Materials 2018. https://doi.org/10.1002/adma.201800159.
(14) Shao, G.; Hai, R.; Sun, C. 3D Printing Customized Optical Lens in Minutes.
Advanced Optical Materials 2020. https://doi.org/10.1002/adom.201901646.
(15) Vaidya, N.; Solgaard, O. 3D Printed Optics with Nanometer Scale Surface
131
Roughness. Microsystems and Nanoengineering 2018.
https://doi.org/10.1038/s41378-018-0015-4.
(16) Chen, X.; Liu, W.; Dong, B.; Lee, J.; Ware, H. O. T.; Zhang, H. F.; Sun, C. High-
Speed 3D Printing of Millimeter-Size Customized Aspheric Imaging Lenses with
Sub 7 Nm Surface Roughness. Advanced Materials 2018.
https://doi.org/10.1002/adma.201705683.
(17) Kotz, F.; Risch, P.; Helmer, D.; Rapp, B. E. High-Performance Materials for 3D
Printing in Chemical Synthesis Applications. Advanced Materials 2019.
https://doi.org/10.1002/adma.201805982.
(18) Capel, A. J.; Rimington, R. P.; Lewis, M. P.; Christie, S. D. R. 3D Printing for
Chemical, Pharmaceutical and Biological Applications. Nature Reviews
Chemistry. 2018. https://doi.org/10.1038/s41570-018-0058-y.
(19) Kitson, P. J.; Glatzel, S.; Chen, W.; Lin, C. G.; Song, Y. F.; Cronin, L. 3D Printing
of Versatile Reactionware for Chemical Synthesis. Nature Protocols 2016.
https://doi.org/10.1038/nprot.2016.041.
(20) Okafor, O.; Weilhard, A.; Fernandes, J. A.; Karjalainen, E.; Goodridge, R.; Sans,
V. Advanced Reactor Engineering with 3D Printing for the Continuous-Flow
Synthesis of Silver Nanoparticles. Reaction Chemistry and Engineering 2017, 2
(2), 129–136. https://doi.org/10.1039/c6re00210b.
(21) Carstea, E. M.; Bridgeman, J.; Baker, A.; Reynolds, D. M. Fluorescence
Spectroscopy for Wastewater Monitoring: A Review. Water Research. 2016.
https://doi.org/10.1016/j.watres.2016.03.021.
132
(22) Tiwari, C. P.; Delgado-Licona, F.; Valencia-Llompart, M.; Nuñez-Correa, S.;
Nigam, K. D. P.; Montesinos-Castellanos, A.; López-Guajardo, E. A.; Aguirre-
Soto, A. Shining Light on the Coiled-Flow Inverter - Continuous-Flow
Photochemistry in a Static Mixer. Industrial and Engineering Chemistry Research
2020. https://doi.org/10.1021/acs.iecr.9b05008.
(23) Tsai, H. K. A.; Moschou, E. A.; Daunert, S.; Madou, M.; Kulinsky, L. Integrating
Biosensors and Drug Delivery: A Step Closer toward Scalable Responsive Drug-
Delivery Systems. Advanced Materials 2009.
https://doi.org/10.1002/adma.200801770.
(24) Gowers, S. A. N.; Rogers, M. L.; Booth, M. A.; Leong, C. L.; Samper, I. C.;
Phairatana, T.; Jewell, S. L.; Pahl, C.; Strong, A. J.; Boutelle, M. G. Clinical
Translation of Microfluidic Sensor Devices: Focus on Calibration and Analytical
Robustness. Lab on a Chip 2019. https://doi.org/10.1039/c9lc00400a.
(25) Islam, M. M.; Loewen, A.; Allen, P. B. Simple, Low-Cost Fabrication of Acrylic
Based Droplet Microfluidics and Its Use to Generate DNA-Coated Particles.
Scientific Reports 2018. https://doi.org/10.1038/s41598-018-27037-5.
(26) Andersson, M.; Hjort, K.; Klintberg, L. Fracture Strength of Glass Chips for High-
Pressure Microfluidics. Journal of Micromechanics and Microengineering 2016.
https://doi.org/10.1088/0960-1317/26/9/095009.
(27) Wlodarczyk, K. L.; Carter, R. M.; Jahanbakhsh, A.; Lopes, A. A.; Mackenzie, M.
D.; Maier, R. R. J.; Hand, D. P.; Maroto-Valer, M. M. Rapid Laser Manufacturing
of Microfluidic Devices from Glass Substrates. Micromachines 2018.
133
https://doi.org/10.3390/mi9080409.
(28) Shui, L.; Van Den Berg, A.; Eijkel, J. C. T. Scalable Attoliter Monodisperse Droplet
Formation Using Multiphase Nano-Microfluidics. Microfluidics and Nanofluidics
2011. https://doi.org/10.1007/s10404-011-0776-7.
(29) Choudhari, C. M.; Patil, V. D. Product Development and Its Comparative Analysis
by SLA, SLS and FDM Rapid Prototyping Processes. In IOP Conference Series:
Materials Science and Engineering; 2016. https://doi.org/10.1088/1757-
899X/149/1/012009.
(30) Thakore, S. .; Bhatt, B. . Introduction to Process Engineering and Design.
(31) Porteus, J. O. Relation between the Height Distribution of a Rough Surface and
the Reflectance at Normal Incidence. Journal of the Optical Society of America
1963. https://doi.org/10.1364/josa.53.001394.
134
Chapter 5 5. Summary and Future Work 5.1 Summary
A study on continuous flow photochemistry was performed in a custom designed
fluidic platform employing a milli scale static mixer/ reactor – ‘a coiled flow inverter (CFI)’.
Commercial zinc oxide was functionalized with APTMS via covalent bonding making way
for electrostatic attraction between (-NH3+) of APTMS and negatively charged gold
nanoparticles at operating pH~7. This synergy of electrostatic interaction between the two
makes it efficacious for transfer of electrons from the lower work function material to the
higher work function material (i.e. from Au~5.0 eV to ZnO~5.2 eV). Therefore, it alters the
absorption band spectra to yield a micro-composite sensitive to the visible spectrum.
Online reaction monitoring via fluorescence spectroscopy greatly enhances the
experience by the instantaneous surveillance of kinetic study while the reaction is going
on. Fluorescence imaging helped to identify hotspots and the dark spots for the complex
geometry of CFI and its visualization in three dimensions for uniaxial vs. multiaxial lighting
arrangements. CFI was found to score a significantly higher value of PSTY- a recently
found benchmark for photoreactor comparison amongst the slurry reactor category. This
high value of PSTY resulted because of multiple parameters namely: Superlative mixing
leading to a better light attenuation and enhanced mass transfer amongst the pollutant-
photocatalyst interaction at slurry flow initially, employment of highly efficient LED light
source, avoiding light leakage and aiding in maximum possible photon absorption with
the custom made reflective surface platform; all benefits engaging together to give an
overall efficient system.
135
Although, there was some orange coloured deposition observed towards the end of
the reaction. These deposits are alluded to be rooted from the surface interactions of
dye/degradation products and possibly limit the kinetics for the photo-degradation.
Therefore, poisoning the photocatalyst and varying the stability of solution leading to
suspension destabilization and hence the deposition.
To tackle the challenge on the fabrication front for making complex geometrical
designs of milli-scale photoreactors which are conventionally fabricated by complex,
costly and gnarly techniques like glass blowing, it is dealt by exploring SLA 3d printing
technique by using a clear resin and traversing through various post processing steps for
achieving transparency is discussed. Preliminary relation of different post processing
protocols with the transmission spectroscopy measurement across the UV-VIS spectra is
shown and how surface roughness is the dominant facet in deciding the transparency of
the material is discussed briefly as the study is still under consideration and preliminary
results subject to vary/improve possibly.
5.2 Future work
Considerable strides are being made in the field of photochemistry lately since
last 10-15 years, and with perspective to observations of the studies carried out for
this thesis, below are listed the few possible areas (chronologically as per studies
carried out) which are of imminent interest to be looked upon:
• The improvisation of modular micro/milli-scale photocatalytic platforms with
more flexible light arrangements can be employed for multiple complex reactor
136
geometries with the least possible dark spots for continuous flow
photochemistry, not limited to photodegradation but chemical synthesis also.
• For effective utilization of sunlight coupled with artificial highly efficient light
sources, for making hybrid modular systems which can makes better utilization
of light all day around.
• Exploring new inherently safer, abundantly available, cheaper, and effective
photocatalytic materials (like g-C3N4 and many more) and innovative ways of
utilizing conventionally UV absorptive catalyst for the visible spectrum by
nanoscale surface enhancements by using facile techniques.
• Exploring innovative designs for the reactor can inherently solve
photochemical processes' limitations to a significant extent (like CFI).
• To Delve more into studying the chemical/pollutants' surface interactions over
the photocatalyst for better kinetics understanding.
• Focusing on materials aspect mainly on surface-atmosphere interaction and
curing process of the SLA based prints to achieve inherently more transparent
3d printed materials with less/least post-processing dealing with nanoscale
imperfections.
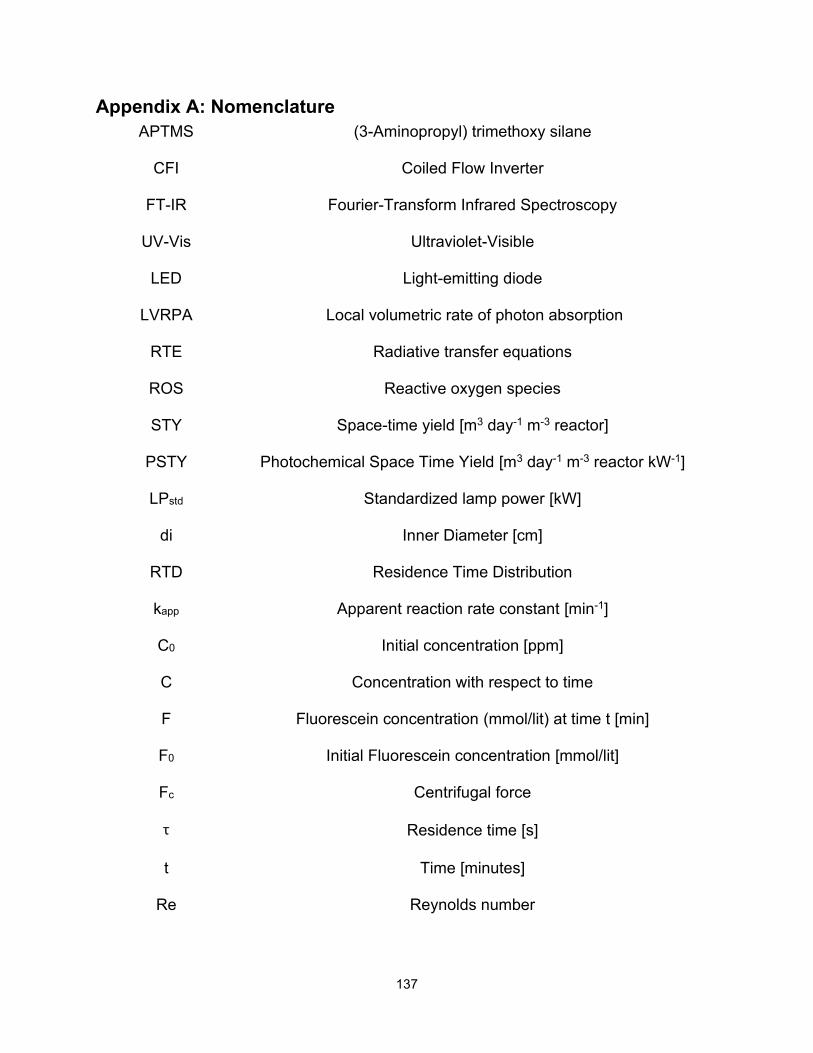
137
Appendix A: Nomenclature APTMS (3-Aminopropyl) trimethoxy silane
CFI Coiled Flow Inverter
FT-IR Fourier-Transform Infrared Spectroscopy
UV-Vis Ultraviolet-Visible
LED Light-emitting diode
LVRPA Local volumetric rate of photon absorption
RTE Radiative transfer equations
ROS Reactive oxygen species
STY Space-time yield [m3 day-1 m-3 reactor]
PSTY Photochemical Space Time Yield [m3 day-1 m-3 reactor kW-1]
LPstd Standardized lamp power [kW]
di Inner Diameter [cm]
RTD Residence Time Distribution
kapp Apparent reaction rate constant [min-1]
C0 Initial concentration [ppm]
C Concentration with respect to time
F Fluorescein concentration (mmol/lit) at time t [min]
F0 Initial Fluorescein concentration [mmol/lit]
Fc Centrifugal force
τ Residence time [s]
t Time [minutes]
Re Reynolds number

138
Dc Curvature diameter
Bo Bodenstein number [-]
De Dean number [-]
λc Curvature ratio, Dc/ di [-]
A Photon flux [mol L-1 s-1]
R Reaction rate in [mol L-1 s-1]
Ep Photonic efficiency [dimensionless]
Φ Quantum efficiency [mol/einstein]
ε Molar attenuation coefficient
θi The angle of the incidence on the surface
λ Wavelength of light
PMMA Poly (methyl methacrylate)
DLP Dynamic light processing
TIS Total integrated scatter
T Transmittance
A Absorbance
Rq Root mean square surface roughness
R0 Theoretical reflectance
FDM Fused deposition modeling
SLA Stereolithography
RMS Root mean square
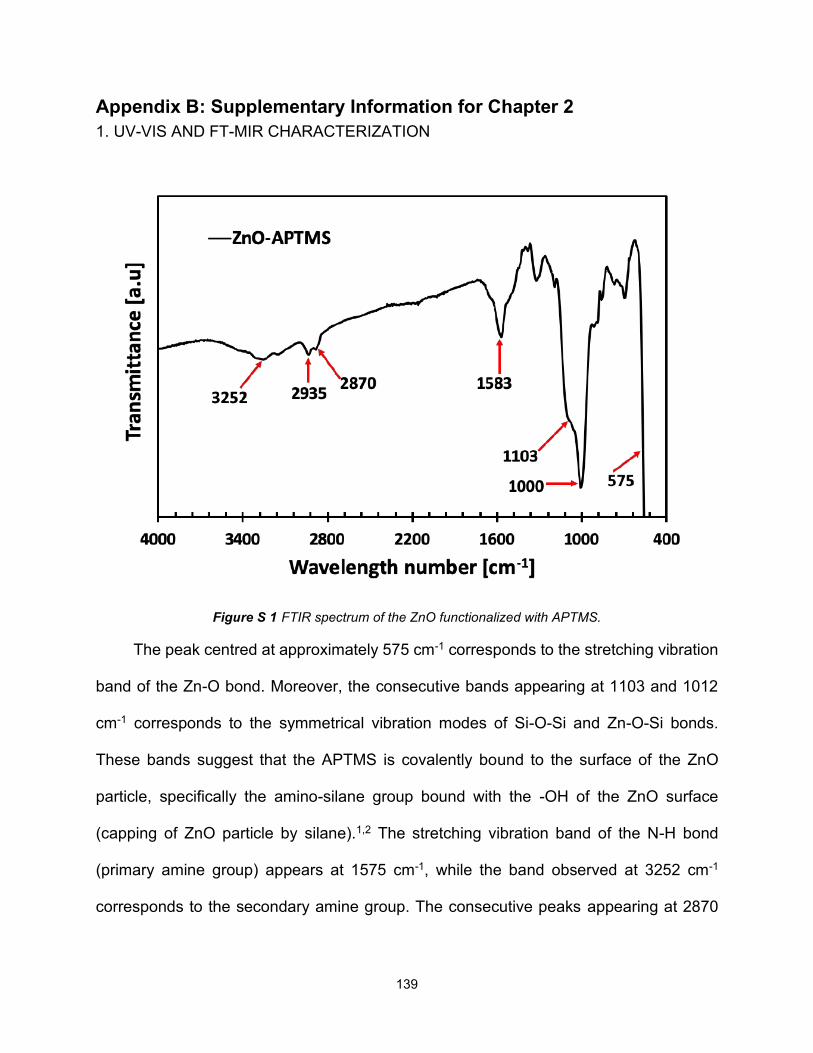
139
Appendix B: Supplementary Information for Chapter 2 1. UV-VIS AND FT-MIR CHARACTERIZATION
Figure S 1 FTIR spectrum of the ZnO functionalized with APTMS.
The peak centred at approximately 575 cm-1 corresponds to the stretching vibration
band of the Zn-O bond. Moreover, the consecutive bands appearing at 1103 and 1012
cm-1 corresponds to the symmetrical vibration modes of Si-O-Si and Zn-O-Si bonds.
These bands suggest that the APTMS is covalently bound to the surface of the ZnO
particle, specifically the amino-silane group bound with the -OH of the ZnO surface
(capping of ZnO particle by silane).1,2 The stretching vibration band of the N-H bond
(primary amine group) appears at 1575 cm-1, while the band observed at 3252 cm-1
corresponds to the secondary amine group. The consecutive peaks appearing at 2870
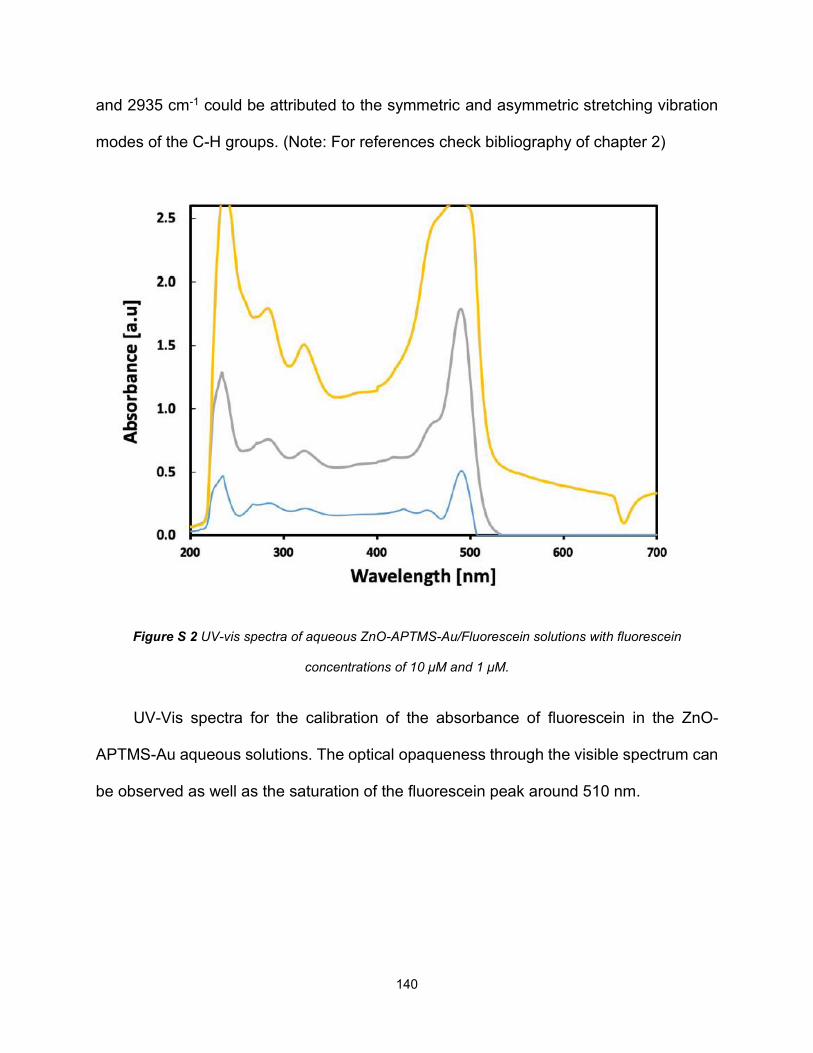
140
and 2935 cm-1 could be attributed to the symmetric and asymmetric stretching vibration
modes of the C-H groups. (Note: For references check bibliography of chapter 2)
Figure S 2 UV-vis spectra of aqueous ZnO-APTMS-Au/Fluorescein solutions with fluorescein
concentrations of 10 μM and 1 μM.
UV-Vis spectra for the calibration of the absorbance of fluorescein in the ZnO-
APTMS-Au aqueous solutions. The optical opaqueness through the visible spectrum can
be observed as well as the saturation of the fluorescein peak around 510 nm.
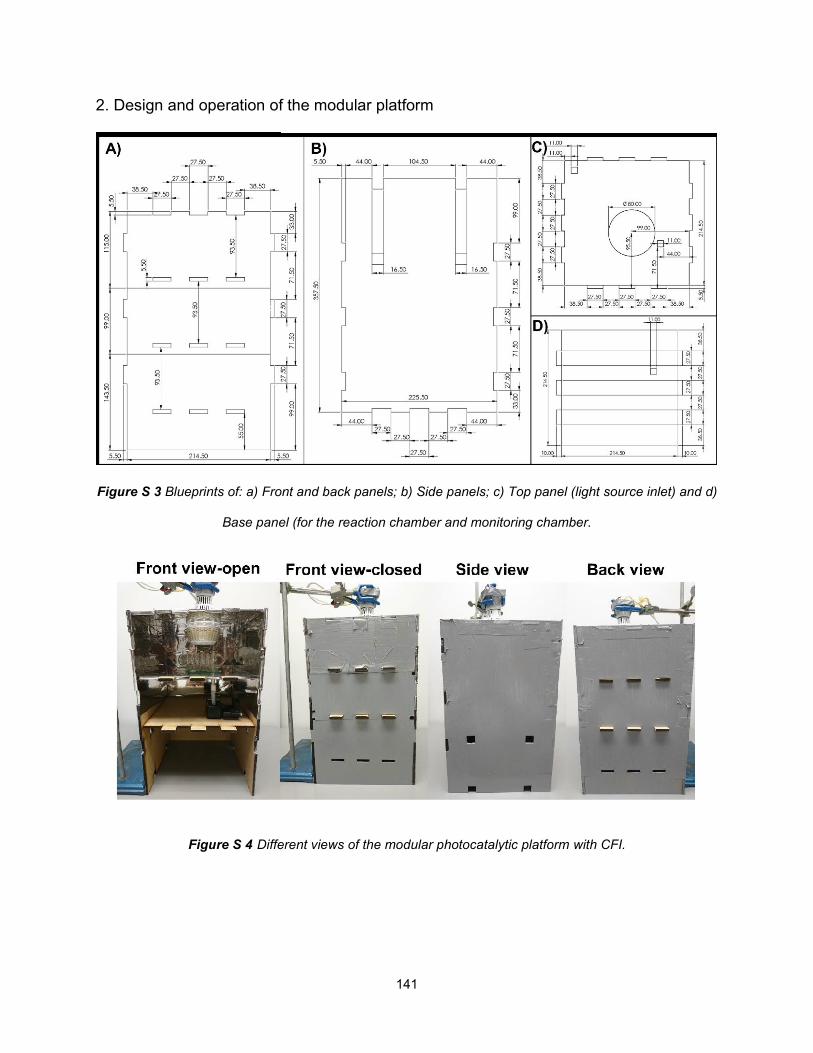
141
2. Design and operation of the modular platform
Figure S 3 Blueprints of: a) Front and back panels; b) Side panels; c) Top panel (light source inlet) and d)
Base panel (for the reaction chamber and monitoring chamber.
Figure S 4 Different views of the modular photocatalytic platform with CFI.
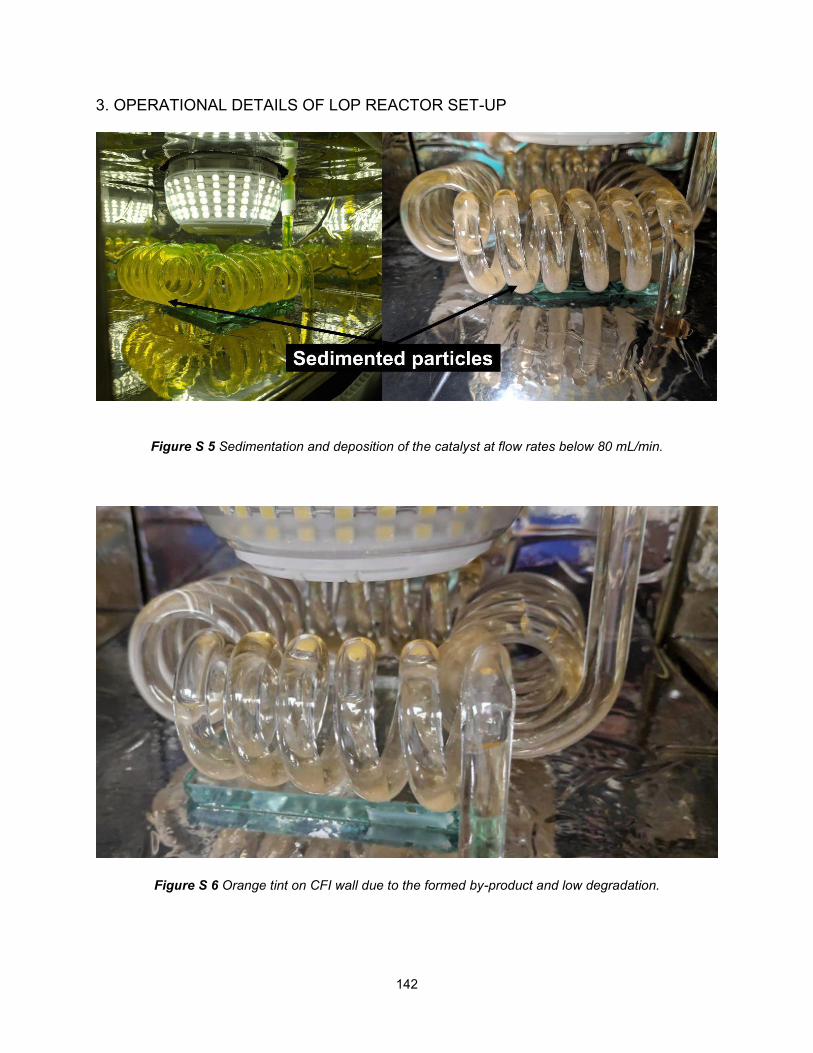
142
3. OPERATIONAL DETAILS OF LOP REACTOR SET-UP
Figure S 5 Sedimentation and deposition of the catalyst at flow rates below 80 mL/min.
Figure S 6 Orange tint on CFI wall due to the formed by-product and low degradation.
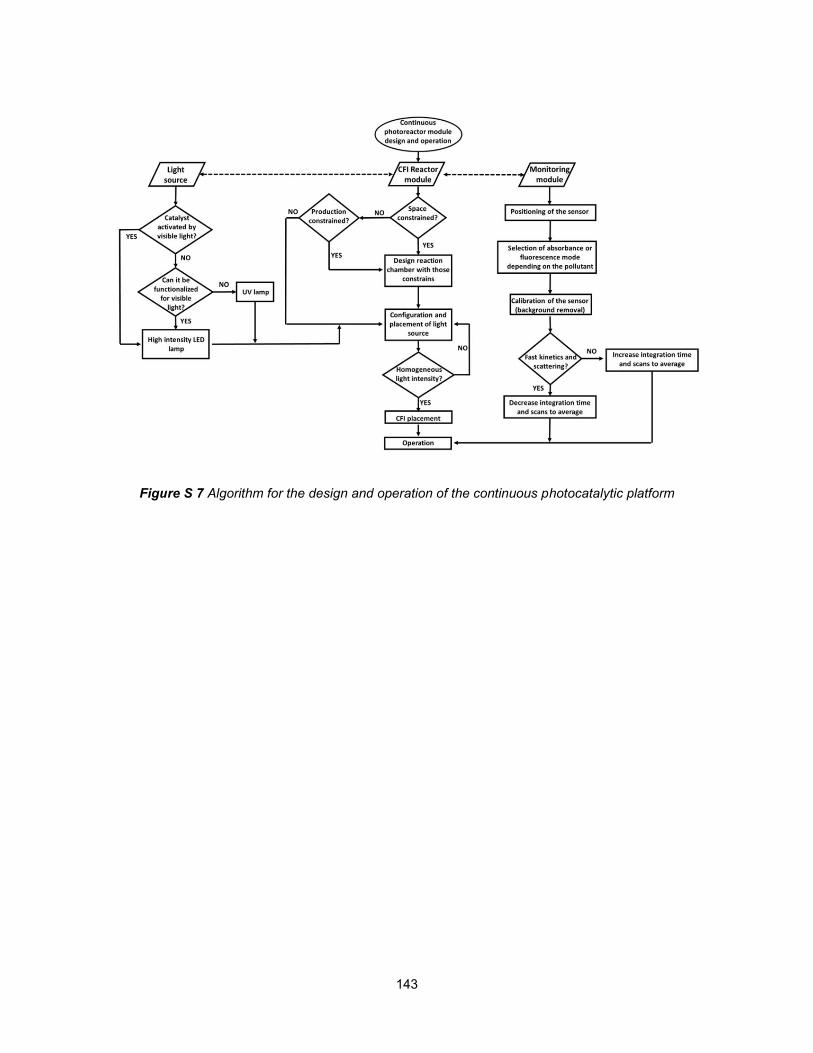
143
Figure S 7 Algorithm for the design and operation of the continuous photocatalytic platform
144
Appendix C: Published Work


