Embed Size (px)
Citation preview
August 2020
Save-to-thriveEnterprise transformation and performance improvement strategies during the COVID-19 pandemic
The COVID-19 pandemic is reshaping the global business landscape and fundamentally changing how people around the world live and work. To better understand the short- and long-term impacts of the crisis—and what companies around the world are doing about it—we recently conducted a special mid-cycle version of our regular biennial survey of global cost management practices and transformation trends.
Actions that companies are taking right now to address COVID-19 can have a major impact on their long-term competitiveness and performance. As such, it is crucial for decision-makers to understand how the crisis is unfolding from a business perspective, and what the future is likely to hold.
The results of this mid-cycle survey include responses from 1,089 executives with direct involvement in their companies’ cost management and enterprise transformation efforts, and represent a broad range of industries and global geographies—with particularly strong representation from countries that have been highly impacted by COVID-19.
In this report, we discuss the key survey findings using a three-stage framework (Respond-Recover-Thrive) to analyze companies’ actions and expectations as they cope with the pandemic and position themselves for the post-crisis world (the “next normal”).
Our 2019 global survey1, which was conducted prior to COVID-19, found the prevailing mindset for strategic cost management was “Save-to-Transform” (using the strategic levers of cost, growth, talent, technology and digital enablement to transform how companies
do business). Now, in response to COVID-19, we are seeing that transformation mindset evolve into “Save-to-Thrive,” with the crisis shining extra light on the talent lever and accelerating key transformation actions such as automation and remote work that can help companies thrive once the virus is contained and the next normal emerges.
In contrast to the downturn that began in 2008, which was structural in nature, the current crisis was triggered by external factors and is demand-driven. As such, although two-thirds of our respondents expect at least one more wave of COVID-19 relapses to occur, companies around the world are generally optimistic about the future and intend to bounce back as quickly as possible, adopting a Save-to-Thrive mindset that can help them make strategic shifts to their operating models, products and services, and customer engagement capabilities.
We hope you find the insights in this special report useful, and look forward to hearing your thoughts and feedback.
Foreword
Sam Balaji Global Consulting Leader Deloitte Touche Tohmatsu Limited
Omar Aguilar Strategic Cost Transformation Global Market Offering Leader Deloitte Consulting LLP
1. “Save-to-Transform as a catalyst for embracing digital disruption: Deloitte’s second biennial global cost survey,” Deloitte, 2019
Contents
Executive summary 4
About the survey 9
Key global insights 17
Coping with COVID-19: Respond-Recover-Thrive 23
The “Next Normal”— New business conditions after COVID-19 29
Industry sector analysis 35
Save-to-Thrive 39
Conclusion 42
Appendix 47
3
Save-to-Thrive | Enterprise transformation and performance improvement strategies during the COVID-19 pandemicSave-to-Thrive | Enterprise transformation and performance improvement strategies during the COVID-19 pandemic

Expectations for positive revenue growth have declined significantly due to COVID-19. Compared to pre-COVID-19 expectations, the percentage of respondents globally expecting positive revenue growth is down 40 points.
COVID-19 is boosting the focus on cost reduction. Relative to pre-COVID-19 levels, the likelihood of undertaking cost reduction initiatives increased globally by 74% (28 percentage points). Two of three companies globally (66%) now expect to pursue cost reduction over the next 12 months, up from just 38% reported before COVID-19.
Cost structure is considered the top internal challenge. Inability to adjust cost structure to meet demand is the top internal challenge globally and in all regions. Inability to meet employee safeguards, and inability to satisfy increased demand round out the top three.
Inability to rapidly address cost structure to meet demand: 78%
Inability to meet higher measures related to employee safeguards: 74%
Inability to satisfy increased demand or increased sales opportunities: 71%
Lack of liquidity or credit to ensure business continuity: 69%
COVID-19 financial impacts are demand-driven. The top external challenges reported globally are: drop in consumer demand (74%); shift in consumer behavior (67%); cyber security vulnerabilities (65%), and supply chain challenges (65%).
The crisis is driving more companies to pursue aggressive cost reduction targets. Globally, the percentage of respondents pursuing cost reduction targets greater than 10% increased by 61% (25 percentage points) compared to pre-COVID-19 levels. Two of three companies globally (66%) now have cost reduction targets that exceed 10%. Regionally, the percentage of companies with those aggressive targets is highest in LATAM (83%) and lowest in the US (59%).
Executive summaryCoping with COVID-19: Respond-Recover-Thrive
Required actions to address the COVID-19 crisis can be divided into three major stages: respond, recover and thrive. These three stages are interspersed with two additional interim stages (“respond to recover” and “recover to thrive”, and culminate in a long-term operating environment we call the “next normal.”
The global focus for the COVID-19 crisis is shifting from respond to recover. Most companies globally have effectively responded to the immediate crisis and are now starting to focus on recovery. The majority of companies surveyed (59%) now see themselves in the “respond to recover” or “recover” stages.
Revenue growth expectations are very positive in the thrive stage. Expectations for revenue growth, although down from pre-COVID-19 levels, remain somewhat positive in the respond stage (55%) and recover stage (58%). In the thrive stage, the vast majority of companies globally (74%) and in all regions have a positive revenue outlook.
Automation is the top transformation action arising from the COVID-19 crisis. Globally and across all regions, roughly two of three companies expect to pursue automation in all three stages of Respond-Recover-Thrive.
Working through all stages is expected to require about a year and a half. Although the expected durations for each stage vary widely by region, on average respondents globally expect the respond stage to last about three months, the recover stage about six months, and the thrive stage about 10 months.
4 5
Save-to-Thrive | Enterprise transformation and performance improvement strategies during the COVID-19 pandemic Save-to-Thrive | Enterprise transformation and performance improvement strategies during the COVID-19 pandemic
Save-to-Thrive
Save-to-Transform is becoming Save-to-Thrive. The strategic priorities associated with the COVID-19 thrive stage are very consistent with the Save-to-Transform trend we identified in 2019, which uses the strategic levers of cost, growth, talent, technology and digital enablement to transform how companies do business. And as
companies bounce back from the COVID-19 crisis and position themselves to thrive in the next normal, many expect to continue focusing on those same levers—but with an increased and accelerated emphasis on technology and digital enablement, along with a renewed emphasis on growth and talent. We call this evolved mindset “Save-to-Thrive.”
Most companies expect a second wave of COVID-19. The majority of respondents (67%) expect a COVID-19 relapse, with an estimated timeframe of early 2021. Those that follow strategies consistent with Save-to-Thrive will likely be the ones best positioned to weather potential challenges resulting from a second wave.
Decisions that companies make today to cope with the COVID-19 crisis can help or hinder their positioning for the future. By using cost reduction and performance improvement strategically to transform the enterprise and improve competitiveness—which includes investing in key capabilities such as automation and
remote work that align with the new realities of a post-crisis business environment—companies can leverage their cost savings and improvement efforts to not only transform how they operate, but to position themselves to thrive in the next normal.
Industry sector analysis
Expected growth impacts over the next 12 months vary by sector. Revenue expectations over the next 12 months vary widely by sector, with the COVID-19 crisis impacting sectors both negatively and positively. On the negative side of the spectrum, a relatively high percentage of sector respondents expect revenue to decline in Transportation (61%) and Hospitality (60%). On the positive side, revenue growth is expected in Medical Technology (63%), Telecom (58%), Pharmaceuticals (58%), and Software & IT Services (57%).
Different sectors are at different stages of progress. In addressing the challenges of COVID-19, the average rate of progress in all sectors falls somewhere between the respond and recover stages. The median progress in sectors such as Hospitality, Capital Markets, and Medical Technology is skewed towards the respond stage, while sectors such as Insurance (both General and Life/Annuity), Consumer Products, and Banking are generally further along, with progress skewed toward the recover stage.
Revenue outlooks vary significantly by industry. Although the future revenue outlook remains generally positive for all sectors—especially in the thrive stage—expectations vary significantly by sector. In the respond stage, Transportation and Consumer Products have the most negative revenue outlooks, while Medical Technology and Pharmaceuticals have the most positive outlooks. In the recover stage, Transportation and Hospitality have
the most negative revenue outlooks, while Medical Technology and Pharmaceuticals have the most positive outlooks. In the thrive stage, Hospitality, Chemicals & Specialty Materials, and Hardware & Semiconductors have the most negative outlooks, while Medical Technology and Telecom have the most positive outlooks.
The “Next Normal”— New business conditions after COVID-19
When mapping out strategies to respond, recover, and thrive, it helps to have informed insights about the future business environment. In the wake of the 2008 financial crisis, many people called the resulting business environment the “new normal.” However, every new normal eventually gets replaced by a new new normal, so in our view it makes sense to call the post-COVID business environment the next normal.
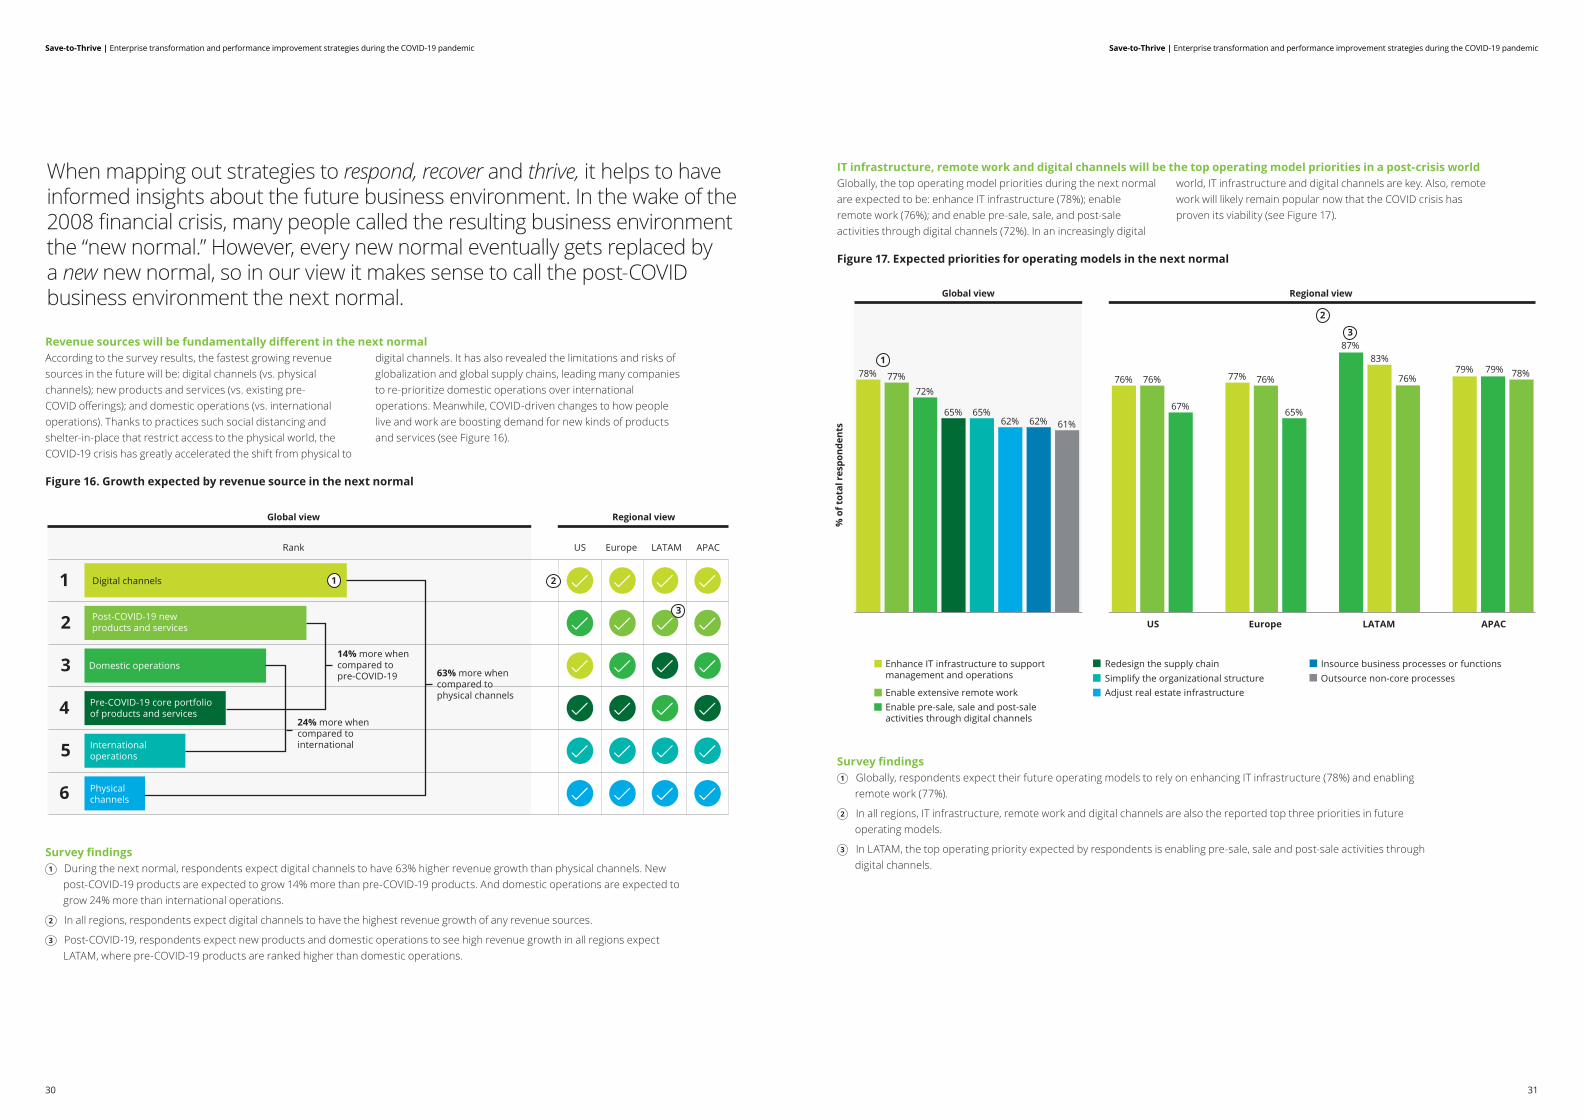
Revenue sources will be fundamentally different in the next normal. Due to practices such social distancing and shelter-in-place that restrict access to the physical world, the COVID-19 crisis has greatly accelerated the shift from physical to digital channels. It has also revealed the limitations and risks of globalization and global supply chains, leading many companies to re-prioritize domestic operations over international operations. Meanwhile, COVID-driven changes to how people live and work are boosting demand for new kinds of products and services. According to the survey results, the fastest growing revenue sources in the future will be: digital channels (vs. physical channels); new products and services (vs. existing pre-COVID offerings); and domestic operations (vs. international operations).
IT infrastructure, remote work and digital channels are expected to be the top operating model priorities. In a post-crisis, increasingly digital world, IT infrastructure and digital channels will be key. Also, remote work will likely remain popular now that the COVID crisis has proven its viability. Globally, the top operating model priorities during the next normal are expected to be: enhance IT infrastructure (78%); enable remote work (76%); and enable pre-sale, sale, and post-sale activities through digital channels (72%).
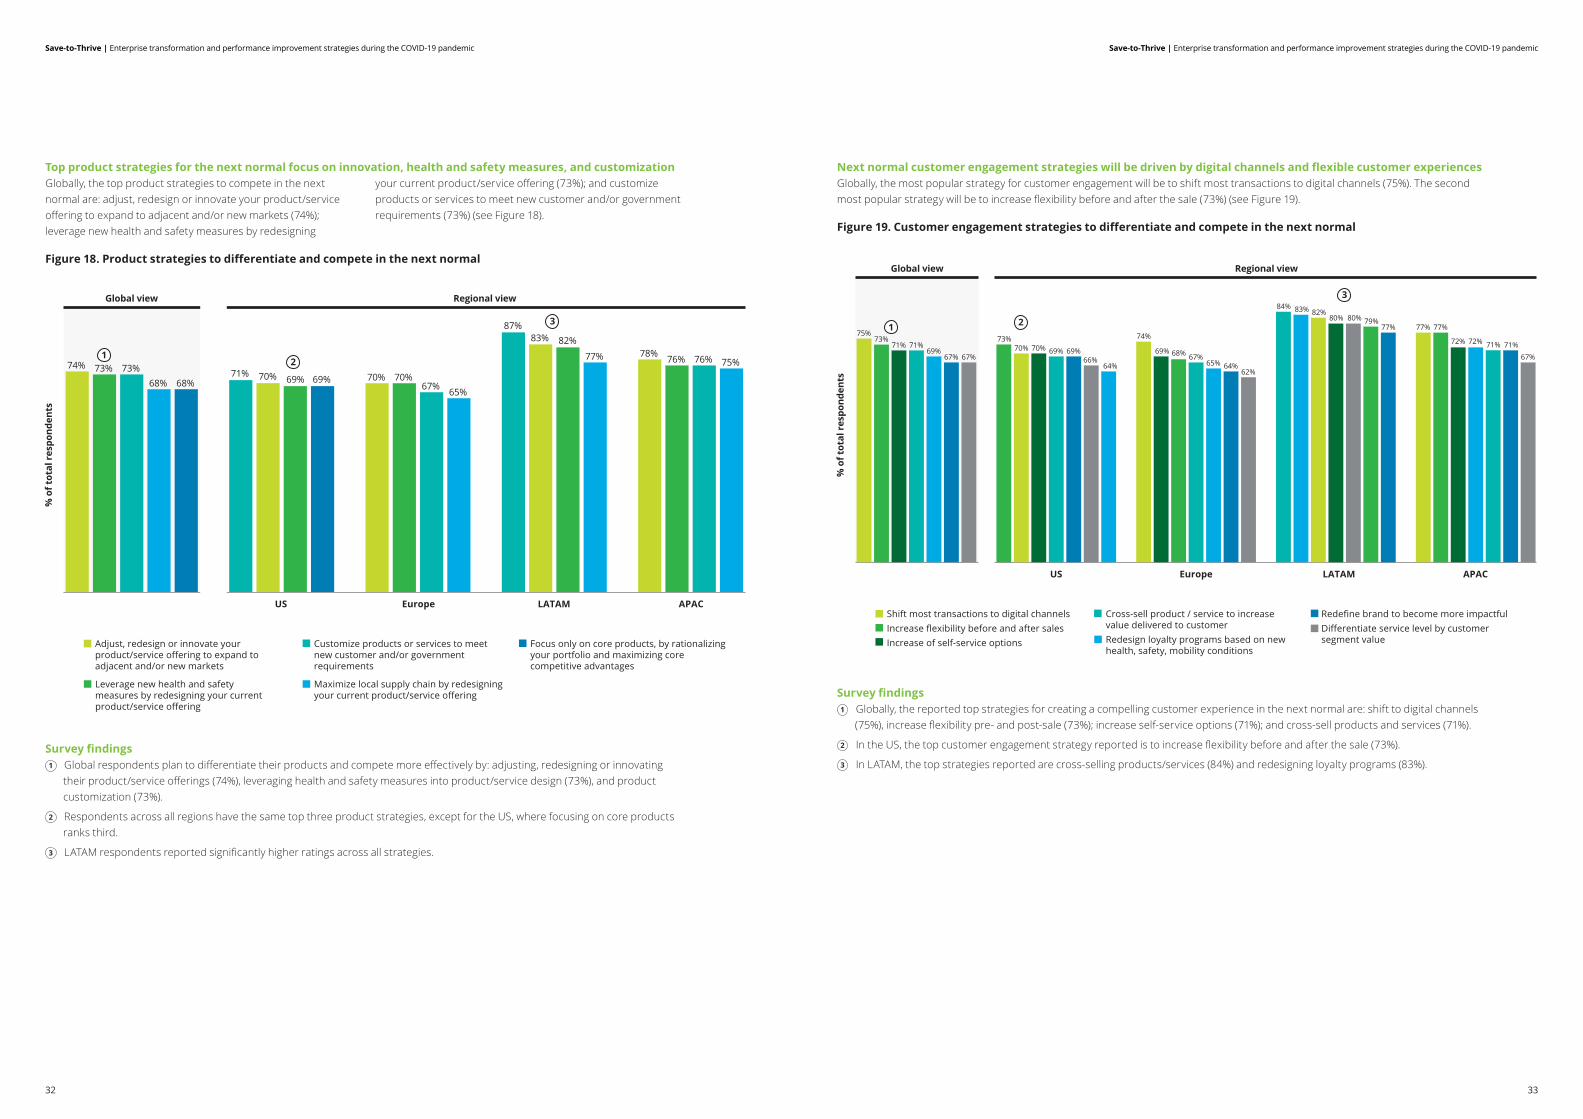
Top product strategies for the next normal focus on innovation, health and safety measures, and customization. Globally, the top product strategies to compete in the next normal are: adjust, redesign or innovate your product/service offering to expand to adjacent and/or new markets (74%); leverage new health and safety measures by redesigning your current product/service offering (73%); and customize products or services to meet new customer and/or government requirements (73%).
Next normal customer engagement strategies will be driven by digital channels and flexible customer experiences. Globally, the most popular strategies for customer engagement will be: shift most transactions to digital channels (75%), and increase flexibility before and after the sale (73%).
Cybersecurity and cloud will be the key technologies. According to the survey, the most relevant technologies in the next normal will be cybersecurity solutions (80%) and cloud computing (80%).
6 7
Save-to-Thrive | Enterprise transformation and performance improvement strategies during the COVID-19 pandemic Save-to-Thrive | Enterprise transformation and performance improvement strategies during the COVID-19 pandemic
About the survey
8 99
Save-to-Thrive | Enterprise transformation and performance improvement strategies during the COVID-19 pandemic Save-to-Thrive | Enterprise transformation and performance improvement strategies during the COVID-19 pandemic
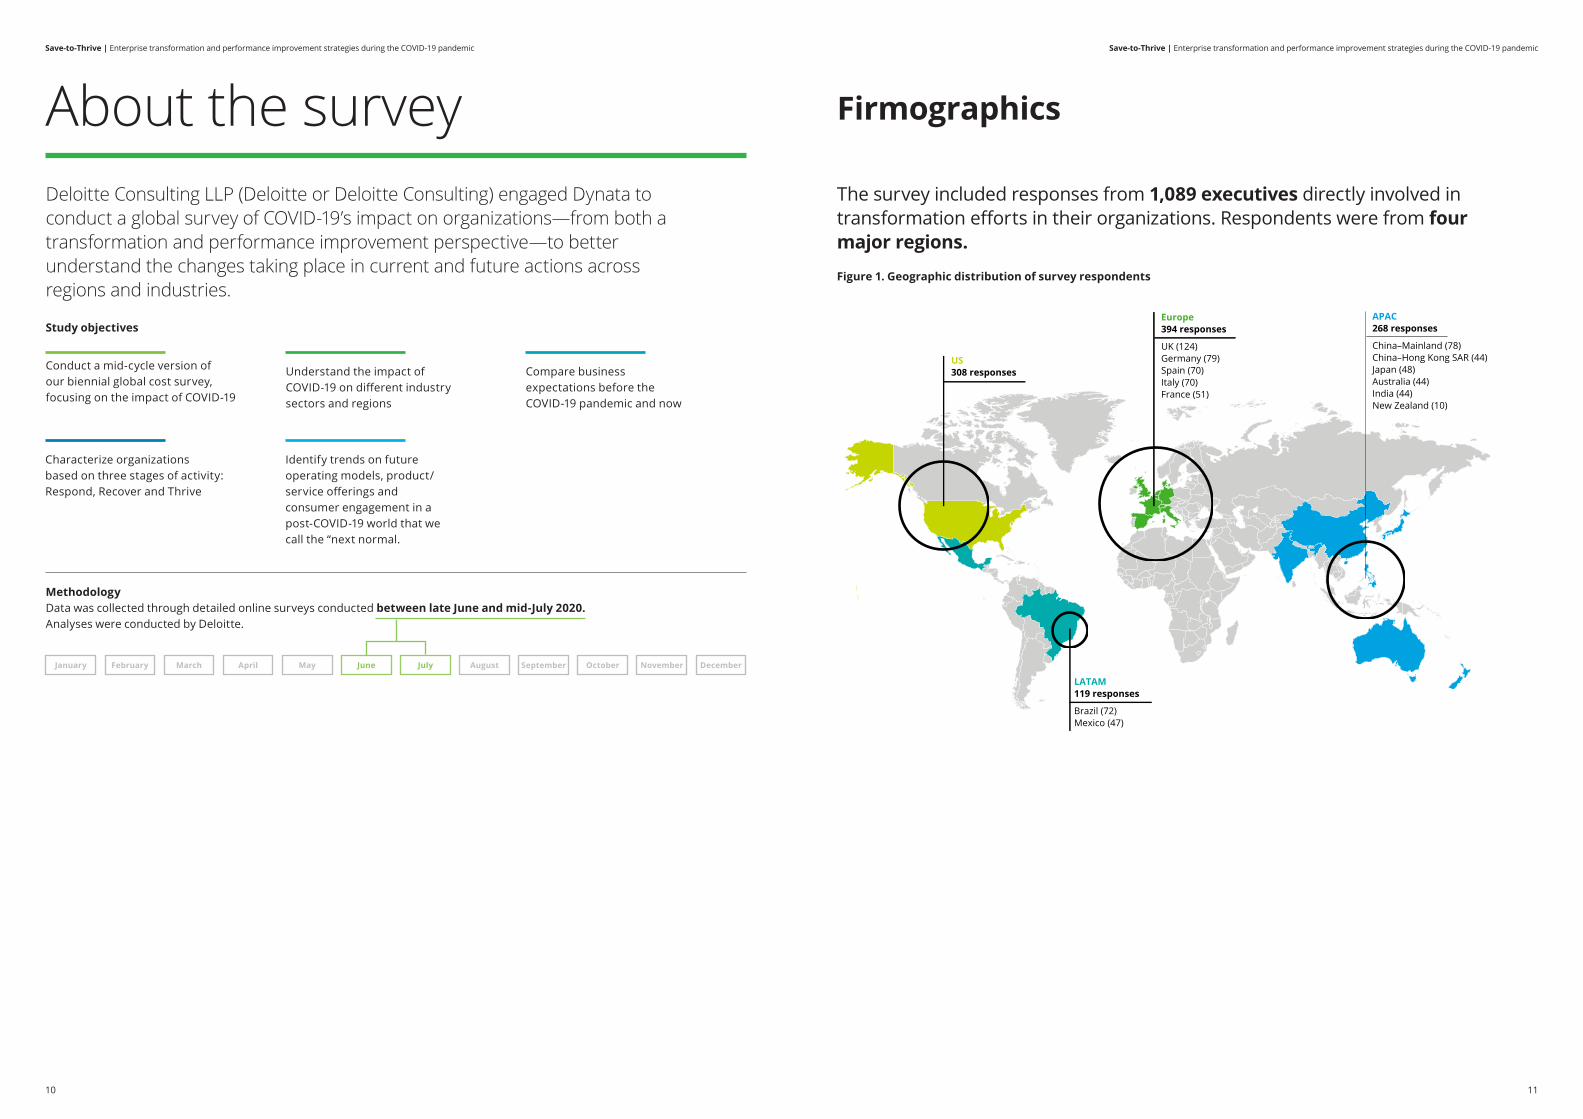
LATAM119 responses
Brazil (72)Mexico (47)
US308 responses
Europe394 responses
UK (124)Germany (79)Spain (70)Italy (70)France (51)
APAC268 responses
China–Mainland (78)China–Hong Kong SAR (44)Japan (48)Australia (44)India (44)New Zealand (10)
Deloitte Consulting LLP (Deloitte or Deloitte Consulting) engaged Dynata to conduct a global survey of COVID-19’s impact on organizations—from both a transformation and performance improvement perspective—to better understand the changes taking place in current and future actions across regions and industries.
Study objectives
Conduct a mid-cycle version of our biennial global cost survey, focusing on the impact of COVID-19
Understand the impact of COVID-19 on different industry sectors and regions
Compare business expectations before the COVID-19 pandemic and now
Characterize organizations based on three stages of activity: Respond, Recover and Thrive
Identify trends on future operating models, product/service offerings and consumer engagement in a post-COVID-19 world that we call the “next normal.
MethodologyData was collected through detailed online surveys conducted between late June and mid-July 2020. Analyses were conducted by Deloitte.
January February March April May June July August September October November December
About the survey Firmographics
The survey included responses from 1,089 executives directly involved in transformation efforts in their organizations. Respondents were from four major regions.
Figure 1. Geographic distribution of survey respondents
10 111010 11
Save-to-Thrive | Enterprise transformation and performance improvement strategies during the COVID-19 pandemic Save-to-Thrive | Enterprise transformation and performance improvement strategies during the COVID-19 pandemic
Source: The World Bank – GDP 2019
Survey sample coverage1
(% of respondents’ economic distribution according to 2019 global GDP)
Survey sample coverage2
(% of respondents’ economic distribution according to 2019 regional GDP)
30%
70%
GDP of countries surveyed GDP of countries not surveyed
APACLATAMEuropeUS
100%
65%
35%
54%
46%
12%
88%
Survey respondents represent 70% of the
world’s economy
Europe: UK, Germany, Spain, Italy, FranceLATAM: Brazil, MexicoAPAC: China–Mainland, Japan, Australia, India, China–Hong Kong SAR, New Zealand
*Source: The World Bank – GDP 2019
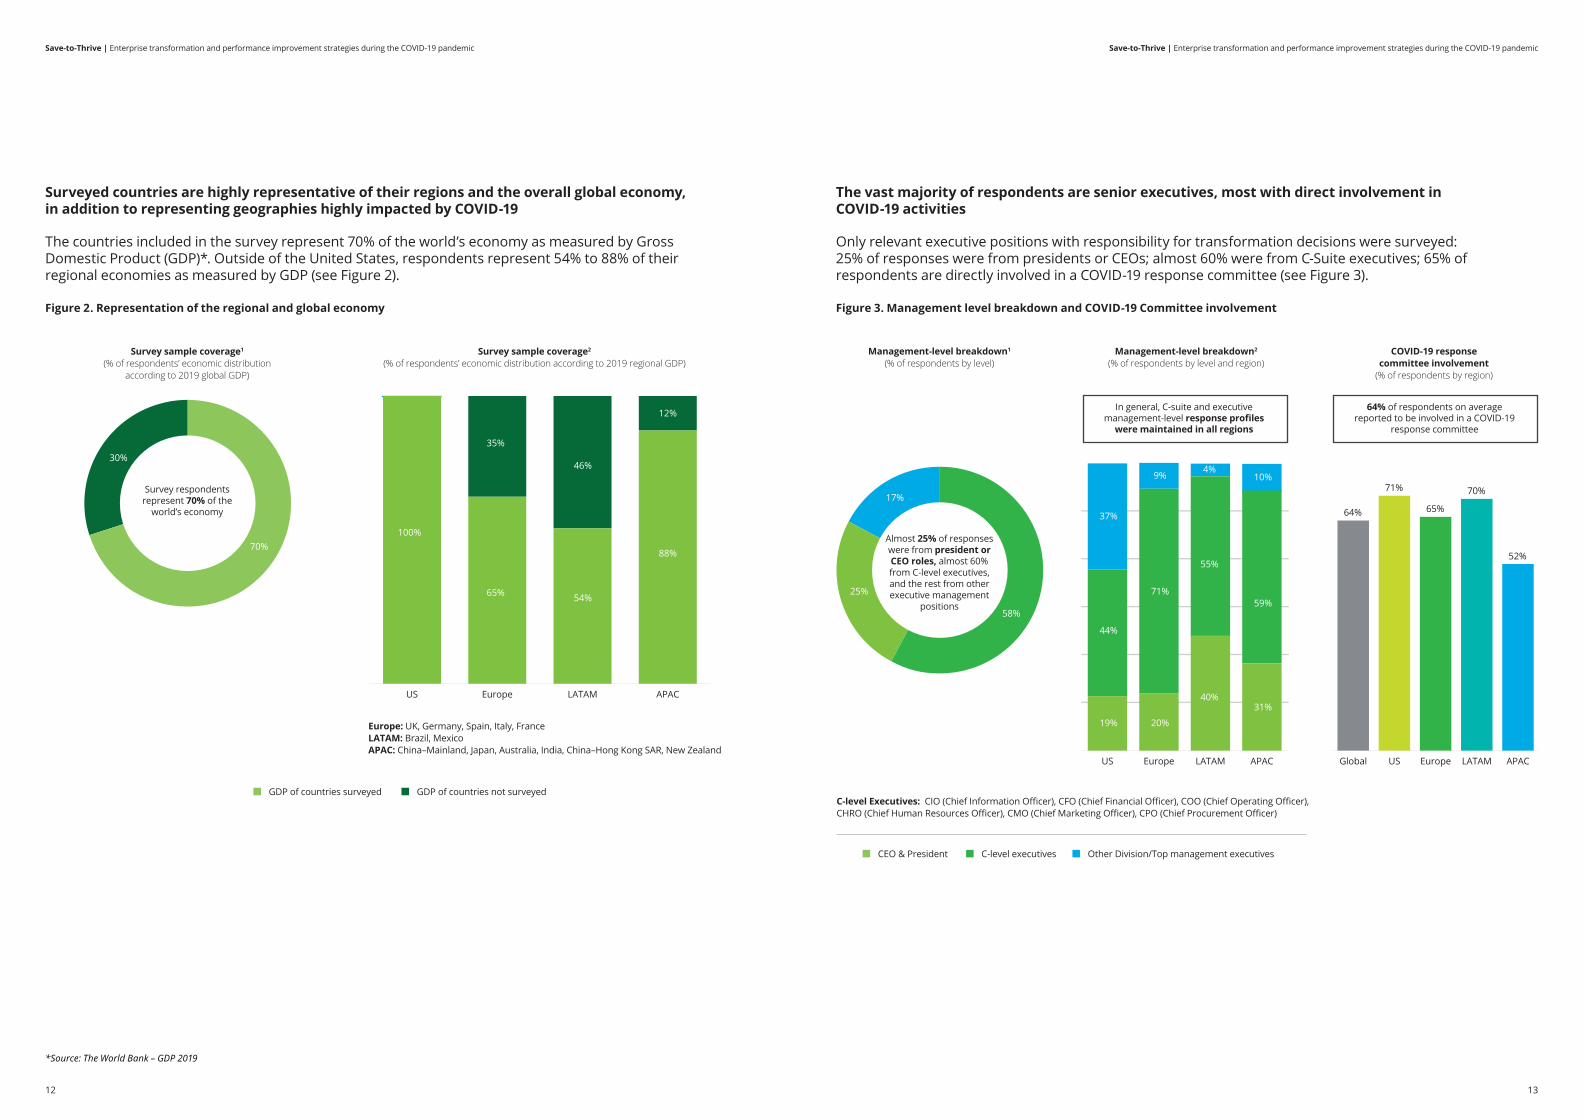
Surveyed countries are highly representative of their regions and the overall global economy, in addition to representing geographies highly impacted by COVID-19
The countries included in the survey represent 70% of the world’s economy as measured by Gross Domestic Product (GDP)*. Outside of the United States, respondents represent 54% to 88% of their regional economies as measured by GDP (see Figure 2).
Figure 2. Representation of the regional and global economy
The vast majority of respondents are senior executives, most with direct involvement in COVID-19 activities
Only relevant executive positions with responsibility for transformation decisions were surveyed: 25% of responses were from presidents or CEOs; almost 60% were from C-Suite executives; 65% of respondents are directly involved in a COVID-19 response committee (see Figure 3).
Figure 3. Management level breakdown and COVID-19 Committee involvement
Management-level breakdown1
(% of respondents by level)
Management-level breakdown2
(% of respondents by level and region) COVID-19 response
committee involvement(% of respondents by region)
CEO & President C-level executives Other Division/Top management executives
17%
25%
58%
Almost 25% of responses were from president or CEO roles, almost 60% from C-level executives, and the rest from other executive management
positions
C-level Executives: CIO (Chief Information Officer), CFO (Chief Financial Officer), COO (Chief Operating Officer), CHRO (Chief Human Resources Officer), CMO (Chief Marketing Officer), CPO (Chief Procurement Officer)
APACLATAMEuropeUS
37%
44%
19% 20%
9%
71%
10%
59%
31%40%
55%
4%
APACLATAMEuropeUSGlobal
64%
71%
52%
70%
65%
In general, C-suite and executive management-level response profiles
were maintained in all regions
64% of respondents on average reported to be involved in a COVID-19
response committee
12 1312 13
Save-to-Thrive | Enterprise transformation and performance improvement strategies during the COVID-19 pandemic Save-to-Thrive | Enterprise transformation and performance improvement strategies during the COVID-19 pandemic
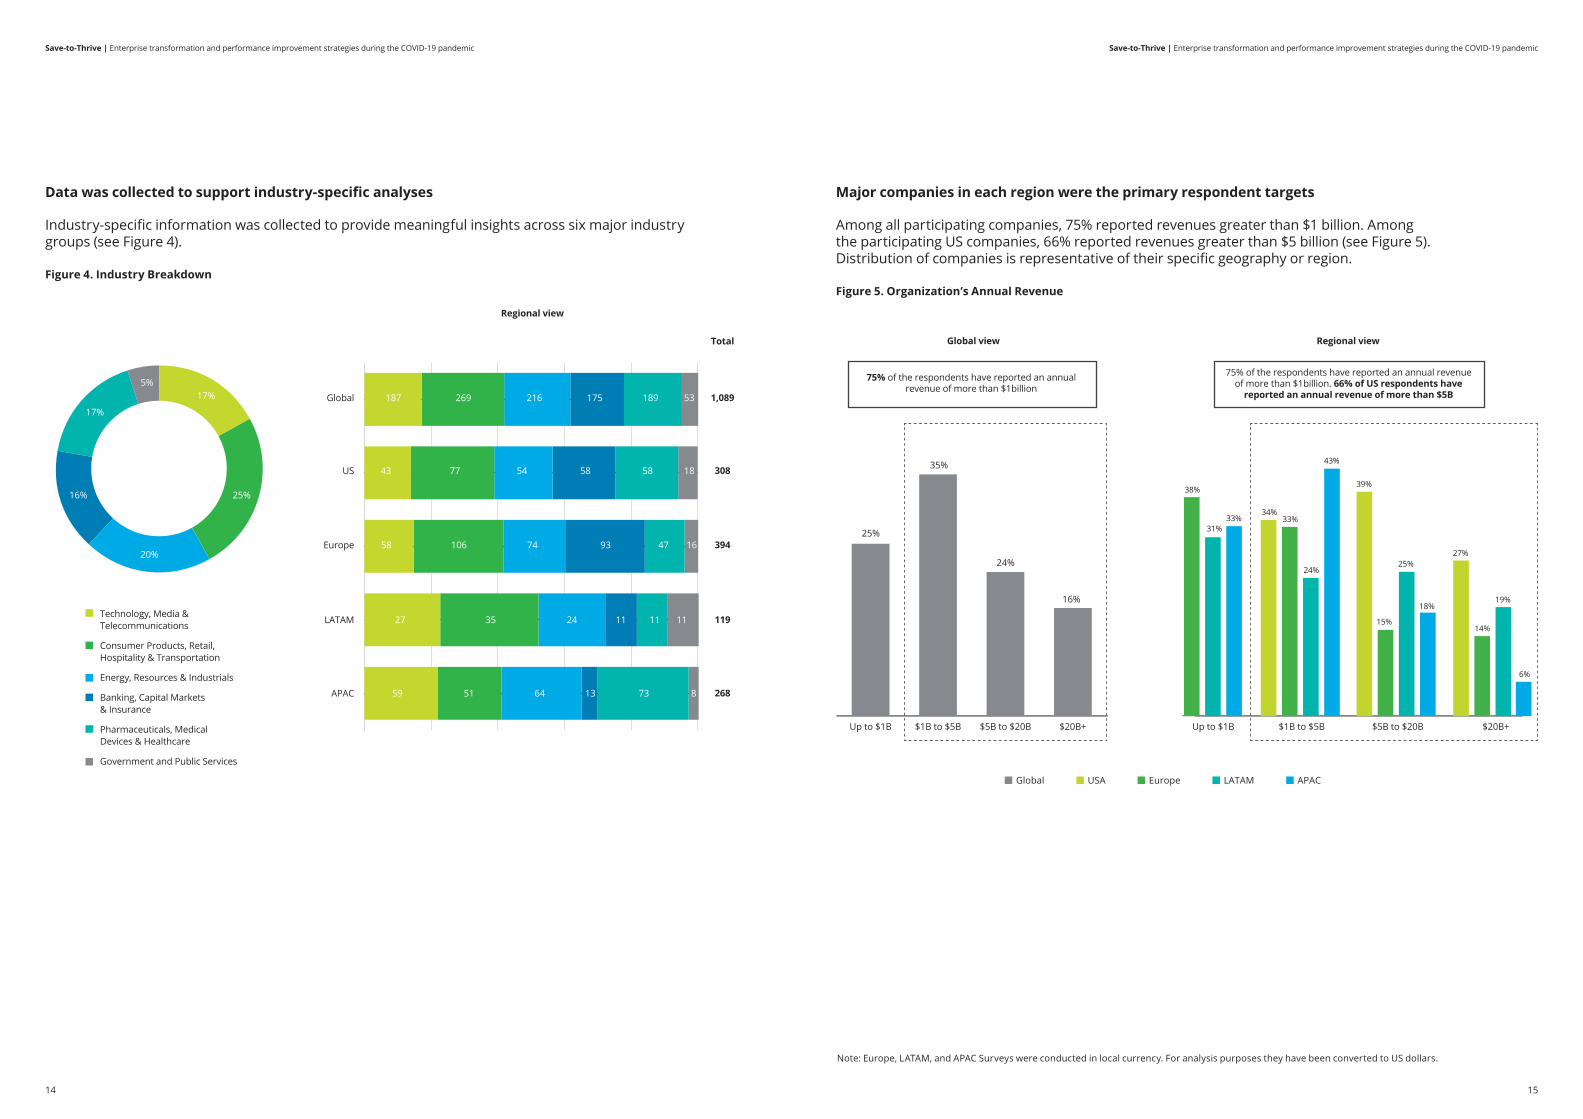
Major companies in each region were the primary respondent targets
Among all participating companies, 75% reported revenues greater than $1 billion. Among the participating US companies, 66% reported revenues greater than $5 billion (see Figure 5). Distribution of companies is representative of their specific geography or region.
Figure 5. Organization’s Annual Revenue
Note: Europe, LATAM, and APAC Surveys were conducted in local currency. For analysis purposes they have been converted to US dollars.
Global view Regional view
$20B+$5B to $20B$1B to $5BUp to $1B
25%
35%
24%
16%
$20B+$5B to $20B$1B to $5BUp to $1B
38%
31%33%
34%
24%
43%
39%
25%
19%
6%
14%15%
18%
27%
33%
75% of the respondents have reported an annual revenue of more than $1billion
75% of the respondents have reported an annual revenue of more than $1billion. 66% of US respondents have
reported an annual revenue of more than $5B
LATAM APACGlobal USA Europe
Data was collected to support industry-specific analyses
Industry-specific information was collected to provide meaningful insights across six major industry groups (see Figure 4).
Figure 4. Industry Breakdown
17%
16%
5%
17%
20%
25%
Technology, Media & Telecommunications
Consumer Products, Retail, Hospitality & Transportation
Energy, Resources & Industrials
Banking, Capital Markets& Insurance
Pharmaceuticals, Medical Devices & Healthcare
Government and Public Services
Regional view
Total
1,089
394
119
268APAC
LATAM
Europe
Global 187
58 106
27
59 6451 73 813
35 24 11 11 11
74 93 47 16
58
216269 189175 53
308US 43 77 5854 18
14 1514 15
Save-to-Thrive | Enterprise transformation and performance improvement strategies during the COVID-19 pandemic Save-to-Thrive | Enterprise transformation and performance improvement strategies during the COVID-19 pandemic
Key global insights
16 17
Save-to-Thrive | Enterprise transformation and performance improvement strategies during the COVID-19 pandemic Save-to-Thrive | Enterprise transformation and performance improvement strategies during the COVID-19 pandemic
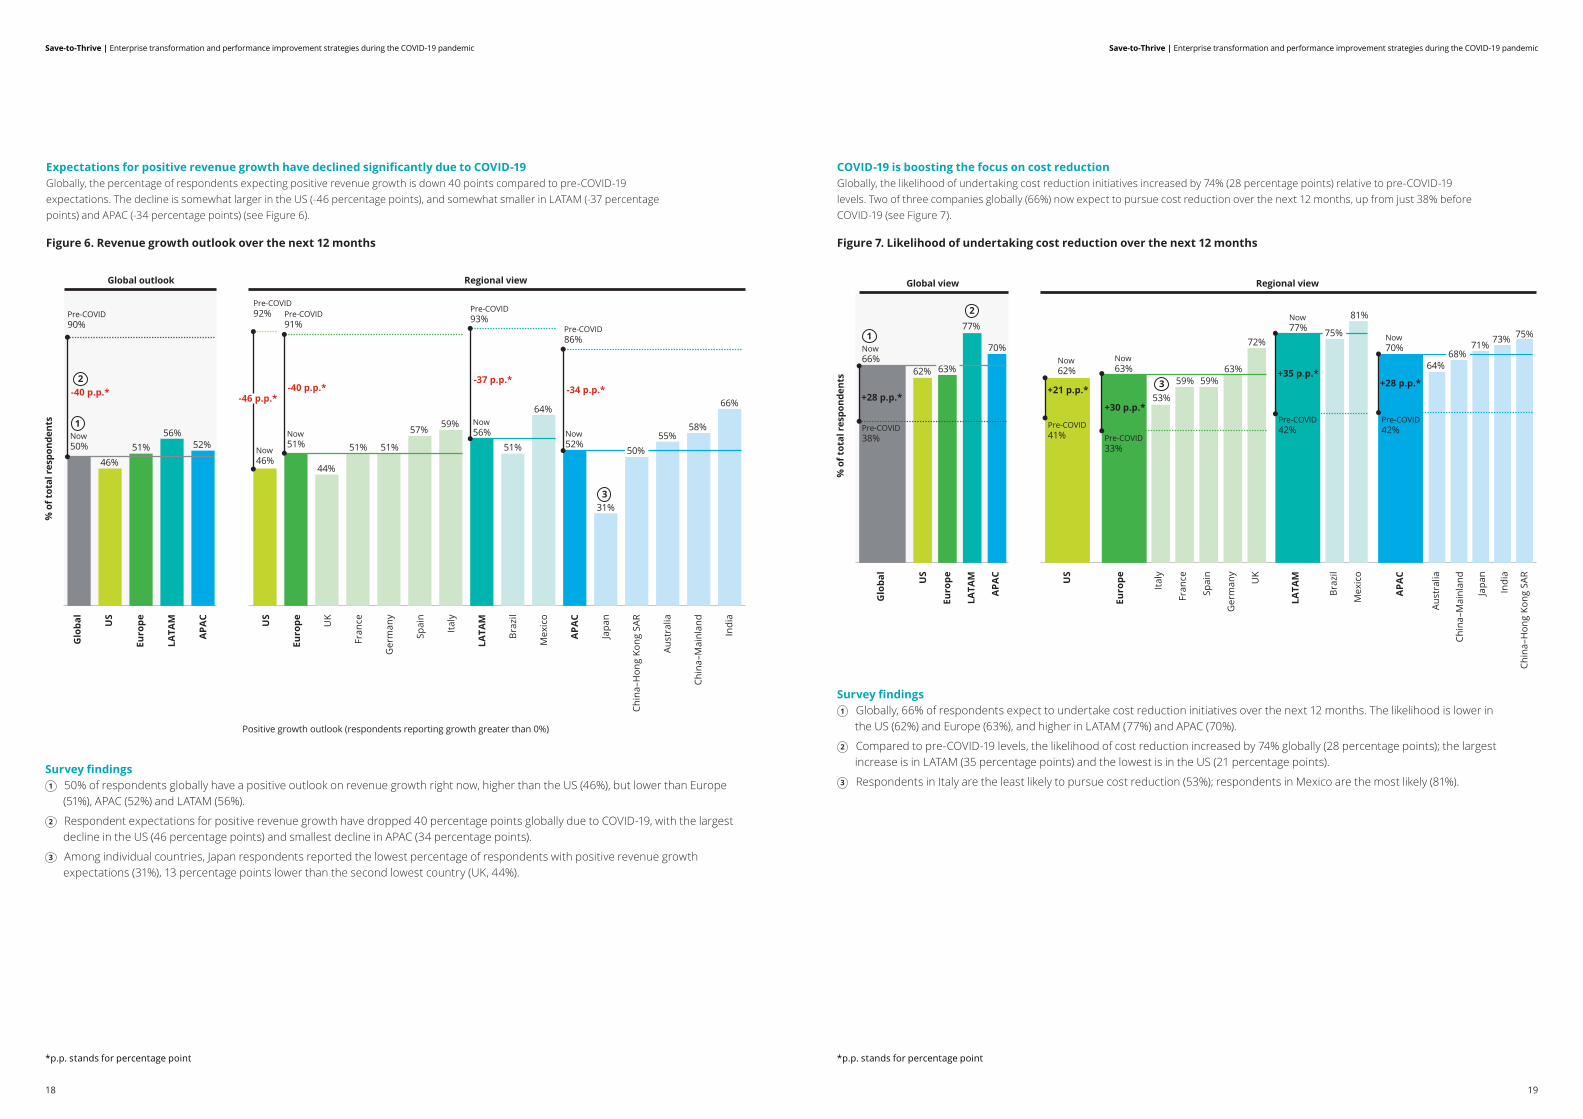
Survey findings1 50% of respondents globally have a positive outlook on revenue growth right now, higher than the US (46%), but lower than Europe
(51%), APAC (52%) and LATAM (56%).
2 Respondent expectations for positive revenue growth have dropped 40 percentage points globally due to COVID-19, with the largest decline in the US (46 percentage points) and smallest decline in APAC (34 percentage points).
3 Among individual countries, Japan respondents reported the lowest percentage of respondents with positive revenue growth expectations (31%), 13 percentage points lower than the second lowest country (UK, 44%).
Expectations for positive revenue growth have declined significantly due to COVID-19Globally, the percentage of respondents expecting positive revenue growth is down 40 points compared to pre-COVID-19 expectations. The decline is somewhat larger in the US (-46 percentage points), and somewhat smaller in LATAM (-37 percentage points) and APAC (-34 percentage points) (see Figure 6).
Figure 6. Revenue growth outlook over the next 12 months
% o
f tot
al r
espo
nden
ts
Positive growth outlook (respondents reporting growth greater than 0%)
Global outlook Regional view
Glo
bal
US
Euro
pe
LATA
M
APA
C US
Euro
pe UK
Fran
ce
Ger
man
y
Spai
n
Italy
LATA
M
Braz
il
Mex
ico
APA
C
Japa
n
Chin
a–H
ong
Kong
SAR
Aust
ralia
Chin
a–M
ainl
and
Indi
a
Pre-COVID90%
Pre-COVID92%
Now46%
Pre-COVID91%
Now51%
Pre-COVID93%
Now56% Now
52%Now50%
46%51%
56%52%
44%
51% 51% 51%
64%
31%
55%
66%
50%
59%57% 58%
Pre-COVID86%
-40 p.p.* -46 p.p.*-40 p.p.*
-37 p.p.*-34 p.p.*
1
2
3
Survey findings1 Globally, 66% of respondents expect to undertake cost reduction initiatives over the next 12 months. The likelihood is lower in
the US (62%) and Europe (63%), and higher in LATAM (77%) and APAC (70%).
2 Compared to pre-COVID-19 levels, the likelihood of cost reduction increased by 74% globally (28 percentage points); the largest increase is in LATAM (35 percentage points) and the lowest is in the US (21 percentage points).
3 Respondents in Italy are the least likely to pursue cost reduction (53%); respondents in Mexico are the most likely (81%).
COVID-19 is boosting the focus on cost reductionGlobally, the likelihood of undertaking cost reduction initiatives increased by 74% (28 percentage points) relative to pre-COVID-19 levels. Two of three companies globally (66%) now expect to pursue cost reduction over the next 12 months, up from just 38% before COVID-19 (see Figure 7).
Figure 7. Likelihood of undertaking cost reduction over the next 12 months
% o
f tot
al r
espo
nden
ts
Global view Regional view
Glo
bal
US
Euro
pe
LATA
M
APA
C US
Euro
pe
Italy
Fran
ce
Spai
n
Ger
man
y
UK
LATA
M
Braz
il
Mex
ico
APA
C
Aust
ralia
Chin
a–M
ainl
and
Japa
n
Indi
a
Chin
a–H
ong
Kong
SAR
Pre-COVID38%
Now62%
Pre-COVID33%
Pre-COVID41%
Now63%
Pre-COVID42%
Pre-COVID42%
Now70%Now
66%70%
53%
81%
64%
71%75%
68%
75%
59% 59%
72%
63%
77%
63%62%
73%
Now77%
+28 p.p.* +21 p.p.*
+30 p.p.*
+35 p.p.*+28 p.p.*
1
2
3
*p.p. stands for percentage point*p.p. stands for percentage point
18 19
Save-to-Thrive | Enterprise transformation and performance improvement strategies during the COVID-19 pandemic Save-to-Thrive | Enterprise transformation and performance improvement strategies during the COVID-19 pandemic
Survey findings1 Globally, 66% of respondents have cost reduction target above 10%, with the US (59%) and Europe (63%) below the global
average, and LATAM (83%) and APAC (70%) above it.
2 Compared to pre-COVID-19 levels, the percentage of companies globally with cost reduction targets above 10% increased by 61% (25 percentage points), with a largest increase in LATAM (36 percentage points) and the smallest in APAC and the US (23 percentage points)
3 Japan (56%) has the smallest percentage of respondents pursuing cost reduction targets greater than 10%; Mexico (85%) has the largest.
The crisis is prompting many more companies to pursue aggressive cost reduction targetsGlobally, the percentage of respondents pursuing cost reduction targets greater than 10% increased by 61% (25 percentage points) compared to pre-COVID-19 levels. Two of three companies globally
(66%) now have cost reduction targets that exceed 10%. Regionally, the percentage of companies with those aggressive targets is highest in LATAM (83%) and lowest in the US (59%) (see Figure 8).
Figure 8. Respondents reporting annual cost reduction targets greater than 10%
% o
f tot
al r
espo
nden
ts
Global view Regional view
Glo
bal
US
Euro
pe
LATA
M
APA
C US
Euro
pe
Italy
Fran
ce
Spai
n
Ger
man
y
UK
LATA
M
Braz
il
Mex
ico
APA
C
Japa
n
Chin
a–M
ainl
and
Aust
ralia
Chin
a–H
ong
Kong
SAR
Indi
a
Pre-COVID41%
Now59%
Pre-COVID38%Pre-COVID
36%
Now63%
Pre-COVID47%
Pre-COVID47%
Now70%Now
66%70%
85%
56%
73%
82%
64%
82%
59%59%63%
69%
63%
83%
63%59%
80%
Now83%
+25 p.p.*+23 p.p.*
+25 p.p.*
+36 p.p.*
+23 p.p.*
1
2
3
% o
f tot
al r
espo
nden
ts
Global view Regional view
US Europe LATAM APAC
74%
67%65% 65%
60%
48% 48%
75%70%
67%72% 70% 70%
84%
71% 70% 70% 69%
62%
1
2 23
Drop in consumer demandShift in consumer behavior Lack of liquidity and/or credit
availabilityCyber security vulnerabilities
Supply Chain and distribution challenges
Speed of Digital Transformation
Increased regulatory requirements to reopen business activity
Survey findings1 Drop in consumer demand is the top external challenge reported globally (74%) and in all regions: US (75%), Europe (72%), LATAM
(84%) and APAC (70%).
2 US and APAC respondents reported supply chain and distribution challenges among their top three external challenges.
3 LATAM was the only region to cite lack of liquidity and/or credit availability as a top three external challenge.
COVID-19 financial impacts are demand-drivenThe top external challenge reported globally is a drop in consumer demand (74%), followed by a related shift in consumer behavior (67%). Cyber security vulnerabilities (65%) and
supply chain challenges (65%) round out the top four external challenges. In the US and APAC, supply chain and distribution challenges rank among the top three (see Figure 9).
Figure 9. External challenges currently faced by organizations due to COVID-19 impacts
*p.p. stands for percentage point
20 21
Save-to-Thrive | Enterprise transformation and performance improvement strategies during the COVID-19 pandemic Save-to-Thrive | Enterprise transformation and performance improvement strategies during the COVID-19 pandemic
% o
f tot
al r
espo
nden
ts
Global view Regional view
US Europe LATAM APAC
78%74%
71% 69%
55%
46%
78%75%
63% 63%
78%73% 73% 71%
79%74% 74% 73%
76% 76% 74% 72%
1
2
3
Inability to rapidly adjust cost structure to meet demand
Inability to meet higher measures related to employee safeguards
Inability to satisfy increased demand or increased sales opportunities
Lack of liquidity or credit to ensure business continuity
Inability to enable digital infrastructure to meet new external business conditions and scale
Challenges with technology infrastructure to meet new internal business conditions
Survey findings1 Adjusting cost structure to meet demand was reported as the top internal challenge globally (78%) and in all regions.
2 Adjusting cost structure, meeting employee safeguards, and satisfying increased demand are the top three internal challenges reported in all regions except Europe.
3 Lack of liquidity or credit (73%) is a top three concern reported only in Europe.
Cost structure is considered the top internal challengeInability to adjust cost structure to meet demand is the top internal challenge globally and in all regions. Inability to meet employee safeguards, and inability to satisfy increased demand round out the top three internal challenges globally (see Figure 10).
Figure 10. Internal challenges currently faced by organizations due to COVID-19 impacts
Coping with COVID-19: Respond, Recover and Thrive
22 23
Save-to-Thrive | Enterprise transformation and performance improvement strategies during the COVID-19 pandemic Save-to-Thrive | Enterprise transformation and performance improvement strategies during the COVID-19 pandemic
1RespondCurrently taking actions to immediately respond to the COVID-19 crisis and ensure business continuity
2
Between respond and recoverNear completion of immediate response actions and starting to take actions towards stabilizing operations under COVID-19 conditions
RecoverCurrently taking actions to stabilize operations under COVID-19 conditions
Between recover and thriveNear completion of Stabilization actions and starting to take structural actions to operate in the “Next Normal“
3ThriveCurrently taking structural actions as result of a defined strategy to operate and compete in the “Next Normal”
“Next Normal”The new business conditions established, after the Thrive stage, as a result of the societal, commercial and technological changes caused by public and private reactions to COVID-19
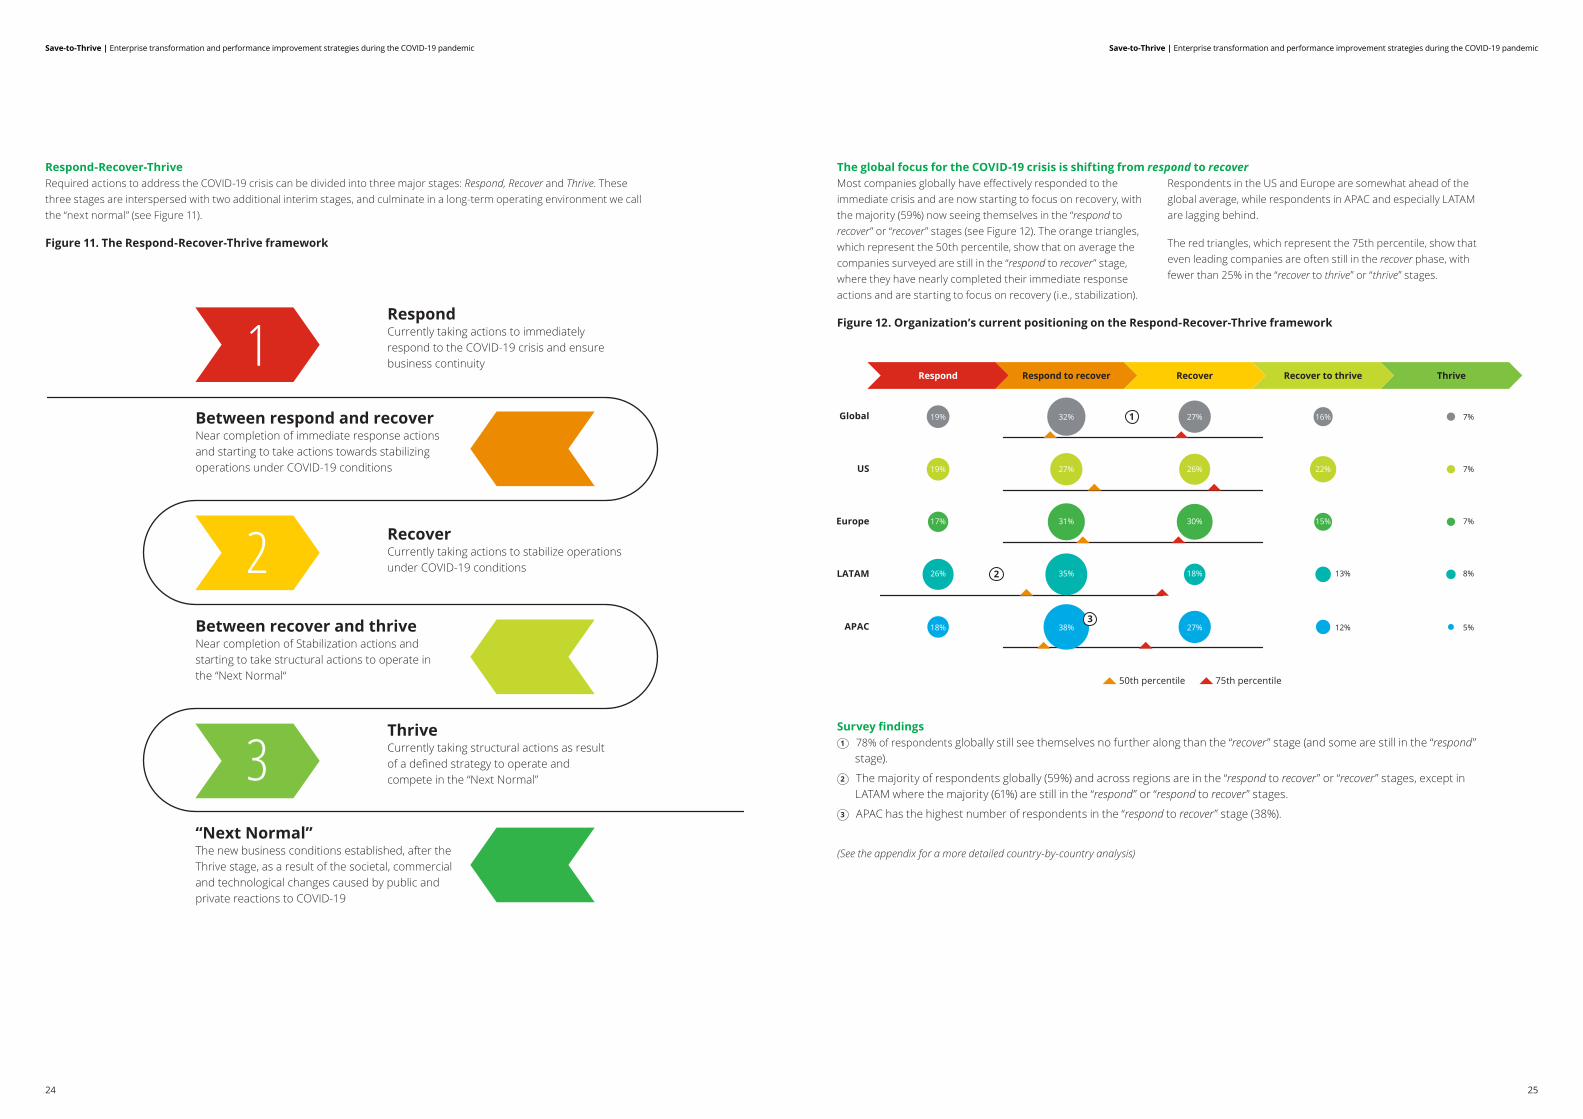
Respond-Recover-ThriveRequired actions to address the COVID-19 crisis can be divided into three major stages: Respond, Recover and Thrive. These three stages are interspersed with two additional interim stages, and culminate in a long-term operating environment we call the “next normal” (see Figure 11).
Figure 11. The Respond-Recover-Thrive framework
Survey findings1 78% of respondents globally still see themselves no further along than the “recover” stage (and some are still in the “respond”
stage).
2 The majority of respondents globally (59%) and across regions are in the “respond to recover” or “recover” stages, except in LATAM where the majority (61%) are still in the “respond” or “respond to recover” stages.
3 APAC has the highest number of respondents in the “respond to recover” stage (38%).
(See the appendix for a more detailed country-by-country analysis)
The global focus for the COVID-19 crisis is shifting from respond to recoverMost companies globally have effectively responded to the immediate crisis and are now starting to focus on recovery, with the majority (59%) now seeing themselves in the “respond to recover” or “recover” stages (see Figure 12). The orange triangles, which represent the 50th percentile, show that on average the companies surveyed are still in the “respond to recover” stage, where they have nearly completed their immediate response actions and are starting to focus on recovery (i.e., stabilization).
Respondents in the US and Europe are somewhat ahead of the global average, while respondents in APAC and especially LATAM are lagging behind.
The red triangles, which represent the 75th percentile, show that even leading companies are often still in the recover phase, with fewer than 25% in the “recover to thrive” or “thrive” stages.
Figure 12. Organization’s current positioning on the Respond-Recover-Thrive framework
Respond to recover Recover Recover to thrive ThriveRespond
Global
Europe
US
LATAM
APAC
1
2
50th percentile 75th percentile
19% 32% 27% 7%16%
19% 27% 26% 7%22%
17% 31% 30% 7%15%
26% 35% 18% 8%13%
18% 38% 27% 5%12%3
24 25
Save-to-Thrive | Enterprise transformation and performance improvement strategies during the COVID-19 pandemic Save-to-Thrive | Enterprise transformation and performance improvement strategies during the COVID-19 pandemic
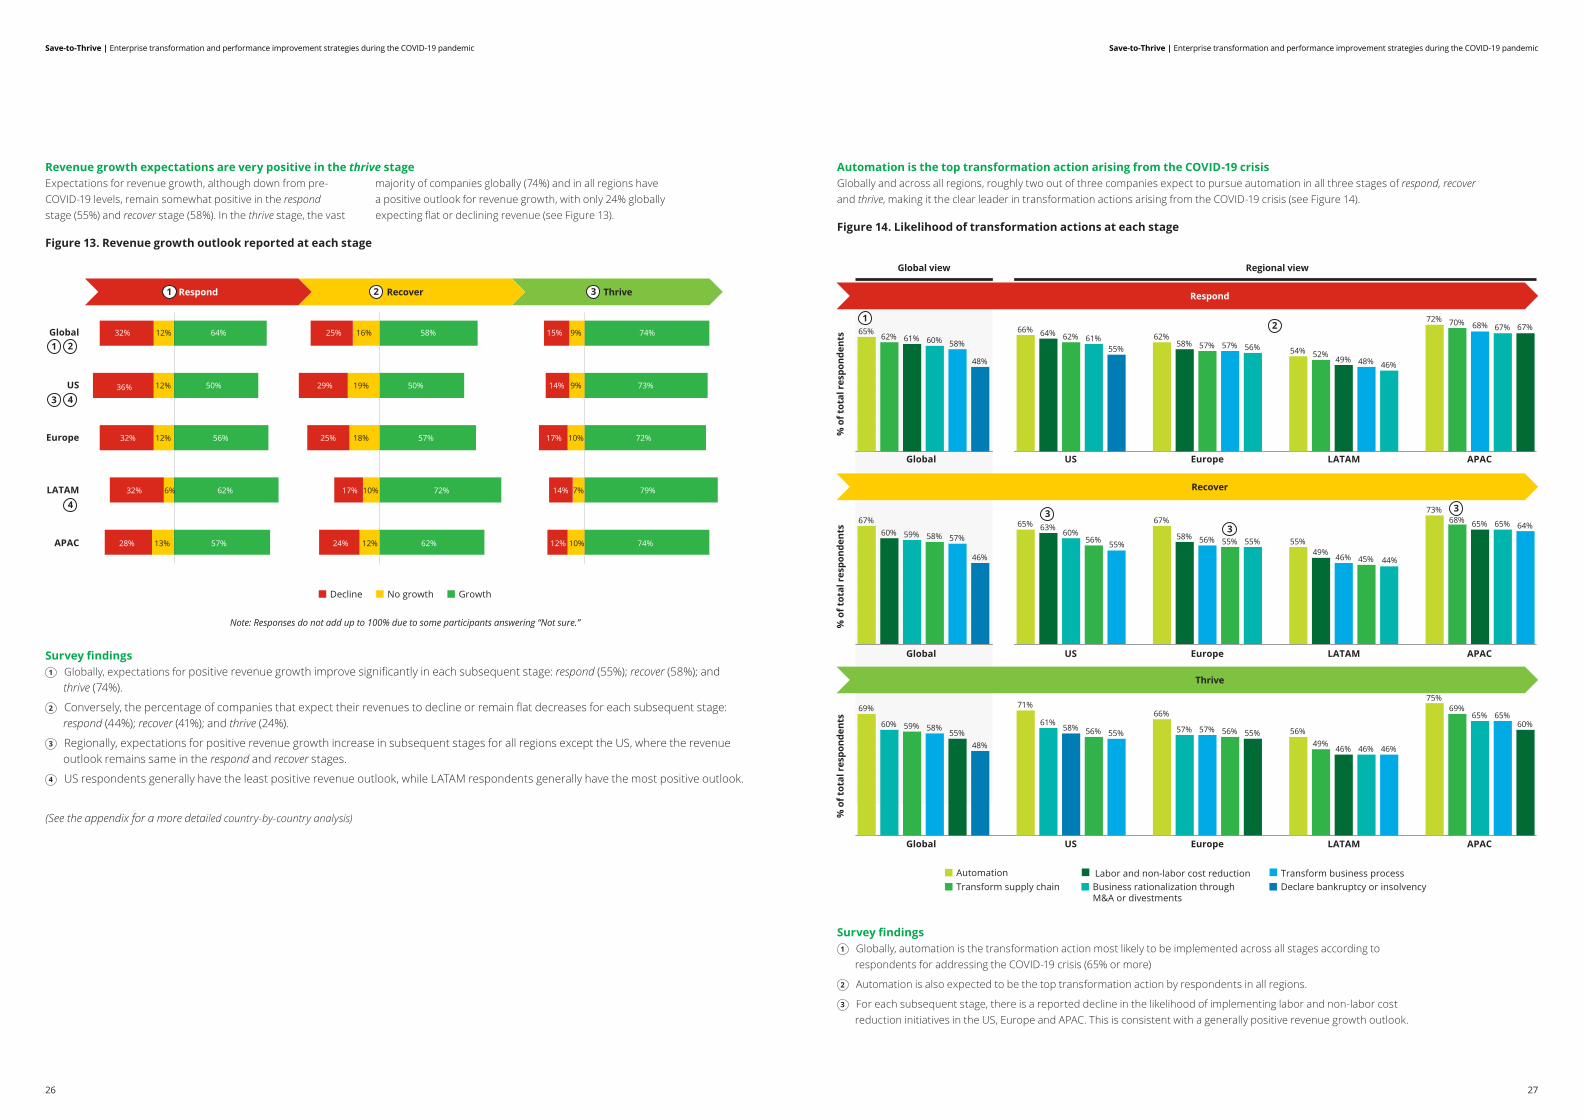
Survey findings1 Globally, expectations for positive revenue growth improve significantly in each subsequent stage: respond (55%); recover (58%); and
thrive (74%).
2 Conversely, the percentage of companies that expect their revenues to decline or remain flat decreases for each subsequent stage: respond (44%); recover (41%); and thrive (24%).
3 Regionally, expectations for positive revenue growth increase in subsequent stages for all regions except the US, where the revenue outlook remains same in the respond and recover stages.
4 US respondents generally have the least positive revenue outlook, while LATAM respondents generally have the most positive outlook.
(See the appendix for a more detailed country-by-country analysis)
Revenue growth expectations are very positive in the thrive stageExpectations for revenue growth, although down from pre-COVID-19 levels, remain somewhat positive in the respond stage (55%) and recover stage (58%). In the thrive stage, the vast
majority of companies globally (74%) and in all regions have a positive outlook for revenue growth, with only 24% globally expecting flat or declining revenue (see Figure 13).
Figure 13. Revenue growth outlook reported at each stage
Recover
Note: Responses do not add up to 100% due to some participants answering “Not sure.”
ThriveRespond
Global
Europe
US
LATAM
APAC
1
1
2
2
3 4
4
3
Decline No growth Growth
12%32% 64%
12%36% 50%
12%32% 56%
6%32% 62%
13%28% 57%
16%25% 58%
19%29% 50%
18%25% 57%
10%17% 72%
12%24% 62%
9%15% 74%
9%14% 73%
10%17% 72%
7%14% 79%
10%12% 74%
Survey findings1 Globally, automation is the transformation action most likely to be implemented across all stages according to
respondents for addressing the COVID-19 crisis (65% or more)
2 Automation is also expected to be the top transformation action by respondents in all regions.
3 For each subsequent stage, there is a reported decline in the likelihood of implementing labor and non-labor cost reduction initiatives in the US, Europe and APAC. This is consistent with a generally positive revenue growth outlook.
Automation is the top transformation action arising from the COVID-19 crisisGlobally and across all regions, roughly two out of three companies expect to pursue automation in all three stages of respond, recover and thrive, making it the clear leader in transformation actions arising from the COVID-19 crisis (see Figure 14).
Figure 14. Likelihood of transformation actions at each stage
% o
f tot
al r
espo
nden
ts
Global view Regional view
US Europe LATAM APAC
US Europe LATAM APAC
USGlobal
Global
Global
Europe LATAM APAC
% o
f tot
al r
espo
nden
ts%
of t
otal
res
pond
ents
55%62%
57% 56%52%
46%
70% 67%67%
48%
72%68%
54%49%
58% 57%61%62%64%66%
58%
48%
60%61%62%65%
55%
67%
56% 55%49%
44%
68%64%65%
45%
73%
65%
55%
46%
58% 55%56%60%
63%65%
57%
46%
58%59%60%67%
55%
66%
57% 55%49%
46%
69%
60%65%
46%
65%
56%
46%
57% 56%56%58%61%
71%
55%48%
58%59%60%
69%
Respond
Recover
Thrive
AutomationTransform supply chain Business rationalization through
M&A or divestments
Labor and non-labor cost reductionDeclare bankruptcy or insolvencyTransform business process
75%
33 3
12
26 27
Save-to-Thrive | Enterprise transformation and performance improvement strategies during the COVID-19 pandemic Save-to-Thrive | Enterprise transformation and performance improvement strategies during the COVID-19 pandemic
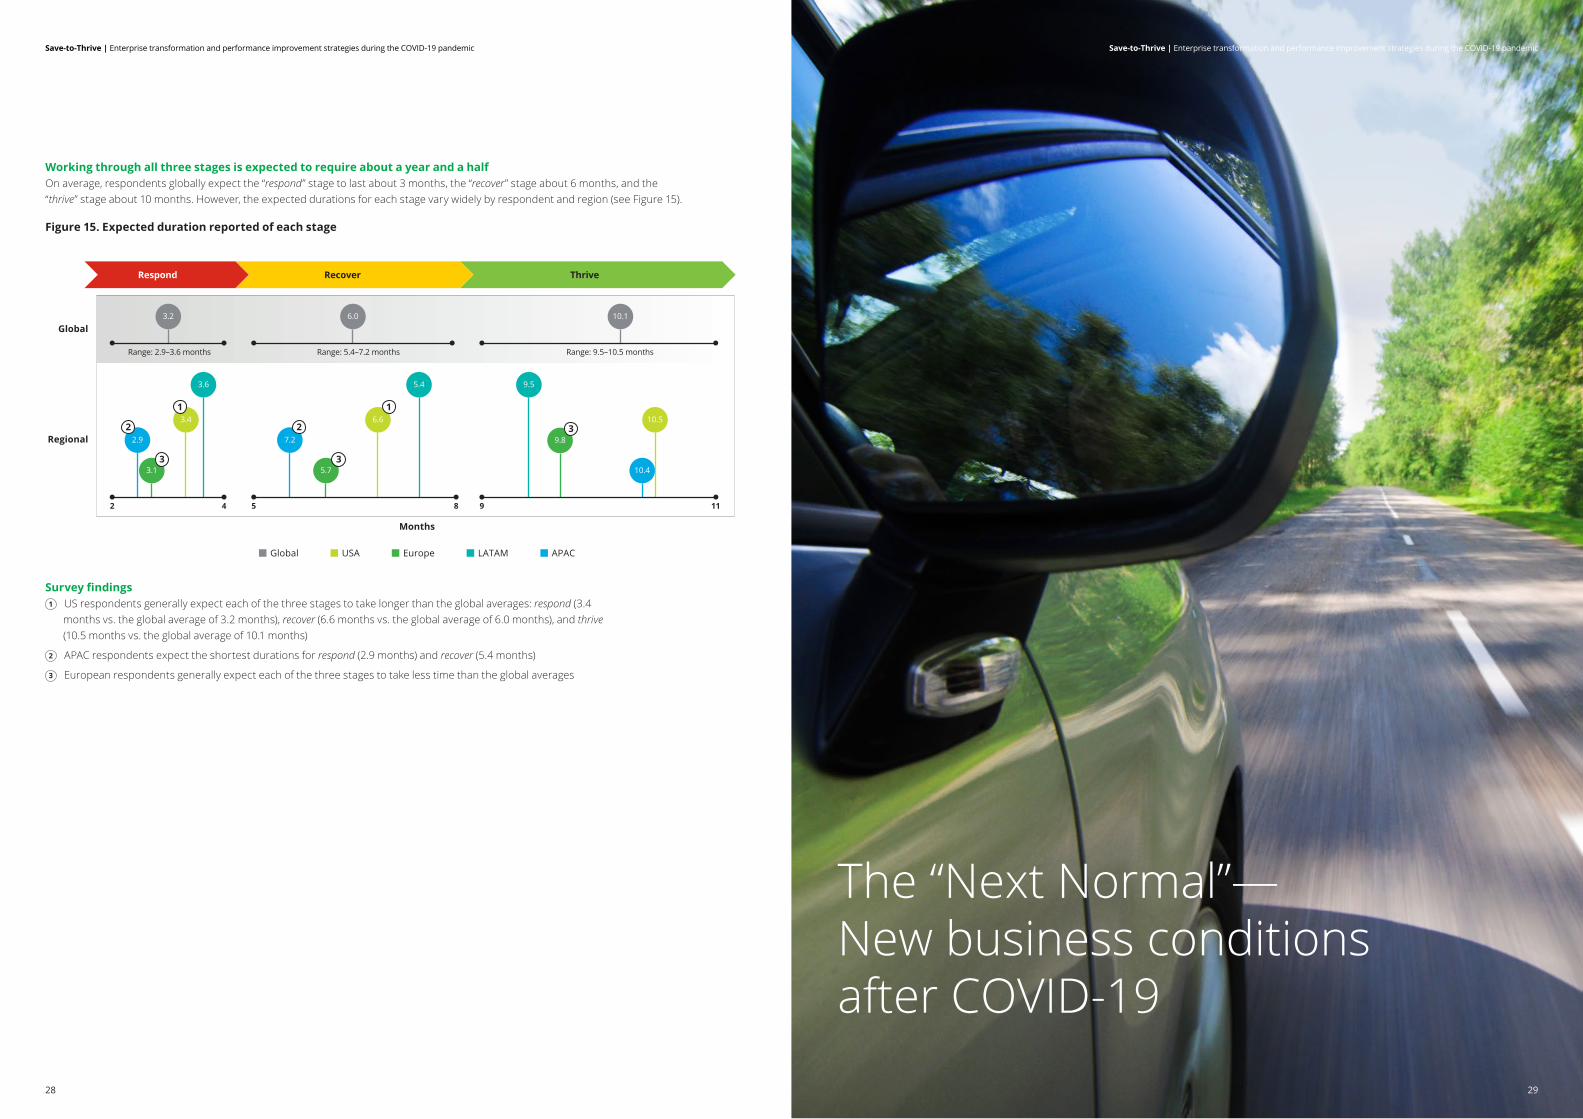
Survey findings1 US respondents generally expect each of the three stages to take longer than the global averages: respond (3.4
months vs. the global average of 3.2 months), recover (6.6 months vs. the global average of 6.0 months), and thrive (10.5 months vs. the global average of 10.1 months)
2 APAC respondents expect the shortest durations for respond (2.9 months) and recover (5.4 months)
3 European respondents generally expect each of the three stages to take less time than the global averages
Working through all three stages is expected to require about a year and a halfOn average, respondents globally expect the “respond” stage to last about 3 months, the “recover” stage about 6 months, and the “thrive” stage about 10 months. However, the expected durations for each stage vary widely by respondent and region (see Figure 15).
Figure 15. Expected duration reported of each stage
3.6
2.9
Global
Regional
Recover ThriveRespond
LATAM APACGlobal USA Europe
3.4
3.1
5.4
7.2
5.7
6.6
9.5
9.8
10.5
Range: 2.9–3.6 months
2 4 5 8 9 11
Range: 5.4–7.2 months Range: 9.5–10.5 months
6.0 10.13.2
10.4
1
Months
1
2 2
3 3
3
The “Next Normal”— New business conditions after COVID-19
28 29
Save-to-Thrive | Enterprise transformation and performance improvement strategies during the COVID-19 pandemic Save-to-Thrive | Enterprise transformation and performance improvement strategies during the COVID-19 pandemic
When mapping out strategies to respond, recover and thrive, it helps to have informed insights about the future business environment. In the wake of the 2008 financial crisis, many people called the resulting business environment the “new normal.” However, every new normal eventually gets replaced by a new new normal, so in our view it makes sense to call the post-COVID business environment the next normal.
Survey findings1 During the next normal, respondents expect digital channels to have 63% higher revenue growth than physical channels. New
post-COVID-19 products are expected to grow 14% more than pre-COVID-19 products. And domestic operations are expected to grow 24% more than international operations.
2 In all regions, respondents expect digital channels to have the highest revenue growth of any revenue sources.
3 Post-COVID-19, respondents expect new products and domestic operations to see high revenue growth in all regions expect LATAM, where pre-COVID-19 products are ranked higher than domestic operations.
Revenue sources will be fundamentally different in the next normalAccording to the survey results, the fastest growing revenue sources in the future will be: digital channels (vs. physical channels); new products and services (vs. existing pre-COVID offerings); and domestic operations (vs. international operations). Thanks to practices such social distancing and shelter-in-place that restrict access to the physical world, the COVID-19 crisis has greatly accelerated the shift from physical to
digital channels. It has also revealed the limitations and risks of globalization and global supply chains, leading many companies to re-prioritize domestic operations over international operations. Meanwhile, COVID-driven changes to how people live and work are boosting demand for new kinds of products and services (see Figure 16).
Figure 16. Growth expected by revenue source in the next normal
Global view Regional view
USRank Europe LATAM APAC
1
6
5
4
3
2
1 Digital channels
63% more when compared to physical channels
14% more when compared to pre-COVID-19
24% more when compared to international
Post-COVID-19 new products and services
Domestic operations
Pre-COVID-19 core portfolio of products and services
International operations
Physical channels
2
3
% o
f tot
al r
espo
nden
ts
Global view Regional view
US Europe LATAM APAC
78% 77%72%
65% 65%62% 62% 61%
76% 76%
67%
77% 76%
65%
87%83%
76%79% 79% 78%
1
2
3
Enhance IT infrastructure to support management and operations
Enable extensive remote work Adjust real estate infrastructure
Redesign the supply chainOutsource non-core processesSimplify the organizational structureInsource business processes or functions
Enable pre-sale, sale and post-sale activities through digital channels
IT infrastructure, remote work and digital channels will be the top operating model priorities in a post-crisis worldGlobally, the top operating model priorities during the next normal are expected to be: enhance IT infrastructure (78%); enable remote work (76%); and enable pre-sale, sale, and post-sale activities through digital channels (72%). In an increasingly digital
world, IT infrastructure and digital channels are key. Also, remote work will likely remain popular now that the COVID crisis has proven its viability (see Figure 17).
Figure 17. Expected priorities for operating models in the next normal
Survey findings1 Globally, respondents expect their future operating models to rely on enhancing IT infrastructure (78%) and enabling
remote work (77%).
2 In all regions, IT infrastructure, remote work and digital channels are also the reported top three priorities in future operating models.
3 In LATAM, the top operating priority expected by respondents is enabling pre-sale, sale and post-sale activities through digital channels.
3130
Save-to-Thrive | Enterprise transformation and performance improvement strategies during the COVID-19 pandemicSave-to-Thrive | Enterprise transformation and performance improvement strategies during the COVID-19 pandemic
% o
f tot
al r
espo
nden
ts
Global view Regional view
US Europe LATAM APAC
74% 73% 73%68% 68%
71% 70% 69% 69% 70% 70%67% 65%
87%83% 82%
77% 78% 76% 76% 75%1
2
3
Adjust, redesign or innovate your product/service offering to expand to adjacent and/or new markets
Maximize local supply chain by redesigning your current product/service offering
Focus only on core products, by rationalizing your portfolio and maximizing core competitive advantages
Leverage new health and safety measures by redesigning your current product/service offering
Customize products or services to meet new customer and/or government requirements
Top product strategies for the next normal focus on innovation, health and safety measures, and customizationGlobally, the top product strategies to compete in the next normal are: adjust, redesign or innovate your product/service offering to expand to adjacent and/or new markets (74%); leverage new health and safety measures by redesigning
your current product/service offering (73%); and customize products or services to meet new customer and/or government requirements (73%) (see Figure 18).
Figure 18. Product strategies to differentiate and compete in the next normal
Survey findings1 Global respondents plan to differentiate their products and compete more effectively by: adjusting, redesigning or innovating
their product/service offerings (74%), leveraging health and safety measures into product/service design (73%), and product customization (73%).
2 Respondents across all regions have the same top three product strategies, except for the US, where focusing on core products ranks third.
3 LATAM respondents reported significantly higher ratings across all strategies.
Next normal customer engagement strategies will be driven by digital channels and flexible customer experiencesGlobally, the most popular strategy for customer engagement will be to shift most transactions to digital channels (75%). The second most popular strategy will be to increase flexibility before and after the sale (73%) (see Figure 19).
Figure 19. Customer engagement strategies to differentiate and compete in the next normal
Survey findings1 Globally, the reported top strategies for creating a compelling customer experience in the next normal are: shift to digital channels
(75%), increase flexibility pre- and post-sale (73%); increase self-service options (71%); and cross-sell products and services (71%).
2 In the US, the top customer engagement strategy reported is to increase flexibility before and after the sale (73%).
3 In LATAM, the top strategies reported are cross-selling products/services (84%) and redesigning loyalty programs (83%).
% o
f tot
al r
espo
nden
ts
Global view Regional view
US Europe LATAM APAC
74%73%75%
67%67%69%
71%71%73%
70% 70% 69%66%
69%69% 68% 67%
77%
67%
71% 71%72%72%
77%79%
65%
80%
64%
80%
62%
82%83%84%
77%
64%
1 2
3
Shift most transactions to digital channelsIncrease flexibility before and after salesIncrease of self-service options
Cross-sell product / service to increase value delivered to customerRedesign loyalty programs based on new health, safety, mobility conditions
Redefine brand to become more impactfulDifferentiate service level by customer segment value
32 33
Save-to-Thrive | Enterprise transformation and performance improvement strategies during the COVID-19 pandemic Save-to-Thrive | Enterprise transformation and performance improvement strategies during the COVID-19 pandemic
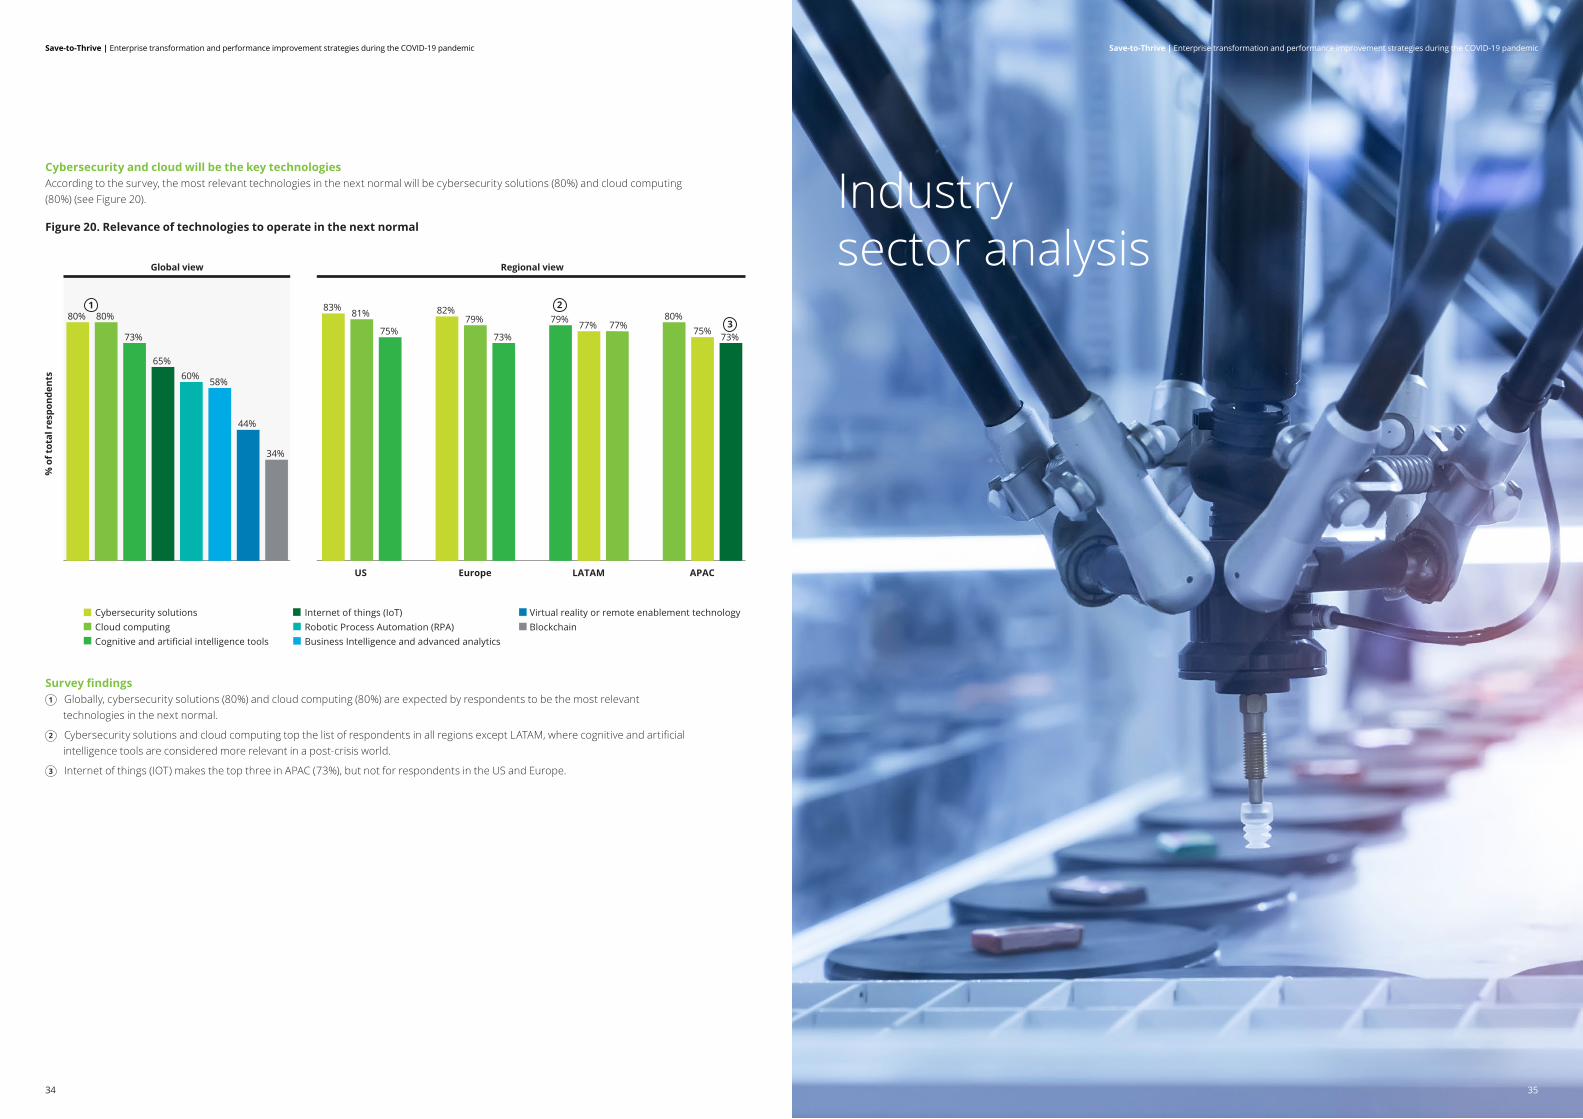
Cybersecurity and cloud will be the key technologiesAccording to the survey, the most relevant technologies in the next normal will be cybersecurity solutions (80%) and cloud computing (80%) (see Figure 20).
Figure 20. Relevance of technologies to operate in the next normal
Survey findings1 Globally, cybersecurity solutions (80%) and cloud computing (80%) are expected by respondents to be the most relevant
technologies in the next normal.
2 Cybersecurity solutions and cloud computing top the list of respondents in all regions except LATAM, where cognitive and artificial intelligence tools are considered more relevant in a post-crisis world.
3 Internet of things (IOT) makes the top three in APAC (73%), but not for respondents in the US and Europe.
% o
f tot
al r
espo
nden
ts
Global view Regional view
US Europe LATAM APAC
2
Cybersecurity solutionsCloud computingCognitive and artificial intelligence tools
Internet of things (IoT)Robotic Process Automation (RPA)Business Intelligence and advanced analytics
Virtual reality or remote enablement technologyBlockchain
80%
65%
80%
73%
34%
44%
58%
73%
80%79% 77%73%
77% 75%
82%79%
75%
81%
60%
83%1
3
Industry sector analysis
3534
Save-to-Thrive | Enterprise transformation and performance improvement strategies during the COVID-19 pandemic Save-to-Thrive | Enterprise transformation and performance improvement strategies during the COVID-19 pandemic
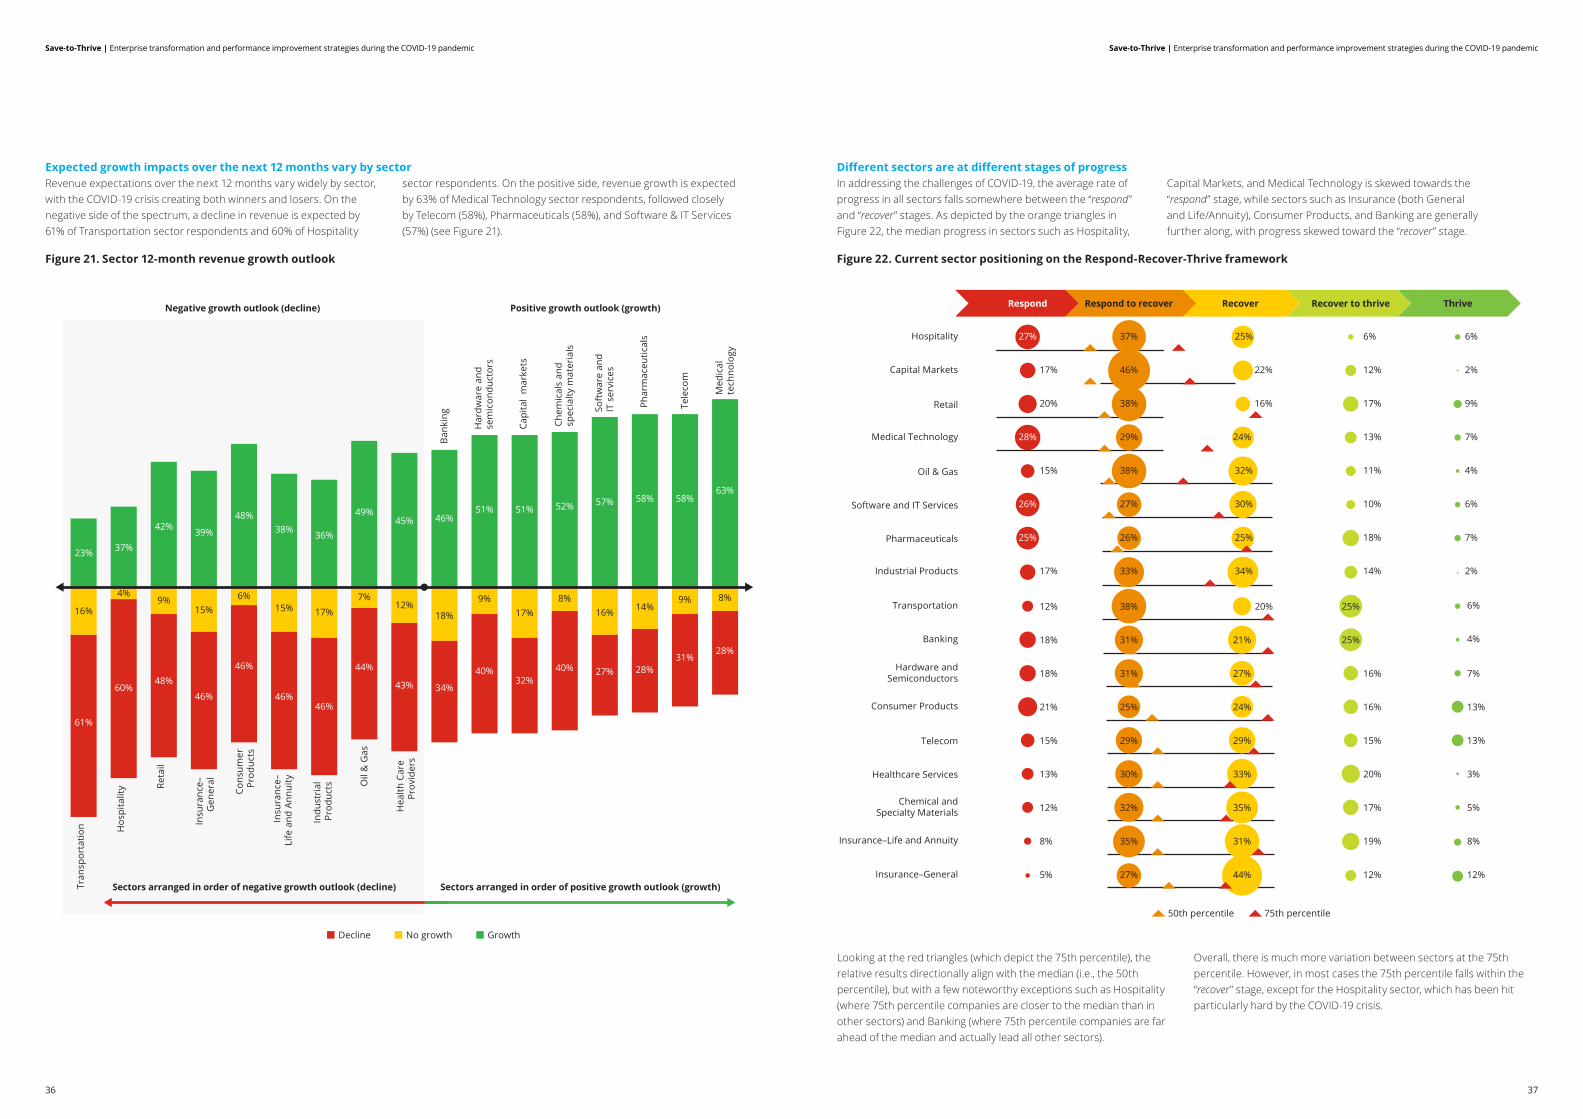
Expected growth impacts over the next 12 months vary by sectorRevenue expectations over the next 12 months vary widely by sector, with the COVID-19 crisis creating both winners and losers. On the negative side of the spectrum, a decline in revenue is expected by 61% of Transportation sector respondents and 60% of Hospitality
sector respondents. On the positive side, revenue growth is expected by 63% of Medical Technology sector respondents, followed closely by Telecom (58%), Pharmaceuticals (58%), and Software & IT Services (57%) (see Figure 21).
Figure 21. Sector 12-month revenue growth outlook
Tran
spor
tatio
n
Bank
ing
Har
dwar
e an
dse
mic
ondu
ctor
s
Capi
tal
mar
kets
Chem
ical
s an
dsp
ecia
lty m
ater
ials
Soft
war
e an
dIT
ser
vice
s
Phar
mac
eutic
als
Tele
com
Med
ical
tech
nolo
gy
Hos
pita
lity Re
tail
Insu
ranc
e–G
ener
al
Cons
umer
Prod
ucts
Insu
ranc
e–Li
fe a
nd A
nnui
ty
Indu
stri
alPr
oduc
ts Oil
& G
as
Hea
lth C
are
Prov
ider
s
Decline No growth Growth
Positive growth outlook (growth)Negative growth outlook (decline)
Sectors arranged in order of positive growth outlook (growth)Sectors arranged in order of negative growth outlook (decline)
23% 37%
42% 39%
48%38% 36%
49%45% 46%
51% 51% 52% 57% 58% 58%63%
16%
4%9%
15%6%
15% 17%7%
12%18%
9%17%
8%16% 14%
9% 8%
61%
60%48%
46%
46%
46%46%
44%
43% 34%
40%32%
40% 27% 28%31%
28%
Different sectors are at different stages of progressIn addressing the challenges of COVID-19, the average rate of progress in all sectors falls somewhere between the “respond” and “recover” stages. As depicted by the orange triangles in Figure 22, the median progress in sectors such as Hospitality,
Capital Markets, and Medical Technology is skewed towards the “respond” stage, while sectors such as Insurance (both General and Life/Annuity), Consumer Products, and Banking are generally further along, with progress skewed toward the “recover” stage.
Figure 22. Current sector positioning on the Respond-Recover-Thrive framework
Looking at the red triangles (which depict the 75th percentile), the relative results directionally align with the median (i.e., the 50th percentile), but with a few noteworthy exceptions such as Hospitality (where 75th percentile companies are closer to the median than in other sectors) and Banking (where 75th percentile companies are far ahead of the median and actually lead all other sectors).
Overall, there is much more variation between sectors at the 75th percentile. However, in most cases the 75th percentile falls within the “recover” stage, except for the Hospitality sector, which has been hit particularly hard by the COVID-19 crisis.
Hospitality
Capital Markets
Retail
Medical Technology
Oil & Gas
Software and IT Services
Pharmaceuticals
Industrial Products
Respond to recover Recover Recover to thrive ThriveRespond
Transportation
Banking
Hardware andSemiconductors
Consumer Products
Telecom
Healthcare Services
Chemical andSpecialty Materials
Insurance–Life and Annuity
Insurance–General
27% 37% 25% 6% 6%
17% 46% 22% 12% 2%
20% 38% 16% 17% 9%
28% 29% 24% 13% 7%
15%
12%
18%
18%
21%
15%
13%
12%
8%
5%
38%
31%
31%
25%
29%
30%
32%
35%
27%
20%
21%
27%
24%
29%
33%
35%
31%
44%
25%
25%
16%
16%
15%
20%
17%
19%
12%
7%
13%
6%
4%
13%
3%
5%
8%
12%
38% 32% 11% 4%
26% 27% 30% 10% 6%
25% 26% 25% 18% 7%
17% 33% 34% 14% 2%
50th percentile 75th percentile
36 37
Save-to-Thrive | Enterprise transformation and performance improvement strategies during the COVID-19 pandemicSave-to-Thrive | Enterprise transformation and performance improvement strategies during the COVID-19 pandemic
Save-to-Thrive | Enterprise transformation and performance improvement strategies during the COVID-19 pandemic
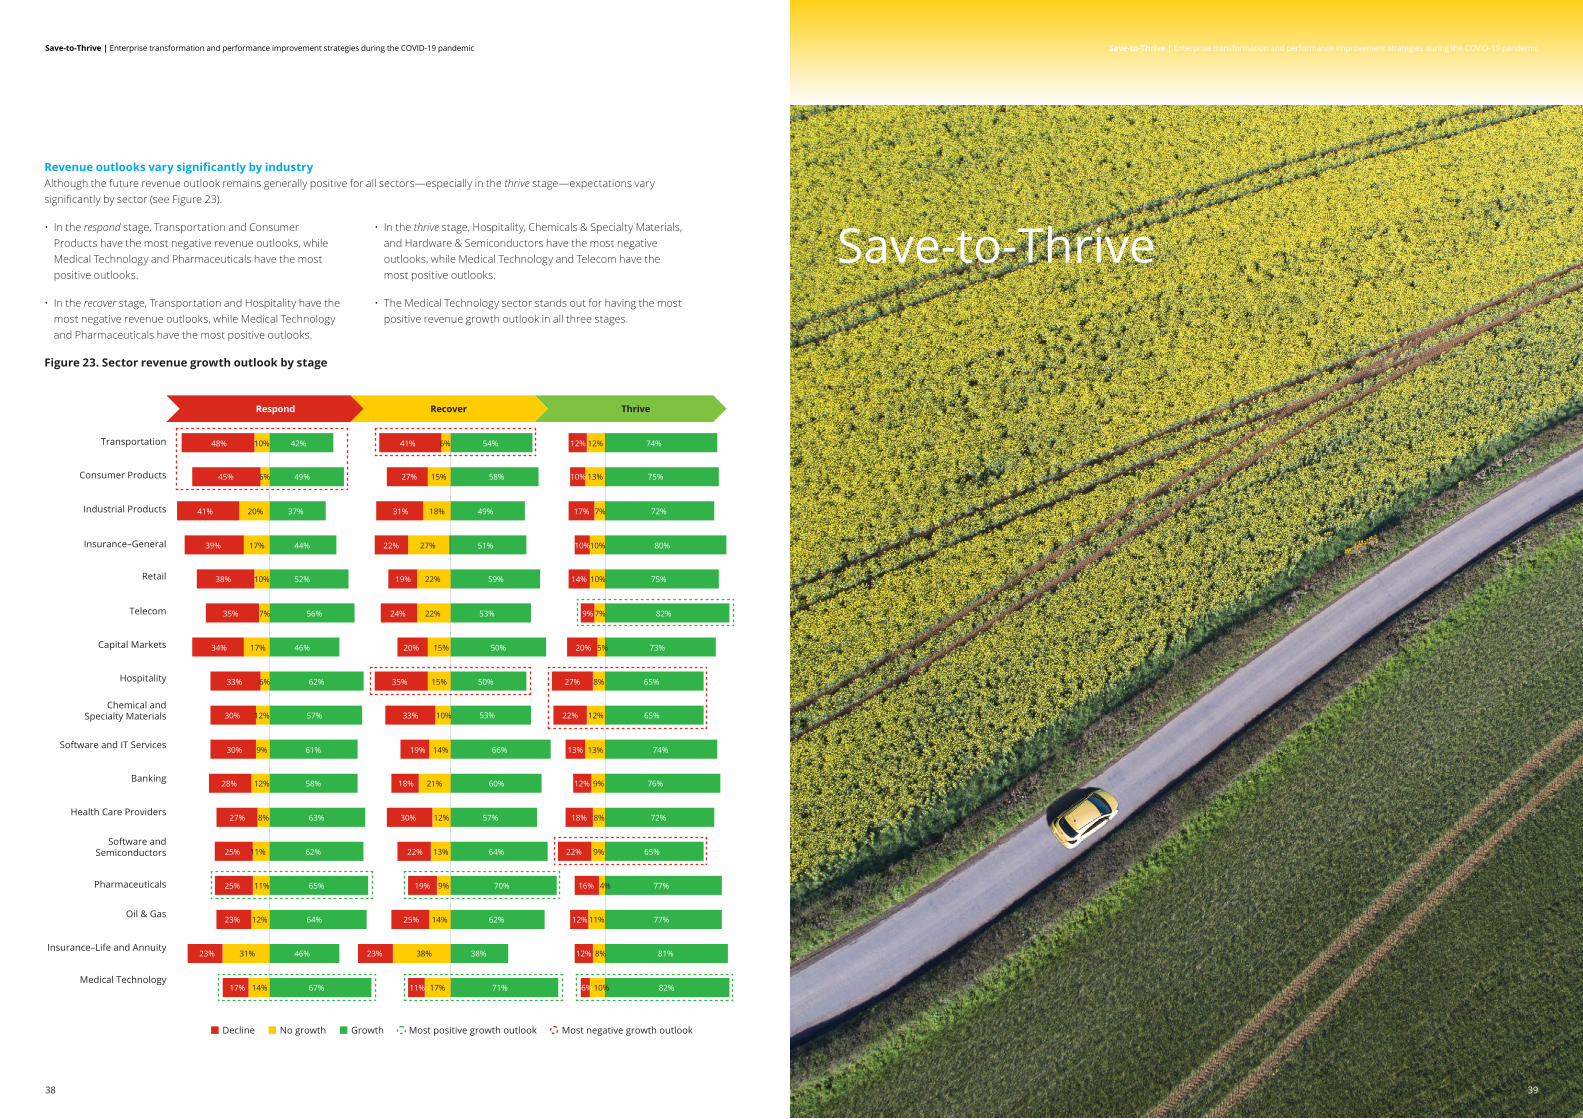
Revenue outlooks vary significantly by industryAlthough the future revenue outlook remains generally positive for all sectors—especially in the thrive stage—expectations vary significantly by sector (see Figure 23).
• In the respond stage, Transportation and Consumer Products have the most negative revenue outlooks, while Medical Technology and Pharmaceuticals have the most positive outlooks.
• In the recover stage, Transportation and Hospitality have the most negative revenue outlooks, while Medical Technology and Pharmaceuticals have the most positive outlooks.
• In the thrive stage, Hospitality, Chemicals & Specialty Materials, and Hardware & Semiconductors have the most negative outlooks, while Medical Technology and Telecom have the most positive outlooks.
• The Medical Technology sector stands out for having the most positive revenue growth outlook in all three stages.
Figure 23. Sector revenue growth outlook by stage
Transportation
Industrial Products
Consumer Products
Insurance–General
Retail
Telecom
Capital Markets
Hospitality
Chemical andSpecialty Materials
Recover ThriveRespond
Software and IT Services
Banking
Health Care Providers
Software andSemiconductors
Pharmaceuticals
Oil & Gas
Insurance–Life and Annuity
Medical Technology
Decline No growth Growth Most positive growth outlook Most negative growth outlook
10%48% 42%
6%45% 49%
20%41% 37%
17%39% 44%
10%38% 52%
7%35% 56%
17%34% 46%
6%33% 62%
12%30% 57%
9%30% 61%
12%28% 58%
8%27% 63%
11%25% 62%
11%25% 65%
12%23% 64%
31%23% 46%
14%17% 67%
6%41% 54%
15%27% 58%
18%31% 49%
27%22% 51%
22%19% 59%
22%24% 53%
15%20% 50%
15%35% 50%
10%33% 53%
14%19% 66%
21%18% 60%
12%30% 57%
13%22% 64%
9%19% 70%
14%25% 62%
38%23% 38%
17%11% 71%
12%12% 74%
13%10% 75%
7%17% 72%
10%10% 80%
10%14% 75%
7%9% 82%
5%20% 73%
8%27% 65%
12%22% 65%
13%13% 74%
9%12% 76%
8%18% 72%
9%22% 65%
4%16% 77%
11%12% 77%
8%12% 81%
10%6% 82%
Save-to-Thrive
3938
Save-to-Thrive | Enterprise transformation and performance improvement strategies during the COVID-19 pandemicSave-to-Thrive | Enterprise transformation and performance improvement strategies during the COVID-19 pandemic
Survey findings1 IT-related strategic priorities (i.e. digital enablement and technology
implementation) top the list of global respondents in all three stages of Respond-Recover-Thrive.
2 Respondents expect sales growth to rise as a strategic priority in each subsequent stage, bringing the priorities into alignment with Save-to-Transform at the thrive stage.
3 In all stages, respondents continue to rank “talent to manage new ways of working” among the top priorities (along with technology and growth).
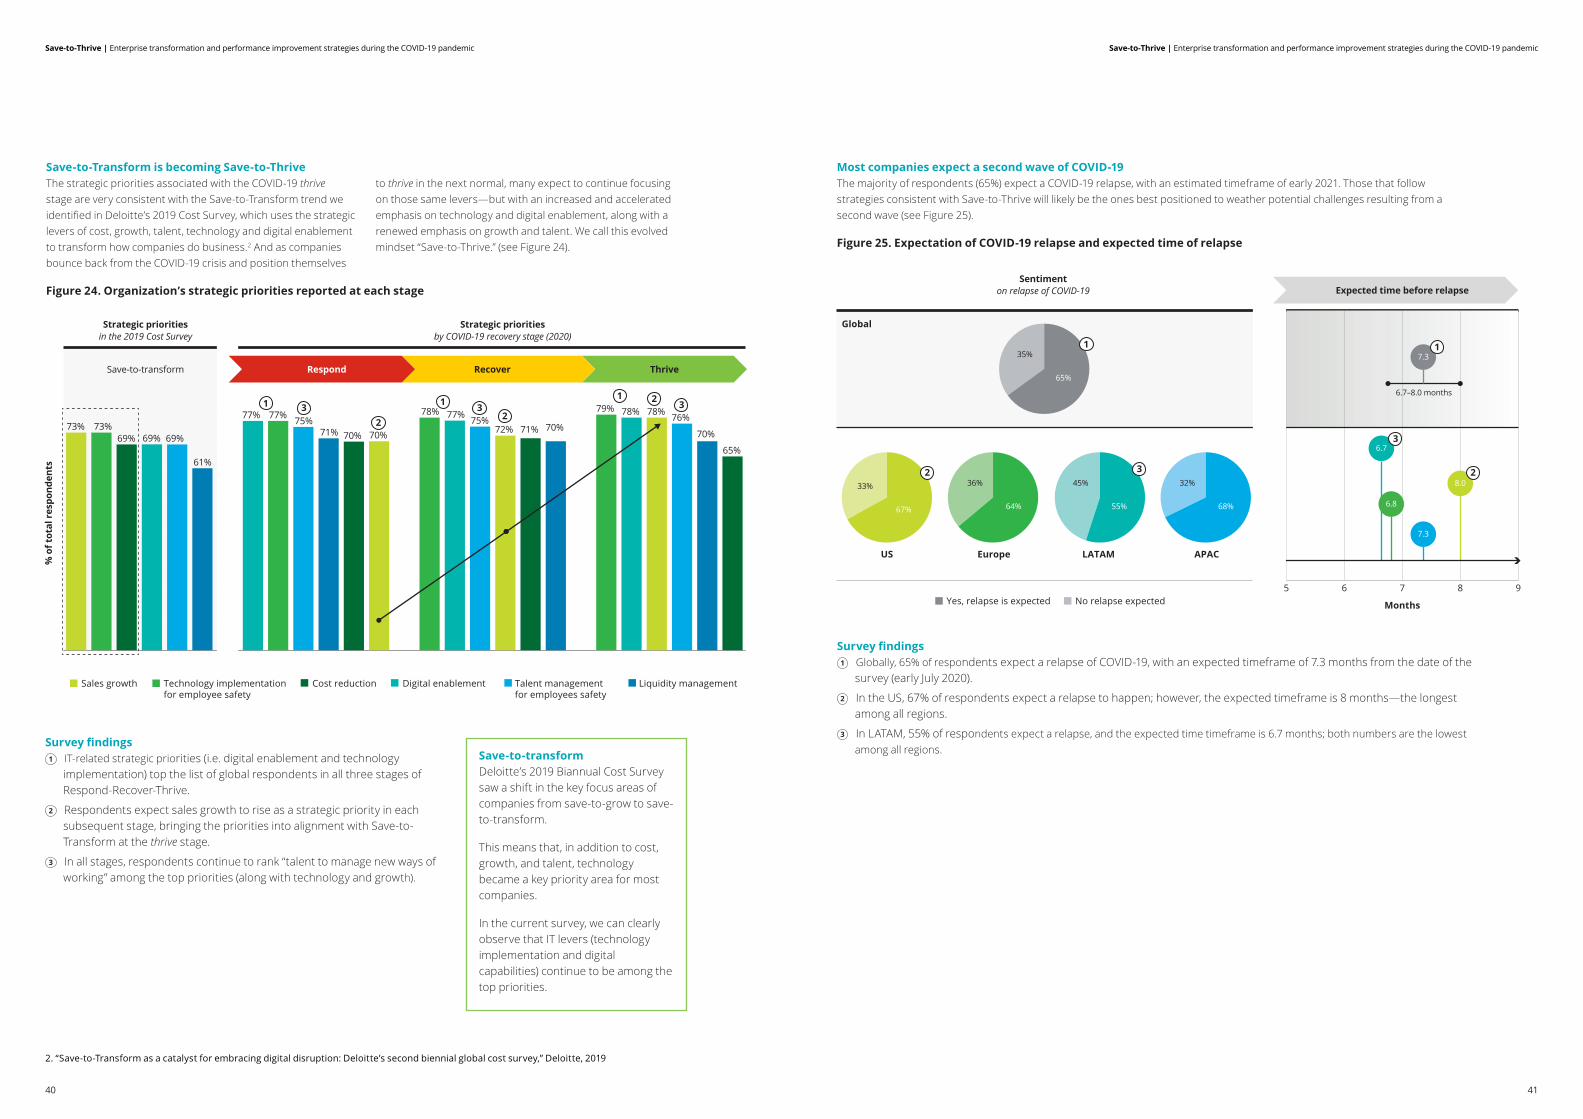
Save-to-Transform is becoming Save-to-ThriveThe strategic priorities associated with the COVID-19 thrive stage are very consistent with the Save-to-Transform trend we identified in Deloitte’s 2019 Cost Survey, which uses the strategic levers of cost, growth, talent, technology and digital enablement to transform how companies do business.2 And as companies bounce back from the COVID-19 crisis and position themselves
to thrive in the next normal, many expect to continue focusing on those same levers—but with an increased and accelerated emphasis on technology and digital enablement, along with a renewed emphasis on growth and talent. We call this evolved mindset “Save-to-Thrive.” (see Figure 24).
Figure 24. Organization’s strategic priorities reported at each stage
2. “Save-to-Transform as a catalyst for embracing digital disruption: Deloitte’s second biennial global cost survey,” Deloitte, 2019
Save-to-transformDeloitte’s 2019 Biannual Cost Survey saw a shift in the key focus areas of companies from save-to-grow to save-to-transform.
This means that, in addition to cost, growth, and talent, technology became a key priority area for most companies.
In the current survey, we can clearly observe that IT levers (technology implementation and digital capabilities) continue to be among the top priorities.
% o
f tot
al r
espo
nden
ts
Strategic prioritiesin the 2019 Cost Survey
Strategic prioritiesby COVID-19 recovery stage (2020)
Sales growth Digital enablementCost reductionTechnology implementation for employee safety
Talent management for employees safety
Liquidity management
73%69%
73%69%
77%
61%
78%
71%70% 72%
79% 78%75%
70%
65%
70%
76%78%
70%
77%
71%75%
69%
77%
Save-to-transform
1 1 133 3
2
2
2
Recover ThriveRespond
Most companies expect a second wave of COVID-19The majority of respondents (65%) expect a COVID-19 relapse, with an estimated timeframe of early 2021. Those that follow strategies consistent with Save-to-Thrive will likely be the ones best positioned to weather potential challenges resulting from a second wave (see Figure 25).
Figure 25. Expectation of COVID-19 relapse and expected time of relapse
Survey findings1 Globally, 65% of respondents expect a relapse of COVID-19, with an expected timeframe of 7.3 months from the date of the
survey (early July 2020).
2 In the US, 67% of respondents expect a relapse to happen; however, the expected timeframe is 8 months—the longest among all regions.
3 In LATAM, 55% of respondents expect a relapse, and the expected time timeframe is 6.7 months; both numbers are the lowest among all regions.
Global
Yes, relapse is expected No relapse expected
6.7
6.8
8.0
6.7–8.0 months
7.3
7.3
Months
3
Expected time before relapseSentiment
on relapse of COVID-19
5 6 7 8 9
33%
67%
36%
64%
45%
55%
35%
65%
32%
68%
US Europe LATAM APAC
1 1
3 22
40 41
Save-to-Thrive | Enterprise transformation and performance improvement strategies during the COVID-19 pandemic Save-to-Thrive | Enterprise transformation and performance improvement strategies during the COVID-19 pandemic
ConclusionThe COVID-19 pandemic is having a massive impact on the global business environment. Yet many companies continue to expect positive revenue growth—particularly in the thrive stage when they have successfully responded to and recovered from the early challenges of the crisis.
Decisions that companies make today to cope with COVID-19 can help or hinder their positioning for the future. Before the pandemic, the prevailing mindset for strategic cost management and transformations in general was “Save-to-Transform”—using the strategic levers of cost, growth, talent, technology and digital enablement to transform how companies do business. Now, we are seeing that Save-to-Transform mindset evolve into “Save-to-Thrive,” with the crisis highlighting and accelerating changes in key transformation areas such as technology and talent.
By using cost reduction and performance improvement strategically to transform the enterprise and improve competitiveness—which includes investing in key capabilities such as automation and remote work that align with the new realities of a post-crisis business environment—companies can leverage their cost savings and performance improvement efforts to not only transform how they operate, but to position themselves to thrive in the next normal.
Author
Contributors
Omar Aguilar PrincipalStrategic Cost Transformation Global Market Offering LeaderDeloitte Consulting LLP USA: +1 215 870 0464 International: +1 267 226 [email protected]
Fernando Jimenez BarríaManager Monitor Deloitte Deloitte Consulting SLUMadrid, Spainf [email protected]
David Izquierdo SánchezManager Monitor Deloitte Deloitte Consulting SLU Madrid, [email protected]
Paulina Fainberg Ríos ConsultantOperations Transformation Deloitte Advisory SpaSantiago, [email protected]
Satya GuptaConsultant Strategy & Analytics Deloitte Consulting India Private LimitedMumbai, [email protected]
Divya Bhalla AnalystStrategy & Analytics Deloitte Consulting India Private Limited New Delhi, India [email protected]
As the global leader of the Strategic Cost Transformation Market Offering for Deloitte Consulting LLP, Omar focuses on broad business transformation efforts, and on providing innovative and lasting solutions to local and multinational clients’ complex problems at the CEO and CXO levels in the US and globally. Omar’s areas of expertise include strategic cost transformation, margin improvement, restructuring, turnarounds, disruptive cost strategies and business model transformations enabled by “save-to-turnaround”, “save-to-fund”, “save-to-grow” and “save-to-transform” strategies to achieve sustainable results.
Omar has published widely on the topic of sustainable and scalable cost management, and has been quoted by or has written for Business Finance, The Journal of Cost Management, Strategic Finance, Chief Executive, and The Wall Street Journal, among others. He is a frequent speaker and has been a guest lecturer at the University of Pennsylvania’s Wharton School of Business, Stanford University’s Graduate School of Business, and Carnegie Mellon’s Tepper School of Business.
Prior to his current role, he served as the Americas Regional Strategy & Operations Consulting Leader, and prior to that he was the US Consulting Leader for Enterprise Cost Management.
He holds Bachelor and Master of Science degrees in Nuclear Engineering from the University of Missouri-Rolla, and a Master of Business Administration (MBA) from the University of Notre Dame.
42 43
Save-to-Thrive | Enterprise transformation and performance improvement strategies during the COVID-19 pandemic Save-to-Thrive | Enterprise transformation and performance improvement strategies during the COVID-19 pandemic
EUROPE
BelgiumCatherine HannossetPartnerStrategy, Business Design and M&A Leader D Consulting & Advisory +32 494 56 68 [email protected]
Ben Desmet DirectorStrategic Cost Transformation LeaderD Consulting & Advisory +32 496 72 77 [email protected]
FranceOlivier PerrinPartnerMonitor Deloitte Deloitte France+33 6 87 14 17 [email protected]
Alexandre KuzmanovicDirectorBusiness Transformation Deloitte [email protected]
Jean-Michel PintoDirectorStrategy and Business Design Deloitte [email protected]
GermanyUemit AydinPartnerStrategy & Operations | Operations TransformationDeloitte Consulting GmbH+49 151 5807 7317 [email protected]
IrelandDavid ReynoldsPartnerFinancial ServicesDeloitte Ireland+35 3 1417 [email protected]
ItalyUmberto MazzuccoEquity PartnerSupply Chain & Network Operations Leader Deloitte Consulting SRL+39 02 8332 [email protected]
LuxembourgPascal Martino PartnerStrategy LeaderDeloitte Luxembourg+352 45145 [email protected]
NetherlandsWillem Christiaan van Manen PartnerBusiness Model Transformation Leader Deloitte Consulting B.V.+31 6 1004 [email protected]
Laurens PettenPartnerMonitor Deloitte Deloitte Consulting B.V.+31 6 4049 [email protected]
NordicsAnders Harritz Lund (Denmark) PartnerStrategic Cost Transformation Leader Deloitte Denmark+45 30 93 69 [email protected]
Tuomo Saari (Finland)PartnerStrategy, Analytics, M&A Leader Deloitte Finland+35 84 0505 [email protected] i
Bjorn Grenman (Norway) PartnerStrategic Cost Transformation Leader Deloitte AS+47 911 61 [email protected]
Jonas Malmlund (Sweden) Strategy, Analytics and M&A Leader Deloitte Sweden+46 75 246 33 [email protected]
PortugalNelson FontainhasPartnerCFO Program LeaderDeloitte Portugal+35 1 210 422 [email protected]
SpainGorka BrionesPartnerStrategy and Business Design Deloitte Consulting, S.L.+34 914 432 [email protected]
SwitzerlandPatrik SpillerPartnerStrategy, Analytics and M&A Leader Deloitte Consulting Switzerland+41 78 649 5605 [email protected]
Dieter KleinDirectorStrategy and Business Design Deloitte Consulting Switzerland+41 79 575 [email protected]
United KingdomLorraine BarnesPartnerCore Business Operations Leader Deloitte MCS Limited+44 77 6589 [email protected]
Gillian MolyneuxDirectorStrategic Cost Transformation Leader Deloitte MCS Limited+44 78 0278 6903 [email protected]
Tony SchofieldPartnerGlobal Operations Transformation Leader Deloitte MCS Limited+07 711 334 252 [email protected]
US Contacts Global Contacts
Global Strategic Cost Transformation
Omar Aguilar PrincipalStrategic Cost Transformation | Global Market Offering Leader Deloitte Consulting LLP [email protected]
US Strategic Cost Transformation (MarginPLUS™) Leaders
Caleb LongenbergerPrincipalMarginPLUS Co-Lead | Strategy & AnalyticsDeloitte Consulting [email protected]
Faisal ShaikhPrincipalMarginPLUS Col-Lead | Mergers & AcquisitionsDeloitte Consulting [email protected]
US Market Offering Leaders
Anne KwanManaging DirectorTransformation Strategy & Design Leader Strategy & Analytics Deloitte Consulting LLP +1 415 307 2454 [email protected]
Kuttayan Annamalai Principal Value Creation Services Leader Mergers & Acquisitions Deloitte Consulting LLP+1 214 597 5083 [email protected]
AMERICAS
BrazilHeloisa MontesPartnerStrategy, Analytics and M&A Leader Deloitte Consultores+55 11 5186 6910 [email protected]
Caroline YokomizoPartnerStrategic Cost TransformationBrazil Leader Deloitte Consultores+55 11 99258 [email protected]
CanadaSimon KingSenior ManagerStrategic Cost Transformation Deloitte Canada+1 437 993 [email protected]
ChilePablo TipicPartnerOperations Transformation LeaderDeloitte Advisory SPA+569 6844 4636 [email protected]
Daniel OrtegaDirectorStrategic Cost Transformation Offering Leader Deloitte Advisory SPA+569 9649 [email protected]
MexicoFrancisco SilvaPartnerFinance & Performance LeaderDeloitte Consulting Mexico +52 1 55 1295 6587 [email protected]
Horacio PenaManaging Director Performance Management Deloitte Consulting Mexico +52 1 55 4441 5996 [email protected]
ASIA PACIFIC
AustraliaTony O’DonnellPartnerStrategic Cost Transformation Leader Deloitte ToucheTohmatsu+613 9671 [email protected]
ChinaDavid Wai Kit WuPartnerCore Business Operations Leader Deloitte Advisory (Hong Kong) +86 21 6141 [email protected]
Phillip SavioDirectorCore Business OperationsDeloitte Advisory (Hong Kong) +85 22 852 [email protected]
IndiaShridhar KamathBusiness Model Transformation Deloitte Touche Tohmatsu India LLP+91 22 6122 [email protected]
JapanTetsuo TakasagoPartnerOperations Transformation Leader Deloitte Tohmatsu Consulting LLC+81 7 04506 2932t [email protected]
Arata TakahashiAssociate DirectorOperations Transformation Deloitte Tohmatsu Consulting LLC+81 8 0436 08038 [email protected]
New ZealandPaul ShallardPartnerCore Business Operations Leader Deloitte New Zealand+64 21 645 [email protected]
Chris RodgersPartnerStrategy and Business Design Deloitte New Zealand+64 21 220 3000 [email protected]
44 45
Save-to-Thrive | Enterprise transformation and performance improvement strategies during the COVID-19 pandemic Save-to-Thrive | Enterprise transformation and performance improvement strategies during the COVID-19 pandemic

Appendix
4747
Save-to-Thrive | Enterprise transformation and performance improvement strategies during the COVID-19 pandemic Save-to-Thrive | Enterprise transformation and performance improvement strategies during the COVID-19 pandemic
LuxembourgContacts
Basil Sommerfeld Partner Operations & Human Capital Deloitte Luxembourg+352 45145 2646 [email protected]
Michael Cravatte Partner Business Transformation Deloitte Luxembourg+352 45145 4758 [email protected]
Joachim HeukmesPartnerCorporate Finance AdvisoryDeloitte Luxembourg+352 45145 [email protected]
Arnaud WillemsPartnerOperations Excellence & Human Capital Deloitte Luxembourg+352 45145 [email protected]
Patrick Laurent PartnerACG Leader & Innovation Leader Deloitte Luxembourg+352 45145 [email protected]
Simon RamosPartnerIM Advisory & Consulting Leader Deloitte Luxembourg+352 45145 [email protected]
Jean-Pierre MaissinPartnerStrategy, Analytics and M&A Leader Deloitte Luxembourg+352 45145 2834 [email protected]
46
Global
Europe
Spain
Italy
UK
Germany
France
Respond to recover Recover Recover to thrive ThriveRespond
7%
7%
6%
10%
6%
8%
19%
17%
10%
10%
6%
16%
15%
10%
9%16%
14%
24%
18%
27%
30%
30%
41%
28%
27%
24%
32%
31%
31%
42%
32%
27%
23%
24%
25%
24%
Global
LATAM
Brazil
Mexico
Respond to recover Recover Recover to thrive ThriveRespond
7%
8%
10%
6%
19% 16%
13%
6%
18%
8%
23%13%
32% 27%
32%26%
35%26%
42%35%
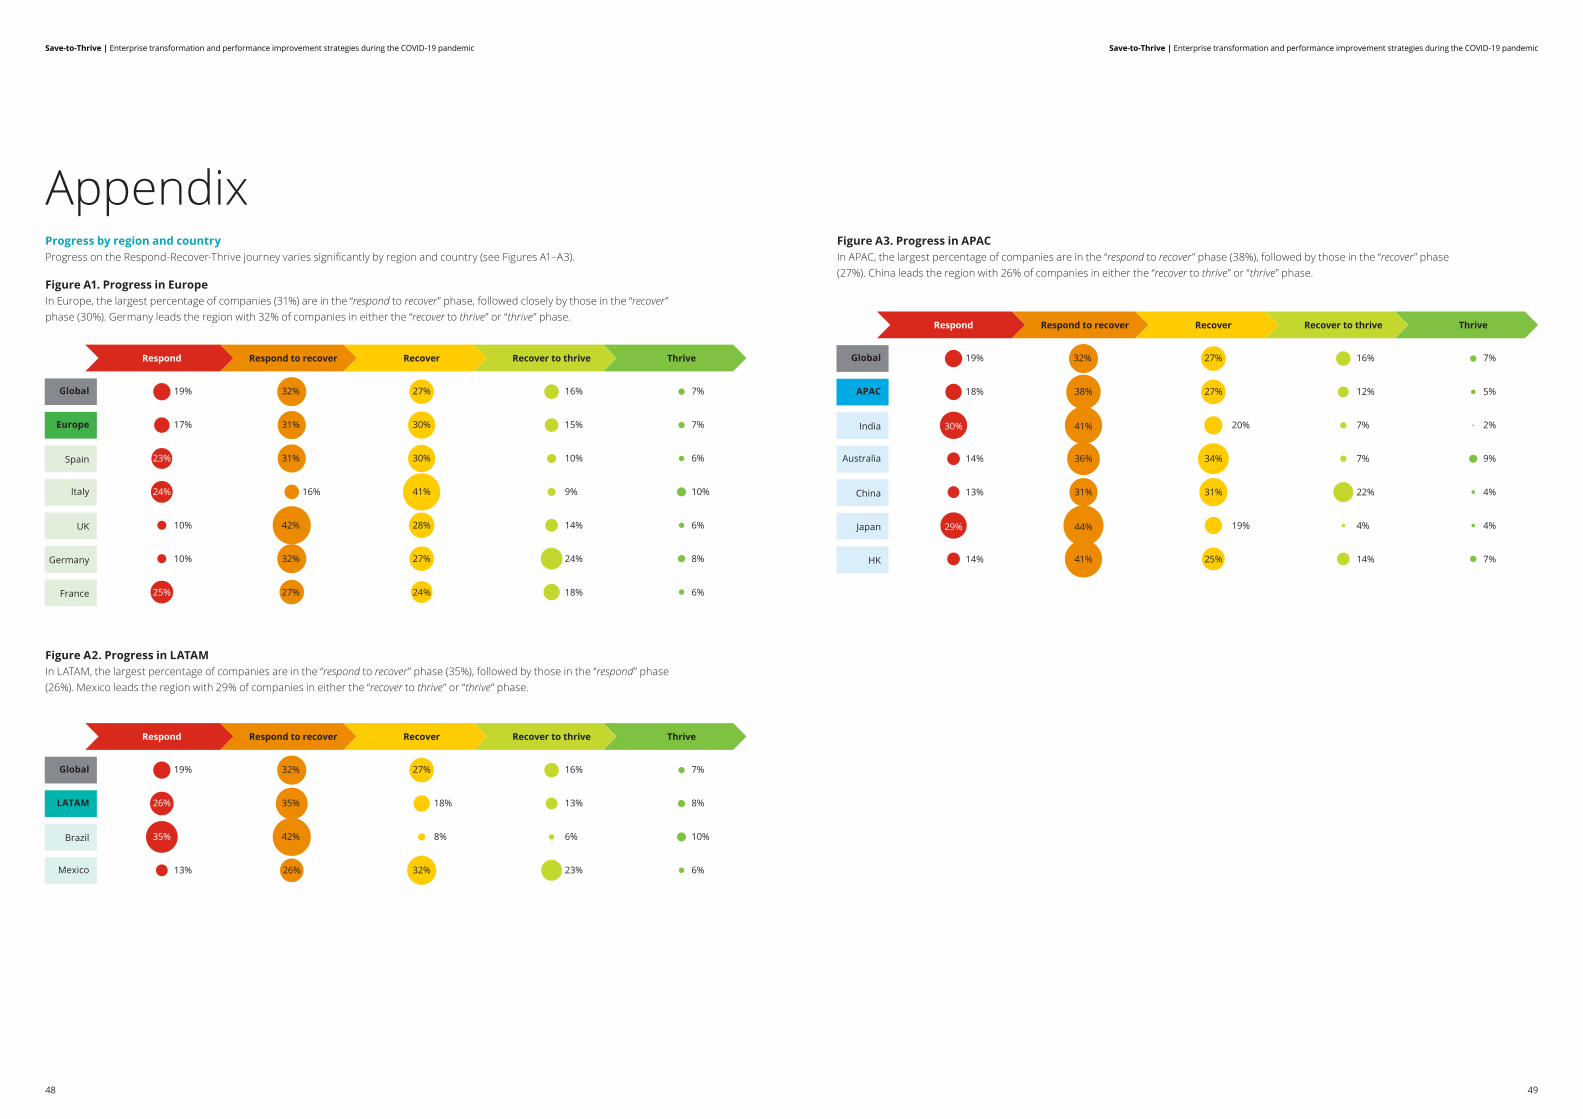
AppendixProgress by region and countryProgress on the Respond-Recover-Thrive journey varies significantly by region and country (see Figures A1–A3).
Figure A1. Progress in EuropeIn Europe, the largest percentage of companies (31%) are in the “respond to recover” phase, followed closely by those in the “recover” phase (30%). Germany leads the region with 32% of companies in either the “recover to thrive” or “thrive” phase.
Figure A2. Progress in LATAMIn LATAM, the largest percentage of companies are in the “respond to recover” phase (35%), followed by those in the “respond” phase (26%). Mexico leads the region with 29% of companies in either the “recover to thrive” or “thrive” phase.
Figure A3. Progress in APACIn APAC, the largest percentage of companies are in the “respond to recover” phase (38%), followed by those in the “recover” phase (27%). China leads the region with 26% of companies in either the “recover to thrive” or “thrive” phase.
Global
APAC
India
Australia
China
Japan
HK
Respond to recover Recover Recover to thrive ThriveRespond
7%
5%
2%
9%
4%
4%
19%
7%
16%
12%
7%
7%
22%
4%
14%
18%
14%
13%
14%
20%
19%
27%32%
27%
34%
31%
25%
38%
36%
41%30%
31%
44%29%
41%
4948
Save-to-Thrive | Enterprise transformation and performance improvement strategies during the COVID-19 pandemicSave-to-Thrive | Enterprise transformation and performance improvement strategies during the COVID-19 pandemic
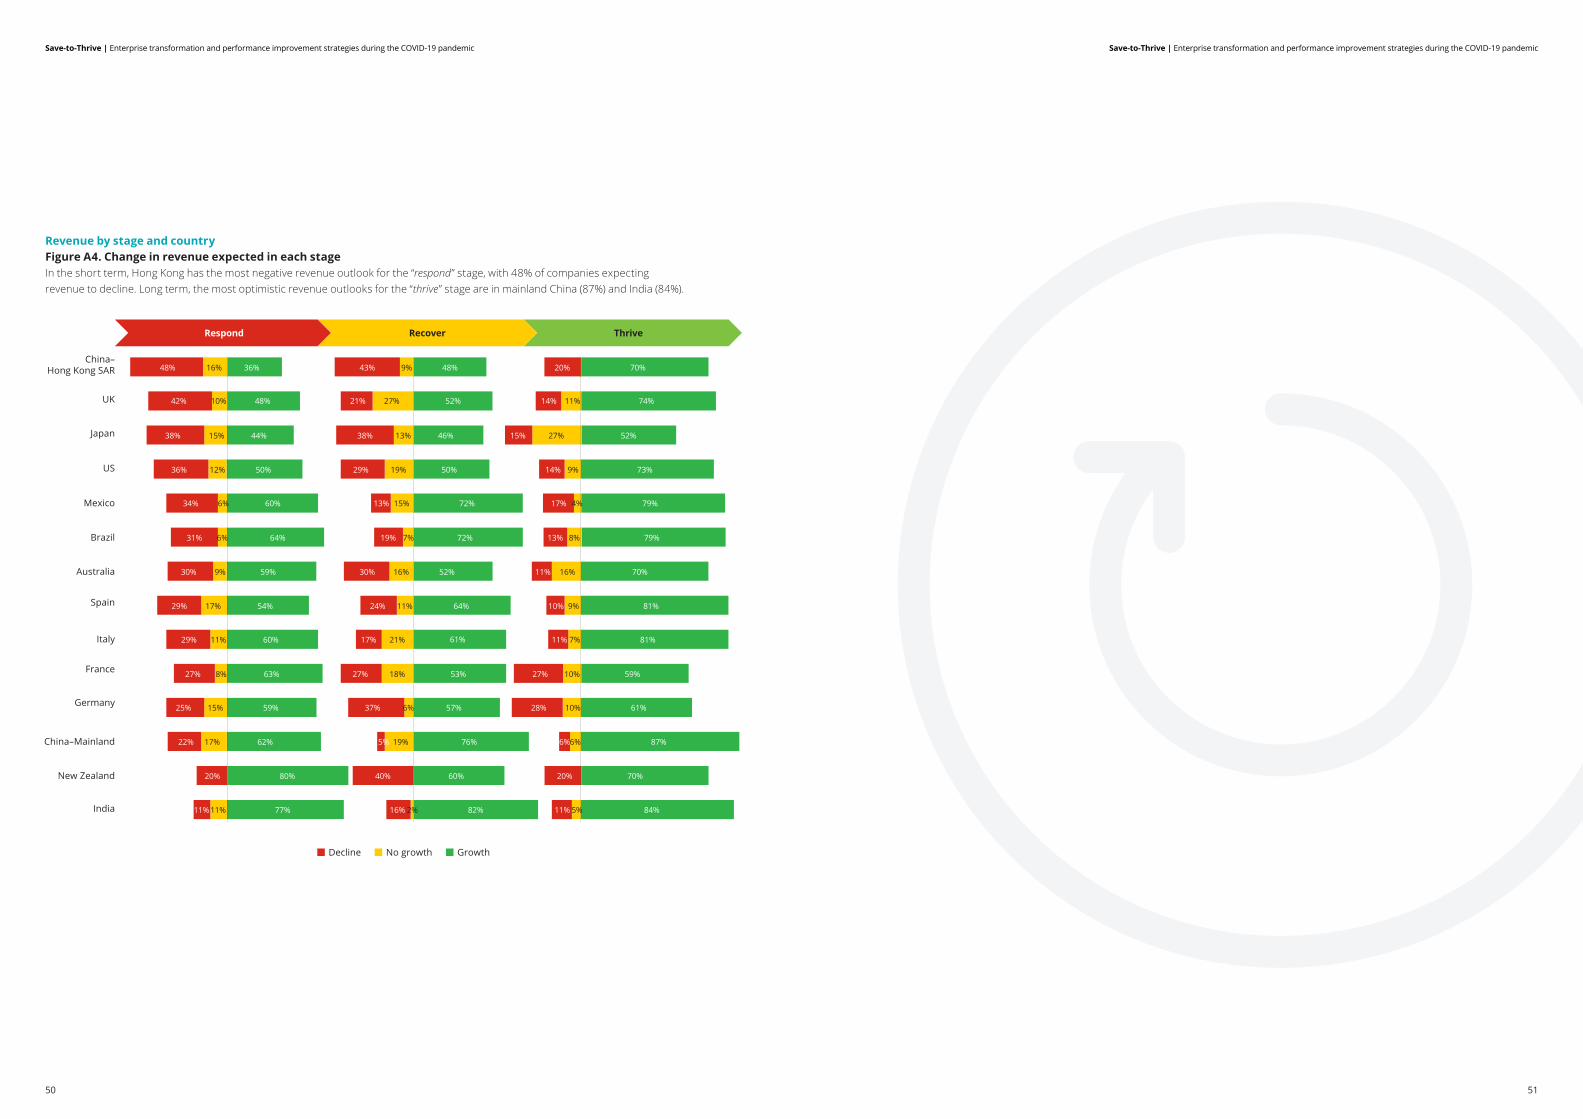
Revenue by stage and countryFigure A4. Change in revenue expected in each stageIn the short term, Hong Kong has the most negative revenue outlook for the “respond” stage, with 48% of companies expecting revenue to decline. Long term, the most optimistic revenue outlooks for the “thrive” stage are in mainland China (87%) and India (84%).
China–Hong Kong SAR
Japan
UK
US
Mexico
Brazil
Australia
Spain
Italy
Recover ThriveRespond
France
Germany
China–Mainland
New Zealand
India
Decline No growth Growth
16%48% 36%
10%42% 48%
15%38% 44%
12%36% 50%
6%34% 60%
6%31% 64%
9%30% 59%
17%29% 54%
11%29% 60%
8%27% 63%
15%25% 59%
17%22% 62%
20% 80%
11%11% 77%
9%43% 48%
27%21% 52%
13%38% 46%
19%29% 50%
15%13% 72%
7%19% 72%
16%30% 52%
11%24% 64%
21%17% 61%
18%27% 53%
6%37% 57%
19%5% 76%
40% 60%
2%16% 82%
20% 70%
11%14% 74%
27%15% 52%
9%14% 73%
4%17% 79%
8%13% 79%
16%11% 70%
9%10% 81%
7%11% 81%
10%27% 59%
10%28% 61%
6%6% 87%
20% 70%
5%11% 84%
50 51
Save-to-Thrive | Enterprise transformation and performance improvement strategies during the COVID-19 pandemic Save-to-Thrive | Enterprise transformation and performance improvement strategies during the COVID-19 pandemic

Deloitte refers to one or more of Deloitte Touche Tohmatsu Limited (“DTTL”), its global network of member firms, and their related entities (collectively, the “Deloitte organization”). DTTL (also referred to as “Deloitte Global”) and each of its member firms and related entities are legally separate and independent entities, which cannot obligate or bind each other in respect of third parties. DTTL and each DTTL member firm and related entity is liable only for its own acts and omissions, and not those of each other. DTTL does not provide services to clients. Please see www.deloitte.com/about to learn more. Deloitte is a leading global provider of audit and assurance, consulting, financial advisory, risk advisory, tax and related services. Our global network of member firms and related entities in more than 150 countries and territories (collectively, the “Deloitte organization”) serves four out of five Fortune Global 500® companies. Learn how Deloitte’s approximately 312,000 people make an impact that matters at www.deloitte.com. This communication contains general information only, and none of Deloitte Touche Tohmatsu Limited (“DTTL”), its global network of member firms or their related entities (collectively, the “Deloitte organization”) is, by means of this communication, rendering professional advice or services. Before making any decision or taking any action that may affect your finances or your business, you should consult a qualified professional adviser. No representations, warranties or undertakings (express or implied) are given as to the accuracy or completeness of the information in this communication, and none of DTTL, its member firms, related entities, employees or agents shall be liable or responsible for any loss or damage whatsoever arising directly or indirectly in connection with any person relying on this communication. DTTL and each of its member firms, and their related entities, are legally separate and independent entities.
© 2020. For information, contact Deloitte Touche Tohmatsu Limited.


