Embed Size (px)
Citation preview
ELUCIDATING PATHOLOGICAL MECHANISMS OF JOINT DEGENERATIVE DISORDERS
A Dissertation Presented to
The Academic Faculty
by
Giuliana E. Salazar-Noratto
In Partial Fulfillment of the Requirements for the Degree
Doctor of Philosophy in Biomedical Engineering
Georgia Institute of Technology and Emory University
August 2018
COPYRIGHT © 2018 BY GIULIANA E. SALAZAR-NORATTO
ELUCIDATING PATHOLOGICAL MECHANISMS OF JOINT DEGENERATIVE DISORDERS
Approved by:
Dr. Robert E. Guldberg, Advisor George W. Woodruff School of Mechanical Engineering Georgia Institute of Technology
Dr. Nick J. Willett Department of Orthopaedics Emory University
Dr. Greg Gibson School of Biological Sciences Georgia Institute of Technology
Dr. S. Clifton Willimon Orthopaedics Children’s Healthcare of Atlanta
Dr. Johnna S. Temenoff Wallace H. Coulter Department of Biomedical Engineering Georgia Institute of Technology
Date Approved: May 29, 2018


To Giuliana D. Noratto Dongo, Katherine A. Salazar Noratto, Gino A. Salazar Noratto,
Adonel A. Salazar Mendoza, Doris T. Dongo Montoya and C. Eva Mendoza de
Salazar—my family, who has supported me and loved me unconditionally.

iv
ACKNOWLEDGEMENTS
When I think about how many people have been part of this journey, I am amazed
at how truly collaborative this thesis work turned out to be. First of all, I need—and
want—to thank my advisor, Robert (Bob) E. Guldberg. He has often been more positive
about my data and excited about my projects than myself, and his encouragement and
positivity were just what my projects needed sometimes. I specially need to thank Bob
for being supportive of the iPSC project I pitched to him and of me going to Ireland for a
whole year to learn the technology in Frank Barry’s lab. This single decision made the
difference in the world for my dissertation. I am happy that Bob chose me as one of his
graduate students and will be forever thankful for the trust that he placed on me to carry
out these projects.
I need to thank the members of my committee as well. I will always appreciate the
genuine excitement and interest that Greg Gibson had for my projects, and science in
general. He truly opened up his lab for me, and became an amazing mentor in more ways
than one. I enjoyed talking to him about science and about life nuances, such as us
becoming American citizens. I am happy to have worked with him, and I do sincerely
hope that we keep in touch in the future. I met Nick J. Willett as a post-doc in Bob’s lab
when I first joined the lab, and soon after, Nick became a professor in Emory University.
Therefore, I believe that our relationship has leaned more towards peers than with my
other committee members. This is why it was so special to me, because I learned from
Nick things that I couldn’t have from other people. I was able to discuss and disagree
with Nick more openly, which gave me the confidence to do the same with senior

v
professors, and that helped me grow as a scientist. I need to also thank Johnna Temenoff,
who pushed me to think more critically of my projects and what contribution I was
actually making to the scientific field. It is because of her that Aim 3 became what it did,
and I will be eternally grateful for that, because I do think that it helped me become a
better scientist. Finally, I need to thank Clifton Willimon, who provided me with patient
samples for my JOCD projects and expertise about JOCD as a disease. I truly appreciate
the time and effort he gave me considering that he is a very busy surgeon. He made time
to meet with me, even if it was at 6 am, and to call me on my phone when I had
questions. He was also constantly worried that I needed more patient samples and
recruited several staff members at Children’s Healthcare of Atlanta to help me. In that
sense, I also have to thank Dr. David Busch for being another JOCD doctor who provided
me with patient samples and Margaux Johnson, who was the person responsible for
coordinating the patient sample collection and until she came around the project was
stagnant.
I need to thank my labmates for being the best labmates I could have asked for.
Tanushree Thote, Alice Lin, Ashley Allen, and Lauren Priddy were the senior girls (and
now doctors) in the lab when I joined, and I learned a lot from them. I also learned about
how to be a female scientist, which is something I had never thought would be different
from a regular scientist, but I learned that females do still have it difficult in a male-
dominated field and that the experiences that we have are not often what our male
counterparts would experience. I thank them for fighting the good fight, and I hope to do
the same. Marian Hettiaratchi and Marissa Rhuele were great back-row desk-mates, and I
am very thankful to have become great friends with them as well. It meant a lot to me

vi
that Marian teleconferenced from Canada to watch my defense, and that Marissa became
a close confidant of mine. I will miss Marissa’s and mine walks from and to work.
David Reece was a fun labmate to have and his upbeat and friendly personality
always lightened up the day. Brett Klosterhoff was also a great labmate, who would be
genuinely interested in people’s projects and provide feedback and suggestions. His
dancing and karaoke skills were also on point! I had a lot of fun hanging out with him
and his wife Kayla. Then, there were Albert Cheng, Brennan Torstrick and Olivia
Burnsed. We were all the same year, and we made of the lair a real chaos, especially
Albert and Brennan—and it was all great fun! I am very happy that I had three other
people to share my experiences with and that those two guys became like brothers to me.
Albert, especially, was a great, close friend, who helped me in more ways than I could
imagine.
Lastly, I also would like to thank Ryan Akman, Gilad Doron, Angela Lin, and
Laxmi Krishnan for their friendliness and readiness to help, especially during surgeries,
and Casey Vantucci for her crazy friendship. And of course, I need to thank Hazel Y.
Stevens for all the help she has provided me. More than scientifically, it has been
emotional help. She has truly helped me finished up my dissertation, by ordering
materials at late hours of the night and reading my papers and chapters. She has been like
a (lab) mother to me these past couple of months, and I am eternally grateful to have had
her in my life and my lab life. The Guldberg lab will definitely never be the same without
her! Moreover, I would like to take this opportunity to thank Eric O’neil, who is Andres
Garcia’s lab manager, but who helped me nonetheless with lab and protocol-related
questions in the absence of Hazel.

vii
I had several undergraduate students work with me in these projects that I need to
thank. Destiny Cobb was my first undergraduate student, and I have to thank her for
teaching me how to be a better manager and mentor for future students. Nica De Nijs was
an amazing undergraduate, who helped me a lot with the first project and while I was in
Ireland. She remained in Atlanta in charge of culturing JOCD skin fibroblasts, and there
is no one else in the world I would have trusted to do this job. She is a real hard-worker
and she deserves the best. Mohib Hasain and Catriana (Cat) Nations were my last
students, and they helped me with the last project in particular. I specially need to thank
Cat for all the help she provided me this last month. Even when things were wrapping up,
there was a lot to do and she stayed many nights until 3 am or later with me just to help
me finish. She also provided me with a constant supply of coffee and some snacks, for
which I was really grateful. Her dedication to the JOCD project was astounding, and I
will always appreciate the help and time she gave me.
The third project of this thesis work was carried out in collaboration with Frank
Barry’s lab in the National University of Ireland Galway, and I need to thank him and his
lab. When I pitched the JOCD project to Bob, he was highly skeptical and it was Frank
Barry’s support and enthusiasm that convince him that this was a project worth pursuing.
Therefore, I have to thank Frank not only for hosting when I was in Ireland learning
about iPSCs, but really for believing in this project from the very beginning; participating
in the National Science Foundation/Science Foundation Ireland grant I wrote and helping
me give form to this idea. I also would like to thank Mary Murphy who was also a
mentor while I was in Ireland and was always interested in the work I was doing and
provided valuable feedback.

viii
I would like to thank Katya McDonagh and Stephanie Boomkamp, post-doctoral
fellows at the time in the Regenerative Medicine Institute (REMEDI), for helping me
with the iPSCs. Culturing iPSCs is a difficult task, especially when the medium
formulations required daily changes (not longer the case for future iPSC scientists), and I
do not think I could have made it without the iPSC community in REMEDI. Katya and
Stephanie taught me best practices for iPSC culture and taught me what I could get away
with dong or not doing. Most importantly, they helped me feed my iPSCs when I needed
a break from the long 12-hour-plus feeding days, or when I injured my shoulder. Besides
labwork, Katya and Stephanie were my best friends in Galway, and I have countless fond
memories of our infamous steak and wine dates.
Sean Gaynard helped me with the mesenchymal stem cell aspect of the third
project, and I am immensely grateful that, busy as he was writing his own dissertation, he
came in the weekends to help me run flow for multiple hours in a day. Cathy Brougham
helped me with adipogenesis, but most importantly, she helped me as a labmate and a
friend. I truly do not know what I would have done without the support of Cathy and
Claire Dooley in the lab. They helped me ship my cells and they would help me in assays
for which I wasn’t an expert in. Claire, especially, helped me stained the iPSCs for
pluripotency when I was swamped with other work. These girls were the labmates I
needed in Ireland, and they were also my best friends. I will never forget about Monday
dinner nights turned shots/wine night outs, or the Irish lock-ins. Cathy was particularly
working long hours as well to finish her thesis work, and I am grateful that she was there
at late hours and on weekends with me, and that we would go out after lab in very classy
Irish style (me with my backpack).

ix
Living in Ireland taught me many things and allowed me to mature as a scientist
and person. The lesson that I perhaps value the most is that, despite weather or workload,
one should always have a good amount of crazy fun! Irish fun was my kind of crazy fun,
and I am grateful for the experience and the people who contributed to this experience. I
am also thankful to Silvia Rosati, Swarna Raman and Patrizio Mancuso for being my
labmates and friends in Ireland.
Besides REMEDI and the Barry lab, the Gibson lab was my other foster lab. Greg
Gibson opened up his lab to me and allowed me to make it my home, and I am grateful
for that. I am also thankful to Dalia Arafat for helping me with the technical aspect of
Fluidigm, as well as Monica Pena-Rojas who taught me the JMP software and was
involved in the original JOCD project collaboration with Children’s Healthcare of
Atlanta. I am thankful to the Drissi lab and Hicham Drissi specifically because, even
though he was not involved in my project or was a collaborator, he took the time to meet
with me in multiple occasions to talk about the third project (JOCD) and took genuine
interest in my career as a scientist.
The scientific work in this thesis could not have been possible without the IBB
core labs. I specially want to thank Aqua Asberry (histology), Andrew Shaw (optical
microscopy), and David Small (mass spectrometry). In the Emory core labs, I would like
to thank Hong Yi who carried out the TEM work, which was not presented in this thesis.
I would also like to thank Laure Paige (BioE coordinator) for helping me get through the
logistics of these last couple of months, even though I was not part of the BioE program.

x
At this point, I would like to thank my friends, which truly became my Atlanta
family. I was lucky to part of the 2012 Biomedical Engineering (BME) Cohort, which in
my opinion was the most friendly, fun, and collaborative. Cheryl San Emeterio (née Lau)
was the first person who talked to me and became my friend in the program, and she
introduced me to the rest of our squad: Elizabeth (Betsy) Campbell, Candice Hovell,
Claire Olingy (née Segar), and Efrain Cermeño. I cannot begin to imagine my life in
Atlanta without these people. They have all been supportive through tough times and
essential to all the fun activities and memories I experienced in Atlanta and during my
Ph.D. Betsy will always be the voice of reason to me (and an amazing gin friend), and
Efrain my dancing and drinking buddy. Melissa Alvarado-Velez and Juliana Soto-Giron
were also my best friends, and I am thankful for having them through the fun and tough
times of this Ph.D. journey. Finally, the lair people, who are the graduate students of the
Guldberg and Garcia labs, have also been an important part of my life here.
Before thanking my family, I do need to thank two more people who I believe
have played an essential role in my accomplishments. Firstly, Linda Jo Huff (née
Martinez) was my sophomore (high school) math teacher. I connected with her more than
I had with any other teacher, and it was with her help that I won multiple scholarships for
college, because her letters of recommendation assured the committees that she had faith
on me beyond any reasonable doubt that I was going to make a difference in the world. I
can only hope that I do not disappoint Mrs. Huff. Secondly, I would like to thank Dr.
Kristen Maitland, who is a professor in BME at Texas A&M University, my
undergraduate institution. Dr. Maitland never taught me a single course, and yet she
helped me write my NSF Graduate Research Fellowship Program Application and polish

xi
it. I do believe that she helped me win the NSF fellowship, and it was because she
genuinely wanted to help this undergraduate student, me. She also taught me something
that was very empowering and I will never forget: that I should not let people tell me that
I have gotten where I am because I am a female or a minority. My identities do not cancel
out my accomplishments, which were earned with hard work and sweat. I believe that it
is people like Dr. Maitland that will change the science world for the better, and I will
always be thankful that she changed my world.
Finally, my family. I am grateful for all the love and support my family has
always provided me. I have a big family, with more than 15 cousins, and they all have
always believed in me and have been proud of every accomplishment along the way, no
matter how small. My uncle Gino Noratto flew from Peru for my defense presentation,
and that meant the world to me. I know that all of my other uncles and aunts would have
loved to be here as well, and I also know that I would not be who I am today without my
family. I am thankful that my sister, Katherine (Kati) Salazar-Noratto, grew up with me,
because I know now that I will always have a friend in her no matter what happens. Her
support and her constructive criticisms are things I really value in our friendship. My
brother, Gino Salazar-Noratto, is the best person I know in this world, and he always
believes the best of me. His love and understanding have carried me through many
situations and especially this Ph.D. journey. I am also thankful for my dad, Adonel
Salazar Mendoza, for always trying his best.
My mom, Giuliana Noratto Dongo, is the strongest woman I know, and after
finishing this Ph.D. journey, I am simply in awe at how she was able to do her own Ph.D.
as a single mother with three (very difficult) children. She is my hero, because since I

xii
was little she taught me that “si no puedes es porque no quieres” (if you can’t do
something, you must not really want it). Her resilience and constant drive to better herself
are characteristics I admire. It is because of her that I am strong, confident, and a female
scientist. It is because of her that I believe all dreams are attainable and that we, as
humans, can do anything in the world as long as we set out minds to it. It is, really,
because of her that this thesis work has been accomplished. I thank my mother for all of
her support—especially her emotional support through turbulent times during this
journey—and for coming to take care of me when I needed her to and helping me analyze
data when I was overwhelmed.
xiii
TABLE OF CONTENTS
Page
ACKNOWLEDGEMENTS iv
LIST OF TABLES xvi
LIST OF FIGURES xvii
LIST OF SYMBOLS AND ABBREVIATIONS xxi
SUMMARY xxiii
CHAPTER 1. SPECIFIC AIMS 11.1 Introduction 11.2 Specific Aim I 21.3 Specific Aim 2 21.4 Specific Aim 3 31.5 Significance and Scientific Impact 4
CHAPTER 2. BACKGROUND 72.1 Osteoarthritis 7
2.1.1 Biological and molecular pathomechanisms 92.2 Juvenile osteochondritis dissecans 12
2.2.1 Diagnosis and Classification 132.2.2 Treatment 162.2.3 Etiology 182.2.4 Biological and molecular pathomechanisms 21
CHAPTER 3. REGIONAL GENE EXPRESSION ANALYSIS OF MULTIPLE TISSUES OF THE MEDIAL MENISCUS TRANSECTION MODEL OF POST-TRAUMATIC OSTEOARTHRITIS 233.1 Abstract 233.2 Introduction 243.3 Materials and methods 26
3.3.1 MMT model 263.3.2 Microarray gene expression experiment 263.3.3 Gene expression statistical analyses 303.3.4 Immunohistochemistry 31
3.4 Results 323.4.1 Articular cartilage gene expression 323.4.2 Synovial membrane gene expression 463.4.3 Confirmation of genes at the protein level 53
3.5 Discussion 553.5.1 Localized gene expression 553.5.2 Articular cartilage of the medial tibial plateau 55
xiv
3.5.3 Osteophyte tissue 583.5.4 Distal medial synovial membrane 603.5.5 Inflammation in the MMT model 60
CHAPTER 4. LOCALIZED OSTEOARTHRITIS DISEASE-MODIFYING CHANGES DUE TO INTRA-ARTICULAR INJECTION OF MICRONIZED DEHYDRATED HUMAN AMNION/CHORION MEMBRANE 624.1 Abstract 624.2 Introduction 634.3 Materials and methods 65
4.3.1 Animals: Surgery and treatment 654.3.2 Microarray gene expression 664.3.3 Histological analysis 694.3.4 Statistical analyses 69
4.4 Results 714.4.1 Articular cartilage 714.4.2 Synovial membrane 764.4.3 Osteophyte region 824.4.4 AmnioFix sequestration 834.4.5 Recruitment of helper cells by AmnioFix 83
4.5 Discussion 84
CHAPTER 5. DEVELOPMENT AND CHARACTERIZATION OF patient-specific INDUCED PLURIPOTENT STEM CELL-derived IN VITRO MODELS OF JUVENILE OSTEOCHONDRITIS DISSECANS 915.1 Abstract 915.2 Introduction 925.3 Materials and methods 94
5.3.1 Tissue and cell samples 945.3.2 iPSC culture, characterization and validation 975.3.3 iMSC differentiation 985.3.4 iMSC characterization and validation 995.3.5 Chondrogenic and endochondral ossification differentiation models 1015.3.6 Quantitative analyses of differentiation 1025.3.7 Gene expression 1035.3.8 Histology 1065.3.9 Transmission electron microscopy (TEM) 1085.3.10 Statistical analyses 108
5.4 Results 1085.4.1 iPSC reprogramming, characterization and validation 1085.4.2 iMSC characterization and validation 1095.4.3 Chondrogenesis model 1115.4.4 Endochondral ossification model 1155.4.5 Protein accumulation in the ER during differentiation 117
5.5 Discussion 118
xv
CHAPTER 6. ENDOPLASMIC RETICULUM STRESS RESPONSE SIGNALING IN JUVENILE OSTEOCHONDRITIS DISSECANS IN VITRO MODELS 1226.1 Abstract 1226.2 Introduction 1236.3 Materials and methods 126
6.3.1 Cell lines 1266.3.2 Chondrogenic and endochondral ossification models (organoids) 1276.3.3 ER stress-induction model 1276.3.4 Gene expression 1286.3.5 Statistical analyses 131
6.4 Results 1326.4.1 Differentiation models 1326.4.2 ER-stress models 137
6.5 Discussion 141
CHAPTER 7. SUMMARY AND FUTURE DIRECTIONS 1457.1 Overall summary 1457.2 Future directions 146
APPENDIX A. TOWARDS AN EARLY-STAGE SMALL ANIMAL MODEL OF OSTEOCHONDRITIS DISSECANS 148A.1 Introduction 148A.2 Success criteria 149
A.2.1 Bone 149A.2.2 Articular cartilage 150
A.3 Chemical insult 150A.3.1 Surgical procedure 150A.3.2 Results and discussion 152
A.3 Thermal insult 153A.3.1 Surgical procedure 153A.3.2 Results and discussion 154
A.4 Mechanical-barrier insult 158A.4.1 Surgical procedure 158A.4.2 Results and discussion 160
REFERENCES 161
xvi
LIST OF TABLES
Table 1 Osteochondritis Dissecans grading system. 14
Table 2
Taqman Gene Expression assays utilized for the characterization of the MMT model.
29
Table 3
Taqman Gene Expression Assays utilized for the evaluation of the effects of AmnioFix in the MMT model.
68
Table 4 Detailed characteristics of JOCD iPSC lines. 95
Table 5 Detailed characteristics of control iPSC lines. 96
Table 6 iPSC lines (and iMSCs and organoids) studied in each group: control vs. JOCD patients.
97
Table 7 Summary of criteria to identify MSC, as set by the International Society for Cellular Therapy [144].
99
Table 8
List of Taqman Gene Expression Assays used for each experiment in the development of JOCD-specific iPSC-based in vitro models of chondrogenesis and endochondral ossification.
106
Table 9 List of primary antibodies used in immunohistochemistry for each experiment in the development of JOCD-specific iPSC-based in vitro models of chondrogenesis and endochondral ossification.
107
Table 10 Unfolded protein response (UPR) has three major ER-stress sensors: PERK, ATF6 and IRE1, which play particular roles in the ER-stress related activated response [162].
125
Table 11 iMSC lines (and organoids) studied in each group: control vs. JOCD patients.
127
Table 12
List of Taqman gene expression assays used to evaluate the expression of ER-stress-related genes in the JOCD-iPSC-based chondrogenesis and endochondral ossification in vitro models.
130
Table 13
List of Taqman gene expression assays used to evaluate the molecular response of JOCD and control cell lines to ER-stress induction models.
131
xvii
LIST OF FIGURES
Figure 1 Prevalence of self-reported musculoskeletal disease by age group, reported by the National Health Interview Survey (NHIS)
8
Figure 2 Osteochondritis dissecans 13
Figure 3 Decision-making algorithm for treating JOCD of the knee 16
Figure 4 Representation of an operated left leg in which the medial meniscus has been transected (MMT model)
27
Figure 5 Volcano plots of the control (unoperated) group of the articular cartilage of the tibial plateau.
33
Figure 6 Volcano plots and multivariate analysis of the lateral side of the articular cartilage of the tibial plateau.
34
Figure 7 Clustering of the medial side of the articular cartilage of the tibial plateau.
36
Figure 8 Radar plot of averaged (mean) ΔCt expression of individual genes in the unoperated, control medial tibial plateau cartilage (control), the MMT medial tibial plateau cartilage (MMT) and the sham medial tibial plateau cartilage (sham), at different timepoints.
36
Figure 9 Significantly differently expressed genes of articular cartilage of the medial tibial plateau for all groups.
38
Figure 10 Multivariate analysis between articular cartilage from the medial tibial plateau and the osteophyte tissue.
41
Figure 11 Significantly differently expressed genes of the articular cartilage from the medial tibial plateau of MMT animals (MMT group) vs. tissue from the osteophyte-developing region of MMT animals (osteo group).
42
Figure 12 Radar plot of averaged (mean) ΔCt expression of individual genes in the sham osteophyte tissue (sham) and the MMT osteophyte tissue (MMT), at different timepoints.
45
xviii
Figure 13 Significantly differently expressed genes of the osteophyte region between the sham and MMT groups for both timepoints.
46
Figure 14 Multivariate analysis and clustering of the synovial membrane. 47
Figure 15 Clustering of the medial side of the synovial membrane. 49
Figure 16 Radar plot of averaged (mean) ΔCt expression of individual genes in the unoperated, control medial synovial membrane (control), the sham medial synovial membrane (sham) and the MMT medial synovial membrane (MMT), at different timepoints.
50
Figure 17 Significantly expressed genes in the distal medial synovial membrane for all groups.
51
Figure 18 Fluorescent immunohistochemistry of collagen type 2, Mmp13, and osteopontin of the articular cartilage and the synovium at week 3.
54
Figure 19 Clustering and multivariate analysis of the articular cartilage of the medial tibial plateau in response to AmnioFix treatment.
72
Figure 20 Significantly different genes in the medial tibial plateau cartilage between AmnioFix and saline groups.
73
Figure 21 Significantly differently expressed genes in the medial articular cartilage of the tibial plateau, between control and treatment groups.
75
Figure 22 Clustering and multivariate analysis of the medial side of the synovial membrane in response to AmnioFix treatment.
77
Figure 23 Significantly expressed genes between AmnioFix and saline groups of the medial synovial membrane.
79
Figure 24 Significantly different genes in the medial synovial membrane, between the control group and the treatment groups.
81
Figure 25 Clustering and multivariate analysis of tissue from the osteophyte region in response to AmnioFix treatment.
82
Figure 26 Hematoxylin & Eosin staining of the synovial membrane shows traces of AmnioFix Injectable in the AmnioFix treatment group and not in the saline group at 7 days post-surgery.
83
Figure 27 CD68+ staining of cells was observed at day 7 post-surgery in the AmnioFix group, but not in the saline group.
84
xix
Figure 28 iPSC characterization and validation. 109
Figure 29 Characterization and validation of iMSCs. 110
Figure 30 Gene expression in chondrogenic pellets over time. 112
Figure 31 GAG deposition by chondrogenic pellets, normalized to DNA content; graphed as means ± SEM.
113
Figure 32 Immunohistochemistry staining of chondrogenic pellets for collage type II/collagen type I and aggrecan.
114
Figure 33 Gene expression in pellets undergoing endochondral ossification.
116
Figure 34 Calcium deposition by osteogenic pellets, normalized by DNA content; graphed as means ± SEM.
116
Figure 35 Immunohistochemistry staining of osteogenic pellets for collagen type II/collagen type I.
117
Figure 36 TEM representative images of chondrogenic pellets at day 49. 118
Figure 37 Normalized relative expression of ER-stress related genes in response to 3D endochondral ossification differentiation, graphed as means ± SEM.
134
Figure 38 Normalized relative expression of ER-stress related genes in response to 3D endochondral ossification differentiation, graphed as means ± SEM.
136
Figure 39 Normalized relative expression (ΔΔCt) of ER-stress related genes in response to PTIC drug.
138
Figure 40 Normalized relative expression of (ΔΔCt) of ER-stress related genes in response to TUN drug.
140
Figure 41 OCD grading system. Early-stage OCD includes grades I and II. Our goal was to develop an animal model that emulated OCD grade I.
150
Figure 42 Set-up of stereotaxic frame and cauterizer for OCD surgeries. 151
Figure 43 MC3T3 pre-osteoblast cells after 24 hours of MIA treatment at the various concentrations.
152
Figure 44 Preliminary results from chemically-induced OCD surgical procedure.
153
xx
Figure 45 Diagram of surgical procedure for thermally-induced OCD animal model.
154
Figure 46 Representative pictures of gross morphology of the different groups in the thermally-induced OCD surgical procedure.
155
Figure 47 DAPI staining of the different groups in the thermally-induced OCD surgical procedure.
156
Figure 48 Histological staining (saf-o/fast green) of the different groups in the thermally-induced OCD surgical procedure.
157
Figure 49 Attachment for the liquid nitrogen sprayer/gun, of the same diameter as the drill hole (0.5 mm).
158
Figure 50 Preliminary results from mechanically-induced OCD surgical procedure.
160
xxi
LIST OF SYMBOLS AND ABBREVIATIONS
ANOVA Analysis of variance
BM-MSC Bone marrow-derived mesenchymal stem cell
BMP Bone morphogenetic protein
cDNA Complementary deoxyribonucleic acid
DMOAD Disease-modifying osteoarthritis drug
DNA Deoxyribonucleic acid
EB Embryonic body
ECM Extracellular matrix
ELISA Enzyme-linked immunosorbent assay
EPIC-µCT Equilibrium partitioning of an iconic contrast agent via micro-CT
ER Endoplasmic reticulum
ERSD Endoplasmic reticulum storage diseases
FDA The Food and Drug Administration
GAG Glycosaminoglycans
H&E Hematoxylin and Eosin
IHC Immunohistochemistry
iMSC Induced pluripotent stem cell-derived mesenchymal stem cells
IL Interleukin
iPSC Induced pluripotent stem cell
JOCD Juvenile Osteochondritis Dissecans
MCL Medial collateral lligament
MIA Monosodium iodoacetate
xxii
MMP Matrix metalloproteinase
MMT Medial meniscus transection
MSC Mesenchymal stem cell
NBF Neutral buffered formalin
NO Nitric oxide
OA Osteoarthritis
OCD Osteochondritis Dissecans
PTIC Protein transport inhibitor cocktail
QRO Quantile range outlier
RA Rheumatoid arthritis
rER Rough endoplasmic reticulum
RNA Ribonucleic acid
ROS Reactive oxygen species
RT-PCR Real time polymerase chain reaction
RT Room temperature
SD Standard deviation
SEM Standard error of the mean
sGAG Sulfated glycosaminoglycans
TEM Transmission electron microscopy
TNF Tumor necrosis factor
TUN Tunicamycin
xxiii
SUMMARY
Joint degenerative disorders impose a large burden on lifestyle and the healthcare
system. The goals of this thesis were to elucidate pathological mechanisms in
osteoarthritis (OA) and juvenile osteochondritis dissecans (JOCD) in order to improve
understanding of these diseases, and to provide well-characterized platforms for
therapeutic development and testing. OA is the leading cause of disability in the U.S., and
it is a disease of the joint that affects multiple tissues. Despite breakthroughs in molecular
events (e.g. mechanisms in cartilage degradation), its pathological mechanisms are still
largely unknown. There are currently no FDA-approved disease modifying OA drugs
(DMOADs), despite promising preclinical data. In order to bridge the gap in knowledge
between preclinical and clinical studies, we characterized molecular events that occur in
the rat medial meniscus transection (MMT) model of post-traumatic OA as the disease
develops and progresses. Our results indicated that pathological events in the articular
cartilage and synovium of the MMT model are similar to known human OA
development. Our results also suggested feedback interactions between joint tissues
during disease progression.
Second, we investigated the mechanisms of action of micronized dehydrated
human amnion/chorion membrane (AmnioFix Injectable, MiMedx, USA) in order to
elucidate potential disease-modifying mechanisms of this therapeutic. Results showed
that AmnioFix does not have a direct influence on the gene expression of articular
cartilage or tissue from the osteophyte-forming region of the joint. Instead, AmnioFix
acted through the synovial membrane, modulating its microenvironment to a favorable
xxiv
chondro-protective profile. These results further supported the importance of tissue
interactions in the MMT model and in OA, and also provided a new view point
concerning disease-modifying approaches for OA.
JOCD is an increasingly common disorder that affects children and adolescents
with an open physis. JOCD results in the partial or complete fragmentation of a necrotic
osteochondral body from the parent bone, which permanently affects the joint and alters
its mechanics. Therefore, JOCD patients have a higher probability of developing OA at
an early age. JOCD presents a unique challenge, as treatment strategies are limited to
surgical interventions at advanced stages. Although there a number of hypotheses about
the etiology of JOCD, its pathological mechanisms are yet to be investigated. In this
thesis, we established induced pluripotent stem cell (iPSC)-derived models of JOCD
chondrogenesis and endochondral ossification in order to study its pathology. Our results
demonstrated that cells from JOCD patients have a lower chondrogenic capacity than
normal, control cells. Results also showed that although endochondral ossification is
successfully accomplished, there may be irregularities in its process. We also established
ER-stress induction models in order to dissect mechanistically how JOCD-iPSC-derived
mesenchymal stem cells (iMSCs) responded to ER stress. Our results showed that JOCD
cells have a different response to ER stress, which could lead to cell death should the ER
stressor persist. We propose that this pathological feature could lead to the onset of
clinical JOCD.
Taken together, this thesis significantly contributed to the knowledge gap of OA
and JOCD pathomechanisms. This work provided new insights into development of joint
degeneration in the MMT model and established a well-characterized baseline to evaluate
xxv
mechanistic effects of potential therapeutic agents in this OA-like model. It also
investigated mechanisms of action of AmnioFix, which may be leveraged to develop
more specific DMOADs. Most importantly, this thesis presented pioneering work on
patient-specific iPSC-based disease modeling. This is the first study to elucidate
pathomechanisms of JOCD and to establish JOCD-specific in vitro models for future
therapeutic testing.
1
CHAPTER 1. SPECIFIC AIMS
1.1 Introduction
As the population ages and lives longer, joint degenerative disorders impose a
larger burden in the healthcare system. Osteoarthritis (OA) is the most common form of
musculoskeletal disability, affecting approximately 30 million people in the US alone [1].
It is forecast that one in four people will develop OA in their lifetime [2]. Due to its
complexity and the many interactions in the joint space, the pathological events that take
place in OA development remain largely unknown. Therefore, current available
treatments are limited to pain management and eventual total joint replacement.
When OA affects the working or pediatric populations, the burden on lifestyle and
the healthcare system increases. Juvenile OsteoChondritis Dissecans (JOCD) affects
children and adolescents, and often progresses to early onset OA. The etiology of JOCD
is not fully understood, but it is believed to be a combination of factors such as
biomechanical overuse, trauma, and genetic predisposition. Unfortunately, molecular
pathological mechanisms are virtually unknown. Previous research has been primarily
focused on retrospective clinical studies, which has also hampered the development of
effective therapeutics for this disorder and the prevention of its progression to OA.
Current treatments are limited to invasive surgical interventions to salvage the necrotic
lesion at advance stages of this disorder.
The overall objective of this thesis is to elucidate pathophysiological mechanisms
of OA and JOCD models in order to fill gaps in knowledge as well to provide the field
2
with well-characterized platforms for future therapeutic development and testing. We
approached this objective through the following specific aims:
1.2 Specific Aim I
Investigate localized molecular events of disease progression in an in vivo post-
experimental model of post-traumatic OA
The rat medial meniscus transection (MMT) model is a frequently used model of
post-traumatic OA and is of high clinical relevance. This model replicates many
characteristics attributed to human OA, such as cartilage degeneration, osteophyte and
focal lesion formation, and cartilage fibrillation. However, this model has not yet been
characterized at the molecular level. The microenvironment that treatments encounter
upon delivery is unknown and thus mechanisms of action for the therapeutic in question
cannot be properly assessed. The objective of this aim was to characterize the MMT OA
model at the molecular level (gene expression), for multiple tissues, regions of interest
within the joint, and timepoints. Our hypothesis was that the MMT model replicates some
of the observed human OA pathomechanisms, such as degradation and remodeling of the
extracellular matrix (ECM) of the articular cartilage and chondrocyte dedifferentiation.
1.3 Specific Aim 2
Elucidate therapeutic mechanisms of micronized dehydrated amnion/chorion
membrane as a potential disease-modifying OA drug
In a previous study, intra-articular delivery of micronized dehydrated human
amnion/chorion membrane (AmnioFix Injectable, MiMedx, GA, USA) showed a
3
chondro-protective effect in the MMT post-traumatic OA animal model [3]. AmnioFix is
hypothesized to act through the synovial membrane. However, it is unknown how
AmnioFix modulates the microenvironment of the synovial membrane or the joint space,
if at all. As an ECM-based treatment, AmnioFix Injectable contains a cocktail of growth
factors and cytokines, and so, in order to dissect its potential disease-modifying
attributes, in-depth molecular analyses need to be performed. The objective of this aim
was to elucidate the mechanisms of action (via microarray gene expression) of AmnioFix
Injectable in the MMT model, in multiple tissues of different regions and at multiple
timepoints. We hypothesized that AmnioFix does indeed act through the synovial
membrane, down-regulating ECM degradation markers in the synovium, which protects
the articular cartilage from a faster degradation rate.
1.4 Specific Aim 3
Develop patient-specific iPSC-derived in vitro models of JOCD in order to elucidate
pathological mechanisms
iPSCs allow an endless supply of patient-specific cells and to be able to study
multiple aspects of the same disease by differentiating multiple tissues. Because JOCD
occurs in the still-developing pediatric population, its onset has been theoretically linked
with aberrations in the differentiation of the secondary physis. Previous research has
studied JOCD primary chondrocytes, but not chondrogenic differentiation or
endochondral ossification, which occur in the affected joints around the time JOCD
develops. Moreover, other diseases under the OCD umbrella (familial and equine) have
4
been directly associated with ER dysfunction, yet there are no studies to this date that
have investigated this pathological feature in JOCD patients.
The objective of this aim was to develop and study patient-specific iPSC-derived in
vitro models of JOCD of chondrogenesis and endochondral ossification (both considered
important processes in JOCD) and of ER-induced stress. Our overarching hypothesis was
that JOCD patients have a suboptimal bone matrix synthesis and assembly due to
impaired ER-stress-related responses, which may lead to a higher susceptibility to clinical
JOCD. These models did not only shed light in our understanding of JOCD pathology,
but also provided the field with well-characterized platforms for testing of therapeutic
interventions.
1.5 Significance and Scientific Impact
The burden of joint diseases is continually increasing as the population lives
longer and the incidence of co-morbidities (e.g. obesity) increase. The lack of effective
disease-modifying therapeutics is in part due to a gap in knowledge concerning the
pathological mechanisms of these diseases and the relevance of pre-clinical models. The
work described in this thesis is significant because it provides novel information that may
help bridge this gap for OA and JOCD. It also presents innovative tools and platforms to
test new therapeutic interventions for these diseases.
OA is a complex multi-tissue joint disease with various sub-phenotypes.
Therefore, the models in which potential drugs are tested should be thoroughly
characterized in order to understand the mechanisms of action of the therapeutic and to
infer for which OA cases it may be most efficacious. This thesis is the first to utilize
5
microarray gene expression technology to characterize the molecular events of OA
development in multiple tissues and regions of interest in the MMT post-traumatic
model. This work will provide the scientific community with a baseline to determine
whether the MMT model is appropriate for testing the therapeutic in question.
Furthermore, by studying molecular events in the MMT model, we shed light on tissue
interactions and the complexity of OA-like development in this model.
This work has also isolated molecular events that occur in the MMT model as a
response to ECM-based therapeutic AmnioFix Injectable. AmnioFix is currently
considered a potential disease-modifying treatment, and by utilizing our microarray gene
expression tool, we were able to suggest mechanisms that may be leveraged to create a
more specific therapeutic than AmnioFix. This thesis introduces the scientific community
to a perspective concerning the treatment of OA. Conventional approaches often seek to
treat or inhibit pro-inflammatory pathways within the joint; instead, we suggest the
approach of modulating the microenvironment of the joint towards a phenotype that
promotes wound healing mechanisms.
While OA is an active area of research within the musculoskeletal field, research
about the development and pathology of JOCD is very limited. This work is the first to
investigate JOCD differentiation mechanisms, in chondrogenesis and endochondral
ossification, as well as JOCD-specific mechanistic response to ER stress. By developing
JOCD-specific iPSC-derived in vitro models, not only did this thesis introduced cutting-
edge technology to the field, but it also became the first work to elucidate possible
pathological molecular events in JOCD. Early therapeutic interventions in JOCD are
conservative and with a high rate of failure (34% to 50%, [4-7]). The observations

6
presented in this work may help in the development of treatments and thus possible
prevention of OA in these patients. This work has also significantly contributed by being
the first to introduce JOCD-specific in vitro models, both of differentiation and of ER-
stress induction.
7
CHAPTER 2. BACKGROUND
2.1 Osteoarthritis
OA is the most common cause of musculoskeletal pain and disability worldwide,
with almost $200 billion per year impact on healthcare costs in the U.S. [1, 8, 9].
Although typically viewed as a result of bodily “wear and tear”, OA is now considered a
multifactorial disorder and to affect multiple tissues within the joint cavity. OA can be
divided into subtypes, some of which might have a more biochemical, inflammatory or
genetic signature than others, but all of which eventually converge into the common
phenotype [10]. OA is a full organ disease, and it is characterized by the progressive
breakdown of the articular cartilage, the formation of bony outgrowths at the joint margin
(osteophytes), subchondral bone sclerosis, hypertrophy of the joint capsule and
inflammation of the synovial membrane (synovitis) [11, 12]. Despite improved
understanding, the consequences of pathological events in OA are still poorly understood.
This is in part due to the heterogeneity of the disease and the complexity of interactions
among the different tissues within the joint space. Many questions remain about missing
links (unknown processes) and how the known processes come together to mediate the
pathogenesis of OA.
Currently, there are no FDA-approved DMOADs in the market. Therapeutic
interventions are targeted towards symptomatic management via pain control,
viscosupplementation (via intra-articular injections of hyaluronic acid) and joint
replacements [3, 9, 12]. Knee replacements alone cost nearly $30 billion annually in the
U.S., and they are primarily attributed to knee OA [13]. Total joint replacements are only
8
expected to last 15 to 20 years; therefore, doctors do not recommend these surgeries to
patients younger than 50 years old. This younger population has to endure OA symptoms
for longer periods of time despite their advanced stage, and when given the replacement
surgery, they outlive the implants and need revision surgeries. Although OA is typically
associated with old age, with approximately 37% of the US population over 60 years of
age affected [12, 14, 15] and 45% adults expected to suffer from it by the age of 85 [16],
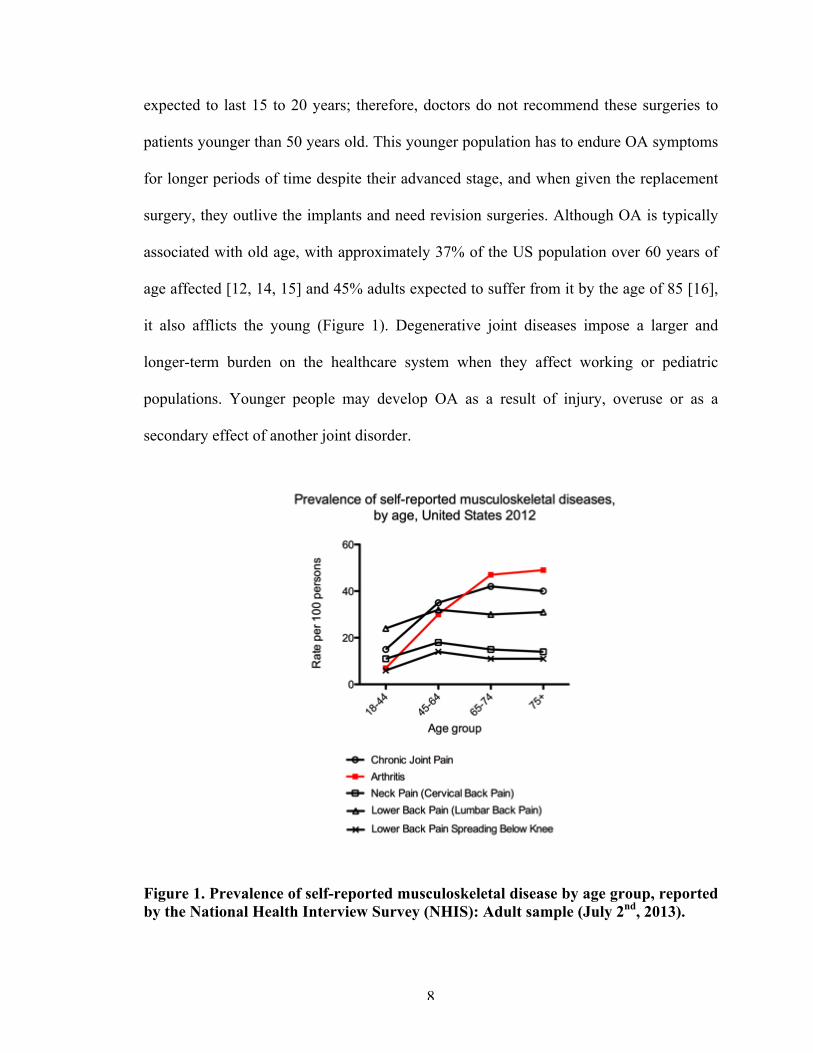
it also afflicts the young (Figure 1). Degenerative joint diseases impose a larger and
longer-term burden on the healthcare system when they affect working or pediatric
populations. Younger people may develop OA as a result of injury, overuse or as a
secondary effect of another joint disorder.
Figure 1. Prevalence of self-reported musculoskeletal disease by age group, reported by the National Health Interview Survey (NHIS): Adult sample (July 2nd, 2013).
9
2.1.1 Biological and molecular pathomechanisms
2.1.1.1 Cartilage
Key events occurring in cartilage during pathogenesis of OA include an
imbalance of metabolic and degradative signals, driven by cytokine cascades and the
production of inflammatory mediators [17]. Moreover, altered biomechanics, such as
those seen in joint malalignment, obesity or advanced stages of OA, induce and
potentiate further biochemical changes. Mechanical stress, by both static and intermittent
compression, increases nitric oxide (NO) production by chondrocytes as well as nitric
oxide synthase expression [17]. NO contributes to articular cartilage damage: it inhibits
collagen and proteoglycan synthesis, activates matrix metalloproteinases (MMPs), and
increases susceptibility to other oxidant injury [17]. Furthermore, two important
pathogenic events characteristic of OA chondrocytes, premature senescence and
apoptosis, appear to results from NO and other oxidative injury [17-21]. As a result, it has
been postulated that OA is a disease of premature aging of the joint; mechanically driven,
and chemically, particularly reactive oxygen species (ROS)-mediated [17].
2.1.1.2 Synovium
Accumulating evidence indicates that inflammation has a critical role in OA
pathogenesis, and that this inflammation is distinct from that in rheumatoid arthritis and
other autoimmune diseases: it is chronic, comparatively low-grade [12]. Because of this
feature and its low synovial fluid leukocyte counts, OA is classified as a non-
inflammatory arthritis. Yet, synovitis occurs even in early OA and can be sub-clinical, as
arthroscopic studies suggest that localized proliferative (thickening) and inflammatory
10
changes of the synovium occur in up to 50% of OA patients – many of whom do not
appear to have active inflammation [11, 17, 22]. Unlike rheumatoid arthritis, synovial
inflammation of OA is mostly confined to areas adjacent to pathologically damaged
cartilage and bone [23], which suggests that synovitis is a response to cartilage injury.
Once cartilage breakdown has begun, the synovial cells phagocytose the
breakdown products released into the synovial fluid, resulting in the synovial membrane
becoming hypertrophic and hyperplasic [11]. The activated synovium then releases pro-
inflammatory cytokines and catabolic mediators, which further alter the balance of
cartilage matrix degradation and repair and lead to excess production of the proteolytic
enzymes responsible for cartilage breakdown [11]. In this sense, the synovium and the
cartilage enter a positive feedback loop, in which destructive molecules are produced in a
vicious autocrine and paracrine fashion [17]. This inflammatory response is amplified by
activated synovial T cells, B cells and infiltrating macrophages [11].
To counteract this inflammatory response, the synovium has shown to produce
anti-inflammatory cytokines, which decrease the release of pro-inflammatory cytokines
and MMPs and inhibit the apoptosis of synovial cells, thus contributing to synovial
hypertrophy [11]. Unfortunately, persistence of the stimuli (injured cartialge) greatly
complicates the resolution of this inflammatory response in the synovium.
2.1.1.3 Bone
Given the intimate contact between the cartilage and bone, alterations of either
tissue will modulate the properties and function of the other joint component [24].
Marked alteration in the contour of the adjacent articulating surfaces in OA result in
11
modification in joint congruity that contribute to an adverse biomechanical environment
for both the bone and the cartilage itself [24]. Then, cellular processes of remodeling and
modeling occur in the bone as an adaptation to mechanical loads and damage.
Bone changes in OA can be divided into distinct patterns based on the anatomic
location and mechanisms involved in their pathogenesis [25]. These alterations include
progressive increase in subchondral plate thickness, modification in the architecture of
subchondral trabecular bone, formation of new bone at the joint margins (osteophytes),
development of subchondral bone cysts, bone marrow lesions, and advancement of the
tidemark associated with vascular invasion of the calcified cartilage [24-27].
Osteophytes are commonly thought to develop from mesenchymal cells in or near
the periosteum [28, 29], as a repair response to help stabilize degrading joint surfaces
[25], even though osteophytes also cause obvious negative effects such as pain and loss
of movement [30]. In this process, periosteal mesenchymal cells begin to proliferate at
the joint margin and subsequently differentiate into chondrocytes that undergo
hypertrophy and then endochondral ossification to create an enlarging skeletal outgrowth
at the joint margin [25].
Osteophyte formation is thought to be initiated and accelerated by the local
production of growth factors, particularly from the inflamed synovium. Apart from
mediating synovial activation, macrophages in the synovial lining can produce several
growth factors in high quantities, including chondroosseous-forming factors (e.g.
transforming growth factor-β, and bone morphogenetic protein-2 and -4) [30]. In several
models of experimental arthritis, selective depletion of macrophages from the synovial
12
lining prevents osteophyte formation [30-32]. Thus, synovial macrophages are crucial
intermediaries in the formation of osteophytes.
2.2 Juvenile osteochondritis dissecans
JOCD is an increasingly common cause of pain and dysfunction among skeletally
immature and young adult patients (typically ages 6 to 19), and progresses to early onset
OA [33-36]. Increased incidence is in part due to earlier and increasingly competitive
athletic endeavors and improved advanced imaging technology and diagnostic guidelines
[37-39]. The majority of JOCD lesions (61.7% [40]) are found in the knee, most
commonly in the medial femoral condyle. A study found that out of all JOCD lesions,
35.3% progressed to surgery, and out of that percentage, 58.5% were knee JOCD [40].
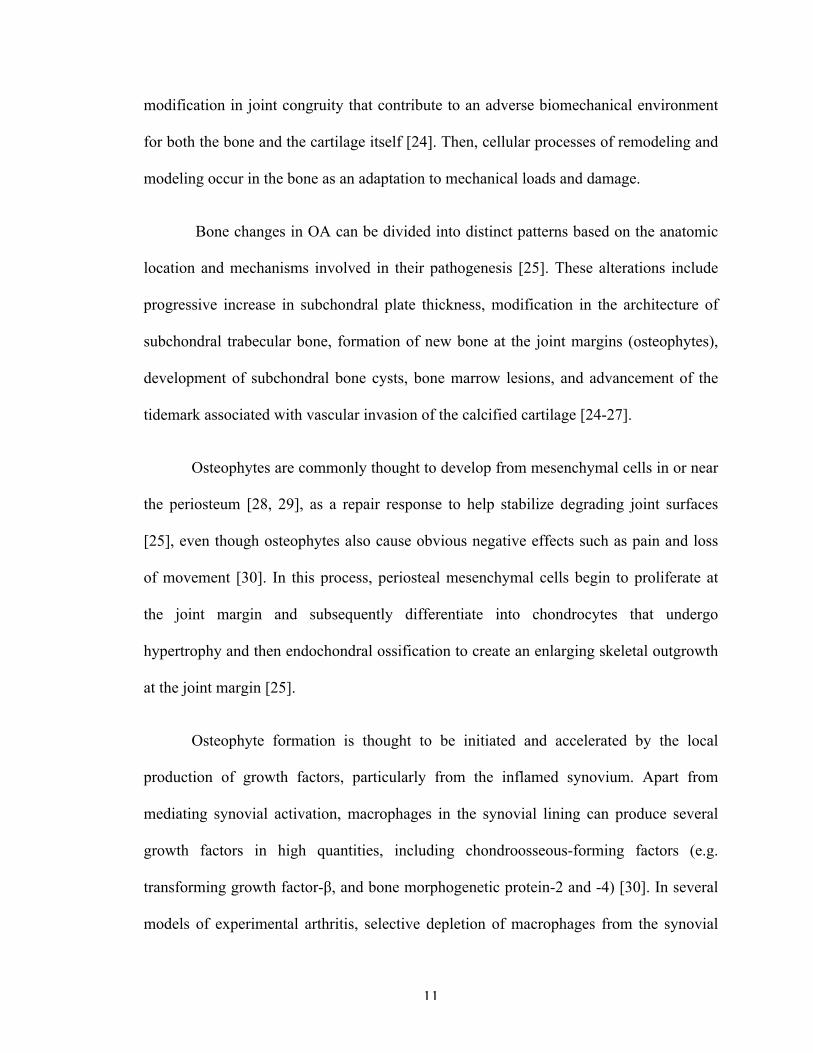
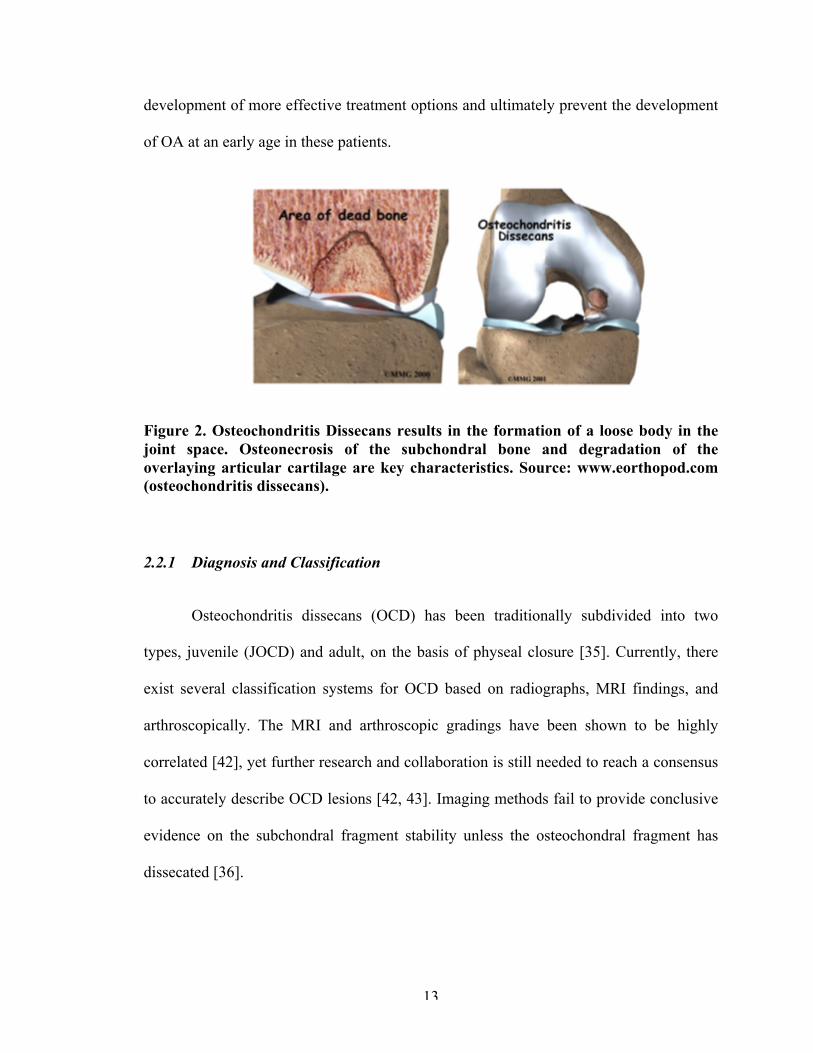
JOCD is hypothesized to initially involve the formation of an avascular lesion in
the subchondral bone with secondary effects in the overlaying articular cartilage [33, 34,
41]. During late stages of this musculoskeletal disorder, the lesion becomes unstable and
separation of an osteochondral fragment (loose body) ensues (Figure 2). Lesions early in
their course are associated with poorly defined symptoms: variable pain and swelling. As
the lesion progresses, catching, locking and pain are constant. The etiology of JOCD is
not fully understood but believed to be a multifactorial combination of biomechanical
overuse and genetic predisposition. However, previous research has been primarily
limited to retrospective clinical studies, and no study to date has thoroughly characterized
the pathological mechanisms associated with the onset and progression of JOCD [34]. An
improved understanding of the pathobiological mechanisms of JOCD may facilitate the
13
development of more effective treatment options and ultimately prevent the development
of OA at an early age in these patients.
Figure 2. Osteochondritis Dissecans results in the formation of a loose body in the joint space. Osteonecrosis of the subchondral bone and degradation of the overlaying articular cartilage are key characteristics. Source: www.eorthopod.com (osteochondritis dissecans).
2.2.1 Diagnosis and Classification
Osteochondritis dissecans (OCD) has been traditionally subdivided into two
types, juvenile (JOCD) and adult, on the basis of physeal closure [35]. Currently, there
exist several classification systems for OCD based on radiographs, MRI findings, and
arthroscopically. The MRI and arthroscopic gradings have been shown to be highly
correlated [42], yet further research and collaboration is still needed to reach a consensus
to accurately describe OCD lesions [42, 43]. Imaging methods fail to provide conclusive
evidence on the subchondral fragment stability unless the osteochondral fragment has
dissecated [36].
14
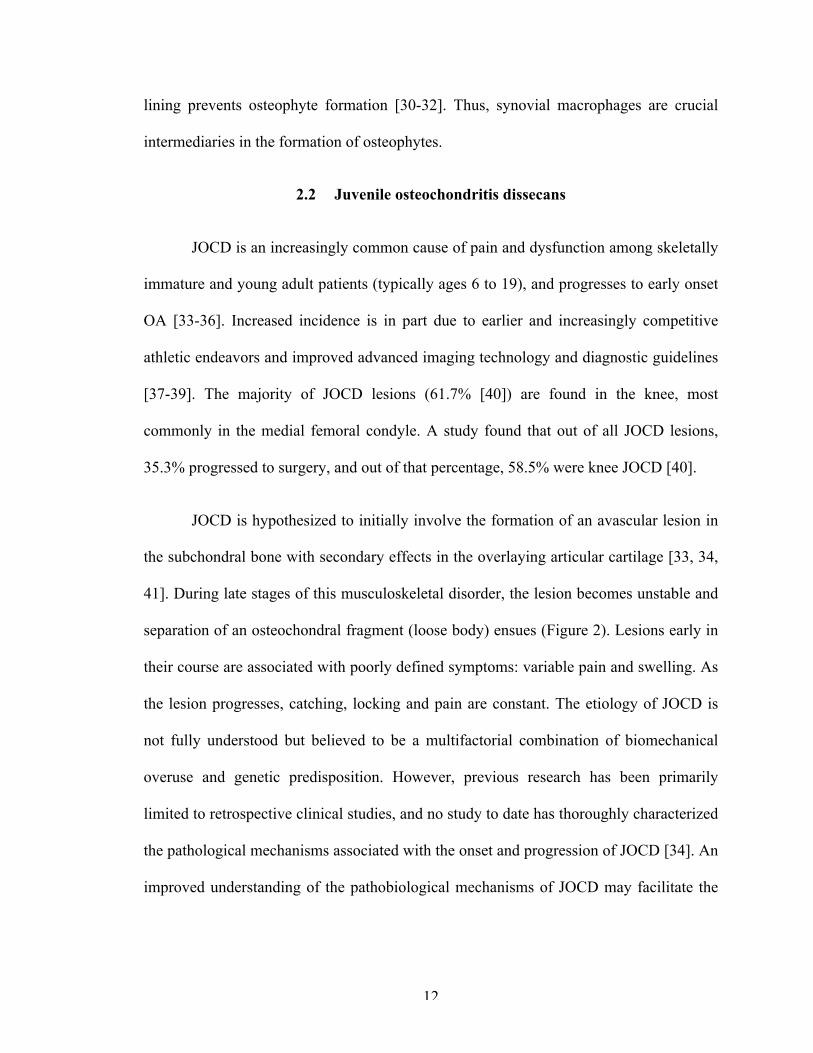
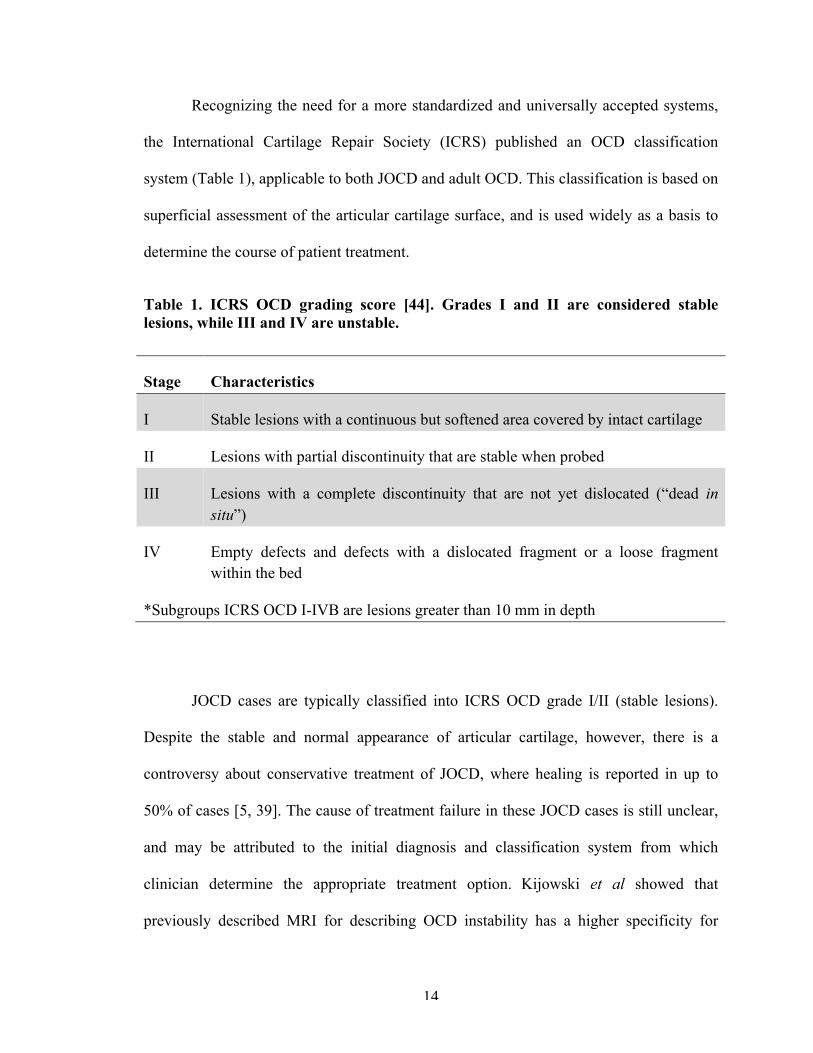
Recognizing the need for a more standardized and universally accepted systems,
the International Cartilage Repair Society (ICRS) published an OCD classification
system (Table 1), applicable to both JOCD and adult OCD. This classification is based on
superficial assessment of the articular cartilage surface, and is used widely as a basis to
determine the course of patient treatment.
Table 1. ICRS OCD grading score [44]. Grades I and II are considered stable lesions, while III and IV are unstable.
Stage Characteristics
I Stable lesions with a continuous but softened area covered by intact cartilage
II Lesions with partial discontinuity that are stable when probed
III Lesions with a complete discontinuity that are not yet dislocated (“dead in situ”)
IV Empty defects and defects with a dislocated fragment or a loose fragment within the bed
*Subgroups ICRS OCD I-IVB are lesions greater than 10 mm in depth
JOCD cases are typically classified into ICRS OCD grade I/II (stable lesions).
Despite the stable and normal appearance of articular cartilage, however, there is a
controversy about conservative treatment of JOCD, where healing is reported in up to
50% of cases [5, 39]. The cause of treatment failure in these JOCD cases is still unclear,
and may be attributed to the initial diagnosis and classification system from which
clinician determine the appropriate treatment option. Kijowski et al showed that
previously described MRI for describing OCD instability has a higher specificity for
15
adult (100% sensitivity, 100% specific) but not juvenile lesions of the knee (100%
sensitivity, 11% specific) [45].
Moreover, Yonetani et al. demonstrated that JOCD lesions in 8 symptomatic
patients had pathological instability despite stability at the articular surface [35].
Arthroscopically, the surface of the JOCD lesions appeared normal and stable.
Cylindrical biopsy (articular cartilage and bone) samples were obtained, and the extent of
damage was histologically evaluated. It was found that all biopsy specimen had
undergone separation between the cartilage and the subchondral bone, and that fibrous
and fibro-cartilage tissue filled in the separation site [35]. Therefore, there is a clear need
for an improved understanding and classification method for JOCD patients exclusively.
In spite of similarity, studies have demonstrated that there are physical features in adult
OCD, which are absent in JOCD. These distinct differences may be explained by the
level of skeletal maturation, and are sufficient to warrant separate diagnosis and
classification for JOCD.
In a recent epidemiology study, Weiss et al showed that progression to surgery for
OCD of the knee, elbow, and ankle strongly correlated with patient age at the time of
diagnosis [40]. Patients aged 12 to 19 years were 8.2 times more likely to progress to
surgery for all OCD lesions than patients aged 6 to 11 years [40]. This drastic difference
even among skeletally immature patients further supports the need for a better system of
JOCD classification in order to accurately diagnose a stage and its most appropriate
treatment. While imaging technology has helped push forward JOCD diagnosis, it has
shown its limits, and the implementation of biological markers may steer towards an
improved precise medicine.
16
2.2.2 Treatment
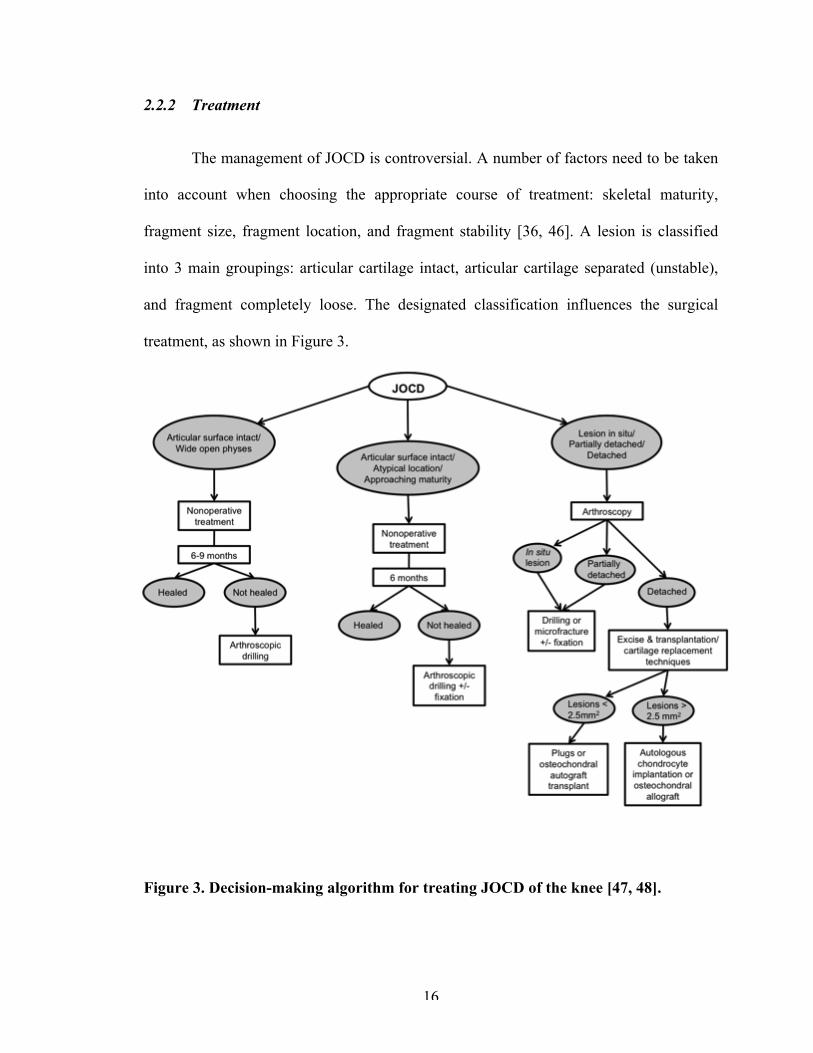
The management of JOCD is controversial. A number of factors need to be taken
into account when choosing the appropriate course of treatment: skeletal maturity,
fragment size, fragment location, and fragment stability [36, 46]. A lesion is classified
into 3 main groupings: articular cartilage intact, articular cartilage separated (unstable),
and fragment completely loose. The designated classification influences the surgical
treatment, as shown in Figure 3.
Figure 3. Decision-making algorithm for treating JOCD of the knee [47, 48].
17
Reportedly, non-operative treatment of JOCD is very successful in properly
selected patients. However, thanks to the implementation of advanced imaging
techniques with a higher sensitivity for diagnosis and outcome evaluation of JOCD, new
studies have started to report a much higher rate of failure. Wall et al. showed 34%
failure after non-operative treatment using MRI, while Cahill et al reported 50% failure
using more sensitive bone scintigraphy and radiographs [4-6]. Pain and/or mechanical
symptoms or lack of evidence of healing on radiographs or MRI that persist represent
failed non-operative treatment and indicate the need for surgery in up to 50% of patients
with stable JOCD lesions [4]. With non-operative treatment, an estimated 5% cumulative
incidence at 5 years after diagnosis developed symptomatic OA; 10% at 10 years, 20% at
25 years, and 30% at 35 years [49]. Depending on the age at which JOCD was diagnosed,
this could mean developing OA as early as 15 years of age.
Bone marrow stimulation techniques, in particular arthroscopic drilling, is
recommended for stable lesions with intact cartilage. The goal of this technique is to
create channels for vascular ingress stimulating local revascularization [36]. This
technique has been successful in skeletally immature patients, with healing rates of 75%
and higher [7, 50]. In patients with unstable or partially detached (ICRS OCD grade III)
lesions, fixation with pins or screws is the treatment of choice. Despite success rate,
patient morbidity associated with intra-articular fragment fixation and complications have
been reported in a number of cases [36]. Once the lesion has reached ICRS OCD grade
IV, the loose osteochondral fragment is excise and salvage procedures include
perichondral/periosteal autografts, autogeneous cell transplantation, abrasion
chondroplasty, osteochondral autografts, and osteochondral allografts depending on the
18
size and appearance of the lesion [46]. Unfortunately, most of these treatment options
result in the formation of fibrocartilage covering over the exposed defect rather than true
hyaline cartilage [36, 39, 46]. The long-term results from these procedures have yet to be
clearly determined [46], but fragment excision procedures have reported 79%
degenerative findings at a mean 11 year follow-up [51]. Advanced OCD lesions cause
mechanical disruption of joint motion, loose body formation, mechanical wear, and
attrition of associated surfaces on the tibial plateau or the meniscus [39]. In short, they
lead to the onset of OA.
2.2.3 Etiology
2.2.3.1 Repetitive trauma
Repeated microtrauma is the most recognized cause of OCD, because of the rising
incidence of this disorder among athletes. Aichroth et al. demonstrated 60% of the
patients with OCD in his study were involved in high-level, competitive sports [52]. A
multicenter study conducted by the European Pediatric Orthopeadic Society found nearly
55% of the patients with OCD were either regularly active in sports or performed
“strenuous athletic activity” [53].
The classic location of OCD in the posterolateral portion of the medial femoral
condyle suggests that indirect trauma is more likely the cause [54]. Repeated
impingement of the tibial spine on the lateral aspect of the medial femoral condyle during
internal rotation of the tibia has also been suggested to be a contributing factor [54, 55].
However, this theory would only explain lesions in that particular location.
19
2.2.3.2 Ischemia
Ischemia has been proposed as a potential cause of OCD. Enneking et al. found
the vascular supply to the subchondral bone to have poor anastomoses to surrounding
arterioles [54, 56]. It has been suggested that this propensity for ischemia could lead
subchondral none to form sequestra, making it particularly vulnerable to traumatic insult,
resultant fracture, and potential separation [54]. However, this hypothesis has met a
number of opposing arguments. Rogers and Gladstone studied the vascularity of the
distal part of the femur and found numerous anastomoses to intramedullary cancellous
bone [57]. Milgram demonstrated revascularization in 50 OCD lesions that were only
partially attached [58]. Furthermore, a few studies have shown a lack of osseous necrosis
upon examination of intact OCD lesions [35, 59], which may suggest that necrosis found
in OCD may be secondary to the actual detachment of the lesion rather than the
underlying etiology of formation [51]. Moreover, a number of research scientists believe
the ischemia hypothesis to be less likely in JOCD cases, because these young patients
probably have a good distal femoral blood supply (for knee OCD cases) [34].
2.2.3.3 Genetics
While an initial study by Petrie in 1977 found no clear genetic etiology for OCD
[60], several cases since then have been reported in which symmetric lesions in multiple
joins were present [61, 62] and in sets of monozygotic and dizygotic twins [62-68].
Furthermore, a new study by Gornitzky et al. found that the proportion of pediatric
patients with OCD (JOCD specifically) with positive family history was 14% [69].
2.2.3.4 Epiphyseal abnormalities
20
It has been hypothesized in the past that an aberrant development of only a
portion of the epiphyseal growth plate may lead to OCD formation [51, 70, 71]. The
concept is as follows: a single or repetitive insult to the endochondral epiphyseal growth
plate occurs at an unspecified time (this is where the hypothesis of trauma may converge)
[51]. With skeletal development, the uninjured region of endochondral epiphyseal
ossification continues to ossify unhindered creating an ever enlarging OCD, whereas the
injured region either completely stops ossification or temporarily stops [51]. In support
of this theory, current unpublished data from the ROCK (Research in OsteoChondritis of
the Knee) study group shows MRI signal (T2 fat saturation) for the epiphysis appears
disrupted at the margins of the OCD lesion [51]. In addition, Laor et al. found a
statistically significant frequency of discontinuity of the epiphysis overlaying JOCD
lesions and postulated that the chondroosseous irregularities observed might be the result
of disruption of normal process of endochondral ossification from the epiphysis [37].
Abnormal epiphysis ossification may also be the result of disruption of local
vasculature. In the epiphyseal ossification center, the newest bone formation occurs at the
chondroosseous junction of the growing epiphyseal ossification center. Thus, the
immediate subchondral bone can be considered a “metaphyseal equivalent.” As such,
disruption in the vascular supply to the secondary physis would result in persistent
cartilage extending deep and central to the chondroosseous border of the developing
epiphysis [37]. Increased width of overlying chondroepiphysis would be observed, just
like what was found in all of Laor’s JOCD subjects [37]. Furthermore, results of studies
in veterinary literature suggest that vascular injury to the epiphysis is responsible for the
development of osteochondral lesions that progress to OCD in animals such as rabbits,
21
birds, and foals [37, 72-75]. Transection of blood vessels within epiphyseal cartilage
canals in foals resulted in necrosis of vessels and chondrocytes, which led to a focal delay
in endochondral ossification and pathological cartilage fracture [75]. However, it is
unclear whether the initial insult in children would be located within the overlaying
chondroepiphysis or the metaphyseal-equivalent portion of the developing secondary
center of ossification [37].
2.2.4 Biological and molecular pathomechanisms
It has been shown that chondrocytes isolated from detached JOCD fragments
maintain similar cell viability and proliferative activity to those from normal healthy
cartilage [41, 76, 77]. CD166, a MSC surface marker, was detected in chondrocytes
packaged in normal cartilages and JOCD chondrocytes, suggesting similar regenerative
potential between these groups [41]. However, compared with normal chondrocytes
isolated from control samples, both JOCD loose body- and cartilage biopsy-derived
chondrocytes showed intracellular accumulation of matrix proteins that affected their
morphology [77]. Histological assessment of JOCD biopsies showed abnormal ECM
composition, which may be explained by the retention of matrix proteins intracellularly.
This feature has also been observed in familial [78] and equine OCD [79], and in
endoplasmic reticulum storage diseases (ERSD) [77]. All ERSD, including type II
collagenopathies, show a critical accumulation of misfolded proteins that result in
defective protein trafficking causing a phenotype characteristics of disease [77]. These
disease similarities may suggest a direct role of the endoplasmic reticulum (ER) in the
pathogenesis of JOCD.
22
Furthermore, JOCD is a disorder of the articular cartilage as well as the
subchondral bone; however, no study to date has explored the mechanisms in JOCD
endochondral ossification or the involvement of JOCD osteoblasts in the pathological
mechanisms of the disorder. Osteoblasts are highly specialized cells that synthesize bone.
They are key players in bone remodeling, and their misregulation may contribute to
failure to heal the initial bone lesion in JOCD.
23
CHAPTER 3. REGIONAL GENE EXPRESSION ANALYSIS OF
MULTIPLE TISSUES OF THE MEDIAL MENISCUS
TRANSECTION MODEL OF POST-TRAUMATIC
OSTEOARTHRITIS
3.1 Abstract
The objective of this study was to characterize local disease progression of the medial
meniscus transection (MMT) model of post-traumatic OA at the molecular level, in order to
establish a baseline for therapeutic testing at the preclinical stage and possibly discern molecular
events that may further elucidate OA pathogenesis. Weight-matched male Lewis rats underwent
MMT or sham surgery on the left limb with the right leg as contralateral control. At 1 and 3
weeks post-surgery, tissues were harvested from different areas of the articular cartilage (medial
and lateral tibial plateaus, and medial osteophyte region) and synovium (medial and lateral), and
analyzed separately. RNA was extracted and used for microarray gene expression (RT-PCR)
analysis.
Results showed that gene expression changes due to surgery were isolated to the medial
side of the joint. In the articular cartilage, gene changes in chondrocyte phenotype preceded
changes in tissue composition genes. Differences in inflammatory markers were only observed at
the osteophyte region at 3 weeks post-surgery. In the synovium, there was surgical noise at week
1, which dissipated at 3 weeks post-surgery. At this later timepoint, meniscal instability resulted
in elevated expression of matrix degradation markers and osteogenic markers in the synovium
and cartilage. These results suggest feedback interactions between joint tissues during disease
progression. Regional tissue expression differences found in MMT joints indicated similar
pathophysiology to human OA, and provided novel insights about this degeneration model. The
24
examination of gene expression at a localized level in multiple tissues provided a well-
characterized baseline to evaluate mechanistic effects of potential therapeutic agents on OA
disease progression in the MMT model.
3.2 Introduction
There is a need for full characterization of pre-clinical models, with a view to
comparison to human OA pathophysiology and to establish a baseline for therapeutic
testing in these systems. Preclinical animal models of OA include experimentally
accelerated but naturally occurring joint degeneration, transgenic mouse models, and
surgically or chemically induced OA [80]. Unfortunately, none of these models can fully
replicate the features and symptoms of human OA. Nevertheless, the impact of
preclinical research will depend largely on the choice of the most appropriate model of
OA for the specific process under investigation [80]. The disconnect between positive
results in preclinical studies and failed clinical trials supports the need for better
understanding of currently available preclinical models at the biological and molecular
level in order to evaluate more accurately the therapeutic mechanisms of the tested
treatment.
The rat MMT model is a frequently used model of post-traumatic OA, and is of
high clinical relevance. The transection of the meniscus at its narrowest point alters the
mechanical stability of the knee joint and induces OA-like progressive damage: cartilage
degeneration involving chondrocyte and proteoglycan loss, osteophyte and focal lesion
formation, collagen degradation and cartilage fibrillation [81]. The MMT model is known
for localized degeneration primarily restricted to the medial tibial plateau. However,
25
despite being the industry standard for therapeutic testing, local disease progression
events have not been thoroughly characterized in this model and assessment of
therapeutic outcomes is largely limited to classical histology or microCT (morphological
analyses) as endpoint readouts [81].
To date, a single study has reported on changes in the articular cartilage
transcriptome of the rat MMT model. 20 genes differentially expressed between MMT
and sham groups were identified, and the study concluded that the model paralleled key
features of OA pathology, namely articular cartilage extracellular matrix (ECM)
remodeling, angiogenesis, and chondrocyte cell death [82]. In this study, articular
cartilage from both medial and lateral sides of the tibial plateaus and femoral condyles
were collected from each animal, and then the cartilage tissue from 5 animals was pooled
to create a single sample [82]. Cartilage collection from the entire joint and pooling of
samples is standard for gene expression analyses in OA small animal models [82-84]. Yet
this practice may mask identification of localized events in such models, and fails to
account for inter-individual variability. With advances in microarray RT-PCR
technology, we are now able to analyze tissues of much lower cell concentration.
The objective of this study was to characterize the gene expression changes in
MMT, sham and control groups for each side of the articular cartilage of the tibial
plateau, for the osteophyte region, and for each side of the synovium. This study is the
first to elucidate localized disease progression in the rat MMT model and to identify
genetic regulation in osteophyte and synovial tissues in an OA preclinical model.
26
3.3 Materials and methods
3.3.1 MMT model
The Georgia Institute of Technology Institutional Animal Care and Use
Committee approved all experimental animal procedures (IACUC protocol #A14023). 48
Weight-matched male Lewis rats (300-325 g) were acclimated for 1 week before
surgeries. A small incision was made through the skin on the medial aspect of the
femoro-tibial joint of the left limb. The medial collateral ligament (MCL) was exposed by
blunt dissection and transected to visualize the joint space and medial meniscus. In the
MMT group (24 animals), the meniscus was transected completely at its narrowest point;
while in the sham group (24 animals), the meniscus was exposed but left intact. The
inclusion of the sham group enabled distinction of gene expression changes due to joint
instability from those simply due to surgery. The skin was closed with 4.0 silk sutures
and then stapled using wound clips. MMT and sham surgeries were randomized.
Rats were euthanized via CO2 inhalation at 1 and 3 weeks post-surgery (n=12 per
group per timepoint), and tissues were harvested and analyzed in a blind manner. The
naïve right limbs were used as contralateral baseline controls. 9 animals were allocated
for gene expression experiments and 3 for histology per group (power analysis: α=0.05,
β=0.05).
3.3.2 Microarray gene expression experiment
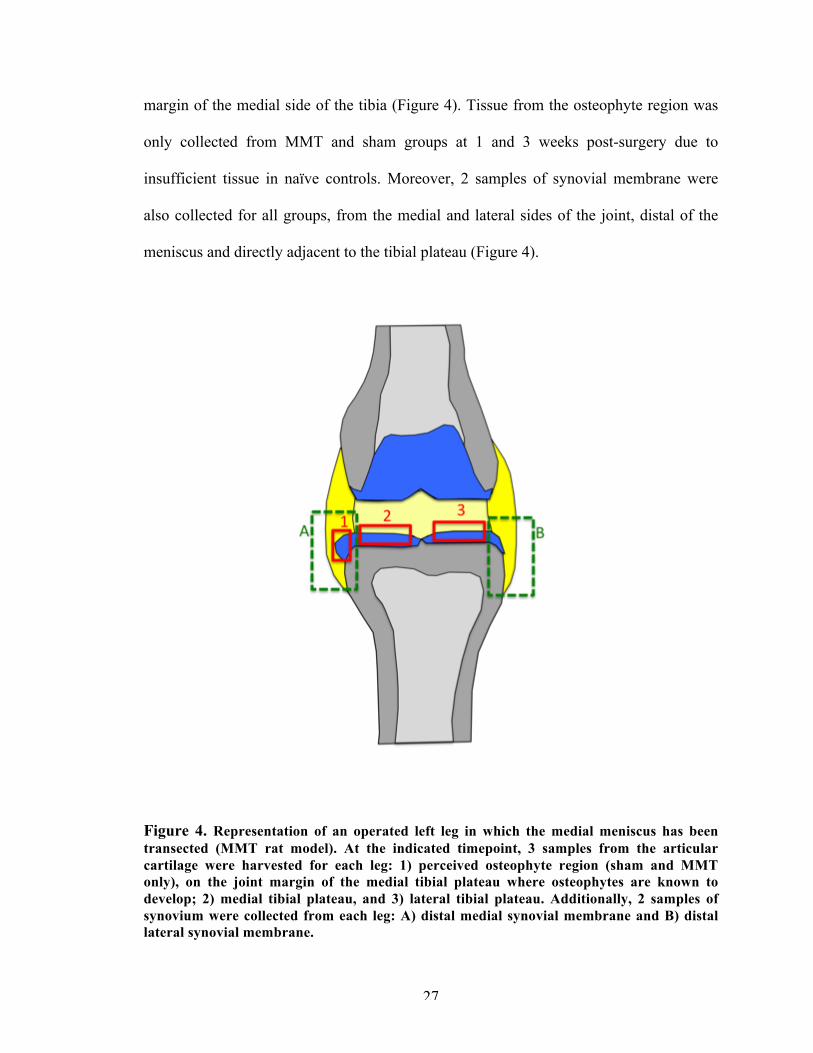
From each leg, 3 samples of cartilage tissue were collected: the medial tibial
plateau region, the lateral tibial plateau region, and the osteophyte region at the joint
27
margin of the medial side of the tibia (Figure 4). Tissue from the osteophyte region was
only collected from MMT and sham groups at 1 and 3 weeks post-surgery due to
insufficient tissue in naïve controls. Moreover, 2 samples of synovial membrane were
also collected for all groups, from the medial and lateral sides of the joint, distal of the
meniscus and directly adjacent to the tibial plateau (Figure 4).
Figure 4. Representation of an operated left leg in which the medial meniscus has been transected (MMT rat model). At the indicated timepoint, 3 samples from the articular cartilage were harvested for each leg: 1) perceived osteophyte region (sham and MMT only), on the joint margin of the medial tibial plateau where osteophytes are known to develop; 2) medial tibial plateau, and 3) lateral tibial plateau. Additionally, 2 samples of synovium were collected from each leg: A) distal medial synovial membrane and B) distal lateral synovial membrane.
28
Total RNA from cartilage tissues was extracted using the RNeasy MinElute
Clean-up Kit with QIAzol Lysis Reagent. Total RNA from synovium was extracted using
the RNeasy Lipid Tissue Mini Kit with QIAzol Lysis Reagent. RNA quality and
concentration for all samples were determined using the Nanodrop ND-1000
Spectrophotometer (ThermoFisher). Normalized RNA was converted to cDNA via the
RT2 First Strand Kit. All reagents were from Qiagen unless otherwise stated.
RNA expression was quantified using the Taqman real-time PCR Fluidigm
Dynamic Array Integrated Fluidic Circuits (BioMark, Fluidigm). Our cDNA samples
were tested against 40 genes (TaqMan gene expression assays, ThermoFisher, Table 2),
which were selected from human OA literature. AccuRef rat universal cDNA (Gene
Scientific) and ultrapure water were used as positive and negative controls, respectively,
to ensure run fidelity. The Ct values greater than 37 were treated as 37, namely as null
(lower Ct values correspond to higher expression since they represent the PCR cycle at
which a threshold level of product is observed).
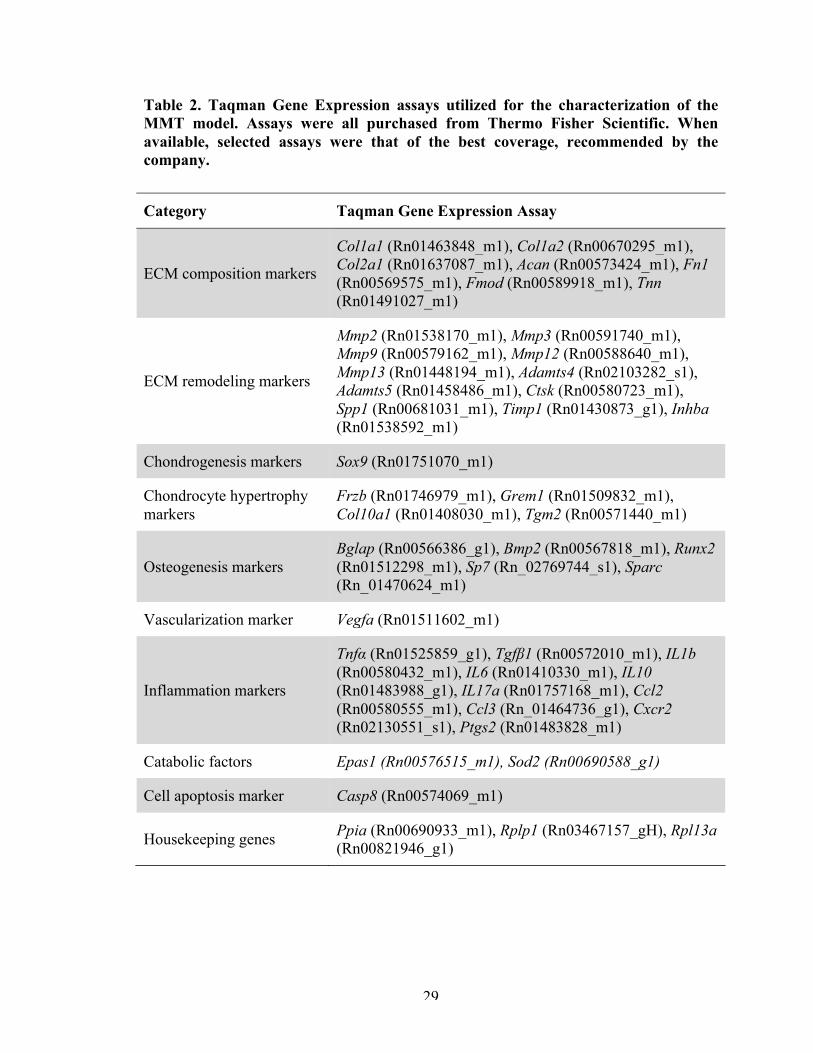
29
Table 2. Taqman Gene Expression assays utilized for the characterization of the MMT model. Assays were all purchased from Thermo Fisher Scientific. When available, selected assays were that of the best coverage, recommended by the company.
Category Taqman Gene Expression Assay
ECM composition markers
Col1a1 (Rn01463848_m1), Col1a2 (Rn00670295_m1), Col2a1 (Rn01637087_m1), Acan (Rn00573424_m1), Fn1 (Rn00569575_m1), Fmod (Rn00589918_m1), Tnn (Rn01491027_m1)
ECM remodeling markers
Mmp2 (Rn01538170_m1), Mmp3 (Rn00591740_m1), Mmp9 (Rn00579162_m1), Mmp12 (Rn00588640_m1), Mmp13 (Rn01448194_m1), Adamts4 (Rn02103282_s1), Adamts5 (Rn01458486_m1), Ctsk (Rn00580723_m1), Spp1 (Rn00681031_m1), Timp1 (Rn01430873_g1), Inhba (Rn01538592_m1)
Chondrogenesis markers Sox9 (Rn01751070_m1)
Chondrocyte hypertrophy markers
Frzb (Rn01746979_m1), Grem1 (Rn01509832_m1), Col10a1 (Rn01408030_m1), Tgm2 (Rn00571440_m1)
Osteogenesis markers Bglap (Rn00566386_g1), Bmp2 (Rn00567818_m1), Runx2 (Rn01512298_m1), Sp7 (Rn_02769744_s1), Sparc (Rn_01470624_m1)
Vascularization marker Vegfa (Rn01511602_m1)
Inflammation markers
Tnfα (Rn01525859_g1), Tgfβ1 (Rn00572010_m1), IL1b (Rn00580432_m1), IL6 (Rn01410330_m1), IL10 (Rn01483988_g1), IL17a (Rn01757168_m1), Ccl2 (Rn00580555_m1), Ccl3 (Rn_01464736_g1), Cxcr2 (Rn02130551_s1), Ptgs2 (Rn01483828_m1)
Catabolic factors Epas1 (Rn00576515_m1), Sod2 (Rn00690588_g1)
Cell apoptosis marker Casp8 (Rn00574069_m1)
Housekeeping genes Ppia (Rn00690933_m1), Rplp1 (Rn03467157_gH), Rpl13a (Rn00821946_g1)
30
3.3.3 Gene expression statistical analyses
Ct values were subtracted from 37 in order to invert them: this converts the data
to a more intuitive scale in which higher values now represent higher levels of RNA
transcription for each gene. To calculate the relative gene expression (ΔCt), Ct values
were normalized by the geometric mean of three housekeeping genes: Ppia, Rplp1 and
Rpl13a (Equation 1). The raw Ct values of these housekeeping genes were not
statistically different across different tissue types (cartilage and synovium), regions of
interest (medial, lateral or osteophyte regions), or timepoints (1 and 3 weeks) (data not
shown). In order to correct experimental differences observed between biological
replicates and runs, the medians of each replicate experiment were median centered by
subtracting the median normalized relative expression level across all conditions in a
given replicate experiment for that same experiment. This step does not affect the fold
induction, but it provides a correction for the difference in background or control level
between independent biological repeats [85]. The Quantile Range Outlier (QRO) test was
performed to remove any outliers. All statistical calculations were performed with JMP
Genomic software (SAS Institute, Cary, NC, USA).
∆𝐶𝑡 = 𝐶𝑡!"#$%! − 𝐶𝑡!!"#$%$$&'() !"#"
Equation 1. Equation for the relative expression of a target gene (ΔCt).
3.3.3.1 Principal component analysis (PCA) and unsupervised clustering analysis.
Scripts from JMP Genomic software were used to perform both analyses. In the
weighted average proportions of the PCA models, a residual (unexplained) variance
higher than 60% was considered as too noisy and to have too many potential confounding
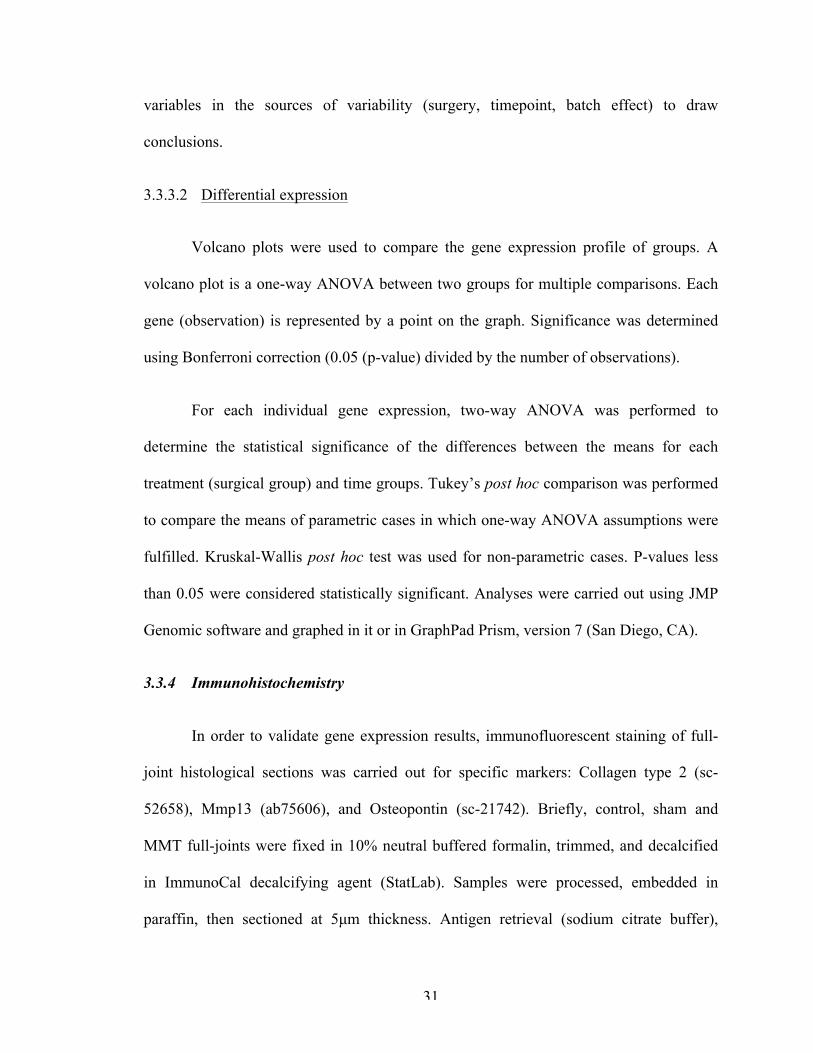
31
variables in the sources of variability (surgery, timepoint, batch effect) to draw
conclusions.
3.3.3.2 Differential expression
Volcano plots were used to compare the gene expression profile of groups. A
volcano plot is a one-way ANOVA between two groups for multiple comparisons. Each
gene (observation) is represented by a point on the graph. Significance was determined
using Bonferroni correction (0.05 (p-value) divided by the number of observations).
For each individual gene expression, two-way ANOVA was performed to
determine the statistical significance of the differences between the means for each
treatment (surgical group) and time groups. Tukey’s post hoc comparison was performed
to compare the means of parametric cases in which one-way ANOVA assumptions were
fulfilled. Kruskal-Wallis post hoc test was used for non-parametric cases. P-values less
than 0.05 were considered statistically significant. Analyses were carried out using JMP
Genomic software and graphed in it or in GraphPad Prism, version 7 (San Diego, CA).
3.3.4 Immunohistochemistry
In order to validate gene expression results, immunofluorescent staining of full-
joint histological sections was carried out for specific markers: Collagen type 2 (sc-
52658), Mmp13 (ab75606), and Osteopontin (sc-21742). Briefly, control, sham and
MMT full-joints were fixed in 10% neutral buffered formalin, trimmed, and decalcified
in ImmunoCal decalcifying agent (StatLab). Samples were processed, embedded in
paraffin, then sectioned at 5µm thickness. Antigen retrieval (sodium citrate buffer),
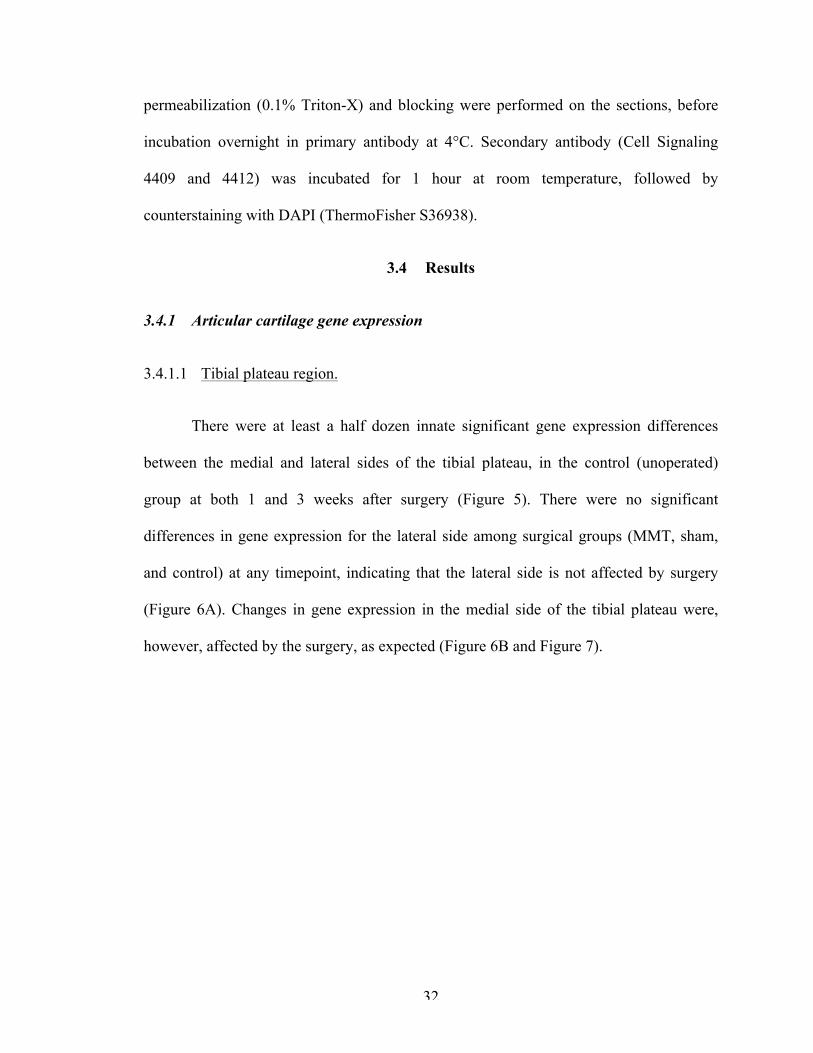
32
permeabilization (0.1% Triton-X) and blocking were performed on the sections, before
incubation overnight in primary antibody at 4°C. Secondary antibody (Cell Signaling
4409 and 4412) was incubated for 1 hour at room temperature, followed by
counterstaining with DAPI (ThermoFisher S36938).
3.4 Results
3.4.1 Articular cartilage gene expression
3.4.1.1 Tibial plateau region.
There were at least a half dozen innate significant gene expression differences
between the medial and lateral sides of the tibial plateau, in the control (unoperated)
group at both 1 and 3 weeks after surgery (Figure 5). There were no significant
differences in gene expression for the lateral side among surgical groups (MMT, sham,
and control) at any timepoint, indicating that the lateral side is not affected by surgery
(Figure 6A). Changes in gene expression in the medial side of the tibial plateau were,
however, affected by the surgery, as expected (Figure 6B and Figure 7).
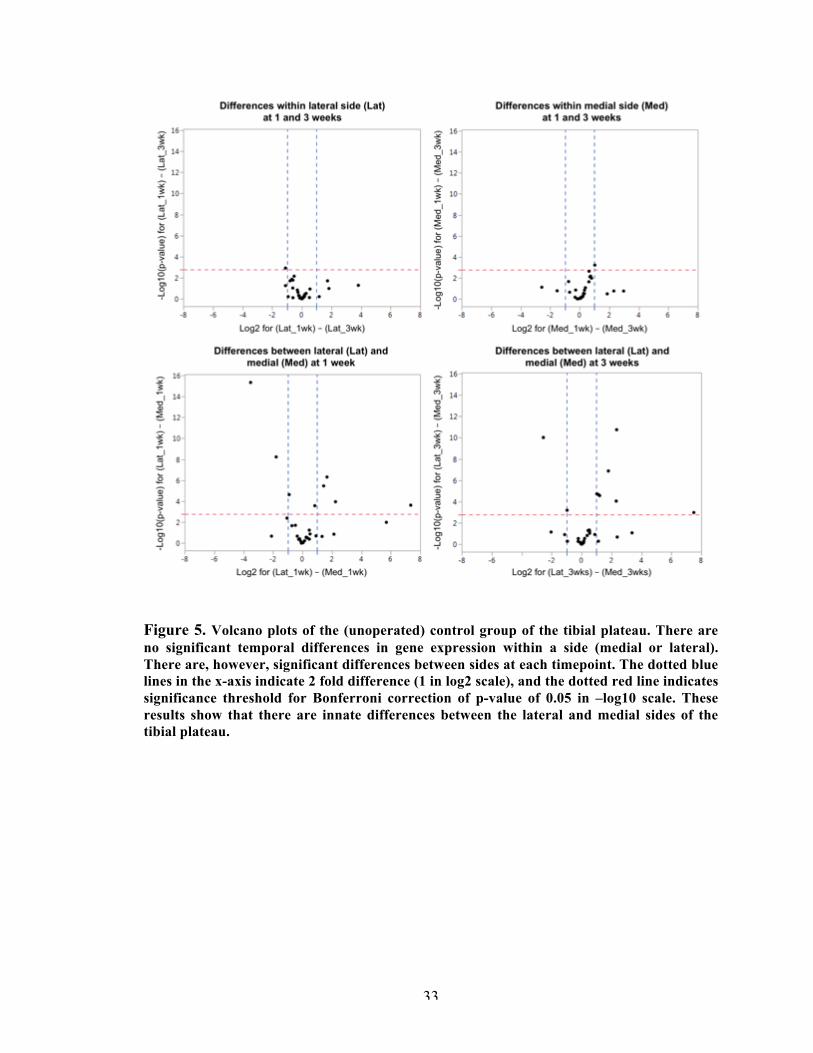
33
Figure 5. Volcano plots of the (unoperated) control group of the tibial plateau. There are no significant temporal differences in gene expression within a side (medial or lateral). There are, however, significant differences between sides at each timepoint. The dotted blue lines in the x-axis indicate 2 fold difference (1 in log2 scale), and the dotted red line indicates significance threshold for Bonferroni correction of p-value of 0.05 in –log10 scale. These results show that there are innate differences between the lateral and medial sides of the tibial plateau.
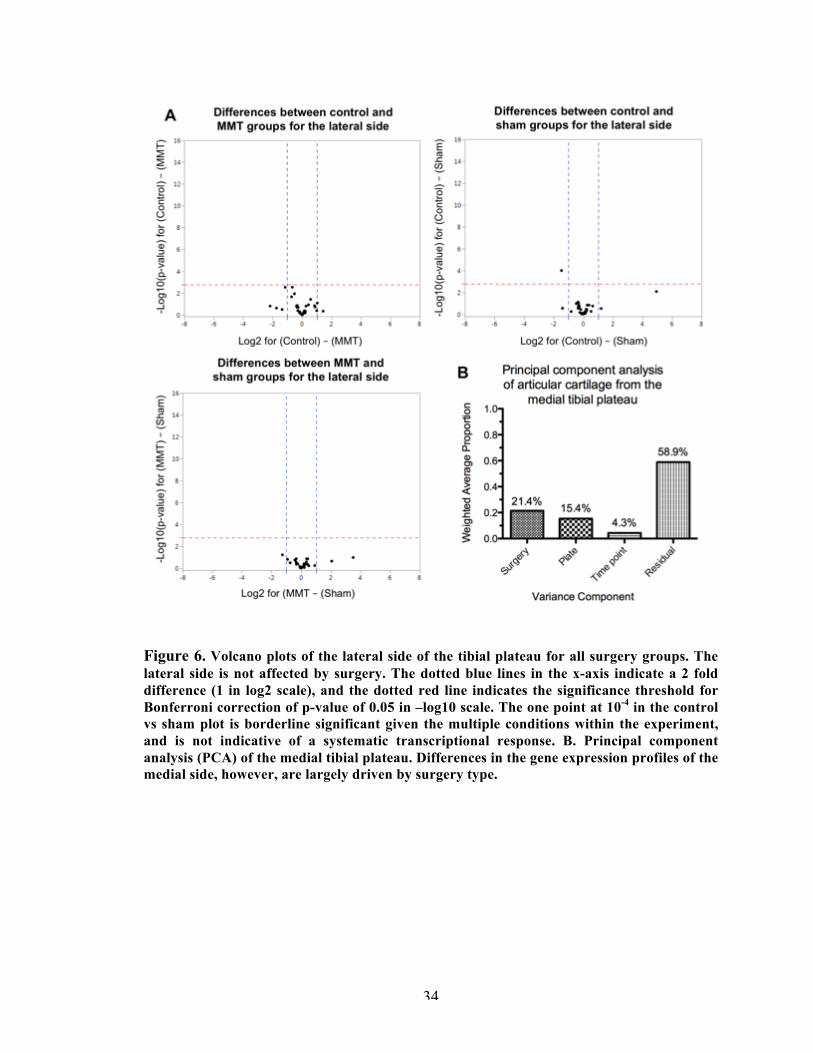
34
Figure 6. Volcano plots of the lateral side of the tibial plateau for all surgery groups. The lateral side is not affected by surgery. The dotted blue lines in the x-axis indicate a 2 fold difference (1 in log2 scale), and the dotted red line indicates the significance threshold for Bonferroni correction of p-value of 0.05 in –log10 scale. The one point at 10-4 in the control vs sham plot is borderline significant given the multiple conditions within the experiment, and is not indicative of a systematic transcriptional response. B. Principal component analysis (PCA) of the medial tibial plateau. Differences in the gene expression profiles of the medial side, however, are largely driven by surgery type.
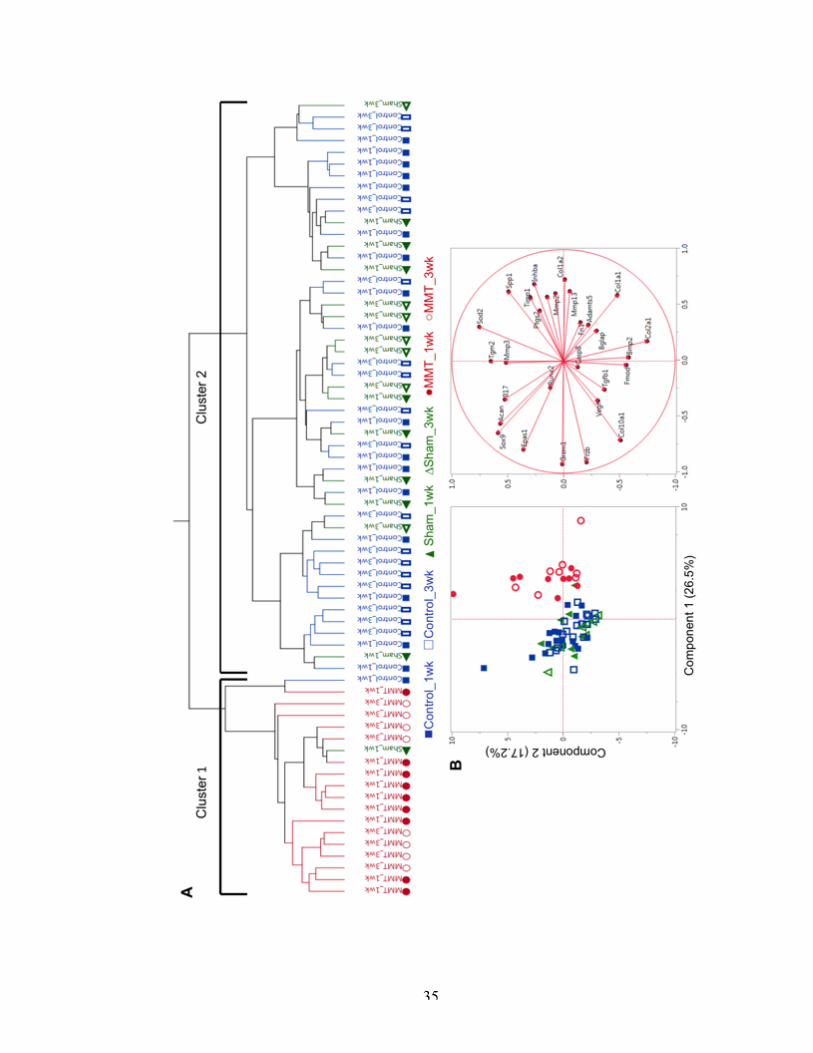
35
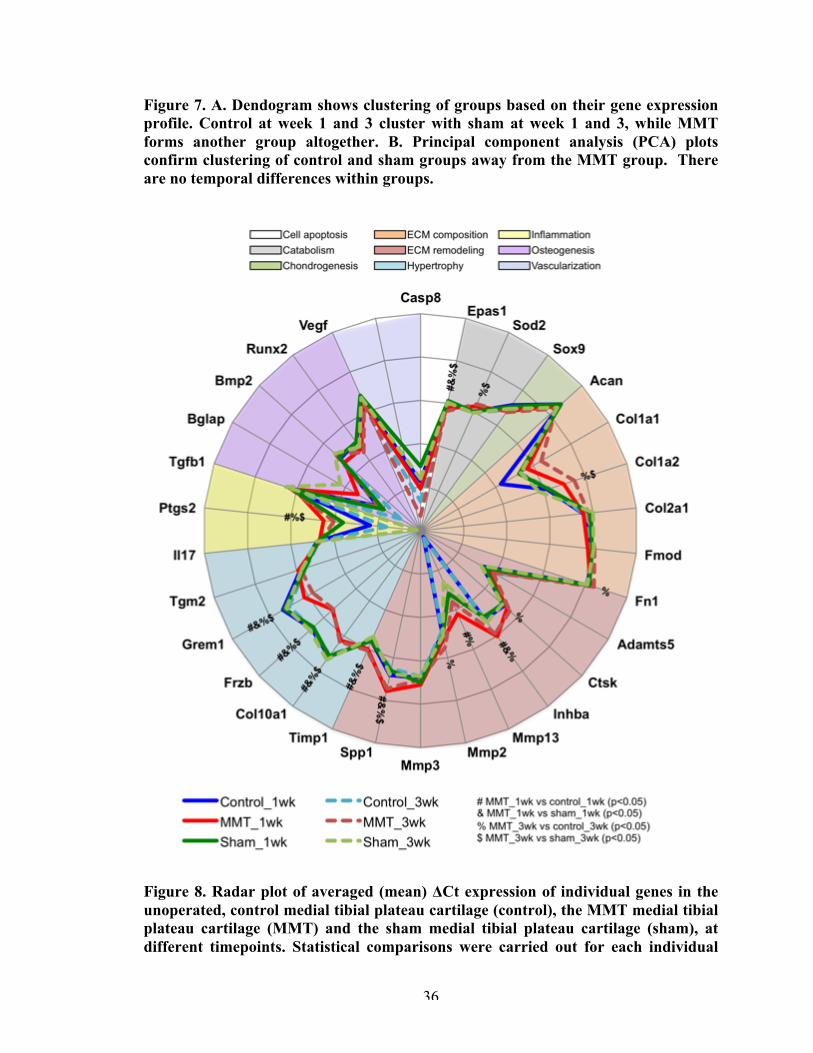
36
Figure 7. A. Dendogram shows clustering of groups based on their gene expression profile. Control at week 1 and 3 cluster with sham at week 1 and 3, while MMT forms another group altogether. B. Principal component analysis (PCA) plots confirm clustering of control and sham groups away from the MMT group. There are no temporal differences within groups.
Figure 8. Radar plot of averaged (mean) ΔCt expression of individual genes in the unoperated, control medial tibial plateau cartilage (control), the MMT medial tibial plateau cartilage (MMT) and the sham medial tibial plateau cartilage (sham), at different timepoints. Statistical comparisons were carried out for each individual
37
gene as described in the methods. # indicates significant (p<0.05) difference between MMT and control at week 1; & between MMT and sham at week 1; % between MMT and control at week 3; and $ between MMT and sham at week 3. There were not statistical differences between timepoints within surgical groups.
3.4.1.1.1 Medial tibial plateau.
A clustering analysis showed that the gene expression profiles of control and
sham samples were similar enough to be grouped into one cluster, while the MMT
samples belonged to a different cluster entirely (Figure 7). This was confirmed with a
PCA (Figure 1), which showed that MMT samples cluster separately from the control and
sham groups. There were no temporal differences (week 1 vs. 3) within each cluster.
Overall, expression of 14 genes was significantly different in the MMT group, when
compared to control and sham groups (Figure 8 and Figure 9). There were no significant
differences between the control and sham groups.
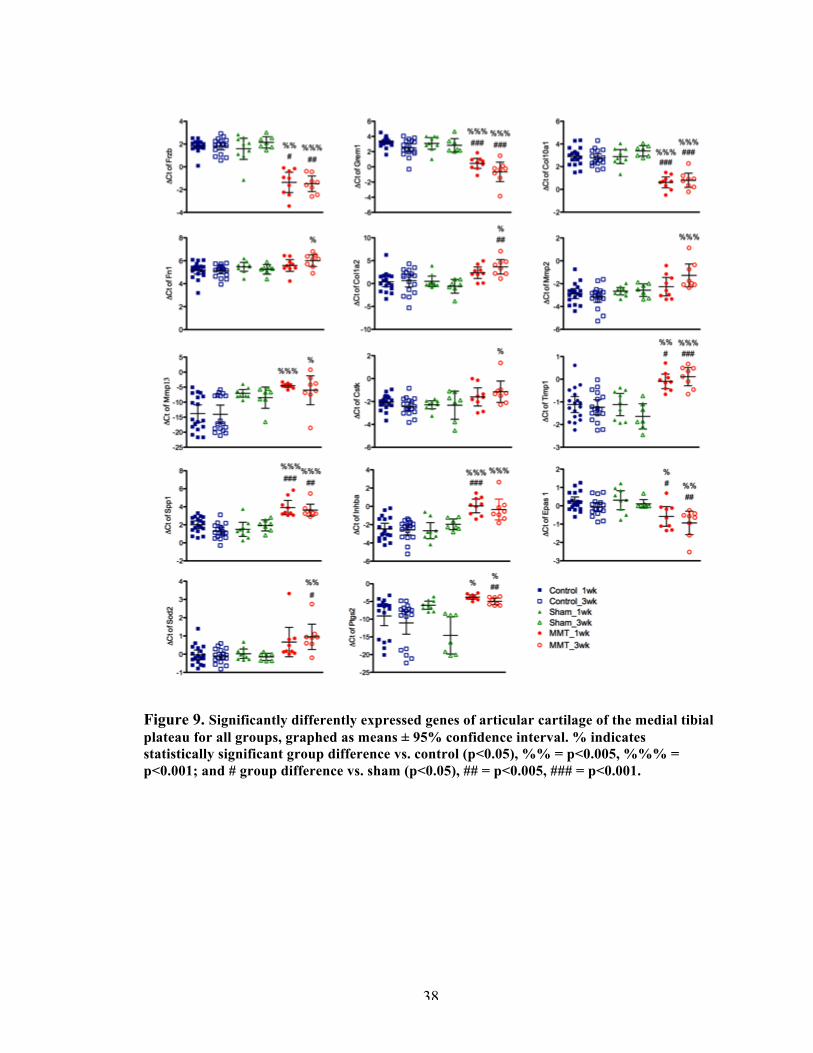
38
Figure 9. Significantly differently expressed genes of articular cartilage of the medial tibial plateau for all groups, graphed as means ± 95% confidence interval. % indicates statistically significant group difference vs. control (p<0.05), %% = p<0.005, %%% = p<0.001; and # group difference vs. sham (p<0.05), ## = p<0.005, ### = p<0.001.
39
Chondrocyte hypertrophy genes were differentially regulated as early as 1 week
in the MMT group: Frzb, Grem1, Col10a1. Frzb (Frizzle-related protein) and Grem1
(Gremlin 1) are Wnt-pathway antagonists, and were downregulated at weeks 1 and 3. The
Wnt pathway is associated with articular chondrocyte dedifferentiation [86]. Its activation
in vivo and in vitro leads to reprogramming of articular chondrocytes toward catabolism
or loss of stable phenotype with subsequent loss of tissue structure and function [87].
Col10a1 (type 10 collagen) was also underexpressed in the MMT group, observed at both
week 1 and 3.
Gene expression of key cartilage extracellular matrix (ECM) protein markers,
Col2a1 (type II collagen) and Acan (aggrecan), was not significantly different among
groups. However, Fn1 (fibronectin) and Col1a2 (type I collagen) were overexpressed by
week 3 in the MMT model.
Markers for matrix degradation proteins and their inhibitors were also
differentially expressed in the MMT group. Mmp13 (metalloproteinase) is considered the
primary collagenase in OA, and it was overexpressed at weeks 1 and 3, while Mmp2 and
Ctsk (cathepsin k) were elevated at week 3 only. Timp1 and Inhba are inhibitors of these
matrix degradation s, and they were both overexpressed at weeks 1 and 3. Timp1 is a
metalloproteinase inhibitor which acts on Mmps (relevant to this study, Mmp2, Mmp3,
Mmp9, Mmp12, Mmp13). Inhba has shown to inhibit aggrecanase-mediated cleavage of
aggrecan in human and rat articular cartilage [82].
Spp1 (osteopontin) is a matrix remodeling marker and was overexpressed as early
as week 1 in the MMT model. Spp1 has been implicated in a number of physiological and
40
pathological events, including maintenance or reconfiguration of tissue integrity during
inflammatory processes [88].
Known catabolic factors in OA were dysregulated in the MMT model. Epas1
encodes hypoxia-inducible factor-2alpha (HIF-2α), a known catabolic factor in the
osteoarthritic process. HIF-2α regulates the expression of several matrix-degrading
enzymes, and its overexpression is associated with increased chondrocyte apoptosis and
OA cartilage destruction [89]. In this study, however, we observed a lower expression of
Epas1 at weeks 1 and 3. Sod2 (superoxide dismutase 2) is also a marker for catabolism in
the articular cartilage, and it was overexpressed in the MMT group at weeks 1 and 3.
Sod2 is a mitochondrial enzyme that converts superoxide to hydrogen peroxide, acts in
oxidative stress response, and may affect aging [82].
Lastly, Ptgs2 (prostaglandin-endoperoxide synthase 2 encoding cyclooxygenase 2
[COX-2]) is an inflammatory response gene whose product converts arachidonate to
inflammatory prostaglandins [82]. Ptgs2 was significantly overexpressed in the MMT
group at weeks 1 and 3.
3.4.1.2 Osteophyte region.
There was significantly more RNA extracted from tissue collected from the joint
margin (osteophyte) region in the MMT than the sham at 3 weeks (Figure 10). This
difference in RNA concentration was not observed for any other tissue, for either groups
or timepoints. A PCA showed that regardless of surgical group, tissue from this
osteophyte region was distinctively different from that which had been collected from the
articular tibial plateau (Figure 10). We observed significant overexpression of osteogenic
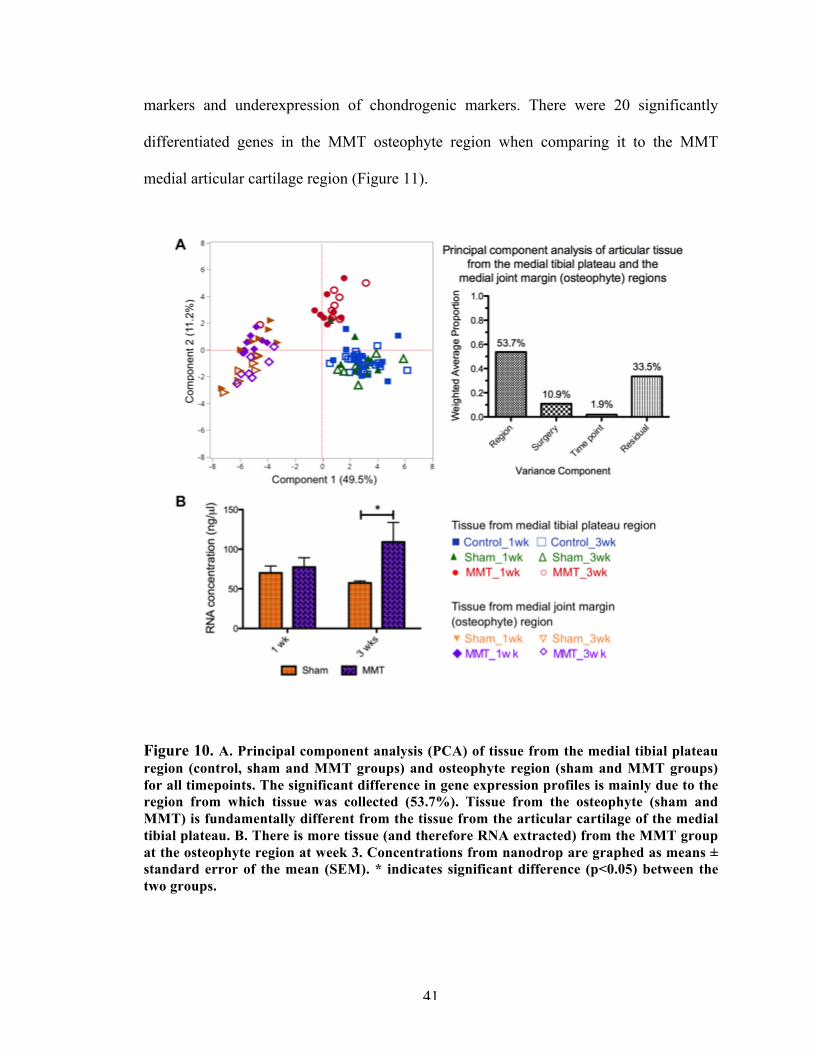
41
markers and underexpression of chondrogenic markers. There were 20 significantly
differentiated genes in the MMT osteophyte region when comparing it to the MMT
medial articular cartilage region (Figure 11).
Figure 10. A. Principal component analysis (PCA) of tissue from the medial tibial plateau region (control, sham and MMT groups) and osteophyte region (sham and MMT groups) for all timepoints. The significant difference in gene expression profiles is mainly due to the region from which tissue was collected (53.7%). Tissue from the osteophyte (sham and MMT) is fundamentally different from the tissue from the articular cartilage of the medial tibial plateau. B. There is more tissue (and therefore RNA extracted) from the MMT group at the osteophyte region at week 3. Concentrations from nanodrop are graphed as means ± standard error of the mean (SEM). * indicates significant difference (p<0.05) between the two groups.
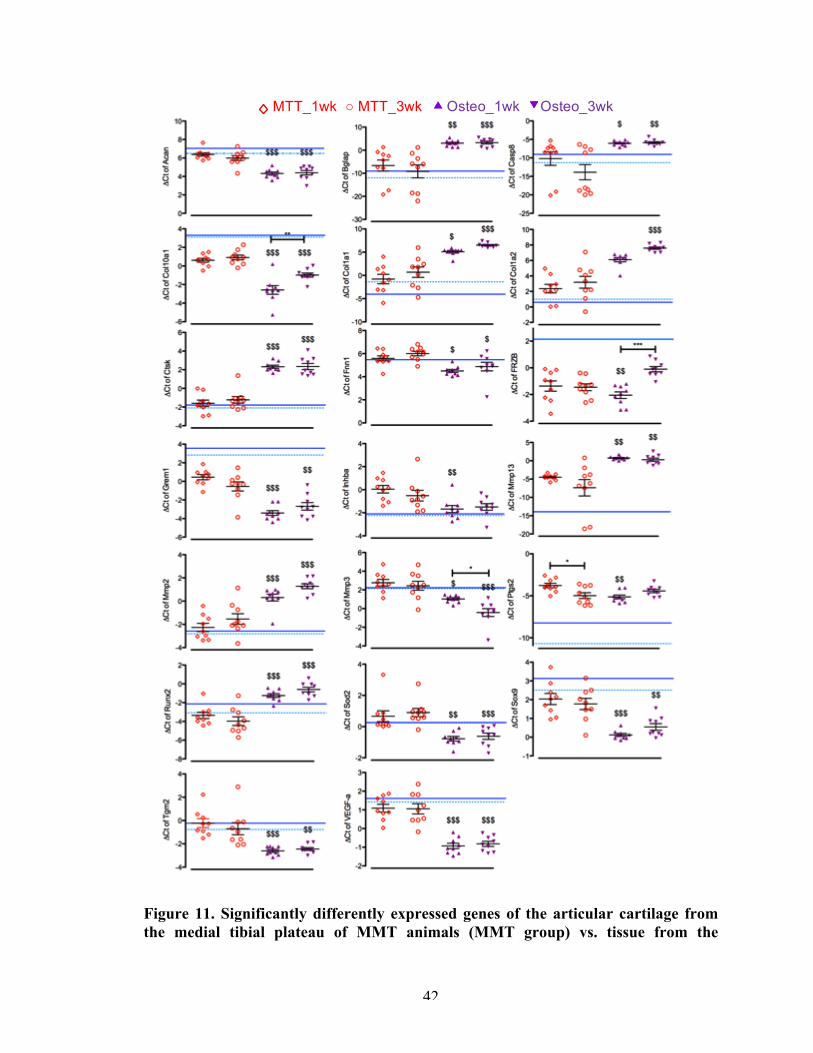
42
Figure 11. Significantly differently expressed genes of the articular cartilage from the medial tibial plateau of MMT animals (MMT group) vs. tissue from the
MTT_1wk ○ MTT_3wk Osteo_1wk Osteo_3wk
43
osteophyte-developing region of MMT animals (osteo group), graphed as means ± SEM. The solid blue lines is the mean expression for the articular cartilage from the medial tibial plateau of control at 1 week post-surgery, unoperated animals; while the dashed light blue line is at 3 weeks post-surgery. $ indicates significance between the MMT and osteo groups at the indicated timepoint at a p-value<0.05 ; $$ at a p-value<0.01; and $$$ at a p-value<0.001.
The osteophyte region generally expressed a higher degree of osteogenic genes
and ECM markers related to osteogenesis than the MMT medial tibial plateau region.
Col1a1, Col1a2, Runx2, and Bglap (Osteocalcin) were significantly higher expressed in
the osteophyte region as early as week 1.
Chondrocyte hypertrophic markers were also differentially regulated in the
osteophyte region when compared to the medial tibial plateau region of the MMT group.
At week 1 and 3, Col10, Tgm2 (transglutaminase-2) and Grem1 were significantly
underexpressed. Frzb was significantly underexpressed in the osteophyte region at week
1, but at week 3 it went up to similar levels of that of the MMT medial tibial plateau,
though still lower than the control/sham medial tibial plateau.
Chondrogenic and ECM-remodeling markers were also altered depending on the
region of interest within MMT group. Acan and Fn1 were significantly underexpressed in
the osteophyte region. Sox9, a marker of chondrogenesis, had significantly lower
expression levels in the osteophyte region at week 1 and 3. Inhba and Mmp3 were
significantly underexpressed in the osteophyte region at week 1, while Mmp2, Mmp13
and Ctsk were significantly overexpressed in the osteophyte region at both time points.
Catabolic factor Sod2 was lower expressed in the osteophyte region at week 1 and
3 when compared to the medial tibial plateau in the MMT model. Apoptosis marker
Casp8 was higher expressed at both timepoints. In the osteophyte region, Ptgs2 was
44
significantly lower at week 1 than the MMT medial tibial plateau and comparable to the
control medial tibial plateau. Interestingly, Vegf was significantly underexpressed in the
osteophyte region as early as week 1.
Given that the tibial plateau cartilage is dissimilar to the osteophyte tissue, we
proceeded with comparisons exclusively within the osteophyte tissue of sham vs. MMT
at the different timepoints. We found that 6 genes were differentially expressed between
these 2 groups (Figure 12 and Figure 13).
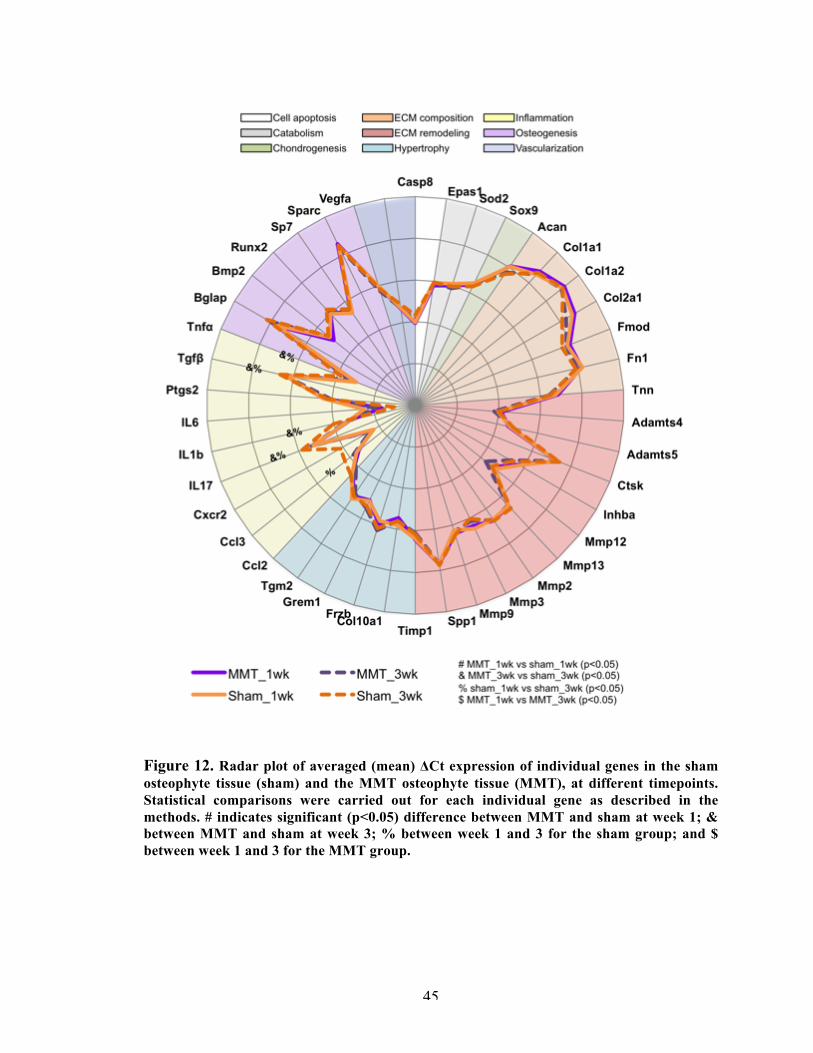
45
Figure 12. Radar plot of averaged (mean) ΔCt expression of individual genes in the sham osteophyte tissue (sham) and the MMT osteophyte tissue (MMT), at different timepoints. Statistical comparisons were carried out for each individual gene as described in the methods. # indicates significant (p<0.05) difference between MMT and sham at week 1; & between MMT and sham at week 3; % between week 1 and 3 for the sham group; and $ between week 1 and 3 for the MMT group.
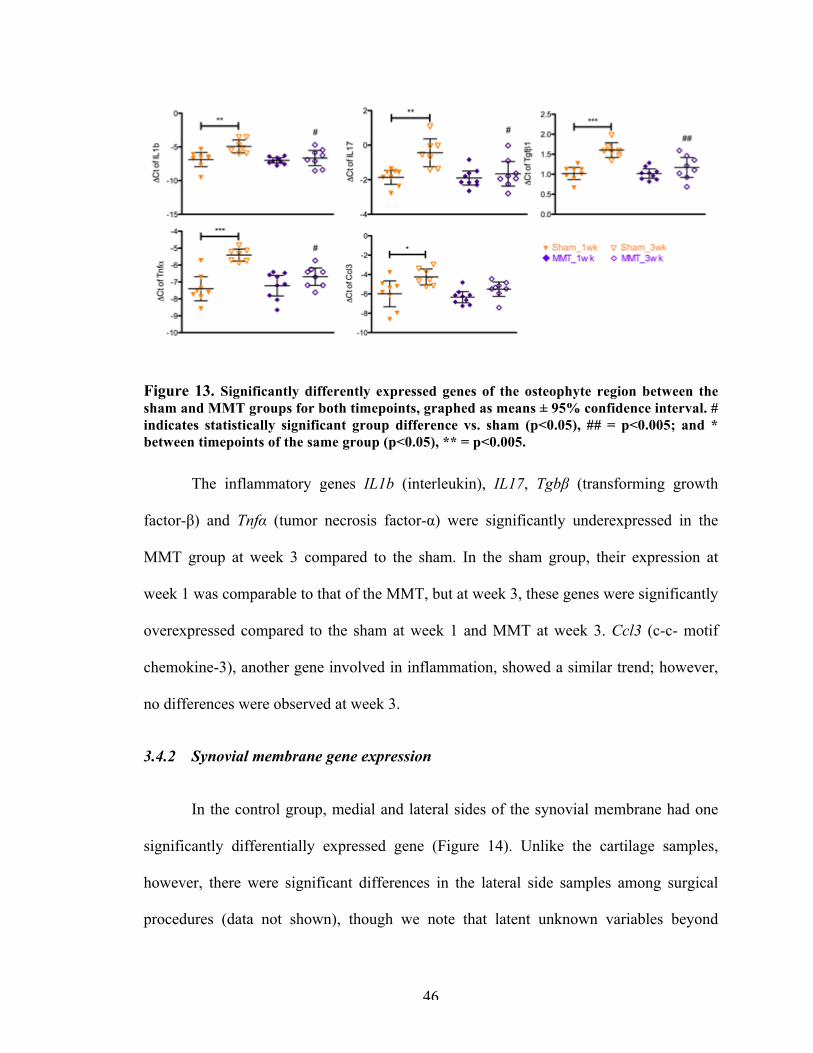
46
Figure 13. Significantly differently expressed genes of the osteophyte region between the sham and MMT groups for both timepoints, graphed as means ± 95% confidence interval. # indicates statistically significant group difference vs. sham (p<0.05), ## = p<0.005; and * between timepoints of the same group (p<0.05), ** = p<0.005.
The inflammatory genes IL1b (interleukin), IL17, Tgbβ (transforming growth
factor-β) and Tnfα (tumor necrosis factor-α) were significantly underexpressed in the
MMT group at week 3 compared to the sham. In the sham group, their expression at
week 1 was comparable to that of the MMT, but at week 3, these genes were significantly
overexpressed compared to the sham at week 1 and MMT at week 3. Ccl3 (c-c- motif
chemokine-3), another gene involved in inflammation, showed a similar trend; however,
no differences were observed at week 3.
3.4.2 Synovial membrane gene expression
In the control group, medial and lateral sides of the synovial membrane had one
significantly differentially expressed gene (Figure 14). Unlike the cartilage samples,
however, there were significant differences in the lateral side samples among surgical
procedures (data not shown), though we note that latent unknown variables beyond
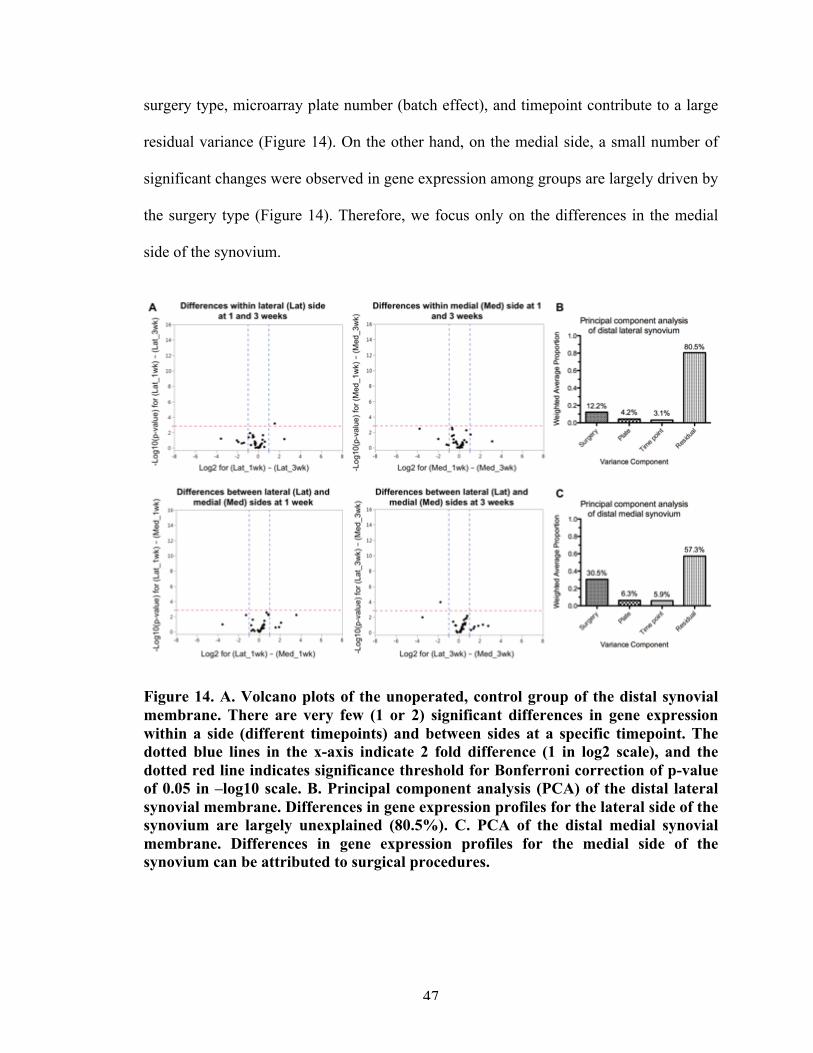
47
surgery type, microarray plate number (batch effect), and timepoint contribute to a large
residual variance (Figure 14). On the other hand, on the medial side, a small number of
significant changes were observed in gene expression among groups are largely driven by
the surgery type (Figure 14). Therefore, we focus only on the differences in the medial
side of the synovium.
Figure 14. A. Volcano plots of the unoperated, control group of the distal synovial membrane. There are very few (1 or 2) significant differences in gene expression within a side (different timepoints) and between sides at a specific timepoint. The dotted blue lines in the x-axis indicate 2 fold difference (1 in log2 scale), and the dotted red line indicates significance threshold for Bonferroni correction of p-value of 0.05 in –log10 scale. B. Principal component analysis (PCA) of the distal lateral synovial membrane. Differences in gene expression profiles for the lateral side of the synovium are largely unexplained (80.5%). C. PCA of the distal medial synovial membrane. Differences in gene expression profiles for the medial side of the synovium can be attributed to surgical procedures.
48
3.4.2.1 Medial synovial membrane.
Our cluster analysis showed that there were temporal differences in the sham
group (Figure 15). Sham samples at week 1 cluster with the MMT samples (both
timepoints). At week 3, however, sham samples are equally split between the control
cluster and the MMT cluster. The PCA further confirms this clustering and shows that
expression of Mmps is a key driver of principal component 1 (Figure 15). Overall, there
were 16 genes that were differentially expressed among groups (Figure 16 and Figure
17). There were no statistical differences between the sham and MMT groups at week 1,
but this was not the case at week 3.
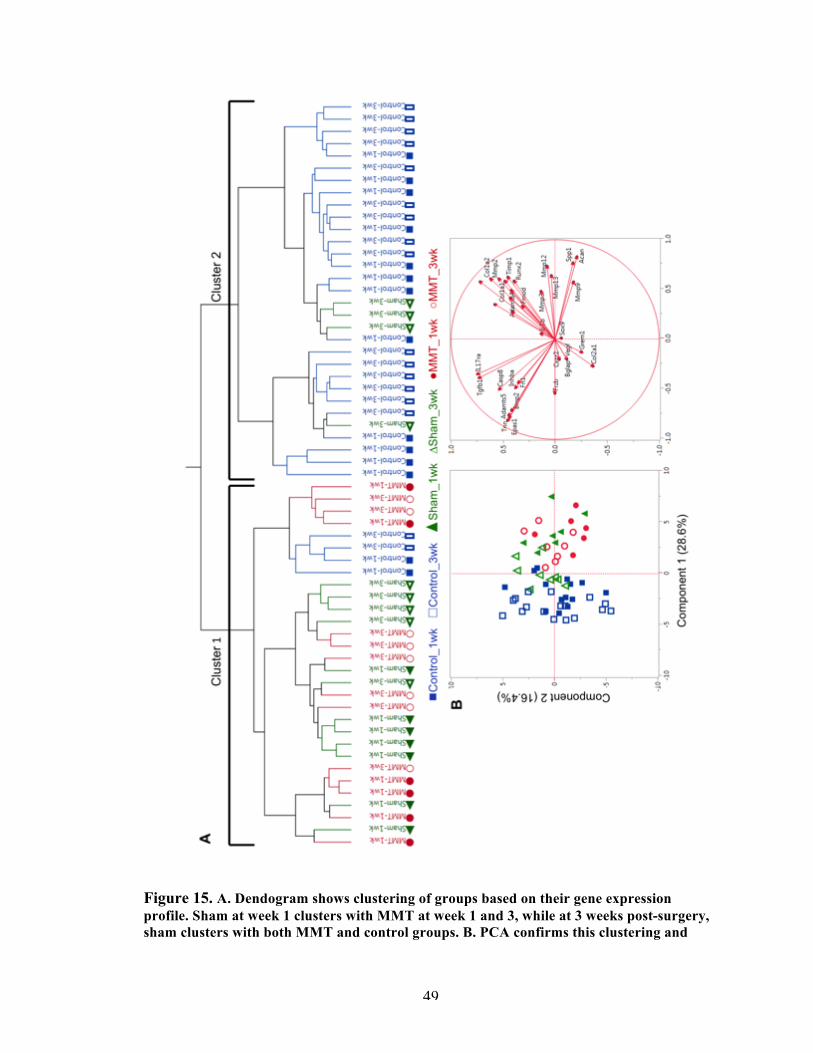
49
Figure 15. A. Dendogram shows clustering of groups based on their gene expression profile. Sham at week 1 clusters with MMT at week 1 and 3, while at 3 weeks post-surgery, sham clusters with both MMT and control groups. B. PCA confirms this clustering and
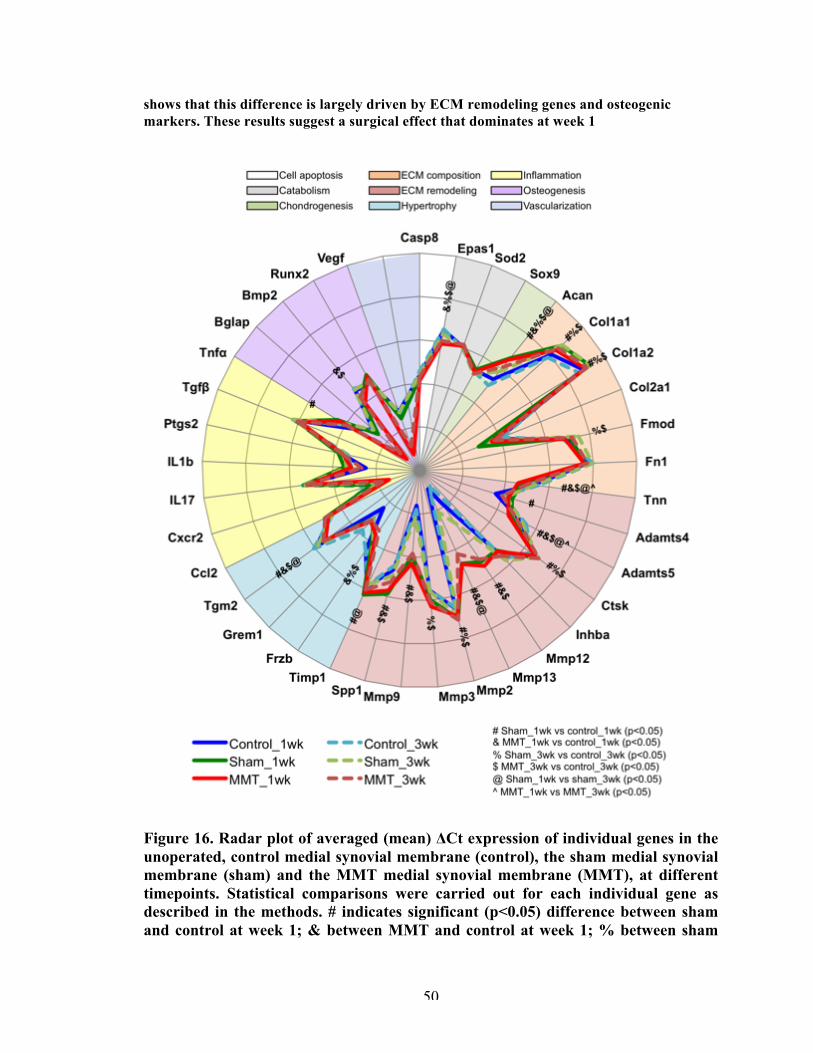
50
shows that this difference is largely driven by ECM remodeling genes and osteogenic markers. These results suggest a surgical effect that dominates at week 1
Figure 16. Radar plot of averaged (mean) ΔCt expression of individual genes in the unoperated, control medial synovial membrane (control), the sham medial synovial membrane (sham) and the MMT medial synovial membrane (MMT), at different timepoints. Statistical comparisons were carried out for each individual gene as described in the methods. # indicates significant (p<0.05) difference between sham and control at week 1; & between MMT and control at week 1; % between sham
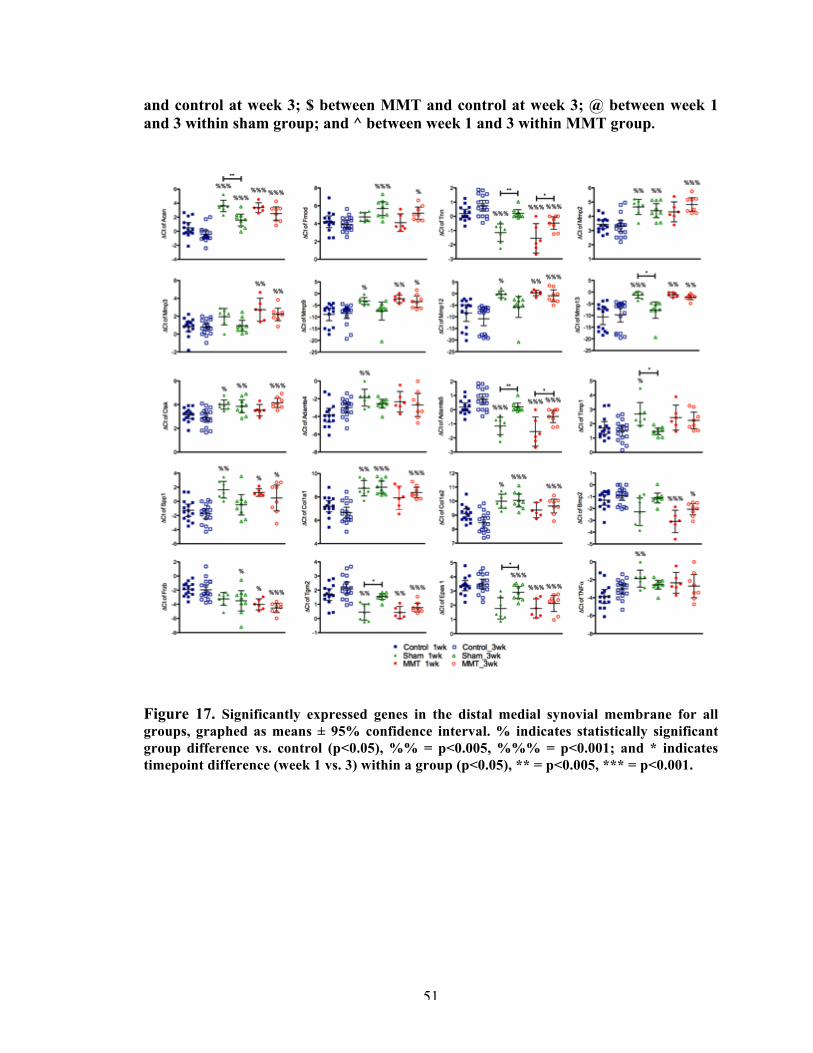
51
and control at week 3; $ between MMT and control at week 3; @ between week 1 and 3 within sham group; and ^ between week 1 and 3 within MMT group.
Figure 17. Significantly expressed genes in the distal medial synovial membrane for all groups, graphed as means ± 95% confidence interval. % indicates statistically significant group difference vs. control (p<0.05), %% = p<0.005, %%% = p<0.001; and * indicates timepoint difference (week 1 vs. 3) within a group (p<0.05), ** = p<0.005, *** = p<0.001.
52
In general, surgery had an effect on genes related to the ECM. ECM proteins
Acan and Fmod (fibromodulin) were significantly upregulated, in both sham and MMT.
Acan was overexpressed in the MMT and sham groups at week 1 and 3, compared to the
control groups. Fmod was overexpressed in both surgery groups at week 3 only. While
Tnn (tenascin) was significantly underexpressed at week 1 for the MMT and sham
groups, it reached the level of the control group at week 3 for the sham group but
remained significantly lower for the MMT group.
Comparing to the naïve control group, the synovium had a sustained significantly
elevated expression of matrix degradation markers in the MMT group. In the sham
surgery, these genes were also elevated at week 1 but most declined to the control level
by week 3. Mmp3, Mmp9, Mmp12, and Mmp13 were significantly higher in the MMT
group at week 1 and remained so by week 3. Mmp2 and Ctsk were significantly higher
only at week 3 in the MMT group. In the sham group, Mmp2, Mmp9, Mmp12, Mmp13
and Ctsk were significantly overexpressed at week 1. However, all, with the exception of
Mmp2 and Ctsk, declined to expression levels comparable to the control group by week 3.
Adamts4 was significantly higher in the sham group (vs. control) at week 1, but a similar
trend could be observed; there seemed to be higher expression in the MMT groups at
both timepoints and a lower level in the sham group at week 3 (vs. week 1). Adamts5 was
downregulated in the MMT group (vs. control) at week 1 and 3, while again in the sham
group it was significantly lower at week 1 but recovered to the control group level by
week 3. Matrix remodeling gene Spp1 was overexpressed in both the sham and MMT at
week 1 (vs. control), but only remainded overexpressed in the MMT at week 3.
Metalloproteinase inhibitor Timp1 was significantly higher in the sham group (vs.
53
control) at week 1, but followed the same pattern in that this expression significantly
decreased by week 3 in the sham group, to a level comparable to the control. In the
MMT, Timp1 seemed to remain elevated, though this observation was not statistically
significant.
Osteogenic markers were also dysregulated in the synovium. Col1a1 and Col1a2
were overexpressed in both the sham and MMT groups at week 1 (vs. control), but
remained elevated in the MMT group at week 3. Although Bmp2 (bone morphogenetic
protein-2) showed significantly lower expression in the MMT group alone compared to
the control at both timepoints, a similar trend was observed where the sham expression
seemed lower at week 1 and closer to control levels by week 3.
Frzb was downregulated in both the sham and the MMT groups (vs. control) as
early as week 1, but in this case, it remained low for the sham group as well as the MMT
at week 3. Epas1 had a similar profile, where both sham and MMT groups had
significantly low expression even at week 3. Tgm2 (transglutaminase-2) was
underexpressed at week 1 for both groups (vs. control), yet recovered to the control level
in the sham group by week 3. Tgm2 is modulated by inflammatory cytokines, and
regulates chondrocyte hypertrophic differentiation and ECM mineralization [90, 91].
3.4.3 Confirmation of genes at the protein level
Immunostaining (Figure 18) of collagen type 2 protein (col2a1 gene) showed
morphological differences in the medial articular cartilage at week 3, confirming damage
to this area due to MMT surgery. Mmp13 protein detection in the MMT group at week 3
was confined to the articular cartilage and synovium, confirming our gene expression
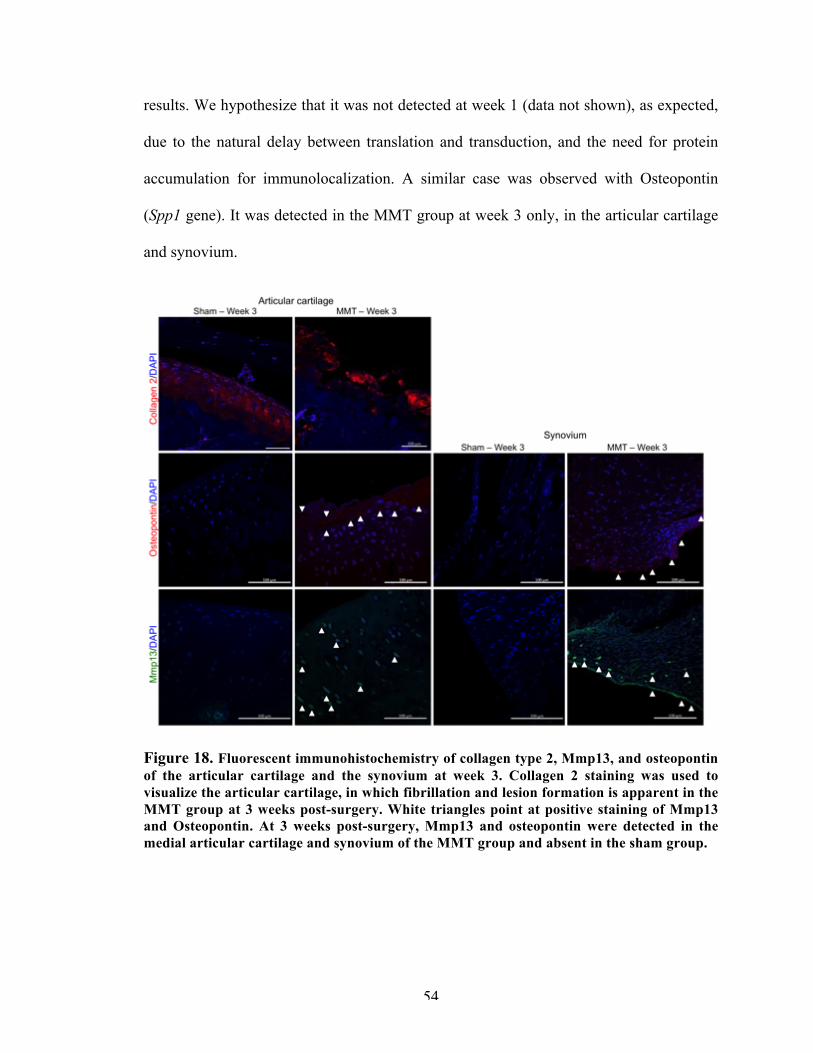
54
results. We hypothesize that it was not detected at week 1 (data not shown), as expected,
due to the natural delay between translation and transduction, and the need for protein
accumulation for immunolocalization. A similar case was observed with Osteopontin
(Spp1 gene). It was detected in the MMT group at week 3 only, in the articular cartilage
and synovium.
Figure 18. Fluorescent immunohistochemistry of collagen type 2, Mmp13, and osteopontin of the articular cartilage and the synovium at week 3. Collagen 2 staining was used to visualize the articular cartilage, in which fibrillation and lesion formation is apparent in the MMT group at 3 weeks post-surgery. White triangles point at positive staining of Mmp13 and Osteopontin. At 3 weeks post-surgery, Mmp13 and osteopontin were detected in the medial articular cartilage and synovium of the MMT group and absent in the sham group.
55
3.5 Discussion
3.5.1 Localized gene expression
Regional analysis of the tibial plateau shows that the lateral and medial sides have
a significantly different gene expression profile, which is not surprising given the
differences in anatomy between these two sides. MMT surgery creates localized damage
in the medial tibial plateau [81], and analysis of this specific region allow us to pinpoint
changes in tissue that might otherwise be lost by the pooling of tissue from both sides of
the tibial plateaus and femoral condyles; a standard practice in gene expression studies
[82-84].
Localized gene expression analysis is particularly important in the synovium. In
this tissue type, there are differences in gene expression profiles among medial
(unoperated) control, sham and MMT groups. In fact, we showed that there is a surgical
effect that dominates at week 1 and which mostly subsides by week 3, though not
entirely. This is not wholly surprising as the synovial membrane is cut to access and
visualize the meniscus in both sham and MMT surgeries. Equally important, this study
demonstrates that, unlike articular cartilage, both sides of the synovial membrane are
affected by surgery and show significant differences in their gene expression profiles.
The fact that changes in the lateral side cannot be pinpointed to the surgery type,
microarray plate number (batch effect), or timepoint reemphasizes the importance of
analyzing localized tissue (medial side, in this case) instead of pooling sample from the
entire joint cavity.
3.5.2 Articular cartilage of the medial tibial plateau
56
This study is the first to report gene expression findings specifically for the
medial tibial plateau of the MMT model. Here, we showed that the MMT model
replicated several pathologies observed in human OA. Our findings also suggest that
changes in chondrocyte phenotype may precede changes in ECM in this animal model,
indicating that the response to destabilization may be firstly to readdress tissue
composition and secondly to remodel.
Chondrocyte phenotype changes begin as early as week 1 in the MMT model.
Previous studies have identified Wnt signaling to be involved in the response to
mechanical injury to cartilage [87, 92, 93], since Wnt antagonists, Frzb and Grem1
function as natural brakes on hypertrophic differentiation of articular cartilage [94].
While Frzb inhibits Wnt directly, Bmp antagonist Grem1 functions indirectly [94].
Therefore, lower expression of Frzb and Grem1 in the MMT group points toward a de-
differentiation of chondrocytes into the hypertrophic state in the medial tibial plateau.
Col10 expression was also significantly lower in the MMT model at week 1 and
3. Although col10 is a hypertrophic marker associated with endochondral ossification
during growth and fracture healing and might, therefore, be expected to be expressed at
higher levels, previous studies have also shown that its gene expression level is actually
reduced in the OA disease state in animal models. In the anterior cruciate ligament (ACL)
rabbit model of OA, Bluteau et al. (2001) observed reduced Col10 expression in the
articular cartilage at 2 and 4 weeks post-surgery, whereas there was an increase in the
meniscus at 9 weeks post-surgery [95]. Other studies have demonstrated the occurrence
of col10 at the surface of normal human, porcine and rat articular cartilage, and have
57
suggested that the presence of this protein may be associated with the load bearing
properties in different zones of the articular surface [96].
While chondrocyte phenotypic changes were discernible at week 1, changes in the
articular cartilage ECM composition (elevated Fn1 and Col1a2) were not significant until
week 3. In OA, chondrocytes synthesize elevated levels of fibronectin, altering the
cartilage ECM [97]. Although often considered an earlier sign of OA [97, 98], the MMT
model did not show significant differences in Fn1 expression until week 3. This suggests
that, in the MMT model, changes in chondrocyte phenotype precede changes in the ECM
of the articular cartilage. This is further supported by the fact that Acan and Col2a1 were
not expressed significantly different from the control group by week 3.
It is still unclear whether the increased synthesis of fibronectin in OA acts as an
attempt by the chondrocytes to repair cartilage or whether it has a deleterious effect [97].
Its increased activity has been linked with a switch in synthesis of collagen type, an
increased activity of locally secreted Mmps and induction of proteolytic activities against
gelatin and fibronectin itself [97, 99]. In this study, we observed significantly higher
expression of Col1a2, Mmp2, Mmp13, and Ctsk at week 3, the same timepoint as Fn1,
paralleling the proposed mechanism for human OA [100, 101] and other rodent models
[102].
The fact that metalloproteinase and aggrecanase inhibitors Timp1 and Inhba
(respectively) are overexpressed in the MMT group as early as week 1 suggests a
protective mechanism in OA in the MMT model. This may be further corroborated by the
downregulation of Epas1 in the MMT group. A previous study has shown that
58
chondrocyte-specific knockout of Epas1 in mice suppressed DMM (destabilization of the
medial meniscus)-induced chondrocyte apoptosis and inhibited OA cartilage destruction
[89]. We, therefore, propose that downregulation of Epas1 in this case may be part of a
protective mechanism in the MMT model.
Higher expression of the catabolism marker Sod2 at weeks 1 and 3 indicates a
homeostatic imbalance within the chondrocytes. Oxidative stress and dysregulated
chondrocyte mitochondrial function contribute not only to impaired matrix synthetic
function and viability, but also to molecular inflammatory processes and matrix
catabolism in OA [103]. Ptgs2, which we have shown to be overexpressed in the MMT,
is an inflammatory responsive gene and is regulated by nitric oxide [104].
Altogether, analysis of the medial tibial plateau articular cartilage shows that
sham behaves similarly to the unoperated, control group and that MMT surgery replicates
several human OA pathomechanisms. The pathomechanistic implications outlined in this
study should be taken into account when using this model to test and/or explore
therapeutic mechanisms. It is particularly important to understand the microenvironment
which is encountered by the therapy of interest upon delivery, for which in depth
molecular analysis and characterization of the MMT model as the disease progresses is
needed.
3.5.3 Osteophyte tissue
At the joint margins in the interface between the cortical bone marrow and the
periosteal lining, osteophytes form in human and experimental OA [105, 106]. While
osteophytes have been reported and quantified at week 3 in the MMT model [81], they
59
are non-detectable via morphological analysis at week 1. In this study, we showed that
we are able to detect gene expression differences between the sham and MMT groups at
3 weeks as well.
Osteophyte formation features vascularization of the tissue followed by
endochondral ossification. It is well established that there are morphological differences
in osteophyte formation between the MMT and sham groups at 3 weeks post-surgery,
including increased mineralization and tissue formation [81]. However, we were not able
to detect differences in these markers between the sham and MMT groups. Interestingly,
we detected significant differences only in genes related to inflammation. Recent studies
have reported evidence of the effects of inflammatory mediators on cellular
differentiation [107]. In fact, Tnfα, IL1β, and NF-κB stimulate osteogenesis at low
concentrations and inhibit it at high concentrations [107-112]. We, therefore, believe that
the observed downregulation of inflammation genes in the MMT group is actually
indicative of a pre-ossification phase of this region at week 3.
It is worthwhile mentioning that, while gene expression related to chondrogenic,
chondrocyte hypertrophy and osteogenic markers is not different between the sham and
MMT groups at any timepoint, there are signs of cell proliferation in the MMT group at
week 3. The tissue from this region of the joint is fundamentally different than the tibial
plateau, and so, we postulate that morphological differences between the sham and MMT
at 3 weeks post-surgery are due to there simply being more tissue in the MMT model at
this timepoint. To test this hypothesis, thorough profiling of markers related to
proliferation in this area, perhaps by RNA sequencing, as well as extended timepoints of
analyses, will be required.
60
3.5.4 Distal medial synovial membrane
To the best of our knowledge, this is the first study to report gene expression
profiles of the synovial membrane in an experimental animal model, and specifically on
the medial side of the synovial membrane. Surgical effect (sham and MMT) dominates
the gene expression profile of the medial synovium at week 1, and it is not until week 3
that this surgical noise dissipates and meniscal instability starts to have a pronounced
effect on the medial synovium. This MMT characteristic is of the upmost importance
when considering experimental design of a new therapy, and it reemphasizes the
importance of a sham group in an experiment.
Overall, we observed an increase in markers related to matrix degradation and
remodeling in the synovium that remained elevated in the MMT at week 3. We also
showed an overexpression of most osteogenic markers and underexpression of Wnt
antagonists in the MMT. These findings suggest a feedback loop with the articular
cartilage. As in human OA, the synovium is affected by the mechanical instability of the
model and may exacerbate the changes to the articular cartilage. We, therefore, postulate
that the joint space acts in concert in the MMT model.
3.5.5 Inflammation in the MMT model
Surprisingly, apart from Ptgs2, our genes related to inflammation (pro- or anti-)
were not differentially regulated, except in the osteophyte region. We believe that this
may have been due to our harvesting timepoint. Collecting tissues at earlier timepoints
may have shown a detectable signal difference between unoperated and operated legs
(control vs. sham and MMT). However, for the purpose of this study, we wanted to
61
minimize noise due to surgery (inflammation that is inevitable post-surgery) and so we
decided to collect samples starting at week 1. It was, therefore, interesting that we still
detected evidence of surgery in the synovium at this timepoint.
The MMT model is a mechanically induced model and it is generally not
associated with substantial inflammation, unlike the MIA model [113]. Nevertheless, it is
worth pointing out that even though we do not observe changes in genes generally
associated with inflammation at our timepoints, we may be observing the consequences
of their dysregulation in the sham and MMT surgical groups. In OA, IL1 (pro-
inflammatory) is synthesized by chondrocytes and capable of inducing the expression of
Mmps and other catabolic genes [114]. A variety of inflammatory mediators and growth
factors, including IL1, Tnfα and Pdgf (platelet-derived growth factor), stimulate Spp1
transcription [88]. In fact, Spp1 has both pro- and anti-inflammatory actions [88]. We
have shown changes in the expression of several Mmps and Spp1 in the articular cartilage
and synovium in this study due to MMT surgery. Whether these changes are indeed
downstream of inflammatory processes remains to be answered, and evaluating the model
at earlier timepoints would be a useful start for future directions.
62
CHAPTER 4. LOCALIZED OSTEOARTHRITIS DISEASE-
MODIFYING CHANGES DUE TO INTRA-ARTICULAR
INJECTION OF MICRONIZED DEHYDRATED HUMAN
AMNION/CHORION MEMBRANE
4.1 Abstract
Micronized dehydrated human amnion/chorion membrane (AmnioFix Injectable,
MiMedx, Marietta, GA, USA) has anti-inflammatory, low immunogenic and anti-fibrotic
properties, and its delivery intra-articular delivery into the joint space has been shown to
have a chondro-protective effect on the articular cartilage in an in vivo model of post-
traumatic OA. AmnioFix is an ECM-derived therapeutic, and its mechanisms of action on
OA progression and potential modification remain largely undetermined. As AmnioFix is
sequestered in the synovial membrane, we hypothesized that injection of AmnioFix
attenuates catabolic and inflammatory signaling in the synovium, which in turn protects
the articular cartilage from further degradation.
The objective of this study was to elucidate the molecular mechanisms of action of
AmnioFix treatment with OA development and progression. Weight-matched Lewis rats
underwent MMT surgery to induce OA-like clinical symptoms, and AmnioFix or saline
was injected intra-articularly 1 day post-surgery. At 5, 7, and 21 days post-surgery,
articular cartilage, synovial membrane, and osteophyte tissues from multiple regions were
collected and analyzed by microarray RT-PCR.
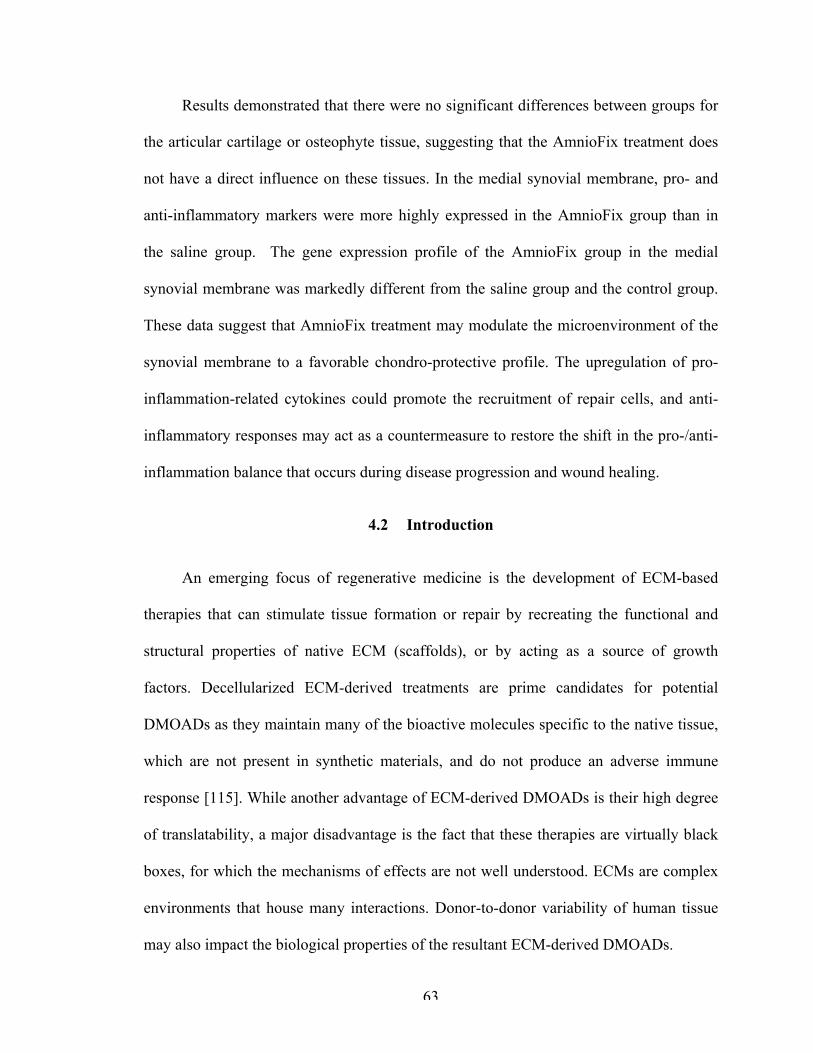
63
Results demonstrated that there were no significant differences between groups for
the articular cartilage or osteophyte tissue, suggesting that the AmnioFix treatment does
not have a direct influence on these tissues. In the medial synovial membrane, pro- and
anti-inflammatory markers were more highly expressed in the AmnioFix group than in
the saline group. The gene expression profile of the AmnioFix group in the medial
synovial membrane was markedly different from the saline group and the control group.
These data suggest that AmnioFix treatment may modulate the microenvironment of the
synovial membrane to a favorable chondro-protective profile. The upregulation of pro-
inflammation-related cytokines could promote the recruitment of repair cells, and anti-
inflammatory responses may act as a countermeasure to restore the shift in the pro-/anti-
inflammation balance that occurs during disease progression and wound healing.
4.2 Introduction
An emerging focus of regenerative medicine is the development of ECM-based
therapies that can stimulate tissue formation or repair by recreating the functional and
structural properties of native ECM (scaffolds), or by acting as a source of growth
factors. Decellularized ECM-derived treatments are prime candidates for potential
DMOADs as they maintain many of the bioactive molecules specific to the native tissue,
which are not present in synthetic materials, and do not produce an adverse immune
response [115]. While another advantage of ECM-derived DMOADs is their high degree
of translatability, a major disadvantage is the fact that these therapies are virtually black
boxes, for which the mechanisms of effects are not well understood. ECMs are complex
environments that house many interactions. Donor-to-donor variability of human tissue
may also impact the biological properties of the resultant ECM-derived DMOADs.
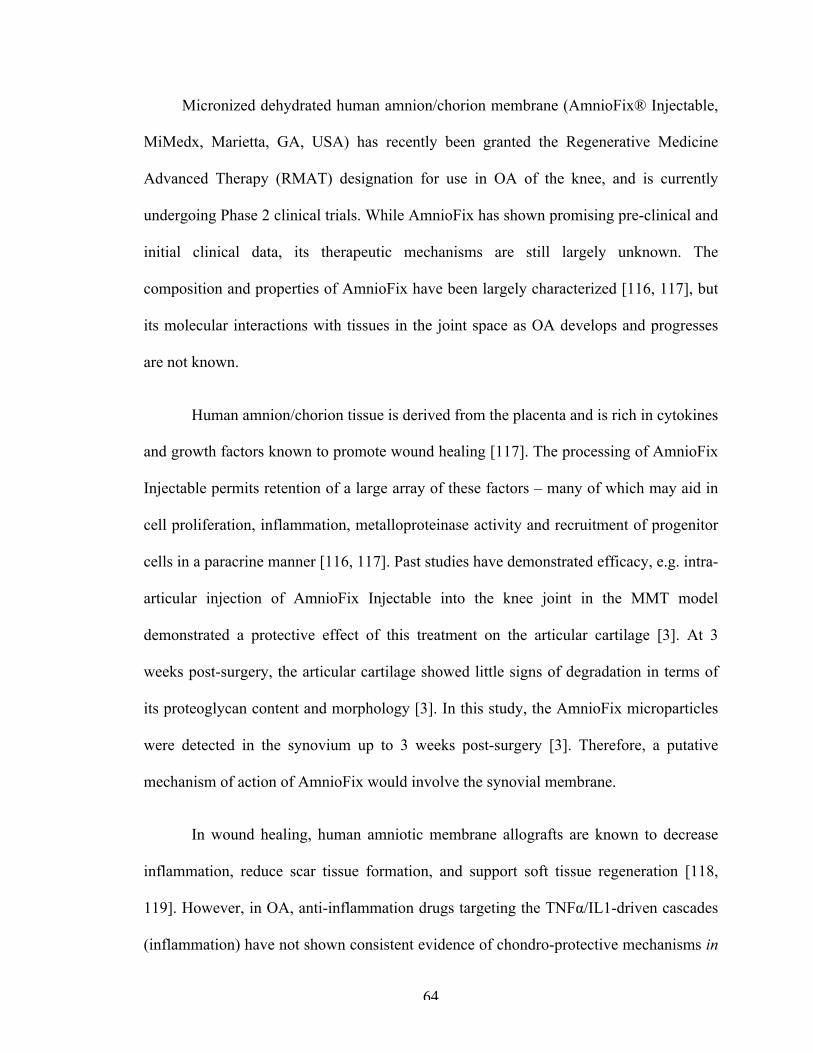
64
Micronized dehydrated human amnion/chorion membrane (AmnioFix® Injectable,
MiMedx, Marietta, GA, USA) has recently been granted the Regenerative Medicine
Advanced Therapy (RMAT) designation for use in OA of the knee, and is currently
undergoing Phase 2 clinical trials. While AmnioFix has shown promising pre-clinical and
initial clinical data, its therapeutic mechanisms are still largely unknown. The
composition and properties of AmnioFix have been largely characterized [116, 117], but
its molecular interactions with tissues in the joint space as OA develops and progresses
are not known.
Human amnion/chorion tissue is derived from the placenta and is rich in cytokines
and growth factors known to promote wound healing [117]. The processing of AmnioFix
Injectable permits retention of a large array of these factors – many of which may aid in
cell proliferation, inflammation, metalloproteinase activity and recruitment of progenitor
cells in a paracrine manner [116, 117]. Past studies have demonstrated efficacy, e.g. intra-
articular injection of AmnioFix Injectable into the knee joint in the MMT model
demonstrated a protective effect of this treatment on the articular cartilage [3]. At 3
weeks post-surgery, the articular cartilage showed little signs of degradation in terms of
its proteoglycan content and morphology [3]. In this study, the AmnioFix microparticles
were detected in the synovium up to 3 weeks post-surgery [3]. Therefore, a putative
mechanism of action of AmnioFix would involve the synovial membrane.
In wound healing, human amniotic membrane allografts are known to decrease
inflammation, reduce scar tissue formation, and support soft tissue regeneration [118,
119]. However, in OA, anti-inflammation drugs targeting the TNFα/IL1-driven cascades
(inflammation) have not shown consistent evidence of chondro-protective mechanisms in
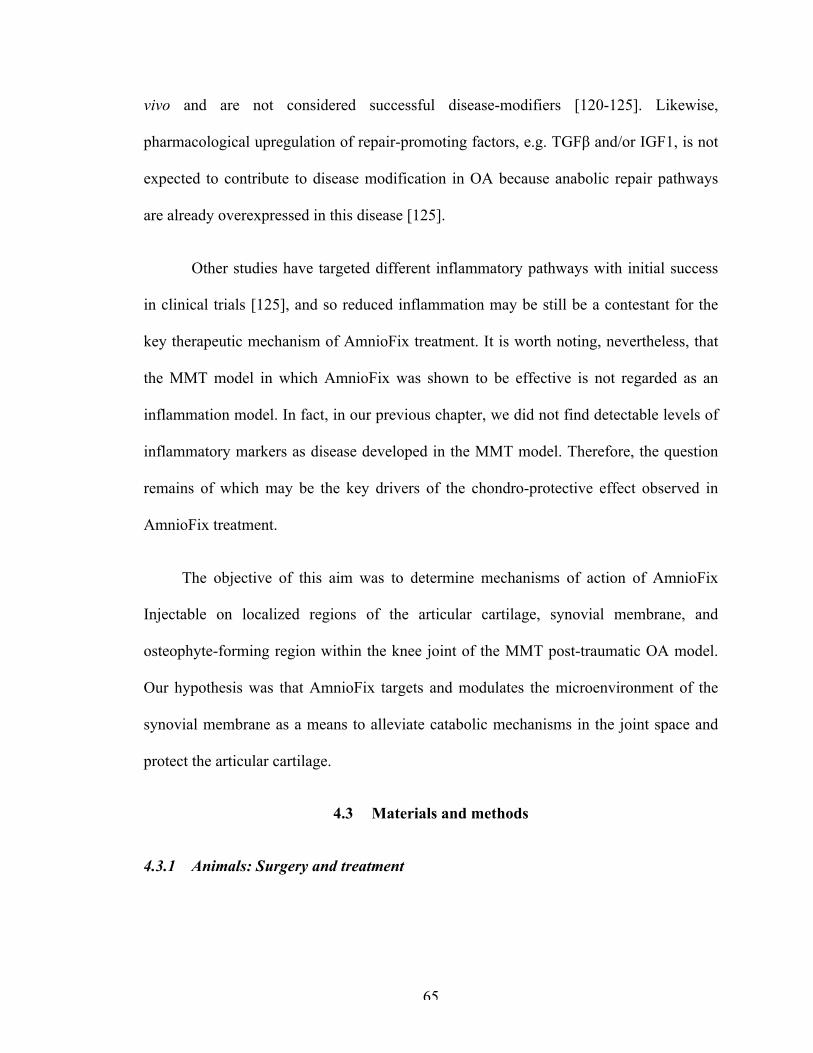
65
vivo and are not considered successful disease-modifiers [120-125]. Likewise,
pharmacological upregulation of repair-promoting factors, e.g. TGFβ and/or IGF1, is not
expected to contribute to disease modification in OA because anabolic repair pathways
are already overexpressed in this disease [125].
Other studies have targeted different inflammatory pathways with initial success
in clinical trials [125], and so reduced inflammation may be still be a contestant for the
key therapeutic mechanism of AmnioFix treatment. It is worth noting, nevertheless, that
the MMT model in which AmnioFix was shown to be effective is not regarded as an
inflammation model. In fact, in our previous chapter, we did not find detectable levels of
inflammatory markers as disease developed in the MMT model. Therefore, the question
remains of which may be the key drivers of the chondro-protective effect observed in
AmnioFix treatment.
The objective of this aim was to determine mechanisms of action of AmnioFix
Injectable on localized regions of the articular cartilage, synovial membrane, and
osteophyte-forming region within the knee joint of the MMT post-traumatic OA model.
Our hypothesis was that AmnioFix targets and modulates the microenvironment of the
synovial membrane as a means to alleviate catabolic mechanisms in the joint space and
protect the articular cartilage.
4.3 Materials and methods
4.3.1 Animals: Surgery and treatment
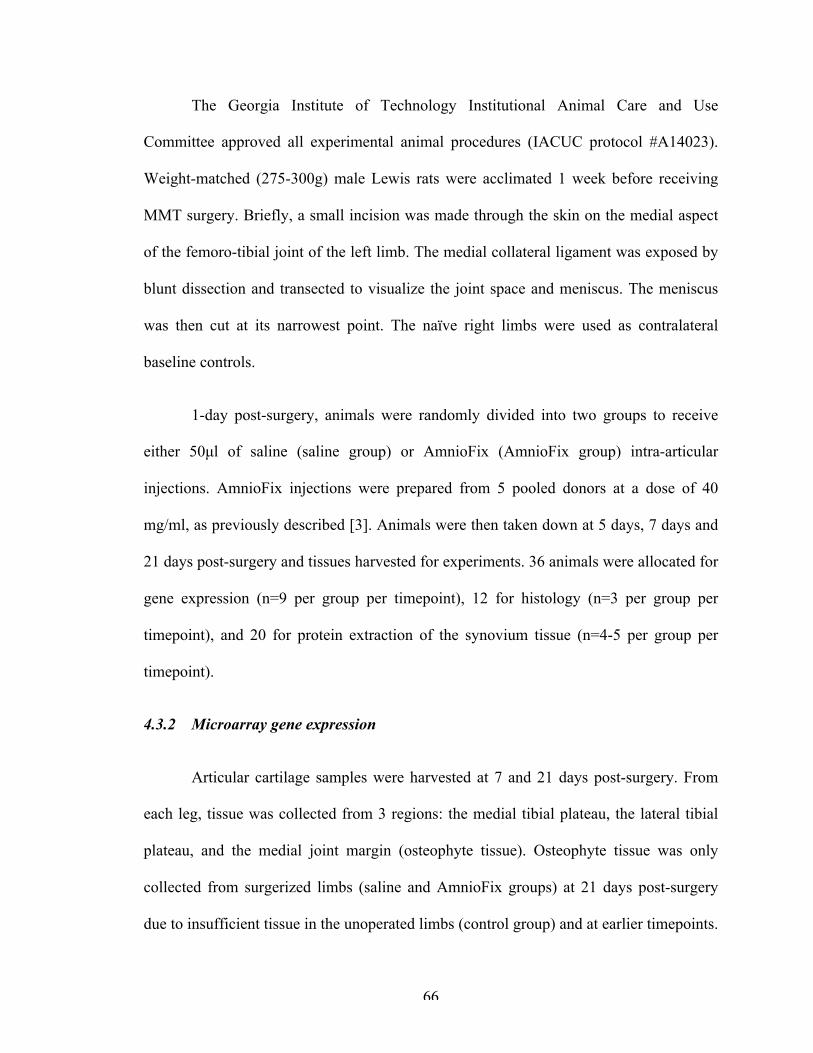
66
The Georgia Institute of Technology Institutional Animal Care and Use
Committee approved all experimental animal procedures (IACUC protocol #A14023).
Weight-matched (275-300g) male Lewis rats were acclimated 1 week before receiving
MMT surgery. Briefly, a small incision was made through the skin on the medial aspect
of the femoro-tibial joint of the left limb. The medial collateral ligament was exposed by
blunt dissection and transected to visualize the joint space and meniscus. The meniscus
was then cut at its narrowest point. The naïve right limbs were used as contralateral
baseline controls.
1-day post-surgery, animals were randomly divided into two groups to receive
either 50µl of saline (saline group) or AmnioFix (AmnioFix group) intra-articular
injections. AmnioFix injections were prepared from 5 pooled donors at a dose of 40
mg/ml, as previously described [3]. Animals were then taken down at 5 days, 7 days and
21 days post-surgery and tissues harvested for experiments. 36 animals were allocated for
gene expression (n=9 per group per timepoint), 12 for histology (n=3 per group per
timepoint), and 20 for protein extraction of the synovium tissue (n=4-5 per group per
timepoint).
4.3.2 Microarray gene expression
Articular cartilage samples were harvested at 7 and 21 days post-surgery. From
each leg, tissue was collected from 3 regions: the medial tibial plateau, the lateral tibial
plateau, and the medial joint margin (osteophyte tissue). Osteophyte tissue was only
collected from surgerized limbs (saline and AmnioFix groups) at 21 days post-surgery
due to insufficient tissue in the unoperated limbs (control group) and at earlier timepoints.
67
Synovial membrane was harvested at 5, 7 and 21 days post-surgery. From each leg, 2
synovium samples were collected, from the medial and lateral sides of the joint, distal of
the meniscus and directly adjacent to the tibial plateau. Each sample was stored
separately in RNAlater (Ambion Inc.) at 4°C until processed.
Total RNA from cartilage and osteophyte tissues was extracted using the RNeasy
MinElute Clean-up Kit with QIAzol Lysis Reagent. Total RNA from synovium was
extracted using the RNeasy Lipid Tissue Mini Kit with QIAzol Lysis Reagent. RNA
quality and concentration for all samples were determined using the Nanodrop ND-1000
Spectrophotometer (ThermoFisher). Normalized RNA was converted to cDNA via the
RT2 First Strand Kit. All reagents were from Qiagen unless otherwise stated.
RNA expression was quantified using the Taqman RT-PCR Fluidigm Dynamic
Array Integrated Fluidic Circuits (BioMark, Fluidigm). Our cDNA samples were tested
against 58 genes (TaqMan gene expression assays, ThermoFisher, Table 3), which were
selected from literature detailing human OA pathomechanisms and about AmnioFix
composition. AccuRef rat universal cDNA (Gene Scientific) and ultrapure water were
used as positive and negative controls, respectively, to ensure run fidelity. The Ct values
greater than 37 were treated as 37, namely as null (lower Ct values correspond to higher
expression since they represent the PCR cycle at which a threshold level of product is
observed).
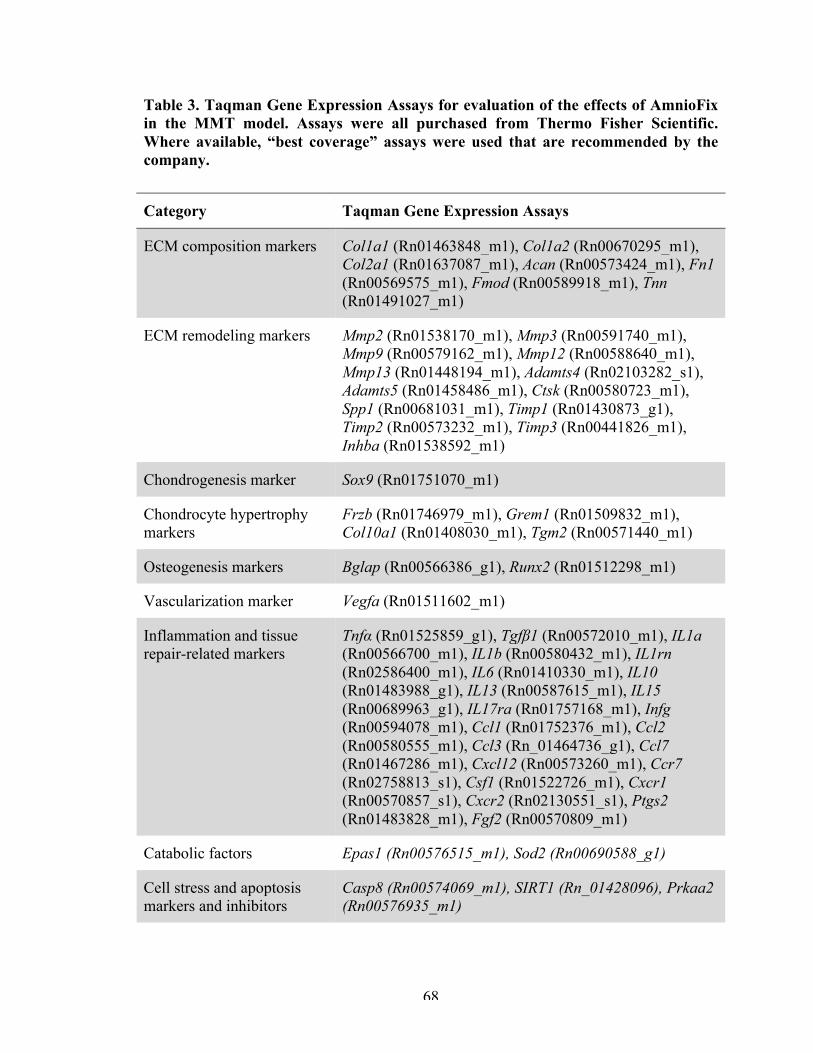
68
Table 3. Taqman Gene Expression Assays for evaluation of the effects of AmnioFix in the MMT model. Assays were all purchased from Thermo Fisher Scientific. Where available, “best coverage” assays were used that are recommended by the company.
Category Taqman Gene Expression Assays
ECM composition markers Col1a1 (Rn01463848_m1), Col1a2 (Rn00670295_m1), Col2a1 (Rn01637087_m1), Acan (Rn00573424_m1), Fn1 (Rn00569575_m1), Fmod (Rn00589918_m1), Tnn (Rn01491027_m1)
ECM remodeling markers Mmp2 (Rn01538170_m1), Mmp3 (Rn00591740_m1), Mmp9 (Rn00579162_m1), Mmp12 (Rn00588640_m1), Mmp13 (Rn01448194_m1), Adamts4 (Rn02103282_s1), Adamts5 (Rn01458486_m1), Ctsk (Rn00580723_m1), Spp1 (Rn00681031_m1), Timp1 (Rn01430873_g1), Timp2 (Rn00573232_m1), Timp3 (Rn00441826_m1), Inhba (Rn01538592_m1)
Chondrogenesis marker Sox9 (Rn01751070_m1)
Chondrocyte hypertrophy markers
Frzb (Rn01746979_m1), Grem1 (Rn01509832_m1), Col10a1 (Rn01408030_m1), Tgm2 (Rn00571440_m1)
Osteogenesis markers Bglap (Rn00566386_g1), Runx2 (Rn01512298_m1)
Vascularization marker Vegfa (Rn01511602_m1)
Inflammation and tissue repair-related markers
Tnfα (Rn01525859_g1), Tgfβ1 (Rn00572010_m1), IL1a (Rn00566700_m1), IL1b (Rn00580432_m1), IL1rn (Rn02586400_m1), IL6 (Rn01410330_m1), IL10 (Rn01483988_g1), IL13 (Rn00587615_m1), IL15 (Rn00689963_g1), IL17ra (Rn01757168_m1), Infg (Rn00594078_m1), Ccl1 (Rn01752376_m1), Ccl2 (Rn00580555_m1), Ccl3 (Rn_01464736_g1), Ccl7 (Rn01467286_m1), Cxcl12 (Rn00573260_m1), Ccr7 (Rn02758813_s1), Csf1 (Rn01522726_m1), Cxcr1 (Rn00570857_s1), Cxcr2 (Rn02130551_s1), Ptgs2 (Rn01483828_m1), Fgf2 (Rn00570809_m1)
Catabolic factors Epas1 (Rn00576515_m1), Sod2 (Rn00690588_g1)
Cell stress and apoptosis markers and inhibitors
Casp8 (Rn00574069_m1), SIRT1 (Rn_01428096), Prkaa2 (Rn00576935_m1)
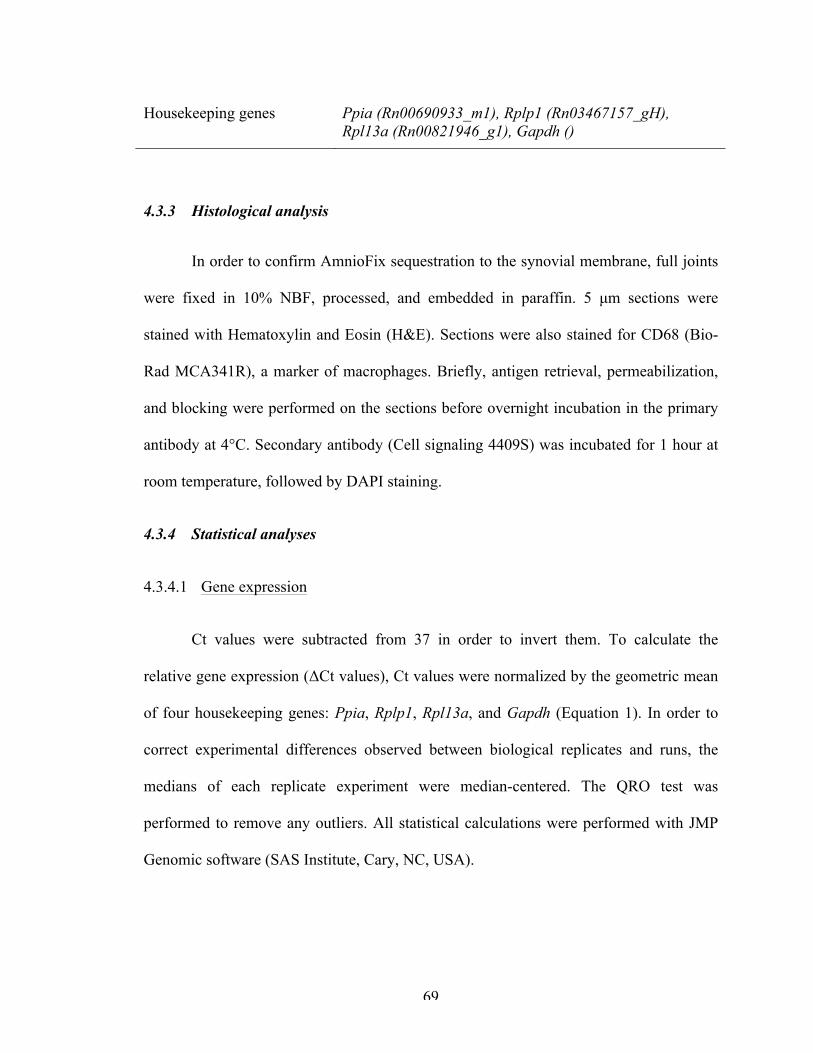
69
Housekeeping genes Ppia (Rn00690933_m1), Rplp1 (Rn03467157_gH), Rpl13a (Rn00821946_g1), Gapdh ()
4.3.3 Histological analysis
In order to confirm AmnioFix sequestration to the synovial membrane, full joints
were fixed in 10% NBF, processed, and embedded in paraffin. 5 µm sections were
stained with Hematoxylin and Eosin (H&E). Sections were also stained for CD68 (Bio-
Rad MCA341R), a marker of macrophages. Briefly, antigen retrieval, permeabilization,
and blocking were performed on the sections before overnight incubation in the primary
antibody at 4°C. Secondary antibody (Cell signaling 4409S) was incubated for 1 hour at
room temperature, followed by DAPI staining.
4.3.4 Statistical analyses
4.3.4.1 Gene expression
Ct values were subtracted from 37 in order to invert them. To calculate the
relative gene expression (ΔCt values), Ct values were normalized by the geometric mean
of four housekeeping genes: Ppia, Rplp1, Rpl13a, and Gapdh (Equation 1). In order to
correct experimental differences observed between biological replicates and runs, the
medians of each replicate experiment were median-centered. The QRO test was
performed to remove any outliers. All statistical calculations were performed with JMP
Genomic software (SAS Institute, Cary, NC, USA).
70
4.3.4.1.1 Principal component analysis (PCA) and unsupervised clustering analysis.
Scripts from JMP Genomic software were used to perform both analyses. In the
weighted average proportions of the PCA models, a residual (unexplained) variance
higher than 60% was considered as too noisy and to have too many potential confounding
variables in the sources of variability (surgery, timepoint, batch effect) to draw
conclusions.
4.3.4.1.1 Differential expression
Volcano plots were used to compare the gene expression profile of two groups.
Significance was determined using Bonferroni correction (0.05 (p-value) divided by the
number of observations).
For each individual gene expression, two-way ANOVA was used to compare
differences among all groups (control, AmnioFix and saline). Tukey’s post hoc
comparison was performed to compare the means of parametric cases in which one-way
ANOVA assumptions were fulfilled. Kruskal-Wallis post hoc test was used for non-
parametric cases. P-values less than 0.05 were considered statistically significant.
Then, to calculate the difference in normalized expressions between the saline and
AmnioFix groups, ΔΔCt values were calculated by subtracting the mean of the control
group from the mean of the experimental group (saline or AmnioFix) for each individual
gene expression (Equation 2). The SEM for ΔΔCt values was calculated using Gauβ error
propagation equation (Equation 3). Two-way ANOVA was performed to determine the
statistical significance of the differences between the means for each treatment and time
71
groups. Tukey’s and Kruskal-Wallis were used as post hoc tests when appropriate. P-
values less than 0.05 were considered statistically significant.
All graphs were plotted as means ± SEM. Analyses were carried out using JMP
Genomic software and graphed in JMP, Excel, or GraphPad Prism, version 7 (San Diego,
CA).
∆∆𝐶𝑡 = ∆𝐶𝑡!"#!$%&!'()* !"#$% − ∆𝐶𝑡!"#!"#$%&# !"#$%
Equation 2. Equation to calculate normalized relative expression (∆∆𝑪𝒕) for each individual gene expression. In this chapter, samples from the unoperated contralateral control group were used as the calibrator.
𝑆𝐷! = 𝑆𝐷!"#!$%&!'()* !"#$%! + 𝑆𝐷!"#$%&"'(& !"#$%!
Equation 3. Equation for SD of ΔΔCt, derived using Gauβ’s error propagation.
4.4 Results
4.4.1 Articular cartilage
In agreement with the previous chapter, no significant differences in gene
expression were observed in the lateral side of the articular cartilage from the tibial
plateau between the (unoperated) control and the MMT surgery (regardless of treatment)
(data not shown). This is expected, as it has been shown before that the MMT surgery
creates a focal defect on the medial side of the tibial plateau, exclusively [81]. Therefore,
we discuss only the medial side of the synovium forthwith.
4.4.1.1 Medial articular cartilage
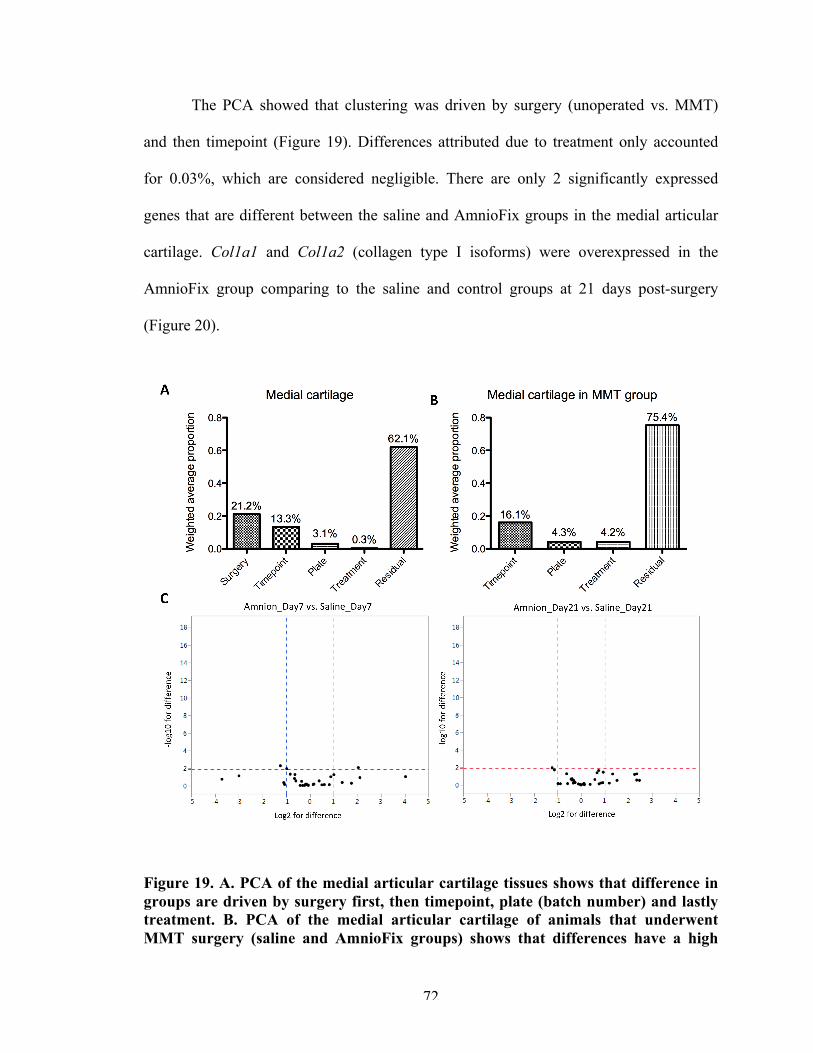
72
The PCA showed that clustering was driven by surgery (unoperated vs. MMT)
and then timepoint (Figure 19). Differences attributed due to treatment only accounted
for 0.03%, which are considered negligible. There are only 2 significantly expressed
genes that are different between the saline and AmnioFix groups in the medial articular
cartilage. Col1a1 and Col1a2 (collagen type I isoforms) were overexpressed in the
AmnioFix group comparing to the saline and control groups at 21 days post-surgery
(Figure 20).
Figure 19. A. PCA of the medial articular cartilage tissues shows that difference in groups are driven by surgery first, then timepoint, plate (batch number) and lastly treatment. B. PCA of the medial articular cartilage of animals that underwent MMT surgery (saline and AmnioFix groups) shows that differences have a high
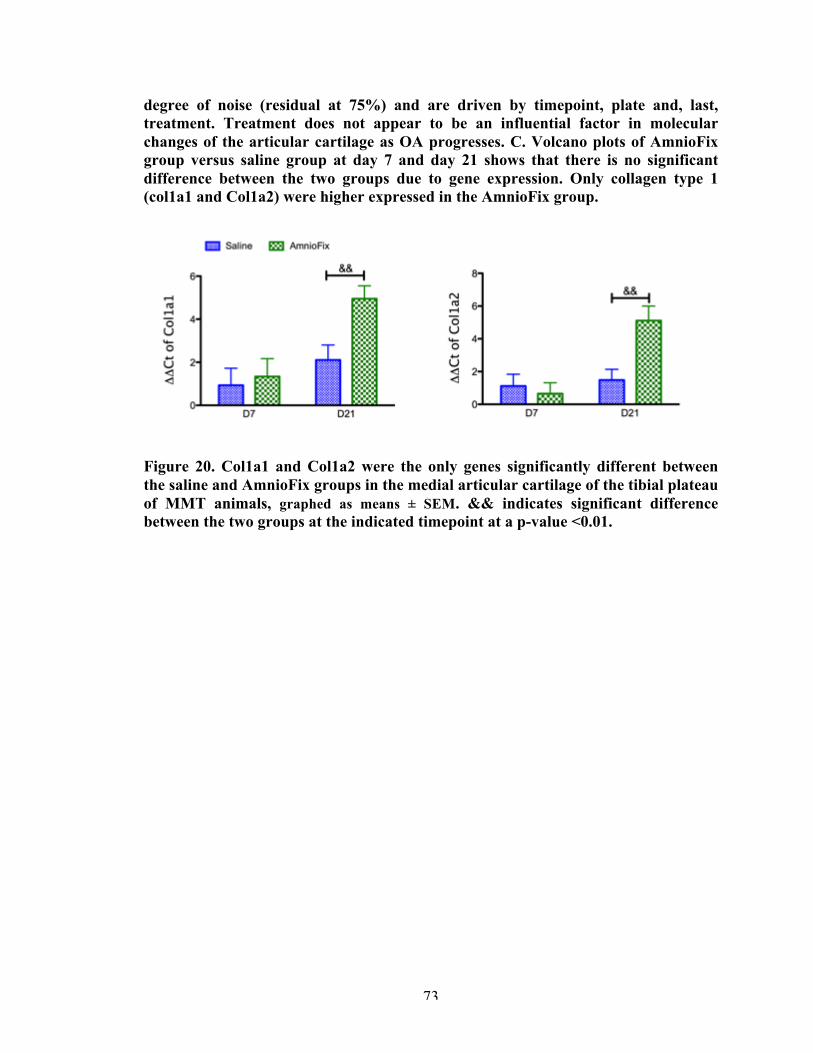
73
degree of noise (residual at 75%) and are driven by timepoint, plate and, last, treatment. Treatment does not appear to be an influential factor in molecular changes of the articular cartilage as OA progresses. C. Volcano plots of AmnioFix group versus saline group at day 7 and day 21 shows that there is no significant difference between the two groups due to gene expression. Only collagen type 1 (col1a1 and Col1a2) were higher expressed in the AmnioFix group.
Figure 20. Col1a1 and Col1a2 were the only genes significantly different between the saline and AmnioFix groups in the medial articular cartilage of the tibial plateau of MMT animals, graphed as means ± SEM. && indicates significant difference between the two groups at the indicated timepoint at a p-value <0.01.
74
11 genes were differentially expressed between the unoperated animals (control
group) and those which received MMT surgery (regardless of treatment, AmnioFix or
saline groups), as shown in Figure 21. ECM gene Fn1 (fibronectin) was significantly
lower in the control group than in the saline and AmnioFix groups at day 21. ECM
remodeling genes were also dysregulated due to MMT surgery. Timp1 was significantly
lower in the control than saline and AmnioFix at all timepoints. Mmp13 and Mmp2 were
significantly lower in the control than the saline or AmnioFix at day 21. Ctsk was
significantly lower in the control than the AmnioFix alone at day 21. Spp1 was
significantly lower in the control than saline at day 21 and AmnioFix at days 7 and 21.
Inhba was significantly lower in the control than saline at days 7 and 21 and than
AmnioFix at day 21 only. Chondrocyte hypertrophic markers Frzb were significantly
higher in the control group than the saline and AmnioFix groups for all timepoints, while
Grem1 was significantly higher than saline at day 7 and than AmnioFix at day 21. Tgm2
was significantly lower in the control group than the other two at day 21 only. Col10a1
was significantly higher in the control group than the AmnioFix group at all timepoints.
Finally, Sod2 was significantly lower in the control than in AmnioFix at day 21.
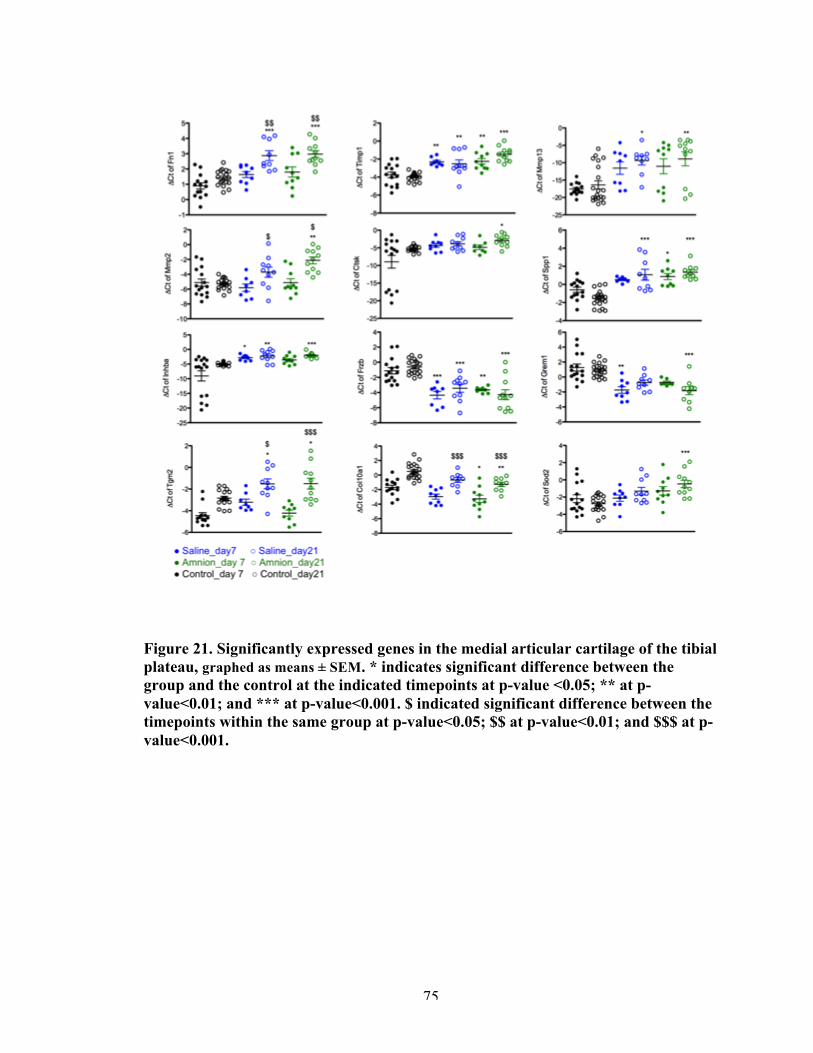
75
Figure 21. Significantly expressed genes in the medial articular cartilage of the tibial plateau, graphed as means ± SEM. * indicates significant difference between the group and the control at the indicated timepoints at p-value <0.05; ** at p-value<0.01; and *** at p-value<0.001. $ indicated significant difference between the timepoints within the same group at p-value<0.05; $$ at p-value<0.01; and $$$ at p-value<0.001.
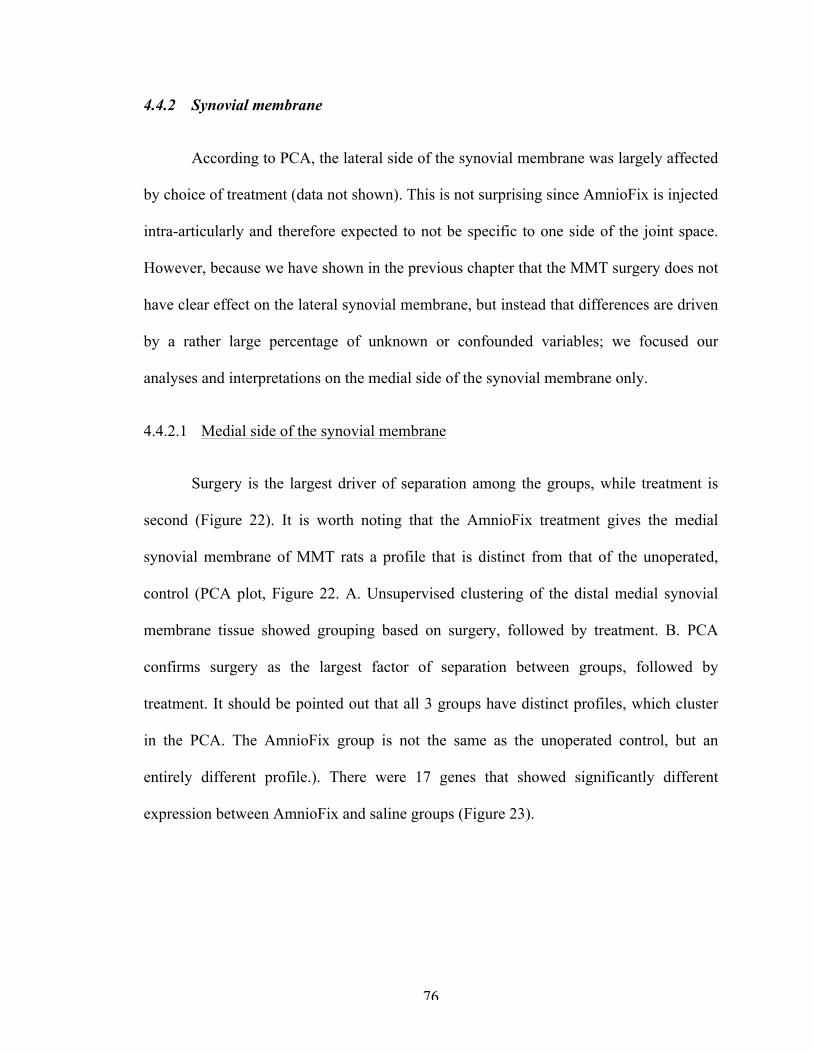
76
4.4.2 Synovial membrane
According to PCA, the lateral side of the synovial membrane was largely affected
by choice of treatment (data not shown). This is not surprising since AmnioFix is injected
intra-articularly and therefore expected to not be specific to one side of the joint space.
However, because we have shown in the previous chapter that the MMT surgery does not
have clear effect on the lateral synovial membrane, but instead that differences are driven
by a rather large percentage of unknown or confounded variables; we focused our
analyses and interpretations on the medial side of the synovial membrane only.
4.4.2.1 Medial side of the synovial membrane
Surgery is the largest driver of separation among the groups, while treatment is
second (Figure 22). It is worth noting that the AmnioFix treatment gives the medial
synovial membrane of MMT rats a profile that is distinct from that of the unoperated,
control (PCA plot, Figure 22. A. Unsupervised clustering of the distal medial synovial
membrane tissue showed grouping based on surgery, followed by treatment. B. PCA
confirms surgery as the largest factor of separation between groups, followed by
treatment. It should be pointed out that all 3 groups have distinct profiles, which cluster
in the PCA. The AmnioFix group is not the same as the unoperated control, but an
entirely different profile.). There were 17 genes that showed significantly different
expression between AmnioFix and saline groups (Figure 23).
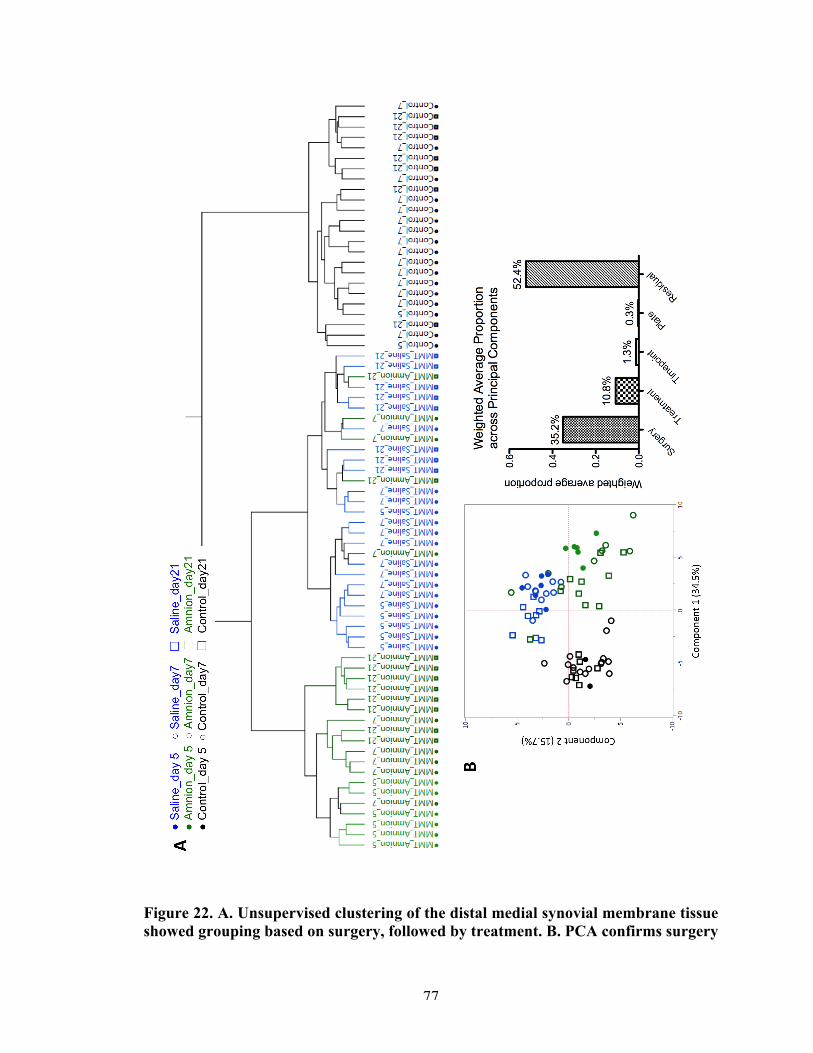
77
Figure 22. A. Unsupervised clustering of the distal medial synovial membrane tissue showed grouping based on surgery, followed by treatment. B. PCA confirms surgery

78
as the largest factor of separation between groups, followed by treatment. It should be pointed out that all 3 groups have distinct profiles, which cluster in the PCA. The AmnioFix group is not the same as the unoperated control, but an entirely different profile.
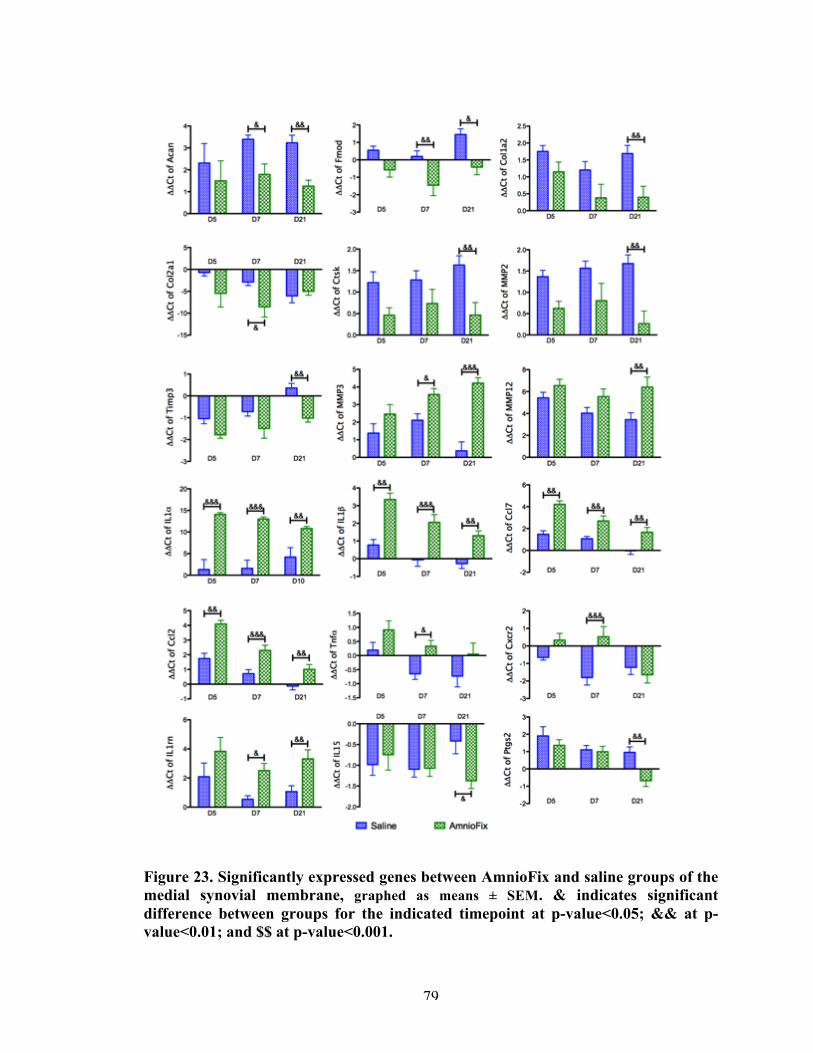
79
Figure 23. Significantly expressed genes between AmnioFix and saline groups of the medial synovial membrane, graphed as means ± SEM. & indicates significant difference between groups for the indicated timepoint at p-value<0.05; && at p-value<0.01; and $$ at p-value<0.001.
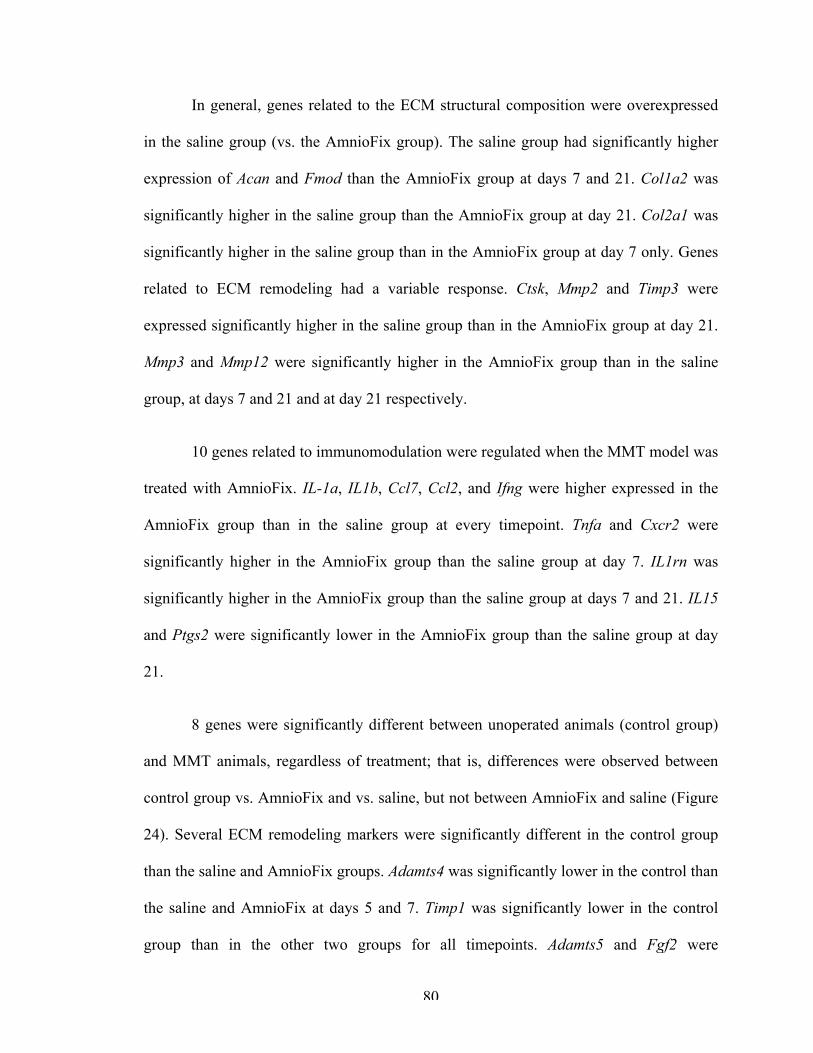
80
In general, genes related to the ECM structural composition were overexpressed
in the saline group (vs. the AmnioFix group). The saline group had significantly higher
expression of Acan and Fmod than the AmnioFix group at days 7 and 21. Col1a2 was
significantly higher in the saline group than the AmnioFix group at day 21. Col2a1 was
significantly higher in the saline group than in the AmnioFix group at day 7 only. Genes
related to ECM remodeling had a variable response. Ctsk, Mmp2 and Timp3 were
expressed significantly higher in the saline group than in the AmnioFix group at day 21.
Mmp3 and Mmp12 were significantly higher in the AmnioFix group than in the saline
group, at days 7 and 21 and at day 21 respectively.
10 genes related to immunomodulation were regulated when the MMT model was
treated with AmnioFix. IL-1a, IL1b, Ccl7, Ccl2, and Ifng were higher expressed in the
AmnioFix group than in the saline group at every timepoint. Tnfa and Cxcr2 were
significantly higher in the AmnioFix group than the saline group at day 7. IL1rn was
significantly higher in the AmnioFix group than the saline group at days 7 and 21. IL15
and Ptgs2 were significantly lower in the AmnioFix group than the saline group at day
21.
8 genes were significantly different between unoperated animals (control group)
and MMT animals, regardless of treatment; that is, differences were observed between
control group vs. AmnioFix and vs. saline, but not between AmnioFix and saline (Figure
24). Several ECM remodeling markers were significantly different in the control group
than the saline and AmnioFix groups. Adamts4 was significantly lower in the control than
the saline and AmnioFix at days 5 and 7. Timp1 was significantly lower in the control
group than in the other two groups for all timepoints. Adamts5 and Fgf2 were
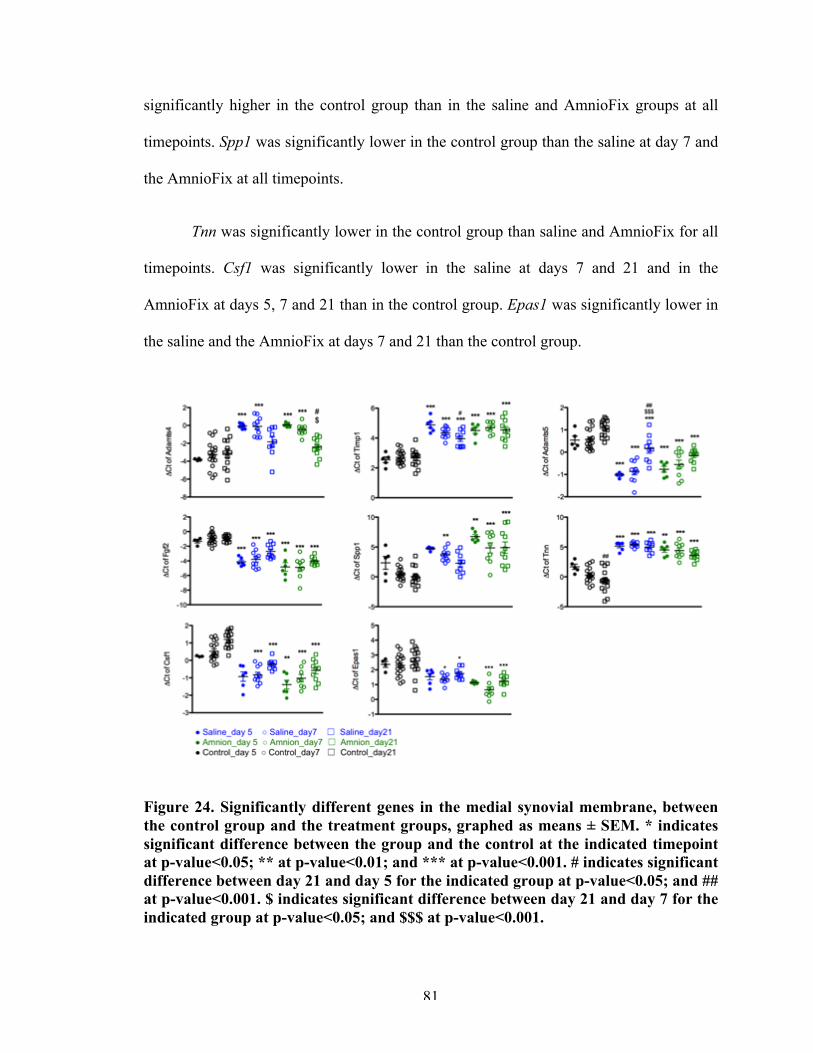
81
significantly higher in the control group than in the saline and AmnioFix groups at all
timepoints. Spp1 was significantly lower in the control group than the saline at day 7 and
the AmnioFix at all timepoints.
Tnn was significantly lower in the control group than saline and AmnioFix for all
timepoints. Csf1 was significantly lower in the saline at days 7 and 21 and in the
AmnioFix at days 5, 7 and 21 than in the control group. Epas1 was significantly lower in
the saline and the AmnioFix at days 7 and 21 than the control group.
Figure 24. Significantly different genes in the medial synovial membrane, between the control group and the treatment groups, graphed as means ± SEM. * indicates significant difference between the group and the control at the indicated timepoint at p-value<0.05; ** at p-value<0.01; and *** at p-value<0.001. # indicates significant difference between day 21 and day 5 for the indicated group at p-value<0.05; and ## at p-value<0.001. $ indicates significant difference between day 21 and day 7 for the indicated group at p-value<0.05; and $$$ at p-value<0.001.
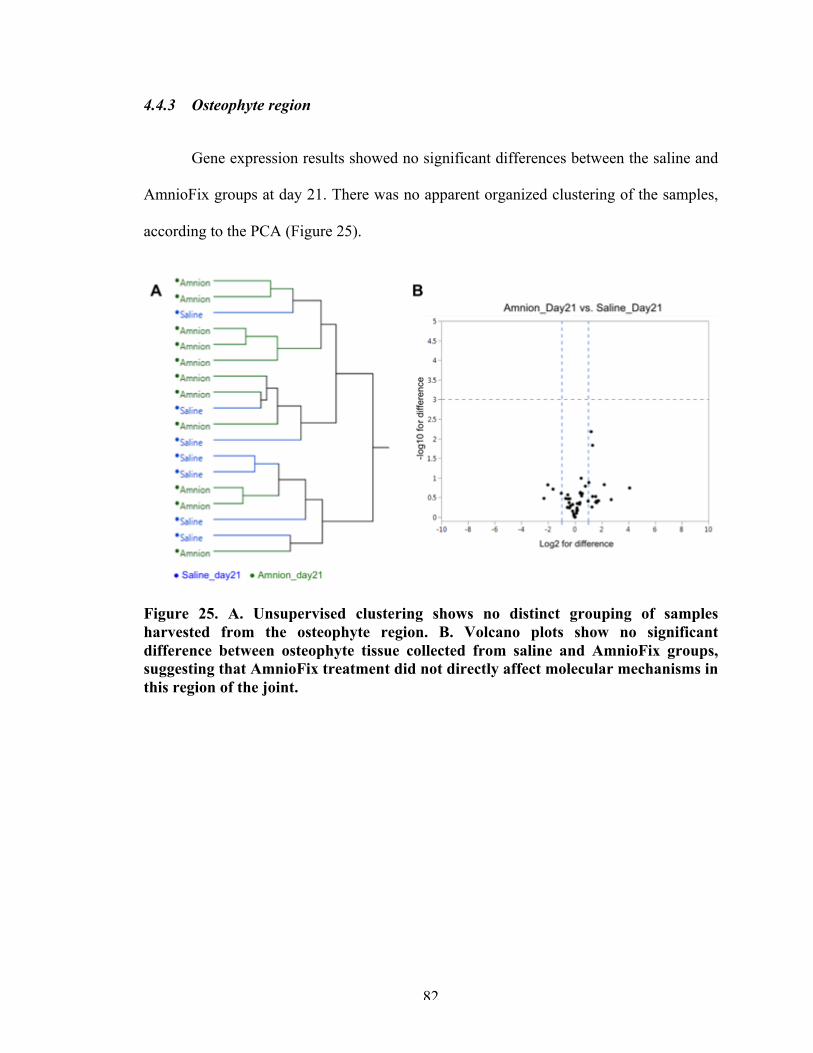
82
4.4.3 Osteophyte region
Gene expression results showed no significant differences between the saline and
AmnioFix groups at day 21. There was no apparent organized clustering of the samples,
according to the PCA (Figure 25).
Figure 25. A. Unsupervised clustering shows no distinct grouping of samples harvested from the osteophyte region. B. Volcano plots show no significant difference between osteophyte tissue collected from saline and AmnioFix groups, suggesting that AmnioFix treatment did not directly affect molecular mechanisms in this region of the joint.
83
4.4.4 AmnioFix sequestration
At 7 days post-surgery, traces of AmnioFix Injectable were discernable only in
the AmnioFix-treated group in the synovial membrane (Figure 26). AmnioFix was not
discernable at 21 days post-surgery.
Figure 26. Hematoxylin & Eosin staining of the synovial membrane shows traces of AmnioFix Injectable in the AmnioFix treatment group and not in the saline group at 7 days post-surgery.
4.4.5 Recruitment of helper cells by AmnioFix
At 7 days post-surgery, cells in the AmnioFix treatment stained positive for CD68
marker of macrophages in the synovial membrane (Figure 27). No positive CD68
staining was observed in the saline group in the synovial membrane.
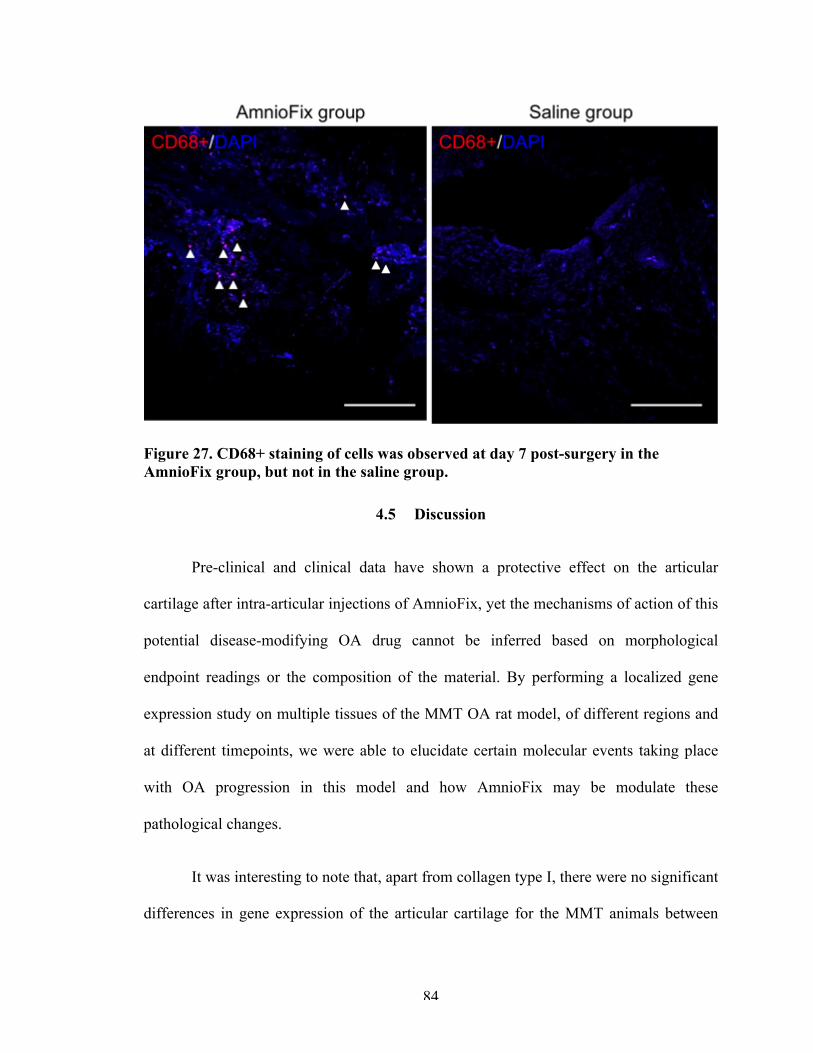
84
Figure 27. CD68+ staining of cells was observed at day 7 post-surgery in the AmnioFix group, but not in the saline group.
4.5 Discussion
Pre-clinical and clinical data have shown a protective effect on the articular
cartilage after intra-articular injections of AmnioFix, yet the mechanisms of action of this
potential disease-modifying OA drug cannot be inferred based on morphological
endpoint readings or the composition of the material. By performing a localized gene
expression study on multiple tissues of the MMT OA rat model, of different regions and
at different timepoints, we were able to elucidate certain molecular events taking place
with OA progression in this model and how AmnioFix may be modulate these
pathological changes.
It was interesting to note that, apart from collagen type I, there were no significant
differences in gene expression of the articular cartilage for the MMT animals between
85
treatments (saline vs. AmnioFix). In the previous chapter, we have shown that there are
pathological changes at the molecular level which are identifiable using this gene analysis
platform, and here also, we observed distinct changes in gene expression due to the MMT
surgery (regardless of treatment). However, AmnioFix does not appear to act directly on
the articular cartilage, or on the osteophyte-forming region of this post-traumatic OA
model. The disease progressing mechanisms, including increased levels of ECM
remodeling markers and activation of chondrocyte hypertrophic switches, are still taking
place in the articular cartilage. Mmp13, Mmp2, Ctsk, Inhba, Timp1, Timp3, and Spp1
were all upregulated as a consequence of MMT surgery, and AmnioFix treatment did not
appear to influence these genes. Underexpression of Grem1 and Frzb and overexpression
of Tgm2 may lift the block on chondrogenic differentiation and allows chondrocytes to
become hypertrophic. These results suggest that, in spite of AmnioFix treatment,
molecular pathomechanisms still continue in the articular cartilage. They also emphasize
the role the synovial membrane plays in OA development in the MMT rat model. It is
possible that by treating the synovial membrane, AmnioFix is able to delay
morphological changes in the articular cartilage, even though changes have been initiated
at the molecular level.
The influence of the synovial membrane in OA has been highlighted as a silent,
yet pivotal contributor to disease progression in recent years [10, 11]. The joint acts as an
organ, and it has been shown that OA-induced cartilage degradation triggers a Janus-like
pro-inflammatory and anti-inflammatory response from the synovium [11]. It is believed
that, due to the initial stimulus (cartilage injury) not being addressed, the immunogenic
response becomes chronic and the synovium and the articular cartilage enter a positive
86
feedback loop, in which catabolic factors released by the synovium exacerbate the
damage to the cartilage. The anti-inflammatory response from the synovium cannot offset
the catabolic mechanisms at this point.
In the medial side of the synovial membrane, AmnioFix Injectable elevated the
expression of pro-inflammatory cytokines and chemokines: IL-1a, IL1-b, IL15, Ccl2 and
Ifng. AmnioFix Injectable itself is known to contain these factors [117], and results
suggest that contact with the synovium may have stimulated further production by
synovial cells. We suggest that this pro-inflammatory gene expression driven by
AmnioFix may initiate remodeling/repair mechanisms akin to wound healing in the
synovium, which may alleviate the microenvironment of the cells and prevent the
synovium from entering the feedback loop with injured cartilage.
In wound healing, pro-inflammatory signals recruit helper cells, which in turn act
to modulate the microenvironment of the wound by secretion of factors (including anti-
inflammatory signals) and start the repair process. By promoting a pro-inflammatory
state, AmnioFix may be recruiting repair cells to the synovial lining. Ccl2 and Ccl7 are
CC-Chemokines that mediate inflammatory (LY6Chi) monocyte recruitment [126].
Furthermore, high expression of Ccl2 suggests macrophage (MΦ) differentiation under
the influence of macrophage colony-stimulating factor (M-CSF) [127, 128], indicating
the specialization of recruited monocytes. Expression of Ifng and IL1 suggest a
preference for M1 (proinflammatory, classically activated)-MΦ phenotype, which is
involved with cytotoxicity and tissue injury [127]. Although studies have hypothesized
that M-CSF-derived MΦ are pre-oriented to M2 (anti-inflammatory, alternatively
activated) subtype [128-130], some studies have found that MC-CSF MΦ can polarize
87
toward a M1 phenotype after Ifng stimulation [129, 131]. If indeed MΦ infiltrate the
synovium during OA development in the MMT model, our results suggest a bias toward
polarization to the M1 phenotype. It is worth pointing out that MΦ polarization is not an
analogy for a dial turning one direction or the other but, instead, for a spectrum in which
cells can demonstrate traits of a phenotype along the x-axis and of another phenotype
along the y-axis. In fact, Lacey et al. found the degree of anti-inflammatory phenotype of
M1-MΦ to be the highest when derived from M-CSF origin [129, 132, 133].
Low expression of IL-15 and high expression of IL1rn (usually considered a M2-
MΦ marker [129, 134, 135]) would also suggest an upregulation of an anti-inflammatory
response in the AmnioFix group. Altogether, these results may suggest that intra-articular
injection of AmnioFix enhances the recruitment of helper cells to the synovial membrane
in the MMT model and that these cells may be differentiated along the pro-
inflammatory/anti-inflammatory spectrum in such a way that their secretome is
counteracting cartilage catabolism.
Moreover, IL-1 (alpha or beta) and IL-1ra can be produced by the same cells
(early or late macrophages) [136, 137]. Cauli et al. found that in OA patients, there was a
higher percentage of macrophages positively stained for IL-1ra detected than those for
IL-1a, compared to RA in which there is no a statistical difference between the two [136].
This high IL-1ra/low IL1a ratio may be a driver for the observed chronic, low
inflammation in the synovium as OA develops. Therefore the ratio between IL-1a and
IL-1ra may help determine the disease process within the joint. Studies have indicated
that in order to block IL-1-mediated effects, a 100-fold excess of IL-1ra is needed [136,
88
138, 139] Although probably not on this scale, AmnioFix Injectable may help neutralize
the catabolic effects of IL-1 by influencing this ratio.
Synovial fibroblast-like cells make up the majority of cells in the synovium, yet a
study has found that selective depletion of MΦ in the synovium during OA results in the
downregulation of several fibroblast-produced cytokines and MMPs [140]. This would
indicate that MΦ play a role not only by secreting factors themselves, but also by
stimulating responses from synovial fibroblasts, possibly activating them. The synovium
is part of the joint organ, and so its state and composition affects the articular cartilage
and bone and vice versa. In a collagenase-induced OA mouse model, MΦ from the
synovial lining played a pivotal role in mediating osteophyte formation and other OA-
related pathology [30]. In the MMT model, we have not been able to detect
inflammation-related responses due to injury (previous chapter), and so we are not able to
postulate the baseline role of helper cells as OA-like characteristics develops in this
model. We did, however, provide baseline molecular events as OA develops in this
model, such as dysregulation of ECM composition markers and upregulation of ECM
remodeling markers, especially elevated levels of MMPs. In this study, we have found
that treatment with AmnioFix Injectable maintained ECM composition markers to levels
comparable with the unoperated control group and that some ECM remodeling markers
are downregulated. More interestingly, we observed a spike in the expression of
immunomodulatory markers in response to AmnioFix treatment in the MMT model. We
postulate that by targeting the synovium, AmnioFix is modulating its microenvironment
in such a way that could lead to a bias in polarization of MΦ and their secretome. This
would then influence the secretome to perhaps alleviate the catabolic factors produced by
89
the articular cartilage and thus slow down damage. In order to test this hypothesis,
isolated cells from the medial synovial membrane of MMT rats with/without AmnioFix
treatment would need to be further studied.
This study introduces a new perspective in the OA field, as conventional
approaches have often focused on lowering inflammation by inhibiting inflammatory
responses with agonists. Yet, to this date, these approaches have not shown a significant
advantage as DMOADs, or consistent chondro-protective characteristics. We suggest to
take a different perspective on inflammation, and instead of attempting to prevent it or
remove it from the equation, that we leverage it to enhance tissue-repair responses such
as the ones observed in response to AmnioFix treatment. Initial pro-inflammatory
signaling is important in wound healing, yet if it extends into a chronic state, it would
become a problem.
As an ECM-derived drug, AmnioFix is composed of many factors that may have
several effects that cross-reference each other that we have not tested in this study.
Moreover, the MMT model is a post-traumatic model, and it is not generally associated
with the inflammatory OA subphenotype. Therefore, we suggest that the mechanisms of
action of AmnioFix should continue to be studied, particularly in different models where
inflammation is prominent. An in vitro study from this lab found that AmnioFix
downregulated the pro-inflammatory response in cytokine-activated synovial fibroblasts.
It could be entirely possible that, given its complex composition, AmnioFix has different
effects in different models; that is, in different microenvironments. We propose that
AmnioFix is further tested in OA models with an inflammatory component, such as the
monoiodoacetate (MIA) model, and in models of rheumatoid arthritis (RA). RA occurs

90
when the immune system mistakenly attacks the synovial membrane, starting the
pathological events that cause bone erosion and joint deformity. Since we have shown
that AmnioFix directly targets the synovial membrane and that it is able to modulate its
microenvironment, we think it would be a good candidate for RA treatment and it is
worth investigating.
91
CHAPTER 5. DEVELOPMENT AND CHARACTERIZATION OF
PATIENT-SPECIFIC INDUCED PLURIPOTENT STEM CELL-
DERIVED IN VITRO MODELS OF JUVENILE
OSTEOCHONDRITIS DISSECANS
5.1 Abstract
JOCD is a degenerative joint disorder in which an osteonecrotic lesion in the
subchondral bone has secondary effects on the overlaying articular cartilage. Over time, a
necrotic osteochondral fragment develops and detaches from the parent bone,
permanently affecting the joint and altering its mechanics. These 5 to 19 year-olds
develop early onset of OA and contribute to a larger burden to the healthcare system.
JOCD treatments are mostly conservative, and in advanced stages, surgical intervention
is used to fix the fragment in place or replace it with an allograft. Limited treatments are
due to the lack of knowledge about the onset and development of JOCD. The objective of
this study was to develop JOCD patient-specific iPSC-derived models of chondrogenic
and endochondral ossification organoids in order to elucidate pathological mechanisms of
this disorder.
JOCD-specific iPSCs from 3 donors were reprogrammed from skin fibroblasts
and validated for pluripotency. Then, they were differentiated into MSCs (iMSCs) and
validated according to the established minimal criteria. JOCD- and control-iMSCs
underwent 3D chondrogenesis and endochondral ossification, and these organoids were
92
harvested at different timepoints for gene expression, GAG and calcium quantification,
histology, and TEM.
Results from the chondrogenic model showed that cells derived from JOCD
patients had a significantly lower chondrogenic capacity than those from control patients.
In the endochondral ossification model, JOCD cells produced the same amount of
calcium and stained equally well for collagen type I, yet their gene expression profile was
significantly different than that of the control cells. This may suggest that although JOCD
cells are able to undergo endochondral ossification, there are irregularities in this process,
when compared to control cells. This study has utilized cutting-edge iPSC technology to
study JOCD in vitro and it is the first to report on JOCD pathomechanisms during
chondrogenesis and endochondral ossification.
5.2 Introduction
JOCD is an increasingly common degenerative joint disorder that predominantly
affects adolescent and young adults, and progresses to early onset OA. JOCD is
hypothesized to involve the formation of an avascular lesion in the subchondral bone
with secondary effects in the overlaying articular cartilage. As this disease progresses,
partial or complete fragmentation of the necrotic bone may occur, which jeopardizes the
bone integrity and significantly alters the joint mechanisms [36]. Previous research has
been limited to retrospective clinical studies, and the pathophysiological mechanisms
associated with the onset and progression of JOCD have yet to be fully characterized.
Previous studies have shown that chondrocytes isolated from detached JOCD
fragments maintain similar cell viability and proliferative activity to those from normal
93
healthy cartilage [41, 76, 77]. However, both JOCD loose body- and JOCD cartilage
biopsy-derived primary chondrocytes showed intracellular accumulation of matrix
proteins that affected their morphology [77]. This feature has also been observed in
familial OCD (FOCD) [78] and in endoplasmic reticulum storage diseases (ERSD) [77].
Unlike JOCD, FOCD is associated with a mutation in the aggrecan gene. A previous
study by Xu et al. showed that, because of this mutation, large amounts of the aggrecan
protein accumulated within the ER of FOCD chondrocytes, which led to a marked
absence of aggrecan in the ECM [78]. FOCD is, therefore, considered to be an ERSD. All
ERSDs show critical accumulation of misfolded proteins that result in defective protein
trafficking, which may cause defective ECM assembly [77].
However, JOCD is not known to be a genetic disease; there isn’t a specific
mutation associated with it, and a recent study has found that only 14% of patients have
family history [69]. Furthermore, characteristic features of FOCD are systemic: people
with FOCD have multiple lesions that affect several joints, have short stature and develop
OA at an early age. In contrast, JOCD is not systemic. There may be lesions in one than
one joint, but developmental abnormalities are not associated with JOCD, as they are in
the case of FOCD. Therefore, it is unclear whether JOCD may also be a disease of the
ER. Previous studies have focused on isolated primary chondrocytes and the cartilage
aspect of JOCD, yet this disorder is hypothesized to initiate in the subchondral bone, in
the secondary ossification center. Because JOCD patients are still developing, the
endochondral epiphyseal ossification is still undergoing. This differentiation process is
prominent in JOCD patients, yet it has never been studied.
94
The objective of this study is to establish JOCD patient-specific iPSC-derived in
vitro models of chondrogenesis and endochondral ossification in order to investigate
pathological mechanisms in this disorder. Because these are pediatric patients and their
lesions are usually treated without the excision of the fragment, stem cells were not a
viable source. Instead, with as little as a 2mm2 skin biopsy, we were able to generate
patient-specific iPSCs, which provided us with an unlimited supply of disease-specific
stem cells and the ability to differentiate them into different tissues to study different
aspects of the same disease. We chose to study endochondral ossification processes as
they are highly relevant to the site where JOCD lesions develop (epiphyseal ossification),
and chondrogenesis processes because cartilaginous templates are a key step in
endochondral ossification. We hypothesized that cells from JOCD patients produce a
suboptimal matrix during endochondral ossification and that this is a result of protein
accumulation in the ER.
5.3 Materials and methods
5.3.1 Tissue and cell samples
Sin biopsies (2mm in diameter) from 3 JOCD patients were obtained in
collaboration with Children’s Healthcare of Atlanta, Orthopeadics department (IRB study
#13-098). Dermal fibroblasts from these biopsies were sent to Washington University’s
iPSC core facility (St. Louis, MI) for reprogramming with sendai virus. 3 clones from
each JOCD iPSC line were chosen in order to have (3) biological copies of each JOCD
patient. In order to study a disease, it is important to work with multiple clones per
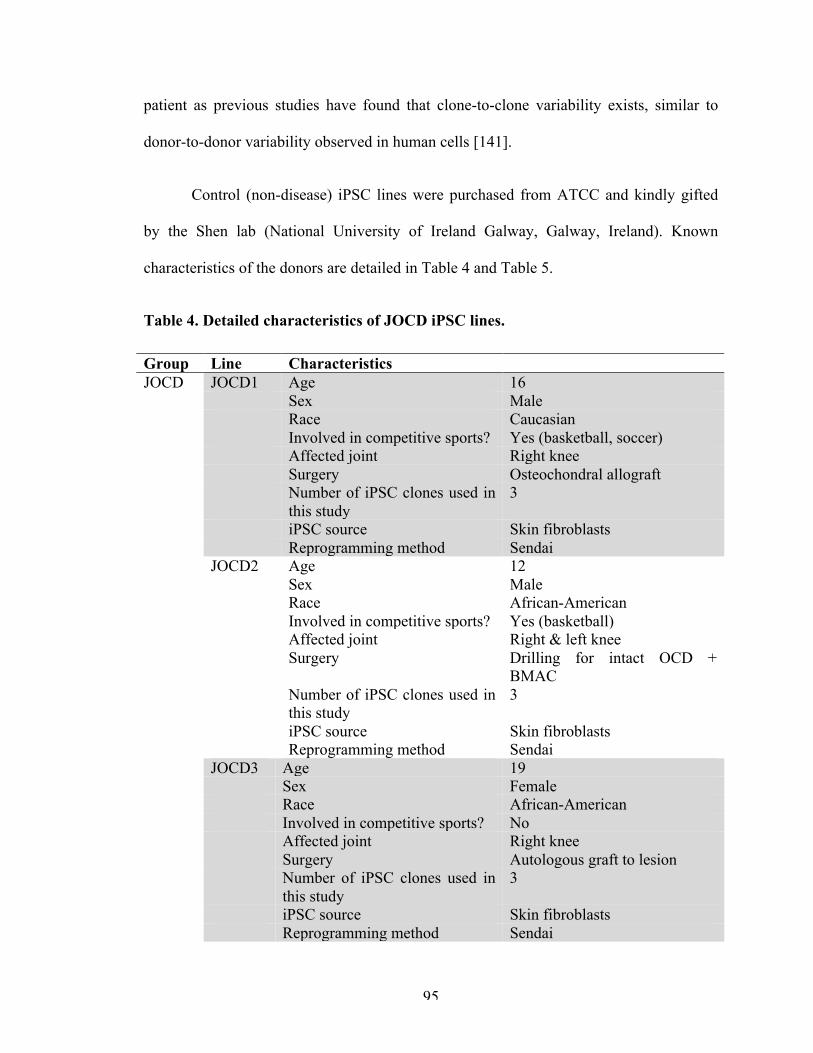
95
patient as previous studies have found that clone-to-clone variability exists, similar to
donor-to-donor variability observed in human cells [141].
Control (non-disease) iPSC lines were purchased from ATCC and kindly gifted
by the Shen lab (National University of Ireland Galway, Galway, Ireland). Known
characteristics of the donors are detailed in Table 4 and Table 5.
Table 4. Detailed characteristics of JOCD iPSC lines.
Group Line Characteristics JOCD JOCD1 Age 16 Sex Male Race Caucasian Involved in competitive sports? Yes (basketball, soccer) Affected joint Right knee Surgery Osteochondral allograft Number of iPSC clones used in
this study 3
iPSC source Skin fibroblasts Reprogramming method Sendai JOCD2 Age 12 Sex Male Race African-American Involved in competitive sports? Yes (basketball) Affected joint Right & left knee Surgery Drilling for intact OCD +
BMAC Number of iPSC clones used in
this study 3
iPSC source Skin fibroblasts Reprogramming method Sendai JOCD3 Age 19 Sex Female Race African-American Involved in competitive sports? No Affected joint Right knee Surgery Autologous graft to lesion Number of iPSC clones used in
this study 3
iPSC source Skin fibroblasts Reprogramming method Sendai
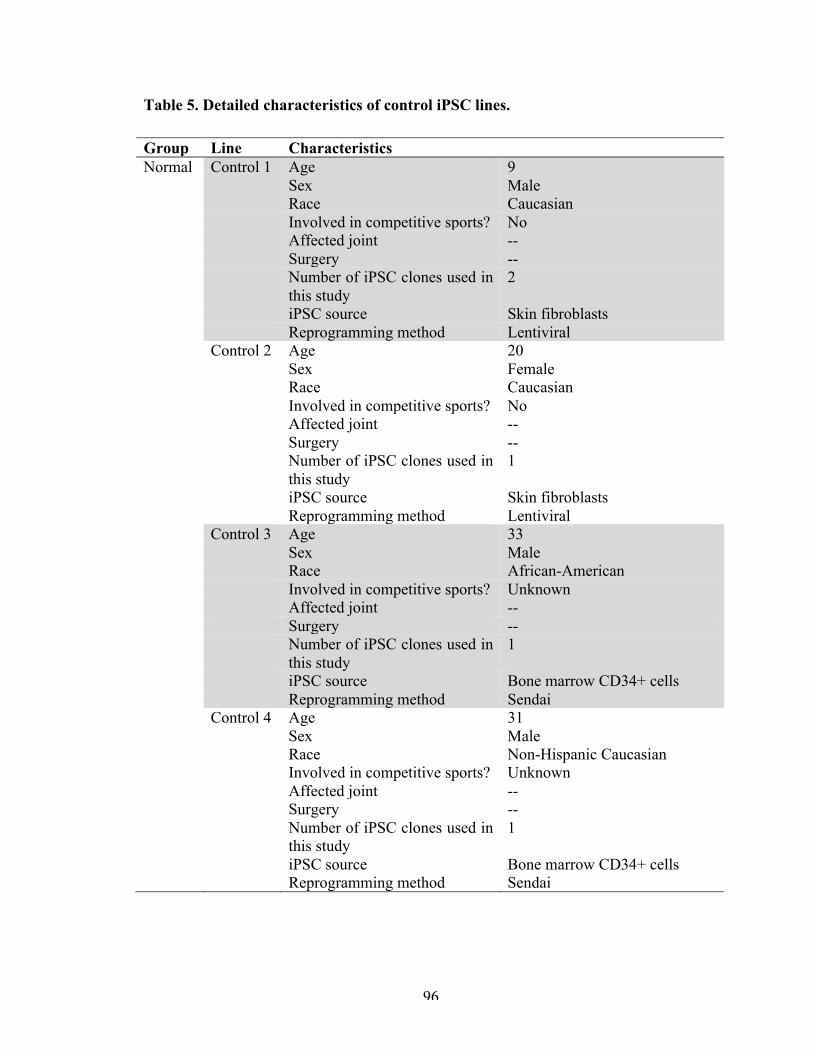
96
Table 5. Detailed characteristics of control iPSC lines.
Group Line Characteristics Normal Control 1 Age 9 Sex Male Race Caucasian Involved in competitive sports? No Affected joint -- Surgery -- Number of iPSC clones used in
this study 2
iPSC source Skin fibroblasts Reprogramming method Lentiviral Control 2 Age 20 Sex Female Race Caucasian Involved in competitive sports? No Affected joint -- Surgery -- Number of iPSC clones used in
this study 1
iPSC source Skin fibroblasts Reprogramming method Lentiviral Control 3 Age 33 Sex Male Race African-American Involved in competitive sports? Unknown Affected joint -- Surgery -- Number of iPSC clones used in
this study 1
iPSC source Bone marrow CD34+ cells Reprogramming method Sendai Control 4 Age 31 Sex Male Race Non-Hispanic Caucasian Involved in competitive sports? Unknown Affected joint -- Surgery -- Number of iPSC clones used in
this study 1
iPSC source Bone marrow CD34+ cells Reprogramming method Sendai
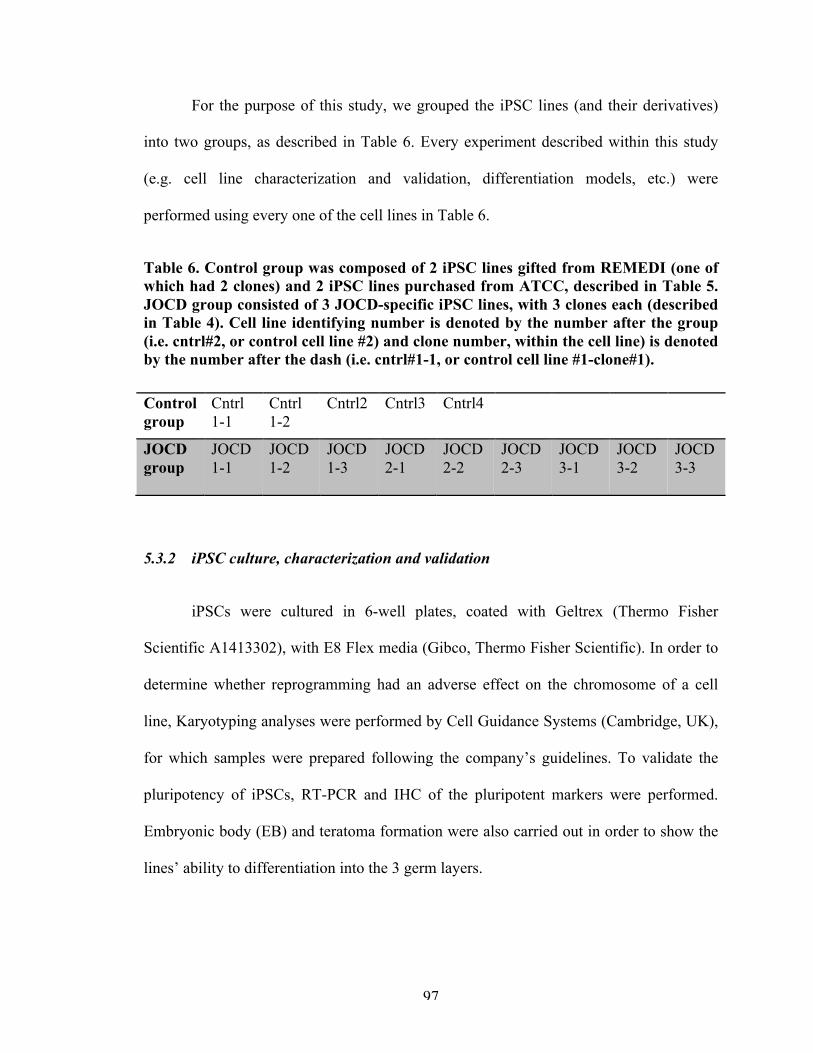
97
For the purpose of this study, we grouped the iPSC lines (and their derivatives)
into two groups, as described in Table 6. Every experiment described within this study
(e.g. cell line characterization and validation, differentiation models, etc.) were
performed using every one of the cell lines in Table 6.
Table 6. Control group was composed of 2 iPSC lines gifted from REMEDI (one of which had 2 clones) and 2 iPSC lines purchased from ATCC, described in Table 5. JOCD group consisted of 3 JOCD-specific iPSC lines, with 3 clones each (described in Table 4). Cell line identifying number is denoted by the number after the group (i.e. cntrl#2, or control cell line #2) and clone number, within the cell line) is denoted by the number after the dash (i.e. cntrl#1-1, or control cell line #1-clone#1).
Control group
Cntrl 1-1
Cntrl 1-2
Cntrl2 Cntrl3 Cntrl4
JOCD group
JOCD 1-1
JOCD 1-2
JOCD 1-3
JOCD 2-1
JOCD 2-2
JOCD 2-3
JOCD 3-1
JOCD 3-2
JOCD 3-3
5.3.2 iPSC culture, characterization and validation
iPSCs were cultured in 6-well plates, coated with Geltrex (Thermo Fisher
Scientific A1413302), with E8 Flex media (Gibco, Thermo Fisher Scientific). In order to
determine whether reprogramming had an adverse effect on the chromosome of a cell
line, Karyotyping analyses were performed by Cell Guidance Systems (Cambridge, UK),
for which samples were prepared following the company’s guidelines. To validate the
pluripotency of iPSCs, RT-PCR and IHC of the pluripotent markers were performed.
Embryonic body (EB) and teratoma formation were also carried out in order to show the
lines’ ability to differentiation into the 3 germ layers.
98
To form EBs, iPSC colonies were dissociated with Dispase (Stemcell
Technologies 07923) for 10 min at 37 °C and cultured in ultra-low attachment well plates
(Corning CLS3471). Two days after, medium was changed to 50:50 E8 Flex medium
(iPSC medium) : EB medium. Then, two days after, medium was changed to 100% EB
medium, which contains knock-out DMEN, 20% FBS, 1% L-glutamine, 1% non-
essential amino acid (NEAA), and 0.014mM β-mercaptoethanol. EB medium was
changed every other day, and EBs were fixed in 10% NFB (overnight, at 4°C) at the 5
week timepoint.
To form teratomas, iPSCs were dissociated with Dispase and injected
subcutaneously (Georgia Institute of Technology IACUC protocol A16043) in 60%
Geltrex. Teratomas were allowed to grow for 8 to 12 weeks.
5.3.3 iMSC differentiation
iPSCs were differentiated into iMSCs (iPSC-derived mesenchymal stem cells) via
an EB intermediate step, as previously described [142, 143]. EBs were formed as
previously described. After 9 days, EBs were plated on gelatin (0.1%)-coated flasks with
EB medium. After 5 days, the outgrowth cells were typsinized and passaged into gelatin-
coated T-75 flasks with MSC differentiation medium, which contains knock-out DMEN,
10% FBS, 1% Penicillin streptomycin (PS), 1% L-glutamine, and 1% NEAA. Cells were
cultured and passaged until a homogeneous (>70%) fibroblastic morphology appeared.
Then, differentiating cells were passaged to non-coated, standard tissue culture flasks,
and cultured with MSC maintenance media (αMEM, 10% FBS and 1% PS) with 2 ng/ml
FGF2.
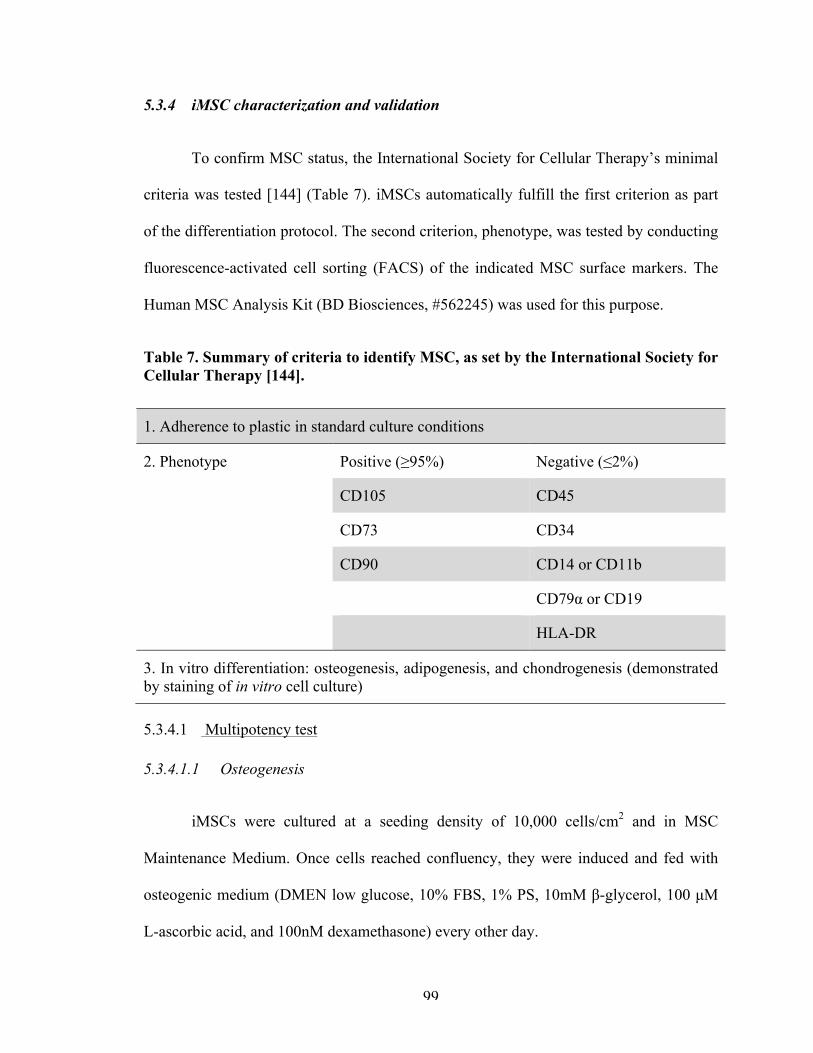
99
5.3.4 iMSC characterization and validation
To confirm MSC status, the International Society for Cellular Therapy’s minimal
criteria was tested [144] (Table 7). iMSCs automatically fulfill the first criterion as part
of the differentiation protocol. The second criterion, phenotype, was tested by conducting
fluorescence-activated cell sorting (FACS) of the indicated MSC surface markers. The
Human MSC Analysis Kit (BD Biosciences, #562245) was used for this purpose.
Table 7. Summary of criteria to identify MSC, as set by the International Society for Cellular Therapy [144].
1. Adherence to plastic in standard culture conditions
2. Phenotype Positive (≥95%) Negative (≤2%)
CD105 CD45
CD73 CD34
CD90 CD14 or CD11b
CD79α or CD19
HLA-DR
3. In vitro differentiation: osteogenesis, adipogenesis, and chondrogenesis (demonstrated by staining of in vitro cell culture)
5.3.4.1 Multipotency test
5.3.4.1.1 Osteogenesis
iMSCs were cultured at a seeding density of 10,000 cells/cm2 and in MSC
Maintenance Medium. Once cells reached confluency, they were induced and fed with
osteogenic medium (DMEN low glucose, 10% FBS, 1% PS, 10mM β-glycerol, 100 µM
L-ascorbic acid, and 100nM dexamethasone) every other day.
100
After 4 weeks, cultures were taken down for Alizarin Red and Von Kossa
stainings. For Alizarin Red, cells were washed with PBS and fixed with 10% NBF at RT
for 15 minutes. Cells were then rinsed with dH2O and stained with Alizarin Red (pH 4.1)
for 5 minutes. For Von Kossa, cells were washed with PBS and fixed with 70% Et-OH
for 30 minutes at RT. Cells were rinsed with dH2O and incubated with silver nitrate under
UV. The reaction was stopped with sodium thiosulfate.
5.3.4.1.1 Adipogenesis
iMSCs were cultured at a seeding density of 20,000 cells/ cm2 and in MSC
Maintenance Medium. Once cells reached confluency, they were induced with
adipogenic induction medium (DMEN high glucose, 10% FBS, 1µM dexamethasone,
10µg/ml insulin, 200µM indomethacin, 500µM MIX, and 1%PS). Adipogenic induction
medium was changed every 3-4 days, 3 times; then, medium was switched to adipogenic
maintenance medium (DMEN high glucose, 10% FBS, 10µg/ml insulin, and 1% PS) for
3 days before fixing. Cells were fixed with 10% NBF for 10 minutes at RT and stained
with oil red-o solution.
5.3.4.1.1 Chondrogenesis
2 × 10! iMSCs in 10 µl of MSC maintenance media were incubated at 37°C for 2
hours in low-adherence tubes. Then, 200 µl of MSC maintenance medium was added to
each tube, followed by overnight incubation. The next day, medium was replaced by
chondrogenic medium (DMEN high glucose, 100nM dexamethasone, 50µg/ml Ascorbic
acid, 40 µg/ml L-proline, 1% ITS + supplement, 1mM sodium pyruviate, and 1% PS)
with 10ng/ml of TGF-β3 and changed every second day for 21 days. Cell pellets were
101
fixed with 10% NBF overnight at 4°C, routinely processed, embedded in paraffin, and
sectioned at 5 µm thickness. Sections were stained with 0.01% toluidine blue (pH 4.0)
and counterstained with nuclear fast red.
5.3.5 Chondrogenic and endochondral ossification differentiation models
5.3.5.1 3D chondrogenesis
3D chondrogenesis model of iMSCs was performed using the high cell-density
micromass culture model as previously described [78]. Briefly, 2 × 10! iMSCs in 10 µl
of MSC maintenance media were incubated at 37°C for 2 hours in low-adherence round-
bottom 96-well plates (Sigma-Aldrich). Then, 200 µl of MSC maintenance medium was
added to each well, followed by overnight incubation. Medium was replaced by
chondrogenic medium with 10ng/ml TGF-β3 (Peprotech) the following day and was
changed every second day for 49 days. Micromass cultures were harvested at different
timepoints.
5.3.5.2 3D Endochondral ossification
The 3D endochondral ossification differentiation model was carried out as shown
in Figure X. The micromass cultures for endochondral ossification were started like in the
chondrogenesis model and cultured with chondrogenic media for the first 21 days. At day
21, medium was replaced by osteogenic medium and changed every second day for an
additional 28 days. Micromass cultures were harvested at different timepoints.
102
5.3.6 Quantitative analyses of differentiation
5.3.6.1 DNA
Samples were harvested at day 21 and day 49 (n=5 per cell line). Pellets were
digested overnight in papain (Sigma Aldrich) at 60°C. DNA was measured by Picogreen
dsDNA assay kit (Thermo Fisher Scientific), according to the manufacturer’s protocol.
5.3.6.2 Sulfated glycosaminoglycan (GAG)
Dimethylmethylene blue (DMMB) quantification was performed as previously
described [78], with the same papain-digested samples that were used for DNA
quantification. To assess the chondrogenic capability of control- and JOCD-iMSCs, the
ratio of GAG to DNA per sample was calculated.
5.3.6.3 Calcium
Samples designated for calcium (n=5 per cell line, per timepoint) were vortexed
overnight at 4°C in 1 N acetic acid to solubilize calcium. Calcium deposition was
determined by the colorimetric Arsenazo III readent assay (Diagnostic Chemicals Ltd.,
Oxford, CT, USA). To assess the osteogenic capability of iMSCs, the ratio of calcium to
DNA was calculated. Because these two assays were not quantified from the same
pellets, the mean and SD of each assay was calculated separately. Then, the ratio was
computed by dividing the mean of the calcium content by the mean of the DNA
concentration, for each group. To calculate the SD of the ratio (averaged calcium :
averaged DNA content), Taylor’s expansion formula was used with the assumption of
independent variables (Equation 4 and Equation 5).
103
𝑉(𝐴 𝐵) =𝐴𝐵
!
×𝑉!𝐴! +
𝑉!𝐵! −
2 × 𝐶(𝐴,𝐵)𝐴 × 𝐵
Equation 4. Approximation formula [145, 146] for the variance of the quotient of two random variables; where A and B are the mean values and VA and VB are their corresponding variances. The covariance (C(A,B)) is zero and drops out of the equation when variables are assumed to be independent.
𝑺𝑫(𝑨 𝑩) = 𝑽(𝑨 𝑩)
Equation 5. The variance is squared-rooted in order to calculate the sampled standard deviation.
5.3.7 Gene expression
5.3.7.1 iPSCs and iMSCs
Total RNA was extracted by RNeasy Mini Kit (Qiagen). Normalized RNA was
then synthesized to cDNA using SuperScript VIlo cDNA synthesis kit (Invitrogen). RT-
PCR was run following Taqman’s Gene Expression Assays Protocol, using the Taqman
gene expression assays specified in Table 8. AccuRef human universal cDNA (Gene
Scientific) and ultrapure water were used as positive and negative controls, respectively,
to ensure run fidelity.
Ct values greater than 37 were treated as 37, namely as null. Gene expression
analysis was carried out using the ΔΔCt method, outlined in Equation 1 and Equation 2.
Briefly, the Ct value of each gene was normalized by the expression of the housekeeping
gene GAPDH to get the relative expression (ΔCt). Then, the ΔCt of each target was
normalized by the ΔCt of the calibrator (in this case, a control BM-MSC line), to get the
104
ΔΔCt for each gene. In order to get the fold change, ΔΔCt values were transformed using
Equation 6. Results were graphed in log10 format.
𝐹𝑜𝑙𝑑 𝑐ℎ𝑎𝑛𝑔𝑒 = 2!∆∆!"
Equation 6. Equation to calculate fold change from the normalized relative expression (ΔΔCt).
5.3.7.2 Differentiation models
Total RNA from micromass cultures was extracted using the RNeasy MinElute
Clean-up Kit with QIAzol Lysis Reagent (Qiagen). Then, normalized RNA was
synthesized to cDNA using RT2 First Strand Kit (Qiagen).
RNA expression was quantified using the Taqman real-time PCR Fluidigm
Dynamic Array Integrated Fluidic Circuits (BioMark, Fluidigm), for the Taqman gene
expression assays specified in Table 8. AccuRef human universal cDNA (Gene
Scientific) and ultrapure water were used as positive and negative controls, respectively,
to ensure run fidelity.
Ct values greater than 37 were treated as 37 (null). Gene expression analysis was
carried out using the ΔΔCt method, outlined in Equation 1 and Equation 2. The Ct value
of each gene was normalized by the geometric mean of the expressions of the
housekeeping genes to get the relative expression (ΔCt). Then, the ΔCt of each target was
normalized by the ΔCt of the calibrator to get the ΔΔCt for each gene. For the
differentiation experiments, the calibrators were the micromass cultures at 2 hours post-
seeding, of the respective cell line. SD was derived using Gauβ’s error propagation
(Equation 3).

105
Then, in order to calculate the averaged control or JOCD expression for a specific
gene, the weighted averaged was computed. The pooled SD formula (Equation 7) was
used to calculate the SD of averaged control or JOCD expression results.
𝑆𝐷!""#$% =𝑛! − 1 𝑆𝐷!! + 𝑛! − 1 𝑆𝐷!! +⋯+ 𝑛! − 1 𝑆𝐷!!
𝑛! + 𝑛! +⋯+ 𝑛! − 𝑘
Equation 7. Equation for calculating the pooled SD for three or more groups [145, 147, 148].
Results were graphed in the log2 form (ΔΔCt) because this is the linear form of
the values and allow for representation of values with descriptive statistics (mean, SD,
SEM). Converting ΔΔCt into fold change would change the distribution to not longer
symmetric and would not allow these descriptive statistics, which are essential for
comparison of statistical significance.
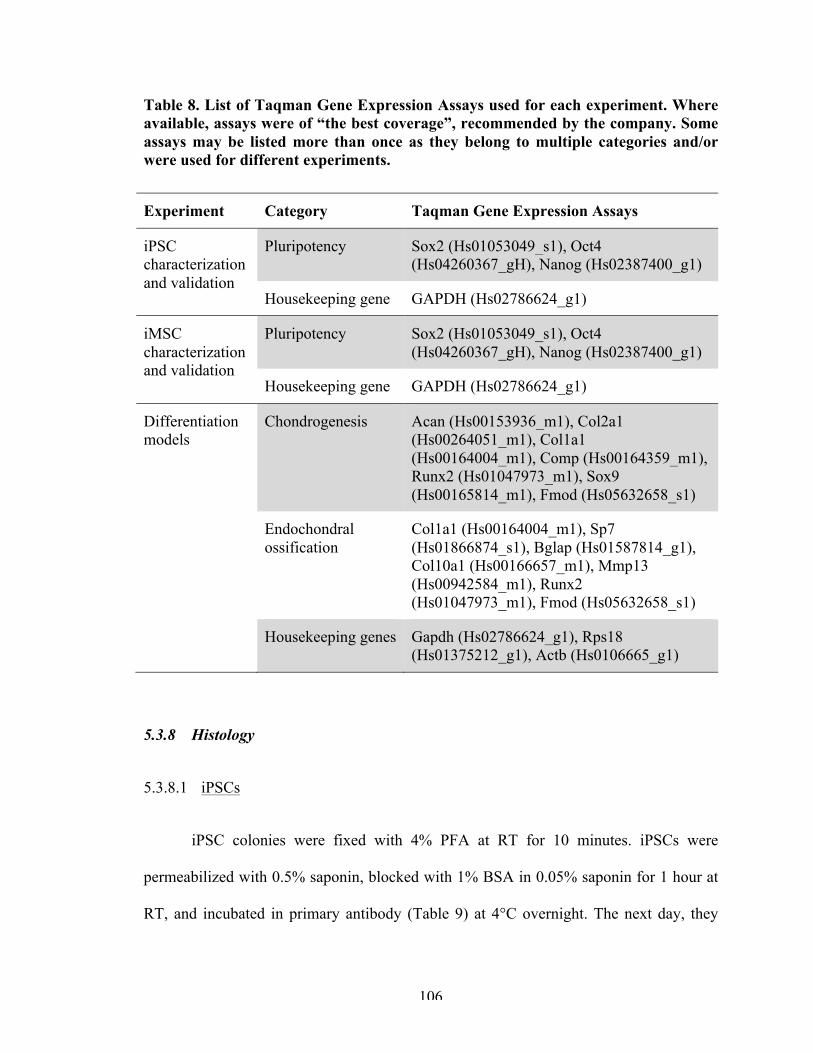
106
Table 8. List of Taqman Gene Expression Assays used for each experiment. Where available, assays were of “the best coverage”, recommended by the company. Some assays may be listed more than once as they belong to multiple categories and/or were used for different experiments.
Experiment Category Taqman Gene Expression Assays
iPSC characterization and validation
Pluripotency Sox2 (Hs01053049_s1), Oct4 (Hs04260367_gH), Nanog (Hs02387400_g1)
Housekeeping gene GAPDH (Hs02786624_g1)
iMSC characterization and validation
Pluripotency Sox2 (Hs01053049_s1), Oct4 (Hs04260367_gH), Nanog (Hs02387400_g1)
Housekeeping gene GAPDH (Hs02786624_g1)
Differentiation models
Chondrogenesis Acan (Hs00153936_m1), Col2a1 (Hs00264051_m1), Col1a1 (Hs00164004_m1), Comp (Hs00164359_m1), Runx2 (Hs01047973_m1), Sox9 (Hs00165814_m1), Fmod (Hs05632658_s1)
Endochondral ossification
Col1a1 (Hs00164004_m1), Sp7 (Hs01866874_s1), Bglap (Hs01587814_g1), Col10a1 (Hs00166657_m1), Mmp13 (Hs00942584_m1), Runx2 (Hs01047973_m1), Fmod (Hs05632658_s1)
Housekeeping genes Gapdh (Hs02786624_g1), Rps18 (Hs01375212_g1), Actb (Hs0106665_g1)
5.3.8 Histology
5.3.8.1 iPSCs
iPSC colonies were fixed with 4% PFA at RT for 10 minutes. iPSCs were
permeabilized with 0.5% saponin, blocked with 1% BSA in 0.05% saponin for 1 hour at
RT, and incubated in primary antibody (Table 9) at 4°C overnight. The next day, they
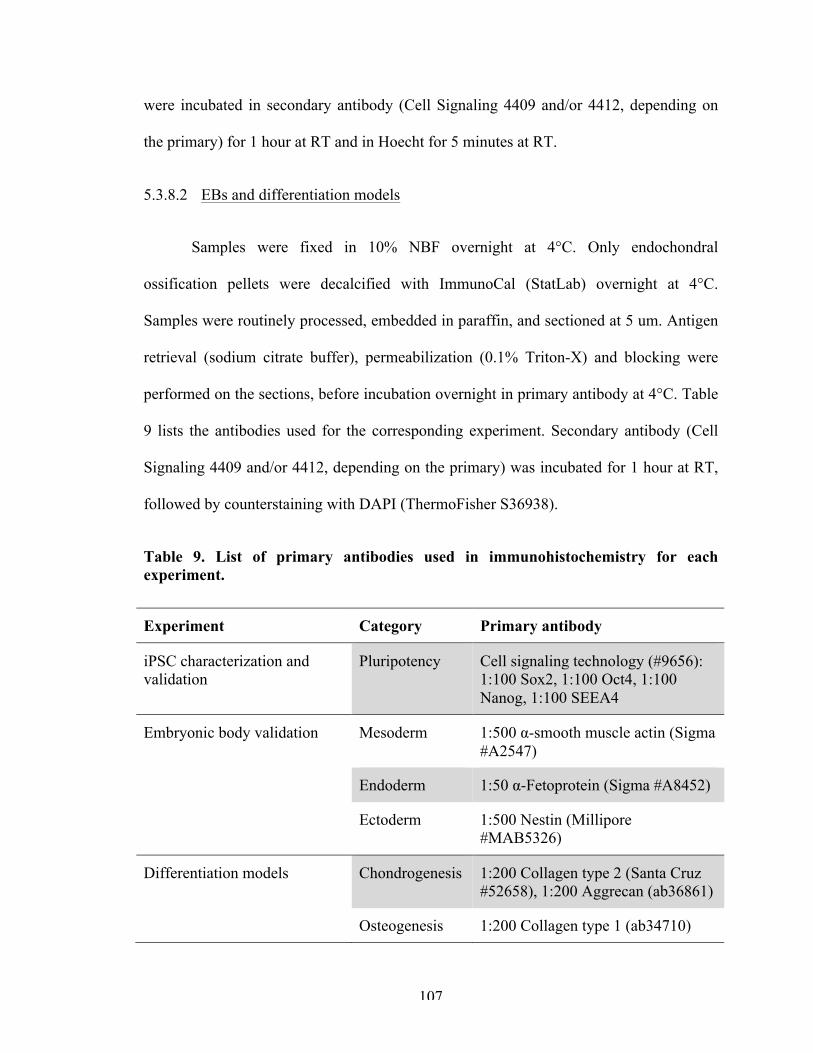
107
were incubated in secondary antibody (Cell Signaling 4409 and/or 4412, depending on
the primary) for 1 hour at RT and in Hoecht for 5 minutes at RT.
5.3.8.2 EBs and differentiation models
Samples were fixed in 10% NBF overnight at 4°C. Only endochondral
ossification pellets were decalcified with ImmunoCal (StatLab) overnight at 4°C.
Samples were routinely processed, embedded in paraffin, and sectioned at 5 um. Antigen
retrieval (sodium citrate buffer), permeabilization (0.1% Triton-X) and blocking were
performed on the sections, before incubation overnight in primary antibody at 4°C. Table
9 lists the antibodies used for the corresponding experiment. Secondary antibody (Cell
Signaling 4409 and/or 4412, depending on the primary) was incubated for 1 hour at RT,
followed by counterstaining with DAPI (ThermoFisher S36938).
Table 9. List of primary antibodies used in immunohistochemistry for each experiment.
Experiment Category Primary antibody
iPSC characterization and validation
Pluripotency Cell signaling technology (#9656): 1:100 Sox2, 1:100 Oct4, 1:100 Nanog, 1:100 SEEA4
Embryonic body validation Mesoderm 1:500 α-smooth muscle actin (Sigma #A2547)
Endoderm 1:50 α-Fetoprotein (Sigma #A8452)
Ectoderm 1:500 Nestin (Millipore #MAB5326)
Differentiation models Chondrogenesis 1:200 Collagen type 2 (Santa Cruz #52658), 1:200 Aggrecan (ab36861)
Osteogenesis 1:200 Collagen type 1 (ab34710)
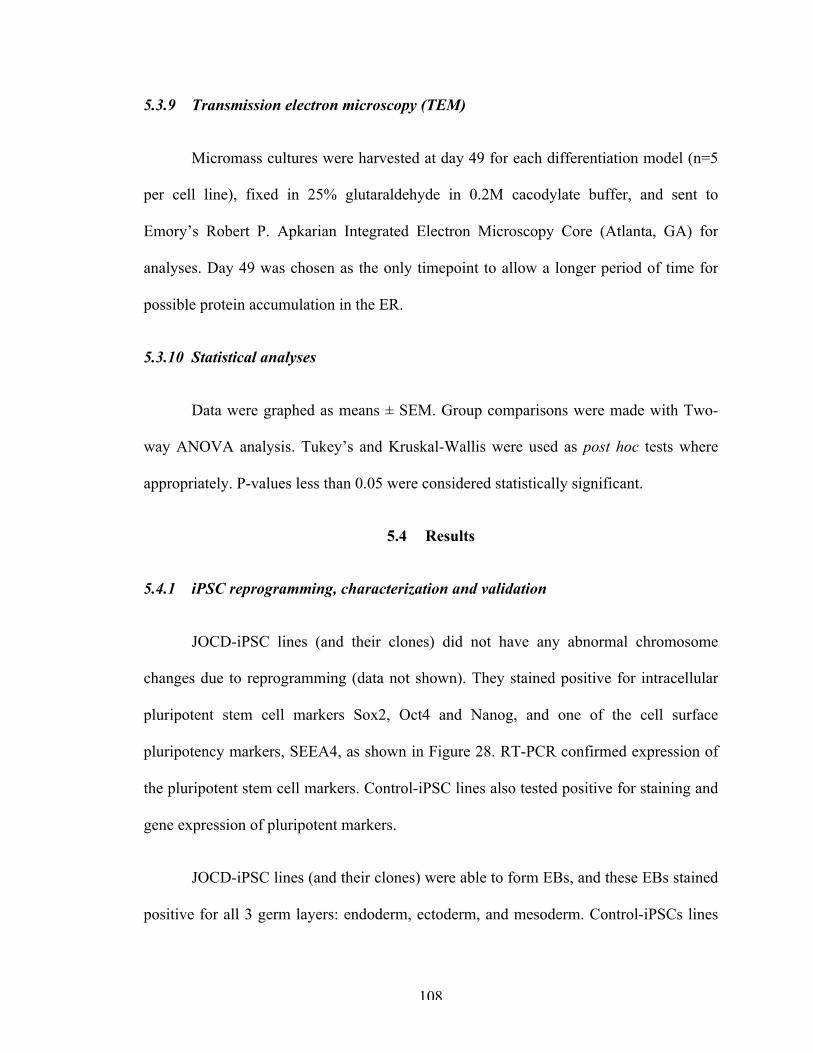
108
5.3.9 Transmission electron microscopy (TEM)
Micromass cultures were harvested at day 49 for each differentiation model (n=5
per cell line), fixed in 25% glutaraldehyde in 0.2M cacodylate buffer, and sent to
Emory’s Robert P. Apkarian Integrated Electron Microscopy Core (Atlanta, GA) for
analyses. Day 49 was chosen as the only timepoint to allow a longer period of time for
possible protein accumulation in the ER.
5.3.10 Statistical analyses
Data were graphed as means ± SEM. Group comparisons were made with Two-
way ANOVA analysis. Tukey’s and Kruskal-Wallis were used as post hoc tests where
appropriately. P-values less than 0.05 were considered statistically significant.
5.4 Results
5.4.1 iPSC reprogramming, characterization and validation
JOCD-iPSC lines (and their clones) did not have any abnormal chromosome
changes due to reprogramming (data not shown). They stained positive for intracellular
pluripotent stem cell markers Sox2, Oct4 and Nanog, and one of the cell surface
pluripotency markers, SEEA4, as shown in Figure 28. RT-PCR confirmed expression of
the pluripotent stem cell markers. Control-iPSC lines also tested positive for staining and
gene expression of pluripotent markers.
JOCD-iPSC lines (and their clones) were able to form EBs, and these EBs stained
positive for all 3 germ layers: endoderm, ectoderm, and mesoderm. Control-iPSCs lines
109
from the Shem lab also tested positive for the 3 germ layers. EB pluripotency test was not
performed for Control-iPSC lines from ATCC as they were certified by ATCC itself.
Figure 28. iPSC characterization and validation. Representative images from JOCD1-1 (JOCD-iPSC donor #1, clone #1) showed A. positive staining for pluripotent stem cells markers, B. gene expression of pluripotent stem cell markers, and C. positive staining for the 3 germ layers once differentiated into EBs: αSMC (mesoderm), β-tubulin (ectoderm), and AFP (endoderm).
5.4.2 iMSC characterization and validation
Control- and JOCD-iMSCs passed the International Society for Cellular
Therapy’s minimum criteria. As Figure 29 shows, chosen iMSCs passed the approved
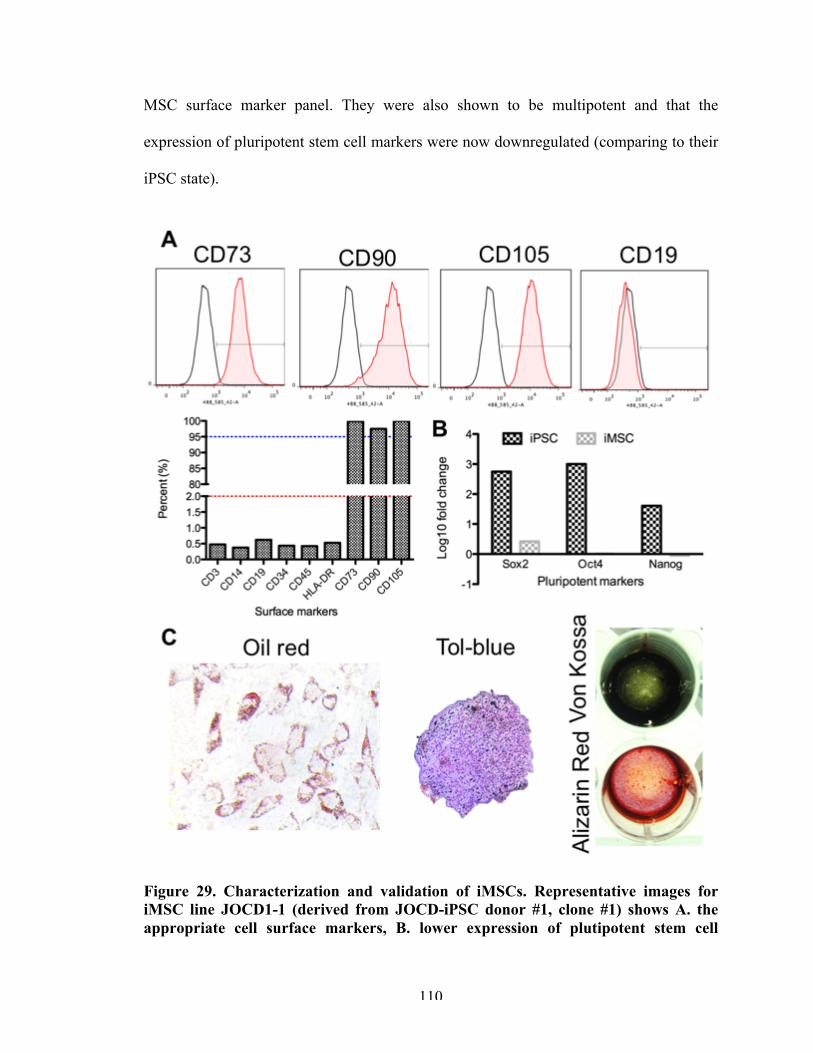
110
MSC surface marker panel. They were also shown to be multipotent and that the
expression of pluripotent stem cell markers were now downregulated (comparing to their
iPSC state).
Figure 29. Characterization and validation of iMSCs. Representative images for iMSC line JOCD1-1 (derived from JOCD-iPSC donor #1, clone #1) shows A. the appropriate cell surface markers, B. lower expression of plutipotent stem cell
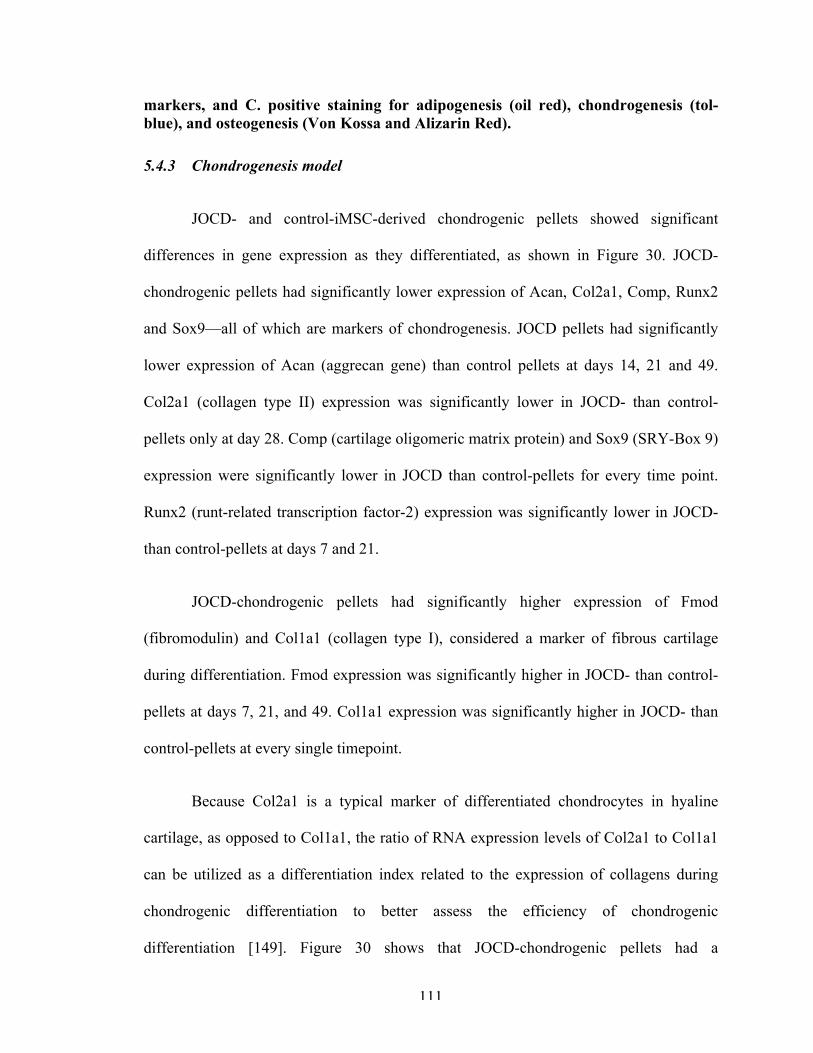
111
markers, and C. positive staining for adipogenesis (oil red), chondrogenesis (tol-blue), and osteogenesis (Von Kossa and Alizarin Red).
5.4.3 Chondrogenesis model
JOCD- and control-iMSC-derived chondrogenic pellets showed significant
differences in gene expression as they differentiated, as shown in Figure 30. JOCD-
chondrogenic pellets had significantly lower expression of Acan, Col2a1, Comp, Runx2
and Sox9—all of which are markers of chondrogenesis. JOCD pellets had significantly
lower expression of Acan (aggrecan gene) than control pellets at days 14, 21 and 49.
Col2a1 (collagen type II) expression was significantly lower in JOCD- than control-
pellets only at day 28. Comp (cartilage oligomeric matrix protein) and Sox9 (SRY-Box 9)
expression were significantly lower in JOCD than control-pellets for every time point.
Runx2 (runt-related transcription factor-2) expression was significantly lower in JOCD-
than control-pellets at days 7 and 21.
JOCD-chondrogenic pellets had significantly higher expression of Fmod
(fibromodulin) and Col1a1 (collagen type I), considered a marker of fibrous cartilage
during differentiation. Fmod expression was significantly higher in JOCD- than control-
pellets at days 7, 21, and 49. Col1a1 expression was significantly higher in JOCD- than
control-pellets at every single timepoint.
Because Col2a1 is a typical marker of differentiated chondrocytes in hyaline
cartilage, as opposed to Col1a1, the ratio of RNA expression levels of Col2a1 to Col1a1
can be utilized as a differentiation index related to the expression of collagens during
chondrogenic differentiation to better assess the efficiency of chondrogenic
differentiation [149]. Figure 30 shows that JOCD-chondrogenic pellets had a
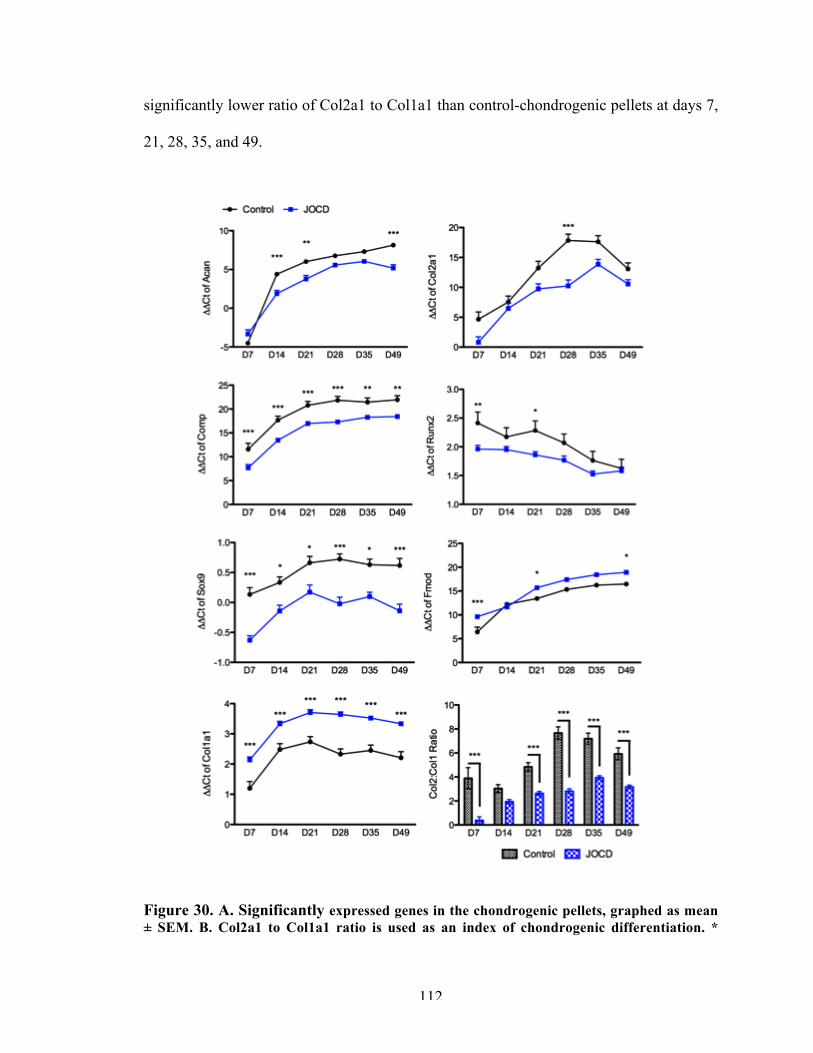
112
significantly lower ratio of Col2a1 to Col1a1 than control-chondrogenic pellets at days 7,
21, 28, 35, and 49.
Figure 30. A. Significantly expressed genes in the chondrogenic pellets, graphed as mean ± SEM. B. Col2a1 to Col1a1 ratio is used as an index of chondrogenic differentiation. *
113
indicates statistically significant difference between JOCD-chondrogenic pellets and control-chondrogenic pellets at p-value<0.05, ** at p-value<0.01, *** at p-value <0.001
There were no significant differences between GAG content in the control-
chondrogenic pellets versus the JOCD-chondrogenic pellets (Figure 31).
Figure 31. GAG deposition by chondrogenic pellets, normalized to DNA content; graphed as means ± SEM.
Col2/Col1 IHC staining showed positive staining at both day 21 and day 49 of
both markers (Figure 32). At day 21, control-iMSC-derived chondrogenic pellets had
seemingly less Col1 staining than JOCD-iMSC-derived chondrogenic pellets. At day 49,
both groups showed an overall increase in Col1-postive staining, and JOCD-
chondrogenic pellets had more Col1-positive staining than control-chondrogenic pellets.
JOCD-chondrogenic pellets were more likely to form a fibrous shell (2/3 of the time vs.
½ of the time). Col1 and Col2 stained throughout the pellets, with no apparent signs of
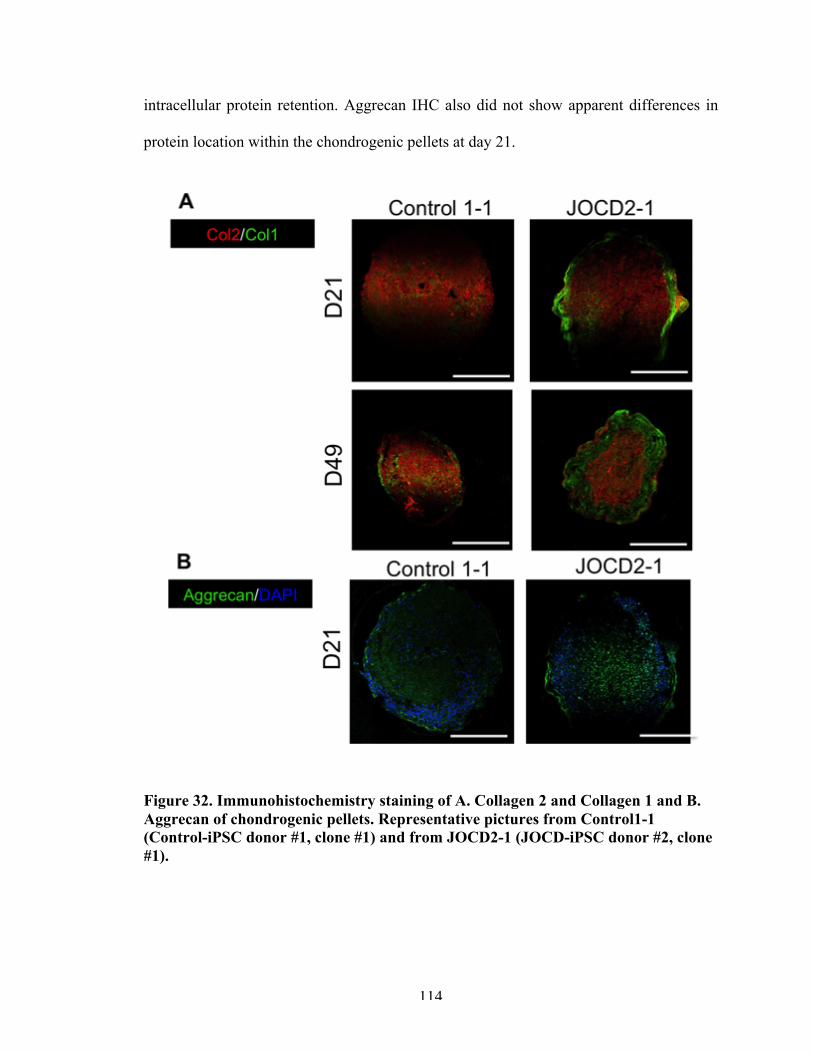
114
intracellular protein retention. Aggrecan IHC also did not show apparent differences in
protein location within the chondrogenic pellets at day 21.
Figure 32. Immunohistochemistry staining of A. Collagen 2 and Collagen 1 and B. Aggrecan of chondrogenic pellets. Representative pictures from Control1-1 (Control-iPSC donor #1, clone #1) and from JOCD2-1 (JOCD-iPSC donor #2, clone #1).
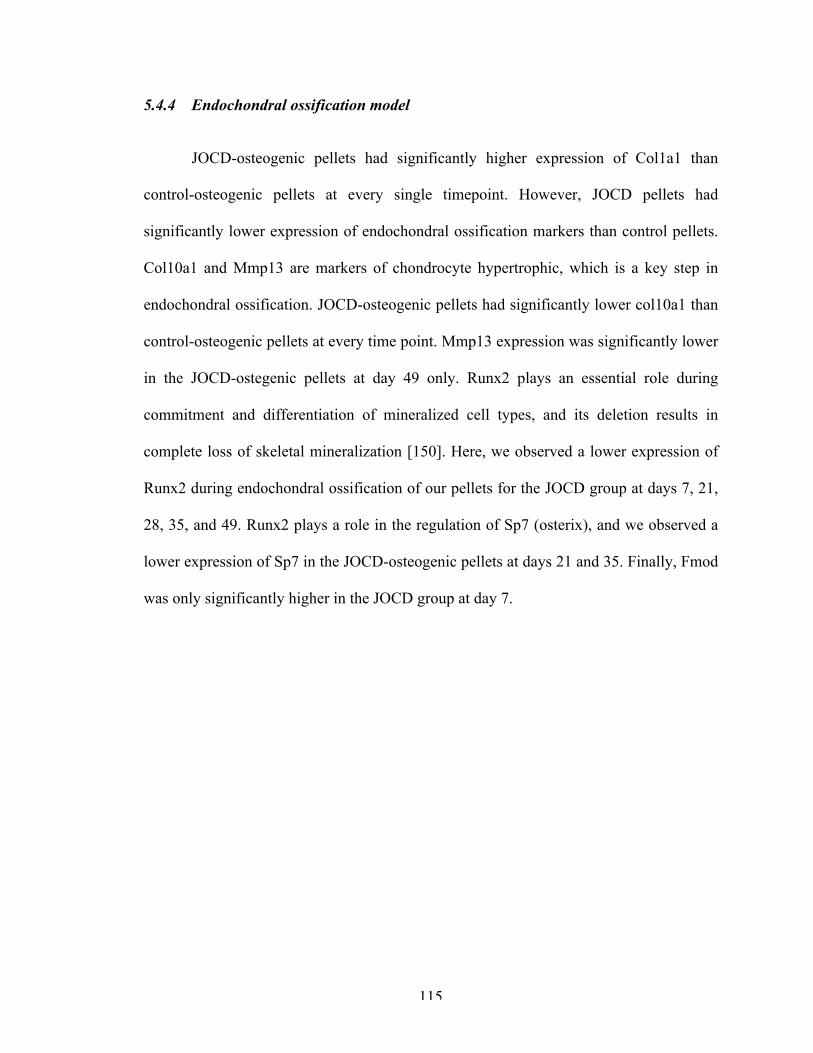
115
5.4.4 Endochondral ossification model
JOCD-osteogenic pellets had significantly higher expression of Col1a1 than
control-osteogenic pellets at every single timepoint. However, JOCD pellets had
significantly lower expression of endochondral ossification markers than control pellets.
Col10a1 and Mmp13 are markers of chondrocyte hypertrophic, which is a key step in
endochondral ossification. JOCD-osteogenic pellets had significantly lower col10a1 than
control-osteogenic pellets at every time point. Mmp13 expression was significantly lower
in the JOCD-ostegenic pellets at day 49 only. Runx2 plays an essential role during
commitment and differentiation of mineralized cell types, and its deletion results in
complete loss of skeletal mineralization [150]. Here, we observed a lower expression of
Runx2 during endochondral ossification of our pellets for the JOCD group at days 7, 21,
28, 35, and 49. Runx2 plays a role in the regulation of Sp7 (osterix), and we observed a
lower expression of Sp7 in the JOCD-osteogenic pellets at days 21 and 35. Finally, Fmod
was only significantly higher in the JOCD group at day 7.
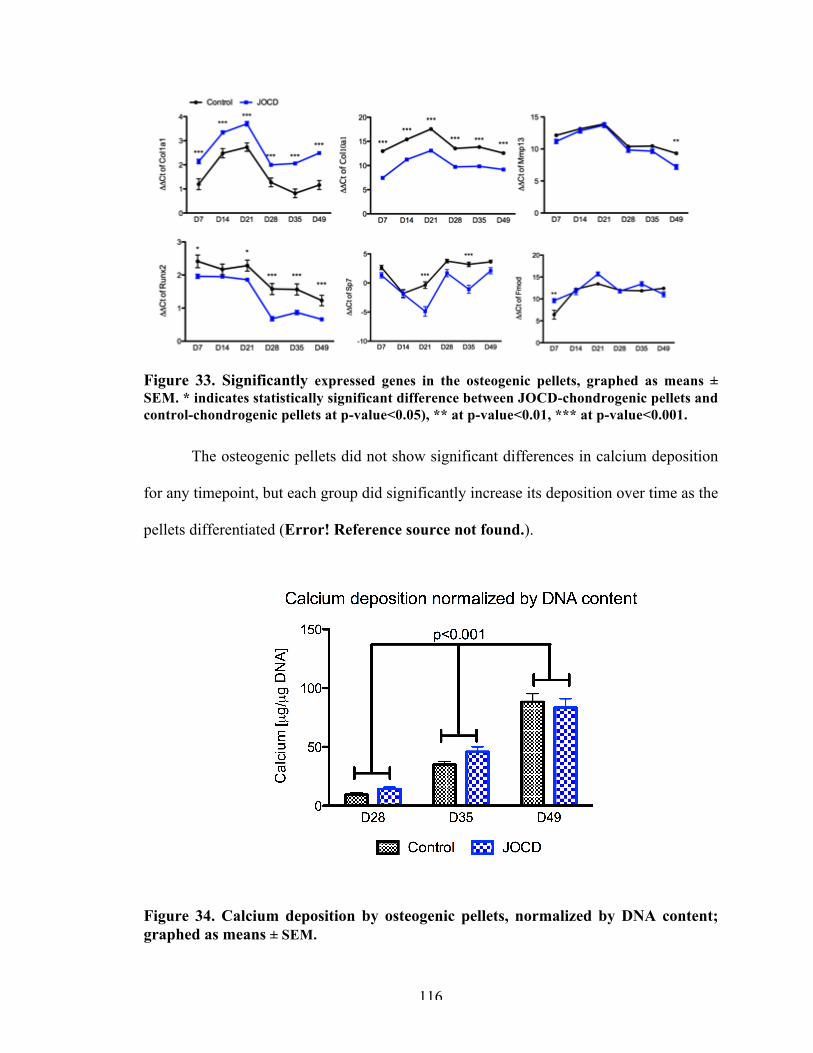
116
Figure 33. Significantly expressed genes in the osteogenic pellets, graphed as means ± SEM. * indicates statistically significant difference between JOCD-chondrogenic pellets and control-chondrogenic pellets at p-value<0.05), ** at p-value<0.01, *** at p-value<0.001.
The osteogenic pellets did not show significant differences in calcium deposition
for any timepoint, but each group did significantly increase its deposition over time as the
pellets differentiated (Error! Reference source not found.).
Figure 34. Calcium deposition by osteogenic pellets, normalized by DNA content; graphed as means ± SEM.
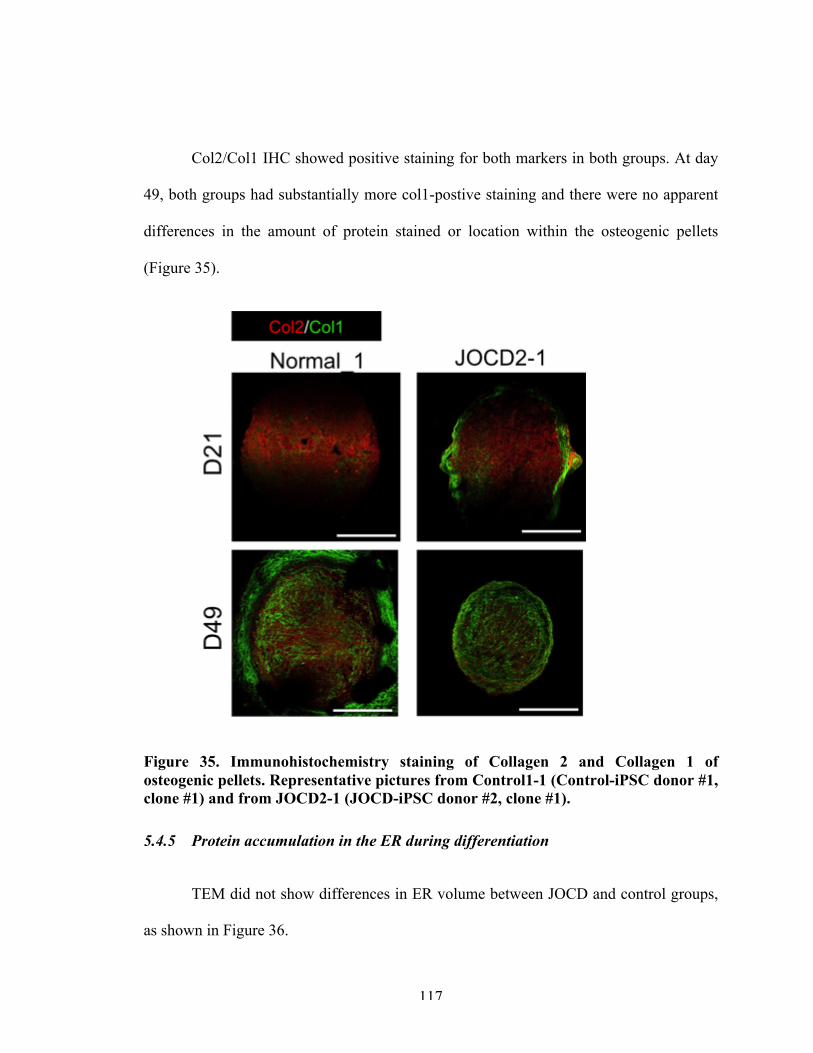
117
Col2/Col1 IHC showed positive staining for both markers in both groups. At day
49, both groups had substantially more col1-postive staining and there were no apparent
differences in the amount of protein stained or location within the osteogenic pellets
(Figure 35).
Figure 35. Immunohistochemistry staining of Collagen 2 and Collagen 1 of osteogenic pellets. Representative pictures from Control1-1 (Control-iPSC donor #1, clone #1) and from JOCD2-1 (JOCD-iPSC donor #2, clone #1).
5.4.5 Protein accumulation in the ER during differentiation
TEM did not show differences in ER volume between JOCD and control groups,
as shown in Figure 36.
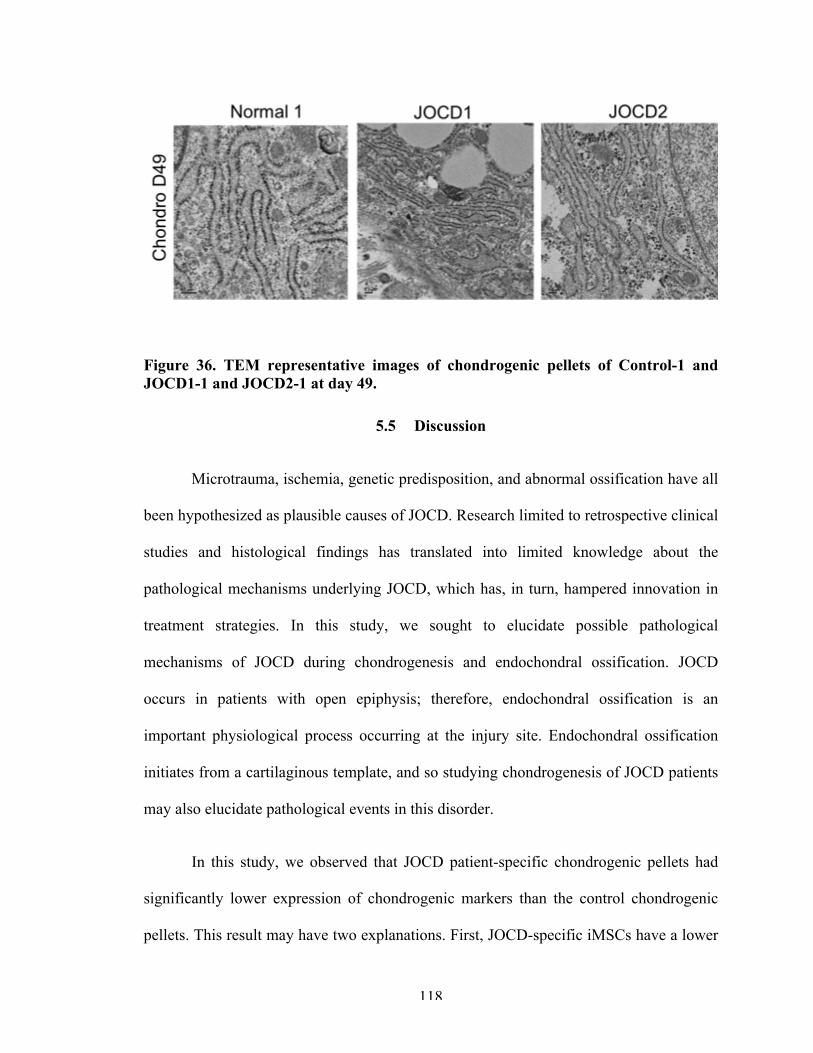
118
Figure 36. TEM representative images of chondrogenic pellets of Control-1 and JOCD1-1 and JOCD2-1 at day 49.
5.5 Discussion
Microtrauma, ischemia, genetic predisposition, and abnormal ossification have all
been hypothesized as plausible causes of JOCD. Research limited to retrospective clinical
studies and histological findings has translated into limited knowledge about the
pathological mechanisms underlying JOCD, which has, in turn, hampered innovation in
treatment strategies. In this study, we sought to elucidate possible pathological
mechanisms of JOCD during chondrogenesis and endochondral ossification. JOCD
occurs in patients with open epiphysis; therefore, endochondral ossification is an
important physiological process occurring at the injury site. Endochondral ossification
initiates from a cartilaginous template, and so studying chondrogenesis of JOCD patients
may also elucidate pathological events in this disorder.
In this study, we observed that JOCD patient-specific chondrogenic pellets had
significantly lower expression of chondrogenic markers than the control chondrogenic
pellets. This result may have two explanations. First, JOCD-specific iMSCs have a lower
119
chondrogenic potential than control-iMSCs. This result is supported by the significant
differences in col2a1 to col1a1 ratio, for which JOCD-chondrogenic pellets show a lower
index of chondrogenic differentiation for most timepoints. IHC confirmed this lower
chondrogenic potential hypothesis. The GAG assay, however, did not show significant
differences between the control and JOCD chondrogenic pellets, but the DMMB assay
may not be sensitive enough. Another possibility for the lower expression of
chondrogenic markers may be that there is a small amount of protein accumulation in the
ER, and although not enough to visibly engorge the ER (TEM), it is having an effect on
protein production. When proteins get accumulated in the ER, response mechanisms
include the downregulation of those proteins until the cell is able to reduce stress in the
ER. In order to test this second explanation, we would have to test for ER stress-related
genes in the differentiation models over time.
JOCD endochondral ossification model showed decreased expression of
chondrocyte hypertrophic markers as well endochondral ossification orchestrators Runx2
and Sp7. Because col1a1 expression, a key protein in bone, was significantly higher in
JOCD-osteogenic pellets, it is unclear whether the endochondral ossification process is
impaired. We suggest that cells from JOCD patients may have an irregular endochondral
ossification, as demonstrated by significantly lower expressions of Runx2 and Sp7, but
additional markers would have to be assessed to elucidate pathological pathways.
During skeletogenesis, Runx2 is expressed in both chondrocytes and osteoblasts,
and its global deletion results in disrupted chondrocyte and osteoblast differentiation
[150]. Runx2 expression is required to promote chondrocyte hypertrophy, and conditional
ablation of Runx2 gene in chondrocytes leads to failed endochondral ossification [150].
120
In both the chondrogenic and endochondral ossification models, we observed
significantly lower expression of Runx2 in JOCD organoids. This result may suggest
lower ability to undergo endochondral ossification for JOCD cells. Runx2 also regulates
Sp7, which regulates MSC-mediated endochondral ossification.
With respect to the endochondral ossification model, it was surprising to see that
once medium was changed at day 21 to induce osteogenesis on the chondrogenic pellets,
the expression of most markers decreased. It is unclear why expression of Col1a1
decreased from day 21 to day 28. A possible explanation may be that the snapshots in
time that we chose (timepoints) missed a spiked expression of the markers earlier.
Another explanation may be that these findings in gene expression are specific to the in
vitro model we have developed. In vitro models often diverge in differentiation pathways
due to a number of factors (e.g. cell source variability, difference in FBS and other
materials, etc) when compared to in vivo.
Additionally, it is worth pointing out that, despite successfully fulfilling all the
MSC criteria, iMSCs are not MSCs. iPSCs are thought to be reprogrammed cells that
replicate embryonic state. Differentiation of MSCs derived from embryonic, fetal and
adult sources varies. One studied showed that human embryonic and fetal MSCs were
able to differentiate towards 3 different cardiac lineages, in contract with adult MSCs,
and the key difference was cellular response to stimuli [151]. Furthermore, the scientific
community is often revising its definition of MSCs, as much uncertainty still remains
regarding the defining characteristics of these cells, including their potency and self-
renewal [152]. For example, the majority of the surface markers in the International
Society for Cellular Therapy’s minimal criteria are exclusion markers for other cell types.
121
Only 3 markers in the panel are specific to MSCs, and CD105 has been shown to be
expressed in other cell types [153, 154] and to be absent in some MSCs [155] .
Despite these potential shortcomings of iPSC-based in vitro models, iPSCs
provide a limitless source of stem cells and are already launching forward the stem cell
field. In disease modeling, iPSCs allow for patient-specific models, which may
revolutionize precision and personalized medicine. In this study, JOCD-specific
chondrogenic and osteogenic organoid models were developed and studied. Results
suggest that JOCD cells may have a lower chondrogenic potential than control cells.
Furthermore, while they are able to undergo calcification to a level comparable to the
control cell lines (as shown by histology and calcium deposition), the gene expression
profile of JOCD cell lines during endochondral ossification may suggest irregularities in
this process. Altogether, we postulate that JOCD pathological mechanisms are tied in
with chondrogenesis and endochondral ossification processes. Mechanistic studies should
be done in the future to dissect possible aberrant pathways during differentiation. Lastly,
because we did not see protein accumulation in the ER at day 49 in either differentiation
model, we can conclude that protein accumulation was not a key driver of JOCD
pathology. However, ER stress may still be implicated in the development and
progression of JOCD.
122
CHAPTER 6. ENDOPLASMIC RETICULUM STRESS
RESPONSE SIGNALING IN JUVENILE OSTEOCHONDRITIS
DISSECANS IN VITRO MODELS
6.1 Abstract
FOCD and equine OCD have been linked to ER dysfunction, and JOCD has been
hypothesized to involve the ER as well, by evidence of protein accumulation in primary
chondrocytes. However, no study to date has investigated the role of the ER in JOCD.
Unlike FOCD, JOCD is not associated with a gene mutation and is not present at the
systemic level. Therefore, the following question arises: if protein accumulation is a
pathological event in JOCD, why is clinical JOCD not seen in all joint, similar to FOCD?
The objective of this study was to isolate the ER mechanism in JOCD-specific cells by
studying the response signaling to induce ER-stress. We hypothesized that JOCD is
indeed an ER stress-related disease but its pathomechanisms are not in response to
protein accumulation, but instead, that an impaired UPR is responsible and may cause
cell death, and thus ultimately the initial necrotic lesion in the epiphyseal.
In the JOCD-specific chondrogenic and endochondral ossification differentiation
models, we observed a heightened ER-stress response, which may indicate that JOCD
cells experienced higher levels of ER stress during differentiation. When the ER stress
was equated (using our ER-stress induction models), results demonstrated a significantly
lower expression of all ER-stress-response markers in JOCD than in control cell lines,
with the exception of those associated with protein degradation. Altogether, these
123
findings suggest that JOCD cells do respond differently to ER stress (during
physiological and pathological processes). We propose that the impaired ER-stress
response of JOCD cells may lead to cell death in this disorder, which may initiate the
necrotic lesion in JOCD patients under pathological processes, such as microtrauma or
interruption of the microvasculature.
6.2 Introduction
ER stress has been hypothesized to be a key player in the disease development of
the OCD umbrella (FOCD, equine OCD, and potentially JOCD). A study by Skagen et al
found abundant accumulation of matrix proteins within dilated rER in chondrocytes from
JOCD-loose fragments and cartilage biopsies [77]. However, it remains unclear what
could have trigged this protein accumulation and whether this is a pathological feature of
JOCD. In our previous chapter, we did not observed protein accumulation in our JOCD-
specific in vitro models of chondrogenesis or endochondral ossification. In FOCD,
however, a similar model of FOCD-specific in vitro chondrogenesis showed protein
accumulation, marked by dilated ERs [78]. Unlike JOCD, FOCD is associated with a
mutation in the aggrecan gene that prevents its released into the ECM, and this initial
protein accumulation leads to secondary accumulation of other matrix proteins, resulting
in a compromised ECM. While FOCD is systemic, JOCD occurs as a single incident.
Therefore, the following questions remain to be answered: does protein accumulation
occur in JOCD as well? If it does, what may cause a localized protein accumulation
versus the systemic event observed in FOCD? Is protein accumulation primary or
secondary feature of JOCD?
124
Protein accumulation leads to ER stress, but the opposite is also true. Cells can
accumulate protein in response to ER stress, which can be induced due to change in the
internal and external microenvironment of the cells and due to both physiological [156]
and pathological insults [77, 157]. Chondrocytes and osteoblasts undergo physiological
ER stress-related response signaling in the course of normal maturation [158].
Endochondral ossification is regulated by several genes that also regulate stress responses
to the ER [159]. Moreover, conditions such as ischemia, obesity (nutrition in pathological
excess), diabetes mellitus, under-nourishment (glucose starvation), infection and
chemically induced tissue injury might also give rise to ER stress and therefore
accumulation of proteins in cells [77].
The ER stress-related response signaling is called the unfolded protein response
(UPR). 4 processes may be activated with the UPR: increased expression of ER resident
protein chaperones and protein foldases; increased rate of ER-associated degradation
(ERAD) to eliminate irreparably misfolded proteins; decreased protein production; and
when the prosurvival efforts are exhausted, ER-stress related apoptosis [160]. In
mammals, the UPR is signaled through three ER transmembrane protein sensors: inositol-
requiring kinase 1 (IRE1), pancreatic ER eIF2 kinase (PERK), and activating
transcription factor 6 (ATF6) [161]. Table 10 shows the three major ER-stress sensors
and their role to the UPR activated processes.
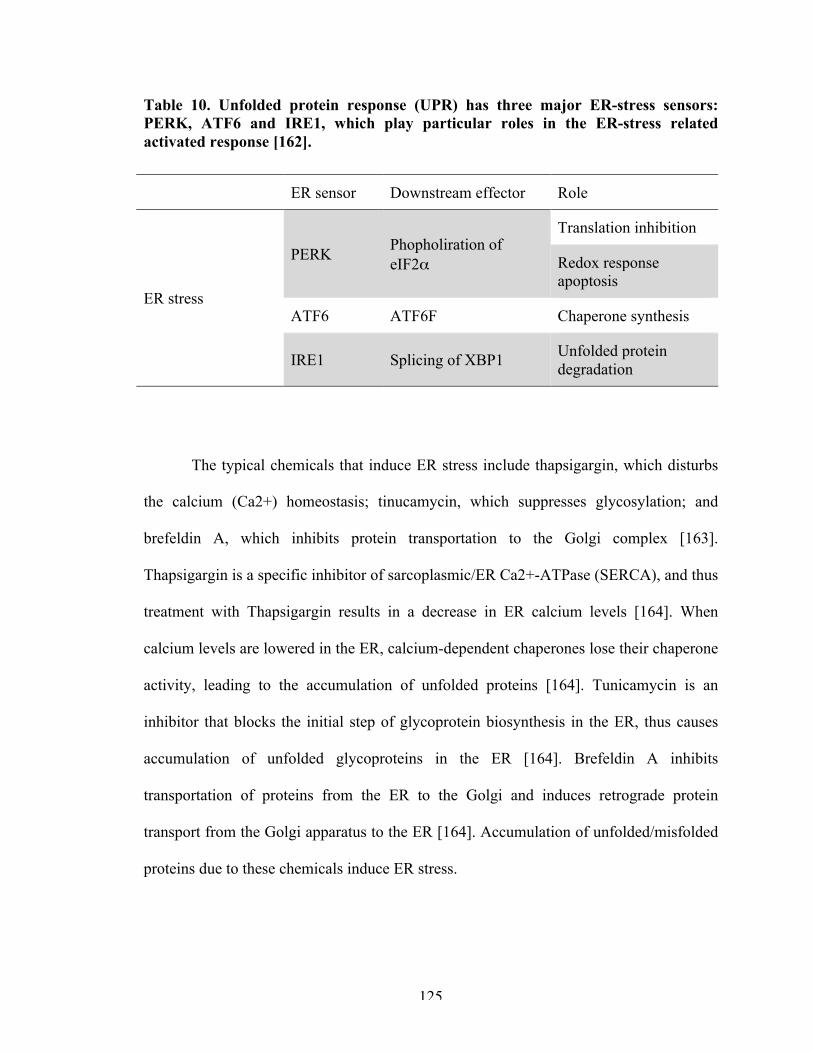
125
Table 10. Unfolded protein response (UPR) has three major ER-stress sensors: PERK, ATF6 and IRE1, which play particular roles in the ER-stress related activated response [162].
ER sensor Downstream effector Role
ER stress
PERK Phopholiration of eIF2α
Translation inhibition
Redox response apoptosis
ATF6 ATF6F Chaperone synthesis
IRE1 Splicing of XBP1 Unfolded protein degradation
The typical chemicals that induce ER stress include thapsigargin, which disturbs
the calcium (Ca2+) homeostasis; tinucamycin, which suppresses glycosylation; and
brefeldin A, which inhibits protein transportation to the Golgi complex [163].
Thapsigargin is a specific inhibitor of sarcoplasmic/ER Ca2+-ATPase (SERCA), and thus
treatment with Thapsigargin results in a decrease in ER calcium levels [164]. When
calcium levels are lowered in the ER, calcium-dependent chaperones lose their chaperone
activity, leading to the accumulation of unfolded proteins [164]. Tunicamycin is an
inhibitor that blocks the initial step of glycoprotein biosynthesis in the ER, thus causes
accumulation of unfolded glycoproteins in the ER [164]. Brefeldin A inhibits
transportation of proteins from the ER to the Golgi and induces retrograde protein
transport from the Golgi apparatus to the ER [164]. Accumulation of unfolded/misfolded
proteins due to these chemicals induce ER stress.
126
The objective of this study was to evaluate the UPR in JOCD-specific models in
order to assess their response to ER stress. To this end, we utilized our differentiation in
vitro models (chondrogenesis and endochondral ossification) in order to assess responses
to physiological ER stress during differentiation, and established ER-stress induction
models to study the ER-stress related responses to well-controlled, pathological settings.
We hypothesized that JOCD is indeed an ER stress-related disease but its
pathomechanisms are not in response to protein accumulation, but instead, that an
impaired UPR is responsible and may cause cell death, and thus ultimately the initial
necrotic lesion in the epiphyseal. Therefore, we expect to observe lower levels of most of
the UPR-related genes tested in our ER-stress induction models, except for those which
are also related to ER-stress associated apoptosis.
6.3 Materials and methods
6.3.1 Cell lines
Skin biopsies from 3 JOCD patients were used to derive JOCD-specific iPSC
lines. In order to establish the disease phenotype per patient, 3 clones (analogous to
biological copies) were used per cell line as indicated in Table 11. Control (non-disease)
patients were gifted by REMEDI and purchased from ATCC.
iMSCs from JOCD and control groups were differentiated from iPSCs via an EB
intermediate step, as previously described [142, 143]. iMSCs were characterized and
validated according to the International Society of Cell Therapy’s minimum criteria
[144]. iMSCs were cultures in MSC maintenance medium with 2 ng/ml FGF2
(Peprotech), until experiments.
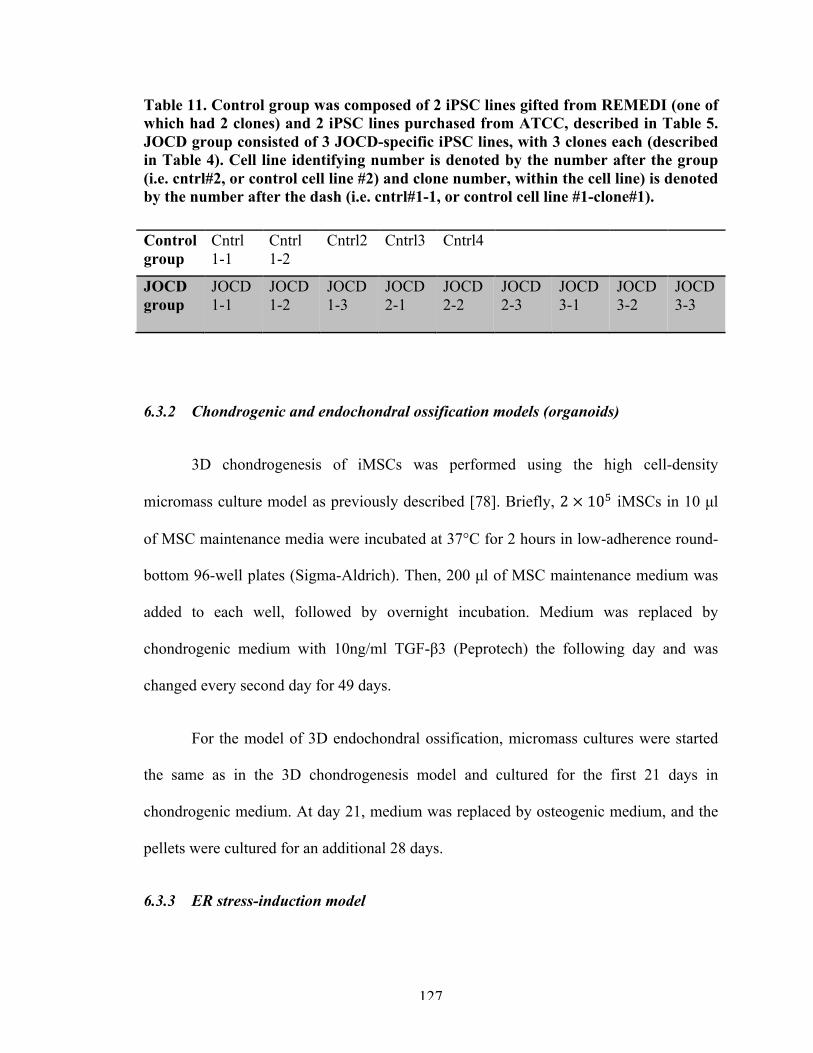
127
Table 11. Control group was composed of 2 iPSC lines gifted from REMEDI (one of which had 2 clones) and 2 iPSC lines purchased from ATCC, described in Table 5. JOCD group consisted of 3 JOCD-specific iPSC lines, with 3 clones each (described in Table 4). Cell line identifying number is denoted by the number after the group (i.e. cntrl#2, or control cell line #2) and clone number, within the cell line) is denoted by the number after the dash (i.e. cntrl#1-1, or control cell line #1-clone#1).
Control group
Cntrl 1-1
Cntrl 1-2
Cntrl2 Cntrl3 Cntrl4
JOCD group
JOCD 1-1
JOCD 1-2
JOCD 1-3
JOCD 2-1
JOCD 2-2
JOCD 2-3
JOCD 3-1
JOCD 3-2
JOCD 3-3
6.3.2 Chondrogenic and endochondral ossification models (organoids)
3D chondrogenesis of iMSCs was performed using the high cell-density
micromass culture model as previously described [78]. Briefly, 2 × 10! iMSCs in 10 µl
of MSC maintenance media were incubated at 37°C for 2 hours in low-adherence round-
bottom 96-well plates (Sigma-Aldrich). Then, 200 µl of MSC maintenance medium was
added to each well, followed by overnight incubation. Medium was replaced by
chondrogenic medium with 10ng/ml TGF-β3 (Peprotech) the following day and was
changed every second day for 49 days.
For the model of 3D endochondral ossification, micromass cultures were started
the same as in the 3D chondrogenesis model and cultured for the first 21 days in
chondrogenic medium. At day 21, medium was replaced by osteogenic medium, and the
pellets were cultured for an additional 28 days.
6.3.3 ER stress-induction model
128
iMSCs were seeded at a 5,000/cm2 cell density in 35mm petri dishes and cultured
with MSC Maintenance Medium. Once cells reached 60-70% confluency, the medium
was replaced by MSC Maintenance Medium + ER-stress drug (5ng/ml Tunicamycin
(Sigma Aldrich) or Protein Transport Inhibitor Cocktail (eBioscience)). It was important
to expose cells to the ER-stressor at subconfluency in order to prevent cell-contact
inhibition. Furthermore, we chose 3 different drugs in order to observe cell responses
across different ER-stress stimuli and confirm potential mechanistic results.
6.3.4 Gene expression
6.3.4.1 RNA extraction
Total RNA from organoid cultures was extracted using the RNeasy MinElute
Clean-up Kit with QIAzol Lysis Reagent (Qiagen). Total RNA from the ER-stress-
induction cultures was extracted using the RNeasy MinElute Clean-up Kit (Qiagen).
Normalized RNA was synthesized to cDNA using the RT2 First Strand Kit (Qiagen).
6.3.4.2 Microarray RT-PCR
RNA expression was quantified using the Taqman real-time PCR Fluidigm
Dynamic Array Integrated Fluidic Circuits (BioMark, Fluidigm). Differentiation models
were tested again the array indicated in Table 12, and ER-stress induction models were
tested again the array specified in Table 13. AccuRef human universal cDNA (Gene
Scientific) and ultrapure water were used as positive and negative controls, respectively,
to ensure run fidelity.
129
Ct values greater than 37 were treated as 37 (null). Gene expression analysis was
carried out using the ΔΔCt method, outlined in Equation 1 and Equation 2. The Ct value
of each gene was normalized by the geometric mean of the expressions of the
housekeeping genes to get the relative expression (ΔCt). Then, the ΔCt of each target was
normalized by the ΔCt of the calibrator to get the ΔΔCt for each gene. For the
differentiation experiments, the calibrators were the micromass cultures at 2 hours post-
seeding of the respective cell line. For the ER-stress induction cultures, the calibrators
were the respective cell line at the 0 hr timepoint, before the induction of stress with
drugs. SEM was derived using Gauβ’s error propagation (Equation 3).
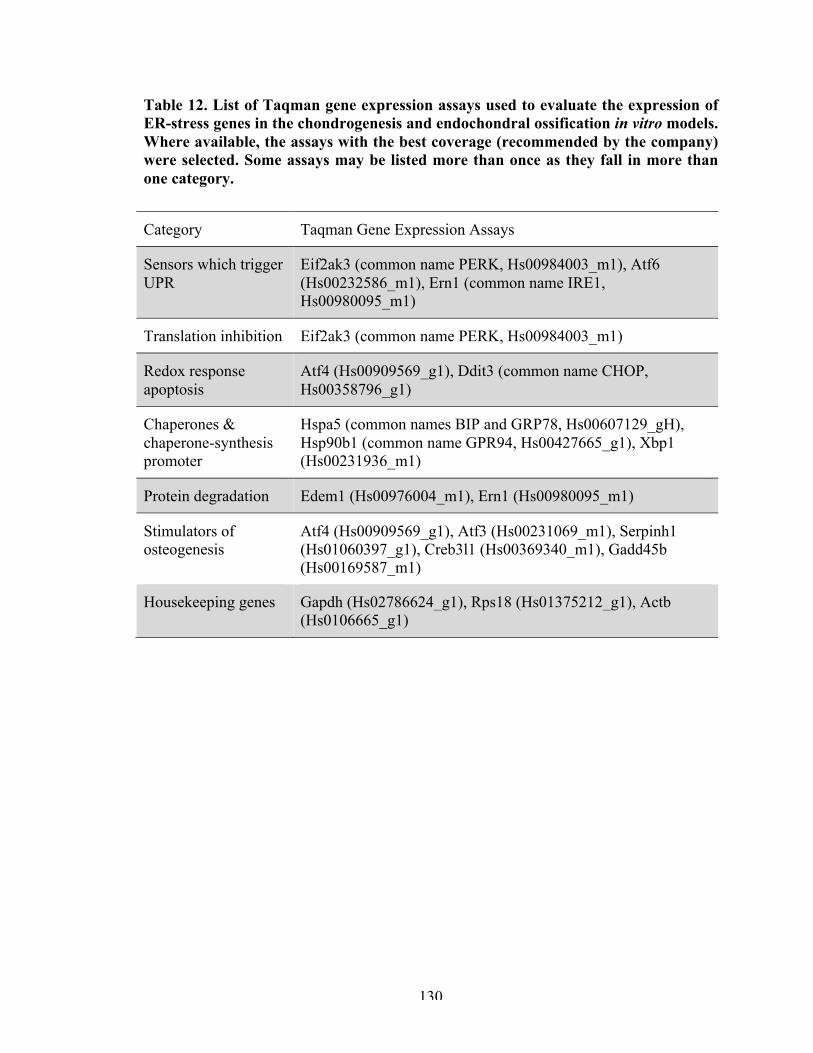
130
Table 12. List of Taqman gene expression assays used to evaluate the expression of ER-stress genes in the chondrogenesis and endochondral ossification in vitro models. Where available, the assays with the best coverage (recommended by the company) were selected. Some assays may be listed more than once as they fall in more than one category.
Category Taqman Gene Expression Assays
Sensors which trigger UPR
Eif2ak3 (common name PERK, Hs00984003_m1), Atf6 (Hs00232586_m1), Ern1 (common name IRE1, Hs00980095_m1)
Translation inhibition Eif2ak3 (common name PERK, Hs00984003_m1)
Redox response apoptosis
Atf4 (Hs00909569_g1), Ddit3 (common name CHOP, Hs00358796_g1)
Chaperones & chaperone-synthesis promoter
Hspa5 (common names BIP and GRP78, Hs00607129_gH), Hsp90b1 (common name GPR94, Hs00427665_g1), Xbp1 (Hs00231936_m1)
Protein degradation Edem1 (Hs00976004_m1), Ern1 (Hs00980095_m1)
Stimulators of osteogenesis
Atf4 (Hs00909569_g1), Atf3 (Hs00231069_m1), Serpinh1 (Hs01060397_g1), Creb3l1 (Hs00369340_m1), Gadd45b (Hs00169587_m1)
Housekeeping genes Gapdh (Hs02786624_g1), Rps18 (Hs01375212_g1), Actb (Hs0106665_g1)
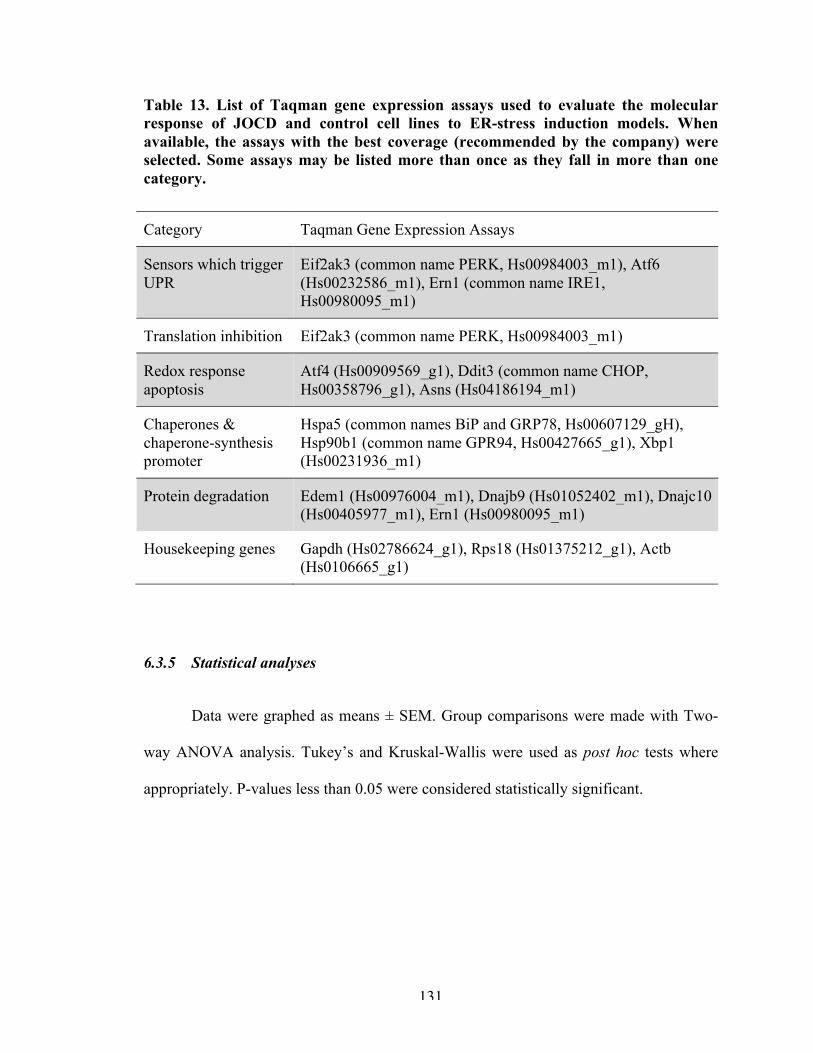
131
Table 13. List of Taqman gene expression assays used to evaluate the molecular response of JOCD and control cell lines to ER-stress induction models. When available, the assays with the best coverage (recommended by the company) were selected. Some assays may be listed more than once as they fall in more than one category.
Category Taqman Gene Expression Assays
Sensors which trigger UPR
Eif2ak3 (common name PERK, Hs00984003_m1), Atf6 (Hs00232586_m1), Ern1 (common name IRE1, Hs00980095_m1)
Translation inhibition Eif2ak3 (common name PERK, Hs00984003_m1)
Redox response apoptosis
Atf4 (Hs00909569_g1), Ddit3 (common name CHOP, Hs00358796_g1), Asns (Hs04186194_m1)
Chaperones & chaperone-synthesis promoter
Hspa5 (common names BiP and GRP78, Hs00607129_gH), Hsp90b1 (common name GPR94, Hs00427665_g1), Xbp1 (Hs00231936_m1)
Protein degradation Edem1 (Hs00976004_m1), Dnajb9 (Hs01052402_m1), Dnajc10 (Hs00405977_m1), Ern1 (Hs00980095_m1)
Housekeeping genes Gapdh (Hs02786624_g1), Rps18 (Hs01375212_g1), Actb (Hs0106665_g1)
6.3.5 Statistical analyses
Data were graphed as means ± SEM. Group comparisons were made with Two-
way ANOVA analysis. Tukey’s and Kruskal-Wallis were used as post hoc tests where
appropriately. P-values less than 0.05 were considered statistically significant.

132
6.4 Results
6.4.1 Differentiation models
6.4.1.1 Chondrogenesis
ER-stress genes related to chondrogenic maturation and osteogenic differentiation
were upregulated in the JOCD group (Figure 37). Atf3 was significantly higher in JOCD
than control at days 14, 21, 35 and 49. Atf4 was significantly higher in JOCD than
control at days 14, 21, 28, 35 and 49. Creb3l1, Gadd45b and Serpinh1 were significantly
higher in the JOCD group than control at all timepoints.
Expression of the sensors which trigger UPR were also upregulated in the JOCD
group (Figure 37). Atf6 was significantly higher in JOCD at days 14, 35 and 49. Eif2ak3
(common name PERK) was significantly higher in the JOCD group than the control
group at days 7, 14, 28, 35, and 49. Ern1 (common name IRE1) was significantly higher
at days 14, 21, 28, 35 and 49. Eif2ak3 is directly involved in inhibition of protein
inhibition and Ern1 in degradation of unfolded protein. Edem1 is also a marker of ER-
associated degradation, and it was significantly higher in JOCD at days 14, 21, 28, 35 and
49.
Total Xbp1 expression is related to an increased in protein chaperone synthesis,
and this gene was unregulated in the JOCD group at all timepoints. Consistently,
chaperone Hspa5 (commonly known as BIP or GPR78) was significantly higher in the
JOCD group than the control group at days 7, 14, 28, 35, and 49. Chaperone Hsp90b1
(known as GRP94) was significantly higher in JOCD at day 14 only.

133
Genes associated with ER-stress-induced apoptosis had a variable response
(Figure 37). Atf4 was significantly higher in JOCD at days 14, 21, 28, 35 and 49. Ddit3
(commonly known as CHOP) was higher in the control group at day 7, but higher in the
JOCD group at the later timepoints days 35 and 49.
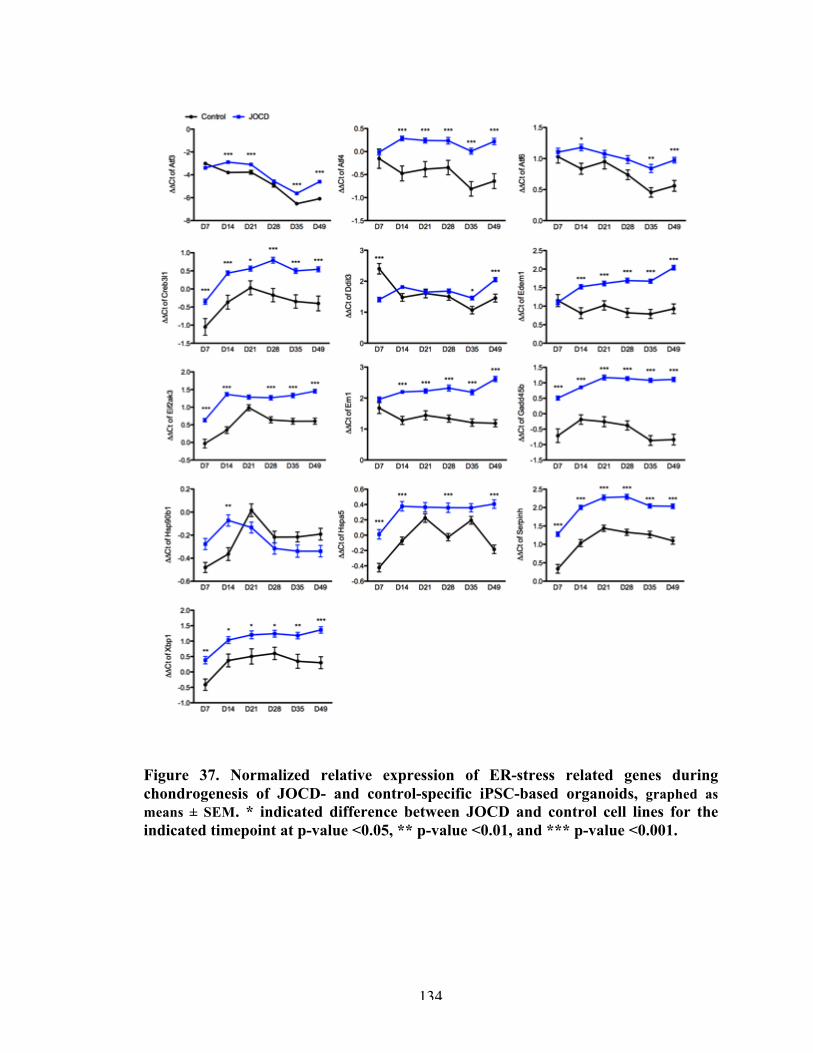
134
Figure 37. Normalized relative expression of ER-stress related genes during chondrogenesis of JOCD- and control-specific iPSC-based organoids, graphed as means ± SEM. * indicated difference between JOCD and control cell lines for the indicated timepoint at p-value <0.05, ** p-value <0.01, and *** p-value <0.001.
135
6.4.1.2 Endochondral ossification
In general, the JOCD group expressed higher levels of all ER-stress related genes
during endochondral ossification (Figure 38). Genes specifically related to ER stress
during chondrocyte maturation and osteogenesis (Atf4, Creb3l1 and Gadd45b) were
significantly higher in JOCD at all timepoints. Atf3 was significantly higher at days 28
and 49.
Expression of the three sensors which trigger UPR (Eif2ak3, Atf6 and Ern1) were
upregulated in the JOCD group. Eif2ak3 and Ern1 were significantly higher in JOCD at
all timepoints, while Atf6 was only significantly higher at days 14, 35 and 49. Edem1,
like Ern1, is a marker of ER-associated degradation, and it was significantly higher in the
JOCD group than control group at days 14, 21, 48, 35 and 49.
Xbp1 and Hspa5, markers of increased chaperone activity, were also significantly
higher in JOCD. Xbp1 was significantly higher at days 35 and 49, and Hspa5 at every
timepoint. Chaperone Hsp9b1, however, was not significantly different between the
JOCD and control groups, for any timepoint. Atf4 is also an indicator of redox balance
apoptosis and so is Ddit3. Ddit3 was significantly higher in JOCD at days 28 and 35.
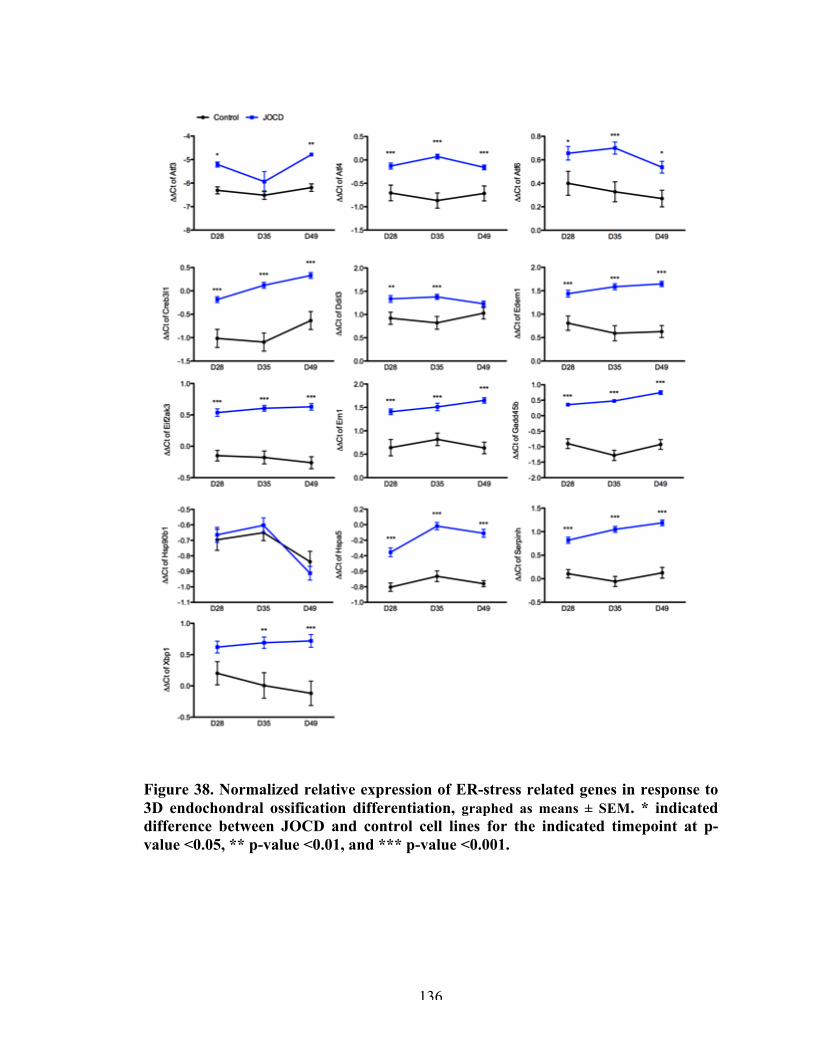
136
Figure 38. Normalized relative expression of ER-stress related genes in response to 3D endochondral ossification differentiation, graphed as means ± SEM. * indicated difference between JOCD and control cell lines for the indicated timepoint at p-value <0.05, ** p-value <0.01, and *** p-value <0.001.
137
6.4.2 ER-stress models
6.4.2.1 Protein Transport Inhibitor Cocktail
The normalized relative expression of all genes tested is shown in Figure 39. The
gene markers for the three sensors that are triggered by ER stress and thus initiate UPR
had variable expression. Eif2ak3 and Atf6 had similar expression in the control group as
the JOCD group, for all timepoints. Ern1 was significantly higher in JOCD at 2, 6 and 12
hours than control. Ern1 is also a marker of ER-stress-associated protein degradation, as
well as Dnjab9, Dnajc10 and Edem1. Dnajb9 and Edem1 were significantly higher in the
JOCD group than the control group at 6 hours, while Dnajc10 had similar expression in
both groups.
Expression of genes related to ER-stress induced redox balance apoptosis were
upregulated in the control group. Ddit3 was significantly higher in the control group than
JOCD at 12 hours, and Asns at 12 and 24 hours. Expression of genes related to protein
chaperones were generally upregulated in the JOCD group. Xbp1 was significantly
higher in the JOCD group at 6 hours, and chaperone Hspa5 was significantly higher in
the JOCD group at all timepoints. There were no significant differences between JOCD
and control for chaperone Hsp90b1.
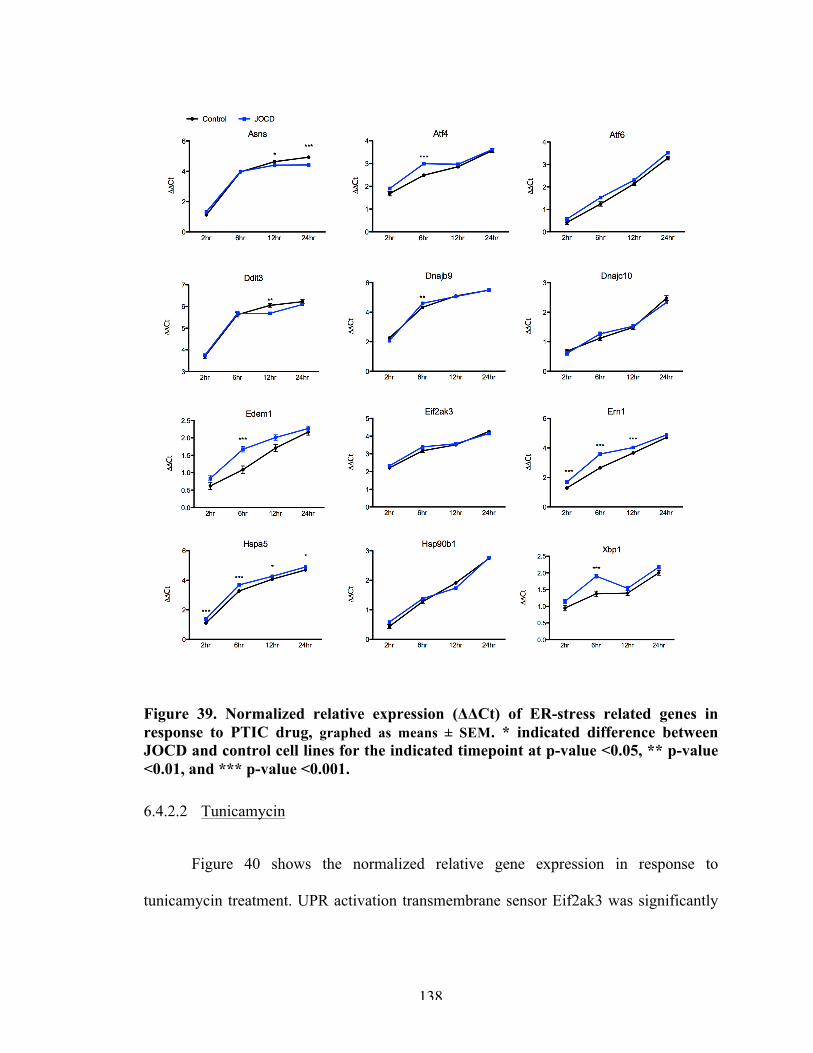
138
Figure 39. Normalized relative expression (ΔΔCt) of ER-stress related genes in response to PTIC drug, graphed as means ± SEM. * indicated difference between JOCD and control cell lines for the indicated timepoint at p-value <0.05, ** p-value <0.01, and *** p-value <0.001.
6.4.2.2 Tunicamycin
Figure 40 shows the normalized relative gene expression in response to
tunicamycin treatment. UPR activation transmembrane sensor Eif2ak3 was significantly
139
higher in the control at 6 and 24 hours, while Ern1 and Atf6 had similar expressionin
both groups for all timepoints.
The expression of other markers of protein degradation were upregulated in the
control group: Dnjab9 was significantly higher in the control group than the JOCD group
at 2 and 24 hours, while Dnajc10 was significantly higher in the control group at 2, 6 and
24 hours. Dnjac10 was significantly lower in the control group than the JOCD group at
12 hours. Finally, Edem1 was also significantly lower in the control group than JOCD
group at 12 hours. Increased chaperone activity and synthesis were also observed in the
JOCD group. Hspb901 was significantly higher in the control group at 2 hours and lower
in the control group than the JOCD group at 12 hours. Hspa5 was also significantly lower
in the control group than the JOCD group at 12 hours. Xbp1 showed a similar trend, but
differences between groups were not significant.
Markers related to ER-stress-induced apoptosis were also upregulated in the
control group. Asns was significantly higher in the control group than JOCD at 2, 6 and
24 hours, while Ddit3 was significantly higher at 24 hours. Atf4 was significantly higher
in the JOCD group than the control group at 12 hours.
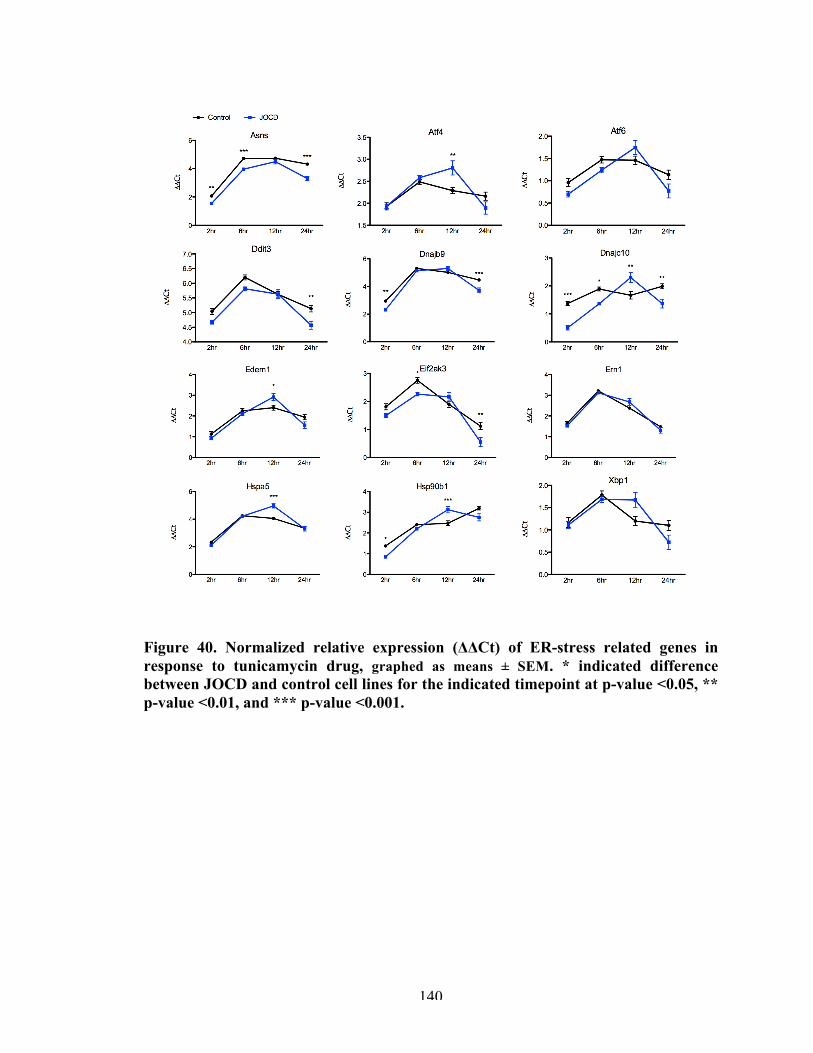
140
Figure 40. Normalized relative expression (ΔΔCt) of ER-stress related genes in response to tunicamycin drug, graphed as means ± SEM. * indicated difference between JOCD and control cell lines for the indicated timepoint at p-value <0.05, ** p-value <0.01, and *** p-value <0.001.
141
6.5 Discussion
ER stress is an important physiological response to normal processes, such as
osteogenic differentiation, and pathological conditions. Although FOCD and equine OCD
have been linked with ER-stress related pathogenesis, to this date, no study had explored
the molecular mechanisms of JOCD related to ER stress. The objective of this work was
to investigate ER-stress mechanisms during chondrogenic and endochondral ossification
of JOCD cell lines and in a controlled environment in response to ER-stress inducers.
Our chondrogenic and endochondral ossification differentiation models showed
increased expression of UPR-related genes in the JOCD group. This result may suggest
that JOCD cell lines may be experiencing a higher ER stress during differentiation than
control cell lines. Higher expression of Eif2ak3, Atf6, and Ern1 particularly suggest the
activation of the three transmembrane sensors, which act in response to protein
accumulation and ER stress. Chaperone Hsp90b1 was the only marker that did not have a
significantly different expression in JOCD versus control cell lines. Previous studies have
pointed at distinct functions between the chaperones Hsp90b1 and Hspa5 [165].
Compared to Hsp5, the client proteins of Hsp90b1 are more selective with critical roles in
immunity, growth signaling and cell adhesion [166], which may discard these types of
proteins from being the culprit of heightened ER stress in JOCD cell lines during
differentiation.
Higher expression of ER-related genes that are also involved in chondrocyte
maturation and osteogenesis may indicate a premature differentiation of our model to
chondrocyte hypertrophy in the JOCD group. This suggestion agrees with the previous
142
chapter, in which we observed a higher gene expression of col1a1 and deposition of
collagen type I protein in JOCD chondro-organoids. Expression of Gadd45b is essential
for chondrocytes during terminal differentiation. In fact, its expression has been shown to
increase from the proliferative phase to the hypertrophic phase, and to stimulate Mmp13
(a marker of terminal differentiation of hypertrophic chondrocytes) [167]. Atf4 stimulates
osteoblast-specific genes and Atf3, whose upregulation has been also reported during
chondrocyte differentiation and shown to activate a Runx2-dependent promoter [159].
Creb3l1 is a transcription factor expressed in osteoblasts, which activates Atf6 of the
UPR pathway [168]. Atf6 is related to the increased synthesis of protein chaperones, and
we observed this feature in our differentiation models, including Serpinh1. Serpinh1 is a
collagen-specific molecular chaperone that, unlike other chaperones, specifically
recognizes the folded conformation of its client [169], and it is, therefore, directly
involved in collagen biosynthesis.
Differentiation of cells is a highly variable process, and even under the same
differentiation-promoting conditions, there is known donor-to-donor variability and also
clone-to-clone variability within the same iPSC donor [170-173]. In other words, cell
lines respond differently to the same stimuli during differentiation. Therefore, in order to
investigate the cells’ response to ER stress in a controlled environment, ER stress was
induced with PTIC and tunicamycin.
PTIC is a cocktail of Brefeldin A and Monensin, and thus prevents protein
transport to the extracellular space, retaining proteins in the ER and inducing ER stress.
In PTIC-treated cells, results indicated an increased ER-stress response in JOCD-specific
143
cells comparing to control cells. This heightened response was particularly observed at
earlier timepoints and confirmed by tunicamycin treatment.
In PTIC and tunicamycin treatments, the only genes for which JOCD cells lines
had a significantly lower expression than control cells were related to ER-stress-induced
apoptosis: Asns and Ddit3 (CHOP). The increased expression of the other genes related
to the UPR mechanisms in JOCD cells may lead to higher survival and thus lower
activation of these apoptotic markers.
Altogether, these observations point to two overarching conclusions. The first,
the results from the differentiation models and ER-stress induction models may suggest
that JOCD cell lines are more susceptible to stress (i.e. physiological and pathological
stresses). This may indicate that upon encounter with physiological and pathological
stresses, JOCD cells may respond differently and this characteristic may be linked to its
pathology. Dysregulated UPR activity may lead to failure to cope with ER stress over
prolonged periods of time, which may eventually lead to cell death and may be
responsible for the initial necrotic lesion observed in clinical JOCD.
Ischemia is a pathological stresses and a hypothesized etiology for JOCD. It may
be that upon trauma, which can cause interruption of the microvasculature, JOCD cells
are not able to cope with the temporary ischemia as well as non-JOCD cells and thus they
undergo ER-stress-induced cell death, causing initial necrotic lesion observed in JOCD
patients. This hypothesis may be tested by studying our chondro- or osteo-organoids
under ischemic conditions (low glucose or a glucose-blocker, and low oxygen).
144
Secondly, we may conclude that chondrogenic and endochondral ossification
differentiations trigger a higher ER stress in JOCD cell lines, which may suggest that
there is a difference in differentiation processes between the two groups. This suggestion
also partially agrees with the previous chapter, in which we saw that although the end
result of endochondral ossification was similar between the two groups (calcium content
and collagen type I staining), gene expression during differentiation was significantly
different. This second point is not in conflict with our first, but an entirely different
observation. A study by Vellanki et al. showed that knock-down of Creb3l1 in human
glioma cell lines resulted in an attenuated UPR to ER stress, but induction of the col1a1
was unaffected [174]. JOCD cells may have a different UPR activation compared to
control cell lines, but this does not necessarily affect their osteogenic ability.
145
CHAPTER 7. SUMMARY AND FUTURE DIRECTIONS
7.1 Overall summary
In order to improve therapeutic interventions of joint disorders, the knowledge
gap concerning their pathological mechanisms need to be bridged. The overall objective
of this thesis was to elucidate pathomechanisms of OA and JOCD in order to provide
insights about their development and how they may be addressed therapeutically. Both
OA and JOCD are complex joint diseases that lack appropriate disease-modifying
treatments.
In the case of OA, the lack of well-characterized models may be partially
responsible for failed clinical trials with promising pre-clinical data. In accordance with
our overall objective, we developed a microarray gene expression tool and established a
baseline of molecular events for multiple tissues, in different regions, and at different
timepoints, for the MMT model of post-traumatic OA (Specific Aim I, Chapter 3). By
characterizing OA development in this model, we were also able to provide insights
about possible tissue interactions in OA. Utilizing this microarray gene expression tool,
we then investigated the mechanisms of action of micronized dehydrated human
amnion/chorion membrane (AmnioFix Injectable, MiMedx, USA) with the goal to
understand its chondro-protective effect to leverage it in the future development of more
specific therapeutic (Specific Aim II, Chapter 4). Results showed that AmnioFix does not
have a direct influence on the gene expression of articular cartilage or tissue from the
osteophyte-forming region of the joint. Instead, AmnioFix acted through the synovial
membrane, modulating its microenvironment. These results further supported the

146
importance of tissue interactions in the MMT model and in OA, and also provided a new
viewpoint concerning disease-modifying approaches for OA.
Lastly, we sought to elucidate pathological mechanisms of JOCD by establishing
novel disease-specific iPSC-derived in vitro models (Specific Aim III, Chapter 5 and 6).
This groundbreaking technology allowed us to study different aspects of JOCD. JOCD-
specific chondrogenic organoids demonstrated a lower chondrogenic ability than control
(non-diseased)-specific organoids. Even though JOCD-specific endochondral ossification
model was able to calcify and produce an ECM similar to that of the controls, we suspect
from the gene expression results that there are irregularities in this differentiation process
for JOCD. Through ER-stress induction models, we were able to further dissect
pathological mechanisms of JOCD and demonstrated that JOCD cells possess a
significantly different UPR signaling (compared to control). We ultimately hypothesized
that when physiological or pathological events that induce ER stress in the epiphyseal
occur, JOCD patient cells may not respond properly, which may lead to the eventual
death of these cells, which turns into the initial necrotic lesion observed in JOCD
patients. Microtauma and ischemic injury may be possible initiators of the demonstrated
JOCD pathological events.
Overall, this thesis presents original research regarding joint degenerative models
for OA and JOCD, and it provides the scientific field with well-characterized platforms
for future therapeutic development and testing.
7.2 Future directions
147
There a number of exciting directions that the work presented in this thesis may
take. Firstly, AmnioFix Injectable should be further explored in an inflammatory in vivo
model in order to validate the results observed in this work, or perhaps elucidate the
variable effect of AmnioFix in environments with different degrees of inflammation.
Effects of AmnioFix in RA would be particularly interesting, since the primary
pathomechanisms in RA affect both the synovial membrane and the immune system.
With respect to OA, the suggested mechanistic effects of AmnioFix in the MMT model
may point to a benefit from increased pro-inflammatory signaling. Pro-inflammation is,
after all, important in wound healing at early timepoints. Future work should attempt to
regulate the inflammatory response in the synovial membrane of the MMT model in
order to see if similar results are obtained. It will also be worth assessing the response of
the MMT model due to prolonged modulation, possibly by multiple treatments of
AmnioFix Injectable with temporal proximity.
The differentiation processes of JOCD-specific cell lines should also be further
assessed. We observed potential dysregulation in endochondral ossification processes in
JOCD, yet similar end-point results between JOCD and control. We propose large-scale
array analyses, such as RNA-seq, in order to further dissect differences in cell
differentiation in JOCD patients. From our ER-stress induction models, we hypothesized
that a different UPR activation in JOCD cells may ultimately lead to ER-stress-associated
cell death in the epiphyseal due to changes to the extracellular environment, such as
ischemia. This hypothesis should be tested by studying our JOCD-specific in vitro
models under ischemic-like conditions (low to no glucose, low oxygen).
148
APPENDIX A. TOWARDS AN EARLY-STAGE SMALL ANIMAL
MODEL OF OSTEOCHONDRITIS DISSECANS
A.1 Introduction
Currently, there are no disease models which recapitulate the development and
progression of JOCD. A mechanically-induced lapine model is currently available;
however, this model only replicates the severe late stage in which the osteochondral
fragment is completely separated from the native bone (stage IV) [175]. In skeletally
immature female New Zealand White rabbits, a 4-mm diameter plug is taken from the
weight-bearing osteochondral surface on the medial femoral condyle, as shown in Figure
5A [175]. Then, a piece of acellular collagen-glycosaminoglycan matrix is placed into the
cavity and the plug is replaced (Figure 5B) [175]. The matrix prevents healing and
reattachment of the osteochondral plug, thus creating an osteochondral defect and
replicating the last stage of JOCD.
The Mauck group has developed a similar technique in a swine model. An
osteochondral defect was created using a curved osteotome, removed, and later replaced
following interposition of a slowly degrading nanofibrous poly(ε-caprolactone) (PCL)
barrier membrane [176]. Unlike in the lapine model, sutures were used to secure the
progeny fragment to the defect site. This swine OCD model attempts to replicate ICRS
OCD grade III, in which there is a partially detached lesion; essentially, a dissecan in situ.
However, thanks to advanced imaging modalities and improved guidelines, JOCD is now
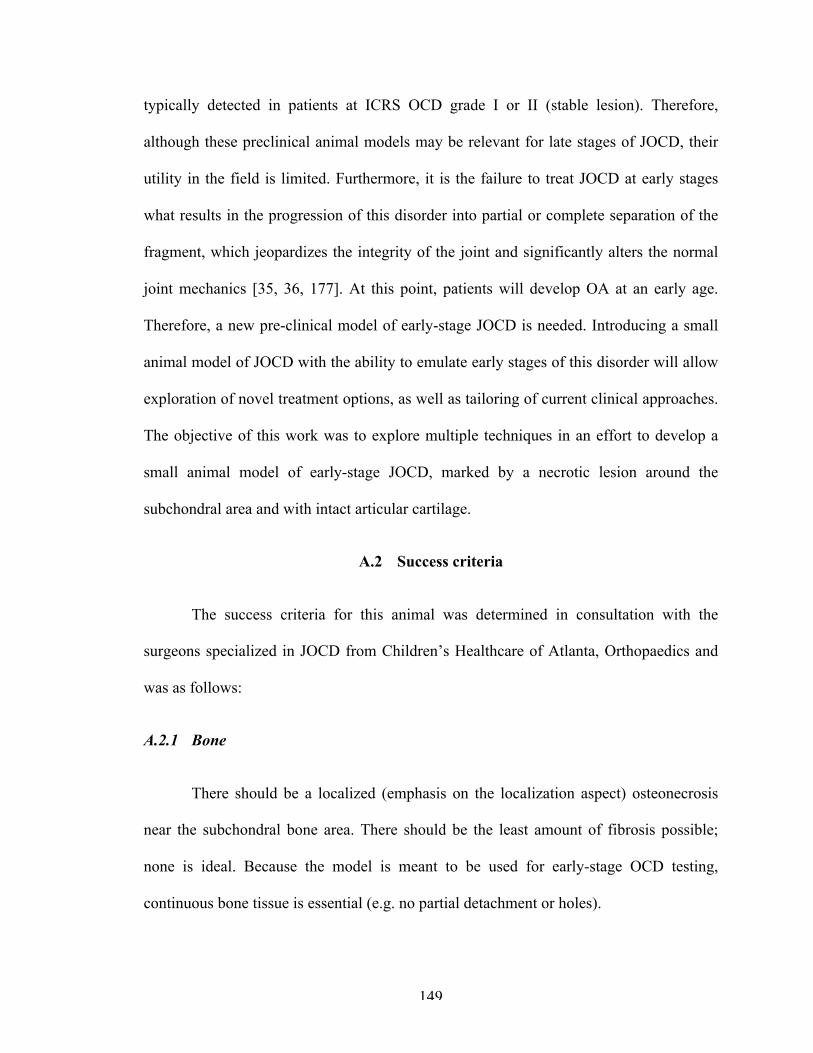
149
typically detected in patients at ICRS OCD grade I or II (stable lesion). Therefore,
although these preclinical animal models may be relevant for late stages of JOCD, their
utility in the field is limited. Furthermore, it is the failure to treat JOCD at early stages
what results in the progression of this disorder into partial or complete separation of the
fragment, which jeopardizes the integrity of the joint and significantly alters the normal
joint mechanics [35, 36, 177]. At this point, patients will develop OA at an early age.
Therefore, a new pre-clinical model of early-stage JOCD is needed. Introducing a small
animal model of JOCD with the ability to emulate early stages of this disorder will allow
exploration of novel treatment options, as well as tailoring of current clinical approaches.
The objective of this work was to explore multiple techniques in an effort to develop a
small animal model of early-stage JOCD, marked by a necrotic lesion around the
subchondral area and with intact articular cartilage.
A.2 Success criteria
The success criteria for this animal was determined in consultation with the
surgeons specialized in JOCD from Children’s Healthcare of Atlanta, Orthopaedics and
was as follows:
A.2.1 Bone
There should be a localized (emphasis on the localization aspect) osteonecrosis
near the subchondral bone area. There should be the least amount of fibrosis possible;
none is ideal. Because the model is meant to be used for early-stage OCD testing,
continuous bone tissue is essential (e.g. no partial detachment or holes).
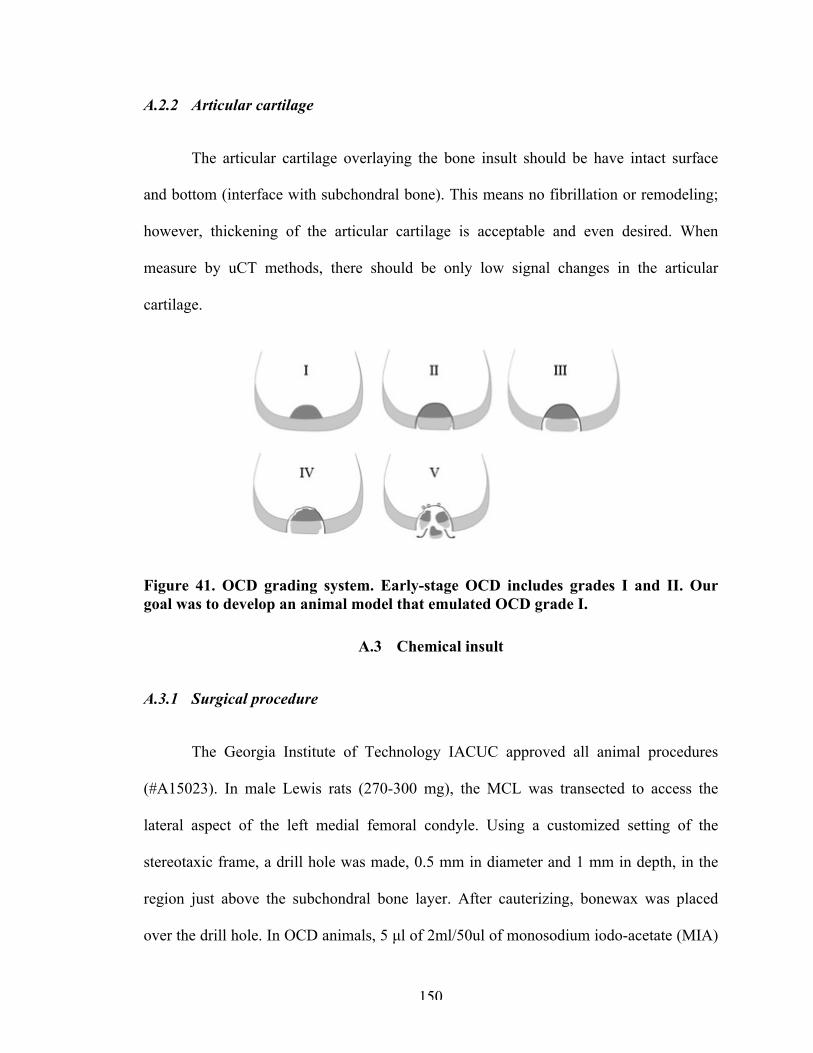
150
A.2.2 Articular cartilage
The articular cartilage overlaying the bone insult should be have intact surface
and bottom (interface with subchondral bone). This means no fibrillation or remodeling;
however, thickening of the articular cartilage is acceptable and even desired. When
measure by uCT methods, there should be only low signal changes in the articular
cartilage.
Figure 41. OCD grading system. Early-stage OCD includes grades I and II. Our goal was to develop an animal model that emulated OCD grade I.
A.3 Chemical insult
A.3.1 Surgical procedure
The Georgia Institute of Technology IACUC approved all animal procedures
(#A15023). In male Lewis rats (270-300 mg), the MCL was transected to access the
lateral aspect of the left medial femoral condyle. Using a customized setting of the
stereotaxic frame, a drill hole was made, 0.5 mm in diameter and 1 mm in depth, in the
region just above the subchondral bone layer. After cauterizing, bonewax was placed
over the drill hole. In OCD animals, 5 µl of 2ml/50ul of monosodium iodo-acetate (MIA)
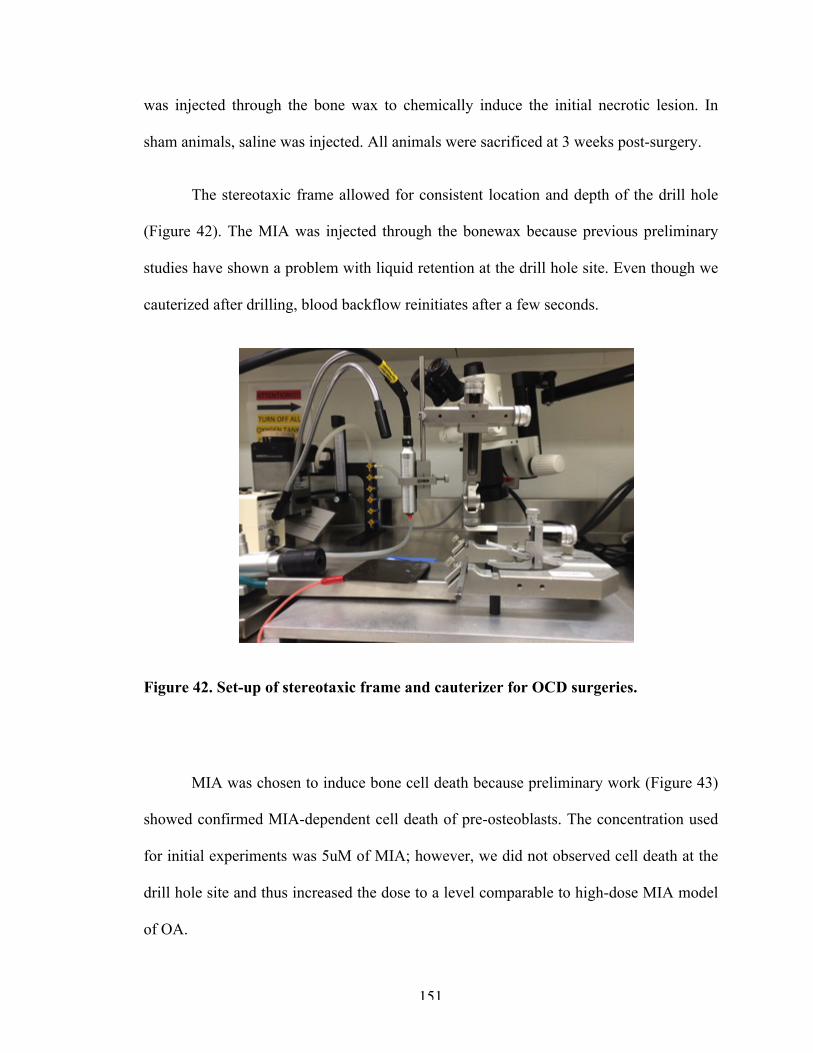
151
was injected through the bone wax to chemically induce the initial necrotic lesion. In
sham animals, saline was injected. All animals were sacrificed at 3 weeks post-surgery.
The stereotaxic frame allowed for consistent location and depth of the drill hole
(Figure 42). The MIA was injected through the bonewax because previous preliminary
studies have shown a problem with liquid retention at the drill hole site. Even though we
cauterized after drilling, blood backflow reinitiates after a few seconds.
Figure 42. Set-up of stereotaxic frame and cauterizer for OCD surgeries.
MIA was chosen to induce bone cell death because preliminary work (Figure 43)
showed confirmed MIA-dependent cell death of pre-osteoblasts. The concentration used
for initial experiments was 5uM of MIA; however, we did not observed cell death at the
drill hole site and thus increased the dose to a level comparable to high-dose MIA model
of OA.
152
Figure 43. MC3T3 pre-osteoblast cells after 24 hours of MIA treatment at the various concentrations. MTT assay was used to read cell survival after treatment. *** indicates p-value <0.001.
A.3.2 Results and discussion
We observed a reproducible technique in terms of drill hole location and depth
thanks to the use of the stereotaxic frame. However, MIA injections did not show
significant differences from saline injections (sham animals), indicating that the MIA
injections were not having an effect (Figure 44). This is mostly due to the limited space
allowed for injections (0.5 mm drill hole). We hypothesize that MIA in simply not
retained at the drill hole site.
Moreover, histological analysis of the bone showed signs of remodeling (Figure
44). It appeared that fibrous tissue had formed around the drill hole site. For the purpose
of this model, we want zero to very minimal fibrous tissue in the bone and we need the
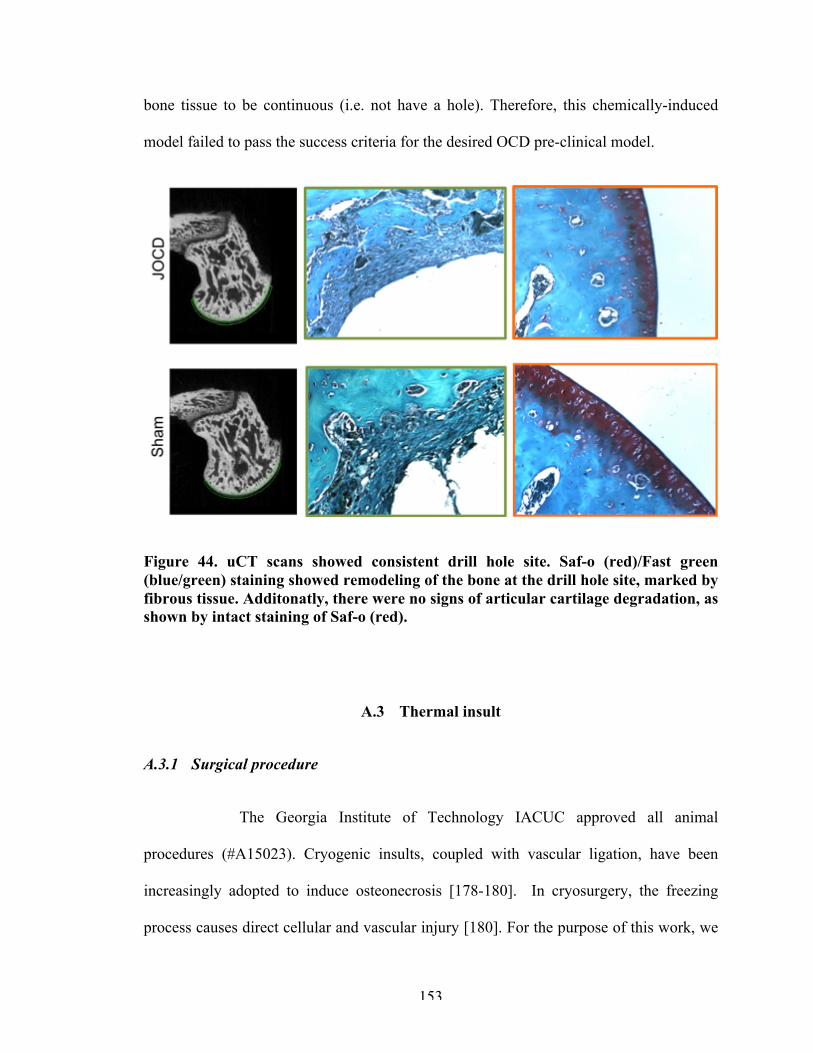
153
bone tissue to be continuous (i.e. not have a hole). Therefore, this chemically-induced
model failed to pass the success criteria for the desired OCD pre-clinical model.
Figure 44. uCT scans showed consistent drill hole site. Saf-o (red)/Fast green (blue/green) staining showed remodeling of the bone at the drill hole site, marked by fibrous tissue. Additonatly, there were no signs of articular cartilage degradation, as shown by intact staining of Saf-o (red).
A.3 Thermal insult
A.3.1 Surgical procedure
The Georgia Institute of Technology IACUC approved all animal
procedures (#A15023). Cryogenic insults, coupled with vascular ligation, have been
increasingly adopted to induce osteonecrosis [178-180]. In cryosurgery, the freezing
process causes direct cellular and vascular injury [180]. For the purpose of this work, we
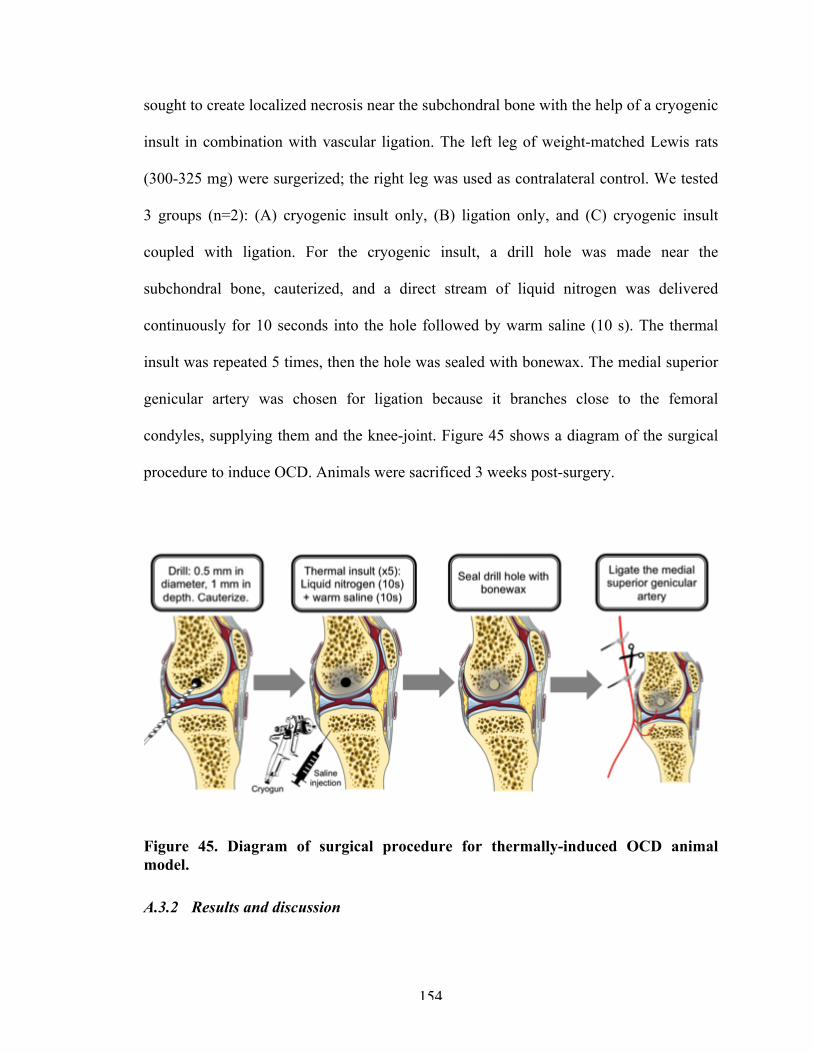
154
sought to create localized necrosis near the subchondral bone with the help of a cryogenic
insult in combination with vascular ligation. The left leg of weight-matched Lewis rats
(300-325 mg) were surgerized; the right leg was used as contralateral control. We tested
3 groups (n=2): (A) cryogenic insult only, (B) ligation only, and (C) cryogenic insult
coupled with ligation. For the cryogenic insult, a drill hole was made near the
subchondral bone, cauterized, and a direct stream of liquid nitrogen was delivered
continuously for 10 seconds into the hole followed by warm saline (10 s). The thermal
insult was repeated 5 times, then the hole was sealed with bonewax. The medial superior
genicular artery was chosen for ligation because it branches close to the femoral
condyles, supplying them and the knee-joint. Figure 45 shows a diagram of the surgical
procedure to induce OCD. Animals were sacrificed 3 weeks post-surgery.
Figure 45. Diagram of surgical procedure for thermally-induced OCD animal model.
A.3.2 Results and discussion
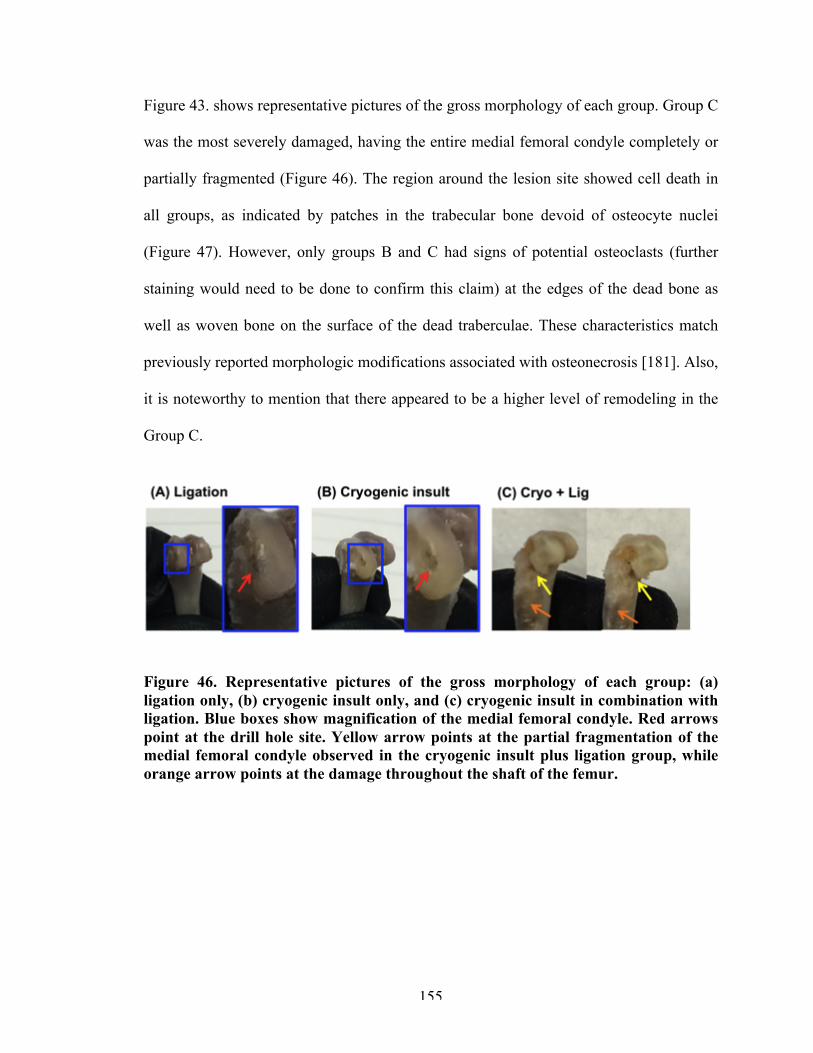
155
Figure 43. shows representative pictures of the gross morphology of each group. Group C
was the most severely damaged, having the entire medial femoral condyle completely or
partially fragmented (Figure 46). The region around the lesion site showed cell death in
all groups, as indicated by patches in the trabecular bone devoid of osteocyte nuclei
(Figure 47). However, only groups B and C had signs of potential osteoclasts (further
staining would need to be done to confirm this claim) at the edges of the dead bone as
well as woven bone on the surface of the dead traberculae. These characteristics match
previously reported morphologic modifications associated with osteonecrosis [181]. Also,
it is noteworthy to mention that there appeared to be a higher level of remodeling in the
Group C.
Figure 46. Representative pictures of the gross morphology of each group: (a) ligation only, (b) cryogenic insult only, and (c) cryogenic insult in combination with ligation. Blue boxes show magnification of the medial femoral condyle. Red arrows point at the drill hole site. Yellow arrow points at the partial fragmentation of the medial femoral condyle observed in the cryogenic insult plus ligation group, while orange arrow points at the damage throughout the shaft of the femur.
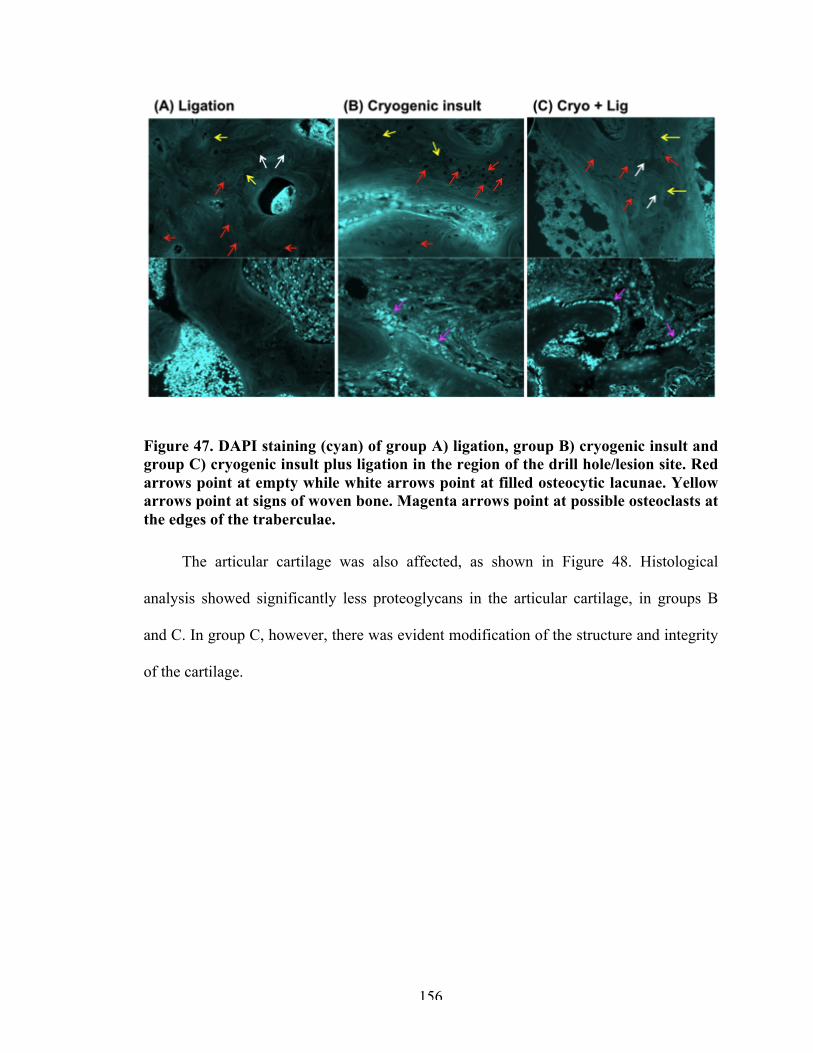
156
Figure 47. DAPI staining (cyan) of group A) ligation, group B) cryogenic insult and group C) cryogenic insult plus ligation in the region of the drill hole/lesion site. Red arrows point at empty while white arrows point at filled osteocytic lacunae. Yellow arrows point at signs of woven bone. Magenta arrows point at possible osteoclasts at the edges of the traberculae.
The articular cartilage was also affected, as shown in Figure 48. Histological
analysis showed significantly less proteoglycans in the articular cartilage, in groups B
and C. In group C, however, there was evident modification of the structure and integrity
of the cartilage.
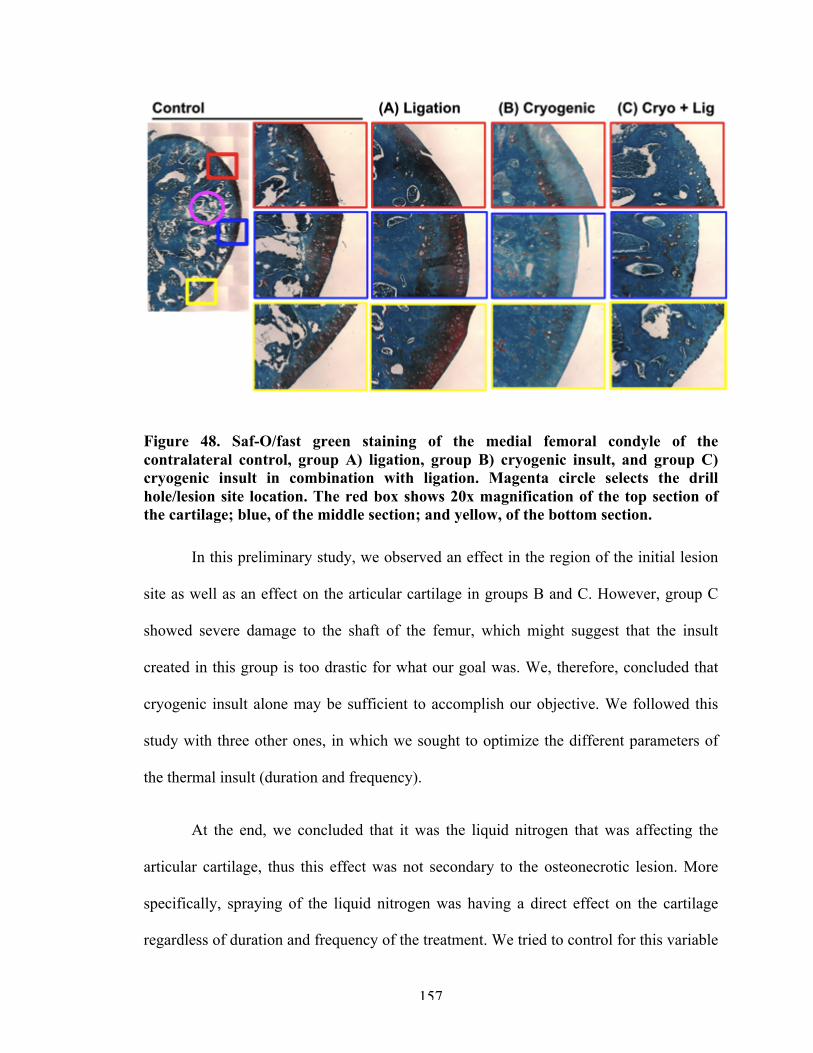
157
Figure 48. Saf-O/fast green staining of the medial femoral condyle of the contralateral control, group A) ligation, group B) cryogenic insult, and group C) cryogenic insult in combination with ligation. Magenta circle selects the drill hole/lesion site location. The red box shows 20x magnification of the top section of the cartilage; blue, of the middle section; and yellow, of the bottom section.
In this preliminary study, we observed an effect in the region of the initial lesion
site as well as an effect on the articular cartilage in groups B and C. However, group C
showed severe damage to the shaft of the femur, which might suggest that the insult
created in this group is too drastic for what our goal was. We, therefore, concluded that
cryogenic insult alone may be sufficient to accomplish our objective. We followed this
study with three other ones, in which we sought to optimize the different parameters of
the thermal insult (duration and frequency).
At the end, we concluded that it was the liquid nitrogen that was affecting the
articular cartilage, thus this effect was not secondary to the osteonecrotic lesion. More
specifically, spraying of the liquid nitrogen was having a direct effect on the cartilage
regardless of duration and frequency of the treatment. We tried to control for this variable
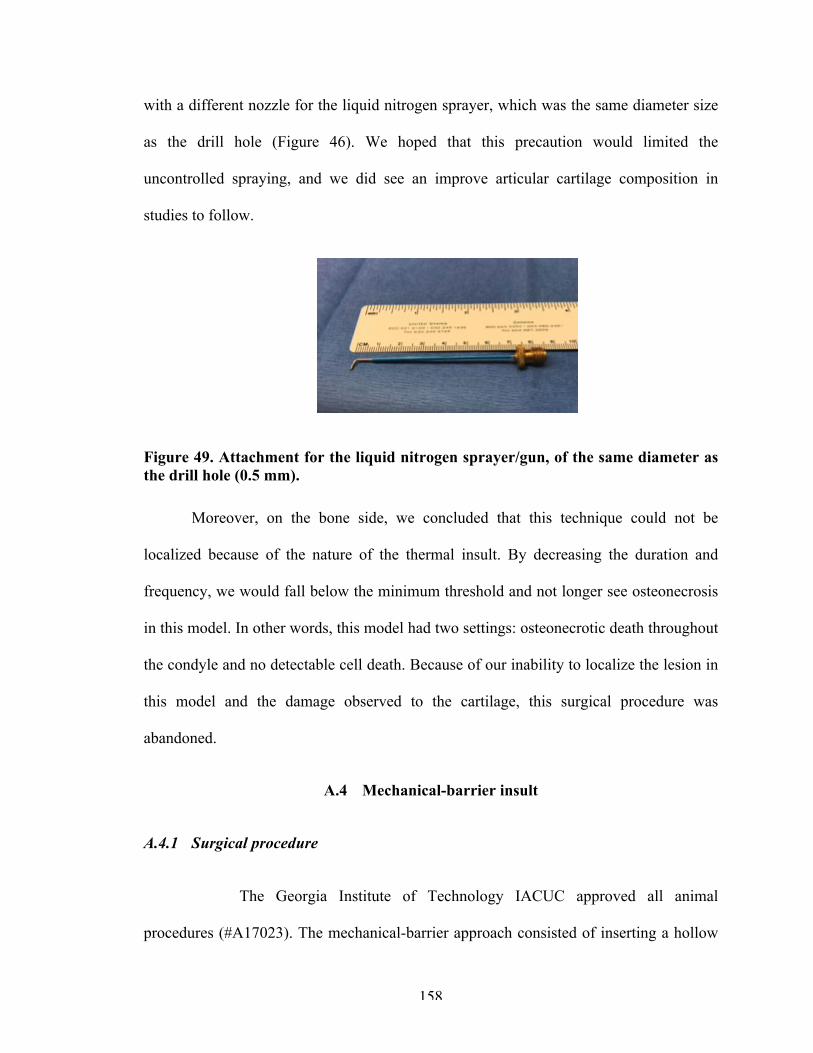
158
with a different nozzle for the liquid nitrogen sprayer, which was the same diameter size
as the drill hole (Figure 46). We hoped that this precaution would limited the
uncontrolled spraying, and we did see an improve articular cartilage composition in
studies to follow.
Figure 49. Attachment for the liquid nitrogen sprayer/gun, of the same diameter as the drill hole (0.5 mm).
Moreover, on the bone side, we concluded that this technique could not be
localized because of the nature of the thermal insult. By decreasing the duration and
frequency, we would fall below the minimum threshold and not longer see osteonecrosis
in this model. In other words, this model had two settings: osteonecrotic death throughout
the condyle and no detectable cell death. Because of our inability to localize the lesion in
this model and the damage observed to the cartilage, this surgical procedure was
abandoned.
A.4 Mechanical-barrier insult
A.4.1 Surgical procedure
The Georgia Institute of Technology IACUC approved all animal
procedures (#A17023). The mechanical-barrier approach consisted of inserting a hollow

159
tube in the bone of the femoral condyle with the expectation that the bone in contact with
this surface would undergo osteonecrosis. It was hypothesized that, after a period of time,
when the hollow tube was pulled out, there will be an osteonecrotic lesion akin to OCD.
The lateral aspect of the femoral condyles of male Lewis rats (~400mg) was
assessed through blunt dissection. Then, a 2mm biopsy punch was used to core out
spacing in the lateral femoral condyle for the microtube. The lateral femoral condyle was
chosen as the lesion site because it was anatomically more resistant to this process. We
found that medial femoral condyles would collapse more easily under the force of the
biopsy punch. Furthermore, a biopsy punch was chosen as our tool to make spacing for
inserting the microtube because companies do not manufacture holesaws (or trephine) of
the size we needed. In accordance with our success criteria, we did not want to
compromise the entire condyle, thus 2 mm diameter was the largest size we could core in
the femoral condyle.
The microtube was polyamide-made, 1.98 mm in diameter and 1.5 mm in depth
(courtesy of MicroLumen, FL). Before surgeries, it was washed in detergent and
subsequent water washes in the sonicator, and then autoclaved sterilized. The
microtubes were fit-pressed into the spacing made by the biopsy punch, in the lateral
condyle. One week after surgery, a second surgery took place to remove the microtubes.
Animals were taken down 2 weeks after the second surgery.
In sham animals, the biopsy punch was used to make the spacing for the
microtube, but no microtube was inserted. The right, contralateral legs were used as naïve
controls.
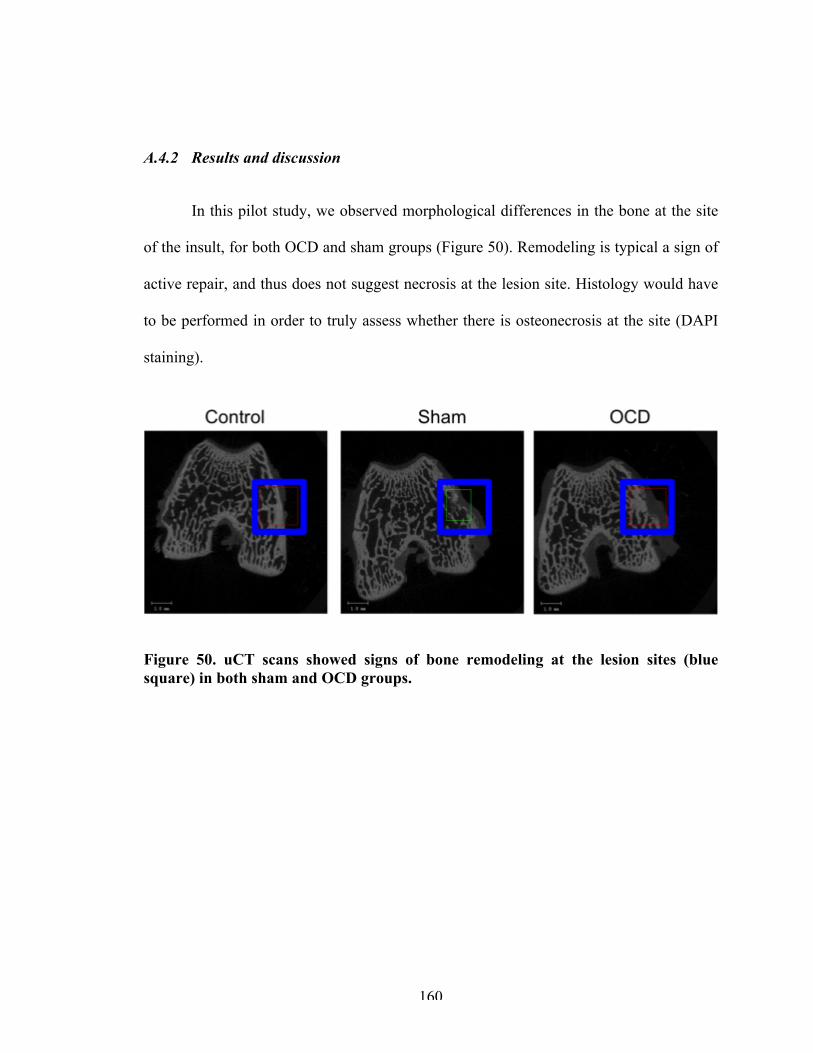
160
A.4.2 Results and discussion
In this pilot study, we observed morphological differences in the bone at the site
of the insult, for both OCD and sham groups (Figure 50). Remodeling is typical a sign of
active repair, and thus does not suggest necrosis at the lesion site. Histology would have
to be performed in order to truly assess whether there is osteonecrosis at the site (DAPI
staining).
Figure 50. uCT scans showed signs of bone remodeling at the lesion sites (blue square) in both sham and OCD groups.
161
REFERENCES
1. Kotlarz, H., et al., Insurer and out-of-pocket costs of osteoarthritis in the US. Arthritis & Rheumatism, 2009. 60(12): p. 3546-3553.
2. Amoako, A.O. and G.G.A. Pujalte, Osteoarthritis in Young, Active, and Athletic Individuals. Clin Med Insights Arthritis Musculoskelet Disord, 2014. 7: p. 27-32.
3. Willett, N.J., et al., Intra-articular injection of micronized dehydrated human amnion/chorion membrane attenuates osteoarthritis development. Arthritis Res Ther, 2014. 16(1).
4. Krause, M., et al., Healing predictors of stable juvenile osteochondritis dissecans knee lesions after 6 and 12 months of nonoperative treatment. Am J Sports Med, 2013. 41(10): p. 2384-2391.
5. Cahill, B.R., M.R. Phillips, and N. Navarro, The results of conservative management of juvenile osteochondritis dissecans using joint scintigraphy: a prospective study. Am J Sports Med, 1989. 17(5): p. 601-605.
6. Wall, E.J., J. Vourazeris, and G.D. Myer, The healing potential of stable juvenile osteochondritis dissecans knee lesions. J Bone Joint Surg Am, 2008. 90(12): p. 2655-2664.
7. Eismann, E.A., et al., Management strategies for osteochondritis dissecans of the knee in the skeletally immature athlete. J Orthop Sports Phys Ther, 2014. 44(9): p. 665-79.
8. Arthritis: National Statistics. 2015.
9. Tanna, S., Osteoarthritis: Opportunities to addess pharmaceutical gaps, in Osteoarthritis. 2004: World Health Organization.
10. Kapoor, M., et al., Role of proinflammatory cytokines in the pathophysiology of osteoarthritis. Nat Rev Rheumatol, 2011. 7(1): p. 33-42.
11. Sellam, J. and F. Berenbaum, The role of synovitis in pathophysiology and clinical symptoms of osteoarthritis. Nat Rev Rheumatol, 2010. 6(11): p. 625-35.
12. Robinson, W.H., et al., Low-grade inflammation as a key mediator of the pathogenesis of osteoarthritis. Nat Rev Rheumatol, 2016. 12(10): p. 580-92.
162
13. Murphy, L. and C.G. Helmick, The impact of osteoarthritis in the United States: A population-health perspective. American Journal of Nursing, 2012. 112(3).
14. Zhang, Y. and J.M. Jordan, Epidemiology of Osteoarthritis. Clin Geriatr Med, 2010. 26(3): p. 355-69.
15. Lawrence, R.C., et al., Estimates of the prevalence of arthritis and other rheumatic conditions in the United States. Part II. Arthritis Rheum, 2008. 58(1): p. 26-35.
16. Murphy, L., et al., Lifetime risk of symptomatic knee osteoarthritis. Arthritis Rheum, 2008. 59(9): p. 1207-13.
17. Krasnokutsky, S., et al., Current concepts in the pathogenesis of osteoarthritis. Osteoarthritis Cartilage, 2008. 16 Suppl 3: p. S1-3.
18. Afonso, V., et al., Reactive oxygen species and superoxide dismutases: role in joint diseases. Joint Bone Spine, 2007. 74(4): p. 324-9.
19. Loeser, R.F., Molecular Mechanisms of Cartilage Destruction: Mechanics, Inflammatory Mediators, and Aging Collide. Arthritis Rheum, 2006. 54(5): p. 1357-60.
20. Kim, H.A. and F.J. Blanco, Cell death and apoptosis in osteoarthritic cartilage. Curr Drug Targets, 2007. 8(2): p. 333-45.
21. Blanco, F.J., et al., Osteoarthritis chondrocytes die by apoptosis. A possible pathway for osteoarthritis pathology. Arthritis Rheum, 1998. 41(2): p. 284-9.
22. Ayral, X., et al., Arthroscopic evaluation of chondropathy in osteoarthritis of the knee. J Rheumatol, 1996. 23(4): p. 698-706.
23. Ayral, X., et al., Synovitis: a potential predictive factor of structural progression of medial tibiofemoral knee osteoarthritis -- results of a 1 year longitudinal arthroscopic study in 422 patients. Osteoarthritis Cartilage, 2005. 13(5): p. 361-7.
24. Goldring, S.R., Alterations in periarticular bone and cross talk between subchondral bone and articular cartilage in osteoarthritis. Ther Adv Musculoskelet Dis, 2012. 4(4): p. 249-58.
25. Goldring, M.B. and S.R. Goldring, Articular cartilage and subchondral bone in the pathogenesis of osteoarthritis. Ann N Y Acad Sci, 2010. 1192: p. 230-7.
26. Walsh, D.A., et al., Angiogenesis in the synovium and at the osteochondral junction in osteoarthritis. Osteoarthritis and Cartilage, 2007. 15: p. 743-751.
27. Goldring, S.R., Role of bone in osteoarthritis pathogenesis. Med Clin North Am, 2009. 93(1): p. 25-35, xv.
163
28. Sandell, L.J. and T. Aigner, Articular cartilage and changes in arthritis. An introduction: cell biology of osteoarthritis. Arthritis Res, 2001. 3(2): p. 107-13.
29. Matyas, J.R., L.J. Sandell, and M.E. Adams, Gene expression of type II collagens in chondro-osteophytes in experimental osteoarthritis. Osteoarthritis Cartilage, 1997. 5(2): p. 99-105.
30. Blom, A.B., et al., Synovial lining macrophages mediate osteophyte formation during experimental osteoarthritis. Osteoarthritis Cartilage, 2004. 12(8): p. 627-35.
31. Blom, A.B., et al., Crucial role of macrophages in matrix metalloproteinase-mediated cartilage destruction during experimental osteoarthritis: involvement of matrix metalloproteinase 3. Arthritis Rheum, 2007. 56(1): p. 147-57.
32. van Lent, P.L., et al., Crucial role of synovial lining macrophages in the promotion of transforming growth factor beta-mediated osteophyte formation. Arthritis Rheum, 2004. 50(1): p. 103-11.
33. Grimm, N.L., et al., Osteochondritis dissecands of the knee: Pathoanatomy, epidemiology, and diagnosis. Clin Sports Med, 2014. 33: p. 181-188.
34. Shea, K.G., et al., Osteochondritis dissecans knee histology studies have variable findings and theories of ethiology. Clin Orthop Relat Res, 2012. 471(4): p. 1127-1136.
35. Yonetani, Y., et al., Histological evaluation of juvenile osteochondritis dissecans of the knee: a case series. Knee Surg Sports Traumatol Arthrosc, 2010. 18: p. 723-730.
36. Schindler, O.S., Osteochondritis dissecans of the knee. Current Orthopaedics, 2007. 21: p. 47-58.
37. Laor, T., et al., Juvenile Osteochondritis Dissecans: Is it a growth disturbance of the secondary physis of the epiphysis? Am J Reseach, 2012. 199: p. 1121-1128.
38. The diagnosis and treatment of osteochondritis dissecans: Guideline and evidence report, in AAOS Clinical Practice Guidelines Unit. 2010, American Academy of Orthopaedic Surgeons.
39. Owens, J.B. and C. Lattermann, Management of Osteochondritis Dissecans of the Knee, in Biologic Joint Reconstruction: Alternatives to arthroplasty. 2009, Slack Incorporated.
40. Weiss, J.M., et al., The Incidence of Surgery in Osteochondritis Dissecans in Children and Adolescents. Orthop J Sports Med, 2016. 4(3).
164
41. Sakata, K., et al., Comparison between normal and loose fragment chondrocytes in proliferation and redifferentiation potential. International Orthopaedics, 2012. 37: p. 159-165.
42. O’Connor, M., et al., Osteochondritis dissecans of the knee in children. A comparison of MRI and arthroscopic findings. J Bone Joint Surg Br, 2002. 84(2): p. 258–262.
43. Milewski, M.D., Osteochondritis Dissecans: Diagnosis and Treatment Opetions for Atletes. Clinicas Review Articles. 2014, Elsevier Health Sciences.
44. ICRS Clinical Cartilage Injury Evaluation System. 2000, International Cartilage Repair Society: http://www.cartilage.org/.
45. Kijowski, R., et al., Juvenile versus adult osteochondritis dissecans of the knee: appropriate MR imaging criteria for instability. Radiology, 2008. 148(2): p. 571-8.
46. Robertson, W., B.T. Kelly, and D.W. Green, Osteochondritis dissecans of the knee in children. Current Opinion in Pediatrics, 2003. 15: p. 38-44.
47. Erickson, B.J., et al., Surgical management of osteochondritis dissecans of the knee. Curr Rev Musculoskelet Med, 2013. 6: p. 102-114.
48. Ganley, T.J., Symposia: Treatment of Osteochondritis Dissecans in Children and Adolescents, in ISAKOS Congress. 2013: Toronto, Canada.
49. Sanders, T.L., et al., Nonoperative Management of Osteochondritis Dissecans of the Knee: Progression to Osteoarthritis and Arthroplasty at Mean 13-Year Follow-up. Orthop J Sports Med, 2017. 5(7).
50. Winthrop, Z., G. Pinkowsky, and W. Hennrikus, Surgical treatment for osteochondritis dessicans of the knee. Curr Rev Musculoskelet Med, 2015. 8(4): p. 467-75.
51. Edmonds, E. and J. Polousky, A review of knowledge in osteochondritis dissecans: 123 years of minimal evolution from Konig to the ROCK study group. Clin Orthop Relat Res, 2013. 471(4): p. 1118-26.
52. Aichroth, P., Osteochondritis dissecans of the knee. A clinical survey. J Bone Joint Surg Br, 1971. 53(3): p. 440-7.
53. Hefti, F., et al., Osteochondritis dissecans: a multicenter study of the European Pediatric Orthopedic Society. J Pediatr Orthop B, 1999. 8(4): p. 231-45.
54. Zanon, G., G. Di Vico, and M. Marullo, Osteochondritis dissecans of the knee. Joints, 2014. 2(1): p. 29-36.
165
55. Pape, D., et al., Disease-specific clinical problems associated with the subchondral bone. Knee Surg Sports Traumatol Arthrosc, 2010. 18(4): p. 448-62.
56. Enneking, W.F., Clinical musculoskeletal pathology. 3 ed. 1990: Florida: University of Florida Press.
57. Rogers, W.M. and H. Gladstone, Vascular foramina and arterial supply of the distal end of the femur. J Bone Joint Surg Am, 1950. 32 a(4): p. 867-74.
58. Milgram, J.W., Radiological and pathological manifestations of osteochondritis dissecans of the distal femur. A study of 50 cases. Radiology, 1978. 126(2): p. 305-11.
59. Uozumi, H., et al., Histologic findings and possible causes of osteochondritis dissecans of the knee. Am J Sports Med, 2009. 37(10): p. 2003-8.
60. Petrie, P.W., Aetiology of osteochondritis dissecans. Failure to establish a familial background. J Bone Joint Surg Br, 1977. 59(3): p. 366-7.
61. Mubarak, S.J. and N.C. Carroll, Juvenile osteochondritis dissecans of the knee: etiology. Clin Orthop Relat Res, 1981(157): p. 200-11.
62. Jeong, J.H., R. Mascarenhas, and H.S. Yoon, Bilateral Osteochondritis Dissecans of the Femoral Condyles in Both Knees: A Report of Two Sibling Cases. Knee Surg Relat Res, 2013. 25(2): p. 88-92.
63. Mackie, T. and R.M. Wilkins, Case report: Osteochondritis dissecans in twins: treatment with fresh osteochondral grafts. Clin Orthop Relat Res, 2010. 468(3): p. 893-7.
64. Woods, K. and I. Harris, Osteochondritis dissecans of the talus in identical twins. J Bone Joint Surg Br, 1995. 77(2): p. 331.
65. Onoda, S., et al., Osteochondritis dissecans of the knee in identical twins: a report of two cases. J Orthop Surg (Hong Kong), 2012. 20(1): p. 108-10.
66. Richie, L.B. and M.J. Sytsma, Matching osteochondritis dissecans lesions in identical twin brothers. Orthopedics, 2013. 36(9): p. e1213-6.
67. Mei-Dan, O., et al., Bilateral osteochondritis dissecans of the knees in monozygotic twins: the genetic factor and review of the etiology. Am J Orthop (Belle Mead NJ), 2009. 38(9): p. E152-5.
68. Gans, I., et al., Identical osteochondritis dissecans lesions of the knee in sets of monozygotic twins. Orthopedics, 2013. 36(12): p. e1559-62.
166
69. Gornitzky, A.L., et al., Osteochondritis Dissecans Lesions in Family Members: Does a Positive Family History Impact Phenotypic Potency? Clin Orthop Relat Res, 2017. 475(6): p. 1573-1580.
70. Barrie, H.J., Hypertrophy and laminar calcification of cartilage in loose bodies as probable evidence of an ossification abnormality. J Pathol, 1980. 132(2): p. 161-8.
71. Barrie, H.J., Hypothesis--a diagram of the form and origin of loose bodies in osteochondritis dissecans. J Rheumatol, 1984. 11(4): p. 512-3.
72. Trueta, J. and A. Trias, The vascular contribution to osteogenesis. IV. The effect of pressure upon the epiphysial cartilage of the rabbit. J Bone Joint Surg Br, 1961. 43-b: p. 800-13.
73. Ytrehus, B., C.S. Carlson, and S. Ekman, Etiology and pathogenesis of osteochondrosis. Vet Pathol, 2007. 44(4): p. 429-48.
74. Riddell, C., Studies on the pathogenesis of tibial dyschondroplasia in chickens. III. Effect of body weight. Avian Dis, 1975. 19(3): p. 497-505.
75. Olstad, K., et al., Transection of vessels in epiphyseal cartilage canals leads to osteochondrosis and osteochondrosis dissecans in the femoro-patellar joint of foals; a potential model of juvenile osteochondritis dissecans. Osteoarthritis Cartilage, 2013. 21(5): p. 730-8.
76. Pascual-Garrido, C., et al., Viability of loose body fragments in osteochondritis dissecans of the knee. A series of cases. Int Orthop, 2010. 34(6): p. 827-831.
77. Skagen, P.S., et al., Osteochondritis dissecans (OCD), an endoplasmic reticulum storage disease?: a morphological and molecular study of OCD fragments. Scand J Med Sci Sports, 2011. 21(6): p. e17-33.
78. Xu, M., et al., Chondrocytes Derived From Mesenchymal Stromal Cells and Induced Pluripotent Cells of Patients With Familial Osteochondritis Dissecans Exhibit an Endoplasmic Reticulum Stress Response and Defective Matrix Assembly. Stem Cells Transl Med, 2016. 5(9): p. 1171-81.
79. Desjardin, C., et al., Involvement of mitochondrial dysfunction and ER-stress in the physiopathology of equine osteochondritis dissecans (OCD). Exp Mol Pathol, 2014. 96(3): p. 328-38.
80. Thysen, S., F.P. Luyten, and R.J. Lories, Targets, models and challenges in osteoarthritis research. Dis Model Mech, 2015. 8(1): p. 17-30.
81. Thote, T., et al., Localized 3D analysis of cartilage composition and morphology in small animal models of joint degeneration. Osteoarthritis and Cartilage, 2013. 21(8): p. 1132-1141.
167
82. Wei, T., et al., Analysis of early changes in the articular cartilage transcriptisome in the rat meniscal tear model of osteoarthritis: pathway comparisons with the rat anterior cruciate transection model and with human osteoarthritic cartilage. Osteoarthritis Cartilage, 2010. 18(7): p. 992-1000.
83. Appleton, C.T., et al., Global analyses of gene expression in early experimental osteoarthritis. Arthritis Rheum, 2007. 56(6): p. 1854-68.
84. Endo, J., et al., Comparative Analysis of Gene Expression between Cartilage and Menisci in Early-Phase Osteoarthritis of the Knee-An Animal Model Study. J Knee Surg, 2017.
85. Willems, E., L. Leyns, and J. Vandesompele, Standardization of real-time PCR gene expression data from independent biological replicates. Anal Biochem, 2008. 379(1): p. 127-9.
86. Hwang, S.G., et al., Wnt-7a causes loss of differentiated phenotype and inhibits apoptosis of articular chondrocytes via different mechanisms. J Biol Chem, 2004. 279(25): p. 26597-604.
87. Lories, R.J. and F.P. Luyten, Osteoimmunology: Wnt antagonists: for better or worse? Nat Rev Rheumatol, 2009. 5(8): p. 420-1.
88. Denhardt, D.T., et al., Osteopontin as a means to cope with environmental insults: regulation of inflammation, tissue remodeling, and cell survival. J Clin Invest, 2001. 107(9): p. 1055-61.
89. Ryu, J.H., et al., Hypoxia-inducible factor-2alpha regulates Fas-mediated chondrocyte apoptosis during osteoarthritic cartilage destruction. Cell Death Differ, 2012. 19(3): p. 440-50.
90. Cecil, D.L. and R. Terkeltaub, Transamidation by transglutaminase 2 transforms S100A11 calgranulin into a procatabolic cytokine for chondrocytes. J Immunol, 2008. 180(12): p. 8378-85.
91. Yin, X., et al., Tissue transglutaminase (TG2) activity regulates osteoblast differentiation and mineralization in the SAOS-2 cell line. Braz J Med Biol Res, 2012. 45(8): p. 693-700.
92. Dell'Accio, F., et al., Activation of WNT and BMP signaling in adult human articular cartilage following mechanical injury. Arthritis Res Ther, 2006. 8(5): p. R139.
93. Dell'accio, F., et al., Identification of the molecular response of articular cartilage to injury, by microarray screening: Wnt-16 expression and signaling after injury and in osteoarthritis. Arthritis Rheum, 2008. 58(5): p. 1410-21.
168
94. Leijten, J.C., et al., Gremlin 1, frizzled-related protein, and Dkk-1 are key regulators of human articular cartilage homeostasis. Arthritis Rheum, 2012. 64(10): p. 3302-12.
95. Bluteau, G., et al., Matrix metalloproteinase-1, -3, -13 and aggrecanase-1 and -2 are differentially expressed in experimental osteoarthritis. Biochimica et Biophysica Acta, 2001: p. 147-158.
96. Rucklidge, G.J., G. Milne, and S.P. Robins, Collagen type X: a component of the surface of normal human, pig, and rat articular cartilage. Biochem Biophys Res Commun, 1996. 224(2): p. 297-302.
97. Chevalier, X., Fibronectin, cartilage, and osteoarthritis. Semin Arthritis Rheum, 1993. 22(5): p. 307-18.
98. Lust, G., N. Burton-Wurster, and H. Leipold, Fibronectin as a marker for osteoarthritis. J Rheumatol, 1987. 14 Spec No: p. 28-9.
99. Perez-Garcia, S., et al., Healthy and Osteoarthritic Synovial Fibroblasts Produce a Disintegrin and Metalloproteinase with Thrombospondin Motifs 4, 5, 7, and 12: Induction by IL-1beta and Fibronectin and Contribution to Cartilage Damage. Am J Pathol, 2016. 186(9): p. 2449-61.
100. Satkunananthan, P.B., et al., In vivo fluorescence reflectance imaging of protease activity in a mouse model of post-traumatic osteoarthritis. Osteoarthritis Cartilage, 2014. 22(10): p. 1461-9.
101. Troeberg, L. and H. Nagase, Proteases involved in cartilage matrix degradation in osteoarthritis. Biochim Biophys Acta, 2012. 1824(1): p. 133-45.
102. Chia, S.L., et al., Fibroblast growth factor 2 is an intrinsic chondroprotective agent that suppresses ADAMTS-5 and delays cartilage degradation in murine osteoarthritis. Arthritis Rheum, 2009. 60(7): p. 2019-27.
103. Liu-Bryan, R. and R. Terkeltaub, Emerging regulators of the inflammatory process in osteoarthritis. Nat Rev Rheumatol, 2015. 11(1): p. 35-44.
104. Yang, S., et al., Hypoxia-inducible factor-2alpha is a catabolic regulator of osteoarthritic cartilage destruction. Nat Med, 2010. 16(6): p. 687-93.
105. Xu, Z., et al., Cartilaginous Metabolomic Study Reveals Potential Mechanisms of Osteophyte Formation in Osteoarthritis. J Proteome Res, 2017. 16(4): p. 1425-1435.
106. Hashimoto, S., et al., Development and regulation of osteophyte formation during experimental osteoarthritis. Osteoarthritis Cartilage, 2002. 10(3): p. 180-7.
169
107. Jenner, F., et al., Differential Gene Expression of the Intermediate and Outer Interzone Layers of Developing Articular Cartilage in Murine Embryos. Stem Cells Dev, 2014. 23(16): p. 1883-98.
108. Cho, H.H., et al., NF-kappaB activation stimulates osteogenic differentiation of mesenchymal stem cells derived from human adipose tissue by increasing TAZ expression. J Cell Physiol, 2010. 223(1): p. 168-77.
109. Hess, K., et al., TNFalpha promotes osteogenic differentiation of human mesenchymal stem cells by triggering the NF-kappaB signaling pathway. Bone, 2009. 45(2): p. 367-76.
110. Nam, D., et al., T-lymphocytes enable osteoblast maturation via IL-17F during the early phase of fracture repair. PLoS One, 2012. 7(6): p. e40044.
111. Sonomoto, K., et al., Interleukin-1beta induces differentiation of human mesenchymal stem cells into osteoblasts via the Wnt-5a/receptor tyrosine kinase-like orphan receptor 2 pathway. Arthritis Rheum, 2012. 64(10): p. 3355-63.
112. Yeh, L.C., M.C. Zavala, and J.C. Lee, Osteogenic protein-1 and interleukin-6 with its soluble receptor synergistically stimulate rat osteoblastic cell differentiation. J Cell Physiol, 2002. 190(3): p. 322-31.
113. Teeple, E., et al., Animal models of osteoarthritis: challenges of model selection and analysis. Aaps j, 2013. 15(2): p. 438-46.
114. Goldring, M.B. and M. Otero, Inflammation in osteoarthritis. Curr Opin Rheumatol, 2011. 23(5): p. 471-8.
115. Ren, T., Y. van der Merwe, and M.B. Steketee, Developing Extracellular Matrix Technology to Treat Retinal or Optic Nerve Injury. eNeuro, 2015. 2(5).
116. Koob, T.J., et al., Properties of dehydrated human amnion/chorion composite grafts: Implications for wound repair and soft tissue regeneration. J Biomed Mater Res B Appl Biomater, 2014. 102(6): p. 1353-62.
117. Koob, T.J., et al., Biological properties of dehydrated human amnion/chorion composite graft: implications for chronic wound healing. Int Wound J, 2013. 10(5): p. 493-500.
118. Niknejad, H., et al., Properties of the amniotic membrane for potential use in tissue engineering. Eur Cell Mater, 2008. 15: p. 88-99.
119. Sheikh, E.S., E.S. Sheikh, and D.E. Fetterolf, Use of dehydrated human amniotic membrane allografts to promote healing in patients with refractory non healing wounds. Int Wound J, 2014. 11(6): p. 711-7.
170
120. Chevalier, X., et al., Intraarticular injection of anakinra in osteoarthritis of the knee: a multicenter, randomized, double-blind, placebo-controlled study. Arthritis Rheum, 2009. 61(3): p. 344-52.
121. Kraus, V.B., et al., Effects of intraarticular IL1-Ra for acute anterior cruciate ligament knee injury: a randomized controlled pilot trial (NCT00332254). Osteoarthritis Cartilage, 2012. 20(4): p. 271-8.
122. Gallagher, B., et al., Chondroprotection and the prevention of osteoarthritis progression of the knee: a systematic review of treatment agents. Am J Sports Med, 2015. 43(3): p. 734-44.
123. Magnano, M.D., et al., A pilot study of tumor necrosis factor inhibition in erosive/inflammatory osteoarthritis of the hands. J Rheumatol, 2007. 34(6): p. 1323-7.
124. Cho, H., et al., Study of Osteoarthritis Treatment with Anti-Inflammatory Drugs: Cyclooxygenase-2 Inhibitor and Steroids. Biomed Res Int, 2015. 2015.
125. Verbruggen, G., Chondroprotective drugs in degenerative joint diseases. Rheumatology, 2006. 45(2): p. 129-138.
126. Shi, C. and E.G. Pamer, Monocyte recruitment during infection and inflammation. Nat Rev Immunol, 2014. 11(11): p. 762-74.
127. Zdrenghea, M.T., et al., The role of macrophage IL-10/innate IFN interplay during virus-induced asthma. Rev Med Virol, 2015. 25(1): p. 33-49.
128. Fleetwood, A.J., et al., Granulocyte-macrophage colony-stimulating factor (CSF) and macrophage CSF-dependent macrophage phenotypes display differences in cytokine profiles and transcription factor activities: implications for CSF blockade in inflammation. J Immunol, 2007. 178(8): p. 5245-52.
129. Jaguin, M., et al., Polarization profiles of human M-CSF-generated macrophages and comparison of M1-markers in classically activated macrophages from GM-CSF and M-CSF origin. Cell Immunol, 2013. 281(1): p. 51-61.
130. Fleetwood, A.J., et al., GM-CSF- and M-CSF-dependent macrophage phenotypes display differential dependence on type I interferon signaling. J Leukoc Biol, 2009. 86(2): p. 411-21.
131. Martinez, F.O., et al., Transcriptional profiling of the human monocyte-to-macrophage differentiation and polarization: new molecules and patterns of gene expression. J Immunol, 2006. 177(10): p. 7303-11.
132. Lacey, D.C., et al., Defining GM-CSF- and macrophage-CSF-dependent macrophage responses by in vitro models. J Immunol, 2012. 188(11): p. 5752-65.
171
133. Verreck, F.A., et al., Phenotypic and functional profiling of human proinflammatory type-1 and anti-inflammatory type-2 macrophages in response to microbial antigens and IFN-gamma- and CD40L-mediated costimulation. J Leukoc Biol, 2006. 79(2): p. 285-93.
134. Mantovani, A., et al., The chemokine system in diverse forms of macrophage activation and polarization. Trends Immunol, 2004. 25(12): p. 677-86.
135. Vannier, E., L.C. Miller, and C.A. Dinarello, Coordinated antiinflammatory effects of interleukin 4: interleukin 4 suppresses interleukin 1 production but up-regulates gene expression and synthesis of interleukin 1 receptor antagonist. Proc Natl Acad Sci U S A, 1992. 89(9): p. 4076-80.
136. Cauli, A., G. Yanni, and G.S. Panayi, Interleukin-1, interleukin-1 receptor antagonist and macrophage populations in rheumatoid arthritis synovial membrane. Br J Rheumatol, 1997. 36(9): p. 935-40.
137. Andersson, J., et al., Lipopolysaccharide induces human interleukin-1 receptor antagonist and interleukin-1 production in the same cell. Eur J Immunol, 1992. 22(10): p. 2617-23.
138. Arend, W.P., et al., Biological properties of recombinant human monocyte-derived interleukin 1 receptor antagonist. J Clin Invest, 1990. 85(5): p. 1694-7.
139. Arend, W.P. and B.P. Coll, Interaction of recombinant monocyte-derived interleukin 1 receptor antagonist with rheumatoid synovial cells. Cytokine, 1991. 3(5): p. 407-13.
140. Bondeson, J., et al., The role of synovial macrophages and macrophage-produced cytokines in driving aggrecanases, amtrix metalloproteinases, and other destructive and inflammatory responses in osteoarthritis. Arthritis Research & Therapy, 2006. 8(6).
141. Nasu, A., et al., Genetically Matched Human iPS Cells Reveal that Propensity for Cartilage and Bone Differentiation Differs with Clones, not Cell Type of Origin. PLOS ONE, 2013. 8(1): p. e53771.
142. Brown, S.E., W. Tong, and P.H. Krebsbach, The Derivation of Mesenchymal Stem Cells from Human Embryonic Stem Cells. Cells Tissues Organs, 2008. 189(1-4): p. 256-60.
143. Teramura, T., et al., Induction of mesenchymal progenitor cells with chondrogenic property from mouse-induced pluripotent stem cells. Cell Reprogram, 2010. 12(3): p. 249-61.
144. Dominici, M., et al., Minimal criteria for defining multipotent mesenchymal stromal cells. The International Society for Cellular Therapy position statement. Cytotherapy, 2006. 8(4): p. 315-7.
172
145. Mood, A.M., F.A. Graybill, and D.C. Boes, Introduction to the Theory of Statistics. 1974, New York: McGraw-Hill.
146. Council, N.R., Appendix F: Construction of confidence intervals for mathematical combinations of random variables. Regulating pesticides. 1980, Washington, D.C.: National Academies.
147. Cohen, J., Statistical power analysis for the behavioral sciences. 2nd. 1988, Hillsdale, NJ: erlbaum.
148. Hedges, L.V., Olkin, 1.(1985). Statistical methods for meta-analysis. Orlando, FL: Academic Pre55, 1990.
149. Toh, W.S., et al., Differentiation and enrichment of expandable chondrogenic cells from human embryonic stem cells in vitro. J Cell Mol Med, 2009. 13(9b): p. 3570-90.
150. Chen, H., et al., Runx2 Regulates Endochondral Ossification through Control of Chondrocyte Proliferation and Differentiation. J Bone Miner Res, 2014. 29(12): p. 2653-65.
151. Ramkisoensing, A.A., et al., Human Embryonic and Fetal Mesenchymal Stem Cells Differentiate toward Three Different Cardiac Lineages in Contrast to Their Adult Counterparts. PLOS ONE, 2011. 6(9): p. e24164.
152. Bianco, P., P.G. Robey, and P.J. Simmons, Mesenchymal stem cells: revisiting history, concepts, and assays. Cell Stem Cell, 2008. 2(4): p. 313-9.
153. Lin, C.S., et al., Commonly Used Mesenchymal Stem Cell Markers and Tracking Labels: Limitations and Challenges. Histol Histopathol, 2013. 28(9): p. 1109-16.
154. Nassiri, F., et al., Endoglin (CD105): a review of its role in angiogenesis and tumor diagnosis, progression and therapy. Anticancer Res, 2011. 31(6): p. 2283-90.
155. Anderson, P., et al., CD105 (Endoglin)-Negative Murine Mesenchymal Stromal Cells Define a New Multipotent Subpopulation with Distinct Differentiation and Immunomodulatory Capacities. 2013. 8(10).
156. Yang, L., et al., Multiple signals induce endoplasmic reticulum stress in both primary and immortalized chondrocytes resulting in loss of differentiation, impaired cell growth, and apoptosis. J Biol Chem, 2005. 280(35): p. 31156-65.
157. Kim, P.S. and P. Arvan, Endocrinopathies in the family of endoplasmic reticulum (ER) storage diseases: disorders of protein trafficking and the role of ER molecular chaperones. Endocr Rev, 1998. 19(2): p. 173-202.
173
158. Hughes, A., et al., Endoplasmic Reticulum Stress and Unfolded Protein Response in Cartilage Pathophysiology; Contributing Factors to Apoptosis and Osteoarthritis. Int J Mol Sci, 2017. 18(3).
159. Hamamura, K. and H. Yokota, Stress to Endoplasmic Reticulum of Mouse Osteoblasts Induces Apoptosis and Transcriptional Activation for Bone Remodeling. FEBS Lett, 2007. 581(9): p. 1769-74.
160. Wu, J. and R.J. Kaufman, From acute ER stress to physiological roles of the Unfolded Protein Response. Cell Death And Differentiation, 2006. 13: p. 374.
161. Cao, S.S. and R.J. Kaufman, Unfolded protein response. Current Biology, 2012. 22(16): p. R622-R626.
162. Zamarbide, M., et al., Phenyl acyl acids attenuate the unfolded protein response in tunicamycin-treated neuroblastoma cells. PLoS One, 2013. 8(8): p. e71082.
163. Ding, W.X., et al., Differential effects of endoplasmic reticulum stress-induced autophagy on cell survival. J Biol Chem, 2007. 282(7): p. 4702-10.
164. Oslowski, C.M. and F. Urano, Measuring ER stress and the unfolded protein response using mammalian tissue culture system. Methods Enzymol, 2011. 490: p. 71-92.
165. Audouard, C., et al., Oocyte–Targeted Deletion Reveals That Hsp90b1 Is Needed for the Completion of First Mitosis in Mouse Zygotes. PLOS ONE, 2011. 6(2): p. e17109.
166. Zhu, G. and A.S. Lee, Role of the Unfolded Protein Response, GRP78 and GRP94 in Organ Homeostasis. J Cell Physiol, 2015. 230(7): p. 1413-20.
167. Zenmyo, M., et al., Gadd45beta expression in chondrosarcoma: a pilot study for diagnostic and biological implications in histological grading. Diagn Pathol, 2010. 5: p. 69.
168. Lindert, U., et al., MBTPS2 mutations cause defective regulated intramembrane proteolysis in X-linked osteogenesis imperfecta. Nat Commun, 2016. 7: p. 11920.
169. Widmer, C., et al., Molecular basis for the action of the collagen-specific chaperone Hsp47/SERPINH1 and its structure-specific client recognition. Proc Natl Acad Sci U S A, 2012. 109(33): p. 13243-7.
170. Tavakoli, T., et al., Self-renewal and differentiation capabilities are variable between human embryonic stem cell lines I3, I6 and BG01V. BMC Cell Biol, 2009. 10: p. 44.
174
171. Féraud, O., et al., Donor Dependent Variations in Hematopoietic Differentiation among Embryonic and Induced Pluripotent Stem Cell Lines. PLoS One, 2016. 11(3).
172. Sundelacruz, S., M. Levin, and D.L. Kaplan, Comparison of the depolarization response of human mesenchymal stem cells from different donors. Sci Rep, 2015. 5: p. 18279.
173. Vitale, A.M., et al., Variability in the Generation of Induced Pluripotent Stem Cells: Importance for Disease Modeling. Stem Cells Transl Med, 2012. 1(9): p. 641-50.
174. Vellanki, R.N., L. Zhang, and A. Volchuk, OASIS/CREB3L1 is induced by endoplasmic reticulum stress in human glioma cell lines and contributes to the unfolded protein response, extracellular matrix production and cell migration. PLoS One, 2013. 8(1): p. e54060.
175. Lyon, R., et al., Does extracorporeal shock wave therapy enhance healing of osteochondritis dissecans of the rabbit knee?: A pilot study. Clin Orthop Relat Res, 2013. 471: p. 1159-1165.
176. Pfeifer, C.G., et al., Development of a large animal model of osteochondritis dissecans of the knee: A pilot study. The Orthopaedic Journal of Sports Medicine, 2015. 3(2).
177. Kon, E., et al., How to treat osteochondritis dissecans of the knee: Surgical techniques and new trends. The Journal of Bone and Joint Surgery, Inc., 2012. 94.
178. Velez, R., et al., A new preclinical femoral head osteonecrosis model in sheep. Arch Orthop Trauma Surg, 2011. 131: p. 5-9.
179. Conzemius, M.G., et al., A new animal model of femoral head osteonecrosis: One that progresses to human-like mechanical failure. Journal of Orthopaedic Research, 2006. 20: p. 303-309.
180. Fan, M., et al., Experimental animal models of osteonecrosis. Rheumatol Int, 2011. 31: p. 983-994.
181. Fondi, C. and A. Franchi, Definition of bone necrosis by the pathologist. Clin Cases Miner Bone Metab, 2007. 4(1): p. 21-26.


