Embed Size (px)
Citation preview

857
MicroRNAs are small noncoding RNAs that are in-volved in post-transcriptional regulation of gene
expression.1,2 Recent studies have uncovered pronounced effects of microRNAs on the cardiovascular extracellular matrix (ECM). The miR-29 family has attracted particular attention. It consists of 3 members that exhibit very high ho-mology: miR-29a, miR-29b, and miR-29c. In the heart, dys-regulation of miR-29b coincided with ECM remodeling after acute myocardial infarction.3 In the vasculature, inhibition of miR-29 has been consistently shown to reduce aortic aneu-rysm formation.4–6 Although there is conflicting evidence for the directionality of the changes of miR-29b expression in angiotensin II (Ang II)–induced murine aneurysms, target-ing of elastin and collagens was proposed as the underlying mechanism for the role of miR-29b in aneurysmal disease.4–7
Editorial, see p 812 In This Issue, see p 811
The ECM is the key structural component determining dila-tation and aneurysm formation in the aortic wall.8 Abdominal aortic aneurysms (AAAs) are characterized by loss of elastin and increased collagen turnover. Apart from miR-29, the miR-15 family has been implicated in collagen remodeling and the characteristic postnatal silencing of elastin.9 The miR-15 fam-ily consists of 6 highly conserved microRNAs (miR-15a, miR-15b, miR-16-1, miR-16-2, miR-195, and miR-497), which are clustered on 3 separate chromosomes. They have a common seed region (AGCAGCA) and varying degrees of sequence ho-mology in the 3′ region of the mature microRNA.10 Expression of miR-195 and miR-497 is altered in human aortic specimen
Cellular Biology
© 2014 American Heart Association, Inc.
Circulation Research is available at http://circres.ahajournals.org DOI: 10.1161/CIRCRESAHA.115.304361
Rationale: Abdominal aortic aneurysms constitute a degenerative process in the aortic wall. Both the miR-29 and miR-15 families have been implicated in regulating the vascular extracellular matrix.
Objective: Our aim was to assess the effect of the miR-15 family on aortic aneurysm development.Methods and Results: Among the miR-15 family members, miR-195 was differentially expressed in aortas of
apolipoprotein E–deficient mice on angiotensin II infusion. Proteomics analysis of the secretome of murine aortic smooth muscle cells, after miR-195 manipulation, revealed that miR-195 targets a cadre of extracellular matrix proteins, including collagens, proteoglycans, elastin, and proteins associated with elastic microfibrils, albeit miR-29b showed a stronger effect, particularly in regulating collagens. Systemic and local administration of cholesterol-conjugated antagomiRs revealed better inhibition of miR-195 compared with miR-29b in the uninjured aorta. However, in apolipoprotein E–deficient mice receiving angiotensin II, silencing of miR-29b, but not miR-195, led to an attenuation of aortic dilation. Higher aortic elastin expression was accompanied by an increase of matrix metalloproteinases 2 and 9 in mice treated with antagomiR-195. In human plasma, an inverse correlation of miR-195 was observed with the presence of abdominal aortic aneurysms and aortic diameter.
Conclusions: We provide the first evidence that miR-195 may contribute to the pathogenesis of aortic aneurysmal disease. Although inhibition of miR-29b proved more effective in preventing aneurysm formation in a preclinical model, miR-195 represents a potent regulator of the aortic extracellular matrix. Notably, plasma levels of miR-195 were reduced in patients with abdominal aortic aneurysms suggesting that microRNAs might serve as a noninvasive biomarker of abdominal aortic aneurysms. (Circ Res. 2014;115:857-866.)
Key Words: aneurysm ■ biological markers ■ extracellular matrix ■ microRNAs ■ myocytes, smooth muscle
Original received May 13, 2014; revision received September 6, 2014; accepted September 8, 2014. In August, 2014, the average time from submission to first decision for all original research papers submitted to Circulation Research was 13.55 days.
From the King’s British Heart Foundation Centre (A.Z., R.A., U.M., R.S.M.G., A.P., X.Y., S.R.L., R.L., B.F., M.F., J.B.-B., C.M., A.A., M.W., R.B., A.S., M.M.) and Institute of Psychiatry (P.-W.S.), King’s College London, United Kingdom; Department of Public Health and Primary Care, University of Cambridge, Cambridge, United Kingdom (P.W.); and Department of Cardiac Surgery, St George’s Healthcare NHS Trust, London, United Kingdom (M.F., M.J.).
The online-only Data Supplement is available with this article at http://circres.ahajournals.org/lookup/suppl/doi:10.1161/CIRCRESAHA. 115.304361/-/DC1.
Correspondence to Dr Anna Zampetaki or Prof Manuel Mayr, King’s British Heart Foundation Centre, King’s College London, 125 Coldharbour Lane, London SE59NU, United Kingdom. E-mail [email protected] or [email protected]
Role of miR-195 in Aortic Aneurysmal DiseaseAnna Zampetaki, Rizwan Attia, Ursula Mayr, Renata S.M. Gomes, Alkystis Phinikaridou, Xiaoke Yin, Sarah R. Langley, Peter Willeit, Ruifang Lu, Bruce Fanshawe, Marika Fava, Javier Barallobre-Barreiro, Chris Molenaar, Po-Wah So, Abeera Abbas, Marjan Jahangiri,
Matthew Waltham, Rene Botnar, Alberto Smith, Manuel Mayr
by guest on May 22, 2015http://circres.ahajournals.org/Downloaded from by guest on May 22, 2015http://circres.ahajournals.org/Downloaded from by guest on May 22, 2015http://circres.ahajournals.org/Downloaded from by guest on May 22, 2015http://circres.ahajournals.org/Downloaded from by guest on May 22, 2015http://circres.ahajournals.org/Downloaded from by guest on May 22, 2015http://circres.ahajournals.org/Downloaded from by guest on May 22, 2015http://circres.ahajournals.org/Downloaded from by guest on May 22, 2015http://circres.ahajournals.org/Downloaded from by guest on May 22, 2015http://circres.ahajournals.org/Downloaded from by guest on May 22, 2015http://circres.ahajournals.org/Downloaded from by guest on May 22, 2015http://circres.ahajournals.org/Downloaded from by guest on May 22, 2015http://circres.ahajournals.org/Downloaded from by guest on May 22, 2015http://circres.ahajournals.org/Downloaded from by guest on May 22, 2015http://circres.ahajournals.org/Downloaded from by guest on May 22, 2015http://circres.ahajournals.org/Downloaded from by guest on May 22, 2015http://circres.ahajournals.org/Downloaded from by guest on May 22, 2015http://circres.ahajournals.org/Downloaded from by guest on May 22, 2015http://circres.ahajournals.org/Downloaded from by guest on May 22, 2015http://circres.ahajournals.org/Downloaded from by guest on May 22, 2015http://circres.ahajournals.org/Downloaded from by guest on May 22, 2015http://circres.ahajournals.org/Downloaded from by guest on May 22, 2015http://circres.ahajournals.org/Downloaded from by guest on May 22, 2015http://circres.ahajournals.org/Downloaded from by guest on May 22, 2015http://circres.ahajournals.org/Downloaded from by guest on May 22, 2015http://circres.ahajournals.org/Downloaded from by guest on May 22, 2015http://circres.ahajournals.org/Downloaded from by guest on May 22, 2015http://circres.ahajournals.org/Downloaded from by guest on May 22, 2015http://circres.ahajournals.org/Downloaded from by guest on May 22, 2015http://circres.ahajournals.org/Downloaded from by guest on May 22, 2015http://circres.ahajournals.org/Downloaded from by guest on May 22, 2015http://circres.ahajournals.org/Downloaded from by guest on May 22, 2015http://circres.ahajournals.org/Downloaded from by guest on May 22, 2015http://circres.ahajournals.org/Downloaded from by guest on May 22, 2015http://circres.ahajournals.org/Downloaded from

858 Circulation Research October 24, 2014
with evidence of dissection.11 Direct binding of miR-195 to several ECM transcripts was detected in H4 cancer cells.12
In the present study, we compare the role of miR-29 and miR-15 family members in aortic aneurysm development. Besides biomarker candidates, the regulation of the vascular ECM by microRNAs may reveal novel mechanistic insights and potential therapeutic targets.
MethodsAn expanded Methods section is available in the Online Data Supplement.
Clinical CohortsPatients with AAA were identified from the local aneurysm surveil-lance and screening program. Subjects screened negative for AAA served as controls. The study was approved by the local research eth-ics committee, and all patients provided written informed consent (REC 07/Q0702/62). Statistical analysis was performed as described previously.13
Cell CultureSmooth muscle cells (SMCs) were isolated by enzymatic digestion of mouse aortas, as described elsewhere,14 and were cultured in DMEM supplemented with 10% FCS, 2 mmol/L l-glutamine, and 100 mg/L gentamicin, at 37ºC in a humidified atmosphere of 95% air/5% CO
2.
Nonstandard Abbreviations and Acronyms
AAA abdominal aortic aneurysm
Ang II angiotensin II
ECM extracellular matrix
MMP matrix metalloproteinase
SMC smooth muscle cell
-15
A
B
Figure 1. Proteomic analysis of smooth muscle cell (SMC) secretome. SMCs were transfected with miR-195 precursor, anti-miR-195, or their respective controls and their secretome was analyzed by proteomics. Extracellular matrix proteins identified in the conditioned media and displaying differential expression are depicted in the volcano plots. After miR-195 overexpression (A) and miR-195 inhibition (B). Log2 fold change (FC) is calculated using the normalized spectral abundance factor counts and averaged for 3 biological replicates. FDR indicates false discovery rate.
by guest on May 22, 2015http://circres.ahajournals.org/Downloaded from

Zampetaki et al miR-195 and Aortic Aneurysms 859
TransfectionsCells were plated at 60% to 70% confluency on the day be-fore transfection. Mouse Pre-miR microRNA precursors and microRNA mimics were synthesized by Life Technologies, and Mercury LNA-anti-miRs by Exiqon. The following sequences were used: LNA-195: CCAATATTTCTGTGCTGCT; LNA-29b: ACTGATTTCAAATGGRGCT; LNA-CTL: GTGTAACA CGTCTATACGCCCA; Pre-miR-195:UAGCAGCACAGAAAUAU UGGC; Pre-miR-29b: UAGCACCAUUUGAAAUCAGUGUU; Pre-miR-CTL2: sequence not specified. LNA inhibitors and precursor microRNA were transfected at a final concentration of 90 and 20 nmol/L, respectively, using Lipofectamine RMAiMAX (Invitrogen) according to the manufacturer’s recommendations.
Proteomics AnalysisSMCs were carefully washed in serum-free medium and then incubated in fresh serum-free medium for 48 hours. Cell debris was removed by centrifugation at 4000 rpm for 10 minutes. The supernatant was trans-ferred into a new tube and stored at −80°C. Samples were subsequently desalted using Zeba Spin desalting columns (Thermo Scientific), vac-uum-dried, and resuspended in 60 μL ddH
2O. Thirty microliters was
used for the proteomic analysis as described previously.15
AntagomiR TreatmentCholesterol-conjugated antagomiR constructs from Fidelity Biosystems were resuspended in sterile PBS at 37°C and stored at −20°C. The sequences of the antagomiR constructs were as follows:
Control antagomiR: 5′- A*A*GGCAAGCUGACCCUGAA*G*U*U* Chol*T-3′
AntagomiR-195: 5′- G*C*CAAUAUUUCUGUGCU*G*C*U* Chol*T-3′
AntagomiR-29b: A*A*CACUGAUUUCAAAUGGUG*C*U*A*-Chol*T-3′
C57BL6 mice were treated by intraperitoneal injection with a dose of 65 mg/kg per day at days 0, 1, and 2. Mice were euthanized at day 7 to collect aortic tissue.
Ang II Infusion ModelOsmotic pumps (Alzet model 2004) containing Ang II (1 μg/kg per minute; Sigma-Aldrich) were implanted in 10-week-old apoE−/− male mice (day 0; C57BL/6J background; Charles River Edinburgh, United Kingdom). Housing and animal care was in accordance with the UK Animals (Scientific Procedures) Act 1986. The antagomiR constructs were injected intraperitoneally at a dose of 80 mg/kg per day on 3 consecutive days (days 1, 2, and 3).
MR ImagingMice were imaged by MRI before and after implantation of os-motic pumps to obtain aortic and cardiac parameters. The aortic scans were performed using 0.4 mmol/kg of an elastin-specific MR agent.16,17
A
B C D
Figure 2. Regulation of the extracellular matrix (ECM) by miR-29b and miR-195 in vitro. A, Heat maps illustrate the expression levels of potential ECM targets. A panel of 30 genes of the ECM was assessed by quantitative polymerase chain reaction after microRNA (miR) overexpression (left) and inhibition (right). The highlighted targets were predicted by at least 1 prediction algorithm (RNA22, miRanda, miRDB, TargetScan, RNAhybrid, PITA, PICTAR, and Diana-microT). B, Validation of ECM protein secretion in the conditioned media of transfected smooth muscle cells (SMCs) by Western blot analysis. Part of the corresponding silver-stained gel is shown as loading control in the lowest panel. C, Matrix metalloproteinase (MMP) 2 and MMP9 expression in SMCs after miR inhibition in vitro. Gene expression was normalized to β-actin. *P<0.05 compared with LNA-control. D, Enzymatic activity of gelatinases in the conditioned media of SMCs after miR-29b and miR-195 inhibition, as assessed by zymography. Representative of 3 independent experiments.
by guest on May 22, 2015http://circres.ahajournals.org/Downloaded from

860 Circulation Research October 24, 2014
ResultsmiR-195 in Murine AortasElastin is the major structural protein that imparts elasticity to blood vessels. Degradation of elastin is an early event in the development of aortic aneurysms. Two microRNA fami-lies, miR-29 and miR-15, have been linked to elastin regu-lation. Differential expression of miR-29b in the aneurysmal aorta has been reported previously.4,5 Here, we investigated the expression of miR-15 family members in a mouse model of aortic dilation. Ang II (1μg/kg per minute) was infused to apoE−/− mice using subcutaneously implanted osmotic mini-pumps. Among the miR-15 family, only miR-195 was signifi-cantly increased (Online Figure I). The miRWALK algorithm predicts putative binding sites for miR-195 and miR-29b in the coding region and the 3′ untranslated region of elastin, respec-tively. Overexpression of miR-195 as well as miR-29b led to a similar reduction in elastin (Online Figure II). Reporter assays using vectors harboring these sites revealed reduced activity, suggesting that elastin is a direct target of both microRNAs. Although miR-29b has been investigated previously,4–6 little is known about the role of miR-195 in the vasculature.
miR-195 and ECM Secretion by SMCsTo further explore the effect of miR-195 on ECM deposition by SMCs, we performed a proteomic analysis of the condi-tioned medium from SMCs transfected with pre-miRs and an-ti-miRs. A total of 129 secreted proteins were identified, with
pre-miRs having a more pronounced effect than anti-miRs (Figure 1; Online Tables I and II). A normalized spectral abun-dance factor coupled with a power law global error model was used to determine the differences in expression. Proteins with a false discovery rate <5% were considered to be significant. Transfection with pre-miR-195 induced differential expres-sion of 87 proteins in the secretome of SMCs. Using different microRNA prediction algorithms (RNA22, miRanda, miRDB, TargetScan, RNAhybrid, PITA, PICTAR, and Diana-microT), only 24 of them were predicted as direct targets.
Comparison With miR-29bThirty ECM genes and ECM-degrading enzymes were quan-tified in SMCs after transfection with inhibitors and mimics of miR-195 and miR-29b. As expected, both miR-29b and miR-195 targeted elastin (Eln; Figure 2A). However, the gene expression profiles of extracellular proteins differed. For ex-ample, mimics of miR-29b elicited a more robust repression of collagens (col1a1, col1a2, col3a1, col4a1, col4a2, col5a1, col5a2). These results were also validated at the protein level by immunoblotting (Figure 2B). Notably, matrix metallo-proteinase (MMP) 2 expression was increased on miR-195 inhibition, whereas targeting miR-29b led to a reduction of MMP9 (Figure 2C) as confirmed by zymography (Figure 2D; Online Figure IID).
Figure 3. Regulation of the extracellular matrix by miR-195 and miR-29b in vivo. A, Expression levels of the miR-15 family in the aorta after antagomiR-195 treatment. B, Elastin expression in the aorta after antagomiR-195 administration. C, Correlation between the miR-195 levels in the aorta and the expression of collagens and elastin as quantified by quantitative polymerase chain reaction. D, Expression levels of the miR-29 family in the aorta after antagomiR-29b treatment. E, Elastin expression in the aorta after antagomiR-29b injection. F, Correlation between the miR-29b levels and the expression of collagens and elastin in the aorta. miR expression was normalized to U6. Gene expression was normalized to β-actin. *P<0.05 compared with antagomiR control. RQ indicates relative quantification.
by guest on May 22, 2015http://circres.ahajournals.org/Downloaded from

Zampetaki et al miR-195 and Aortic Aneurysms 861
Systemic Inhibition of miR-195 and miR-29bTo determine the role of miR-29b and miR-195 in ECM gene regulation in vivo, C57Bl wild-type mice were injected with cholesterol-conjugated antagomiRs (65 mg/kg per day; intraperitoneal). AntagomiR-195 was effective in target-ing miR-195 expression in the aorta leading to a 60% reduc-tion without affecting other members of the miR-15 family (Figure 3A). Similarly, no off-target effect on the miR-29 fami-ly was observed (compared with control antagomiR: 1.17±0.12, 1.13±0.13, and 1.11±0.09 for miR-29a, miR-29b, and miR-29c, respectively; n=5 per group). In vivo inhibition of miR-195 in-creased expression of elastin (Figure 3B) and of several other ECM genes in the aorta (Figure 3C; Online Figure III). Detailed expression data are presented in Online Figure IV. Surprisingly, the same dose of antagomiR-29b had only marginal effects on miR-29b levels in the uninjured aorta. The observed reduction of miR-29b in the vasculature was small (Figure 3D), and aortic elastin expression was not affected (Figure 3E). A negative cor-relation between miR-29b levels and ECM genes in the aorta was observed for Col1a1, Col1a2, Col4a2 (Figure 3F), and few other targets (Online Figure V). Detailed expression data are presented in Online Figure VI. In contrast, a marked suppres-sion of miR-29b was observed in the liver. Accordingly, elastin and other ECM genes were upregulated in the liver of mice in-jected with antagomiR-29b (Online Figure VII). Thus, the un-injured aorta is more susceptive for therapeutic interventions by antagomiR-195 than antagomiR-29b.
Effect of miR-195 and miR-29b on AAA FormationTo study whether miR-195 may contribute to the pathogenesis of AAA, we compared the effects of miR-195 and miR-29b inhibi-tion on aortic dilation. AntagomiRs were administered systemi-cally as detailed in the Methods section. Uptake of a Cy3-labeled antagomiR was detected in the medial layer of the murine aorta (Online Figure VIII). The total aortic wall area was determined by using an elastin-specific MR contrast agent18 (Figure 4A). A significant decrease in the aortic diameter size was observed in mice treated with antagomiR-29b (n=8; Figure 4B). This was accompanied by enhanced survival compared with control an-tagomiR- and PBS-injected mice (n=8 each; Figure 4C). Despite significantly elevated expression of elastin and collagens (Online Figure IX), the effect of antagomiR-195 on survival as well as aortic diameter size was not as pronounced (Figure 4B and 4C).
Local Inhibition of miR-195 and miR-29b in Aortic IsograftsTo discern systemic from local effects, we used an aortic isograft model.19 Aortas were harvested, incubated with cholesterol-bound LNA anti-miRs for 2 hours, and then iso-grafted into the carotid artery of recipient mice (Figure 5A). This local administration was sufficient to result in an up-take of the antagomiRs by the aortic tissue, as demonstrated by the incorporation of a Cy3-labeled antagomiR in the outer layers of SMCs (Figure 5B). The grafts were harvest-ed 7 days later and expression levels of microRNAs were determined. In this setting, miR-195 was significantly in-hibited, whereas other members of the miR-15 family were largely unaffected (Figure 5C). Local inhibition of miR-195
was accompanied by derepression of MMPs, in particular MMP2, in the aortic wall (Figure 5D). The same dose of LNA-miR-29b did not significantly inhibit miR-29 expres-sion in aortic grafts (data not shown). In vivo inhibition of miR-195 resulted in a derepression of MMPs in all 3 mod-els (Figure 5E), including aortic tissue of Ang II–infused apoE−/− mice (Online Figure X).
0.00
0.25
0.50
0.75
1.00
8 8 7 6Group = AntagomiR-1958 8 8 7Group = AntagomiR-29b
16 16 12 10Group = ControlNumber at risk
0 15 25 35Length of follow-up, days
ControlAntagomiR-29b (Plog-rank=0.085)AntagomiR-195 (Plog-rank=0.541)
Kaplan-Meier survival estimates
0
1
2
3
4
5
D0 D10 D35
AntagomiR-29b AntagomiR-195 Control
Fold
Cha
nge
A
B
C
*
Figure 4. MicroRNA inhibition and angiotensin II (Ang II)–mediated aortic dilatation. Ang II (1 μg/kg per minute) was infused to apoE−/− mice using subcutaneously implanted osmotic minipumps. AntagomiRs (80 mg/kg per day) were injected intraperitoneally for 3 consecutive days. A, MR time-of-flight angiogram of aortas from apoE−/− mice infused with Ang II demonstrating a suprarenal aortic aneurysm. The red line indicates the imaging plane of subsequent performed axial MRI sequences. B, In vivo assessment of the aortic aneurysm diameter after antagomiR-29b or antagomiR-195 treatment (n=8 per group) on days 10 and 35. AntagomiR-control and PBS-injected mice are designated as control group (n=16). *P<0.05 compared with control. C, Kaplan–Meier survival analysis for Ang II–infused mice after injections of antagomiR-29b or antagomiR-195.
by guest on May 22, 2015http://circres.ahajournals.org/Downloaded from

862 Circulation Research October 24, 2014
miR-195 in Patients With AAAFinally, plasma samples were obtained from the local aneurysm surveillance and screening program designed to identify patients with AAAs. Male patients with AAAs and male controls were matched on hypertension and diabetes mellitus (Table). Fifteen other microRNAs, including some previously related to cardio-vascular disease, were added for comparison. Statistical analyses were performed using conventional and L
1-penalized logistic/lin-
ear regression, with the latter being developed to explore associa-tions in presence of high-dimensional and collinear data. miR-195
showed the strongest associations using either a continuous (aor-tic diameter size; n=44; Figure 6) or a categorical classification of disease (n=22 per group; Figure 7). Other microRNAs displaying significant inverse correlations with aortic diameter size included miR-148a, miR-125b, miR-20a, and miR-340. Expression levels of these 4 microRNAs, however, were highly correlated to miR-195 (Online Table III), and their association with aortic diameter size was attenuated after adjustment for miR-195 (Online Figures XI and XII). Instead, significant associations emerged for miR-133a and miR-145, suggesting that their relation to AAA may
A
DC
E
B
LNA-miR-195 LNA-miR-29bLNA-Control
MMP2Uninjured aorta
Overall
Aortic graftsAng II day 16
MMP9Uninjured aorta
Overall
Aortic graftsAng II day 16
10
28
108
10
28
108
n
-0.68 (-0.92, -0.08)
-0.60 (-0.82, -0.24)
-0.44 (-0.84, 0.26)-0.69 (-0.94, 0.03)
-0.77 (-0.94, -0.28)
-0.70 (-0.87, -0.40)
-0.78 (-0.96, -0.17)
0.030
0.002
0.2100.059
0.007
<0.001
0.115
P value
-0.53 (-0.87, 0.14)
Pearson correlation coefficient (95% CI)between log miR-195 and MMPs
0.020
0-1 -.5 0 .5
Figure 5. Regulation of matrix metalloproteinase (MMP) 2 and MMP9 by miR-195. A, Schematic representation of the aortic isograft model. B, Uptake of a Cy3-labeled antagomiR by the mouse aorta. SMA indicates smooth muscle actin. C, Expression levels of the miR-15 family in the aortic graft after LNA-miR-195 treatment ex vivo. D, Expression of MMP2 and MMP9 in the aortic grafts after microRNA (miR) inhibition, as quantified by quantitative polymerase chain reaction (QPCR). RQ indicates relative quantification. #P<0.05 (ANOVA with Bonferroni post hoc tests for differences to LNA-miR-29b). E, Correlation between the levels of miR-195 in the aorta and the expression of MMP2 and MMP9 as quantified by QPCR. miR expression was normalized to U6. Gene expression was normalized to β-actin. *P<0.05 compared with control (Con).
by guest on May 22, 2015http://circres.ahajournals.org/Downloaded from
Zampetaki et al miR-195 and Aortic Aneurysms 863
be independent of miR-195. The significant inverse associations of miR-195 with the presence of AAA and the aortic diameter was confirmed by extending the analyses to all participants in the program (n=73; Online Table IV; Online Figures XIII and XIV). In comparison to miR-195, miR-29b levels in plasma were low (Ct >32 cycles; Online Figure XV) rendering plasma miR-29b less suitable as a biomarker of AAA.
DiscussionThe principal merits of this study are (1) the measurements of plasma microRNAs in a patient cohort of AAA and (2) the di-rect comparison of 2 microRNA families known to target elas-tin in in vitro studies in vascular SMCs and in in vivo studies using 3 different animal models (uninjured aorta and aortic isografts in wild-type mice; Ang II infusion in apoE−/− mice). Although both miR-195 and miR-29b affect elastin in vitro and antagomiRs to miR-195 were more efficient in upregulating aortic elastin expression in vivo, antagomiR treatment to miR-195 did not recapitulate the protective effects of miR-29b inhi-bition on aneurysm formation. In contrast to miR-29b, silencing of miR-195 induced a derepression of MMPs, which is likely to contribute to the adverse outcome in ECM homeostasis. miR-195, however, emerged as a biomarker candidate for AAA.
MicroRNAs as BiomarkersWe have previously performed the first population-based study on circulating microRNAs for type II diabetes mellitus20 and myocardial infarction.13 We also determined the platelet origin of several microRNAs related to cardiovascular disease by sub-jecting healthy volunteers to limb ischemia/reperfusion injury generated by thigh cuff inflation13 and performing a dose esca-lation study of platelet inhibition.21 The association of plasma microRNAs and AAA is unclear. In the present study, we mea-sured 16 microRNAs in 73 participants from a local aneurysm surveillance and screening program. Among the most robust changes was miR-195, which dominated the penalized regres-sion analyses for aortic diameter size and categorical disease outcome in terms of association strength. miR-195 belongs to the miR-15 family that consists of highly conserved microRNAs that regulate key processes in cancer, neural, and cardiovascular diseases. miR-195 expression increases in cardiac hypertrophy, and cardiac overexpression of miR-195 resulted in heart failure in transgenic mice.22 To our knowledge this is the first report as-sociating plasma levels of miR-195 with aortic disease.
Clinical RelevanceAortic disease leads to significant morbidity and mortality as well as high economic burden.23,24 There are currently no good blood tests that identify patients with AAA or predict which AAAs are likely to rupture or expand and require surgical intervention. The diameter of the aneurysm is currently the best predictor of rupture, but not always reliable. Better diagnostic tools are urgently needed to identify patients at risk, monitor disease progression, and imple-ment novel therapeutic and preemptive strategies.25–27 Identification of those patients with AAAs at risk of subsequent expansion or rupture by a simple cheap noninvasive method of predicting subse-quent AAA growth would meet an important clinical need. Once AAA is diagnosed, patients at high risk may be treated with earlier surgical repair to prevent rupture. Conversely, if a simple blood test showed a low risk of disease progression, then patients with signifi-cant comorbidity or high surgical risk might be safely kept under surveillance rather than proceed with surgery. Our findings await confirmation in larger cohorts. Thus, their exploratory/hypothesis-generating nature has to be emphasized. Future studies will need to show whether AAA-specific microRNA profiles that character-ize aneurysm formation and positive responders to treatment might lead to the development of innovative microRNA-based diagnostic and therapeutic strategies for AAA.
MicroRNAs and AAAThus far, miR-29b was identified as a pivotal regulator of aortic dilation in an elastase infusion model of experimental AAA in wild-type mice and in an Ang II infusion model in apoE−/− mice.4 Additionally, miR-21 was implicated as a modulator of prolif-eration and apoptosis of vascular SMCs during development of AAA.28 The age-related increase of miR-29 expression was pro-posed to render the aorta susceptible to aneurysm development, whereas inhibition of miR-29b, by treatment with LNA-anti-miR-29b, reduced aortic dilation after Ang II infusion in aged mice.5 Similar results were obtained in a model of genetically induced aneurysms in Fibulin-4R/R mice. In Marfan syndrome, a connective tissue disorder that can lead to the development of aortic root aneurysms, expression of miR-29b was increased in
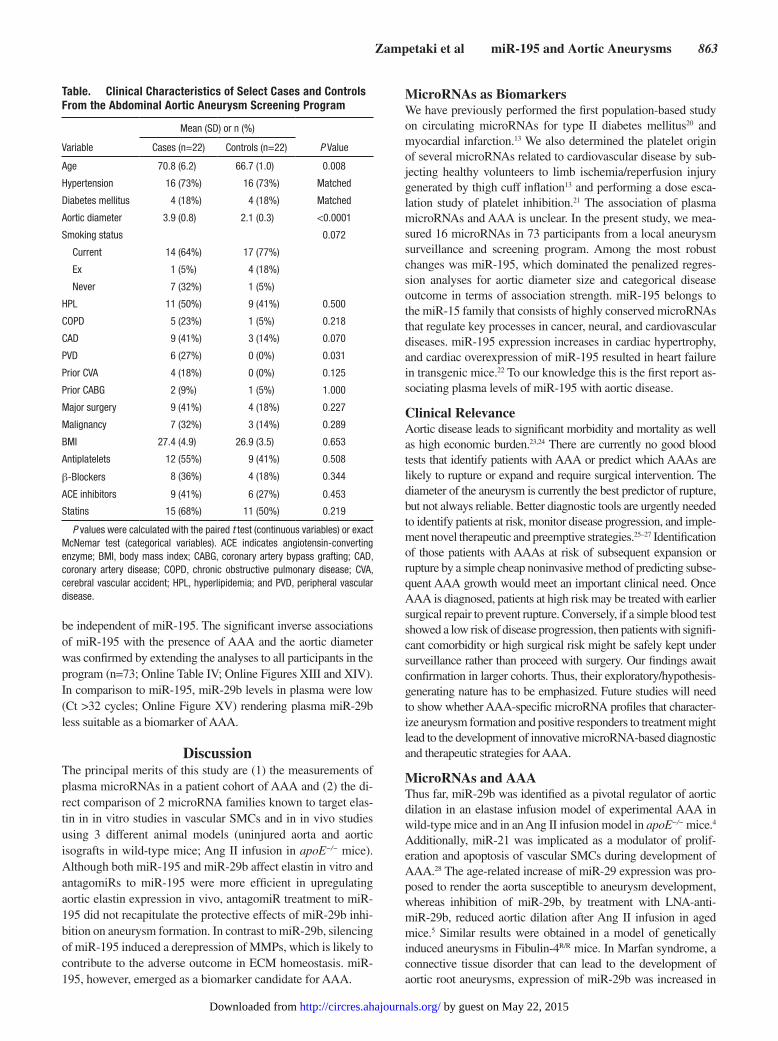
Table. Clinical Characteristics of Select Cases and Controls From the Abdominal Aortic Aneurysm Screening Program
Variable
Mean (SD) or n (%)
P ValueCases (n=22) Controls (n=22)
Age 70.8 (6.2) 66.7 (1.0) 0.008
Hypertension 16 (73%) 16 (73%) Matched
Diabetes mellitus 4 (18%) 4 (18%) Matched
Aortic diameter 3.9 (0.8) 2.1 (0.3) <0.0001
Smoking status 0.072
Current 14 (64%) 17 (77%)
Ex 1 (5%) 4 (18%)
Never 7 (32%) 1 (5%)
HPL 11 (50%) 9 (41%) 0.500
COPD 5 (23%) 1 (5%) 0.218
CAD 9 (41%) 3 (14%) 0.070
PVD 6 (27%) 0 (0%) 0.031
Prior CVA 4 (18%) 0 (0%) 0.125
Prior CABG 2 (9%) 1 (5%) 1.000
Major surgery 9 (41%) 4 (18%) 0.227
Malignancy 7 (32%) 3 (14%) 0.289
BMI 27.4 (4.9) 26.9 (3.5) 0.653
Antiplatelets 12 (55%) 9 (41%) 0.508
β-Blockers 8 (36%) 4 (18%) 0.344
ACE inhibitors 9 (41%) 6 (27%) 0.453
Statins 15 (68%) 11 (50%) 0.219
P values were calculated with the paired t test (continuous variables) or exact McNemar test (categorical variables). ACE indicates angiotensin-converting enzyme; BMI, body mass index; CABG, coronary artery bypass grafting; CAD, coronary artery disease; COPD, chronic obstructive pulmonary disease; CVA, cerebral vascular accident; HPL, hyperlipidemia; and PVD, peripheral vascular disease.
by guest on May 22, 2015http://circres.ahajournals.org/Downloaded from

864 Circulation Research October 24, 2014
the ascending aorta. Inhibition of miR-29b prevented early an-eurysm development.6 Thus, several studies suggest a role for miR-29b in aortic aneurysms. Mechanistically, upregulation of elastin,5 increased collagen deposition,4 and suppression of MMP activity were implicated in reducing aortic dilation after miR-29b inhibition.4
MicroRNA Target IdentificationHerein, we assess the effect of 2 elastin-targeting microRNAs, miR-195 and miR-29b, both in vitro and in vivo. We have pre-viously used proteomics to study the role of miR-29b in cardiac fibrosis.15 We now use proteomic analysis to characterize the secre-tome of SMCs after manipulation of miR-195 and perform a com-parison of the ECM changes induced by miR-195 and miR-29b. Detailed in vitro analyses showed that miR-195 and miR-29b had similar efficiency in targeting elastin. However, miR-29b exerted a more robust effect on ECM deposition by SMCs than miR-195. Collagens, in particular, are more efficiently targeted by mimics to miR-29b than mimics to miR-195. This is consistent with previ-ous findings by Maegdefessel et al4 showing a significant increase in collagen expression and to a lesser extent in elastin content on
miR-29 inhibition, although an extensive profiling of ECM genes, as in the present study, was not performed.
Targeting Efficiency In VivoThe targets observed in vitro were further confirmed in vivo us-ing cholesterol-conjugated antagomiRs. When the same doses of antagomiRs were administered systemically to C57Bl mice, an-tagomiRs to miR-195 proved to be more effective in upregulat-ing elastin expression in the uninjured aorta than antagomiRs to miR-29b. In a separate model of Ang II infusion in apoE−/− mice, the efficiency of antagomiRs against miR-195 and miR-29b was compared with regard to preventing aneurysm formation, de-creasing aortic diameter, and improving survival. AntagomiR-29b was superior to antagomiR-195 in reducing aortic dilation and increasing survival in Ang II–infused apoE−/− mice. This therapeutic benefit cannot be solely attributed to the derepres-sion of aortic elastin or collagens: both occurred also after miR-195 inhibition; moreover, targeting of miR-29b in murine aortas was less efficient compared with miR-195, with systemic or lo-cal delivery of antagomiRs or anti-miRs, respectively.
A
B
Figure 6. MicroRNAs (miRs) associated with aortic diameter. A, L1-penalized linear regression analysis (least absolute shrinkage and selection operator method). The graph shows linear regression coefficients of miRs (y axis) for different levels of penalization (the tuning parameter λ1 escalates beyond 20). Variables withstanding shrinkage up to high λ1 values are those most relevant for disease prediction. B, Linear regression adjusted for age, matched on hypertension and diabetes mellitus (for details see Table and Methods section). Expression levels were normalized to exogenous cel-miR-39 spike-in control.
by guest on May 22, 2015http://circres.ahajournals.org/Downloaded from

Zampetaki et al miR-195 and Aortic Aneurysms 865
ECM Degradation in AAAConsiderable evidence from human and experimental animal mod-els of AAA points toward a prominent role for MMP2 and MMP9 in AAA development. Elevated levels of MMP2 and MMP9 activity were reported in the aneurysmal part of the mouse aorta after Ang II infusion.29 MMP2 and MMP9 are 2 key proteases in ECM destruc-tion, with MMP2 being unique in its ability to target both elastin and fibrillar collagen.30 MMP9, on the contrary, is the most abundant ge-latinolytic MMP in AAA tissue and is secreted in high levels from AAA explants. MMP9-deficient mice displayed preservation of the elastic lamellae of the aortic wall and were shown to be resistant to aneurysm development.31 Our observation that miR-195 inhibition induced MMP activity offers a plausible explanation for the differ-ent therapeutic outcome compared with silencing miR-29b.
ConclusionsIn this study, the therapeutic efficacy of miR-195 and miR-29b was compared with regard to regulating ECM and ECM-associated proteins in vitro and in vivo. Additionally, we provide proof-of-principle that microRNAs might have clini-cal utility as biomarkers for AAA by observing an inverse
relationship between plasma miR-195 and the presence of AAA and aortic diameter.
Sources of FundingA. Zampetaki is an Intermediate Fellow of the British Heart Foundation. M. Mayr is a Senior Fellow of the British Heart Foundation. This work was supported by the Fondation Leducq (MIRVAD) and the National Institute of Health Research Biomedical Research Center based at Guy’s and St Thomas’ National Health Service Foundation Trust and King’s College London in partnership with King’s College Hospital.
DisclosuresNone.
References 1. Bartel DP. MicroRNAs: target recognition and regulatory functions. Cell.
2009;136:215–233. 2. Liu N, Olson EN. MicroRNA regulatory networks in cardiovascular devel-
opment. Dev Cell. 2010;18:510–525. 3. van Rooij E, Sutherland LB, Thatcher JE, DiMaio JM, Naseem RH,
Marshall WS, Hill JA, Olson EN. Dysregulation of microRNAs after
A
B
Figure 7. MicroRNA (miRs) associated with abdominal aortic aneurysm (AAA). A, L1-penalized logistic regression analysis (least absolute shrinkage and selection operator method). The graph shows logistic regression coefficients of miRs (y axis) for different levels of penalization (the tuning parameter λ1). Variables withstanding shrinkage up to high λ1 values are those most relevant for disease prediction. B, Logistic regression adjusted for age, matched on hypertension and diabetes mellitus (for details see Table and Methods section). Expression levels were normalized to exogenous cel-miR-39 spike-in control.
by guest on May 22, 2015http://circres.ahajournals.org/Downloaded from

866 Circulation Research October 24, 2014
myocardial infarction reveals a role of miR-29 in cardiac fibrosis. Proc Natl Acad Sci U S A. 2008;105:13027–13032.
4. Maegdefessel L, Azuma J, Toh R, Merk DR, Deng A, Chin JT, Raaz U, Schoelmerich AM, Raiesdana A, Leeper NJ, McConnell MV, Dalman RL, Spin JM, Tsao PS. Inhibition of microRNA-29b reduces murine abdomi-nal aortic aneurysm development. J Clin Invest. 2012;122:497–506.
5. Boon RA, Seeger T, Heydt S, Fischer A, Hergenreider E, Horrevoets AJ, Vinciguerra M, Rosenthal N, Sciacca S, Pilato M, van Heijningen P, Essers J, Brandes RP, Zeiher AM, Dimmeler S. MicroRNA-29 in aortic dilation: implications for aneurysm formation. Circ Res. 2011;109:1115–1119.
6. Merk DR, Chin JT, Dake BA, Maegdefessel L, Miller MO, Kimura N, Tsao PS, Iosef C, Berry GJ, Mohr FW, Spin JM, Alvira CM, Robbins RC, Fischbein MP. miR-29b participates in early aneurysm development in Marfan syndrome. Circ Res. 2012;110:312–324.
7. Zhang P, Huang A, Ferruzzi J, Mecham RP, Starcher BC, Tellides G, Humphrey JD, Giordano FJ, Niklason LE, Sessa WC. Inhibition of microRNA-29 en-hances elastin levels in cells haploinsufficient for elastin and in bioengineered vessels–brief report. Arterioscler Thromb Vasc Biol. 2012;32:756–759.
8. Daugherty A, Cassis LA. Mechanisms of abdominal aortic aneurysm for-mation. Curr Atheroscler Rep. 2002;4:222–227.
9. Ott CE, Grünhagen J, Jäger M, Horbelt D, Schwill S, Kallenbach K, Guo G, Manke T, Knaus P, Mundlos S, Robinson PN. MicroRNAs differen-tially expressed in postnatal aortic development downregulate elastin via 3’ UTR and coding-sequence binding sites. PLoS One. 2011;6:e16250.
10. Porrello ER, Johnson BA, Aurora AB, Simpson E, Nam YJ, Matkovich SJ, Dorn GW II, van Rooij E, Olson EN. MiR-15 family regulates postnatal mitotic arrest of cardiomyocytes. Circ Res. 2011;109:670–679.
11. Liao M, Zou S, Weng J, Hou L, Yang L, Zhao Z, Bao J, Jing Z. A microRNA profile comparison between thoracic aortic dissection and normal thoracic aorta indicates the potential role of microRNAs in contributing to thoracic aortic dissection pathogenesis. J Vasc Surg. 2011;53:1341–1349.e3.
12. Nelson PT, Wang WX, Mao G, Wilfred BR, Xie K, Jennings MH, Gao Z, Wang X. Specific sequence determinants of miR-15/107 microRNA gene group targets. Nucleic Acids Res. 2011;39:8163–8172.
13. Zampetaki A, Willeit P, Tilling L, Drozdov I, Prokopi M, Renard JM, Mayr A, Weger S, Schett G, Shah A, Boulanger CM, Willeit J, Chowienczyk PJ, Kiechl S, Mayr M. Prospective study on circulating microRNAs and risk of myocardial infarction. J Am Coll Cardiol. 2012;60:290–299.
14. Zampetaki A, Zhang Z, Hu Y, Xu Q. Biomechanical stress induces IL-6 expression in smooth muscle cells via Ras/Rac1-p38 MAPK-NF-kappaB signaling pathways. Am J Physiol Heart Circ Physiol. 2005;288:H2946–H2954.
15. Abonnenc M, Nabeebaccus AA, Mayr U, et al. Extracellular matrix secre-tion by cardiac fibroblasts: role of microRNA-29b and microRNA-30c. Circ Res. 2013;113:1138–1147.
16. Makowski MR, Wiethoff AJ, Blume U, Cuello F, Warley A, Jansen CH, Nagel E, Razavi R, Onthank DC, Cesati RR, Marber MS, Schaeffter T, Smith A, Robinson SP, Botnar RM. Assessment of atherosclerotic plaque burden with an elastin-specific magnetic resonance contrast agent. Nat Med. 2011;17:383–388.
17. Makowski MR, Preissel A, von Bary C, Warley A, Schachoff S, Keithan A, Cesati RR, Onthank DC, Schwaiger M, Robinson SP, Botnar RM.
Three-dimensional imaging of the aortic vessel wall using an elastin-spe-cific magnetic resonance contrast agent. Invest Radiol. 2012;47:438–444.
18. Botnar RM, Wiethoff AJ, Ebersberger U, Lacerda S, Blume U, Warley A, Jansen CH, Onthank DC, Cesati RR, Razavi R, Marber MS, Hamm B, Schaeffter T, Robinson SP, Makowski MR. In vivo assessment of aortic aneurysm wall integrity using elastin-specific molecular magnetic reso-nance imaging. Circ Cardiovasc Imaging. 2014;7:679–689.
19. Zampetaki A, Zeng L, Margariti A, Xiao Q, Li H, Zhang Z, Pepe AE, Wang G, Habi O, deFalco E, Cockerill G, Mason JC, Hu Y, Xu Q. Histone deacetylase 3 is critical in endothelial survival and atherosclerosis devel-opment in response to disturbed flow. Circulation. 2010;121:132–142.
20. Zampetaki A, Kiechl S, Drozdov I, Willeit P, Mayr U, Prokopi M, Mayr A, Weger S, Oberhollenzer F, Bonora E, Shah A, Willeit J, Mayr M. Plasma microRNA profiling reveals loss of endothelial miR-126 and other mi-croRNAs in type 2 diabetes. Circ Res. 2010;107:810–817.
21. Willeit P, Zampetaki A, Dudek K, et al. Circulating microRNAs as novel biomarkers for platelet activation. Circ Res. 2013;112:595–600.
22. van Rooij E, Sutherland LB, Liu N, Williams AH, McAnally J, Gerard RD, Richardson JA, Olson EN. A signature pattern of stress-responsive microRNAs that can evoke cardiac hypertrophy and heart failure. Proc Natl Acad Sci U S A. 2006;103:18255–18260.
23. Lederle FA, Wilson SE, Johnson GR, et al; Aneurysm Detection and Management Veterans Affairs Cooperative Study Group. Immediate repair compared with surveillance of small abdominal aortic aneurysms. N Engl J Med. 2002;346:1437–1444.
24. Golledge J, Muller J, Daugherty A, Norman P. Abdominal aortic an-eurysm: pathogenesis and implications for management. Arterioscler Thromb Vasc Biol. 2006;26:2605–2613.
25. Hellenthal FA, Buurman WA, Wodzig WK, Schurink GW. Biomarkers of AAA progression. Part 1: extracellular matrix degeneration. Nat Rev Cardiol. 2009;6:464–474.
26. Hellenthal FA, Buurman WA, Wodzig WK, Schurink GW. Biomarkers of abdominal aortic aneurysm progression. Part 2: inflammation. Nat Rev Cardiol. 2009;6:543–552.
27. Klink A, Hyafil F, Rudd J, et al. Diagnostic and therapeutic strategies for small abdominal aortic aneurysms. Nat Rev Cardiol. 2011;8:338–347.
28. Maegdefessel L, Azuma J, Toh R, Deng A, Merk DR, Raiesdana A, Leeper NJ, Raaz U, Schoelmerich AM, McConnell MV, Dalman RL, Spin JM, Tsao PS. MicroRNA-21 blocks abdominal aortic aneurysm development and nicotine-augmented expansion. Sci Transl Med. 2012;4:122ra22.
29. Deng GG, Martin-McNulty B, Sukovich DA, Freay A, Halks-Miller M, Thinnes T, Loskutoff DJ, Carmeliet P, Dole WP, Wang YX. Urokinase-type plasminogen activator plays a critical role in angiotensin II-induced abdominal aortic aneurysm. Circ Res. 2003;92:510–517.
30. Aimes RT, Quigley JP. Matrix metalloproteinase-2 is an interstitial col-lagenase. Inhibitor-free enzyme catalyzes the cleavage of collagen fibrils and soluble native type I collagen generating the specific ¾- and ¼-length fragments. J Biol Chem. 1995;270:5872–5876.
31. Pyo R, Lee JK, Shipley JM, Curci JA, Mao D, Ziporin SJ, Ennis TL, Shapiro SD, Senior RM, Thompson RW. Targeted gene disruption of ma-trix metalloproteinase-9 (gelatinase B) suppresses development of experi-mental abdominal aortic aneurysms. J Clin Invest. 2000;105:1641–1649.
What Is Known?
• miR-29b and miR-195 have been shown to suppress expression of elastin and collagens.
• Inhibition of miR-29b protects against aortic aneurysm development and its expansion in mice.
What New Information Does This Article Contribute?
• Inhibition of miR-195 increases the expression of elastin in the murine aorta.
• AntagomiR treatment to miR-195 does not recapitulate the protective effects of miR-29b inhibition on aortic dilatation.
• Unlike miR-29b, silencing of miR-195 is associated with a derepres-sion of matrix metalloproteinases.
• In humans, plasma levels of miR-195 are inversely associated with the aortic diameter and the presence of AAAs.
We assessed the effect of 2 elastin-targeting microRNAs, miR-195 and miR-29b, both in vitro and in vivo. We found that miR-195 regulates extracellular matrix deposition and that its plasma levels were associated with AAAs. There are currently no validated biomarkers to identify patients with AAA or predict which AAAs are likely to rupture or expand and require surgi-cal intervention. The diameter of the aneurysm is currently the best predictor of rupture but not always reliable. Studies in larger cohorts are needed to establish whether plasma microRNA sig-natures can identify patients with AAA at high risk of expansion or rupture.
Novelty and Significance
by guest on May 22, 2015http://circres.ahajournals.org/Downloaded from

SUPPLEMENTAL MATERIAL
Role of miR-195 in Aortic Aneurysmal Disease
Anna Zampetaki1, Rizwan Attia1, Ursula Mayr1, Renata S.M. Gomes1, Alkystis Phinikaridou1, Xiaoke Yin1, Sarah R. Langley1, Peter Willeit2, Ruifang Lu1, Bruce Fanshawe1, Marika Fava1,3, Javier Barallobre-Barreiro1, Chris Molenaar1, Po-Wah So4, Abeera Abbas1, Marjan Jahangiri3, Matthew Waltham1, Rene Botnar1, Alberto Smith1 and Manuel Mayr1.
1 King’s British Heart Foundation Centre, King’s College London, UK 2 Department of Public Health and Primary Care, University of Cambridge, UK 3 Department of Cardiac Surgery, St. George’s Healthcare NHS Trust, London, UK 4 Institute of Psychiatry, King’s College London, UK !

! 2!
Methods
Clinical study. Patients with AAA were identified from the local aneurysm surveillance and screening programme. Plasma samples were also obtained from subjects screened negative for AAA matched for hypertension and diabetes status. The clinical characteristics of the entire cohort are shown in Online Table IV. The study was approved by the local research ethics committee and all patients provided written informed consent (REC 07/Q0702/62).
Cell culture. Smooth muscle cells (SMCs) were isolated by enzymatic digestion of mouse aortas, as described elsewhere1 and were cultured in DMEM supplemented with 10% FCS, 2 mmol/L L-glutamine and 100 mg/L gentamicin, at 37ºC in a humidified atmosphere of 95% air / 5% CO2.
Immunblotting. SMCs were carefully washed in serum-free medium and then incubated in fresh serum-free medium for 48 hours (“conditioned medium”). Cell debris was removed by centrifuging the conditioned medium at 4000 rpm for 10 min. The supernatant was transferred into a new tube and stored at -80°C. Samples were subsequently desalted using Zeba Spin desalting columns (Thermo Scientific), vacuum dried and resuspended in 60 µL of ddH2O. 30 µL was used for the proteomic analysis and 30 µL to run a SDS-PAGE gel for immunoblotting. Membranes were probed with antibodies against decorin (sc-72895), collagen VI (sc-9855), collagen I (ab96723), collagen IV (ab6586) and collagen 3a1 (sc-28888) to validate the secretion of ECM proteins.
Transfections. Cells were plated at 60-70% confluency on the day before transfection. Mouse Pre-miR™ miRNA precursors and miRNA mimics were synthesized by Life Technologies and Mercury™ LNA-antimirs by Exiqon. The following sequences were used: LNA-195: CCAATATTTCTGTGCTGCT; LNA-29b: ACTGATTTCAAATGGRGCT; LNA-CTL: GTGTAACACGTCTATACGCCCA, Pre-miR-195:UAGCAGCACAGAAAUAUUGGC Pre-miR-29b: UAGCACCAUUUGAAAUCAGUGUU; Pre-miR-CTL2: sequence not specified. LNA inhibitors and precursor miRNA were transfected at a final concentration of 90 nmol/ L and 20nmol/ L respectively, using LipofectamineTM RMAiMAX (Invitrogen) according to the manufacturer’s recommendations.
MicroRNA target prediction. The prediction of miR-195 and miR-29b targets was performed with the miRWALK algorithm (http://www.umm.uni-heidelberg.de/apps/zmf/mirwalk). Predicted MiRNA targets on the 3' UTRs of all known genes in mouse were identified using 8 established miRNA prediction programs (RNA22, miRanda, miRDB, TargetScan, RNAhybrid, PITA, PICTAR and Diana-microT).
RNA isolation from tissue or cultured cells. Total RNA from tissue or cultured cells was prepared using the miRNeasy kit (Qiagen) as described previously2. In brief, cells were lysed with 700µl of QIAzol reagent. Following a brief incubation at ambient temperature, 140 µl of chloroform were added and the solution was mixed vigorously. The samples were then centrifuged at 12,000 rpm for 15 min at 4°C. The aqueous phase was carefully transferred to a new tube and 1.5 volumes of ethanol were added. The samples were applied directly to columns and washed according to the company’s protocol. Total RNA was eluted in 25 µl of nuclease free H2O. For gene expression studies, 1µg of RNA was reversed transcribed into cDNA using the High Capacity Reverse Transcriptase kit (Life Technologies).Quantitative polymerase chain reaction (QPCR) using Taqman Assays was used to assess the gene expression levels. Beta Actin was used as a normalization control.
MegaPlex reverse transcription. To assess levels of specific miRNA in cells 100 ng of RNA

! 3!
from the 25 µl eluate were reverse transcribed using the Megaplex Primer Pools (Rodent Pool A v.2.0) from Life Technologies. RT reaction was performed according to the company’s recommendations (0.8 µl of Pooled Primers were combined with 0.2 µl of 100mmol/L dNTPs with dTTP, 0.8 µl of 10x Reverse-Transcription Buffer, 0.9 µl of MgCl2 (25mmol/L), 1.5 µl of Multiscribe Reverse-Transcriptase and 0.1 µl of RNAsin (20U/µl) to a final volume of 7.5 µl). The RT-PCR reaction was set as follows: 16°C for 2 min, 42°C for 1 min and 50°C for 1 sec for 40 cycles and then incubation at 85°C for 5 min using a Veriti thermocycler (Life Technologies). The RT reaction products were diluted to 1ng/ µl corresponding RNA and stored at -20ºC.
Taqman qPCR assay. Taqman miRNA assays were used to assess the expression of individual miRNA. 2.25 ng of Megaplex reverse transcription product were combined with 0.25 µl of Taqman miRNA Assay (20X) (Life Technologies) and 2.5 µl of the Taqman Universal PCR Master Mix No AmpErase UNG (2X) to a final volume of 5 µl. QPCR was performed on an Viia7 thermocycler at 95ºC for 10 min, followed by 40 cycles of 95ºC for 15 sec and 60ºC for 1 min. U6 was used as a normalization control.
Plasma RNA extraction, reverse transcription and preamplification. MiRNAs were extracted using the miRNeasy kit (Qiagen). A fixed volume of 3 µl of the 25 µl RNA eluate was used as input for reverse transcription (RT) reactions as described previously2. In brief, miRNAs were reversely transcribed using Megaplex Primer Pools (Human Pools A v2.1, Life Technologies). RT reaction products were further amplified using the Megaplex PreAmp Primers (Primers A v2.1). Both RT and PreAmp products were stored at -20°C. Taqman miRNA assays were used to assess the expression of individual miRNAs. 0.5 µl diluted pre-amplification product were combined with 0.25 µl Taqman miRNA Assay (20x) (Life Technologies) and 2.5 µl Taqman Universal PCR Master Mix No AmpErase UNG (2x) to a final volume of 5 µl. qPCR was performed on an Life Technologies 7900HT thermocycler at 95°C for 10 min, followed by 40 cycles of 95°C for 15 sec and 60°C for 1 min. All samples were run in duplicates. Relative quantification was performed using the software SDS 2.2 (Life Technologies). Exogenous miRNA (cel-miR-39) was used as a spike-in normalization control as described previously3. Luciferase reporter assays. The 3’ untranslated regions of mouse elastin harboring putative binding sites of the miR-29 family were cloned into the dual-luciferase reporter vector psiCheck2 (Promega). The following primer sets were used:
ELN 3 UTR Forward ‘ATATACTCGAGCTGACTCGCGACCTCATC’ ELN 3 UTR Reverse ‘AGATAGTTTAAACAGTGTGAGGAGCCATCTG’ Part of the coding region of mouse elastin harboring putative binding sites of the miR-195 as predicted by miRWalk, was cloned into the dual-luciferase reporter vector psiCheck2 (Promega). The following primer sets were used:
ELN CD Forward ‘GTATACTCGAGGTTGGTGTTGGTGGGATTC’ ELN CD Reverse ‘GTGTGGTTTAAACCATATTTGGCTGCCTTAGC’ The reporter vectors (100 ng of psiCheck2 construct) were transfected together with 20 nmol/L of miRNA mimic or the mimic negative control (CON) in triplicate into SMCs plated in 6-well plates using Lipofectamine 2000 (Lifetech) as described above. After 48 h, the Renilla and firefly luciferase activities was assessed after harvesting cells in 200 µL Glo Lysis Buffer (Promega). 30 µL of each lysate were analyzed using Dual-Glo Luciferase reagents (Promega). Renilla luciferase activity was normalized to constitutive firefly luciferase activity for each well.

! 4!
Proteomics analysis. Samples were prepared as described above for immunoblotting, denatured with 4x sample loading buffer at 96°C for 5 min and then separated in Bis-Trisdiscountinuous 4-12% polyacrylamide gradient gels (NuPage, Invitrogen) as previously4. Protein standards were run along side the samples (pre-stained All Blue, Precision Plus, BioRad Laboratories). After electrophoresis, the gels were stained using Coomassie staining. Each gel lane was cut into 8 bands. Subsequently, all gel bands were subjected to in-gel tryptic digestion using an Investigator ProGest (Digilab) robotic digestion system. Tryptic peptides were separated on a nanoflow LC system (Dionex UltiMate 3000 RSLC, UK) and eluted with a 40-min gradient (4-25% B in 35 min, 25-40% B in 5 min, 99% B in 10 min and 2% B in 20min where A is 2% ACN, 0.1% formic acid in HPLC H2O and B is 80% ACN, 0.1% formic acid in HPLC H2O). The column (Dionex PepMap C18, 25 cm length, 75µm i.d, 3µm particle size) was coupled to a nanospray source (Picoview). Spectra were collected from a high-mass accuracy analyzer (LTQ Orbitrap XL, Thermo Fisher Scientific) using full ion scan mode over the mass-to-charge (m/z) range 400-1600. MS/MS was performed on the top six ions in each MS scan using the data-dependent acquisition mode with dynamic exclusion enabled. MS/MS mass spectra were extracted by extract_msn_com.exe version 5.0. Charge state deconvolution and deisotoping were not performed. All MS/MS samples were analyzed using Mascot (Matrix Science, London, UK; version 2.3.01). Mascot was set up to search the UniProt/SwissProt database (version 2014_01, selected for Mammalia, 66254 protein entries) assuming the digestion enzyme trypsin. Two missed cleavages were allowed. Mascot was searched with a fragment ion mass tolerance of 0.8 Da and a parent ion tolerance of 10 ppm. Carbamidomethylation of cysteine was specified in Mascot as a fixed modification. Oxidation of methionine was specified in Mascot as a variable modification. Scaffold (version 4.3.0, Proteome Software Inc., Portland, OR) was used to validate MS/MS based peptide and protein identifications. Peptide identifications were accepted if they could be established at greater than 95.0% probability as specified by the Peptide Prophet algorithm5. Protein identifications were accepted if they could be established at greater than 99.0% probability and contained at least 2 independent peptides. Protein probabilities were assigned by the Protein Prophet algorithm6. Proteins that contained similar peptides and could not be differentiated based on MS/MS analysis alone were grouped to satisfy the principles of parsimony. Secreted proteins with spectra in more than two samples per group (53, >30%), were retained for analysis. Co-expressions between all pairs of normalized protein spectra counts across primary cell culture and treated CFs were expressed through Pearson correlation coefficients (PCCs). Proteomic differential expression was assessed using the normalized spectral abundance factor - power law global error model (NSAF-PLGEM)7. This eliminates some of the assumptions needed for standard statistical tests and can increase the power of the analysis when there are a limited number of replicates available. The Normalized Spectral Abundance Factor was calculated for each protein detected. Spectral count values of 0 were replaced by an empirically derived fractional value. The value was calculated to be the smallest value between 0 and 1, which provided the best fit to a normal distribution, as determined by a Shapiro-Wilkes test. The NASF values were fit to a power-law global error model; differentially expressed proteins were then identified through a signal-to-noise (STN) test statistic. We considered proteins with a FDR <5% to be significant. NSAF values were used to generate the volcano plots.
Systemic silencing of miRNAs in mice. Cholesterol bound antagomiR constructs from Fidelity Biosystems were resuspended in sterile PBS at 37°C and stored at -20°C. The sequences of the antagomiR constructs were the following: Control AntagomiR: 5`- A*A*GGCAAGCUGACCCUGAA*G*U*U* Chol*T-3’, AntagomiR-195: 5`- G*C*CAAUAUUUCUGUGCU*G*C*U*Chol*T-3’, AntagomiR-29b: A*A*CACUGAUUUCAAAUGGUG*C*U*A*-Chol*T-3’. C57BL6 mice were treated by

! 5!
intraperitoneal injection with a dose of 65 mg/kg/day of antagomiR constructsat day 0, day 1 and day 2. Mice were sacrificed at day 7 and the aortic tissue was collected.
Angiotensin II infusion model. Osmotic pumps (model 2004, Alzet) containing Angiotensin II (1 µg/kg/min, Sigma-Aldrich) were introduced in 10-week-old apoE–/– male mice (day 0) (C57BL/6J background, Charles River Edinburgh UK) as previously described. Housing and animal care was in accordance with the UK Animals (Scientific Procedures) Act 1986. The antagomir constructs were injected intraperitoneal (i.p.) at a dose of 80 mg/kg/day on days 1, 2 and 3. Zymography. SMCs were transfected with LNA-Control, LNA-miR-29b or LNA-miR-195 as described above and serum deprived for 48h. The conditioned media was harvested and cell debris was removed by centrifugation at 4000 rpm for 10 min. The supernatant was transferred into a new tube and was concentrated using Zeba Spin columns (Thermo Scientific). Samples were mixed with non-reducing Tris-Glycine SDS sample buffer (2x) and loaded to a Novex® 10% zymography gel (gelatin, Life Technologies) gel. After electrophoresis, the gel was renatured and developed at 37ºC overnight according to the manufacturer’s recommendations. The gel was stained with Simply blue Safestain (Life Technologies). Images were quantified using the ImageJ software.
Immunohistochemistry. To assess the uptake of Cy3 labeled antagomiR by the aorta, cryosections were prepared from mouse aortic tissue and used for immunofluorescence staining. The slides were fixed with ice-cold acetone for 20 min and air-dried. After a brief wash with PBS, the sections were blocked with 5% normal swine serum in PBS for 30 min and incubated with the primary antibody for smooth muscle actin (SMA, cat.A5228 (1:200) from SIGMA) for 1h at 37°C. Subsequently, the bound primary antibody was detected by incubation with Alexa488 anti-mouse secondary antibodies for 30 min. The slides were counterstained with 4', 6-diamidino-2-phenylindole (DAPI; Sigma) in Floromount-G (DAKOCytomation, Glostrup, Denmark). Microscopic analysis was performed using a 60 x 1.49 NA objective on a Nikon Ti-Eclipse microscope equipped with a Yokagawa CSU-X1-M2 spinning disk unit, and an Andor Neo sCMOS camera. Coherent lasers (405, 488, 561nm) were coupled to the CSU-X1 with optical fibers. The dichroic mirror in the spinning-disk unit was a Di01-T405/488/568/647 from Semrock Inc. A Sutter instruments filter wheel with Chroma emission filters was used. Typically, a Z-stack over 10 micron was acquired.
Paraffin sections from the suprarenal aortic tissue derived from mice injected with antagomiR-195 or antagomiR-Con were used to determine the MMP9 expression. In brief, the slides were deparaffinized and antigen unmasking was performed by heating the sections with 10mM sodium citrate for 10 min. The slides were air dried and washed in dH2O and endogenous peroxidase activity was quenched by incubation with 3% H2O2 for 20 min. After a short wash with PBS, the sections were blocked with 5% normal swine serum in PBS for 20 min and incubated with the primary antibody for MMP9 (ab38898 from Abcam, 1:200) for 1h. Subsequently, the bound primary antibody was detected by incubation with swine antirabbit IgG–HRP conjugate for 30 min. Peroxidase activity was assessed using DAB reagent and the sections were counterstained with haematoxylin, dehydrated and mounted on microscope slides.
Inhibition of miRNAs in aortic grafts. LNA cholesterol bound microRNA inhibitors from Exiqon were resuspended in sterile PBS at 37°C and stored at -20°C. The sequences of the inhibitors were the following:
LNA-MiR-195: 5’ CCAATATTTCTGTGCTGCT/CholT 3’,

! 6!
LNA-Control: 5’ AAGGCAAGCTGACCCTGAAGTTT/CholT 3’,
LNA-MiR-29b: 5’ AACACTGATTTCAAATGGTGC/ CholT 3’.
The procedure for the mouse aortic isograft was similar to that described recently8. Aortas were isolated from donor C57/BL mice. The tissue was incubated in DMEM at 37°C with LNA inhibitors or nontargeting control for 2h to a final concentration of 400nM and subsequently cut into 2 pieces and isografted into the recipient mice. A week later, the grafts were harvested and miRNA and gene expression profiles were assessed as above.
MRI imaging. The animals were imaged using MRI prior to and post osmotic pump implantation to obtain aortic and cardiac parameters. The aortic scans were performed using 0.4mmol/kg of an elastin-specific magnetic resonance agent (ESMA, Lantheus Medical imaging, North Billerica, Massachusetts)9, 10 as described previously in studying the porcine vascular tree10 and atherosclerotic plaques in ApoE-/- mice9. The agent is composed of D-amino acid phenylalanine linked to gadolinium diethylenetriaminepentaacetic acid (Gd-DTPA) chelate. ESMA binds to elastin and tropoelastin in the vessel wall, with a half-life similar to other Gd bound contrast agents9.
In vivo MRI protocol at 3T for aortic imaging.The imaging was performed with a Philips Achieva MRI scanner (Philips Healthcare, Best, Netherlands) equipped with a clinical gradient system (30mT/m, 200mT/m per millisecond) and a single-loop surface coil (diameter=47 mm). Mice were imaged in the prone position 120mins after intravenous (i.v.) administration of 0.04mmol/kg ESMA. Supra-renal and abdominal aorta was localised with a 3-dimensional gradient recalled echo scout scan. Contrast-enhanced angiography images were acquired for visualization of the suprarenal aorta. Coronal and transverse orientation slices were acquired according to the following parameters: field-of-view (FOV) = 200 mm, matrix = 320, slice thickness = 2 mm, TR/TE = 20/5.8ms, flip angle = 30° and slices = 9. Following the scout image a 2-D time of flight (TOF) scan in transverse plane was performed for visualising the orientation of the aorta. The images were acquired with FOV = 20x20x10 mm, matrix = 160, in-plane spatial resolution = 0.3 x 0.3 mm (reconstructed 0.13 x 0.13 mm), slice thickness = 0.5 mm, TR/TE = 37/7.7 ms and flip angle = 60°. A maximum intensity projection (MIP) was created to display an angiogram of the suprarenal aorta. This was used to acquire further sequences for DE-MRI and T1 mapping sequences. A 2-dimensional look-locker sequence was used to determine the optimal inversion time TI for blood signal nulling. Imaging parameters included: FOV = 30mm, matrix = 75, inplane spatial resolution = 0.4 x 0.4 mm, slice thickness = 2 mm, TR/TE = 19 / 8.6 ms, TR between subsequent IR pulses = 1000 ms, and flip angle = 10°. Imaging parameters of the IR 3D fast gradient echo DE-MRI scan employed for visualization of contrast agent uptake were: FOV 30 mm, matrix = 300, inplane spatial resolution = 0.1 x 0.1, 0.5 mm slice thickness (reconstructed slice thickness = 0.25 mm), 40 slices, TR/TE = 28 / 8.2 ms, TR between subsequent IR pulses = 1000 ms, and flip angle = 30°. A 3-dimensional T1 mapping sequence was acquired with two inversion recovery prepared modified look-locker sequence11, 12. The sequence started with a non-selective inversion pulse using specific inversion times followed by eight segmental read outs for eight images. Inversion time (T1) is the time from preparation pulse to acquisition of the k0 profile in k space. Low-high k space ordering with 500ms delay between image acquisition was performed to minimise the saturation effects and allow accurate quantification of T1 values. The imaging planes were acquired at FOV = 18 x 36 mm, matrix = 180 x 151, measured voxel size 0.2 x 0.2 x 0.5 mm, TR/TE = 9.8/5.1 ms, flip angle = 8° and acquisition window = 157 ms. T1 values were computed pixel-wise with a three-parameter curve fitting procedure of the longitudinal magnetization Mz(TI) including a T1 correction12.

! 7!
Mz(TI) = M0*- (M0+M0*)e-(TI((1/T1)-(1/TR)ln(cos alpha))) T1 then can be calculated as 13 T1 = T1* (((M0+M0*)/(M0*)) – 1) M0 is the equilibrium of magnetization; this is sampled during the recovery, as the recovery is affected by constant RF-pulses that leads to apparent relaxation time T1* (T1* < T1; R1=1/T1; 1/T1=T/T1+1/T1looklocker) and decreased equilibrium magnetization M0*. MR image analysis. Analysis was performed using OsiriX (OsiriX foundationGeneva, Switzerland). The luminal and arterial wall DIACOM datasets from the aortic aneurysms from the TOF sequences were automatically coregistered and overlaid with the high-resolution DE-MRI images. Morphometric analysis was performed on the high resolution images after the ESMA adminstration. Regions of interest (ROI) encompassing the aneurysm were manually segmented on the images acquired. The mean signal intensity (SI) and area (cm2) of each ROI was recorded. Aortic aneurysm maps were generated based on formula using an Osirix plug-in for visualization of the areas protein-rich within the aneurysm. The maximal aortic lumen diameter and wall thickness were determined for each aneurysm. 3-dimensional rendered images of the aortic aneurysms were generated for analysis.
Statistics. Statistical analysis was performed with Graphpad Prism 5 using the Student’s t test. A p value of <0.05 was considered significant. Correlations were analyzed using the Spearman method. To calculate a pooled correlation coefficient between log miR-195 and MMPs across all available aortic tissue samples, tissue type-specific correlation coefficients were Fisher z-transformed and pooled with a Mantel and Haenszel meta-analysis. Data are presented as mean and error bars depict the standard deviation. In the patient cohort, statistical analysis was performed with Graphpad Prism 5 and with STATA version 12.1. Patient characteristics are summarized as means ± standard deviation (SD) for continuous variables and as numbers and percentages for categorical variables. P values for differences between AAA cases and controls were calculated with the Student’s t t-test or Fisher’s exact test (categorical variables). MiRNAs levels were loge-transformed used for all computations. To identify the subset or pattern of miRNA with the strongest association with AAA we utilized the technique called L1-penalization implementing the ‘least absolute shrinkage and selection operator [lasso] algorithm’ to all 16 miRNAs, as previously described3. L1-penalized methods shrink the estimates of the regression coefficients towards zero relative to the maximum likelihood estimates. The technique has been employed to generate gene signatures from microarray data and prevents overfit arising from both co-linearity and high-dimensionality. The amount of shrinkage is determined by the tuning parameter λ1, which is progressively increased up to the value that shrinks all regression coefficients to zero. Plots of fitted regression coefficients (y-axis) versus λ1 (x-axis) were generated using the ‘penalized’ package of R statistical software14. The lasso method allows assessing the relevance and robustness of individual explanatory variables but produces biased estimated for the regression coefficients. Igor Pro v.6 (WaveMetrics) was used for graphics.
!

! 8!
References!
1. Zampetaki A, Zhang Z, Hu Y, Xu Q. Biomechanical stress induces IL-6 expression in smooth muscle cells via ras/rac1-p38 MAPK-NF-kappaB signaling pathways. Am J Physiol Heart Circ Physiol. 2005;288:H2946-2954.
2. Zampetaki A, Kiechl S, Drozdov I, Willeit P, Mayr U, Prokopi M, Mayr A, Weger S, Oberhollenzer F, Bonora E, Shah A, Willeit J, Mayr M. Plasma microRNA profiling reveals loss of endothelial miR-126 and other microRNAs in type 2 diabetes. Circ Res. 2010;107:810-817.
3. Zampetaki A, Willeit P, Tilling L, Drozdov I, Prokopi M, Renard JM, Mayr A, Weger S, Schett G, Shah A, Boulanger CM, Willeit J, Chowienczyk PJ, Kiechl S, Mayr M. Prospective study on circulating microRNAs and risk of myocardial infarction. J Am Coll Cardiol. 2012;60:290-299.
4. Abonnenc M, Nabeebaccus AA, Mayr U, Barallobre-Barreiro J, Dong X, Cuello F, Sur S, Drozdov I, Langley SR, Lu R, Stathopoulou K, Didangelos A, Yin X, Zimmermann WH, Shah AM, Zampetaki A, Mayr M. Extracellular matrix secretion by cardiac fibroblasts: Role of microRNA-29b and microRNA-30c. Circ Res. 2013;113:1138-1147.
5. Keller A, Nesvizhskii AI, Kolker E, Aebersold R. Empirical statistical model to estimate the accuracy of peptide identifications made by MS/MS and database search. Anal Chem. 2002;74:5383-5392.
6. Nesvizhskii AI, Keller A, Kolker E, Aebersold R. A statistical model for identifying proteins by tandem mass spectrometry. Anal Chem. 2003;75:4646-4658.
7. Pavelka N, Fournier ML, Swanson SK, Pelizzola M, Ricciardi-Castagnoli P, Florens L, Washburn MP. Statistical similarities between transcriptomics and quantitative shotgun proteomics data. Mol Cell Proteomics. 2008;7:631-644.
8. Zampetaki A, Zeng L, Margariti A, Xiao Q, Li H, Zhang Z, Pepe AE, Wang G, Habi O, deFalco E, Cockerill G, Mason JC, Hu Y, Xu Q. Histone deacetylase 3 is critical in endothelial survival and atherosclerosis development in response to disturbed flow. Circulation. 2010;121:132-142.
9. Makowski MR, Wiethoff AJ, Blume U, Cuello F, Warley A, Jansen CH, Nagel E, Razavi R, Onthank DC, Cesati RR, Marber MS, Schaeffter T, Smith A, Robinson SP, Botnar RM. Assessment of atherosclerotic plaque burden with an elastin-specific magnetic resonance contrast agent. Nat Med. 2011;17:383-388.
10. Makowski MR, Preissel A, von Bary C, Warley A, Schachoff S, Keithan A, Cesati RR, Onthank DC, Schwaiger M, Robinson SP, Botnar RM. Three-dimensional imaging of the aortic vessel wall using an elastin-specific magnetic resonance contrast agent. Invest Rad. 2012;47:438-444.
11. Look Look DC, Locker DR. Time Saving in Measurement of NMR and EPR Relaxation Times. Rev Sci Instrum. 1970;41: 250-251.
12. Messroghli DR Radjenovic A, Kozerke S, Higgins DM. Sivananthan MU, Ridgway JP. Modified look-locker inversion recovery (molli) for high resolution T1 mapping of the heart. Magn Reson Med. 2004;52:141-146.
13. Deichmann R, Hahn D, Haase A. Fast t1 mapping on a whole-body scanner. Magn Reson Med. 1999;42:206-209.
14. Goeman JJ. L1 penalized estimation in the cox proportional hazards model. Biom J. 2010;52:70-84.
!

Online&Table&I.&Extracellular&proteins&identified&in&the&secretome&of&SMCs&transfected&with&pre=miR=195
PreCon PreCon PreCon Pre195 Pre195 Pre195 Average Average Ratio ttest# Identified&Proteins& Accession&Number Molecular&WeightPreCon=1 PreCon=2 PreCon=3 Pre195=1 Pre195=2 Pre195=3 PreCon Pre195 195/Con 195/Con FDR log10&FDR log2&FC
536 Disintegrin,and,metalloproteinase,domain3containing,protein,9, ADAM9_MOUSE 92,kDa 3.0 2.9 4.9 0.0 0.0 3.0 3.6 1.0 0.28 0.098 0.028 1.553 31.837144 Adipocyte,enhancer3binding,protein,1, AEBP1_MOUSE 128,kDa 6.0 10.5 6.6 2.4 0.8 25.5 7.7 9.6 1.25 0.825 0.35 0.456 0.321284 Agrin, AGRIN_MOUSE 208,kDa 13.2 19.7 10.5 0.0 0.0 3.3 14.5 1.1 0.08 0.010 0.004 2.398 33.730669 Angiogenin, ANGI_MOUSE 16,kDa 4.6 6.8 0.0 0.0 0.0 1.4 3.8 0.5 0.13 0.183 0.002 2.699 32.980267 Annexin,A1 ANXA1_MOUSE 39,kDa 6.2 12.5 4.4 6.6 4.5 5.0 7.7 5.4 0.69 0.407 0.102 0.991 30.527393 Annexin,A2, ANXA2_MOUSE 39,kDa 5.2 3.1 3.3 0.0 6.3 9.0 3.9 5.1 1.31 0.681 0.207 0.684 0.393318 Beta323microglobulin, B2MG_MOUSE 14,kDa 6.1 2.7 9.1 9.6 5.4 2.9 6.0 6.0 1.00 0.998 0.854 0.069 0.002259 Bone,morphogenetic,protein,1, BMP1_MOUSE 112,kDa 14.7 16.1 4.1 0.0 0.0 6.0 11.6 2.0 0.17 0.086 0.004 2.398 32.548122 Complement,C1r3A,subcomponent, C1RA_MOUSE 80,kDa 17.7 32.2 32.4 6.3 5.1 11.3 27.4 7.6 0.28 0.019 0.002 2.699 31.85674 Calreticulin, CALR_MOUSE 48,kDa 25.2 22.1 29.3 22.6 24.5 27.1 25.6 24.7 0.97 0.752 0.645 0.190 30.048
235 Calumenin, CALU_MOUSE 37,kDa 10.2 8.2 11.0 6.5 5.4 4.0 9.8 5.3 0.54 0.015 0.022 1.658 30.892256 Adenylyl,cyclase3associated,protein,1, CAP1_MOUSE 52,kDa 2.7 2.7 0.9 12.8 12.8 3.3 2.1 9.7 4.62 0.078 0.003 2.523 2.20885 Cathepsin,B, CATB_MOUSE 37,kDa 30.6 40.6 31.3 9.3 10.5 27.4 34.2 15.7 0.46 0.050 0.003 2.523 31.121
486 Cathepsin,Z, CATZ_MOUSE 34,kDa 2.1 2.1 6.6 3.8 3.6 3.0 3.6 3.4 0.96 0.933 0.712 0.148 30.05664 Carboxypeptidase,E, CBPE_MOUSE 53,kDa 42.0 46.2 39.5 21.1 25.0 17.5 42.6 21.2 0.50 0.002 0.004 2.398 31.005
600 Hematopoietic,progenitor,cell,antigen,CD34, CD34_MOUSE 41,kDa 0.0 0.9 1.0 4.3 2.5 0.8 0.7 2.5 3.85 0.150 0.015 1.824 1.94441 Complement,factor,H, CFAH_MOUSE 139,kDa 91.8 77.2 64.2 11.2 2.5 17.3 77.7 10.3 0.13 0.002 0.001 3.000 32.914
356 60,kDa,heat,shock,protein,,mitochondrial, CH60_MOUSE 61,kDa 4.5 1.8 8.2 4.5 1.7 5.0 4.8 3.7 0.78 0.640 0.295 0.530 30.364364 Clusterin, CLUS_MOUSE 52,kDa 5.2 8.3 6.5 0.0 0.0 4.0 6.6 1.3 0.20 0.031 0.004 2.398 32.300
4 Collagen,alpha31(I),chain, CO1A1_MOUSE 138,kDa 380.6 362.8 405.6 168.3 150.1 53.2 383.0 123.9 0.32 0.002 0.001 3.000 31.6281 Collagen,alpha32(I),chain, CO1A2_MOUSE 130,kDa 377.5 381.0 440.0 178.0 150.0 66.3 399.5 131.4 0.33 0.002 0.001 3.000 31.604
196 Complement,C2, CO2_MOUSE 85,kDa 16.6 17.0 7.2 0.0 0.0 6.6 13.6 2.2 0.16 0.042 0.002 2.699 32.62417 Complement,C3, CO3_MOUSE 186,kDa 126.7 138.3 112.4 22.1 7.7 63.8 125.8 31.2 0.25 0.007 0.001 3.000 32.0135 Collagen,alpha31(III),chain, CO3A1_MOUSE 139,kDa 267.8 277.5 293.1 94.5 93.8 25.5 279.5 71.2 0.25 0.001 0.001 3.000 31.972
202 Collagen,alpha31(IV),chain, CO4A1_MOUSE 161,kDa 14.2 17.2 20.9 12.8 12.4 0.8 17.4 8.7 0.50 0.116 0.043 1.367 31.008104 Collagen,alpha32(IV),chain, CO4A2_MOUSE 167,kDa 31.3 32.5 28.6 18.4 16.5 0.0 30.8 11.6 0.38 0.032 0.01 2.000 31.40642 Collagen,alpha32(V),chain, CO5A2_MOUSE 145,kDa 47.5 58.5 63.8 71.8 58.0 2.5 56.6 44.1 0.78 0.595 0.136 0.866 30.36135 Collagen,alpha31(VI),chain, CO6A1_MOUSE 108,kDa 83.7 89.9 79.5 25.9 20.9 15.7 84.4 20.8 0.25 0.000 0.001 3.000 32.02166 Collagen,alpha32(VI),chain, CO6A2_MOUSE 110,kDa 50.9 61.9 38.4 6.4 5.0 6.6 50.4 6.0 0.12 0.003 0.001 3.000 33.07543 Collagen,alpha31(XII),chain, COCA1_MOUSE 340,kDa 78.3 76.9 43.2 25.5 31.1 0.0 66.1 18.9 0.29 0.034 0.004 2.398 31.80982 Cofilin31, COF1_MOUSE 19,kDa 21.2 22.1 23.8 30.9 33.8 23.9 22.4 29.5 1.32 0.077 0.03 1.523 0.400
145 Coatomer,subunit,alpha, COPA_MOUSE 138,kDa 7.7 9.6 4.7 18.0 12.3 1.6 7.3 10.6 1.45 0.543 0.176 0.754 0.538401 UPF0556,protein,C19orf10,homolog, CS010_MOUSE 18,kDa 12.2 9.5 9.1 4.1 4.1 2.9 10.2 3.7 0.36 0.003 0.002 2.699 31.47560 Complement,C1s3A,subcomponent, CS1A_MOUSE 77,kDa 60.7 47.6 56.3 18.9 17.0 18.1 54.9 18.0 0.33 0.001 0.002 2.699 31.608
174 Macrophage,colony3stimulating,factor,1, CSF1_MOUSE 61,kDa 12.8 14.5 15.2 2.5 6.6 15.7 14.2 8.3 0.58 0.210 0.035 1.456 30.775107 Versican,core,protein, CSPG2_MOUSE 367,kDa 26.5 19.7 22.2 9.4 17.8 14.7 22.8 14.0 0.61 0.048 0.133 0.876 30.705201 Calsyntenin31, CSTN1_MOUSE 109,kDa 11.7 8.5 10.3 1.7 1.7 9.1 10.2 4.2 0.41 0.085 0.026 1.585 31.292395 Protein,CYR61, CYR61_MOUSE 42,kDa 5.1 5.6 6.0 4.1 2.9 4.0 5.5 3.7 0.67 0.017 0.112 0.951 30.585106 Cystatin3C, CYTC_MOUSE 16,kDa 32.4 30.1 38.8 15.8 15.5 14.5 33.8 15.3 0.45 0.002 0.001 3.000 31.145303 Dystroglycan, DAG1_MOUSE 97,kDa 10.3 12.5 9.8 2.7 5.0 0.0 10.9 2.5 0.23 0.007 0.006 2.222 32.101210 Dihydropyrimidinase3related,protein,3, DPYL3_MOUSE 62,kDa 6.6 7.1 4.6 20.8 13.4 6.8 6.1 13.7 2.24 0.138 0.012 1.921 1.165114 Extracellular,matrix,protein,1 ECM1_MOUSE 63,kDa 31.8 26.6 29.4 9.0 4.1 6.2 29.3 6.4 0.22 0.000 0.001 3.000 32.187394 EMILIN31, EMIL1_MOUSE 108,kDa 2.9 5.7 9.3 0.0 0.0 0.0 6.0 0.0 0.00 0.032 0.002 2.699 313.901
7 Fibulin32, FBLN2_MOUSE 132,kDa 170.4 164.2 175.4 111.0 116.9 87.7 170.0 105.2 0.62 0.002 0.007 2.155 30.692321 EGF3containing,fibulin3like,extracellular,matrix,protein,2, FBLN4_MOUSE 49,kDa 8.1 8.0 3.6 0.9 0.0 2.5 6.6 1.1 0.17 0.030 0.003 2.523 32.530203 Fibulin35, FBLN5_MOUSE 50,kDa 18.7 13.9 11.5 4.5 5.9 5.0 14.7 5.1 0.35 0.011 0.004 2.398 31.51229 Fibrillin31, FBN1_MOUSE 312,kDa 56.2 48.8 50.2 38.7 25.1 0.0 51.7 21.3 0.41 0.058 0.013 1.886 31.2823 Fibronectin, FINC_MOUSE 272,kDa 82.9 183.6 168.5 64.7 58.6 64.2 145.0 62.5 0.43 0.058 0.004 2.398 31.214
456 Fibromodulin, FMOD_MOUSE 43,kDa 9.0 5.3 3.6 0.0 0.0 0.0 6.0 0.0 0.00 0.020 0.001 3.000 313.90681 Follistatin3related,protein,1, FSTL1_MOUSE 35,kDa 35.7 37.5 27.0 18.7 18.5 8.4 33.4 15.2 0.45 0.018 0.002 2.699 31.13659 Glucose363phosphate,isomerase, G6PI_MOUSE 63,kDa 31.5 29.2 26.3 33.4 27.9 31.0 29.0 30.7 1.06 0.478 0.557 0.254 0.083
479 Growth,arrest3specific,protein,6, GAS6_MOUSE 75,kDa 2.4 2.0 2.0 0.0 0.0 0.0 2.1 0.0 0.00 0.000 0.004 2.398 312.393176 Gelsolin, GELS_MOUSE 86,kDa 8.8 16.9 10.5 12.8 12.9 9.2 12.1 11.6 0.97 0.886 0.71 0.149 30.051282 Granulins, GRN_MOUSE 63,kDa 6.2 9.2 14.5 0.9 1.0 8.0 10.0 3.3 0.33 0.119 0.007 2.155 31.595147 Hepatoma3derived,growth,factor, HDGF_MOUSE 26,kDa 18.4 11.4 9.4 6.6 11.4 14.9 13.1 10.9 0.84 0.588 0.185 0.733 30.257150 Insulin3like,growth,factor3binding,protein,4, IBP4_MOUSE 28,kDa 22.5 22.2 22.1 3.8 5.5 8.0 22.2 5.8 0.26 0.000 0.001 3.000 31.947258 Insulin3like,growth,factor3binding,protein,6, IBP6_MOUSE 25,kDa 12.1 12.0 7.9 0.0 0.0 3.0 10.7 1.0 0.09 0.005 0.001 3.000 33.409278 Insulin3like,growth,factor3binding,protein,7, IBP7_MOUSE 29,kDa 13.4 10.5 14.3 8.5 5.4 0.0 12.7 4.6 0.36 0.041 0.003 2.523 31.462138 Plasma,protease,C1,inhibitor, IC1_MOUSE 56,kDa 12.7 24.3 22.2 0.0 0.0 10.7 19.7 3.6 0.18 0.033 0.001 3.000 32.467171 Insulin3degrading,enzyme, IDE_MOUSE 118,kDa 5.8 4.7 6.2 17.2 14.1 13.2 5.6 14.8 2.65 0.002 0.012 1.921 1.408286 Insulin3like,growth,factor,I, IGF1_MOUSE 17,kDa 4.6 15.0 12.1 1.4 0.0 4.3 10.6 1.9 0.18 0.062 0.001 3.000 32.481574 Leukocyte,elastase,inhibitor,A, ILEUA_MOUSE 43,kDa 4.1 2.1 4.4 0.0 1.8 0.0 3.5 0.6 0.17 0.035 0.005 2.301 32.569624 Inter3alpha3trypsin,inhibitor,heavy,chain,H2, ITIH2_MOUSE 106,kDa 1.0 0.9 0.0 0.0 4.6 0.8 0.6 1.8 2.81 0.466 0.092 1.036 1.49375 Laminin,subunit,alpha35, LAMA5_MOUSE 404,kDa 13.2 14.1 8.2 1.9 2.1 4.9 11.8 3.0 0.25 0.013 0.031 1.509 31.997
233 Laminin,subunit,beta31, LAMB1_MOUSE 197,kDa 14.2 8.6 7.7 6.4 5.0 7.4 10.2 6.3 0.61 0.139 0.145 0.839 30.702168 Laminin,subunit,gamma31, LAMC1_MOUSE 177,kDa 13.1 15.3 22.0 2.4 3.3 5.8 16.8 3.8 0.23 0.010 0.006 2.222 32.136601 Low3density,lipoprotein,receptor, LDLR_MOUSE 95,kDa 0.0 0.9 0.0 0.0 0.0 5.8 0.3 1.9 6.14 0.455 0.026 1.585 2.618141 Galectin31, LEG1_MOUSE 15,kDa 19.8 17.6 22.7 20.3 23.0 21.5 20.0 21.6 1.08 0.405 0.36 0.444 0.109112 Galectin333binding,protein, LG3BP_MOUSE 64,kDa 15.7 25.5 25.7 3.6 2.1 13.6 22.3 6.4 0.29 0.032 0.002 2.699 31.796640 Lysyl,oxidase,homolog,3, LOXL3_MOUSE 84,kDa 1.2 2.0 3.9 0.0 0.0 0.8 2.4 0.3 0.12 0.073 0.012 1.921 33.09653 Latent3transforming,growth,factor,beta3binding,protein,1, LTBP1_MOUSE 187,kDa 56.3 51.6 48.9 26.7 22.5 39.7 52.3 29.6 0.57 0.016 0.027 1.569 30.818
170 Latent3transforming,growth,factor,beta3binding,protein,4, LTBP4_MOUSE 179,kDa 14.2 22.0 8.9 0.0 0.8 18.1 15.0 6.3 0.42 0.284 0.032 1.495 31.249426 Protein3lysine,63oxidase, LYOX_MOUSE 47,kDa 2.0 5.2 4.9 0.0 0.0 0.0 4.0 0.0 0.00 0.016 0.002 2.699 313.339320 Mesencephalic,astrocyte3derived,neurotrophic,factor, MANF_MOUSE 20,kDa 9.1 8.6 6.9 9.2 7.8 6.1 8.2 7.7 0.94 0.689 0.538 0.269 30.089448 Matrilin32, MATN2_MOUSE 107,kDa 4.9 5.7 3.1 0.0 0.0 1.7 4.5 0.6 0.12 0.013 0.007 2.155 33.043425 Macrophage,migration,inhibitory,factor, MIF_MOUSE 13,kDa 7.6 2.7 6.1 5.5 6.8 5.7 5.5 6.0 1.10 0.734 0.42 0.377 0.137281 Mimecan,O MIME_MOUSE 34,kDa 12.4 13.6 7.3 0.0 0.0 1.0 11.1 0.3 0.03 0.005 0.001 3.000 35.060559 72,kDa,type,IV,collagenase, MMP2_MOUSE 74,kDa 3.5 4.9 2.9 0.0 0.0 0.0 3.8 0.0 0.00 0.003 0.002 2.699 313.252760 Stromelysin31, MMP3_MOUSE 54,kDa 2.7 2.7 1.8 0.0 0.0 0.0 2.4 0.0 0.00 0.001 0.002 2.699 312.583438 Mesothelin, MSLN_MOUSE 69,kDa 5.2 4.2 4.4 0.0 1.8 3.0 4.6 1.6 0.35 0.031 0.025 1.602 31.52420 Nidogen31, NID1_MOUSE 137,kDa 89.5 86.8 56.0 42.7 47.1 34.6 77.4 41.5 0.54 0.034 0.008 2.097 30.901
216 Nidogen32, NID2_MOUSE 154,kDa 2.1 5.0 5.5 0.0 0.0 0.0 4.2 0.0 0.00 0.017 0.004 2.398 313.389590 NAD(P)H3hydrate,epimerase, NNRE_MOUSE ? 0.0 3.8 3.9 1.0 0.0 2.0 2.6 1.0 0.39 0.331 0.027 1.569 31.348595 Protein,NOV,homolog, NOV_MOUSE 39,kDa 4.5 3.5 2.7 0.0 0.0 0.0 3.6 0.0 0.00 0.002 0.001 3.000 313.169469 Epididymal,secretory,protein,E1, NPC2_MOUSE 16,kDa 3.0 3.8 3.9 2.1 1.0 4.0 3.6 2.4 0.66 0.258 0.07 1.155 30.610291 Plasminogen,activator,inhibitor,1, PAI1_MOUSE 45,kDa 2.7 1.8 0.0 5.4 9.3 9.2 1.5 8.0 5.34 0.013 0.002 2.699 2.418123 Procollagen,C3endopeptidase,enhancer,1 PCOC1_MOUSE 50,kDa 26.5 16.8 20.2 0.9 0.8 10.9 21.2 4.2 0.20 0.018 0.001 3.000 32.331240 Phosphatidylethanolamine3binding,protein,1, PEBP1_MOUSE 21,kDa 6.1 4.8 8.9 9.2 9.8 5.0 6.6 8.0 1.22 0.494 0.187 0.728 0.28770 Pigment,epithelium3derived,factor, PEDF_MOUSE 46,kDa 33.4 31.5 27.6 26.2 20.3 25.1 30.8 23.8 0.77 0.049 0.086 1.066 30.371
403 Probable,aminopeptidase,NPEPL1, PEPL1_MOUSE 56,kDa 3.6 2.7 1.8 5.4 5.1 5.9 2.7 5.4 2.02 0.008 0.044 1.357 1.01730 Basement,membrane3specific,heparan,sulfate,proteoglycan,core,protein, PGBM_MOUSE 398,kDa 61.8 58.6 67.1 21.3 30.7 13.5 62.5 21.8 0.35 0.002 0.008 2.097 31.51937 Biglycan, PGS1_MOUSE 42,kDa 50.8 50.9 45.7 32.3 38.3 38.1 49.1 36.3 0.74 0.008 0.032 1.495 30.43899 Decorin, PGS2_MOUSE 40,kDa 40.4 27.5 26.3 5.4 5.1 9.2 31.4 6.6 0.21 0.006 0.001 3.000 32.25148 Peptidyl3prolyl,cis3trans,isomerase,A, PPIA_MOUSE 18,kDa 43.5 39.5 44.8 52.8 39.2 56.8 42.6 49.6 1.16 0.278 0.089 1.051 0.219
383 Peroxiredoxin34, PRDX4_MOUSE 31,kDa 10.1 10.5 12.8 4.1 3.9 8.1 11.1 5.4 0.48 0.023 0.008 2.097 31.05496 Profilin31, PROF1_MOUSE 15,kDa 30.4 25.7 19.7 32.6 28.4 26.8 25.3 29.3 1.16 0.321 0.123 0.910 0.212
434 Pentraxin3related,protein,PTX3, PTX3_MOUSE 42,kDa 3.7 3.9 5.6 2.7 9.5 0.0 4.4 4.1 0.92 0.910 0.594 0.226 30.11861 Peroxidasin,homolog, PXDN_MOUSE 165,kDa 38.5 30.5 16.4 14.6 15.0 4.3 28.4 11.3 0.40 0.080 0.011 1.959 31.331
105 Sulfhydryl,oxidase,1, QSOX1_MOUSE 83,kDa 20.6 32.4 25.6 3.6 1.0 4.1 26.2 2.9 0.11 0.003 0.001 3.000 33.168346 Ribonuclease,inhibitor, RINI_MOUSE 50,kDa 2.7 1.8 3.6 4.5 5.1 11.0 2.7 6.9 2.54 0.125 0.015 1.824 1.347172 RNA,binding,motif,protein,,X3linked3like31, RMXL1_MOUSE 42,kDa 17.2 16.4 12.6 13.7 17.3 27.1 15.4 19.4 1.26 0.403 0.139 0.857 0.330204 Ribonuclease,4, RNAS4_MOUSE 17,kDa 18.2 17.6 18.2 12.4 13.5 15.8 18.0 13.9 0.77 0.016 0.052 1.284 30.374599 Ribonuclease,T2, RNT2_MOUSE 30,kDa 4.1 2.1 4.4 0.0 0.0 1.0 3.5 0.3 0.09 0.016 0.002 2.699 33.41194 Sulfated,glycoprotein,1, SAP_MOUSE 61,kDa 25.6 30.7 22.6 14.6 12.2 19.1 26.3 15.3 0.58 0.024 0.02 1.699 30.782
412 Stromal,cell3derived,factor,1, SDF1_MOUSE 11,kDa 7.6 4.1 6.1 8.3 8.1 2.9 5.9 6.4 1.09 0.818 0.437 0.360 0.118225 Semaphorin33A, SEM3A_MOUSE 89,kDa 5.9 13.4 14.7 2.7 3.1 6.2 11.3 4.0 0.35 0.068 0.011 1.959 31.511546 Semaphorin33E, SEM3E_MOUSE 90,kDa 2.4 8.9 2.0 0.9 0.0 1.0 4.4 0.6 0.15 0.173 0.007 2.155 32.773111 Superoxide,dismutase,[Cu3Zn], SODC_MOUSE 16,kDa 21.3 18.7 12.4 13.0 17.1 24.2 17.5 18.1 1.04 0.887 0.617 0.210 0.051722 Extracellular,superoxide,dismutase,[Cu3Zn], SODE_MOUSE 27,kDa 5.2 2.1 4.4 0.0 0.0 0.0 3.9 0.0 0.00 0.014 0.001 3.000 313.28357 SPARC, SPRC_MOUSE 34,kDa 50.7 44.1 41.6 22.6 24.3 15.7 45.5 20.9 0.46 0.003 0.002 2.699 31.12572 Sushi,,von,Willebrand,factor,type,A,,EGF,and,pentraxin,domain3containing,protein,1,SVEP1_MOUSE 387,kDa 47.4 52.5 40.8 17.0 16.7 0.0 46.9 11.2 0.24 0.006 0.005 2.301 32.062
220 Translationally3controlled,tumor,protein, TCTP_MOUSE 19,kDa 7.1 6.7 4.9 11.3 9.8 13.1 6.2 11.4 1.83 0.012 0.008 2.097 0.872539 Tenascin, TENA_MOUSE 232,kDa 0.0 1.0 0.0 0.8 0.8 4.1 0.3 1.9 6.00 0.237 0.067 1.174 2.583243 Thioredoxin, THIO_MOUSE 12,kDa 13.7 12.2 12.1 9.6 9.5 4.3 12.7 7.8 0.62 0.056 0.008 2.097 30.699385 Metalloproteinase,inhibitor,1, TIMP1_MOUSE 23,kDa 9.1 12.7 7.1 0.9 1.0 0.0 9.7 0.6 0.07 0.006 0.001 3.000 33.919149 Metalloproteinase,inhibitor,2, TIMP2_MOUSE 24,kDa 15.2 18.1 13.8 10.3 8.8 15.1 15.7 11.4 0.73 0.135 0.05 1.301 30.461485 Thrombospondin31, TSP1_MOUSE 130,kDa 0.0 0.0 0.0 10.1 5.8 0.8 0.0 5.6 #DIV/0! 0.106 0.002 2.699 13.807

Online&Table&II.&Extracellular&proteins&identified&in&the&secretome&of&SMCs&transfected&with&anti=miR=195
AntiCon AntiCon AntiCon Anti195 Anti195 Anti195 Average Average Ratio ttest# Identified&Proteins& Accession&Number Molecular&Weight AntiCon=1 AntiCon=2 AntiCon=3 Anti195=1 Anti195=2 Anti195=3 AntiCon Anti195 195/Con 195/Con FDR log10&FDR log2&FC
483 Disintegrin,and,metalloproteinase,domain3containing,protein,9, ADAM9_MOUSE 92,kDa 1.0 4.5 4.7 1.0 2.1 2.0 3.4 1.7 0.50 0.242 0.088 1.056 30.998174 Adipocyte,enhancer3binding,protein,1, AEBP1_MOUSE 128,kDa 9.6 17.0 5.7 6.9 6.8 22.8 10.8 12.2 1.13 0.836 0.521 0.283 0.174160 Agrin, AGRIN_MOUSE 208,kDa 4.8 30.3 9.1 20.5 14.8 24.0 14.8 19.8 1.34 0.579 0.235 0.629 0.423267 Annexin,A1, ANXA1_MOUSE 39,kDa 1.1 5.1 3.9 8.7 1.1 10.6 3.3 6.8 2.03 0.333 0.029 1.538 1.018326 Annexin,A2, ANXA2_MOUSE 39,kDa 3.3 4.1 1.9 5.4 2.2 4.8 3.1 4.1 1.34 0.409 0.21 0.678 0.427196 Beta323microglobulin, B2MG_MOUSE 14,kDa 15.0 11.9 1.3 12.1 16.8 12.5 9.4 13.8 1.47 0.376 0.03 1.523 0.551256 Bone,morphogenetic,protein,1, BMP1_MOUSE 112,kDa 6.9 8.8 12.1 7.7 8.7 12.1 9.3 9.5 1.03 0.909 0.807 0.093 0.03881 Complement,C1r3A,subcomponent, C1RA_MOUSE 80,kDa 35.1 19.8 22.1 31.6 27.7 31.5 25.7 30.3 1.18 0.403 0.279 0.554 0.23874 Calreticulin, CALR_MOUSE 48,kDa 18.8 19.9 23.5 27.4 24.3 21.3 20.7 24.3 1.17 0.190 0.261 0.583 0.229
135 Calumenin, CALU_MOUSE 37,kDa 12.3 9.4 13.0 15.7 7.7 14.0 11.6 12.5 1.08 0.754 0.544 0.264 0.108417 Adenylyl,cyclase3associated,protein,1, CAP1_MOUSE 52,kDa 0.9 3.3 0.9 2.0 1.9 1.8 1.7 1.9 1.10 0.836 0.65 0.187 0.14377 Cathepsin,B, CATB_MOUSE 37,kDa 23.5 25.2 31.5 21.1 32.2 18.7 26.7 24.0 0.90 0.600 0.351 0.455 30.155
415 Cathepsin,Z, CATZ_MOUSE 34,kDa 2.2 5.1 0.0 4.3 3.3 3.8 2.4 3.8 1.59 0.394 0.094 1.027 0.67039 Carboxypeptidase,E, CBPE_MOUSE 53,kDa 59.8 47.4 39.0 40.9 54.6 46.0 48.7 47.2 0.97 0.844 0.687 0.163 30.046
518 Hematopoietic,progenitor,cell,antigen,CD34, CD34_MOUSE 41,kDa 2.9 3.5 3.7 1.9 0.9 0.0 3.4 0.9 0.28 0.015 0.013 1.886 31.82837 Complement,factor,H, CFAH_MOUSE 139,kDa 42.9 50.0 59.1 38.4 52.9 42.4 50.7 44.6 0.88 0.395 0.36 0.444 30.185
407 60,kDa,heat,shock,protein,,mitochondrial, CH60_MOUSE 61,kDa 5.6 0.8 5.2 2.0 0.0 0.0 3.9 0.7 0.17 0.124 0.009 2.046 32.577227 Clusterin, CLUS_MOUSE 52,kDa 15.0 10.0 12.6 5.4 5.5 14.4 12.5 8.4 0.67 0.282 0.074 1.131 30.574
2 Collagen,alpha31(I),chain, CO1A1_MOUSE 138,kDa 340.1 290.9 346.5 313.9 327.1 326.4 325.9 322.5 0.99 0.861 0.81 0.092 30.0151 Collagen,alpha32(I),chain, CO1A2_MOUSE 130,kDa 425.1 359.4 410.6 385.4 415.8 338.6 398.4 379.9 0.95 0.572 0.498 0.303 30.068
134 Complement,C2, CO2_MOUSE 85,kDa 18.5 11.3 16.7 7.6 11.2 16.5 15.5 11.8 0.76 0.332 0.18 0.745 30.3946 Complement,C3, CO3_MOUSE 186,kDa 229.9 203.0 179.9 200.2 170.3 184.3 204.3 184.9 0.91 0.314 0.334 0.476 30.1444 Collagen,alpha31(III),chain, CO3A1_MOUSE 139,kDa 255.8 256.1 290.6 227.3 230.4 207.2 267.5 221.6 0.83 0.028 0.1 1.000 30.271
112 Collagen,alpha31(IV),chain, CO4A1_MOUSE 161,kDa 19.2 12.8 17.3 15.8 13.8 13.5 16.4 14.3 0.87 0.364 0.492 0.308 30.19673 Collagen,alpha32(IV),chain, CO4A2_MOUSE 167,kDa 35.2 21.0 32.6 28.6 28.5 27.8 29.6 28.3 0.96 0.782 0.722 0.141 30.065
298 Collagen,alpha31(V),chain, CO5A1_MOUSE 184,kDa 6.7 2.7 5.8 5.9 5.9 3.5 5.1 5.1 1.01 0.971 0.857 0.067 0.01630 Collagen,alpha32(V),chain, CO5A2_MOUSE 145,kDa 48.8 42.9 63.1 37.5 38.5 42.7 51.6 39.6 0.77 0.123 0.144 0.842 30.38312 Collagen,alpha31(VI),chain, CO6A1_MOUSE 108,kDa 120.7 89.0 104.2 85.6 86.7 93.4 104.6 88.6 0.85 0.164 0.175 0.757 30.24118 Collagen,alpha32(VI),chain, CO6A2_MOUSE 110,kDa 76.8 57.5 72.2 67.5 68.2 72.4 68.8 69.4 1.01 0.931 0.838 0.077 0.01226 Collagen,alpha31(XII),chain, COCA1_MOUSE 340,kDa 100.7 78.2 81.0 12.8 13.5 18.7 86.6 15.0 0.17 0.001 0.003 2.523 32.52786 Cofilin31, COF1_MOUSE 19,kDa 27.1 24.6 27.1 23.1 22.8 20.8 26.2 22.2 0.85 0.021 0.14 0.854 30.241
190 Coatomer,subunit,alpha, COPA_MOUSE 138,kDa 11.7 14.6 3.6 18.9 14.9 13.5 10.0 15.7 1.57 0.194 0.095 1.022 0.654451 Cysteine3rich,with,EGF3like,domain,protein,2, CREL2_MOUSE 38,kDa 1.9 1.7 3.5 3.9 1.9 2.7 2.3 2.8 1.21 0.574 0.397 0.401 0.278399 UPF0556,protein,C19orf10,homolog, CS010_MOUSE 18,kDa 1.0 7.9 9.4 0.0 3.2 1.0 6.1 1.4 0.23 0.161 0.003 2.523 32.13240 Complement,C1s3A,subcomponent, CS1A_MOUSE 77,kDa 59.4 41.5 45.8 44.0 44.5 51.1 48.9 46.5 0.95 0.707 0.614 0.212 30.072
144 Macrophage,colony3stimulating,factor,1, CSF1_MOUSE 61,kDa 9.7 11.7 11.9 12.6 16.5 14.7 11.1 14.6 1.32 0.057 0.159 0.799 0.39658 Versican,core,protein, CSPG2_MOUSE 367,kDa 27.1 25.1 24.5 49.5 34.9 27.9 25.6 37.4 1.46 0.139 0.148 0.830 0.548
146 Calsyntenin31, CSTN1_MOUSE 109,kDa 14.6 10.4 8.3 13.3 12.2 15.6 11.1 13.7 1.23 0.283 0.31 0.509 0.304410 Protein,CTLA323alpha, CTL2A_MOUSE 16,kDa 8.5 2.6 1.3 6.0 6.1 1.4 4.2 4.5 1.08 0.906 0.547 0.262 0.113329 Protein,CYR61, CYR61_MOUSE 42,kDa 6.2 1.8 6.5 2.1 4.7 4.9 4.8 3.9 0.81 0.634 0.319 0.496 30.30355 Cystatin3C, CYTC_MOUSE 16,kDa 50.4 40.2 32.0 59.5 53.3 52.4 40.9 55.1 1.35 0.070 0.021 1.678 0.430
204 Dystroglycan, DAG1_MOUSE 97,kDa 9.8 13.0 11.7 12.9 7.8 9.6 11.5 10.1 0.88 0.468 0.482 0.317 30.18795 Extracellular,matrix,protein,1, ECM1_MOUSE 63,kDa 25.3 17.3 28.9 17.2 18.9 13.5 23.8 16.5 0.69 0.125 0.068 1.167 30.529
312 EMILIN31, EMIL1_MOUSE 108,kDa 5.8 0.9 8.3 4.8 3.7 11.5 5.0 6.7 1.33 0.638 0.289 0.539 0.414482 Endoplasmic,reticulum,aminopeptidase,1, ERAP1_MOUSE 107,kDa 2.9 3.5 1.9 3.8 4.7 0.8 2.7 3.1 1.13 0.790 0.617 0.210 0.177
7 Fibulin32, FBLN2_MOUSE 132,kDa 159.1 144.8 160.3 154.2 160.8 144.4 154.7 153.1 0.99 0.827 0.824 0.084 30.015232 EGF3containing,fibulin3like,extracellular,matrix,protein,2, FBLN4_MOUSE 49,kDa 8.5 5.0 10.4 6.9 9.7 6.2 8.0 7.6 0.95 0.854 0.708 0.150 30.070164 Fibulin35, FBLN5_MOUSE 50,kDa 10.6 12.4 11.7 11.1 14.2 14.2 11.6 13.1 1.14 0.244 0.403 0.395 0.18315 Fibrillin31, FBN1_MOUSE 312,kDa 55.2 39.7 43.6 43.5 42.9 38.8 46.2 41.7 0.90 0.411 0.538 0.269 30.1463 Fibronectin, FINC_MOUSE 272,kDa 204.5 96.7 171.5 82.8 188.2 177.1 157.6 149.3 0.95 0.867 0.601 0.221 30.077
224 Fibromodulin, FMOD_MOUSE 43,kDa 11.6 9.4 6.2 4.9 6.8 9.2 9.0 7.0 0.77 0.353 0.174 0.759 30.38062 Follistatin3related,protein,1 FSTL1_MOUSE 35,kDa 35.8 26.3 28.7 26.1 32.0 31.0 30.3 29.7 0.98 0.868 0.761 0.119 30.02968 Glucose363phosphate,isomerase, G6PI_MOUSE 63,kDa 19.8 24.1 22.6 21.5 23.3 26.6 22.2 23.8 1.07 0.447 0.548 0.261 0.103
406 Growth,arrest3specific,protein,6, GAS6_MOUSE 75,kDa 6.0 2.9 4.8 0.0 1.0 3.0 4.6 1.3 0.29 0.062 0.018 1.745 31.789178 Gelsolin, GELS_MOUSE 86,kDa 13.0 10.5 5.5 14.3 9.8 8.9 9.7 11.0 1.14 0.653 0.478 0.321 0.187229 Granulins, GRN_MOUSE 63,kDa 9.6 9.4 9.1 10.7 5.0 9.8 9.3 8.5 0.91 0.653 0.551 0.259 30.140175 Hepatoma3derived,growth,factor, HDGF_MOUSE 26,kDa 9.4 13.2 11.1 9.4 10.5 9.1 11.2 9.7 0.86 0.261 0.302 0.520 30.213119 Hypoxia,up3regulated,protein,1, HYOU1_MOUSE 111,kDa 7.7 18.2 8.6 18.6 22.2 15.3 11.5 18.7 1.62 0.141 0.068 1.167 0.70094 Insulin3like,growth,factor3binding,protein,4, IBP4_MOUSE 28,kDa 30.8 19.5 22.4 14.8 21.5 28.3 24.3 21.5 0.89 0.622 0.299 0.524 30.174
148 Insulin3like,growth,factor3binding,protein,6, IBP6_MOUSE 25,kDa 11.4 9.8 16.5 15.6 11.8 14.6 12.6 14.0 1.11 0.572 0.391 0.408 0.154206 Insulin3like,growth,factor3binding,protein,7, IBP7_MOUSE 29,kDa 9.8 7.1 8.7 6.5 7.8 9.6 8.5 8.0 0.93 0.657 0.591 0.228 30.10098 Plasma,protease,C1,inhibitor, IC1_MOUSE 56,kDa 34.7 22.1 23.6 19.1 25.1 18.6 26.8 21.0 0.78 0.262 0.129 0.889 30.356
259 Insulin3degrading,enzyme, IDE_MOUSE 118,kDa 1.0 8.7 5.6 3.8 5.6 4.9 5.1 4.8 0.95 0.910 0.746 0.127 30.081168 Insulin3like,growth,factor,I, IGF1_MOUSE 17,kDa 16.7 15.0 18.1 8.6 14.4 16.6 16.6 13.2 0.79 0.252 0.093 1.032 30.333370 Leukocyte,elastase,inhibitor,A, ILEUA_MOUSE 43,kDa 4.3 7.1 5.8 2.2 4.5 4.8 5.8 3.8 0.66 0.165 0.101 0.996 30.596262 Laminin,subunit,alpha35, LAMA5_MOUSE 404,kDa 11.6 13.4 9.9 4.8 4.2 9.6 11.6 6.2 0.54 0.052 0.126 0.900 30.902184 Laminin,subunit,beta31, LAMB1_MOUSE 197,kDa 11.4 13.7 7.7 10.8 7.9 11.7 10.9 10.1 0.93 0.720 0.683 0.166 30.110104 Laminin,subunit,gamma31, LAMC1_MOUSE 177,kDa 20.0 9.1 15.3 18.7 15.7 14.4 14.8 16.3 1.10 0.683 0.588 0.231 0.139108 Galectin31, LEG1_MOUSE 15,kDa 25.1 24.7 16.1 33.2 26.0 23.7 22.0 27.6 1.26 0.239 0.065 1.187 0.33272 Galectin333binding,protein, LG3BP_MOUSE 64,kDa 34.2 27.1 24.8 31.5 37.4 29.1 28.7 32.7 1.14 0.348 0.325 0.488 0.187
510 Lysyl,oxidase,homolog,3, LOXL3_MOUSE 84,kDa 2.0 1.8 1.0 4.8 3.0 0.0 1.6 2.6 1.61 0.530 0.187 0.728 0.69038 Latent3transforming,growth,factor,beta3binding,protein,1, LTBP1_MOUSE 187,kDa 52.5 40.3 47.8 56.6 61.3 44.1 46.9 54.0 1.15 0.317 0.354 0.451 0.204
247 Latent3transforming,growth,factor,beta3binding,protein,4, LTBP4_MOUSE 179,kDa 10.5 2.7 6.7 5.9 6.9 10.8 6.6 7.9 1.18 0.675 0.498 0.303 0.242446 Lumican, LUM_MOUSE 38,kDa 6.6 2.5 1.7 0.0 1.9 1.8 3.6 1.2 0.34 0.220 0.017 1.770 31.542304 Protein3lysine,63oxidase, LYOX_MOUSE 47,kDa 5.1 3.1 4.6 2.1 4.1 3.9 4.2 3.4 0.79 0.374 0.306 0.514 30.336320 Mesencephalic,astrocyte3derived,neurotrophic,factor, MANF_MOUSE 20,kDa 7.2 8.1 8.5 7.2 5.3 12.7 7.9 8.4 1.06 0.836 0.585 0.233 0.088316 Matrilin32, MATN2_MOUSE 107,kDa 2.9 6.9 4.6 3.8 4.7 4.9 4.8 4.5 0.93 0.787 0.697 0.157 30.109369 Macrophage,migration,inhibitory,factor, MIF_MOUSE 13,kDa 7.5 4.0 8.0 6.0 6.1 2.8 6.5 5.0 0.77 0.417 0.105 0.979 30.385151 Mimecan, MIME_MOUSE 34,kDa 14.1 12.2 7.8 13.0 15.3 19.1 11.4 15.8 1.39 0.160 0.075 1.125 0.478268 72,kDa,type,IV,collagenase, MMP2_MOUSE 74,kDa 10.1 5.5 8.7 6.7 6.9 3.1 8.1 5.6 0.69 0.247 0.144 0.842 30.534392 Stromelysin31, MMP3_MOUSE 54,kDa 3.8 4.2 0.9 2.9 3.9 4.4 2.9 3.7 1.28 0.506 0.317 0.499 0.356337 Mesothelin, MSLN_MOUSE 69,kDa 2.2 4.1 6.8 3.2 3.3 5.8 4.3 4.1 0.95 0.893 0.74 0.131 30.07713 Nidogen31, NID1_MOUSE 137,kDa 63.6 70.9 84.7 77.5 92.7 76.7 73.1 82.3 1.13 0.316 0.337 0.472 0.172
357 Nidogen32, NID2_MOUSE 154,kDa 5.4 3.0 6.8 3.2 6.7 3.8 5.1 4.6 0.90 0.766 0.66 0.180 30.145501 NAD(P)H3hydrate,epimerase, NNRE_MOUSE ? 4.1 2.7 0.0 4.1 3.2 2.0 2.3 3.1 1.36 0.577 0.207 0.684 0.447426 Epididymal,secretory,protein,E1, NPC2_MOUSE 16,kDa 4.1 2.7 1.9 2.1 4.3 2.9 2.9 3.1 1.07 0.845 0.637 0.196 0.092473 Olfactomedin3like,protein,3, OLFL3_MOUSE 46,kDa 2.8 2.5 2.6 2.0 4.9 1.8 2.6 2.9 1.08 0.838 0.662 0.179 0.115105 Procollagen,C3endopeptidase,enhancer,1, PCOC1_MOUSE 50,kDa 16.0 22.3 18.3 20.6 21.3 18.7 18.9 20.2 1.07 0.545 0.562 0.250 0.098212 Phosphatidylethanolamine3binding,protein,1, PEBP1_MOUSE 21,kDa 13.4 7.2 8.5 9.2 9.6 4.9 9.7 7.9 0.82 0.507 0.184 0.735 30.29063 Pigment,epithelium3derived,factor, PEDF_MOUSE 46,kDa 27.3 33.6 35.3 29.5 27.2 32.3 32.1 29.6 0.92 0.442 0.465 0.333 30.11431 Basement,membrane3specific,heparan,sulfate,proteoglycan,core,protein, PGBM_MOUSE 398,kDa 38.2 48.7 45.7 81.3 63.5 69.4 44.2 71.4 1.61 0.011 0.069 1.161 0.69125 Biglycan, PGS1_MOUSE 42,kDa 46.0 47.3 49.4 60.9 60.3 48.9 47.6 56.7 1.19 0.085 0.134 0.873 0.25371 Decorin, PGS2_MOUSE 40,kDa 29.7 27.5 22.7 22.1 26.6 45.9 26.6 31.6 1.18 0.552 0.187 0.728 0.24453 Peptidyl3prolyl,cis3trans,isomerase,A, PPIA_MOUSE 18,kDa 46.5 48.7 40.1 38.3 41.5 50.0 45.1 43.3 0.96 0.695 0.545 0.264 30.060
360 Prolactin32C2, PR2C2_MOUSE,(+1) 25,kDa 3.3 2.0 1.9 2.2 6.7 3.8 2.4 4.2 1.76 0.260 0.05 1.301 0.813263 Peroxiredoxin34, PRDX4_MOUSE 31,kDa 7.2 9.8 5.7 9.2 6.4 5.9 7.6 7.2 0.95 0.817 0.66 0.180 30.07884 Profilin31, PROF1_MOUSE 15,kDa 34.6 34.9 24.1 42.2 33.2 29.3 31.2 34.9 1.12 0.515 0.217 0.664 0.163
347 Pentraxin3related,protein,PTX3, PTX3_MOUSE 42,kDa 2.8 3.3 1.7 0.0 0.0 4.4 2.6 1.5 0.56 0.498 0.088 1.056 30.83185 Peroxidasin,homolog, PXDN_MOUSE 165,kDa 15.3 20.1 23.0 17.6 19.6 18.8 19.5 18.7 0.96 0.756 0.75 0.125 30.05848 Sulfhydryl,oxidase,1, QSOX1_MOUSE 83,kDa 44.2 39.7 41.0 32.5 41.5 40.1 41.6 38.0 0.91 0.312 0.452 0.345 30.130
459 Ribonuclease,inhibitor, RINI_MOUSE 50,kDa 2.8 0.8 1.7 1.0 1.0 1.8 1.8 1.2 0.69 0.429 0.259 0.587 30.535182 RNA,binding,motif,protein,,X3linked3like31, RMXL1_MOUSE 42,kDa 13.6 10.6 15.4 14.7 19.1 13.3 13.2 15.7 1.19 0.336 0.272 0.565 0.246199 Ribonuclease,4, RNAS4_MOUSE 17,kDa 14.6 13.2 10.7 12.1 15.3 13.9 12.8 13.8 1.07 0.557 0.483 0.316 0.102431 Ribonuclease,T2, RNT2_MOUSE 30,kDa 2.2 2.0 1.0 5.4 3.3 2.9 1.7 3.9 2.25 0.067 0.026 1.585 1.170102 Sulfated,glycoprotein,1, SAP_MOUSE 61,kDa 23.6 21.4 23.1 23.3 23.9 17.4 22.7 21.5 0.95 0.615 0.639 0.194 30.077270 Stromal,cell3derived,factor,1, SDF1_MOUSE 11,kDa 16.5 9.3 9.4 7.5 13.8 5.6 11.7 9.0 0.76 0.469 0.063 1.201 30.387121 Semaphorin33A, SEM3A_MOUSE 89,kDa 10.1 10.9 14.4 17.2 18.1 10.3 11.8 15.2 1.29 0.285 0.209 0.680 0.368513 Semaphorin33D, SEM3D_MOUSE 90,kDa 2.8 1.7 3.5 0.0 2.9 1.8 2.7 1.6 0.59 0.336 0.156 0.807 30.765440 Slit,homolog,3,protein, SLIT3_MOUSE 168,kDa 4.7 2.5 5.2 3.9 1.9 1.8 4.1 2.5 0.61 0.214 0.206 0.686 30.703120 Superoxide,dismutase,[Cu3Zn], SODC_MOUSE 16,kDa 16.4 12.0 17.2 9.2 21.1 17.5 15.2 15.9 1.05 0.862 0.599 0.223 0.066321 Extracellular,superoxide,dismutase,[Cu3Zn], SODE_MOUSE 27,kDa 4.3 4.1 3.9 3.2 5.6 3.8 4.1 4.2 1.03 0.867 0.77 0.114 0.044437 Spondin32, SPON2_MOUSE 36,kDa 3.3 3.0 1.9 2.2 3.3 1.0 2.7 2.2 0.79 0.502 0.316 0.500 30.34944 SPARC, SPRC_MOUSE 34,kDa 36.7 34.2 39.1 38.2 33.6 33.0 36.7 34.9 0.95 0.474 0.576 0.240 30.06967 Sushi,,von,Willebrand,factor,type,A,,EGF,and,pentraxin,domain3containing,protein,1,SVEP1_MOUSE 387,kDa 57.1 37.3 40.9 17.9 13.7 12.2 45.1 14.6 0.32 0.009 0.013 1.886 31.628
219 Translationally3controlled,tumor,protein, TCTP_MOUSE 19,kDa 9.3 5.4 6.6 10.3 11.7 12.7 7.1 11.6 1.64 0.029 0.026 1.585 0.710528 Tissue,factor,pathway,inhibitor, TFPI1_MOUSE 35,kDa 2.1 0.9 1.9 0.0 4.3 2.9 1.6 2.4 1.49 0.580 0.163 0.788 0.575194 Thioredoxin, THIO_MOUSE 12,kDa 13.5 13.2 6.7 19.6 15.3 12.5 11.2 15.8 1.42 0.199 0.03 1.523 0.505203 Metalloproteinase,inhibitor,1, TIMP1_MOUSE 23,kDa 5.4 14.3 9.6 9.6 8.9 6.8 9.8 8.4 0.86 0.644 0.301 0.521 30.213113 Metalloproteinase,inhibitor,2 TIMP2_MOUSE 24,kDa 23.6 15.2 19.8 14.4 20.3 18.6 19.6 17.8 0.91 0.579 0.373 0.428 30.140

Online Table III. Correlation patterns of circulating miRNAs in the AAA cohort.
Values of miRNA levels were log-transformed before calculation of correlation coefficients. Values are Pearson correlation coefficients between level of miRNAs in 22 controls. Bonferroni-corrected P values are indicated as: *P<0.05, **P<0.01 and ***P<0.001.

Online Table IV. Clinical characteristics of all participants in the AAA screening programme (n=73).
P values were calculated using unpaired t-tests (continuous variables) or Fisher's exact tests (categorical variables).
Variable P value Cases Controls
(n = 32) (n = 41) Age 70.5 (6.7) 66.6 (1.0) <0.001 Hypertension 25 (78%) 15 (37%) <0.001 Diabetes 11 (34%) 4 (10%) 0.018 diameter 3.9 (0.7) 2.0 (0.3) <0.001 Smoking status <0.001 Never 2 (6%) 21 (51%) Ex 22 (69%) 17 (42%) Current 8 (25%) 3 (7%) HPL 18 (56%) 14 (34%) 0.095 COPD 6 (19%) 1 (2%) 0.039 CAD 14 (44%) 3 (7%) 0.001 PVD 8 (25%) 0 (0%) 0.001 PriorCVA 5 (16%) 0 (0%) 0.013 PriorCABG 5 (16%) 1 (2%) 0.08 Major Surgery 15 (47%) 5 (12%) 0.001 Malignancy 9 (28%) 4 (10%) 0.064 BMI 27.1 (4.8) 26.2 (3.1) 0.295 Antiplatelets 20 (63%) 11 (27%) 0.004 Betablockers 12 (38%) 4 (10%) 0.009 Aceinhibitors 15 (47%) 6 (15%) 0.004 Statins 24 (75%) 11 (27%) <0.001
Mean (SD) or n (%)

Online Figure I. Expression of miR-15 family in the aorta of Ang II infused mice. Expression levels of the miR-15 family in the mouse aorta following infusion of Angiotensin II (n=4, per group). MiRNA expression was normalized to U6. *p<0.05, Bonferroni post hoc tests for differences to control. Data presented as means±SD.
Fold
Exp
ress
ion
*

A
C
Fold
Exp
ress
ion
* *
*
*
Rep
orte
r Act
ivity
B
Online Figure II. MiR-195 and miR-29b regulate ECM expression in SMCs. A, Elastin expression in SMCs following overexpression of miR-195 or miR-29b as assessed by QPCR. Beta- actin was used as a normalization control. B, Reporter assays using vectors harboring putative binding sites for miR-195 and C, miR-29b in the coding region and the 3’UTR of elastin respectively. The reporter vectors (100 ng of psiCheck2 construct) were transfected together with 20 nM of miR-195, miR-29b mimic or the mimic negative control (Control) in triplicate into mouse aortic smooth muscle cells using Lipofectamine 2000 (Lifetech). Renilla 3′UTR-coupled luciferase activity was normalized to constitutive firefly luciferase activity for each well. D, Quantification of the zymography experiment using the Image J software. Three independent experiments were assessed. *, p<0.05 compared to control.
Rep
orte
r Act
ivity
D
Arb
itrar
y un
its (A
U)
*
Elastin (Eln)
MMP-9 (zymography)

Online Figure III. Effect of antagomiR-195 in the mouse aorta. Correlation between the efficiency of miR-195 knockdown and the derepression of 30 ECM genes as quantified by QPCR. Gene expression was normalized to beta-actin.

Online Figure IV. Effect of antagomiR-195 in the mouse aorta. Bean plots depicting the expression levels of the 30 ECM genes following antagomiR-195 administration. Expression was normalized to beta-actin. RQ: Relative Quantification
AntagomiR-CON AntagomiR-195
RQ
R
Q

Online Figure IV. Effect of antagomiR-195 in the mouse aorta. Bean plots depicting the expression levels of the 30 ECM genes following antagomiR-195 administration. Expression was normalized to beta-actin. RQ: Relative Quantification
RQ
R
Q
AntagomiR-CON AntagomiR-195

Online Figure IV. Effect of antagomiR-195 in the mouse aorta. Bean plots depicting the expression levels of the 30 ECM genes following antagomiR-195 administration. Expression was normalized to beta-actin. RQ: Relative Quantification
RQ
R
Q
AntagomiR-CON AntagomiR-195

Online Figure V. Effect of antagomiR-29b in the mouse aorta. Correlation between the efficiency of miR-29b knockdown and the derepression of 30 ECM genes as quantified by QPCR. Gene expression was normalized to beta-actin.

Online Figure VI. Effect of antagomiR-29b in the mouse aorta. Bean plots depicting the expression levels of the 30 ECM genes following antagomiR-29b administration. Expression was normalized to beta-actin. RQ: Relative Quantification
AntagomiR-CON AntagomiR-29b
RQ
R
Q

Online Figure VI. Effect of antagomiR-29b in the mouse aorta. Bean plots depicting the expression levels of the 30 ECM genes following antagomiR-29b administration. Expression was normalized to beta-actin. RQ: Relative Quantification
RQ
R
Q
AntagomiR-CON AntagomiR-29b

Online Figure VI. Effect of antagomiR-29b in the mouse aorta. Bean plots depicting the expression levels of the 30 ECM genes following antagomiR-29b administration. Expression was normalized to beta-actin. RQ: Relative Quantification
RQ
R
Q
AntagomiR-CON AntagomiR-29b

Online Figure VII. Regulation of the ECM by miR-29b in the liver. A, Expression levels of the miR-29 family in the liver following antagomiR-29b administration. MiRNA expression was normalized to U6. B, Hepatic elastin expression following antagomiR treatment. C, Correlation between the efficiency of miR-29b knockdown and the derepression of ECM genes as quantified by QPCR. Gene expression was normalized to beta-actin (n=5, per group). *p<0.05 compared to AntagomiR-CON. RQ, relative quantification.
A B
RQ
Fold
Exp
ress
ion
*
Elastin p=0.0099
AntagomiR-CON AntagomiR-29b

Online Figure VII. Regulation of the ECM by miR-29b in the liver. A, Expression levels of the miR-29 family in the liver following antagomiR-29b administration. MiRNA expression was normalized to U6. B, Hepatic elastin expression following antagomiR treatment. C, Correlation between the efficiency of miR-29b knockdown and the derepression of ECM genes as quantified by QPCR. Gene expression was normalized to beta-actin (n=5, per group). *p<0.05 compared to AntagomiR-CON. RQ, relative quantification.
Cor
rela
tion
C

Online Figure VIII. Uptake of antagomiRs by the mouse aorta. Angiotensin II (Ang II, 1µg/kg/min) was infused to ApoE-/- mice using subcutaneously implanted osmotic minipumps and Cy3 labeled antagomiRs (80mg/kg/day) were injected intraperitoneally for three consecutive days. A substantial incorporation of the antagomiR in the media layer was observed on day 6. Red: Cy3 labeled antagomiR, Green: Smooth muscle actin (SMA), Blue: DAPI.
Cy3 SMA
DAPI Merge
14 µm 14 µm
14 µm 14 µm
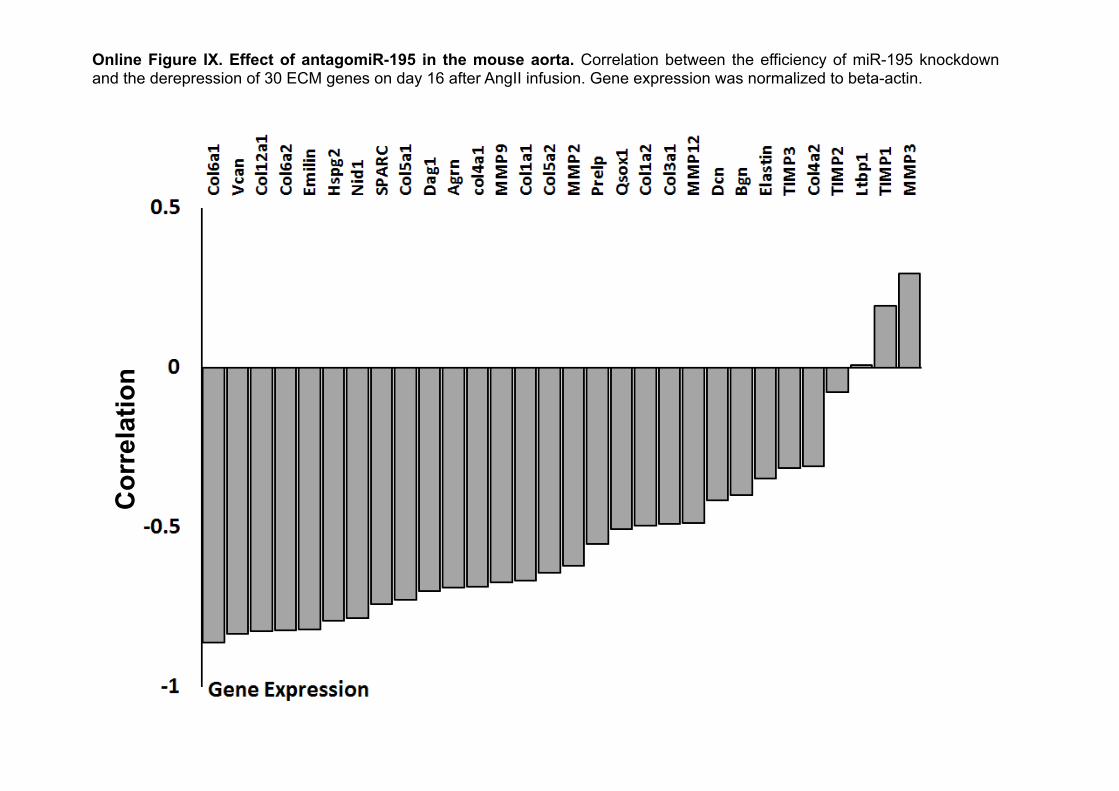
Online Figure IX. Effect of antagomiR-195 in the mouse aorta. Correlation between the efficiency of miR-195 knockdown and the derepression of 30 ECM genes on day 16 after AngII infusion. Gene expression was normalized to beta-actin.
Cor
rela
tion

50 µm 50 µm
50 µm 50 µm
Online Figure X. Immunohistochemistry. MMP9 expression in aortic sections following miR-195 inhibition in Ang II-infused mice.

Online Figure XI. MiRNAs associated with aortic diameter. Linear regression adjusted for age and miR-195, matched on hypertension and diabetes (n=44, for details see Methods). Expression levels were normalised to exogenous cel-miR-39 spike-in control.
Log miR-130b Log miR-20a Log miR-126 Log miR-363 Log miR-328 Log miR-423-5p Log miR-145 Log miR-27a Log miR-139-3p Log miR-133a Log miR-143 Log miR-340 Log miR-99a Log miR-125b Log miR-148a
MiRNA
0.37 (0.05, 0.69) 0.33 (-0.21, 0.88) 0.31 (-0.15, 0.76) 0.27 (-0.07, 0.60) 0.26 (-0.04, 0.55) 0.26 (-0.01, 0.52) 0.23 (-0.10, 0.56) 0.20 (-0.25, 0.64) 0.18 (-0.06, 0.42) 0.17 (-0.13, 0.48) 0.15 (-0.14, 0.44) 0.05 (-0.33, 0.44) 0.00 (-0.29, 0.29) -0.07 (-0.51, 0.38) -0.22 (-0.58, 0.14)
0.030 0.235 0.198 0.124 0.093 0.063 0.184 0.387 0.144 0.276 0.318 0.788 0.991 0.772 0.232
P-value
0 -1 -.5 0 .5 1
Aortic diameter difference per 1 SD higher level of miRNA (95% CI)

Online Figure XII. MiRNAs associated with AAA. Logistic regression adjusted for age and miR-195, matched on diabetes and hypertension (n=22 per group, for details see Methods). Expression levels were normalised to exogenous cel-miR-39 spike-in control.
Log miR-133a Log miR-363 Log miR-126 Log miR-145 Log miR-20a Log miR-130b Log miR-423-5p Log miR-27a Log miR-328 Log miR-139-3p Log miR-99a Log miR-143 Log miR-148a Log miR-340 Log miR-125b
MiRNA
5.30 (1.10, 25.40) 4.08 (0.88, 18.85) 3.80 (0.81, 17.91) 3.31 (1.04, 10.51) 2.73 (0.48, 15.39) 2.43 (0.92, 6.42) 2.36 (0.96, 5.79) 2.18 (0.59, 7.98) 2.09 (0.83, 5.25) 1.36 (0.66, 2.78) 1.28 (0.56, 2.94) 1.13 (0.48, 2.64) 0.89 (0.32, 2.50) 0.85 (0.31, 2.33) 0.66 (0.20, 2.15)
Odds ratio for presence of AAA per 1 SD higher level of miRNA (95% CI)
0.037 0.072 0.091 0.042 0.255 0.072 0.061 0.240 0.118 0.402 0.562 0.785 0.832 0.757 0.492
P-value
1 .05 .1 .25 .5 1 2 4 8 16 32

Online Figure XIII. MiRNAs associated with aortic diameter. Linear regression adjusted for age, hypertension and diabetes (n=73, for details see Methods). Expression levels were normalised to exogenous cel-miR-39 spike-in control.
Log miR-143 Log miR-133a Log miR-139-3p Log miR-363 Log miR-99a Log miR-423-5p Log miR-328 Log miR-130b Log miR-145 Log miR-27a Log miR-340 Log miR-126 Log miR-20a Log miR-125b Log miR-148a Log miR-195
MiRNA
0.21 (-0.03, 0.45) 0.14 (-0.09, 0.38) 0.11 (-0.12, 0.35) 0.11 (-0.17, 0.39) 0.04 (-0.19, 0.27) 0.02 (-0.23, 0.28) -0.02 (-0.26, 0.22) -0.04 (-0.28, 0.19) -0.06 (-0.32, 0.20) -0.22 (-0.47, 0.02) -0.23 (-0.46, 0.00) -0.24 (-0.46, -0.01) -0.24 (-0.47, -0.02) -0.25 (-0.49, -0.01) -0.29 (-0.48, -0.09) -0.34 (-0.56, -0.12)
Aortic diameter difference per 1 SD higher level of miRNA (95% CI)
0.089 0.241 0.352 0.459 0.718 0.848 0.880 0.714 0.631 0.072 0.058 0.043 0.037 0.042 0.006 0.003
P-value
0 -1 -.5 0 .5 1

MiRNA Odds ratio for presence of AAA per 1 SD higher level of miRNA (95% CI)
P-value
1 .1 .25 .5 1 2 4
1.87 (0.93, 3.76)
1.85 (0.94, 3.65)
1.37 (0.71, 2.64)
1.24 (0.63, 2.47)
1.16 (0.62, 2.19)
1.09 (0.61, 1.94)
1.04 (0.54, 1.99)
1.03 (0.56, 1.87)
0.92 (0.51, 1.64)
0.62 (0.32, 1.20)
0.60 (0.33, 1.11)
0.58 (0.33, 1.02)
0.56 (0.29, 1.05)
0.52 (0.27, 1.02)
0.49 (0.24, 1.00)
0.39 (0.19, 0.80)
0.078
0.077
0.345
0.534
0.640
0.767
0.904
0.930
0.766
0.157
0.106
0.057
0.070
0.058
0.051
0.010
Log miR-133a
Log miR-143
Log miR-139-3p
Log miR-363
Log miR-423-5p
Log miR-99a
Log miR-145
Log miR-328
Log miR-130b
Log miR-27a
Log miR-126
Log miR-148a
Log miR-340
Log miR-20a
Log miR-125b
Log miR-195
Online Figure XIV. MiRNAs associated with AAA. Logistic regression adjusted for age, hypertension and diabetes (n=32 case, n=41 controls, for details see Methods). Expression levels were normalised to exogenous cel-miR-39 spike-in control.

Samples
Ct v
alue
(cyc
les)
Online Figure XV. MiR-29b assessment in plasma samples. Expression levels of miR-29b were evaluated by QPCR and presented as unadjusted Ct values (cycles). The majority of samples demonstrate Ct>32 cycles indicating that miR-29b cannot be reliably quantified in these samples.

Waltham, Rene Botnar, Alberto Smith and Manuel MayrBarallobre-Barreiro, Chris Molenaar, Po-Wah So, Abeera Abbas, Marjan Jahangiri, Matthew
Xiaoke Yin, Sarah R. Langley, Peter Willeit, Ruifang Lu, Bruce Fanshawe, Marika Fava, Javier Anna Zampetaki, Rizwan Attia, Ursula Mayr, Renata S.M. Gomes, Alkystis Phinikaridou,
Role of miR-195 in Aortic Aneurysmal Disease
Print ISSN: 0009-7330. Online ISSN: 1524-4571 Copyright © 2014 American Heart Association, Inc. All rights reserved.is published by the American Heart Association, 7272 Greenville Avenue, Dallas, TX 75231Circulation Research
doi: 10.1161/CIRCRESAHA.115.3043612014;115:857-866; originally published online September 8, 2014;Circ Res.
http://circres.ahajournals.org/content/115/10/857World Wide Web at:
The online version of this article, along with updated information and services, is located on the
http://circres.ahajournals.org/content/suppl/2014/09/08/CIRCRESAHA.115.304361.DC1.htmlData Supplement (unedited) at:
http://circres.ahajournals.org//subscriptions/
is online at: Circulation Research Information about subscribing to Subscriptions:
http://www.lww.com/reprints Information about reprints can be found online at: Reprints:
document. Permissions and Rights Question and Answer about this process is available in the
located, click Request Permissions in the middle column of the Web page under Services. Further informationEditorial Office. Once the online version of the published article for which permission is being requested is
can be obtained via RightsLink, a service of the Copyright Clearance Center, not theCirculation Researchin Requests for permissions to reproduce figures, tables, or portions of articles originally publishedPermissions:
by guest on May 22, 2015http://circres.ahajournals.org/Downloaded from


