Embed Size (px)
Citation preview
Science of the Total Environment 719 (2020) 137461
Contents lists available at ScienceDirect
Science of the Total Environment
j ourna l homepage: www.e lsev ie r .com/ locate /sc i totenv
Right tree, right place (urban canyon): Tree species selection approachfor optimum urban heat mitigation - development and evaluation
Tobi Eniolu Morakinyo a,b,⁎, Wanlu Ouyang c, Kevin Ka-Lun Lau a, Chao Ren a,d, Edward Ng a,c
a Institute of Future Cities, The Chinese University of Hong Kong, New Territories, Hong Kongb School of Geography, University College Dublin, Dublin, Irelandc School of Architecture, The Chinese University of Hong Kong, New Territories, Hong Kongd Faculty of Architecture, The University of Hong Kong, Pokfulam, Hong Kong
H I G H L I G H T S G R A P H I C A L A B S T R A C T
• A “Right tree, right place” approach foroptimum urban heat mitigation wasproposed.
• The approachwas developed and evalu-ated through a parametric case studyunder hot-humid prevailing climate.
• Proposed approach was found signifi-cantly more efficient compared to twoothers in a realistic urban neighbor-hood.
• Heat reduction potential of trees waslocation-dependent and species-specific.
⁎ Corresponding author at: Institute of Future Cities, ThE-mail addresses: [email protected], tobimorak@
https://doi.org/10.1016/j.scitotenv.2020.1374610048-9697/© 2020 Elsevier B.V. All rights reserved.
a b s t r a c t
a r t i c l e i n f oArticle history:Received 4 November 2019Received in revised form 18 February 2020Accepted 19 February 2020Available online 21 February 2020
Editor: Scott Sheridan
The re-integration of trees into the urban landscape is a veritable strategy for urban climatemitigation and adap-tation. However, dysfunctional trees in terms of urban heat mitigation are dominant in many sub-tropical cities'landscapes due to the lack of scientific basis of tree selection. Therefore, this study proposes and evaluates amethodological framework as an approach for “right tree, right place” for urban heat mitigation through para-metric ENVI-met simulations that involve the combination of 54 generic tree forms and 10 characteristic urbanmorphology – Sky-View Factor (SVF). Results show variable temperature regulation by tree forms (species)with varying magnitude in different urban morphology. Daytime and nighttime temperature regulation effectswere between 0.3 °C – 1.0 °C and 0.0 °C – 2.0 °C, respectively depending on tree forms and SVF value. Further-more, the Heat Reduction Potential (HRP) of trees formswere determined in terms of their human thermal com-fort improvement. In general, we found a range of +5% and − 20% depending on SVF, negative and positivevalues imply heat reduction and increment, respectively. With the competing shading effect of buildings, theHRP of trees reduces from high to low SVF area with variable magnitude among tree forms (species). Hence,the proposedmorphology-based tree selection approachwas evaluated by comparisonwith two uninformed se-lection approaches in a realistic urban neighborhood in Hong Kong. Results clearly indicate the proposedapproach's capability in improving human thermal comfort by up two times more than either of the other ap-proaches. Finally, evidence-based recommendations were given for the reference of policy-makers when theymake urban green development plan.
© 2020 Elsevier B.V. All rights reserved.
Keywords:UHI, thermal comfortTree-plantingTree forms (species)Street-canyonUrban densities
e Chinese University of Hong Kong, New Territories, Hong Kong.yahoo.com (T.E. Morakinyo).
2 T.E. Morakinyo et al. / Science of the Total Environment 719 (2020) 137461
1. Introduction
1.1. Background of study
Cities are amalgam of “grey” (such as residential and industrialbuildings, roads, utilities and parking lots); “blue” (such aswaterbodies; lakes, rivers, ponds and water channels); and “green”(such as trees, shrubs and grasses in green spaces and streets) infra-structures which all interact with the prevailing weather conditionsto determine the local micro-climate and thermal comfort percep-tion of urban dwellers. Most densely populated cities have now be-come concrete jungles deficient of the natural ecosystem due to therapid increases in the global urban population resulting in unprece-dented growth in the “grey” at the detriment of the “blue” and“green” infrastructures, especially, trees which is the focus of thisstudy.
Consequently, a huge amount of energy is absorbed by the abun-dant paved surfaces during the daytime which results in thewarming of the immediate atmosphere. At nighttime, the absorbedenergy during solar hours is released, warming up the cities to ahigher degree than surrounding rural areas, a phenomenon often re-ferred to as Urban Heat Island (UHI) effect (Oke, 1988). This effect isintensified by the increasing global mean surface and air tempera-ture projected to further increase by 2.6–4.8 °C and 2–4 °C, respec-tively by the end of this century especially in urban areas (Brysseet al., 2013; Chairs et al., 2014). Thus, higher frequency and intensityof summer temperature extremes, urban heat stress or thermal dis-comfort, and heatwaves have been observed in most tropical coun-tries and has led to heat-related mortality and morbidity asreported around the world (Zittis et al., 2014; Lhotka and Kyselý,2015; Wang et al., 2019). Also, cooling energy consumption is highlycorrelated with urban overheating as increases in urban tempera-ture is a precursor to energy consumption in many cities by increas-ing the demand for refrigeration and air conditioning; and reducingspace heating demand (Morakinyo et al., 2019; Santamouris et al.,2017).
One of the sustainable methods of dealing with this problem is theimplementation of urban climate mitigation and adaptation strategiessuch as the innovative choice and combination of urban fabrics, mor-phology, and re-integration of green infrastructures into the city plan-ning and design (Morakinyo et al., 2017a; Lobaccaro and Acero, 2015).In particular, increasing the coverage of green infrastructures (espe-cially trees) within our cities cannot be overemphasized due to theirshading and transpirational cooling capacities. Knowing this, several cit-ies have developed tree planting policies which have resulted in an in-crease in the coverage of green spaces especially within their heatisland hotspots (Müller et al., 2013; Klemm et al., 2015). However, re-cent studies have shown that trees cooling capacity is not the samebut varies from species to species due to their different physical or struc-tural characteristics and their location of placement in an urban envi-ronment (Morakinyo et al., 2017b; de Abreu-Harbich et al., 2015; Tanet al., 2017; Kong et al., 2017). Hence, an improved cooling benefit canbe realized if the right tree species are selected for the right location.Meanwhile, there is scant documentation of tree species selection strat-egies for urban heat mitigation for many cities. Thus, the study aims todevelop, evaluate, and implement a generalized methodology that en-ables urban planners, foresters and landscaper architects to select theright tree species, in the right place (local environment) for optimumurban heat mitigation. The proposed methodology is founded on inves-tigations of the relationship between tree forms (species), thermal per-formances and urban morphology.
1.2. Urban morphology and cooling potential of trees
As stated earlier, some previous studies (Morakinyo et al., 2017b;Tan et al., 2017; Kong et al., 2017; Tan et al., 2015) have revealed a
relationship between urban morphology and trees' performance forurban heat mitigation. Such a relationship is expatiated in this sec-tion. Urban morphology characterized by the canyon's sky-view fac-tor (SVF) which is the degree of sky visibility within street canyons(Gong et al., 2018) when trees and other elements view factors arenot considered, is one of the primary determinants of the thermalenvironment of an area. This is because it determines the dailysolar exposure and exposed human heat balance (Oke, 1988; Oke,1973). Several studies have shown a linear relationship betweenurban morphology (i.e. SVF or aspect ratio) and urban microclimate,nocturnal urban heat island (UHI) effect and human thermal comfort(Morakinyo et al., 2017b; Tan et al., 2017; Tan et al., 2015; Johansson,2006). Specifically, Johansson (Johansson, 2006) found daytime airand surface temperature are lower in deeper than shallow canyons(i.e. low SVF) because of solar blocking and shadowing effect of tallerbuildings when anthropogenic heating was not considered. Also,daytime relative humidity was found to be higher in such deep can-yons whereas wind speed was also found to be lower and more sta-ble than in shallow canyons. Furthermore, urban heat islandintensity is higher in deep than shallow canyons which are causedby the trapping for longwave radiation in such canyon while the re-verse is true for shallow canyons (Oke, 1988; Johansson andEmmanuel, 2006). Giridharan et al. (Giridharan et al., 2004) furtherreported that a 1% reduction in SVF would reduce the daytime UHIintensity by 1–4% under subtropical climatic conditions. Thus, interms of thermal comfort typified by mean radiant temperature(MRT)or Physiological Equivalent Temperature (PET), the deepstreet canyons are often more thermally comfortable (i.e. lowerMRT and PET) than their shallow or open counterparts (Morakinyoet al., 2017b; Morakinyo and Lam, 2016).
Another shading element aside buildings' shadow are trees, theyhelp in urban heat mitigation and improvement of the thermal envi-ronment through their shading and evaporative cooling capacities.Therefore, the shadow-cast effect of buildings which could eithercomplement or outweigh the tree shading potential especially indeep canyons and vice-versa for open and shallow street canyon(Morakinyo et al., 2017b; Morakinyo et al., 2018). Understandingthe relationship between these two shading factors could further in-form a morphology-based urban planning guidelines and strategies.For instance, a profound difference was found between air tempera-ture reduction of a tree-shaded and unshaded area in high SVF do-main even though the differences with medium-low SVF is notsignificant (Tan et al., 2015; Morakinyo and Lam, 2016; Ali-ToudertandMayer, 2006). However, in terms of radiation shading, a substan-tial reduction under trees was found in medium-low SVFs than theirhigh SVF counterparts mainly because of the additional shading byshadow-cast effects (Morakinyo et al., 2017b; Tan et al., 2015;Morakinyo and Lam, 2016).
However, the tree-shading effect on mean radiant temperature wasmore sensitive to the building morphology of the site(Ali-Toudert andMayer, 2006) and more evident under cloudy conditions than undersunny conditions(Tan et al., 2017). Norton et.al (Norton et al., 2015) de-veloped an urban tree planting prioritization scheme based on this un-derstandingwhich accorded lowpriority in a highly dense urban settingand vice-versa for open-low density areas. While their framework is ef-ficient at identifying suitable planting locations for heat mitigation, it isvoid of tree species selection technique or approach for optimum urbanheatmitigation.Meanwhile, recent studies have shown variable coolingeffects and heat mitigation outcomes (i.e. solar attenuation, air cooling,and thermal comfort improvement with different tree-species. Suchvariability in the cooling effects have been found to be related to the dif-ferences in their morphological or structural characteristics such asheight, foliage density, crown diameter, shape, trunk height, leaves'thickness and colour, and tree trunk and branches' architecture(Morakinyo et al., 2017b; de Abreu-Harbich et al., 2015; Kong et al.,2017; Lin and Lin, 2010). Thus, as an assumption in this paper, tree
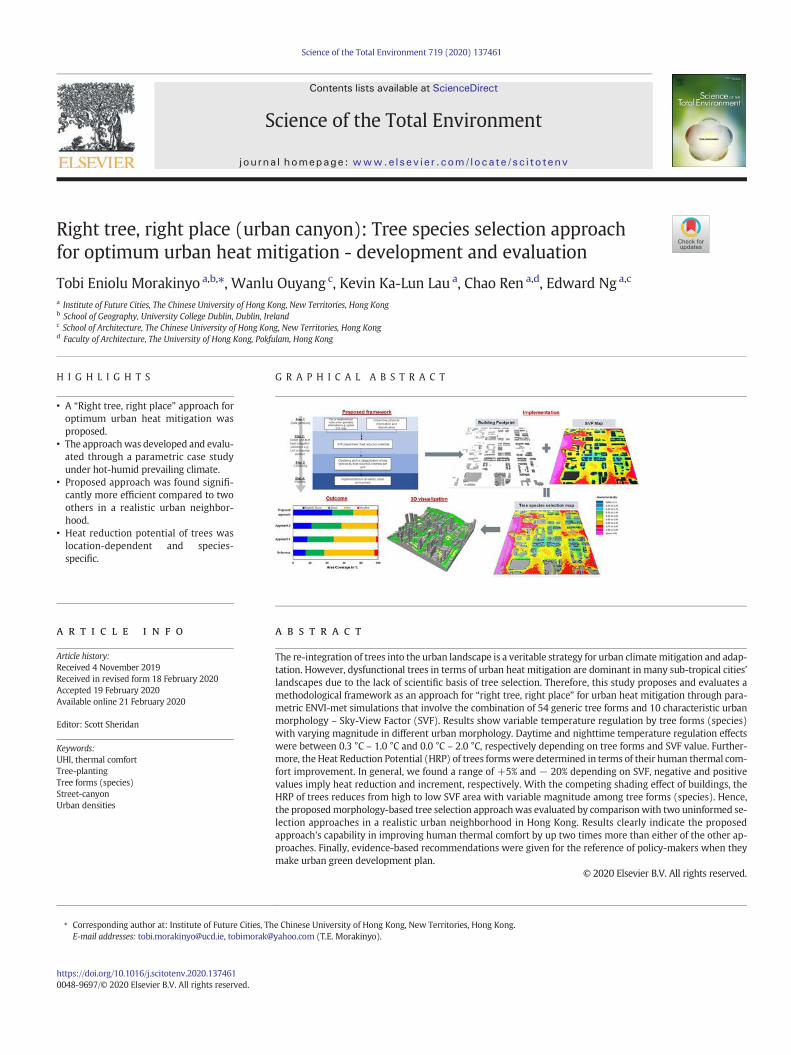
Urban tree physical information and
classification
Clustering and re-categorization of tree species by heat reduction potential per
SVF
City or neighborhood scale urban geometry information e.g. spatial
SVF map
Implementation in a realistic urban environment
Step 1: Data gathering
Step 2: Select and test heat mitigation indicators e.g. UHI or thermal
comfort
Step 3: Clustering
Step 4: Practice
SVF-based trees’ heat reduction potential
Fig. 1. Proposed right tree species, right place selection methodological framework for urban heat mitigation.
3T.E. Morakinyo et al. / Science of the Total Environment 719 (2020) 137461
species are equated to tree form, hence, parameterized using four mor-phological characteristics i.e. height, trunk height, foliage density andcrown diameter”.
The aim of the present study is to introduce, implement and eval-uate a generalized methodological framework for right tree-speciesselection for urban heat mitigation through the relationship betweenurban morphology characterized by SVF and tree morphologywhich in this study is assumed to be a proxy to tree species Unlikeprevious studies, the full range (i.e. 0 to 1) of SVF is considered to-gether with 54 forms of trees developed based on a generic tree clas-sification scheme parameterized by foliage density, tree height,trunk height, and crown diameter. The goal is to propose urban mor-phology (i.e. SVF) as a tool to select appropriate trees form (or treespecies) capable of mitigating urban heat in a certain street or
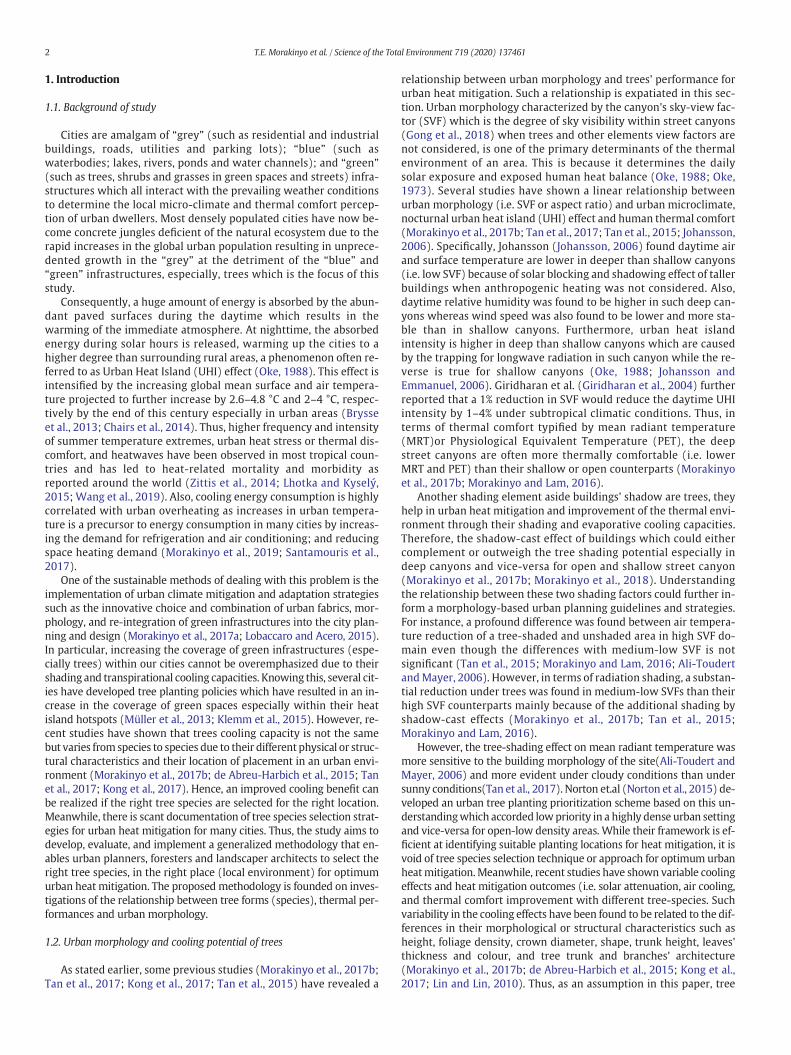
Urban Geometry
Full range of Sky-View Factor ( 0
Ten (10) SVF = 0.16, 0.25, 0.31, 00.54. 0.60, 0.79 , 0.83 and 1.0
Derive relationship among ucharacteristics and urban hea
a rea
Step 1: SelectUrban
Infrastructure
Step 2: Parameterization
Step 3: Numerical Simulation
Step 4: Tree selection
strategies
Develop and scenarios using
hot-hum
Fig. 2. A methodological framework for right tree species
urban domain. This method has two main advantages: 1) detectionand prioritization of locations or hotspots for greening interven-tions; 2) assist in planting the right trees at the right place. Withthe right description of the form or morphology of trees that couldmeet the thermal needs of an urban environment, correspondingtree species can be easily selected for planting thus reducing dys-functional, inefficient and under-utilized trees in the urban domain.In addition to the optimal thermal benefits, this method can aid therealization of high diversity of species and genera has been sug-gested as a key requirement to have and maintain a healthy and sus-tainable urban tree population (Giridharan et al., 2004; Morakinyoand Lam, 2016). Results provide planning recommendations for pro-fessionals and policy/decision-makers on cities' tree planting plansand the maintenance of an urban microclimate.
Urban trees
Using tree physical information such as tree height, trunk height , foliage density and crown diameter 54 tree forms were
developed
to 1)
.45,
rban geometry, generalized tree physical t mitigation potential and implementation in listic neighborhood
simulate parametric model the ENVI-met model under id prevailing climate
, right place for urban heat mitigation in Hong Kong.
(a) (b)
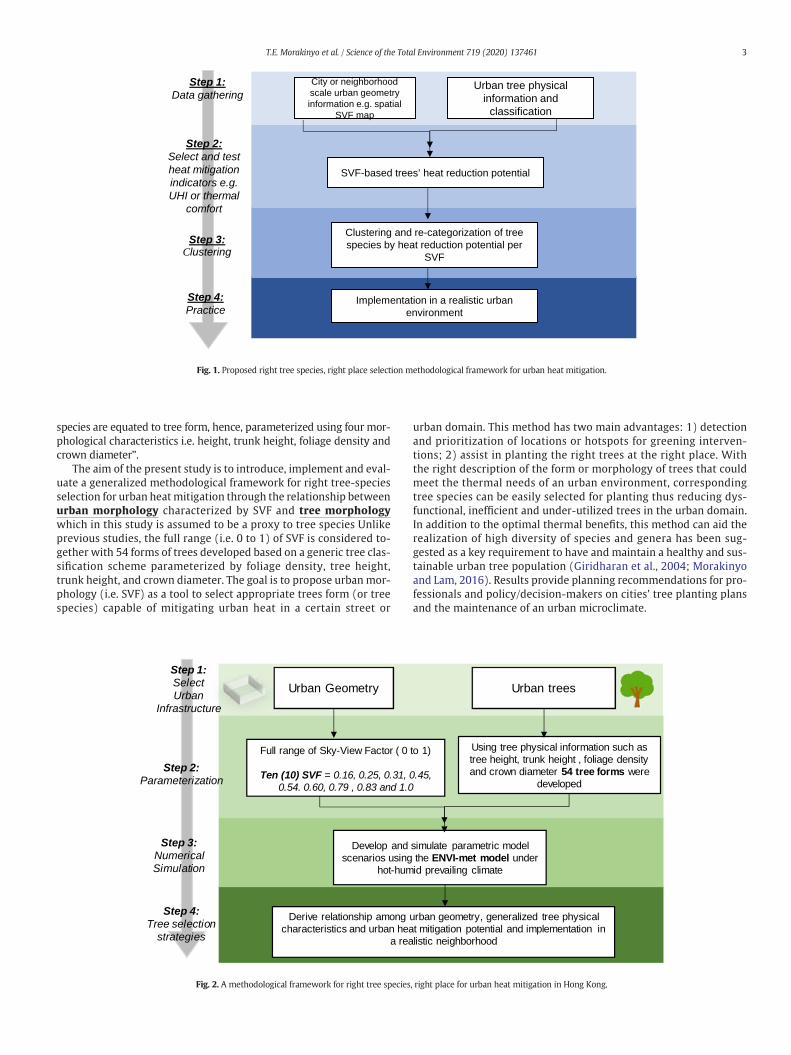
Fig. 3. (a)Typical Hong Kongurbanmorphology and buildings (source: Google images) (b) Sky-view factor distribution in the dense Tsim Shai Tsui area of Hong Kong (source: (Chen et al.,2012))
4 T.E. Morakinyo et al. / Science of the Total Environment 719 (2020) 137461
2. The “right tree, right place” approach for optimum urban heatmitigation
This section presents the “right tree, right canyon” selection ap-proach which adopts the generalization procedure that enables thequantification of the trees' thermal effect for any urban location undera particular prevailing climate. The approach is applicable in any city
y = 0.7318e-0.43x
R² = 0.8989
0.00.10.20.30.40.50.60.70.80.91.0
0.0 2.0 4.0 6.0 8.0
FVS detaluclaC
Height-to-width ratio
Selected SVF
y
0.1
0.2
0.3
0.4
0.1 0.2
IVNE-
)muidop hti
w( FVS tem
ENVI-met SVF
(a)
(c)
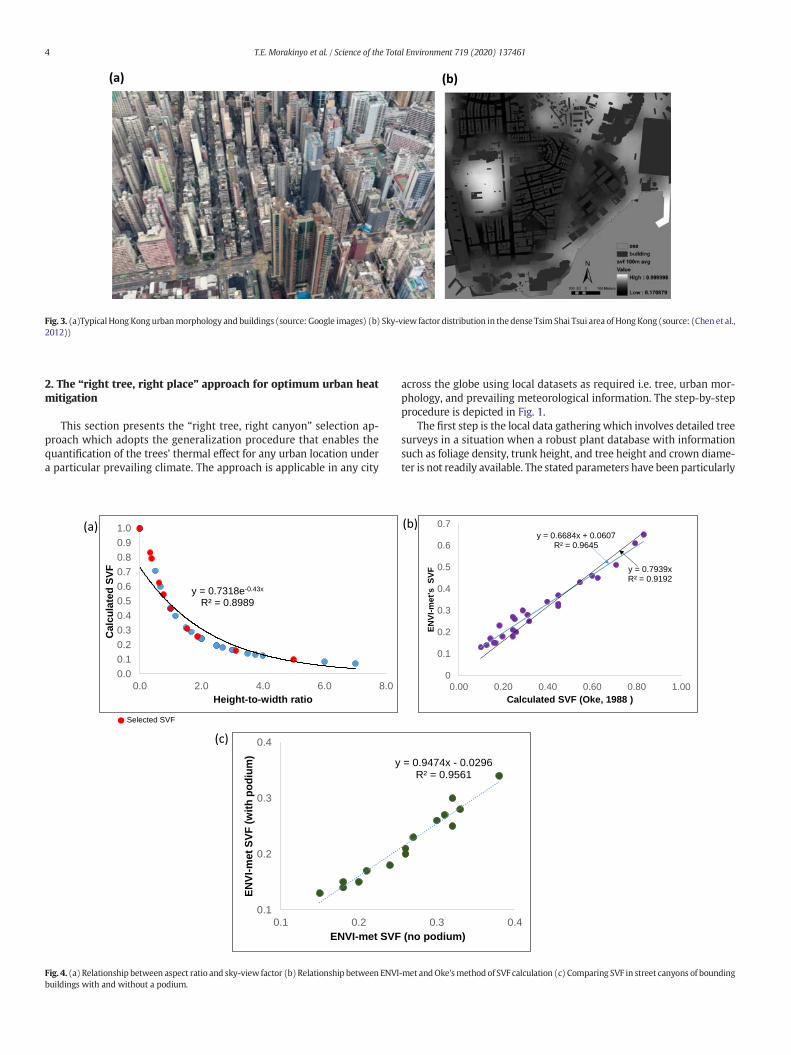
Fig. 4. (a) Relationship between aspect ratio and sky-view factor (b) Relationship between ENVIbuildings with and without a podium.
across the globe using local datasets as required i.e. tree, urban mor-phology, and prevailing meteorological information. The step-by-stepprocedure is depicted in Fig. 1.
The first step is the local data gathering which involves detailed treesurveys in a situation when a robust plant database with informationsuch as foliage density, trunk height, and tree height and crown diame-ter is not readily available. The stated parameters have been particularly
y = 0.6684x + 0.0607R² = 0.9645
y = 0.7939xR² = 0.9192
0
0.1
0.2
0.3
0.4
0.5
0.6
0.7
0.00 0.20 0.40 0.60 0.80 1.00
IVNE-
FVS s'tem
Calculated SVF (Oke, 1988 )
= 0.9474x - 0.0296R² = 0.9561
0.3 0.4 (no podium)
(b)
-met andOke'smethodof SVF calculation (c) Comparing SVF in street canyons of bounding
5T.E. Morakinyo et al. / Science of the Total Environment 719 (2020) 137461
found to be correlated to the cooling capacity of trees (Morakinyo et al.,2018; Lin and Lin, 2010; Shashua-Bar et al., 2011). By permutation andcombination, several forms of trees which essentially represent differ-ent tree species can be derived. With the different combinations of theselected trees' structural parameters, 54 different tree forms are possi-ble, and any tree across the world have a high chance of falling in oneof the forms.
As an urban-focusedmethodology, the parameterization of the builtenvironment is quite important. Due to the possibility of spatial visual-ization, the canyon's sky-view factor (SVF) defined as the degree of skyvisibility within street canyons or open-space (Gong et al., 2018) is rec-ommended as the urban morphology indicator and adopted in our im-plementation case study. It is important to note that SVF here does notconsider the view factors of trees and other elements. Combining boththe urban morphology and urban tree species datasets, we can haveseveral test scenarios of tree forms (i.e. tree species) in different urbancanyons (SVF).
In the second step, the heat reduction potential of each combina-tion of tree form and urban morphology is evaluated using a
Open area without tree Open area with tree
Street canyon without tree Street canyon with tree
H
W
= htgnel noynaC
50m
Sec�on of analysis
Receptor
(a) (b)
(d)
(i
Tree-lined in the m
(c)
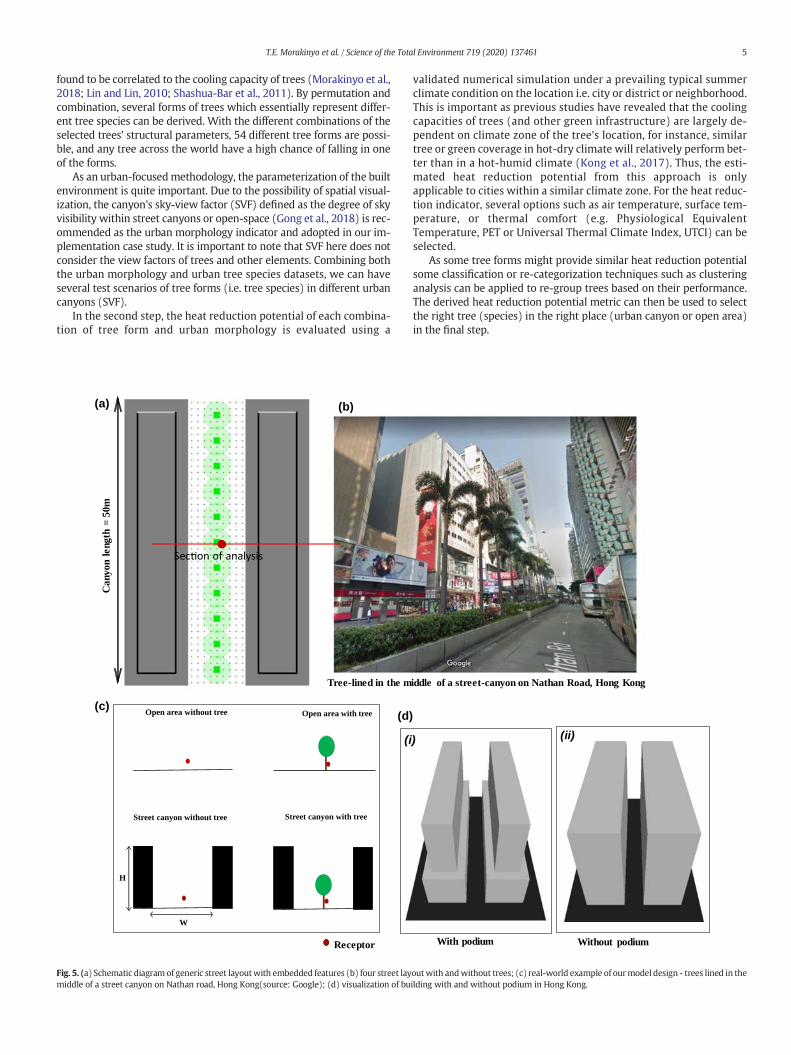
Fig. 5. (a) Schematic diagram of generic street layoutwith embedded features (b) four street laymiddle of a street canyon on Nathan road, Hong Kong(source: Google); (d) visualization of bu
validated numerical simulation under a prevailing typical summerclimate condition on the location i.e. city or district or neighborhood.This is important as previous studies have revealed that the coolingcapacities of trees (and other green infrastructure) are largely de-pendent on climate zone of the tree's location, for instance, similartree or green coverage in hot-dry climate will relatively perform bet-ter than in a hot-humid climate (Kong et al., 2017). Thus, the esti-mated heat reduction potential from this approach is onlyapplicable to cities within a similar climate zone. For the heat reduc-tion indicator, several options such as air temperature, surface tem-perature, or thermal comfort (e.g. Physiological EquivalentTemperature, PET or Universal Thermal Climate Index, UTCI) can beselected.
As some tree forms might provide similar heat reduction potentialsome classification or re-categorization techniques such as clusteringanalysis can be applied to re-group trees based on their performance.The derived heat reduction potential metric can then be used to selectthe right tree (species) in the right place (urban canyon or open area)in the final step.
With podium Without podium
) (ii)
iddle of a street-canyon on Nathan Road, Hong Kong
outwith andwithout trees; (c) real-world example of ourmodel design - trees lined in theilding with and without podium in Hong Kong.
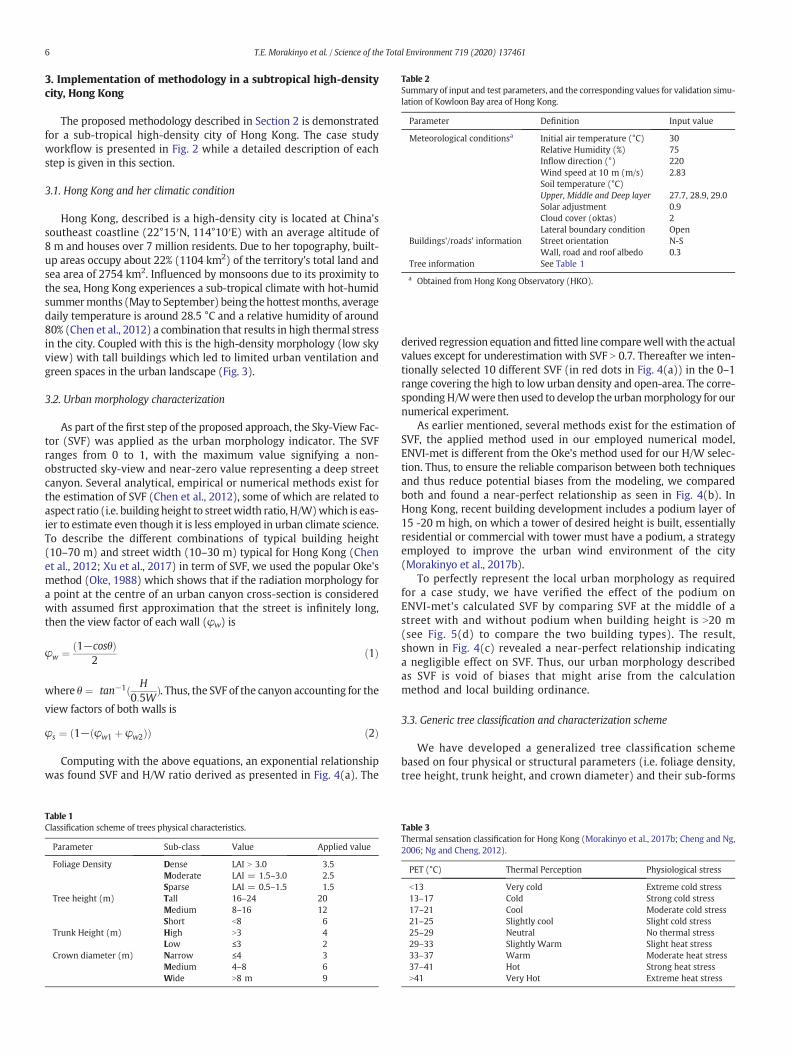
Table 2Summary of input and test parameters, and the corresponding values for validation simu-lation of Kowloon Bay area of Hong Kong.
Parameter Definition Input value
Meteorological conditionsa Initial air temperature (°C)Relative Humidity (%)Inflow direction (°)Wind speed at 10 m (m/s)Soil temperature (°C)Upper, Middle and Deep layerSolar adjustmentCloud cover (oktas)Lateral boundary condition
30752202.83
27.7, 28.9, 29.00.92Open
Buildings'/roads' information Street orientationWall, road and roof albedo
N-S0.3
Tree information See Table 1
a Obtained from Hong Kong Observatory (HKO).
6 T.E. Morakinyo et al. / Science of the Total Environment 719 (2020) 137461
3. Implementation of methodology in a subtropical high-densitycity, Hong Kong
The proposed methodology described in Section 2 is demonstratedfor a sub-tropical high-density city of Hong Kong. The case studyworkflow is presented in Fig. 2 while a detailed description of eachstep is given in this section.
3.1. Hong Kong and her climatic condition
Hong Kong, described is a high-density city is located at China'ssoutheast coastline (22°15′N, 114°10′E) with an average altitude of8 m and houses over 7 million residents. Due to her topography, built-up areas occupy about 22% (1104 km2) of the territory's total land andsea area of 2754 km2. Influenced by monsoons due to its proximity tothe sea, Hong Kong experiences a sub-tropical climate with hot-humidsummermonths (May to September) being the hottestmonths, averagedaily temperature is around 28.5 °C and a relative humidity of around80% (Chen et al., 2012) a combination that results in high thermal stressin the city. Coupled with this is the high-density morphology (low skyview) with tall buildings which led to limited urban ventilation andgreen spaces in the urban landscape (Fig. 3).
3.2. Urban morphology characterization
As part of the first step of the proposed approach, the Sky-View Fac-tor (SVF) was applied as the urban morphology indicator. The SVFranges from 0 to 1, with the maximum value signifying a non-obstructed sky-view and near-zero value representing a deep streetcanyon. Several analytical, empirical or numerical methods exist forthe estimation of SVF (Chen et al., 2012), some of which are related toaspect ratio (i.e. buildingheight to streetwidth ratio, H/W)which is eas-ier to estimate even though it is less employed in urban climate science.To describe the different combinations of typical building height(10–70 m) and street width (10–30 m) typical for Hong Kong (Chenet al., 2012; Xu et al., 2017) in term of SVF, we used the popular Oke'smethod (Oke, 1988) which shows that if the radiation morphology fora point at the centre of an urban canyon cross-section is consideredwith assumed first approximation that the street is infinitely long,then the view factor of each wall (φw) is
φw ¼ 1−cosθð Þ2
ð1Þ
where θ ¼ tan−1ð H0:5W
Þ. Thus, the SVF of the canyon accounting for the
view factors of both walls is
φs ¼ 1− φw1 þ φw2ð Þð Þ ð2Þ
Computing with the above equations, an exponential relationshipwas found SVF and H/W ratio derived as presented in Fig. 4(a). The
Table 1Classification scheme of trees physical characteristics.
Parameter Sub-class Value Applied value
Foliage Density Dense LAI N 3.0 3.5Moderate LAI = 1.5–3.0 2.5Sparse LAI = 0.5–1.5 1.5
Tree height (m) Tall 16–24 20Medium 8–16 12Short b8 6
Trunk Height (m) High N3 4Low ≤3 2
Crown diameter (m) Narrow ≤4 3Medium 4–8 6Wide N8 m 9
derived regression equation and fitted line comparewell with the actualvalues except for underestimation with SVF N 0.7. Thereafter we inten-tionally selected 10 different SVF (in red dots in Fig. 4(a)) in the 0–1range covering the high to low urban density and open-area. The corre-sponding H/Wwere then used to develop the urbanmorphology for ournumerical experiment.
As earlier mentioned, several methods exist for the estimation ofSVF, the applied method used in our employed numerical model,ENVI-met is different from the Oke's method used for our H/W selec-tion. Thus, to ensure the reliable comparison between both techniquesand thus reduce potential biases from the modeling, we comparedboth and found a near-perfect relationship as seen in Fig. 4(b). InHong Kong, recent building development includes a podium layer of15 -20 m high, on which a tower of desired height is built, essentiallyresidential or commercial with tower must have a podium, a strategyemployed to improve the urban wind environment of the city(Morakinyo et al., 2017b).
To perfectly represent the local urban morphology as requiredfor a case study, we have verified the effect of the podium onENVI-met's calculated SVF by comparing SVF at the middle of astreet with and without podium when building height is N20 m(see Fig. 5(d) to compare the two building types). The result,shown in Fig. 4(c) revealed a near-perfect relationship indicatinga negligible effect on SVF. Thus, our urban morphology describedas SVF is void of biases that might arise from the calculationmethod and local building ordinance.
3.3. Generic tree classification and characterization scheme
We have developed a generalized tree classification schemebased on four physical or structural parameters (i.e. foliage density,tree height, trunk height, and crown diameter) and their sub-forms
Table 3Thermal sensation classification for Hong Kong (Morakinyo et al., 2017b; Cheng and Ng,2006; Ng and Cheng, 2012).
PET (°C) Thermal Perception Physiological stress
b13 Very cold Extreme cold stress13–17 Cold Strong cold stress17–21 Cool Moderate cold stress21–25 Slightly cool Slight cold stress25–29 Neutral No thermal stress29–33 Slightly Warm Slight heat stress33–37 Warm Moderate heat stress37–41 Hot Strong heat stressN41 Very Hot Extreme heat stress
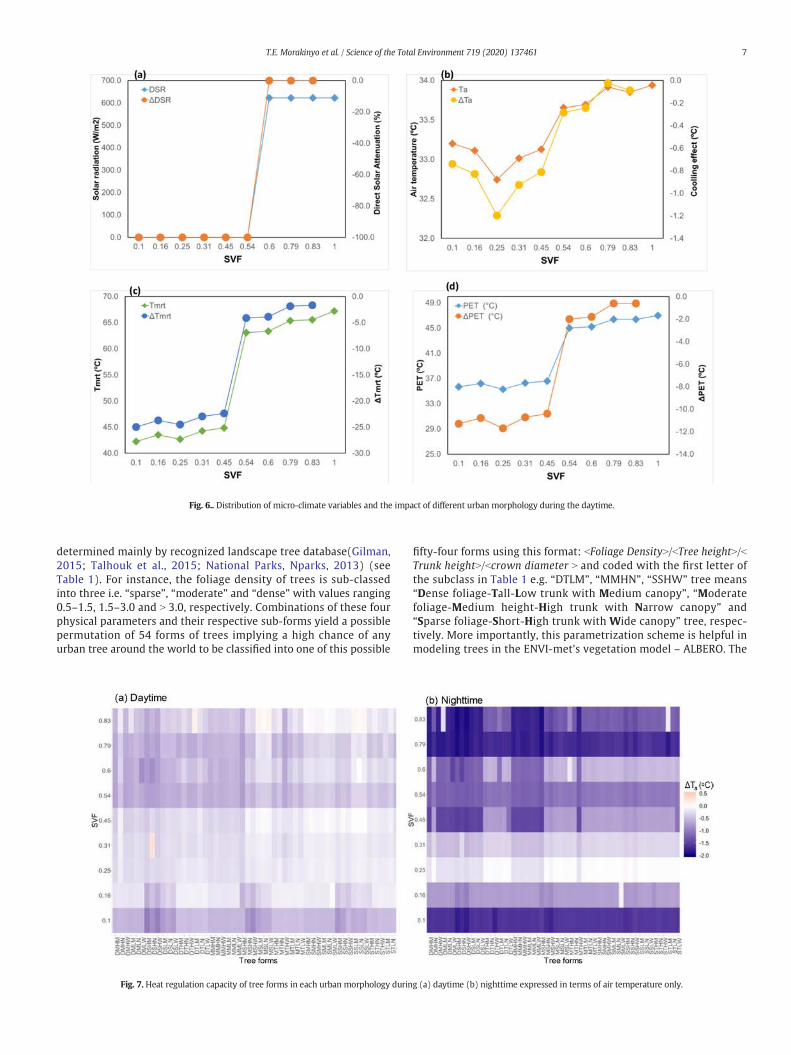
Fig. 6.. Distribution of micro-climate variables and the impact of different urban morphology during the daytime.
7T.E. Morakinyo et al. / Science of the Total Environment 719 (2020) 137461
determined mainly by recognized landscape tree database(Gilman,2015; Talhouk et al., 2015; National Parks, Nparks, 2013) (seeTable 1). For instance, the foliage density of trees is sub-classedinto three i.e. “sparse”, “moderate” and “dense” with values ranging0.5–1.5, 1.5–3.0 and N 3.0, respectively. Combinations of these fourphysical parameters and their respective sub-forms yield a possiblepermutation of 54 forms of trees implying a high chance of anyurban tree around the world to be classified into one of this possible
Fig. 7. Heat regulation capacity of tree forms in each urban morphology durin
fifty-four forms using this format: bFoliage DensityN/bTree heightN/bTrunk heightN/bcrown diameter N and coded with the first letter ofthe subclass in Table 1 e.g. “DTLM”, “MMHN”, “SSHW” tree means“Dense foliage-Tall-Low trunk with Medium canopy”, “Moderatefoliage-Medium height-High trunk with Narrow canopy” and“Sparse foliage-Short-High trunk with Wide canopy” tree, respec-tively. More importantly, this parametrization scheme is helpful inmodeling trees in the ENVI-met's vegetation model – ALBERO. The
g (a) daytime (b) nighttime expressed in terms of air temperature only.
8 T.E. Morakinyo et al. / Science of the Total Environment 719 (2020) 137461
9T.E. Morakinyo et al. / Science of the Total Environment 719 (2020) 137461
generalized 54 forms of trees are tested in each of the selected 10SVFs described in Section 3.1.
3.4. ENVI-met model description
The parametric studies simulations were conducted using theurban micro-climate model, ENVI-met (Bruse and Fleer, 1998;Huttner and Bruse, 2009) selected for its ability to simulate at highspatial(0.5 to 5 m) and temporal (1 to 5 s) resolution the surface-plant-air interactions resulting in near-accurate modeling of micro-climatic parameters in a complex environment with buildings andsurfaces of a diverse materials and green infrastructures. In ENVI-met, plants are porous, living and dynamical bodies with modifiablestructural features and can interact through evapotranspiration andenergy absorption with the surrounding environment. This specifi-cation is important for this study given the aim to apply the under-standing of the relationship between urban morphology anddetailed tree structural characteristics with reasonable accuracy.The model has been adopted by a wide range of practitioners and re-searchers interested in evaluating the effectiveness of certain urbanheat mitigation and adaptation strategies such as urban greeneryand water bodies. Further information on the model, including allembedded equations, documentation and downloads can be foundat http://www.envi-met.info.
3.5. A parametric study, model setting, initialization, and model validation
To develop a relationship between urban morphology (i.e. SVF)and tree structural characteristics (i.e. tree forms/species), 540case studies which are combination of the selected 10 SVF values be-tween 0 and 1, and 54 tree forms were simulated in the ENVI-metmodel to derive the micro-climate modification and urban heat mit-igation potential of each tree form per SVF. The generic layout of oursetup is given in Fig. 5(a) which shows the canyon length of 50 mbut variable building height to street width ratio corresponding tothe associated SVF. Trees with overlapping crowns were planted inthe middle of the street canyon while data for analysis was ex-tracted at 1.5 m the centre of the canyon (red dot) or correspondingpoint in an open area. A real-world example of the model design isdepicted in Fig. 5(b) which shows row of trees lined in a street can-yon on Nathan road, Hong Kong. Four street layouts shown in Fig. 5(c) were considered: ‘Open area without trees’ which representsopen-street with no nearby buildings and trees; ‘Open area withtrees’ represents open-street with no nearby buildings but withtree-shades; ‘Street canyon without trees’ represents a tree-freestreet canyon and ‘Street canyon with trees’ represents street can-yons with trees.
The computational domainwith constant lengthof 50mbut variablewidth depending on the case's street width all have grid size with2 m × 2 m × 2 m while ten (10) nested grids were also added to thecomputational domain to ensure enough distance before the upstreambuilding and after the downstream building and also to minimizeedge-effect.
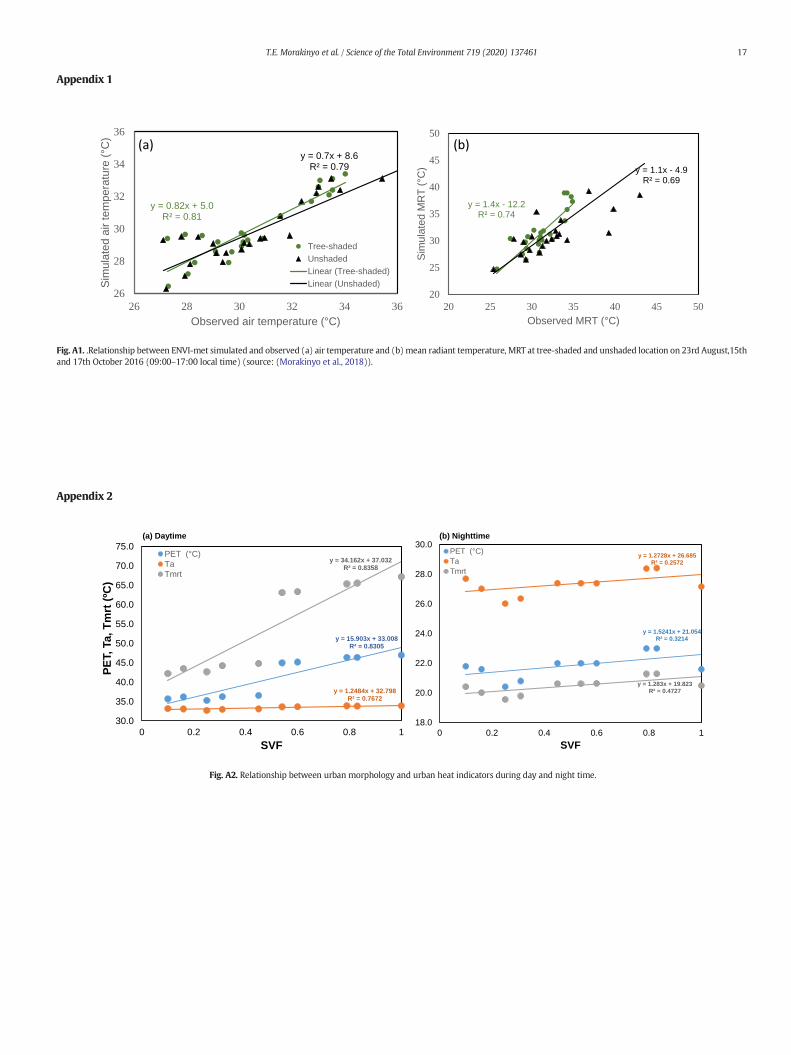
To initialize the simulation a previously validated ENVI-metmodel setting fully reported our previous study (Morakinyo et al.,2018) was employed. The setting mimicked a hot summer day inHong Kong with initial hourly air temperature was set to 30 °C,relative humidity at 75%, prevailing wind speed at 2.83 m/s and di-rection 220. Table 2 provides a summary of all the input parame-ters and values for the validation simulation exercise. With thesetting, a good correlation of R2 = 0.79–0.81 and 0.70–0.74 forair temperature and mean radiant temperature, respectively was
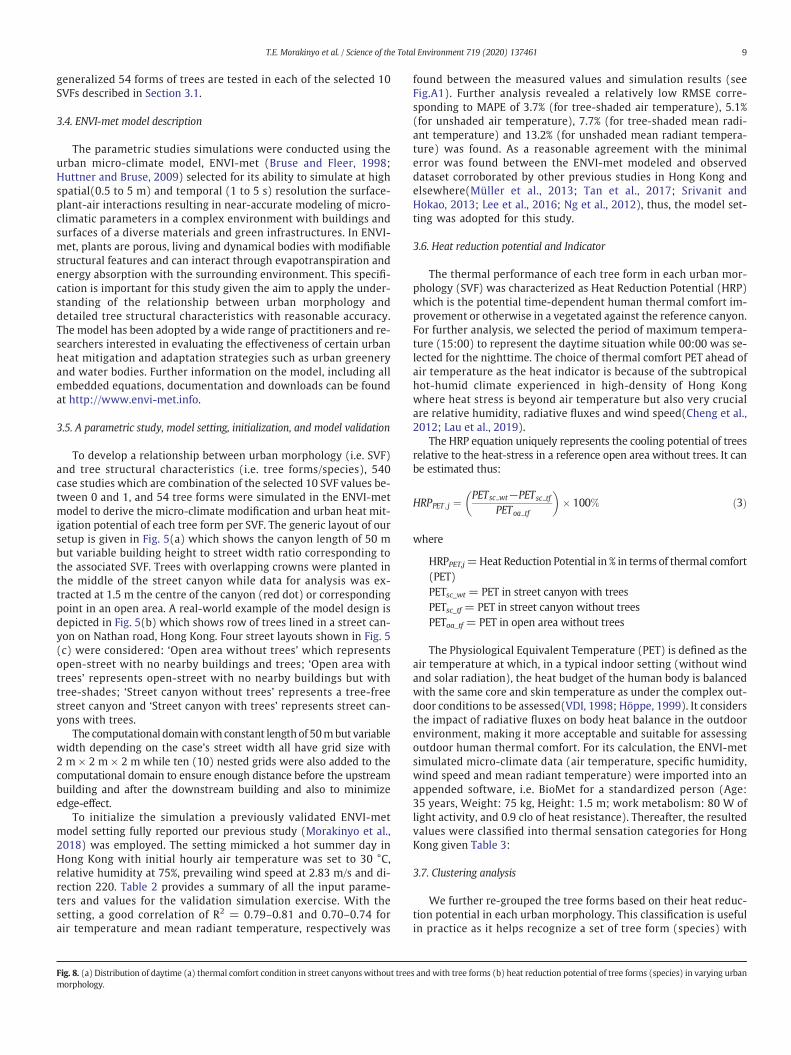
Fig. 8. (a) Distribution of daytime (a) thermal comfort condition in street canyons without treemorphology.
found between the measured values and simulation results (seeFig.A1). Further analysis revealed a relatively low RMSE corre-sponding to MAPE of 3.7% (for tree-shaded air temperature), 5.1%(for unshaded air temperature), 7.7% (for tree-shaded mean radi-ant temperature) and 13.2% (for unshaded mean radiant tempera-ture) was found. As a reasonable agreement with the minimalerror was found between the ENVI-met modeled and observeddataset corroborated by other previous studies in Hong Kong andelsewhere(Müller et al., 2013; Tan et al., 2017; Srivanit andHokao, 2013; Lee et al., 2016; Ng et al., 2012), thus, the model set-ting was adopted for this study.
3.6. Heat reduction potential and Indicator
The thermal performance of each tree form in each urban mor-phology (SVF) was characterized as Heat Reduction Potential (HRP)which is the potential time-dependent human thermal comfort im-provement or otherwise in a vegetated against the reference canyon.For further analysis, we selected the period of maximum tempera-ture (15:00) to represent the daytime situation while 00:00 was se-lected for the nighttime. The choice of thermal comfort PET ahead ofair temperature as the heat indicator is because of the subtropicalhot-humid climate experienced in high-density of Hong Kongwhere heat stress is beyond air temperature but also very crucialare relative humidity, radiative fluxes and wind speed(Cheng et al.,2012; Lau et al., 2019).
The HRP equation uniquely represents the cooling potential of treesrelative to the heat-stress in a reference open area without trees. It canbe estimated thus:
HRPPET ; j ¼PETsc wt−PETsc tf
PEToa tf
� �� 100% ð3Þ
where
HRPPET,j=Heat Reduction Potential in % in terms of thermal comfort(PET)PETsc_wt = PET in street canyon with treesPETsc_tf = PET in street canyon without treesPEToa_tf = PET in open area without trees
The Physiological Equivalent Temperature (PET) is defined as theair temperature at which, in a typical indoor setting (without windand solar radiation), the heat budget of the human body is balancedwith the same core and skin temperature as under the complex out-door conditions to be assessed(VDI, 1998; Höppe, 1999). It considersthe impact of radiative fluxes on body heat balance in the outdoorenvironment, making it more acceptable and suitable for assessingoutdoor human thermal comfort. For its calculation, the ENVI-metsimulated micro-climate data (air temperature, specific humidity,wind speed and mean radiant temperature) were imported into anappended software, i.e. BioMet for a standardized person (Age:35 years, Weight: 75 kg, Height: 1.5 m; work metabolism: 80 W oflight activity, and 0.9 clo of heat resistance). Thereafter, the resultedvalues were classified into thermal sensation categories for HongKong given Table 3:
3.7. Clustering analysis
We further re-grouped the tree forms based on their heat reduc-tion potential in each urban morphology. This classification is usefulin practice as it helps recognize a set of tree form (species) with
s and with tree forms (b) heat reduction potential of tree forms (species) in varying urban
10 T.E. Morakinyo et al. / Science of the Total Environment 719 (2020) 137461
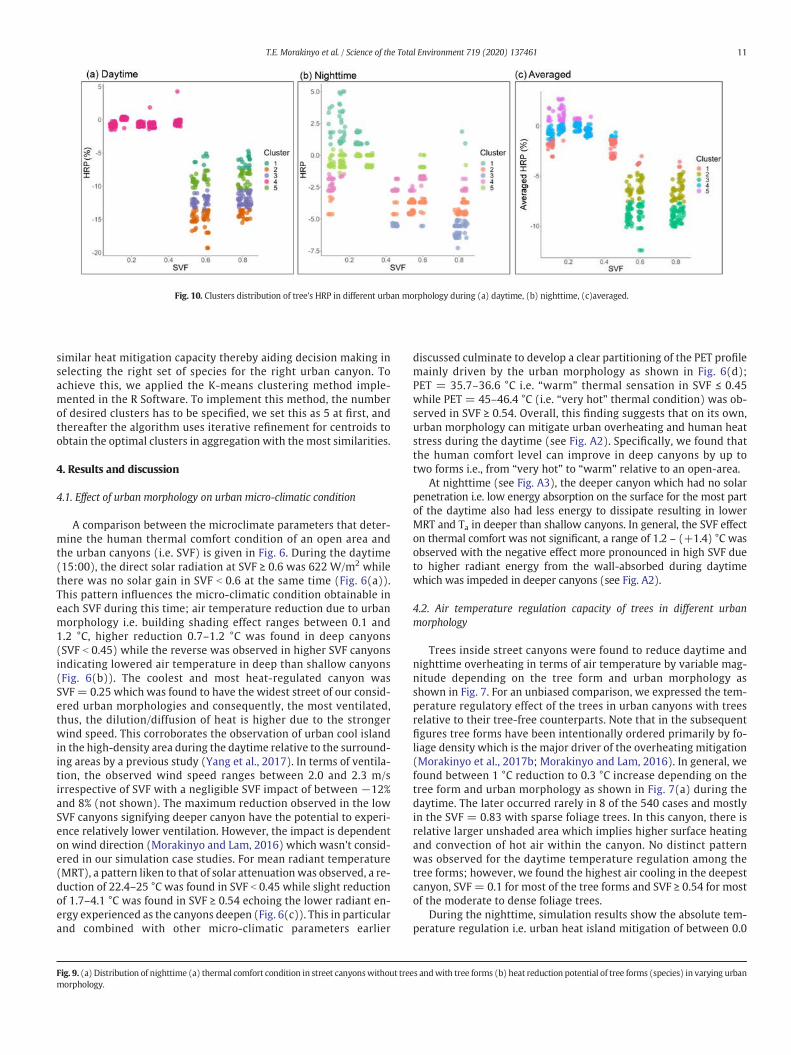
Fig. 10. Clusters distribution of tree's HRP in different urban morphology during (a) daytime, (b) nighttime, (c)averaged.
11T.E. Morakinyo et al. / Science of the Total Environment 719 (2020) 137461
similar heat mitigation capacity thereby aiding decision making inselecting the right set of species for the right urban canyon. Toachieve this, we applied the K-means clustering method imple-mented in the R Software. To implement this method, the numberof desired clusters has to be specified, we set this as 5 at first, andthereafter the algorithm uses iterative refinement for centroids toobtain the optimal clusters in aggregation with the most similarities.
4. Results and discussion
4.1. Effect of urban morphology on urban micro-climatic condition
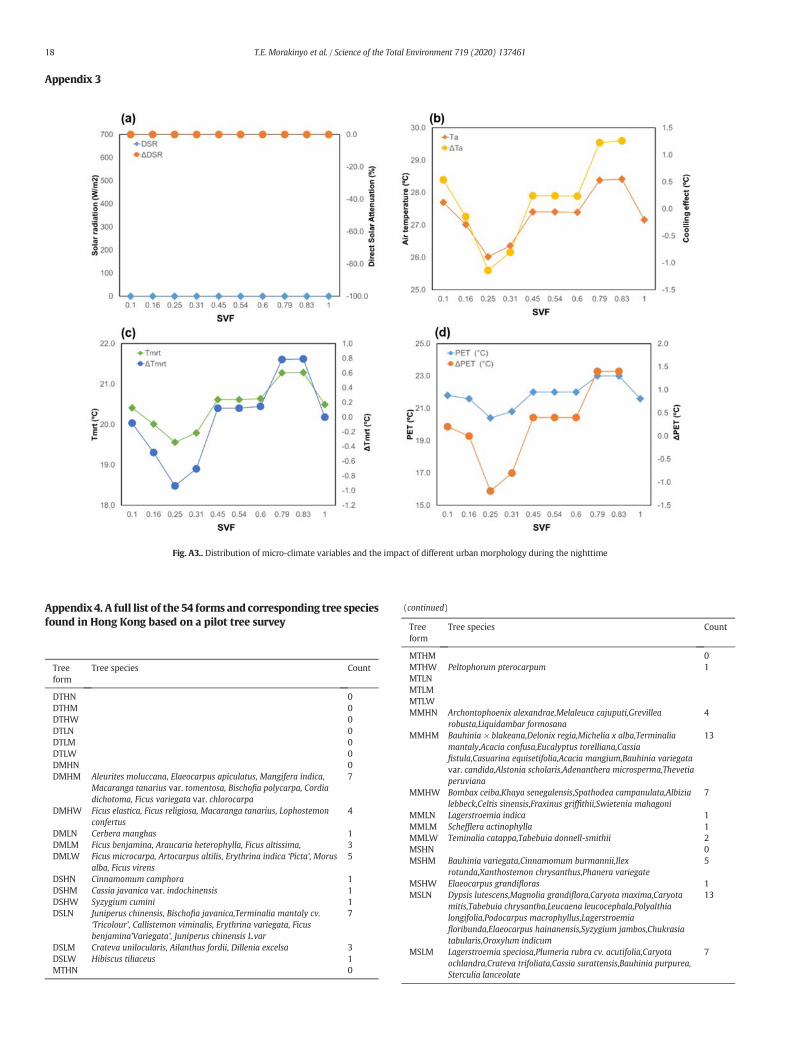
A comparison between the microclimate parameters that deter-mine the human thermal comfort condition of an open area andthe urban canyons (i.e. SVF) is given in Fig. 6. During the daytime(15:00), the direct solar radiation at SVF ≥ 0.6 was 622 W/m2 whilethere was no solar gain in SVF b 0.6 at the same time (Fig. 6(a)).This pattern influences the micro-climatic condition obtainable ineach SVF during this time; air temperature reduction due to urbanmorphology i.e. building shading effect ranges between 0.1 and1.2 °C, higher reduction 0.7–1.2 °C was found in deep canyons(SVF b 0.45) while the reverse was observed in higher SVF canyonsindicating lowered air temperature in deep than shallow canyons(Fig. 6(b)). The coolest and most heat-regulated canyon wasSVF = 0.25 which was found to have the widest street of our consid-ered urban morphologies and consequently, the most ventilated,thus, the dilution/diffusion of heat is higher due to the strongerwind speed. This corroborates the observation of urban cool islandin the high-density area during the daytime relative to the surround-ing areas by a previous study (Yang et al., 2017). In terms of ventila-tion, the observed wind speed ranges between 2.0 and 2.3 m/sirrespective of SVF with a negligible SVF impact of between −12%and 8% (not shown). The maximum reduction observed in the lowSVF canyons signifying deeper canyon have the potential to experi-ence relatively lower ventilation. However, the impact is dependenton wind direction (Morakinyo and Lam, 2016) which wasn't consid-ered in our simulation case studies. For mean radiant temperature(MRT), a pattern liken to that of solar attenuation was observed, a re-duction of 22.4–25 °C was found in SVF b 0.45 while slight reductionof 1.7–4.1 °C was found in SVF ≥ 0.54 echoing the lower radiant en-ergy experienced as the canyons deepen (Fig. 6(c)). This in particularand combined with other micro-climatic parameters earlier
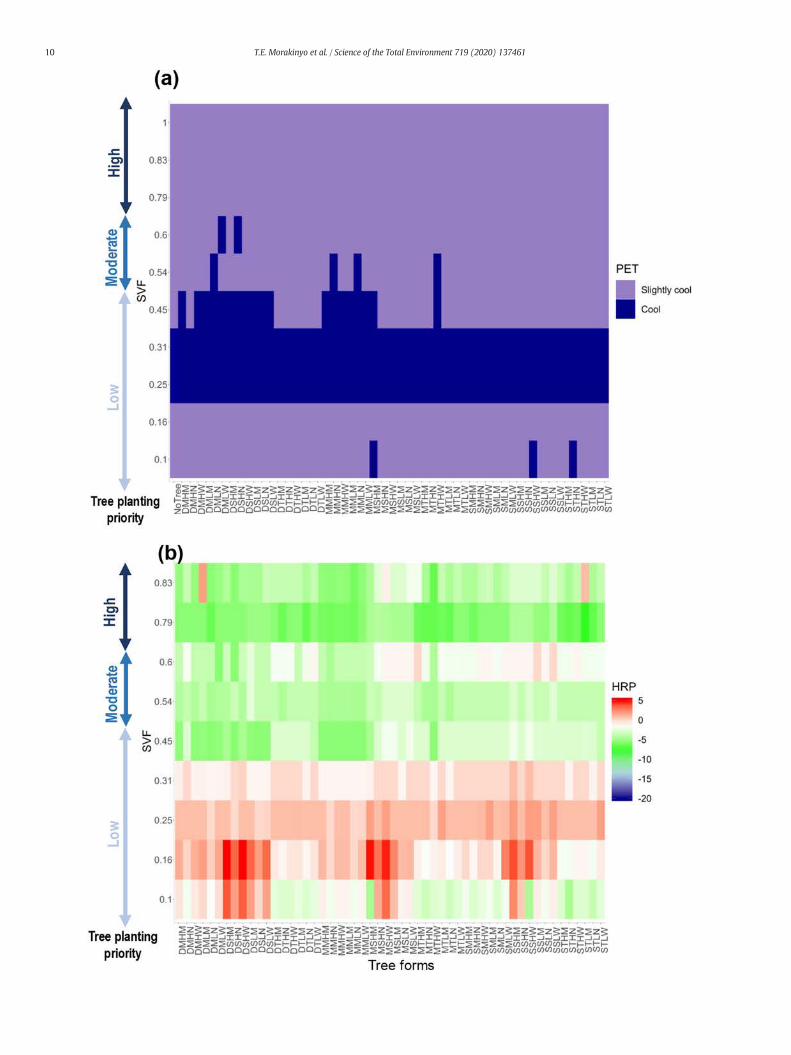
Fig. 9. (a) Distribution of nighttime (a) thermal comfort condition in street canyonswithout treemorphology.
discussed culminate to develop a clear partitioning of the PET profilemainly driven by the urban morphology as shown in Fig. 6(d);PET = 35.7–36.6 °C i.e. “warm” thermal sensation in SVF ≤ 0.45while PET = 45–46.4 °C (i.e. “very hot” thermal condition) was ob-served in SVF ≥ 0.54. Overall, this finding suggests that on its own,urban morphology can mitigate urban overheating and human heatstress during the daytime (see Fig. A2). Specifically, we found thatthe human comfort level can improve in deep canyons by up totwo forms i.e., from “very hot” to “warm” relative to an open-area.
At nighttime (see Fig. A3), the deeper canyon which had no solarpenetration i.e. low energy absorption on the surface for the most partof the daytime also had less energy to dissipate resulting in lowerMRT and Ta in deeper than shallow canyons. In general, the SVF effecton thermal comfort was not significant, a range of 1.2 – (+1.4) °C wasobserved with the negative effect more pronounced in high SVF dueto higher radiant energy from the wall-absorbed during daytimewhich was impeded in deeper canyons (see Fig. A2).
4.2. Air temperature regulation capacity of trees in different urbanmorphology
Trees inside street canyons were found to reduce daytime andnighttime overheating in terms of air temperature by variable mag-nitude depending on the tree form and urban morphology asshown in Fig. 7. For an unbiased comparison, we expressed the tem-perature regulatory effect of the trees in urban canyons with treesrelative to their tree-free counterparts. Note that in the subsequentfigures tree forms have been intentionally ordered primarily by fo-liage density which is the major driver of the overheating mitigation(Morakinyo et al., 2017b; Morakinyo and Lam, 2016). In general, wefound between 1 °C reduction to 0.3 °C increase depending on thetree form and urban morphology as shown in Fig. 7(a) during thedaytime. The later occurred rarely in 8 of the 540 cases and mostlyin the SVF = 0.83 with sparse foliage trees. In this canyon, there isrelative larger unshaded area which implies higher surface heatingand convection of hot air within the canyon. No distinct patternwas observed for the daytime temperature regulation among thetree forms; however, we found the highest air cooling in the deepestcanyon, SVF = 0.1 for most of the tree forms and SVF ≥ 0.54 for mostof the moderate to dense foliage trees.
During the nighttime, simulation results show the absolute tem-perature regulation i.e. urban heat island mitigation of between 0.0
s andwith tree forms (b) heat reduction potential of tree forms (species) in varying urban
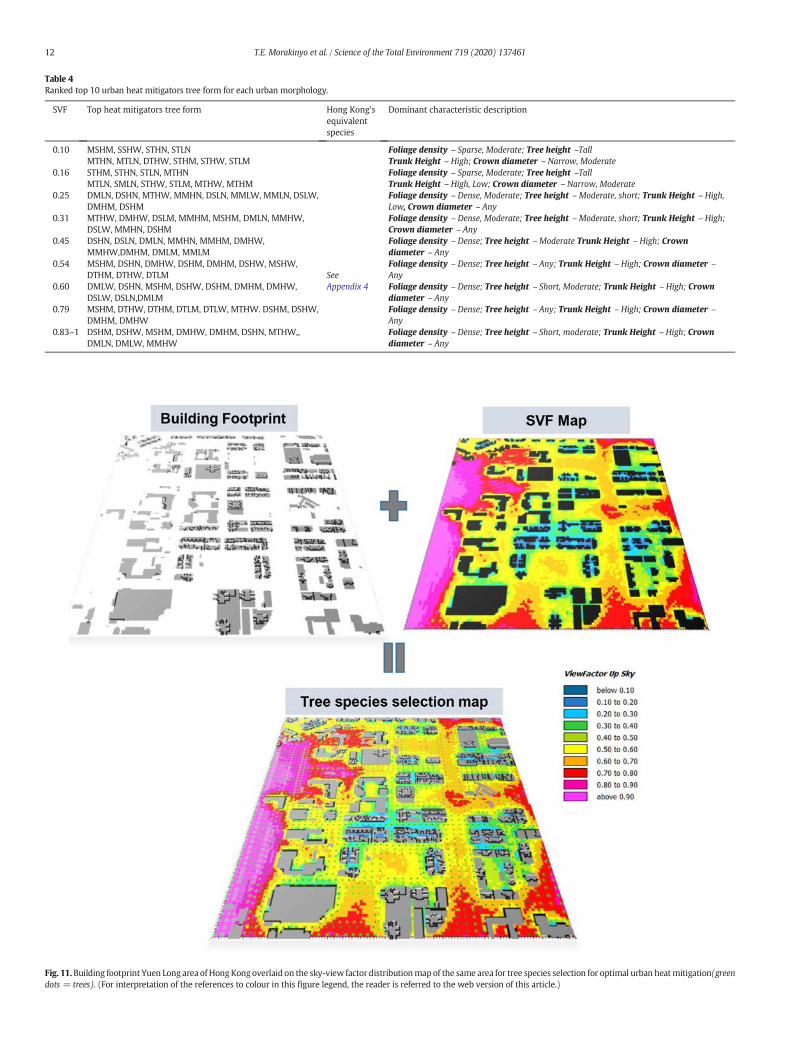
Fig. 11.Building footprint Yuen Long area ofHongKong overlaid on the sky-view factor distributionmap of the same area for tree species selection for optimal urban heatmitigation(greendots = trees). (For interpretation of the references to colour in this figure legend, the reader is referred to the web version of this article.)
Table 4Ranked top 10 urban heat mitigators tree form for each urban morphology.
SVF Top heat mitigators tree form Hong Kong'sequivalentspecies
Dominant characteristic description
0.10 MSHM, SSHW, STHN, STLNMTHN, MTLN, DTHW, STHM, STHW, STLM
SeeAppendix 4
Foliage density – Sparse, Moderate; Tree height –TallTrunk Height – High; Crown diameter – Narrow, Moderate
0.16 STHM, STHN, STLN, MTHNMTLN, SMLN, STHW, STLM, MTHW, MTHM
Foliage density – Sparse, Moderate; Tree height –TallTrunk Height – High, Low; Crown diameter – Narrow, Moderate
0.25 DMLN, DSHN, MTHW, MMHN, DSLN, MMLW, MMLN, DSLW,DMHM, DSHM
Foliage density – Dense, Moderate; Tree height – Moderate, short; Trunk Height – High,Low, Crown diameter – Any
0.31 MTHW, DMHW, DSLM, MMHM, MSHM, DMLN, MMHW,DSLW, MMHN, DSHM
Foliage density – Dense, Moderate; Tree height – Moderate, short; Trunk Height – High;Crown diameter – Any
0.45 DSHN, DSLN, DMLN, MMHN, MMHM, DMHW,MMHW,DMHM, DMLM, MMLM
Foliage density – Dense; Tree height – Moderate Trunk Height – High; Crowndiameter – Any
0.54 MSHM, DSHN, DMHW, DSHM, DMHM, DSHW, MSHW,DTHM, DTHW, DTLM
Foliage density – Dense; Tree height – Any; Trunk Height – High; Crown diameter –Any
0.60 DMLW, DSHN, MSHM, DSHW, DSHM, DMHM, DMHW,DSLW, DSLN,DMLM
Foliage density – Dense; Tree height – Short, Moderate; Trunk Height – High; Crowndiameter – Any
0.79 MSHM, DTHW, DTHM, DTLM, DTLW, MTHW. DSHM, DSHW,DMHM, DMHW
Foliage density – Dense; Tree height – Any; Trunk Height – High; Crown diameter –Any
0.83–1 DSHM, DSHW, MSHM, DMHW, DMHM, DSHN, MTHW,,DMLN, DMLW, MMHW
Foliage density – Dense; Tree height – Short, moderate; Trunk Height – High; Crowndiameter – Any
12 T.E. Morakinyo et al. / Science of the Total Environment 719 (2020) 137461
13T.E. Morakinyo et al. / Science of the Total Environment 719 (2020) 137461
and 1.9 °C (see Fig. 7(b)) depending on canyon morphology andtree form. It was found that the trees provide optimum cooling inSVF = 0.1 (very deep canyon) and open canyons while minimalcooling was found in SVF = 0.25–0.31. The magnitude of tempera-ture reduction at this period is dependent on the unshaded-shadedtotal surface area ratio which determines the amount of heat stor-age during the daytime and ventilation reduction. The larger theshaded surface, the less the heat storage and consequently air tem-perature reduction. This was the situation with the maximum re-duction in very deep and open canyons. This results generallyechoes the role of vegetation in mitigating nighttime heat islandseffect as found in other previous studies (Gousseau et al., 2011;Santamouris et al., 2018).
4.3. Heat reduction potential of tree forms in different urban morphology
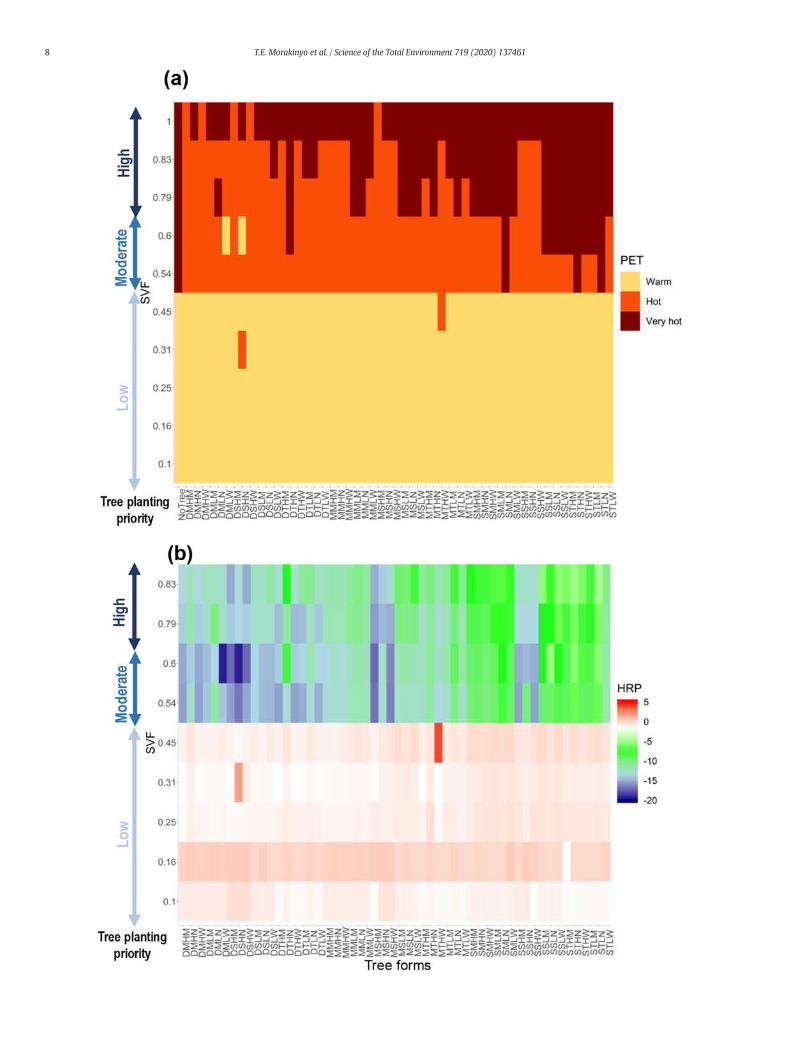
In this section, we present the results of the estimation of the HRP ofindividual tree form per SVF, classified by five scales at 5% interval. TheHRP was computed with respect to PET as indicated in Eq. (3) to holis-tically account for all micro-climate variables that determine urban heatmitigation. The best and worst-performing trees are classified as “VeryHigh” and “Very Low” HRP, respectively. Furthermore, we applied thek-means clustering technique to group tree forms of similar perfor-mance in each SVF, thus aiding the development of tree selectionsrecommendations.
Fig. 8(a) represents the PET classification in each SVF and treeform. Without trees, SVF ≤ 0.45 experience “Warm” comfort level(35.3–36.6 °C) while SVF ≥ 0.54 experience “Very Hot” (45–46.4 °C)with 47 °C observed in the reference open area (SVF = 1). The figure
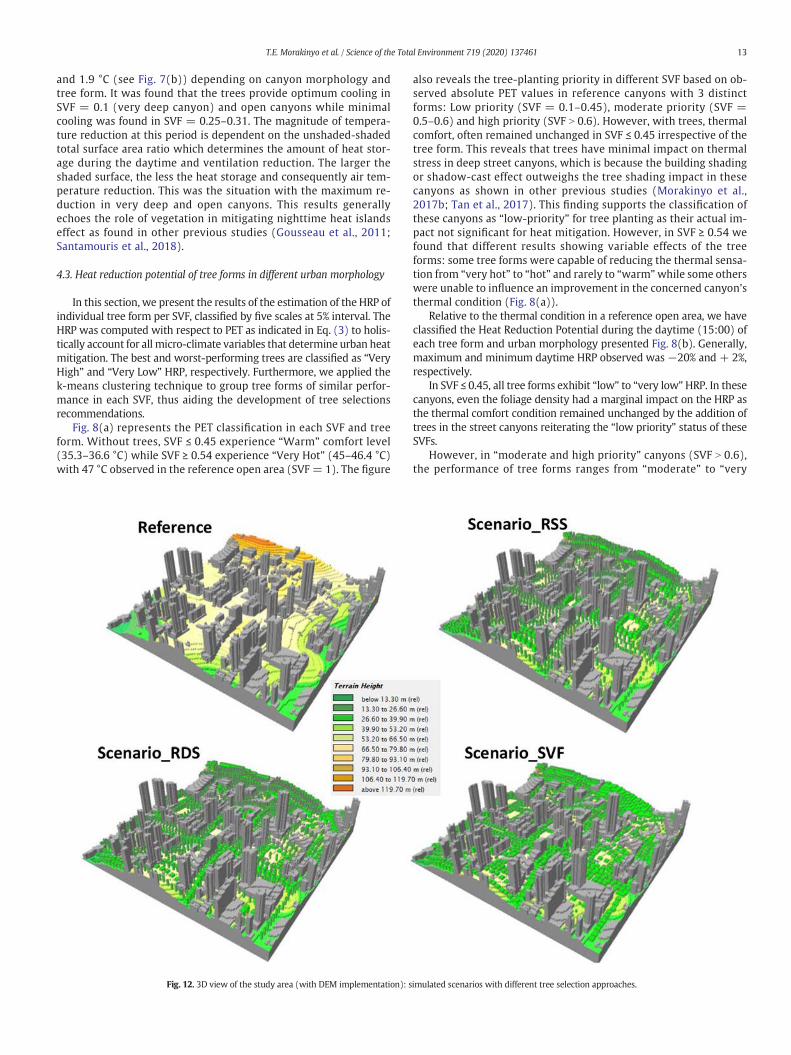
Fig. 12. 3D view of the study area (with DEM implementation): s
also reveals the tree-planting priority in different SVF based on ob-served absolute PET values in reference canyons with 3 distinctforms: Low priority (SVF = 0.1–0.45), moderate priority (SVF =0.5–0.6) and high priority (SVF N 0.6). However, with trees, thermalcomfort, often remained unchanged in SVF ≤ 0.45 irrespective of thetree form. This reveals that trees have minimal impact on thermalstress in deep street canyons, which is because the building shadingor shadow-cast effect outweighs the tree shading impact in thesecanyons as shown in other previous studies (Morakinyo et al.,2017b; Tan et al., 2017). This finding supports the classification ofthese canyons as “low-priority” for tree planting as their actual im-pact not significant for heat mitigation. However, in SVF ≥ 0.54 wefound that different results showing variable effects of the treeforms: some tree forms were capable of reducing the thermal sensa-tion from “very hot” to “hot” and rarely to “warm”while some otherswere unable to influence an improvement in the concerned canyon'sthermal condition (Fig. 8(a)).
Relative to the thermal condition in a reference open area, we haveclassified the Heat Reduction Potential during the daytime (15:00) ofeach tree form and urban morphology presented Fig. 8(b). Generally,maximum and minimum daytime HRP observed was−20% and + 2%,respectively.
In SVF ≤ 0.45, all tree forms exhibit “low” to “very low”HRP. In thesecanyons, even the foliage density had a marginal impact on the HRP asthe thermal comfort condition remained unchanged by the addition oftrees in the street canyons reiterating the “low priority” status of theseSVFs.
However, in “moderate and high priority” canyons (SVF N 0.6),the performance of tree forms ranges from “moderate” to “very
imulated scenarios with different tree selection approaches.
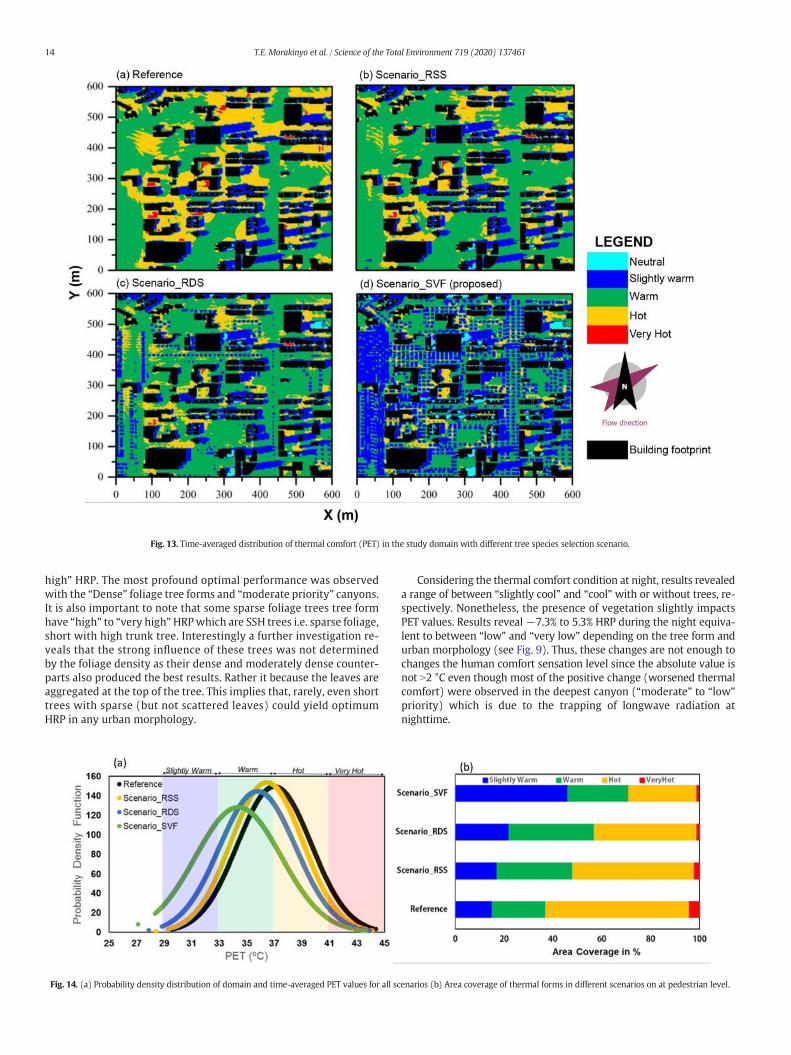
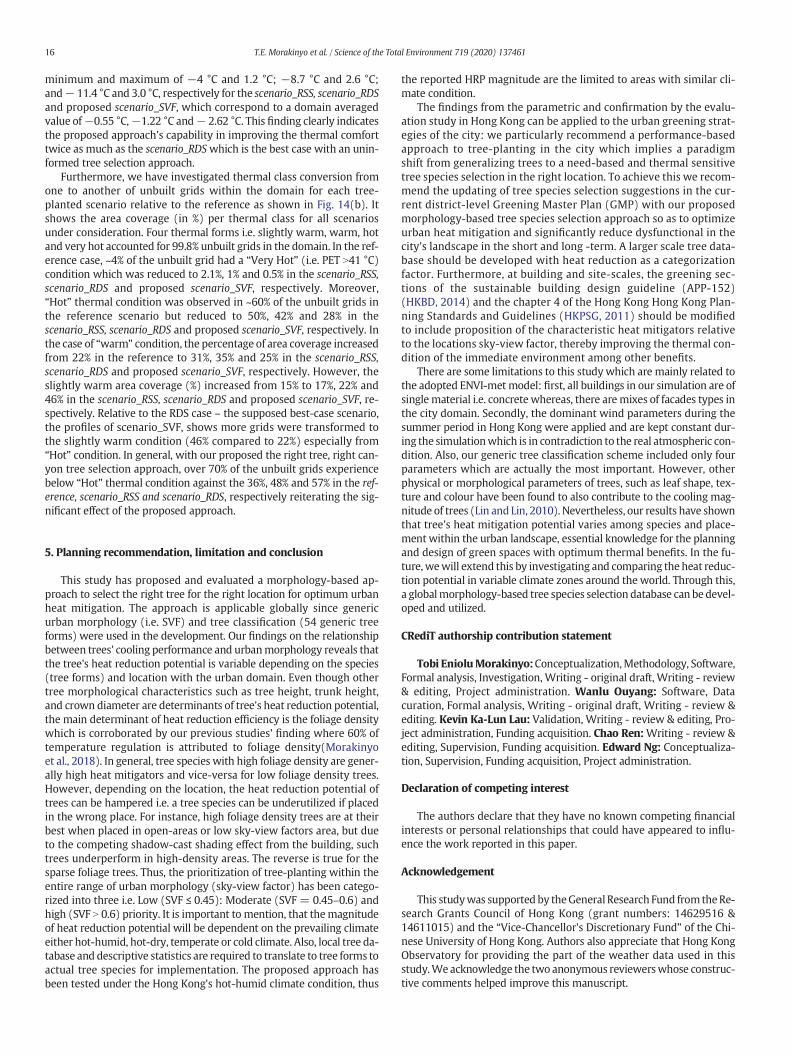
Fig. 13. Time-averaged distribution of thermal comfort (PET) in the study domain with different tree species selection scenario.
14 T.E. Morakinyo et al. / Science of the Total Environment 719 (2020) 137461
high” HRP. The most profound optimal performance was observedwith the “Dense” foliage tree forms and “moderate priority” canyons.It is also important to note that some sparse foliage trees tree formhave “high” to “very high”HRPwhich are SSH trees i.e. sparse foliage,short with high trunk tree. Interestingly a further investigation re-veals that the strong influence of these trees was not determinedby the foliage density as their dense and moderately dense counter-parts also produced the best results. Rather it because the leaves areaggregated at the top of the tree. This implies that, rarely, even shorttrees with sparse (but not scattered leaves) could yield optimumHRP in any urban morphology.
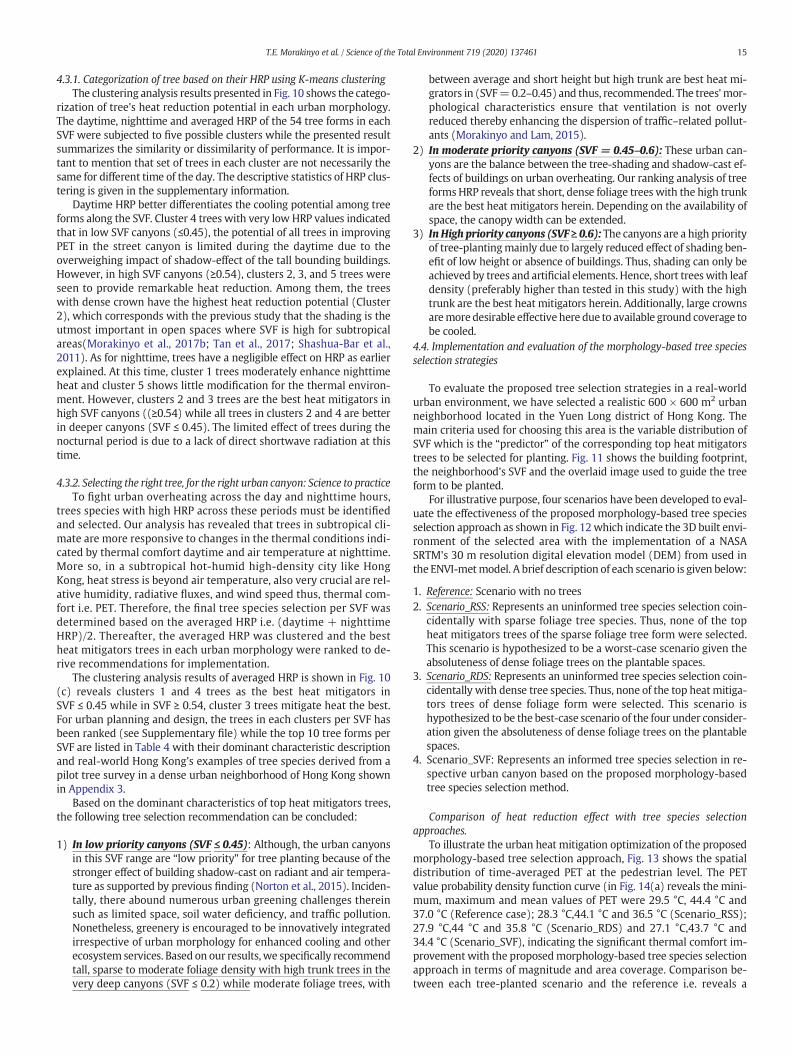
Fig. 14. (a) Probability density distribution of domain and time-averaged PET values for all sc
Considering the thermal comfort condition at night, results revealeda range of between “slightly cool” and “cool” with or without trees, re-spectively. Nonetheless, the presence of vegetation slightly impactsPET values. Results reveal −7.3% to 5.3% HRP during the night equiva-lent to between “low” and “very low” depending on the tree form andurban morphology (see Fig. 9). Thus, these changes are not enough tochanges the human comfort sensation level since the absolute value isnot N2 °C even though most of the positive change (worsened thermalcomfort) were observed in the deepest canyon (“moderate” to “low”priority) which is due to the trapping of longwave radiation atnighttime.
enarios (b) Area coverage of thermal forms in different scenarios on at pedestrian level.
15T.E. Morakinyo et al. / Science of the Total Environment 719 (2020) 137461
4.3.1. Categorization of tree based on their HRP using K-means clusteringThe clustering analysis results presented in Fig. 10 shows the catego-
rization of tree's heat reduction potential in each urban morphology.The daytime, nighttime and averaged HRP of the 54 tree forms in eachSVF were subjected to five possible clusters while the presented resultsummarizes the similarity or dissimilarity of performance. It is impor-tant to mention that set of trees in each cluster are not necessarily thesame for different time of the day. The descriptive statistics of HRP clus-tering is given in the supplementary information.
Daytime HRP better differentiates the cooling potential among treeforms along the SVF. Cluster 4 trees with very low HRP values indicatedthat in low SVF canyons (≤0.45), the potential of all trees in improvingPET in the street canyon is limited during the daytime due to theoverweighing impact of shadow-effect of the tall bounding buildings.However, in high SVF canyons (≥0.54), clusters 2, 3, and 5 trees wereseen to provide remarkable heat reduction. Among them, the treeswith dense crown have the highest heat reduction potential (Cluster2), which corresponds with the previous study that the shading is theutmost important in open spaces where SVF is high for subtropicalareas(Morakinyo et al., 2017b; Tan et al., 2017; Shashua-Bar et al.,2011). As for nighttime, trees have a negligible effect on HRP as earlierexplained. At this time, cluster 1 trees moderately enhance nighttimeheat and cluster 5 shows little modification for the thermal environ-ment. However, clusters 2 and 3 trees are the best heat mitigators inhigh SVF canyons ((≥0.54) while all trees in clusters 2 and 4 are betterin deeper canyons (SVF ≤ 0.45). The limited effect of trees during thenocturnal period is due to a lack of direct shortwave radiation at thistime.
4.3.2. Selecting the right tree, for the right urban canyon: Science to practiceTo fight urban overheating across the day and nighttime hours,
trees species with high HRP across these periods must be identifiedand selected. Our analysis has revealed that trees in subtropical cli-mate are more responsive to changes in the thermal conditions indi-cated by thermal comfort daytime and air temperature at nighttime.More so, in a subtropical hot-humid high-density city like HongKong, heat stress is beyond air temperature, also very crucial are rel-ative humidity, radiative fluxes, and wind speed thus, thermal com-fort i.e. PET. Therefore, the final tree species selection per SVF wasdetermined based on the averaged HRP i.e. (daytime + nighttimeHRP)/2. Thereafter, the averaged HRP was clustered and the bestheat mitigators trees in each urban morphology were ranked to de-rive recommendations for implementation.
The clustering analysis results of averaged HRP is shown in Fig. 10(c) reveals clusters 1 and 4 trees as the best heat mitigators inSVF ≤ 0.45 while in SVF ≥ 0.54, cluster 3 trees mitigate heat the best.For urban planning and design, the trees in each clusters per SVF hasbeen ranked (see Supplementary file) while the top 10 tree forms perSVF are listed in Table 4 with their dominant characteristic descriptionand real-world Hong Kong's examples of tree species derived from apilot tree survey in a dense urban neighborhood of Hong Kong shownin Appendix 3.
Based on the dominant characteristics of top heat mitigators trees,the following tree selection recommendation can be concluded:
1) In low priority canyons (SVF ≤ 0.45): Although, the urban canyonsin this SVF range are “low priority” for tree planting because of thestronger effect of building shadow-cast on radiant and air tempera-ture as supported by previous finding (Norton et al., 2015). Inciden-tally, there abound numerous urban greening challenges thereinsuch as limited space, soil water deficiency, and traffic pollution.Nonetheless, greenery is encouraged to be innovatively integratedirrespective of urban morphology for enhanced cooling and otherecosystem services. Based on our results,we specifically recommendtall, sparse to moderate foliage density with high trunk trees in thevery deep canyons (SVF ≤ 0.2) while moderate foliage trees, with
between average and short height but high trunk are best heat mi-grators in (SVF=0.2–0.45) and thus, recommended. The trees'mor-phological characteristics ensure that ventilation is not overlyreduced thereby enhancing the dispersion of traffic–related pollut-ants (Morakinyo and Lam, 2015).
2) In moderate priority canyons (SVF = 0.45–0.6): These urban can-yons are the balance between the tree-shading and shadow-cast ef-fects of buildings on urban overheating. Our ranking analysis of treeforms HRP reveals that short, dense foliage trees with the high trunkare the best heat mitigators herein. Depending on the availability ofspace, the canopy width can be extended.
3) InHigh priority canyons (SVF ≥ 0.6): The canyons are a high priorityof tree-plantingmainly due to largely reduced effect of shading ben-efit of low height or absence of buildings. Thus, shading can only beachieved by trees and artificial elements. Hence, short treeswith leafdensity (preferably higher than tested in this study) with the hightrunk are the best heat mitigators herein. Additionally, large crownsaremore desirable effective here due to available ground coverage tobe cooled.
4.4. Implementation and evaluation of the morphology-based tree speciesselection strategies
To evaluate the proposed tree selection strategies in a real-worldurban environment, we have selected a realistic 600 × 600 m2 urbanneighborhood located in the Yuen Long district of Hong Kong. Themain criteria used for choosing this area is the variable distribution ofSVF which is the “predictor” of the corresponding top heat mitigatorstrees to be selected for planting. Fig. 11 shows the building footprint,the neighborhood's SVF and the overlaid image used to guide the treeform to be planted.
For illustrative purpose, four scenarios have been developed to eval-uate the effectiveness of the proposed morphology-based tree speciesselection approach as shown in Fig. 12which indicate the 3D built envi-ronment of the selected area with the implementation of a NASASRTM's 30 m resolution digital elevation model (DEM) from used inthe ENVI-metmodel. A brief description of each scenario is given below:
1. Reference: Scenario with no trees2. Scenario_RSS: Represents an uninformed tree species selection coin-
cidentally with sparse foliage tree species. Thus, none of the topheat mitigators trees of the sparse foliage tree form were selected.This scenario is hypothesized to be a worst-case scenario given theabsoluteness of dense foliage trees on the plantable spaces.
3. Scenario_RDS: Represents an uninformed tree species selection coin-cidentally with dense tree species. Thus, none of the top heat mitiga-tors trees of dense foliage form were selected. This scenario ishypothesized to be the best-case scenario of the four under consider-ation given the absoluteness of dense foliage trees on the plantablespaces.
4. Scenario_SVF: Represents an informed tree species selection in re-spective urban canyon based on the proposed morphology-basedtree species selection method.
Comparison of heat reduction effect with tree species selectionapproaches.
To illustrate the urban heat mitigation optimization of the proposedmorphology-based tree selection approach, Fig. 13 shows the spatialdistribution of time-averaged PET at the pedestrian level. The PETvalue probability density function curve (in Fig. 14(a) reveals the mini-mum, maximum and mean values of PET were 29.5 °C, 44.4 °C and37.0 °C (Reference case); 28.3 °C,44.1 °C and 36.5 °C (Scenario_RSS);27.9 °C,44 °C and 35.8 °C (Scenario_RDS) and 27.1 °C,43.7 °C and34.4 °C (Scenario_SVF), indicating the significant thermal comfort im-provement with the proposedmorphology-based tree species selectionapproach in terms of magnitude and area coverage. Comparison be-tween each tree-planted scenario and the reference i.e. reveals a
16 T.E. Morakinyo et al. / Science of the Total Environment 719 (2020) 137461
minimum and maximum of −4 °C and 1.2 °C; −8.7 °C and 2.6 °C;and− 11.4 °C and 3.0 °C, respectively for the scenario_RSS, scenario_RDSand proposed scenario_SVF, which correspond to a domain averagedvalue of−0.55 °C,−1.22 °C and− 2.62 °C. This finding clearly indicatesthe proposed approach's capability in improving the thermal comforttwice as much as the scenario_RDSwhich is the best case with an unin-formed tree selection approach.
Furthermore, we have investigated thermal class conversion fromone to another of unbuilt grids within the domain for each tree-planted scenario relative to the reference as shown in Fig. 14(b). Itshows the area coverage (in %) per thermal class for all scenariosunder consideration. Four thermal forms i.e. slightly warm, warm, hotand very hot accounted for 99.8% unbuilt grids in the domain. In the ref-erence case, ~4% of the unbuilt grid had a “Very Hot” (i.e. PET N41 °C)condition which was reduced to 2.1%, 1% and 0.5% in the scenario_RSS,scenario_RDS and proposed scenario_SVF, respectively. Moreover,“Hot” thermal condition was observed in ~60% of the unbuilt grids inthe reference scenario but reduced to 50%, 42% and 28% in thescenario_RSS, scenario_RDS and proposed scenario_SVF, respectively. Inthe case of “warm” condition, the percentage of area coverage increasedfrom 22% in the reference to 31%, 35% and 25% in the scenario_RSS,scenario_RDS and proposed scenario_SVF, respectively. However, theslightly warm area coverage (%) increased from 15% to 17%, 22% and46% in the scenario_RSS, scenario_RDS and proposed scenario_SVF, re-spectively. Relative to the RDS case – the supposed best-case scenario,the profiles of scenario_SVF, shows more grids were transformed tothe slightly warm condition (46% compared to 22%) especially from“Hot” condition. In general, with our proposed the right tree, right can-yon tree selection approach, over 70% of the unbuilt grids experiencebelow “Hot” thermal condition against the 36%, 48% and 57% in the ref-erence, scenario_RSS and scenario_RDS, respectively reiterating the sig-nificant effect of the proposed approach.
5. Planning recommendation, limitation and conclusion
This study has proposed and evaluated a morphology-based ap-proach to select the right tree for the right location for optimum urbanheat mitigation. The approach is applicable globally since genericurban morphology (i.e. SVF) and tree classification (54 generic treeforms) were used in the development. Our findings on the relationshipbetween trees' cooling performance and urbanmorphology reveals thatthe tree's heat reduction potential is variable depending on the species(tree forms) and location with the urban domain. Even though othertree morphological characteristics such as tree height, trunk height,and crown diameter are determinants of tree's heat reduction potential,the main determinant of heat reduction efficiency is the foliage densitywhich is corroborated by our previous studies' finding where 60% oftemperature regulation is attributed to foliage density(Morakinyoet al., 2018). In general, tree species with high foliage density are gener-ally high heat mitigators and vice-versa for low foliage density trees.However, depending on the location, the heat reduction potential oftrees can be hampered i.e. a tree species can be underutilized if placedin the wrong place. For instance, high foliage density trees are at theirbest when placed in open-areas or low sky-view factors area, but dueto the competing shadow-cast shading effect from the building, suchtrees underperform in high-density areas. The reverse is true for thesparse foliage trees. Thus, the prioritization of tree-planting within theentire range of urban morphology (sky-view factor) has been catego-rized into three i.e. Low (SVF ≤ 0.45): Moderate (SVF = 0.45–0.6) andhigh (SVF N 0.6) priority. It is important to mention, that themagnitudeof heat reduction potential will be dependent on the prevailing climateeither hot-humid, hot-dry, temperate or cold climate. Also, local tree da-tabase and descriptive statistics are required to translate to tree forms toactual tree species for implementation. The proposed approach hasbeen tested under the Hong Kong's hot-humid climate condition, thus
the reported HRP magnitude are the limited to areas with similar cli-mate condition.
The findings from the parametric and confirmation by the evalu-ation study in Hong Kong can be applied to the urban greening strat-egies of the city: we particularly recommend a performance-basedapproach to tree-planting in the city which implies a paradigmshift from generalizing trees to a need-based and thermal sensitivetree species selection in the right location. To achieve this we recom-mend the updating of tree species selection suggestions in the cur-rent district-level Greening Master Plan (GMP) with our proposedmorphology-based tree species selection approach so as to optimizeurban heat mitigation and significantly reduce dysfunctional in thecity's landscape in the short and long -term. A larger scale tree data-base should be developed with heat reduction as a categorizationfactor. Furthermore, at building and site-scales, the greening sec-tions of the sustainable building design guideline (APP-152)(HKBD, 2014) and the chapter 4 of the Hong Kong Hong Kong Plan-ning Standards and Guidelines (HKPSG, 2011) should be modifiedto include proposition of the characteristic heat mitigators relativeto the locations sky-view factor, thereby improving the thermal con-dition of the immediate environment among other benefits.
There are some limitations to this study which are mainly related tothe adopted ENVI-met model: first, all buildings in our simulation are ofsinglematerial i.e. concretewhereas, there aremixes of facades types inthe city domain. Secondly, the dominant wind parameters during thesummer period in Hong Kong were applied and are kept constant dur-ing the simulationwhich is in contradiction to the real atmospheric con-dition. Also, our generic tree classification scheme included only fourparameters which are actually the most important. However, otherphysical or morphological parameters of trees, such as leaf shape, tex-ture and colour have been found to also contribute to the cooling mag-nitude of trees (Lin and Lin, 2010). Nevertheless, our results have shownthat tree's heat mitigation potential varies among species and place-ment within the urban landscape, essential knowledge for the planningand design of green spaces with optimum thermal benefits. In the fu-ture, wewill extend this by investigating and comparing the heat reduc-tion potential in variable climate zones around the world. Through this,a globalmorphology-based tree species selection database can bedevel-oped and utilized.
CRediT authorship contribution statement
Tobi EnioluMorakinyo:Conceptualization,Methodology, Software,Formal analysis, Investigation, Writing - original draft, Writing - review& editing, Project administration. Wanlu Ouyang: Software, Datacuration, Formal analysis, Writing - original draft, Writing - review &editing. Kevin Ka-Lun Lau: Validation, Writing - review & editing, Pro-ject administration, Funding acquisition. Chao Ren:Writing - review &editing, Supervision, Funding acquisition. Edward Ng: Conceptualiza-tion, Supervision, Funding acquisition, Project administration.
Declaration of competing interest
The authors declare that they have no known competing financialinterests or personal relationships that could have appeared to influ-ence the work reported in this paper.
Acknowledgement
This studywas supported by theGeneral Research Fund from theRe-search Grants Council of Hong Kong (grant numbers: 14629516 &14611015) and the “Vice-Chancellor's Discretionary Fund” of the Chi-nese University of Hong Kong. Authors also appreciate that Hong KongObservatory for providing the part of the weather data used in thisstudy.Weacknowledge the two anonymous reviewerswhose construc-tive comments helped improve this manuscript.
17T.E. Morakinyo et al. / Science of the Total Environment 719 (2020) 137461
Appendix 1
y = 1.4x - 12.2R² = 0.74
y = 1.1x - 4.9R² = 0.69
20
25
30
35
40
45
50
20 25 30 35 40 45 50
( TR
M detalumiS
°C)
Observed MRT (°C)
(b)
y = 0.82x + 5.0R² = 0.81
y = 0.7x + 8.6R² = 0.79
26
28
30
32
34
36
26 28 30 32 34 36
( erutarepmet ria detalu
miS°C
)
Observed air temperature (°C)
Tree-shadedUnshadedLinear (Tree-shaded)Linear (Unshaded)
(a)
Fig. A1. .Relationship between ENVI-met simulated and observed (a) air temperature and (b) mean radiant temperature, MRT at tree-shaded and unshaded location on 23rd August,15thand 17th October 2016 (09:00–17:00 local time) (source: (Morakinyo et al., 2018)).
Appendix 2
y = 15.903x + 33.008R² = 0.8305
y = 1.2484x + 32.798R² = 0.7672
y = 34.162x + 37.032R² = 0.8358
30.0
35.0
40.0
45.0
50.0
55.0
60.0
65.0
70.0
75.0
0 0.2 0.4 0.6 0.8 1
)Cº( tr
mT ,aT ,TEP
SVF
PET (°C)TaTmrt
y = 1.5241x + 21.054R² = 0.3214
y = 1.2728x + 26.685R² = 0.2572
y = 1.283x + 19.823R² = 0.4727
18.0
20.0
22.0
24.0
26.0
28.0
30.0
0 0.2 0.4 0.6 0.8 1SVF
PET (°C)TaTmrt
(a) Daytime (b) Nighttime
Fig. A2. Relationship between urban morphology and urban heat indicators during day and night time.
18 T.E. Morakinyo et al. / Science of the Total Environment 719 (2020) 137461
Appendix 3
(
M
Fig. A3.. Distribution of micro-climate variables and the impact of different urban morphology during the nighttime
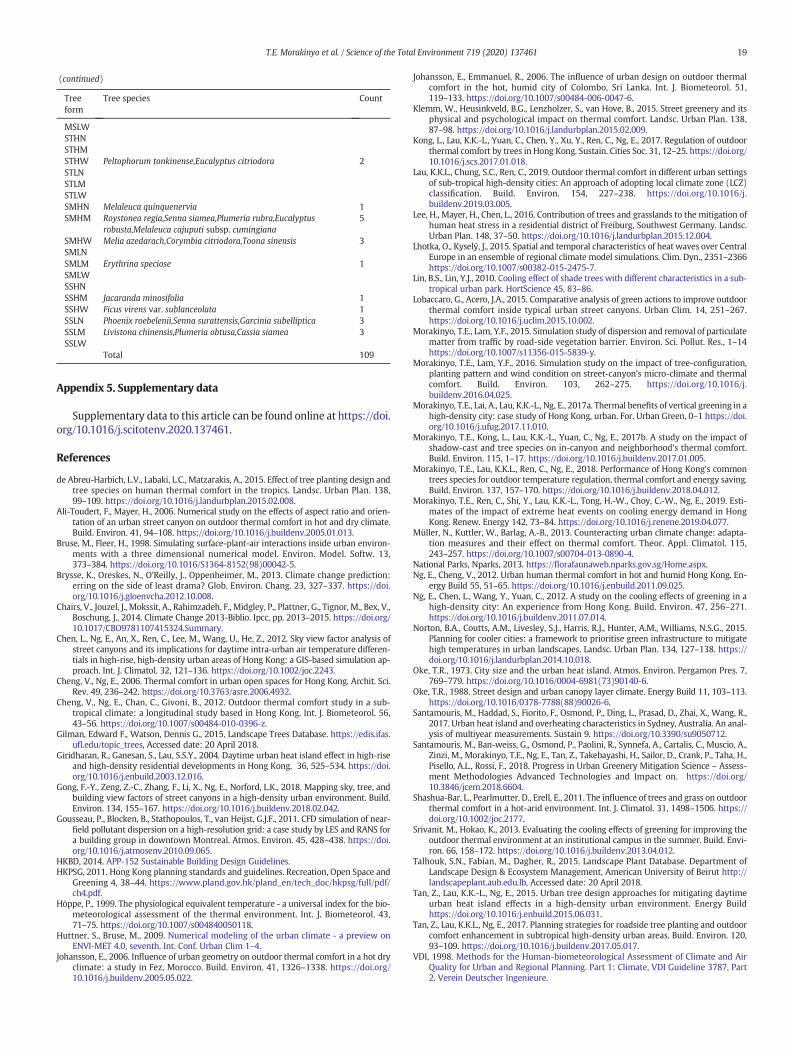
Appendix 4. A full list of the 54 forms and corresponding tree speciesfound in Hong Kong based on a pilot tree survey
MM
Treeform
DDDDDDDD
D
DDD
DDDD
DDM
Tree species
CountMM
THN 0M
THM 0 THW 0M
TLN 0 TLM 0 TLW 0 MHN 0 MHMM
Aleurites moluccana, Elaeocarpus apiculatus, Mangifera indica,Macaranga tanarius var. tomentosa, Bischofia polycarpa, Cordiadichotoma, Ficus variegata var. chlorocarpa
7
M
MHWM
Ficus elastica, Ficus religiosa, Macaranga tanarius, Lophostemonconfertus
4
M
MLN Cerbera manghas 1M
MLM Ficus benjamina, Araucaria heterophylla, Ficus altissima, 3M
MLW Ficus microcarpa, Artocarpus altilis, Erythrina indica ‘Picta’, Morusalba, Ficus virens5
M
SHN Cinnamomum camphora 1M
SHM Cassia javanica var. indochinensis 1 SHW Syzygium cumini 1 SLN Juniperus chinensis, Bischofia javanica,Terminalia mantaly cv.‘Tricolour’, Callistemon viminalis, Erythrina variegata, Ficusbenjamina'Variegata’, Juniperus chinensis L.var
7
M
SLM Crateva unilocularis, Ailanthus fordii, Dillenia excelsa 3 SLW Hibiscus tiliaceus 1 THN 0continued)
Treeform
Tree species
CountTHM
0 THW Peltophorum pterocarpum 1 TLN TLM TLW MHN Archontophoenix alexandrae,Melaleuca cajuputi,Grevillearobusta,Liquidambar formosana
4MHM
Bauhinia × blakeana,Delonix regia,Michelia x alba,Terminaliamantaly,Acacia confusa,Eucalyptus torelliana,Cassiafistula,Casuarina equisetifolia,Acacia mangium,Bauhinia variegatavar. candida,Alstonia scholaris,Adenanthera microsperma,Thevetiaperuviana13
MHW
Bombax ceiba,Khaya senegalensis,Spathodea campanulata,Albizialebbeck,Celtis sinensis,Fraxinus griffithii,Swietenia mahagoni7
MLN
Lagerstroemia indica 1 MLM Schefflera actinophylla 1 MLW Teminalia catappa,Tabebuia donnell-smithii 2 SHN 0 SHM Bauhinia variegata,Cinnamomum burmannii,Ilexrotunda,Xanthostemon chrysanthus,Phanera variegate
5SHW
Elaeocarpus grandifloras 1 SLN Dypsis lutescens,Magnolia grandiflora,Caryota maxima,Caryotamitis,Tabebuia chrysantha,Leucaena leucocephala,Polyalthialongifolia,Podocarpus macrophyllus,Lagerstroemiafloribunda,Elaeocarpus hainanensis,Syzygium jambos,Chukrasiatabularis,Oroxylum indicum
13
SLM
Lagerstroemia speciosa,Plumeria rubra cv. acutifolia,Caryotaochlandra,Crateva trifoliata,Cassia surattensis,Bauhinia purpurea,Sterculia lanceolate7
(
19T.E. Morakinyo et al. / Science of the Total Environment 719 (2020) 137461
continued)
Treeform
MSTSTSTSTSTSTSMSM
SMSMSMSMSSSSSSSSSSSS
Tree species
CountSLW
HN HM HW Peltophorum tonkinense,Eucalyptus citriodora 2 LN LM LW HN Melaleuca quinquenervia 1 HM Roystonea regia,Senna siamea,Plumeria rubra,Eucalyptusrobusta,Melaleuca cajuputi subsp. cumingiana
5HW
Melia azedarach,Corymbia citriodora,Toona sinensis 3 LN LM Erythrina speciose 1 LW HN HM Jacaranda minosifolia 1 HW Ficus virens var. sublanceolata 1 LN Phoenix roebelenii,Senna surattensis,Garcinia subelliptica 3 LM Livistona chinensis,Plumeria obtusa,Cassia siamea 3 LWTotal
109Appendix 5. Supplementary data
Supplementary data to this article can be found online at https://doi.org/10.1016/j.scitotenv.2020.137461.
References
de Abreu-Harbich, L.V., Labaki, L.C., Matzarakis, A., 2015. Effect of tree planting design andtree species on human thermal comfort in the tropics. Landsc. Urban Plan. 138,99–109. https://doi.org/10.1016/j.landurbplan.2015.02.008.
Ali-Toudert, F., Mayer, H., 2006. Numerical study on the effects of aspect ratio and orien-tation of an urban street canyon on outdoor thermal comfort in hot and dry climate.Build. Environ. 41, 94–108. https://doi.org/10.1016/j.buildenv.2005.01.013.
Bruse, M., Fleer, H., 1998. Simulating surface-plant-air interactions inside urban environ-ments with a three dimensional numerical model. Environ. Model. Softw. 13,373–384. https://doi.org/10.1016/S1364-8152(98)00042-5.
Brysse, K., Oreskes, N., O’Reilly, J., Oppenheimer, M., 2013. Climate change prediction:erring on the side of least drama? Glob. Environ. Chang. 23, 327–337. https://doi.org/10.1016/j.gloenvcha.2012.10.008.
Chairs, V., Jouzel, J., Mokssit, A., Rahimzadeh, F., Midgley, P., Plattner, G., Tignor, M., Bex, V.,Boschung, J., 2014. Climate Change 2013-Biblio. Ipcc, pp. 2013–2015. https://doi.org/10.1017/CBO9781107415324.Summary.
Chen, L., Ng, E., An, X., Ren, C., Lee, M., Wang, U., He, Z., 2012. Sky view factor analysis ofstreet canyons and its implications for daytime intra-urban air temperature differen-tials in high-rise, high-density urban areas of Hong Kong: a GIS-based simulation ap-proach. Int. J. Climatol. 32, 121–136. https://doi.org/10.1002/joc.2243.
Cheng, V., Ng, E., 2006. Thermal comfort in urban open spaces for Hong Kong. Archit. Sci.Rev. 49, 236–242. https://doi.org/10.3763/asre.2006.4932.
Cheng, V., Ng, E., Chan, C., Givoni, B., 2012. Outdoor thermal comfort study in a sub-tropical climate: a longitudinal study based in Hong Kong. Int. J. Biometeorol. 56,43–56. https://doi.org/10.1007/s00484-010-0396-z.
Gilman, Edward F., Watson, Dennis G., 2015. Landscape Trees Database. https://edis.ifas.ufl.edu/topic_trees, Accessed date: 20 April 2018.
Giridharan, R., Ganesan, S., Lau, S.S.Y., 2004. Daytime urban heat island effect in high-riseand high-density residential developments in Hong Kong. 36, 525–534. https://doi.org/10.1016/j.enbuild.2003.12.016.
Gong, F.-Y., Zeng, Z.-C., Zhang, F., Li, X., Ng, E., Norford, L.K., 2018. Mapping sky, tree, andbuilding view factors of street canyons in a high-density urban environment. Build.Environ. 134, 155–167. https://doi.org/10.1016/j.buildenv.2018.02.042.
Gousseau, P., Blocken, B., Stathopoulos, T., van Heijst, G.J.F., 2011. CFD simulation of near-field pollutant dispersion on a high-resolution grid: a case study by LES and RANS fora building group in downtown Montreal. Atmos. Environ. 45, 428–438. https://doi.org/10.1016/j.atmosenv.2010.09.065.
HKBD, 2014. APP-152 Sustainable Building Design Guidelines.HKPSG, 2011. Hong Kong planning standards and guidelines. Recreation, Open Space and
Greening 4, 38–44. https://www.pland.gov.hk/pland_en/tech_doc/hkpsg/full/pdf/ch4.pdf.
Höppe, P., 1999. The physiological equivalent temperature - a universal index for the bio-meteorological assessment of the thermal environment. Int. J. Biometeorol. 43,71–75. https://doi.org/10.1007/s004840050118.
Huttner, S., Bruse, M., 2009. Numerical modeling of the urban climate - a preview onENVI-MET 4.0, seventh. Int. Conf. Urban Clim 1–4.
Johansson, E., 2006. Influence of urban geometry on outdoor thermal comfort in a hot dryclimate: a study in Fez, Morocco. Build. Environ. 41, 1326–1338. https://doi.org/10.1016/j.buildenv.2005.05.022.
Johansson, E., Emmanuel, R., 2006. The influence of urban design on outdoor thermalcomfort in the hot, humid city of Colombo, Sri Lanka. Int. J. Biometeorol. 51,119–133. https://doi.org/10.1007/s00484-006-0047-6.
Klemm, W., Heusinkveld, B.G., Lenzholzer, S., van Hove, B., 2015. Street greenery and itsphysical and psychological impact on thermal comfort. Landsc. Urban Plan. 138,87–98. https://doi.org/10.1016/j.landurbplan.2015.02.009.
Kong, L., Lau, K.K.-L., Yuan, C., Chen, Y., Xu, Y., Ren, C., Ng, E., 2017. Regulation of outdoorthermal comfort by trees in Hong Kong. Sustain. Cities Soc. 31, 12–25. https://doi.org/10.1016/j.scs.2017.01.018.
Lau, K.K.L., Chung, S.C., Ren, C., 2019. Outdoor thermal comfort in different urban settingsof sub-tropical high-density cities: An approach of adopting local climate zone (LCZ)classification. Build. Environ. 154, 227–238. https://doi.org/10.1016/j.buildenv.2019.03.005.
Lee, H., Mayer, H., Chen, L., 2016. Contribution of trees and grasslands to the mitigation ofhuman heat stress in a residential district of Freiburg, Southwest Germany. Landsc.Urban Plan. 148, 37–50. https://doi.org/10.1016/j.landurbplan.2015.12.004.
Lhotka, O., Kyselý, J., 2015. Spatial and temporal characteristics of heat waves over CentralEurope in an ensemble of regional climate model simulations. Clim. Dyn., 2351–2366https://doi.org/10.1007/s00382-015-2475-7.
Lin, B.S., Lin, Y.J., 2010. Cooling effect of shade trees with different characteristics in a sub-tropical urban park. HortScience 45, 83–86.
Lobaccaro, G., Acero, J.A., 2015. Comparative analysis of green actions to improve outdoorthermal comfort inside typical urban street canyons. Urban Clim. 14, 251–267.https://doi.org/10.1016/j.uclim.2015.10.002.
Morakinyo, T.E., Lam, Y.F., 2015. Simulation study of dispersion and removal of particulatematter from traffic by road-side vegetation barrier. Environ. Sci. Pollut. Res., 1–14https://doi.org/10.1007/s11356-015-5839-y.
Morakinyo, T.E., Lam, Y.F., 2016. Simulation study on the impact of tree-configuration,planting pattern and wind condition on street-canyon’s micro-climate and thermalcomfort. Build. Environ. 103, 262–275. https://doi.org/10.1016/j.buildenv.2016.04.025.
Morakinyo, T.E., Lai, A., Lau, K.K.-L., Ng, E., 2017a. Thermal benefits of vertical greening in ahigh-density city: case study of Hong Kong, urban. For. Urban Green, 0–1 https://doi.org/10.1016/j.ufug.2017.11.010.
Morakinyo, T.E., Kong, L., Lau, K.K.-L., Yuan, C., Ng, E., 2017b. A study on the impact ofshadow-cast and tree species on in-canyon and neighborhood’s thermal comfort.Build. Environ. 115, 1–17. https://doi.org/10.1016/j.buildenv.2017.01.005.
Morakinyo, T.E., Lau, K.K.L., Ren, C., Ng, E., 2018. Performance of Hong Kong’s commontrees species for outdoor temperature regulation, thermal comfort and energy saving.Build. Environ. 137, 157–170. https://doi.org/10.1016/j.buildenv.2018.04.012.
Morakinyo, T.E., Ren, C., Shi, Y., Lau, K.K.-L., Tong, H.-W., Choy, C.-W., Ng, E., 2019. Esti-mates of the impact of extreme heat events on cooling energy demand in HongKong. Renew. Energy 142, 73–84. https://doi.org/10.1016/j.renene.2019.04.077.
Müller, N., Kuttler, W., Barlag, A.-B., 2013. Counteracting urban climate change: adapta-tion measures and their effect on thermal comfort. Theor. Appl. Climatol. 115,243–257. https://doi.org/10.1007/s00704-013-0890-4.
National Parks, Nparks, 2013. https://florafaunaweb.nparks.gov.sg/Home.aspx.Ng, E., Cheng, V., 2012. Urban human thermal comfort in hot and humid Hong Kong. En-
ergy Build 55, 51–65. https://doi.org/10.1016/j.enbuild.2011.09.025.Ng, E., Chen, L., Wang, Y., Yuan, C., 2012. A study on the cooling effects of greening in a
high-density city: An experience from Hong Kong. Build. Environ. 47, 256–271.https://doi.org/10.1016/j.buildenv.2011.07.014.
Norton, B.A., Coutts, A.M., Livesley, S.J., Harris, R.J., Hunter, A.M., Williams, N.S.G., 2015.Planning for cooler cities: a framework to prioritise green infrastructure to mitigatehigh temperatures in urban landscapes. Landsc. Urban Plan. 134, 127–138. https://doi.org/10.1016/j.landurbplan.2014.10.018.
Oke, T.R., 1973. City size and the urban heat island. Atmos. Environ. Pergamon Pres. 7,769–779. https://doi.org/10.1016/0004-6981(73)90140-6.
Oke, T.R., 1988. Street design and urban canopy layer climate. Energy Build 11, 103–113.https://doi.org/10.1016/0378-7788(88)90026-6.
Santamouris, M., Haddad, S., Fiorito, F., Osmond, P., Ding, L., Prasad, D., Zhai, X., Wang, R.,2017. Urban heat island and overheating characteristics in Sydney, Australia. An anal-ysis of multiyear measurements. Sustain 9. https://doi.org/10.3390/su9050712.
Santamouris, M., Ban-weiss, G., Osmond, P., Paolini, R., Synnefa, A., Cartalis, C., Muscio, A.,Zinzi, M., Morakinyo, T.E., Ng, E., Tan, Z., Takebayashi, H., Sailor, D., Crank, P., Taha, H.,Pisello, A.L., Rossi, F., 2018. Progress in Urban Greenery Mitigation Science – Assess-ment Methodologies Advanced Technologies and Impact on. https://doi.org/10.3846/jcem.2018.6604.
Shashua-Bar, L., Pearlmutter, D., Erell, E., 2011. The influence of trees and grass on outdoorthermal comfort in a hot-arid environment. Int. J. Climatol. 31, 1498–1506. https://doi.org/10.1002/joc.2177.
Srivanit, M., Hokao, K., 2013. Evaluating the cooling effects of greening for improving theoutdoor thermal environment at an institutional campus in the summer. Build. Envi-ron. 66, 158–172. https://doi.org/10.1016/j.buildenv.2013.04.012.
Talhouk, S.N., Fabian, M., Dagher, R., 2015. Landscape Plant Database. Department ofLandscape Design & Ecosystem Management, American University of Beirut http://landscapeplant.aub.edu.lb, Accessed date: 20 April 2018.
Tan, Z., Lau, K.K.-L., Ng, E., 2015. Urban tree design approaches for mitigating daytimeurban heat island effects in a high-density urban environment. Energy Buildhttps://doi.org/10.1016/j.enbuild.2015.06.031.
Tan, Z., Lau, K.K.L., Ng, E., 2017. Planning strategies for roadside tree planting and outdoorcomfort enhancement in subtropical high-density urban areas. Build. Environ. 120,93–109. https://doi.org/10.1016/j.buildenv.2017.05.017.
VDI, 1998. Methods for the Human-biometeorological Assessment of Climate and AirQuality for Urban and Regional Planning. Part 1: Climate, VDI Guideline 3787, Part2. Verein Deutscher Ingenieure.

20 T.E. Morakinyo et al. / Science of the Total Environment 719 (2020) 137461
Wang, D., Lau, K.K.L., Ren, C., Goggins, W.B., Shi, Y., Ho, H.C., Lee, T.C., Lee, L.S., Woo, J., Ng,E., 2019. The impact of extremely hot weather events on all-cause mortality in ahighly urbanized and densely populated subtropical city: a 10-year time-seriesstudy (2006–2015). Sci. Total Environ. 690, 923–931. https://doi.org/10.1016/j.scitotenv.2019.07.039.
Xu, Y., Ren, C., Ma, P., Ho, J., Wang, W., Lau, K.K.L., Lin, H., Ng, E., 2017. Urban morphologydetection and computation for urban climate research. Landsc. Urban Plan. 167,212–224. https://doi.org/10.1016/j.landurbplan.2017.06.018.
Yang, X., Li, Y., Luo, Z., Chan, P.W., 2017. The urban cool island phenomenon in a high-risehigh-density city and its mechanisms. Int. J. Climatol. 37, 890–904. https://doi.org/10.1002/joc.4747.
Zittis, G., Hadjinicolaou, P., Lelieveld, J., 2014. Projected changes of heat wave characteris-tics in the easternMediterranean and the Middle East. Int. Conf. Adapt., 1–12 https://doi.org/10.1007/s10113-014-0753-2.


