Embed Size (px)
Citation preview

Article
Rhythmic Working Memor
y Activation in the HumanHippocampusGraphical Abstract
Highlights
d Working memory depends on rhythmic fluctuations in the
human hippocampus
d Periods of memory activation are interleaved with periods of
constant power levels
d Fluctuations between these two modes of processing are
organized by delta rhythm
d A hierarchy of oscillations predicts successful performance
and individual capacity
Leszczy�nski et al., 2015, Cell Reports 13, 1272–1282November 10, 2015 ª2015 The Authorshttp://dx.doi.org/10.1016/j.celrep.2015.09.081
Authors
Marcin Leszczy�nski, Juergen Fell, Nikolai
Axmacher
[email protected] (M.L.),[email protected] (N.A.)
In Brief
Leszczy�nski et al. find in two independent
datasets that successful workingmemory
maintenance is a dynamic process. It
depends critically on rhythmic
fluctuations between two different
oscillatory modes of processing in the
human hippocampus. These fluctuations
predict successful task performance and
individual working memory capacity.

Cell Reports
Article
Rhythmic Working Memory Activationin the Human HippocampusMarcin Leszczy�nski,1,3,* Juergen Fell,1 and Nikolai Axmacher1,2,3,*1Department of Epileptology, University of Bonn, Sigmund-Freud-Strasse 25, 53127 Bonn, Germany2German Center for Neurodegenerative Diseases (DZNE), Ernst Robert Curtius Strasse 12, 53117 Bonn, Germany3Department of Neuropsychology, Institute of Cognitive Neuroscience, Ruhr University Bochum, Universitatsstrasse 150,
44801 Bochum, Germany
*Correspondence: [email protected] (M.L.), [email protected] (N.A.)http://dx.doi.org/10.1016/j.celrep.2015.09.081
This is an open access article under the CC BY-NC-ND license (http://creativecommons.org/licenses/by-nc-nd/4.0/).
SUMMARY
Working memory (WM) maintenance is assumed torely on a single sustained process throughout theentiremaintenanceperiod. This assumption, althoughfundamental, has never been tested. We used intra-cranial electroencephalography (EEG) recordingsfrom the human hippocampus in two independentexperiments to investigate the neural dynamics un-derlying WM maintenance. We observed periodicfluctuations between two different oscillatory re-gimes: Periods of ‘‘memory activation’’ were reflectedby load-dependent alpha power reductions andlower levels of cross-frequency coupling (CFC). Theyoccurred interleaved with periods characterized byload-independent high levels of alpha power andCFC. During memory activation periods, a relevantCFC parameter (load-dependent changes of thepeak modulated frequency) correlated with individualWM capacity. Fluctuations between these two pe-riods predicted successful performance and werelocked to the phase of endogenous delta oscillations.These results show that hippocampal maintenance isa dynamic rather than constant process and dependscritically on a hierarchy of oscillations.
INTRODUCTION
Working memory (WM) refers to the temporary retention of infor-
mation that is no longer perceived. Therefore, successful perfor-
mance in WM tasks requires keeping neural representations
active during the maintenance interval. According to the multi-
plexing buffer model of WM,maintenance of multiple items relies
on repeated interactions between neural oscillations in a high-
and a low-frequency range (Lisman and Idiart, 1995; Lisman
and Jensen, 2013). In detail, this model assumes that indi-
vidual WM items are represented by cells firing synchronized
in the gamma cycle (>30 Hz). Maintenance of item sequences
depends on the sequential reactivation of these assemblies dur-
ing consecutive phase ranges of simultaneous low-frequency
oscillations.
1272 Cell Reports 13, 1272–1282, November 10, 2015 ª2015 The Au
Themultiplexing buffermodel assumes that representations of
individual items (via high-frequency oscillations) do not occur
during the entire cycle of low-frequency oscillations. Instead,
these high-frequency oscillations are thought to be restricted
to active ‘‘duty cycles,’’ i.e., restricted phase ranges that corre-
spond to higher levels of neural excitability (Mehta et al., 2002;
Jensen et al., 2012, 2014). Between successive duty cycles,
excitability is actively reduced in order to avoid overlap and inter-
ference between the representations of item sequences. Such
an active inhibition has been related to oscillations in the alpha
frequency range (8–12 Hz; Jensen et al., 2012; Sauseng et al.,
2009; Thut et al., 2006; Jokisch and Jensen, 2007; Bonnefond
and Jensen, 2012; Klimesch, 2012; Haegens et al., 2011; Spaak
et al., 2012), although a similar function has been attributed to
theta as well (Mehta et al., 2002). In particular, alpha power
and phase reflect an attenuation of action potentials (Haegens
et al., 2011) and high-frequency activity (Spaak et al., 2012).
We will use the term ‘‘inhibition’’ when referring to this property
of alpha oscillations. Notably, this term refers to an interpretation
of alpha oscillations and not to electrophysiologically measured
inhibition. A decrease of alpha power, in turn, reflects a release
from inhibition (c.f. disinhibition). Furthermore, according to
this alpha-inhibition model, increases in alpha power are accom-
panied by shorter duty cycles and decreases in alpha oscilla-
tions by longer duty cycles, respectively (Jensen et al., 2014;
Figure 1A).
As a consequence of the separation of duty cycles by periods
of inhibition, the amplitude of high-frequency activity is modu-
lated by the phase of low-frequency activity, a phenomenon
described as phase-amplitude cross-frequency coupling (CFC;
Siegel et al., 2009; Axmacher et al., 2010). The multiplexing
buffer model assumes a functional relevance of the CFC ratio,
i.e., the frequency ratio between the most strongly modulated
high-frequency activity (mHFA-max) and the most strongly
modulating low-frequency oscillation (mLFA-max). This ratio
(mHFA-max/mLFA-max) should be positively correlated with
WM capacity, because longer low-frequency cycles allow repre-
senting longer sequences of items.
When alpha power is high, gamma-band activity occurs during
amore restricted alpha phase range (shorter duty cycles), so that
CFC strength is enhanced (Spaak et al., 2012; as described
above, a similar function has previously been assigned to theta
oscillations; Mehta et al., 2002). In the context of WM, this
thors

A
B C
D
Figure 1. Theoretical Model, Experimental Paradigm, and Behavioral
Results
(A) Theoretical model integrating the alpha inhibition and multiplexing buffer
model of WM. The length of a duty cycle depends on power in the alpha fre-
quency range. Low alpha power (on the left) results in longer duty cycles,
whereas high alpha power (on the right) is associated with shorter duty cycle.
The length of a duty cycle constrains gamma power, which in turn may be
reflected as modulations to the theta-gamma code. In particular, long duty
cycles may be observed as decreases in strength of the theta-gamma mod-
ulation index (modulating activity is broadly distributed across the low-fre-
quency phase; upper left). In contrast, short duty cycles may be reflected by
increases in CFC strength (upper right).
(B) Serial WM Sternberg task with consecutive presentation of one, three, five,
or seven digits. Here, an example trial with three digits is presented. Partici-
pants needed to encode, maintain, and recall the sequence of digits.
(C) Coronal slice from one patient with hippocampal electrode contacts
marked by spheres. A mask from the AAL atlas was used for identification of
electrodes in the hippocampus (red; green mask, parahippocampal gyrus).
(D) Left: accuracy scores as a function of memory load. Right: WM capacity
split across memory loads and the maximal value of capacity (kmax). Dots
indicate single-subject scores. Error bars show SEM.
framework predicts that maintenance of longer sequences re-
quires a reduction of alpha power, so thatmore items can be rep-
resented during longer duty cycles. Therefore, a highWMcapac-
Cell Rep
ity should correspond to a decrease of CFC strength, because
the modulated frequency would be more broadly distributed
across the entire cycle of mLFA. WM capacity should be
maximal if the duration of individual low-frequency cycles was
as long as possible (lower frequencies of these oscillations), if
high-frequency cycles were as short as possible (higher fre-
quencies of these oscillations), or if CFC ratios were high.
Thus, this model would lead to the prediction that WM capacity
should be maximal when gamma-band activity is uniformly
distributed across the entire cycle of low-frequency oscillations,
i.e., in the absence of CFC. However, this may then lead to
possible interference between consecutive representations of
item sequences. This possible tradeoff between the demand to
code as many items as possible over the entire phase range
and the requirement to leave a temporal gap for non-coding
phase ranges has not been investigated. Note that this model
does not imply that during more extended duty cycles either
CFC or the interacting oscillations of different frequencies
become irrelevant, but it suggests that the phase-amplitude
code is modulated by the length of duty cycles.
Here, we studied the dynamics of oscillatory duty cycles
and their role for the maintenance of multiple items in WM.
In two experiments, we presented participants with sequences
of one, three, five, or seven digits (experiment 1), or one,
two, or four faces (experiment 2). Items had to be maintained
for 3 s and then recalled. WM capacity was measured as
the amount of information that could be successfully main-
tained, controlled for guessing. During both experiments, we
recorded intracranial electroencephalography (EEG) activity
from the hippocampus of two independent groups of epilepsy
patients, because previous results from neuroimaging (Nichols
et al., 2006) and intracranial EEG (Axmacher et al., 2010; van
Vugt et al., 2010) have shown that the hippocampus activates
during WM maintenance of multiple items or item features.
Furthermore, studies have shown that patients with hippocam-
pal lesions have deficits when they are asked to maintain mul-
tiple items or associations between multiple item features in
WM (e.g., Aggleton et al., 1992; Nichols et al., 2006; Olson
et al., 2006). Thus, these studies suggest that the hippocam-
pus is not only activated during WM tasks but also essential
under certain conditions.
RESULTS
We will first report all results of experiment 1 (maintenance of
digits; nine patients) and later describe the findings of experi-
ment 2 (maintenance of faces; eight patients).
Load-Dependent Hippocampal Power Decrease:Memory ActivationWe testedwhether activity in the lower-frequency range (4–30 Hz)
depends onWM load.We used surrogate-based cluster statistics
to identify significant linear changes in power across memory
loads (Maris andOostenveld, 2007). Across our group of nine par-
ticipants, we found four significant clusters (pcorrected < 0.05 each)
in which power decreased linearly with increasing memory load
(see Figures 2A, S1, and S3). These four clusters had an average
duration of 208 ± 35 ms (mean ± SD across the four clusters),
orts 13, 1272–1282, November 10, 2015 ª2015 The Authors 1273

A
D
E
B C
Figure 2. Difference between CFC during Periods with and without Load-Dependent Release from Alpha/Beta-Related Inhibition
(A) Load-dependent linear power decreases resulting from t statistic for regression coefficients calculated for each participant obtained by regressing the
subject-specific spectro-temporal data onWM load. For each subject, data were averaged across trials of the same condition (loads 1, 3, 5, and 7). The subject-
specific average across trials entered linear regression acrossmemory loads. Note that the data were not averaged or summed across patients. In order to further
test if the power fluctuations are consistent across the subjects, we calculated t statistic cluster-corrected for multiple comparisons. The color map reflects the
results of this random-effects group-level t statistic (n = 9) showing that the power fluctuations calculated within each subject are consistent across the pool of
patients. Bottom: time course of the linear regression averaged across frequencies where significant clusters were observed (i.e., between 7 and 23 Hz). See also
Figure S1 for single subject data and Figure S3 for further analysis of the power fluctuations.
(B)Averagedalpha/betapower (7–23Hz) duringperiodswith (bottom) andwithout (top) load-dependentpowerdecrease (memoryactivationand interleavingperiods,
respectively), showing that the difference between the two types of intervals is due to different distributions of power acrossmemory loads. Error bars indicate SEM.
(C) Clustering of endogenous 2-Hz oscillation phases during periods with load-dependent memory activation (polar plot with 20 phase bins, each covering 18�).Data are pooled across nine patients and four clusters.
(D) Grand average CFC during time intervals with (left) and without (middle) load-dependent release from alpha/beta-related inhibition (memory activation pe-
riods). Color indicates CFC index (left, middle) and the difference between these periods (right), demonstrating higher CFC during periods without load-
dependent disinhibition.
(E) CFC strength is lower during memory activation periods than interleaved periods. Left: each dot reflects data from a single subject with CFC calculated
separately during time intervals with load-dependent power decrease (x axis) and without (y axis). Right: bar plot reflects group average of the CFC during in-
tervals with (gray) and without (orange) load-dependent power decrease. Each line depicts a single subject. Error bars reflect SEM.
See also Figures S1 and S3.
1274 Cell Reports 13, 1272–1282, November 10, 2015 ª2015 The Authors

covered frequencies in the alpha/beta range between 7 Hz and
23 Hz, and were distributed across the entire maintenance period
with intervals of �540 ms between them. Thus, the load-depen-
dent decrease of alpha/beta power was organized into discrete
short and repetitive time intervals rather than being sustained
over the entire maintenance period.
These periods of linear power decrease were periodically
interleaved with intervals without any indication of load-depen-
dent power decrease (see Figures 2A and 2B). In addition, we
observed a load-dependent increase of power in the gamma
frequency range (30–150 Hz; see Supplemental Results). We
suggest that the periods of load-dependent reductions of
alpha-band activity reflect a rhythmic transient activation of
working memory representations in the hippocampus. Below,
we will report behavioral support for this interpretation.
Fluctuation of Memory Activation Periods at 2 HzThe clusters showing load-dependent reductions of alpha/beta
power occurred rhythmically every �500 ms. Fast Fourier
transform of the time course of the t scores for regression
values indeed showed a peak in the power spectrum at 2 Hz,
indicating dominant fluctuations at 2 Hz (see Figures S3B and
S3C). We observed four clear cycles of load-dependent power
reduction during the maintenance interval (Figure 2A, bottom).
We tested whether the fluctuations of intervals showing release
from alpha-dependent inhibition are consistently related to the
phase of endogenous slow oscillations (Lakatos et al., 2005).
We thus analyzed the phase angles of 2-Hz oscillations during
these ‘‘memory activation’’ intervals using Rayleigh’s test for
non-uniformity of circular data. The phase angles were ex-
tracted during all time points when power effects occurred.
The significant Rayleigh test shows that 2-Hz phases were
indeed clustered during these intervals (z = 3.19, p < 0.05)
and showed a preferred direction of 90� (Figures 2C, S3B,
and S3C; Supplemental Results). This effect is consistent
across the whole group of patients. Thus, intervals of memory
activation occur during consistent phases of endogenous 2-Hz
oscillations, indicating a hierarchy of hippocampal oscillations
during WM processing.
Periodic Switching of Cross-Frequency CouplingPatternsNext, we tested predictions from the multiplexing model of
WM that posits interactions between the phase of low-fre-
quency oscillations and the power of high-frequency activity
as a mechanism for multi-item WM. Over the entire mainte-
nance phase, we observed a significant increase of CFC as
compared to surrogate data. The difference was found in a
broad frequency range of 2–16 Hz for phase and 4–150 Hz
for amplitude (t(8) = 3.96, pcorrected < 0.05), and also within a
smaller range of 5–9 Hz for phase and 30–150 Hz for amplitude
that was predicted by the original model of CFC (Lisman and
Idiart, 1995; Lisman and Jensen, 2013; t(8) = 3.99, pcorrected <
0.05; Figure S3E).
Our initial observation that the load-dependent decrease of
alpha/beta power (memory activation) occurs periodically in
distinct temporal clusters led us to hypothesize that CFC might
show a similar pattern of periodic fluctuations. To this end, we
Cell Rep
calculated CFC within 200-ms intervals centered on significant
load-modulated alpha power reductions (memory activation)
and interleaved intervals during which power was constant
across memory loads. Indeed, we found that CFC strength
was associated with alpha/beta load effects (Figures 2D and
2E). To quantify this effect, we directly compared CFC strength
during periods with and without significant load-dependent
decreases of alpha/beta power (t(8) = 2.3699, p < 0.05; Fig-
ure 2E). These results were not biased by differences in
signal-to-noise ratio, as average load-independent power did
not differ between the two interval types (t(8) = 0.6126, p =
0.5571).
To summarize, our data show that CFC strength is lower dur-
ing periods in which alpha/beta-related inhibition is releasedwith
WM load. During these periods, CFC may support a process of
memory activation during which modulated high-frequency ac-
tivity (mHFA) is distributed across broader phase ranges of
modulating low-frequency activity (mLFA), supporting mainte-
nance of multiple items (see Figure 1A for the model, Figures
2D and 2E, and Discussion).
Correlations between CFC and WM CapacityWe calculated inter-individual correlations between individual
WM capacity (Figure 1D, right) and CFC ratio, mLFA-max, and
mHFA-max (Figure S5). Notably, we did not consider ‘‘raw’’
mLFA, mHFA and CFC frequency values but selected the fre-
quencies at which CFC strength was maximally reduced during
the memory activation periods as compared to the interleaved
periods. These analyses were conducted separately for periods
with and without load-dependent alpha/beta power effects (i.e.,
for memory activation periods and for the interleaved periods).
The correlations were performed using Kendall’s tau, which is
a particularly conservative rank-correlation test to investigate
correlations in small populations. It does not assume that the
data are normally distributed (Abdi, 2007).
During memory activation periods, we observed a significant
positive correlation between mHFA-max and WM capacity
(Figure 3A; Kendall’s tau = 0.59161, p < 0.05). No such rela-
tionship was observed for mHFA-max during periods without
load-dependent release from inhibition (tau < 0.2, p > 0.6).
Neither mLFA-max nor CFC ratio correlated with capacity dur-
ing memory activation (all tau < 0.2, all p > 0.5) or during
interleaved intervals (all tau < 0.6, all p > 0.1). In other words,
patients with higher WM capacity showed modulations of
gamma-band activity at higher frequencies during memory
activation periods.
Replication Study: Periodic Switching Generalizes toWM of Novel ContentTo test for the robustness of our results, we conducted the same
analyses in a second independent dataset. Another group of
eight different patients, again with hippocampal intracranial
EEG (iEEG) electrodes, conducted a slightly different WM para-
digm inwhich one, two, or four trial-unique unknown faces had to
be maintained (Figure 4A). Results from this dataset have been
published before (Axmacher et al., 2007, 2010).
We performed the same surrogate-based cluster statistics
as in the first experiment to identify significant linear changes
orts 13, 1272–1282, November 10, 2015 ª2015 The Authors 1275

A
B
Figure 3. Behavioral Relevance of CFC
Experiment 1 (A) and experiment 2 (B). Left: during
memory activation periods, individual WM capac-
ity correlates with load-dependent changes in the
frequency for amplitude. Right: this could be ex-
plained by faster cycles of high-frequency activity
representing individual items in a sequence (top:
digits; bottom: faces) and therefore increasing in-
dividual sequence WM span. See also Figure S5.
in low-frequency power across memory loads. We found three
significant clusters (pcorrected < 0.05 each) in which power
decreased linearly with increasing memory load (Figures 4D
and 4E). These three clusters had an average duration of
627 ± 91 ms (mean ± SD across the three clusters), covered
frequencies in the theta/alpha/beta range between 4 Hz and
20 Hz, and were distributed across the maintenance period
with a center to center distance of 660ms. Thus, similar to exper-
iment 1, the load-dependent decrease of low-frequency power
was organized into discrete short and repetitive time intervals
rather than being sustained over the entire maintenance interval.
Next, we tested whether the periodicity of memory activation
intervals was again related to the phase of endogenous slow-fre-
quency oscillations. A fast Fourier transformation of the time
series of regression t scores revealed a peak in the spectrum be-
tween 2 and 6 Hz (Figures S4B and S4C). We thus extracted the
phases at this frequency range and analyzed whether phase
values duringmemory activation periodswere clustered. Indeed,
a Rayleigh test showed phase values were not uniformly distrib-
uted (z = 5.21, p < 0.005) but were clustered at�164� (Figure 4F).Memory activation intervals occurred during consistent phases
of underlying slow oscillations. This replicates the finding of
an oscillatory hierarchy during WM maintenance from our first
experiment.
Next, we again compared the strength of CFC during memory
activation and interleaved intervals. As in our first experiment, we
1276 Cell Reports 13, 1272–1282, November 10, 2015 ª2015 The Authors
observed that CFC was reduced during
memory activation periods as compared
to the interleaving intervals (t(7) = 2.57,
p < 0.05). Again, we excluded that CFC
was artificially driven by differences in
(load-independent) power values (no
difference in load-independent power
across the two types of intervals: t(7) =
0.79, p = 0.4551).
Finally, we tested the behavioral rele-
vance ofCFC forWMcapacity.Weexactly
reproduced our results from experiment 1.
Again, during memory activation intervals,
we observed a positive correlation be-
tween the frequency of mHFA-max and
WM capacity (Kendall’s tau = 0.62, p <
0.05; Figure 3B). Thus, higher WM capac-
ities are related to higher frequencies of
mHFA-max, which correspond to shorter
cycles of amplitude-modulated high-
frequency oscillations. Putatively, longer
memory sets can be maintained when individual items are repre-
sented by fastermHFAcycles.Wedid not observe any correlation
between WM capacity and mLFA frequency (tau = 0.38, p = 0.26)
or CFC ratio (tau = 0.214, p = 0.54) in both types of interval.
Rhythmic Duty Cycles Are Critical for Successful WMPerformance in the HippocampusTo further assess the functional relevance of the observed peri-
odicity of memory activation periods, we analyzed low-fre-
quency power and CFC during incorrect trials (Figure 5). In these
trials, we did not observe any load-dependent reduction of
alpha/beta power. Interestingly, this was not due to an overall
reduction of CFC, which was increased as compared to correct
trials (0.033 versus 0.022: t(14) = 2.07, p = 0.057 in experiment 1
and 0.059 versus 0.034: t(14) = 3.04, p < 0.01 in experiment 2).
This suggests that the temporally distributed reduction of CFC
rather than the absolute CFC strength is critical for successful
WM performance. Again, results were qualitatively identical in
the two experiments (Figure 5).
DISCUSSION
Our data show that multi-item WMmaintenance relies on a hier-
archy of oscillations in the hippocampus reflecting switching
between two separate functional processingmodes. In two inde-
pendent datasets, we found evidence for load-dependent linear

A B C
D E F
G
H
Figure 4. Replication Study
(A) Serial WM Sternberg task with one, two, or four unfamiliar faces as stimuli. Here, an example trial with two faces is presented. Participants needed to encode,
maintain, and recall the stimuli.
(B) Accuracy scores as a function of memory load.
(C) WM capacity split across memory load and maximal value of capacity across load conditions (kmax). Dots indicate single-subject scores. Error bars
show SEM.
(D) Periodic fluctuations between periods with and without load-dependent release from low-frequency-related inhibition. Top: regression coefficients indicating
load effects on theta/alpha/beta power. Bottom: time course of averaged t values for regression coefficients between frequencies where clusters were observed
(legend continued on next page)
Cell Reports 13, 1272–1282, November 10, 2015 ª2015 The Authors 1277

A
C D
B
Figure 5. Data from Incorrect Trials: Absence of Memory Activation Periods during Incorrect Trials
(A and B) Top: regression coefficients indicating no linear decrease in power with memory load in experiment 1 and 2, respectively. Bottom: time course of
averaged t values for regression coefficients between 7 and 23 Hz (A) and 4 and 20 Hz (B) in experiments 1 and 2, respectively. No significant differences were
found.
(C) Bar plots indicate increased CFC during incorrect (red) as compared to correct trials during experiment 1 (left) and experiment 2 (right). Each ‘‘X’’ represents
data from one single subject.
(D) Schematic depiction of incorrect trials with lack of memory activation periods. Absence of linear power decreases in the low-frequency range. Thus, there are
no periods during which cycles of high-frequency activity are broadly distributed across larger phase ranges of low-frequency oscillations (corresponding to
lower levels of CFC).
power decreases in the hippocampus that occurred periodically
and phase-locked to endogenous delta oscillations. During
these periods, the strength of cross-frequency coupling was
overall reduced, while the load-dependent change in the peak
modulated frequency was inter-individually correlated with WM
capacity.
(4–20 Hz). Color arrows represent distinct periods, with gray depicting memory ac
for single-subject data. The horizontal gray bar represents the temporal structure
(E) Averaged alpha/beta/theta power (4–20 Hz) during periods with (bottom) and
leaving periods, respectively), showing that the difference between the two types o
bars indicate SEM.
(F) Clustering of endogenous 2- to 6-Hz oscillation phases during periodswith load
patients and three clusters. See also Figure S3B.
(G) Grand average CFC during time intervals with (left) and without (middle) load-d
index (left, middle) and difference between these periods (right), demonstrating h
(H) CFC strength is lower during memory activation periods than interleaved pe
separately during time intervals with load-dependent power decrease (x axis) an
tervals with (gray) and without (orange) load-dependent power decrease. Each li
See also Figures S2 and S4.
1278 Cell Reports 13, 1272–1282, November 10, 2015 ª2015 The Au
Alpha Inhibition ModelOur findings support a model in which alpha oscillations serve as
a gating mechanism to prioritize relevant information (Jensen
et al., 2012). We observed that during the maintenance interval,
hippocampal low-frequency activity decreased with WM load
(experiment 1: Figures 2A and 2B; experiment 2: Figures 4D
tivation periods and orange reflecting interleaved intervals. See also Figure S2
of the paradigm (S, presentation of the last stimulus; P, probe for recall).
without (top) load-dependent power decrease (memory activation and inter-
f intervals is due to different distributions of power across memory loads. Error
-dependent power decrease (memory activation). Data are pooled across eight
ependent release from theta/alpha/beta-related inhibition. Color indicates CFC
igher CFC during periods without load-dependent disinhibition.
riods. Left: each dot reflects data from a single subject with CFC calculated
d without (y axis). Right: bar plot reflects group average of the CFC during in-
ne depicts data from one single subject. Error bars reflect SEM.
thors

and 4E). This decrease was not continuous across the entire
maintenance phase but was organized into intervals that were
equally spaced across the maintenance phase and interleaved
with intervals showing no load-dependent disinhibition. Impor-
tantly, this power decrease and its periodicity were absent in
incorrect trials (Figure 5). Several previous EEG and magnetoen-
cephalography studies have provided consistent evidence that
the power of parieto-occipital alpha oscillations increases
when irrelevant information has to be suppressed in order to
refine, or ‘‘tune,’’ representations of relevant items (Sauseng
et al., 2009; Thut et al., 2006; Jokisch and Jensen, 2007; Bonne-
fond and Jensen, 2012; for reviews, see Jensen et al., 2012,
2014). These findings suggest that alpha oscillations reflect
active inhibition, consistent with the negative correlations be-
tween alpha power and either action potential rates (Haegens
et al., 2011) or high-frequency activity (Spaak et al., 2012).
Conversely, release from alpha-related inhibition is required to
process relevant information (Jensen et al., 2012). According
to a slightly different perspective, reduced power of alpha oscil-
lations improves information processing capacity via an increase
of neuronal entropy (Hanslmayr et al., 2012). Beta oscillations
have been reported to support similar inhibitory functions as
alpha oscillations (Waldhauser et al., 2012). Our results show
that alpha/beta activity was linearly reduced with WM load, sug-
gesting that hippocampal alpha/beta activity plays a similar
inhibitory role as alpha/beta activity in parieto-occipital net-
works. Furthermore, our results show that such a disinhibition
is critical for successful performance in WM task.
We performed our analyses of low-frequency power signals
within a broad frequency range (<30 Hz). Since there are no
data available yet on alpha-related inhibition in the human hippo-
campus, we wanted to reduce prior assumptions regarding
frequencies where the effects of functional inhibition might
be observed. In particular, we suspected that both theta (Fell
et al., 2011; Huang et al., 2014; Jensen et al., 2015; Mehta
et al., 2002; van Kerkoerle et al., 2014) and beta (Bauer et al.,
2014; Jensen et al., 2015; van Kerkoerle et al., 2014; Waldhauser
et al., 2012) oscillations may show functional similar effects to
alpha oscillations. Indeed, we found that the load-dependent
reductions of power are not limited to the frequency range of
8–14 Hz but spread across a broader range of frequencies
(7–23 Hz and 4–20 Hz in experiments 1 and 2, respectively).
Furthermore, it should be noted that there are no data regarding
frequencies of oscillations in the hippocampus that correspond
to the alpha range in the neocortex. The current results suggest
that the hippocampus exhibits functionally similar oscillations
across a broader frequency range.
Multiplexing Buffer ModelCFC was reduced during the memory activation periods as
compared to the interleaving periods (Figures 2D, 2E, 4G, and
4H). This result may appear surprising because CFC has been
related to active maintenance of relevant information by the mul-
tiplexing buffer model (Lisman and Idiart, 1995; Lisman and Jen-
sen, 2013). However, weaker CFC reflects broader distributions
of mHFA across the phase of mLFA, maximizing the number of
items that can be simultaneously maintained (Figure 1A). Thus,
our finding of weaker CFC during intervals with load-dependent
Cell Rep
hippocampal disinhibition is consistent with an increasing in-
volvement of the hippocampus for representing longer se-
quences (see also the Supplemental Discussion).
Relation of CFC to Working Memory CapacityThe current results confirm one very prominent prediction from
the multiplexing model of WM. In two independent datasets,
we observed inter-individual correlations between WM capacity
and a central measure of CFC, the peak frequency for modulated
activity. In particular, we observed that higher numbers of items
that participants were able to maintain (with increasing load)
were associated with more pronounced increases of the fre-
quency for amplitude. Patients who show stronger increases in
the peak frequency-for-amplitude from lower to higher loads
are capable of maintaining longer sequences in working mem-
ory. Importantly, this relation was observed for different types
of material: We observed similar correlations during mainte-
nance of simple and highly familiar visual features (digits) and
for trial unique, novel, and complex stimuli (faces). Given that
the frequency-for-phase was constant across memory loads,
the increasing peak frequency-for-amplitude for participants
with higher WM capacity may be associated with more distinct
representations at increasing memory load. A very interesting
follow-up question is whether this mechanism is specific to the
hippocampus or whether it generalizes to other brain networks
that are involved in visual working memory such as prefrontal,
parietal, or occipital cortices.
Periodic Switching between Two Modes of Processingin the Human HippocampusThe current finding of slow fluctuations between two different
oscillatory regimes phase-locked to endogenous delta oscilla-
tions might reflect a similar process of switching between
different modes as observed in rodents in the firing pattern of en-
torhinal grid cells (De Almeida et al., 2012) and CA1 local field po-
tentials (Colgin et al., 2009). Entorhinal grid cells have been found
to operate in twomodes: (1) a predictive mode in which grid cells
represent a location ahead of an animal and (2) a short-term
memory mode in which the cells represent a position just
passed. Importantly, both modes are organized by theta and
gamma oscillations (De Almeida et al., 2012). Since theta oscilla-
tions have been suggested to correspond to the human delta
rhythm (Lega et al., 2012; Watrous et al., 2013), the current re-
sults might reflect a homologous mechanism of periodic switch-
ing between twomodes in the human hippocampus. Colgin et al.
(2009) observed that gamma oscillations in the CA1 also alter-
nate between two modes. Fast gamma (�65–140 Hz) oscilla-
tions in CA1 were synchronized with fast gamma in medial
entorhinal cortex (MEC), whereas slow gamma oscillations in
CA1 (�25–50 Hz) were synchronized with slow gamma in CA3.
Importantly, these two types of gamma were locked to distinct
phases of the CA1 theta rhythm. These results suggest that infor-
mation routing between CA1 and CA3/MEC fluctuates periodi-
cally with theta phase, providing a mechanism for temporal
segregation of information from different sources. The current
CFC attenuation observed during memory activation intervals
coherently locked to delta phase might reflect an analogous
mechanism for temporal segregation of potentially interfering
orts 13, 1272–1282, November 10, 2015 ª2015 The Authors 1279

information in the human hippocampus (e.g., already maintained
information and incoming new information).
Periodic Gating by a Hierarchy of Oscillations in theHippocampusThe hippocampus shows a periodic switching between power
decrease periods supporting maintenance of relevant informa-
tion and periods during which constant power is maintained
regardless of memory load. This rhythmic switching was locked
to the phase of endogenous delta oscillations (Figures 2C, 4F,
S3B, S3C, S4B, and S4C; Supplemental Discussion), corre-
sponding to an oscillatory hierarchy (Lakatos et al., 2005) in
which the phase of delta oscillations is coupled to the strength
of CFC between two other oscillations.
Slow-frequency oscillations have been suggested to serve as
a gating mechanism during WM (Raghavachari et al., 2001,
2006). Here, we report that the hippocampus is being gated
by a hierarchy of oscillations fluctuating with delta rhythm rather
than by continuous and sustained oscillations. What might, un-
der natural conditions, be the benefit of the rhythmic fluctuation
of load-dependent disinhibition; i.e., why is memory activation
not sustained across the entire maintenance period? Of course,
we can only speculate about possible functional advantages of
this periodicity. It seems likely that the memory activation inter-
feres with some other process, like an updating of memory
representations that might depend on interactions between
the hippocampus and prefrontal regions. Maintenance of multi-
ple items during periods when the hippocampus is released
from inhibition may benefit from a general strengthening of
WM representations. The very same representations might
then be updated for potentially new, upcoming information dur-
ing periods with high levels of hippocampal inhibition across all
memory loads. Although somewhat speculative, this interpreta-
tion has a precedent in other domains of cognition: A similar
mechanism of periodic switching between strengthening and in-
hibiting of neural responses has been found to maximize limited
sensory capacities during visual perception (Busch and Van-
Rullen, 2010).
The current study finds evidence for a periodic switching
between functional modes in two independent datasets re-
corded from the human hippocampus. Note that our conclu-
sions regarding rhythmic switching during WM maintenance
are limited to the human hippocampus. In particular, our
data by no means exclude that there may be another brain
area outside of the hippocampus (e.g., prefrontal or occipital
cortex) that exhibits continuous rather than rhythmic activity
patterns during WM maintenance. This continuous WM buffer
may then drive the hippocampus during one of the hippo-
campal states (e.g., the memory activation state), but not the
other.
Taken together, our results show periodic fluctuations be-
tween two different oscillatory regimes in the human hippocam-
pus during WM maintenance, which are critical for successful
performance. During memory activation periods, we observed
decreased CFC strength and interindividual correlations be-
tween CFC parameters and WM capacity. In contrast, the inter-
leaved periods were characterized by high levels of hippocampal
inhibition and increased CFC strength. The human hippocampus
1280 Cell Reports 13, 1272–1282, November 10, 2015 ª2015 The Au
supportsmulti-itemWMby periodically switching between these
two functions at delta frequency.
EXPERIMENTAL PROCEDURES
Experiment 1
Details about participants, recordings, and analyses can be found in the Sup-
plemental Experimental Procedures.
Task
Participants performed a modified Sternberg WM task with digits serving as
stimuli. Each trial contained a sequence of either one (load 1), three (load 3),
five (load 5), or seven (load 7) digits. Each item was presented for 0.5 s, fol-
lowed by an inter-stimulus interval of a duration that was randomly jittered be-
tween 1.5 s and 2 s. Once the sequence had been presented, participants had
to maintain the representation of the entire memory set for the duration of a
retention interval lasting 3 s. Next, a question mark informed participants to
type all digits in correct order using a keyboard (Figure 1B). We tested free
recall of entire sequences because the hippocampus is known to be particu-
larly relevant for sequence memory (Eichenbaum, 2000; Kumaran and Ma-
guire, 2006). A total of 120 trials were presented (30 trials per load condition)
in random order. During the experiment, iEEG signals from depth electrodes
(Figure 1C) as well as from the linked mastoids were continuously recorded.
The study was approved by the local medical ethics committee, and all pa-
tients gave written informed consent.
Time-Frequency Analysis
Continuous EEG data were segmented into 7-s-long epochs with a 2-s pres-
timulus period and a 5-s poststimulus interval relative to presentation onset
of the last item in each trial. Such relatively long segments were used to mini-
mize edge effects. The epoched data were convolved with four-cycle Morlet
wavelets from 4 Hz to 150 Hz in steps of 1 Hz. Power values were normalized
with respect to prestimulus time windows from �1.3 s to�0.3 s separately for
each patient, frequency, and trial. Since we were interested in the activity spe-
cific to the retention interval, activity during the time period after the offset of
the last item in each trial and across the entire 3-s maintenance period was
analyzed. Based on our a priori hypothesis of linear decreases of alpha/beta
activity with memory load, we calculated regression coefficients across the
four memory loads. To this end, condition-specific data for each participant
were averaged across trials. We then calculated regression coefficients within
each participant, regressing subject specific spectro-temporal data on work-
ing memory load. In order to test reliability of the subject-specific linear de-
creases of power across memory loads, we further calculated non-parametric
surrogate statistics with cluster correction for multiple comparisons (Maris and
Oostenveld, 2007; Supplemental Experimental Procedures).
Cross-Frequency Coupling
In order to investigate ifWMmaintenance of sequence information depends on
the coupling of high-frequency power to low-frequency phase, we calculated a
modulation measure according to a previously described procedure and
compared these results to surrogate data obtained by randomly re-assigning
trials for amplitude and trials for phase (Axmacher et al., 2010; Supplemental
Experimental Procedures).
As load effects on power in the alpha/beta frequency range appeared to be
periodically modulated (Results; Figures 2A, 2B, 4D, and 4E), we were inter-
ested if the CFC modulation index shows similar periodic fluctuations. Thus,
we computed the CFC calculated within 200-ms windows centered on mem-
ory activation periods and interleaved intervals. Concatenated results were
compared between two types of interval using pairwise t tests within the fre-
quency-frequency range predicted by the multiplexing model (Lisman and
Idiart, 1995; Lisman and Jensen, 2013).
The multiplexing buffer model predicts that participants with a high WM ca-
pacity can maintain more items because more cycles of high-frequency activ-
ity ‘‘fit’’ onto one cycle of low-frequency activity for these participants. In other
words, this model predicts that participants with high WM capacity are char-
acterized by lower peak modulating frequencies, while the peak modulated
frequencies remain constant. Alternatively, they could show the same mLFA
frequency as participants with a lower capacity but higher mHFA frequencies.
To test these predictions, we quantified for each participant the frequencies of
thors

mLFA-max and mHFA-max at which the difference of CFC was maximal be-
tween periods showing load-dependent disinhibition and interleaving periods,
and we extracted the CFC ratio at this point. Then, we calculated Kendall’s tau
to quantify the relationship between individual WM capacity (as described
above) and CFC ratio, mHFA-max, and mLFA-max.
Experiment 2
We aimed to replicate the observed effects in an independent dataset. A
new group of patients (n = 8, mean age of 43 years, two females) implanted
with electrodes in the hippocampus performed a similar WM task (Figure 4A;
for details, see Axmacher et al., 2007, 2010). All patients had well-defined
lateralized ictal onset zones (four patients had a seizure-onset zone within
the left hippocampus and the other four in the right hippocampus). There
were three main differences regarding the previous design: (1) Instead of
simple and highly familiar stimuli used in experiment 1, we now used images
of faces that were complex materials consisting of multiple features and un-
familiar to our participants; (2) participants were probed with a stimulus and
were supposed to indicate if the probed face was presented in the WM set
or if the face was new (a two-alternative forced choice task [2AFC] instead
of a whole report task); and (3) memory load was one, two, or four faces.
Timing of stimulus presentation and retention duration were the same as
in experiment 1. All preprocessing steps and statistical analyses were the
same.
SUPPLEMENTAL INFORMATION
Supplemental Information includes Supplemental Results, Supplemental Dis-
cussion, Supplemental Experimental Procedures, and five figures and can be
foundwith this article online at http://dx.doi.org/10.1016/j.celrep.2015.09.081.
AUTHOR CONTRIBUTIONS
M.L., J.F., and N. A. designed the study, analyzed the data, and wrote the
manuscript.
ACKNOWLEDGMENTS
The authors would like to thank Anne Do Lam for support during data collec-
tion, Amirhossein Jahanbekam and Carina Oehrn for helpful discussions, and
Lorena Deuker, Patrizia Thoma, and Andrew Watrous for comments on earlier
versions of the manuscript. M.L. and N.A. were supported by grant AX82/2.
N.A. and J.F. received additional funding through SFB 1089.
Received: February 26, 2015
Revised: August 18, 2015
Accepted: September 25, 2015
Published: October 29, 2015
REFERENCES
Abdi, H. (2007). Kendall rank correlation. In Encyclopedia of Measurement and
Statistics, N.J. Salkind, ed. (Sage Publications), pp. 508–510.
Aggleton, J.P., Keith, A.B., Rawlins, J.N., Hunt, P.R., and Sahgal, A. (1992).
Removal of the hippocampus and transection of the fornix produce compara-
ble deficits on delayed non-matching to position by rats. Behav. Brain Res. 52,
61–71.
Axmacher, N., Mormann, F., Fernandez, G., Cohen, M.X., Elger, C.E., and Fell,
J. (2007). Sustained neural activity patterns during working memory in the hu-
man medial temporal lobe. J. Neurosci. 27, 7807–7816.
Axmacher, N., Henseler, M.M., Jensen, O., Weinreich, I., Elger, C.E., and Fell,
J. (2010). Cross-frequency coupling supports multi-item working memory in
the human hippocampus. Proc. Natl. Acad. Sci. USA 107, 3228–3233.
Bauer, M., Stenner, M.P., Friston, K.J., and Dolan, R.J. (2014). Attentional
modulation of alpha/beta and gamma oscillations reflect functionally distinct
processes. J. Neurosci. 34, 16117–16125.
Cell Rep
Bonnefond, M., and Jensen, O. (2012). Alpha oscillations serve to protect
working memory maintenance against anticipated distracters. Curr. Biol. 22,
1969–1974.
Busch, N.A., and VanRullen, R. (2010). Spontaneous EEG oscillations reveal
periodic sampling of visual attention. Proc. Natl. Acad. Sci. USA 107,
16048–16053.
Colgin, L.L., Denninger, T., Fyhn, M., Hafting, T., Bonnevie, T., Jensen, O.,
Moser, M.B., and Moser, E.I. (2009). Frequency of gamma oscillations routes
flow of information in the hippocampus. Nature 462, 353–357.
De Almeida, L., Idiart, M., Villavicencio, A., and Lisman, J. (2012). Alternating
predictive and short-term memory modes of entorhinal grid cells. Hippocam-
pus 22, 1647–1651.
Eichenbaum, H. (2000). A cortical-hippocampal system for declarative mem-
ory. Nat. Rev. Neurosci. 1, 41–50.
Fell, J., Ludowig, E., Staresina, B.P., Wagner, T., Kranz, T., Elger, C.E., and Ax-
macher, N. (2011). Medial temporal theta/alpha power enhancement precedes
successful memory encoding: evidence based on intracranial EEG.
J. Neurosci. 31, 5392–5397.
Haegens, S., Nacher, V., Luna, R., Romo, R., and Jensen, O. (2011). a-Oscil-
lations in the monkey sensorimotor network influence discrimination perfor-
mance by rhythmical inhibition of neuronal spiking. Proc. Natl. Acad. Sci.
USA 108, 19377–19382.
Hanslmayr, S., Staudigl, T., and Fellner, M.-C. (2012). Oscillatory power de-
creases and long-termmemory: the information via desynchronization hypoth-
esis. Front. Hum. Neurosci. 6, 74.
Huang, S., Rossi, S., Hamalainen, M., and Ahveninen, J. (2014). Auditory con-
flict resolution correlates with medial-lateral frontal theta/alpha phase syn-
chrony. PLoS ONE 9, e110989.
Jensen, O., Bonnefond, M., and VanRullen, R. (2012). An oscillatory mecha-
nism for prioritizing salient unattended stimuli. Trends Cogn. Sci. 16, 200–206.
Jensen, O., Gips, B., Bergmann, T.O., and Bonnefond, M. (2014). Temporal
coding organized by coupled alpha and gamma oscillations prioritize visual
processing. Trends Neurosci. 37, 357–369.
Jensen, O., Bonnefond, M., Marshall, T.R., and Tiesinga, P. (2015). Oscillatory
mechanisms of feedforward and feedback visual processing. Trends Neuro-
sci. 38, 192–194.
Jokisch, D., and Jensen, O. (2007). Modulation of gamma and alpha activity
during a working memory task engaging the dorsal or ventral stream.
J. Neurosci. 27, 3244–3251.
Klimesch, W. (2012). a-band oscillations, attention, and controlled access to
stored information. Trends Cogn. Sci. 16, 606–617.
Kumaran, D., and Maguire, E.A. (2006). The dynamics of hippocampal activa-
tion during encoding of overlapping sequences. Neuron 49, 617–629.
Lakatos, P., Shah, A.S., Knuth, K.H., Ulbert, I., Karmos, G., and Schroeder,
C.E. (2005). An oscillatory hierarchy controlling neuronal excitability and stim-
ulus processing in the auditory cortex. J. Neurophysiol. 94, 1904–1911.
Lega, B.C., Jacobs, J., and Kahana, M. (2012). Human hippocampal theta os-
cillations and the formation of episodic memories. Hippocampus 22, 748–761.
Lisman, J.E., and Idiart, M.A. (1995). Storage of 7 +/- 2 short-term memories in
oscillatory subcycles. Science 267, 1512–1515.
Lisman, J.E., and Jensen, O. (2013). The q-g neural code. Neuron 77, 1002–
1016.
Maris, E., and Oostenveld, R. (2007). Nonparametric statistical testing of EEG-
and MEG-data. J. Neurosci. Methods 164, 177–190.
Mehta, M.R., Lee, A.K., and Wilson, M.A. (2002). Role of experience and oscil-
lations in transforming a rate code into a temporal code. Nature 417, 741–746.
Nichols,E.A.,Kao,Y.-C.,Verfaellie,M., andGabrieli, J.D.E. (2006).Workingmem-
ory and long-term memory for faces: Evidence from fMRI and global amnesia
for involvement of the medial temporal lobes. Hippocampus 16, 604–616.
Olson, I.R., Page, K., Moore, K.S., Chatterjee, A., and Verfaellie, M. (2006).
Working memory for conjunctions relies on the medial temporal lobe.
J. Neurosci. 26, 4596–4601.
orts 13, 1272–1282, November 10, 2015 ª2015 The Authors 1281

Raghavachari, S., Kahana, M.J., Rizzuto, D.S., Caplan, J.B., Kirschen, M.P.,
Bourgeois, B., Madsen, J.R., and Lisman, J.E. (2001). Gating of human theta
oscillations by a working memory task. J. Neurosci. 21, 3175–3183.
Raghavachari, S., Lisman, J.E., Tully, M., Madsen, J.R., Bromfield, E.B., and
Kahana, M.J. (2006). Theta oscillations in human cortex during a working-
memory task: evidence for local generators. J. Neurophysiol. 95, 1630–
1638.
Sauseng, P., Klimesch, W., Heise, K.F., Gruber, W.R., Holz, E., Karim, A.A.,
Glennon, M., Gerloff, C., Birbaumer, N., and Hummel, F.C. (2009). Brain oscil-
latory substrates of visual short-term memory capacity. Curr. Biol. 19, 1846–
1852.
Siegel, M., Warden, M.R., and Miller, E.K. (2009). Phase-dependent neuronal
coding of objects in short-term memory. Proc. Natl. Acad. Sci. USA 106,
21341–21346.
Spaak, E., Bonnefond, M., Maier, A., Leopold, D.A., and Jensen, O. (2012).
Layer-specific entrainment of g-band neural activity by the a rhythm inmonkey
visual cortex. Curr. Biol. 22, 2313–2318.
1282 Cell Reports 13, 1272–1282, November 10, 2015 ª2015 The Au
Thut, G., Nietzel, A., Brandt, S.A., and Pascual-Leone, A. (2006). Alpha-
band electroencephalographic activity over occipital cortex indexes visuo-
spatial attention bias and predicts visual target detection. J. Neurosci. 26,
9494–9502.
van Kerkoerle, T., Self, M.W., Dagnino, B., Gariel-Mathis, M.A., Poort, J., van
der Togt, C., and Roelfsema, P.R. (2014). Alpha and gamma oscillations char-
acterize feedback and feedforward processing in monkey visual cortex. Proc.
Natl. Acad. Sci. USA 111, 14332–14341.
van Vugt, M.K., Schulze-Bonhage, A., Litt, B., Brandt, A., and Kahana, M.J.
(2010). Hippocampal gamma oscillations increase with memory load.
J. Neurosci. 30, 2694–2699.
Waldhauser, G.T., Johansson, M., and Hanslmayr, S. (2012). a/b oscillations
indicate inhibition of interfering visual memories. J. Neurosci. 32, 1953–1961.
Watrous, A.J., Lee, D.J., Izadi, A., Gurkoff, G.G., Shahlaie, K., and Ekstrom,
A.D. (2013). A comparative study of human and rat hippocampal low-fre-
quency oscillations during spatial navigation. Hippocampus 23, 656–661.
thors

Cell Reports
Supplemental Information
Rhythmic Working Memory Activation
in the Human Hippocampus
Marcin Leszczyński, Juergen Fell, and Nikolai Axmacher

Rhythmic working memory activation
in the human hippocampus
Marcin Leszczyński, Juergen Fell, Nikolai Axmacher
Supplemental Data
Supplemental Figures
Figure S1 related to Figure 2. Single subject data in Experiment 1. Inference statistics calculated
separately for each of the 9 patients resulting from a linear regression of power across memory loads in
Experiment 1. Importantly, the single subject data follow the group pattern showing that power

exhibits periodic changes between two operating modes, one being characterized by a linear decrease
with increasing memory load (reflected by troughs), the other showing no change or even a linear
increase with increasing memory load (reflected by peaks).

Figure S2 related to Figure 4. Single subject data in Experiment 2. Inference statistics calculated
separately for each of the 8 patients resulting from a linear regression with memory load as a predictor
and power as dependent measure in Experiment 2. Importantly, the single subject data follow the group
pattern replicating the results from Experiment 1.

Figure S3 related to Figure 2. Periodicity in the delta range during Experiment 1. (A) Grand
average of low frequency activity (4-30Hz) during load 1, 3, 5 and 7. Color indicates change from
baseline. The horizontal gray bar above the spectrogram represents the temporal structure of the
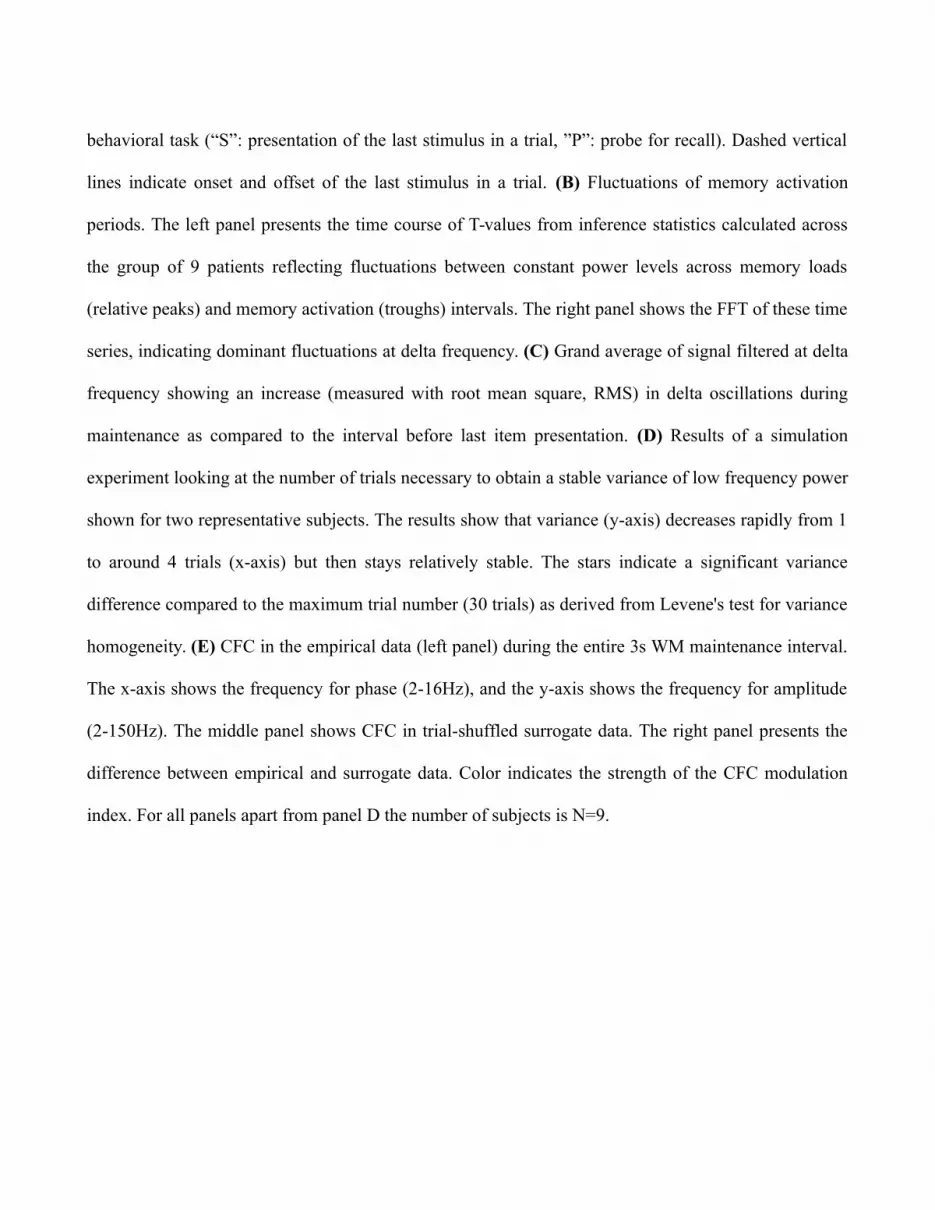
behavioral task (“S”: presentation of the last stimulus in a trial, ”P”: probe for recall). Dashed vertical
lines indicate onset and offset of the last stimulus in a trial. (B) Fluctuations of memory activation
periods. The left panel presents the time course of T-values from inference statistics calculated across
the group of 9 patients reflecting fluctuations between constant power levels across memory loads
(relative peaks) and memory activation (troughs) intervals. The right panel shows the FFT of these time
series, indicating dominant fluctuations at delta frequency. (C) Grand average of signal filtered at delta
frequency showing an increase (measured with root mean square, RMS) in delta oscillations during
maintenance as compared to the interval before last item presentation. (D) Results of a simulation
experiment looking at the number of trials necessary to obtain a stable variance of low frequency power
shown for two representative subjects. The results show that variance (y-axis) decreases rapidly from 1
to around 4 trials (x-axis) but then stays relatively stable. The stars indicate a significant variance
difference compared to the maximum trial number (30 trials) as derived from Levene's test for variance
homogeneity. (E) CFC in the empirical data (left panel) during the entire 3s WM maintenance interval.
The x-axis shows the frequency for phase (2-16Hz), and the y-axis shows the frequency for amplitude
(2-150Hz). The middle panel shows CFC in trial-shuffled surrogate data. The right panel presents the
difference between empirical and surrogate data. Color indicates the strength of the CFC modulation
index. For all panels apart from panel D the number of subjects is N=9.

Figure S4 related to Figure 4. Periodicity in the delta range in Experiment 2. (A) Grand average of
low frequency activity (4-30Hz) during load 1, 2, 4. (B) Fluctuations of memory activations periods.
The left panel presents the time course of T-values from inference statistics calculated across the group
of 8 patients reflecting fluctuations between constant power levels across memory loads (relative
peaks) and memory activation (troughs) intervals. The right panel shows the FFT of these time series,
indicating dominant fluctuations at delta frequency. (C) Grand average of signal filtered at delta
frequency showing an increase (measured with root mean square, RMS) in delta oscillations during

maintenance as compared to the interval before last item presentation. (D) The result of a simulation
experiment looking at the number of trials necessary to obtain stable variance of low frequency power
shown for two representative subjects. For all panels apart from panel D the number of subjects is N=8.

Figure S5 related to Figure 3. Peak frequencies used for correlations with behavior. Peak
frequencies for amplitude, phase and CFC ratio (left to right panels, respectively) in Experiment 1
during “memory activation” periods (A) and interleaved intervals (B) plotted as a function of memory
load. Peak frequencies in Experiment 2 during memory activation (C) and interleaved intervals (D).
Error bars present SEM. Line plots reflect individual subjects. No significant differences were
observed.

Supplemental Experimental Procedures
Participants, recordings and analyses
Participants. Data was recorded from a group of 9 pharmaco-resistant epilepsy patients (mean age of
35.8 years, ranging from 24 to 58, four female) implanted with intracranial EEG electrodes for
diagnostic purposes. All patients were implanted bilaterally and had well-defined lateralized ictal onset
zones (7 of them had a seizure onset zone within the left hippocampus, the other two in the right
hippocampus). Only electrodes localized in the seizure-free hemisphere were considered for analysis.
Recordings were performed at the Department of Epileptology, University of Bonn, Germany.
Recordings. Data from the hippocampus was recorded with multicontact depth electrodes. Each
electrode had a diameter of 1.3mm, comprising 10 cylindrical platinum contact sites with a length of
2.5mm and an inter-contact spacing of 4mm. Data was sampled at 1kHz and referenced to linked
mastoids. Only contacts contralateral to the epileptic focus were considered for analysis. Continuous
data was visually inspected for artifacts (predominantly arising from epileptiform activity). All samples
contaminated by artifacts were marked and removed from further analysis. For each patient, we
selected recording sites in a two-step procedure. First, we anatomically localized sites in the healthy
hippocampus (anatomical criterion). To determine the anatomical location of each contact, we used
post-implantation MRIs coregistered to pre-implantation MRIs and normalized to standard MNI space.
For power analysis, we averaged across activity in all of these anatomically selected channels (5±2
hippocampal channels [mean±standard deviation]). We note that the results were qualitatively identical
if a single channel was used (as for the analysis of phase data). For all analyses related to phase
information, averaging across several channels might smear the results because of traveling wave
properties (Lubenov and Siapas, 2009). Thus, for phase analyses we selected one hippocampal channel

in each patient with the highest amplitude of the hippocampal P300 component averaged across trials
(Axmacher et al., 2010b). Note that to avoid contamination of the analyzed signal by an ERP response
that served for electrode selection (P3 ERP elicited by last stimulus onset), we excluded the time
interval during stimulus presentation. Thus, we restricted our analyses to data from the maintenance
phase when no stimulus was presented. Indeed, another article from our group based on the same
intracranial EEG data shows that the main P3 response is observed during the initial 500ms of stimulus
presentation and disappears during the maintenance period (see Axmacher et al., 2007).
Behavioral analysis. A trial was considered correct if the sequence of all items was reported in correct
order. Accuracy was separately calculated for each memory load condition and then compared between
memory loads using repeated-measures one-way ANOVA with “memory load” (1, 3, 5, 7) as a factor.
All ANOVAs were tested for sphericity using Mauchly's test. In case the assumption of sphericity was
violated the Huynh-Feldt correction was performed.
To estimate individual WM capacity, we first counted in each trial how many digits from the
original sequence were correctly reported (single trial hit rate) and how many digits were reported that
had not been presented in the initial sequence (single trial false alarm rate). Then, we averaged single
trial hit and false alarm rates across all trials in each memory load condition. Finally, we subtracted this
false alarm rate from the hit rate, and multiplied the result with the set size which resulted in our load
specific capacity estimate (K). The maximal value across memory loads (Kmax) was used for correlation
analysis. This measure controls for individual guessing rate (for a similar metric see Cusack et al., 2009
and Sauseng et al., 2009).
Time-frequency analyses. For each time-frequency point, beta coefficients were extracted if they
corresponded to a p-value below 0.05, and contiguous above threshold values in time-frequency space

were summed up into clusters. Next, we created surrogate data by randomly permuting the assignment
of time-frequency values to the memory load conditions. One thousand surrogates were computed for
each subject and each memory load condition (resulting in 4000 surrogate time-frequency spectra for
the four surrogate load conditions). These surrogate data were used to calculate surrogate regression
coefficients analogous to the way regression coefficients were estimated in the real data. Again, clusters
consisting of contiguous coefficients corresponding to p-values below 0.05 were identified and
quantified (by summing up the coefficients in each cluster). The corrected significance for the
empirical data was then calculated as the number of surrogate clusters exceeding the empirically
observed clusters divided by the number of permutations, i.e. divided by 1000 (Maris and Oostenveld,
2007).
Cross-frequency coupling (CFC). The CFC method used in the current study is based on Pearson’s
correlations between the filtered low-frequency signal and the power time series of the high-frequency
signal (for a similar method, see the “envelope-to-signal correlation” described by Penny et al., 2008;
Tort et al., 2010). In order to account for possible inter-individual differences between the phase of the
low-frequency signal at which the amplitude of the high-frequency signal was maximal, we shifted the
low-frequency signal by the subject-specific “modulation phase” at which the strength of amplitude-
phase modulation (assessed by the “modulation index” described by Canolty and colleagues; Canolty et
al., 2006) was maximal for each participant (Axmacher et al., 2010). In order to calculate the
modulation phase, we extracted low (2Hz – 16Hz) and high frequency activity (2Hz – 150Hz) by
convolving the segmented data with four-cycle Morlet wavelets. This resulted in time series of complex
numbers for low-frequency activity (activitylow) and high-frequency activity (activityhigh). Subsequently,
the absolute value of the high-frequency data (amplitudehigh) and the phase angle of the low-frequency

time-series (phaselow) were used to create a composite signal (Canolty et
al., 2006). Next, the low-frequency time-series was phase shifted by the phase of the averaged
composite signal (averaged across all trials in each subject). Then, we calculated the Pearson’s
correlation coefficient between the real part of the phase-shifted low-frequency signal and the
amplitude of the high-frequency signal. The resulting correlation coefficients values were Fisher-z-
transformed for statistical analysis.
To test if the observed CFC during maintenance was reliably stronger than chance, we
compared it with surrogate data. The surrogates were created by splitting the data into the low- and
high-frequency bands, shuffling the assignment of trials for low-frequency phase and high-frequency
amplitude within individual subjects. In other words, while in the empirical data the low-frequency
phases and high-frequency amplitudes were extracted from the same trials, in the surrogate data the
low-frequency phases and the high-frequency amplitudes were taken from randomly drawn trials. All
subsequent steps were identical for empirical and surrogate data. Such a procedure preserves both the
power spectrum and the phase distribution of the analyzed data, and only destroys the trial-specific
relationship of high-frequency power and low-frequency phase values. For statistical comparison of the
empirical and surrogate CFC values, we did not compare data in individual frequency-frequency pairs
but averaged in a wider range of 5-9Hz for the low-frequency oscillation and 30-150Hz for the high-
frequency activity (these frequency ranges were derived from the multiplexing model of WM described
in Lisman and Idiart, 1995; Lisman and Jensen, 2013). Subsequently, the CFC values within these
ranges were averaged, and the averaged value entered into a paired-sample T-test. We performed
correction for multiple comparisons based on the overall number of all possible low-to-high frequency
clusters of the same size as the selected window (Axmacher et al., 2010). This resulted in 5 (5-9Hz;
low frequency) x 121 (30-150Hz; high frequency) = 605 frequency-frequency pairs that entered
statistical testing. The total analyzed frequency-frequency space was 15 (2-16Hz; low frequency) x 149
(2-150Hz; high frequency) = 2235 pairs. The correction factor was calculated dividing the total space
by the selected space 2235/ 605 ≈ 4.
Analyses of incorrect trials. Seven out of nine patients in Experiment 1 and all eight patients in Experiment 2
had incorrect trials in all conditions. Only these subjects were considered for the analysis of incorrect trials. To
quantify the difference between correct (N=9, N=8, Experiment 1 and 2, respectively) and incorrect trials (N=7,
N=8, Experiment 1 and 2 respectively) we calculated independent samples t-tests.
Supplemental Results
Behavioral results
Experiment 1. We measured accuracy (percentage of correct trials) and WM capacity. First, we
calculated accuracy as a function of WM load. A one-way repeated measures ANOVA with “memory
load” (1, 3, 5, 7 items) as factor revealed a significant main effect (F(3,24) = 107.3, p < 0.0001). Post-
hoc paired-samples t-tests showed that accuracy in memory load 1 (93%) was higher than in load 3
(87%; t(8) = 4.1, p < 0.005); accuracy in load 3 was higher than in load 5 (78%; t(8) = 4.2, p < 0.005);
and accuracy in load 5 was higher than in load 7 (23%; t(8) = 9.6, p < 0.00001; see Figure 1D).
Individual WM capacity was calculated as the maximum number of correctly maintained items,
controlled for guessing (kmax, see Methods). Kmax was at 5.54 ± 0.20 (mean ± S.E.M.) and varied
between participants from 4.7 to 6.3. These results indicate that participants were able to maintain
around 5 digits in a sequence.
Experiment 2. A one-way repeated measures ANOVA with memory load (1, 2, 4 items) as factor
revealed a significant drop in accuracy across memory loads (F(2,14) = 4.18, p < 0.05; see Figure 4B).
A post-hoc paired-sample t-test showed that accuracy in the load 1 condition was higher than accuracy
in the load 4 condition (t(7) = 2.42, p < 0.05). There was no significant difference between accuracy in
load 1 and 2, and between load 2 and 4 (all t < 1.85, all p > 0.10). Individual WM capacity k max was at
1.79 ± 0.80 (mean ± S.E.M.) and ranged between 0.53 and 3.33 (see Figure 4C).
Peak frequencies for correlation with WM capacity
Experiment 1. The frequency at which frequency-for-amplitude was maximal was 115 ± 20Hz, 118 ±
19Hz, 112 ± 11Hz, 112 ± 19Hz during load dependent intervals and 122 ± 22Hz, 120 ± 20Hz, 118 ±
24Hz, 131 ± 18Hz during load independent intervals (mean ± standard deviation) for loads 1, 3, 5 and
7, respectively (see Figure S5A, B). A two-way repeated measures ANOVA with memory load (1, 3, 5,
7) and interval type (load dependent, load independent) revealed neither main effects nor an interaction
(all F < 3.4, all p > 0.10). The frequency-for-phase was maximal at 10 ± 3Hz, 11 ± 3Hz, 12 ± 3Hz, 10 ±
4Hz during load dependent intervals and 9 ± 3Hz, 11 ± 4Hz, 10 ± 3Hz, 8 ± 4Hz during load
independent intervals, respectively. Neither the main effects nor the interaction was significant (all F <
2.0, all p > 0.34). Finally, the ratio between frequencies where CFC was maximal was 14 ± 7, 12 ± 5,
10 ± 3, 14 ± 6 during load dependent intervals and 14 ± 4, 12 ± 5, 13 ± 4, 18 ± 8 during load
independent intervals. The two-way ANOVA showed a marginally significant main effect of memory
load (F(3,24) = 2.85, p = 0.085) but no main effect of interval nor an interaction (all F < 1.88, all p >
0.20). Post-hoc paired t-tests revealed a significant decrease in CFC ratio from load 1 to load 3 (t(8) =
2.53, p < 0.05) and an increase from load 5 to 7 (t(8) = 2.87, p < 0.05). No other difference was
observed (all t < 1.75, all p > 0.12).

Experiment 2. The frequency at which frequency-for-amplitude was maximal in Experiment 2 was at
71 ± 27Hz, 60 ± 22Hz, 58 ± 22 Hz during load dependent intervals and 78 ± 29Hz, 71 ± 19Hz, 71 ±
25Hz during load independent intervals (mean ± standard deviation) for loads 1, 2, and 4, respectively
(see Figure S5C, D). A two way repeated measures ANOVA with memory load (1, 2, 4) and interval
type (load dependent, load independent) showed a marginally significant effect of interval type: The
maximal frequency-for-amplitude increased in load independent as compared to load dependent
intervals (63Hz vs. 73Hz: F(1,7) = 4.93, p = 0.062). No other difference was observed (all F < 0.57, all
p > 0.59). The frequency-for-phase was maximal at 10 ± 2 Hz, 9 ± 2 Hz and 8 ± 1 Hz during load
dependent intervals and 9 ± 2Hz, 10 ± 2Hz, 10 ± 2Hz during load independent intervals, respectively.
Neither the main effects nor the interaction was significant (all F < 1.18, all p > 0.34). The ratio
between frequencies where the frequency-for-amplitude and frequency-for-phase was maximal was at 7
± 2Hz, 7 ± 2Hz, 7 ± 3Hz during load dependent and 9 ± 4Hz, 8 ± 2Hz, 8 ± 3Hz during load
independent intervals. Neither the main effects nor the interaction was significant (all F < 2.68, all p >
0.14).
Load-dependent changes in gamma power
Experiment 1. Rapid power fluctuations in high frequency bands (>30Hz) can render cluster-based
statistical methods ineffective. Previous studies (e.g., Axmacher et al., 2007, Fell et al., 2001, Jokisch
and Jensen, 2007) have quantified time-frequency effects in the high-frequency range by using analysis
of variance on data averaged over time and frequency windows. Therefore, we averaged power values
in three consecutive (non-overlapping) 1000ms time windows during the maintenance interval for
statistical analysis across the frequency range between 31Hz and 150Hz. Next, we calculated a 3 x 4
repeated measures ANOVA with “time window” (1-1000ms, 1001-2000ms, 2001-3000ms) and

“memory load” (1 item, 3 items, 5 items, 7 items) as factors and again analyzed linear trends.
This analysis revealed no main effect of “memory load”, but a significant “memory load” x “time
interval” interaction (F(6,48) = 3.66, p < 0.005). We thus calculated one-way ANOVAs separately for
each time window, which revealed a main effect of memory load specifically during the last second of
the maintenance phase (F(3,24) = 3.80, p < 0.05). In this time period, we also observed a significant
linear effect of memory load (F(1,8) = 4.90, p = 0.05). In summary, gamma-band activity linearly
increased as a function of memory load specifically during the late maintenance phase, putatively
reflecting increased hippocampal recruitment with rising memory load.
Experiment 2. We performed a similar analysis of variance on data from the second experiment. Here
we calculated a 3 x 3 repeated measures ANOVA with “time window” (1-1000ms, 1001-2000ms, 2001-
3000ms) and “memory load” (1 face, 2 faces, 4 faces) as factors. The analysis revealed significant
linear effects of memory load F(1,7) = 7.65, p < 0.05) and interval (F(1,7) = 8.28, p < 0.05) but no
interaction (F < 1.9, p > 0.2). Thus, we again observed a linear increase of gamma-band activity with
memory load, though this effect occurred throughout the entire maintenance phase and not only during
the last second of the maintenance period (even though it was numerically strongest in this interval).
Note that gamma effects in both experiments were independent of the periodicity observed in low
frequencies.
Please also note that in both experiments univariate power effect in the gamma range but also
cross-frequency coupling was observed across a broad frequency range (up to 150Hz). This suggests
that not only gamma oscillations within a narrow frequency range, but also non-oscillatory gamma-
band activity (putatively reflecting multi-unit activity) is modulated by the phase of low-frequency
oscillations.
Single subject data.
In order to assess single-subject data, we calculated within each subject a linear regression of low
frequency power changes across WM loads. These results are shown in Figures S1 and S2 for data
from Experiment 1 and Experiment 2, respectively. Although noisy, the single subject data show that
slow frequency fluctuations of load effects occur at individual subject level. This is observed as a
fluctuating pattern of regression results with intervals showing linear decreases (negative t-values) and
constant level of power or even increases (positive t-values) rather than continuously sustained
patterns.
Fluctuation of memory activation periods at delta frequency.
To quantify fluctuations of memory activation, we calculated an FFT of T-values obtained from the
linear regression analysis. Figures S3B and S4B present the periodicity of memory activation observed
as a peak in the FFT spectrum during Experiment 1 (maintenance of numbers, Figure S3B) and
Experiment 2 (maintenance of faces, Figure S4B).
Delta oscillations increase during maintenance interval
To further explore the effect of endogenous delta phase clustering observed in Figure 2A and Figure 4D
we calculated delta oscillations in the average response across trials and subjects. To this end, we
filtered the raw data in the frequency in which we expected (based on the average intervals between the
load effects) to see phase-locked delta oscillations and averaged across trials and then across patients.
These data are shown in Figures S3C and S4C for Experiment 1 and 2, respectively. The results show
that there are increased delta oscillations during maintenance as compared to baseline prior to the last
item. To quantify the effect we calculated the root mean square (RMS = sqrt(mean(data^2))) separately
for the time interval before and after last stimulus presentation and compared the two with a pairwise t-
test. Note, that we excluded the interval during the last stimulus presentation to avoid contamination by
event-related potentials. This is a very conservative estimation of delta oscillations. First, because we
exclude the interval during stimulus presentation although we would expect significant delta
oscillations already during this period. Second, we compare the maintenance interval to the period
before the last stimulus but this is a time interval during which information is already maintained.
Nevertheless, a significant increase in delta oscillations was observed in both experiments (t(8) = 3.31,
p < 0.05; t(7)= 2.5, p < 0.05, respectively). This further corroborates our conclusion that endogenous
delta oscillations influence processing of information in the human hippocampus during maintenance in
working memory.
Simulation on the impact of the number of trials on low frequency power variance.
One important concern in cognitive neuroscience and empirical research at all is whether the number of
data available is sufficient. In order to estimate how many trials are necessary to obtain stable patterns
of low frequency power (frequency where we found significant results) we performed a simulation
looking at variance of single trials from both experiments (for a similar approach see Hanslmayr et al.,
2009). With the simulation we intended to answer the question how many trials in the current dataset
are needed to stabilize inter-individual variance of theta/alpha/beta power across the trial set. To this
end, a given number of trials was randomly drawn from the set of 30 trials (per condition, per subject).
The power within the theta/alpha/beta range was averaged across these trials. This procedure was
repeated 50 times and variance was calculated across these 50 permutations. The same procedure was

repeated with increasing numbers of trials starting with 1 and ending with 30 which was the number of
trials we collected per condition, per patient. The results of this simulation in two randomly selected
patients are presented in Figures S3D and S4D for load 7 (Experiment 1) and load 4 (Experiment 2)
where we expect to see the highest variance. All other subjects show similar results (with ~6 trials
required to stabilize variance at the group level). To quantitatively estimate how many trials are needed
in the current dataset for variance to stabilize, we used a variance homogeneity test (Levene's test). We
compared the variance of each single trial bin (1, 2, 3, …, 29 trials) with the variance of the bin with
the maximum number of trials (30 trials). The results show a pronounced decrease in the variance from
1 to 4 trials. The decrease slows after 4 trials. Finally, and most importantly for our analyses, the
variance stabilized at around 7 trials. Similar results were obtained for both Experiment 1 and
Experiment 2 (see Figures S3D and S4D). Altogether, this led us to the conclusion that 30 trials per
condition, per patient is a sufficient number given the high signal to noise ratio in intracranial EEG
data.
Supplemental Discussion
Multiplexing buffer model
Our results corroborate several predictions of the multiplexing buffer model of WM (Lisman and Idiart,
1995; Lisman and Jensen, 2013). First, in agreement with previous empirical results (Sauseng et al.,
2009; Siegel et al., 2009; Axmacher et al., 2010), we observed CFC between the phase of low-
frequency oscillations and the power of high-frequency activity during maintenance of multiple items
in WM (Figure S3E). While we have previously provided evidence for hippocampal CFC during
maintenance of trial-unique faces of unknown persons (Axmacher et al., 2010; Experiment 2), the data

from Experiment 1 are first evidence that hippocampal CFC occurs also for familiar material (i.e.,
digits). These findings add to the growing literature of the role of the hippocampus for multi-item WM
(Axmacher et al., 2010; Nichols et al., 2006; van Vugt et al., 2010; Aggleton et al., 1992); moreover,
they suggest that hippocampal involvement does not depend critically on whether the maintained items
themselves are familiar or novel (Hasselmo and Stern, 2006), but rather on the amount of information
that has to be maintained simultaneously. Second, and also consistent with the multiplexing buffer
model of WM, we found a correlation between individual WM capacity and the CFC parameters (CFC
ratio and mHFA-max frequencies). Together, these observations suggest that individual WM capacity
depends on the number of mHFA nested in mLFA. Importantly, it is independent of the complexity of
stimuli material used (cf. faces, digits). Our results suggest that successful performance in a multi-item
WM task benefits from a broad distribution of mHFA across the phase of a duty cycle (cf. mLFA).
Periodic gating by a hierarchy of oscillations in the hippocampus
We found that theta/alpha/beta power was linearly reduced across memory loads. This reduction was
not continuously sustained but restricted to short repetitive periods distributed across the whole
maintenance interval. Similar periodicity was observed in the cross-frequency coupling. Furthermore,
endogenous delta oscillation around 2Hz showed consistent phase clustering during these “memory
activation” intervals. In other words, we observed a hierarchy of oscillations: the power of
theta/alpha/beta and cross-frequency coupling strength was locked to the endogenous phase of 2 Hz
oscillations. Interestingly, in the previous studies by Lakatos and colleagues (Lakatos et al., 2005),
delta oscillations were driven by a rhythmic entrainment to stimuli that were presented at delta rate (see
also Besle et al., 2011). Although we did not present digit sequences (Experiment 1) or faces
(Experiment 2) at 2Hz, the presentation time of individual items in both experiments was exactly

500ms; thus, one might speculate that the frequency of periodic switching between the different
oscillatory regimes is related to the initial presentation time of WM stimuli. The current design,
however, makes this hypothesis unlikely because we used a jittered time interval between item
presentations which would distort any rhythm entrained by visual presentation.
One might wonder why the WM-related CFC effects observed in our study are not restricted to
a specific theta frequency or to narrower gamma frequency ranges. Goutagny and colleagues (2009)
have investigated septal input-free CA1 theta oscillations in complete hippocampal preparations of rats
(see also Colgin and Moser, 2009). They found evidence for multiple coexisting theta generators with
different center frequencies. These theta oscillations were weakly coupled and modulated the firing of
principle cells and interneurons (and thus possibly modulate the amplitude of gamma activity, which,
however, was not demonstrated). Recently, Balakrishnan and Pearce (2015) investigated the
characteristics of gamma activity in the CA1 region of awake behaving mice. They identified multiple
coexisting gamma oscillations at different frequencies. Interestingly, the amplitudes of slow and mid-
frequency gamma activity (30-90 Hz) were clearly modulated by the phase of local theta oscillations,
similar to the gamma frequency range observed for WM-related theta-gamma coupling in our study.
Moreover, broadband gamma activity has been previously related to multi-unit activity (Mukamel et
al., 2005). Hence, another possibility is that the broadband frequency-for-amplitude range observed in
our study might reflect multi-unit activity (MUA).

Supplemental References
Axmacher, N., Cohen, M.X., Fell, J., Haupt, S., Dümpelmann, M., Elger, C.E., Schlaepfer, T.E.,
Lenartz, D., Sturm, V., Ranganath, C. (2010b). Intracranial EEG correlates of expectancy and memory
formation in the human hippocampus and nucleus accumbens. Neuron 65, 541–549.
Balakrishnan, S., and Pearce, R.A. (2015). Spatiotemporal characteristics and pharmacological
modulation of multiple gamma oscillations in the CA1 region of the hippocampus. Front. Neural
Circuit 8, 150.
Besle, J., Schevon, C.A., Mehta, A.D., Lakatos, P., Goodman, R.R., McKhann, G.M., Emerson, R.G.,
and Schroeder, C.E. (2011). Tuning of the human neocortex to the temporal dynamics of attended
events. J. Neurosci. 31, 3176–3185.
Canolty, R.T., Edwards, E., Dalal, S.S., Soltani, M., Nagarajan, S.S., Kirsch, H.E., Berger, M.S.,
Barbaro, N.M., and Knight, R.T. (2006). High gamma power is phase-locked to theta oscillations in
human neocortex. Science 313, 1626–1628.
Colgin, L.L., and Moser, E.I. (2009). Hippocampal theta rhythms follow the beat of their own drum.
Nat. Neurosci. 12, 1483-1484.
Cusack, R., Lehmann, L., Veldsman, M., and Mitchell, D.J. (2009). Encoding strategy and not visual
working memory capacity correlates with intelligence. Psychon. Bull. Rev. 16, 641-647.
Fell, J., Klaver, P., Lehnertz, K., Grunwald, T., Schaller, C., Elger, C.E. and Fernández, G. (2001).
Human memory formation is accompanied by rhinal-hippocampal coupling and decoupling. Nat.
Neurosci. 4, 1259–1264.
Goutagny, R., Jackson, J., and Williams, S. (2009). Self-generated theta oscillations in the
hippocampus. Nat. Neurosci. 12, 1491-1493.
Hanslmayr, S., Spitzer, B., and Bäuml K.H. (2009). Brain Oscillations Dissociate between Semantic

and Nonsemantic Encoding of Episodic Memories. Cereb. Cortex. 19, 1631-1640.
Hasselmo, M.E., and Stern, C.E. (2006). Mechanisms underlying working memory for novel
information. Trends Cogn. Sci. 10, 487–493.
Lubenov, E.V., and Siapas, A.G. (2009). Hippocampal theta oscillations are travelling waves. Nature
459, 534–539.
Moran, T.P., Jendrusina, A.A., and Moser, J.S. (2013). The psychometric properties of the late positive
potential during emotion processing and regulation. Brain Res. 1516, 66-75.
Mukamel, R., Gelbard, H., Arieli, A., Hasson, U., Fried, I., and Malach, R. (2005). Coupling between
neuronal firing, field potentials, and FMRI in human auditory cortex. Science 309, 951-954.
Penny, W.D., Duzel, E., Miller, K.J., and Ojemann, J.G. (2008). Testing for nested oscillation. J.
Neurosci. Methods 174, 50–61.
Tort, A.B.L., Komorowski, R., Eichenbaum, H., and Kopell, N. (2010). Measuring phase-amplitude
coupling between neuronal oscillations of different frequencies. J. Neurophysiol. 104, 1195–1210.


