Embed Size (px)
Citation preview

International Journal of Computer Applications Technology and Research
Volume 4– Issue 6, 419 - 424, 2015, ISSN:- 2319–8656
www.ijcat.com 419
Review on Techniques and Tools used for Opinion
Mining
Asmita Dhokrat
Dept. of CS & IT
Dr. Babasaheb Ambedkar
Marathwada University
Aurangabad, India
Sunil Khillare
Dept. of CS & IT
Dr. Babasaheb Ambedkar
Marathwada University
Aurangabad, India
C. Namrata Mahender
Dept. of CS & IT
Dr. Babasaheb Ambedkar
Marathwada University Aurangabad, India
Abstract Humans communication is generally under the control of emotions and full of opinions. Emotions and their opinions plays an
important role in thinking process of mind, influences the human actions too. Sentiment analysis is one of the ways to explore user’s
opinion made on any social media and networking site for various commercial applications in number of fields. This paper takes into
account the basis requirements of opinion mining to explore the present techniques used to developed an full fledge system. Is highlights
the opportunities or deployment and research of such systems. The available tools used for building such applications have even
presented with their merits and limitations.
Keywords: Opinion Mining, Emotion, Sentiment Analysis, EM Algorithm, SVM algorithm
1. INTRODUCTION Emotions are the complex state of feelings that results in
physical and emotional changes that influences our behavior.
Emotion is a subjective, conscious experience characterized
mainly by psycho-physiological expressions, biological
reactions, and mental states. Emotion is often associated and
considered commonly significant with mood, nature,
personality, disposition, and motivation. It is also influenced by
hormones and neurotransmitters such as dopamine,
noradrenaline, serotonin, oxytocin, cortisol and GABA [1].
Emotion is a positive or negative experience that is associated
with a particular pattern of physiological activity. Humans
carry lot of emotions like happiness, sadness, angry, disgust,
surprise, fear, panic, scared etc. identifying these emotions are
very easy in face to face communication compare to written
communication. But now a day’s use of social media has
increased rapidly and the huge amount of textual data became
available on web, mining and managing this vast data has
become a crucial task. As the growth of E-facilities have
increased lots of people got encouraged to write their emotions,
views, opinions about a person, product, place or anything they
want.
Opinion Mining or Sentiment analysis involves building a
system to explore user’s opinions made in blog posts,
comments, reviews or tweets, about the product, policy or a
topic [2]. Opinion mining is nothing but finding the opinion of
person from sentences and classify them on the basis of
polarity. As the world changed into E-World the way of
expression has dramatically changed for example wide use of
smiley’s and symbols can be seen as expression while texting.
Social communication can be observed on internet and new
term has been coined for various ways of communication like
texting, twitting, posting etc. people like to communicate with
others through internet, they want to share their feelings, likes,
dislikes, opinions, views, reviews, emotions etc. people are
happy to share their personal life via social media, the use of
social media has increased so much and so rapidly that even no
body worries about what they are sharing and is this good to
share our personal life with unknown persons? Is there any
need to share our photos, videos or our daily activities on
internet? So finding the sentiment, emotion behind this activity
is also an important task for understanding the psycho-socio
status. So from that text, mining the opinions of people and
finding their views, reaction, sentiments and emotions have
become challenging task.
Opinion Mining is the field of study that analyzes people’s
opinion, sentiments, evaluations, attitudes and emotions from
written text. Opinion Mining is one of the most active research
areas in Natural Language Processing and is also widely
studied in data mining, web mining and text mining this
research has spread outside of computer science to the
management science and social science due to its importance
to business and society. The growing importance of sentiment
analysis coincides with the growth of social media such as
Reviews, Forums, discussion groups, chatting, blogs, micro-
blogs, twitter and social networks.
1.1 Categorization of Text Sentiment analysis is also called as opinion mining; as it mines
the information from various text forms such as reviews, news
& blogs and classifies them on the basis of their polarity as
positive, negative or neutral [3]. It focuses on categorizing the
text at the level of subjective and objective nature. Subjectivity
indicates that the text contains/bears opinion content for e.g.
Battery life of Samsung mobiles is good. (This sentence has an
opinion, it talks about the Samsung mobile phones and showing
positive (good) opinion hence it is Subjective). Samsung
mobiles are having long battery life. (This sentence is a fact,
general information rather than an opinion or a view of some
individual and hence its objective) [4]

International Journal of Computer Applications Technology and Research
Volume 4– Issue 6, 419 - 424, 2015, ISSN:- 2319–8656
www.ijcat.com 420
1.2 Components of Opinion Mining There are mainly three components of Opinion Mining [3]:
• Opinion Holder: Opinion holder is the holder of a particular
opinion; it may be a person or an organization that holds the
opinion. In the case of blogs and reviews, opinion holders are
those persons who write these reviews or blogs.
• Opinion Object: Opinion object is an object on which the
opinion holder is expressing the opinion.
• Opinion Orientation: Opinion orientation of an opinion on
an object determines whether the opinion of an opinion holder
about an object is positive, negative or neutral.
Figure 1 Components of opinion Mining
2. DIFFERENT LEVELS OF
SENTIMENT ANALYSIS In general, sentiment analysis has been investigated mainly at
three levels [4].
• Document level: The task at this level is to classify whether
a whole opinion document expresses a positive or negative
sentiment. For example, given a product review, the system
determines whether the review expresses an overall positive or
negative opinion about the product. This task is commonly
known as document level sentiment classification.
• Sentence level: The task at this level goes to the sentences
and determines whether each sentence expressed a positive,
negative, or neutral opinion. Neutral usually means no opinion.
This level of analysis is closely related to subjectivity
classification which distinguishes sentences (called objective
sentences) that express factual information from sentences
(called subjective sentences) that express subjective views and
opinions.
• Entity and Aspect level: Both the document-level and
sentence-level analyses do not discover what exactly people
liked and did not like. Aspect level performs fine-grained
analysis. Aspect level was earlier called feature level (feature-
based opinion mining and summarization).
3. CHALLENGES IN OPINION
MINING There are several challeges in Opinion Mining as follows,
• Domain-independence: The biggest challenge faced by
opinion mining and sentiment analysis is the domain dependent
nature of sentiment words. One features set may give very good
performance in one domain, at the same time it perform very
poor in some other domain[5].
• Asymmetry in availability of opinion mining software: The
opinion mining software is very expensive and currently
affordable only to big organizations and government. It is
beyond the common citizen’s expectation. This should be
available to all people, so that everyone gets benefit from it[6].
• Detection of spam and fake reviews: The web contains both
authentic and spam contents. For effective Sentiment
classification, this spam content should be eliminated before
processing. This can be done by identifying duplicates, by
detecting outliers and by considering reputation of reviewer[5].
• Incorporation of opinion with implicit and behavior data:
For successful analysis of sentiment, the opinion words should
integrate with implicit data. The implicit data determine the
actual behavior of sentiment words[6].
• Mixed Sentences: Suppose the word is positive in one
situation may be negative in another situation. For e.g. Word
LONG, suppose if customer says the battery life of Samsung
mobile is too long so that would be a positive opinion. But
suppose if customer says that Samsung mobile take too long
time to start or to charge so it would be a negative opinion.
• Way of Expressing the Opinion: The people don’t always
express opinions in the same way. The opinion of every
individual is different because the way of thinking, the way of
expressing is vary from person to person.
• Use of Abbreviations and shortforms: People using social
media more and that to for chatting, expressing their views
using shortcuts or abbreviations so the use of colloquial words
is increased. Uses of abbreviation, synonyms, special symbols
is also increase day by day so finding opinion from that is too
difficult. For e.g. F9 for fine, thnx for thanks, u for you, b4 for
before, b’coz for because, h r u for how are you etc.
• Typographical Errors: Sometimes typographical errors
cause problems while extracting opinions.
• Orthographics Words: People use orthographic words for
expressing their excitement, happiness for e.g. Word Sooo…..
Sweeetttt….., I am toooo Haappy or if they in hurry they stress
the words for e.g. comeeeee fassssssst I am waittttnggg.
• Natural language processing overheads: The natural
language overhead like ambiguity, co-reference, Implicitness,
inference etc. created hindrance in sentiment analysis tool [6].
4. DATA SOURCES AND TOOLS OF
OPINION MINING While doing research the collection of data is the biggest issue
and for the task like opinion mining, sentiment analysis its too
difficult because lots of information is available on internet and
collection of that data and extraction of opinion from huge
amount of data is too hard. So here we discussed about some
available data sources and the tools which is used for extraction
the sentiments and opinion of the given text.

International Journal of Computer Applications Technology and Research
Volume 4– Issue 6, 419 - 424, 2015, ISSN:- 2319–8656
www.ijcat.com 421
4.1 Data Sources available for Opinion
mining There are various data sources available on web, i.e. Blogs,
Micro blogs, online posts, News feeds, Forums, review sites
etc.
• Blogs: Blogs are nothing but the user own space or diary
on internet where they can share their views, opinions
about topics they want.
• Online Reviews: on Internet various review sites are
available through that you can check online reviews of any
product before purchasing that.
• Micro blogging: Micro blogs allow users to exchange small
elements of content such as short sentences, individual
images, or video links", which may be the major reason for
their popularity.
• Online Posts: people share their own ideas, opinions,
photos, videos, views, likes, dislikes, comments on specific
topics etc.
• Forums: An Internet forum, or message board, is an
online discussion site where people can hold conversations
in the form of posted messages.
This table gives you an idea about the available data sources
along with the address of sites from which you can download
the posts, tweets, reviews for products etc.
Table 1. Available Data sources with web address
D
at
a
S
o
u
rc
es
Respective Sites/ Source
Bl
o
gs
http://indianbloggers.org/,http://www.bloggersideas.c
om/, http://www.digitaltrends.com/,
http://thoughts.com/free-blog,http://blog.com/,
http://blog. hubspot.com/https://wordpress.com/,
R
ev
ie
w
Si
te
s
http://www.sitejabber.com/,http://www.toptenreviews
.com/,http://www.trustedreviews.com/,
https://in.pinterest.com,http://www.business-
edge.com/, http://www.websitemagazine.com/,
http://www. yellowpages.com
M
ic
ro
-
Bl
o
g
gi
n
g
https://tumblr.com/(Tumblr),http://friendfeed.com/(Fr
endfeed),http://www.plurk.com/top/(Plurk),
https://twitter.com/(Twitter),http://www.jaiku.com
/(Jaiku),http://www.qaiku.com/(Quiku),https://
www.identi.ca/(Identica),http://www.spotjots.com/(S
potjots),http://www.meetme.com/(Meet me)
O
nl
in
e
P
os
ts
https://www.facebook.com/(Facebook),https://myspa
ce.com/(MySpace),http://www.skype.com/en/
(Skype),https://www.linkedin.com/(Linkedin),
https://diasporafoundation.org/(Diaspora),https://plus.
google.com/(GooglePlus),https://www.whatsapp.com
/(Whatsapp),https://www.snapchat.com/
(Snapchat),https://telegram.org/(Telegram),https://w
ww.flickr.com/(Flickr)
F
or
u
m
s
http://www.forums.mysql.com,http://www.forums.cn
et.com,http://www.forum.joomla.org,https://forums.d
igitalpoint.com,http://www.bookforum.com,http://ww
w.myspace.com/forums,http://tsrmatters.com/(The
Student Room),http://ubuntuforums.org/,
https://stackoverflow.com/,
4.2 Tools available for Opinion mining As we discussed in 4.1 there are various data sources are
available on web and mining those data is difficult task.
Main difficulty is extraction of emotions, structure of text,
form of data i.e. image or text, the language used on internet
for communication is vary from person to person or state
to state. So here are some ready to use tools for opinion
mining for various purposes like data preprocessing,
classification of text, clustering, opinion mining, sentiment
analysis etc.
The table no. 2 shows the name of particular tool as well as
uses of these tools.
Table 2. List of available tools
Name of
Tools Uses
STANFORD
CORENLP
[7]
POS tagging, Named entity recognizer,
Parsing, Coreference resolution system,
Sentiment analysis, Bootstrapped pattern
learning
WEKA [8] Machine learning algorithm for Data Mining,
Data pre-processing, Classification,
Regression, Clustering, Association rules,
Visualization.
NLTK [9] Classification, Tokenization, Stemming,
Tagging, Parsing, Semantic reasoning,
Provides lexical resources such as WordNet
APACHE
OPENNLP
[10]
Tokenization, Sentence segmentation, Part-of-
speech tagging, Named entity extraction,
Chunking, Parsing, Coreference resolution
LingPipe
[11]
Entity extraction, POS tagging, Clustering,
Classification.
GATE [12] Tokenizer, Gazetteer, Sentence splitter, POS
tagging, Named entities transducer,
Coreference tagger
Pattern [13] Data mining, POS tagging, N-gram search,
Sentiment analysis, WordNet, Machine
learning, Network analysis, Visualization
Robust
Accurate
Statistical
Parsing [14]
Statistical Parser, Tokenization, Tagging,
Lemmatization and Parsing
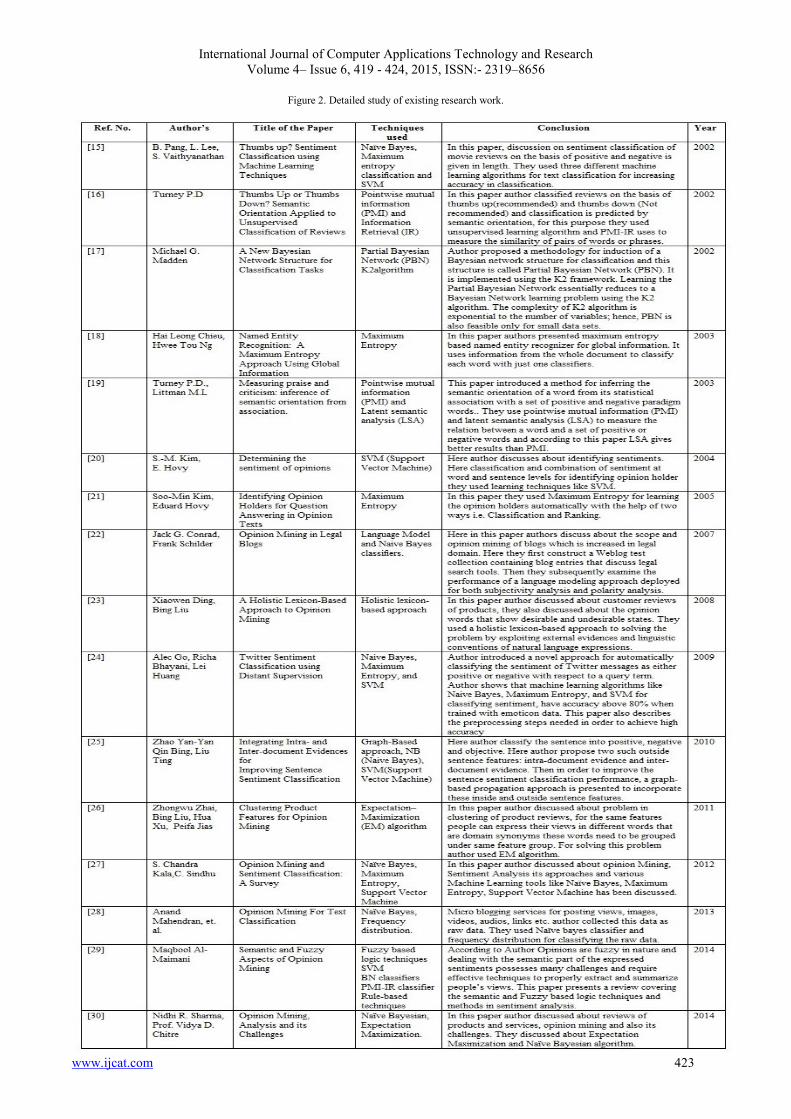
5. EXISTING WORK IN OPINION
MINING As we know the beginning of opinion mining has marked in
late 90’s but this paper discusses the advances carried out from
the year 2002 to 2014. In this section brief tabulated
information about the major contribution in the field of opinion
mining is shown. The table no. 3 shows details about the author,
their work, different techniques used while working on Opinion

International Journal of Computer Applications Technology and Research
Volume 4– Issue 6, 419 - 424, 2015, ISSN:- 2319–8656
www.ijcat.com 422
Mining and brief introduction of that paper as conclusion of
that paper.
International Journal of Computer Applications Technology and Research
Volume 4– Issue 6, 419 - 424, 2015, ISSN:- 2319–8656
www.ijcat.com 423
Figure 2. Detailed study of existing research work.
International Journal of Computer Applications Technology and Research
Volume 4– Issue 6, 419 - 424, 2015, ISSN:- 2319–8656
www.ijcat.com 424
The above table information suggest that statistical techniques
have been used mostly used by the researchers for extracting or
mining the opinions.
6. CONCLUSION Emotions are often associated and considered commonly
significant with mood, nature, personality, disposition, and
motivation. Opinion Mining or Sentiment analysis refers to
extraction of opinion from given text and classify them on the
basis of polarity i.e. positive, negative and neutral. In this paper,
we discussed about various levels of sentiment analysis and
technique used to identify and extract opinions. Here we gave
some challenges used while working on opinion mining like
some orthographic errors, typographical mistakes,
abbreviations, colloquial words etc. are the major challenges.
This paper provides a brief review to cover the major
challenges, stages, application and advantages of opinion
mining. In our study, we find some techniques like Naive
Bayes, Maximum Entropy, and SVM etc. are very often used
in opinion mining and sentiment analysis.
7. ACKNOWLEDGMENTS We are thankful to the Computational and Psycho-linguistic
Research Lab, Dept. of Computer Science & Information
Technology, Dr. Babasaheb Ambedkar Marathwada
University, Aurangabad (MS) for providing the facility for
carrying out the research. Our thanks to the experts who have
contributed towards development of the template.
8. REFERENCES [1] Cacioppo, 27 Nov 2014 “Studyguide for Discovering
Psychology: The Science of Mind,” John Publication.
[2] S. ChandraKala and C. Sindhu, October 2012 “Opinion
Mining and Sentiment Classification: A Survey,”
ICTACT Journal On Soft Computing, Volume: 03, Issue:
01.
[3] Sharma .R. et al., March 2014 “Opinion Mining in Hindi
Language: A Survey,” International Journal in Computer
Science & Technology (IJFCST), Vol 4, No. 2.
[4] Bing L., 2012 “Sentiment Analysis and Opinion Mining,”
Morgan & Claypool Publishers.
[5] Liu, B., 2010 “Sentiment Analysis and Subjectivity,”
Appeared in Handbook of Natural Language Processing,
Indurkhya, N. & Damerau, F.J. [Eds.].
[6] Haseena Rahmath, 2014 “Opinion Mining and Sentiment
Analysis - Challenges and Applications,” International
Journal of Application or Innovation in Engineering &
Management (IJAIEM), Volume 3, Issue 5.
[7] http://nlp.stanford.edu/software/corenlp.html
[8] http://www.cs.waikato.ac.nz/ml/weka/
[9] http://www.nltk.org/
[10] https://opennlp.apache.org/
[11] http://alias-i.com/lingpipe/
[12] https://gate.ac.uk/
[13] http://www.clips.ua.ac.be/pattern
[14] http://www.sussex.ac.uk/Users/johnca/rasp/offline-
demo.html
[15] B. Pang, L. Lee, and S. Vaithyanathan, 2002 “Thumbs up?
Sentiment classification using machine learning
techniques,” Proceedings of the Conference on Empirical
Methods in Natural Language Processing, pp. 79-86.
[16] Turney P.D., 2002 “Thumbs up or down? Semantic
orientation applied to unsupervised classification of
reviews”, ACL, p. 417-424.
[17] M.G. Madden, 2002 “A new Bayesian network structure
for classification tasks,” Proceedings of 13th Irish
Conference on Arti ficial Intelligence & Cognitive
Science, vol. 2464.
[18] Hai Leong Chieu . et al., “Named Entity Recognition: A
Maximum Entropy Approach Using Global Information,”
http://www.cnts.ua.ac.be/conll2003/pdf/16063 chi.pdf
[19] Turney P.D., Littman M.L., 2003 “Measuring praise and
criticism: Inference of semantic orientation from
association,” ACM TOIS 21(4) , p. 315-346
[20] S.-M. Kim and E. Hovy, 2004 “Determining the sentiment
of opinions,” Proceedings COLING-04, the Conference
on Computational Linguistics, Geneva, Switzerland.
[21] S.-M. Kim and E. Hovy, 2005 “Identifying opinion
holders for question answering in opinion texts,”
Proceedings of AAAI Workshop on Question Answering
in Restricted Domains, pp.20-26.
[22] Jack G. Conrad and Frank Schilder, June 4-8, 2007
“Opinion Mining in Legal Blogs,” ACM, ICAIL ’07.
[23] Xiaowen Ding, Bing Liu, 2008 “A Holistic Lexicon-
Based Approach to Opinion Mining,” ACM WSDM’08,
February 11-12.
[24] Alec Go, Richa Bhayani, Lei Huang, 2009 “Twitter
sentiment classification using distant supervision,”
CS224N Project Report, Stanford.
[25] Zhao Yan-Yan, Qin Bing, Liu Ting, 2010 “Integrating
Intra- and Inter-document Evidences for Improving
Sentence Sentiment Classification,” ACTA
AUTOMATICA SINICA, Elsevier.
[26] Zhongwu Zhai, . et al., February 9–12, 2011 “Clustering
Product Features for Opinion Mining”, WSDM’11 Hong
Kong, China,.
[27] S. Chandra Kala,C. Sindhu, October 2012 “Opinion
Mining and Sentiment Classification: A Survey,”
ICTACT Journal on Soft Computing, Volume: 03, Issue:
01.
[28] Anand Mahendran, 1 June 2013 “Opinion Mining For
Text Classification”, International Journal of Scientific
Engineering and Technology (ISSN: 2277-1581) Volume
No.2, Issue No.6, pp: 589-594.
[29] Maqbool Al-Maimani et. al., 20th May 2014 “Semantic
and Fuzzy Aspects of Opinion Mining,” Journal of
Theoretical and Applied Information Technology, Vol. 63
No.2.
[30] Nidhi R. Sharma et. al., April 2014 “Opinion Mining,
Analysis and its Challenges,” International Journal of
Innovations & Advancement in Computer Science IJIACS
ISSN 2347 – 8616 Volume 3, Issue 1.
International Journal of Computer Applications Technology and Research
Volume 4– Issue 6, 425 - 434, 2015, ISSN:- 2319–8656
www.ijcat.com 425
Securing an Information Systems from Threats: A
Critical Review
Grace L. Samson
Department of Computer Science
University of Abuja
Gwagwalada–Abuja, Nigeria
Mistura M. Usman
Department of Computer Science
University of Abuja
Gwagwalada-Abuja, Nigeria
Abstract: The technology behind information systems in today’s world has been embedded in nearly every aspect of our lives. Thus,
the idea of securing our information systems and/or computer networks has become very paramount. Owing to the significance of
computer networks in transporting the information and knowledge generated by the increased diversity and sophistication of
computational machinery, it would be very imperative to engage the services of network security professionals to manage the
resources that are passed through the various terminals (end points) of the these network, so as to achieve a maximum reliability of the
information passed, making sure that this is achieved without creating a discrepancy between the security and usability of such
network. This paper examines the various techniques involved in securely maintaining the safe states of an active computer network,
its resources and the information it carries. We examined techniques of compromising an information system by breaking into the
system without authorised access (Hacking), we also looked at the various phases of digital analysis of an already compromised
system, and then we investigated the tools and techniques for digitally analysing a compromised system in other to bring it back to a
safe state.
Keywords: Computer Security, Hacking, Digital Analysis, Computer Networks, Risk and Vulnerability
1. INTRODUCTION Computer Networks according to [1] satisfy a broad range of
purposes and meet various requirements which include (a)
Provide the sharing of resources such as information or
processors, (b) provide inter-process communication among
users and processors, (c) provide distribution of processing
functions, (d) provide centralised control for a geographically
distributed system, (e) provide centralised management and
allocation of network resources etc. The most important
characteristic of a computer network as identified by [2] is its
generality. Computer networks are built primarily from
general-purpose programmable hardware, and they are not
optimized for a particular application like making phone calls
or delivering television signals. Instead, they are able to carry
many different types of data, and they support a wide and
ever-growing range of applications. A computer network
therefore means an interconnected collection of autonomous
computers [1]. Owing to this significance of computer
networks in transporting the information and knowledge
generated by the increased diversity and sophistication of
computational machinery [3], it would be very imperative to
engage the services of network security professionals to
manage the resources that are passed through the various
terminals (end points) of these networks, so as to achieve a
maximum reliability of the information passed over these
networks making sure that this is achieved without creating a
discrepancy between the security and usability of such
network – since these two are the main concerns of any
network owners. Consequently, the issue of managing a
computer network should include finding a balance between
security and usability of the network so as to achieve the
purpose, confidentiality, authenticity, accountability,
availability and of course integrity of that network
1.1 Computer Security [4] Identified three main factors that could be encountered in
managing a computer network. According to him these
include assets, threats, vulnerability and risk, where;
Risk = assets + threats + vulnerability [4]
However, he also acknowledged the fact that computer
security has to do with the protection of assets from threats
and vulnerability in other to reduce the amount of risk the
system may face.
[5], in his own view defined the security of an information
system as the state of being free from danger and being
unexposed to damage from accidents or attacks of any form.
He also added that computer security is a process of achieving
a state that is optimally desirable for an information system;
stating clearly that the main goal of an information system
security is to optimize the performance of the system with
respect to the measure of risk to which the system is exposed
to. [6] describes Computer security in this form and he states;
“If a system always stays in states that are allowed, and users
can only perform actions that are allowed, the system is
secure. But if the system can enter a disallowed state, or if a
user can successfully execute a disallowed action, the system
is non-secure” [6].
The technology behind information systems in today’s world
according to [7] has been embedded in nearly every aspect of
our lives. Thus, the idea of securing our information systems
and/or computer networks has become very paramount.
According to them, the major reason for securing information
systems is to attain the five main tenets of a secured system.
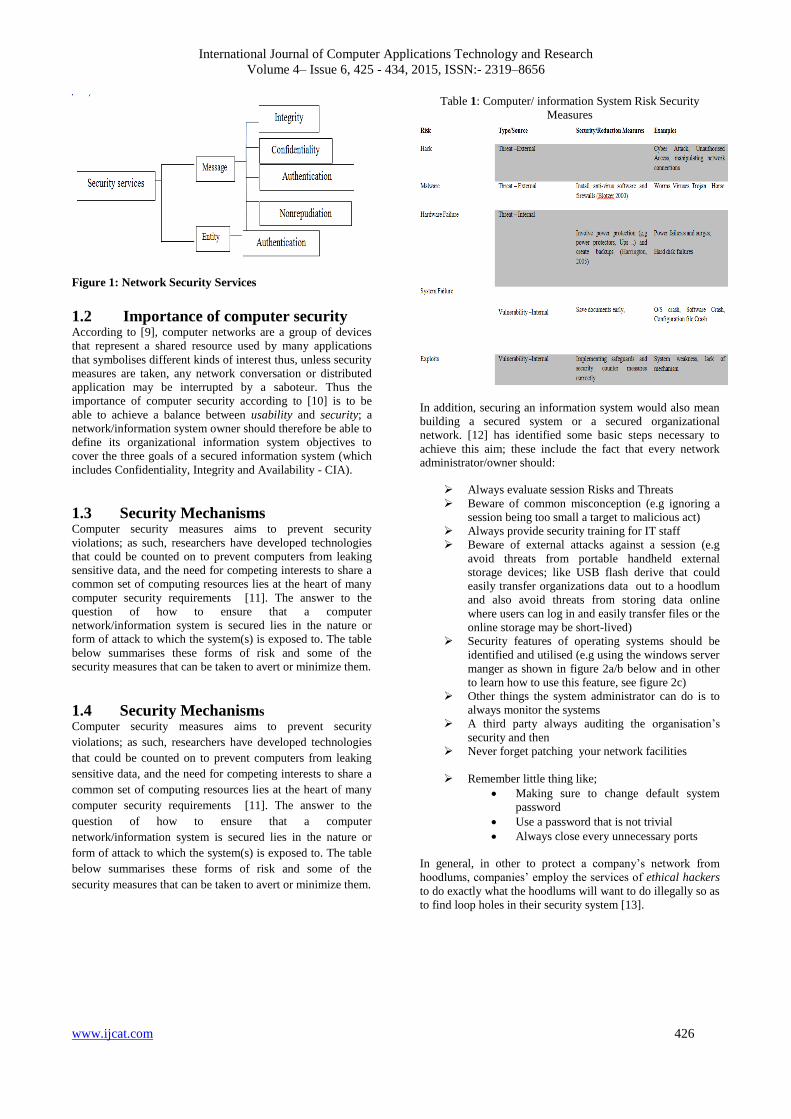
Specifically, network security is the ability of a computer
network to provide one of the services expected of an
information system [8]; the first four confidentiality, integrity,
authentication and nonrepudiation has to do with the message
being exchanged over the network and the other one has to do
with authentication of users (see figure 1).
International Journal of Computer Applications Technology and Research
Volume 4– Issue 6, 425 - 434, 2015, ISSN:- 2319–8656
www.ijcat.com 426
Figure 1: Network Security Services
1.2 Importance of computer security According to [9], computer networks are a group of devices
that represent a shared resource used by many applications
that symbolises different kinds of interest thus, unless security
measures are taken, any network conversation or distributed
application may be interrupted by a saboteur. Thus the
importance of computer security according to [10] is to be
able to achieve a balance between usability and security; a
network/information system owner should therefore be able to
define its organizational information system objectives to
cover the three goals of a secured information system (which
includes Confidentiality, Integrity and Availability - CIA).
1.3 Security Mechanisms Computer security measures aims to prevent security
violations; as such, researchers have developed technologies
that could be counted on to prevent computers from leaking
sensitive data, and the need for competing interests to share a
common set of computing resources lies at the heart of many
computer security requirements [11]. The answer to the
question of how to ensure that a computer
network/information system is secured lies in the nature or
form of attack to which the system(s) is exposed to. The table
below summarises these forms of risk and some of the
security measures that can be taken to avert or minimize them.
1.4 Security Mechanisms Computer security measures aims to prevent security
violations; as such, researchers have developed technologies
that could be counted on to prevent computers from leaking
sensitive data, and the need for competing interests to share a
common set of computing resources lies at the heart of many
computer security requirements [11]. The answer to the
question of how to ensure that a computer
network/information system is secured lies in the nature or
form of attack to which the system(s) is exposed to. The table
below summarises these forms of risk and some of the
security measures that can be taken to avert or minimize them.
Table 1: Computer/ information System Risk Security
Measures
In addition, securing an information system would also mean
building a secured system or a secured organizational
network. [12] has identified some basic steps necessary to
achieve this aim; these include the fact that every network
administrator/owner should:
Always evaluate session Risks and Threats
Beware of common misconception (e.g ignoring a
session being too small a target to malicious act)
Always provide security training for IT staff
Beware of external attacks against a session (e.g
avoid threats from portable handheld external
storage devices; like USB flash derive that could
easily transfer organizations data out to a hoodlum
and also avoid threats from storing data online
where users can log in and easily transfer files or the
online storage may be short-lived)
Security features of operating systems should be
identified and utilised (e.g using the windows server
manger as shown in figure 2a/b below and in other
to learn how to use this feature, see figure 2c)
Other things the system administrator can do is to
always monitor the systems
A third party always auditing the organisation’s
security and then
Never forget patching your network facilities
Remember little thing like;
Making sure to change default system
password
Use a password that is not trivial
Always close every unnecessary ports
In general, in other to protect a company’s network from
hoodlums, companies’ employ the services of ethical hackers
to do exactly what the hoodlums will want to do illegally so as
to find loop holes in their security system [13].

International Journal of Computer Applications Technology and Research
Volume 4– Issue 6, 425 - 434, 2015, ISSN:- 2319–8656
www.ijcat.com 427
Figure 2c: how to use windows security facilities
2. HACKING
The essence of this section is to bring to our attention the
major security issues that are worth mentioning in a
discussion of network security of which the most obvious of
these is computer network hacking.
2.0 What is hacking? Hacking means getting access to and secretly looking at or
changing information on a computer network resource or its
information without an authorised permission. In other words
it involves finding an unintended or overlooked use of an
information system in an innovative way in other to use the
outcome to solve a given problem [14]. Hacking tools are
basically codes which a hacker writes when he wants to
automate a task. [15] has identified three (3) major types of
these codes as we have shown below.
2.1 The hacking process: Hacking or cracking a network according to [16] would
usually involve the process as described by the diagram below
2.2 Performing reconnaissance –
organization’s information system/network
exploration The first step a successful hacker must take is information
gathering. This is a way of successfully executing an attack
against an organization’s information system/network by
gathering as much intelligence about the organization as
possible. According to [17], some of the methods that one
could adopt include: (a) dumpster driving (b) search engine
querying (c) public database querying (d) social networking
e.t.c
Nmap,
Nessus
Netcat.

International Journal of Computer Applications Technology and Research
Volume 4– Issue 6, 425 - 434, 2015, ISSN:- 2319–8656
www.ijcat.com 428
Table 2: detailed tools and information gathered during
reconnaissance [13]
Like any successful hacker, you have to know what you are
looking for and the best place to find it is from Company or
institutional sites.
2.2.1 Tools for performing reconnaissance and
information gained
Table 3: brief summary of passive reconnaissance
tools
2.3 Scanning/Enumerating – organization’s
information system/network exploration Active reconnaissance (network scanning/enumeration)
involves probing the targeted network or a specific host, in
other to detect vulnerabilities. Many attackers will avoid
active scanning, because it will often leave traces in the target
system's logs, making their activities easier to trace. Active
scanning include port scanning to find open ports, testing web
applications for weak passwords or insecure code, or sending
web links to user’s shopping that they will visit a web site that
will log their IP address and information that might identify
potential attack vectors [18].
Similarly [19] acknowledged that network scanning can help
the attacker to find IP address range, show live addresses,
device manufacturer, MAC address, any available user, and
DNS name. It can also be used to identify shared folders,
HTTP, HTTPS and FTP. Network scanning can easily be
achieved through the internet by using methods like ping tool
discovery, port scan and ping sweep. Scanning is used, for
recognizing active machines and finding open ports and
access points. It is important to note according to [20] that
Ports 0 to 1023 are well-known ports used for specific
protocols and port 80 is the well-known port for HTTP. Thus
If a port scan discovers port 80 open, the attacker knows that
HTTP (which is most likely a web server) is very likely
running on the system. A further attack after finding open
ports, live systems and operating systems is enumeration. [18]
describes network enumeration as a process of identifying
domain names and their associated networks. At this hacking
stage according to [13], the hacker tries to identify resources
that are shared on the network (by using specific OS tools),
discover user accounts login (probably by guessing of
passwords after determining a username) and attempt to
retrieve information and gain access to servers by using
company employees’ logon accounts already discovered.
Tools for scanning an organization’s network
and information gained
Hacking tools are basically codes which a hacker writes when
he wants to automate a task. In general, some major tools for
scanning according to [16] include;
o Internet control message protocols (ICMP) scanners
o Scanners
o Diallers
o Ping sweep
o Mappers e.t.c
Table 4 : detailed identifiable information during hacking and what the hacker can get [21]
www.ijcat.com 429
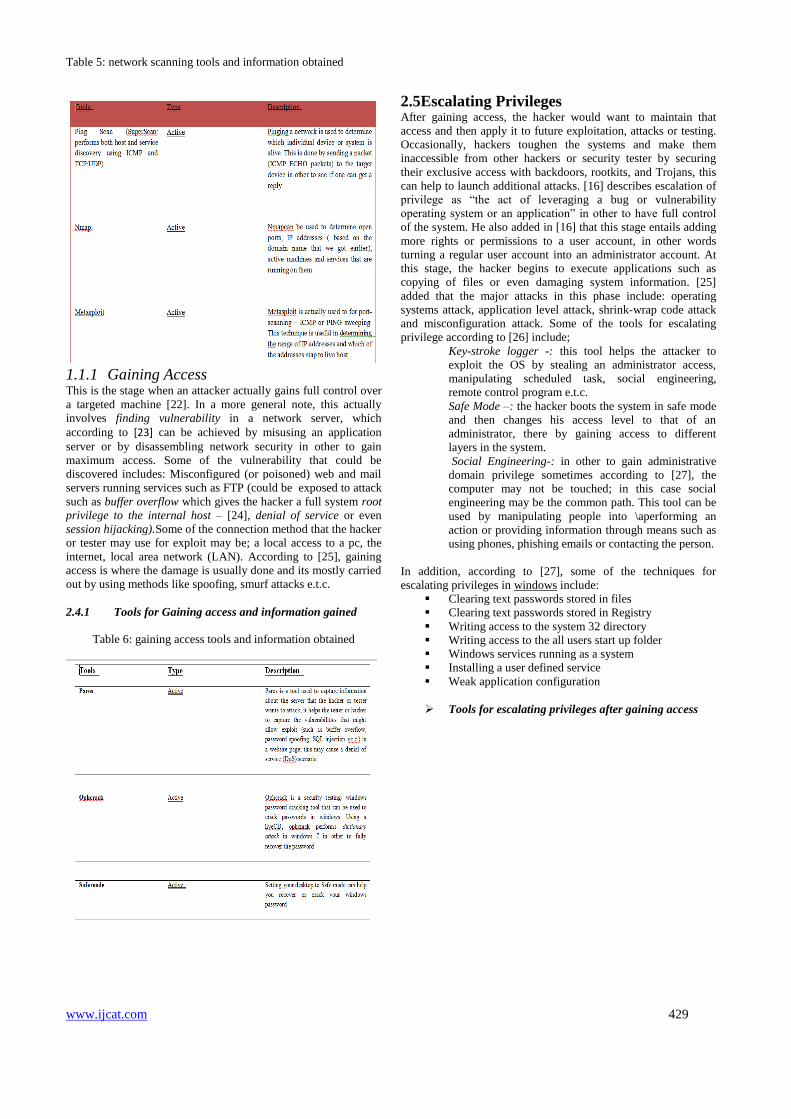
Table 5: network scanning tools and information obtained
1.1.1 Gaining Access This is the stage when an attacker actually gains full control over
a targeted machine [22]. In a more general note, this actually
involves finding vulnerability in a network server, which
according to [23] can be achieved by misusing an application
server or by disassembling network security in other to gain
maximum access. Some of the vulnerability that could be
discovered includes: Misconfigured (or poisoned) web and mail
servers running services such as FTP (could be exposed to attack
such as buffer overflow which gives the hacker a full system root
privilege to the internal host – [24], denial of service or even
session hijacking).Some of the connection method that the hacker
or tester may use for exploit may be; a local access to a pc, the
internet, local area network (LAN). According to [25], gaining
access is where the damage is usually done and its mostly carried
out by using methods like spoofing, smurf attacks e.t.c.
2.4.1 Tools for Gaining access and information gained
Table 6: gaining access tools and information obtained
2.5Escalating Privileges After gaining access, the hacker would want to maintain that
access and then apply it to future exploitation, attacks or testing.
Occasionally, hackers toughen the systems and make them
inaccessible from other hackers or security tester by securing
their exclusive access with backdoors, rootkits, and Trojans, this
can help to launch additional attacks. [16] describes escalation of
privilege as “the act of leveraging a bug or vulnerability
operating system or an application” in other to have full control
of the system. He also added in [16] that this stage entails adding
more rights or permissions to a user account, in other words
turning a regular user account into an administrator account. At
this stage, the hacker begins to execute applications such as
copying of files or even damaging system information. [25]
added that the major attacks in this phase include: operating
systems attack, application level attack, shrink-wrap code attack
and misconfiguration attack. Some of the tools for escalating
privilege according to [26] include;
Key-stroke logger -: this tool helps the attacker to
exploit the OS by stealing an administrator access,
manipulating scheduled task, social engineering,
remote control program e.t.c.
Safe Mode –: the hacker boots the system in safe mode
and then changes his access level to that of an
administrator, there by gaining access to different
layers in the system.
Social Engineering-: in other to gain administrative
domain privilege sometimes according to [27], the
computer may not be touched; in this case social
engineering may be the common path. This tool can be
used by manipulating people into \aperforming an
action or providing information through means such as
using phones, phishing emails or contacting the person.
In addition, according to [27], some of the techniques for
escalating privileges in windows include:
Clearing text passwords stored in files
Clearing text passwords stored in Registry
Writing access to the system 32 directory
Writing access to the all users start up folder
Windows services running as a system
Installing a user defined service
Weak application configuration
Tools for escalating privileges after gaining access
International Journal of Computer Applications Technology and Research
Volume 4– Issue 6, 425 - 434, 2015, ISSN:- 2319–8656
www.ijcat.com 430
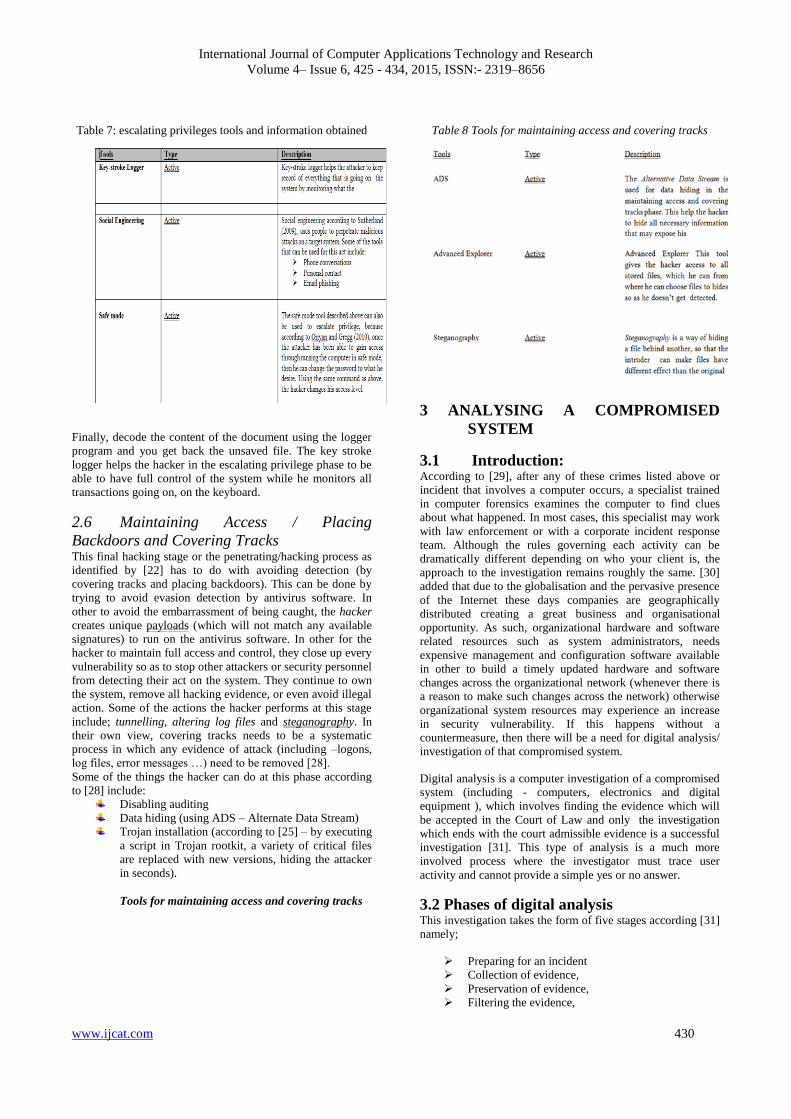
Table 7: escalating privileges tools and information obtained
Finally, decode the content of the document using the logger
program and you get back the unsaved file. The key stroke
logger helps the hacker in the escalating privilege phase to be
able to have full control of the system while he monitors all
transactions going on, on the keyboard.
2.6 Maintaining Access / Placing
Backdoors and Covering Tracks This final hacking stage or the penetrating/hacking process as
identified by [22] has to do with avoiding detection (by
covering tracks and placing backdoors). This can be done by
trying to avoid evasion detection by antivirus software. In
other to avoid the embarrassment of being caught, the hacker
creates unique payloads (which will not match any available
signatures) to run on the antivirus software. In other for the
hacker to maintain full access and control, they close up every
vulnerability so as to stop other attackers or security personnel
from detecting their act on the system. They continue to own
the system, remove all hacking evidence, or even avoid illegal
action. Some of the actions the hacker performs at this stage
include; tunnelling, altering log files and steganography. In
their own view, covering tracks needs to be a systematic
process in which any evidence of attack (including –logons,
log files, error messages …) need to be removed [28].
Some of the things the hacker can do at this phase according
to [28] include:
Disabling auditing
Data hiding (using ADS – Alternate Data Stream)
Trojan installation (according to [25] – by executing
a script in Trojan rootkit, a variety of critical files
are replaced with new versions, hiding the attacker
in seconds).
Tools for maintaining access and covering tracks
Table 8 Tools for maintaining access and covering tracks
3 ANALYSING A COMPROMISED
SYSTEM
3.1 Introduction: According to [29], after any of these crimes listed above or
incident that involves a computer occurs, a specialist trained
in computer forensics examines the computer to find clues
about what happened. In most cases, this specialist may work
with law enforcement or with a corporate incident response
team. Although the rules governing each activity can be
dramatically different depending on who your client is, the
approach to the investigation remains roughly the same. [30]
added that due to the globalisation and the pervasive presence
of the Internet these days companies are geographically
distributed creating a great business and organisational
opportunity. As such, organizational hardware and software
related resources such as system administrators, needs
expensive management and configuration software available
in other to build a timely updated hardware and software
changes across the organizational network (whenever there is
a reason to make such changes across the network) otherwise
organizational system resources may experience an increase
in security vulnerability. If this happens without a
countermeasure, then there will be a need for digital analysis/
investigation of that compromised system.
Digital analysis is a computer investigation of a compromised
system (including - computers, electronics and digital
equipment ), which involves finding the evidence which will
be accepted in the Court of Law and only the investigation
which ends with the court admissible evidence is a successful
investigation [31]. This type of analysis is a much more
involved process where the investigator must trace user
activity and cannot provide a simple yes or no answer.
3.2 Phases of digital analysis This investigation takes the form of five stages according [31]
namely;
Preparing for an incident
Collection of evidence,
Preservation of evidence,
Filtering the evidence,
International Journal of Computer Applications Technology and Research
Volume 4– Issue 6, 425 - 434, 2015, ISSN:- 2319–8656
www.ijcat.com 431
Acquisition message displayed
Presentation of evidence
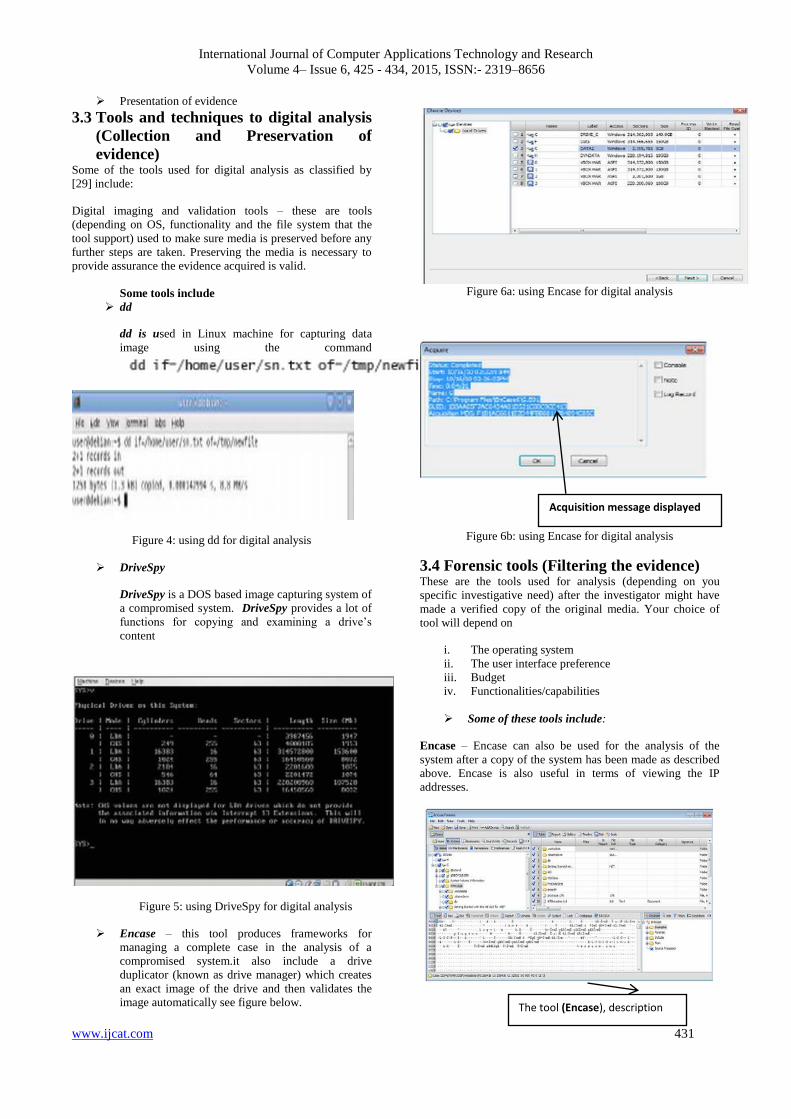
3.3 Tools and techniques to digital analysis
(Collection and Preservation of
evidence) Some of the tools used for digital analysis as classified by
[29] include:
Digital imaging and validation tools – these are tools
(depending on OS, functionality and the file system that the
tool support) used to make sure media is preserved before any
further steps are taken. Preserving the media is necessary to
provide assurance the evidence acquired is valid.
Some tools include
dd
dd is used in Linux machine for capturing data
image using the command
Figure 4: using dd for digital analysis
DriveSpy
DriveSpy is a DOS based image capturing system of
a compromised system. DriveSpy provides a lot of
functions for copying and examining a drive’s
content
Figure 5: using DriveSpy for digital analysis
Encase – this tool produces frameworks for
managing a complete case in the analysis of a
compromised system.it also include a drive
duplicator (known as drive manager) which creates
an exact image of the drive and then validates the
image automatically see figure below.
Figure 6a: using Encase for digital analysis
Figure 6b: using Encase for digital analysis
3.4 Forensic tools (Filtering the evidence) These are the tools used for analysis (depending on you
specific investigative need) after the investigator might have
made a verified copy of the original media. Your choice of
tool will depend on
i. The operating system
ii. The user interface preference
iii. Budget
iv. Functionalities/capabilities
Some of these tools include:
Encase – Encase can also be used for the analysis of the
system after a copy of the system has been made as described
above. Encase is also useful in terms of viewing the IP
addresses.
The tool (Encase), description

International Journal of Computer Applications Technology and Research
Volume 4– Issue 6, 425 - 434, 2015, ISSN:- 2319–8656
www.ijcat.com 432
Figure 7a: using Encase or digital analysis (Filtering the
evidence)
.
Figure 7b: using Encase or digital analysis (Filtering the
evidence)
Forensic Toolkit (FTK)
This is another tool used for digital investigation of a
compromised system, used particularly for evidence
processing (see diagram below).
Figure 8: using Forensic Toolkit (FTK) for digital analysis
(Filtering the evidence)
Sift
According to [29] another tool for digital analysis is the SIFT
(SANS Investigative Forensic Toolkit). This is a collection of
open source forensic utilities for digital analysis which is
available either as a VMware virtual machine or as an ISO
image to create a bootable CD. It provides the ability to
examine disks and images created using other forensic
software. Some of the file systems supported by SIFT include:
Windows (FAT, VFAT, and NTFS), Mac (HFS), Solaris
(UFS) and Linux (ext2/ext3).
Figure 9: using Wireshark Network Analyser (one of the tools
contained in SIFT toolkit)
4. CONCLUSION
Security is what we do to ensure privacy. Securing a computer
network or an organization’s information system, would
include the protection of its primary assets based on its size,
its ownership, the distance it covers and its physical
architecture. Consequently, the issue of managing a computer
network should include finding solution to major information
systems threats. There are basically two sources of
information systems threats; Internal and External. Among the
external threats and vulnerabilities faced by a computer
networks is information system hack. Hacking is away to
penetrates a network’s security or cause disruption through
denial of service attacks, buffer overflows, malware etc. A
computer “system” is secured if it is free from worry and if it
is safe from threats and vulnerability. However, because we
believes that computers constantly communicate with one
another; and an isolated computer is crippled, securing a
computer system for an application may mean first assuring
that the system will be available for use and will deliver
uncorrupted information which assures the confidentiality of
the information delivered. Basically, if we disconnect our
information system from the network it will reduce usability,
and if we connect our machine without firewalls or security
patches we would make it highly vulnerable. Thus, the issue
of computer information security is very vital to
organizational goal achievement and the ability to achieve a
balance between usability and security is the major concern of
an information system owner.
5. REFERENCES [1] Shinde, S.S. (2009) Computer Network. Daryaganj,
Delhi, IND: New Age International, pp 46.
[Available online at
http://site.ebrary.com/lib/uoh/Doc?id=10367725&ppg=6. Viewed 14th October 2012.
[2] Peterson, L. L. and Davie, B.S. (2012) Computer
networks: a systems approach.Amsterdam: Morgan
Kaufmann.
The tool (Encase), is used to search for
keywords
International Journal of Computer Applications Technology and Research
Volume 4– Issue 6, 425 - 434, 2015, ISSN:- 2319–8656
www.ijcat.com 433
[3] Cerf, V.G. (1991) "Networks", Scientific
American, vol. 265, no. 3, pp. 72-81.
[4] Gollmann, D. (2011) Computer security, Wiley:
Chichester.
[5] Bosworth, S., Kabay, M.E. and Whyne, E. eds.
(2012) Computer Security Handbook. US: Wiley.
[6] Bishop, M. (2003) "What is computer security?"
IEEE Security & Privacy Magazine, 1 (1), pp. 67-
69.
[7] Whittaker, J.A. and Andrews, M. (2004) "Computer
security", IEEE Security & Privacy Magazine 2 (5)
pp. 68-71.
[8] Murthy, C.S.V. (2010 ) Data Communication and
Networking. New Delhi: Himalaya Publishing
House.
[9] Peterson, L. L. and Davie, S. Eds (2007) Computer
Networks: A Systems Approach (4th Edition).
Burlington, MA, USA: Morgan Kaufmann,pp 2
online available on [14th oct 2012]
http://site.ebrary.com/lib/uoh/Doc?id=10382874&
ppg=31
[10] Newman, R.C. (2010) Computer security:
protecting digital resources. Sudbury, Mass: Jones
and Bartlett Publishers.
[11] Landwehr, C.E. (2001) "Computer security",
International Journal of Information Security. 1
(1), pp. 3-13.
[12] Vacca, J.R. (2010) Network and system security.
Burlington, MA: Syngress/Elsevier.
[13] Simpson, M. T., Kent, Backman. and James, E. C.
(2012)"Chapter 6 - Enumeration". Hands-On
Ethical Hacking and Network Defense. Cengage
Learning. [Online] Available at
http://common.books24x7.com.libaccess.hud.ac.uk
/toc.aspx?bookid=46364 [Accessed November 25,
2012]
[14] Erickson, J. (2007) Hacking: The Art of
Exploitation (2nd Edition), No Starch Press,
Incorporated.
[15] Barber, R. (2001) "Hacking Techniques The tools
that hackers use, and how they are evolving to
become more sophisticated", Computer Fraud &
Security. 2001 (3), pp. 9-12.
[16] Graves, Kimberly. (2010) CEH : Certified Ethical
Hacker Study Guide. Hoboken, NJ, USA: Sybex.
[Online] Available at <
http://site.ebrary.com/lib/uoh/Doc?id=10383604&
ppg=154> [Accessed 5th December 2012]
[17] Dhanjani, N., Rios B., and Hardin B. (2009)
Hacking: the next generation. US: O'Reilly.
[18] Barker, W., Beau, H. and Gene, S. (2010) Network
Scanning, Intrusion Detection, and Intrusion
Prevention Tools. Berkeley, CA: Apress. [Online]
Available at
<http://common.books24x7.com.libaccess.hud.ac.uk
/toc.aspx?bookid=35387> [Accessed November 19,
2012]
[19] Gibbs, M. (2012) “Google Around, Network
Scanning, and Pinging With TCP” Network World.
29 (8), p. 16
[20] Darril, G. (2011) Microsoft Windows Security
Essentials. Hoboken NJ, USA: Sybex Inc, US. pp.
151. [Online] Available at <
http://site.ebrary.com/lib/uoh/Doc?id=10484740&p
pg=177> [Accessed 24th Nov. 2012]
[21] Mcclure, S., Scambray, J., and George, K. (2005)
Hacking Exposed: Network Security and Solutions.
Emeryville Calif: Mcgraw Hill. [Online] Available
at <Http: common books. Books
24x7.Libaccess.hud.ac.uk/toc.aspx?bookid=18191>
[Accessed 25th November 2012]
[22] Kennedy, D., O’Gorman, J., Kearns,
D. and Aharoni, M. (2011) Metasploit: the
penetration tester's guide.No Starch Press: [Online]
Available at
<http://common.books24x7.com.libaccess.hud.ac.uk
/toc.aspx?bookid=43618> [Accessed 25th
November 2012]
[23] Seymour, B., Kabay, M. E. and Whyne eds. (2009)
"Chapter 21 - Web-Based
Vulnerabilities". Computer Security Handbook, 7th
ed. John Wiley & Sons. [Online] Available at
http://common.books24x7.com.libaccess.hud.ac.uk
/toc.aspx?bookid=29816> [accessed November 25,
2012]
[24] Cowan, C., Wagle, P., Pu, C., Beattie, S. and
Walpole, J. (2000) "Buffer Overflows: Attacks and
Defenses for the Vulnerability of the Decade," paper
presented at DISCEX 000, January 25–27, 2000,
Hilton Head, S.C. Proceedings of the DARPA
Information Survivability Conference and
Exposition (Los Alamitos, CA: IEEE
ComputerSociety Press, 2000).
[25] Steven, H. and Marah, B. eds. (2010) Ethical
Hacking and Counter measures: Attack Phases.
US:EC-Council
[26] Stewart, M. (2011) Network security, Firewalls and
VPN. US: Jones and Bartlett Learning LLC
[27] Sutherland, S. (2009) Windows Privileged
Escalation Part 2: Domain Admin Privilege.
[Online] Available at <
http://www.netspi.com/blog/2009/10/05/windows-
privilege-escalation-part-1-local-administrator-
privileges/ > [Accessed Dec7 2012].
[28] Oriyan, S-P. and Gregg, M. (2010) Hacker
Techniques, Tools and Incident Handling. US:
Jones and Bartlett.
[29] Solomon, M, G., Rudolph, K., and Tittel, Ed.
(2011)Computer Forensics JumpStart (2nd
Edition).Hoboken, NJ, USA: Sybex. Pp. 19
[Online] Available at <
http://site.ebrary.com/lib/uoh/Doc?id=10510709&
ppg=19> [Accessed 7th Dec. 2012]
International Journal of Computer Applications Technology and Research
Volume 4– Issue 6, 425 - 434, 2015, ISSN:- 2319–8656
www.ijcat.com 434
[30] Obialero R (2006) Forensic Analysis of a
Compromised Intranet Server. SANS Institute
[Online] Available at <
http://www.sans.org/reading_room/whitepapers/f
orensics/forensic-analysis-compromised-intranet-
server_1652> [Accessed 7th Dec 2012]
[31] Jovanovic, Z., and Redd, I. D. D. (2012) “Computer
Forensics Investigation Phases.” Journal of Digital
Evidence. 2 (2), pp. 1 – 20.
[32] Blotzer, M. J. (2000) "Computer security",
Occupational Hazards. 62 (5), pp. 99.
[33] Harrington, J.L. (2005) Network security: a
practical approach: Morgan Kaufmann Publishers,
Amsterdam.
[34] Rowlingson, R. (2011) The Essential Guide to
Home Computer Security, BCS. Swindon: The
Chartered Institute for IT.
International Journal of Computer Applications Technology and Research
Volume 4– Issue 6, 435 - 437, 2015, ISSN:- 2319–8656
www.ijcat.com 435
Expert System Offer Solutions for Automated Telescope
Dome, Imaging System and Focus
Hatem Abdel kader
Department of Information
System
Menoufia University
Menoufia, Egypt
Ibrahim Selim
Department of Computer
Science
Higher Technological Institute
10th of Ramadan city, Egypt
Mona Mohamed
Department of Information
System
Higher Technological Institute
10th of Ramadan city, Egypt
Abstract : Nowadays, weather consider the important component in many domains so, these domains use weather station to measure
the parameters of weather through embedded sensors and view the measurements by using monitoring system which allow the user to
make analysis about an obtained data of the weather Our work based on usage of weather station to measure certain parameters which
effect on our telescope (mirror) which responsible for orbs vision in the space, and view the measurements through monitoring system
to make analysis about these measurements to control closing and opening operations of shutter of the building and telescope
( mirror)in this building . These operations can operate by building expert system by using EXsys corvid software program and that
system like human expertise through usage of knowledge base and inference engine .
Keywords: Weather Station, Expert System, Monitoring System, EXsys corvid
1. INTRODUCTION We The weather and the climate are effect in many domains so ,
measuring of the weather parameters as temperature ,Humidity,
Rainfall, Wind speed, Solar radiation intensity, dew point,
Atmospherics pressures , etc……; these parameters of the
weather can measure by using weather station so, many
domains important for them to use weather station as
agriculture, because the measurement obtained through weather
station which determine timing cropping through measure the
certain parameters as :
Temperature
Wind speed
Solar radiation intensity
By using sensors as optokopler sensor to measure wind speed,
LM 35 sensor to measure temperature and intensitas LDR
sensor to measure sun which embed in weather station ,the
signals from sensors processed. through microcontroller to wind
speed, temperature ,and Solar radiation intensity and presented
that transferred data via LCD display, and data transmitted to
PC via receiver unit [1].
Although the weather station is important component ,the
monitoring system also important which use to measure trends
of different indicators depend on collected data and the
monitoring important for viewing the disaster which determine
the suitable action based on the disaster so, the monitoring
provide sufficient information to decision makers which help in
identify problems to choose suitable solution or action[2]; and
important for the weather station which receive weather data
from microcontroller embed in weather station and monitoring
present weather data and help user to make analysis for data
via GUI that authorized the user to treat with data .
We will use the data extract from weather station and send the
data to monitoring system in dome building that obtain data in
GUI figure.
Through GUI figure in the monitoring system we will send
orders (signals) for opening or closing the shutter and mirror of
dome, this signals receive by controller embed in shutter and
mirror ;this operation depend on analysis make on weather data
in monitoring system .
The weather become constitute hazard in the road and may
causes accidents, so the monitoring system for the weather
become safety for the road and other fields to observe and
monitor the measurements of the weather[3].
So, we will build expert system instead of human to make
suitable decision for closing and opening the shutter and mirror
of dome's building depend on the analysis for weather data view
in monitoring system by using GUI figure ;that expert system
has user interface which help use to interact with the expert
system and inference engine which aim expert to find suitable
solutions and decision through knowledge base owned to expert
system which has knowledge related to this domain .
2. RELATED WORK Many researchers used the weather station in their domains as
an important component to measure different parameters that
had an effect on their different domains and used sensors
embed in weather station to measure temperature, atmosphere
pressure and relative humidity, an analogue output obtained
from sensors convert to digital signals and processed by
microcontroller that data act as data logged ,data logged transfer
to PC have GUI program [4]. And developed Automatic
Weather Station (AWS) that measure Air temperature, relative
humidity, dew point, wind speed, and rainfall, AWS consist of
remote weather station and main weather station ;that remote
weather station measure factors through sensors connected to
microcontroller and transmit data to main weather station
which logged and data received through receiver unit connected
to PC that PC has Matlab that present data via GUI that
authorized the user to treat with data (analysis data and present
it via Matlab) [5].
used remote sensors to measure dew point temperature, relative
humidity, temperature, atmospherics pressures which displayed
International Journal of Computer Applications Technology and Research
Volume 4– Issue 6, 435 - 437, 2015, ISSN:- 2319–8656
www.ijcat.com 436
and show through weather monitoring [LCD display]or[display
unit], the System used for weather monitoring had
microcontroller which convert analogue output obtained by
sensors to digital through ADC in microcontroller and data of
the weather displayed via display unit and receiver unit had
software used for forecasting to data view in weather
monitoring for analysis [6].
There are 6 approaches for monitoring system which view the
temperature of bee colony and how temperature of bee colony
transfer to bee keeper and each approach can solve the
drawbacks of the previous approach and the simplest approach
is the first one which the data obtained on the site not in any
where ,the monitoring can help beekeeper to manage honey
bee colonies and observe temperature of bee colony and make
analysis on the viewed temperature and determine suitable
action or decision depend on that the analysis[7] .
Usage of expert system can help us in the work to make
decisions which can solve the problem of timing for closing and
opening automatic, the science of the expert system branched
from AI which simulate human thinking who has expertise in
the specific domain to solve any problems related to that
specific domain through knowledge in the expert system for
specific domain [8][9]
And the expert system can use in many domains as Diagnosis
of Some Diseases in domain of Medicine as heart diseases ,the
expert system can diagnosis the disease for the patient through
symptoms and analyzes for patients to help expert system to
choose the correct decisions for treatments through knowledge
base owned for expert system [10,20-37]
And use in diagnosis of kidney diseases which the diagnose
obtained from the computer is similar to the the diagnose
given by an expert doctor in that certain area ,the system its
knowledge base has 27 for kidney diseases which difficult to
diagnose by human; the user can asked by the system and
answer with Yes or No and depend on these answers the system
diagnose the symptoms and its suitable treatment [11]
And other applications that expert system success as :
Predicting
Diagnosing
Planning
Monitoring
Controlling
There are 3 parts for the expert system Knowledge base which
has data to specific domain to solve the problem, Working
memory which has specific data should be task and Inference
engine aim to arrive to conclusions based on task data [12,14-
25]
And used in other domain is business which propose a
heuristics fuzzy expert system to indicate the price of the
products [13-37] .
3. PROPOSED SYSTEM Our proposed system will develop through the following steps:
3.1 Collection of data
We collect data of the weather by weather station through
embed sensors specify to parameters of the weather and take in
our consideration certain parameters as temperature, humidity,
wind direction, dew point.
3.2 Monitoring system
After the process of collection of data done through the weather
station ,the weather data view through monitoring system or PC
which help in making accurate analysis for these weather data.
3.3 System development
We will build an expert system by using exsys corvid software
that mimic human thinking and expertises which instead of
human by making decisions for close or open operation of the
shutter and mirror of dome's building that decisions make
depend on the measurements of the data extract from weather
station; the proposed system and any other system consist if
knowledge base ,inference engine and user interface
3.4 System verification
We will apply our expert System which responsible for decisions
making on dome building.
4. FUTURE WORK After apply our expert system on the dome building; the future
work will be making forecasting for data extract from weather
station among 3 years ago, and apply data for each year on our
expert system individually to close or open shutter and mirror,
and make analysis on the results obtain from decisions of the
expert system for each other individually and take the
observations of data for each year to make forecasting.
5. REFERENCES [1] Muhammad, Helman. "WEATHER MONITORING
STATION WITH REMOTE RADIO FREQUENCY
WIRELESS COMMUNICATIONS." International Journal of
Embedded Systems & Applications 2.3 (2012).
[2] Fengler, Wolfgang, Ahya Ihsan, and Kai Kaiser. Managing
Post-Disaster Reconstruction Finance. Vol. 4475. World Bank
Publications, 2008.
[3] Miró, J. R., R. Veciana, and A. Sairouni. "The use of
advanced meteorological tools for monitoring the Weather
hazards in roads." 17th International Road Weather
Conference, SIRWEC. 2014.
[4] Noordin, Kamarul Ariffin, Chow Chee Onn, and Mohamad
Faizal Ismail. "A low-cost microcontroller-based weather
monitoring system." CMU Journal 5.1 (2006): 33-39.
[5] Sharan, Roneel V. "Development of a Remote Automatic
Weather Station with a PC-based Data Logger." International
Journal of Hybrid Information Technology 7.1 (2014).
[6] Gouda, K. C., V. R. Preetham, and MN Shanmukha Swamy.
"MICROCONTROLLER BASED REAL TIME WEATHER
MONITORING DEVICE WITH GSM."Volume 3, Issue 7,
July 2014.
[7] Kviesis, Armands, and Aleksejs Zacepins. "System
Architectures for Real-time Bee Colony Temperature
Monitoring." Procedia Computer Science 43 (2015): 86-94.
[8] Joseph, Giarratano, and Riley Gary. "Expert systems
principles and programming." PWS Publishing Company 2
(1998): 321.
[9] Wielinga, Bob J., A. Th Schreiber, and Jost A. Breuker.
"KADS: A modelling approach to knowledge engineering."
Knowledge acquisition 4.1 (1992): 5-53.
[10] Soltan, R. A., M. Z. Rashad, and B. El-Desouky.
"Diagnosis of Some Diseases in Medicine via computerized
International Journal of Computer Applications Technology and Research
Volume 4– Issue 6, 435 - 437, 2015, ISSN:- 2319–8656
www.ijcat.com 437
Experts System." International Journal of Computer Science &
Information Technology 5.5 (2013).
[11] Roventa, Eugena, and George Rosu. "The diagnosis of
some kidney diseases in a small prolog Expert System." Soft
Computing Applications, 2009. SOFA'09. 3rd International
Workshop on. IEEE, 2009.
[12] Buchanan, Bruce G., and Reid G. Smith. "Fundamentals of
expert systems." Annual review of computer science 3.1 (1988):
23-58.
[13] Hesami, Masoud, Hamid Eslami Nosratabadi, and Hamed
Fazlollahtabar. "Design of a fuzzy expert system for
determining adjusted price of products and services."
International Journal of Industrial and Systems Engineering
13.1 (2013): 1-26.
[14] Berényi, Zsolt, and István Vajk. "Sensors and Intelligent
systems."
[15] Turban, Efraim, and Louis E. Frenzel. Expert systems and
applied artificial intelligence. Prentice Hall Professional
Technical Reference, 1992.
[16] Biondo, Samuel J., ed. Fundamentals of expert systems
technology: principles and concepts. Intellect Books, 1990.
[17] Dym, Clive L., and Raymond E. Levitt. Knowledge-based
systems in engineering. McGraw-Hill Book Company, 1991.
[18]Rauch-Hindin, Wendy B. "Artificial intelligence in
business, science, and industry. Vol. I: Fundamentals." (1986).
[19] Rauch-Hindin, Wendy B. "Artificial intelligence in
business, science, and industry. Vol. I: Fundamentals." (1986).
[20] Cragun, Brian J., and Harold J. Steudel. "A decision-table-
based processor for checking completeness and consistency in
rule-based expert systems." International Journal of Man-
Machine Studies 26.5 (1987): 633-648.
[21] Yahia, M. E., et al. "Rough neural expert systems." Expert
Systems with Applications 18.2 (2000): 87-99.
[22] Michie, Donald, ed. Introductory readings in expert
systems. Vol. 1. CRC Press, 1982.
[23] Bobrow, Daniel G., Sanjay Mittal, and Mark J. Stefik.
"Expert systems: perils and promise." Communications of the
ACM 29.9 (1986): 880-894.
[24] Bobrow, Daniel G., Sanjay Mittal, and Mark J. Stefik.
"Expert systems: perils and promise." Communications of the
ACM 29.9 (1986): 880-894.
[25] Natke, Hans Günther, and Czes A. Cempel. Model-aided
diagnosis of mechanical systems: fundamentals, detection,
localization, and assessment. Springer-Verlag New York, Inc.,
1997.
[26] Tamer Cavusgil, S., and Cuneyt Evirgen. "Use of expert
systems in international marketing: an application for co-
operative venture partner selection." European Journal of
Marketing 31.1 (1997): 73-86.
[27] Grzymala-Busse, Jerzy W. Managing uncertainty in expert
systems. Vol. 143. Springer Science & Business Media, 1991.
[28] Davis, Randall. "Expert systems: where are we? and where
do we go from here?." AI magazine 3.2 (1982): 3.
[29] Mockler, Robert J., and D. Dorothy G. Dologite. An
Introduction to expert systems: Knowledge-based systems.
Macmillan Publishing Company, 1992.
[30] Laurini, Robert, and Derek Thompson, eds. Fundamentals
of spatial information systems. Vol. 37. Academic press, 1992.
[31] Nowakowska, Maria. "Fundamentals of expert systems: I.
Judgements formation and problems of description."
Mathematical Social Sciences 9.2 (1985): 93-171.
[32] Turban, Efraim, J. Aronson, and Ting-Peng Liang.
Decision Support Systems and Intelligent Systems 7 “” Edition.
Pearson Prentice Hall, 2005.
[33] Rangaswamy, Arvind, et al. "Developing marketing expert
systems: An application to international negotiations." The
Journal of Marketing (1989): 24-39.
[34] Swartout, William R., and Stephen W. Smoliar. "On
making expert systems more like experts." Expert Systems 4.3
(1987): 196-208.
[35] Berry, Dianne C., and Donald E. Broadbent. "Expert
systems and the man–machine interface." Expert systems 3.4
(1986): 228-231.
[36] Cowan, Robin. "Expert systems: aspects of and limitations
to the codifiability of knowledge." Research Policy 30.9 (2001):
1355-1372.
[37] Kusiak, Andrew, and Jaekyoung Ahn. "Intelligent
scheduling of automated machining systems." Computer
Integrated Manufacturing Systems 5.1 (1992): 3-14.
International Journal of Computer Applications Technology and Research
Volume 4– Issue 6, 438 - 443, 2015, ISSN:- 2319–8656
www.ijcat.com 438
Design and Implementation of Online Fashion Store
“Demi Outfits” Based on Android
Yana Hendriana
Department of Informatics
Universitas Ahmad Dahlan
Yogyakarta, Indonesia
Richki Hardi
Department of Informatics
STITEK Bontang
Bontang, Indonesia
Andri Pranolo
Department of Informatics
Universitas Ahmad Dahlan
Yogyakarta, Indonesia
Abstract: Android technology developments that are currently able to occupy the highest positions of gadgets and computer market, it
is certainly due to the sophistication of technology information and applications that are on it that is currently a trend among mobile
users because it can help all areas of the job so much easier. The purpose of Technopreneurship in the field of Design and
implementation of online fashion store based on android is designed to assist in the sales transaction of business units called “Demi
Outfits” has been established since 2013, making it easier for the android-based online transactions. Thus the computer tools and
android smartphone is necessary given the various transactions were originally done manually. Given these tools various transactions
can be completed quickly and efficiently than when using a manual system. To expedite the process of search services and purchases
by customers towards these online stores, we need a system that allows customers to access the service online stores, especially the
process of buying fashion online using android based mobile applications store. This application will also provide facilities that assist
in the search for collection until the transaction purchases by customers. The system will tell to customers whether the collection to be
purchased is available or not and their status are trends or expired.
Keywords: Android; fashion; mobile; store; online; technopreneurship
1. INTRODUCTION People need jobs to earn a living and meet daily needs.
Among these men there who have the ability to establish their
own jobs and be hired for other human beings as self-
employed, to meet an advantage in setting up the business and
is always ready to accept failure or loss on such business [1].
Purchasing fashion in society at large still manually, each
person must come directly to the fashion store. For those who
are busy with activity and employment, the purchase method
is time consuming and labor making it less effective and
efficient. Most of them do not have a vehicle, so it cannot buy
clothes because of these constraints. In terms of business, the
market share of conventional fashion store business is still
less extensive [3].
A variety of technological devices developed and used to
support the achievement of the marketing process in the field
of entrepreneurship. Currently, efforts are developed to store
business that is using accessing websites via the Internet [2].
It is still a weakness because not everyone can use the web-
based applications and not everyone has a computer that can
access to the internet.
To expedite the process of search services and purchases by
customers towards these online stores, we need a system that
allows customers to access the service online stores,
especially the process of purchasing fashion online using
android based mobile store applications. This application will
also provide facilities that assist in the search for collection
until the transaction purchases made by customers. The
system will tell you whether the collection available to be
purchased or not and their status are trends or expired.
Android is an operating system for mobile phones based on
Linux. Android SDK (Software Development Kit) provides
the tools and API (Application Programming Interface) that is
necessary for developers to create and develop applications
that use the Android operating system on mobile phones using
the Java programming language [4].
2. RELATED WORKS The unique and novel, mobile and online based ordering and
reservation platform and system, for such time sensitive
services, provides the mobile phone and Internet users and
various types of business owners with comprehensive sets of
options, including the mobile phones installed with the open
source “Android” software platform developed by the “Open
Handheld Alliance (OHA), such as the “gPhone” released by
“Google”, to deliver the requests and responses automatically
and instantly through means of synchronization between
mobile and Internet communications. Based on the open
source mobile phone platform and the Internet server
infrastructure, an intuitive and easy-to-use mobile phone and
online based ordering and reservation management system is
uniquely defined in the architecture of the current invention to
allow both the business owners and end consumers with real
time communications for a plural of mobile and online
ordering and reservation services [6].
The study also adds what are argued to be key consumer
characteristics such as Opinion Leadership, Impulsiveness,
Web Shopping Compatibility, Internet Self-Efficacy,
Perceived Web Security, Satisfaction with web sites, and
Shopping Orientation to understand the adoption of Web
retailing by Internet users’. A Web based survey was
developed and administered, yielding 392 responses. The
findings indicate that TAM is a valid theoretical framework to
understand users adoption of the Web for retail purposes. Also
Internet users’ perceived usefulness and perceived ease of use
were effected differentially by Opinion Leadership, Web
Shopping Compatibility, Internet Self-Efficacy, Perceived
Web Security, Impulsiveness, Satisfaction with web sites, and
Shopping Orientation [7].
Electronic commerce typically lacks human warmth and
sociability, since it is more impersonal, anonymous and
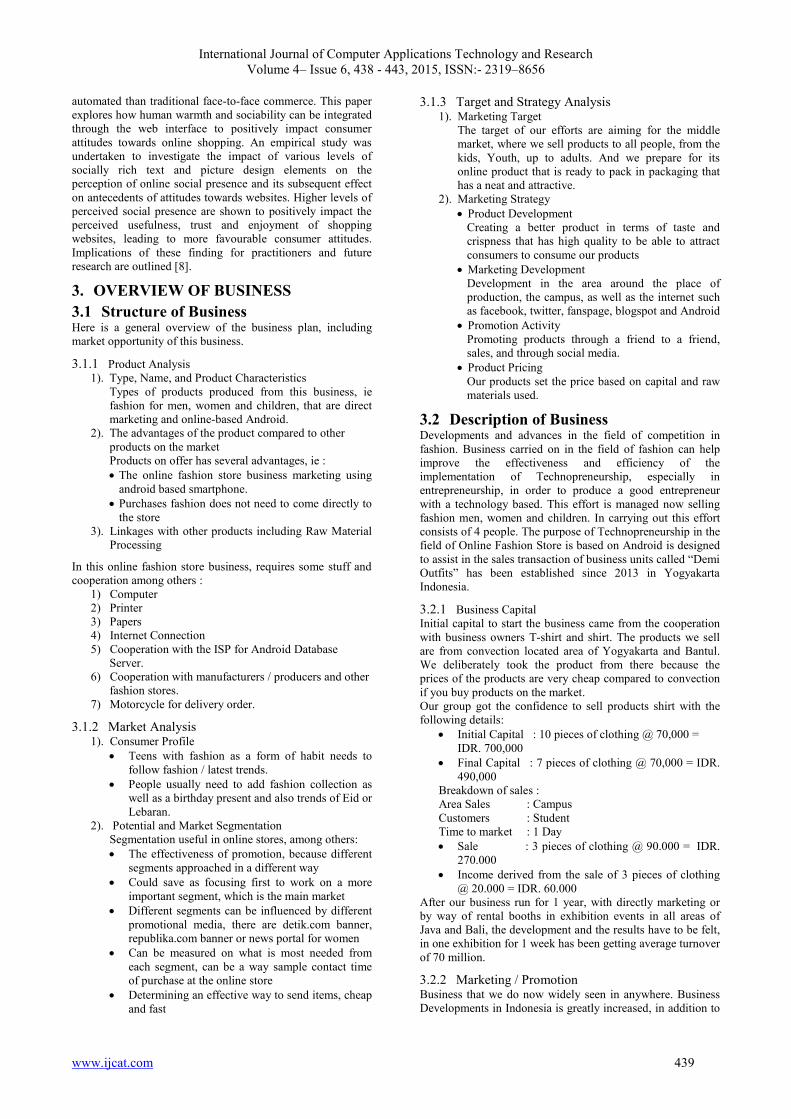
International Journal of Computer Applications Technology and Research
Volume 4– Issue 6, 438 - 443, 2015, ISSN:- 2319–8656
www.ijcat.com 439
automated than traditional face-to-face commerce. This paper
explores how human warmth and sociability can be integrated
through the web interface to positively impact consumer
attitudes towards online shopping. An empirical study was
undertaken to investigate the impact of various levels of
socially rich text and picture design elements on the
perception of online social presence and its subsequent effect
on antecedents of attitudes towards websites. Higher levels of
perceived social presence are shown to positively impact the
perceived usefulness, trust and enjoyment of shopping
websites, leading to more favourable consumer attitudes.
Implications of these finding for practitioners and future
research are outlined [8].
3. OVERVIEW OF BUSINESS
3.1 Structure of Business Here is a general overview of the business plan, including
market opportunity of this business.
3.1.1 Product Analysis 1). Type, Name, and Product Characteristics
Types of products produced from this business, ie
fashion for men, women and children, that are direct
marketing and online-based Android.
2). The advantages of the product compared to other
products on the market
Products on offer has several advantages, ie :
The online fashion store business marketing using
android based smartphone.
Purchases fashion does not need to come directly to
the store
3). Linkages with other products including Raw Material
Processing
In this online fashion store business, requires some stuff and
cooperation among others :
1) Computer
2) Printer
3) Papers
4) Internet Connection
5) Cooperation with the ISP for Android Database
Server.
6) Cooperation with manufacturers / producers and other
fashion stores.
7) Motorcycle for delivery order.
3.1.2 Market Analysis 1). Consumer Profile
Teens with fashion as a form of habit needs to
follow fashion / latest trends.
People usually need to add fashion collection as
well as a birthday present and also trends of Eid or
Lebaran.
2). Potential and Market Segmentation
Segmentation useful in online stores, among others:
The effectiveness of promotion, because different
segments approached in a different way
Could save as focusing first to work on a more
important segment, which is the main market
Different segments can be influenced by different
promotional media, there are detik.com banner,
republika.com banner or news portal for women
Can be measured on what is most needed from
each segment, can be a way sample contact time
of purchase at the online store
Determining an effective way to send items, cheap
and fast
3.1.3 Target and Strategy Analysis 1). Marketing Target
The target of our efforts are aiming for the middle
market, where we sell products to all people, from the
kids, Youth, up to adults. And we prepare for its
online product that is ready to pack in packaging that
has a neat and attractive.
2). Marketing Strategy
Product Development
Creating a better product in terms of taste and
crispness that has high quality to be able to attract
consumers to consume our products
Marketing Development
Development in the area around the place of
production, the campus, as well as the internet such
as facebook, twitter, fanspage, blogspot and Android
Promotion Activity
Promoting products through a friend to a friend,
sales, and through social media.
Product Pricing
Our products set the price based on capital and raw
materials used.
3.2 Description of Business Developments and advances in the field of competition in
fashion. Business carried on in the field of fashion can help
improve the effectiveness and efficiency of the
implementation of Technopreneurship, especially in
entrepreneurship, in order to produce a good entrepreneur
with a technology based. This effort is managed now selling
fashion men, women and children. In carrying out this effort
consists of 4 people. The purpose of Technopreneurship in the
field of Online Fashion Store is based on Android is designed
to assist in the sales transaction of business units called “Demi
Outfits” has been established since 2013 in Yogyakarta
Indonesia.
3.2.1 Business Capital Initial capital to start the business came from the cooperation
with business owners T-shirt and shirt. The products we sell
are from convection located area of Yogyakarta and Bantul.
We deliberately took the product from there because the
prices of the products are very cheap compared to convection
if you buy products on the market.
Our group got the confidence to sell products shirt with the
following details:
Initial Capital : 10 pieces of clothing @ 70,000 =
IDR. 700,000
Final Capital : 7 pieces of clothing @ 70,000 = IDR.
490,000
Breakdown of sales :
Area Sales : Campus
Customers : Student
Time to market : 1 Day
Sale : 3 pieces of clothing @ 90.000 = IDR.
270.000
Income derived from the sale of 3 pieces of clothing
@ 20.000 = IDR. 60.000
After our business run for 1 year, with directly marketing or
by way of rental booths in exhibition events in all areas of
Java and Bali, the development and the results have to be felt,
in one exhibition for 1 week has been getting average turnover
of 70 million.
3.2.2 Marketing / Promotion Business that we do now widely seen in anywhere. Business
Developments in Indonesia is greatly increased, in addition to
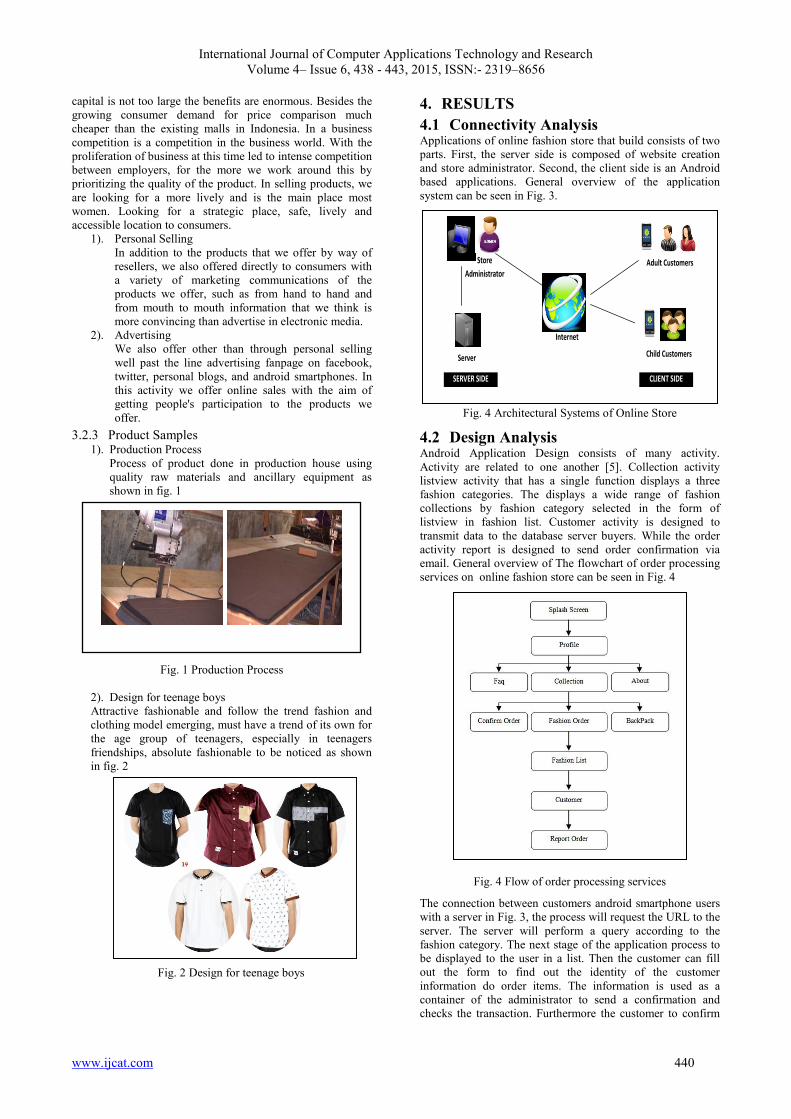
International Journal of Computer Applications Technology and Research
Volume 4– Issue 6, 438 - 443, 2015, ISSN:- 2319–8656
www.ijcat.com 440
capital is not too large the benefits are enormous. Besides the
growing consumer demand for price comparison much
cheaper than the existing malls in Indonesia. In a business
competition is a competition in the business world. With the
proliferation of business at this time led to intense competition
between employers, for the more we work around this by
prioritizing the quality of the product. In selling products, we
are looking for a more lively and is the main place most
women. Looking for a strategic place, safe, lively and
accessible location to consumers.
1). Personal Selling
In addition to the products that we offer by way of
resellers, we also offered directly to consumers with
a variety of marketing communications of the
products we offer, such as from hand to hand and
from mouth to mouth information that we think is
more convincing than advertise in electronic media.
2). Advertising
We also offer other than through personal selling
well past the line advertising fanpage on facebook,
twitter, personal blogs, and android smartphones. In
this activity we offer online sales with the aim of
getting people's participation to the products we
offer.
3.2.3 Product Samples 1). Production Process
Process of product done in production house using
quality raw materials and ancillary equipment as
shown in fig. 1
Fig. 1 Production Process
2). Design for teenage boys
Attractive fashionable and follow the trend fashion and
clothing model emerging, must have a trend of its own for
the age group of teenagers, especially in teenagers
friendships, absolute fashionable to be noticed as shown
in fig. 2
Fig. 2 Design for teenage boys
4. RESULTS
4.1 Connectivity Analysis Applications of online fashion store that build consists of two
parts. First, the server side is composed of website creation
and store administrator. Second, the client side is an Android
based applications. General overview of the application
system can be seen in Fig. 3.
Fig. 4 Architectural Systems of Online Store
4.2 Design Analysis Android Application Design consists of many activity.
Activity are related to one another [5]. Collection activity
listview activity that has a single function displays a three
fashion categories. The displays a wide range of fashion
collections by fashion category selected in the form of
listview in fashion list. Customer activity is designed to
transmit data to the database server buyers. While the order
activity report is designed to send order confirmation via
email. General overview of The flowchart of order processing
services on online fashion store can be seen in Fig. 4
Fig. 4 Flow of order processing services
The connection between customers android smartphone users
with a server in Fig. 3, the process will request the URL to the
server. The server will perform a query according to the
fashion category. The next stage of the application process to
be displayed to the user in a list. Then the customer can fill
out the form to find out the identity of the customer
information do order items. The information is used as a
container of the administrator to send a confirmation and
checks the transaction. Furthermore the customer to confirm
Server
Adult Customers
Child Customers
Store
Administrator
SERVER SIDE CLIENT SIDE
Internet

International Journal of Computer Applications Technology and Research
Volume 4– Issue 6, 438 - 443, 2015, ISSN:- 2319–8656
www.ijcat.com 441
the order. The tangible confirmation email sent to the
administrator and the customer. Applications using GMAIL as
the SMTP email sender media.
4.3 Implementation System Implementation of the system is the stage of putting the
system in accordance with the design that has been created
and is ready to operate. This phase is done after doing system
design that is making the program. Display applications have
been made as the following:
Fig. 5 Splashscreen
Fig. 5 shows the basic features in this application,
splashscreen is the first page that appears when the
application is run the online fashion shop based on android.
This page is a splash page when the application runs.
Splashscreen page consists of View “Demioutfits” Logo, and
TextView.
Fig. 6 Login Menu
Fig. 6 shows view of loginmenu as an initial menu. On the
Login menu the user can enter into the system. If users do not
already have an account then be able to register first in order
to have the account password through “Need Account”
button.
Fig. 7 List Product of Hot Item
Fig. 7 shows List product of Hot Item in the main page. On
the main page there are 3 menu options that can be selected by
the user, namely: Hot Item, More Categories, Discount Item.
Fig. 8 List Product of More Categories
Fig. 8 shows List product of More Categories. On the More
Categories there are more item of product offered to users. to
display the product detail the user can select / click the
product image.
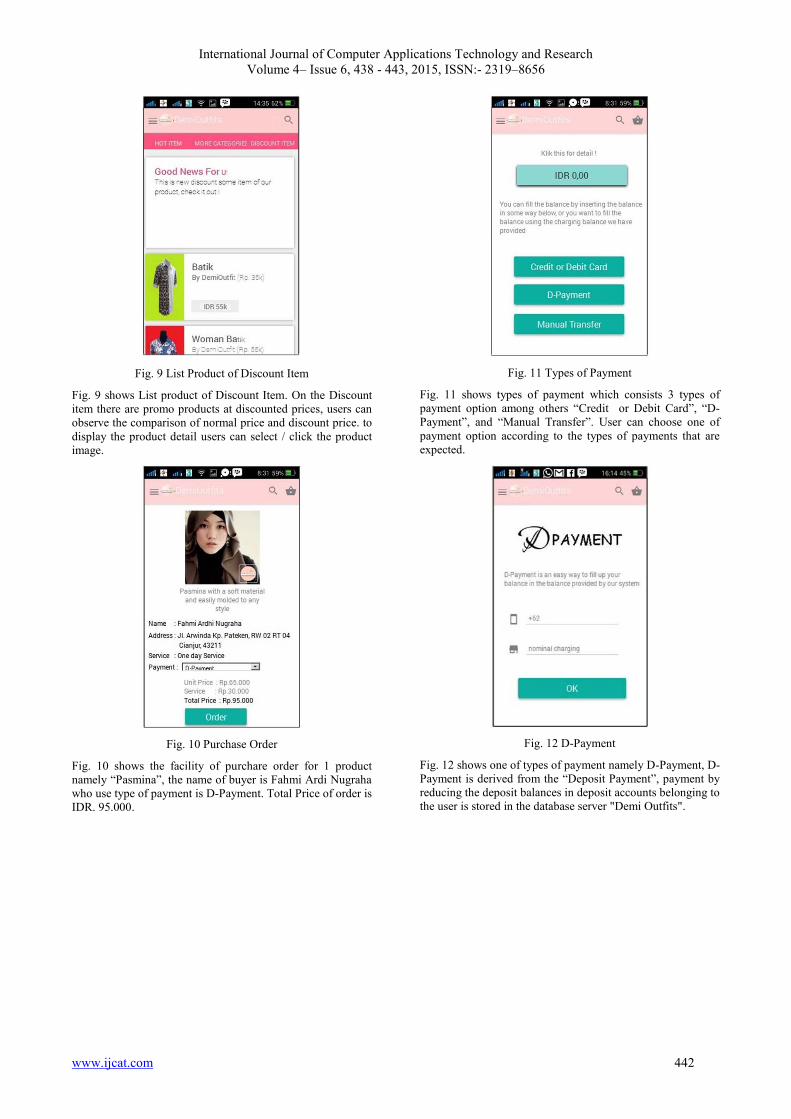
International Journal of Computer Applications Technology and Research
Volume 4– Issue 6, 438 - 443, 2015, ISSN:- 2319–8656
www.ijcat.com 442
Fig. 9 List Product of Discount Item
Fig. 9 shows List product of Discount Item. On the Discount
item there are promo products at discounted prices, users can
observe the comparison of normal price and discount price. to
display the product detail users can select / click the product
image.
Fig. 10 Purchase Order
Fig. 10 shows the facility of purchare order for 1 product
namely “Pasmina”, the name of buyer is Fahmi Ardi Nugraha
who use type of payment is D-Payment. Total Price of order is
IDR. 95.000.
Fig. 11 Types of Payment
Fig. 11 shows types of payment which consists 3 types of
payment option among others “Credit or Debit Card”, “D-
Payment”, and “Manual Transfer”. User can choose one of
payment option according to the types of payments that are
expected.
Fig. 12 D-Payment
Fig. 12 shows one of types of payment namely D-Payment, D-
Payment is derived from the “Deposit Payment”, payment by
reducing the deposit balances in deposit accounts belonging to
the user is stored in the database server "Demi Outfits".
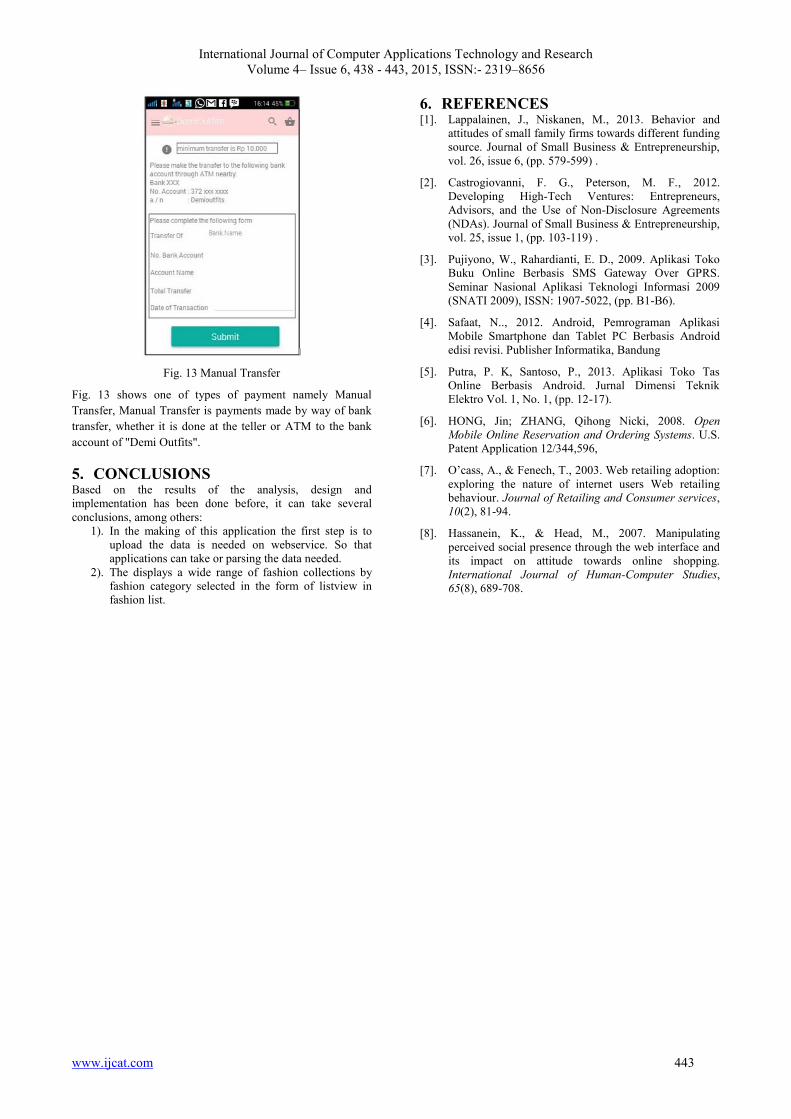
International Journal of Computer Applications Technology and Research
Volume 4– Issue 6, 438 - 443, 2015, ISSN:- 2319–8656
www.ijcat.com 443
Fig. 13 Manual Transfer
Fig. 13 shows one of types of payment namely Manual
Transfer, Manual Transfer is payments made by way of bank
transfer, whether it is done at the teller or ATM to the bank
account of "Demi Outfits".
5. CONCLUSIONS Based on the results of the analysis, design and
implementation has been done before, it can take several
conclusions, among others:
1). In the making of this application the first step is to
upload the data is needed on webservice. So that
applications can take or parsing the data needed.
2). The displays a wide range of fashion collections by
fashion category selected in the form of listview in
fashion list.
6. REFERENCES [1]. Lappalainen, J., Niskanen, M., 2013. Behavior and
attitudes of small family firms towards different funding
source. Journal of Small Business & Entrepreneurship,
vol. 26, issue 6, (pp. 579-599) .
[2]. Castrogiovanni, F. G., Peterson, M. F., 2012.
Developing High-Tech Ventures: Entrepreneurs,
Advisors, and the Use of Non-Disclosure Agreements
(NDAs). Journal of Small Business & Entrepreneurship,
vol. 25, issue 1, (pp. 103-119) .
[3]. Pujiyono, W., Rahardianti, E. D., 2009. Aplikasi Toko
Buku Online Berbasis SMS Gateway Over GPRS.
Seminar Nasional Aplikasi Teknologi Informasi 2009
(SNATI 2009), ISSN: 1907-5022, (pp. B1-B6).
[4]. Safaat, N.., 2012. Android, Pemrograman Aplikasi
Mobile Smartphone dan Tablet PC Berbasis Android
edisi revisi. Publisher Informatika, Bandung
[5]. Putra, P. K, Santoso, P., 2013. Aplikasi Toko Tas
Online Berbasis Android. Jurnal Dimensi Teknik
Elektro Vol. 1, No. 1, (pp. 12-17).
[6]. HONG, Jin; ZHANG, Qihong Nicki, 2008. Open
Mobile Online Reservation and Ordering Systems. U.S.
Patent Application 12/344,596,
[7]. O’cass, A., & Fenech, T., 2003. Web retailing adoption:
exploring the nature of internet users Web retailing
behaviour. Journal of Retailing and Consumer services,
10(2), 81-94.
[8]. Hassanein, K., & Head, M., 2007. Manipulating
perceived social presence through the web interface and
its impact on attitude towards online shopping.
International Journal of Human-Computer Studies,
65(8), 689-708.
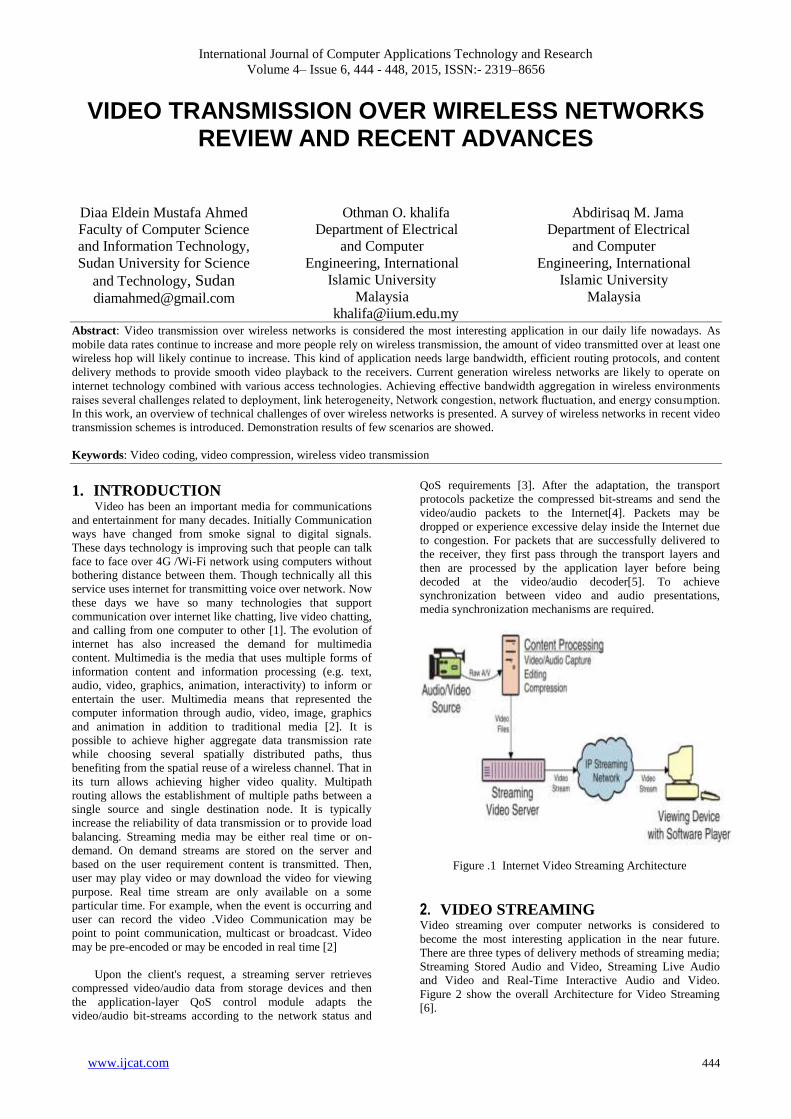
International Journal of Computer Applications Technology and Research
Volume 4– Issue 6, 444 - 448, 2015, ISSN:- 2319–8656
www.ijcat.com 444
VIDEO TRANSMISSION OVER WIRELESS NETWORKS REVIEW AND RECENT ADVANCES
Diaa Eldein Mustafa Ahmed Faculty of Computer Science
and Information Technology,
Sudan University for Science
and Technology, Sudan
Othman O. khalifa
Department of Electrical
and Computer
Engineering, International
Islamic University
Malaysia
Abdirisaq M. Jama
Department of Electrical
and Computer
Engineering, International
Islamic University
Malaysia
Abstract: Video transmission over wireless networks is considered the most interesting application in our daily life nowadays. As
mobile data rates continue to increase and more people rely on wireless transmission, the amount of video transmitted over at least one
wireless hop will likely continue to increase. This kind of application needs large bandwidth, efficient routing protocols, and content
delivery methods to provide smooth video playback to the receivers. Current generation wireless networks are likely to operate on
internet technology combined with various access technologies. Achieving effective bandwidth aggregation in wireless environments
raises several challenges related to deployment, link heterogeneity, Network congestion, network fluctuation, and energy consumption.
In this work, an overview of technical challenges of over wireless networks is presented. A survey of wireless networks in recent video
transmission schemes is introduced. Demonstration results of few scenarios are showed.
Keywords: Video coding, video compression, wireless video transmission
1. INTRODUCTION Video has been an important media for communications
and entertainment for many decades. Initially Communication
ways have changed from smoke signal to digital signals.
These days technology is improving such that people can talk
face to face over 4G /Wi-Fi network using computers without
bothering distance between them. Though technically all this
service uses internet for transmitting voice over network. Now
these days we have so many technologies that support
communication over internet like chatting, live video chatting,
and calling from one computer to other [1]. The evolution of
internet has also increased the demand for multimedia
content. Multimedia is the media that uses multiple forms of
information content and information processing (e.g. text,
audio, video, graphics, animation, interactivity) to inform or
entertain the user. Multimedia means that represented the
computer information through audio, video, image, graphics
and animation in addition to traditional media [2]. It is
possible to achieve higher aggregate data transmission rate
while choosing several spatially distributed paths, thus
benefiting from the spatial reuse of a wireless channel. That in
its turn allows achieving higher video quality. Multipath
routing allows the establishment of multiple paths between a
single source and single destination node. It is typically
increase the reliability of data transmission or to provide load
balancing. Streaming media may be either real time or on-
demand. On demand streams are stored on the server and
based on the user requirement content is transmitted. Then,
user may play video or may download the video for viewing
purpose. Real time stream are only available on a some
particular time. For example, when the event is occurring and
user can record the video .Video Communication may be
point to point communication, multicast or broadcast. Video
may be pre-encoded or may be encoded in real time [2]
Upon the client's request, a streaming server retrieves
compressed video/audio data from storage devices and then
the application-layer QoS control module adapts the
video/audio bit-streams according to the network status and
QoS requirements [3]. After the adaptation, the transport
protocols packetize the compressed bit-streams and send the
video/audio packets to the Internet[4]. Packets may be
dropped or experience excessive delay inside the Internet due
to congestion. For packets that are successfully delivered to
the receiver, they first pass through the transport layers and
then are processed by the application layer before being
decoded at the video/audio decoder[5]. To achieve
synchronization between video and audio presentations,
media synchronization mechanisms are required.
Figure .1 Internet Video Streaming Architecture
2. VIDEO STREAMING Video streaming over computer networks is considered to
become the most interesting application in the near future.
There are three types of delivery methods of streaming media;
Streaming Stored Audio and Video, Streaming Live Audio
and Video and Real-Time Interactive Audio and Video.
Figure 2 show the overall Architecture for Video Streaming
[6].

International Journal of Computer Applications Technology and Research
Volume 4– Issue 6, 444 - 448, 2015, ISSN:- 2319–8656
www.ijcat.com 445
Figure 2 Architecture for Video Streaming [5]
This kind of application needs large bandwidth, efficient
routing protocols, and content delivery methods to provide
smooth video playback to the receivers. Video streaming
systems are classified into two categories including:
2.1 Live video Streaming In live video streaming, synchronized streams are played
back in all nodes, and all users watch the same video frames
simultaneously.
2.2 Video on Demand (VoD) streaming, users watch different video frames of the
same video stream at a given instant of time. In other words,
the playbacks of the same video streams on different clients
are not synchronized for a VoD streaming. Real-time
multimedia data applications, such as video streaming and
video telephony, are regarded as “killer applications” in the
emerging wireless networks. Video applications usually
involve a large volume of data transmitted in a time sensitive
fashion [7]. However, the underlying wireless networks only
provide time-varying and limited bandwidth, high data error
rate, packet delay and jitter. Extensive research has been
done on either video data coding algorithms or wireless
network protocols. But the traditional layered network model
limits the video transmission over wireless networks because
it tries to separate information and functions between
different layers[8]. To enable more efficient real-time data
transmission over dynamic wireless environments, the
applications and underlying wireless networks should
cooperate in order to share information and optimize the
transmission process dynamically. In this parts reviews the
state-of-the-art research efforts on video coding, error
control, and rate control algorithms. New cross-layer
algorithms are presented which coordinate the algorithms at
different layers in order to get better performance than using
them separately. The cross-layer rate control algorithm
matches the application’s future bandwidth requirement to
the available bandwidth in the network so that an optimum
data transmission rate can be selected. In cross-layer
architecture, layers exchange information and jointly
optimize in order to improve the overall performance[9].
Also the cross-layer error control algorithm, lower layers are
responsible for error detection and fast retransmission, while
application layer conducts an adaptive error correction
algorithm with the help of lower layers [10].
Multimedia services and applications became the
driving force in the development and widespread deployment
of wireless broadband access technologies and high speed
local area networks. Mobile phone service providers are now
offering a wide range of multimedia applications over high
speed wireless data networks. People can watch live TV,
stream on-demand video clips and place video telephony calls
using multimedia capable mobile devices. The variety and
quality of these applications are increasing every day. Mobile
devices will soon support capturing and displaying high
definition video. Similar evolution is also occurring in the
local area domain. The video receiver or storage devices were
conventionally connected to display devices using cables. By
using wireless local area networking (WLAN) technologies,
convenient and cable-free connectivity can be achieved.
Media over wireless home networks prevents the cable mess
and provides mobility to portable TVs.
However, there still exits challenges for improving the
quality-of-service (QoS) of multimedia applications.
Conventional service architectures, network structures and
protocols lack to provide a robust distribution medium since
most of them are not designed considering the high data rate
and real-time transmission requirements of digital video[11].
3. LITERATURE REVIEW AND
RELATED WORK Many researchers are working on improving the video
transmission over wireless network via different approaches
Table.2 shows some of the recent state of the art or
contributions in this area, it is classified the video
transmission schemes into three major schemes:
(A) Cross Layer Design Schemes(CLDS)
(B) Multiple Descriptions Coding Schemes(MDCS)
(C) Multipath Routing Schemes (MPRS)
(D) Resource Allocation Schemes(RAS)
Table.2 State of the art of the recent video transmission schemes
Author(s) Proposed Method Gained Results
(Contributions)
Limitation(s)
[15]- Vinod
B. and et al.
[2013]
(1)-Without considering channel status
Condition
(2)-The video signal is encoded with the H.264
coding technique at the frame rate of 24 frames
per second, with bit rate of 100kbps.
(3)-Develop methods to take care of resource
allocation in cooperative wireless sensor
networks (CWSNs).
From this simulation result, we
observed that: rather than
encoding the frame itself, the
difference between current frame
and the previous frame is
encoded so that the amount of
information transmitted will be
drastically reduced.
(1)-The frames can be
properly analyzed to assign
the security codes.
(2)-Since energy is the crucial
parameter in the cooperative
wireless sensor networks, the
resource allocated may be
controlled using cross layer
design based on the priority
International Journal of Computer Applications Technology and Research
Volume 4– Issue 6, 444 - 448, 2015, ISSN:- 2319–8656
www.ijcat.com 446
[16] P. A.
Chaparro, and
et al.[2010]
(1)- Presented DACME-SV, a novel QoS
framework to support scalable video
transmission over MANETs.
(2)- Benefits of using this novel solution that
combines the flexibility of the H.264/SVC
codec with distributed admission control
algorithms.
(3)-The strategy proposed allows to
dynamically adjust the video quality according
to end-to-end path conditions, thus optimizing
available resource usage.
(1)- Experimental showed that
DACME-SV is able to improve
global performance by
decreasing the frequency of
interruptions on video
communications, while
simultaneously improving
fairness among users by favoring
similar conditions for QoS flows.
(2)-Channel utilization was also
improved with this strategy.
As future work they plan to
introduce further
improvements to DACME-
SV by also including support
for end to-end delay bounds.
[17] Detti and
et al. [2010]
(1)-Evaluated and demonstrated a technique for
streaming H.264 SVC video over a DDS
middleware.
(2)-The structure of the DDS data unit
designed by them was able to carry H.264 SVC
video-units.
(3)-Also they designed a receiver-driven rate-
control mechanism based on the DDS data unit,
which exploited specific DDS functionality.
Their implementation showed
the effectiveness of their
mechanism in IEEE 802.11
wireless scenario, comparing
their proposal with other
solutions.
It is a demonstration work
with out explaining the theory
behind.
[18]Kalvein
Rantelobo, et
al.
[2012]
(1)- Create Combined Scalable Video Coding
(CSVC) method that match the QoS of video
streaming service on wireless channel
(2)- Use Joint Scalable Video Model (JSVM)
amendment standard.
(3)- The proposed scheme has implemented on
Network Simulator II (NS2) for wireless
broadband network application.
(4)- This new scheme is an evaluation platform
for the implementation CSVC on a more
realistic simulation over wireless broadband
networks based on open-source program.
(5)- The results show that implementation of
CSVC on mode of the medium grain scalable
(MGS) outperforms coarse grain scalable
(CGS) mode.
(1)-T his research proves that
CGS and MGS mode on video
transmission on wireless
broadband network (WLAN
IEEE 802.11e) is implementable
on NS2 we ll.
(2)-T he use of mode MGS gave
result t hat is more satisfactory
compared to CGS mode.
(3)-Investigated the impacts of
the use of MG S and CGS modes
on performance of this system
(4)-T he applications of MG S
mode on CSV C increases the
performance compared to CGS
mode.
Video transmission based on
the CSVC over broadband
wireless network (WLAN
IEEE 802.11e), simulated by
NS2 with ideal assumption
conditions.
[19]
Gopikrishnan.
R[2014]
(1)-proposed a novel MAC-level multicast
protocol named REMP
(2)-In REMP, AP selectively retransmits
erroneous multicast frames and dynamically
adjusts MCS under varying channel conditions
based on the advanced feedback mechanism
from multicast receivers.
(3)- In addition, he proposed S-REMP, an
extended version of REMP , for efficient
delivery of scalable video over IEEE 802.11n
WLANs.
(1)- Via extensive simulation
results, we proved the
effectiveness of the proposed
protocols enhances the
reliability and efficiency of
multicast transmissions in IEEE
802.11n WLANs.
(3)- In S-REMP, different layers
of scalable video can be
transmitted with different MCSs
to provide the minimal video
quality to all users while
providing a higher video quality
to users exhibiting better channel
conditions.
In this work S-REMP to
guarantee minimal video
quality to all users in future
work to guarantee a maximal
video quality to all users.
4. Result Analysis for Simulation Scenario In this simulation scenario, there are 9 QoS active stations
transmitting data to one access point. There are 3 groups of
stations with three stations each. The first group transmits
video flow, while the second transmits voice flow and the
third transmits best effort data flow. The same simulation
parameters in Table 3 are used in this scenario.
In this scenario, the aim is to study the effect of
varying the propagation distance on the performance of
IEEE802.11e WLAN. The propagation distance was changed
by varying the topology from 100 to 1000 square meters. All
the QoS active stations move randomly within the coverage
area of the access point. All the results are average over five
simulations to overcome the errors occur when the stations
move on the borders of the coverage area.
The second scenario shows the effect of varying the
propagation distance on the average end-to-end delay and the
packet loss ratio. These two performance metrics are affected
the most in this simulation. Figure 7 illustrates the relationship
between the average end-to-end delay and the change of
topology.
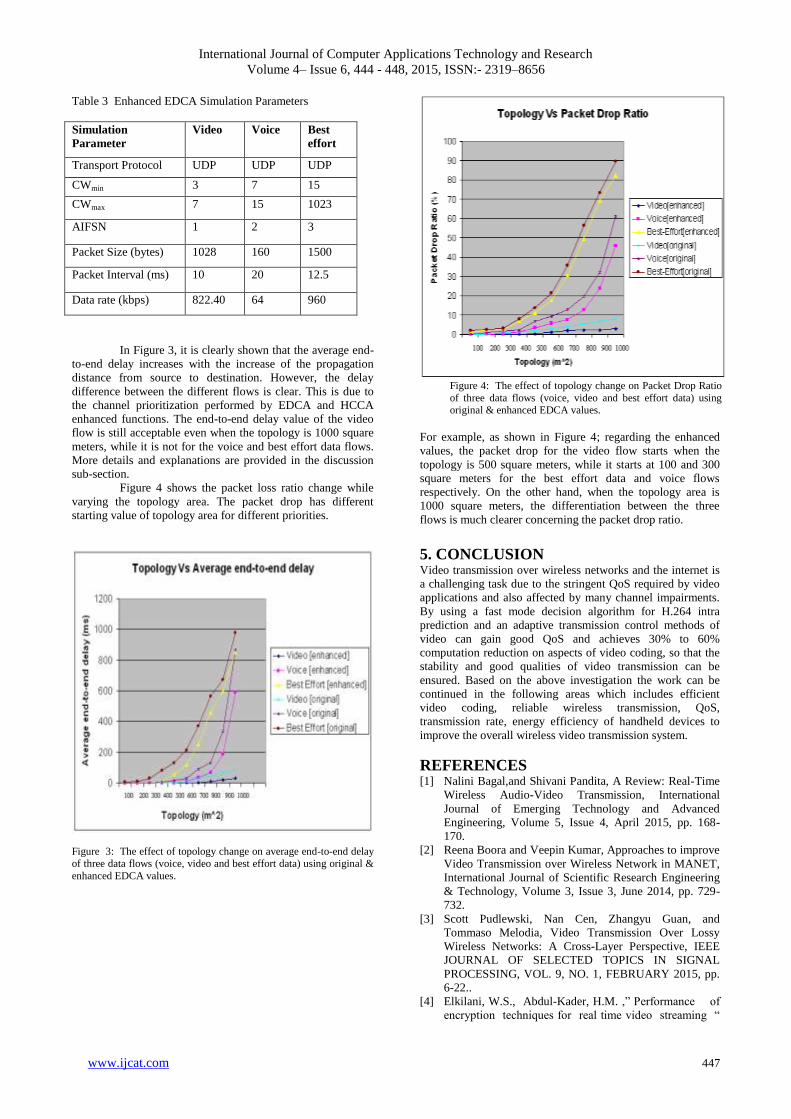
International Journal of Computer Applications Technology and Research
Volume 4– Issue 6, 444 - 448, 2015, ISSN:- 2319–8656
www.ijcat.com 447
Table 3 Enhanced EDCA Simulation Parameters
Simulation
Parameter
Video Voice Best
effort
Transport Protocol UDP UDP UDP
CWmin 3 7 15
CWmax 7 15 1023
AIFSN 1 2 3
Packet Size (bytes) 1028 160 1500
Packet Interval (ms) 10 20 12.5
Data rate (kbps) 822.40 64 960
In Figure 3, it is clearly shown that the average end-
to-end delay increases with the increase of the propagation
distance from source to destination. However, the delay
difference between the different flows is clear. This is due to
the channel prioritization performed by EDCA and HCCA
enhanced functions. The end-to-end delay value of the video
flow is still acceptable even when the topology is 1000 square
meters, while it is not for the voice and best effort data flows.
More details and explanations are provided in the discussion
sub-section.
Figure 4 shows the packet loss ratio change while
varying the topology area. The packet drop has different
starting value of topology area for different priorities.
Figure 3: The effect of topology change on average end-to-end delay
of three data flows (voice, video and best effort data) using original &
enhanced EDCA values.
Figure 4: The effect of topology change on Packet Drop Ratio
of three data flows (voice, video and best effort data) using original & enhanced EDCA values.
For example, as shown in Figure 4; regarding the enhanced
values, the packet drop for the video flow starts when the
topology is 500 square meters, while it starts at 100 and 300
square meters for the best effort data and voice flows
respectively. On the other hand, when the topology area is
1000 square meters, the differentiation between the three
flows is much clearer concerning the packet drop ratio.
5. CONCLUSION Video transmission over wireless networks and the internet is
a challenging task due to the stringent QoS required by video
applications and also affected by many channel impairments.
By using a fast mode decision algorithm for H.264 intra
prediction and an adaptive transmission control methods of
video can gain good QoS and achieves 30% to 60%
computation reduction on aspects of video coding, so that the
stability and good qualities of video transmission can be
ensured. Based on the above investigation the work can be
continued in the following areas which includes efficient
video coding, reliable wireless transmission, QoS,
transmission rate, energy efficiency of handheld devices to
improve the overall wireless video transmission system.
REFERENCES [1] Nalini Bagal,and Shivani Pandita, A Review: Real-Time
Wireless Audio-Video Transmission, International
Journal of Emerging Technology and Advanced
Engineering, Volume 5, Issue 4, April 2015, pp. 168-
170.
[2] Reena Boora and Veepin Kumar, Approaches to improve
Video Transmission over Wireless Network in MANET,
International Journal of Scientific Research Engineering
& Technology, Volume 3, Issue 3, June 2014, pp. 729-
732.
[3] Scott Pudlewski, Nan Cen, Zhangyu Guan, and
Tommaso Melodia, Video Transmission Over Lossy
Wireless Networks: A Cross-Layer Perspective, IEEE
JOURNAL OF SELECTED TOPICS IN SIGNAL
PROCESSING, VOL. 9, NO. 1, FEBRUARY 2015, pp.
6-22..
[4] Elkilani, W.S., Abdul-Kader, H.M. ,” Performance of
encryption techniques for real time video streaming “
International Journal of Computer Applications Technology and Research
Volume 4– Issue 6, 444 - 448, 2015, ISSN:- 2319–8656
www.ijcat.com 448
International Conference on Networking and Media
Convergence, ICNM 2009, pp. 130 – 134 .
[5] Kamisetty Rao, Zoran Bojkovic, Dragorad Milovanovic,
“Introduction to Multimedia Communications:
Applications, Middleware, Networking” , John Wiley
and Sons Publications 2006.
[6] Behrang Barekatain, Mohd Aizaini Maarof, Alfonso
Ariza Quintana and Alicia Triviño Cabrera “ GREENIE:
a novel hybrid routing protocol for efficient video
streaming over wireless mesh networks” , New
Technologies and Research Trends for Wireless, Mobile
and Ubiquitous Multimedia ,2013.
[7] Azzedine Boukerche , “ Handbook of Algorithms for
Wireless Networking and Mobile Computing ”
,chapman & Hall/CRC Computer and information
Science Series ,2006.
[8] G. Ding, X. Wu, and B. Bhargava. "Cross-Layer
Algorithm for Video Transmission over Wireless
Network." in Handbook of Algorithms for Mobile and
Wireless Networking and Computing (A. Bourkerche,
ed.), CRC Press, 2005.
[9] Srivastana, V., Motani, M.: Cross-layer design: a survey
and the road ahead. IEEE Commun.Mag. 43(12), 112–
119 (2005)
[10] G. Ding, X. Wu and B. Bhargava, "Cross-layer Control
of Real-time Data Transmission over Wireless
Networks.", 2003
[11] Mehmet Umut Demircin , Robust Video Streaming Over
Time-Varying Wireless Networks, PhD thesis, Georgia
Institute of Technology August 2008.
[12] Pavlos Antoniou, Andreas Pitsillides, Vasos Vassiliou ,
“Adaptive Methods for the Transmission of Video
Streams in Wireless Networks “ , University of Cyprus
, Department of Computer Science ,Networks Research
Laboratory ,2002 .
[13] Imed Bouazizi,“Proxy Caching for RobustVideo
Delivery over Lossy Networks “, PhD Dissertation
,2004.
[14] ITU-T Recommendation G.1010, End-user multimedia
QoS categories, 2001.
[15] Vinod B Durdi, P. T. Kulkarni, and K. L. Sudha ,”
Robust Video Transmission over Wireless Networks
Using Cross Layer Approach” , Journal of Industrial and
Intelligent Information Vol.1, No. 2, June 2013:
[16] P. A. Chaparro, J. Alcober J. Monteiro ,C. T. Calafate,
J.C. Cano, P. Manzoni‖ Supporting Scalable video
transmission in MANETs through distributed admission
control mechanisms ‖18th Euromicro Conference on
Parallel, Distributed and Network -based Processing
2010 IEEE DOI 10.1109/PDP.2010.44
[17] A. Detti, P. Loreti, N. Blefari-Melazzi, and F. Fedi,
“Streaming H.264 scalable video over data distribution
service in a wireless environment,” in Proceedings of the
IEEE International Symposium on A World of Wireless,
Mobile and Multimedia Networks (WoWMoM '10), June
2010.
[18] Kalvein Rantelobo, Wirawan, G. Hendrantoro, A.
Affandi, and Hua-An Zhao, “A New Scheme for
Evaluating Video Transmission over Broadband
Wireless Network “ , Future Wireless Networks and
Information Systems, LNEE 143, pp. 335–341,
Springerlink.com © Springer-Verlag Berlin Heidelberg
2012
[19] Gopikrishnan.R , “An Efficient Real Time Video
Multicasting Protocol and WLANs Cross-Layer
Optimization in IEEE 802.11N “, IJCSMC, Vol. 3, Issue.
2, February 2014, pg.811 – 814.
International Journal of Computer Applications Technology and Research
Volume 4– Issue 6, 449 - 452, 2015, ISSN:- 2319–8656
www.ijcat.com 449
Water Distribution Forecasting Using Least Square In
The Local Government Drinking Water Company Tirta
Mon Pase Lhokseumawe
Mutammimul Ula
Department of Informatics
Universitas Malikussaleh
Aceh Utara, Indonesia
Eva Darnila
Department of Informatics
Universitas Malikussaleh
Aceh Utara, Indonesia
Cut Yusra Novita
Department of Informatics
Universitas Malikussaleh
Aceh Utara, Indonesia
Abstract: Local Government Drinking WATER Company TIRTA MON Pase can not fulfill the needs of the people in the
Lhokseumawe city because the population of Lhokseumawe city continues to increase every year. Therefore, it has increased the need
for the clean water. The artificial intelligence can be used to forecast the continuous distribution of water demand. This study aims to
predict the volume of water to m the water demand using Least Square method. The modeling results using the least squares method,
in 2018, with the population of 218 067 people, the water supply needed is 5,689,849,205 liters/day, and the possibility of water
leakage is 107573120 liters/day. This system can minimize the possibility of the errors due to the amount of water leakage.
Keywords: Forecasting, Least Square, distribution of water
1. INTRODUCTION The population of the Lhokseumawe city has increased every
year, therefore, it has an impact on the increased clean water
consumption. The population of Lhoksumawein 2009-2013 is
159239-186467, the total quantityof water must be supplied is
867180 liters/year. From 2009-2013, total volume of water
supplied is 1739871077 to 3529658057.Therefore, the data is
required for the demand fulfillment of how much the water is
needed by people of Lhoksumawe. Therefore data analysis
tool is highly needed in the measurement, control processes,
formulate information from the data, and help make decisions
based on the data1.
Local government drinking WATER company (PDAM),
which manages the distribution of water in Lhokseumawe city
is facing problems regarding the water distribution volume to
every district in the region. This is due to the limited volume
of water availability and the lack distribution system
measurement. The water distribution company must be able to
distributesufficient quantity of quality water in for consumers
needs2.
Forecasting tool for determining the quantity of water to
distribute is not currently implemented.Therefore, the
effectiveness and efficiency of water distribution is very low,
moreover, it has been causing water distribution leakage that
can affect the availability of the water in Lhokseumawe city.
This condition would be harmful to PDAM Tirta Mon PASE
because it can not fulfill the consumers needs. The unsatisfied
consumerswith the service provided can cause a bad image for
the PDAM.
This water distribution problem requires a design with the
placement of the shape of the desired input and output. In this
section we developed a high performance database
application, to produce a report that accurately forecast the
amount of water to distribute next year in PDAM Tirta Mon
PASE. With the system ability, it is expected that the process
of water distribution will be increased and more efficient.
Artificial intelligent can predict the future state through
available data in the past and forecast the events in the future
on the basis of patterns in the past3. The water distribution
information system built is software that can help the PDAM
in determining the amount of water needed for consumers.
The system built is not to substitute for the PDAM in
predicting the future distribution of water, but it can help the
PDAM to predict the amount of water needed in the future
that give some alternatives based on the analysis system
result. By combining the expertise of information technology,
especially in the field of system forecasting, it is expected to
solve the existing problems. Furthermore, decision support
systems in water distribution aims to help decision makers
utilize particular data and models to solve the various
problems which are not structured4.
Benefits for forecasting water distribution is to determine the
level of accuracy of the least squares method based on the
calculation of the mean squared (root mean squared error)5.
Forecasting data can facilitate the distribution of water and
PDAM Tirta Mon PaseLhokseumawe in taking a policy in
terms of the future distribution of water. The system is
proposed to predict the distribution of clean water to meet the
water in the PDAM Lhokseumawe.
Forecasting water distribution is a method to estimate future
water needs on the basis of the existing conditions of the
water distribution year by year6. Forecasting method assumes
that the conditions that generate the data in the past arethe
same with future conditions, unless the variables are explicitly
used in that period5.
Least Square method is the most widely used method to
determine the equation of the data trend. Least squares
method is divided into two cases, namely the even data case
and odd data case6. Least Square method is most often used to
predict Y, because it calculation is more accurate. The least
squares line has properties as follows: (1) The sum of the
whole points of vertical deviation to lineis zero; (2) The sum
of squared vertical deviationsof historical data from the line is
the minimum; (3) The line through the mean of X and Y.
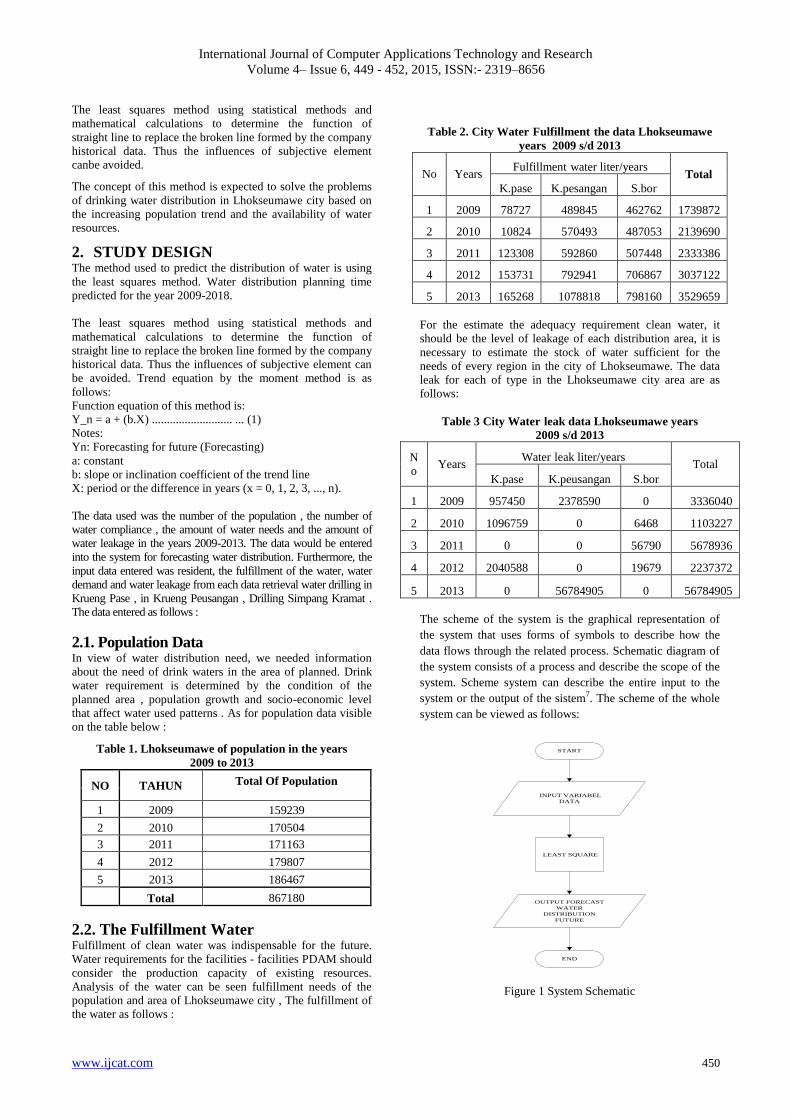
International Journal of Computer Applications Technology and Research
Volume 4– Issue 6, 449 - 452, 2015, ISSN:- 2319–8656
www.ijcat.com 450
The least squares method using statistical methods and
mathematical calculations to determine the function of
straight line to replace the broken line formed by the company
historical data. Thus the influences of subjective element
canbe avoided.
The concept of this method is expected to solve the problems
of drinking water distribution in Lhokseumawe city based on
the increasing population trend and the availability of water
resources.
2. STUDY DESIGN The method used to predict the distribution of water is using
the least squares method. Water distribution planning time
predicted for the year 2009-2018.
The least squares method using statistical methods and
mathematical calculations to determine the function of
straight line to replace the broken line formed by the company
historical data. Thus the influences of subjective element can
be avoided. Trend equation by the moment method is as
follows:
Function equation of this method is:
Y_n = a + (b.X) ........................... ... (1)
Notes:
Yn: Forecasting for future (Forecasting)
a: constant
b: slope or inclination coefficient of the trend line
X: period or the difference in years (x = 0, 1, 2, 3, ..., n).
The data used was the number of the population , the number of
water compliance , the amount of water needs and the amount of
water leakage in the years 2009-2013. The data would be entered
into the system for forecasting water distribution. Furthermore, the
input data entered was resident, the fulfillment of the water, water
demand and water leakage from each data retrieval water drilling in
Krueng Pase , in Krueng Peusangan , Drilling Simpang Kramat .
The data entered as follows :
2.1. Population Data In view of water distribution need, we needed information
about the need of drink waters in the area of planned. Drink
water requirement is determined by the condition of the
planned area , population growth and socio-economic level
that affect water used patterns . As for population data visible
on the table below :
Table 1. Lhokseumawe of population in the years
2009 to 2013
NO TAHUN Total Of Population
1 2009 159239
2 2010 170504
3 2011 171163
4 2012 179807
5 2013 186467
Total 867180
2.2. The Fulfillment Water Fulfillment of clean water was indispensable for the future.
Water requirements for the facilities - facilities PDAM should
consider the production capacity of existing resources.
Analysis of the water can be seen fulfillment needs of the
population and area of Lhokseumawe city , The fulfillment of
the water as follows :
Table 2. City Water Fulfillment the data Lhokseumawe
years 2009 s/d 2013
No Years Fulfillment water liter/years
Total
K.pase K.pesangan S.bor
1 2009 78727 489845 462762 1739872
2 2010 10824 570493 487053 2139690
3 2011 123308 592860 507448 2333386
4 2012 153731 792941 706867 3037122
5 2013 165268 1078818 798160 3529659
For the estimate the adequacy requirement clean water, it
should be the level of leakage of each distribution area, it is
necessary to estimate the stock of water sufficient for the
needs of every region in the city of Lhokseumawe. The data
leak for each of type in the Lhokseumawe city area are as
follows:
Table 3 City Water leak data Lhokseumawe years
2009 s/d 2013
N
o Years
Water leak liter/years Total
K.pase K.peusangan S.bor
1 2009 957450 2378590 0 3336040
2 2010 1096759 0 6468 1103227
3 2011 0 0 56790 5678936
4 2012 2040588 0 19679 2237372
5 2013 0 56784905 0 56784905
The scheme of the system is the graphical representation of
the system that uses forms of symbols to describe how the
data flows through the related process. Schematic diagram of
the system consists of a process and describe the scope of the
system. Scheme system can describe the entire input to the
system or the output of the sistem7. The scheme of the whole
system can be viewed as follows:
START
INPUT VARIABEL
DATA
LEAST SQUARE
OUTPUT FORECAST
WATER
DISTRIBUTION
FUTURE
END
Figure 1 System Schematic
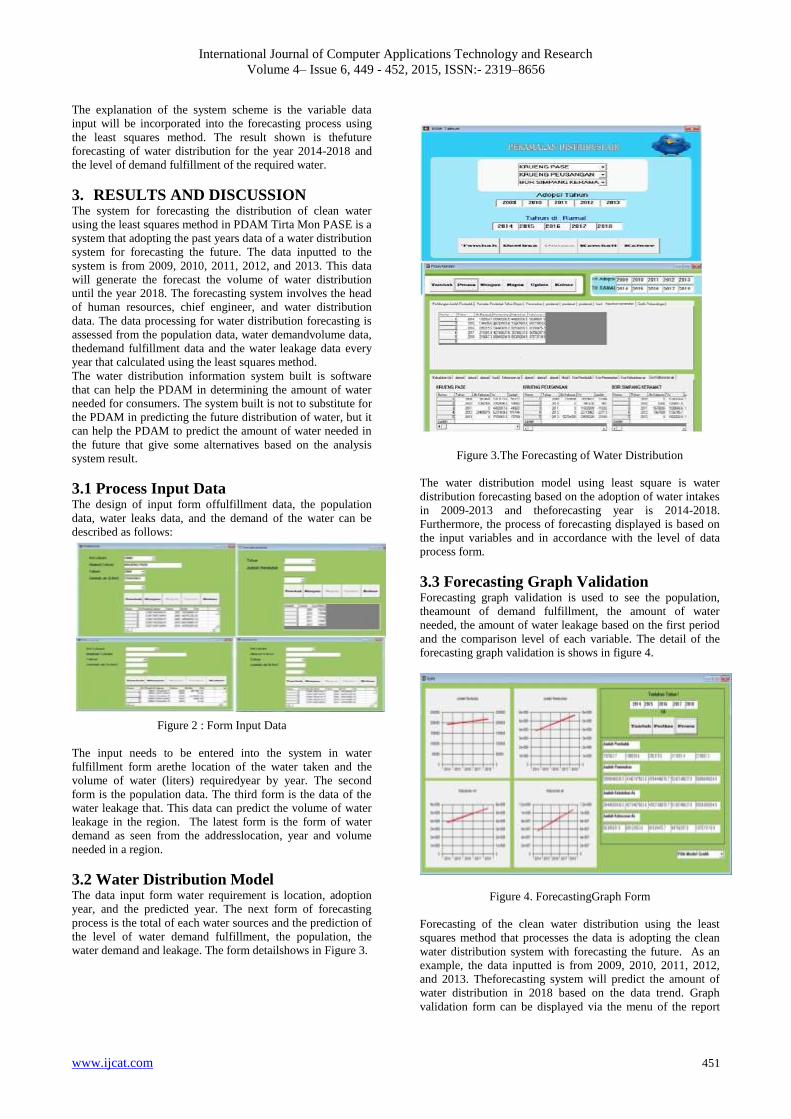
International Journal of Computer Applications Technology and Research
Volume 4– Issue 6, 449 - 452, 2015, ISSN:- 2319–8656
www.ijcat.com 451
The explanation of the system scheme is the variable data
input will be incorporated into the forecasting process using
the least squares method. The result shown is thefuture
forecasting of water distribution for the year 2014-2018 and
the level of demand fulfillment of the required water.
3. RESULTS AND DISCUSSION The system for forecasting the distribution of clean water
using the least squares method in PDAM Tirta Mon PASE is a
system that adopting the past years data of a water distribution
system for forecasting the future. The data inputted to the
system is from 2009, 2010, 2011, 2012, and 2013. This data
will generate the forecast the volume of water distribution
until the year 2018. The forecasting system involves the head
of human resources, chief engineer, and water distribution
data. The data processing for water distribution forecasting is
assessed from the population data, water demandvolume data,
thedemand fulfillment data and the water leakage data every
year that calculated using the least squares method.
The water distribution information system built is software
that can help the PDAM in determining the amount of water
needed for consumers. The system built is not to substitute for
the PDAM in predicting the future distribution of water, but it
can help the PDAM to predict the amount of water needed in
the future that give some alternatives based on the analysis
system result.
3.1 Process Input Data The design of input form offulfillment data, the population
data, water leaks data, and the demand of the water can be
described as follows:
Figure 2 : Form Input Data
The input needs to be entered into the system in water
fulfillment form arethe location of the water taken and the
volume of water (liters) requiredyear by year. The second
form is the population data. The third form is the data of the
water leakage that. This data can predict the volume of water
leakage in the region. The latest form is the form of water
demand as seen from the addresslocation, year and volume
needed in a region.
3.2 Water Distribution Model The data input form water requirement is location, adoption
year, and the predicted year. The next form of forecasting
process is the total of each water sources and the prediction of
the level of water demand fulfillment, the population, the
water demand and leakage. The form detailshows in Figure 3.
Figure 3.The Forecasting of Water Distribution
The water distribution model using least square is water
distribution forecasting based on the adoption of water intakes
in 2009-2013 and theforecasting year is 2014-2018.
Furthermore, the process of forecasting displayed is based on
the input variables and in accordance with the level of data
process form.
3.3 Forecasting Graph Validation Forecasting graph validation is used to see the population,
theamount of demand fulfillment, the amount of water
needed, the amount of water leakage based on the first period
and the comparison level of each variable. The detail of the
forecasting graph validation is shows in figure 4.
Figure 4. ForecastingGraph Form
Forecasting of the clean water distribution using the least
squares method that processes the data is adopting the clean
water distribution system with forecasting the future. As an
example, the data inputted is from 2009, 2010, 2011, 2012,
and 2013. Theforecasting system will predict the amount of
water distribution in 2018 based on the data trend. Graph
validation form can be displayed via the menu of the report
International Journal of Computer Applications Technology and Research
Volume 4– Issue 6, 449 - 452, 2015, ISSN:- 2319–8656
www.ijcat.com 452
form. Graph validation form is used for inputting, correcting,
processing the value of the variables. This form consists of a
choice of year, the total population, the amount of demand
fulfillment, the amount of water needs, and the amount of
water leakage. This validation form can show the level of
required water demand fulfillment and the level of water
leakage.
4. CONCLUSION Based on the result of clean water distribution forecasting
using the least squares method,this study concluded that:
1. The least squares method can predict the distribution of
drinking water in the town of Lhokseumawe from year
2014-2018. The results of clean water distribution
predictionto fulfill the water demand in PDAM
Lhokseumawe by using several variables including; the
population, the level of water demand fulfillment, the
amount of water needs and the amount of water leakage.
This system can reduce errors in the distribution of water
from each region.
2. The allocation of water in each district is used to calculate
the periodic data in 2014-2018. The result calculate the
population of Lhoksumawe is 218067,3 in 2018. The
amount of water that must be supplyis 5689849204.9
liters/day. The amount of water needed by the people of
Lhokseumawe is 5559389204.9 liters/day and the
possibility of water leaks in the PDAM system is around
107573119.9 liters/day.
5. REFERENCES [1] Hasan, Iqbal, 2009. The statistical analysis of research
data, Bumi Aksara, Yogyakarta.
[2] Hick & Edward, 1996. Using Pump Technology, Edisi
Bahasa Indonesia, Erlangga, Jakarta.
[3] Ginting, Rosnani, 2007. Production system, Graha Ilmu,
Yogyakarta.
[4] Turban, E., Aronson, J.E., and Liang, T.P., 2005, Decision
Support System and Intelligent System, 7th Edition,
Pearson Education Inc., Upper Saddle River, New Jersey.
[5] Makridakis, Wheelwright, & McGee, 2000. Forecasting Methods and Applications, Edisi Bahasa Indonesia jilid 2,
Interaksa, Batam
[6] Prasetya, Hery & Fitri Lukiastuti, 2009. Operations
Management, Media Presindo, Yogyakarta.
[7] Pressman, R.S., 2001, Software Engineering, A
Practitioner’s Approach, 5th Edition, McGraw-Hill, Inc.
New York

International Journal of Computer Applications Technology and Research
Volume 4– Issue 6, 453 - 460, 2015, ISSN:- 2319–8656
www.ijcat.com 453
Integrated Technology of Data Remote sensing and GIS Techniques
Assess the Land use and Land Cover Changes of Madurai City
Between the Year 2003-2008
R.Srinivasan
Department of Computer
Science
S.LS.MAVMM.AV.College
Madurai,Tamilnadu
India
Dr.P.Venkataraman
Department of Geology
V.O.C College
Tutucorin,Tamilnadu
India
Abstract The present study focuses on the nature and pattern of urban expansion of Madurai city
over its surrounding region during the period from 2003 to 2008. Based on its proximity to the
Madurai city, Preparation of various thematic data such Land use and Land cover using Land sat
data. Create a land use land cover map from satellite imagery using supervised classification. Find
out the areas from the classified data. The study is based on secondary data, the satellite imagery has
downloaded from GLCF (Global Land Cover Facility) web site, for the study area (path101 row 67),
the downloaded imagery subset using Imagery software to clip the study area. The clipped satellite
imagery has used to prepare the land use and land cover map using supervised classification.
Keywords: Land use, Land Cover, Landsat data, Satellite imagery
1. INTRODUCTION
Land use is obviously constrained by
environmental factors such as soil characteristics, climate,
topography, and vegetation. But it also reflects the
importance of land as a key and finite resource for most
human activities including agriculture, industry, forestry,
energy production, settlement, recreation, and water
catchment and storage. Land is a fundamental factor of
production, and through much of the course of human
history, it has been tightly coupled with economic growth.
Often improper Land use is causing various forms of
environmental degradation. For sustainable utilization of
the land ecosystems, it is essential to know the natural
characteristics, extent and location, its quality,
productivity, suitability and limitations of various. Land
use is a product of interactions between a society's cultural
background, state, and its physical needs on the one hand,
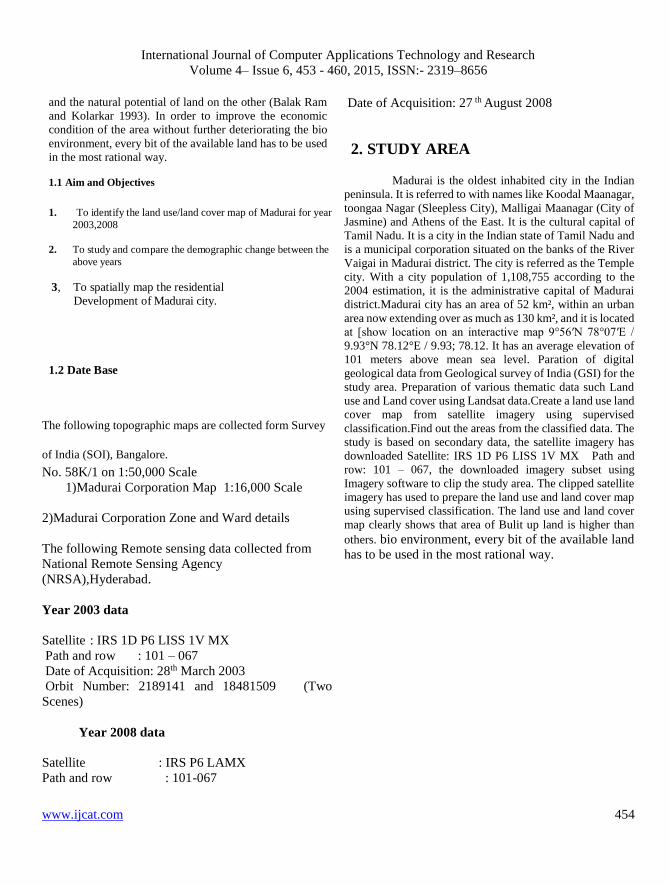
International Journal of Computer Applications Technology and Research
Volume 4– Issue 6, 453 - 460, 2015, ISSN:- 2319–8656
www.ijcat.com 454
and the natural potential of land on the other (Balak Ram
and Kolarkar 1993). In order to improve the economic
condition of the area without further deteriorating the bio
environment, every bit of the available land has to be used
in the most rational way.
1.1 Aim and Objectives
1. To identify the land use/land cover map of Madurai for year
2003,2008
2. To study and compare the demographic change between the
above years
3, To spatially map the residential
Development of Madurai city.
1.2 Date Base
The following topographic maps are collected form Survey
of India (SOI), Bangalore.
No. 58K/1 on 1:50,000 Scale
1)Madurai Corporation Map 1:16,000 Scale
2)Madurai Corporation Zone and Ward details
The following Remote sensing data collected from
National Remote Sensing Agency
(NRSA),Hyderabad.
Year 2003 data
Satellite : IRS 1D P6 LISS 1V MX
Path and row : 101 – 067
Date of Acquisition: 28th March 2003
Orbit Number: 2189141 and 18481509 (Two
Scenes)
Year 2008 data
Satellite : IRS P6 LAMX
Path and row : 101-067
Date of Acquisition: 27 th August 2008
2. STUDY AREA
Madurai is the oldest inhabited city in the Indian
peninsula. It is referred to with names like Koodal Maanagar,
toongaa Nagar (Sleepless City), Malligai Maanagar (City of
Jasmine) and Athens of the East. It is the cultural capital of
Tamil Nadu. It is a city in the Indian state of Tamil Nadu and
is a municipal corporation situated on the banks of the River
Vaigai in Madurai district. The city is referred as the Temple
city. With a city population of 1,108,755 according to the
2004 estimation, it is the administrative capital of Madurai
district.Madurai city has an area of 52 km², within an urban
area now extending over as much as 130 km², and it is located
at [show location on an interactive map 9°56′N 78°07′E /
9.93°N 78.12°E / 9.93; 78.12. It has an average elevation of
101 meters above mean sea level. Paration of digital
geological data from Geological survey of India (GSI) for the
study area. Preparation of various thematic data such Land
use and Land cover using Landsat data.Create a land use land
cover map from satellite imagery using supervised
classification.Find out the areas from the classified data. The
study is based on secondary data, the satellite imagery has
downloaded Satellite: IRS 1D P6 LISS 1V MX Path and
row: 101 – 067, the downloaded imagery subset using
Imagery software to clip the study area. The clipped satellite
imagery has used to prepare the land use and land cover map
using supervised classification. The land use and land cover
map clearly shows that area of Bulit up land is higher than
others. bio environment, every bit of the available land
has to be used in the most rational way.
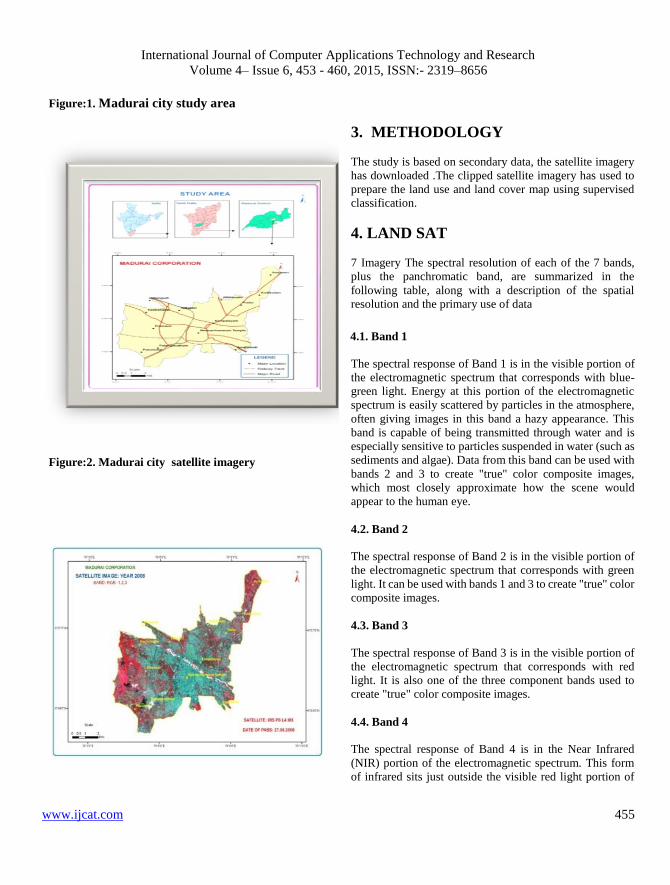
International Journal of Computer Applications Technology and Research
Volume 4– Issue 6, 453 - 460, 2015, ISSN:- 2319–8656
www.ijcat.com 455
Figure:1. Madurai city study area
Figure:2. Madurai city satellite imagery
3. METHODOLOGY
The study is based on secondary data, the satellite imagery
has downloaded .The clipped satellite imagery has used to
prepare the land use and land cover map using supervised
classification.
4. LAND SAT
7 Imagery The spectral resolution of each of the 7 bands,
plus the panchromatic band, are summarized in the
following table, along with a description of the spatial
resolution and the primary use of data
4.1. Band 1
The spectral response of Band 1 is in the visible portion of
the electromagnetic spectrum that corresponds with blue-
green light. Energy at this portion of the electromagnetic
spectrum is easily scattered by particles in the atmosphere,
often giving images in this band a hazy appearance. This
band is capable of being transmitted through water and is
especially sensitive to particles suspended in water (such as
sediments and algae). Data from this band can be used with
bands 2 and 3 to create "true" color composite images,
which most closely approximate how the scene would
appear to the human eye.
4.2. Band 2
The spectral response of Band 2 is in the visible portion of
the electromagnetic spectrum that corresponds with green
light. It can be used with bands 1 and 3 to create "true" color
composite images.
4.3. Band 3
The spectral response of Band 3 is in the visible portion of
the electromagnetic spectrum that corresponds with red
light. It is also one of the three component bands used to
create "true" color composite images.
4.4. Band 4
The spectral response of Band 4 is in the Near Infrared
(NIR) portion of the electromagnetic spectrum. This form
of infrared sits just outside the visible red light portion of

International Journal of Computer Applications Technology and Research
Volume 4– Issue 6, 453 - 460, 2015, ISSN:- 2319–8656
www.ijcat.com 456
the electromagnetic spectrum. This form of radiation is
reflected to a high degree off leafy vegetation since
chlorophyll (the green pigment in green vegetation) reflects
much of the NIR that reaches it (it has a high albedo in this
band)
4.5. Band 5
The spectral response of Band 5 is in the Middle Infrared
(Mid-IR) portion of the electromagnetic spectrum. This
portion of the spectrum is sensitive to variations in water
content in both leafy vegetation and soil moisture. This
band allows an observer to distinguishes between clouds
(which appear dark) and bright snow covr (which appear
light). Sensors in this band also respond to variations in
ferric iron (Fe2O3) in rocks and soils, showing higher
reflectance as iron content increases. This allows one to use
these data to determine mineral content and soil types from
space
4.6. Band 6
The spectral response of Band 6 is in the Thermal
Infrared portion of the electromagnetic spectrum.
Thermal infrared is radiation that is detected as heat
energy, therefore the thermal Band 6 on the ETM+
sensor can distinguish temperature difference of about
0.6 Celsius, which allows it to detect relatively small
differences in land and water surface temperatures. This
makes the thermal IR band useful for a variety of
purposes. For example, using band 6 data, researchers
can discriminate among rock types whose thermal
properties show differences in temperature near the
surface. This assists researchers in creating geologic
mapping of land surfaces from space. This data supports
agricultural and mineral exploration efforts. ETM Band
6 data can detect changes in ground temperature due to
moisture variations, assisting in drought planning, flood
forecasting, and agricultural assessment. The cooling
effect of water evaporating from vegetation can be
detected, assisting in efforts to map land use
characteristics of a region.
4.7. Band 7
Spectral response of Band 7 is in the Middle
Infrared (Mid-IR) portion of the electromagnetic spectrum.
This portion of the electromagnetic spectrum is sensitive to
moisture and thus responds to the moisture contents in soils
and vegetation. The sensitivity to moisture contents is suited
to detecting certain water-loving minerals, such as clays, in
geologic settings. This band is also useful in detecting
moisture levels in leafy vegetation, which can change under
certain environmental conditions (e.g. drought, pollution,
insect infestation) and thus provides a means to monitor
productivity and identify agricultural areas that are under
stress.
1.4.8. Panchromatic
0.52 to 0.90 pedometers black and white sensor with a 15 m
spatial resolution. The higher resolution of this data assists
land-use researchers by making identification of smaller
objects easier. Items smaller then 30 m will appear fuzzy or
ill defined in the 30 m bands of the ETM+. The 15m
resolution of the panchromatic band will allow researchers to
make better determinations of land use and will assist in
producing accurate land use maps.
SL.N
O
LANDUSE
CODE
LANDUSE NAME
NO. OF
FREQUENCY
AREA IN
SQ.KM
1 100 Built-up Land 7 27.96
2 200 Mixed Built-up Land 24 4.98
3 300 Vacant land 54 1.05
4 400 Recreational land 13 0.30
5 500 Crop Land 32 2.97
6 600 Fallow Land 25 2.79
7 700 Plantation 26 0.70
8 800 Land with Scrub 39 3.77
9 900 Land Without Scrub 21 2.91
10 1000 Tank / Pond 19 3.49
11 1100 River / Canal 2 2.41
12 1200 Forest 1 1.33
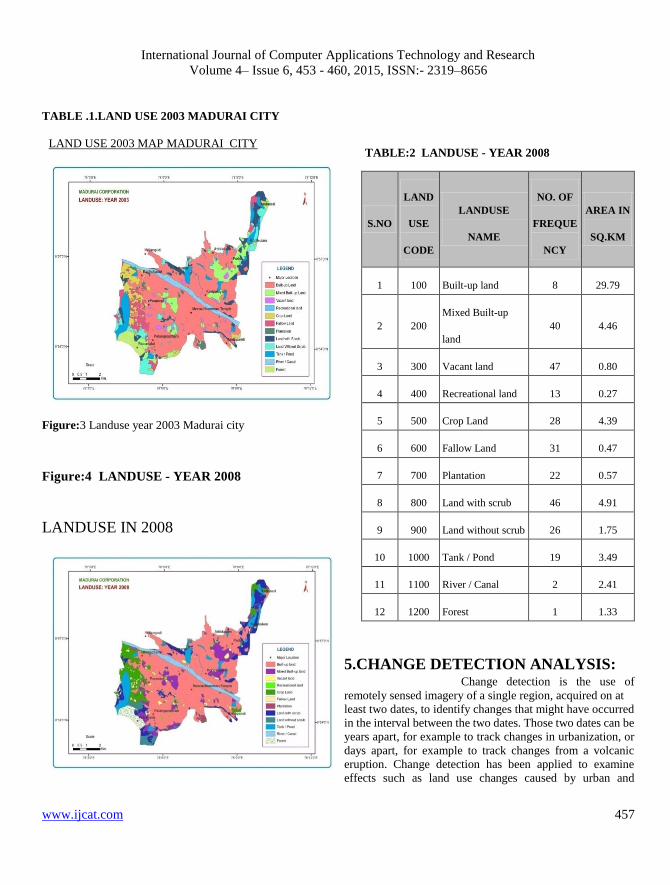
International Journal of Computer Applications Technology and Research
Volume 4– Issue 6, 453 - 460, 2015, ISSN:- 2319–8656
www.ijcat.com 457
TABLE .1.LAND USE 2003 MADURAI CITY
LAND USE 2003 MAP MADURAI CITY
Figure:3 Landuse year 2003 Madurai city
Figure:4 LANDUSE - YEAR 2008
LANDUSE IN 2008
TABLE:2 LANDUSE - YEAR 2008
5.CHANGE DETECTION ANALYSIS: Change detection is the use of
remotely sensed imagery of a single region, acquired on at
least two dates, to identify changes that might have occurred
in the interval between the two dates. Those two dates can be
years apart, for example to track changes in urbanization, or
days apart, for example to track changes from a volcanic
eruption. Change detection has been applied to examine
effects such as land use changes caused by urban and
S.NO
LAND
USE
CODE
LANDUSE
NAME
NO. OF
FREQUE
NCY
AREA IN
SQ.KM
1 100 Built-up land 8 29.79
2 200
Mixed Built-up
land
40 4.46
3 300 Vacant land 47 0.80
4 400 Recreational land 13 0.27
5 500 Crop Land 28 4.39
6 600 Fallow Land 31 0.47
7 700 Plantation 22 0.57
8 800 Land with scrub 46 4.91
9 900 Land without scrub 26 1.75
10 1000 Tank / Pond 19 3.49
11 1100 River / Canal 2 2.41
12 1200 Forest 1 1.33
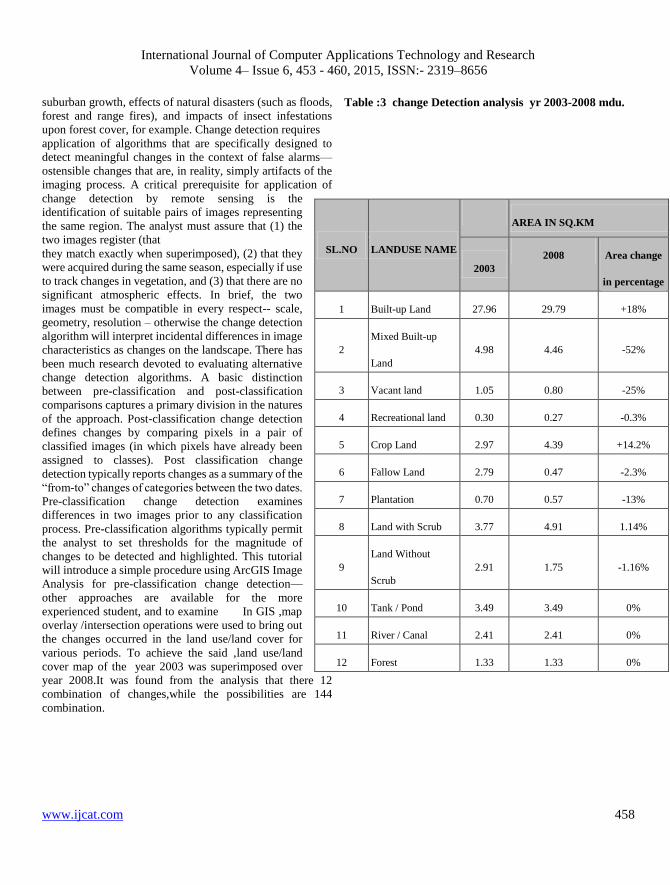
International Journal of Computer Applications Technology and Research
Volume 4– Issue 6, 453 - 460, 2015, ISSN:- 2319–8656
www.ijcat.com 458
suburban growth, effects of natural disasters (such as floods,
forest and range fires), and impacts of insect infestations
upon forest cover, for example. Change detection requires
application of algorithms that are specifically designed to
detect meaningful changes in the context of false alarms—
ostensible changes that are, in reality, simply artifacts of the
imaging process. A critical prerequisite for application of
change detection by remote sensing is the
identification of suitable pairs of images representing
the same region. The analyst must assure that (1) the
two images register (that
they match exactly when superimposed), (2) that they
were acquired during the same season, especially if use
to track changes in vegetation, and (3) that there are no
significant atmospheric effects. In brief, the two
images must be compatible in every respect-- scale,
geometry, resolution – otherwise the change detection
algorithm will interpret incidental differences in image
characteristics as changes on the landscape. There has
been much research devoted to evaluating alternative
change detection algorithms. A basic distinction
between pre-classification and post-classification
comparisons captures a primary division in the natures
of the approach. Post-classification change detection
defines changes by comparing pixels in a pair of
classified images (in which pixels have already been
assigned to classes). Post classification change
detection typically reports changes as a summary of the
“from-to” changes of categories between the two dates.
Pre-classification change detection examines
differences in two images prior to any classification
process. Pre-classification algorithms typically permit
the analyst to set thresholds for the magnitude of
changes to be detected and highlighted. This tutorial
will introduce a simple procedure using ArcGIS Image
Analysis for pre-classification change detection—
other approaches are available for the more
experienced student, and to examine In GIS ,map
overlay /intersection operations were used to bring out
the changes occurred in the land use/land cover for
various periods. To achieve the said ,land use/land
cover map of the year 2003 was superimposed over
year 2008.It was found from the analysis that there 12
combination of changes,while the possibilities are 144
combination.
Table :3 change Detection analysis yr 2003-2008 mdu.
SL.NO LANDUSE NAME
AREA IN SQ.KM
2003
2008 Area change
in percentage
1 Built-up Land 27.96 29.79 +18%
2
Mixed Built-up
Land
4.98 4.46 -52%
3 Vacant land 1.05 0.80 -25%
4 Recreational land 0.30 0.27 -0.3%
5 Crop Land 2.97 4.39 +14.2%
6 Fallow Land 2.79 0.47 -2.3%
7 Plantation 0.70 0.57 -13%
8 Land with Scrub 3.77 4.91 1.14%
9
Land Without
Scrub
2.91 1.75 -1.16%
10 Tank / Pond 3.49 3.49 0%
11 River / Canal 2.41 2.41 0%
12 Forest 1.33 1.33 0%
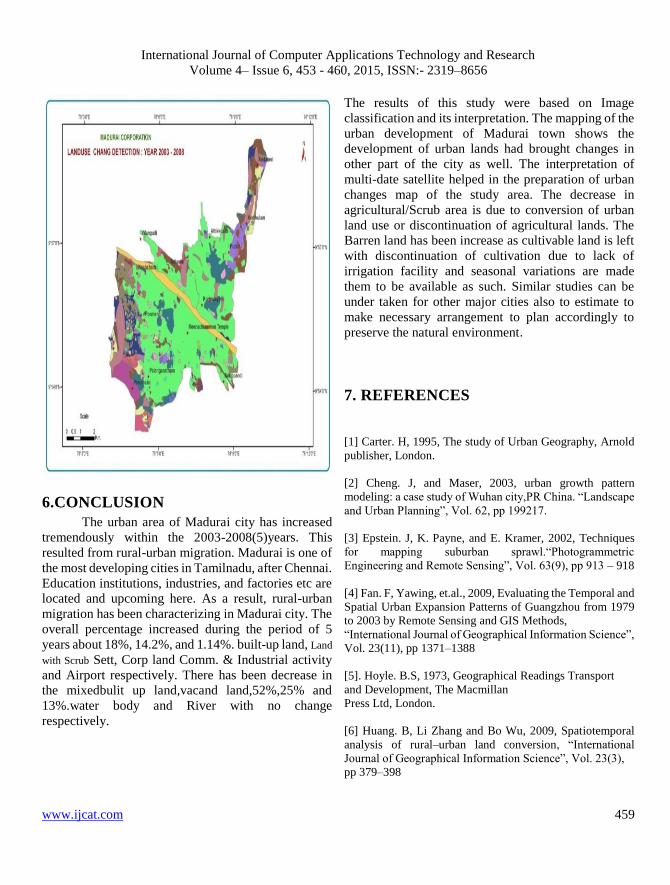
International Journal of Computer Applications Technology and Research
Volume 4– Issue 6, 453 - 460, 2015, ISSN:- 2319–8656
www.ijcat.com 459
6.CONCLUSION
The urban area of Madurai city has increased
tremendously within the 2003-2008(5)years. This
resulted from rural-urban migration. Madurai is one of
the most developing cities in Tamilnadu, after Chennai.
Education institutions, industries, and factories etc are
located and upcoming here. As a result, rural-urban
migration has been characterizing in Madurai city. The
overall percentage increased during the period of 5
years about 18%, 14.2%, and 1.14%. built-up land, Land
with Scrub Sett, Corp land Comm. & Industrial activity
and Airport respectively. There has been decrease in
the mixedbulit up land,vacand land,52%,25% and
13%.water body and River with no change
respectively.
The results of this study were based on Image
classification and its interpretation. The mapping of the
urban development of Madurai town shows the
development of urban lands had brought changes in
other part of the city as well. The interpretation of
multi-date satellite helped in the preparation of urban
changes map of the study area. The decrease in
agricultural/Scrub area is due to conversion of urban
land use or discontinuation of agricultural lands. The
Barren land has been increase as cultivable land is left
with discontinuation of cultivation due to lack of
irrigation facility and seasonal variations are made
them to be available as such. Similar studies can be
under taken for other major cities also to estimate to
make necessary arrangement to plan accordingly to
preserve the natural environment.
7. REFERENCES
[1] Carter. H, 1995, The study of Urban Geography, Arnold
publisher, London.
[2] Cheng. J, and Maser, 2003, urban growth pattern
modeling: a case study of Wuhan city,PR China. “Landscape
and Urban Planning”, Vol. 62, pp 199217.
[3] Epstein. J, K. Payne, and E. Kramer, 2002, Techniques
for mapping suburban sprawl.“Photogrammetric
Engineering and Remote Sensing”, Vol. 63(9), pp 913 – 918
[4] Fan. F, Yawing, et.al., 2009, Evaluating the Temporal and
Spatial Urban Expansion Patterns of Guangzhou from 1979
to 2003 by Remote Sensing and GIS Methods,
“International Journal of Geographical Information Science”,
Vol. 23(11), pp 1371–1388
[5]. Hoyle. B.S, 1973, Geographical Readings Transport
and Development, The Macmillan
Press Ltd, London.
[6] Huang. B, Li Zhang and Bo Wu, 2009, Spatiotemporal
analysis of rural–urban land conversion, “International
Journal of Geographical Information Science”, Vol. 23(3),
pp 379–398
International Journal of Computer Applications Technology and Research
Volume 4– Issue 6, 453 - 460, 2015, ISSN:- 2319–8656
www.ijcat.com 460
[7] Jensen. J.R, and D.L. Toll, 1982, Detecting residential
landuse development at the urbanfringe, “Photogrammetric
Engineering and Remote Sensing”, Vol. 48(4), pp 629643.
[8] Mahdibeigi. H, M. Mahdavi and A. Alihosseini, 2010,
Transforming large villages intosmall towns and studying
their role in rural development through Network Analysis
Methodology: Rural district of Southern Behnam Arab
(Javad Abad zone from the regionof Varamin), “Journal of
Geography and Regional Planning”, Vol. 3(6), pp 158168.
[9] Siyuan. W, L. Jingshi and Y. Cunjian, 2007, Temporal
change in the landscape erosion pattern in the Yellow River
Basin, China, “International Journal of Geographical
Information Science”, Vol. 21(10), pp 1077–1092
[10] Sudhira.H.S, T.V. Ramachandra, K.S.Jagadish, 2004,
Urban sprawl: metrics, dynamics and modelling using GIS,
“International Journal of Applied Earth Observation and
Geoinformation”, Vol. 5, pp 29–391.
[11] Anderson, James R., 1971, Land use classification
schemes used in selected recent geographic applications of
remote sensing: Photogramm.Eng, v. 37, no. 4, p. 379-387.
[12] Anderson, James R., Hardy, Ernest E., and Roach,
John T., 1972, A land-use classification system for use
with remote-sensor data: U.S. Geol. Survey Cire. 671, 16
p., refs.
[13] Bhat M .M and Shah A R. 2011; Agricultural Land
Use and Cropping Pattern in Jammu and Kashmir,
Research Journal of Agricultural Sciences, 2(3): 710-712.
[14] Chakraborty K, Joshi P.K,. Sharma K.K M 2009;
Land use / Land cover Dynamics in Umngot Watershed of
Meghalaya using Geospatial tools; .Journal of Indian
Science of Remote Sensing. 37:99-106.
[15] Daniel Ayalew Mengistu and Ayobami T. Salami
2007; Application of remote sensing and GIS inland
use/land cover mapping and change detection in a part of
south western Nigeria; African Journal of Environmental
Science and Technology Vol. 1 (5), pp. 099-109,
December,
[16] Gautam N.C. and Raghavswamy V 2004; Land
Use/Land Cover and Management Practices in India; BSP,
viii, 310 p, maps, tables, figs, ISBN: 8178000520.
[17] Golam Rasul2009; Ecosystem services and
agricultural land-use practices: a case study of the
Chittagong Hill Tracts of Bangladesh, Sustainability:
Science, Practice, & Policy, Fall | Volume 5 | Issue 2.
[18] Kaul M, Dadhwal V.K , Mohren G.M.J2009;
Land use change and net C flux in Indian forests; Forest
Ecology and Management 258 100–108, Indian Institute of
Remote Sensing (IIRS), 4 Kalidas Road, Dehradun, UA
248001, India.
[19] Krishnamurthy Y.V.N., Dy. Head, RRSSC, Nagpur
and Shri S.Adiga, Director, NNRMS-RRSSC, ISRO Hqs,
Bangalore Nationwide Land Use/Land Cover Mapping
Using Indian Remote Sensing Satellite Data-a Digital
Mapping Approach.
[20] Wani M.H, Baba S.H and Shahid Yousuf 2009;
Land-use Dynamics in Jammu and Kashmir. Agricultural
Economics Research Review Vol. 22, pp 145-154.
[21] National Wetland Atlas Jammu and Kashmir,
Sponsored by Ministry of Environment and Forests,
Government of India.
AC/RESA/AFEG/NWIA/ATLAS/16/2010.
[22] Prakasam.C; Land use and land cover change
detection through remote sensing approach: A case study
of Kodaikanal taluk, Tamil nadu, International Journal of
Geomatics and Geosciences Volume 1, No 2, 2010, ISSN
0976 – 4380.
[23] 13. Rounsevell M.D.A, Reay D.S Land use and
climate change in the UK Land Use Policy 26S (2009)
S160–S169
International Journal of Computer Applications Technology and Research
Volume 4– Issue 6, 461 - 466, 2015, ISSN:- 2319–8656
www.ijcat.com 461
Nigeria beyond Oil: Information Technology Pointing a
Way to New Economy
Eke B. O.
Department of Computer Science
University of Port Harcourt
Port Harcourt, Nigeria
Ndigwe C. F.
Department of Computer Science
Anambra State University
Uli, Nigeria
Abstract: Nigeria is an oil producing nation which have been relying heavily on oil revenue for its economic well being. Oil depletes
and its price can crash making dependence on oil as a mono means for the country’s future futile. Information and communication
technology (ICT) on the other hand has impacted the economic growth of various nations such as India. ICT seems to be a key factor
in stimulating the development of a country’s productivity across most sectors of the economy and ensuring global competiveness and
a move to a New Economy. This Paper examines if a causal relationship exists between ICT and economic wellbeing (GCI) and if ICT
can offer a way forward for Nigeria to move from oil based to service and product based economy. The paper also conducts an
empirical analysis to find out if oil producing nations experience better growth against ICT innovative nations using 10 countries. The
results of the analysis support the believe that ICT led development and of the existence of a causal link between ICT and economic
growth and non-existence of a causal link between oil production alone and economic development.
Keywords: Beyond oil; Information Technology; Competiveness; ICT innovation; empirical analysis
1. INTRODUCTION In the late 1950 Nigeria discovered oil in the Niger delta part
of the country and started mass production just at the eve of
its independence. Before oil, the developmental effort of the
country was largely dependent on non-oil export, oil was just
coming into play at that time. In the period between 1970 to
1980 the oil became the main stay of the economy making the
country to almost abandon other sources of income and
concentrating on oil. Oil have continued to fluctuate bringing
in gallops on the economy.
The prospect of oil drying up in the nearest future is even a
much more serious concern which the country and even the
Niger Delta needed to pay more attention to. The Niger delta
may not be totally cleaned up before the oil dries up and
adequate plan needed to be put in place to find an alternative
now before the anticipated evil day. In this paper the
researcher intend to examine and proffer the adoption of ICT
as a stimulant for the development of Nigeria’s productive
capacity across all sectors of the economy.
The question that continues to be of considerable theoretical
and empirical interest is whether increased investment in ICT
can leapfrog stages of Nigeria economic development. In a
research by Maryam [1] it was suggested that ICT offers a
unique opportunity for developing countries to free
themselves from historical and geographic disadvantages
allowing trade and economic activities to be conducted as
efficiently as in the developed world. Moreover it is believed
that an evolving and increasingly powerful ICT infrastructure
has fundamentally changed the nature of global relationships,
sources of competitive advantage and opportunities for
economic and social development. Technologies such as the
Internet, personal computers, broadband and wireless
telephony have created an interconnected global network of
individuals, firms and governments. For the developing world,
a modern telecommunications infrastructure is not only
essential for domestic economic growth, but also a
prerequisite for participation in increasingly competitive
world markets and for attracting the much-needed new
investments.
While there is substantial evidence that new information
technologies are in many ways transforming how modern
economies operate according to Organization for Economic
Co-operation and Development (OECD),, the impacts on
productivity and economic growth have been much harder to
detect. Recent literature about the role of ICT on economic
growth has been mixed. Among the country level studies, Seo
[2] found a significant relationship between IT investment and
productivity growth with the data from 12 Asia Pacific
countries. Shiu, and Lam, [3] used a data set from 36
countries for the period 1985-1993 and showed that IT
investment is positive for developed countries but not
significant for developing countries, conclusion that IT plays
a significant role in economic growth in developed countries
but no substantiated role in developing countries.
However, single country studies, Maryam [1] on Ireland;
USA; Maryam [1]’s study of Singapore; and Joseph [4] on
India, showed that ICT contributed to economic growth.
The empirical growth literature that developed, regressed
growth in real per capita GDP on its initial level and a wide
variety of control variables of interest. Within this literature
many papers have included various measures of technology or
telecommunication related variables among these control
variables. Many of these papers found significant positive
correlations across countries between growth and technology
related variables, controlling for other factors. These studies
have been influential in reinforcing the consensus among
many economists that “ ICT promotes growth”.
However, the mixed results from empirical work in the ICT
literature is due mainly to the omission of a relevant
mechanism through which openness or the re-structuring of an
economy promotes growth. Liberalization, in particular, is
expected to increase foreign direct investment (FDI). If a
complementary relationship between FDI and ICT exists, then
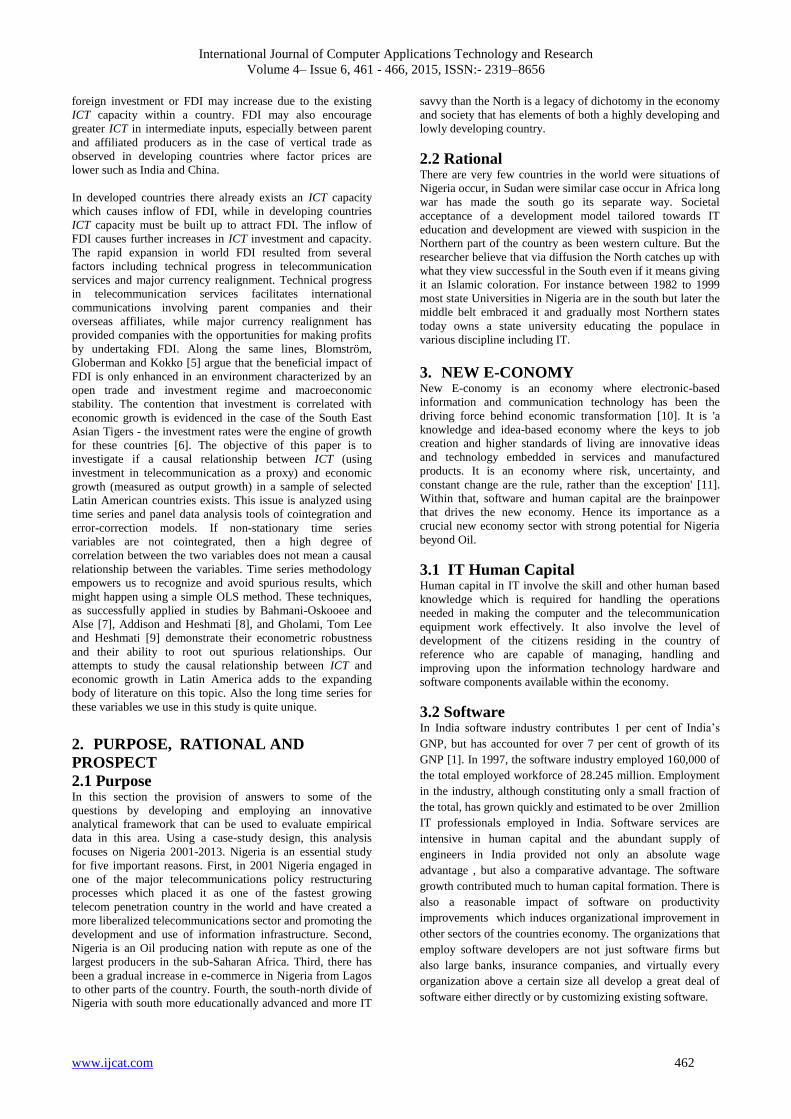
International Journal of Computer Applications Technology and Research
Volume 4– Issue 6, 461 - 466, 2015, ISSN:- 2319–8656
www.ijcat.com 462
foreign investment or FDI may increase due to the existing
ICT capacity within a country. FDI may also encourage
greater ICT in intermediate inputs, especially between parent
and affiliated producers as in the case of vertical trade as
observed in developing countries where factor prices are
lower such as India and China.
In developed countries there already exists an ICT capacity
which causes inflow of FDI, while in developing countries
ICT capacity must be built up to attract FDI. The inflow of
FDI causes further increases in ICT investment and capacity.
The rapid expansion in world FDI resulted from several
factors including technical progress in telecommunication
services and major currency realignment. Technical progress
in telecommunication services facilitates international
communications involving parent companies and their
overseas affiliates, while major currency realignment has
provided companies with the opportunities for making profits
by undertaking FDI. Along the same lines, Blomström,
Globerman and Kokko [5] argue that the beneficial impact of
FDI is only enhanced in an environment characterized by an
open trade and investment regime and macroeconomic
stability. The contention that investment is correlated with
economic growth is evidenced in the case of the South East
Asian Tigers - the investment rates were the engine of growth
for these countries [6]. The objective of this paper is to
investigate if a causal relationship between ICT (using
investment in telecommunication as a proxy) and economic
growth (measured as output growth) in a sample of selected
Latin American countries exists. This issue is analyzed using
time series and panel data analysis tools of cointegration and
error-correction models. If non-stationary time series
variables are not cointegrated, then a high degree of
correlation between the two variables does not mean a causal
relationship between the variables. Time series methodology
empowers us to recognize and avoid spurious results, which
might happen using a simple OLS method. These techniques,
as successfully applied in studies by Bahmani-Oskooee and
Alse [7], Addison and Heshmati [8], and Gholami, Tom Lee
and Heshmati [9] demonstrate their econometric robustness
and their ability to root out spurious relationships. Our
attempts to study the causal relationship between ICT and
economic growth in Latin America adds to the expanding
body of literature on this topic. Also the long time series for
these variables we use in this study is quite unique.
2. PURPOSE, RATIONAL AND
PROSPECT
2.1 Purpose In this section the provision of answers to some of the
questions by developing and employing an innovative
analytical framework that can be used to evaluate empirical
data in this area. Using a case-study design, this analysis
focuses on Nigeria 2001-2013. Nigeria is an essential study
for five important reasons. First, in 2001 Nigeria engaged in
one of the major telecommunications policy restructuring
processes which placed it as one of the fastest growing
telecom penetration country in the world and have created a
more liberalized telecommunications sector and promoting the
development and use of information infrastructure. Second,
Nigeria is an Oil producing nation with repute as one of the
largest producers in the sub-Saharan Africa. Third, there has
been a gradual increase in e-commerce in Nigeria from Lagos
to other parts of the country. Fourth, the south-north divide of
Nigeria with south more educationally advanced and more IT
savvy than the North is a legacy of dichotomy in the economy
and society that has elements of both a highly developing and
lowly developing country.
2.2 Rational There are very few countries in the world were situations of
Nigeria occur, in Sudan were similar case occur in Africa long
war has made the south go its separate way. Societal
acceptance of a development model tailored towards IT
education and development are viewed with suspicion in the
Northern part of the country as been western culture. But the
researcher believe that via diffusion the North catches up with
what they view successful in the South even if it means giving
it an Islamic coloration. For instance between 1982 to 1999
most state Universities in Nigeria are in the south but later the
middle belt embraced it and gradually most Northern states
today owns a state university educating the populace in
various discipline including IT.
3. NEW E-CONOMY New E-conomy is an economy where electronic-based
information and communication technology has been the
driving force behind economic transformation [10]. It is 'a
knowledge and idea-based economy where the keys to job
creation and higher standards of living are innovative ideas
and technology embedded in services and manufactured
products. It is an economy where risk, uncertainty, and
constant change are the rule, rather than the exception' [11].
Within that, software and human capital are the brainpower
that drives the new economy. Hence its importance as a
crucial new economy sector with strong potential for Nigeria
beyond Oil.
3.1 IT Human Capital Human capital in IT involve the skill and other human based
knowledge which is required for handling the operations
needed in making the computer and the telecommunication
equipment work effectively. It also involve the level of
development of the citizens residing in the country of
reference who are capable of managing, handling and
improving upon the information technology hardware and
software components available within the economy.
3.2 Software In India software industry contributes 1 per cent of India’s
GNP, but has accounted for over 7 per cent of growth of its
GNP [1]. In 1997, the software industry employed 160,000 of
the total employed workforce of 28.245 million. Employment
in the industry, although constituting only a small fraction of
the total, has grown quickly and estimated to be over 2million
IT professionals employed in India. Software services are
intensive in human capital and the abundant supply of
engineers in India provided not only an absolute wage
advantage , but also a comparative advantage. The software
growth contributed much to human capital formation. There is
also a reasonable impact of software on productivity
improvements which induces organizational improvement in
other sectors of the countries economy. The organizations that
employ software developers are not just software firms but
also large banks, insurance companies, and virtually every
organization above a certain size all develop a great deal of
software either directly or by customizing existing software.
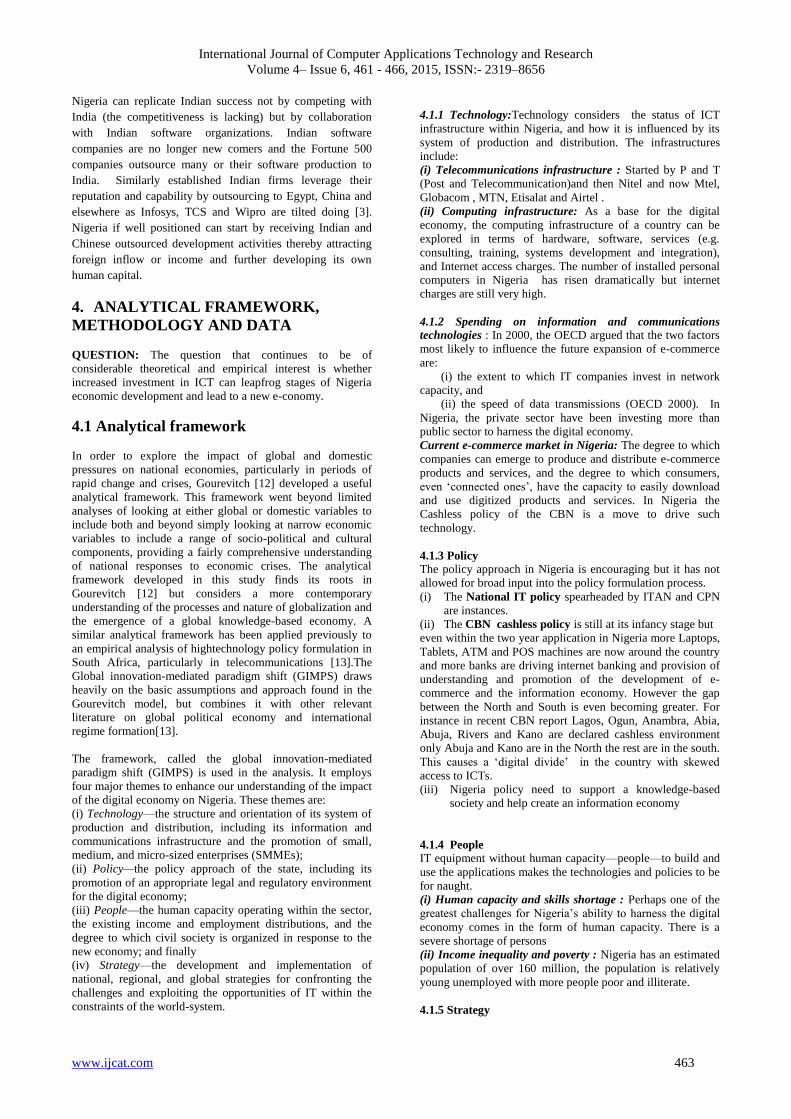
International Journal of Computer Applications Technology and Research
Volume 4– Issue 6, 461 - 466, 2015, ISSN:- 2319–8656
www.ijcat.com 463
Nigeria can replicate Indian success not by competing with
India (the competitiveness is lacking) but by collaboration
with Indian software organizations. Indian software
companies are no longer new comers and the Fortune 500
companies outsource many or their software production to
India. Similarly established Indian firms leverage their
reputation and capability by outsourcing to Egypt, China and
elsewhere as Infosys, TCS and Wipro are tilted doing [3].
Nigeria if well positioned can start by receiving Indian and
Chinese outsourced development activities thereby attracting
foreign inflow or income and further developing its own
human capital.
4. ANALYTICAL FRAMEWORK,
METHODOLOGY AND DATA
QUESTION: The question that continues to be of
considerable theoretical and empirical interest is whether
increased investment in ICT can leapfrog stages of Nigeria
economic development and lead to a new e-conomy.
4.1 Analytical framework
In order to explore the impact of global and domestic
pressures on national economies, particularly in periods of
rapid change and crises, Gourevitch [12] developed a useful
analytical framework. This framework went beyond limited
analyses of looking at either global or domestic variables to
include both and beyond simply looking at narrow economic
variables to include a range of socio-political and cultural
components, providing a fairly comprehensive understanding
of national responses to economic crises. The analytical
framework developed in this study finds its roots in
Gourevitch [12] but considers a more contemporary
understanding of the processes and nature of globalization and
the emergence of a global knowledge-based economy. A
similar analytical framework has been applied previously to
an empirical analysis of hightechnology policy formulation in
South Africa, particularly in telecommunications [13].The
Global innovation-mediated paradigm shift (GIMPS) draws
heavily on the basic assumptions and approach found in the
Gourevitch model, but combines it with other relevant
literature on global political economy and international
regime formation[13].
The framework, called the global innovation-mediated
paradigm shift (GIMPS) is used in the analysis. It employs
four major themes to enhance our understanding of the impact
of the digital economy on Nigeria. These themes are:
(i) Technology—the structure and orientation of its system of
production and distribution, including its information and
communications infrastructure and the promotion of small,
medium, and micro-sized enterprises (SMMEs);
(ii) Policy—the policy approach of the state, including its
promotion of an appropriate legal and regulatory environment
for the digital economy;
(iii) People—the human capacity operating within the sector,
the existing income and employment distributions, and the
degree to which civil society is organized in response to the
new economy; and finally
(iv) Strategy—the development and implementation of
national, regional, and global strategies for confronting the
challenges and exploiting the opportunities of IT within the
constraints of the world-system.
4.1.1 Technology:Technology considers the status of ICT
infrastructure within Nigeria, and how it is influenced by its
system of production and distribution. The infrastructures
include:
(i) Telecommunications infrastructure : Started by P and T
(Post and Telecommunication)and then Nitel and now Mtel,
Globacom , MTN, Etisalat and Airtel .
(ii) Computing infrastructure: As a base for the digital
economy, the computing infrastructure of a country can be
explored in terms of hardware, software, services (e.g.
consulting, training, systems development and integration),
and Internet access charges. The number of installed personal
computers in Nigeria has risen dramatically but internet
charges are still very high.
4.1.2 Spending on information and communications
technologies : In 2000, the OECD argued that the two factors
most likely to influence the future expansion of e-commerce
are:
(i) the extent to which IT companies invest in network
capacity, and
(ii) the speed of data transmissions (OECD 2000). In
Nigeria, the private sector have been investing more than
public sector to harness the digital economy.
Current e-commerce market in Nigeria: The degree to which
companies can emerge to produce and distribute e-commerce
products and services, and the degree to which consumers,
even ‘connected ones’, have the capacity to easily download
and use digitized products and services. In Nigeria the
Cashless policy of the CBN is a move to drive such
technology.
4.1.3 Policy The policy approach in Nigeria is encouraging but it has not
allowed for broad input into the policy formulation process.
(i) The National IT policy spearheaded by ITAN and CPN
are instances.
(ii) The CBN cashless policy is still at its infancy stage but
even within the two year application in Nigeria more Laptops,
Tablets, ATM and POS machines are now around the country
and more banks are driving internet banking and provision of
understanding and promotion of the development of e-
commerce and the information economy. However the gap
between the North and South is even becoming greater. For
instance in recent CBN report Lagos, Ogun, Anambra, Abia,
Abuja, Rivers and Kano are declared cashless environment
only Abuja and Kano are in the North the rest are in the south.
This causes a ‘digital divide’ in the country with skewed
access to ICTs.
(iii) Nigeria policy need to support a knowledge-based
society and help create an information economy
4.1.4 People
IT equipment without human capacity—people—to build and
use the applications makes the technologies and policies to be
for naught.
(i) Human capacity and skills shortage : Perhaps one of the
greatest challenges for Nigeria’s ability to harness the digital
economy comes in the form of human capacity. There is a
severe shortage of persons
(ii) Income inequality and poverty : Nigeria has an estimated
population of over 160 million, the population is relatively
young unemployed with more people poor and illiterate.
4.1.5 Strategy
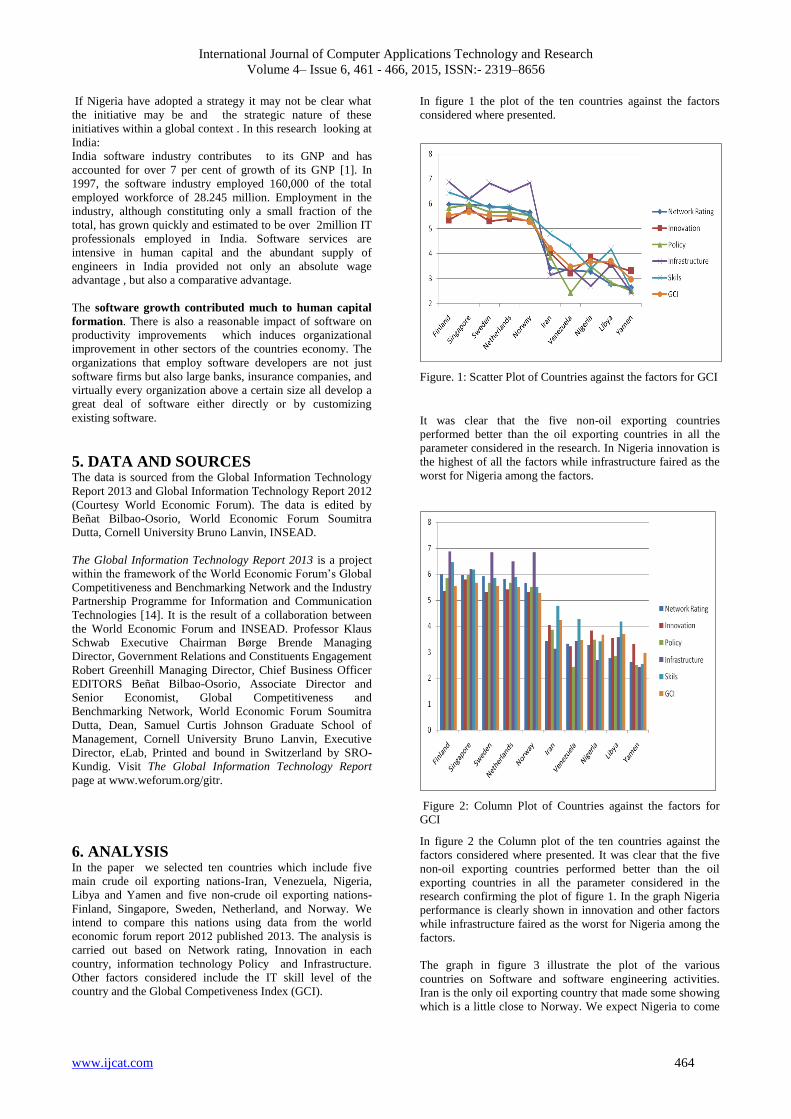
International Journal of Computer Applications Technology and Research
Volume 4– Issue 6, 461 - 466, 2015, ISSN:- 2319–8656
www.ijcat.com 464
If Nigeria have adopted a strategy it may not be clear what
the initiative may be and the strategic nature of these
initiatives within a global context . In this research looking at
India:
India software industry contributes to its GNP and has
accounted for over 7 per cent of growth of its GNP [1]. In
1997, the software industry employed 160,000 of the total
employed workforce of 28.245 million. Employment in the
industry, although constituting only a small fraction of the
total, has grown quickly and estimated to be over 2million IT
professionals employed in India. Software services are
intensive in human capital and the abundant supply of
engineers in India provided not only an absolute wage
advantage , but also a comparative advantage.
The software growth contributed much to human capital
formation. There is also a reasonable impact of software on
productivity improvements which induces organizational
improvement in other sectors of the countries economy. The
organizations that employ software developers are not just
software firms but also large banks, insurance companies, and
virtually every organization above a certain size all develop a
great deal of software either directly or by customizing
existing software.
5. DATA AND SOURCES The data is sourced from the Global Information Technology
Report 2013 and Global Information Technology Report 2012
(Courtesy World Economic Forum). The data is edited by
Beñat Bilbao-Osorio, World Economic Forum Soumitra
Dutta, Cornell University Bruno Lanvin, INSEAD.
The Global Information Technology Report 2013 is a project
within the framework of the World Economic Forum’s Global
Competitiveness and Benchmarking Network and the Industry
Partnership Programme for Information and Communication
Technologies [14]. It is the result of a collaboration between
the World Economic Forum and INSEAD. Professor Klaus
Schwab Executive Chairman Børge Brende Managing
Director, Government Relations and Constituents Engagement
Robert Greenhill Managing Director, Chief Business Officer
EDITORS Beñat Bilbao-Osorio, Associate Director and
Senior Economist, Global Competitiveness and
Benchmarking Network, World Economic Forum Soumitra
Dutta, Dean, Samuel Curtis Johnson Graduate School of
Management, Cornell University Bruno Lanvin, Executive
Director, eLab, Printed and bound in Switzerland by SRO-
Kundig. Visit The Global Information Technology Report
page at www.weforum.org/gitr.
6. ANALYSIS In the paper we selected ten countries which include five
main crude oil exporting nations-Iran, Venezuela, Nigeria,
Libya and Yamen and five non-crude oil exporting nations-
Finland, Singapore, Sweden, Netherland, and Norway. We
intend to compare this nations using data from the world
economic forum report 2012 published 2013. The analysis is
carried out based on Network rating, Innovation in each
country, information technology Policy and Infrastructure.
Other factors considered include the IT skill level of the
country and the Global Competiveness Index (GCI).
In figure 1 the plot of the ten countries against the factors
considered where presented.
Figure. 1: Scatter Plot of Countries against the factors for GCI
It was clear that the five non-oil exporting countries
performed better than the oil exporting countries in all the
parameter considered in the research. In Nigeria innovation is
the highest of all the factors while infrastructure faired as the
worst for Nigeria among the factors.
Figure 2: Column Plot of Countries against the factors for
GCI
In figure 2 the Column plot of the ten countries against the
factors considered where presented. It was clear that the five
non-oil exporting countries performed better than the oil
exporting countries in all the parameter considered in the
research confirming the plot of figure 1. In the graph Nigeria
performance is clearly shown in innovation and other factors
while infrastructure faired as the worst for Nigeria among the
factors.
The graph in figure 3 illustrate the plot of the various
countries on Software and software engineering activities.
Iran is the only oil exporting country that made some showing
which is a little close to Norway. We expect Nigeria to come
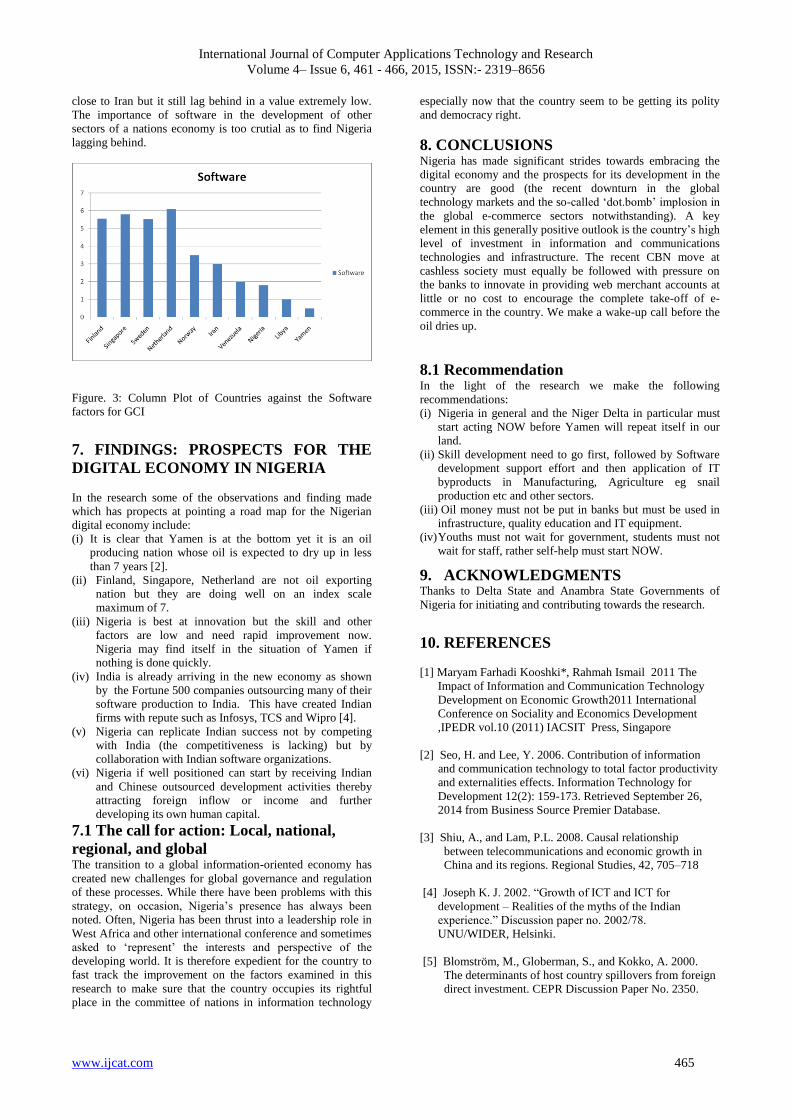
International Journal of Computer Applications Technology and Research
Volume 4– Issue 6, 461 - 466, 2015, ISSN:- 2319–8656
www.ijcat.com 465
close to Iran but it still lag behind in a value extremely low.
The importance of software in the development of other
sectors of a nations economy is too crutial as to find Nigeria
lagging behind.
Figure. 3: Column Plot of Countries against the Software
factors for GCI
7. FINDINGS: PROSPECTS FOR THE
DIGITAL ECONOMY IN NIGERIA
In the research some of the observations and finding made
which has propects at pointing a road map for the Nigerian
digital economy include:
(i) It is clear that Yamen is at the bottom yet it is an oil
producing nation whose oil is expected to dry up in less
than 7 years [2].
(ii) Finland, Singapore, Netherland are not oil exporting
nation but they are doing well on an index scale
maximum of 7.
(iii) Nigeria is best at innovation but the skill and other
factors are low and need rapid improvement now.
Nigeria may find itself in the situation of Yamen if
nothing is done quickly.
(iv) India is already arriving in the new economy as shown
by the Fortune 500 companies outsourcing many of their
software production to India. This have created Indian
firms with repute such as Infosys, TCS and Wipro [4].
(v) Nigeria can replicate Indian success not by competing
with India (the competitiveness is lacking) but by
collaboration with Indian software organizations.
(vi) Nigeria if well positioned can start by receiving Indian
and Chinese outsourced development activities thereby
attracting foreign inflow or income and further
developing its own human capital.
7.1 The call for action: Local, national,
regional, and global The transition to a global information-oriented economy has
created new challenges for global governance and regulation
of these processes. While there have been problems with this
strategy, on occasion, Nigeria’s presence has always been
noted. Often, Nigeria has been thrust into a leadership role in
West Africa and other international conference and sometimes
asked to ‘represent’ the interests and perspective of the
developing world. It is therefore expedient for the country to
fast track the improvement on the factors examined in this
research to make sure that the country occupies its rightful
place in the committee of nations in information technology
especially now that the country seem to be getting its polity
and democracy right.
8. CONCLUSIONS Nigeria has made significant strides towards embracing the
digital economy and the prospects for its development in the
country are good (the recent downturn in the global
technology markets and the so-called ‘dot.bomb’ implosion in
the global e-commerce sectors notwithstanding). A key
element in this generally positive outlook is the country’s high
level of investment in information and communications
technologies and infrastructure. The recent CBN move at
cashless society must equally be followed with pressure on
the banks to innovate in providing web merchant accounts at
little or no cost to encourage the complete take-off of e-
commerce in the country. We make a wake-up call before the
oil dries up.
8.1 Recommendation In the light of the research we make the following
recommendations:
(i) Nigeria in general and the Niger Delta in particular must
start acting NOW before Yamen will repeat itself in our
land.
(ii) Skill development need to go first, followed by Software
development support effort and then application of IT
byproducts in Manufacturing, Agriculture eg snail
production etc and other sectors.
(iii) Oil money must not be put in banks but must be used in
infrastructure, quality education and IT equipment.
(iv) Youths must not wait for government, students must not
wait for staff, rather self-help must start NOW.
9. ACKNOWLEDGMENTS Thanks to Delta State and Anambra State Governments of
Nigeria for initiating and contributing towards the research.
10. REFERENCES
[1] Maryam Farhadi Kooshki*, Rahmah Ismail 2011 The
Impact of Information and Communication Technology
Development on Economic Growth2011 International
Conference on Sociality and Economics Development
,IPEDR vol.10 (2011) IACSIT Press, Singapore
[2] Seo, H. and Lee, Y. 2006. Contribution of information
and communication technology to total factor productivity
and externalities effects. Information Technology for
Development 12(2): 159-173. Retrieved September 26,
2014 from Business Source Premier Database.
[3] Shiu, A., and Lam, P.L. 2008. Causal relationship
between telecommunications and economic growth in
China and its regions. Regional Studies, 42, 705–718
[4] Joseph K. J. 2002. “Growth of ICT and ICT for
development – Realities of the myths of the Indian
experience.” Discussion paper no. 2002/78.
UNU/WIDER, Helsinki.
[5] Blomström, M., Globerman, S., and Kokko, A. 2000.
The determinants of host country spillovers from foreign
direct investment. CEPR Discussion Paper No. 2350.
International Journal of Computer Applications Technology and Research
Volume 4– Issue 6, 461 - 466, 2015, ISSN:- 2319–8656
www.ijcat.com 466
[6] Srinivasan. T.N., and Bhagwati, J. 1999 "Outward-
Orientation and Development: Are revisionists rights?"
Yale University, mimeo # 806
[7] Bahmani-Oskooe, M., and Alse, S. 1993. “Export
Growth and Economic Growth: An application of
cointegration and error correction modeling.” Journal of
Developing Areas 27: 535-542.
[8] Addison, T. and Heshmati, A. 2003. “The new global
determinants of FDI flows to developing countries – The
importance of ICT and Democratization.” Discussion
paper no. 2003/45. UNU/WIDER. Helsinki
[9] Gholami, G., Tom Lee, S. and Heshmati, A. 2003. “The
causal relationship between Information and
communication technology and foreign direct
investment.” Discussion paper no. 2003/30,
UNU/WIDER, Helsinki.
[10] Cohen, S. S, Delong J. B., and John Z. 2000. 'Tools
for Thought:What is New and Important About the
‘Economy’?'Brie Working Paper138.
[11] Atkinson, R. D, and Court R. H. 1998. 'The New
Economy Index: Understanding America’s Economic
Transformation'. Progressive Policy Institute
Technology, Innovation, and New Economy Project;
November.(www.neweconomyindex.org)
[12] Gourevitch, P. 1986. Politics in Hard Times :
Comparative Responses to International Economic
Crises. Ithaca: Cornell University Press.
[13] Cogburn, D. L., and C. N. Adeya 2001. ‘Prospects for
the Digital Economy in South Africa Technology,
Policy, People, and Strategies . UNU/INTECH
Discussion Paper 2001/77. Maastricht, The Netherlands:
UNU/INTECH.
[14] Beñat B., Soumitra D., and Bruno L. 2013 The Global
Information Technology Report 2013, Growth and Jobs
in a Hyperconnected World, Pulished by World Economic
Forum USA.
[15]International Telecommunication Union 2010.
Measuring the Information Society: The ICT
Development Index, Place des Nations CH-1211 Geneva
Switzerland
11. ABOUT THE AUTHORS
Mrs Chinwe Ndigwe is a Lecturer at Department of Computer
Science, Anambra State University, Uli. Her research interest
is ICT and Data Mining..
Dr. Eke Bartholomew is a
Software Engineering Lecturer
in Uniport and Petroluem
Geoscience IT visiting
Instructor at Institute of
Petroluem Studies UPH. His
research interest is in SE
Methodologies and IT
deployment analysis.
International Journal of Computer Applications Technology and Research
Volume 4– Issue 6, 467 - 474, 2015, ISSN:- 2319–8656
www.ijcat.com 467
Association Analysis of Pharmaceutical Imports in Kenya
Christopher Moturi
School of Computing and Informatics
University of Nairobi
Nairobi, Kenya
Victor Wahinya Kahonge
School of Computing and Informatics
University of Nairobi
Nairobi, Kenya
Abstract: The objective of this study was to apply Data Mining in the analysis of imports of pharmaceutical products in Kenya with the
aim of discovering patterns of association and correlation among the various product groups. The RapidMiner Data Mining was used to
analyze data obtained from the Pharmacy and Poison Board, the regulator of pharmaceutical products in the country, covering the period
2008 to 2010. The CRISP method was used to get a business understanding of the Board, understand the nature of the data held, prepare
the data for analyze and actual analysis of the data. The results of the study discovered various patterns through correlation and
association analysis of various product groups. The results were presented through various graphs and discussed with the domain experts.
These patterns are similar to prescription patterns from studies in Ethiopia, Nigeria and India. The research will provide regulators of
pharmaceutical products, not only in Kenya but other African countries, a better insight into the patterns of imports and exports of
pharmaceutical products. This would result into better controls, not only in import and exports of the products, but also enforcement on
their usage in order to avert negative effects to the citizens.
Keywords: Data Mining, Pharmaceutical Imports, Drug Discovery, Pharmacy and Poisons Board of Kenya
1.0.INTRODUCTION A drug is any substance used to treat and or prevent disease.
According to the Kenyan Pharmacy and Poisons Act CAP 244
a drug includes any medicine, medicinal preparation or
therapeutic substance. A medicinal substance refers to any
medicine, product, article, or substance which is claimed to be
useful for purposes such as; treating, preventing, alleviating
disease or symptoms of disease, diagnosing disease, preventing
or interfering with the normal operation of a physiological
function whether permanently or temporarily. The Pharmacy
and Poisons Board (PPB) was created by an act of the Kenyan
Parliament in 1957 to make better provision for the control of
the profession of pharmacy and the trade in drugs and poisons.
PPB is mandated by the Kenya Government to regulate the
import and export of all medicines and their raw materials
which are referred to as active pharmaceutical ingredients.
PPB has in place information systems that generate vast
amounts of valuable data that, if exploited with the correct
tools, will enable management unlock the relevant knowledge
lying hidden in its databases and files. Currently PPB does not
employ any tools relating to artificial intelligence in the
extraction of knowledge from its data. However, with the
current technological advances and the need to adapt to current
trends will move it to utilizing the data they hold for more than
what they are using it for.
Data Mining (DM), a relatively new field of analysis, is defined
as the process of discovering several models, summaries and
derived values from a given collection of data (Kantardzic,
2011). Data Mining which is often referred to as Knowledge
Discovery in Databases (KDD) aims at the automatic
interpretation of large datasets (Kriegel, Borgwardt, Kröger,
Pryakhin, Matthias, &Zimek, 2007).
The potential of DM has been shown through application in
various medical disciplines. Wilson et al (2003) discussed the
potential use of data mining and knowledge discovery in
databases for detection of adverse drug events in
pharmacovigilance. They suggested the likely increase in
importance of DM in the process of pharmacovigilance as they
are likely to be able to detect signals earlier than using other
methods. Ji et al (2013) discussed the effects of applying DM
to the analysis of hierarchical nursing effects as an effective
method to help hospitals improve service quality and
strengthen clinical management. Other applications include
Santosa et al (2013) and Deshpande (2010).
This research sought to analyze the data on imports of
pharmaceutical products in Kenya with the aim of discovering
patterns of association and correlation between the various
pharmaceutical product groups. Pharmaceutical products are
highly sensitive in terms of monetary value and social
implications. Some of them are utilized in the black market to
produce drugs which can be abused by the general public. Other
pharmaceutical products such as antibiotics are prone to misuse
leading to drug resistance (Afsan, Haque, Alam, & Noor,
2012). The benefits of obtaining patterns of imports or exports
will be very valuable to pharmaceutical regulators in the
process of making decisions and forecasting future needs.
Control of such products will result in keeping citizens safe.
2.0.RELATED LITERATURE
2.1. Knowledge Discovery Process
Data Mining is a key phase in the process of Knowledge
Discovery in Databases that is used in the creation of models
from the mass data thus producing meaningful information. A
review of the applications of data mining techniques to support
knowledge management process has been done by
(Silwattananusarn & Tuamsuk, 2012). The process of Data
Mining has two primary goals which are prediction and
description of a particular dataset under study. Prediction
entails the use of some variables occurring in a data set so as to
predict unknown values of other relevant variables Predictive
data mining includes classification, regression, and anomaly
detection. Description entails the discovery of human
understandable patterns and sequences in the data. Descriptive
data mining includes clustering, association rule learning, and
summarization. Our study involved the use of descriptive data
mining so as to bring out the patterns in the data they hold. This
is because there is the need to know what information you hold
first before you proceed to predict the future with the current
data. The iterative nature of knowledge discovery process is
represented by the model shown in fig 1.

International Journal of Computer Applications Technology and Research
Volume 4– Issue 6, 467 - 474, 2015, ISSN:- 2319–8656
www.ijcat.com 468
Figure 1: Process steps of Knowledge Discovery Source: http://www.microsegment.hu/ms/methodology1.php
The steps are outlined below.
Business Understanding - This initial phase focuses on
understanding the project objectives and requirements from a
business perspective and then converting this knowledge into a
data mining problem definition, and a preliminary project plan
designed to achieve the objectives.
Data Understanding - The data understanding phase starts with
an initial data collection and proceeds with activities in order to
get familiar with the data. Its aim is to identify data quality
problems, to discover first insights into the data, or to detect
interesting subsets to form hypotheses for hidden information.
Data Preparation - The data preparation phase covers all
activities to construct the final dataset from the initial raw data.
Raw data is usually noisy, incomplete or impure which is very
likely to hamper the discovery useful patterns Current data
mining tools require high quality data and high quality data
results in intelligent patterns (Zhang, Zhang, & Yang, 2003).
Data preparation tasks are likely to be performed multiple
times, and not in any prescribed order. Tasks include table,
record, and attribute selection, data cleaning, construction of
new attributes, and transformation of data for modelling tools.
Modelling - In this phase, various modelling techniques are
selected and applied, and their parameters are calibrated to
optimal values. Typically, there are several techniques for the
same data mining problem type as some techniques require
specific data formats. There is a close link between Data
Preparation and Modelling. Often, one realizes data problems
while modelling or one gets ideas for constructing new data.
Evaluation - At this stage evaluation of models built are
thoroughly evaluated in order to ascertain that it properly
answers the business questions and satisfies the objectives set
out at the beginning. Once this is complete, the model can now
be used by the customer to solve the problem or satisfy the
objectives set out.
Deployment - After the creation of the model, the usefulness of
the model needs to be utilised by the customer (Džeroski,
2007), thereby justifying why so much time and resources have
been spent on the project. The aim of this phase is to hand over
the model to the customer in a way that he/she can utilise it on
other similar scenarios with the same data source.
2.2. Knowledge Discovery in the
Pharmaceutical Industry
The pharmaceutical industry mainly relies on decision oriented
and systemic selection models which enable decision makers to
evaluate the expected results of management decisions. A
firm’s competitive advantage and decision making ability can
be greatly increased through the understanding of knowledge
hidden in pharmaceutical data (Ranjan, 2007).This can be done
through the application knowledge discovery to data
repositories held by organizations. Data mining is currently
being utilized in the development of solutions for the
pharmaceutical industry in areas such as such as drug discovery
technology, improved marketing strategies, and decision
support (Yang, Adelstein, &Kassis, 2009). Yang et al (2009)
propose data mining in the Target Discovery phase of the
process of drug discovery as this phase utilizes biological data
and information contained in vast data warehouses that usually
double every two years or so.
Studies have been done to determine prescription patterns of
the specific medicines within the pharmaceutical product
groups. Studies done in Ethiopia show that the average number
of drugs per prescription ranges from 1.98 to 2.24 (Angamo,
Wabe, & Raju, 2011) and this goes to show that a visit to the
hospital or pharmacy outlet will give a person more than one
type of drug. Studies by (Kajungu, et al., 2012) shows that
indeed there is irrational use of drugs in Tanzania which is quite
similar to Kenya. Our study was aimed at understanding
prescribing patterns in health facilities in order to reduce the
rate of irrational use of drugs. The study utilized classification
trees which are generally easy to represent information
obtained from analysis. Kajungu et al (2012) propose that data
mining is paramount in the process of the identification and
control of polypharmacy. While polypharmacy may not
necessarily be wrong, the practice may place patients at high
risk of adverse drug reactions and increased bacterial
resistance. The same phenomenon is replicated in a study in
Nigeria by (Okoro & Shekari, 2013) where there is a high
occurrence of polypharmacy.
2.3. Review of Knowledge Discovery Tools
2.3.1. WEKA WEKA (Waikato Environment for Knowledge Analysis) is an
open source data mining tool consisting of a wide array of state-
of-the-art data mining and machine learning algorithms which
are implemented in Java (Mikut&Reischl, 2011). The
algorithms can either be applied directly to a dataset or called
from Java code (Hall, Frank, Holmes, Pfahringer, Reutemann,
& Witten, 2012). WEKA is recognized as a landmark system
in data mining and machine learning. It has achieved
widespread acceptance within academia and business circles,
and has become a widely used tool for data mining research.
WEKA has several tools incorporated into its structure namely:
Data pre-processing, Classification, Regression, Clustering,
Association rules and Visualization. WEKA has a modular and
extensible architecture allowing users to test and compare
different machine learning methods on new data sets while
building sophisticated data mining processes from the wide
collection of base algorithms.
2.3.2. KEEL KEEL (Knowledge Extraction based on Evolutionary
Learning) is an open source software that supports data
management and a designer of experiments while paying
special attention to the implementation of evolutionary learning
and soft computing based techniques for Data Mining problems
including regression, classification, clustering, and pattern
mining (Alcalá-Fdez, et al., 2011). KEEL is implemented in
Java and empowers the user to analyze the behaviour of
evolutionary learning for different kinds of DM problems such
as regression, classification, unsupervised learning. KEEL
contains a library with evolutionary learning algorithms based
on different paradigms and simplifies the integration of
evolutionary learning algorithms with different pre-processing
techniques thus reducing programming work. It requires less
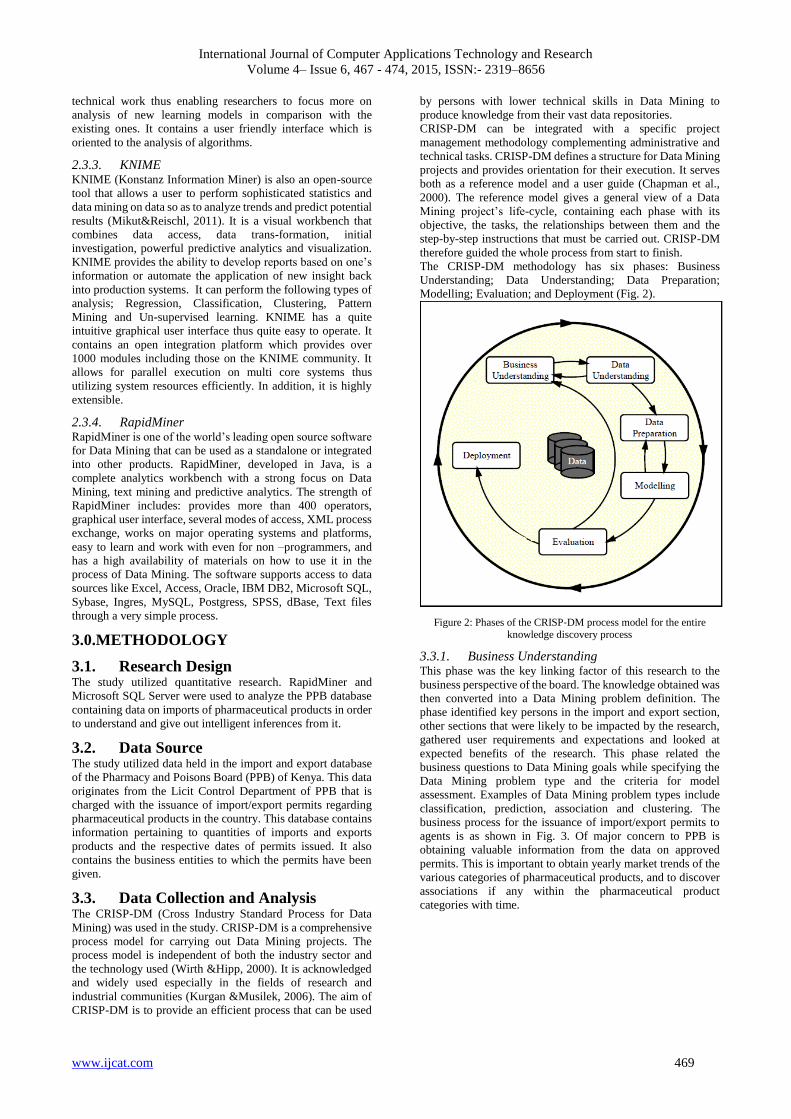
International Journal of Computer Applications Technology and Research
Volume 4– Issue 6, 467 - 474, 2015, ISSN:- 2319–8656
www.ijcat.com 469
technical work thus enabling researchers to focus more on
analysis of new learning models in comparison with the
existing ones. It contains a user friendly interface which is
oriented to the analysis of algorithms.
2.3.3. KNIME KNIME (Konstanz Information Miner) is also an open-source
tool that allows a user to perform sophisticated statistics and
data mining on data so as to analyze trends and predict potential
results (Mikut&Reischl, 2011). It is a visual workbench that
combines data access, data trans-formation, initial
investigation, powerful predictive analytics and visualization.
KNIME provides the ability to develop reports based on one’s
information or automate the application of new insight back
into production systems. It can perform the following types of
analysis; Regression, Classification, Clustering, Pattern
Mining and Un-supervised learning. KNIME has a quite
intuitive graphical user interface thus quite easy to operate. It
contains an open integration platform which provides over
1000 modules including those on the KNIME community. It
allows for parallel execution on multi core systems thus
utilizing system resources efficiently. In addition, it is highly
extensible.
2.3.4. RapidMiner RapidMiner is one of the world’s leading open source software
for Data Mining that can be used as a standalone or integrated
into other products. RapidMiner, developed in Java, is a
complete analytics workbench with a strong focus on Data
Mining, text mining and predictive analytics. The strength of
RapidMiner includes: provides more than 400 operators,
graphical user interface, several modes of access, XML process
exchange, works on major operating systems and platforms,
easy to learn and work with even for non –programmers, and
has a high availability of materials on how to use it in the
process of Data Mining. The software supports access to data
sources like Excel, Access, Oracle, IBM DB2, Microsoft SQL,
Sybase, Ingres, MySQL, Postgress, SPSS, dBase, Text files
through a very simple process.
3.0.METHODOLOGY
3.1. Research Design The study utilized quantitative research. RapidMiner and
Microsoft SQL Server were used to analyze the PPB database
containing data on imports of pharmaceutical products in order
to understand and give out intelligent inferences from it.
3.2. Data Source The study utilized data held in the import and export database
of the Pharmacy and Poisons Board (PPB) of Kenya. This data
originates from the Licit Control Department of PPB that is
charged with the issuance of import/export permits regarding
pharmaceutical products in the country. This database contains
information pertaining to quantities of imports and exports
products and the respective dates of permits issued. It also
contains the business entities to which the permits have been
given.
3.3. Data Collection and Analysis The CRISP-DM (Cross Industry Standard Process for Data
Mining) was used in the study. CRISP-DM is a comprehensive
process model for carrying out Data Mining projects. The
process model is independent of both the industry sector and
the technology used (Wirth &Hipp, 2000). It is acknowledged
and widely used especially in the fields of research and
industrial communities (Kurgan &Musilek, 2006). The aim of
CRISP-DM is to provide an efficient process that can be used
by persons with lower technical skills in Data Mining to
produce knowledge from their vast data repositories.
CRISP-DM can be integrated with a specific project
management methodology complementing administrative and
technical tasks. CRISP-DM defines a structure for Data Mining
projects and provides orientation for their execution. It serves
both as a reference model and a user guide (Chapman et al.,
2000). The reference model gives a general view of a Data
Mining project’s life-cycle, containing each phase with its
objective, the tasks, the relationships between them and the
step-by-step instructions that must be carried out. CRISP-DM
therefore guided the whole process from start to finish.
The CRISP-DM methodology has six phases: Business
Understanding; Data Understanding; Data Preparation;
Modelling; Evaluation; and Deployment (Fig. 2).
Figure 2: Phases of the CRISP‐DM process model for the entire
knowledge discovery process
3.3.1. Business Understanding This phase was the key linking factor of this research to the
business perspective of the board. The knowledge obtained was
then converted into a Data Mining problem definition. The
phase identified key persons in the import and export section,
other sections that were likely to be impacted by the research,
gathered user requirements and expectations and looked at
expected benefits of the research. This phase related the
business questions to Data Mining goals while specifying the
Data Mining problem type and the criteria for model
assessment. Examples of Data Mining problem types include
classification, prediction, association and clustering. The
business process for the issuance of import/export permits to
agents is as shown in Fig. 3. Of major concern to PPB is
obtaining valuable information from the data on approved
permits. This is important to obtain yearly market trends of the
various categories of pharmaceutical products, and to discover
associations if any within the pharmaceutical product
categories with time.

International Journal of Computer Applications Technology and Research
Volume 4– Issue 6, 467 - 474, 2015, ISSN:- 2319–8656
www.ijcat.com 470
* AgentPermit
VerificationImport/Export Permit Application
Verified
Permits
Verified Permit
Invoicing and
Payments
Verified Permit
Permits for
assessment
Fully paid permit
Permit
Assessment
Fully paid permit
Approved
Permits
Permit issue
Approved permit
Approved Permit
Approved permit
* Agent
Invoice
Payment
Figure 3: Data flow diagram representing the process of the application
of a permit till issue
3.3.2. Data Understanding Data on imports and exports permits was available from the
electronic data repository from the data entry system. The
database is housed in Microsoft Access and contains several
tables and the tables have several attributes. The following are
the tables as they appear in the repository of the data entry
system.
Table 1: Summary of the PPB Import/Export Database
Table name Information contained
dbo_dbo_Agent Stores basic information of the agent such
as City, Postal Address, Telephone
Number and email
dbo_dbo_invoice Stores information on the Proforma
Invoice of each consignment, the
manufacturer, the agent importing the
consignment, the origin country and port,
destination country and port, and the
Invoice Value of the consignment
dbo_dbo_Manufacturer Stores basic information of the
Manufacturer such as City, Postal
Address, Telephone Number and email
dbo_dbo_Country Stores a list of all countries in the world
dbo_dbo_LineItem Stores detailed information of the
products imported/exported within each
proforma Invoice. It is linked to
dbo_dbo_invoice via a foreign key and is
also linked to dbo_dbo_IDF via foreign
key
dbo_dbo_IDF Stores data from the IDF details such as
the IDF total value, IDF number and the
date of import
Fig. 4 shows an illustration of the various relationships that exist
in the database that was used in the generation of queries to the
database.
dbo_dbo_Agent
PK ID
AgentName
Address
PostalCode
Town
Tel1
Comments
dbo_dbo_invoice
PK ID
InvoiceNo
FK2 ManufacturerID
FK1 AgentID
FK3 OriginCountry
OriginPort
DestinationCountry
DestinationPort
InvoiceFOB
dbo_dbo_Manufacturer
PK ID
Name
Address
PostalCode
Town
Tel1
dbo_dbo_Country
PK ID
Country
dbo_dbo_LineItem
PK,FK2 ID
ItemID
FK1 InvoiceID
FK2 IDFID
UnitOfQuantity
PackUnits
Quantity
FOBValue
dbo_dbo_IDF
PK ID
RefNo
Date
AgentID
FK1 CountryID
TotalValue
PhamacistInCharge
Figure 4: Entity relationship diagram of the PPB import / export
database
3.3.3. Data Preparation A full backup of the database was taken from PPB and migrated
to Microsoft SQL Server through the Upsizing wizard present
in Microsoft Access. Based on the relationships outlined in the
data understanding phase, specific database scripts (see
appendix 1) were developed to query the database of relevant
data for the study. On running scripts missing data was
identified and upon discussion with domain experts it was
agreed to omit all missing values.
The process of data entry skipped the years 2009 and 2010.
Classification is usually done by the domain experts, who in
this case are pharmacists and pharmaceutical technologists,
who are conversant with the Kenyan pharmaceutical market.
They usually match the names on the product to a list of
existing group for example in the group ‘Antibiotic’ there are
products having the name or part of their name containing
‘Amoxil’, a product having part of its name as ‘Malarid’ is
likely to fall within the category if ‘Anti-Malarials’ and so on.
Due to the large number of records in the database, it was close
to impossible to classify the items one by one through a
pharmaceutical expert.
With this knowledge of the technique of matching, a sample of
all product names and their respective group names was
obtained from PPB and this was used to generate a database
script that was used to group all the products into their
respective classifications. A new table was created to contain
the names of all product categories and their category ID.
3.3.4. Modelling The data obtained from the data preparation phase was fed into
the RapidMiner for analysis. Since our data was in MSSQL
Server, the first step was to create a database connection to be
used to connect RapidMiner to MSSQL Server without having
to specify the details over and over again each time a new query
is to be run. The dates were changed appropriately so that the
results could be obtained for the various years within the
dataset. The next stage is the opening of a new ‘process’ which
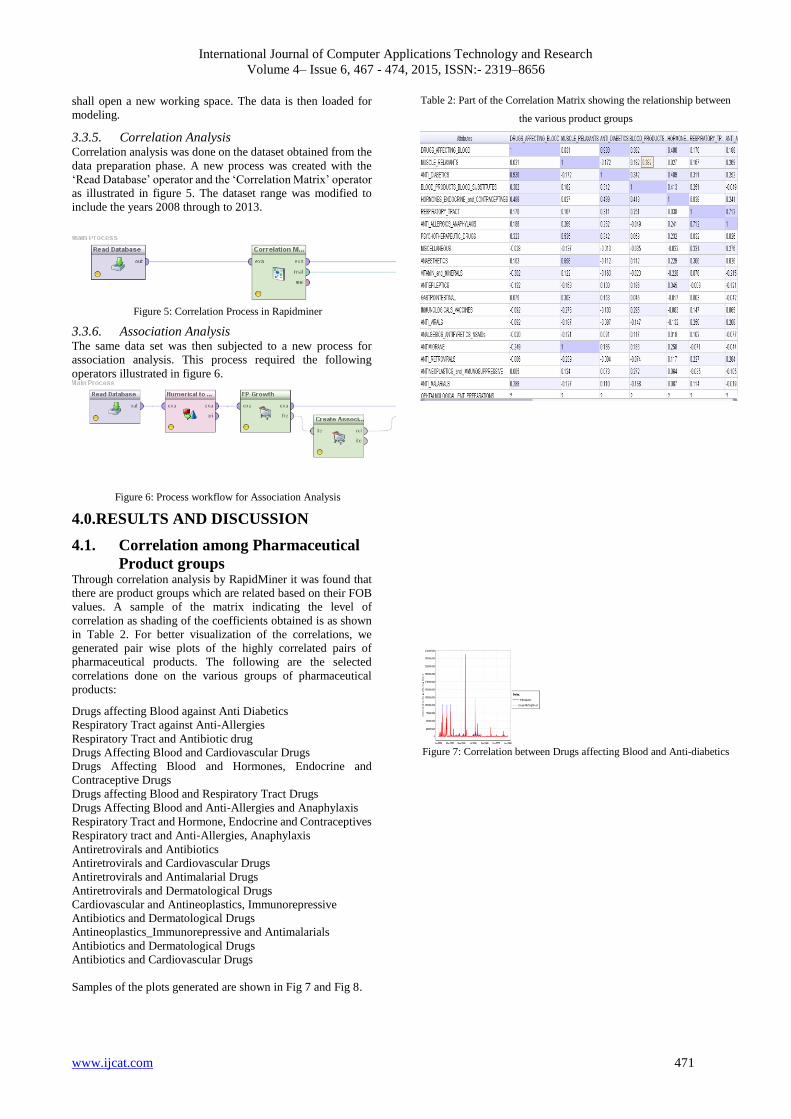
International Journal of Computer Applications Technology and Research
Volume 4– Issue 6, 467 - 474, 2015, ISSN:- 2319–8656
www.ijcat.com 471
shall open a new working space. The data is then loaded for
modeling.
3.3.5. Correlation Analysis Correlation analysis was done on the dataset obtained from the
data preparation phase. A new process was created with the
‘Read Database’ operator and the ‘Correlation Matrix’ operator
as illustrated in figure 5. The dataset range was modified to
include the years 2008 through to 2013.
Figure 5: Correlation Process in Rapidminer
3.3.6. Association Analysis The same data set was then subjected to a new process for
association analysis. This process required the following
operators illustrated in figure 6.
Figure 6: Process workflow for Association Analysis
4.0.RESULTS AND DISCUSSION
4.1. Correlation among Pharmaceutical
Product groups Through correlation analysis by RapidMiner it was found that
there are product groups which are related based on their FOB
values. A sample of the matrix indicating the level of
correlation as shading of the coefficients obtained is as shown
in Table 2. For better visualization of the correlations, we
generated pair wise plots of the highly correlated pairs of
pharmaceutical products. The following are the selected
correlations done on the various groups of pharmaceutical
products:
Drugs affecting Blood against Anti Diabetics
Respiratory Tract against Anti-Allergies
Respiratory Tract and Antibiotic drug
Drugs Affecting Blood and Cardiovascular Drugs
Drugs Affecting Blood and Hormones, Endocrine and
Contraceptive Drugs
Drugs affecting Blood and Respiratory Tract Drugs
Drugs Affecting Blood and Anti‐Allergies and Anaphylaxis
Respiratory Tract and Hormone, Endocrine and Contraceptives
Respiratory tract and Anti‐Allergies, Anaphylaxis
Antiretrovirals and Antibiotics
Antiretrovirals and Cardiovascular Drugs
Antiretrovirals and Antimalarial Drugs
Antiretrovirals and Dermatological Drugs
Cardiovascular and Antineoplastics, Immunorepressive
Antibiotics and Dermatological Drugs
Antineoplastics_Immunorepressive and Antimalarials
Antibiotics and Dermatological Drugs
Antibiotics and Cardiovascular Drugs
Samples of the plots generated are shown in Fig 7 and Fig 8.
Table 2: Part of the Correlation Matrix showing the relationship between
the various product groups
Figure 7: Correlation between Drugs affecting Blood and Anti-diabetics
International Journal of Computer Applications Technology and Research
Volume 4– Issue 6, 467 - 474, 2015, ISSN:- 2319–8656
www.ijcat.com 472
Figure 8: Correlation between Respiratory Tract against Anti‐Allergics
From the selected plots of correlated product groups, the
presence of correlation can be visually confirmed in addition to
the correlation matrix. These correlations are indicative of the
fact that importation of Respiratory Tract drugs and Anti-
Allergics occurs simultaneously. The same case applies to
Drugs Affecting Blood and Anti-diabetics. These correlations
also indicate that an increase in the value of imports of one
category is directly linked to an increase in the other.
4.2. Association Analysis The occurrence of frequent item sets is common within
transactions containing items. Frequent item sets are simply
groups of items that often occur together in a data set. The data
on imports of pharmaceuticals contains various associations. It
was observed that the product group Antibiotics is associated
to a number of other combinations of product groups which
implies that within the various item sets, there exists an
Antibiotic. It also implies that an antibiotic is a common
conclusion to many product groups imported into the country.
Table 3: Association Rules obtained from Rapid Miner at 0.95
confidence level
PREMISES CONCLUSION SUPPORT CONFIDENCE
DERMATOLOGICAL ANTI_BIOTICS 0.618557 0.952381
GASTROINTESTINAL, ANALGESICS
ANTIPYRETICS_NSAIDs
ANTI_BIOTICS 0.573883 0.95977
GASTROINTESTINAL,
RESPIRATORY_TRACT
ANTI_BIOTICS 0.573883 0.965318
GASTROINTESTINAL,
DERMATOLOGICAL
ANTI_BIOTICS 0.563574 0.982036
ANTI_BIOTICS, CARDIOVASCULAR GASTROINTESTINAL 0.560137 0.958824
GASTROINTESTINAL,
CARDIOVASCULAR
ANTI_BIOTICS 0.560137 0.970238
ANALGESICS_ANTIPYRETICS_NSAIDs,
RESPIRATORY_TRACT
ANTI_BIOTICS 0.539519 0.969136
ANALGESICS_ANTIPYRETICS_NSAIDs,
RESPIRATORY_TRACT
GASTROINTESTINAL 0.532646 0.95679
ANALGESICS_ANTIPYRETICS_NSAIDs,
DERMATOLOGICAL
ANTI_BIOTICS 0.52921 0.968553
ANALGESICS_ANTIPYRETICS_NSAIDs,
CARDIOVASCULAR
ANTI_BIOTICS 0.522337 0.962025
Investigation of the associations conducted included the
following groups of pharmaceutical products:
Dermatological and Antibiotics
Gastrointestinal, Analgesic, Antipyretic, NSAIDS and
Antibiotics
Gastrointestinal, Antibiotics and Respiratory Tract
Gastrointestinal, Dermatological and Antibiotics
Antibiotics, Cardiovascular and Intestinal Drugs
Analgesics, Antipyretics, NSAIDS, Respiratory Tract and
Antibiotics
Analgesics, Antipyretics, NSAIDS, Dermatological and
Antibiotics
Analgesics, Antipyretics, NSAIDS, Cardiovascular and
Antibiotics
Sample charts are shown in Fig 9 and Fig 10
Figure 9: Association among three Products - Gastrointestinal,
Respiratory Tract and Antibiotics
Figure 10: Association among three Products – Gastrointestinal,
Cardiovascular, and Antibiotics

International Journal of Computer Applications Technology and Research
Volume 4– Issue 6, 467 - 474, 2015, ISSN:- 2319–8656
www.ijcat.com 473
The following is a brief description of the functions of the
mentioned categories:
Gastrointestinal – Drugs that are used to treat ailments of the
digestive system which is also referred to as the gastrointestinal
tract.
Antibiotics – Drugs that are used to treat diseases brought about
by bacterial infections.
Respiratory Tract – drugs that are used in the treatment of
diseases affecting the respiratory system.
Cardiovascular- Drugs used to control ailments related to the
heart and blood circulation
4.3. Discussion After performing correlation and association analysis on the
data on imports of pharmaceutical products, some inferences
can be made from it. From correlation analysis, it can be
concluded that within the pharmaceutical product groups
imported, there are related pairs based on the results of the
coefficients in the correlation matrix. From association
analysis, it can be shown that there are associations between
several product groups which are represented as frequent item
sets. The results also show that there are rules to which the
instantaneous imports are done. For every instant purchase of
Gastrointestinal and Dermatological drug, there is an Antibiotic
drug as indicated by the rule Gastrointestinal, Dermatological
Antibiotics with a confidence of 0.982036. These are
indicative of various product groups being imported at the same
time and a particular order of occurrence. The common
occurrence of Antibiotics as a conclusion to most premises is
indicative of the fact that antibiotics are widely used to treat
many infections which are mostly bacterial in nature. Graphs
of combined product groups plotted against time, for example
Gastrointestinal, Respiratory Tract, and Antibiotics, show a
similar trend to confirm their association with periods of
inactivity in June and September.
There is a major concern on the use of antibiotics, cough and
cold medicines, painkillers and anti-diarrhœals in many
developing countries (Le Grand, Hogerzeil, &Haaijer-Ruskam,
1999). The study shows that the sales of the aforementioned
classes of medicines exceed the medical condition they are
supposed to treat. From the association and correlation analysis
done, it can be assumed that inflow of drugs into Kenya follows
distinct patterns.
Through this research, we have demonstrated the existence of
correlations and associations among the various groups of
pharmaceutical products imported to Kenya. There correlations
and associations are well described through the observation of
trends of the particular product groups of interest. These trends
are most likely due to the market responding to a particular
need or situation. Research has shown that a visit to a hospital
is likely to result in the prescription of a number of medicines
to cure the ailment suffered (Adebayo &Hussain, 2010).
Usually quite a number of Antibiotics are prescribed.
Research in Bangladesh on drug use and prescribing patterns
of medical staff shows existence of a trend on issuance of
multiple medicines or poly-pharmacy (Afsan et al, 2012). The
same phenomenon is replicated in Ethiopia whereby the
average number of drugs per prescription ranges from 1.98 to
2.24 (Angamo, Wabe, &Raju, 2011). The issuance of multiple
medicines to a patient implies that there are associations
between the various types of medicines available in the country
and hence the importance of discovering these association
patterns within them.
5.0.CONCLUSION
This research sought to demonstrate the application of Data
Mining in the analysis of imports of pharmaceutical products
in Kenya with the objective of discovering patterns of
association and correlation among the product groups.
Correlation analysis showed the product groups which are
related. Association analysis showed the combination of
product groups that are associated, for Antibiotics and several
other groups.
It is hoped that this research will give regulators of
pharmaceutical products in African countries a better insight
into the usage of permits and licenses issued to agents for
imports and exports of pharmaceutical products. This would
result into better control mechanisms of the patterns of import
and exports of the products in order to keep their citizen safe
from abuse of these highly controlled products.
Associations between the various pharmaceutical product
groups and the deduction that this is linked to the actual use,
would require the regulators, such as the Pharmacy and Poison
Board (PPB) of Kenya, to enforce its influence in the use of
doctors’ prescriptions in drug shops or liaise with partner
regulatory boards such as those regulating doctors to look into
the composition of their prescriptions of medicines to patients.
The study can provide regulators with indications of excessive
or limited amounts of a particular category of product so as to
trigger the necessary regulatory action within its mandate to
address the situation and avert negative effects to the country’s
citizens. The study might also trigger the investigation of the
use of a particular product group, for example Antibiotics, with
the aim of enforcing their proper use to reduce resistance and
other issues related to their abuse.
6.0.REFERENCES
Angamo, M. T., Wabe, N. T., & Raju, N. J. (2011).
Assessment of Patterns of Drug use by using World
Health Organization’s Prescribing,Patient Care and
Health facility indicators inSelected Health
Facilities in Southwest Ethiopia. Journal of Applied
Pharmaceutical Science, 7, 62 - 66.
Džeroski, S. (2007). Towards a General Framework for Data
Mining. Knowledge Discovery in Inductive
Databases, 4747.
Kajungu, D. K., Selemani, M., Masanja, I., Baraka, A., Njozi,
M., Khatib, R., . . . Speybroeck, N. (2012). Using
classification tree modelling to investigate drug
prescription practices at health facilities in rural
Tanzania. Malaria Journal, 11: 311.
Kantardzic, M. (2011). Data Mining: Concepts, Models,
Methods, and Algorithms. New Jersey: John Wiley
& Sons.
Kriegel, H.-P., Borgwardt, K. M., Kröger, P., Pryakhin, A.,
Matthias, & Zimek, A. (2007). Future trends in data
mining. Data Mining Knowledge Discovery, 15:87–
97.
Kurgan, L. A., & Musilek, P. (2006). A survey of Knowledge
Discovery and Data Mining Process Models. The
Knowledge Engineering Review, 1 - 24.
Le Grand, A., Hogerzeil, H. V., & Haaijer-Ruskam, F. M.
(1999). Intervention Research in Rational use of
International Journal of Computer Applications Technology and Research
Volume 4– Issue 6, 467 - 474, 2015, ISSN:- 2319–8656
www.ijcat.com 474
Drugs: a Review. Health Policy and Planning, 89 -
102.
Okoro, R. N., & Shekari, B. G. (2013). Physicians’ drug
prescribing patterns at the national health insurance
scheme unit of a teaching hospital in the North
Eastern Nigeria. Archives of Pharmacy Practice,
4(1), 3-8.
Ranjan, J. (2007). Application of Data Mining Techniques in
the Pharmaceutical Industry. Journal of Theoretical
and Applied Information Technology, 61 - 67.
Silwattananusarn, T., & Tuamsuk, K. (2012). Data
Management and Its Application for Knowledge
Management: A Literature Review from 2007 to
2012. International Journal of Data Mining &
Knowledge Management Process, 13 - 24.
Wirth, R., & Hipp, J. (2000). CRISP-DM: Towards a
Standard Process Model for Data Mining.
Proceedings of the 4th International Conference on
the Practical Applications of Knowledge Discovery
and Data Mining, 29 - 39.
Yang, Y., Adelstein, S. J., & Kassis, A. I. (2009, February).
Target discovery from data mining approaches.
Drug Discovery Today, 14(3-4), 147-154.
Zhang, S., Zhang, C., & Yang, Q. (2003). Data Preparation
for Data Mining. Applied Artificial Intelligence, 375
- 381.
International Journal of Computer Applications Technology and Research
Volume 4– Issue 6, 475 - 480, 2015, ISSN:- 2319–8656
www.ijcat.com 475
Performance Analysis of MLP, Modified ERNN
and TDNN on Telugu Command Recognition
Smt. P. Prithvi
NIT Warangal
Warangal, India
B. Kishore Kumar
NIT Warangal
Warangal, India
Abstract: In this paper, Telugu speech recognition is implemented using MLP and dynamic neural networks in MATLAB. Ten
Telugu commands are the words of interest for recognition. Speech samples are collected for ten Telugu words from 30 different
speakers in a noise free environment. Front end processing and LPC feature extraction are applied to raw speech data. Data is divided
into training and testing sets. This paper gives different topologies of Artificial Neural Networks are used to investigate the Automated
Speech Recognition of Telugu speech. The neural network topologies considered are MLP, Modified ERNN and TDNN. The word
models are created by giving training data set as inputs to these networks and trained using backpropagation algorithm. Each neural
network is trained to identify and classify the words into the respective word models. The testing data set is used to analyze the
performance of the network.
Keywords: Telugu command Recognition, MLP, Modified ERNN, TDNN and Backpropagation.
1. INTRODUCTION The motive of speech recognition is to design a system that
can be used to automate many tasks that previously required
hands– on human interaction, such as recognizing simple
spoken commands. A variety of methods and tools are
available to implement speech recognition for small size
vocabulary to voluminous dictionary applications. The
simplest task in human machine communication is recognition
of isolated words.
The concept of speech recognition started in early 1940s [3],
practically the first speech recognition program has came into
sight in 1952 at the bell labs, which was about to identify a
digit in the clean environment [4], [5]. The work on speech
recognition is extended to large vocabularies were used and
the statistical analysis is introduced in the speech
recognition with a wide range of networks for handling
language structures were implemented [16]. The invention of
hidden markov model (HMM) and the statistical models
together allowed researchers to solve continuous speech
recognition problem [3].
In 1990s, the major technologies used were statistical
language understanding, acoustic learning and language
models, and many methods were implemented for large
vocabulary speech understanding systems.
In recent years, the speech recognitions developed for
different languages. Syllable based speech recognition has
been adopted for various languages in the literature. This had
been developed for Japanese [12], Portuguese [13] and many
others.
After so much of research, different methods in speech
recognition have finally benefiting the users in variety of
ways. The main goal of designing a system that acts like an
intelligent human. So far, there has been less research on
Telugu speech recognition compared to the other languages.
So, I was motivated to find out the best recognition method
for Telugu speech recognition.
To apply different neural network topologies i.e., MLP,
TDNN and modified ERNN to implement the automatic
speech recognition to detect the Telugu commands. To
compare the accuracy of the different techniques used.
The thesis gives is organized in 5 parts. The part II gives the
methodology in which different methods for speech
recognition are explained. The part III framed by the result of
used methods. The chapter IV framed by the conclusions and
the future work. Finally, references are given in the chapter V.
2. METHODOLOGY The standard architecture of speech recognition system is
illustrated in Figure 1. The elements are as follows:
Figure. 1 Recognition system Architecture
Speech signal: acquired speech signal is sampled at a high
frequency e.g., 16 KHz over a microphone or 8 KHz over a
telephone. This gives the amplitude values of the speech
signal over time.
Signal analysis: acquired speech initially transformed, to
make the further processing steps easy. Signal analysis
techniques which can extract the features from the speech
signal.
Linear Predictive Coding (LPC) gives different coefficients of
a linear equation that estimate the past history of the acquired
speech signal.
Classifier: This block is to classify the different words. The
classifiers considered are MLP and Modified ERNN.
Recognition
Results
Speech
signal
Pre-
processing
Word
Models
Feature
Extraction
Classifier
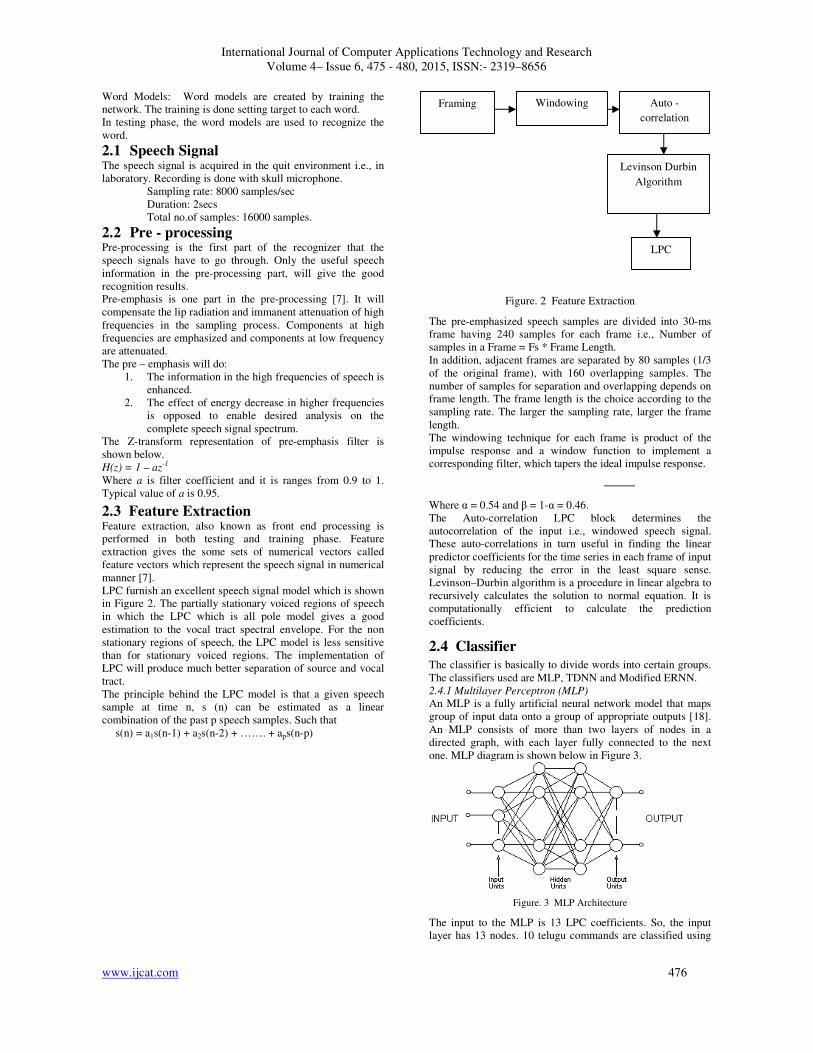
International Journal of Computer Applications Technology and Research
Volume 4– Issue 6, 475 - 480, 2015, ISSN:- 2319–8656
www.ijcat.com 476
Word Models: Word models are created by training the
network. The training is done setting target to each word.
In testing phase, the word models are used to recognize the
word.
2.1 Speech Signal The speech signal is acquired in the quit environment i.e., in
laboratory. Recording is done with skull microphone.
Sampling rate: 8000 samples/sec
Duration: 2secs
Total no.of samples: 16000 samples.
2.2 Pre - processing Pre-processing is the first part of the recognizer that the
speech signals have to go through. Only the useful speech
information in the pre-processing part, will give the good
recognition results.
Pre-emphasis is one part in the pre-processing [7]. It will
compensate the lip radiation and immanent attenuation of high
frequencies in the sampling process. Components at high
frequencies are emphasized and components at low frequency
are attenuated.
The pre – emphasis will do:
1. The information in the high frequencies of speech is
enhanced.
2. The effect of energy decrease in higher frequencies
is opposed to enable desired analysis on the
complete speech signal spectrum.
The Z-transform representation of pre-emphasis filter is
shown below.
H(z) = 1 – az-1
Where a is filter coefficient and it is ranges from 0.9 to 1.
Typical value of a is 0.95.
2.3 Feature Extraction Feature extraction, also known as front end processing is
performed in both testing and training phase. Feature
extraction gives the some sets of numerical vectors called
feature vectors which represent the speech signal in numerical
manner [7].
LPC furnish an excellent speech signal model which is shown
in Figure 2. The partially stationary voiced regions of speech
in which the LPC which is all pole model gives a good
estimation to the vocal tract spectral envelope. For the non
stationary regions of speech, the LPC model is less sensitive
than for stationary voiced regions. The implementation of
LPC will produce much better separation of source and vocal
tract.
The principle behind the LPC model is that a given speech
sample at time n, s (n) can be estimated as a linear
combination of the past p speech samples. Such that
s(n) = a1s(n-1) + a2s(n-2) + ……. + aps(n-p)
Figure. 2 Feature Extraction
The pre-emphasized speech samples are divided into 30-ms
frame having 240 samples for each frame i.e., Number of
samples in a Frame = Fs * Frame Length.
In addition, adjacent frames are separated by 80 samples (1/3
of the original frame), with 160 overlapping samples. The
number of samples for separation and overlapping depends on
frame length. The frame length is the choice according to the
sampling rate. The larger the sampling rate, larger the frame
length.
The windowing technique for each frame is product of the
impulse response and a window function to implement a
corresponding filter, which tapers the ideal impulse response.
Where α = 0.54 and β = 1-α = 0.46.
The Auto-correlation LPC block determines the
autocorrelation of the input i.e., windowed speech signal.
These auto-correlations in turn useful in finding the linear
predictor coefficients for the time series in each frame of input
signal by reducing the error in the least square sense.
Levinson–Durbin algorithm is a procedure in linear algebra to
recursively calculates the solution to normal equation. It is
computationally efficient to calculate the prediction
coefficients.
2.4 Classifier
The classifier is basically to divide words into certain groups.
The classifiers used are MLP, TDNN and Modified ERNN.
2.4.1 Multilayer Perceptron (MLP)
An MLP is a fully artificial neural network model that maps
group of input data onto a group of appropriate outputs [18].
An MLP consists of more than two layers of nodes in a
directed graph, with each layer fully connected to the next
one. MLP diagram is shown below in Figure 3.
Figure. 3 MLP Architecture
The input to the MLP is 13 LPC coefficients. So, the input
layer has 13 nodes. 10 telugu commands are classified using
LPC
Framing Windowing Auto -
correlation
Levinson Durbin
Algorithm
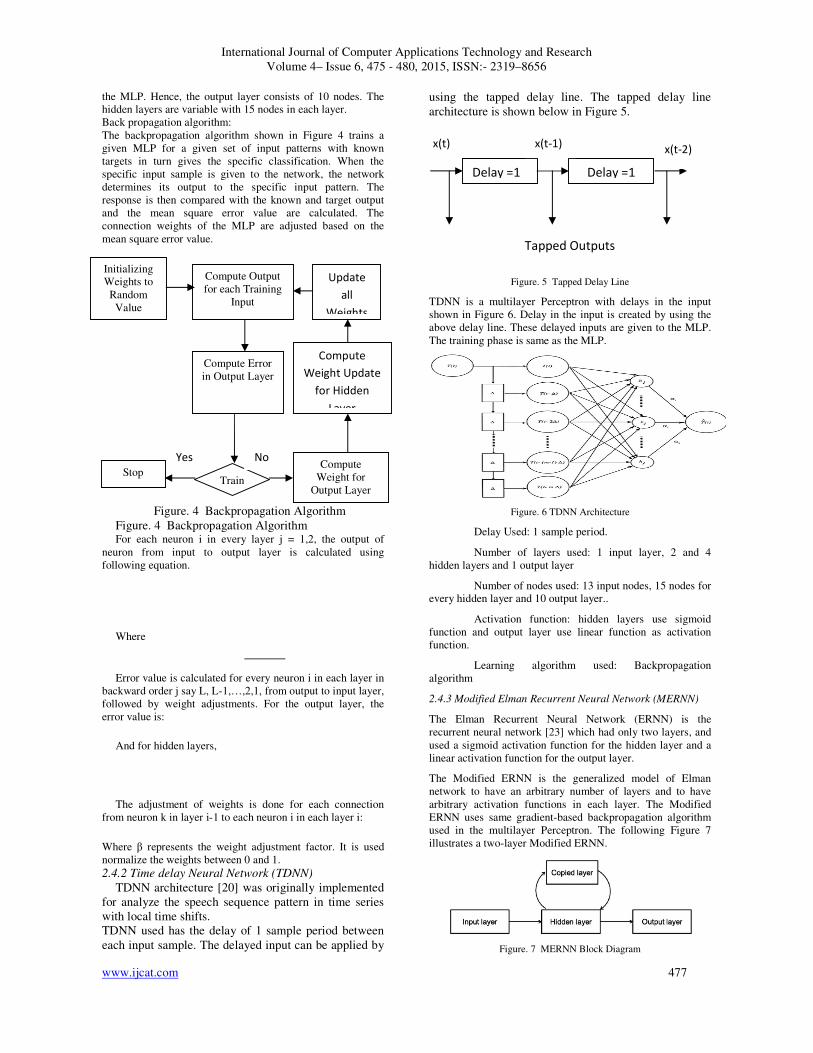
International Journal of Computer Applications Technology and Research
Volume 4– Issue 6, 475 - 480, 2015, ISSN:- 2319–8656
www.ijcat.com 477
the MLP. Hence, the output layer consists of 10 nodes. The
hidden layers are variable with 15 nodes in each layer.
Back propagation algorithm:
The backpropagation algorithm shown in Figure 4 trains a
given MLP for a given set of input patterns with known
targets in turn gives the specific classification. When the
specific input sample is given to the network, the network
determines its output to the specific input pattern. The
response is then compared with the known and target output
and the mean square error value are calculated. The
connection weights of the MLP are adjusted based on the
mean square error value.
Figure. 4 Backpropagation Algorithm
Figure. 4 Backpropagation Algorithm For each neuron i in every layer j = 1,2, the output of
neuron from input to output layer is calculated using
following equation.
Where
Error value is calculated for every neuron i in each layer in
backward order j say L, L-1,…,2,1, from output to input layer,
followed by weight adjustments. For the output layer, the
error value is:
And for hidden layers,
The adjustment of weights is done for each connection
from neuron k in layer i-1 to each neuron i in each layer i:
Where β represents the weight adjustment factor. It is used
normalize the weights between 0 and 1.
2.4.2 Time delay Neural Network (TDNN)
TDNN architecture [20] was originally implemented
for analyze the speech sequence pattern in time series
with local time shifts.
TDNN used has the delay of 1 sample period between
each input sample. The delayed input can be applied by
using the tapped delay line. The tapped delay line
architecture is shown below in Figure 5.
Figure. 5 Tapped Delay Line
TDNN is a multilayer Perceptron with delays in the input
shown in Figure 6. Delay in the input is created by using the
above delay line. These delayed inputs are given to the MLP.
The training phase is same as the MLP.
Figure. 6 TDNN Architecture
Delay Used: 1 sample period.
Number of layers used: 1 input layer, 2 and 4
hidden layers and 1 output layer
Number of nodes used: 13 input nodes, 15 nodes for
every hidden layer and 10 output layer..
Activation function: hidden layers use sigmoid
function and output layer use linear function as activation
function.
Learning algorithm used: Backpropagation
algorithm
2.4.3 Modified Elman Recurrent Neural Network (MERNN)
The Elman Recurrent Neural Network (ERNN) is the
recurrent neural network [23] which had only two layers, and
used a sigmoid activation function for the hidden layer and a
linear activation function for the output layer.
The Modified ERNN is the generalized model of Elman
network to have an arbitrary number of layers and to have
arbitrary activation functions in each layer. The Modified
ERNN uses same gradient-based backpropagation algorithm
used in the multilayer Perceptron. The following Figure 7
illustrates a two-layer Modified ERNN.
Figure. 7 MERNN Block Diagram
Initializing
Weights to
Random
Value
Compute Error
in Output Layer
Update
all
Weights
Compute
Weight Update
for Hidden
Layer
Compute
Weight for
Output Layer Train
Stop
Compute Output
for each Training
Input
Yes No
Delay =1 Delay =1
x(t) x(t-1) x(t-2)
Tapped Outputs
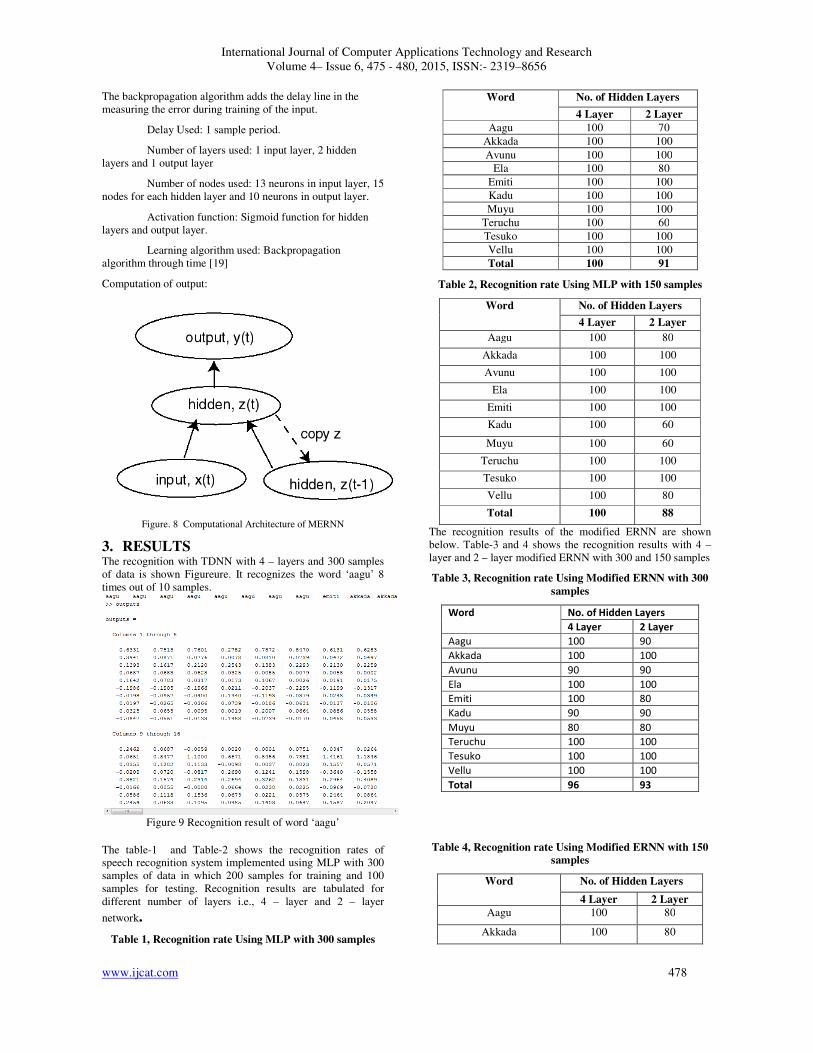
International Journal of Computer Applications Technology and Research
Volume 4– Issue 6, 475 - 480, 2015, ISSN:- 2319–8656
www.ijcat.com 478
The backpropagation algorithm adds the delay line in the
measuring the error during training of the input.
Delay Used: 1 sample period.
Number of layers used: 1 input layer, 2 hidden
layers and 1 output layer
Number of nodes used: 13 neurons in input layer, 15
nodes for each hidden layer and 10 neurons in output layer.
Activation function: Sigmoid function for hidden
layers and output layer.
Learning algorithm used: Backpropagation
algorithm through time [19]
Computation of output:
Figure. 8 Computational Architecture of MERNN
3. RESULTS The recognition with TDNN with 4 – layers and 300 samples
of data is shown Figureure. It recognizes the word ‘aagu’ 8
times out of 10 samples.
Figure 9 Recognition result of word ‘aagu’
The table-1 and Table-2 shows the recognition rates of
speech recognition system implemented using MLP with 300
samples of data in which 200 samples for training and 100
samples for testing. Recognition results are tabulated for
different number of layers i.e., 4 – layer and 2 – layer
network.
Table 1, Recognition rate Using MLP with 300 samples
Word No. of Hidden Layers
4 Layer 2 Layer
Aagu 100 70
Akkada 100 100
Avunu 100 100
Ela 100 80
Emiti 100 100
Kadu 100 100
Muyu 100 100
Teruchu 100 60
Tesuko 100 100
Vellu 100 100
Total 100 91
Table 2, Recognition rate Using MLP with 150 samples
Word No. of Hidden Layers
4 Layer 2 Layer
Aagu 100 80
Akkada 100 100
Avunu 100 100
Ela 100 100
Emiti 100 100
Kadu 100 60
Muyu 100 60
Teruchu 100 100
Tesuko 100 100
Vellu 100 80
Total 100 88
The recognition results of the modified ERNN are shown
below. Table-3 and 4 shows the recognition results with 4 –
layer and 2 – layer modified ERNN with 300 and 150 samples
Table 3, Recognition rate Using Modified ERNN with 300
samples
Word No. of Hidden Layers
4 Layer 2 Layer
Aagu 100 90
Akkada 100 100
Avunu 90 90
Ela 100 100
Emiti 100 80
Kadu 90 90
Muyu 80 80
Teruchu 100 100
Tesuko 100 100
Vellu 100 100
Total 96 93
Table 4, Recognition rate Using Modified ERNN with 150
samples
Word No. of Hidden Layers
4 Layer 2 Layer
Aagu 100 80
Akkada 100 80
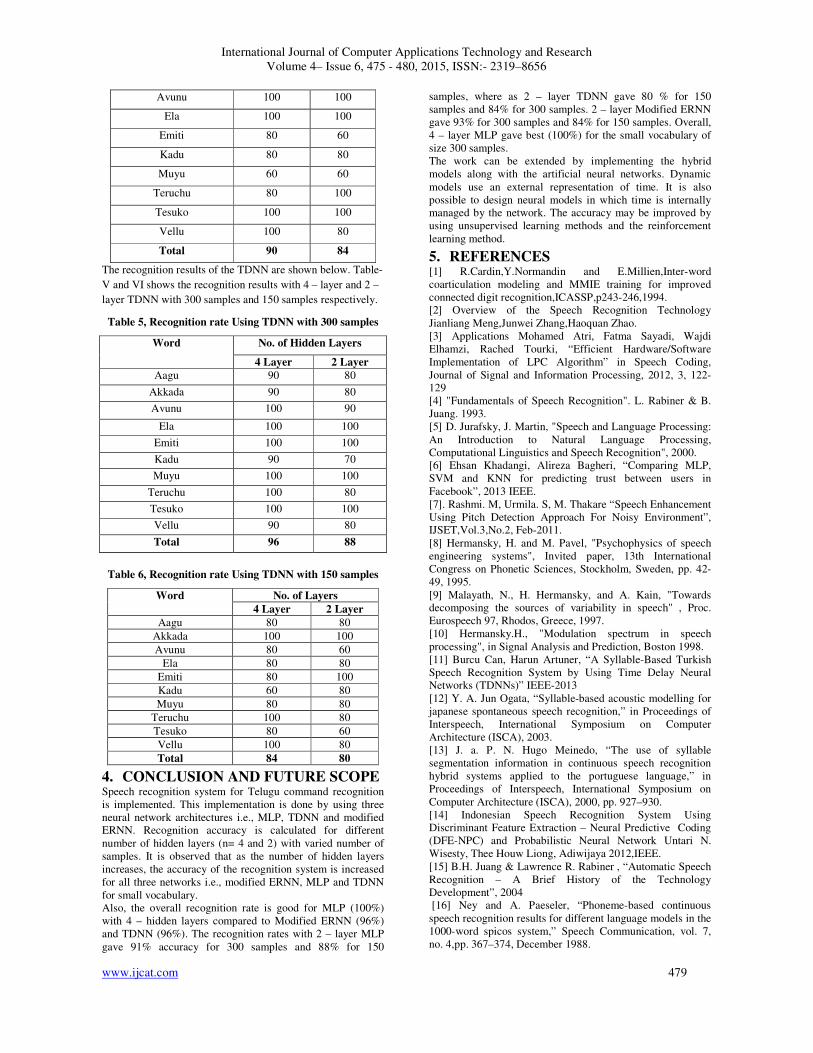
International Journal of Computer Applications Technology and Research
Volume 4– Issue 6, 475 - 480, 2015, ISSN:- 2319–8656
www.ijcat.com 479
Avunu 100 100
Ela 100 100
Emiti 80 60
Kadu 80 80
Muyu 60 60
Teruchu 80 100
Tesuko 100 100
Vellu 100 80
Total 90 84
The recognition results of the TDNN are shown below. Table-
V and VI shows the recognition results with 4 – layer and 2 –
layer TDNN with 300 samples and 150 samples respectively.
Table 5, Recognition rate Using TDNN with 300 samples
Word No. of Hidden Layers
4 Layer 2 Layer
Aagu 90 80
Akkada 90 80
Avunu 100 90
Ela 100 100
Emiti 100 100
Kadu 90 70
Muyu 100 100
Teruchu 100 80
Tesuko 100 100
Vellu 90 80
Total 96 88
Table 6, Recognition rate Using TDNN with 150 samples
Word No. of Layers
4 Layer 2 Layer
Aagu 80 80
Akkada 100 100
Avunu 80 60
Ela 80 80
Emiti 80 100
Kadu 60 80
Muyu 80 80
Teruchu 100 80
Tesuko 80 60
Vellu 100 80
Total 84 80
4. CONCLUSION AND FUTURE SCOPE Speech recognition system for Telugu command recognition
is implemented. This implementation is done by using three
neural network architectures i.e., MLP, TDNN and modified
ERNN. Recognition accuracy is calculated for different
number of hidden layers (n= 4 and 2) with varied number of
samples. It is observed that as the number of hidden layers
increases, the accuracy of the recognition system is increased
for all three networks i.e., modified ERNN, MLP and TDNN
for small vocabulary.
Also, the overall recognition rate is good for MLP (100%)
with 4 – hidden layers compared to Modified ERNN (96%)
and TDNN (96%). The recognition rates with 2 – layer MLP
gave 91% accuracy for 300 samples and 88% for 150
samples, where as 2 – layer TDNN gave 80 % for 150
samples and 84% for 300 samples. 2 – layer Modified ERNN
gave 93% for 300 samples and 84% for 150 samples. Overall,
4 – layer MLP gave best (100%) for the small vocabulary of
size 300 samples.
The work can be extended by implementing the hybrid
models along with the artificial neural networks. Dynamic
models use an external representation of time. It is also
possible to design neural models in which time is internally
managed by the network. The accuracy may be improved by
using unsupervised learning methods and the reinforcement
learning method.
5. REFERENCES [1] R.Cardin,Y.Normandin and E.Millien,Inter-word
coarticulation modeling and MMIE training for improved
connected digit recognition,ICASSP,p243-246,1994.
[2] Overview of the Speech Recognition Technology
Jianliang Meng,Junwei Zhang,Haoquan Zhao.
[3] Applications Mohamed Atri, Fatma Sayadi, Wajdi
Elhamzi, Rached Tourki, “Efficient Hardware/Software
Implementation of LPC Algorithm” in Speech Coding,
Journal of Signal and Information Processing, 2012, 3, 122-
129
[4] "Fundamentals of Speech Recognition". L. Rabiner & B.
Juang. 1993.
[5] D. Jurafsky, J. Martin, "Speech and Language Processing:
An Introduction to Natural Language Processing,
Computational Linguistics and Speech Recognition", 2000.
[6] Ehsan Khadangi, Alireza Bagheri, “Comparing MLP,
SVM and KNN for predicting trust between users in
Facebook”, 2013 IEEE.
[7]. Rashmi. M, Urmila. S, M. Thakare “Speech Enhancement
Using Pitch Detection Approach For Noisy Environment”,
IJSET,Vol.3,No.2, Feb-2011.
[8] Hermansky, H. and M. Pavel, "Psychophysics of speech
engineering systems", Invited paper, 13th International
Congress on Phonetic Sciences, Stockholm, Sweden, pp. 42-
49, 1995.
[9] Malayath, N., H. Hermansky, and A. Kain, "Towards
decomposing the sources of variability in speech" , Proc.
Eurospeech 97, Rhodos, Greece, 1997.
[10] Hermansky.H., "Modulation spectrum in speech
processing", in Signal Analysis and Prediction, Boston 1998.
[11] Burcu Can, Harun Artuner, “A Syllable-Based Turkish
Speech Recognition System by Using Time Delay Neural
Networks (TDNNs)” IEEE-2013
[12] Y. A. Jun Ogata, “Syllable-based acoustic modelling for
japanese spontaneous speech recognition,” in Proceedings of
Interspeech, International Symposium on Computer
Architecture (ISCA), 2003.
[13] J. a. P. N. Hugo Meinedo, “The use of syllable
segmentation information in continuous speech recognition
hybrid systems applied to the portuguese language,” in
Proceedings of Interspeech, International Symposium on
Computer Architecture (ISCA), 2000, pp. 927–930.
[14] Indonesian Speech Recognition System Using
Discriminant Feature Extraction – Neural Predictive Coding
(DFE-NPC) and Probabilistic Neural Network Untari N.
Wisesty, Thee Houw Liong, Adiwijaya 2012,IEEE.
[15] B.H. Juang & Lawrence R. Rabiner , “Automatic Speech
Recognition – A Brief History of the Technology
Development”, 2004
[16] Ney and A. Paeseler, “Phoneme-based continuous
speech recognition results for different language models in the
1000-word spicos system,” Speech Communication, vol. 7,
no. 4,pp. 367–374, December 1988.
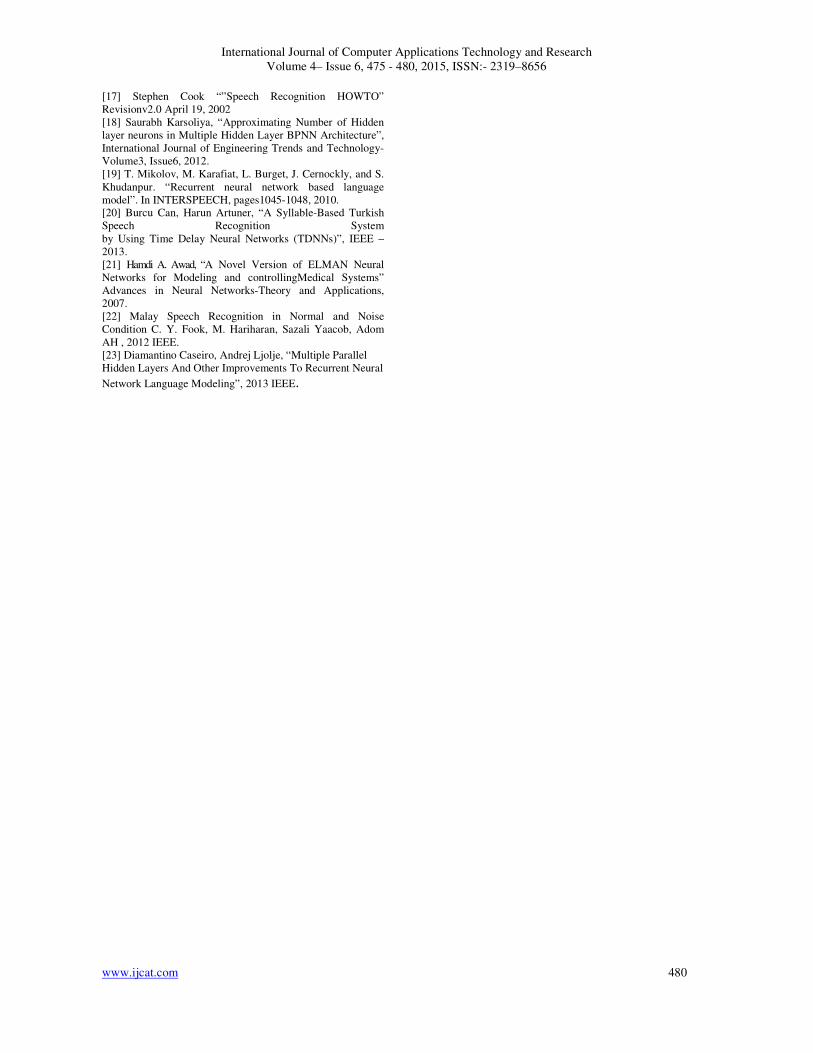
International Journal of Computer Applications Technology and Research
Volume 4– Issue 6, 475 - 480, 2015, ISSN:- 2319–8656
www.ijcat.com 480
[17] Stephen Cook “”Speech Recognition HOWTO”
Revisionv2.0 April 19, 2002
[18] Saurabh Karsoliya, “Approximating Number of Hidden
layer neurons in Multiple Hidden Layer BPNN Architecture”,
International Journal of Engineering Trends and Technology-
Volume3, Issue6, 2012.
[19] T. Mikolov, M. Karafiat, L. Burget, J. Cernockly, and S.
Khudanpur. “Recurrent neural network based language
model”. In INTERSPEECH, pages1045-1048, 2010.
[20] Burcu Can, Harun Artuner, “A Syllable-Based Turkish
Speech Recognition System
by Using Time Delay Neural Networks (TDNNs)”, IEEE –
2013.
[21] Hamdi A. Awad, “A Novel Version of ELMAN Neural
Networks for Modeling and controllingMedical Systems”
Advances in Neural Networks-Theory and Applications,
2007.
[22] Malay Speech Recognition in Normal and Noise
Condition C. Y. Fook, M. Hariharan, Sazali Yaacob, Adom
AH , 2012 IEEE.
[23] Diamantino Caseiro, Andrej Ljolje, “Multiple Parallel
Hidden Layers And Other Improvements To Recurrent Neural
Network Language Modeling”, 2013 IEEE.