Embed Size (px)
Citation preview
Review of current estuarine monitoring, gap analysis and recommendations
Onkaparinga Estuary
Faith Cook and Peri Coleman
15 October 2007
Delta Review of current monitoring, gap analysis and recommendations
LIMITATIONS STATEMENT The sole purpose of this report and the associated services performed by Delta Environmental Consulting is to conduct a review of existing studies carried out in the vicinity of the Onkaparinga Estuary, in accordance with the scope of services set out in the contract between Delta Environmental Consulting (‘Delta’) and the Adelaide and Mount Lofty NRM Board (‘the Client’). That scope of services was defined by the requests of the Client, by the time and budgetary constraints imposed by the Client, and by the availability of access to the site. Delta derived the data in this report primarily from visual inspections, examination of records in the public domain and interviews with individuals with information about the site. The passage of time, manifestation of latent conditions or impacts of future events may require further exploration at the site and subsequent data, analysis and a re-evaluation of the findings, observations and conclusions expressed in this report. In preparing this report, Delta has relied upon and presumed accurate certain information (or the absence thereof) relative to the site, provided by government officials and authorities, the Client and others identified herein. Except as otherwise stated in the report, Delta has not attempted to verify the accuracy or completeness of any such information. The findings, observations and conclusions expressed by Delta in this report are not, and should not be considered, an opinion concerning environmental or operational liability. No warranty or guarantee, whether express or implied, is made with respect to the data reported or to the findings, observations and conclusions expressed in this report. Further, such data, findings, observations and conclusions are based solely upon site conditions and information in existence at the time of the investigation. This report has been prepared on behalf of and for the exclusive use of the Client, and is subject to and issued in connection with the provisions of the agreement between Delta and the Client. Delta accepts no liability or responsibility whatsoever for or in respect of any use of or reliance upon this report by any third party. Document history First draft issued for review: 17 August 2007 (NRM, CPB, Waterwatch, CoO) Final version released: 15 October 2007 (PC)
AML-ONK-001-FC/PC Page 2
Delta Review of current monitoring, gap analysis and recommendations
Table of Contents
1. INTRODUCTION 5
2. CONSULTANT 5
3. REVIEW OF CURRENT MONITORING PROGRAMS 6
4. GAPS ANALYSIS 7
4.1 Overall monitoring effort 7
4.2 Discussion on current monitoring programs 10 4.2.1 EPA 10 4.2.2 Waterwatch 10 4.2.3 Environmental flows program 10 4.2.4 DWLBC flows monitoring 11
4.3 Once off surveys and short duration monitoring 11
5. MATCHING MONITORING TO DATA REQUIREMENTS 12 5.1.1 Measuring impacts or ecosystem health 12 5.1.2 Deciding between surveys or a monitoring program 12
5.1.2.1 Surveys 12 5.1.2.2 Monitoring programs 13
5.1.3 Whole of estuary water balance and potential impacts 14 5.1.4 Review of past data 15
6. MONITORING PROGRAM DESIGN 18
6.1 Client requirements 18
6.2 Recommended monitoring program 18
6.3 Data interpretation 19
6.4 Selecting appropriate test methods 20 6.4.1.1 Field observations 20 6.4.1.2 Field measurements 20 6.4.1.3 Laboratory testing 21
6.5 Less frequent investigations 22 6.5.1 Vegetation transects 22 6.5.2 Aerial photograph analysis 22 6.5.3 Turbidity monitoring during floods 22
AML-ONK-001-FC/PC Page 3
Delta Review of current monitoring, gap analysis and recommendations
7. REFERENCES 23
8. APPENDIX 1 – ONKAPARINGA ESTUARY MAP 24
9. APPENDIX 2 – DETAILS OF CONSULTANTS 25 Figures Figure 1: Past (yellow) and present (red) sample locations..............................................................7 Figure 2: Heavy metals.....................................................................................................................8 Figure 3: Physiochemical (turbidity, pH etc) ...................................................................................9 Figure 4 - Typical trend line for improving water quality..............................................................13 Figure 5 – Observed discharges to the Onkaparinga estuary .........................................................15 Tables Table 1: Frequency versus program duration .................................................................................14 Table 2 - Parameter relationships ...................................................................................................17 Table 3: Good and poor thresholds for individual samples............................................................19 Table 4: Correlations between parameters to be tested and parameters of interest. .......................19
AML-ONK-001-FC/PC Page 4
Delta Review of current monitoring, gap analysis and recommendations
1. Introduction Tony Flaherty from the Adelaide and Mount Lofty Natural Resources Management Board (the NRM Board) approached Delta Environmental Consulting on 30 April 2007, to discuss the potential for Delta to develop a monitoring programme for the Onkaparinga Estuary. The monitoring program is to cost no more than $15,000 per year to implement, and is to support activities from the Onkaparinga Estuary Action Plan. The monitoring program will identify the current estuarine water quality status and the state of key estuary environmental values. Results of the monitoring program shall provide quality assured data on;
• Efficiency of constructed wetlands • Significance of untreated stormwater • Seasonal water quality characteristics • Water quality issues during the summer recreational period.
The recommended sampling program will include consideration of tidal condition, diurnal effects, location, season and observation of other activities in the catchment.
2. Consultant Delta Environmental Consulting is an independent South Australian consulting business. The company provides services in the areas of: biological survey work, environmental education programs, saltfield technology and saline wetland ecology, scientific illustration & desktop publishing, preparation of herbarium and museum specimens, taxonomy and classification, revegetation and rehabilitation, and computer application development. The company is a member of Standards Australia, and its quality assurance management system has been third party certified to the international Q-base standard by NATA Certification Services International. A copy of the scope of certification is available on request. Delta Environmental Consulting has a policy of continuous improvement in the areas of: • providing a quality service to our clients • providing ongoing training and educational opportunities for our consultants • maintaining high standards in the areas of health, safety and environment both within
Delta and while working with our clients The consultants undertaking this project are detailed in Appendix 2 - Details of Consultants.
AML-ONK-001-FC/PC Page 5
Delta Review of current monitoring, gap analysis and recommendations
3. Review of current monitoring programs A range of organizations were contacted for information on past and current monitoring programs. Organization Contact Data provided EPA Clive Jenkins Clive provided data for 4 Onkaparinga monitoring
sites. One is upstream and has a variable location. Coast Protection Branch
Doug Fotheringham and Sheilee Cox
No current monitoring programs, other than beach profile transects.
Biological Survey of SA
Website 2 once-only survey sites at Mouth.
Birds Australia Website Map grid bird lists from the Bird Atlas –there was no answer to phone calls for more detailed, estuary specific data.
NRM Board Tony, Peter & Steve
Data on Action Plan, Environmental flows monitoring and past water quality monitoring.
Onkaparinga Council
Eva Oldzyak & Joe LaSpina
Wetland map. Details of community forum.
DWLBC Michelle Bald Monitoring Review for the Onkaparinga plus a range of other reports.
Eco Management Services
Paul Manning Was involved in current wetland design and is involved in future sludge lagoon remediation, however did not supply data within the project timeline.
SA Water Karen Rouse Provided a report entitled Christies Beach Sludge Drying Lagoon Hydrogeological Investigations Stages 2, 3 & 4.
Waterwatch Jeremy Gramp Supplied Waterwatch database and locations for the region.
University of Adelaide
Travis Elsdon Indicated that most University programs are once-only surveys.
AML-ONK-001-FC/PC Page 6
Delta Review of current monitoring, gap analysis and recommendations
4. Gaps analysis
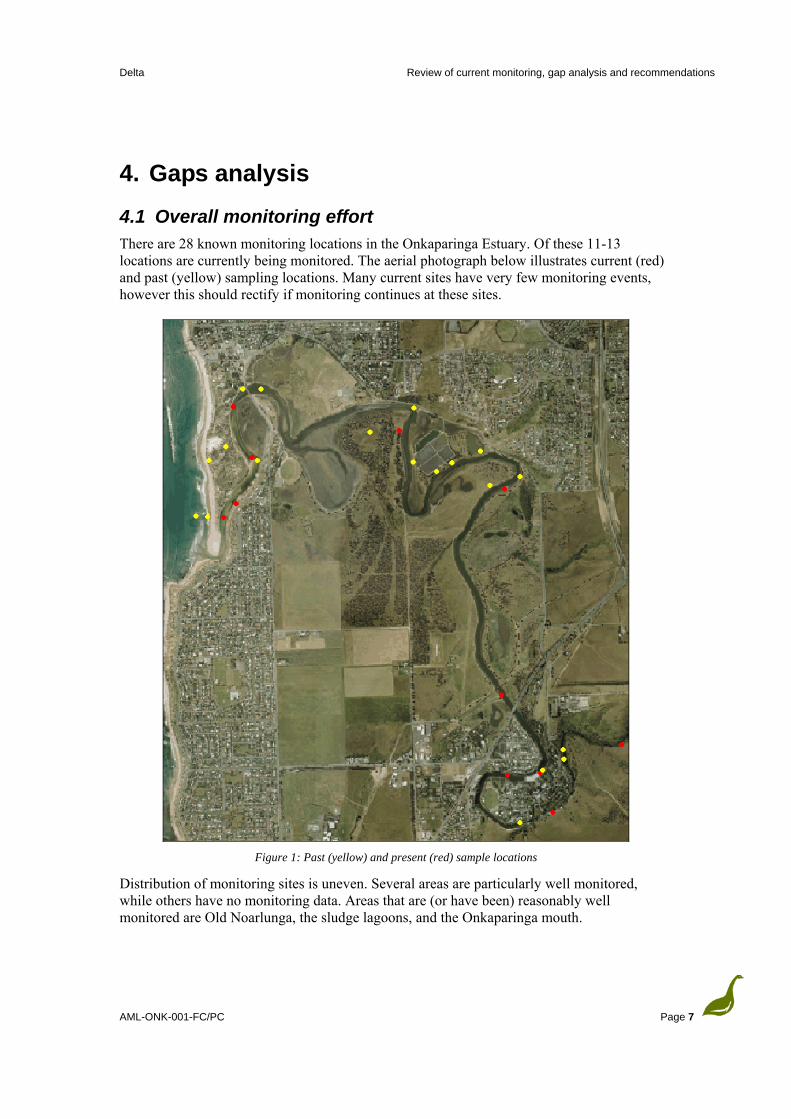
4.1 Overall monitoring effort There are 28 known monitoring locations in the Onkaparinga Estuary. Of these 11-13 locations are currently being monitored. The aerial photograph below illustrates current (red) and past (yellow) sampling locations. Many current sites have very few monitoring events, however this should rectify if monitoring continues at these sites.
Figure 1: Past (yellow) and present (red) sample locations
Distribution of monitoring sites is uneven. Several areas are particularly well monitored, while others have no monitoring data. Areas that are (or have been) reasonably well monitored are Old Noarlunga, the sludge lagoons, and the Onkaparinga mouth.
AML-ONK-001-FC/PC Page 7
Delta Review of current monitoring, gap analysis and recommendations
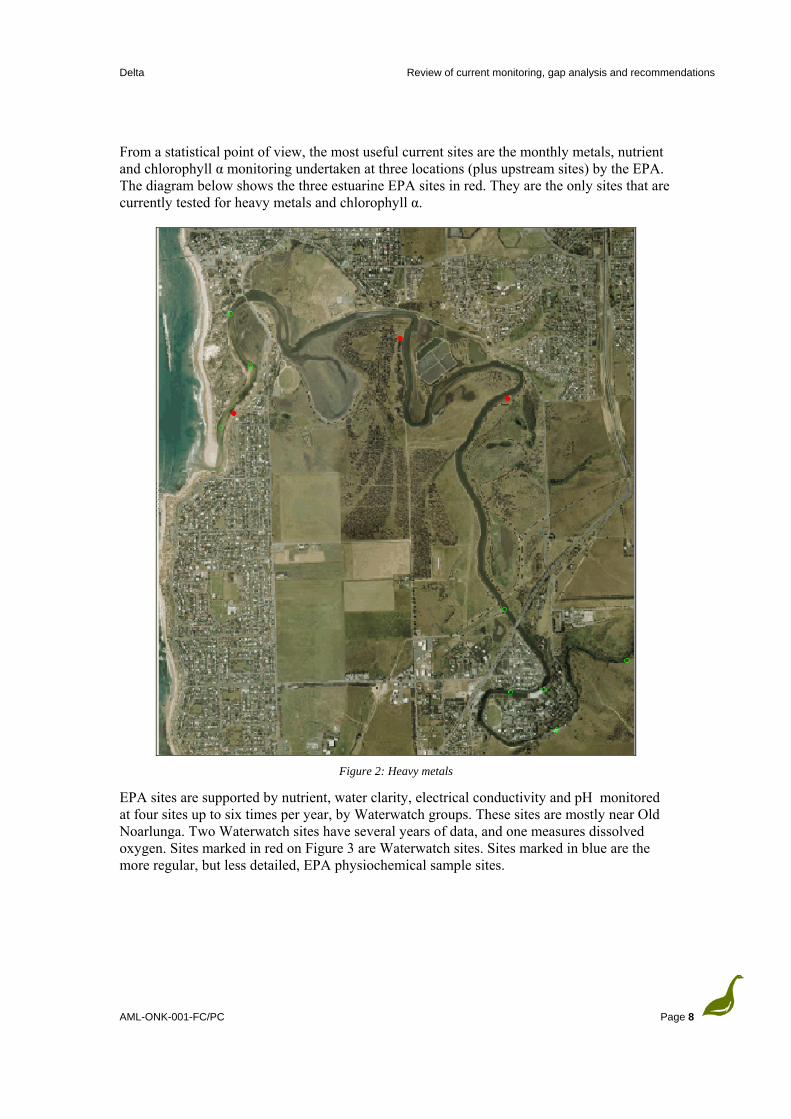
From a statistical point of view, the most useful current sites are the monthly metals, nutrient and chlorophyll α monitoring undertaken at three locations (plus upstream sites) by the EPA. The diagram below shows the three estuarine EPA sites in red. They are the only sites that are currently tested for heavy metals and chlorophyll α.
Figure 2: Heavy metals
EPA sites are supported by nutrient, water clarity, electrical conductivity and pH monitored at four sites up to six times per year, by Waterwatch groups. These sites are mostly near Old Noarlunga. Two Waterwatch sites have several years of data, and one measures dissolved oxygen. Sites marked in red on Figure 3 are Waterwatch sites. Sites marked in blue are the more regular, but less detailed, EPA physiochemical sample sites.
AML-ONK-001-FC/PC Page 8
Delta Review of current monitoring, gap analysis and recommendations
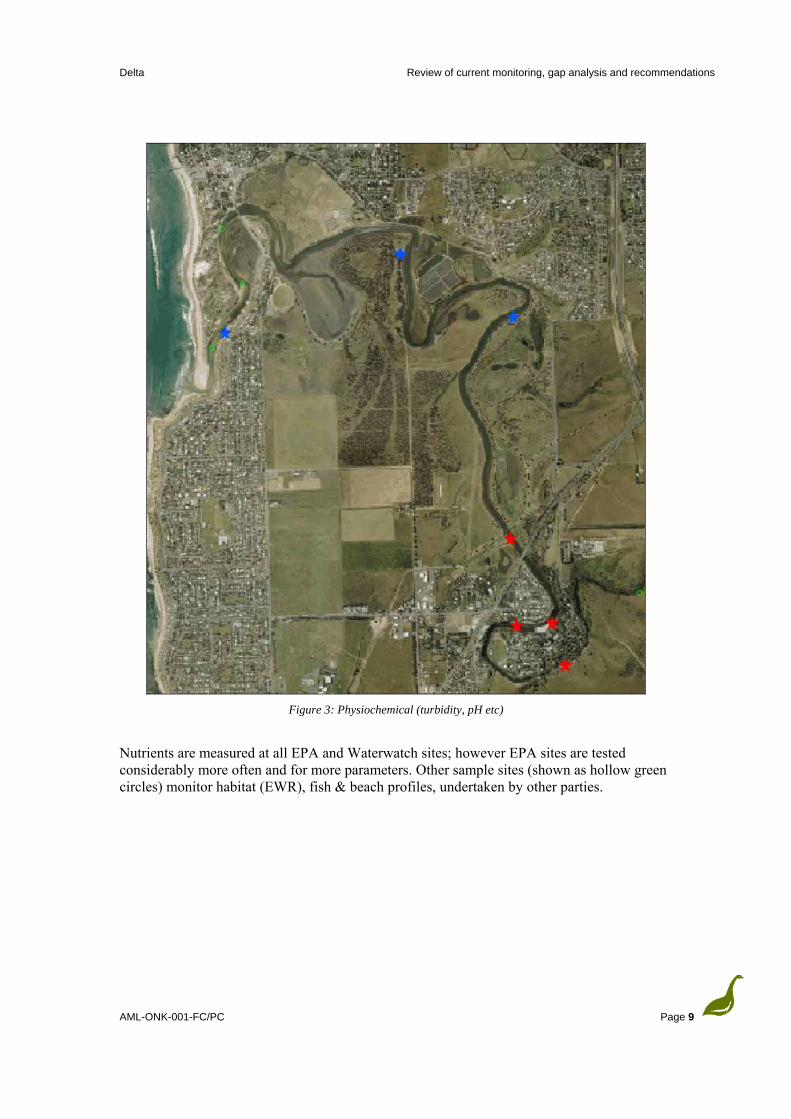
Figure 3: Physiochemical (turbidity, pH etc)
Nutrients are measured at all EPA and Waterwatch sites; however EPA sites are tested considerably more often and for more parameters. Other sample sites (shown as hollow green circles) monitor habitat (EWR), fish & beach profiles, undertaken by other parties.
AML-ONK-001-FC/PC Page 9
Delta Review of current monitoring, gap analysis and recommendations
4.2 Discussion on current monitoring programs
4.2.1 EPA EPA monitors four locations in or near the estuary. Three of these have fixed locations and are tested for basic physiochemical parameters plus chlorophyll α, metals and nutrients. There is one additional location near Old Noarlunga, however it did not have formal coordinates and could not be placed from water quality data alone. It is interesting to note that turbidity at these sites is measured in a laboratory, in contravention to Regulatory monitoring and testing - water and wastewater sampling guidelines produced by the SA EPA. Turbidity results are stated to a level significantly finer than that recommended in Standard Methods for the Examination of Water and Wastewater (APHA). This program has been undertaken on a monthly basis for eight years, although most parameters have gaps in their data sets. Another six months to two years of monitoring is required before each site has statistically robust data on most parameters. Data on sampling times and tidal state would make this data significantly more informative.
4.2.2 Waterwatch Watchwatch has four current sites within the Onkaparinga Estuary; however these are clustered in and around old Noarlunga. The most downstream site is at the outlet of Wetland 2, downstream of South Road Bridge. Two of these sites have had 16-18 sampling events, whereas the others are recent additions. All sites are monitored during most Snapshot weeks (6 times a year), with no additional monitoring events. There are seven historic Waterwatch sites, mainly downstream of the current monitoring locations, which have 1-8 sampling events each. It would be best if these sites could be reactivated as new groups come on board, so that this data could contribute to a statistically significant data set.
4.2.3 Environmental flows program There has been substantial work undertaken upstream of the estuary by the NRM Board, quantifying and assessing the adequacy of environmental flows. The original baseline work is now being complemented with ongoing monitoring of flows, riparian vegetation, physical attributes and aquatic life. There is one current fish monitoring point within the estuary, established as part of the environmental flows project, and one historic fish monitoring site, which may be revisited in the future.
AML-ONK-001-FC/PC Page 10
Delta Review of current monitoring, gap analysis and recommendations
4.2.4 DWLBC flows monitoring The Old Noarlunga flow monitoring station was operational from 1973-1988. The environmental flows program added to this data in 2006. A new permanent station has just been installed to provide daily flows and volume data.
4.3 Once off surveys and short duration monitoring A large number of once-off or short duration surveys have been undertaken in the estuary over the past 25 years. These include monitoring of fish, vegetation, groundwater movement, heavy metals and sediments. Much of this work has been completed by university students and private enterprises, with significant portions being maintained privately, as grey literature. Data in the pubic domain includes biannual beach profiles undertaken by the Coast Protection Branch, and two once-only Biodiversity Vegetation Survey sites in the sand dunes near the mouth. The Onkaparinga Catchment Water Management Board monitored three estuarine sites (in a similar manner to the current SA EPA program) for four years (1999-2003), but ceased shortly before a statistically significant data set could be obtained.
AML-ONK-001-FC/PC Page 11
Delta Review of current monitoring, gap analysis and recommendations
5. Matching monitoring to data requirements 5.1.1 Measuring impacts or ecosystem health Physical and chemical measures reliably delineate areas of impact; however they only provide an indirect indication of ecosystem health. It is commonly accepted that only direct monitoring of biota can provide reliable ecosystem health measures. Monitoring change in the biota is complicated by issues such as the natural heterogeneity of the environment, the impact of natural events such as storms and the often erratic recruitment patterns of the fauna being examined. Monitoring change using chemical parameters is considerably more predictable; however this also has heterogeneity issues. Measuring change is relatively straightforward, compared to interpretation of causes of change. Simple monitoring of change does not determine the cause of change - it can only identify a correlation between potential causes and the end result. Significant changes caused by human impacts may be the result of the cumulative effects of a number of impacts, in which case the removal of one impact will not necessarily result in an improvement in ecosystem health. Alternatively, separate impacts may negate each other and the removal of one impact may actually cause a decrease in ecosystem health. Additionally, changes caused by humans are only significant and important if they are greater than naturally occurring changes. These can be the result of decadal and longer weather pattern changes, or geomorphological changes such as the terrestrialisation of estuarine areas. While measuring ecosystem health allows one to establish that an area is, or is not, impacted, the same technique is not necessarily useful to determine the effects of management actions. This is because change or lack of change, observed in an ecosystem may not be related to changes in the impacts being assessed, or the ecosystem changes may have a significant ‘lag time’.
5.1.2 Deciding between surveys or a monitoring program
5.1.2.1 Surveys Programs that identify a large subset of the ecology or water quality parameters in several locations, on an infrequent basis, are best described as ‘surveys.’ Surveys include infrequent macroinvertebrate and fish studies, or short term water quality assessment programs. These types of studies are relatively expensive compared to longer monitoring, due to the intense nature of the testing involved. Natural systems are patchy, which means that a large numbers of replicates need collecting to obtain a representative sample. This increases costs of surveys and can result in fewer sampling events, leading to a distinct lack of statistical power. Modern multivariate statistical methods can assist in dealing with the large, but numerically shallow, datasets resulting from surveys. These statistical tools can separate different chemical or species associations and correlate local impact sources to those associations.
AML-ONK-001-FC/PC Page 12
Delta Review of current monitoring, gap analysis and recommendations
All statistics are limited by the data that is input. If only one impact source is detailed, then a correlation will not be able to evaluate the strength of that impact’s relationship with each parameter, compared to another impact’s relationship with the same parameter. Difficulties with distinguishing impacts may cause researchers to focus on monitoring an impact that has only a minor correlation to the impacted species association. In areas where multiple impacts occur congruently, all possible impacts should be correlated against the biological data to determine the impacts with the strongest correlation. If a study can not be conducted co-operatively between organisations responsible for, or interested in, all known impacts, obtaining the appropriate data may be difficult and the impact that has the strongest relationship to the impacted parameter may not be separable from other possible impacts.
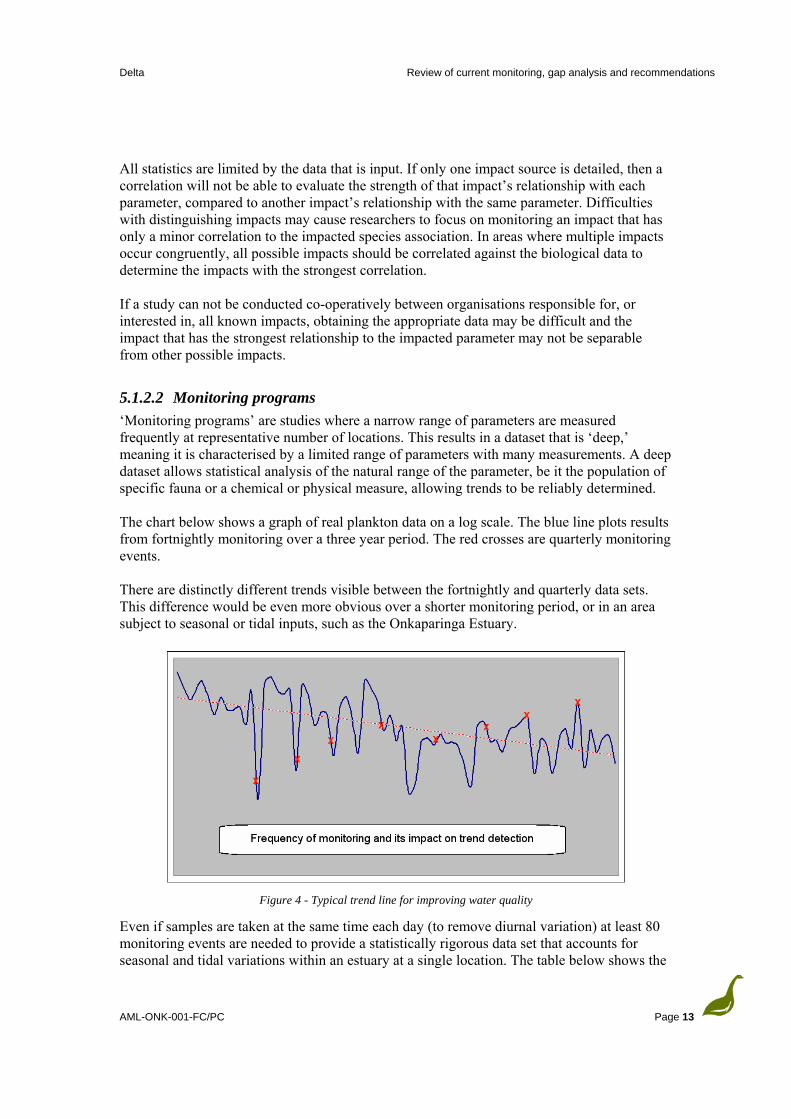
5.1.2.2 Monitoring programs ‘Monitoring programs’ are studies where a narrow range of parameters are measured frequently at representative number of locations. This results in a dataset that is ‘deep,’ meaning it is characterised by a limited range of parameters with many measurements. A deep dataset allows statistical analysis of the natural range of the parameter, be it the population of specific fauna or a chemical or physical measure, allowing trends to be reliably determined. The chart below shows a graph of real plankton data on a log scale. The blue line plots results from fortnightly monitoring over a three year period. The red crosses are quarterly monitoring events. There are distinctly different trends visible between the fortnightly and quarterly data sets. This difference would be even more obvious over a shorter monitoring period, or in an area subject to seasonal or tidal inputs, such as the Onkaparinga Estuary.
Figure 4 - Typical trend line for improving water quality
Even if samples are taken at the same time each day (to remove diurnal variation) at least 80 monitoring events are needed to provide a statistically rigorous data set that accounts for seasonal and tidal variations within an estuary at a single location. The table below shows the
AML-ONK-001-FC/PC Page 13
Delta Review of current monitoring, gap analysis and recommendations
time required to accumulate a statistically significant data set for each site, at a range of sampling event frequencies.
Table 1: Frequency versus program duration
Frequency Duration
Daily 1 month Weekly 18 months Fortnightly 3 years Monthly 7 years Seasonally 20 years
A single batch of data for a single site, as described above, does not provide enough data for before / after impact assessments or for analysis of numerous impacts spatially, however it does allow for identification of long-term trends under a single management regime, for that site.
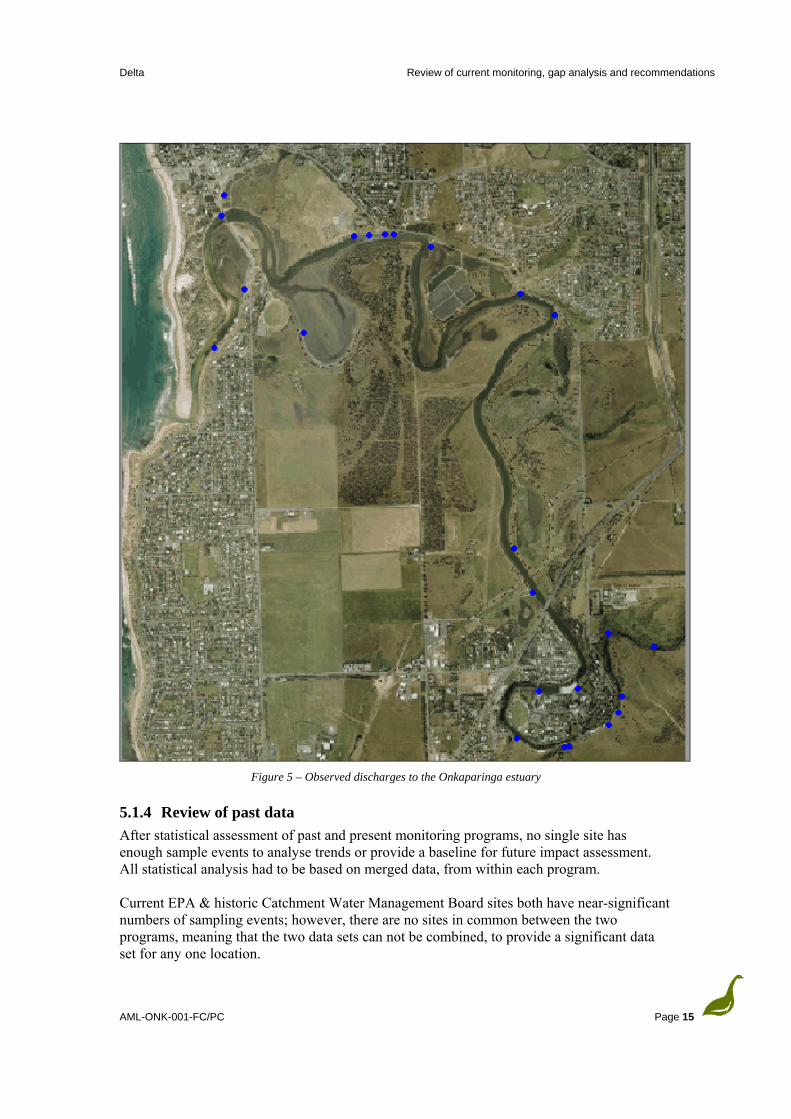
5.1.3 Whole of estuary water balance and potential impacts The scope of the proposed monitoring program is to provide data on stormwater management and water quality. Given that headwater inputs, seawater quality, and seepage from sludge drying lagoons are reasonably well quantified in existing monitoring programs, the main inputs for quantification or qualification are treated and untreated stormwater flows. The consultants undertook a field visit to investigate stream accessibility, and locate stormwater outfall points. Twenty-two stormwater outfalls were found and one emergency sewage overflow point. All of these potential discharge points are shown as blue dots in the following diagram.
AML-ONK-001-FC/PC Page 14
Delta Review of current monitoring, gap analysis and recommendations
Figure 5 – Observed discharges to the Onkaparinga estuary
5.1.4 Review of past data After statistical assessment of past and present monitoring programs, no single site has enough sample events to analyse trends or provide a baseline for future impact assessment. All statistical analysis had to be based on merged data, from within each program. Current EPA & historic Catchment Water Management Board sites both have near-significant numbers of sampling events; however, there are no sites in common between the two programs, meaning that the two data sets can not be combined, to provide a significant data set for any one location.
AML-ONK-001-FC/PC Page 15
Delta Review of current monitoring, gap analysis and recommendations
AML-ONK-001-FC/PC Page 16
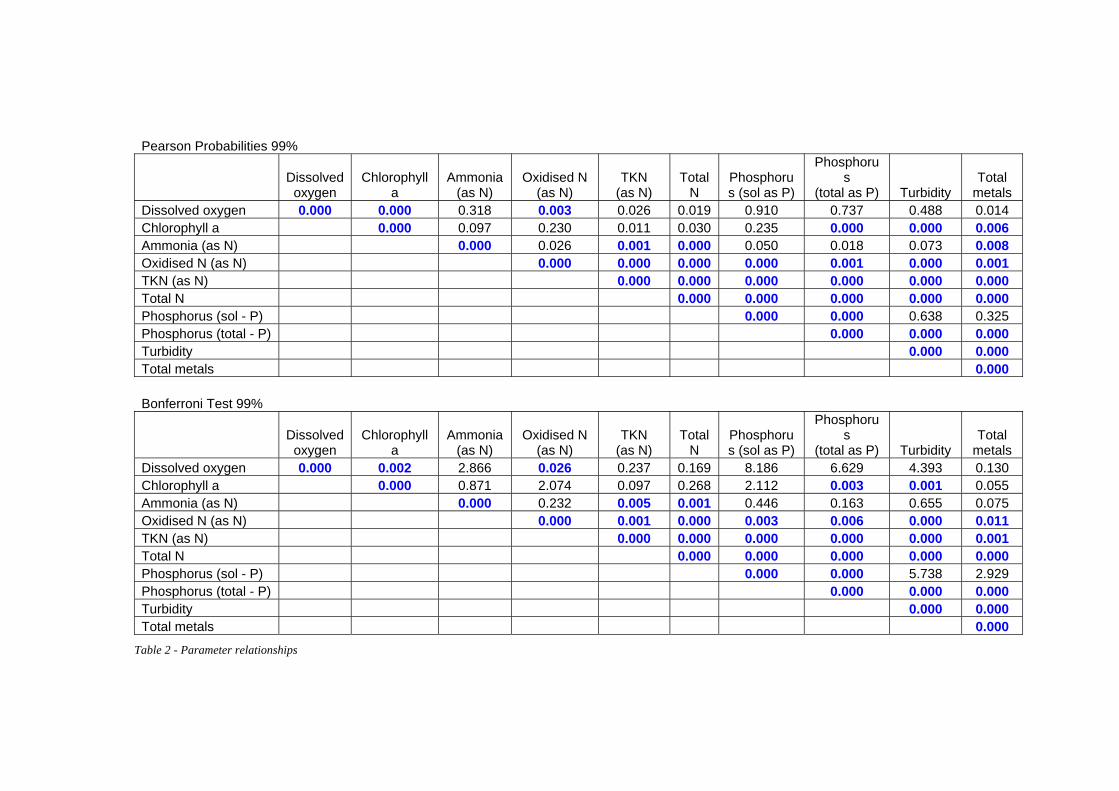
There is enough data available in the merged EPA data to establish relationships or correlations between test parameters for the entire estuary. As this data set contains no data on rainfall, tidal stage or time, the relationships could not be tested against these variables; however they were tested for seasonal variation. The correlation matrices on the next page show the likelihood of data similarities occurring due to a relationship between the parameters, rather than pure chance. Correlations that have a greater than 99% chance of being a true relationship under each test are highlighted in blue. The Pearson’s probability matrix is a traditional test of multivariate correlations. The Bonferroni test is a more rigorous test, which takes into account the number of variables being analysed. The Bonferroni test is thought to be too rigorous by many statisticians, excluding otherwise significant correlations. As can be seen from the matrix, there is a strong correlation between turbidity and a range of other parameters, including Chlorophyll α, NOX, TKN, total N & heavy metals. It is expected that these correlations would be even stronger with in-situ turbidity testing. From a practical perspective, these correlations support the theory that the major polluting impact to the estuary (for these parameters) is contaminated sediment or particulate matter, most likely introduced via stormwater. If EPA monitoring can be complemented by more frequent, spatially detailed in-situ turbidity monitoring, distribution of correlated parameters can be more accurately estimated. These estimations can then be supported by occasional, event based or seasonal habitat surveys, nutrient and faecal coliform testing.
Pearson Probabilities 99%
Dissolved
oxygen Chlorophyll
a Ammonia
(as N) Oxidised N
(as N) TKN
(as N) Total
N Phosphorus (sol as P)
Phosphorus
(total as P) Turbidity Total
metals Dissolved oxygen 0.000 0.000 0.318 0.003 0.026 0.019 0.910 0.737 0.488 0.014Chlorophyll a 0.000 0.097 0.230 0.011 0.030 0.235 0.000 0.000 0.006Ammonia (as N) 0.000 0.026 0.001 0.000 0.050 0.018 0.073 0.008 Oxidised N (as N) 0.000 0.000 0.000 0.000 0.001 0.000 0.001TKN (as N) 0.000 0.000 0.000 0.000 0.000 0.000Total N 0.000 0.000 0.000 0.000 0.000Phosphorus (sol - P) 0.000 0.000 0.638 0.325Phosphorus (total - P) 0.000 0.000 0.000Turbidity 0.000 0.000Total metals 0.000 Bonferroni Test 99%
Dissolved
oxygen Chlorophyll
a Ammonia
(as N) Oxidised N
(as N) TKN
(as N) Total
N Phosphorus (sol as P)
Phosphorus
(total as P) Turbidity Total
metals Dissolved oxygen 0.000 0.002 2.866 0.026 0.237 0.169 8.186 6.629 4.393 0.130Chlorophyll a 0.000 0.871 2.074 0.097 0.268 2.112 0.003 0.001 0.055 Ammonia (as N) 0.000 0.232 0.005 0.001 0.446 0.163 0.655 0.075Oxidised N (as N) 0.000 0.001 0.000 0.003 0.006 0.000 0.011TKN (as N) 0.000 0.000 0.000 0.000 0.000 0.001Total N 0.000 0.000 0.000 0.000 0.000Phosphorus (sol - P) 0.000 0.000 5.738 2.929Phosphorus (total - P) 0.000 0.000 0.000Turbidity 0.000 0.000Total metals 0.000
Table 2 - Parameter relationships
6. Monitoring program design
6.1 Client requirements Current in-stream water quality monitoring in the Onkaparinga Estuary is undertaken 6-12 times per year, at seven locations. Although informative, this does not provide sufficient data to assess changes that may occur as a result of implementing the Action Plan. The client requires that the monitoring program provide quality assured data on;
• Efficiency of constructed wetlands • Significance of untreated stormwater • Seasonal water quality characteristics • Water quality issues during the summer recreational period.
The recommended sampling program is to include consideration of tidal condition, diurnal effects, location, season and observation of other activities in the catchment. Client requirements focus on the impacts of stormwater and stormwater management. The main issues regularly raised in relation to stormwater discharges are sedimentation, coliforms, heavy metals and nutrients.
6.2 Recommended monitoring program Given the stormwater and water quality focus of the proposed monitoring program, Delta staff recommend that the program include fortnightly monitoring at 8-12 sites for pH, electrical conductivity, dissolved oxygen, turbidity and temperature, along with records of time, tidal stage and general observations. In summer, coliforms should be tested in 3-4 locations per fortnight. In winter, stormwater outfalls should be tested for nutrients opportunistically. These could be supported by salt-marsh transects (every 1-3 years) to identify diversity changes and sedimentation issues. Aerial photo analysis every 5-10 years could measure significant impacts to salt-marsh cover.
Delta Review of current monitoring, gap analysis and recommendations
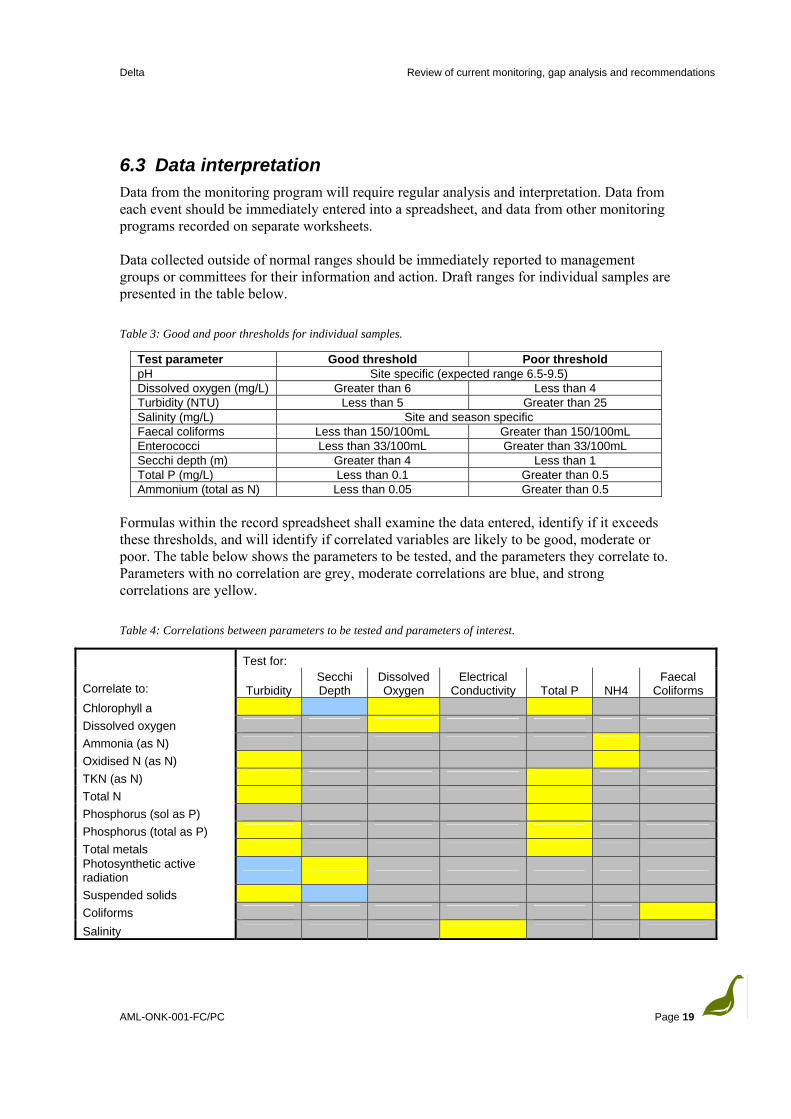
6.3 Data interpretation Data from the monitoring program will require regular analysis and interpretation. Data from each event should be immediately entered into a spreadsheet, and data from other monitoring programs recorded on separate worksheets. Data collected outside of normal ranges should be immediately reported to management groups or committees for their information and action. Draft ranges for individual samples are presented in the table below. Table 3: Good and poor thresholds for individual samples.
Test parameter Good threshold Poor threshold pH Site specific (expected range 6.5-9.5) Dissolved oxygen (mg/L) Greater than 6 Less than 4 Turbidity (NTU) Less than 5 Greater than 25 Salinity (mg/L) Site and season specific Faecal coliforms Less than 150/100mL Greater than 150/100mL Enterococci Less than 33/100mL Greater than 33/100mL Secchi depth (m) Greater than 4 Less than 1 Total P (mg/L) Less than 0.1 Greater than 0.5 Ammonium (total as N) Less than 0.05 Greater than 0.5
Formulas within the record spreadsheet shall examine the data entered, identify if it exceeds these thresholds, and will identify if correlated variables are likely to be good, moderate or poor. The table below shows the parameters to be tested, and the parameters they correlate to. Parameters with no correlation are grey, moderate correlations are blue, and strong correlations are yellow. Table 4: Correlations between parameters to be tested and parameters of interest.
Test for:
Correlate to: Turbidity Secchi Depth
Dissolved Oxygen
Electrical Conductivity Total P NH4
Faecal Coliforms
Chlorophyll a Dissolved oxygen Ammonia (as N) Oxidised N (as N) TKN (as N) Total N Phosphorus (sol as P) Phosphorus (total as P) Total metals Photosynthetic active radiation Suspended solids Coliforms Salinity
AML-ONK-001-FC/PC Page 19
Delta Review of current monitoring, gap analysis and recommendations
Additional data such as depth, pH, temperature, time, tidal records & observations should be used to verify or validate other test results. They will also provide guidance for corrective action identification. An annual or seasonal review of data should be conducted to test collated data against SA EPA Ambient Water Quality Monitoring criteria.
6.4 Selecting appropriate test methods
6.4.1.1 Field observations Although visual observations in the field are rarely precise and numerical, they do assist with verifying other monitoring actions. While in the field, typical estuarine observations include;
• Time • Weather • Relative water level • Flow • Tidal stage • Odours • Unusual scums or algae growth • Surface water conditions
If precise observations are required from untrained or regularly changing operators, a range of guides or visual aids can be issued to assist with standardizing what is recorded, and when.
6.4.1.2 Field measurements Some parameters degrade quickly after being sampled or are difficult to obtain a representative sample for, and are best tested in the field. AS/NZS 5667.1 and the SA EPA Water and wastewater sampling guidelines recommend that the following parameters be measured in the field, rather than in a laboratory;
• Dissolved oxygen • Temperature • pH • Conductivity • Turbidity • Secchi depth
Field testing equipment is often less precise than laboratory testing, however it is precise enough for environmental monitoring purposes, while providing a far more complete assessment of field conditions than laboratory tests alone. For operators used to measuring parameters in a stationary sample, field measurement using a sensor array may seem inaccurate, as the displayed readings may change while being recorded. This is because water is constantly passing the sensor, taking any suspended particles with it.
AML-ONK-001-FC/PC Page 20
Delta Review of current monitoring, gap analysis and recommendations
Regular calibration and careful handing is critical, if accurate field results are to be obtained. This requirement is off-set by the reduced need for labor, bottles, preservatives and transport equipment that would be required to get samples back to a laboratory. All-in-one field measurement units can save considerable time, and therefore cost, however they need to be handled with special care. Some units will not work at all if any one sensor is out of specification. To minimize the need to abort monitoring runs, field equipment should always be checked and calibrated immediately before each monitoring event. Turbidity sensors are optical in nature, so rely on regular cleaning to maintain accuracy. The sensor should never be left with hard, dirty or chlorinated water in contact with an optical surface, as this will allow build up of films, making turbidity read-outs unstable or inaccurate. Turbidity vials, tubes or backscatter sensors should be rinsed with distilled water immediately after being used, and cleaned with a manufacturer-supplied brush or cloth. Whenever turbidly sensors refuse to calibrate or become unstable, they should be soaked overnight in a mixture of laboratory detergent and distilled water, before following the cleaning process discussed above. For most parameters, the sensor head should be kept as still as possible, however a flow of at least 30cm/sec over the DO sensor will be required to obtain a dissolved oxygen reading, as the membrane-based platinum sensors consume oxygen. This flow can be achieved by gently moving the sensor head around while recording this parameter. When the sensor is moving at the correct speed, the reading will stabilize (neither continuously climbing nor falling).
6.4.1.3 Laboratory testing Some parameters are sufficiently stable to be measured in a laboratory environment or are unable to be quanitified in the field.
• Heavy metals • Coliforms • Nutrients • Chlorophyll α • Suspended sediments
Laboratory testing may be expensive and labour intensive, in comparison to in-situ testing. Many of these parameters can be correlated to in-situ tested parameters, significantly reducing the frequency and number of laboratory tests required.
AML-ONK-001-FC/PC Page 21
Delta Review of current monitoring, gap analysis and recommendations
6.5 Less frequent investigations Some variables change slowly, are event specific, or provide baseline information on which to base other assessments. These are more suited to a more survey-like monitoring method, where they are examined in detail, every few years.
6.5.1 Vegetation transects Estuarine water quality has a direct but delayed impact on vegetation cover and diversity within the intestinal and sub-tidal zones. Vegetation cover can be assessed remotely, however the most accurate way to assess species diversity changes is regularly examining species presence and distribution along a set transect. Care must be taken not to visit transects too frequently, and to always walk to one side of the transect line, as regular traffic can change the habitats and species found at that site. In salt-marsh communities, assessment once every 2-5 years is generally considered sufficient.
6.5.2 Aerial photograph analysis Data from vegetation transect assessments should be assessed in the light of each transect’s significance to whole-of estuary vegetation cover and habitat type statistics. Vegetation cover and habitat type figures are obtained via unsupervised, supervised and manual classification of aerial photography. Aerial photographs are only taken occasionally, and these statistics should change slowly, so this sort of analysis is best undertaken as changes are noticed, or every 6-10 years.
6.5.3 Turbidity monitoring during floods The amount of sediment carried out to sea, or that enters the estuary, during a flood is currently unknown. This could be quantified by testing a range of points entering or exiting the estuary, on an hourly basis during one or more flood events. This assessment would only need completing once before undertaking significant changes in catchment management or composition, then again after the changes have been completed.
AML-ONK-001-FC/PC Page 22
Delta Review of current monitoring, gap analysis and recommendations
7. References Lord, D.A. (1996) Estuary and Lakes Flushing Model, report for the MFP Australia,
Adelaide.
SA Environment Protection Authority (2007) Regulatory monitoring and testing: Water and wastewater sampling. South Australian Environment Protection Authority. Adelaide.
AML-ONK-001-FC/PC Page 23
Delta Review of current monitoring, gap analysis and recommendations
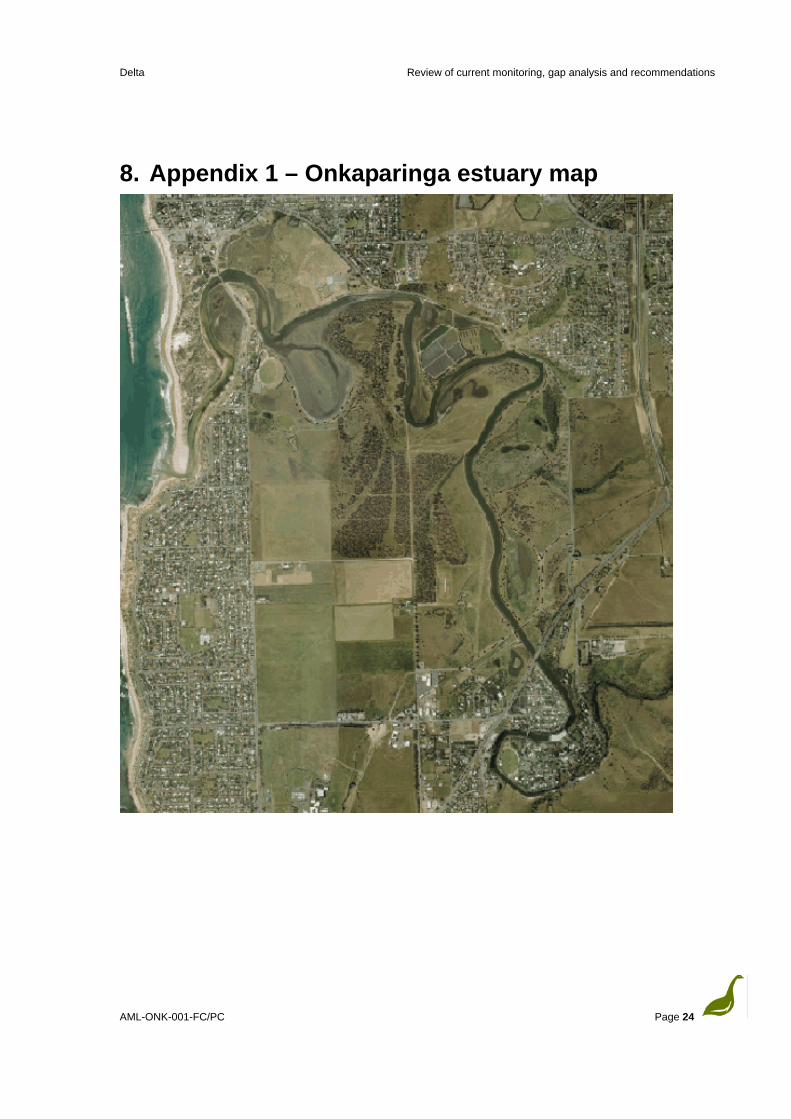
8. Appendix 1 – Onkaparinga estuary map
AML-ONK-001-FC/PC Page 24

Delta Review of current monitoring, gap analysis and recommendations
9. Appendix 2 – Details of consultants
Faith Cook Faith Cook (Grad Dip GIS & Remote Sensing, Dip Environmental Management) is employed by Delta Environmental Consulting to provide technical and consulting services. Faith has strengths in Natural Resource Management policy, remote sensing, statistics and biometrics. Faith spent two years preparing and starting implementation of the Tintinara-Coonalpyn Land and Water Management Plan. Faith’s duties included community empowerment, establishing a management committee, issues documentation, community consultation, stakeholder consultation, consultancy management, organizing a ministerial launch of the plan, media relations and obtaining external funding. Faith often provides services in the areas of GIS and mapping, policy development, environmental risk assessments, water quality management, laboratory testing, fieldwork, and desktop design. She has extensive project management experience, regularly working to tight timeframes, often in situations that require significant systems analysis and prioritization. Faith’s interests include salt lake research, kayaking and radio telemetry. She has an Australian Communications Authority Amateur Radio Operator license, a CAMS official license and a Marine band license for operation of marine emergency systems. She is a Resource Leader for Guides Australia, providing mentoring and leadership opportunities to teenage youth. Faith is a fellow of the Royal Society of South Australia and a member of the International Society for Salt Lake Research. Her current research interests include diatom ecological preferences, and samphire ecology.
Peri Coleman Peri Coleman (M AppSc - Environmental Management and Restoration) has extensive experience in identifying marine and terrestrial flora and fauna of the mainland states and Tasmania, conducting biological surveys, and producing reports and educational materials. Her main interests include biological survey work, revegetation and rehabilitation, scientific illustration and desktop publishing, preparation of herbarium and museum specimens, management plans, taxonomy and classification, solar salt field biology, environmental education
AML-ONK-001-FC/PC Page 25
Delta Review of current monitoring, gap analysis and recommendations
programs, computer application development, wetland studies and mangrove and samphire ecosystems. Peri owns, and is senior consultant for, Delta Environmental Consulting. She is a member of the South Australian Coast Protection Board, Barker Inlet Port Estuary Committee and chairs of the Jeffries Buckland Park Community Consultation Committee. Peri has a strong commitment to research, with several recent papers accepted for international publication. She is a fellow of the Royal Society of South Australia and member of the International Society for Salt Lake Research.
AML-ONK-001-FC/PC Page 26


