Embed Size (px)
Citation preview

Reuse Waste Textiles for Composites Production
Sunil Kumar Ramamoorthy1, Anders Persson2* and Mikael Skrifvars1
1. School of Engineering, University of Borås , SE-501 90, Borås, Sweden
2. The Swedish School of Textiles, University of Borås, SE-501 90, Borås, Sweden
*Correspondence: [email protected], Phone: +46 33 4354163
1. INTRODUCTION
Re-using valuable resources in more feasible method contributes to sustainable living. There
are several ongoing researches to re-use the products from non-renewable resources.
Polyethylene terephthalate (PET) is widely used thermoplastic polymer which is from non-
renewable petroleum resource needs to be re-used or re-cycled. PET is extensively used to
produce textile fibers and containers. Re-cycling technique of PET bottles is extensively used
but re-cycling becomes difficult when PET is used in textile industry as polymer fibers are
generally mixed with other fibers [1]. Large quantity of polyester (PET); approximately 39
million tons of PET out of 49 million tons in 2008 was used in textile industry. About 74% of
the PET used in textile industry was used to make staple fibers. These staple fibers were
mostly used to mix together with cotton fibers to produce cotton/PET blend fabrics [2] [3].
These blended fabrics are frequently disposed after use which ends in landfills. The
degradation of PET is slow and there are environmental problems. In addition, the valuable
non-renewable petroleum resource is wasted.
There are methods available to re-cycle PET from cotton but these methods are still not
economically feasible [4] [5]. PET from other resources such as bottles or fibers is recycled in
many ways; melting PET [6-8], glycolysis [9], hydrolysis [10], methanolysis [11] but these
techniques cannot be applicable in recycling of cotton/PET blend fabrics. Complex mixture of

cotton and PET in fabrics cannot be separated mechanically. Other method is to dissolve PET
from cotton/PET blend fabric; practically it is possible but economically it is not feasible
because PET has limited solvents and those solvents are expensive. It is necessary to find
alternative methods which are less expensive to re-cycle/re-use and handle cotton/PET
blend fabrics. All the discussed recycling routes have the effect that the material in some or
several aspect loose value, i.e. down grading. Thermodynamically the entropy inevitably
increases. Efforts to make a material of high regularity are wasted, e.g. if a woven fabric is
shredded. If the discarded fabric can be used as received and further refined to a new
construction the down grading is avoided.
This project concentrates on re-using the waste cotton/PET blend fabrics and developing
new products. The blend fabrics were directly made into composites through three methods
by compression molding technique. In the first method, the fabric was simply compression
molded above the polyester’s melting temperature, either as received or with addition of
plasticizer. In the second method, external bio-based matrix from soybean oil was used as
matrix. Third method; external bicomponent fibers were used as matrix. The main
advantages of these methods are low cost, simple method and new product is developed
from the waste.
The feasibility of the three concepts was evaluated in terms of mechanical performance
quantified by tensile and impact tests. DMTA, DSC, TGA and SEM were used to describe the
morphology and process related effects of the composites. The effect of plasticizers was also
studied on comparison of mechanical properties of composites with plasticizers and
composites without plasticizers.
2. EXPERIMENTAL

2.1 Materials
Used cotton/PET (50:50) fabric was obtained from Textilia, Sweden. The fabric was used in
hospital and it had surface weight 210 g/m2. Plasticizers, Glycerol (ACS reagent grade, ≥
99.5%) and 2 phenyl phenol (reagent grade, 99%), were supplied by Sigma-Aldrich Sweden
AB. Ethanol (reagent grade, 99.8%) were supplied by Fisher Scientific. Free radical initiator,
tert-butlyperoxybenzoate was supplied by Aldrich Chemical Company, Wyoming, USA.
Methacrylated soybean oil (MSO) was synthesized according to the method described in this
reference [12]. Bicomponent fibers (CoPET/PET, core sheath construction) were obtained
from Fiberpartner ApS, Vejle, Denmark. These bicomponent staple fibers has round cross-
section with length 32 mm. These fibers were carded and needled in order to align the fibers
in one direction.
2.2 Composite Production
Cotton/Polyester blended fabrics were first cut in to 20 cm × 20 cm pieces. The fabric pieces
were dried in oven at 105˚C for 2 hours. The composites were produced by compression
molding of fabric pieces with/without plasticizers, with/without external matrix (Rondol hot
press, Staffordshire, UK). Composites are formed after 20 seconds to 10 minutes, and then
the mould is removed and cooled down at room temperature for 5 minutes before taking
out the composites. Matrix and compression temperature are type dependent as mentioned
in table 1. Compression factors cannot be generalized for all three types of composite
production. DSC melting curves used to decide the compression temperature. Processing
parameters for each type is given in table 1.
Type 1 – Compression molding of neat fabrics (C1)

It is possible to produce the composites by melting and re-molding the thermoplastic
polymer available in the blended fabric, while the cotton fibers act as reinforcement. The
composites were produced as mentioned in [2]. As the melting point of PET lies between
250˚C - 260˚C, it is necessary to subject the blended fabric above this temperature. The
compression molding was done at various temperatures between 270˚C and 290˚C for 20 to
40 seconds.
At this temperature, the cotton fibers are expected to degrade. To minimize the
degradation, compression time is reduced significantly. It is also possible to lower the
melting point of PET by adding plasticizers. In this project, glycerol and 2-Phenylphenol were
used as plasticizers (5 wt% of the fabric). The compression temperature was reduced on
using plasticizers.
Type 2 – Compression molding of soybean based thermoset resin reinforced with blended
fabric (C2)
In this method, soybean based thermoset rein is used to reduce the compression
temperature. By reducing the compression temperature, there is no or minimal degradation
of cotton. Soybean oil was chemically modified to methacrylated soybean oil (MSO).
Initiator, 2 wt% tert-butyl peroxybenzoate, was mixed with the MSO. The compression
molding was done at several temperatures between 160 ˚C and 200˚C for 5 to 10 minutes
with 160 – 200 kN pressure. The amount of matrix in the composites varied between 20 – 50
wt%.
Type 3 – Compression molding of bicomponent reinforced with blended fabric (C3)
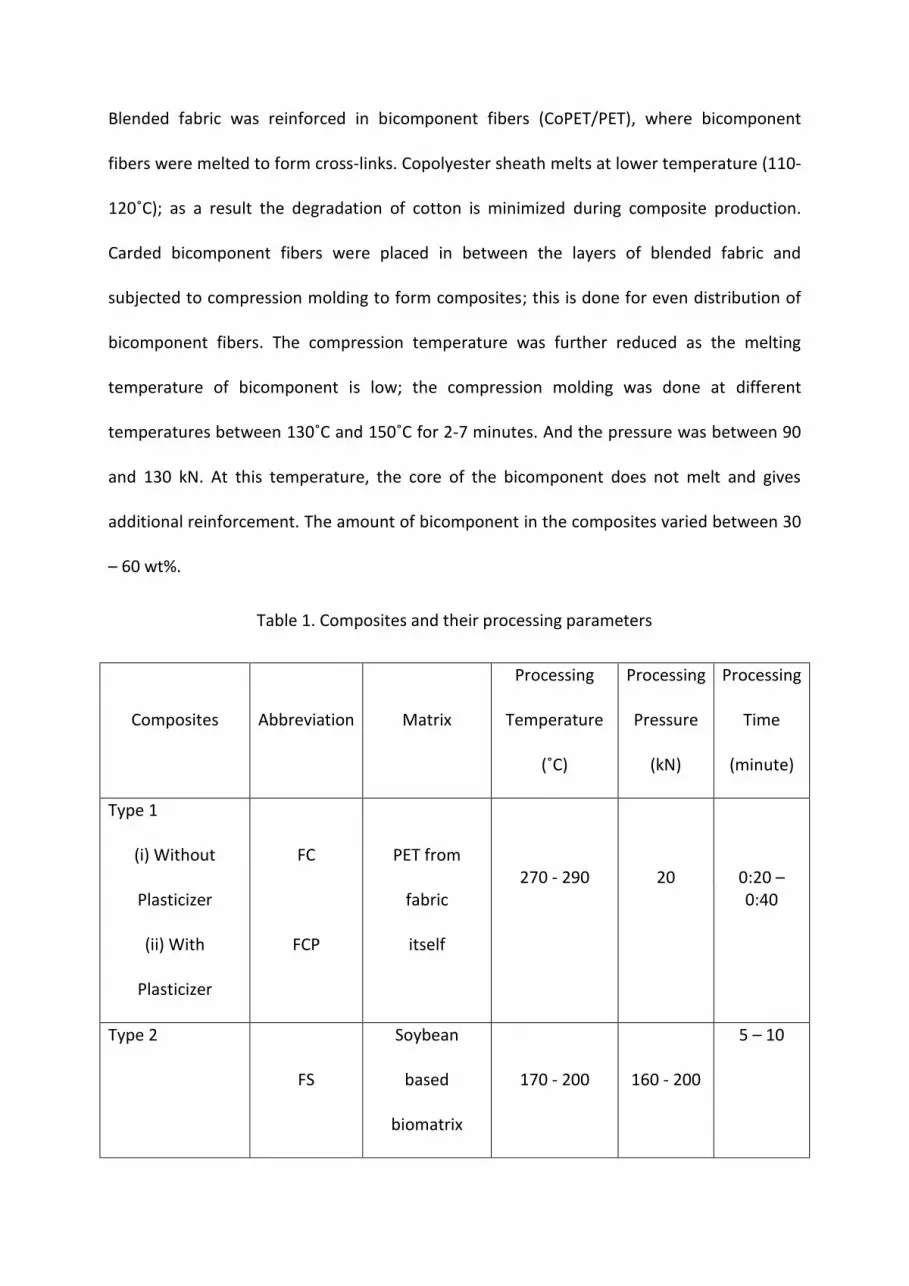
Blended fabric was reinforced in bicomponent fibers (CoPET/PET), where bicomponent
fibers were melted to form cross-links. Copolyester sheath melts at lower temperature (110-
120˚C); as a result the degradation of cotton is minimized during composite production.
Carded bicomponent fibers were placed in between the layers of blended fabric and
subjected to compression molding to form composites; this is done for even distribution of
bicomponent fibers. The compression temperature was further reduced as the melting
temperature of bicomponent is low; the compression molding was done at different
temperatures between 130˚C and 150˚C for 2-7 minutes. And the pressure was between 90
and 130 kN. At this temperature, the core of the bicomponent does not melt and gives
additional reinforcement. The amount of bicomponent in the composites varied between 30
– 60 wt%.
Table 1. Composites and their processing parameters
Composites Abbreviation Matrix
Processing
Temperature
(˚C)
Processing
Pressure
(kN)
Processing
Time
(minute)
Type 1
(i) Without
Plasticizer
(ii) With
Plasticizer
FC
FCP
PET from
fabric
itself
270 - 290
20
0:20 – 0:40
Type 2
FS
Soybean
based
biomatrix
170 - 200 160 - 200
5 – 10
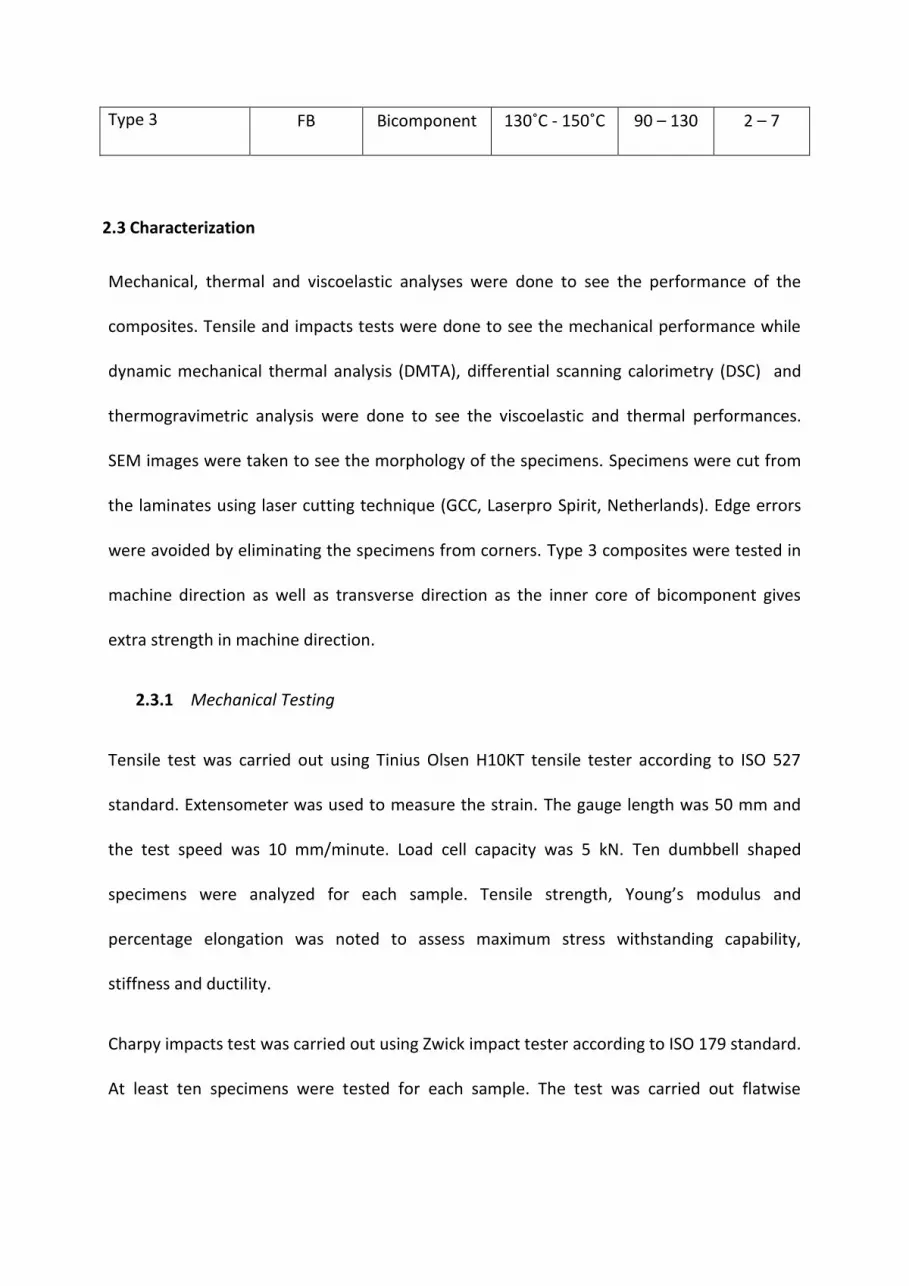
Type 3 FB Bicomponent 130˚C - 150˚C 90 – 130 2 – 7
2.3 Characterization
Mechanical, thermal and viscoelastic analyses were done to see the performance of the
composites. Tensile and impacts tests were done to see the mechanical performance while
dynamic mechanical thermal analysis (DMTA), differential scanning calorimetry (DSC) and
thermogravimetric analysis were done to see the viscoelastic and thermal performances.
SEM images were taken to see the morphology of the specimens. Specimens were cut from
the laminates using laser cutting technique (GCC, Laserpro Spirit, Netherlands). Edge errors
were avoided by eliminating the specimens from corners. Type 3 composites were tested in
machine direction as well as transverse direction as the inner core of bicomponent gives
extra strength in machine direction.
2.3.1 Mechanical Testing
Tensile test was carried out using Tinius Olsen H10KT tensile tester according to ISO 527
standard. Extensometer was used to measure the strain. The gauge length was 50 mm and
the test speed was 10 mm/minute. Load cell capacity was 5 kN. Ten dumbbell shaped
specimens were analyzed for each sample. Tensile strength, Young’s modulus and
percentage elongation was noted to assess maximum stress withstanding capability,
stiffness and ductility.
Charpy impacts test was carried out using Zwick impact tester according to ISO 179 standard.
At least ten specimens were tested for each sample. The test was carried out flatwise
direction for un-notched specimens. Charpy impact strength was found out to analyze the
impact resistance of the specimen.
2.3.2 Water Absorption Test
Water absorption tests were carried out to see the moisture absorption of the composites.
Four specimens were examined for each sample. The specimens were conditioned for 24h at
60˚C and they were kept in desiccators in order to bring down to room temperature. The
weight of the specimen is note as Wo before immersing the specimen in water. The water
absorption is measured every 24h for 10 days by taking out the specimen and weighing it
after wiping the surface dry, it is noted as W. The percentage of water absorption is
measured by the formula below.
WA%=[(W-Wo)/Wo]×100
2.3.3 Thermal Analysis
Differential scanning calorimetry (DSC) was carried out using DSC Q2000 from TA
Instruments, New Castle, DE, USA. The temperature range was -30˚C to 300˚C with the
heating rate was 10˚C/min. Glass transition temperature (Tg) and melting temperature (Tm)
were noted.
Thermogravimetric analysis was performed using TA instrument, TGA Q 500, supplied by
Waters LLC, USA. Approximately 15 mg of the samples were heated from 30˚C to 600˚C at
10˚C/min in a nitrogen purge stream. The flow of nitrogen was 50 ml/min. The weight loss
over the temperature rise is related to degradation of the sample.
2.3.4 Viscoelastic Analysis
Dynamic mechanical thermal analysis (DMTA) was carried out using DMA Q800 from TA
Instruments, New Castle, DE, USA. Dual cantilever clamp was used to perform the tests. The
frequency was 1 Hz and the amplitude was 15 µm. The temperature range was from 30˚C to
150˚C at the heating rate of 3˚C/min. Three specimens were tested for each sample. Storage
modulus, loss modulus and the glass transition temperature was noted to assess elastic
response and viscous response of the specimen.
2.3.5 Scanning Electron Microscopy
SEM images were taken by environmental scanning electron microscope (ESEM), FEI Quanta
200 F, in order to perform morphological analysis. The experiment was run at high voltage
and low vacuum.
3. RESULTS AND DISCUSSION
3.1 Mechanical Testing
3.1.1 Type 1 Composites
Tensile Test:
Tensile properties were analyzed for the specimens made by melting the polyester of the
fabric at different compression temperatures and time. Tensile properties were also
analyzed for specimens with plasticizers, glycerol (G) and 2-phenylphenol (2P). Tensile
strength, E-modulus and % elongation of the specimens were studied.
Fig 1 shows the tensile strength of the specimens. G and 2P represents the specimens with
glycerol and 2-phenylphenol plasticizers respectively. Change in temperature and time have
influence on tensile strength. Specimens without plasticizers had tensile strength of 17.72
MPa when compression temperature and time were 270˚C and 20 seconds respectively. On
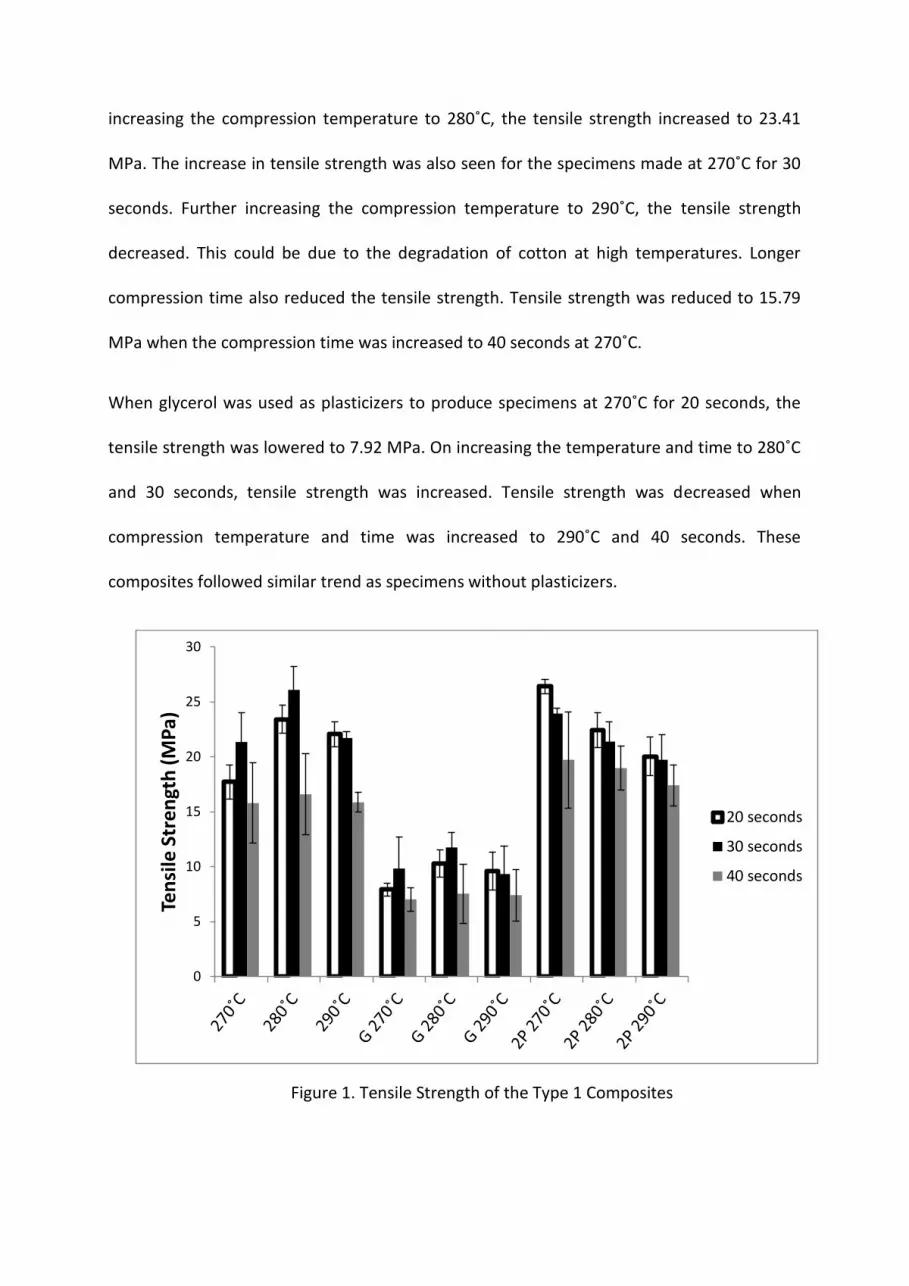
increasing the compression temperature to 280˚C, the tensile strength increased to 23.41
MPa. The increase in tensile strength was also seen for the specimens made at 270˚C for 30
seconds. Further increasing the compression temperature to 290˚C, the tensile strength
decreased. This could be due to the degradation of cotton at high temperatures. Longer
compression time also reduced the tensile strength. Tensile strength was reduced to 15.79
MPa when the compression time was increased to 40 seconds at 270˚C.
When glycerol was used as plasticizers to produce specimens at 270˚C for 20 seconds, the
tensile strength was lowered to 7.92 MPa. On increasing the temperature and time to 280˚C
and 30 seconds, tensile strength was increased. Tensile strength was decreased when
compression temperature and time was increased to 290˚C and 40 seconds. These
composites followed similar trend as specimens without plasticizers.
Figure 1. Tensile Strength of the Type 1 Composites
0
5
10
15
20
25
30
Ten
sile
Str
en
gth
(M
Pa)
20 seconds
30 seconds
40 seconds
Highest tensile strength was obtained when specimens were processed with 2-phenylphenol
plasticizers at 270˚C for 30 seconds. Tensile strength decreased when the compression
temperature was raised to 280˚C and 290˚C. Similar trend was observed when compression
time was increased to 30 and 40 seconds. High tensile strength at lower temperature could
be due to reduction in melting temperature, the same could be reason for decrease in
tensile strength at higher temperatures.
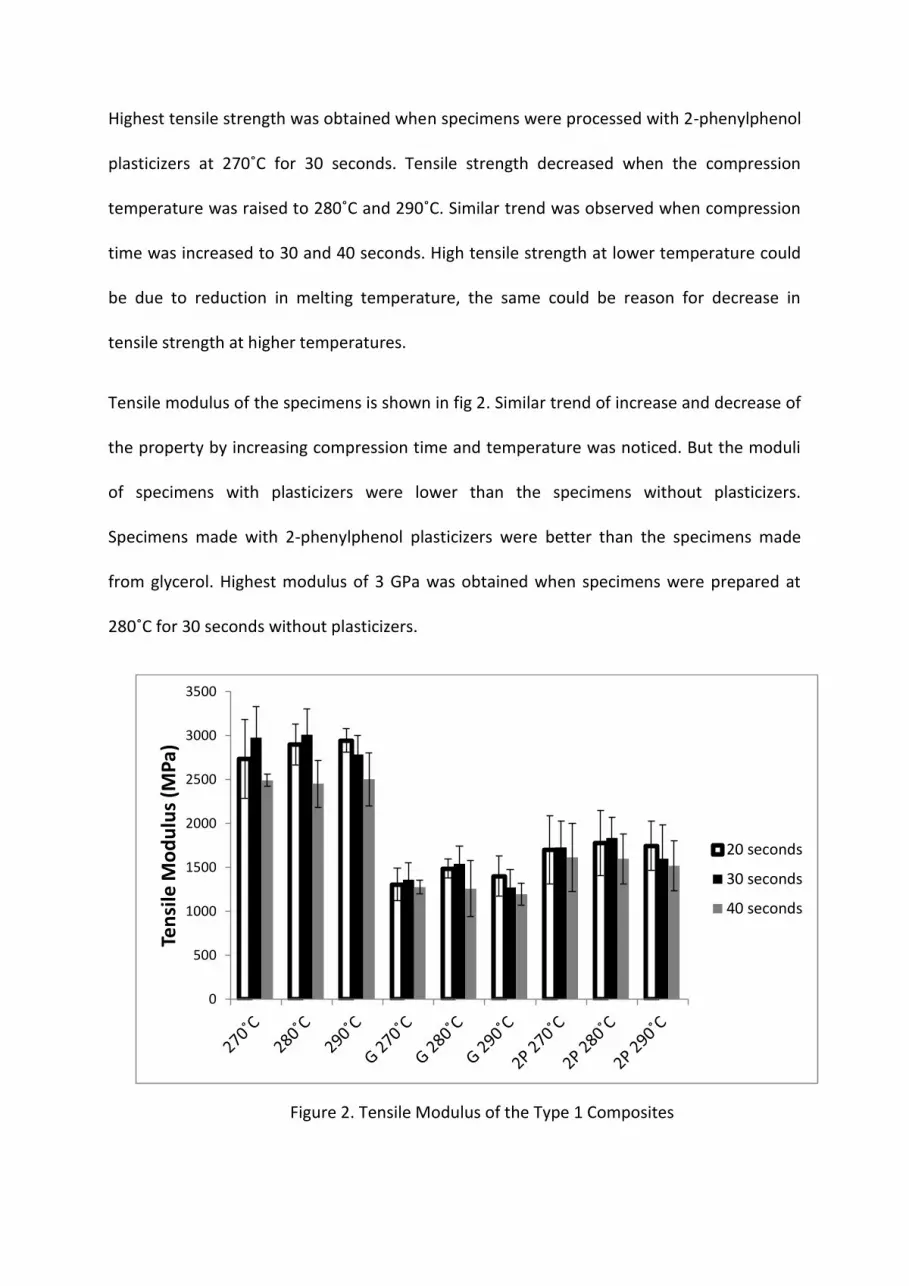
Tensile modulus of the specimens is shown in fig 2. Similar trend of increase and decrease of
the property by increasing compression time and temperature was noticed. But the moduli
of specimens with plasticizers were lower than the specimens without plasticizers.
Specimens made with 2-phenylphenol plasticizers were better than the specimens made
from glycerol. Highest modulus of 3 GPa was obtained when specimens were prepared at
280˚C for 30 seconds without plasticizers.
Figure 2. Tensile Modulus of the Type 1 Composites
0
500
1000
1500
2000
2500
3000
3500
Ten
sile
Mo
du
lus
(MP
a)
20 seconds
30 seconds
40 seconds

Fig 3 shows the percentage elongation of composites. The percentage elongation of the
specimens was studied and highest elongation was obtained from specimen with 2-
phenylphenol plasticizer. Degradation of cotton in the reinforcement fabric might be the
reason for decreasing trend of elongation on increasing the temperature and time.
Specimens with plasticizers showed good and comparable elongation to the specimens
without plasticizers. 2-phenylphenol plasticizer specimens showed better results than
glycerol plasticizer specimens.
Figure 3. Percentage Elongation of the Type 1 composites
Impact Strength:
Impact strength was studied for the composites without plasticizer and it is shown in fig 4. It
depends on temperature and time of compression. Impact strength of 24.55 kJ/m2 was
obtained for the specimen processed at 270˚C for 20 seconds. The strength increased to
27.04 kJ/m2 on increasing the compression time; on further increase of compression time,
0,0
0,2
0,4
0,6
0,8
1,0
1,2
1,4
1,6
1,8
2,0
% E
lon
gati
on
20 seconds
30 seconds
40 seconds
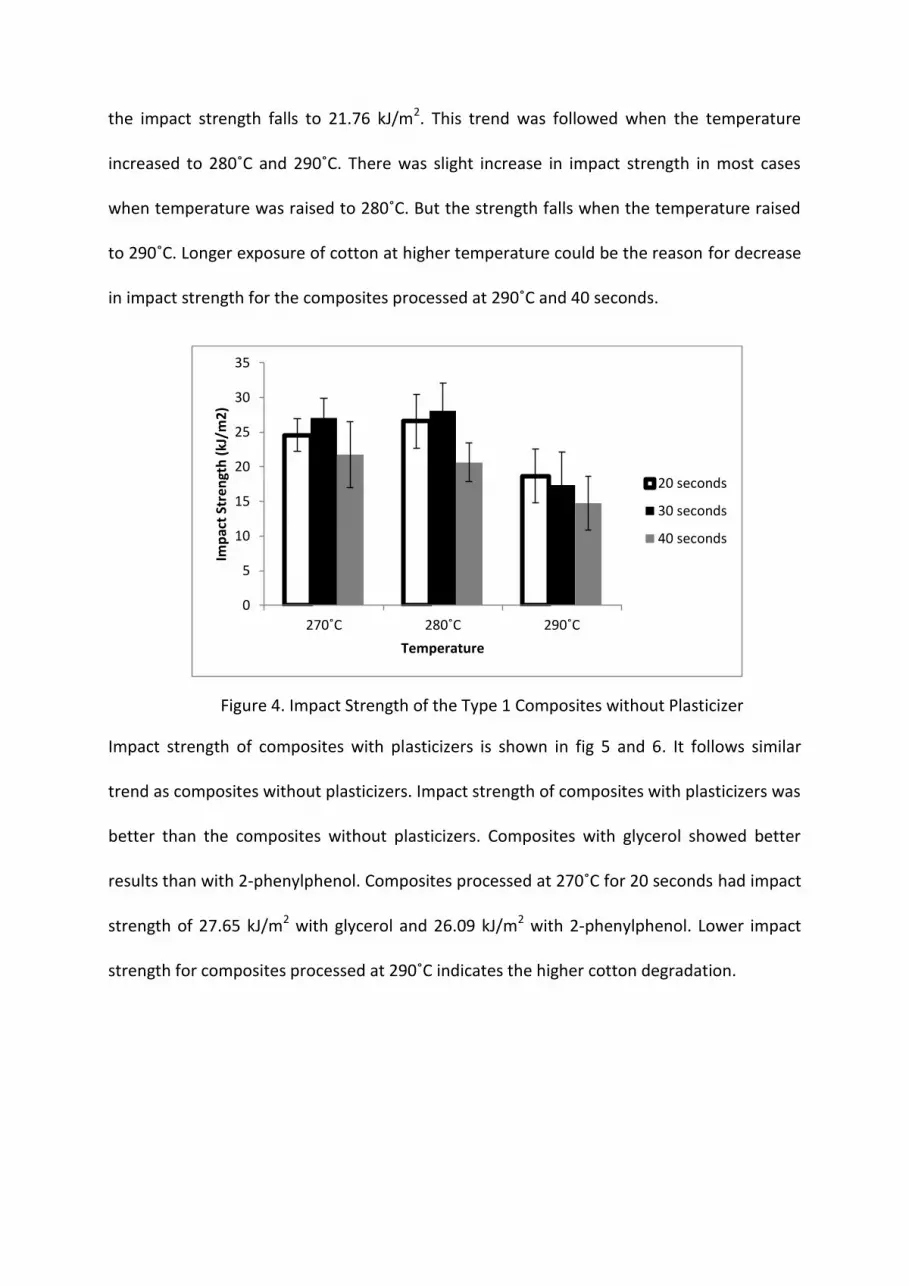
the impact strength falls to 21.76 kJ/m2. This trend was followed when the temperature
increased to 280˚C and 290˚C. There was slight increase in impact strength in most cases
when temperature was raised to 280˚C. But the strength falls when the temperature raised
to 290˚C. Longer exposure of cotton at higher temperature could be the reason for decrease
in impact strength for the composites processed at 290˚C and 40 seconds.
Figure 4. Impact Strength of the Type 1 Composites without Plasticizer
Impact strength of composites with plasticizers is shown in fig 5 and 6. It follows similar
trend as composites without plasticizers. Impact strength of composites with plasticizers was
better than the composites without plasticizers. Composites with glycerol showed better
results than with 2-phenylphenol. Composites processed at 270˚C for 20 seconds had impact
strength of 27.65 kJ/m2 with glycerol and 26.09 kJ/m2 with 2-phenylphenol. Lower impact
strength for composites processed at 290˚C indicates the higher cotton degradation.
0
5
10
15
20
25
30
35
270˚C 280˚C 290˚C
Imp
act
Stre
ngt
h (
kJ/m
2)
Temperature
20 seconds
30 seconds
40 seconds
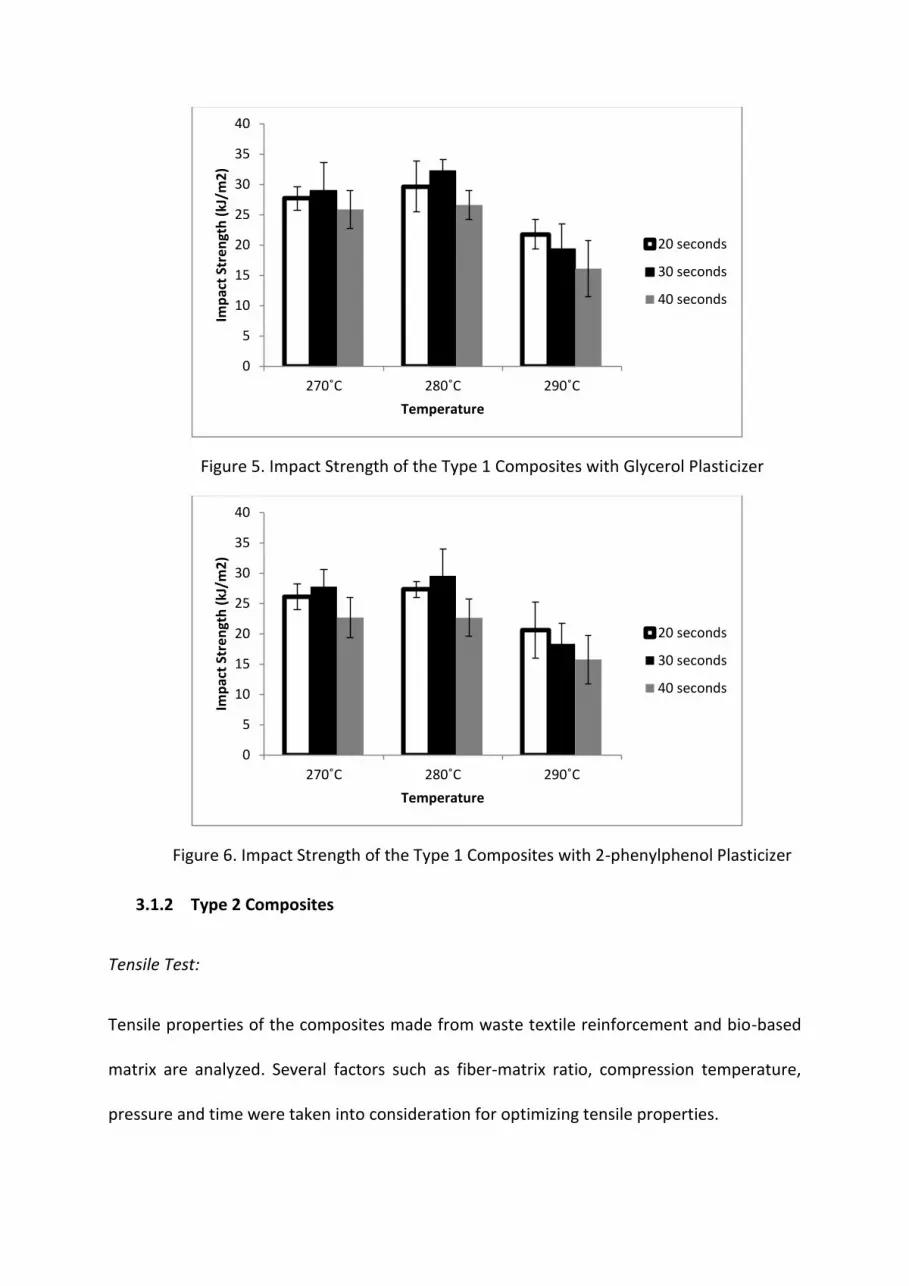
Figure 5. Impact Strength of the Type 1 Composites with Glycerol Plasticizer
Figure 6. Impact Strength of the Type 1 Composites with 2-phenylphenol Plasticizer
3.1.2 Type 2 Composites
Tensile Test:
Tensile properties of the composites made from waste textile reinforcement and bio-based
matrix are analyzed. Several factors such as fiber-matrix ratio, compression temperature,
pressure and time were taken into consideration for optimizing tensile properties.
0
5
10
15
20
25
30
35
40
270˚C 280˚C 290˚C
Imp
act
Stre
ngt
h (
kJ/m
2)
Temperature
20 seconds
30 seconds
40 seconds
0
5
10
15
20
25
30
35
40
270˚C 280˚C 290˚C
Imp
act
Stre
ngt
h (
kJ/m
2)
Temperature
20 seconds
30 seconds
40 seconds
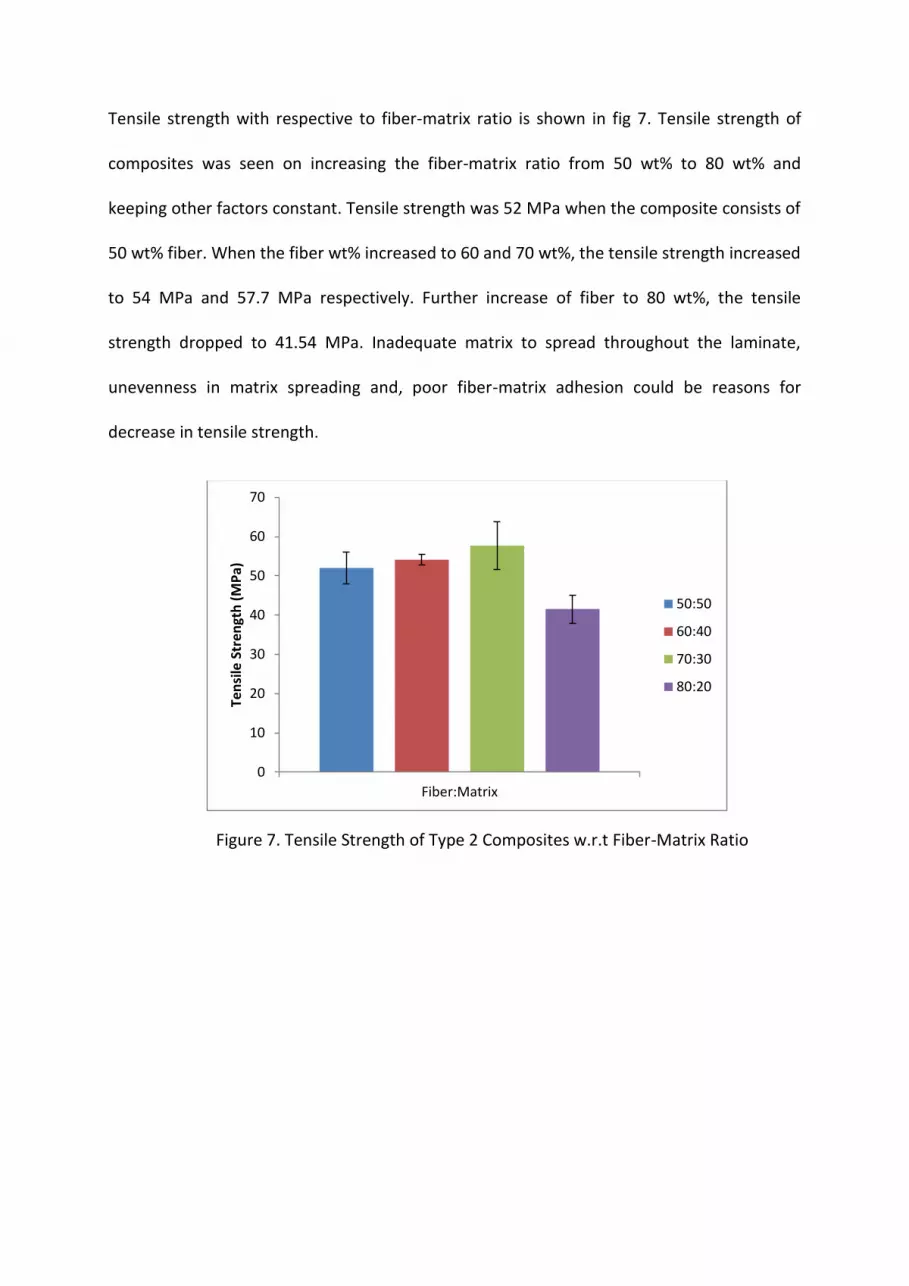
Tensile strength with respective to fiber-matrix ratio is shown in fig 7. Tensile strength of
composites was seen on increasing the fiber-matrix ratio from 50 wt% to 80 wt% and
keeping other factors constant. Tensile strength was 52 MPa when the composite consists of
50 wt% fiber. When the fiber wt% increased to 60 and 70 wt%, the tensile strength increased
to 54 MPa and 57.7 MPa respectively. Further increase of fiber to 80 wt%, the tensile
strength dropped to 41.54 MPa. Inadequate matrix to spread throughout the laminate,
unevenness in matrix spreading and, poor fiber-matrix adhesion could be reasons for
decrease in tensile strength.
Figure 7. Tensile Strength of Type 2 Composites w.r.t Fiber-Matrix Ratio
0
10
20
30
40
50
60
70
Fiber:Matrix
Ten
sile
Str
en
gth
(M
Pa)
50:50
60:40
70:30
80:20

Figure 8. Tensile Strength of Type 2 Composites w.r.t Temperature, Time and
Pressure
Tensile strength with respective to temperature, time and pressure is shown in fig 8. Tensile
strength increased on increasing the temperature from 170˚C to 185˚C and 200˚C.
Composite had tensile strength of 45 MPa when compression temperature was 170˚C; it
increased to 51.8 MPa and 52 MPa. Similar trend was seen when processing time was
increased. Tensile strength increased from 45 MPa to 50.3 MPa and 50.6 MPa when the
processing time increased from 5 mins to 7 mins and 10 mins respectively. Tensile strength
increased when pressure was increased from 160 kN to 180 kN but there was slight decrease
in tensile strength when pressure was further raised to 200 kN.
Tensile modulus followed similar trend as tensile strength in all cases. Tensile strength
increased on increasing the fiber wt% from 50 to 60 and 70 wt%, but it decreased on
0
10
20
30
40
50
60
Temperature (170, 185, 200 ˚C) Time (5, 7, 10 mins) Pressure (160, 180, 200 kN)
Ten
sile
Str
en
gth
(M
Pa)
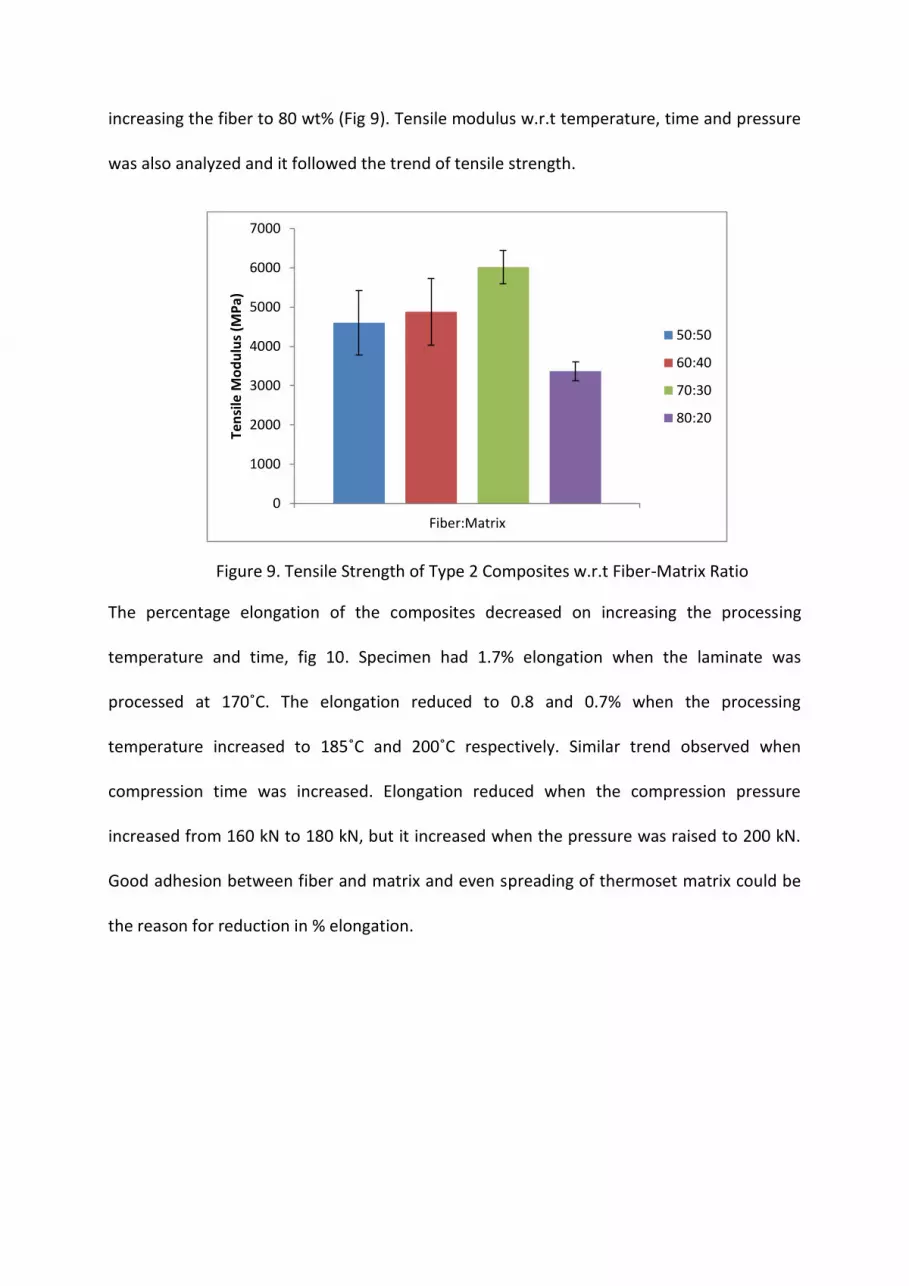
increasing the fiber to 80 wt% (Fig 9). Tensile modulus w.r.t temperature, time and pressure
was also analyzed and it followed the trend of tensile strength.
Figure 9. Tensile Strength of Type 2 Composites w.r.t Fiber-Matrix Ratio
The percentage elongation of the composites decreased on increasing the processing
temperature and time, fig 10. Specimen had 1.7% elongation when the laminate was
processed at 170˚C. The elongation reduced to 0.8 and 0.7% when the processing
temperature increased to 185˚C and 200˚C respectively. Similar trend observed when
compression time was increased. Elongation reduced when the compression pressure
increased from 160 kN to 180 kN, but it increased when the pressure was raised to 200 kN.
Good adhesion between fiber and matrix and even spreading of thermoset matrix could be
the reason for reduction in % elongation.
0
1000
2000
3000
4000
5000
6000
7000
Fiber:Matrix
Ten
sile
Mo
du
lus
(MP
a)
50:50
60:40
70:30
80:20

Figure 10. Tensile Strength of Type 2 Composites w.r.t Temperature, Time and
Pressure
Impact Test:
Impact strength of the composites is shown in fig 11. Impact strength increased on
increasing the fiber wt% in the composite from 50 wt% to 60 and 70 wt%, but it decreased
when the fiber amount in the composite was increased to 80 wt%. Improper adhesion
between fiber and matrix and uneven spreading of matrix could be the reason for lower
impact strength. Strength increased when the processing pressure increased from 160 kN to
180 and 200 kN. Similar trend was seen when the processing temperature was increased
from 170˚C to 185 and 200˚C. Impact strength of the composite was 64 kJ/m2 when
composite was processed for 5 mins, it increased to 70 kJ/m2 and 71 kJ/m2 when processing
times were 7 and 10 mins.
0
0,2
0,4
0,6
0,8
1
1,2
1,4
1,6
1,8
2
Temperature (170, 185, 200 ˚C) Time (5, 7, 10 mins) Pressure (160, 180, 200 kN)
% E
lon
gati
on

Figure 11. Impact Strength of Type 2 Composites
3.1.3 Type 3 Composites
Tensile Test:
(i) Tested in machine direction (Longitudinal)
Tensile strength of composites is shown in fig 12. Interaction plot was drawn considering
several factors such as fiber wt%, temperature, pressure and time of molding. Bi-component
is melted to form laminates; it had tensile strength of 57.6 MPa. When known amount of
fabric is added as reinforcement, the tensile strength improved. Tensile strength of 88.4 MPa
was achieved on introducing the reinforcement. It is expected as reinforcement gives extra
strength to the composites. Tensile strength was also dependent on temperature, pressure
and time of compression. When the temperature was raised from 130˚C to 150˚C and
keeping other factors constant, the tensile strength raised to 73.3 MPa from 61.5 MPa when
composite had 40 wt% reinforcement. Tensile strength of composite consisting 60 wt%
reinforcement was 54 MPa when 90 kN pressure applied during compression. Tensile
strength rose to 63.8 MPa when pressure raised to 110 kN, it was further raised to 93.5 MPa
0
10
20
30
40
50
60
70
80
90
Fiber (50, 60, 70,80 wt%) Pressure (160, 180, 200kN)
Temperature (170, 185, 200 ˚C)
Time (5, 7, 10 mins)
Imp
act
Stre
ngt
h (
kJ/m
2)
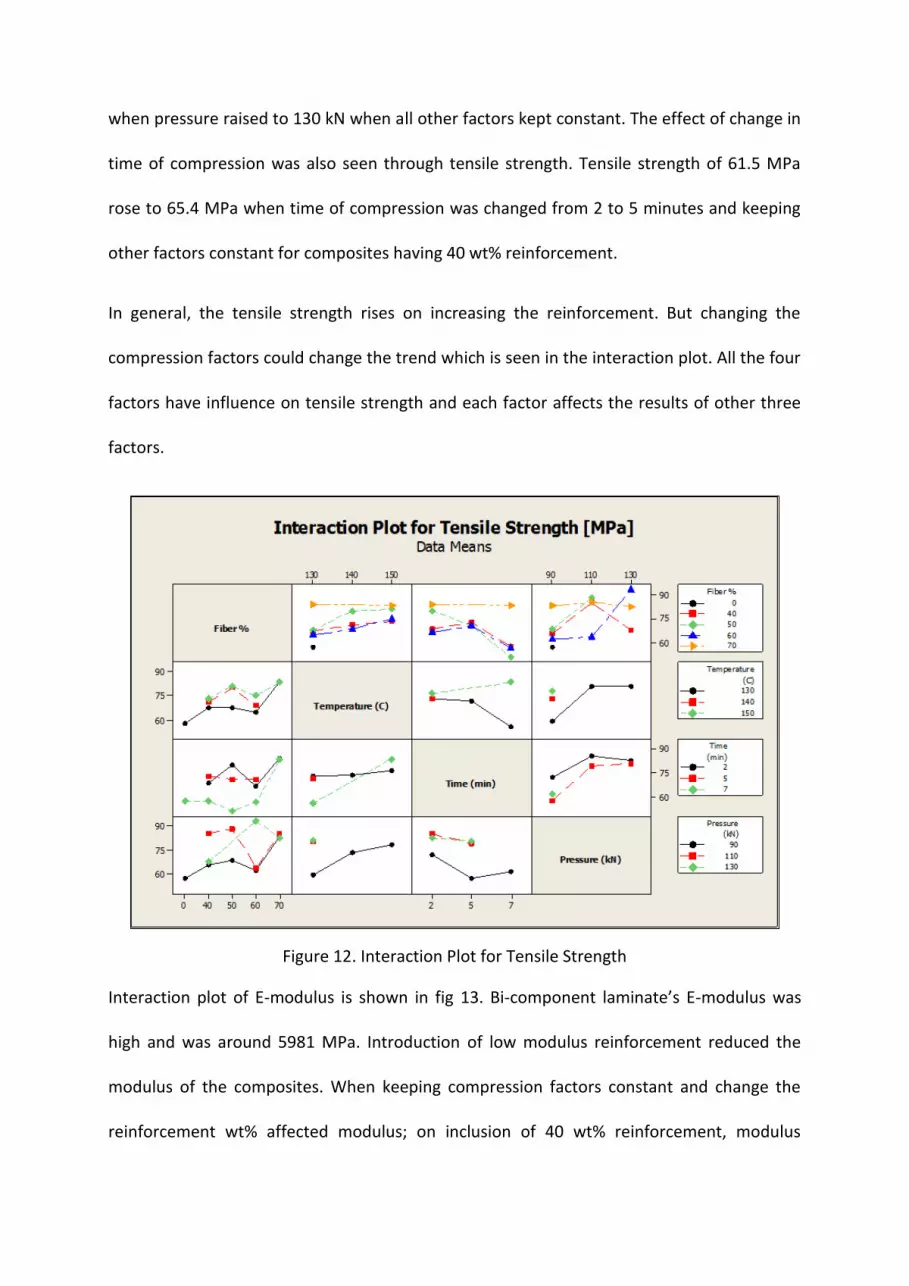
when pressure raised to 130 kN when all other factors kept constant. The effect of change in
time of compression was also seen through tensile strength. Tensile strength of 61.5 MPa
rose to 65.4 MPa when time of compression was changed from 2 to 5 minutes and keeping
other factors constant for composites having 40 wt% reinforcement.
In general, the tensile strength rises on increasing the reinforcement. But changing the
compression factors could change the trend which is seen in the interaction plot. All the four
factors have influence on tensile strength and each factor affects the results of other three
factors.
Figure 12. Interaction Plot for Tensile Strength
Interaction plot of E-modulus is shown in fig 13. Bi-component laminate’s E-modulus was
high and was around 5981 MPa. Introduction of low modulus reinforcement reduced the
modulus of the composites. When keeping compression factors constant and change the
reinforcement wt% affected modulus; on inclusion of 40 wt% reinforcement, modulus

reduced to 3556.8 MPa, it was further reduced to 2854.3 MPa when composites had 60 wt%
reinforcement. Modulus was affected when compression time was changed while keeping
other factors constant; modulus was 2584.3 MPa when compression time was 2 minutes, it
was increased to 3414 MPa and 4580 MPa when the time was changed to 5 and 7 minutes
respectively. The effect of pressure was seen when all the factors keep constant except
pressure, the tensile modulus increased from 3706.8 MPa to 5170.5 MPa when pressure of
compression raised to 130 kN from 110 kN.
Figure 13. Interaction Plot for Tensile Modulus
Similarly, compression temperature also affects the tensile modulus; the modulus of 3556.8
MPa was obtained when temperature was 130˚C, it was increased by increasing the
temperature and keeping other factors constant. Modulus rose to 4336.2 MPa and it was
further increased to 5814 MPa when the compression temperature was 140˚C and 150˚C
respectively.

The E-modulus of bi-component fibers are high while the waste fabric used as reinforce has
lower modulus. So, the introduction of reinforcement decreased the modulus of the
composites. The trend was affected by the compression factors such as time, pressure and
temperature which are shown in interaction plot.
The percentage elongation of the composites was between 4 and 16% and the interaction
plot is shown in fig 14. The interaction plot tells the effect of each factor on tensile strength
and the effect of each factor on others. Bi-component laminate had percentage elongation
around 12.6%. This was reduced to 11% and 7% on inclusion of reinforcement 40 and 60
wt% reinforcement. The percentage elongation decreased on increasing the compression
temperature. It was reduced from 12.7% to 11.8% and further to 10.1% when the
temperature was 130˚C, 140˚C and 150˚C. The effect of compression pressure was noticed
when there was change in pressure and all the other factors kept constant. The percentage
elongation increased from 4.3% to 7.5% and further to 11% when the pressure was 90 kN,
110 kN and 130 kN respectively.
The influence of each factor and the effect of one factor on others were seen in all three
tensile properties. The reason could be due to melting of bi-component, spreading of matrix,
cross-linking of matrix, role of core of bi-component, time needed for even distribution of
heat throughout the laminates, pressure needed for even distribution of matrix, pressure
needed for pore free composites, role of temperature, amount of waste fabric in composite
and combined effect of the all the above mentioned factors.
The interaction plots show the importance of considering the four factors together. The
effect of un-melted core was seen as it increases the properties of composites. It is also
necessary to see the properties of the composites in transverse direction.
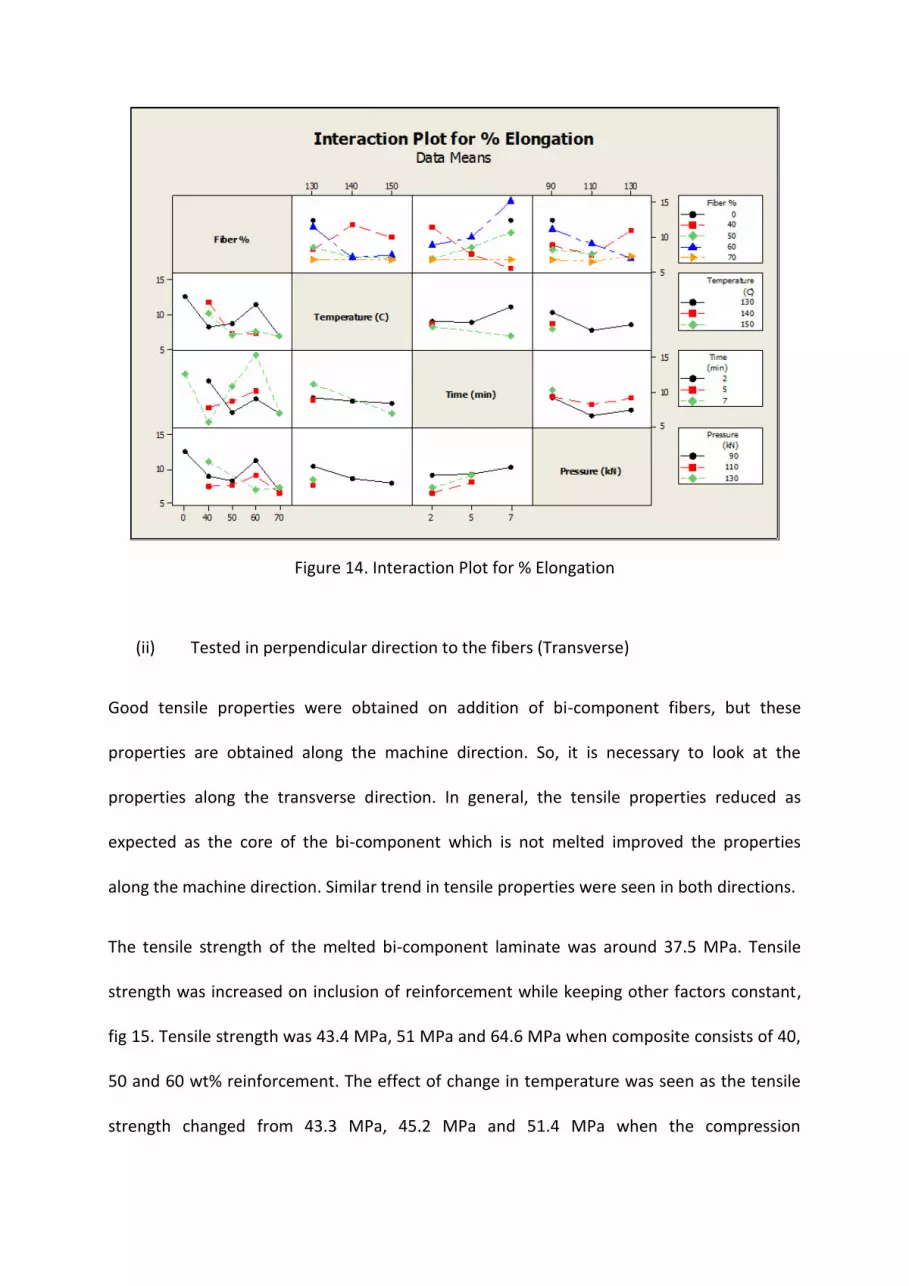
Figure 14. Interaction Plot for % Elongation
(ii) Tested in perpendicular direction to the fibers (Transverse)
Good tensile properties were obtained on addition of bi-component fibers, but these
properties are obtained along the machine direction. So, it is necessary to look at the
properties along the transverse direction. In general, the tensile properties reduced as
expected as the core of the bi-component which is not melted improved the properties
along the machine direction. Similar trend in tensile properties were seen in both directions.
The tensile strength of the melted bi-component laminate was around 37.5 MPa. Tensile
strength was increased on inclusion of reinforcement while keeping other factors constant,
fig 15. Tensile strength was 43.4 MPa, 51 MPa and 64.6 MPa when composite consists of 40,
50 and 60 wt% reinforcement. The effect of change in temperature was seen as the tensile
strength changed from 43.3 MPa, 45.2 MPa and 51.4 MPa when the compression
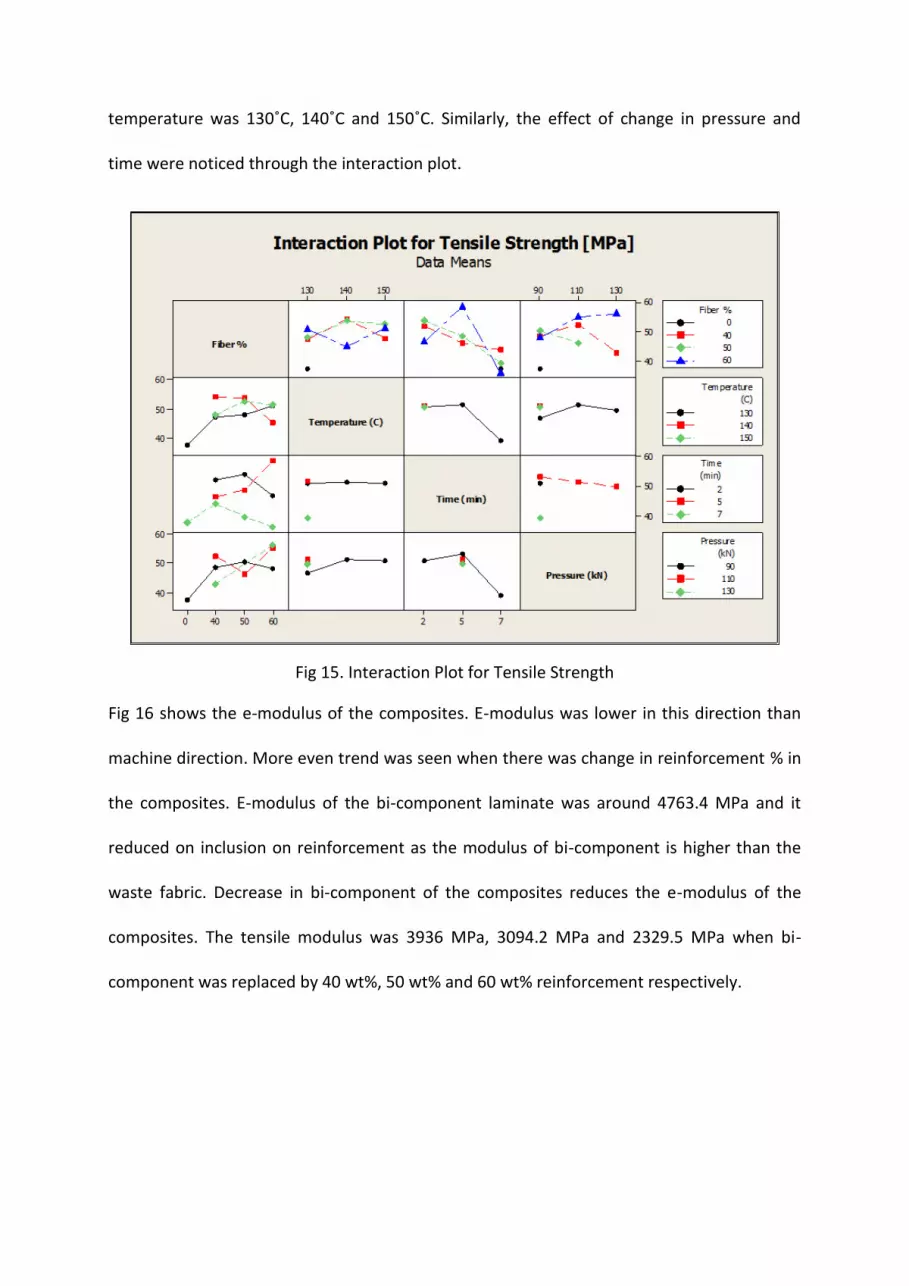
temperature was 130˚C, 140˚C and 150˚C. Similarly, the effect of change in pressure and
time were noticed through the interaction plot.
Fig 15. Interaction Plot for Tensile Strength
Fig 16 shows the e-modulus of the composites. E-modulus was lower in this direction than
machine direction. More even trend was seen when there was change in reinforcement % in
the composites. E-modulus of the bi-component laminate was around 4763.4 MPa and it
reduced on inclusion on reinforcement as the modulus of bi-component is higher than the
waste fabric. Decrease in bi-component of the composites reduces the e-modulus of the
composites. The tensile modulus was 3936 MPa, 3094.2 MPa and 2329.5 MPa when bi-
component was replaced by 40 wt%, 50 wt% and 60 wt% reinforcement respectively.
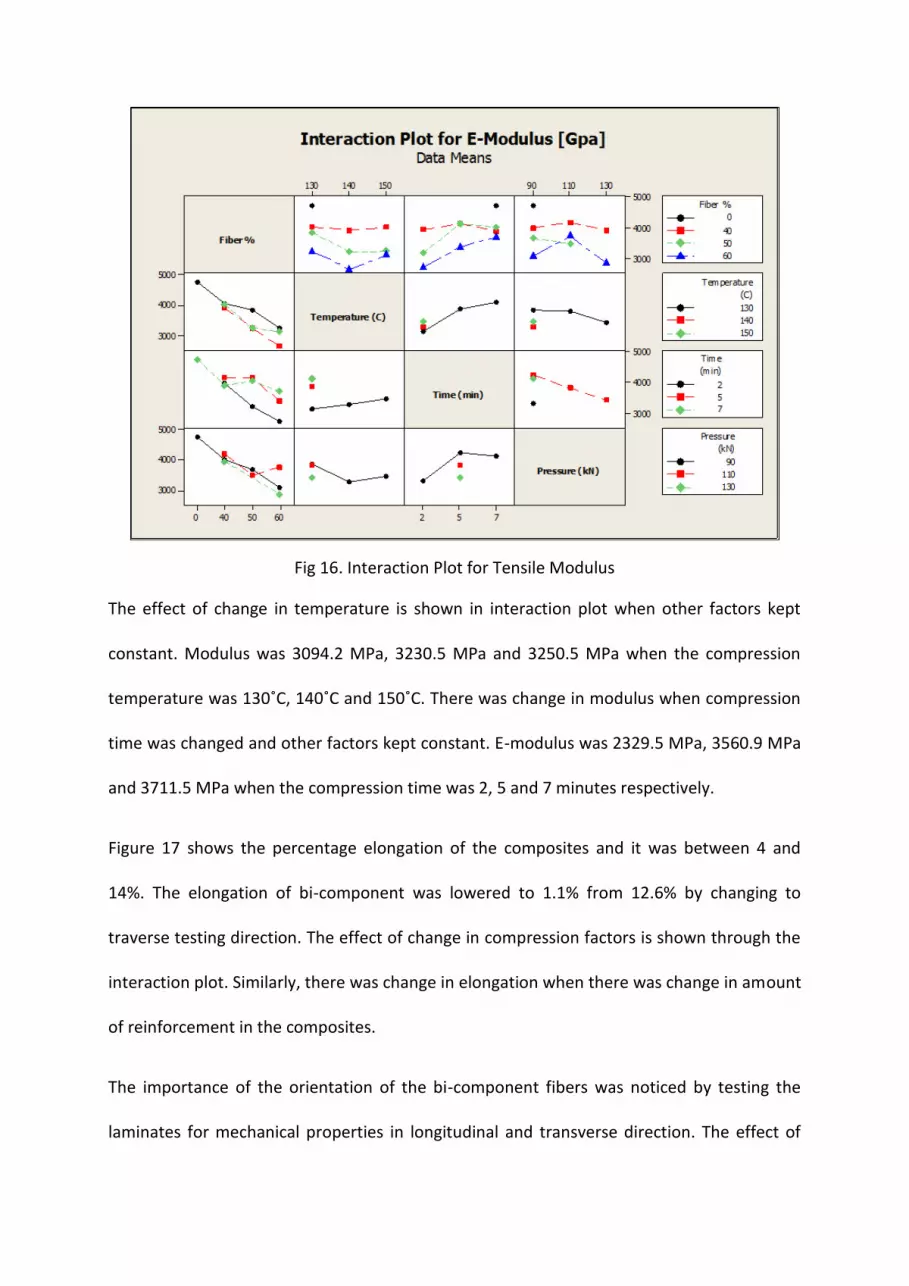
Fig 16. Interaction Plot for Tensile Modulus
The effect of change in temperature is shown in interaction plot when other factors kept
constant. Modulus was 3094.2 MPa, 3230.5 MPa and 3250.5 MPa when the compression
temperature was 130˚C, 140˚C and 150˚C. There was change in modulus when compression
time was changed and other factors kept constant. E-modulus was 2329.5 MPa, 3560.9 MPa
and 3711.5 MPa when the compression time was 2, 5 and 7 minutes respectively.
Figure 17 shows the percentage elongation of the composites and it was between 4 and
14%. The elongation of bi-component was lowered to 1.1% from 12.6% by changing to
traverse testing direction. The effect of change in compression factors is shown through the
interaction plot. Similarly, there was change in elongation when there was change in amount
of reinforcement in the composites.
The importance of the orientation of the bi-component fibers was noticed by testing the
laminates for mechanical properties in longitudinal and transverse direction. The effect of
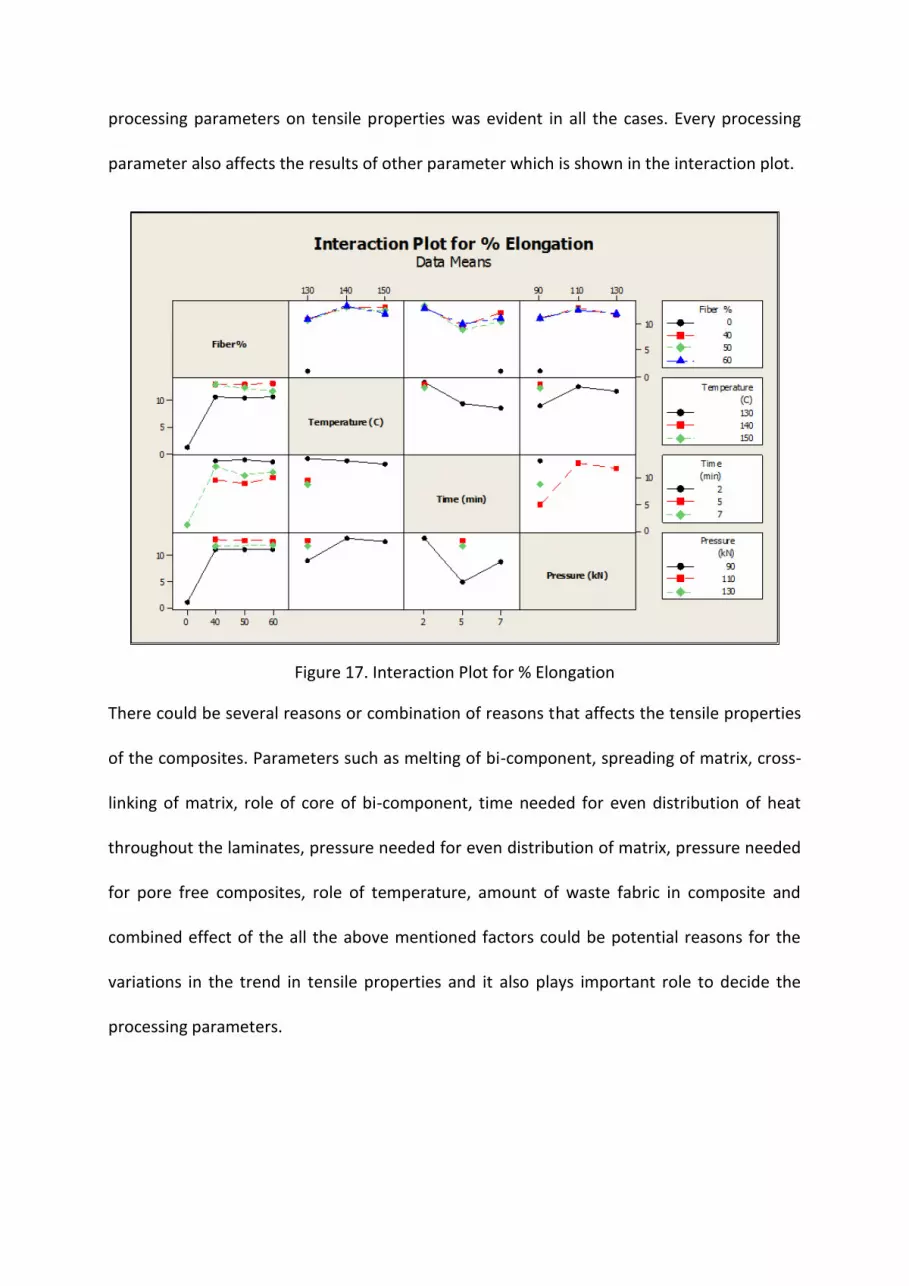
processing parameters on tensile properties was evident in all the cases. Every processing
parameter also affects the results of other parameter which is shown in the interaction plot.
Figure 17. Interaction Plot for % Elongation
There could be several reasons or combination of reasons that affects the tensile properties
of the composites. Parameters such as melting of bi-component, spreading of matrix, cross-
linking of matrix, role of core of bi-component, time needed for even distribution of heat
throughout the laminates, pressure needed for even distribution of matrix, pressure needed
for pore free composites, role of temperature, amount of waste fabric in composite and
combined effect of the all the above mentioned factors could be potential reasons for the
variations in the trend in tensile properties and it also plays important role to decide the
processing parameters.

Impact Test:
The effect of change in amount of reinforcement in the composites on impact strength is
shown in fig 18. Impact strength was noted with change in fiber-matrix ratio while keeping
other processing parameters constant. Impact strength was higher when the laminates were
tested in longitudinal direction than transverse in all cases. In both directions, the impact
strength increased on increasing the amount of reinforcement in the composites. Impact
strength of pure bi-component laminate in longitudinal direction was 37.1 kJ/m2, and it was
increased to 49.1 kJ/m2, 52.8 kJ/m2, 54 kJ/m2 and 59.4 kJ/m2 by replacing 40 wt%, 50 wt%,
60 wt% and 70 wt% of bi-component with waste fabric reinforcement respectively. Similarly
impact strength was increased from 23.7 kJ/m2 to 29.3 kJ/m2 by replacing 40 wt% bi-
component to reinforcement. It was further increased to 31.9 kJ/m2, 34.6 kJ/m2 and 38
kJ/m2 by replacing bi-component of 50 wt%, 60 wt% and 70 wt%.
Figure 18. Impact strength of the type 3 composites
Impact strength was slightly increased on increasing the processing temperature and
keeping other factors constant, fig 19. Impact strength was 49 kJ/m2, 54 kJ/m2 and 55 kJ/m2
when processing temperature was 130˚C, 140˚C and 150˚C.
0
10
20
30
40
50
60
70
0:100 40:60 50:50 60:40 70:30
Imp
act
Stre
ngt
h (
kJ/m
2)
Fiber:Matrix
Longitudinal
Transverse

Figure 19. Impact strength of type 3 composites
There was small effect on impact strength when the processing pressure or time was
changed, fig 20 and 21. Similar results were seen as transversely tested laminates had lower
impact strength than longitudinal laminates. There was slight increase in impact strength on
increasing the processing pressure and time.
Figure 20. Impact Strength of type 3 composites
0
10
20
30
40
50
60
70
130˚C 140˚C 150˚C
Imp
act
Stre
ngt
h (
kJ/m
2)
Temperature
Longitudinal
Transverse
0
10
20
30
40
50
60
70
90 kN 110 kN 130 kN
Imp
act
Stre
ngt
h (
kJ/m
2)
Pressure
Longitudinal
Transverse
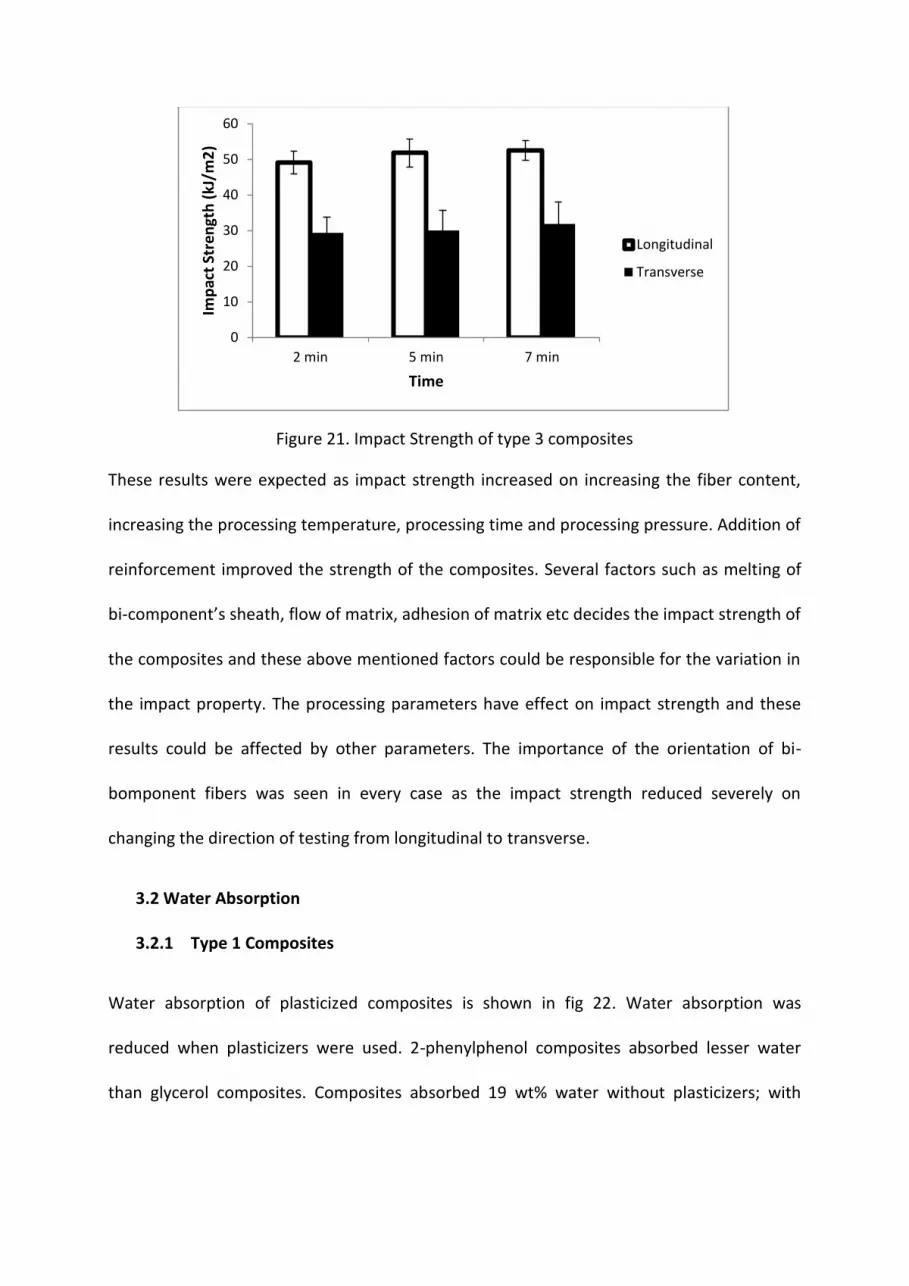
Figure 21. Impact Strength of type 3 composites
These results were expected as impact strength increased on increasing the fiber content,
increasing the processing temperature, processing time and processing pressure. Addition of
reinforcement improved the strength of the composites. Several factors such as melting of
bi-component’s sheath, flow of matrix, adhesion of matrix etc decides the impact strength of
the composites and these above mentioned factors could be responsible for the variation in
the impact property. The processing parameters have effect on impact strength and these
results could be affected by other parameters. The importance of the orientation of bi-
bomponent fibers was seen in every case as the impact strength reduced severely on
changing the direction of testing from longitudinal to transverse.
3.2 Water Absorption
3.2.1 Type 1 Composites
Water absorption of plasticized composites is shown in fig 22. Water absorption was
reduced when plasticizers were used. 2-phenylphenol composites absorbed lesser water
than glycerol composites. Composites absorbed 19 wt% water without plasticizers; with
0
10
20
30
40
50
60
2 min 5 min 7 min
Imp
act
Stre
ngt
h (
kJ/m
2)
Time
Longitudinal
Transverse

glycerol and 2-phenylphenol, the water absorption was reduced to around 16 and 14 wt%
respectively.
Figure 22. Water Absorption of Plasticized Composites
Fig 23 shows the water absorption with different temperatures. Water absorption was
reduced from 19 to 15 wt% when the temperature was raised from 270˚C to 280˚C. But the
water absorption increased when the processing temperature was 290˚C. The pores created
on degradation of reinforcement might be the reason for increased water absorption.
Figure 23. Water absorption at different processing temperatures
0
5
10
15
20
25
0 1 2 3 4 5 6 7 8 9 10
Wte
r A
bso
rpti
on
%
Day
Without Plasticizer
Glycerol
2-phenylphenol
0
5
10
15
20
25
30
0 1 2 3 4 5 6 7 8 9 10
Wat
er
Ab
sorp
tio
n %
Day
270˚C
280˚C
290˚C

The effect of processing time on water absorption is given in fig 24. At lower temperature
(270˚C), higher processing time absorbs less water due to proper melting of matrix; but at
higher temperature (290˚C) the processing time might increase the water absorption due to
degradation of reinforcement. Water absorption was reduced from 19 wt% to 15 wt% when
the processing time was increased from 20 seconds to 40 seconds.
Figure 24. Water absorption with different processing time
3.2.2 Type 2 Composites
Fig 25 shows water absorption with respect to fiber-matrix ratio. Composites absorbed more
water on increasing the fiber content; this is because the thermoset matrix used absorbs
negligible amount of water and reduction of matrix contributes to absorption of water by
additional reinforcement added. Water absorption was more evident for first three days and
it reached a point nearer to saturation. Composite with 50 wt% fiber absorbed around 19
wt% water at the end of ten days. When the fiber content in the composite increased to 60,
70 and 80 wt%, the water absorption was around 26, 34, 39 wt% respectively.
0
5
10
15
20
25
0 1 2 3 4 5 6 7 8 9 10
Wat
er
Ab
sorp
tio
n %
Day
20 seconds
30 seconds
40 seconds
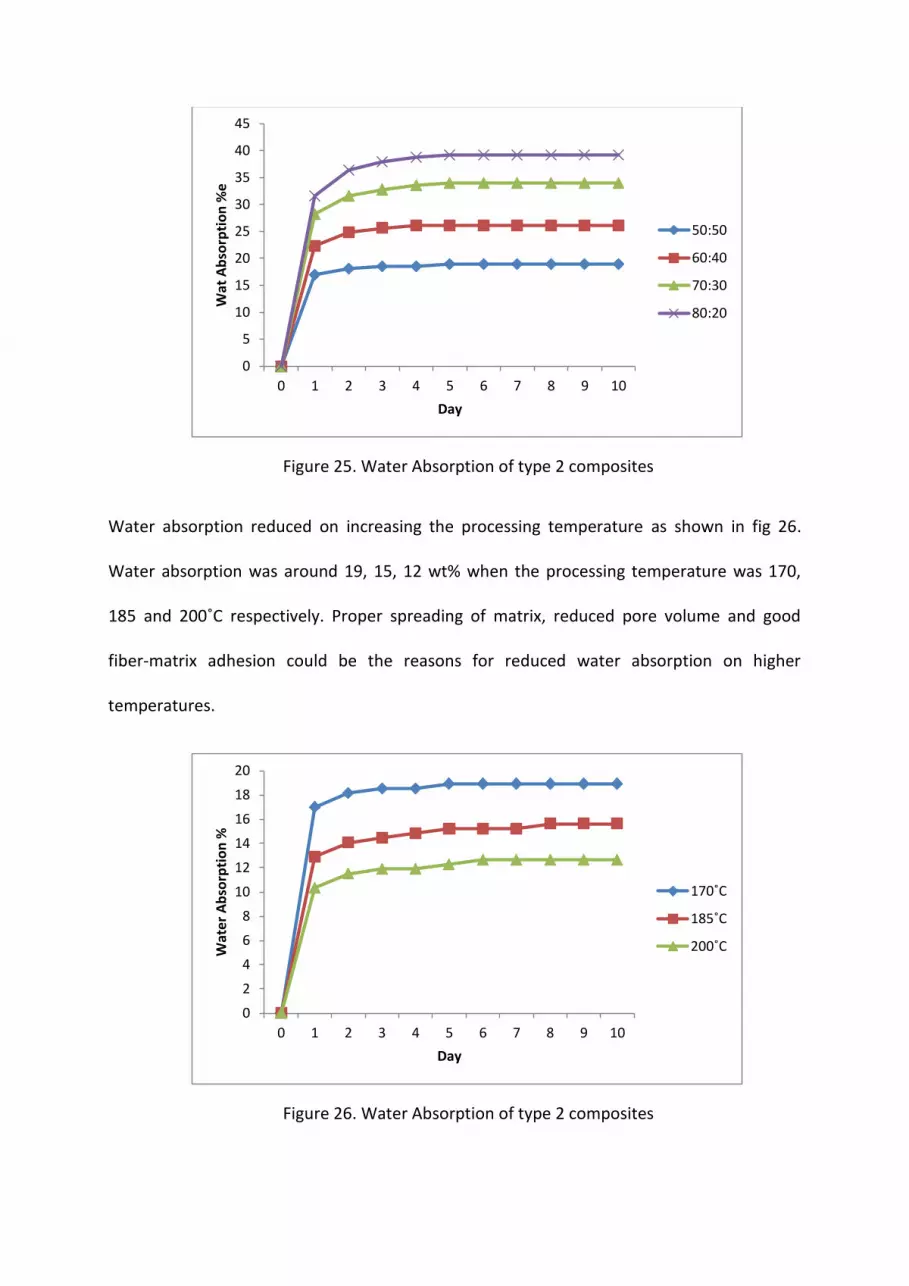
Figure 25. Water Absorption of type 2 composites
Water absorption reduced on increasing the processing temperature as shown in fig 26.
Water absorption was around 19, 15, 12 wt% when the processing temperature was 170,
185 and 200˚C respectively. Proper spreading of matrix, reduced pore volume and good
fiber-matrix adhesion could be the reasons for reduced water absorption on higher
temperatures.
Figure 26. Water Absorption of type 2 composites
0
5
10
15
20
25
30
35
40
45
0 1 2 3 4 5 6 7 8 9 10
Wat
Ab
sorp
tio
n %
e
Day
50:50
60:40
70:30
80:20
0
2
4
6
8
10
12
14
16
18
20
0 1 2 3 4 5 6 7 8 9 10
Wat
er
Ab
sorp
tio
n %
Day
170˚C
185˚C
200˚C

The effect of compression time on water absorption is shown in fig 27. Water absorption
decreased on increasing the compression time. When the compression time was 5, 7 and 10
mins, the corresponding water absorption was around 19, 16 and 14 wt%. Even distribution
of heat over the laminate, giving enough time for the matrix to melt well and giving time for
matrix to bind with fibers could be the reasons for reducing the water absorption on
increasing the processing time of the composites.
Figure 27. Water Absorption of type 2 composites
3.2.3 Type 3 Composites
Fig 28 shows the water absorption of the composites on change of fiber-matrix ratio. The
water absorption increased on increasing the reinforcement wt% in the composites. The
water absorption was more evident on the first day and increased slightly from day two. Bi-
component laminate absorbed only around 1 wt% water at the end of tenth day. On 40 wt%
inclusion of reinforcement, the water absorption rose to 17.14 wt%. It was further rose to
26.3 wt% when the composite had 50 wt% reinforcement. It was further raised to 34.8 wt%
and 38.9 wt% when the composites had 60 wt% and 70 wt% reinforcement.
0
2
4
6
8
10
12
14
16
18
20
0 1 2 3 4 5 6 7 8 9 10
Wat
er
Ab
sorp
tio
n %
Day
5 mins
7 mins
10 mins

Figure 28. Water Absorption of type 3 composites
The effect of processing pressure was noticed when other parameters kept constant during
composites manufacturing, fig 29. Water absorption was more on first day and there was
slight increase from day two. Water absorption increased on increasing the processing
pressure. This might be due to restricting the spreading of matrix by pressure.
Figure 29. Water Absorption of type 3 composites
Fig 30 shows the water absorption of the laminates when the processing temperature
changes and other factors were kept constant. Water absorption decreases on increasing
0
5
10
15
20
25
30
35
40
45
0 1 2 3 4 5 6 7 8 9 10
Wat
er
Ab
sorp
tio
n %
Day
0:100
40:60
50:50
60:40
70:30
Fiber:Matrix
0
2
4
6
8
10
12
14
16
18
0 1 2 3 4 5 6 7 8 9 10
Wat
er
Ab
sorp
tio
n %
Day
90 kN
110 kN
130 kN
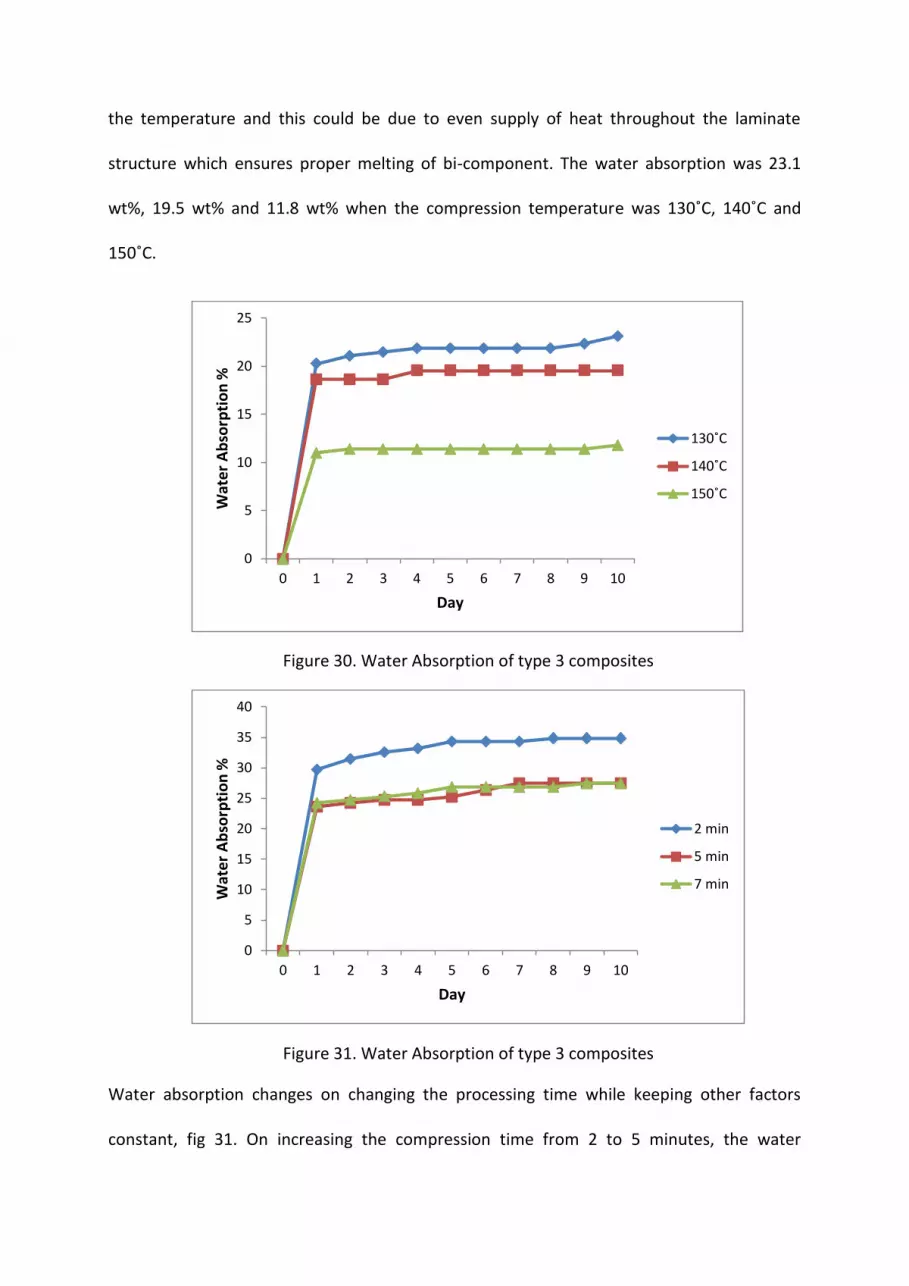
the temperature and this could be due to even supply of heat throughout the laminate
structure which ensures proper melting of bi-component. The water absorption was 23.1
wt%, 19.5 wt% and 11.8 wt% when the compression temperature was 130˚C, 140˚C and
150˚C.
Figure 30. Water Absorption of type 3 composites
Figure 31. Water Absorption of type 3 composites
Water absorption changes on changing the processing time while keeping other factors
constant, fig 31. On increasing the compression time from 2 to 5 minutes, the water
0
5
10
15
20
25
0 1 2 3 4 5 6 7 8 9 10
Wat
er
Ab
sorp
tio
n %
Day
130˚C
140˚C
150˚C
0
5
10
15
20
25
30
35
40
0 1 2 3 4 5 6 7 8 9 10
Wat
er
Ab
sorp
tio
n %
Day
2 min
5 min
7 min

absorption was reduced to 27.4 wt% from 34.8 wt% after ten days. When the time was
further increased to 7 minutes, there was only small change.
3.3 Thermal Analysis
Differential scanning calorimetry
Differential scanning calorimetry (DSC) curves shows that the melting temperature was
reduced due to plasticizers, fig 32. Melting temperature reduced from 260˚C to 255.25˚C and
253.31 on addition of plasticizers glycerol and 2-phenylphenol respectively. The effect of 2-
phenylphenol was more evident than glycerol; 2-phenylphenol reduced the melting
temperature more than glycerol.
Figure 32. DSC curves showing the effect of plasticizers
This change in melting point was used to change the compression temperature. Increasing
the compression time and temperature melts polyester and gives better adhesion between
matrix and fiber; this also improves the mechanical properties. However, at high
compression temperature and longer compression time, the cotton will degrade which
reduces the mechanical properties. So, it is necessary to reduce the compression
temperature and time by reducing the melting temperature.
A small exotherm was seen before melting temperature in type 2 composite which is due to
incomplete curing of the resin. The crystallization temperature was affected by the
plasticizers.
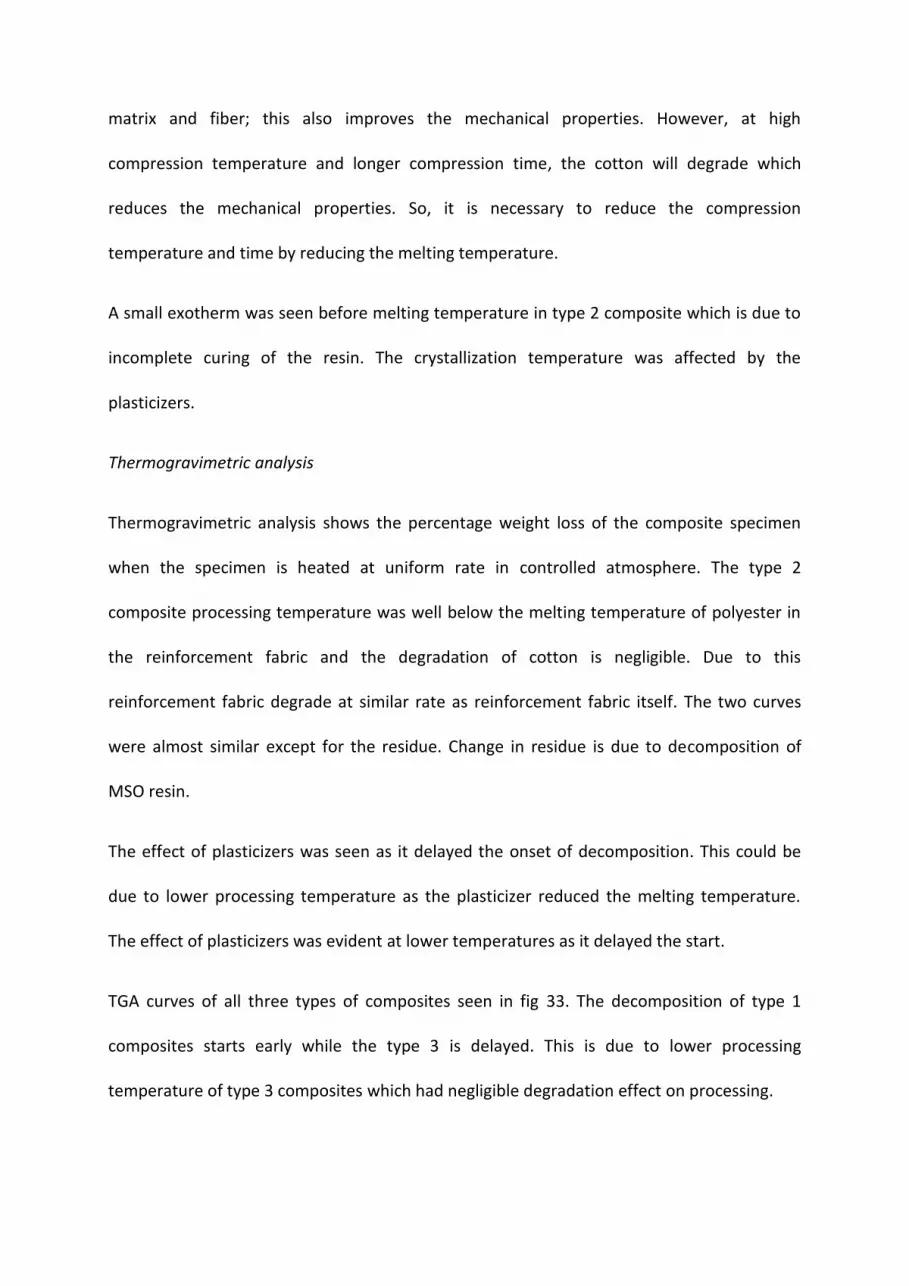
Thermogravimetric analysis
Thermogravimetric analysis shows the percentage weight loss of the composite specimen
when the specimen is heated at uniform rate in controlled atmosphere. The type 2
composite processing temperature was well below the melting temperature of polyester in
the reinforcement fabric and the degradation of cotton is negligible. Due to this
reinforcement fabric degrade at similar rate as reinforcement fabric itself. The two curves
were almost similar except for the residue. Change in residue is due to decomposition of
MSO resin.
The effect of plasticizers was seen as it delayed the onset of decomposition. This could be
due to lower processing temperature as the plasticizer reduced the melting temperature.
The effect of plasticizers was evident at lower temperatures as it delayed the start.
TGA curves of all three types of composites seen in fig 33. The decomposition of type 1
composites starts early while the type 3 is delayed. This is due to lower processing
temperature of type 3 composites which had negligible degradation effect on processing.
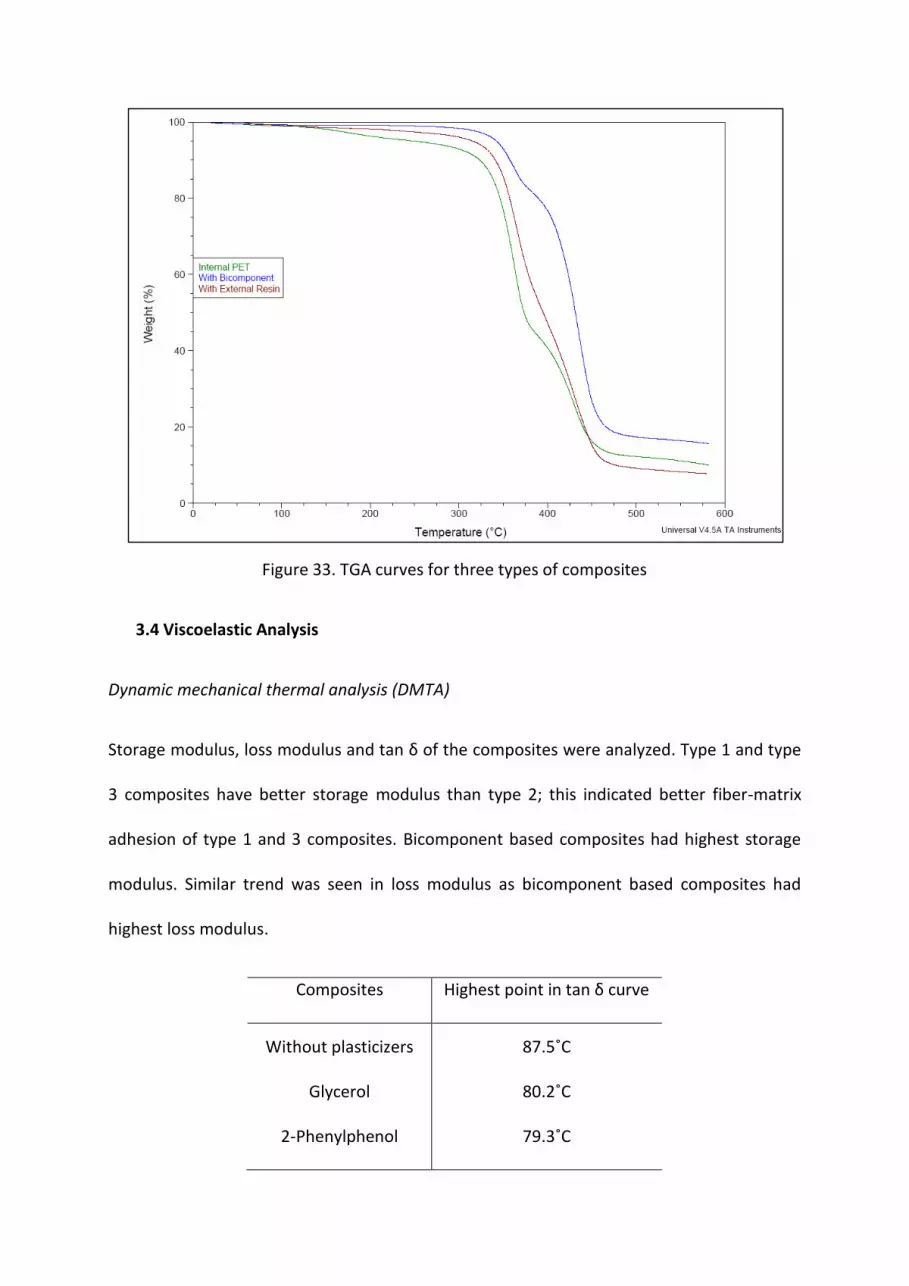
Figure 33. TGA curves for three types of composites
3.4 Viscoelastic Analysis
Dynamic mechanical thermal analysis (DMTA)
Storage modulus, loss modulus and tan δ of the composites were analyzed. Type 1 and type
3 composites have better storage modulus than type 2; this indicated better fiber-matrix
adhesion of type 1 and 3 composites. Bicomponent based composites had highest storage
modulus. Similar trend was seen in loss modulus as bicomponent based composites had
highest loss modulus.
Composites Highest point in tan δ curve
Without plasticizers
Glycerol
2-Phenylphenol
87.5˚C
80.2˚C
79.3˚C

Highest point in tan δ curve was reduced from 87.5˚C to 80.2˚C and 79.3˚C by plasticizers
glycerol and 2-phenylphenol respectively.
4. CONCLUSION
Three potential routes to use discarded 50/50 cotton/polyester bed linen as raw material for
heat compression of composites were evaluated. The first concept was to use the fabric as a
pre-preg and simply melt the polyester but it took plasticizing additives to avoid fatal
thermal cotton degradation. The second concept was to use a resin which was made out of
soybean oil. The third concept is the use of bicomponent as matrix, sheath is melted and
core remains to give additional strength. The effect of plasticizers was also seen. In general,
Plasticizers, glycerol and 2-phenylphenol, improved the properties of the type 1 composites.
The degradation of cotton fibers was obvious at high temperature and it was seen in type 1
composites. The degradation was reduced on using plasticizers as the processing
temperature could be reduced. On reducing the degradation, the mechanical properties
could be improved. The effect of plasticizers was seen in thermal and viscoelastic properties
as well. Type 1 composites had good interfacial adhesion between fiber and matrix.
The compression temperature was further reduced on using external biobased resin as
matrix (type 2). These composites also showed good mechanical, thermal and viscoelastic
properties. The fiber pull out was noticed in these composites which shows the fiber-matrix
adhesion was not as strong as type 1 composites.
Bicomponent based composites had good mechanical, thermal and viscoelastic properties
than type 1 and 2. It also had good fiber-matrix adhesion. Superior properties of
bicomponent fiber itself could be the reason behind good properties. The orientation of
bicomponent fibers was studied.

This project is continuation of Zou et all’s work [2]. It was possible to get better properties by
different types of composite processing. The separation of two fibers; Cotton from PET, is
omitted because cotton acts as reinforcement and improves the strength. In the first
method, cotton acts as reinforcement while in the second and third methods, the fabric
(cotton along with PET) acts as reinforcement. Melting and recrystallization erases the
orientation that the PET fibers got during manufacture by melt spinning. Hence, its
reinforcement potential still remains if an external matrix is added.
Further investigation of textile based composites with enhanced properties and could bring
these recycled textiles into composite field. There is good potential of recycled
cotton/polyester fabrics in composite field.
ACKNOWLEDGEMENT
Textilia and Fiberpartner ApS are gratefully acknowledged for supplying the recycled
cotton/polyester fabric and bicomponent fiber respectively. Authors would like to thank
Department of Applied Physics, Chalmers University and Swerea IVF for using their facilities
for SEM imaging and impact testing.
REFERENCES
[1] Awaja F, Pavel D. Recycling of PET. European Polymer Journal. 2005;41(7):1453-1477.
[2] Zou Y, Reddy N, Yang Y. Reusing polyester/cotton blend fabrics for composites.
Composites Part B: Engineering. 2011;42(4):763-770.
[3] Oerlikon. The Fiber Year 2008/09: A World Survey on Textile and Nonwovens Industry.

[4] Oakley EO, Gorman FJ, Mason JD. Process for recycling polyester/cotton blends. United
States Patent, Patent number US5236959. 1993.
[5] Serad SL. Polyester dissolution for polyester/cotton blend recycle. United States Patent,
Patent number US5342854. 1994.
[6] Oromiehie A, Mamizadeh A. Recycling PET beverage bottles and improving properties.
Polymer International. 2004;53(6):728-732.
[7] Fraisse F, Verny V, Commereuc S, Obadal M. Recycling of poly(ethylene terephthalate)/
polycarbonate blends. Polymer Degradation and Stability. 2005;90(2):250-255.
[8] Avila AF, Duarte MV. A mechanical analysis on recycled PET/HDPE composites. Polymer
Degradation and Stability. 2003;80(2):373-382.
[9] Carta D, Cao G, D’Angeli C. Chemical recycling of poly(ethylene terephthalate) (PET) by
hydrolysis and glycolysis. Environment Science and Pollution Research International.
2003;10(6):390-394.
[10] Liu F, Cui X, Yu S, Li Z, Ge X. Hydrolysis reaction of poly(ethylene terephthalate) using
ionic liquids as solvent and catalyst. Journal of Applied Polymer Science. 2009;114(6):3561-
3565.
[11] Nikles DE, Farahat MS. New Motivation for the Depolymerization Products Derived from
Poly(Ethylene Terephthalate) (PET) Waste: a Review. Macromolecular Materials and
Engineering. 2005;290(1):13-30.

[12] Adekunle K, Åkesson D, Skrifvars M. Synthesis of reactive soybean oils for use as a
biobased thermoset resins in structural natural fiber composites. Journal of Applied Polymer
Science. 2010;115(6):3137-3145.
[13] Adekunle K, Cho SW, Ketzscher R, Skrifvars. Mechanical properties of natural fiber
hybrid composites based on renewable thermoset resins derived from soybean oil, for use in
technical applications. Journal of Applied Polymer Science. 2012;124(6):4530-4541.


