Embed Size (px)
Citation preview
Lehrstuhl für Elektrische Energiespeichertechnik
Fakultät für Elektrotechnik und Informationstechnik
TECHNISCHE UNIVERSITÄT MÜNCHEN
Reuse of Automotive Lithium-Ion Batteries:
An Assessment from the Cell Aging Perspective
Simon F. Schuster
Vollständiger Abdruck der von der Fakultät für Elektrotechnik und Informationstechnik der Technischen Universität München zur Erlangung des akademischen Grades eines
Doktor-Ingenieurs (Dr.-Ing.)
genehmigten Dissertation.
Vorsitzender: Prof. Dr.-Ing. Ulrich Wagner
Prüfer der Dissertation: 1. Prof. Dr.-Ing. Andreas Jossen
2. Prof. Dr. Jürgen Garche Universität Ulm
Die Dissertation wurde am 29.06.2016 bei der Technischen Universität München eingereicht und durch die Fakultät für Elektrotechnik und Informationstechnik am 02.09.2016 angenommen.


Vorwort und Danksagung
Die vorliegende Dissertation „Reuse of Automotive Lithium-Ion Batteries: An Assessment from
the Cell Aging Perspective“ entstand während meiner Tätigkeit als wissenschaftlicher Mitarbeiter
am Lehrstuhl für Elektrische Energiespeichertechnik der Technischen Universität München
zwischen August 2012 und Juni 2016. Dem Lehrstuhlinhaber, Prof. Dr.-Ing. Andreas Jossen,
möchte ich für die zahlreichen Denkanstöße danken, welche mir stets dabei geholfen haben
meine Forschung voranzubringen. Zudem bedanke ich mich bei Prof. Dr. Jürgen Garche für die
interessanten Diskussionsrunden und das Erstellen des Zweitgutachtens.
Weiterhin gilt mein Dank Martin Brand, der den Verlauf meiner Promotion durch Beantragen des
Projekts „ABattReLife“ wesentlich mitbestimmt hat. In diesem Sinne möchte ich mich auch bei
Tobias Bach und Jana Müller für die tolle Zusammenarbeit während des Projekts bedanken.
Bei Ehsan Rahimzei bedanke ich mich für die vorbildliche Betreuung und Koordination während
der Bearbeitung der Studie „Second-Life-Konzepte für Lithium-Ionen-Batterien aus
Elektrofahrzeugen“. Bei Sebastian Fischhaber, Anika Regett und Dr. Holger Hesse möchte ich
mich für die intensive Zusammenarbeit während der Studienbearbeitung bedanken, welche
maßgeblich zum Erfolg der Studie beigetragen hat.
Mein Dank gilt zudem sämtlichen Studenten und Kollegen am Lehrstuhl, die an meiner
Forschung mitgewirkt haben. Abschließend möchte ich meiner Familie sowie Lebensgefährtin,
Theresa-Maria Bauer, für die fortwährende Unterstützung danken. Diese Arbeit ist meinem
Vater, Ralf Schuster, gewidmet.
München, 28. September 2016 Simon F. Schuster

Kurzfassung
Die mögliche Weiterverwendung gealterter Batterien aus elektrischen Fahrzeugen in „Second-
Life-Anwendungen“ wird derzeit häufig in der Öffentlichkeit diskutiert. Neben rechtlichen und
logistischen Fragestellungen bestehen bei der Umsetzung aber insbesondere auch technische
Probleme, die direkt aus dem Alterungsverhalten von Lithium-Ionen-Zellen hervorgehen.
Dessen tiefgründiges Verständnis stellt aber eine Grundvoraussetzung dar, um den
wirtschaftlichen Nutzen sowie die Gesamtsystemkosten beurteilen zu können.
Die zwei zentralen zellalterungsbedingten technischen Probleme bei der Umsetzung sind das
Phänomen der nichtlinearen Alterung (ein sprunghafter Anstieg der Alterungsgeschwindigkeit)
sowie der kontinuierlichen Zunahme einer bereits im Neuzustand vorhandenen Zellstreuung
während des Betriebs in vielzelligen Batterieanwendungen. Diese zwei Kernthemen werden in
der vorliegenden Arbeit umfassend analysiert und beurteilt. Daraufhin werden Lösungsansätze
vorgeschlagen und zwar für ersteres Problem eine alterungsabhängige Anpassung der
jeweiligen elektrischen Last sowie für letzteres Problem die Anwendung von so genannten
Alterungsschnelltests.
Das Einsetzen der nichtlinearen Alterung, welches bei Restkapazitäten von ca. 80 % beobachtet
wird, kann durch einen Betrieb mit einer Begrenzung der Laderate und des Spannungshubs bei
einem zellspezifischen Temperaturoptimum verzögert oder gar vermieden werden. Der Einfluss
der betrieblichen Vorgeschichte wird dabei als unbedeutend eingeschätzt (für zyklisierte Zellen
des untersuchten Typs), da eine Lastanpassung (z.B. Reduktion der Laderate und/oder des
Spannungshubs) erst kurz vor Einsetzen des nichtlinearen Alterungsverhaltens dennoch die
erreichbare Betriebszeit im „Second-Life“ deutlich verlängert. Daher wird davon ausgegangen,
dass das zugrunde liegende technische Problem kein Hemmnis darstellt, sofern dessen
Eintreten mit hinreichender Genauigkeit vorhergesagt werden kann.
Die als Folge des Zellproduktionsprozesses anfänglich vorhandene Zellstreuung nimmt während
des Betriebs in vielzelligen Batterieanwendungen mit dem Alterungsfortschritt aufgrund von
externen Einflüssen (z.B. Auseinanderdriften von Zellladezuständen, Temperaturgradienten im
Batteriepack) kontinuierlich zu. Insbesondere Temperaturgradienten im Batteriepack können
dabei die Übertragung der Zellstreuung auf Modulebene bewirken. Diese ist als besonders
kritisch zu erachten, da als Folge dessen lediglich ein Teil der Module selbst aus einer
Fahrzeugbatterie für die mögliche Weiterverwendung geeignet sein könnte. Um diese
schnellstmöglich und mit wenig Aufwand (verglichen mit der herkömmlichen
Kapazitätsmessung) zu erkennen, werden Alterungsschnelltests vorgeschlagen. Aufgrund derer
begrenzter Genauigkeit wird allerdings vorerst empfohlen, Alterungsschnelltests lediglich als
zusätzlichen Schritt in der Modulvorauswahl heranzuziehen (Reduktion der Anzahl an zu

vermessenden Batteriemodulen). Schließlich sollten reversible bzw. leicht lösbare Zell- und
Modulverbindungstechniken (je nach Verschaltungstopologie) verwendet werden, da der
Restwert gealterter Fahrzeugbatterien bei Verringerung der aufzubringenden
Wiederaufbereitungskosten ansteigt.
Aus Sicht der zellalterungsbedingten technischen Probleme erscheint die Umsetzung von
„Second-Life-Konzepten“ als gut durchführbar. Eine Beantwortung der rechtlichen sowie
logistischen Fragestellungen erscheint, besonders in Anbetracht der hohen Anzahl an
beteiligten Akteuren, allerdings als deutlich komplexer. Dabei wird insbesondere empfohlen,
aktuell bestehende Standards und Normen mit Augenmerk auf Weiterverwendungsszenarien zu
überprüfen, um so Rechtssicherheit für einen gänzlich neuen Markt zu schaffen.

Executive Summary
The potential reuse of lithium-ion batteries, exhausted upon electric vehicle operation, is
currently a broadly discussed topic. Regarding its implementation, aside from legal and logistic
issues, there are also certain technological issues, which directly arise from the nature of lithium-
ion cell aging. A profound understanding of the battery aging behavior is regarded, however, as
a prerequisite to assess overall system costs and economic benefit of battery reuse.
The two technological core issues of potential battery reuse are the phenomenon of nonlinear
aging (a sudden increase of the aging rate) and the continuous increase of the initial cell-to-cell
parameter variation in multi-cell battery applications. In this work, the two effects are analyzed in
detail, and solution approaches are provided, which are, aging dependent load adaption and
usage of state of health quick tests.
The effect of nonlinear aging, which is generally observed at residual capacities of approx. 80%,
can be delayed or even avoided by battery operation at the cell specific temperature optimum,
with a limitation of the voltage swing and the charging rate. The effect of the operational
prehistory appears as marginal (for cycled cells of the investigated model), which is why aging
dependent load adaption, shortly before the occurrence of nonlinear aging, clearly prolongs as
well the reachable second service life. Finally, nonlinear aging is considered to be well-
controllable, e.g. by reducing the charging rate and/or the voltage swing. Though, its onset must
not be missed under any circumstances, which in turn underlines the importance of the
refinement of state of health detection methodologies.
The initial cell-to-cell variation, which results from deviations in the cell production process, is
generally increased in multi-cell battery applications with the progress of aging due to external
influences like drifts of the state of charge of cells or temperature gradients in the battery pack.
Especially the latter might provoke a scale-up of cell-to-cell variation up to the module level,
which is critical towards battery reuse implementation. As, consequently, only a share of battery
modules, even from the same automotive battery, might be reusable, state of health quick tests
are capable of reducing the measurement effort compared with common capacity measurement
techniques. However, with regard to their limited precision, only a supporting role should be
considered in the battery module pre-selection process, in which inappropriate ones are sorted
out in advance. After all, to support the profitability of battery reuse concepts, reversible and
easily detachable cell and/or module interconnection techniques should be favored, as reduced
refurbishing costs clearly increase the residual value of aged automotive lithium-ion batteries.
Finally, with regard to the technological barriers which emerge directly from the nature of lithium-
ion cell aging, battery second life scenarios are regarded as well implementable, especially if
online state of health detection is refined; in contrast, legal and logistic issues (which are

especially present due to the high number of involved actors) are considered to be the more
challenging part. Here, the key is to revise present standards and norms, specifically with regard
to battery reuse concepts and thus, creating legal certainty for an utterly new market.

List of Publications
Selection of Conference Contributions
S. Schuster, M. Brand, T. Bach, E. Fleder, M. Stelz, J. Müller, G. Sextl, A. Jossen, Effects of
vibration loads on Li-ion cells in electric vehicles, 3rd European Electric Vehicle Congress
(EEVC), Brussels, December 2014 (Oral Presentation).
S.F. Schuster, T.C. Bach, E. Fleder, J. Müller, G. Sextl, A. Jossen, Untersuchung des zyklischen
Alterungsverhaltens von Li-Ion-Zellen: Ursachen für einen abrupten Kapazitätsabfall, 22.
DESIGN & ELEKTRONIK-Entwicklerforum, Munich, March 2015 (Oral Presentation).
S.F. Schuster, T.C. Bach, E. Fleder, J. Müller, G. Sextl, A. Jossen, Investigations on the cyclic
aging behavior of Li-ion cells: Reasons for an abrupt drop of capacity, 28th International Electric
Vehicle Symposium and Exhibition (EVS), Goyang, May 2015 (Oral Presentation).
S. Schuster, P. Keil, C. von Lüders, H. Hesse, A. Jossen, New Charging Method to Avoid
Nonlinear Aging of Lithium-Ion Batteries, Batteries Event, Nice, October 2015 (Poster).
S.F. Schuster, P. Keil, C. von Lüders, H. Hesse, A. Jossen, Innovatives Ladeverfahren zum
Umgehen von nichtlinearer Alterung bei Lithium-Ionen-Batterien, Forum Batterietechnik,
Speicher für die Mobilität 2020 und die Energieversorgung, Nördlingen, November 2015 (Oral
Presentation).
S. Schuster, M. Brand, C. Campestrini, M. Gleissenberger, A. Jossen, Correlation between
capacity and impedance of lithium-ion cells during calendar and cycle life, 4th European Electric
Vehicle Congress (EEVC), Brussels, December 2015 (Oral Presentation).
S. Fischhaber, A. Regett, S.F. Schuster, H. Hesse, Second-Life-Konzepte für Lithium-Ionen-
Batterien aus Elektrofahrzeugen, Ergebniskonferenz Schaufenster Elektromobilität, Leipzig,
April 2016 (Oral Presentation).
Peer-Reviewed Scientific Reports
S. Fischhaber, A. Regett, S.F. Schuster, H. Hesse, Second-Life-Konzepte für Lithium-Ionen-
Batterien aus Elektrofahrzeugen, Ergebnispapier Nr. 18 (Begleit- und Wirkungsforschung),
Frankfurt am Main, 2016.
Peer-Reviewed Journal Contributions (Co-Author)
M.J. Brand, S.F. Schuster, T. Bach, E. Fleder, M. Stelz, S. Gläser, J. Müller, G. Sextl, A. Jossen,
Effects of vibrations and shocks on lithium-ion cells, J. Power Sources 288 (2015) 62-69.
T.C. Bach, S.F. Schuster, E. Fleder, J. Müller, M.J. Brand, H. Lorrmann, A. Jossen, G. Sextl,
Nonlinear aging of cylindrical lithium-ion cells linked to heterogeneous compression, J. Energy
Storage 5 (2016) 212-223.
C. Campestrini, P. Keil, S.F. Schuster, A. Jossen, Ageing of lithium-ion battery modules with
dissipative balancing compared with single-cell ageing, J. Energy Storage 6 (2016) 142-152.
P. Keil, S.F. Schuster, J. Wilhelm, J. Travi, A. Hauser, R.C. Karl, A. Jossen, Calendar Aging of
Lithium-Ion Batteries. Part I: Impact of the Graphite Anode on Capacity Fade, J. Electrochem.
Soc. 163 (2016) A1872-A1880.
Journal Contributions (Lead Author)
S. Schuster, T. Bach, Jäher Absturz, DESIGN & ELEKTRONIK KNOW HOW FÜR
ENTWICKLER 02 (2015) 27-30.
Peer-Reviewed Journal Contributions (Lead Author) *
S.F. Schuster, T. Bach, E. Fleder, J. Müller, M. Brand, G. Sextl, A. Jossen, Nonlinear aging
characteristics of lithium-ion cells under different operational conditions, J. Energy Storage 1
(2015) 44-53. (1)
S.F. Schuster, M.J. Brand, P. Berg, M. Gleissenberger, A. Jossen, Lithium-ion cell-to-cell
variation during battery electric vehicle operation, J. Power Sources 297 (2015) 242-251. (2)
S.F. Schuster, M.J. Brand, C. Campestrini, M. Gleissenberger, A. Jossen, Correlation between
capacity and impedance of lithium-ion cells during calendar and cycle life, J. Power Sources 305
(2016) 191-199. (3)
* Self-produced sections of peer-reviewed lead author journal contributions are partially
contained in this doctoral thesis without any further reference in the running text (figures are
continuously referenced); in particular, this involves Chapter 6 (1), 7 (2) and 8 (3).

List of Contents
1 Introduction ........................................................................................................................... 1
1.1 Motivation ...................................................................................................................... 1
1.2 Review of Automotive Battery Reuse Investigations ...................................................... 2
1.3 Objectives and Further Procedure ................................................................................. 6
2 Second Life Concepts ........................................................................................................... 9
2.1 Main Process ................................................................................................................ 9
2.2 Refurbishing Process .................................................................................................. 12
3 Fundamentals of Lithium-Ion Cell Aging ............................................................................. 19
3.1 Review of Aging Mechanisms ..................................................................................... 21
3.2 Interaction of Capacity Fade and Impedance Increase ................................................ 26
3.3 Causes of Nonlinear Aging .......................................................................................... 30
3.4 End of Life Criteria ...................................................................................................... 38
3.5 Causes of Increasing Cell-to-Cell Variation ................................................................. 39
4 Methods of Descriptive Statistics ........................................................................................ 41
4.1 Univariate Analysis ...................................................................................................... 41
4.2 Bivariate Analysis ........................................................................................................ 43
4.3 Link to the Battery Cell and Module Interconnection Configuration .............................. 44
5 Experimental ...................................................................................................................... 48
5.1 Aging Diagnosis .......................................................................................................... 48
5.2 Design of Experiments ................................................................................................ 50
5.3 Examined Battery Electric Vehicles ............................................................................. 55
6 Lithium-Ion Cell Aging ......................................................................................................... 60
6.1 Nonlinear Aging Behavior under Different Operational Conditions ............................... 61
6.1.1 Dependency on the Voltage Swing....................................................................... 62
6.1.2 Dependency on the Current Rate ......................................................................... 64
6.1.3 Dependency on the Temperature ......................................................................... 69
6.2 Influence of the Operational Prehistory........................................................................ 73
6.2.1 Controllability of Nonlinear Aging Behavior ........................................................... 75
6.2.1.1 Two-Step Parameter Adaption .......................................................................... 75
6.2.1.2 Continuous Charging Rate Adaption ................................................................. 79
6.2.2 Storage Conditions before Cycling ....................................................................... 81
6.3 Conclusion .................................................................................................................. 84
7 Lithium-Ion Cell-to-Cell Variation ........................................................................................ 87
7.1 Distribution Fit Analysis ............................................................................................... 88
7.2 Influence of Operational Histories of Examined Vehicles ............................................. 97
7.3 Characterization of Cell Outliers .................................................................................. 98
7.4 Conclusion .................................................................................................................. 99
8 Correlation between Capacity Fade and Impedance Increase of Lithium-Ion Cells ........... 102
8.1 Single Aging State Analysis ....................................................................................... 103
8.2 Aging Progress Regression Analysis ......................................................................... 106
8.3 Validation of the State of Health Quick Test Approach .............................................. 108
8.4 Extended Single Aging State Analysis ....................................................................... 110
8.5 Conclusion ................................................................................................................ 111
9 Final Conclusion ............................................................................................................... 113
9.1 Summary ................................................................................................................... 113
9.2 Recommendations for Action .................................................................................... 116
List of References ................................................................................................................... 118
List of Abbreviations ................................................................................................................ 134

Introduction
1
1 Introduction
In the beginning of this thesis, investigated issues are put into a topical context at first. Then, a
comprehensive review of former and recent automotive battery reuse investigations is given to
point out the central idea, the temporal development and the still present challenges of the
practical implementation of so called second life concepts (SLC). Thereof, objectives of this
thesis are derived and the further procedure is presented.
1.1 Motivation
A global wide launch of battery electric vehicles (BEV), accompanied by an increased share of
renewable energies in the grid, is without any serious alternative to tackle major issues of
society like high greenhouse gas (GHG) emissions, air pollution, oil depletion, energy security
and continuous population growth [1-3]. In addition to large parts of known oil reserves being
situated in politically unstable regions, current projections predict oil depletion in approximately
50 years [1]. GHG emissions lead to global warming which in turn e.g. results in glacial and sea
ice melting, sea level rise and expanded aridity zones. Such effects are directly connected with
species extinction or a degradation of ecological life conditions in general. Air pollutants
(especially from diesel vehicles) like NOx, PM10 and other volatile organic compounds are e.g.
responsible for a variety of respiratory diseases [4]. The progressive global population growth
additionally complicates the finding of effective approaches to aforementioned issues.
However, regarding the situation in Germany for example, neither the desired number of one
million BEV until 2020, nor the aim of climate policies with a GHG emission reduction of 40%
until 2020 and at minimum 80% until 2050 referred to 1990 (Kyoto base year), will likely be
reached. On the 1st of January in 2015, the share of BEV and hybrid electric vehicles (HEV) in
the pool of passenger cars was vanishingly low with only about 0.3% (18.948 BEV, 107.754
HEV, 44.403.124 vehicles in total) [5]. Commissioned by the German government, a recent
study predicts a reduction of GHG emissions in the energy sector of 36% until 2020 and 65%
until 2050 [6]. Although the government’s aims refer to all sectors in complete, it is mentioned
that the unconsidered sectors like transport or agriculture will not be able to compensate the
deficits of the energy sector. The additional aim of a halved energy consumption until 2050 will
probably be failed with reaching only 42% referred to 2008. As the only positive trend, the
government’s aims for the share of renewable energies in the electricity sector with 35% until
2020 are expected to be surpassed which mainly originates from the ongoing increase of using
decentralized photovoltaic systems for self-generation as well as wind power plants [7].
Introduction
2
Principal factors which impede the launch of BEV are a limited maximum range in comparison
with internal combustion engine vehicles, an underdeveloped charging infrastructure and a high
price which in turn is mainly caused by the costly battery storage. The latter factor is also the
main cause to impede a wider use of lithium-ion batteries (LIB) in stationary energy storage
applications [8]. Furthermore, the resale value of actual BEV is supposed to be low due to
upcoming technological leaps which lead to a strong price decline of then outdated BEV
versions. As the recycling of LIB in contrast to lead-acid batteries (PbB) is currently not
economically feasible but prescribed by the German battery law “Batteriegesetz” (BattG), a
distinct approach which could create a residual value in contrast to directly arising recycling
costs is the reuse of aged automotive batteries in applications with a minor challenging load
profile (such as in the field of stationary energy storage) [9, 10].
Major advantage of such a SLC is the potential of reducing the total costs of ownership (TCO)
of BEV and simultaneously creating a market with cheap batteries for stationary energy
storage. In addition, as LIB recycling processes are expected to become more energy-effective,
current costs of up to 0.5 €/kg automotive battery system are likely to move for profits in the
near future (due to the presence of precious metals like cobalt and nickel) [11-13]. So, the
reuse of aged automotive lithium-ion batteries (ALIB) in SLC can even be imagined as a
temporal bridge from uneconomical to economical recycling [14]. However, the ongoing price
reduction of new LIB systems (e.g. due to an increase of produced quantities) generally
promotes the launch of BEV and stationary battery storages, but simultaneously counteracts
the profitability of SLC as a second life battery (SLB) system has always to compete with the
costs of a new one [14-16]. So, reusing degraded ALIB in second life applications (SLA) might
be a viable option to foster both the launch of BEV and stationary battery storages in the next
few years, but probably lose its economic efficiency in the long-term. In the next subchapter, a
comprehensive review of former and recent battery reuse investigations is given, wherefrom
objectives of this thesis are derived.
1.2 Review of Automotive Battery Reuse Investigations
The potential reuse of aged ALIB is currently a hotly debated topic which mainly aims at a
reduction of the TCO of electric vehicles. Simultaneously, stationary energy storage
applications would be promoted by making cheaper batteries available. As the recycling of
disused ALIB is currently not economically feasible but prescribed by German law (§ 5 BattG),
by implementation of SLC, in other respects directly arising recycling costs could at least be
offset for years [10, 17].
As the zero-emissions vehicle mandate entered into force in California in 1990, aiming at a
share of 2%, 10% and 18% until 1998, 2003 and 2018, respectively, this led to intensified BEV
research and development [18]. At the same time, suggestions of reusing aged automotive
Introduction
3
batteries in SLA came up. In a first investigation, the Argonne National Laboratory compared
the aging behavior of PbB with the one of pre-aged nickel metal hydride (NiMH) batteries for
the United States Advanced Battery Consortium (USABC) in 1998 [19]. Results showed that
NiMH automotive batteries which had already been used in BEV still fulfilled the requirements
of stationary energy storage applications, and particularly could compete with new PbB. By
taking up these first findings, Sandia National Laboratories evaluated the economic efficiency
of SLC with aged NiMH prototype-BEV battery modules in 2003 [20]. The authors
demonstrated technical feasibility but doubted their profitability. They cited a standardized,
modular construction of automotive battery packs to be inevitable for an economic realization of
SLC. As most promising fields of application, back-up storages for telecommunication systems,
decentralized storages to avoid grid extension and interim storages for renewable energies in
the residential and mid-scale industrial domain, were identified. Additionally, regarding the
evaluation of a SLC’s profitability, the difficulty of predicting the aging behavior of NiMH
batteries was designated to stand for a material uncertainty.
This serious issue is also explicitly pointed out in [21] to exist for LIB. Furthermore, the usage of
aged ALIB in the consumer field (like interim storage for renewable energies in the domestic
domain) is preferred before the field of large-scale energy storage as the modification and
refurbishment is estimated to be easier to handle and thus more cost-effective. Contrarily, a
profitable realization of grid-related large-scale storage systems is mentioned in [22] and [23] to
be feasible if distinct applications, like e.g. primary control reserve regulation (PCRR) and
intraday electricity market trading, are run combined in one storage. By deploying SLB instead
of new LIB for PCRR or in a home energy storage system, it was shown in [14] that net present
values increased about 33% or 26% within a depreciation time of 20 years, respectively.
However, latest studies consistently state, anyway, that the potential of reducing the TCO of
BEV by implementation of SLC must be regarded as rather low [24-26]. The maximum TCO
reduction is mentioned in [14] to be mainly limited by the ongoing price decline of new LIB
systems. Possibly, there are further financial benefits for the final user at the last stage of the
vehicle’s life cycle. In addition, storage and integration of renewable energies could be fostered
due the availability of cheaper batteries with effects like reduced GHG emissions or a
deceleration of the ongoing electricity price increase. So, the main aim of reducing the TCO of
BEV is most likely unreachable or vanishingly low, but there are other positive side effects for
society which can be reached by a broad distribution of SLC.
Besides of several technological hurdles regarding SLC implementation, there are also legal
and logistic questions (like warranty claims or battery ownership structure), which have to be
answered [27, 28]. A standardized, modular construction method of ALIB, which is applied
beyond the boundaries of a single vehicle manufacturer, is needed to minimize SLB
refurbishing costs. As such a refurbishing process basically consists of the disassembly of
aged ALIB packs, the selection of battery units (cells, modules, etc.) suitable for reuse and
Introduction
4
finally the construction of “new” SLB in desired topology and size, especially cost-effective
methods of state of health (SoH) detection (like online-tracking of aging dependent battery
parameters or SoH quick tests) are required to maximize the profitability of SLC [16]. Thereby,
it has to be considered that even within one ALIB only a fraction of battery units might be
suitable for reuse because of an increasing lithium-ion cell-to-cell parameter variation during
the progress of aging. As stationary energy storage systems are usually run for a quite long
period of time, moreover, a profound understanding and predictability of the aging behavior of
LIB are a prerequisite to assess overall system costs and economic benefit of battery reuse.
Thus, understanding the aging behavior of LIB is directly linked with the decision to invest in a
battery reuse project. However, lifetime projections are challenging, especially as a turning
away from regular aging behavior to increased aging rates is observed at deep residual
capacities of lithium-ion cells (LIC). This aging phenomenon is regarded as a major barrier of
profitable SLC implementation as it may strongly limit the second service life [29].
Due to the presence of several challenging hurdles to overcome, as well as the low availability
of aged ALIB packs, at present, there are mainly research projects dealing with the subject
matter of SLC. The project “Second Life Batteries” of an alliance of Vattenfall, Bosch and the
BMW Group is currently in its initial phase in which a 2 MW SLB storage, consisting of aged
ActiveE and i3 ALIB packs, is built up in Hamburg. The storage is planned to be used for PCRR
from the mid of 2016 until 2020 [30]. Another large-scale battery storage consisting of approx.
650 aged ALIB with a total capacity of 13 MWh and a power of 13 MW is currently built up in
North Rhine-Westphalia by a joint venture of Daimler Automotive, The Mobility House and the
GETEC Group [31]. The storage is planned to be used for PCRR as well. In an already finished
project, Vattenfall and the BMW Group tested the viability of using aged ALIB as buffer storage
for BEV fast charging stations. The feasibility of such buffer storages for fast charging stations
with SLB was also simulated and confirmed experimentally in [32]. Another large ALIB reuse
project has been started in the autumn of 2015 by EDF, Forsee Power, Mitsubishi Motors
Corporation and PSA Peugeot-Citroën in the domicile of Forsee Power in the near of Paris [33].
In this project, photovoltaic modules and BEV (incl. charging stations) are connected with new
LIB and SLB in a bidirectional flow to be used for grid-stabilization and to cover the energy
need of the company’s main building. Finally, in terms of completeness, a selection of publicly
promoted projects in Germany which dealt with SLC shall be mentioned here: Sun2Car@GAP,
EOL-IS, StaTrak and ABattReLife.
As already described before, a reuse of aged ALIB could be used to build a temporal bridge
from times of uneconomical to economical recycling, or at least to offset directly arising
recycling costs from the present. However, as the recycling process of ALIB is prescribed by
German law and can only be postponed, SLC are no alternative to recycling, but
remanufacturing of aged ALIB is an alternative to SLC. If only a small fraction of battery units
are damaged and thus limit the capacity and power capability of the whole pack, these could be
Introduction
5
replaced by new (or already used but still suitable) units to restore required pack properties.
Advantage of this distinct approach is the avoidance of costly SLB manufacturing processes,
but, however, cost-effective methods of SoH detection like online-tracking of aging dependent
battery parameters or SoH quick tests are needed as well. Additional costs could occur if
removed battery units had to be stored temporarily before tracking a suitable car to be
deployed in [28]. It may be assumed, however, that none of both approaches, i.e.,
remanufacturing and reuse, will drive its opponent completely from the (at present imaginary)
market. Instead, the authors of [14] postulate that remanufacturing of aged ALIB will be a useful
supplement of battery SLC.
Besides of new LIB, another direct competitor of SLB is the PbB which is still by far the most
commonly used secondary battery with a total market share of approximately 50% [34]. In
many applications which are regarded as suitable for SLB (e.g. vehicle starter batteries, back-
up storages for telecommunication systems, emergency power supply, traction batteries for
forklift trucks, etc.), the PbB represents the type of battery which is, at present, usually used by
default [24, 35, 36]. In spite of several technological advantages of LIB (like a longer service
life), a widespread drive from the market of PbB is not forthcoming because of the presence of
currently still higher LIB system costs as well as unanswered technological disadvantages like
a poorer low temperature behavior and increased safety problems at high temperatures.
However, as e.g. the price decline of LIB home energy storage systems surpasses the one of
PbB systems, the share of LIB will further increase in the future [7]. The Eidgenössische
Technische Hochschule (ETH) Zurich compared costs and technical specifications of PbB with
those of LIB in a comprehensive literature review which was published in 2013 [8]: Regarding
the mean calendar life, the LIB slightly outperformed the PbB with 11.5 years in contrast to 8.5
years. For the mean maximum number of cycles at a charge and discharge cycle depth of
80%, the technological superiority of LIB with 10.250 cycles in contrast to PbB with 1.250
cycles was considerable. Also the mean round-trip efficiency of LIB with 90% surpassed the
one of PbB with 82%. However, these technological advantages of LIB faced higher battery
system costs with 844 €/kWh compared to 171 €/kWh for PbB systems.
Especially for the battery system costs which are listed in [8], it has to be considered, though,
that mentioned values are no longer current. In the meanwhile, LIB system costs declined to
values between 300 €/kWh and 400 €/kWh, whereas actual PbB systems are settled within a
range from 100 €/kWh to 150 €/kWh [15, 24]. In spite of the strong decline of LIB system
prices, nevertheless, there is still a heavy demand for PbB systems. As SLB would be
significantly cheaper available than new LIB, however, this offered the chance of being cost-
competitive with PbB which in turn principally enabled the entry in the large, already existing
market of PbB. For the costs of new LIB and SLB, a relationship could be derived in [14], which
quoted the price limit of SLB (at residual capacities of 80%) to be approximately the half from
new LIB (in €/kWh, regardless of the price development of new LIB). If it is assumed that the
Introduction
6
price decline of LIB continues to surpass the one of PbB, this could lead to a price advantage
of SLB compared with PbB in a few years. So, in combination with aforementioned
technological advantages (assumed here to be valid for LIB and also SLB), SLB might bear a
real chance to absorb parts of the PbB market.
An additional field of application in which SLB could replace currently deployed technologies,
which are PbB or diesel generator sets, is the electrification of rural areas in developing nations
by using micro- or mini-grid systems. Regarding the application-related reachable service life,
for SLB values between six and eight years in contrast to three and four years for PbB, are
mentioned in [37]. One reason for the inferior service life of PbB is their greater sensitivity
towards high ambient temperatures which, however, are typical for developing nations like
Central Africa or South East Asia. The limited service life of certain types of PbB is further
reduced if the water filling level is not maintained by regularly inserting purified water.
Furthermore, with a gravimetric (70 Wh/kg - 100 Wh/kg at SoH = 70%) and volumetric energy
density (175 Wh/l - 280 Wh/l at SoH = 70%) of SLB, still being approximately two and three
times higher than values of PbB, respectively, economical and also ecological benefits both
emerge e.g. at freighter transportation of batteries [37].
Generally, battery reuse is regarded as a promising approach to reduce emissions and
resource requirements associated with electromobility. If the production of new batteries (e.g.
PbB or LIB) is avoided by deploying SLB, an ecological savings potential can be assumed [38,
39]. As is shown in [29, 40, 41], this potential depends on the investigated application, the
respective electricity mix and the competing technology. Exemplarily, based on substitution of
new LIB with SLB and the German electricity mix, an ecological savings potential of 34 kg -
106 kg CO2 equivalent (CO2e) and 30 kg - 95 kg CO2e per initial kWh battery nominal capacity
was calculated in [14] for PCRR and deployment in a home energy storage system,
respectively. Hereby, increased losses during operation, due to a decreased efficiency of SLB
compared with new batteries (for the period of the service life), were not considered, but just
the savings from refurbishing aged ALIB rather than producing new storage systems (the
electricity mix was referred to the energy expenditure of the refurbishing or the production
process of application specific storage systems). After this comprehensive review of previous
battery reuse investigations, in the following subchapter, main issues of this thesis are
concisely summarized, objectives highlighted and the further procedure is presented.
1.3 Objectives and Further Procedure
Currently, the presence of several technological, legal and logistic hurdles impedes a
widespread implementation of SLC. Main topic of this thesis is, as the title already suggests,
the investigation of technological barriers which originate from the nature of LIC aging. First
core issue is, thereby, the phenomenon of a suddenly increasing cell aging rate which severely
Introduction
7
challenges lifetime projections. These, however, are necessary for assessing the profitability of
SLC. Henceforth, the phenomenon of a suddenly increasing cell aging rate at deep residual
capacities is denoted as nonlinear aging. Second core issue is the lithium-ion cell-to-cell
parameter variation which is observed to increase with the progress of aging. Regarding the
implementation of SLC, as a consequence, this is crucial as only a fraction of the units of a
BEV battery pack might be worthy to refurbish from an economic point of view. Both of these
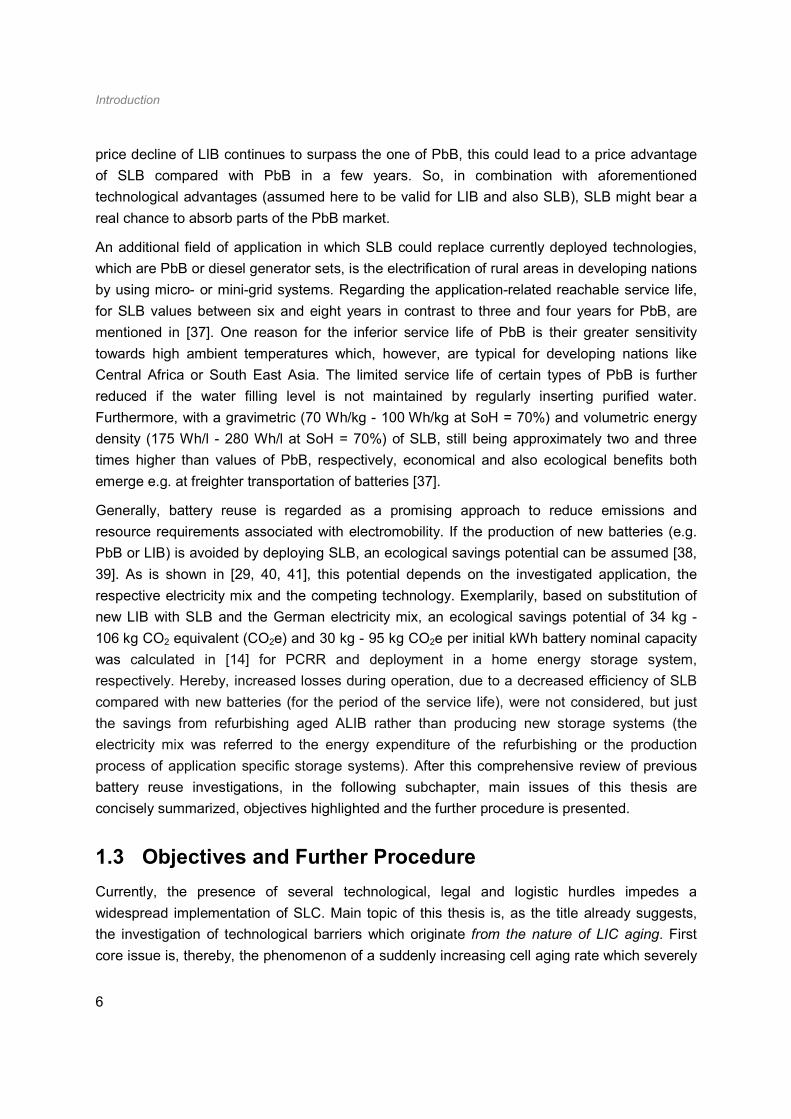
core issues are investigated in detail and solution approaches are provided to promote SLC
implementation. The scheme in Figure 1 is henceforth used in this thesis for progress control
and clarification of connecting chapters.
Figure 1: Scheme of investigated core issues and provided solution approaches.
Considering nonlinear aging characteristics of LIC, at first, load profile parameters are varied to
identify those which promote the underlying aging mechanism(s). Additionally, by that, perfect
foresight, when nonlinear aging characteristics will start, is obtained for a certain type of load.
With this knowledge, ways of mitigation or prevention by load adaption are examined.
Regarding the ALIB reuse scenario, a “two-step” load profile adaption (from BEV to SLA) thus
aims at extending the battery’s total service life by preventing nonlinear aging characteristics.
The aging dependency of lithium-ion cell-to-cell parameter variation is examined by gauging
large LIC batches in the new and aged state (approximately three years of BEV operation).
Yielded results are statistically analyzed and compared with the operational histories of
Introduction
8
investigated BEV. The increase of cell-to-cell parameter variation is the reason for needing
cost-effective SoH detection methods, for which there is basically either the online-tracking of
aging dependent battery parameters or the so called SoH quick tests. One approach for the
latter is based on the correlation between capacity fade and impedance increase of LIC, which
is investigated and evaluated in this thesis. With a reliable and cost-effective method of SoH
detection, profitability of SLC can effectively be fostered by reduction of SLB refurbishing costs.
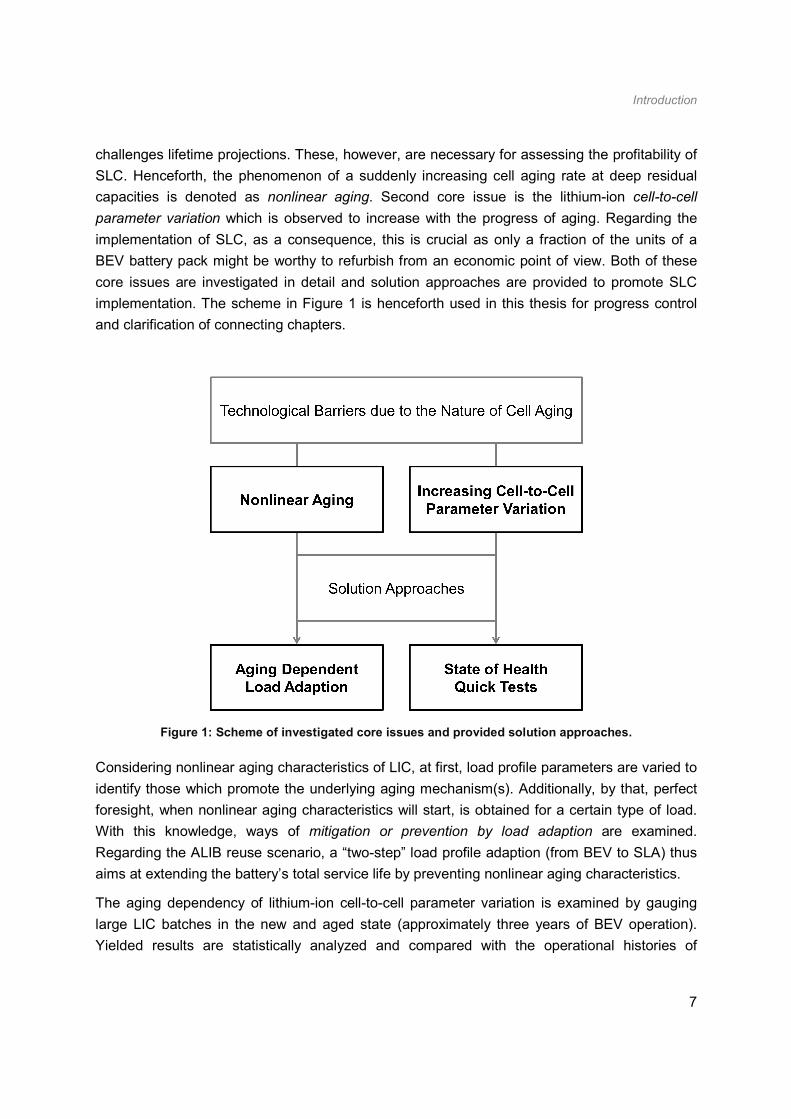
The thesis “Reuse of Automotive Lithium-Ion Batteries: An Assessment from the Cell Aging
Perspective” is structured as is shown in Figure 2. In Chapter 1, the topical context and a
comprehensive review of former battery reuse investigations were given. In Chapter 2, the
distinct stages and processes of SLC are described. Completing the “Framework &
Fundamentals” block, basic information on the aging behavior of LIC is reviewed in Chapter 3.
Regarding the next block which is denoted as “Modeling & Setup”, in Chapter 4, statistical
methods which are used afterwards to analyze yielded experimental data sets are explained.
Additionally, the presented theoretical methods are referred to interconnection configurations of
cells and modules in ALIB. Information on the setup of performed experiments is given in
Chapter 5. In the “Results & Discussion” block, experimental findings regarding nonlinear aging
characteristics, cell-to-cell parameter variation and the correlation behavior (between capacity
fade and impedance increase) are shown and interpreted in Chapter 6, 7 and 8, respectively. In
the concluding Chapter 9 (not shown in Figure 2), main issues and results of this thesis are
summarized and an outlook is given in which forthcoming scientific steps are recommended.
Figure 2: Structure of the thesis “Reuse of Automotive Lithium-Ion Batteries: An Assessment from the
Cell Aging Perspective” with assigned numbers of chapters.
Second Life Concepts
9
2 Second Life Concepts
In spite of a variety of imaginable constellations of SLC (like regarding the battery ownership
structure), there are certain stages or processes yet which define a battery reuse scenario. In
this chapter, relevant processes of SLC and a general definition of SLB are presented. As part of
the main process, the refurbishing process, i.e., all necessary steps from automotive battery
removal to the development of new SLB, plays an essential role in reaching profitability of SLC.
Thereof, in turn, the detection of the SoH of disassembled battery units is regarded to be the
most relevant part to do so.
2.1 Main Process
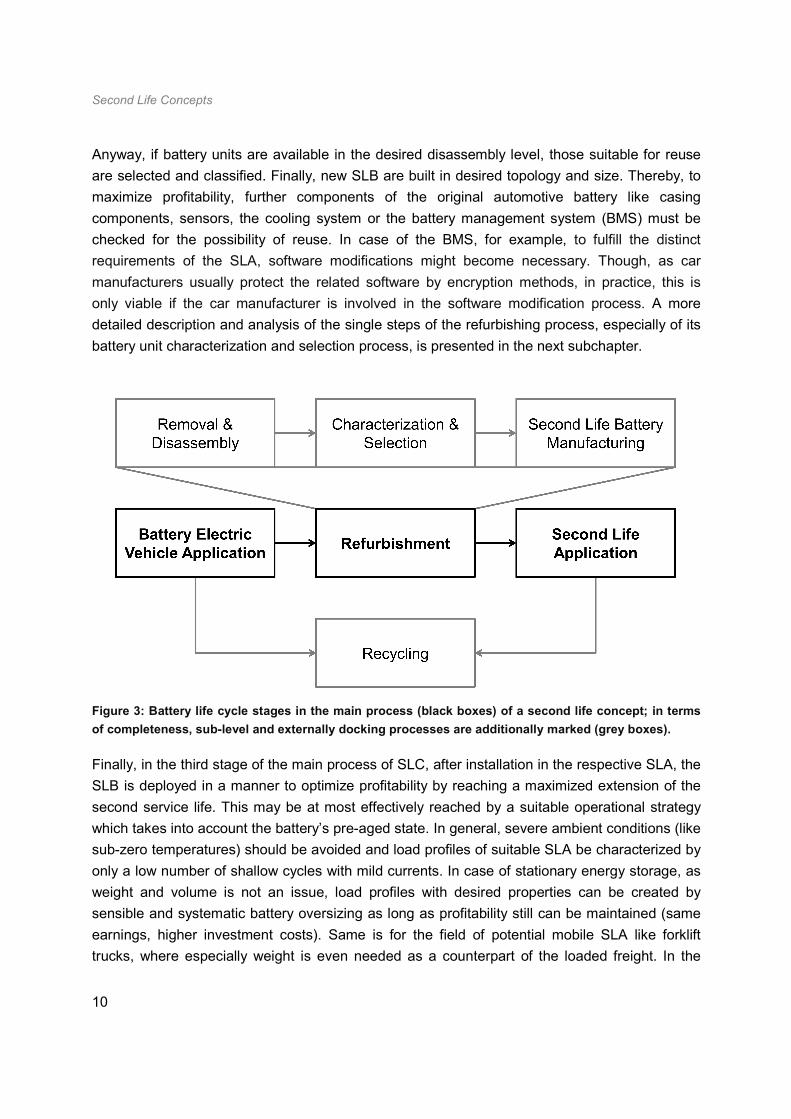
The three characteristic battery life cycle stages which define the main process of SLC are
shown in Figure 3 as black boxes (instead of grey boxes representing sub-level or externally
docking process steps). In the battery’s first stage, i.e., the deployment as automotive battery,
reachable service life is influenced by a variety of factors like battery dimensioning,
management, operational strategy, user’s driving style and charging habits, as well as ambient
conditions. With an expected automobile lifetime of slightly more than ten years, main aim is that
the battery of an electrified vehicle withstands this period’s everyday use and thus, no premature
battery exchange becomes necessary [16]. Insignificant for the SLC process, by all means, as
soon as the BEV requirements cannot be fulfilled anymore (i.e., the automotive battery’s end of
life (EoL) is reached), the automotive battery must be removed. In the literature, the end of first
life (Eo1L) is usually mentioned for BEV to be reached when the remaining capacity is between
70% and 80% of its nominal capacity [16, 42-45]. Definition and value range of Eo1L are
critically analyzed and discussed later in Subchapter 3.4 after explanation of therefore needed
fundamentals of LIC aging.
In the second stage of the main process of SLC, i.e., the refurbishment, at first, the aged battery
is removed from the BEV and disassembled into its single units (not mandatory). In the field, the
maximum disassembly level to be economically viable is most likely limited to modules because
e.g. a breakup of single cells’ soldered joints might be too costly even for large cells. As the
reuse possibilities of ALIB are yet assessed in this thesis from the cell aging perspective, the
interrelationship between battery cell-to-cell and module-to-module parameter variation is
comprehensively analyzed and discussed in Subchapter 4.3. Alternatively, for the construction
of large-scale battery energy storages, several refurbished packs may be interconnected in
complete to minimize refurbishing costs. In this case, the fundamental relationships which are
presented in Subchapter 4.3 can easily be transferred.
Second Life Concepts
10
Anyway, if battery units are available in the desired disassembly level, those suitable for reuse
are selected and classified. Finally, new SLB are built in desired topology and size. Thereby, to
maximize profitability, further components of the original automotive battery like casing
components, sensors, the cooling system or the battery management system (BMS) must be
checked for the possibility of reuse. In case of the BMS, for example, to fulfill the distinct
requirements of the SLA, software modifications might become necessary. Though, as car
manufacturers usually protect the related software by encryption methods, in practice, this is
only viable if the car manufacturer is involved in the software modification process. A more
detailed description and analysis of the single steps of the refurbishing process, especially of its
battery unit characterization and selection process, is presented in the next subchapter.
Figure 3: Battery life cycle stages in the main process (black boxes) of a second life concept; in terms
of completeness, sub-level and externally docking processes are additionally marked (grey boxes).
Finally, in the third stage of the main process of SLC, after installation in the respective SLA, the
SLB is deployed in a manner to optimize profitability by reaching a maximized extension of the
second service life. This may be at most effectively reached by a suitable operational strategy
which takes into account the battery’s pre-aged state. In general, severe ambient conditions (like
sub-zero temperatures) should be avoided and load profiles of suitable SLA be characterized by
only a low number of shallow cycles with mild currents. In case of stationary energy storage, as
weight and volume is not an issue, load profiles with desired properties can be created by
sensible and systematic battery oversizing as long as profitability still can be maintained (same
earnings, higher investment costs). Same is for the field of potential mobile SLA like forklift
trucks, where especially weight is even needed as a counterpart of the loaded freight. In the
Second Life Concepts
11
literature, even if partially contradictory, several suitable fields of SLB application like as interim
storage for renewable energies, back-up storage for telecommunication systems, decentralized
storage for mini-grids or to avoid grid extension, as forklift truck traction battery, or storage for
PCRR and peak shaving, have been identified [14, 20, 24, 37].
So, important finding is that SLB aging may be decelerated by battery oversizing (independent
of SLA type) which is feasible as long as profits still exceed expenses. Especially for the case of
avoiding SLB exchanges within fixed project periods, battery oversizing is lucrative as involved
reinvestment costs can be considerably reduced [46]. Finally, if the requirements of SLA cannot
be fulfilled anymore, i.e., the end of second life (Eo2L) is reached, the main process of SLC
ends and the SLB must be brought to a recycling facility. In the literature, values of the Eo2L
criterion for SLB in an arbitrary SLA are given within a range of 20% and 40% residual capacity
[29]. However, as this value range appears to be strongly undifferentiated, same as for the Eo1L
criterion, it is critically analyzed and assessed later in Subchapter 3.4.
As already mentioned before, the recycling process is prescribed by German law and so
mandatory either directly after the first, or after the second life of the respective battery.
Jurisdiction hereof depends on the battery ownership structure: in accordance with § 5 BattG,
the manufacturer of an end product with battery storage is obliged to recycle it for the end
consumer [10]. Regarding SLC, instead of this to be the car manufacturer by default, after
alteration of the ownership structure, distinct constellations with a transferred recycling obligation
are conceivable as well [14]. In any case, if the offset of directly arising recycling costs and the
aforementioned temporal bridge from uneconomic to economic times of recycling are excluded,
battery recycling is an external docking process of SLC and thus not further investigated in this
thesis. In the next subchapter, the single steps of refurbishment are analyzed and assessed in
more detail. Before, based on the lessons recently learned, a henceforth valid definition of a SLB
is given.
Definition of a second life battery:
The term second life battery characterizes a battery system, consisting of automotive battery
units which were used in battery electric vehicles and refurbished for reuse (in a second life
application with a minor challenging load profile, especially taking into account the battery units’
pre-aged state). [14]
With regard to this definition of SLB, constellations without battery removal and refurbishment,
such as BEV reselling from long-distance to short-distance drivers or city leasing companies,
sometimes also referred to as SLA, are especially excluded in this thesis.
Second Life Concepts
12
2.2 Refurbishing Process
The increasing cell-to-cell (and module-to-module) parameter variation in an automotive battery
during BEV operation is the reason for needing SoH detection of battery units to separate those
suitable for reuse from those which should be immediately recycled. The refurbishing process
basically consists of battery removal and disassembly, battery unit characterization and
selection, and finally the manufacturing of new SLB (see Figure 3). The refurbishment expenses
considerably reduce the residual value of aged automotive batteries. For the complete
refurbishing process, in the literature, values between 150 $/kWh and 15 $/kWh are given,
whereby a broader distribution of SLC would lead to lower values [20, 24, 26, 36]. It must be
considered, though, that values given in the literature not even refer to a certain SLA, and thus,
only represent a rough guide which must be rechecked in the field.
In any case, if there is a hypothetical cost limit of a SLB, which the prospective customer is
willingly to pay at maximum, refurbishment expenses must be subtracted thereof to yield the
residual value of an aged automotive battery [14, 24, 35, 36]. Regarding the customer side, the
hypothetical cost limit of SLB depends on the actual price of new batteries of the respective
technology (LIB in this thesis), the aging state of the used batteries and a psychological “second
hand” factor [35, 47]. The latter is e.g. comparable with the disproportionate fall in value in the
first year of use of a new passenger vehicle. Additionally, the hypothetical cost limit of SLB at the
customer side is always as low as costs of competing technologies like PbB (if technological
properties are assumed to be equal) [14]. Regarding the vendor side, relevant criterion is that
the residual value of an aged automotive battery is positive because, otherwise, in the base
case scenario, it would be immediately given to recycling (not to refurbishment). However, in
alternative case scenarios, negative residual values may be allowed if a profit from the offset of
recycling costs leads at least to break-even (for covered expenses only, there is at least an
ecological benefit). Finally, suggested scenarios strongly depend on the battery ownership
structure and the related jurisdiction of the obliged recycling process.
Generally, compliance with several legal regulations is mandatory in the context of battery
production and distribution [10]. Regarding a specific application in the second life compared
with the application “BEV”, if there are any additional battery regulations, it must be ensured in
the refurbishing process to satisfactorily comply with them. Additionally, to assess refurbishment
expenses of aged automotive batteries, it has to be checked how far existing regulations are
influenced by the battery’s first life and the refurbishing process itself. As there are no specific
regulations addressing the modification of already certified battery systems, a retesting
procedure is not compulsorily prescribed even if e.g. a new SLB system is built partially from
certified old and new but untested parts (like deploying old modules with a new BMS). Especially
if integrated safety precautions of ALIB are modified in the refurbishing process, retesting is
nevertheless useful in conclusion and a regulation regarding this should be added to existing
Second Life Concepts
13
norms and standards. However, as there are no reuse regulations yet at present, assumptions
are made hereafter.
Due to the nonexistence of relevant regulations, principally, no additional information must be
provided which has not been already before in the new state. It must be assumed, though, that
disposition to buy is small for customers being uninformed of relevant data like product age,
residual capacity or power capability. In the following, as this thesis deals with the technology of
LIB, respective legal regulations are analyzed and costs of single refurbishment steps are
qualitatively assessed. Finally, major matters of expense are highlighted and recommended
actions are provided.
Regarding the UN 38.3 transport standard which is a global prerequisite for road, rail, maritime
and air transportation, unaffectedness by the operational ALIB prehistory and the refurbishing
process is restrictedly assumed. This is based on the battery units not being altered regarding
their safety precautions, but only be removed from their corresponding battery pack compounds.
However, the UN 38.3.2.2 must especially be considered, as this passage prescribes retesting
of battery units with a capacity fade of more than 20%. The individual tests (vibration, shock,
overcharging, external short-circuiting, altitude simulation, etc.) of the transport standard are
estimated to be very time-consuming and costly. Thus, battery units with 80% residual capacity
are assumed to be just allowed for transportation without retesting. Additionally, as shown in
[48], although LIC pass the respective vibrational tests of UN 38.3 without failure, long-term
accumulated vibrational loads like in BEV, where vibration is a constant companion, may lead to
spontaneous cell failure. With regard to stationary SLA, associated risks are presumably small
but recheck of the UN 38.3 standard is suggested for mobile SLA like the deployment of SLB in
forklift trucks.
The directive of electromagnetic compatibility 2014/30/EU is assumed to stay unaffected of
battery prehistory and refurbishment. In contrast to that, quotation of the nominal capacity of LIB
(mandatory in accordance to § 17 BattG, DIN EN 61960 and the European directive 1103/2010)
is recommended for SLB to be renewed during/after refurbishment. Besides of discussed legal
regulations, there is a variety of voluntary quality standards which mainly recommend
methodologies of measuring characteristic values of LIB like actual capacity, power capability or
aging behavior like DIN EN 62660-1/2, ISO 12405-1 DIS and ISO 12405-2 WD. [14]
Main aim of effective refurbishing process implementation is to separate those steps of quality
assurance which are inevitable, from those, which can be cancelled or at least be operated with
little effort (compared with standards in the new state of LIB). Reducing refurbishing costs
directly leads to increased residual values of aged ALIB. The single steps of the exemplary
refurbishing process which is shown in Figure 4 are critically discussed hereafter. Additionally,
reduction potentials are highlighted. It has to be considered, though, that the illustrated
refurbishment process is just an example, as there is, principally, a variety of constellations
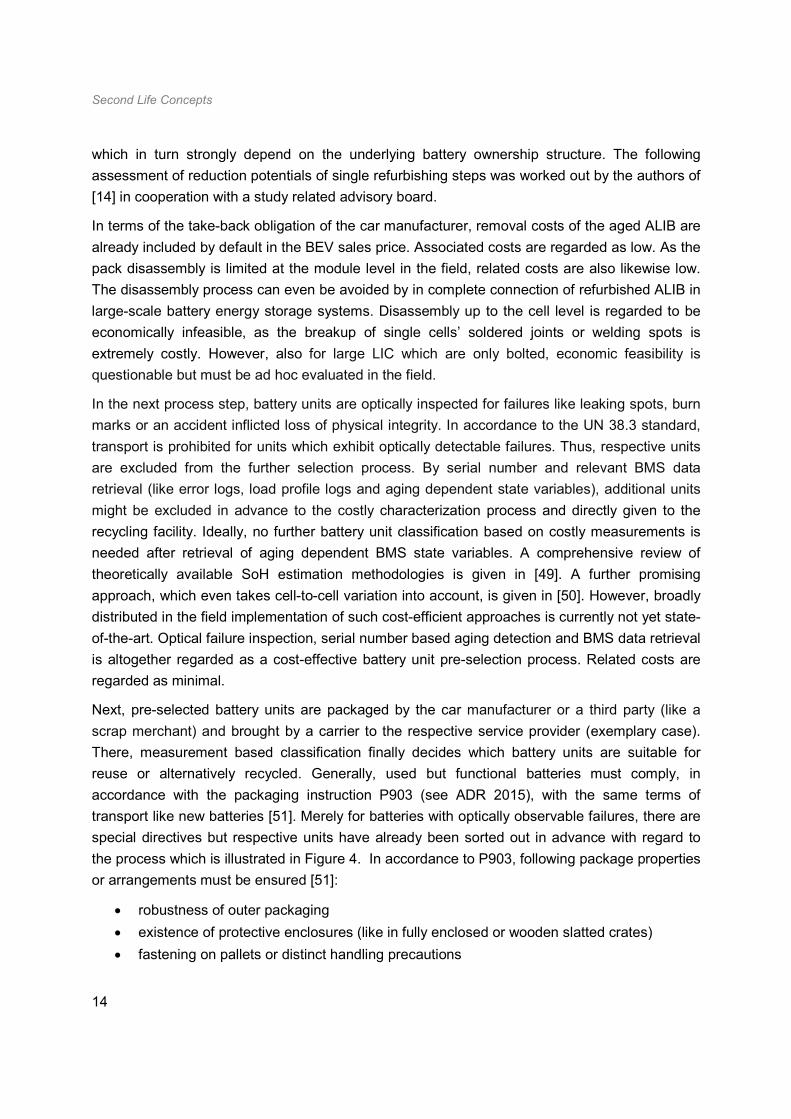
Second Life Concepts
14
which in turn strongly depend on the underlying battery ownership structure. The following
assessment of reduction potentials of single refurbishing steps was worked out by the authors of
[14] in cooperation with a study related advisory board.
In terms of the take-back obligation of the car manufacturer, removal costs of the aged ALIB are
already included by default in the BEV sales price. Associated costs are regarded as low. As the
pack disassembly is limited at the module level in the field, related costs are also likewise low.
The disassembly process can even be avoided by in complete connection of refurbished ALIB in
large-scale battery energy storage systems. Disassembly up to the cell level is regarded to be
economically infeasible, as the breakup of single cells’ soldered joints or welding spots is
extremely costly. However, also for large LIC which are only bolted, economic feasibility is
questionable but must be ad hoc evaluated in the field.
In the next process step, battery units are optically inspected for failures like leaking spots, burn
marks or an accident inflicted loss of physical integrity. In accordance to the UN 38.3 standard,
transport is prohibited for units which exhibit optically detectable failures. Thus, respective units
are excluded from the further selection process. By serial number and relevant BMS data
retrieval (like error logs, load profile logs and aging dependent state variables), additional units
might be excluded in advance to the costly characterization process and directly given to the
recycling facility. Ideally, no further battery unit classification based on costly measurements is
needed after retrieval of aging dependent BMS state variables. A comprehensive review of
theoretically available SoH estimation methodologies is given in [49]. A further promising
approach, which even takes cell-to-cell variation into account, is given in [50]. However, broadly
distributed in the field implementation of such cost-efficient approaches is currently not yet state-
of-the-art. Optical failure inspection, serial number based aging detection and BMS data retrieval
is altogether regarded as a cost-effective battery unit pre-selection process. Related costs are
regarded as minimal.
Next, pre-selected battery units are packaged by the car manufacturer or a third party (like a
scrap merchant) and brought by a carrier to the respective service provider (exemplary case).
There, measurement based classification finally decides which battery units are suitable for
reuse or alternatively recycled. Generally, used but functional batteries must comply, in
accordance with the packaging instruction P903 (see ADR 2015), with the same terms of
transport like new batteries [51]. Merely for batteries with optically observable failures, there are
special directives but respective units have already been sorted out in advance with regard to
the process which is illustrated in Figure 4. In accordance to P903, following package properties
or arrangements must be ensured [51]:
• robustness of outer packaging
• existence of protective enclosures (like in fully enclosed or wooden slatted crates)
• fastening on pallets or distinct handling precautions
Second Life Concepts
15
Figure 4: Flow chart of an exemplary refurbishing process of aged automotive batteries with a closer
examination of the contained battery unit characterization and selection process. Based on [14].
Battery units must especially be secured against unintentional movement. Furthermore, direct
loading on top of the units, imposed by other freight material, is prohibited. In complete,
packaging and transport costs are assessed as moderate or even high. However, as new LIB
and SLB must be packaged and transported to their place of action in the same fashion, no
additional costs emerge in the SLC for the final transport to the end user. In contrast to that, for
each interposed transport process, like in Figure 4 from the car manufacturer to a not in-house
service provider (where battery unit selection and SLB manufacturing is performed), additional
costs emerge which directly reduce the residual value of aged ALIB. So, recommended action is
that the car manufacturer takes over measurement based battery unit selection and SLB
manufacturing to avoid additional packaging and transport processes. Alternatively, an in-house
service provider can be commissioned.
To finally decide whether a battery unit should be reused or immediately recycled, the SoH must
be measured which is defined by its actual power capability or residual capacity referred to a
reference value. In general, methodologies of measuring characteristic battery parameters like
capacity, power capability or aging behavior are e.g. recommended in DIN EN 62660-1/2, ISO
12405-1 DIS and ISO 12405-2 WD. Regarding an energy-optimized application like BEV, the

Second Life Concepts
16
SoH is ordinarily quantified by the ratio of the actual referred to the nominal or the initial capacity
[52, 53], as per:
SoH = Cact / C0 (1)
Thereby, C0 and Cact are the capacity in the new and the actual state, respectively. The term
“aging rate” is henceforth used in this thesis to approx. give an idea of the rate of the aging
progress and could be defined as:
αC = ∆Cact / ∆t (2)
However, whereas the reference to time is useful to characterize calendric aging, for cyclic aging
also reference to the charge throughput or number of cycles is conceivable. In addition,
depending on the context, the parameter capacity can also be replaced by impedance parts.
In any case, with regard to time effort and required machinery, conventional capacity
measurement techniques are costly [54]. For example, capacity determination according to
standards or manufacturer guidelines usually requires at least a complete charge and discharge
cycle with a current rate equal or less than 1.0 C [55]. In DIN EN 62660-1, capacity
measurement is even recommended to be performed with a current rate of 1/3 C (resulting in
approximately 6 h per full cycle and battery unit). Additionally, as the performance of LIB strongly
depends on the temperature, preconditioning waiting periods must be precisely kept. So, a quick
and easy SoH test, without the need of costly machinery, might be of great use and could
especially improve the economic feasibility of reusing aged ALIB by reducing costs of
refurbishment.
To assess the actual power capability of a battery unit, the impedance can be determined either
in the frequency or in the time domain [56, 57]. Regarding the applicableness for SoH quick
tests, the raised impedance part must be independent of the state of charge (SoC), which is
defined as follows [14]:
SoC = ∙
(3)
Equation (3) basically describes the methodology of Ah-counting in which the actually stored
amount of charge is referred to Cact. In any case, a prior adjustment of the SoC would be as
time-consuming as capacity measurement itself; thus, in a SoH quick test, this is not a viable
option. As an alternative to the required SoC independency of the raised impedance part, a SoC
correction function could be implemented.
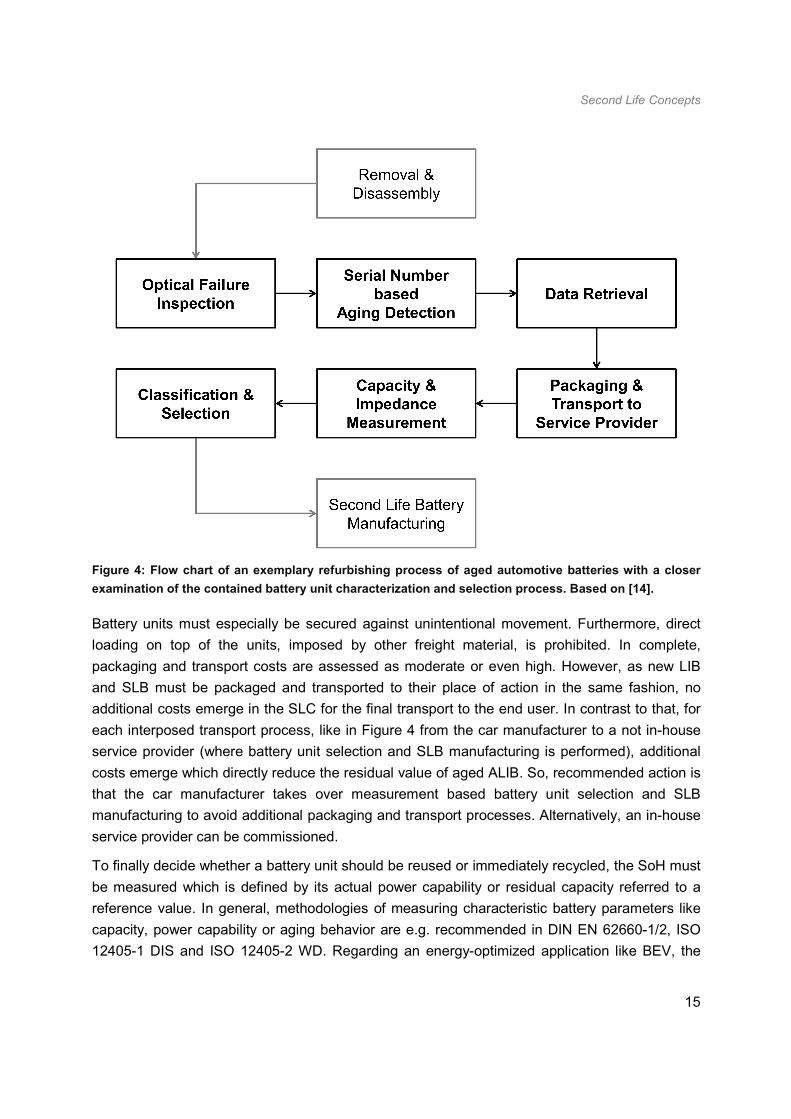
In the frequency domain, for LIC made of different active materials, the complex impedance
value at which the imaginary part is zero, i.e., the ohmic resistance (in this thesis denoted as Rzc,
see Subchapter 5.1), can approximately be regarded as independent of the SoC [54, 58, 59].
Figure 5 depicts the Rzc (normalized to the respective value at a SoC = 100%) versus the full
SoC range for LIC models of different manufacturers. As is observable, the assumption of the
Second Life Concepts
17
Rzc to be independent of the SoC is justified with one exception; for the IHR18650A by E-One
Moli Energy Corp. (with Rzc = 66.59 mΩ at a SoC = 100%), a SoC correction function is required
(in this thesis, though, statistical analysis is anyway based on data with adjusted SoC). The clear
SoC dependency is possibly linked to characteristics of the contained electrolyte components
but this must further be investigated. The Rzc values at a SoC = 100% of the Panasonic
NCR18650PD, the A123 APR18650m1A, the Sony US18650VT1 and the Sanyo UR18650E are
23.70 mΩ, 17.54 mΩ, 29.67 mΩ and 32.88 mΩ, respectively. The presented data sets have
been recorded by Peter Keil and Martin Brand (and/or by students under their supervision) at the
Institute for Electrical Energy Storage Technology of the Technical University of Munich.
Figure 5: Dependency of the impedance part Rzc of the state of charge for lithium-ion cell models of
different manufacturers; data sets are normalized to the respective value at a state of charge of 100%.
This part of impedance is also quickly to measure because of its occurrence at high frequencies
in the magnitude of 1 kHz, as reported in [57] for LIC comprising graphite on the negative and
lithium-nickel-manganese-cobalt-oxide (NMC) on the positive electrode. In addition to the
independency of the SoC (for the majority of LIC models) and the quick measurability, another
advantage of the Rzc is its negligibly dependency of the operational prehistory (impedance parts
at lower frequencies are well known to be affected from relaxation processes for up to 40 h after
operation) [60]. Besides, with regard to the high temperature sensitivity of the impedance of a
LIC, precise temperature preconditioning is of major importance.
In terms of acceleration possibilities of SoH detection (and thus increasing cost-efficiency),
approaches of reasoning the actual capacity from the corresponding impedance value were e.g.
recommended in [54] and [61] to be auspicious. Main idea is to calculate a functional
dependency for the variables capacity and impedance, e.g. by simple linear regression.
Therefore required value pairs must be collected in advance within a laboratory aging
experiment. If functional dependencies are known and so, correlation behavior is described
mathematically, the residual capacity of a battery unit can quickly be calculated by inserting the

Second Life Concepts
18
respective impedance value in the detected equation (like Cact = Cy + a · Rzc, with the axis
intercept Cy and the slope a). However, as regression curves presented in [54] and [61] were
only parameterized with data from one single type of load (and due to the absence of further
investigations), correlation behavior must yet be analyzed and assessed for distinct types of load
(different storage and operational conditions). In any case, such a SoH quick test must be
universally applicable as e.g. load profiles and ambient conditions of BEV strongly differ. So,
independency of storage and operational conditions is needed for successful implementation. If
this is reachable, costs of refurbishment could considerably be reduced. Possible causes of
interaction of capacity fade and impedance increase, i.e., reference to the underlying aging
mechanisms, is presented in Subchapter 3.2. Required statistical methods are explained in
Chapter 4. Finally, the results of the correlation analysis are presented in Chapter 8.
After the respective battery units have been measured, final decision can be made with the
options of either recycling or reuse. Then, battery units with similar characteristics are classified
and can finally be selected for the manufacturing of proper SLB. To deploy SLB in a manner
which takes into account their pre-aged state, and thus to optimize the second service life,
understanding of the aging behavior and mechanisms of LIC is of major importance. Therefore,
fundamentals of LIC aging (behavior, mechanisms) are comprehensively described and
discussed in the next chapter.
Fundamentals of Lithium-Ion Cell Aging
19
3 Fundamentals of Lithium-Ion Cell Aging
Regarding the aim of an economic SLC implementation, profound understanding and
predictability of the aging behavior of LIB are a prerequisite to assess overall system costs and
economic benefit. Thus, the ability of assessing the aging behavior to expect within the project
period is directly linked with the decision to invest. The fundamentals of LIC aging which are
needed for such challenging lifetime projections are presented in this chapter.
Basically, the aging behavior of a LIC consists of a calendric and a cyclic component, i.e.,
calendric and cyclic aging. For a BEV, exemplarily, this means that even in inactive periods,
when the vehicle is parked, the ALIB suffers from calendric aging. In addition to that, cyclic aging
is caused by the driving operation and the charging process [43, 62]. Especially the latter is said
to remarkably influence the aging behavior. Consequences of aging are, generally, a loss of
capacity and power capability with the latter originating from an increase of impedance.
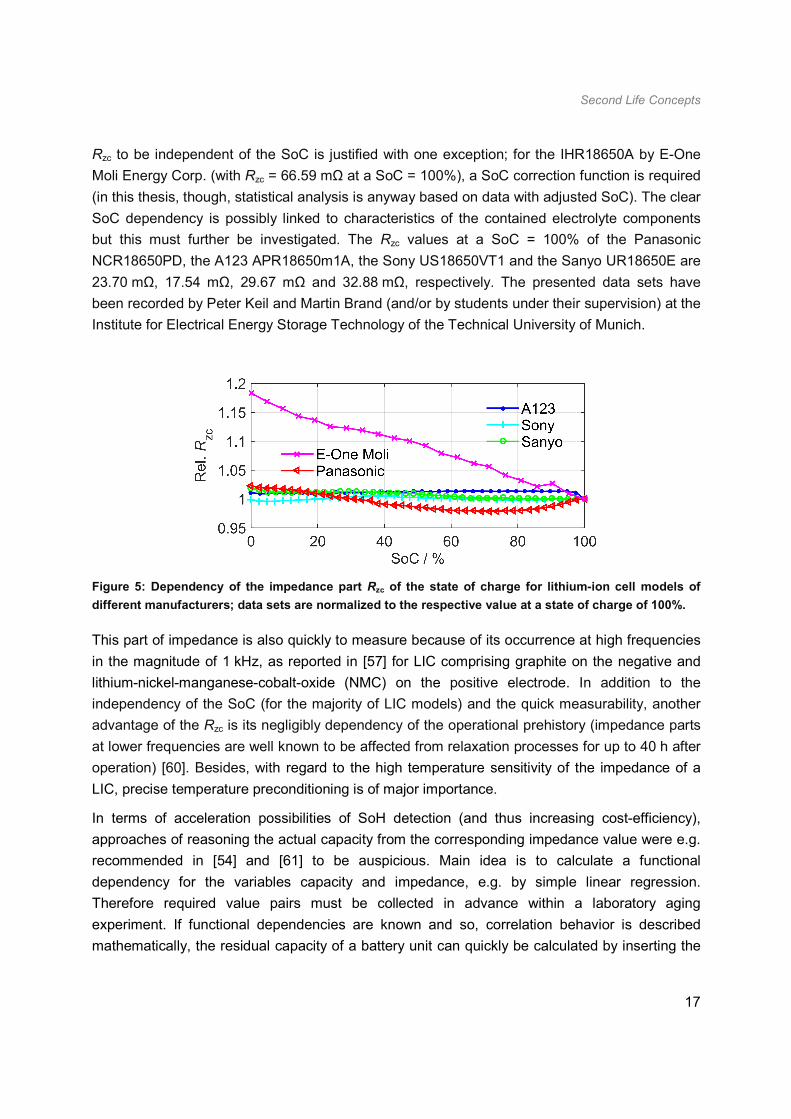
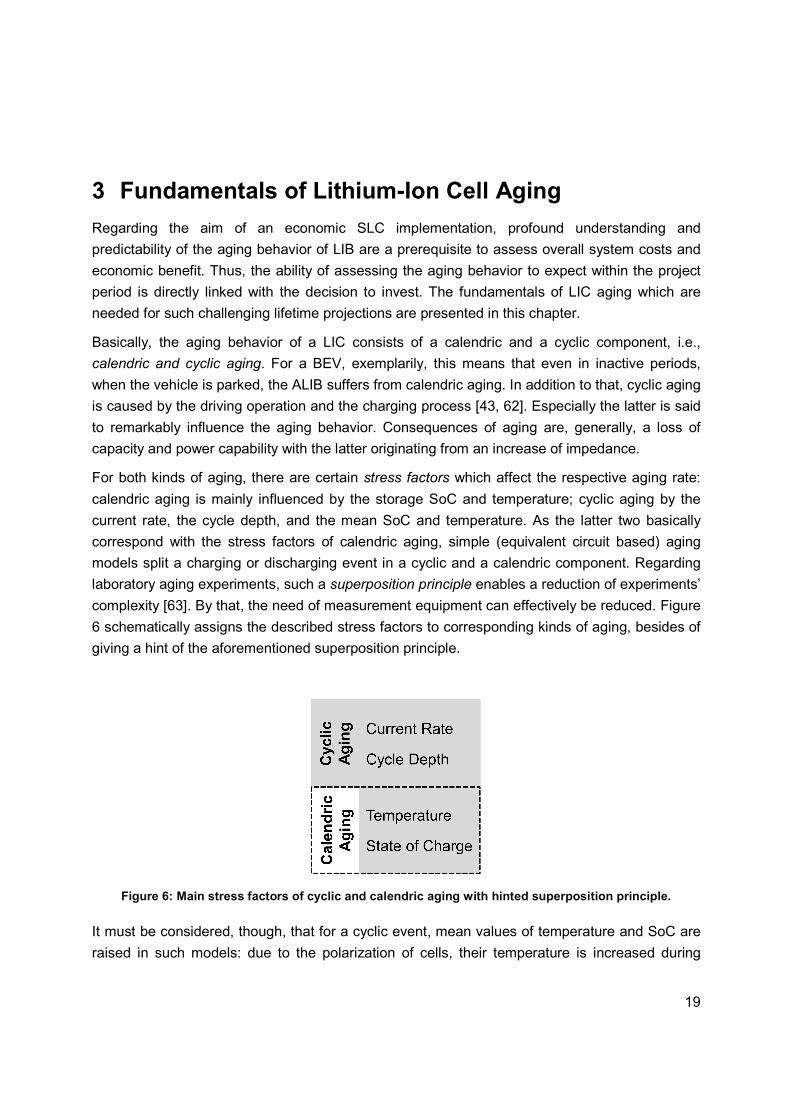
For both kinds of aging, there are certain stress factors which affect the respective aging rate:
calendric aging is mainly influenced by the storage SoC and temperature; cyclic aging by the
current rate, the cycle depth, and the mean SoC and temperature. As the latter two basically
correspond with the stress factors of calendric aging, simple (equivalent circuit based) aging
models split a charging or discharging event in a cyclic and a calendric component. Regarding
laboratory aging experiments, such a superposition principle enables a reduction of experiments’
complexity [63]. By that, the need of measurement equipment can effectively be reduced. Figure
6 schematically assigns the described stress factors to corresponding kinds of aging, besides of
giving a hint of the aforementioned superposition principle.
Figure 6: Main stress factors of cyclic and calendric aging with hinted superposition principle.
It must be considered, though, that for a cyclic event, mean values of temperature and SoC are
raised in such models: due to the polarization of cells, their temperature is increased during
Fundamentals of Lithium-Ion Cell Aging
20
current load which is why the temperature of cells must be averaged; for the SoC, the mean
value of the upper and lower bound SoC of a half cycle event (charging, discharging) is usually
used [63].
Regarding the stress factors of pure cyclic aging, basically, an increase of current rate
(especially for charging) and cycle depth leads to enhanced aging for all common models of LIC
[64-66]. The basic idea of SLC is based on that relationship as the reuse of an aged automotive
battery in a SLA normally should come along with a reduction of current rate and cycle depth (for
SLA with deep cycles like photovoltaic interim home storage, oversizing is conceivable) [14].
However, for the stress factors of calendric aging, relationships vary for LIC models comprising
(graphite anodes but) differently structured cathode materials: whereas the aging rate is
basically increased with increasing SoC for cathodes with a layered (like NMC) or olivine (like
lithium-iron-phosphate (LFP)) structure, the relationship is more complex for spinel cathodes
(like lithium-manganese-spinel (LMO)) [67, 68]. In addition, it was recently shown in [69] that for
cells with graphite anodes and cathodes with a layered or olivine structure, the aging rate is not
continuously increased with increasing SoC, but is characterized by the occurrence of plateaus
and stages which directly arise from the staging phenomenon of graphite anodes.
Considering the relationship of aging rate and temperature, trends are equal for distinct LIC
models. However, it must be distinguished from calendric and cyclic aging: for stored cells, a
reduction of temperature leads to reduced aging; for cells in operation, there is an optimal
operation temperature around 25 °C with increased aging at lower and higher temperatures [70].
Reasons for the existence of such an optimal operation temperature are described in the next
subchapter. Anyway, as all experiments, which are presented in this thesis, have been
conducted with a classic LIC model with layered transition metal oxide cathode (NMC) and
graphite anode, the relationship between stress factors and aging rate is comparably simple: the
calendric aging rate is increased with increasing SoC and temperature; the cyclic aging rate with
increased current rate, cycle depth, mean SoC and temperatures which deviate from the
aforementioned operating temperature optimum.
In Subchapter 3.1, relevant aging mechanisms of LIC are concisely summarized. At this,
statements and findings are mainly based on studies presented in the literature which deal with
LIC models with graphite anodes and layered structure type cathodes (especially NMC). Thus,
the review of aging mechanisms is basically valid for the variety of LIC with layered metal oxide
cathodes (like NMC, lithium-nickel-cobalt-aluminum-oxide (NCA), lithium-cobalt-oxide (LCO),
etc.). In Subchapter 3.2, an explanation for the interaction of capacity fade and impedance
increase is given, which is regarded as the theoretical background for the later presented SoH
quick test approach. Afterwards, assumptions and hypotheses with regard to the cause of
nonlinear aging characteristics are comprehensively described in Subchapter 3.3. Based on the
lessons learned in this and the prior chapter, the end of life criteria of SLC (Eo1L, Eo2L) are
Fundamentals of Lithium-Ion Cell Aging
21
critically analyzed again and discussed in Subchapter 3.4. Finally, in Subchapter 3.5, different
causes of a rising cell-to-cell variation (in a multi-cell battery application) with the progress of
aging are given.
3.1 Review of Aging Mechanisms
As already mentioned before, all types of LIC suffer from calendric and cyclic aging. Basically,
consequences of aging are a loss of capacity and power capability (as impedance increase
results in higher overpotentials). The reasons for aging can generally be divided into three
groups, which are, namely, the loss of active materials, the loss of usable lithium and a
deterioration of ionic kinetics [71]. The latter mainly originates from passive layer growth, which
in turn is a result of electrolyte decomposition. To understand the aging of LIC is rather complex
in terms of the quantity of distinct but partially interacting aging mechanisms. Because of that, in
the following, a terse and concise review of most relevant aging mechanisms, as well as their
dependencies and interactions, is given.
The formation and evolution of passive layers in the electrode-electrolyte interfaces take on a
key role in the aging of LIC [72]. Usually, the layer at the anode is referred to as the solid
electrolyte interphase (SEI) and the one at the cathode as solid permeable interphase (SPI).
Whereas the SEI strongly suppresses electrolyte reduction at the anode after formation (so
called formation cycle, further information in [72]), unimpeded electrolyte oxidation continuously
takes place in the cathodic interface due to the SPI’s eponymous characteristic of being only
slightly passivating [73-75]. As far as is known, both passive layers are usually in the magnitude
of several nm [68]. In general, electrolyte decomposition (by reduction at the anode and
oxidation at the cathode) leads to an increase of the ohmic resistance. Both layers tend to grow
at high temperatures and SoC (due to increased electrolyte decomposition). Furthermore, the
layers can break due to volumetric changes of active materials caused by insertion and
extraction of lithium cations (explanation follows shortly) [76-78]. Destruction of the protective
layers results in automatic reconstruction due to the electrodes’ restored exposition to the
electrolyte and thus, new onset of electrolyte decomposition. In contrast to that, under
permanent extreme conditions like at high SoC and temperature, the passive layers are even
said to be capable of isolating active material by growing into its porous structure or clogging the
separator’s pores [68].
As the formation, thickening and reconstruction of both passive layers occur under the
consumption of active lithium, the occurrence of these processes directly correlates with
capacity loss. Besides, as the layers must be regarded as obstacles through which the lithium
cations have to penetrate (when inserted into or extracted from the electrodes), there is also a
link to increased impedance [76, 77, 79-81]. As an intermediate result, the importance of passive
layers regarding the aging behavior of LIC is based on their unavoidable existence due to
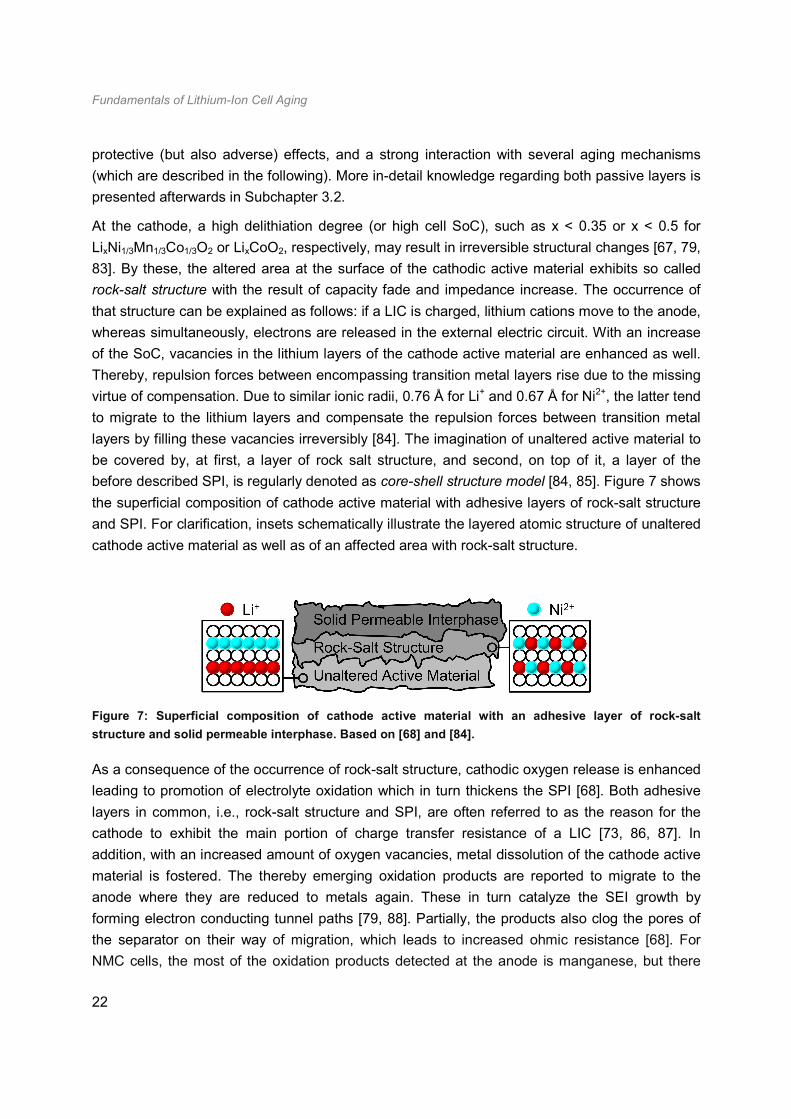
Fundamentals of Lithium-Ion Cell Aging
22
protective (but also adverse) effects, and a strong interaction with several aging mechanisms
(which are described in the following). More in-detail knowledge regarding both passive layers is
presented afterwards in Subchapter 3.2.
At the cathode, a high delithiation degree (or high cell SoC), such as x < 0.35 or x < 0.5 for
LixNi1/3Mn1/3Co1/3O2 or LixCoO2, respectively, may result in irreversible structural changes [67, 79,
83]. By these, the altered area at the surface of the cathodic active material exhibits so called
rock-salt structure with the result of capacity fade and impedance increase. The occurrence of
that structure can be explained as follows: if a LIC is charged, lithium cations move to the anode,
whereas simultaneously, electrons are released in the external electric circuit. With an increase
of the SoC, vacancies in the lithium layers of the cathode active material are enhanced as well.
Thereby, repulsion forces between encompassing transition metal layers rise due to the missing
virtue of compensation. Due to similar ionic radii, 0.76 Å for Li+ and 0.67 Å for Ni2+, the latter tend
to migrate to the lithium layers and compensate the repulsion forces between transition metal
layers by filling these vacancies irreversibly [84]. The imagination of unaltered active material to
be covered by, at first, a layer of rock salt structure, and second, on top of it, a layer of the
before described SPI, is regularly denoted as core-shell structure model [84, 85]. Figure 7 shows
the superficial composition of cathode active material with adhesive layers of rock-salt structure
and SPI. For clarification, insets schematically illustrate the layered atomic structure of unaltered
cathode active material as well as of an affected area with rock-salt structure.
Figure 7: Superficial composition of cathode active material with an adhesive layer of rock-salt
structure and solid permeable interphase. Based on [68] and [84].
As a consequence of the occurrence of rock-salt structure, cathodic oxygen release is enhanced
leading to promotion of electrolyte oxidation which in turn thickens the SPI [68]. Both adhesive
layers in common, i.e., rock-salt structure and SPI, are often referred to as the reason for the
cathode to exhibit the main portion of charge transfer resistance of a LIC [73, 86, 87]. In
addition, with an increased amount of oxygen vacancies, metal dissolution of the cathode active
material is fostered. The thereby emerging oxidation products are reported to migrate to the
anode where they are reduced to metals again. These in turn catalyze the SEI growth by
forming electron conducting tunnel paths [79, 88]. Partially, the products also clog the pores of
the separator on their way of migration, which leads to increased ohmic resistance [68]. For
NMC cells, the most of the oxidation products detected at the anode is manganese, but there

Fundamentals of Lithium-Ion Cell Aging
23
are also traces of nickel and cobalt; proposed dissolution mechanisms are a Mn3+
disproportionation reaction or an acid corrosion (which occurs due to the presence of moisture
traces in the electrolyte) [67, 89]. Whereas the anode material is principally not damaged by
these deposits, a deterioration of ionic kinetics takes place [90-94]. Besides, in [66], it is
mentioned for anodes of cells, which have been continuously charged to a high upper boundary
SoC, to be more contaminated with oxidation products than cells stored at that SoC. Thus, cell
operation (with a high upper boundary SoC) maybe eases cathodic metal dissolution and
oxidation product migration.
As aforementioned, aging can be inflicted by volumetric changes of active materials during
intercalation or deintercalation processes. When lithium cations are inserted into or extracted
from active material, the concomitant volumetric change, approx. 10.2% for graphite anodes [95,
96] and 2.4% for NMC transition metal layer cathodes [96, 97], can lead to a loss of particles’
bonds due to micro cracks or a loss of the contact of particles to the current collector. Electrically
unconnected clusters of active material (anode or cathode), as is shown in Figure 8, or clusters
with highly increased contact resistances, cannot be used anymore and thus, electrode capacity
is reduced. Due to higher volumetric changes, graphite anodes are generally more prone to
associated detrimental effects than most common cathode materials.
Figure 8: Current collector and electrode active material with partially unconnected clusters.
It is assumed for graphite that especially the crossing of phase transitions results in erratic
volumetric changes, indicating that also small cycle depths which cross a potential of phase
transitions may lead to severe aging effects [65, 98]. As the relative variation of graphite’s lattice
parameters is increased at two-phase reactions between different stages at the almost
delithiated state, sliding and buckling of graphite planes must especially be considered when LIC
are discharged to low SoC [95, 99]. Such an irreversible structural disordering in the lattice of
graphite leads to active material loss and thus, capacity reduction of the anode. When the
binding agent, typically polyvinylidene difluoride (PVDF), is decomposed, active materials may
expand permanently which facilitates a contact loss of particle to particle or collector [75, 86]. As
a consequence, active material may be isolated resulting in a loss of the electrode’s capacity.
Besides, passive layers may help to compensate volumetric changes but further capacity loss
occurs if the layers break and need to be reconstructed [66, 77].
Fundamentals of Lithium-Ion Cell Aging
24
At a high SoC, the potential of graphite anodes can come close to the critical value of 0 V vs.
Li/Li+. Low temperatures generally lead to a higher polarization due to slower diffusion processes
and a hampered charge transfer [100, 101]. Thus, when charging LIC at low temperatures with
high currents, the graphite potential may drop below 0 V vs. Li/Li+ [102]. In addition, as the
cathodic compared with the anodic overpotentials increase more slowly with decreasing
temperature, limitation of the charging end voltage at the cell level cannot reliably prevent lithium
plating. As a consequence of negative potentials vs. Li/Li+ at the graphite anode, lithium cannot
be intercalated and is plated between graphite active material and SEI. The thickness of such a
metallic lithium layer could be determined in [103] for a C//LFP cell with structural 26650 shape
and 2.5 Ah nominal capacity to be approx. 5 µm. For a C//NMC pouch type cell with a nominal
capacity of 20 Ah, a relationship of 16 µm per plated Ah (regardless of the number of electrode
layers) could be derived in [104]. In any case, plated lithium layers in the magnitude of several
µm can impose serious mechanical stress onto respective cell components (like the jelly roll) as
metallic lithium at the anode takes up more space than when intercalated into graphite [104,
105]. Additionally, in case of a thermal runaway of LIC, plated lithium is reported to increase
heat formation and thus, safety is considerably reduced [105].
Lithium plating is a reversible process as long as the plated lithium exhibits a conductive
connection to the graphite active material [106-108]. In that case, there are basically two
different possibilities of the so called stripping of plated lithium:
• dissolution in a subsequent discharge process
• electrochemical intercalation into graphite during cell relaxation
Dissolution of conductively connected parts of plated lithium in the subsequent discharge
process starts before deintercalation of intercalated lithium as the oxidation potential of plated
lithium is approx. 100 mV higher than the deintercalation potential [109, 110]. Therefore, at the
beginning of the discharge process, plated lithium is removed at first which is apparent from a
specific voltage plateau [111]. As long as the reversibly plated lithium layer is dissolved during
discharge and thus, the voltage plateau is visible, the ratio of LiC6 and LiC12 is reported to stay
constant [112]. Principally, the mentioned voltage plateau is a promising candidate for the
challenging in-operando detection of lithium plating. However, with sufficient precision, it is only
observable for small discharge currents at very low temperatures around -20 °C (due to slowed
kinetics) and thus, practical implementation is critical [102].
During cell relaxation, subsequent to a charging process which caused lithium plating, reversibly
plated lithium is electrochemically intercalated into graphite. Thereby, the ratio of LiC6 is
observed to increase, while the one of LiC12 decreases [112]. In correspondence to the
dissolution of plated lithium in a subsequent discharge process, a voltage plateau emerges
during cell relaxation which can be explained as follows: at the end of the charging process, i.e.,
when the cell current is set zero, the negative anode potential vs. Li/Li+ (for which plating occurs)
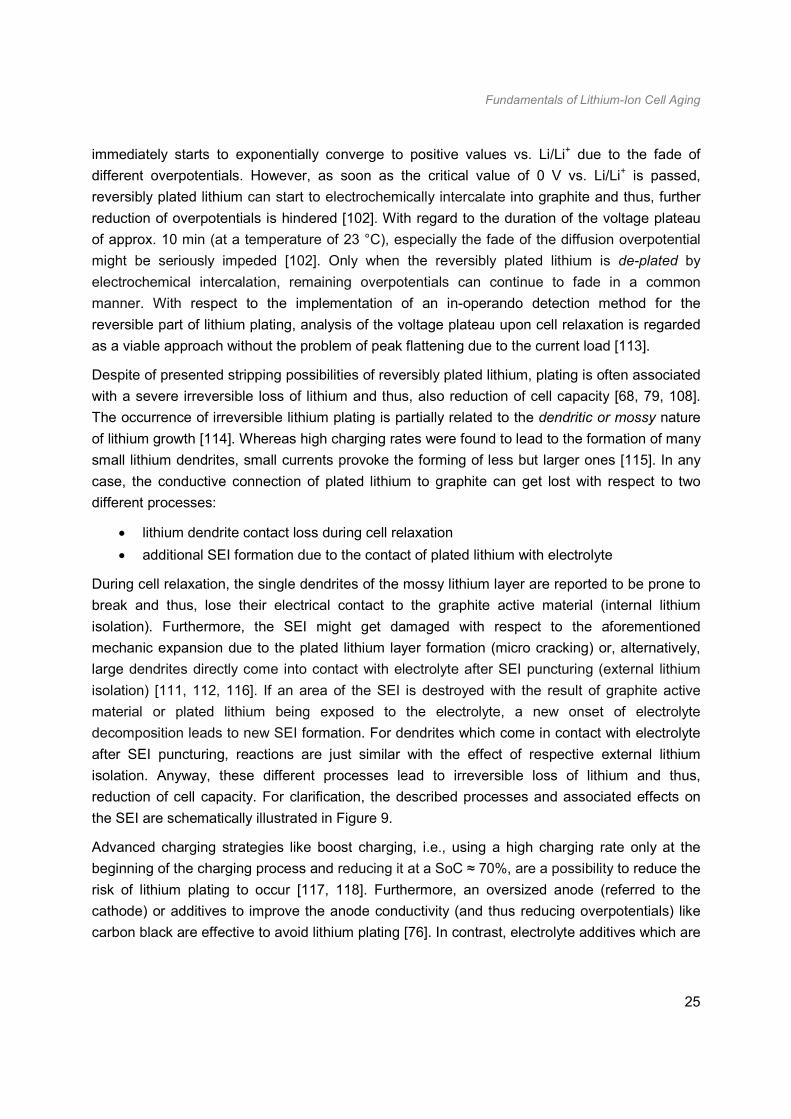
Fundamentals of Lithium-Ion Cell Aging
25
immediately starts to exponentially converge to positive values vs. Li/Li+ due to the fade of
different overpotentials. However, as soon as the critical value of 0 V vs. Li/Li+ is passed,
reversibly plated lithium can start to electrochemically intercalate into graphite and thus, further
reduction of overpotentials is hindered [102]. With regard to the duration of the voltage plateau
of approx. 10 min (at a temperature of 23 °C), especially the fade of the diffusion overpotential
might be seriously impeded [102]. Only when the reversibly plated lithium is de-plated by
electrochemical intercalation, remaining overpotentials can continue to fade in a common
manner. With respect to the implementation of an in-operando detection method for the
reversible part of lithium plating, analysis of the voltage plateau upon cell relaxation is regarded
as a viable approach without the problem of peak flattening due to the current load [113].
Despite of presented stripping possibilities of reversibly plated lithium, plating is often associated
with a severe irreversible loss of lithium and thus, also reduction of cell capacity [68, 79, 108].
The occurrence of irreversible lithium plating is partially related to the dendritic or mossy nature
of lithium growth [114]. Whereas high charging rates were found to lead to the formation of many
small lithium dendrites, small currents provoke the forming of less but larger ones [115]. In any
case, the conductive connection of plated lithium to graphite can get lost with respect to two
different processes:
• lithium dendrite contact loss during cell relaxation
• additional SEI formation due to the contact of plated lithium with electrolyte
During cell relaxation, the single dendrites of the mossy lithium layer are reported to be prone to
break and thus, lose their electrical contact to the graphite active material (internal lithium
isolation). Furthermore, the SEI might get damaged with respect to the aforementioned
mechanic expansion due to the plated lithium layer formation (micro cracking) or, alternatively,
large dendrites directly come into contact with electrolyte after SEI puncturing (external lithium
isolation) [111, 112, 116]. If an area of the SEI is destroyed with the result of graphite active
material or plated lithium being exposed to the electrolyte, a new onset of electrolyte
decomposition leads to new SEI formation. For dendrites which come in contact with electrolyte
after SEI puncturing, reactions are just similar with the effect of respective external lithium
isolation. Anyway, these different processes lead to irreversible loss of lithium and thus,
reduction of cell capacity. For clarification, the described processes and associated effects on
the SEI are schematically illustrated in Figure 9.
Advanced charging strategies like boost charging, i.e., using a high charging rate only at the
beginning of the charging process and reducing it at a SoC ≈ 70%, are a possibility to reduce the
risk of lithium plating to occur [117, 118]. Furthermore, an oversized anode (referred to the
cathode) or additives to improve the anode conductivity (and thus reducing overpotentials) like
carbon black are effective to avoid lithium plating [76]. In contrast, electrolyte additives which are
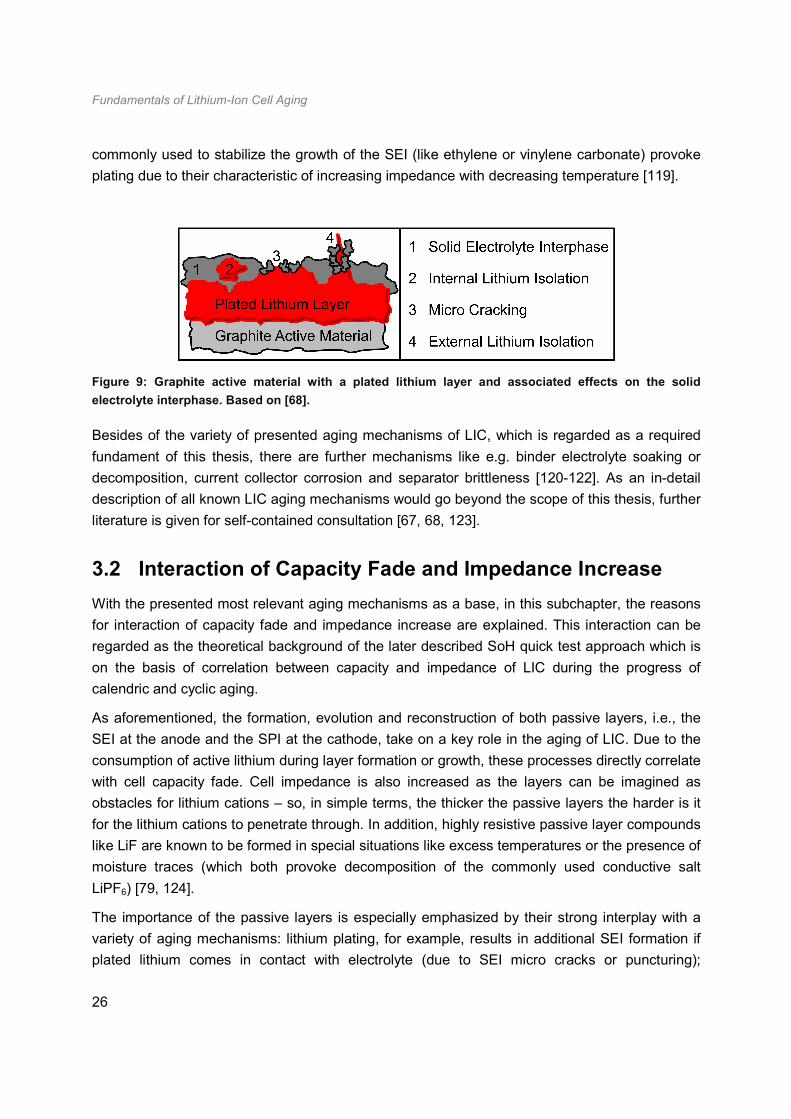
Fundamentals of Lithium-Ion Cell Aging
26
commonly used to stabilize the growth of the SEI (like ethylene or vinylene carbonate) provoke
plating due to their characteristic of increasing impedance with decreasing temperature [119].
Figure 9: Graphite active material with a plated lithium layer and associated effects on the solid
electrolyte interphase. Based on [68].
Besides of the variety of presented aging mechanisms of LIC, which is regarded as a required
fundament of this thesis, there are further mechanisms like e.g. binder electrolyte soaking or
decomposition, current collector corrosion and separator brittleness [120-122]. As an in-detail
description of all known LIC aging mechanisms would go beyond the scope of this thesis, further
literature is given for self-contained consultation [67, 68, 123].
3.2 Interaction of Capacity Fade and Impedance Increase
With the presented most relevant aging mechanisms as a base, in this subchapter, the reasons
for interaction of capacity fade and impedance increase are explained. This interaction can be
regarded as the theoretical background of the later described SoH quick test approach which is
on the basis of correlation between capacity and impedance of LIC during the progress of
calendric and cyclic aging.
As aforementioned, the formation, evolution and reconstruction of both passive layers, i.e., the
SEI at the anode and the SPI at the cathode, take on a key role in the aging of LIC. Due to the
consumption of active lithium during layer formation or growth, these processes directly correlate
with cell capacity fade. Cell impedance is also increased as the layers can be imagined as
obstacles for lithium cations – so, in simple terms, the thicker the passive layers the harder is it
for the lithium cations to penetrate through. In addition, highly resistive passive layer compounds
like LiF are known to be formed in special situations like excess temperatures or the presence of
moisture traces (which both provoke decomposition of the commonly used conductive salt
LiPF6) [79, 124].
The importance of the passive layers is especially emphasized by their strong interplay with a
variety of aging mechanisms: lithium plating, for example, results in additional SEI formation if
plated lithium comes in contact with electrolyte (due to SEI micro cracks or puncturing);

Fundamentals of Lithium-Ion Cell Aging
27
regarding the volumetric changes of active materials during intercalation and deintercalation
processes, effects are just similar with automatic reconstruction of passive layers as a
consequence of their destruction. In the case of irreversible structural changes of the cathode
active material, on the one hand, oxygen release is increased which leads to electrolyte
oxidation and thus, thickening of the SPI; on the other hand, by the increased amount of oxygen
vacancies, cathodic metal dissolution is fostered which provokes the migration of oxidation
products to the SEI which in turn grows as a result of it. To suppress the causal electron
conducting tunnel path effect, vinylene carbonate as electrolyte additive is known to be efficient
[125]; however, by the same, the occurrence of lithium plating is favored due to the associated
impedance increase especially at low temperatures [119].
As a conclusion, various aging mechanisms lead either to a growth of passive layers or a
required reconstruction after their destruction. Because of that, the layers have a central
meaning regarding the aging behavior of LIC. Their evolution is especially associated both with
capacity fade and impedance increase which is why the following hypothesis is constructed:
Due to the central meaning of the evolution of the two passive layers, which is associated with
continuous capacity fade and impedance increase, there is a causative negative correlation
between capacity and impedance during calendar and cycle life of a lithium-ion cell.
In the literature, correlation between capacity fade and impedance increase is reported for
graphite based LIC with a variety of cathode chemistries such as LCO [54], NMC [63] or LFP
[98]. In contrast to that, the authors of [126] report on aged C//LMO cells with highly increased
impedance but low capacity fade and the other way round, i.e., without a correlating
development. Ambiguous results are also reported in [127] for C//NMC cells. However, these
findings should not be solely transferred to employed cell chemistries, but could also originate
from distinct types of passive layer evolution depending on the operational conditions as a result
of their multilayered structure. For example, both passive layers generally exhibit a layer of
mainly inorganic lithium salts close to the electrode active material (anode or cathode), and a
layer of mainly organic salts near the electrolyte [77]. So, effects on capacity and impedance
could vary for calendric and cyclic aging as the first may only lead to a thickening of the organic
salt layer close to the electrolyte but the second necessitate complete reconstruction. As a
result, capacity and impedance development could correlate for calendric and cyclic aging, but
impedance increase for the same capacity fade would differ for the two kinds of aging. In the
following, due to the assumed link of the multilayered structure of passive layers and the
correlation between capacity fade and impedance increase, its single components are
considered in more detail.
As aforementioned, in the direction from the electrode active material to the electrolyte, the
passive layers exhibit a multilayered structure of inorganic lithium salts, organic salts and a
mixture of semi and polycarbonates (SEI) or polymers and polycarbonates (SPI) [77]. For the
Fundamentals of Lithium-Ion Cell Aging
28
SEI, there is an additional layer of trapped gas molecules between the graphite active material
and the layer of inorganic lithium salts. For clarification, the multilayered structure of the passive
layers between electrode active material (anode or cathode) and electrolyte is illustrated in
Figure 10. In addition, it is indicated that calendric aging might provoke only the growth of the
single layers (organic salts etc.) close to the electrolyte, whereas cyclic aging is assumed to
result in reconstruction likewise of all the single layers of the multilayered structure.
Figure 10: Multilayered structure of passive layers between electrode active material and electrolyte
(based on [77]); thereby, calendric aging might only lead to a thickening of the single layers close to the
electrolyte, cyclic aging provoke complete reconstruction.
In the beginning of SEI formation, solvent co-intercalation is an unavoidable process which
results in gas evolution and, in extreme cases, graphite exfoliation due to the associated
mechanical strain [68]. The bubble-like structure of trapped gas molecules (“blisters”) are known
to partially grow even into the graphite surface area. Additives like ethylene or propylene sulfites
reduce the occurrence of solvent co-intercalation in the beginning of SEI formation and thus,
help to avoid graphite active material loss which can result from the mechanical strain due to
gassing [128]. In the case of a maturely formed SEI, solvent co-intercalation and related
processes are prevented by its feature of removing any adhesive solvent products from the
lithium cations during the process of graphite intercalation (“solvent stripping”).
In general, both passive layers consist of lithium and electrolyte decomposition products.
Because of that, the exact composition of the multilayered structure always depends on the
used electrolyte. The inorganic lithium salts (and for the SEI, trapped gas molecules) are in the
near of the electrode active material as these products emerge in a primary reaction (which is
mainly the decomposition of the conductive salt LiPF6). Regarding the inorganic salts, Li2CO3 is
known to be the main component to protect from electrolyte decomposition [129]. In addition,
compounds like LiF, Li2O, LiCl or LiOH are commonly found. The layers of organic lithium salts
Fundamentals of Lithium-Ion Cell Aging
29
as well as of polycarbonates and polymers (SPI), or semi and polycarbonates (SEI), are more
close to the electrolyte as these products emerge from a secondary reaction (which is mainly the
decomposition of the solvent). Besides, at least for the SEI, it is known that these products are
instable in direct contact with the anode active material. In the layer of organic salts, commonly,
compounds like lithium alkyl carbonates or a variety of lithium alkoxides (e.g., ROCO2Li, ROLi or
HCOLi) are found [130-132].
As a summary assessment, the composition of the SEI and the SPI, as far as is known, is similar
except for the trapped gas molecules at the anode, and polymers instead of semi carbonates at
the cathode. However, their processes of formation and growth differ: the SEI is immediately
formed in the formation cycle due to electrolyte reduction (and anode oxidation); after formation,
the SEI strongly suppresses any further electrolyte reduction and thus, it grows comparably
slow. The SPI is not formed immediately as the most of common cathode materials are within
the electrochemical stability window of the electrolyte; instead, it is formed eventually with regard
to released oxygen which in turn provokes electrolyte oxidation. The polymers in the SPI (which
are not present in the SEI) are assumed to be created by that electrolyte decomposition reaction
[133]. The significant difference of the SEI and the SPI is their different effectiveness towards
the prevention of electrolyte decomposition: whereas the SEI prevents almost completely any
further electrolyte reduction at the anode surface (if properly formed), at the cathode electrolyte
interface, the SPI’s eponymous characteristic of being only slightly passivating results in an
unimpeded electrolyte oxidation throughout the service life of a LIC. To slow down this
unavoidable reaction, cathode coatings like MgO, SiO2, AlF3, Ni3(PO4)2, Co3(PO4)2 or AlPO4 can
be incorporated [134].
As already described before, a link of the multilayered structure of passive layers and the
correlation between capacity fade and impedance increase is assumed. As calendric aging is
suspected to lead only to a thickening of the external layers (like the one of organic lithium
salts), but cyclic aging to provoke complete reconstruction, if the respective passive layer is
destroyed, the arising effects on capacity and impedance could differ.
Regarding the SEI for example, in resting periods, only the layer of organic lithium salts close to
the electrolyte is assumed to grow as a consequence of electrolyte reduction; thereby, electrons
tunnel from the graphite electrode through the multilayered structure of the SEI to reduce the
electrolyte (accompanied by lithium cations to keep electrical neutrality). The resulting
consumption of lithium cations (“lithium trapping”) in the layer of organic lithium salts is mainly
associated with capacity fade. Due to the porosity of the layer, impedance increase is thereby
considered as rather low. However, as aforementioned, the SEI can be destroyed (e.g., due to
volumetric changes of graphite or lithium plating) resulting in a direct exposure of the electrode
to the electrolyte. If the electrolyte directly reacts e.g. with LiC6, lithium cations are trapped as
well (which results in capacity fade) but predominantly, the resulting growth of the dense layer of

Fundamentals of Lithium-Ion Cell Aging
30
inorganic lithium salts is associated with impedance increase [77]. It has to be considered,
though, that if a LIC is cycled, processes of calendric and cyclic aging typically emerge in
superposition (see Figure 6) [63]. Furthermore, impedance increase may nevertheless be even
more intense for calendric aging than for cyclic aging, as cathodic oxidation products which
migrate to the negative electrode are known to catalyze the growth of the SEI by producing
especially highly resistive compounds [67, 89].
In any case, correlation between capacity and impedance development is assumed for both
kinds of aging, but, impedance increase for the same capacity fade could disagree (for an
assumed linear relationship, gradients would differ). Due to the little information in the literature
on the correlation behavior between capacity and impedance of LIC during calendar and cycle
life, an in-detail analysis of it, accompanied by an assessment if it is suitable as a base for SoH
quick tests, is presented in Chapter 8. In the following subchapter, the causes of the so called
nonlinear aging behavior, i.e., the effect of a sudden increase of the aging rate at deep residual
capacities, are comprehensively explained.
3.3 Causes of Nonlinear Aging
Most calendric aging studies of LIC reveal a capacity fade with a square root dependency on
time [52, 62, 65, 94, 132]. Thereby, the related temperature influence is usually modeled by the
Arrhenius law [135]. The capacity under load is commonly reported to fade nearly linear with the
charge throughput [63, 65, 94, 136]. In rejection of these well-known dependencies, an
enhanced aging rate upon prolonged cycling (at deep residual capacities) is observed in a few
studies for distinct types of LIC. This phenomenon, entitled in the following as nonlinear aging, is
assessed as severely challenging regarding a successful implementation of SLC due to the
imposed problems of predicting the aging behavior in a SLA.
Nonlinear aging is e.g. observed for LIC with NCA [137], NMC [65, 88], LFP [98, 103, 138, 139]
or NMC-LMO blend cathodes [66], and, for all in common, graphite anodes. Thus, the
assumption may be indicated that the relevant aging mechanism to provoke nonlinear aging
takes place at the anode – and in particular, at the graphite anode, as no study yet observed the
effect for a cell with a different type of anode. However, although there are several studies which
observed the phenomenon of nonlinear aging, only a few explicitly address and investigate its
origins [79, 98, 103, 138, 139]. In this subchapter, the causes of nonlinear aging, i.e., the
relevant mechanism(s) which provoke the effect, are comprehensively described, and, based on
that, dependencies and mitigation possibilities by load adaption are derived. These are
evaluated later in Chapter 6.
Figure 11 a) clarifies the appearance of nonlinear aging upon prolonged cycling by showing a
capacity development versus equivalent full cycles (EFC) of the C//NMC cell which has been
used in all experiments of this work (IHR18650A by E-One Moli Energy Corp., specifications are

Fundamentals of Lithium-Ion Cell Aging
31
given in Chapter 5). The load profile of the presented test case consisted of constant current
(CC) charging with 0.5 C to a charging end voltage of 4.2 V, a break of 20 min between half
cycles and CC discharging with 1.0 C to a discharging end voltage of 3.0 V. The ambient
temperature was 35 °C. Until a residual capacity of approx. 80%, the assumption of the capacity
fade to be linearly depending on the charge throughput (or EFC) seems to be justified if first data
points are neglected. The slightly enhanced aging rate at the beginning of cycling could be
related to a closing formation of passive layers [141]. In the literature, the turning point from
linear to nonlinear aging is also observed at residual capacities of approx. 80% or increased
ohmic resistances of approx. 150% [65, 137]. By comparing the aging rate before (αC ≈ 2.4% per
100 EFC) and after (αC ≈ 17.2% per 100 EFC) the occurrence of nonlinear aging for the capacity
development in Figure 11 a), an increase by factor seven can be estimated.
Figure 11: a) Development of the relative capacity versus equivalent full cycles; b) Nyquist plots of the
impedance and c) slow discharge curves referring to the three spots in a): new cell (blue), directly
before (cyan) and after (green) the onset of nonlinear aging. [140]
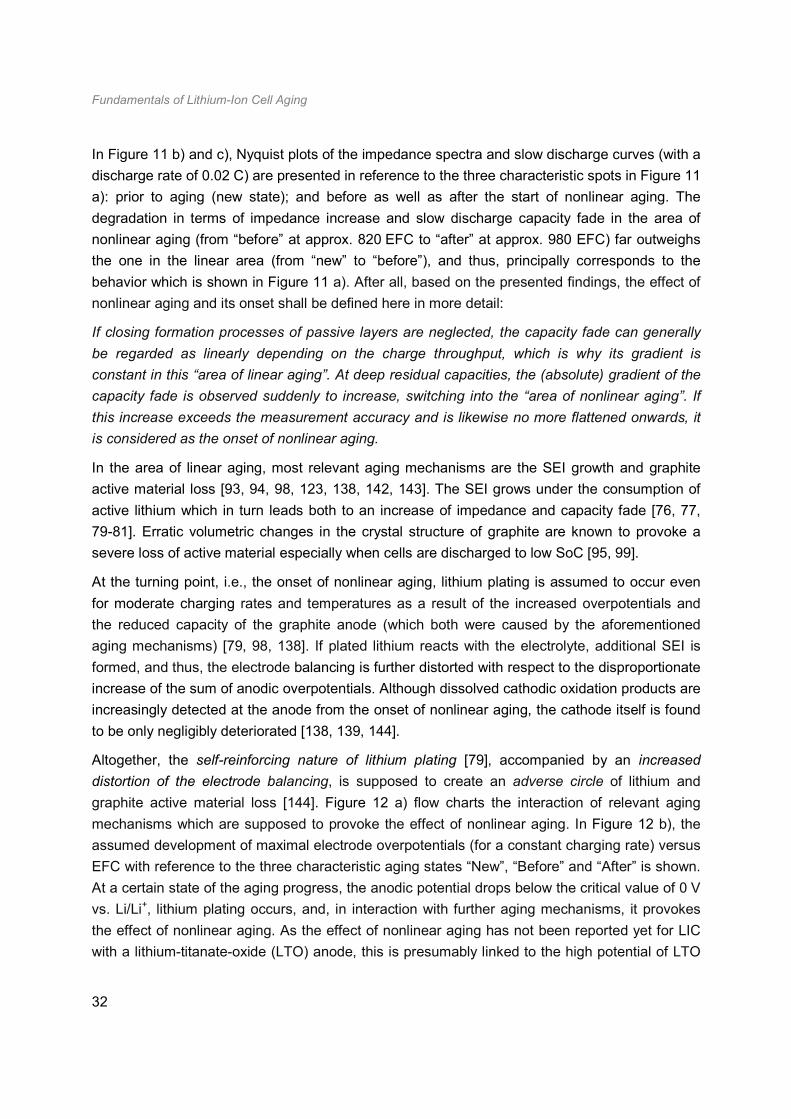
Fundamentals of Lithium-Ion Cell Aging
32
In Figure 11 b) and c), Nyquist plots of the impedance spectra and slow discharge curves (with a
discharge rate of 0.02 C) are presented in reference to the three characteristic spots in Figure 11
a): prior to aging (new state); and before as well as after the start of nonlinear aging. The
degradation in terms of impedance increase and slow discharge capacity fade in the area of
nonlinear aging (from “before” at approx. 820 EFC to “after” at approx. 980 EFC) far outweighs
the one in the linear area (from “new” to “before”), and thus, principally corresponds to the
behavior which is shown in Figure 11 a). After all, based on the presented findings, the effect of
nonlinear aging and its onset shall be defined here in more detail:
If closing formation processes of passive layers are neglected, the capacity fade can generally
be regarded as linearly depending on the charge throughput, which is why its gradient is
constant in this “area of linear aging”. At deep residual capacities, the (absolute) gradient of the
capacity fade is observed suddenly to increase, switching into the “area of nonlinear aging”. If
this increase exceeds the measurement accuracy and is likewise no more flattened onwards, it
is considered as the onset of nonlinear aging.
In the area of linear aging, most relevant aging mechanisms are the SEI growth and graphite
active material loss [93, 94, 98, 123, 138, 142, 143]. The SEI grows under the consumption of
active lithium which in turn leads both to an increase of impedance and capacity fade [76, 77,
79-81]. Erratic volumetric changes in the crystal structure of graphite are known to provoke a
severe loss of active material especially when cells are discharged to low SoC [95, 99].
At the turning point, i.e., the onset of nonlinear aging, lithium plating is assumed to occur even
for moderate charging rates and temperatures as a result of the increased overpotentials and
the reduced capacity of the graphite anode (which both were caused by the aforementioned
aging mechanisms) [79, 98, 138]. If plated lithium reacts with the electrolyte, additional SEI is
formed, and thus, the electrode balancing is further distorted with respect to the disproportionate
increase of the sum of anodic overpotentials. Although dissolved cathodic oxidation products are
increasingly detected at the anode from the onset of nonlinear aging, the cathode itself is found
to be only negligibly deteriorated [138, 139, 144].
Altogether, the self-reinforcing nature of lithium plating [79], accompanied by an increased
distortion of the electrode balancing, is supposed to create an adverse circle of lithium and
graphite active material loss [144]. Figure 12 a) flow charts the interaction of relevant aging
mechanisms which are supposed to provoke the effect of nonlinear aging. In Figure 12 b), the
assumed development of maximal electrode overpotentials (for a constant charging rate) versus
EFC with reference to the three characteristic aging states “New”, “Before” and “After” is shown.
At a certain state of the aging progress, the anodic potential drops below the critical value of 0 V
vs. Li/Li+, lithium plating occurs, and, in interaction with further aging mechanisms, it provokes
the effect of nonlinear aging. As the effect of nonlinear aging has not been reported yet for LIC
with a lithium-titanate-oxide (LTO) anode, this is presumably linked to the high potential of LTO
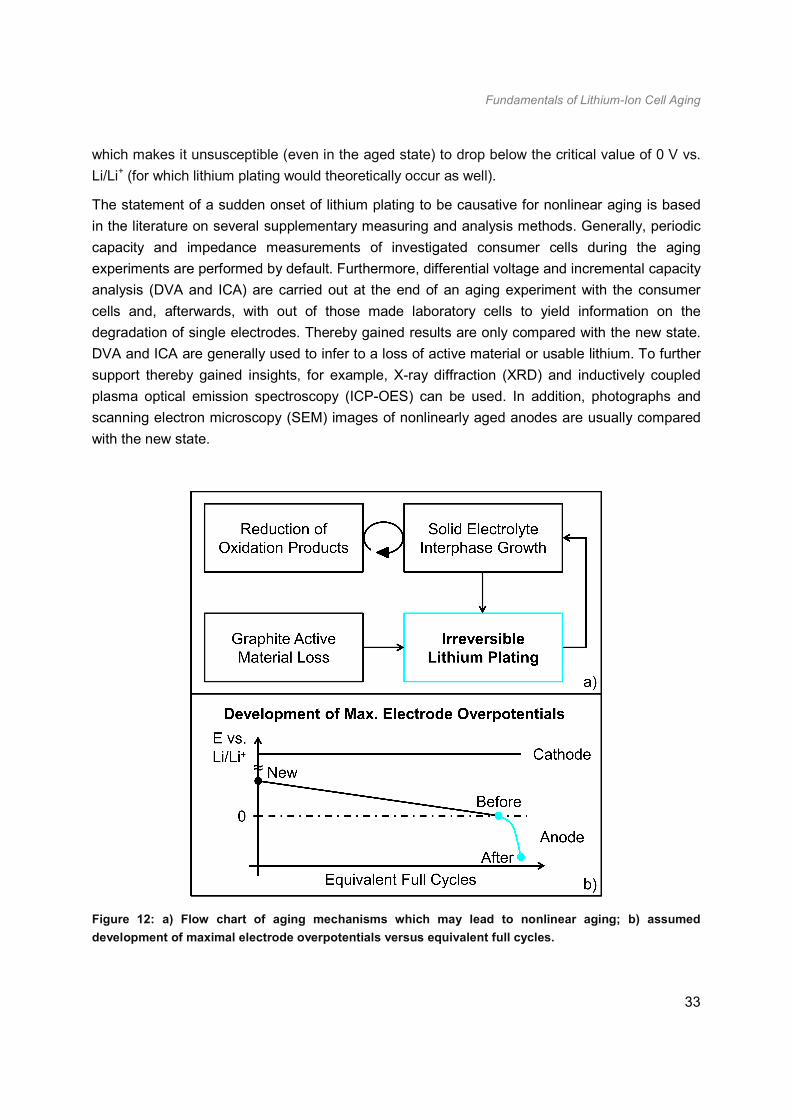
Fundamentals of Lithium-Ion Cell Aging
33
which makes it unsusceptible (even in the aged state) to drop below the critical value of 0 V vs.
Li/Li+ (for which lithium plating would theoretically occur as well).
The statement of a sudden onset of lithium plating to be causative for nonlinear aging is based
in the literature on several supplementary measuring and analysis methods. Generally, periodic
capacity and impedance measurements of investigated consumer cells during the aging
experiments are performed by default. Furthermore, differential voltage and incremental capacity
analysis (DVA and ICA) are carried out at the end of an aging experiment with the consumer
cells and, afterwards, with out of those made laboratory cells to yield information on the
degradation of single electrodes. Thereby gained results are only compared with the new state.
DVA and ICA are generally used to infer to a loss of active material or usable lithium. To further
support thereby gained insights, for example, X-ray diffraction (XRD) and inductively coupled
plasma optical emission spectroscopy (ICP-OES) can be used. In addition, photographs and
scanning electron microscopy (SEM) images of nonlinearly aged anodes are usually compared
with the new state.
Figure 12: a) Flow chart of aging mechanisms which may lead to nonlinear aging; b) assumed
development of maximal electrode overpotentials versus equivalent full cycles.
Fundamentals of Lithium-Ion Cell Aging
34
Out of the set of described measuring and analysis methods, with DVA, ICA, XRD and ICP-
OES, loss of usable lithium could be identified as the main source of nonlinear aging, followed
(to a lesser extent) by graphite active material loss [103, 138, 139, 144]. In combination with
aforementioned anode photographs and SEM images, the authors of these studies finally
concluded that lithium plating is causative for nonlinear aging, as there was a metallic sheen
observable on the rolled out anode jelly rolls. SEM images additionally elucidated the presence
of a thick surface film in these bright areas which could be a result of irreversibly plated lithium
that had been in contact with electrolyte.
For the three characteristic spots which are marked in Figure 11 a), anode photographs and
SEM images of the same type of C//NMC cell were taken within the scope of [144]. In the left
box of Figure 13, the photograph of the new anode basically reveals its black appearance which
is to expect for delithiated graphite. However, even in the new state (i.e., after 2 cycles for cell
characterization), there is a first sign of regularly spaced vertical stripes which turn to clear
metallic bright areas for the anode of the cell just before the occurrence of nonlinear aging. As
this is a clear sign for a deficiency in the production process, focus is laid on it later again. The
anode of the cell after nonlinear aging finally shows that the metallic patterns have spread to
cover the whole anode surface area. Regarding the corresponding SEM images, in the black
areas, there is only a slight surface film formation which is possibly due to an ordinary growth of
the SEI. In contrast to that, in the bright areas, SEM images (before and after nonlinear aging)
reveal the presence of thick surface films which could result from additional SEI growth due to
the contact of irreversibly plated lithium with electrolyte.
However, although the authors of [103, 138, 139, 144] already inferred that lithium plating is
causative for nonlinear aging (based on the just presented findings), final scientific evidence
cannot be given only on the base of the irreversible part of lithium plating. Exemplarily, as the
manganese content at the anode, regarding again the three characteristic spots of Figure 11 a),
obviously exhibits a trend suiting to the one of nonlinear aging (from 11 nmol·cm-2 (new) to
33 nmol·cm-2 (before, mixed area) to 46 nmol·cm-2 (after, black area) or 139 nmol·cm-2 (after,
bright area) [144]), distinct aging mechanisms are theoretically conceivable to provoke nonlinear
aging. Principally, the related characteristic of capacity fade could also stem from a strong
ordinary SEI growth (not due to lithium plating) which is known to be catalyzed by cathodic
oxidation products which are reduced at the anode (and thus, form electron conducting tunnel
paths) [79, 88].
As there is actually no satisfying analysis method to differentiate ordinary SEI growth from the
additional one which results from irreversibly plated lithium, a further chance to reach scientific
evidence is to add information which is based on the reversible part of lithium plating (see
stripping and electrochemical intercalation of reversibly plated lithium in Subchapter 3.1). For
plated anodes, this part was described before to result in a characteristic potential plateau

Fundamentals of Lithium-Ion Cell Aging
35
during cell relaxation – which in turn is present exactly as long as the metallic lithium needs to be
electrochemically intercalated into graphite (≈ 10 min [102]).
Thus, the authors of [102] opened cells and optically investigated their graphite anodes by SEM
more quickly than the observed duration of the potential plateau. As lithium plating is assumed
to be predominantly reversible (but self-reinforcing), there must be, principally, a thick layer of
metallic lithium which still exhibits a conductive connection to graphite. They took a SEM image
of a plated anode immediately after plating had been provoked (< 10 min), as well as, for
another plated anode, after having it been given enough time for relaxation. As a reference, an
un-plated anode was investigated immediately after the charging process.
Figure 13: Left box: Photographs and scanning electron microscopy images of graphite negative
electrodes; right box: scanning electron microscopy images of corresponding separators (for the
negative and positive side each); the different rows correspond to the three characteristics spots in
Figure 11 a). [144]
Fundamentals of Lithium-Ion Cell Aging
36
By doing so, the scientists found a thick mossy and net-like layer of metallic lithium covering the
graphite surface of the cell which was opened immediately after plating had occurred (which is
also in accordance to [114, 139, 145]). The plated anode of the cell, which had been given
enough time for relaxation, only showed some inactive remnants of the net-like lithium structure,
but aside from, it resembled the un-plated anode (where e.g. graphite particles were clearly
recognizable). The remnants correspond to the irreversible part of lithium plating, as there is
obviously no conductive connection to graphite anymore. As aforementioned, lithium is generally
known to be irreversibly plated due to internal or external lithium isolation, as well as SEI micro
cracking, with regard to Figure 9. The described synergies between the time-variant optical
findings on the anode surface and the characteristic relaxation behavior (in addition to the DVA,
ICA, XRD and ICP-OES results), are regarded as adequate to finally conclude that lithium
plating is the cause of nonlinear aging. Therefore, in the following, the reasons for the observed
locally distributed onset (e.g., regularly spaced vertical stripes in Figure 13) and subsequent
strong propagation of lithium plating are considered in more detail.
Generally, phenomena like inhomogeneous potential distributions, current densities, mechanical
strains or temperature gradients are well-known to be present in LIC [146-151]. In the linear area
of aging, where the SEI growth and loss of graphite active material are considered to be
prevailing, effects of such non-uniform distributions may be increasingly problematic as e.g. local
overcharge or deep discharge could be the result. For cells upon prolonged cycling, at a certain
SoH, the onset of local lithium plating, as is observable in Figure 13 on the left, is hence
conceivable which in turn initiates the onset of nonlinear aging.
Based on ICA, the effects of local lithium plating on the electrochemical behavior of LIC are
described in [144] with regard to the three characteristic spots of Figure 11 a): if the new
graphite jelly roll is imagined as a parallel connection of several individual areas (like a raster),
the total capacity corresponds to the sum of the single capacities of individual areas. For a cell
just before the start of nonlinear aging, as the less active areas with a metallic sheen are rare
and only small-sized, the effect on the total graphite anode capacity is therefore limited.
However, as the less active areas instead lead to increased electrical (and mechanical) loads for
the insane areas, the self-reinforcing nature of lithium plating provokes quick propagation of
bright areas. Moreover, the propagation is assumed to be additionally fostered by excess
currents which occur at the edge of an electrochemically more active area next to one which is
less active [152]. Thus, in the end, more and more individual areas of the jelly roll are disabled
with a dramatic effect on the total graphite anode capacity.
Besides of the increasing electrical loads in insane black areas, progressively inhomogeneous
mechanical loads are the consequence of plated lithium which is known to take up more space
than when intercalated into graphite [104, 105]. Regarding the right box of Figure 13, even the
separators appear to be seriously damaged due to the contact with plated lithium: besides of a

Fundamentals of Lithium-Ion Cell Aging
37
few clogged pores due to impurities or effects of compression, areas facing the cathode, or un-
plated sectors of the anode, stay unaffected; however, for separator areas facing plated bright
sectors (before and after nonlinear aging), there are craters in the magnitude of µm which could
be the result of local heating and melting or chemical degradation [144, 153]. Due to increased
overpotentials in these degraded separator areas the occurrence of local lithium plating is hence
additionally promoted which suits to its self-reinforcing nature (in accordance to [122]).
Furthermore, aside from the described mechanical loads which are caused by the plated lithium
itself, a connection between mechanical loads as a result of external strains or cell components
and the occurrence of lithium plating is observed: e.g., regarding the new graphite jelly roll in
Figure 13, there are already first signs of regularly spaced vertical stripes; for the anode just
before the start of nonlinear aging, exactly these stripes turn to bright areas (which is the
indicator for lithium plating). This must be regarded as a clear sign of a deficiency in the
production process of the investigated type of cell. By means of micro computed tomography
within the scope of [144], the stripe patterns could be clearly linked to the positive current
collector tab which especially inflicts deformation of the inner jelly roll layers close to the cell
center as a result of the imposed mechanical load. For further clarification, the same authors
conducted a control experiment for plating susceptibility, where a hose clamp was fixed around
the diameter of a cell to externally impose mechanical strain. As a result, bright metallic areas
appeared on the overlap of the hose clamp and the positive current collector tab after only a few
cycles. The connection of an inhomogeneous pressure distribution and the occurrence of lithium
plating might e.g. be explainable by affected lithium ion diffusion through the separator (due to
alterations of its porosity and tortuosity) [121, 122, 154]. In terms of the difficulty of reaching
homogeneous pressure distributions e.g. at the edges of pouch cells, this observance must be
considered as a critical issue [155, 156].
As the occurrence of lithium plating is promoted by high charging rates and end voltages at low
temperatures, focus is laid on these stress factors with respect to the design of the aging
experiment of this work. Regarding the implementation of SLC, the possibility to delay or even
prevent nonlinear aging by load adaption (in consistency with the reuse of an ALIB in a SLA) is
of major importance. Thus, in a first step, for a certain set of parameters, it is investigated when
nonlinear aging starts to occur for a given load; and in a second step, with the thereby gained
perfect foresight, load adaption (with regard to the stress factors of lithium plating) is carried out
just before the onset of nonlinear aging to investigate how far it can be delayed or prevented.
The thereby gained results of the aging experiment are presented in Chapter 6. In the next
subchapter, based on the described context of nonlinear aging and further relevant issues like
norms and standards, the end of life criteria of SLC are discussed again in more detail.
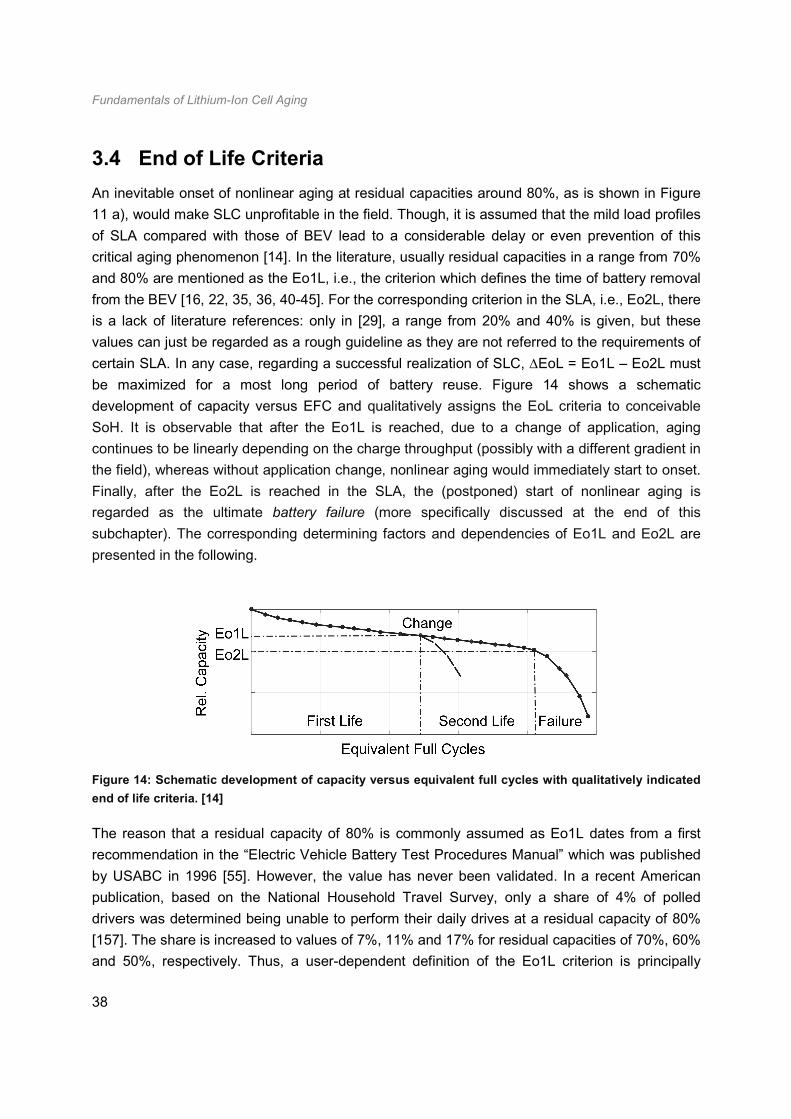
Fundamentals of Lithium-Ion Cell Aging
38
3.4 End of Life Criteria
An inevitable onset of nonlinear aging at residual capacities around 80%, as is shown in Figure
11 a), would make SLC unprofitable in the field. Though, it is assumed that the mild load profiles
of SLA compared with those of BEV lead to a considerable delay or even prevention of this
critical aging phenomenon [14]. In the literature, usually residual capacities in a range from 70%
and 80% are mentioned as the Eo1L, i.e., the criterion which defines the time of battery removal
from the BEV [16, 22, 35, 36, 40-45]. For the corresponding criterion in the SLA, i.e., Eo2L, there
is a lack of literature references: only in [29], a range from 20% and 40% is given, but these
values can just be regarded as a rough guideline as they are not referred to the requirements of
certain SLA. In any case, regarding a successful realization of SLC, ∆EoL = Eo1L – Eo2L must
be maximized for a most long period of battery reuse. Figure 14 shows a schematic
development of capacity versus EFC and qualitatively assigns the EoL criteria to conceivable
SoH. It is observable that after the Eo1L is reached, due to a change of application, aging
continues to be linearly depending on the charge throughput (possibly with a different gradient in
the field), whereas without application change, nonlinear aging would immediately start to onset.
Finally, after the Eo2L is reached in the SLA, the (postponed) start of nonlinear aging is
regarded as the ultimate battery failure (more specifically discussed at the end of this
subchapter). The corresponding determining factors and dependencies of Eo1L and Eo2L are
presented in the following.
Figure 14: Schematic development of capacity versus equivalent full cycles with qualitatively indicated
end of life criteria. [14]
The reason that a residual capacity of 80% is commonly assumed as Eo1L dates from a first
recommendation in the “Electric Vehicle Battery Test Procedures Manual” which was published
by USABC in 1996 [55]. However, the value has never been validated. In a recent American
publication, based on the National Household Travel Survey, only a share of 4% of polled
drivers was determined being unable to perform their daily drives at a residual capacity of 80%
[157]. The share is increased to values of 7%, 11% and 17% for residual capacities of 70%, 60%
and 50%, respectively. Thus, a user-dependent definition of the Eo1L criterion is principally
Fundamentals of Lithium-Ion Cell Aging
39
regarded as useful, but simultaneously making SLC implementation more complicated (e.g. due
to a strongly varying SoH of battery units which are considered for reuse). Additionally, ∆EoL,
and thus the reachable time of battery reuse, would be lowered which definitely reduces the
profitability of SLC.
A particularly practicable approach is the orientation towards warranty details of BEV
manufacturers. Usually, they promise functionality of the automotive battery for a time of 8 to 10
years or 100.000 km, which in turn is mostly defined of residual capacities greater than at least
70% [158, 159]. However, for residual capacities smaller than 80%, retesting regarding the
transportability of respective battery units is prescribed in accordance to UN 38.3.2.2. As this
must be regarded as elimination criterion for SLC if transportation is necessary (due to the
expensive retesting procedure), reuse is considered in this thesis only for battery units with
residual capacities equal or greater than 80%. The observed onset of nonlinear aging at residual
capacities of approx. 80% supports the scope limitation, even if automotive batteries are not
assumed to immediately exhibit enhanced aging rates at residual capacities of 80% (as long as
suitable operational conditions are kept which particularly take the actual SoH into account).
However, transport regulations must be reconsidered in any case as the transportation of
disused SLB to the recycling facility is likewise critical.
Costs of a SLB system’s periphery are assumed to increase with a decrease of the Eo2L
criterion: to cope with the same load profile of a SLA, a smaller Eo2L results in a larger (and
heavier) SLB which in turn might require a larger casing or stronger cooling system. Aside from
this economical aspect, as is shown in Figure 14, the onset of nonlinear aging is regarded as the
ultimate end of battery life as its origin, lithium plating, severely reduces the safety of the SLB
storage (e.g. thermal runaway). Thus, the onset of nonlinear aging must not be missed under
any circumstances. Hard figures are waived here for the Eo2L criterion, as in the field tests are
required to assess the possibility to delay or prevent nonlinear aging. Afterwards, the reachable
service life can be related to the costs of refurbishing. Additionally, reduced efficiency due to
increased impedance must be likewise considered for batteries with a very low SoH. The
correlation between capacity and impedance of LIC during calendar and cycle life is analyzed in
Chapter 8.
3.5 Causes of Increasing Cell-to-Cell Variation
Although having been removed from one aged BEV battery pack, only a fraction of its single
units might be worthy to refurbish from an economic point of view, since an unavoidable cell-to-
cell parameter variation (capacity, impedance, etc.) in the new state is known to even increase
with the progress of aging [142, 160-162]. As a result of it, the necessity of time-consuming and
costly measurements to classify battery units and select most suitable ones clearly reduces the
Fundamentals of Lithium-Ion Cell Aging
40
profitability of SLC (see Subchapter 2.2). Here in this subchapter, the origins of cell-to-cell
variation in the new state and its increase with the progress of aging are concisely summarized.
In the new state, cell-to cell (and lot-to-lot) parameter variation must be attributed to deviations in
the production process, such as changes in the weight fraction of active materials or the
thickness of electrodes [50, 163, 164]. Reducing the mixing or thickness tolerance leads to
excessive manufacturing costs at a comparably low improvement of the cells’ performance
[163]. However, e.g. thicker electrodes result in higher cell capacities, but, contrarily, also
promote cyclic aging due to stronger volumetric changes upon intercalation and deintercalation
processes. Thus, there is a direct interplay between cell-to-cell variation which results from the
production process and its increase with the progress of aging [127].
Aside from this intrinsic origin of cell-to-cell parameter variation, in multi-cell battery applications,
there are extrinsic origins which e.g. comprise [165]:
• temperature gradients in the battery pack
• SoC drifts due to uneven current loads (parallel strings)
• deviations in the cycle depth (serial strings; for LFP based cells: also parallel strings)
• deviations in the conductor or cells’ contact resistances
For a parallel string, differences in the cells’ resistances lead to an uneven current distribution,
which in turn causes a drift of corresponding SoC [166]. Cells connected in series are loaded
with the same current but distinct cycle depths, as the weakest cell always determines the
performance of the whole string [50, 58]. In conclusion, intrinsic cell-to-cell variation leads to
different cell loads in multi-cell battery applications, which in turn results in different aging
mechanisms and rates. As an example, for two C//LFP cells connected in parallel, a 20%
mismatch in the ohmic resistance led to a lifetime reduction by 40% when compared to a
compound with optimally matched resistances [166].
As a consequence of a continuously increasing cell-to-cell variation (with the progress of aging),
in multi-cell battery applications, effective balancing algorithms must be implemented in BMS to
ensure a safe and efficient mode of operation. To do so, relevant parameters of new and aged
batches of cells are investigated by distribution fit analysis in Subchapter 7.1. For a summary of
the presented chapter “Fundamentals of Lithium-Ion Cell Aging”, the reader is hereby referred to
Subchapter 9.1. In the following chapter, the statistical methods, which were used to analyze the
experimental data of this work, are presented. At its end, in Subchapter 4.3, the interrelation
between cell-to-cell parameter variation and the battery (cell and module) interconnection
configuration is analyzed and discussed from a theoretical point of view.
Methods of Descriptive Statistics
41
4 Methods of Descriptive Statistics
As the name already suggests, methods of descriptive statistics basically aim to describe and
present (one- to multi-dimensional) data sets in a most clear way. By the so called univariate
analysis of descriptive statistics, distributions of one-dimensional data sets (i.e., single variables
like capacity or impedance parts) are investigated in terms of central tendency and dispersion.
Respective univariate methods were used for the investigation of the development of cell-to-cell
parameter variation which is presented in Chapter 7. Contrarily, bivariate analysis is used to
describe the relationship between pairs of variables. In Chapter 8, the correlation between
capacity and corresponding impedance parts of LIC during calendar and cycle life is analyzed by
respective bivariate methods. Thereupon, it is assessed whether the correlation behavior is a
suitable base regarding the implementation of SoH quick tests. In the following, most relevant
univariate and bivariate analysis techniques are tersely described.
4.1 Univariate Analysis
The symmetric normal (or Gaussian) distribution is commonly used to describe the intrinsic cell-
to-cell parameter variation in the new state. Hence, basically, production processes can be
evaluated by it [167-170]. In the field, a total dispersion is mostly composed of multiple smaller
dispersions. If these are normally distributed, same is obtained for their sum. Otherwise, if the
distribution is unknown or abnormal, the central limit theorem helps stating that the sum of a
sufficiently large number of stochastically independent dispersions can approximately be
regarded as normally distributed [171]. In other words, if a distribution appears to be normal,
only random errors underlie, which characterizes a high-quality production process without any
systematic errors. The normal probability density function of the normal distribution is expressed
as follows:
, μ, σ = √∙ ∙
!"#$$%$ (4)
Thereby, the parameter µ is the arithmetic mean value of the distribution, σ its standard
deviation and σ2 the variance. To be able to compare different sets of data, the relative
coefficient of variation κ = σ · µ-1 is used. As an example, the distribution of capacity or internal
resistance of 20,000 pristine LFP based LIC was reported in [160] to correspond to a normal
distribution with κC = 1.3% or κR = 5.8%, respectively (i.e., the relative coefficient of capacity
variation κC was observed to be lower than the one of the internal resistance κR).
Another well-known parameter to characterize if a variation is normally distributed is the
skewness s, which is calculated as follows with the expected value E:
Methods of Descriptive Statistics
42
s, μ, σ = '( )** (5)
The skewness describes the asymmetry of the data around the mean value. If s < 0, the
distribution is left-skewed, which means that the data is more spread to the left, and for s > 0,
distribution is right-skewed. For a symmetrical distribution (like normal distribution), s is equal to
zero.
In contrast to the normal distribution, the Weibull distribution is typically used in materials
engineering for reliability analysis, i.e., to describe probabilities of failure and make predictions of
it within confidence bounds [132, 171-176]. As such, there is a major distinction in the typical
field of application of these two distributions: while the normal distribution is generally used to
describe the dispersion of a parameter for a fixed period of application, the Weibull distribution is
usually raised to characterize the life cycle or the spread of maximal periods of application
before the failure of an electronic device.
As Chapter 7 aims to compare the cell-to-cell parameter variation in the new state to that after
BEV operation, the normal distribution is used in its typical field. However, this suggests a new
and alienated area of use for the Weibull distribution as cell-to-cell parameter variation at a fixed
period of application is investigated. The Weibull probability density function in terms of a two-
parameter distribution (β, η) is expressed as follows:
, β,η = ,η∙ -(
η., ∙ -!η.
/ (6)
Thereby, β is the shape parameter which can be raised to refer to different types of failure in
case of classical use of Weibull for lifetime analysis. According to [177], a β < 1.0 represents a
defect in the initial step caused by manufacturing errors with a decreasing failure rate vs. time (x
= t), a β = 1.0 a random failure with a constant failure rate and a β > 1.0 a failure caused by
abrasion or aging and therefore an increasing failure rate vs. time. The scale parameter η
quantifies the expected life of a device by giving the value for which 63.2% will have failed. In
case of failures which definitely do not start at t = 0 days, years, cycles, etc., the three-parameter
Weibull distribution should be used instead with the additional failure-free time, minimum life or
location parameter γ [177]. Substitution of x in Equation (6) by x - γ transforms the two- to a
three-parameter distribution which is expressed as follows:
, β,η, γ = ,η∙ -( 1
η., ∙ -!"2η ./
(7)
There is no definite rule which one of the two Weibull distributions is the better choice for a
certain set of data of a product without known lifetime expectation. Decision has to be made
based on engineering expertise and experience, and by assumptions about the expected
lifetime of the investigated product. However, Equation (7) is only valid if a finite failure-free time
γ can absolutely be ensured.

Methods of Descriptive Statistics
43
It has to be considered, that in classical reliability analysis, the length of operation time until
failure is investigated. In Chapter 7, the parameter variation of aged ALIB cells, all employed for
the same operation time and without having remarkably failed, is compared with the Weibull
distribution. Not a classical life cycle distribution at a predefined EoL is investigated, but the
distribution of characteristic cell parameters at a concrete charge throughput. Therefore, the
values of parameters (β, η) which are given in Subchapter 7.1 deviate from typical values of
reliability analysis and thus cannot be interpreted as known from the past. Anyway, regarding
the capacity of aged LIC, the Weibull distribution should be left-skewed with β > 3.6, according
to [171], which can be interpreted as a surplus of capacities below the mode of distribution. For
the special case of β ≈ 3.6, the skewness of the Weibull distribution can be neglected and thus
principally resembles the shape of a normal distribution [171]. Theoretically, with respect to
resistances of LIC in the aged state, the Weibull distribution in the relevant range of β, which is
much greater than 3.6, as will be shown and explained in Subchapter 7.1, is only useful to
compare with its reciprocal value, i.e., the conductance, because resistances are assumed to be
distributed right-skewed. In simple terms, if a cell capacity or conductance distribution
proficiently corresponds to Weibull, disproportionately more cells exhibit a lower capacity or
conductance as e.g. compared with a normal distribution. In the following subchapter, after the
description of most relevant methods of univariate analysis of descriptive statistics,
corresponding methods for two-dimensional data sets are explained.
4.2 Bivariate Analysis
Bivariate analysis basically describes two-dimensional data sets e.g. by scatter plots, the
Pearson product-moment correlation coefficient (PPMCC) or regression functions. To
mathematically quantify the grade of correlation by direction and strength, the PPMCC rX,Y can
be raised. Thereby, the variables X and Y with X = (x1, x2, ..., xn) and Y = (y1, y2, ..., yn) represent
the investigated two-dimensional data set [178]. Throughout in this work, the one variable is cell
capacity, the other a corresponding impedance value. So, for each measurement, a pair of
capacity and investigated impedance part is created. The PPMCC rX,Y describes the extent of
linear relationship between these two variables [179]. Its values range from −1 to 1, whereby a
negative sign represents a negative correlation which is to expect for capacities and
corresponding impedance parts of a LIC. The PPMCC rX,Y is described by Equation (8) [167]:
34,5 = 6789,:9∙: =
∑ (< (∙>< >?@<AB∑ (< ($∙∑ >< >?$@<A@<A
(8)
Thereby, the covariance covX,Y is standardized by division by the standard deviations σX and σY.
The following gradations of absolute rX,Y can be interpreted as:
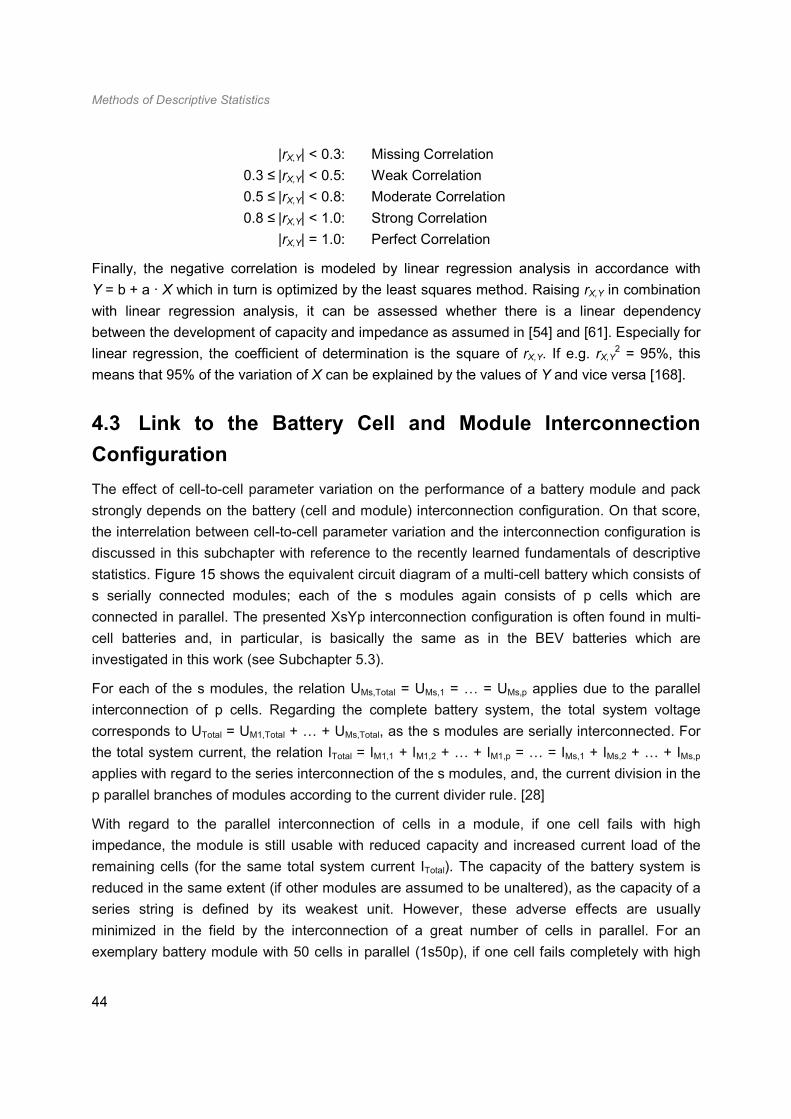
Methods of Descriptive Statistics
44
|rX,Y| < 0.3: Missing Correlation
0.3 ≤ |rX,Y| < 0.5: Weak Correlation
0.5 ≤ |rX,Y| < 0.8: Moderate Correlation
0.8 ≤ |rX,Y| < 1.0: Strong Correlation
|rX,Y| = 1.0: Perfect Correlation
Finally, the negative correlation is modeled by linear regression analysis in accordance with
Y = b + a · X which in turn is optimized by the least squares method. Raising rX,Y in combination
with linear regression analysis, it can be assessed whether there is a linear dependency
between the development of capacity and impedance as assumed in [54] and [61]. Especially for
linear regression, the coefficient of determination is the square of rX,Y. If e.g. rX,Y2 = 95%, this
means that 95% of the variation of X can be explained by the values of Y and vice versa [168].
4.3 Link to the Battery Cell and Module Interconnection
Configuration
The effect of cell-to-cell parameter variation on the performance of a battery module and pack
strongly depends on the battery (cell and module) interconnection configuration. On that score,
the interrelation between cell-to-cell parameter variation and the interconnection configuration is
discussed in this subchapter with reference to the recently learned fundamentals of descriptive
statistics. Figure 15 shows the equivalent circuit diagram of a multi-cell battery which consists of
s serially connected modules; each of the s modules again consists of p cells which are
connected in parallel. The presented XsYp interconnection configuration is often found in multi-
cell batteries and, in particular, is basically the same as in the BEV batteries which are
investigated in this work (see Subchapter 5.3).
For each of the s modules, the relation UMs,Total = UMs,1 = r = UMs,p applies due to the parallel
interconnection of p cells. Regarding the complete battery system, the total system voltage
corresponds to UTotal = UM1,Total + r + UMs,Total, as the s modules are serially interconnected. For
the total system current, the relation ITotal = IM1,1 + IM1,2 + r + IM1,p = r = IMs,1 + IMs,2 + r + IMs,p
applies with regard to the series interconnection of the s modules, and, the current division in the
p parallel branches of modules according to the current divider rule. [28]
With regard to the parallel interconnection of cells in a module, if one cell fails with high
impedance, the module is still usable with reduced capacity and increased current load of the
remaining cells (for the same total system current ITotal). The capacity of the battery system is
reduced in the same extent (if other modules are assumed to be unaltered), as the capacity of a
series string is defined by its weakest unit. However, these adverse effects are usually
minimized in the field by the interconnection of a great number of cells in parallel. For an
exemplary battery module with 50 cells in parallel (1s50p), if one cell fails completely with high
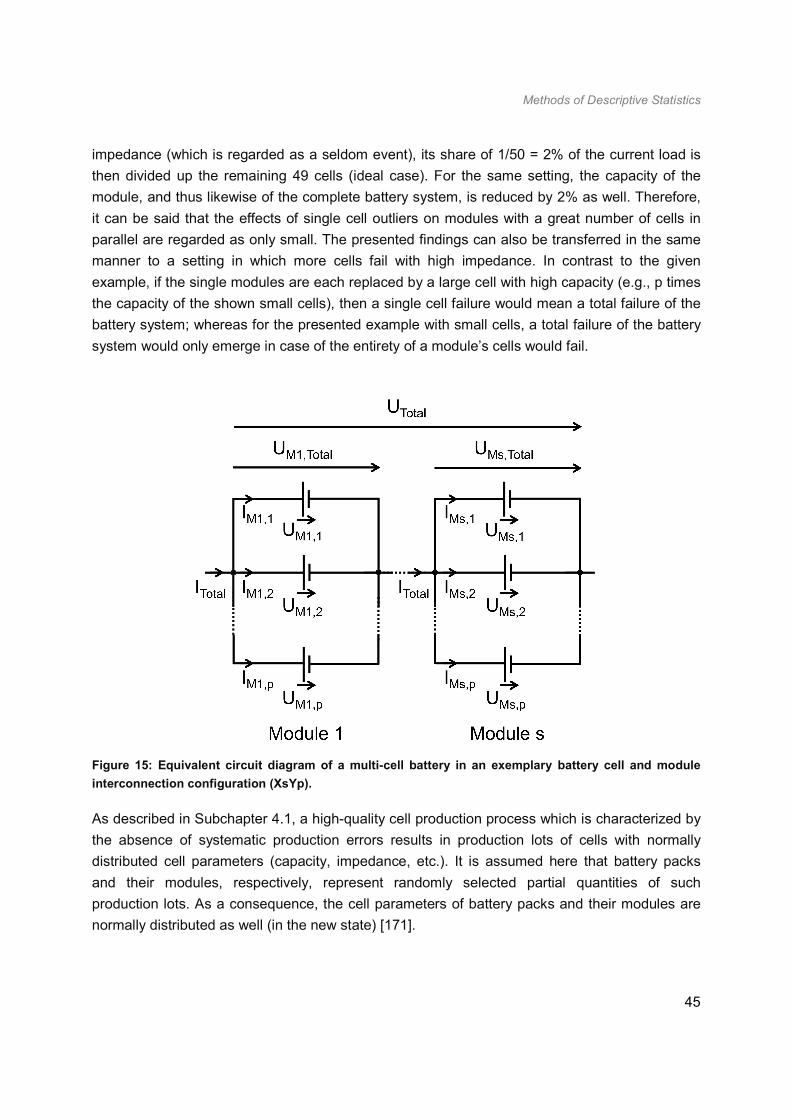
Methods of Descriptive Statistics
45
impedance (which is regarded as a seldom event), its share of 1/50 = 2% of the current load is
then divided up the remaining 49 cells (ideal case). For the same setting, the capacity of the
module, and thus likewise of the complete battery system, is reduced by 2% as well. Therefore,
it can be said that the effects of single cell outliers on modules with a great number of cells in
parallel are regarded as only small. The presented findings can also be transferred in the same
manner to a setting in which more cells fail with high impedance. In contrast to the given
example, if the single modules are each replaced by a large cell with high capacity (e.g., p times
the capacity of the shown small cells), then a single cell failure would mean a total failure of the
battery system; whereas for the presented example with small cells, a total failure of the battery
system would only emerge in case of the entirety of a module’s cells would fail.
Figure 15: Equivalent circuit diagram of a multi-cell battery in an exemplary battery cell and module
interconnection configuration (XsYp).
As described in Subchapter 4.1, a high-quality cell production process which is characterized by
the absence of systematic production errors results in production lots of cells with normally
distributed cell parameters (capacity, impedance, etc.). It is assumed here that battery packs
and their modules, respectively, represent randomly selected partial quantities of such
production lots. As a consequence, the cell parameters of battery packs and their modules are
normally distributed as well (in the new state) [171].
Methods of Descriptive Statistics
46
In general, the sum Z = X + Y of two independent, normally distributed random variables
X ~ N(µX, σX2) and Y ~ N(µY, σY
2) is again normally distributed [168]:
Z ~ N(µX + µY, σX2 + σY
2) (9)
In the following, the entirety of battery cells (which is available for battery module and pack
construction) is assumed to consist of independent cell groups which are characterized by
normally distributed cell parameters (capacity, resistance, conductance, etc.). Furthermore, it is
assumed that the arithmetic mean values and standard deviations of cell parameters are even
for distributions of the different cell groups.
Then, with regard to Equation (9), if p cells are randomly selected from those groups and
interconnected in parallel, the interrelation between the mean capacity µMod,C of the battery
module (which consists of p cells in parallel) and the one of a single cell µCell,C from the entirety
of available cells is calculated as follows:
µMod,C = µCell,C · p (10)
Simultaneously, the interrelation between the standard deviation of a battery module and its p
cells in parallel is yielded as per:
σMod,C = σCell,C · √p (11)
By that, the relative coefficient of variation κMod,C of a battery module which consists of p cells in
parallel is lastly derived from Equation (10) and (11):
κMod,C = σMod,C / µMod,C = σCell,C / (µCell,C · √p) (12)
Thereby, it is obvious from Equation (12) that κMod,C decreases with an increase of p (which is
the number of cells in parallel). Furthermore, for a parallel cell interconnection, aside from the
parameter “capacity”, Equations (10-12) are valid in the same manner for the parameter
“conductance”. For a serial cell interconnection, Equations (10-12) are likewise valid for the
parameter “resistance” (which is the reciprocal value of the parameter “conductance”).
Regarding the parameter “capacity” for a serial cell interconnection, though, relations between
statistical values of a battery module and its cells are more complex as the performance of a
serial string is always limited to its worst cell. If p battery cells from a cell batch with a normal
capacity distribution are randomly selected and interconnected in series, with an increase of p,
the probability is continuously increased to select a cell with a capacity which is lower than the
capacity distribution modus. Finally, if a battery cell is selected, which is an outlier cell towards
small capacities, the capacity of the serial string is likewise strongly limited. With regard to the
common serial interconnection of battery modules in a battery pack, this is critical as SLC are
most likely realized at the battery module level (as aforementioned, though, effects of cell
outliers in battery modules are usually minimized by interconnecting a large number of cells in
parallel).
Methods of Descriptive Statistics
47
However, if battery cells from different production lots or from BEV with different operational
histories are interconnected, the assumption of normally distributed parameters with even
arithmetic mean values and standard deviations is problematic. Likewise, battery cells might be
divided into different cell groups during operation in a battery pack, e.g. due to the presence of
temperature gradients. By the simplifying assumption that there are only two groups of cells
which are still normally distributed around two arithmetic mean values µ1 and µ2, the resulting
distribution of all cells in common would be bimodal. With regard to the central limit theorem,
only for a sufficiently large number of independent distributions, the sum is approx. normally
distributed again. Nevertheless, with the progress of cell aging, though, it is furthermore
assumed that the symmetric normal distributions of cell parameters continuously gain in
skewness (see Chapter 7).
In any case, contrary to the effect of a cell outlier which is compensated in a battery module with
a great number of cells in parallel, by the formation of cell groups with different properties, whole
areas of inferior and superior modules (in which all cells each are particularly bad or good) are
created in a multi-cell battery. By that, cell-to-cell variation is basically scaled up to the next level
which is module-to-module variation. This is critical as SLC implementation is presumably
realized at the module level; as a consequence, SoH detection of battery modules is inevitable.
Regarding the interconnection of complete battery packs, the presented relations can be
transferred with regard to the battery interconnection configuration of the former ALIB and the
planned SLB.
From the description of the required fundamentals of descriptive statistics, as well as of the
interrelation between cell-to-cell parameter variation and the interconnection configuration, it is
led over to the experimental part of this work, beginning with an overview of the experimental
setup and general framework.

Experimental
48
5 Experimental
Throughout in this work, the BEV high-energy type LIC “Molicel IHR18650A” by E-One Moli
Energy Corp. with a nominal capacity of 1.95 Ah was raised for investigation. For this cell, the
manufacturer recommends an operational voltage swing ∆V from 3.0 V to 4.2 V, and maximum
current rates of 1.0 C for charging and 2.0 C for discharging. With regard to the manufacturer’s
data sheet, the nominal capacity is reached within the given voltage swing for discharging rates
smaller than 0.5 C at room temperature. The active materials of the investigated type of cell are
graphite and NMC regarding the anode and cathode, respectively. Cells out of two identical BEV
were compared with new cells of the same type and manufacturer.
Within the scope of [144], the type of cell was characterized in more detail. By ICP-OES, the
cathode material was detected to be Li1.06±0.02Ni0.33±0.01Mn0.33±0.01Co0.33±0.01O2 in the fully lithiated
state after cell formation (hinted measurement accuracy, oxygen derived from the crystal
structure). Regarding the total initial content of lithium, a share of 4.5% is assumed to be
unavoidably lost due to either the SEI formation or the buffering effect of the graphite anode
(thus, before cell formation, lithium content in the crystal structure amounted to be 1.11±0.02).
Furthermore, the cathode, and thus likewise the cell, was determined (by measurements with
commercial El-Cell three-electrode laboratory cells) to have a capacity of 3.0 mAh·cm-2 [144].
In the following, regarding the conducted aging experiment, the methodology of diagnosing the
current aging status and its design itself are presented; in addition, comprehensive information
with respect to the investigated BEV is provided.
5.1 Aging Diagnosis
The large aging experiment within the scope of this work was periodically stopped to track the
current aging status. The weekly basis of measuring in the beginning of the experiment had
been switched to a two weekly one in a later phase, as the aging behavior of cells was yet better
known. The periodical checkup procedure, which consisted of capacity and impedance
measurements, was conducted at a controlled ambient temperature of 25 °C. Utilized test
devices were a Cell Test System (CTS) by BaSyTec for capacity measurements and cycling of
cells as well as a VMP3 potentiostat by Biologic Science Instruments for impedance
measurements; both in combination with custom-made climate chambers. Figure 16 flow charts
the single steps of the one/two-weekly checkup procedure, which are described in the following
in more detail.
After interruption of the aging experiment and temperature preconditioning for 1 h at 25 °C, the
checkup procedure started with the measurement of capacity. Cells were charged with a CC of
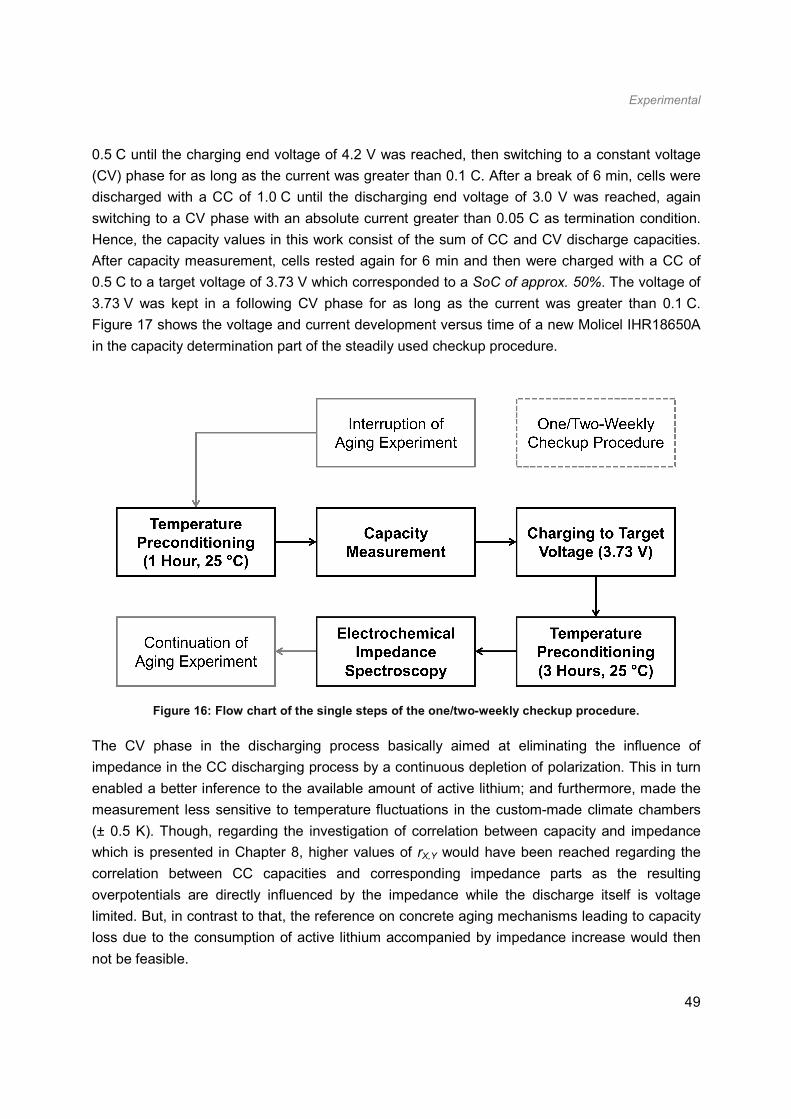
Experimental
49
0.5 C until the charging end voltage of 4.2 V was reached, then switching to a constant voltage
(CV) phase for as long as the current was greater than 0.1 C. After a break of 6 min, cells were
discharged with a CC of 1.0 C until the discharging end voltage of 3.0 V was reached, again
switching to a CV phase with an absolute current greater than 0.05 C as termination condition.
Hence, the capacity values in this work consist of the sum of CC and CV discharge capacities.
After capacity measurement, cells rested again for 6 min and then were charged with a CC of
0.5 C to a target voltage of 3.73 V which corresponded to a SoC of approx. 50%. The voltage of
3.73 V was kept in a following CV phase for as long as the current was greater than 0.1 C.
Figure 17 shows the voltage and current development versus time of a new Molicel IHR18650A
in the capacity determination part of the steadily used checkup procedure.
Figure 16: Flow chart of the single steps of the one/two-weekly checkup procedure.
The CV phase in the discharging process basically aimed at eliminating the influence of
impedance in the CC discharging process by a continuous depletion of polarization. This in turn
enabled a better inference to the available amount of active lithium; and furthermore, made the
measurement less sensitive to temperature fluctuations in the custom-made climate chambers
(± 0.5 K). Though, regarding the investigation of correlation between capacity and impedance
which is presented in Chapter 8, higher values of rX,Y would have been reached regarding the
correlation between CC capacities and corresponding impedance parts as the resulting
overpotentials are directly influenced by the impedance while the discharge itself is voltage
limited. But, in contrast to that, the reference on concrete aging mechanisms leading to capacity
loss due to the consumption of active lithium accompanied by impedance increase would then
not be feasible.
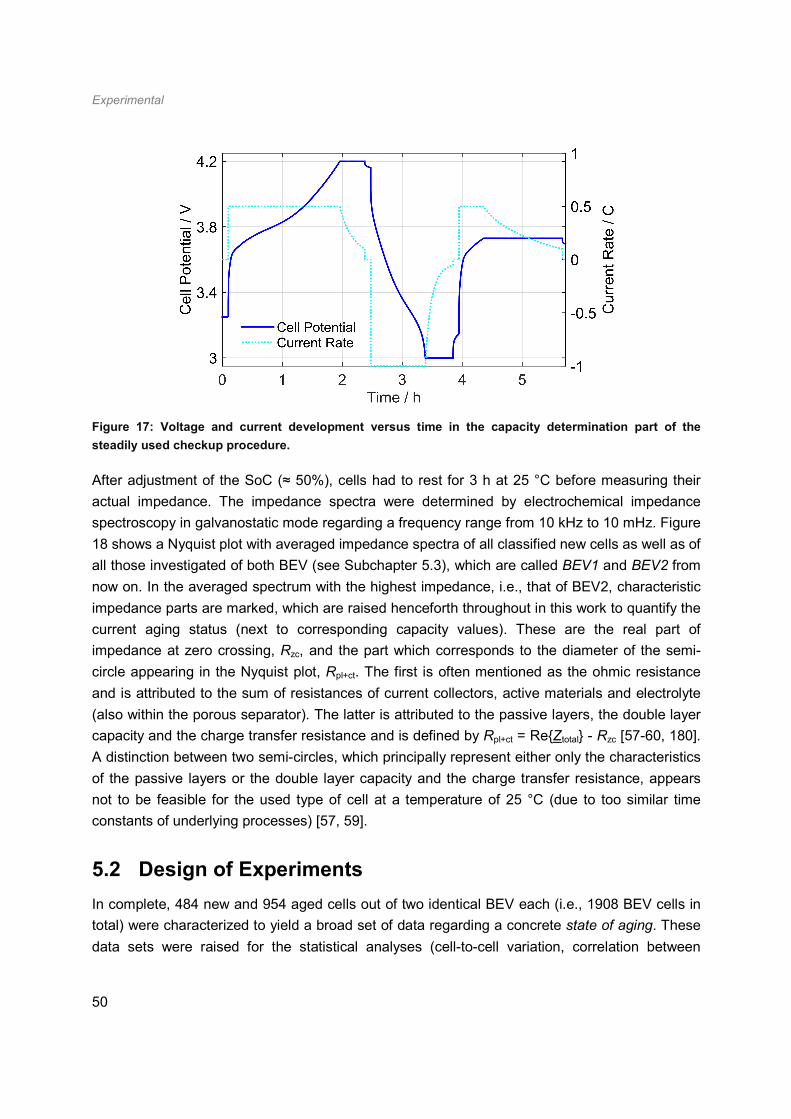
Experimental
50
Figure 17: Voltage and current development versus time in the capacity determination part of the
steadily used checkup procedure.
After adjustment of the SoC (≈ 50%), cells had to rest for 3 h at 25 °C before measuring their
actual impedance. The impedance spectra were determined by electrochemical impedance
spectroscopy in galvanostatic mode regarding a frequency range from 10 kHz to 10 mHz. Figure
18 shows a Nyquist plot with averaged impedance spectra of all classified new cells as well as of
all those investigated of both BEV (see Subchapter 5.3), which are called BEV1 and BEV2 from
now on. In the averaged spectrum with the highest impedance, i.e., that of BEV2, characteristic
impedance parts are marked, which are raised henceforth throughout in this work to quantify the
current aging status (next to corresponding capacity values). These are the real part of
impedance at zero crossing, Rzc, and the part which corresponds to the diameter of the semi-
circle appearing in the Nyquist plot, Rpl+ct. The first is often mentioned as the ohmic resistance
and is attributed to the sum of resistances of current collectors, active materials and electrolyte
(also within the porous separator). The latter is attributed to the passive layers, the double layer
capacity and the charge transfer resistance and is defined by Rpl+ct = ReZtotal - Rzc [57-60, 180].
A distinction between two semi-circles, which principally represent either only the characteristics
of the passive layers or the double layer capacity and the charge transfer resistance, appears
not to be feasible for the used type of cell at a temperature of 25 °C (due to too similar time
constants of underlying processes) [57, 59].
5.2 Design of Experiments
In complete, 484 new and 954 aged cells out of two identical BEV each (i.e., 1908 BEV cells in
total) were characterized to yield a broad set of data regarding a concrete state of aging. These
data sets were raised for the statistical analyses (cell-to-cell variation, correlation between

Experimental
51
capacity and impedance) which are presented in Chapter 7 and 8. Out of the 484 new cells,
most similar ones were selected with respect to ReZtotal for the conducted laboratory aging
experiments. In a first phase of experiments, aging data of cells during the progress of aging
was collected within calendric and cyclic aging experiments. The yielded data of this first phase
was used in terms of the investigation of correlation between capacity and impedance (next to
aforementioned cell batches). Therefore, all in all, 83 cells from laboratory tests were raised. As
only data from 62 laboratory test cells (see Table 1 and Table 3, plus three cells of the special
test case “2CCCV”) is presented in this thesis (except from Chapter 8), the difference is
explainable by the addition of cells from supplementary measurements in order to yield larger
cell batches. Aging data from the second phase, i.e., experiments which were conducted in the
course of load adaption (to delay or prevent nonlinear aging) were not considered in Chapter 8.
Figure 18: Nyquist plot of averaged impedance spectra of all new cells and of all those investigated of
BEV1 and BEV2 (at a SoC ≈ 50%). [127]
As aforementioned, cyclic aging depends on numerous parameters like cycle depth, mean SoC,
current rate and temperature. As the mean SoC of all test cases presented in this work is
approx. 50%, the effect of this parameter is excluded and not further investigated. However, with
respect to the superposition principle, it is assumed that aging is enhanced with increasing mean
SoC. Regarding the cycle depth, fixed charging and discharging end voltages were used
throughout in this work which is why the term voltage swing ∆V is used instead in the following.
Thereby, it has to be considered that the accumulated charge throughput per cycle decreases
upon prolonged cycling as polarization is increased due to growing impedances.
Table 1 lists the investigated parameters of the first phase of the cyclic aging experiment which
are the voltage swing ∆V, the charging and discharging rate as well as the temperature. Cells
were either charged with a CC or with a constant current constant voltage (CCCV) process,
whereas the termination condition for the latter was a current smaller 0.1 C in the supplementary
Experimental
52
CV phase. In all test cases, cells were discharged with CC and a break of 20 min was kept
between half cycles.
Additionally in Table 1, for each test case, the amount of inspected cells and an explicit identifier
(ID) of the respective experiment is given. The column “Cell Batch” refers to the laboratory cell
batch of the correlation analysis of Chapter 8, which is subdivided into the cell batches “Cyclic”
(ID 1-11 + cells from supplementary measurements, see Table 1), “Calendric” (ID 21-30 + cells
from supplementary measurements, see Table 2) and “Mild Cyclic” (ID 12, see Table 1). The
supplementary measurements had same or similar setups than those within associated batches.
For most test cases which were executed from the start of the aging experiment, three cells
were used to be able to average the aging behavior and exclude outliers, if necessary. For test
cases which were started at a later stage of the aging experiment, the number of cells could be
reduced, as prior tests had already revealed a sufficiently homogeneous aging behavior of cells
cycled with the same load profile at same ambient conditions. Before the start of all experiments,
selected cells were preloaded with four cycles to avoid ongoing formation processes.
The second phase of the cyclic aging experiment aimed to assess the possibility of delaying or
preventing nonlinear aging by load adaption (which corresponds to the central idea of SLC).
Based on experiences from the first phase of the aging experiment, a reference base case (ID 3)
was chosen for which it was known when nonlinear aging would start to occur. The load profile
of the reference base case consisted of CC charging with 0.5 C to a charging end voltage of
4.2 V (without CV phase), a break of 20 min between half cycles and CC discharging with 1.0 C
to a discharging end voltage of 3.0 V. The ambient temperature was 35 °C. Nonlinear aging
characteristics for cells cycled with this load profile were shown in Figure 11; furthermore, it
corresponds to the cycling base case in the course of [144] (see Figure 13).
Anyway, if the cells of one adaption test case had been fallen below a mean residual capacity of
85%, the load was adapted with respect to experiences from the first phase of the cyclic aging
experiment (here mentioned beforehand just for clarity): ∆V was reduced from 1.2 V to 0.94 V
(ID 13); the charging rate from 0.5 C to 0.2 C (ID 15); the temperature was both decreased and
increased from 35 °C to 25 °C (ID 17) and 50 °C (ID 19). In addition, regarding the test case “All”
(ID 20), all investigated parameters were simultaneously adapted (temperature: 35 °C → 50 °C).
The discharging rate was excluded in the second phase of the experiment. As the temperature
and charging rate adapted load profiles are not included in the matrix of Table 1 (only with
CCCV charging), as mild reference test cases, cells were additionally cycled with these profiles
beginning from the new state (ID 14, 16, 18). Table 2 presents the aging matrix of the second
phase of the cyclic aging experiment.
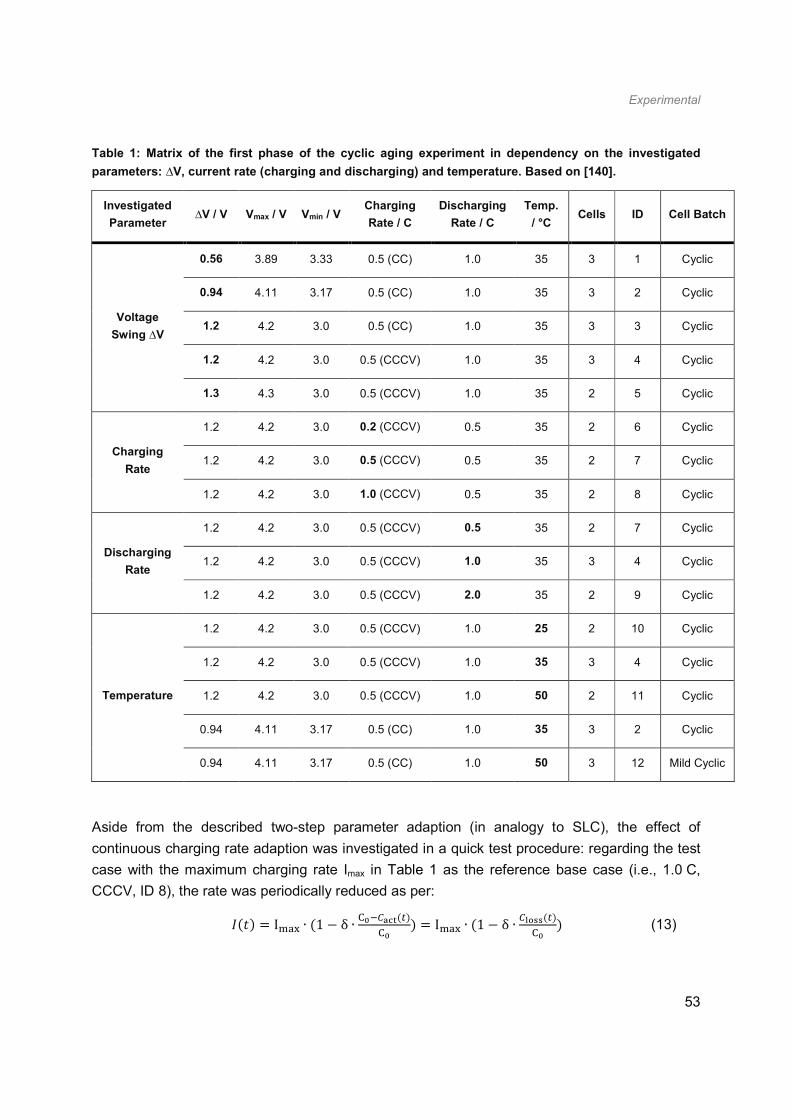
Experimental
53
Table 1: Matrix of the first phase of the cyclic aging experiment in dependency on the investigated
parameters: ∆V, current rate (charging and discharging) and temperature. Based on [140].
Investigated
Parameter ∆V / V Vmax / V Vmin / V
Charging
Rate / C
Discharging
Rate / C
Temp.
/ °C Cells ID Cell Batch
Voltage
Swing ∆V
0.56 3.89 3.33 0.5 (CC) 1.0 35 3 1 Cyclic
0.94 4.11 3.17 0.5 (CC) 1.0 35 3 2 Cyclic
1.2 4.2 3.0 0.5 (CC) 1.0 35 3 3 Cyclic
1.2 4.2 3.0 0.5 (CCCV) 1.0 35 3 4 Cyclic
1.3 4.3 3.0 0.5 (CCCV) 1.0 35 2 5 Cyclic
Charging
Rate
1.2 4.2 3.0 0.2 (CCCV) 0.5 35 2 6 Cyclic
1.2 4.2 3.0 0.5 (CCCV) 0.5 35 2 7 Cyclic
1.2 4.2 3.0 1.0 (CCCV) 0.5 35 2 8 Cyclic
Discharging
Rate
1.2 4.2 3.0 0.5 (CCCV) 0.5 35 2 7 Cyclic
1.2 4.2 3.0 0.5 (CCCV) 1.0 35 3 4 Cyclic
1.2 4.2 3.0 0.5 (CCCV) 2.0 35 2 9 Cyclic
Temperature
1.2 4.2 3.0 0.5 (CCCV) 1.0 25 2 10 Cyclic
1.2 4.2 3.0 0.5 (CCCV) 1.0 35 3 4 Cyclic
1.2 4.2 3.0 0.5 (CCCV) 1.0 50 2 11 Cyclic
0.94 4.11 3.17 0.5 (CC) 1.0 35 3 2 Cyclic
0.94 4.11 3.17 0.5 (CC) 1.0 50 3 12 Mild Cyclic
Aside from the described two-step parameter adaption (in analogy to SLC), the effect of
continuous charging rate adaption was investigated in a quick test procedure: regarding the test
case with the maximum charging rate Imax in Table 1 as the reference base case (i.e., 1.0 C,
CCCV, ID 8), the rate was periodically reduced as per:
= IDEF ∙ 1 − δ ∙ J J = IDEF ∙ 1 − δ ∙ KLMMJ (13)

Experimental
54
C0 and Cact(t) are the capacity in the new and the actual state, respectively; Closs(t) is the current
capacity loss (i.e., C0 referred to Cact(t)), and δ ϵ 1; 2; 4 a gain factor which controls the
proportion of charging rate adaption. For a δ = 1, principally, the adaption leads to a constant
capacity-related charging rate, as it is reduced in the same manner as the capacity fades. In
contrast, without charging rate adaption, the capacity-related charging rate is increased as it is
usually referred to the fixed value of nominal capacity (like in this work) [181].
Table 2: Matrix of the second phase of the cyclic aging experiment in dependency on the load adapted
parameters: ∆V, charging rate and temperature. For each adapted test case, cells were cycled with the
respective mild load profile from the beginning in addition to the base case reference.
Investigated
Parameter ∆V / V Vmax / V Vmin / V
Charging
Rate / C
Discharging
Rate / C
Temp.
/ °C Cells ID
Base Case 1.2 4.2 3.0 0.5 (CC) 1.0 35 3 3
Voltage
Swing ∆V
0.94 4.11 3.17 0.5 (CC) 1.0 35 3 2
1.2 → 0.94 4.2 → 4.11 3.0 → 3.17 0.5 (CC) 1.0 35 3 13
Charging
Rate
1.2 4.2 3.0 0.2 (CC) 1.0 35 3 14
1.2 4.2 3.0 0.5 → 0.2 (CC) 1.0 35 3 15
Temperature
1.2 4.2 3.0 0.5 (CC) 1.0 25 2 16
1.2 4.2 3.0 0.5 (CC) 1.0 35 → 25 2 17
1.2 4.2 3.0 0.5 (CCCV) 1.0 50 3 18
1.2 4.2 3.0 0.5 (CC) 1.0 35 → 50 3 19
“All” 1.2 → 0.94 4.2 → 4.11 3.0 → 3.17 0.5 → 0.2 (CC) 1.0 35 → 50 3 20
In order to investigate the effects of calendric aging in the laboratory, cells were stored (without
float charging) either at a SoC of 0%, 10%, 50%, 90% or 100%, and a temperature of 35 °C (ID
21-25) or 50 °C (ID 26-30). The relevant data is listed again in Table 3. Stored cells were given
to checkup only once a month in contrast to cycled cells. As the output SoC of the checkup
procedure was 50%, the SoC of cells which were stored at a SoC = 50% had not to be adjusted
afterwards. For cells stored at a different SoC, the adjustment was conducted by CC discharging
(SoC < 50%) or charging (SoC > 50%) with 0.5 C until the desired target voltage was reached
(3.0 V, 3.5 V, 3.69 V, 4.01 V and 4.2 V, respectively), switching to a CV phase for as long as the
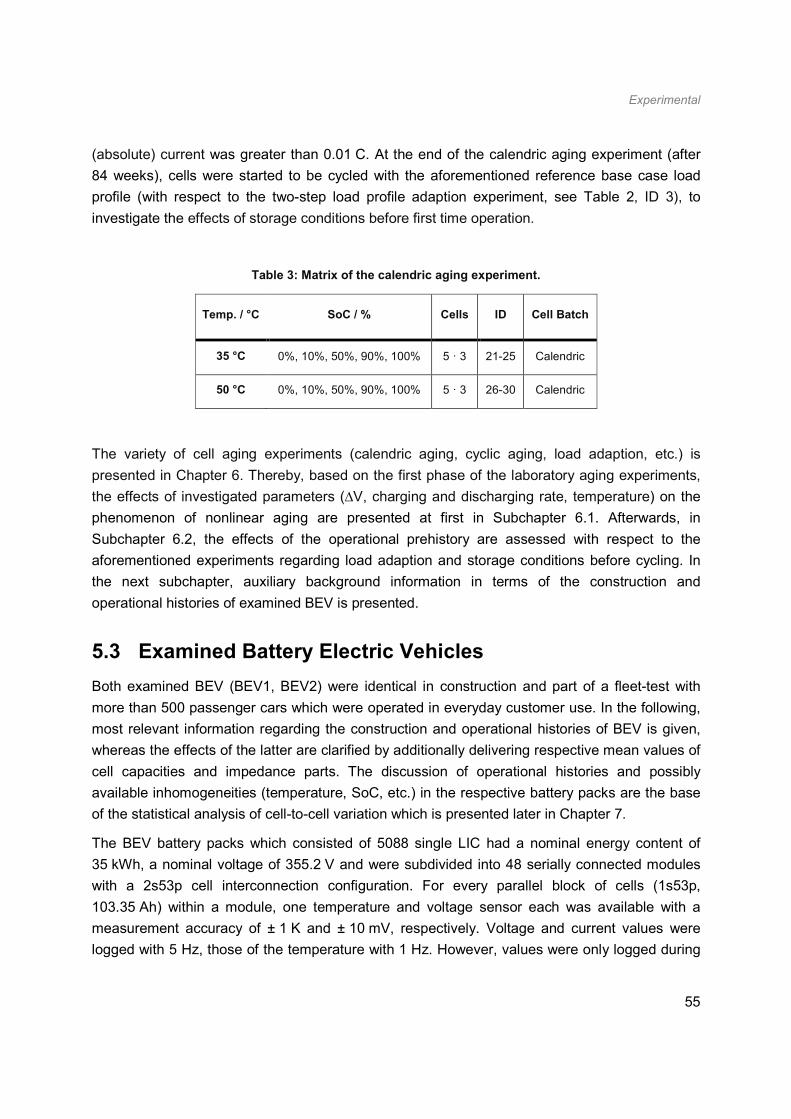
Experimental
55
(absolute) current was greater than 0.01 C. At the end of the calendric aging experiment (after
84 weeks), cells were started to be cycled with the aforementioned reference base case load
profile (with respect to the two-step load profile adaption experiment, see Table 2, ID 3), to
investigate the effects of storage conditions before first time operation.
Table 3: Matrix of the calendric aging experiment.
Temp. / °C SoC / % Cells ID Cell Batch
35 °C 0%, 10%, 50%, 90%, 100% 5 · 3 21-25 Calendric
50 °C 0%, 10%, 50%, 90%, 100% 5 · 3 26-30 Calendric
The variety of cell aging experiments (calendric aging, cyclic aging, load adaption, etc.) is
presented in Chapter 6. Thereby, based on the first phase of the laboratory aging experiments,
the effects of investigated parameters (∆V, charging and discharging rate, temperature) on the
phenomenon of nonlinear aging are presented at first in Subchapter 6.1. Afterwards, in
Subchapter 6.2, the effects of the operational prehistory are assessed with respect to the
aforementioned experiments regarding load adaption and storage conditions before cycling. In
the next subchapter, auxiliary background information in terms of the construction and
operational histories of examined BEV is presented.
5.3 Examined Battery Electric Vehicles
Both examined BEV (BEV1, BEV2) were identical in construction and part of a fleet-test with
more than 500 passenger cars which were operated in everyday customer use. In the following,
most relevant information regarding the construction and operational histories of BEV is given,
whereas the effects of the latter are clarified by additionally delivering respective mean values of
cell capacities and impedance parts. The discussion of operational histories and possibly
available inhomogeneities (temperature, SoC, etc.) in the respective battery packs are the base
of the statistical analysis of cell-to-cell variation which is presented later in Chapter 7.
The BEV battery packs which consisted of 5088 single LIC had a nominal energy content of
35 kWh, a nominal voltage of 355.2 V and were subdivided into 48 serially connected modules
with a 2s53p cell interconnection configuration. For every parallel block of cells (1s53p,
103.35 Ah) within a module, one temperature and voltage sensor each was available with a
measurement accuracy of ± 1 K and ± 10 mV, respectively. Voltage and current values were
logged with 5 Hz, those of the temperature with 1 Hz. However, values were only logged during
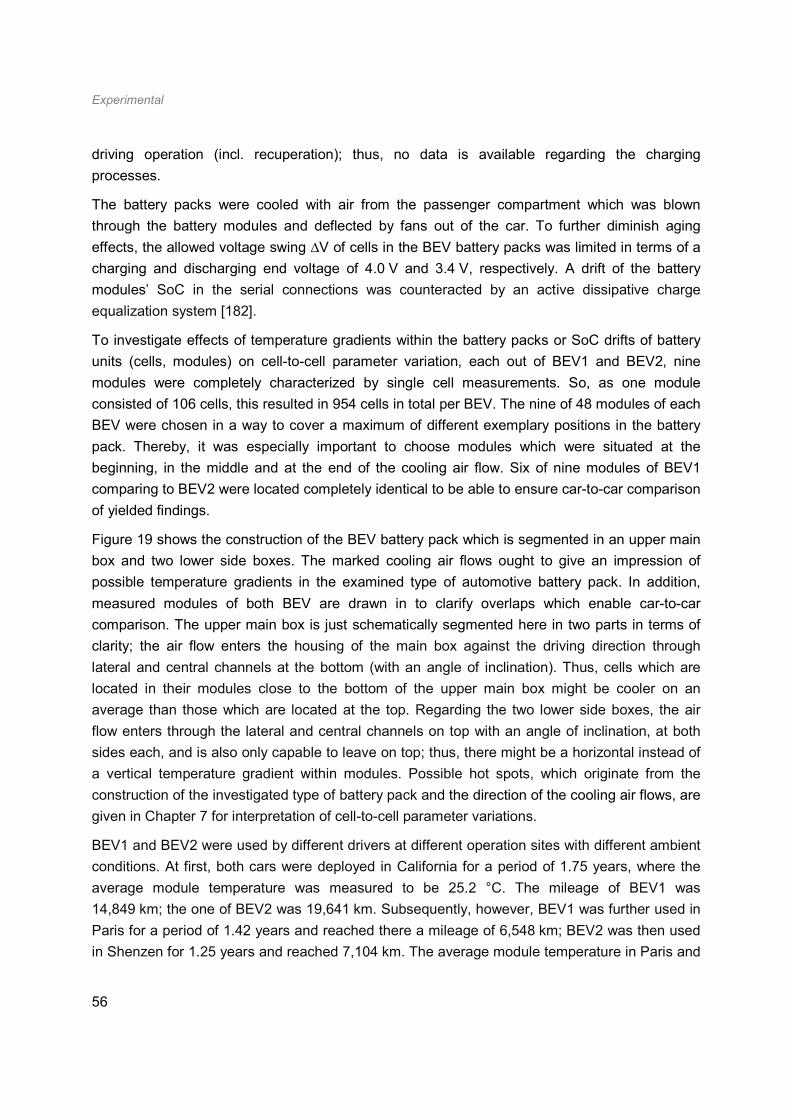
Experimental
56
driving operation (incl. recuperation); thus, no data is available regarding the charging
processes.
The battery packs were cooled with air from the passenger compartment which was blown
through the battery modules and deflected by fans out of the car. To further diminish aging
effects, the allowed voltage swing ∆V of cells in the BEV battery packs was limited in terms of a
charging and discharging end voltage of 4.0 V and 3.4 V, respectively. A drift of the battery
modules’ SoC in the serial connections was counteracted by an active dissipative charge
equalization system [182].
To investigate effects of temperature gradients within the battery packs or SoC drifts of battery
units (cells, modules) on cell-to-cell parameter variation, each out of BEV1 and BEV2, nine
modules were completely characterized by single cell measurements. So, as one module
consisted of 106 cells, this resulted in 954 cells in total per BEV. The nine of 48 modules of each
BEV were chosen in a way to cover a maximum of different exemplary positions in the battery
pack. Thereby, it was especially important to choose modules which were situated at the
beginning, in the middle and at the end of the cooling air flow. Six of nine modules of BEV1
comparing to BEV2 were located completely identical to be able to ensure car-to-car comparison
of yielded findings.
Figure 19 shows the construction of the BEV battery pack which is segmented in an upper main
box and two lower side boxes. The marked cooling air flows ought to give an impression of
possible temperature gradients in the examined type of automotive battery pack. In addition,
measured modules of both BEV are drawn in to clarify overlaps which enable car-to-car
comparison. The upper main box is just schematically segmented here in two parts in terms of
clarity; the air flow enters the housing of the main box against the driving direction through
lateral and central channels at the bottom (with an angle of inclination). Thus, cells which are
located in their modules close to the bottom of the upper main box might be cooler on an
average than those which are located at the top. Regarding the two lower side boxes, the air
flow enters through the lateral and central channels on top with an angle of inclination, at both
sides each, and is also only capable to leave on top; thus, there might be a horizontal instead of
a vertical temperature gradient within modules. Possible hot spots, which originate from the
construction of the investigated type of battery pack and the direction of the cooling air flows, are
given in Chapter 7 for interpretation of cell-to-cell parameter variations.
BEV1 and BEV2 were used by different drivers at different operation sites with different ambient
conditions. At first, both cars were deployed in California for a period of 1.75 years, where the
average module temperature was measured to be 25.2 °C. The mileage of BEV1 was
14,849 km; the one of BEV2 was 19,641 km. Subsequently, however, BEV1 was further used in
Paris for a period of 1.42 years and reached there a mileage of 6,548 km; BEV2 was then used
in Shenzen for 1.25 years and reached 7,104 km. The average module temperature in Paris and
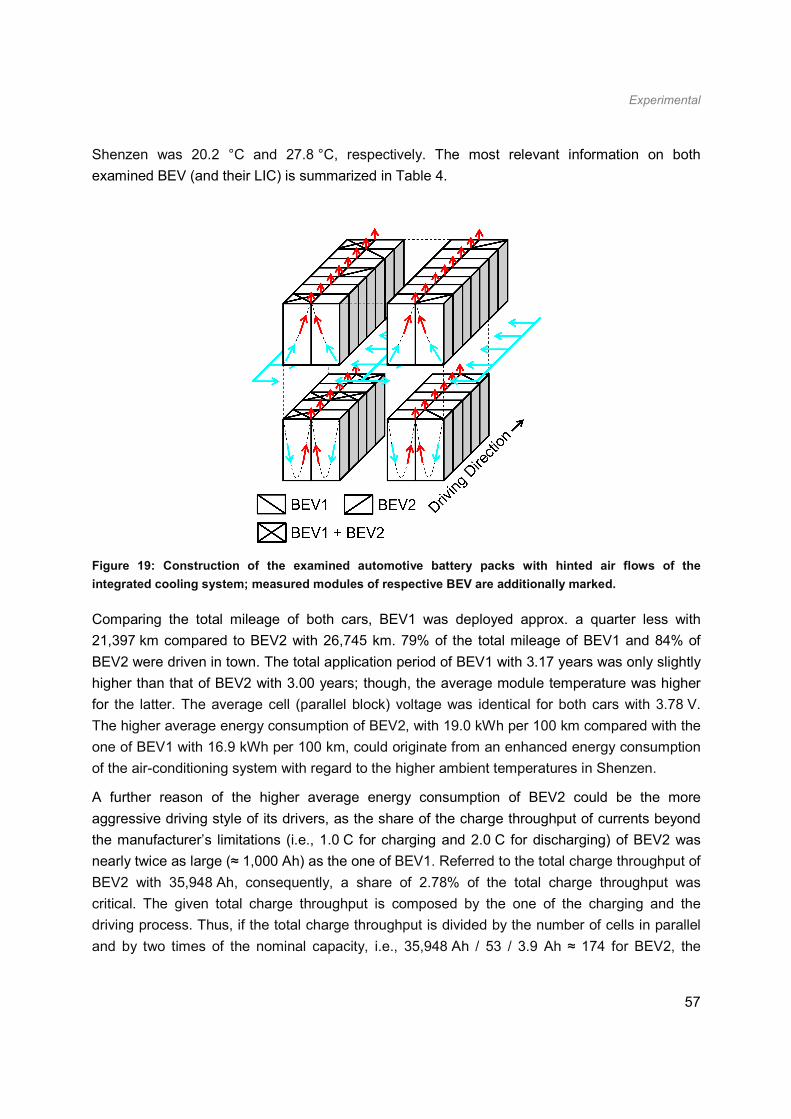
Experimental
57
Shenzen was 20.2 °C and 27.8 °C, respectively. The most relevant information on both
examined BEV (and their LIC) is summarized in Table 4.
Figure 19: Construction of the examined automotive battery packs with hinted air flows of the
integrated cooling system; measured modules of respective BEV are additionally marked.
Comparing the total mileage of both cars, BEV1 was deployed approx. a quarter less with
21,397 km compared to BEV2 with 26,745 km. 79% of the total mileage of BEV1 and 84% of
BEV2 were driven in town. The total application period of BEV1 with 3.17 years was only slightly
higher than that of BEV2 with 3.00 years; though, the average module temperature was higher
for the latter. The average cell (parallel block) voltage was identical for both cars with 3.78 V.
The higher average energy consumption of BEV2, with 19.0 kWh per 100 km compared with the
one of BEV1 with 16.9 kWh per 100 km, could originate from an enhanced energy consumption
of the air-conditioning system with regard to the higher ambient temperatures in Shenzen.
A further reason of the higher average energy consumption of BEV2 could be the more
aggressive driving style of its drivers, as the share of the charge throughput of currents beyond
the manufacturer’s limitations (i.e., 1.0 C for charging and 2.0 C for discharging) of BEV2 was
nearly twice as large (≈ 1,000 Ah) as the one of BEV1. Referred to the total charge throughput of
BEV2 with 35,948 Ah, consequently, a share of 2.78% of the total charge throughput was
critical. The given total charge throughput is composed by the one of the charging and the
driving process. Thus, if the total charge throughput is divided by the number of cells in parallel
and by two times of the nominal capacity, i.e., 35,948 Ah / 53 / 3.9 Ah ≈ 174 for BEV2, the
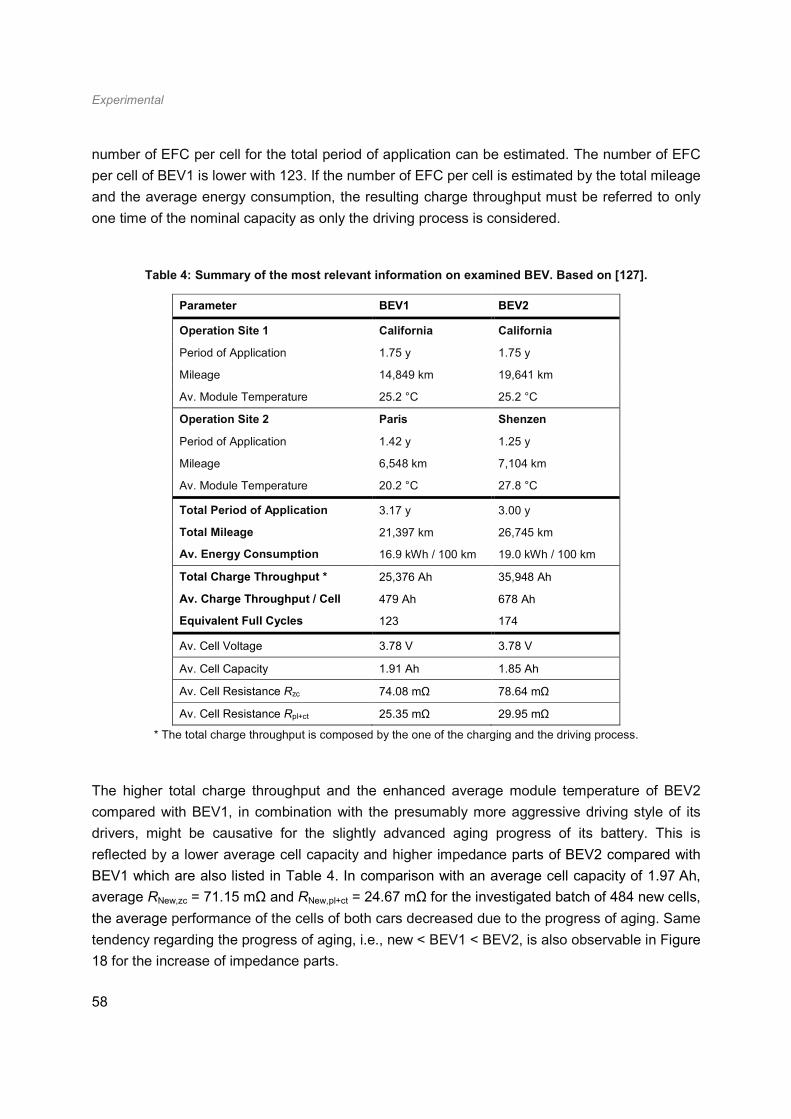
Experimental
58
number of EFC per cell for the total period of application can be estimated. The number of EFC
per cell of BEV1 is lower with 123. If the number of EFC per cell is estimated by the total mileage
and the average energy consumption, the resulting charge throughput must be referred to only
one time of the nominal capacity as only the driving process is considered.
Table 4: Summary of the most relevant information on examined BEV. Based on [127].
Parameter BEV1 BEV2
Operation Site 1 California California
Period of Application 1.75 y 1.75 y
Mileage 14,849 km 19,641 km
Av. Module Temperature 25.2 °C 25.2 °C
Operation Site 2 Paris Shenzen
Period of Application 1.42 y 1.25 y
Mileage 6,548 km 7,104 km
Av. Module Temperature 20.2 °C 27.8 °C
Total Period of Application 3.17 y 3.00 y
Total Mileage 21,397 km 26,745 km
Av. Energy Consumption 16.9 kWh / 100 km 19.0 kWh / 100 km
Total Charge Throughput * 25,376 Ah 35,948 Ah
Av. Charge Throughput / Cell 479 Ah 678 Ah
Equivalent Full Cycles 123 174
Av. Cell Voltage 3.78 V 3.78 V
Av. Cell Capacity 1.91 Ah 1.85 Ah
Av. Cell Resistance Rzc 74.08 mΩ 78.64 mΩ
Av. Cell Resistance Rpl+ct 25.35 mΩ 29.95 mΩ
* The total charge throughput is composed by the one of the charging and the driving process.
The higher total charge throughput and the enhanced average module temperature of BEV2
compared with BEV1, in combination with the presumably more aggressive driving style of its
drivers, might be causative for the slightly advanced aging progress of its battery. This is
reflected by a lower average cell capacity and higher impedance parts of BEV2 compared with
BEV1 which are also listed in Table 4. In comparison with an average cell capacity of 1.97 Ah,
average RNew,zc = 71.15 mΩ and RNew,pl+ct = 24.67 mΩ for the investigated batch of 484 new cells,
the average performance of the cells of both cars decreased due to the progress of aging. Same
tendency regarding the progress of aging, i.e., new < BEV1 < BEV2, is also observable in Figure
18 for the increase of impedance parts.
Experimental
59
Furthermore, by comparing the parameter values of BEV cells with those of new cells, the
progress of aging appears as only low for both BEV1 and BEV2, but their total period of
application is likewise just about a quarter of the commonly expected lifetime of an automobile.
The upcoming aging behavior can easily be estimated by e.g. assuming a linear dependency
from the charge throughput and raising the nominal cell capacity as initial value, besides from
the presented values after the known period of BEV operation.
From the given information on the experimental setup of the conducted aging experiments and
the general framework (cell type, BEV fleet-test, etc.), it is led over to the main part of this work.
In the following chapter, the results of the aging experiments (calendric, cyclic, load adaption,
etc.) are presented and discussed.

Lithium-Ion Cell Aging
60
6 Lithium-Ion Cell Aging
In the beginning of the main part of this thesis, the phenomenon of nonlinear aging is
investigated in detail. As aforementioned, the effect is regarded as a major technological barrier
towards a successful SLC implementation, since it might severely limit the reachable second
service life of a refurbished ALIB. Apart from that, it basically complicates the prediction of the
expectable aging behavior. These general conditions are, though, directly linked with the
decision of an interested party to invest in a storage project with SLB.
In Subchapter 6.1, the dependency of nonlinear aging on the voltage swing, the current rate
(charging and discharging) and the temperature is assessed. Based on the thereby yielded
results, operational strategies to delay or prevent the occurrence of nonlinear aging can be
derived. In Subchapter 6.2, presented experiments address a suppression of nonlinear aging by
either a two-step parameter (∆V, charging rate, temperature) or continuous charging rate
adaption; in addition, the effect of different long-term storage conditions before cycling is
evaluated. For clarification, Figure 20 highlights the progress of work which is reached in
Chapter 6.
Figure 20: Progress of work in Chapter 6: the boxes of the presented core issue (nonlinear aging) and
the corresponding solution approach (aging dependent load adaption) are colored in cyan.
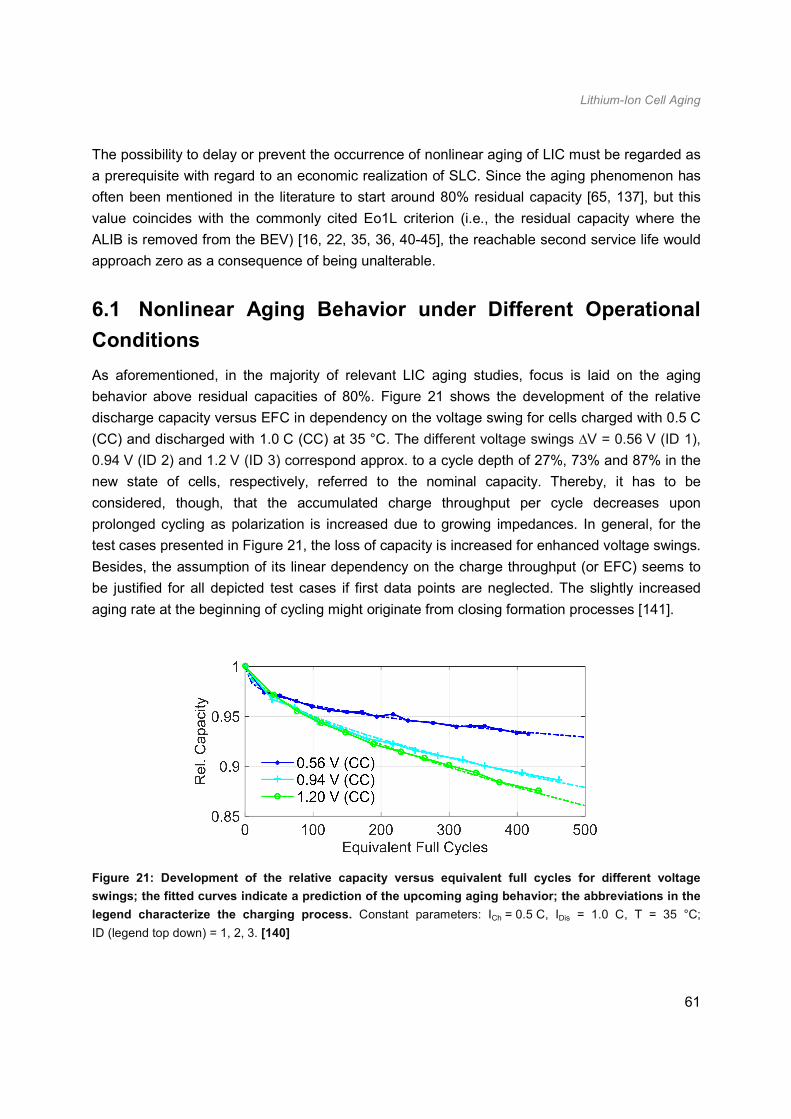
Lithium-Ion Cell Aging
61
The possibility to delay or prevent the occurrence of nonlinear aging of LIC must be regarded as
a prerequisite with regard to an economic realization of SLC. Since the aging phenomenon has
often been mentioned in the literature to start around 80% residual capacity [65, 137], but this
value coincides with the commonly cited Eo1L criterion (i.e., the residual capacity where the
ALIB is removed from the BEV) [16, 22, 35, 36, 40-45], the reachable second service life would
approach zero as a consequence of being unalterable.
6.1 Nonlinear Aging Behavior under Different Operational
Conditions
As aforementioned, in the majority of relevant LIC aging studies, focus is laid on the aging
behavior above residual capacities of 80%. Figure 21 shows the development of the relative
discharge capacity versus EFC in dependency on the voltage swing for cells charged with 0.5 C
(CC) and discharged with 1.0 C (CC) at 35 °C. The different voltage swings ∆V = 0.56 V (ID 1),
0.94 V (ID 2) and 1.2 V (ID 3) correspond approx. to a cycle depth of 27%, 73% and 87% in the
new state of cells, respectively, referred to the nominal capacity. Thereby, it has to be
considered, though, that the accumulated charge throughput per cycle decreases upon
prolonged cycling as polarization is increased due to growing impedances. In general, for the
test cases presented in Figure 21, the loss of capacity is increased for enhanced voltage swings.
Besides, the assumption of its linear dependency on the charge throughput (or EFC) seems to
be justified for all depicted test cases if first data points are neglected. The slightly increased
aging rate at the beginning of cycling might originate from closing formation processes [141].
Figure 21: Development of the relative capacity versus equivalent full cycles for different voltage
swings; the fitted curves indicate a prediction of the upcoming aging behavior; the abbreviations in the
legend characterize the charging process. Constant parameters: ICh = 0.5 C, IDis = 1.0 C, T = 35 °C;
ID (legend top down) = 1, 2, 3. [140]
Lithium-Ion Cell Aging
62
Accordingly, if the upcoming capacity development is predicted based on the presented data
(see fitted curves), by further assuming a linear dependency from the charge throughput, the
maximally reachable number of cycles up to a defined EoL criterion would be overestimated, if
the effect of nonlinear aging occurs but is not considered. Regarding a storage project with SLB,
this would lead to severe miscalculations in the business outlook. Therefore, in the following, the
aging behavior upon prolonged cycling is presented for different operational conditions to figure
out the effects on the turning point from linear to nonlinear aging characteristics. The following
subchapters are divided into the effects of different voltage swings, current rates (charging and
discharging) and temperatures.
6.1.1 Dependency on the Voltage Swing
In this subchapter, the aging behavior upon prolonged cycling is presented for different voltage
swings. In addition to the test cases which are shown in Figure 21, two load profiles with a
supplementary CV phase in the charging process, and thus longer periods at high SoC and
deeper cycles, were added in order to provoke an early turning point from linear to nonlinear
aging. These additional voltage swings ∆V = 1.2 V (ID 4) and 1.3 V (ID 5) correspond to a cycle
depth of approx. 94% and 98% in the new state of cells, respectively. Thereby, it is especially
apparent from the test case with the voltage swing ∆V = 1.3 V (which is even larger than
recommended), that the accumulated charge throughput per cycle is nonetheless smaller than
the nominal capacity (due to the discharging rate of 1.0 C; the nominal capacity is reached only
for rates < 0.5 C according to the cell specifications of the manufacturer, see Chapter 5).
Figure 22 a) shows the development of the relative discharge capacity versus EFC for different
voltage swings upon prolonged cycling. It is clearly visible that higher voltage swings and
supplementary CV phases in the charging process result in an earlier onset of nonlinear aging.
For the test cases with CC charging, a reduction from ∆V = 1.2 V to 0.94 V extends the area of
linear aging at about 42%, and, in addition, the effect of nonlinear aging appears less intensive.
Furthermore, for the test cases with CCCV charging, a reduction from ∆V = 1.3 V to 1.2 V results
in a prolongation of about 46%. When comparing the test cases ∆V = 1.2 V with CC and CCCV
charging, the longer periods at high SoC and deeper cycles accelerate the onset of the turning
point at about 29%. The test case with a ∆V = 1.2 V and CC charging (cyan curve with “plus”
markers) represents the reference base case of the two-step parameter adaption experiments
which are presented in Subchapter 6.2.
Figure 22 b) and c) show the development of Rzc and Rpl+ct versus EFC, respectively. It is
apparent, in general, that the increase of Rpl+ct far outweighs the one of Rzc. Furthermore, a
strong negative correlation to the development of the capacity is visible, i.e., a loss of capacity
comes out with an appropriate rise of impedance parts and vice versa. As a consequence, there
should be the possibility of perceiving or even predicting the occurrence of the turning point from
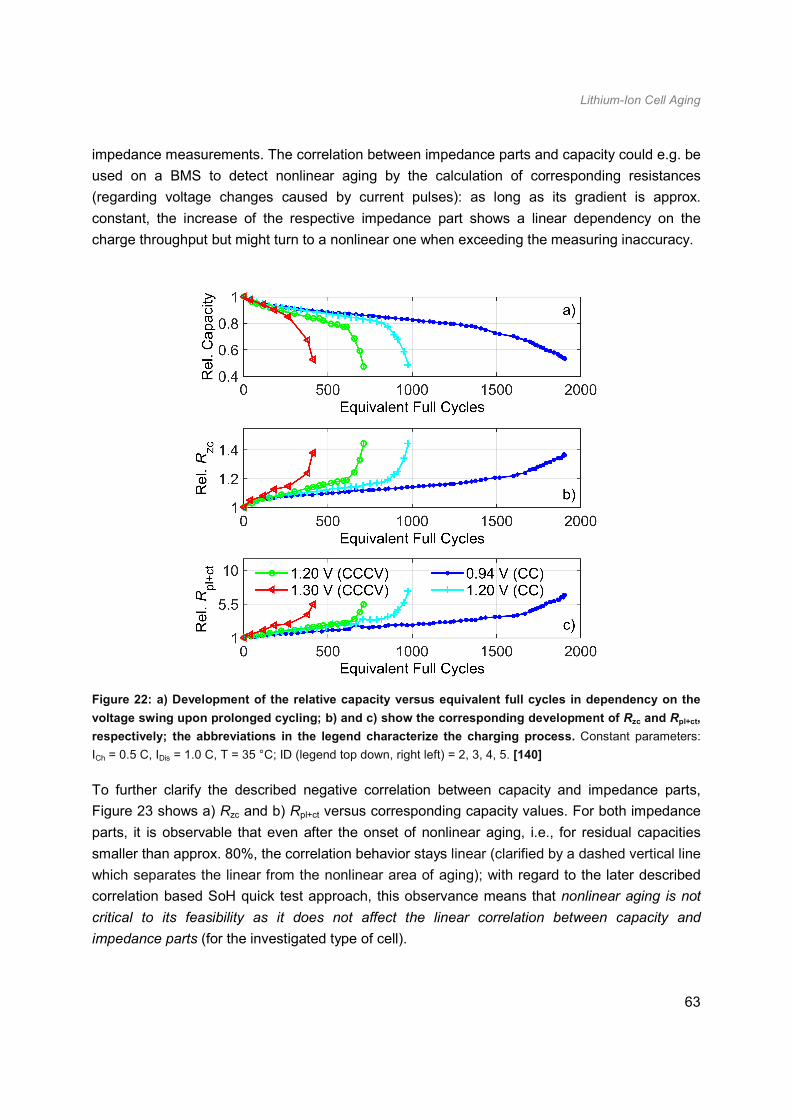
Lithium-Ion Cell Aging
63
impedance measurements. The correlation between impedance parts and capacity could e.g. be
used on a BMS to detect nonlinear aging by the calculation of corresponding resistances
(regarding voltage changes caused by current pulses): as long as its gradient is approx.
constant, the increase of the respective impedance part shows a linear dependency on the
charge throughput but might turn to a nonlinear one when exceeding the measuring inaccuracy.
Figure 22: a) Development of the relative capacity versus equivalent full cycles in dependency on the
voltage swing upon prolonged cycling; b) and c) show the corresponding development of Rzc and Rpl+ct,
respectively; the abbreviations in the legend characterize the charging process. Constant parameters:
ICh = 0.5 C, IDis = 1.0 C, T = 35 °C; ID (legend top down, right left) = 2, 3, 4, 5. [140]
To further clarify the described negative correlation between capacity and impedance parts,
Figure 23 shows a) Rzc and b) Rpl+ct versus corresponding capacity values. For both impedance
parts, it is observable that even after the onset of nonlinear aging, i.e., for residual capacities
smaller than approx. 80%, the correlation behavior stays linear (clarified by a dashed vertical line
which separates the linear from the nonlinear area of aging); with regard to the later described
correlation based SoH quick test approach, this observance means that nonlinear aging is not
critical to its feasibility as it does not affect the linear correlation between capacity and
impedance parts (for the investigated type of cell).
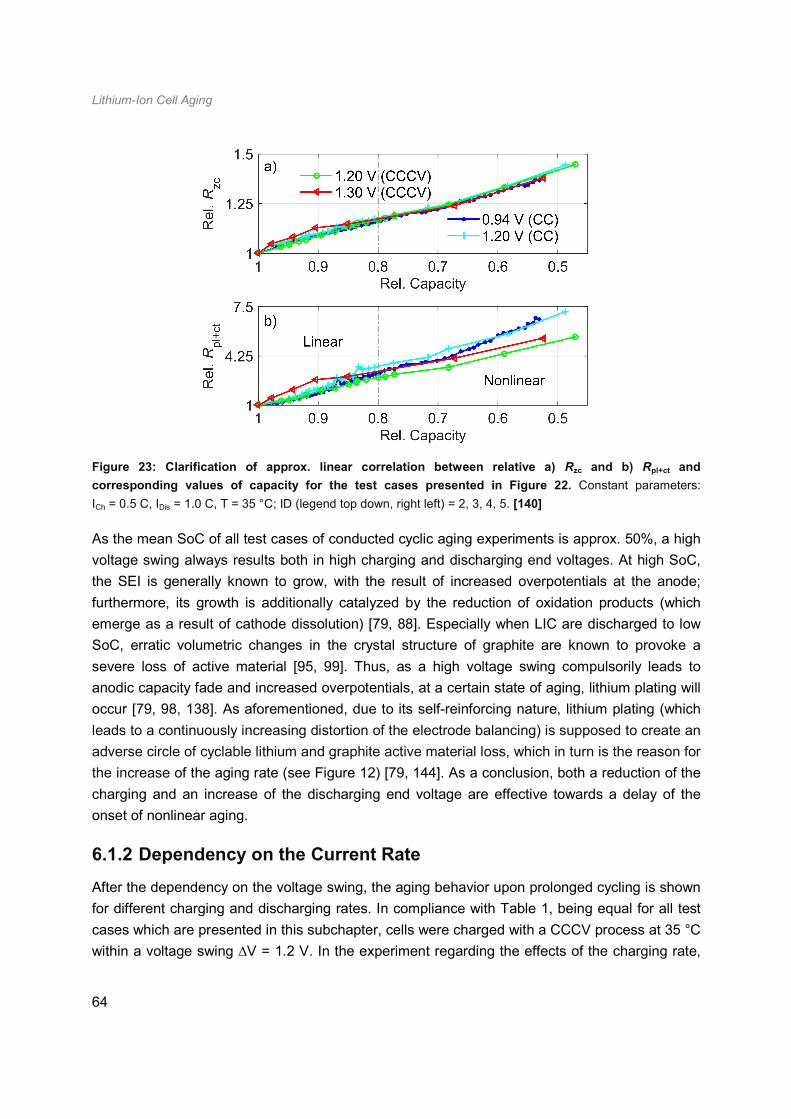
Lithium-Ion Cell Aging
64
Figure 23: Clarification of approx. linear correlation between relative a) Rzc and b) Rpl+ct and
corresponding values of capacity for the test cases presented in Figure 22. Constant parameters:
ICh = 0.5 C, IDis = 1.0 C, T = 35 °C; ID (legend top down, right left) = 2, 3, 4, 5. [140]
As the mean SoC of all test cases of conducted cyclic aging experiments is approx. 50%, a high
voltage swing always results both in high charging and discharging end voltages. At high SoC,
the SEI is generally known to grow, with the result of increased overpotentials at the anode;
furthermore, its growth is additionally catalyzed by the reduction of oxidation products (which
emerge as a result of cathode dissolution) [79, 88]. Especially when LIC are discharged to low
SoC, erratic volumetric changes in the crystal structure of graphite are known to provoke a
severe loss of active material [95, 99]. Thus, as a high voltage swing compulsorily leads to
anodic capacity fade and increased overpotentials, at a certain state of aging, lithium plating will
occur [79, 98, 138]. As aforementioned, due to its self-reinforcing nature, lithium plating (which
leads to a continuously increasing distortion of the electrode balancing) is supposed to create an
adverse circle of cyclable lithium and graphite active material loss, which in turn is the reason for
the increase of the aging rate (see Figure 12) [79, 144]. As a conclusion, both a reduction of the
charging and an increase of the discharging end voltage are effective towards a delay of the
onset of nonlinear aging.
6.1.2 Dependency on the Current Rate
After the dependency on the voltage swing, the aging behavior upon prolonged cycling is shown
for different charging and discharging rates. In compliance with Table 1, being equal for all test
cases which are presented in this subchapter, cells were charged with a CCCV process at 35 °C
within a voltage swing ∆V = 1.2 V. In the experiment regarding the effects of the charging rate,
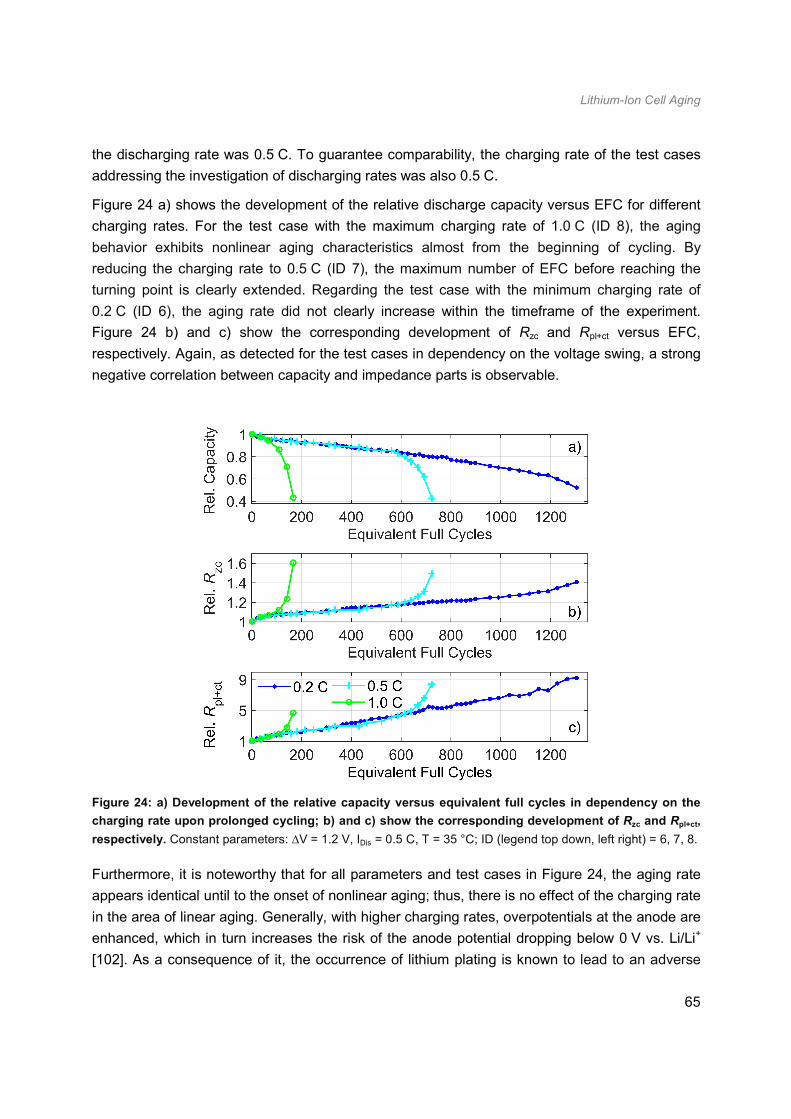
Lithium-Ion Cell Aging
65
the discharging rate was 0.5 C. To guarantee comparability, the charging rate of the test cases
addressing the investigation of discharging rates was also 0.5 C.
Figure 24 a) shows the development of the relative discharge capacity versus EFC for different
charging rates. For the test case with the maximum charging rate of 1.0 C (ID 8), the aging
behavior exhibits nonlinear aging characteristics almost from the beginning of cycling. By
reducing the charging rate to 0.5 C (ID 7), the maximum number of EFC before reaching the
turning point is clearly extended. Regarding the test case with the minimum charging rate of
0.2 C (ID 6), the aging rate did not clearly increase within the timeframe of the experiment.
Figure 24 b) and c) show the corresponding development of Rzc and Rpl+ct versus EFC,
respectively. Again, as detected for the test cases in dependency on the voltage swing, a strong
negative correlation between capacity and impedance parts is observable.
Figure 24: a) Development of the relative capacity versus equivalent full cycles in dependency on the
charging rate upon prolonged cycling; b) and c) show the corresponding development of Rzc and Rpl+ct,
respectively. Constant parameters: ∆V = 1.2 V, IDis = 0.5 C, T = 35 °C; ID (legend top down, left right) = 6, 7, 8.
Furthermore, it is noteworthy that for all parameters and test cases in Figure 24, the aging rate
appears identical until to the onset of nonlinear aging; thus, there is no effect of the charging rate
in the area of linear aging. Generally, with higher charging rates, overpotentials at the anode are
enhanced, which in turn increases the risk of the anode potential dropping below 0 V vs. Li/Li+
[102]. As a consequence of it, the occurrence of lithium plating is known to lead to an adverse
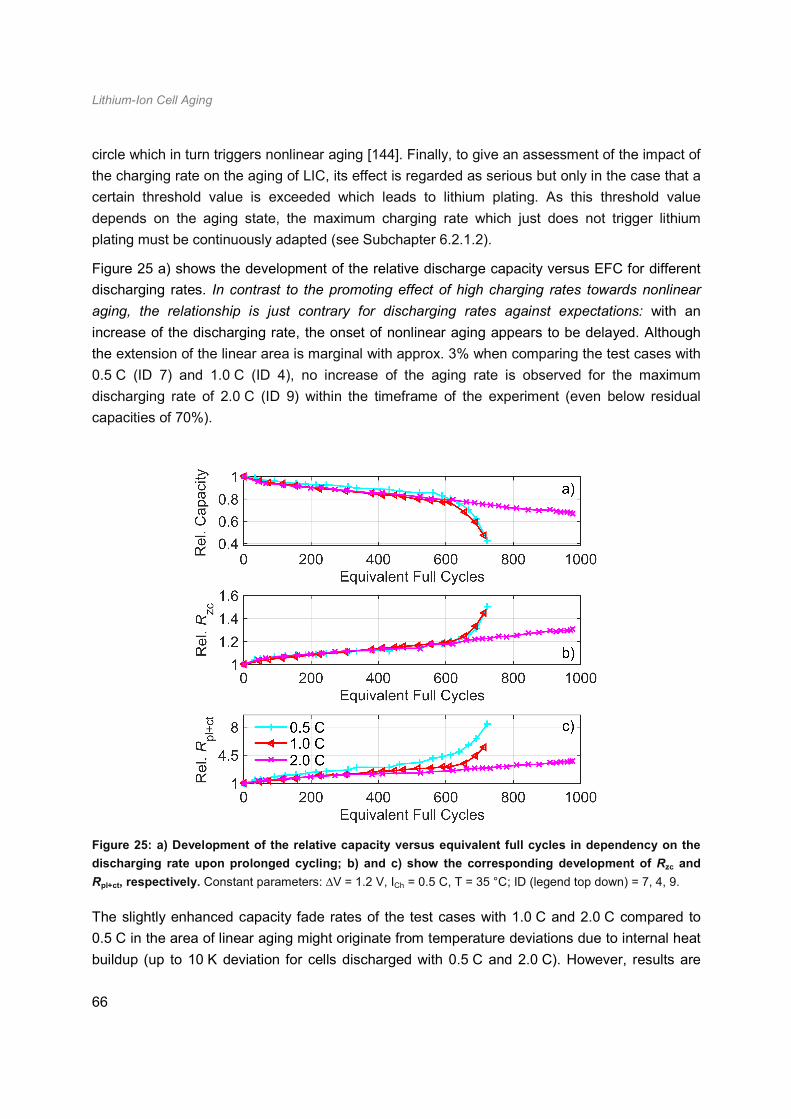
Lithium-Ion Cell Aging
66
circle which in turn triggers nonlinear aging [144]. Finally, to give an assessment of the impact of
the charging rate on the aging of LIC, its effect is regarded as serious but only in the case that a
certain threshold value is exceeded which leads to lithium plating. As this threshold value
depends on the aging state, the maximum charging rate which just does not trigger lithium
plating must be continuously adapted (see Subchapter 6.2.1.2).
Figure 25 a) shows the development of the relative discharge capacity versus EFC for different
discharging rates. In contrast to the promoting effect of high charging rates towards nonlinear
aging, the relationship is just contrary for discharging rates against expectations: with an
increase of the discharging rate, the onset of nonlinear aging appears to be delayed. Although
the extension of the linear area is marginal with approx. 3% when comparing the test cases with
0.5 C (ID 7) and 1.0 C (ID 4), no increase of the aging rate is observed for the maximum
discharging rate of 2.0 C (ID 9) within the timeframe of the experiment (even below residual
capacities of 70%).
Figure 25: a) Development of the relative capacity versus equivalent full cycles in dependency on the
discharging rate upon prolonged cycling; b) and c) show the corresponding development of Rzc and
Rpl+ct, respectively. Constant parameters: ∆V = 1.2 V, ICh = 0.5 C, T = 35 °C; ID (legend top down) = 7, 4, 9.
The slightly enhanced capacity fade rates of the test cases with 1.0 C and 2.0 C compared to
0.5 C in the area of linear aging might originate from temperature deviations due to internal heat
buildup (up to 10 K deviation for cells discharged with 0.5 C and 2.0 C). However, results are
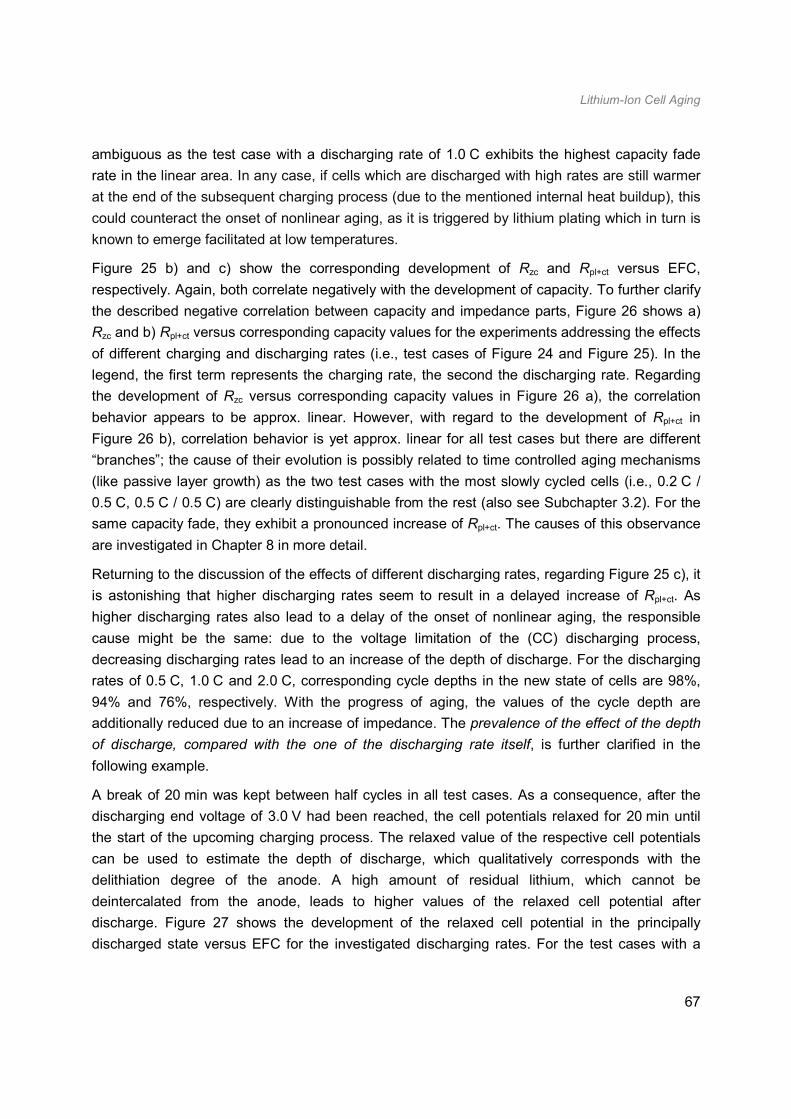
Lithium-Ion Cell Aging
67
ambiguous as the test case with a discharging rate of 1.0 C exhibits the highest capacity fade
rate in the linear area. In any case, if cells which are discharged with high rates are still warmer
at the end of the subsequent charging process (due to the mentioned internal heat buildup), this
could counteract the onset of nonlinear aging, as it is triggered by lithium plating which in turn is
known to emerge facilitated at low temperatures.
Figure 25 b) and c) show the corresponding development of Rzc and Rpl+ct versus EFC,
respectively. Again, both correlate negatively with the development of capacity. To further clarify
the described negative correlation between capacity and impedance parts, Figure 26 shows a)
Rzc and b) Rpl+ct versus corresponding capacity values for the experiments addressing the effects
of different charging and discharging rates (i.e., test cases of Figure 24 and Figure 25). In the
legend, the first term represents the charging rate, the second the discharging rate. Regarding
the development of Rzc versus corresponding capacity values in Figure 26 a), the correlation
behavior appears to be approx. linear. However, with regard to the development of Rpl+ct in
Figure 26 b), correlation behavior is yet approx. linear for all test cases but there are different
“branches”; the cause of their evolution is possibly related to time controlled aging mechanisms
(like passive layer growth) as the two test cases with the most slowly cycled cells (i.e., 0.2 C /
0.5 C, 0.5 C / 0.5 C) are clearly distinguishable from the rest (also see Subchapter 3.2). For the
same capacity fade, they exhibit a pronounced increase of Rpl+ct. The causes of this observance
are investigated in Chapter 8 in more detail.
Returning to the discussion of the effects of different discharging rates, regarding Figure 25 c), it
is astonishing that higher discharging rates seem to result in a delayed increase of Rpl+ct. As
higher discharging rates also lead to a delay of the onset of nonlinear aging, the responsible
cause might be the same: due to the voltage limitation of the (CC) discharging process,
decreasing discharging rates lead to an increase of the depth of discharge. For the discharging
rates of 0.5 C, 1.0 C and 2.0 C, corresponding cycle depths in the new state of cells are 98%,
94% and 76%, respectively. With the progress of aging, the values of the cycle depth are
additionally reduced due to an increase of impedance. The prevalence of the effect of the depth
of discharge, compared with the one of the discharging rate itself, is further clarified in the
following example.
A break of 20 min was kept between half cycles in all test cases. As a consequence, after the
discharging end voltage of 3.0 V had been reached, the cell potentials relaxed for 20 min until
the start of the upcoming charging process. The relaxed value of the respective cell potentials
can be used to estimate the depth of discharge, which qualitatively corresponds with the
delithiation degree of the anode. A high amount of residual lithium, which cannot be
deintercalated from the anode, leads to higher values of the relaxed cell potential after
discharge. Figure 27 shows the development of the relaxed cell potential in the principally
discharged state versus EFC for the investigated discharging rates. For the test cases with a
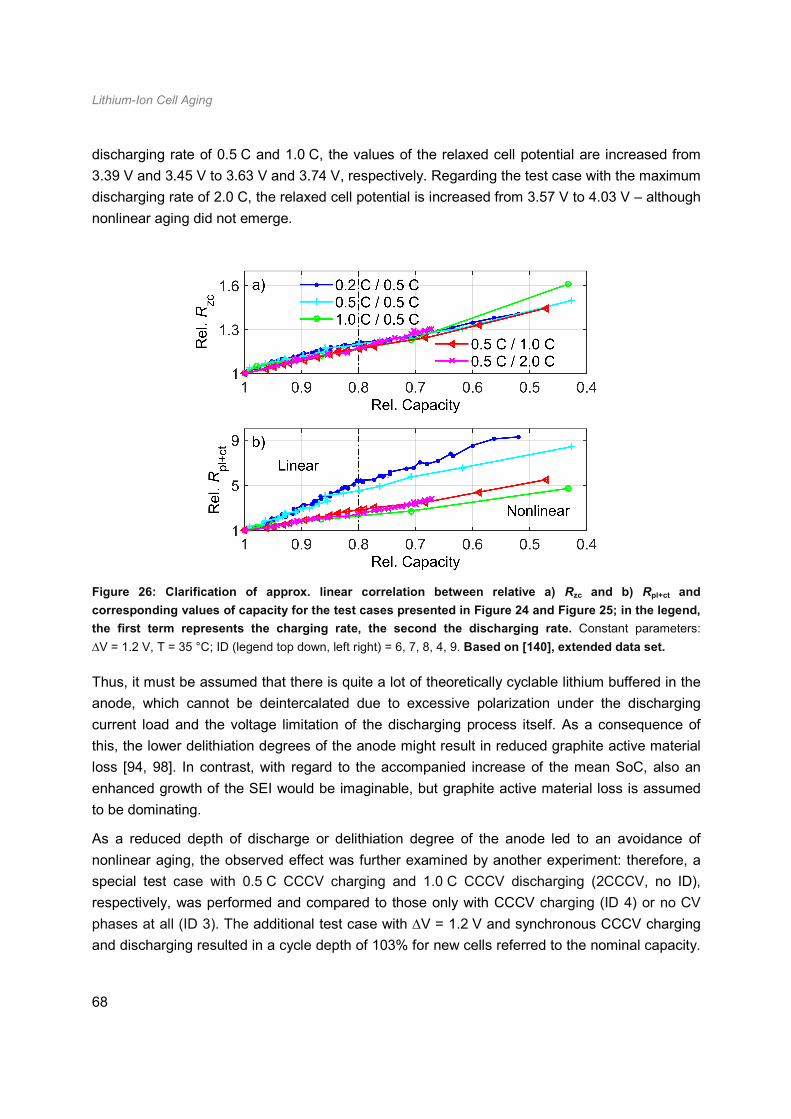
Lithium-Ion Cell Aging
68
discharging rate of 0.5 C and 1.0 C, the values of the relaxed cell potential are increased from
3.39 V and 3.45 V to 3.63 V and 3.74 V, respectively. Regarding the test case with the maximum
discharging rate of 2.0 C, the relaxed cell potential is increased from 3.57 V to 4.03 V – although
nonlinear aging did not emerge.
Figure 26: Clarification of approx. linear correlation between relative a) Rzc and b) Rpl+ct and
corresponding values of capacity for the test cases presented in Figure 24 and Figure 25; in the legend,
the first term represents the charging rate, the second the discharging rate. Constant parameters:
∆V = 1.2 V, T = 35 °C; ID (legend top down, left right) = 6, 7, 8, 4, 9. Based on [140], extended data set.
Thus, it must be assumed that there is quite a lot of theoretically cyclable lithium buffered in the
anode, which cannot be deintercalated due to excessive polarization under the discharging
current load and the voltage limitation of the discharging process itself. As a consequence of
this, the lower delithiation degrees of the anode might result in reduced graphite active material
loss [94, 98]. In contrast, with regard to the accompanied increase of the mean SoC, also an
enhanced growth of the SEI would be imaginable, but graphite active material loss is assumed
to be dominating.
As a reduced depth of discharge or delithiation degree of the anode led to an avoidance of
nonlinear aging, the observed effect was further examined by another experiment: therefore, a
special test case with 0.5 C CCCV charging and 1.0 C CCCV discharging (2CCCV, no ID),
respectively, was performed and compared to those only with CCCV charging (ID 4) or no CV
phases at all (ID 3). The additional test case with ∆V = 1.2 V and synchronous CCCV charging
and discharging resulted in a cycle depth of 103% for new cells referred to the nominal capacity.
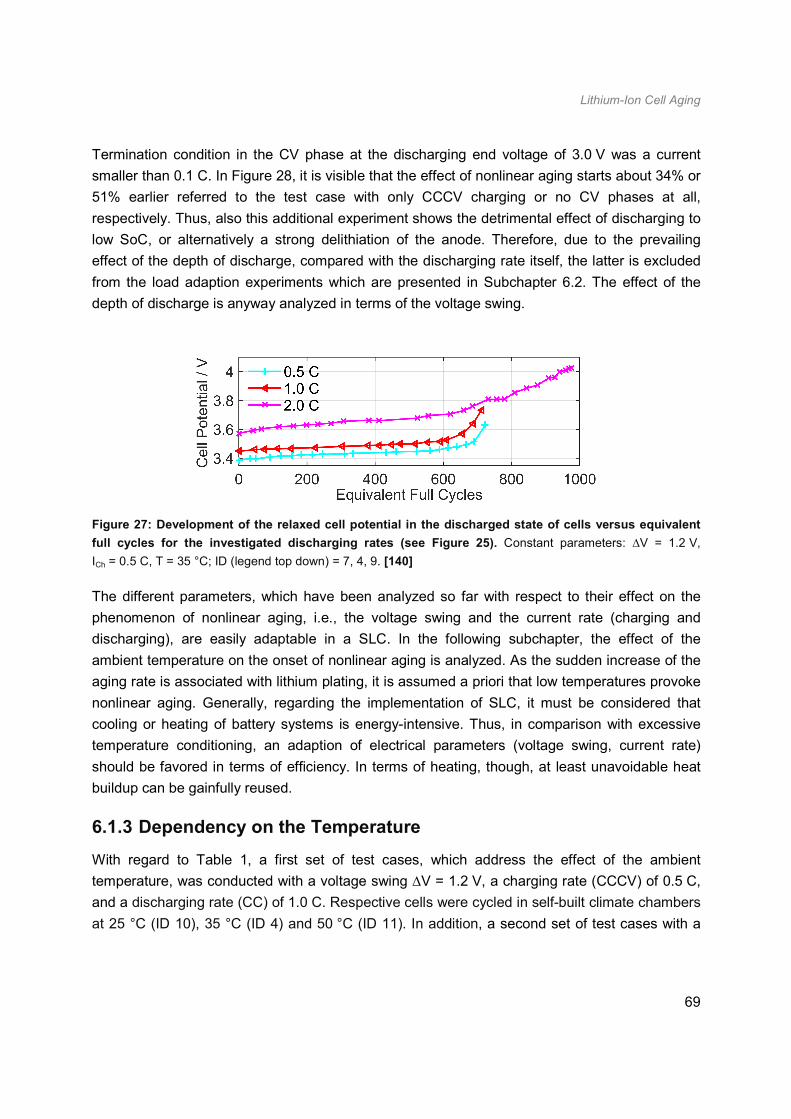
Lithium-Ion Cell Aging
69
Termination condition in the CV phase at the discharging end voltage of 3.0 V was a current
smaller than 0.1 C. In Figure 28, it is visible that the effect of nonlinear aging starts about 34% or
51% earlier referred to the test case with only CCCV charging or no CV phases at all,
respectively. Thus, also this additional experiment shows the detrimental effect of discharging to
low SoC, or alternatively a strong delithiation of the anode. Therefore, due to the prevailing
effect of the depth of discharge, compared with the discharging rate itself, the latter is excluded
from the load adaption experiments which are presented in Subchapter 6.2. The effect of the
depth of discharge is anyway analyzed in terms of the voltage swing.
Figure 27: Development of the relaxed cell potential in the discharged state of cells versus equivalent
full cycles for the investigated discharging rates (see Figure 25). Constant parameters: ∆V = 1.2 V,
ICh = 0.5 C, T = 35 °C; ID (legend top down) = 7, 4, 9. [140]
The different parameters, which have been analyzed so far with respect to their effect on the
phenomenon of nonlinear aging, i.e., the voltage swing and the current rate (charging and
discharging), are easily adaptable in a SLC. In the following subchapter, the effect of the
ambient temperature on the onset of nonlinear aging is analyzed. As the sudden increase of the
aging rate is associated with lithium plating, it is assumed a priori that low temperatures provoke
nonlinear aging. Generally, regarding the implementation of SLC, it must be considered that
cooling or heating of battery systems is energy-intensive. Thus, in comparison with excessive
temperature conditioning, an adaption of electrical parameters (voltage swing, current rate)
should be favored in terms of efficiency. In terms of heating, though, at least unavoidable heat
buildup can be gainfully reused.
6.1.3 Dependency on the Temperature
With regard to Table 1, a first set of test cases, which address the effect of the ambient
temperature, was conducted with a voltage swing ∆V = 1.2 V, a charging rate (CCCV) of 0.5 C,
and a discharging rate (CC) of 1.0 C. Respective cells were cycled in self-built climate chambers
at 25 °C (ID 10), 35 °C (ID 4) and 50 °C (ID 11). In addition, a second set of test cases with a

Lithium-Ion Cell Aging
70
reduced voltage swing ∆V = 0.94 V, but same current rates, was conducted at 35 °C (ID 2) and
50 °C (ID 12).
Figure 28: Development of the relative capacity versus equivalent full cycles for different cycling
processes; the abbreviations in the legend characterize the charging process; 2CCCV represents a
synchronous cycling with CCCV charging and CCCV discharging. Constant parameters: ICh = 0.5 C,
IDis = 1.0 C, T = 35 °C; ID (legend top down) = 3, 4, special case (no ID). [140]
Figure 29 a) shows the development of the relative discharge capacity versus EFC for both sets
of test cases. For the set with ∆V = 1.2 V, cycling at the lowest temperature, i.e., 25 °C, results in
the quickest occurrence of the turning point. In comparison, for the test case at 50 °C, the
number of EFC before reaching the turning point is prolonged at about 8%. The test case
between those boundaries, i.e., at a temperature of 35 °C, seems to be the optimum resulting in
a prolongation of the linear area of roughly 40% referred to the test case at 25 °C. Regarding the
reference test cases in the two-step temperature adaption experiment (identical setup except CC
instead of CCCV charging, see Figure 32), same rank order is obtained regarding the emerging
aging rates (35 °C < 50 °C < 25 °C). For the second set of test cases with a reduced voltage
swing ∆V = 0.94 V, the capacity fade rate at 35 °C compared with 50 °C is smaller at first, but
only for the test case at the lower temperature, a turning point to nonlinear aging is observable
(even though it appears only less pronounced). Figure 29 b) and c) show the corresponding
development of Rzc and Rpl+ct versus EFC, respectively. A negative correlation with regard to
respective capacity values is again noticeable with one exception: regarding the development of
Rzc in Figure 29 b), its increase for the test case with a reduced voltage swing ∆V = 0.94 V at a
temperature of 50 °C is disproportionately strong and starts to stagnate at about 1100 EFC.
It is assumed that time controlled aging mechanisms have led to a strong rise of Rzc but to a
comparably low fade of capacity for cycling with a rather mild load profile at a high ambient
temperature. Such a behavior could principally originate from an excessive growth of passive
layers and/or a loss of conducting salts in the electrolyte [76, 77]. However, it is astonishing that
the corresponding development of Rpl+ct is inconspicuous. In any case, such an ambiguous
behavior is known for C//NMC cells, and was e.g. associated in [141] with time controlled
mechanisms.
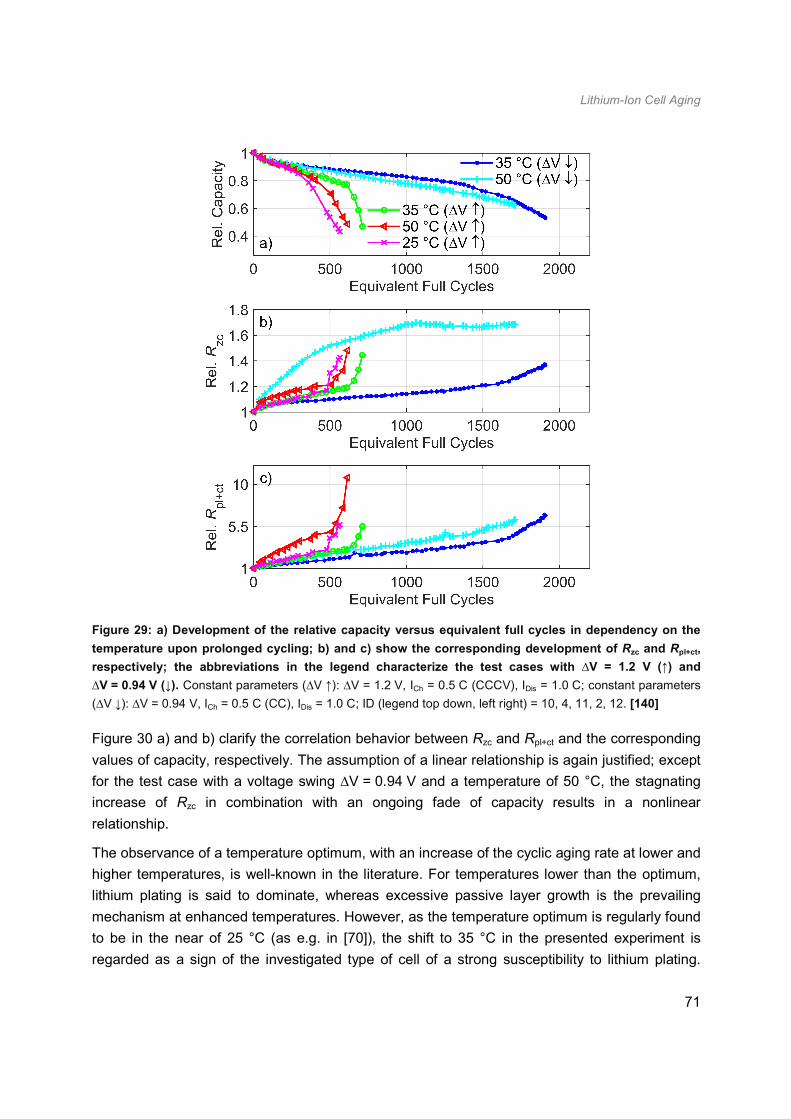
Lithium-Ion Cell Aging
71
Figure 29: a) Development of the relative capacity versus equivalent full cycles in dependency on the
temperature upon prolonged cycling; b) and c) show the corresponding development of Rzc and Rpl+ct,
respectively; the abbreviations in the legend characterize the test cases with ∆V = 1.2 V (↑) and
∆V = 0.94 V (↓). Constant parameters (∆V ↑): ∆V = 1.2 V, ICh = 0.5 C (CCCV), IDis = 1.0 C; constant parameters
(∆V ↓): ∆V = 0.94 V, ICh = 0.5 C (CC), IDis = 1.0 C; ID (legend top down, left right) = 10, 4, 11, 2, 12. [140]
Figure 30 a) and b) clarify the correlation behavior between Rzc and Rpl+ct and the corresponding
values of capacity, respectively. The assumption of a linear relationship is again justified; except
for the test case with a voltage swing ∆V = 0.94 V and a temperature of 50 °C, the stagnating
increase of Rzc in combination with an ongoing fade of capacity results in a nonlinear
relationship.
The observance of a temperature optimum, with an increase of the cyclic aging rate at lower and
higher temperatures, is well-known in the literature. For temperatures lower than the optimum,
lithium plating is said to dominate, whereas excessive passive layer growth is the prevailing
mechanism at enhanced temperatures. However, as the temperature optimum is regularly found
to be in the near of 25 °C (as e.g. in [70]), the shift to 35 °C in the presented experiment is
regarded as a sign of the investigated type of cell of a strong susceptibility to lithium plating.

Lithium-Ion Cell Aging
72
Unfortunately, if the temperature optimum is shifted to higher values, this is due to the
dominating effect of lithium plating compared with the growth of passive layers (in accordance
with the observed rank order of aging rates which is 25 °C > 50 °C > 35 °C). However,
nonetheless, at enhanced temperatures, passive layer growth is increased with regard to the
Arrhenius law. For the same LIC model as is inspected in this work (IHR18650A by E-One Moli
Energy Corp.), it was shown in [93] that the area of linear aging could be extended (which
corresponds to the avoidance of lithium plating) by filling the cells with a mixture of different
electrolyte components which synergistically prevent excessive SEI growth. Thus, a sense of
balance is needed in the mechanical design and chemical engineering of LIC to reach a desired
value of optimal operational temperature. Looked at it from the other side, however, for a given
type of cell, operational strategies can always be optimized by electrical engineering to maximize
the reachable service life.
Figure 30: Clarification of approx. linear correlation between relative a) Rzc and b) Rpl+ct and
corresponding values of capacity for the test cases presented in Figure 29. Constant parameters (∆V ↑):
∆V = 1.2 V, ICh = 0.5 C (CCCV), IDis = 1.0 C; constant parameters (∆V ↓): ∆V = 0.94 V, ICh = 0.5 C (CC),
IDis = 1.0 C; ID (legend top down, left right) = 10, 4, 11, 2, 12. [140]
In any case, the observances implicate that, with regard to the implementation of SLC, rather
heating than cooling is useful to avoid the effect of nonlinear aging (as lithium plating is the
cause). As aforementioned, however, a suitable adaption of electrical parameters is always to
prefer in terms of the battery system’s efficiency. Nonetheless, as the voltage swing, the
charging rate and the temperature were shown to affect the onset of nonlinear aging, these
parameters are raised as final control elements in the following load adaption experiments.
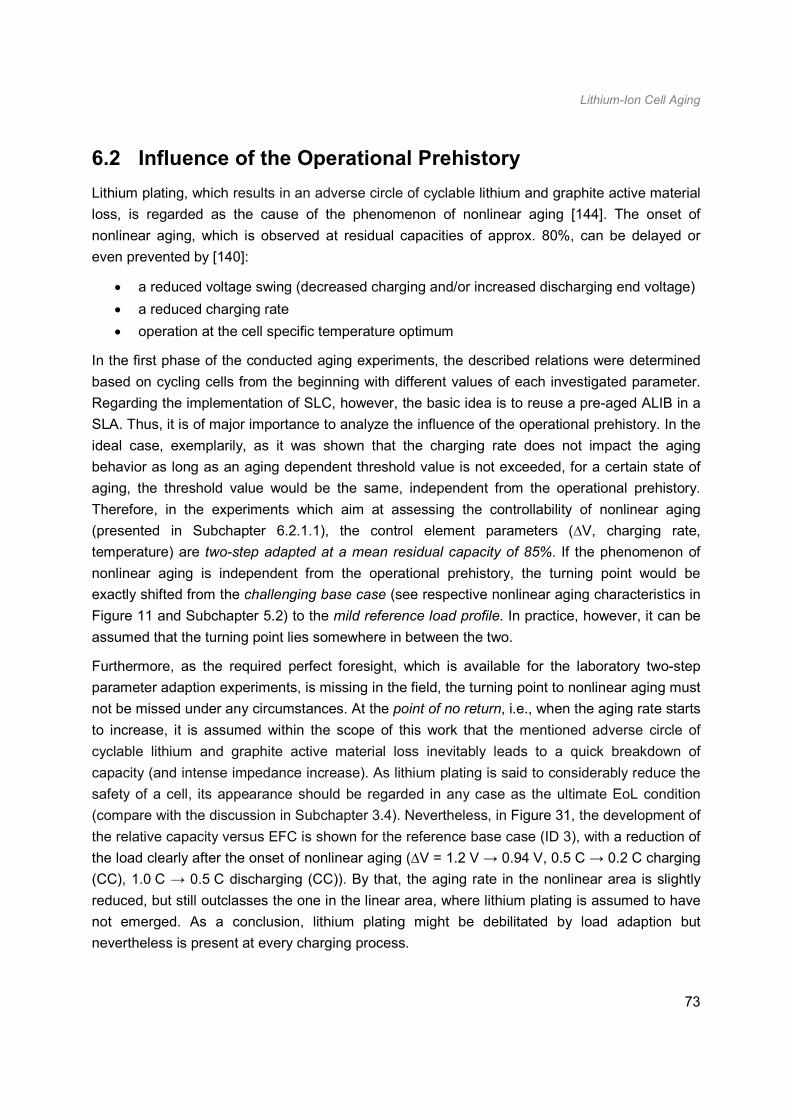
Lithium-Ion Cell Aging
73
6.2 Influence of the Operational Prehistory
Lithium plating, which results in an adverse circle of cyclable lithium and graphite active material
loss, is regarded as the cause of the phenomenon of nonlinear aging [144]. The onset of
nonlinear aging, which is observed at residual capacities of approx. 80%, can be delayed or
even prevented by [140]:
• a reduced voltage swing (decreased charging and/or increased discharging end voltage)
• a reduced charging rate
• operation at the cell specific temperature optimum
In the first phase of the conducted aging experiments, the described relations were determined
based on cycling cells from the beginning with different values of each investigated parameter.
Regarding the implementation of SLC, however, the basic idea is to reuse a pre-aged ALIB in a
SLA. Thus, it is of major importance to analyze the influence of the operational prehistory. In the
ideal case, exemplarily, as it was shown that the charging rate does not impact the aging
behavior as long as an aging dependent threshold value is not exceeded, for a certain state of
aging, the threshold value would be the same, independent from the operational prehistory.
Therefore, in the experiments which aim at assessing the controllability of nonlinear aging
(presented in Subchapter 6.2.1.1), the control element parameters (∆V, charging rate,
temperature) are two-step adapted at a mean residual capacity of 85%. If the phenomenon of
nonlinear aging is independent from the operational prehistory, the turning point would be
exactly shifted from the challenging base case (see respective nonlinear aging characteristics in
Figure 11 and Subchapter 5.2) to the mild reference load profile. In practice, however, it can be
assumed that the turning point lies somewhere in between the two.
Furthermore, as the required perfect foresight, which is available for the laboratory two-step
parameter adaption experiments, is missing in the field, the turning point to nonlinear aging must
not be missed under any circumstances. At the point of no return, i.e., when the aging rate starts
to increase, it is assumed within the scope of this work that the mentioned adverse circle of
cyclable lithium and graphite active material loss inevitably leads to a quick breakdown of
capacity (and intense impedance increase). As lithium plating is said to considerably reduce the
safety of a cell, its appearance should be regarded in any case as the ultimate EoL condition
(compare with the discussion in Subchapter 3.4). Nevertheless, in Figure 31, the development of
the relative capacity versus EFC is shown for the reference base case (ID 3), with a reduction of
the load clearly after the onset of nonlinear aging (∆V = 1.2 V → 0.94 V, 0.5 C → 0.2 C charging
(CC), 1.0 C → 0.5 C discharging (CC)). By that, the aging rate in the nonlinear area is slightly
reduced, but still outclasses the one in the linear area, where lithium plating is assumed to have
not emerged. As a conclusion, lithium plating might be debilitated by load adaption but
nevertheless is present at every charging process.
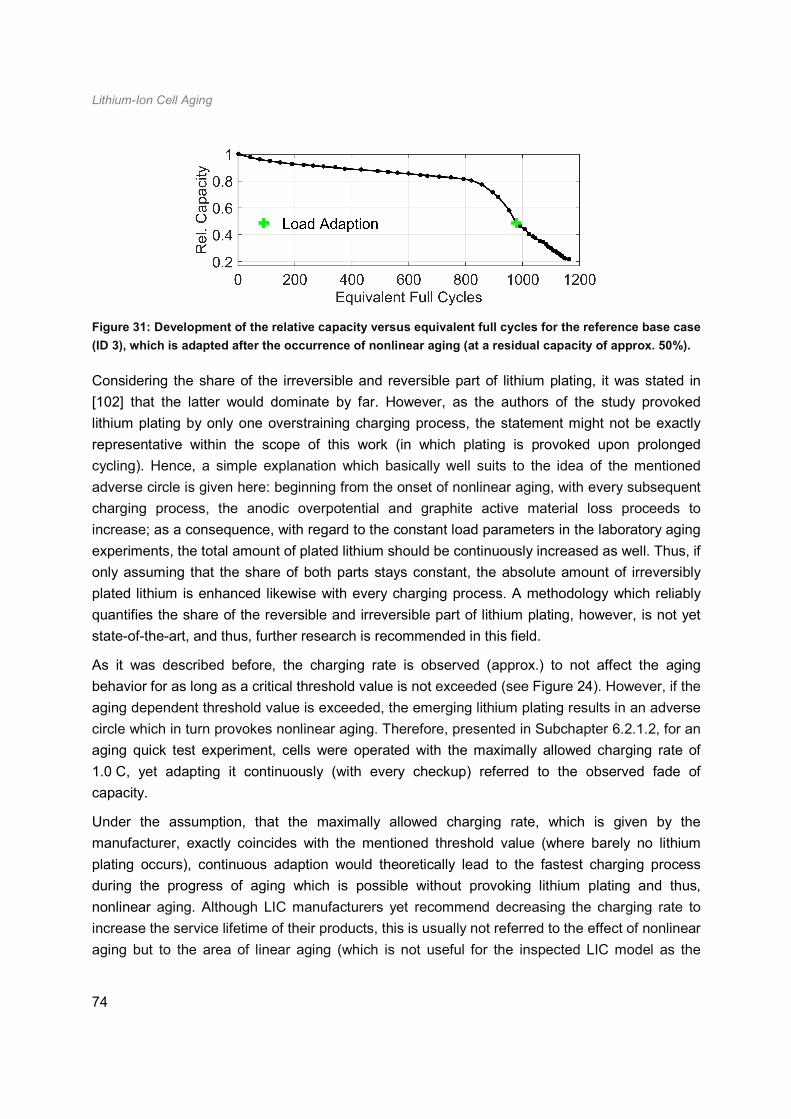
Lithium-Ion Cell Aging
74
Figure 31: Development of the relative capacity versus equivalent full cycles for the reference base case
(ID 3), which is adapted after the occurrence of nonlinear aging (at a residual capacity of approx. 50%).
Considering the share of the irreversible and reversible part of lithium plating, it was stated in
[102] that the latter would dominate by far. However, as the authors of the study provoked
lithium plating by only one overstraining charging process, the statement might not be exactly
representative within the scope of this work (in which plating is provoked upon prolonged
cycling). Hence, a simple explanation which basically well suits to the idea of the mentioned
adverse circle is given here: beginning from the onset of nonlinear aging, with every subsequent
charging process, the anodic overpotential and graphite active material loss proceeds to
increase; as a consequence, with regard to the constant load parameters in the laboratory aging
experiments, the total amount of plated lithium should be continuously increased as well. Thus, if
only assuming that the share of both parts stays constant, the absolute amount of irreversibly
plated lithium is enhanced likewise with every charging process. A methodology which reliably
quantifies the share of the reversible and irreversible part of lithium plating, however, is not yet
state-of-the-art, and thus, further research is recommended in this field.
As it was described before, the charging rate is observed (approx.) to not affect the aging
behavior for as long as a critical threshold value is not exceeded (see Figure 24). However, if the
aging dependent threshold value is exceeded, the emerging lithium plating results in an adverse
circle which in turn provokes nonlinear aging. Therefore, presented in Subchapter 6.2.1.2, for an
aging quick test experiment, cells were operated with the maximally allowed charging rate of
1.0 C, yet adapting it continuously (with every checkup) referred to the observed fade of
capacity.
Under the assumption, that the maximally allowed charging rate, which is given by the
manufacturer, exactly coincides with the mentioned threshold value (where barely no lithium
plating occurs), continuous adaption would theoretically lead to the fastest charging process
during the progress of aging which is possible without provoking lithium plating and thus,
nonlinear aging. Although LIC manufacturers yet recommend decreasing the charging rate to
increase the service lifetime of their products, this is usually not referred to the effect of nonlinear
aging but to the area of linear aging (which is not useful for the inspected LIC model as the

Lithium-Ion Cell Aging
75
aging behavior is only influenced by the charging rate if a critical threshold value is exceeded).
Henceforth, in any case, the suggested approach is entitled as close-to-the-edge charging,
inspired by the aforementioned critical threshold value. The respective approach has been
applied for patent by the authors of [181].
Finally, in Subchapter 6.2.2, the effects of different long-term storage conditions before cell
operation (at first time) are analyzed and assessed. Presented results shall give an impression
on the usability of “old” LIC, like such which have been remained in the shelf for a long time;
theoretically, if e.g. passive layers have excessively grown during long-term storage, also
moderate charging loads might immediately provoke nonlinear aging due to increased
impedances. In contrast to that, approaches to intentionally pre-store cells with the aim of
optimizing the formation process and thus decelerating the aging rate in the subsequent
operation, as investigated in [183], are beyond the scope of this work and thus not considered.
6.2.1 Controllability of Nonlinear Aging Behavior
6.2.1.1 Two-Step Parameter Adaption
Figure 32 shows the development of the relative discharge capacity versus EFC upon prolonged
cycling for the challenging reference base case, for the respective mild reference load profiles
and the ones with the corresponding two-step parameter adaption. The black circles mark the
adaption moment (which is at a mean residual capacity of 85%). In Figure 32 a), by comparing
the curves of the reference test cases (with ∆V = 1.2 V and 0.94 V) with the load adapted one
(ID 13), it is observable that the latter lies in between the two reference curves, as expected. In
comparison with the reference base case, the onset of nonlinear aging can clearly be delayed.
The gradients of the adaption test case correspond approx. with the respective reference; that
is, the negative gradient is slightly attenuated after load adaption. Especially the comparably
mild appearance of nonlinear aging characteristics of the reference test case with ∆V = 0.94 V is
similar to the one of the adaption test case, at what, however, starts to occur slightly in advance.
Thus, as a conclusion from the findings of the first control element parameter, there might be an
effect of the operational prehistory, which is however, only less pronounced.
Figure 32 b) contains the respective plots regarding the charging rate. As aforementioned, there
are no different gradients in the capacity development detectable for different rates (in the linear
area of aging); i.e., the aging behavior appears to be independent of the charging rate. For the
mild reference with a charging rate of 0.2 C (ID 14), no onset of nonlinear aging has been
detectable within the timeframe of this work. After having passed the turning point to nonlinear
aging of the reference base case with a charging rate of 0.5 C, the capacity fade of the charging
rate adapted test case (ID 15) continues linearly. Although the length of the mild reference curve
is inadequate to give a precise statement, an ongoing linear development can be assumed, as
the development of the adaption test case is likewise linear for more than 300 EFC. Thus, from
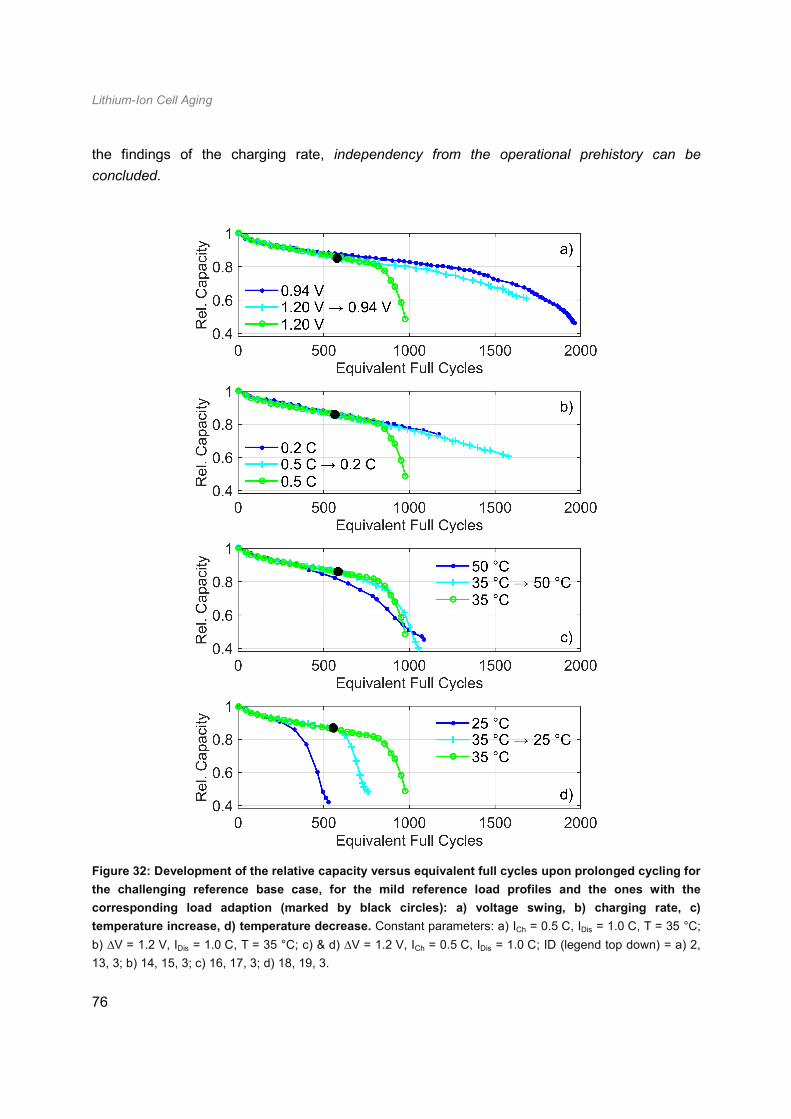
Lithium-Ion Cell Aging
76
the findings of the charging rate, independency from the operational prehistory can be
concluded.
Figure 32: Development of the relative capacity versus equivalent full cycles upon prolonged cycling for
the challenging reference base case, for the mild reference load profiles and the ones with the
corresponding load adaption (marked by black circles): a) voltage swing, b) charging rate, c)
temperature increase, d) temperature decrease. Constant parameters: a) ICh = 0.5 C, IDis = 1.0 C, T = 35 °C;
b) ∆V = 1.2 V, IDis = 1.0 C, T = 35 °C; c) & d) ∆V = 1.2 V, ICh = 0.5 C, IDis = 1.0 C; ID (legend top down) = a) 2,
13, 3; b) 14, 15, 3; c) 16, 17, 3; d) 18, 19, 3.
Lithium-Ion Cell Aging
77
In Figure 32 c) and d), the adaption experiments of increasing and decreasing the temperature
are shown, respectively. As the temperature optimum for the investigated type of cell is at 35 °C,
for both experiments, pronounced aging or, more precisely, an accelerated onset of nonlinear
aging is expected. Indeed, the assumption attunes for both the temperature increasing (ID 18,
19) and decreasing experiment (ID 16, 17); as the reference base case turning point to nonlinear
aging has already been passed at the moment of load adaption, after it, as a consequence, the
capacity fade rate immediately starts to increase. Compared with the experiment of increasing
the temperature, the onset of nonlinear aging after lowering the temperature is clearly more
pronounced and erratic; a simple explanation for a smaller gradient in the nonlinear area for
increasing the temperature could be a mixture of responsible causes: assuming that nonlinear
aging at low temperatures originates purely from lithium plating without the occurrence of further
side reactions, high temperature nonlinear aging could be lithium plating, which is, however,
superposed or accompanied by strong passive layer growth. Simply said, for a given lithium
inventory, the part which is lost to passive layer growth cannot be lost anymore to lithium plating,
which is why the latter appears debilitated. Conclusions on the impact of the operational
prehistory are not feasible with regard to the temperature adaption experiments, but there is a
clear causative relationship detectable: if it is switched from a mild to a challenging load, at a
number of EFC for which nonlinear aging has already onset for the reference of the latter, also
for the adaption test case, capacity fade will immediately start to increase.
Figure 33 a) jointly shows the relative discharge capacity development versus EFC for the
reference base case and the load adaption test cases (regarding the temperature, only the
increase of it), which have been presented so far. By it, the even slightly pronounced effect of
reducing the voltage swing, compared with the charging rate, on the aging behavior of the
investigated cell, is visualized. Figure 33 b) and c) show the corresponding development of Rzc
and Rpl+ct versus EFC, respectively. Again, the development of both impedance parts clearly
appears to negatively correlate with the respective capacity values. Furthermore, an additional
adaption test case “All” (ID 20) is included in Figure 33, which combines the different parameter
adaptions of the three other test cases (∆V = 1.2 V → 0.94 V, 0.5 C → 0.2 C charging (CC),
35 °C → 50 °C). For it, the beneficial effect of decreasing the voltage swing and the charging
rate is obvious with regard to the prolonged linear area of aging. Nonlinear aging does not occur
for the all combining test case. However, in addition, the disadvantageous effect of increasing
the temperature is observable as well, as the capacity fade rate in the linear area is higher
compared with the test cases of only decreasing the voltage swing or the charging rate.
As a conclusion from the two-step parameter adaption experiments, for both the voltage swing
and the charging rate, a reduction leads to a clear prolongation of the reachable service life,
which is promising in terms of SLC implementation. Based on these two experiments, the impact
of the operational prehistory (on the onset of nonlinear aging) can be regarded as marginal,
which reduces the complexity of predicting the forthcoming aging behavior of a LIC.
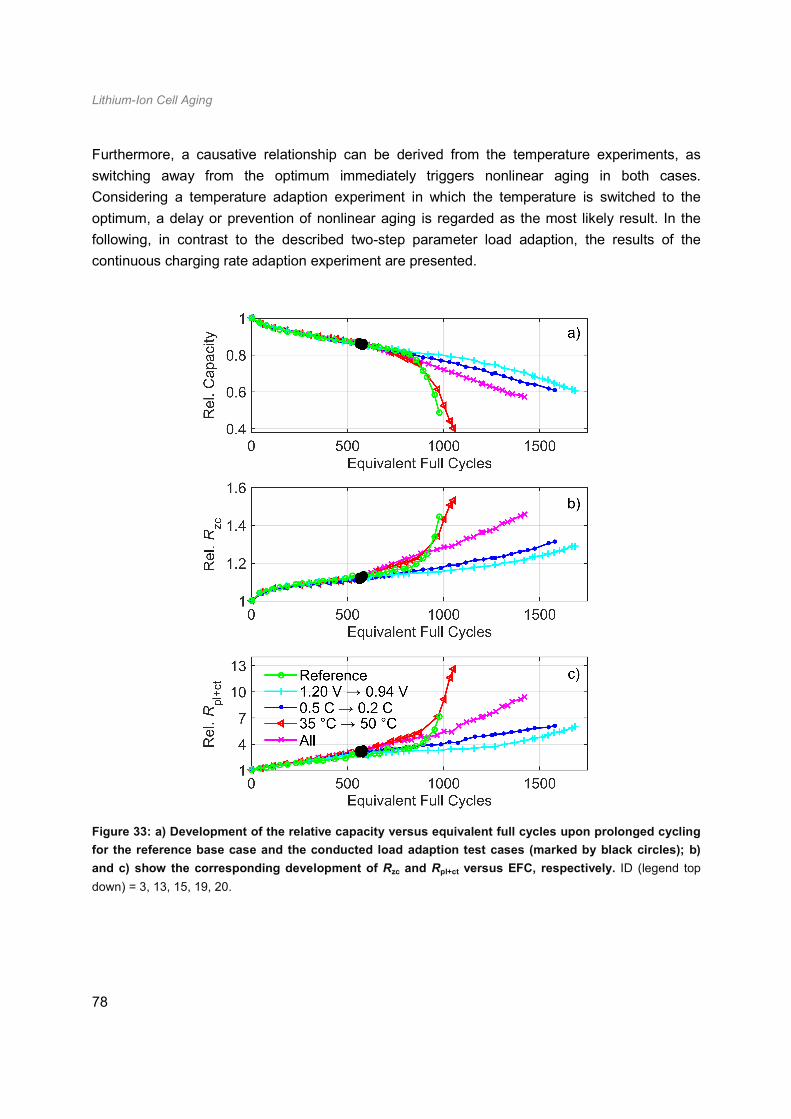
Lithium-Ion Cell Aging
78
Furthermore, a causative relationship can be derived from the temperature experiments, as
switching away from the optimum immediately triggers nonlinear aging in both cases.
Considering a temperature adaption experiment in which the temperature is switched to the
optimum, a delay or prevention of nonlinear aging is regarded as the most likely result. In the
following, in contrast to the described two-step parameter load adaption, the results of the
continuous charging rate adaption experiment are presented.
Figure 33: a) Development of the relative capacity versus equivalent full cycles upon prolonged cycling
for the reference base case and the conducted load adaption test cases (marked by black circles); b)
and c) show the corresponding development of Rzc and Rpl+ct versus EFC, respectively. ID (legend top
down) = 3, 13, 15, 19, 20.
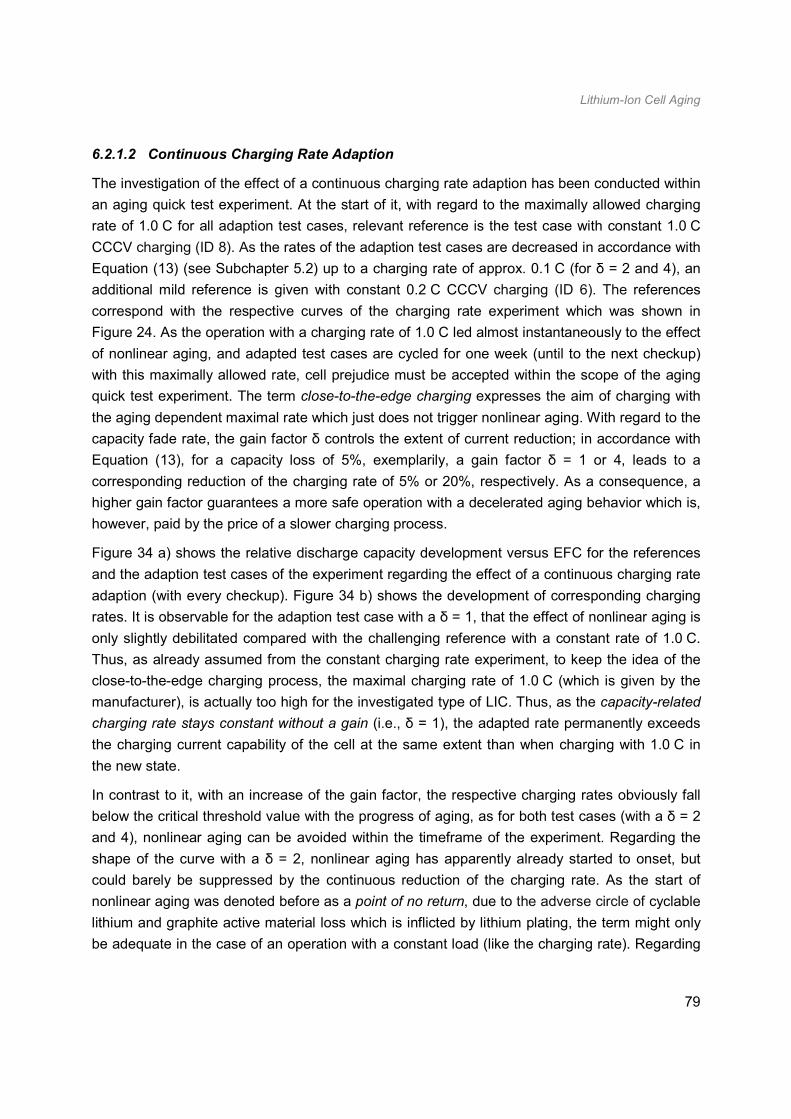
Lithium-Ion Cell Aging
79
6.2.1.2 Continuous Charging Rate Adaption
The investigation of the effect of a continuous charging rate adaption has been conducted within
an aging quick test experiment. At the start of it, with regard to the maximally allowed charging
rate of 1.0 C for all adaption test cases, relevant reference is the test case with constant 1.0 C
CCCV charging (ID 8). As the rates of the adaption test cases are decreased in accordance with
Equation (13) (see Subchapter 5.2) up to a charging rate of approx. 0.1 C (for δ = 2 and 4), an
additional mild reference is given with constant 0.2 C CCCV charging (ID 6). The references
correspond with the respective curves of the charging rate experiment which was shown in
Figure 24. As the operation with a charging rate of 1.0 C led almost instantaneously to the effect
of nonlinear aging, and adapted test cases are cycled for one week (until to the next checkup)
with this maximally allowed rate, cell prejudice must be accepted within the scope of the aging
quick test experiment. The term close-to-the-edge charging expresses the aim of charging with
the aging dependent maximal rate which just does not trigger nonlinear aging. With regard to the
capacity fade rate, the gain factor δ controls the extent of current reduction; in accordance with
Equation (13), for a capacity loss of 5%, exemplarily, a gain factor δ = 1 or 4, leads to a
corresponding reduction of the charging rate of 5% or 20%, respectively. As a consequence, a
higher gain factor guarantees a more safe operation with a decelerated aging behavior which is,
however, paid by the price of a slower charging process.
Figure 34 a) shows the relative discharge capacity development versus EFC for the references
and the adaption test cases of the experiment regarding the effect of a continuous charging rate
adaption (with every checkup). Figure 34 b) shows the development of corresponding charging
rates. It is observable for the adaption test case with a δ = 1, that the effect of nonlinear aging is
only slightly debilitated compared with the challenging reference with a constant rate of 1.0 C.
Thus, as already assumed from the constant charging rate experiment, to keep the idea of the
close-to-the-edge charging process, the maximal charging rate of 1.0 C (which is given by the
manufacturer), is actually too high for the investigated type of LIC. Thus, as the capacity-related
charging rate stays constant without a gain (i.e., δ = 1), the adapted rate permanently exceeds
the charging current capability of the cell at the same extent than when charging with 1.0 C in
the new state.
In contrast to it, with an increase of the gain factor, the respective charging rates obviously fall
below the critical threshold value with the progress of aging, as for both test cases (with a δ = 2
and 4), nonlinear aging can be avoided within the timeframe of the experiment. Regarding the
shape of the curve with a δ = 2, nonlinear aging has apparently already started to onset, but
could barely be suppressed by the continuous reduction of the charging rate. As the start of
nonlinear aging was denoted before as a point of no return, due to the adverse circle of cyclable
lithium and graphite active material loss which is inflicted by lithium plating, the term might only
be adequate in the case of an operation with a constant load (like the charging rate). Regarding
Lithium-Ion Cell Aging
80
an operation which considers cell aging, the so called adverse circle is obviously possible to
escape from. Though, in any case, as the capacity fade rate of the test case with a δ = 2 clearly
outclasses the one of the reference with constant 0.2 C charging, the yielded quicker charging
(up to approx. 350 EFC) is in no relation with the severely reduced service life.
Figure 34: a) Development of the relative capacity versus equivalent full cycles for the test cases of the
continuous charging rate adaption experiment; b) shows the development of corresponding charging
rates; the gain factor δ controls the extent of current reduction. Constant parameters: ∆V = 1.2 V,
IDis = 1.0 C, T = 35 °C; ID of references (left right) = 6, 8. Based on [181], extended data set.
For the test case with a δ = 4, the aging behavior stays completely linear within the timeframe of
the experiment. However, the gradient in the linear area of aging is slightly more negative
compared with the reference of constant charging with 0.2 C. At a number of approx. 350 EFC,
as for the adaption test case with a δ = 2, the charging rate is reduced to 0.2 C, which
corresponds to the rate of the mild reference. However, in contrast to the smaller gain, the
capacity fade rate is only slightly higher compared with the reference, but up to 350 EFC, the
average charging rate is threefold as high. Thus, it depends on the individual application and the
users’ specific needs if the adapted test case would be preferred before the mild reference. The
experiment of continuous charging rate adaption ended, as, for the test case with the maximal
gain δ = 4, the current had to be reduced below the value of the termination condition in the
CCCV charging process (which was 0.1 C).
The presented close-to-the-edge charging process is beneficial for the maximal gain δ = 4, if a
high charging rate is preferred before a long service life (e.g. conceivable in the consumer
electronics domain). However, the suggested charging process might be more useful for a
Lithium-Ion Cell Aging
81
decreased charging rate in the beginning of operation, as cell prejudice would be reduced as a
consequence. Alternatively, further functional interrelations of adapting the charging rate
(referred to the capacity fade) should be tested, as it seems that the applied approach
(according to Equation (13)) causes a charging rate adaption, which is too mild in the beginning
of operation but progressively too low in the end. A multi-step charging rate adaption approach,
in which aforementioned gain factors at high SoH are proportionately higher than at low SoH, is
promising to solve this issue.
Moreover, as the presented experiment considered only the charging rate as control element
parameter, a superior close-to-the-edge charging process should be designed based on the
optimization of a variety of parameters (like voltage swing, charging rate, temperature,
operational prehistory, etc.). In the following, the effects of different long-term storage conditions
before the first time operation of a LIC are analyzed and assessed.
6.2.2 Storage Conditions before Cycling
As described in the beginning of Chapter 3, most models of LIC with layered transition metal
cathodes (like NMC) suffer from calendric aging, which is generally increased at enhanced SoC
and temperatures. The main aging mechanism under storage is the growth of passive layers [68,
69]. As a result of it, the capacity fades due to the loss of cyclable lithium; however, even more
prevailing is the associated increase of impedance. Regarding the test cases with mild
compared to challenging load profiles (for which time dependent aging mechanisms are
assumed to dominate), the increase of impedance is higher at the same residual capacity, as is
known from Figure 26 and Figure 30. The phenomenon, which is possibly related to the
multilayered structure of the passive layers, is comprehensively analyzed in Chapter 8 (in
addition, see Subchapter 3.2).
Figure 35 shows the relative discharge capacity development versus storage time in weeks for
cells which have been stored at a SoC = 0%, 10%, 50%, 90% or 100% and a temperature of
either 35 °C (ID 21-25) or 50 °C (ID 26-30). For both temperatures, the aging rate is increased
with an increase of the SoC. Regarding the effect of the temperature, by comparing the residual
capacity values of cells with a SoC = 100% at the end of the experiment (week 84), it can be
estimated that an increase of 15 K leads to a doubled rate of calendric aging. As
aforementioned, for LIC models with graphite anode and NMC cathode, calendric aging which is
increased with increasing SoC and temperature is reported in the literature as well [65].
However, there is a currently inexplicable phenomenon as the capacities of cells with a SoC =
0% and 100% (and SoC = 10% at 35 °C) slightly rise from the new state to the next measuring
point, even if respective cells have been preloaded with four cycles to avoid ongoing formation
processes. For the cells stored at a SoC = 100%, only due to the more negative gradient of the
capacity fade after this increase, the expected aging rate rank order (0% < 10% < 50% < 90% <
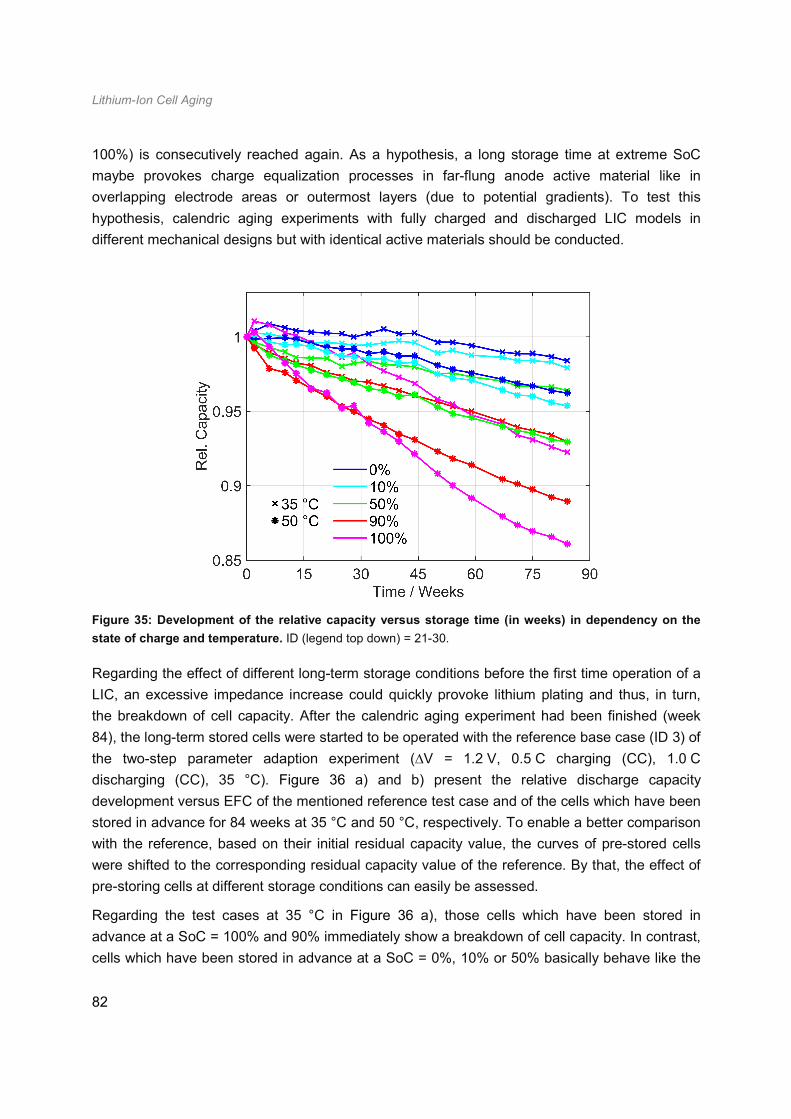
Lithium-Ion Cell Aging
82
100%) is consecutively reached again. As a hypothesis, a long storage time at extreme SoC
maybe provokes charge equalization processes in far-flung anode active material like in
overlapping electrode areas or outermost layers (due to potential gradients). To test this
hypothesis, calendric aging experiments with fully charged and discharged LIC models in
different mechanical designs but with identical active materials should be conducted.
Figure 35: Development of the relative capacity versus storage time (in weeks) in dependency on the
state of charge and temperature. ID (legend top down) = 21-30.
Regarding the effect of different long-term storage conditions before the first time operation of a
LIC, an excessive impedance increase could quickly provoke lithium plating and thus, in turn,
the breakdown of cell capacity. After the calendric aging experiment had been finished (week
84), the long-term stored cells were started to be operated with the reference base case (ID 3) of
the two-step parameter adaption experiment (∆V = 1.2 V, 0.5 C charging (CC), 1.0 C
discharging (CC), 35 °C). Figure 36 a) and b) present the relative discharge capacity
development versus EFC of the mentioned reference test case and of the cells which have been
stored in advance for 84 weeks at 35 °C and 50 °C, respectively. To enable a better comparison
with the reference, based on their initial residual capacity value, the curves of pre-stored cells
were shifted to the corresponding residual capacity value of the reference. By that, the effect of
pre-storing cells at different storage conditions can easily be assessed.
Regarding the test cases at 35 °C in Figure 36 a), those cells which have been stored in
advance at a SoC = 100% and 90% immediately show a breakdown of cell capacity. In contrast,
cells which have been stored in advance at a SoC = 0%, 10% or 50% basically behave like the
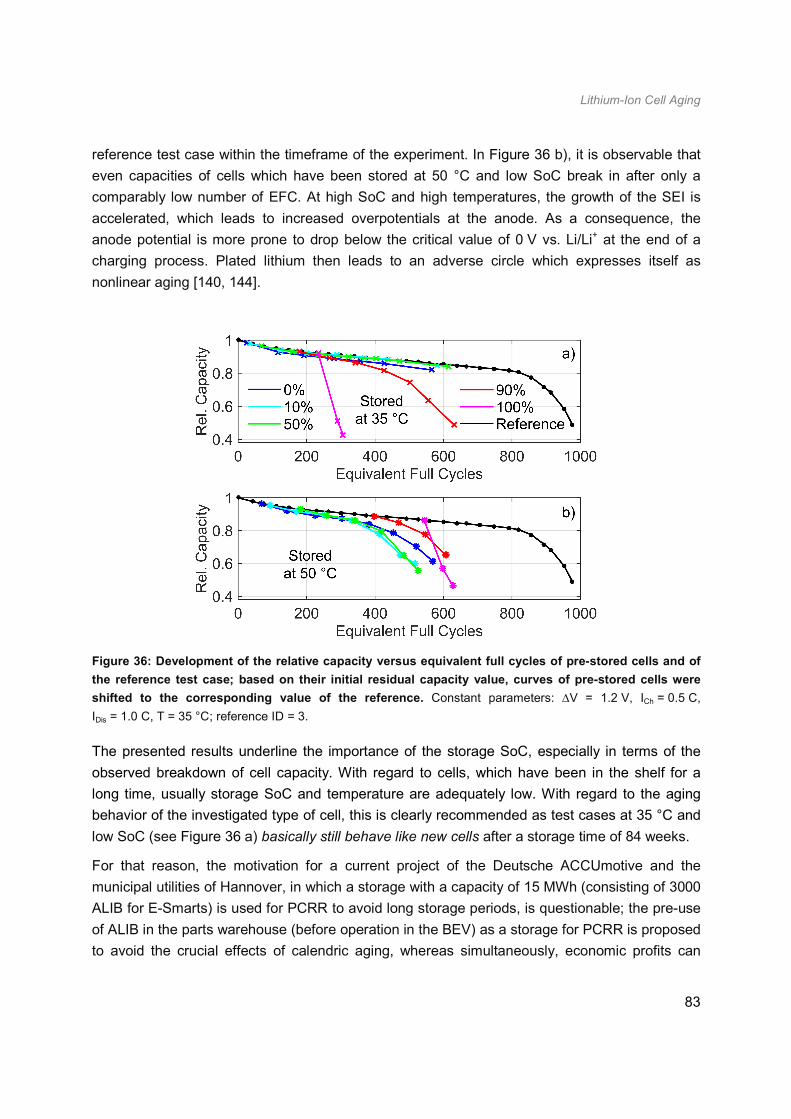
Lithium-Ion Cell Aging
83
reference test case within the timeframe of the experiment. In Figure 36 b), it is observable that
even capacities of cells which have been stored at 50 °C and low SoC break in after only a
comparably low number of EFC. At high SoC and high temperatures, the growth of the SEI is
accelerated, which leads to increased overpotentials at the anode. As a consequence, the
anode potential is more prone to drop below the critical value of 0 V vs. Li/Li+ at the end of a
charging process. Plated lithium then leads to an adverse circle which expresses itself as
nonlinear aging [140, 144].
Figure 36: Development of the relative capacity versus equivalent full cycles of pre-stored cells and of
the reference test case; based on their initial residual capacity value, curves of pre-stored cells were
shifted to the corresponding value of the reference. Constant parameters: ∆V = 1.2 V, ICh = 0.5 C,
IDis = 1.0 C, T = 35 °C; reference ID = 3.
The presented results underline the importance of the storage SoC, especially in terms of the
observed breakdown of cell capacity. With regard to cells, which have been in the shelf for a
long time, usually storage SoC and temperature are adequately low. With regard to the aging
behavior of the investigated type of cell, this is clearly recommended as test cases at 35 °C and
low SoC (see Figure 36 a) basically still behave like new cells after a storage time of 84 weeks.
For that reason, the motivation for a current project of the Deutsche ACCUmotive and the
municipal utilities of Hannover, in which a storage with a capacity of 15 MWh (consisting of 3000
ALIB for E-Smarts) is used for PCRR to avoid long storage periods, is questionable; the pre-use
of ALIB in the parts warehouse (before operation in the BEV) as a storage for PCRR is proposed
to avoid the crucial effects of calendric aging, whereas simultaneously, economic profits can
Lithium-Ion Cell Aging
84
even be generated [184]. This is regarded as interesting from the economic point of view, but as
is observable from the presented pre-storage experiments, the effects of calendric aging on the
performance of LIC can likewise be minimized by just choosing suited storage conditions.
In general, for applications with long inactive periods (such as BEV), optimized operational
strategies should always aim at decreasing the storage SoC if possible (besides from
temperature conditioning) [43]. With regard to the pre-aged state of SLB, due to the increased
risk of nonlinear aging, related concern is even enhanced. In the following subchapter, the main
results and statements of Chapter 6 are repetitively summarized.
6.3 Conclusion
In this chapter, the results of a large LIC aging experiment were presented; in the first phase of
it, the parameters voltage swing, current rate and temperature were varied to detect their
respective effect towards nonlinear aging (which is generally observed at residual capacities of
approx. 80%). For the second phase, yielded results of the first one were used to define
appropriate values of control element parameters. These in turn were used within further
experiments which aimed at analyzing and assessing the controllability of nonlinear aging by
either a two-step parameter (voltage swing, charging rate, temperature) or a continuous
charging rate adaption. Furthermore, the effects of different long-term storage conditions before
a first operation were investigated by combining calendric and cyclic aging experiments.
Lithium plating, which results in an adverse circle of cyclable lithium and graphite active material
loss, is regarded as the cause of nonlinear aging. In accordance with the stress factors of lithium
plating, i.e., high charging rates and end voltages at low temperatures, the onset of nonlinear
aging could be offset within the first phase of aging experiments: while the maximally allowed
charging rate of 1.0 C almost immediately triggered nonlinear aging, no increase of the aging
rate was observed for the minimum charging rate of 0.2 C; a reduction of the voltage swing ∆V
from 1.2 V to 0.94 V extended the area of linear aging around 42%. Regarding the temperature,
an increase from 25 °C to 35 °C resulted in an extension of almost 40% before reaching the
turning point, but cycling at 50 °C compared with 35 °C shortened the length of the linear area
about 34%. To sum up, the onset of nonlinear aging could be delayed or even prevented by:
• a reduced voltage swing (decreased charging and/or increased discharging end voltage)
• a reduced charging rate
• operation at the cell specific temperature optimum
Between the development of considered impedance parts and corresponding capacity values, a
linear negative correlation was clearly observable for almost all test cases, even after the onset
of nonlinear aging; i.e., the impedance parts correspondingly exhibited an intense increase,
simultaneously with the breakdown of capacity. The correlation between capacity fade and
Lithium-Ion Cell Aging
85
impedance increase of LIC represents the base of a later presented (correlation based) aging
quick test. Regarding its realization, an observed phenomenon could be critical: for test cases
with a mild compared with a challenging load profile, impedance parts were observed to be
higher at corresponding values of the residual capacity. The causes of the effect might be
related to the multilayered structure of the passive layers (see Subchapter 3.2 and Chapter 8).
Regarding the results of the two-step parameter load adaption experiments in the second phase,
for both, the voltage swing and the charging rate, a reduction led to a clear prolongation of the
reachable service life, as nonlinear aging could be completely prevented. Due to the similar
aging behavior of reference and adaption test cases, the effect of the operational prehistory
appeared as only marginal. Furthermore, a causative relationship could be derived from the
temperature experiments, as switching away from the optimum immediately triggered nonlinear
aging in both the temperature increasing and decreasing experiment. In the reverse, considering
the case of temperature adaption towards the optimum, a delay or prevention of nonlinear aging
is assumed as the most likely result, as a consequence.
The close-to-the-edge charging process, which was derived from the continuous charging rate
adaption experiment, was only useful for a gained adaption, as e.g. for a linear adaption of the
current rate without a gain (referred to the capacity fade), capacity breakdown quickly occurred
nevertheless. This was especially due to the acceleration of the aging experiment by starting
with the maximally allowed charging rate of 1.0 C. However, for a reduced value of the charging
rate in the beginning, the charging process, which considers the progress of aging, is regarded
as promising and capable of enabling fast charging without a reduced service life.
The experiment, which addressed the effects of different long-term storage conditions before the
first cell operation, underlined the detrimental effects of high storage temperatures and SoC.
Only those cells which had been stored for 84 weeks at the lower temperature of 35 °C and
lower SoC (0%, 10%, and 50%) could be operated afterwards in a satisfactory manner. The rest
exhibited a quick breakdown of cell capacity from the beginning of operation.
With regard to the implementation of SLC, the findings on the effect of nonlinear aging are
promising, as the adaption experiments clearly showed the possibility of extending the service
life by load reduction. However, a major issue is to reliably predict the onset of nonlinear aging,
which must not be missed under any circumstances. Thus, it is relevant to find the ideal hand-
over time, i.e., when the respective ALIB is removed from the car, refurbished, and finally reused
in a SLA as stationary energy storage (not compulsory). There, energy density is of minor
importance and thus, the respective storage can simply be oversized to reach the required mild
load profile (i.e., a reduced voltage swing and charging rate), with regard to the pre-aged state of
the battery. Furthermore, regarding the effect of the temperature, especially low values are
regarded as critical during operation (as the occurrence of lithium plating is promoted).
Temperature conditioning should always ensure operation at the cell specific and aging
Lithium-Ion Cell Aging
86
dependent temperature optimum (which is around room temperature). However, cooling or
heating is in any case accompanied by a reduction of the battery system’s efficiency. Contrary to
active application periods, optimized operational strategies should always aim at decreasing the
storage SoC and temperature, if possible, to avoid a strong rise of impedance. Due to the
increased risk of nonlinear aging as a consequence of their pre-aged state, the related concern
is especially enhanced for SLB. Finally, if the special characteristics of SLB are gratifyingly
considered with regard to an adequate load and temperature, due to the resulting extension of
the service life, SLC might be economically realizable (from the perspective of the aging
behavior of a single LIC).
Lithium-Ion Cell-to-Cell Variation
87
7 Lithium-Ion Cell-to-Cell Variation
Aside from the effect of nonlinear aging, the increasing cell-to-cell parameter variation is
regarded as the second core issue towards the implementation of SLC. The value of the
variation in the new state, which is a consequence of deviations in the production process, is
inevitably increased with the progress of aging, even if the charge equalization and the
temperature conditioning system work sufficiently effective. Regarding the implementation of
SLC, cell-to-cell variation is crucial as only a fraction of the units of a BEV battery pack might be
worthy to refurbish from an economic point of view. This is why the battery units must be
measured to select only those, which are suitable for reuse. However, especially the measuring
of capacity is time-consuming and thus, costly.
In complete, 484 new and 954 aged cells out of two identical BEV each (i.e., 1908 BEV cells in
total) were characterized to yield a broad set of data for the distribution fit analysis, which is
presented in Subchapter 7.1. Therein, the results are presented only from a pure mathematical
perspective. However, afterwards in Subchapter 7.2, they are compared with the operational
histories of the respective BEV (see Subchapter 5.3). Finally, as single cell outliers are capable
of remarkably influencing whole cell compounds (in dependency on the respective cell
interconnection configuration), they are characterized in Subchapter 7.3. Figure 37 clarifies the
progress of work which is reached in Chapter 7.
With regard to the implementation of SLC, cell outliers are rather critical if the desired level of
battery units, at which they are planned to be reinstalled in SLB, is the single cell; exemplarily,
considering reuse constellations of large cells with bolted connections, the effect of cell-to-cell
variation would be tremendous. However, reuse at the cell level is regarded as unlikely from the
economic point of view, as, e.g., either the breakup of single cells’ soldered joints or just the
opening of bolts might be too costly even for large cells.
Regarding reuse constellations at the module level, cell outliers play only a minor role, if the BEV
battery units consist of a large number of cells in parallel which is often the case. As a
consequence, the effect of a single cell outlier is compensated. However, e.g. temperature
gradients might result in whole areas of inferior and superior modules (in which all cells each are
particularly bad or good) in a battery pack. Thus, as BEV modules are generally connected in
series, the performance of the whole pack is limited to the worst; the sufficiently accurate online
detection of wrongdoing modules, though, is currently not yet state-of-the-art, which is why
modules must be costly measured to select those suitable for reuse. That is, cell-to-cell variation
is rather relevant regarding the implementation of SLC, if not only single cell outliers are present,
but cell-to-cell variation is scaled up to the next level due to affected whole areas of cell
compounds (basically resulting in module-to-module variation). Regarding large-scale energy

Lithium-Ion Cell-to-Cell Variation
88
storage projects with SLB, capacity measurement can probably be even skipped, as a scale-up
effect of cell-to-cell or module-to-module variation is compensated by the high number of cells or
modules, respectively; thus, it might be adequate, as a consequence, to select similar ones only
based on comparing the mileage and the mean logged temperature values.
Figure 37: Progress of work in Chapter 7: the box of the presented core issue (increasing cell-to-cell
variation) is colored in cyan.
7.1 Distribution Fit Analysis
This subchapter deals with the distribution of capacity, Rzc and Rpl+ct with consideration of all
cells in the new and the aged state (out of BEV1 and BEV2). At first, no distinction is made
regarding the position of cells in a module or of modules in the battery pack; likewise the
influence of interconnections, the direction of the cooling air flow etc. is not considered. Focus is
on the pure statistical analysis of the overall amount of investigated cells. All statistical
calculations were thereby performed by use of the MATLAB Statistics Toolbox. Figure 38 shows
nine histograms of the relative frequency of capacity, Rzc and Rpl+ct (row 1 - 3) for the batches of
new cells, BEV1 and BEV2 (column a) - c)). Histograms are fitted to normal distribution
according to Equation (4), represented by solid lines. Additionally, two-parameter Weibull
distribution fits, marked by dotted lines, are calculated according to Equation (6). The two-
instead of three-parameter Weibull distribution is chosen because no minimum life parameter γ
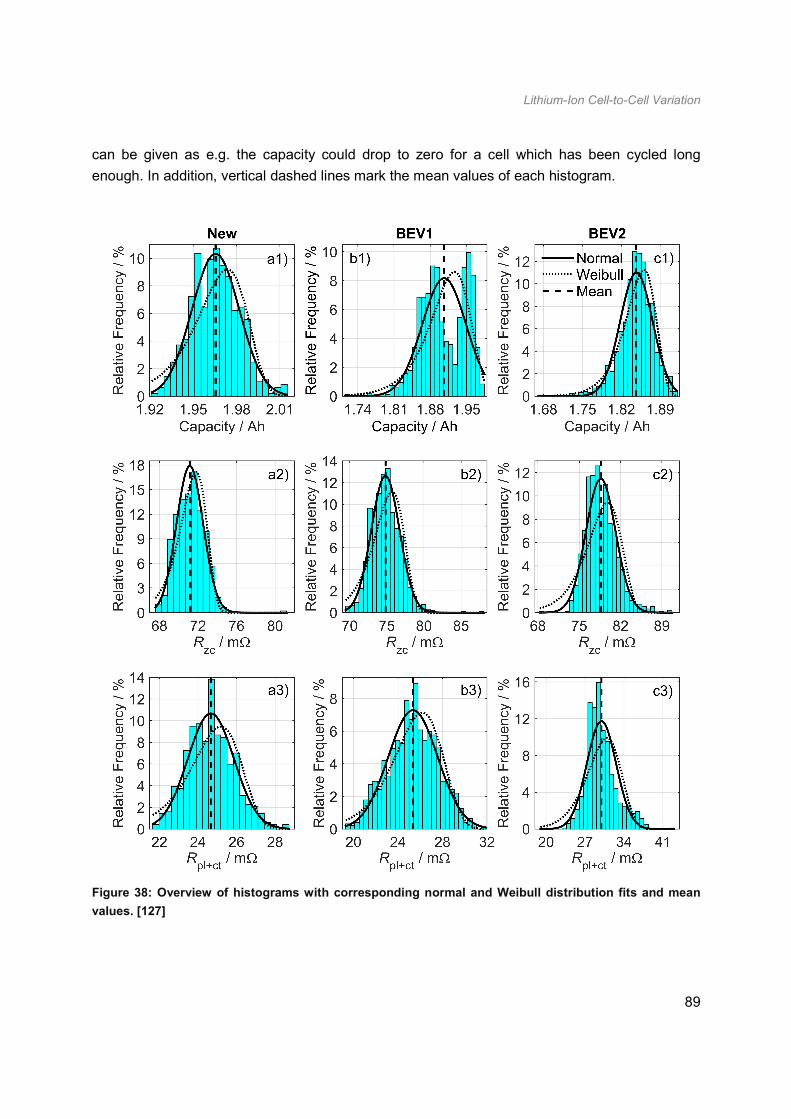
Lithium-Ion Cell-to-Cell Variation
89
can be given as e.g. the capacity could drop to zero for a cell which has been cycled long
enough. In addition, vertical dashed lines mark the mean values of each histogram.
Figure 38: Overview of histograms with corresponding normal and Weibull distribution fits and mean
values. [127]
Lithium-Ion Cell-to-Cell Variation
90
It has to be mentioned that all data values are considered and plotted in the respective
frequency class, but strong outliers are not regarded for distribution fit analysis. Strong outliers
are defined here as bins more far away from the mean value before or after the first appearance
of histogram classes equal to zero. This is useful because the distribution shape is strongly
influenced by strong outliers and therefore quality of the fit decreases. In terms of supporting
clarity, the total value range including outliers can be identified by the range of the distribution
plots even for classes with bins which are invisible due to the small relative frequency value.
As already mentioned in Subchapter 5.3, the mean capacity value of the batch of new cells
µNew,C = 1.97 Ah dropped to µBEV1,C = 1.91 Ah and µBEV2,C = 1.85 Ah, respectively. Besides of the
capacity fade due to the progress of aging, also the parameter variation is reported to alter as a
result of it [142, 160-162]. This is reflected by κNew,C = 0.8%, κBEV1,C = 2.25% and κBEV2,C = 1.57%
with regard to the normal distribution fit. As BEV2 exhibits the lowest mean capacity value but
BEV1 the highest coefficient of variation κ, the assumed relationship of increasing dispersion
with the progress of aging can only partially, i.e., referred to the new state, be proven. However,
this ambiguous tendency could originate from distinct reasons like local weak spots in the
battery pack of BEV1 as the histogram itself appears to be bimodal. Regarding the development
of Rzc, the mean value of the new state with µNew,zc = 71.15 mΩ is increased to µBEV1,zc =
74.08 mΩ or µBEV2,zc = 78.64 mΩ, respectively. Assumption of increased parameter variation with
the progress of aging is unambiguous with regard to Rzc, as κNew,zc = 1.94%, κBEV1,zc = 2.56% and
κBEV2,zc = 3.19%. Considering Rpl+ct, the average value of the batch of new cells is increased from
µNew,pl+ct = 24.67 mΩ to µBEV1,pl+ct = 25.35 mΩ or µBEV2,pl+ct = 29.95 mΩ, respectively. Same as for
Rzc, there is a clear correlation for the progress of aging and the coefficients of variation with
κNew,pl+ct = 4.86%, κBEV1,pl+ct = 8.76% and κBEV2,pl+ct = 8.78%. As a conclusion from the normal
distribution fit analysis, the assumption of an increased parameter spread with the progress of
aging, i.e., new < BEV1 < BEV2, is justified for the three investigated parameters. However,
regarding capacity values, tendency is ambiguous due to the bimodal shape of the histogram of
BEV1 which leads to a disproportionately high coefficient of variation κ.
After normal distribution fit analysis, same is performed for the two-parameter Weibull
distribution. In contrast to arithmetic mean values µ and coefficients of variation κ, when dealing
with normal distribution, the scale and shape parameter η and β are used to parameterize the
Weibull distribution fit. Thereby, all Weibull fits are calculated by the maximum likelihood
estimation method. Regarding capacities, results with the same tendency as for normal
distribution fit analysis are obtained for the Weibull approach, with scale parameters of ηNew,C =
1.97 Ah, ηBEV2,C = 1.93 Ah and ηBEV2,C = 1.86 Ah. Comparing the scale parameters η to the
corresponding mean values µ of BEV1 and BEV2, deviation is small with approx. 1.05% and
0.54%, respectively. However, parameters must be interpreted differently as the scale parameter
η in classical reliability analysis reflects the value of the data set for which 63.2% of devices will
have failed. Calculated values for the corresponding shape parameters βNew,C = 116.06, βBEV1,C =
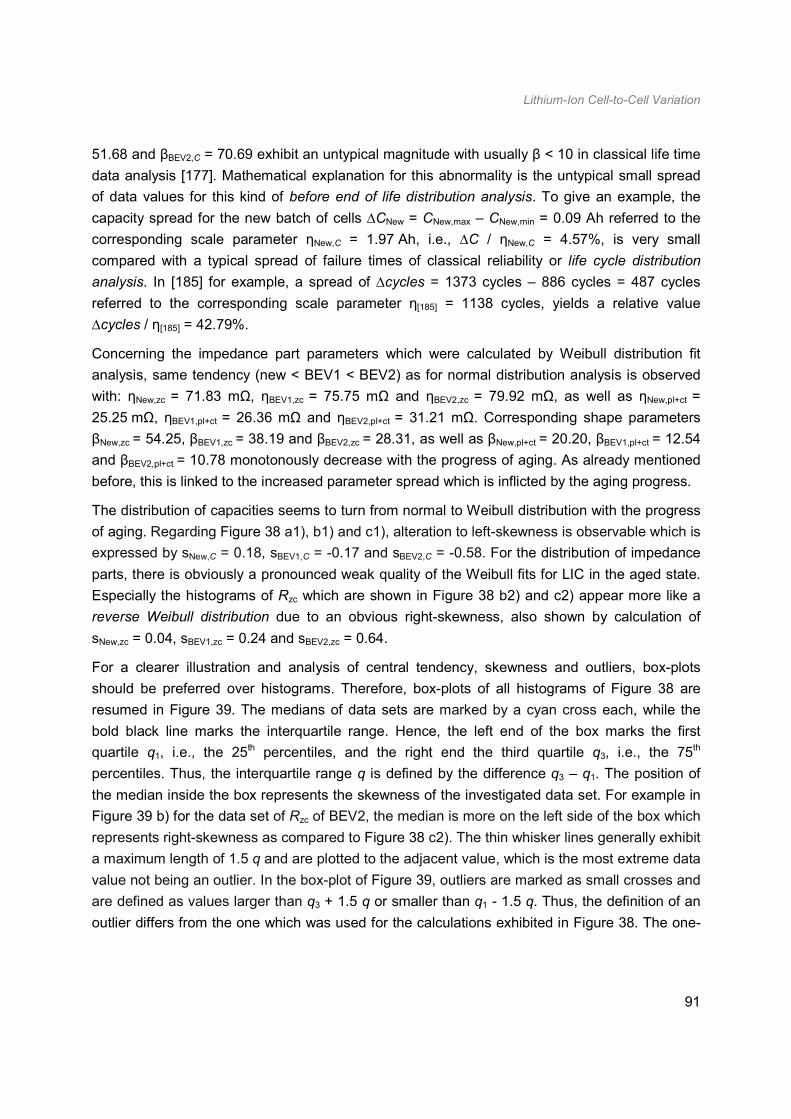
Lithium-Ion Cell-to-Cell Variation
91
51.68 and βBEV2,C = 70.69 exhibit an untypical magnitude with usually β < 10 in classical life time
data analysis [177]. Mathematical explanation for this abnormality is the untypical small spread
of data values for this kind of before end of life distribution analysis. To give an example, the
capacity spread for the new batch of cells ∆CNew = CNew,max – CNew,min = 0.09 Ah referred to the
corresponding scale parameter ηNew,C = 1.97 Ah, i.e., ∆C / ηNew,C = 4.57%, is very small
compared with a typical spread of failure times of classical reliability or life cycle distribution
analysis. In [185] for example, a spread of ∆cycles = 1373 cycles – 886 cycles = 487 cycles
referred to the corresponding scale parameter η[185] = 1138 cycles, yields a relative value
∆cycles / η[185] = 42.79%.
Concerning the impedance part parameters which were calculated by Weibull distribution fit
analysis, same tendency (new < BEV1 < BEV2) as for normal distribution analysis is observed
with: ηNew,zc = 71.83 mΩ, ηBEV1,zc = 75.75 mΩ and ηBEV2,zc = 79.92 mΩ, as well as ηNew,pl+ct =
25.25 mΩ, ηBEV1,pl+ct = 26.36 mΩ and ηBEV2,pl+ct = 31.21 mΩ. Corresponding shape parameters
βNew,zc = 54.25, βBEV1,zc = 38.19 and βBEV2,zc = 28.31, as well as βNew,pl+ct = 20.20, βBEV1,pl+ct = 12.54
and βBEV2,pl+ct = 10.78 monotonously decrease with the progress of aging. As already mentioned
before, this is linked to the increased parameter spread which is inflicted by the aging progress.
The distribution of capacities seems to turn from normal to Weibull distribution with the progress
of aging. Regarding Figure 38 a1), b1) and c1), alteration to left-skewness is observable which is
expressed by sNew,C = 0.18, sBEV1,C = -0.17 and sBEV2,C = -0.58. For the distribution of impedance
parts, there is obviously a pronounced weak quality of the Weibull fits for LIC in the aged state.
Especially the histograms of Rzc which are shown in Figure 38 b2) and c2) appear more like a
reverse Weibull distribution due to an obvious right-skewness, also shown by calculation of
sNew,zc = 0.04, sBEV1,zc = 0.24 and sBEV2,zc = 0.64.
For a clearer illustration and analysis of central tendency, skewness and outliers, box-plots
should be preferred over histograms. Therefore, box-plots of all histograms of Figure 38 are
resumed in Figure 39. The medians of data sets are marked by a cyan cross each, while the
bold black line marks the interquartile range. Hence, the left end of the box marks the first
quartile q1, i.e., the 25th percentiles, and the right end the third quartile q3, i.e., the 75th
percentiles. Thus, the interquartile range q is defined by the difference q3 – q1. The position of
the median inside the box represents the skewness of the investigated data set. For example in
Figure 39 b) for the data set of Rzc of BEV2, the median is more on the left side of the box which
represents right-skewness as compared to Figure 38 c2). The thin whisker lines generally exhibit
a maximum length of 1.5 q and are plotted to the adjacent value, which is the most extreme data
value not being an outlier. In the box-plot of Figure 39, outliers are marked as small crosses and
are defined as values larger than q3 + 1.5 q or smaller than q1 - 1.5 q. Thus, the definition of an
outlier differs from the one which was used for the calculations exhibited in Figure 38. The one-
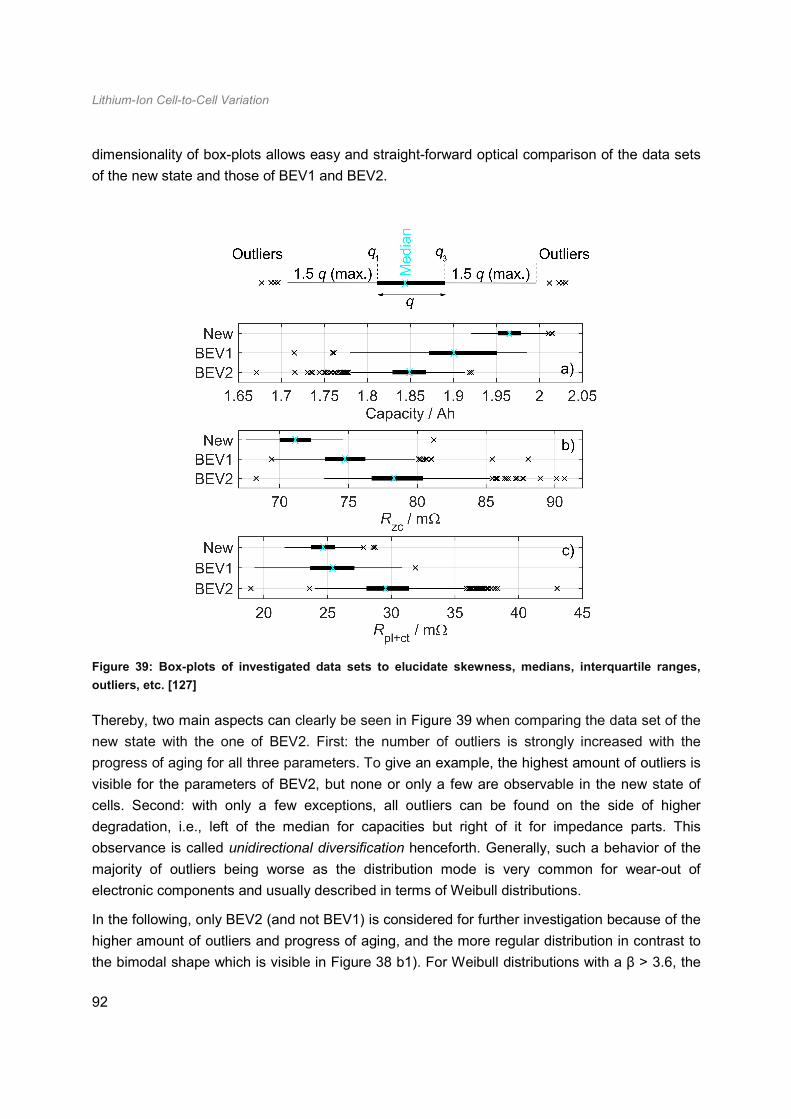
Lithium-Ion Cell-to-Cell Variation
92
dimensionality of box-plots allows easy and straight-forward optical comparison of the data sets
of the new state and those of BEV1 and BEV2.
Figure 39: Box-plots of investigated data sets to elucidate skewness, medians, interquartile ranges,
outliers, etc. [127]
Thereby, two main aspects can clearly be seen in Figure 39 when comparing the data set of the
new state with the one of BEV2. First: the number of outliers is strongly increased with the
progress of aging for all three parameters. To give an example, the highest amount of outliers is
visible for the parameters of BEV2, but none or only a few are observable in the new state of
cells. Second: with only a few exceptions, all outliers can be found on the side of higher
degradation, i.e., left of the median for capacities but right of it for impedance parts. This
observance is called unidirectional diversification henceforth. Generally, such a behavior of the
majority of outliers being worse as the distribution mode is very common for wear-out of
electronic components and usually described in terms of Weibull distributions.
In the following, only BEV2 (and not BEV1) is considered for further investigation because of the
higher amount of outliers and progress of aging, and the more regular distribution in contrast to
the bimodal shape which is visible in Figure 38 b1). For Weibull distributions with a β > 3.6, the

Lithium-Ion Cell-to-Cell Variation
93
majority of outliers are situated left from the median due to the resulting left-skewness. As
already mentioned earlier, this is invalid for the description of impedance parts in the aged state
of cells, as an obvious right-skewness of respective distributions is observable. Calculation of
the reciprocal values of investigated impedance parts, i.e., raising the conductances Gzc = 1 / Rzc
and Gpl+ct = 1 / Rpl+ct, can solve that issue. Exemplarily, the yielded data sets of BEV2 are plotted
as histograms in Figure 40 and analyzed again by the normal and the Weibull distribution fitting
approach. In case of the normal distribution fit, calculated values of the skewness are sBEV2,zc,cond
= -0.45 and sBEV2,pl+ct,cond = -0.17, which represents left-skewness. For the Weibull fit, parameters
obtained are ηBEV2,zc,cond = 12.91 S, ηBEV2,pl+ct,cond = 34.92 S, βBEV2,zc,cond = 36.54 and βBEV2,pl+ct,cond =
12.64. Especially for GBEV2,zc, whose histogram is depicted in Figure 40 a), the resulting shape
fits much better to a Weibull distribution as compared with the data set of RBEV2,zc which is
illustrated in Figure 38 c2). Again as already explained for the histograms which are depicted in
Figure 38, outliers appear as invisible due to the low height of histogram bins but the lines of
distribution fit analyses mark the total value range.
Figure 40: Histograms of a) GBEV2,zc and b) GBEV2,pl+ct with corresponding normal and Weibull
distributions and mean values. [127]
For GBEV2,pl+ct, the quality of the normal and Weibull fit is difficult to assess due to ambiguous
results. For the capacity distributions which are shown in Figure 38 a1) and c1), and RBEV2,zc
resp. GBEV2,zc distributions which are shown in Figure 38 a2) and Figure 40 a), the new
hypothesis is constructed that described histograms turn from a normal to a Weibull distribution
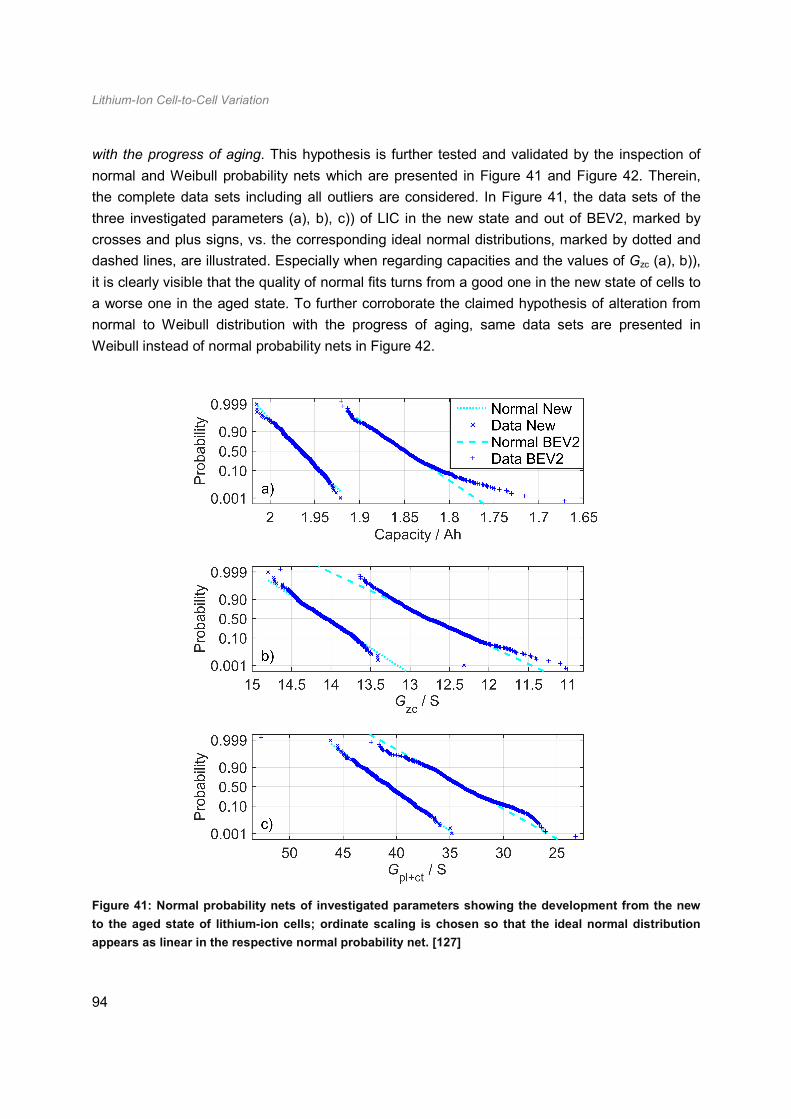
Lithium-Ion Cell-to-Cell Variation
94
with the progress of aging. This hypothesis is further tested and validated by the inspection of
normal and Weibull probability nets which are presented in Figure 41 and Figure 42. Therein,
the complete data sets including all outliers are considered. In Figure 41, the data sets of the
three investigated parameters (a), b), c)) of LIC in the new state and out of BEV2, marked by
crosses and plus signs, vs. the corresponding ideal normal distributions, marked by dotted and
dashed lines, are illustrated. Especially when regarding capacities and the values of Gzc (a), b)),
it is clearly visible that the quality of normal fits turns from a good one in the new state of cells to
a worse one in the aged state. To further corroborate the claimed hypothesis of alteration from
normal to Weibull distribution with the progress of aging, same data sets are presented in
Weibull instead of normal probability nets in Figure 42.
Figure 41: Normal probability nets of investigated parameters showing the development from the new
to the aged state of lithium-ion cells; ordinate scaling is chosen so that the ideal normal distribution
appears as linear in the respective normal probability net. [127]
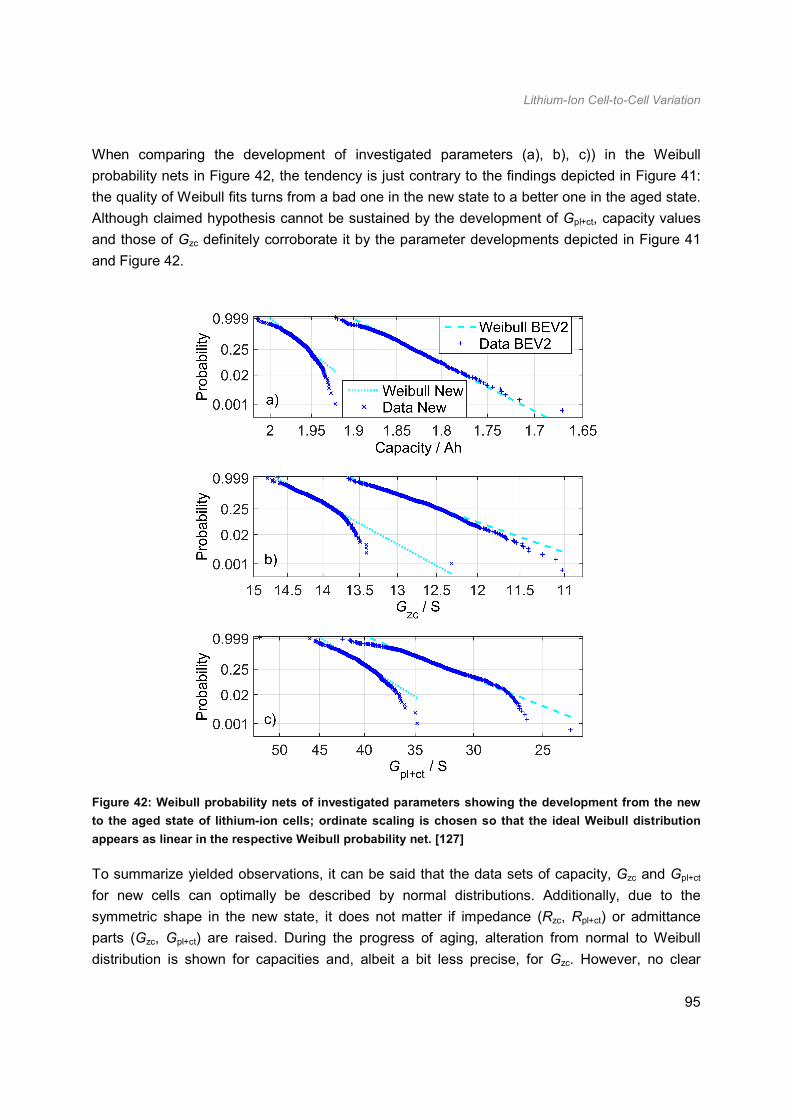
Lithium-Ion Cell-to-Cell Variation
95
When comparing the development of investigated parameters (a), b), c)) in the Weibull
probability nets in Figure 42, the tendency is just contrary to the findings depicted in Figure 41:
the quality of Weibull fits turns from a bad one in the new state to a better one in the aged state.
Although claimed hypothesis cannot be sustained by the development of Gpl+ct, capacity values
and those of Gzc definitely corroborate it by the parameter developments depicted in Figure 41
and Figure 42.
Figure 42: Weibull probability nets of investigated parameters showing the development from the new
to the aged state of lithium-ion cells; ordinate scaling is chosen so that the ideal Weibull distribution
appears as linear in the respective Weibull probability net. [127]
To summarize yielded observations, it can be said that the data sets of capacity, Gzc and Gpl+ct
for new cells can optimally be described by normal distributions. Additionally, due to the
symmetric shape in the new state, it does not matter if impedance (Rzc, Rpl+ct) or admittance
parts (Gzc, Gpl+ct) are raised. During the progress of aging, alteration from normal to Weibull
distribution is shown for capacities and, albeit a bit less precise, for Gzc. However, no clear
Lithium-Ion Cell-to-Cell Variation
96
statement can be made for Gpl+ct in the aged state regarding the available data. Probably, longer
operation time and thus pronounced aging could deliver clearer results.
In the following, the reasons of the parameters (capacity, Gzc) to turn from normal to Weibull
distribution with the progress of aging are discussed more specifically. Thereby, extrinsic
reasons like temperature gradients in a battery pack are excluded, but considered in the
upcoming subchapter. Focus here is the interaction between deviations in the production
process and aging mechanisms at the cell level. Possibly linked with the production process,
even for pre-selected cells cycled with the same load profile under controlled atmosphere in the
laboratory, the aging behavior is reported to vary [160]. In the production process, cells are
manufactured with the aim to yield the respective nominal capacity as accurately as possible.
Therefore, e.g. the active materials or electrodes are controlled to stay within predefined mixing
or thickness tolerances, respectively, in order to obtain the desired characteristics of the
fabricated cell model [50, 163, 164]. Result of such a manufacturing and screening process is
that the normal distribution is optimally suited to describe the parameter variation of LIC in the
new state.
However, a minimum deviation e.g. in the thickness of electrodes is only scarcely avoidable, as
an additional reduction of tolerances would result in excessively increased manufacturing costs
at a comparably low improvement of performance [163]. Although when satisfying the required
tolerances, e.g. deviations in the mixture of the electrolyte might influence the evolution of
passive layers; or deviations in the thickness of electrodes might lead to differently pronounced
aging effects caused by the electrodes’ volumetric changes. For the latter, thicker electrodes
result in higher capacities in the new state which is paid by the price of pronounced cyclic aging;
or in the reverse, thinner electrodes lead to lower capacities but also to a deceleration of cyclic
aging [50, 163, 164].
The reason for alteration from normal to Weibull distribution with the progress of aging might be
explainable by such an interrelationship between deviations in the production process and a
variety of aging mechanisms of LIC. As the majority of new cells exhibits parameters in the near
of the normal distribution mode (average), aging behavior can also be assumed to proceed
ordinarily. It is mainly provoked by unavoidable mechanisms like passive layer growth,
irreversible structural changes of the cathode or aforementioned volumetric changes which
especially lead to anode active material loss [67, 68]. However, there are also cells which have
just barely complied with required tolerances. As already mentioned before, thinner electrodes
might result in reduced cyclic aging due to lower volumetric changes, reduced overpotentials
and heat generation. However, zero aging behavior can never be reached with common LIC
technologies as there are unavoidable aging mechanisms like passive layer growth [67].
According to this, thicker electrodes might provoke accelerated cyclic aging behavior. If it is
assumed, that cells which bear characteristics at the upper and lower bound of tolerances (like

Lithium-Ion Cell-to-Cell Variation
97
electrode thickness) are uniformly distributed, it is still questionable why there are more cells in
the aged state at the higher side of degradation.
This unidirectional diversification, which is typical for Weibull distribution, might be explained by
additional aging or failure mechanisms, like e.g. detachment of active materials from the current
collectors, pronounced aging which results from local lithium plating, or faulty triggering of
internal safety devices [48, 140]. Due to such mechanisms, cells may exhibit strong dispersion
as degradation itself is strong compared with conventional, unavoidable aging mechanisms
which were described before. As a conclusion, there is an interrelationship between deviations
in the production process and a variety of aging mechanisms, which might be the reason that
the aging rate of LIC (and so the parameter variation in the aged state) can be described by
Weibull distribution.
7.2 Influence of Operational Histories of Examined Vehicles
In the distribution fit analysis, no distinction is made regarding the position of modules, SoC drifts
or temperature gradients along the cooling air flow in the battery pack, but treats every LIC in the
same manner. These influences which could e.g. lead to local weak spots in the battery pack
are combined henceforth in the umbrella term extrinsic influences. So, this subchapter aims at
explaining abnormalities of cell parameters (capacity, Rzc resp. Gzc, Rpl+ct resp. Gpl+ct) which were
observed in the distribution fit analysis by comparison with the data of operational histories of
examined BEV. In the literature, it is mentioned that although if intrinsic cell-to-cell variation
(caused by the production process) is minimized by pre-selection of most similar cells, the LIC of
a multi-cell battery system will inevitably spread due to extrinsic influences like described above
[142, 160-162].
However, the calculation of the mean values of the module temperatures at begin and end of
each drive showed a maximum deviation of approx. 2 K between the coolest and hottest module
without a clear linkage to the module position in the battery pack or the rank order with regard to
the cooling air flow (see Figure 19). If the limited sensor accuracy of ±1 K is considered, no hot
spots in the battery pack or insufficiently cooled modules can clearly be stated. Additionally, also
the mean voltage (or SoC) dispersion of battery units versus all drives shows to be smaller than
the sensor measurement accuracy of ±10 mV. As a conclusion, it can be stated that both the
charge equalization and the temperature conditioning system work sufficiently effective and
thus, without creating locally situated weak spots in the battery packs of the investigated cars.
For the most part, the investigation of the aged modules of BEV1 reveals equally distributed
outliers regarding the values of cell capacity within the analyzed modules. The bimodal or two-
peak distribution, which is depicted in Figure 38 b1), is observable again at the module level as
four modules exhibit a mean capacity of approx. 1.95 Ah, whereas the residual five modules
have only one of approx. 1.87 Ah. However, no clear linkage to the position of these two groups
Lithium-Ion Cell-to-Cell Variation
98
of modules with distinct performance values is observable. Also when regarding the values of
Rzc of these modules, outliers mostly concentrate on definite modules but again no clear linkage
to the position of modules within the pack can be made. In addition, also for BEV2, no influence
of the position of modules on the investigated parameters and their dispersion is observable.
Besides, the assumption of a missing correlation between the module position and the
performance of cells within the progress of aging is corroborated by comparing the six
completely identically located modules of BEV1 and BEV2 (see Figure 19). Also for these 12
modules in total, no clear tendency can be observed as e.g. weak modules from a concrete
position in the battery pack of BEV1 face good modules in the corresponding position of BEV2.
Though, for a definite statement, all 48 modules of both cars instead of only nine should be
investigated; resulting measurement effort would be enormous, however, whereas it can be
assumed that the same results would be obtained.
Because of the measured homogenous temperature and voltage distribution and due to the non-
existing dependency on the position of battery units within the pack, prevalence of cell outliers is
assumed to be of cell-intrinsic nature provoked by tolerances during the production process,
distinct thermal loads of cells in the soldering process and the aforementioned interrelationship
of these deviations with a variety of aging mechanisms.
7.3 Characterization of Cell Outliers
As aforementioned, a negative correlation between capacity fade and impedance increase has
been observed for a variety of loads, even after the onset of nonlinear aging (see Subchapter
6.1). Generally, most people would expect a negative correlation also for outlier cells, meaning a
cell with a remarkably high or low capacity coming along with low or high impedance,
respectively. This appears especially logical in the discharge direction (no CV phase), as the
discharge end voltage is reached earlier for cells with an increased impedance due to enhanced
overpotentials; as a consequence, the available discharge capacity is limited. In the following,
different types of cell outliers within two exemplary battery modules are tried to be characterized,
also with regard to the cooling air flow of the temperature conditioning system (see Figure 19).
Figure 43 shows the value pairs of capacity and Rzc of the 106 cells of the two exemplary battery
modules, arranged in accordance with the cooling air flow of the temperature conditioning
system. That is, cells are numbered consecutively along their rank regarding the cooling air flow
through the module, i.e., cell number one is the first at the cooling air entrance, while cell
number 106 being the last at the side of deflection. Both capacity and Rzc for BEV1 and BEV2,
which are represented by dotted and solid lines, respectively, do not exhibit dependency from
the cell positioning, because the parameters appear randomly distributed around a relatively
constant mean value. Thus, no hot spots are detectable within the two exemplary battery
modules.
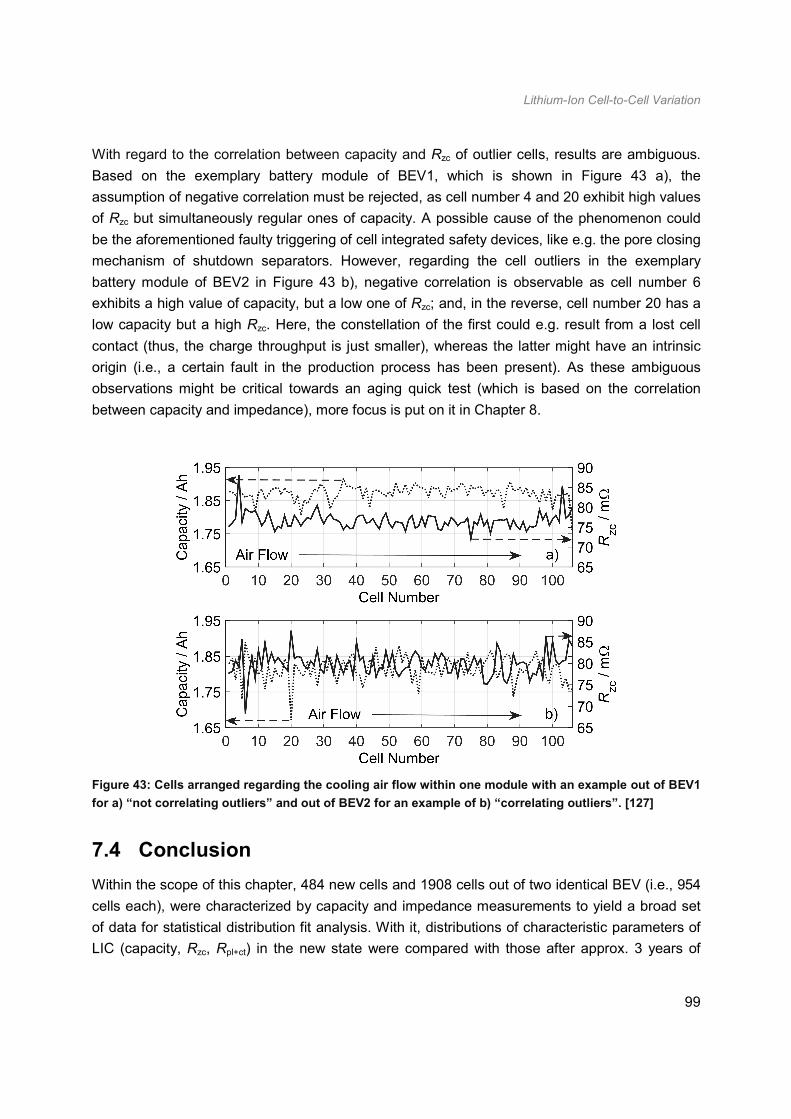
Lithium-Ion Cell-to-Cell Variation
99
With regard to the correlation between capacity and Rzc of outlier cells, results are ambiguous.
Based on the exemplary battery module of BEV1, which is shown in Figure 43 a), the
assumption of negative correlation must be rejected, as cell number 4 and 20 exhibit high values
of Rzc but simultaneously regular ones of capacity. A possible cause of the phenomenon could
be the aforementioned faulty triggering of cell integrated safety devices, like e.g. the pore closing
mechanism of shutdown separators. However, regarding the cell outliers in the exemplary
battery module of BEV2 in Figure 43 b), negative correlation is observable as cell number 6
exhibits a high value of capacity, but a low one of Rzc; and, in the reverse, cell number 20 has a
low capacity but a high Rzc. Here, the constellation of the first could e.g. result from a lost cell
contact (thus, the charge throughput is just smaller), whereas the latter might have an intrinsic
origin (i.e., a certain fault in the production process has been present). As these ambiguous
observations might be critical towards an aging quick test (which is based on the correlation
between capacity and impedance), more focus is put on it in Chapter 8.
Figure 43: Cells arranged regarding the cooling air flow within one module with an example out of BEV1
for a) “not correlating outliers” and out of BEV2 for an example of b) “correlating outliers”. [127]
7.4 Conclusion
Within the scope of this chapter, 484 new cells and 1908 cells out of two identical BEV (i.e., 954
cells each), were characterized by capacity and impedance measurements to yield a broad set
of data for statistical distribution fit analysis. With it, distributions of characteristic parameters of
LIC (capacity, Rzc, Rpl+ct) in the new state were compared with those after approx. 3 years of
Lithium-Ion Cell-to-Cell Variation
100
BEV customer operation. Obtained results indicated alteration from normal to left-skewed
Weibull distribution especially for the values of capacities and conductances Gzc with the
progress of aging. As a majority of the values of Rzc in the aged state of LIC was observed to be
higher than compared with the mode of distribution, this suggested right-skewness which was
the reason to raise the reciprocal value, i.e., the conductance Gzc. In general, with only a few
exceptions, all the cell outliers were found on the side of higher degradation, i.e., left of the
median for capacities (and admittance parts) but right of it for impedance parts. This
unidirectional diversification is very common for wear-out of electronic components which in turn
is usually described by Weibull distributions. An interrelationship between deviations in the LIC
production process and a variety of aging mechanisms is assumed to be responsible for the
alteration from normal to Weibull distribution. Furthermore, the total amount of cell outliers and
the lithium-ion cell-to-cell parameter spread were generally observed to increase with the
progress of aging.
Besides of the pure statistical analysis of data sets of new and aged LIC, obtained results were
additionally compared with the operational history of examined BEV by raising logged data of
operation of approx. 3 years of customer usage. Thereby, it was especially aimed at linking
suspicious values of parameters to weak spots of the battery pack, which e.g. could had been
caused by an insufficiently working charge equalization or temperature conditioning system.
However, because of the measured homogenous temperature and voltage distribution and due
to the non-existing dependency on the position of battery units (modules, cells) within the battery
pack, prevalence of cell outliers was assumed to be of cell-intrinsic nature provoked by
tolerances during the production process or distinct thermal loads of cells in the soldering
process. These deviations might then have been again in interrelationship with a variety of aging
mechanisms of LIC. By inspection of different sorts of outlier cells, there were those to list which
exhibited a negative correlation between capacity and impedance, but this was not always the
case. Furthermore, for one of the two investigated vehicles, examined modules could be split in
two groups with respect to their performance (see bimodal variation in BEV1); however, as
aforementioned, the relevant causes for this module-to-module variation stayed inexplicable,
especially as general local weak spots in the battery pack could be excluded by car-to-car
comparison.
Finally, as cell outliers appear unavoidably even in the presence of sufficiently effective charge
equalization and temperature conditioning systems, it is of major importance that the BMS
reliably detects LIC with suspicious parameters and effectively balances resulting SoC drifts to
guarantee a safe way of operation of the installed battery storage. Regarding the thereby
resulting decrease of efficiency, though, nothing else remains than to replace defect battery
units, i.e., to remanufacture the BEV battery pack. Furthermore, if battery unit parameters are
not monitored by the BMS at the cell level, consideration of cell parameter variation by
Lithium-Ion Cell-to-Cell Variation
101
implementation of respective distributions is not useful, as a systematic deviation would be
created; deviations are minimized by referring to the mean parameter values instead.
From the perspective of SLC implementation, observed appearance of cell outliers is considered
to be uncritical, as the effect of only a few cell outliers in modules is usually compensated
(depending on the cell interconnection configuration). However, as e.g. temperature gradients in
a battery pack can lead to local areas of inferior and superior modules (in which all cells are
either remarkably bad or good, respectively), cell-to-cell variation is basically scaled up to the
module level. Regarding reuse constellations at the module level, this is critical as the effect
basically underlines the need of costly capacity measuring to select only those which are
capable for reuse. A less expensive approach of detecting the status of aging is presented in the
following. Regarding large-scale energy storage projects with SLB, capacity measurement can
probably be skipped in general, as a scale-up effect of cell-to-cell or module-to-module variation
is compensated by the high number of cells or modules, respectively; thus, it might be adequate,
as a consequence, to select similar ones only based on comparing the mileage and the mean
logged temperature value.

Correlation between Capacity Fade and Impedance Increase of Lithium-Ion Cells
102
8 Correlation between Capacity Fade and Impedance
Increase of Lithium-Ion Cells
As aforementioned, e.g. temperature gradients might lead to local whole areas of inferior and
superior modules (in which all cells each are particularly bad or good) in BEV battery packs.
That is, parameter variation which starts at the cell level is basically scaled up to the module
level. Besides of the severe impact on the performance of the respective automotive battery,
regarding reuse constellations at the module level, this is critical as consequently capacity
measuring is required to select only those modules which are still suited. Unfortunately, capacity
measuring is time-consuming and thus, costly (see Subchapter 2.2).
In this chapter, a SoH quick test approach is presented, which is based on the correlation
between capacity fade and impedance increase. Regarding the aging behavior of nearly all
conducted test cases, which were presented in Chapter 6, a (negative) linear correlation
behavior was observed even after the onset of nonlinear aging. Thus, nonlinear aging would not
affect the functionality of the SoH quick test. Though, possibly critical for SoH quick test
implementation, it was also observed, that for challenging compared with mild load profiles at
high temperatures, the latter led to higher values of impedance parts at corresponding residual
capacities (i.e., for an assumed linear relationship, the respective gradients differed). As was
described in Subchapter 3.2, this phenomenon is possibly linked to the multilayered structure of
passive layers, as calendric aging might only provoke a growth of the respective outer layers,
whereas cyclic aging could make complete reconstruction necessary. The observed
phenomenon is discussed again in this chapter specifically with regard to its meaning for the
suggested SoH quick test.
Thereby, as the name of the chapter already suggests, the correlation behavior during the
progress of aging is comprehensively analyzed and assessed (not only focused on the
realization of the SoH quick test). Based on the fundamental investigation of the correlation
behavior, with regard to the quick test approach, though, the most suitable impedance part is
selected and its reachable scope of precision is presented. Therefore, for reuse constellations at
the module level, either module aging data sets must be available (which is unlikely in terms of
the enormous effort), or the scalability of respective cell aging data must be assumed as a
consequence. In the case of this work, presented in Subchapter 8.1, single aging state
correlation analysis is conducted based on the data sets of the 484 new and 1908 aged BEV
cells. The regression functions of the SoH quick test, presented in Subchapter 8.2, are basically
parameterized by the complete laboratory data sets of the first phase of aging experiments,
accompanied by data from supplementary cell measurements (see Subchapter 5.2). The
validation of the suggested quick test approach, which is given in Subchapter 8.3, is based
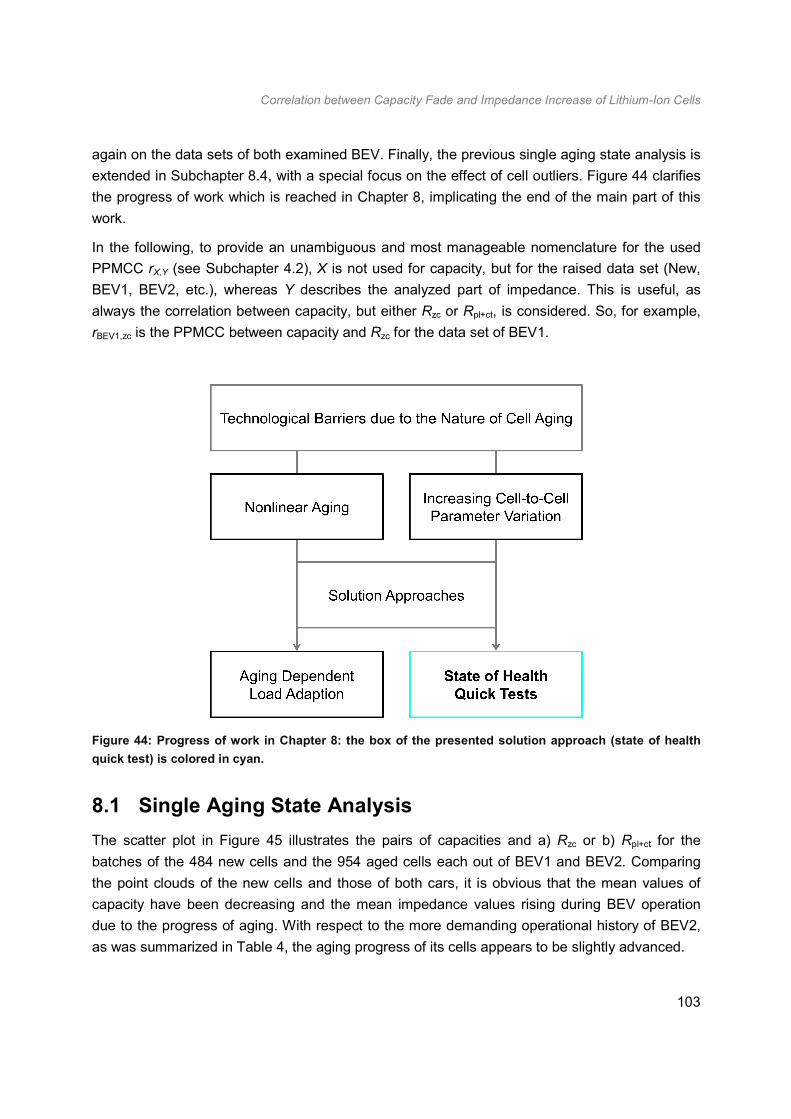
Correlation between Capacity Fade and Impedance Increase of Lithium-Ion Cells
103
again on the data sets of both examined BEV. Finally, the previous single aging state analysis is
extended in Subchapter 8.4, with a special focus on the effect of cell outliers. Figure 44 clarifies
the progress of work which is reached in Chapter 8, implicating the end of the main part of this
work.
In the following, to provide an unambiguous and most manageable nomenclature for the used
PPMCC rX,Y (see Subchapter 4.2), X is not used for capacity, but for the raised data set (New,
BEV1, BEV2, etc.), whereas Y describes the analyzed part of impedance. This is useful, as
always the correlation between capacity, but either Rzc or Rpl+ct, is considered. So, for example,
rBEV1,zc is the PPMCC between capacity and Rzc for the data set of BEV1.
Figure 44: Progress of work in Chapter 8: the box of the presented solution approach (state of health
quick test) is colored in cyan.
8.1 Single Aging State Analysis
The scatter plot in Figure 45 illustrates the pairs of capacities and a) Rzc or b) Rpl+ct for the
batches of the 484 new cells and the 954 aged cells each out of BEV1 and BEV2. Comparing
the point clouds of the new cells and those of both cars, it is obvious that the mean values of
capacity have been decreasing and the mean impedance values rising during BEV operation
due to the progress of aging. With respect to the more demanding operational history of BEV2,
as was summarized in Table 4, the aging progress of its cells appears to be slightly advanced.
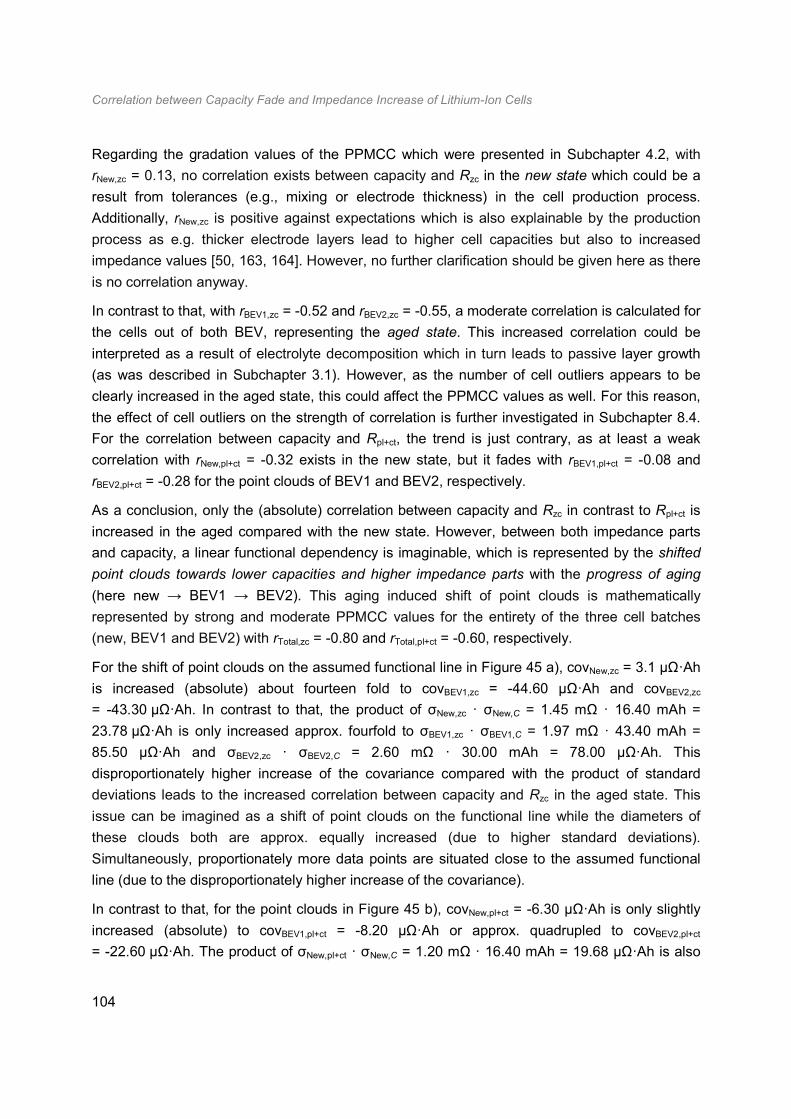
Correlation between Capacity Fade and Impedance Increase of Lithium-Ion Cells
104
Regarding the gradation values of the PPMCC which were presented in Subchapter 4.2, with
rNew,zc = 0.13, no correlation exists between capacity and Rzc in the new state which could be a
result from tolerances (e.g., mixing or electrode thickness) in the cell production process.
Additionally, rNew,zc is positive against expectations which is also explainable by the production
process as e.g. thicker electrode layers lead to higher cell capacities but also to increased
impedance values [50, 163, 164]. However, no further clarification should be given here as there
is no correlation anyway.
In contrast to that, with rBEV1,zc = -0.52 and rBEV2,zc = -0.55, a moderate correlation is calculated for
the cells out of both BEV, representing the aged state. This increased correlation could be
interpreted as a result of electrolyte decomposition which in turn leads to passive layer growth
(as was described in Subchapter 3.1). However, as the number of cell outliers appears to be
clearly increased in the aged state, this could affect the PPMCC values as well. For this reason,
the effect of cell outliers on the strength of correlation is further investigated in Subchapter 8.4.
For the correlation between capacity and Rpl+ct, the trend is just contrary, as at least a weak
correlation with rNew,pl+ct = -0.32 exists in the new state, but it fades with rBEV1,pl+ct = -0.08 and
rBEV2,pl+ct = -0.28 for the point clouds of BEV1 and BEV2, respectively.
As a conclusion, only the (absolute) correlation between capacity and Rzc in contrast to Rpl+ct is
increased in the aged compared with the new state. However, between both impedance parts
and capacity, a linear functional dependency is imaginable, which is represented by the shifted
point clouds towards lower capacities and higher impedance parts with the progress of aging
(here new → BEV1 → BEV2). This aging induced shift of point clouds is mathematically
represented by strong and moderate PPMCC values for the entirety of the three cell batches
(new, BEV1 and BEV2) with rTotal,zc = -0.80 and rTotal,pl+ct = -0.60, respectively.
For the shift of point clouds on the assumed functional line in Figure 45 a), covNew,zc = 3.1 µΩ·Ah
is increased (absolute) about fourteen fold to covBEV1,zc = -44.60 µΩ·Ah and covBEV2,zc
= -43.30 µΩ·Ah. In contrast to that, the product of σNew,zc · σNew,C = 1.45 mΩ · 16.40 mAh =
23.78 µΩ·Ah is only increased approx. fourfold to σBEV1,zc · σBEV1,C = 1.97 mΩ · 43.40 mAh =
85.50 µΩ·Ah and σBEV2,zc · σBEV2,C = 2.60 mΩ · 30.00 mAh = 78.00 µΩ·Ah. This
disproportionately higher increase of the covariance compared with the product of standard
deviations leads to the increased correlation between capacity and Rzc in the aged state. This
issue can be imagined as a shift of point clouds on the functional line while the diameters of
these clouds both are approx. equally increased (due to higher standard deviations).
Simultaneously, proportionately more data points are situated close to the assumed functional
line (due to the disproportionately higher increase of the covariance).
In contrast to that, for the point clouds in Figure 45 b), covNew,pl+ct = -6.30 µΩ·Ah is only slightly
increased (absolute) to covBEV1,pl+ct = -8.20 µΩ·Ah or approx. quadrupled to covBEV2,pl+ct
= -22.60 µΩ·Ah. The product of σNew,pl+ct · σNew,C = 1.20 mΩ · 16.40 mAh = 19.68 µΩ·Ah is also
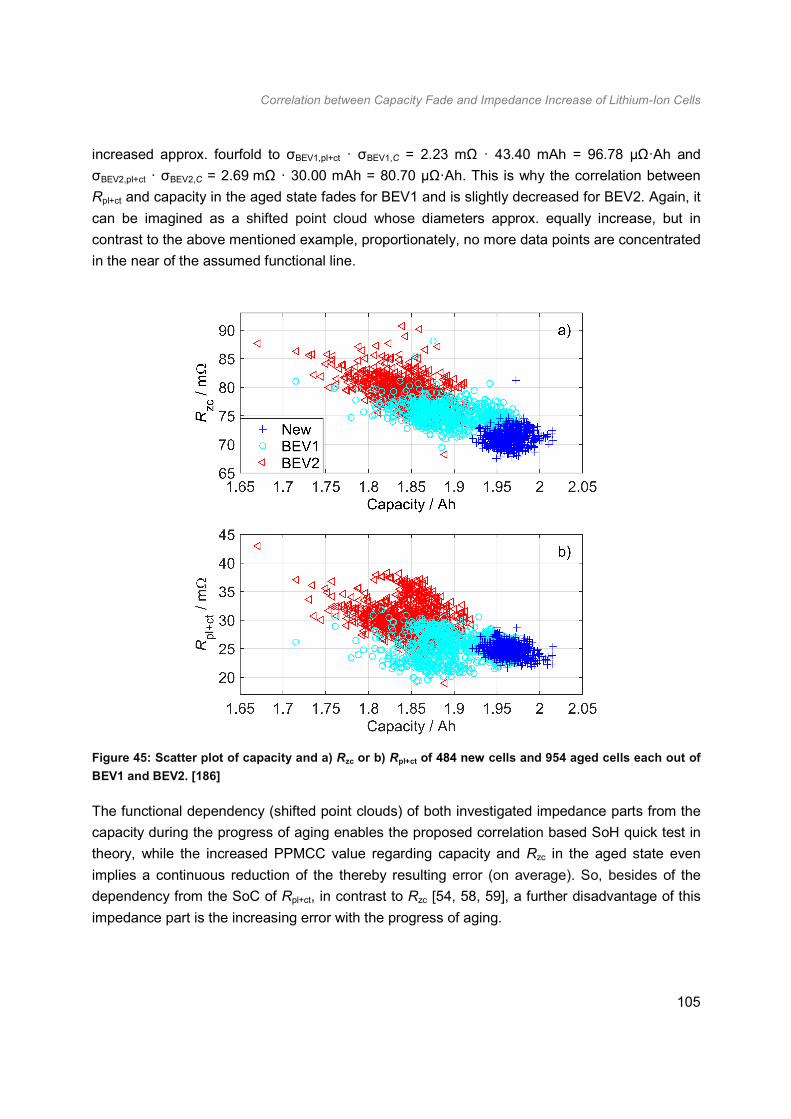
Correlation between Capacity Fade and Impedance Increase of Lithium-Ion Cells
105
increased approx. fourfold to σBEV1,pl+ct · σBEV1,C = 2.23 mΩ · 43.40 mAh = 96.78 µΩ·Ah and
σBEV2,pl+ct · σBEV2,C = 2.69 mΩ · 30.00 mAh = 80.70 µΩ·Ah. This is why the correlation between
Rpl+ct and capacity in the aged state fades for BEV1 and is slightly decreased for BEV2. Again, it
can be imagined as a shifted point cloud whose diameters approx. equally increase, but in
contrast to the above mentioned example, proportionately, no more data points are concentrated
in the near of the assumed functional line.
Figure 45: Scatter plot of capacity and a) Rzc or b) Rpl+ct of 484 new cells and 954 aged cells each out of
BEV1 and BEV2. [186]
The functional dependency (shifted point clouds) of both investigated impedance parts from the
capacity during the progress of aging enables the proposed correlation based SoH quick test in
theory, while the increased PPMCC value regarding capacity and Rzc in the aged state even
implies a continuous reduction of the thereby resulting error (on average). So, besides of the
dependency from the SoC of Rpl+ct, in contrast to Rzc [54, 58, 59], a further disadvantage of this
impedance part is the increasing error with the progress of aging.

Correlation between Capacity Fade and Impedance Increase of Lithium-Ion Cells
106
For a quick classification of cells in the new state, with disregard of the SoC dependency, raising
the correlation between Rpl+ct and capacity would be the better choice (for the investigated type
of cell), as its PPMCC is initially higher. However, correlation based quick classification of cells
in the new state is critical nevertheless as no or only a weak correlation exists between capacity
and Rzc or Rpl+ct, respectively. As aforementioned, this is assumed to be linked with tolerances in
the production process. The slightly increased absolute PPMCC values between capacity and
Rpl+ct compared with Rzc in the new state could be a result from the SEI formation process in
which the passive layer is firstly created under the consumption of active lithium.
In the next subchapter, data sets of both calendric and cyclic aging experiments are investigated
by linear regression analysis and PPMCC value calculation. By the first, a functional interrelation
between capacity and respective impedance parts is yielded, which is required for the SoH quick
test. By the latter, its reachable precision can be estimated. As aforementioned, Rpl+ct cannot be
used for the SoH quick test because of its SoC dependency; nevertheless, same investigations
than for Rzc are presented in the following, which aim at a fundamental understanding of the
correlation behavior between capacity and different impedance parts.
8.2 Aging Progress Regression Analysis
In this subchapter, regression curves are calculated for capacity and corresponding impedance
parts during the progress of aging. Thereby, it is important to distinguish from the inspection of
point clouds of single aging states (as shown in Figure 45), compared with a data set describing
the progress of aging as presented in Figure 46. In the first, each measuring point represents a
single cell, in contrast to the latter, in which a variety of points belongs to the same cell, basically
quantifying the number of checkups during the aging experiment.
The scatter plot in Figure 46 illustrates the pairs of capacities and a) Rzc or b) Rpl+ct for 83 cells
during the progress of aging in the laboratory under a variety of storage and operational
conditions (as presented in Subchapter 5.2; first phase of experiments). Thereby, it is apparent
in Figure 46 a) that cells from calendric (ID 21-30 + cells from supplementary measurements,
see Table 2) and cyclic (ID 1-11 + cells from supplementary measurements, see Table 1) aging
experiments, represented by plus-signs and triangles, form two different branches. For the same
value of capacity, the value of Rzc is higher for cells which have been stored only. A special
case, henceforth named as “Mild Cyclic” (represented by circles, ID 12, see Table 1), exhibits
the same behavior as observed for the cells of the calendric aging experiment. Cells of this test
case have been cycled with a rather mild load profile, i.e., current rates of 0.5 C / 1.0 C for
charging / discharging (both CC) within a small voltage swing ∆V = 0.94 V at a high temperature
of 50 °C. Such an observance of prevailing time-controlled aging mechanisms for cells cycled
with an unchallenging load profile at high temperatures has e.g. been reported in [141].
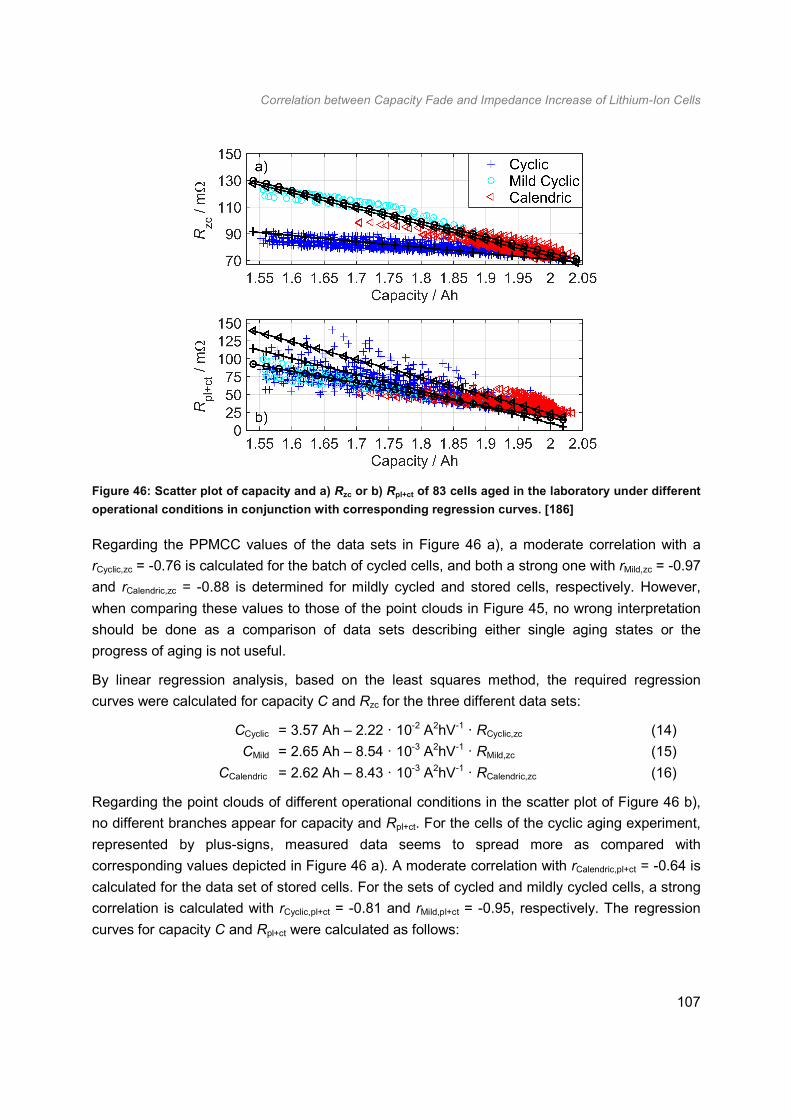
Correlation between Capacity Fade and Impedance Increase of Lithium-Ion Cells
107
Figure 46: Scatter plot of capacity and a) Rzc or b) Rpl+ct of 83 cells aged in the laboratory under different
operational conditions in conjunction with corresponding regression curves. [186]
Regarding the PPMCC values of the data sets in Figure 46 a), a moderate correlation with a
rCyclic,zc = -0.76 is calculated for the batch of cycled cells, and both a strong one with rMild,zc = -0.97
and rCalendric,zc = -0.88 is determined for mildly cycled and stored cells, respectively. However,
when comparing these values to those of the point clouds in Figure 45, no wrong interpretation
should be done as a comparison of data sets describing either single aging states or the
progress of aging is not useful.
By linear regression analysis, based on the least squares method, the required regression
curves were calculated for capacity C and Rzc for the three different data sets:
CCyclic = 3.57 Ah – 2.22 · 10-2 A2hV-1 · RCyclic,zc (14)
CMild = 2.65 Ah – 8.54 · 10-3 A2hV-1 · RMild,zc (15)
CCalendric = 2.62 Ah – 8.43 · 10-3 A2hV-1 · RCalendric,zc (16)
Regarding the point clouds of different operational conditions in the scatter plot of Figure 46 b),
no different branches appear for capacity and Rpl+ct. For the cells of the cyclic aging experiment,
represented by plus-signs, measured data seems to spread more as compared with
corresponding values depicted in Figure 46 a). A moderate correlation with rCalendric,pl+ct = -0.64 is
calculated for the data set of stored cells. For the sets of cycled and mildly cycled cells, a strong
correlation is calculated with rCyclic,pl+ct = -0.81 and rMild,pl+ct = -0.95, respectively. The regression
curves for capacity C and Rpl+ct were calculated as follows:

Correlation between Capacity Fade and Impedance Increase of Lithium-Ion Cells
108
CCyclic = 2.04 Ah – 4.40 · 10-3 A2hV-1 · RCyclic,pl+ct (17)
CMild = 2.11 Ah – 6.12 · 10-3 A2hV-1 · RMild,pl+ct (18)
CCalendric = 2.10 Ah – 3.99 · 10-3 A2hV-1 · RCalendric,pl+ct (19)
In the following subchapter, the correlation based SoH quick test is validated by usage of the
BEV data sets.
8.3 Validation of the State of Health Quick Test Approach
By inserting the measured impedance values of the BEV data sets in the detected equations
(which describe the functional interrelation between capacity and impedance values), SoH quick
test capacity is given as a result. To illustrate the approach of validation, BEV point clouds are
shown in the scatter plots of Figure 47 a) and b) in combination with the detected regression
curves. Thereby, it is obvious from Figure 47 a), that only a SoH quick test, which is based on
the regression curve of the data set of regularly cycled cells, can deliver good results. For the
entirety of operated cells, only cells of the “Mild Cyclic” batch which were operated with a mild
load profile at 50 °C formed an additional branch, as aforementioned. As the average module
temperature of both BEV was even lower than 30 °C, though, it was expectable that the BEV
data sets would rather behave like the one of the “Cyclic” batch.
Figure 47: Comparison of the value pairs of BEV1 and BEV2 with the linear regression functions. [186]
Because of that obviousness, only the regression curve of the “Cyclic” aging data set is raised
for further validation. By inserting the impedance values of BEV cells in the corresponding
regression functions, SoH quick test capacities are yielded as a result; then, these are each
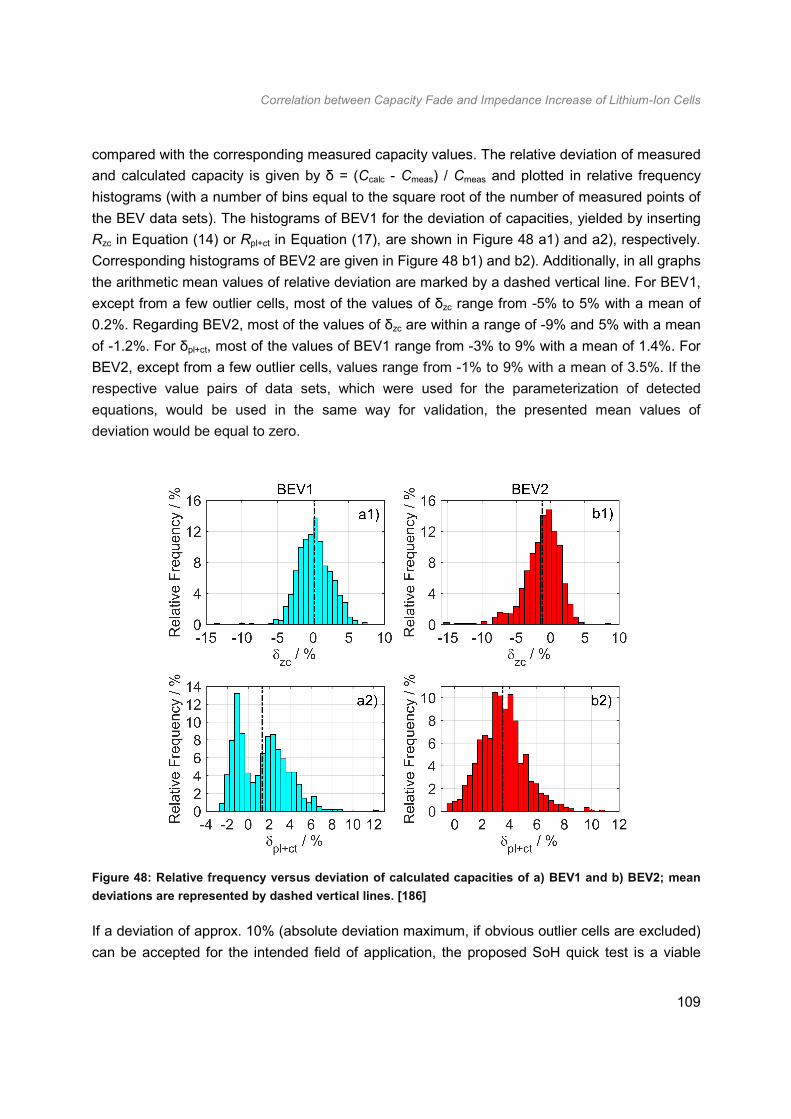
Correlation between Capacity Fade and Impedance Increase of Lithium-Ion Cells
109
compared with the corresponding measured capacity values. The relative deviation of measured
and calculated capacity is given by δ = (Ccalc - Cmeas) / Cmeas and plotted in relative frequency
histograms (with a number of bins equal to the square root of the number of measured points of
the BEV data sets). The histograms of BEV1 for the deviation of capacities, yielded by inserting
Rzc in Equation (14) or Rpl+ct in Equation (17), are shown in Figure 48 a1) and a2), respectively.
Corresponding histograms of BEV2 are given in Figure 48 b1) and b2). Additionally, in all graphs
the arithmetic mean values of relative deviation are marked by a dashed vertical line. For BEV1,
except from a few outlier cells, most of the values of δzc range from -5% to 5% with a mean of
0.2%. Regarding BEV2, most of the values of δzc are within a range of -9% and 5% with a mean
of -1.2%. For δpl+ct, most of the values of BEV1 range from -3% to 9% with a mean of 1.4%. For
BEV2, except from a few outlier cells, values range from -1% to 9% with a mean of 3.5%. If the
respective value pairs of data sets, which were used for the parameterization of detected
equations, would be used in the same way for validation, the presented mean values of
deviation would be equal to zero.
Figure 48: Relative frequency versus deviation of calculated capacities of a) BEV1 and b) BEV2; mean
deviations are represented by dashed vertical lines. [186]
If a deviation of approx. 10% (absolute deviation maximum, if obvious outlier cells are excluded)
can be accepted for the intended field of application, the proposed SoH quick test is a viable
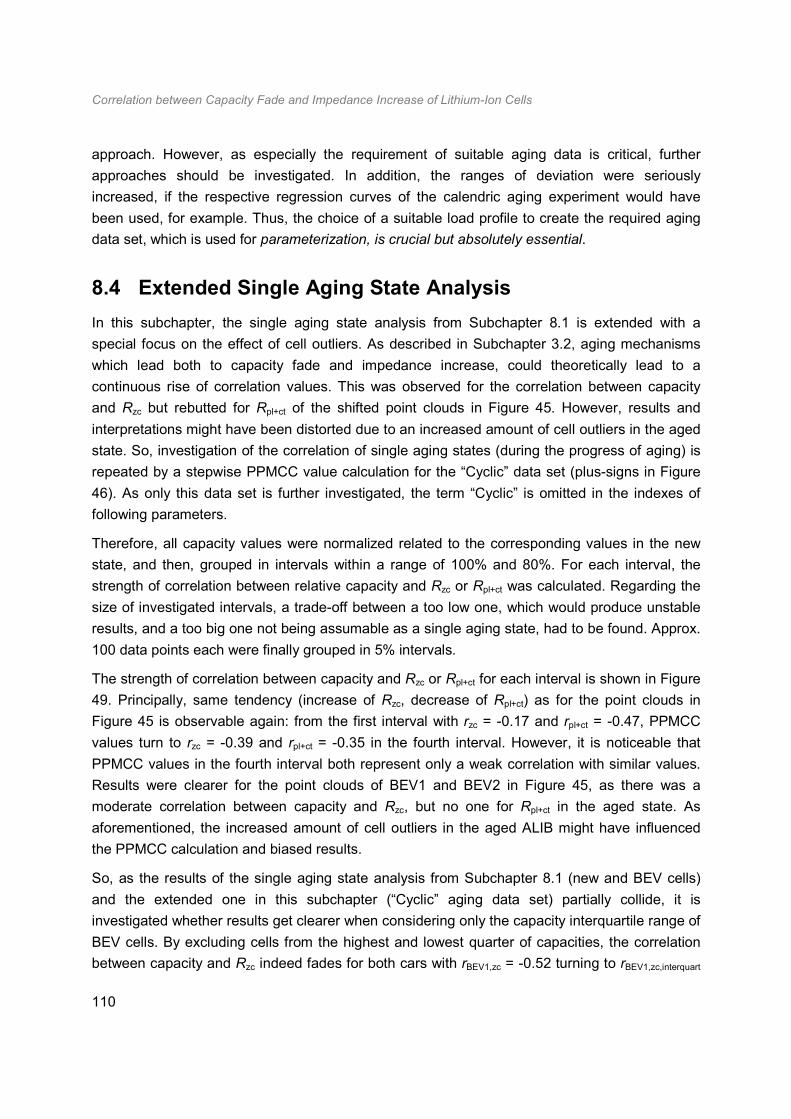
Correlation between Capacity Fade and Impedance Increase of Lithium-Ion Cells
110
approach. However, as especially the requirement of suitable aging data is critical, further
approaches should be investigated. In addition, the ranges of deviation were seriously
increased, if the respective regression curves of the calendric aging experiment would have
been used, for example. Thus, the choice of a suitable load profile to create the required aging
data set, which is used for parameterization, is crucial but absolutely essential.
8.4 Extended Single Aging State Analysis
In this subchapter, the single aging state analysis from Subchapter 8.1 is extended with a
special focus on the effect of cell outliers. As described in Subchapter 3.2, aging mechanisms
which lead both to capacity fade and impedance increase, could theoretically lead to a
continuous rise of correlation values. This was observed for the correlation between capacity
and Rzc but rebutted for Rpl+ct of the shifted point clouds in Figure 45. However, results and
interpretations might have been distorted due to an increased amount of cell outliers in the aged
state. So, investigation of the correlation of single aging states (during the progress of aging) is
repeated by a stepwise PPMCC value calculation for the “Cyclic” data set (plus-signs in Figure
46). As only this data set is further investigated, the term “Cyclic” is omitted in the indexes of
following parameters.
Therefore, all capacity values were normalized related to the corresponding values in the new
state, and then, grouped in intervals within a range of 100% and 80%. For each interval, the
strength of correlation between relative capacity and Rzc or Rpl+ct was calculated. Regarding the
size of investigated intervals, a trade-off between a too low one, which would produce unstable
results, and a too big one not being assumable as a single aging state, had to be found. Approx.
100 data points each were finally grouped in 5% intervals.
The strength of correlation between capacity and Rzc or Rpl+ct for each interval is shown in Figure
49. Principally, same tendency (increase of Rzc, decrease of Rpl+ct) as for the point clouds in
Figure 45 is observable again: from the first interval with rzc = -0.17 and rpl+ct = -0.47, PPMCC
values turn to rzc = -0.39 and rpl+ct = -0.35 in the fourth interval. However, it is noticeable that
PPMCC values in the fourth interval both represent only a weak correlation with similar values.
Results were clearer for the point clouds of BEV1 and BEV2 in Figure 45, as there was a
moderate correlation between capacity and Rzc, but no one for Rpl+ct in the aged state. As
aforementioned, the increased amount of cell outliers in the aged ALIB might have influenced
the PPMCC calculation and biased results.
So, as the results of the single aging state analysis from Subchapter 8.1 (new and BEV cells)
and the extended one in this subchapter (“Cyclic” aging data set) partially collide, it is
investigated whether results get clearer when considering only the capacity interquartile range of
BEV cells. By excluding cells from the highest and lowest quarter of capacities, the correlation
between capacity and Rzc indeed fades for both cars with rBEV1,zc = -0.52 turning to rBEV1,zc,interquart
Correlation between Capacity Fade and Impedance Increase of Lithium-Ion Cells
111
= -0.18 and rBEV2,zc = -0.55 to rBEV2,zc,interquart = -0.16. For Rpl+ct, PPMCC values turn from rBEV1,pl+ct =
-0.08 to rBEV1,pl+ct,interquart = -0.06 and rBEV2,pl+ct = -0.28 to rBEV2,pl+ct,interquart = -0.09. Thus, outlier cells
seem to have a strong effect when calculating PPMCC values, which is why precaution must be
exercised when interpreting results.
By eliminating outlier cells (like only regarding the interquartile range), no or only a weak
correlation exists between both investigated impedance parts and capacity in the new as well as
in the aged state. For the proposed SoH quick test, this means that there is no systematic
deviation in dependency from the actual SoH (in the absence of outliers), as there is no clear
tendency for the correlation itself during the progress of aging. Most important, however, the
SoC dependency of Rpl+ct is a disqualifier for SoH quick tests as a prior SoC adjustment would
result in a loss of any temporal advantage. So, only the correlation between capacity and Rzc
seems to be useful for the proposed SoH quick test – regardless of the correlation between
investigated impedance parts and capacity in any specific state of aging.
Figure 49: Stepwise calculation of single aging state PPMCC values for the batch of “Cyclic” cells. [186]
8.5 Conclusion
In this chapter, the correlation between capacity and impedance parts of LIC during calendar
and cycle life was investigated. Therefore, again the characterization data sets of the 484 new
cells and 954 aged cells, out of two BEV each, were used. In addition, the aging data of 83 cells
from the first phase of the laboratory aging experiments was considered, which in turn consisted
of a variety of storage and operational conditions.
By analyzing yielded data sets of single aging states with PPMCC calculation, results let assume
an increase of correlation between Rzc and capacity, but a decrease between capacity and Rpl+ct.
However, these tendencies seemed to depend strongly on the amount of cell outliers and thus,
should not be used for interpretation with regard to any specific aging mechanisms.
Correlation between Capacity Fade and Impedance Increase of Lithium-Ion Cells
112
Regression curves for impedance parts and corresponding capacity values were calculated by
linear regression analysis. By inserting values of respective impedance parts in these equations,
SoH quick test capacity for a LIC (of the same type) in any specific state of aging was quickly
given as a result. Thereby, the main reason to use the impedance part Rzc in contrast to Rpl+ct for
the SoH quick test was its SoC independency and occurrence at high frequencies in the
impedance spectrum. However, a major issue was the observance of different “branches” in the
scatter plots; the values of Rzc of stored compared with cycled cells were higher at
corresponding residual capacities. The branch of cells cycled with an unchallenging load profile
at high temperatures was congruent with the one of stored cells.
The appearance of different branches for cycled and stored cells might origin from the
multilayered structure of passive layers with mainly inorganic or organic salts close to the
electrode or electrolyte, respectively; therefore, the effects on capacity and impedance could
vary for calendric and cyclic aging as the first may only lead to a thickening of the layer close to
the electrolyte but the second provoke complete reconstruction. As a result, capacity and
impedance development could correlate nevertheless for each single case, but impedance
increase for the same capacity fade would differ. Thus, the choice of a suited load profile to
create the required aging data set, which is used for parameterization, is crucial but absolutely
essential.
With regard to the refurbishing process of SLB, optical failure inspection, serial number based
aging detection and analysis of logged BEV data is usually conducted before the costly capacity
measuring process. As a consequence, battery units which are apparently not suited for reuse
are sorted out in advance to minimize refurbishing costs. Generally, if a deviation of approx. 10%
can be accepted for the intended field of application, the proposed SoH quick test is regarded as
a viable approach. Though, with regard to the limited precision, it is recommended to use the
suggested approach in the refurbishing process only to additionally reduce the amount of battery
units in advance to the capacity measuring process. To omit it completely, the precision of SoH
quick test must be generally increased on the one hand, whereas on the other, legal certainty
should be created, as there are currently no related standards.
Final Conclusion
113
9 Final Conclusion
To finally conclude the thesis “Reuse of Automotive Lithium-Ion Batteries: An Assessment from
the Cell Aging Perspective”, at first, the main findings are summarized in the following
subchapter. Additionally, a short outlook is given, pointing out still present SLC research fields.
Afterwards, in Subchapter 9.2, for a most successful realization of battery reuse scenarios, the
top three priority recommendations for action are presented. These special tasks were worked
out, and after all decided by vote, by the authors of [14] in cooperation with a study related
advisory board. Those recommended actions are discussed and assessed within the scope of
this work.
9.1 Summary
In Chapter 1, former battery reuse studies were concisely summed up, and the topic was put into
an actual broader context, which is basically, the energy revolution and the launch of BEV.
Latest studies consistently state, on the one hand, that the potential of SLC to reduce the
acquisition costs of BEV must be regarded as rather low, but, on the other hand, there are
positive effects, which especially arise from the availability of cheap SLB for stationary energy
storage. Moreover, reuse concepts of aged ALIB can be imagined as a temporal bridge from
uneconomic to economic times of recycling (whereas the latter are expected to be reached in
the near future).
The different battery life cycle stages within a SLC were presented in Chapter 2. Aside from an
adequate operation of SLB, which especially considers their pre-aged state, the refurbishing
process, i.e., all necessary steps from automotive battery removal to the development of “new”
SLB, has been identified to play an essential role in reaching profitability of SLC. As a part of the
refurbishing process, SoH detection of respective battery units is regarded as the crucial point.
Thereby, either SoH quick tests, or ideally, algorithm implementation which enables online
logging of relevant state variables in BEV with sufficient precision, could lead to clearly reduced
costs of the refurbishing process and thus, to an increase of the residual value of aged ALIB.
The different aging mechanisms, which are known to occur in LIC, were described in Chapter 3.
Thereby, focus was laid particularly on those mechanisms, which lead to the so called effect of
nonlinear aging. This aging phenomenon is critical regarding the implementation of SLC, as the
desired second service life would be severely limited by its occurrence (which is usually
observed at residual capacities of approx. 80%). At the turning point, i.e., the start of nonlinear
aging, lithium plating is assumed to occur as a result of the increased overpotentials and
reduced capacity of the graphite anode. Because of the self-reinforcing nature of lithium plating,
Final Conclusion
114
which is accompanied by an increased distortion of the electrode balancing, an adverse circle of
lithium and graphite active material loss is finally assumed to provoke the effect of nonlinear
aging. With regard to the stress factors, which promote the occurrence of lithium plating, i.e.,
high charging rates and end voltages at low temperatures, SLC specific operational strategies
can be derived (which especially aim at extending the second service life of SLB by suppressing
nonlinear aging). Furthermore, at the end of Chapter 3, causes were described, which lead to a
continuous increase of the cell-to-cell variation in multi-cell battery applications (such as BEV);
thereby, an intrinsic cell-to-cell variation, which results from deviations in the production process,
is basically increased with the progress of aging due to external influences like SoC drifts of cells
or temperature gradients in a battery pack.
The required statistical fundamentals (univariate and bivariate analysis, link to the battery cell
and module interconnection configuration) were presented in Chapter 4. Afterwards, in Chapter
5, the experimental setup was described. Moreover, background information on the examined
BEV was provided. The main part of the work “Reuse of Automotive Lithium-Ion Batteries: An
Assessment from the Cell Aging Perspective” (Chapter 6, 7 and 8) was structured in two
technological core issues, which directly originate from the nature of LIC aging, and two
corresponding solution approaches. As the respective chapters in the main part of the work
already end in each case with a conclusion, to avoid unnecessary repetition, the results were
additionally reduced to the essential, and presented here in headword style.
Core Issue: Nonlinear Aging → Solution Approach: Aging Dependent Load Adaption
• nonlinear aging can be delayed or even avoided by a reduction of the charging rate; by a
reduction of the voltage swing (reduced charging end voltage, increased discharging end
voltage); by operation at the cell specific temperature optimum
• two-step parameter (voltage swing, charging rate, temperature) load adaption, shortly
before the onset of nonlinear aging, is effective towards its suppression
• the influence of the operational prehistory is marginal for cells (of the investigated model)
which mainly suffered from cyclic aging
• the influence of the operational prehistory is significant for cells (of the investigated
model) which severely suffered from calendric aging (i.e., those stored at high SoC and
temperature) as they quickly exhibit capacity breakdown after the start of cycling
• continuous charging rate adaption (close-to-the-edge charging) principally enables fast
charging without a reduction of the reachable service life
Finally, nonlinear aging is considered to be controllable by aging dependent load adaption;
though, as its onset must not be missed under any circumstances, reliable and precise online
SoH detection of battery modules is the key to success. In general, a well-coordinated
operational strategy appears to be capable of reducing the risk of nonlinear aging up to the
minimum.

Final Conclusion
115
Core Issue: Increasing Cell-to-Cell Variation → Solution Approach: SoH Quick Tests
• strength of variation and amount of outlier cells is increased with the progress of aging
• outlier cells are mostly found on the side of higher degradation (lower capacity, higher
impedance; “unidirectional diversification”)
• alteration from symmetric normal to skewed Weibull distribution
• appearance of outlier cells seems to be random and inevitable
• cell-to-cell variation, which is transferred to the module level, is more critical than cell
outliers with regard to the implementation of SLC
• correlation (between capacity and impedance) based SoH quick tests must be
parameterized with aging data which is similar to the practical use
• SoH quick tests (with limited precision) are capable of sorting out battery units in
advance to the costly capacity measuring process
After all, to support the profitability of SLC, reversible and easily detachable cell and module
interconnection techniques should be favored, as reduced refurbishing costs clearly increase the
residual value of aged ALIB. With regard to the limited precision of SoH quick tests, currently
only a supporting role in the pre-selection process of battery units is recommended. Following
the flow charts of the main and the refurbishing process of SLC (shown in Figure 3 and Figure
4), an adapted battery unit characterization and selection process is presented in Figure 50, in
which the SoH quick test is upstream to the capacity (and impedance) measurement. Main aim
is to sort out battery units, which are not reusable, in advance to the costly capacity measuring
process. Ideally, no further battery unit classification based on costly measurements would be
needed at all after retrieval of aging dependent BMS state variables. Therefore, it is necessary
to develop highly-precise SoH quick tests, which are runnable on the BMS of an ALIB.
Figure 50: Adapted battery unit characterization and selection process with the state of health quick
test only to support the steps of pre-selection.
Final Conclusion
116
Finally, with regard to the technological barriers which emerge directly from the nature of LIC
aging, battery SLC are regarded as well implementable (especially if online SoH detection is
refined); in contrast, legal and logistic issues (which are especially present due to the high
number of involved actors) are considered to be the more challenging part of economic SLC
realization. Here, the key is to revise present standards and norms, specifically with regard to
battery reuse concepts and thus, creating legal certainty for an utterly new market.
9.2 Recommendations for Action
The top three priority recommended actions to promote the implementation of battery reuse
scenarios (determined by vote by the authors of [14] and a study related advisory board) are:
• interface standardization to enable simple insight in the battery operational history
• definition of safety specific norms and standards for pre-aged batteries
• comprehensive analysis of the SLB market
The interface standardization is needed for straightforward data acquisition. In the ideal case, as
aforementioned, aging dependent BMS state variables already enable to separate reusable
battery units from those which are not. The costly capacity measurement process would then be
obsolete. Thus, the refinement of online SoH detection methodologies is of great importance
regarding the implementation of SLC, and the operation of LIB in general.
In the literature, there are contradicting statements regarding the issue if the safety of LIB is
influenced by the progress of aging. Exemplarily, it is stated in [81, 187] that aging leads to
reduced safety but just the opposite is mentioned in [188]. With regard to the implementation of
SLC, results of commonly prescribed safety tests, performed with new batteries and aged ones
with residual capacities smaller than 80%, should be compared to answer this serious question.
By that, insurance companies could be encouraged to offer coverage to SLB storage operators.
Furthermore, as strong capacity fade (like residual capacities smaller than 80%) can be an
indicator e.g. for small internal short-circuits, quickly classifying a battery as “safe” is actually just
possible if the battery operational prehistory is available. If the respective data set does not
disclose any signs of nonlinear aging, the battery can principally be regarded as safe even if the
battery aging progress is heavily advanced (but still in the area of linear aging).
The market acceptance towards used batteries is generally a considerable uncertainty. The
target groups of the, at present, imaginary SLB market and simultaneously their willingness to
pay must therefore be analyzed in more detail. Additionally, the availability of aged automotive
batteries must be compared with storage capacities of applications which are suitable for SLB,
via supply and demand analysis. Finally, the market acceptance towards used batteries is also
influenced by a variety of technological aspects, like the aforementioned safety level or the
ecological impact of batteries. Thus, upcoming battery research and development is decisive for
Final Conclusion
117
SLC implementation, but could also counteract its profitability as a SLB has always to compete
with a technologically superior, new battery model.
List of References
118
List of References
[1] B.G. Pollet, I. Staffell, J.L. Shang, Current status of hybrid, battery and fuel cell electric
vehicles: From electrochemistry to market prospects, Electrochim. Acta 84 (2012) 235-
249.
[2] O. van Vliet, A.S. Brouwer, T. Kuramochi, M. van den Broek, A. Faaij, Energy use, cost
and CO2 emissions of electric cars, J. Power Sources 196 (2011) 2298-2310.
[3] R. McCarthy, C. Yang, Determining marginal electricity for near-term plug-in and fuel cell
vehicle demands in California: Impacts on vehicle greenhouse gas emissions, J. Power
Sources 195 (2010) 2099-2109.
[4] S. Dunn, Hydrogen futures: toward a sustainable energy system, Int. J. Hydrogen Energ.
27 (2002) 235-264.
[5] Kraftfahrtbundesamt (29. October 2015):
http://www.kba.de/DE/Statistik/Fahrzeuge/Bestand/Umwelt/2014_b_umwelt_dusl_absolut.html
[6] Prognos AG, Energiewirtschaftliches Institut an der Universität Köln, Gesellschaft für
wirtschaftliche Strukturforschung, Entwicklung der Energiemärkte –
Energiereferenzprognose, Project Nr. 57/12, Basel, Cologne, Osnabrück, 2015.
[7] K. Kairies, D. Haberschusz, D. Magnor, M. Leuthold, J. Badeda, D.U. Sauer,
Wissenschaftliches Mess- und Evaluierungsprogramm Solarstromspeicher, Institut für
Stromrichtertechnik und Elektrische Antriebe (iSEA), Annual Report, Aachen, 2015.
[8] B. Battke, T.S. Schmidt, D. Grosspietsch, V.H. Hoffmann, A review and probabilistic
model of lifecycle costs of stationary batteries in multiple applications, Renew.
Sustainable Energy Rev. 25 (2013) 240-250.
[9] H. Vikström, S. Davidsson, M. Höök, Lithium availability and future production outlooks,
Appl. Energy 110 (2013) 252-266.
[10] E. Rahimzei, K. Sann, M. Vogel, Kompendium: Li-Ionen-Batterien - Grundlagen,
Bewertungskriterien, Gesetze und Normen, VDE Verband der Elektrotechnik, Frankfurt
am Main, 2015.
[11] D.C.R. Espinosa, A.M. Bernardes, J.A.S. Tenório, An overview on the current processes
for the recycling of batteries, J. Power Sources 135 (2004) 311-319.
[12] L. Gaines, R. Cuenca, Costs of Lithium-Ion Batteries for Vehicles, Argonne National
Laboratory, Technical Report ANL/ESD-42, Chicago, 2000.
List of References
119
[13] M. Gellner, L. Wuschke, H. Jäckel, U.A. Peuker, Akkus mechanisch aufbereiten,
RECYCLING Magazin 16 (2015) 26-29.
[14] S. Fischhaber, A. Regett, S.F. Schuster, H. Hesse, Second-Life-Konzepte für Lithium-
Ionen-Batterien aus Elektrofahrzeugen, Ergebnispapier Nr. 18 (Begleit- und
Wirkungsforschung), Frankfurt am Main, 2016.
[15] B. Nykvist, M. Nilsson, Rapidly falling costs of battery packs for electric vehicles, Nat.
Clim. Chang. 5 (2015) 329-332.
[16] EFS, DNV GL, What's driving tomorrow's electricity grid, Position Paper, Høvik, Wien,
2015.
[17] B.D. Williams, T.E. Lipman, Strategies for transportation electric fuel implementation in
California: Overcoming battery first-cost hurdles, California Energy Commission, PIER
Transportation Program, Final Report CEC-500-2009-091, Berkeley, 2010.
[18] California Environmental Protection Agency: Air Resources Board (6. September 2015):
http://www.arb.ca.gov/msprog/zevprog/zevprog.htm
[19] N. Pinsky, Electric Vehicle Battery 2nd Use Study, Argonne National Laboratory, Lemont,
1998.
[20] E. Cready, J. Lippert, J. Pihl, I. Weinstock, P. Symons, R.G. Jungst, Technical and
Economic Feasibility of Applying Used EV Batteries in Stationary Applications: A Study
for the DOE Energy Storage Systems Program, U.S. Department of Energy, Sandia
National Laboratories, Final Report SAND2002-4084, Albuquerque, Livermore, 2003.
[21] A. Burke, Performance, Charging, and Second-use Considerations for Lithium Batteries
for Plug-in Electric Vehicles, Institute of Transportation Studies, Research Report UCD-
ITS-RR-09-17, Davis, 2009.
[22] B. Williams, T. Lipman, Analysis of the combined vehicle- and post-vehicle-use value of
lithium-ion plug-in-vehicle propulsion batteries. Task 3, Second life applications and
value of "traction" lithium batteries, Transportation of Sustainability Research Center,
Final Report 500-02-004, Berkeley, 2011.
[23] C.K. Narula, R. Martinez, O. Onar, M.R. Starke, G. Andrews, Economic analyses of
deploying used batteries in power systems, U.S. Department of Energy, Oak Ridge
National Laboratory, Final Report ORNL/TM-2011/151, Oak Ridge, 2011.
[24] J. Neubauer, K. Smith, E. Wood, A. Pesaran, Identifying and Overcoming Critical
Barriers to Widespread Second Use of PEV Batteries, National Renewable Energy
Laboratory, Technical Report NREL/TP-5400-63332, Golden, 2015.
List of References
120
[25] M. Bowler, J. Weber, D. Bodde, J. Taiber, T. Kurfess, Battery second use: Sustainable
life cycle design through the extension of tools used in the vehicle development process,
5th International Conference on Sustainable Automotive Technologies (ICSAT),
Ingolstadt, September 2013.
[26] E.N. Elkind, S. Hecht, C. Horowitz, S. Weissman, REUSE AND REPOWER - How to
Save Money and Clean the Grid with Second-Life Electric Vehicle Batteries, CLEE,
Emmett Institute, Final Report, California, 2014.
[27] D. Beverungen, C. Fabry, W. Ganz, M. Matzner, G. Satzger, Dienstleistungsinnovationen
für Elektromobilität, DELFIN, Final Report, Aachen, Karlsruhe, Münster, Stuttgart, 2015.
[28] J. Warner, The Handbook of Lithium-Ion Battery Pack Design, 1st ed., Elsevier Science,
2015.
[29] R. Sathre, C.D. Scown, O. Kavvada, T.P. Hendrickson, Energy and climate effects of
second-life use of electric vehicle batteries in California through 2050, J. Power Sources
288 (2015) 82-91.
[30] D. Hustadt, Vattenfall Company Blog (21. August 2015): http://blog.vattenfall.de/das-zweite-leben-der-e-mobility-batterien/
[31] Heise Autos, Heise online (26. October 2015): http://www.heise.de/autos/artikel/Joint-Venture-baut-Speicher-aus-gebrauchten-E-Auto-Akkus-
2854938.html
[32] S.J. Tong, A. Same, M.A. Kootstra, J.W. Park, Off-grid photovoltaic vehicle charge using
second life lithium batteries: An experimental and numerical investigation, Appl. Energy
104 (2013) 740-750.
[33] Forsee Power - Designing Tomorrow (10. July 2015): http://www.forseepower.fr/wp-content/uploads/2015/07/10072015_2nd-Life-Project_DE.pdf
[34] Battery University Website (3. November 2015):
http://batteryuniversity.com/learn/article/battery_statistics
[35] J. Neubauer, A. Pesaran, The ability of battery second use strategies to impact plug-in
electric vehicle prices and serve utility energy storage applications, J. Power Sources
196 (2011) 10351-10358.
[36] J.S. Neubauer, A. Pesaran, B. Williams, M. Ferry, J. Eyer, A Techno-Economic Analysis
of PEV Battery Second Use Repurposed-Battery Selling Price and Commercial and
Indrustrial End-User Value, SAE International 2012-01-0349 (2012).
[37] H. Ambrose, D. Gershenson, A. Gershenson, D. Kammen, Driving rural energy access: a
second-life application for electric-vehicle batteries, Environ. Res. Lett. 9 (2014) 094004.
List of References
121
[38] K.N. Genikomsakis, C.S. Ioakimidis, A. Murillo, A. Trifonova, D. Simic, A Life Cycle
Assessment of a Li-ion urban electric vehicle battery, 27th International Electric Vehicle
Symposium and Exhibition (EVS), Barcelona, November 2013.
[39] D. Kim, A. Geissler, C. Menn, D. Hengevoss, Quantifizierung des Umweltnutzens von
gebrauchten Batterien aus Elektrofahrzeugen als gebäudeintegrierte 2nd-Life-
Stromspeichersysteme, Bauphysik 37 (2015) 213-222.
[40] R. Faria, P. Marques, R. Garcia, P. Moura, F. Freire, J. Delgado, A.T. de Almeida,
Primary and secondary use of electric mobility batteries from a life cycle perspective, J.
Power Sources 262 (2014) 169-177.
[41] L. Ahmadi, A. Yip, M. Fowler, S.B. Young, R.A. Fraser, Environmental feasibility of re-
use of electric vehicle batteries, Sust. Energy Tech. Assess. 6 (2014) 64-74.
[42] E. Wood, M. Alexander, T.H. Bradley, Investigation of battery end-of-life conditions for
plug-in hybrid vehicles, J. Power Sources 11 (2011) 5147-5154.
[43] B. Lunz, Z. Yan, J.B. Gerschler, D.U. Sauer, Influence of plug-in hybrid electric vehicle
charging strategies on charging and battery degradation costs, Energy Policy 46 (2012)
511-519.
[44] J. Neubauer, A. Brooker, E. Wood, Sensitivity of plug-in hybrid electric vehicle economics
to drive patterns, electric range, energy management, and charge strategies, J. Power
Sources 236 (2013) 357-364.
[45] C. Heymans, S.B. Walker, S.B. Young, M. Fowler, Economic analysis of second use
electric vehicle batteries for residential energy storage and load-levelling, Energy Policy
71 (2014) 22-30.
[46] M. Naumann, R.C. Karl, C.N. Truong, H. Hesse, A. Jossen, Lithium-ion battery cost
analysis in PV-household application, 9th International Renewable Energy Storage
Conference (IRES), Düsseldorf, March 2015.
[47] C. Guenther, M. Taumann, J. Li, M.A. Danzer, Calculation of the Residual Value of Used
Electric Vehicle Batteries for Stationary Second Life Applications, European Advanced
Automotive & Stationary Battery Conference (AABC), Mainz, January 2015.
[48] M.J. Brand, S.F. Schuster, T. Bach, E. Fleder, M. Stelz, S. Gläser, J. Müller, G. Sextl, A.
Jossen, Effects of vibrations and shocks on lithium-ion cells, J. Power Sources 288
(2015) 62-69.
[49] S.M. Rezvanizaniani, Z. Liu, Y. Chen, J. Lee, Review and recent advances in battery
health monitoring and prognostics technologies for electric vehicle (EV) safety and
mobility, J. Power Sources 256 (2014) 110-124.
List of References
122
[50] Y. Zheng, L. Lu, X. Han, J. Li, M. Ouyang, LiFePO4 battery pack capacity estimation for
electric vehicles based on charging cell voltage curve transformation, J. Power Sources
226 (2013) 33-41.
[51] K. Ridder, J. Holzhäuser, ADR 2015, 30st ed., ecomed - Storck GmbH, Heidelberg,
Munich, Landsberg, Frechen, Hamburg, 2014.
[52] S. Grolleau, A. Delaille, H. Gualous, P. Gyan, R. Revel, J. Bernard, E. Redondo-Iglesias,
J. Peter, Calendar aging of commercial graphite/LiFePO4 cell - Predicting capacity fade
under time dependent storage conditions, J. Power Sources 255 (2014) 450-458.
[53] A. Barré, B. Deguilhem, S. Grolleau, M. Gérard, F. Suard, D. Riu, A review on lithium-ion
battery ageing mechanisms and estimations for automotive applications, J. Power
Sources 241 (2013) 680-689.
[54] K. Takeno, M. Ichimura, K. Takano, J. Yamaki, S. Okada, Quick testing of batteries in
lithium-ion battery packs with impedance-measuring technology, J. Power Sources 128
(2004) 67-75.
[55] G. Hunt, Electric Vehicle Battery Test Procedures Manual. U.S. Adv. Battery Consort.,
LLC, 1996.
[56] R.B. Wright, J.P. Christophersen, C.G. Motloch, J.R. Belt, C.D. Ho, V.S. Battaglia, J.A.
Duong, R.A. Sutula, Power fade and capacity fade from cycle-life testing of Advanced
Technology Development Program lithium-ion batteries, J. Power Sources 119-121
(2003) 865-869.
[57] W. Waag, S. Käbitz, D.U. Sauer, Experimental investigation of the lithium-ion battery
impedance characteristic at various conditions and aging states and its influence on the
application, Appl. Energy 102 (2013) 885-897.
[58] C.T. Love, M.B.V. Virji, R.E. Rocheleau, K.E. Swider-Lyons, State-of-health monitoring of
18650 4S packs with a single-point impedance diagnostic, J. Power Sources 266 (2014)
512-519.
[59] D. Andre, M. Meiler, K. Steiner, Ch. Wimmer, T. Soczka-Guth, D.U. Sauer,
Characterization of high-power lithium-ion batteries by electrochemical impedance
spectroscopy. I. Experimental investigation, J. Power Sources 196 (2011) 5334-5341.
[60] F.M. Kindermann, A. Noel, S.V. Erhard, A. Jossen, Long-term equalization effects in Li-
ion batteries due to local state of charge inhomogeneities and their impact on impedance
measurements, Electrochim. Acta 185 (2015) 107-116.
[61] H. Dong, X. Liu, Y. Lou, C. Wang, Lithium-ion battery state of health monitoring and
remaining useful life prediction based on support vector regression-particle filter, J.
Power Sources 271 (2014) 114-123.
List of References
123
[62] P. Keil, S.F. Schuster, C. von Lüders, H. Hesse, R. Arunachala, A. Jossen, Lifetime
Analyses of Lithium-Ion EV Batteries, Electromobility Challenging Issues Conference
(ECI), Singapore, December, 2015.
[63] J. Schmalstieg, S. Käbitz, M. Ecker, D.U. Sauer, A holistic aging model for Li(NiMnCo)O2
based 18650 lithium-ion batteries, J. Power Sources 257 (2014) 325-334.
[64] J. Wang, P. Liu, J. Hicks-Garner, E. Sherman, S. Soukiazian, M. Verbrugge, H. Tataria,
J. Musser, P. Finamore, Cycle-life model for graphite-LiFePO4 cells, J. Power Sources
196 (2011) 3942-3948.
[65] M. Ecker, N. Nieto, S. Käbitz, J. Schmalstieg, H. Blanke, A. Warnecke, D.U. Sauer,
Calendar and cycle life study of Li(NiMnCo)O2-based 18650 lithium-ion batteries, J.
Power Sources 248 (2014) 839-851.
[66] D.A. Stevens, R.Y. Ying, R. Fathi, J.N. Reimers, J.E. Harlow, J.R. Dahn, Using High
Precision Coulometry Measurements to Compare the Degradation Mechanisms of
NMC/LMO and NMC-Only Automotive Scale Pouch Cells, J. Electrochem. Soc. 161
(2014) A1364-A1370.
[67] M. Wohlfahrt-Mehrens, C. Vogler, J. Garche, Aging mechanisms of lithium cathode
materials, J. Power Sources 127 (2004) 58-64.
[68] J. Vetter, P. Novák, M.R. Wagner, C. Veit, K.-C. Möller, J.O. Besenhard, M. Winter, M.
Wohlfahrt-Mehrens, C. Vogler, A. Hammouche, Ageing mechanisms in lithium-ion
batteries, J. Power Sources 147 (2005) 269-281.
[69] P. Keil, S.F. Schuster, J. Wilhelm, J. Travi, A. Hauser, R.C. Karl, A. Jossen, Calendar
Aging of Lithium-Ion Batteries. Part I: Impact of the Graphite Anode on Capacity Fade, J.
Electrochem. Soc. 163 (2016) A1872-A1880.
[70] T. Waldmann, M. Wilka, M. Kasper, M. Fleischhammer, M. Wohlfahrt-Mehrens,
Temperature dependent ageing mechanisms in Lithium-ion batteries - A Post-Mortem
study, J. Power Sources 262 (2014) 129-135.
[71] M. Kassem, J. Bernard, R. Revel, S. Pélissier, F. Duclaud, C. Delacourt, Calendar aging
of a graphite/LiFePO4 cell, J. Power Sources 208 (2012) 296-305.
[72] P. Balbuena, Y. Wang, Lithium-Ion Batteries - Solid-Electrolyte Interphase, first ed.,
World Scientific Pub Co, London, 2004.
[73] M. Shikano, H. Kobayashi, S. Koike, H. Sakaebe, Y. Saito, H. Hori, H. Kageyama, K.
Tatsumi, X-ray absorption near-edge structure study on positive electrodes of degraded
lithium-ion battery, J. Power Sources 196 (2011) 6881-6883.
List of References
124
[74] M.K. Rahman, Y. Saito, Investigation of positive electrodes after cycle testing of high-
power Li-ion battery cells III: An approach to the power fade mechanism using FT-IR-
ATR, J. Power Sources 174 (2007) 889-894.
[75] N. Dupré, J. Martin, J. Oliveri, P. Soudan, A. Yamada, R. Kanno, D. Guyomard,
Relationship between surface chemistry and electrochemical behavior of LiNi1/2Mn1/2O2
positive electrode in a lithium-ion battery, J. Power Sources 196 (2011) 4791-4800.
[76] V. Agubra, J. Fergus, Lithium Ion Battery Anode Aging Mechanisms, Mater. 6 (2013)
1310-1325.
[77] S. Kim, A.C.T. van Duin, V.B. Shenoy, Effect of electrolytes on the structure and
evolution of the solid electrolyte interphase (SEI) in Li-ion batteries: A molecular
dynamics study, J. Power Sources 196 (2011) 8590-8597.
[78] B. Rieger, S. Schlueter, S.V. Erhard, J. Schmalz, G. Reinhart, A. Jossen, Multi-scale
investigation of thickness changes in a commercial pouch type lithium-ion battery, J.
Energy Storage 6 (2016) 213-221.
[79] M. Broussely, P. Biensan, F. Bonhomme, P. Blanchard, S. Herreyre, K. Nechev, R.J.
Staniewicz, Main aging mechanisms in Li ion batteries, J. Power Sources 146 (2005) 90-
96.
[80] H.J. Ploehn, P. Ramadass, R.E. White, Solvent Diffusion Model for Aging of Lithium-Ion
Battery Cells, J. Electrochem. Soc. 151 (2004) A456-A462.
[81] P. Röder, B. Stiaszny, J. Ziegler, N. Baba, P. Lagaly, H. Wiemhöfer, The impact of
calendar aging on the thermal stability of a LiMn2O4-Li(Ni1/3Mn1/3Co1/3)O2/graphite lithium-
ion cell, J. Power Sources 268 (2014) 315-325.
[82] E. Sarasketa-Zabala, I. Gandiaga, L.M. Rodriguez-Martinez, I. Villarreal, Calendar
ageing analysis of a LiFePO4/graphite cell with dynamic model validations: Towards
realistic lifetime predictions, J. Power Sources 272 (2014) 45-47.
[83] J. Choi, A. Manthiram, Role of Chemical and Structural Stabilities on the Electrochemical
Properties of Layered LiNi1/3Mn1/3Co1/3O2 Cathodes, J. Electrochem. Soc. 152 (2005)
A1714-A1718.
[84] D. Mohanty, H. Gabrisch, Microstructural investigation of LixNi1/3Mn1/3Co1/3O2 (x ≤ 1) and
its aged products via magnetic and diffraction study, J. Power Sources 220 (2012) 405-
412.
[85] R. Chen, F. Liu, Y. Chen, Y. Ye, Y. Huang, F. Wu, L. Li, An investigation of functionalized
electrolyte using succinonitrile additive for high voltage lithium-ion batteries, J. Power
Sources 306 (2016) 70-77.
List of References
125
[86] J. Zhou, P.H.L. Notten, Studies on the degradation of Li-ion batteries by the use of
microreference electrodes, J. Power Sources 177 (2008) 553-560.
[87] J. Xia, M. Nie, L. Ma, J.R. Dahn, Variation of coulombic efficiency versus upper cutoff
potential of Li-ion cells tested with aggressive protocols, J. Power Sources 306 (2016)
233-240.
[88] I. Buchberger, S. Seidlmayer, A. Pokharel, M. Piana, J. Hattendorff, P. Kudejova, R.
Gilles, H.A. Gasteiger, Aging Analysis of Graphite/LiNi1/3Mn1/3Co1/3O2 Cells Using XRD,
PGAA, and AC Impedance, J. Electrochem. Soc. 162 (2015) A2737-A2746.
[89] F. Lin, I.M. Markus, D. Nordlund, T. Weng, M.D. Asta, H.L. Xin, M.M. Doeff, Surface
reconstruction and chemical evolution of stoichiometric layered cathode materials for
lithium-ion batteries, Nat. Commun. 5 (2014) Art. 3529.
[90] B. Stiaszny, J.C. Ziegler, E.E. Krauß, M. Zhang, J.P. Schmidt, E. Ivers-Tiffée,
Electrochemical characterization and post-mortem analysis of aged LiMn2O4-
NMC/graphite lithium ion batteries part II: Calendar aging, J. Power Sources 258 (2014)
61-75.
[91] J. Wang, Y. Tang, J. Yang, R. Li, G. Liang, X. Sun, Nature of LiFePO4 aging process:
Roles of impurity phases, J. Power Sources 238 (2013) 454-463.
[92] L. Bodenes, R. Naturel, H. Martinez, R. Dedryvère, M. Menetrier, L. Croguennec, J.
Pérès, C. Tessier, F. Fischer, Lithium secondary batteries working at very high
temperature: Capacity fade and understanding of aging mechanisms, J. Power Sources
236 (2013) 265-275.
[93] J.C. Burns, A. Kassam, N.N. Sinha, L.E. Downie, L. Solnickova, B.M. Way, J.R. Dahn,
Predicting and Extending the Lifetime of Li-ion Batteries, J. Electrochem. Soc. 160 (2013)
A1451-A1456.
[94] J. Wang, J. Purewal, P. Liu, J. Hicks-Garner, S. Soukazian, E. Sherman, A. Sorenson, L.
Vu, H. Tataria, M.W. Verbrugge, Degradation of lithium ion batteries employing graphite
negatives and nickel-cobalt-manganese oxide + spinel manganese oxide positives: Part
1, aging mechanisms and life estimation, J. Power Sources 269 (2014) 937-948.
[95] T. Ohzuku, Y. Iwakoshi, K. Sawai, Formation of Lithium-Graphite Intercalation
Compounds in Nonaqueous Electrolytes and Their Application as a Negative Electrode
for a Lithium Ion (Shuttlecock) Cell, J. Electrochem. Soc. 140 (1993) 2490-2498.
[96] W.H. Woodford, W.C. Carter, Y. Chiang, Design criteria for electrochemical shock
resistant battery electrodes, Energy Environ. Sci. 5 (2012) 8014-8024.

List of References
126
[97] W. Yoon, K.Y. Chung, J. McBreen, X. Yang, A comparative study on structural changes
of LiCo1/3Ni1/3Mn1/3O2 and LiNi0.8Co0.15Al0.05O2 during first charge using in situ XRD,
Electrochem. Commun. 8 (2006) 1257-1262.
[98] M. Klett, R. Eriksson, J. Groot, P. Svens, K.C. Högström, R.W. Lindström, H. Berg, T.
Gustafson, G. Lindbergh, K. Edström, Non-uniform aging of cycled commercial
LiFePO4//graphite cylindrical cells revealed by post-mortem analysis, J. Power Sources
257 (2014) 126-137.
[99] J. Groot, State-of-Health Estimation of Li-ion Batteries: Cycle Life Test Methods,
Chalmers University of Electronics, Licentiate Thesis, Gothenburg, 2012.
[100] K. Xu, "Charge-Transfer" Process at Graphite/Electrolyte Interface and the Solvation
Sheath Structure of Li+ in Nonaqueous Electrolytes, J. Electrochem Soc. 154 (2007)
A162-A167.
[101] M.D. Levi, E. Markevich, D. Aurbach, The Effect of Slow Interfacial Kinetics on the
Chronoamperometric Response of Composite Lithiated Graphite Electrodes and on the
Calculation of the Chemical Diffusion Coefficient of Li Ions in Graphite, J. Phys. Chem. B
109 (2005) 7420-7427.
[102] C. Uhlmann, J. Illig, M. Ender, R. Schuster, E. Ivers-Tiffée, In situ detection of lithium
metal plating on graphite in experimental cells, J. Power Sources 279 (2015) 428-438.
[103] M. Petzl, M. Kasper, M. Danzer, Lithium plating in a commercial lithium-ion battery - A
low-temperature aging study, J. Power Sources 275 (2015) 799-807.
[104] B. Bitzer, A. Gruhle, A new method for detecting lithium plating by measuring the cell
thickness, J. Power Sources 262 (2014) 297-302.
[105] M. Fleischhammer, T. Waldmann, G. Bisle, B. Hogg, M. Wohlfahrt-Mehrens, Interaction
of cyclic ageing at high-rate and low temperatures and safety in lithium-ion batteries, J.
Power Sources 274 (2015) 432-439.
[106] W. Lu, C.M. López, N. Liu, J.T. Vaughey, A. Jansen, D.W. Dennis, Overcharge Effect on
Morphology and Structure of Carbon Electrodes for Lithium-Ion Batteries, J.
Electrochem. Soc. 159 (2012) A566-A570.
[107] A.N. Jansen, D.W. Dees, D.P. Abraham, K. Amine, G.L. Henriksen, Low-temperature
study of lithium-ion cells using LiySn micro-reference electrode, J. Power Sources 174
(2007) 373-379.
[108] S.S. Zhang, K. Xu, T.R. Jow, Study of the charging process of a LiCoO2-based Li-ion
battery, J. Power Sources 160 (2006) 1349-1354.
List of References
127
[109] R.V. Bugga, M.C. Smart, Lithium plating behavior in lithium-ion cells, ECS Transactions
25 (2010) 241-252.
[110] R. Mukherjee, A.V. Thomas, D. Datta, E. Singh, J. Li, O. Eksik, V.B. Shenoy, N.
Koratkar, Defect-induced plating of lithium metal within porous graphene networks, Nat.
Commun. 5 (2014) Art. 3710.
[111] N. Legrand, B. Knosp, P. Desprez, F. Lapicque, S. Rael, Physical characterization of the
charging process of a Li-ion battery and prediction of Li plating by electrochemical
modelling, J. Power Sources 245 (2014) 208-216.
[112] V. Zinth, C. von Lüders, M. Hofmann, J. Hattendorff, I. Buchberger, S. Erhard, J. Rebelo-
Kornmeier, A. Jossen, R. Gilles, Lithium plating in lithium-ion batteries at sub-ambient
temperatures investigated by in situ neutron diffraction, J. Power Sources 271 (2014)
152-159.
[113] S. Schindler, M. Bauer, M. Petzl, M.A. Danzer, Voltage relaxation and impedance
spectroscopy as in-operando methods for the detection of lithium plating on graphitic
anodes in commercial lithium-ion cells, J. Power Sources 304 (2016) 170-180.
[114] J. Wandt, C. Marino, H.A. Gasteiger, P. Jakes, R. Eichel, J. Granwehr, Operando
electron paramagnetic resonance spectroscopy - formation of mossy lithium on lithium
anodes during charge-discharge cycling, Energy Environ. Sci. 8 (2015) 1358-1367.
[115] F. Sagane, R. Shimokawa, H. Sano, H. Sakaebe, Y. Iriyama, In-situ scanning electron
microscopy observations of Li plating and stripping reactions at the lithium phosphorus
oxynitride glass electrolyte/Cu interface, J. Power Sources 225 (2013) 245-250.
[116] M. Petzl, M.A. Danzer, Nondestructive detection, characterization, and quantification of
lithium plating in commercial lithium-ion batteries, J. Power Sources 254 (2014) 80-87.
[117] S.S. Zhang, The effect of the charging protocol on the cycle life of a Li-ion battery, J.
Power Sources 161 (2006) 1385-1391.
[118] P.H.L. Notten, J.H.G. Op het Veld, J.R.G. van Beek, Boostcharging Li-ion batteries: A
challenging new charging concept, J. Power Sources 145 (2005) 89-94.
[119] M.C. Smart, R.V. Bugga, Effects of Electrolyte Composition on Lithium Plating in Lithium-
Ion Cells, J. Electrochem. Soc. 158 (2011) A379-A389.
[120] C. Peabody, C.B. Arnold, The role of mechanically induced separator creep in lithium-ion
battery capacity fade, J. Power Sources 196 (2011) 8147-8153.
[121] J. Cannarella, C.B. Arnold, Stress evolution and capacity fade in constrained lithium-ion
pouch cells, J. Power Sources 245 (2014) 745-751.
List of References
128
[122] J. Cannarella, C.B. Arnold, The Effects of Defects on Localized Plating in Lithium-Ion
Batteries, J. Electrochem. Soc. 162 (2015) A1365-A1373.
[123] K. Jalkanen, J. Karppinen, L. Skogström, T. Laurila, M. Nisula, K. Vuorilehto, Cycle aging
of commercial NMC/graphite pouch cells at different temperatures, Appl. Energy 154
(2015) 160-172.
[124] L. Terborg, S. Weber, F. Blaske, S. Passerini, M. Winter, U. Karst, S. Nowak,
Investigation of thermal aging and hydrolysis mechanisms in commercial lithium ion
battery electrolyte, J. Power Sources 242 (2013) 832-837.
[125] J. Li, E. Murphy, J. Winnick, P.A. Kohl, The effects of pulse charging on cycling
characteristics of commercial lithium-ion batteries, J. Power Sources 102 (2001) 302-
309.
[126] Z. Ma, J. Jiang, W. Shi, W. Zhang, C.C. Mi, Investigation of path dependence in
commercial lithium-ion cells for pure electric bus applications: Aging mechanism
identification, J. Power Sources 274 (2015) 29-40.
[127] S.F. Schuster, M.J. Brand, P. Berg, M. Gleissenberger, A. Jossen, Lithium-ion cell-to-cell
variation during battery electric vehicle operation, J. Power Sources 297 (2015) 242-251.
[128] D.J. Moosbauer, Elektrochemische Charakterisierung von Elektrolyten und Elektroden
für Lithium-Ionen-Batterien, University Regensburg, Doctoral Thesis, Regensburg, 2010.
[129] S. Bourlot, P. Blanchard, S. Robert, Investigation of aging mechanisms of high power Li-
ion cells used for hybrid electric vehicles, J. Power Sources 196 (2011) 6841-6846.
[130] S.S. Zhang, Electrochemical study of the formation of a solid electrolyte interphase on
graphite in a LiBC2O4F2-based electrolyte, J. Power Sources 163 (2007) 713-718.
[131] H. Jannesari, M.D. Emami, C. Ziegler, Effect of electrolyte transport properties and
variations in the morphological parameters on the variation of side reaction rate across
the anode electrode and the aging of lithium ion batteries, J. Power Sources 196 (2011)
9654-9664.
[132] M.B. Pinson, M.Z. Bazant, Theory of SEI Formation in Rechargeable Batteries: Capacity
Fade, Accelerated Aging and Lifetime Prediction, J. Electrochem. Soc. 160 (2013) A243-
A250.
[133] S.K. Martha, H. Sclar, Z.S. Framowitz, D. Kovacheva, N. Saliyski, Y. Gofer, P. Sharon, E.
Golik, B. Markovsky, D. Aurbach, A comparative study of electrodes comprising
nanometric and submicron particles of LiNi0.50Mn0.50O2, LiNi0.33Mn0.33Co0.33O2 and
LiNi0.40Mn0.40Co0.20O2 layered compounds, J.Power Sources 189 (2009) 248-255.
List of References
129
[134] X. Xiong, Z. Wang, P. Yue, H. Guo, F. Wu, J. Wang, X. Li, Washing effects on
electrochemical performance and storage characteristics of LiNi0.8Co0.1Mn0.1O2 as
cathode material for lithium-ion batteries, J. Power Sources 222 (2013) 318-325.
[135] B.Y. Liaw, E.P. Roth, R.G. Jungst, G. Nagasubramanian, H.L. Case, D.H. Doughty,
Correlation of Arrhenius behaviors in power and capacity fades with cell impedance and
heat generation in cylindrical lithium-ion cells, J. Power Sources 119-121 (2003) 874-
886.
[136] A. Barré, F. Suard, M. Gerard, M. Montaru, D. Riu, Statistical Method Tools to Analyze
Ageing Effects on Li-Ion Battery Performances, SAE International (2013) 2013-01-1429.
[137] K. Smith, J. Neubauer, E. Wood, M. Jun, A. Pesaran, Models for Battery Reliability and
Lifetime - Applications in Design and Health Management, Battery Congress, Ann Arbor,
April 2013, National Renewable Laboratory Website (25. December 2015): http://www.nrel.gov/docs/fy13osti/58550.pdf
[138] E. Sarasketa-Zabala, F. Aguesse, I. Villarreal, L.M. Rodriguez-Martinez, C.M. López, P.
Kubiak, Understanding Lithium Inventory Loss and Sudden Performance Fade in
Cylindrical Cells during Cycling with Deep-Discharge Steps, J. Phys. Chem. C, 119
(2015) 896-906.
[139] M. Ouyang, Z. Chu, L. Lu, J. Li, X. Han, X. Feng, G. Liu, Low temperature aging
mechanism identification and lithium deposition in a large format lithium iron phosphate
battery for different charge profiles, J. Power Sources 286 (2015) 309-320.
[140] S.F. Schuster, T. Bach, E. Fleder, J. Müller, M. Brand, G. Sextl, A. Jossen, Nonlinear
aging characteristics of lithium-ion cells under different operational conditions, J. Energy
Storage 1 (2015) 44-53.
[141] A.J. Smith, H.M. Dahn, J.C. Burns, J.R. Dahn, Long-Term Low-Rate Cycling of
LiCoO2/Graphite Li-Ion Cells at 55 °C, J. Electrochem. Soc.159 (2012) A705-A710.
[142] T. Baumhöfer, M. Brühl, S. Rothgang, D.U. Sauer, Production caused variation in
capacity aging trend and correlation to initial cell performance, J. Power Sources 247
(2014) 332-338.
[143] M. Dubarry, C. Truchot, M. Cugnet, B.Y. Liaw, K. Gering, S. Sazhin, D. Jamison, C.
Michelbacher, Evaluation of commercial lithium-ion cells based on composite positive
electrode for plug-in hybrid electric vehicle applications. Part I: Initial characterization, J.
Power Sources 196 (2011) 10328-10335.
[144] T.C. Bach, S.F. Schuster, E. Fleder, J. Müller, M.J. Brand, H. Lorrmann, A. Jossen, G.
Sextl, Nonlinear aging of cylindrical lithium-ion cells linked to heterogeneous
compression, J. Energy Storage 5 (2016) 212-223.
List of References
130
[145] Y. Wu, Lithium-Ion Batteries: Fundamentals and Applications, 1st ed., CRC Press, Tokyo,
2015.
[146] P.J. Osswald, S.V. Erhard, J. Wilhelm, H.E. Hoster, A. Jossen, Simulation and
Measurement of Local Potentials of Modified Commercial Cylindrical Cells I: Cell
Preparation and Measurements, J. Electrochem. Soc. 162 (2015) A2099-A2105.
[147] S.V. Erhard, P.J. Osswald, J. Wilhelm, A. Rheinfeld, S. Kosch, A. Jossen, Simulation and
Measurement of Local Potentials of Modified Commercial Cells II: Multi-Dimensional
Modeling and Validation, J. Electrochem. Soc. 162 (2015) A2707-A2719.
[148] D.P. Finegan, M. Scheel, J.B. Robinson, B. Tjaden, I. Hunt, T.J. Mason, J. Millichamp, M.
Di Michiel, G.J. Offer, G. Hinds, D.J.L. Brett, P.R. Shearing, In-operando high-speed
tomography of lithium-ion batteries during thermal runaway, Nat. Commun. 6 (2015) Art.
7924.
[149] M. Wang, H. Li, Spatiotemporal modeling of internal states distribution for lithium-ion
battery, J. Power Sources 301 (2016) 261-270.
[150] R. Gonzalez-Arrabal, M. Panizo-Laiz, K. Fujita, K. Mima, A. Yamazaki, T. Kamiya, Y.
Orikasa, Y. Uchimoto, H. Sawada, C. Okuda, Y. Kato, J.M. Perlado, Meso-scale
characterization of lithium distribution in lithium-ion batteries using ion beam analysis
techniques, J. Power Sources 299 (2015) 587-595.
[151] D.S. Eastwood, V. Yufit, J. Gelb, A. Gu, R.S. Bradley, S.J. Harris, D.J.L. Brett, N.P.
Brandon, P.D. Lee, P.J. Withers, P.R. Shearing, Lithiation-Induced Dilation Mapping in a
Lithium-Ion Battery Electrode by 3D X-Ray Microscopy and Digital Volume Correlation,
Adv. Energy Mat. 4 (2014) Art. 130050.
[152] K.B. Oldham, Edge effects in semiinfinite diffusion, J. Electroanal. Chem. Interfacial
Electrochem. 122 (1981) 1-17.
[153] M. Dollé, L. Sannier, B. Beaudoin, M. Trentin, J. Tarascon, Live Scanning Electron
Microscope Observations of Dendritic Growth in Lithium/Polymer Cells, Electrochem.
Solid-State Lett. 5 (2002) A286-A289.
[154] J. Cannarella, C.B. Arnold, Ion transport restriction in mechanically strained separator
membranes, J. Power Sources 226 (2013) 149-155.
[155] L. Cai, K. An, Z. Feng, C. Liang, S.J. Harris, In-situ observation of inhomogeneous
degradation in large format Li-ion cells by neutron diffraction, J. Power Sources 236
(2013) 163-168.
[156] M. Tang, P. Albertus, J. Newman, Two-Dimensional Modeling of Lithium Deposition
during Cell Charging, J. Electrochem. Soc. 156 (2009) A390-A399.
List of References
131
[157] S. Saxena, C. Le Floch, J. MacDonald, S. Moura, Quantifying EV battery end-of-life
through analysis of travel needs with vehicle powertrain models, J. Power Sources 282
(2015) 265-276.
[158] E. Musk, Tesla Motors Website (31. January 2016):
https://www.teslamotors.com/blog/infinite-mile-warranty
[159] S. Viehmann, Focus Online (31. January 2016):
http://www.focus.de/auto/fahrberichte/tid-34017/fahrbericht-bmw-i3-nie-wieder-tanken-trotzdem-
vollgas-rollendes-iphone-fuer-reiche-der-bmw-i3-im-ersten-test-das-muessen-sie-sonst-noch-
zum-i3-wissen_aid_1124731.html
[160] S. Paul, C. Diegelmann, H. Kabza, W. Tillmetz, Analysis of ageing inhomogeneities in
lithium-ion battery systems, J. Power Sources 239 (2013) 642-650.
[161] Y. Zheng, M. Ouyang, L. Lu, J. Li, Understanding aging mechanisms in lithium-ion
battery packs: From cell capacity loss to pack capacity evolution, J. Power Sources 278
(2015) 287-295.
[162] M. Dubarry, C. Truchot, A. Devie, B.Y. Liaw, State-of-Charge Determination in Lithium-
Ion Battery Packs Based on Two-Point Measurements in Life, J. Electrochem. Soc. 162
(2015) A877-A884.
[163] S. Santhanagopalan, R.E. White, Quantifying Cell-to-Cell Variations in Lithium Ion
Batteries, Int. J. Electrochem. (2012) Art. 395838.
[164] B. Kenney, K. Darcovich, D.D. MacNeil, I.J. Davidson, Modelling the impact of variations
in electrode manufacturing on lithium-ion battery modules, J. Power Sources 213 (2012)
391-401.
[165] M. Dubarry, N. Vuillaume, B.Y. Liaw: Origins and accomodation of cell variations in Li-ion
battery pack modeling, Int. J. Energ. Res. 34 (2010) 216-231.
[166] R. Gogoana, M.B. Pinson, M.Z. Bazant, S.E. Sarma, Internal resistance matching for
parallel-connected lithium-ion cells and impacts on battery pack cycle, J. Power Sources
252 (2014) 8-13.
[167] R. Leonhart, Lehrbuch Statistik: Einstieg und Vertiefung, 3rd ed., Hans Huber, Bern,
2013.
[168] J. Hartung, B. Elpelt, K. Klösener, Statistik, Lehr- und Handbuch der angewandten
Statistik, 1st ed., Oldenbourg, Munich, 2005.
[169] H. Degen, P. Lorscheid, Statistik-Lehrbuch: Methoden der Statistik im
wirtschaftswissenschaftlichen Bachelor-Studium, 3rd ed., Oldenbourg, Munich, 2012.

List of References
132
[170] J. Li, J.K. Barillas, C. Guenther, M.A. Danzer, Multicell state estimation using variation
based sequential Monte Carlo filter for automotive battery packs, J. Power Sources 277
(2015) 95-103.
[171] L. Papula, Mathematik für Ingenieure und Naturwissenschaftler Band 3: Vektoranalysis,
Wahrscheinlichkeitsrechnung, Mathematische Statistik, Fehler- und Ausgleichsrechnung,
6th ed., Vieweg+Teubner, Wiesbaden, 2011.
[172] C.M. Harmann, Accelerated life cycle testing and analysis for early failure prediction
using two types of lead/acid batteries, J. Power Sources 37 (1992) 363-368.
[173] W. Spindler, How handy is Weibull? or, the use of failure distributions in the planning and
analysis of battery experiments, Journal of Power Sources 17 (1986) 269-278.
[174] K. Aström, E. Fontell, S. Virtanen, Reliability analysis and initial requirements for FC
systems and stacks, J. Power Sources 171 (2006) 46-54.
[175] E.S. Kumar, B. Sarkar, Improvement of life time and reliability of battery, Int. J. Engin.
Sci. Adv. Tech. 5 (2012) 1210-1217.
[176] R. Li, J. Wu, H. Wang, J. Guo, G. Li, Reliability assessment and failure analysis of lithium
iron phosphate batteries, Inform. Sci. 259 (2014) 359-368.
[177] P. O’Connor, A. Kleyner, Practical Reliability Engineering, 5th ed., John Wiley & Sons,
West Susses, 2012.
[178] H. Zuse, A framework of software measurement, 1st ed., Walter de Gruyter, Berlin, 1998.
[179] D.J. Sheshkin, Handbook of parametric and nonparametric statistical procedures, 5th ed.,
Taylor & Francis Ltd., Boca Raton, 2011.
[180] A. Jossen, Fundamentals of battery dynamics, J. Power Sources 154 (2006) 530-538.
[181] S. Schuster, P. Keil, C. von Lüders, H. Hesse, A. Jossen, New Charging Method to Avoid
Nonlinear Aging of Lithium-Ion Batteries, Batteries Event, Nice, October 2015.
[182] J. Gallardo-Lozano, E. Romero-Cadaval, M.I. Milanes-Montero, M.A. Guerrero-Martinez,
Battery equalization active methods, J. Power Sources 246 (2014) 934-949.
[183] M.S. Lepiorz, Betriebsbedingte Alterung von Lithium-Ionen-Batterien in stationären und
mobilen Anwendungen, Technical University of Munich, Doctoral Thesis, Munich, 2015.
[184] D. Stoller, INGENIEUR.de (2. February 2016): http://www.ingenieur.de/Themen/Energiespeicher/Wie-Daimler-Smart-Batterien-Verkauf-Geld-
verdient
[185] S. Eom, M. Kim, I. Kim, S. Moon, Y. Sun, H. Kim, Life prediction and reliability
assessment of lithium secondary batteries, J. Power Sources 174 (2007) 954-958.

List of References
133
[186] S.F. Schuster, M.J. Brand, C. Campestrini, M. Gleissenberger, A. Jossen, Correlation
between capacity and impedance of lithium-ion cells during calendar and cycle life, J.
Power Sources 305 (2016) 191-199.
[187] M. Wu, P.J. Chiang, J. Lin, Y. Jan, Correlation between electrochemical characteristics
and thermal stability of advanced lithium-ion batteries in abuse tests–short-circuit tests,
Electrochim. Acta 49 (2004) 1803-1812.
[188] E.P. Roth, D.H. Doughty, Thermal abuse performance of high-power 18650 Li-ion cells,
J. Power Sources 128 (2004) 308-318.
List of Abbreviations
134
List of Abbreviations
ALIB automotive lithium-ion battery / batteries
BattG German battery law (from German, “Batteriegesetz”, battery law)
BEV battery electric vehicle / vehicles
BMS battery management system / systems
CC constant current
CCCV constant current constant voltage
CO2e CO2 equivalent / equivalents
CV constant voltage
DVA differential voltage analysis
EFC equivalent full cycles
EoL end of life
Eo1L end of first life
Eo2L end of second life
GHG greenhouse gas
HEV hybrid electric vehicle / vehicles
ICA incremental capacity analysis
ICP-OES inductively coupled plasma optical emission spectroscopy
ID identifier / identifiers
LCO lithium-cobalt-oxide
LFP lithium-iron-phosphate
LIB lithium-ion battery / batteries
LIC lithium-ion cell / cells
LMO lithium-manganese-spinel
LTO lithium-titanate-oxide
NCA lithium-nickel-cobalt-aluminum-oxide
NiMH nickel metal hydride
List of Abbreviations
135
NMC lithium-nickel-manganese-cobalt-oxide
PbB lead-acid battery / batteries (from Latin, “plumbum”, lead)
PCRR primary control reserve regulation
PPMCC Pearson product-moment correlation coefficient / coefficients
PVDF polyvinylidene difluoride
SEI solid electrolyte interphase
SEM scanning electron microscopy
SLA second life application / applications
SLB second life battery / batteries
SLC second life concept / concepts
SoC state / states of charge
SoH state / states of health
SPI solid permeable interphase
TCO total cost / costs of ownership
USABC United States Advanced Battery Consortium
XRD X-ray diffraction


