Embed Size (px)
Citation preview
Chapter 2
Global Megatrends, Asian Renaissance of Low-Carbon Green Growth, and Covid-19: Changing Perceptions
This chapter should be cited as
ERIA Study team(2022), ‘Global Megatrends, Asian Renaissance of Low-Carbon Green Growth, and Covid-19: Changing Perceptions’, in Anbumozhi, V., K. Kalirajan, and X. Yao (eds.), Rethinking Asia’s Low-Carbon Growth in the Post-Covid World: Towards a Net-Zero Economy, Jakarta: ERIA, pp.26-61.

Chapter 2Global Megatrends, Asian Renaissance of Low-Carbon Green Growth, and Covid -19: Changing Perceptions
Chapter 2Global Megatrends, Asian Renaissance of Low-Carbon Green Growth and Covid -19: Changing Perceptions
1 Introduction 262 Long-Standing, Multi-Year Megatrends 272.1 Economic: Asia’s Economic Rise, Competitiveness, and
Sustainable Development 27
2.2 Society: Rapid Urbanisation – Challenges and Opportunities of Growing Densities 33
2.3 Environment: Growing Awareness of Climate and Environmental Issues 36
2.4 Governance: Progress on Regional Cooperation and Integration 39
2.5 Technology: New Transition Pathways 41
2.6 Collective Impact of Long-Standing Trends 43
3 Megatrends that Emerged During the Crisis 44
3.1 Economic Concerns: Global Markets and Trade – Supply Chain Disruptions 44
3.2 Social Concerns: Shifts in Employment Patterns and Outlooks 45
3.3 Environment I: A Break from Surging Energy Demand Aligns with the Increasing Competitiveness of Renewables 46
3.4 Environment II: The Rise of Net Zero Ambitions 47
3.5 Governance: Realising Climate Priorities in an Era of New Budgetary Constraints 48
3.6 Collective Impact of Trends that Emerged During the Crisis 49
4. Moving Forward – Key Priorities and Opportunities 50
4.1 Addressing Uneven Economic Recovery 514.2 Creating Positive Momentum for Moving Beyond Paris to
Net Zero 52
4.3 New Momentum Behind Carbon Pricing? 53
4.4 Low-Carbon Technologies as Opportunities for Growth 57
4.5 Moving Towards Zero – Together 58
5. Key Takeaways 59
Rethinking Asia’s Low-Carbon Growth in the Post-Covid World26
1. Introduction
The coronavirus disease (COVID-19) pandemic has caused unprecedented global disruption, but has proved that societies can act decisively in times of need. Addressing the public health crisis and recovering from the first Asia-wide recession in nearly 6 decades presents considerable challenges (ADB, 2020d). Tackling these issues, together with decisive action to combat the climate crisis, is not only a political imperative but is also efficient in the long term. A post-pandemic recovery strategy must aim for solutions that support economic recovery and accelerate the transition towards decarbonisation in future growth for resilience and inclusiveness.
This chapter explores key regional and global megatrends that inform and shape the course of the transition to a low-carbon economy in the Association of Southeast Asian Nations (ASEAN) and East Asia. In doing so, it attempts to distinguish between long-standing, multi-year megatrends that were present before the 2020–2021 COVID-19 pandemic and trends that emerged during the crisis and the associated responses (things which have otherwise broken with expectations for business as usual). The chapter also notes several potential megatrends in how countries are looking to exit the crisis period that, though nascent, could represent game changers for the region’s energy strategies and overall outlook. Within each of these sections, key economic, social, environmental, market,
technological, and governance trends are considered.
The key trends, issues, and drivers that are particularly relevant from the perspective of the decarbonisation of Asia’s economies, are:
• the state of economic development in Asia, including persistent challenges in addressing inequality within and across countries;
• changing societal features, such as shifts in employment patterns and rapid urbanisation;
• the region’s accelerating adoption of green and digital technologies, as notably driven by their increased technical viability, declining costs, and ongoing challenges and opportunities for implementation; and
• evolving regional perspectives on environment and climate concerns; opportunities from low-carbon technologies; and green growth synergies with other key issues such as air quality, resilience, and energy security.
In examining the collective impacts of these megatrends, the chapter argues that prospects for accelerating low-carbon green development in Asia – and in China, India, and numerous sites across Southeast Asia in particular— continue to be bolstered by a number of factors. These include a growing recognition that well-designed green policies can not only address urgent climate concerns, but also support new economic growth and ‘future-oriented’ jobs. The chapter also notes several factors that may challenge this more positive outlook, including growing
Global Megatrends, Asian Renaissance of Low-Carbon Green Growth, and Covid -19: Changing Perceptions 27
concerns about the long-term impacts of the pandemic on the region’s most vulnerable communities. The chapter concludes by highlighting a number of key takeaways and recommendations for how regional decision-makers might tackle these challenges, all while dramatically improving the region’s long-term energy and environmental outlook.
2 Long-Standing, Multi-Year Megatrends
2.1. Economic: Asia’s Economic Rise, Competitiveness, and Sustainable Development
Over the past 60 years, Asia’s economic transformation has been remarkable in both speed and scale. Between 1960 and 2018, per capita gross domestic product (GDP) grew roughly threefold in Australia, fivefold in Japan, and a whopping 15-fold in Asia overall (ADB, 2020a). While 68% of the region lived in extreme poverty in the 1960s, that number stood at less than 8% as of 2015 (ADB, 2020a). More than 1.3 billion people have been lifted out of extreme poverty since 1980.1 In tandem with this rising economic power, the region has undergone a dramatic shift in the drivers of its GDP activity. ASEAN, for example, has undergone a relatively recent and dramatic shift from a predominantly agriculture-based economy to an industry-dominated one, with signs of gradually moving towards a service-driven economy (Tay and Puspadewi Tijaja, 2017). This shift in key drivers matches trends observed earlier in China, the Republic of Korea (henceforth, Korea), and Japan.
1 As defined in the underlying source material, ‘extreme poverty’ refers to living under ‘the US$1.90 per day international poverty line at 2011 purchasing power parity’ (ADB, 2020a: 5)
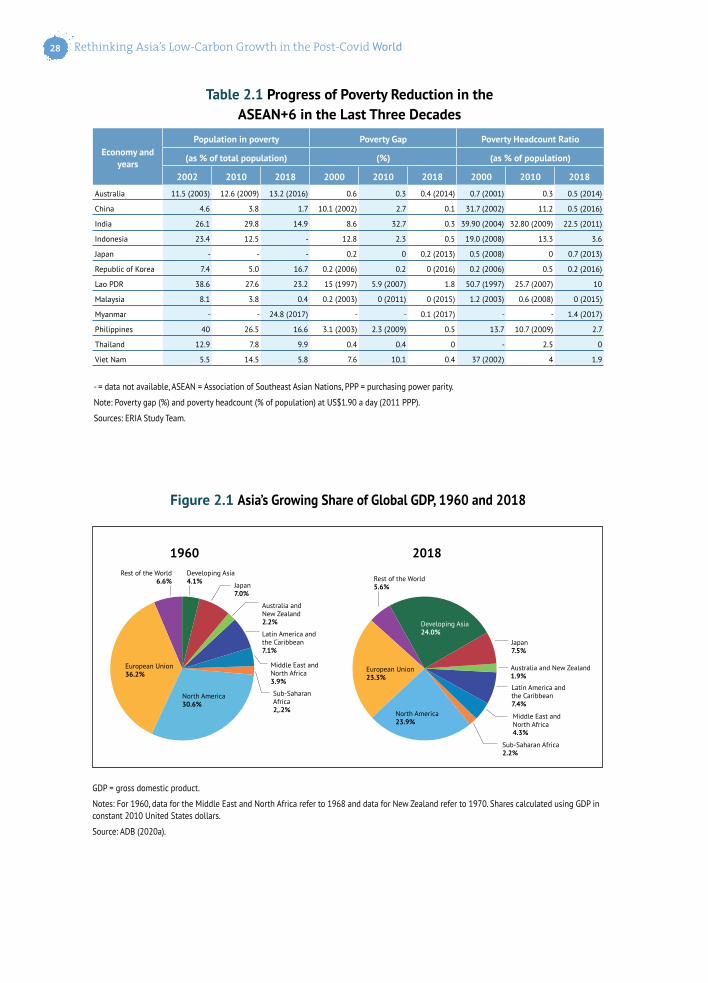
Such dramatic shifts during a relatively brief period have been enabled by a range of factors. These include a robust expansion of energy, transport, and other physical infrastructure; greater openness to foreign trade and investment; and large-scale market and policy reforms – all of which contributed to better positioning Asia to benefit from generally positive global development trends during this period (ADB, 2020a). Meanwhile, these advances have contributed to the countries’ progress in reducing income poverty (Table 2.1). They have also helped to support how countries have resourced social welfare systems and other public goods. This includes the notable expansion of national healthcare systems, universal public education, and various social safety nets, which, in turn, has helped to fuel even greater economic growth and overall productivity gains.
Placing these trends in a global context, it is worth noting that Asia’s development gains have significantly outstripped global averages during the same period, resulting in the region capturing a growing share of global GDP (Figure 2.1).
Consequentially, the region’s rise has had implications for shifting patterns of production and consumption globally. Moreover, the region has emerged as the home of some of the world’s most successful companies; and developers in both the region’s advanced and emerging economies are aggressively pursuing global leadership in industries ranging from advanced manufacturing to new energy technologies. Asia’s economies have thus emerged as not only important destination markets, but as globally competitive market leaders in their own right – ones that shape how numerous regional and global economic and investment megatrends are unfolding.
Rethinking Asia’s Low-Carbon Growth in the Post-Covid World28
- = data not available, ASEAN = Association of Southeast Asian Nations, PPP = purchasing power parity.
Note: Poverty gap (%) and poverty headcount (% of population) at US$1.90 a day (2011 PPP).
Sources: ERIA Study Team.
Table 2.1 Progress of Poverty Reduction in the ASEAN+6 in the Last Three Decades
Economy and years
Population in poverty Poverty Gap Poverty Headcount Ratio
(as % of total population) (%) (as % of population)
2002 2010 2018 2000 2010 2018 2000 2010 2018
Australia 11.5 (2003) 12.6 (2009) 13.2 (2016) 0.6 0.3 0.4 (2014) 0.7 (2001) 0.3 0.5 (2014)
China 4.6 3.8 1.7 10.1 (2002) 2.7 0.1 31.7 (2002) 11.2 0.5 (2016)
India 26.1 29.8 14.9 8.6 32.7 0.3 39.90 (2004) 32.80 (2009) 22.5 (2011)
Indonesia 23.4 12.5 - 12.8 2.3 0.5 19.0 (2008) 13.3 3.6
Japan - - - 0.2 0 0.2 (2013) 0.5 (2008) 0 0.7 (2013)
Republic of Korea 7.4 5.0 16.7 0.2 (2006) 0.2 0 (2016) 0.2 (2006) 0.5 0.2 (2016)
Lao PDR 38.6 27.6 23.2 15 (1997) 5.9 (2007) 1.8 50.7 (1997) 25.7 (2007) 10
Malaysia 8.1 3.8 0.4 0.2 (2003) 0 (2011) 0 (2015) 1.2 (2003) 0.6 (2008) 0 (2015)
Myanmar - - 24.8 (2017) - - 0.1 (2017) - - 1.4 (2017)
Philippines 40 26.5 16.6 3.1 (2003) 2.3 (2009) 0.5 13.7 10.7 (2009) 2.7
Thailand 12.9 7.8 9.9 0.4 0.4 0 - 2.5 0
Viet Nam 5.5 14.5 5.8 7.6 10.1 0.4 37 (2002) 4 1.9
GDP = gross domestic product.
Notes: For 1960, data for the Middle East and North Africa refer to 1968 and data for New Zealand refer to 1970. Shares calculated using GDP in constant 2010 United States dollars.
Source: ADB (2020a).
Figure 2.1 Asia’s Growing Share of Global GDP, 1960 and 2018
1960Developing Asia4.1% Japan
7.0%
Australia and New Zealand2.2%
Latin America and the Caribbean7.1%
Middle East and North Africa3.9%
Sub-Saharan Africa2,.2%
North America30.6%
European Union36.2%
Rest of the World6.6%
2018
Developing Asia24.0%
Japan7.5%
Australia and New Zealand1.9%
Latin America and the Caribbean7.4%
Middle East and North Africa4.3%
Sub-Saharan Africa2.2%
North America23.9%
European Union23.3%
Rest of the World5.6%
Global Megatrends, Asian Renaissance of Low-Carbon Green Growth, and Covid -19: Changing Perceptions 29
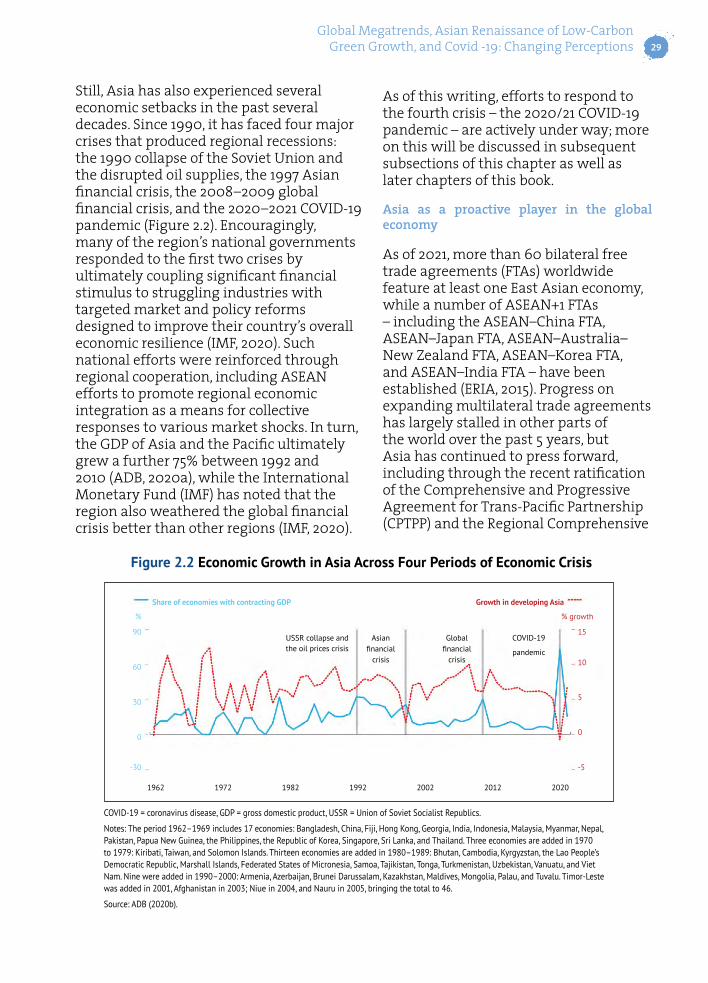
Still, Asia has also experienced several economic setbacks in the past several decades. Since 1990, it has faced four major crises that produced regional recessions: the 1990 collapse of the Soviet Union and the disrupted oil supplies, the 1997 Asian financial crisis, the 2008–2009 global financial crisis, and the 2020–2021 COVID-19 pandemic (Figure 2.2). Encouragingly, many of the region’s national governments responded to the first two crises by ultimately coupling significant financial stimulus to struggling industries with targeted market and policy reforms designed to improve their country’s overall economic resilience (IMF, 2020). Such national efforts were reinforced through regional cooperation, including ASEAN efforts to promote regional economic integration as a means for collective responses to various market shocks. In turn, the GDP of Asia and the Pacific ultimately grew a further 75% between 1992 and 2010 (ADB, 2020a), while the International Monetary Fund (IMF) has noted that the region also weathered the global financial crisis better than other regions (IMF, 2020).
COVID-19 = coronavirus disease, GDP = gross domestic product, USSR = Union of Soviet Socialist Republics.
Notes: The period 1962–1969 includes 17 economies: Bangladesh, China, Fiji, Hong Kong, Georgia, India, Indonesia, Malaysia, Myanmar, Nepal, Pakistan, Papua New Guinea, the Philippines, the Republic of Korea, Singapore, Sri Lanka, and Thailand. Three economies are added in 1970 to 1979: Kiribati, Taiwan, and Solomon Islands. Thirteen economies are added in 1980–1989: Bhutan, Cambodia, Kyrgyzstan, the Lao People’s Democratic Republic, Marshall Islands, Federated States of Micronesia, Samoa, Tajikistan, Tonga, Turkmenistan, Uzbekistan, Vanuatu, and Viet Nam. Nine were added in 1990–2000: Armenia, Azerbaijan, Brunei Darussalam, Kazakhstan, Maldives, Mongolia, Palau, and Tuvalu. Timor-Leste was added in 2001, Afghanistan in 2003; Niue in 2004, and Nauru in 2005, bringing the total to 46.
Source: ADB (2020b).
Figure 2.2 Economic Growth in Asia Across Four Periods of Economic Crisis
90 15
Share of economies with contracting GDP Growth in developing Asia
% % growth
60 10
30 5
-30 -5
1962 1972
USSR collapse and the oil prices crisis
Asian financial
crisis
Global financial
crisis
COVID-19
pandemic
1982 1992 2002 2012 2020
0 0
As of this writing, efforts to respond to the fourth crisis – the 2020/21 COVID-19 pandemic – are actively under way; more on this will be discussed in subsequent subsections of this chapter as well as later chapters of this book.
Asia as a proactive player in the global economy
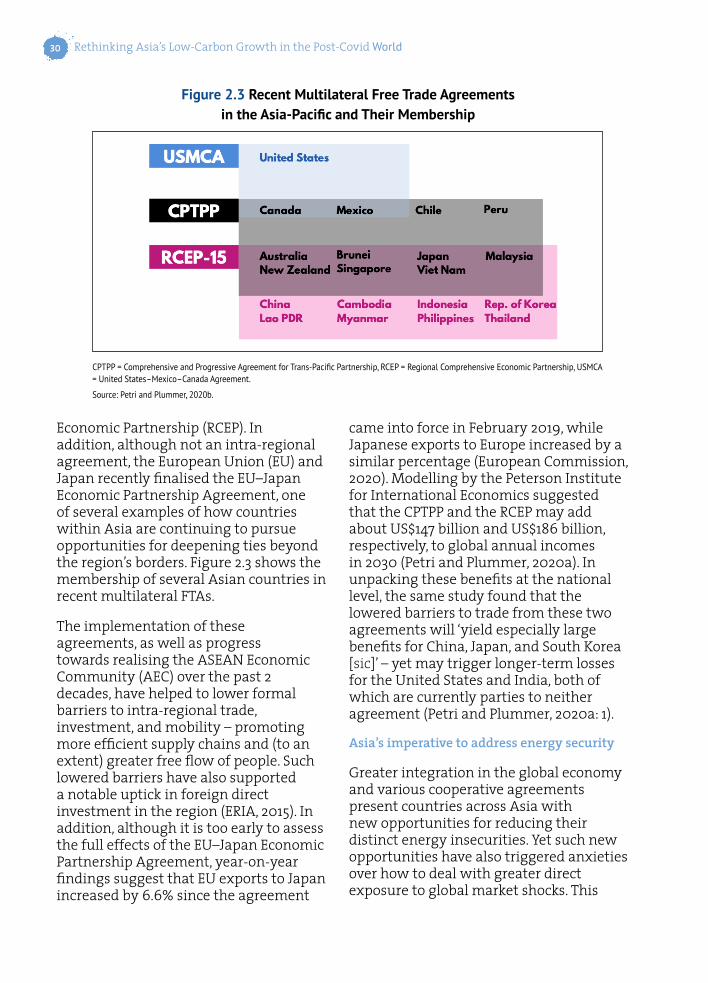
As of 2021, more than 60 bilateral free trade agreements (FTAs) worldwide feature at least one East Asian economy, while a number of ASEAN+1 FTAs – including the ASEAN–China FTA, ASEAN–Japan FTA, ASEAN–Australia–New Zealand FTA, ASEAN–Korea FTA, and ASEAN–India FTA – have been established (ERIA, 2015). Progress on expanding multilateral trade agreements has largely stalled in other parts of the world over the past 5 years, but Asia has continued to press forward, including through the recent ratification of the Comprehensive and Progressive Agreement for Trans-Pacific Partnership (CPTPP) and the Regional Comprehensive
Rethinking Asia’s Low-Carbon Growth in the Post-Covid World30
Economic Partnership (RCEP). In addition, although not an intra-regional agreement, the European Union (EU) and Japan recently finalised the EU–Japan Economic Partnership Agreement, one of several examples of how countries within Asia are continuing to pursue opportunities for deepening ties beyond the region’s borders. Figure 2.3 shows the membership of several Asian countries in recent multilateral FTAs.
The implementation of these agreements, as well as progress towards realising the ASEAN Economic Community (AEC) over the past 2 decades, have helped to lower formal barriers to intra-regional trade, investment, and mobility – promoting more efficient supply chains and (to an extent) greater free flow of people. Such lowered barriers have also supported a notable uptick in foreign direct investment in the region (ERIA, 2015). In addition, although it is too early to assess the full effects of the EU–Japan Economic Partnership Agreement, year-on-year findings suggest that EU exports to Japan increased by 6.6% since the agreement
CPTPP = Comprehensive and Progressive Agreement for Trans-Pacific Partnership, RCEP = Regional Comprehensive Economic Partnership, USMCA = United States–Mexico–Canada Agreement.
Source: Petri and Plummer, 2020b.
Figure 2.3 Recent Multilateral Free Trade Agreements in the Asia-Pacific and Their Membership
came into force in February 2019, while Japanese exports to Europe increased by a similar percentage (European Commission, 2020). Modelling by the Peterson Institute for International Economics suggested that the CPTPP and the RCEP may add about US$147 billion and US$186 billion, respectively, to global annual incomes in 2030 (Petri and Plummer, 2020a). In unpacking these benefits at the national level, the same study found that the lowered barriers to trade from these two agreements will ‘yield especially large benefits for China, Japan, and South Korea [sic]’ – yet may trigger longer-term losses for the United States and India, both of which are currently parties to neither agreement (Petri and Plummer, 2020a: 1).
Asia’s imperative to address energy security
Greater integration in the global economy and various cooperative agreements present countries across Asia with new opportunities for reducing their distinct energy insecurities. Yet such new opportunities have also triggered anxieties over how to deal with greater direct exposure to global market shocks. This
Global Megatrends, Asian Renaissance of Low-Carbon Green Growth, and Covid -19: Changing Perceptions 31
anxiety can be especially pronounced in the context of declining self-sufficiency levels across the region – with Korea and Japan already 100% reliant on imports to meet their fossil fuel needs, and China, India, and many others in Southeast Asia either already at or approaching net importer status (IEA, 2019). To that end, over the past 40 years, a range of multilateral efforts led by the International Energy Agency (IEA), the East Asia Summit, ASEAN, and others have sought to address regional (and global) concerns about energy supply chain disruptions, extreme price shocks, and other market volatility risks. As suggested earlier, these efforts have already paid positive dividends in Asia, including bolstering collective action in areas as diverse as energy efficiency and fuel stockpiling.
Nonetheless, volatility remains a prominent feature of global energy markets – and an area where governments across Asia continue to argue that additional efforts may be required to reduce their exposure to its most negative effects. Here, a key debate has centred around how to manage dramatic swings in world oil and gas markets such as the 2014–2016 crash in global prices. For producer countries where oil or gas revenues represent a sizeable share of national GDP (e.g. Indonesia, Myanmar, Brunei Darussalam, and Malaysia), variable revenues have served as an added strain on national budgets and a complication in mid- and long-term strategic planning. The volatility of oil and gas prices creates the risk that depressed prices might incentivise overconsumption or undercut the sense of urgency surrounding energy efficiency campaigns – threatening to set back the region’s clean energy transition while leaving these economies highly exposed to subsequent price spikes (National Bureau of Asian Research, 2021).
Recent regional efforts to respond to volatility concerns focus on the phase-out of fossil fuel subsidies and a greater focus on low-carbon technologies. Growing attention to fossil fuel subsidy reform can be observed in several countries (e.g. Indonesia and India) which often aim to seize upon periods of lower global prices as an opportunity to reduce subsidies. Such policy efforts have multiple lasting benefits. They contribute to improving the rationalisation of energy prices, reducing fiscal burdens and, with alternative means of support, improving the effectiveness of assistance to the poor and vulnerable. Meanwhile, many countries (e.g. Japan, China, India, and Singapore) have also articulated national energy strategies designed to better manage their overall dependency on energy supply imports, often with an eye towards reducing their relative reliance on oil, gas, and coal in various sectors. To that end, a larger take-up of renewable energies that is good for addressing climate change is also good for reducing their dependence on power sector imports and thus the exposure to energy market volatility.
Steady yet uneven progress on sustainable development for all
Asia’s economic rise – in particular, steep rises in average incomes and overall living standards – has generated significant knock-on benefits over the past 6 decades, as alluded to in prior sections. To that end, between 1960 and 2018 the region saw ‘life expectancy increase from 45 to 72 years and the under-five mortality rate decline sixfold’ (ADB, 2020a: 5–6). Looking
Rethinking Asia’s Low-Carbon Growth in the Post-Covid World32
at the metrics provided by the 17 Sustainable Development Goals (SDGs) of the United Nations (UN), several studies (UNESCAP 2020a, 2021a; ILO, 2021) have found that the region has made significant gains since 2000 across a number of development areas, including working towards eliminating hunger and promoting decent work opportunities for all.
Yet in many ways, ensuring inclusive development remains an elusive and challenging task. In its seminal 2011 Asia 2050 study, the Asian Development Bank (ADB) noted that ‘the world’s fastest growing region remains home to the majority of the world’s extreme poor. “Factory Asia” may be a global hub for manufacturing and information technology services, but vast numbers of its people are illiterate and unemployed’ (ADB, 2011: xxiii). A decade later, many of its concerns still ring true. To that end, a 2021 UN assessment noted with concern that the region’s development progress appears to have stalled in many areas, with more effort needed in areas such as increasing investment in basic services to the poor and vulnerable, and enhancing social protection more broadly (UNESCAP, 2021a).
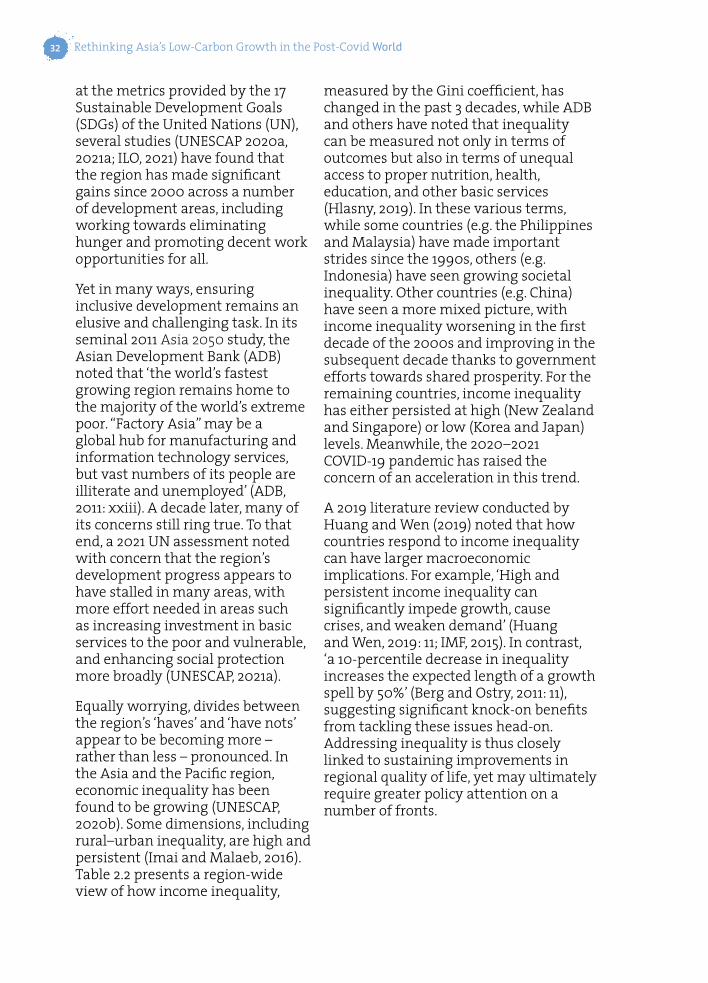
Equally worrying, divides between the region’s ‘haves’ and ‘have nots’ appear to be becoming more – rather than less – pronounced. In the Asia and the Pacific region, economic inequality has been found to be growing (UNESCAP, 2020b). Some dimensions, including rural–urban inequality, are high and persistent (Imai and Malaeb, 2016). Table 2.2 presents a region-wide view of how income inequality,
measured by the Gini coefficient, has changed in the past 3 decades, while ADB and others have noted that inequality can be measured not only in terms of outcomes but also in terms of unequal access to proper nutrition, health, education, and other basic services (Hlasny, 2019). In these various terms, while some countries (e.g. the Philippines and Malaysia) have made important strides since the 1990s, others (e.g. Indonesia) have seen growing societal inequality. Other countries (e.g. China) have seen a more mixed picture, with income inequality worsening in the first decade of the 2000s and improving in the subsequent decade thanks to government efforts towards shared prosperity. For the remaining countries, income inequality has either persisted at high (New Zealand and Singapore) or low (Korea and Japan) levels. Meanwhile, the 2020–2021 COVID-19 pandemic has raised the concern of an acceleration in this trend.
A 2019 literature review conducted by Huang and Wen (2019) noted that how countries respond to income inequality can have larger macroeconomic implications. For example, ‘High and persistent income inequality can significantly impede growth, cause crises, and weaken demand’ (Huang and Wen, 2019: 11; IMF, 2015). In contrast, ‘a 10-percentile decrease in inequality increases the expected length of a growth spell by 50%’ (Berg and Ostry, 2011: 11), suggesting significant knock-on benefits from tackling these issues head-on. Addressing inequality is thus closely linked to sustaining improvements in regional quality of life, yet may ultimately require greater policy attention on a number of fronts.
Global Megatrends, Asian Renaissance of Low-Carbon Green Growth, and Covid -19: Changing Perceptions 33
Countries (ASEAN+6) 1990–2000 2000–2010 2010–2020
New Zealand 0.468 2002 0.462 2010 0.459 2016
Singapore 0.442 2000 0.482 2007 0.452 2011
Philippines 0.477 2000 0.463 2009 0.423 2019
Malaysia 0.491 1997 0.463 2009 0.411 2013
Lao PDR 0.349 1997 0.354 2007 0.388 2016
China 0.387 1999 0.437 2010 0.385 2018
Indonesia 0.286 2000 0.364 2010 0.382 2015
India 0.317 1993 0.354 2009 0.357 2011
Thailand 0.428 2000 0.394 2010 0.349 2018
Viet Nam 0.354 1997 0.393 2010 0.349 2019
Australia 0.326 1995 0.347 2010 0.344 2014
Japan 0.317 1989 0.321 2010 0.329 2019
Korea, Rep. of 0.298 1999 0.320 2010 0.314 2018
ASEAN = Association of Southeast Asian Nations.
Sources: ERIA Study Team; World Bank (n.d.), DataBank, Gini index. https://data.worldbank.org/indicator/SI.POV.GINI (accessed 12 July 2021); Republic of Korea: Kang, S. (2001), ‘FDI, Human Capital and Education in Developing Countries’, Technical Meeting, Paris, 13–14 December. https://www.oecd.org/dev/2698445.pdf (accessed 12 July 2021); and New Zealand: NZIER (2013), ‘Understanding Inequality: Dissecting the Dimensions, Data and Debate’. Wellington: New Zealand Institute of Economic Research. https://www.businessnz.org.nz/__data/assets/pdf_file/0004/85927/NZIER-Understanding-Inequality.pdf (accessed 12 July 2021 )
Table 2.2 Inequality growth (Gini index), 1990–2019
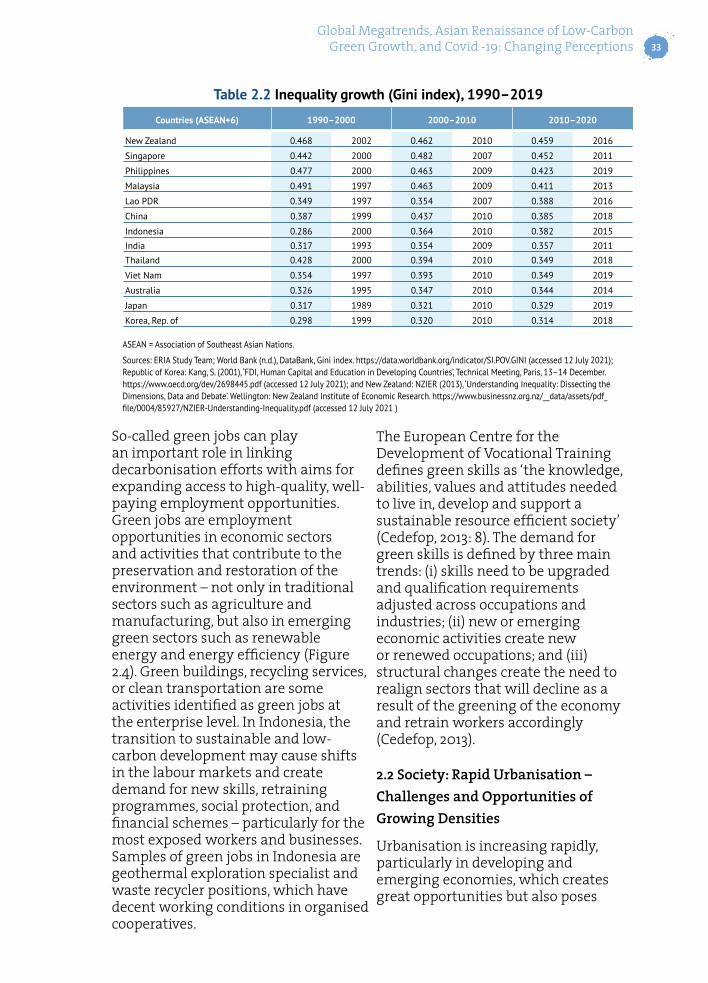
So-called green jobs can play an important role in linking decarbonisation efforts with aims for expanding access to high-quality, well-paying employment opportunities. Green jobs are employment opportunities in economic sectors and activities that contribute to the preservation and restoration of the environment – not only in traditional sectors such as agriculture and manufacturing, but also in emerging green sectors such as renewable energy and energy efficiency (Figure 2.4). Green buildings, recycling services, or clean transportation are some activities identified as green jobs at the enterprise level. In Indonesia, the transition to sustainable and low-carbon development may cause shifts in the labour markets and create demand for new skills, retraining programmes, social protection, and financial schemes – particularly for the most exposed workers and businesses. Samples of green jobs in Indonesia are geothermal exploration specialist and waste recycler positions, which have decent working conditions in organised cooperatives.
The European Centre for the Development of Vocational Training defines green skills as ‘the knowledge, abilities, values and attitudes needed to live in, develop and support a sustainable resource efficient society’ (Cedefop, 2013: 8). The demand for green skills is defined by three main trends: (i) skills need to be upgraded and qualification requirements adjusted across occupations and industries; (ii) new or emerging economic activities create new or renewed occupations; and (iii) structural changes create the need to realign sectors that will decline as a result of the greening of the economy and retrain workers accordingly (Cedefop, 2013).
2.2 Society: Rapid Urbanisation – Challenges and Opportunities of Growing Densities
Urbanisation is increasing rapidly, particularly in developing and emerging economies, which creates great opportunities but also poses
Rethinking Asia’s Low-Carbon Growth in the Post-Covid World34
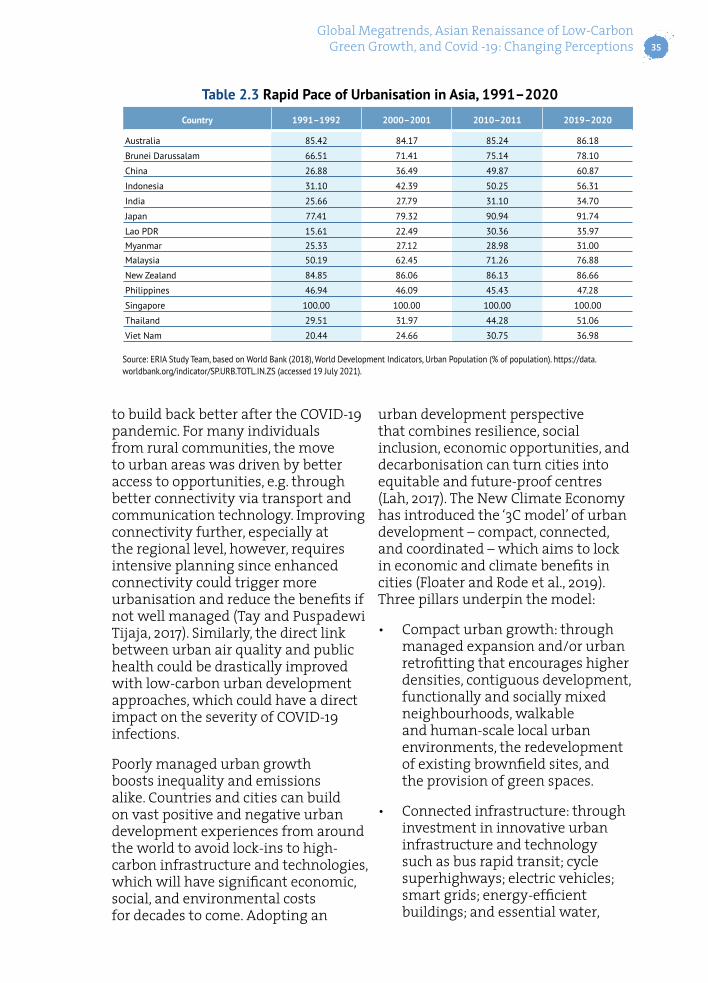
Source: ERIA Study Team based on ILO (2021).
Figure 2.4 Green Job Activities
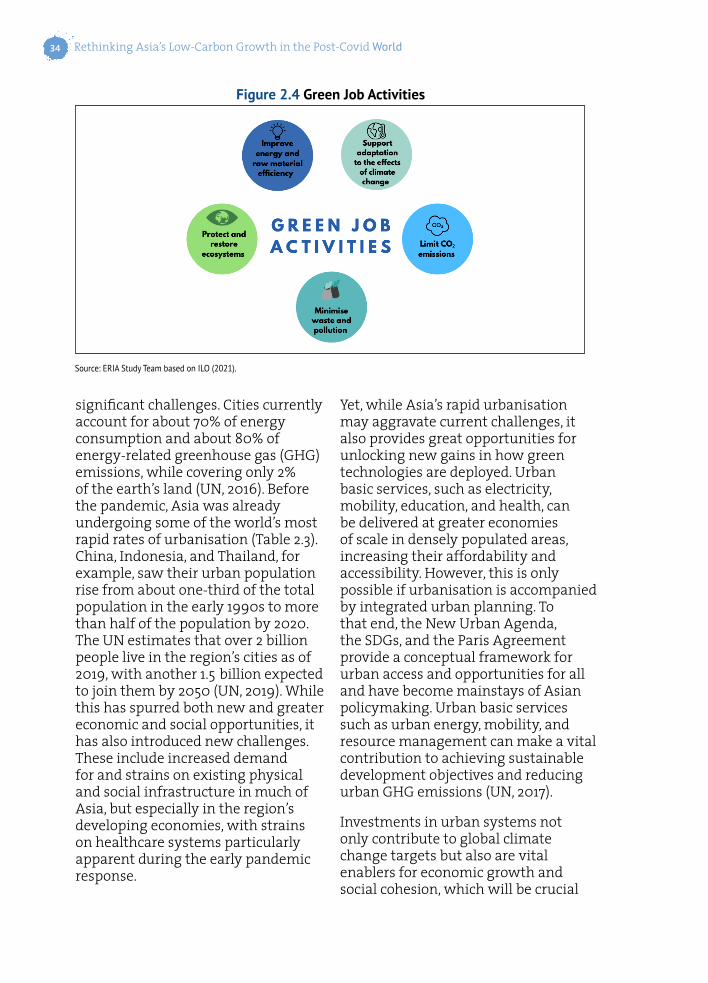
significant challenges. Cities currently account for about 70% of energy consumption and about 80% of energy-related greenhouse gas (GHG) emissions, while covering only 2% of the earth’s land (UN, 2016). Before the pandemic, Asia was already undergoing some of the world’s most rapid rates of urbanisation (Table 2.3). China, Indonesia, and Thailand, for example, saw their urban population rise from about one-third of the total population in the early 1990s to more than half of the population by 2020. The UN estimates that over 2 billion people live in the region’s cities as of 2019, with another 1.5 billion expected to join them by 2050 (UN, 2019). While this has spurred both new and greater economic and social opportunities, it has also introduced new challenges. These include increased demand for and strains on existing physical and social infrastructure in much of Asia, but especially in the region’s developing economies, with strains on healthcare systems particularly apparent during the early pandemic response.
Yet, while Asia’s rapid urbanisation may aggravate current challenges, it also provides great opportunities for unlocking new gains in how green technologies are deployed. Urban basic services, such as electricity, mobility, education, and health, can be delivered at greater economies of scale in densely populated areas, increasing their affordability and accessibility. However, this is only possible if urbanisation is accompanied by integrated urban planning. To that end, the New Urban Agenda, the SDGs, and the Paris Agreement provide a conceptual framework for urban access and opportunities for all and have become mainstays of Asian policymaking. Urban basic services such as urban energy, mobility, and resource management can make a vital contribution to achieving sustainable development objectives and reducing urban GHG emissions (UN, 2017).
Investments in urban systems not only contribute to global climate change targets but also are vital enablers for economic growth and social cohesion, which will be crucial
Global Megatrends, Asian Renaissance of Low-Carbon Green Growth, and Covid -19: Changing Perceptions 35
Country 1991–1992 2000–2001 2010–2011 2019–2020
Australia 85.42 84.17 85.24 86.18
Brunei Darussalam 66.51 71.41 75.14 78.10
China 26.88 36.49 49.87 60.87
Indonesia 31.10 42.39 50.25 56.31
India 25.66 27.79 31.10 34.70
Japan 77.41 79.32 90.94 91.74
Lao PDR 15.61 22.49 30.36 35.97
Myanmar 25.33 27.12 28.98 31.00
Malaysia 50.19 62.45 71.26 76.88
New Zealand 84.85 86.06 86.13 86.66
Philippines 46.94 46.09 45.43 47.28
Singapore 100.00 100.00 100.00 100.00
Thailand 29.51 31.97 44.28 51.06
Viet Nam 20.44 24.66 30.75 36.98
Source: ERIA Study Team, based on World Bank (2018), World Development Indicators, Urban Population (% of population). https://data.worldbank.org/indicator/SP.URB.TOTL.IN.ZS (accessed 19 July 2021).
Table 2.3 Rapid Pace of Urbanisation in Asia, 1991–2020
to build back better after the COVID-19 pandemic. For many individuals from rural communities, the move to urban areas was driven by better access to opportunities, e.g. through better connectivity via transport and communication technology. Improving connectivity further, especially at the regional level, however, requires intensive planning since enhanced connectivity could trigger more urbanisation and reduce the benefits if not well managed (Tay and Puspadewi Tijaja, 2017). Similarly, the direct link between urban air quality and public health could be drastically improved with low-carbon urban development approaches, which could have a direct impact on the severity of COVID-19 infections.
Poorly managed urban growth boosts inequality and emissions alike. Countries and cities can build on vast positive and negative urban development experiences from around the world to avoid lock-ins to high-carbon infrastructure and technologies, which will have significant economic, social, and environmental costs for decades to come. Adopting an
urban development perspective that combines resilience, social inclusion, economic opportunities, and decarbonisation can turn cities into equitable and future-proof centres (Lah, 2017). The New Climate Economy has introduced the ‘3C model’ of urban development – compact, connected, and coordinated – which aims to lock in economic and climate benefits in cities (Floater and Rode et al., 2019). Three pillars underpin the model:
• Compact urban growth: through managed expansion and/or urban retrofitting that encourages higher densities, contiguous development, functionally and socially mixed neighbourhoods, walkable and human-scale local urban environments, the redevelopment of existing brownfield sites, and the provision of green spaces.
• Connected infrastructure: through investment in innovative urban infrastructure and technology such as bus rapid transit; cycle superhighways; electric vehicles; smart grids; energy-efficient buildings; and essential water,

Rethinking Asia’s Low-Carbon Growth in the Post-Covid World36
sanitation, and waste services.
• Coordinated governance: through effective and accountable institutions to support the coordinated planning and implementation of programmes of activity and investment across public and private sectors and civil society, particularly for land-use change and transport (Floater and Rode et al., 2019).
This model reflects on the complexity of urban systems, their development dynamics, interventions areas, and decision-making processes. Rarely will a single measure achieve comprehensive climate change impacts and generate economic, social, and environmental benefits. Many policy and planning decisions have synergistic effects, meaning that their impacts are larger if implemented together. It is therefore generally best to implement and evaluate integrated programmes rather than individual strategies. In particular at the city level, the combination of measures can help in integrating packages of interventions to deliver synergies and minimise rebound effects.
2.3 Environment: Growing Awareness of Climate and Environmental Issues
Alongside the above challenges, countries across Asia also face the daunting question of how to address increasingly dire environmental degradation and climate change. Since the 1960s, dramatic upticks in GHG emissions and fine particulate matter – driven by both agricultural practices and greater consumption of fossil fuels by firms and households – has led to worsening air quality across much of the region. In addition, while earlier so-called ‘airpocalypse’ events in Fukuoka, Beijing, and other sites have
sparked national conversations that led to stronger power plant, vehicle, and industrial emission standards, about 92% of Asia and the Pacific – or about 4 billion people – live with air pollution levels considered a ‘significant risk’ to human health (UNEP, APCAP, CCAP, 2019).
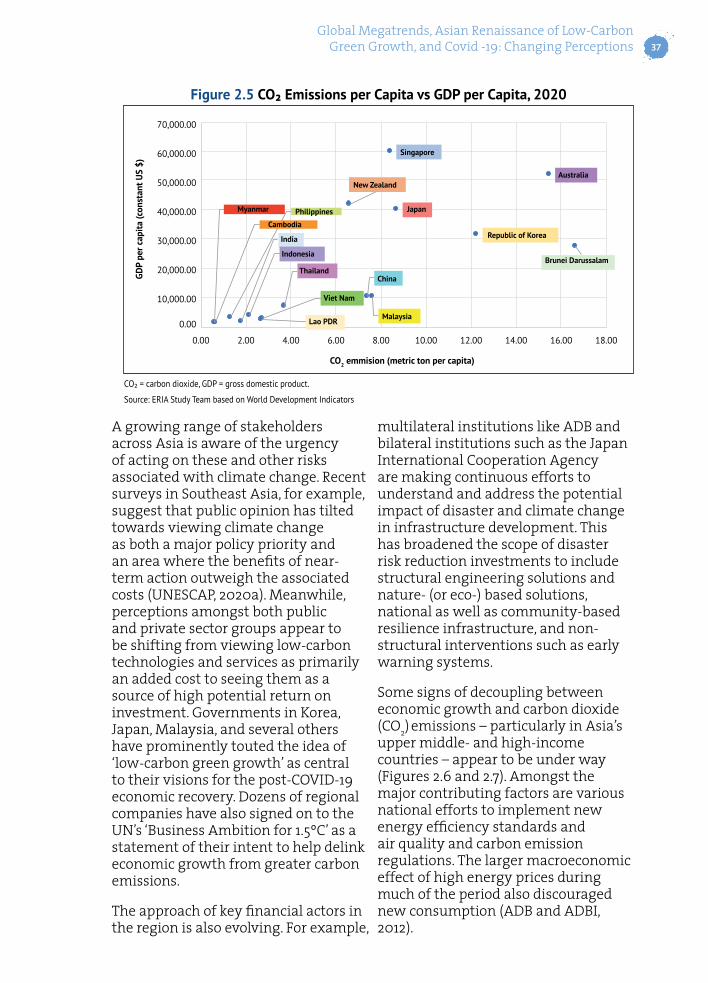
Meanwhile, carbon emissions are closely related to increases in income levels (Figure 2.5). The cascading effects of rising global GHG emissions have led to increasing average temperatures and major, often erratic, shifts in weather patterns. Such effects have included more frequent and pronounced droughts in India, Cambodia, and the Lao People’s Democratic Republic (Lao PDR), while Bangladesh, Myanmar, Thailand, the Philippines, and Japan have also grappled with severe flooding and typhoons.
Collectively, these trends pose not only serious and direct threats to public health, safety, and well-being, but also threaten to undermine the region’s economic development ambitions. Earlier regional studies projected severe economic impacts if mitigation and adaptation actions were not taken urgently. For example, a 2015 model by ADB found that climate change could reduce Southeast Asia’s otherwise projected GDP growth by 11% by the end of the 21st century (ADB, 2015: 69). The ADB Institute projected in 2013 that disruptions to agriculture could push 64 million Asians into poverty for every 10% change in food prices; and major population centres and coastal cities such as Bangkok, Ho Chi Minh City, Manila, and Yangon could see mass economic and social disruption with even moderate sea-level rises (ADB and ADBI, 2012).
Global Megatrends, Asian Renaissance of Low-Carbon Green Growth, and Covid -19: Changing Perceptions 37
Figure 2.5 CO₂ Emissions per Capita vs GDP per Capita, 2020
CO₂ = carbon dioxide, GDP = gross domestic product.
Source: ERIA Study Team based on World Development Indicators
70,000.00
50,000.00
30,000.00
10,000.00
60,000.00
40,000.00
GDP
per c
apita
(con
stan
t US
$)
CO2 emmision (metric ton per capita)
20,000.00
0.00
0.00 2.00 8.004.00 10.00 14.006.00 12.00 16.00 18.00
Myanmar
Cambodia
Philippines
India
Indonesia
Thailand
Viet Nam
Lao PDR
China
Malaysia
Japan
New Zealand
Singapore
Republic of Korea
Brunei Darussalam
Australia
A growing range of stakeholders across Asia is aware of the urgency of acting on these and other risks associated with climate change. Recent surveys in Southeast Asia, for example, suggest that public opinion has tilted towards viewing climate change as both a major policy priority and an area where the benefits of near-term action outweigh the associated costs (UNESCAP, 2020a). Meanwhile, perceptions amongst both public and private sector groups appear to be shifting from viewing low-carbon technologies and services as primarily an added cost to seeing them as a source of high potential return on investment. Governments in Korea, Japan, Malaysia, and several others have prominently touted the idea of ‘low-carbon green growth’ as central to their visions for the post-COVID-19 economic recovery. Dozens of regional companies have also signed on to the UN’s ‘Business Ambition for 1.5ºC’ as a statement of their intent to help delink economic growth from greater carbon emissions.
The approach of key financial actors in the region is also evolving. For example,
multilateral institutions like ADB and bilateral institutions such as the Japan International Cooperation Agency are making continuous efforts to understand and address the potential impact of disaster and climate change in infrastructure development. This has broadened the scope of disaster risk reduction investments to include structural engineering solutions and nature- (or eco-) based solutions, national as well as community-based resilience infrastructure, and non-structural interventions such as early warning systems.
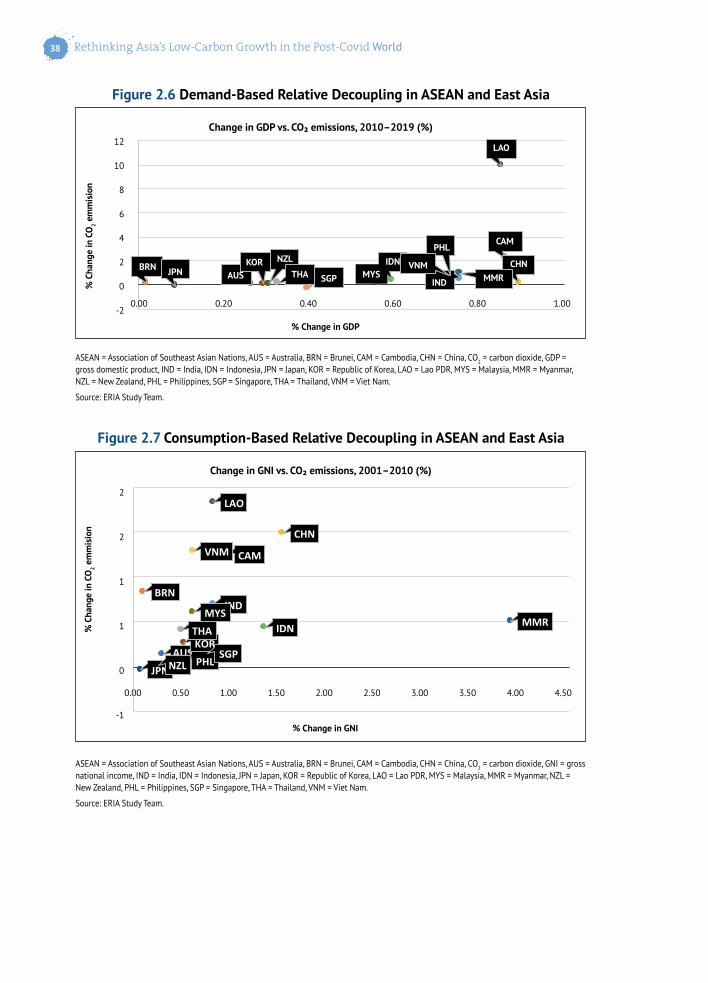
Some signs of decoupling between economic growth and carbon dioxide (CO2) emissions – particularly in Asia’s upper middle- and high-income countries – appear to be under way (Figures 2.6 and 2.7). Amongst the major contributing factors are various national efforts to implement new energy efficiency standards and air quality and carbon emission regulations. The larger macroeconomic effect of high energy prices during much of the period also discouraged new consumption (ADB and ADBI, 2012).
Rethinking Asia’s Low-Carbon Growth in the Post-Covid World38
Figure 2.6 Demand-Based Relative Decoupling in ASEAN and East Asia
Figure 2.7 Consumption-Based Relative Decoupling in ASEAN and East Asia
ASEAN = Association of Southeast Asian Nations, AUS = Australia, BRN = Brunei, CAM = Cambodia, CHN = China, CO2 = carbon dioxide, GDP = gross domestic product, IND = India, IDN = Indonesia, JPN = Japan, KOR = Republic of Korea, LAO = Lao PDR, MYS = Malaysia, MMR = Myanmar, NZL = New Zealand, PHL = Philippines, SGP = Singapore, THA = Thailand, VNM = Viet Nam.
Source: ERIA Study Team.
ASEAN = Association of Southeast Asian Nations, AUS = Australia, BRN = Brunei, CAM = Cambodia, CHN = China, CO2 = carbon dioxide, GNI = gross national income, IND = India, IDN = Indonesia, JPN = Japan, KOR = Republic of Korea, LAO = Lao PDR, MYS = Malaysia, MMR = Myanmar, NZL = New Zealand, PHL = Philippines, SGP = Singapore, THA = Thailand, VNM = Viet Nam.
Source: ERIA Study Team.
12
8
4
0
-2
10
6
% C
hang
e in
CO
2 em
mis
ion
% Change in GDP
Change in GDP vs. CO₂ emissions, 2010–2019 (%)
2
0.00
BRN JPN AUSKOR NZL
THA SGP MYSIDN VNM
PHL
IND
CAM
LAO
MMRCHN
0.20 0.40 0.60 0.80 1.00
2
1
0
-1
2
1% C
hang
e in
CO
2 em
mis
ion
% Change in GNI
Change in GNI vs. CO₂ emissions, 2001–2010 (%)
0.00 0.50 1.50 2.50 3.501.00 2.00 3.00 4.00 4.50
CHN
Global Megatrends, Asian Renaissance of Low-Carbon Green Growth, and Covid -19: Changing Perceptions 39
Still, a large gap remains between ambition and action to reduce pollution and environmental degradation in most countries in Asia (Kimura and Han, 2021). As part of the adoption of the Paris Agreement in 2015, countries across the region set often ambitious targets for tackling their GHG emissions. Yet, while notable progress has occurred to date, several studies by the Economic Research Institute for ASEAN and East Asia (ERIA) have suggested that the pace of progress falls far short of what is required to prevent a catastrophic rise in global temperatures (Anbumozhi, Kalirajan, and Kimura, 2016; Anbumozhi and Kalirajan, 2017; Anbumozhi, Kalirajan, and Kimura, 2019; Kimura and Han, 2021). Amongst the region’s developed economies, neither Korea nor Australia are on track to achieve their 2030 targets. Meanwhile, Southeast Asia’s CO2 emissions are expected to increase seven times as fast as the global average during 2018–2040 (IEA, 2019). Although this could be partly because the subregion is home to a number of developing economies whose overall energy demand is rising more rapidly than others globally, this highlights the extent to which more aggressive action may be necessary to avoid increasingly dire regional environmental and climate projections.
A joint study by the IEA, the World Bank, and the World Economic Forum (2021) emphasised the urgency of supporting energy transitions and clean energy investment in emerging and developing economies. The report pointed out that unless the speed of the transition is accelerated and the scale of investment is substantially expanded in emerging and developing economies, the world will face a major fault line in efforts to address climate change and achieve other SDGs. A
key factor underlying this urgency is that most of the growth in global emissions in the coming decades is set to come from emerging and developing economies as they grow, industrialise, and urbanise. The imperative to decouple development from emissions is crucial so that future development meets citizens’ aspirations while avoiding the high-carbon pathways adopted by industrialised economies.
2.4 Governance: Progress on Regional Cooperation and Integration
Regional cooperation is a valuable collaborative governance mechanism to address pressing development challenges of common concern. Cooperative mechanisms take on different forms and processes for different topics. In Asia, some of the prominent platforms include the East Asia Summit, Asia-Pacific Economic Cooperation (APEC), and ASEAN-led initiatives (e.g. ASEAN+3,2 ASEAN+6,3 and the AEC), which serve as overlapping yet distinct processes that support broader regional economic, financial, social, and security cooperation.
The 1997–1998 Asian financial crisis was a turning point for East Asian and Southeast Asian regionalism. It led to further regional cooperation on monetary and financial issues, spurring innovative mechanisms built on previous initiatives such as the ASEAN Swap Arrangements. ASEAN+3 developed several initiatives to strengthen resilience against
2 ASEAN+3 comprises the 10 ASEAN Member States (AMS) plus China, Japan, and Korea. 3 ASEAN+6 comprises the 10 AMS plus Australia, China, India, Japan, Korea, and New Zealand.
Rethinking Asia’s Low-Carbon Growth in the Post-Covid World40
financial stability, such as the Chiang Mai Initiative (2000) as a network of currency swap arrangements and the Asian Bond Markets Initiative (2002) to promote long-term financing within the region. This was advanced under the 2003 Bali Concord II, and through the adoption of the AEC Blueprint in 2007 and its subsequent implementation under the ASEAN+6 framework for regional cooperation. Meanwhile, to strengthen their collective preparedness for future crises, the ASEAN+3 launched the Chiang Mai Initiative Multilateralization (CMIM) in 2010 and the ASEAN+3 Macroeconomic Research Office in 2011 to monitor CMIM economies, support the implementation of the CMIM, and provide technical assistance to CMIM members. No further developments have since taken place, and no country has applied for the use of the CMIM.
In the past 2 decades, Asia has seen the expansion of regional and subregional forums to address emerging challenges. This includes notable work at the nexus of pursuing energy security, sustainable development, and climate action. At the 2nd East Asia Summit in 2007, for example, 16 countries jointly affirmed what would become the Cebu Declaration on East Asian Energy Security, agreeing to strengthen collective action on promoting regional energy security, including through greater attention to developing more efficient and cleaner energy supplies and technologies, with the establishment of an Energy Cooperation Taskforce (ASEAN, 2007). Meanwhile, at the subregional level, ASEAN has made considerable progress in developing collaborative mechanisms for addressing the issue of cross-boundary air pollution. This includes the ratification of the
ASEAN Agreement on Transboundary Haze Pollution and subsequent adoption of the Roadmap on ASEAN Cooperation Towards Transboundary Haze Control Pollution with Means of Implementation (Tay and Puspadewi Tijaja, 2017).
Asian countries promote global cooperative processes to address the global concerns of inclusive development, sustainable infrastructure, energy systems, and climate change. The G20 is a prime example of Asia’s proactive engagement at the global level, with six Asian developed and major economies participating. Through successive summits hosted by Asian countries, the G20 champions renewed emphasis on development through infrastructure. This infrastructure agenda has been deepened to promote the financing of low-carbon investments; enhance the environmental, social, and governance performance of infrastructure investments and services; and safeguard the sound management of infrastructure assets (G20, 2019).
Global and regional cooperation contributes to advancing Asia’s energy transitions. ERIA studies (Anbumozhi and Tuan, 2015; Yoshikawa and Anbumozhi, 2018; Kimura and Han, 2021) have pointed out that greater access to energy supplies and technologies available in global markets has played a positive role in making a wide range of cleaner fuels and technologies more viable and affordable to deploy, e.g. contributing to dramatic declines in the cost of solar panels. Nonetheless, ongoing barriers to trade risk undercutting the pace and overall potential for accelerating Asia’s clean energy transition. Challenging questions include debates on the pace
Global Megatrends, Asian Renaissance of Low-Carbon Green Growth, and Covid -19: Changing Perceptions 41
and desirability of removing tariffs or restrictive export/import quotas on both products (e.g. wind turbines or solar photovoltaic (PV) technologies) as well as the raw materials critical to their production (e.g. critical minerals). More broadly, though, several regional forums including APEC have expressed concern that economies across the region will need to complement action on trade liberalisation with additional domestic market reforms to take full advantage of trends in global markets. As discussed earlier, countries in the region need to make greater progress on fossil fuel subsidy reform and overall market liberalisation so that cleaner fuels and technologies can compete against well-entrenched, yet often less sustainable, alternatives. In this regard, global and regional forums serve as important platforms for countries to share their experience and learn lessons when adopting and sustaining such reform initiatives.
2.5 Technology: New Transition Pathways
Some of the key factors that have affected the transition to low-carbon technologies in key sectors are the availability of the technologies and their economic viability, acceptability, and application. This has changed drastically over the last decade.
Going into 2020, ASEAN, China, and India were in the midst of a revolution regarding the affordability and viability of a range of clean energy technologies, with implications for how countries might navigate the megatrends individually and collectively. In India, for example, the rapid expansion of solar power, combined with smart policymaking, is transforming the country’s electricity sector, enabling it to provide clean,
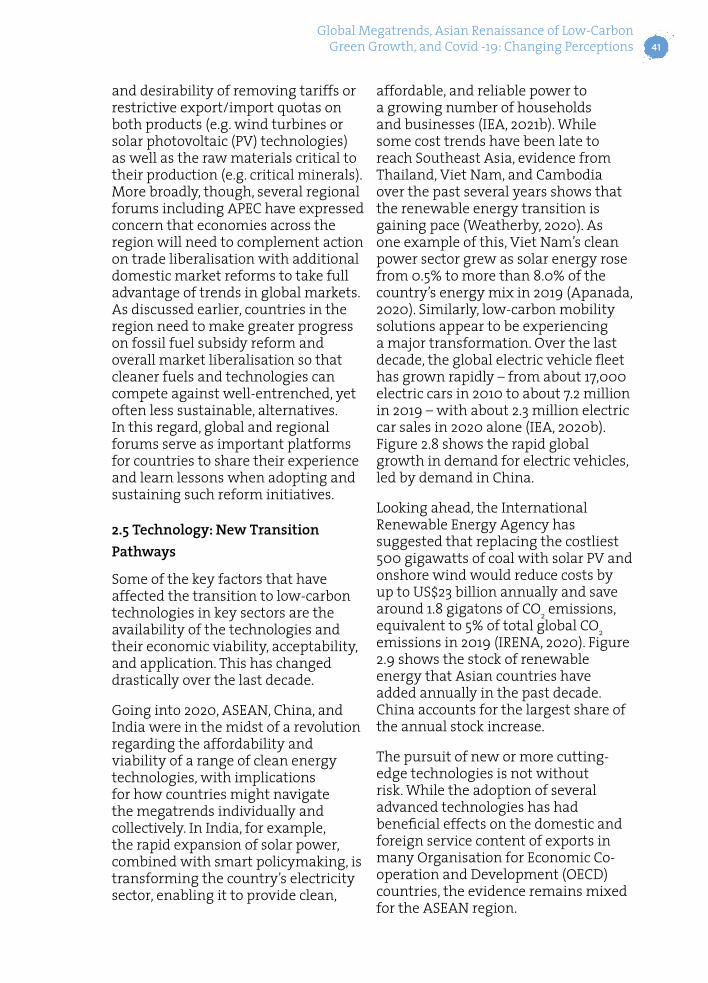
affordable, and reliable power to a growing number of households and businesses (IEA, 2021b). While some cost trends have been late to reach Southeast Asia, evidence from Thailand, Viet Nam, and Cambodia over the past several years shows that the renewable energy transition is gaining pace (Weatherby, 2020). As one example of this, Viet Nam’s clean power sector grew as solar energy rose from 0.5% to more than 8.0% of the country’s energy mix in 2019 (Apanada, 2020). Similarly, low-carbon mobility solutions appear to be experiencing a major transformation. Over the last decade, the global electric vehicle fleet has grown rapidly – from about 17,000 electric cars in 2010 to about 7.2 million in 2019 – with about 2.3 million electric car sales in 2020 alone (IEA, 2020b). Figure 2.8 shows the rapid global growth in demand for electric vehicles, led by demand in China.
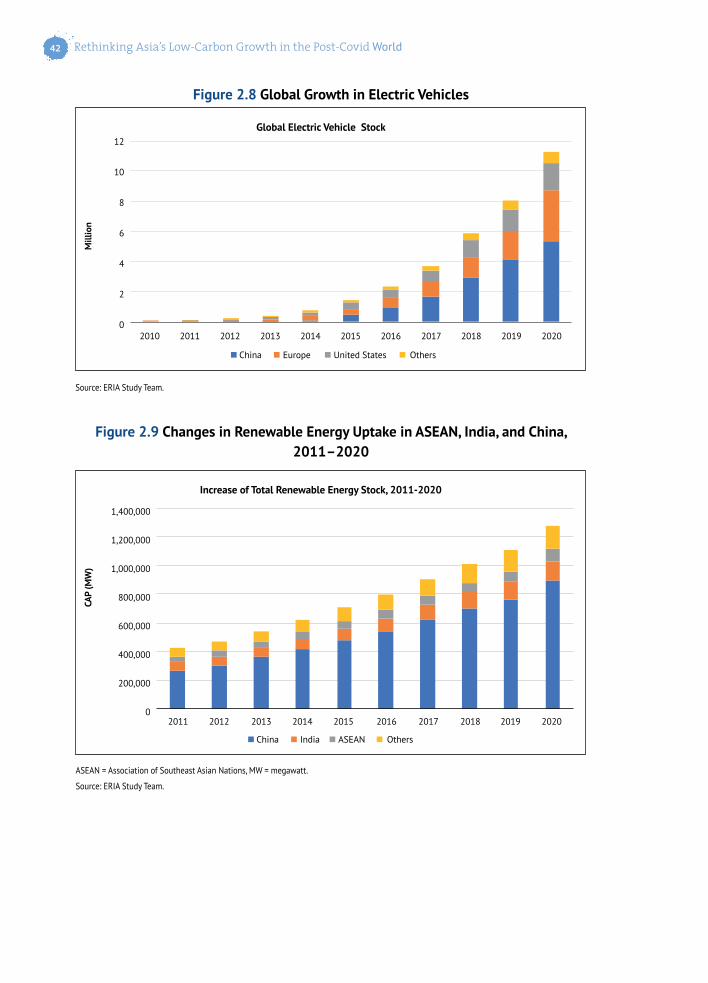
Looking ahead, the International Renewable Energy Agency has suggested that replacing the costliest 500 gigawatts of coal with solar PV and onshore wind would reduce costs by up to US$23 billion annually and save around 1.8 gigatons of CO2 emissions, equivalent to 5% of total global CO2 emissions in 2019 (IRENA, 2020). Figure 2.9 shows the stock of renewable energy that Asian countries have added annually in the past decade. China accounts for the largest share of the annual stock increase.
The pursuit of new or more cutting-edge technologies is not without risk. While the adoption of several advanced technologies has had beneficial effects on the domestic and foreign service content of exports in many Organisation for Economic Co-operation and Development (OECD) countries, the evidence remains mixed for the ASEAN region.
Rethinking Asia’s Low-Carbon Growth in the Post-Covid World42
Figure 2.8 Global Growth in Electric Vehicles
Figure 2.9 Changes in Renewable Energy Uptake in ASEAN, India, and China, 2011–2020
Source: ERIA Study Team.
ASEAN = Association of Southeast Asian Nations, MW = megawatt.
Source: ERIA Study Team.
12
8
4
0
10
6
2010 20142012 2016 20192011 2015 20182013 2017 2020
Mill
ion
Global Electric Vehicle Stock
2
China Europe United States Others
2011 20152013 20192012 2016 20182014 2017 2020
CAP
(MW
)
Increase of Total Renewable Energy Stock, 2011-2020
1,400,000
1,000,000
600,000
0
1,200,000
800,000
400,000
200,000
China India ASEAN Others
Global Megatrends, Asian Renaissance of Low-Carbon Green Growth, and Covid -19: Changing Perceptions 43
Singapore, for example, is said to have increased its service value-added content of exports while other ASEAN Member States (AMS) have recorded reductions.
Moreover, large-scale investments in emerging or advanced technologies may not be enough to ensure community acceptance. A key example here is the sharp decline in support for nuclear energy witnessed both globally and across the region in the aftermath of the 2011 Fukushima Daiichi disaster, despite earlier views of its centrality to clean energy transitions in Japan, Korea, and elsewhere.
Addressing these concerns is likely to require both national and international commitments. Nationally, ADB, the UN, and others have encouraged embedding sustainability targets into larger national planning agendas. However, for Bangladesh and the Maldives (which are considered amongst the most vulnerable to rising sea levels yet have only modest domestic CO2 emission profiles), even aggressive domestic decarbonisation strategies are likely to be highly insufficient on their own. Thus, collective action is critical to both how individual countries might succeed – as well as how the region might be able to progress more rapidly.
2.6 Collective Impact of Long-Standing Trends
Together, these trends have shaped the character and nature of Asia’s emergence as the centre of world energy markets. While only 67% of developing Asia had access to electricity in 2000, that number was 96% in 2019 – a level of progress that has extended access to about 1.2 billion people (IEA, 2020b). As a result
of such development gains, strong economic growth, and still growing populations as of 2020, the region accounted for nearly half of global energy consumption, with China, India, Indonesia, Japan, and Korea ranking amongst the world’s top 10 consumers. In addition, while parts of the region show promising signs of decoupling energy demand growth and emissions, both developed and developing economies in the region continue to struggle with making greater strides in this area. Still, key growth in low-carbon energy technologies in both deployment and innovation are on the rise – particularly in China and India – suggesting at least one potentially promising pathway forward.
Development status amongst Asian country groups differs. A distinct feature across the region, therefore, is that countries have pursued a multi-track, multi-speed approach in dealing with the complex issue of climate change, and in developing their targets for renewable energy and energy efficiency. Cooperation amongst countries at different stages of development, based on the open regionalism approach, aims to make markets work better to result in specific sectoral initiatives such as the development of voluntary guidelines for emission reduction and resource efficiency improvement, with the overall objective of reducing the carbon intensity of development. This should not distract from the fact that Asia’s rapid and strong energy demand growth continues to fuel specific and severe environmental challenges, which will need to be addressed through more aggressive action.
Despite positive public statements at both the national and multinational levels, ASEAN’s progress in adopting

Rethinking Asia’s Low-Carbon Growth in the Post-Covid World44
renewable energy has been outpaced by the region’s increasing energy demand. During 2000–2018, fossil fuels accounted for 85% of the growth in primary energy demand and the share of renewables in the primary energy mix stagnated. Although ASEAN aims for renewable sources to account for 23% of the region’s total primary energy supply by 2025, this target is not expected to be met as the AMS national energy policy frameworks are still largely focused on fossil fuels.
Over the next 2 decades, Asia is projected to comprise about two-thirds of new global demand growth. While China and India continue to see pronounced increases in their overall consumption, Southeast Asia will represent a rising share of added growth. According to IEA estimates, Southeast Asia’s consumption is projected to increase by about 6% per year between 2020 and 2040 (IEA, 2020c). Finding ways to meet the energy demand of developing AMS is essential to improving overall standards of living and sustaining economic growth, even though many countries will need to radically transform their energy mix to avoid worsening air quality or other conditions that may make cities unliveable. In this context, the sudden crash in regional energy demand caused by the COVID-19 pandemic has offered a vision of what a potential break from business as usual might look like – even as it raises questions regarding how best to move forward.
3. Megatrends that Emerged During the Crisis The Asia-Pacific energy and environmental outlook continues to be shaped by the long-standing factors mentioned in the preceding section. However, the COVID-19 pandemic
represents an unprecedented level of disruption in both global energy markets and daily life. As of July 2021, the pandemic has claimed more than 4 million lives, with the United States and India alone representing one-quarter of this total.
During 2020–2021, policy responses to the global crisis have involved making tough choices, the most prominent being actions to contain the spread of COVID-19 and its mutations. This includes community-level and nationwide lockdowns that have caused economic curtailment and immobility within and, most prominently, across borders. For some countries, early and aggressive interventions have played a vital role in not only slowing the spread of the virus but also allowing for a quicker return to regular activity levels – at least on a domestic level. Yet, for developing economies in ASEAN in particular, the pandemic has triggered a deep and pronounced recession – the first such region-wide recession in nearly six decades (ADB, 2020d). Such strains, if not well managed, could undermine the region’s development ambitions on several fronts, including undercutting the resources available for accelerating clean energy transitions. More on each of these issues is explored in the subsequent subsections.
3.1 Economic Concerns: Global Markets and Trade – Supply Chain Disruptions
As noted by the Brookings Institution, ‘much of the economic activity that continues in a pandemic – health services, housing services, utilities – is not traded internationally, while the widely traded goods such as cars, electronics, and tourism are cut back as people face an uncertain future’ (Dollar, 2020: 47).
Global Megatrends, Asian Renaissance of Low-Carbon Green Growth, and Covid -19: Changing Perceptions 45
Thus, perhaps not surprisingly, at the height of the COVID-19 pandemic, global trade declined dramatically – and still fell 14.5% year on year even after a moderate recovery in the third and fourth quarters of 2020 (UNESCAP, 2020b). Similarly, foreign direct investment in virtually all corners of the globe declined dramatically. For Asia and the Pacific, the economic effects have been staggering. The UN estimates that the region experienced a loss of US$2.2 trillion in trade (UNESCAP, 2021b), reducing the resources available to countries as they plan how to build back better.
Slowing global trade has produced ripple effects on domestic development projects within the Asia-Pacific, due to pandemic-caused disruptions to the highly interconnected global supply networks. For example, a 2020 study by the International Finance Cooperation found that for the energy sector in particular, local and international travel restrictions, quarantine requirements, and lockdowns have resulted in project delays and have added to project construction costs (Bakovic et al., 2020: 3). Moreover, such impacts have been felt across the range of power sector projects under construction – including renewable energy projects. ADB (2020e) reported, for example, that in early 2020, many solar PV developers in Asia and elsewhere experienced protracted delays with imports of solar PV modules and other supplies, while concerns over supply chain disruptions continue with the uncertainty of how long lockdowns will last (ADB, 2021).
International trade and investment have long played a vital role in bolstering Asia’s development efforts and access to resources, and sustaining a positive role for these factors (including through bolstering
supply chain resilience) may ultimately prove critical to the region’s full societal recovery from the COVID-19 pandemic (Kimura, 2020: Anbumozhi, Kimura, and Thangavelu, 2020; UNESCAP, 2021b). In this light, it is disconcerting to see the populist moves on deglobalisation and the rising protectionism, such as the increasing tariffs on most traded commodities which make major economies collide (Dollar, 2020). It is important to note that international trade and investment, as well as resilient supply chains, are indispensable for recovery from the COVID-19 pandemic (Kimura, 2020; Anbumozhi, Kimura, and Thangavelu, 2020; UNESCAP, 2021b).
3.2 Social Concerns: Shifts in Employment Patterns and Outlooks
The COVID-19 pandemic has had an uneven impact on different employment sectors in individual countries and the region. Employment in travel and tourism, for example, has been negatively impacted by immobility and other disruptions in virtually every country; industrial employment has also been heavily hit, although less uniformly given that production levels have remained high in some sectors. Unemployment increased by 15 million in the region in 2020. Compared with 2019, workers in the region lost 7.1% of their labour income in 2020 – more than US$1.0 trillion. In April 2020, lockdown measures impacted some 829 million informal workers in the Asia-Pacific region (UNESCAP, 2021a). In the energy sector, depressed demand linked to transportation and industry has led to layoffs and other forms of cuts in employment. Further, while this trend has been especially pronounced in the oil and gas sector, employment in both renewable energy and energy

Rethinking Asia’s Low-Carbon Growth in the Post-Covid World46
efficiency has also been affected as companies observed some new developments being delayed or paused, at least in the near term (ADB, 2021; DeConcini and Neuberger, 2020).
Alongside these disruptions has been a pronounced shift in how business activities have been conducted, with the pandemic spurring on accelerated digitalisation across much of the region. During 2020, lockdowns and other emergency measures taken in response to COVID-19 led to an unprecedented shift in ‘work-from-home’ employment as well as notable shifts in how typical consumer activities are handled. This included a large surge in the use of digital services for food delivery, shopping, payment processing, and other online services across the Asia-Pacific. Meanwhile, a study by Google, Temasek, and Bain & Company estimated that as many as 40 million people from six countries in Southeast Asia – Singapore, Malaysia, Indonesia, Viet Nam, Thailand, and the Philippines – came online for the first time in 2020 (Google, Temasek, and Bain, 2020: 9), pushing the region’s total online population to 400 million and suggesting greater potential acceleration in the region’s digital transformation (Anbumozhi, Gross, and Wesiak, 2019).
Most countries are cautiously eyeing timelines for relaxing pandemic-related restrictions by 2022. Demand levels for goods and services from the most impacted sectors are expected to recover gradually by 2025, potentially with some shifts in demand patterns triggered by the pandemic. On the whole, though, countries continue to explore targeted interventions to help strengthen the recovery. This will depend on the effectiveness of the policy instruments used and the
availability of stimulus funds. All this will have implications for employment and social well-being, especially of the poor and vulnerable.
3.3 Environment I: A Break from Surging Energy Demand Aligns with the Increasing Competitiveness of Renewables
IEA (2020a) observed that the COVID-19 pandemic has caused more disruption to the energy sector than any other event in recent history. Globally, energy demand is estimated to have dropped by about 5% in 2020 while energy investment declined by 18% compared with the pre-pandemic projection of strong year-on-year growth in both areas (IEA, 2020b). Mobility declined at ‘an unprecedented scale’ in early 2020, with ‘global average road transport activity almost falling to 50% of the 2019 level by the end of March’ (IEA, 2020c: 138).
The IEA (2020c) observed a notable trend in Asia that the pandemic has accelerated the ongoing decline of coal as a share of power generation within Asia. Further, while total energy demand plummeted in absolute terms, demand for wind and solar power remained relatively resilient compared with other power sector generation sources.
For ASEAN and East Asia, reduced consumption of oil, natural gas, and coal in 2020 led to year-on-year reductions in CO2 emissions in most countries, with India seeing a pronounced uptick in both so-called ‘blue sky’ days and overall local air quality. However, this near-term dividend may be offset by risks to longer-term sustainability efforts. For example, regional subway, bus, and
Global Megatrends, Asian Renaissance of Low-Carbon Green Growth, and Covid -19: Changing Perceptions 47
other public transit use have been negatively impacted by decreased mobility during the pandemic, while ongoing anxiety about local spread could discourage their use in favour of single-passenger or other low-capacity vehicles. Thus, public transit might not fully recover for months if not years, depending on local conditions – challenging the extent to which they may be able to fulfil their envisioned role in mitigating overall emissions levels.
Nevertheless, the COVID-19 pandemic provides further impetus for countries across Asia to integrate economic resilience and public health concerns into their development strategies. This entails numerous near-term needs and opportunities. Providing other low-carbon mobility alternatives such as walking and cycling and (shared) electric mobility, for example, is a vital step towards providing sustainable mobility options; and will enable a more systemic change once mobility demand returns to pre-COVID-19 paths. Before the pandemic, many countries across Asia were moving forward with low-carbon, green growth strategies. An open question now is if countries will not only stay the course but also be able to lead in building back better from the crisis, including by demonstrating a strategic and financial commitment to prioritising more sustainable and climate-resilient infrastructure.
3.4 Environment II: The Rise of Net Zero Ambitions
While the temporary drop in demand caused by the pandemic has created numerous environmental dividends, these gains could be short-lived if the recovery is not well managed. In addition, as discussed earlier,
there is an ongoing effort to scale up renewable energy in Asia. Even if ambitious targets for scaling up renewable energy in China, India, and ASEAN are fully realised, this may not be enough to minimise the risk of catastrophic climate impacts.
A number of countries in the region and globally appear to have responded to this short-term windfall not by de-prioritising climate action but by entrenching it more firmly in their larger development planning and post-crisis exit strategies. As of March 2021, more than 127 countries globally (representing 63% of worldwide GHG emissions) have formally adopted, announced, or begun crafting plans to reach net zero (i.e. carbon neutrality) around 2050 (UNEP, 2020). In Asia, this list includes Bhutan, Japan, Korea, the Lao PDR, Myanmar, New Zealand, Fiji, China, Nepal, and Cambodia as of June 2021 (Energy & Climate Intelligence Unit, 2021); and several of these countries (including Korea) have formally ensconced these commitments in their post-COVID-19 recovery strategies. Table 2.4 lists the Asian countries that have indicated a goal for net zero emissions as of August 2021 and their target year for realizing that goal.
Several other countries aim to enhance their leadership on decarbonisation technologies. The European Union has formally adopted a binding target of a reduction in net GHG emissions of at least 55% by 2030 compared with 1990, and agreed on a path to achieve climate neutrality by 2050. Similar ambitions have been announced by the US, Japan, and Korea, although legislative action is not yet fully consistent with these ambitions. Australia has detailed a national strategy for bringing hydrogen energy

Rethinking Asia’s Low-Carbon Growth in the Post-Covid World48
Achieved In law Proposed legislation In policy document Target under discussion
Bhutan Japan (Target year: 2050)
Republic of Korea (Target year: 2050)
Lao PDR (Target year: 2050)
Myanmar (Target year: 2050)
New Zealand(Target year: 2050)
Fiji (Target year: 2050)
China (Target year: 2060)
Nepal (Target year: 2050)
Cambodia (Target year: 2050)
Source: Adapted from Energy & Climate Intelligence Unit (2021).
Table 2.4 Net Zero Emission Targets and Timelines in Asia
to scale as a means of using existing energy resources more efficiently and sustainably, while pursuing large-scale investments in carbon capture, utilisation, and storage and other technologies that could lower emissions from fossil fuels, but these have yet to be proven viable and affordable.
While the growing recognition of the urgency for climate action and substantial progress in the formulation of mid- and long-term goals to reduce emissions are very positive, the current nationally determined contributions (NDCs) – at least so far – lack substantial detail regarding the contributions of key sectors of the economy.
3.5 Governance: Realising Climate Priorities in an Era of New Budgetary Constraints
Countries in the ASEAN and East Asia region are continuing to examine closely how to operationalise their high-level commitments to tackling greenhouse gas emissions, including recently announced ‘net zero’ pledges. Prior studies have argued that decarbonisation strategies must be comprehensive in their coverage, explicit in their targets, and include concrete measures to be successful (IPCC, 2014). Yet, as the UN noted in its
December 2020 Emissions Gap Report (UNEP, 2020), one reason that countries have fallen behind in their NDC progress is that many submissions do not have specific government actions backing the stated government policy goals. Equally troubling is that an early analysis of post-pandemic recovery packages suggests that while green stimulus was notably prioritised during 2008 recovery packages, the same level of commitment could not be said of COVID-19-related recovery packages as of March 2021 (IMF, 2020).
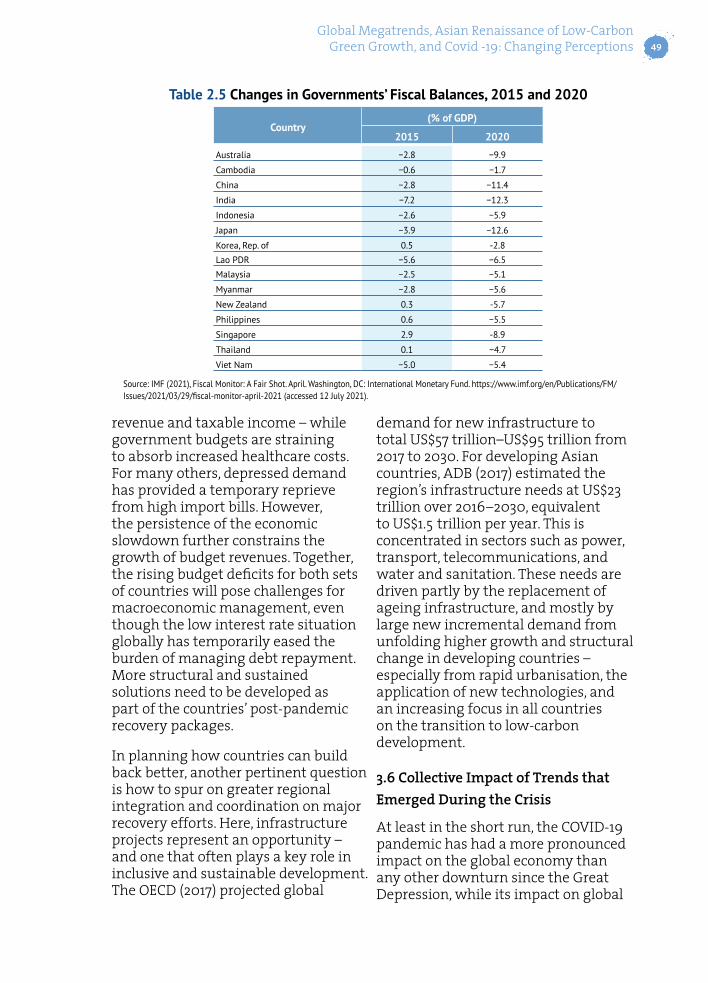
It should be noted that despite the interest in doing more, the COVID-19 pandemic has resulted in a significant impact on government budgets, even amongst the region’s developed economies. Table 2.5 shows that the fiscal deficits were higher in 2020 than in 2015 for a number of Asian countries due to public spending by Asian governments to address the adverse impacts of COVID-19.
Countries have had to deal with not only better resourcing their public health infrastructure, but doing so when economic disruption has reduced expectations for taxation-linked budget revenues. A dramatic decline in global demand for oil and natural gas has had immediate economic implications for major energy exporters such as Indonesia – including in lost potential
Global Megatrends, Asian Renaissance of Low-Carbon Green Growth, and Covid -19: Changing Perceptions 49
Country(% of GDP)
2015 2020
Australia −2.8 −9.9
Cambodia −0.6 −1.7
China −2.8 −11.4
India −7.2 −12.3
Indonesia −2.6 −5.9
Japan −3.9 −12.6
Korea, Rep. of 0.5 -2.8
Lao PDR −5.6 −6.5
Malaysia −2.5 −5.1
Myanmar −2.8 −5.6
New Zealand 0.3 -5.7
Philippines 0.6 −5.5
Singapore 2.9 -8.9
Thailand 0.1 −4.7
Viet Nam −5.0 −5.4
Source: IMF (2021), Fiscal Monitor: A Fair Shot. April. Washington, DC: International Monetary Fund. https://www.imf.org/en/Publications/FM/Issues/2021/03/29/fiscal-monitor-april-2021 (accessed 12 July 2021).
Table 2.5 Changes in Governments’ Fiscal Balances, 2015 and 2020
revenue and taxable income – while government budgets are straining to absorb increased healthcare costs. For many others, depressed demand has provided a temporary reprieve from high import bills. However, the persistence of the economic slowdown further constrains the growth of budget revenues. Together, the rising budget deficits for both sets of countries will pose challenges for macroeconomic management, even though the low interest rate situation globally has temporarily eased the burden of managing debt repayment. More structural and sustained solutions need to be developed as part of the countries’ post-pandemic recovery packages.
In planning how countries can build back better, another pertinent question is how to spur on greater regional integration and coordination on major recovery efforts. Here, infrastructure projects represent an opportunity – and one that often plays a key role in inclusive and sustainable development. The OECD (2017) projected global
demand for new infrastructure to total US$57 trillion–US$95 trillion from 2017 to 2030. For developing Asian countries, ADB (2017) estimated the region’s infrastructure needs at US$23 trillion over 2016–2030, equivalent to US$1.5 trillion per year. This is concentrated in sectors such as power, transport, telecommunications, and water and sanitation. These needs are driven partly by the replacement of ageing infrastructure, and mostly by large new incremental demand from unfolding higher growth and structural change in developing countries – especially from rapid urbanisation, the application of new technologies, and an increasing focus in all countries on the transition to low-carbon development.
3.6 Collective Impact of Trends that Emerged During the Crisis
At least in the short run, the COVID-19 pandemic has had a more pronounced impact on the global economy than any other downturn since the Great Depression, while its impact on global

Rethinking Asia’s Low-Carbon Growth in the Post-Covid World50
energy demand is without historical parallel. Even once the immediate crisis has passed, the ripple effects of the pandemic appear likely to continue to affect the conduct of fiscal policy within the Asia-Pacific, given the projected rising debt levels, ongoing high levels of unemployment in certain sectors and communities, and the potential political ramifications of these and other economic shifts which may in turn constrain or alternatively empower decision-makers (Auerbach et al., 2020).
Alongside this, the pandemic has underscored the importance of – and challenges surrounding – access to a wide range of advanced technologies and services. Since the outbreak of the pandemic, patterns of work and trade have centred heavily on digitalisation as one of the essential enablers for participation in the economy and society. Improving equitable access to digital services thus remains a high priority for fostering more resilience in participation in the economy irrespective of physical access, and economic and job opportunities. To do this will require substantial investment in digital and physical infrastructure to reap the benefits of embracing new technologies. Stimulus packages and other measures designed to respond to the varied economic, health, and social impacts of the COVID-19 crisis remain an ongoing opportunity to bridge the gap between stated ambitions and tangible measures to decarbonise regional economies, an issue that chapters 3 and 4 will explore in greater detail.
Some of the changing patterns of work, economic, and social interaction were under way before the COVID-19 pandemic. However, the drastic, sudden, and global shifts that have
followed from the response to the pandemic have dramatically accelerated trends in various areas, including boosting the role of digitalisation as both a driver of energy demand and a tool for demand management. As will be discussed in section 2.4, there is evidence of these trends continuing to accelerate.
4. Moving Forward – Key Priorities and Opportunities
The dual challenge of addressing the public health crisis and the climate crisis at the same time creates substantial pressure on policymakers at all levels in ASEAN and East Asia. The ability to respond to these challenges differs greatly across the continent, and there is a high risk that the financial resources and capacities of authorities are not sufficient to meet this dual challenge.
In the short term, Asia needs to get the public health crisis under control as a prerequisite for a return to regular trade and economic activity levels. However, it will be vital to keep up the pace and overall potential of low-carbon solutions in this region. This includes investment opportunities in future-proof sectors, closing development gaps, and maintaining a positive role for even greater regional trade and economic integration – issues which ERIA and others have argued are likely to require ongoing attention for accelerating national market and policy reforms in many parts of the region (including the region’s advanced economies) (Anbumozhi, Gross, and Wesiak, 2019). High levels of continued diversity across

Global Megatrends, Asian Renaissance of Low-Carbon Green Growth, and Covid -19: Changing Perceptions 51
countries – particularly in terms of overall development levels, available domestic resources (both natural and human), and access to capital – also suggest that different countries will confront varied challenges, where greater regional and international collaboration could be a vital tool in helping to realise new gains.
4.1 Addressing Uneven Economic Recovery
Regional progress towards recovering from the 2020–2021 COVID-19 pandemic remains uneven on a country-by-country basis, due to differences in the health and economic impacts and in the policy response capacity (IMF, 2020). Countries experiencing prolonged adverse impacts and delayed recovery may see millions slipping into poverty, representing a drastic erosion of the development gains made in recent decades. Such trends suggest the need for close, sustained attention by regional decision-makers. This includes through the potential application of additional stimulus measures as well as greater policy reforms designed to strengthen the underlying economic health and resilience of several countries.
The rapid growth of several Southeast Asian economies, along with China and India, has created substantial regional economic potential that could be beneficial for less developed economies in the region (ADB and ADBI, 2014). While all the dynamic developing economies in the region share common boundaries, opportunities, and challenges, regional cooperation is lacking across the continent on trade, investment, coordinated value chains, and infrastructure development (ADBI, 2014). The AEC, for example,
could benefit greatly from improved interconnectedness, coordination on innovation, the digital economy, sustainable development, and stakeholder engagement (ASEAN, 2016). However, there are promising signs of a convergence of economic and environmental priorities in developing Asia, in policymaking and implementation. Many Asian countries are aiming to utilise the potential of green industries such as solar and wind power manufacturing and electric mobility. Efforts are visible in the development of innovative and cost-competitive products in renewable energy and low-carbon transport, and in the testing of low-carbon technologies in the context of urban living labs. It is noteworthy that countries have been exploring the synergy of low-carbon and smart digital technologies in the continuing process of economic transformation.
Asia’s renaissance journey has never been smooth or without challenge (ADB, 2020a). The region’s experience teaches the important lesson that crisis management does not only involve coping with the immediate economic and social impacts, but also developing and strengthening institutional capability at all levels (community, national, and regional) to prevent and mitigate crisis impacts in the future. To that end, roadmaps such as the ASEAN Vision 2040 have sought to detail regional and subregional priorities for collective action (ERIA, 2019).
The slowdown in global economies in 2008 shifted demand to Asian economies, which have worked to expand regional supply chains while retaining a spirit of open regionalism and multilateralism. Countries in the region have been focusing on the decoupling of economic growth
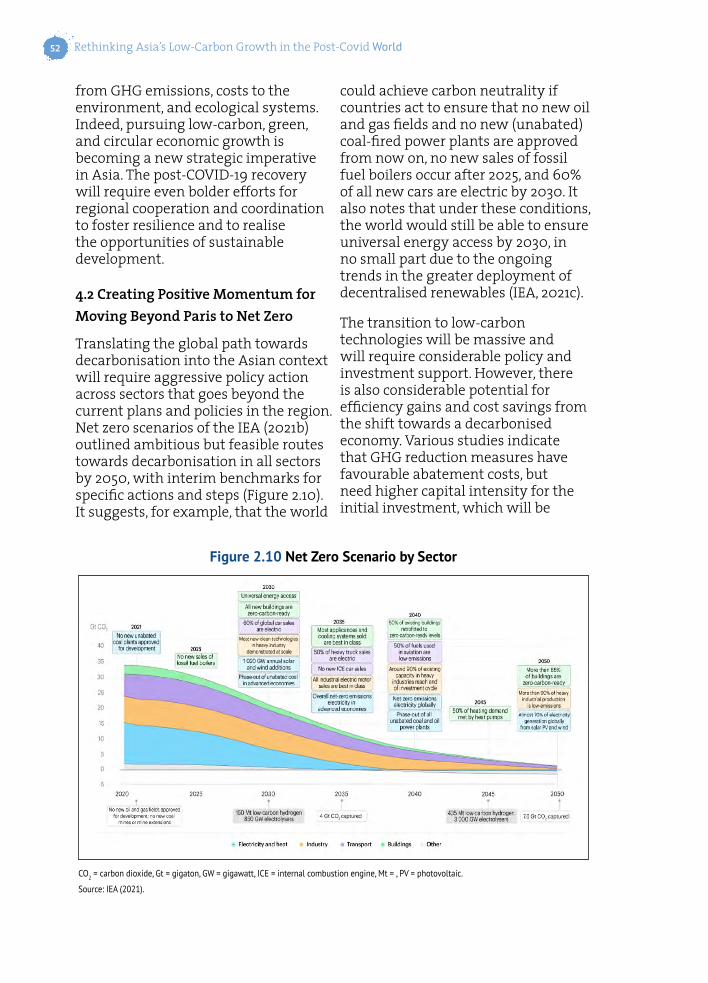
Rethinking Asia’s Low-Carbon Growth in the Post-Covid World52
from GHG emissions, costs to the environment, and ecological systems. Indeed, pursuing low-carbon, green, and circular economic growth is becoming a new strategic imperative in Asia. The post-COVID-19 recovery will require even bolder efforts for regional cooperation and coordination to foster resilience and to realise the opportunities of sustainable development.
4.2 Creating Positive Momentum for Moving Beyond Paris to Net Zero
Translating the global path towards decarbonisation into the Asian context will require aggressive policy action across sectors that goes beyond the current plans and policies in the region. Net zero scenarios of the IEA (2021b) outlined ambitious but feasible routes towards decarbonisation in all sectors by 2050, with interim benchmarks for specific actions and steps (Figure 2.10). It suggests, for example, that the world
could achieve carbon neutrality if countries act to ensure that no new oil and gas fields and no new (unabated) coal-fired power plants are approved from now on, no new sales of fossil fuel boilers occur after 2025, and 60% of all new cars are electric by 2030. It also notes that under these conditions, the world would still be able to ensure universal energy access by 2030, in no small part due to the ongoing trends in the greater deployment of decentralised renewables (IEA, 2021c).
The transition to low-carbon technologies will be massive and will require considerable policy and investment support. However, there is also considerable potential for efficiency gains and cost savings from the shift towards a decarbonised economy. Various studies indicate that GHG reduction measures have favourable abatement costs, but need higher capital intensity for the initial investment, which will be
CO2 = carbon dioxide, Gt = gigaton, GW = gigawatt, ICE = internal combustion engine, Mt = , PV = photovoltaic.
Source: IEA (2021).
Figure 2.10 Net Zero Scenario by Sector
Global Megatrends, Asian Renaissance of Low-Carbon Green Growth, and Covid -19: Changing Perceptions 53
offset by the reduced cost for fuels and resources (Shalizi and Lecocq, 2009; IPCC, 2014; IEA, 2020b). Even though these investments lead to considerable economy-wide benefits, they may not create sufficient returns for the individual companies or consumers responsible for investment decisions. To reduce the cost barrier of new technologies, several Asian governments and industries have cooperated successfully in generating a mutually reinforcing cycle of market expansion and cost reduction. This has led to large-scale deployment of low-carbon technologies in Asia (Anbumozhi and Kimura, 2018)). While investments are needed in large infrastructure projects, especially sustainable energy and transport systems, the risk of overemphasis on these types of projects at the expense of smaller but highly efficient interventions needs to be considered when designing implementation projects and funding programmes.
A key factor holding back more ambitious transitions to low-carbon technologies remains the split incentive between individual cost and economy-wide benefits, which is particularly strong in the energy and transport sectors. Decisions are made by companies and/or individuals who apply discount rates that are considerably higher than the societal perspective. As such, only a small percentage of the economy-wide benefits is taken into consideration when deciding on a purchase, with negative consequences on the economy-wide benefits/costs over the approximate lifespan of an electrified installation or a vehicle. This suggests a potentially powerful and necessary role for comprehensive strategic planning, including in sending market signals through fiscal and other monetary
incentives. It also emphasises the role of local and national governments in fostering the adoption of low-carbon technologies such as renewables, energy-efficient appliances, and electric vehicles through regulation, incentive schemes, and procurement.
Recognising the challenges in the adoption of low-carbon technologies, countries in Asia can take – and are taking – steps to strengthen domestic conditions for bolstering and sustaining clean energy transitions. For example, as the pandemic hit, Viet Nam received a credit of US$84.4 million from the International Development Association to support its multisectoral policy reforms to promote climate-resilient landscapes, green transport, and energy systems (World Bank, 2020a). In the Philippines, the country’s Climate Change Commission has advocated for an economic recovery centred on ecological investment and programmes that build climate resilience. This includes supporting low-carbon technologies, eco-construction and design policies, research and development for ecological purposes, and natural capital investment for ecosystem resilience and regeneration (Apanada, 2020).
4.3 New Momentum Behind Carbon Pricing?
With more countries moving towards net zero emissions goals, the value of effective carbon pricing to incentivise research and development as well as investment decisions (what, where, and how much) cannot be overemphasised. Effective carbon pricing aims to direct investment decisions away from high-carbon activities and towards low-carbon activities. Such carbon pricing mechanisms can include carbon taxes,
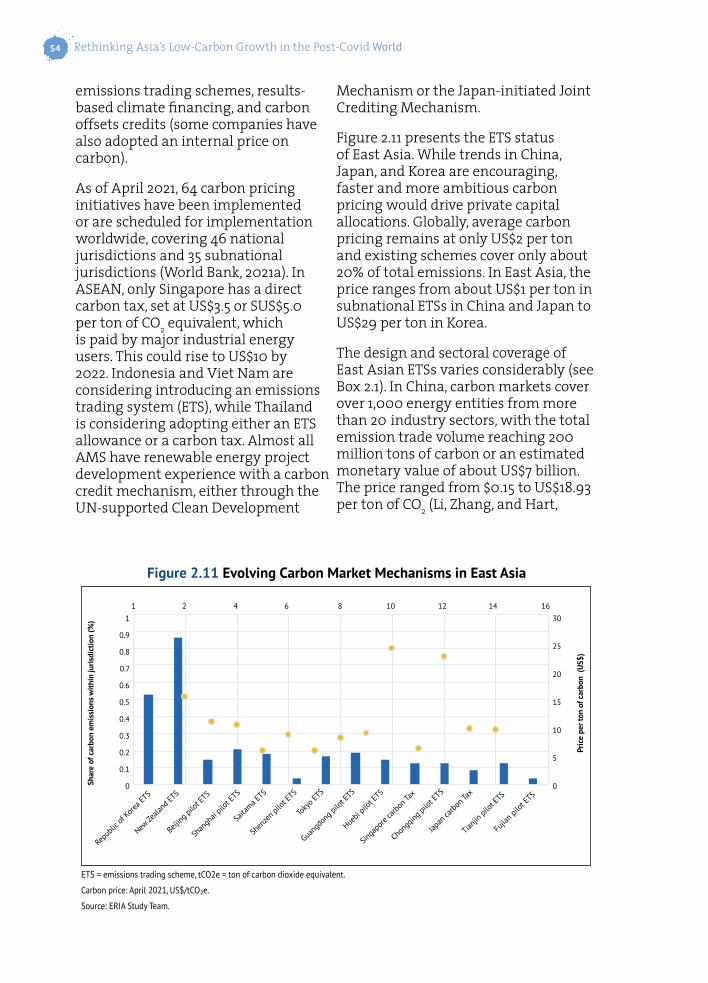
Rethinking Asia’s Low-Carbon Growth in the Post-Covid World54
emissions trading schemes, results-based climate financing, and carbon offsets credits (some companies have also adopted an internal price on carbon).
As of April 2021, 64 carbon pricing initiatives have been implemented or are scheduled for implementation worldwide, covering 46 national jurisdictions and 35 subnational jurisdictions (World Bank, 2021a). In ASEAN, only Singapore has a direct carbon tax, set at US$3.5 or SUS$5.0 per ton of CO2 equivalent, which is paid by major industrial energy users. This could rise to US$10 by 2022. Indonesia and Viet Nam are considering introducing an emissions trading system (ETS), while Thailand is considering adopting either an ETS allowance or a carbon tax. Almost all AMS have renewable energy project development experience with a carbon credit mechanism, either through the UN-supported Clean Development
Mechanism or the Japan-initiated Joint Crediting Mechanism.
Figure 2.11 presents the ETS status of East Asia. While trends in China, Japan, and Korea are encouraging, faster and more ambitious carbon pricing would drive private capital allocations. Globally, average carbon pricing remains at only US$2 per ton and existing schemes cover only about 20% of total emissions. In East Asia, the price ranges from about US$1 per ton in subnational ETSs in China and Japan to US$29 per ton in Korea.
The design and sectoral coverage of East Asian ETSs varies considerably (see Box 2.1). In China, carbon markets cover over 1,000 energy entities from more than 20 industry sectors, with the total emission trade volume reaching 200 million tons of carbon or an estimated monetary value of about US$7 billion. The price ranged from $0.15 to US$18.93 per ton of CO2 (Li, Zhang, and Hart,
ETS = emissions trading scheme, tCO2e = ton of carbon dioxide equivalent.
Carbon price: April 2021, US$/tCO₂e.
Source: ERIA Study Team.
Figure 2.11 Evolving Carbon Market Mechanisms in East Asia
1 30
0.9
1 4 8 122 6 10 14 16
25
0.7
150.5
5
0.3
0.1
0.8
200.6
100.4
0.2
0 0Shar
e of
car
bon
emis
sion
s w
ithin
juris
dict
ion
(%)
Pric
e pe
r ton
of c
arbo
n (U
S$)
Repu
blic o
f Kore
a ETS
New Ze
aland
ETS
Beijing
pilot
ETS
Shan
ghai
pilot
ETS
Saita
ma ETS
Shen
zen p
ilot E
TS
Toky
o ETS
Guang
dong
pilot
ETS
Chong
qing p
ilot E
TS
Tianji
n pilo
t ETS
Fujia
n pilo
t ETS
Huebi
pilot
ETS
Singa
pore
carbo
n Tax
Japan
carbo
n Tax
Global Megatrends, Asian Renaissance of Low-Carbon Green Growth, and Covid -19: Changing Perceptions 55
2018). Japanese voluntary ETSs have 389 members and achieved a reduction of 59,419 tons of carbon from 2012 to 2019, with a mean trading price of US$2 per ton of CO2 (Arimura and Abe, 2021). Korea’s ETS has an estimated emissions cap of 538.7 million tons of CO2, covering mostly the power and manufacturing industries (Choi, Liu, and Lee, 2017).
The International Carbon Action Partnership (ICAP, 2021) surveyed the latest plans and schedules of countries across the globe to introduce carbon pricing mechanisms. Many steps are being taken to strengthen existing ETSs or introduce carbon pricing mechanisms, but much remains to be done regarding carbon pricing. Several areas of concern are of particular relevance: the level and scope of pricing, a fuller understanding of pricing impacts for more informed policymaking, and greater efforts in regional cooperation. Beyond these are some operational matters to improve the effectiveness of carbon markets. There is also the important issue of how to use carbon taxes to support industrial and residential decarbonisation efforts. In this regard, the policy adopted by Singapore of using carbon tax revenues to subsidise energy efficiency is worth replicating and adapting in other countries. This redistribution of carbon taxes and similar measures could be vital for the acceptance and social balance of corresponding interventions. It could also help lower the cost of low-carbon technologies or provide suitable alternatives that are accessible for all.
The UN Economic and Social Commission for Asia and the Pacific (UNESCAP, 2020a) called for raising the level of ambition on carbon pricing in Asia and the Pacific. Moves to expand
the coverage and raise the level of pricing will also need to consider how these moves lead to differential impacts across sectors. A related policy concern is the employment impact of carbon pricing. However, this needs to be placed in a much broader context of structural transformation towards the New Climate Economy, featuring low-carbon or net zero emissions.
Another policy concern relates to regional cooperation in carbon pricing. This priority becomes especially important as Asian economies are increasingly integrated, e.g. through regional supply chains. An ERIA regional cooperation study (Anbumozhi et al., 2016) outlined some concrete actions for pursuing regional cooperation in this area. Finally, amongst the major operational concerns on carbon markets, greater transparency in governance and standards enforcement must be developed and implemented to ensure that carbon markets function effectively to incentivise emissions reductions and to channel the revenues for supporting activities in the low-carbon transition. Broadly speaking, the low-carbon transition must have public support and be socially just. It is critical not only to plan policies carefully, including carbon pricing, but also to communicate proactively with the public about the benefits they can bring to our communities, workers, and environment.
A low-carbon green growth strategy requires sector policy interventions that promote a wide spectrum of technologies, and thereby reduce carbon emissions despite rapidly growing demand. Developing and implementing such a programme is affected by sector-specific economic policies (notably subsidies, tariff

Rethinking Asia’s Low-Carbon Growth in the Post-Covid World56
Box 2.1 ETS Developments in Asia and the Pacific
Central Asia
Kazakhstan: Completed the final year of the system’s third phase, during which participating operators could choose between grandparenting and product-based benchmarking as the allocation method. Operators participating in the fourth phase must use benchmarking as the method of allocation. A new National Allocation Plan was also issued, setting the cap for 2021.
Oceania
New Zealand: Completed comprehensive legislative reforms in 2020, laying the foundations for new regulatory settings for 2021–2025 in line with newly legislated net zero targets to 2050. A cap on emissions was established for the first time under the New Zealand ETS, and auctioning was introduced in March 2021, incorporating new market stability measures. Other reforms include the phase down of free allocation for EITE activities, forestry sector accounting changes, and plans to put a price on agricultural emissions by 2025.
barriers, and industrial policies); institutions; consumer preferences; political economic considerations; and technological choices.
EITE = Emissions-Intensive Trade-Exposed, ETS = emissions trading scheme, tCO2 = ton of carbon dioxide.Source: ICAP (2021)
China: In late 2020, President Xi pledged to peak China’s emissions before 2030 and achieve net zero by 2060. In this context, the Chinese national ETS became operational in 2021 as the world’s largest system, covering more than 4 billion tCO2 (about 40% of national carbon emissions). The system operates as an intensity-based ETS and covers the power sector, with other sectors expected to be introduced later. The national registry and trading platform are currently being developed, and details of key design elements (e.g. monitoring, reporting, and verification) are being finalised.
Chinese pilot projects: Throughout 2020, the eight Chinese regional ETS pilots continued operating and further developed allocation, offsetting, and trading rules. While the Chinese pilots will initially operate in parallel to the national ETS, it is anticipated that overlapping entities will be gradually integrated into the national market.
Taiwan: An act creating a mandate for an ETS is currently under revision.
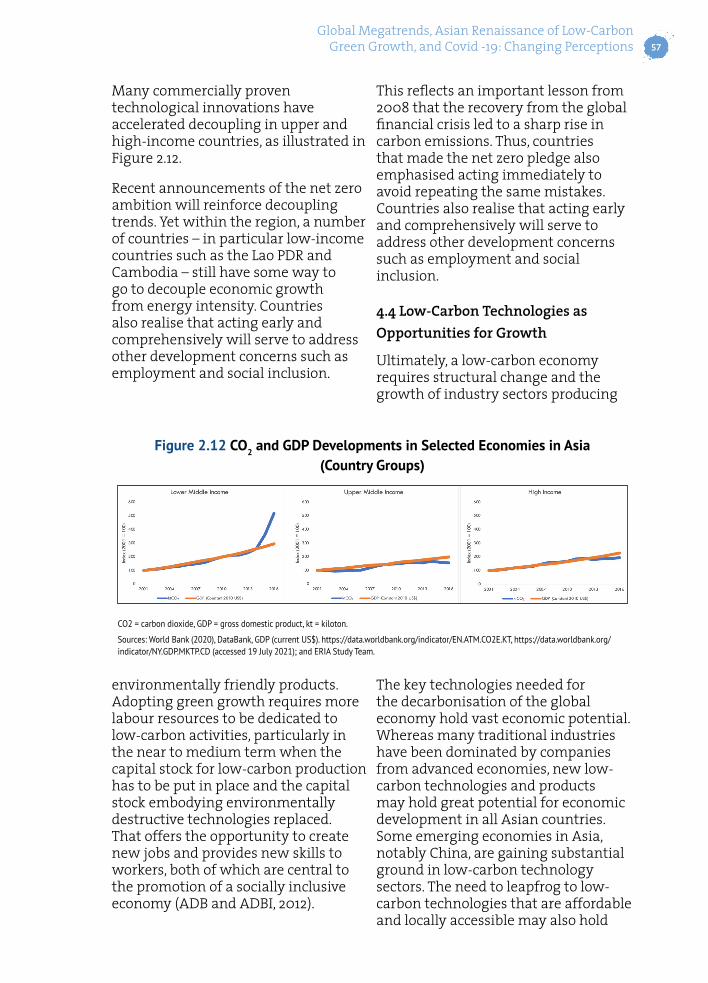
Global Megatrends, Asian Renaissance of Low-Carbon Green Growth, and Covid -19: Changing Perceptions 57
Many commercially proven technological innovations have accelerated decoupling in upper and high-income countries, as illustrated in Figure 2.12.
Recent announcements of the net zero ambition will reinforce decoupling trends. Yet within the region, a number of countries – in particular low-income countries such as the Lao PDR and Cambodia – still have some way to go to decouple economic growth from energy intensity. Countries also realise that acting early and comprehensively will serve to address other development concerns such as employment and social inclusion.
CO2 = carbon dioxide, GDP = gross domestic product, kt = kiloton.
Sources: World Bank (2020), DataBank, GDP (current US$). https://data.worldbank.org/indicator/EN.ATM.CO2E.KT, https://data.worldbank.org/indicator/NY.GDP.MKTP.CD (accessed 19 July 2021); and ERIA Study Team.
Figure 2.12 CO2 and GDP Developments in Selected Economies in Asia (Country Groups)
This reflects an important lesson from 2008 that the recovery from the global financial crisis led to a sharp rise in carbon emissions. Thus, countries that made the net zero pledge also emphasised acting immediately to avoid repeating the same mistakes. Countries also realise that acting early and comprehensively will serve to address other development concerns such as employment and social inclusion.
4.4 Low-Carbon Technologies as Opportunities for Growth
Ultimately, a low-carbon economy requires structural change and the growth of industry sectors producing
environmentally friendly products. Adopting green growth requires more labour resources to be dedicated to low-carbon activities, particularly in the near to medium term when the capital stock for low-carbon production has to be put in place and the capital stock embodying environmentally destructive technologies replaced. That offers the opportunity to create new jobs and provides new skills to workers, both of which are central to the promotion of a socially inclusive economy (ADB and ADBI, 2012).
The key technologies needed for the decarbonisation of the global economy hold vast economic potential. Whereas many traditional industries have been dominated by companies from advanced economies, new low-carbon technologies and products may hold great potential for economic development in all Asian countries. Some emerging economies in Asia, notably China, are gaining substantial ground in low-carbon technology sectors. The need to leapfrog to low-carbon technologies that are affordable and locally accessible may also hold

Rethinking Asia’s Low-Carbon Growth in the Post-Covid World58
substantial potential for less advanced economies in the region – focusing on energy, industry, and mobility solutions that are fit for purpose but also that are affordable and generate local value. Electric mobility is one area where locally produced two- and three-wheelers or minibuses could become a viable option for industrial development, even for least-developed economies (Lah, 2018).
Global demand for electric vehicles will surge over the coming decades, with estimated demand for more than 200 million battery electric and plug-in vehicles globally in just the next 10 years, in a sustainable development scenario that is in line with the Paris Agreement (IEA, 2021b). Similarly, the demand for renewable energies will continue to be very high to enable the decarbonisation of the electricity and industry sectors. The share of renewables in global electricity will need to grow from 27% in 2019 to almost half of generation by 2030 to be in line with the Paris Agreement (IEA, 2021b). This creates substantial challenges for countries in Asia to shift their electricity generation towards renewables, but also creates opportunities for the development of renewable energy solutions for the domestic, regional, and global markets.
4.5 Moving Towards Zero – Together
In moving towards net zero economies, advanced industrialised economies of the region – such as Japan, Korea, Singapore, Australia, and New Zealand – have advanced infrastructure, regulations, and skilled human resources and are in a better position to exploit the technological potential of new innovations in niche areas of alternative energy sources such as hydrogen fuel, financing energy
efficiency, and the application of digital services. Energy and resource efficiency are a welcome side effect of the digital economy, but rarely a key objective of deploying them. A more conscious and targeted approach for linking emerging technologies could create more opportunities for the region’s advanced economies to reduce their carbon footprints at the global level.
Emerging economies in the region – such as China, India, Viet Nam, the Philippines, Indonesia, and Thailand – have developed or are developing new zero emission strategies for their societies and key industrial sectors. They are also important suppliers for global value chains. Their low-carbon actions are often driven by market demands as well as the need for finding the co-benefits of improved pollution prevention and reducing inequalities. Market orientation and social inclusion could therefore play an important role in pushing low-carbon policies and practices in these emerging economies.
Developing economies in Asia – such as the Lao PDR, Cambodia, and Myanmar – have made significant progress in developing policies, infrastructure, and institutions that drive low-carbon resilient growth. They have realised the potential benefits of low-carbon green growth through collaborative and often community-led innovations, as well as government-led demonstrative pilot initiatives. However, they face severe technological and financial challenges with respect to net zero emissions growth. In ‘leapfrogging’ to make their countries’ development low-carbon and resilient, these countries need proactive international development assistance and regional cooperation in finance and technology. International cooperation frameworks for a net zero

Global Megatrends, Asian Renaissance of Low-Carbon Green Growth, and Covid -19: Changing Perceptions 59
economy should therefore consider the economic and social implications associated with setting high ambitions for those countries and help them to turn the risks into opportunities.
5. Key Takeaways This chapter has given a broad overview of major developments globally and across Asia. It outlines distinct forms of megatrends that continue to influence development policymaking in developing Asia. Asia’s continuing economic renaissance and low-carbon development create potentially mutually converging paths. A salient point from this overview is that COVID-19 does not appear to have derailed Asia’s development trajectory. The pandemic has only served to create urgency for countries to broaden the scope and step up the speed of future growth that is inclusive, sustainable, and resilient.
Reflecting on the Asia-wide experience with the pandemic crisis management and looking ahead to possible recovery pathways, we can identify the following takeaways.
a. As countries continue to deal with the fall-out from COVID-19, Asia as a regional whole is already seeing a clear reset of the development agenda focusing on both short-term responses (rescue and recovery) and long-term commitments (net zero).
In the heat of the crisis response, much discussion emerged on how response operations could avoid or minimise irreversible negative impacts in the long term. Such concerns were wide-ranging – from social and economic matters to the public and private sector, such as medical waste disposal, infrastructure
construction, budget management efficiency and effectiveness, the stability of the financial system, and entrepreneurship.
In connecting the short-term responses to long-term commitments, terms such as inclusive, sustainable, and resilient are no longer rhetorical, but carry real and substantive meaning. COVID-19 brings forth particular emphasis on the importance of resilience on top of efficiency considerations. Serious efforts have been made to review and scrutinise the response budget programmes to ensure consistency with the long-term commitment to inclusive, sustainable, and resilient development. The green recovery strategy features prominently at the national and regional levels.
An added feature of the green recovery strategy is the emphasis on technological and institutional innovations to move to a new era of development. For example, in November 2020, ASEAN promulgated a coordinated plan of action by AMS to pursue a five-pillar recovery strategy, including pillar 4 (digital transformation) and pillar 5 (low-carbon and resilient development). In announcing their commitment to the net zero emissions goal by 2050, China, Japan, and Korea are actively at work to integrate digital platform and smart technologies into the new green growth strategy for a low-carbon growth agenda.
b. Differences between national roadmaps and economic opportunities for low-carbon development
Countries face different pressures from energy security concerns, reflecting

Rethinking Asia’s Low-Carbon Growth in the Post-Covid World60
their domestic resources and stages of development. While subscribing to the same set of overarching goals, different countries may pursue country-focused pathways to inclusive, sustainable, and resilient development. NDCs are such processes to develop and implement the country-relevant strategic plans. Recent experience suggests that integrating NDCs into national development strategies has become the norm. Growing recognition that environmental concerns and economic development are two sides of the same coin will be a vital enabler to participate in global competition for innovative low-carbon products and technologies.
While countries in Asia are at different stages of development, there are opportunities for all of them. Low-income countries will benefit from avoiding locking into technologies and infrastructures that are inefficient and carbon-intensive, and may find niches for innovative low-carbon products in regional and global markets. There are also opportunities for firms in low-income countries to explore innovations which are the first in their own domestic market (ADB, 2020b). Middle-income countries have the capacity and potential to pursue low-carbon research and development and to deploy new technologies abroad, including to low-income countries. The post-COVID-19 era presents an opportunity for advanced high-income economies such as Japan and Korea to reset their growth priorities. Indeed, they can and are pursuing low-carbon technological frontiers, in combination with digital and smart platforms.
Low-income countries face critical concerns regarding national capacity and institutional capability that must be addressed for them to pursue
effective planning and implementation of national roadmaps. Past experiences with externally supported capacity building have generated mixed results. A workable practice is to integrate the adoption of new technology from abroad in the context of active local learning and experimentation (Andrews et al., 2007).
c. Governance, the role of local and national governments, and regional cooperation
A coherent and coordinated low-carbon, sustainable development strategy for Asia will require effective governance underpinned by active engagement of all policy actors at the local and national levels, along with private sector players. The implementation gap is often a result of capacity constraints, which can be overcome through concerted capacity building programmes, combined with policy, investment, and business development support. There is also a need to ensure effective accountability regarding how strategic implementation progress and performance undergo monitoring, reporting, and verification. SDG performance tracking is one example of performance monitoring and reporting. Such an approach could be extended to monitoring and reporting on the implementation of low-carbon or net zero emission strategies.
While countries assume the principal role of designing and implementing low-carbon green growth strategies, important concerns must be tackled at the regional level through greater cooperation amongst countries. These involve joint technology development and deployment. Regional supply chains and production networks are

Global Megatrends, Asian Renaissance of Low-Carbon Green Growth, and Covid -19: Changing Perceptions 61
being recalibrated in the context of the RCEP and other regional and bilateral agreements that will broaden and deepen economic interdependence and regional integration in the era after COVID-19.
Chapter 1
Putting Long-term Sustainable Growth in Perspective
This chapter should be cited as
ERIA Study team(2022), ‘Putting Long-term Sustainable Growth in Perspective’, in Anbumozhi, V., K. Kalirajan, and X. Yao (eds.), Rethinking Asia’s Low-Carbon Growth in the Post-Covid World: Towards a Net-Zero Economy, Jakarta: ERIA, pp.3-25.


