Embed Size (px)
Citation preview
MARINE ECOLOGY PROGRESS SERIESMar Ecol Prog Ser
Vol. 380: 43–57, 2009doi: 10.3354/meps07917
Published April 7
INTRODUCTION
Anthropogenic nutrient inputs have led to wide-spread eutrophication of coastal marine environments(Duarte 1995). This nutrient enrichment has alteredcoastal communities so that 65% of US coastal envi-ronments studied showed moderate or severe symp-toms of eutrophication (Bricker et al. 2007), andhypoxic conditions were observed in 75% of UScoastal waters (Diaz 2001). As humans alter the coastallandscape, it becomes increasingly important to under-stand changes taking place at the species, community,and ecosystem levels. Cloern (2001) emphasized the
importance of understanding the linkages of all partsof the ecosystem and many potential interactingresponses to eutrophication.
The effects of land-derived nutrient inputs includeincreases in phytoplankton biomass (Nixon 1992) andproliferation of opportunistic macroalgal blooms incoastal waters worldwide (Valiela et al. 1992, Duarte1995). Macroalgal blooms, in particular, have had fur-ther consequences, often shading and replacing sea-grass meadows (McGlathery 2001, Hauxwell et al.2001). Enrichment of coastal waters has also been cor-related with lower dissolved oxygen concentrations inbottom waters, largely because of stimulated metabo-
© Inter-Research 2009 · www.int-res.com*Email: [email protected]
Restructuring of benthic communities in eutrophicestuaries: lower abundance of prey leads to
trophic shifts from omnivory to grazing
Sophia E. Fox1, 2,*, Mirta Teichberg1, 3, Ylva S. Olsen1, 4, Leanna Heffner1, 5, Ivan Valiela1, 2
1Boston University Marine Program, Marine Biological Laboratory, 7 MBL Street, Woods Hole, Massachusetts 02543, USA
2Present address: The Ecosystems Center, Marine Biological Laboratory, 7 MBL Street, Woods Hole, Massachusetts 02543, USA
3Present address: Zentrum für Marine Tropenökologie, Fahrenheitstrasse 6, 28359 Bremen, Germany4Present address: School of Ocean Sciences, University of Bangor, Wales, Menai Bridge, Anglesey LL59 5AB, UK
5Present address: Graduate School of Oceanography, University of Rhode Island, 215 South Ferry Road, Narragansett, Rhode Island 02822, USA
ABSTRACT: Anthropogenic nutrient loading to coastal waters has increased producer biomass, lead-ing to more frequent hypoxic events particularly in estuarine systems. To examine how eutrophica-tion and hypoxia might alter consumer assemblages, we surveyed benthic communities in 2 sub-estuaries of Waquoit Bay, Massachusetts, representing a eutrophic–hypoxic regime and anoligotrophic–oxic regime. The number of consumer species and abundance of organisms were lowerin the eutrophic estuary. In particular, there were fewer primary consumers, mainly small crus-taceans. These differences in consumer community structure also alter trophic interactions. To exam-ine changes in food web structure that might result from lower prey abundance, we sampled organ-isms from the 2 sub-estuaries and determined their trophic relationships based on nitrogen stableisotope ratios. Reduced numbers of primary consumers, and hence lower prey availability, led tochanges in food web linkages. Specifically, omnivores shifted their diets from an omnivorous diet thatis mainly carnivorous in the oligotrophic estuary to feeding mainly as herbivores in the eutrophicestuary, where prey were scarce and macroalgae were abundant. These shifts in trophic structuremay have consequences for higher trophic levels.
KEY WORDS: Eutrophication · Hypoxia · Benthic community · Crustacean · Food web · Trophic structure · Macroalgae
Resale or republication not permitted without written consent of the publisher
Mar Ecol Prog Ser 380: 43–57, 2009
lism in these systems (Cloern 2001). High benthicmacroalgal biomass increases the frequency and dura-tion of intermittent hypoxia in stratified estuaries(D’Avanzo & Kremer 1994, Diaz 2001). Respiration ofbenthic macroalgae and fauna can create hypoxic con-ditions in bottom waters overnight, and daytime photo-synthesis of the macroalgae replenishes the oxygenconsumed as well as producing an excess of oxygen,often driving concentrations to saturation (D’Avanzo &Kremer 1994). Persistent hypoxia can, however,develop during a series of cloudy days, when photo-synthesis does not produce enough oxygen to meet orexceed respiration demands (D’Avanzo & Kremer1994).
Eutrophication and the resulting hypoxia alter ben-thic consumer communities, often reducing benthicspecies richness (Harper et al. 1981, Sogard & Able1991, Diaz & Rosenberg 2008), and decreasing theabundance of invertebrates (Baden et al. 1990, Tagli-apietra et al. 1998, Österling & Pihl 2001) and fish(Baden et al. 1990). The degree of ecological effects ofhypoxia depends on minimum dissolved oxygen con-centrations, duration of exposure to low oxygen, andthe areal extent of hypoxic regions (Diaz & Rosenberg2001).
Changes in species composition and abundanceassociated with hypoxia may in turn create prey limita-tion and alter feeding habits of consumers that remain(Breitburg 1992, Pihl 1994, Österling & Pihl 2001,Wennhage & Pihl 2007, Jephson et al. 2008). Alterna-
tively, increased primary production owing to nutrientsupply can provide more food and shelter for highertrophic levels in both benthic and pelagic food webs(Sogard & Able 1991, Ware & Thompson 2005). Thesechanges in composition and feeding behaviors of con-sumers may alter trophic relationships in estuaries sub-ject to eutrophication and hypoxia.
Nitrogen stable isotopes (δ15N) have been used todetermine food web relationships (Peterson & Fry1987, McClelland et al. 1997, Martinetto et al. 2006)because consumers are enriched in δ15N (more 15Nthan 14N) relative to their food source (Minagawa &Wada 1984). δ15N signatures have also been used todetermine sources of nitrogen entering coastal waters,with estuarine producers having heavier δ15N values ineutrophic estuaries than in non-eutrophic estuariesowing to heavier δ15N of the nitrogen source fromhuman-derived wastewater (McClelland & Valiela1998a, Costanzo et al. 2001, Cole et al. 2004).
In the present study, we took advantage of estuariessubject to different levels of land-derived nitrogenloading to examine whether increased eutrophicationcan lead to differences in the benthic food web bychanging the abundance of different species enough toshift trophic links, forcing consumers to change trophicposition. To assess benthic community structure, wesurveyed benthic organisms in a non-eutrophic and aeutrophic estuary. To determine food web linkages, wemeasured δ15N values of benthic organisms in these 2estuaries.
44
EstuaryCR SLP Source
Nitrogen load (kg N ha–1 yr–1) 601 12 Bowen & Valiela (2001)Water residence time (d) 2.0 1.5 Carmichael & Valiela (2005)Sediment character (%) Silt & clay 11.5 ± 2.50 5.5 ± 3.5 Carmichael & Valiela (2005)Sand 94.0 ± 3.00 88.5 ± 2.50 Carmichael & Valiela (2005)
Nutrient concentration (µM)NO3
Groundwater 92.1 ± 33.6 7.2 ± 2.0 Holmes (2008)Water column 13.9 ± 3.20 0.3 ± 0.1 Holmes (2008)
NH4
Groundwater 5.7 ± 1.7 21.7 ± 4.60 Holmes (2008)Water column 1.4 ± 0.2 2.1 ± 0.5 Holmes (2008)
PO4
Groundwater 5.3 15.7 Holmes (2008)Water column 0.1 ± 00 0.1 ± 000 Holmes (2008)
Seagrass biomass (g dry wt m–2) 0 43.7 ± 3.30 Fox et al. (2008)Macroalgal biomass (g dry wt m–2) 181 ± 200 46 ± 90 Fox (2008)Eutrophication status Eutrophic Oligotrophic Fox et al. (2008)
Table 1. Land-derived nitrogen loads, residence times, sediment character (mean ± SE), groundwater and water column nutrientconcentrations (annual mean ± SE), seagrass and macroalgal biomass (mean ± SE), and eutrophication status of the 2 estuaries,
Childs River (CR) and Sage Lot Pond (SLP)
Fox et al.: Eutrophication restructures benthic communities
MATERIALS AND METHODS
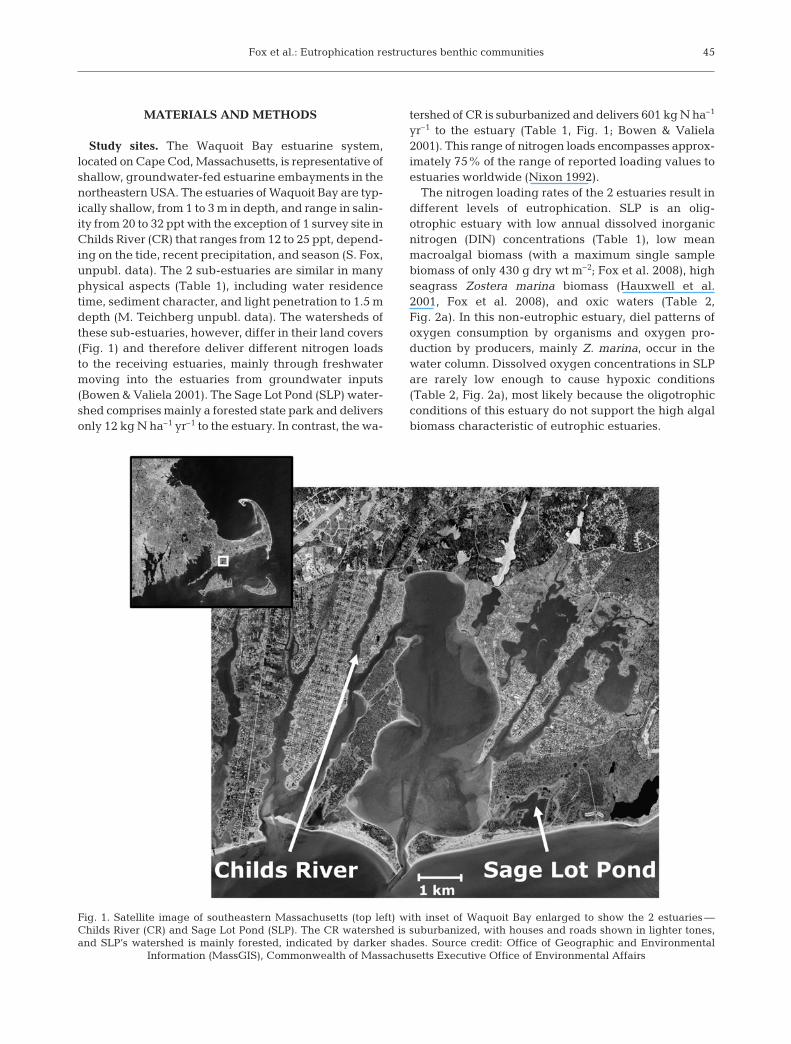
Study sites. The Waquoit Bay estuarine system,located on Cape Cod, Massachusetts, is representative ofshallow, groundwater-fed estuarine embayments in thenortheastern USA. The estuaries of Waquoit Bay are typ-ically shallow, from 1 to 3 m in depth, and range in salin-ity from 20 to 32 ppt with the exception of 1 survey site inChilds River (CR) that ranges from 12 to 25 ppt, depend-ing on the tide, recent precipitation, and season (S. Fox,unpubl. data). The 2 sub-estuaries are similar in manyphysical aspects (Table 1), including water residencetime, sediment character, and light penetration to 1.5 mdepth (M. Teichberg unpubl. data). The watersheds ofthese sub-estuaries, however, differ in their land covers(Fig. 1) and therefore deliver different nitrogen loadsto the receiving estuaries, mainly through freshwatermoving into the estuaries from groundwater inputs(Bowen & Valiela 2001). The Sage Lot Pond (SLP) water-shed comprises mainly a forested state park and deliversonly 12 kg N ha–1 yr–1 to the estuary. In contrast, the wa-
tershed of CR is suburbanized and delivers 601 kg N ha–1
yr–1 to the estuary (Table 1, Fig. 1; Bowen & Valiela2001). This range of nitrogen loads encompasses approx-imately 75% of the range of reported loading values toestuaries worldwide (Nixon 1992).
The nitrogen loading rates of the 2 estuaries result indifferent levels of eutrophication. SLP is an olig-otrophic estuary with low annual dissolved inorganicnitrogen (DIN) concentrations (Table 1), low meanmacroalgal biomass (with a maximum single samplebiomass of only 430 g dry wt m–2; Fox et al. 2008), highseagrass Zostera marina biomass (Hauxwell et al.2001, Fox et al. 2008), and oxic waters (Table 2,Fig. 2a). In this non-eutrophic estuary, diel patterns ofoxygen consumption by organisms and oxygen pro-duction by producers, mainly Z. marina, occur in thewater column. Dissolved oxygen concentrations in SLPare rarely low enough to cause hypoxic conditions(Table 2, Fig. 2a), most likely because the oligotrophicconditions of this estuary do not support the high algalbiomass characteristic of eutrophic estuaries.
45
Fig. 1. Satellite image of southeastern Massachusetts (top left) with inset of Waquoit Bay enlarged to show the 2 estuaries —Childs River (CR) and Sage Lot Pond (SLP). The CR watershed is suburbanized, with houses and roads shown in lighter tones,and SLP’s watershed is mainly forested, indicated by darker shades. Source credit: Office of Geographic and Environmental
Information (MassGIS), Commonwealth of Massachusetts Executive Office of Environmental Affairs
Mar Ecol Prog Ser 380: 43–57, 2009
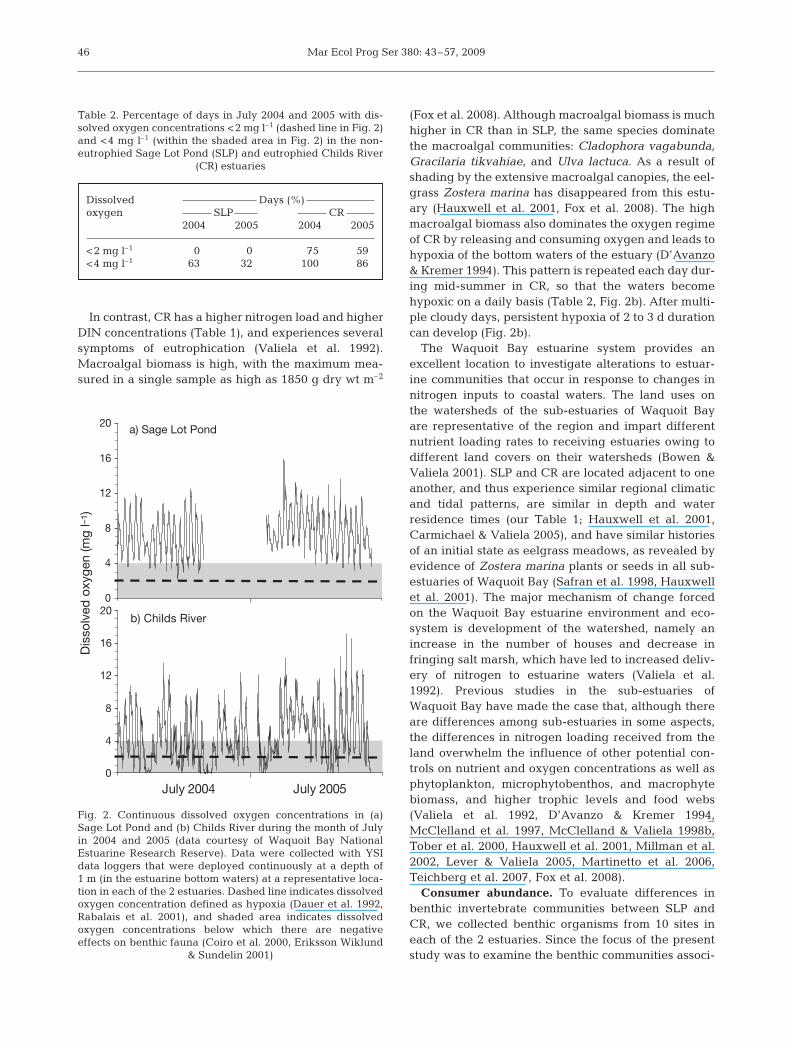
In contrast, CR has a higher nitrogen load and higherDIN concentrations (Table 1), and experiences severalsymptoms of eutrophication (Valiela et al. 1992).Macroalgal biomass is high, with the maximum mea-sured in a single sample as high as 1850 g dry wt m–2
(Fox et al. 2008). Although macroalgal biomass is muchhigher in CR than in SLP, the same species dominatethe macroalgal communities: Cladophora vagabunda,Gracilaria tikvahiae, and Ulva lactuca. As a result ofshading by the extensive macroalgal canopies, the eel-grass Zostera marina has disappeared from this estu-ary (Hauxwell et al. 2001, Fox et al. 2008). The highmacroalgal biomass also dominates the oxygen regimeof CR by releasing and consuming oxygen and leads tohypoxia of the bottom waters of the estuary (D’Avanzo& Kremer 1994). This pattern is repeated each day dur-ing mid-summer in CR, so that the waters becomehypoxic on a daily basis (Table 2, Fig. 2b). After multi-ple cloudy days, persistent hypoxia of 2 to 3 d durationcan develop (Fig. 2b).
The Waquoit Bay estuarine system provides anexcellent location to investigate alterations to estuar-ine communities that occur in response to changes innitrogen inputs to coastal waters. The land uses onthe watersheds of the sub-estuaries of Waquoit Bayare representative of the region and impart differentnutrient loading rates to receiving estuaries owing todifferent land covers on their watersheds (Bowen &Valiela 2001). SLP and CR are located adjacent to oneanother, and thus experience similar regional climaticand tidal patterns, are similar in depth and waterresidence times (our Table 1; Hauxwell et al. 2001,Carmichael & Valiela 2005), and have similar historiesof an initial state as eelgrass meadows, as revealed byevidence of Zostera marina plants or seeds in all sub-estuaries of Waquoit Bay (Safran et al. 1998, Hauxwellet al. 2001). The major mechanism of change forcedon the Waquoit Bay estuarine environment and eco-system is development of the watershed, namely anincrease in the number of houses and decrease infringing salt marsh, which have led to increased deliv-ery of nitrogen to estuarine waters (Valiela et al.1992). Previous studies in the sub-estuaries ofWaquoit Bay have made the case that, although thereare differences among sub-estuaries in some aspects,the differences in nitrogen loading received from theland overwhelm the influence of other potential con-trols on nutrient and oxygen concentrations as well asphytoplankton, microphytobenthos, and macrophytebiomass, and higher trophic levels and food webs(Valiela et al. 1992, D’Avanzo & Kremer 1994,McClelland et al. 1997, McClelland & Valiela 1998b,Tober et al. 2000, Hauxwell et al. 2001, Millman et al.2002, Lever & Valiela 2005, Martinetto et al. 2006,Teichberg et al. 2007, Fox et al. 2008).
Consumer abundance. To evaluate differences inbenthic invertebrate communities between SLP andCR, we collected benthic organisms from 10 sites ineach of the 2 estuaries. Since the focus of the presentstudy was to examine the benthic communities associ-
46
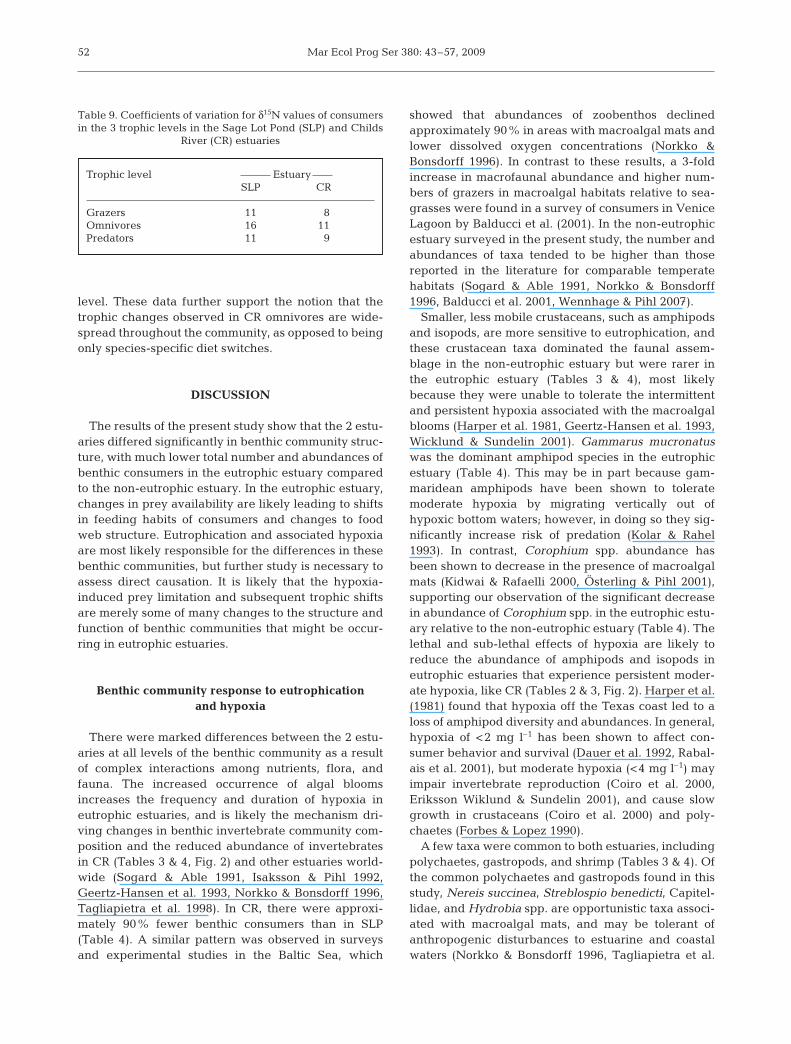
Dissolved Days (%)oxygen SLP CR
2004 2005 2004 2005
<2 mg l–1 0 0 75 59<4 mg l–1 63 32 100 86
Table 2. Percentage of days in July 2004 and 2005 with dis-solved oxygen concentrations <2 mg l–1 (dashed line in Fig. 2)and <4 mg l–1 (within the shaded area in Fig. 2) in the non-eutrophied Sage Lot Pond (SLP) and eutrophied Childs River
(CR) estuaries
0
4
8
12
16
20
0
4
8
12
16
20
July 2004 July 2005
b) Childs River
Dis
solv
ed o
xyge
n (m
g l–1
)
a) Sage Lot Pond
Fig. 2. Continuous dissolved oxygen concentrations in (a)Sage Lot Pond and (b) Childs River during the month of Julyin 2004 and 2005 (data courtesy of Waquoit Bay NationalEstuarine Research Reserve). Data were collected with YSIdata loggers that were deployed continuously at a depth of1 m (in the estuarine bottom waters) at a representative loca-tion in each of the 2 estuaries. Dashed line indicates dissolvedoxygen concentration defined as hypoxia (Dauer et al. 1992,Rabalais et al. 2001), and shaded area indicates dissolvedoxygen concentrations below which there are negativeeffects on benthic fauna (Coiro et al. 2000, Eriksson Wiklund
& Sundelin 2001)
Fox et al.: Eutrophication restructures benthic communities
ated with macroalgae-dominated habitats, the 10 siteswere distributed throughout the estuary withinmacroalgal canopies to representatively include shal-low as well as deeper portions of the estuaries. Thesampling sites were 300 to 500 m apart. In SLP, sam-ples were taken in macroalgal canopies at least 10 maway from Zostera marina beds. At each site, a samplewas collected using a 15 × 15 cm Ekman benthic grab.The collected material was rinsed through a 1 mmsieve to remove mud and brought back to the labora-tory to be sorted. In a qualitative analysis, we deter-mined that a 1 mm sieve sufficiently sampled themacrofauna in this system, since few additional macro-organisms were retained on a 500 µm sieve after pass-ing through the 1 mm sieve. Organisms in each samplewere preserved in 70% ethanol for identification andcounting. Unfortunately, this method was not suitablefor sampling fish, so we have not included fish in theabundance analysis.
To statistically examine whether abundance of indi-vidual taxa differed between the 2 estuaries, we used t-tests to examine differences between the 2 estuaries inabundance of each consumer and consumer groups. Toexamine the similarity in species composition betweenthe 2 estuaries, we calculated the Jaccard’s index, asimilarity index based on presence/absence data.
Stable isotopic study of macroalgae-based foodwebs. To examine differences in trophic links withinthe macroalgae-based food webs of SLP and CR, wesampled macroalgae and benthic invertebrates andfish in 9 macroalgae-dominated sites in each of the 2estuaries. Samples were taken using a 30 × 20 × 20 cm(length × width × height) dip net with 1 mm mesh sizedragged along the sediment surface in 3 locationsthrough the macroalgal canopy for a distance of 1 m ateach site. Collected material, including macroalgaeinvertebrates, and fish, was sieved to remove mud andstored in a fine mesh bag to prevent anoxia within thesample during transport to the laboratory. The sampleswere sorted live to the species level until 10 to 50 ind.of each species present in the sample were collectedfor isotopic analysis. Rarer species may have had fewerthan 10 ind. To ensure that the analysis measured onlyfood material assimilated in the tissues of the animals,organisms of each species were placed in individualcontainers with filtered seawater for 24 h to allow forevacuation of gut contents, and guts were removedfrom larger organisms. Specimens of all species ofmacroalgae and consumers were then rinsed withdeionized water to remove salts, dried at 60°C for 48 h,and ground into a fine powder. δ15N values were deter-mined by mass spectrometry at the Stable IsotopeFacility, University of California at Davis.
To normalize the δ15N data for differences in nitro-gen sources entering the estuaries and allow for direct
comparison of trophic linkages between species fromthe 2 estuaries, δ15N values were normalized by sub-tracting the mean δ15N value of all macroalgal speciescollected within each estuary (4.05‰ for SLP and7.54‰ for CR) from the δ15N values of the producersand consumers from that estuary. The mean value ofδ15N of macroalgae was subtracted because macroal-gal δ15N values are indicators of nitrogen enrichmentto the estuary and this enrichment is transferred viaalgae up the food web to consumers (McClelland et al.1997, McClelland & Valiela 1998a, Cole et al. 2004).
To determine differences in the trophic positions ofconsumers between the 2 estuaries, we initially usedliterature reports of feeding habits to sort the taxa intotrophic categories (Zimmerman et al. 1979, Nelson 1979,Morgan 1980, Nicotri 1980, Heck & Thoman 1981, Kneib1985, McClelland et al. 1997, McClelland & Valiela1998b, MacNeil et al. 1999, Griffin & Valiela 2001,McCurdy et al. 2005, Martinetto et al. 2006). We thenpooled the taxa into macroalgae, grazers, omnivores,and predators. Only taxa for which there was publishedinformation on diets were included in the stable isotopicanalysis. Information was available on feeding habitsfor about 85% of the number of organisms and 50%of the taxa found in our abundance survey samples.
To statistically examine whether there were differ-ences in trophic structure between the 2 estuaries, weexamined abundance and stable isotope data sepa-rately. We used t-tests to examine differences betweenthe 2 estuaries in the abundance of consumers at thegrazer, omnivore, and predator trophic levels. Todetermine differences in normalized δ15N values ofconsumers in each estuary at the different trophiclevels, we performed an ANOVA using a partial hier-archical design (Brownlee 1965).
RESULTS
Benthic community structure
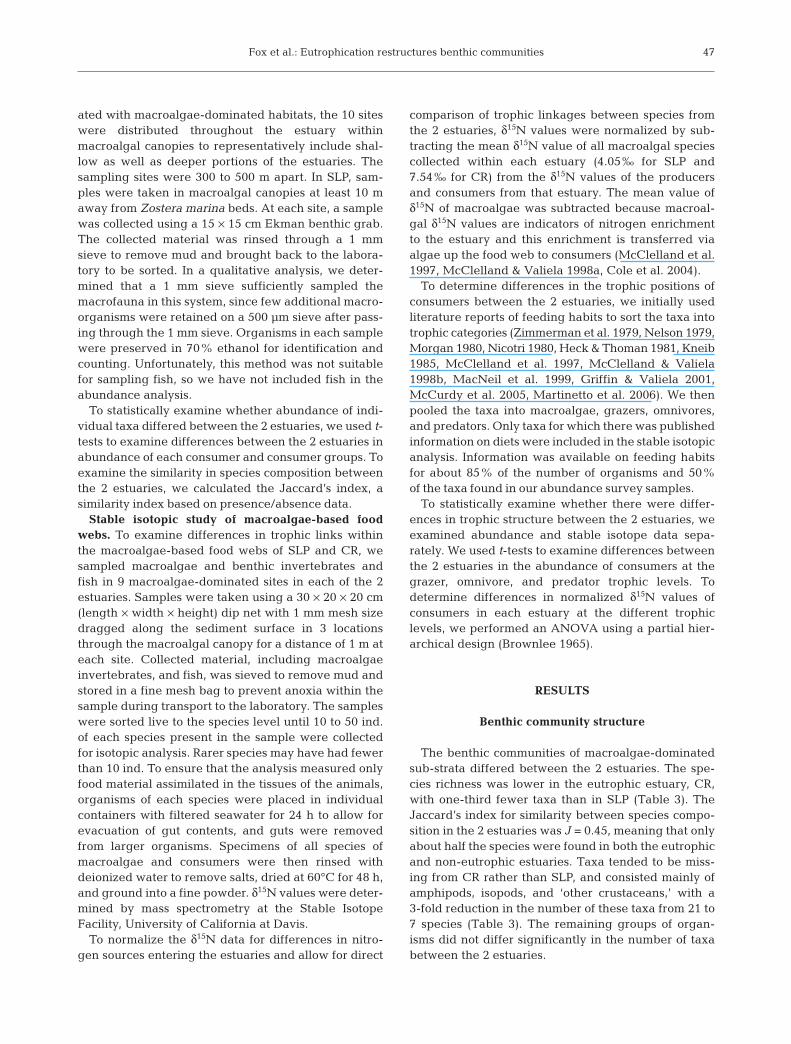
The benthic communities of macroalgae-dominatedsub-strata differed between the 2 estuaries. The spe-cies richness was lower in the eutrophic estuary, CR,with one-third fewer taxa than in SLP (Table 3). TheJaccard’s index for similarity between species compo-sition in the 2 estuaries was J = 0.45, meaning that onlyabout half the species were found in both the eutrophicand non-eutrophic estuaries. Taxa tended to be miss-ing from CR rather than SLP, and consisted mainly ofamphipods, isopods, and ‘other crustaceans,’ with a3-fold reduction in the number of these taxa from 21 to7 species (Table 3). The remaining groups of organ-isms did not differ significantly in the number of taxabetween the 2 estuaries.
47
Mar Ecol Prog Ser 380: 43–57, 2009
Abundances of benthic organisms in macroalgalhabitats were 7-fold lower in the eutrophic estuarythan in the non-eutrophic estuary (Table 4). The majorreduction in abundance was seen in small crustaceans,which decreased by 2 orders of magnitude fromapproximately 11 000 to 100 ind. m–2 between the 2estuaries. The abundance of most taxa tended todecrease from SLP to CR: 22% significantly decreasedwhile only 3% significantly increased (Table 4).
Most small crustaceans (amphipods, isopods, and‘other crustaceans’) were abundant in the non-eutrophic estuary, while only 2 small crustaceans (theisopod Edotea triloba and the amphipod Gammarusmucronatus) were common in the eutrophic estuary(Table 4). E. triloba was common in both estuaries,occurring at 40% of the survey sites in CR and 90% ofthe sites in SLP. G. mucronatus was also found in both
48
Taxon EstuarySLP CR Difference
Amphipods 11 5 6Isopods 5 2 3Crabs 1 2 –1Shrimp 3 3 0Other crustaceans 5 0 5Gastropods 7 7 0Bivalves 2 2 0Polychaetes 16 15 1Nemerteans 3 1 2Other 6 3 3Total 59 40 19
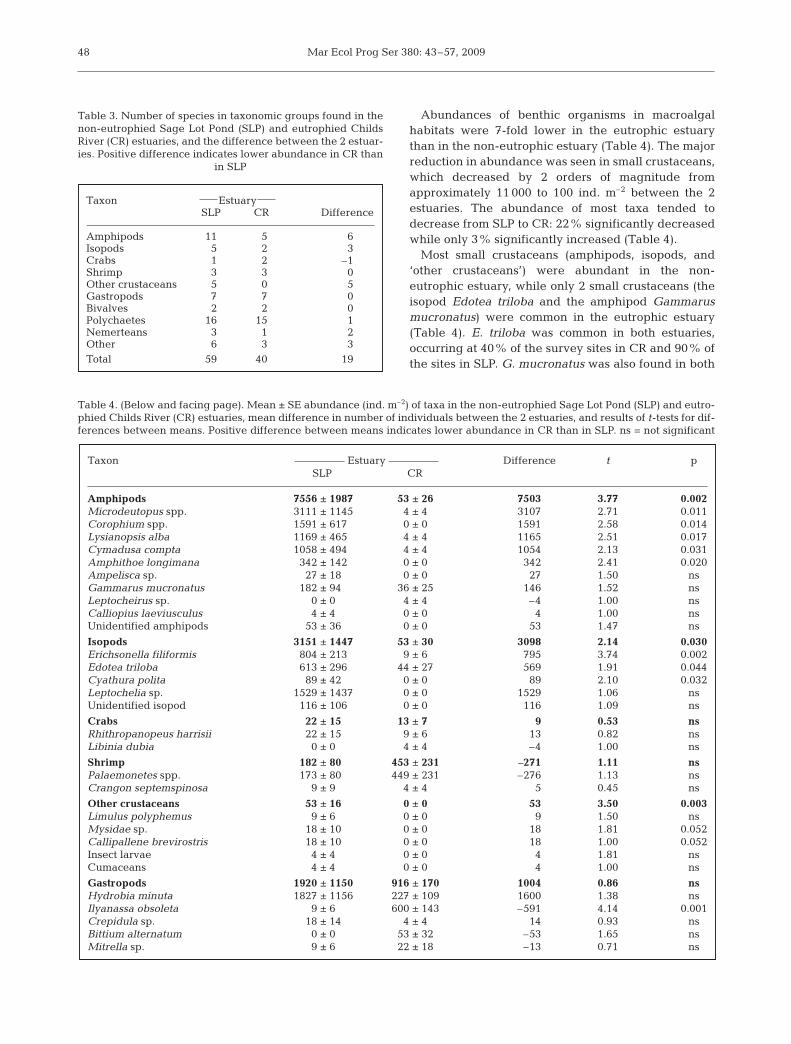
Table 3. Number of species in taxonomic groups found in thenon-eutrophied Sage Lot Pond (SLP) and eutrophied ChildsRiver (CR) estuaries, and the difference between the 2 estuar-ies. Positive difference indicates lower abundance in CR than
in SLP
Taxon Estuary Difference t pSLP CR
Amphipods 7556 ± 1987 53 ± 26 7503 3.77 0.002Microdeutopus spp. 3111 ± 1145 4 ± 4 3107 2.71 0.011Corophium spp. 1591 ± 617 0 ± 0 1591 2.58 0.014Lysianopsis alba 1169 ± 465 4 ± 4 1165 2.51 0.017Cymadusa compta 1058 ± 494 4 ± 4 1054 2.13 0.031Amphithoe longimana 342 ± 142 0 ± 0 342 2.41 0.020Ampelisca sp. 27 ± 18 0 ± 0 27 1.50 nsGammarus mucronatus 182 ± 94 36 ± 25 146 1.52 nsLeptocheirus sp. 0 ± 0 4 ± 4 –4 1.00 nsCalliopius laeviusculus 4 ± 4 0 ± 0 4 1.00 nsUnidentified amphipods 53 ± 36 0 ± 0 53 1.47 ns
Isopods 3151 ± 1447 53 ± 30 3098 2.14 0.030Erichsonella filiformis 804 ± 213 9 ± 6 795 3.74 0.002Edotea triloba 613 ± 296 44 ± 27 569 1.91 0.044Cyathura polita 89 ± 42 0 ± 0 89 2.10 0.032Leptochelia sp. 1529 ± 1437 0 ± 0 1529 1.06 nsUnidentified isopod 116 ± 106 0 ± 0 116 1.09 ns
Crabs 22 ± 15 13 ± 7 9 0.53 nsRhithropanopeus harrisii 22 ± 15 9 ± 6 13 0.82 nsLibinia dubia 0 ± 0 4 ± 4 –4 1.00 ns
Shrimp 182 ± 80 453 ± 231 –271 1.11 nsPalaemonetes spp. 173 ± 80 449 ± 231 –276 1.13 nsCrangon septemspinosa 9 ± 9 4 ± 4 5 0.45 ns
Other crustaceans 53 ± 16 0 ± 0 53 3.50 0.003Limulus polyphemus 9 ± 6 0 ± 0 9 1.50 nsMysidae sp. 18 ± 10 0 ± 0 18 1.81 0.052Callipallene brevirostris 18 ± 10 0 ± 0 18 1.00 0.052Insect larvae 4 ± 4 0 ± 0 4 1.81 nsCumaceans 4 ± 4 0 ± 0 4 1.00 ns
Gastropods 1920 ± 1150 916 ± 170 1004 0.86 nsHydrobia minuta 1827 ± 1156 227 ± 109 1600 1.38 nsIlyanassa obsoleta 9 ± 6 600 ± 143 –591 4.14 0.001Crepidula sp. 18 ± 14 4 ± 4 14 0.93 nsBittium alternatum 0 ± 0 53 ± 32 –53 1.65 nsMitrella sp. 9 ± 6 22 ± 18 –13 0.71 ns
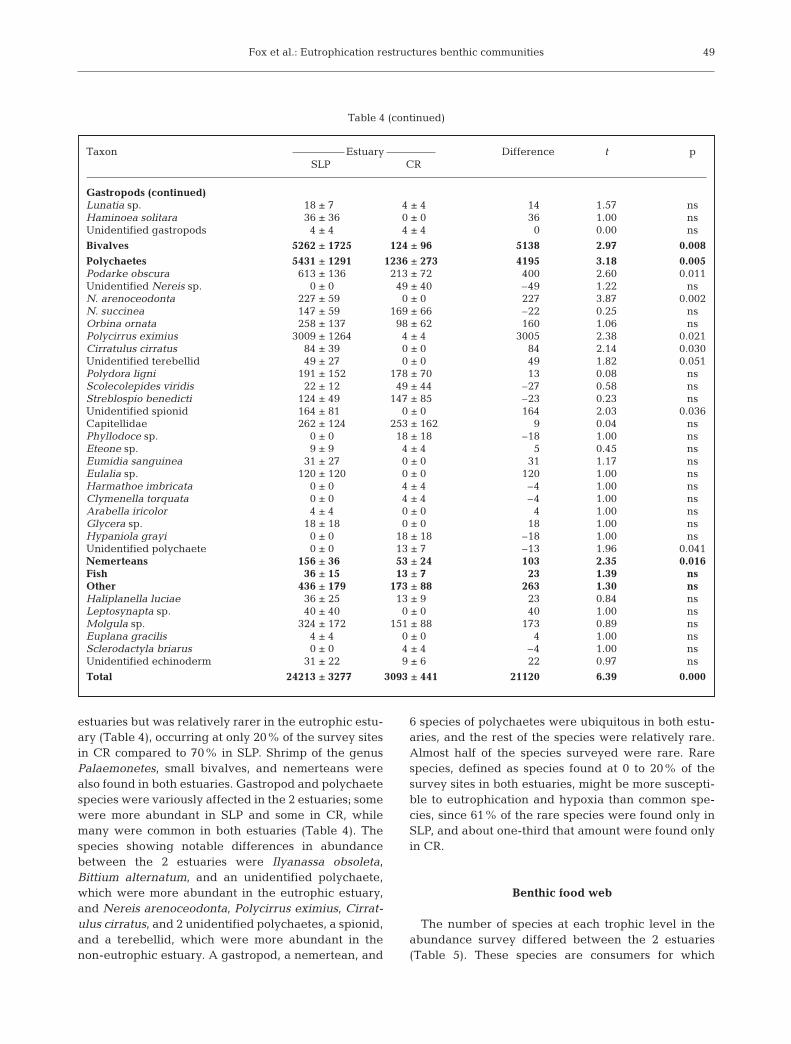
Table 4. (Below and facing page). Mean ± SE abundance (ind. m–2) of taxa in the non-eutrophied Sage Lot Pond (SLP) and eutro-phied Childs River (CR) estuaries, mean difference in number of individuals between the 2 estuaries, and results of t-tests for dif-ferences between means. Positive difference between means indicates lower abundance in CR than in SLP. ns = not significant
Fox et al.: Eutrophication restructures benthic communities
estuaries but was relatively rarer in the eutrophic estu-ary (Table 4), occurring at only 20% of the survey sitesin CR compared to 70% in SLP. Shrimp of the genusPalaemonetes, small bivalves, and nemerteans werealso found in both estuaries. Gastropod and polychaetespecies were variously affected in the 2 estuaries; somewere more abundant in SLP and some in CR, whilemany were common in both estuaries (Table 4). Thespecies showing notable differences in abundancebetween the 2 estuaries were Ilyanassa obsoleta,Bittium alternatum, and an unidentified polychaete,which were more abundant in the eutrophic estuary,and Nereis arenoceodonta, Polycirrus eximius, Cirrat-ulus cirratus, and 2 unidentified polychaetes, a spionid,and a terebellid, which were more abundant in thenon-eutrophic estuary. A gastropod, a nemertean, and
6 species of polychaetes were ubiquitous in both estu-aries, and the rest of the species were relatively rare.Almost half of the species surveyed were rare. Rarespecies, defined as species found at 0 to 20% of thesurvey sites in both estuaries, might be more suscepti-ble to eutrophication and hypoxia than common spe-cies, since 61% of the rare species were found only inSLP, and about one-third that amount were found onlyin CR.
Benthic food web
The number of species at each trophic level in theabundance survey differed between the 2 estuaries(Table 5). These species are consumers for which
49
Taxon Estuary Difference t pSLP CR
Gastropods (continued)Lunatia sp. 18 ± 7 4 ± 4 14 1.57 nsHaminoea solitara 36 ± 36 0 ± 0 36 1.00 nsUnidentified gastropods 4 ± 4 4 ± 4 0 0.00 ns
Bivalves 5262 ± 1725 124 ± 96 5138 2.97 0.008
Polychaetes 5431 ± 1291 1236 ± 273 4195 3.18 0.005Podarke obscura 613 ± 136 213 ± 72 400 2.60 0.011Unidentified Nereis sp. 0 ± 0 49 ± 40 –49 1.22 nsN. arenoceodonta 227 ± 59 0 ± 0 227 3.87 0.002N. succinea 147 ± 59 169 ± 66 –22 0.25 nsOrbina ornata 258 ± 137 98 ± 62 160 1.06 nsPolycirrus eximius 3009 ± 1264 4 ± 4 3005 2.38 0.021Cirratulus cirratus 84 ± 39 0 ± 0 84 2.14 0.030Unidentified terebellid 49 ± 27 0 ± 0 49 1.82 0.051Polydora ligni 191 ± 152 178 ± 70 13 0.08 nsScolecolepides viridis 22 ± 12 49 ± 44 –27 0.58 nsStreblospio benedicti 124 ± 49 147 ± 85 –23 0.23 nsUnidentified spionid 164 ± 81 0 ± 0 164 2.03 0.036Capitellidae 262 ± 124 253 ± 162 9 0.04 nsPhyllodoce sp. 0 ± 0 18 ± 18 –18 1.00 nsEteone sp. 9 ± 9 4 ± 4 5 0.45 nsEumidia sanguinea 31 ± 27 0 ± 0 31 1.17 nsEulalia sp. 120 ± 120 0 ± 0 120 1.00 nsHarmathoe imbricata 0 ± 0 4 ± 4 –4 1.00 nsClymenella torquata 0 ± 0 4 ± 4 –4 1.00 nsArabella iricolor 4 ± 4 0 ± 0 4 1.00 nsGlycera sp. 18 ± 18 0 ± 0 18 1.00 nsHypaniola grayi 0 ± 0 18 ± 18 –18 1.00 nsUnidentified polychaete 0 ± 0 13 ± 7 –13 1.96 0.041Nemerteans 156 ± 36 53 ± 24 103 2.35 0.016Fish 36 ± 15 13 ± 7 23 1.39 nsOther 436 ± 179 173 ± 88 263 1.30 nsHaliplanella luciae 36 ± 25 13 ± 9 23 0.84 nsLeptosynapta sp. 40 ± 40 0 ± 0 40 1.00 nsMolgula sp. 324 ± 172 151 ± 88 173 0.89 nsEuplana gracilis 4 ± 4 0 ± 0 4 1.00 nsSclerodactyla briarus 0 ± 0 4 ± 4 –4 1.00 nsUnidentified echinoderm 31 ± 22 9 ± 6 22 0.97 ns
Total 24213 ± 3277 3093 ± 441 21120 6.39 0.000
Table 4 (continued)
Mar Ecol Prog Ser 380: 43–57, 2009
dietary information is available and include approxi-mately half of the species listed in Table 4. The numberof species found only in SLP was larger than that ofspecies only occurring in CR, and there were also moregrazer species in SLP (Table 5). Most species repre-sented in Tables 5 & 6, however, were found in bothestuaries.
The abundance of grazers (predominantly amphi-pods, isopods, and gastropods) was significantly lowerin the eutrophic estuary than in the non-eutrophicestuary, with an almost 25-fold decrease (Table 6). Theabundance of omnivores (mostly decapods) did not sig-nificantly differ between estuaries (Table 6). Fewerpredators were sampled in CR than in SLP, and preda-
tors consisted mainly of the predatory polychaetesPodarke obscura and Glycera sp. Larger, more mobilepredators, such as fish, were not well sampled usingthe benthic grab.
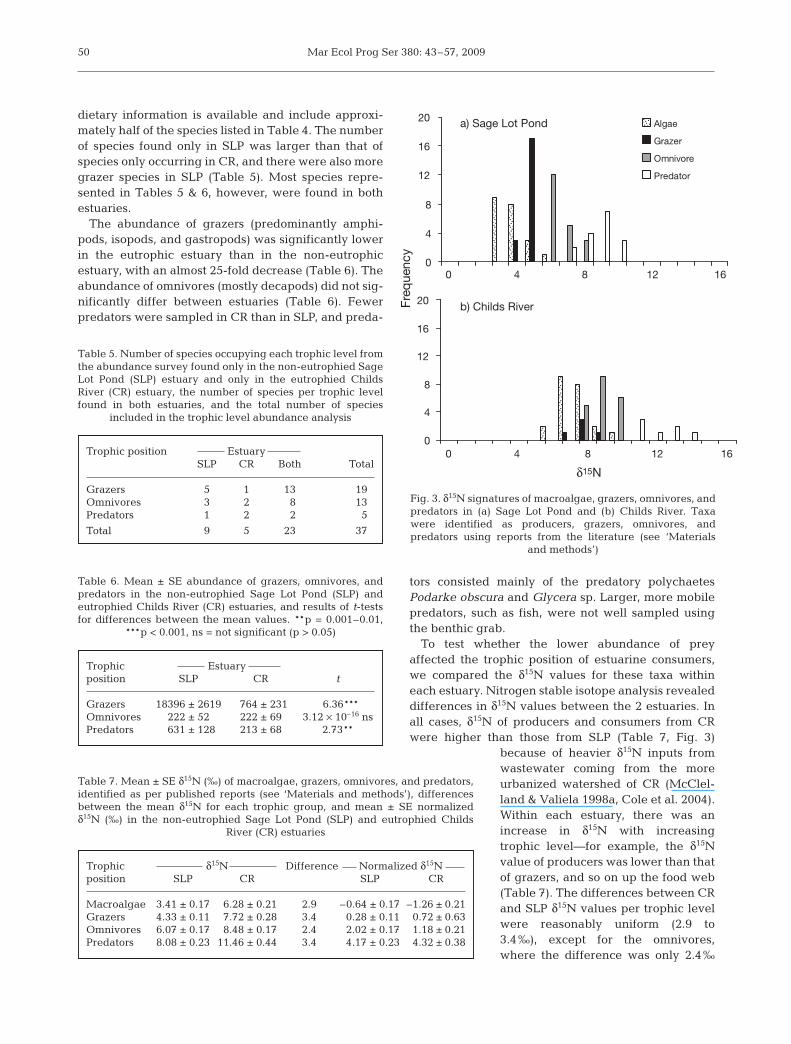
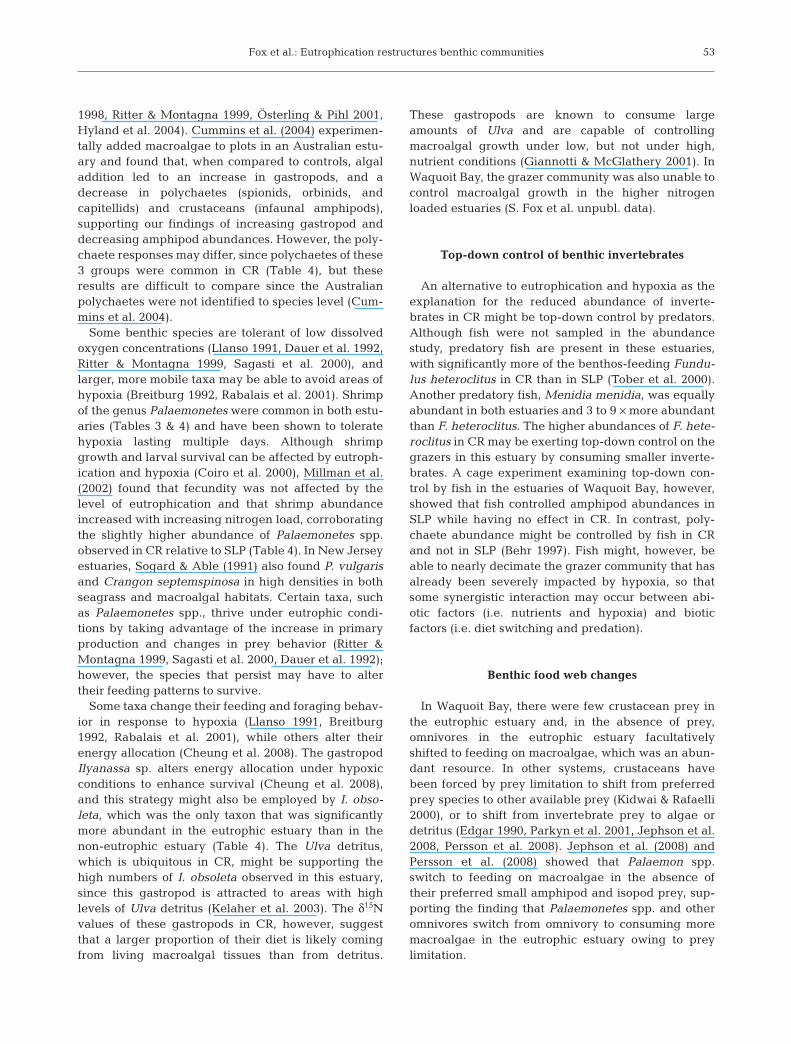
To test whether the lower abundance of preyaffected the trophic position of estuarine consumers,we compared the δ15N values for these taxa withineach estuary. Nitrogen stable isotope analysis revealeddifferences in δ15N values between the 2 estuaries. Inall cases, δ15N of producers and consumers from CRwere higher than those from SLP (Table 7, Fig. 3)
because of heavier δ15N inputs fromwastewater coming from the moreurbanized watershed of CR (McClel-land & Valiela 1998a, Cole et al. 2004).Within each estuary, there was anincrease in δ15N with increasingtrophic level—for example, the δ15Nvalue of producers was lower than thatof grazers, and so on up the food web(Table 7). The differences between CRand SLP δ15N values per trophic levelwere reasonably uniform (2.9 to3.4‰), except for the omnivores,where the difference was only 2.4‰
50
Trophic position EstuarySLP CR Both Total
Grazers 5 1 13 19Omnivores 3 2 8 13Predators 1 2 2 5
Total 9 5 23 37
Table 5. Number of species occupying each trophic level fromthe abundance survey found only in the non-eutrophied SageLot Pond (SLP) estuary and only in the eutrophied ChildsRiver (CR) estuary, the number of species per trophic levelfound in both estuaries, and the total number of species
included in the trophic level abundance analysis
Trophic Estuaryposition SLP CR t
Grazers 18396 ± 2619 764 ± 231 6.36***Omnivores 222 ± 52 222 ± 69 3.12 × 10⁻¹⁶ nsPredators 631 ± 128 213 ± 68 2.73**
Table 6. Mean ± SE abundance of grazers, omnivores, andpredators in the non-eutrophied Sage Lot Pond (SLP) andeutrophied Childs River (CR) estuaries, and results of t-testsfor differences between the mean values. **p = 0.001–0.01,
***p < 0.001, ns = not significant (p > 0.05)
Trophic δ15N Difference Normalized δ15Nposition SLP CR SLP CR
Macroalgae 3.41 ± 0.17 6.28 ± 0.21 2.9 –0.64 ± 0.17 –1.26 ± 0.21Grazers 4.33 ± 0.11 7.72 ± 0.28 3.4 0.28 ± 0.11 0.72 ± 0.63Omnivores 6.07 ± 0.17 8.48 ± 0.17 2.4 2.02 ± 0.17 1.18 ± 0.21Predators 8.08 ± 0.23 11.46 ± 0.44 3.4 4.17 ± 0.23 4.32 ± 0.38
Table 7. Mean ± SE δ15N (‰) of macroalgae, grazers, omnivores, and predators,identified as per published reports (see ‘Materials and methods’), differencesbetween the mean δ15N for each trophic group, and mean ± SE normalizedδ15N (‰) in the non-eutrophied Sage Lot Pond (SLP) and eutrophied Childs
River (CR) estuaries
0
4
8
12
16
20
0 4 8 12 16
0 4 8 12 16
Algae
Grazer
Omnivore
Predator
0
4
8
12
16
20
δ15N
Freq
uenc
y
b) Childs River
a) Sage Lot Pond
Fig. 3. δ15N signatures of macroalgae, grazers, omnivores, andpredators in (a) Sage Lot Pond and (b) Childs River. Taxawere identified as producers, grazers, omnivores, andpredators using reports from the literature (see ‘Materials
and methods’)
Fox et al.: Eutrophication restructures benthic communities
(Table 7). This difference in δ15N values of the omni-vores suggested a change in trophic step for the group,with CR omnivores having lighter δ15N values thanwould be expected for organisms feeding omnivo-rously in this estuary.
To ascertain whether the trophic position of omni-vores in CR and SLP differed relative to feeding habitsreported in the literature, we compared the δ15N val-ues of trophic groups within each estuary. In thisanalysis, we were not concerned with differences inδ15N values owing to different nitrogen sources enter-ing the estuaries, and we knew that δ15N of externalnitrogen sources propagated up in each food web(McClelland et al. 1997, Martinetto et al. 2006). Todirectly compare trophic linkages, we normalized theδ15N values of all producers and consumers against themean δ15N values for macroalgae from that estuary(Table 7). By normalizing the data, we removed theeffect of 15N enrichment from nitrogen sources, so thatwe could focus on and compare the relative differencesin δ15N values for producers, grazers, omnivores, andpredators within each estuary. There were no signifi-cant effects of estuary (Table 8), so that indeed normal-izing data eliminated between-estuary differences inδ15N values owing to nitrogen sources.
The 2 estuaries differed in the mean normalized δ15Nvalues of omnivores relative to grazers, with the δ15Nvalues of omnivores being similar to those of grazers inCR and relatively more distinct from those of grazers inSLP (Table 7). In SLP, the δ15N values of omnivoresonly overlapped with predators, whereas in CR, omni-vores overlapped considerably with grazers ratherthan predators (Fig. 3). There were significant differ-ences among the 4 trophic groups between the 2 estu-aries (Tables 7 & 8), and within each estuary, δ15N val-ues also significantly differed among the trophicgroups (Tables 7 & 8). In CR, the δ15N values of omni-vores were not significantly different from the those ofgrazers (p = 0.982), and the δ15N values of omnivoreswere significantly different from those of grazers in
SLP (p = 0.002). In both estuaries, the δ15N values ofomnivores were significantly different from those ofpredators (p < 0.001 for both comparisons). Organismsthat have been reported to feed omnivorously in the lit-erature tended to be feeding as herbivores in CR, theeutrophic estuary, where prey were limited. In SLP,where many more prey were available (Tables 4 & 6),omnivores remained omnivorous, with more prey intheir diet and less of their diet coming from herbivory.
There appeared to be differences in the change inmean δ15N among trophic levels between the 2 estuar-ies (Table 7). The difference between mean δ15N ofgrazers and omnivores was larger in SLP than in CR,while the difference in mean δ15N between omnivoresand predators was larger in CR than in SLP (Table 7).The lack of a pattern in what is known as trophic frac-tionation observed in these data is likely owing to thediversity of organisms and to organisms of differentsizes constituting each trophic level. For example,grazers include amphipods and isopods as well as thetaxonomically and anatomically very different bi-valves, gastropods, and echinoderms. Organisms willfractionate nitrogen differently depending on theirprey, metabolism, taxonomy, and size (Macko et al.1982, Vander Zanden & Rasmussen 2001, Vanderklift& Ponsard 2003, Crawley et al. 2007).
To determine whether taxa that differed in abun-dance between CR and SLP were feeding differently inthe 2 estuaries, we compared stable isotope values forselected taxa from both sites. There were no consistentpatterns in diet switching between individual taxa,with some of the invertebrate species showing diet dif-ferences between the 2 estuaries, while others did not.The amphipod Gammarus mucronatus was herbivo-rous in the non-eutrophic estuary and omnivorous inthe eutrophic estuary (normalized δ15N value of 0.62 inSLP and 1.45 in CR). In contrast, the grass shrimpPalaemonetes spp. were more herbivorous in theeutrophic estuary than in the non-eutrophic estuary(normalized δ15N value of 2.63 in SLP and 1.1 in CR),and the mud snail Ilyanassa obsoleta, which is knownto be omnivorous, was a strict grazer in CR (normalizedδ15N value of 0.59). The 5 fish species sampled, Fun-dulus heteroclitus, F. majalis, Apeltes quadracus, An-guilla rostrata, and Menidia menidia, were strictpredators in all samples (normalized δ15N values from3.47 to 5.79).
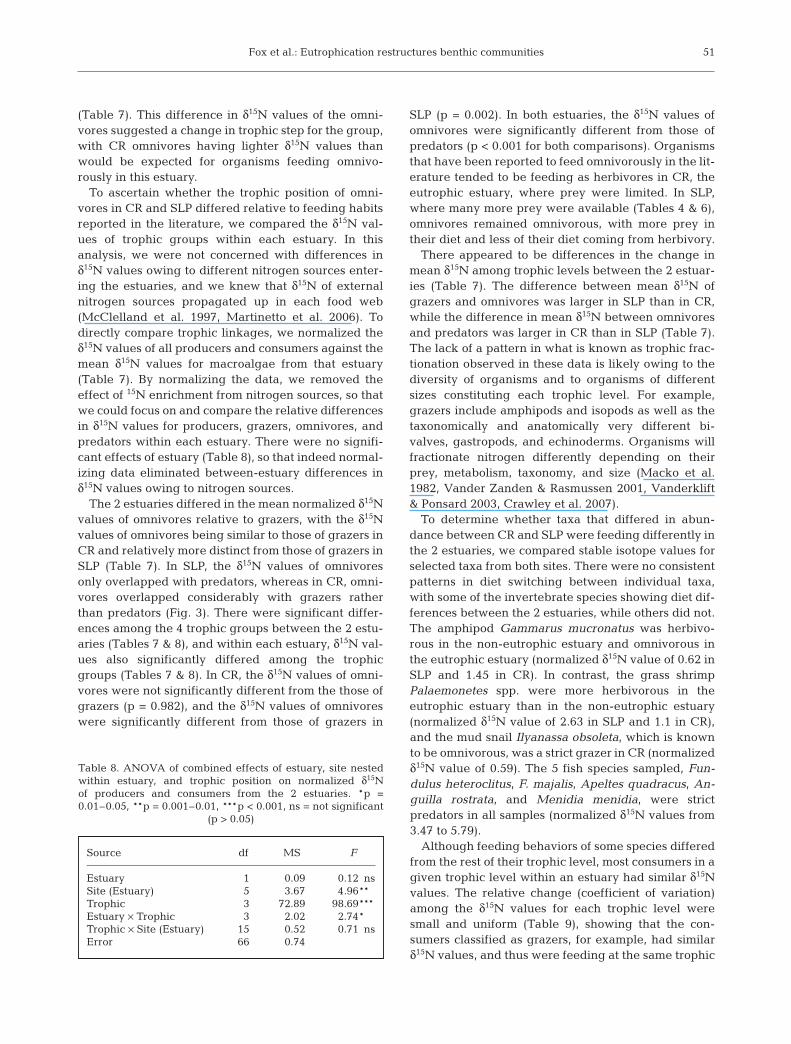
Although feeding behaviors of some species differedfrom the rest of their trophic level, most consumers in agiven trophic level within an estuary had similar δ15Nvalues. The relative change (coefficient of variation)among the δ15N values for each trophic level weresmall and uniform (Table 9), showing that the con-sumers classified as grazers, for example, had similarδ15N values, and thus were feeding at the same trophic
51
Source df MS F
Estuary 1 0.09 0.12 nsSite (Estuary) 5 3.67 4.96**Trophic 3 72.89 98.69***Estuary × Trophic 3 2.02 2.74*Trophic × Site (Estuary) 15 0.52 0.71 nsError 66 0.74
Table 8. ANOVA of combined effects of estuary, site nestedwithin estuary, and trophic position on normalized δ15Nof producers and consumers from the 2 estuaries. *p =0.01–0.05, **p = 0.001–0.01, ***p < 0.001, ns = not significant
(p > 0.05)
Mar Ecol Prog Ser 380: 43–57, 2009
level. These data further support the notion that thetrophic changes observed in CR omnivores are wide-spread throughout the community, as opposed to beingonly species-specific diet switches.
DISCUSSION
The results of the present study show that the 2 estu-aries differed significantly in benthic community struc-ture, with much lower total number and abundances ofbenthic consumers in the eutrophic estuary comparedto the non-eutrophic estuary. In the eutrophic estuary,changes in prey availability are likely leading to shiftsin feeding habits of consumers and changes to foodweb structure. Eutrophication and associated hypoxiaare most likely responsible for the differences in thesebenthic communities, but further study is necessary toassess direct causation. It is likely that the hypoxia-induced prey limitation and subsequent trophic shiftsare merely some of many changes to the structure andfunction of benthic communities that might be occur-ring in eutrophic estuaries.
Benthic community response to eutrophication and hypoxia
There were marked differences between the 2 estu-aries at all levels of the benthic community as a resultof complex interactions among nutrients, flora, andfauna. The increased occurrence of algal bloomsincreases the frequency and duration of hypoxia ineutrophic estuaries, and is likely the mechanism dri-ving changes in benthic invertebrate community com-position and the reduced abundance of invertebratesin CR (Tables 3 & 4, Fig. 2) and other estuaries world-wide (Sogard & Able 1991, Isaksson & Pihl 1992,Geertz-Hansen et al. 1993, Norkko & Bonsdorff 1996,Tagliapietra et al. 1998). In CR, there were approxi-mately 90% fewer benthic consumers than in SLP(Table 4). A similar pattern was observed in surveysand experimental studies in the Baltic Sea, which
showed that abundances of zoobenthos declinedapproximately 90% in areas with macroalgal mats andlower dissolved oxygen concentrations (Norkko &Bonsdorff 1996). In contrast to these results, a 3-foldincrease in macrofaunal abundance and higher num-bers of grazers in macroalgal habitats relative to sea-grasses were found in a survey of consumers in VeniceLagoon by Balducci et al. (2001). In the non-eutrophicestuary surveyed in the present study, the number andabundances of taxa tended to be higher than thosereported in the literature for comparable temperatehabitats (Sogard & Able 1991, Norkko & Bonsdorff1996, Balducci et al. 2001, Wennhage & Pihl 2007).
Smaller, less mobile crustaceans, such as amphipodsand isopods, are more sensitive to eutrophication, andthese crustacean taxa dominated the faunal assem-blage in the non-eutrophic estuary but were rarer inthe eutrophic estuary (Tables 3 & 4), most likelybecause they were unable to tolerate the intermittentand persistent hypoxia associated with the macroalgalblooms (Harper et al. 1981, Geertz-Hansen et al. 1993,Wicklund & Sundelin 2001). Gammarus mucronatuswas the dominant amphipod species in the eutrophicestuary (Table 4). This may be in part because gam-maridean amphipods have been shown to toleratemoderate hypoxia by migrating vertically out ofhypoxic bottom waters; however, in doing so they sig-nificantly increase risk of predation (Kolar & Rahel1993). In contrast, Corophium spp. abundance hasbeen shown to decrease in the presence of macroalgalmats (Kidwai & Rafaelli 2000, Österling & Pihl 2001),supporting our observation of the significant decreasein abundance of Corophium spp. in the eutrophic estu-ary relative to the non-eutrophic estuary (Table 4). Thelethal and sub-lethal effects of hypoxia are likely toreduce the abundance of amphipods and isopods ineutrophic estuaries that experience persistent moder-ate hypoxia, like CR (Tables 2 & 3, Fig. 2). Harper et al.(1981) found that hypoxia off the Texas coast led to aloss of amphipod diversity and abundances. In general,hypoxia of <2 mg l–1 has been shown to affect con-sumer behavior and survival (Dauer et al. 1992, Rabal-ais et al. 2001), but moderate hypoxia (<4 mg l–1) mayimpair invertebrate reproduction (Coiro et al. 2000,Eriksson Wiklund & Sundelin 2001), and cause slowgrowth in crustaceans (Coiro et al. 2000) and poly-chaetes (Forbes & Lopez 1990).
A few taxa were common to both estuaries, includingpolychaetes, gastropods, and shrimp (Tables 3 & 4). Ofthe common polychaetes and gastropods found in thisstudy, Nereis succinea, Streblospio benedicti, Capitel-lidae, and Hydrobia spp. are opportunistic taxa associ-ated with macroalgal mats, and may be tolerant ofanthropogenic disturbances to estuarine and coastalwaters (Norkko & Bonsdorff 1996, Tagliapietra et al.
52
Trophic level EstuarySLP CR
Grazers 11 8Omnivores 16 11Predators 11 9
Table 9. Coefficients of variation for δ15N values of consumersin the 3 trophic levels in the Sage Lot Pond (SLP) and Childs
River (CR) estuaries
Fox et al.: Eutrophication restructures benthic communities
1998, Ritter & Montagna 1999, Österling & Pihl 2001,Hyland et al. 2004). Cummins et al. (2004) experimen-tally added macroalgae to plots in an Australian estu-ary and found that, when compared to controls, algaladdition led to an increase in gastropods, and adecrease in polychaetes (spionids, orbinids, andcapitellids) and crustaceans (infaunal amphipods),supporting our findings of increasing gastropod anddecreasing amphipod abundances. However, the poly-chaete responses may differ, since polychaetes of these3 groups were common in CR (Table 4), but theseresults are difficult to compare since the Australianpolychaetes were not identified to species level (Cum-mins et al. 2004).
Some benthic species are tolerant of low dissolvedoxygen concentrations (Llanso 1991, Dauer et al. 1992,Ritter & Montagna 1999, Sagasti et al. 2000), andlarger, more mobile taxa may be able to avoid areas ofhypoxia (Breitburg 1992, Rabalais et al. 2001). Shrimpof the genus Palaemonetes were common in both estu-aries (Tables 3 & 4) and have been shown to toleratehypoxia lasting multiple days. Although shrimpgrowth and larval survival can be affected by eutroph-ication and hypoxia (Coiro et al. 2000), Millman et al.(2002) found that fecundity was not affected by thelevel of eutrophication and that shrimp abundanceincreased with increasing nitrogen load, corroboratingthe slightly higher abundance of Palaemonetes spp.observed in CR relative to SLP (Table 4). In New Jerseyestuaries, Sogard & Able (1991) also found P. vulgarisand Crangon septemspinosa in high densities in bothseagrass and macroalgal habitats. Certain taxa, suchas Palaemonetes spp., thrive under eutrophic condi-tions by taking advantage of the increase in primaryproduction and changes in prey behavior (Ritter &Montagna 1999, Sagasti et al. 2000, Dauer et al. 1992);however, the species that persist may have to altertheir feeding patterns to survive.
Some taxa change their feeding and foraging behav-ior in response to hypoxia (Llanso 1991, Breitburg1992, Rabalais et al. 2001), while others alter theirenergy allocation (Cheung et al. 2008). The gastropodIlyanassa sp. alters energy allocation under hypoxicconditions to enhance survival (Cheung et al. 2008),and this strategy might also be employed by I. obso-leta, which was the only taxon that was significantlymore abundant in the eutrophic estuary than in thenon-eutrophic estuary (Table 4). The Ulva detritus,which is ubiquitous in CR, might be supporting thehigh numbers of I. obsoleta observed in this estuary,since this gastropod is attracted to areas with highlevels of Ulva detritus (Kelaher et al. 2003). The δ15Nvalues of these gastropods in CR, however, suggestthat a larger proportion of their diet is likely comingfrom living macroalgal tissues than from detritus.
These gastropods are known to consume largeamounts of Ulva and are capable of controllingmacroalgal growth under low, but not under high,nutrient conditions (Giannotti & McGlathery 2001). InWaquoit Bay, the grazer community was also unable tocontrol macroalgal growth in the higher nitrogenloaded estuaries (S. Fox et al. unpubl. data).
Top-down control of benthic invertebrates
An alternative to eutrophication and hypoxia as theexplanation for the reduced abundance of inverte-brates in CR might be top-down control by predators.Although fish were not sampled in the abundancestudy, predatory fish are present in these estuaries,with significantly more of the benthos-feeding Fundu-lus heteroclitus in CR than in SLP (Tober et al. 2000).Another predatory fish, Menidia menidia, was equallyabundant in both estuaries and 3 to 9 × more abundantthan F. heteroclitus. The higher abundances of F. hete-roclitus in CR may be exerting top-down control on thegrazers in this estuary by consuming smaller inverte-brates. A cage experiment examining top-down con-trol by fish in the estuaries of Waquoit Bay, however,showed that fish controlled amphipod abundances inSLP while having no effect in CR. In contrast, poly-chaete abundance might be controlled by fish in CRand not in SLP (Behr 1997). Fish might, however, beable to nearly decimate the grazer community that hasalready been severely impacted by hypoxia, so thatsome synergistic interaction may occur between abi-otic factors (i.e. nutrients and hypoxia) and bioticfactors (i.e. diet switching and predation).
Benthic food web changes
In Waquoit Bay, there were few crustacean prey inthe eutrophic estuary and, in the absence of prey,omnivores in the eutrophic estuary facultativelyshifted to feeding on macroalgae, which was an abun-dant resource. In other systems, crustaceans havebeen forced by prey limitation to shift from preferredprey species to other available prey (Kidwai & Rafaelli2000), or to shift from invertebrate prey to algae ordetritus (Edgar 1990, Parkyn et al. 2001, Jephson et al.2008, Persson et al. 2008). Jephson et al. (2008) andPersson et al. (2008) showed that Palaemon spp.switch to feeding on macroalgae in the absence oftheir preferred small amphipod and isopod prey, sup-porting the finding that Palaemonetes spp. and otheromnivores switch from omnivory to consuming moremacroalgae in the eutrophic estuary owing to preylimitation.
53
Mar Ecol Prog Ser 380: 43–57, 2009
In the present study, stable isotope ratios differenti-ated between functional and trophic roles of omni-vores. δ15N values of CR omnivores revealed incorpo-ration of the macroalgal food source into body tissues,since the δ15N values of omnivores were not signifi-cantly different from δ15N values of grazers, solidifyingtheir role as both functional and trophic herbivores. Incontrast, other crustaceans have been shown to befunctional omnivores by gut content analysis, feedingon invertebrates and detritus, but stable isotopic analy-sis defined these crustaceans as trophic predators,indicating that the detritus in their guts was not incor-porated into body mass (Parkyn et al. 2001). In theeutrophic estuary in Waquoit Bay, where herbivoreswere rare, some omnivores may have been forced tofeed as herbivores because of limited prey.
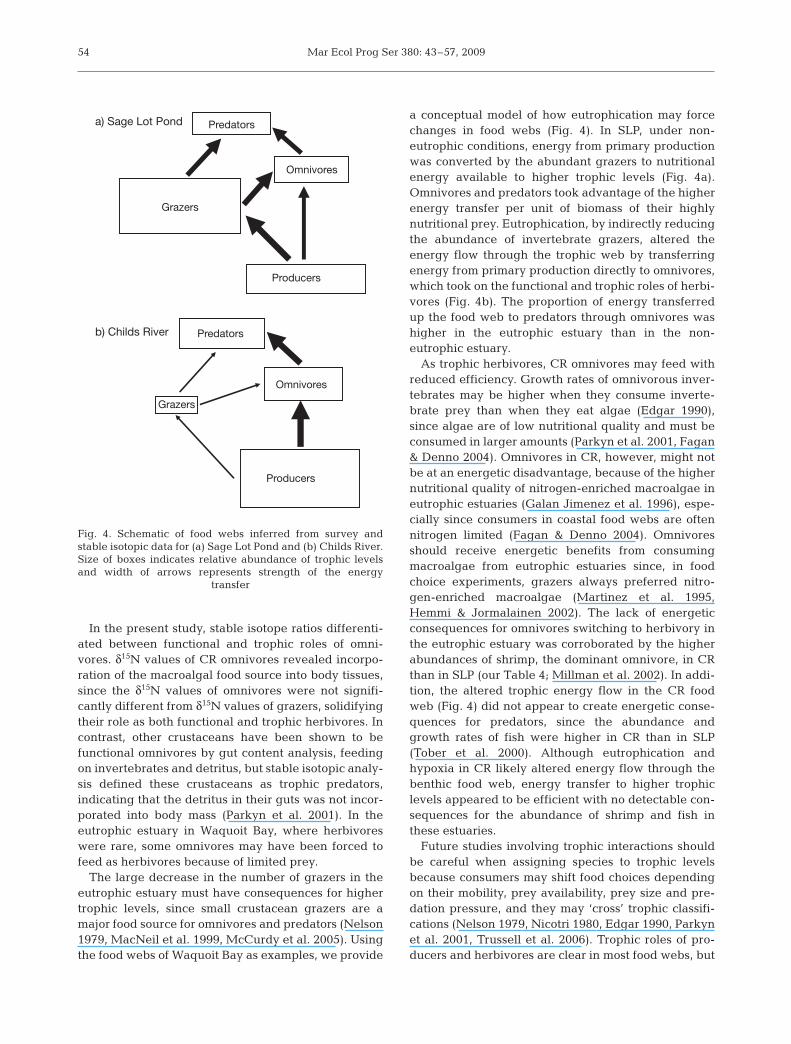
The large decrease in the number of grazers in theeutrophic estuary must have consequences for highertrophic levels, since small crustacean grazers are amajor food source for omnivores and predators (Nelson1979, MacNeil et al. 1999, McCurdy et al. 2005). Usingthe food webs of Waquoit Bay as examples, we provide
a conceptual model of how eutrophication may forcechanges in food webs (Fig. 4). In SLP, under non-eutrophic conditions, energy from primary productionwas converted by the abundant grazers to nutritionalenergy available to higher trophic levels (Fig. 4a).Omnivores and predators took advantage of the higherenergy transfer per unit of biomass of their highlynutritional prey. Eutrophication, by indirectly reducingthe abundance of invertebrate grazers, altered theenergy flow through the trophic web by transferringenergy from primary production directly to omnivores,which took on the functional and trophic roles of herbi-vores (Fig. 4b). The proportion of energy transferredup the food web to predators through omnivores washigher in the eutrophic estuary than in the non-eutrophic estuary.
As trophic herbivores, CR omnivores may feed withreduced efficiency. Growth rates of omnivorous inver-tebrates may be higher when they consume inverte-brate prey than when they eat algae (Edgar 1990),since algae are of low nutritional quality and must beconsumed in larger amounts (Parkyn et al. 2001, Fagan& Denno 2004). Omnivores in CR, however, might notbe at an energetic disadvantage, because of the highernutritional quality of nitrogen-enriched macroalgae ineutrophic estuaries (Galan Jimenez et al. 1996), espe-cially since consumers in coastal food webs are oftennitrogen limited (Fagan & Denno 2004). Omnivoresshould receive energetic benefits from consumingmacroalgae from eutrophic estuaries since, in foodchoice experiments, grazers always preferred nitro-gen-enriched macroalgae (Martinez et al. 1995,Hemmi & Jormalainen 2002). The lack of energeticconsequences for omnivores switching to herbivory inthe eutrophic estuary was corroborated by the higherabundances of shrimp, the dominant omnivore, in CRthan in SLP (our Table 4; Millman et al. 2002). In addi-tion, the altered trophic energy flow in the CR foodweb (Fig. 4) did not appear to create energetic conse-quences for predators, since the abundance andgrowth rates of fish were higher in CR than in SLP(Tober et al. 2000). Although eutrophication andhypoxia in CR likely altered energy flow through thebenthic food web, energy transfer to higher trophiclevels appeared to be efficient with no detectable con-sequences for the abundance of shrimp and fish inthese estuaries.
Future studies involving trophic interactions shouldbe careful when assigning species to trophic levelsbecause consumers may shift food choices dependingon their mobility, prey availability, prey size and pre-dation pressure, and they may ‘cross’ trophic classifi-cations (Nelson 1979, Nicotri 1980, Edgar 1990, Parkynet al. 2001, Trussell et al. 2006). Trophic roles of pro-ducers and herbivores are clear in most food webs, but
54
Producers
Grazers
Omnivores
Predatorsa) Sage Lot Pond
Grazers
Producers
Omnivores
Predatorsb) Childs River
Fig. 4. Schematic of food webs inferred from survey andstable isotopic data for (a) Sage Lot Pond and (b) Childs River.Size of boxes indicates relative abundance of trophic levelsand width of arrows represents strength of the energy
transfer
Fox et al.: Eutrophication restructures benthic communities
for non-herbivore consumers trophic levels are anabstraction and can be described more correctly as a‘trophic tangle’ (Thompson et al. 2007).
CONCLUSIONS
Eutrophication of coastal waters has led to macroal-gae-dominated estuaries with moderate intermittenthypoxia, causing significant changes to benthic com-munity structure and food web relationships. Manybenthic consumers are unable to survive the degrada-tion of water quality associated with high nutrientloading. Those that are the most tolerant, like Palae-monetes spp., are omnivores with flexible generalistdiets that are able to take advantage of eutrophic con-ditions and new resources and, in doing so, changetheir function in the benthic food web. By filling thetrophic vacancy, these omnivores may be able to main-tain the stability of anthropogenically impacted coastalcommunities and their food webs.
Acknowledgements. We thank L. Fox for assistance in thefield and the laboratory. This research was supported by thefollowing funding sources: NOAA National EstuarineResearch Reserve and EPA STAR Graduate Research Fellow-ships to S.E.F., Palmer McCleod Fellowship awarded to M.T.,Woods Hole Marine Science Consortium undergraduateinternship awarded to L.H., and NOS/ECOHAB grant#NA16OP2728.
LITERATURE CITED
Baden SP, Loo LO, Pihl L, Rosenberg R (1990) Effects ofeutrophication on benthic communities including fish:Swedish west coast. Ambio 19:113–122
Balducci C, Sfriso A, Pavoni B (2001) Macrofauna impact onUlva rigida C. Ag. production and relationship with envi-ronmental variables in the lagoon of Venice. Mar EnvironRes 52:27–49
Behr PJ (1997) The effects of nitrogen loads on fish and theeffects of fish on macrobenthos in Waquoit Bay. MA thesis,Boston University, Boston, MA
Bowen JL, Valiela I (2001) The ecological effects of urbaniza-tion of coastal watersheds: historical increases in nitrogenloads and eutrophication of Waquoit Bay. Can J FishAquat Sci 58:1489–1500
Breitburg DL (1992) Episodic hypoxia in Chesapeake Bay:interacting effects of recruitment, behavior, and physicaldisturbance. Ecol Monogr 62:525–546
Bricker S, Longstaff B, Dennison W, Jones A, Boicourt K,Wicks C, Woerner J (2007) Effects of nutrient enrichmentin the nation’s estuaries: a decade of change. NOAAcoastal ocean program decision analysis series no. 26.National Centers for Coastal Ocean Science, SilverSpring, MD
Brownlee KA (1965) Statistical theory and methodology in sci-ence and engineering, 2nd edn. John Wiley & Sons, NewYork
Carmichael RH, Valiela I (2005) Coupling of near-bottom ses-ton and surface sediment composition: changes with nutri-
ent enrichment and implications for estuarine food supplyand biogeochemical processing. Limnol Oceanogr 50:97–105
Cheung SG, Chan HY, Liu CC, Shin PKS (2008) Effect of pro-longed hypoxia on food consumption, respiration, growthand reproduction in marine scavenging gastropod Nassar-ius festivus. Mar Pollut Bull 57:280–286
Cloern JE (2001) Our evolving conceptual model of thecoastal eutrophication problem. Mar Ecol Prog Ser 210:223–253
Coiro LL, Poucher SL, Miller DC (2000) Hypoxic effects ongrowth of Palaemonetes vulgaris larvae and other species:using constant exposure to estimate cyclic exposureresponse. J Exp Mar Biol Ecol 247:243–255
Cole ML, Valiela I, Kroeger KD, Tomasky GL and others(2004) Assessment of a δ15N isotopic method to indicateanthropogenic eutrophication in aquatic ecosystems.J Environ Qual 33:124–132
Costanzo SD, O’Donohue MJ, Dennison WC, Loneragan NR,Thomas M (2001) A new approach for detecting and map-ping sewage impacts. Mar Pollut Bull 42:149–156
Crawley KR, Hyndes GA, Vanderklift MA (2007) Variationamong diets in discrimination of δ13C and δ15N in theamphipod Allorchestes compressa. J Exp Mar Biol Ecol349:370–377
Cummins SP, Roberts DE, Zimmerman KD (2004) Effects ofthe green macroalga Enteromorpha intestinalis on mac-robenthic and seagrass assemblages in a shallow coastalestuary. Mar Ecol Prog Ser 266:77–87
D’Avanzo C, Kremer JN (1994) Diel oxygen dynamics andanoxic events in an eutrophic estuary of Waquoit Bay,Massachusetts. Estuaries 17:131–139
Dauer DM, Rodi AJ, Ranasinghe JA (1992) Effects of low dis-solved oxygen events on the macrobenthos of the lowerChesapeake Bay. Estuaries 15:384–391
Diaz RJ (2001) Overview of hypoxia around the world.J Environ Qual 30:275–281
Diaz RJ, Rosenberg R (2001) Overview of anthropogenically-induced hypoxic effects on marine benthic fauna. In:Rabalais NN, Turner RE (eds) Coastal hypoxia: conse-quences for living resources and ecosystems. AmericanGeophysical Union, Washington, DC, p 129–145
Diaz RJ, Rosenberg R (2008) Spreading dead zones and con-sequences for marine ecosystems. Science 321:926–929
Duarte C (1995) Submerged aquatic vegetation in relation todifferent nutrient regimes. Ophelia 41:87–112
Edgar GJ (1990) Predator–prey interactions in seagrass beds.I. The influence of macrofaunal abundance and size-struc-ture on the diet and growth of the western rock lobsterPanulirus Cygnus George. J Exp Mar Biol Ecol 139:1–22
Eriksson Wicklund AK, Sundelin B (2001) Impaired reproduc-tion in the amphipods Monoporeia affinis and Pontoporeiafemorata as a result of moderate hypoxia and increasedtemperature. Mar Ecol Prog Ser 222:131–141
Fagan WF, Denno RF (2004) Stoichiometry of actual vs. poten-tial predator–prey interactions: insights into nitrogen lim-itation for arthropod predators. Ecol Lett 7:876–883
Forbes TL, Lopez GR (1990) The effect of food concentration,body size, and environmental oxygen tension on thegrowth of the deposit-feeding polychaete, Capitellaspecies 1. Limnol Oceanogr 35:1535–1544
Fox SE (2008) Ecological effects of nitrogen loading to tem-perate estuaries: macrophyte and consumer communitystructure and food web relationships. PhD dissertation,Boston University, Boston, MA
Fox SE, Stieve E, Valiela I, Hauxwell J, McClelland J (2008)Macrophyte abundance in Waquoit Bay: effects of land-
55
Mar Ecol Prog Ser 380: 43–57, 2009
derived nitrogen loads on seasonal and multi-yearbiomass patterns. Estuaries Coasts 31:532–541
Galan Jimenez EG, Hauxwell J, Heckscher E, Rietsma C,Valiela I (1996) Selection of nitrogen-enriched macroalgae(Cladophora vagabunda and Gracilaria tikvahiae) by theherbivorous amphipod Microdeutopus gryllotalpa. BiolBull 191:323–324
Geertz-Hansen O, Sand-Jensen K, Hansen DF, ChristiansenA (1993) Growth and grazing control of abundance of themarine macroalga, Ulva lactuca L. in a eutrophic Danishestuary. Aquat Bot 46:101–109
Giannotti AL, McGlathery KJ (2001) Consumption of Ulvalactuca (Chlorophyta) by the omnivorous mud snailIlyanassa obsoleta (Say). J Phycol 37:209–215
Griffin MPA, Valiela I (2001) δ15N isotope studies of life his-tory and trophic position of Fundulus heteroclitus andMenidia menidia. Mar Ecol Prog Ser 214:299–305
Harper DE, McKinney LD, Salzer RR, Case RJ (1981) Theoccurrence of hypoxic bottom water off the upper Texascoast and its effect on the benthic biota. Contrib Mar Sci24:53–79
Hauxwell J, Cebrian J, Furlong C, Valiela I (2001) Macroalgalcanopies contribute to eelgrass (Zostera marina) decline intemperate estuarine ecosystems. Ecology 82:1007–1022
Heck KL Jr, Thoman TA (1981) Experiments on predator–prey interactions in vegetated aquatic habitats. J Exp MarBiol Ecol 53:125–134
Hemmi A, Jormalainen V (2002) Nutrient enhancement in-creases performance of a marine herbivore via quality ofits food alga. Ecology 83:1052–1064
Holmes GT (2008) Nutrient supply, water residence time,temperature, and grazing as controls of size-fractionatedphytoplankton biomass in shallow temperate estuarineecosystems. PhD thesis, Boston University, Boston, MA
Hyland JL, Balthis WL, Posey M, Hackney CT, Alphin T(2004) The soft-bottom macrobenthos of North Carolinaestuaries. Estuaries 27:501–514
Isaksson I, Pihl L (1992) Structural changes in benthicmacrovegetation and associated epifaunal benthic com-munities. Neth J Sea Res 30:131–140
Jephson T, Nyström P, Moksnes PO, Baden SP (2008) Trophicinteractions in Zostera marina beds along the Swedishcoast. Mar Ecol Prog Ser 369:63–76
Kelaher BP, Levinton JS, Hoch JM (2003) Foraging by themud snail, Ilyanassa obsoleta (Say), modulates spatialvariation in benthic community structure. J Exp Mar BiolEcol 292:139–157
Kidwai S, Raffaelli D (2000) Food selection and growth pat-terns of Crangon crangon L. in the presence of macroalgalmats: field experiment on the Ythan estuary (Aberdeen-shire, Scotland). Pak J Zool 32:201–206
Kneib RT (1985) Predation and disturbance by grass shrimp,Palaemonetes pugio Holthius, in soft-substratum benthicinvertebrate assemblages. J Exp Mar Biol Ecol 93:91–102
Kolar CS, Rahel FJ (1993) Interaction of a biotic factor (predatorpresence) and an abiotic factor (low oxygen) as an influenceon benthic invertebrate communities. Oecologia 95:210–219
Lever MA, Valiela I (2005) Response of microphytobenthicbiomass to experimental nutrient enrichment and grazerexclusion at different land-derived nitrogen loads. MarEcol Prog Ser 294:117–129
Llanso RJ (1991) Tolerance of low dissolved oxygen andhydrogen sulfide by the polychaete Streblospio benedicti(Webster). J Exp Mar Biol Ecol 153:165–178
Macko SA, Lee WY, Parker PL (1982) Nitrogen and carbonisotope fraction by two species of marine amphipods: lab-oratory and field studies. J Exp Mar Biol Ecol 63:145–149
MacNeil C, Dick JTA, Elwood RW (1999) The dynamics ofpredation on Gammarus spp. (Crustacea: Amphipoda).Biol Rev Camb Philos Soc 74:375–395
Martinetto P, Teichberg M, Valiela I (2006) Coupling of estu-arine benthic and pelagic food webs to land-derived nitro-gen sources in Waquoit Bay, Massachusetts, USA. MarEcol Prog Ser 307:37–48
Martinez N, Hauxwell J, Valiela I (1995) Effect of macroalgalspecies and nitrogen loading rates in colonization ofmacroalgae by herbivorous amphipods. Biol Bull 189:244–245
McClelland JW, Valiela I (1998a) Linking nitrogen in estuar-ine producers to land-derived sources. Limnol Oceanogr43:577–585
McClelland JW, Valiela I (1998b) Changes in food webstructure under the influence of increased anthropo-genic nitrogen inputs to estuaries. Mar Ecol Prog Ser168:259–271
McClelland JW, Valiela I, Michener RH (1997) Nitrogen-stable isotope signatures in estuarine food webs: a recordof increasing urbanization in coastal watersheds. LimnolOceanogr 42:930–937
McCurdy DG, Forbes MR, Logan SP, Lancaster D, Mautner SI(2005) Foraging and impacts by benthic fish on the inter-tidal amphipod Corophium volutator. J Crustac Biol 25:558–564
McGlathery KJ (2001) Macroalgal blooms contribute todecline of seagrass in nutrient-enriched coastal waters.J Phycol 37:453–456
Millman M, Teichberg M, Martinetto P, Valiela I (2002)Response of shrimp populations to land-derived nitrogenin Waquoit Bay, Massachusetts. Biol Bull 203:263–264
Minagawa M, Wada E (1984) Stepwise enrichment of 15Nalong food chains: further evidence and the relationbetween δ15N and animal age. Geochim Cosmochim Acta48:1135–1140
Morgan MD (1980) Grazing and predation of the grass shrimpPalaemonetes pugio. Limnol Oceanogr 25:896–902
Nelson WG (1979) Experimental studies of selective preda-tion on amphipods: consequences for amphipod distribu-tion and abundance. J Exp Mar Biol Ecol 38:225–245
Nicotri ME (1980) Factors involved in herbivore food prefer-ence. J Exp Mar Biol Ecol 42:13–26
Nixon SW (1992) Quantifying the relationship between nitro-gen input and the productivity of marine ecosystems. ProcAdvancements Mar Technol Conf, Tokyo 5:57–83
Norkko A, Bonsdorff E (1996) Population responses of coastalzoobenthos to stress induced by drifting algal mats. MarEcol Prog Ser 140:141–151
Österling M, Pihl L (2001) Effects of filamentous green algalmats on benthic macrofaunal functional feeding groups.J Exp Mar Biol Ecol 263:159–183
Parkyn SM, Collier KJ, Hicks BJ (2001) New Zealand streamcrayfish: functional omnivores but trophic predators?Freshw Biol 46:641–652
Persson M, Andersson S, Baden S, Moksnes PO (2008)Trophic role of the omnivorous grass shrimp Palaemonelegans in a Swedish eelgrass system. Mar Ecol Prog Ser371:203–212
Peterson BJ, Fry B (1987) Stable isotopes in ecosystem stud-ies. Annu Rev Ecol Syst 18:293–320
Pihl L (1994) Changes in the diet of demersal fish due toeutrophication-induced hypoxia in the Kattegat, Sweden.Can J Fish Aquat Sci 51:321–336
Rabalais NN, Harper DE Jr, Turner RE (2001) Responses ofnekton and demersal and benthic fauna to decreasingoxygen concentrations. In: Rabalais NN, Turner RE (eds)
56
Fox et al.: Eutrophication restructures benthic communities
Coastal hypoxia: consequences for living resources andecosystems. American Geophysical Union, Washington,DC, p. 115–128
Ritter C, Montagna PA (1999) Seasonal hypoxia and models ofbenthic response in a Texas bay. Estuaries 22:7–20
Safran RE, Legra JC, Valiela I (1998) Effects of nitrogen load-ing on eelgrass seed coat abundance, C to N ratios, andδ15N in sediments of Waquoit Bay. Biol Bull 195:245–246
Sagasti A, Schaffner LC, Duffy JE (2000) Epifaunal communi-ties thrive in an estuary with hypoxic episodes. Estuaries23:474–487
Sogard SM, Able KW (1991) A comparison of eelgrass, sea let-tuce macroalgae, and marsh creeks as habitats for epiben-thic fishes and decapods. Estuar Coast Shelf Sci 33:501–519
Tagliapietra D, Pavan M, Wagner C (1998) Macrobenthiccommunity changes related to eutrophication in Paludedella Rosa (Venetian Lagoon, Italy). Estuar Coast Shelf Sci47:217–226
Teichberg M, Heffner LR, Fox S, Valiela I (2007) Nitratereductase and glutamine synthetase activity, internal Npools, and growth of Ulva lactuca: responses to long andshort-term N supply. Mar Biol 151:1249–1259
Thompson RM, Hemberg M, Starzomski BM, Shurin JB(2007) Trophic levels and trophic tangles: the prevalenceof omnivory in real food webs. Ecology 88:612–617
Tober JD, Griffin MPA, Valiela I (2000) Growth and abun-dance of Fundulus heteroclitus and Menidia menidia inestuaries of Waquoit Bay, Massachusetts exposed to dif-ferent rates of nitrogen loading. Aquat Ecol 34:299–306
Trussell GC, Ewanchuk PJ, Matassa CM (2006) The fear ofbeing eaten reduces energy transfer in a simple foodchain. Ecology 87:2979–2984
Valiela I, Foreman K, LaMontagne M, Hersh D and others(1992) Couplings of watersheds and coastal waters:sources and consequences of nutrient enrichment inWaquoit Bay, Massachusetts. Estuaries 15:443–457
Vander Zanden MJ, Rasmussen JB (2001) Variation in δ15Nand δ13C trophic fractionation: implications for aquaticfood web studies. Limnol Oceanogr 46:2061–2066
Vanderklift MA, Ponsard S (2003) Sources of variation in con-sumer-diet δ15N enrichment: a meta-analysis. Oecologia136:169–182
Ware DM, Thompson RE (2005) Bottom-up ecosystem trophicdynamics determine fish production in northeast Pacific.Science 308:1280–1284
Wennhage H, Pihl L (2007) From flatfish to sticklebacks:assemblage structure of epibenthic fauna in relation tomacroalgal blooms. Mar Ecol Prog Ser 335:187–198
Zimmerman R, Gibson R, Harrington J (1979) Herbivory anddetritivory among gammaridean amphipods from aFlorida seagrass community. Mar Biol 54:41–47
57
Editorial responsibility: Kenneth Heck,Dauphin Island, Alabama, USA
Submitted: June 6, 2008; Accepted: January 6, 2009Proofs received from author(s): March 30, 2009


