Embed Size (px)
Citation preview
Research Results from A Few Alternate Methods of Interior Duct Systems in Factory Built Housing Located In the Hot Humid Climate
Authors Neil Moyer, Dennis Stroer, David Hoak, Janet McIlvaine and Subrato Chandra
Original Publication Moyer, N., Stroer, D., Hoak, D., McIlvaine, J., and Chandra, S., "Research Results from A
Few Alternate Methods of Interior Duct Systems in Factory Built Housing Located In the Hot Humid Climate", Sixteenth Symposium on Improving Building Systems in Hot and Humid
Climates, December 15-17, 2008, Dallas, TX.
Publication Number
FSEC-PF-444-08
Copyright
Copyright © Florida Solar Energy Center/University of Central Florida 1679 Clearlake Road, Cocoa, Florida 32922, USA
(321) 638-1000 All rights reserved.
Disclaimer The Florida Solar Energy Center/University of Central Florida nor any agency thereof, nor any of their employees, makes any warranty, express or implied, or assumes any legal liability or responsibility for the accuracy, completeness, or usefulness of any information, apparatus, product, or process disclosed, or represents that its use would not infringe privately owned rights. Reference herein to any specific commercial product, process, or service by trade name, trademark, manufacturer, or otherwise does not necessarily constitute or imply its endorsement, recommendation, or favoring by the Florida Solar Energy Center/University of Central Florida or any agency thereof. The views and opinions of authors expressed herein do not necessarily state or reflect those of the Florida Solar Energy Center/University of Central Florida or any agency thereof.
Research Results from A Few Alternate Methods of Interior Duct Systems in Factory Built Housing Located In the Hot Humid Climate
Neil Moyer Dennis Stroer David Hoak Janet McIlvaine Subrato Chandra
Research Engineer Principal Researcher Research Analyst Program Director Florida Solar Energy
Center Cocoa, FL USA
Calcs-Plus Venice, FL USA
Florida Solar Energy Center,
Cocoa, FL USA
Florida Solar Energy Center
Cocoa, FL USA
Florida Solar Energy Center
Cocoa, FL USA
ABSTRACT The U.S. Department of Energy’s (DOE)
Building America1 Industrialized Housing Partnership (BAIHP) has collaborated with two of its industry partners to work on a portion of the project that relates to the construction and evaluation of prototype interior duct systems. In 2006, work began on a duct system design that would locate the entire length of duct work within the air and thermal barriers of the envelope. One of these designs incorporated a high-side supply register that connects to the conventional floor duct. The other design utilized a single soffit located within the conditioned space at the marriage line.
The Florida Solar Energy Center’s (FSEC)
Manufactured Housing Lab (MHLab) was retrofitted with an interior soffit duct. The duct system was added on so that either the attic duct system or the new interior duct system would be able to supply air to the conditioned space using the same mechanical equipment.
The initial results of this work show
approximately a 10% to 20% heating/cooling savings when compared to conventional attic duct work construction techniques and nearly 7% savings when compared to a conventional in-floor system.
INTRODUCTION
The overall objective of the Building America Industrialized Housing Partnership2, a U.S. DOE funded project, is to conduct cost-shared research to accelerate the nationwide development of cost-
1 Building America (www.buildingamerica.gov) forms
research partnerships with all facets of the residential building industry to improve the quality and energy efficiency of homes. The goal is to develop cost effective solutions that reduce the average energy use of housing by 40% to 100%. Ultimately, Building America research will lead to net zero energy homes, which produce as much energy as they use.
2 www.baihp.org
effective, production-ready energy technologies that can be widely implemented by factory and site builders to achieve 30% to 50% savings in whole-house energy use through a combination of energy efficiency and renewable energy measures. BAIHP focuses on factory builders (HUD code, Modular and Panelized), which is the housing segment not emphasized by the other BA teams. BAIHP employs BA systems engineering principles to enhance the energy efficiency, comfort, durability, indoor air quality, insurability, affordability, marketability and construction productivity of U.S. housing.
It has been documented that leaky ducts in
residential attics are a major cause of excessive energy use in hot, humid climates. Leaky ducts in manufactured housing can contribute to mold growth, soft drywall and comfort problems, in addition to high cooling and heating energy usei (Moyer et al. 2001). For the last several years, we have worked with all our factory builder partners and changed the traditional construction methods from taped ducts to ducts sealed with mastic. This has resulted in excellent air tightness of ducts constructed in the factoryii (Chasar et al., 2004). While we have made significant strides in improving ductwork construction in the factory, there are still major issues with the site connection of the ductwork between the two halves (crossover duct), belly penetrations and the connections with the external unit with a unitary system. These issues are still problematic for many manufacturers.
In 2006, we began working with our
manufactured housing partners, Cavalier Homes and Southern Energy Homes, on a duct system design that brings all duct work within the thermal envelope. A different prototype design was produced by each of the partners. Cavalier Homes featured a high side discharge (HSD) supply register that uses the interior wall cavities as a conduit that connects to the floor trunks. Southern Energy Homes took a radical departure from the standard manufacturer duct system approach. A single soffit located within the
conditioned space at the marriage line provided the space to aesthetically place the duct system.
We also provided training and assistance to
design the supply and return duct systems to ACCA Manual D and size the heating and cooling systems to ACCA Manual J8. This is to help solve some comfort-related complaints reported despite having tight ducts. This effort will also produce ductwork that has better airflow and less noise.
METHODOLOGY
The process of design, simulation and prototype construction provides the needed feedback relative to the viability of incorporating all of the duct work within the conditioned space in manufactured housing, especially those built to Title 24 of the HUD code PART 3280--Manufactured Home Construction and Safety Standards. Energy simulation and Building America benchmarking was done using the Florida Solar Energy Center’s EnergyGauge® USA software. Building loads and duct design were completed using ACCA Manual J8 in Elite’s RHVAC and Duct design software packages. Mock-ups of the various designs were completed to assess feasibility, performance and appearance. Finally, prototype full-scale homes were built incorporating the new designs. The homes were moved and setup where performance was continually monitored. FSEC’s MHLab was retrofitted with an interior duct that is located along the marriage line of the ceiling. This duct was connected to the same air handler that
supplies air to the attic ductwork. The intent was to use the same mechanical system while being able to switch between the attic and conditioned space ductwork. The lab is well instrumented and will provide data to determine the amount of savings from the relocated duct system.
ENERGY ANALYSIS
The proposed duct system prototypes and the base cases of the manufactured home are analyzed using the FSEC developed EnergyGauge® USA (Version 2.7.02) software program. This program predicts building energy consumption using the DOE2 analysis engine with a user-friendly front end that develops DOE2 input files and models that are more appropriate for residential building systemsiii (Parker, et. al, 1999).
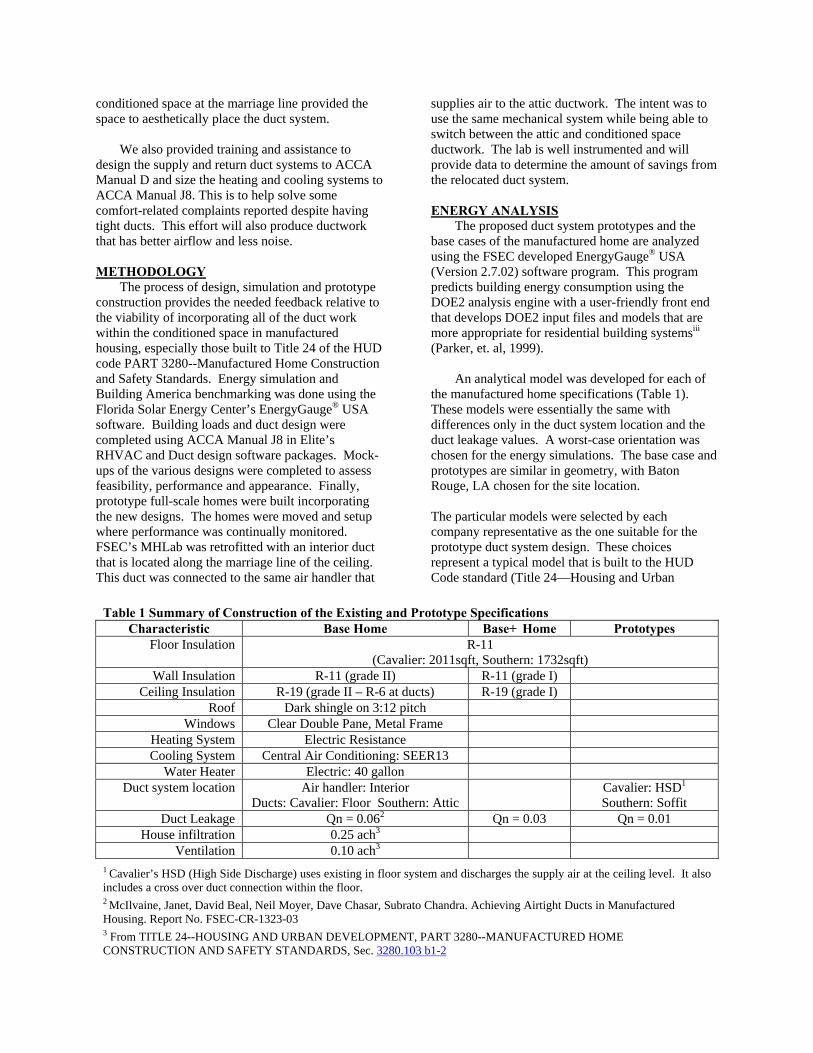
An analytical model was developed for each of the manufactured home specifications (Table 1). These models were essentially the same with differences only in the duct system location and the duct leakage values. A worst-case orientation was chosen for the energy simulations. The base case and prototypes are similar in geometry, with Baton Rouge, LA chosen for the site location. The particular models were selected by each company representative as the one suitable for the prototype duct system design. These choices represent a typical model that is built to the HUD Code standard (Title 24—Housing and Urban
Table 1 Summary of Construction of the Existing and Prototype Specifications
Characteristic Base Home Base+ Home Prototypes Floor Insulation R-11
(Cavalier: 2011sqft, Southern: 1732sqft) Wall Insulation R-11 (grade II) R-11 (grade I)
Ceiling Insulation R-19 (grade II – R-6 at ducts) R-19 (grade I) Roof Dark shingle on 3:12 pitch
Windows Clear Double Pane, Metal Frame Heating System Electric Resistance Cooling System Central Air Conditioning: SEER13
Water Heater Electric: 40 gallon Duct system location Air handler: Interior
Ducts: Cavalier: Floor Southern: Attic Cavalier: HSD1
Southern: Soffit Duct Leakage Qn = 0.062 Qn = 0.03 Qn = 0.01
House infiltration 0.25 ach3 Ventilation 0.10 ach3
1 Cavalier’s HSD (High Side Discharge) uses existing in floor system and discharges the supply air at the ceiling level. It also includes a cross over duct connection within the floor. 2 McIlvaine, Janet, David Beal, Neil Moyer, Dave Chasar, Subrato Chandra. Achieving Airtight Ducts in Manufactured Housing. Report No. FSEC-CR-1323-03 3 From TITLE 24--HOUSING AND URBAN DEVELOPMENT, PART 3280--MANUFACTURED HOME CONSTRUCTION AND SAFETY STANDARDS, Sec. 3280.103 b1-2
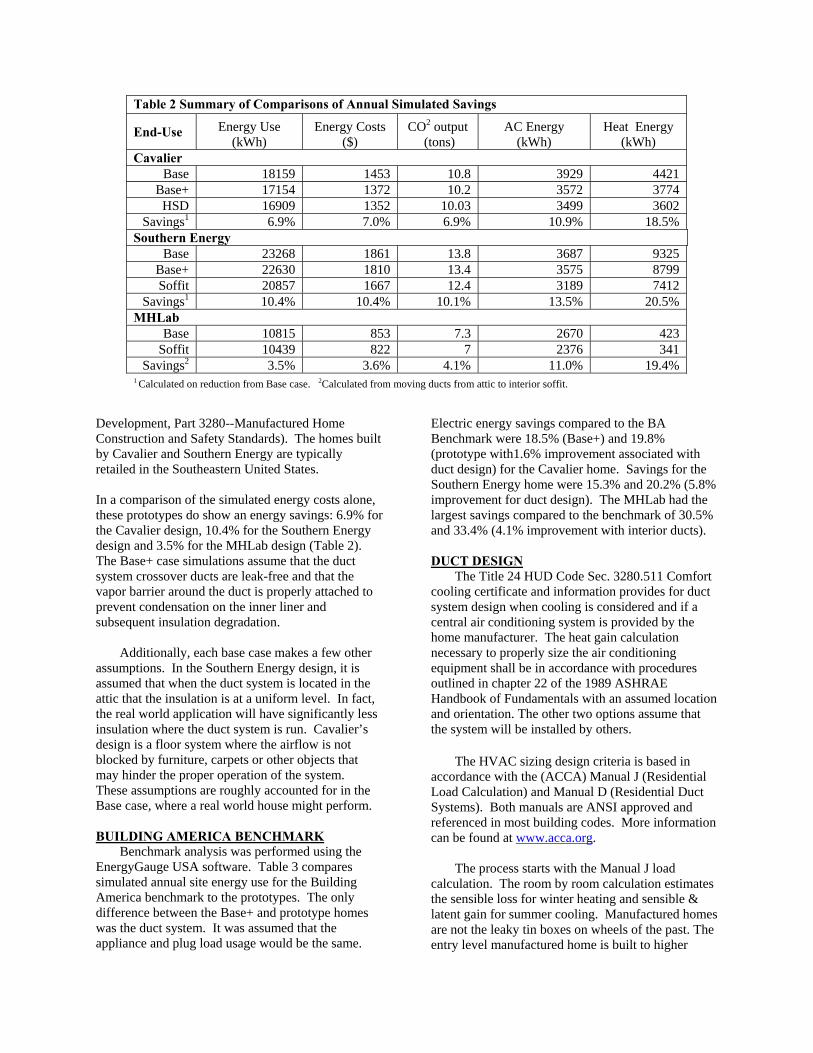
Development, Part 3280--Manufactured Home Construction and Safety Standards). The homes built by Cavalier and Southern Energy are typically retailed in the Southeastern United States. In a comparison of the simulated energy costs alone, these prototypes do show an energy savings: 6.9% for the Cavalier design, 10.4% for the Southern Energy design and 3.5% for the MHLab design (Table 2). The Base+ case simulations assume that the duct system crossover ducts are leak-free and that the vapor barrier around the duct is properly attached to prevent condensation on the inner liner and subsequent insulation degradation.
Additionally, each base case makes a few other
assumptions. In the Southern Energy design, it is assumed that when the duct system is located in the attic that the insulation is at a uniform level. In fact, the real world application will have significantly less insulation where the duct system is run. Cavalier’s design is a floor system where the airflow is not blocked by furniture, carpets or other objects that may hinder the proper operation of the system. These assumptions are roughly accounted for in the Base case, where a real world house might perform. BUILDING AMERICA BENCHMARK
Benchmark analysis was performed using the EnergyGauge USA software. Table 3 compares simulated annual site energy use for the Building America benchmark to the prototypes. The only difference between the Base+ and prototype homes was the duct system. It was assumed that the appliance and plug load usage would be the same.
Electric energy savings compared to the BA Benchmark were 18.5% (Base+) and 19.8% (prototype with1.6% improvement associated with duct design) for the Cavalier home. Savings for the Southern Energy home were 15.3% and 20.2% (5.8% improvement for duct design). The MHLab had the largest savings compared to the benchmark of 30.5% and 33.4% (4.1% improvement with interior ducts). DUCT DESIGN
The Title 24 HUD Code Sec. 3280.511 Comfort cooling certificate and information provides for duct system design when cooling is considered and if a central air conditioning system is provided by the home manufacturer. The heat gain calculation necessary to properly size the air conditioning equipment shall be in accordance with procedures outlined in chapter 22 of the 1989 ASHRAE Handbook of Fundamentals with an assumed location and orientation. The other two options assume that the system will be installed by others.
The HVAC sizing design criteria is based in
accordance with the (ACCA) Manual J (Residential Load Calculation) and Manual D (Residential Duct Systems). Both manuals are ANSI approved and referenced in most building codes. More information can be found at www.acca.org.
The process starts with the Manual J load
calculation. The room by room calculation estimates the sensible loss for winter heating and sensible & latent gain for summer cooling. Manufactured homes are not the leaky tin boxes on wheels of the past. The entry level manufactured home is built to higher
Table 2 Summary of Comparisons of Annual Simulated Savings
End-Use Energy Use (kWh)
Energy Costs ($)
CO2 output (tons)
AC Energy (kWh)
Heat Energy (kWh)
Cavalier Base 18159 1453 10.8 3929 4421
Base+ 17154 1372 10.2 3572 3774 HSD 16909 1352 10.03 3499 3602
Savings1 6.9% 7.0% 6.9% 10.9% 18.5% Southern Energy
Base 23268 1861 13.8 3687 9325 Base+ 22630 1810 13.4 3575 8799 Soffit 20857 1667 12.4 3189 7412
Savings1 10.4% 10.4% 10.1% 13.5% 20.5% MHLab
Base 10815 853 7.3 2670 423 Soffit 10439 822 7 2376 341
Savings2 3.5% 3.6% 4.1% 11.0% 19.4% 1 Calculated on reduction from Base case. 2Calculated from moving ducts from attic to interior soffit.
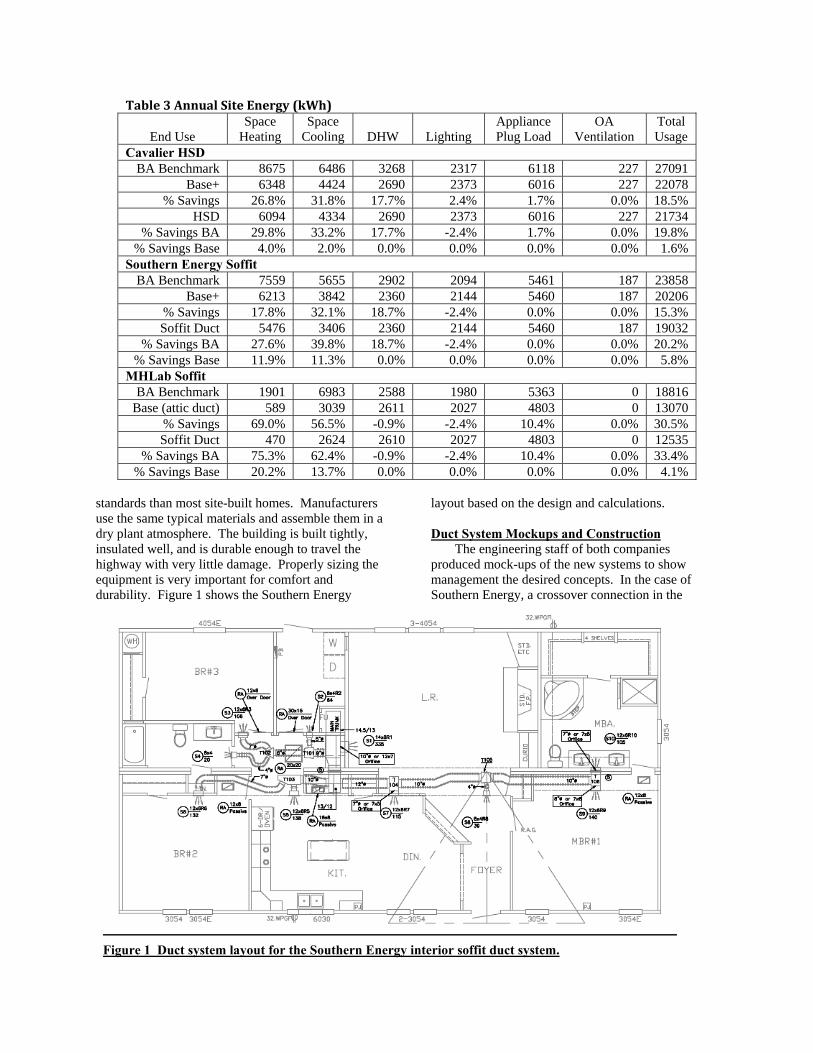
standards than most site-built homes. Manufacturers use the same typical materials and assemble them in a dry plant atmosphere. The building is built tightly, insulated well, and is durable enough to travel the highway with very little damage. Properly sizing the equipment is very important for comfort and durability. Figure 1 shows the Southern Energy
layout based on the design and calculations. Duct System Mockups and Construction
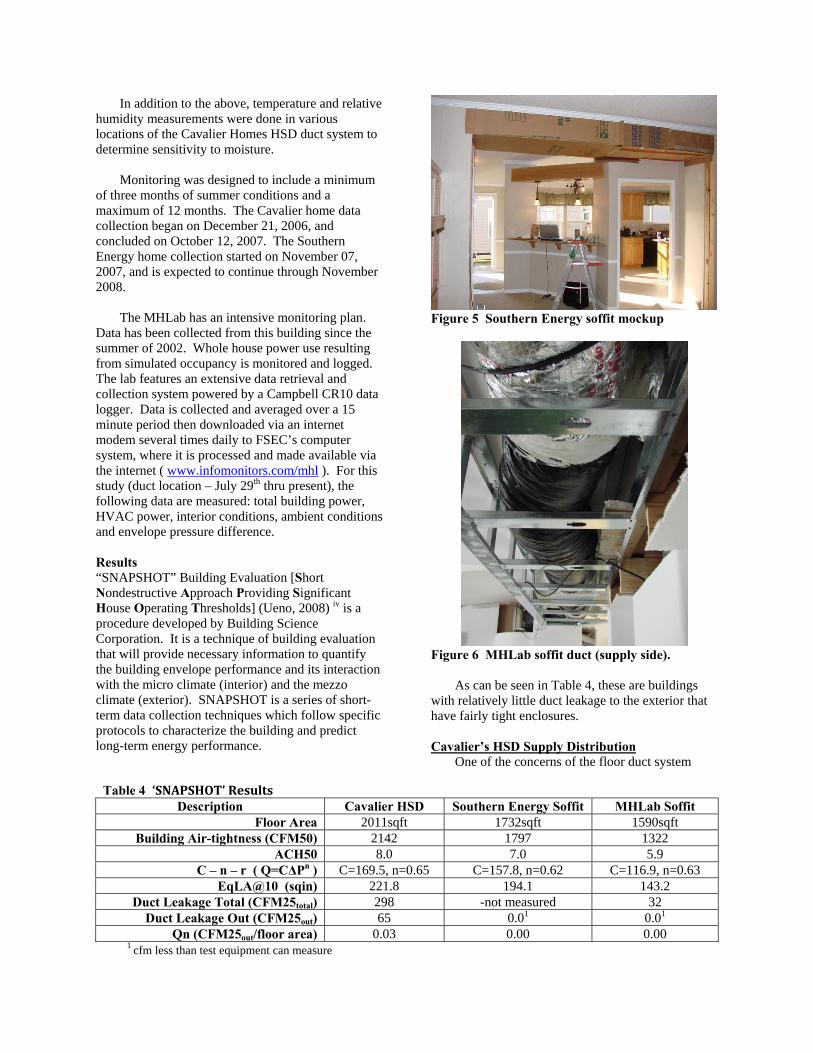
The engineering staff of both companies produced mock-ups of the new systems to show management the desired concepts. In the case of Southern Energy, a crossover connection in the
Table 3 Annual Site Energy (kWh)
End Use Space
Heating Space
Cooling DHW Lighting Appliance Plug Load
OA Ventilation
Total Usage
Cavalier HSD BA Benchmark 8675 6486 3268 2317 6118 227 27091
Base+ 6348 4424 2690 2373 6016 227 22078 % Savings 26.8% 31.8% 17.7% 2.4% 1.7% 0.0% 18.5%
HSD 6094 4334 2690 2373 6016 227 21734 % Savings BA 29.8% 33.2% 17.7% -2.4% 1.7% 0.0% 19.8%
% Savings Base 4.0% 2.0% 0.0% 0.0% 0.0% 0.0% 1.6% Southern Energy Soffit
BA Benchmark 7559 5655 2902 2094 5461 187 23858 Base+ 6213 3842 2360 2144 5460 187 20206
% Savings 17.8% 32.1% 18.7% -2.4% 0.0% 0.0% 15.3% Soffit Duct 5476 3406 2360 2144 5460 187 19032
% Savings BA 27.6% 39.8% 18.7% -2.4% 0.0% 0.0% 20.2% % Savings Base 11.9% 11.3% 0.0% 0.0% 0.0% 0.0% 5.8%
MHLab Soffit BA Benchmark 1901 6983 2588 1980 5363 0 18816
Base (attic duct) 589 3039 2611 2027 4803 0 13070 % Savings 69.0% 56.5% -0.9% -2.4% 10.4% 0.0% 30.5% Soffit Duct 470 2624 2610 2027 4803 0 12535
% Savings BA 75.3% 62.4% -0.9% -2.4% 10.4% 0.0% 33.4% % Savings Base 20.2% 13.7% 0.0% 0.0% 0.0% 0.0% 4.1%
Figure 1 Duct system layout for the Southern Energy interior soffit duct system.
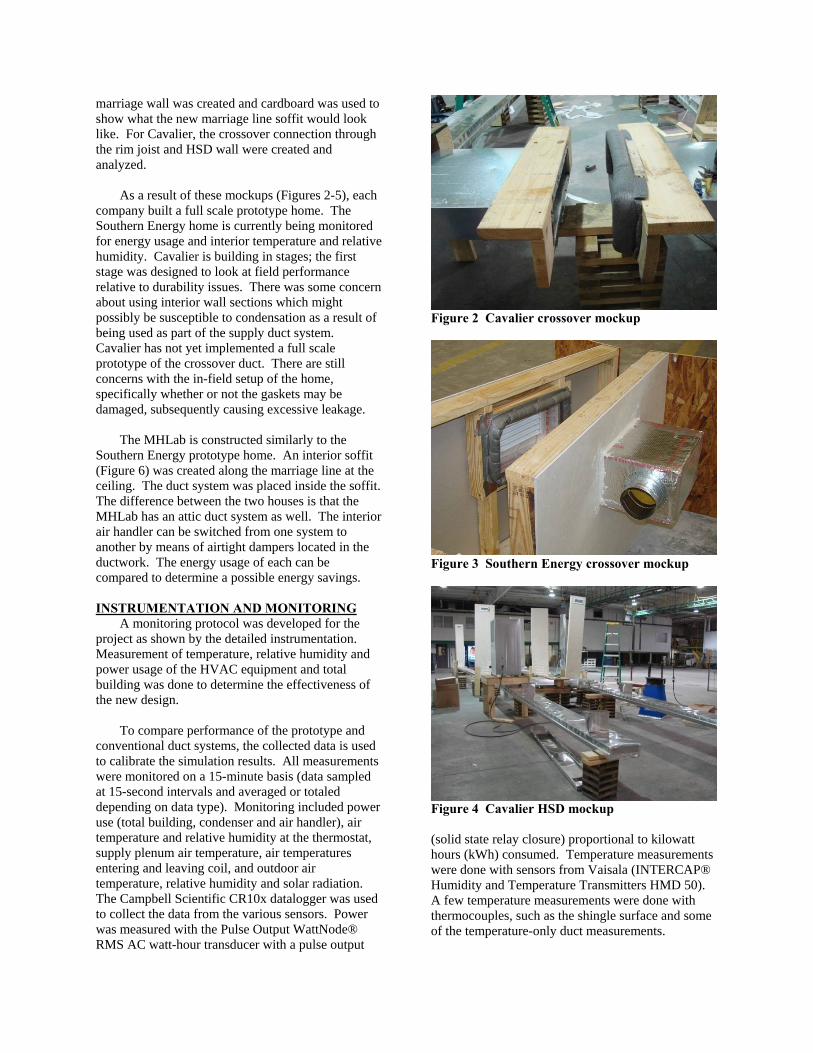
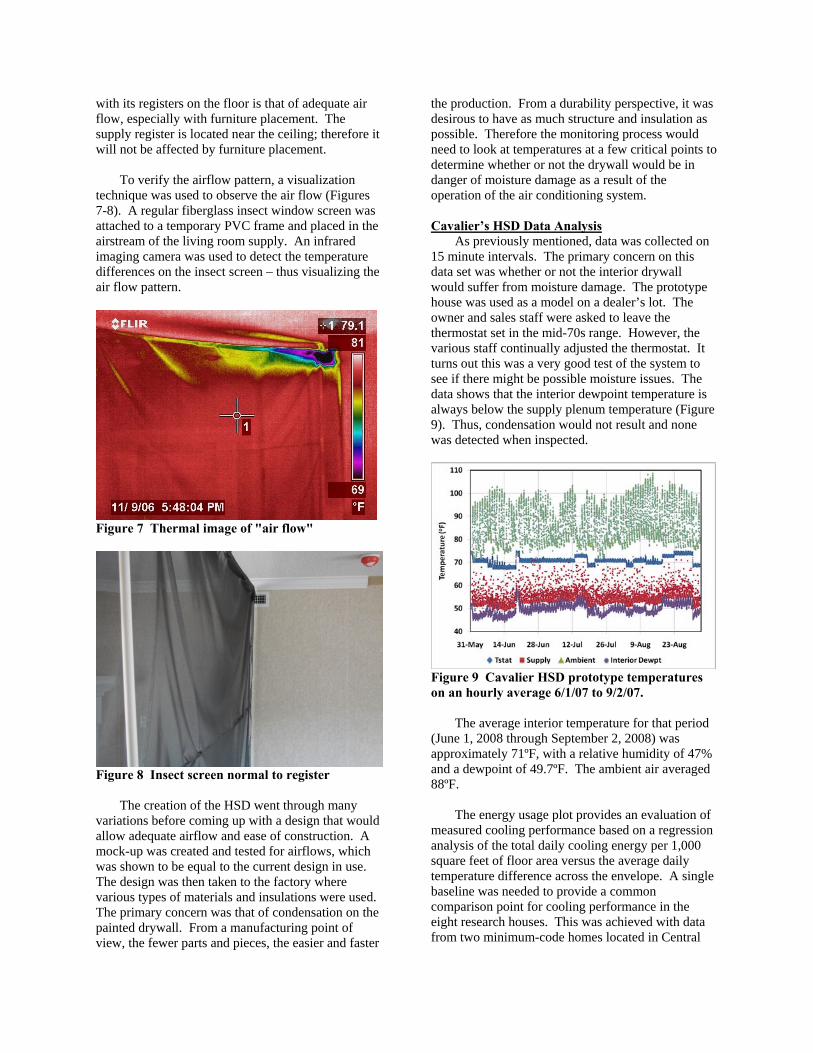
marriage wall was created and cardboard was used to show what the new marriage line soffit would look like. For Cavalier, the crossover connection through the rim joist and HSD wall were created and analyzed.
As a result of these mockups (Figures 2-5), each company built a full scale prototype home. The Southern Energy home is currently being monitored for energy usage and interior temperature and relative humidity. Cavalier is building in stages; the first stage was designed to look at field performance relative to durability issues. There was some concern about using interior wall sections which might possibly be susceptible to condensation as a result of being used as part of the supply duct system. Cavalier has not yet implemented a full scale prototype of the crossover duct. There are still concerns with the in-field setup of the home, specifically whether or not the gaskets may be damaged, subsequently causing excessive leakage.
The MHLab is constructed similarly to the Southern Energy prototype home. An interior soffit (Figure 6) was created along the marriage line at the ceiling. The duct system was placed inside the soffit. The difference between the two houses is that the MHLab has an attic duct system as well. The interior air handler can be switched from one system to another by means of airtight dampers located in the ductwork. The energy usage of each can be compared to determine a possible energy savings.
INSTRUMENTATION AND MONITORING
A monitoring protocol was developed for the project as shown by the detailed instrumentation. Measurement of temperature, relative humidity and power usage of the HVAC equipment and total building was done to determine the effectiveness of the new design.
To compare performance of the prototype and
conventional duct systems, the collected data is used to calibrate the simulation results. All measurements were monitored on a 15-minute basis (data sampled at 15-second intervals and averaged or totaled depending on data type). Monitoring included power use (total building, condenser and air handler), air temperature and relative humidity at the thermostat, supply plenum air temperature, air temperatures entering and leaving coil, and outdoor air temperature, relative humidity and solar radiation. The Campbell Scientific CR10x datalogger was used to collect the data from the various sensors. Power was measured with the Pulse Output WattNode® RMS AC watt-hour transducer with a pulse output
(solid state relay closure) proportional to kilowatt hours (kWh) consumed. Temperature measurements were done with sensors from Vaisala (INTERCAP® Humidity and Temperature Transmitters HMD 50). A few temperature measurements were done with thermocouples, such as the shingle surface and some of the temperature-only duct measurements.
Figure 2 Cavalier crossover mockup
Figure 3 Southern Energy crossover mockup
Figure 4 Cavalier HSD mockup
In addition to the above, temperature and relative humidity measurements were done in various locations of the Cavalier Homes HSD duct system to determine sensitivity to moisture.
Monitoring was designed to include a minimum
of three months of summer conditions and a maximum of 12 months. The Cavalier home data collection began on December 21, 2006, and concluded on October 12, 2007. The Southern Energy home collection started on November 07, 2007, and is expected to continue through November 2008.
The MHLab has an intensive monitoring plan.
Data has been collected from this building since the summer of 2002. Whole house power use resulting from simulated occupancy is monitored and logged. The lab features an extensive data retrieval and collection system powered by a Campbell CR10 data logger. Data is collected and averaged over a 15 minute period then downloaded via an internet modem several times daily to FSEC’s computer system, where it is processed and made available via the internet ( www.infomonitors.com/mhl ). For this study (duct location – July 29th thru present), the following data are measured: total building power, HVAC power, interior conditions, ambient conditions and envelope pressure difference.
Results “SNAPSHOT” Building Evaluation [Short Nondestructive Approach Providing Significant House Operating Thresholds] (Ueno, 2008) iv is a procedure developed by Building Science Corporation. It is a technique of building evaluation that will provide necessary information to quantify the building envelope performance and its interaction with the micro climate (interior) and the mezzo climate (exterior). SNAPSHOT is a series of short-term data collection techniques which follow specific protocols to characterize the building and predict long-term energy performance.
As can be seen in Table 4, these are buildings with relatively little duct leakage to the exterior that have fairly tight enclosures.
Cavalier’s HSD Supply Distribution
One of the concerns of the floor duct system
Figure 5 Southern Energy soffit mockup
Figure 6 MHLab soffit duct (supply side).
Table 4 ‘SNAPSHOT’ Results Description Cavalier HSD Southern Energy Soffit MHLab Soffit
Floor Area 2011sqft 1732sqft 1590sqft Building Air-tightness (CFM50) 2142 1797 1322
ACH50 8.0 7.0 5.9 C – n – r ( Q=C∆Pn ) C=169.5, n=0.65 C=157.8, n=0.62 C=116.9, n=0.63
EqLA@10 (sqin) 221.8 194.1 143.2 Duct Leakage Total (CFM25total) 298 -not measured 32
Duct Leakage Out (CFM25out) 65 0.01 0.01 Qn (CFM25out/floor area) 0.03 0.00 0.00
1 cfm less than test equipment can measure
with its registers on the floor is that of adequate air flow, especially with furniture placement. The supply register is located near the ceiling; therefore it will not be affected by furniture placement.
To verify the airflow pattern, a visualization
technique was used to observe the air flow (Figures 7-8). A regular fiberglass insect window screen was attached to a temporary PVC frame and placed in the airstream of the living room supply. An infrared imaging camera was used to detect the temperature differences on the insect screen – thus visualizing the air flow pattern.
Figure 7 Thermal image of "air flow"
Figure 8 Insect screen normal to register
The creation of the HSD went through many variations before coming up with a design that would allow adequate airflow and ease of construction. A mock-up was created and tested for airflows, which was shown to be equal to the current design in use. The design was then taken to the factory where various types of materials and insulations were used. The primary concern was that of condensation on the painted drywall. From a manufacturing point of view, the fewer parts and pieces, the easier and faster
the production. From a durability perspective, it was desirous to have as much structure and insulation as possible. Therefore the monitoring process would need to look at temperatures at a few critical points to determine whether or not the drywall would be in danger of moisture damage as a result of the operation of the air conditioning system.
Cavalier’s HSD Data Analysis
As previously mentioned, data was collected on 15 minute intervals. The primary concern on this data set was whether or not the interior drywall would suffer from moisture damage. The prototype house was used as a model on a dealer’s lot. The owner and sales staff were asked to leave the thermostat set in the mid-70s range. However, the various staff continually adjusted the thermostat. It turns out this was a very good test of the system to see if there might be possible moisture issues. The data shows that the interior dewpoint temperature is always below the supply plenum temperature (Figure 9). Thus, condensation would not result and none was detected when inspected.
Figure 9 Cavalier HSD prototype temperatures on an hourly average 6/1/07 to 9/2/07.
The average interior temperature for that period
(June 1, 2008 through September 2, 2008) was approximately 71ºF, with a relative humidity of 47% and a dewpoint of 49.7ºF. The ambient air averaged 88ºF.
The energy usage plot provides an evaluation of
measured cooling performance based on a regression analysis of the total daily cooling energy per 1,000 square feet of floor area versus the average daily temperature difference across the envelope. A single baseline was needed to provide a common comparison point for cooling performance in the eight research houses. This was achieved with data from two minimum-code homes located in Central
Florida. The low energy reference is the Lakeland high efficiency home and represents 72% less cooling energy use than the baselinev (Chasar, et.al, 2006).
Figure 10 shows the energy usage plot for the
HSD prototype home. The slope of the line indicates the building’s overall efficiency and the magnitude or position on the y-axis is an indicator of the cooling system efficiency and internal heat gain. The HSD test house was unoccupied house without any attempt at occupancy simulation. While the slope of the line is similar to the baseline, the energy usage is less. This is a result of a more efficient unit (SEER13) than the baseline (SEER10) and an improvement in the air delivery system. Those improvements would include less duct leakage and all the ductwork is within conditioned space.
The typical daily ambient to interior temperature
difference on a peak summer day would be around 7ºF for that area of the country (a range from the low 70s to the mid 90s – TMY data Baton Rouge, LA). The EnergyGauge USA® simulation for a peak summer day shows an HVAC usage of 29.3 kWh. That is with an average daily ambient temperature of 85ºF and an interior temperature of 78ºF.
Figure 10 HSD daily energy usage verses average daily temperature difference across envelope.
Southern Energy Soffit Duct Data Analysis
The data that has been collected on the Southern Energy prototype duct house has been during the heating season (November 8, 2007 to April 14, 2008) and the later portion of the cooling season (August 27 to September 11, 2008). The cooling data for the most of the summer was lost due to logger communication failure.
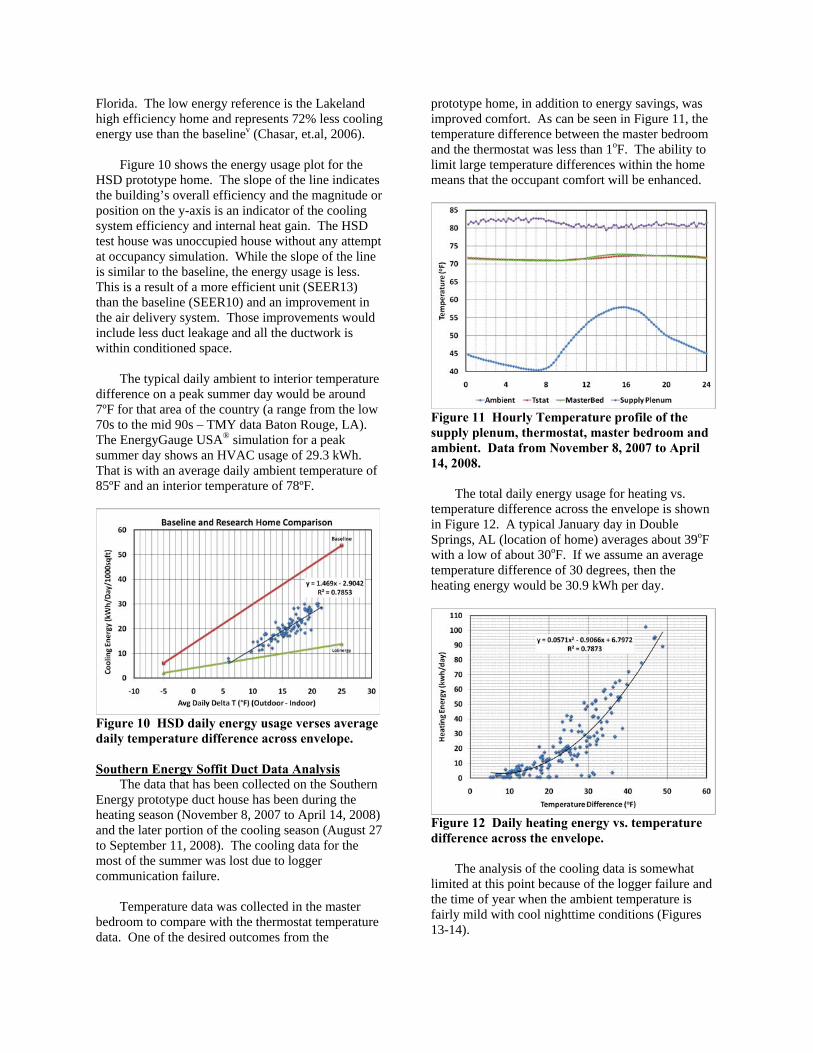
Temperature data was collected in the master bedroom to compare with the thermostat temperature data. One of the desired outcomes from the
prototype home, in addition to energy savings, was improved comfort. As can be seen in Figure 11, the temperature difference between the master bedroom and the thermostat was less than 1oF. The ability to limit large temperature differences within the home means that the occupant comfort will be enhanced.
Figure 11 Hourly Temperature profile of the supply plenum, thermostat, master bedroom and ambient. Data from November 8, 2007 to April 14, 2008.
The total daily energy usage for heating vs.
temperature difference across the envelope is shown in Figure 12. A typical January day in Double Springs, AL (location of home) averages about 39oF with a low of about 30oF. If we assume an average temperature difference of 30 degrees, then the heating energy would be 30.9 kWh per day.
Figure 12 Daily heating energy vs. temperature difference across the envelope.
The analysis of the cooling data is somewhat
limited at this point because of the logger failure and the time of year when the ambient temperature is fairly mild with cool nighttime conditions (Figures 13-14).
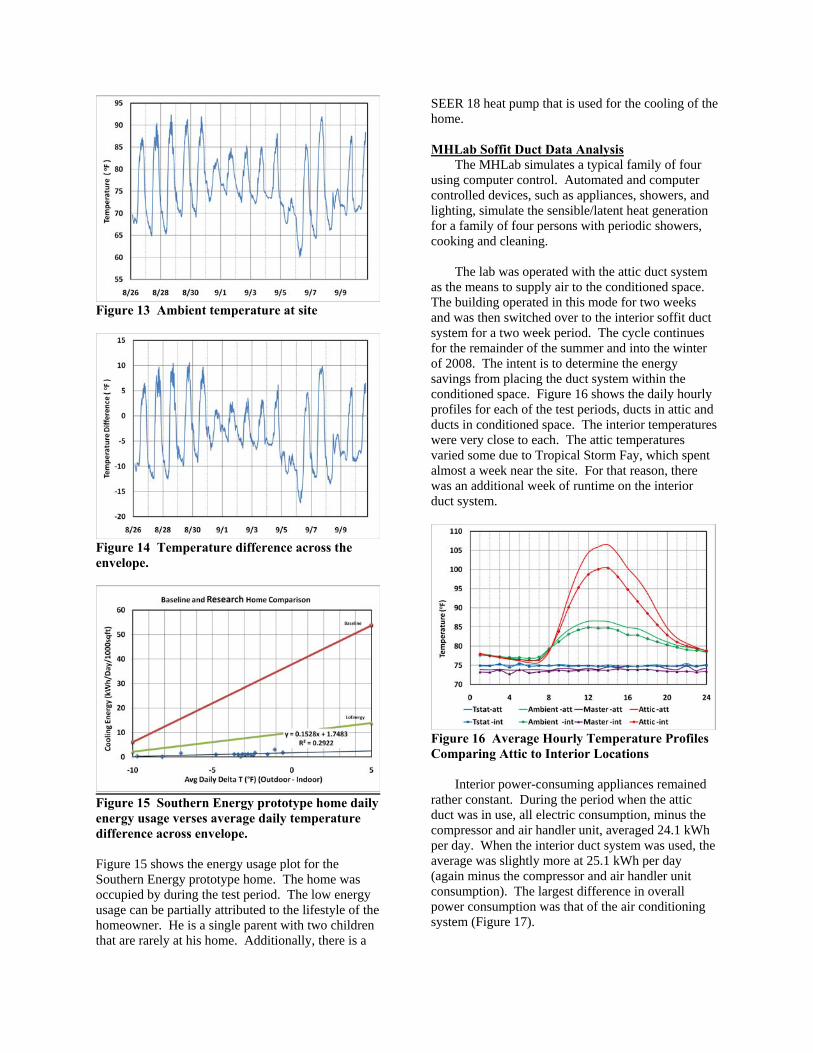
Figure 13 Ambient temperature at site
Figure 14 Temperature difference across the envelope.
Figure 15 Southern Energy prototype home daily energy usage verses average daily temperature difference across envelope. Figure 15 shows the energy usage plot for the Southern Energy prototype home. The home was occupied by during the test period. The low energy usage can be partially attributed to the lifestyle of the homeowner. He is a single parent with two children that are rarely at his home. Additionally, there is a
SEER 18 heat pump that is used for the cooling of the home. MHLab Soffit Duct Data Analysis
The MHLab simulates a typical family of four using computer control. Automated and computer controlled devices, such as appliances, showers, and lighting, simulate the sensible/latent heat generation for a family of four persons with periodic showers, cooking and cleaning.
The lab was operated with the attic duct system
as the means to supply air to the conditioned space. The building operated in this mode for two weeks and was then switched over to the interior soffit duct system for a two week period. The cycle continues for the remainder of the summer and into the winter of 2008. The intent is to determine the energy savings from placing the duct system within the conditioned space. Figure 16 shows the daily hourly profiles for each of the test periods, ducts in attic and ducts in conditioned space. The interior temperatures were very close to each. The attic temperatures varied some due to Tropical Storm Fay, which spent almost a week near the site. For that reason, there was an additional week of runtime on the interior duct system.
Figure 16 Average Hourly Temperature Profiles Comparing Attic to Interior Locations
Interior power-consuming appliances remained
rather constant. During the period when the attic duct was in use, all electric consumption, minus the compressor and air handler unit, averaged 24.1 kWh per day. When the interior duct system was used, the average was slightly more at 25.1 kWh per day (again minus the compressor and air handler unit consumption). The largest difference in overall power consumption was that of the air conditioning system (Figure 17).
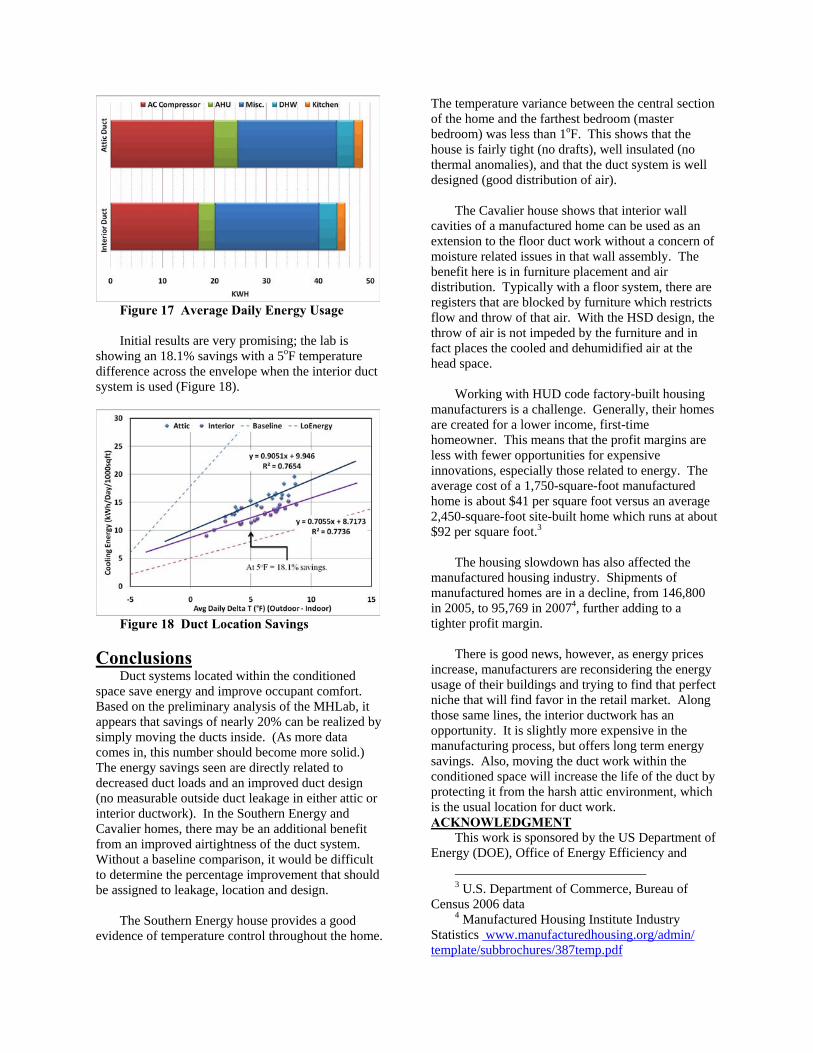
Figure 17 Average Daily Energy Usage Initial results are very promising; the lab is
showing an 18.1% savings with a 5oF temperature difference across the envelope when the interior duct system is used (Figure 18).
Figure 18 Duct Location Savings
Conclusions Duct systems located within the conditioned
space save energy and improve occupant comfort. Based on the preliminary analysis of the MHLab, it appears that savings of nearly 20% can be realized by simply moving the ducts inside. (As more data comes in, this number should become more solid.) The energy savings seen are directly related to decreased duct loads and an improved duct design (no measurable outside duct leakage in either attic or interior ductwork). In the Southern Energy and Cavalier homes, there may be an additional benefit from an improved airtightness of the duct system. Without a baseline comparison, it would be difficult to determine the percentage improvement that should be assigned to leakage, location and design.
The Southern Energy house provides a good
evidence of temperature control throughout the home.
The temperature variance between the central section of the home and the farthest bedroom (master bedroom) was less than 1oF. This shows that the house is fairly tight (no drafts), well insulated (no thermal anomalies), and that the duct system is well designed (good distribution of air).
The Cavalier house shows that interior wall
cavities of a manufactured home can be used as an extension to the floor duct work without a concern of moisture related issues in that wall assembly. The benefit here is in furniture placement and air distribution. Typically with a floor system, there are registers that are blocked by furniture which restricts flow and throw of that air. With the HSD design, the throw of air is not impeded by the furniture and in fact places the cooled and dehumidified air at the head space.
Working with HUD code factory-built housing
manufacturers is a challenge. Generally, their homes are created for a lower income, first-time homeowner. This means that the profit margins are less with fewer opportunities for expensive innovations, especially those related to energy. The average cost of a 1,750-square-foot manufactured home is about $41 per square foot versus an average 2,450-square-foot site-built home which runs at about $92 per square foot.3
The housing slowdown has also affected the
manufactured housing industry. Shipments of manufactured homes are in a decline, from 146,800 in 2005, to 95,769 in 20074, further adding to a tighter profit margin.
There is good news, however, as energy prices
increase, manufacturers are reconsidering the energy usage of their buildings and trying to find that perfect niche that will find favor in the retail market. Along those same lines, the interior ductwork has an opportunity. It is slightly more expensive in the manufacturing process, but offers long term energy savings. Also, moving the duct work within the conditioned space will increase the life of the duct by protecting it from the harsh attic environment, which is the usual location for duct work. ACKNOWLEDGMENT
This work is sponsored by the US Department of Energy (DOE), Office of Energy Efficiency and
3 U.S. Department of Commerce, Bureau of
Census 2006 data 4 Manufactured Housing Institute Industry
Statistics www.manufacturedhousing.org/admin/ template/subbrochures/387temp.pdf
Renewable Energy, Building Technologies Program under cooperative agreement number DE-FC26-06NT42767. This support does not constitute DOE endorsement of the views expressed in this paper.
REFERENCES i Moyer, N., D. Beal, D. Chasar, J. McIlvaine, C.
Withers Jr., S. Chandra, “Moisture Problems in Manufactured Housing: Probable Causes and Cures ", Florida Solar Energy Center , Rpt: FSEC-GP-212-01, Nov. 01, 2001
ii Chasar, D., Moyer, N., McIlvaine, J., Beal, D. and Chandra, S., "Energy Star Manufactured Homes: The Plant Certification Process," Proceedings of ACEEE 2004 Summer Study, American Council for an Energy Efficient Economy, Washington, DC, August 2004.
iii Parker, D., P. Broman, J. Grant, L. Gu, M. Anello, R. Vieira and H. Henderson, "EnergyGauge USA: A Residential Building Energy Design Tool." Proceedings of Building Simulation '99, Kyoto, Japan. International Building Performance Simulation Association, Texas A&M University, College Station, TX, September 1999.
ivUeno, K., Building Science Corp., www.buildingscience.com/documents/reports/rr-0413-the-snapshot2014a-quick-description, 2008
v Chasar, D., Chandra, S., Parker, D., Sherwin, J., Beal, D., Hoak, D., Moyer, N., McIlvaine, J., "Cooling Performance Assessment of Building America Homes", Fifteenth Symposium on Improving Building Systems in Hot and Humid Climates, July 24-26, 2006 Orlando, FL.


