Embed Size (px)
Citation preview
ITMI Country Paper, The Philippines No. 7
Research Interventions to Strengthen Irrigators’ Associations
Research Interventions t Strengthen Irrigators’
,
I - ‘k\ ~ ., . , ~ ::: ;- .:.
, ,
I
~ I : Fay M. Lauraya Antonia Lea R. Sala C.M. Wijayaratna
INTERNATIONAL IRRIGATION MANAGEMENT INSTITUTE (IIMI) BICOL UNTVERSITY (BU)
NATIONAL IRRIGATION ADMINISTRATION (NIA)
Lauraya, F.M.; Sala, A.L.R.: Wijayaratna, C.M. 1996. Research interventions to strengthen irrigators' associations. Colombo, Sri Lanka: International Irrigation Management Institute (IIMI). xii, 156p. (IIMI Country Paper, the Philippines No.7)
/ irrigation management / water distribution /financing /data collection / operation / maintenance / performance indexes / privatization /farmer- agency interactiuns / institution building / farmer,s' associations / training / participatory management/ leadership /Philippines/Bicol I
DDC: 631.7 ISBN: 92-9090-174-8
IIMI's Country Papers comprise a series of papers for each country where IIMI maintains a collaborating field operations activity. These papers record the results of research conducted by IIMI's Country Programs in consultation with their National Consultative Committees. Country Papers are intended principally for national rather than international audienccs.
IIMI welcomes comments on this paper, which should be sent either to IIMI or to the authors at the following address:
Information and Communications Division International Irrigation Management Institute P.O. Box 2075 Colombo Sri Lanka
0 IIMI, 1996
Responsibility for the contents of this paper rests with the authors All rights reserved.
Cover: Artist's impression of farmer-farmer interactions (by D.C. Karunaratne).
Contents
Figures . . . . . . . . . . . . . . . . . . . . . . . . . . . . . vii
Tables . . . . . . . . . . . . . . . . . . . . . . . . . . . . . ix
Acknowledgements . . . . . . . . . . . . . . . . . . . . . . . . . . . xi
Chapter 1 . Introduction . . . . . . . . . . . . . . . . . . . . . . . . 1
Chapter 2 . Project Background and Objectives . . . . . . . . . . . 5 Background . . . . . . . . . . . . . . . . . . . . . . . . . 5 Objectives . . . . . . . . . . . . . . . . . . . . . . . . . . 8
Description of Project Site and Chapter 3 . Profile of Farmer Leaders . . . . . . . . . . . . . . . 9
Profile of the Farmer Leaders . . . . . . . . . . . . . . 13
Chapter 4 . Conceptual Framework . . . . . . . . . . . . . . . . . 21
Chapter 5 . Intervention Activities and Methodologies . . . . . . 25 Institutionalizing the Self-Assessment Mechanism . . . 26 Building Up the Us’ Financial Resources . . . . . . . . 31 Spot-Mapping for Baseline Data Generation . . . . . . 35 Introduction of the Self-Assessment Mechanism
for O&M Personnel of the NIA Systems Office . . . 37 The Project Team Composition and Management . . . . 40
Indicators of Success of Intervention Activities . . . . 43 Performance Indicators Used . . . . . . . . . . . . . . . 43 Validity and Objectivity of the Self-Assessment Process . 48 Project Outcome . . . . . . . . . . . . . . . . . . . . . 50
The Project Site . . . . . . . . . . . . . . . . . . . . . . . 9
Chapter 6 .
V
vi Conrents
Chapter 7 . The Sclf-Assessment Process as Viewed by the TSALs . . . 91
Chapter 8 . The Project Turnover Process . . . . . . . . . . . . . 95
Chapter 9 . Lessons and Challenges . . . . . . . . . . . . . . . . 97 Utilization of Self-Assessment Process Results . . . . . 97 Provision of Incentives to Improve Performance . . . . 98 Fund Raising . . . . . . . . . . . . . . . . . . . . . . . 98 Integration of the Sell-Assessment Process into a
NIB lnfmnation System . . . . . . . . . . . . . . . 99 Compliance of NIA to the O&M Contract . . . . . . . . 99 Effecting a More Equitable Sharing System for ISF
Collection between the IA and the NIA . . . . . . . 100
Bibliography . . . . . . . . . . . . . . . . . . . . . . . . . . . . 105
Annexes . . . . . . . . . . . . . . . . . . . . . . . . . . . . 107
Figures
1 . Organimtional structure of the IA adopted by the Action Research Project . . . . . . . . . . . . . . . . . . . 1 1
Conceptual framework . . . . . . . . . . . . . . . . . . . . . . . 22 2 .
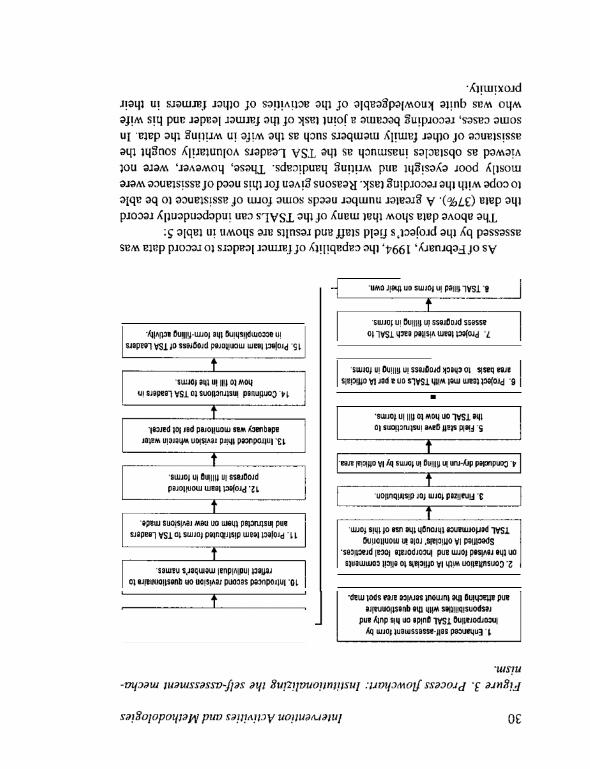
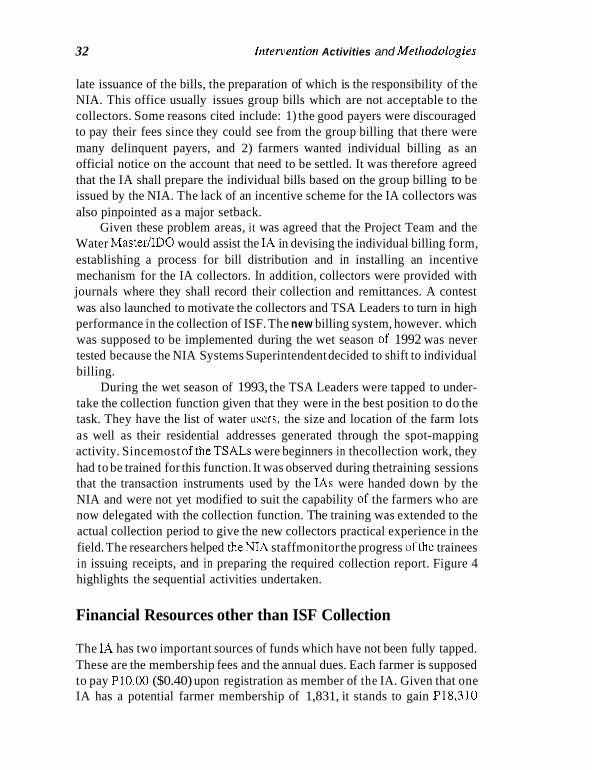
3 . Process flowchart: Institutionalizing the self-assessment mechanism . . . . . . . . . . . . . . . . . 30
4 . Process flowchart: Improving IA collection efficiency . . . . . . 33
5 . Process flowchart: Spot-mapping for baseline data generation . . 36
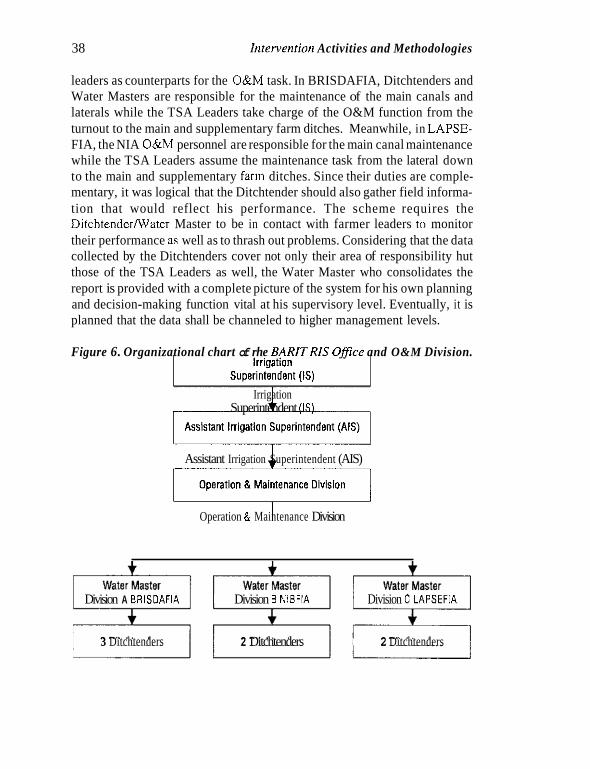
6 . Organizational chart of the BARIT RIS Office and O&M Division . . . . . . . . . . . . . . . . . . . . . . . . . 38
7 . Process flowchart: Self-assessment mechanism for WMs and DTs . . . . . . . . . . . . . . . . . . . . . . . . 39
8 . Layout of main and lateral canal and main and supplementary farm ditches . . . 46
9 . Comparative collection efficiency . . . . . . . . . . . . . . . . . 52
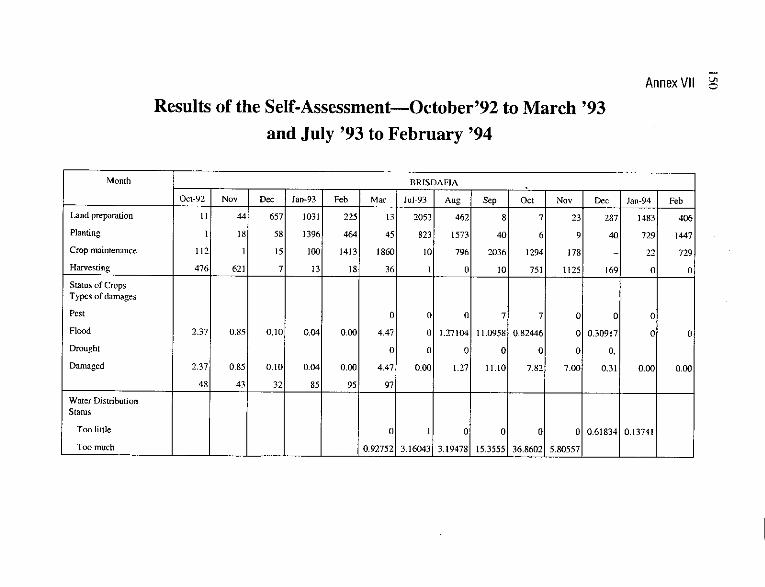
1Oa . BRISDAFIA: Stage offarming activities . . . . . . . . . . . . . 59
10b . LAPSEFIA: Stage offarming activities . . . . . . . . . . . . . . 60
1 l a . BRISDAFIA: Stage of farming activities (cumulative) . . . . . . 61
1 l b . LAPSEFIA: Stage of farming activities (cumulative) . . . . . . . 62
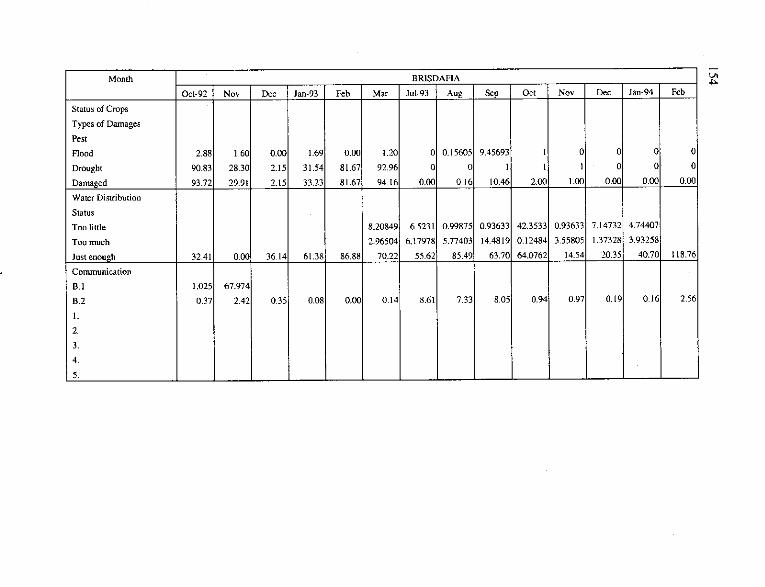
12 . Status of crops: Farm lots in satisfactory condition . . . . . . . . 64
13 . BRISDAFIA and LAPSEFIA. Water distribution . . . . . . . . . 67
14a . BRISDAFIA: Water distribution . . . . . . . . . . . . . . . . . . 69
14b . LAPSEFIA: Water distribution . . . . . . . . . . . . . . . . . . 70
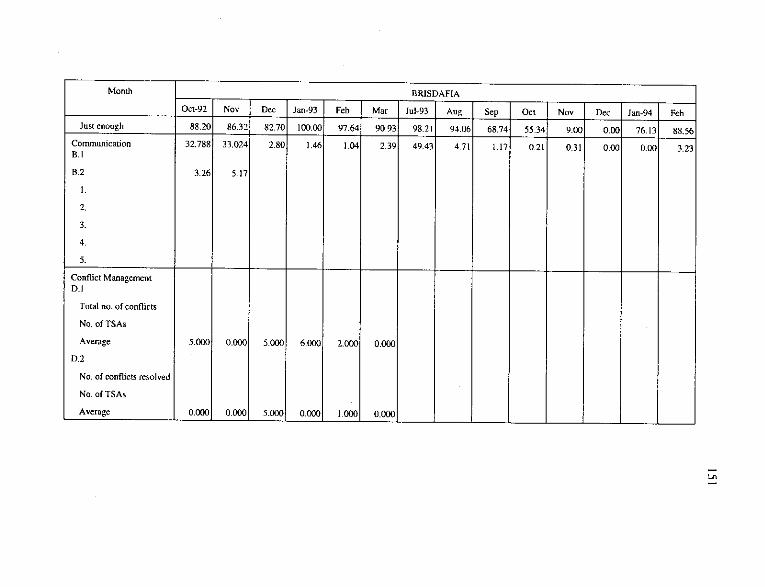
15 . Water management: Communication on water schedule . . . . . 72
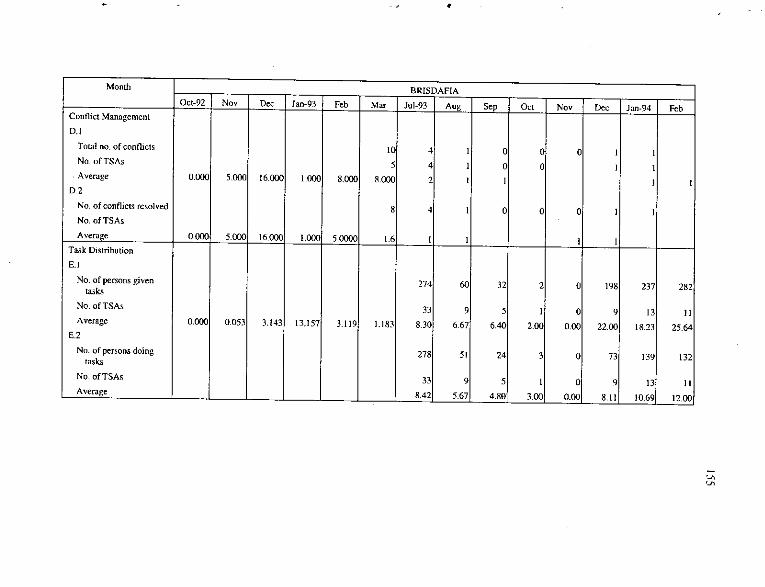
16a . BRISDAFIA: Conflict management . . . . . . . . . . . . . . . . 74
vii
... Vl l l Figures
I6b . LAPSEFIA: Conflict managemelit . . . . . . . . . . . . . . . . . 75
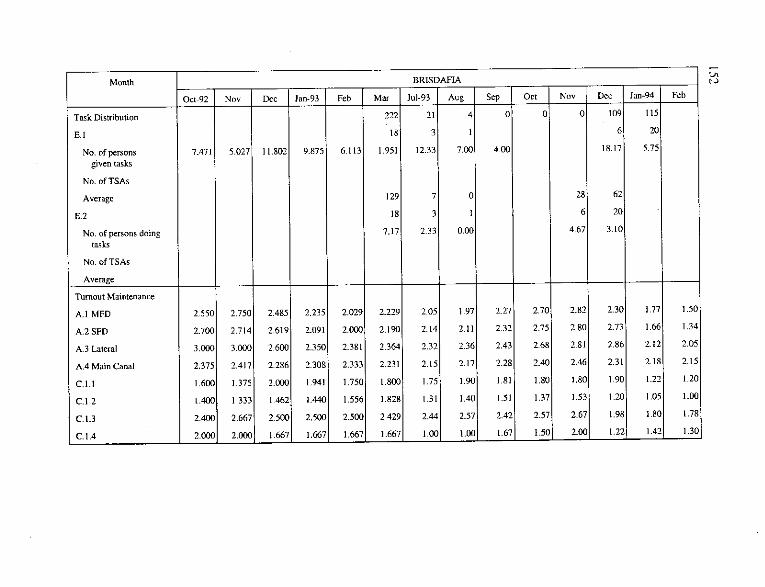
17a . BRISDAFIA: Task distrikdtion . . . . . . . . . . . . . . . . . . 77
17b . LAPSEFIA: Task distribution . . . . . . . . . . . . . . . . . . . 78
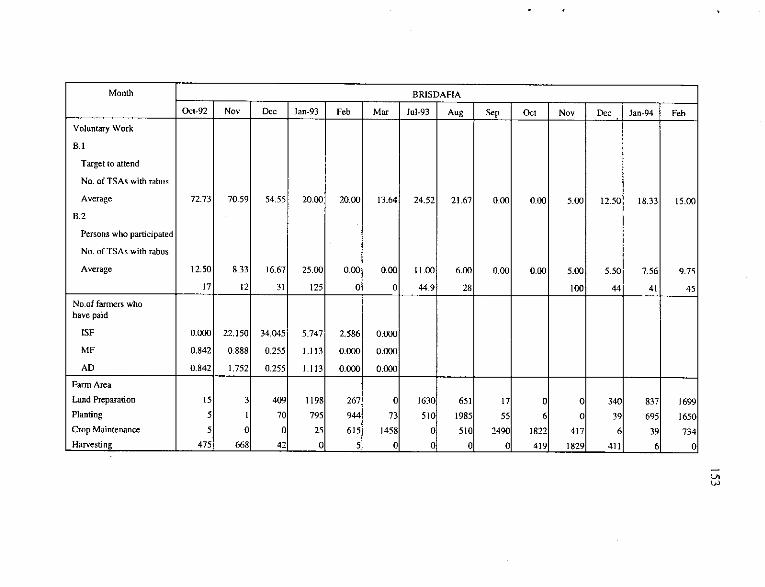
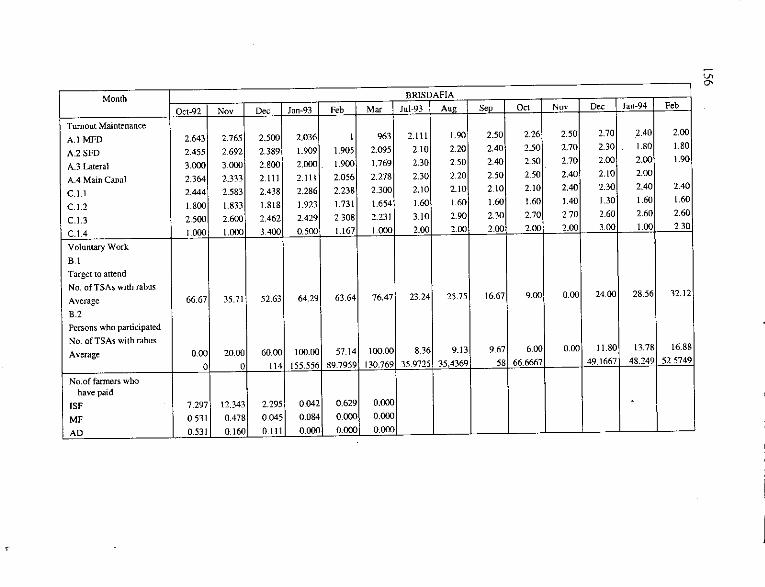
18 . BRISDAFIA and LAPSEFIA: Participation in voluntary work . . 80
19a . BRISDAFIA: Turnout inairitenance . . . . . . . . . . . . . . . . 85
19b . LAPSEFIA: Turnout niaintensnce . . . . . . . . . . . . . . . . . 86
20a . BRISDAFIA: Maintenance of structures . . . . . . . . . . . . . 87
20b . LAPSEFIA: Maintenance of structures . . . . . . . . . . . . . . 88
2 la . BRISDAFIA financial aspect: ISF, membership. annual dues and collection . . . . . . . . . . . . . . . . . . . 89
21 b . LAPSEFIA financial aspzct: ISF. membership. annual dues and collection . . . . . . . . . . . . . . . . . . . 90
1
2
3 .
4 .
5 .
6 . 7 .
8 .
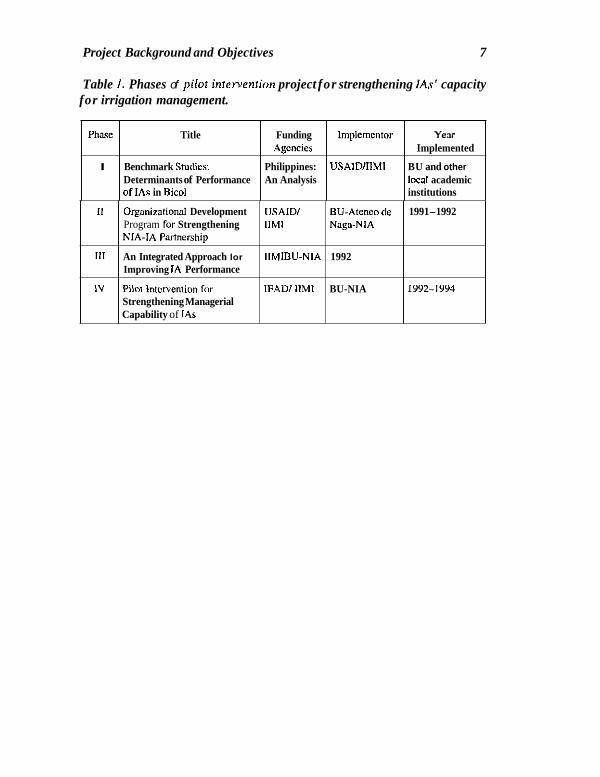
Phases of pilot intervention project for strengthening IAs’ capacity for irrigation management . . . . . . . . .
Turnout Service Area Leaders’ profile . . . . . . . . . . . .
IA profile during the wet season (July to December). 1992 .
Vision of TSA Leaders for the IA . . . . . . . . . . . . . .
Capability of farmer leaders to record data. February 1994 .
IA performance indicators
.Information generated by TSALs and their respective uses .
Status of crops: Percentage of crops damaged by pest. floods and drought . . . . . . . . . . . . . . . . . . . .
. . . . 7
. . . 10
. . . 14
. . . 19
. . . 31
. . . 44
. . . 47
. . . 65
ix
Acknowledgements
WE WISH TO sincerely acknowledge the many persons and institutions that helped in the completion and realization of this research work. In particular, we convey our gratitude to:
Dr. PatriaG. Lorenzo, third President of the Bicol University for opening opportunities for irrigation research among the faculty and graduate students of the university by forging a partnership with the NIA; Dr. Emiliano A. Aberin, for his continuing support and interest in research; Dr. Lylia C. Sena and the administration officials, especially Dr. Nelia S. Ciocson, Dr. Jose P. Leveriza, Dr. Federico Raguindin, Jr., and Dr. Susana Cabredo for the encouragement and moral support which gave us the confidence to continue our quest for more knowledge and understanding of the dynamics of irrigation management:
Our energetic field staff of the Bicol University team namely: Juliet Garbiles and Malou Sapinoso for their patience and steadfast assistance to the farmers, IA leaders and NIA personnel of BARIT RIS; Gabriel Armea for deciphering the maze of scribbles and arrows; Mr. Nanda Abeywickrema, IIMI's former Director for International Cooperation for direction and indi- vidual advice during all phases of the project (1989-94), Dr. Douglas Ver- million of IIMI headquarters for taking time out to review one ofour project reports related to Farmer-Managed Irrigation Systems, (FMIS) grant; FMIS- Network of IIMI, Dr. Shad Manor in particular, for recognizing the signifi- cance of the self-assessment process for improving IAs and systems performance; Delia Valdez, Celso Manangan and Peping Bosi of the IIMI- Philippines Field Opcrations Office and Mrs. Kamani Rajmayake of IIMI-Sri Lanka Field Operations Office for providing support and facilitating our logistical needs.
Engr. Rogelio S. King, Engr. Benjamin Enriquez, Wilmor Miolas, Jesus Barela, Merle Bongon, Mercurio Morillo, Armando Velasco, Jose Llanes, Rustico Velasco and Crispin Tucio, all of the BARIT RIS Systems Office for treating us as co-workers, rather than "outsiders" and receiving our ideas with much professionalism and interest; Engr. Feliciano Berdin, OIC Regional Manager of NIA Regional Office V for his keen interest in our project, and
xi
xii Acknow1edgeniwt.s
Engr. Tomas Francia and Engr. Willy Papaya. for being there when the "going got rough."
The farmers and IA leaders of BRISDAFIA and LAPSEFIA for sharing with us their vision of a progressive IA and for making the self-assessment process one of the means for making that vision a reality.
And, finally, to MI. Kingsley Kurukulasuriya, Production Editor, IIMI for making drastic linguistic and other changes, making this paper more readable, and for his enormous patience with us while editing this paper.
Fay M. Lauraya Antonia Lea R. Sala C.M. Wijayaratna
CHAPTER 1
Introduction
RECOGNIZING THE LIMITATIONS of expanding areas under irrigation, recent development efforts in irrigated agriculture have placed emphasis on devising new management strategies to increase productivity in this sector. One such strategy is the devolution of tasks by government agencies to farmer organi- zations in areas ranging from operation and maintenance (OSrM) and fee collections to fullmanagement turnover, which in the Philippines is popularly called the "participatory approach," pioneered by the National Irrigation Administration (NIA). Past studies on the impact of farmers' involvement in irrigation systems management provide evidence that turnover of manage- ment responsibilities to Irrigators' Associations (IAs) has led to significant improvement in system performance. A study of the Institute of Philippine Culture (IPC) using four national systems under NIA's participatory program as samples showed that the systems improved in financial viability and gained in their areas and cropping intensities after farmers were engaged in system management(Jopil10 anddelosReyes 1988). Inaddition, Wijayaratna(1993) assessing the Philippine experience in irrigation turnover and self-manage- ment, reported that access to water, reliability, adequacy and equity in water distribution have improved. farmer satisfaction has increased and conflicts over water distribution have decreased following full or partial turnover of system management toIAs. A Bicol University-IIMIresearch on theperform- ance of IAs revealed that IA performance efficiency significantly contributes to system performance. This collaborative research then concluded that system performance can be enhanced by strengthening the IAs' capability for irrigation management and maximizing farmers' involvement in the system management and planning process (Lauraya and Sala 1990).
1
2 Introductiorr
In recent years, IAs in the country have been assuming important system management responsibilities, particularly those under Types I, I1 and 111 contracts.’ In Type I contmct the IA simply undertakes the routine mainte- nance works of a certain length of the irrigation canal system. Under Type I1 contract, farmer organizations assume the system operations and irrigation service fee (ISFjcollectionfunctions. Systemoperations include: 1 j planning the O&M activities and undertaking the O&M lrom the turnout to the main and supplementary farm ditches; 2) planning. implementing and monitoring the cropping calendar; 3) water allocation and distribution; 4) conflict man- agement; and 5 ) maintaining linkages between the farmer users and theNIA. Collection functions include: I ) planning effective collection strategies; 2) distribution of ISF bills; and 3) undertaking ISF collection. Meanwhile, under Type 111 contract, there is full turnover of the whole or part of the irrigation system to the farmers. IAs under Type I and Type I1 are given incentives for their participation in the O&M and ISF collection. Under Type 111 contract, the IA shall amortize the investment and rehabilitation costs of the whole or part of the system in not more than 50 years. The NIA-IA obligations and the corresponding incentives in the three types of contracts are given in detail in Annex I. Although the farmer leaders of IAs undergo leadership training before their organizations assume the tasks specified in the O&M contract, i n many cases, they do not have successfully internalized mechanisms that strengthen management capabilities to face the challenges posed by their new irrigation management responsibilities.
The 1A’s sustainability is of prime interest to the NIA particularly after the national government cut off its subsidy to finance the agency’s regular operations and maintenance functions. The IAs’ new responsibility of col- lecting ISF, a vital source of funds capacitating the IAs to succeed in their water management tasks dovetailed with the NIA’s aim of achieving viability in national systems nationwide. Farmer leaders of IAs themselves have recognized the need to improve their management capability to direct the organization towards self-reliance and governance.
I Prior to Ihc implcinenlation of Types I, I1 and 111 contrncls, NIA classified IAs into three stages of development md cumrpondingiy Ihe contmcts entered into were tefenrd to ns Stage I, I I and 111 contracts. Thcrc were slight r l i l fercnce in the NIA-IA obligations under these stage contracts but IAs slnnd to gain a higher share from ISFcollcction. Starling 1990. 1As undertaking O&M functions lor the first lilnc weir contracted by NIA using Type I. I1 and Illcontrzcls, hut the stz~geconrracls continued lobeenforccdforthoe lAs ttuthadsuch Cmitrncls with the NIA. Hence, BRISDAFIA curies a Type I 1 CooVacl while LAPSEFIA carries B Slnge I1 contra~t. Chaptcr 8 of this repon givcs further elnbomian on the basic dilfercncer of Ihc 2 types of contracting schemes.
Introduction 3
Concomitant to the NIA’s objective of achieving full turnover status for the majority of the national systems, the Bicol University, for the past five years, in coordination with IIMI Philippines and NIA Regional Office V, has been exploring innovative management strategies with the view of packaging a model intervention approach that would fit to the requirements of Farmers’ or Irrigators’ Associations (IAs) as they vary in maturity from a developing organization to one which is ready for full management turnover.
From 1989 to 1994, a four-phase pilot intervention project had been implemented aimed at strengthening IAs and systems’ performance. Initial activities concentrated on benchmark studies to establish entry points in the institution-building task. Results underscored the need to restructure the farmer’s organization into smaller groups below the turnout service area level based on water and work distribution. A self-assessment technique was also initially introduced among farmer leaders as acountercheck on the evaluation measures done by the project team.
Drawing from the lessons learned from the preparatory stages of the project, the last 2 years were devoted to the development and institutionali- zation of a systematic process of performance assessment and monitoring of IA activities. Referred to as “self-assessment of performance” among farmer leaders. this 2-year project aimed at institutionalizing the self-assessment process, further developing it into a management information system for the IAs as a whole. In jointly managed systems such as thenational systems where theNIA sbaresmanagement responsibilities with theIA, the need tocorrobo- rate plans retlecting both the farmers’ and government’s management needs becomes imperative. As conceived therefore data generated by the IA shall eventually be linked to the NIA’s information needs. This would reduce the agency’s work in collecting data at the grassroots level because farmers are now being developed to have the capacity to gather and consequently analyze irrigation data. Most importantly, the farmers’ perceived inadequacies, par- ticularly in repairs and maintenance could be regularly integrated into the agency’s plans. It is expected that once this Management Information System is institutionalized, i t would: I ) improve interaction among members, be- tween members and leaders and among leaders themselves; 2) help resolve conflicts; 3) increase awareness of O&M problems among IA and TSA leaders; 4) provide a basis for the IA’s feedbacking to NIA on the O&M requirements of the part of the system within NlA’s responsibility; and 5) strengthen theO&M ofthe systems. Hence, the self-assessment pi-ocess could lead to the enhancement of system performance and eventually spin off improvement in agricultural productivity.
4 Introduction
Documented herein a e the intervention activities implemented during the 2-year period from March 1992 to April 1994, and the project’s effect as indicated by some performance indicators. This report is organized into 9 chapters. Following the introduction, Chapter 2 renders a briefaccount of the project background and outlines the objectives of the intervention project while Chapter 3 describes the project site and the profile of the farmer leaders who are the key participants of the self-assessment process. Chapter 4 provides a description of the project’s conceptual framework while Chapter 5 documents the process and methodologies of the intervention activities carried out during the 13-month period. Chapter 5 also introduces five major activities and traces the chronological sequence of the process of implemen- tation including the rationale for pursuing these activities. Chapter 6 presents some indicators of success of the intervention activities. It defines the performance indicators used and outlines the measures adopted by the re- searchers to ensure validity and objectivity of the self-assessment process. This is followed by Chapter 7 which documents the TSA Leaders’ perspec- tives on the self-assessment process as gathered through a survey by an independent researcher. Chapter 8 delves on the project turnover process and the final chapter presents the lessons and challenges that need to be confronted for a successful project replication.
CHAPTER 2
Project Background and Objectives
BACKGROUND
To PROVIDE THE reader with a holistic view of the action research described herein, the activities and results of the three other phases pursued earlier are discussed below. Each phase has been documented in separate project reports available at IIMI. Table 1 provides the specifics of each phase.
Phase I delved on benchmark studies which involved several academic institutions. The Bicol University was tasked to assess the performance of Irrigators Associations under the NIA’s national systems in the Bicol Region and pinpoint factors that are constraining or nurturing the IAs’ successful participation in irrigation system management. Four out of a total of 8 gravity type irrigation systems were chosen as study sites and all the 22 IAs within these systems were taken as samples. The outcome of the 1-year research undertaking led to the identification of appropriate mechanisms to improve the performance of the IAs and the systems.
These recommendations were field-tested through a one-year intensive action research which involved about 4,000 farmer members in 2 IAs of the Barit River Irrigation System, a large national system located 400 kilometers (km) south of Manila. The intervention strategies adopted were: a) restruc- turing theorganizational setup of the farmer’s organization adopting thesmall group approach below the Turnout Service Area (TSA) level based on water source and task distribution: b) redesigning the NIA training programs by integrating the value-clarification concept in systems maintenance trainings, tapping farmers to train farmers, and by adopting the experiential learning approaches; c) distributing information, education and communication (IEC) materials which promoted the values taken up in the training; d) crafting new
5
6 Project Background and Objectives
roles for the O&M personnel by letting them perform institutional functions; and e) introducing a participatory self-assessment process as a mechanism that would monitor and evaluate the project's outcome, to supplement the researcher's summational evaluation. Phases I and 2 were undertaken under the irrigation research component of the USAID-funded Accelerated Agr - cultural Productivity Project (AAPP) which also aimed to enhance the research capability of the local universities involved.
The second phase of the project was successful in bringing about the following changes in the IAs involved: a) increased effectiveness of the organizational task structure for water distribution services; b) increased membership participation in irrigation activities; c) increased IA collection efficiency; and d) improved systems O&M. One notable outcome was the involvement of the O&M personnel (Water Masters and Ditchtenders) in institutional development work. The systems management training entailed a self-analysis among the farmer members to determine the root causes of dysfunctional structures and damaged irrigation facilities. In the midst ofthe proceedings are the O&M personnel interacting closely with the farmers. At the end of the session, the Water Masters, Ditchtenders and the farmers had developed an action plan for the O&M of the turnouts, detailing the respon- sibilities ofeach ofthem. Compared to theregularlnstitutional Development Officer, the O&M personnel were in the best position to assist the IA in planning their systems maintenance activities given that O&M are these personnel's own territory. These plans were implemented through the small groups formed which were effectively the work teams in the TSAs.
Engaging the Water Masters and Ditchtenders in institutional tasks is the best alternative that might be explored by NIA given the I A s increasing participation in O&M activities. With full irrigation management turnover, the O&M personnel would become redundant within the IA. in which case other options may become imperative. There is the "golden handshake" or voluntary retirement with attractive exit packages. But such may pose finan- cial drawbacks to the agency given its budgetary constraints. Another alter- native would be for the IA to employ the above-mentioned personnel which may not yet he feasible given the fact that most IAs have very low collection efficiencies and can ill-afford to pay for professional workers.
Project Background and Objectives 7
Table 1. Phases of pilor inremention project for strengthening IAs' capacity for irrigation management.
Phme
I
Title Funding Implementor Year Agcncies Implemented
Benchmark Studics: Philippines: USAlDlllMl BU and other Determinants of Performance An Analysis local academic of IAs in Bicol institutions
II
111
1V
Orgnnizationol Development USAID/ BU-Atenco de 1991-1992 Program far Strengthening IlMl Nnga-NIA NIA-IA Parmership
An Integrated Approach lor IIMIBU-NIA 1992 Improving IA Performance
Pilot lntcrvenlion for IFAD/ IlMl BU-NIA 192-1994 Strengthening Managerial Capability of IAs
8 Project Bnrk,qroarml and Objectives
OBJECTIVES
The self-assessment scheme is a learning process by which farmers and farmer leaders are being trained to systematically record and evaluate their performance and use these data €or planning and decision-making functions. Specifically, its objectives are:
I. To develop and test a method to monitor and evaluate performance of irrigation systems in general and IAs in particular
To introduce a learning process to identify and characterize the types of strategies that could he used internally to catalyze collective action and thereby improve system performance as an alternative to external cata- lysttintervention
To develop a generalizable method to strengthen the IA's managerial capability by introducing a systematic process for participatory planning and monitoring IA activities (both for operational and organizational)
To determine whether or not farmers have the objective capacity to collect and analyze self-assessment performance data
To test the practical value of self-assessment as a general strategy for strengthening organizational capacity of farmer groups to take over irrigation management tasks
To link the self-assessment strategy with NIA's information system
2.
3.
4 .
5 .
6.
CHAPTER 3
Description of Project Site of Farmer Leaders
THE PROJECT SITE
nd Profil
THEPROJECTCOVERED two IAs of the Barit River Irrigation System (BRIS) in Camarines SU? namely: Barit River Irrigation System Division A Farmer Irrigation Association (BRISDAFIA) and the La Purisima, Sta. Eulalia Farmer Irrigator’s Association (LAPSEFIA). These two IAs are located at the extreme points of the main canal, BRISDAFIA at the head and LAPSE- FIA at the tail end. The characteristics of these two IAs are given in table 2.
The BRISDAFIA has 57 turnout service areas (TSAs) spread across 15 barangays (v i l l ap ) . Its total service area is 740 ha of which 683.5 ha had been reported as irrigated area by the TSA Leaders during the wet season of 1992 (July - December). Altogether there are about 1,831 farmers of whom only 5.7 percent or 104 are registered members. Although i t appears that the number of registered members is quite small, i t should not be interpreted that only this number participates in IA activities such as ra6us (voluntary work), meetings, payment of ISF and the like. As observed, the only difference between members and nonmembers is that the former have paid the required membership fee (registration fee). All water users, whether they are registered as members of the 1A or not, benefit from water service delivery and are expected to participate in IA activities. However, since membership fee is one of IAs’ sources of income, it should seriously contemplate on strategies
2 Cameriner Sur is one of the six provinces of the Bicol Region. It has the largest prcnt id inigable area(406.171 hs)amongthe six provinces, ofwhich63 percenthadbeen developed for itfigation m of 1989.
9
10 Description of Project Site and Profile of Farmer Leaders
that would motivate farmers to register as IA members. This concern is true to both IAs covered by the project.
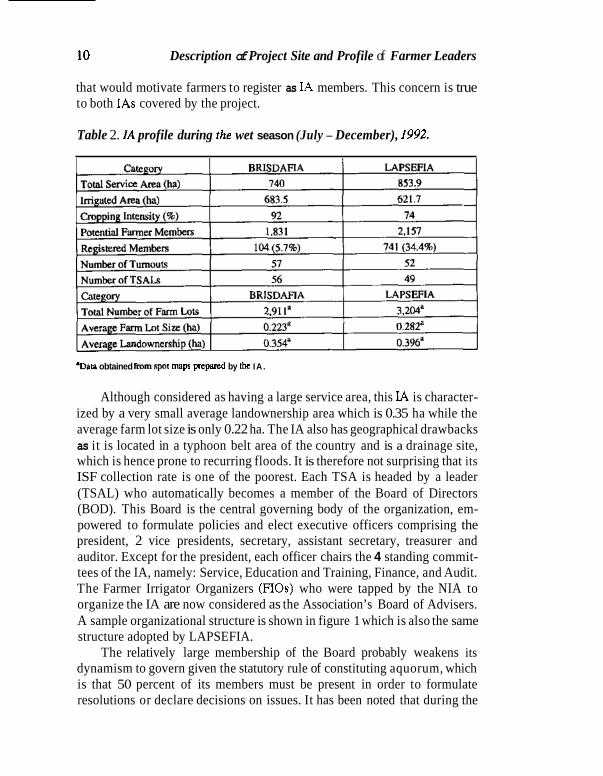
Table 2. IA profile during the wet season (July - December), 1992.
‘Data obtained from $pol mQ5 pepand by Ihe IA .
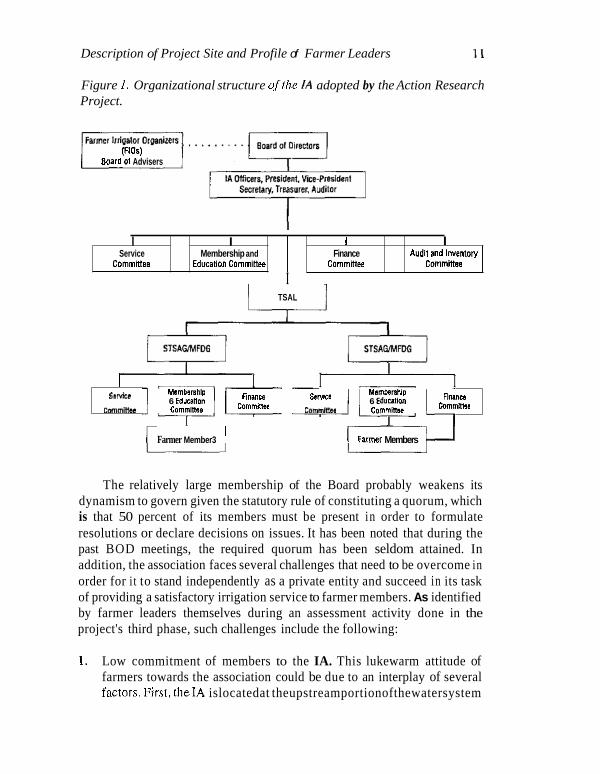
Although considered as having a large service area, this IA is character- ized by a very small average landownership area which is 0.35 ha while the average farm lot size is only 0.22 ha. The IA also has geographical drawbacks as it is located in a typhoon belt area of the country and is a drainage site, which is hence prone to recurring floods. It is therefore not surprising that its ISF collection rate is one of the poorest. Each TSA is headed by a leader (TSAL) who automatically becomes a member of the Board of Directors (BOD). This Board is the central governing body of the organization, em- powered to formulate policies and elect executive officers comprising the president, 2 vice presidents, secretary, assistant secretary, treasurer and auditor. Except for the president, each officer chairs the 4 standing commit- tees of the IA, namely: Service, Education and Training, Finance, and Audit. The Farmer Irrigator Organizers (FlOs) who were tapped by the NIA to organize the IA are now considered as the Association’s Board of Advisers. A sample organizational structure is shown in figure 1 which is also the same structure adopted by LAPSEFIA.
The relatively large membership of the Board probably weakens its dynamism to govern given the statutory rule of constituting aquorum, which is that 50 percent of its members must be present in order to formulate resolutions or declare decisions on issues. It has been noted that during the
Description of Project Site and Profile of Farmer Leaders 11
Figure 1. Organizational structure ofthe /A adopted by the Action Research Project.
(FiOr) 8 M t d 01 Advisers
I I Service Membership and
CQmmRfW Education Comminee
1 I Finance Audit and inventmy
Commines Committee
I TSAL
I I I I I
R N n n Msmbsrship 6 EduIalim IMCI
C ~ m m i n ~ o cornminee Commiftal Comrnma Mlmbrrihlp 6 EdYCnlsn cornminee
Farmer Member3 ' Farmer Members
Finance S d € c
commmsa I I
The relatively large membership of the Board probably weakens its dynamism to govern given the statutory rule of constituting a quorum, which is that 50 percent of its members must be present in order to formulate resolutions or declare decisions on issues. It has been noted that during the past BOD meetings, the required quorum has been seldom attained. In addition, the association faces several challenges that need to be overcome in order for i t to stand independently as a private entity and succeed in its task of providing a satisfactory irrigation service to farmer members. As identified by farmer leaders themselves during an assessment activity done in the project's third phase, such challenges include the following:
I. Low commitment of members to the IA. This lukewarm attitude of farmers towards the association could be due to an interplay of several factors.First, theIA islocatedat theupstreamportionofthewatersystem
12 Descripfion of Project Sire and Profile of Farmer Leaders
and, hence, there is sufficient water in most parts of its service area. Farmers do not feel the urgency to undertake the required maintenance tasks as there is always plenty of water whether or not they maintain the canals. Another factor is the inability of the IA to provide more services to the members other than water delivery. Since farmers benefit from water delivery service whether or not they become registered members orparticipatein theIAactivities, thereisnoincentiveforthem to actively get involved in IA activities. The IA leaders have recognized that their organization should be able to offer services beyond water delivery exclusively for members’ benefit to ensure their commitment to the IA.
Inactive Turnout Service Area Leaders. More than half of the TSA Leaders of this IA are preoccupied with secondary economic activities which compete with the time that otherwise could have been devoted to the fulfillment of their functions as TSA Leaders. It should be mentioned that these leaders shoulder their duties and responsibilities without any compensation. Given their low farm income, itisquitejustifiable to think of material incentives to motivate these leaders to turn in a good man- agement performance.
Poor maintenance of facilities and unregulated use of water resulting in inequity of water distribution in certain parts of the IA as well as water inadequacy in the other IA located downstream. Some portions of BRISDAFIA suffer from tlooding while other parts experience water inadequacy within the same cropping season. These concerns are inter- related to the above-mentioned two problems. In addition, the TSA Leaders complain about the lack of control structures like steel gates which weakens their ability to regulate water flow in their areas of responsibility .
Lack of a systematic collection process for irrigation service fees and membership dues. The IA has a service area of 740 ha and i t has only 9 authorized IA collectors. On average, each collector is expected to cover about 80 ha. Although the IA has assumed the collection functions from the NIA for the ISF since 1991, the NIA continues to provide them assistance in undertaking this function. It is the NIA which prepares the bills and sets the target collection for the IA collectors. Since the NIA also bas its own constraints, the bills are usuallydelayed and thus the ISF could not be collected during the harvest period. Fiestas (community
2.
3.
4.
Description of Project Sife and Profile of Farmer Leaders 13
celebrations to honorapatron saint) are usually observed after the harvest and it has been the practice of the farmers to overspend during these occasions. If a collector arrives after these fiestas, i t is seldom that the farmers are able to pay. It is therefore important that collection be timed with the harvest period.
Low IA share from ISF collection. This problem is both an outcome of situation number 4 and the very minimal share of the IA in the IA-NIA sharing system stipulated in the Type I1 contract.
The LAPSEFIA has 52 turnout service areas dispersed across 9 baran- gays. The total farm lots inventoried through the spot maps prepared by the TSA Leaders aggregated to 3,024 covering 853.8 ha of irrigated area. These farm lots are tilled by 2,157 farmers of whom 741 (34%) are registered members to date. The average farm lot size is 0.2823 ha while the average landownership is 0.3958 ha.
The IA at present carries a Stage I1 contract with NIA and given its commendable performance on collection and maintenance, this IA would be ready to assume full management responsibility in the very near future under NIA's full turnover arrangement or the Stage Ill contracting system.
Being at the tail end, the IA suffers from water inadequacy, particularly during the peak of the dry season. This threat, however, is cushioned by the dedication of its leaders and a high sense of cooperation among the farmer members. The IA is now looking at the prospect of venturing into non-water services to complement the delivery of irrigation service to the farmers.
5.
PROFILE OF THE FARMER LEADERS
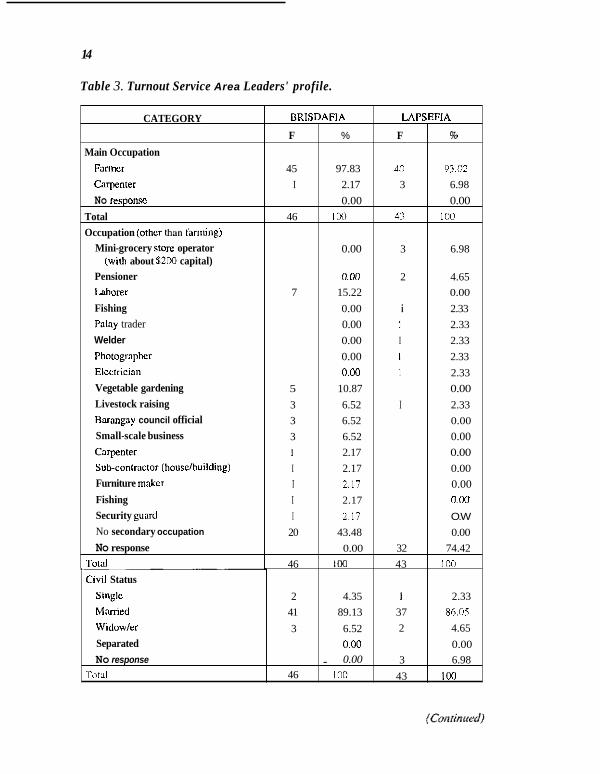
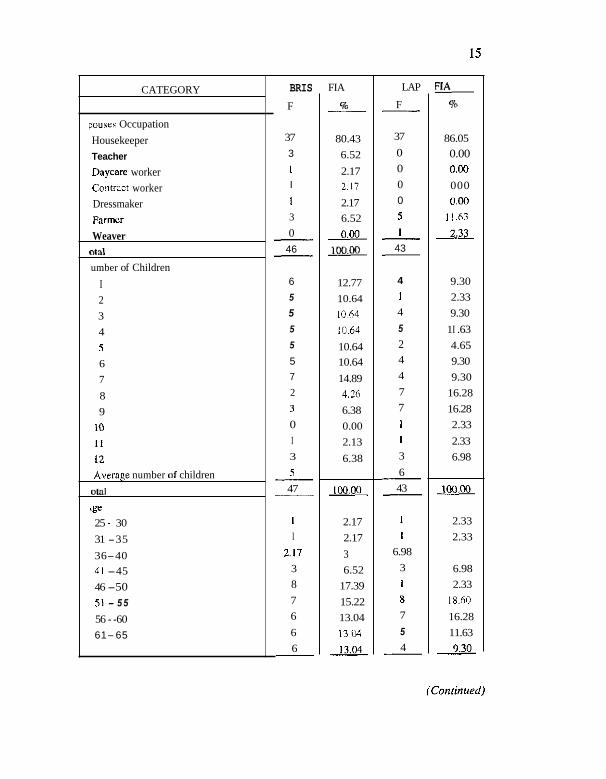
Described herein are the characteristics of the turnout service area leaders (TSALs) in the two Us covered by the study. This provides a backdrop on the intervention strategies adopted and the project outcome after the 13- month period of project implementation. The data used in this section were based on a one-page Personal Profile Questionnaire distributed to all TSA Leaders in January, 1993. In BRISDAFIA, 46 out of the 56 TSA Leaders completed the questionnaires while 43 out of 49 TSA Leaders from LAPSE- FIA provided the needed information. Details of the succeeding discussion are presented in table 3.
14
Table 3. Turnout Service Area Leaders' profile.
CATEGORY
Main Occupation Farmcr Cqenter No respansc
Total Occupation (othcr than fanning)
Mini-grocery store operator (with about $200 capital)
Pensioner Lvbonr Fishing Palay trader Welder Photographer
Vegetable gardening Livestock raising Barsngay council official Small-scale business Cnrpenter Sub-contractor (howlbuilding) Furniture maker Fishing Security guard No secondary occupation
Elcctncian
No response Total Civil Status
BRlSDAFlA LAPSEFIA
F % F 5%
45 97.83 40 93.02 I 2.17 3 6.98
0.00 0.00 46 I W 41 I00
0.00 3 6.98
0.00 2 4.65 7 15.22 0.00
0.00 i 2.33 0.00 1 2.33 0.00 I 2.33 0.00 I 2.33 0.00 1 2.33
5 10.87 0.00
3 6.52 0.00 3 6.52 0.00 1 2.17 0.00 I 2.17 0.00 I 2.17 0.00 I 2.17 0.00 I 2.17 O.W
20 43.48 0.00 0.00 32 74.42
46 I00 43 I00
3 6.52 I 2.33
Single 2 4.35 Merried 41 89.13 Widowler 3 6.52 Separated 0.00 No response . 0.00
Tot21 46 I00
I 2.33 37 86.0.5 2 4.65
0.00 3 6.98
43 100
15
CATEGORY
pouses Occupation Housekeeper Teacher
Daycare worker Contract worker Dressmaker Farmer Weaver
O l d
umber of Children I 2 3 4 S
6 7 8 9
10 11
I2 Average number of children
OW1
.ge 25 - 30 31 -35 36-40 41 -45 46 -50 51 - 5 5
56 - 60 61-65
BRIS F
37 3
1 1 1 3 0
46 ~
~
6 5
5 5
5
5 7 2 1 0 I 3
5 47
__ __
1
I 2.17
3 8 7 6 6 6 -
FIA
70 __
80.43 6.52 2.17 2.17 2.17 6.52 0.w Iww
12.77 10.64 10.64 10.64 10.64 10.64 14.89 4.?6 6.38 0.00 2.13 6.38
Iww
2.17 2.17 3 6.52
17.39 15.22 13.04 13.04 13.04
LAP
F - 37 0 0 0 0 5 1
43 ~
- 4
1 4 5 2 4 4 7 7 1 1
3 6 43
~
-
1
1 6.98
3 1
8 7 5 4 __
FIA 70
86.05 0.00 0.00 000 0.00
11.63 2.33
9.30 2.33 9.30
1 I .63 4.65 9.30 9.30
16.28 16.28 2.33 2.33 6.98
100.00
2.33 2.33
6.98 2.33
18.60 16.28 11.63 9.30
(Continued)
16
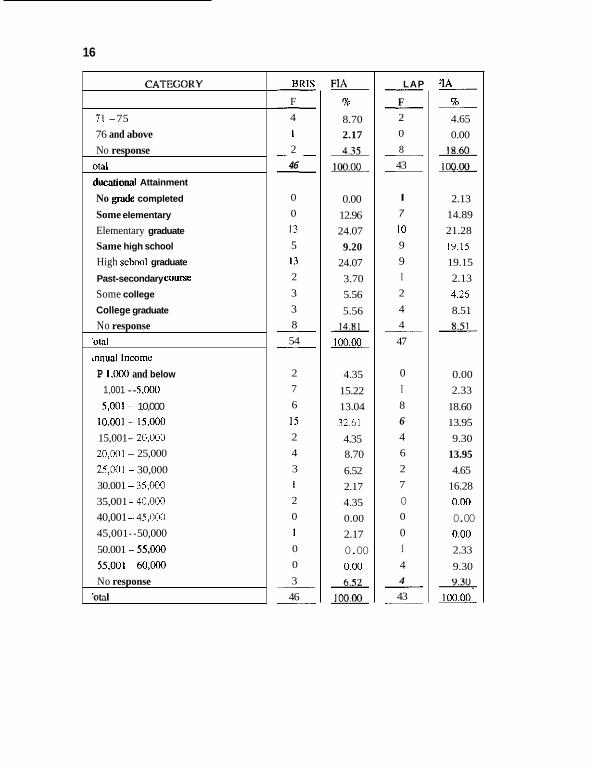
71 -75 76 and above No response
Ot.4
ducnrional Attainment
No grade completed
Some elementary
Elementary graduate
Same high school
High schwl graduate
Past-secondary course Some college
College graduate
No response 'oral
m u a l Income P 1,ooO and below
1,001 - 5,000 5 , 0 0 1 ~ 10,000
I0,WI - 15.m 15,001 -20.wo 20,WI - 25,000 25,001 ~ 30,000 30.001 ~ 35.000 35,001 - 40,000 40,001 -45,000 45,001 - 50,000 50.001 - 55 ,m 55.001 ~ 60,wO No response 'Old
RRlS
F 4 I
2 46
__ __
__ __
0 0 13 5 13 2 3 3 8
54 __ __
2 7 6 15 2 4 3 1
2 0 I
0 0 3
46 __ __
FIA %
8.70 2.17
435 1OOOO
0.00 12.96 24.07 9.20
24.07 3.70 5.56 5.56 1481 100.00
4.35 15.22 13.04 32.61 4.35 8.70 6.52 2.17 4.35 0.00 2.17 0.00 0.00 652 loow
LAP __ F 2 0 8
43
__
__ __
I
7
10 9 9 I 2 4 4 47
__
0 I 8 6 4 6 2 7 0 0
0 I 4 4
43 __ __
'IA %
4.65 0.00
__
1860 & y u L
2.13 14.89 21.28 19.15 19.15 2.13 4.26 8.51 851
0.00 2.33
18.60 13.95 9.30
13.95 4.65
16.28 0.w 0.00 0.00 2.33 9.30 2 IW.00
Description of Projecf Sire and Profile of Farmer Leaders 17
BRISDAFIA
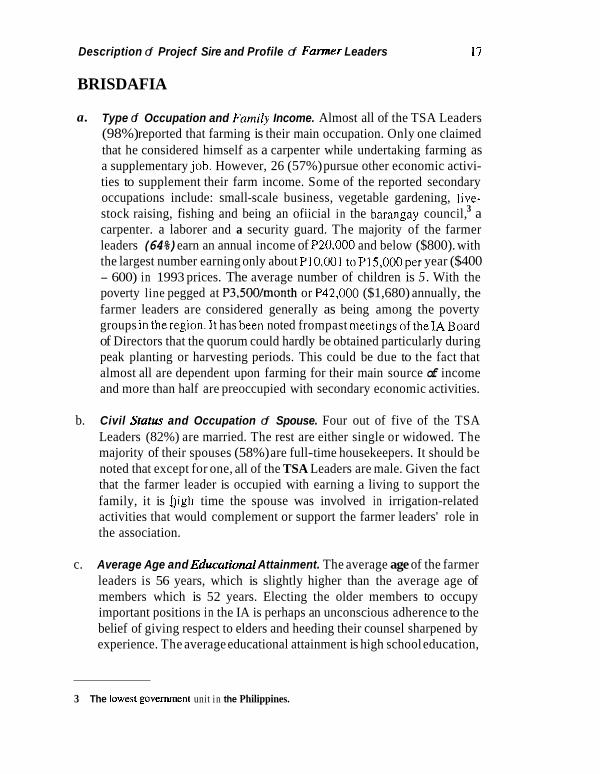
a. Type of Occupation and Famil)' Income. Almost all of the TSA Leaders (98%) reported that farming is their main occupation. Only one claimed that he considered himself as a carpenter while undertaking farming as a supplementary job. However, 26 (57%) pursue other economic activi- ties to supplement their farm income. Some of the reported secondary occupations include: small-scale business, vegetable gardening, live- stock raising, fishing and being an ofiicial in the barangay council, a carpenter. a laborer and a security guard. The majority of the farmer leaders (64%) earn an annual income of P20.000 and below ($800). with the largest number earning only about P10.001 toP15,000per year ($400 - 600) in 1993 prices. The average number of children is 5. With the poverty line pegged at P3,500/month or P42,OOO ($1,680) annually, the farmer leaders are considered generally as being among the poverty groups intheregion.It has been noted frompast meetingsoftheIABoard of Directors that the quorum could hardly be obtained particularly during peak planting or harvesting periods. This could be due to the fact that almost all are dependent upon farming for their main source of income and more than half are preoccupied with secondary economic activities.
Civil Status and Occupation of Spouse. Four out of five of the TSA Leaders (82%) are married. The rest are either single or widowed. The majority of their spouses (58%) are full-time housekeepers. It should be noted that except for one, all of the TSA Leaders are male. Given the fact that the farmer leader is occupied with earning a living to support the family, it is bigh time the spouse was involved in irrigation-related activities that would complement or support the farmer leaders' role in the association.
Average Age and Educariorial Attainment. The average age of the farmer leaders is 56 years, which is slightly higher than the average age of members which is 52 years. Electing the older members to occupy important positions in the IA is perhaps an unconscious adherence to the belief of giving respect to elders and heeding their counsel sharpened by experience. The average educational attainment is high school education,
3
b.
c.
3 The lowest government unit in the Philippines.
18 Description of Project Site and Profile of Farmer Leaders
which again is higher than that obtained by most members, which is elementary level.
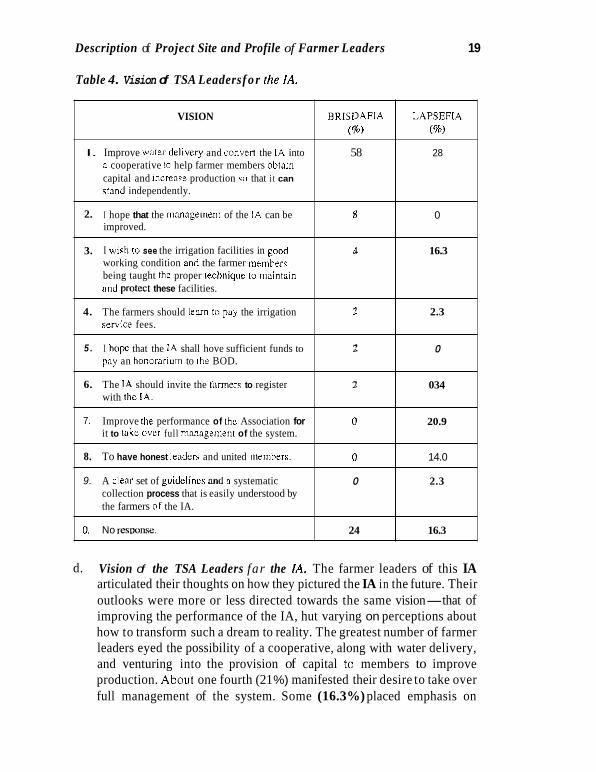
Vision of the TSA Leaders of the IA. When asked to share what they want the IA to be in the future, more than half(58%) expressed their desire to improve water delivery service of the IA, convert it to a cooperative and go into the provision of support services to members. Other responses included: improve its management, attend to the condition of the irriga- tion facilities, inform farmers about their obligation to pay irrigation fees, compensate the leaders for their services to the IA and campaign among fellow farmers to register as members. It is notable, however, that the farmer leaders in this LA who have not expressed their views on what they believe should be the direction of the IA in the future comprised 24 percent. Table 4 reveals the vision of the TSA Leaders for the IA.
d.
LAPSEFIA
a. Type of Occupation and Annual Family Income. As in BRISDAFIA, 93 percent of the farmer leaders confirmed that farming is their main occupation. Only 25 percent had secondary activities to supplement their farm income. More than half earn an income ofP20,OOO ($800) or higher per year which indicates that farmer leaders in this I A are relatively better off than their counterparts in BRISDAFIA. The average number of children is 6.
Civil Status and occupation of Spouse. The farmer leaders are predomi- nantly male (only one is female) and married (86%). Most of their spouses (72%) are housekeepers while 3 (7%) reported that they were involved in farming.
Average Age and Educational Attainment. The average age and educa- tional attainment are more or less similar to those of the counterparts in BRISDAFIA: 56 years and high school level.
b.
c.
Description of Project Site and Profile of Farmer Leaders 19
VISION
I. Improve water drlivcly and conven the LA into B cooperative to help farmer members obtain capital and incmnse production so that i t can stand independently.
I hope that the management of the IA can be 2. improved.
I wish to see the irrigation facilities in good working condition and the farmer memhers being taught thc proper lechniquc to maintain and p r o t ~ ~ t these facilities.
The farmers should lemn to pay the irrigation service fees.
3.
4.
5 . I hope that the IA shall hove sufficient funds to pay an honorarium to the BOD.
The IA should invite the farmem to register with thc IA.
Improve the performance of fhc Association for it to take ovec full management of the system.
To have honest leadden and united memhers.
A clear set of guidelines a d B systematic collection process that is easily understood by the farmers of the IA.
6.
7.
8.
9.
0. No resIlunsr.
Table 4. Vision of TSA Leaders f o r fhe /A.
BRlSDAFlA LAPSEFIA (S) (9%)
58 28
d 0
J 16.3
?. 2.3
2 0
2 034
0 20.9
0 14.0
0 2.3
24 16.3
d. Vision of the TSA Leaders far the IA. The farmer leaders of this IA articulated their thoughts on how they pictured the IA in the future. Their outlooks were more or less directed towards the same vision-that of improving the performance of the IA, hut varying on perceptions about how to transform such a dream to reality. The greatest number of farmer leaders eyed the possibility of a cooperative, along with water delivery, and venturing into the provision of capital to members to improve production. Ahout one fourth (21 %) manifested their desire to take over full management of the system. Some (16.3%) placed emphasis on

20 Description of Project Site and Profile of Farmer Leaders
improving the irrigation facilities and the need to inform members on their proper use and protection. Others saw the need to have a set of honest leaders and united members as the basic foundation of a progres- sive association (table 4).
CHAPTER 4
Conceptual Framework
As THE TERM suggests, the self-assessment mechanism requires the Turnout Service Area Leaders (TSALs) to gather data pertaining to their turnouts which will indicate how well are performing their O&M and institutional development responsibilities. This self-correcting scheme is complemented by participatory assessment by farmer members at the lowest stratum of the organizational hierarchy, spearheaded by the farmer leaders at the supple- mentary ditch levels. Utilization of the TSA Leaders’ performance report by the Board of Directors (BOD) and officials at the central level of the IA would provide these officials an insight into the performance of the IA as a whole and would serve as a rich source of information for planning future activities. The self-assessment process then becomes the nucleus for the IA’s Manage- ment Information System.
In this project i t is asserted that a sound feedback mechanism will have a direct consequence on the performance level of Supplementary TSALs and IA officials which in turn will have bearing on the degree of effectiveness of the farmer organization in delivering services to the water users. It is assumed that NIA would also benefit from the IA’s Management Information System by facilitating its data-generation requirement at the grassroots level. It may be mentioned that as part of the project’s intervention activities, the O&M personnel have adopted their own performance assessment system utilizing the data reported by the TSA Leaders. Through regular interaction with farmer leaders, NIA personnel and the IA are provided with timely informa- tion that could be used as a basis for planning the management work of the irrigation system. The designed reciprocal action between the agency person- nel and the farmer leaders is hoped to result in a better working relationship
21
22 Conceptual Framework
between these water management partners which would propel an improve- ment in irrigation system performance.
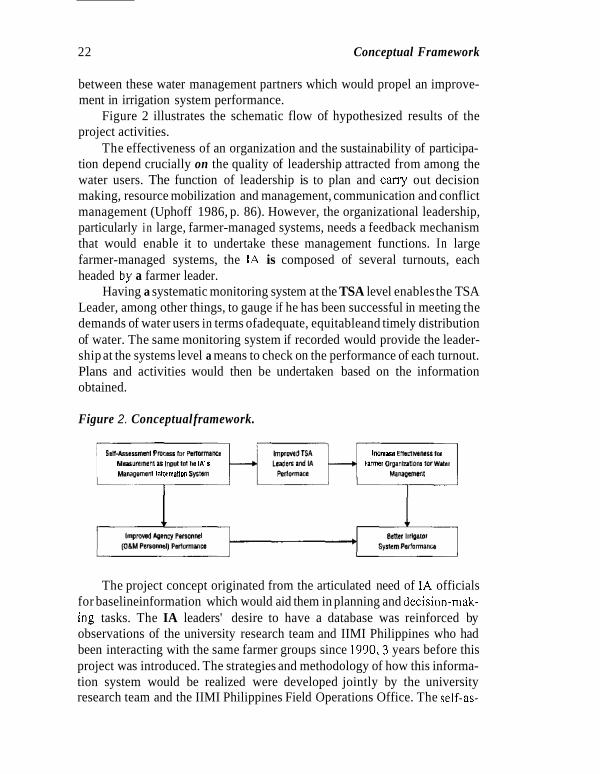
Figure 2 illustrates the schematic flow of hypothesized results of the project activities.
The effectiveness of an organization and the sustainability of participa- tion depend crucially on the quality of leadership attracted from among the water users. The function of leadership is to plan and cany out decision making, resource mobilization and management, communication and conflict management (Uphoff 1986, p. 86). However, the organizational leadership, particularly in large, farmer-managed systems, needs a feedback mechanism that would enable it to undertake these management functions. In large farmer-managed systems, the IA is composed of several turnouts, each headed by a farmer leader.
Having a systematic monitoring system at the TSA level enables the TSA Leader, among other things, to gauge if he has been successful in meeting the demands of water users in terms ofadequate, equitableand timely distribution of water. The same monitoring system if recorded would provide the leader- ship at the systems level a means to check on the performance of each turnout. Plans and activities would then be undertaken based on the information obtained.
Figure 2. Conceptual framework.
sen-krsummt Q ~ W S lor mnormam M~UunwnlY InputMhi livs
I I m m EHedMn(Il1oi Farmer Olqlnblonr ,O,WII8,
Ma~lornml lnlorrnlon ly(ttm M a W m l l
The project concept originated from the articulated need of IA officials for baselineinformation which would aid them in planning and decision-mak- ing tasks. The IA leaders' desire to have a database was reinforced by observations of the university research team and IIMI Philippines who had been interacting with the same farmer groups since 1990,3 years before this project was introduced. The strategies and methodology of how this informa- tion system would be realized were developed jointly by the university research team and the IIMI Philippines Field Operations Office. The self-as-
Conceptual Framework 23
sessment process for obtaining data on and assessing farmer leaders, IAs and systems performance was largely influenced by the experience gained in participatory management at the Gal Oya Scheme, Sri Lanka.
However, the actual performance monitoring tool was constructed in close consultation with the IA officials and the NIA Systems Staff. The indicators of leaders, IA and system performance were identified jointly by the project team and the IA officials. The latter determined which information was important to them and on this basis, preliminary indicators listed were either retained or deleted from the forms. On their part, the NIA O&M personnel identified the needed information from the IA which was required by their agency. Through a series of test runs involving the TSALs, the monitoring forms were refined incorporating the comments of these leaders who were the actual users and the key participants of the self-assessment method. The idea to link the IA's information system to that of the NIA had taken into account the changes that the agency need to institute given its participatory approach policy.
CHAPTER 5
Intervention Activities and Methodologies
To MEET THE project objectives, a series of intervention activities had been outlined. The initial activities conceived focused simply on revising the self-assessment forms and institutionalizing the process in the IA. It would be recalled that the self-assessment process was already introduced to the farmers and farmer leaders in 1991. But at that time, the intention was just for a one-shot activity to supplement the researchers’ summative evaluation of the AAPP. Institutionalizing the self-assessment mechanism requires not only the involvement of the IA leaders but of the NIA office O&M personnel as well. The project plan therefore also included the introduction of the self-assessment mechanism for Water Masters and Ditchtenders and the implementation of a strategy to link the two activities to serve the information needs of both the IA and the NIA.
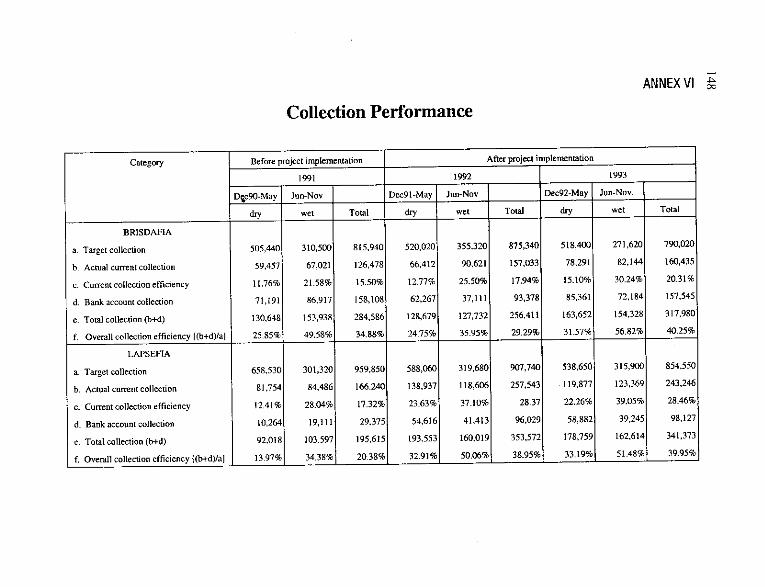
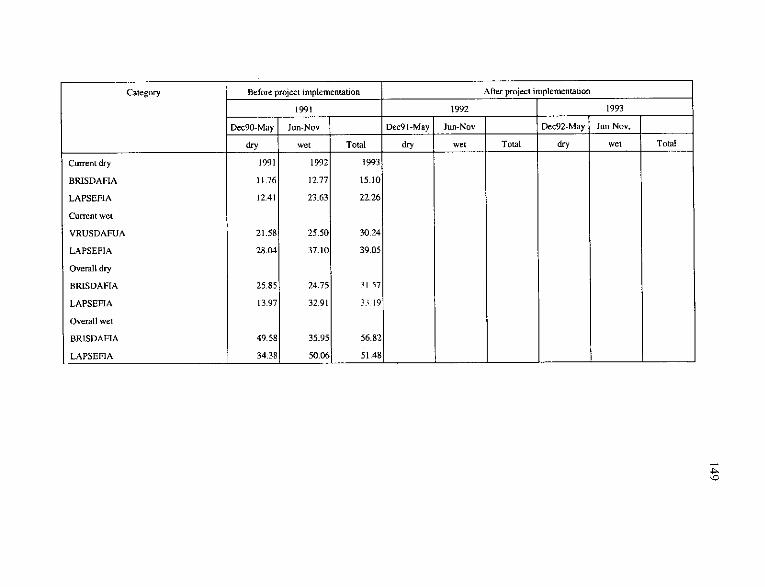
In pursuing the above-mentioned tasks, the researchers realized that they could not confine the scope of assistance as embodied in the plan. The activities undertaken expanded in response to farmers’ needs like the inter- vention for improving IA collection efficiency. Results of the participatory assessment process showed that most problems at the turnout level were caused by dysfunctional structures or canals needing repairs. The IAs are pressured to act on these problems to ensure continued member participation. In this regard the IAs have to generate funds internally by way of increasing collection from irrigation fees. One important performance indicator that NIA uses in assessing the level of IA’s share in the fees collected is collection efficiency, which is the ratio of the actual to the target ISF collections, especially in IAs which assume the collection function, as in the case of LAPSEFIA and BRISDAFIA. These two IAs expressed the need to install a mechanism that would improve their present collection efficiency. Records
25
26 Intervention Activities and Methodologies
show that prior to the implementation of this project, the collection efficiency in these two IAs was very low-less than 50 percent on average. As a result, BRISDAFIA failed to receive any ISF share and feelings of disillusion prevailed over IA collectors as they did not get a single centavo for their efforts. Further, it surfaced that the IAs did not have the funds to cover their administrative costs like honoraria for the TSA Leaders. Considering that most of them depend on farm income and need to pursue secondary occupa- tions to meet basic necessities, there must be a tangible incentive for involving themselves in additional organizational work such as the self-assessment scheme. Of course, their basic reason for joining the IA was the benefits brought by the irrigation system. However, the project requires that additional work be input in the IA by the TSA Leaders which would mean competing with time which otherwise could be devoted to gainful economic activity. It was therefore quite understandable that some farmer leaders would expect real incentives such as honoraria in return for an increased intensity in their performanceas TSA Leaders. In view of this, thc projezt team, in consultation with thc IA officials and the NIA staff, introduced some strategies to improve the financial resources of the two IAs.
INSTITUTIONALIZING THE SELF-ASSESSMENT MECHANISM
The self-assessment process involves the officials of the turnout and the IA as key participants. Using a simple structured questionnaire, the TSA Leader records significant information pertaining to the situation of his turnout such as the stage of farming activities within his area of responsibility, status of crops, water adequacy at farm level, organizational activities, conflicts that occurred and were resolved, status of irrigation structures and facilities, payment of ISF by farmers and problems encountered.
The report at the TSA level was to be monitored and consolidated by the IA officials who agreed among themselves to divide the service nreas into clusters with one IA official having I to 8 turnout service areas to he monitored. To carry out the monitoring task, the IA official checks the record kept by the TSA Leader and consolidates the reported data using another form, the contents of which shall be reported at the monthly meetings of the Board of Directors.
Intervention Activities and Methodologies 21
In designing the self-assessment tool, the project team closely worked with the IA officials, TSA Leaders and NIA O&M staff. Because of this, the instrument was able to take into account the dynamics of the IA organization activities vis-a-vis farming activities. The fanner leaders analyzethedata they themselves have collected. As a result of a series of consultation meetings with farmer leaders the instrument used in 1991 was streamlined to reflect the most essential questions needed by the TSA Leaders to carry out their functions. The questions have also been transformed to facilitate recording and at the same time to draw out vital information for planning and decision making. Inasmuch as the self-assessment process was structured to capture the performance indicators ofthe TSA Leaders, a list of the latter’s duties and responsibilities was attached to the questionnaire. This list served as the link between the self-assessment process and the farmer leaders’ mandated duties. By emphasizing the objective of the self-assessment process, (i.e., it would guide the leader how to perform his duties better), the researchers gained the farmer leaders’ cooperation and appreciation for the need of the recording process. The spot map drawn by the TSA Leader which contains valuable baseline data was appended to the self-assessment questionnaire. The spot map served as a reference point in filling in the questionnaire.
The research team conducted a series of test runs specifically to deter- mine if the self-assessment tool adequately covered all areas of TSAL performance; to evaluate the utility of accomplishing or answering the questions and to clarify among farmer leaders the importance of the self-as- sessment process by linking it to the duties and responsibilities embodied in the farmer organization (IA) bylaws. A significant outcome of this series of meetings with the TSALs was the discussion of common issues or problems encountered and the sharing of actual experiences among farmer leaders. The self-assessment tool served as a guide for them to systematically evaluate the farm situation, and as a consequence, to catalyze action for problem resolu- tion.
The research team distributed the monitoring forms in October 1992. Field work then focused on training the TSA Leaders in recording the performance data required. The researchers were grouped into 2. one for each IA. On average, each team covered 5 TSA Leaders per.day.
The form used for the self-assessment continued to evolve as the project team learned from the farmer leaders’ feedback. The research team and the TSA Leaders agreed to adopt several changes with the objectives of devel- oping a simple and functional assessment instrument. The project team believes that the latest self-assessment form would still undergo changes in
28 Intewention Activities and Methodologies
the future as the IA evolves and takes on additional functions or encounters significant experiences that would substantially affect their information needs.
In the first form introduced, the TSA Leaders recorded such aggregate data regarding the turnout as total number of parcels planted, total number of farmers following the cropping calendar and total number of farm lots with adequate water. It was noted that these questions could not be answered without looking into the status of each individual lot. Besides, the aggregate data per se may be useful to an external evaluator interested in assessing the TSA Leader’s performance, but these figures would be quite meaningless to the leader unless he could easily identify who among the farmers failed to comply with the cropping calendar if this is the aspect which was being assessed. Considering that individual farm data were generated from the spot map, the team and the TSA Leaders contemplated using this to facilitate the latter’s work.
It should be mentioned that prioi to project implementation the farmer leaders were already undertaking data-generating functions for the NIA. The joint management contract between the NIA and the IA required the TSA Leader to submit to the NIA systems office a weekly report on the planted area under his supervision. The NIA provides the reporting format which entails listing each lot number of every irrigated parcel that had been planted, its actual tiller or owner and their addresses. This information is used by the NIA to estimate the target collection of Irrigation Service Fees (ISF) for the current cropping season as well as the basis for determining which farmers used irrigation water and how much they would be billed. On NIA’s part, the farmer leader’s participation in the preparation of this crucial report resulted in billing inefficiencies caused by thedelayed report submission by the farmer leader. The Ditchtenders presumed that the TSA Leaders’ inability to submit the report was due to their lack of cooperation when, in fact, it was due to difficulties such as writing handicaps. Hence, these personnel had to do the reports themselves rather than face the ire of the systems office for submitting late reports. Expecting the same behavior from the TSA Leaders, some Ditchtenders fell into the habit of doing the report themselves. This is effectively an “informal” withdrawal of the leaders’ role in the reporting system thereby eroding the participatory process that NIA expects.
Discussing the project team’s desire to modify the self-assessment forms with the NIA systems staff resulted in NIA’s sharing of the dilemma on the List of Irrigated and Planted Area (LIPA) form. It surfaced that the forms used by NIA could not be filled in by the TSA Leaders because of difficulty
Intervention Activities and Methodologies 29
of writing the names of individual water users given the size of the turnout service area membership and the leaders’ advanced age and low educational attainment. It was therefore agreed that the Project Team would assist NIA in devising the form such that all names of water users in the area would already be printed together with farm lot size and lot numbers which shall be taken from the result of the spot mapping activity. Given this innovation, the TSA Leader was then expected to simply check the names of those who were able to plant during the week being monitored. The Ditchtender then collects the forms and submits them to the NIA Systems Office.
The innovation introduced in the LIPA form was also adopted in the self-assessment form. Columns were provided to reflect the different stages of farming activities per month. Starting in July and going on to November 1993, the leaders agreed to check in the appropriate space required to fill in data for the farming stage of a particular farm lot. Moreover, additional columns were incorporated in the same page to reflect status of payment of the various Financial dues by farmer members. With this method. recording became easier, quicker and more accurate. The leaders can, at one glance, determine the names of farmers not complying with the cropping calendar and who among them needed to be reminded to pay their dues. One major drawback of this revised approach is that much paper is required to incorpo- rate all the names of the farmers per TSA. This is worth emphasizing because the additional cost of printing and reproduction might hamper the sustainabil- ity of the entire process after project phase out considering that the IAs’ financial resources are very meager. The final modifications introduced called for monitoring water distribution on a per farm lot basis. The aim was to shorten the questionnaire and attain higher accuracy in data gathering. Annex I1 shows the original form while Annex 11-a is the final form used.
The project team deemed it necessary to visit each TSAL to give him further training in filling in the form. This function was slowly transferred to the 1A official assigned to supervise a group of TSALs. Eventually, the IA officials are expected to use the self-assessment results as a means to gauge the level of performance of the TSA Leaders. On their part, the TSA Leaders would be able to assess which functions they were able to carry out effectively and those that need to he improved. The present data analysis among TSA Leaders is limited to the data needed by the NIA such as those for the preparation of the LIPA and for the report on damaged farm areas due to pests, flood or drought needed for determining which farm lots are eligible to be exempted from ISF payment. Figure 3 illustrates the specific activities undertaken to date.
.
Intervention Activities and Methodologies 31
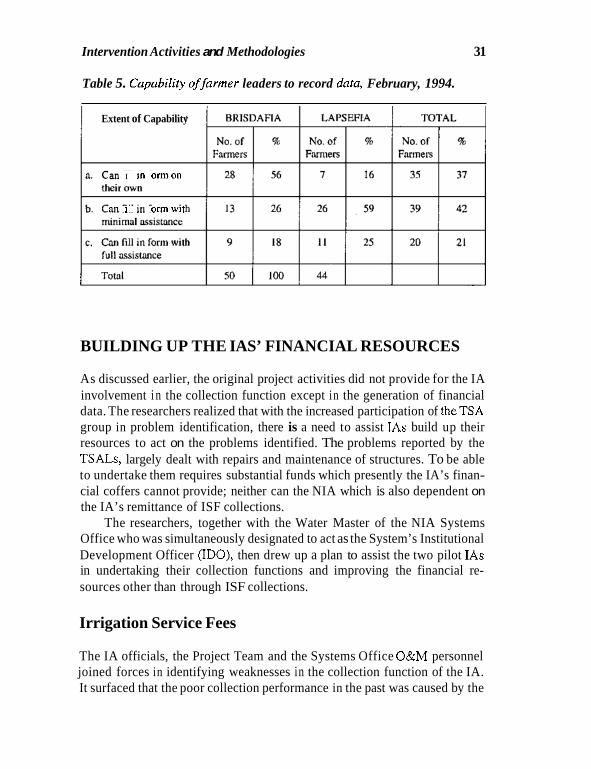
Table 5. Capabiliry offarmer leaders to record data, February, 1994.
Extent of Capability
an I in mmon
an I In ormwit
BUILDING UP THE IAS’ FINANCIAL RESOURCES
As discussed earlier, the original project activities did not provide for the IA involvement i n the collection function except in the generation of financial data. The researchers realized that with the increased participation of theTSA group in problem identification, there is a need to assist IAs build up their resources to act on the problems identified. The problems reported by the TSALs, largely dealt with repairs and maintenance of structures. To be able to undertake them requires substantial funds which presently the IA’s finan- cial coffers cannot provide; neither can the NIA which is also dependent on the IA’s remittance of ISF collections.
The researchers, together with the Water Master of the NIA Systems Office who was simultaneously designated to act as the System’s Institutional Development Officer (IDO), then drew up a plan to assist the two pilot IAs in undertaking their collection functions and improving the financial re- sources other than through ISF collections.
Irrigation Service Fees
The IA officials, the Project Team and the Systems Office O&M personnel joined forces in identifying weaknesses in the collection function of the IA. It surfaced that the poor collection performance in the past was caused by the
32 Intenmtion Activities and Methoddogies
late issuance of the bills, the preparation of which is the responsibility of the NIA. This office usually issues group bills which are not acceptable to the collectors. Some reasons cited include: 1) the good payers were discouraged to pay their fees since they could see from the group billing that there were many delinquent payers, and 2) farmers wanted individual billing as an official notice on the account that need to be settled. It was therefore agreed that the IA shall prepare the individual bills based on the group billing to be issued by the NIA. The lack of an incentive scheme for the IA collectors was also pinpointed as a major setback.
Given these problem areas, it was agreed that the Project Team and the Water MastedIDO would assist the 1A in devising the individual billing form, establishing a process for bill distribution and in installing an incentive mechanism for the IA collectors. In addition, collectors were provided with journals where they shall record their collection and remittances. A contest was also launched to motivate the collectors and TSA Leaders to turn in high performance in the collection of ISF. The new billing system, however. which was supposed to be implemented during the wet season of 1992 was never tested because the NIA Systems Superintendent decided to shift to individual billing.
During the wet season of 1993, the TSA Leaders were tapped to under- take the collection function given that they were in the best position to do the task. They have the list of water uscrs, the size and location of the farm lots as well as their residential addresses generated through the spot-mapping activity. Sincemost oftheTSALs were beginners in thecollection work, they had to be trained for this function. It was observed during thetraining sessions that the transaction instruments used by the IAs were handed down by the NIA and were not yet modified to suit the capability of the farmers who are now delegated with the collection function. The training was extended to the actual collection period to give the new collectors practical experience in the field. The researchers helped theNIA staffmonitor the progress ofthe trainees in issuing receipts, and in preparing the required collection report. Figure 4 highlights the sequential activities undertaken.
Financial Resources other than ISF Collection
The 1A has two important sources of funds which have not been fully tapped. These are the membership fees and the annual dues. Each farmer is supposed to pay PI 0.00 ($0.40) upon registration as member of the IA. Given that one IA has a potential farmer membership of 1,831, it stands to gain P18,310
Interveniion Activities and Methodologies 33
($732.40). Once a farmer becomes a member, he is obliged to pay an annual due of P5.00 ($0.20). Again, multiplying this with the number of potential members, the IA would be able to generate P9,155 per year ($366.20). These sources were not fully tapped by the IA. By July 1992, in BRISDAFIA, only 6 percent of its potential members had registered while in LAPSEFIA, the number was 34 percent. There was a need therefore to campaign for mem- bership to the IA and enhance collection of the membership fees and annual dues. Thus the following activities were implemented:
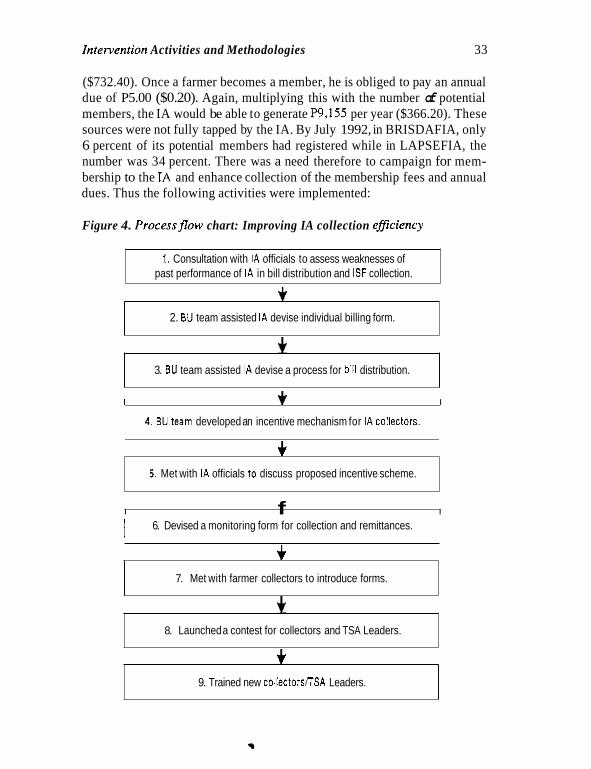
Figure 4. Processflow chart: Improving IA collection eflciency
1. Consultation with IA officials to assess weaknesses of past performance of IA in bill distribution and ISF collection. +
2. BU team assisted IA devise individual billing form.
+ 3. BU team assisted IA devise a process for bill distribution.
I .c. I
I 4. BU team developed an incentive mechanism for IAcollectors. I c
5. Met with IA officials to discuss proposed incentive scheme.
I f I
j 6. Devised a monitoring form for collection and remittances. 1 c
+ 7. Met with farmer collectors to introduce forms.
8. Launched a contest for collectors and TSA Leaders.
c 9. Trained new coilectorsiTSA Leaders.
34 Inrewention Activiries and Merhodologies
a. Membership campaign. The IA officials headed by their president took the responsibility for organizing membership campaign meetings with the assistance of the NIA Institutional Development Officer (IDO) and the BU Research Team. In February 1994, the number of registered members increased from 34 percent to 41 percent in LAPSEFIA while in BRISDAFIA the change in the number of registered members was quite negligible.
Decentralizing membership fee and annual dues collection. Before the start of the project, the collection scheme for the dues was centralized at the IA level and became a function of the IA treasurer. With this setup, the treasurer found it very difficult to collect individually from the members resulting in a very low collection rate. Tapping the IA collec- tors to do this function was not very successful as the task did not provide any incentives in return for the collectors’ efforts.
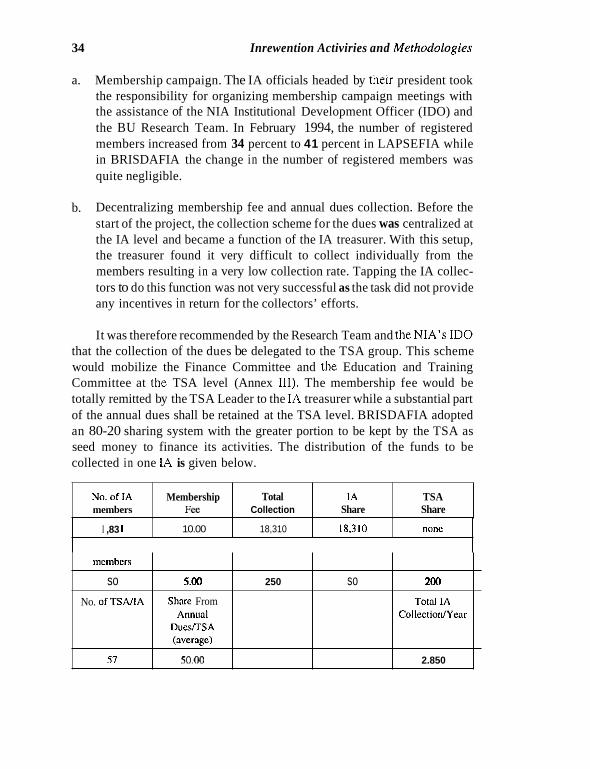
It was therefore recommended by the Research Team and theNIA’s I D 0 that the collection of the dues be delegated to the TSA group. This scheme would mobilize the Finance Committee and the Education and Training Committee at the TSA level (Annex 111). The membership fee would be totally remitted by the TSA Leader to the IA treasurer while a substantial part of the annual dues shall be retained at the TSA level. BRISDAFIA adopted an 80-20 sharing system with the greater portion to be kept by the TSA as seed money to finance its activities. The distribution of the funds to be collected in one IA is given below.
b.
No. of IA members
Membership Total IA TSA Fee Collection Share Share
I ,83 1 10.00 18,310 i8.3111 none
mcmbcrs
so No. ofTSiVlA
57
5.00 250 so 200
Share From Total IA
DucsfTSA Annual CollectiarllYrar
(average)
moo 2.850
Intervention Activities and Methodologies 35
The collection of these funds is entirely dependent on the IA and its ability to encourage members to participate in the IAs affairs. Payment of these dues is a good indicator of the members' interest to be part of the organization. Hopefully, the scheme would:
a.
b.
c.
train the TSAL/TSA group in the collection function
provide seed money to finance planned activities
trigger excitement at the TSA level to generate money to fund their own activities
develop self-reliance at the TSA level
improve collection rate of membership fees and annual dues
d.
e.
SPOT-MAPPING FOR BASELINE DATA GENERATION
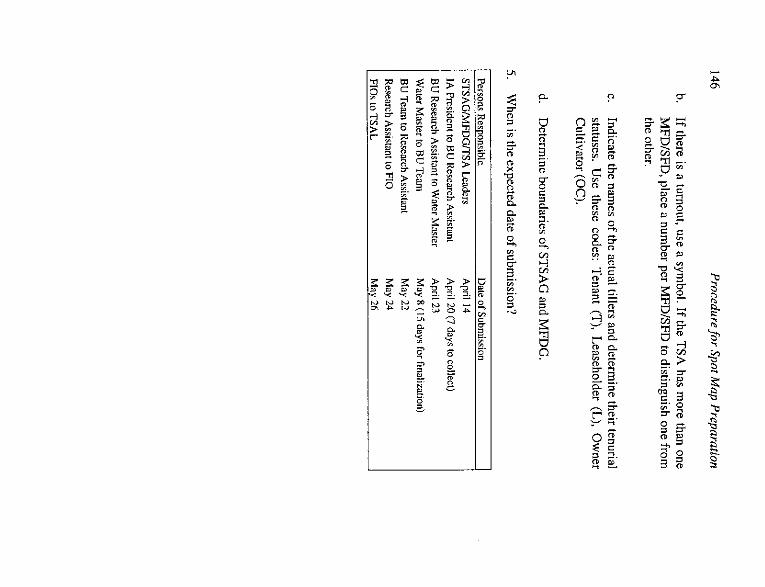
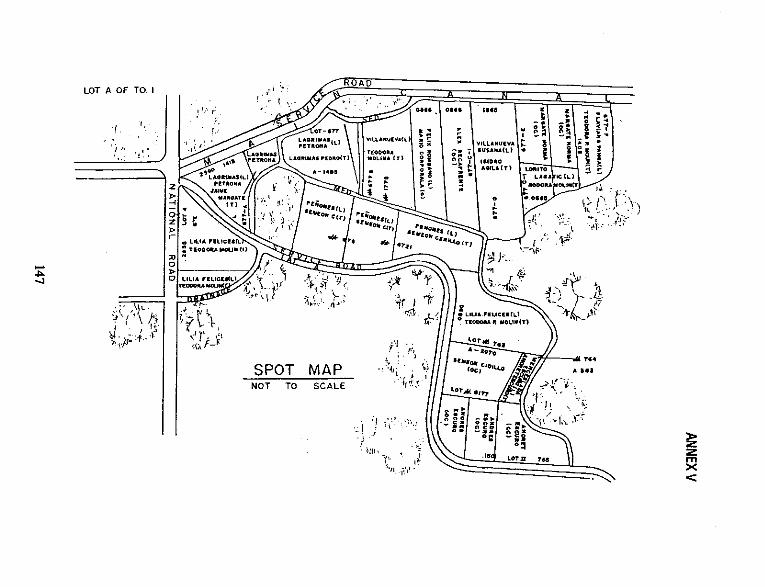
The spot-mapping activity was conceived when IA officials expressed their desire to have a profile of the IA and the TSAs which reflects baseline information about their area of responsibility and this could be readily used when establishing linkages with other agencies. In addition, spot maps were deemed an important tool in the self-assessment process in that leaders would have a defined and clear picture of their area of responsibility, including an accurate estimate of the size of farms and number of farmers under their jurisdictions. With the spot map, the TSAL can also easily indicate the status of canals, main and supplementary farm ditches and facilities. Specifically, the spot map contains:
a. boundary of the TSA, Supplementary TSA (STSA) and Main Farm Group (MFD)
b. lot number and lot area
c. structures and facilities
36 lnterveniion Aciiviiies and Methodologies
d.
e. tenurial status
names of owners and tillers
/
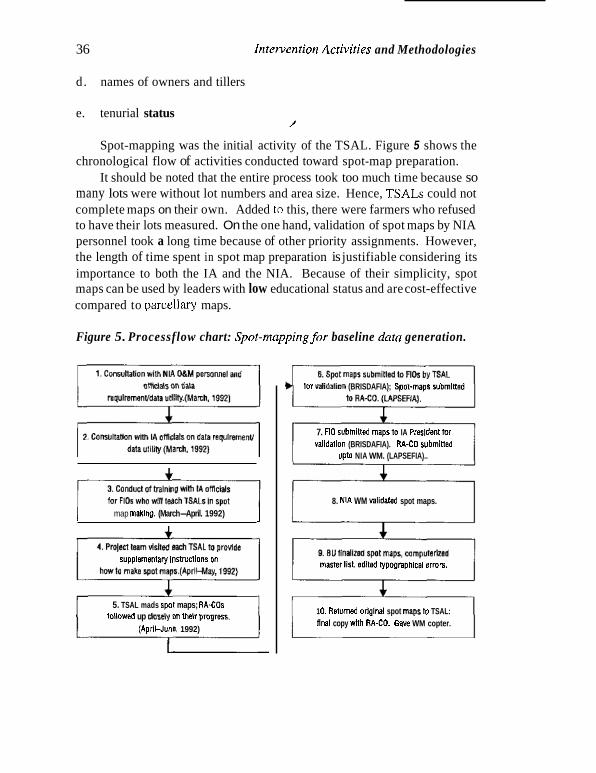
Spot-mapping was the initial activity of the TSAL. Figure 5 shows the chronological flow of activities conducted toward spot-map preparation.
It should be noted that the entire process took too much time because so many lots were without lot numbers and area size. Hence, TSALs could not complete maps on their own. Added to this, there were farmers who refused to have their lots measured. On the one hand, validation of spot maps by NIA personnel took a long time because of other priority assignments. However, the length of time spent in spot map preparation is justifiable considering its importance to both the IA and the NIA. Because of their simplicity, spot maps can be used by leaders with low educational status and are cost-effective compared to parcellary maps.
Figure 5. Processflow chart: Spoi-mappingfor baseline daia generation.
1 map maklng. (March-April. 1992) J
iupplcrnsntaly inrlmclionr on
5. TSAL mads spat maps; RA-COS lollowed up aOseiy m their ~rogres .
(AprilJuns. 1992)
lo1 Md%on (BRISDAFIA); Spot-maps iubrnlnsd
7. FID Wbmltted mapilo IA Pissldenlfoi Mlidalion (BRISDAFIA). RPI-CD submitted
Upta NIA WM. (LAPSEFIA)..
8. NiA WM nlidaled spot maps.
m l l e r lisl, edited typographical erron.
1 0. Returned original spot maps lo TSAL: Rnal copy wllh RA-CD. Gave WM copter.
Intervention Activities and Methodologies 37
The detailed procedures for spot map preparation which were distributed to the TSALs are given in Annex IV (only the English version). Also a sample of a spot map made by the leaders is given as Annex V.
The NIA management acknowledged the importance of this endeavor because the information generated had a number of uses and advantages:
a. Update the list of registered members needed for LIPA preparation. In the process of preparing the spot maps, initial findings disclosed that a number of water users had not paid ISF for years. They were not registered members and their farm lots were not reflected on the parcel- l a y map.
Determine area harvested, area benefited and area planted. These are required for ISF computation. In the past, i t was the responsibility of the O&M personnel to generate these data, who in turn tapped the assistance of the FIOs and the TSALs.
Area served during the wet and dry seasons. The data are specially relevant to LAPSEFIA since seasonal discrepancies arise due to sub- merging of areas during the wet season.
By April 1994,92 percent of the maps were validated and are now being used by the TSAL in the self-assessment process. The spot mapping activity was to identify 28 hectares of benefited area which were not registered with the IA and NIA and so were not billed. It is expected that there will be an increase in ISF collection due to the inclusion of newly identified water users in the IANIA's billing list.
b.
c.
INTRODUCTION OF THE SELF-ASSESSMENT MECHANISM FOR O&M PERSONNEL OF THE NIA SYSTEMS OFFICE
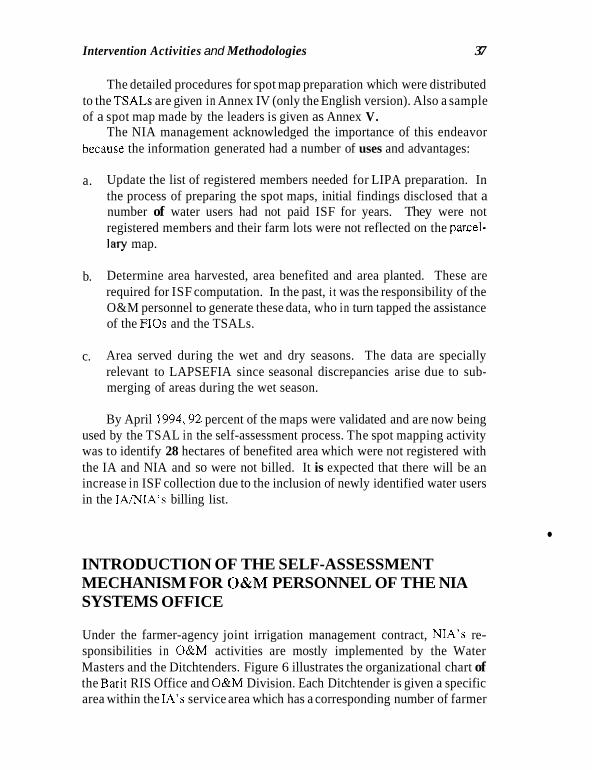
Under the farmer-agency joint irrigation management contract, NIA's re- sponsibilities in O&M activities are mostly implemented by the Water Masters and the Ditchtenders. Figure 6 illustrates the organizational chart of the Barit RIS Office and O&M Division. Each Ditchtender is given a specific area within the IA's service area which has a corresponding number of farmer
38 Intenlention Activities and Methodologies
leaders as counterparts for the O&M task. In BRISDAFIA, Ditchtenders and Water Masters are responsible for the maintenance of the main canals and laterals while the TSA Leaders take charge of the O&M function from the turnout to the main and supplementary farm ditches. Meanwhile, in LAPSE- FIA, the NIA O&M personnel are responsible for the main canal maintenance while the TSA Leaders assume the maintenance task from the lateral down to the main and supplementary farm ditches. Since their duties are comple- mentary, it was logical that the Ditchtender should also gather field informa- tion that would reflect his performance. The scheme requires the DitchtenderlWater Master to be in contact with farmer leaders to monitor their performance as well as to thrash out problems. Considering that the data collected by the Ditchtenders cover not only their area of responsibility hut those of the TSA Leaders as well, the Water Master who consolidates the report is provided with a complete picture of the system for his own planning and decision-making function vital at his supervisory level. Eventually, it is planned that the data shall be channeled to higher management levels.
Figure 6. Organizational chart of rhe BARlTRlS Office and O&M Division.
Irrigation Superintendent (IS)
Assistant Irrigation Superintendent (AIS) : Operation & Maintenance Division
Division A BRlSDAFlA Division B NiBFlA Division C LAPSEFiA
3 Ditchtenders 2 Ditchtenders 2 Ditchtenders
Intervention Activities and Methodologies 39
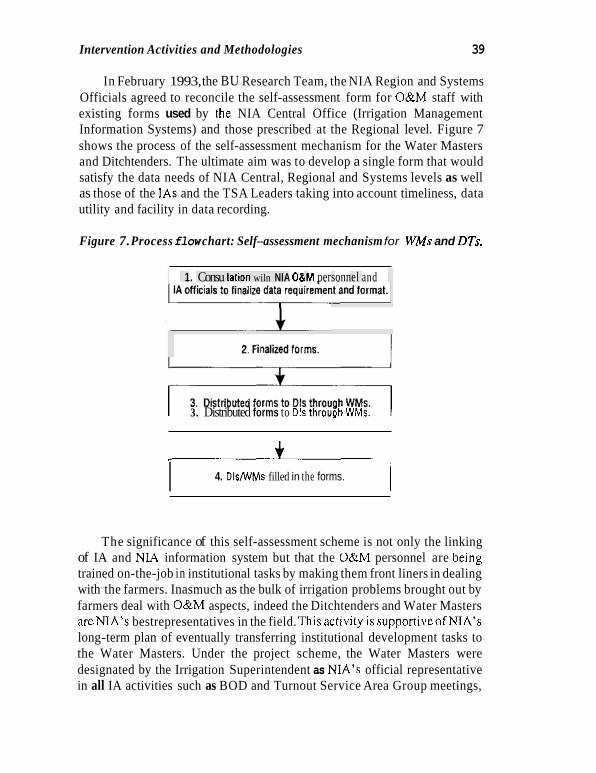
In February 1993, the BU Research Team, the NIA Region and Systems Officials agreed to reconcile the self-assessment form for O&M staff with existing forms used by the NIA Central Office (Irrigation Management Information Systems) and those prescribed at the Regional level. Figure 7 shows the process of the self-assessment mechanism for the Water Masters and Ditchtenders. The ultimate aim was to develop a single form that would satisfy the data needs of NIA Central, Regional and Systems levels as well as those of the IAs and the TSA Leaders taking into account timeliness, data utility and facility in data recording.
Figure 7. Process flow chart: Self--assessment mechanism for WMs and DTs.
I 1. Consu talion wiln NIA OBM personnel and
I 2 finalized lorms.
I 7 3. Distributed forms to Dls throuQh WMs.
f I 4. D l W M s filled in the forms. I
The significance of this self-assessment scheme is not only the linking of IA and NIA information system but that the O&M personnel are being trained on-the-job in institutional tasks by making them front liners in dealing with the farmers. Inasmuch as the bulk of irrigation problems brought out by farmers deal with O&M aspects, indeed the Ditchtenders and Water Masters areMA’s bestrepresentatives in the field. Thisactivity issupporliveofNIA’s long-term plan of eventually transferring institutional development tasks to the Water Masters. Under the project scheme, the Water Masters were designated by the Irrigation Superintendent as NIA’s official representative in all IA activities such as BOD and Turnout Service Area Group meetings,
40 hirervention Activifies and Methodologies
membership campaigns, and the like. A Water Master WJS also given author- ity to act on NIA-IA matters that do not require higher-level decisions. On the other hand, the Ditchtenders were assigned to monitor a specified number of TSA Leaders with regard to the accornplisliment of the self-assessment forms. With the recent streamlining of the Institutional Development Officers (IDO) due to financial constraints, the Water Master had fully assumed all the official duties of the I D 0 in the 2 IAs covered by the project.
THE PROJECT TEAM COMPOSITION AND MANAGEMENT
Although the Bicol University Research Team assumed the overall manage- ment of the project due to the working agreemeiit made with IIMI. the lead implementing agency was the BARIT Rinconada Systems Office headed by the Irrigation Superintendent. The Bicol University served as a partner of the NIA in strengthening the managerial capability of the IAs in consonance with its participatory management policy. ?be NIA Bicol Regional Office coordi- nated and monitored the prqject implementation while IIMI provided the funding support and technical supervision and also monitored the project.
On NIA’s part, the project involved the Irrigatioii Superintendent. the Assistant Superintendent who heads the Systems O&M Division, two Water Masters in charge of the Pilot IAs, six Ditchtenders and one Instituticinal Development Officer (IDO). At the time of project phase-out, one of the two Water Masters was doing the work of an I D 0 since the services of the previous one were terminated due to budgetary constraints. Likewise, the number of Ditchtenders wns reduced to three due to the same reason. The Regional Office of the NIA was represented by the Chief of the Institutional Division and a representative from the Research Section. By the middle of the project implementation, the Regional Manager retired and the designated Officer-in-Charge showed keen interest i n the project having been one of those who piloted the participatory process in the Philippines.
The Bicol University Research Team consisted of two Study Leaders, with one acting concurrently as Project Leader, a Community Development Specialist (CDS) and two Research Assistants (RAs) and had a Word Proc- essor. The RAs worked lull time i n the field and were residents of the Pilot IAs. The Study Leaders and the CDS wete Professors in the University who were partly released from their teaching tasks Lo be able to undertake the
Intervention Activities and Methodologies 41
project. On average, each devoted 24 hours in the project site per week. The introduction of the self-assessment process was spearheaded by the BU Research Team. Their role was to conceptualize the project activities in consultation with the NIA and IA officials. The IA officials and TSA Leaders were the key participants in the self-assessment scheme. The IA and NIA officials took a very active part in the design of the instrument after which the BU Research Team trained the TSA Leaders in filling in the forms and monitored their progress. The TSA Leaders filled in the forms in consultation with the farmer members. The results were reported to theIA officials through the organization’s regular Board of Directors’ meeting.
IIMI was involved in all phases of project implementation, from the planning stage, actual operation, documentation and in the analysis of the project outcome. As earlier mentioned, the general strategies and methodol- ogy for operationalizing the self-assessment process was conceptualized jointly by the Bicol University project team and IIMI. Valuable inputs were given by IIMI researchers particularly in initially identifying the dimensions of organizational performance that should be assessed. Monitoring was done periodically and its output became the basis for providing the BU Research Team directions in future activities to be undertaken in the field. IIMI also provided the project team very relevant literature which kept the team in touch with research activities pursued in other countries.
CHAPTER 6
Indicators of Success of Intervention Activities
PERFORMANCE INDICATORS USED
THEULTIMATETEST of IA performance is whether the organization has satisfied the general objective of ensuring adequate and timely delivery as well as equitable distribution of irrigation water among beneficiaries. As a corollary, the attainment of this objective necessitates that canals and structures he maintained properly, timely and cost-eff&tively. In this context, the self-as- sessment process captures the performance of TSALs who are the principal actors involved in the execution of the above-mentioned function. The questionnaire which is filled in by the TSAL monthly, incorporates a number of performance indicators which revolve around the five major activities required in managing the irrigation system. These are: water allocation and distribution, system maintenance and repair, financial management, planning of organizational activities, and conflict management. Table 6 summarizes the indicators reflected in the self-assessment process and how these were quantified.
The extent of efficiency in water allocation and distribution at the TSA level is manifested by the actual number of farmers who have adhered to the cropping calendar, the number of farm lots whose water supply is perceived to be adequate, and conversely, the number of ,lots damaged due to pests, flooding, drought, etc. These items of information are specially important in LAPSEFIA as it is perennially beset by water-short problems due to its tail-end location. For efficient utilization of scarce water, therefore, strict enforcement of the cropping calendar and adherence to rotation schedules are imperative and are duly recognized by the NIS as well as the IAs. This policy should particularly be addressed to most upstream farmers belonging to the
43
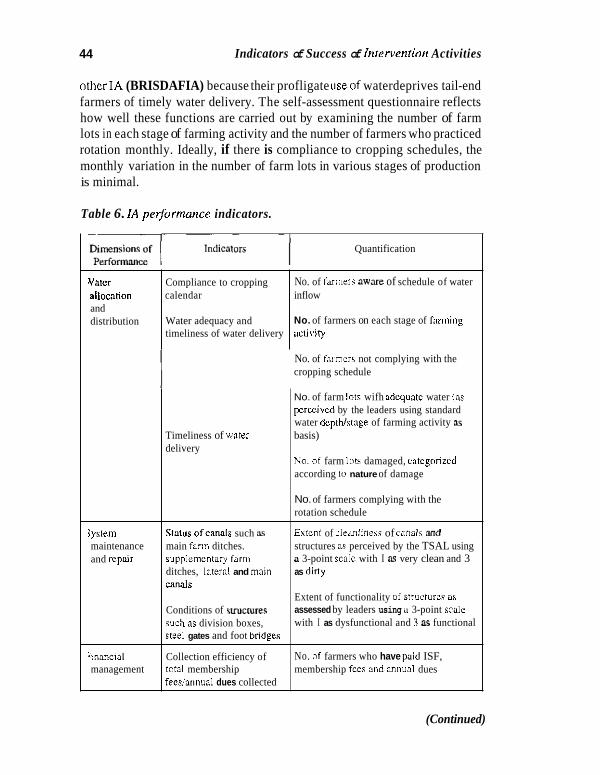
44 Indicators of Success of lnterventiorr Activities
otherIA (BRISDAFIA) because their profligate useof waterdeprives tail-end farmers of timely water delivery. The self-assessment questionnaire reflects how well these functions are carried out by examining the number of farm lots in each stage of farming activity and the number of farmers who practiced rotation monthly. Ideally, if there is compliance to cropping schedules, the monthly variation in the number of farm lots in various stages of production is minimal.
Table 6. IA Performance indicators.
Yatcr allocation and distribution
Quantification
Compliance to cropping calendar inflow
Water adequacy and timeliness of water delivery octiviry
No. of farmen wart of schedule of water
No. of farmers on each stage of farming
iystem maintenance and repair
:inancia1 management
No. of farmen not complying with the cropping schedule
No. of farm lots wifh adequate water (as perceived by the leaders using standard water depthJstage of farming activity as
Timeliness of water basis) delivery
No. of farm lots damaged, categorized according to nature of damage
No. of farmers complying with the rotation schedule
Extent of cleanliness of canals and structures a.. perceived by the TSAL using a 3-point scdc with I s very clean and 3 as dirly
Extent of functionality of Structures as assessed by leaders using B 3-point scale with I as dysfunctional and 1 as functional
Status ofcanals such &s main fann ditches. supplerncntvry farm ditches, Islerill and main canals
Conditions of SVUctures such 3s division boxes, steel gates and foot bndges
Collection efficiency of total membership feeslannual dues collected
No. of farmers who have paid ISF, membership fces and wnual dues
(Continued)
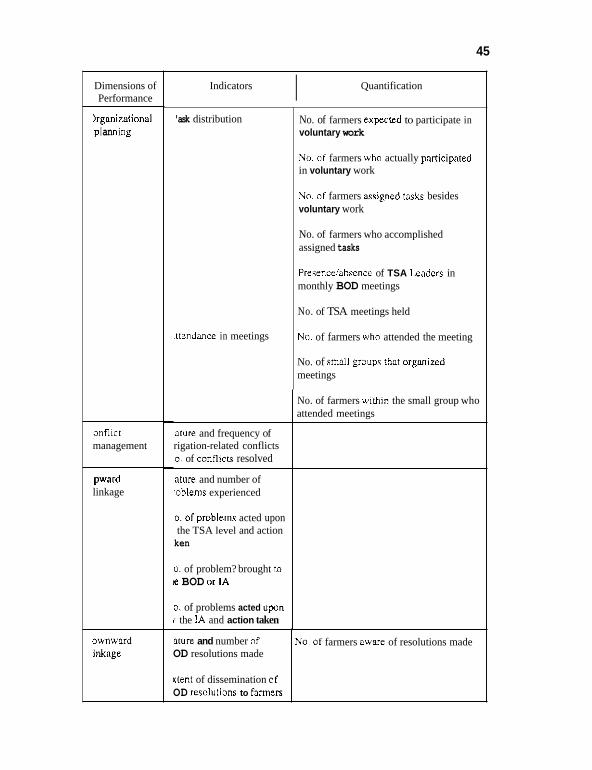
45
ature and number of OD resolutions made
rtent of dissemination of OD resolulions to farmen
Dimensions of Performance
hganirational p I an n i n g
No. of farmers aware of resolutions made
'onflict management
pward linkage
awnward inkage
Indicators Quantification I 'ask distribution
.ttendmce in meetings
No. of farmers expected to participate in voluntary work
No. of farmers who actually pamicipated in voluntary work
No. of farmers vssigned wsks besides voluntary work
No. of farmers who accomplished assigned tasks
Presencdabsence of TSA Leadcn in monthly BOD meetings
No. of TSA meetings held
No. of farmers who attended the meeting
No. of small groups thar organized meetings
No. of farmers within the small group who attended meetings
lalure and frequency of rigation-related conflicts '0. of conflicu resolved
m r e and number of roblems experienced
0. ofproblems acted upon the TSA level and action ken
0. of problem? brought to !e BOD or I A
0. of problems acted upan i the IA and action taken
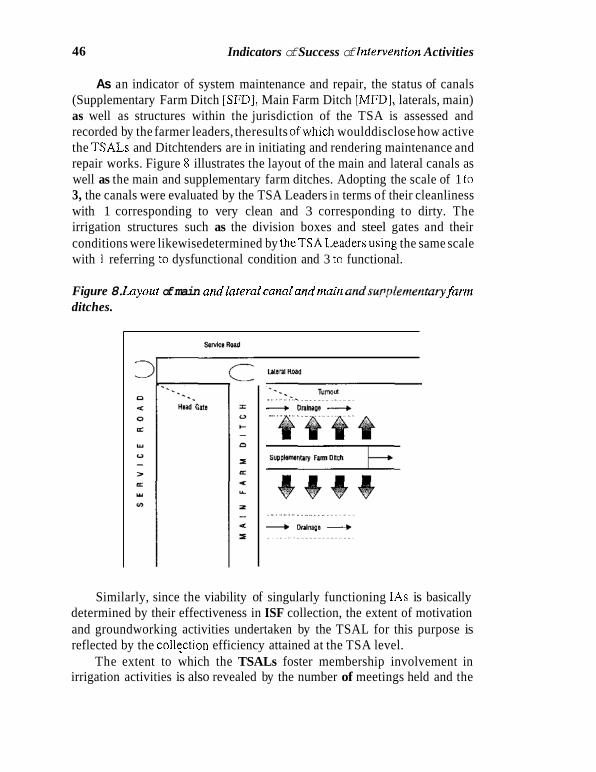
46 Indicators of Success of Intervention Activities
As an indicator of system maintenance and repair, the status of canals (Supplementary Farm Ditch [SFD], Main Farm Ditch [MFD], laterals, main) as well as structures within the jurisdiction of the TSA is assessed and recorded by the farmer leaders, theresults ofwhich woulddisclose how active the TSALs and Ditchtenders are in initiating and rendering maintenance and repair works. Figure 8 illustrates the layout of the main and lateral canals as well as the main and supplementary farm ditches. Adopting the scale of 1 to 3, the canals were evaluated by the TSA Leaders in terms of their cleanliness with 1 corresponding to very clean and 3 corresponding to dirty. The irrigation structures such as the division boxes and steel gates and their conditions were likewisedetermined by theTSA Leadersusing the same scale with 1 referring to dysfunctional condition and 3 to functional.
Figure 8. Luyout of main andlateralcanal andmain a?rdsur[~lenrentary farm ditches.
. .. .
Similarly, since the viability of singularly functioning IAs is basically determined by their effectiveness in ISF collection, the extent of motivation and groundworking activities undertaken by the TSAL for this purpose is reflected by the collpction efficiency attained at the TSA level.
The extent to which the TSALs foster membership involvement in irrigation activities is also revealed by the number of meetings held and the
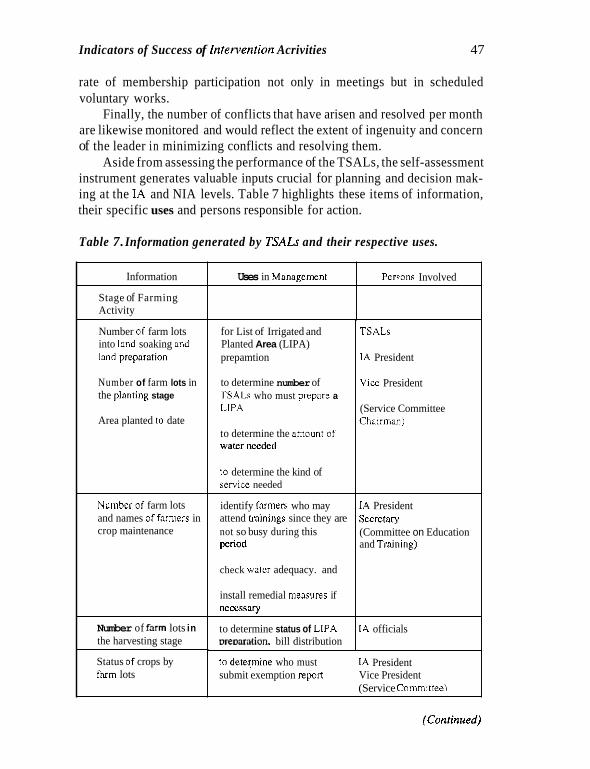
Indicators of Success of Intervention Acrivities 47
rate of membership participation not only in meetings but in scheduled voluntary works.
Finally, the number of conflicts that have arisen and resolved per month are likewise monitored and would reflect the extent of ingenuity and concern of the leader in minimizing conflicts and resolving them.
Aside from assessing the performance of the TSALs, the self-assessment instrument generates valuable inputs crucial for planning and decision mak- ing at the IA and NIA levels. Table 7 highlights these items of information, their specific uses and persons responsible for action.
Table 7. Information generated by TSALs and their respective uses.
Uses in Management Information
Stage of Farming Activity
Number of farm lots into land soaking and land preparation
Number of farm lots in the planting stage
Area planted to date
Pcrsons Involved
Numkra f farm lots and names offarmers in crop maintenance
for List of Irrigated and Planted Area (LIPA) prepamtion
to determine number of TSALq who must prepare a LIPA
to determine the amount of water needed
to determine the kind of sewice needed
identify farmerr. who may attend vainings since they are not so busy during this period
check watcr adequacy. and
install remedial measures if necessvry
to determine status of LiPA DrCDJIBtiOn. bill distribution
Number of farm lots in the harvesting stage
Status of crops by fnrm lots
TSALs
IA President
Vice President
(Service Committee Chairman)
IA President Secretary (Committee on Education and Tmining)
I A officials
to detymine who must submit exemption repon Vice President
IA President
(Service Committee)
(Conrinued)
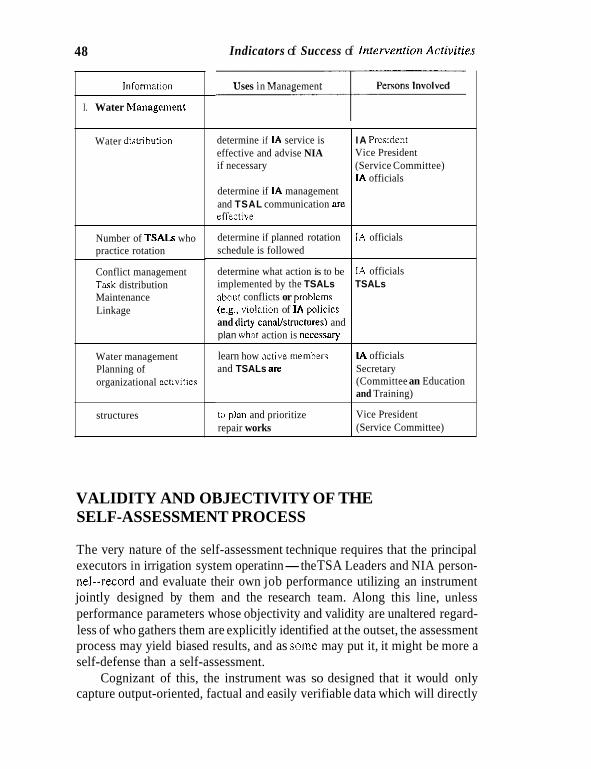
48
determine if I A service is effective and advise NIA if necessary
determine if I A management and TSAL communication are errective
determine if planned rotation schedule is followed
determine what action is to be implemented by the TSALs about conflicts or problems (e.g., violation of IA policics and dirty cnnalistructures) and plan what action is necessaly
learn how active memben and TSALs are
Indicators of Success of lnierveniion Aciiviiies
I A Prcsident Vice President (Service Committee) I A officials
I A officials
IA officials TSALs
I A officials Secretary (Committee an Education and Training)
lnfomatio"
to plan and prioritize repair works
I. Water Manegcmmt
Water disvlbution
Vice President (Service Committee)
Number of TSALq who practice rotation
Conflict management Twk distribution Maintenance Linkage
Water management Planning of organizational mivities
structures
Uses in Management
VALIDITY AND OBJECTIVITY OF THE SELF-ASSESSMENT PROCESS
The very nature of the self-assessment technique requires that the principal executors in irrigation system operatinn-the TSA Leaders and NIA person- nelhecord and evaluate their own job performance utilizing an instrument jointly designed by them and the research team. Along this line, unless performance parameters whose objectivity and validity are unaltered regard- less of who gathers them are explicitly identified at the outset, the assessment process may yield biased results, and as snme may put it, it might be more a self-defense than a self-assessment.
Cognizant of this, the instrument was so designed that it would only capture output-oriented, factual and easily verifiable data which will directly
Indicators of Success ojlntervention Acrivities 49
or indirectly gauge the TSA Leaders’ performance. It must be stressed that, in addition to the usefulness of the self-assessment data as a basis for judging the TSA Leaders’ performance, the process of recording itself acts as an impetus to improve further their own performance. This is because data-gen- eration cannot be possibly done with the TSA Leaders sitting down. The magnitude of work necessitates them to go around the fields, closely monitor their assigned territory and interact with farmers, the latter being a major source of information. In other words, because of the self-assessment exer- cise, the farmers recognize the presence of the leaders and are given the chance to express their irrigation-related problems. Such interaction may ultimately motivate the TSA group to get more actively involved in IA work.
To ensure the validity of the self-assessment outcomes, it becomes expedient to install a checking mechanism which would assay these perform- ance results. To elucidate, one major function of a TSA Leader is to enforce compliance of the cropping calendar to optimize the use of the limited water resources. To assess how well this task has been accomplished, the leader records the number of farmers who are into various stages of farming activity. These data are then used to prepare the list of planted areas (LIPA) which is submitted to the NIA for billing purposes. Since a NIA Ditchtender is assigned to collect the LIPA and monitor the area, he would be in a position to examine the accuracy of the submitted report. Besides, a leader is expected to exercise care in preparing the report and would not really include an area in the LIPA which is not actually planted because this would cause the ire of the farm owner who eventually would be billed and required to pay the corresponding irrigation service fee.
The collection efficiency in the rotational area is another indicator of performance and could be culled from the self-assessment form. It must be recognized, however, that the collection performance is heavily dependent on the current farm yield which in turn is influenced by a number of other factors such as pests, prevailing weather condition and inputs used. It cannot be refuted, however, that the system of collection and the collection efforts exerted also influence collection performance. Specifically, this aspect re- flects theefficiency ofthe leader in bill distribution as well as his effectiveness in motivating farmers to pay their dues. Again, accuracy of the report is ensured because the leaders who are at the same time collectors use the self-assessment report as a basis in preparing the weekly and monthly collection reports which in turn are submitted to the IA treasurer together with the amount collected. Thus, the self-assessment form becomes a monitoring
50 lridicarors of Success of Intervention Activities
tool not only of the treasurer but also of the leaderlcollector since the instrument at one glance shows which farmers have yet to pay their dues.
As an indicator to the extent to which equity in water distribution in the rotational area is realized, the TSA Leader assesses each farm lot in terms of water adequacy and keeps track of the location as well as the number of farm lots which have inadequate, excessive or enough irrigation water. He also records the number of farmers who practice rotation when scarcity of water is experienced. Similarly, he evaluates the cleanliness of canals and function- ality of structures. These and other data are consolidated by an 1A officer and are then reported to the BOD meeting. This presentation serves a dual purpose-first, to provide the IA officials with a holistic perspective of the operational dynamics of the association from which decision making and planning shall emanate, and second, as a means of verifying the reliability of the individual reports of the TSALs. A leader who values his credibility and integrity therefore would be compelled to record only factual data because other BOD members, especially in the adjacent areas, would certainly be well informed of the status in their neighboring areas and could therefore attest to or contradict the results.
Meanwhile, the self-assessment instruments which are filled up by the NIA officials contain data gathered by the TSA Leader, among others. Basically, the performance of the Ditchtenders is based on how well their assigned areas of responsibility function. This is in turn translated to a number of indicators which are similarly applied to the TSAL, such as maintenance of canals and structures, collection efficiency and resolutions of conflicts. As with the TSA Leaders, the NIA personnel would be obliged to reflect only truthful information as these could be easily verified by their supervisor, the Water Master, who just has to attend the BOD meetings where, as previously discussed, performance reports ofTSALs andNIA Ditchtenders are regularly reviewed and evaluated.
PROJECT OUTCOME
Irrigation experts in the Philippines as in other countries are unanimous in recognizing the crucial role of local farmer organizations entrusted to take over some responsibilities i n irrigation management on the viability and sustainability of irrigation systems. To this end, institutional development of IAs in the Philippines which in the past was given lukewarm attention by the
Indicators of Success of Intervention Activities 51
NIA, now stands on equal footing with physical rehabilitation and construc- tion of systems. The present project therefore deems to enhance social infrastructure, the thrust of which is to capacitatefarmer leaders to effectively carry out their mandated functions. If realized, the gains shall ultimately redound to more strengthened and better performing IAs.
The subsequent discussion highlights the project’s accomplishments after two years of implementation.
Increase in Collection Efficiency
The focus on collection efficiency as the choice of performance measure emanates from the contention that the ISF collection will be greatly improved once the TSA Leaders are emboldened to execute their functions more effectively, which is precisely what the self-assessment process hoped to accomplish. Since the IA performance is just a summation of the individual TSA’s contribution, a better-performing IA can ensure more efficient and adequate water delivery which consequently shall contribute to higher farm yields and ultimately increase the capacity of farmers to pay the ISF. This presupposition however, will be well grounded if water adequacy is the only limiting factor in attaining optimal yield. As it is, farm produce is determined by an interplay of water and non-water factors such as the weather conditions (e.g., existence of flooding, drought), level of production inputs used, and soil type, among others. Hence, in utilizing the collection figures as an indicator of IA performance, one must take note of these conditionalities which will provide a backdrop for the evaluation.
In practice, collection efficiency at the IA level is computed in two ways; current collection efficiency which is the ratio of actual collection to the current target collection, and overall collection efficiency which compares current collections and actual back account collections to current target collections. The former is used to determine the share that would accrue to the IAs under TypeIStage I1 contracts. Incidentally, the use of collection efficiency as a measure of IA performance jibes with what the NIA uses as the indicator of systems performance called “viability” which is computed as the ratio of revenues (mainly arising from ISF collections) to O&M expenses at the systems level.
The bar graphs (figure 9) present the comparative collection efficiencies in the two IAs before (wet and dry of 1991) and after (1991-1993) project implementation.
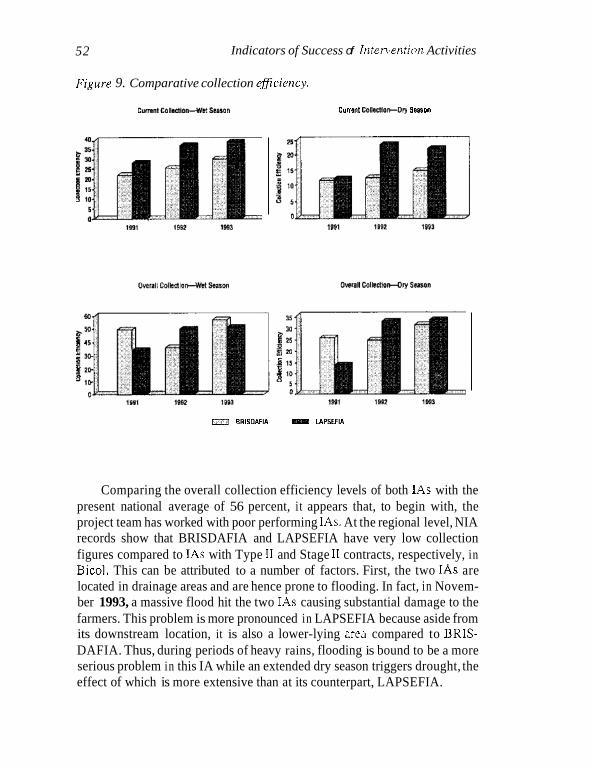
52
Figure 9. Comparative collection eflciency.
Indicators of Success of Intervention Activities
cvrrant colllrtlorrDry sanon
[3 BAISOAPIA I ULPSEFIA
Comparing the overall collection efficiency levels of both IAs with the present national average of 56 percent, i t appears that, to begin with, the project team has worked with poor performing IAs. At the regional level, NIA records show that BRISDAFIA and LAPSEFIA have very low collection figures compared to IAs with Type I1 and Stage I1 contracts, respectively, in Bicol. This can be attributed to a number of factors. First, the two IAs are located in drainage areas and are hence prone to flooding. In fact, in Novem- ber 1993, a massive flood hit the two IAs causing substantial damage to the farmers. This problem is more pronounced in LAPSEFIA because aside from its downstream location, it is also a lower-lying area compared to BRIS- DAFIA. Thus, during periods of heavy rains, flooding is bound to be a more serious problem in this IA while an extended dry season triggers drought, the effect of which is more extensive than at its counterpart, LAPSEFIA.
lndicators of Success of Intervention Activiries 53
Second, the average farm lot sizes in BRISDAFIA and LAPSEFIA (0.223 and 0.282 ha, respectively) are well below the average farm size of 1.4 ha in the Bicol Region as disclosed in a previous study (Lauraya and Sala 1990). As such, the collection function is much more tedious and difficult in these two IAs because of the necessity to cover so many farmers, each tilling a negligible parcel of farmland. The same research revealed that the 22 IAs in the National System studied had an average size of 307 members and an average area of 332 ha. Compare this to the average membership size of 1,994 and an average irrigated area of 653 ha in the two IAs under btudy. Indeed, for the same collection efforts expended, collection efficiency is expected to be higher in IAs whose average farm lot is relatively big. Also, since the farm size generally determines the economic status of the farmer, it could be surmised that farmers with big landholdings are in a better position to pay the ISF than those small farmers whose produce is barely enough for subsistence as in the case of the majority of the water users in the two participant IAs.
Focusing on current collection efficiency data (Annex VI), i t is transpar- ent that despite these odds, the IAs have achieved a marked improvement in this aspect speculated to be a result of the intervention efforts. Compared to thewetseasonin 199l,therewasanupwardtrend(12.41%in 1991 to23.63% in LAPSEFIA in 1992) in the two succeeding seasons in both IAs during the implementation phase. The same observation is noted during the dry seasons although a slight decline in collection efficiency was recorded in LAPSEFIA from 1992 to 1993 which could be attributed to the low harvests of members particularly those in the downstream areas whose farms have been seriously bit by the extended drought that took place. This adversity is evidenced by the sharp reduction in target collections (wet 1993) in this 1A as a result of exemptions from payment of ISF emanating from farm.destruction. Consis- tent with NIA’s policy, farmers may be exempted to pay ISF partially or fully depending on theextentoffarmdamage arisingfrom pests, floodsordrought. The role of TSA Leaders in this case is very crucial because they are the ones charged to prepare the exemption reports, to be submitted to the NIA.
With respect to overall collection efficiency, while figures in LAPSEFIA consistently rose, a slight decline was noted in BRISDAFIA in 1992 for both seasons which rose again in 1993. The reduction was due to low back account collections which more than offset the rise in current collection efficiencies. During this period, the systems office, as part of its collection campaign took a hard stance and informed the water users that terminal drainage would be extended indefinitely unless ISF collections improved. Hence, some farmers with back accounts could have been induced to pay the current dues first. On
54 Indicators of Success oflnrervention Acriviries
hindsight, however, it can be discerned that the strategy had hardly any impact.
Focusing on the reported collection figures once more, it is interesting to note that the back account collections whether in absolute terms or expressed as a percentage of actual collection in BRISDAFIA during the three-year period were consistently higher than in LAPSEFIA even if collec- tion efficiencies in both 1As are not too divergent. This trend, which the researchers anticipate would persist, is partly the result of deviations in the sharing schemes being followed by each association. While LAPSEFIA, under a Stage I1 contract, stands to collect an incentive for any amount collected for current collectibles, BRISDAFIA, with aType I1 contract. is not entitled to any share if current collection efficiency falls short of 50.01 percent. Meanwhile, a different system is followed for back accounts. Both IAs shall automatically receive incentives computed as a proportion of total back account collection using a fixed percentage, e.g., 25 percent of old accounts incurred prior to the effectivity of the contract, and 2 percent of new back accounts i n BRISDAFIA. Since this IA never exceeded the 50 percent mark in current collection from the time it entered the Type I1 contract. it has yet to receive a share from current collections. With what has been experi- enced, it is but rational for IA collectors to give priority to back account collections, knowing that they would be compensated for their efforts.
A shrewd collector might even deliberately encourage late payment of ISF as this amount would be eventually charged to back accounts. From the farmers’ viewpoint, there is an incentive to be delinquent in paying dues because the penalty expressed as interest added to back account (]%/month) is much lower than the prevailing rate in both the formal (2%/month) and informal (lO%/month) credit markets. Therefore, farmers who lack produc- tion capital may opt to use the money intended for ISF payment to sustain the succeeding production cycle rather than avail of production loans. Clearly, this situation, being detrimental to NIh’s finances considering the opportu- nity cost of funds, requires some policy changes. For the penalty to be enforceable, itsimpact must bebig enough tooutweighany gains arising from late payment of ISF. Laxity in enforcing sanctions against delinquent payers perpetuates the concept that an irrigation system is a public good, the maintenance of which should be the responsibility of the government. The IAs are charged with the responsibility of collecting irrigation fees and yet, the NIA assumes the responsibility for penalizing delinquent payers. To date, however. no one has been penalized despite the fact that many farmers have accumulated enormous back accounts. Since it is now the IAs that have direct
Indicators of Success of Intervention Activifies 55
contact with individual farmers, i t is reasonable that penalties arising from back accounts be imposed by them instead of the N U . In turn, the NIA could impose penalties on the IAs through contracts.
It is viewed that the present incentive scheme for back account collection of 2 percent is insufficient to encourage IA collectors to seriously pursue delinquent farmers. A higher percentage given to the IA, say 25 percent of back accounts collected, will certainly trigger their interest to attain higher collections. Such a strategy could therefore minimize NIA’s problem on back accounts which has burgeoned over the years.
Paradoxically, the poor collection performance is brought about by the poor maintenance service. Since it has been shown that the self-assessment process can be a tool to inspire ISF collection, it can be viewed as a means to break that vicious circle. It is anticipated that the IA as well as the NIA performance levels would be further enhanced once the self-assessment process is well internalized by the farmers, and, most importantly, linked to the data needs of the NIA.
Identification of Benefited Areas not Previously Billed and Updated NIA’s Master List
Aside from the self-assessment process, the preparation of the spot maps by the TSA Leaders helped update the master list of water users and resulted in arise in thebilledarea, which contributed totheincreasein theISFcollection. Specifically, 28.3 ha were identified as benefited areas but were not reflected in the NIA’s master list. If one would compute for the added revenue given the present rate of ISF, the newly identified areas would mean an increase of P 42.462 ($1,698) per year. Presuming that 100 percent collection efficiency is attained on these areas, collection efficiency is expected to increase by 5 perce.nt based on the 1993 wet season collection figures on both IAs (Annex VI).
The NIA Regional Office, the NIS and the IAs have acknowledged the utility of the spot maps as a cost-effective source of farm-level information. Earlier, the NIA office relied on the parcellary maps which had never been updated since it was developed a decade or so ago. As a result, farmers who have bequeathed or disposed of their farm properties, or have already passed away were still being billed by the NIA office, to the consternation oftbe new water users. There were also reports on some discrepancies in billing areas. As a result, farmers who were made to pay a larger ISF than the actual ISF, because the billed area exceeded actual farm size, have long complained but
56 Indicators of Success of lntervenrion Activiries
their complaints had fallen on deaf ears. In cases where farm sizes were bigger than what was reflected in the NIA master list, they clearly represented losses on the side of the IA and NIA. Similarly, in instances where the farm lots with irregular areas were subdivided to heirs, refusal to pay the ISF was common because of the confusion as to how much each tiller has to pay, thereby aggravating further the already grave back account problems.
All these have been resolved with the preparation of the spot maps at almost no cost to the NIA. It should be borne in mind that the TSA Leaders spearheaded the spot map preparation voluntarily, the results of which were validated by the Ditchtenders and Water Masters. It is worthwhile to mention that the participatory nature of evolving the spot maps established the leadership of the TSA Leaders and forged a closer link between them and the farmers. In the process of spot map preparation, the leaders felt the necessity to consult with the water users especially when farm lot measurements were put in question. Together with the owners, the TSA Leaders and the Ditcht- enders were involved in farm area measurements.
Recognizing these successes, other Water Masters in the same NIS have replicated these activities to other IAs. The Regional Office has also articu- lated its desire to introduce the concept to the other systems.
Enhancing the TSA Leaders’ Capability to Prepare Reports
Prior to the project. preparation of the List of Irrigated and Planted Areas (LIPA) was still being done by the NIA Ditchtenders and Water Masters although this task was supposed to be carried out by the TSA Leaders. As already discussed in the previous section, the self-assessment process paved the way for the revision of the LIPA form used by NIA to make it easy for farmers to prepare it. As a result, a heavy burden has been lifted from the NIA staff. Also, the self-assessment process has enhanced the capability of the leaders in preparing exemption reports arising from crop damages and has allowed them to submit accurate reports promptly. Previously, as with the LIPA, the NIA personnel were forced to prepare these exemption reports due to the lack of baseline data available at the TSA level. Because of the sheer number of individual farmers that need to be monitored by a handful of NIA staff, not all farmers entitled to be exempted from ISFpayment were included in their reports; hence, farmers’ complaints concerning this have been noted in the past.
Indicators of Success of Intervention Activities
Capacitating the TSA Leaders to Effectively Respond to All Facets of Irrigation Management
51
The subsequent discussion details the results of the self-assessment done by the farmer leaders from October 1992 to February 1994. The focus is to demonstrate how the data collected were used by the TSA Leaders in assessing the farmer leaders’ actual accomplishments vis-a-vis the expected roles in irrigation management and how the resulting assessment served as input in improving performance.
It might be mentioned that the mere process of data recording sets in motion the process of improvement in the performance of the TSA Leaders. While gathering field data, it became necessary for the leaders to closely interact and discuss not only with the members under them, but with other TSA Leaders and the NIA field staff as well. As a result, and as communica- tion flows improved, all parties became more aware of pertinent irrigation issues. In anumber of instances, conflicts were immediately responded to and the water problems resolved.
The two IAs practice two cropping seasons annualty. The wet season starts in June and ends in November while the dry season starts in December and ends in May of the following year. The filling in of the self-assessment instrument began during the last two months of the wet season in 1992 (October and November) and covered the three succeeding cropping seasons. The occurrence of drought from April to June 1993 extended the terminal drainage till June 16,1993,anddelayedthecroppingcalendarin the following period. Note that during the last cropping season under study, the cut-off date for data consolidation by the project team was set for February 1994 because the project wasdueforcompletion inMarch 1994. Thisisnottosay, however, that the leaders also ceased recording data after the set date. Since the dry season extends up to June, recording is expected to continue until then. In the following wet season, new forms will have to be distributed to the TSA Leaders by the NIA as previously agreed.
Compliance of the Farmers to the Cropping Calendar
Since the two IAs share the same source of imgation water, the cropping calendar of both IAs is basically the same. From experience however, the farmers belonging to the upstream IA (BRISDAFIA) undertake farming operations a few weeks ahead of those in the downstream portion. Control of
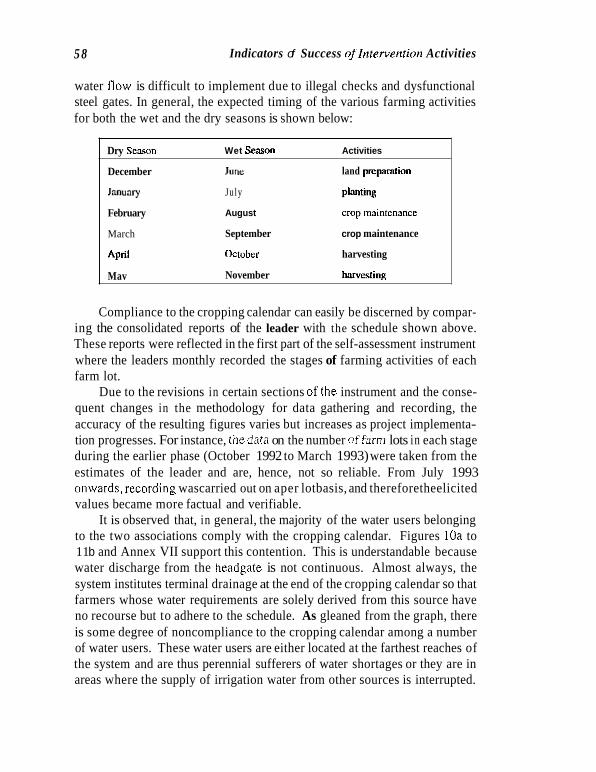
5 8 Indicators of Success ojlntervenrion Activities
water flow is difficult to implement due to illegal checks and dysfunctional steel gates. In general, the expected timing of the various farming activities for both the wet and the dry seasons is shown below:
Dry Seasun Wet Scason Activities
December June land prcpvrotian
January July plmting
February August crop maintcnnnce
March September crop maintenance
Apnl October harvesting
Mav November harvesting
Compliance to the cropping calendar can easily be discerned by compar- ing the consolidated reports of the leader with the schedule shown above. These reports were reflected in the first part of the self-assessment instrument where the leaders monthly recorded the stages of farming activities of each farm lot.
Due to the revisions in certain sections ofthe instrument and the conse- quent changes in the methodology for data gathering and recording, the accuracy of the resulting figures varies but increases as project implementa- tion progresses. For instance, thedata on the number offarm lots in each stage during the earlier phase (October 1992 to March 1993) were taken from the estimates of the leader and are, hence, not so reliable. From July 1993 onwards,recording wascarried out on aper lotbasis, and thereforetheelicited values became more factual and verifiable.
It is observed that, in general, the majority of the water users belonging to the two associations comply with the cropping calendar. Figures IOa to 11 b and Annex VII support this contention. This is understandable because water discharge from the headgate is not continuous. Almost always, the system institutes terminal drainage at the end of the cropping calendar so that farmers whose water requirements are solely derived from this source have no recourse but to adhere to the schedule. As gleaned from the graph, there is some degree of noncompliance to the cropping calendar among a number of water users. These water users are either located at the farthest reaches of the system and are thus perennial sufferers of water shortages or they are in areas where the supply of irrigation water from other sources is interrupted.
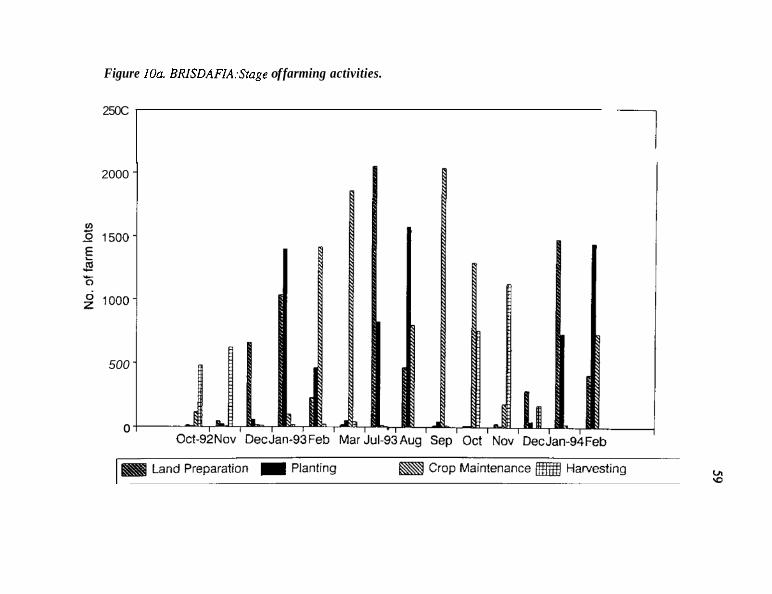
Figure IOa BRISDAF1A:Stage of farming activities.
250C
2000
500
0
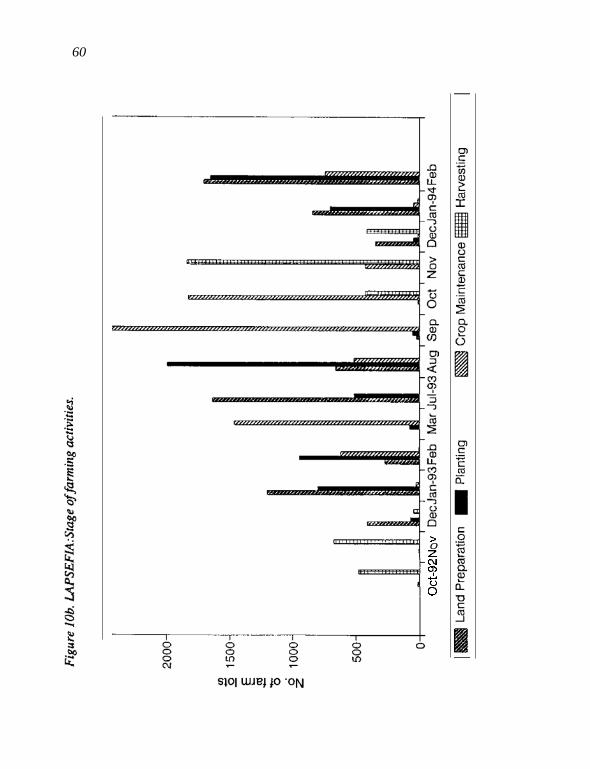
60
> 0 z N a) +d
8
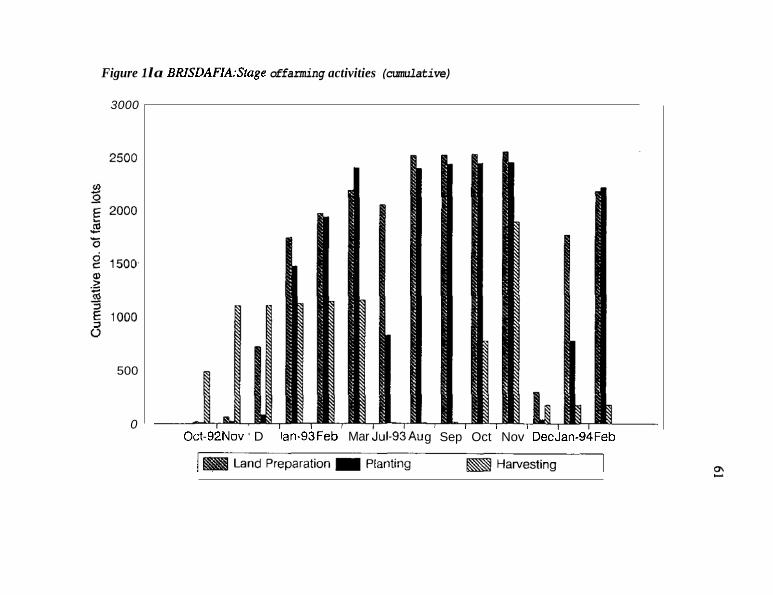
Figure 1 la BR1SDAFIA:Stage of farming activities (cumulative)
3000
500
0 Oct-9ZNov ' D Ian-93Feb' Mar h 9 3 A u g ' Sep ' Oct ' Nov ' D e c h 9 4 F e b
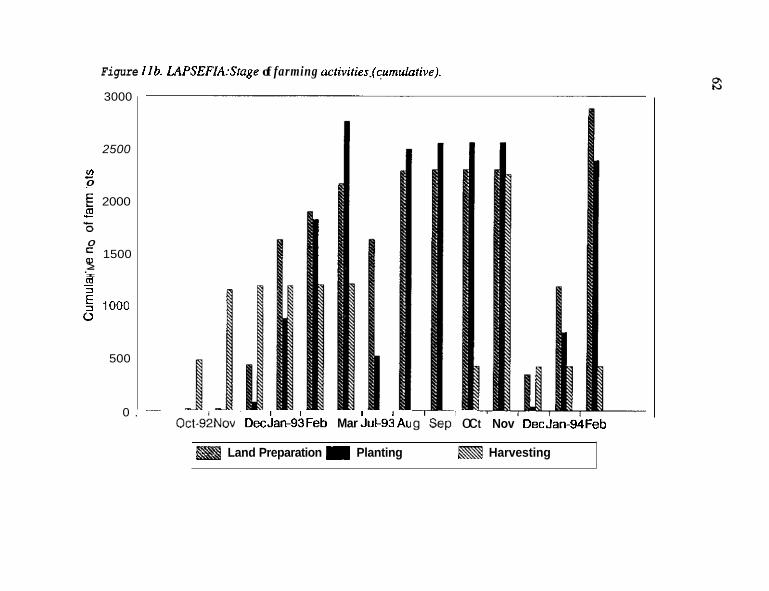
Figure I Ib. L4PSEFIA:Stage of farming activities.(cumulotive).
0 .
3000
2500
v)
0 I
- E 2000 m c
0 1500
0 > m .- I - 3
5 1000 0
500
Oct-9;Nov ' Declan-93Feb ' Mar h 9 d Au I oc t Nov Dec Jan-94Feb
I Land Preparation = Planting Harvesting
Indicators of Success of Intervention Activities 63
There is not much difference in the number of noncomplying farmers between the two associations but the reason for it varies. In LAPSEFIA, its tail-end location forces its members to be at the mercy of their neighbors in BRIS- DAFIA who are able to enjoy and maximize the use of water first, being at the upstream. These fortunate farmers can freely do so because some control structures such as steel gates are rendered dysfunctional. There is also laxity in the enforcement of penalties on illegal checks in this IA. Noncompliance to the cropping schedule in BRISDAFIA is mainly due to the desire of some farmers to practice three croppings particularly when terminal drainage is not instituted.
Information elicited from this portion of the self-assessment form is used as input for preparing the LIPA which in turn become bases for billing. A leader is therefore expected to exercise care in data-recording since any discrepancy might cause the ire of farm owners who might be billed and required to pay the irrigation fee even when they do not use irrigation water.
Status of Crops
Data from October 1992 to March 1993 were taken from the unrevised self-assessment instrument. The figures show the percentage of farm lots in satisfactory condition and those damaged due to flooding or drought. In- itially, the leaders estimated these percentages outright. Looking at the graph (figure 12), one would notice a decreasing trend in the number of farm lots in satisfactory condition from October to December. This observation should not be interpreted unfavorably because only those farm lots which were in the maintenawe stage were assessed as to their condition. Farm lots at the harvesting stage were not included in the assessment. Since the number of harvested farm lots increased gradually from October to December, the farm lots whose conditions were to be evaluated correspondingly and successively decreased which consequently explains the downtrend in the number of farm lots in satisfactory condition. From the standpoint of leaders, this procedure did not elicit very useful data and hence the instrument was improved taking this weakness into account.
From July 1993 until the end of the projects (table X), the listing of farm lots incorporated in the revised questionnaires was used, on a monthly basis, by the leader in identifying the damaged farm lots as well as the nature of
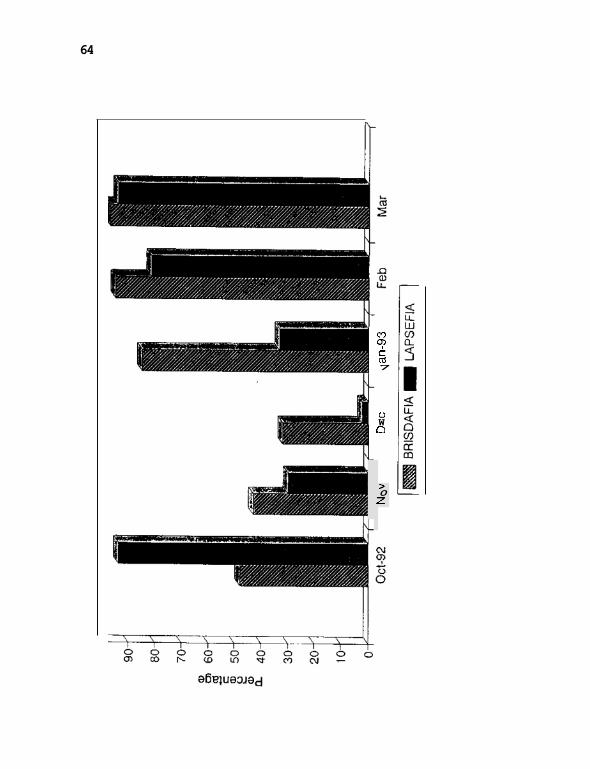
64
m P m 7
0 W 0
> 0 z
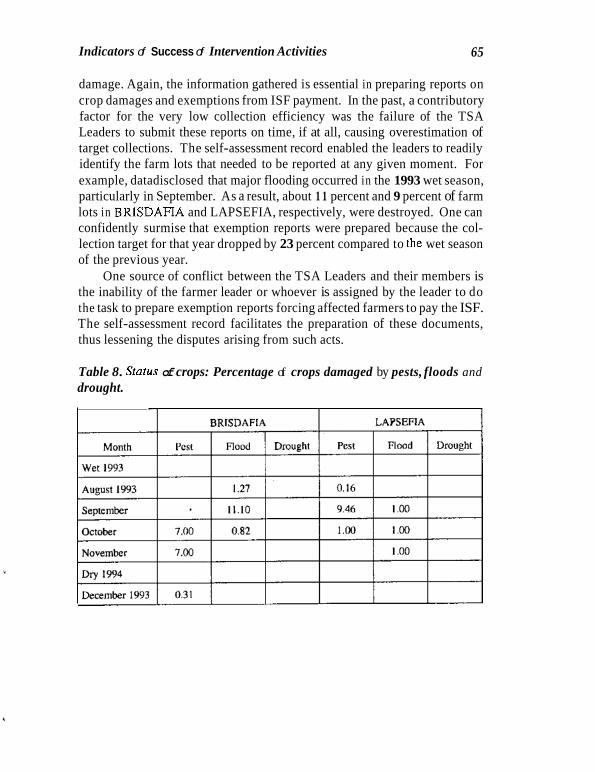
Indicators of Success of Intervention Activities 65
damage. Again, the information gathered is essential in preparing reports on crop damages and exemptions from ISF payment. In the past, a contributory factor for the very low collection efficiency was the failure of the TSA Leaders to submit these reports on time, if at all, causing overestimation of target collections. The self-assessment record enabled the leaders to readily identify the farm lots that needed to be reported at any given moment. For example, datadisclosed that major flooding occurred in the 1993 wet season, particularly in September. As a result, about 1 1 percent and 9 percent of farm lots in BRISDAFTA and LAPSEFIA, respectively, were destroyed. One can confidently surmise that exemption reports were prepared because the col- lection target for that year dropped by 23 percent compared to the wet season of the previous year.
One source of conflict between the TSA Leaders and their members is the inability of the farmer leader or whoever is assigned by the leader to do the task to prepare exemption reports forcing affected farmers to pay the ISF. The self-assessment record facilitates the preparation of these documents, thus lessening the disputes arising from such acts.
Table 8. Status of crops: Percentage of crops damaged by pests, floods and drought.
66
Water Management
Indicators of Success of lrirervenrion Activifies
Water Allocation and Distribution
Initially, water distribution was assessed in terms of percentage of farmhold- ings with sufficient water per month. Ideally, for a given stage of farming activity, water sufficiency is measured by approximating the water height in the field and comparing it with a given standard. For example, water requirement is deemed adequate if the water level is about 2-3 cm during the planting period. However, the original self-assessment instrument failed to take this into account hut utilized instead the perception of the leaders as to water adequacy. In this case, it was assumed that the judgement ofthe leader could be used as a reliable basis for evaluktion. As observed during the collection of data, the TSAL considered a farm lot to have sufficient water supply if there was actual water in the field regardless of the stage of farming activity. As a consequence, those areas which are ripe for harvesting and hence did not require water anymore were regarded as having an inadequate water supply. This explains why there was a declining trend in the number of farm lots in satisfactory condition from October to December 1992 (figure 13).
Since most pf the farm lots were at the harvesting stage and did not have water in the field, the leaders excluded them in the count of farm lots with adequate water. Given this process of evaluation, i t is expected that while the number of barvestable areas progressively increases, the number offarm lots in good condition will conversely decrease. This flaw was not easily recog- nized by the project team during the initial monthly visit because the original self-assessment instrument did not retlect the individual listing of farm lots. Refinements in the questionnaires were instituted to retlect better and more accurate figures in the succeeding months. Nevertheless, the resulting graphs from October 1992 to March 1993 should not he rendered entirely useless. For one, comparable values offarm lots receiving enough water during the start of the dry season (December) showed that almost 100 percent of farm lots was reported to be enjoying a sufficient water supply in BRISDAFIA in January 1993 while the number only peaked in LAPSEFIA in February 1993. This simply confirmed that BRISDAFIA, being at the upstream, made use of irrigation water first and that only when almost all their wafer requirements were met did the upstream farmers allow water to flow to the tail end
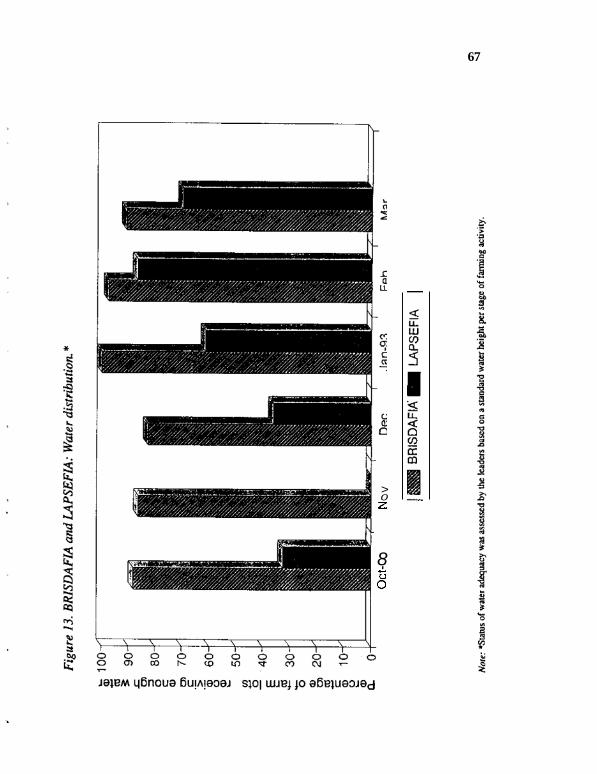
67
> 0 z
8 8 r:
68 Indicators of Success of Intervention Activities
(LAPSEFIA). This is the primary reason why LAPSEFIA perennially expe- riences water inadequacy problems (almost 1/4 of the irrigated area during the 1991 dry season suffered from drought). It should be emphasized that the main source of irrigation water of those two IAs is the Buhi Lake and that there are competing water users such as the fishermen and the National Power Corporation. There is an existing agreement between the Buhi Municipal Government and the NIA that only when the water level has exceeded the minimum requirements of fishermen will the NIA be able to source irrigation water from the lake. As the dry season progresses, [he available water in the dam also diminishes and hence there is not enough pressure for the water to reach downstream.
The initial solution thought of was to advance the cropping calendar for LAPSEFIA relative to BRISDAFIA. This strategy was not effective since it was observed that farmers in BRISDAFIA did not adhere to the set schedule for several reasons; there were undisciplined farmers who resorted to illegal checking during nighttime to avoid being caught, and in some areas, water continued to flow to the farm ditches due to the dysfunctional control structures. Once irrigation water is conveyed from the headgate, the imme- diate response of some upstream farmers would be to start the farming activity. They rationalize that since water is already available, it would be wasteful if they would not make use of it, unaware perhaps that the conse- quence of their action represents water deprivation to downstream farmers. This attitude is indicative of two factors, lack of dissemination of rotational schedule which is the responsibility of the TSA Leader and poor concept of the value of sharing.
NIA is aware that water supply will almost always be inadequate for the two IAs during the dry season and that long-term solutions must be explored, i.e., provision of an alternative water source.
Starting in July 1993, the leaders used letter codes to assess the status of water delivery by farm lot; T for tama or just enough, K for kulang or too little, S for sobra or too much, by comparing the actual water height in the field with a given standard per farming stage. The process of assessing water adequacy at the farm level required the TSA Leaders to monitor the fields and consult with the members. For instance, during the regular visits by the project team, one TSA Leader said he could not yet produce the data as he had not yet gone around the assigned area, to check on the water status. Resulting figures underscored the established fact that water inadequacy is a serious problem i n LAPSEFIA. While as many as 42 percent of farm lots
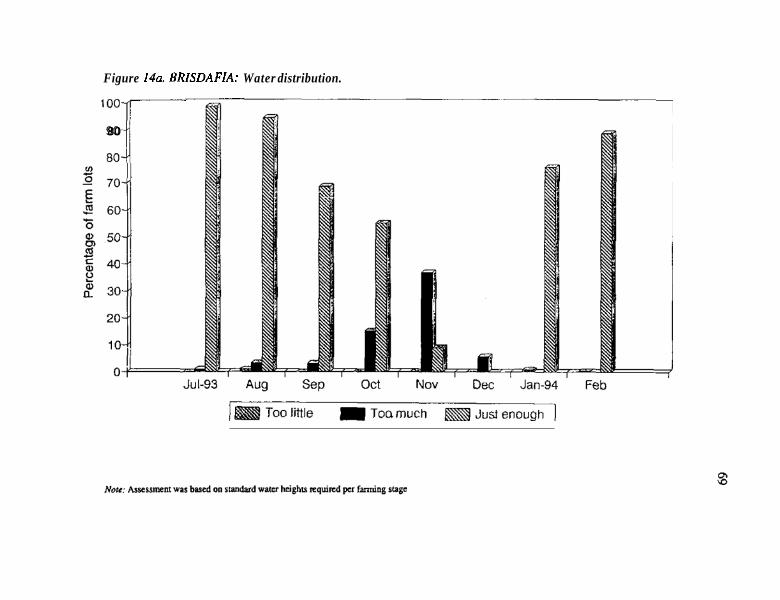
Figure 14a. BRISDAFIA: Water distribution.
'q-- 80
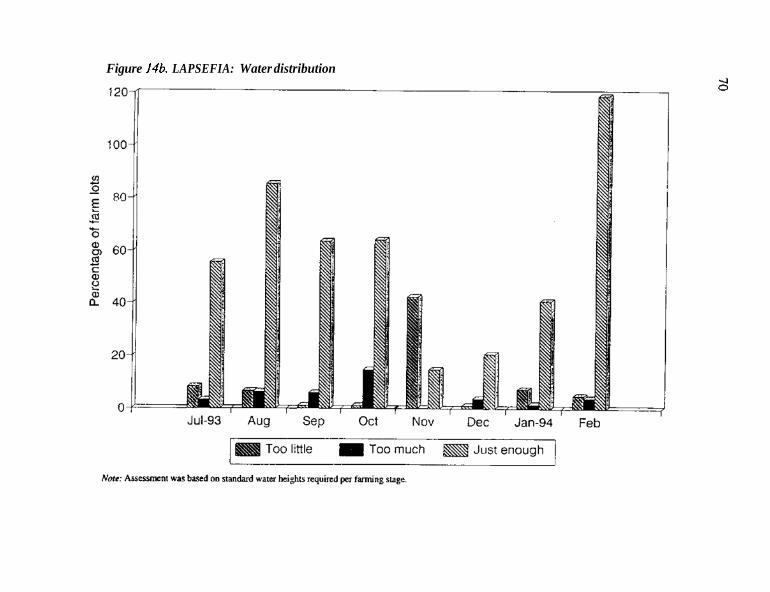
Figure 146. LAPSEFIA: Water distribution
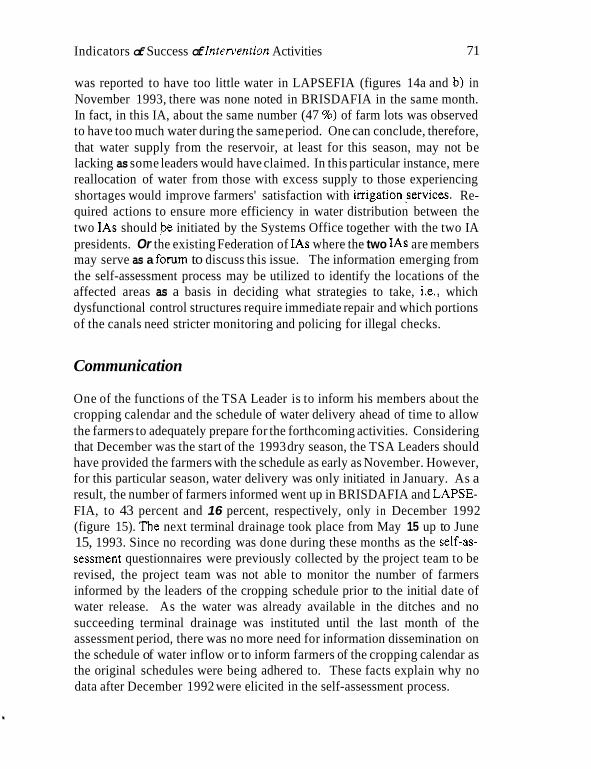
Indicators of Success of Intervention Activities 71
was reported to have too little water in LAPSEFIA (figures 14a and b) in November 1993, there was none noted in BRISDAFIA in the same month. In fact, in this IA, about the same number (47 S) of farm lots was observed to have too much water during the same period. One can conclude, therefore, that water supply from the reservoir, at least for this season, may not be lacking as some leaders would have claimed. In this particular instance, mere reallocation of water from those with excess supply to those experiencing shortages would improve farmers' satisfaction with irrigationservices. Re- quired actions to ensure more efficiency in water distribution between the two IAs should ,be initiated by the Systems Office together with the two IA presidents. Or the existing Federation of IAs where the two IAs are members may serve as a fonun to discuss this issue. The information emerging from the self-assessment process may be utilized to identify the locations of the affected areas as a basis in deciding what strategies to take, i.e., which dysfunctional control structures require immediate repair and which portions of the canals need stricter monitoring and policing for illegal checks.
Communication
One of the functions of the TSA Leader is to inform his members about the cropping calendar and the schedule of water delivery ahead of time to allow the farmers to adequately prepare for the forthcoming activities. Considering that December was the start of the 1993 dry season, the TSA Leaders should have provided the farmers with the schedule as early as November. However, for this particular season, water delivery was only initiated in January. As a result, the number of farmers informed went up in BRISDAFIA and LAPSE- FIA, to 43 percent and 16 percent, respectively, only in December 1992 (figure 15). The next terminal drainage took place from May 15 up to June 15, 1993. Since no recording was done during these months as the self-as- sessment questionnaires were previously collected by the project team to be revised, the project team was not able to monitor the number of farmers informed by the leaders of the cropping schedule prior to the initial date of water release. As the water was already available in the ditches and no succeeding terminal drainage was instituted until the last month of the assessment period, there was no more need for information dissemination on the schedule of water inflow or to inform farmers of the cropping calendar as the original schedules were being adhered to. These facts explain why no data after December 1992 were elicited in the self-assessment process.
12
Indicators of Success of Intenwzrion Activities
Conflict Management
From experience, it was found that the number of irrigation-related problems rose at the onset of the cropping period when farmers made demands that their farm lots be irrigated first and during the land-soaking and crop-main- tenance phase when the need for irrigation water is at its peak. True enough, the number of conflicts declined during the initial harvest period (October 1992 -November 1992) but once again it picked up in December or during the start of the 1993 dry season. From July 1993 until the end of the assessment period, no conflicts were reported in BRISDAFIA. Meanwhile, in LAPSEFIA, the highest number of conflicts recorded was 10, occurring in 5 turnout service areas at the start of the 1993 wet cropping season. This finding just highlights the difference in water adequacy in the two IAs, i t beingamajor sourceofdiscord among water users. Figures ldaand 16bshow the difference between the two IAs in terms of conflict management.
The farmer leaders started to monitor the number of conflicts resolved only in January 1992. Results show that in BRISDAFIA, of the six conflicts experienced by the TSAs in January 1992, not one was resolved in the same month. Of the two conflicts recorded in February, only one was settled. In LAPSEFIA, it is observed that while the number of conflicts rises, the number of resolved conflicts correspondingly increases. Of the 10 reported in July 1993, 8 were resolved. In the succeeding months, a11 conflicts experienced were straightened out. Again, these findings imply that the TSA Leaders in LAPSEFIA seem to do better in facing and resolving conflicts, This reflects the relative maturity of this IA as an independent entity. As mentioned earlier, this IA. being at the tail end, is often confronted with water-adequacy problems which are caused mainly by the insufficient quantity of water that reaches the la's area of responsibility. Hence,most water-shortage problems in this respect could be beyond the control of the TSALs. As observed by the researchers, the members of the BOD in this IA are now made to render accomplishment reports during their regular monthly meetings and, in the process, thrash out conflicts between TSAs. It is heartening to note that the reporting of leaders during BOD meetings was triggered by the self-assess- ment process.
From the perspective of the TSA Leader, the record of conflicts encoun- tered, their nature as well as those which remain to be unresolved may be used as the document in reporting to the monthly BOD meetings. These sessions may serve as an avenue to resolve problems which require intervention from the central IA officials.
13
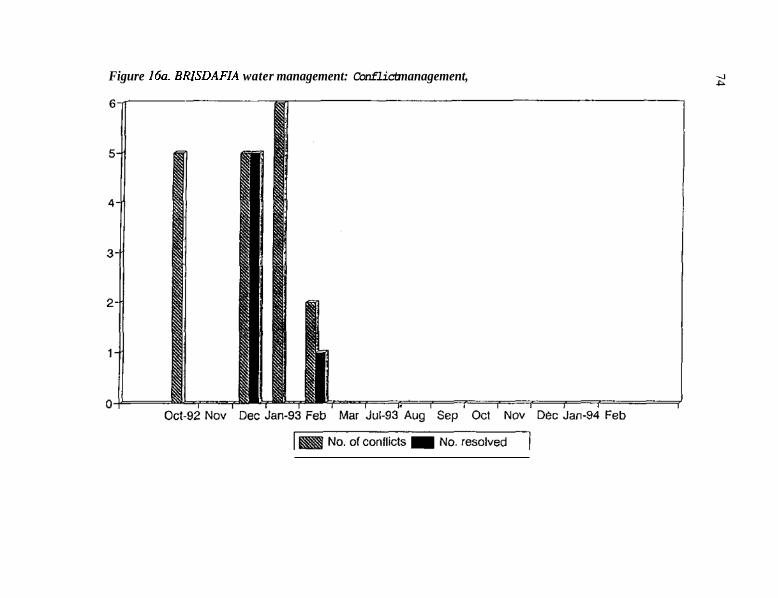
Figure 16a BRISDAFIA water management: Conflict management,
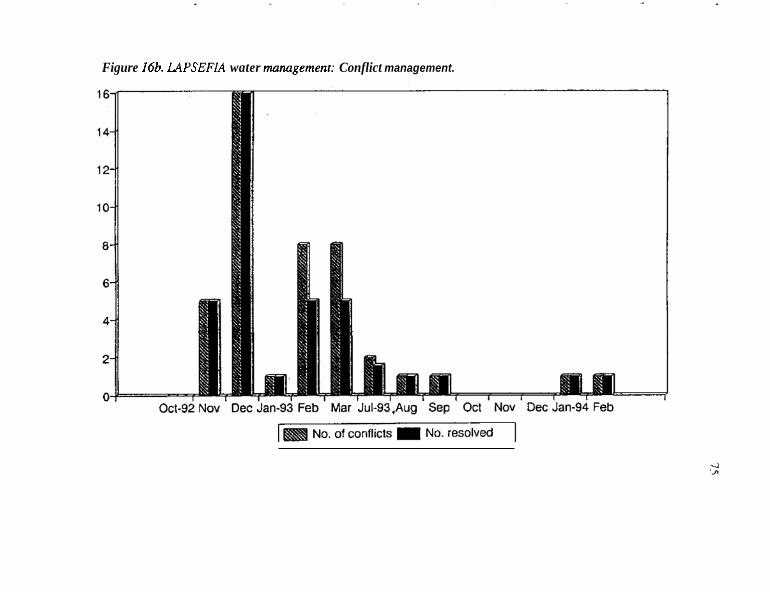
Figure 166. UPSEFIA water managemenr: Conflict management.
76 Indicofors of Success ojlnrervention Activities
Task Dktribution
Besides initiating voluntary work, the TSA Leader, from time to time, assigns the small group leaders or some members to perform other irrigation-related tasks ranging from groundwork activities such as membershipcampaigns and dissemination of informationlresolutions emanating from the IA Board. distribution of bills, monitoring of water inflow to actual cleaning and maintenance of canal sections. It must be noted that the formation of small groups below the TSA level to strengthen mass-based membership was a component of the earlier action research implemented by the project team. It is heartening to observe that several small groups are now functional and are actively undertaking tasks assigned to them. Task distribution is particularly applied in LAPSEFIA where, as a policy, some water users are released to perform voluntaiy workifthey turn over to the IA the 1Opercentdiscount from cash payment of current ISF that they are supposed to avail of. These funds shall then be utilized to remunerate other members willing to take over the responsibilities left by those who obtained money for their labor contributions.
It is a common practice in the two IAs to undertake cleaning of canals and minor repairs a few days before the schedule of water inflow after terminal drainage. Resulting data bear this out. For example, in BRIS- DAFIA, the average number of farmers assigned tasks per TSA peaked in December, July and February (figures 17a and b), as these corresponded to thefirst months ofthecroppingcalendarwherecleanlinessofcanals iscrucial in ensuring delivery of water. As the seasons progressed, the number of assigned tasks declined. In LAPSEFIA, water delivery for the 1993 dry season was carried out only in January 1993, or a month later compared to BRISDAFIA. This schedule was consistent with the agreement between the IA presidents and NIA that BRISDAFIA would now be supplied with irrigation water first instead of LAPSEFIA as initially agreed because, from experience, any plans of allowing farmers i n LAPSEFIA to plant ahead are never realized. The situation being so, the number of farmers given tasks in LAPSEFIA peaked i n January of that season and correspondingly declined i n the subsequent months.
In December 1994, the number of persons given tasks in hotb IAs rose significantly even if land preparation activities commenced in BRISDAFIA only in January or even 2 months later in LAPSEFIA. The need for mainte- nance activities was due to the massive flooding which literally engulfed the entire municipality of Nabua where the system is located. Canals had to be
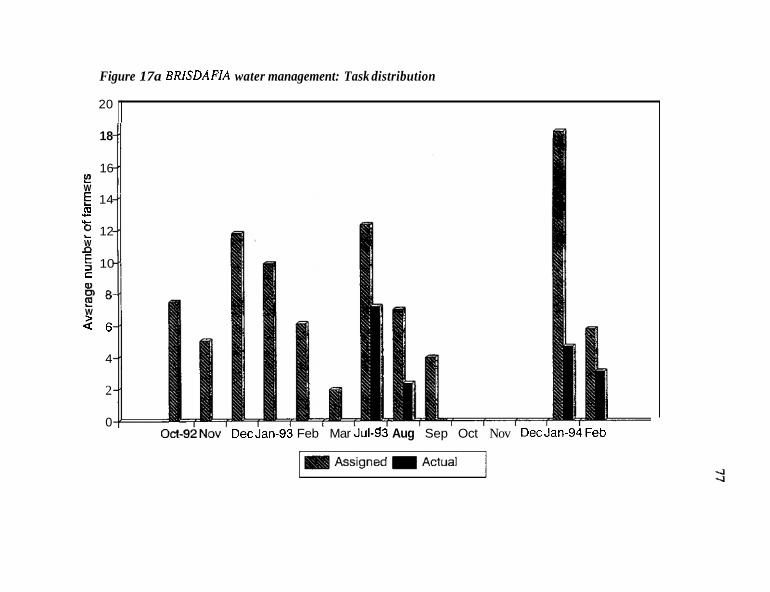
Figure 17a BRISDAFIA water management: Task distribution
20
18
16
14
E W
m c c 0 12
5 10
W a
C
i 8 W
4 6
4
2
0 Oct-92Nov DecJan-93 Feb Mar Jul-93 Aug Sep Oct Nov DecJan-94Feb
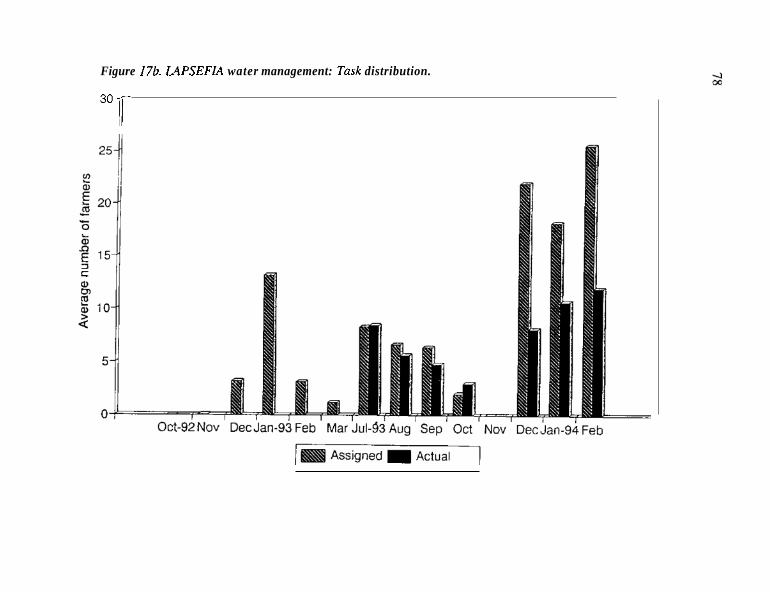
Figure 17b. LAPSEFIA water management: Task distribution.
"T I1
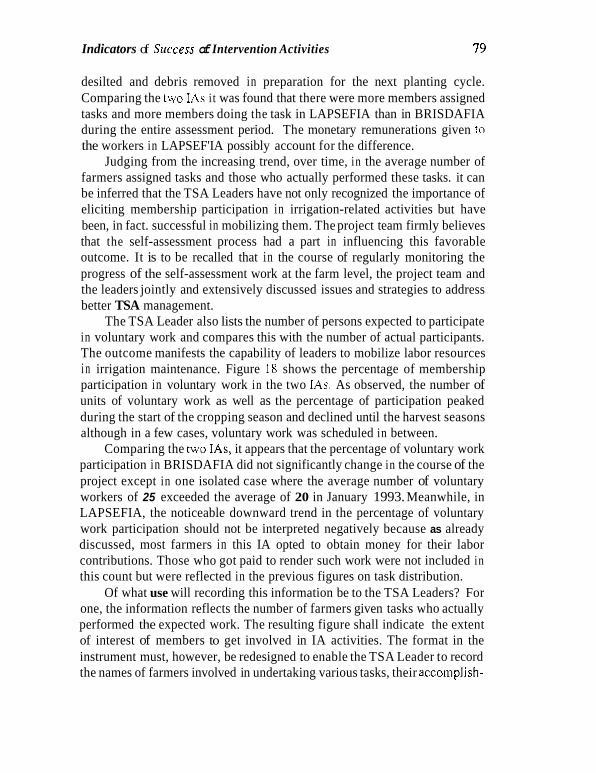
Indicators of Skiccess of Intervention Activities 19
desilted and debris removed in preparation for the next planting cycle. Comparing the two IAs it was found that there were more members assigned tasks and more members doing the task in LAPSEFIA than in BRISDAFIA during the entire assessment period. The monetary remunerations given to the workers in LAPSEF'IA possibly account for the difference.
Judging from the increasing trend, over time, in the average number of farmers assigned tasks and those who actually performed these tasks. it can be inferred that the TSA Leaders have not only recognized the importance of eliciting membership participation in irrigation-related activities but have been, in fact. successful in mobilizing them. The project team firmly believes that the self-assessment process had a part in influencing this favorable outcome. It is to be recalled that in the course of regularly monitoring the progress of the self-assessment work at the farm level, the project team and the leaders jointly and extensively discussed issues and strategies to address better TSA management.
The TSA Leader also lists the number of persons expected to participate in voluntary work and compares this with the number of actual participants. The outcome manifests the capability of leaders to mobilize labor resources i n irrigation maintenance. Figure 18 shows the percentage of membership participation in voluntary work in the two IAs. As observed, the number of units of voluntary work as well as the percentage of participation peaked during the start of the cropping season and declined until the harvest seasons although in a few cases, voluntary work was scheduled in between.
Comparing the two IAs, it appears that the percentage of voluntary work participation in BRISDAFIA did not significantly change in the course of the project except in one isolated case where the average number of voluntary workers of 25 exceeded the average of 20 in January 1993. Meanwhile, in LAPSEFIA, the noticeable downward trend in the percentage of voluntary work participation should not be interpreted negatively because as already discussed, most farmers in this IA opted to obtain money for their labor contributions. Those who got paid to render such work were not included in this count but were reflected in the previous figures on task distribution.
Of what use will recording this information be to the TSA Leaders? For one, the information reflects the number of farmers given tasks who actually performed the expected work. The resulting figure shall indicate the extent of interest of members to get involved in IA activities. The format in the instrument must, however, be redesigned to enable the TSA Leader to record the names of farmers involved in undertaking various tasks, their accomplish-
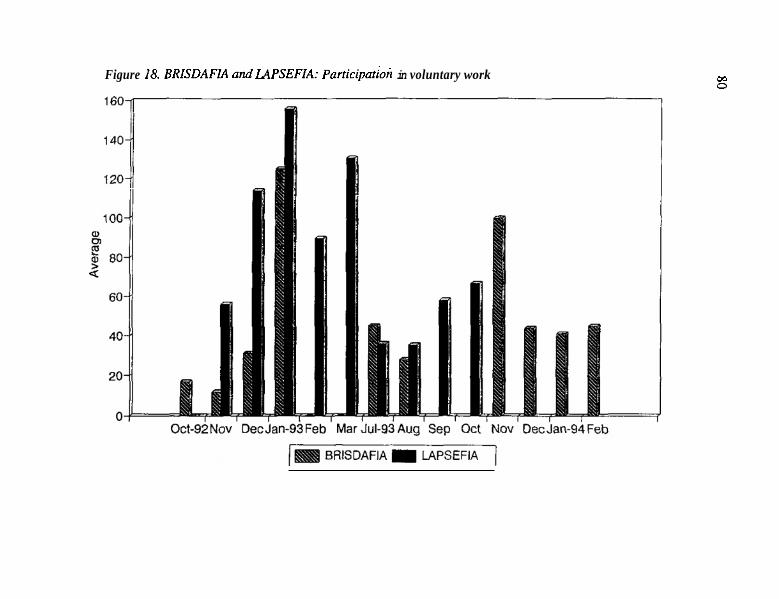
Figure 18. BRiSDAFiA and IAPSEFIA: Purticipution in voluntary work m 0
Indicators of Success of Intervention Activities 81
ments, amounts received for the services rendered and, perhaps, the signature of the worker once payment is made. Such documents can then be used for auditing purposes.
It must not be forgotten that mere data-recording by the TSA Leaders indirectly improves their performance because, as has been repeatedly pointed out, it is exigent that they maintain continuous discussions or dia- logues among members to elicit truthful information. The interaction in itself sets a venue where plans are jointly discussed and conflictslwater-related problems thrashed out as is consistent with the participatory process.
Organizational Planning
Ideally, IA activities should be planned during farmers’ meetings. As man- dated in the IA bylaws, TSALs are to initiate monthly meetings with farmers within their area of responsibility in order that problems met or required activities during the month could be discussed and planned in a participatory manner. Unresolved problems could be brought out in the monthly BOD meetings if necessary. However, results revealed that meetings at the TSA level are seldom held. When queried, TSA Leaders confirmed that they stopped calling for meetings since farmer members did not attend them. Instead, they resorted to passing on information from one farmer to another or to use the public address system to disseminate important activities like rabus(vo1untary work) schedule or dates ofirrigation feecollection. The TSA Leaders were almost unanimous in claiming that they, as leaders, no longer place a premium on attendance at meetings a long as farmers maintained the ditches and participated in rabus. In instances where meetings are really needed, TSA Leaders coordinate with fertilizer dealers or sales repre- sentatives to provide the necessary attractions to draw attendance. However, it has been observed that farmers do attend if they think that the meetings are important. Examples of these are meetings where extension workers from the Department of Agriculture are invited to share information on farm technologies. Therefore, TSA Leaders should call meetings when these are demanded by the membership. During the entire duration of the assessment period however, no meeting at the TSA level had been held.
An additional item in the revised instrument reflects the attendance of the TSA Leaders in the regular BOD meetings. A tick with a “ J ” indicates presence while an “X” denotes absence. Upon inspection of his record, a leader thereby becomes cognizant if he has been remiss in his monthly
82 Indicators 0.f Success of Intervention Activities
obligations. Hopefully, this process of self-reflection will eventually induce him to become more conscientious in his attendance.
System Maintenance
The TSA Leaders’ performance with regard to maintenance was assessed in terms of the status of cleanliness of the farm ditches, laterals and main canals (although the latter two items areNIA’s responsibility in BRISDAFIA while main canals are its responsibility in LAPSEFIA). Through ocular inspection by the TSA Leaders and using a rating of 1 to 3 with 1 representing very clean and 3 represznting dirty, it appears that the status varies with the stage of farming activity and coincides with the schedule of maintenance activities. As discussed, structures are commonly cleared before or during the start of the cropping calendar and, hence, the ratings for cleanliness of canals and ditches were at their best during this period but diminished in the succeeding months (figures 1% and b). This trend is understandable since these activities are seldom undertaken after the onset of the cropping period.
Another item of information being gathered by theTSA Leaders pertains to the condition of the structures such as division boxes and steel gates. The TSA Leaders assessed the condition of these structures. The maintenance of these structures is the responsibility of the NIA. The TSA Leaders assessed the condition ofthese structures using the values of I to 3 (with 1 representing dysfunctional condition and 3 representing functional). Figures 20a and b show that in both IAs the steel gates were. given a lower rating compared to division boxes indicating that most of these were considered dysfunctional throughout the assessment period. As observed, the condition progressively worsened indicating that NIA has been remiss in its maintenance tasks. Considering the importance of the steel gates as control structures for imple- menting the cropping calendar, theTSA Leaders haverequested NIA to repair the structures. But the latter could not act on these complaints due to lack of funds. As a consequence, the TSA Leaders cite these damaged structure as the reason tor not being able to regulate the use of water among the members of the turnout group and for failure to implement the cropping calendar more effectively.
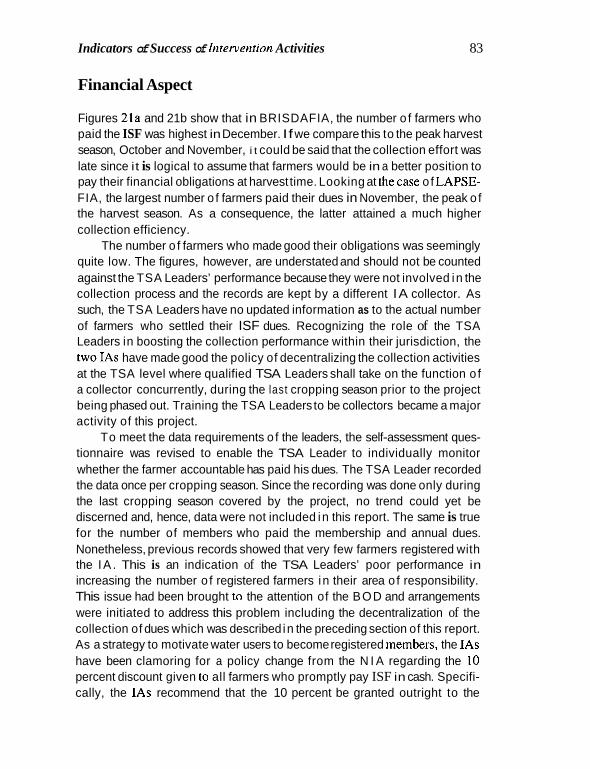
Indicators of Success of lntervcntion Activities 83
Financial Aspect
Figures 21a and 21b show that in BRISDAFIA, the number o f farmers who paid the ISF was highest in December. If we compare this to the peak harvest season, October and November, i t could be said that the collection effort was late since it is logical to assume that farmers would be in a better position to pay their financial obligations at harvest time. Looking at thecase o f LAPSE- FIA, the largest number o f farmers paid their dues in November, the peak o f the harvest season. As a consequence, the latter attained a much higher collection efficiency.
The number o f farmers who made good their obligations was seemingly quite low. The figures, however, are understated and should not be counted against the TSA Leaders’ performance because they were not involved in the collection process and the records are kept by a different IA collector. As such, the TSA Leaders have no updated information as to the actual number of farmers who settled their ISF dues. Recognizing the role of the TSA Leaders in boosting the collection performance within their jurisdiction, the two IAs have made good the policy of decentralizing the collection activities at the TSA level where qualified TSA Leaders shall take on the function o f a collector concurrently, during the last cropping season prior to the project being phased out. Training the TSA Leaders to be collectors became a major activity of this project.
To meet the data requirements o f the leaders, the self-assessment ques- tionnaire was revised to enable the TSA Leader to individually monitor whether the farmer accountable has paid his dues. The TSA Leader recorded the data once per cropping season. Since the recording was done only during the last cropping season covered by the project, no trend could yet be discerned and, hence, data were not included in this report. The same is true for the number of members who paid the membership and annual dues. Nonetheless, previous records showed that very few farmers registered with the IA . This is an indication of the TSA Leaders’ poor performance in increasing the number o f registered farmers in their area o f responsibility. This issue had been brought to the attention of the BOD and arrangements were initiated to address this problem including the decentralization of the collection of dues which was described in the preceding section of this report. As a strategy to motivate water users to become registered members, the IAs have been clamoring for a policy change from the N I A regarding the 10 percent discount given to all farmers who promptly pay ISF in cash. Specifi- cally, the IAs recommend that the 10 percent be granted outright to the

84 indicators of Success of inretverrrioti Activities
association and, in turn, be given the authority todecide as to who among the IA members will be entitled to such discounts. This seems reasonable given that the 1A has direct contact with the water users.
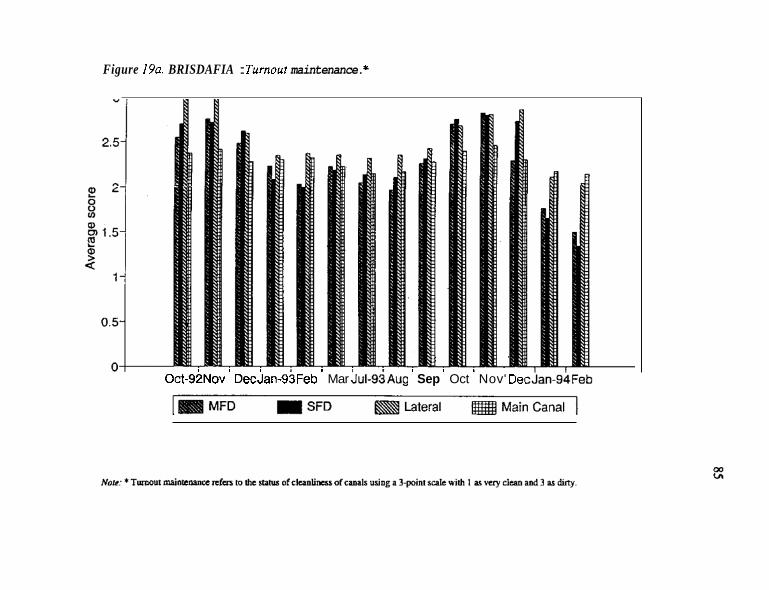
Figure 19a. BRISDAFIA : Turnour maintenance. *
Oct-92Nov ' DecianB3Feb ' Mar h - 9 i A u g ' Sep ' Oct ' Nov' Dec
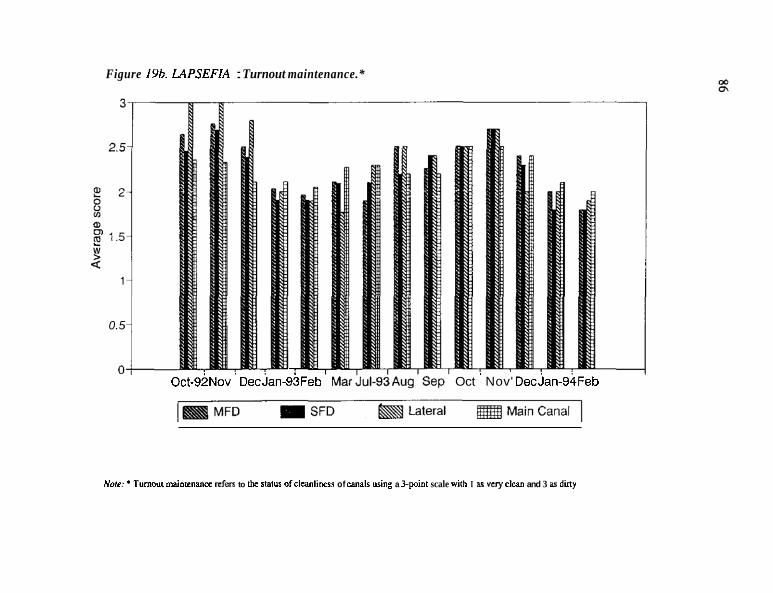
Figure 196. LAPSEFIA : Turnout maintenance.*
L W
0.5
7 , Oct-SiNov ' DecJanDBFeb Ma1 Oct ' Nov' DecJan-94Feb
NoL' * Turnout mainlenancs =fen to Ihe slslus ofcluinlincrs of canals using a 3-pint scale with I as very dm and 3 as diny
Figure 20a. BRISDAFIA : Maintenance of sfmcfures. * 2.5
2
m
v1 W
1.5
m $ 2 ’
0.5
0
. . . . . . . . . . . . . . . . . . . . . . . . . . . . . . .
Oct. Nov. Dec.Jan.-93Feb. Mar. Jul Aug. Sep. Oct. Nov. Dec.Jan.-94Feb. I I I Division Box Steel Gate 1
m -4
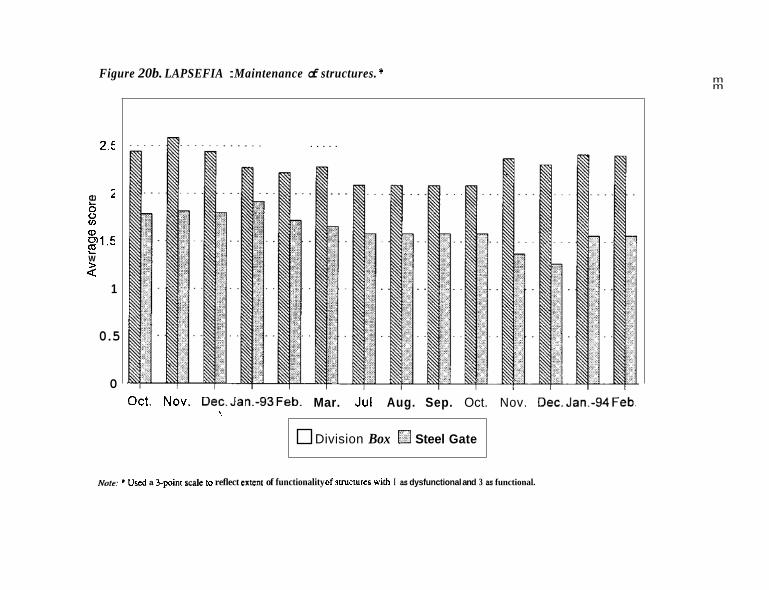
Figure 20b. LAPSEFIA : Maintenance of structures. * m m
2.:
i ? 0 0 01
% 1 5
h S ' W
1
0.5
0
. . . . .
Oct. Nov. Dec.Jan.-93Feb. Mar. Jul Aug. Sep. Oct. Nov. Dec.Jan.-94Feb.
Division Box Steel Gate
k.
~ ~ i ? : * Urcd a 3-p in t $ a l e u) reflect cxtsm of functionality ofsmcarcs with I as dysfunctional and 3 as functional.
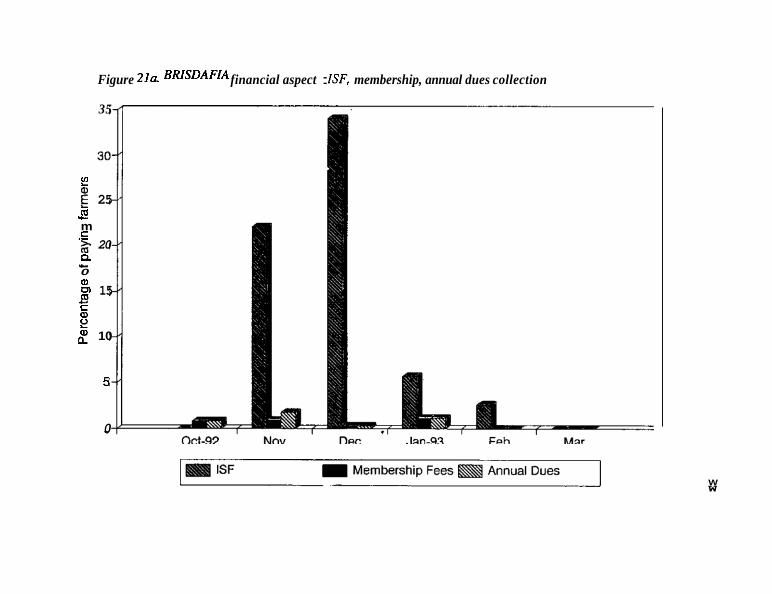
Figure 21a BRlSDAFlA financial aspect : lSF, membership, annual dues collection
35
Lo
d m
: 25 c
Q
0 m
._ 2 20
p 15
3 n" 10
- I c
5
0
W W
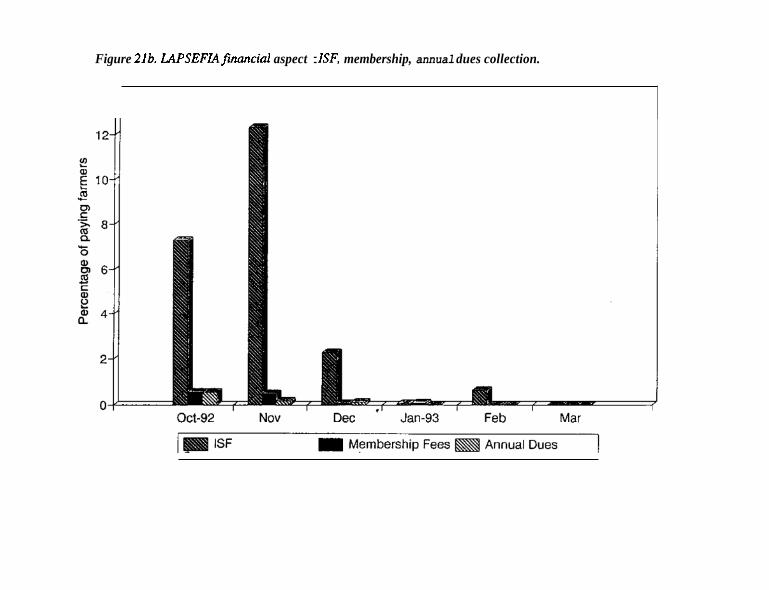
Figure 2lb. LAPSEFIAfiMncial aspect : ISF, membership, annual dues collection.
CHAPTER 7
The Self-Assessment Process as Viewed by the TSALs
A COMPONENT OF the project focuses on how the management innovation5 being introduced could be perpetuated even after external support is phased out. To a large extent, its sustainability is a function of how well the TSA Leaders recognize the worthiness and utility of such strategies. Presuming that the self-assessment process is cost-effective, it could only be adopted as part of their regular activities if the TSA Leaders clearly appreciate its importance and consider it as an indispensable tool to systematically carry out their mandated functions and improve their job performance.
In the desire to determine whether the self-assessment process has potential for institutionalization, the research team embarked on a survey among participating TSA Leaders after 18 months of implementation. The survey results were likewise expected to pinpoint weaknesses in the instru- ment where improvements can be input while the project is still ongoing. It is worth mentioning that the survey was timed during the harvest season when onofarming cycle has been completed so that corrections can be incorporated before the start of the next cropping season. It should be noted, however, that three cropping cycles have already lapsed since the self-assessment process was first introduced. To ensure objectivity of the responses, an independent researcher was requested to do the survey and was instructed to emphasize to the leaders that she is not part of the project. Although during field work the research team is able to obtain valuable feedback from the leaders, criticisms may not be articulated at all. Considering the high value that indigenous leaders place on maintaining smooth interpersonal relationships, they might feel that such remarks could hurt feelings and erode the harmonious relations
91
92 The Self-Assessment Process as Viewed by the TSALs
that have already been established between them and the project implemen- tors. Hence, the need for an impartial survey.
Altogether 29percent or28 PercentoftheTSALeaders equally allocated between the two IAs were interviewed employing a structured questionnaire prepared by the research team. Systematic rondoin sampling was applied to determine the names of the respondents.
The survey questionnaire is composed of four parts. Part A assesses the ability ofthe TSA Leaders in filling up the forms. Part B dwells on the utility of data. Part C determines the sustainability of the self-assessment process while Part D evaluates the extent of usefulness of the various intervention activities the project has implemented aside from the self-assessment tech- nique.
The subsequent section documents the results of the survey. In terms of ability in filling in the forms, about half (48%) of the respondents claimed they were able to fill in with minimal assistance, less than one third (3 I %) can fill in with no assistance, while the remaining 21 percent can fill in only with full assistance. More cfforts should therefore be dcvotcd to train the leaders in data recording. Although the form was already simplified to match the low education of the leaders, modifications are in order and should take into account the detailed assessment of the leaders on their areas of difficulty in the self-assessment form. Results showed that in every item of the self-as- sessnient form, 3-6 of the 39 leaders interviewed encountered difficulty in obtaining and recording the data required.
In terms of utility of data, all except one considered the self-assessment process useful to them as TSA Leaders. In addition, 93 percent claimed that it is also useful to the IA while 82 percent reported that its utility even extends to the NIA. The remaining few could not determine its usefulness to any of the three target users.
The respondents were asked to cite specific functions that were improved due to the use of the self-assessment form. Almost all attributed improve- ments in preparing reports on crop damages and exemptions for ISFpayment, LIPA preparation and conflict resolution to the self-assessment activity. Meanwhile, more than half (59%) noted improvements on water management and resource mobilization work after the implementation of the self-assess- ment scheme. Because of these gains, it is not surprising that almost all TSA Leaders want the self-assessment process to continue as their regular activity. However, only 68 percent contemplated that they would be able to continue the activity on their own without any external assistance.
The SelfAssessment Process ns Viewed By the TSALs 93
The leaders, in turn, assess the extent to which the project as a whole was able to help the IA. Most (79%) reported that the project was of much help to them while the remaining 21 percent felt the project was somewhat helpful to them. When asked which of the various activities (other than the self-as- sessment process) implemented had a positive contribution to 1A perfor- mance, the attendance of the research team at BOD meetings (83%) emerged as the most important factor. As pointed out, the team was able to assist the IA in clarifying issues, and providing insights in settling disputes, making resolutions, and i n disseminating information. Spot-mapping and the im- provement of LIPA pre.paration were cited as the next important contributors to IA performance. Leaders reported that the spot-mapping activity led to the proper identification and measurement of farm lots, and the discovery of unregistered lots whose owners had been using irrigation water for a long time. The leaders found the preparation of LIPA easier and more systematic because of the new scheme introduced by the team.
Finally, the leaders were sought to identify the forms of assistance which could strengthen their IA. Traininglassistance to venture into non-water functions and livelihood activities such as marketing and distribution of inputs emerged as their foremost suggestions. Indeed, transforming the association to undertake multipurpose functions is viewed as providing the members additional benefits which, i n turn, shall elicit more participation from them. Other types of assistance cited were training on farm technology and efficient water utilization.
CHAPTER 8
The Project Turnover Process
THE SELF-ASSESSMENT P~~OCESS or any innovation introduced would only be sustained if the participants perceived some benefits due to its usage. As part of the phase-out activities, the researchers tried to elicit information from the IA officials and TSA Leaders as to their commitment to continue the process. The officials from both IAs affirmed the utility of the technique but contended that not all areas assessed were useful to them. Aspects of the self-assessment form deemed functional and should be retained if the process would be pursued are: the first part where the TSA Leaders record the stages of farming activities of each farmer under their jurisdiction, status of crops and list of the farmers who have paid their dues-membership, annual, and ISF; and the second part where the TSA Leaders assess water adequacy in each farm lot. The portion where rabus activities are monitored should be so modified that the names of the individual farmers would be reflected. This will facilitate identification of those who have contributed voluntary labor at any given time. TheIAneededthis informationtoenforceits policy todeduct lopercent of the ISF due from those who contributed labor for maintenance of the irrigation structures. Nonparticipants in voluntary work shall have to pay 100 percent of what is due. The IA officials also noted that monitoring of turnout maintenance status need not be done since the 1As have already established a pattern for clearing the canals and ditches which is at the beginning of each cropping season. The modified LIPA where the names of tillerslowners are provided was also considered functional.
The officials believed that the TSA Leaders were willing to develop and have already developed the capability to record the data but its continuation is constrained by the nonavailability of funds to reproduce the forms. The officials requested the NIA to supply the forms as well as to take over the
95
96 The Project Turnover Process
monitoring function ofthe BU Team. TheTSA Leaders believed that periodic monitoring encourages them to fill the self-assessment form. Specifically, the Ditchtenders were thought to be in the best position to do the monitoring activities at least once a month.
Noting the gains accruing to the self-assessment process by the officials, the BU Team broached to the NIA Systems Office the possibility of providing assistance to the IA so that this activity can be sustained. By the time of project phase out, the Systems Office was in the process of introducing the manage- ment information system for the IA (IAMIS) in the other systems. This is similar to the self-assessment process. The Irrigation Superintendent and the Acting Regional Manager were committed to continue the self-assessment process in the two pilot IAs while the IAMIS shall be implemented in the other IAs. The Systems Office will then take care of the reproduction, administration and monitoring of the process.
The BU Team was committed to turn over the computer diskettes containing the self-assessment form per TSA, and to train the billing clerks and the Assistant IS on how information from the diskettes can be accessed.
For purposes of replication, the cost of project implementation over a two-year period is estimated to be at $4,732 or $45 per farmer leader. This cost does not include personnel services of the research team since it is assumed that its task shall be assumed by the regular staff of the National Irrigation Administration.
CHAPTER 9
Lessons and Challenges
A ~ E R TWOYEARS of field exposure, i t is worthy to devote serious thinking on certain issues which would be of help to others who are interested in replicating the self-assessment process technique. As in any social interven- tion, its long-term sustainability could be achieved if it produces useful results. Indeed, the success of the self-assessment process is an integrated effect of the contributions of three principal actors; the TSA Leaders, the IA, and the NIA. The project succeeded in demonstrating that theself-assessment process is a useful tool in assessing the performance of TSA Leaders. Since the TSA group is the foundation of the IA, enhancing the capability of the TSA Leaders would in the long run redound to improving the performance of the IA as a whole. Only when the TSA Leaders perceives the importance of the self-assessment process will he they motivated to continue what has been started without prodding and assistance from external catalysts. Inter- nalization of the process would he achieved through the following:
UTILIZATION OF SELF-ASSESSMENT PROCESS RESULTS
The information generated can be utilized at three levels. At the TSA level, i t is a feedback mechanism for the farmer leader on the status of the irrigation service distribution such as the adequacy of water at farm level and his capability to oversee the irrigation-related operations including membership participation. At the IA level, i t is not only a rrieclianism to check on the status of each turnout which would reflect the performance of the TSA Leader but
91
98 Lessons and Challenges
is an input to its overall planning and decision making. Finally, at the NIA level, it is a complement to its information needs. Each of these sectors has experienced the utility of the process which would then ensure its sustainabil- 1ty.
PROVISION OF INCENTIVES TO IMPROVE PERFORMANCE
In the two IAs under study, the TSA Leaders are not provided with funds which they can use to act on matters within their authority. Aside from these, their efforts are not compensated with cash. A challenge that the IA should consider is how to provide real incentives to farmer leaders to turn in higher performance and act on the problems and issues resulting from the feedback mechanism instituted. As Goonesekera concludes (cited in Merrey, Rao and Martin 1988) there is a need to provide irrigation managers with financial incentives to provide good management. IAs should be viewed as business organizations run by managers who need to be given incentives based on their inputs and outputs. This need is articulated in the vision of TSA Leaders that the IA should have sufficient funds to pay their honoraria. An IA's potential source of fund is its share in the ISF collection. If the NIA agrees to increase the IA's percentage share the NIA stands to benefit while the IA would be able to provide better maintenance service to its members which, in turn, increases the ISF collection. A different sharing scheme may be worth exploring which may be tested on a pilot basis. The sixth recommendation presents some innovations which may be made in the NIA-IA contracting scheme.
FUND RAISING
To augment the very limited financial resources of the IA, there is a need to examine ways to generate additional funds. Experience shows that one source of disillusion among members and TSALs is'when problems brought to the IA requiring immediate attention are not acted upon due to lack of funds. To ensure the continuity of the self-assessment process, it is imperative that "fund sourcing" be considered as top priority. One area that the IA can explore is
Lessons and Challenges 99
the possibility of making the collection system more efficient by involving TSALs in the collection function. Another source of possible funds is the registration and annual dues from members. At present, there is only a very small number of registered members.
INTEGRATION OF THE SELF-ASSESSMENT PROCESS INTO A NIA INFORMATION SYSTEM
NIA is currently implementing a management information system on a pilot basis which requires data from the TSAL. This strategy, however, does not have a capability-building component to ensure accuracy of data generated by these leaders. Hence, as practiced, the NIA personnel are burdened with these additional tasks. Considering that the primary concern of the self-as- sessment process is to strengthen the capability of TSALs to record data, this project actually complements NIA’s envisioned information system. Having this i n view, the Project Team has taken into account NIA data requirements in the revised design of the self-assessment instrument. The project proved that the farmer leaders have the capability to generate the needed data, which is also very cost-effective.
COMPLIANCE OF NIA TO THE O&M CONTRACT
For jointly managed systems such as the two IAs under study, i t is inevitable that NIA should play a significant role in the management of the irrigation system. In particular, i t needs to act on O&M issues which are under its jurisdiction as stipulated in the contract. At present, however, it is faced with budgetary constraints limiting its ability to comply with its responsibilities, specifically maintenanceof main canals and repairs ofcontrol structures. This has caused disenchantment among IA members and leaders. Indeed, the Financial Report ofthe NIA Barit River Irrigation System Office, January to December 1992, showed that it did not spend any amount for O&M activities except for the payment of salaries to its O&M personnel. If this persists, the rate of deterioration of the structures and facilities is expected to accelerate. The ray of hope given by the NIA that the requests of the farmers will be adequately served is the implementation of the physical rehabilitation com-
100 Lessons and Challenges
ponent of the Irrigation Operation Support Project (IOSP II), funding for which comes from foreign borrowings. Continued inaction on the physical repairs and maintenance required by the farmers may pose as a stumbling block for the success of the self-assessment process. Since it is foreseen that a budget shortage will prevail in the long run, maintenance needs have to be prioritized jointly by the IA and the NIA. The utility of the self-assessment process will he more appreciated under this arrangement because the IA would he hacked up by information to decide on their maintenance require- ments.
EFFECTING A MORE EQUITABLE SHARING SYSTEM FOR ISF COLLECTION BETWEEN THE IA AND THE NIA
This is a concern of those IAs canying out a Type I1 contract whereby the collection function is undertaken by the IA. It is perceived that the present sharing scheme is partial towards the NIA since the IA only stands to gain a minimal share based on a graduated scheme starting at 2 percent of the target current collection once it has attained 51 percent collection efficiency. To illustrate, BRISDAFIA will get only a minimum amount of P 3,765 ($151) for a collection of P188,249 ($7,530).
However, to reach this level of collection, the IA employed 9 collectors who need to devote at least 30 days per cropping season. If all of the share is allocated to thesecollectors, each will receive only P418 ($17) for amonth’s labor. This figure is very much lower than the minimum wage of P2,070 ($83)/month. The transportation expenses required are also shouldered by the IA collectors who are assigned to cover 80 hectares each on average. The management cost for the IA is not even accounted for as yet. BRISDAFIA has undertaken the collection function for the past two cropping seasons, and although their performance has increased, i t was not enough toreach the point where they could avail of the sharing scheme. Hence, for these two cropping seasons, the collection cost had been underwritten by the IA. Even if one assumes a 75 percent collection efficiency for the target collection of P369,116 ($14,764) for the wet season, 1992, and total IA share percentage increases to 10 percent of total current collection, still the IA stands to gain a very minimal amount of only 27,684 (US $ 1,107). If the collection shall be paid at the rate of the minimum wage for 1 months’ work, the required
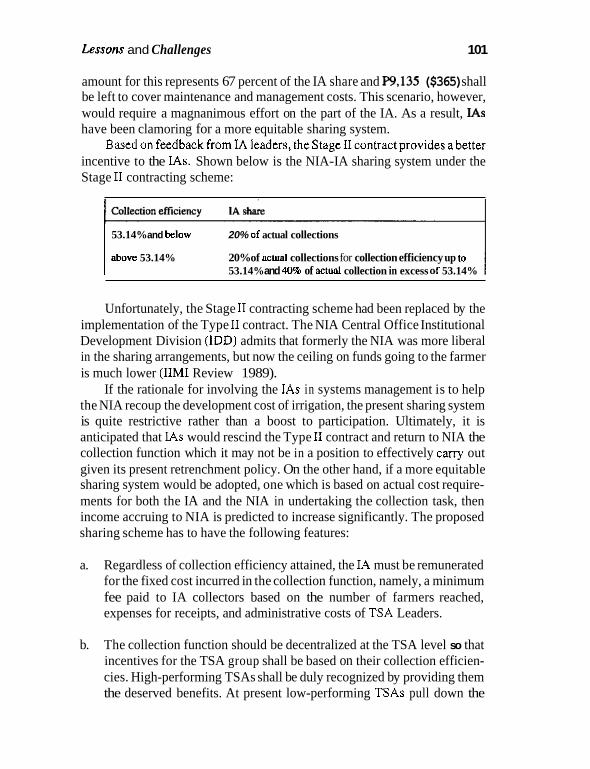
Lessons and Challenges 101
amount for this represents 67 percent of the IA share and p9,135 ($365) shall be left to cover maintenance and management costs. This scenario, however, would require a magnanimous effort on the part of the IA. As a result, Us have been clamoring for a more equitable sharing system.
Basedon feedbackfromIAleaders, theStageIIcontractprovidesabetter incentive to the IAs. Shown below is the NIA-IA sharing system under the Stage I1 contracting scheme:
53.14% and bclow
above 53.14%
20% of actual collections
20% of actual collections for collection efficiency up to 53.14% and 40% of actunl collection in excess of 53.14%
Unfortunately, the Stage I1 contracting scheme had been replaced by the implementation of the Type I1 contract. The NIA Central Office Institutional Development Division (IDD) admits that formerly the NIA was more liberal in the sharing arrangements, but now the ceiling on funds going to the farmer is much lower (IIMI Review 1989).
If the rationale for involving the IAs in systems management is to help the NIA recoup the development cost of irrigation, the present sharing system is quite restrictive rather than a boost to participation. Ultimately, it is anticipated that IAs would rescind the Type I1 contract and return to NIA the collection function which it may not be in a position to effectively cany out given its present retrenchment policy. On the other hand, if a more equitable sharing system would be adopted, one which is based on actual cost require- ments for both the IA and the NIA in undertaking the collection task, then income accruing to NIA is predicted to increase significantly. The proposed sharing scheme has to have the following features:
a. Regardless of collection efficiency attained, the IA must be remunerated for the fixed cost incurred in the collection function, namely, a minimum fee paid to IA collectors based on the number of farmers reached, expenses for receipts, and administrative costs of TSA Leaders.
The collection function should be decentralized at the TSA level so that incentives for the TSA group shall be based on their collection efficien- cies. High-performing TSAs shall be duly recognized by providing them the deserved benefits. At present low-performing TSAs pull down the
b.
102 Lessons and Challenges
good-performing ones since reckoning of collection performance is done at the IA level.
Types I and IIcontracts should be fused into a singlecontract transferring to the IA both the system maintenance and ISF collection functions, similar to the previous arrangements under the Stage I1 contract. How- ever, in the determination of the sharing scheme, it is proposed that incentives given to the IA, in addition to the share covering the fixed cost of collection, shall be provided only when the collection efficiency attained shall have satisfied the NIA expenses for the salaries and wages of existing personnel assigned in the IA plus the said fixed cost of collection defrayed by the NIA. This can be illustrated by citing the case of BRISDAFIA:
c.
1 . Target collection in BRISDAFIA for dry season = PS99,000 (740 ha x 150 kg of palay x P6.00 x 0.90)
NIA’s costs (salaries and wages and collection expenses) = P180,OOO (PSOOO x 6 months. x 0.90) + P10,OOO = P190,OOO
2.
3.
Under this scheme, therefore, if collection efficiency in BRISDAFIA is 32 percent and below, the IA share will only be a fixed amount of PlO,OOO, equivalent to the fixed collection cost. Above 32 percent, incentives on top oftheP10,OOO shall becomputed asapercentageof actual collection, therate of which shall progressively increase as collection efficiency rises.
d.
Collection efficiency = 32% [(190,000/599,000) x 1001
Implementation of automatic retention of the ISF share at the IA level to enable IA to put up equity in minor repairs and immediate compensation to the IA collectors.
Finally, for those who intend to implement action-research projects, the project team wishes to share some insights. Action research is participatory and as such project activities could not be confined to what the project implementors had initially conceptualized prior to field immersion. The process requires several cycles of planning, implementing, observing and evaluating to arrive at a more refined plan for action. In most instances, one

Lessons and Challenges 103
would have to undertake activities in response to the clamor of the partici- pants. It is quite frustrating, however, to be confronted with the reality that onecan only be flexible to theextent thatresources would permit. In thiscase, the expertise of other agencies with whom the IA may forge linkage could be explored.

Bibliography
Jopillo, Sylvia Ma. G. and Romana de 10s Reyes. 1988. Partnership in irrigation; Farmers and government in agency-managed systems. Institute of Philippine Culture, Quezon City, Philippines, p.208.
Lauraya, Fay M. and Antonia Lea Sala. 1990. The determinants of performance of irrigation associations in national irrigation systems in Bicol: An analysis. An IIMI publication.
Lauraya, Fay M., AntoniahdSalaand JulietaCaceres. 1992. Evolvingamanagement information system for IAs. Paper presented to the Asian Regional Workshop on the Inventory of Farmer-Managed Irrigation Systcms and Management Information Systems, 13 - 15 October, 1992, Manila, Philippines.
Lauraya, Fay M., Antonia Lea Sala and Julieta Caceres. 1992. Organizational devel- opment program for strengthening IAs and IA-NIA partnership: A pilot inter- vention for Bicol, Philippines. Projcct report submitted to IIMI, 1992.
Lauraya, Fay M., Antonia Lea Sala and Iulieta Caceres. 1993. An integrated devel- opment approach for improving IA performance. Project report submitted to IIMI, 1993.
Merrey, Douglas I. , P.S. Ran and Edward Marlin. 1988. Irrigation management research in Sri Lanka: A review of selected literature. IIMI Occasional Paper,
National Irrigation Administration (NIA). 1989. Improving performance through participation. IIMI Review, Vo1.3 No.1. October.
NIA-Barit River Irrigation SystemOffice. 1992. Financial Report, January to Decem- ber.
Vermillion, Douglas L. 1991. The turnover and self-management of irrigation insti- tutions in developing countries. A Discussion paper for the New Program of IIMI.
Wijayaratna. C.M. 1993. Irrigation turnover and self-management - The Philippine experience. An unpublished paper, IIMI Sri Lanka Field Operations.
105
ANNEX I
NIA-IA Obligations under Contract Types I, IT and I11
TYPE I CONTRACT-MAINTENANCE CONTRACT
UNDER THis coNTRAcr, the Irrigators’ Association (IA) undertakes routine maintenance works of a certain length of the irrigation canal systems. The following are the IAs’ obligations:
Undertakes grass cutting, clearing, desilting and reshaping slopes for the entire length of canals, at least once a month;
Fills-up potholes and open cuts along canal embankments as well as drains accumulated water from depressed portions of canal embank- ments;
Undertakes minor repairs of irrigation facilities which do not require equipment and construction materials;
Undertakes on a monthly basis as the need requires oiling and greasing of steel gates including turnout gates; particularly the lifting mecha- nisms;
Protects and safeguards from destruction all irrigation facilities and structures;
Prevents any person from constructing open cuts andlor installing addi- tional turnouts without joint clearance from both the NIA and the association; and
107
108 NIA-IA Obligations under Contract Types I, 11 and 111
Removes debris from canals and conveyance structures that restrict the normal flow of irrigation water.
In undertaking the Type I contract the Irrigators’ Association will be paid with P1,lOO upon satisfactory maintenance: weeding, trimming canal em- bankments, reshaping and removal of debris of 3.5 km of unlined canals or 7 km of lined canals. Desilting activities undertaken will be paid for by volume of accomplishment as per agreement entered by and between the NIA and IA.
NIA’s Obligations in Type I Contract
Provides the Association with a list of facilities and structures for maintenance as contained in the inventory jointly undertaken by both parties;
Undertakes repairlrestoration works of facilities and structures jointly with the Association;
Provides the Association a regular supply of used oil and grease for the maintenance of irrigation facilities;
Develops and implements programs to build up the organizational capa- bility of the Association particularly in effectively implementing the maintenance activities;
Conducts regular inspection of the facilities and structures under contract by the Association and provides necessary guidance if there are deficien- cies: and
Assists the Association in the preparation of its policies and procedures in undertaking its maintenance responsibilities.
NIA-lA Obligations under Contract Types I, If nnd III
TYPE I1 CONTRACT-SYSTEM OPERATIONS AND
109
ISF COLLECTION
IA Obligations in Systems Operations
Formulates and firms-up with NIA, the operations and maintenance plan one month before the start of the next cropping season and discusses monthly status of O&M plan implementation with the NIA;
Disseminates information on the water delivery and planting schedule to the irrigation water users within the IA contracted service area;
Delivers and distributes irrigation water equitably to the IA farmer members;
Monitors the status of farming activities and submits to the NIA weekly reports on irrigated and planted areas;
Resolves conflicts arising from water distribution among IA members and other IA internal conflicts that may arise;
Informs the NIA through its representative(s), problems and conflicts on operations beyond the Association’s capacity to resolve; and
Attends meetings and conferences called by the NIA to discuss major problems encountered and formulates solutions for them.
IA Obligations in ISF Collection
Provides the NIA, before the start of each season, an updated master list of farmer-member beneficiaries, should there be changes in the existing master list;
Formulates effective and workable policies to effect a systematic ISF collection scheme with the concurrence of the Irrigation Superintendent;
Distributes promptly Irrigation Service Fee (ISF) bills to each of the farmer-member beneficiaries along with each member’s bank account:
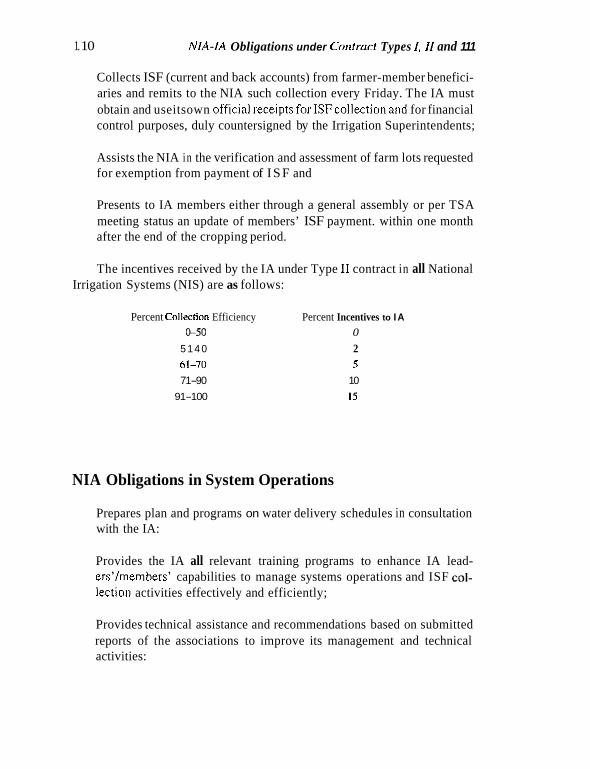
1. 10 NIA-IA Obligations under Contmct Types 1, I1 and 111
Collects ISF (current and back accounts) from farmer-member benefici- aries and remits to the NIA such collection every Friday. The IA must obtain and useitsown officialreceiptsforISFcollectionand for financial control purposes, duly countersigned by the Irrigation Superintendents;
Assists the NIA in the verification and assessment of farm lots requested for exemption from payment of ISF and
Presents to IA members either through a general assembly or per TSA meeting status an update of members’ ISF payment. within one month after the end of the cropping period.
The incentives received by the IA under Type I1 contract in all National Irrigation Systems (NIS) are as follows:
Percent Callrctian Efficiency Percent Incentives to I A &SO 0
5 1 4 0 2 61-70 S 71-90 10
91-100 15
NIA Obligations in System Operations
Prepares plan and programs on water delivery schedules in consultation with the IA:
Provides the IA all relevant training programs to enhance IA lead- ers’lmembers’ capabilities to manage systems operations and ISF COIL lection activities effectively and efficiently;
Provides technical assistance and recommendations based on submitted reports of the associations to improve its management and technical activities:
NIA-IA Obligations under Contract Types I, II and Ill 111
Appraises the IA on the NIA’s current policies relative to systems operations and ISF collection when the need arises;
Undertakes all rehabilitation works and repairs of major damages to the mainllateral canals and other appurtenant structures including the ac- cesslservice roads;
Authorizes the IA to expand the service area of the system without sacrificing any portion of the programmed area;
Facilitates resolution of problems and conflicts beyond the Association’s capacity to resolve;
Formulates with the IA, the system operations plan within one month before the start of the cropping season;
Assists in the preparation of planslfeasibility studies of projects the IA may wish to venture in;
Conducts regular audit of the IA’s book of accounts:
Reviews and approves implementation plans for operations within one month after submission to the NIA by the IA;
Monitors the Association’s activities in the implementation ofjoint water delivery and planting schedules; and
Allocates and delivers adequate amounts of water up to the lateral beadgate for the Association’s contracted area programmed for irrigation in a particular cropping season.
NIA’S Obligation in ISF Collection
Prepares ISF bills based on the verified LIPA submitted by the IA President. The LIPA must be duly approved by the Irrigation Superin- tendent;
I12 NIA-IA Obligatioirs under Contract Types I , I I and 111
Assesses and verifies farm lots requested for exemptions from payment of I S F
Issues NIA official receipts to the IA for all collections remitted by the Associations;
Applies the present discounting policies under a procedure to be worked out between the NIA and the IA; and
Grants to the Association a collection incentive bonus as provided in the contract.
TYPE 111 CONTRACT-TURNOVER OF THE WHOLE OR PART OF THE IRRIGATION SYSTEMS
In this type of contract, the IA assumes full management ofthe system O&M; they will amortize the development cost incurred in the construction and rehabilitation of the whole or part of the system not to exceed 50 years. Below are some of the obligations of both NIA and IA.
Obligations of the Irrigators’ Association
Provides the best talents, skills and judgement in accordance with known accepted management practices and exercises utmost care, diligence and efficiency in the discharge of its duties and tasks; works for and in the best interest of the farmers in general; and takes all reasonable steps to keep expenses to a minimum consistent with sound financial practices.
Undertakes and manages water allocation and distribution to the differ- ent rotational areas from the main lateral canal of the system. This includes water distribution from turnouts and its main farm ditches to the different supplementary farm ditches (SFDs). This water distribution scheme is to be adopted on the NIA-IA jointly approved cropping pattern.
Maintains the main and lateral canals and main farm ditcheslsupplemen- very farm ditches; maintenance includes cutting of grasses, removal of silt and other materials that obstruct normal water flow in the canals. The mainte-
NIA-IA Obligations under Contract Types 1, II and I l l 113
nance will cover the entire length of the main canal and laterals including main farm ditches and supplementary farm ditches within the system.
Undemkesrepair worksconsidered minorand within thecapacityofthe IA. Minor damages to canals will be repaired by the IA provided, however, that in case there is a need for materials, construction materials that the IA cannot provide shall be supplied by the NIA while the labor will be provided by the 1A. This provision by the NIA of construction materials forrepair shall be for a period of two years from the date of turnover of the system to the IA.
Undertakes all maintenance and repair works of the terminal facilities. Prepares the LIPA through the rotational area (RA) leaders which shall
be submitted by the IA President to the NIA for preparation of bills. Distributes bills for ISF to the farmer beneficiaries through the RA
leaders. Collects ISFfrom irrigation users of one and a half (1.5) cavans’ of palay
for the wet-season crop, and two (2) cavans of palay for the dry-season crop, or its equivalent in cash based on the prevailing government support price of palay. Collection shall be done by RA bill collector8 who, in turn, shall remit the same to the NIA every Friday or any day that may be agreed upon.
Resolves conflicts between and among IA members arising from water distribution and allocation, organization management, and other IA internal conflicts that may arise.
Informs the NIA through its representative on O&M problems and conflicts beyond the IA’s capacity to resolve.
Attends meetingslconferences called by the NIA to discuss major prob- lems encountered and to formulate solutions for them.
Makes available to the NIA for training all persons who shall be ulti- mately responsible for O&M and management of the irrigation system.
Submits for approval to the NIA all plans on management of O&M of the system two months before the start of the cropping season and submits reports on specified periods of plan implementation and other reports that may be required by the NIA from time to time.
I 1 cnvan = 50 kilograms
1 I4
Obligations of the NIA
Provides to the IA available managerial and technical training and develop- ment programs for all levels necessary in managing the O&M of the system towards its viability.
Appraises the IA of current policies of the contracting agency andlor laws and decrees affecting the NIA concerning irrigation and organization man- agement.
Authorizes the IA to expand the service area of the system without sacrificing any portion of the programmed service areas.
Undertakes all rehabilitation works and repairs of major damages to the main and laterallsub-lateral canals and other major appurtenant structures including the access and service roads, subject to repayment in accordance with NIA policies.
Provides the IA the necessary and available supplies, tools, equipment and vehicles and other resources based on the approved plans, provided, the IA will shoulder the cost for such supplies and other resources including equipment rentals, in accordance with existing NIA policies.
Provides technical analysis and recommendation based on the submitted reports of the IA to improve its management and technical activities.
Facilitates resolutions of problems and conflicts beyond the Irrigators’ Association’s capacity to resolve.
Facilitates resolutions of productionlmarketing-related problems pre- sented by the IA to the NIA.
Reviews and approves implementation plans for operation within one month after submission to the NIA by the IA.
NIA-IA Obligations under Contract Types I, II and 111
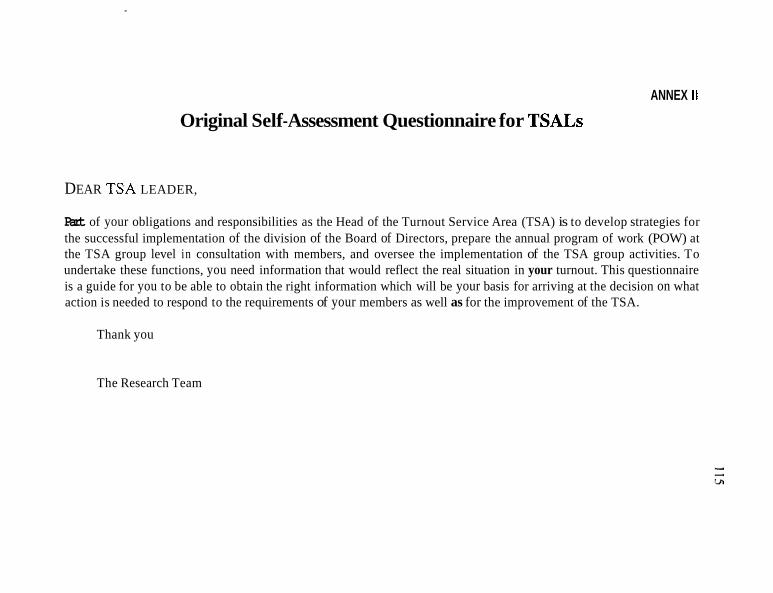
Original Self- Assessment Questionnaire for TSALs ANNEX II
DEAR TSA LEADER,
Part of your obligations and responsibilities as the Head of the Turnout Service Area (TSA) is to develop strategies for the successful implementation of the division of the Board of Directors, prepare the annual program of work (POW) at the TSA group level in consultation with members, and oversee the implementation of the TSA group activities. To undertake these functions, you need information that would reflect the real situation in your turnout. This questionnaire is a guide for you to be able to obtain the right information which will be your basis for arriving at the decision on what action is needed to respond to the requirements of your members as well as for the improvement of the TSA.
Thank you
The Research Team
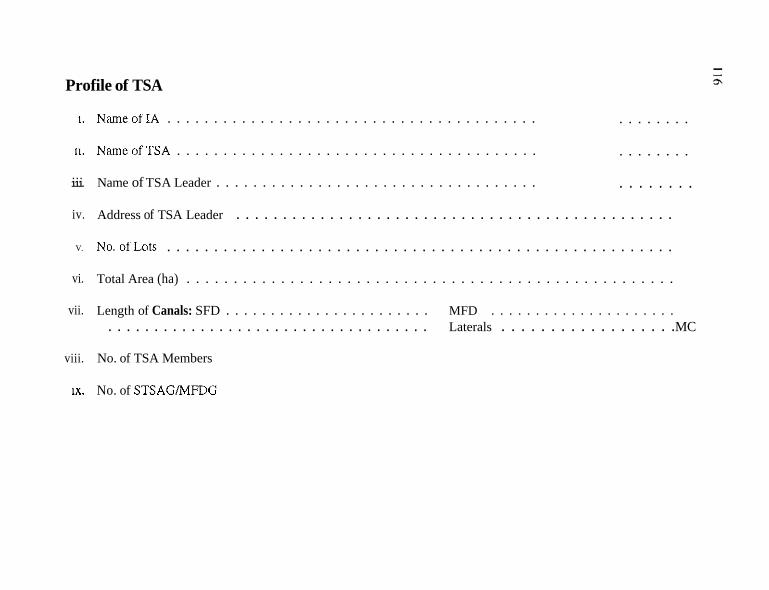
Profile of TSA
1.
11.
... 111.
iv.
V.
vi.
vii.
viii.
IX .
NameofIA . . . . . . . . . . . . . . . . . . . . . . . . . . . . . . . . . . . . . . . .
NameofTSA . . . . . . . . . . . . . . . . . . . . . . . . . . . . . . . . . . . . . . .
Name of TSA Leader . . . . . . . . . . . . . . . . . . . . . . . . . . . . . . . . . . .
. . . . . . . .
. . . . . . . .
. . . . . . . .
Address of TSA Leader . . . . . . . . . . . . . . . . . . . . . . . . . . . . . . . . . . . . . . . . . . . . . . .
No.ofLots . . . . . . . . . . . . . . . . . . . . . . . . . . . . . . . . . . . . . . . . . . . . . . . . . . . . . .
Total Area (ha) . . . . . . . . . . . . . . . . . . . . . . . . . . . . . . . . . . . . . . . . . . . . . . . . . . . .
Length of Canals: SFD . . . . . . . . . . . . . . . . . . . . . . . MFD . . . . . . . . . . . . . . . . . . . . . . . . . . . . . . . . . . . . . . . . . . . . . . . . . . . . . . . . Laterals . . . . . . . . . . . . . . . . . . MC
No. of TSA Members
No. of STSAGMFDG
Obligasiyones asin Responsibilidad Kan TSA Leader (Officers' Handbook)
This short document was prepared to serve as a guide to the TSA Leader in fulfilling his sworn duties and responsibilities as the Head of the TSA.
I . What is a Turnout Service Area Group (TSAG)?
The TSAG is the second level in the organization structure of the IA. It covers an area of around 25-50 hectares served by a turnout to which irrigation water is allocated, delivered and equitably distributed among its members. All farmers whose landholdings are inside the TSA are eligible for membership. The TSAG serves as a coordinating mechanism for better water management at this level.
What are a Supplementary Farm Ditch Group (SFDG) and a Main Farm Ditch Group (MFDG)?
It is the first level in the IA's organizational structure. It is also the smallest group consisting of farmers whose farm lots are located beside or opposite the main farm ditch or supplementary farm ditch within the TSA and is headed by a leader called the STSAG or MFDG leader. This leader assists the TSA Leaders in managing the irrigation water at the STSAG or MFDG level.
What are the qualifications of the TSA Leader?
2.
3.
All officers of TSAGs must possess the following qualifications:
a. b. c. d. e. f.
Must be a member of the IA in good standing. Must know how to read and write. Must be of good moral character. Must be actually engaged in farming within the area of operation of the TSAG where he belongs Must know how to conduct meetings. Has not been involved in any anomaly concerning the farmers’ organization.
4. What are the duties and responsibilities of the TSA Leader?
a. b. C.
d. e. f.
g. h. 1.
j.
Presides over the TSAG (and TSAG officers) meeting. Develops strategies in implementing BOD decisions. Represents the TSAG in the BOD and in all activities to which the TSAG which he belongs is a party In consultation with TSAG offcerslassembly establishes procedures in settling conflicts. Prepares an annual program of work (POW) at the TSAG in consultation with members. Renders report on results of BOD meeting during TSAG assembly meeting. Oversees the implementation of TSAG activities. Spearheads campaign of the ISF collection at the TSAG area. Submits for approval to the BOD all membership applications. Consolidates the list of irrigated and planted area (LIPA) in the TSAG coverage.
k. 1. m.
What are the obligations and responsibilities of the members of the IA?
Every member of the association must render personal service of labor through voluntary service to their association or TSAG organization in addition to timely payment of ISF on such dates and such times as may be determined and agreed by the members. In case of incapacity of a member, he may appoint a substitute acceptable to the Service Committee and the TSAG Chairman.
All irrigation facilities within the coverage of the association shall be maintained through personal and voluntary services of its members in their respective TSAG. The members of the association shall see to it that irrigation canals and drainages are in good operating condition and free from silt deposits and growing grasses that may hinder the fast and free conveyance of the irrigation water.
What are the duties and responsibilities of the TSA Leader for maintaining the facilities and structures in the TSA?
Reviews and evaluates with TSAG officers the status of implementation of the TSAG activities. Holds TSAG meetings once a month and before the BOD meeting. Submits consolidated status of accomplishments of the four TSAG committees to the BOD.
5 .
6.
Inspection of Work
In all work to be done, the TSAG leadership shall make a list of members to work on each particular day. Such a list shall contain the names of members present or absent from work and the list shall be submitted through the TSAG Chairman and subsequently to the Board of Directors in its regular or special meetings for its information - - and for appropriate action. iD
N Duration of Work 0
The TSAG leadership shall fix the time needed for a certain work to be done. However, depending on the expected timetable of completing the work, the Chairman, upon consultation with the members, may extend the scheduled time of work as approved.
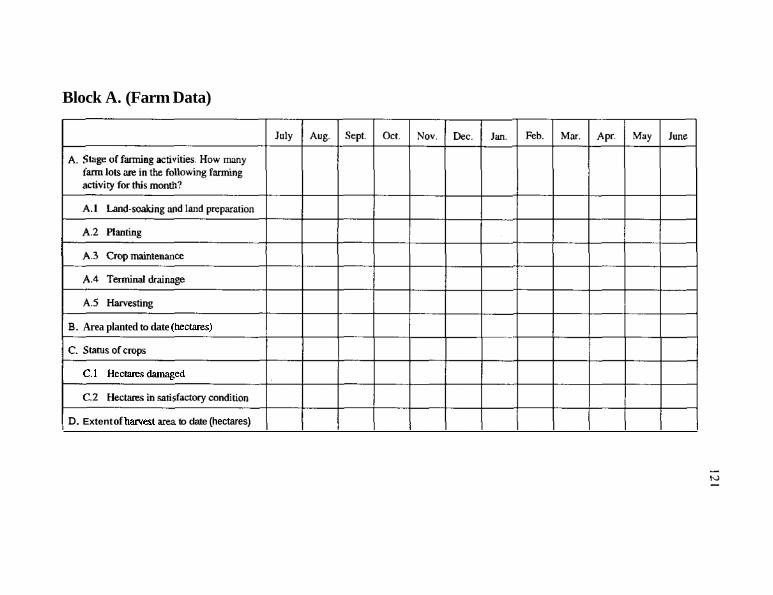
Block A. (Farm Data)
B. Area planted to date (hectares)
C.1 Hectaresdamaged
D. Extent of havest area to date (hectares)
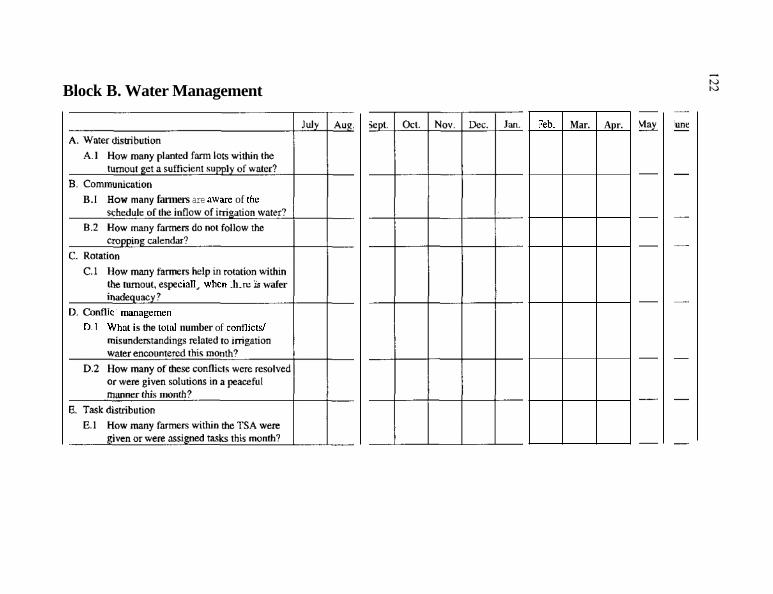
Block B. Water Management
Feb.
B. I How many farmers are awuc of thc
cia11 when h re is wafer
1c managemen D.1 Whnl is the fold number of conflicM
Mar. Apr.
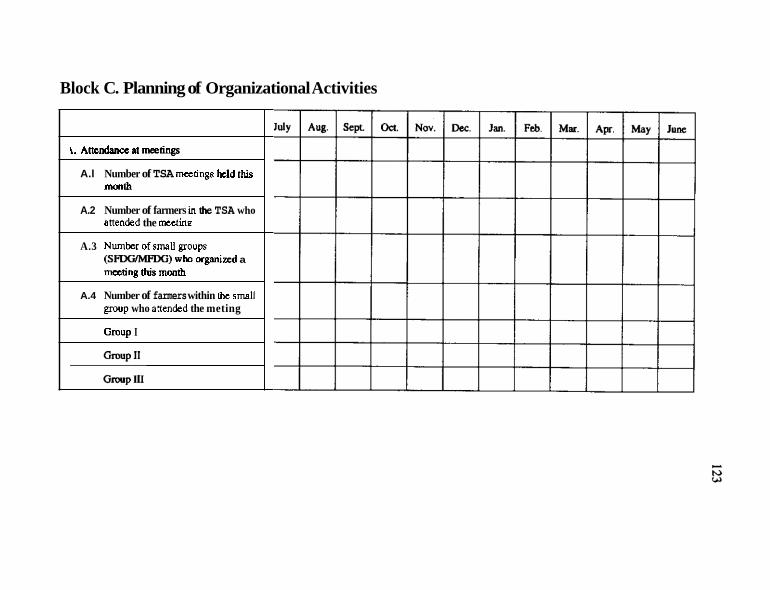
Block C. Planning of Organizational Activities
i. A t a b at msetings
A.l Number of TSA meetings k l d (his month
A.2 Number of farmers in the TSA who auaded the mcuini
A.3 Numberofsmallgmups (SFDG/MFDo) who arganimd a meting this month
A.4 Number of farmers within tk small gmup who attended the meting
Gmup I
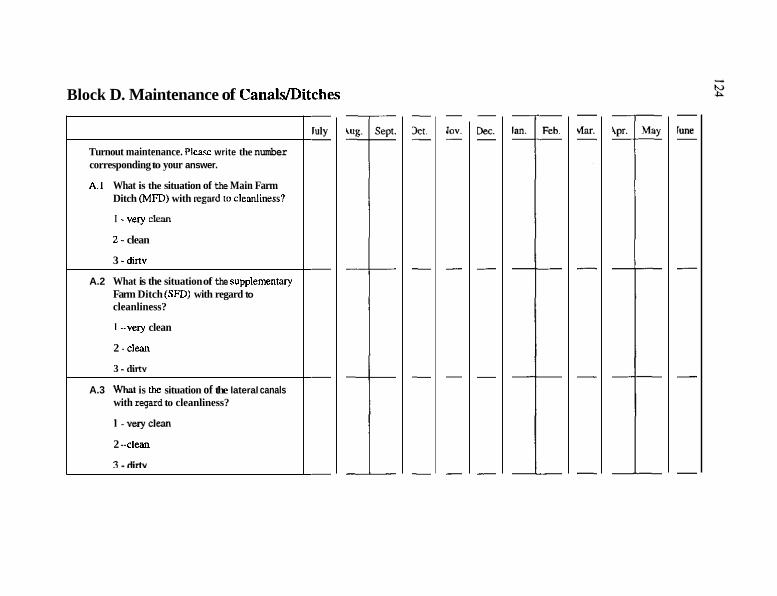
Block D. Maintenance of CanalslDitches
Turnout maintenance. Plea- write the number corresponding to your answer.
A.1 What is the situation of the Main Farm Ditch (MFD) with eggard to cleanliness?
I .very Clem
2 . clean
3 -din"
A.2 What is the situation of the supplementq Farm Ditch (Sm) with regard to cleanliness?
I - very clean
2 -Clean
3 -dim
A.3 What is fhe situation of the lateral canals with regard to cleanliness?
l-velycleatl
2 - clean
1-rlim
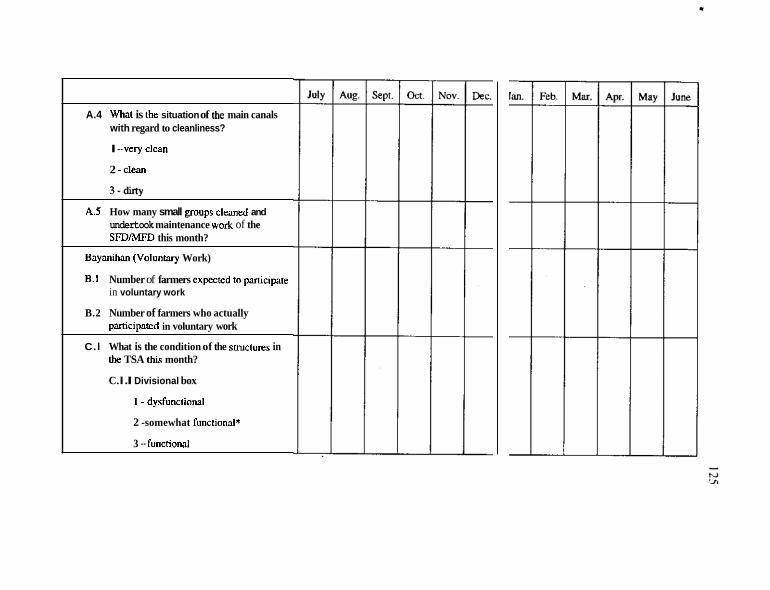
A.4 what is the situation of h e main canals with regard to cleanliness?
I - very clean
2 -Clean
3 . -
A.5 How many small groups cleaned and undertook maintenance w o k of the SFDMFD this month?
Baymihm (Volunwry Work)
B.1 Number of farmers expected to pmicipte in voluntary work
B.2 Number of farmers who actually pmicipated in voluntary work
C.l What is the condition of the smchlres in rhe TSA this month?
C. I. I Divisional box
1 -dysfunctional
2 -somewhat functional*
3 - functional
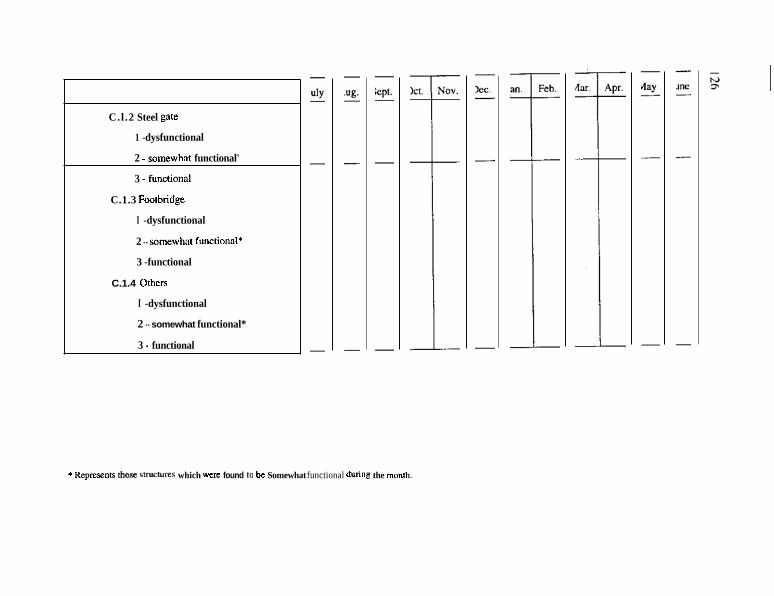
C.l.2 Steel gate
1 -dysfunctional
2 -somewhat functional'
3 -functional
C.1.3 FaorbCdge
I -dysfunctional
2 - somewhat functional*
3 -functional
C.1.4 Others
I -dysfunctional
2 - somewhat functional*
3 - functional
* Reprevnis tho= smcmrts which were found to be Somewhat functional dun", n the month.
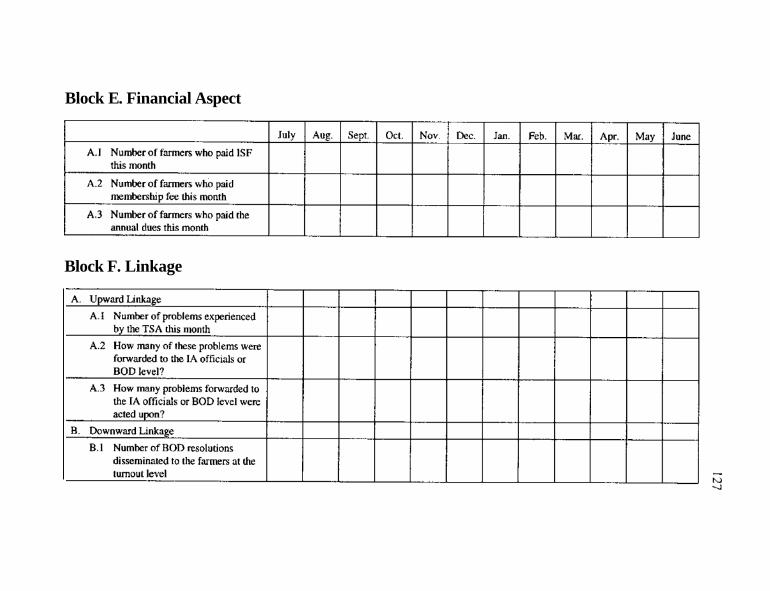
Block E. Financial Aspect
Block F. Linkage
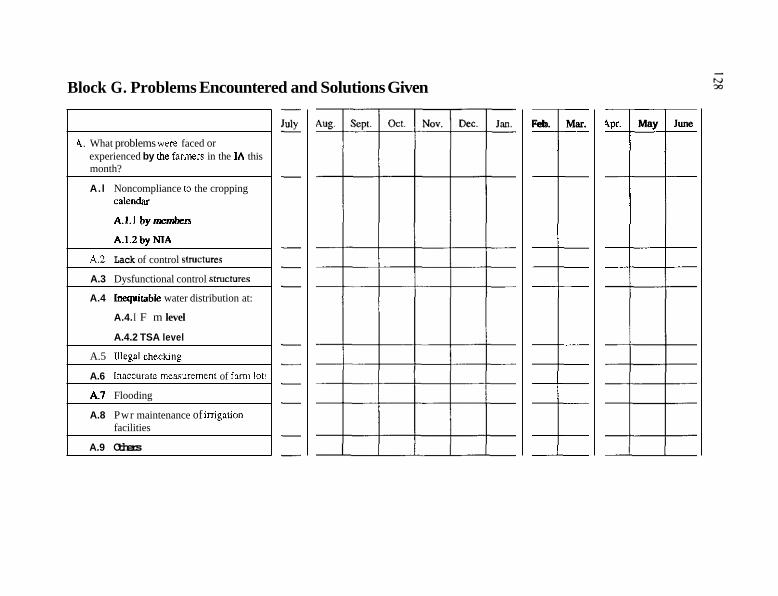
Block G. Problems Encountered and Solutions Given
4. What problems were faced or experienced by the farmers in the IA this month?
A.l Noncompliance to the cropping calendar
A.I.1 bymemben
A.1.2byNIA
A 2 Lack of control smctures
A.3 Dysfunctional control ~mctures
A.4 Inequitable water distribution at:
A.4. I F m level
A.4.2 TSA level
A.5 Illegal checliing
A.6 Inmulillc meaSuremeni of fm lot!
A.1 Flooding
A.8 Pwr maintenance of imgatian facilities
A.9 Others
Feb. Mar. I 4pr. May June i
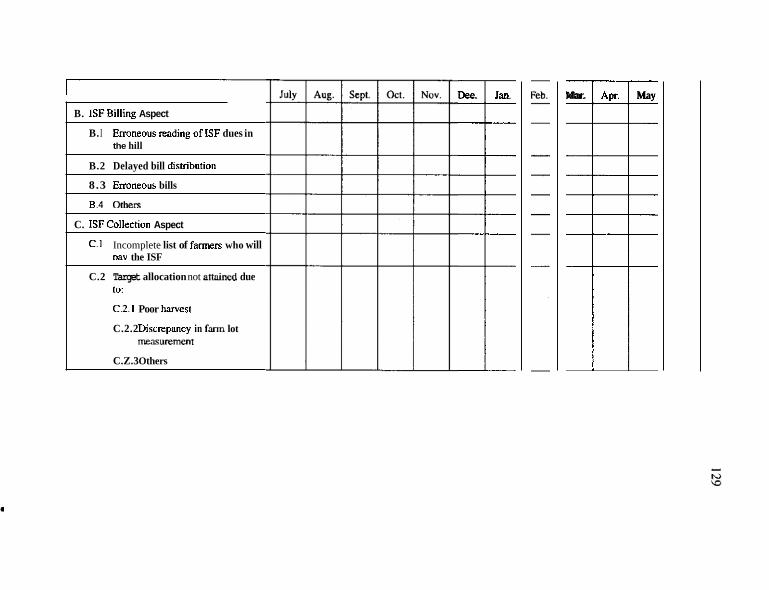
I ~
B. ISFBilling Aspect
B. I Ermneous reading of ISF dues in the hill
B.2 Delayed bill distnbution
8 .3 Ermneous bills
8 . 4 O h m
C. ISFCollection Aspect
C.1 Incomplete list of farmers who will MV the ISF
C.2 Target allocation not =mined due 10:
C.2.1 Poor harvest
C.2.2 Discrepancy in farm lot
C.Z.3 Others
l7E&SWmC"t
Dee. Jan I Mar. Apr. May
i
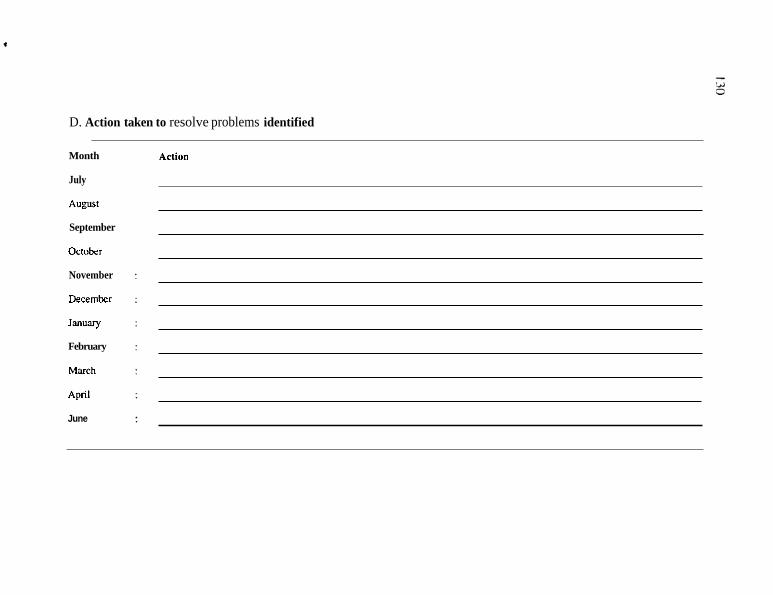
g
D. Action taken to resolve problems identified
Month
July
Au~ust
September
October
November
December
January
February
March
A p d
June
Aelion
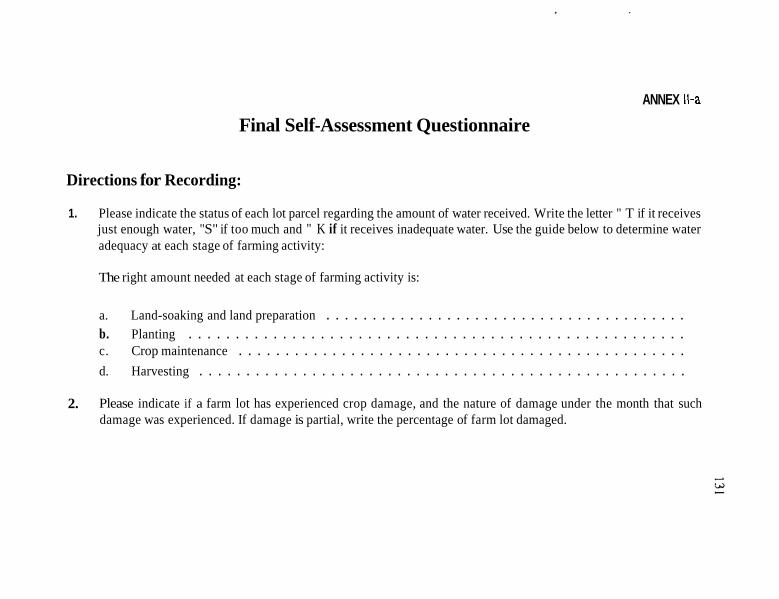
ANNEX 11-a
Final Self-Assessment Questionnaire
Directions for Recording:
1. Please indicate the status of each lot parcel regarding the amount of water received. Write the letter " T if it receives just enough water, "S" if too much and " K if it receives inadequate water. Use the guide below to determine water adequacy at each stage of farming activity:
The right amount needed at each stage of farming activity is:
a. Land-soaking and land preparation . . . . . . . . . . . . . . . . . . . . . . . . . . . . . . . . . . . . . . . b. Planting . . . . . . . . . . . . . . . . . . . . . . . . . . . . . . . . . . . . . . . . . . . . . . . . . . . . . c. Crop maintenance . . . . . . . . . . . . . . . . . . . . . . . . . . . . . . . . . . . . . . . . . . . . . . . . d. Harvesting . . . . . . . . . . . . . . . . . . . . . . . . . . . . . . . . . . . . . . . . . . . . . . . . . . . .
Please indicate if a farm lot has experienced crop damage, and the nature of damage under the month that such damage was experienced. If damage is partial, write the percentage of farm lot damaged.
2.
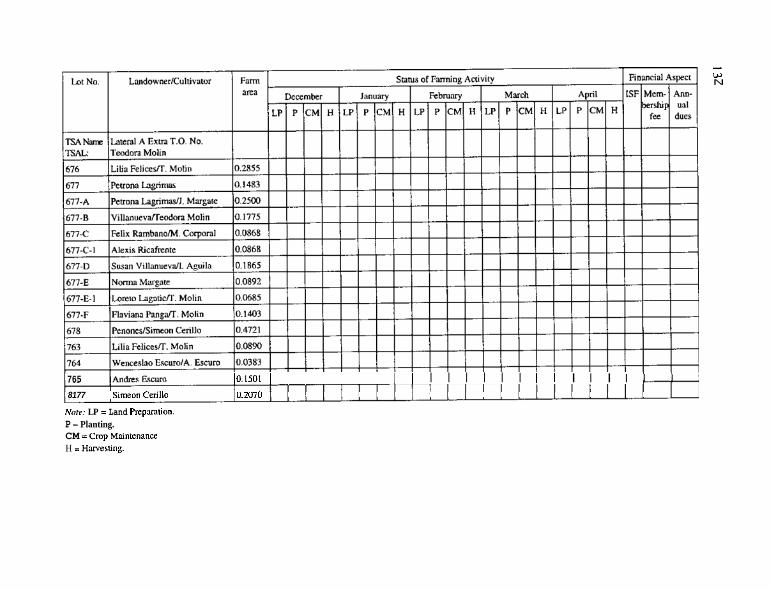
- w N
765 10.15011 I I I I I I I I I I I I I I I I I I I I I I 8177 Sirneon Cenllo 0.2070
Non: LP = Land Rcpmtian. P = Planting. CM =Crop MInenance H = Hmerting.
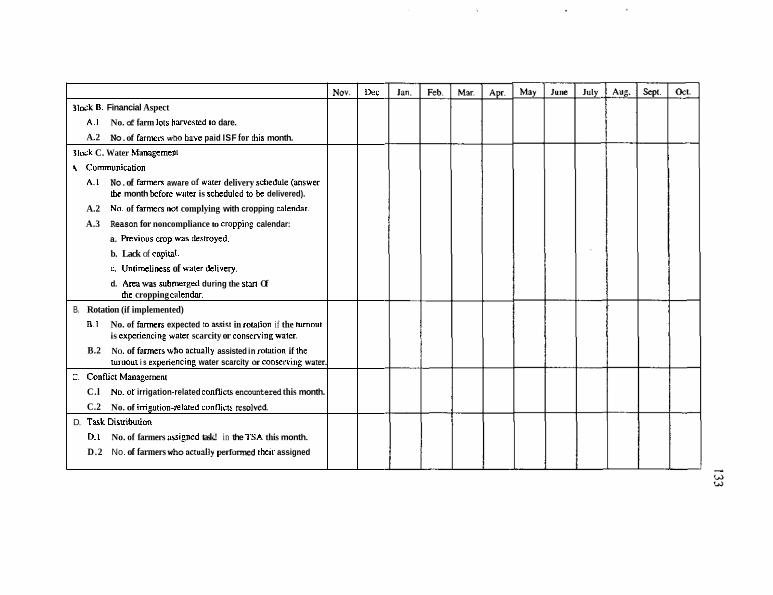
No".
3102k 8. Financial Aspect A.1
A.2 No. of farm lots barvesad to dare.
No. of f a m r s who hrve paid ISF for th~s month.
3la'k C. Water Managemeit 9 communiwtion
A.1 No. of f m r s aware of water delivery schedule (answer L e month before water is scheduled to be delivered).
A.2 No. of farmers not complying with cropping CPlendar.
A.3 Reason for noncompliance to cropping calendar:
a. Revlous m p was deruoyed.
b. Lack of capilal. c. Untimelimsr of w a ~ r dclivcry. d. Area was submerged during the SM Of
thc cropping calendar B. Rotation (if implemented)
B.1
B.2
No. of f-n expected 10 misf in rolarion if the lumm
NO. of f-rs who acfyally assisted in mmtion if the twoout i s eipnencing water scarcity 01 conservinp watec.
No. of irrigation-related confictr encountered this month.
No. of inigarion-related conflicts ~esolvcd.
D.1 No. of farmers arripned task.! in the TSA this month.
D.2 No. of farmers who ~cfusIIy pcfofarrncd their assigned
is experiencing WPQC scarcity or consewingwater.
C. Conflict Management C.l C.2
D. Tut Dismbution
Dec
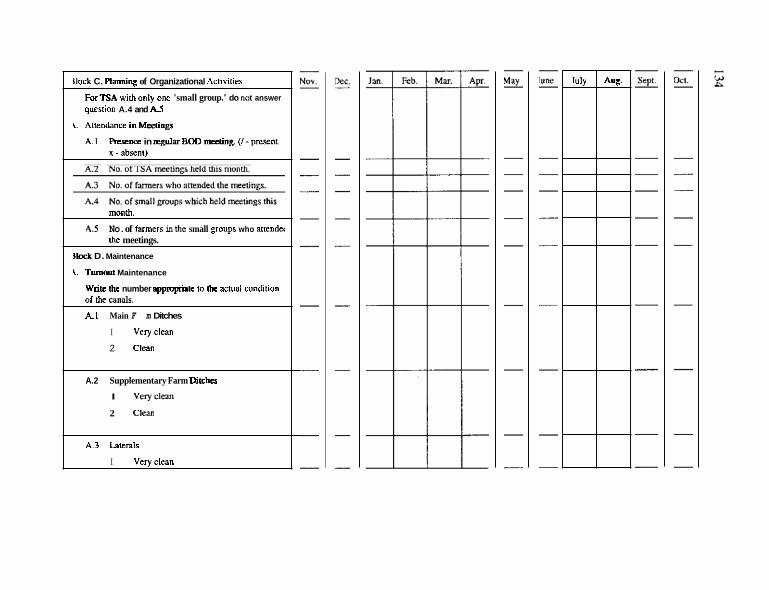
Ilock C. Plannins of Organizational AcIlviIies
ForTSA wilh only one "small group." do not answer question A.4 and A.5
L. Attendance InMeetings
A.1 Presence in renulareOD meetins. ( l-pment, x -absent)
luly
monrh.
No. of farmers in h e small groups who attendei A S *e meetings.
%lack D. Maintenance
\. Turnout Maintenance
Wnte Ihc number appropriate lo Ihc acNal condition O f Ihe canPr.
A.1 Main F m Ditches
I veryc1can
2 Clean
Aug.
A.2 Supplementary Farm Ditches
I velyc1wn
2 Clan
A.3 Laterals
I vcryc1ean
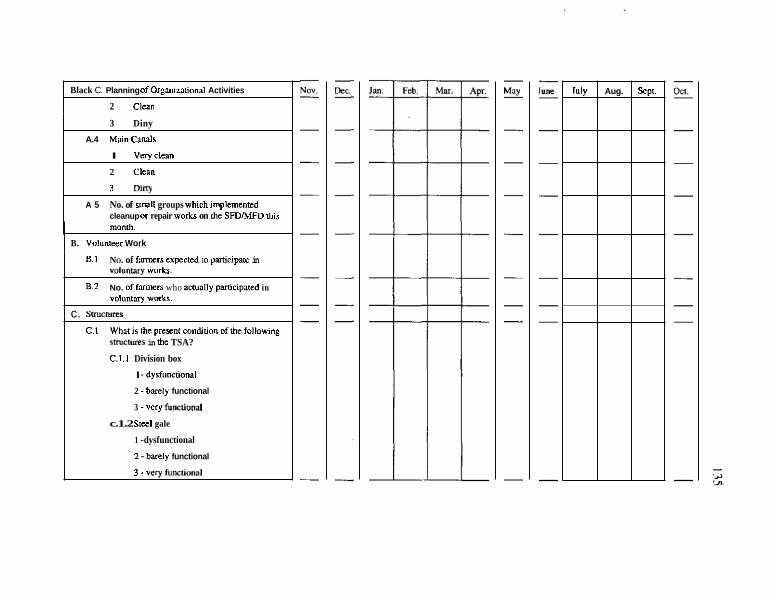
Black C. Planning of Orgarzational Activities
2 Clean
3 Diny
A.4 Maincanals
I Veryclea"
2 Clean
3 Dim
A 5 No. of small groups which implemenfed cleanup or repair work on he SFDMFD Ulir monlh.
B. V~hnleer Work
B.1
8.2
NO. of f m r s expected LO prrUcipate in "01""mry works.
No. of f m m who actually participated in voluntary wakr.
c. smcl!lres
C.1 Wh.ti~lhepre~enrcanditionoffhefollowing S ~ C ~ E in fhe TSA?
C.I.1 Division box
I -dysfunctional
2 -barely functional
3 -very hnctionvl
c.1.2 Slcel gale
1 -dysfunctional
2 . b m l y functional
3 . very runctiOnai
luly Aug. Sepr.
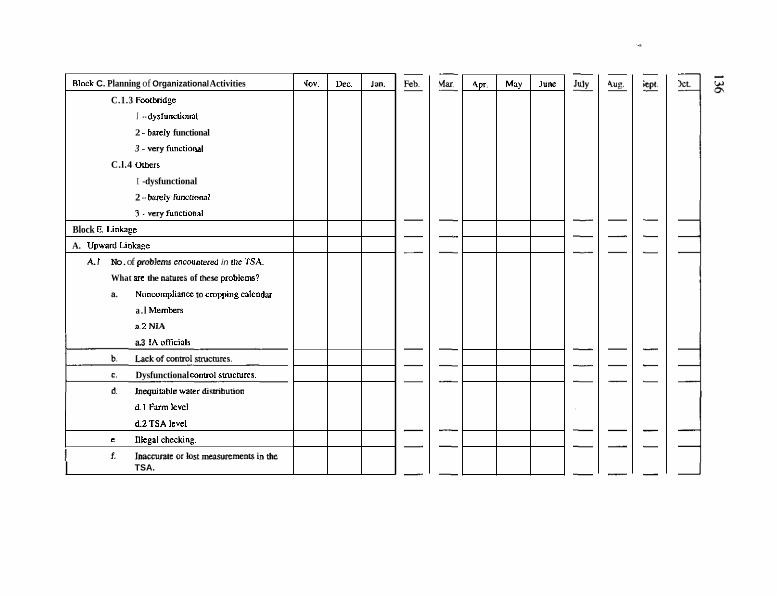
Black C. Planning of Organizational Activities
C.1.3 Foorbndgc
I - dyrfunniond
2 - barely functional
3 - w r y functional
C.l.4 Others
I -dysfunctional
2 - barely f""Cti0"d
3 . "Cry functional
Block E. Linlrage
A. Upward UnLage
A.1 No. of problem encountered in &c TSA.
What M the O ~ I C C S of here problems?
a. Nancampliancc to cropping calendar
a . l Memkrs
2.2 N U a.3 IA Of i iC idS
Dysfunctional confol smcfllms.
lnnsquitlhle w a U hsmbution
d.1 Farm lkvcl
rlov.
d.2TSA level
c lllcgrl chechng.
Dec. Jan.
I TSA.
4pr. May JYne
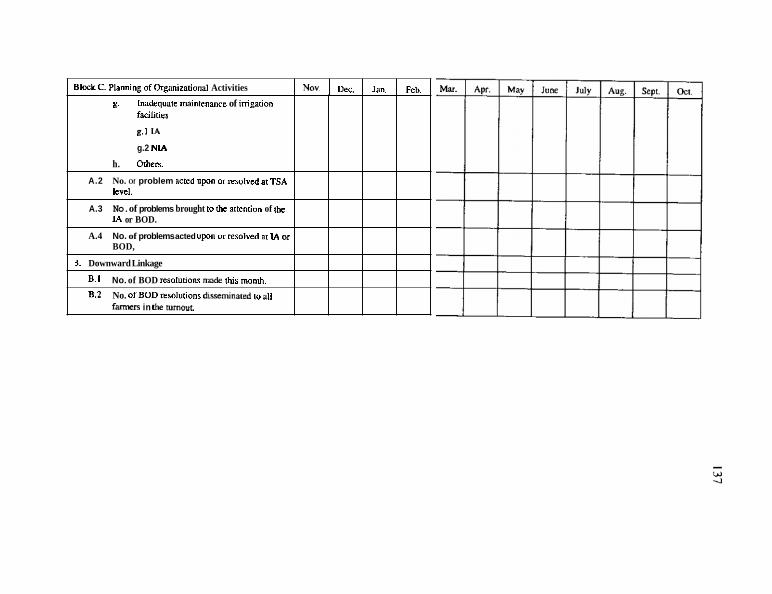
NO". BlmkC. Planningaf Organizational Activities
g. Imdequale min9nance of irrigation facilities
g.1 LA
h. Othcn.
A.2 No. Of problem acted upon orresolved at TSA level.
A.3 No. of problems brought 10 the afention of tk IA or BOD.
A.4 No. of problems acted upon or resolved at IA or
g.2 NL4
BOD,
8. Downward Linkage
6.1
B.2 No. ofBODrcsolutionS &s~eminatcd t o d l
No. of BOD resolutions made his monrh.
f-n in k fllrn0Yf.
Dec. Ian. Feb.
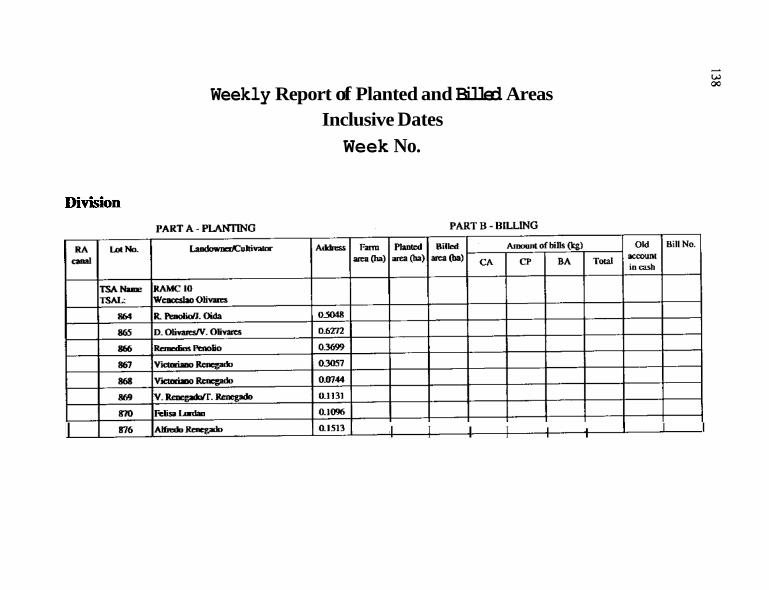
Weekly Report of Planted and Billed Areas Inclusive Dates Week No.
Division
I I I I I I I I I I
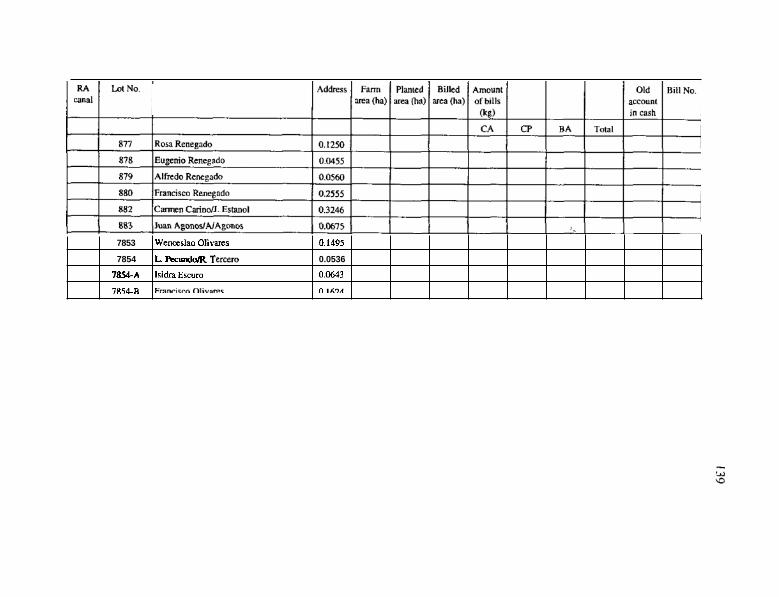
7853
7854
7854-A
SRTCR
wences1ao 01ivarer 0,1495
L. PecundolR. T e r m 0.0536
Isidm Escuro 0.0643 ~~~~i~~~ ",A?&
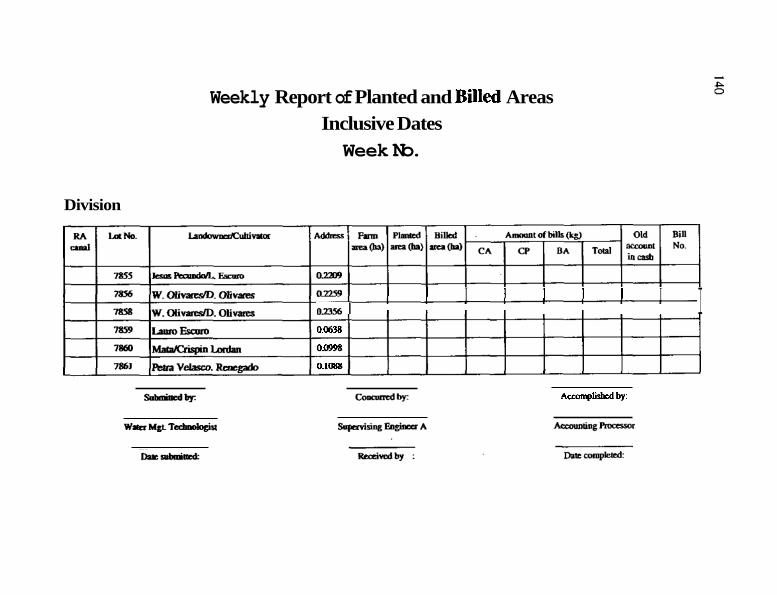
Weekly Report of Planted and BUed Areas Inclusive Dates Week No.
Division
I I I I I I I I n z m I I 0.063
00998
0.1088
Amnpl iskd by:
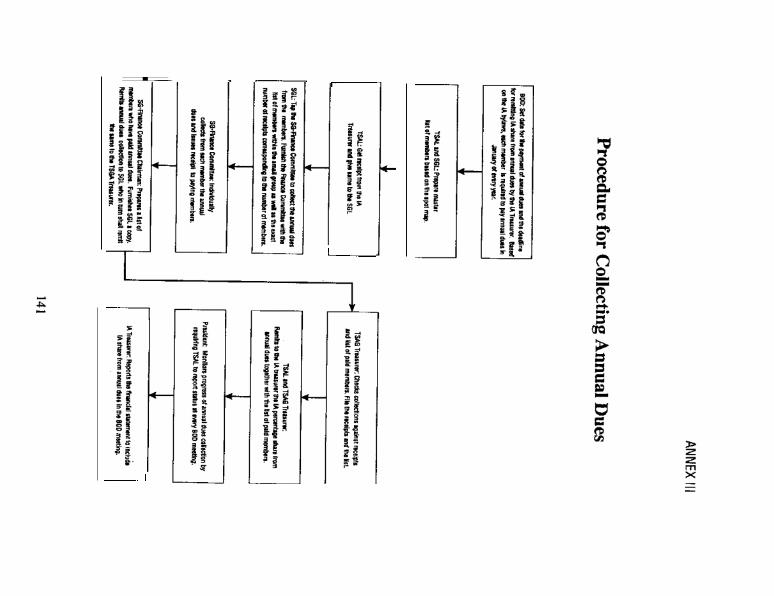
I. I
L
I
I
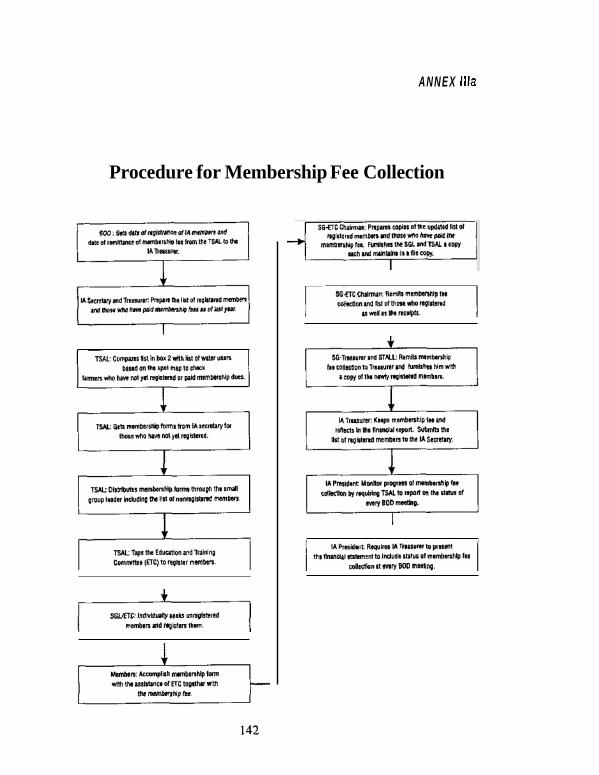
ANNEX llla
Procedure for Membership Fee Collection
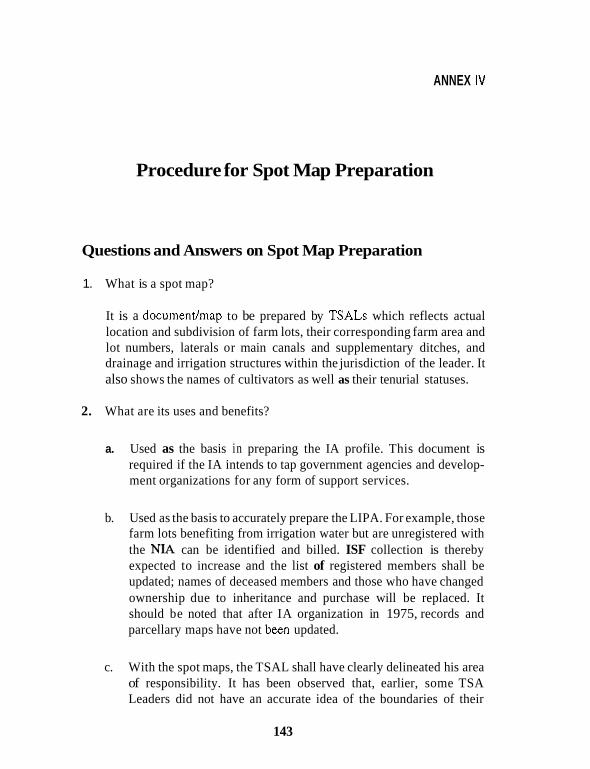
ANNEX IV
Procedure for Spot Map Preparation
Questions and Answers on Spot Map Preparation
1. What is a spot map?
It is a documenthap to be prepared by TSALs which reflects actual location and subdivision of farm lots, their corresponding farm area and lot numbers, laterals or main canals and supplementary ditches, and drainage and irrigation structures within the jurisdiction of the leader. It also shows the names of cultivators as well as their tenurial statuses.
What are its uses and benefits? 2.
a. Used as the basis in preparing the IA profile. This document is required if the IA intends to tap government agencies and develop- ment organizations for any form of support services.
Used as the basis to accurately prepare the LIPA. For example, those farm lots benefiting from irrigation water but are unregistered with the N U can be identified and billed. ISF collection is thereby expected to increase and the list of registered members shall be updated; names of deceased members and those who have changed ownership due to inheritance and purchase will be replaced. It should be noted that after IA organization in 1975, records and parcellary maps have not been updated.
b.
c. With the spot maps, the TSAL shall have clearly delineated his area of responsibility. It has been observed that, earlier, some TSA Leaders did not have an accurate idea of the boundaries of their
143
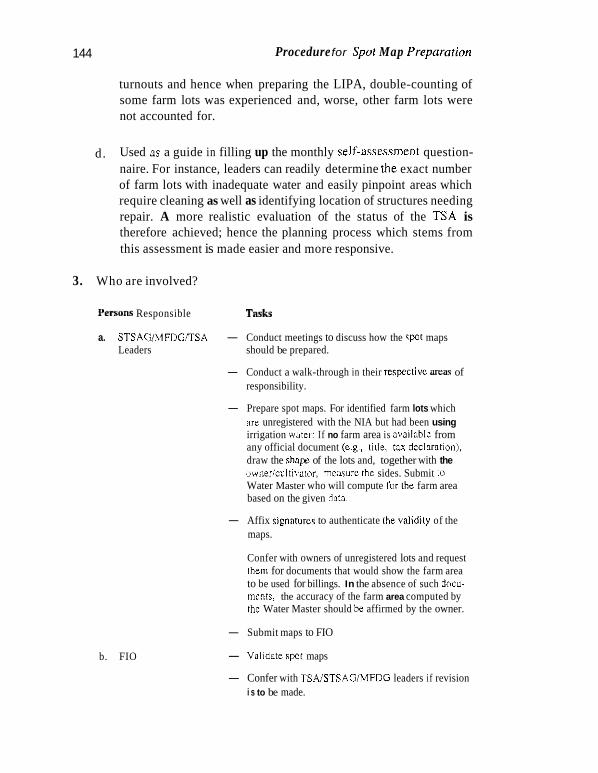
144 Procedure for Spot Map Preparation
turnouts and hence when preparing the LIPA, double-counting of some farm lots was experienced and, worse, other farm lots were not accounted for.
d. Used rls a guide in filling up the monthly self-assessment question- naire. For instance, leaders can readily determine the exact number of farm lots with inadequate water and easily pinpoint areas which require cleaning as well as identifying location of structures needing repair. A more realistic evaluation of the status of the TSA is therefore achieved; hence the planning process which stems from this assessment is made easier and more responsive.
3. Who are involved?
P ~ ~ S O N Responsible Tasks
a. STSAG/MFDGmSA - Conduct meetings to discuss how the s p t maps Leaders should be prepared.
- Conduct a walk-through in their respective m a s of responsibility.
- Prepare spot maps. For identified farm lots which are unregistered with the NIA but had been using irrigation water: If no farm area is availablc from any official document (e.g., title. tax declaration). draw the shapr of the lots and, together with the ownerlcultivator. menure the sides. Submit to Water Master who will compute for the farm area based on the given data.
- Affix signarurcs to authenticate lhe validily of the maps.
b. FIO
Confer with owners of unregistered lots and request lhem for documents that would show the farm area to be used for billings. In the absence of such docu- mcnts, the accuracy of the farm area computed by the Water Master should be affirmed by the owner.
- Submit maps to FIO
- Validate r p t maps
- Confer with TSAISTSAGIMFDG leaders if revision i s to be made.
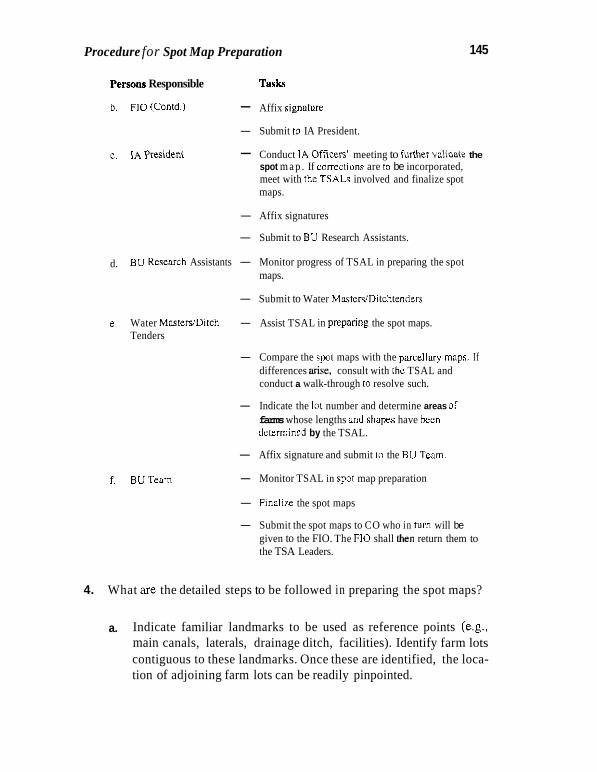
Procedure for Spot Map Preparation
persons Responsible TPSkS
b. FlO (Contd.) - Affix signnture
145
- Submit to IA President.
c. I ~ P r e s i d e n t - Conduct IA Officers' meeting to furlher validate the spot m a p . If cometions are to be incorporated, meet with the TSALs involved and finalize spot maps.
- Affix signatures
- Submit to BU Research Assistants.
BU Re-ch Assistants - Monitor progress of TSAL in preparing the spot maps.
d.
- Submit to Water MasterslDitchtenders
e. Water MasteMDitch - Assist TSAL in preparing the spot maps. Tenders
- Compare the spat maps with the pxcellary maps. If differences afise. consult with the TSAL and conduct a walk-through to resolve such.
- Indicate the lot number and determine areas of farms whose lengths and s h a p have becn dctermincd by the TSAL.
f. BUTeam
- Affix signature and submit to the BU Team.
- Monitor TSAL in spot map preparation
- Finalize the spot maps
- Submit the spot maps to CO who in turn will be given to the FIO. The FlO shall hen return them to the TSA Leaders.
4. What aTe the detailed steps to be followed in preparing the spot maps?
a. Indicate familiar landmarks to be used as reference points (e.g., main canals, laterals, drainage ditch, facilities). Identify farm lots contiguous to these landmarks. Once these are identified, the loca- tion of adjoining farm lots can be readily pinpointed.