Embed Size (px)
Citation preview
1
REQUEST FOR PROPOSALS PROFESSIONAL SERVICES FOR THE COMPLETION OF THE
UPDATE TO HUMAN SERVICES NEEDS ASSESMENT FOR EASTERN ALAMEDA COUNTY (Dublin, Livermore and
Pleasanton, California) ______________________________________________________________________________ Date: February 1, 2022 To: Interested Consultants From: Jay Ingram, Recreation Manager Subject: Request for Proposals (RFP) for professional services related to updating the
Eastern Alameda County Human Services Needs Assessment ______________________________________________________________________________ Introduction The Cities of Dublin, Livermore and Pleasanton are soliciting the services of a qualified consultant to conduct a comprehensive Needs Assessment evaluating the Tri-Valley’s human service delivery network and to provide an implementation plan for the region and additionally for the local jurisdictions as defined in the Scope of Services and Deliverables. The City of Pleasanton (Pleasanton) will act as the contracting agent for all services provided through this solicitation and will function as the point of contact for all questions related to this solicitation, the selection process, and the awarding of the contract. Pleasanton will hold the consultant contract, and Jay Ingram, Recreation Manager, will serve as the project lead. The consultant shall work with the designated representatives from each City. Background The Cities of Dublin, Livermore and Pleasanton (Cities) are collectively known as the Tri-Valley and are located in Eastern Alameda County. The Cities are geographically adjacent to each other totaling 65.95 square miles and have the collective population of 234,282 people. City of Dublin The City of Dublin, incorporated in 1982, is one of the fastest growing communities in California. Named an “All American City” by the National Civic League, and one of the best places to live in the United States according to Money Magazine, Dublin is home to 72,589 residents and comprises nearly 15 square miles in Eastern Alameda County. Located
2
approximately 35 miles East of San Francisco and at the intersection of two interstate highways (I-580 and I-680), Dublin’s strategic location offers opportunities for employers, retailers, and high-quality residential neighborhoods. Dublin is home to local non-profits such as Axis Community Health Dental Clinic, Hively, and the Children’s Emergency Food Bank.
City of Livermore The City of Livermore is the easternmost city in the San Francisco Bay Area and the gateway to the Central Valley. Incorporated in 1869, Livermore is California’s oldest wine region, framed by award-winning wineries, farmlands, and ranches that mirror the valley’s western heritage. Livermore is a technological hub, an academically engaged community and is an integral part of the Bay Area, successfully competing in the global market power by its wealth of research, technology, and innovation. Livermore is home to local non-profits such as Tri-Valley Haven, Livermore Homeless Refuge, Open Heart Kitchen and CityServe of the Tri-Valley. City of Pleasanton The City of Pleasanton is a full service municipality strategically located at the intersections of two interstate highways (I-580 and I-680). Pleasanton is a vibrant community with a historic downtown and more than 1,200 acres of parks, open space, and trails for residents to enjoy. Pleasanton’s highly educated population and workforce reflect a community that values education and actively supports innovation. Pleasanton is the home to local non-profits such as Axis Community Health, CityServe of the Tri-Valley, Hively, and Senior Support Program of the Tri-Valley. Tri-Valley (Dublin/Livermore/Pleasanton) The Tri-Valley Cities have worked collaboratively for many years as it relates to human services. The Cities value regional leadership, innovation, collaboration, and problem solving to maintain and improve the quality of life for our residents. Each City provides a unique perspective on how to meet the needs of their residents. The Cities respect the individuality of each community while focusing on collaboration towards common efforts and regional solutions. The Cities are committed to open and honest communication with a goal of building consensus and a united approach to solutions for Tri-Valley residents. 2011 Eastern Alameda County Human Services Needs Assessment In June of 2012, the Cities received the 2011 Human Services Needs Assessment (Assessment) for the Tri-Valley, which identified service gaps and shortcomings in the human services network (Exhibit A). The Assessment focused on the Cities’ most vulnerable populations: low-income families, individuals, children, seniors and people with disabilities. The 2011 Needs Assessment discovered that in Eastern Alameda County there was a significant and increasing disparity between the growing demand for human services and a stagnating, and at times, declining supply of services. The quality of life for many Tri-Valley residents was deteriorating as they were able to access fewer resources to help with recovery. The Needs Assessment also found that there were two distinct challenges: 1) there was a perception from both outside and within the Tri-Valley that because the area is relatively prosperous (compared to the County as whole) there are few people experiencing poverty; and therefore no need for service delivery expansion; and 2) the perception of relative wealth and privilege resulted in a stigma associated with asking for assistance among individuals and families who were experiencing financial hardship and/or a decline in wellbeing due to illness, age or other transitions.

3
Scope of Services and Deliverables The Needs Assessment main objectives are:
• Using the 2011 Needs Assessment and other relevant documents, capture current and future Tri-Valley human service needs, in both services and infrastructure
• Facilitate community and stakeholder meetings, attend and present at public meetings • Produce one final report that includes, but is not limited to:
o Three human services “service” needs/gap implementation plans, one each for Dublin, Livermore and Pleasanton
o Three human services “infrastructure” needs/gap implementation plans, one each for Dublin, Livermore and Pleasanton
o One Tri-Valley regional implementation plan that will enable the three Cities to work together on larger human service needs and infrastructure needs/gaps
• Develop an executive summary highlighting recommendations • Present a comprehensive final report, including implementation plans, to the three City
Councils for approval. The scope of services and deliverables set forth in this RFP represent, at a minimum but not limited to, an outline of the services the selected consultant will be expected to perform and is presented for the preliminary purpose of allowing the Cities to compare proposals. The precise scope of service to be incorporated into a Professional Services Agreement (Exhibit B) shall be negotiated between the Cities and the selected consultant. The Cities request that the consultant recommend possible changes to the scope of services (as part of this proposal) to achieve project deliverables. Diversity, Equity, Inclusion Additionally, throughout the process the consultant should incorporate a Diversity, Equity, and Inclusion (DEI) framework to ensure an equitable and inclusive Human Services Needs Assessment. Identified deliverables, that include research, recommendations, and action items would help shape the Tri-Valley to become safe, equitable, and inclusive for all while continuing to further improve recognition, promotion and sustainability of DEI in Human Service programs. Project core tasks include, but are not limited to:
1. Project Management and Coordination/Establish Timelines and Schedules 2. Study/Data Review 3. Data Collection and Analysis 4. Peer Review 5. Stakeholder Advisory Committee Outreach 6. Public Meeting Outreach 7. Recommendations and Implementation Plans
Task 1: Project Management and Coordination/Establish Timelines and Schedules
• Establish project timelines, milestones and schedule • Develop schedule for meetings between consultant and project management team • Develop schedule for community and stakeholder meetings • Develop schedule for publicly noticed City meetings
Task Deliverable

4
1 Project Work Plan, Timeline, and Scope of Services
Task 2: Study/Data Review
• Review available information and data applicable to the Tri-Valley Cities planning studies, data and documents completed by the Cities, Alameda County, local nonprofits, social service agencies and hospitals. This would also include the results from the Eastern Alameda 2011 Human Services Needs Assessment Findings Report.
• Review all human services and capital infrastructure associated with services throughout the Tri-Valley.
• Incorporate available 2020 Census data (demographics, income, etc.) as it pertains to the Tri-Valley region.
• Compare demographics data for the Tri-Valley and changes between the 2010 and 2020 Census information. This would include, but not be limited to:
o Ethnicity of people living in the Tri-Valley and the variety of languages spoken o Low and moderate income persons and families; single parent families;
homeless; seniors; disabled; children; etc. o In addition, identify low-income and minority Census tracts and/or other
concentration areas within each city. • Review plans and services currently offered through the local Cities, Alameda County,
private entities (hospitals, Regional Center, etc.) and local nonprofits and social service agencies.
• Review the impacts of public policy and economic events on needs and service delivery. This should include how the changing federal, state and county priorities and guidelines impact resources, impacts of the pandemic, shift in private and public funding streams, and the economic growth on needs, services and infrastructure.
Task Deliverable 2 Itemize and describe existing human services currently being offered in the
Tri-Valley. Summarize potential problems, gaps, areas of overlap, strengths and weaknesses.
Task 3: Data Collection and Analysis
• Identify and interview Tri-Valley human service providers to further clarify human service and infrastructure needs
• Analyze existing Tri-Valley human services including needs and gap areas • Identify where residents needing access to services reside in the Tri-Valley • Analyze all applicable data (federal, state and local) • Identify funding sources including; local, county, state, federal and private funding • Compare information from the 2011 Eastern Alameda County Human Services Needs
Assessment and provide a comprehensive inventory of programs being provided in the Tri-Valley region to identify change/improvements in service deliver and infrastructure
• Prepare forecasts and key trends for Tri-Valley human service and infrastructure needs • Articulate themes through the analysis process into goals, strategies and
implementation plans.
Task Deliverable
5
3 Provide estimated short term (2 - 5 year) and longer (10 year) term human service needs (services and infrastructure) and key trends for the Tri-Valley. Include potential funding partners/sources.
Task 4: Peer Review
• Consultant shall evaluate and compare human service/infrastructure delivery models and policies for similar areas in the greater San Francisco Bay Area and potentially beyond if necessary.
Task Deliverable 4 Peer review report
Task 5: Stakeholder Advisory Committee Outreach
• Establish and coordinate a Stakeholder Advisory Committee (SAC). • SAC shall consist of Tri-Valley human service recipients, Tri-Valley Human Services
City Commissioners, advocates, social service agencies (including Alameda County) and local nonprofits
• Coordinate and facilitate at least three meetings (one per jurisdiction) of the SAC during the study, including all materials and public information.
Task Deliverable 5 SAC Summary Report: Report findings from the SAC discussions and
meetings.
Task 6 – Public Meetings Outreach
• Develop outreach plan for information gathering • Manage the tools necessary to collect community input and data • Engage the communities, lead and facilitate community meetings, focus groups,
stakeholder meetings and service providers • Attend, lead and facilitate City Council, commission and community meetings in all
three Cities.
Task Deliverable 6 Outreach Summary Report: Report findings from all public meetings. details
of attendees and comments received at each presentation.
Task 7: Recommendations and Implementation Plans
• Describe Tri-Valley human service needs for the next five to 10 years • Provide final recommendations that address comprehensive research and analysis

6
• Provide recommendations for innovative changes to human service delivery model(s) • Develop goals, strategies, implementation plans and potential partners and package
these findings into a final report • Final report should include four implementation plans; one that combines all three
Cities as a region and one each for the Cities of Dublin, Livermore and Pleasanton, including; -Ranking human service needs/gap areas in priority order -Providing human service needs/gaps as well as infrastructure needs in each plan -Identifying associated costs for needs/gaps -Identifying potential funding opportunities
• As part of the final report, issue an executive summary that includes statistics and trends addressing human service needs in the Tri-Valley in the present and in the future (2030).
Task Deliverable 7 Final report for adoption by City Council including recommendations and
implementation plans Submittal Requirements Submitted proposals should be limited to 30 pages maximum (excluding resumes, table of contents, and tabbed dividers). Interested consultants should submit qualifications that address the following:
1. Project Description. A brief description of your understanding of the overall project. 2. Approach to Project. Describe the manner and methods you will use to manage and
facilitate the work. This should include a discussion of how each of the separate tasks will be approached, the individual primarily responsible for each task, and the expected number of hours allocated to each task. The project approach should also describe how you plan to incorporate a DEI lens/framework.
3. Scope of Services. Provide a scope of services that responds to the scope of services and deliverables identified above.
4. Consultant Description of Qualifications. For your firm (and any sub-consultants) provide:
a. Firm qualifications and resume(s) of participating individual(s); and b. A description of your experience completing updates for human service needs
assessments for mid-size local jurisdictions. 5. Cost. Provide a cost proposal for the overall effort, including optional additional
meetings. Include the basis and assumptions made for estimated costs. Include hourly rates for each task and each staff person assigned to that task, your hourly rates for this project, and total number of hours. Clearly indicate the subtotaled cost for each task to be performed by your firm and by any sub-consultants, and total cost for your work effort. If the City will be billed for services by sub-consultants at cost plus an administrative charge, indicate that administrative charge on a percentage basis. Be realistic about what can be achieved with the cost proposal provided.

7
6. Schedule. Provide a detailed timeline and schedule indicating timeframes for required stakeholder and public meetings, draft documents and reports, reviews by City staff, and final documents prior to release to the public.
7. Conflict of Interest. Identify any recent, present, or proposed work undertaken by the consultant, any subcontractor or subsidiary, or any other type of business or other relationship that could represent a potential, real, or perceived conflict of interest with respect to this project.
8. References. Provide a list of at least three references for projects of similar scope completed by your firm.
9. Professional Services Agreement and Insurance Requirements. Attached is a copy of the City’s standard agreement, including insurance requirements (Exhibit B). The selected consultant must provide a certificate of insurance in a form acceptable to the City prior to entering into the agreement. Indicate what professional and business insurance you maintain and whether the standard requirements can be met. Review the City’s standard contract and to ensure that your firm would be able to sign this agreement.
10. Business License. The City requires a City of Pleasanton Business License of the selected consultant before the agreement is awarded.
11. Submittal Deadline. Submit six (6) sets of printed qualifications, along with one electronic file on a flash drive in searchable PDF format as a single document (optimized and compressed) to the City of Pleasanton. Proposals must be plainly marked with your company name, address, and telephone number, with “Proposal for Eastern Alameda County Human Services Needs Assessment” clearly visible on the exterior. All proposals must be submitted to the City of Pleasanton, City Clerk’s Office, 123 Main Street, P.O. Box 520, Pleasanton, CA 94566 no later than Wednesday, March 9, 2022 at 2:00 p.m.
Selection Criteria The consultant will be selected based on criteria including, but not limited to:
• Understanding of the required scope of services demonstrated through consultant’s approach to Project Scope and Deliverables
• Consultant’s expertise and ability demonstrated in completion of similar assignments • Consultant’s expertise and ability demonstrated applying a DEI lens/framework to recent
projects. • Qualifications and relevant experience of the consultant • The specific personnel to be assigned by the consultant to this project, and their
experience and abilities • The quality, amount and type of service proposed • Ability to provide multi-lingual services for community meetings, focus groups, etcetera • The results of reference checks • Costs associated with the consultant’s proposal • Any other considerations deemed pertinent by the Cities.
All proposals will be evaluated based on the above criteria by staff from the Cities of Dublin, Livermore and Pleasanton. As part of the evaluation process, the consultant may be required to

8
attend one or more interview(s) with the Cities’ staff and or/community representatives. If a qualified proposer is identified, a recommendation to award a Professional Services Agreement will be made to the City of Pleasanton City Council and then forwarded to the Dublin and Livermore City Councils as information.
As a result of this solicitation, the City intends to award an agreement to the responsive bidder whose response conforms to the solicitation and whose bid presents the greatest value to the Cities, all evaluation criteria considered. The combined weight of the evaluation criteria is greater in importance than cost in determining the greatest value to the Cities. The goal is to award an agreement to the bidder that proposes the best quality as determined by the combined weight of the evaluation criteria. The City may award an agreement of higher qualitative competence over the lowest priced response.
The City has the right to decline to award this Agreement or any part thereof for any reason.
Schedule of RFP Dates Request for Proposal available – Tuesday, February 1, 2022 Last day for questions – Wednesday, February 23, 2022 Request for Proposal Submittal Deadline – Wednesday, March 9, 2022, 2p.m. Review of Proposals – March 2022 Interviews (if necessary) – April 2022 Notification of Selection – May 2022 Contract Award Request to City Council – June 2022 Commencement of Program – July 2022 Staff Contact Information
Jay Ingram, Recreation Manager 400 Old Bernal Avenue, Pleasanton, CA 94566 Phone: (925) 931-5346 Email: [email protected]
Exhibits
A. Eastern Alameda County 2011 Human Services Needs Assessment: Findings Report B. Sample Professional Services Agreement C. Other related Dublin, Livermore and Pleasanton relevant human service needs documents

Eastern Alameda County2011 Human Services Needs Assessment: Findings Report
Commissioned by the cities of:
Pleasanton, Livermore, Dublin
Resource Development Associates 230 Fourth Street | Oakland, CA | 510.488.4345
Approved June 5, 2012, Pleasanton City Council
Exhibit A

Eastern Alameda County Human Services Needs Assessment
FEBRUARY 2012 RESOURCE DEVELOPMENT ASSOCIATES | 2
“Once you are living below the poverty level, you cannot pull yourself out. You have car repairs, or other issues, and then you cannot get to services you need and you can’t get your kids to and from school. It is a downhill slide. Now with the economy, the food budget does not go as far. People are going to food pantries who have never gone before. There is no incentive to get out of the mess they are in. There is no extra help.”
– Focus Group Participant
Eastern Alameda County Human Services Needs Assessment
JUNE 6, 2012 RESOURCE DEVELOPMENT ASSOCIATES | 3
Acknowledgements This report could not have been completed without the support and participation of the cities of Dublin, Livermore, and Pleasanton and social service providers throughout Eastern Alameda County. In addition, thanks are due to all of the residents of the Tri‐Valley who took the time to participate in our focused discussion groups and complete surveys, without which a comprehensive understanding of social service needs would not have been possible. Beyond the above, RDA would like to thank the following individuals for their significant efforts and guidance: Kathleen Yurchak, Community Services Manager, City of Pleasanton, Jean Prasher, Human Services Program Manager, City of Livermore, and Gaylene Burkett, Administrative Analyst, City of Dublin.

Eastern Alameda County Human Services Needs Assessment
JUNE 6, 2012 RESOURCE DEVELOPMENT ASSOCIATES | 4
Table of Contents Eastern Alameda County ............................................................................................................................... 1
2011 Human Services Needs Assessment: Findings Report ......................................................................... 1
Acknowledgements ....................................................................................................................................... 3
Table of Contents .......................................................................................................................................... 4
List of Tables and Figures .............................................................................................................................. 7
Executive Summary ....................................................................................................................................... 9
Methods ........................................................................................................................................................ 9
Growing Demand for Services ............................................................................................................ 10 Decreasing and Stagnating Supply of Services ................................................................................... 10 Impact of Supply and Demand Mismatch ........................................................................................... 11
Introduction and Project Overview............................................................................................................. 13
Background ................................................................................................................................................. 13
Overview ..................................................................................................................................................... 14
Eastern Alameda County Human Services Vision ....................................................................................... 15
Methodology ............................................................................................................................................... 16
U.S. Census, American Community Survey and Alameda County Social Service Utilization Data ............. 16
Hard to Reach Population Survey ............................................................................................................... 17
Social Service Provider Survey .................................................................................................................... 17
Key Informant Interviews............................................................................................................................ 18
List of Key Informants ................................................................................................................................. 18
Focus Groups............................................................................................................................................... 19
Demographic Findings ................................................................................................................................ 20
Population Growth .............................................................................................................................. 20 Language ............................................................................................................................................. 21 Income Levels ..................................................................................................................................... 24
Provider Survey Findings ............................................................................................................................. 27
Hard to Reach Population Survey Findings ................................................................................................. 30
Findings by Area of Concern ....................................................................................................................... 33
Behavioral Health ........................................................................................................................................ 34
Key Findings ........................................................................................................................................ 34 Community Issues ............................................................................................................................... 34

Eastern Alameda County Human Services Needs Assessment
JUNE 6, 2012 RESOURCE DEVELOPMENT ASSOCIATES | 5
Service Delivery Environment ............................................................................................................. 35 Gaps and Barriers ................................................................................................................................ 35 Suggestions for Improvement ............................................................................................................ 37
Affordable Housing ..................................................................................................................................... 37
Key Findings from Pleasanton Housing Element (2007‐2011) ........................................................... 38 Key Findings from Dublin Housing Element (2009‐2014) ................................................................... 38 Key Findings from Livermore Housing Element (2009‐2014) ............................................................. 38 Community Issues ............................................................................................................................... 39 Service Delivery Environment ............................................................................................................. 40 Gaps and Barriers ................................................................................................................................ 42 Suggestions for Improvement ............................................................................................................ 42
Health Care ................................................................................................................................................. 43
Key Findings ........................................................................................................................................ 43 Community Issues ............................................................................................................................... 43 Service Delivery Environment ............................................................................................................. 44 Current Gaps in Services or Barriers to Improving Services ............................................................... 44 Suggestions for Improvement ............................................................................................................ 45
Workforce Development ............................................................................................................................ 46
Key Findings ........................................................................................................................................ 46 Community Issues ............................................................................................................................... 46 Service Delivery Environment ............................................................................................................. 47 Gaps and Barriers ................................................................................................................................ 48 Suggestions for Improvement ............................................................................................................ 48
Homelessness ............................................................................................................................................. 49
Key Findings ........................................................................................................................................ 49 Community Issues ............................................................................................................................... 49 Service Delivery Environment ............................................................................................................. 50 Gaps and Barriers ................................................................................................................................ 50 Suggestions for Improvement ............................................................................................................ 51
Transportation Services and Access ............................................................................................................ 53
Key Findings ........................................................................................................................................ 53 Community Issues ............................................................................................................................... 53 Service Delivery Environment ............................................................................................................. 54 Gaps and Barriers ................................................................................................................................ 54 Suggestions for Improvement ............................................................................................................ 55
Domestic Violence/Child Abuse .................................................................................................................. 55
Key Findings ........................................................................................................................................ 55 Community Issues ............................................................................................................................... 55 Service Delivery Environment ............................................................................................................. 56 Gaps and Barriers ................................................................................................................................ 56 Suggestions for Improvement ............................................................................................................ 56
Disabilities ................................................................................................................................................... 57
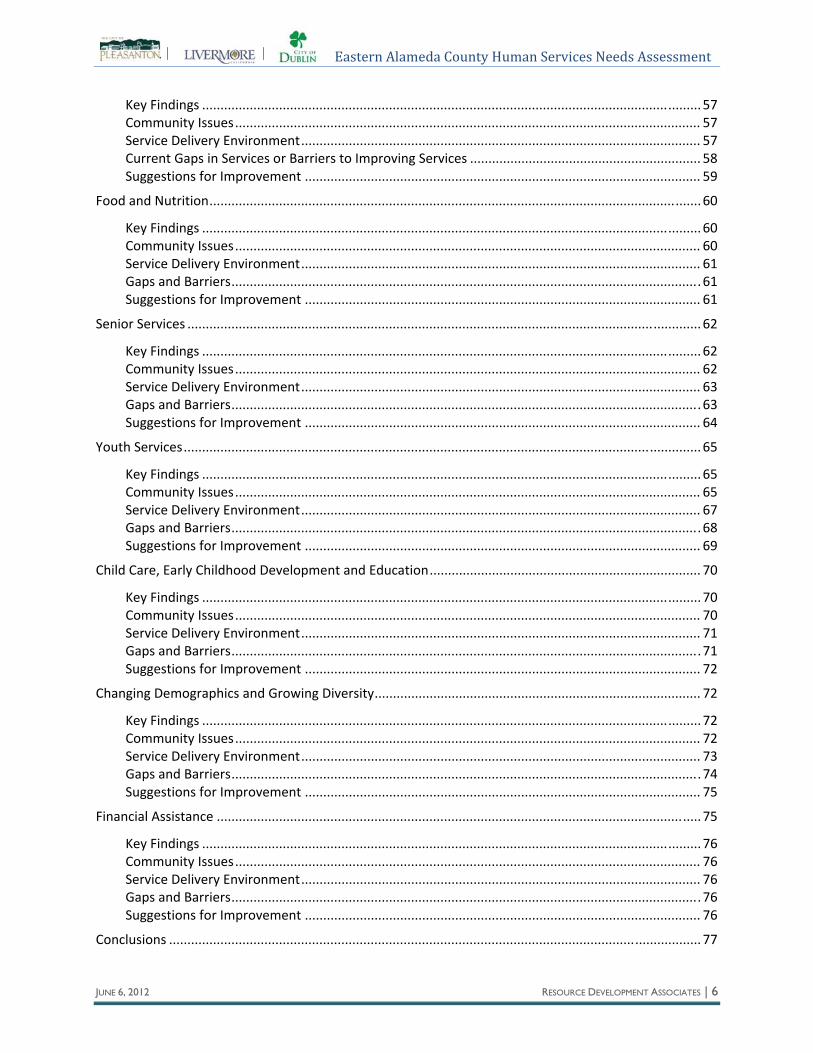
Eastern Alameda County Human Services Needs Assessment
JUNE 6, 2012 RESOURCE DEVELOPMENT ASSOCIATES | 6
Key Findings ........................................................................................................................................ 57 Community Issues ............................................................................................................................... 57 Service Delivery Environment ............................................................................................................. 57 Current Gaps in Services or Barriers to Improving Services ............................................................... 58 Suggestions for Improvement ............................................................................................................ 59
Food and Nutrition ...................................................................................................................................... 60
Key Findings ........................................................................................................................................ 60 Community Issues ............................................................................................................................... 60 Service Delivery Environment ............................................................................................................. 61 Gaps and Barriers ................................................................................................................................ 61 Suggestions for Improvement ............................................................................................................ 61
Senior Services ............................................................................................................................................ 62
Key Findings ........................................................................................................................................ 62 Community Issues ............................................................................................................................... 62 Service Delivery Environment ............................................................................................................. 63 Gaps and Barriers ................................................................................................................................ 63 Suggestions for Improvement ............................................................................................................ 64
Youth Services ............................................................................................................................................. 65
Key Findings ........................................................................................................................................ 65 Community Issues ............................................................................................................................... 65 Service Delivery Environment ............................................................................................................. 67 Gaps and Barriers ................................................................................................................................ 68 Suggestions for Improvement ............................................................................................................ 69
Child Care, Early Childhood Development and Education .......................................................................... 70
Key Findings ........................................................................................................................................ 70 Community Issues ............................................................................................................................... 70 Service Delivery Environment ............................................................................................................. 71 Gaps and Barriers ................................................................................................................................ 71 Suggestions for Improvement ............................................................................................................ 72
Changing Demographics and Growing Diversity ......................................................................................... 72
Key Findings ........................................................................................................................................ 72 Community Issues ............................................................................................................................... 72 Service Delivery Environment ............................................................................................................. 73 Gaps and Barriers ................................................................................................................................ 74 Suggestions for Improvement ............................................................................................................ 75
Financial Assistance .................................................................................................................................... 75
Key Findings ........................................................................................................................................ 76 Community Issues ............................................................................................................................... 76 Service Delivery Environment ............................................................................................................. 76 Gaps and Barriers ................................................................................................................................ 76 Suggestions for Improvement ............................................................................................................ 76
Conclusions ................................................................................................................................................. 77
Eastern Alameda County Human Services Needs Assessment
JUNE 6, 2012 RESOURCE DEVELOPMENT ASSOCIATES | 7
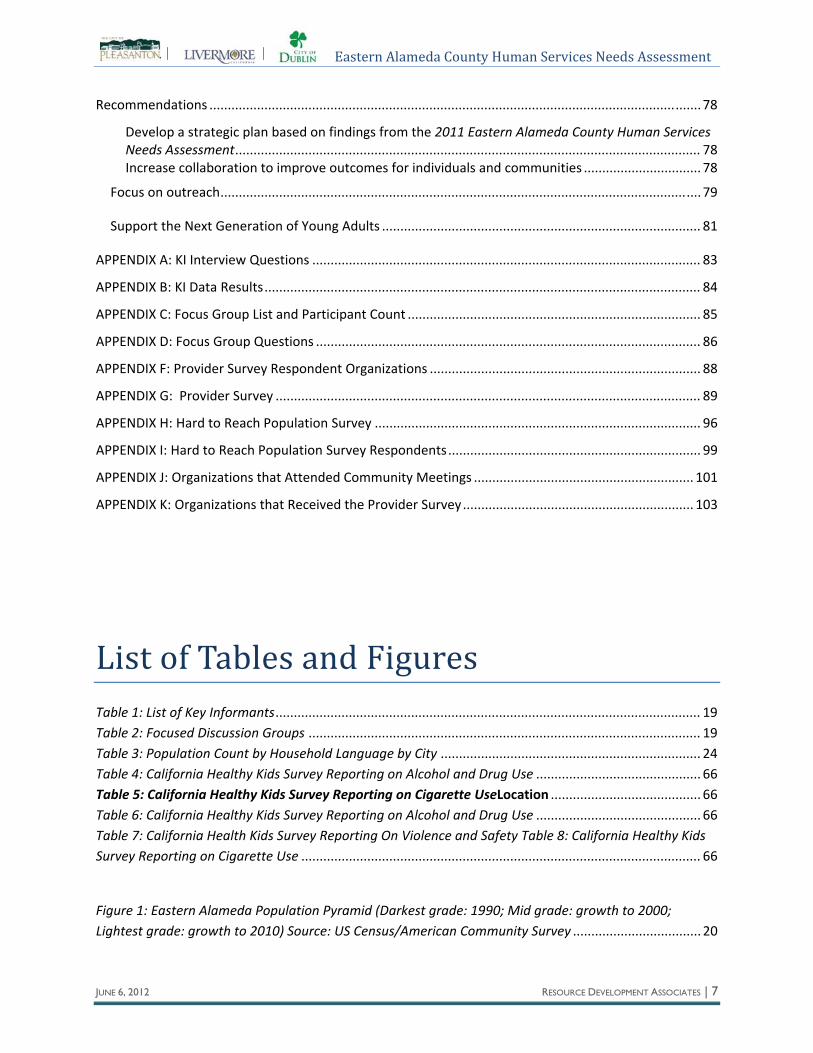
Recommendations ...................................................................................................................................... 78
Develop a strategic plan based on findings from the 2011 Eastern Alameda County Human Services Needs Assessment ............................................................................................................................... 78 Increase collaboration to improve outcomes for individuals and communities ................................ 78
Focus on outreach ................................................................................................................................... 79
Support the Next Generation of Young Adults ....................................................................................... 81
APPENDIX A: KI Interview Questions .......................................................................................................... 83
APPENDIX B: KI Data Results ....................................................................................................................... 84
APPENDIX C: Focus Group List and Participant Count ................................................................................ 85
APPENDIX D: Focus Group Questions ......................................................................................................... 86
APPENDIX F: Provider Survey Respondent Organizations .......................................................................... 88
APPENDIX G: Provider Survey .................................................................................................................... 89
APPENDIX H: Hard to Reach Population Survey ......................................................................................... 96
APPENDIX I: Hard to Reach Population Survey Respondents ..................................................................... 99
APPENDIX J: Organizations that Attended Community Meetings ............................................................ 101
APPENDIX K: Organizations that Received the Provider Survey ............................................................... 103
List of Tables and Figures Table 1: List of Key Informants .................................................................................................................... 19 Table 2: Focused Discussion Groups ........................................................................................................... 19 Table 3: Population Count by Household Language by City ....................................................................... 24 Table 4: California Healthy Kids Survey Reporting on Alcohol and Drug Use ............................................. 66 Table 5: California Healthy Kids Survey Reporting on Cigarette UseLocation ......................................... 66 Table 6: California Healthy Kids Survey Reporting on Alcohol and Drug Use ............................................. 66 Table 7: California Health Kids Survey Reporting On Violence and Safety Table 8: California Healthy Kids Survey Reporting on Cigarette Use ............................................................................................................. 66
Figure 1: Eastern Alameda Population Pyramid (Darkest grade: 1990; Mid grade: growth to 2000; Lightest grade: growth to 2010) Source: US Census/American Community Survey ................................... 20
Eastern Alameda County Human Services Needs Assessment
JUNE 6, 2012 RESOURCE DEVELOPMENT ASSOCIATES | 8
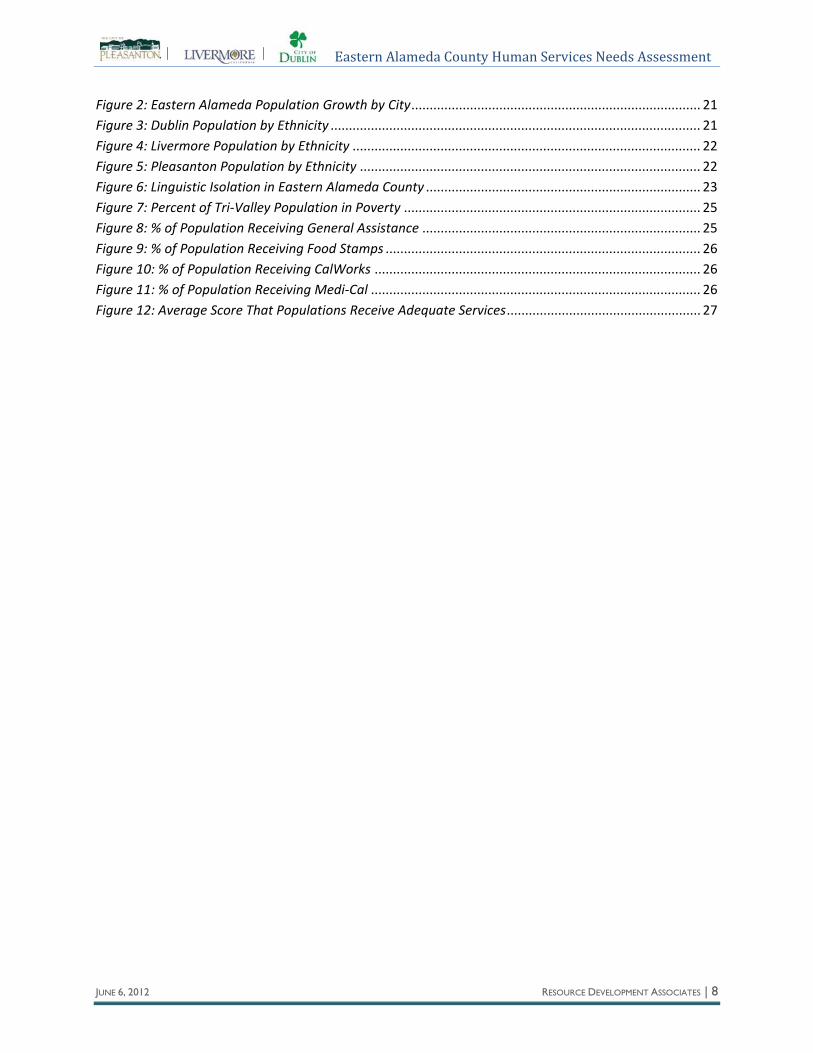
Figure 2: Eastern Alameda Population Growth by City ............................................................................... 21 Figure 3: Dublin Population by Ethnicity ..................................................................................................... 21 Figure 4: Livermore Population by Ethnicity ............................................................................................... 22 Figure 5: Pleasanton Population by Ethnicity ............................................................................................. 22 Figure 6: Linguistic Isolation in Eastern Alameda County ........................................................................... 23 Figure 7: Percent of Tri‐Valley Population in Poverty ................................................................................. 25 Figure 8: % of Population Receiving General Assistance ............................................................................ 25 Figure 9: % of Population Receiving Food Stamps ...................................................................................... 26 Figure 10: % of Population Receiving CalWorks ......................................................................................... 26 Figure 11: % of Population Receiving Medi‐Cal .......................................................................................... 26 Figure 12: Average Score That Populations Receive Adequate Services ..................................................... 27

Eastern Alameda County Human Services Needs Assessment
JUNE 6, 2012 RESOURCE DEVELOPMENT ASSOCIATES | 9
Executive Summary In early 2011, the Cities of Dublin, Livermore and Pleasanton joined together to conduct a broad‐based assessment of human service needs in Eastern Alameda County1. This report expands upon an earlier Needs Assessment, which was conducted in 2003. Much in the Tri‐Valley has changed since the early 2000s, and additional data from the 2010 U.S. Census and American Community Survey is now available to demonstrate demographic and economic trends. This report documents many of these changes and draws on a wide range of community member and service provider perspectives to help demonstrate how these changes affect the lives of vulnerable residents and the services they receive.
Methods
The Cities of Dublin, Pleasanton and Livermore contracted with Resource Development Associates (RDA), a local consulting firm specializing in strategic planning and evaluation for local government and nonprofit entities, to facilitate a community‐driven Needs Assessment process. RDA uses a mixed‐method research approach that draws upon quantitative (hard numbers based on large public data bases and surveys) as well as qualitative (subjective interviews, focus groups, etc.) data sources. The 2011 Needs Assessment began with the formation of the Eastern Alameda County Human Services Steering Committee, which includes diverse leadership from city staff, former elected officials, commissioners, and nonprofit organizations. This committee was tasked with identifying community stakeholders, reviewing findings, and developing a vision statement to help guide current and future activities associated with addressing human service needs in the Tri‐Valley. Data sources for this Needs Assessment include:
• 1990, 2000, and 2010 U.S. Census and American Community Survey data to compare population demographics across time and between jurisdictions;
• Alameda County Social Service Department reports to demonstrate changes in demand for services over time;
• Paper and web‐based surveys administered to local service providers and service recipients to identify the most critical needs, gaps and barriers;
• Key Informant Interviews held with civic, community, and human service organization leadership to qualify findings and understand the needs of local residents from a high‐level, broad‐based perspective;
• Focus groups held with service recipients to understand how service delivery systems or gaps in services impact individual consumers; and
• Community‐wide meetings in Pleasanton, Dublin and Livermore to corroborate initial findings and seek recommendations for improving human services.
1 The authors use the terms “Eastern Alameda County”, “Cities of Dublin, Pleasanton, and Livermore”, and “Tri‐Valley” interchangeably throughout this report.

Eastern Alameda County Human Services Needs Assessment
JUNE 6, 2012 RESOURCE DEVELOPMENT ASSOCIATES | 10
Key Findings
Overall, the 2011 Needs Assessment discovered that in Eastern Alameda County there is a significant and increasing disparity between the growing demand for human services and a stagnating, and at times, declining supply of services. In other words, the quality of life for many residents is deteriorating, and at the same time, they are able to access fewer and fewer resources to help them recover. While this phenomenon is not necessarily unique to the Tri‐Valley, the assessment also found that there are two distinctive challenges facing the area. First, there is a perception from both outside and within the Tri‐Valley that because the area is relatively prosperous (compared to the County as a whole) there are few poor people and therefore no need for service delivery expansion. Secondly, the perception of relative wealth and privilege has resulted in a sense of stigma associated with asking for help among individuals and families who are experiencing financial hardship and/or decline in wellbeing due to illness, age, or other transitions. As a result, many who could benefit most from services are not seeking them out.
Growing Demand for Services Population data from the U.S. Census suggest several trends that impact the local demand for services. First, the overall population in Eastern Alameda County has increased by 51% between 1990 and 2010 (130,540 to 197,289). Significant population growth has occurred among older adults, who are often most dependent on human services such as supportive housing, long‐term care, in‐home support and public transportation. The population of both men and women over the age of 85 has tripled between 1990 and 2010. In addition, the population of Hispanic/Latinos and Asian/Pacific Islanders has grown disproportionately compared to Caucasians and African Americans within the Tri‐Valley. For Asian/Pacific Islanders, the increase in population has resulted in a corresponding increase in linguistically isolated households, suggesting that many of the newcomers are recent immigrants with unique linguistic and cultural service needs.
The demand for services has increased due to current economic trends as well. There was a 58% increase in the number of individuals in poverty in Eastern Alameda County from 1990 to 2010. Unemployment rates have risen from below 2% in 2000 to nearly 7% in 2010; and the proportion of residents receiving general assistance, CalWorks, food stamps, and Medi‐Cal have increased dramatically. The number of residents receiving food stamps increased from 651 to 4,460 (585%) between 2003 and 2011 and Medi‐Cal recipients increased from 3,287 to 11,117 (238%) in the same time period. At the same time, mortgages have ballooned; foreclosures and those at risk of foreclosure have increased, and market rents have remained constant or have increased. As of 2010, over 30% of renting households are paying over 35% of their gross income on rent.
Decreasing and Stagnating Supply of Services The supply of services in Eastern Alameda County has not kept pace with the growing demand; in fact nearly every service provider interviewed reported budget contractions in recent years. For example, there are currently no Adult Day Care programs in Eastern Alameda County. The Tri‐Valley YMCA is currently preparing to open a social Adult Day Care program, in part with philanthropic support. Yet, due to cuts in State Medicare, the Tri‐Valley YMCA will not be able to expand this social program to include a

Eastern Alameda County Human Services Needs Assessment
JUNE 6, 2012 RESOURCE DEVELOPMENT ASSOCIATES | 11
licensed Adult Day Health Care (ADHC) program to meet the needs of low income seniors with health‐related issues. Other funding restrictions have led to staff reductions at Senior Centers, and reductions in Paratransit and In‐Home Supportive Services. Budget cuts have also reportedly resulted in reduced public transportation services, elimination of activities for the developmentally disabled, and reduced public school staffing. In a survey of Tri‐Valley human service providers, 95% of respondents stated that they would need more money to provide those services they think are most critical. Critical services they are unable to provide include mental health care, transportation, substance abuse services, homeless and affordable housing services.
Both service recipients and providers throughout the assessment process reported that the problems associated with service delivery in the Tri‐Valley had less to do with the quality of services but rather, that there were simply not enough services available to meet the demand. Stakeholders described long waiting lists for affordable housing; subsidized child care and after school care; daytime activities for the developmentally disabled; and behavioral and specialty physical health care.
While the population of Eastern Alameda County has grown and there are greater demands for human services, the area remains geographically isolated relative to other cities within Alameda County. Stakeholders described the Tri‐Valley as the County’s “stepchild” and perceive that some providers outside the area are not aware of the issues and challenges faced by residents, or even that the cities of Dublin, Livermore and Pleasanton are located within Alameda County. Other stakeholders report that on a per‐capita basis, the Tri‐Valley receives fewer resources than other areas within the County. At the same time, the Tri‐Valley area is more geographically dispersed. Many critical services are located outside the Tri‐Valley, including specialty medical and behavioral health care. As a result, transportation cost and duration is one of the most significant barriers to receiving services. Other services, such as hot meals, are provided at a different location each day of the week to accommodate the geographic dispersal. These transportation‐related barriers disproportionately affect the elderly, persons with disabilities and families with young children.
Impact of Supply and Demand Mismatch As described above, the residents of Eastern Alameda County who are most affected by the imbalance between supply of and demand for services include older adults, individuals with disabilities, and families with young children. In addition, according to a provider survey, the populations who are least likely to receive adequate services include those living below the poverty level, the mentally ill, the homeless and those at‐risk of homelessness, the working poor and non‐English speakers.
According to the providers surveyed, many Tri‐Valley residents do not receive critical services most notably because of a lack of knowledge of what services are available. Similarly, in a survey of hard to reach populations, 38% reported that they did not know where to get the help that they needed. During discussions with providers, many reported a desire to reach out to underserved populations, but also a fear that by doing so, waiting lists would expand even further.
Service providers in the Tri‐Valley are profoundly aware of the economic and social pressures affecting many of the community’s vulnerable individuals and families. At the same time, they are expected to do

Eastern Alameda County Human Services Needs Assessment
JUNE 6, 2012 RESOURCE DEVELOPMENT ASSOCIATES | 12
more with fewer resources. They are looking at creative strategies to improve service coordination; leverage resources through increased collaboration; educate their workforce about the changing demographics and increasing diversity; inform residents about available services and supports; and measure and improve outcomes through more effective and evidence‐based programs.
Report Structure
This Needs Assessment begins with a vision statement, developed by the Needs Assessment Steering Committee, of how human services should be delivered in the Tri Valley. We then describe many of the economic and social trends that are affecting Tri‐Valley residents. This is followed by a description of findings from provider and hard‐to‐reach population surveys, which articulate the perceived needs and gaps in service delivery across a wide spectrum of areas of concern.
In the next section of the report, fourteen distinct human service areas of concern (such as affordable housing, behavioral health care, disability services, transportation, etc.) are described in terms of current service needs, gaps and barriers to receiving services, how services are delivered, and recommendations for improving services. The report concludes with a summary of key findings and recommendations for system‐level improvements in human service delivery in the Tri‐Valley.

Eastern Alameda County Human Services Needs Assessment
JUNE 6, 2012 RESOURCE DEVELOPMENT ASSOCIATES | 13
Introduction and Project Overview “The demographics of people who are seeking help have changed. Open Heart Kitchen for example says that they are now seeing people drive up in luxury autos. When you live in an area where the most affordable homes are $600,000, you might say of course, like everyone else, they have needs, but if the family is out of work, it might look like everything is fine but it is not.” –Key Informant Interview
Background In 2003, the Cities of Pleasanton and Livermore commissioned their first Human Services Needs Assessment, which provided the Tri‐Valley Region with critical local data for programmatic, policy, and resource allocation decision making. Socio‐economic conditions have changed since 2003; the demand for human services has increased, yet the supply of resources to meet these demands has not followed suit. Service providers are being asked to do more with less. In 2010, the three cities that comprise the Tri‐Valley (Dublin, Livermore and Pleasanton) decided that a follow up to the 2003 report was needed to determine what has changed since the initial report. The goal of the 2011 Eastern Alameda County Human Services Needs Assessment is to update and expand upon the 2003 findings, demonstrate current and future human service needs and service delivery gaps, and to provide recommendations to Dublin, Livermore and Pleasanton, the County of Alameda, and community‐based institutions on how to move forward towards addressing the human service needs of residents. In early 2011, the cities of Dublin, Livermore and Pleasanton commissioned Resource Development Associates (RDA), a consulting firm specializing in planning, evaluation and grant writing for local government and nonprofit initiatives, to facilitate a community‐based, data‐driven, assessment process. In order to ensure that the process encompassed representation from the broadest possible stakeholder perspectives, the consulting team and city staff (Kathleen Yurchak of Pleasanton, Jean Prasher of Livermore and Gaylene Burkett of Dublin), formed a Needs Assessment Steering Committee comprised of local service providers and governance leadership. The Steering Committee developed a vision for future human service efforts in Eastern Alameda County, helped to ensure that the process was inclusive and representative of the diverse communities within Dublin, Livermore and Pleasanton, and reviewed findings to ensure accuracy and completeness. This report is the product of these efforts.
Key Objectives for Human Service Needs Assessment
• Build consensus on most urgent community needs, identifying:
o gaps in services o opportunities or
resources that can be leveraged
• Help prioritize community‐building efforts
• Build capacity to collaborate between agencies and across jurisdictions
• Establish basis for resource development
Eastern Alameda County Human Services Needs Assessment
JUNE 6, 2012 RESOURCE DEVELOPMENT ASSOCIATES | 14
Overview The Cities of Dublin, Livermore and Pleasanton, referred to interchangeably as Eastern Alameda County and the Tri‐Valley, are geographically and culturally distinct from other cities within Alameda County. The center of County government and most nonprofit services are concentrated “over the hill” in Oakland, Hayward and San Leandro. Some people in western Alameda County are not even aware that Dublin, Livermore and Pleasanton are part of the County, and many others believe that due to the relative prosperity of the Tri‐Valley, there are very few people in need of services. The purpose of this Human Services Needs Assessment is to cast light on the myriad issues faced by lower‐income and other vulnerable residents within the Tri‐Valley, and to demonstrate the gaps and barriers associated with meeting human service needs. This Assessment examines the need for services across a broad range of service delivery systems, including physical and behavioral health, nutrition and food security, housing and homeless services, education and child development, transportation, and financial assistance. Because human service needs are interconnected and mutually reinforcing, the report focuses on the impact of service delivery systems on the people needing the services. This population‐based approach provides a system‐level rather than a program‐level perspective. This report is not intended to serve as an evaluation of individual programs; it does not suggest which services in which area are most effective or least effective. It does, however, provide critical data on key population demographics impacting service delivery systems, service accessibility, barriers to addressing needs, existing gaps in services, and, finally, opportunities to address existing and future needs and gaps. The analysis in this report is based upon quantitative and qualitative data from a range of sources, including the U.S. Census, the American Community Survey, and Alameda County Social Services Agency. In addition, 18 interviews with community leaders, 14 focus groups with social service recipients, a Hard to Reach Population Survey with over 300 responses, and a Social Service Provider Survey completed by over 70 representatives of 38 Eastern Alameda County social service organizations provided additional local data. Additional qualitative data was collected during community‐wide meetings held in each of the three cities in September 2011. Both the qualitative and quantitative data continues to demonstrate that even during relatively prosperous times, there was a need for welfare, homeless, food and nutrition and other critical services. What is new in the current economic climate is the increased need for services among the recently unemployed and those suffering the consequences of the housing market downturn. At the same time, the demographic makeup of the Tri‐Valley is changing, with a rapidly growing Asian/Pacific Islander community and a significant increase in seniors, particularly those over the age of 85. These demographic shifts, coupled with diminishing resources and budgetary constraints, has transformed and stressed existing systems of social service provision.
“I went to speak to someone at the County and they said, ‘Why are you even talking to me, Pleasanton is in
Contra Costa County.’” ‐‐Meeting Participant

Eastern Alameda County Human Services Needs Assessment
JUNE 6, 2012 RESOURCE DEVELOPMENT ASSOCIATES | 15
The most commonly cited community issues include a lack of affordable transportation and difficulty accessing services, increasing mental health concerns, increasing homelessness, a shortage of affordable housing, and the need to ensure culturally competent services and outreach to underserved communities. Despite these challenges, it is clear that there have been significant successes in the Tri‐Valley. Tax revenue derived from a high‐end housing market and steadily growing commercial real estate development have allowed for the building of parks and libraries and the preservation of high‐quality schools. Many local providers, according to the interviewees, provide high quality and effective services. Unemployment and poverty rates are lower than they are in many neighboring communities. Yet, there are issues that remain to be addressed. These issues and areas for growth, along with informants’ suggestions for improvement and findings from data analysis, are addressed in this report.
Eastern Alameda County Human Services Vision
In order to ensure diverse representation, the Eastern Alameda County Human Services Steering Committee included membership from Dublin, Livermore and Pleasanton city staff, Human Services Commissioners from Livermore and Pleasanton, a former elected official, leadership from Childrens Emergency Food Bank, representatives from Tri‐Valley Haven, Eden I&R, ECHO Fair Housing, Community Resources for Independent Living, Bay Area Community Services, Community Association for Preschool Education, Senior Support Program of the Tri‐Valley and Axis Community Health. Members, many of whom are advocates for a specific population or address a particular concern, participated in an exercise – in which participants ranked areas of concern by greatest need – in order to broaden their individual goals and objectives and adopt a community‐wide vision. As a result of this exercise, the Eastern Alameda County Steering Committee developed the following vision statement to help guide current and future activities associated with addressing human service needs in the Tri‐Valley.
In the next 10 years, this committee envisions that all Eastern Alameda County residents will be able to access basic services such as affordable housing, healthcare, mental health, and nutrition without having to leave the Tri‐Valley region and without experiencing stigma associated with asking for help. All individuals and families with multifaceted needs will have access to accurate information and safe and accessible services, including supportive permanent and transitional housing, emergency shelter, therapeutic nursery schools, comprehensive case management, and specialized healthcare. Similarly, residents of Eastern Alameda will be able to engage in local grassroots efforts—such as volunteerism and participation in faith‐based initiatives—to support and assist their neighbors.

Eastern Alameda County Human Services Needs Assessment
JUNE 6, 2012 RESOURCE DEVELOPMENT ASSOCIATES | 16
Finally, this committee envisions that county and regional agencies, community‐based organizations and funders recognize that poverty, discrimination and other human service challenges cross geographic boundaries, and that resources are distributed based on current and accurate data on human need and not based on preconceived notions of
. We envision that through this Needs Assessment, the erable Eastern Alameda County residents will be better supported.
wealthy versus poor regionshuman service needs of vulnrecognized, understood and
Methodology The 2011 Eastern Alameda County Human Services Needs Assessment uses a mixed‐method (qualitative and quantitative) approach to collecting and analyzing local and regional data. Data sources include quantitative elements, such as the U.S. Census, American Community Survey and Alameda County Social Services Agency reports, as well as qualitative data gathered from public servants, service delivery providers, and service recipients. Informants and survey respondents were diverse—representing parents and providers of services to infants, children and transitional age youth, adults, and older adults; men and women; ethnic minorities and immigrants; day laborers; residents of different neighborhoods within Dublin, Livermore and Pleasanton; people with disabilities; the homeless and those at risk of homelessness; the faith community; and the unemployed. This multifaceted and multilevel assessment approach enables RDA to compare findings from multiple sources, which helps paint a complete picture of population needs and service delivery gaps.
U.S. Census, American Community Survey and Alameda County Social Service Utilization Data To demonstrate demographic change over time in the Tri‐Valley, this report uses U.S. Census data from 1990, 2000, and 2010. At the time of this writing, the U.S. Census Bureau has not released 2010 data for the city of Dublin due to smaller sample size. Therefore, when describing current demographic differences between each city, we use American Community Survey Data from 2007 – 2009 as a current proxy. Census data is used in this report to describe:
• Population growth for each city
• Race/ethnic distribution for each city
• Tri‐Valley trends in: o Population age and sex distribution o Linguistic isolation o Federal poverty rates o Proportion of household income used for rent
In addition, RDA analyzed Alameda County Social Services data for 2003 and 2011 to demonstrate the increase in the number of residents using Alameda County subsidized services, including CalFresh,
Eastern Alameda County Human Services Needs Assessment
JUNE 6, 2012 RESOURCE DEVELOPMENT ASSOCIATES | 17
CalWorks, General Assistance and Medi‐Cal. Due to the availability of data, utilization records from the June 2003 Quarterly Report were compared to one month’s data from February 2011. In spite of the longer period for 2003, 2011 data showed a higher utilization rate. Data analyzed for this report includes the following, for each city and the Tri‐Valley:
• Medi‐Cal recipients
• Food stamp recipients
• General Assistance recipients
• CalWORKS recipients
Hard to Reach Population Survey A paper‐based survey comprised of 12 multiple choice and several open‐ended questions was administered to Tri‐Valley residents identified as ‘Hard to Reach.’ A Hard to Reach individual or family is defined as one that receives services sporadically, who may need additional services but does not seek them, has challenges accessing needed services, or is unable to receive services. This population may be facing physical, cultural, linguistic, emotional, or behavioral challenges limiting their overall access. The English, Spanish and Chinese surveys were administered to a targeted sample of respondents drawn from locations in Dublin, Livermore, and Pleasanton where individuals were most likely to be found, according to Key Informants and Steering Committee Members. On‐site surveying was conducted at Open Heart Kitchen during meal services in Livermore and Pleasanton, the Livermore Multi Service Center, The Groves senior housing in Dublin, the sidewalk in front of Home Depot in Pleasanton, and at the ACE Train Station in Pleasanton. Surveyors spent 24 hours visiting these locations and administering surveys. Locations were targeted in each of the three cities in order to collect data from a representative sample of individuals from Dublin, Livermore, and Pleasanton. The final sample of in‐person surveys included 73 survey responses. RDA also sent both soft copies (via email), as well as hard copies of the Hard to Reach Population Survey to all providers that had participated in the Key Informant Interviews, helped to schedule focused discussion groups, or responded to the Social Service Provider Survey. Providers were instructed to administer surveys to individuals receiving services at their respective organizations. Providers were given four weeks to administer surveys and return them to RDA. Providers submitted 233 surveys to RDA within the data collection timeframe. In total, 306 responses were received. The Hard to Reach Population Survey can be found in Appendix H of this report.
Social Service Provider Survey The Social Service Provider Survey is a 22‐question, web‐based survey administered to social service providers who serve residents of the Tri‐Valley. The survey consists of nine short response questions and 12 multiple choice questions and was distributed to the directors or administrators of each human
Eastern Alameda County Human Services Needs Assessment
JUNE 6, 2012 RESOURCE DEVELOPMENT ASSOCIATES | 18
service organization listed in the Tri‐Valley Pocket Guide. These recipients were asked to email the survey link to their management, staff and volunteers who serve Tri‐Valley residents. In total, 74 unique individuals representing 38 Eastern Alameda County organizations responded to the web‐based survey. The Social Service Provider Survey can be found in Appendix G of this report.
Key Informant Interviews To ensure high‐end, experienced, and knowledgeable perspectives, hour‐long key informant interviews were conducted in March 2011 with 18 individuals representing civic, community and human service organization leadership in the Tri‐Valley. To ensure a diversity of perspectives, RDA and city staff selected individuals that represent each area of concern as well as individuals who represent many of the cultural/ethnic communities within Dublin, Livermore and Pleasanton. Interviews were structured around 13 general questions and several specific questions tailored to the expertise of the interviewee. Interviewees were informed that their responses would remain anonymous, but that their participation would be noted in the final report. Interview questions are located in Appendix A.
List of Key Informants Contact City/Subject Position/Organization
Carol Thompson Early Childhood Child Care Links
Cheryl Cook‐Kalio Pleasanton City Council Member
Dr. Marshall Kamena Livermore Mayor (former)
James Nguyen Public Health Alameda County Public Health
Jan Cornish‐Barcuis Transportation WHEELS
Joni Pattillo Dublin City Manager
Kelly Dulka Tri‐Valley YMCA
Leticia Cooper Welfare/Food Stamps County Office at Multi‐Service Center
Linda Barton Livermore City Manager
Marjorie Rocha Housing Executive Director, Echo
Marlene Petersen Seniors Senior Support of Tri‐Valley
Marsha McInnis Behavioral Health NAMI
Michael Galvan Transitional Age Youth Abode Services‐Project Independence
Michael Pelfini Children with Special Needs Easter Seal
Nelson Fialho Pleasanton City Manager
Susan Gonzalez Sensory Disabilities Deaf Counseling, Advocacy & Referral Agency
Tami Ratto Disability East Bay Innovations
Vivian Valentine Homelessness Shepard's Gate‐Livermore
Eastern Alameda County Human Services Needs Assessment
JUNE 6, 2012 RESOURCE DEVELOPMENT ASSOCIATES | 19
Contact City/Subject Position/Organization
Yvette Carrillo Immigrant/Language Axis Community Health
Table 1: List of Key Informants
Focus Groups Between May 7, 2011 and June 30, 2011, researchers facilitated 14 focus groups with targeted groups of social service recipients. Participants were identified and recruited by community based organizations and human service providers working in the Tri‐Valley with guidance from RDA and city staff. Groups averaged eight participants, with the largest groups consisting of 20 individuals. Each focus group opened with an overview of the project, a discussion of ground rules, and a group exercise where participants ranked their most critical service needs. Sessions lasted between one and a half and two hours, with participants addressing five questions in an open‐discussion format. Focus group participants included:
Focused Discussion Group Host Organization
Adults with Disabilities Community Resources for Independent Living
Day Laborers ‐ Spanish Hayward Day Labor Center
Family Members of those with Mental Illness National Association on Mental Illness (NAMI) Tri‐Valley
Homeless Families Tri‐Valley Haven
Homeless Individuals Livermore Homeless Refuge
Parents of Disabled Children E‐Soccer
Parents of Older Children ‐ English Horizons Family Counseling
Parents of Older Children ‐ Spanish Horizons Family Counseling
Parents of Young Children ‐ English Community Association for Preschool Education (CAPE)
Parents of Young Children ‐ Spanish Community Association for Preschool Education (CAPE)
Residents Facing Foreclosure Tri‐Valley Housing Opportunity Center
Seniors Pleasanton Senior Center
Survivors of Domestic Violence Tri‐Valley Haven
Interfaith Community Members Trinity Lutheran Church
Table 2: Focused Discussion Groups
Following the data collection activities described above, preliminary findings were publically presented at community meetings held in each of the three cities. Participants at these meetings were provided the opportunity to ask questions; these questions were incorporated into the final draft of the report. The list of organizations that attended the community meetings is located in Appendix J of this report.

Eastern Alameda County Human Services Needs Assessment
JUNE 6, 2012 RESOURCE DEVELOPMENT ASSOCIATES | 20
Demographic Findings The following section describes the demographic changes in Eastern Alameda County using U.S. Census and American Community Survey data from 1990, 2000, and 2010. Population Growth The cities of Dublin, Livermore and Pleasanton have experienced significant population growth since 1990. As of 2010, Livermore is home to 80,968 residents, Pleasanton to 70,285 residents, and Dublin to 46,036 residents. The ‘population pyramid’ in Figure 1 demonstrates several demographic trends. At the top of the pyramid are the oldest residents, over the age of 85, and the bottom represents the youngest residents, who are under the age of four. The darkest colors (blue is male; red is female) represent the population in 1990, the lighter colors represent the population in 2000, and the lightest colors represent the population in 2010. The top of the pyramid shows that the number of women over age 85 has quadrupled between 1990 and 2010.
The population of residents aged 50 to 64 has doubled between 1990 and 2010. However, there are proportionately fewer residents between the ages of 20 and 24, a notable lack of population growth among residents aged 20 to 34, and a decrease in population among males aged 30‐34. In summary, the population is aging and the proportion of young adults is decreasing in the Tri‐Valley.
Figure 1: Eastern Alameda Population Pyramid (Darkest grade: 1990; Mid grade: growth to 2000; Lightest grade: growth to 2010) Source: US Census/American Community Survey

Eastern Alameda County Human Services Needs Assessment
JUNE 6, 2012 RESOURCE DEVELOPMENT ASSOCIATES | 21
0 20,000 40,000 60,000 80,000 100,000
Pleasanton
Livermore
Dublin
Eastern Alameda Population Growth by City
1990
2000
2010
Figure 2 illustrates population trends in each of the three cities of the Tri‐Valley between 1990 and 2010. The total population count in Dublin has more than doubled in the last 20 years. The cities of Pleasanton and Livermore are still growing, although, at a slower pace.
Language There are several distinct changes in the demographic makeup of Dublin, Livermore and Pleasanton in the last 20 years (as illustrated in Figures 3 – 5). In Dublin, there is a notable increase in the number of Asian/Pacific Islander (API) population – a group that includes many distinct cultural and linguistic categories, including Afghan and Indian populations. This population is growing in Livermore and Pleasanton as well, albeit more slowly.
In each city, the rate of growth among the Hispanic/Latino population has remained relatively steady over the course of the last twenty years, but has shown steady increases over the last decade and a slightly smaller rate of growth in Dublin. Although White/Caucasians are the ethnic majority in the Tri‐Valley, this population has demonstrated a negative growth rate between 2000 and 2010. Therefore, the populations of the three
Figure 2: Eastern Alameda Population Growth by City
0 20,000 40,000 60,000
White
Hispanic or Latino
Asian/Pacific Islander
American Indian/Alaskan …
African American
Dublin Population by Ethnicity
1990
2000
2010
Figure 3: Dublin Population by Ethnicity

Eastern Alameda County Human Services Needs Assessment
JUNE 6, 2012 RESOURCE DEVELOPMENT ASSOCIATES | 22
0 20,000 40,000 60,000
White
Hispanic or Latino
Asian/Pacific Islander
American Indian/Alaskan …
African American
Livermore Population by Ethnicity
1990
2000
2010
cities are becoming less White/Caucasian, steadily more Hispanic/Latino, and significantly more Asian/Pacific Islander.
The Asian/Pacific Islander community is experiencing a rapid increase in population, combined with the highest levels of household linguistic isolation of any other ethnic group in the Tri‐Valley, as seen in Figure 6.
0 20,000 40,000 60,000
White
Hispanic or Latino
Asian/Pacific Islander
American Indian/Alaskan …
African American
Pleasanton Population by Ethnicity
1990
2000
2010
Figure 4: Livermore Population by Ethnicity
Figure 5: Pleasanton Population by Ethnicity
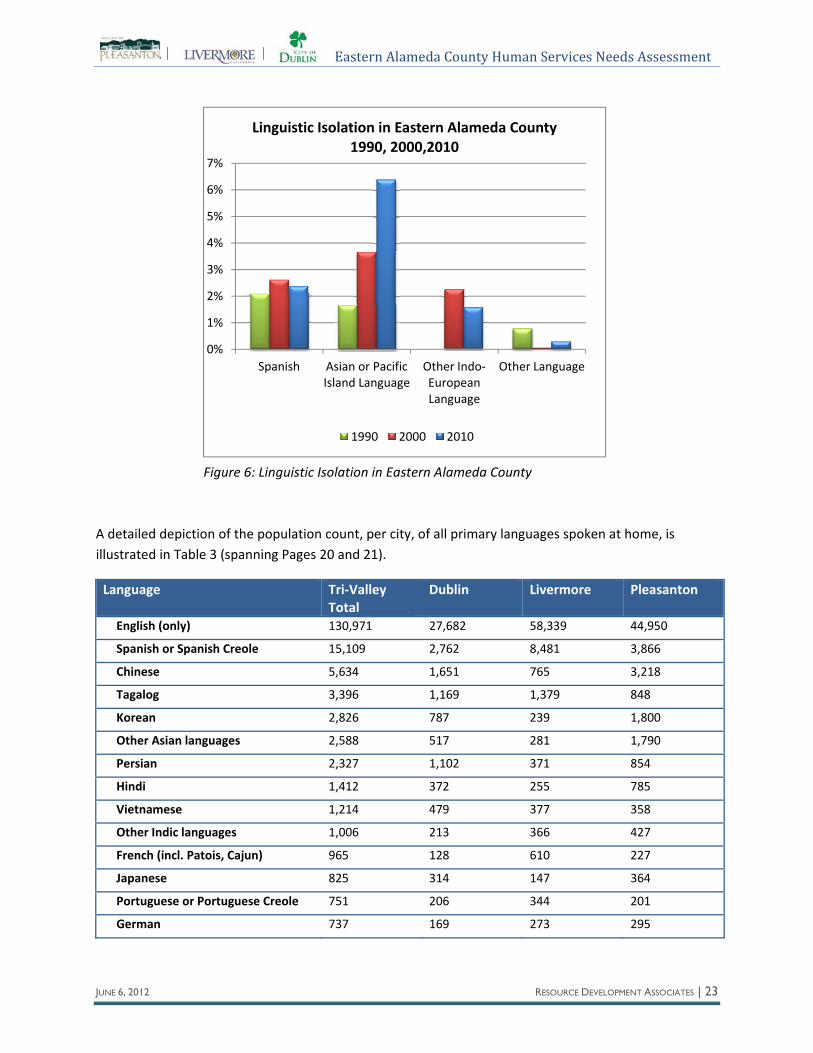
Eastern Alameda County Human Services Needs Assessment
JUNE 6, 2012 RESOURCE DEVELOPMENT ASSOCIATES | 23
A detailed depiction of the population count, per city, of all primary languages spoken at home, is illustrated in Table 3 (spanning Pages 20 and 21).
Language Tri‐Valley Total
Dublin Livermore Pleasanton
English (only) 130,971 27,682 58,339 44,950
Spanish or Spanish Creole 15,109 2,762 8,481 3,866
Chinese 5,634 1,651 765 3,218
Tagalog 3,396 1,169 1,379 848
Korean 2,826 787 239 1,800
Other Asian languages 2,588 517 281 1,790
Persian 2,327 1,102 371 854
Hindi 1,412 372 255 785
Vietnamese 1,214 479 377 358
Other Indic languages 1,006 213 366 427
French (incl. Patois, Cajun) 965 128 610 227
Japanese 825 314 147 364
Portuguese or Portuguese Creole 751 206 344 201
German 737 169 273 295
0%
1%
2%
3%
4%
5%
6%
7%
Spanish Asian or Pacific Island Language
Other Indo‐European Language
Other Language
Linguistic Isolation in Eastern Alameda County1990, 2000,2010
1990 2000 2010
Figure 6: Linguistic Isolation in Eastern Alameda County

Eastern Alameda County Human Services Needs Assessment
JUNE 6, 2012 RESOURCE DEVELOPMENT ASSOCIATES | 24
Other Pacific Island languages 626 397 106 123
Language Tri‐Valley Total
Dublin Livermore Pleasanton
Russian 606 108 162 336
Urdu 545 254 59 232
Gujarati 389 74 4 311
Other Indo‐European languages 357 142 96 119
Italian 279 31 130 118
Arabic 240 72 111 57
Serbo‐Croatian 213 71 0 142
Scandinavian languages 211 108 88 15
Greek 159 85 65 9
African languages 119 56 63 0
Armenian 118 10 90 18
Other West Germanic languages 108 63 0 45
Thai 105 14 31 60
Polish 89 25 0 64
Hungarian 76 0 35 41
Hebrew 73 37 14 22
Other Native North American 66 59 0 7
Other and unspecified languages 49 0 0 49
French Creole 43 11 32 0
Mon‐Khmer, Cambodian 40 11 29 0
Other Slavic languages 32 19 13 0
Laotian 15 0 15 0
Source: U.S. Census Bureau
Linguistic isolation is defined as a household in which all individuals over the age of 14 speak a language other than English, and none speak English “very well.” The rate of linguistic isolation in Asian/Pacific Islander households, relative to all households in the Tri‐Valley, has more than tripled since 1990, reaching an overall household level of just over six percent in 2010. Notably, linguistic isolation in Hispanic/Latino households has decreased between 2000 and 2010, despite demonstrating a slight increase between 1990 and 2000. Linguistic isolation has also demonstrated an overall decrease in other Indo‐European language households.
Income Levels Overall poverty in Eastern Alameda County increased between 2000 and 2010. The Census Bureau defines the Federal Poverty Level (FPL) using a set of income thresholds that vary by family size and composition. A family is considered impoverished if the total family income is less than a specific income
Table 3: Population Count by Household Language by City

Eastern Alameda County Human Services Needs Assessment
JUNE 6, 2012 RESOURCE DEVELOPMENT ASSOCIATES | 25
0.00% 0.02% 0.04% 0.06% 0.08% 0.10%
Pleasanton
Livermore
Dublin
Percent of PopulationReceiving General Assistance
2003
2011
Figure 8: % of Population Receiving General Assistance
0.0%
1.0%
2.0%
3.0%
4.0%
5.0%
6.0%
7.0%
1990 2000 2010
Percent of the Eastern Alameda Population in Poverty
Percent in Poverty
amount that is updated based on the Consumer Price Index. In 2011, The FPL for a family of four is $22,350. Overall, 4.5% of the population in the three cities lives below the FPL (Figure 7).
The increase in federally defined household poverty is dwarfed by the increase in the proportion of East County residents receiving General Assistance, Food Stamps, Medi‐Cal and CalWorks. Analyzing Figures 8 and 9, it is clear that the overall proportaion of the population receiving General Assistance and Food Stamps is relatively small; however, it is the increase in recipients of these services, coupled with the growing number of residents receiving CalWorks and Medi‐Cal benefits that demonstrate the poverty growth in the Tri‐Valley. (Figures 10 and 11)
In Dublin, Livermore and Pleasanton, the proportion of the population receiving Medi‐Cal and CalWorks increased notably in the last eight years. In the three cities combined, the proportion of the population
Figure 7: Percent of Tri‐Valley Population in Poverty

Eastern Alameda County Human Services Needs Assessment
JUNE 6, 2012 RESOURCE DEVELOPMENT ASSOCIATES | 26
receiving Medi‐Cal benefits has increased from just under two percent to over five percent of the overall population. The proportion receiving CalWorks has increased from less than one quarter of one percent to just under one percent.
0% 1% 2% 3% 4%
Pleasanton
Livermore
Dublin
Percent of Population Receiving Food Stamps
2003
2011
Figure 9: % of Population Receiving Food Stamps
0.0% 0.5% 1.0% 1.5% 2.0%
Pleasanton
Livermore
Dublin
Percent of PopulationReceiving CalWorks
2003
2011
Figure 10: % of Population Receiving CalWorks
0% 2% 4% 6% 8% 10%
Pleasanton
Livermore
Dublin
Percent of Population Receiving MediCal
2003
2011
Figure 11: % of Population Receiving Medi‐Cal In conclusion, the increase in population, the changing ethnic/racial demographics, growing poverty, and the corresponding increase in the proportion of the community receiving General Assistance, Food Stamps, CalWORKS and Medi‐Cal, all point to an increasing demand for human services in the Tri‐Valley.
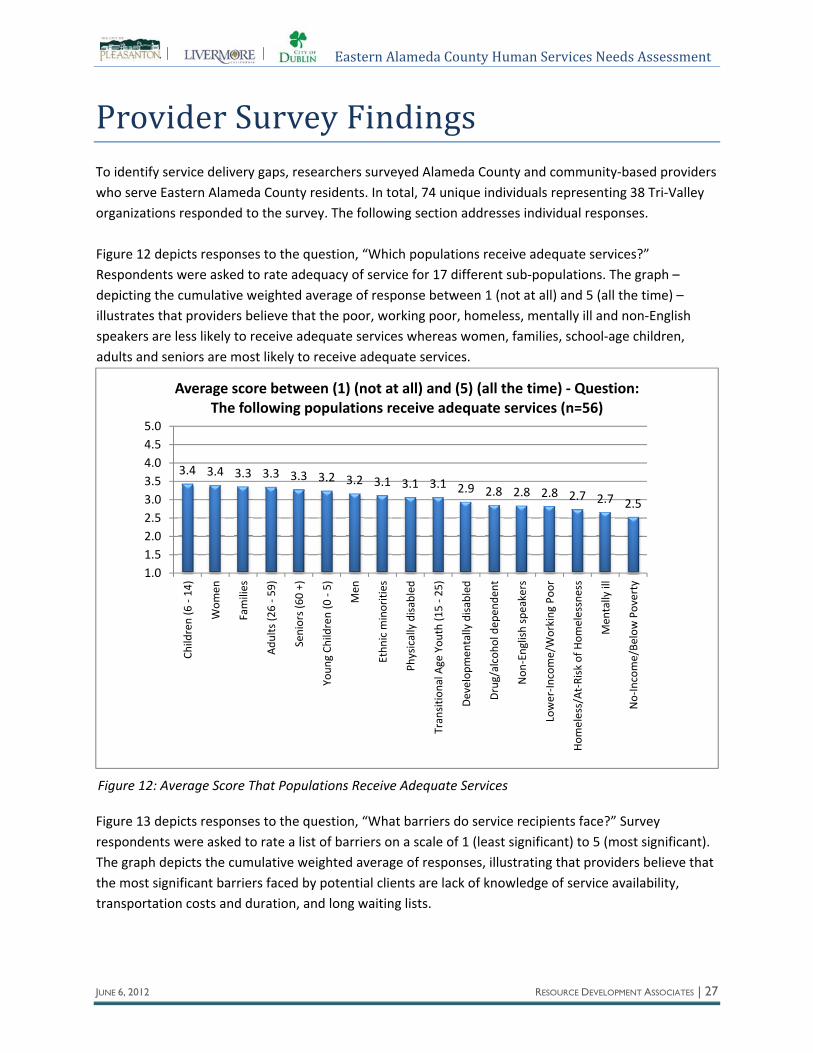
Eastern Alameda County Human Services Needs Assessment
JUNE 6, 2012 RESOURCE DEVELOPMENT ASSOCIATES | 27
Provider Survey Findings To identify service delivery gaps, researchers surveyed Alameda County and community‐based providers who serve Eastern Alameda County residents. In total, 74 unique individuals representing 38 Tri‐Valley organizations responded to the survey. The following section addresses individual responses. Figure 12 depicts responses to the question, “Which populations receive adequate services?” Respondents were asked to rate adequacy of service for 17 different sub‐populations. The graph – depicting the cumulative weighted average of response between 1 (not at all) and 5 (all the time) – illustrates that providers believe that the poor, working poor, homeless, mentally ill and non‐English speakers are less likely to receive adequate services whereas women, families, school‐age children, adults and seniors are most likely to receive adequate services.
3.4 3.4 3.3 3.3 3.3 3.2 3.2 3.1 3.1 3.1 2.9 2.8 2.8 2.8 2.7 2.7 2.5
1.01.52.02.53.03.54.04.55.0
Children (6 ‐14)
Wom
en
Families
Adu
lts (2
6 ‐5
9)
Seniors (60 +)
Youn
g Ch
ildren (0 ‐5)
Men
Ethn
ic m
inorities
Physically disabled
Transitio
nal A
ge You
th (1
5 ‐2
5)
Develop
men
tally disabled
Drug/alcoho
l dep
ende
nt
Non
‐English speakers
Lower‐In
come/Working
Poo
r
Hom
eless/At‐Risk of H
omelessness
Men
tally ill
No‐Income/Be
low Poverty
Average score between (1) (not at all) and (5) (all the time) ‐ Question: The following populations receive adequate services (n=56)
Figure 12: Average Score That Populations Receive Adequate Services
Figure 13 depicts responses to the question, “What barriers do service recipients face?” Survey respondents were asked to rate a list of barriers on a scale of 1 (least significant) to 5 (most significant). The graph depicts the cumulative weighted average of responses, illustrating that providers believe that the most significant barriers faced by potential clients are lack of knowledge of service availability, transportation costs and duration, and long waiting lists.

Eastern Alameda County Human Services Needs Assessment
JUNE 6, 2012 RESOURCE DEVELOPMENT ASSOCIATES | 28
1.5%
21.5%
72.3%
4.6%
My organization and others like it are able and for
services (n=65):to meet Tri‐Valley residents' dem
None of the time
Some of the time
Most of the time
Always
3.4 3.3 3.22.9 2.8
2.52.2
2.0 1.91.5 1.5
1.0
1.5
2.0
2.5
3.0
3.5
4.0
4.5
5.0Lack of kno
wledge of
available services
Transportatio
n (cost)
Transportatio
n (tim
e)
Long
waitin
g lists fo
r services
Cost of services
Language barriers
Lack of cultural
represen
tatio
n
Immigratio
n status
Disability barriers
Age barriers
Gen
der b
arriers
which of the following are barriers faced by residents seeking services? (n=62)
Average score between (1) (least significant) and (5) (most significant) ‐
Despite identifying those sub‐populations who providers believe face barriers to receiving effective services – including the poor, working poor, homeless and mentally ill – a wide majority of providers surveyed believe that most of the time they and their colleagues provide sufficient services to meet demand. Figure 14 illustrates that less than two percent of service providers indicated that they can never meet the demand for services. Whereas, over 72% of respondents indicate that they can meet the needs of the community “Most of the time”.
Figure 14: Meeting Demand for Services
Figure 13: Barriers are Faced by Residents Seeking Services
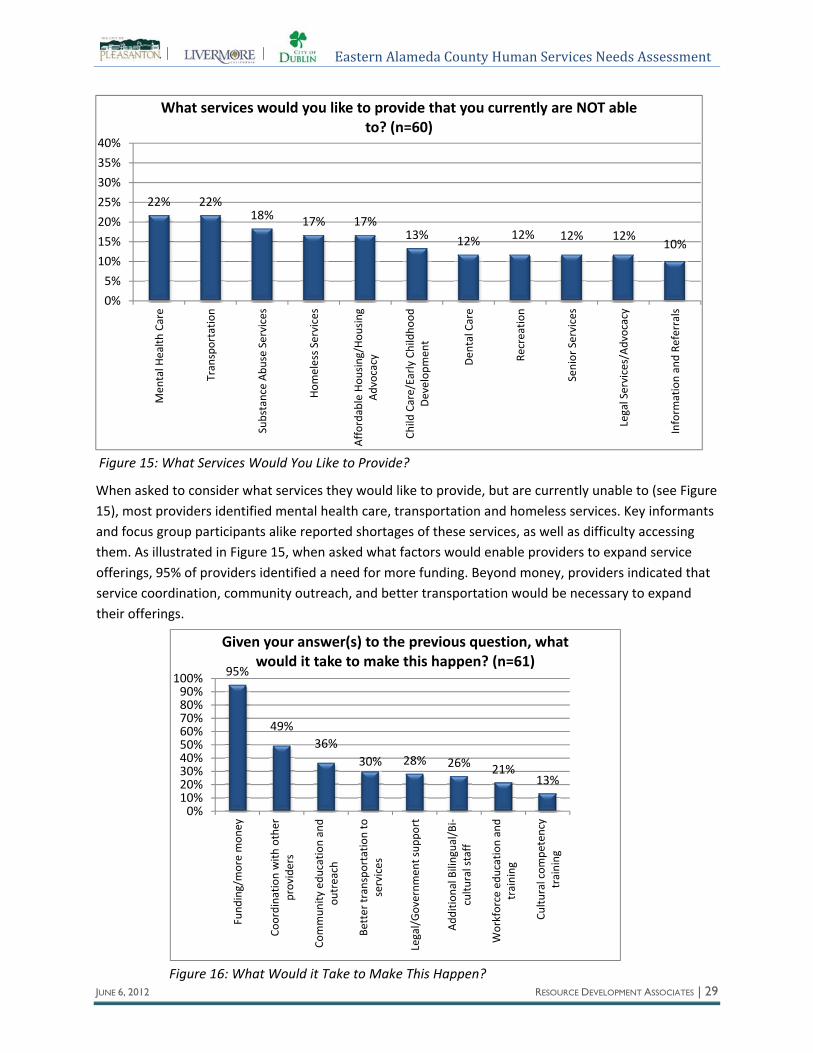
Eastern Alameda County Human Services Needs Assessment
JUNE 6, 2012 RESOURCE DEVELOPMENT ASSOCIATES | 29
22% 22%18% 17% 17%
13% 12% 12% 12% 12%10%
0%
5%
10%
15%
20%
25%
30%
35%
40%Men
tal H
ealth
Care
Transportatio
n
Substance Abu
se Services
Hom
eless Services
Affordable Hou
sing/Hou
sing
Advocacy
Child
Care/Early Ch
ildho
od
Develop
men
t
Den
tal Care
Recreatio
n
Senior Services
Legal Services/Advocacy
Inform
ation and Re
ferrals
What services would you like to provide that you currently are NOT able to? (n=60)
Figure 15: What Services Would You Like to Provide?
When asked to consider what services they would like to provide, but are currently unable to (see Figure 15), most providers identified mental health care, transportation and homeless services. Key informants and focus group participants alike reported shortages of these services, as well as difficulty accessing them. As illustrated in Figure 15, when asked what factors would enable providers to expand service offerings, 95% of providers identified a need for more funding. Beyond money, providers indicated that service coordination, community outreach, and better transportation would be necessary to expand their offerings.
95%
49%36%
30% 28% 26% 21%13%
0%10%20%30%40%50%60%70%80%90%
100%
mon
ey
othe
r
and
to
supp
ort
al/Bi‐
and
y
Given your answer(s) to the previous question, what would it take to make this happen? (n=61)
Fund
ing/more
Coordinatio
n with
providers
Commun
ity edu
catio
nou
treach
Better transportatio
nservices
Legal/Governm
ent
Add
ition
al Bilingu
cultu
ral staff
Workforce edu
catio
ntraining
Cultu
ral com
petenc
training
Figure 16: What Would it Take to Make This Happen?
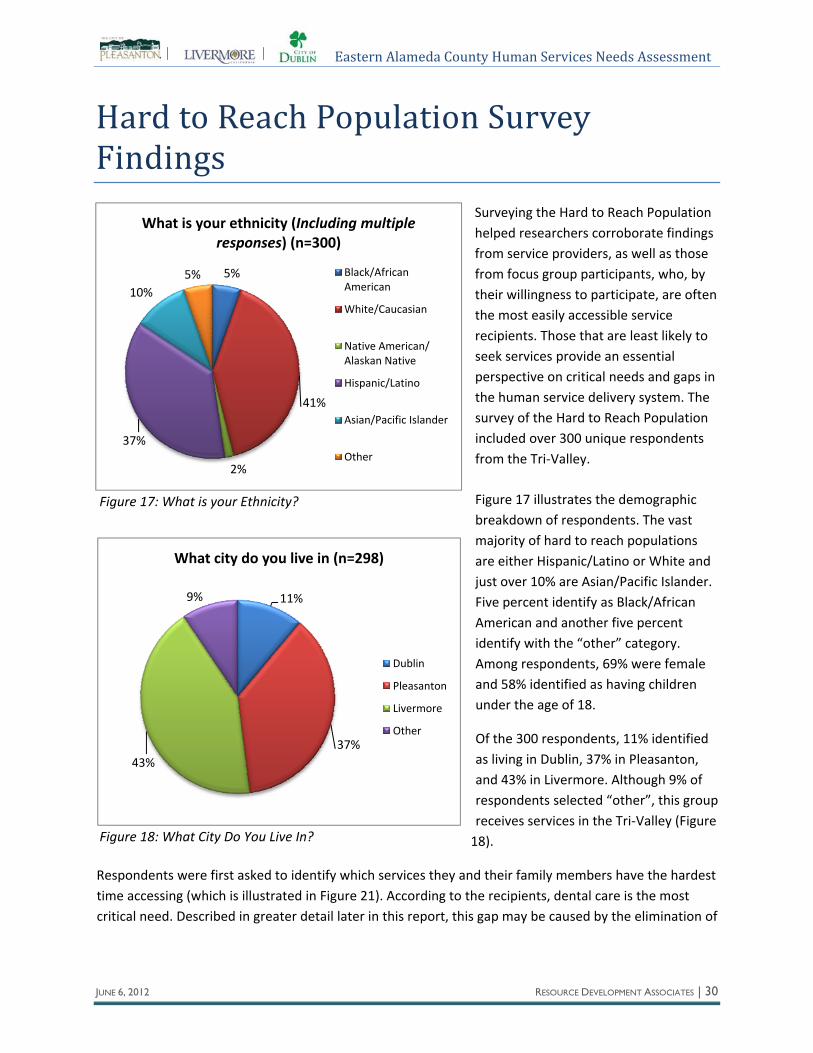
Eastern Alameda County Human Services Needs Assessment
JUNE 6, 2012 RESOURCE DEVELOPMENT ASSOCIATES | 30
11%
37%43%
9%
What city do you live in (n=298)
Dublin
Pleasanton
Livermore
Other
Figure 17: What is your Ethnicity?
5%
41%
2%
37%
10%5%
(Including multiple sponses) (n=300)
What is your ethnicityre
Black/African American
White/Caucasian
Native American/ Alaskan Native
Hispanic/Latino
Asian/Pacific Islander
Other
Hard to Reach Population Survey Findings
Surveying the Hard to Reach Population helped researchers corroborate findings from service providers, as well as those from focus group participants, who, by their willingness to participate, are often the most easily accessible service recipients. Those that are least likely to seek services provide an essential perspective on critical needs and gaps in the human service delivery system. The survey of the Hard to Reach Population included over 300 unique respondents from the Tri‐Valley.
Figure 17 illustrates the demographic breakdown of respondents. The vast majority of hard to reach populations are either Hispanic/Latino or White and just over 10% are Asian/Pacific Islander. Five percent identify as Black/African American and another five percent identify with the “other” category. Among respondents, 69% were female and 58% identified as having children under the age of 18.
Of the 300 respondents, 11% identified as living in Dublin, 37% in Pleasanton, and 43% in Livermore. Although 9% of respondents selected “other”, this group receives services in the Tri‐Valley (Figure 18). Figure 18: What City Do You Live In?
Respondents were first asked to identify which services they and their family members have the hardest time accessing (which is illustrated in Figure 21). According to the recipients, dental care is the most critical need. Described in greater detail later in this report, this gap may be caused by the elimination of

Eastern Alameda County Human Services Needs Assessment
JUNE 6, 2012 RESOURCE DEVELOPMENT ASSOCIATES | 31
most dental care services from Medi‐Cal coverage benefits. Other notable gaps include primary health, transportation, job training and placement, food and nutrition, and affordable housing.
To identify barriers faced by Hard to Reach populations, survey respondents were also asked to check boxes that complete the statement: “Sometimes I do not get the services I need because…” Respondents to this question were most likely to identify the cost of services to be the greatest barrier, as illustrated in Figure 19. The cost of transportation is also a significant barrier, and aligns with the findings from the Provider Survey. Not qualifying for services and not knowing where to go for services were also noteworthy barriers identified by the Hard to Reach population. Additionally, six percent of the population surveyed offered that their disability presents a challenge to receiving services.
52%48%
40%38%
35%
10% 9% 8% 6%
0%
10%
20%
30%
40%
50%
60%
… I can't a
fford the services.
… it costs to
o much to get to
whe
re I
need
to go.
… I do
n't q
ualify for the services.
… I do
n't k
now whe
re to
get help.
… it ta
kes too long
to get to
whe
re I
need
to go.
… I do
n't trust th
e service provider.
… th
ere is no on
e that spe
aks my
language.
… th
e service provider doe
s no
t un
derstand
my cultu
re.
… I can't a
ccess them
because of
disability.
Sometimes I do not get the services I need because...(n=244)
Figure 19: Sometimes I Do Not Get The Services I Need Because...

Eastern Alameda County Human Services Needs Assessment
JUNE 6, 2012 RESOURCE DEVELOPMENT ASSOCIATES | 32
57%
37%33%
29% 28% 26% 23%17% 15% 14% 14% 12% 9% 7% 5% 5% 5% 3% 2%
0%10%20%30%40%50%60%70%80%90%
100%
Den
tal Care
Prim
ary Health
Care
Food
and
nutritio
n / food
stamps wic
welfare and
TANF
Affordable Hou
sing/Hou
sing
Assistance
Job Training/Job
Placemen
t
Transportatio
n
Child
Care
Specialty
Health
Care
Clothing
or Other Don
ated
Item
s
Adu
lt Education/Literacy
Men
tal H
ealth
Care
Legal Services/Advocacy
Senior Services
Disability/Spe
cial Needs
Substance Abu
se Services
Child
Welfare/Child Protective
Services
Recreatio
n
Hom
eless Shelter
Dom
estic
Violence Services
What services do you and your family need but have a hard time accessing? (n=214)
77.3%
9.1%
13.6%
5.6%
77.8%
5.6%
11.1%
0.0% 20.0% 40.0% 60.0% 80.0% 100.0%
White/Caucasian
Hispanic/Latino
Asian/Pacific Islander
Other
Sometimes I do not get the services I need because…(n=22)
the service provider does not understand my culture.
there is no one that speaks my language.
Over 90% of respondents indicated that neither a language barrier nor lack of cultural understanding were barriers, as illustrated in Figure 20. However, among the 10% who identified that culture and language were significant barriers, over 77% were Hispanic/Latino.
Figure 20: Sometimes I don’t get the services I need because…
Figure 21: What Services Do You and Your Family Need But Have a Hard Time Accessing

Eastern Alameda County Human Services Needs Assessment
JUNE 6, 2012 RESOURCE DEVELOPMENT ASSOCIATES | 33
Findings by Area of Concern During the initial planning phase for this Needs Assessment, the Eastern Alameda County Human Services Steering Committee identified 14 human service areas of concern. Key informants then ranked these concerns according to perceived level of importance. The areas of concern, in order of ranked importance are:
• Behavioral health (mental health and substance abuse)
• Affordable housing
• Health care
• Workforce development
• Homelessness
• Transportation services and access
• Domestic violence and child abuse
• Disabilities
• Food and nutrition
• Senior services
• Youth services
• Child care, early childhood development and education
• Changing demographics and growing diversity
• Financial assistance
The following sections of the report address each human service area of concern in terms of:
• Community Issues illustrate the needs in the community.
• Service Delivery Environment addresses available services. This section is not a complete description of services and supports available in the Tri‐Valley, but rather, a description of those service delivery systems emphasized by key informants and participants in focus groups. This section draws no conclusions as to the performance or the effectiveness of programs mentioned.
• Current Gaps in Services or Barriers to Improving Service identifies gaps in services and barriers to improving services as addressed by informants in discussion groups, interviews, and surveys. This section is a summary of the experience of recipients of services, providers of services, community advocates, and subject‐area experts in Eastern Alameda County.
• Suggestions for Improvement distills the suggestions made by community members and service providers, and includes additional research on best practice approaches for implementation.
Eastern Alameda County Human Services Needs Assessment
JUNE 6, 2012 RESOURCE DEVELOPMENT ASSOCIATES | 34
Behavioral Health “I don’t know anyone who hasn’t been hit economically; we’ve been in a depression. Now there are a greater number of people who are suffering. This kind of stress can trigger mental illness. I don’t know anyone providing services out here for whom mental health is not a factor.” –Key Informant
Key Findings • Behavioral health services are insufficient in the Tri‐Valley. Population growth and increasing
stress related to economic conditions has strained the existing behavioral health service delivery system.
• Services for teens and young adults dealing with substance and behavioral health issues are insufficient to meet growing needs.
• There is no local Psychiatric Health Facility or in‐patient drug rehabilitation facility, nor is there a sufficient number of board and care facilities in the Tri‐Valley.
• The lack of coordination among behavioral health providers makes access to treatment and services difficult.
• Tri‐Valley residents have to travel to Oakland or beyond to receive in‐patient mental health, alcohol or other drug (AOD) treatment services.
• Social stigma, community misunderstanding of mental health and cultural or language barriers prevent those with behavioral health needs from seeking treatment and support.
Community Issues Provider and consumer stakeholders throughout the Tri‐Valley report that behavioral health (mental health and substance abuse) is one of the greatest social concerns in Eastern Alameda County. There is a great deal of stigma associated with seeking care in the Tri‐Valley. In Livermore, for example, one mental health advocate states, “There is an image here that we don’t have [behavioral health related] problems. But this is certainly not the case.” A general unwillingness to recognize human service needs and a lack of understanding of mental health needs, in particular, was a common theme among stakeholders. The stigma associated with drug abuse and mental illness impedes people from seeking services early on, resulting in more deeply rooted mental health concerns. Multiple stakeholders suggested that there is a need for a community‐wide educational campaign and open dialogue acknowledging the presence of mental health needs in the Tri‐Valley. Youth and transitional age youth, in particular, are at risk due to the stigma and unwillingness to address the issue directly. Suicidal thinking and behavior and underage drinking and drug use are a serious concern to many of the parent stakeholders. One person speaking of a series of teen suicides in Pleasanton called it an “epidemic.” Others spoke of the many environmental and cultural stressors commonly attributed to wealthier communities, such as academic and family pressures to succeed. Other stressors identified include cultural identity and isolation, and gender‐related discrimination. Several interviewees emphasized the under‐recognized prevalence of prescription drug abuse among youth – particularly the unauthorized use of OxyContin, a prescription, narcotic pain medication. In a
Eastern Alameda County Human Services Needs Assessment
JUNE 6, 2012 RESOURCE DEVELOPMENT ASSOCIATES | 35
parent focus group, alcohol abuse among teens in the schools was emphasized. One parent has noticed that many youth are bringing alcohol to school in water bottles.
Also, older adults in the Tri‐Valley are vulnerable to substance abuse and mental health disorders. According to a participant in a senior focus group:
“It’s common for older people to drink more, abuse prescription drugs, and [suffer from] depression. These issues are not being addressed, they are happening but not much is being done about it, and I’m not aware of any programs that address these issues. There are many seniors that are caught up in these issues without getting any help.”
Another common theme articulated by service providers is that current economic conditions are affecting the psychological wellbeing of residents, particularly those who have been directly affected by layoffs, foreclosures and service cuts. One service provider noted, “We have seen an increase in clients with mental health issues. Their illnesses are more pronounced as well, because they can’t afford to purchase their medications.”
Service Delivery Environment Stakeholders recognize the availability of some services that can help address the behavioral health needs of at‐risk youth. Two mental health service coordinators described a joint partnership between one of Eastern Alameda County’s continuation high schools and Alameda County Behavioral Health Care Services that provides mental health consultation to teachers and staff. The program empowers teachers and staff to be effective mental health liaisons in the schools. Similarly, Horizons Family Counseling, under contract with Alameda County Probation Department, provides family counseling, case management, and parent training to first‐offender juveniles with minor offenses. They employ two on‐site licensed mental health professionals for students who need mental health counseling at Del Valle High School in Livermore. Offering consultation, treatment and/or prevention services in the community settings and schools, particularly continuation schools, are an effective and efficient strategy to reach traditionally underserved and at‐risk youth. Additionally, Tri‐Valley Community Foundation is partnering with Alameda County Behavioral Health Care to provide early intervention to Tri‐Valley Latino families from their office at the Livermore Multi‐Service Center. The National Alliance on Mental Illness (NAMI) facilitates support groups for family members of people with mental illness residing in the Tri‐Valley. One service provider explained, “The support groups are huge because there is so much need. We don’t advertise because we don’t have the means or money to accept all the potential participants, but if we did we would get more people involved.” One participant in a family support group said, “20 years ago when my daughter was diagnosed there was nothing to go to during the ‘what’s next’ phase. Now at least we have NAMI for families that are in crisis.”
Gaps and Barriers Several significant barriers impact Eastern Alameda County residents’ capacity to seek and maintain behavioral health prevention and treatment services. In addition to the common theme of growing demand for services and stagnating or declining public funding, several individuals expressed a belief that Eastern Alameda County does not get a “fair share” of County resources. One focus group

Eastern Alameda County Human Services Needs Assessment
JUNE 6, 2012 RESOURCE DEVELOPMENT ASSOCIATES | 36
participant reported, “The support system has been taken away; the only programs that had psycho‐social services are now gone; my question is, ‘what happened?’” The shortage of resources is compounded by the geographic isolation of Eastern Alameda County from many County services, primarily those located in Oakland. Lower income residents are more dispersed throughout Eastern Alameda County, posing a barrier to centrally locating services in areas of greatest need. The following statements from stakeholders and mental health advocates demonstrate the challenges associated with geographic remoteness:
“If you are in crisis…and have to take the whole family on the bus, you can’t get to Fremont like that.”
“I am the mother of a mentally ill son. The reason why my son doesn’t live closer to me is because there are no psycho‐social services that match his needs.”
“There aren’t sufficient providers in Eastern Alameda County. If you have a mental health emergency and you’re on Medi‐Cal, the closest clinic is in Oakland.”
Some behavioral health services, such as psychiatric medication management, are available in Eastern Alameda County for low income and indigent residents, but they are insufficient to meet demand. One service provider expressed frustration about long waiting lists, stating:
“I don’t have many avenues; I usually go through Axis Community Health, but it takes about one month to get an appointment to get a patient to intake, another one month or two to actually see the doctor, or they have to go to San Leandro to see a doctor who will give them a prescription for only 10 days and then the process starts all over again! Mental and physical evaluations need to be completed in a timely manner in order for people to get stable. Until they get stable I can’t help them address the other issues they have.”
Another provider expressed a similar issue, “I refer patients to psychologists that accept Medi‐Care, but often they are over their quotas. I had to stop accepting Medi‐Cal or Medi‐Care patients myself because the reimbursement rate is so low.”
Some stakeholders reported that gaps and barriers in behavioral health service provision in the Tri‐Valley have to do with a lack of coordination. For example, knowing how to access services can be challenging, “We have a system where there is no single portal of entry, and you need to know where to enter and where you need to go next.” For those with language barriers, the problem is compounded by a shortage of bilingual mental health providers, particularly psychiatrists and licensed clinicians.
In addition to what is described above, stakeholders reported the following local gaps in service:
• Universal prevention strategies;
• Case management and crisis stabilization programs for youth and transitional age youth at risk of serious mental illness;
• Inpatient AOD treatment, particularly for youth;
• Psychiatric Health Facilities for youth and adults;

Eastern Alameda County Human Services Needs Assessment
JUNE 6, 2012 RESOURCE DEVELOPMENT ASSOCIATES | 37
• Supportive housing and board and care;
• Mental health providers specializing in older adults; and
• Services for persons with co‐occurring mental health and substance use disorders.
Suggestions for Improvement The issue of stigma emerged repeatedly within discussion groups and in interviews. Several factors contribute to stigma as a local issue.
• The myth that families with higher incomes and in nicer homes don’t suffer from mental illness and substance use disorders;
• Stress and alienation associated with job loss and housing instability;
• A growing population that does not yet know about available support networks; and
• Shortages of cultural brokers that can help immigrants navigate service delivery systems.
Alameda County and the three Eastern Alameda County cities should jointly focus attention on reducing stigma associated with seeking behavioral health services. In addition, the cities could employ cultural brokers or Promotores2 to inform newcomers about behavioral health as well as other critical services available. Based off the very successful model in Contra Costa County, and funded by Kaiser Permanente, Livermore is in the process of training up to 15 residents to become Promotra’s to provide information and assistance to families on a variety of health and wellness issues. One of the major challenges faced by behavioral health advocates in the Tri‐Valley is demonstrating the extent of local need. By helping traditionally underserved people access services, advocates will be able to more accurately demonstrate demand. Additionally, by employing cultural brokers to expand local knowledge and reduce stigma, service providers can intervene earlier and prevent behavioral health conditions from worsening, which will ultimately reduce the long‐term costs of treatment.3 Several stakeholders expressed interest in increasing their advocacy role in the Tri‐Valley. One NAMI member said,
“We are extremely motivated to be involved at the County‐level, to interact with colleagues at county mental health, Kaiser, etc., and to gain support for our community. We are looking at how we can help to make this happen. We can do this, but we see a big job ahead of us.”
Affordable Housing The following findings are based on an analysis of the General Plan Housing Elements for each of the three cities. An analysis for each city follows.
2 Promotores de Salud are paid community health workers who have a close understanding of an underserved community, and who share the same language, ethnicity, or socioeconomic status of their target population. While initially implemented in Spanish‐speaking communities, this evidence‐based practice can be adapted successfully to other cultural contexts. 3 http://counselingoutfitters.com/vistas/vistas06/vistas06.16.pdf

Eastern Alameda County Human Services Needs Assessment
JUNE 6, 2012 RESOURCE DEVELOPMENT ASSOCIATES | 38
• As the numbers of economically distressed families and foreclosed homeowners increase, so does the demand for affordable rental housing.
• The increased demand for rental housing has resulted in higher rents. • While efforts are being made by Tri‐Valley cities to address the affordable housing shortage,
existing resources to prevent foreclosure and eviction and to provide subsidies for low income renters are insufficient to meet growing demands.
Key Findings from Pleasanton Housing Element (20072011) • The shortage of affordable housing particularly affects lower‐income renters and first time
homebuyers, including those who have grown up in Pleasanton and would like to establish permanent residency here.
• Overall, the greatest needs in Pleasanton are housing for low income residents, large families, the elderly, and single‐parent households.
• The city has promoted housing affordability through support of nonprofit providers, creation of housing programs, and participation in and approval of subsidized rental developments.
• A total of 4,008 new construction units are needed to meet household and employment projections, including 981 low income and 1,554 very low income units.
Key Findings from Dublin Housing Element (20092014) • Dublin has 1,091 assisted rental housing units.
• Of the 321 extremely low income households (0 ‐ 30% Median Family Income [MFI]), 71% spent more than 50% of their income on housing. Of the 588 very low income households (31 ‐ 50% MFI), 53% spent more than 50% of their income on housing. Projected housing gaps include a need for additional Housing Choice Vouchers and rehabilitated rental housing.
• Approximately 23% of the senior‐headed homeowner households overpaid for housing and 75% of senior‐headed renter households overpaid.
Key Findings from Livermore Housing Element (20092014) • Forty eight percent of senior‐headed households spent more than 30% of their income on
housing; thirty two percent of renter households spent more than 50% of their income on housing.
• There are 38 licensed community care facilities in Livermore for persons with special needs. Two housing developments, totaling 18 below market units, are specifically reserved for developmentally disabled adults.
• The median Livermore home price in June/July 2008 was $510,000 compared to $623,500 for the Tri‐Valley.
• Livermore rentals are relatively affordable compared to the County overall. One bedrooms averaged $1,118 per month as opposed to $1,278 countywide.
• There is a higher incidence of over‐crowding among renter‐occupied households in Livermore than in Alameda County as a whole.
• Renters in Livermore are more cost burdened than owners, with 47% of renters versus 35% of owners paying more than 30% of their income on housing.
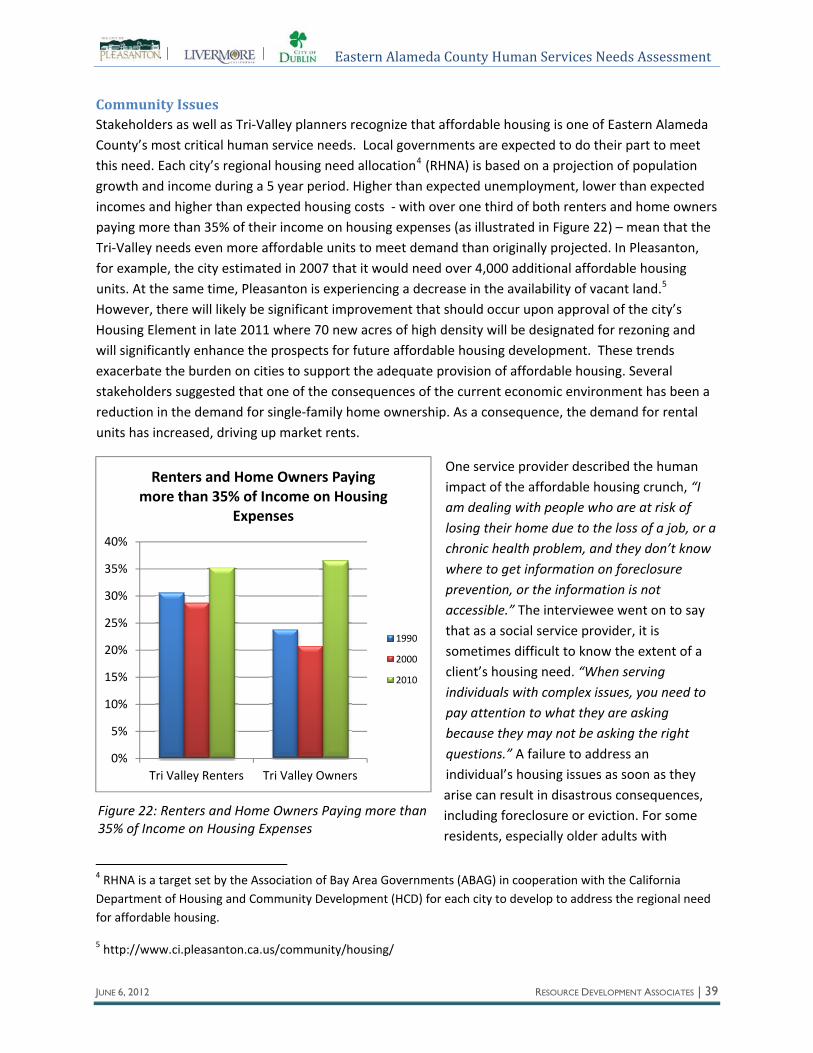
Eastern Alameda County Human Services Needs Assessment
JUNE 6, 2012 RESOURCE DEVELOPMENT ASSOCIATES | 39
Figure 22: Renters and Home Owners Paying more than 35% of Income on Housing Expenses
0%
5%
10%
15%
20%
25%
30%
35%
40%
Tri Valley Renters Tri Valley Owners
Renters and Home Owners Paying more than 35% of Income on Housing
Expenses
1990
2000
2010
Community Issues Stakeholders as well as Tri‐Valley planners recognize that affordable housing is one of Eastern Alameda County’s most critical human service needs. Local governments are expected to do their part to meet this need. Each city’s regional housing need allocation4 (RHNA) is based on a projection of population growth and income during a 5 year period. Higher than expected unemployment, lower than expected incomes and higher than expected housing costs ‐ with over one third of both renters and home owners paying more than 35% of their income on housing expenses (as illustrated in Figure 22) – mean that the Tri‐Valley needs even more affordable units to meet demand than originally projected. In Pleasanton, for example, the city estimated in 2007 that it would need over 4,000 additional affordable housing units. At the same time, Pleasanton is experiencing a decrease in the availability of vacant land.5 However, there will likely be significant improvement that should occur upon approval of the city’s Housing Element in late 2011 where 70 new acres of high density will be designated for rezoning and will significantly enhance the prospects for future affordable housing development. These trends exacerbate the burden on cities to support the adequate provision of affordable housing. Several stakeholders suggested that one of the consequences of the current economic environment has been a reduction in the demand for single‐family home ownership. As a consequence, the demand for rental units has increased, driving up market rents.
One service provider described the human impact of the affordable housing crunch, “I am dealing with people who are at risk of losing their home due to the loss of a job, or a chronic health problem, and they don’t know where to get information on foreclosure prevention, or the information is not accessible.” The interviewee went on to say that as a social service provider, it is sometimes difficult to know the extent of a client’s housing need. “When serving individuals with complex issues, you need to pay attention to what they are asking because they may not be asking the right questions.” A failure to address an individual’s housing issues as soon as they arise can result in disastrous consequences, including foreclosure or eviction. For some residents, especially older adults with
4 RHNA is a target set by the Association of Bay Area Governments (ABAG) in cooperation with the California Department of Housing and Community Development (HCD) for each city to develop to address the regional need for affordable housing.
5 http://www.ci.pleasanton.ca.us/community/housing/
Eastern Alameda County Human Services Needs Assessment
JUNE 6, 2012 RESOURCE DEVELOPMENT ASSOCIATES | 40
dementia, cognitive disabilities, mental health issues or substance use disorders, intervention can mean the difference between a secure living situation or becoming homeless.
Another issue that was brought up by stakeholders is that few landlords accept Section 8 Vouchers because they are insufficient to cover market rents or because Section 8 tenants are perceived to be irresponsible. As a result, those low income individuals who are fortunate to have received a voucher may still face barriers in finding a safe and affordable place to live.
Commenting on the affordable housing situation in Pleasanton, one service provider noted that “the trend I see is that there has been no subsidized housing [expansion] in the last 5 years. Federal and state funding is just not there to do it. Livermore has its own Housing Authority and can meet community members needs better than Pleasanton. They are lumped with Alameda Housing Authority – for a Pleasanton community member to get a subsidy to live in their own apartment is almost impossible.” Yet even where there are effective Section 8 programs, “There’s a two year waiting list; it was only open for a week for the lottery. And currently it is closed.”
Service Delivery Environment The following organizations provide housing services in Eastern Alameda County:
• ECHO Fair Housing in Livermore provides fair housing education, tenant/landlord mediation and rental assistance.
• Tri‐Valley Housing Opportunity Center, also in Livermore, provides information on private sector lending programs, down payment assistance, homebuyer education, and foreclosure counseling.
• The Tri‐Valley Housing Resource Center, located in the Livermore Multi‐Service Center, provides assistance through the Homeless Prevention and Rapid Re‐Housing program (HPRP), which provides stabilization services to individuals and families who are homeless or at risk of becoming homeless.
• The Cities of Dublin, Livermore and Pleasanton provide housing information, including listings of affordable housing, such as the Tri‐Valley Area Affordable Rental Housing Directory, on all city websites.
• Eden I&R 211 provides information and referral regarding affordable housing and shelter services.
• Tri‐Valley Housing Scholarship Program, administered through Abode Services, provides temporary rental support to low income individuals and families who are enrolled in educational and job training programs to Livermore and Pleasanton residents.
• In partnership with Abode Services, Livermore also provides rental subsidy and supportive services to youth emancipating out of foster care through Project Independence.
• The Deparment of Veterans Affairs provides a VA Home Loan Guarantee program to help veterans refinance their homes and avoid foreclosure.
The following initiatives are being coordinated by the Cities of Dublin, Livermore and Pleasanton:

Eastern Alameda County Human Services Needs Assessment
JUNE 6, 2012 RESOURCE DEVELOPMENT ASSOCIATES | 41
• According to its Housing Element, the city of Dublin has made significant strides towards reaching the goals established in their Regional Housing Needs Assessment. Since 2009, 311 new units have been constructed specifically for the Very Low Income population, 238 for the Low Income population, and 380 for the Moderate Income population. Specifically, the Camellia Place, Wicklow Square, and new Arroyo Vista projects “include a range of affordable units, including units for extremely low income households.”6 Further, as of March 2007, the city offers a density bonus to developers, and works with these developers to ensure incentives for expanding affordable and senior housing. The city of Dublin contracts through the office of Alameda County Housing and Community Development Department with ECHO Housing to look into fair housing complaints and ensure provision of fair housing counseling and mediation services.
• In Pleasanton, the 2000 Inclusionary Zoning Ordinance (IZO) requires that any new single‐family residential development of 15 or more units must include a 20% allocation at below‐market sales. As of September 2008, the city had approved the 350‐unit Stoneridge Station multi‐unit development, which will include 70 apartments for very low income households at 50% or less of the Area Median Income (AMI). In accordance with the 2007‐2014 Housing Element, Pleasanton has also been evaluating community outreach efforts to identify sites for higher density, multi‐family housing. The city has also committed to accommodating 3,277 total rental units, including 1,076 very‐low income units, 728 low income units, 720 moderate‐income units, and 753 above‐moderate income units prior to or concurrent with adoption of 2007‐2014 Housing Element Update.7
• The city of Livermore in conjunction with Abode Services and ECHO Housing has provided assistance to 465 clients in 173 families throughout the first two years of the Homeless Prevention and Rapid Re‐housing program. Livermore was also selected as one of 5 cities in Alameda County to participate in the development and implementation of the new Housing Bonus Program. This program is based off of Berkeley’s very successful Square One program and will provide housing vouchers with supportive services to homeless in the downtown. Additionally, at least 200 homeless and 200 domestic violence survivors will receive assistance through one of the city’s three local shelters. Livermore also has several housing complexes providing below market rate units: Arroyo Commons, Bluebell, Chestnut Street, Carmen Avenue, Diablo Vista, Hillcrest Gardens, Las Posadas, Leahy Square, The Outrigger, Owl’s Landing, and Stoney Creek. Arbor Vista, Vandenburg Villa, and Vineyard Village provide affordable senior housing. Heritage Estates senior housing complex provides affordable and market rate independent senior rental apartments. An additional 40 units of affordable rental units for seniors, disabled and families are planned to be built within the next three years.
6 http://www.ci.dublin.ca.us/DocumentView.aspx?DID=156 7 http://www.ci.pleasanton.ca.us/pdf/DraftHousingElementBackground‐082011.pdf

Eastern Alameda County Human Services Needs Assessment
JUNE 6, 2012 RESOURCE DEVELOPMENT ASSOCIATES | 42
Gaps and Barriers There is a widely recognized shortage of financing options throughout the State for the development of affordable housing for extremely low, low and moderate income families. In the Tri‐Valley, housing shortages are most notable for seniors, disabled adults, large families and single parents. Stakeholders cited other service gaps including insufficient Housing Choice (Section 8) vouchers, and revenue losses for community‐based, non‐profit housing providers and housing assistance. According to one service provider in this area, “There have been serious cutbacks to funding, so we’re not providing enough services, but the number of people who need services hasn’t diminished.”
One interviewee noted, “Pleasanton has lots of jobs and is very affluent. It has a high level of premium housing stock. That’s good. But it has also put us at direct odds with State requirements that we accommodate our fair share of affordable housing. We’ve been doing catch up.” Another community member noted that in Livermore, there is a desire to increase the stock of affordable housing, but also acknowledged budgetary tightening, saying “In terms of affordable housing, no one can afford to build it right now. We are at a standstill.” In Pleasanton, one interviewee noted “We are missing the affordable starter homes for our children coming home to live or for service sector workers. We have an inclusionary housing ordinance but there are not enough Section 8 units.”
Community opposition to rezoning to permit higher‐density development was noted as a significant barrier to developing affordable housing in the Tri‐Valley. Some residents equate high‐density housing with “slums”. One informant summed up this perspective: “No one wants high density next to them!” One member of the faith‐based community stated that “Housing is a hard issue to address. There was talk of building high density housing, but people were concerned about the value of their homes dropping, and people were concerned about noise; noise is code for not wanting low income folks in neighborhoods.” Despite this opposition, all three cities are planning for higher density housing. Dublin offers density bonuses to developers, and Pleasanton is seeking locations for higher density housing. Livermore has been providing density bonus for developers over the last decade and has updated its zoning codes to address State laws governing bonuses. This update won the 2011 award from the Form‐Based Code Institute.
Suggestions for Improvement Stakeholder suggestions for increasing affordable housing came down, primarily, to spending more money. “We need to spend more money on subsidized housing and support those programs that are already working.” Other recommendations to the Cities included:
• Strengthening inclusionary housing ordinances;
• Increasing transit oriented development;
• Rezoning to permit multi‐unit higher density housing;
• Permitting additional prefabricated homes and mobile homes on vacant or underutilized land;
• Applying for additional federal and state grants;
• Allowing or providing incentives for homeowners to build second units on their properties;
• Regulating condominium conversions to ensure a sufficient supply of rental units; and

Eastern Alameda County Human Services Needs Assessment
JUNE 6, 2012 RESOURCE DEVELOPMENT ASSOCIATES | 43
• Giving priority to people who live and/or work in the Tri‐Valley for placement on affordable housing waiting lists.
Stakeholders consistently recommended prioritizing the affordable housing needs of persons with physical and developmental disabilities and the elderly, because these populations often live on fixed incomes, incur higher health care costs, face multiple challenges accessing services, and require particular in‐home design features. Recommendations included: 1) providing support to landlords and developers to increase ADA compliance and improve access; 2) supporting agencies that enforce fair housing regulations8; and 3) co‐locating social services in neighborhoods/housing developments that have the highest density of seniors, people with disabilities and low income families.
Finally, to address the needs of the growing homeless population, several stakeholders referenced a Housing First strategy. Housing First begins with local jurisdictions providing housing in conjunction with supportive services tailored to the specific needs of the household.9 This approach emphasizes that housing insecurity and homelessness are at the root of many other issues facing vulnerable populations. Housing stability is shown to increase responsiveness to other human services such as mental health and substance abuse treatment; employment preparation; and child welfare, and to decrease reliance on emergency services. For example, in Los Angeles, CA, the Housing First Program for Homeless Families has incorporated the Housing First strategy to mitigate homelessness, particularly among single mothers with children, across Los Angeles County. Between 1989 and 2008, the program helped over 4,500 homeless families and over 12,000 adults and children to find sustainable, permanent housing.10
Health Care “Primary care here is not bad. Finding specialists, though, is a major issue.” – Focus Group Participant
Key Findings • Specialized medical care is often only available outside the Tri‐Valley, especially from providers
who accept Medicare and Medi‐Cal.
• Subsidized dental care for low income residents, particularly the elderly, is very scarce.
• Reimbursement rates for subsidized health care are insufficient to cover costs, creating a disincentive for providers to serve low income populations.
• Culturally competent services are required to accommodate shifts in demographic composition in the Tri‐Valley.
Community Issues This assessment focused primarily on health care needs for the low income and indigent populations of Eastern Alameda County. Among these populations, the most critical issues have to do with insufficient
8 http://www.cityoflivermore.net/civica/filebank/blobdload.asp?BlobID=2821 9 http://www.nowrongdoor.ca/downloads/Housing%20First%20Strategy.pdf 10 http://www.beyondshelter.org/aaa_programs/housing_first.shtml
Eastern Alameda County Human Services Needs Assessment
JUNE 6, 2012 RESOURCE DEVELOPMENT ASSOCIATES | 44
health insurance, particularly for those with moderately low incomes; and access to dental care and specialty healthcare services. Insecurity around health care access has taken a toll on many marginally low income residents. Residents reported fear of losing their jobs because of preexisting conditions. The working poor are particularly vulnerable, because they may not receive health coverage through their work, but their income is above the threshold that allows them to qualify for subsidies. One focus group participant stated “There is no recourse for people like us who are not qualified for Medi‐Cal and who can’t afford private insurance.” These challenges are also faced by veterans, who are a sizable portion of the Tri‐Valley community. Veterans are older and face significant unmet medical needs, including a need for in‐home supportive services and hospice care. Additionally, some respondents expressed concern that due to changing Medi‐Care coverage, many medications that have been subsidized may become prohibitively costly. Those with Medi‐Cal and Medicare coverage reported difficulty finding local medical providers who will accept subsidies. Medi‐Cal recipients also report challenges with dental coverage. One recipient stated, “People do not understand the gravity of not having dental needs met. The only thing Medi‐Cal provides right now is extraction.”
Service Delivery Environment Tri‐Valley providers and healthcare consumers report the following services for low income and indigent residents:
• Axis Community Health Medical Clinic is a Federally Qualified Health Center (FQHC) that provides comprehensive family primary care for free or based on a sliding‐scale fee in Livermore and Pleasanton.
• The HOPE Project provides medical services to the homeless population in Livermore through a mobile clinic.
• The Tri‐City Health Center provides HIV Services and programming at the Livermore Multi‐ Service Center.
• The VA currently operates a hospital and Long Term Care facility for veterans in Livermore, although this facility is slated to close in 2018.
According to Needs Assessment participants, the Tri‐Valley Adolescent Health Initiative is successful in raising awareness of adolescent health needs in the Tri‐Valley. The organization runs a youth group, coordinates meetings, and has identified service delivery gaps. It has been responsible for improving the coordination of mental health services at the school site level. The program, administered through Alameda Health Care Services Agency continues to expand mental health in Dublin, Livermore, Pleasanton high schools.
Current Gaps in Services or Barriers to Improving Services Gaps in health care service for low income and indigent residents of the Tri‐Valley include a shortage of local providers of specialty care services and providers who accept subsidized patients. One senior focus group participant stated, “If you need help with vision and hearing impairments you have to go outside of the Tri‐Valley to get services. We have no choice but to go out of the cities to get the help we need.”

Eastern Alameda County Human Services Needs Assessment
JUNE 6, 2012 RESOURCE DEVELOPMENT ASSOCIATES | 45
One stakeholder with Medi‐Cal offered, “You usually have to go to Oakland to get dental care and especially if the procedure requires anesthetics or teeth pulling.”
In addition to transportation costs and trip duration, a variety of other barriers affect low income residents’ ability to access critical health care services. People with disabilities have an especially hard time accessing specialty medical care. One disabled focus group participant explained, “It is hard for me to get around. I wish that there were specialists here. Valley Care does a wonderful job, but when I have to go outside, it is confusing and hard to get there.” In Spanish focus groups, uninsured participants reported having to go to Highland Hospital in Oakland for emergency services. One participant shared that she waited from 6pm to 10am to receive care at Highland Hospital, all the while enduring heart pain. According to these participants, a trip to Oakland in an ambulance can cost $2,000.
Other interviewees reported that while primary care was available in the Tri‐Valley for people with subsidized insurance, facilities such as Axis are crowded and wait times can be very long. One focus group participant, currently dealing with foreclosure proceedings and in need of low cost health services, stated, “Axis is in high demand and over capacity. Not everyone is guaranteed access…and only some services are free.” Although Axis provides services to anyone seeking health services in the community, not everyone qualifies for free care, which is based on income and family size. Sliding scale and reduced charge services are available for those that do not qualify for free care. Addressing the growing population of non‐English‐speakers in health care environments in the Tri‐Valley can be challenging. Patients and family members may be experiencing stress and providers are frequently in a hurry. One informant spoke of the challenges associated with diversity and a shortage of providers who are proficient in working with the many different ethnic groups in Eastern Alameda County:
“Clinicians who are addressing the needs of people don’t always understand the people they serve. I would say this is due to 1) a lack of training and education, and 2) staff being overworked and carrying heavy workloads. It seems that a lack of training about specific populations is the more pressing issue. People have good intentions but they don’t always know what’s appropriate or best.”
Suggestions for Improvement One informant offered the following suggestion for improving healthcare services: “As leaders, we need to mandate that physicians need to take Medi‐Cal and Medicare. These folks are practicing in the community and choosing to eliminate people based on their being impoverished. I believe that community leaders have to mandate that they do this, especially dentists and doctors.” Alternatively, the city could provide incentives and awards to those medical providers who serve subsidized patients. More doctors taking Medi‐Cal and Medicare recipients would reduce burdens on providers that currently do take these patients. Another suggestion was for the Tri‐Valley cities or community organizations to sponsor a health or dental fair, where low income residents could receive free services, perhaps on an annual basis. In April,

Eastern Alameda County Human Services Needs Assessment
JUNE 6, 2012 RESOURCE DEVELOPMENT ASSOCIATES | 46
0%
2%
4%
6%
8%
2000 2001 2002 2003 2004 2005 2006 2007 2008 2009 2010
Eastern Alameda County Unemployment Rate Over Time
Dublin
Livermore
Pleasanton
2011, Remote Area Medical, an international nonprofit volunteer health program, sponsored a free event at the Oakland Coliseum, where over 3,000 doctors, dentists, and medical assistants provided dental cleanings, fillings, extractions, x‐rays, medical treatment and eye care to thousands of needy residents. The event was successful at drawing attention to the demand for services; thousands of patients were seen over the course of three days. Eastern Alameda County could start small, with a similar type of event, focusing on medical and/or dental care, and drawing volunteer medical providers from throughout the Tri‐Valley.
Workforce Development “People keep telling us that they need support in times of transition, job loss, death of a family member, divorce, etc. These are issues for the marginalized middle class and these services are not really available here.” –Key Informant
Key Findings • Increased unemployment in the Tri‐Valley has led to a greater demand for adult education and
vocational skills development at all skill levels, but particularly for those with low educational attainment levels.
• Most job placement and training is located outside the area, particularly in Oakland.
• There is a shortage of workforce development opportunities for the disabled and developmentally disabled, youth, and immigrants.
• There is insufficient child care to support low income families. This disproportionately impacts low income workers and job seekers.
Community Issues Much like many parts of the country, unemployment rates in the Tri‐Valley have spiked in recent years (see Figure 23), suggesting an increase in need and demand for workforce development services. As reported in various other sections of this report, employment loss in Eastern Alameda County is intrinsically linked to a variety of human service needs, including housing and homeless assistance,
Figure 23: Eastern Alameda Unemployment Over Time
Eastern Alameda County Human Services Needs Assessment
JUNE 6, 2012 RESOURCE DEVELOPMENT ASSOCIATES | 47
family stress, food and nutrition, subsidized medical care, etc. According to one interviewee, “Job security is a big priority on a lot of people’s minds. You can’t get into housing without a stable income…you need a consistent income to support housing.” Another service provider noted a change in who is affected by the economic downturn, stating, “The recession has impacted the higher end workers too. Even residents who are accustomed to working in Silicon Valley have experienced foreclosures.” Key informants reported that there are fewer part‐time jobs in Eastern Alameda County, which has had an impact that does not show up in the unemployment statistics. Fewer part‐time jobs affect parents of young children seeking supplementary income, youth and transitional age youth looking for summer and after school jobs, and people with disabilities who cannot work full‐time. High unemployment rates and local job scarcity have other downstream impacts. Commute times pose a challenge already for workers in the Tri‐Valley, many of whom must travel over the hill daily. Residents are facing difficult choices and longer commutes as their employment options decrease. This in turn affects children, who are left unsupervised for longer periods of the day. Job scarcity also affects youth looking for entry‐level positions, suggesting that the lack of population growth in the Tri‐Valley among transitional age youth may not improve anytime soon. One concerned parent explained, “Where is the next generation going to find jobs if we don’t have a plan for job creation? Are we creating new generations of working poor?” High unemployment rates are coupled with a widely recognized shift in demand for more skilled “knowledge economy” workers, specifically those with higher degrees. Many residents report being left behind:
• “I am doing a lot of job searching; they ask for training and experience. If you have no experience and no training, they will not hire you. I did computer classes, but they ask for office experience, which I do not have.”
• “After 10 years in the family business my skills are obsolete. I need to go online to make a resume, which is so hard.”
Service Delivery Environment The Cities of Dublin, Livermore and Pleasanton have Economic Development Departments that work towards attracting and retaining businesses through demonstrating the competitiveness of Eastern Alameda County’s local economy and employment base. Livermore recently won several international awards in recognition of, "successful strategies to promote new paradigms in economic development in this period of global recovery" and “showing that they are at the forefront of the economic development profession and are using innovative and effective practices that can be replicated in other communities." Economic development strategies are broad‐based and affect the economic climate of the Tri‐Valley. Community residents and providers recognized the following local workforce development programs for low income and unemployed individuals:
• Temporary Assistance for Needy Families (TANF) and CalWORKS programs through Las Positas College and Alameda County’s Social Service Agency are located in Livermore.
Eastern Alameda County Human Services Needs Assessment
JUNE 6, 2012 RESOURCE DEVELOPMENT ASSOCIATES | 48
• The Tri‐Valley One‐Stop Career Center, a program of California State Employment Development Department (EDD), is located in Pleasanton and provides job search assistance.
• Libraries: Livermore, for example, has a volunteer job coach that periodically offer coaching and resume assistance through a volunteer program.
• Livermore Adult Education, Amador Valley Adult and Community Education, in Pleasanton, and Dublin Community Education Center offer adult education classes, ESL, GED, and vocational training.
• Tri‐Valley Regional Occupation Program, in Livermore, provides vocational, technical and occupational education for high school and adult students.
• Most individualized workforce development programs used by residents are located outside the Tri‐Valley. One unemployed resident stated, “I go to One Stop Career Center, but it would be nice to have something locally. It is hard to be commuting and hard to have enough time there to get what I need.” The One Stop Center this interviewee is referring to, run by the Private Industry Council, is located in downtown Oakland.
• Tri‐Valley Community Foundation offers youth employment services sponsored by Alameda County Workforce Investment Board at Horizon High, Village High School and Las Positas College to assist youth in attaining their educational and vocational goals.
Some of the most vulnerable workers receive employment support from the Hayward Day Labor Center. Although located in Hayward, this organization has a draw of clients from Dublin, Livermore and Pleasanton due to its unique service offerings. According to one client at the Center, “They teach you to do all kinds of work. Many people come here without education and don’t know how to do other types of skills. The Center teaches us how to work with electric tools, as many members come here not knowing how to safely use tools like a saw.” This organization also helps with placement, and offers a legal backbone to allow clients to defend themselves against predatory employers.
Gaps and Barriers There are two notable gaps in available workforce development opportunities. Firstly, as indicated above, several workforce development programs are located outside the Tri‐Valley; using these services requires a car or transit fare. Secondly, stakeholders consistently reported that there are few local job development opportunities for youth and youth with disabilities transitioning to adulthood. Parents of disabled children, speaking to what they anticipate will be needed for their children in the future, suggested that there are few local opportunities for the disabled and developmentally challenged. For instance, one parent of an emotionally challenged adult said, “I feel like my son is wasting away. He could benefit from some vocational training. He would like to live on his own but he has no income or experience, and I can’t provide that for him. The support for those who have fallen through the cracks does not exist here.”
Suggestions for Improvement Multiple stakeholders reported an interest in increasing the availability of job training for young people. Programs that help high school students, particularly seniors, find a part‐time job and gain access to on‐
Eastern Alameda County Human Services Needs Assessment
JUNE 6, 2012 RESOURCE DEVELOPMENT ASSOCIATES | 49
the‐job training were recommended. Others recommended increasing adult education programming at the adult schools. Other suggestions included local employment requirements for city contracts.
Homelessness “We don’t have many shelters for men in the Tri‐Valley area. [Most of] the shelters that we have only accept women or women with children; they deal with a lot of domestic violence. So for families, men would have to be separated from their families. Therefore, we have some families choosing to live in their cars, which is problematic.” –Key Informant
Key Findings • Human service providers report an increase in Tri‐Valley individuals and families seeking
homeless and homeless prevention services.
• There are no year‐round facilities that serve single men in Eastern Alameda County.
• Homeless families are disrupted due to a shortage of homeless family shelters that accept fathers and teenage sons.
• Recently homeless families and individuals have experienced stigma and lack of knowledge about available services and supports.
• The homeless and other indigent residents face long waiting lists for healthcare services and disproportionately use emergency medical services.
Community Issues Homelessness and risk of homelessness is a growing concern in Eastern Alameda County. According to one provider, “We have noticed a greater number of homeless people…We are getting complaints from our citizens about the increased number of homeless people that ask for money.” One Livermore service provider noted that the increase in homelessness is due to changing economic and social conditions, stating, “The homeless person today has a different face. It is families who were foreclosed on or laid off, and it’s happening more than people know. We need to make accommodations for them.” According to one homeless focus group participant, “There are people who don’t even know what’s going on because they are new to being homeless. It’s an epidemic, and cities are turning their heads.” Housing security is impacted by a variety of factors, including market rents and access to living wages. Stakeholders emphasized the links between Tri‐Valley homelessness and unemployment, particularly unemployment among those with lower educational attainment levels. They also emphasized the connection between homelessness and the shortage of affordable housing. Elaborating on the connection between these issues, one informant noted that, “When you’re under‐ or unemployed, housing is very difficult to maintain, and when you’re homeless, it’s difficult to find a job.” Homelessness in the Tri‐Valley, like many other areas, is highly stigmatized. One homeless resident described his experience with law enforcement: “I got harassed by a cop, and was stereotyped for being a drug addict or mentally ill. That was such a terrible experience.” The focus group with homeless adults revealed the precarious position and lack of support for those who are most vulnerable. “There was a
Eastern Alameda County Human Services Needs Assessment
JUNE 6, 2012 RESOURCE DEVELOPMENT ASSOCIATES | 50
homeless encampment [in Livermore] that got removed, but where are people going to go? Cops are giving tickets for sleeping in cars; if you’re homeless how are you supposed to pay for it? You have no job. You get harassed, you get ticketed, you get a warrant, and you get thrown in jail.” Providers recognize not only the growing number of homeless individuals, often referred to as the “visible homeless”, but also the growing number of homeless families. These families are described by informants as “invisible,” doubling up in apartments, sleeping in vehicles or in family shelters. Many are recently homeless due to job loss, eviction or foreclosure; many are single women with children. One recently homeless resident described her experience:
“I am married with three children. We are temporarily displaced, and homeless, and we’ve been doing everything to provide for our children, staying in hotels, making the most of the situation...We find ourselves choosing between food and hotel rooms. We can’t rely on friends and family, I try to remain optimistic even though it’s tough times. We now live out of our car.”
Homeless families described their fear of being forcibly separated. One family member noted, “There are a lot of homeless families and they won’t come out because they are afraid of having their children taken away from them.” Others fear separation due to the shortage of shelter beds for male family members. According to service providers, some transitional age youth in the Tri‐Valley, including foster children, are at‐risk of homelessness due to the lack of transitional support services. Others, according to one provider, are homeless because “they get kicked out of their homes because they’re too old, don’t get along with families, etc.” Such observations are supported by demographic data that show a relative scarcity of transitional age youth in Dublin, Livermore and Pleasanton, which suggests that the Tri‐Valley is not affordable to young people in transition.
Service Delivery Environment There are several year‐round homeless shelters in Eastern Alameda County. Shepard’s Gate provides emergency shelter to women and their children. Tri‐Valley Haven offers shelter to victims of domestic violence and other shelter services to families, including men and teenage boys, albeit to a limited degree. There are no year‐round shelters for single men, although, Livermore Homeless Refuge, an organization consisting of volunteers from community and faith‐based organizations provide emergency shelter when temperatures drop, as well as other critical services such as laundry and hot showers. Hot meals are also available, and described in greater detail in the section on Food Security and Nutrition. The HOPE van is a mobile clinic‐based medical service program that serves the homeless in Eastern Alameda County. According to one homeless resident, “The HOPE Van is very strict about giving services to those that are only homeless. If you mention you stayed at someone’s house they won’t serve you. They provide dental care sometimes.”
Gaps and Barriers The most widely recognized gap in homeless services has to do with the shortage of services for single men and men with families. One single homeless resident of the Tri‐Valley stated, “Many of us are law abiding citizens. We have nowhere to go in this area.” A service provider stated, “Our major concern is
Eastern Alameda County Human Services Needs Assessment
JUNE 6, 2012 RESOURCE DEVELOPMENT ASSOCIATES | 51
shelters, because many will not take males over the age of five. We don’t agree with this practice. We need more shelters that accept families.”
Another recognized gap in homeless service provision is timely healthcare access. According to one provider, “It can take up to two months for them to get an appointment at Axis Community Health to see a doctor. Homeless people tend to go to urgent care or emergency rooms, which is not very cost effective for the health system. This is the same for dental care.” Other basic needs service gaps include:
• Safe locations to sleep in vehicles: “A lot of people used to park at Wal‐Mart at night, but it’s not allowed anymore”;
• Drinking fountains, which one homeless resident reports are turned off at night; and
• Cooking facilities, laundry facilities, restrooms, and showers.
Repeatedly, Stakeholders brought up the issue of service coordination, community outreach and provider education, particularly in regards to the changing demographics of homelessness. One stakeholder suggested, in reference to the growing need for family shelters, that “they are going to have to adjust some of the regulations or make shelters specific to these people that are not served or are underserved.” Another interviewee admitted that 211 is not sufficient to meet the needs of “new middle class families who have never had to deal with social services.” Some social service providers, according to colleagues and the homeless, lack knowledge about homelessness and are influenced by the same social stigma as the community at large. One resident described her experience, saying, “My experience with social workers was not positive; they asked me very personal and insensitive questions. My experience the first time I was in a shelter alone with my teenage girls, I was a bit scared. We were put in a room with a lot of unstable people.” The social stigma associated with homelessness creates a unique barrier to service provision. Several interviewees explained the community belief that homeless services attract more homeless people to the Tri‐Valley. Such hypotheses, whether validated or not, challenge the willingness of public servants, policymakers and advocates to support increased services for this vulnerable population.
Suggestions for Improvement Stakeholders recommended a variety of strategies for improving homeless services,11 including:
• Increase the variety of housing options and services for homeless in the area;
• Supporting advocacy and legal aid for the homeless;
• Allowing fathers and teenage sons into homeless family shelters; and
• Increasing access to kitchens and showers.
During a Dublin community meeting, participants discussed providing a sanctioned space for the homeless to camp or park automobiles and RVs. Focus group participants stated that Dublin, Livermore and Pleasanton had sufficient vacant land for such purposes, and many homeless people would be willing to help with maintenance and coordination. One model is in Washington State. In 2010, the Washington Legislature passed a law authorizing religious organizations to host temporary homeless
11 Preventing homelessness and housing security is addressed in the section on Affordable Housing.

Eastern Alameda County Human Services Needs Assessment
JUNE 6, 2012 RESOURCE DEVELOPMENT ASSOCIATES | 52
encampments, specifically on property owned or controlled by a religious organization. Local jurisdictions may only intervene in ensuring public health.12 One such tent city in Kings County provides space for up to 100 homeless residents. The space has a code of conduct and managers for the space.13 A similar program – Pinellas Hope, a program of Catholic Charities Diocese of St. Petersburg, Florida – set up a tent encampment on church land in 2007. The space has since expanded and now includes a community center, kitchen, meeting rooms, a covered dining area and 80 apartments for transitional housing.14
Other Tri‐Valley residents suggested that to address the root causes and long‐term implications of homelessness, civic leaders, law enforcement, community and faith‐based organizations, business leaders and service providers need to collaborate to address stigma. “[The community] needs to understand that we do have homelessness in the Tri‐Valley area and be open to working with other collaborators and building partnerships to help improve this issue.” Several models for this type of multi‐organizational partnership exist. Using a public health model, the city of Concord, California, formed the Monument Corridor Partnership to address the needs of residents in one low income neighborhood. Police, neighbors, advocates, housing providers, healthcare providers and city officials met together on an ongoing basis to strategically address community needs. Such partnerships would need to include representation from homeless individuals and families, according to one homeless resident, “so we can have representation in policy, votes, etc.”
In Los Angeles, The Skid Row Families Demonstration Project executed by the non‐profit agency Beyond Shelter was facilitated through a partnership with the County Departments of Children and Family Services (DCFS), Public Social Services (DPSS), Mental Health (DMH), Health Services (DHS), and Public Health (DPH), and the Housing Authorities, city of Los Angeles (HACLA) and County of Los Angeles (HACoLA).Using a rapid re‐housing model, the project succeeded in placing 82% of residents in permanent housing.15
In Miami‐Dade County, The Miami‐Dade County Community Homeless Plan has been identified as a national model. The Community Partnership for Homeless is a private‐public partnership that is funded largely by the one percent sales tax on food and beverages. The partnership operates two homeless shelters, and has been successfully transitioning people out of homelessness for over ten years.16
One focus group participant suggested that raising awareness and working to reduce stigma could result in a citizens’ initiative: “Between the three cities, there should be a tax, like a $1 per household that goes toward a homeless fund. But my reservation is that if a government manages this it will go to waste.” There are examples of tax‐based strategies; in Kalamazoo, Michigan, the County Legislature is currently reviewing a proposed property tax increase that is expected to generate $2.7 million annually over six years for a “Local Housing Assistance Fund.” In the proposed bill, $1.49 million per year would be 12 http://www.mrsc.org/Subjects/Housing/tentcity/tentcity.aspx#Leg 13 http://seattletimes.nwsource.com/html/localnews/2003566787_homeless11m0.html 14 http://home.catholicweb.com/pinellashope/ 15 http://www.beyondshelter.org/aaa_programs/demonstration_projects.shtml 16 http://www.cphi.org/about_history.asp

Eastern Alameda County Human Services Needs Assessment
JUNE 6, 2012 RESOURCE DEVELOPMENT ASSOCIATES | 53
allocated to providing rent subsidies for 222 residents at risk of homelessness. Other funds would be used for homeless prevention, renovation of homes to be converted into affordable units, and to help those with temporary, emergency housing payments.17
Transportation Services and Access “If someone in Livermore has mental illness and they want to get involved, all of our meetings, even consumer meetings, are in Oakland. Everything is in Oakland.” –Key Informant
Key Findings • Frequent, affordable, and reliable transit networks connecting commercial, government and
residential centers are fundamental to effective service delivery in the Tri‐Valley.
• Reductions in public transportation, including elimination of subsidies for low income and vulnerable populations, impede access to most other human services available to those in the Tri‐Valley.
• Seniors and the disabled rely heavily on downtown bus services and subsidized taxi services.
• Transportation networks between Eastern Alameda County and other population centers is not well‐coordinated, which results in extended trips for critical human services that are not available locally.
Community Issues Survey, key informant and focus group data all reveal that transportation issues, including cost and trip duration, are major impediments to effective human service delivery in the Tri‐Valley. One public official summarized the impact of transportation issues on low income residents:
“It is difficult for people to get to where the services are. Many of them don’t have a car, they count on public transportation, which can be a long trip and expensive. It is expensive to go on BART to Oakland. So people who are already facing challenges are further challenged by this barrier. Anything that makes getting services more difficult is one less chance that someone will [get the help they need].”
A variety of geographic factors contribute to the problem. Eastern Alameda County is a fairly large area; the population is less dense than other parts of the County; there are smaller pockets of low income residents spread out over greater distance; and many crucial services are located outside the Tri‐Valley, and require not only transfers along multiple routes, but also across multiple agencies. Stakeholders reported that the following critical services used by Tri‐Valley residents are located outside of Dublin, Livermore and Pleasanton: specialty medical care and affordable dentistry; emergency medical care; behavioral health in‐patient services and medication management; homeless and family court; day laborer services; adult day care; and supportive housing. Transit access has perhaps the greatest impact on seniors and the disabled. According to one senior focus group participant, “Transportation is
17 http://www.mlive.com/news/kalamazoo/index.ssf/2011/06/group_wants_voters_to_approve.html
Eastern Alameda County Human Services Needs Assessment
JUNE 6, 2012 RESOURCE DEVELOPMENT ASSOCIATES | 54
especially hard for seniors when they need specialty services. It is not easy for seniors to get out and do things.”
Service Delivery Environment According to stakeholders engaged in the Needs Assessment, the following public transit options are available in the Tri‐Valley:
• Livermore Amador Valley Transit Authority (LAVTA)’s WHEELS, provides bus services throughout Dublin, Livermore, Pleasanton, and the surrounding unincorporated areas of Alameda County. Services include Rapid bus service, which runs every 10 minutes during commute hours, as well as Dial‐A‐Ride paratransit services (described below).
• Dial‐A‐Ride paratransit, run by WHEELS, provides door‐to‐door service to the disabled in Dublin, Livermore and Pleasanton.
• The ACE train, with stops in Pleasanton, Livermore and Vasco Road, travels with few stops between San Jose and Stockton.
• BART provides access to locations throughout the Bay Area, but this commuter rail provider is considered costly for low income residents.
• Pleasanton Paratransit Services provides two programs: door‐to‐door shared rides for people over the age of 60 and qualified disabled adults, and the Downtown Route, which is a fixed‐route shuttle service.
• One focus group participant referenced the city of Pleasanton’s same day fixed route transit service – Downtown Route – saying, “Downtown Bus service is really great! It picks people up at senior housing services, takes people to the mall, grocery stores, etc., and costs $1.50.”
Gaps and Barriers Due to budgetary restraints, transit providers in the Tri‐Valley, as well as many throughout the State, have had to make difficult decisions – either cut services or increase fares. In Eastern Alameda County, budget restrictions have led to public transportation service cuts. At the same time, social service agencies have had to cut back on transportation vouchers and other forms of subsidy. One transportation official described the current service environment: “In the past, with State funding, all agencies, for example schools, had either grants or state money to supply transportation for families and individuals in need. Those programs no longer exist.” The following are additional gaps in transportation services cited by key informants and focus group participants:
• “Paratransit is only available for a limited window of time, and it takes some acumen to maneuver through the system. It’s hard to jump through the steps to qualify for people who are at risk.”
• “Our paratransit services do not go outside of the Tri‐Valley. Oftentimes, if you have to go outside of the Tri‐Valley, you must transfer from paratransit to public transportation (BART, buses, etc.). It can be a difficult commute.”
Eastern Alameda County Human Services Needs Assessment
JUNE 6, 2012 RESOURCE DEVELOPMENT ASSOCIATES | 55
• “There is only one bus that starts at 5 a.m.; others don’t start running until 7 a.m. If I have an appointment at 9 a.m., I have to get up early but sometimes the busses are not on time. Then you miss your appointment.”
Suggestions for Improvement Many informants made suggestions for improving public transit, including increasing the frequency of buses, increasing inter‐city transit options and increasing the number of bus routes. However, there were no tangible suggestions about how to make this change, short of increasing service, and thereby, increasing budget allocations for transit services. One transportation official noted that there may be a scholarship program in the future to provide fares to communities in need that could be funded directly through city and county staff members, thereby avoiding conflict with federal regulations that prohibit fare reductions based on economic need. Additionally, Dublin, Livermore and Pleasanton should advocate for an effective inter‐county transportation agreement to improve accessibility for residents to cross between Alameda, Contra Costa, and Santa Clara Counties. This is outlined in the Metropolitan Transportation Commission Transit Coordination Implementation Plan, which emphasizes the need for “Developing subregional coordination agreements between connecting agencies” in the Greater Bay Area.18
Domestic Violence/Child Abuse “We are starting to see an increase in domestic violence. Kids and parents are being impacted.” –Service Provider
Key Findings • Current economic conditions have made it more difficult for survivors of domestic violence to
leave their abusers; more permanent, affordable housing options are needed for those transitioning from shelters.
• Additional outreach and service coordination is needed to raise awareness about available supports for victims of domestic violence.
Community Issues Key informants and focus group participants and domestic violence service providers report that current economic conditions have placed greater stress on families. Victims of abuse are reluctant to leave their abusers due to financial constraints. Displacement resulting from leaving an abusive situation disrupts child care and school enrollment, housing stability, social networks and employment. For this reason, in the Tri‐Valley, domestic violence remains underreported and often “invisible”. One survivor of domestic violence explained, “Domestic violence is very common, and should be much better known. Most people don’t report it when they are in that situation. It was too late by the time I started talking about it.”
18 http://www.mtc.ca.gov/planning/connectivity/Final_Connectivity_Study/finalsummary.pdf

Eastern Alameda County Human Services Needs Assessment
JUNE 6, 2012 RESOURCE DEVELOPMENT ASSOCIATES | 56
Service Delivery Environment Tri‐Valley Haven's Shiloh Domestic Violence Shelter helps women and children that are victims of domestic violence. Services include a crisis hotline, temporary shelter in a confidential location, emergency food and clothing, individual counseling, and case management to meet housing, legal, vocational and financial needs. According to one focus group participant, “They are life savers; starting eighteen years ago I utilized their legal services to get protection for my family. I still go to therapy there today.” Another Tri‐Valley resource is Shepherd’s Gate, a Christian ministry, which provides shelter and resources for women and children displaced by abuse, financial hardships, and addictions. Services include counseling, case management, medical services, parenting and life skills classes and bible studies. Both Shepherd’s Gate and Shiloh Shelter serve women with children in Livermore, Pleasanton and Dublin. Information about, and referrals to, domestic violence services are made via referrals from Alameda County Social Services Agency. One focused discussion group participant mentioned that she received a referral from a social worker at the Multi‐Service Center in Livermore.
Gaps and Barriers According to both service providers and survivors, one of the most critical gaps in domestic violence services in Tri‐Valley is the lack of permanent housing options for people leaving unsafe homes and shelters. One provider explained, “There are very few subsidized housing options for low income families and single women. We are running out of options for permanent placement for the women in our program. They are going into other shelters, which is becoming a vicious cycle of homelessness.” A second reported barrier to accessing services has to do with the lack of community knowledge about domestic violence programs in the area. Because of the sensitivity and safety issues surrounding domestic violence issues, one client indicated it is hard for victims to locate services.
Suggestions for Improvement The only suggestion for improving domestic violence services offered by interview contacts, focus group participants and service providers centered on improving permanent affordable housing options for survivors of domestic violence upon the end of their stay in Tri‐Valley shelters. Given the high correlation between homeless mothers and domestic violence, this is unsurprising, and demonstrates a need for an interconnected approach to affordable housing and domestic violence. The Housing First Model, addressed in the Affordable Housing section of this report, would also be appropriate to ensure stable housing options for women leaving domestic violence or homeless shelters. 19
19 http://www.endhomelessness.org/content/article/detail/4249
Eastern Alameda County Human Services Needs Assessment
JUNE 6, 2012 RESOURCE DEVELOPMENT ASSOCIATES | 57
Disabilities “I’ve had good days and bad days. When I am sick it is even harder. When I am applying for services, they put this stack of papers in front of you. It’s intimidating and then it’s very frustrating.” – Focus Group Participant
Key Findings • Transportation cost and complexity, such as coordinating transfers between transit agencies and
across county lines, is one of the biggest challenges for adults with disabilities.
• Paratransit, though subsidized, can be cost prohibitive to people on a fixed income.
• Job scarcity impacts youth and adults with disabilities; workforce development options are limited.
• Shortages of resources for children with disabilities and adults with profound disabilities create significant hardships for family caregivers.
• For issues concerning developmental disabilities in young children, see Child Care, Early Childhood Development and Education Section beginning on page 66.
Community Issues Stakeholders in a focus group for parents of children with disabilities reported the following concerns regarding youth with disabilities in the Tri‐Valley: insufficient training for special education teachers; difficulty obtaining an Individualized Education Program (IEP); a shortage of appropriate after school and summer care; and difficulty obtaining information on available services. Participants agreed that they typically relied on word of mouth to find out about available services for their children. The scarcity of support for children with disabilities and their families means that some Eastern Alameda County residents must make difficult decisions. One mother reported having to decide between the following options: not working and staying home to care for her child; prohibitively expensive day care; and even more expensive in‐home support. Another parent, whose child attends public schools, offered, “I’ve fought his whole school life to get everyone to understand what is going on with him. They are not providing effective services with children that fall between the cracks.” Focus group participants reported the following concerns for disabled adults in Dublin, Livermore and Pleasanton: difficulty accessing services due to transportation challenges; too few independent and supportive living facilities; a shortage of workforce training and job opportunities; stigma; and complications in meeting eligibility criteria with “invisible” disabilities. One service provider drew attention to another issue specific to those with developmental disabilities. This participant offered that:
“Social integration is so desperately needed – what ends up happening, especially in Livermore, is that we can help a lot of our clients meet their necessity goals, medical needs, etc., but finding social activities that allow people to meet one another and do fun things in a healthy environment is not available.”
Service Delivery Environment Focus group participants referred to a variety of programs that provide support to youth and adults with either physical or developmental disabilities. The following programs are offered within the Tri‐Valley:

Eastern Alameda County Human Services Needs Assessment
JUNE 6, 2012 RESOURCE DEVELOPMENT ASSOCIATES | 58
• The city of Pleasanton offers Recreational Activities for the Developmentally Disabled (RADD) for youth and adults ages 15 and above.
• East Bay Innovations, through their office in Livermore, provides independent living, supported living, and employment services to adults with disabilities who are clients of the Regional Center (services provided in Oakland).
• Community Resources for Independent Living (CRIL), with an office in Livermore, provides advocacy, case management and referrals for adults with disabilities.
• Bay Area Community Services (BACS) provides services and employment to adults with psychiatric disabilities.
• Pleasanton Paratransit and WHEELS Dial‐a‐Ride offer subsidized transportation (see Transportation section of this report).
• Arc of Alameda County offers independent living skills, case management and advocacy for adults and children with developmental disabilities in its office in Livermore.
• Easter Seals Kaleidoscope offers an after school program for developmentally disabled children in Dublin.
• Keystone Adult Learning Center in Pleasanton provides support to family caregivers and living skills to adults with developmental disabilities.
• The National Federation of the Blind has a Tri‐Valley Chapter located in Pleasanton, and provides advocacy, information and referrals.
• Resources Education Activities Community Housing (REACH) provides resources, education, activities, community participation and housing opportunities that enable adults with developmental challenges to approximate the pattern of everyday living available to people without disabilities.
Current Gaps in Services or Barriers to Improving Services Parents reported that in general, there are not enough services available in Eastern Alameda County to meet the needs of disabled children. Several focus group participants expressed concern about the gap in services for transitional age developmentally disabled youth. They cited a shortage of workforce development opportunities, the small number of group homes in the Tri‐Valley, and the lack of socially appropriate and engaging daytime activities. As an example, some East Bay Innovations programs are not available to new clients, who must ask to be placed on a waiting list. Parents described other programs with long waiting lists as well, many of which do not conduct outreach for fear of growing the waitlist. One parent elaborated, “If you don’t know what to look for then you don’t find out about it.” The lack of centralized information, or a “help desk”, in the Tri‐Valley is a challenge for those with special needs and disabilities and their families. Budget cuts have eliminated other programs for the disabled. For example, Livermore Area Recreation and Park District’s RADD and TADD (Teen Activities for the Developmentally Disabled) programs were eliminated due to district wide budget cuts. Several focus group parents who decided that public schools were not an appropriate option for their severely disabled children found that they had to send their children to private schools outside of the

Eastern Alameda County Human Services Needs Assessment
JUNE 6, 2012 RESOURCE DEVELOPMENT ASSOCIATES | 59
Tri‐Valley because there were no appropriate private schools in Dublin, Livermore and Pleasanton. For many families of limited means, this would not be an option.
Disabled adults reported that one of the most critical gaps in Eastern Alameda County is affordable housing devoted to people with disabilities. One participant summed up the challenges associated with finding an affordable home, “Disability and housing, they go hand in hand.” Participants also described transportation gaps for adults with disabilities. Some volunteer‐based services are not equipped to transport disabled people and their equipment (such as a wheelchair). One disabled Tri‐Valley resident noted that paratransit services do not wait for people while they transfer to other public transit services, especially those outside the Dublin, Livermore and Pleasanton, “This can be problematic because people get confused or lost, or can have a lapse into another [disorienting] condition.” Transportation for the disabled can be prohibitively expensive for the disabled, many of whom are living on a fixed income. Such expenses may result in social isolation and inability to access critical services. Several disabled advocates described a lack of knowledge and cultural sensitivity among the general public and some social service providers in the Tri‐Valley. People with less obvious disabilities face discrimination, disbelief and invasive questioning even by well‐meaning providers who are not knowledgeable about discrimination policies and the law. People with sensory disabilities (auditory and visual) face unique challenges that are exacerbated by a lack of familiarity among providers. For example, for the deaf community, according to one service provider to those with sensory disabilities: "If an agency only has drop in hours, the deaf and hard of hearing clients cannot just drop in. There would be no one to help with communication." Similarly, a lack of knowledge and cultural sensitivity towards persons with disabilities places a difficult burden on people with disabilities, who must sometimes defend their rights in order to access services. One advocate explained, “Even though the laws are still there, agencies will discontinue interpretation services to save money. It’s come down to the bottom line, and the bottom line is that the agencies are more concerned with funding than compliance with the law."
Suggestions for Improvement Focus group participants suggested that public school teachers in the Tri‐Valley, including special education teachers, need additional training in integrating disabled children into the classroom. “Teachers need to understand the wide range of disabilities, including Downs Syndrome, Autism, etc.” One parent recommended that programs “focus on the potential of the child, the positive, not just the negative. For example, sometimes their bad behavior is emphasized more than their special gifts and talents.” Other suggestions included increasing the availability of summer programs, after school programs, independent living programs, and job training programs specific to youth with disabilities. One specific suggestion was to offer special needs students in the 12th grade the option of taking more “hands‐on” job training classes, to improve their potential for finding employment after graduating. Adults with disabilities also emphasized the need for job training. One focus group participant stated, “I need job training. We need more jobs for people with learning disabilities.”

Eastern Alameda County Human Services Needs Assessment
JUNE 6, 2012 RESOURCE DEVELOPMENT ASSOCIATES | 60
Food and Nutrition “We have services for those most marginalized, but there is not much for those in between.” –Key Informant
Key Findings • The need for food and nutrition assistance in the Tri‐Valley area is growing, particularly among
the newly or marginally food‐insecure families.
• Food assistance provided by faith‐based and nonprofit organizations augment limited County resources.
• Many individuals who use food pantries may qualify for public assistance such as WIC or CalFresh: however, do not apply or face multiple barriers to applying for assistance.
• Many migrant employees and families experience food insecurity.
• Homeless residents of the Tri‐Valley are almost exclusively reliant on food and nutrition services due to a lack of kitchen facilities.
• Access to hot meal service and food pantries is limited by geographic dispersion of the target population and a shortage of transportation options.
Community Issues Key informants and focus group participants described a growing need among the recently unemployed for food and nutrition services. However, this population may not be familiar with public resources and may in fact avoid services due to the stigma associated with asking for help. Such individuals may qualify for a variety of services such as WIC, CalFresh (food stamps), or TANF (Temporary Aid for Needy Families); food pantries, for example, can serve as a portal for information regarding emergency assistance. Other individuals who need additional assistance may not qualify or face barriers such as language and literacy‐related issues, immigration status or reluctance to hand over sensitive personal information. Many immigrants, particularly those with uncertain legal status, are vulnerable to food insecurity. Often immigrants live in overcrowded households. One interviewee with expertise in food insecurity explained:
“Some people live with many others in a single apartment, and some food services put restrictions based on household size. Many don’t have documents for everyone in the house, so they get food for just one person. They need proof of residency to show where they live but they can’t get that because proof of residence such as a utility bill is not in their name. These are not intact families so they cannot get services.”
Some of the most vulnerable residents of Eastern Alameda County, such as the elderly or the homeless, rely on hot meal services because they cannot prepare meals or do not have the facilities to cook. One homeless resident of Livermore said, “We’re limited in what we can eat because we have no facilities. It would be helpful to have a place to cook, so we can eat healthier.”
Eastern Alameda County Human Services Needs Assessment
JUNE 6, 2012 RESOURCE DEVELOPMENT ASSOCIATES | 61
Service Delivery Environment There are a number of providers of hot meal services and food pantry services in the Tri‐Valley. Stakeholders cited the following resources:
• Open Heart Kitchen offers healthy and hot meals at various locations on a rotational basis.
• Tri‐Valley Haven Food Pantry provides free groceries to low income residents.
• Spectrum Community Services offers a Meals on Wheels program, delivering hot meals to homebound seniors who are unable to cook in Dublin, Livermore, Pleasanton, and Sunol.
• Axis Community Health WIC Program provides supplemental food, nutrition and counseling to pregnant women, infants and children.
• Children’s Emergency Council distributes emergency food boxes and food vouchers intermittently to residents of Dublin and Pleasanton.
• Faith based communities provide food pantries in Dublin, Livermore and Pleasanton that supplement larger food service delivery programs.
Gaps and Barriers Access to food and nutrition services in Eastern Alameda County is limited by a number of factors. Stakeholders cited the following gaps and barriers:
• Some programs limit the number of times an individual may seek assistance. “Many of the sites only offer services one or two times a month for the same person. So they can only go every two weeks to get food.”
• Open Heart Kitchen, while providing a vital service throughout the Tri‐Valley, changes locations on a daily basis. This can be confusing and can pose significant challenges to those who rely on public transportation.
• Food pantry services used to be open five days per week, but are now open only four days.
• Many food and nutrition programs rely on local faith‐based organizations, whereas in the past the County supported the nutritional needs of low income families. This means that local organizations have to make difficult choices between feeding the hungry and offering other vital services.
• Some families who could benefit from nutrition services do not apply due to social stigma or because they are not eligible because of immigration status.
Suggestions for Improvement Along with the widespread call for more funding, several stakeholders spoke of successful efforts to better coordinate services. For example, one interviewee described the following:
“A number of food banks were able to get a single freezer. The cost of the freezer was prohibitive, but the three can now all use it and a have better use of electricity. Now in holiday times, when grocery stores have a lot of overstock, they can store the food. This was just one person’s idea, and they made it happen.”

Eastern Alameda County Human Services Needs Assessment
JUNE 6, 2012 RESOURCE DEVELOPMENT ASSOCIATES | 62
Another stakeholder suggested that agencies and organizations in the area provide resources to ensure that linguistically and culturally competent outreach workers identify and assist qualifying families with enrollment in nutritional assistance and other programs, such as WIC and CalFresh.
Senior Services “Transportation is especially hard for seniors who live in isolation. It is not always easy for seniors to get out and do things.” –Key Informant
Key Findings • Outreach is needed to help identify homebound seniors.
• Social isolation exacerbates mental and physical health issues and prevents access to services.
• Many lower‐income seniors do not meet income thresholds which would qualify them for critical services such as supportive housing.
• The cost and complexity of using public transportation prohibits many older adults from accessing critical services.
• There are no licensed Adult Day Health Care (ADHC) programs in the Tri‐Valley to serve low income seniors with health‐related issues, and State budget cuts are eliminating such programs in neighboring communities.
• Currently, the Tri‐Valley YMCA is in the process of renovating a facility to be used for implementing an adult day care social program; the date for the opening of the facility is yet to be determined.
Community Issues Many older adults in Eastern Alameda County live on a fixed income; while the cost of living is increasing, their income is not. Many services that would greatly improve the lives of older residents are restricted to the most indigent. According to one interviewee, “many seniors fall into the category of poverty but they don’t qualify for many services, for example food stamps, or Medi‐Cal if they are above a certain income. But, they are still poor.” Another focus group participant with disabilities corroborated this, saying that for her mother, it is difficult to afford food and transportation, and because of her income, she is not eligible for food stamps.
Current economic conditions are placing unique intergenerational burdens on families. As the population of adults over the age of 85 burgeons, more and more middle‐aged children are shouldering the burden. One senior services provider reported that attendance in caregiver support groups has outpaced her agency’s capacity to staff them. At the same time, an increasing number of adults are moving in with or otherwise relying financially on their aging parents due to unemployment or underemployment. Speaking to this issue, one informant noted that, “It’s difficult to afford taking care of [family members], transportation, rent, home maintenance, and basic needs, such as heat. There is a lot of financial stress.”
Another issue facing older adults in the Tri‐Valley is isolation. According to one senior in the community, “There are many seniors that are homebound without any help. There are in‐home supports but these

Eastern Alameda County Human Services Needs Assessment
JUNE 6, 2012 RESOURCE DEVELOPMENT ASSOCIATES | 63
are limited. I just think this hides issues and explains why they are not being addressed.” One key informant senior service provider said, “I basically see it as less access to services and more isolation; We have fewer services available, more difficulty getting to services. Basically, the quality of life for seniors is on a trajectory that is going down, not up.” The lack of services, difficulty in accessing services, limitations because of geographic isolation, and reduced federal incentives, including SSI, were mentioned in concert – indicating that there are inextricable connections between these issues.
Service Delivery Environment The most widely recognized and accessible services for seniors in the Tri‐Valley are the multi‐service senior centers located in Dublin, Livermore and Pleasanton.
• The Senior Support Program of the Tri‐Valley is a nonprofit organization jointly funded by the Cities of Dublin, Livermore and Pleasanton, and County Department of Behavioral Health. The program supports volunteer home visitors through its Friendly Visiting Program. It offers case management for individuals able to maintain independent lifestyles; alcohol and drug treatment; family caregiver support; rides to medical appointments when paratransit is not appropriate; nutrition and fitness programming; and a registry for in‐home supportive services.
• Dublin Senior Center, run by the city, offers low‐cost lunch programs, enrichment programs, health screenings, trips and special events.
• Livermore Area Recreation and Park District operates a Senior Services program that provides recreation, a lunch program, enrichment programs and social services, including case management.
• The Pleasanton Senior Center provides enrichment activities, informational materials on housing, transportation and safety, legal counseling and access to Medicare. Support groups are offered for caregivers, and people with Alzheimer’s and Parkinson’s. Lunch is offered to qualifying seniors on a donation basis.
• Tri‐Valley YMCA is planning on opening a social model adult day care facility in Dublin for seniors through a partnership between the Livermore Area Recreation and Park Department (LARPD), Dublin Unified School District, and the three cities.
Subsidized transportation is also available in the Tri‐Valley (see Transportation section of this report). According to one older adult focus group participant, in addition to Paratransit’s Dial A Ride, the Dial A Taxi program is very helpful. “It is the only program that has same day cab service. About $200 per month [in subsidy] is allowed for each person, and they also allow one additional person to go with you free of charge to serve as your helper.”
Gaps and Barriers A major gap in service is a shortage of housing options for low income seniors. According to one senior seeking these services, “Affordable housing providers do not provide enough affordable housing for disabled adults and disabled seniors. There are a lot of seniors who are disabled.” Interviewees also indicated that two adult day care programs, one in Pleasanton run by Easter Seals and another in Livermore, have closed. To date, there are no adult day health care programs in the Tri‐Valley, however

Eastern Alameda County Human Services Needs Assessment
JUNE 6, 2012 RESOURCE DEVELOPMENT ASSOCIATES | 64
the Tri‐Valley YMCA is in the process of opening a licensed adult day facility in Dublin that will serve all of Eastern Alameda County.
As articulated in the Behavioral Health section of this report, mental health and substance abuse services are insufficient to meet the needs of the growing senior population. Other necessary services reported to be lacking include free and subsidized legal help.
One of the major barriers to older adults receiving services is cost. One senior resident said, “You have to think about cost. For example, coming to the Senior Center for lunch adds up over time; paratransit costs $3 each way. It can total $10 per day. Not everyone can afford it. I’ve seen the lunch program decrease in participation because people are just not able to afford it regularly.”
Another critical barrier to providing culturally competent services to older adults is a lack of knowledge about what is needed to accommodate seniors. According to one contact in Pleasanton, “People are too embarrassed to tell you or ask for help…The elderly, especially those who are affected by chronic illness, are less likely to ask for help because they don’t have the energy to do it.” Senior centers have worked to increase outreach. For example, one senior service provider reported that her center mails out menus and activity schedules, but only to those on the mailing list. She believes that there are many seniors who do not know to sign up or are reluctant to pursue services.
Suggestions for Improvement Budget cuts have eliminated and reduced a number of senior programs in the area. One senior focus group participant suggested that, “Programs might be able to stay open if there were volunteers. The Senior Center[s] should put out a request to coordinate volunteers to help out. For instance, maybe they could reach out to teenagers. They can volunteer, fulfilling the needs of teens and seniors.” Additionally, working through churches and medical offices to distribute information about resources would ensure that available programs are adequately utilizied. Another focus group participant suggested that a program that encourages neighbors to check‐in on homebound seniors would be helpful: “We need to look out for our neighbors, because ultimately, this is something senior centers can’t provide.” For this respondent, such outreach could be as simple as saying hello to neighbors, and about a neighbor’s whereabouts and status. This respondent went on to say that “We should be available to help our neighbors, we need to extend ourselves, and we need community building. We need to talk to people daily to make sure they get some contact or help if they need it.” One participant suggested that Dublin, Livermore and Pleasanton could fund respite care for caregivers of elderly and the disabled, which would help alleviate the stress of both older adults and their caregivers, especially for those caring for people with serious medical conditions or dementia. A number of communities, such as Amador County, have used MHSA prevention and early intervention funds for respite care.20
20 http://www.co.amador.ca.us/Modules/ShowDocument.aspx?documentid=7575

Eastern Alameda County Human Services Needs Assessment
JUNE 6, 2012 RESOURCE DEVELOPMENT ASSOCIATES | 65
Youth Services “There is very high drug and alcohol use and suicidality among our youth. These issues are affecting our schools and the places that teens hang out every day.” –Key Informant
Key Findings • Many residents and organizations are unaware of the stressors faced by youth in the Tri‐Valley.
• Substance use and other risky behaviors among youth are increasing.
• There are a shortage of low‐cost after‐school and summer enrichment activities for Eastern Alameda County youth.
• Public schools can serve as community hubs and as a venue for stigma‐free services for families in need.
• Non‐English‐speaking parents face challenges in advocating for their children and communicating with teachers and school administrators.
Community Issues The most common concerns expressed by community stakeholders regarding youth and transitional age youth relate to academic stress and pressure to succeed; growing rates of substance use and other risky behaviors; lack of engaging and supervised extracurricular activities; and parental absenteeism due to long commutes. Informants reported that risky behaviors are now being observed in younger children. One stakeholder offered that, “Youth get together and smoke and use drugs, and our younger kids are watching and susceptible to the same patterns of bad behaviors. This happens when parents are working and kids are left alone.” RDA heard many reports of gang activity, teen pregnancy, abortion, and vandalism as well. Stakeholders, including mental health providers, also reported that Tri‐Valley teens are pressured by their parents and the schools to succeed, but don’t receive sufficient emotional or peer support. At the same time, those stakeholders working with low income, minority and English as a second language students report differential treatment. One interviewee explained, “I asked a school counselor about the kids who are struggling with English. The schools don’t want them to have a negative effect on test scores, so they end up at a continuation high school.” Others reported that non‐English‐speaking parents reported difficulty communicating with teachers and school administrators, and could not adequately advocate for their children. One parent said that, ““Many Hispanic parents do not have the resources at school to access all they need to help their children. They do not have the basic English skills to advocate for their children and fluently communicate with teachers.” Such issues, according to one interviewee, speak to a huge need for cultural competence work in the schools.
The following data is from the California Health Kids Survey 2009‐2010, a statewide survey of resiliency, protective factors, and risk behaviors of youth. This survey illustrates risk factors related to alcohol and drug use. All responses in the following table represent the portion of students that “Agree” or “Strongly Agree” with the listed statement.
Alcohol/Drug Use Tri‐Valley Dublin Livermore Pleasanton
Percentage of 11th grade students who reported consuming 4 or more alcoholic drinks in their lifetime.
39% 43% 44% 35%

Eastern Alameda County Human Services Needs Assessment
JUNE 6, 2012 RESOURCE DEVELOPMENT ASSOCIATES | 66
Table 4: California Healthy Kids Survey Reporting on Alcohol and Drug Use
Alcohol/Drug Use Tri‐Valley Dublin Livermore Pleasanton
Percentage of 9th grade students who reported it is easy to obtain alcohol.
66% 53% 68% 68%
Percentage of 11th grade students who reported it is easy to obtain alcohol.
78% 78% 77% 78%
Percentage of 11th grade students who reported using marijuana 4 or more times in their lifetime.
32% 38% 38% 27%
Percentage of 9th grade students who reported it is easy to obtain marijuana.
54% 49% 61% 50%
Percentage of 11th grade students who reported it is easy to obtain marijuana.
71% 74% 73% 68%
Percentage of 9th grade students who reported use of an illegal drug, pill, or alcohol in the past 30 days.
24% 22% 32% 17%
Percentage of 11th grade students who reported use of an illegal drug, pill, or alcohol in the past 30 days.
35% 40% 37% 33%
Even though peer disapproval of cigarette use was high among all students (92% of Pleasanton youth disapprove of smoking, as do 87% in Livermore, 86% in Dublin, and 89% in the Tri‐Valley), when asked to estimate the prevalence of peer smoking, many believed that their peers smoked cigarettes at least once a month. This is illustrated in Table 5, below.
Location 7th grade 9th grade 11th grade
Dublin 42% 76% 91%
Livermore 70% 94% 94%
Pleasanton 40% 84% 91%
Tri‐Valley 51% 84% 92%
Violence and Safety Tri‐Valley Dublin Livermore Pleasanton
The percentage of 9th grade students reporting at least one incident of verbal harassment on school property within the past 12 months where, “sexual jokes/comments/ gestures are made to you”
50% 51% 50% 50%
Table 5: California Healthy Kids Survey Reporting Disapproval of Cigarette Use
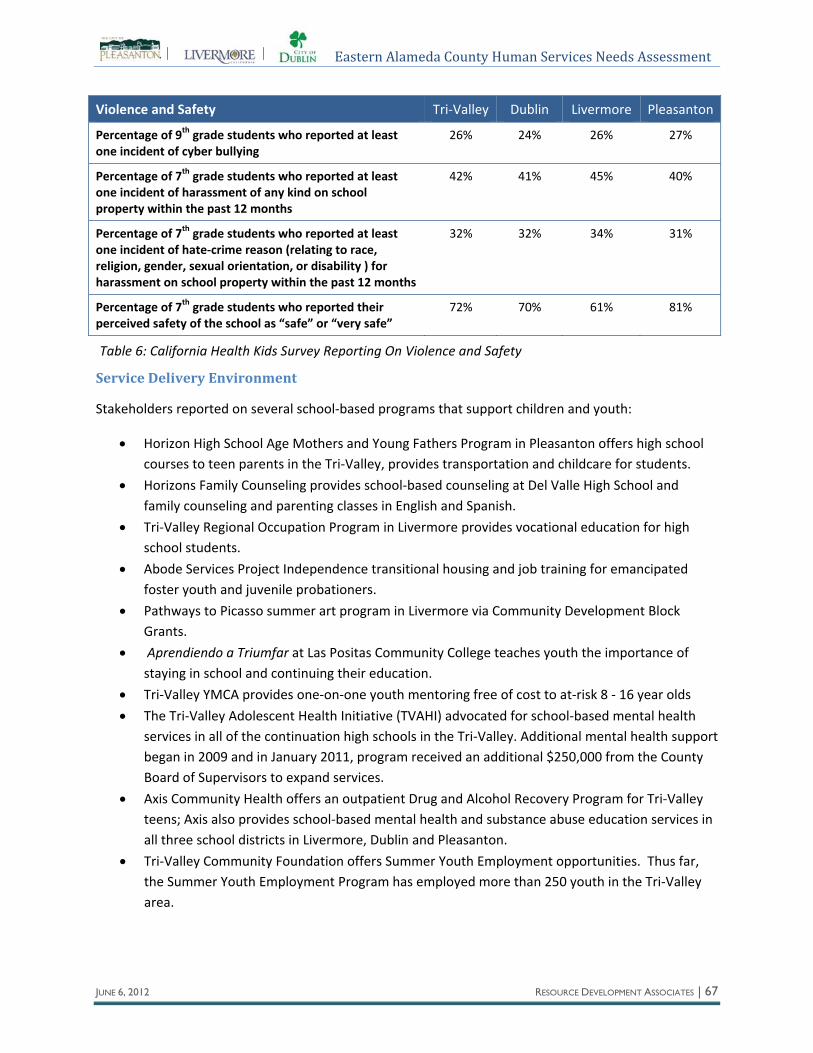
Eastern Alameda County Human Services Needs Assessment
JUNE 6, 2012 RESOURCE DEVELOPMENT ASSOCIATES | 67
Table 6: California Health Kids Survey Reporting On Violence and Safety
Service Delivery Environment
Stakeholders reported on several school‐based programs that support children and youth:
• Horizon High School Age Mothers and Young Fathers Program in Pleasanton offers high school courses to teen parents in the Tri‐Valley, provides transportation and childcare for students.
• Horizons Family Counseling provides school‐based counseling at Del Valle High School and family counseling and parenting classes in English and Spanish.
• Tri‐Valley Regional Occupation Program in Livermore provides vocational education for high school students.
• Abode Services Project Independence transitional housing and job training for emancipated foster youth and juvenile probationers.
• Pathways to Picasso summer art program in Livermore via Community Development Block Grants.
• Aprendiendo a Triumfar at Las Positas Community College teaches youth the importance of staying in school and continuing their education.
• Tri‐Valley YMCA provides one‐on‐one youth mentoring free of cost to at‐risk 8 ‐ 16 year olds
• The Tri‐Valley Adolescent Health Initiative (TVAHI) advocated for school‐based mental health services in all of the continuation high schools in the Tri‐Valley. Additional mental health support began in 2009 and in January 2011, program received an additional $250,000 from the County Board of Supervisors to expand services.
• Axis Community Health offers an outpatient Drug and Alcohol Recovery Program for Tri‐Valley teens; Axis also provides school‐based mental health and substance abuse education services in all three school districts in Livermore, Dublin and Pleasanton.
• Tri‐Valley Community Foundation offers Summer Youth Employment opportunities. Thus far, the Summer Youth Employment Program has employed more than 250 youth in the Tri‐Valley area.
Violence and Safety Tri‐Valley Dublin Livermore Pleasanton
Percentage of 9th grade students who reported at least one incident of cyber bullying
26% 24% 26% 27%
Percentage of 7th grade students who reported at least one incident of harassment of any kind on school property within the past 12 months
42% 41% 45% 40%
Percentage of 7th grade students who reported at least one incident of hate‐crime reason (relating to race, religion, gender, sexual orientation, or disability ) for harassment on school property within the past 12 months
32% 32% 34% 31%
Percentage of 7th grade students who reported their perceived safety of the school as “safe” or “very safe”
72% 70% 61% 81%
Eastern Alameda County Human Services Needs Assessment
JUNE 6, 2012 RESOURCE DEVELOPMENT ASSOCIATES | 68
• Tri‐Valley Community Foundation offers a gang intervention and prevention program based at Livermore High School. The program provides young people with after school activities including tutoring, mentoring, healthy living classes and recreation.
• In conjunction with Las Positas College, St. Michaels and local Latino Community Leaders, Tri‐Valley Community Foundation provides an annual conference for youth and families to provide education about community college retention, financial aid education, ESL workshops and a better understanding of the community college setting.
Gaps and Barriers A shortage of free or low‐cost recreational, enriching extracurricular activities were the most commonly cited gaps in services for youth. Stakeholders reported that this gap has contributed to an increase in risky behaviors and illegal activities such as vandalism and gang affiliation. Several resources are available for the most at‐risk youth, for example, summer school in Livermore is offered only for students who need academic intervention and Pleasanton no longer offers fee‐based enrichment activities in its summer school program. Other programs, such as YMCA mentoring and Horizons Family Counseling are only available to at‐risk or juvenile justice involved youth and their families.
Parents reported that there is a lack of information about low‐cost programs for youth. One parent in a focus group said that her child was involved in an after school program that had scholarships, but they were not advertised because there was already a substantial waiting list. For parents who do not speak English, finding out about programs for youth is even more challenging. Other barriers include a lack of transportation to those programs that are available. Other gaps cited by providers and parents include a lack of job opportunities and job training for youth. This phenomenon has been exacerbated by current economic conditions, whereby in the past, there were abundant summer and part‐time entry‐level jobs; today, many of these jobs are being taken by underemployed adults. One parent said that she has been looking for employment for her son for over one year. “There is nothing in the 14 to 16 age range. There are some extra‐curricular activities, but a job is different because it increases self‐esteem.” One mental health advocate articulated concern around the cutting of funding for AB3632 – legislation that ensures that children with disabilities are entitled to a free and equal education, which is manifested in an Individualized Education Program (IEP). With funding cut to AB3632, this advocate offered, “I am concerned about what will happen to these kids, especially those in a low economic bracket, as well as their families. If [AB3632] dies on the vine, it will knock more parents into bankruptcy and cause economic hardship beyond your and my imagination.” Changing demographics, particularly related to the increase in linguistic isolation among many newcomers presents a significant barrier for some parents in Eastern Alameda County. One parent of a child in a Tri‐Valley public school stated, “Hispanic parents do not have the resources at school to access all they need to help their children. They need to know basic English to advocate for their children.” (The demographic findings in this report suggest that Asian/Pacific Islander parents also face these barriers.) Other communities throughout California with large influxes of immigrants have addressed the issue by offering English as a Second Language classes with a focus on student education and have provided

Eastern Alameda County Human Services Needs Assessment
JUNE 6, 2012 RESOURCE DEVELOPMENT ASSOCIATES | 69
ongoing cultural competency training to their staff. One stakeholder suggested, “We need some kind of group at the school working on helping parents to communicate effectively with teachers. I would like to see well trained staff so parents get what they need. Not all teachers need to be bilingual, but there should be a team that knows the languages and can work with teachers.” Another barrier cited by stakeholders has to do with a lack of service coordination within and between school districts in Eastern Alameda County. Educational budget cuts have increased the need for school‐based supportive services, but as a result of these cuts, one parent and focus group participant explained, “fewer staff on school sites mean there are fewer adults for youth to build relationships with.” This is of particular concern for youth transitioning out of foster care services in the Tri‐Valley. Each school district works independently to address human service issues, and reportedly, do so without significant communications with city and county agencies. One official reported:
“There are disparate responses in the three communities. One district is saying, ‘we are working to sort this out.’ In [another district], it is, ‘not our kids, there is no problem here.’ Still another school district says it is addressing the issue. But there is not a comprehensive, overarching approach for services for kids and teens.”
Finally, service coordination for youth in Eastern Alameda County is reportedly obstructed by a prevalent expression of denial. According to one interviewee, “There is a level of denial that our kids need help.” This denial leads to resistance in dealing with issues facing young people. According to one community advocate, “I hear all the time – ‘we keep quiet about drugs and alcohol, we don’t want to acknowledge these issues as a community – it might bring down home values, etc. This leads to divergent community responses.”
Suggestions for Improvement Stakeholders in community meetings and focus groups consistently expressed an interest in increasing human service provision in public schools. Providing services on school grounds can help reduce the stigma associated with asking for help, since most parents already visit the schools. Most commonly, stakeholders recommended increasing Alcohol and Other Drug (AOD) services, mental health prevention and early intervention, outreach and mentoring on school sites. One provider specifically referenced the need to retain those programs that are currently available and working, “We need to get a longer‐term MHSA funding stream, now that the programs are initiated.” The provision of medical and dental care in the schools was also suggested to close the gap in health services for low income youth. One parent suggested that, “There are cities where dentists come into the schools, give an exam and offer effective prevention services.” Another suggestion was to have a youth medical clinic in the Tri‐Valley, with one stakeholder offering that there are similar programs functioning in Oakland that could serve as partners in the process. Dublin civic leaders have expressed interest in a cutting‐edge strategy for revenue sharing between schools and the city. Recognizing that the local economy depends on high quality education and quality local public education depends upon a healthy community, Dublin City staff and council members, together with local school districts, have explored ways to work more effectively together. In a 2011
Eastern Alameda County Human Services Needs Assessment
JUNE 6, 2012 RESOURCE DEVELOPMENT ASSOCIATES | 70
National Civic League Report,21 Dublin was recognized for city/school collaboration planning and shared revenue measures; shared facilities; and joint community outreach and engagement. One civic leader expressed optimistically, “We are looking for a shared revenue strategy for schools and city, which is practically unheard of. Santa Monica and Emeryville are models. The National Civic League was amazed that we were having this discussion.” Dublin should share findings and identify opportunities to work with the Cities of Livermore and Pleasanton to further its goals. The creation of a safe space for low cost or free recreation activities for teens – a joint use facility – was emphasized in focus groups as one important step towards addressing the problems indicated above. One parent hoped that “If we provide youth a space to be creative and involved in something extracurricular, little by little we can expand these programs. For example, if they are interested in art or ceramics, we could have an art exhibition and sell some of their works to fundraise for more programs.” Parents in the Spanish‐speaking focus group were eager to get involved in such a project, saying, “There are lots of parents willing to volunteer their time.”
Child Care, Early Childhood Development and Education “My biggest concern about the future is child care. If my kids aren’t taken care of then I can’t get out and have a job.” ‐Focus Group Participant
Key Findings • There are long waiting lists for subsidized childcare in Eastern Alameda County.
• Few providers offer extended hours child care, especially at night or on weekends.
• Social, emotional and developmental screenings are not universal in the Tri‐Valley.
• There is a growing demand for services for children with autism spectrum disorder and other developmental delays.
• Providers of services to young children lack knowledge and education about child development, particularly for those with developmental disabilities.
Community Issues High quality child care is important for improving the lives of families and children, especially those facing economic hardships. According to several informants, the inability to access consistent, low cost childcare is one of the greatest barriers to financial and social stability among families in the Tri‐Valley. Low income and single parents require subsidized childcare, but also extended hour care, on weekends and evenings. Waiting lists for subsidized child care are long, especially for parents of infants or those with developmental challenges. One community member reported, “I am a nursing assistant and I work in the evening. It is hard to get someone to watch my kids. The night shift pays well, which will help us in the future, but I need child care.”
21 http://www.allamericacityaward.com/2011/02/14/dublin‐california‐holds‐joint‐city‐schools‐forum/

Eastern Alameda County Human Services Needs Assessment
JUNE 6, 2012 RESOURCE DEVELOPMENT ASSOCIATES | 71
Increased awareness, improved screening and diagnostic tools, early screening and possible increased incidence rates have resulted in higher detection rates of autism spectrum and other developmental disorders. Correspondingly, the demand for specialty child care has increased but the supply of services has not kept pace. Many providers are not sufficiently educated or trained in child development. According to one provider, “There is a systemic issue of awareness and a lack of capacity for some organizations. So the issue continues to be that service providers are underserving the needs of children and families with disabilities.”
Service Delivery Environment Stakeholders involved in the Needs Assessment referenced the following available programs:
• Child Care Links provides child care referrals and subsidies to low income residents and has recently extended services to older children. Services include support groups, therapy support services, and arts education programs for low income children. The organization is also continuing to seek out and build collaborations and community‐based partnerships.
• The Community Association for Preschool Education (CAPE) is the Head Start and Early Head Start provider for Eastern Alameda County. The agency provides high‐quality child care, extended care and preschool programs to low income families and children with developmental disabilities. One parent of a young child noted that, “CAPE takes good care of my kids. The teachers refer us to medical services and make sure my kids are growing up well. The teachers have good relationships with the families. My kids have received language and speech therapy. I really like how they take care of my children.”
• Kidango provides subsidized care to children 0 ‐ 5 in Dublin, Livermore and Pleasanton.
• Livermore Area Recreation and Park District (LARPD) offers developmentally appropriate classes for preschoolers and their parents, including “Baby and Me”. In a joint agreement with Livermore schools, LARPD offers extended student services and kids zone for ten elementary schools.
• School of Imagination – Opened in Dublin in October 2011 ‐ is an education center devoted to children with developmental disabilities.
• Pleasanton’s Gingerbread Preschool offers children ages 2‐5 a part‐time, recreational program in which children learn through play and the process of participating in activities. Qualified participants can receive financial assistance to help offset the cost of the program.
Specialty services are also available for survivors of domestic violence and families involved with Child Protective Services. One focus group participant stated, “My children needed more speech help, and worked through the school district to get an extra half hour of services per week. CPS moved my case more quickly with custody, placement and supporting my children.”
Gaps and Barriers Stakeholders are concerned with the recent loss of programs and the shortage of providers in general. One provider stated, “There used to be a drop in child care center, but it went under. And we have no crisis drop‐in center for families; the closest one is in Concord.” The Tri‐Valley is affected by state funding cuts as well. One informant described a shift in how services for children with disabilities and their
Eastern Alameda County Human Services Needs Assessment
JUNE 6, 2012 RESOURCE DEVELOPMENT ASSOCIATES | 72
families are paid for, “Traditionally it’s been that the State Department of Developmental Services paid for treatments and services. That system has become just about bankrupt.” In addition, she described cuts to CalWORKs, which resulted in a decrease of funding for child care services formerly offered through Child Care Links.
Suggestions for Improvement Several stakeholders, including parents of developmentally disabled and special needs children, suggested that the Tri‐Valley should increase developmental screenings for children before they enter kindergarten. However, they acknowledged that early and more frequent screenings result in higher rates of diagnosis. Higher diagnostic rates impact K‐12 schools because they are required to provide services to these children. Nonetheless, early detection has been linked directly to improved outcomes for children with developmental disorders, and an increase in demand for services resulting from appropriate diagnosis should not deter early intervention. A local assessment that includes annual projections based on higher rates of diagnosis would help schools and early care providers plan for increased demand, which will help address service bottlenecks in the future. In addition, increases in diagnosis and the awareness that early intervention can improve long‐term outcomes and ultimately save public resources suggests that an investment in provider education about early childhood development would be prudent.
Changing Demographics and Growing Diversity “Demographics are changing rapidly and I don’t see human services keeping pace. We, as providers of services, need to continue to build in supports for families, especially newly emigrating families.” –Key Informant
Key Findings • Eastern Alameda County is becoming increasingly diverse; more people are moving to the area,
thereby broadening expectations and cultural norms. Many are immigrants and non‐English‐speakers.
• There is a need to improve community outreach and coordination of services to ensure that underserved, geographically and linguistically‐isolated communities have access to services.
• There are insufficient multilingual providers and providers with experience and expertise in working with the broad array of newly arrived cultures and communities, especially in healthcare and educational institutions.
• Community‐building efforts are needed to increase the diversity of representation in local decisions and on City Boards and Commissions.
• Volunteers from underserved communities could be supported to act as liaisons to improve the coordination of services, access to services and increase representation in planning and decision making.
Community Issues There are increasing numbers of Asian/Pacific Islander residents in Eastern Alameda County. In Pleasanton, there is a growing Mandarin‐speaking population. In Livermore, there are increasing numbers of Spanish‐speaking residents. Many recent African American residents, according to one

Eastern Alameda County Human Services Needs Assessment
JUNE 6, 2012 RESOURCE DEVELOPMENT ASSOCIATES | 73
interviewee, are coming from communities where they represent 30 or 40 percent of the population. In Eastern Alameda County, they only now represent three to four percent of the community. This creates challenges for those moving into the area and for providers that must rapidly adapt services to meet the needs of new communities. Recent newcomers, particularly immigrants and people from underserved communities, experience three unique challenges in accessing critical services: First, they report not knowing about available services and complications in understanding how the service delivery system works. Those with limited English skills face language barriers that further complicate their understanding. Second, newcomers report a shortage of bilingual/bicultural providers who understand and respect their culture and their language. Third, in a few instances, stakeholders reported animosity or discrimination by other community members as well as, in a few instances, by service providers. One provider who works with immigrants spoke to the challenge, “I think the Tri‐Valley is barely getting into the groove of addressing the needs of people who don’t speak English.” Another provider described her experience with the lack of cultural competency among certain providers in Eastern Alameda County: “Racial profiling really crosses all areas of service delivery. Many kids here are second generation U.S. residents… they are still likely to be viewed as the outsider.” In spite of these barriers, service providers are reporting increasing diversity of service recipients:
“We see the population we are serving changing dramatically – so much so that in the past, our parenting readiness class would be 90% White; now 17 out of 18 are primarily non‐English speakers. We had to change our services – we added a coaching dimension to our parenting workshop to help people navigate the school district. How do they know how to sign up for school when the forms are only in English, not in Hindi, Urdu, and Mandarin? I worry that we are missing health issues when kids are signing up for school.”
Service Delivery Environment The city of Livermore’s Multi Service Center was repeatedly cited as providing a wide array of culturally and linguistically competent services all under one roof. This type of centralized service center increases visibility of services, and may improve access for people that are unaware of the range of available human services. For instance, the organizations listed in the following table all collaborate to provide services at the Livermore Multi Service Center, and would be visible to those receiving any service at the facility.
• Abode Services
• Alameda County Associated Community Action Program (ACAP)
• Alameda Co. Behavioral Health
• Alameda Co. Social Services
• Axis Community Health Center
• CRIL (Community Resources for Independent Living)
• East Bay Innovations
• ECHO (Eden Hope Council for Hope & Opportunity) Housing
• Law Center for Families
• Medi‐Cal Services
• Department of Rehabilitation
• Tri‐City Health Center AIDS Project
• Tri‐Valley Interfaith Poverty

Eastern Alameda County Human Services Needs Assessment
JUNE 6, 2012 RESOURCE DEVELOPMENT ASSOCIATES | 74
• Tri‐City Homeless Coalition
Another program mentioned specifically is Aprendiendo a Triumfar at Las Positas Community College, which teaches youth the importance of staying in school and continuing their education. The program is tied to school districts, the faith‐based community, and immigration programs. Beyond this, interviewees mentioned that there are community groups and faith‐based organizations representative of emerging demographics. Nearly all social delivery programs cited that they provide interpretation service via bilingual staff or, when necessary, a phone interpretation line. Additionally, the city of Pleasanton and the Pleasanton Chamber of Commerce partner on the Leadership Pleasanton Program – this program promotes community volunteerism and educates participants about the city and school district. The city of Dublin offers Inside Dublin, which is sponsored by the city of Dublin and open to applicants interested in learning about the issues facing the community, and to encourage community involvement at all levels. The program includes presentations on topics such as public safety, local government, and community services. In Livermore, the Livermore Chamber of Commerce in partnership with the City of Livermore offers Leadership Livermore, a nine month program that builds relationships between community members and civic leaders. These programs serve as a means to engage community members in the civic process, building representativeness in political decision making.
Gaps and Barriers Human service providers from many different organizations reported on the challenges they face in providing culturally and linguistically appropriate services. Most commonly, staff reported a need to “play catch‐up” in terms of employing staff that speak the same language as their clients. Organizations are working to meet current demand, and are not necessarily projecting future needs based on demographic trends. One provider explained, “We serve a large Hispanic population, but we don’t have enough staff to accommodate this. We have to do a lot of face‐to‐face interviews but we only have two bilingual Spanish staff. We sometimes have to use tele‐interpreters.” Other staff report on the shortage of multilingual candidates applying for jobs in the Tri‐Valley:
“In our organization we have a good number of people who are bilingual, the doctors speak multiple languages, and 80% of staff in the medical clinics are bilingual. However, there has been a 20% drop in bilingual staff within the behavioral health department. We are making this our priority because we serve this specific community.”
Another challenge, which was identified by stakeholders in Eastern Alameda County, has to do with the shortage of diverse civic leadership and its impact on creating culturally competent policy. One interviewee noted,
“In the Tri‐Valley, 60% moving in are now foreign born or non‐Caucasian…What they provide may not be embraced by community leaders. The most pressing issue now is about diversifying the city leadership. When I go to a community meeting, all 20 leaders are often White. They are

Eastern Alameda County Human Services Needs Assessment
JUNE 6, 2012 RESOURCE DEVELOPMENT ASSOCIATES | 75
not representative of the community they serve. So issues are not brought up first hand, they are coming filtered.”
Suggestions for Improvement Stakeholders recommended a variety of strategies for improving services for underserved communities in the Tri‐Valley. One strategy is aimed at increasing knowledge and improving relationships between the many different cultures that make up the community.
“We should sponsor annual festivals, for example, making sure that everyone has an opportunity to be celebrated, and educate each other about each other’s cultures in order to create understanding and tolerance within our community. This is a huge opportunity for learning and providing exposure to our kids. If change is viewed as negative, this is hugely problematic… if these differences are not embraced and managed well, these issues will continue to be problematic.”
Another interviewee noted that many in the Latino community, for example, “feel intimidated by the bureaucracy of the institutions; and this is coupled with the fear of deportation.” Therefore, “These communities need a home base, a cultural center, to feel more empowered. Still another stakeholder suggested that communities need to identify leadership to participate in planning and civic decision‐making in order to “help build trust.” Another suggestion was related to improving the synchronization and coordination of information. One informant offered that “It would be helpful if we had a bilingual newspaper. The Livermore paper is only in English. We learn about community events from reading flyers posted around town, near and in stores, like Mexican markets, Wal‐Mart, Lucky’s and Safeway.” Other stakeholders suggested that the cities or community based organizations coordinate volunteers from within these communities that can act as liaisons to improve access to services. Alternatively, the city could hire “Promotores from the community, who can work in different areas of focus and conduct outreach and education, lead support groups, etc.” Suggestions also addressed the school system. One parent and community advocate offered that “Many Hispanic parents do not have the resources at school to access all they need to help their children. They need to know Basic English to advocate for their children. We need some kind of group at the school working on helping parents to communicate effectively with teachers.” For this parent, this comes down to emphasizing training for teachers and administration members, in order to reduce the difficulty of working through the school system for mono‐lingual parents.
Financial Assistance “The County provides General Assistance, but doesn’t have enough money. So last year we enacted time limits. Now people can only get assistance for about three months. In my opinion this is not enough assistance.” –Key Informant

Eastern Alameda County Human Services Needs Assessment
JUNE 6, 2012 RESOURCE DEVELOPMENT ASSOCIATES | 76
Key Findings • Cash aid to indigent adults (General Assistance) is insufficient to meet existing needs.
• Better service coordination and culturally competent support is needed to help eligible individuals apply for assistance and navigate bureaucratic structures.
• Social stigma prevents would‐be first time recipients from asking for financial assistance.
Community Issues Ballooning mortgages, catastrophic health care costs, and job loss have all contributed to a new and growing demographic of individuals and families needing financial assistance. As shown in the Demographic Findings section of this report, the proportion of Tri‐Valley residents receiving General Assistance has more than doubled in the last eight years; food stamp recipients have increased more than five‐fold and CalWORKS recipients have about tripled. Stakeholders participating in the Needs Assessment stated that Eastern Alameda County residents have not historically asked for financial assistance, compounding social stigma associated with asking for help.
Service Delivery Environment Alameda County offers two cash assistance programs: CalWORKs (for individuals with families) and the General Assistance program (for single individuals without minor children). Additionally, the County participates in CalFresh, formally known as Food Stamps. Other financial assistance programs provided by the state and federal government include disability (SSI, SSDI, SDI) and Unemployment Insurance. For veterans, Social Services provide a Veterans Service Office to assist veterans and their families seeking to apply for benefits and services.
Gaps and Barriers The biggest service delivery gaps cited by Tri‐Valley stakeholders had to do with the quantity and duration of assistance provided. For example, a single person in need of assistance receives $336 per month for three months within a one year period in General Assistance and up to $200 per month CalFresh. No recipient may own property worth more than $1,000; home owners do not qualify. Families with children can receive cash assistance through CalWORKS for up to four years (48 months). Prior to July 1, 2011, the time limit was five years (60 months). According to participants, the barriers to receiving financial assistance have to do with the challenges with meeting eligibility requirements (especially for immigrants), stigma around receiving services, and the complexity, repetitiveness, and difficulty of filling out technical documents required for applications.
Suggestions for Improvement Respondents offered a common suggestion for improving services around financial assistance – increasing coordination of service providers to reduce redundancy in filling out paperwork and employing volunteers to help people navigate benefits programs. One participant in the faith‐based community focus group noted that, “Many of the people that use our services qualify for welfare/food stamps, but it’s very hard for them to fill out an application…it’s stressful on top of their already stressful lives.” Additionally, stakeholders recommended that financial assistance programs should be advertised so that they are more visible. According to the parent of a child enrolled in a Head Start program, “The community should be more aware of welfare, WIC, and also, the food pantries.”

Eastern Alameda County Human Services Needs Assessment
JUNE 6, 2012 RESOURCE DEVELOPMENT ASSOCIATES | 77
Conclusions This report has addressed key concerns related to human services provision in the Tri‐Valley. Stakeholders informing our assessment most commonly identified needs, gaps and barriers related to transportation and access to services; mental health; homelessness; affordable housing; and culturally competent services and outreach to underserved communities. Several common themes emerged from focus groups, informant interviews, and surveys:
• The demand for human services is increasing at the same time that resources to provide services are diminishing. Providers are being expected to do more with less. Budget reductions, cutbacks in services, and a growing population and increasing poverty rates have created a significant challenge to human service providers. Providers need additional financial support to continue to provide services, expand capacity, and offer ongoing training to staff to improve linguistic and cultural competency.
• Public transportation limitations present a significant barrier to residents seeking human services. Transportation costs and trip duration are significant barriers to seniors, people with mobility challenges, and families with young children. Many critical services are located outside the Tri‐Valley in Western Alameda County and Contra Costa County. Transportation agencies have had to make difficult choices between reducing less popular routes and increasing fares.
• An increase in ethnic diversity and linguistic isolation creates a barrier to accessing services, and organizations are struggling to adjust. Newcomers experience cultural misunderstanding, communication challenges and even hostility. Some service providers in the Tri‐Valley do not yet have the capacity to meet the cultural and linguistic needs of the growing Asian/Pacific Islander, Latino and other immigrant communities.
• There is not enough affordable housing to meet the growing demand. The cities of Dublin, Livermore, and Pleasanton have recently completed their housing elements, demonstrating how they plan to meet their fair share of affordable housing needs in the future. However, the current demand for housing means many low and very low income households face housing insecurity.
• Increased homelessness has amplified the demand for a variety of housing options and services. This need is pronounced particularly among homeless men, who have limited options for shelter in the Tri‐Valley. Some shelters accommodating men are only open during inclement weather.
• There are not enough Mental Health and Alcohol and Other Drug Services located in the Tri‐Valley. The lack of a Psychiatric Health Facility (PHF), in‐patient drug rehabilitation providers, and a limited number of psychiatrists and clinicians offering subsidized and non‐English services
Eastern Alameda County Human Services Needs Assessment
JUNE 6, 2012 RESOURCE DEVELOPMENT ASSOCIATES | 78
means that residents may have to leave the area for services. Social stigma associated with mental illness is widely reported in Eastern Alameda County.
• There is insufficient affordable extended care, after school, and summer programming in the Tri‐Valley to support the social development of children and youth. This is a particular concern in Eastern Alameda County because many parents are commuting long distances and children are left unsupervised and unengaged. The shortage of recreational, enrichment, and vocational services is pronounced for transitional age youth, teens and adults with developmental disabilities. This can make it difficult for family caregivers to secure and maintain employment.
• There are insufficient workforce development opportunities in the Tri‐Valley, particularly for women, seniors, youth, and the disabled. Growing unemployment in the Tri‐Valley has increased the demand for vocational training and employment counseling. Due to current economic conditions, there are fewer after school and summer jobs and part time jobs for the growing older adult population. Child care costs are a work barrier to many single and low income parents.
Recommendations Recommendations to address human service needs in Eastern Alameda County emerged during interviews, focus groups and community meetings. Some of these strategies are specific to one of the 14 areas of concern, and are included in the appropriate section. The following are more general recommendations, some of which address multiple areas of concern. These recommendations may be embraced by one or all of the cities in the Tri‐Valley, by Alameda County or by local community and faith‐based organizations. Many require collaboration by multiple agencies and organizations. The following recommendations aim to stimulate further collaboration in order to address community needs.
Develop a strategic plan based on findings from the 2011 Eastern Alameda County Human Services Needs Assessment The first and most labor intensive step in any community‐based strategic planning process is to collect and analyze data pertaining to local needs. The needs assessment serves several important functions. First, it provides consensus around a vision and the critical issues affecting the community. Secondly, it generates a sense of urgency among stakeholders to address the needs. Therefore, the Cities of Dublin, Livermore, and Pleasanton should work collaboratively to prioritize the issues they would like to address in the next five years, identify resources, and develop goals, measurable objectives and strategies for meeting those objectives.
Increase collaboration to improve outcomes for individuals and communities This Needs Assessment demonstrated that vulnerable individuals and families need multiple interventions to address interrelated challenges. Repeatedly we heard residents say, “I need a job so that I can afford housing, but I need stable housing before I can realistically find a job.” Similarly, “I need child care so that I can go out and get a job, but I can’t afford child care until I have a job.” Collaboration
Eastern Alameda County Human Services Needs Assessment
JUNE 6, 2012 RESOURCE DEVELOPMENT ASSOCIATES | 79
can happen at two levels‐‐the program level, to benefit individual clients, and the system level, to address a critical community issue.
• Program‐level collaboration: Human service programs within each city can work together to identify the most at‐risk individuals in their community and, working with those individuals, develop a multi‐disciplinary poverty‐alleviation and treatment plan. One model of program‐level collaboration is the multidisciplinary team. Depending on the needs of the individual, mental health or substance abuse professionals, adult or child protective services, probation departments, clergy, health and social service providers can serve on the team. City staff or a nonprofit provider funded by a city can serve as conveners and coordinators for these types of collaborative meetings.
• System‐level collaboration: The three cities can establish a partnership to address a specific human service related issue such as growing homelessness; youth violence; healthcare access; or increasing diversity. Dublin, Livermore and Pleasanton can arrange joint meetings between key stakeholders such as public safety and public health officers, school administrators, affordable housing providers, local residents, business leaders, and elected officials. One example of such a partnership is the Monument Corridor Partnership (MCP), funded by The California Endowment. The MCP works collaboratively to address affordable housing concerns, greater access to health services, and to promote economic development in a low income neighborhood in Concord, California. As a result, the partnership was able to establish a mobile health clinic and a job training center and distribute welcome packets in English and Spanish to new residents, and hosted an annual health fair. In an evaluation of the project, one MCP stakeholder said, “There was a huge study by the transportation and land use commission and they found that Monument folks could not get on public transportation to get to health providers…we all got together and…we were able to get a new bus route for us that got us to health services.”22 MCP used a community organizing strategy to ensure ongoing resident participation in planning meetings.
Focus on outreach Several key themes emerged related to service demand in Eastern Alameda County. First, policymakers and funders outside the Tri‐Valley are not aware of the increasing need and growing demand for services. As a result, they are unlikely to prioritize resources for Dublin, Livermore and Pleasanton. Secondly, many service recipients and providers report long waiting lists or wait times for services, including housing subsidies, child care and health care. Thirdly, providers are afraid to reach out beyond their typical client base because of fear of being unable to meet a greater demand. And finally, because many newcomers to the Tri‐Valley and people experiencing need for the first time do not know about services. To break this cycle, the Cities of Dublin, Livermore and Pleasanton need to demonstrate the
22 http://www.partnershipph.org/sites/default/files/PPH%20Final%20report%20Legacy%20Of%20Partnership_02‐09‐09%20FINAL%20FOR%20DISTR%20%281%29.pdf

Eastern Alameda County Human Services Needs Assessment
JUNE 6, 2012 RESOURCE DEVELOPMENT ASSOCIATES | 80
true demand for services. To do so, they need to prioritize reaching out to those people who are unaware of what resources are available and make asking for help a safe and stigma‐free experience.
Outreach strategies should target the following communities: non‐English speakers; new residents; people at risk of foreclosure or eviction; the recently unemployed; seniors; people with mobility and sensory disabilities; and family caregivers. The following programmatic suggestions would be effective at outreaching to underserved communities and could be supported by Dublin, Livermore, Pleasanton, a community based organization or a combination thereof.
• Expand the Community Health Workers/Promotores de Salud to the entire Tri‐Valley region: Promotores de Salud are paid community members who have a close understanding of an underserved community, and who share the same language, ethnicity, or socioeconomic status of the target population. Trusting relationships help Promotores serve as a link or an intermediary between the community and the health or social service delivery system, and may improve social and health outcomes for target communities.
• Implement Programs Supporting Volunteer Cultural Brokers: Cultural Brokers mediate between people of different backgrounds and bridge the gap between foreign‐born consumers and service providers, helping them navigate the system and mitigate misunderstandings.
• Expand Street Outreach: This includes mobile outreach to the homeless, youth, and runaways, in order to connect them to immediate food, clothing, shelter and medical care.
• Expand Home Visitors: Home visitors are professionals who visit the homebound disabled or elderly or pregnant and perinatal women to educate them about social services and self‐care and assist them in getting to medical and social service appointments. This type of direct outreach will improve penetration rates of service delivery to target communities.
• Encourage Social or Earned Media Campaigns: ideas may include newspaper editorials, mailings, and brochures in multiple languages.
• Host Health Fairs or Social Service Fairs and Community Back‐to‐School Events: Fairs and Back‐to‐School events bring together a variety of providers and service recipients in a non‐stigmatizing environment; offer a variety of critical services on site such as medical care or school supply giveaways, as well as education about available services and supports.
• Create a Newcomer Community Leadership Program: The New Westminster Community Immigrant Mentorship Program in Vancouver, Canada provides training to a cohort of newcomers and immigrants to help them develop community leadership skills. The program provides one‐on‐one mentorship as well as extensive leadership training to more effectively participate in civic life and community decision‐making.

Eastern Alameda County Human Services Needs Assessment
JUNE 6, 2012 RESOURCE DEVELOPMENT ASSOCIATES | 81
Another strategy that Tri‐Valley cities and community‐based organizations could collectively embrace is supporting the development of a multi‐cultural community center with the specific intent of promoting cross‐cultural understanding as well as offering safe spaces for specific newcomer populations to congregate and build community. The center could be co‐located in an existing facility that provides services – such as the Multi‐Service Center in Livermore, the Pleasanton Senior Center, or the Shannon Community Center in Dublin – thereby increasing visibility and access to services while taking advantage of existing spaces. Multicultural Centers are located in many universities throughout the United States and in cities such as Shreveport, Louisiana (dedicated to understanding and appreciating the history of diverse cultures of the region), Tuskegee, Alabama (dedicated to promoting human and civil rights), and Sioux Falls, South Dakota (offering orientation services to newcomers, English language proficiency and life skills education and social services).
Support the Next Generation of Young Adults Demographic data suggests there are fewer residents between the ages of 20 and 24, and a lack of population growth among residents aged 20 to 34 (previously discussed in the Demographic Findings section). One can conclude that the Tri‐Valley’s population is aging and young adults are moving away from the Tri‐Valley. By offering more services that address the needs of youth and young adults, the cities of Dublin, Livermore, and Pleasanton can prevent future decreases in the young adult population. Some of the immediate needs and challenges faced by this population include:
• Need for more college, career, and vocational preparation and training;
• Need for stable and secure entry‐level jobs (i.e. after school jobs and post‐graduation employment); and
• Need for more opportunities to voice concerns and issues that specifically affect youth and young adults.
• Need more affordable and effective public transit options to promote mobility for young adults seeking services and employment opportunities outside of the Tri‐Valley.
Two approaches may be used to improve support systems and expand opportunities for engagement among transitional age youth and young adults in the Tri Valley. The cities, collectively or independently, can support a commission that allows young adults to actively participate in the development of programs, initiatives, and policies that address their concerns and needs23. Such a commission can partner with local city government so that participants can work directly with civic leaders and policy makers to improve services for youth and young adults. Model programs include the San Francisco Youth Commission, which gives participants ages 12‐23 the opportunity to advise the Board of Supervisors and the Mayor on "the effects of legislative policies, needs, assessments, priorities, programs, and budgets concerning the children and youth of San Francisco."24 Although Dublin,
23 This aligns with a finding from the 2010 Pleasanton Youth Master Plan, in which it is stated that the community should, “Involve children and youth in decision‐making including the need for, and planning of, youth‐oriented programs and spaces.” 24 http://www.sfbos.org/index.aspx?page=5585

Eastern Alameda County Human Services Needs Assessment
JUNE 6, 2012 RESOURCE DEVELOPMENT ASSOCIATES | 82
Livermore and Pleasanton currently facilitate youth engagement through Youth Commissions and Youth Advisory Committees, the cities may consider building upon existing programs, utilizing the model of the San Francisco Youth Commission. A second approach would include engaging youth in the planning and development of a teen center, or designated gathering space providing afterschool and summer programs for young adults in the Tri‐Valley. Such a space would offer young adults that are not involved with sports programs the chance for regular participation in extra‐curricular activities. Focus group participants, cited in the 2010 Pleasanton Youth Master Plan, noted that the YMCA in East Oakland as an example of a model facility that could be replicated to serve young adults in the Tri‐Valley25. Dublin, Livermore and Pleasanton should build upon existing resources, such as the Shannon Community Center in Dublin, and the Elbow Room – located in the Robert Livermore Community Center (RLCC) – to ensure that youth across the Tri‐Valley have a voice in creating, and access to, safe spaces for recreational activities.
This Needs Assessment was developed through public engagement, dialogue, and collaboration. The authors hope that it remains a living document; part of an ongoing participatory process of improving the lives of Eastern Alameda County residents. We hope and anticipate that other ideas for improving human services are generated through review of these findings and ongoing discussion and research.
“The welfare of each is bound up in the welfare of all.” ‐‐ Helen Keller
25 2010 Pleasanton Youth Master Plan, page A‐14.
Eastern Alameda County Human Services Needs Assessment
JUNE 6, 2012 RESOURCE DEVELOPMENT ASSOCIATES | 83
APPENDIX A: KI Interview Questions
1. Please tell me a little bit about your work in Eastern Alameda County and what community issues are most important to you.
2. In terms of [interviewee’s area of interest], how have conditions changed for residents of
Eastern Alameda County in the last 5 – 10 years?
3. What are the most critical human service issues facing residents of Eastern Alameda?
4. How effectively do current services address these needs?
5. What are other major gaps in services?
6. What are the biggest barriers to addressing the human service needs of residents (please be specific)?
7. Are you aware of any unique challenges faced by specific populations (e.g., elderly, children, persons with disabilities, non‐English speakers) that we have not considered?
8. Are there specific geographic regions or neighborhoods within Eastern Alameda that we should be concerned with? If so, what issues are prevalent there?
9. Do you anticipate in any future service‐related needs? If so, what are they?
10. Now I’m going to ask you to do something really hard! I’d like your help in prioritizing human service needs for Eastern Alameda County residents. Please prioritize the following specialty areas with 1 being the most critical local community need to 20 being the least critical. (We recognize that they are all critical needs!)
Implementing Change 1. In the areas of greatest priority, please help us understand what our cities can do to address
community needs:
Resources and Data 2. Do you have any resources or information that we could review, such as reports, datasets, etc.?
Closing Comments
3. Do you have any other comments or questions or Is there anything you would like to tell me about this interview process?
Eastern Alameda County Human Services Needs Assessment
JUNE 6, 2012 RESOURCE DEVELOPMENT ASSOCIATES | 84
APPENDIX B: KI Data Results The table below outlines the results of an exercise offered to interviewees. It was requested that interviewees rank the 19 key areas of concern identified by city stakeholders. The most important categories reflect the perceived area of greatest need, or, where the greatest gaps in services are represented in the network of human services in Eastern Alameda County. The table below contains the overall ranked order of importance, based on the responses of 15 out of the 19 interviewees (with 4 informants abstaining from the exercise) interviewed.
Ranking Area of Concern
1 Mental health 2 Housing/affordable housing 3 Physical health 4 Homelessness 5 Domestic violence/child abuse 6 Disability 6 Food/nutrition 6 Legal services/legal aid/juvenile justice/re‐
entry 9 Senior services 10 K – 12 education 11 Early childhood education and development 12 Public safety 13 Cultural competency 14 Financial services and financial literacy 15 HIV/AIDS 16 Recreation

Eastern Alameda County Human Services Needs Assessment
JUNE 6, 2012 RESOURCE DEVELOPMENT ASSOCIATES | 85
APPENDIX C: Focus Group List and Participant Count
Focused Discussion Group Host Organization Participants
Adults with Disabilities Community Resources for Independent Living
5
Day Laborers ‐ Spanish Hayward Day Labor Center 11
Family Members of those with Mental Illness
National Association on Mental Illness (NAMI) Tri‐Valley
6
Homeless Families Tri‐Valley Haven 5
Homeless Individuals Livermore Homeless Refuge 19
Parents of Disabled Children E‐Soccer 13
Parents of Older Children Horizons Family Counseling 5
Parents of Older Children ‐ Spanish
Horizons Family Counseling 11
Parents of Young Children Community Association for Preschool Education (CAPE)
6
Parents of Young Children ‐ Spanish
Community Association for Preschool Education (CAPE)
5
Residents Facing Foreclosure Tri‐Valley Housing Opportunity Center
5
Seniors Pleasanton Senior Center 11
Survivors of Domestic Violence Tri‐Valley Haven 1
Eastern Alameda County Human Services Needs Assessment
JUNE 6, 2012 RESOURCE DEVELOPMENT ASSOCIATES | 86
APPENDIX D: Focus Group Questions
Tri‐Valley Human Services Needs Assessment 2011
Community Focus Group Protocol
DRAFT
EXERCISE: 3 most critical areas – for your family
Look at this list of needs (See following page). What would you say are you and
your family’s biggest needs? Please place an orange dot by your biggest need, a
green dot by your second biggest need, and a yellow dot by your third biggest
need.
Which of your needs are being met by the social service agencies in the Tri-
Valley?
Which of your needs are being met by social service agencies outside of the Tri-
Valley?
Which of your needs are being met elsewhere?
Which of your needs are not being met?
What challenges do you and your family face when trying to get services? What
are the most difficult challenges? What are the most common challenges?
Do you think that you and your family’s needs will change in the near future?
How?
What recommendations would you make to the cities to improve services?

APPENDIX E: Focus Group Poster
Human Services Needs Assessment of the Tri‐Valley Area Focus Group on Mental Health
The cities of Dublin, Livermore and Pleasanton are currently conducting a Human Services Needs Assessment of the Tri‐Valley Area. As partners in this process, Resource Development Associates (RDA) is organizing focus groups around key issue areas identified by stakeholders. Comments from focus groups, responses from interviews, and data analysis will be used to determine:
∙ What social services needs are in the Tri‐Valley Area
∙ What needs are currently met/how effectively these needs are met
∙ Where there are gaps in service
∙ How can we most effectively close the gaps in service
As one major area of concern is the availability of Drug and Alcohol services, as well as services for teens, we are hoping that individuals receiving services at Axis Community Health would be open to
participating in a brief focus group to express their opinions, experiences and concerns around the issue of mental health services.
Focus groups are scheduled for two hours and will have 8 – 12 participants. All responses are anonymous and no comments made in a focus group session will be attributed to any individual or organization. This is part of an ongoing information gathering process, the end of which will be the presentation of findings and recommendations to the cities of Dublin, Livermore and Pleasanton.
We are hoping to schedule a session in the coming weeks on a Monday or Thursday night, for two hours, between 5 and 8 pm.
If you are interested, please notify the front desk and give them your name, phone number or email and the night that is best for you. Please feel free to contact me at the phone number or email address below with any questions or concerns.
Sincerely, Peter Neely Resource Development Associates 230 4th Street Oakland, CA (510) 488 – 4345 x113

Eastern Alameda County Human Services Needs Assessment
JUNE 6, 2012 RESOURCE DEVELOPMENT ASSOCIATES | 88
APPENDIX F: Provider Survey Respondent Organizations Providers Responding to Survey Alameda County Behavioral Health Care Services ‐ Valley Children's Services Alameda County Behavioral Health Care Services, Valley Children's Mental Health Alameda County Community Food Bank Alameda County Public Health Dept. Chronic Disease Program Alameda County Social Services Axis Community Health Axis Community Health ‐ Behavioral Health Department Bay Area Community Services CAPE Inc. CENTER FOR COMMUNITY DISPUTE SETTLEMENT & TRI VALLEY YOUTH COURT City of Pleasanton Senior Center Community Resources for Independent Living (CRIL) Deaf Counseling Advocacy and Referral Agency Easter Seals Bay Area Eden Council for Hope and Opportunity Eden I & R/ 2‐1‐1 Alameda County Hope Hospice, Inc. Immunization Assistance Project/ Alameda County Public Health LARPD Livermore Amador Valley Transit Authority‐"Wheels" Livermore Senior Services Open Heart Kitchen Ridge View Commons Senior Support Program of the Tri Valley Shepherd's Gate Spectrum Community Services‐Senior Nutrition & Activities Project The Alameda County Urban Male Health Initiative The Arc of Alameda County The Senior Support Program of the Tri‐Valley Tri Valley Haven for women Tri Valley Youth Court Tri‐City Health Center Tri Valley Haven Tri‐Valley Housing Opportunity Center Tri‐Valley YMCA Valley Children's Services ValleyCare Health System

Eastern Alameda County Human Services Needs Assessment
JUNE 6, 2012 RESOURCE DEVELOPMENT ASSOCIATES | 89
APPENDIX G: Provider Survey

Eastern Alameda County Human Services Needs Assessment
JUNE 6, 2012 RESOURCE DEVELOPMENT ASSOCIATES | 96
APPENDIX H: Hard to Reach Population Survey Tri-Valley Human Services Needs Assessment 2011
Hard to Reach Population Survey
1. What services do you and your family NEED but have a hard time accessing? (check all that apply)
� Primary Health Care � Child Welfare/Child Protective Services
� Specialty Health Care � Domestic Violence Services
� Mental Health Care � Homeless Shelter
� Dental Care � Food and Nutrition
� Child Care � Disability/Special Needs
� Drug and Alcohol Services � Senior Services
� Adult Education/Literacy � Legal Services/Advocacy
� Transportation � Welfare/ Food Stamps/WIC /TANF
� Job Training/Job Placement � Affordable Housing/Housing Assistance
� Clothing or Other Donated Items � Other:
2. Please circle TRUE or FALSE for each of the following statements.
SOMETIMES I DON'T GET THE SERVICES I NEED BECAUSE....
… it takes too long to get to where I need to go. TRUE FALSE
… it costs too much to get to where I need to go. TRUE FALSE
… I don't know where to get help. TRUE FALSE
… there is no one that speaks my language. TRUE FALSE
… I don't trust the service provider. TRUE FALSE
… the service provider does not understand my culture. TRUE FALSE
… I can't access them because of disability. TRUE FALSE
… I can't afford the services. TRUE FALSE

Eastern Alameda County Human Services Needs Assessment
JUNE 6, 2012 RESOURCE DEVELOPMENT ASSOCIATES | 97
… I don't qualify for the services. TRUE FALSE
3. What problems have you had trying to get the services you need?
4. What city do you live in? � Dublin � Pleasanton � Livermore � Other:
5. Are you employed? � Yes � No
6. Are you in school? � Yes � No
Eastern Alameda County Human Services Needs Assessment
JUNE 6, 2012 RESOURCE DEVELOPMENT ASSOCIATES | 98
7. If you are employed, what city do you work in? � Dublin � Pleasanton � Livermore � Other:
8. How many children do you have under the age of 18? � 0 � 1 � 2 � 3 � 4+
9. How old are you?
10. What is your gender? � Male � Female � Other
11. What is your ethnicity? � Black/African American � White/Caucasian � Native American/Alaskan Native � Latino � Asian/Pacific Islander � Other:
12. What language(s) do you speak at home?
THANK YOU! This is the END of the survey.
We appreciate your participation.

Eastern Alameda County Human Services Needs Assessment
JUNE 6, 2012 RESOURCE DEVELOPMENT ASSOCIATES | 99
APPENDIX I: Hard to Reach Population Survey Respondents What services do you and your family NEED but have a hard time accessing?
Count n %
Primary Health Care 80 214 37.4%
Specialty Health Care 37 214 17.3%
Mental Health Care 29 214 13.6%
Dental Care 121 214 56.5%
Child Care 49 214 22.9%
Substance Abuse Services 10 214 4.7%
Adult Education/Literacy 31 214 14.5%
Transportation 56 214 26.2%
Job Training/Job Placement 60 214 28.0%
Clothing or Other Donated Items 32 214 15.0%
Child Welfare/Child Protective Services 10 214 4.7%
Domestic Violence Services 4 214 1.9%
Homeless Shelter 6 214 2.8%
Disability/Special Needs 14 214 6.5%
Senior Services 20 214 9.3%
Legal Services/Advocacy 25 214 11.7%
Affordable Housing/Housing Assistance 62 214 29.0%
Other 6 214 2.8%
Food/Nutrition/Food Stamps/WIC/Welfare/TANF 71 214 33.2%
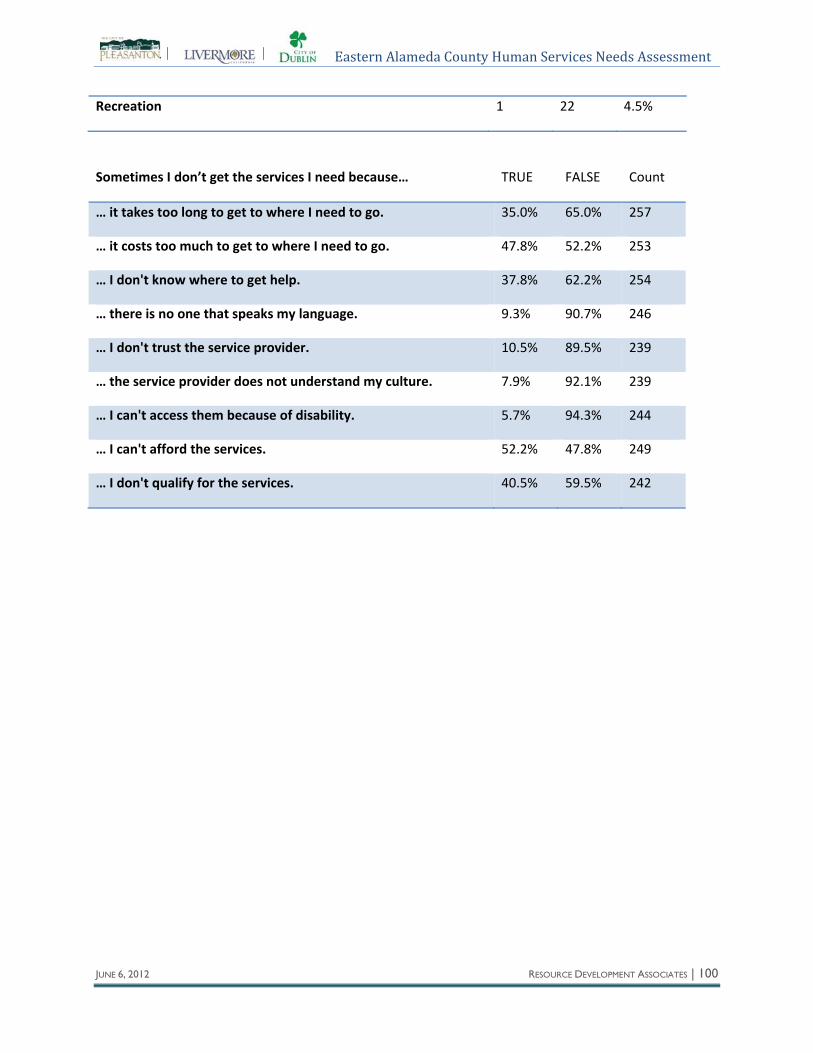
Eastern Alameda County Human Services Needs Assessment
JUNE 6, 2012 RESOURCE DEVELOPMENT ASSOCIATES | 100
Recreation 1 22 4.5%
Sometimes I don’t get the services I need because… TRUE FALSE Count
… it takes too long to get to where I need to go. 35.0% 65.0% 257
… it costs too much to get to where I need to go. 47.8% 52.2% 253
… I don't know where to get help. 37.8% 62.2% 254
… there is no one that speaks my language. 9.3% 90.7% 246
… I don't trust the service provider. 10.5% 89.5% 239
… the service provider does not understand my culture. 7.9% 92.1% 239
… I can't access them because of disability. 5.7% 94.3% 244
… I can't afford the services. 52.2% 47.8% 249
… I don't qualify for the services. 40.5% 59.5% 242

Eastern Alameda County Human Services Needs Assessment
JUNE 6, 2012 RESOURCE DEVELOPMENT ASSOCIATES | 101
APPENDIX J: Organizations that Attended Community Meetings Community Meeting: Livermore 9/27/2011 Participating Organizations Alameda County Food Bank
Axis Community Health
City of Livermore
Deaf Counseling, Advocacy and Referral Agency (DCARA)
Eden I &R
Human Services Commission, City of Livermore
Interfaith Sharing Inc.
Livermore Area Recreation and Parks District (LARPD)
Livermore Homeless Refuge
Livermore Valley Joint Unified School District
The Afghan Woman’s Health Program
Tri Valley Haven
UNCLE Credit Union
Community Meeting: Dublin 9/28/2011Participating Organizations Alameda County Health Care Services Agency
City of Dublin
Dublin Partners in Education
Dublin Sister City Association
Impact Ministries
Office of Assemblymember Joan Buchanan
Pleasanton Human Services Commission
Senior Support Programs of the Tri Valley
The Afghan Woman’s Health Program
Valley Christian Center
Well Outreach Center
Women's Council of Realtors

Eastern Alameda County Human Services Needs Assessment
JUNE 6, 2012 RESOURCE DEVELOPMENT ASSOCIATES | 102
Community Meeting: Pleasanton 9/29/2011 Participating Organizations Alameda County Public Health Commission
City of Pleasanton
Office of County Supervisor Nate Miley
Dublin Senior Center Adv. Board
Hope Hospice
Pleasanton Human Services Commission
Livermore Beautification Committee
Livermore Homeless Refuge
Spectrum
SSPTV
Sutter Health
The Afghan Woman’s Health Program
Tri‐Valley YMCA
Twin Valley Learning Center
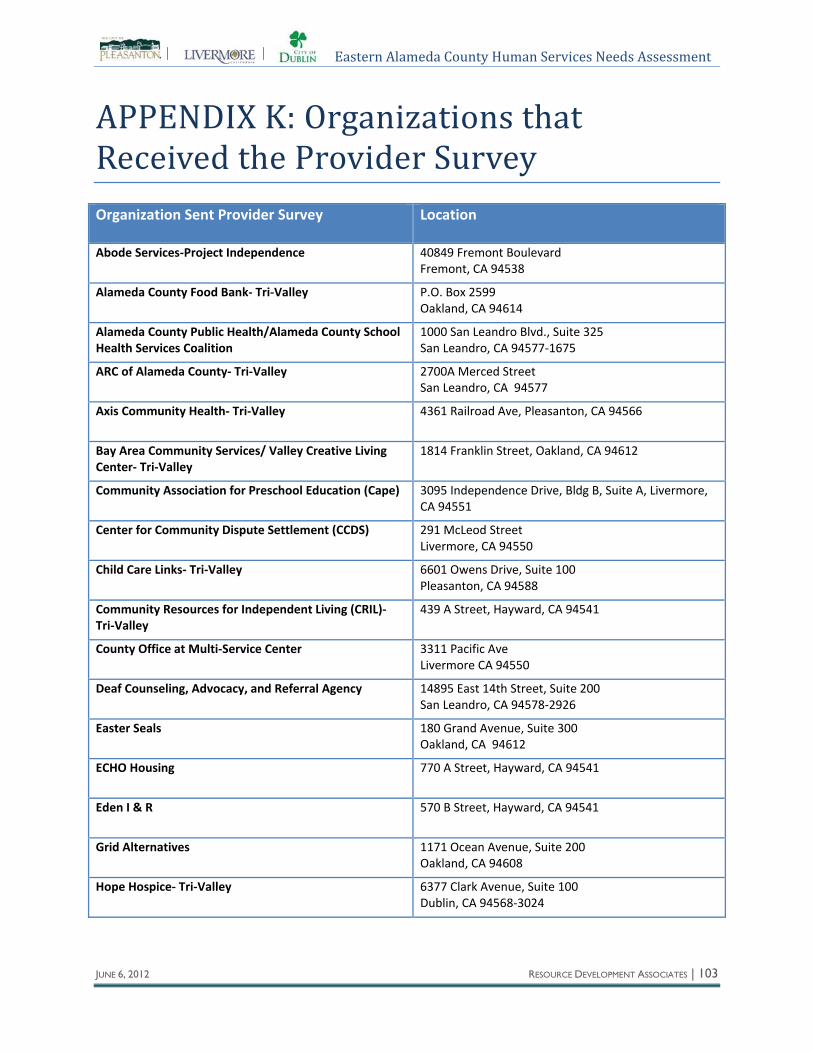
Eastern Alameda County Human Services Needs Assessment
JUNE 6, 2012 RESOURCE DEVELOPMENT ASSOCIATES | 103
APPENDIX K: Organizations that Received the Provider Survey Organization Sent Provider Survey Location
Abode Services‐Project Independence 40849 Fremont BoulevardFremont, CA 94538
Alameda County Food Bank‐ Tri‐Valley P.O. Box 2599Oakland, CA 94614
Alameda County Public Health/Alameda County School Health Services Coalition
1000 San Leandro Blvd., Suite 325 San Leandro, CA 94577‐1675
ARC of Alameda County‐ Tri‐Valley 2700A Merced StreetSan Leandro, CA 94577
Axis Community Health‐ Tri‐Valley 4361 Railroad Ave, Pleasanton, CA 94566
Bay Area Community Services/ Valley Creative Living Center‐ Tri‐Valley
1814 Franklin Street, Oakland, CA 94612
Community Association for Preschool Education (Cape) 3095 Independence Drive, Bldg B, Suite A, Livermore, CA 94551
Center for Community Dispute Settlement (CCDS) 291 McLeod StreetLivermore, CA 94550
Child Care Links‐ Tri‐Valley 6601 Owens Drive, Suite 100 Pleasanton, CA 94588
Community Resources for Independent Living (CRIL)‐Tri‐Valley
439 A Street, Hayward, CA 94541
County Office at Multi‐Service Center 3311 Pacific AveLivermore CA 94550
Deaf Counseling, Advocacy, and Referral Agency 14895 East 14th Street, Suite 200 San Leandro, CA 94578‐2926
Easter Seals 180 Grand Avenue, Suite 300 Oakland, CA 94612
ECHO Housing 770 A Street, Hayward, CA 94541
Eden I & R 570 B Street, Hayward, CA 94541
Grid Alternatives 1171 Ocean Avenue, Suite 200 Oakland, CA 94608
Hope Hospice‐ Tri‐Valley 6377 Clark Avenue, Suite 100 Dublin, CA 94568‐3024

Eastern Alameda County Human Services Needs Assessment
JUNE 6, 2012 RESOURCE DEVELOPMENT ASSOCIATES | 104
Horizons Family Counseling 1110 S. Livermore Ave. Livermore, CA
Kidango 44000 Warm Spring RoadFremont, CA 94538
Livermore Area Recreation & Parks District (LARPD) 4444 East AvenueLivermore, CA 94550
Legal Assistance for Seniors 464 7th StreetOakland, CA 94607
Livermore USD 685 East Jack London Boulevard Livermore, CA 94551
National Alliance for Mental Illness (NAMI)‐ Tri‐Valley P.O. Box 5563Pleasanton, CA 94566
Neighborhood Solutions P.O. Box 3512Walnut Creek, CA 94598
Pantry Open Heart Kitchen‐ Tri‐Valley 1141 Catalina WayMailbox # 137 Livermore, CA 94550
Pleasanton Senior Center 5353 Sunol BoulevardPleasanton, CA 94566
PUSD‐Pleasanton 4665 Bernal Avenue Pleasanton, CA 94566‐7498
Ridgeview Commons 5200 Case Ave., Pleasanton, CA, 94566
Senior Support Program of the Tri‐Valley 5343 Sunol Blvd., Pleasanton, CA 94566
Shepherd's Gate 1660 Portola Avenue • Livermore, CA 94551
Spectrum Community Services‐ Tri‐Valley 2621 Barrington CtHayward, CA 94545
Tri Valley Haven 3663 Pacific Ave, Livermore, CA 94550
Tri Valley Youth Court P.O. Box 1135Livermore, CA 94550
Tri‐City Health Center‐ Tri‐Valley 39500 Liberty Street Fremont, California 94538
Tri‐Valley Housing Opportunity Center 141 N Livermore Ave # ALivermore, CA 94550‐3118
Valley Care 1111 ‐ 1133 E Stanley BlvdLivermore, CA 94550
Valley Community Church 4455 Del Valle ParkwayPleasanton, CA 94566‐6118
Wheels Livermore Amador Valley Transit Authority‐“Wheels”1362 Rutan Court‐Suite #100 Livermore, CA 94551

Eastern Alameda County Human Services Needs Assessment
JUNE 6, 2012 RESOURCE DEVELOPMENT ASSOCIATES | 105
YMCA 6693 Sierra LaneSuite F Dublin, CA 94568
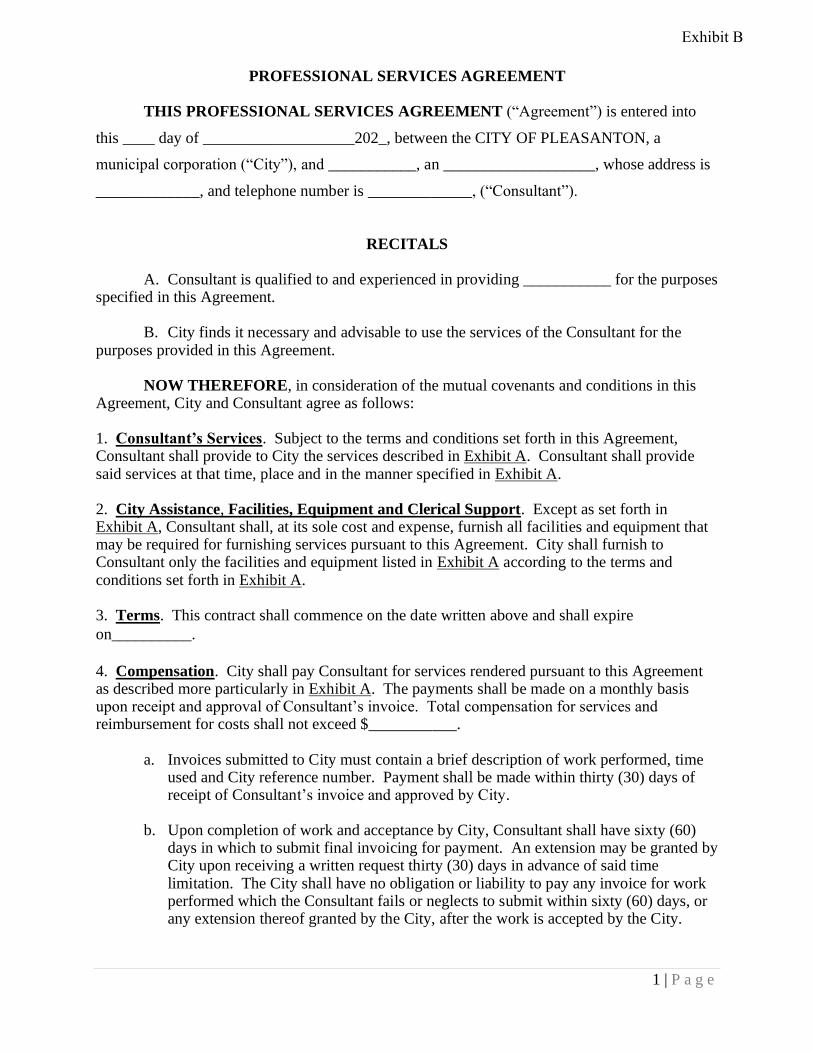
1 | P a g e
PROFESSIONAL SERVICES AGREEMENT
THIS PROFESSIONAL SERVICES AGREEMENT (“Agreement”) is entered into
this ____ day of ___________________202_, between the CITY OF PLEASANTON, a
municipal corporation (“City”), and ___________, an ___________________, whose address is
_____________, and telephone number is _____________, (“Consultant”).
RECITALS
A. Consultant is qualified to and experienced in providing ___________ for the purposesspecified in this Agreement.
B. City finds it necessary and advisable to use the services of the Consultant for thepurposes provided in this Agreement.
NOW THEREFORE, in consideration of the mutual covenants and conditions in this Agreement, City and Consultant agree as follows:
1. Consultant’s Services. Subject to the terms and conditions set forth in this Agreement,Consultant shall provide to City the services described in Exhibit A. Consultant shall providesaid services at that time, place and in the manner specified in Exhibit A.
2. City Assistance, Facilities, Equipment and Clerical Support. Except as set forth inExhibit A, Consultant shall, at its sole cost and expense, furnish all facilities and equipment thatmay be required for furnishing services pursuant to this Agreement. City shall furnish toConsultant only the facilities and equipment listed in Exhibit A according to the terms andconditions set forth in Exhibit A.
3. Terms. This contract shall commence on the date written above and shall expire
on__________.
4. Compensation. City shall pay Consultant for services rendered pursuant to this Agreementas described more particularly in Exhibit A. The payments shall be made on a monthly basisupon receipt and approval of Consultant’s invoice. Total compensation for services andreimbursement for costs shall not exceed $___________.
a. Invoices submitted to City must contain a brief description of work performed, timeused and City reference number. Payment shall be made within thirty (30) days ofreceipt of Consultant’s invoice and approved by City.
b. Upon completion of work and acceptance by City, Consultant shall have sixty (60)days in which to submit final invoicing for payment. An extension may be granted byCity upon receiving a written request thirty (30) days in advance of said timelimitation. The City shall have no obligation or liability to pay any invoice for workperformed which the Consultant fails or neglects to submit within sixty (60) days, orany extension thereof granted by the City, after the work is accepted by the City.
Exhibit B

2 | P a g e
5. Sufficiency of Consultant’s Work. All work product and all other documents prepared by Consultant shall be adequate and sufficient to meet the purposes for which they are prepared. 6. Ownership of Work. All work product and all other documents completed or partially completed by Consultant in the performance of this Agreement shall become the property of the City. All materials shall be delivered to the City upon completion or termination of the work under this Agreement. If any materials are lost, damaged or destroyed before final delivery to the City, the Consultant shall replace them at its own expense. Any and all copyrightable subject matter in all materials is hereby assigned to the City and the Consultant agrees to execute any additional documents that may be necessary to evidence such assignment. Consultant shall keep materials confidential. Materials shall not be used for purposes other than performance of services under this Agreement and shall not be disclosed to anyone not connected with these services, unless the City provides prior written consent. 7. Changes. City may request changes in the scope of services to be provided by Consultant. Any changes and related fees shall be mutually agreed upon between the parties and subject to a written amendment to this Agreement. 8. Consultant’s Status. In performing the obligations set forth in this Agreement, Consultant shall have the status of an independent contractor and Consultant shall not be considered to be an employee of the City for any purpose. All persons working for or under the direction of Consultant are its agents and employees and are not agents or employees of City. 9. Termination for Convenience of City. The City may terminate this Agreement at any time by mailing a notice in writing to Consultant. The Agreement shall then be deemed terminated, and no further work shall be performed by Consultant. If the Agreement is so terminated, the Consultant shall be paid for that percentage of the work actually completed at the time the notice of termination is received. 10. Non-Assignability. The Consultant shall not assign, sublet, or transfer this Agreement or any interest or obligation in the Agreement without the prior written consent of the City, and then only upon such terms and conditions as City may set forth in writing. Consultant shall be solely responsible for reimbursing subcontractors. 11. Indemnity and Hold Harmless. Consultant shall defend, indemnify, and hold harmless, the City and its officers, agents and employees from and against all claims, losses, damage, injury, and liability for damages arising from, or alleged to have arisen from, errors, omissions, negligent or wrongful acts of the Consultant in the performance of its services under this Agreement, regardless of whether the City has reviewed or approved the work or services which has given rise to the claim, loss, damage, injury or liability for damages. This indemnification shall extend for a reasonable period of time after completion of the project as well as during the period of actual performance of services under this Agreement. The City’s acceptance of the insurance certificates required under this Agreement does not relieve the Consultant from its obligation under this paragraph. 12. Insurance. During the term of this Agreement, Consultant shall maintain in full force and effect, at its own cost and expense, insurance coverages with insurers with an A.M. Best’s rating of no less than A:VII. Contractor shall have the obligation to furnish City, as additional insured, the minimum coverages identified below, or such greater or broader coverage for City, if available in the Contractor’s policies:

3 | P a g e
a. General Liability and Bodily Injury Insurance. Commercial general liability
insurance with limits of at least $2,000,000 combined limit for bodily injury and property damage that provides that the City, its officers, employees and agents are named as additional insureds under the policy as evidenced by an additional insured endorsement satisfactory to the City Attorney. The policy shall state in writing either on the Certificate of Insurance or attached rider that this insurance will operate as primary insurance for work performed by Consultant and its subconsultants, and that no other insurance effected by City or other named insured will be called on to cover a loss.
b. Automobile Liability Insurance. Automobile liability insurance with limits not less
than $2,000,000 per person/per occurrence. c. Workers’ Compensation Insurance. Workers’ Compensation Insurance for all of
Consultant’s employees, in strict compliance with State laws, including a waiver of subrogation and Employer’s Liability Insurance with limits of at least $1,000,000.
c. Professional Liability Insurance. Professional liability insurance in the amount of
$2,000,000. d. Certificate of Insurance. Consultant shall file a certificate of insurance with the City
prior to the City’s execution of this Agreement, and prior to engaging in any operation or activity set forth in this Agreement. The Certificate of Insurance shall provide in writing that the insurance afforded by this Certificate shall not be suspended, voided, canceled, reduced in coverage or in limits without providing notice to the City in accordance with California Insurance Code section 677.2 which requires the notice of cancellation to: 1) include the effective date of the cancellation; 2) include the reasons for the cancellation; and 3) be given at least 30 days prior to the effective date of the cancellation, except that in the case of cancellation for nonpayment of premiums or for fraud, the notice shall be given no less than 10 days prior to the effective date of the cancellation. Notice shall be sent by certified mail, return receipt requested. In addition, the insured shall provide thirty (30) days prior written notice to the City of any cancellation, suspension, reduction of coverage or in limits, or voiding of the insurance coverage required by this agreement. The City reserves the right to require complete certified copies of policies.
e. Waiver of Subrogation. The insurer agrees to waive all rights of subrogation against
the City, its officers, employees and agents. f. Defense Costs. Coverage shall be provided on a “pay on behalf of” basis, with
defense costs payable in addition to policy limits. There shall be no cross liability exclusions. g. Subcontractors. Consultant shall include all subcontractors as insured under its
policies or shall furnish separate certificates and endorsements for each subcontractor. All coverages for subcontractors shall be subject to all of the requirements stated in this Agreement, including but not limited naming additional insureds. 13. Notices. All notices herein required shall be in writing and shall be sent by certified or registered mail, postage prepaid, addressed as follows: To Consultant: __________________ To City: City Manager

4 | P a g e
__________________ City of Pleasanton
___________________ P.O. Box 520 Pleasanton, CA 94566
14. Conformance to Applicable Laws. Consultant shall comply with all applicable Federal, State, and Municipal laws, rules, and ordinances. Consultant shall not discriminate in the employment of persons or in the provision of services under this Agreement on the basis of any legally protected classification, including race, color, national origin, ancestry, sex or religion of such person. 15. Licenses, Certifications and Permits. Prior to the City’s execution of this Agreement and prior to the Consultant’s engaging in any operation or activity set forth in this Agreement, Consultant shall obtain a City of Pleasanton business license, which must be kept in effect during the term of this Agreement. Consultant covenants that it has obtained all certificates, licenses, permits and the like required to perform the services under this Agreement. 16. Records and Audits. Consultant shall maintain all records regarding this Agreement and the services performed for a period of three years from the date that final payment is made. At any time during normal business hours, the records shall be made available to the City to inspect and audit. 17. Confidentiality. Consultant shall exercise reasonable precautions to prevent the unauthorized disclosure and use of City reports, information or conclusions. 18. Conflicts of Interest. Consultant covenants that other than this Agreement, Consultant has no financial interest with any official, employee or other representative of the City. Consultant and its principals do not have any financial interest in real property, sources of income or investment that would be affected in any manner of degree by the performance of Consultant’s services under this Agreement. If such an interest arises, Consultant will immediately notify the City. 19. Waiver. In the event either City or Consultant at any time waive any breach of this Agreement by the other, such waiver shall not constitute a waiver of any other or succeeding breach of this Agreement, whether of the same or of any other covenant, condition or obligation. 20. Governing Law. California law shall govern any legal action pursuant to this Agreement with venue in the applicable court or forum for Alameda County. 21. No Personal Liability. No official or employee of City shall be personally liable to Consultant in the event of any default or breach by the City or for any amount due Consultant. 22. Exhibits. All exhibits referred to herein are attached hereto and are by this reference incorporated herein. 23. Counterparts and Electronic Signatures. This Agreement may be executed in multiple counterparts, each of which shall be an original and all of which together shall constitute one agreement. Counterparts may be delivered via facsimile, electronic mail (including pdf or any electronic signature complying with U.S. federal E-Sign Act of 2000 (15 U.S. Code §7001 et seq.), California Uniform Electronic Transactions Act (Cal. Civil Code §1633.1 et seq.), or other
5 | P a g e
applicable law) or other transmission method, and any counterpart so delivered shall be deemed to have been duly and validly delivered and be valid and effective for all purposes. 24. Scope of Agreement. This writing constitutes the entire Agreement between the parties. Any modification to the Agreement shall be in writing and signed by both parties. THIS AGREEMENT executed the date and year first above written.
CITY OF PLEASANTON CONSULTANT __________________________ By: __________________________ Brian Dolan, Acting City Manager Signature ATTEST: __________________________ Print name __________________________ Jocelyn Kwong, City Clerk Its: __________________________ Title APPROVED AS TO FORM: __________________________ Daniel G. Sodergren, City Attorney Rev. 12/21

6 | P a g e
EXHIBIT A Scope of Consultant’s Services Compensation

STAFF REPORT CITYCLERKFile #480-20CITYCOUNCIL
DATE: October20, 2015
TO: Honorable Mayor andCityCouncilmembers
FROM: Christopher L. Foss, CityManager
SUBJECT: Community Grants Program Funding Priorities forProgram Year2016-2017Prepared byLukeSims, Community Development Director
EXECUTIVESUMMARY:
TheCityCouncil willreceive abriefreport onfunding allocations under theCommunity GrantsProgram asapproved bytheCityCouncil forprogram year2015-2016, discuss priorities fortheupcoming Community Grants Program allocation process, anddirectstaffastohowfundingshould beprioritized forthe2016-2017program yearsothatthosepriorities canbeincluded inthecallforproposals whichwillbeinitiated inNovember.
FINANCIALIMPACT:
Funding fortheCommunity Grants Program forFiscalYear2016-2017will include anallocationofGeneral Fundmonies intheamount of $120,000, anestimated $60,000ineligible CommunityDevelopment Block Grant (CDBG) funds, andpossibly $8,000fromtheAffordable HousingFunddepending oneligibility. These funding levelsaresimilar torecent yearallocations withtheexception oftheCDBG program whichmayreceive lessfunding in2016-2017duetothelossofone-timerevenues available inthecurrent year, butnotguaranteed fornextyear.
RECOMMENDATION:
Staff recommends thattheCityCouncil discuss theprioritization ofCommunity GrantProgramfunding forprogram year2016-2017anddirectstaffastohowtheCouncil would likethefundingprioritized intheupcoming yearsostaffcanbetter inform prospective grantees during theCommunity Grant allocation process beginning inNovember, 2015.
Reviewed ByAssistant CityManager
DESCRIPTION:
TheCity ofDublin Community Grants Program provides financial support tolocalnot-for-profitorganizations serving theDublin community. Theprogram issupported through several fundingsources including theFederal Community Development BlockGrant (CDBG) program, theCity’s
ITEMNO. 8.4Page1of2
Exhibit C

General Fund, andtoalimiteddegree, theCity’sAffordable Housing Fund. TheProgram hasevolved inrecent yearsduetotheinformation gained fromtheTri-Valley Human ServicesNeedsAssessment completed in2011, andthefindings ofthe 2012Human Services TaskForcewhichhelped better identify human service needs inDublin. Inpart toassist theCityCouncil intheCommunity Grants Program, theCityCouncil formed theHuman ServicesCommission in2013. TheCommission hassinceprovided funding recommendations forthe2014-2015and2015-2016program years.
Inmaking arecommendation regarding theCommunity Grants Program inJanuary, 2014, theHuman Services Commission suggested theCityCouncil generally emphasize identified humanservices needs inDublin whenfunding recipients oftheProgram. Inparticular, theCommissionrecommended that theProgram notfundperforming artsprograms suchastheLivermoreValley Opera andthePacific Chamber Symphony toallowtheCitytobetter fund humanservices inDublin. TheCityCouncil agreed andallocated thefundsaccordingly. Thisoccurredagain inthedeliberations earlier thisyearwhentheCommission made itsrecommendations forthecurrent program year.
During theStrategic Planning Session onMarch7, 2015, theHuman Services Commission wasinvited toprovide inputonhuman services needstohelpinform theCityCouncil indevelopingitsTwo-YearStrategic Plan. Aspartofthediscussion andexchange ofideas, somemembersoftheCityCouncil andtheCommission stressed again theimportance offocusing theCommunity Grants Program onfunding not-for-profitservice providers thathelped serve themostcritical human service needs. Inaddition, someexpressed concern aboutusing limitedCommunity Grants Program grants tofundcertain activities connected totheDublin UnifiedSchool District whenotherfunding sources maybeavailable. Attachment No. 1isaThree-YearFunding Summary showing whichorganizations andspecific programs wereawarded grantsandthegrantamounts forthepastthreegrantcycles. Italsoincludes acolumn showing theamounts originally requested byapplicants forthisyear.
Staffispreparing tolaunch theCommunity Grants Program for2016-2017. Theinitial GrantWorkshops areplanned forNovember withsubmittals dueinDecember. Staff isseekingdirection fromtheCityCouncil toconfirm thefunding priorities usedinrecent years, orindicatehowtheCouncil would liketoprioritize theCommunity Grants Program going forward. TheCityCouncil direction canthenbecommunicated toprospective applicants andtaken intoconsideration whendeciding tosubmit anapplication. HowtheCouncil would liketoprioritizefunding canalsoassist theHuman Services Commission whentheyformtheir recommendationtotheCouncil attheir regular meeting onJanuary 28, 2016.
NOTICINGREQUIREMENTS/PUBLICOUTREACH:
Staffprovided noticeviaemail toallapplicants fromthecurrent yearcycle.
ATTACHMENTS: 1. CityofDublin Community Grant Program Three-YearFundingSummary
Page2of2

CityofDublin Community Grants Program / Three-YearFunding Summary
Approved ApprovedRequestApprovedOrganizations andProgramsFY 13-14FundingFY 14-15FundingFY 15-16Funding FY15-16Funding
AxisCommunityHealth - AccesstoCare$ 15,000 $ 10,000 **
AxisCommunityHealth - FacilityProjectLoanObligation$ 10,000 $ 13,500 22,386$ 22,386
AxisCommunityHealth - PatientCare 10,000$ 7,530
BayAreaComm. Services - WellnessCenter 3,500******
CALICOCenter - ChildAbuseIntervention 5,000$ 6,500$ 7,500$ 7,300
CARD - HelpingDublinPreparetoProsper! 25,000**
CenterforCommunityDisputeSettlement - Tri-ValleyYouthCourt 3,500$ 3,500
Chabot-LasPositasCommunityCollege - Tri-ValleyOneStopCareerCenter 10,000$ 10,000$ 12,000$ 9,600
ChildCareLinks - EarlyChildhoodEducation 10,000$ 10,000$ 25,000$ 8,000
Children'sEmergencyFoodBank - NewBuilding 20,000$ 7,000
CityServeoftheTri-Valley - CityServe 5,000$ 12,360$ 12,510$ 10,000CommunityResourcesforIndependentLiving - IndependentLiving, Housing
EmploymentServices 3,500$ 3,500$ 5,000$ 5,000
DublinHighPFSO - DublinHighSafeandSoberGradNight 4,000$ 4,000$ 4,000$ 3,500
DublinHighPFSO - Every15MinutesProgram 8,000$ 6,375
DublinHighSchool - DublinHighFreshmanMentorProgram 25,000**
DublinPartnershipsinEducation - DPIECommunityGrant 25,000$ 10,000$ 20,000$ 12,000
EasterSealsBayArea - Kaleidoscope 2,500$ 4,000$ 15,000$ 5,000
EdenI&R, Inc. - 2-1-1AlamedaCountyCommunicationsSystem 10,000$ 10,000$ 10,000$ 10,000
HopeHospice, Inc. - GriefSupportCenter & VolunteerPrograms 10,000$ 11,400$ 15,000**
Kidango - EarlyChildhoodEducation 10,000****
Kidango - EmeraldVistaEnrichment 8,000$ 3,500
LivermoreValleyOpera - DublinStudentProgram 5,000****** LivermoreValleyPerformingArtsCenter - ArtsintheSchoolswithChezaNamiFoundation 13,872**
OpenHeartKitchen - DublinMealPrograms 10,000$ 10,000$ 15,000$ 12,600
PacificChamberSymphony - MusicisFun 5,000**$ 11,500**
PartnersforGolf - FirstTeeTri-ValleyExpansionintoDublin 7,000**
SandraJWingHealingTherapiesFoundation 5,831****
SchoolofImagination - HappyTalkersScreeningandTrainingProject 6,625$ 25,000$ 11,500
SeniorSupportProgramoftheTri-Valley - CaseManagement 10,209$ 9,500$ 11,646$ 11,646
SpectrumCommunityServices - MealsonWheelsforHomeboundSeniors 6,475$ 7,902$ 8,500$ 8,350
Tri-ValleyHaven - DomesticViolenceServices 8,000$ 8,000$ 8,000$ 8,000
Tri-ValleyHaven - HomelessServices 10,000$ 10,000$ 10,000$ 10,000
Tri-ValleyHousingOpportunityCenter - CommunityStabilizationProgram 25,000******
ValleyChildren'sMuseum - MobileMuseumChildren'sActivities 5,000$ 6,625$ 6,000$ 5,125
ValleyCareHealthSystem - CPRinSchools 5,000** YMCAoftheEastBay - BehavioralHealthCareServicesforKidswSpecialNeeds 18,000$ 9,900
YMCAoftheEastBay - BuildAssetsReduceBullying 4,659****
YMCAoftheEastBay - FamilyEngagementatEmeraldVista 10,000$ 10,000****
YMCAoftheEastBay - KidswSpecialNeedsThriveatYCamp 5,000******
YMCAoftheEastBay - MentoringProgram 15,000**
Total 198,184$ 179,743$ 402,414$ 187,912
ATTACHMENT1

Revision 10/12/21
EXHIBIT A
City of Livermore Housing and Human Services Grant Priorities Fiscal Year 2021-22
For Council Approval
1) Public Health• Navigation of Mental Health Services and Substance Use Programs for low-income
and unsheltered community members• Support Services for people with disabilities, seniors, and low-income families• Medical and Dental Services
2) Housing• Affordable Housing units for low-income families, people experiencing
homelessness, and seniors• Rental Assistance• Housing Services to keep low-income families, people with disabilities, and seniors
housed
3) Homeless• Emergency Shelter and Temporary/Transitional Housing• Basic Needs such as showers/restrooms and storage• Employment Services• Supportive Services such as service navigation and counseling
4) Safety Net Access• Access Critical Safety Net Services for non-English speakers, people with
disabilities, seniors, low-income families, and youth• Access and Navigation to Social Services such as but not limited to Cal-Fresh and
Medi-Cal• Food security• Transportation
February 11, 2014| 1
City of Pleasanton Human Services Needs Assessment
Strategic Plan 2014-2016
February 11, 2014| 1
Contents
Background ................................................................................................................................................... 2
Planning Methods, Activities, and Timeline .................................................................................................. 3
Mission, Vision, and Values........................................................................................................................... 4
Assessment of Strengths, Weaknesses, Opportunities, and Threats ........................................................... 5
Pleasanton Needs Assessment ..................................................................................................................... 6
Identification of Strategic Priorities .............................................................................................................. 6
Innovative, Promising, and Best Practices Research .................................................................................... 7
Identification of Strategic Actions ................................................................................................................. 7
Organizational Priorities ............................................................................................................................. 10
Organizational Actions ................................................................................................................................ 11
City of Pleasanton Human Services Needs Assessment – Strategic Plan 2014-2016
February 11, 2014| 2
Background
In 2011, Resource Development Associations (RDA), a local consulting firm specializing in strategic planning and evaluation for local government and nonprofit entities, facilitated a broad-based community-driven assessment of human service needs in Eastern Alameda County (commissioned jointly by the Tri-Valley cities of Dublin, Livermore, and Pleasanton). The 2011 Needs Assessment found a significant and increasing disparity between a growing need for human services and a generally stagnating supply of services available.
The City of Pleasanton’s Human Services Commission (Commission) is a nine-member body (with seven regular members, one alternate member and one non-voting youth member) that oversees the grant application process for the provision of human services assistance and programs. The Commission makes funding recommendations to the Pleasanton City Council regarding 1) the human service needs of the community and 2) methods for meeting these needs. The Commission focuses on the human service needs of the socially and economically disadvantaged, the elderly, and youth in the community. Upon review of the 2011 Needs Assessment, the Commission determined that it needed to develop a community-specific Strategic Plan to ensure that it would carry out its duties in the most thoughtful and effective way. The Commission chose RDA to conduct this strategic planning process.
The Commission identified several key questions it wanted to address in the strategic planning process: How do we use funding in the most effective and efficient way? How do we continue to assess and prioritize needs in the community? How do we measure success? What is the timeline for the strategic plan? How do we account for changes in needs? How can we help our grantees build capacity through collaboration and innovation? How do we develop a relationship with our stakeholders (providers and community members)? How do we go beyond what we are currently providing given the increasing needs? How do we strategically allocate grant funding to catalyze change?

City of Pleasanton Human Services Needs Assessment – Strategic Plan 2014-2016
February 11, 2014| 3
Planning Methods, Activities, and Timeline
Between June and December 2013, the Strategic Planning process included the following activities: Date Methods/Activities Outcomes
June 19, 2013 First Strategic Planning Workshop
Defined strategic planning objectives Group activity to develop Mission, Vision, and Values statement
June 2013
Extraction of Pleasanton-specific data from Eastern Alameda County Human Services Needs Assessment; Focus groups with service providers
Pleasanton-specific needs assessment
July 16, 2013 Second Strategic Planning Workshop
Group activity to develop Strengths, Weaknesses, Opportunities, and Threats (SWOT) Analysis Identification of priority needs and systemic challenges
August 2013 Research on innovative practices/ strategies to address priority needs and systemic challenges
Inventory of best practices for addressing priority needs and systemic challenges
September 11, 2013 Third Strategic Planning Workshop
Identification of strategic actions based on community needs and systemic challenges Commission members finalize strategic priorities and internal development goals through completion of email survey responses
October 2013 Draft Strategic Plan reviewed by City staff.
Feedback from City staff on draft Strategic Plan and revise Plan.
November 6, 2013 Fourth Strategic Planning Workshop Feedback from Commission on the presentation/overview of the Strategic Plan
December 2013 Draft Strategic Plan circulated to Commission members.
Feedback from Commission on draft strategic plan, fill in remaining details, and finalize Plan

City of Pleasanton Human Services Needs Assessment – Strategic Plan 2014-2016
February 11, 2014| 4
Mission, Vision, and Values
Formulating a mission, vision, and values statement clarifies the purpose of the Human Services Needs Assessment’s Strategic Plan and produces internal and external legitimacy. Mission and values statements help all members of an organization identify, and remain focused on, what is truly important in the Strategic Plan. They serve as benchmarks by which organizational strategies and actions can be prioritized.
The Strategic Plan’s mission, vision, and values statement was developed from a group activity in which members answered the following questions:
What problems does the Human Services Needs Assessment address? How do we respond to problems? Who are our stakeholders? What is our relationship with our stakeholders? What does success look like? What are our values? What makes us unique?
Responses to these questions contributed to the formation of this mission, vision, and values statement:
Human Services Needs Assessment Strategic Plan
Mission, Vision, and Values
Mission: The mission of the Human Services Needs Assessment Strategic Plan is to support the provision of highest quality human services so that all residents can meet their basic life needs. To this end, the Commission will advise the City Council, identify and prioritize local needs; assist in the coordination of existing services to address gaps; encourage collaboration and innovation; and promote efficient and effective allocation of public resources.
Vision: All Pleasanton residents should have access to basic health and human services locally and with dignity. Residents should be kept informed of current community resources, should be knowledgeable about the most effective ways to address service gaps, and should engage in efforts to increase the quality of life and self-sufficiency of vulnerable individuals and families.
Values: Effect social change, build capacity, collaborate with partners, learn and innovate, use data to inform decision making, remain flexible as new issues and opportunities arise, measure outcomes.
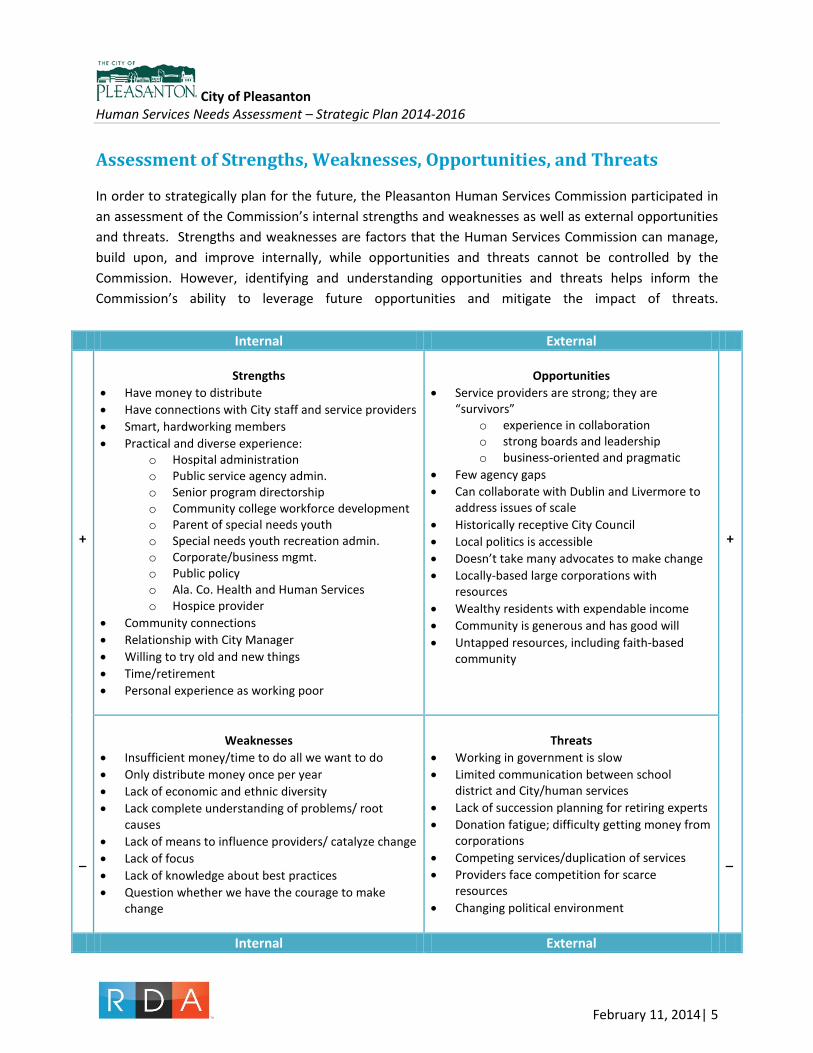
City of Pleasanton Human Services Needs Assessment – Strategic Plan 2014-2016
February 11, 2014| 5
Assessment of Strengths, Weaknesses, Opportunities, and Threats
In order to strategically plan for the future, the Pleasanton Human Services Commission participated in an assessment of the Commission’s internal strengths and weaknesses as well as external opportunities and threats. Strengths and weaknesses are factors that the Human Services Commission can manage, build upon, and improve internally, while opportunities and threats cannot be controlled by the Commission. However, identifying and understanding opportunities and threats helps inform the Commission’s ability to leverage future opportunities and mitigate the impact of threats.
Internal External
+
_
Strengths
• Have money to distribute • Have connections with City staff and service providers • Smart, hardworking members • Practical and diverse experience:
o Hospital administration o Public service agency admin. o Senior program directorship o Community college workforce development o Parent of special needs youth o Special needs youth recreation admin. o Corporate/business mgmt. o Public policy o Ala. Co. Health and Human Services o Hospice provider
• Community connections • Relationship with City Manager • Willing to try old and new things • Time/retirement • Personal experience as working poor
Opportunities
• Service providers are strong; they are “survivors”
o experience in collaboration o strong boards and leadership o business-oriented and pragmatic
• Few agency gaps • Can collaborate with Dublin and Livermore to
address issues of scale • Historically receptive City Council • Local politics is accessible • Doesn’t take many advocates to make change • Locally-based large corporations with
resources • Wealthy residents with expendable income • Community is generous and has good will • Untapped resources, including faith-based
community
+
_
Weaknesses
• Insufficient money/time to do all we want to do • Only distribute money once per year • Lack of economic and ethnic diversity • Lack complete understanding of problems/ root
causes • Lack of means to influence providers/ catalyze change • Lack of focus • Lack of knowledge about best practices • Question whether we have the courage to make
change
Threats
• Working in government is slow • Limited communication between school
district and City/human services • Lack of succession planning for retiring experts • Donation fatigue; difficulty getting money from
corporations • Competing services/duplication of services • Providers face competition for scarce
resources • Changing political environment
Internal External

City of Pleasanton Human Services Needs Assessment – Strategic Plan 2014-2016
February 11, 2014| 6
Pleasanton Needs Assessment
Data extracted from the Eastern Alameda County Human Services Needs Assessment (EACHSNA) and two focus groups with Pleasanton service providers informed the strategic planning process. The EACHSNA data derived from census information, surveys of hard to reach populations, provider surveys, focus groups, and key informant interviews. Two Pleasanton focus groups with service providers were conducted as part of this planning process on July 8, 2013 and on July 9, 2013.
The data from these sources identified current issues affecting human services needs in Pleasanton, including:
Significant population growth over the past two decades, Greater diversity in the population – higher numbers of Asian/Pacific Islanders and
Hispanic/Latinos in the community, Increase in unemployment over the past decade, Increase in percentage of residents receiving social assistance, and Priority needs identified by focus group poll of service providers:
o Affordable housing o Behavioral health services o Health care services o Workforce development o Senior services o Transportation services/accessibility of services.
A more complete Pleasanton-specific Human Services Needs Assessment is included in Appendix A.
Identification of Strategic Priorities
At the second strategic planning workshop, members of the Human Services Commission reviewed the Pleasanton-specific needs assessment, considered their organizational strengths, weaknesses, opportunities and threats and discussed and prioritized human service needs and systemic challenges.
Most Critical Systemic Challenges (listed in alphabetical order):
Lack of consumer information about services/need for education Lack of coordination, missed opportunities for collaboration, and duplication of services among
service providers Time and cost associated with obtaining services Untapped resources
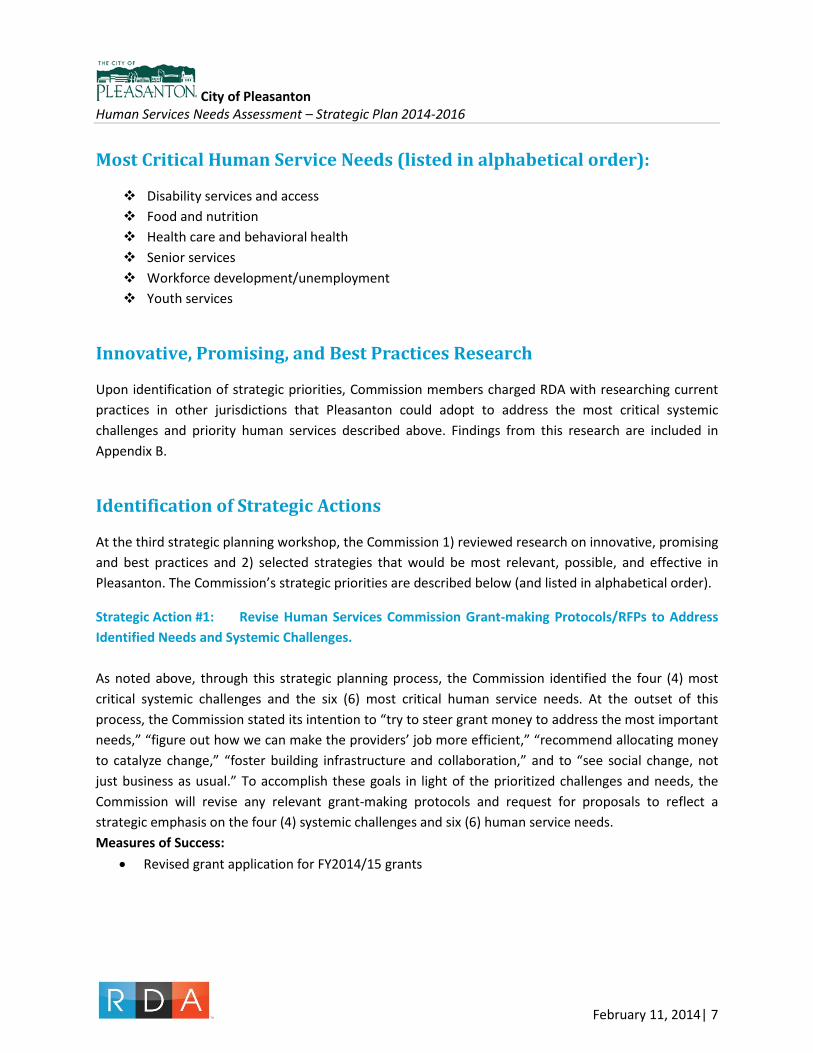
City of Pleasanton Human Services Needs Assessment – Strategic Plan 2014-2016
February 11, 2014| 7
Most Critical Human Service Needs (listed in alphabetical order):
Disability services and access Food and nutrition Health care and behavioral health Senior services Workforce development/unemployment Youth services
Innovative, Promising, and Best Practices Research
Upon identification of strategic priorities, Commission members charged RDA with researching current practices in other jurisdictions that Pleasanton could adopt to address the most critical systemic challenges and priority human services described above. Findings from this research are included in Appendix B.
Identification of Strategic Actions
At the third strategic planning workshop, the Commission 1) reviewed research on innovative, promising and best practices and 2) selected strategies that would be most relevant, possible, and effective in Pleasanton. The Commission’s strategic priorities are described below (and listed in alphabetical order).
Strategic Action #1: Revise Human Services Commission Grant-making Protocols/RFPs to Address Identified Needs and Systemic Challenges. As noted above, through this strategic planning process, the Commission identified the four (4) most critical systemic challenges and the six (6) most critical human service needs. At the outset of this process, the Commission stated its intention to “try to steer grant money to address the most important needs,” “figure out how we can make the providers’ job more efficient,” “recommend allocating money to catalyze change,” “foster building infrastructure and collaboration,” and to “see social change, not just business as usual.” To accomplish these goals in light of the prioritized challenges and needs, the Commission will revise any relevant grant-making protocols and request for proposals to reflect a strategic emphasis on the four (4) systemic challenges and six (6) human service needs. Measures of Success:
• Revised grant application for FY2014/15 grants

City of Pleasanton Human Services Needs Assessment – Strategic Plan 2014-2016
February 11, 2014| 8
Strategic Action #2: Spearhead a Community Engagement and Education Campaign The data from focus groups and the 2011 Eastern Alameda County Needs Assessment identified gaps in local community members’ knowledge about available services and how to access them. In a survey of hard to reach populations, 38% reported that they did not know where to get the help that they needed. This lack of knowledge about services that currently exist presents a critical obstacle to effective service provision. As service providers from the strategic planning focus groups noted:
“People don’t know what services are available, and/or what services they qualify for.” “Getting the word out about existing services is a big challenge.”
This strategic priority, to coordinate a Community Engagement and Education Campaign, is intended to further the work of the Pleasanton Human Services Commission and its grantees by educating the community about needed services. This campaign provides valuable support to the outreach efforts of community-based organizations and other service providers. It serves long-term community building efforts by educating all community members about human services needs in Pleasanton.
This campaign incorporates strategies that were 1) identified either by local community service providers, Human Services Commission members, or by research into innovative and promising programs in other jurisdictions, and 2) chosen by Commission members as the most inspiring and relevant projects to meet Pleasanton’s community needs. The campaign includes the following elements:
Conducting information sessions/health fairs about available services, Presenting service information to the public via a dynamic, interactive kiosk that can be
accessed in well-trafficked, public locations, Developing a community-building public relations campaign highlighting the “different faces of
Pleasanton” to raise community awareness of local needs and increase awareness of local diversity,
Develop a comprehensive program to raise awareness about and understanding of, available public and non-profit services. As part of this program, explore ways to designate one or more city employees, as determined by the city manager, to be responsible for coordinating outreach and education efforts, and
Inclusion of a gamification/public competition element (asking local residents to wrestle with the same issues that public agencies deal with and come up with potential solutions).
Measures of Success (planning) • Written proposal and budget • Potential funders identified • Funding obtained from City Council and other sources • Designate staff to coordinate outreach and education program
City of Pleasanton Human Services Needs Assessment – Strategic Plan 2014-2016
February 11, 2014| 9
Measures of Success (implementation)
• # of activities • # of participants involved in activities • Participant satisfaction • Indicators of community engagement and knowledge
Strategic Action #3: Sponsor Alliance among Nonprofit, Faith-Based, and Public Agency Providers In focus groups, service providers described a lack of knowledge about existing supports, duplication of services, and insufficient communications, in spite of generally having positive relationships with one another. An alliance among human service organizations will help to reduce communication barriers and increase coordination of efforts to address persistent human service needs. Per discussions with providers, an alliance would include quarterly meetings.
Human Services Commission members expressed their desire to create a space for providers to share lessons learned, to develop new and innovative ideas, to coordinate the provision of services, and to troubleshoot human services challenges and needs on a regular basis.
The Commission also identified a need to include public agencies and faith-based organizations in the alliance. The Commission believes that by prioritizing collaboration and information sharing, this effort will ensure that local public agencies (such as schools, the health department, etc.) are connected with what is happening on the ground in the community, and that such knowledge will inform their provision of services. This alliance also connects service providers with faith-based organizations from which volunteers may be recruited. Measures of Success (planning)
• Develop a comprehensive program to raise awareness about, and understanding of, available public and non-profit services
• As part of this program, explore ways to designate one or more City employees, as determined by the City Manager, to be responsible for coordinating outreach and education efforts
Measures of Success (implementation) • # of meetings • # of participants involved in each meeting • # of jointly sponsored campaigns, activities, proposals, etc. • Indicators of campaign, activity, proposal success • Member satisfaction

City of Pleasanton Human Services Needs Assessment – Strategic Plan 2014-2016
February 11, 2014| 10
Strategic Action #4: Workforce Development Project The service provider focus groups and Human Services Commission members each identified workforce development (including job training and career development assistance) as one of the most critical needs in Pleasanton. The inability to find employment affects numerous human service needs, such as an individual’s ability to maintain housing and food/nutritional needs. With this Strategic Priority, the Human Services Commission seeks to support job skills development for the unemployed and under-employed, increase opportunities for residents to participate in on-the-job training programs and paid internships, and develop new mentoring opportunities or support recruiting for existing mentoring programs.
With this strategic priority, the Human Services Commission will look to partner with other cities, agencies, and corporations to fund the programs. The Commission will also seek to partner with job skills programs that may exist in the community (such as the Tri-Valley One Stop Career Center), assist with recruiting new mentors and mentees for existing mentoring programs, and conduct outreach to employers (nonprofits, educational institutions, large and small business, and government agencies) for participation in a paid job/internship program. Measures of Success (planning)
• Identify job skills/workforce development partners in the community • Funding obtained from City Council and other partner cities, agencies, and corporations • Designate staff to research and conduct outreach to partner organizations/programs
Measures of Success (implementation) • # of partner relationships developed or enhanced • # of mentors and mentees recruited for job mentoring programs • # of individuals served in job skills/workforce development programs • # of employers recruited for paid job/internship programs
Organizational Priorities
Organizational priorities are those that strengthen the organization internally and ensure that its members are productive, effective, informed, and competent to meet the organization’s programmatic goals and mission.
Members of the Pleasanton Human Services Commission participated in an October 2013 survey in which they ranked their top organizational priorities from the following nine possibilities.

City of Pleasanton Human Services Needs Assessment – Strategic Plan 2014-2016
February 11, 2014| 11
The highlighted priorities listed, received the highest number of votes (at least 3) from the Commission members:
Welcome and encourage people of diverse backgrounds to become more involved with the Human Services Commission
Building relationships with regional (Livermore, Dublin) staff and government representatives Increasing fundraising capacity Documenting and evaluating Human Services Commission successes Updating strategic planning on a regular basis Building relationships with Pleasanton staff and local government Updating Needs Assessment every 3 years Participating in state-wide advocacy efforts Self-educating about best practices
Organizational Actions
To achieve the organizational priorities, the Commission will take the following actions:
Organizational Action #1: Continue to Reach Out to Livermore and Dublin Human Services Commissions and City Staff. The Pleasanton Human Services Commission seeks to provide a foundation for the development of regional efforts to leverage economies of scale and address human services needs applicable to residents throughout the Tri-Valley region. Greater coordination of regional efforts may also be a strategy to increase regional recognition for an area of Alameda County that is perceived as relatively prosperous and without any need for service expansion. In addition, developing these relationships will encourage further collaboration to address some of the systemic challenges identified in the strategic planning process (e.g., lack of knowledge about available resources, duplication of services).
Pleasanton Human Services Commission will continue to communicate and meet with the Livermore Human Services Commission and the Dublin Human Services Commission to learn more, on a real-time basis, about overlapping needs, priorities, and strategies. The Commission will also reach out to invite Livermore and Dublin Human Services Commission members to attend more Pleasanton Human Services Commission meetings. Measures of Success
• # of meetings planned and facilitated • Average # of attendees at meeting • Meeting minutes taken and distributed • Identification of regional campaign or project to address regional human service need

City of Pleasanton Human Services Needs Assessment – Strategic Plan 2014-2016
February 11, 2014| 12
Organizational Action #2: Diversify Pleasanton Human Services Commission Membership As the EACHSNA revealed, Pleasanton’s population has grown significantly over the past 2 decades, and has become much more diverse. For example, 2,755 Asian/Pacific Islanders resided in Pleasanton in 1990; by 2010, almost six times as many (16,334) were Pleasanton residents. The Hispanic/Latino population in Pleasanton nearly doubled in the same time period. The percentage of residents who are unemployed or who are receiving social assistance, such as food stamps or Medi-Cal, has increased as well in recent years.
At the same time, the Commission’s focus on the human service needs of the socially and economically disadvantaged, the disabled, the elderly, and youth in the community suggests that representation on the Commission of those populations served should also be targeted. Best practices suggest that organizations that better reflect the diversity of the community served are informed by a variety of perspectives and able to make better decisions and recommendations. (The Commission currently includes a non-voting member representing the youth population.)
To increase diversity, the Human Services Commission will welcome and encourage individuals from underserved and underrepresented communities to get involved with the Commission. The Human Services Commission will develop and implement specific strategies (such as posting notices in the community locations where consumers of human services programs go and initiate marketing efforts encourage individuals to get involved and apply for vacant positions on the Commission. Measures of Success
• # of recruitment activities • Type of recruitment activities • Increased # of applications that are received from applicants with underserved/
underrepresented backgrounds

APPENDIX A


July 16, 2013
Resource Development Associates
Jennifer Susskind, MCP
Zoe Loftus-Farren, JD
Agenda 2
Welcome
Update on activities to date
Confirm Mission, Vision, Values
Review Pleasanton data from EAHSNA data
extraction and focus groups
Conduct SWOT
Identify commission priorities and strategies
Wrap-up & next steps

Pleasanton Data Sources 3
Pleasanton data extracted from Eastern Alameda Human
Services Needs Assessment (EAHSNA)
Census Data
Hard to Reach Population Surveys
Provider Surveys
Focus Groups
Key Informant Interviews
Two Pleasanton focus groups with service providers
July 8th, 2013 (14 participants)
July 9th, 2013 (12 participants)

Population Trends in Pleasanton
Pleasanton’s population has grown over the past two decades.
50,553 (1990) - 70,285 (2010).
Pleasanton has become more diverse.
Asian/Pacific Islander 2,755 (1990) - 16,334 (2010)
Hispanic/Latino 3,383 (1990) - 7,264 (2010)
Most common languages spoken at home (after English):
Spanish (3,866)
Chinese (3,218)
Korean (1,800)
Other Asian Languages (1,790)
Tagalog (848).
4
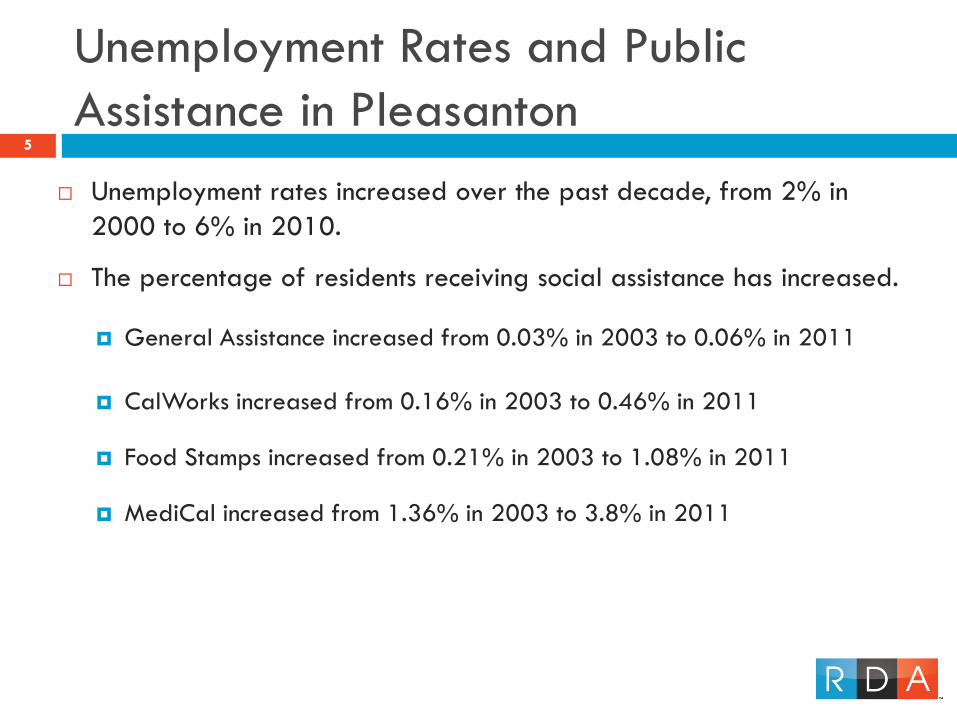
Unemployment Rates and Public
Assistance in Pleasanton
Unemployment rates increased over the past decade, from 2% in
2000 to 6% in 2010.
The percentage of residents receiving social assistance has increased.
General Assistance increased from 0.03% in 2003 to 0.06% in 2011
CalWorks increased from 0.16% in 2003 to 0.46% in 2011
Food Stamps increased from 0.21% in 2003 to 1.08% in 2011
MediCal increased from 1.36% in 2003 to 3.8% in 2011
5

Human Services Needs 6
Focus Group Poll of Service Providers on Top Three Needs
21
15
7 7 7 6
5 5 3 3 3
2 2 2 0
0
5
10
15
20
25
Num
ber
of
Vote
s
Service Need
Priority Needs Identified in Focus Groups

EAHSNA Hard to Reach Population Surveys
7
30%
21%
12% 12% 12% 11%
10% 9% 8%
6% 6% 5%
4% 4% 2% 2% 2%
1% 0%
0%
5%
10%
15%
20%
25%
30%
35%
Perc
enta
ge o
f R
esp
ondents
Human Services Need
What services do you and your family need but have a hard time accessing? (n = 105)
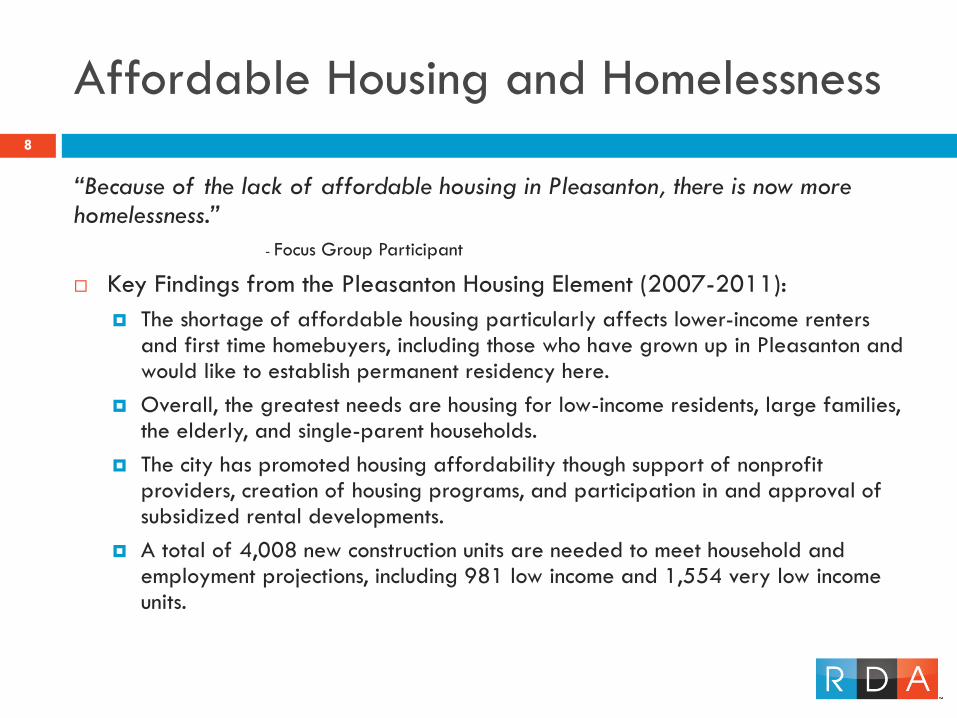
Affordable Housing and Homelessness 8
“Because of the lack of affordable housing in Pleasanton, there is now more homelessness.”
- Focus Group Participant
Key Findings from the Pleasanton Housing Element (2007-2011):
The shortage of affordable housing particularly affects lower-income renters and first time homebuyers, including those who have grown up in Pleasanton and would like to establish permanent residency here.
Overall, the greatest needs are housing for low-income residents, large families, the elderly, and single-parent households.
The city has promoted housing affordability though support of nonprofit providers, creation of housing programs, and participation in and approval of subsidized rental developments.
A total of 4,008 new construction units are needed to meet household and employment projections, including 981 low income and 1,554 very low income units.
Affordable Housing and Homelessness
Continued 9
Focus group participants noted that:
Countywide rents have increased more than 30% in the past two
years.
Housing in Pleasanton is more expensive than in neighboring cities,
but Section 8 coverage is determined regionally. This means that
Section 8 coverage isn’t high enough for Pleasanton tenants.
Fewer landlords are accepting Section 8.
Affordable Housing and Homelessness
Continued 10
The homeless population has grown significantly in the past two years, and even in the past six months.
Homeless individuals/families tend to live in less populated parts of the City, which means they are less visible to the public.
New homeless are people who have lost jobs, lost homes, lost stocks, or tenants of foreclosed homes.
New homeless are living in cars, garages, couch surfing and splitting up families.
“New homeless individuals and families have recently lost their economic stability and don’t know how to get services, or are embarrassed to ask for services.”

Behavioral Health and Health Care
Needs 11
“Stressors related to other issues, such as housing and economic
conditions, contribute to mental health issues.”
- Focus Group Participant
Service providers noted an increase in mental health patients over
the past few years, and a lack of sufficient mental health services.
There is a need for integrated primary health and mental health
services.
Specialty health care services are insufficient for low-income
residents.
Dental care remains a largely unmet need.
Transportation 12
“Residents have to leave Pleasanton to get services.”
- Focus Group Participant
Transportation needs impact access to human services.
It is difficult to get to certain places using public transportation, and
the public transportation system can be difficult to navigate.
Dental services provide a particular challenge with respect to
transportation because you cannot be sedated on buses or
Paratransit.
There is an especially strong need for expanded transportation
options for isolated seniors.

Food and Nutrition 13
“Depending on the day of the week, you may or may not be able to get
food in Pleasanton.”
- Focus Group Participant
In the 2011 EAHSNA, 12% of Pleasanton Hard to Reach Survey
respondents indicated that they had a hard time accessing Food and
Nutrition services when they needed them.

Childhood/Youth Human Service Needs 14
Child Care
In the EAHSNA, 12% of the hard to reach survey respondents in Pleasanton indicated that they had a hard time accessing child care when needed.
Focus group participants indicated that there has been an increase in the number of residents who can’t afford child care.
Childhood Interventions/Children with Autism
“The number of children with autism has increased dramatically in the last two years, and these children will need assistance for the rest of their lives.”
There is a lack of childhood assessment, early childhood intervention, and educational resources for parents of children with developmental disabilities.
There is a disparity in access to early intervention services based on income.
Youth Services
Pleasanton Unified School District has been open to partnerships regarding bullying, healthy relationships, etc.

Additional Needs 15
Seniors
“Seniors are aging. They are also homebound, which makes it harder to count them, and harder to provide them with services.”
Isolated seniors face particular difficultly with transportation issues.
Workforce Development
Workforce development is connected to many other issues, like mental health and housing.
There is a lack of on-the-job training and career development.
10% of Hard to Reach Survey respondents indicated that they have a difficult time accessing job training/job placement services.
Legal Assistance
Focus group participants noted the need for legal services.
8% of Hard to Reach Survey respondents expressed that they have difficulty accessing legal services/advocacy when needed.

Access Barriers and Organizational
Challenges 16
Some of the primary barriers and challenges are:
Time and cost associated with obtaining services
Education and access to information
Cultural competency
Stigma associated with asking for help
Stereotype of Pleasanton as a wealthy community without low-
income residents and associated lack of funding
Challenge of scale

Hard to Reach Population Survey 17
34%
30% 29%
24% 24%
10%
6%
4%
2%
0%
5%
10%
15%
20%
25%
30%
35%
40%
… I can't afford the services.
… I don't qualify for the services.
… it costs too much to get to
where I need to go.
… it takes too long to get to
where I need to go.
… I don't know where to get
help.
… I don't trust the service provider.
… the service provider does not understand
my culture.
… I can't access them because of
disability.
… there is no one that speaks my language.
Perc
enta
ge o
f R
esp
ondents
Access Challenges
Sometimes I don't get the services I need because... (n = 105)

Education and Access to Information 18
“There is a lack of understanding about how the system works. People
don’t see the whole picture, or hear all of the options. If they try to access
services and don’t succeed, they feel like there are no other options.”
- Focus Group Participant
Many low-income residents previously enjoyed economic stability.
They aren’t familiar with the system, and don’t know how to get
information or referrals to services.
For some residents, gaps in information can be as simple as how to
navigate the bus system, or where to get online access.
Many residents don’t know what services are available, and/or what
services they qualify for.

Cultural Competency 19
“The Pleasanton School District doesn’t print materials in different languages because they don’t want to draw attention to the achievement gap.” - Focus Group Participant
“It is more expensive to attract bi-literate and bi-cultural staff.” - Focus Group Participant
6% of Hard to Reach Survey respondents indicated that they had trouble accessing services because services providers didn’t understand their culture.
2% of Hard to Reach Survey respondents indicated that they had a hard time accessing services because providers didn’t speak their language.
Stigma and Community Perceptions 20
“Because of stigma surrounding poverty and asking for help, people in
Pleasanton wait longer to ask for help. This means they sink further into a
financial hole.”
- Focus Group Participant
Focus group participants emphasized:
Stigma associated with asking for help
Perception among some community members that if you can’t afford to live
in Pleasanton, or if Pleasanton doesn’t meet your needs, you should live
somewhere else
Community concern that if you provide too many services, you will attract
more low-income individuals
Residents turn a blind eye to need

Stereotype of Pleasanton as a Community
without Need/Lack of Funding 21
“It is difficult to combat the perception of wealth in Pleasanton and serve
struggling families.”
- Focus Group Participant
Pleasanton was recently designated as having the highest median
income for a city of its size in the country.
People move to Pleasanton for the schools, and don’t expect there to
be low-income residents.
The perception of all-encompassing wealth has made it difficult to
obtain funding for services, including funding from federal, state,
county and private funders.

Challenge of Scale 22
“Pleasanton is a relatively small city. Sometimes it isn’t possible or
doesn’t make sense to create a very specific, limited program,
because there isn’t enough need.” - Focus Group Participant

Strategy Suggestions 23
Establish a Community Foundation
Strong need for an organization that supports local agencies and non-profits with fundraising efforts and local distribution of funds
Non-profit Alliance
An alliance of organizations that provide diverse services
Organizations can share what they are doing, what funding they are seeking, and talk about coordination of services, referrals and duplication of efforts
Attract participants through newsletters, show-casing certain organizations, speakers, etc.
Human Services Fair
Hold a “come learn what your city does for you” fair
Offer services or service vouchers to encourage participation
Rather than host one fair with information in multiple languages, host “one language” fairs where everything is in a specific language, such as Spanish

Strategy Suggestions Continued 24
Wrap-around service delivery and coordinated care
Build organizational relationships that support coordinated care of high-
need individuals
Note: there was some support for this idea, but there were also hesitations
regarding client privacy, funding, and the fact that case managers provide
similar services
Create “one-stop shops”/Multi-Service Center
Offer multiple services at one location to streamline service delivery and
address transportation issues

Strategy Suggestions Continued 25
PR Campaign
“The different faces of Pleasanton”
Raise community awareness of local needs and increase community interest in assisting local individuals and families
Increase local partnerships, for example:
Public-private partnerships to support workforce development
Mentoring initiatives
Partnerships between youth services and the school system
Incentivize/inspire dentists and other potential service partners to donate time and provide services to low-income residents
Utilize/leverage faith-based organizations
Increase advocacy efforts with county government
Attend county meetings and advocate on behalf of clients

Additional Suggestions for the
Commission 26
Focus Group participants suggested the following additional ideas for
the Human Services Commission:
Visit service providers to learn more about existing services and
funding needs
Meet with Housing Commission and discuss separate and
overlapping spheres of influence
Revisit grant-making process
New programs and preventative programs can have a particularly hard
time getting grants

Strategy Ideas from the Human
Services Commission 27
Pleasanton Strategies
Meet with Pleasanton Unified School District
Joint use of facilities (PUSD/City)
Promotores de Salud
Engage/mobilize faith community
Connect with Chamber of Commerce
Consider policy for providing translation services for City
Clarification of HSC and HC roles
Core services still critical for grant funding
Require agencies to register with 2-1-1 when they receive grant funding
Continue to incentivize collaborative grant projects
Co-location of Services (Multi-Service Center) (Pleasanton/Dublin joint strategy)

Strategy Ideas from the Human
Services Commission 28
Tri-Valley Strategies
Information and referral items
Better understand what the transportation issues are and what transportation options are available across the Tri-Valley and into other counties
Meet/involve medical providers in needs assessment discussion (PAMF, SRVRMC, Kaiser, ValleyCare, Sutter, Axis, VA)
Meet with Chabot/Los Positas (workforce development, I&R, event location)
Events and Projects
Community outreach campaign (2-1-1, update pocket guide, faith based newsletters)
Early detection/prevention/screenings for developmental disabilities
Increase services for homeless single men/teens (new models of services)
Items not prioritized
Mental health
Social service event
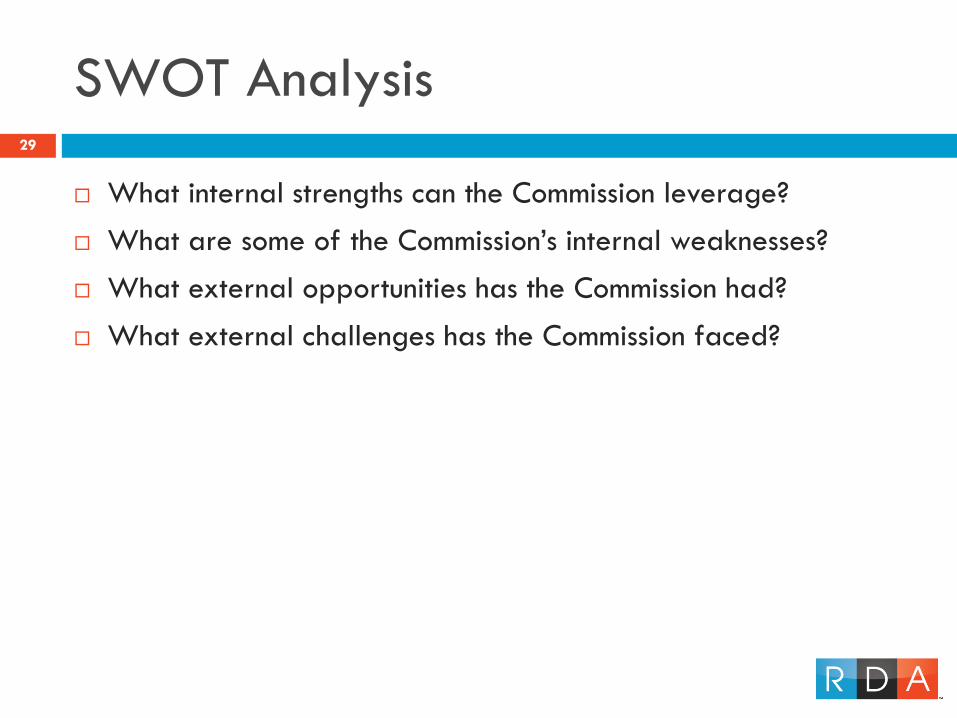
SWOT Analysis 29
What internal strengths can the Commission leverage?
What are some of the Commission’s internal weaknesses?
What external opportunities has the Commission had?
What external challenges has the Commission faced?

30

Jennifer Susskind, 510-984-1603
Zoe Loftus-Farren, 510-984-1559
Contact Us! 31

Resource Development Associates

APPENDIX B


Pleasanton Human Services Commission
Action Planning
A Consumer Education Service Area
A.1.
Information sessions on available services - Example: Union County, NJ offered a series of information sessions to help
community members determine their eligibility for a variety of local, state and federal programs.
Workforce Development
& Unemployment
A.2.
Readable, culturally relevant and age appropriate informational materials - Include information on programs, eligibility, etc.
Can also include QR code that links to website or social media sites.
Workforce
Development/Unemploym
ent; Youth Services
A.3
Transit training programs - Classes/events on getting around without a car, including information on buses, paratransit, biking,
etc. Example: City of Davis has biannual travel training events at the Davis Senior Center.
Health Care/Mental
Health
A.4
Computer classes - Many computer classes are senior-focused, but classes could also be offered for all ages and at multiple
skill levels. Example: San Francisco Public Library Teen Computer Corps Program - computer-savvy teenagers are paired one-on-
one with older adults to help them improve their basic computer skills
Senior Services; Disability
Services
A.5
"Come learn what your city does for you" Fair - This was a Focus Groups suggestion. Example: Somerset County (in NJ) has
had Human services fairs for the past two years to showcase the variety of programs available to youth, adults and families.
Cattaraugus County (in NY) had a similar fair last year.
Disability Services; Youth
Services; Food and
Nutrition
A.6
Focus groups - Conduct focus groups to solicit input on the best methods of communicating with the public regarding available
services, eligibility requirements, etc. Food and Nutrition
A.7
Posting Lists/Information - Posting lists of available services and eligibility information in public places where at need
population in likely to see them. Food and Nutrition
A.8
City outreach/education coordinator - Conducts outreach to raise awareness about and understanding of available
government and non-profit services. Could be a part-time position or volunteer position to minimize costs, or could be shared
between different non-profits and/or city entities.
Senior Services,
Healthcare,
Transportation, etc.
A.9
Community Health Workers/Promotores de Salud - Volunteer or paid health workers who generally come from the
communities in which they work and help community members better understand and access the healthcare system. They
sometimes also provide general health information and/or act as patient advocates. Example: two organizations in San Rafael,
CA just partnered to hire two adult and two youth CHWs to provide the community with information on nutrition and health. All Service Areas
A.10
Support Groups - Groups for parents and families of children/individuals with Alzheimer's, behavioral health issues, diabetes
or other health/mental health issues. Suggested in Focus Groups.
All Service Areas; or
Seniors/Youth
A.11
Other-
A.12
Other-
Prepared by Resource Development Associates 1 10/30/2013

Pleasanton Human Services Commission
Action Planning
B Communication And Collaboration Service Area
B.1.
Advisory Coalition - Washtenaw County, MN, established an advisory coalition to look a the gap between local skills and job
demands, identify emergent job sectors, and identify strategies to meet job demands.
Workforce Development
& Unemployment
B.2.
On-the-Job Training/Paid-Internships/Mentoring - Formalized partnerships between non-profits, educational institutions,
business and/or government to develop and implement targeted education, mentoring, paid-internships and on-the-job
training programs. Example: New Door Ventures in San Francisco provides paid internships at social enterprises that they own,
as well as with partner businesses. SF Mayor's Youth Employment and Education Program in San Francisco and Local
Employment and Apprenticeship Training Program in Tacoma are additional examples.
Workforce
Development/Unemploym
ent; Youth Services
B.3.
Integrated medical, behavioral health and long-term care services - Medicaid enrollees in Snohomish County have access to
care coordinators, specialty care and drug and alcohol services all under one roof - "medical home."
Health Care/Mental
Health
B.4.
Senior and Disability Transportation Coordination - Portland has a Transportation Plan that coordinates senior and disability
transportation services where possible and efficient.
Senior Services; Disability
Services
B.5.
Urban Agriculture and Workforce Development - Lynchburg Grows uses urban agriculture to provide workforce development
and job opportunities for individuals with disabilities and recreational activities for youth; partnership with non-profit.
Disability Services; Youth
Services; Food and
Nutrition
B.6.
Nutrition Education Programs - Partnerships between city, schools, non-profits and farms to conduct nutrition education in
schools. Example: Novato, CA school district has instituted a nutrition program through which students receive nutrition
education in classes, participate in trips to farms to glean produce, and are provided healthy, local food in school lunches. Food and Nutrition
B.7.
Food Policy Councils - Food policy councils are composed of representatives from all components of the food system, including
consumers, farmers, grocers, chefs, food processors, hunger advocates, educators, and government to discuss and address
local food issues. Example: Berkeley Food Policy Council. Food and Nutrition
B.8.
GIS Mapping - Atlanta uses GIS to map high concentration senior areas, housing, healthcare, and other service points to
coordinate both care and transportation.
Senior Services,
Healthcare,
Transportation, etc.
B.9
Non-Profit Alliance - Group where non-profit representatives come together and talk about programs, funding, ideas,
coordination, duplication of services, etc. Suggested in Focus Groups. Example: San Mateo County service providers
established Thrive, The Alliance of Nonprofits for San Mateo County. All Service Areas
B.10.
Collaborative (Multi-disciplinary) Case Conferences - Group where service providers from different agencies get together to
plan services for vulnerable families/individuals. Requires consent to share information.
All Service Areas; or
Seniors/Youth
B.11.
Other-
B.12
Other-
Prepared by Resource Development Associates 2 10/30/2013
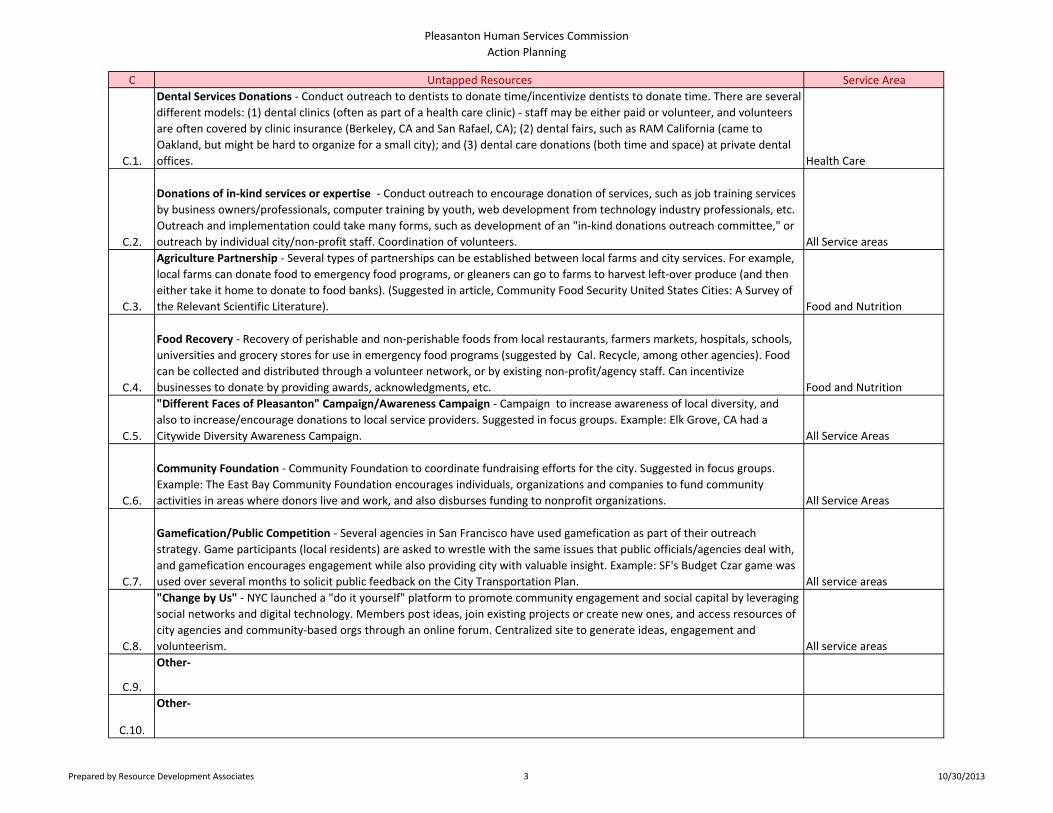
Pleasanton Human Services Commission
Action Planning
C Untapped Resources Service Area
C.1.
Dental Services Donations - Conduct outreach to dentists to donate time/incentivize dentists to donate time. There are several
different models: (1) dental clinics (often as part of a health care clinic) - staff may be either paid or volunteer, and volunteers
are often covered by clinic insurance (Berkeley, CA and San Rafael, CA); (2) dental fairs, such as RAM California (came to
Oakland, but might be hard to organize for a small city); and (3) dental care donations (both time and space) at private dental
offices. Health Care
C.2.
Donations of in-kind services or expertise - Conduct outreach to encourage donation of services, such as job training services
by business owners/professionals, computer training by youth, web development from technology industry professionals, etc.
Outreach and implementation could take many forms, such as development of an "in-kind donations outreach committee," or
outreach by individual city/non-profit staff. Coordination of volunteers. All Service areas
C.3.
Agriculture Partnership - Several types of partnerships can be established between local farms and city services. For example,
local farms can donate food to emergency food programs, or gleaners can go to farms to harvest left-over produce (and then
either take it home to donate to food banks). (Suggested in article, Community Food Security United States Cities: A Survey of
the Relevant Scientific Literature). Food and Nutrition
C.4.
Food Recovery - Recovery of perishable and non-perishable foods from local restaurants, farmers markets, hospitals, schools,
universities and grocery stores for use in emergency food programs (suggested by Cal. Recycle, among other agencies). Food
can be collected and distributed through a volunteer network, or by existing non-profit/agency staff. Can incentivize
businesses to donate by providing awards, acknowledgments, etc. Food and Nutrition
C.5.
"Different Faces of Pleasanton" Campaign/Awareness Campaign - Campaign to increase awareness of local diversity, and
also to increase/encourage donations to local service providers. Suggested in focus groups. Example: Elk Grove, CA had a
Citywide Diversity Awareness Campaign. All Service Areas
C.6.
Community Foundation - Community Foundation to coordinate fundraising efforts for the city. Suggested in focus groups.
Example: The East Bay Community Foundation encourages individuals, organizations and companies to fund community
activities in areas where donors live and work, and also disburses funding to nonprofit organizations. All Service Areas
C.7.
Gamefication/Public Competition - Several agencies in San Francisco have used gamefication as part of their outreach
strategy. Game participants (local residents) are asked to wrestle with the same issues that public officials/agencies deal with,
and gamefication encourages engagement while also providing city with valuable insight. Example: SF's Budget Czar game was
used over several months to solicit public feedback on the City Transportation Plan. All service areas
C.8.
"Change by Us" - NYC launched a "do it yourself" platform to promote community engagement and social capital by leveraging
social networks and digital technology. Members post ideas, join existing projects or create new ones, and access resources of
city agencies and community-based orgs through an online forum. Centralized site to generate ideas, engagement and
volunteerism. All service areas
C.9.
Other-
C.10.
Other-
Prepared by Resource Development Associates 3 10/30/2013
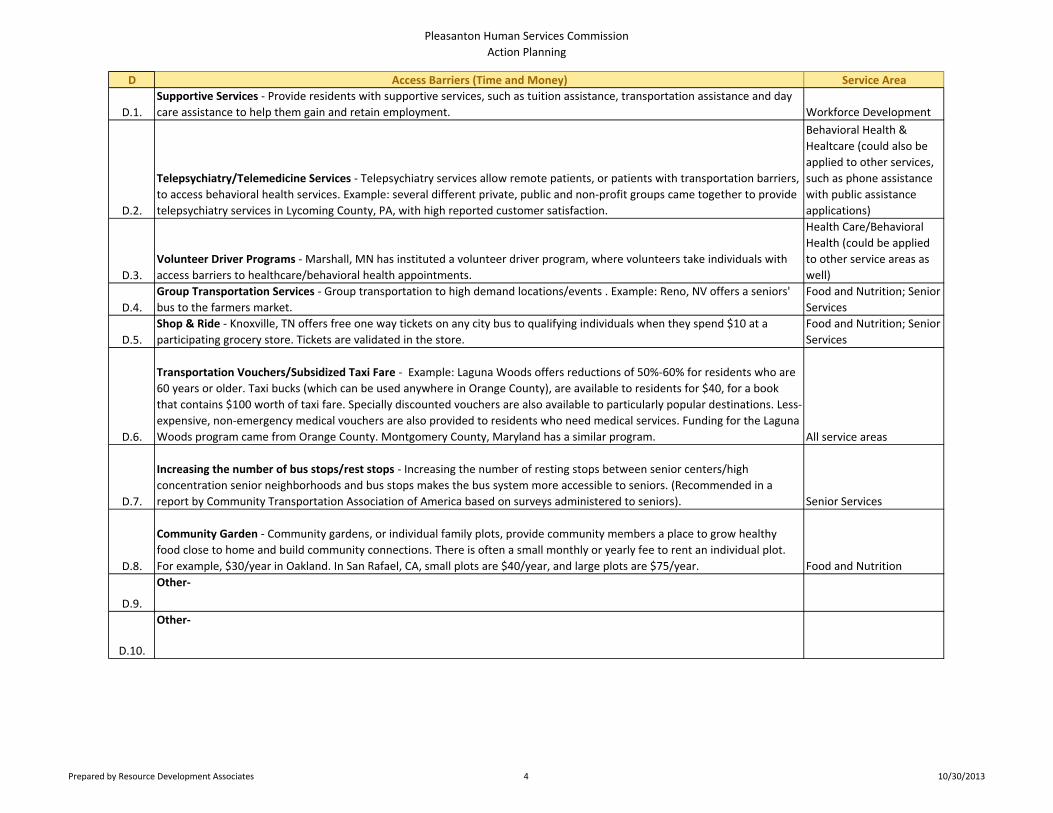
Pleasanton Human Services Commission
Action Planning
D Access Barriers (Time and Money) Service Area
D.1.
Supportive Services - Provide residents with supportive services, such as tuition assistance, transportation assistance and day
care assistance to help them gain and retain employment. Workforce Development
D.2.
Telepsychiatry/Telemedicine Services - Telepsychiatry services allow remote patients, or patients with transportation barriers,
to access behavioral health services. Example: several different private, public and non-profit groups came together to provide
telepsychiatry services in Lycoming County, PA, with high reported customer satisfaction.
Behavioral Health &
Healtcare (could also be
applied to other services,
such as phone assistance
with public assistance
applications)
D.3.
Volunteer Driver Programs - Marshall, MN has instituted a volunteer driver program, where volunteers take individuals with
access barriers to healthcare/behavioral health appointments.
Health Care/Behavioral
Health (could be applied
to other service areas as
well)
D.4.
Group Transportation Services - Group transportation to high demand locations/events . Example: Reno, NV offers a seniors'
bus to the farmers market.
Food and Nutrition; Senior
Services
D.5.
Shop & Ride - Knoxville, TN offers free one way tickets on any city bus to qualifying individuals when they spend $10 at a
participating grocery store. Tickets are validated in the store.
Food and Nutrition; Senior
Services
D.6.
Transportation Vouchers/Subsidized Taxi Fare - Example: Laguna Woods offers reductions of 50%-60% for residents who are
60 years or older. Taxi bucks (which can be used anywhere in Orange County), are available to residents for $40, for a book
that contains $100 worth of taxi fare. Specially discounted vouchers are also available to particularly popular destinations. Less-
expensive, non-emergency medical vouchers are also provided to residents who need medical services. Funding for the Laguna
Woods program came from Orange County. Montgomery County, Maryland has a similar program. All service areas
D.7.
Increasing the number of bus stops/rest stops - Increasing the number of resting stops between senior centers/high
concentration senior neighborhoods and bus stops makes the bus system more accessible to seniors. (Recommended in a
report by Community Transportation Association of America based on surveys administered to seniors). Senior Services
D.8.
Community Garden - Community gardens, or individual family plots, provide community members a place to grow healthy
food close to home and build community connections. There is often a small monthly or yearly fee to rent an individual plot.
For example, $30/year in Oakland. In San Rafael, CA, small plots are $40/year, and large plots are $75/year. Food and Nutrition
D.9.
Other-
D.10.
Other-
Prepared by Resource Development Associates 4 10/30/2013

APPENDIX C


HUMAN SERVICES COMMISSION WORKSHOP AGENDA
Wednesday, June 19, 2013 5:00 P.M.
Operations Services Center – Conference Room 1 3333 Busch Rd., Pleasanton, CA 94566
1. Welcome & Introductions
2. Overview of Human Services Needs Assessment Strategic Plan Process
3. Review City and Commission Roles and Mandates
4. Define Commission Mission and Vision
5. Identify Target Populations for Focus Groups
6. Wrap-up & Next Steps
Notice
Under Government Code §54957.5, any writings/documents regarding an open session item on this agenda provided to a majority of the Commission after distribution of the agenda packet are available for public inspection at the Community Services Department, 200 Old Bernal Avenue, Pleasanton.
Accessible Public Meetings
The City of Pleasanton will provide special assistance for citizens with disabilities to participate in public meetings upon advance notice. If you need an auxiliary hearing aid or sign language assistance at least two working days advanced notice is necessary. Please contact the Community Services Department, PO Box 520, Pleasanton, CA 94566 or (925) 931-5340.


APPENDIX D

June 19, 2013
Resource Development Associates
Jennifer Susskind
Zoe Loftus-Farren

Agenda 2
Welcome and Introductions
Overview of Human Services Strategic Planning
Process
Review Commission Roles and Mandates
Define Commission Vision, Mission and Values
Focus Groups Discussion
Wrap-up & Next Steps
Introductions 3
Please share the following
Your name
Your affiliation
What is one of the most critical human service needs or
gaps in Pleasanton?
Build Our Own: 4
“GOOD MEETING GUIDELINES”

Strategic planning will help us answer:
What is our shared agreement and understanding of what we want to
achieve?
What is our role in the community? How do we make change?
What is our role in relation to the City Council and City staff? Our regional
partners?
How do we generate excitement about our mission and increase our
commitment to participation?
Can we develop a solid plan and still remain flexible?
How can we structure our operations to be more successful?
How do we know if we are being successful?
Other?
5

Strategic Planning Objectives:
To Define:
Who we are: What are our mandates? What is our vision, values, and mission? What are our internal strengths and weaknesses, external opportunities and threats?
Where we want to be: What are the key issues we are facing? What are our goals? What are our strategies for addressing these issues and achieving our goals?
How we will get there: How do we operationalize our strategies? How do we remain flexible as new issues arise? How do we measure our success?
6

Our Strategic Planning Approach:
Done • Initiate and agree on a strategic planning process
Today • Understand organizational mandates • Identify vision, mission, and values
July 8-9 • Conduct focus groups and extract Pleasanton data
July 16
• Assess Organizational SWOT
• Identify priorities based on vision, mission, values, capacities and needs
July/Aug • Best practice and funding strategies research
7
August • Identify activities and measurable objectives related to priorities/goals
August • Draft and finalize strategic plan
Organizational Mandates 8
Understanding organizational mandates -
including ordinances, bylaws and city council
direction - helps us to collectively understand
committee’s purpose and each commissioner’s
roles and responsibilities.

Commission Rules and Mandates City of Pleasanton Commissioner’s Handbook
9
Membership and Terms
Seven regular members, one alternate and one
youth member
Residence within city
Regular attendance of meetings
Four year terms

Commission Rules and Mandates City of Pleasanton Commissioner’s Handbook
10
City Commission Responsibilities
Understand the role and responsibilities of the Commission
Be careful to represent the entire Commission
Be representative of the whole city
Keep the lines of communication open
Stay informed and be thorough in your recommendations
Be conscious of your relationship to the City Council, other commissions and
city staff
Establish a good working relationship with other Commission members
Maintain distinction between personal viewpoints/political participation and
role as a commissioner

Human Services Commission Pleasanton Municipal Code Chapter 2.28
11
Human Service Commission Duties:
Identify and prioritize human service needs of community, with particular emphasis on the needs of the socially and economically disadvantaged, the elderly and the youth of the community.
Remain informed about human services programs within the community and advise City Council concerning relevant information.
Develop and recommend to City Council specific actions to meet human service needs and to coordinate human services delivery within the community.
Evaluate success of human services actions within the community.
Review requests for financial assistance and make funding recommendations to City Council.
Serve as liaison between city and human services agencies.
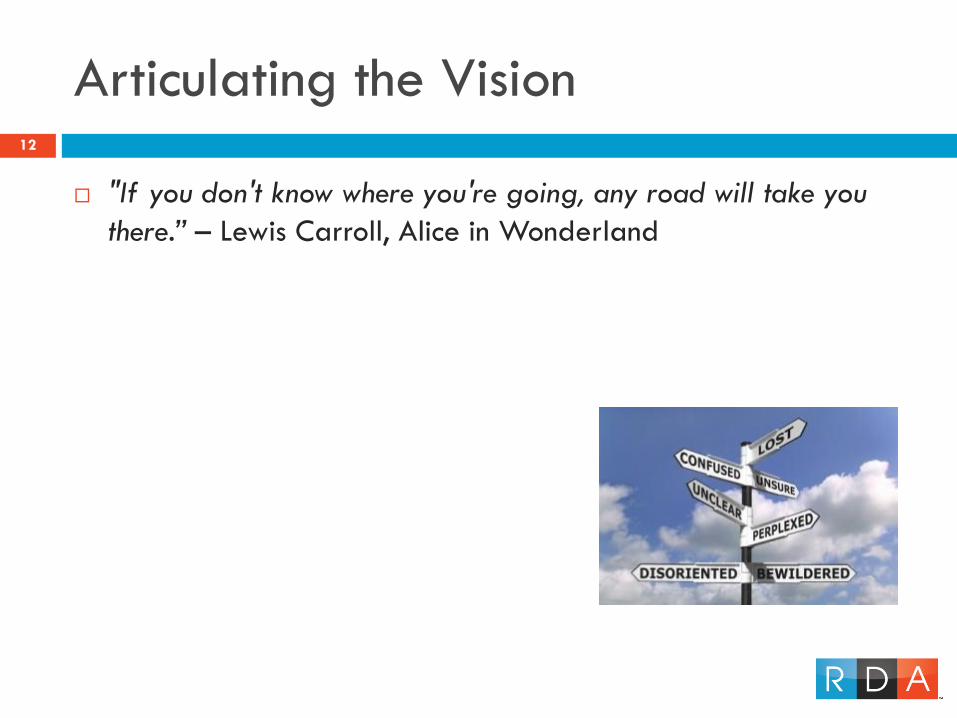
Articulating the Vision 12
"If you don't know where you're going, any road will take you
there.” – Lewis Carroll, Alice in Wonderland

Formulating Mission and Values 13
Formulating a mission clarifies an organization’s purpose and produces internal and external legitimacy.
It helps an organization identify and remain focused on what is truly important.
It serves as a control lever, or criteria in which strategies or activities can be prioritized.
The mission statement is used to reduce conflict between members and move members beyond their self-interest.
Mission statements should be short, targeted, inspiring and activist in tone.

Questions about Mission and Values 14
What problems do we address?
How do we respond to these problems?
What is our relationship with our stakeholders?
What does our success look like?
What are our values?
What makes us unique?
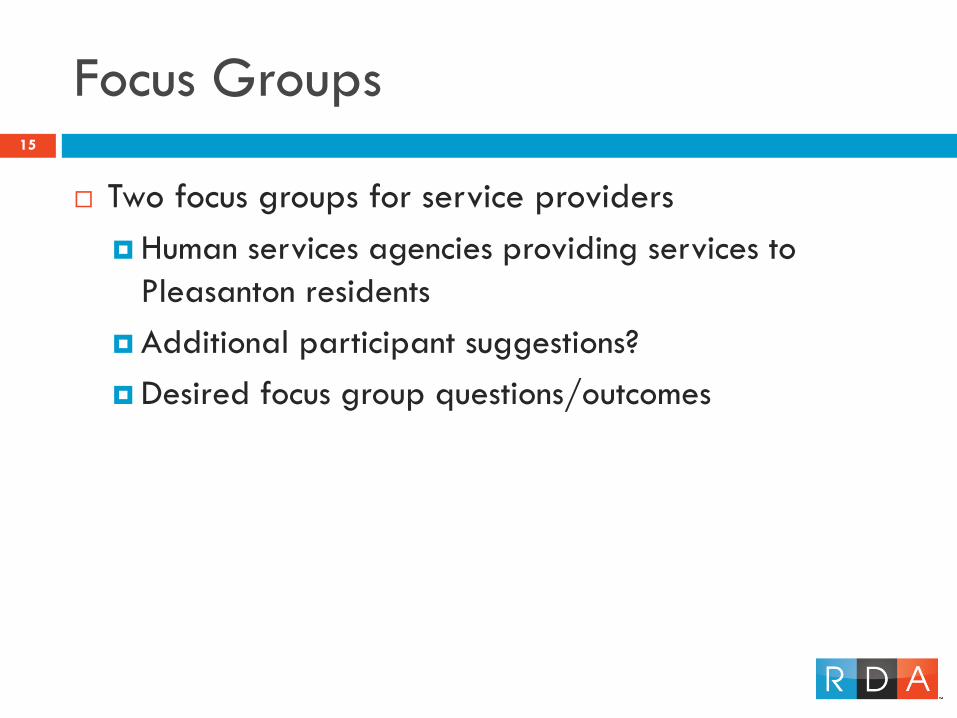
Focus Groups 15
Two focus groups for service providers
Human services agencies providing services to
Pleasanton residents
Additional participant suggestions?
Desired focus group questions/outcomes
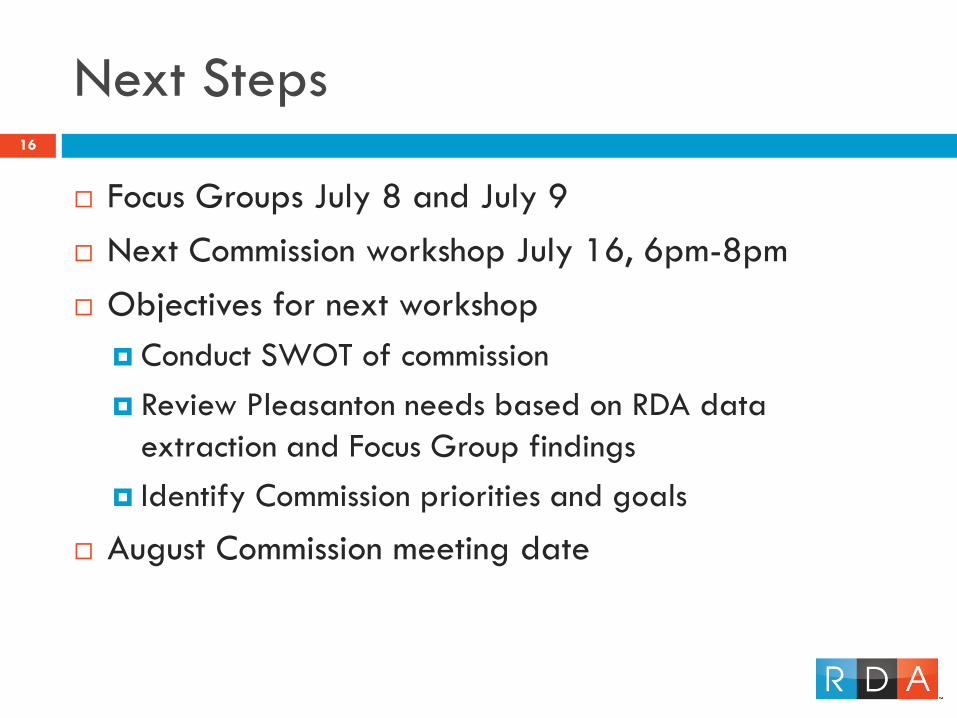
Next Steps 16
Focus Groups July 8 and July 9
Next Commission workshop July 16, 6pm-8pm
Objectives for next workshop
Conduct SWOT of commission
Review Pleasanton needs based on RDA data
extraction and Focus Group findings
Identify Commission priorities and goals
August Commission meeting date

17

Jennifer Susskind, 510-984-1603
Zoe Loftus-Farren, 510-984-1559
Contact Us! 18

Resource Development Associates


APPENDIX E

HUMAN SERVICES COMMISSION WORKSHOP AGENDA
Wednesday, September 11, 2013 6:00 – 8:00 P.M.
Civic Center – 157 Main St. Conference Room 3 Pleasanton, CA 94566
1. Welcome & Introductions
2. Update on Activities to Date
3. Review
Priority Needs and Systemic Challenges
Best Practices and Funding Strategies
4. Action planning
Prioritization exercise
Timeline exercise
Measurable objectives
5. Wrap-up & Next Steps
Notice
Under Government Code §54957.5, any writings/documents regarding an open session item on this agenda provided to a majority of the Commission after distribution of the agenda packet are available for public inspection at the Community Services Department, 200 Old Bernal Avenue, Pleasanton.
Accessible Public Meetings
The City of Pleasanton will provide special assistance for citizens with disabilities to participate in public meetings upon advance notice. If you need an auxiliary hearing aid or sign language assistance at least two working days

Parks and Recreation Commission Agenda Page 2 of 2 January 14, 2010
advanced notice is necessary. Please contact the Community Services Department, PO Box 520, Pleasanton, CA 94566 or (925) 931-5340.

APPENDIX F


September 11, 2013
Resource Development Associates
Jennifer Susskind, MCP

Agenda 2
Welcome
Update on Strategic Planning Activities
Review Community Needs and Systemic Challenges
Prioritize Strategies
Action Planning
Strategy prioritization exercise
Timeline and measurable objectives activity
Wrap-up and Next Steps

Strategic Planning Activities to Date 3
1st Commission Workshop: June Define Mission, Vision, Values
Focus Groups and Pleasanton Data Extraction: July
2nd Commission Meeting: July Pleasanton needs assessment
SWOT
Prioritize community needs
Prioritize systemic challenges
Strategy Research: August
3rd Commission Meeting: September Review strategies
Identify actions
Plan for action
October Commission Meeting Present draft needs assessment
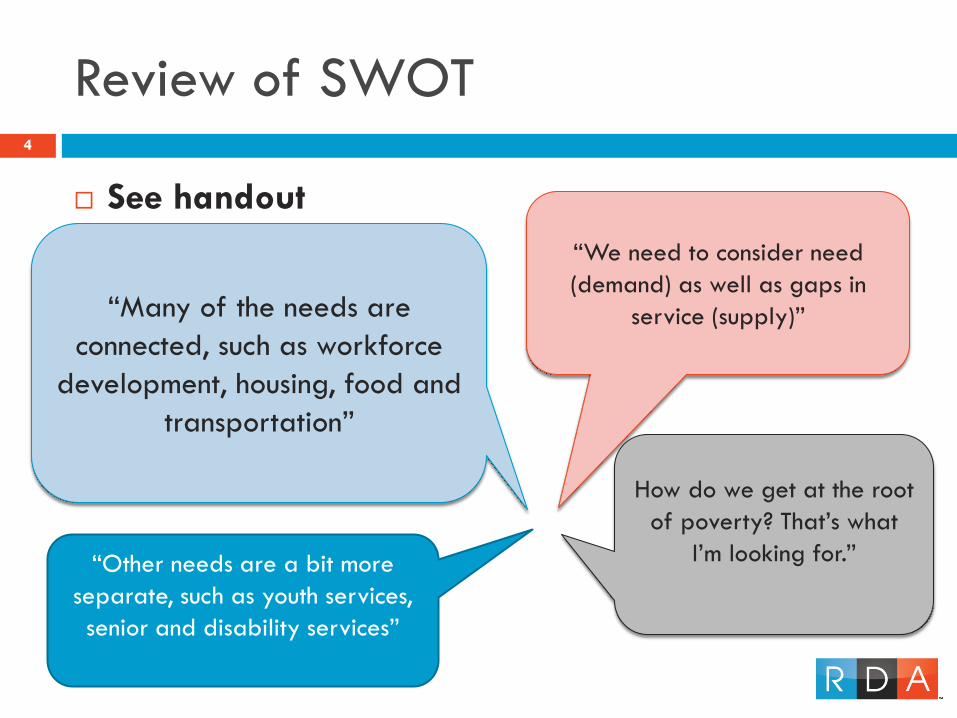
Review of SWOT 4
See handout
“Many of the needs are
connected, such as workforce
development, housing, food and
transportation”
“Other needs are a bit more
separate, such as youth services,
senior and disability services”
“We need to consider need
(demand) as well as gaps in
service (supply)”
How do we get at the root
of poverty? That’s what
I’m looking for.”
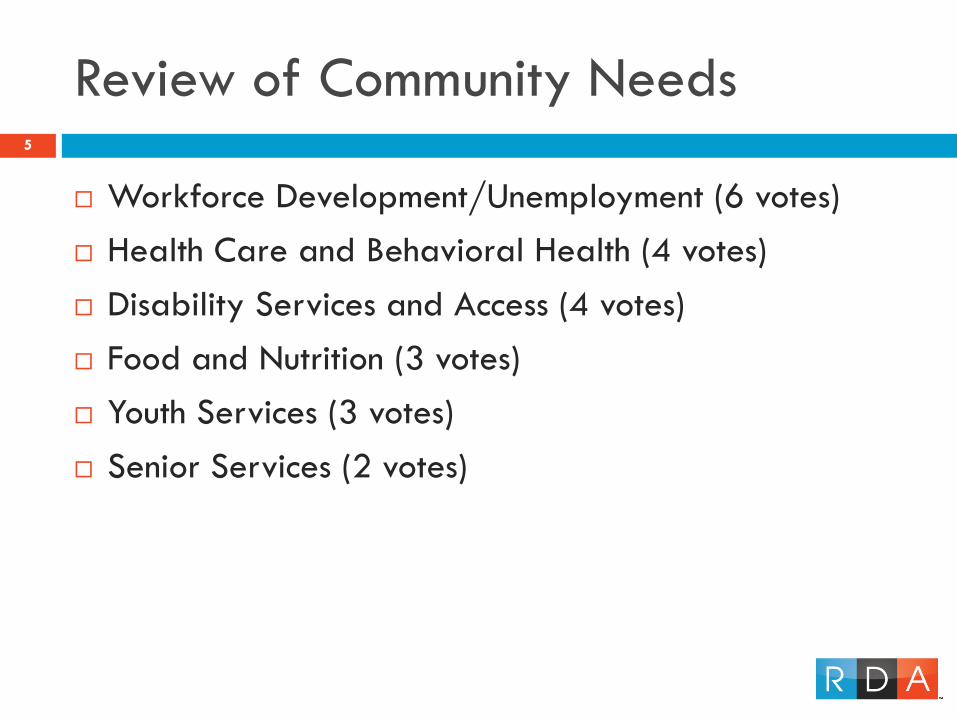
Review of Community Needs 5
Workforce Development/Unemployment (6 votes)
Health Care and Behavioral Health (4 votes)
Disability Services and Access (4 votes)
Food and Nutrition (3 votes)
Youth Services (3 votes)
Senior Services (2 votes)
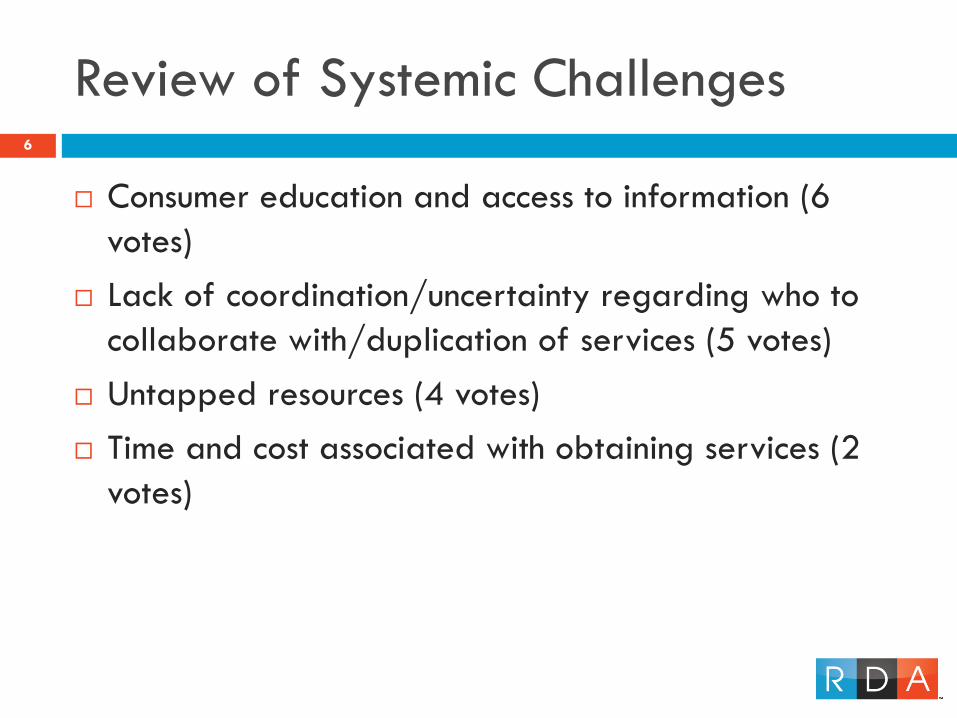
Review of Systemic Challenges 6
Consumer education and access to information (6
votes)
Lack of coordination/uncertainty regarding who to
collaborate with/duplication of services (5 votes)
Untapped resources (4 votes)
Time and cost associated with obtaining services (2
votes)

Best Practices and Strategies 7
Handout
Review potential actions in each systemic challenge category.
Are we missing any potential actions?
Make your case for a specific action.
For each systemic challenge category, please prioritize 3 actions.
Consider the following: Cost/resource intensity?
Potential effectiveness?
Is there a champion?
Scalability?
Commission-initiated or Commission-funded?
Group consensus on actions

Action Planning 8
For each action, identify:
Champion(s)
Partners
Tasks
Timeline
Measurable objectives

9

Resource Development Associates


APPENDIX G


City of Pleasanton 2014-2016 Strategic Plan Timeline – Human Services Commission: DRAFT
November 1, 2013| 1
DRAFT - Pleasanton Human Services Commission Strategic PlanNovember 2013 - November 2016
Nov-Dec
2013
Jan - Mar
2014
Apr - Jun
2014
Jul - Sep
2014
Oct - Dec
2014
Jan - Mar
2015
Apr - Jun
2015
Jul - Sep
2015
Oct - Dec
2015
Jan - Mar
2016
Apr - Jun
2016
Jul - Sep
2016
Oct - Dec
2016
Strategic Action 1: Revise Grantmaking Protocols
Draft Grantee Priorities Statement
Present at Grantees Workshop
Prioritize Grantee Proposals
Strategic Action 2: Community Engagement & Education Campaign
Develop Proposal, Budget, Research Funding Opportunities
Present Proposal to City Council; Request Funds/Staffing
Hire/Assign Staff; Implement Project
Evaluate Processes and Impacts
Strategic Action 3: Sponsor Human Services Alliance
Develop Proposal, Budget, Research Funding Opportunities
Prepare Grantee Priority Statement
Present at Grantees Workshop
Prioritize Grantee Proposals
Hire Contractor; Begin Impementation
Initiate Monthly Meetings
Evaluate Processes and Impacts
Strategic Action 4: Workforce Development Project
Develop Proposal, Budget, Research Funding Opportunities
Present Proposal to City Council; Request Funds/Staffing
Hire Staff/Contract Org; Implement Project
Evaluate Processes and Impacts
Operational Action 1: Dublin, Livermore, Pleasanton Partnership
Spearhead and facilitate biannual meetings
Identify joint campaign
Develop Proposal, Budget, Research Funding Opportunities Unknown
Hire Staff/Contract Org; Implement Project
Evaluate Processes and Impacts
Operational Action 2: Diversify Commission
Recruitment Activities
Evaluate Processes and Impacts
Renew Strategic Planning Process

City Council Adopted - February 5, 2019 | 1
City of Pleasanton Human Services Needs Assessment
Updated Strategic Plan 2018 – 2022
City Council Adopted - February 5, 2019 | 2
Contents Background ........................................................................................................................................................... 3
Planning Methods, Activities, and Timeline ......................................................................................................... 4
Mission, Vision, and Values .................................................................................................................................. 5
Basis for Strategic Plan .......................................................................................................................................... 5
Identification of Strategic Priorities ...................................................................................................................... 6
Identification of Strategic Actions ........................................................................................................................ 8
Organizational Priorities ..................................................................................................................................... 11
Organizational Actions ........................................................................................................................................ 11
Appendix A .......................................................................................................................................................... 13

City of Pleasanton 2018 - 2022 Strategic Plan – Human Services Needs Assessment
September 5, 2018 | 3
Background The Human Services Commission strategic plan was primarily based on the 2011 Eastern Alameda County
Human Services Needs Assessment (EACHSNA). Upon expiration of the strategic plan in 2016, the
commission opted to update it with a city-staff directed process that included public workshops with review
and revision of the existing strategic plan.
The City of Pleasanton’s Human Services Commission is a nine-member body with seven regular
commissioners, one alternate commissioner and one non-voting youth commissioner that oversees the grant
application process for the provision of human services assistance and programs focusing on the human service
needs of the socially and economically disadvantaged, the elderly, and youth in the community. The
commission makes funding recommendations to the Pleasanton City Council regarding 1) the human service
needs of the community and 2) methods for meeting these needs.
The commission began this update by revising the mission, vision and values statements to help guide the
strategic plan for 2018-2022 emphasizing the following statement:
❖ “The Human Services Commission is the advocating body for those in the community who cannot
advocate for themselves.”
The commission also emphasized working closely with Tri-Valley service providers early in the strategic planning process through the public workshops to obtain a clear picture of the most pressing gaps and barriers impacting the community. In addition to the five public workshops, the strategic planning process included agenda reports and discussion during the September 6, May 2, and June 6 Human Services Commission Meetings.

City of Pleasanton 2018 - 2022 Strategic Plan – Human Services Needs Assessment
September 5, 2018 | 4
Planning Methods, Activities, and Timeline Between August 2017 and August 2018 the strategic planning process included the following activities:
Date Methods/Activities Outcomes
August 2, 2017 Commission determined the format for updating the strategic plan through 2022.
Commission recommended a city-staff led process to include five (5) public workshops hearing from subject-matter experts, service providers and the public.
September 6, 2017 Commission determined course of action for the Strategic Plan Update
Updated Mission, Vision, and Values statements
November 1, 2017 Public Workshop #1: Homelessness in the Tri-Valley
Identified gaps and barriers to service related to Homelessness in the Tri-Valley.
November 15, 2017 Public Workshop #2: Senior Citizen Services
Identified gaps and barriers to service related to Senior Citizens.
December 6, 2017 Public Workshop #3: Behavioral Health
Identified gaps and barriers to service related to Behavioral Health.
January 10, 2018 Public Workshop #4: Transportation Services and Access
Identified gaps and barriers to service related to Transportation Services and Access.
January 24, 2018 Public Workshop #5: Domestic Violence and Child Abuse
Identified gaps and barriers to service related to Domestic Violence and Child Abuse.
February 7, 2018 Agenda Report: Commission reviewed public workshops outcomes and provided feedback on strategic priorities.
Commission gave feedback and agreed upon gaps and barriers to service for each of the public workshops. Commission recommended critical systemic challenges and provided feedback on critical human service needs.
May 2, 2018 Agenda Report: Additional feedback on strategic priorities and core safety net services.
Commission gave feedback and requested a draft of strategic priorities for the June meeting.
June 6, 2018 Agenda Report: Review staff proposed strategic priorities, strategic actions, organizational priorities and actions.
Commission recommended strategic priorities and provided additional feedback on strategic actions and organization priorities and actions. Staff will provide a strategic plan draft for the August 8 Commission meeting.
August 8, 2018 Consider recommendation of the draft plan.
Complete strategic plan and add to City Council agenda.
September 5, 2018 Final review of the draft strategic plan.
Recommend the draft Strategic Plan to City Council

City of Pleasanton 2018 - 2022 Strategic Plan – Human Services Needs Assessment
September 5, 2018 | 5
Mission, Vision, and Values Formulating a mission, vision, and values statement clarifies the purpose of the Human Services Needs
Assessment’s Strategic Plan. These statements help all members of an organization identify, and remain
focused on what is important in the Strategic Plan. They serve as benchmarks by which organizational
strategies and actions can be prioritized.
The Strategic Plan’s mission, vision, and values statement was updated during the September 6, 2017
Commission meeting.
Human Services Needs Assessment Strategic Plan Mission, Vision, and Values
MISSION: To support high quality human services so Pleasanton residents can meet their basic human needs with dignity. VISION: To maintain high quality human services that address the community’s needs. VALUES: Prioritize, advocate, collaborate, and innovate to address local human needs.
Basis for Strategic Plan Needs Assessment and Public Workshops Data extracted from the 2011 Eastern Alameda County Human Services Needs Assessment (EACHSNA) and
five (5) public workshops with Tri-Valley service providers, subject matter experts and members of the public
informed this updated strategic plan.
The EACHSNA data was derived from census information, surveys of hard to reach populations, provider
surveys, focus groups, and key informant interviews. While this information was gathered in 2011, in addition
to the 2010 census data, it is the most up-to-date demographic data. One of the priorities for this strategic
plan will be to work with the neighboring Tri-Valley cities to update the EACHSNA in 2021 upon the
completion of the 2020 census.
The data from these sources identified current issues affecting human services needs in Pleasanton,
including:
❖ Significant population growth over the past two decades,
❖ Greater diversity in the population – higher numbers of Asian/Pacific Islanders and Hispanic/Latinos
in the community,
❖ Increase in percentage of residents receiving social assistance, and
❖ Large increase anticipated in the senior population.

City of Pleasanton 2018 - 2022 Strategic Plan – Human Services Needs Assessment
September 5, 2018 | 6
The commission studied the following five (5) topics in the public workshops which included presentations
from subject-matter experts, relevant service providers and members of the public:
❖ Homelessness in the Tri-Valley
❖ Senior Citizen Services in the Tri-Valley
❖ Behavioral Health
❖ Transportation Services and Access
❖ Domestic Violence and Child Abuse
The key service gaps and barriers identified at these workshops can be found in Appendix A.
Identification of Strategic Priorities At the February 7, 2018 Human Services Commission meeting, commission members reviewed the gaps and
barriers learned from the public workshops. Commission members considered and recommended the
following updates to the critical systemic challenges and human service needs from the 2014-2016 strategic
plan.
Most Critical Systemic Challenges: ❖ Lack of consumer information about services/need for education
❖ Lack of coordination, missed opportunities for collaboration, duplication of services among service
providers and lack of centralized database between service providers and public agencies
❖ Time and cost associated with obtaining services including transportation and connectivity of
citizens to services
Most Critical Human Service Needs: Needs listed below were developed and defined by the commission based on information from five public
workshops, commission discussion and the findings from the 2011 EACHSNA.
❖ Health Care and Behavioral Health:
o Wrap around services: coordinated care between service providers, crisis response,
additional providers in Pleasanton
o Prevention: Screening and assessments
o Meeting diverse cultural needs
o Substance abuse, coordination of service providers, transportation to specialized services
outside the Tri-Valley
o Social and cultural stigma to mental health needs
o Lack of subsidized dental care for low income residents
o Insufficient reimbursement rates for providers
o Domestic Violence: community education/outreach/prevention in schools and community,
temporary shelter for victims leaving an abusive relationship
❖ Disability Services and Access:
o Medical Appointment Accessibility as specialist are often outside of the Tri-Valley

City of Pleasanton 2018 - 2022 Strategic Plan – Human Services Needs Assessment
September 5, 2018 | 7
o Shortages of resources for children with developmental disabilities
o Service Cost Reduction: improve eligibility screening, mobility forward study results
o Public transportation/paratransit flexibility and after-hours services
o Optimized service routes with access to service providers
o Ride-sharing app feasibility
o Prevention/Education/Training: technology training for scheduling and planning rides, post-
driving preparation workshops for older adults.
❖ Food and Nutrition:
o Barriers to applying for food assistance, even if qualified
o Improve eligibility screening to ensure resources are allocated to those with the greatest
need
o Food insecurity
o Access to food pantries and hot meal service limited by geographic dispersion of target
population and shortage of transportation options.
❖ Youth Services:
o School Services: normalizing mental health, individual group and family therapy options;
proactive education of services to middle and high school students and families
o Shortage of low cost after-school and summer enrichment activities
o Non-English speaking parents are challenged in advocating for their children and
communicating with teachers and school administrators
❖ Senior Services:
o Case Management: wellness checks; tax prep; advocacy
o Community Awareness: volunteer recruitment; fundraising
o Differentiating between financial difficulties and physical, wellness difficulties through
screenings
o Elder Abuse: financial, emotional and physical
o Food Access: awareness of programs, food availability, and transportation
❖ Homelessness in the Tri-Valley:
o Prevention: offering assistance to families near eviction; education on available services
o Temporary Shelter: assistance for initial 7-10 days of becoming homeless
o Case Management: job training; mental health services; life skills; and coordinated re-entry
o Shortage of homeless shelters that accept single men, fathers and sons.
o Long waiting lists for healthcare services and disproportionate use of emergency medical
services
o Homeless population exclusively reliant on food services due to lack of kitchen facilities
❖ Workforce Development/Unemployment:
o Adult education and vocational skills

City of Pleasanton 2018 - 2022 Strategic Plan – Human Services Needs Assessment
September 5, 2018 | 8
o Job placement, workforce development for developmentally disabled, youth and immigrants
o Job board awareness
o Insufficient child care for low income workers and job seekers
❖ Service Provider Critical Initiatives:
o Dental Project through Axis Community Health
o Tri-Valley Haven Shelter Facility Rehab
o Future Multi-Year Projects as Identified
Identification of Strategic Actions At the June 6, 2018 Human Services Commission meeting, the commission 1) reviewed previous strategic
actions and staff recommendations and 2) selected strategies that would be most relevant, possible and
effective in Pleasanton. Strategic priorities are listed below.
Strategic Action #1: Revise Human Services Commission grant-making protocols/RFPs including exploration of multi-year contracts with core safety-net service providers This strategic action reflects the mission, vision and values of the commission by allowing the organizations
providing core safety-net services the financial stability needed to make more strategic, longer term
decisions.
With this action, the commission will weigh the challenges and opportunities presented with each
distribution method of available grant funds. The commission will also identify the core safety-net services,
develop criteria for funding allocation and work with Livermore and Dublin to determine feasibility of drafting
joint RFPs for core safety net services in the Tri-Valley region.
As noted above, through this strategic planning process, three (3) most critical systemic challenges and the eight (8) most critical human service needs were identified. To accomplish these goals in light of the prioritized challenges and needs, the Commission will continue to evaluate and revise any relevant grant-making protocols and request for proposals.
Measures of success:
• Annually identify core safety net services
• Develop criteria for funding allocation recommendation
• Meet with Livermore and Dublin to explore joint RFPs for core safety-net services
• Annual review and revisions of grant applications
Strategic Action #2: Drive prevention and education campaigns The 2017-2018 public workshops reinforced the data from focus groups and the 2011 EACHSNA which
identified gaps in the local community’s knowledge regarding available services and how to access them. The
commission and service providers agreed, there will always be a need for additional funding and resources.
Commissioners expressed their goal of focusing on prevention and emphasizing educating the community on
available programs and resources to reduce future needs. Additionally, addressing needs early through
screenings, assessments, workshops and outreach.

City of Pleasanton 2018 - 2022 Strategic Plan – Human Services Needs Assessment
September 5, 2018 | 9
Community education on available services and prevention serves long-term community building efforts by
educating all community members about human service needs in Pleasanton.
Prevention was identified at the public workshops by local community service providers and Human Services
Commission members as an area of opportunity to impact the largest number of community members with
the limited resources available.
Measures of Success (planning)
• Number of opportunities identified with service providers to be addressed with prevention
workshops
• Designate staff to coordinate outreach and education programs and bring those topics to the
commission
Measures of Success (implementation)
• Number of activities / workshops
• Number of participants attending activities
• Participant and service provider feedback
• Explore formation of a Human Services Commission sub-committee tasked with providing an open
forum for user groups, clients and citizens at-large to share needs and discuss solutions
Strategic Action #3: Continue collaboration with nonprofit, faith-based, public and volunteer organizations In focus groups, service providers described a lack of knowledge about existing supports, duplication of
services, and insufficient communications. An alliance among human service organizations will help to reduce
communication barriers and increase coordination of efforts to address persistent human service needs. Per
discussions with providers, an alliance would include quarterly meetings.
Human Services Commission members expressed their desire to create a space for providers to share lessons
learned, to develop new and innovative ideas, to coordinate the provision of services, and to troubleshoot
human service challenges and needs on a regular basis.
Since the approval of the strategic plan in 2014, several collaborative groups have been identified in the Tri-
Valley (listed alphabetically):
• CityServe of the Tri-Valley: Established in 2008, CityServe is a non-profit, grown out of the Tri-valley
churches’ desire to serve others close to home. As more local needs were met and other
organizations, non-profits and local city officials saw the impact, partnerships grew. CityServe has
evolved into one of the most comprehensive resources for volunteer opportunities and human
service needs in the Tri-valley.
• Housing and Human Services Networking Social: Meets tri-annually with service providers and city
staff.
• Ptownlife Resource Network: Meets every-other month primarily with non-profit and public sector
organizations to coordinate resources.

City of Pleasanton 2018 - 2022 Strategic Plan – Human Services Needs Assessment
September 5, 2018 | 10
• Tri-Valley Anti-Poverty Collaborative: The Tri-Valley Anti-Poverty Collaborative is a cross-sector
collaboration formed to address issues of hidden poverty in the Tri-Valley Area.
• Tri-Valley School Health Initiative: Serves as a gateway to make contact and engage with under-
served communities, to provide health screenings, linkages, and health care enrollment
opportunities to youth and families in the Tri-Valley. The initiative aims to establish the health fair as
an annual event that increases youth and family‘s access to culturally-relevant prevention services,
and strengthens the continuum of school-linked health supports throughout the Tri-Valley.
Commission members also identified a need to include public agencies, volunteer organizations and faith-
based organizations in the alliance. The commission believes that by prioritizing collaboration and
information sharing, this effort will ensure that local public agencies (such as schools, the health department,
etc.) are connected with what is happening on the ground in the community, and that such knowledge will
inform their provision of services. This alliance also connects service providers with faith-based organizations
from which volunteers may be recruited.
Measures of Success (planning)
• Identify networking groups to partner with to raise awareness about, and understanding of, available
public and non-profit services
• Assign commission members to attend meetings
Measures of Success (implementation)
• Number of jointly sponsored campaigns, activities, proposals, etc.
• Member feedback
• Regular updates from designated staff and commissioners on progress of outreach coordination
Strategic Action #4: Prepare to update 2021 Eastern Alameda County Human Services Needs Assessment (EACHSNA) The commission has expressed their intention to be more data driven in their decision making and funding
recommendations. Much of this data has come from the EACHSNA, which was last completed in 2011. The
data gathered was derived from census information, surveys of hard to reach populations, provider surveys,
focus groups, and key informant interviews.
This vital data takes time, planning and budgeting. In this action, the commission will take steps to use the
2020 census data to update the EACHSNA in 2021. The commission and city staff will partner with Dublin and
Livermore to prepare for an updated Needs Assessment.
Measures of Success:
• Audit the 2011 EACHSNA for effectiveness and usefulness with Livermore, Dublin and key service
providers to determine a scope for the RFP
• Add RFP scope and cost estimates to 2-year budget
• Draft RFP for firm to conduct EACHSNA.

City of Pleasanton 2018 - 2022 Strategic Plan – Human Services Needs Assessment
September 5, 2018 | 11
Organizational Priorities Organizational priorities are those that strengthen the organization internally and ensure that commissioners
are productive, effective, informed, and competent to meet the organization’s programmatic goals and
mission.
During the June 6, 2018 meeting, members of the Pleasanton Human Services Commission participated in an
in depth discussion in which they identified their organizational priorities below.
❖ Continue to foster and strengthen working partnerships with regional, Livermore and Dublin staff
and government representatives to collaborate on human service needs of the Tri-Valley
❖ Evaluate, document and promote Human Services Commission successes
❖ Continued education of commissioners on Tri-Valley human service needs, trends and
opportunities
Organizational Actions To achieve the organizational priorities, the commission members will take the following actions:
Organizational Action #1: Work with Dublin and Livermore to coordinate regional efforts to address human service needs This action builds on a previous organizational action to develop regional efforts addressing human services
needs throughout the Tri-Valley region. Coordination of regional efforts may also be a strategy to increase
regional recognition for an area of Alameda County that is perceived as relatively prosperous and without
any need for service expansion. Additionally, developing these relationships will encourage further
collaboration to address some of the systemic challenges identified in the strategic planning process (e.g.,
lack of knowledge about available resources, duplication of services).
The foundation of this collaboration has helped solidify the regional efforts for human services and this
continued coordination will further those efforts.
Measures of Success:
• Identify opportunities for joint regional human services campaigns/projects/initiatives
• Coordinated regional discussions throughout the grant cycle to ensure stability of core-safety-net
services throughout the Tri-Valley
• Number of joint regional human services campaigns/projects/initiatives offered in the Tri-Valley
Organizational Action #2: Continued education of commissioners on Tri-Valley human service needs, trends and opportunities Through the public workshops, the commission recognized the value in hearing regularly from both the
service providers addressing human service needs along with the public who are working with those service
providers.
City of Pleasanton 2018 - 2022 Strategic Plan – Human Services Needs Assessment
September 5, 2018 | 12
The commission would like to continue this practice in the form of regular presentations at commission
meetings from service providers and subject matter experts addressing topics to keep the commission up-to-
date on current human service needs, trends and opportunities in the Tri-Valley.
Measures of Success
• Identify desired presentation topics
• Number of presentations at commission meetings
Organizational Action #3: Develop human services commission communication plan This action stems from the organizational priority to, “Evaluate, document and promote Human Services
Commission successes.” Commission will recommend human service related projects and priorities to
promote through various channels emphasizing the importance of human service programs and work of the
Tri-Valley service providers. The goal of this action will be to help educate the community about human
service needs and demonstrate the outcomes and impact of grant-funded projects and service providers.
Measures of Success
• Identify relevant communication channels to distribute information
• Number of Human Service topics, projects and service providers to highlight
• Number of initiatives highlighted through distribution channels
City of Pleasanton 2018 - 2022 Strategic Plan – Human Services Needs Assessment
September 5, 2018 | 13
Appendix A Gaps and Priorities Identified in Public Workshops The commission identified five areas they wanted to study further through public workshops. These
workshops would include presentations by subject matter experts and organizations working in that area
along with public comment. These workshops identified priorities for each area and potential service gaps.
These gaps and priorities were discussed at the February 7, 2018 Human Services Commission meeting.
Homelessness in the Tri-Valley: November 1, 2017 ❖ Prevention: Offering assistance to families close to eviction.
❖ Temporary Shelter: Assistance for 7-10 days of first becoming homeless.
❖ Case Management: job training; mental health services; life skills; coordinated entry.
Senior Citizen Services in the Tri-Valley: November 15, 2017 ❖ Food Access: Awareness of programs; food availability; transportation.
❖ Community Awareness: Volunteer recruitment; fundraising; city support (general fund); solicit
council for increase in HHSG funds.
❖ Case Management: Wellness checks; tax preparation; determine needs: financial vs. health and
wellness.
Behavioral Health: December 6, 2017 ❖ School Services: Normalizing mental health; mental health services outside of school day; individual,
group and family therapy options in Pleasanton; priority funding for schools.
❖ Prevention: Screening and assessments; cultural needs; psychological testing; parenting classes;
proactive education for middle school and high school classes.
❖ Care Coordination: Between agencies and service providers; crisis response; additional providers in
Pleasanton.
Transportation Services and Access: January 10, 2018 ❖ Prevention: Transit technical tips workshops; preparing older adults for post-driving options; aging in
place; technology training for scheduling and planning rides.
❖ Medical Appointment Accessibility: Regional trips (to specialists outside the Tri-Valley); recruiting
volunteers to take longer trips.
❖ Service Cost Reduction: Increase effectiveness in eligibility screening and enforcement; streamlined
online application; mobility forward recommendations; scholarship/low income fares.
❖ Flexibility / After-Hours Service: Exploring Uber/Lyft options (not currently wheelchair accessible);
same-day service; optimized fixed-route service; para-taxi program.
Domestic Violence and Child Abuse in the Tri-Valley: January 24, 2018 ❖ Education / Outreach / Prevention: Provide additional resources to schools, students and families
through educational programs and health classes; increased mandated reporting for school staff;
increase awareness of resources and challenges (to increase funding); support groups for families in
regards to stress.

City of Pleasanton 2018 - 2022 Strategic Plan – Human Services Needs Assessment
September 5, 2018 | 14
❖ Affordable Shelter and Housing for Victims: Temporary shelter when a victim leaves and abusive
relationship; coordinated entry once shelter stay in complete; culturally responsive services in
multiple languages.
❖ Increased Staff Training: For interviewers.
❖ Multi-Disciplinary Coordination: Effective communication and coordination between CALICO, PUSD,
PD, CPS and court system.


