Embed Size (px)
Citation preview
BEFORE THE HON'BLE NATIONAL GREEN TRIBUNAL, Principal Bench, New Delhi
In
Original Application No. 249/2020
In the Matter of: -
Tribunal on its own motion
Vs.
Ministry of Environment, Forest & Climate Change and Ors.
Applicant(s)
Respondent(s)
Sr. Page Particulars
No. No. 1. Report in compliance to Hon'ble NGT, Principal Bench, order dated
05.11.2020 in the matter of O.A. No. 249 of 2020 titled as Tribunal on its
own motion Vs. Ministry of Environment, Forest & Climate Change and Ors.
2. Annexure-1: CPCB conducted ambient air quality and noise level monitoring
on selected pre-Deepawali day {09.11.2020) and on Deepawali day
(14.11.2020) in Delhi.
3. Annexure-11 & Ill: CPCB compiled a list of all cities/towns in the country
where the average of the ambient air quality during 1st to 23rd November,
2020 and November 2019 falls under Poor & above category and Moderate
& below category.
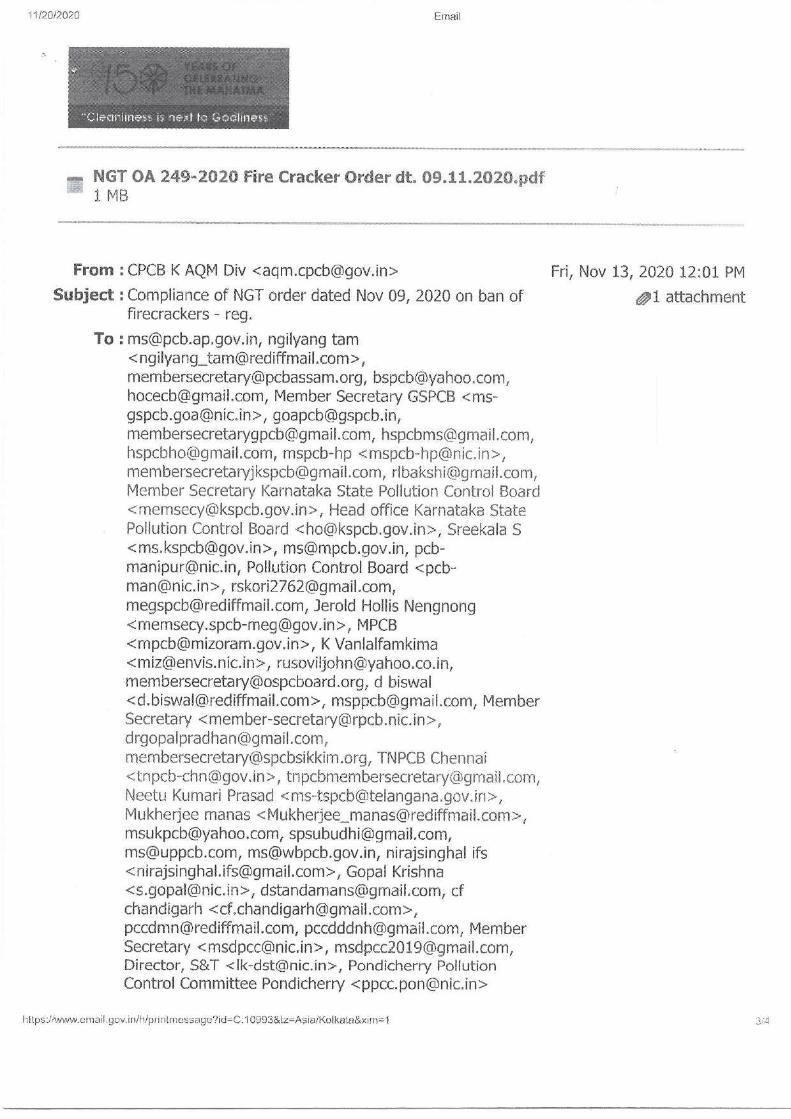
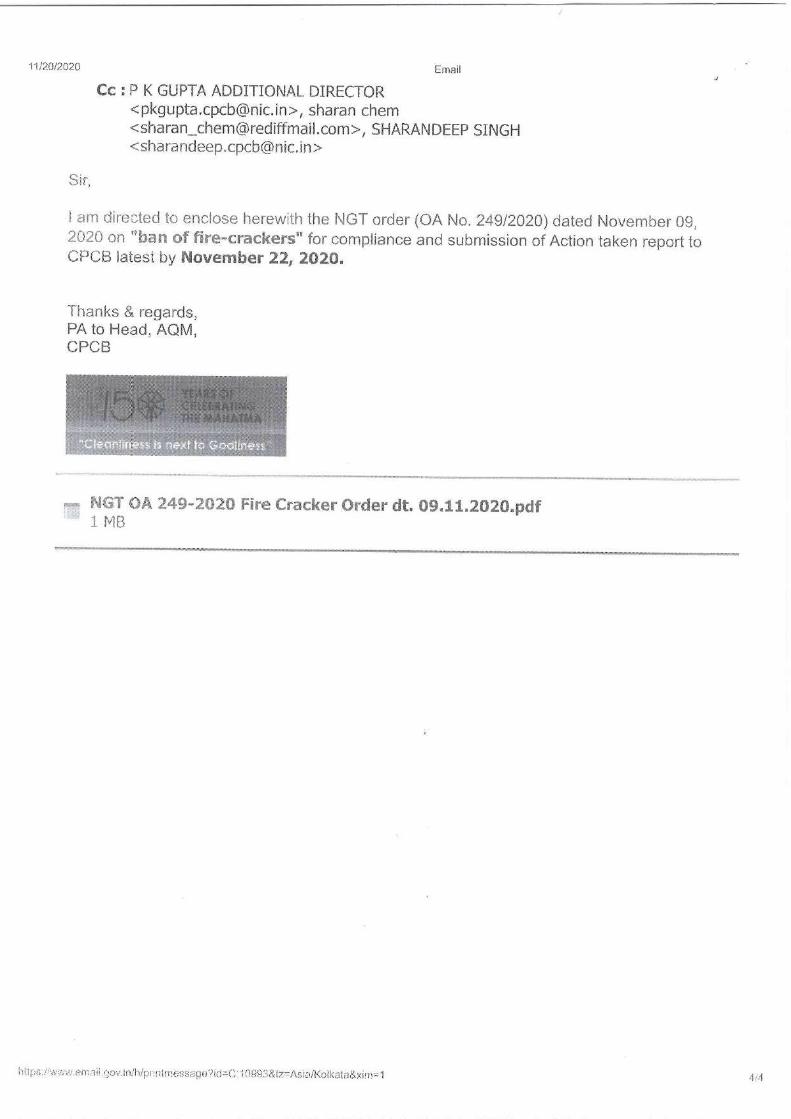
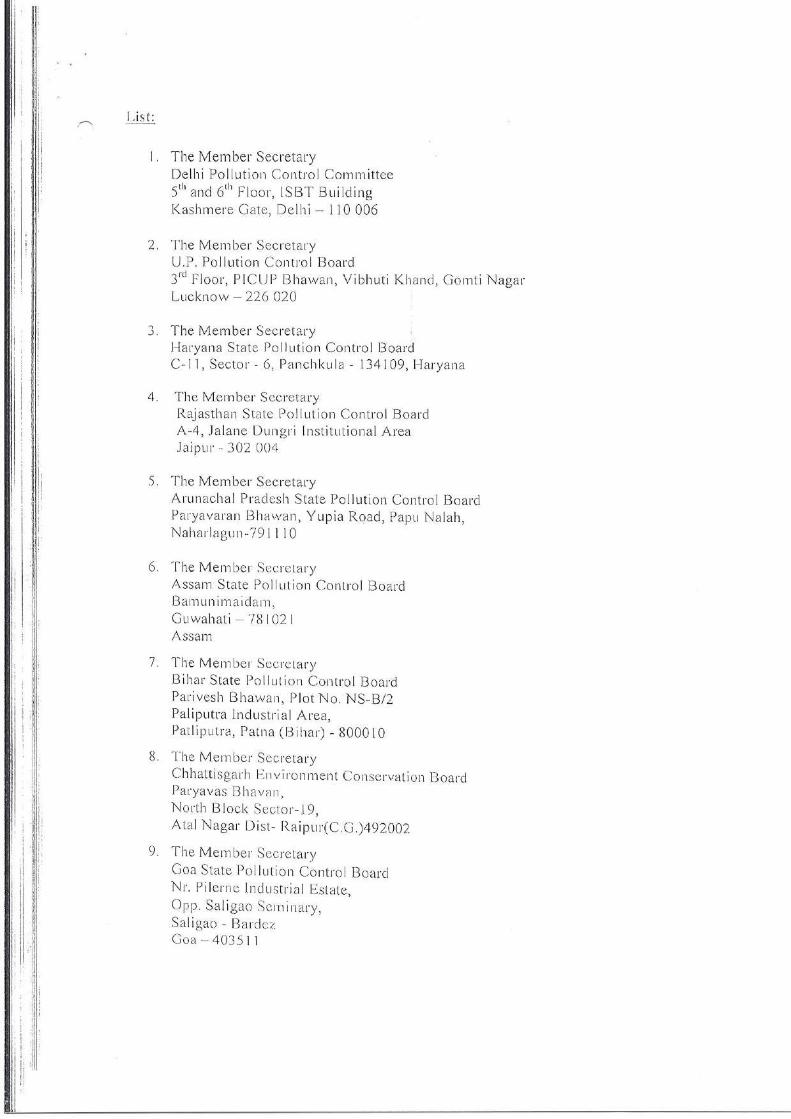
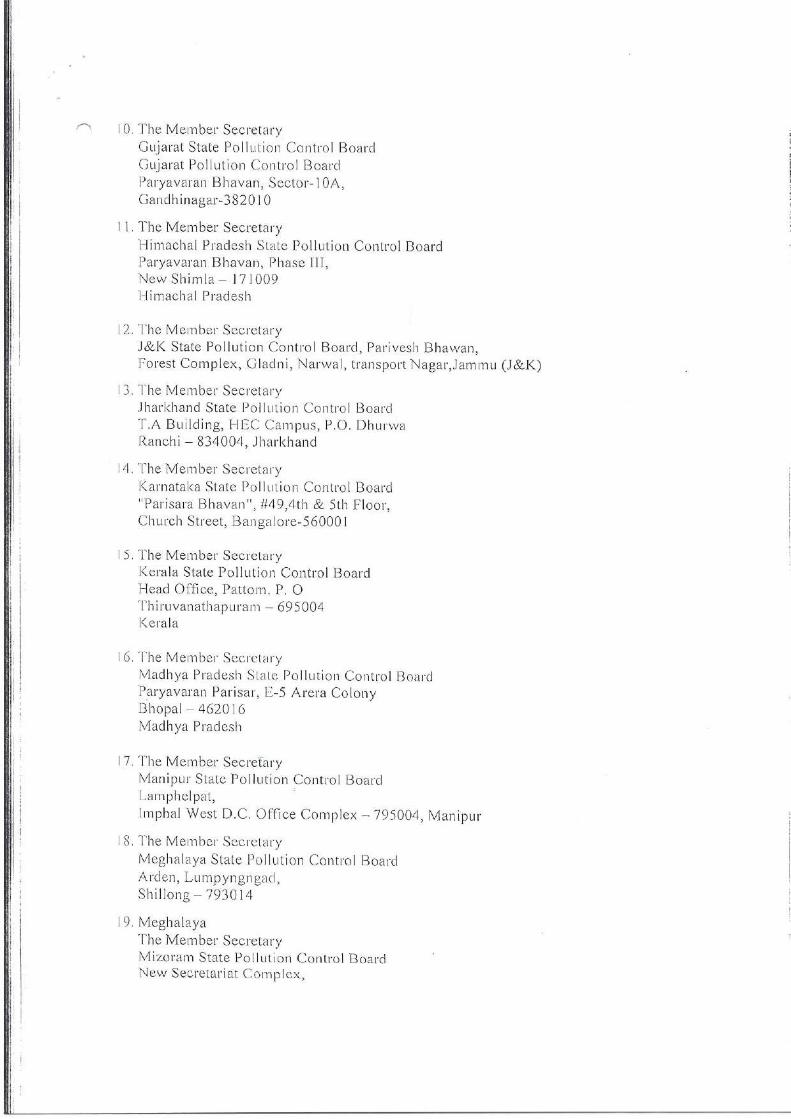
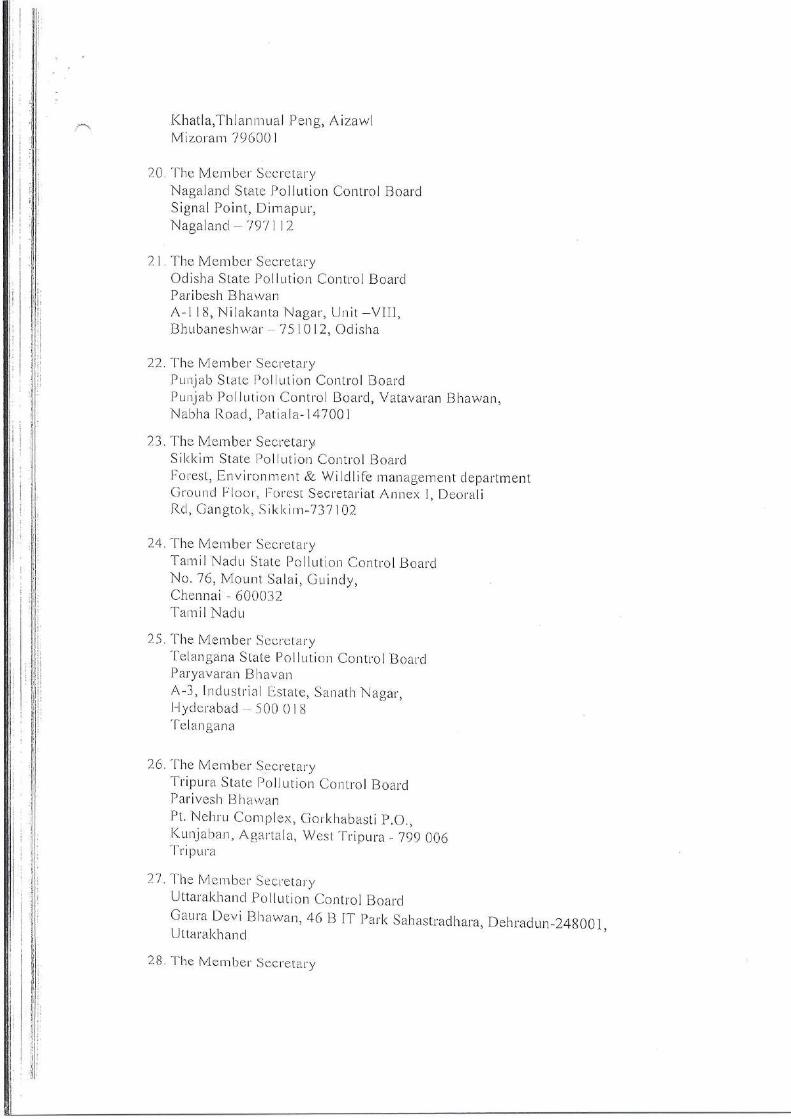
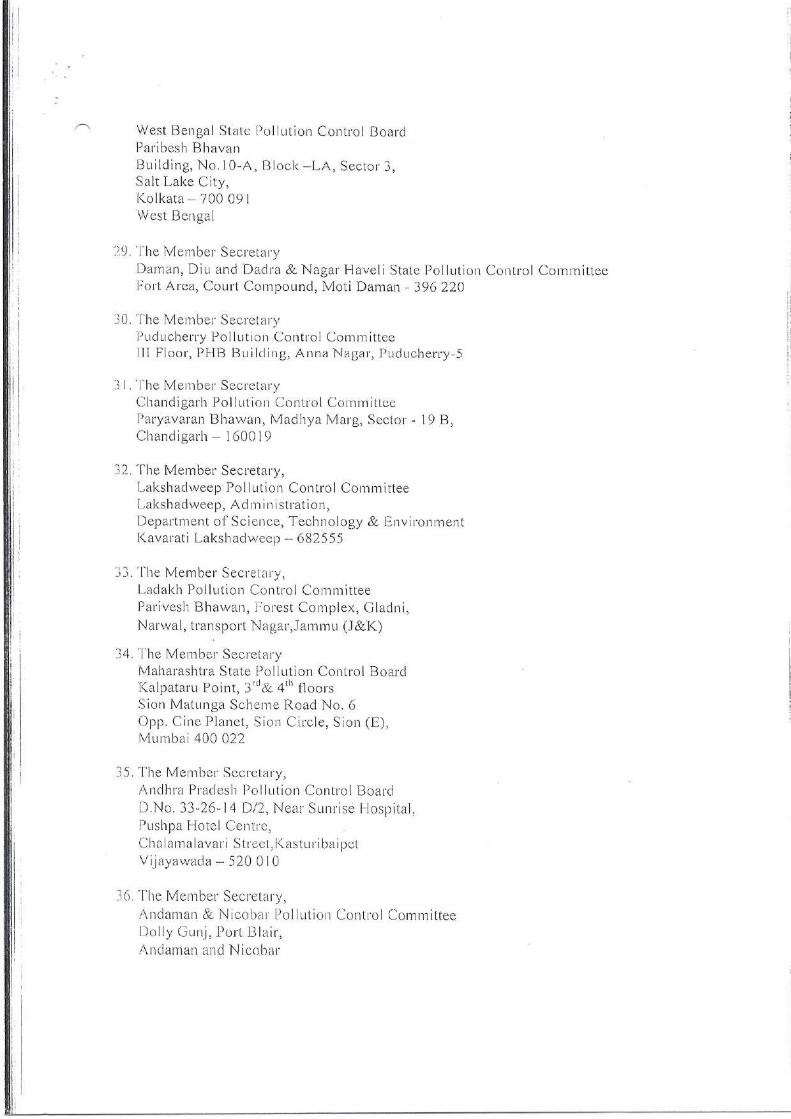
4. Annexure-lV: CPCB vide email dated November 13, 2020, communicated
State Pollution Control Boards and Pollution Control Committee of all Sates
for strict compliance of Hon'ble NGT Order and submit action taken report
by November 22, 2020.
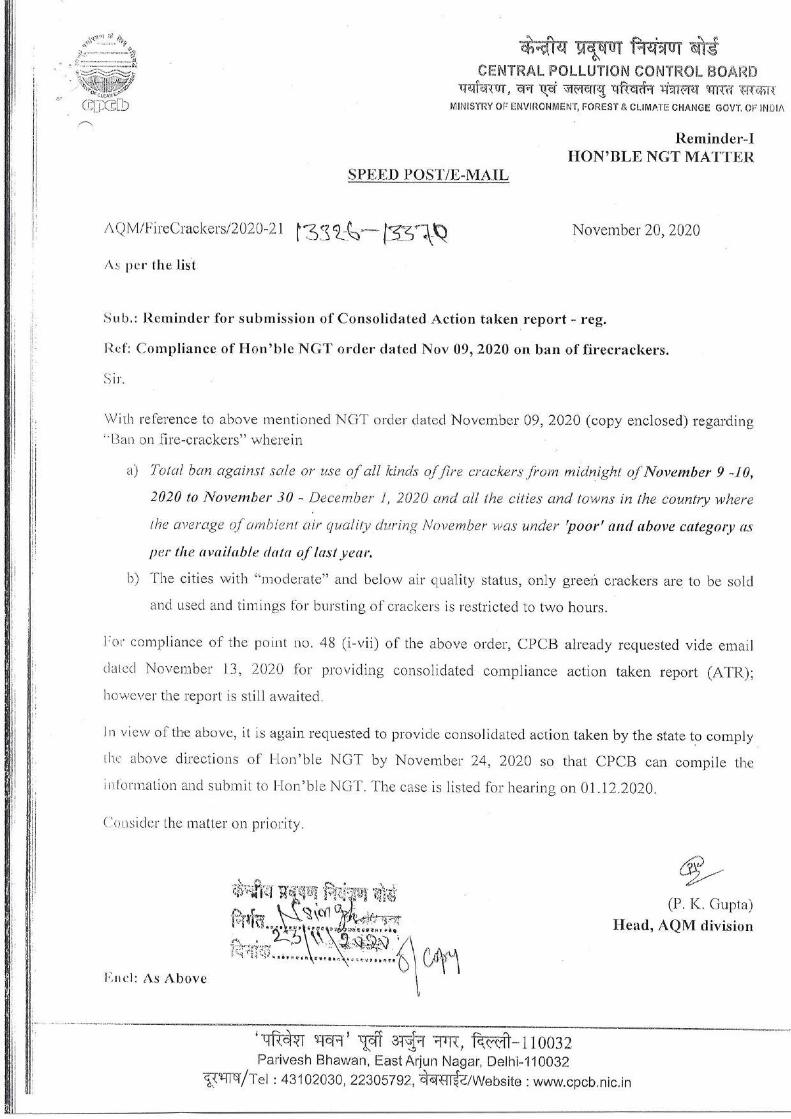
5. Annexure-V: CPCB vide letter dated November 20, 2020 sent reminder to
all the State Pollution Control Boards and Pollution Control Committees for
submitting compliance report by November 24, 2020.
6. Annexure-VI: Report on Ambient Air & Noise Quality of Karnataka State
during Deepavali-2020.
7. Annexure-VII: Ambient air quality and Noise monitoring data of Andhra
Pradesh.
8. Annexure-VIII: Year-wise comparative status and data sheet for ambient
noise monitoring and average air pollutant values of Bihar.
9. Annexure-lX: Air Quality Index observed pre and post Diwali at major
cities, Noise level monitoring during Diwali of Maharashtra.
10. Annexure-X: Report on air quality status in 2019 and in 2020 during Diwali
of Haveli and Dadra and Nagar Daman and Diu.
11. Annexure-XI: Air quality report of district Chhindwara of Madhya Pradesh.
12. Annexure-XII: Compliance of Hon'ble NGT order regarding ban of
Firecrackers and Report of monitoring of ambient air quality in major areas
of Rajasthan.
13. Annexure-XIII: Compliance of Hon'ble NGT order regarding ban of
Firecrackers in West Bengal.
14. Annexure- XIV: Compliance of Hon'ble NGT order regarding ban of
Firecrackers and monitoring of ambient air quality of Chhattisgarh.
15. Annexure-XV: Ambient Air Quality and Noise Level Monitoring Report
During Diwali of major cities of Jharkhand.
16. Annexure-XVI: Status Report on Air Quality and Noise Level Monitoring of
Shillong City during Diwali Festival, 2019 of Meghalaya.
17. Annexure-XVII: Order of compliance and comparative air quality data of
Chandigarh.
18. Annexure-XVIII: Action Taken Report of Tripura .on directions of Hon'ble
NGT in connection with remedial action against pollution caused by use of
fire crackers aggravating the menace of Covid-19.
19. Annexure- XIX: Action Taken Report of Mizoram in respect of the directions
of hon'ble NGT.
20. Annexure-XX: Implementation of directions of Hon'ble NGT regarding
restrictions on sale and use of firecrackers during festive season of Jam mu
& Kashmir.
21. Annexure-XXI: Remedial action against pollution by use of fire crackers by
Kerala Police Department.
22. Annexure-XXII: State Pollution Control Boards of Uttarakhand, Odisha,
Assam, Kera la, Sikkim, and Tamil Nadu have uploaded
data/report/Order/campaigns/notification/press release regarding use of
firecrackers
23. Annexure-XXIII: A copy of Hon'ble NGT order dated 05.11.2020.
~ (P.K. Gupta) Scientist 'E'
Central Pollution Control Board Parivesh Bhawan, East Arjun Nagar
Delhi-110032
Place: Delhi Date: 27th November, 2020
REPORT BEFORE THE NATIONAL GREEN TRIBUNAL PRINCIPAL
BENCH, NEW DELHI O.A. NO 249 OF 2020
SUBMITTED BY
CENTRAL POLLUTION CONTROL BOARD
1
Page 2 of 5
Report of CPCB in compliance to Hon’ble NGT Order dated 05.11.2020 in OA No. 249/2020 in the matter of Tribunal on its own motion Versus Ministry of Environment, Forest & Climate Change and Ors.
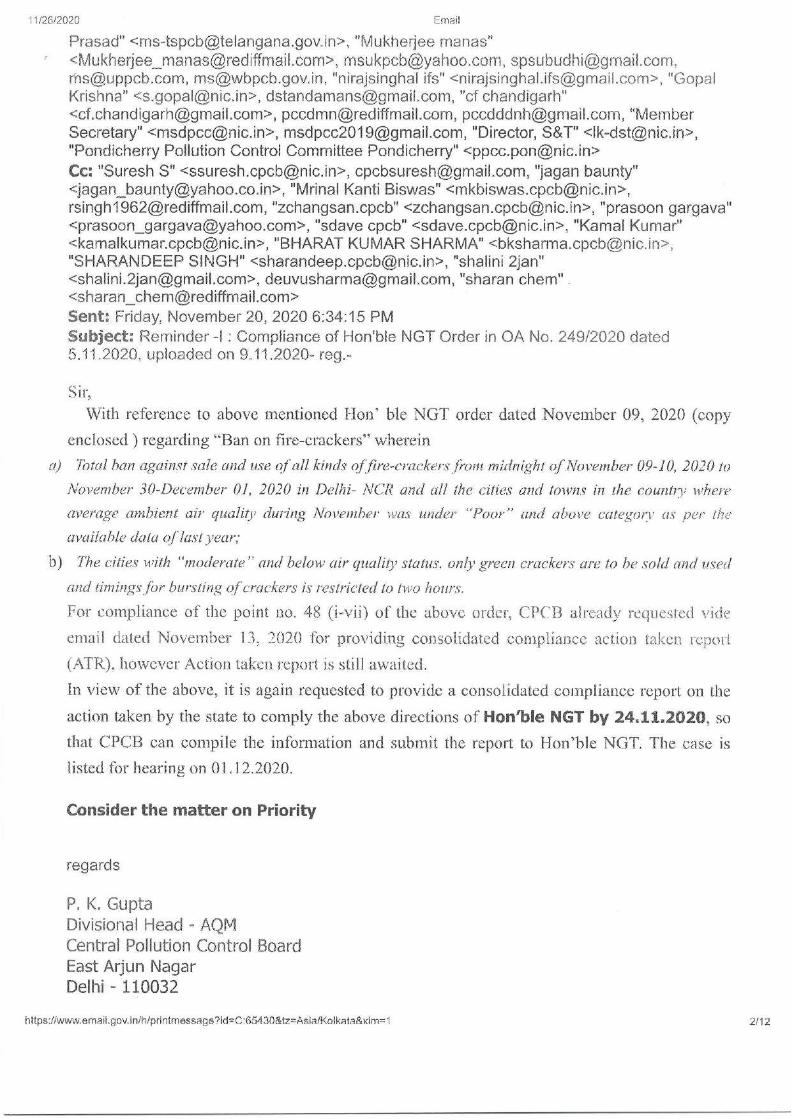
Hon’ble NGT in its Order dated 05.11.2020 in OA No. 249/2020 in the matter of Tribunal on
its own motion Versus Ministry of Environment, Forest & Climate Change and Ors.
regarding “Ban on fire-crackers” has issued certain directions. The relevant para [para 48 (i-
vii)] is reproduced below:
“
(i). There will be total ban against sale or use of all kinds of fire crackers in the
NCR from midnight of November, 9 -10, 2020 to the midnight of November 30
- December 1, 2020, to be reviewed thereafter.
(ii).Direction (i) will also apply to all cities/towns in the country where the average
of ambient air quality during November (as per available data of last year) fall
under 'poor' and above category.
(iii). The cities/towns where air quality is ‘moderate’ or below, only green
crackers be sold and the timings for use and bursting of crackers be restricted
to two hours during festivals, like Diwali, Chatt, New Year/Christmas Eve etc.,
as may be specified by the concerned State. This direction is on pattern of
direction of the Hon’ble Supreme Court in (2019) 13 SCC 523 which we are
applying to areas moderately polluted or below air quality due to aggravated
effect during Covid-19, as already noted. If nothing is specified by the State,
timing will be 8 to 10 pm on Diwali and Gurupurb, 6 am to 8 am on Chatt and
11.55 pm to 12.30 am during Christmas and New year eve (which have yet to
come and do not fall in November but if ban continues) and not otherwise.
(iv). At other places, ban/restrictions are optional for the authorities but if
there are more stringent measures under orders of the authorities, the same
will prevail.
(v).All States/UTs/PCBs/PCCs may initiate special drives to contain air pollution
from all sources in view of potential of aggravation of Covid-19
(vi). The Chief Secretaries and DGPs of all the States/UTs may issue and
circulate an appropriate order in above terms with appropriate enforcement
guidelines to all the District Magistrates and Superintendents of Police,
PCBs/PCCs.
2
Page 3 of 5
(vii). The CPCB and the State PCBs/PCCs may regularly monitor the air
quality during this period which may be uploaded on their respective websites.
CPCB may compile information on the subject, including the status of
compliance of this order from all the States/UTs and file a consolidated report
with data compiled till filing of report, before the next date by e-mail at
[email protected] preferably in the form of searchable PDF/OCR Support
PDF and not in the form of Image PDF.”
Following actions taken by CPCB are humbly submitted in compliance to the above
direction of the Hon’ble NGT:
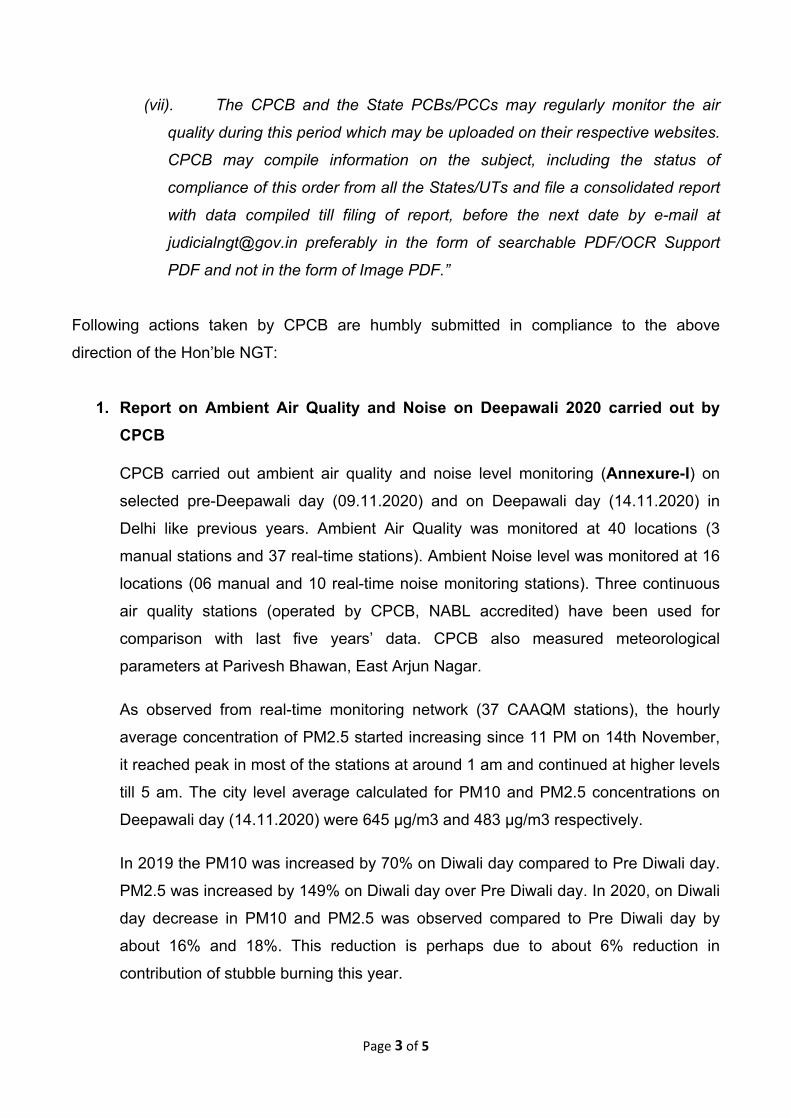
1. Report on Ambient Air Quality and Noise on Deepawali 2020 carried out by CPCB
CPCB carried out ambient air quality and noise level monitoring (Annexure-I) on
selected pre-Deepawali day (09.11.2020) and on Deepawali day (14.11.2020) in
Delhi like previous years. Ambient Air Quality was monitored at 40 locations (3
manual stations and 37 real-time stations). Ambient Noise level was monitored at 16
locations (06 manual and 10 real-time noise monitoring stations). Three continuous
air quality stations (operated by CPCB, NABL accredited) have been used for
comparison with last five years’ data. CPCB also measured meteorological
parameters at Parivesh Bhawan, East Arjun Nagar.
As observed from real-time monitoring network (37 CAAQM stations), the hourly
average concentration of PM2.5 started increasing since 11 PM on 14th November,
it reached peak in most of the stations at around 1 am and continued at higher levels
till 5 am. The city level average calculated for PM10 and PM2.5 concentrations on
Deepawali day (14.11.2020) were 645 μg/m3 and 483 μg/m3 respectively.
In 2019 the PM10 was increased by 70% on Diwali day compared to Pre Diwali day.
PM2.5 was increased by 149% on Diwali day over Pre Diwali day. In 2020, on Diwali
day decrease in PM10 and PM2.5 was observed compared to Pre Diwali day by
about 16% and 18%. This reduction is perhaps due to about 6% reduction in
contribution of stubble burning this year.
3
Page 4 of 5
Overall, this year Deepawali has witnessed higher background levels of pollutants
during pre-diwali days and further addition of particulates during night from
firecrackers.
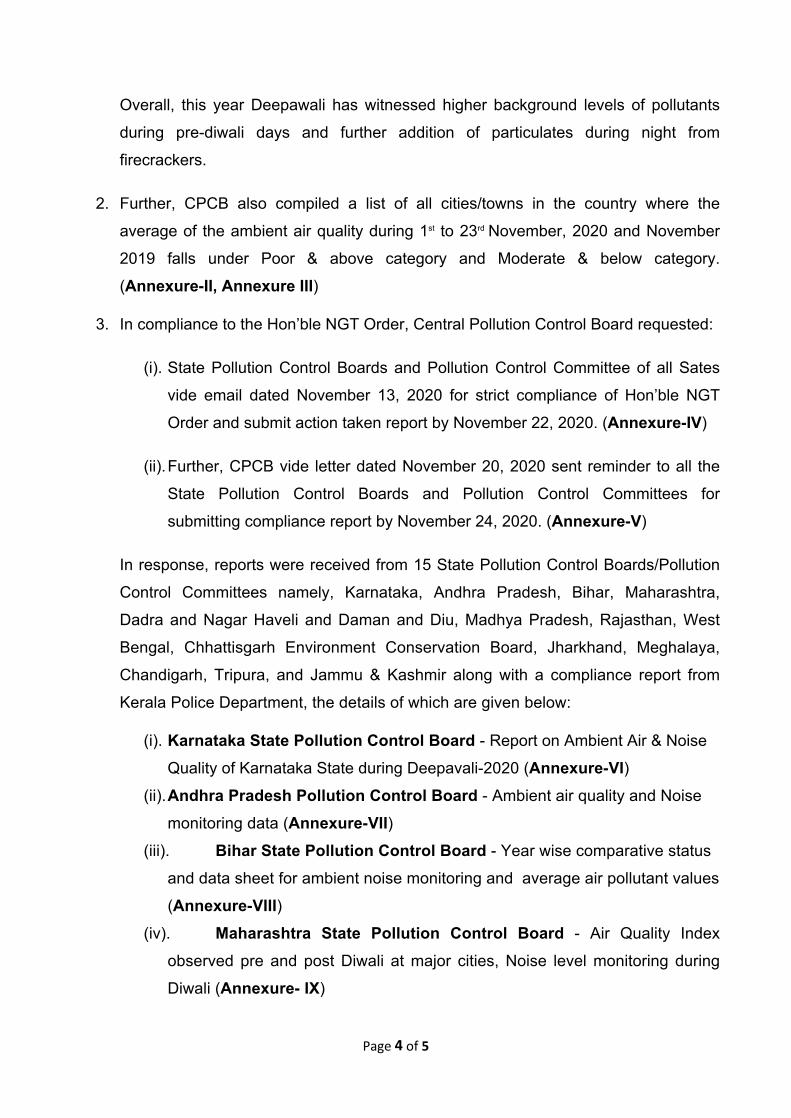
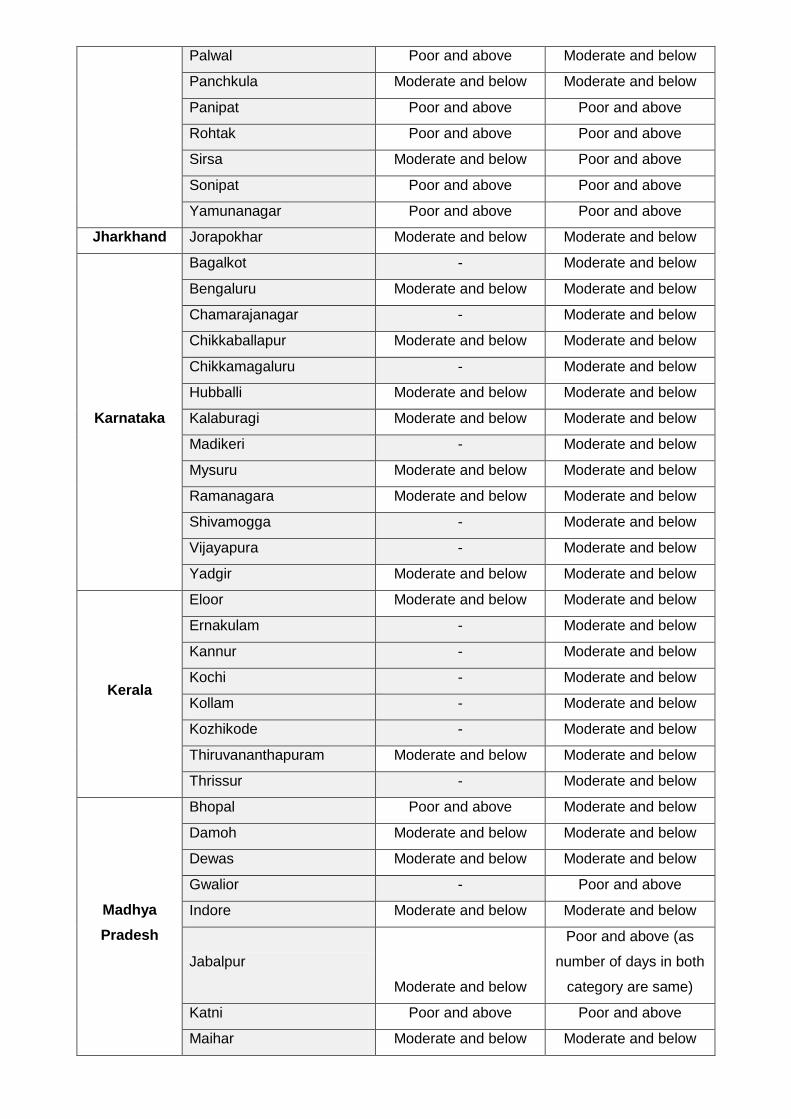
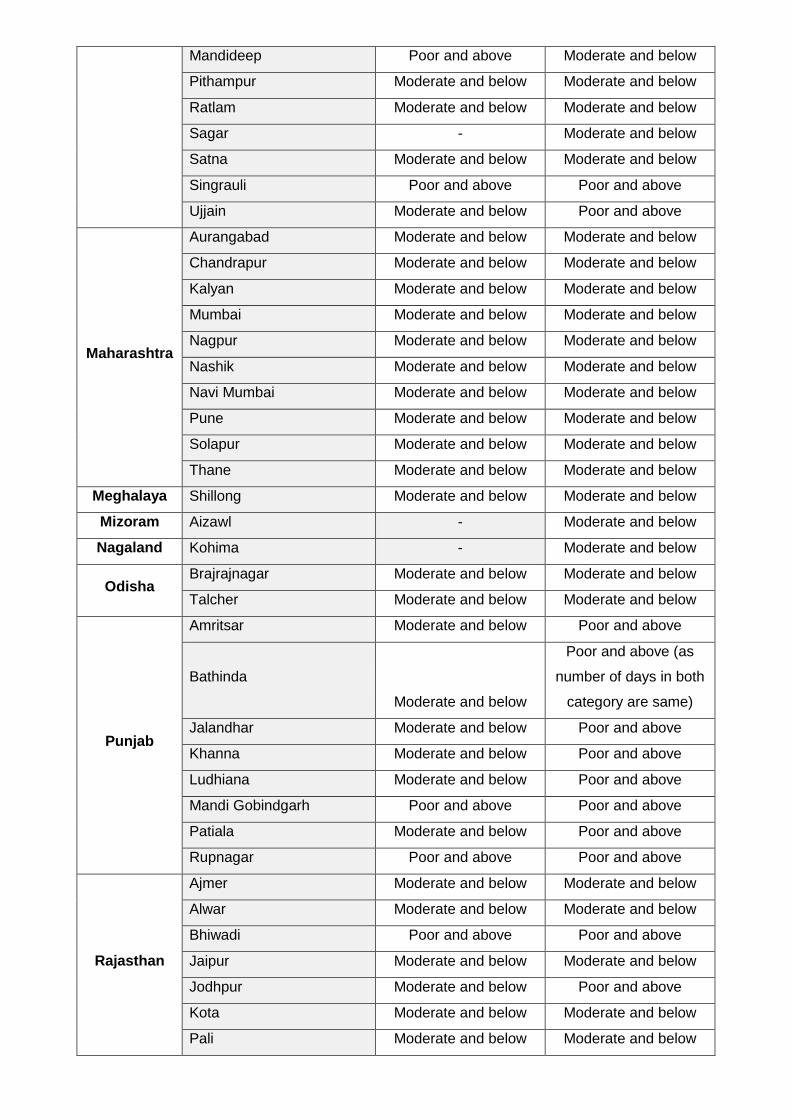
2. Further, CPCB also compiled a list of all cities/towns in the country where the
average of the ambient air quality during 1st to 23rd November, 2020 and November
2019 falls under Poor & above category and Moderate & below category.
(Annexure-II, Annexure III)
3. In compliance to the Hon’ble NGT Order, Central Pollution Control Board requested:
(i). State Pollution Control Boards and Pollution Control Committee of all Sates
vide email dated November 13, 2020 for strict compliance of Hon’ble NGT
Order and submit action taken report by November 22, 2020. (Annexure-IV)
(ii).Further, CPCB vide letter dated November 20, 2020 sent reminder to all the
State Pollution Control Boards and Pollution Control Committees for
submitting compliance report by November 24, 2020. (Annexure-V)
In response, reports were received from 15 State Pollution Control Boards/Pollution
Control Committees namely, Karnataka, Andhra Pradesh, Bihar, Maharashtra,
Dadra and Nagar Haveli and Daman and Diu, Madhya Pradesh, Rajasthan, West
Bengal, Chhattisgarh Environment Conservation Board, Jharkhand, Meghalaya,
Chandigarh, Tripura, and Jammu & Kashmir along with a compliance report from
Kerala Police Department, the details of which are given below:
(i). Karnataka State Pollution Control Board - Report on Ambient Air & Noise
Quality of Karnataka State during Deepavali-2020 (Annexure-VI)(ii).Andhra Pradesh Pollution Control Board - Ambient air quality and Noise
monitoring data (Annexure-VII)(iii). Bihar State Pollution Control Board - Year wise comparative status
and data sheet for ambient noise monitoring and average air pollutant values
(Annexure-VIII)(iv). Maharashtra State Pollution Control Board - Air Quality Index
observed pre and post Diwali at major cities, Noise level monitoring during
Diwali (Annexure- IX)
4
Page 5 of 5
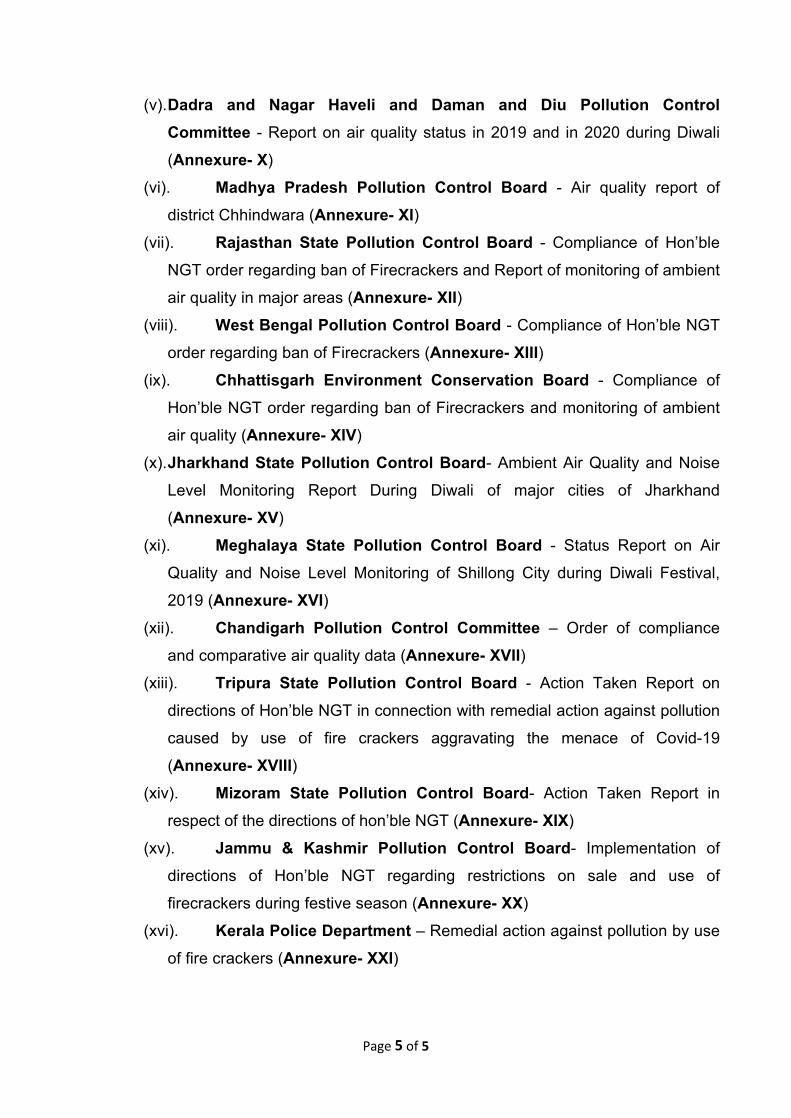
(v).Dadra and Nagar Haveli and Daman and Diu Pollution Control Committee - Report on air quality status in 2019 and in 2020 during Diwali
(Annexure- X)
(vi). Madhya Pradesh Pollution Control Board - Air quality report of
district Chhindwara (Annexure- XI)(vii). Rajasthan State Pollution Control Board - Compliance of Hon’ble
NGT order regarding ban of Firecrackers and Report of monitoring of ambient
air quality in major areas (Annexure- XII)(viii). West Bengal Pollution Control Board - Compliance of Hon’ble NGT
order regarding ban of Firecrackers (Annexure- XIII)(ix). Chhattisgarh Environment Conservation Board - Compliance of
Hon’ble NGT order regarding ban of Firecrackers and monitoring of ambient
air quality (Annexure- XIV)
(x).Jharkhand State Pollution Control Board- Ambient Air Quality and Noise
Level Monitoring Report During Diwali of major cities of Jharkhand
(Annexure- XV)
(xi). Meghalaya State Pollution Control Board - Status Report on Air
Quality and Noise Level Monitoring of Shillong City during Diwali Festival,
2019 (Annexure- XVI)(xii). Chandigarh Pollution Control Committee – Order of compliance
and comparative air quality data (Annexure- XVII)(xiii). Tripura State Pollution Control Board - Action Taken Report on
directions of Hon’ble NGT in connection with remedial action against pollution
caused by use of fire crackers aggravating the menace of Covid-19
(Annexure- XVIII)(xiv). Mizoram State Pollution Control Board- Action Taken Report in
respect of the directions of hon’ble NGT (Annexure- XIX)
(xv). Jammu & Kashmir Pollution Control Board- Implementation of
directions of Hon’ble NGT regarding restrictions on sale and use of
firecrackers during festive season (Annexure- XX)
(xvi). Kerala Police Department – Remedial action against pollution by use
of fire crackers (Annexure- XXI)
5
Page 6 of 5
Further, it was observed that Order regarding compliance of NGT directions (before
14th November, 2020) were issued by Karnataka, Andhra Pradesh, Bihar,
Maharashtra, Dadra and Nagar Haveli and Daman and Diu, Madhya Pradesh,
Rajasthan, Chhattisgarh, Jharkhand, Tripura, Chandigarh, Jammu & Kashmir, and
Kerala State Governments. However, Meghalaya issued communication in this
regard.
State Pollution Control Boards of Karnataka, Bihar, West Bengal, Jharkhand,
Tripura, and Jammu & Kashmir took steps for mass awareness such as Press
Release, Appeal through print media and electronic media. Rajasthan and Tripura
State Pollution Control Board set up mass awareness programs such as
broadcasting on FM channels, TV, Newspapers; Social media campaigns and
through banners. Jharkhand State Pollution Control Board published the Order in
print media as well as by means of electronic media.
Websites of all the State Pollution Control Boards, and Pollution Control
Committees were also visited to check the availability of report/data of air quality
monitoring carried out during Deepawali period. It was observed that Uttarakhand
and Odisha State Pollution Control Boards have uploaded data/report of monitoring
during Deepawali in compliance to the Hon’ble NGT order whereas, State Pollution
Control Boards of Assam, Kerala, Sikkim, and Tamil Nadu have uploaded
Order/campaigns/notification/press release regarding use of firecrackers.
(Annexure XXII)
*****************
6
Report on Ambient Air Quality & Noise on Deepawali 2020
केन्द्रीय प्रदषूण नियंत्रण बोर्ड पर्यावरण, वन एवं जलवयर् ुपररवर्ान मंत्रयलर्,
भयरर् सरकयर
CENTRAL POLLUTION CONTROL BOARD Website: http://www.cpcb.nic.in
Annexure-I
7
CPCB, Deepawali Report 2020 Page 1 of 7
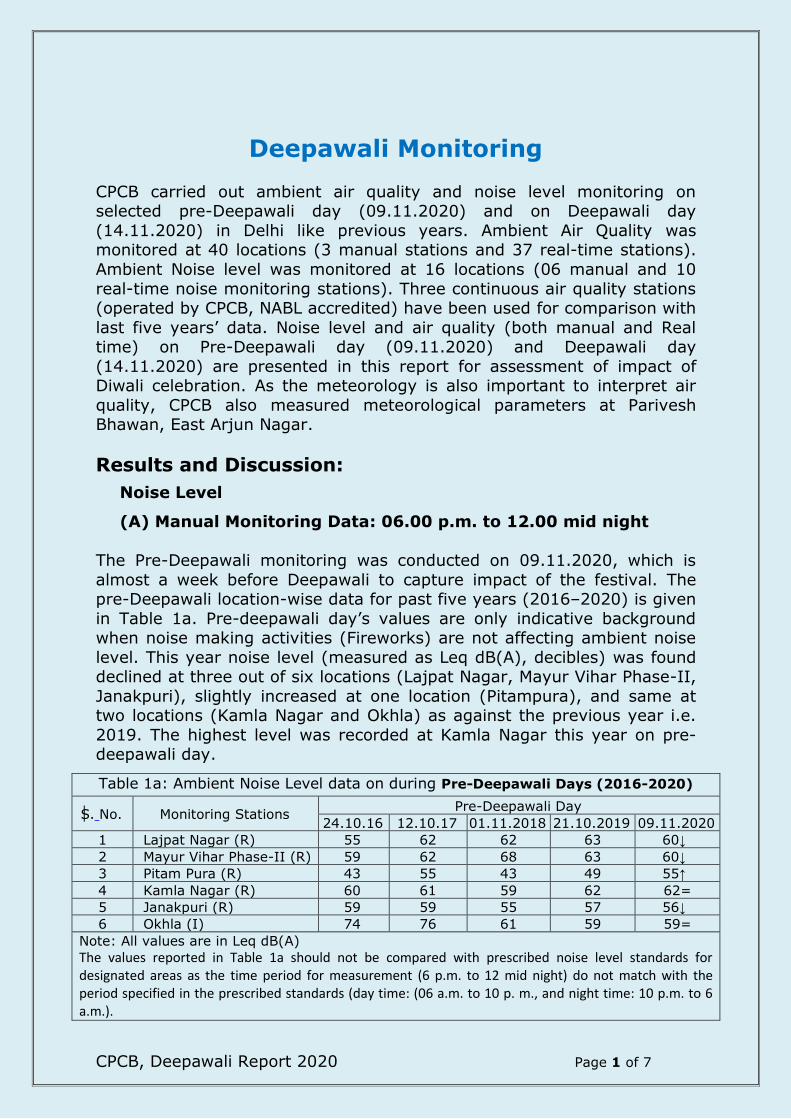
Deepawali Monitoring
CPCB carried out ambient air quality and noise level monitoring on selected pre-Deepawali day (09.11.2020) and on Deepawali day
(14.11.2020) in Delhi like previous years. Ambient Air Quality was monitored at 40 locations (3 manual stations and 37 real-time stations).
Ambient Noise level was monitored at 16 locations (06 manual and 10
real-time noise monitoring stations). Three continuous air quality stations (operated by CPCB, NABL accredited) have been used for comparison with
last five years’ data. Noise level and air quality (both manual and Real time) on Pre-Deepawali day (09.11.2020) and Deepawali day
(14.11.2020) are presented in this report for assessment of impact of Diwali celebration. As the meteorology is also important to interpret air
quality, CPCB also measured meteorological parameters at Parivesh Bhawan, East Arjun Nagar.
Results and Discussion:
Noise Level
(A) Manual Monitoring Data: 06.00 p.m. to 12.00 mid night
The Pre-Deepawali monitoring was conducted on 09.11.2020, which is
almost a week before Deepawali to capture impact of the festival. The pre-Deepawali location-wise data for past five years (2016–2020) is given
in Table 1a. Pre-deepawali day’s values are only indicative background when noise making activities (Fireworks) are not affecting ambient noise
level. This year noise level (measured as Leq dB(A), decibles) was found declined at three out of six locations (Lajpat Nagar, Mayur Vihar Phase-II,
Janakpuri), slightly increased at one location (Pitampura), and same at two locations (Kamla Nagar and Okhla) as against the previous year i.e.
2019. The highest level was recorded at Kamla Nagar this year on pre-deepawali day.
Table 1a: Ambient Noise Level data on during Pre-Deepawali Days (2016-2020)
S. No. Monitoring Stations Pre-Deepawali Day
24.10.16 12.10.17 01.11.2018 21.10.2019 09.11.2020
1 Lajpat Nagar (R) 55 62 62 63 60↓
2 Mayur Vihar Phase-II (R) 59 62 68 63 60↓
3 Pitam Pura (R) 43 55 43 49 55↑
4 Kamla Nagar (R) 60 61 59 62 62=
5 Janakpuri (R) 59 59 55 57 56↓
6 Okhla (I) 74 76 61 59 59=
Note: All values are in Leq dB(A)
The values reported in Table 1a should not be compared with prescribed noise level standards for designated areas as the time period for measurement (6 p.m. to 12 mid night) do not match with the period specified in the prescribed standards (day time: (06 a.m. to 10 p. m., and night time: 10 p.m. to 6 a.m.).
8
CPCB, Deepawali Report 2020 Page 2 of 7
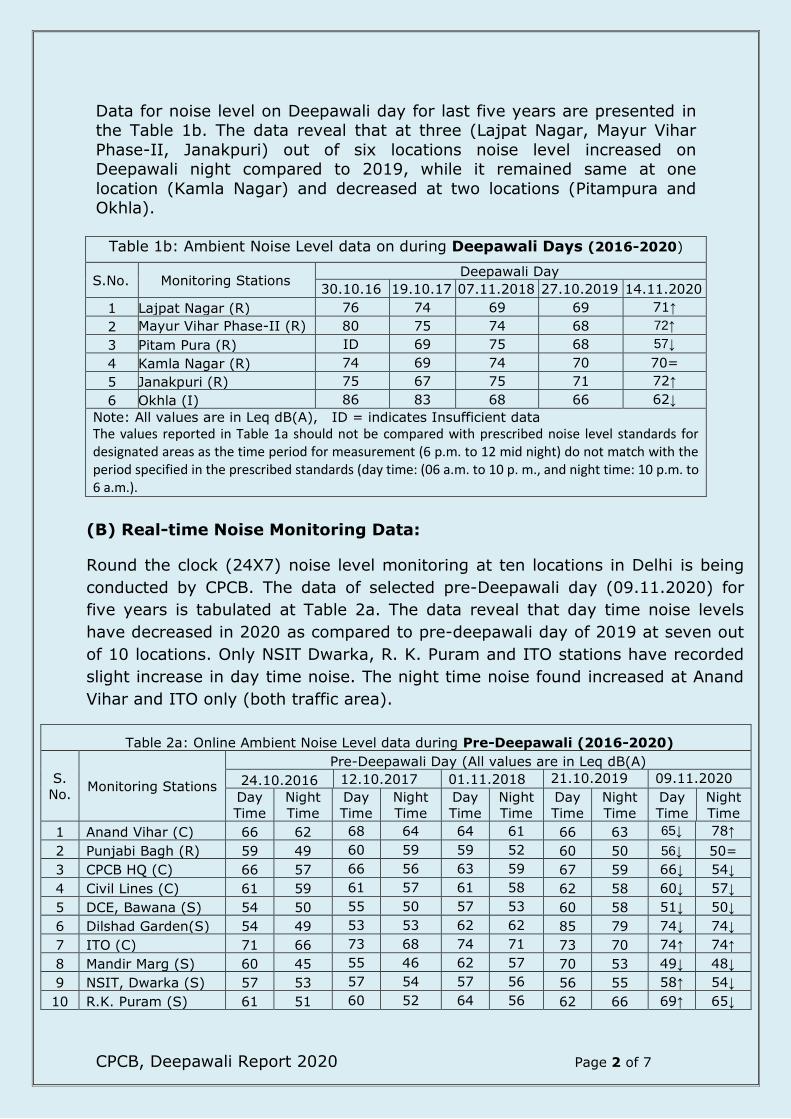
Data for noise level on Deepawali day for last five years are presented in the Table 1b. The data reveal that at three (Lajpat Nagar, Mayur Vihar
Phase-II, Janakpuri) out of six locations noise level increased on Deepawali night compared to 2019, while it remained same at one
location (Kamla Nagar) and decreased at two locations (Pitampura and Okhla).
Table 1b: Ambient Noise Level data on during Deepawali Days (2016-2020)
S.No. Monitoring Stations Deepawali Day
30.10.16 19.10.17 07.11.2018 27.10.2019 14.11.2020
1 Lajpat Nagar (R) 76 74 69 69 71↑
2 Mayur Vihar Phase-II (R) 80 75 74 68 72↑
3 Pitam Pura (R) ID 69 75 68 57↓
4 Kamla Nagar (R) 74 69 74 70 70=
5 Janakpuri (R) 75 67 75 71 72↑
6 Okhla (I) 86 83 68 66 62↓
Note: All values are in Leq dB(A), ID = indicates Insufficient data
The values reported in Table 1a should not be compared with prescribed noise level standards for designated areas as the time period for measurement (6 p.m. to 12 mid night) do not match with the period specified in the prescribed standards (day time: (06 a.m. to 10 p. m., and night time: 10 p.m. to 6 a.m.).
(B) Real-time Noise Monitoring Data:
Round the clock (24X7) noise level monitoring at ten locations in Delhi is being
conducted by CPCB. The data of selected pre-Deepawali day (09.11.2020) for
five years is tabulated at Table 2a. The data reveal that day time noise levels
have decreased in 2020 as compared to pre-deepawali day of 2019 at seven out
of 10 locations. Only NSIT Dwarka, R. K. Puram and ITO stations have recorded
slight increase in day time noise. The night time noise found increased at Anand
Vihar and ITO only (both traffic area).
Table 2a: Online Ambient Noise Level data during Pre-Deepawali (2016-2020)
S.
No. Monitoring Stations
Pre-Deepawali Day (All values are in Leq dB(A)
24.10.2016 12.10.2017 01.11.2018 21.10.2019 09.11.2020
Day
Time
Night
Time
Day
Time
Night
Time
Day
Time
Night
Time
Day
Time
Night
Time
Day
Time
Night
Time
1 Anand Vihar (C) 66 62 68 64 64 61 66 63 65↓ 78↑
2 Punjabi Bagh (R) 59 49 60 59 59 52 60 50 56↓ 50=
3 CPCB HQ (C) 66 57 66 56 63 59 67 59 66↓ 54↓
4 Civil Lines (C) 61 59 61 57 61 58 62 58 60↓ 57↓
5 DCE, Bawana (S) 54 50 55 50 57 53 60 58 51↓ 50↓
6 Dilshad Garden(S) 54 49 53 53 62 62 85 79 74↓ 74↓
7 ITO (C) 71 66 73 68 74 71 73 70 74↑ 74↑
8 Mandir Marg (S) 60 45 55 46 62 57 70 53 49↓ 48↓
9 NSIT, Dwarka (S) 57 53 57 54 57 56 56 55 58↑ 54↓
10 R.K. Puram (S) 61 51 60 52 64 56 62 66 69↑ 65↓
9
CPCB, Deepawali Report 2020 Page 3 of 7
Notes : Day Time – 0600 hrs to 2200 hrs and Night time – 2200 hrs to 0600 hours
Area Designation (C) – Commercial, (R) – Residential, (S) – Sensitive
Prescribed Standards in Leq dB(A) : (C) – 65 (Day time) 55 (night time); (R) - 55 (Day time) 45 (night
time) and (S) - 50 (Day time) 40 (night time)
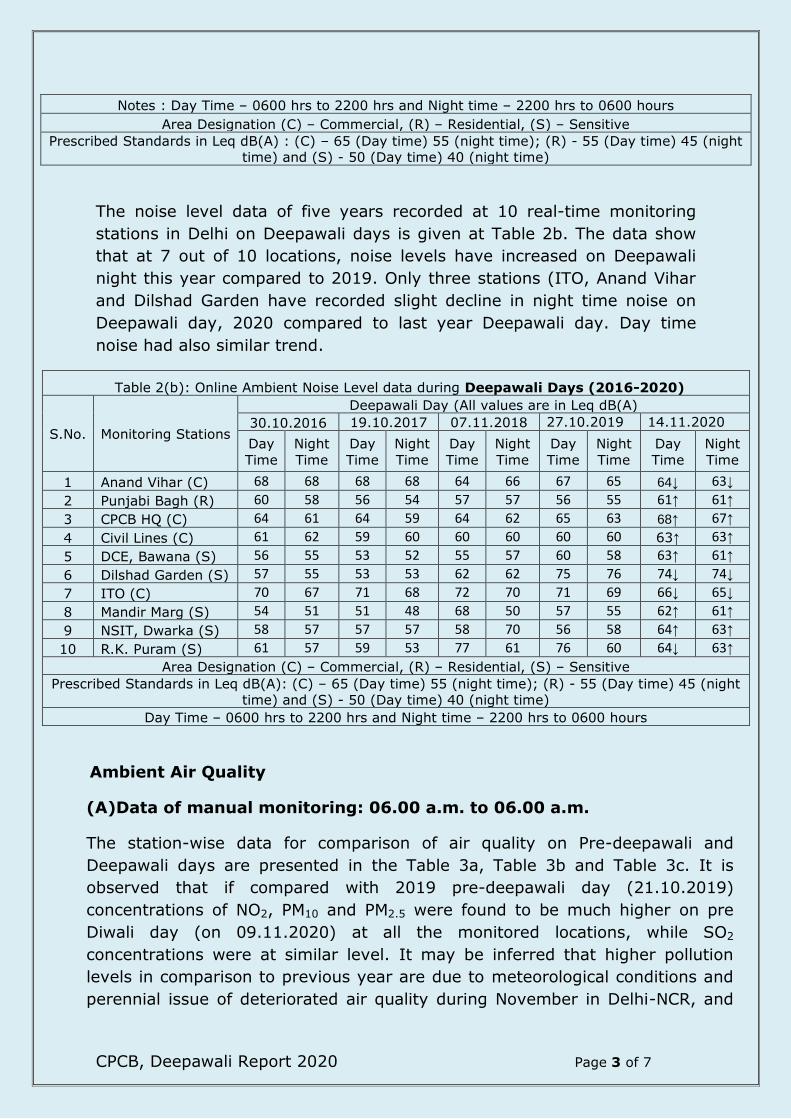
The noise level data of five years recorded at 10 real-time monitoring
stations in Delhi on Deepawali days is given at Table 2b. The data show
that at 7 out of 10 locations, noise levels have increased on Deepawali
night this year compared to 2019. Only three stations (ITO, Anand Vihar
and Dilshad Garden have recorded slight decline in night time noise on
Deepawali day, 2020 compared to last year Deepawali day. Day time
noise had also similar trend.
Table 2(b): Online Ambient Noise Level data during Deepawali Days (2016-2020)
S.No. Monitoring Stations
Deepawali Day (All values are in Leq dB(A)
30.10.2016 19.10.2017 07.11.2018 27.10.2019 14.11.2020
Day
Time
Night
Time
Day
Time
Night
Time
Day
Time
Night
Time
Day
Time
Night
Time
Day
Time
Night
Time
1 Anand Vihar (C) 68 68 68 68 64 66 67 65 64↓ 63↓
2 Punjabi Bagh (R) 60 58 56 54 57 57 56 55 61↑ 61↑
3 CPCB HQ (C) 64 61 64 59 64 62 65 63 68↑ 67↑
4 Civil Lines (C) 61 62 59 60 60 60 60 60 63↑ 63↑
5 DCE, Bawana (S) 56 55 53 52 55 57 60 58 63↑ 61↑
6 Dilshad Garden (S) 57 55 53 53 62 62 75 76 74↓ 74↓
7 ITO (C) 70 67 71 68 72 70 71 69 66↓ 65↓
8 Mandir Marg (S) 54 51 51 48 68 50 57 55 62↑ 61↑
9 NSIT, Dwarka (S) 58 57 57 57 58 70 56 58 64↑ 63↑
10 R.K. Puram (S) 61 57 59 53 77 61 76 60 64↓ 63↑
Area Designation (C) – Commercial, (R) – Residential, (S) – Sensitive
Prescribed Standards in Leq dB(A): (C) – 65 (Day time) 55 (night time); (R) - 55 (Day time) 45 (night
time) and (S) - 50 (Day time) 40 (night time)
Day Time – 0600 hrs to 2200 hrs and Night time – 2200 hrs to 0600 hours
Ambient Air Quality
(A)Data of manual monitoring: 06.00 a.m. to 06.00 a.m.
The station-wise data for comparison of air quality on Pre-deepawali and
Deepawali days are presented in the Table 3a, Table 3b and Table 3c. It is
observed that if compared with 2019 pre-deepawali day (21.10.2019)
concentrations of NO2, PM10 and PM2.5 were found to be much higher on pre
Diwali day (on 09.11.2020) at all the monitored locations, while SO2
concentrations were at similar level. It may be inferred that higher pollution
levels in comparison to previous year are due to meteorological conditions and
perennial issue of deteriorated air quality during November in Delhi-NCR, and
10
CPCB, Deepawali Report 2020 Page 4 of 7
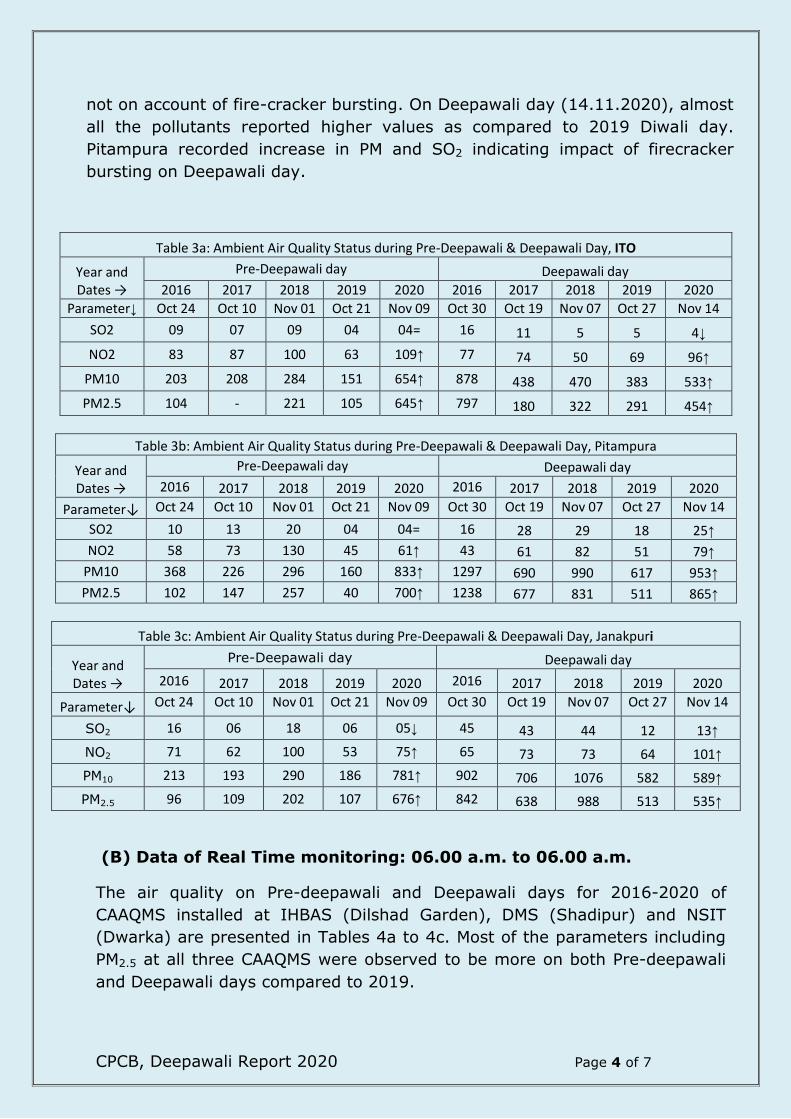
not on account of fire-cracker bursting. On Deepawali day (14.11.2020), almost
all the pollutants reported higher values as compared to 2019 Diwali day.
Pitampura recorded increase in PM and SO2 indicating impact of firecracker
bursting on Deepawali day.
Table 3a: Ambient Air Quality Status during Pre-Deepawali & Deepawali Day, ITO
Year and Dates →
Pre-Deepawali day Deepawali day
2016 2017 2018 2019 2020 2016 2017 2018 2019 2020
Parameter↓ Oct 24 Oct 10 Nov 01 Oct 21 Nov 09 Oct 30 Oct 19 Nov 07 Oct 27 Nov 14
SO2 09 07 09 04 04= 16 11 5 5 4↓
NO2 83 87 100 63 109↑ 77 74 50 69 96↑
PM10 203 208 284 151 654↑ 878 438 470 383 533↑
PM2.5 104 - 221 105 645↑ 797 180 322 291 454↑
Table 3b: Ambient Air Quality Status during Pre-Deepawali & Deepawali Day, Pitampura
Year and Dates →
Pre-Deepawali day Deepawali day
2016 2017 2018 2019 2020 2016 2017 2018 2019 2020
Parameter↓ Oct 24 Oct 10 Nov 01 Oct 21 Nov 09 Oct 30 Oct 19 Nov 07 Oct 27 Nov 14
SO2 10 13 20 04 04= 16 28 29 18 25↑
NO2 58 73 130 45 61↑ 43 61 82 51 79↑
PM10 368 226 296 160 833↑ 1297 690 990 617 953↑
PM2.5 102 147 257 40 700↑ 1238 677 831 511 865↑
Table 3c: Ambient Air Quality Status during Pre-Deepawali & Deepawali Day, Janakpuri
Year and Dates →
Pre-Deepawali day Deepawali day
2016 2017 2018 2019 2020 2016 2017 2018 2019 2020
Parameter↓ Oct 24 Oct 10 Nov 01 Oct 21 Nov 09 Oct 30 Oct 19 Nov 07 Oct 27 Nov 14
SO2 16 06 18 06 05↓ 45 43 44 12 13↑
NO2 71 62 100 53 75↑ 65 73 73 64 101↑
PM10 213 193 290 186 781↑ 902 706 1076 582 589↑
PM2.5 96 109 202 107 676↑ 842 638 988 513 535↑
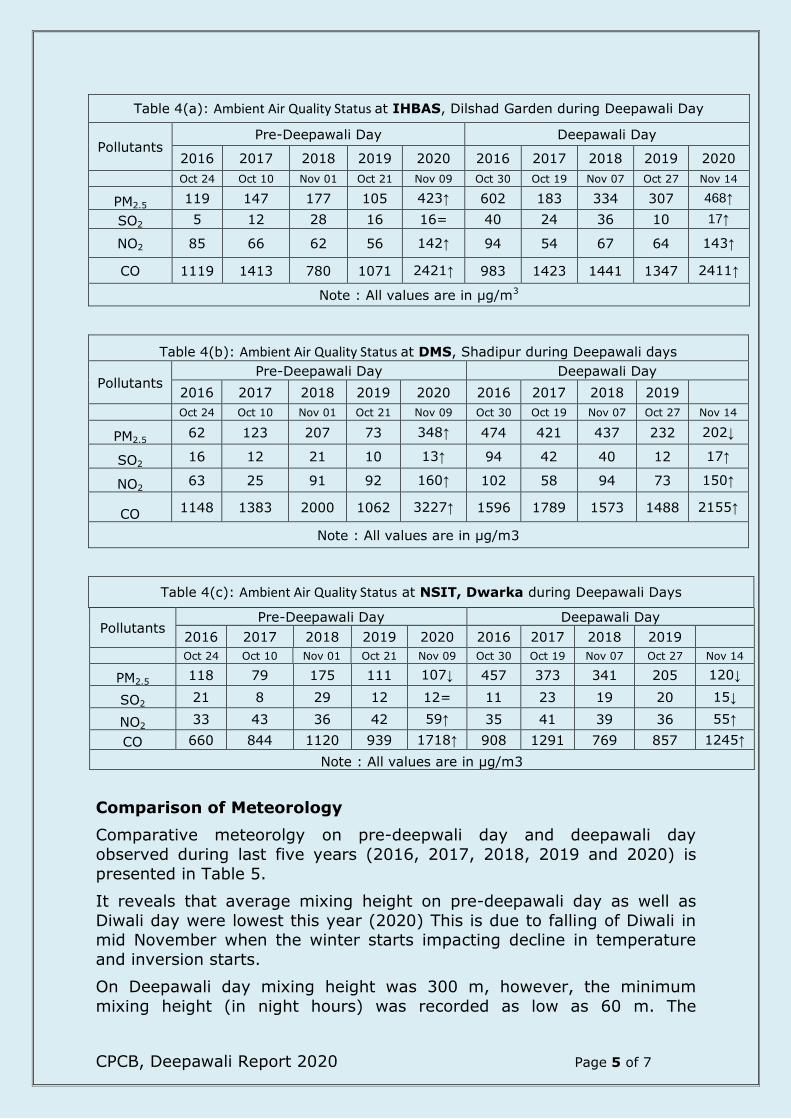
(B) Data of Real Time monitoring: 06.00 a.m. to 06.00 a.m.
The air quality on Pre-deepawali and Deepawali days for 2016-2020 of
CAAQMS installed at IHBAS (Dilshad Garden), DMS (Shadipur) and NSIT
(Dwarka) are presented in Tables 4a to 4c. Most of the parameters including
PM2.5 at all three CAAQMS were observed to be more on both Pre-deepawali
and Deepawali days compared to 2019.
11
CPCB, Deepawali Report 2020 Page 5 of 7
Table 4(a): Ambient Air Quality Status at IHBAS, Dilshad Garden during Deepawali Day
Pollutants Pre-Deepawali Day Deepawali Day
2016 2017 2018 2019 2020 2016 2017 2018 2019 2020
Oct 24 Oct 10 Nov 01 Oct 21 Nov 09 Oct 30 Oct 19 Nov 07 Oct 27 Nov 14
PM2.5 119 147 177 105 423↑ 602 183 334 307 468↑
SO2 5 12 28 16 16= 40 24 36 10 17↑
NO2 85 66 62 56 142↑ 94 54 67 64 143↑
CO 1119 1413 780 1071 2421↑ 983 1423 1441 1347 2411↑
Note : All values are in µg/m3
Table 4(b): Ambient Air Quality Status at DMS, Shadipur during Deepawali days
Pollutants Pre-Deepawali Day Deepawali Day
2016 2017 2018 2019 2020 2016 2017 2018 2019
Oct 24 Oct 10 Nov 01 Oct 21 Nov 09 Oct 30 Oct 19 Nov 07 Oct 27 Nov 14
PM2.5 62 123 207 73 348↑ 474 421 437 232 202↓
SO2 16 12 21 10 13↑ 94 42 40 12 17↑
NO2 63 25 91 92 160↑ 102 58 94 73 150↑
CO 1148 1383 2000 1062 3227↑ 1596 1789 1573 1488 2155↑
Note : All values are in µg/m3
Table 4(c): Ambient Air Quality Status at NSIT, Dwarka during Deepawali Days
Pollutants Pre-Deepawali Day Deepawali Day
2016 2017 2018 2019 2020 2016 2017 2018 2019
Oct 24 Oct 10 Nov 01 Oct 21 Nov 09 Oct 30 Oct 19 Nov 07 Oct 27 Nov 14
PM2.5 118 79 175 111 107↓ 457 373 341 205 120↓
SO2 21 8 29 12 12= 11 23 19 20 15↓
NO2 33 43 36 42 59↑ 35 41 39 36 55↑
CO 660 844 1120 939 1718↑ 908 1291 769 857 1245↑
Note : All values are in µg/m3
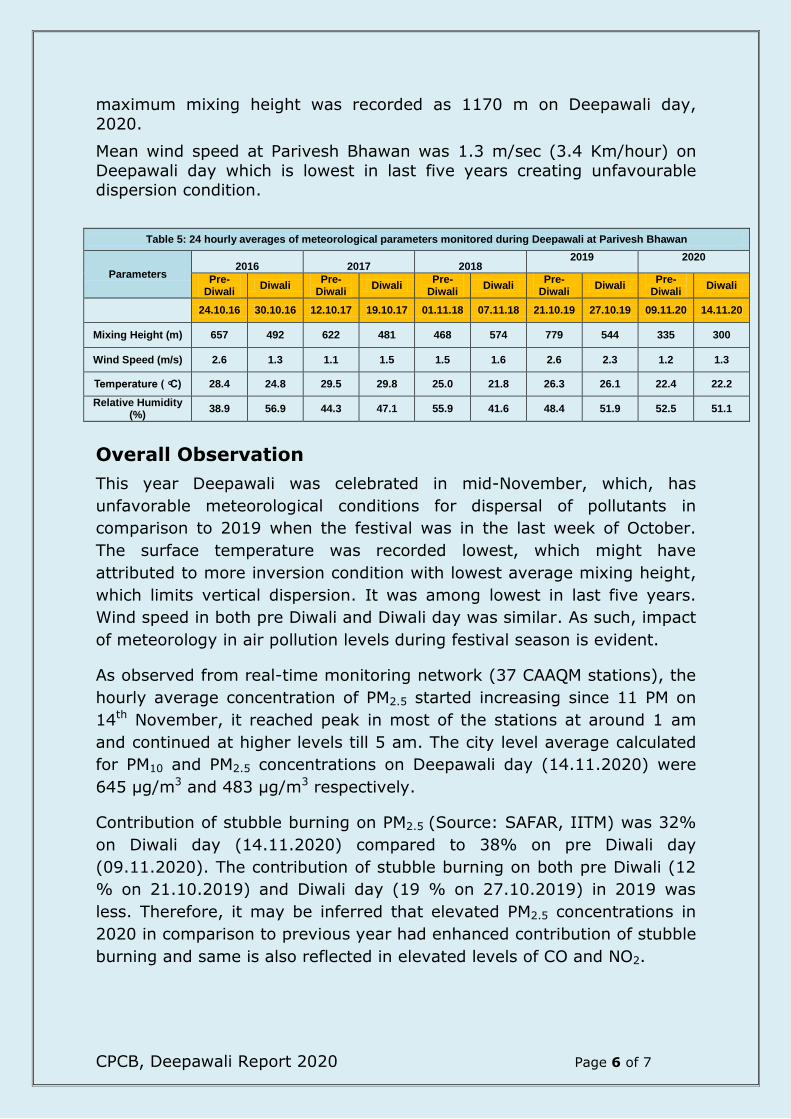
Comparison of Meteorology
Comparative meteorolgy on pre-deepwali day and deepawali day
observed during last five years (2016, 2017, 2018, 2019 and 2020) is
presented in Table 5.
It reveals that average mixing height on pre-deepawali day as well as
Diwali day were lowest this year (2020) This is due to falling of Diwali in mid November when the winter starts impacting decline in temperature
and inversion starts.
On Deepawali day mixing height was 300 m, however, the minimum
mixing height (in night hours) was recorded as low as 60 m. The
12
CPCB, Deepawali Report 2020 Page 6 of 7
maximum mixing height was recorded as 1170 m on Deepawali day,
2020.
Mean wind speed at Parivesh Bhawan was 1.3 m/sec (3.4 Km/hour) on
Deepawali day which is lowest in last five years creating unfavourable dispersion condition.
Table 5: 24 hourly averages of meteorological parameters monitored during Deepawali at Parivesh Bhawan
Parameters 2016 2017 2018
2019 2020
Pre-Diwali
Diwali Pre-
Diwali Diwali
Pre-Diwali
Diwali Pre-
Diwali Diwali
Pre-Diwali
Diwali
24.10.16 30.10.16 12.10.17 19.10.17 01.11.18 07.11.18 21.10.19 27.10.19 09.11.20 14.11.20
Mixing Height (m) 657 492 622 481 468 574 779 544 335 300
Wind Speed (m/s) 2.6 1.3 1.1 1.5 1.5 1.6 2.6 2.3 1.2 1.3
) 28.4 24.8 29.5 29.8 25.0 21.8 26.3 26.1 22.4 22.2
Relative Humidity (%)
38.9 56.9 44.3 47.1 55.9 41.6 48.4 51.9 52.5 51.1
Overall Observation
This year Deepawali was celebrated in mid-November, which, has
unfavorable meteorological conditions for dispersal of pollutants in
comparison to 2019 when the festival was in the last week of October.
The surface temperature was recorded lowest, which might have
attributed to more inversion condition with lowest average mixing height,
which limits vertical dispersion. It was among lowest in last five years.
Wind speed in both pre Diwali and Diwali day was similar. As such, impact
of meteorology in air pollution levels during festival season is evident.
As observed from real-time monitoring network (37 CAAQM stations), the
hourly average concentration of PM2.5 started increasing since 11 PM on
14th November, it reached peak in most of the stations at around 1 am
and continued at higher levels till 5 am. The city level average calculated
for PM10 and PM2.5 concentrations on Deepawali day (14.11.2020) were
645 µg/m3 and 483 µg/m3 respectively.
Contribution of stubble burning on PM2.5 (Source: SAFAR, IITM) was 32%
on Diwali day (14.11.2020) compared to 38% on pre Diwali day
(09.11.2020). The contribution of stubble burning on both pre Diwali (12
% on 21.10.2019) and Diwali day (19 % on 27.10.2019) in 2019 was
less. Therefore, it may be inferred that elevated PM2.5 concentrations in
2020 in comparison to previous year had enhanced contribution of stubble
burning and same is also reflected in elevated levels of CO and NO2.
13
CPCB, Deepawali Report 2020 Page 7 of 7
In 2019 the PM10 was increased by 70% on Diwali day compared to Pre
Diwali day. PM2.5 was increased by 149% on Diwali day over Pre Diwali
day. In 2020, on Diwali day decrease in PM10 and PM2.5 was observed
compared to Pre Diwali day by about 16% and 18%. This reduction is
perhaps due to about 6% reduction in contribution of stubble burning this
year.
Overall, this year Deepawali has witnessed higher background levels of
pollutants during pre-diwali days and further addition of particulates
during night from firecrackers.
14
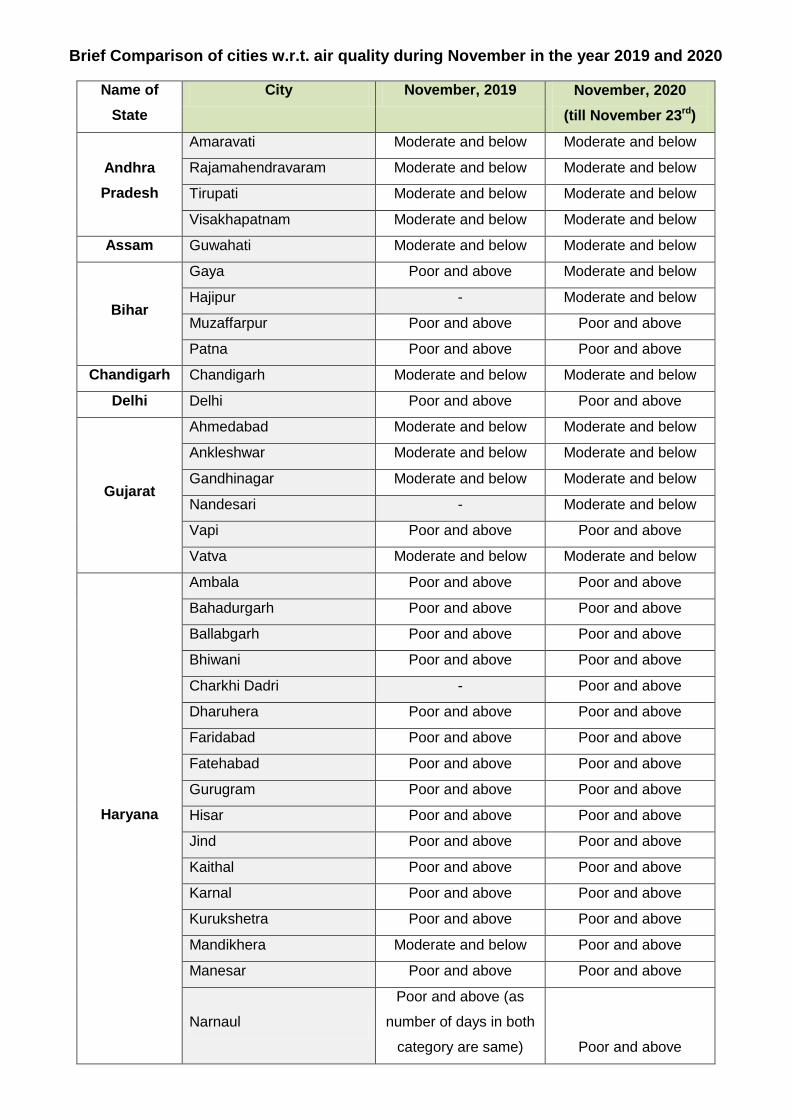
Brief Comparison of cities w.r.t. air quality during November in the year 2019 and 2020
Name of
State
City November, 2019 November, 2020
(till November 23rd)
Andhra
Pradesh
Amaravati Moderate and below Moderate and below
Rajamahendravaram Moderate and below Moderate and below
Tirupati Moderate and below Moderate and below
Visakhapatnam Moderate and below Moderate and below
Assam Guwahati Moderate and below Moderate and below
Bihar
Gaya Poor and above Moderate and below
Hajipur - Moderate and below
Muzaffarpur Poor and above Poor and above
Patna Poor and above Poor and above
Chandigarh Chandigarh Moderate and below Moderate and below
Delhi Delhi Poor and above Poor and above
Gujarat
Ahmedabad Moderate and below Moderate and below
Ankleshwar Moderate and below Moderate and below
Gandhinagar Moderate and below Moderate and below
Nandesari - Moderate and below
Vapi Poor and above Poor and above
Vatva Moderate and below Moderate and below
Haryana
Ambala Poor and above Poor and above
Bahadurgarh Poor and above Poor and above
Ballabgarh Poor and above Poor and above
Bhiwani Poor and above Poor and above
Charkhi Dadri - Poor and above
Dharuhera Poor and above Poor and above
Faridabad Poor and above Poor and above
Fatehabad Poor and above Poor and above
Gurugram Poor and above Poor and above
Hisar Poor and above Poor and above
Jind Poor and above Poor and above
Kaithal Poor and above Poor and above
Karnal Poor and above Poor and above
Kurukshetra Poor and above Poor and above
Mandikhera Moderate and below Poor and above
Manesar Poor and above Poor and above
Narnaul
Poor and above (as
number of days in both
category are same) Poor and above
Annexure-II
15
Palwal Poor and above Moderate and below
Panchkula Moderate and below Moderate and below
Panipat Poor and above Poor and above
Rohtak Poor and above Poor and above
Sirsa Moderate and below Poor and above
Sonipat Poor and above Poor and above
Yamunanagar Poor and above Poor and above
Jharkhand Jorapokhar Moderate and below Moderate and below
Karnataka
Bagalkot - Moderate and below
Bengaluru Moderate and below Moderate and below
Chamarajanagar - Moderate and below
Chikkaballapur Moderate and below Moderate and below
Chikkamagaluru - Moderate and below
Hubballi Moderate and below Moderate and below
Kalaburagi Moderate and below Moderate and below
Madikeri - Moderate and below
Mysuru Moderate and below Moderate and below
Ramanagara Moderate and below Moderate and below
Shivamogga - Moderate and below
Vijayapura - Moderate and below
Yadgir Moderate and below Moderate and below
Kerala
Eloor Moderate and below Moderate and below
Ernakulam - Moderate and below
Kannur - Moderate and below
Kochi - Moderate and below
Kollam - Moderate and below
Kozhikode - Moderate and below
Thiruvananthapuram Moderate and below Moderate and below
Thrissur - Moderate and below
Madhya
Pradesh
Bhopal Poor and above Moderate and below
Damoh Moderate and below Moderate and below
Dewas Moderate and below Moderate and below
Gwalior - Poor and above
Indore Moderate and below Moderate and below
Jabalpur
Moderate and below
Poor and above (as
number of days in both
category are same)
Katni Poor and above Poor and above
Maihar Moderate and below Moderate and below
16
Mandideep Poor and above Moderate and below
Pithampur Moderate and below Moderate and below
Ratlam Moderate and below Moderate and below
Sagar - Moderate and below
Satna Moderate and below Moderate and below
Singrauli Poor and above Poor and above
Ujjain Moderate and below Poor and above
Maharashtra
Aurangabad Moderate and below Moderate and below
Chandrapur Moderate and below Moderate and below
Kalyan Moderate and below Moderate and below
Mumbai Moderate and below Moderate and below
Nagpur Moderate and below Moderate and below
Nashik Moderate and below Moderate and below
Navi Mumbai Moderate and below Moderate and below
Pune Moderate and below Moderate and below
Solapur Moderate and below Moderate and below
Thane Moderate and below Moderate and below
Meghalaya Shillong Moderate and below Moderate and below
Mizoram Aizawl - Moderate and below
Nagaland Kohima - Moderate and below
Odisha Brajrajnagar Moderate and below Moderate and below
Talcher Moderate and below Moderate and below
Punjab
Amritsar Moderate and below Poor and above
Bathinda
Moderate and below
Poor and above (as
number of days in both
category are same)
Jalandhar Moderate and below Poor and above
Khanna Moderate and below Poor and above
Ludhiana Moderate and below Poor and above
Mandi Gobindgarh Poor and above Poor and above
Patiala Moderate and below Poor and above
Rupnagar Poor and above Poor and above
Rajasthan
Ajmer Moderate and below Moderate and below
Alwar Moderate and below Moderate and below
Bhiwadi Poor and above Poor and above
Jaipur Moderate and below Moderate and below
Jodhpur Moderate and below Poor and above
Kota Moderate and below Moderate and below
Pali Moderate and below Moderate and below
17
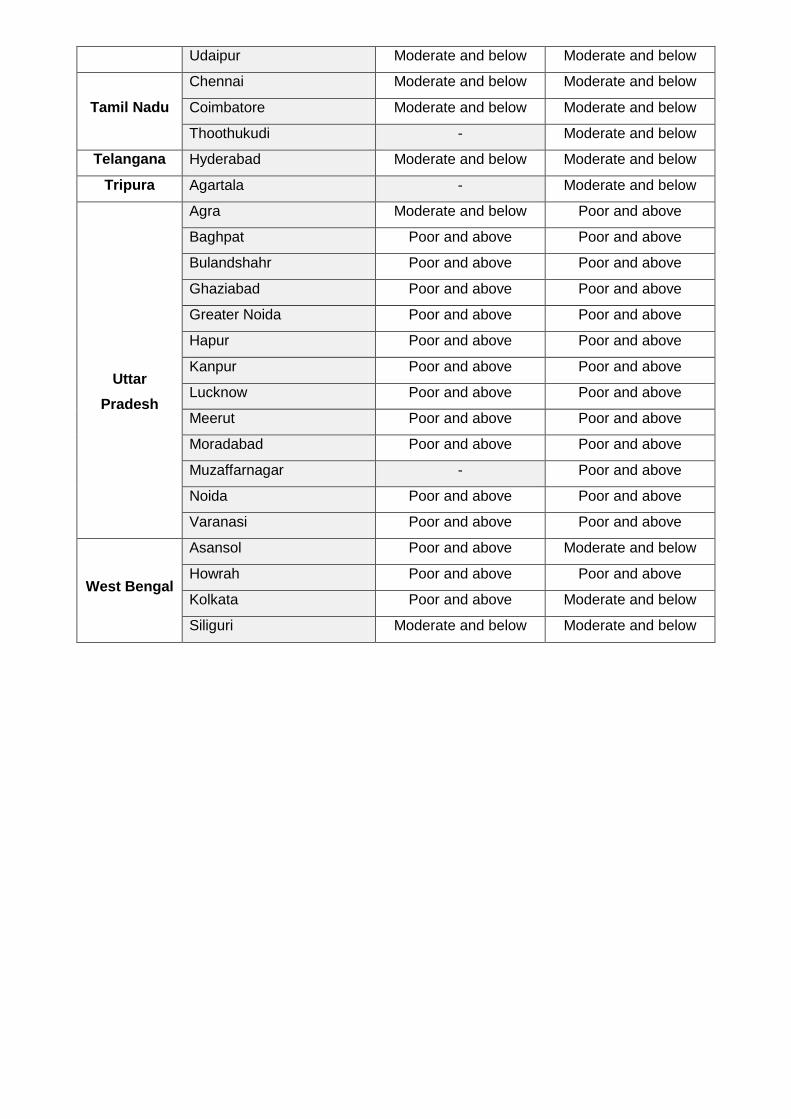
Udaipur Moderate and below Moderate and below
Tamil Nadu
Chennai Moderate and below Moderate and below
Coimbatore Moderate and below Moderate and below
Thoothukudi - Moderate and below
Telangana Hyderabad Moderate and below Moderate and below
Tripura Agartala - Moderate and below
Uttar
Pradesh
Agra Moderate and below Poor and above
Baghpat Poor and above Poor and above
Bulandshahr Poor and above Poor and above
Ghaziabad Poor and above Poor and above
Greater Noida Poor and above Poor and above
Hapur Poor and above Poor and above
Kanpur Poor and above Poor and above
Lucknow Poor and above Poor and above
Meerut Poor and above Poor and above
Moradabad Poor and above Poor and above
Muzaffarnagar - Poor and above
Noida Poor and above Poor and above
Varanasi Poor and above Poor and above
West Bengal
Asansol Poor and above Moderate and below
Howrah Poor and above Poor and above
Kolkata Poor and above Moderate and below
Siliguri Moderate and below Moderate and below
18
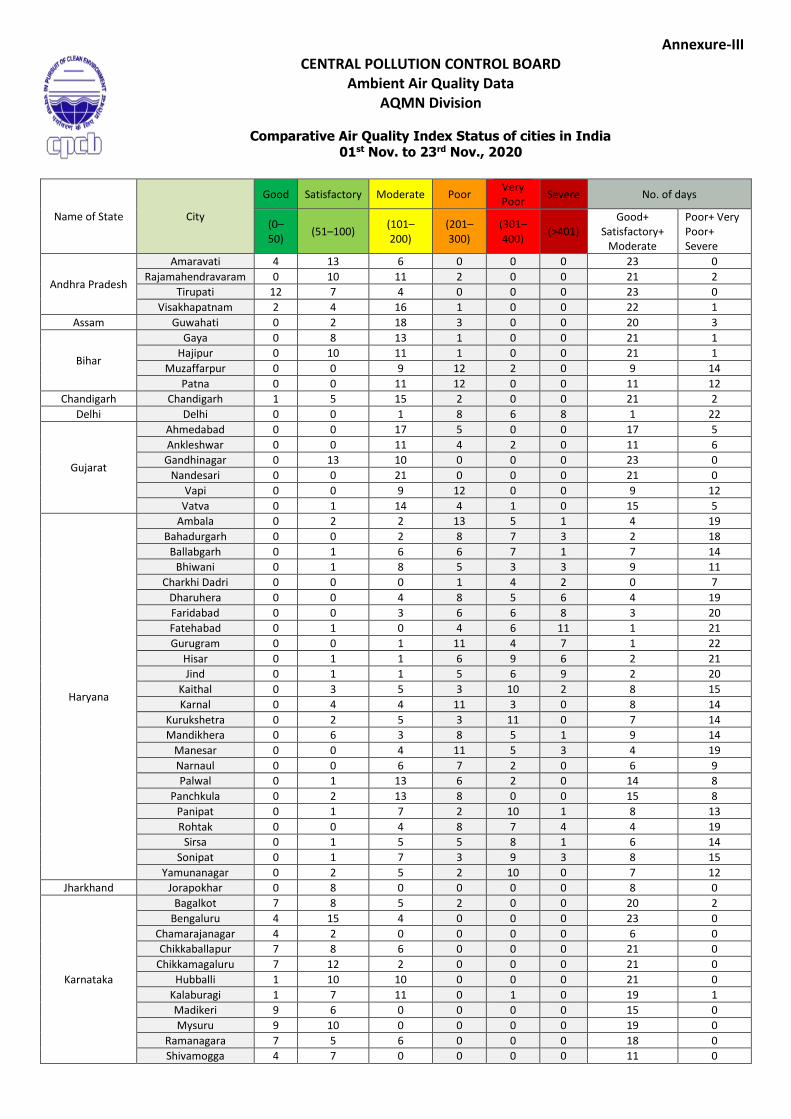
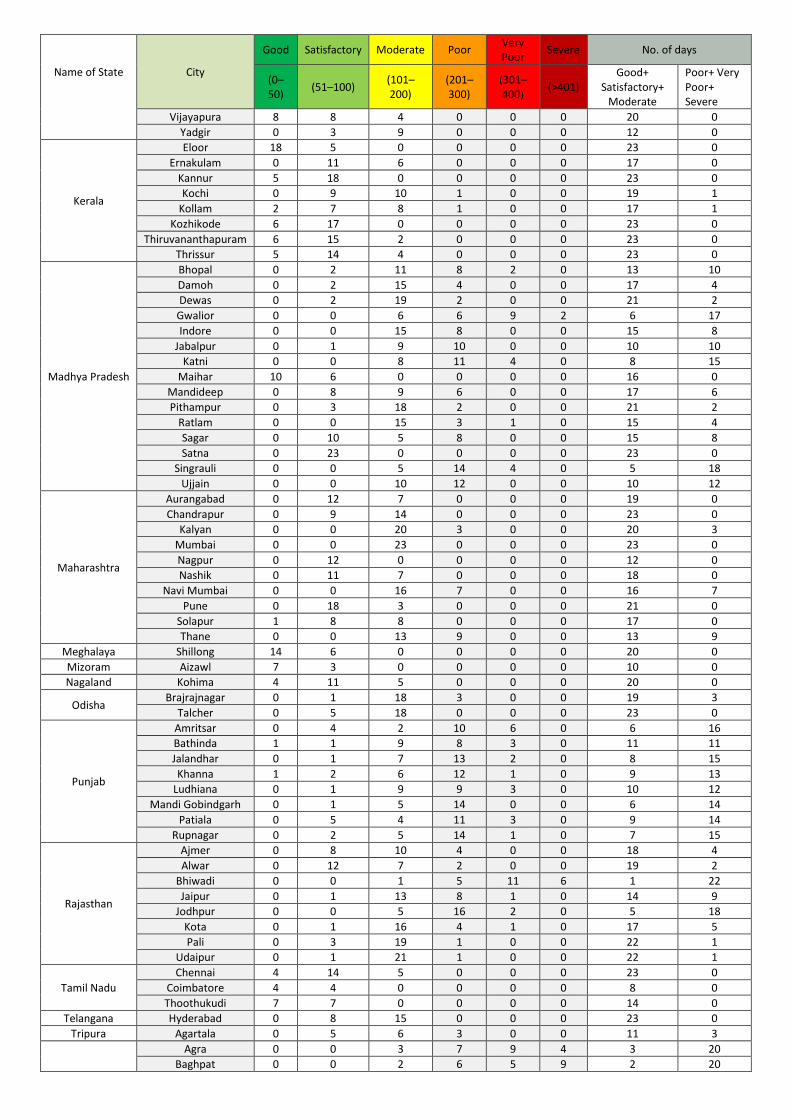
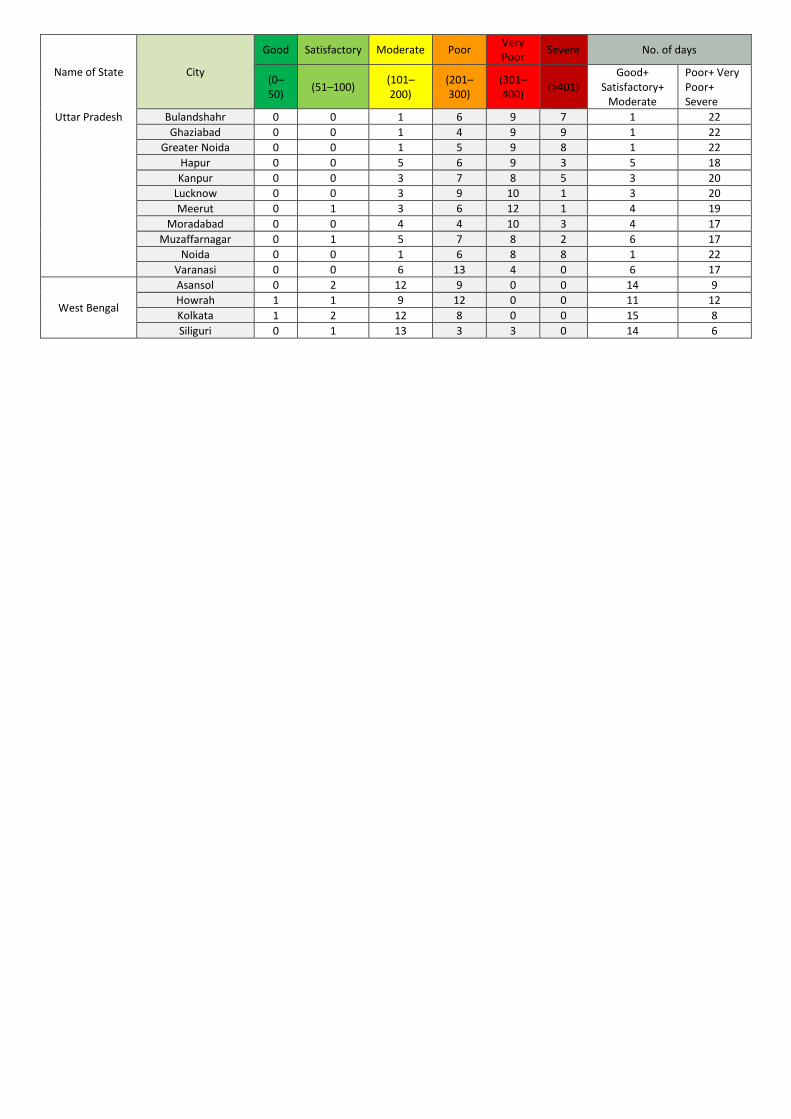
Annexure-III CENTRAL POLLUTION CONTROL BOARD
Ambient Air Quality Data AQMN Division
Comparative Air Quality Index Status of cities in India 01st Nov. to 23rd Nov., 2020
Name of State City
Good Satisfactory Moderate Poor Very Poor
Severe No. of days
(0–50)
(51–100) (101–200)
(201–300)
(301–400)
(>401) Good+
Satisfactory+ Moderate
Poor+ Very Poor+ Severe
Andhra Pradesh
Amaravati 4 13 6 0 0 0 23 0
Rajamahendravaram 0 10 11 2 0 0 21 2
Tirupati 12 7 4 0 0 0 23 0
Visakhapatnam 2 4 16 1 0 0 22 1
Assam Guwahati 0 2 18 3 0 0 20 3
Bihar
Gaya 0 8 13 1 0 0 21 1
Hajipur 0 10 11 1 0 0 21 1
Muzaffarpur 0 0 9 12 2 0 9 14
Patna 0 0 11 12 0 0 11 12
Chandigarh Chandigarh 1 5 15 2 0 0 21 2
Delhi Delhi 0 0 1 8 6 8 1 22
Gujarat
Ahmedabad 0 0 17 5 0 0 17 5
Ankleshwar 0 0 11 4 2 0 11 6
Gandhinagar 0 13 10 0 0 0 23 0
Nandesari 0 0 21 0 0 0 21 0
Vapi 0 0 9 12 0 0 9 12
Vatva 0 1 14 4 1 0 15 5
Haryana
Ambala 0 2 2 13 5 1 4 19
Bahadurgarh 0 0 2 8 7 3 2 18
Ballabgarh 0 1 6 6 7 1 7 14
Bhiwani 0 1 8 5 3 3 9 11
Charkhi Dadri 0 0 0 1 4 2 0 7
Dharuhera 0 0 4 8 5 6 4 19
Faridabad 0 0 3 6 6 8 3 20
Fatehabad 0 1 0 4 6 11 1 21
Gurugram 0 0 1 11 4 7 1 22
Hisar 0 1 1 6 9 6 2 21
Jind 0 1 1 5 6 9 2 20
Kaithal 0 3 5 3 10 2 8 15
Karnal 0 4 4 11 3 0 8 14
Kurukshetra 0 2 5 3 11 0 7 14
Mandikhera 0 6 3 8 5 1 9 14
Manesar 0 0 4 11 5 3 4 19
Narnaul 0 0 6 7 2 0 6 9
Palwal 0 1 13 6 2 0 14 8
Panchkula 0 2 13 8 0 0 15 8
Panipat 0 1 7 2 10 1 8 13
Rohtak 0 0 4 8 7 4 4 19
Sirsa 0 1 5 5 8 1 6 14
Sonipat 0 1 7 3 9 3 8 15
Yamunanagar 0 2 5 2 10 0 7 12
Jharkhand Jorapokhar 0 8 0 0 0 0 8 0
Karnataka
Bagalkot 7 8 5 2 0 0 20 2
Bengaluru 4 15 4 0 0 0 23 0
Chamarajanagar 4 2 0 0 0 0 6 0
Chikkaballapur 7 8 6 0 0 0 21 0
Chikkamagaluru 7 12 2 0 0 0 21 0
Hubballi 1 10 10 0 0 0 21 0
Kalaburagi 1 7 11 0 1 0 19 1
Madikeri 9 6 0 0 0 0 15 0
Mysuru 9 10 0 0 0 0 19 0
Ramanagara 7 5 6 0 0 0 18 0
Shivamogga 4 7 0 0 0 0 11 0
19
Name of State City
Good Satisfactory Moderate Poor Very Poor
Severe No. of days
(0–50)
(51–100) (101–200)
(201–300)
(301–400)
(>401) Good+
Satisfactory+ Moderate
Poor+ Very Poor+ Severe
Vijayapura 8 8 4 0 0 0 20 0
Yadgir 0 3 9 0 0 0 12 0
Kerala
Eloor 18 5 0 0 0 0 23 0
Ernakulam 0 11 6 0 0 0 17 0
Kannur 5 18 0 0 0 0 23 0
Kochi 0 9 10 1 0 0 19 1
Kollam 2 7 8 1 0 0 17 1
Kozhikode 6 17 0 0 0 0 23 0
Thiruvananthapuram 6 15 2 0 0 0 23 0
Thrissur 5 14 4 0 0 0 23 0
Madhya Pradesh
Bhopal 0 2 11 8 2 0 13 10
Damoh 0 2 15 4 0 0 17 4
Dewas 0 2 19 2 0 0 21 2
Gwalior 0 0 6 6 9 2 6 17
Indore 0 0 15 8 0 0 15 8
Jabalpur 0 1 9 10 0 0 10 10
Katni 0 0 8 11 4 0 8 15
Maihar 10 6 0 0 0 0 16 0
Mandideep 0 8 9 6 0 0 17 6
Pithampur 0 3 18 2 0 0 21 2
Ratlam 0 0 15 3 1 0 15 4
Sagar 0 10 5 8 0 0 15 8
Satna 0 23 0 0 0 0 23 0
Singrauli 0 0 5 14 4 0 5 18
Ujjain 0 0 10 12 0 0 10 12
Maharashtra
Aurangabad 0 12 7 0 0 0 19 0
Chandrapur 0 9 14 0 0 0 23 0
Kalyan 0 0 20 3 0 0 20 3
Mumbai 0 0 23 0 0 0 23 0
Nagpur 0 12 0 0 0 0 12 0
Nashik 0 11 7 0 0 0 18 0
Navi Mumbai 0 0 16 7 0 0 16 7
Pune 0 18 3 0 0 0 21 0
Solapur 1 8 8 0 0 0 17 0
Thane 0 0 13 9 0 0 13 9
Meghalaya Shillong 14 6 0 0 0 0 20 0
Mizoram Aizawl 7 3 0 0 0 0 10 0
Nagaland Kohima 4 11 5 0 0 0 20 0
Odisha Brajrajnagar 0 1 18 3 0 0 19 3
Talcher 0 5 18 0 0 0 23 0
Punjab
Amritsar 0 4 2 10 6 0 6 16
Bathinda 1 1 9 8 3 0 11 11
Jalandhar 0 1 7 13 2 0 8 15
Khanna 1 2 6 12 1 0 9 13
Ludhiana 0 1 9 9 3 0 10 12
Mandi Gobindgarh 0 1 5 14 0 0 6 14
Patiala 0 5 4 11 3 0 9 14
Rupnagar 0 2 5 14 1 0 7 15
Rajasthan
Ajmer 0 8 10 4 0 0 18 4
Alwar 0 12 7 2 0 0 19 2
Bhiwadi 0 0 1 5 11 6 1 22
Jaipur 0 1 13 8 1 0 14 9
Jodhpur 0 0 5 16 2 0 5 18
Kota 0 1 16 4 1 0 17 5
Pali 0 3 19 1 0 0 22 1
Udaipur 0 1 21 1 0 0 22 1
Tamil Nadu
Chennai 4 14 5 0 0 0 23 0
Coimbatore 4 4 0 0 0 0 8 0
Thoothukudi 7 7 0 0 0 0 14 0
Telangana Hyderabad 0 8 15 0 0 0 23 0
Tripura Agartala 0 5 6 3 0 0 11 3
Agra 0 0 3 7 9 4 3 20
Baghpat 0 0 2 6 5 9 2 20
20
Name of State City
Good Satisfactory Moderate Poor Very Poor
Severe No. of days
(0–50)
(51–100) (101–200)
(201–300)
(301–400)
(>401) Good+
Satisfactory+ Moderate
Poor+ Very Poor+ Severe
Uttar Pradesh Bulandshahr 0 0 1 6 9 7 1 22
Ghaziabad 0 0 1 4 9 9 1 22
Greater Noida 0 0 1 5 9 8 1 22
Hapur 0 0 5 6 9 3 5 18
Kanpur 0 0 3 7 8 5 3 20
Lucknow 0 0 3 9 10 1 3 20
Meerut 0 1 3 6 12 1 4 19
Moradabad 0 0 4 4 10 3 4 17
Muzaffarnagar 0 1 5 7 8 2 6 17
Noida 0 0 1 6 8 8 1 22
Varanasi 0 0 6 13 4 0 6 17
West Bengal
Asansol 0 2 12 9 0 0 14 9
Howrah 1 1 9 12 0 0 11 12
Kolkata 1 2 12 8 0 0 15 8
Siliguri 0 1 13 3 3 0 14 6
21
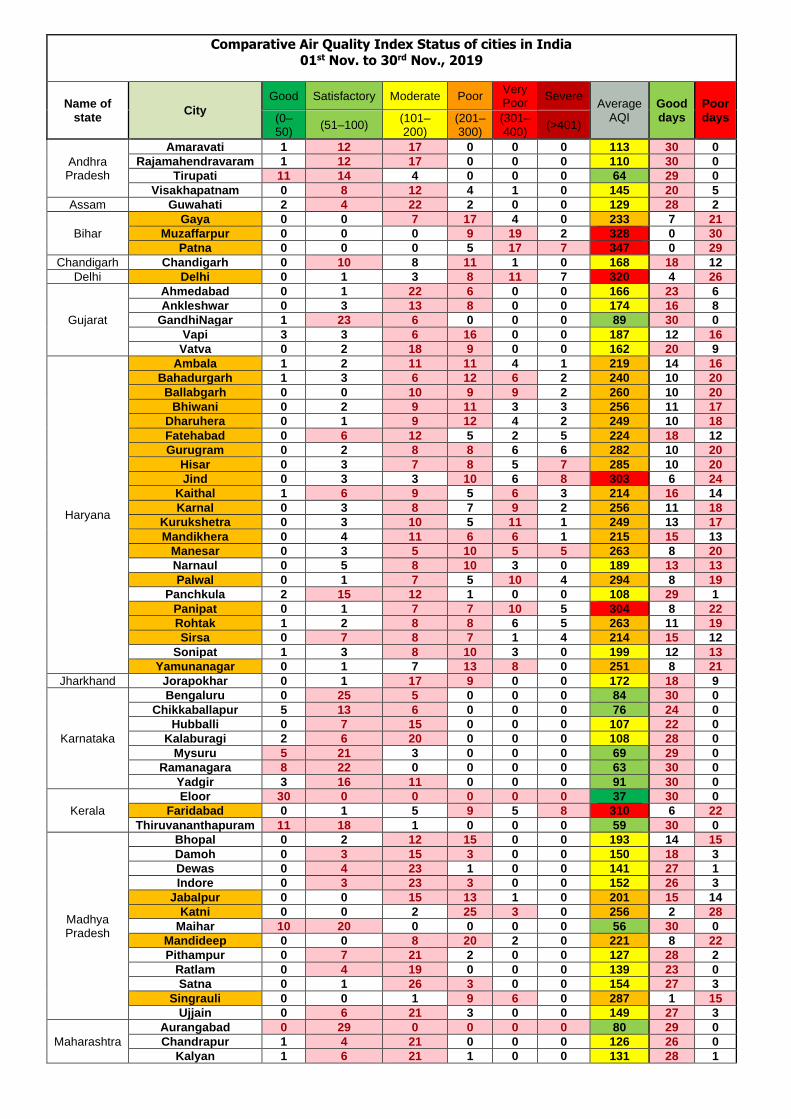
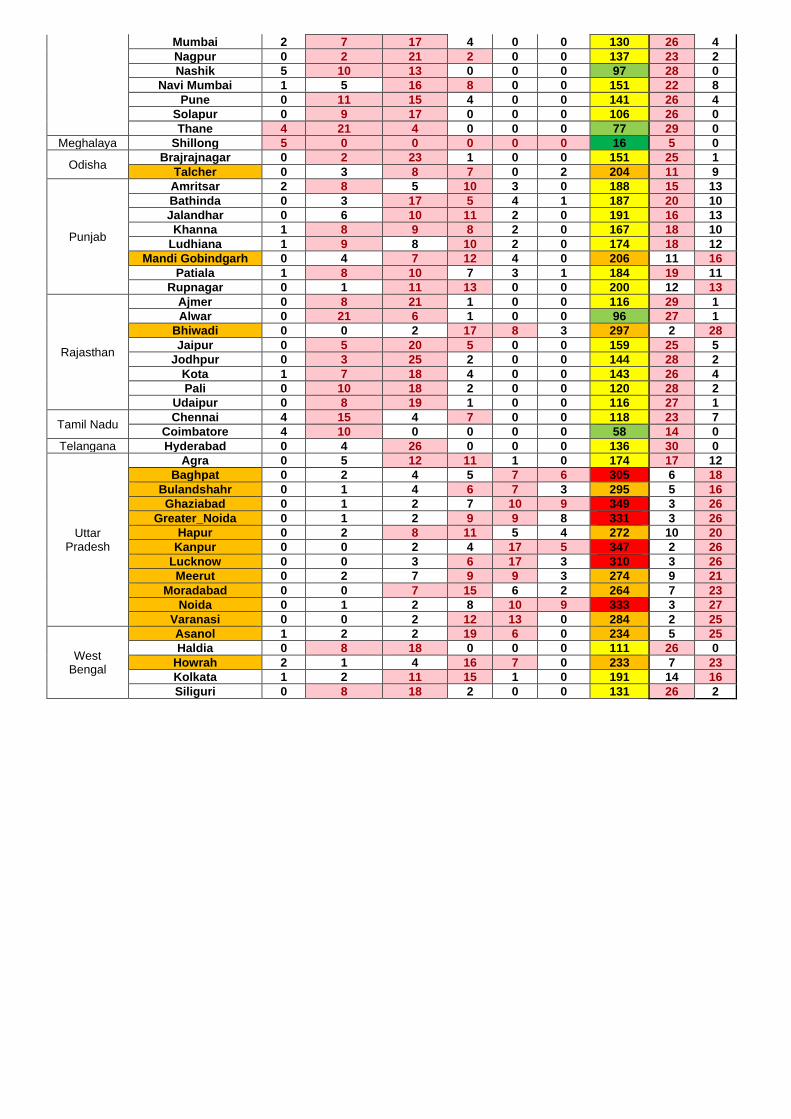
Comparative Air Quality Index Status of cities in India
01st Nov. to 30rd Nov., 2019
Name of state
City
Good Satisfactory Moderate Poor Very Poor
Severe Average
AQI Good days
Poor days (0–
50) (51–100)
(101–200)
(201–300)
(301–400)
(>401)
Andhra Pradesh
Amaravati 1 12 17 0 0 0 113 30 0
Rajamahendravaram 1 12 17 0 0 0 110 30 0
Tirupati 11 14 4 0 0 0 64 29 0
Visakhapatnam 0 8 12 4 1 0 145 20 5
Assam Guwahati 2 4 22 2 0 0 129 28 2
Bihar
Gaya 0 0 7 17 4 0 233 7 21
Muzaffarpur 0 0 0 9 19 2 328 0 30
Patna 0 0 0 5 17 7 347 0 29
Chandigarh Chandigarh 0 10 8 11 1 0 168 18 12
Delhi Delhi 0 1 3 8 11 7 320 4 26
Gujarat
Ahmedabad 0 1 22 6 0 0 166 23 6
Ankleshwar 0 3 13 8 0 0 174 16 8
GandhiNagar 1 23 6 0 0 0 89 30 0
Vapi 3 3 6 16 0 0 187 12 16
Vatva 0 2 18 9 0 0 162 20 9
Haryana
Ambala 1 2 11 11 4 1 219 14 16
Bahadurgarh 1 3 6 12 6 2 240 10 20
Ballabgarh 0 0 10 9 9 2 260 10 20
Bhiwani 0 2 9 11 3 3 256 11 17
Dharuhera 0 1 9 12 4 2 249 10 18
Fatehabad 0 6 12 5 2 5 224 18 12
Gurugram 0 2 8 8 6 6 282 10 20
Hisar 0 3 7 8 5 7 285 10 20
Jind 0 3 3 10 6 8 303 6 24
Kaithal 1 6 9 5 6 3 214 16 14
Karnal 0 3 8 7 9 2 256 11 18
Kurukshetra 0 3 10 5 11 1 249 13 17
Mandikhera 0 4 11 6 6 1 215 15 13
Manesar 0 3 5 10 5 5 263 8 20
Narnaul 0 5 8 10 3 0 189 13 13
Palwal 0 1 7 5 10 4 294 8 19
Panchkula 2 15 12 1 0 0 108 29 1
Panipat 0 1 7 7 10 5 304 8 22
Rohtak 1 2 8 8 6 5 263 11 19
Sirsa 0 7 8 7 1 4 214 15 12
Sonipat 1 3 8 10 3 0 199 12 13
Yamunanagar 0 1 7 13 8 0 251 8 21
Jharkhand Jorapokhar 0 1 17 9 0 0 172 18 9
Karnataka
Bengaluru 0 25 5 0 0 0 84 30 0
Chikkaballapur 5 13 6 0 0 0 76 24 0
Hubballi 0 7 15 0 0 0 107 22 0
Kalaburagi 2 6 20 0 0 0 108 28 0
Mysuru 5 21 3 0 0 0 69 29 0
Ramanagara 8 22 0 0 0 0 63 30 0
Yadgir 3 16 11 0 0 0 91 30 0
Kerala
Eloor 30 0 0 0 0 0 37 30 0
Faridabad 0 1 5 9 5 8 310 6 22
Thiruvananthapuram 11 18 1 0 0 0 59 30 0
Madhya Pradesh
Bhopal 0 2 12 15 0 0 193 14 15
Damoh 0 3 15 3 0 0 150 18 3
Dewas 0 4 23 1 0 0 141 27 1
Indore 0 3 23 3 0 0 152 26 3
Jabalpur 0 0 15 13 1 0 201 15 14
Katni 0 0 2 25 3 0 256 2 28
Maihar 10 20 0 0 0 0 56 30 0
Mandideep 0 0 8 20 2 0 221 8 22
Pithampur 0 7 21 2 0 0 127 28 2
Ratlam 0 4 19 0 0 0 139 23 0
Satna 0 1 26 3 0 0 154 27 3
Singrauli 0 0 1 9 6 0 287 1 15
Ujjain 0 6 21 3 0 0 149 27 3
Maharashtra
Aurangabad 0 29 0 0 0 0 80 29 0
Chandrapur 1 4 21 0 0 0 126 26 0
Kalyan 1 6 21 1 0 0 131 28 1
22
Mumbai 2 7 17 4 0 0 130 26 4
Nagpur 0 2 21 2 0 0 137 23 2
Nashik 5 10 13 0 0 0 97 28 0
Navi Mumbai 1 5 16 8 0 0 151 22 8
Pune 0 11 15 4 0 0 141 26 4
Solapur 0 9 17 0 0 0 106 26 0
Thane 4 21 4 0 0 0 77 29 0
Meghalaya Shillong 5 0 0 0 0 0 16 5 0
Odisha Brajrajnagar 0 2 23 1 0 0 151 25 1
Talcher 0 3 8 7 0 2 204 11 9
Punjab
Amritsar 2 8 5 10 3 0 188 15 13
Bathinda 0 3 17 5 4 1 187 20 10
Jalandhar 0 6 10 11 2 0 191 16 13
Khanna 1 8 9 8 2 0 167 18 10
Ludhiana 1 9 8 10 2 0 174 18 12
Mandi Gobindgarh 0 4 7 12 4 0 206 11 16
Patiala 1 8 10 7 3 1 184 19 11
Rupnagar 0 1 11 13 0 0 200 12 13
Rajasthan
Ajmer 0 8 21 1 0 0 116 29 1
Alwar 0 21 6 1 0 0 96 27 1
Bhiwadi 0 0 2 17 8 3 297 2 28
Jaipur 0 5 20 5 0 0 159 25 5
Jodhpur 0 3 25 2 0 0 144 28 2
Kota 1 7 18 4 0 0 143 26 4
Pali 0 10 18 2 0 0 120 28 2
Udaipur 0 8 19 1 0 0 116 27 1
Tamil Nadu Chennai 4 15 4 7 0 0 118 23 7
Coimbatore 4 10 0 0 0 0 58 14 0
Telangana Hyderabad 0 4 26 0 0 0 136 30 0
Uttar Pradesh
Agra 0 5 12 11 1 0 174 17 12
Baghpat 0 2 4 5 7 6 305 6 18
Bulandshahr 0 1 4 6 7 3 295 5 16
Ghaziabad 0 1 2 7 10 9 349 3 26
Greater_Noida 0 1 2 9 9 8 331 3 26
Hapur 0 2 8 11 5 4 272 10 20
Kanpur 0 0 2 4 17 5 347 2 26
Lucknow 0 0 3 6 17 3 310 3 26
Meerut 0 2 7 9 9 3 274 9 21
Moradabad 0 0 7 15 6 2 264 7 23
Noida 0 1 2 8 10 9 333 3 27
Varanasi 0 0 2 12 13 0 284 2 25
West Bengal
Asanol 1 2 2 19 6 0 234 5 25
Haldia 0 8 18 0 0 0 111 26 0
Howrah 2 1 4 16 7 0 233 7 23
Kolkata 1 2 11 15 1 0 191 14 16
Siliguri 0 8 18 2 0 0 131 26 2
23
Annexure-IV
24
25
26
27
Annexure-V
28
29
30
31
32
33
34
35
36
37
38
39
40
41
42
43
44
45
46
47
48
49
er#)rr, : 080-25586321
6rdrecr/E-mail : [email protected]
du6iref/Website : http://kspcb.gov.in_^\_4_at-r,\rz
E
Dated: 24-11-2020
Z l+ NOV 2020
25581383, 2558911225588151, 2558827025588142,25586520
duorud uoci6 droOd, Oo$o$m drodeKarnataka State Pollution Control Board
"dond qEd", I ood Sile $dads, do. 49, rlrrF Uctsr, rjodc',,d - 560 001, dsir8d, ?Fd"Parisara Bhavana", 1st to 5th Floor, # 49, Church Street, Bengaluru - 560 001, Karnataka, INDIA
No.KSPCB/AQMCtCEot2OzOl r r,I r-v "
To,The Member Secretary,Central Pollution Control Board,Parivesh Bhawan, East Arjun Nagar,Delhi-l10032
G6;i.-,i719)i\.d
"Kind Attenditon : Shri P.K Gupta, Head, AQM Division".
Subject: Compliance to Hon'ble NGT order dated:9-11-2020
on sale and ban of firecrackers - Reg.
Reference: 1 ) CPCB Letter No.Tech./3 9AJGT/RDS/2 020 -21 I 81 6,
Dated:13-l l-20202) CPCB Reminder No.AQM/Fire crackers/ 2020 -21,
Dated:20-l l-2020.
With reference to above subject, please find herein attached the Compliance
report from Kamataka State Pollution Control Board on sale and ban on firecrackers
pertaing to Hon'ble NGT order Dated:9-ll-2020.
Yours sincerely,
sd/-Member Secretary.
Copy to:l) The Regional Director, CPCB, Regional Directorate (South) Nisarga Bhavan,
Bengaluru for kind information.2) Spare.
N'
.l_ lt-W,--
Membti-Secretary.
AVOID UST OF PLASTICS-BE 'ECO' FRIENDTY
Sir,
This is for your kind information and needful.
"4i,.# ud AO*, dbid a& d&f"
Annexure-VI
50
Report on Ambient Air & Noise Quality ofKarnataka State during Deepavali-2O2o
doasud @6, S'-rOd6 Oo$o$eo SodQ
s,Joddrad)
----Jt- : :r j
/-
--
#\tr17KARNATAKA STATE POLLUTION CONTROLBOARD
Website : http ://www. kspcb.gov. in
7
51
Ambient Air Monitoring in Karnataka State duringDeepavali-2020
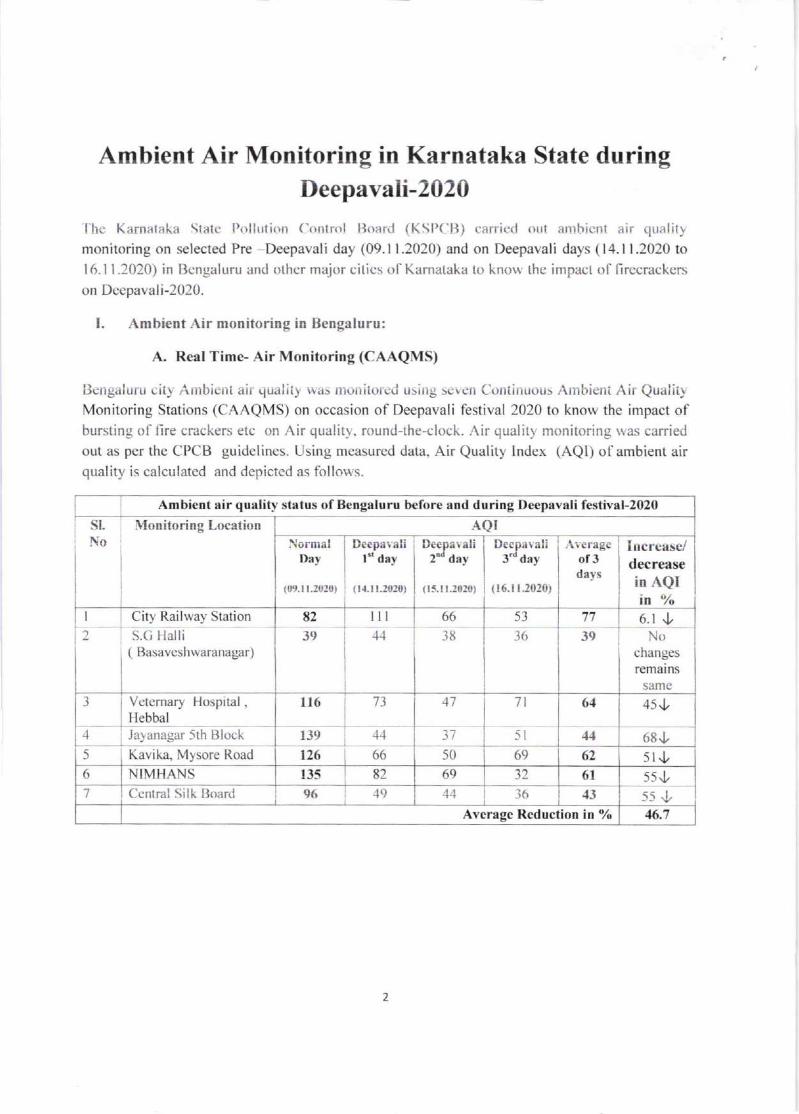
Ihe Karnataka State PollUtion Control lloaril (KSP('l]) carried ()ut anrhient air qualitlmonitoring on selected Pre -Deepavali day (09.11.2020) and on Deepavali days (14.11.2020 tol6.l I .2020) in Bcngaluru and other major citics of Karnataka to know thc impact ol firccrackers
on Deepavali-2020.
I. Ambient Air ntonitoring in Bengaluru:
A. Real Time- Air Monitoring (CAAQMS)
Bengaluru city Ambielit air qualiti was nrouitorcd using seven ('ontinuous Anrbient AiL QualityMonitoring Stations (CAAQMS) on occasion of Deepavali festival 2020 to know the impact ofbursting of fire crackers etc on Air quality. roundthe-clock. Air quality monitoring was carried
out as per the CPCB guidelines. Using measured data, Air Quality tndex (AQI) of ambient airquality is calculatcd and depicted as follows.
SI. Monitoring Location
(rr9.l l.:020) ( l{.1l.!020)
NormalDay
Deeparalit" dey
De€paiali2'd dey
( l5.l r.2020)
Decpavali3d day
( l6-r l-2020)
Averageof3dsys
Increase/decreasein AQIin "h
_6.t JNo
changesrematns
same
51+
5{ -l-
77
J9
J
4
Vetemary Hospital ,HebbalJayanagar 5th Block
5 Kavika" Mysore Road
Ambieot air quality status ofBengaluru bcfore and during Deepavali festival-2020
.{QI
53
S.G Halli( Basaveshwaranagar)
lllJ982
4.1
Citv Railwav Station
45Jll6
119
13
37.+"1
7t
I
6{
{d 68.t66 50 6269 L
I
6l ssJNIMHANSCentral Silk [Joard
6
7
82
l96q135
9(r
32
l6Average Reduction in 7o 46.1
2
66
,18
l126
-ll-1
52
E Normal Oay I Average 3 day5
160
140
120
100
8060
40
20
of R( t r' H.& lLbb.l ,ry. tlh
Blo(X.\*. [lM]tAtat (18 Tolil
Observations:
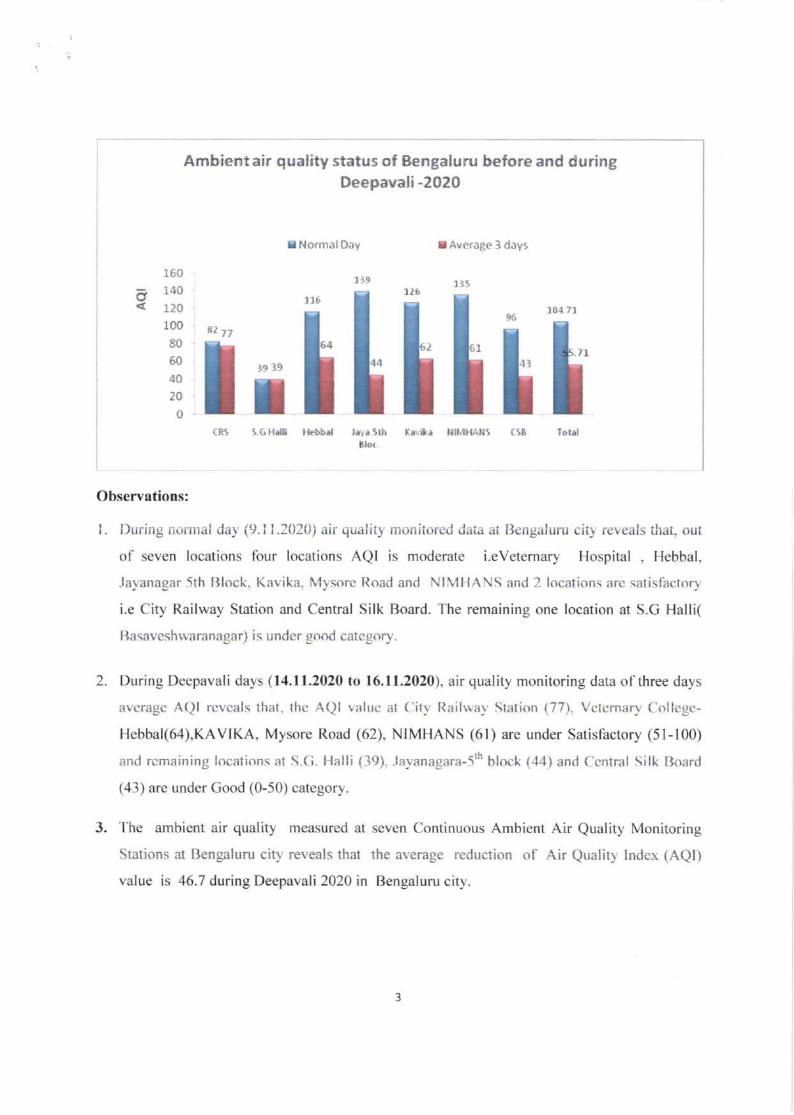
l. During normal day (9.11.2020) air quality monitored data at Bengaluru city reveals that, out
of seven locations four locations AQI is moderate i.evetemary Hospital , Hebbal,
.layanagar 5th Block. Kavika, Mysore Road and NIMHANS and 2 locations are satisfactory
i.e City Railway Station and Central Silk Board. The remaining one location at S.G Halli(
lJasaveshwaranagar) is undcr good category.
2. During Deepavali days (14.11.2020 to 16.11.2020), air quality monitoring data of three days
avcragc A()l rcveals that. the AQI valuc at ('itv Railwav Station (77). Vctcrnarv Collcgc-
Hebbal(64),KAVIKA, Mysore Road (62), NIMHANS (61) are under Satisfactory (51-100)
and rcmaining locations at S.Ci. Halli (39). .layanagara-sth hlock (44) and Ccntral Silk tloard
(43) are under Good (0-50) category.
3. The ambient air quality measured at seven Continuous Ambient Air Quality Monitoring
Stations at Bengaluru city reveals that the average reduction of Air Quality lndex (AQl)
value is 46.7 during Deepavali 2020 in Bengaluru city.
lt9 l]5-d r26
11bl0{ 71
a2 772 1 7t
l9 l9 l
I
3
Ambientair quality status of Bengaluru before and duringD€epavali-2020
53
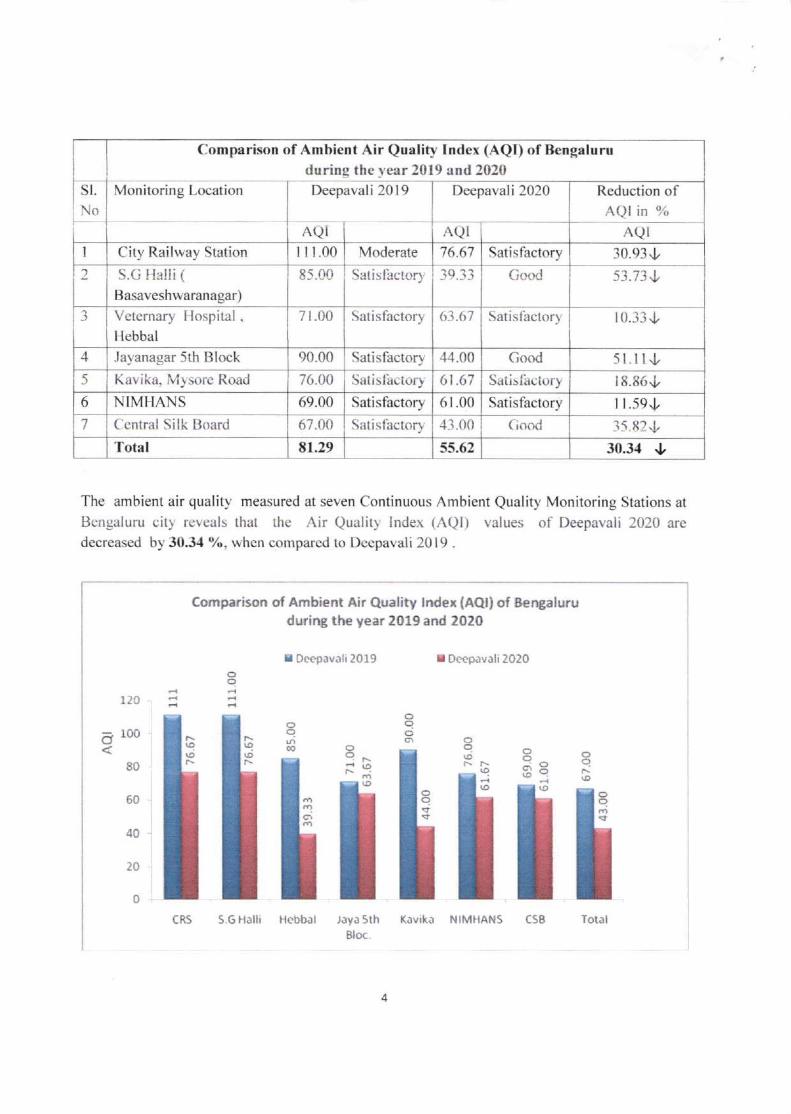
Comparison of Ambient Air Qualify Index (AQI) of Bengaluruduring thc 1,ear 2019 and 2020
sl.No
Monitoring Location Deepavali 2019 Deepavali 2020
AQI
Reduction ofAQI in %
AQiI City Railway Station I I 1.00 Moderate 76_67 Satisfactorv 1n q1.1.
2 S.C Halli (Basaveshwaranagar)
85.00 Satisfactory 3S.33 Cood <2 71 I
-) Veternary l'lospital .
Hebbal
7 r.00 Satisfactory 63.67 Satisfactory r0.33 J
.1 Jayanagar 5th Block 90.00 Sat i sfactory 44.00 Cood 5r.ll+Kavika, N{y sorc Road 76.00 Satislhctory 61.67 Sdiislaetoly 16,60v
6 NIMHANS 69.00 Satisfactory r t.5eJ7 (:cntral Silk Board 67.00 Satisf'actory 15I{2.t
'fotal 81.29 55.62 30.3{ .l,
The ambient air quality measured at seven Continuous Ambient Quality Monitoring Stations at
Bengaluru citl' reveals that the Air Quality lndex (AQl) values of Deepavali 2020 are
decreased by 30.34 Y", when compared to Deepavali 20 l9 .
Comparison of Ambient Air Quality lndex (AQl) of Bengalurudurirg the year 2019 and 2020
I Deepavnli2019 I Deepavali 2020
.,ayJ 5thBloc.
o
q|^'.
120
100
80
60
40
20
0
do;N
!?
oqo
ooI
o.;
oco
<)
Foq
qC1
l'-I
6
4
CRS S.G Halli Hcbbal Kavikr NIMHANS CSB Totnl
Aaa li
6l .00 I Satisfactory
43.00 I (iood
54
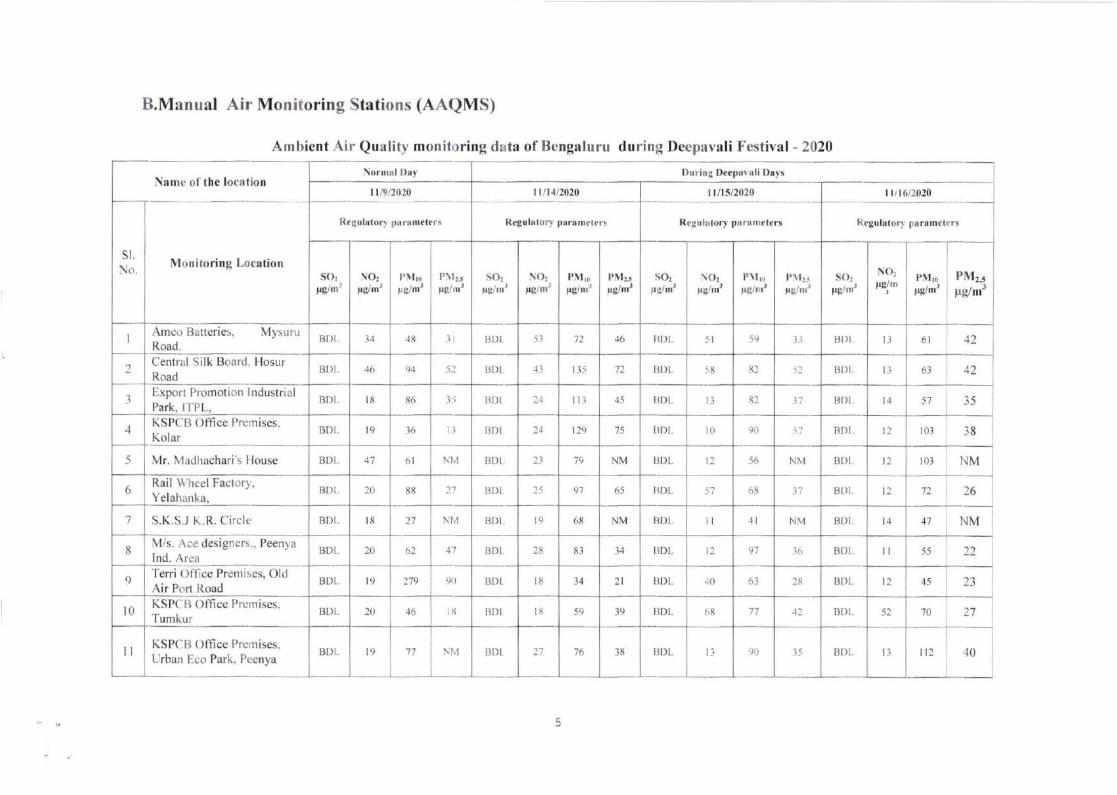
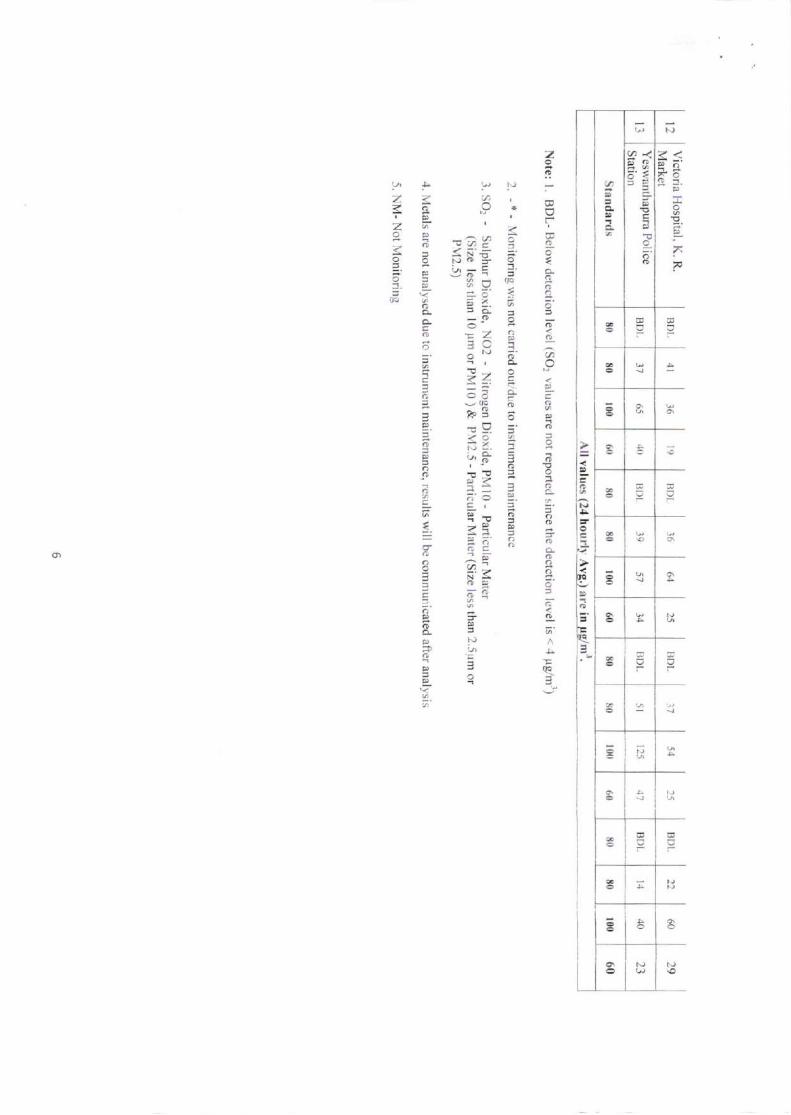
B.Manual Air Monitoring Stations (AAQMS)
Anrhient Air Quality monit,oring data of Bengalurtr during Deepavali t'r:stival - 2020
Namc 0l the lo(ationDt|ring Dc.prtoli D.y.
Monitoring Location
I t/9/20!0
RrBoliton ps meters
I l/t{/2020
Reguhlon prrrmetrl}
r lA5/20r0
Rrguhrtor.v p! r!rnel.rs
I t, t61.1020
sl.No
k€uhton prrrmctcr\
solpginr'
\o:lgm'
11
Pllot g/,n'
Ptrr-r!€/mr
SO:
ug/m
\o:Ig/MJ
t,\lL1r|llnr' ,.g/m'
Sorpg/ r
\o:!g/ml
P\Iro,rg/m'
sorrrei.'
NO:
Pg/mPMr-.Pltr,,
rglm' ;rg/m3
IAmco Baneries. MysuruRoad.Central Silk Board. HosurRoadExport I'romotion IndustrialPark, ITPL,KSPCB Office Prernises.Kolar
Mr. l\'1a(lhachari's I louse
Rail Wheel Factor),Yelahanka,
S.K.S.J K.R. Circk'
Bl)l .l li -tl I]I)I 5l 71 .16 llDl. 5I 59 li lr ) t-i 6I .12
BI)I l6 ,).1 5: lI)t 1l Il5 11 I}I)I, :8 ri: i2 I]I)I l:l 6.1 12.
3 BDI l8 li Ill)t 24
::l
lll lll)1. 1l 8: .\1 I]I)I 1.1 5',l l5
.t BDJ l9 16 IJ llt)t l2t) 75 8Dl. l0 i7 Ill)l ll t0l -r8
BI)] 6l Nt,1 II )l :3 7.) NM lI)I t: 56 frM Ill)l ll r03 l.J t\I
6 ul ): 20 It8 2l Ill)l l5 91 65 lrDl 57 .17 lll)t ll t6
1 BI)I, IN 77 Nt,4 I'I)I l9 6t{ NM Iit)l tl .1t
91
NM llt)r. l1 17 NM
llM/s. Ace designers.. Peenl,aInd. AreaTerri ( )fllce Prentises, OldAir Port l{oad
Bl)i l0 ()l 1l BI)I :!r 8l t.l lI)l tl lll)t tl 55 t:() RI)I 19 179 BI)l 18 :l I )1. qt) 6l :lJ 81)1. ll .15 23
l(l KSPCB Office Premises.Tumkor
BI)] t0 .16 It I]I)I
ut)l
l8 19 I}DI, 68 11 .1: BI )I- 5: 70 )7
!t KSPCB office Prernises-
Urban lico Park. Peenyaut)l l9 "11 NM 21 lli rjt)L l_i q) .15 DI)l t-i II: l0
5
r
41
---.T..
55
6(D'
'!q
=
a=.o
_
z
:-
I.go{o.
s
g
o
o
i
q1f
9r !.)
- a-- q a
i5B A9. E i51. a
-(! 5rZ R
oN 5'
7z ?5a *R"s 6<o If =. ii,,*
=PP I6c P.
H's I<E g
AEa.D
a.caE!..,
o
:, J.7z
zd;aoZ
:1. !)
4
9.
=
-(1
a
=1f
o
=.
o-
!|2-
!
.t-
L]
56
II. Ambient Air monitoring in other major cities of Karnataka
A. A. Real Time- Air Monitoring (CAAQMS)
sl.No
Nlonitoring Location
5e+
68+
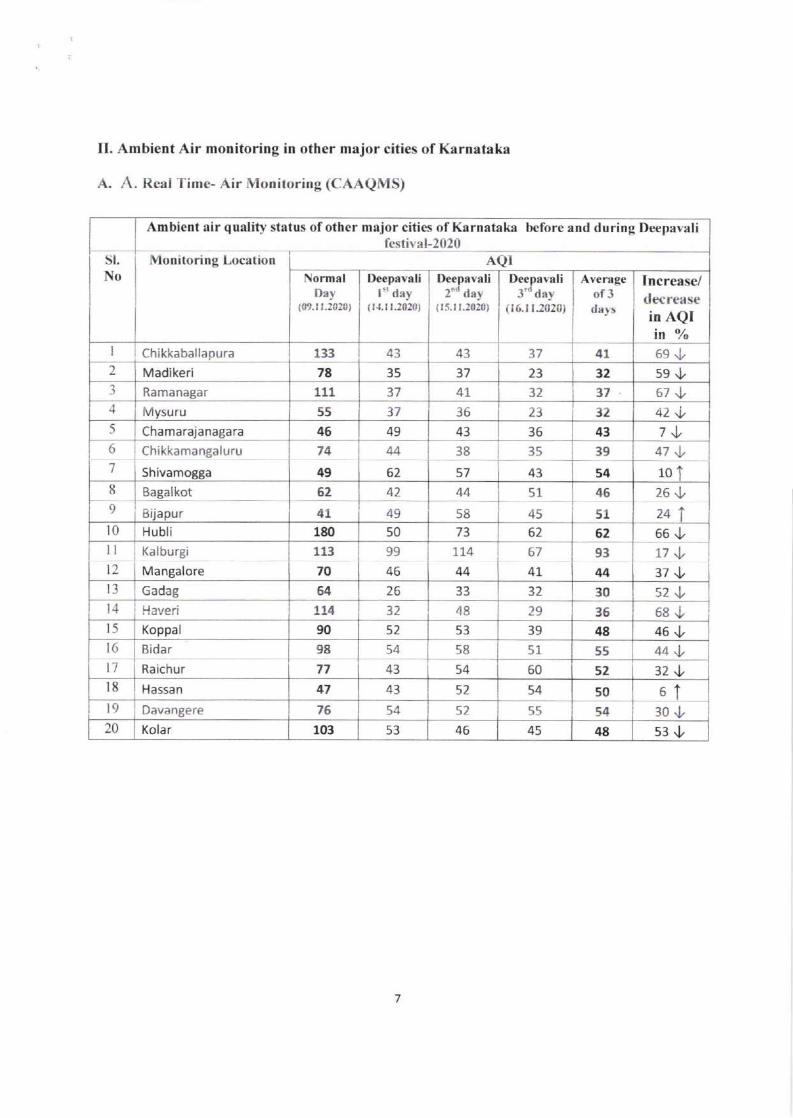
Ambient air quality status of other major cities of Karnataka before and during DeepavalifestiYal-2020
AQINormal
Day(09.1t.2c2ol
Deepavalil" day
( t.t. t I.2020)
Deepavali2"d day
( r5.r r.2020)
Deepavali3'd day
(t6.t t,2o2ol
Averageof3days
Increase/decreasein AQIin %"
I Chikkaballapura j rfr 43 47') Madikeri 78 35 37 12 59 .l,
Ramanagar 111 41 374 | vysuru 55 37 36 23 3t 42 .t5 Chamarajanagara 46 49 43 36 43 7t6
7
Chikkamangaluru
ShivamoBga 49
44
62
38
57
3
4
5
3
39
54
4!!10 1
8
9
Bagalkot
Bijapur
62
4r42
49 I
44
58
51
45
46
51
25 .t24 I
t0 Hubli 180 50 62 62 66JII12
Kalburgi
Mangalore
113
70
99
46
114
44
67
4l93
44
17 ,t37J
rl Gadag 64 26 33 30 s2J14 | Haveri tL4 32 AQ 29 I
I 36t5 Koppal 90 39 48 46Jt6 Bida r 98 54 58
54
51
60
55 44+52 32Jl7 jRaichur 77 43
Hassan 43 52 54 50 blDavangere 76 54 5? 55 54 300
20 Kolar 103 )J 46 48 s3u
7
67+
1l8t9
47
45
57
-{mble[t-{r qur[qr shtus in other cities of KarD:rttki during rrorrnnlrb1' and Deep:run day-2O2O
! No.mal Day ! Average ol 3 d.ys
200
1AO
160
140
120
100
80
60
40
20
o
i
Iiiiiiiits-
II-g
llliil"--'.oi';st$""$51"{o-""'-do'}*$a"%""*"1"e"'***."!-"}c""$
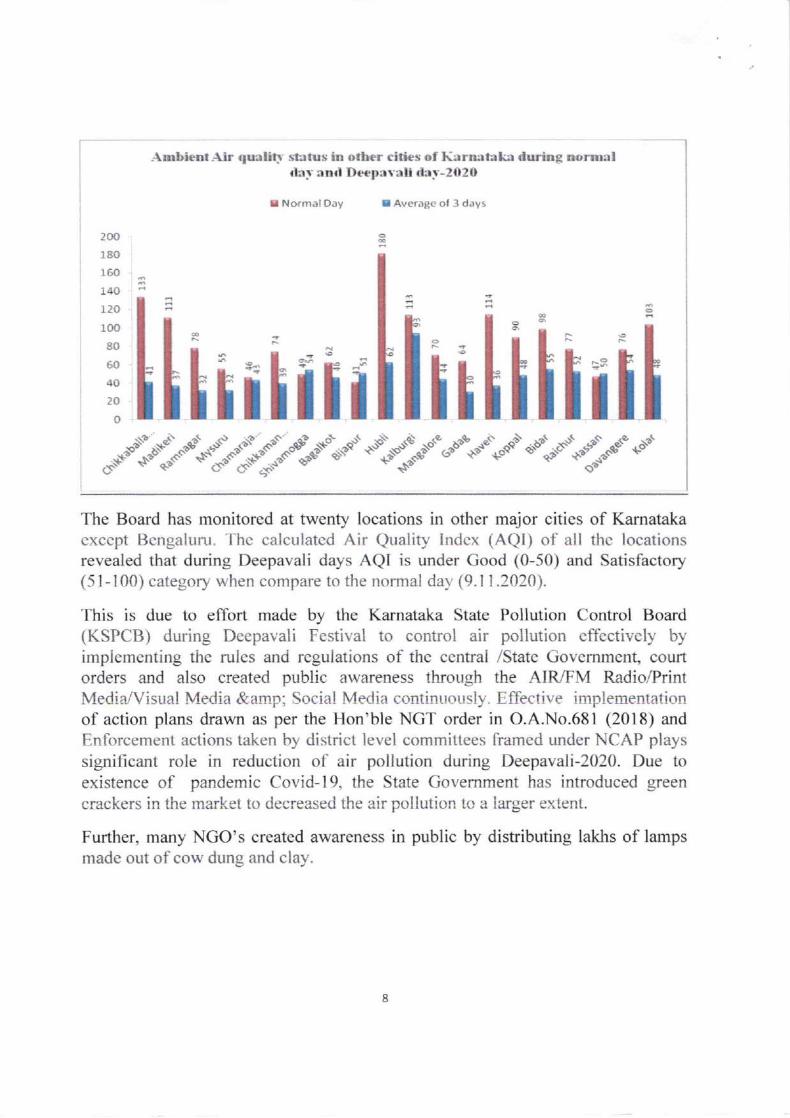
The Board has monitored at twenty locations in other major cities of Karnatakacxccpt Bcngaluru. 'l-hc calculated Air Quality lndcx (AQI) of all the locationsrevealed that during Deepavali days AQI is under Good (0-50) and Satisfactory(51-100) category when compare to the normal day (9.1 1.2020).
This is due to effort made by the Kamataka State Pollution Control Board(KSPCB) during Deepavali Festival to control air pollution effectively byimplementing the rules and regulations of the central /State Goverrrment, courtorders and also created public awareness through the AIR/FM Radio/PrintMediaAy'isual Media & Social Media continuoLrsly. Effective implementationof action plans drawn as perthe Hon'bleNGT order in O.A.No.68l (2018) andEnforcement actions taken by district level committees lramed under NCAP playssignificant role in reduction of air pollution during Deepavali-Z020. Due toexistence of pandemic Covid- 19, the State Govemment has introduced greencrackers in the market to decreased the air pollution to a larger extent.
Further, many NGO's created awareness in public by distributing lakhs of lampsmade out ofcow dung and clay.
8
58
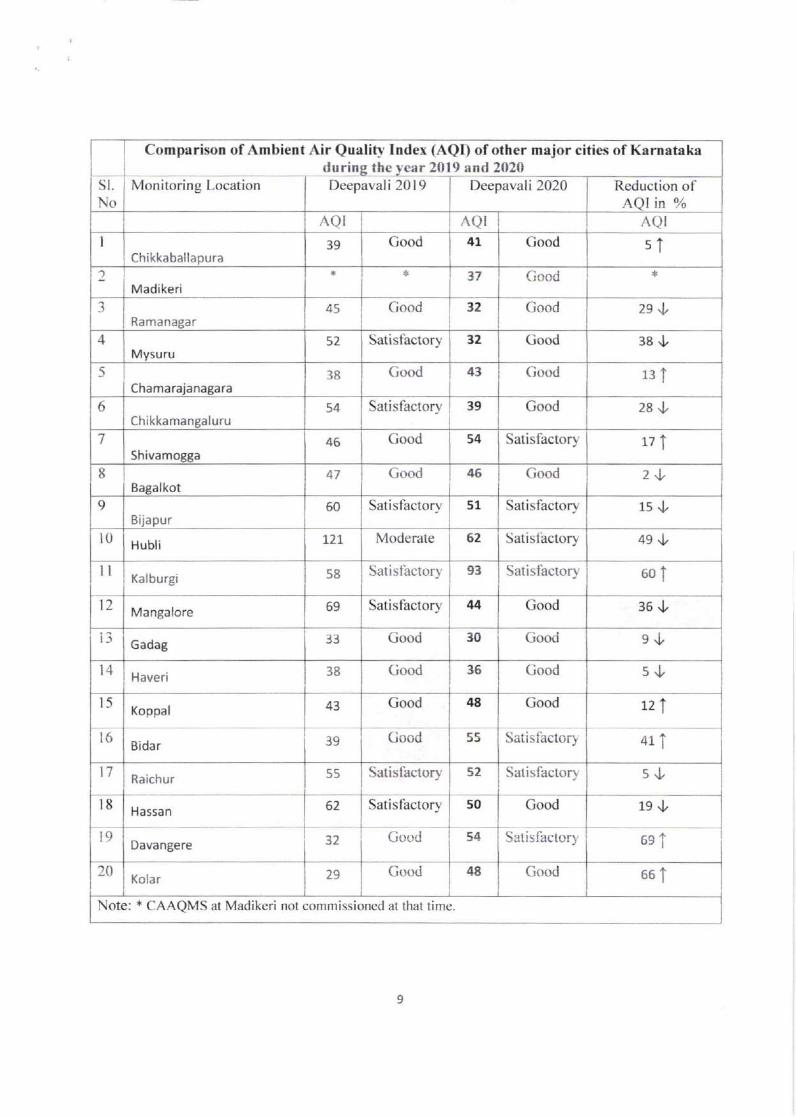
Comparison of Ambient Air Qualilv lndex (AQI) of other major cities of Karnatakaduring the year 2019 and 2020
sl.No
Monitoring Location Deepavali 201 9 Deepavali 2020 Reduction ofAQI in %
^QI I not AQII
ChikkaballapuraGood 41 Good s1
')Mad ke l
37 Good
lRamanagar
4S Cood 32 Good 2e .1,
.1
Mysuru52 Satislactory 32 Good 38J
.\
ChamaraianagaraGood 43 Good 13 I
6chikkamangaluru
54 Satisfactory 39 Good 28 .t
7Shivamogga
(iood 54 Satisfactorv I
17 1
8Bagalkot
47 Good 46 Good I 2J9
Bijapur50 Satisfactory 51 Satisfactory 1s ,t
t0 Hubli LzL Moderate 62 Satistactorv
ll (alburgi Sat i s f'actory 93 Satisfactory 60 1
t2 Mangalore 69 Satisfactory 44 Good 36 .t
IJ Gadag Good 30 Good 9J
l4 Haveri Good 36 Good sJ,
l5Koppal 43 Good 48 Cood 121
Bidar 39 Cood Satisf'actorl
t1Raichur 55 Satisfactory 52 Satisfactory 5J
t8 Hassan 62 Satisfactory 50
32 Good 54
Good
S al is lacto ry
19 .,
6etl9Davangere
20Kolar 29 Cood 48 Good
Note: + CAAQMS at Madikeri nol commissioned al that time.
49 .L
41 1
66 1
9
39
46
59
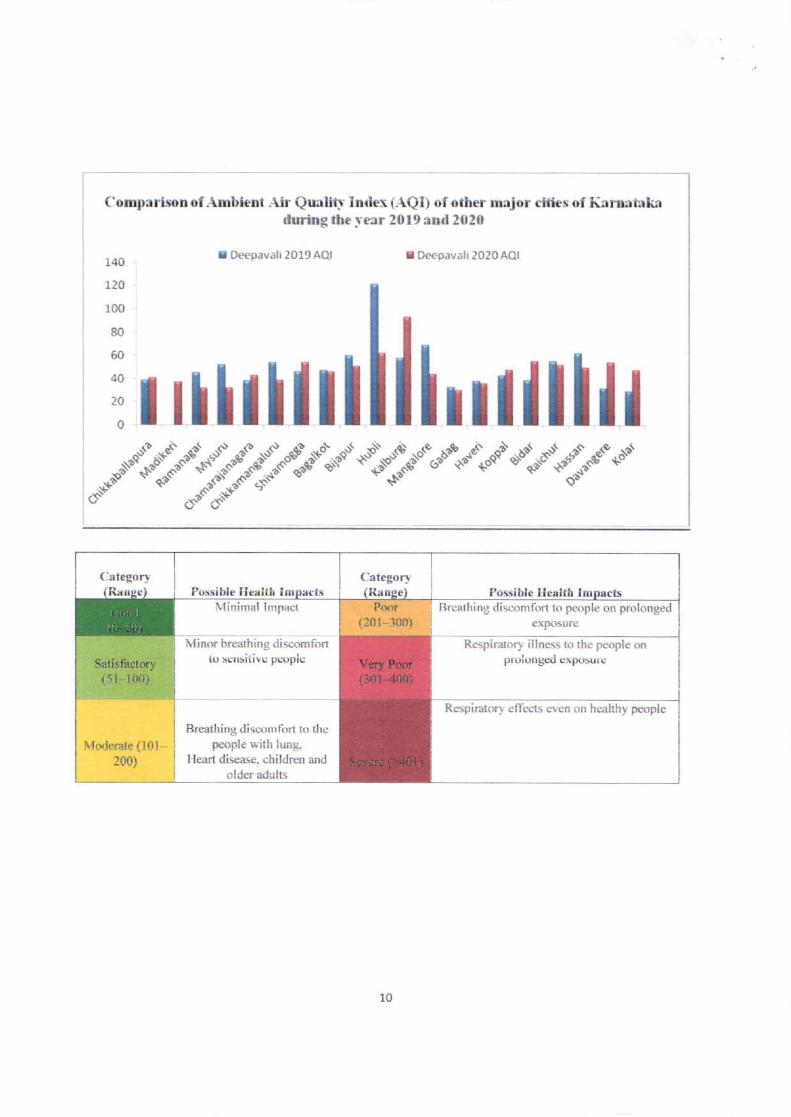
Comparison of -{mbicnt -{ir Qurutr Inde\. (-{QI) of other m:rJor cities of Karnata\aduing tbc }'erar 2019 and 2O2O
14{'
120
100
80
60
40
20
o
a Oeepavali 2019 AQI I Deepavah 2020AQl
It,rrullrlrlhllll""Jo"$ti"$$XI.*l-'"U'$1.f
e**."oi"""'.""d"s*"""*$C"*'
(lategory(Ratrgc) Possible Healli Irrrpacts
Categort{Range) Possiblr Ilealth lnrpacts
Minimal trnpact Brcathing discomfort to people on prolongedexposure
Minor bredhing disco{[fonto sr,:nsitive people
Respirarory illness ro the people <nprolonged exposurc
Mnrlerate /101
200)
Breathing di$conrfo( to thep€ople $ith lun€.
Heart disease. children and
older aduls
Respiratoq' effeas even on heahhy people
Satisfactory{51 l00i
Poor{20 t-lo0)
10
60
II.
Ambient Noise level monitoring in Karnataka State
during Deepavali-2020
I. Ambient Noise level monitoring in Bengaluru
A. Rcal Timc Noise monitoring (CAn*MS)
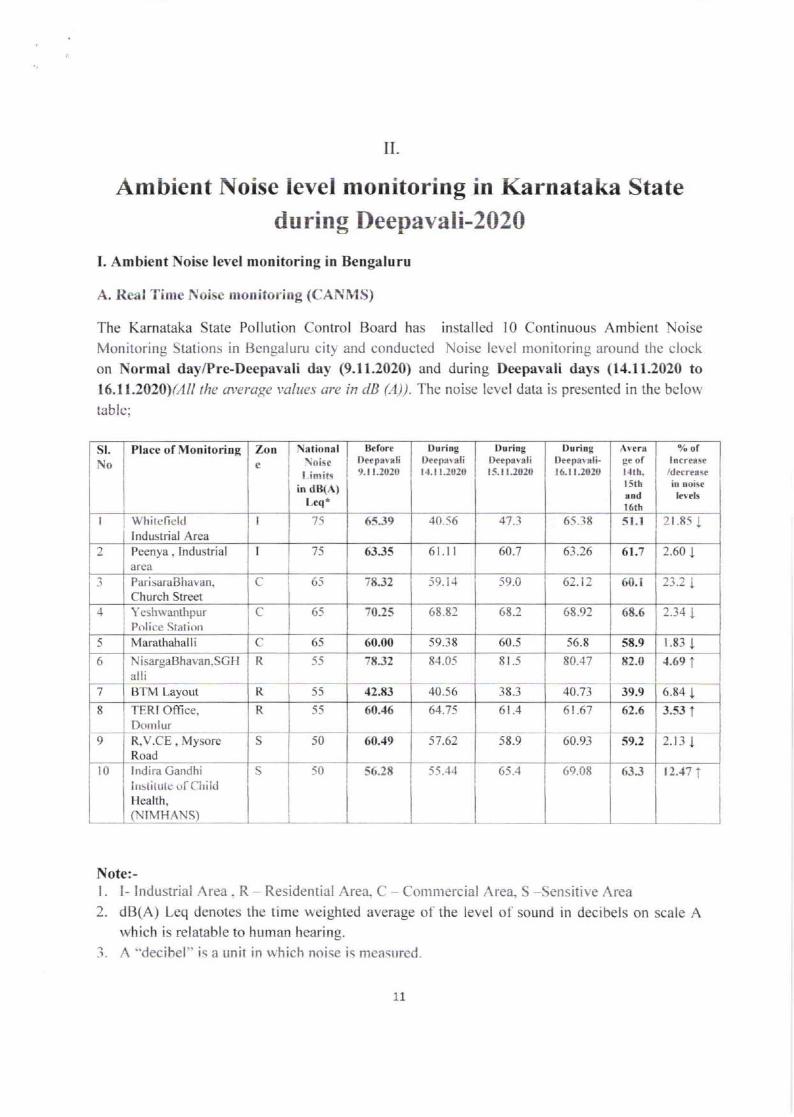
The Karnataka State Pollution Control Board has installed l0 Continuous Ambient NoiseMonitoring Stations in Bengaluru city and conducted Noise level monitoring around the clockon Normel day/Pre.Deepavali day (9.11.2020) and during Deepavali days (14.11.2020 to16.ll.2020)(All the average values are in dB (A)). The noise lcvel data is presented in the below
table;
11..17 I
Note:-l. I- Industrial Area. R - Residential Area- C Commercial Area" S -Sensitive Area2. dB(A) Leq denotes the time weighted average of the level of sound in decibels on scale A
which is relatable to human hearing.
3. A "decibel" is a unit in which noise is measured.
sr.No
Place of Monitoring Lonc
\atir,nal
Linrit.in dB(A)
Lcq"
lleforeIhrprvxli9.t t.:010
DuritrgDerpsvslit.t. t t.2020
Duriogl)e€pavalit5. t 1.2020
DurirgDeepevsli-t6.t 1.2020
gr ofl.lrh,I Sttaedt6th
o/o ol
i[ trois.Lvcl!
I I whirefietdI Industrial Area
I 65.19 40.56 65.',r 8 5l.l 2r.8s I
Peenya . lndustrialarca
75 63.35 6t.ll 60.7 63.26 61.7 2.60 1
ParisaraBhavan.Church Sfeet
C' 6-i 7ti.J2 i9. t.t 59.0 62.i2 66. i 23.2 !
l YeshwanthpurPolioe Stalion
C 65 70.25 68.81 68.2 68..q2 68.6 ,1rtl
5 Marathahalli (' 65 60.00 59.t 8 60.5 56.8 58.9 r.83 l6 NisargaBhavan.SGH
alliR 55 ?8.32 81.05 8t.-r 80..17 82.0 {.69 i
1 t| I M Layout R 55 .12.83 40.56 40.13 19.9 6.84 I8 TERI Office,
l)om lurR,V.CE , MysoreRoad
R
S
55 60.{6
60..19
64.7 5
57.62
61.4
58_9
61.67
60.91
62.6
59.2
3.s3 1
2.1-r I9 50
l0 tndira CandhiIns(itute uf ChildHealth,(NIMHANS)
s 50 56.28 i5.{1 65.4 69.08 6J.J
11
15 4'1 .3
I
61
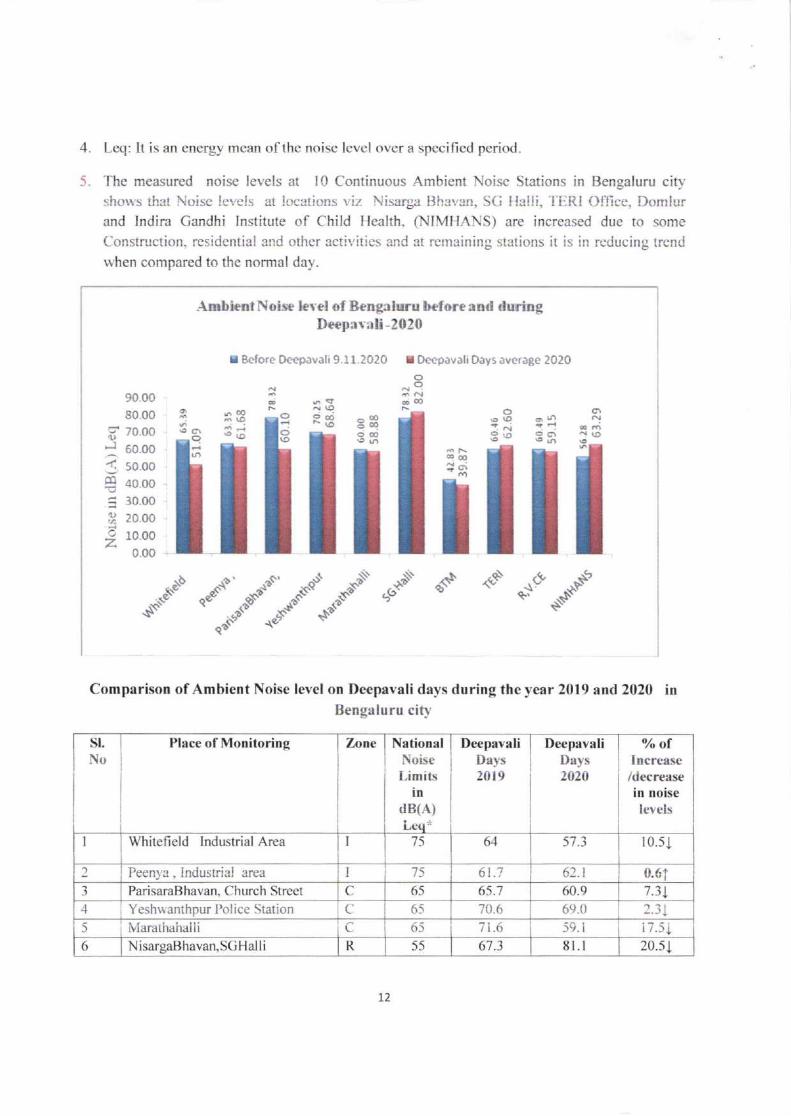
4. Leq: It is an energy mean of the noise level overa specified period.
5. The measured noise levels at I0 Continuous Ambient Noisc Stations in Bengaluru cityshorvs that Noise !e.,,els at loc:.tions viz Nisarya Bhavan, SC tlalli, TERI Office, Domlurand Indira Gandhi Institute of Child Health. (NIMHANS) are increased due to some
Construction, residential and other activities and at remaining stations it is in reducing trendwhen compared to the normal day.
.Lmbieof Noise hl el of BeDgaluru before ond duringDeeprvall-2020
t Bcrore Ocepavali 9.11.2020 I Ocepavali Davs avc,age 2020
90.oo80.00
B'70.oo60,0o50.0040.00
30.oo20.oo
10.00
0.00
Comparison of Ambient Noise level on Deepavali days during the year 2019 and 2020 inBengaluru citl'
st.No
Place of Monitoring Lona
".ccs*.*o"o*""""o"C ..t-
o
;.j..|
^..o9q
g(o5coE3
o
o9"$t,"-- d
^,'+
J.1,
la
oz
q
NationalNoiseLimits
indB(A)
DeepavrliDays20t9
DeepavaliDays2020
o/o ofIncrease/decreasein noiselcvels
I'75I Whitefield lndustrial Area 6.1 57 .3 r0.sl
2 Peen;,a , Industrial area 75 At 1 62.t 0.6iParisaraBhavan. Church Street C 65 65.7 60.9 7.3 t
.l Yeshuanthpur l'olice Station (' 65 t'0.6 69.0 l'tt-.J a
lL5 i Nlararhahalli 6s | 7r.6 | 5e.lR 55 67.3 8l.t 20.s16 NisargaBhavan,SCHalli
t2
17.5i
I
62
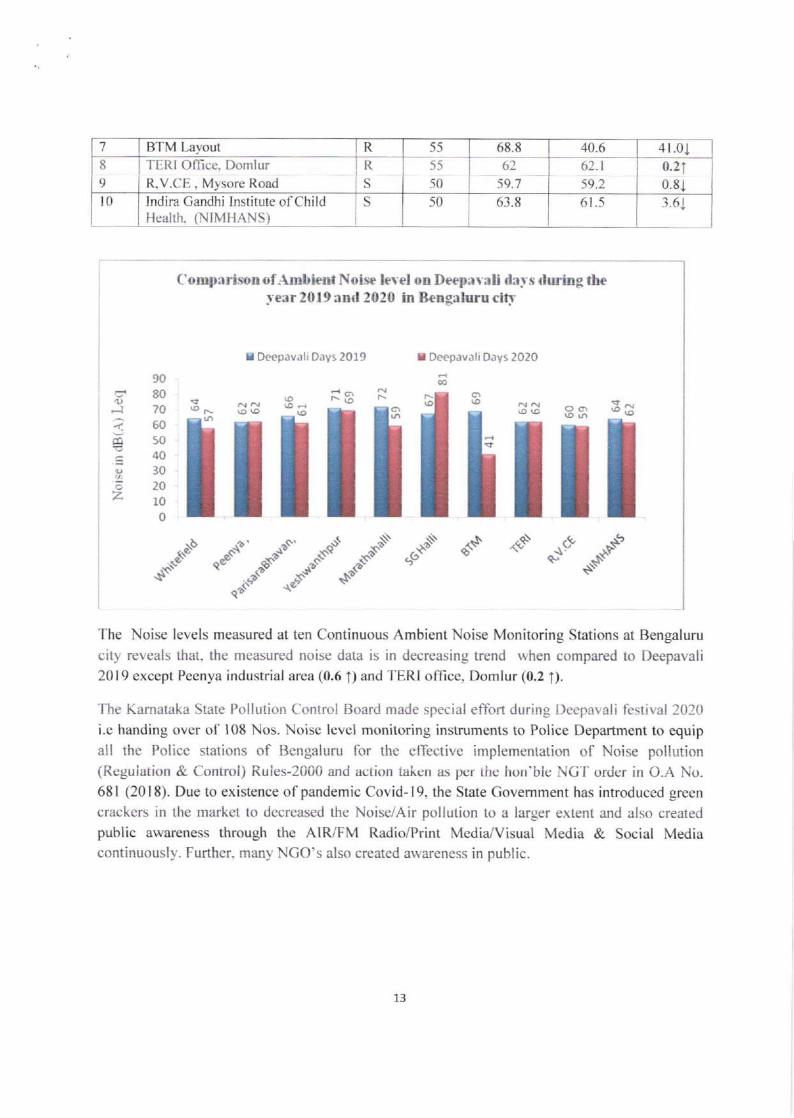
1 BTM Layout It 55 68.8 10.6 4r.018
9I TERI office. Domlur
I n"v.cE , Mysore Road
R
S
55
50
6?
59.7
6:. I
59.2
0.21
0.81l0 Indira Gandhi Institute of Child
Hcalth. (NIMIIANS)S 50 61.8 6t.5 3.6.1
('omplrison of -\mbient Nolsc lerel on Deepavali da1's rturing the;-ear 2019 and 2020 ln Bengaluru cill'
I Deepav.lliDiys 2O19 I Deepav,rliOJys 2020
9080706050403020100
tJ!e
6z
l6 l'-36
*o.-".
.t
o8o' .,"-" 6\$ ""*. "-tt ""a".
The Noise levels measured at ten Continuous Ambient Noise Monitoring Stations at Bengalurucity reveals that, the measured noise data is in decreasing trend when compared to Deepavali
2019 except Peenya industrial area (0.6 f) and TERI oflice, Domlur (0.2 f).'l'he Karnataka State Pollution Control Board made special eflbrt during Deepavali festival 2020i.e handing over of 108 Nos. Noise level monitoring instruments to Police Department to equipall the Police stations of Bengaluru for the effective implementation of Noise pollution(Regulation & Control) Ruies-2000 and action taken as per the hon'ble NCT order in O.A No.681 (2018). Due to existence of pandemic Covid-19, the State Govemment has introduced green
crackers in the market to decreased the Noise/Air pollution to a larger extent and also created
public awareness through the AIR/FM Radio/Print Media./Visual Media & Social Mediacontinuously. Further. many NCO's also created awareness in public.
13
I
63
I-ocations
BeforeDeepavali9.11.2020
DuringDeepavali
l.l.l1.2020
DuringDeepavalil5.l t.2020
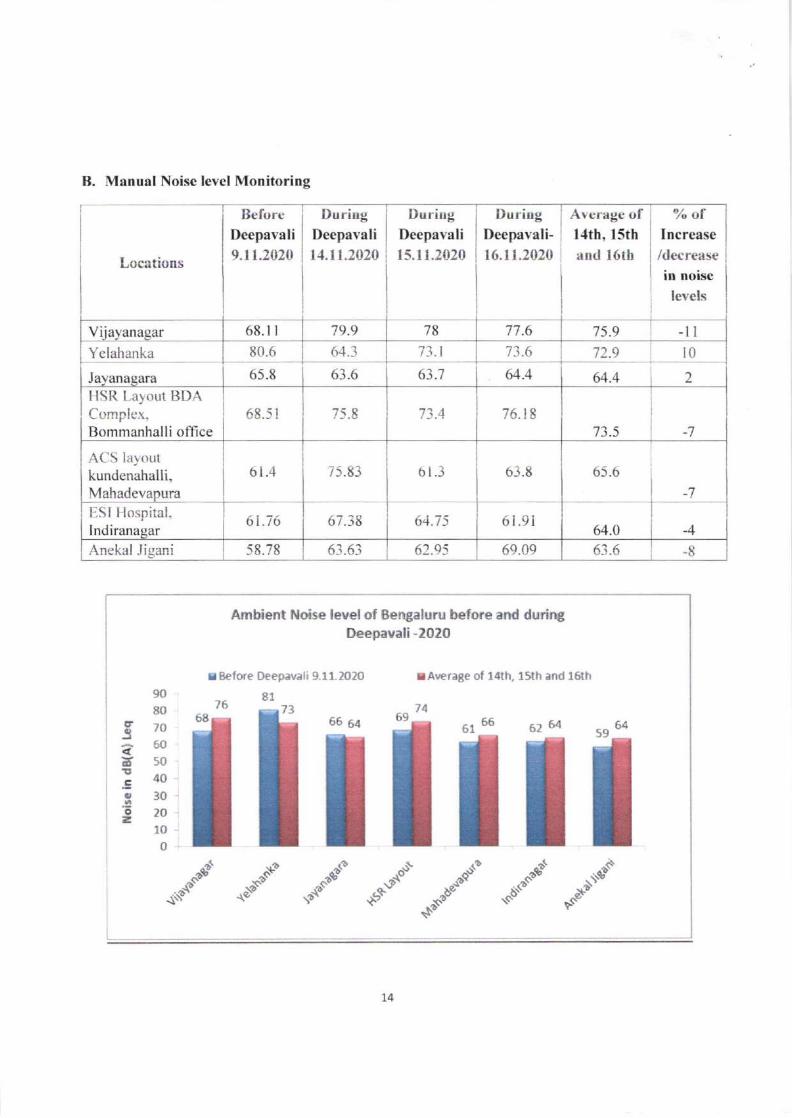
Vilayanagar 68.1 I 79.9 78 77.6 -llYelahanka 80.6 64.3 73 l 73.6 72.9 t0
Jayanagara 65.8 63.6 63.7 64.4 64.4 2
HSR Layout BDAComplex,Bommanhalli oflice
AC S I 75.8 73.4 1A t9
73.5 -7
Af'S lal oLrt
kundenahalli.Mahadevapura
6t.4 75.83 bl.3 6-1.8 65.6
-7ESI Hospital.Indiranagar
61.i6 67.i8 64.75 61.9i64.0 -4
Anekal .ligani 5 8.78 63.63 62.e5 69.A9 63.6 -8
B. Manual Noise level Monitoring
DuritgDeepavali-t6.11.2020
Average of14th, 15th
and 16th
%" ofIncrease
/decrease
in noise
levels
Ambient Noise level of Bengaluru before and duringDeepavali -2020
t Eefore Deepavali 9.11.2O2O rAverage of 141h, 15th and 16lh
8116 13 74
66 oa 6961 66 62 64 64
6a
9080
S70e@EsoIao;30Ero
100
59
od
"'-"'.C
""- """ C"""- ."oC .3*''
L4
)
75.9
64
Comparison of Ambient Noise level on Deepavali days during the year 2019 and 2020 inllcn
sl. I'lace of Monitoring DeepavaliNo
DeepavaliDa-vs 2019 Days 2020
Percentage+/- over
20194.0 I
2.4 I,l
5
Vi a r
HSR Layuui BDr\Complex,Bommanhalli olficcACS layoutkundenahalli.N4ahadeva ura
73.0
75.1
75.9
73.5
65.6
7.s I
63.6 1.s .l64.6
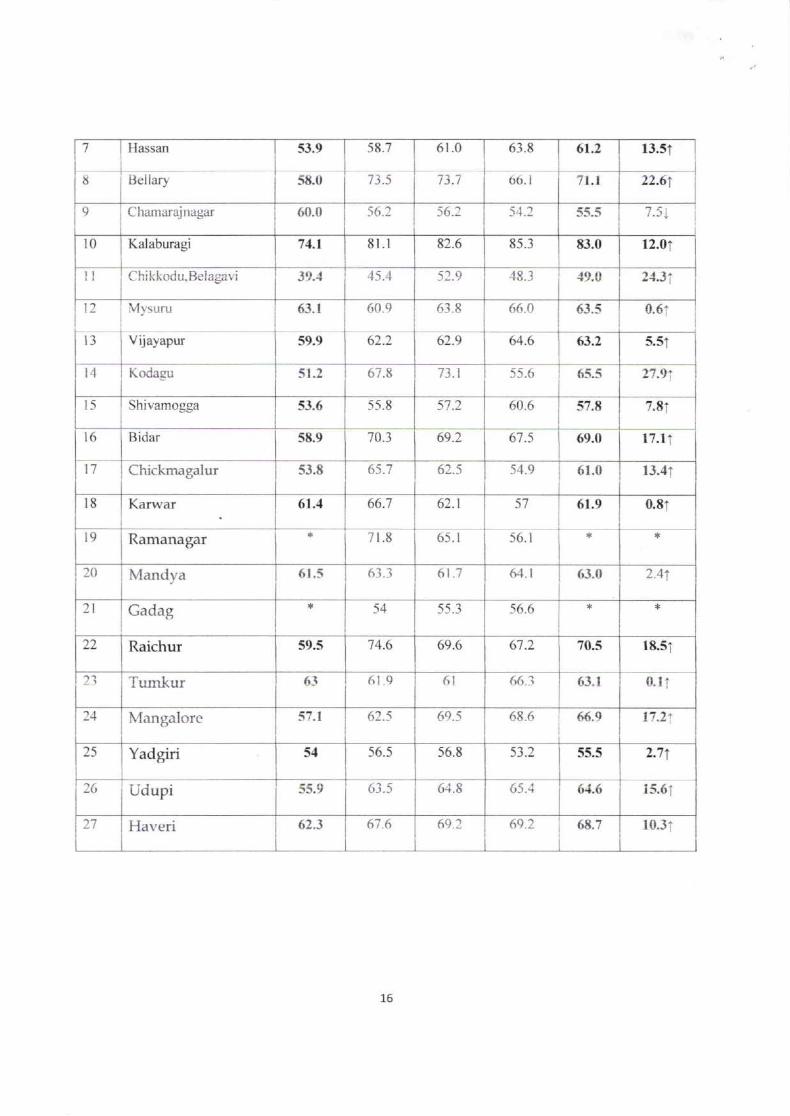
Il. Ambient Noisc level monitoring in other major cities of Karnataka
Impact of Fire crackers on the amhient Noise level in other th{n Bangalore city before andduring Deepavali festival-202O
lncrease/
Dccrease
in Noise
level in
.l. t 'l
064
)'clahanka 80.2 72.9e.1 I
l Jayanagara 65.5 64.4r.7 I
7
69.2rESItl
Anekal Jigani
ital.lndirana
Monitoring Location
{09.11.2020) (l{.r 1.2020) ( l5.l1.2020) (16.1 1.1020)
st.
No NormalDay
DeepaYali
l" da-'-
Deepavali2"d rla.,-
Deepsvali3'd day
AYCrage
of3days
I Bagalkole 70.266.(l 68.7 67 .3 68.7
2 60.9 68.9 7l.0 7t I 70.3 15..11
J
Davangere
lJharwad 57.J 62.E 66.5 65.5 6{.9 rJ.31
.+ Koppal
I
t,J.v 62.560.9
5 Chitradurga 60.7 6t.7 62.7 68.4 61.2 s.8T
66.ti 6?.96 Kolar
l5
69.1 {.3i
lu ru city
65
1
E
Hassan
tlellary
53.9
5E.0
58.7
7 3.5
61 .0 63.8
6b. I
61.2 r3.51
1 J.7 7 t.t 22.61
9 Chamarajnagar 60.0 56.2 JO.- 54.2 55.5
l0 Kalaburagi 71.1 8t.l 82.6 8-s.3 It3.0 12.01
ll Chikkodu,Belagavi 45.4 5:.9 48.3 1r.u
t2 Mysuru 63.1 60.q 61.8 66.0 63.5 0.61
l3 Vijayapur 59.9 62.2 61.9 64.6 63.2 s.s1
I Kodaeut- 51.2 67 .8 73.1 55.6 65.5 27.91
I5 Shivamogga 5t.6 -i 5.8 57 .2 60.6 57.8 7.81
l6 Bidar 5tt.9 70.3 69.2 67 .5 69.0 l7.l T
t7 Chickmagalur 53.8 65.7 61.5 54.9 6 r.0 r3.41
t8 Karwar 61.{ 66.7 62.t 57 61.9 0.81
l9 Ramanagar 7 r.8 65.1 s6.l
l0 Mandya 61.5 OJ. J 6t .7 64. I 63.0 L.+ 1
2l Gadag 54 55.3 56.6
22 Raichur 14.6 69.6 67 .2 70.5 18.51
Tumkur r,l .9 (r1 66.i 6J. t 0. r'i
l.l N{angalorc s7. r 62.5 69.5 68.6 66.9 17.21
25 Yadgiri 5{ 56.5 56.8 53.2 55.5 ', 7+
26 Udupi 55.9 65..1 o{.o lJ.O I
27 Haveri 62.J 67 .6 69.1 69.2 68.7 10.3 i
16
se.s I- ,-I
66
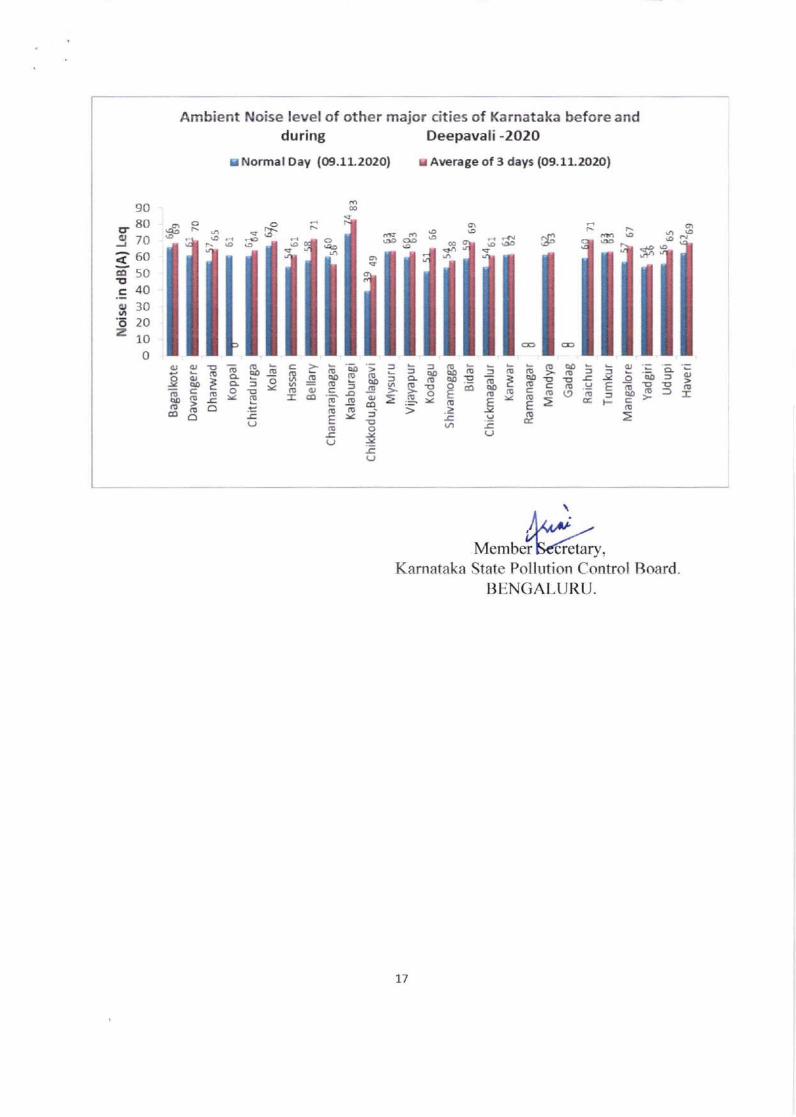
Ambient Noise level of other major cities of Karnataka before andduring Deepavali -2O2O
E Normal Oay (O9.11.2O2O1 r Average of 3 days (O9. U.2O2O)
*E
lilEHE
5E s efi BE
gsgsEu EE EgEE !EFsi
5 F-€ 5 : d:
=i-=
..,!
llrilllllilll
90
oao .a
itl
\A/r,rri -.
Membe(bedi-etary.Karnataka State Pollution Control Board.
BENGAIURU.
77
iI
67
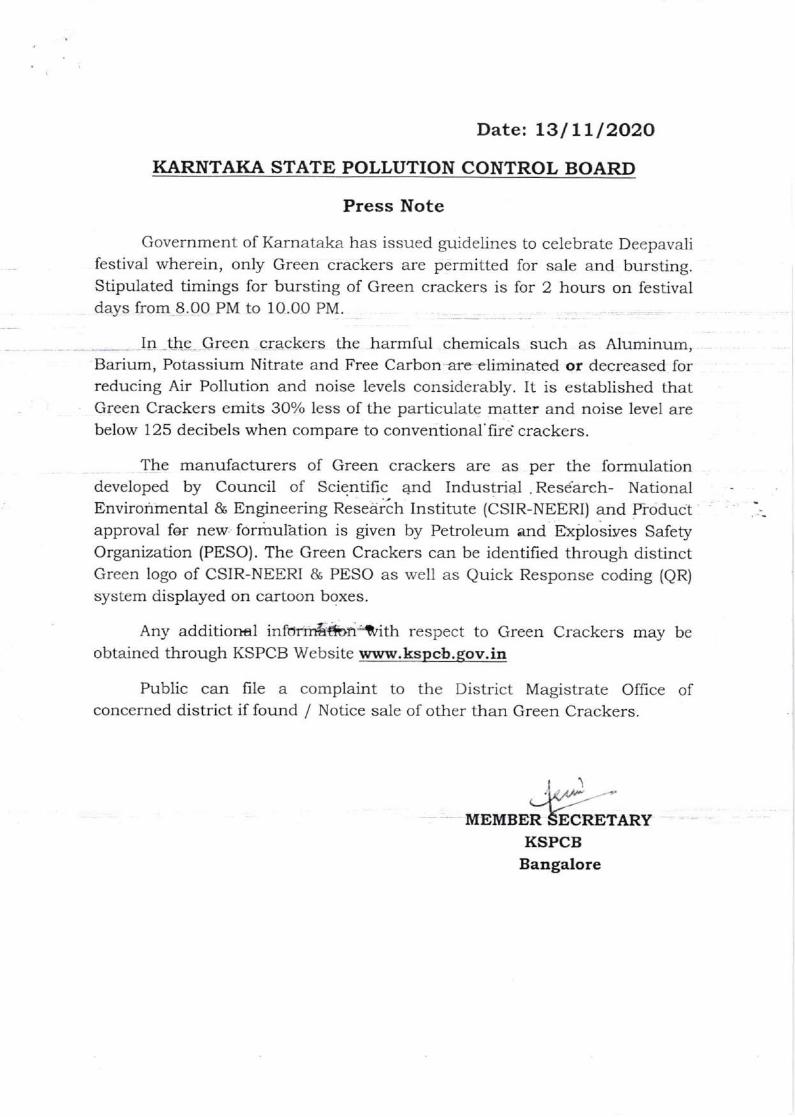
Date:13/LLl2O2O
KARNTAKA STATE POLLUTION CONTROL BOARI)
Press Note
Government of Karnataka has issued guidelines to celebrate Deepavalifestival wherein, only Green crackers are permitted for sale and bursting.Stipulated timings for bursting of Green crackers is for 2 hours on festivaidays from 8.00 PM to 10.00 PM.
_ ._._. _ In .the Green crackers the harmful chemicals such as Aluminum,Barium, Potassium Nitrate and Free Carbon are eliminated or decreased forreducing Air Pollution and noise levels considerably. It is established thatGreen Crackers emits 30%o less of the particulate matter and noise level arebelow 125 decibels when compare to conventional'fird crackers.
The manufacturers of Green crackers are as per the formulationdeveloped by Council of Scientific 4nd Industrial . Research- NationalEnvironmental & Engineering neseai6h Institute (CSIR-NEERI) and Productapproval fer new forrirulhtion is given by Petroleum and Explosives SafetyOrganization (PESO). The Green Crackers can be identified through distinctGreen logo of CSIR-NEERI & PESO as well as Quick Response coding (QR)
system displayed on cartoon boxes.
Any additional inlbrmEdon-?ith respect to Green Crackers may beobtained through KSPCB Website www.ks cb. .tn
Public can file a complaint to the District Magistrate Office ofconcerned district if found / Notice sale of other than Green Crackers.
l\tl
.:*"Y'MEMBER SBCNEIENY
KSPCBBangalore
68
I
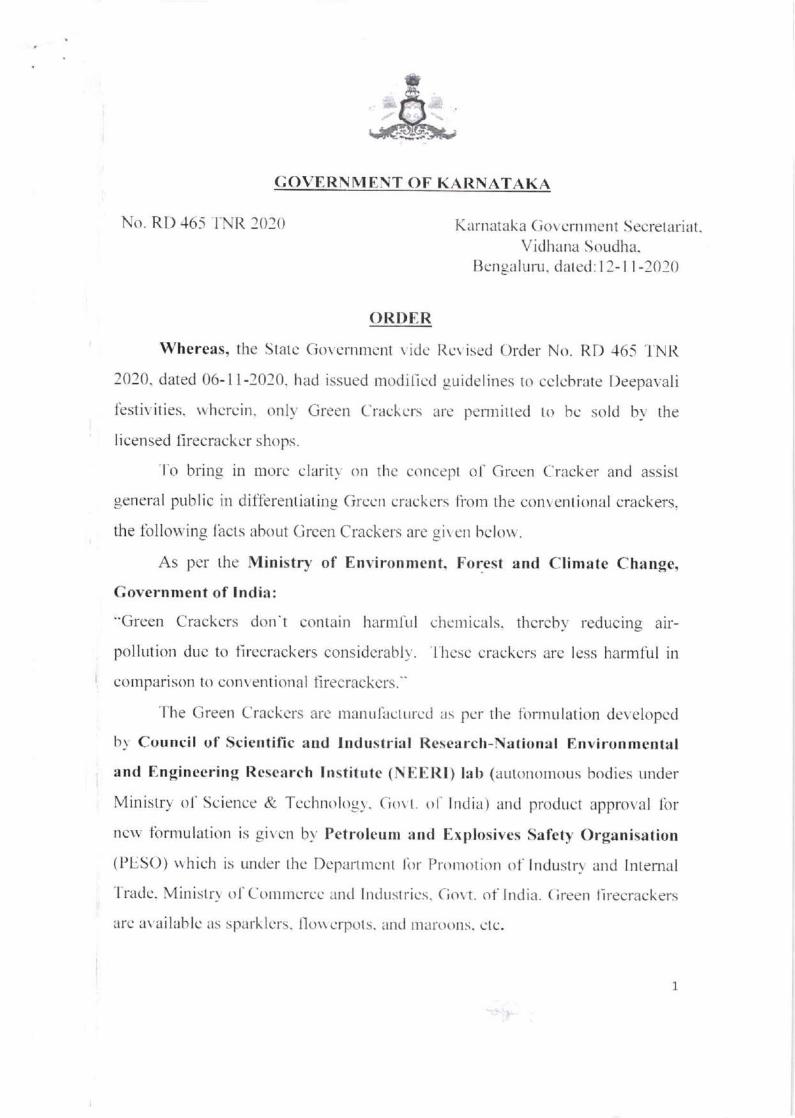
COVEIINNI ENT oF KARNATAKA
No. RI).165 INI{ l0l0 Karnataka Cjovcrntncnt Secretariat.Vidhana Soudha.
Bengaluru. datcd: l2-l l -2020
()til)l,.tt
Whereas, the Slalc Govenrrnent I ide Rcvised Order No. RD 465 'lNlt
2020, dated 06-11-2020. had issued modilicd guidelines ro cclcbrate [)eepavali
tbstir,ities. rvlrcrcin" on11, Green Crackcrs are pennitted to bc sold b1. the
licensed fi recrackcr shops.
'l'o bring in morc clarity on thc concept ol Grccn Cracker and assist
general public in dit'tbrentiating Grecn crackcrs fiorr the con\ entional crackers.
the tbllorving l.hcts about Grcen Crackers are qiven bclorv.
As per the Ministry of Environment, Forcst and Climate Change,
Covernment of lndia:
"Green Crackcrs don't contain harrnlirl chcrnicals. thcrcbl reducing air-
pollution duc to tirccrackers considerabll,. 'l hcsc crackcrs arc less harrnlul in
cornparison to conventional t'irecrackcrs."
The Creen Crackcrs arc manulircturcd as pcr the tonnulation der,elopcd
b1 Council of Scientific and lndustrial Research-National Environmental
and Engineering Rcsearch Institutc (NEERI) lab (autonomous bodies under
Ministry' ol' Science & Tcchnologr'. (lor t. ol- lndia) and product approval Ibr
ncrv fbrmulatit-rn is givcrr bl Petroleum and Explosives Safety Organisation
(l'LSO) uhich is undcr thc Dcpartr.ncnt lirr Prornotion ot'lndustry and lnternal'l'radc. Ministry ol'Comrncrcc and Itrtlustrics. (ior t. ot lndia. ( ireen lirecrackers
arc availablc as sparklcrs. llol crpols. antl nraLoons. clc.
7
69
!'
?
'l'hc (irccn C'r'ackers packing carr he idcrrtilictl lhrotrgh distinct Green
logo of CSIR-NEERI and I'ESO as wcll as n Quick Response (QR) coding
system. QR ('ode is a novcl ltllttrc incorponr(ctl ort the firc crackers lo a\1)id
lnanuf:lcturc arrtl salc of c()unlcrlcit prothrcts. 'l hc specirncn ccrlilicate issucd
h1 (ISII{-NLI-RI is cnclosetl ft'rr rcli'rcncc. I hc abovc lcatures s ill assist in
dilltrentiating Circcn crackers fionr corrr cnl irrnirl crackcrs.
(Anjum Parwez, IAS)l'rirrcipal Sccretar'y ttr (iovt.. Rct'cnue
I)epannlcnt ( l)isastcr Managenrent) andlvl ernbcr Sccrqturr . State [:rc.cut ilc Cornmittee
To:
The Cornpiler. Karnataka Gazeltc. Bengaluru
f
1i
70
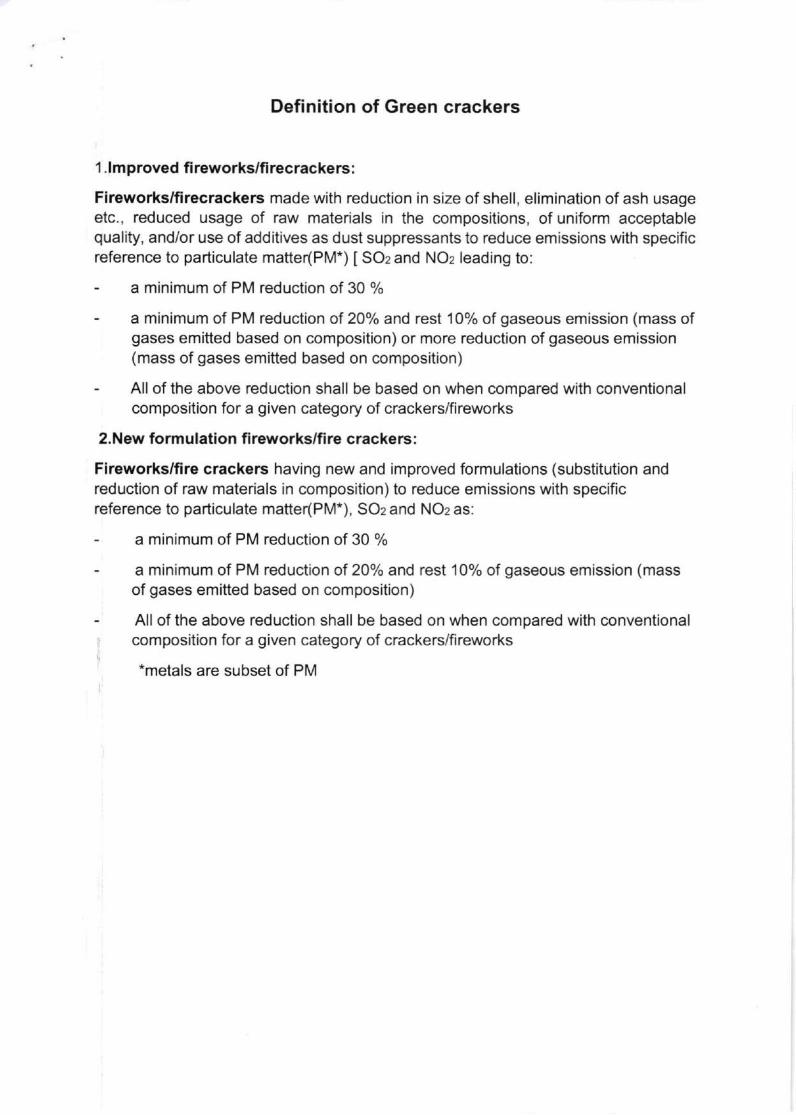
Definition of Green crackers
1 . lmproved fi reworks/fi recrackers:
Fireworks/firecrackers made with reduction in size of shell, elimination of ash usageetc., reduced usage of raw materials in the compositions, of uniform acceptablequality, and/or use of additives as dust suppressants to reduce emissions with specificreference to particulate matter(PM.) [ SOz and NOz leading to:
- a minimum of PM reduction of 30 %
- a minimum of PM reduction of 2Oo/o and rest 10% of gaseous emission (mass ofgases emitted based on composition) or more reduction of gaseous emission(mass of gases emitted based on composition)
- All of the above reduction shall be based on when compared with conventionalcomposition for a given category of crackers/fireworks
2.New formulation fi reworks/fire crackers:
Fireworks/fire crackers having new and improved formulations (substitution andreduction of raw materials in composition) to reduce emissions with specificreference to particulate matte(PM-), SOz and NOz as:
- a minimum of PM reduction of 30 %
a minimum of PM reduction ol ZOoh and rest 10% of gaseous emission (massof gases emitted based on composition)
All of the above reduction shall be based on when compared with conventionalcomposition for a given category of crackers/fireworks
*metals are subset of PM
71
E-trriir
a
EdJ
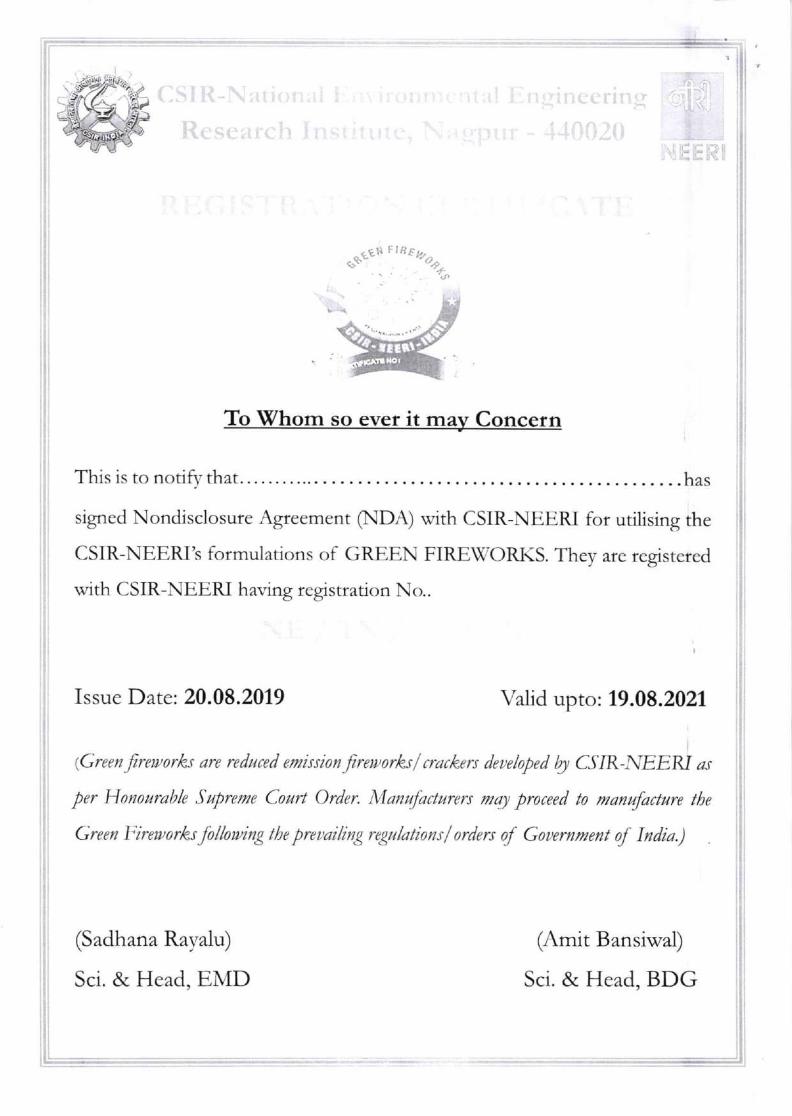
CSIR-National L;i ilonr:Research Institrrtc, l*.
'rrtal Engineeringlrrprrr - 440020
ooll'':,"""'^
This is to notifi'that.... .....has
signed Nondisclosure Agteement Q.{DA) with CSIR-NEERI for utilising the
CSIR-NEERI's formulations of GREEN FIRE$flORKS. They are registered
with CSIR-NEERI having registration No..
Issue Date: 20.08.2019 Valid upto: 79.08.2021
lGrunfreworks are redtced eruisionfreworksf crackers deueloped @ CSIR-NEEKI ar
per Honourable Sapreme Court Order. Manufacturers ma1 proceed to manufactare the
Green Fireworktfolbwing the preuailing regulationsf orders of Gouernment of lrdia.)
(Sadhana Ravalu)
Sci. & Head, EN,ID
(Amit Bansiwal)
Sci. & Head, BDG
To Whom so ever it mav Concern
72
I
'a#
4,/
l-
vr\5t
1\
rt\f
r!
s
II
-,)ry'
l
-
l
-\
D
I.il
.T
Itr
L-{r
I /I
It--a
rdIlr -/
'.4-2
r"
7frEII
h,- -A,li,
z
I
L.
ffi5=-,
4-.-
a
E
t'i..,ffi
d
I
l:rE
73
ANDHRA PRADESH POLLUTION CONTROL BOARD
D. No. 33-26-14D/2, Near Sunrise Hospital, Chalamalavari street,
Kasturibaipet, Vijayawada – 520010.
____________________________________________________
Lr. No. 015/APPCB/LAB/Deepavali/2020- 24/11/2020
To
The Member Secretary,
Central Pollution Control Board,
Parivesh Bhavan,
East Arjun nagar,
Delhi – 110032.
Sir,
Sub: APPCB – LAB – Hon’ble NGT directions in its Order dated 09.11.2020 in O. A. No.249/2020 on fire crackers – Compliance report submitted – Reg.
Ref: 1. Hon’ble NGT Order dated 09.11.2020 in O. A. No. 249/2020. 2. HM & FW Dept. G. O. Rt. No. 692, dated 10.11.2020. 3. CPCB letter No. AQM/Fire Crackers/2020-21, dated 20.11.2020.
It is to inform that the Air Quality Index (AQI) values during the month of November,2019 in the cities and towns of Andhra Pradesh were found to be between good andmoderate.
Accordingly, Health, Medical & Family Welfare Dept., Govt. of Andhra Pradesh has
issued the G. O., vide reference 2nd cited, stipulating that only green crackers shall be soldand used and the timing for use and bursting of crackers is restricted to two hours, i.e., 08.00PM to 10.00 pm on Deepavali day. Copy of the G. O. enclosed.
File No.015/APPCB/LAB/Deepavali/2015 Annexure-VII
74
Further, Andhra Pradesh Pollution Control Board has carried out air & noise qualityduring Deepavali festival, 2020 in the cities and towns as per the CPCB protocol circulated.Air & noise quality data city / town wise along with the AQI values (Annexure - I, II & III) areherewith submitted for information.
Yours sincerely
Enclosures: As above.
Vivek Yadav I A S
Member Secretary
File No.015/APPCB/LAB/Deepavali/2015
75
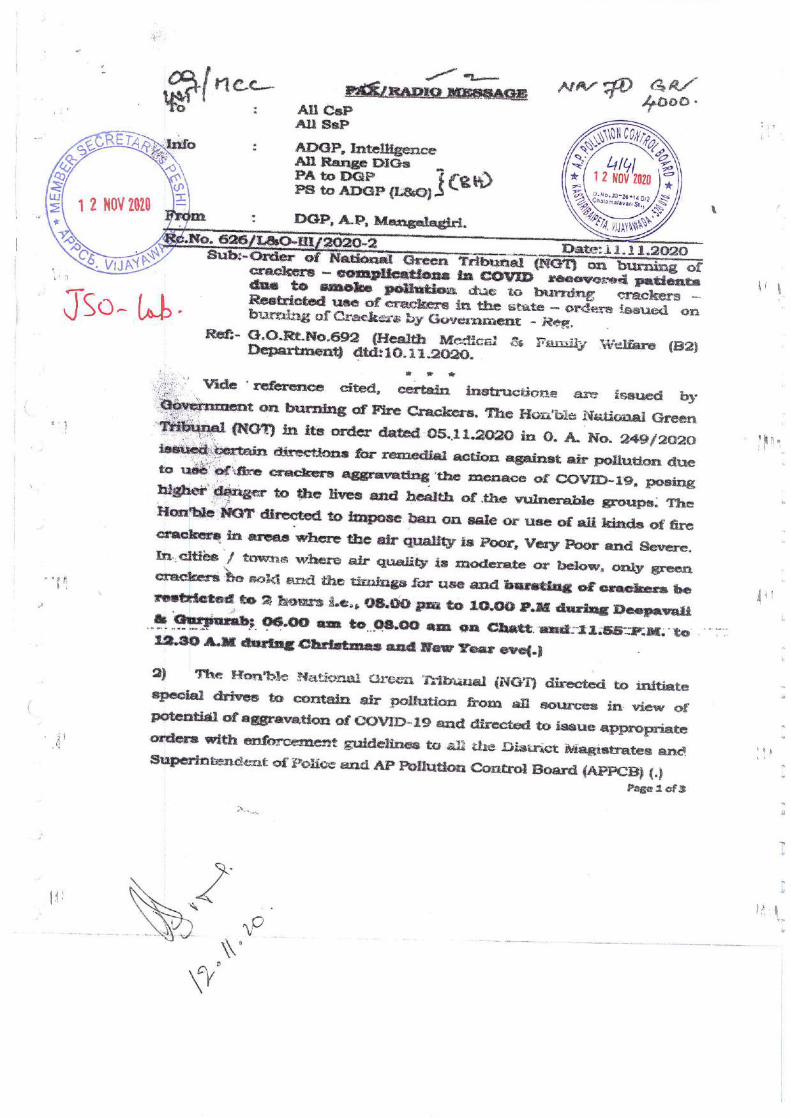
76
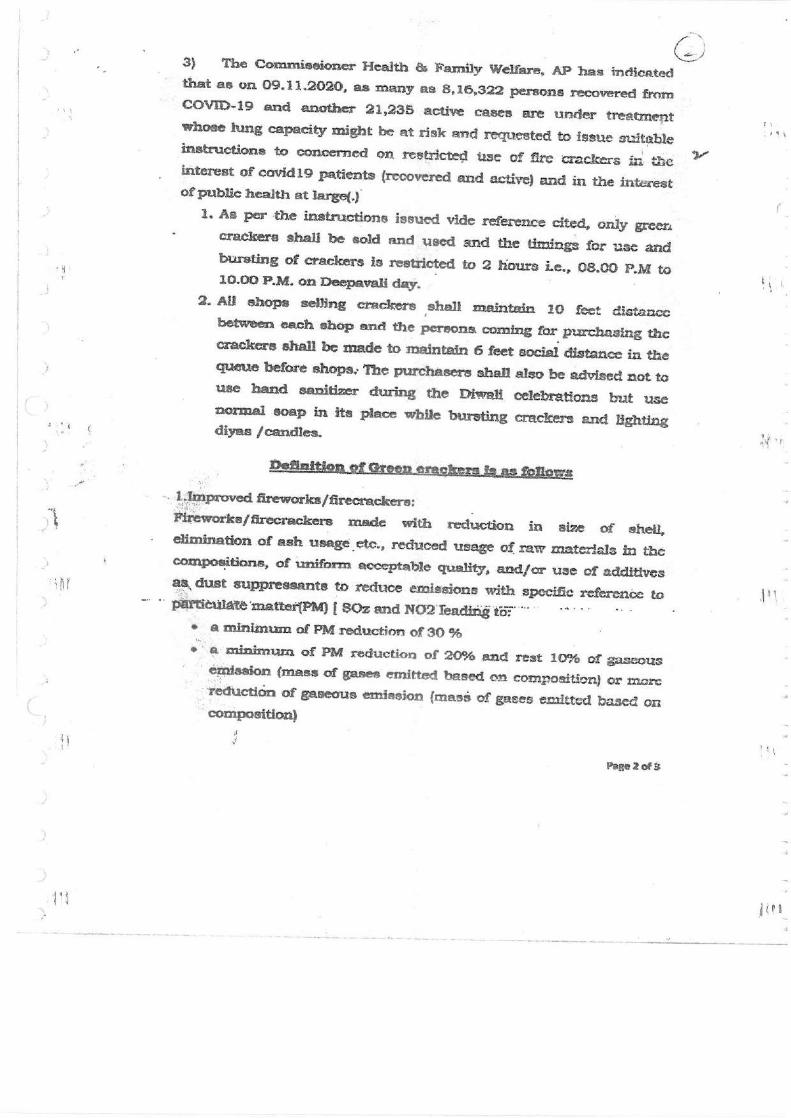
77
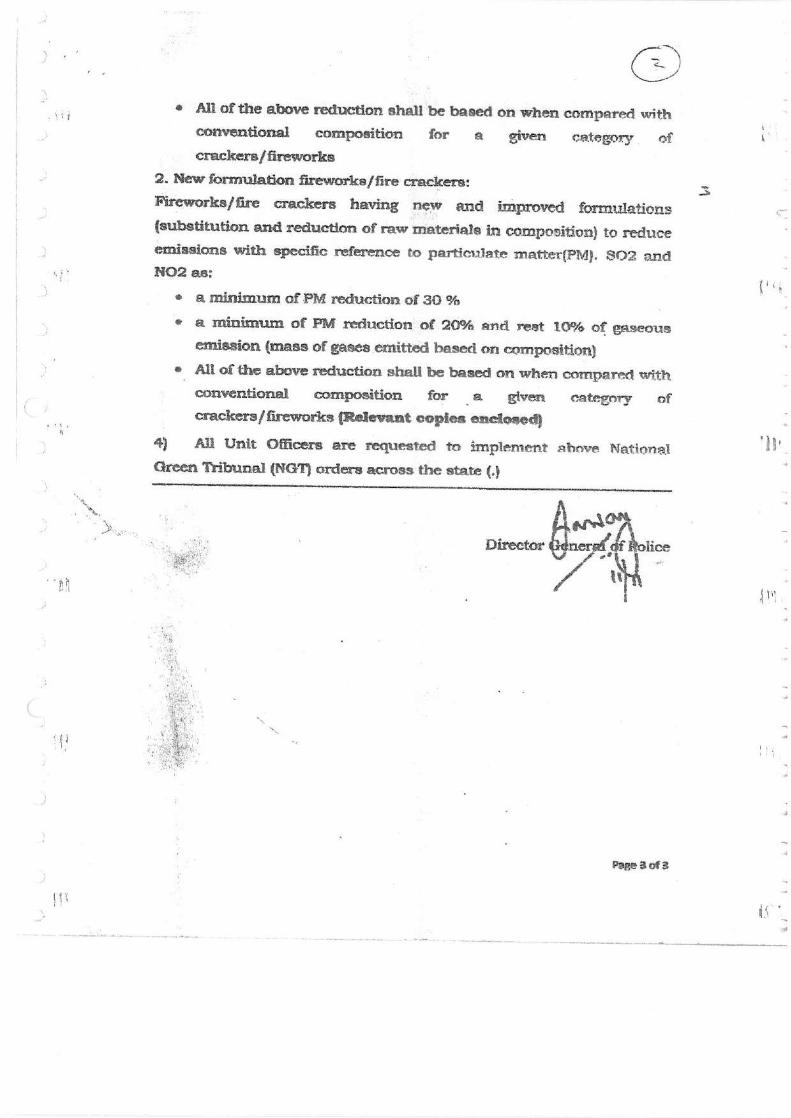
78
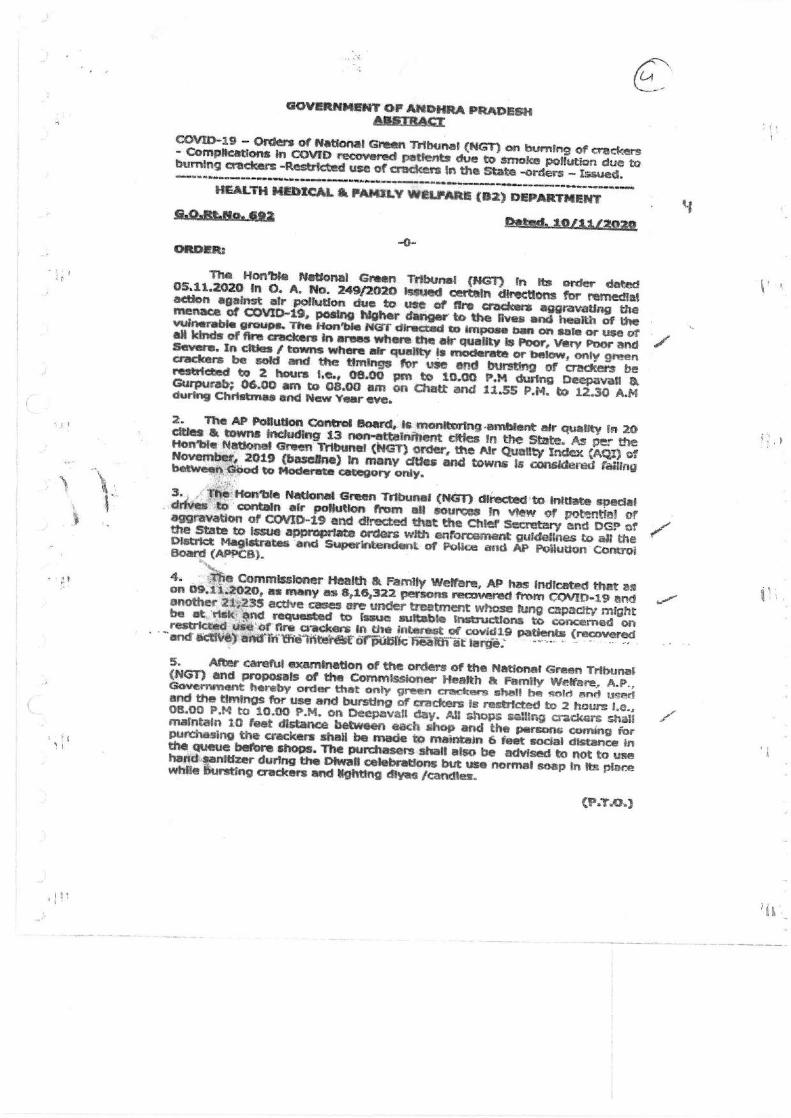
79
80
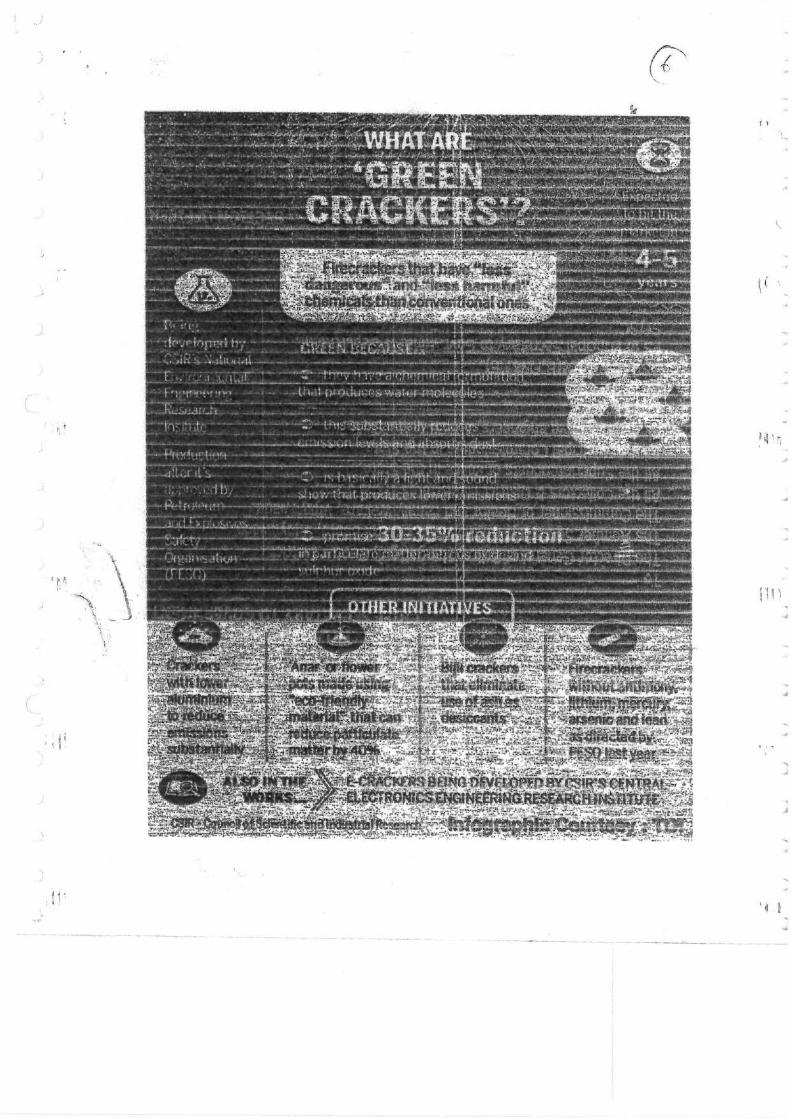
81
82
83
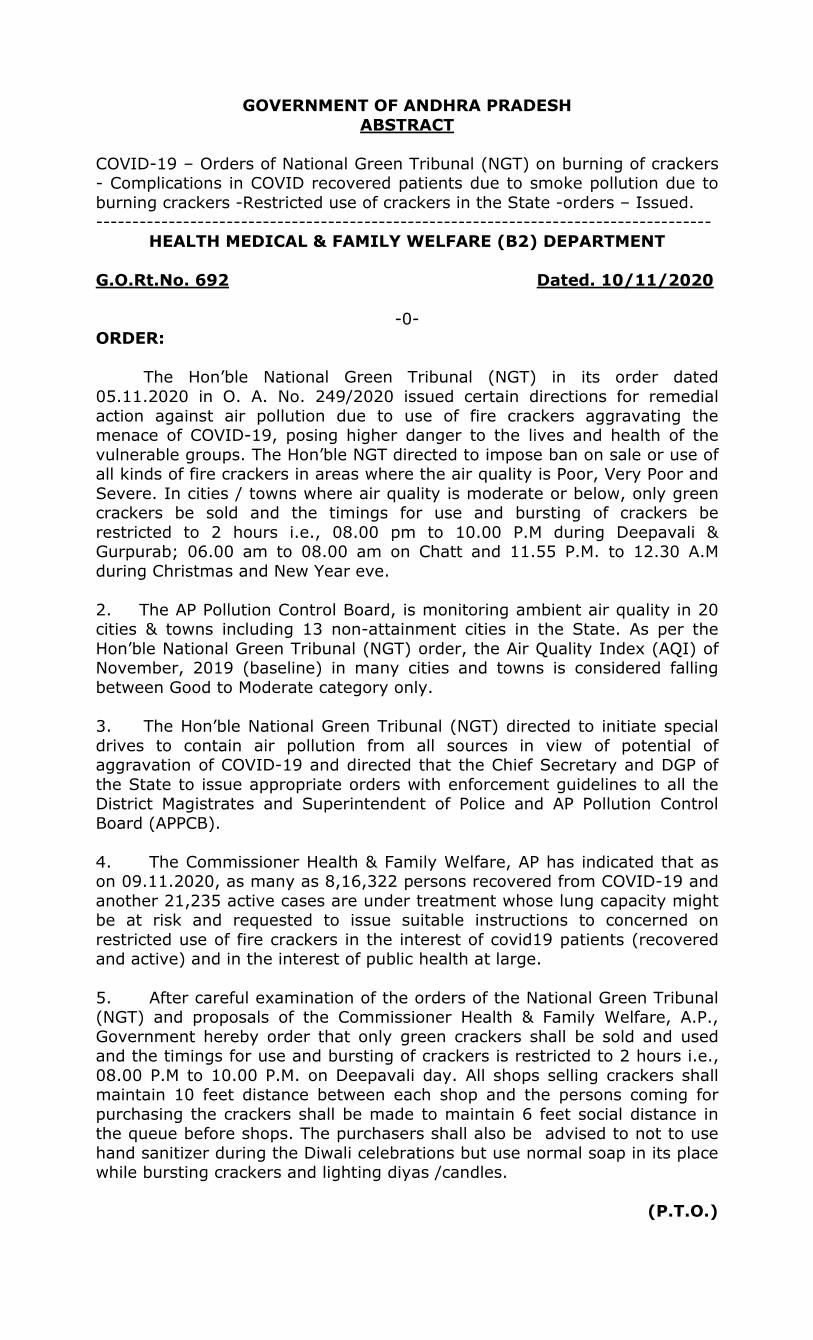
GOVERNMENT OF ANDHRA PRADESH ABSTRACT
COVID-19 – Orders of National Green Tribunal (NGT) on burning of crackers - Complications in COVID recovered patients due to smoke pollution due to burning crackers -Restricted use of crackers in the State -orders – Issued. -------------------------------------------------------------------------------------
HEALTH MEDICAL & FAMILY WELFARE (B2) DEPARTMENT G.O.Rt.No. 692 Dated. 10/11/2020
-0- ORDER:
The Hon’ble National Green Tribunal (NGT) in its order dated 05.11.2020 in O. A. No. 249/2020 issued certain directions for remedial action against air pollution due to use of fire crackers aggravating the menace of COVID-19, posing higher danger to the lives and health of the vulnerable groups. The Hon’ble NGT directed to impose ban on sale or use of all kinds of fire crackers in areas where the air quality is Poor, Very Poor and Severe. In cities / towns where air quality is moderate or below, only green crackers be sold and the timings for use and bursting of crackers be restricted to 2 hours i.e., 08.00 pm to 10.00 P.M during Deepavali & Gurpurab; 06.00 am to 08.00 am on Chatt and 11.55 P.M. to 12.30 A.M during Christmas and New Year eve.
2. The AP Pollution Control Board, is monitoring ambient air quality in 20 cities & towns including 13 non-attainment cities in the State. As per the Hon’ble National Green Tribunal (NGT) order, the Air Quality Index (AQI) of November, 2019 (baseline) in many cities and towns is considered falling between Good to Moderate category only. 3. The Hon’ble National Green Tribunal (NGT) directed to initiate special drives to contain air pollution from all sources in view of potential of aggravation of COVID-19 and directed that the Chief Secretary and DGP of the State to issue appropriate orders with enforcement guidelines to all the District Magistrates and Superintendent of Police and AP Pollution Control Board (APPCB). 4. The Commissioner Health & Family Welfare, AP has indicated that as on 09.11.2020, as many as 8,16,322 persons recovered from COVID-19 and another 21,235 active cases are under treatment whose lung capacity might be at risk and requested to issue suitable instructions to concerned on restricted use of fire crackers in the interest of covid19 patients (recovered and active) and in the interest of public health at large. 5. After careful examination of the orders of the National Green Tribunal (NGT) and proposals of the Commissioner Health & Family Welfare, A.P., Government hereby order that only green crackers shall be sold and used and the timings for use and bursting of crackers is restricted to 2 hours i.e., 08.00 P.M to 10.00 P.M. on Deepavali day. All shops selling crackers shall maintain 10 feet distance between each shop and the persons coming for purchasing the crackers shall be made to maintain 6 feet social distance in the queue before shops. The purchasers shall also be advised to not to use hand sanitizer during the Diwali celebrations but use normal soap in its place while bursting crackers and lighting diyas /candles.
(P.T.O.)
84
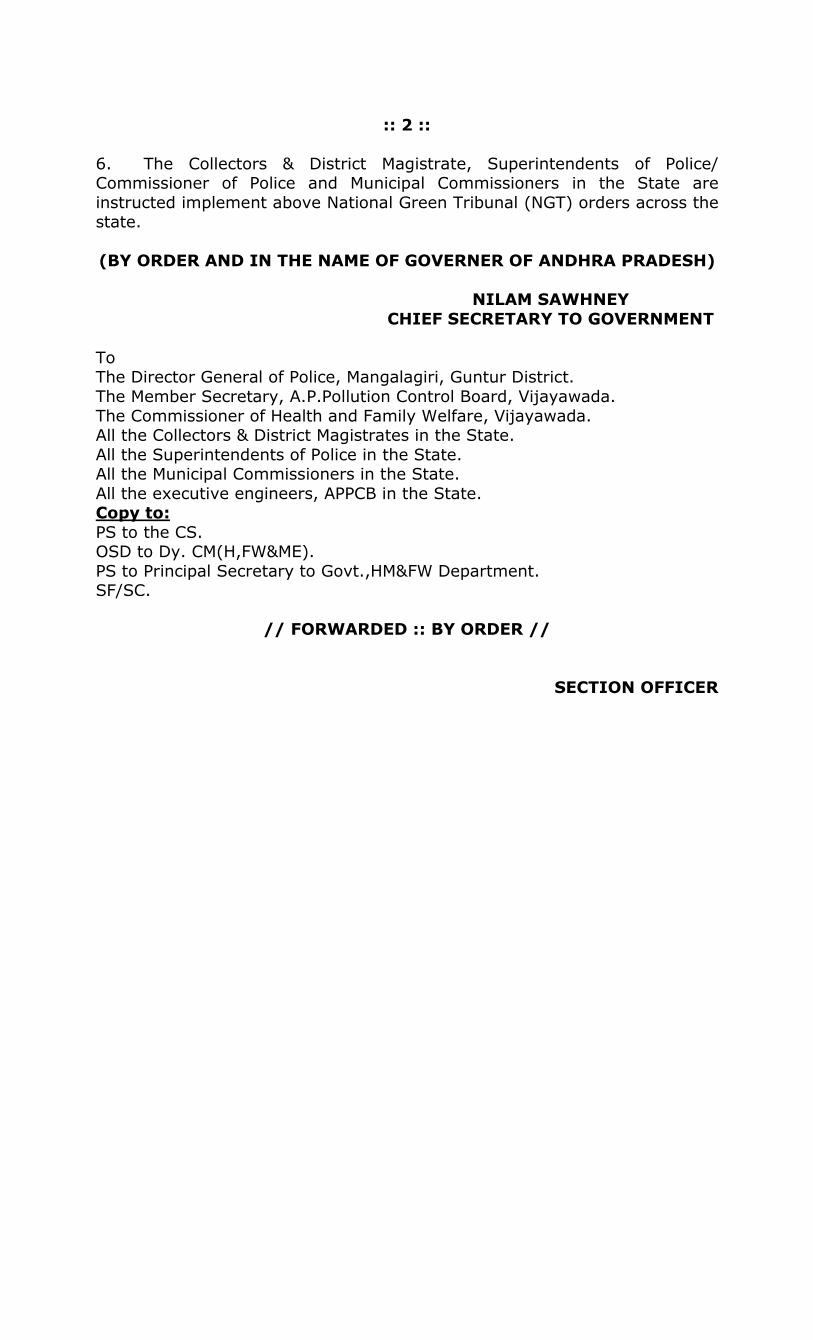
:: 2 ::
6. The Collectors & District Magistrate, Superintendents of Police/ Commissioner of Police and Municipal Commissioners in the State are instructed implement above National Green Tribunal (NGT) orders across the state. (BY ORDER AND IN THE NAME OF GOVERNER OF ANDHRA PRADESH)
NILAM SAWHNEY CHIEF SECRETARY TO GOVERNMENT
To The Director General of Police, Mangalagiri, Guntur District. The Member Secretary, A.P.Pollution Control Board, Vijayawada. The Commissioner of Health and Family Welfare, Vijayawada. All the Collectors & District Magistrates in the State. All the Superintendents of Police in the State. All the Municipal Commissioners in the State. All the executive engineers, APPCB in the State. Copy to: PS to the CS. OSD to Dy. CM(H,FW&ME). PS to Principal Secretary to Govt.,HM&FW Department. SF/SC.
// FORWARDED :: BY ORDER //
SECTION OFFICER
85
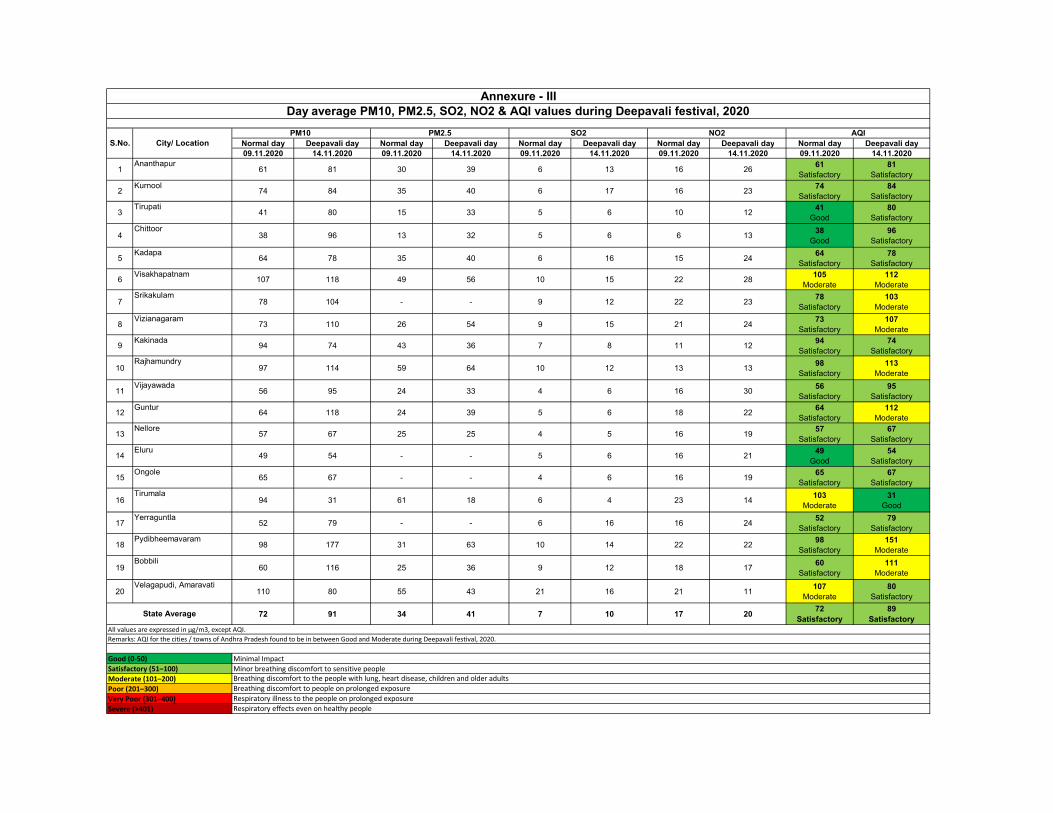
Normal day Deepavali day Normal day Deepavali day Normal day Deepavali day Normal day Deepavali day Normal day Deepavali day09.11.2020 14.11.2020 09.11.2020 14.11.2020 09.11.2020 14.11.2020 09.11.2020 14.11.2020 09.11.2020 14.11.2020
1Ananthapur
61 81 30 39 6 13 16 26 61Satisfactory
81Satisfactory
2 Kurnool 74 84 35 40 6 17 16 23 74Satisfactory
84Satisfactory
3Tirupati
41 80 15 33 5 6 10 12 41Good
80Satisfactory
4Chittoor
38 96 13 32 5 6 6 13 38Good
96Satisfactory
5Kadapa
64 78 35 40 6 16 15 24 64Satisfactory
78Satisfactory
6 Visakhapatnam 107 118 49 56 10 15 22 28 105Moderate
112Moderate
7Srikakulam
78 104 - - 9 12 22 23 78Satisfactory
103Moderate
8Vizianagaram
73 110 26 54 9 15 21 24 73Satisfactory
107Moderate
9 Kakinada 94 74 43 36 7 8 11 12 94Satisfactory
74Satisfactory
10Rajhamundry
97 114 59 64 10 12 13 13 98Satisfactory
113Moderate
11Vijayawada
56 95 24 33 4 6 16 30 56Satisfactory
95Satisfactory
12 Guntur 64 118 24 39 5 6 18 22 64Satisfactory
112Moderate
13Nellore
57 67 25 25 4 5 16 19 57Satisfactory
67Satisfactory
14Eluru
49 54 - - 5 6 16 21 49Good
54Satisfactory
15Ongole
65 67 - - 4 6 16 19 65Satisfactory
67Satisfactory
16Tirumala
94 31 61 18 6 4 23 14 103Moderate
31Good
17Yerraguntla
52 79 - - 6 16 16 24 52Satisfactory
79Satisfactory
18Pydibheemavaram
98 177 31 63 10 14 22 22 98Satisfactory
151Moderate
19Bobbili
60 116 25 36 9 12 18 17 60Satisfactory
111Moderate
20Velagapudi, Amaravati
110 80 55 43 21 16 21 11 107Moderate
80Satisfactory
72 91 34 41 7 10 17 20 72Satisfactory
89Satisfactory
City/ LocationPM10 PM2.5 SO2 NO2
Annexure - III
Poor (201–300)
Minimal ImpactMinor breathing discomfort to sensitive peopleBreathing discomfort to the people with lung, heart disease, children and older adultsBreathing discomfort to people on prolonged exposure
Good (0-50)Satisfactory (51–100)Moderate (101–200)
Remarks: AQI for the cities / towns of Andhra Pradesh found to be in between Good and Moderate during Deepavali festival, 2020.
Day average PM10, PM2.5, SO2, NO2 & AQI values during Deepavali festival, 2020
State Average
S.No.AQI
Very Poor (301–400)Severe (>401)
Respiratory illness to the people on prolonged exposureRespiratory effects even on healthy people
All values are expressed in µg/m3, except AQI.
86
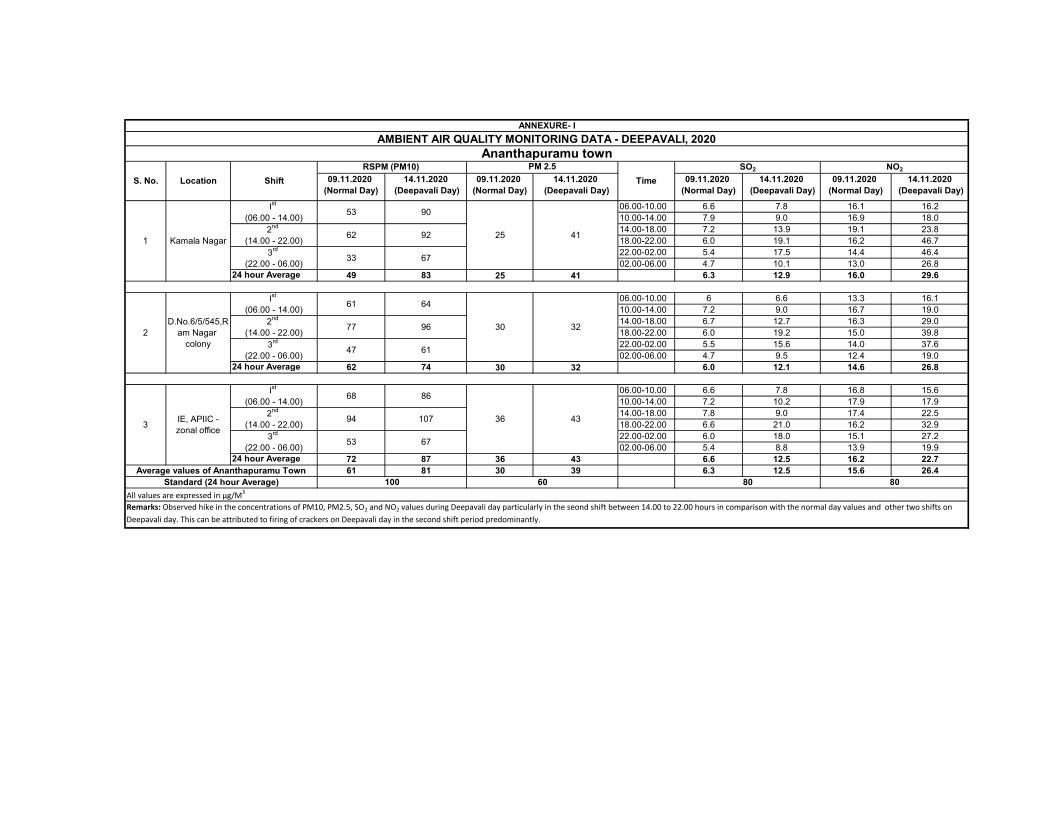
09.11.2020 (Normal Day)
14.11.2020 (Deepavali Day)
09.11.2020 (Normal Day)
14.11.2020 (Deepavali Day)
09.11.2020 (Normal Day)
14.11.2020 (Deepavali Day)
09.11.2020 (Normal Day)
14.11.2020 (Deepavali Day)
06.00-10.00 6.6 7.8 16.1 16.210.00-14.00 7.9 9.0 16.9 18.014.00-18.00 7.2 13.9 19.1 23.818.00-22.00 6.0 19.1 16.2 46.722.00-02.00 5.4 17.5 14.4 46.402.00-06.00 4.7 10.1 13.0 26.8
24 hour Average 49 83 25 41 6.3 12.9 16.0 29.6
06.00-10.00 6 6.6 13.3 16.110.00-14.00 7.2 9.0 16.7 19.014.00-18.00 6.7 12.7 16.3 29.018.00-22.00 6.0 19.2 15.0 39.822.00-02.00 5.5 15.6 14.0 37.602.00-06.00 4.7 9.5 12.4 19.0
24 hour Average 62 74 30 32 6.0 12.1 14.6 26.8
06.00-10.00 6.6 7.8 16.8 15.610.00-14.00 7.2 10.2 17.9 17.914.00-18.00 7.8 9.0 17.4 22.518.00-22.00 6.6 21.0 16.2 32.922.00-02.00 6.0 18.0 15.1 27.202.00-06.00 5.4 8.8 13.9 19.9
24 hour Average 72 87 36 43 6.6 12.5 16.2 22.761 81 30 39 6.3 12.5 15.6 26.4
All values are expressed in µg/M3
Remarks: Observed hike in the concentrations of PM10, PM2.5, SO2 and NO2 values during Deepavali day particularly in the seond shift between 14.00 to 22.00 hours in comparison with the normal day values and other two shifts on Deepavali day. This can be attributed to firing of crackers on Deepavali day in the second shift period predominantly.
100 60 80 80Standard (24 hour Average)
Kamala Nagar
362nd (14.00 - 22.00) 107 43
68
94
D.No.6/5/545,Ram Nagar
colony
Ist (06.00 - 14.00) 61 64
67
IE, APIIC -zonal office
Ist (06.00 - 14.00) 86
53
53 90
30 322nd (14.00 - 22.00) 77 96
3rd (22.00 - 06.00) 47 61
2nd (14.00 - 22.00) 62 92
3rd (22.00 - 06.00) 33
ANNEXURE- IAMBIENT AIR QUALITY MONITORING DATA - DEEPAVALI, 2020
Ananthapuramu town
S. No.
1
Location ShiftPM 2.5 SO2
67
NO2RSPM (PM10) Time
25 41
Ist (06.00 - 14.00)
2
3
Average values of Ananthapuramu Town
3rd (22.00 - 06.00)
87
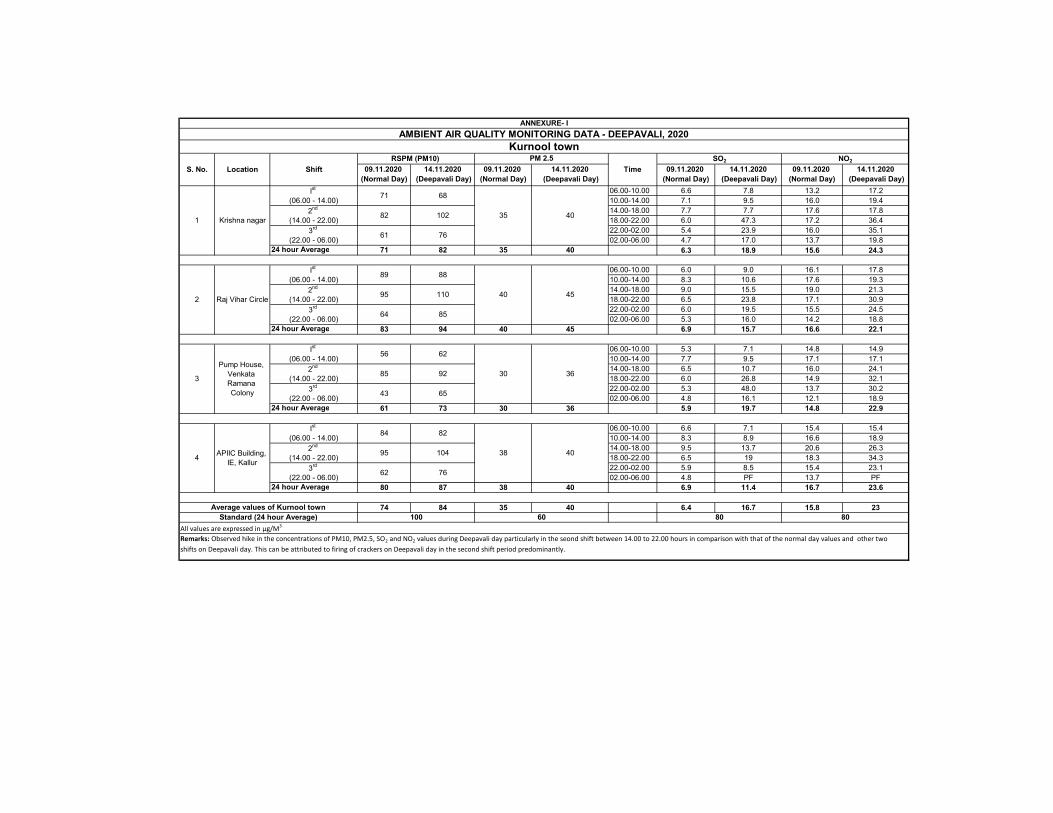
09.11.2020 (Normal Day)
14.11.2020 (Deepavali Day)
09.11.2020 (Normal Day)
14.11.2020 (Deepavali Day)
09.11.2020 (Normal Day)
14.11.2020 (Deepavali Day)
09.11.2020 (Normal Day)
14.11.2020 (Deepavali Day)
06.00-10.00 6.6 7.8 13.2 17.210.00-14.00 7.1 9.5 16.0 19.414.00-18.00 7.7 7.7 17.6 17.818.00-22.00 6.0 47.3 17.2 36.422.00-02.00 5.4 23.9 16.0 35.102.00-06.00 4.7 17.0 13.7 19.8
24 hour Average 71 82 35 40 6.3 18.9 15.6 24.3
06.00-10.00 6.0 9.0 16.1 17.810.00-14.00 8.3 10.6 17.6 19.314.00-18.00 9.0 15.5 19.0 21.318.00-22.00 6.5 23.8 17.1 30.922.00-02.00 6.0 19.5 15.5 24.502.00-06.00 5.3 16.0 14.2 18.8
24 hour Average 83 94 40 45 6.9 15.7 16.6 22.1
06.00-10.00 5.3 7.1 14.8 14.910.00-14.00 7.7 9.5 17.1 17.114.00-18.00 6.5 10.7 16.0 24.118.00-22.00 6.0 26.8 14.9 32.122.00-02.00 5.3 48.0 13.7 30.202.00-06.00 4.8 16.1 12.1 18.9
24 hour Average 61 73 30 36 5.9 19.7 14.8 22.9
06.00-10.00 6.6 7.1 15.4 15.410.00-14.00 8.3 8.9 16.6 18.914.00-18.00 9.5 13.7 20.6 26.318.00-22.00 6.5 19 18.3 34.322.00-02.00 5.9 8.5 15.4 23.102.00-06.00 4.8 PF 13.7 PF
24 hour Average 80 87 38 40 6.9 11.4 16.7 23.6
74 84 35 40 6.4 16.7 15.8 23
362nd (14.00 - 22.00) 85
3rd (22.00 - 06.00) 61 76
95 110
Ist (06.00 - 14.00) 89 88
92
3rd (22.00 - 06.00) 43 65
3rd (22.00 - 06.00)
Remarks: Observed hike in the concentrations of PM10, PM2.5, SO2 and NO2 values during Deepavali day particularly in the seond shift between 14.00 to 22.00 hours in comparison with that of the normal day values and other two shifts on Deepavali day. This can be attributed to firing of crackers on Deepavali day in the second shift period predominantly.
62
38 402nd (14.00 - 22.00) 95 104
3rd (22.00 - 06.00) 62 76
303
Pump House, Venkata Ramana Colony
Ist (06.00 - 14.00) 56
RSPM (PM10)
68
2nd (14.00 - 22.00) 82 102
71
64 85
2 40 452nd (14.00 - 22.00)Raj Vihar Circle
ANNEXURE- IAMBIENT AIR QUALITY MONITORING DATA - DEEPAVALI, 2020
S. No.
1
Kurnool town
TimeSO2 NO2
35 40Krishna nagar
Ist (06.00 - 14.00)
PM 2.5 Location Shift
Standard (24 hour Average)All values are expressed in µg/M3
APIIC Building, IE, Kallur
Ist (06.00 - 14.00) 84 82
100 60 80 80
4
Average values of Kurnool town
88
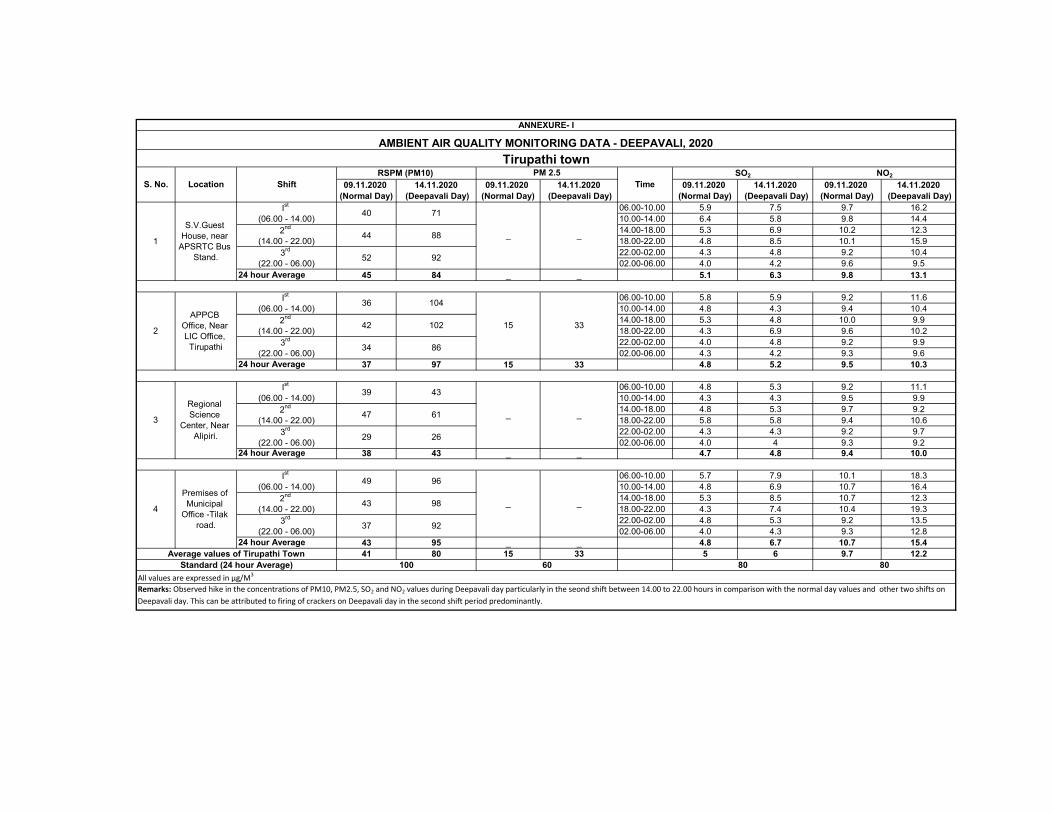
09.11.2020 (Normal Day)
14.11.2020 (Deepavali Day)
09.11.2020 (Normal Day)
14.11.2020 (Deepavali Day)
09.11.2020 (Normal Day)
14.11.2020 (Deepavali Day)
09.11.2020 (Normal Day)
14.11.2020 (Deepavali Day)
06.00-10.00 5.9 7.5 9.7 16.210.00-14.00 6.4 5.8 9.8 14.414.00-18.00 5.3 6.9 10.2 12.318.00-22.00 4.8 8.5 10.1 15.922.00-02.00 4.3 4.8 9.2 10.402.00-06.00 4.0 4.2 9.6 9.5
24 hour Average 45 84 _ _ 5.1 6.3 9.8 13.1
06.00-10.00 5.8 5.9 9.2 11.610.00-14.00 4.8 4.3 9.4 10.414.00-18.00 5.3 4.8 10.0 9.918.00-22.00 4.3 6.9 9.6 10.222.00-02.00 4.0 4.8 9.2 9.902.00-06.00 4.3 4.2 9.3 9.6
24 hour Average 37 97 15 33 4.8 5.2 9.5 10.3
06.00-10.00 4.8 5.3 9.2 11.110.00-14.00 4.3 4.3 9.5 9.914.00-18.00 4.8 5.3 9.7 9.218.00-22.00 5.8 5.8 9.4 10.622.00-02.00 4.3 4.3 9.2 9.702.00-06.00 4.0 4 9.3 9.2
24 hour Average 38 43 _ _ 4.7 4.8 9.4 10.0
06.00-10.00 5.7 7.9 10.1 18.310.00-14.00 4.8 6.9 10.7 16.414.00-18.00 5.3 8.5 10.7 12.318.00-22.00 4.3 7.4 10.4 19.322.00-02.00 4.8 5.3 9.2 13.502.00-06.00 4.0 4.3 9.3 12.8
24 hour Average 43 95 _ _ 4.8 6.7 10.7 15.441 80 15 33 5 6 9.7 12.2
80 80All values are expressed in µg/M3
Remarks: Observed hike in the concentrations of PM10, PM2.5, SO2 and NO2 values during Deepavali day particularly in the seond shift between 14.00 to 22.00 hours in comparison with the normal day values and other two shifts on Deepavali day. This can be attributed to firing of crackers on Deepavali day in the second shift period predominantly.
_
_Regional Science
Center, Near Alipiri.
100 60
3rd (22.00 - 06.00) 37 92
Premises of Municipal
Office -Tilak road.
Ist (06.00 - 14.00) 49 96
3rd (22.00 - 06.00) 52 92
Ist (06.00 - 14.00) 39 43
2 332nd (14.00 - 22.00) 42 102
3rd (22.00 - 06.00) 34 86
Location ShiftRSPM (PM10) PM 2.5
88
APPCB Office, Near LIC Office, Tirupathi
Ist (06.00 - 14.00) 36 104
15
ANNEXURE- I
AMBIENT AIR QUALITY MONITORING DATA - DEEPAVALI, 2020Tirupathi town
S. No.
1
SO2 NO2Time
S.V.Guest House, near
APSRTC Bus Stand.
Ist (06.00 - 14.00) 40 71
_ _2nd (14.00 - 22.00) 44
3
4
Average values of Tirupathi TownStandard (24 hour Average)
_2nd (14.00 - 22.00) 47 61
3rd (22.00 - 06.00) 29 26
_2nd (14.00 - 22.00) 43 98
89
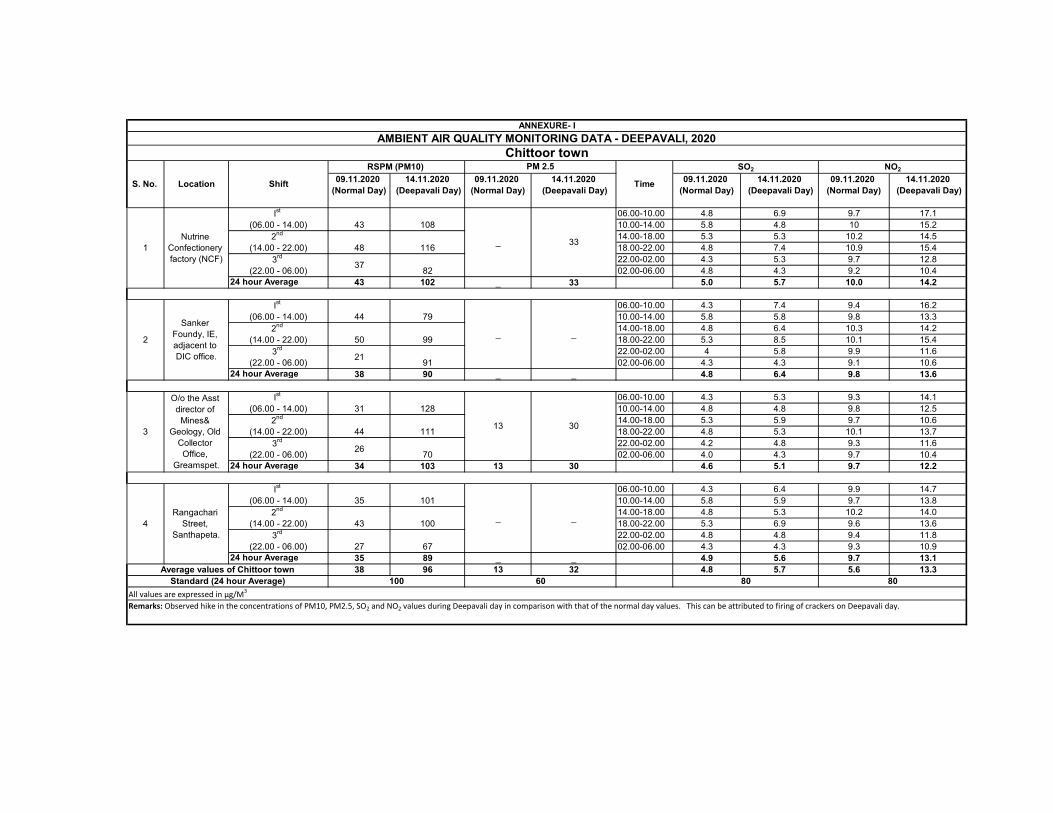
09.11.2020 (Normal Day)
14.11.2020 (Deepavali Day)
09.11.2020 (Normal Day)
14.11.2020 (Deepavali Day)
09.11.2020 (Normal Day)
14.11.2020 (Deepavali Day)
09.11.2020 (Normal Day)
14.11.2020 (Deepavali Day)
06.00-10.00 4.8 6.9 9.7 17.110.00-14.00 5.8 4.8 10 15.214.00-18.00 5.3 5.3 10.2 14.518.00-22.00 4.8 7.4 10.9 15.422.00-02.00 4.3 5.3 9.7 12.802.00-06.00 4.8 4.3 9.2 10.4
24 hour Average 43 102 _ 33 5.0 5.7 10.0 14.2
06.00-10.00 4.3 7.4 9.4 16.210.00-14.00 5.8 5.8 9.8 13.314.00-18.00 4.8 6.4 10.3 14.218.00-22.00 5.3 8.5 10.1 15.422.00-02.00 4 5.8 9.9 11.602.00-06.00 4.3 4.3 9.1 10.6
24 hour Average 38 90 _ _ 4.8 6.4 9.8 13.6
06.00-10.00 4.3 5.3 9.3 14.110.00-14.00 4.8 4.8 9.8 12.514.00-18.00 5.3 5.9 9.7 10.618.00-22.00 4.8 5.3 10.1 13.722.00-02.00 4.2 4.8 9.3 11.602.00-06.00 4.0 4.3 9.7 10.4
24 hour Average 34 103 13 30 4.6 5.1 9.7 12.2
06.00-10.00 4.3 6.4 9.9 14.710.00-14.00 5.8 5.9 9.7 13.814.00-18.00 4.8 5.3 10.2 14.018.00-22.00 5.3 6.9 9.6 13.622.00-02.00 4.8 4.8 9.4 11.802.00-06.00 4.3 4.3 9.3 10.9
24 hour Average 35 89 _ _ 4.9 5.6 9.7 13.138 96 13 32 4.8 5.7 5.6 13.3
Remarks: Observed hike in the concentrations of PM10, PM2.5, SO2 and NO2 values during Deepavali day in comparison with that of the normal day values. This can be attributed to firing of crackers on Deepavali day.
_
100 60 80 80
302nd (14.00 - 22.00) 44 111
3rd (22.00 - 06.00) 26 70
13
_2nd (14.00 - 22.00) 50 99
3rd (22.00 - 06.00) 21 91
_
Ist (06.00 - 14.00) 44 79
_
O/o the Asst director of
Mines& Geology, Old
Collector Office,
Greamspet.
Ist (06.00 - 14.00) 31 128
Sanker Foundy, IE, adjacent to DIC office.
ANNEXURE- IAMBIENT AIR QUALITY MONITORING DATA - DEEPAVALI, 2020
Chittoor town
S. No.
PM 2.5
Time
SO2 NO2
Location Shift
RSPM (PM10)
1
2
3
Nutrine Confectionery factory (NCF)
Ist (06.00 - 14.00) 43 108
332nd (14.00 - 22.00) 48 116
3rd (22.00 - 06.00) 37 82
4
Average values of Chittoor townStandard (24 hour Average)
All values are expressed in µg/M3
_2nd (14.00 - 22.00) 43 100
3rd (22.00 - 06.00) 27 67
Rangachari Street,
Santhapeta.
Ist (06.00 - 14.00) 35 101
90
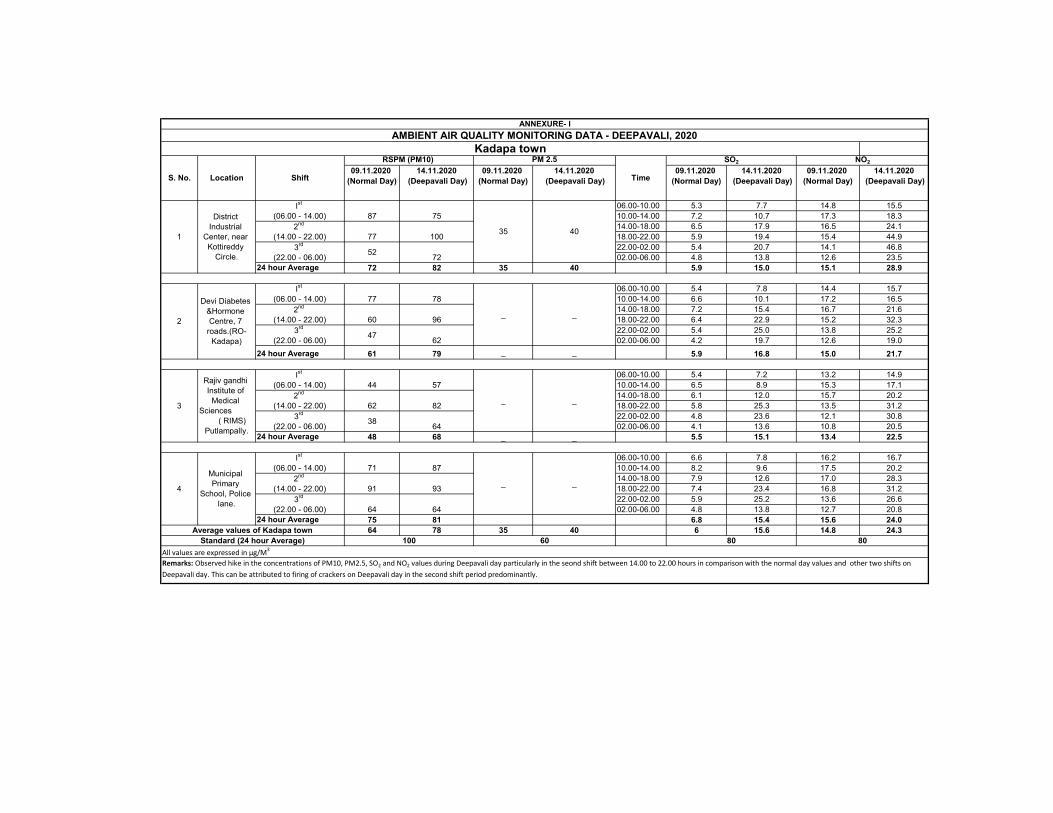
09.11.2020 (Normal Day)
14.11.2020 (Deepavali Day)
09.11.2020 (Normal Day)
14.11.2020 (Deepavali Day)
09.11.2020 (Normal Day)
14.11.2020 (Deepavali Day)
09.11.2020 (Normal Day)
14.11.2020 (Deepavali Day)
06.00-10.00 5.3 7.7 14.8 15.510.00-14.00 7.2 10.7 17.3 18.314.00-18.00 6.5 17.9 16.5 24.118.00-22.00 5.9 19.4 15.4 44.922.00-02.00 5.4 20.7 14.1 46.802.00-06.00 4.8 13.8 12.6 23.5
24 hour Average 72 82 35 40 5.9 15.0 15.1 28.9
06.00-10.00 5.4 7.8 14.4 15.710.00-14.00 6.6 10.1 17.2 16.514.00-18.00 7.2 15.4 16.7 21.618.00-22.00 6.4 22.9 15.2 32.322.00-02.00 5.4 25.0 13.8 25.202.00-06.00 4.2 19.7 12.6 19.0
24 hour Average 61 79 _ _ 5.9 16.8 15.0 21.7
06.00-10.00 5.4 7.2 13.2 14.910.00-14.00 6.5 8.9 15.3 17.114.00-18.00 6.1 12.0 15.7 20.218.00-22.00 5.8 25.3 13.5 31.222.00-02.00 4.8 23.6 12.1 30.802.00-06.00 4.1 13.6 10.8 20.5
24 hour Average 48 68 _ _ 5.5 15.1 13.4 22.5
06.00-10.00 6.6 7.8 16.2 16.710.00-14.00 8.2 9.6 17.5 20.214.00-18.00 7.9 12.6 17.0 28.318.00-22.00 7.4 23.4 16.8 31.222.00-02.00 5.9 25.2 13.6 26.602.00-06.00 4.8 13.8 12.7 20.8
24 hour Average 75 81 6.8 15.4 15.6 24.064 78 35 40 6 15.6 14.8 24.3
All values are expressed in µg/M3
Remarks: Observed hike in the concentrations of PM10, PM2.5, SO2 and NO2 values during Deepavali day particularly in the seond shift between 14.00 to 22.00 hours in comparison with the normal day values and other two shifts on Deepavali day. This can be attributed to firing of crackers on Deepavali day in the second shift period predominantly.
Average values of Kadapa town100 60 80 80Standard (24 hour Average)
_2nd (14.00 - 22.00) 91 93
3rd (22.00 - 06.00) 64 64
_Municipal Primary
School, Police lane.
Ist (06.00 - 14.00) 71 87
_2nd (14.00 - 22.00) 62 82
3rd (22.00 - 06.00) 38 64
_
Rajiv gandhi Institute of
Medical Sciences
( RIMS) Putlampally.
Ist (06.00 - 14.00) 44 57
District Industrial
Center, near Kottireddy
Circle.
Ist (06.00 - 14.00) 87 75
_2nd (14.00 - 22.00) 60 96
3rd (22.00 - 06.00) 47 62
_
78
402nd (14.00 - 22.00) 77
ANNEXURE- IAMBIENT AIR QUALITY MONITORING DATA - DEEPAVALI, 2020
Kadapa townSO2 NO2
Location Shift
RSPM (PM10) PM 2.5
Time
3
4
S. No.
1
2
Devi Diabetes &Hormone Centre, 7
roads.(RO-Kadapa)
Ist (06.00 - 14.00) 77
1003rd
(22.00 - 06.00) 52 72
35
91
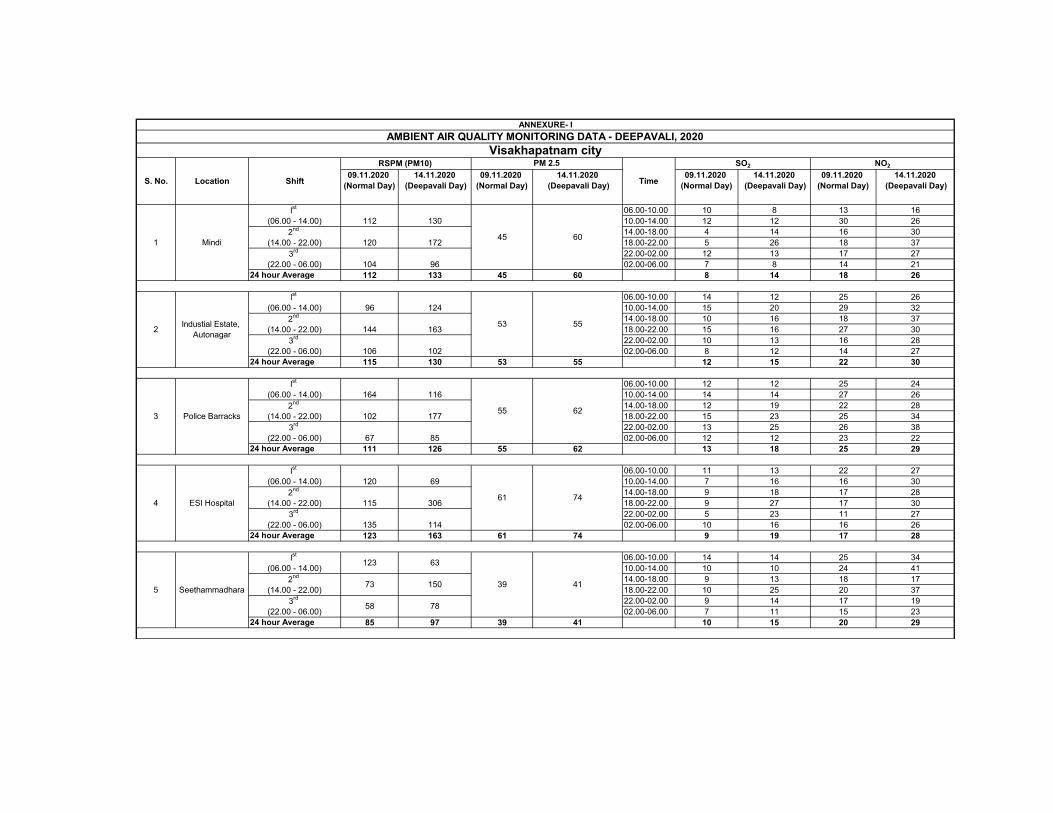
09.11.2020 (Normal Day)
14.11.2020 (Deepavali Day)
09.11.2020 (Normal Day)
14.11.2020 (Deepavali Day)
09.11.2020 (Normal Day)
14.11.2020 (Deepavali Day)
09.11.2020 (Normal Day)
14.11.2020 (Deepavali Day)
06.00-10.00 10 8 13 1610.00-14.00 12 12 30 2614.00-18.00 4 14 16 3018.00-22.00 5 26 18 3722.00-02.00 12 13 17 2702.00-06.00 7 8 14 21
24 hour Average 112 133 45 60 8 14 18 26
06.00-10.00 14 12 25 2610.00-14.00 15 20 29 3214.00-18.00 10 16 18 3718.00-22.00 15 16 27 3022.00-02.00 10 13 16 2802.00-06.00 8 12 14 27
24 hour Average 115 130 53 55 12 15 22 30
06.00-10.00 12 12 25 2410.00-14.00 14 14 27 2614.00-18.00 12 19 22 2818.00-22.00 15 23 25 3422.00-02.00 13 25 26 3802.00-06.00 12 12 23 22
24 hour Average 111 126 55 62 13 18 25 29
06.00-10.00 11 13 22 2710.00-14.00 7 16 16 3014.00-18.00 9 18 17 2818.00-22.00 9 27 17 3022.00-02.00 5 23 11 2702.00-06.00 10 16 16 26
24 hour Average 123 163 61 74 9 19 17 28
06.00-10.00 14 14 25 3410.00-14.00 10 10 24 4114.00-18.00 9 13 18 1718.00-22.00 10 25 20 3722.00-02.00 9 14 17 1902.00-06.00 7 11 15 23
24 hour Average 85 97 39 41 10 15 20 29
73 150
3rd (22.00 - 06.00) 58 78
Seethammadhara
Ist (06.00 - 14.00) 123 63
Industial Estate, Autonagar
Ist (06.00 - 14.00) 96 124
53
622nd (14.00 - 22.00) 102 177
3rd (22.00 - 06.00) 67 85
Police Barracks
Ist (06.00 - 14.00) 164 116
55
Ist (06.00 - 14.00) 112 130
45
552nd (14.00 - 22.00) 144 163
3rd (22.00 - 06.00) 106 102
ANNEXURE- IAMBIENT AIR QUALITY MONITORING DATA - DEEPAVALI, 2020
Visakhapatnam city
S. No.
1
2
3
Location Shift
RSPM (PM10) PM 2.5
Time
SO2 NO2
602nd (14.00 - 22.00) 120 172
3rd (22.00 - 06.00) 104 96
Mindi
4
5
742nd (14.00 - 22.00) 115 306
3rd (22.00 - 06.00) 135 114
ESI Hospital
Ist (06.00 - 14.00) 120 69
61
39 412nd (14.00 - 22.00)
92
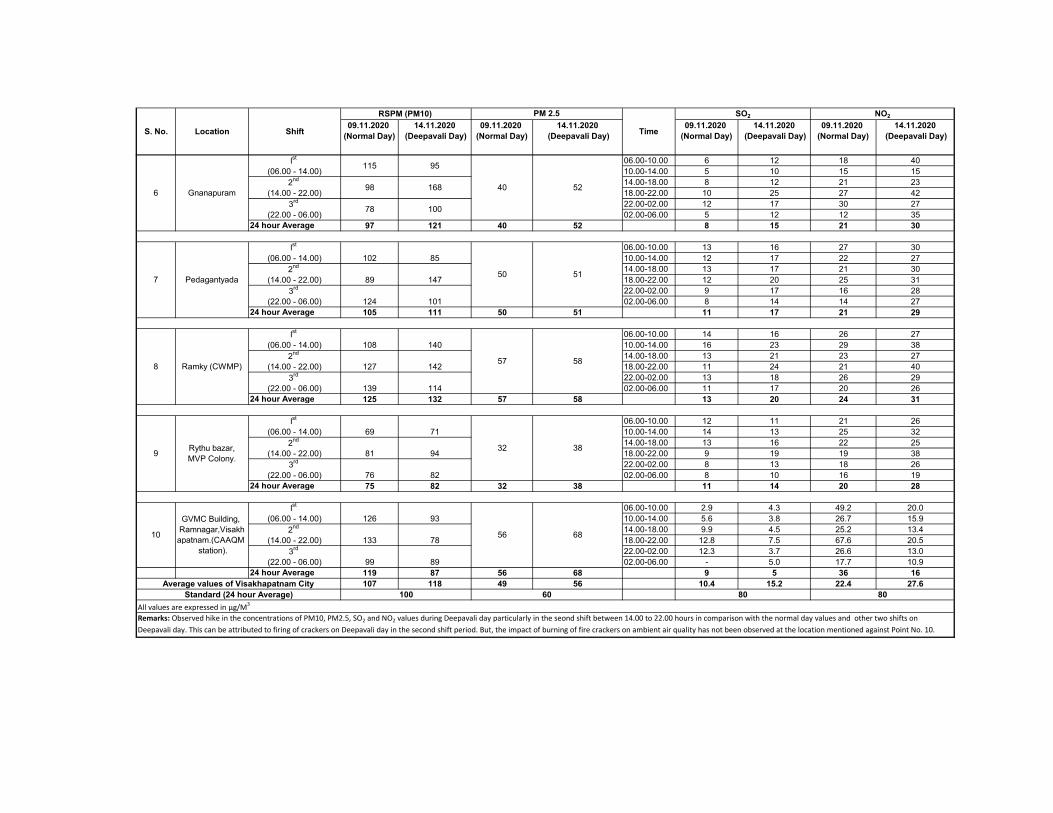
09.11.2020 (Normal Day)
14.11.2020 (Deepavali Day)
09.11.2020 (Normal Day)
14.11.2020 (Deepavali Day)
09.11.2020 (Normal Day)
14.11.2020 (Deepavali Day)
09.11.2020 (Normal Day)
14.11.2020 (Deepavali Day)S. No. Location Shift
RSPM (PM10) PM 2.5
Time
SO2 NO2
06.00-10.00 6 12 18 4010.00-14.00 5 10 15 1514.00-18.00 8 12 21 2318.00-22.00 10 25 27 4222.00-02.00 12 17 30 2702.00-06.00 5 12 12 35
24 hour Average 97 121 40 52 8 15 21 30
06.00-10.00 13 16 27 3010.00-14.00 12 17 22 2714.00-18.00 13 17 21 3018.00-22.00 12 20 25 3122.00-02.00 9 17 16 2802.00-06.00 8 14 14 27
24 hour Average 105 111 50 51 11 17 21 29
06.00-10.00 14 16 26 2710.00-14.00 16 23 29 3814.00-18.00 13 21 23 2718.00-22.00 11 24 21 4022.00-02.00 13 18 26 2902.00-06.00 11 17 20 26
24 hour Average 125 132 57 58 13 20 24 31
06.00-10.00 12 11 21 2610.00-14.00 14 13 25 3214.00-18.00 13 16 22 2518.00-22.00 9 19 19 3822.00-02.00 8 13 18 2602.00-06.00 8 10 16 19
24 hour Average 75 82 32 38 11 14 20 28
06.00-10.00 2.9 4.3 49.2 20.010.00-14.00 5.6 3.8 26.7 15.914.00-18.00 9.9 4.5 25.2 13.418.00-22.00 12.8 7.5 67.6 20.522.00-02.00 12.3 3.7 26.6 13.002.00-06.00 - 5.0 17.7 10.9
24 hour Average 119 87 56 68 9 5 36 16107 118 49 56 10.4 15.2 22.4 27.6
100 60 80 80
382nd (14.00 - 22.00) 81 94
3rd (22.00 - 06.00) 76 82
Ist (06.00 - 14.00) 69 71
32
3rd (22.00 - 06.00) 139 114
Ramky (CWMP)
Ist (06.00 - 14.00) 108 140
512nd (14.00 - 22.00) 89 147
3rd (22.00 - 06.00) 124 101
Pedagantyada
Ist (06.00 - 14.00) 102 85
50
582nd (14.00 - 22.00) 57
522nd (14.00 - 22.00) 98 168
3rd (22.00 - 06.00) 78 100
Gnanapuram
Ist (06.00 - 14.00) 115 95
406
7
Remarks: Observed hike in the concentrations of PM10, PM2.5, SO2 and NO2 values during Deepavali day particularly in the seond shift between 14.00 to 22.00 hours in comparison with the normal day values and other two shifts on Deepavali day. This can be attributed to firing of crackers on Deepavali day in the second shift period. But, the impact of burning of fire crackers on ambient air quality has not been observed at the location mentioned against Point No. 10.
Rythu bazar, MVP Colony.
8
9
10
Average values of Visakhapatnam CityStandard (24 hour Average)
All values are expressed in µg/M3
GVMC Building, Ramnagar,Visakhapatnam.(CAAQM
station).
Ist (06.00 - 14.00) 126 93
56 682nd (14.00 - 22.00) 133 78
3rd (22.00 - 06.00) 99 89
127 142
93
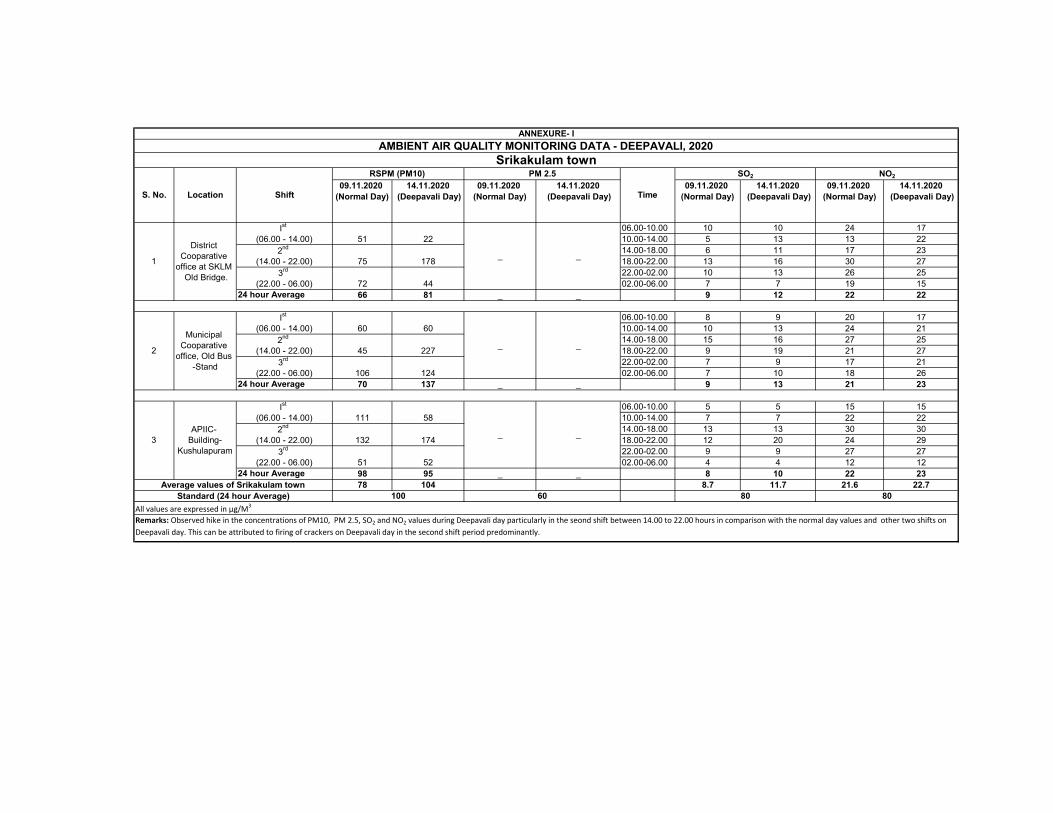
09.11.2020 (Normal Day)
14.11.2020 (Deepavali Day)
09.11.2020 (Normal Day)
14.11.2020 (Deepavali Day)
09.11.2020 (Normal Day)
14.11.2020 (Deepavali Day)
09.11.2020 (Normal Day)
14.11.2020 (Deepavali Day)
06.00-10.00 10 10 24 1710.00-14.00 5 13 13 2214.00-18.00 6 11 17 2318.00-22.00 13 16 30 2722.00-02.00 10 13 26 2502.00-06.00 7 7 19 15
24 hour Average 66 81 _ _ 9 12 22 22
06.00-10.00 8 9 20 1710.00-14.00 10 13 24 2114.00-18.00 15 16 27 2518.00-22.00 9 19 21 2722.00-02.00 7 9 17 2102.00-06.00 7 10 18 26
24 hour Average 70 137 _ _ 9 13 21 23
06.00-10.00 5 5 15 1510.00-14.00 7 7 22 2214.00-18.00 13 13 30 3018.00-22.00 12 20 24 2922.00-02.00 9 9 27 2702.00-06.00 4 4 12 12
24 hour Average 98 95 _ _ 8 10 22 2378 104 8.7 11.7 21.6 22.7
Remarks: Observed hike in the concentrations of PM10, PM 2.5, SO2 and NO2 values during Deepavali day particularly in the seond shift between 14.00 to 22.00 hours in comparison with the normal day values and other two shifts on Deepavali day. This can be attributed to firing of crackers on Deepavali day in the second shift period predominantly.
_ _
_ _
_ _
2nd (14.00 - 22.00) 75 178
3rd (22.00 - 06.00) 72 44
80 8060Standard (24 hour Average)All values are expressed in µg/M3
APIIC- Building-
Kushulapuram
Ist (06.00 - 14.00) 111 58
100
132 1743rd
(22.00 - 06.00) 51 52
ANNEXURE- IAMBIENT AIR QUALITY MONITORING DATA - DEEPAVALI, 2020
Srikakulam town
S. No.
1
District Cooparative
office at SKLM Old Bridge.
Ist (06.00 - 14.00) 51 22
Location Shift
RSPM (PM10)
Time
SO2 NO2PM 2.5
2
3
Average values of Srikakulam town
Municipal Cooparative
office, Old Bus -Stand
Ist (06.00 - 14.00) 60 60
2nd (14.00 - 22.00) 45 227
3rd (22.00 - 06.00) 106 124
2nd (14.00 - 22.00)
94

09.11.2020 (Normal Day)
14.11.2020 (Deepavali Day)
09.11.2020 (Normal Day)
14.11.2020 (Deepavali Day)
09.11.2020 (Normal Day)
14.11.2020 (Deepavali Day)
09.11.2020 (Normal Day)
14.11.2020 (Deepavali Day)
06.00-10.00 7 13 17 2110.00-14.00 10 16 26 2514.00-18.00 9 20 21 2618.00-22.00 16 24 28 3422.00-02.00 13 16 26 2402.00-06.00 6 11 13 22
24 hour Average 70 119 28 60 10 17 22 25
06.00-10.00 6 9 14 1710.00-14.00 12 14 27 2314.00-18.00 13 18 28 2418.00-22.00 11 20 26 3022.00-02.00 10 14 24 2402.00-06.00 7 15 20 25
24 hour Average 66 101 24 48 10 15 23 24
06.00-10.00 7 7 16 1910.00-14.00 5 13 12 2114.00-18.00 9 18 20 2518.00-22.00 7 15 17 2122.00-02.00 11 16 27 2502.00-06.00 9 11 20 22
24 hour Average 83 109 _ _ 8 13 19 2273 110 26 54 9.3 15 21.3 23.7
All values are expressed in µg/M3
Remarks: Observed hike in the concentrations of PM10, PM 2.5, SO2 and NO2 values during Deepavali day particularly in the seond shift between 14.00 to 22.00 hours in comparison with that of the normal day values and other two shifts on Deepavali day. This can be attributed to firing of crackers on Deepavali day in the second shift period predominantly.
APIIC Office,
Industrial Estate, VT Agraharam.
Ist (06.00 - 14.00) 70 120
3rd (22.00 - 06.00) 65 113
281
100 80 80Standard (24 hour Average)
602nd (14.00 - 22.00) 74 123
Location Shift
RSPM (PM10)
60
74 94
Municipal Kaspa High
School , near three
lamp junction.
Ist (06.00 - 14.00) 71 101
2nd (14.00 - 22.00) 53 109
3rd (22.00 - 06.00)
48
Viziangaram Municipal
Office.
Ist (06.00 - 14.00)
ANNEXURE- I
AMBIENT AIR QUALITY MONITORING DATA - DEEPAVALI, 2020 Vizianagaram town
S. No. Time
SO2 NO2PM 2.5
2
3
Average values of ViziangaramTown
58 102
_ _2nd (14.00 - 22.00) 87 113
3rd (22.00 - 06.00) 103 111
24
95
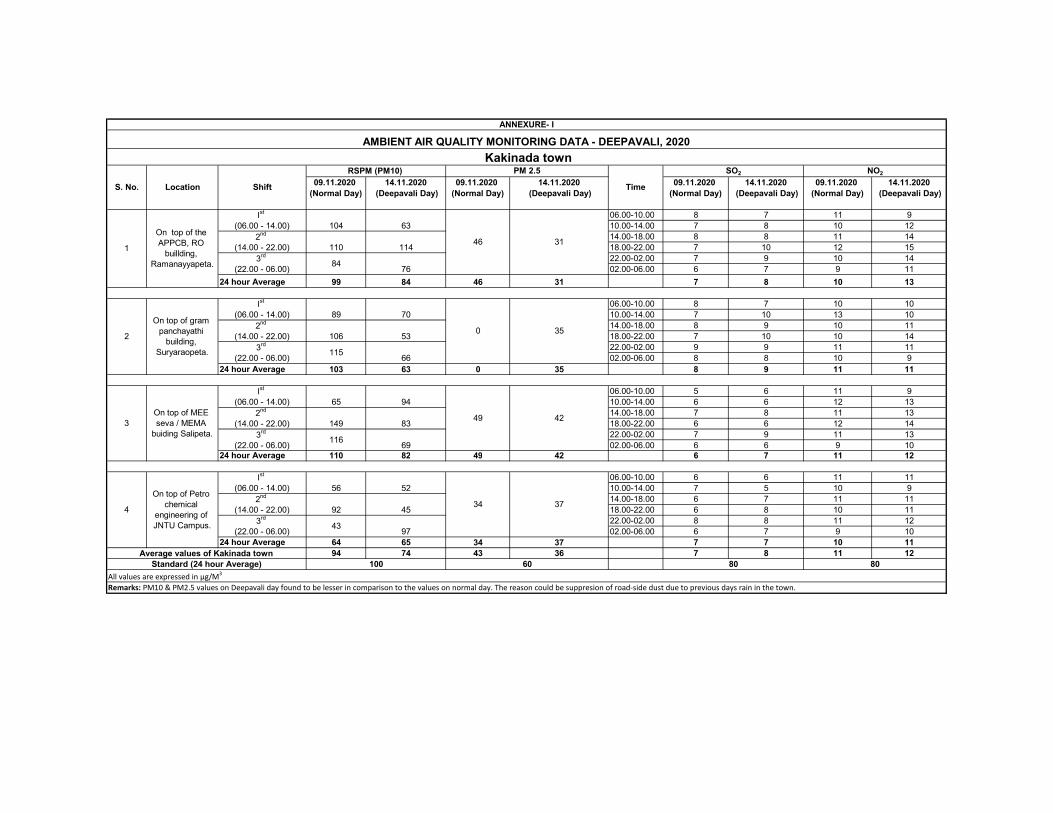
09.11.2020 (Normal Day)
14.11.2020 (Deepavali Day)
09.11.2020 (Normal Day)
14.11.2020 (Deepavali Day)
09.11.2020 (Normal Day)
14.11.2020 (Deepavali Day)
09.11.2020 (Normal Day)
14.11.2020 (Deepavali Day)
06.00-10.00 8 7 11 910.00-14.00 7 8 10 1214.00-18.00 8 8 11 1418.00-22.00 7 10 12 1522.00-02.00 7 9 10 1402.00-06.00 6 7 9 11
24 hour Average 99 84 46 31 7 8 10 13
06.00-10.00 8 7 10 1010.00-14.00 7 10 13 1014.00-18.00 8 9 10 1118.00-22.00 7 10 10 1422.00-02.00 9 9 11 1102.00-06.00 8 8 10 9
24 hour Average 103 63 0 35 8 9 11 11
06.00-10.00 5 6 11 910.00-14.00 6 6 12 1314.00-18.00 7 8 11 1318.00-22.00 6 6 12 1422.00-02.00 7 9 11 1302.00-06.00 6 6 9 10
24 hour Average 110 82 49 42 6 7 11 12
06.00-10.00 6 6 11 1110.00-14.00 7 5 10 914.00-18.00 6 7 11 1118.00-22.00 6 8 10 1122.00-02.00 8 8 11 1202.00-06.00 6 7 9 10
24 hour Average 64 65 34 37 7 7 10 1194 74 43 36 7 8 11 12
Shift
RSPM (PM10) PM 2.5
46 312nd (14.00 - 22.00) 110 114
2
3
352nd (14.00 - 22.00) 106
On top of gram panchayathi
building, Suryaraopeta.
Ist (06.00 - 14.00) 89 70
533rd
(22.00 - 06.00) 115 66
0
100
On top of Petro chemical
engineering of JNTU Campus.
Ist (06.00 - 14.00) 56 52
ANNEXURE- I
AMBIENT AIR QUALITY MONITORING DATA - DEEPAVALI, 2020 Kakinada town
S. No.
13rd
(22.00 - 06.00) 84 76
Time
SO2 NO2
On top of the APPCB, RO
buillding, Ramanayyapeta.
Ist (06.00 - 14.00) 104 63
Location
On top of MEE seva / MEMA
buiding Salipeta.
Ist (06.00 - 14.00) 65 94
422nd (14.00 - 22.00) 149 83
3rd (22.00 - 06.00) 116 69
49
4
Average values of Kakinada townStandard (24 hour Average)
All values are expressed in µg/M3
Remarks: PM10 & PM2.5 values on Deepavali day found to be lesser in comparison to the values on normal day. The reason could be suppresion of road-side dust due to previous days rain in the town.
80 80
34 372nd (14.00 - 22.00) 92 45
3rd (22.00 - 06.00) 43 97
60
96
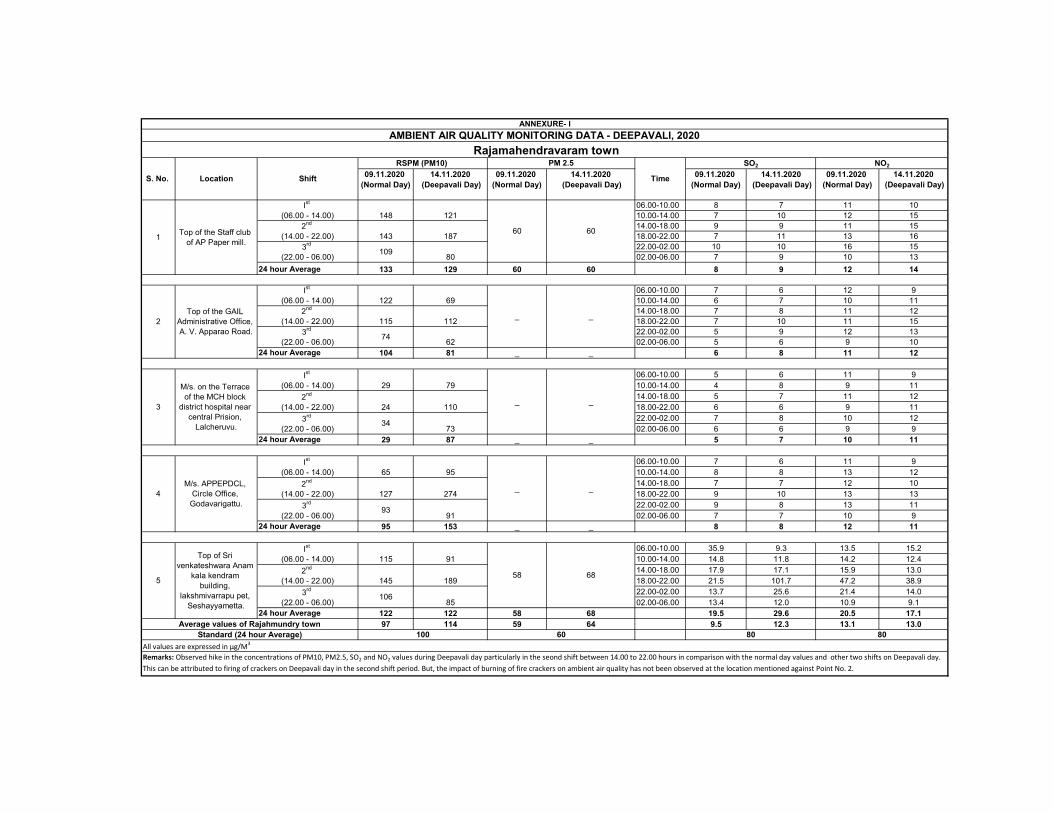
09.11.2020 (Normal Day)
14.11.2020 (Deepavali Day)
09.11.2020 (Normal Day)
14.11.2020 (Deepavali Day)
09.11.2020 (Normal Day)
14.11.2020 (Deepavali Day)
09.11.2020 (Normal Day)
14.11.2020 (Deepavali Day)
06.00-10.00 8 7 11 1010.00-14.00 7 10 12 1514.00-18.00 9 9 11 1518.00-22.00 7 11 13 1622.00-02.00 10 10 16 1502.00-06.00 7 9 10 13
24 hour Average 133 129 60 60 8 9 12 14
06.00-10.00 7 6 12 910.00-14.00 6 7 10 1114.00-18.00 7 8 11 1218.00-22.00 7 10 11 1522.00-02.00 5 9 12 1302.00-06.00 5 6 9 10
24 hour Average 104 81 _ _ 6 8 11 12
06.00-10.00 5 6 11 910.00-14.00 4 8 9 1114.00-18.00 5 7 11 1218.00-22.00 6 6 9 1122.00-02.00 7 8 10 1202.00-06.00 6 6 9 9
24 hour Average 29 87 _ _ 5 7 10 11
06.00-10.00 7 6 11 910.00-14.00 8 8 13 1214.00-18.00 7 7 12 1018.00-22.00 9 10 13 1322.00-02.00 9 8 13 1102.00-06.00 7 7 10 9
24 hour Average 95 153 _ _ 8 8 12 11
06.00-10.00 35.9 9.3 13.5 15.210.00-14.00 14.8 11.8 14.2 12.414.00-18.00 17.9 17.1 15.9 13.018.00-22.00 21.5 101.7 47.2 38.922.00-02.00 13.7 25.6 21.4 14.002.00-06.00 13.4 12.0 10.9 9.1
24 hour Average 122 122 58 68 19.5 29.6 20.5 17.197 114 59 64 9.5 12.3 13.1 13.0
2nd (14.00 - 22.00) 127 274
3rd (22.00 - 06.00)
9391
2nd (14.00 - 22.00) 143 187
_ _2nd (14.00 - 22.00) 24 110
3rd (22.00 - 06.00)
3473
Time
SO2
80 80
_ _
60
NO2
60 60
_ _
2
3
100
Top of the GAIL Administrative Office, A. V. Apparao Road.
Ist (06.00 - 14.00) 122 69
M/s. on the Terrace of the MCH block
district hospital near central Prision,
Lalcheruvu.
Ist (06.00 - 14.00) 29 79
M/s. APPEPDCL, Circle Office,
Godavarigattu.
Ist (06.00 - 14.00) 65 95
Top of Sri venkateshwara Anam
kala kendram building,
lakshmivarrapu pet, Seshayyametta.
Ist (06.00 - 14.00) 115
ANNEXURE- IAMBIENT AIR QUALITY MONITORING DATA - DEEPAVALI, 2020
Rajamahendravaram town
S. No.
1 Top of the Staff club of AP Paper mill.
Ist (06.00 - 14.00) 148 121
3rd (22.00 - 06.00) 109 80
Location Shift
RSPM (PM10) PM 2.5
2nd (14.00 - 22.00) 115 112
3rd (22.00 - 06.00) 74 62
All values are expressed in µg/M3
Remarks: Observed hike in the concentrations of PM10, PM2.5, SO2 and NO2 values during Deepavali day particularly in the seond shift between 14.00 to 22.00 hours in comparison with the normal day values and other two shifts on Deepavali day. This can be attributed to firing of crackers on Deepavali day in the second shift period. But, the impact of burning of fire crackers on ambient air quality has not been observed at the location mentioned against Point No. 2.
4
5
Average values of Rajahmundry townStandard (24 hour Average)
91
58 682nd (14.00 - 22.00) 145 189
3rd (22.00 - 06.00)
10685
97
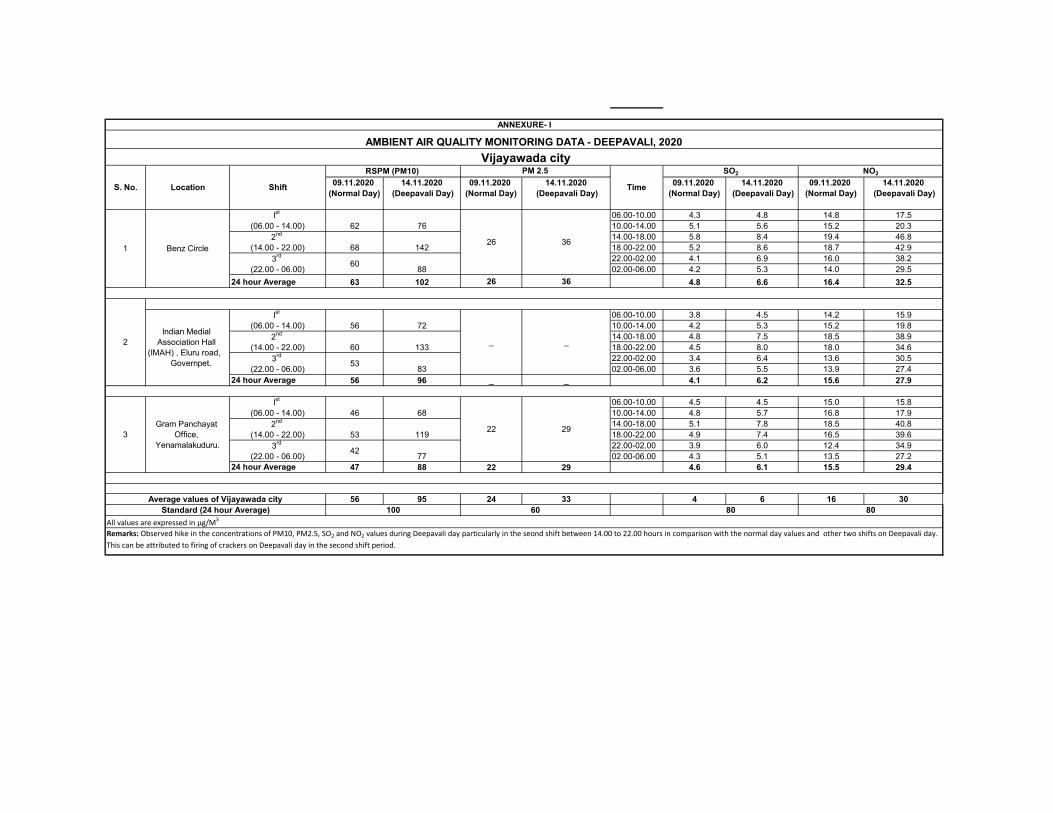
09.11.2020 (Normal Day)
14.11.2020 (Deepavali Day)
09.11.2020 (Normal Day)
14.11.2020 (Deepavali Day)
09.11.2020 (Normal Day)
14.11.2020 (Deepavali Day)
09.11.2020 (Normal Day)
14.11.2020 (Deepavali Day)
06.00-10.00 4.3 4.8 14.8 17.510.00-14.00 5.1 5.6 15.2 20.314.00-18.00 5.8 8.4 19.4 46.818.00-22.00 5.2 8.6 18.7 42.922.00-02.00 4.1 6.9 16.0 38.202.00-06.00 4.2 5.3 14.0 29.5
24 hour Average 63 102 26 36 4.8 6.6 16.4 32.5
06.00-10.00 3.8 4.5 14.2 15.910.00-14.00 4.2 5.3 15.2 19.814.00-18.00 4.8 7.5 18.5 38.918.00-22.00 4.5 8.0 18.0 34.622.00-02.00 3.4 6.4 13.6 30.502.00-06.00 3.6 5.5 13.9 27.4
24 hour Average 56 96 _ _ 4.1 6.2 15.6 27.9
06.00-10.00 4.5 4.5 15.0 15.810.00-14.00 4.8 5.7 16.8 17.914.00-18.00 5.1 7.8 18.5 40.818.00-22.00 4.9 7.4 16.5 39.622.00-02.00 3.9 6.0 12.4 34.902.00-06.00 4.3 5.1 13.5 27.2
24 hour Average 47 88 22 29 4.6 6.1 15.5 29.4
56 95 24 33 4 6 16 30
Indian Medial Association Hall
(IMAH) , Eluru road, Governpet.
__
7256Ist
(06.00 - 14.00)
133602nd
(14.00 - 22.00)
83533rd (22.00 - 06.00)
68
22 292nd (14.00 - 22.00) 53 119
3rd (22.00 - 06.00) 42 77
Benz Circle
Ist (06.00 - 14.00) 62 76
26 362nd (14.00 - 22.00) 68
ANNEXURE- I
AMBIENT AIR QUALITY MONITORING DATA - DEEPAVALI, 2020 Vijayawada city
S. No.
1
Location Shift
RSPM (PM10) PM 2.5
Time
SO2 NO2
1423rd
(22.00 - 06.00) 60 88
All values are expressed in µg/M3
Remarks: Observed hike in the concentrations of PM10, PM2.5, SO2 and NO2 values during Deepavali day particularly in the seond shift between 14.00 to 22.00 hours in comparison with the normal day values and other two shifts on Deepavali day. This can be attributed to firing of crackers on Deepavali day in the second shift period.
2
3
80 8060100Average values of Vijayawada city
Standard (24 hour Average)
Gram Panchayat Office,
Yenamalakuduru.
Ist (06.00 - 14.00) 46
98
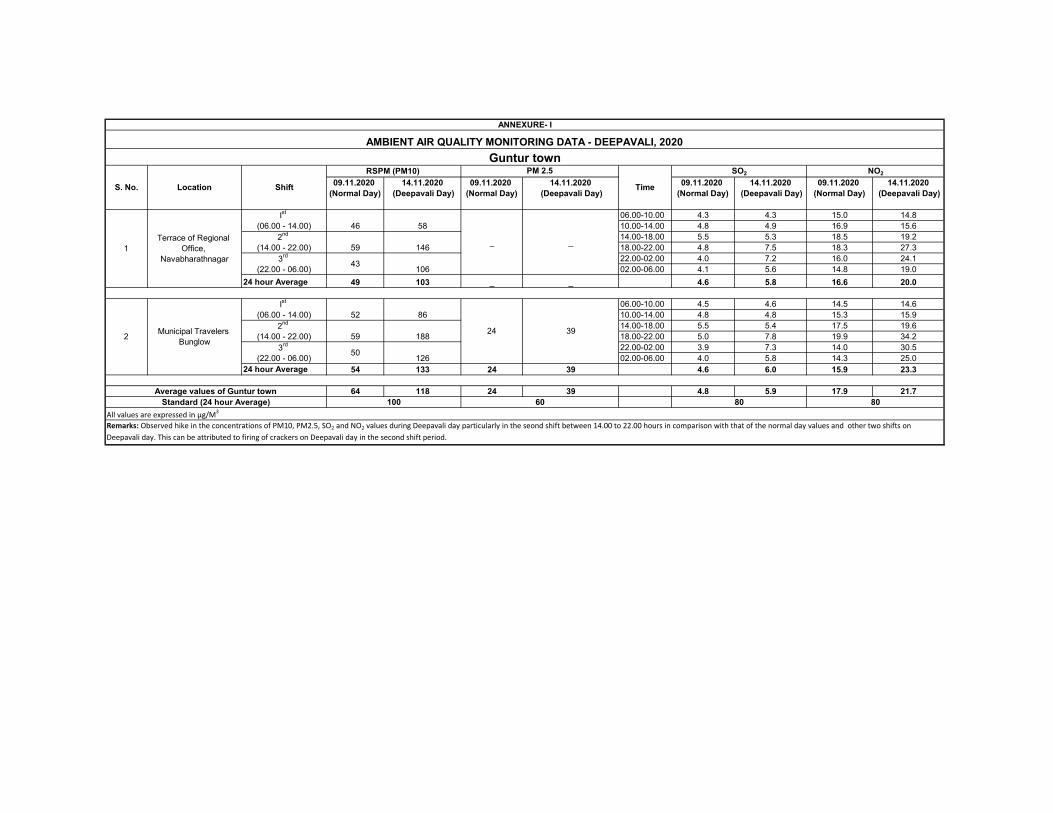
09.11.2020 (Normal Day)
14.11.2020 (Deepavali Day)
09.11.2020 (Normal Day)
14.11.2020 (Deepavali Day)
09.11.2020 (Normal Day)
14.11.2020 (Deepavali Day)
09.11.2020 (Normal Day)
14.11.2020 (Deepavali Day)
06.00-10.00 4.3 4.3 15.0 14.810.00-14.00 4.8 4.9 16.9 15.614.00-18.00 5.5 5.3 18.5 19.218.00-22.00 4.8 7.5 18.3 27.322.00-02.00 4.0 7.2 16.0 24.102.00-06.00 4.1 5.6 14.8 19.0
24 hour Average 49 103 _ _ 4.6 5.8 16.6 20.0
06.00-10.00 4.5 4.6 14.5 14.610.00-14.00 4.8 4.8 15.3 15.914.00-18.00 5.5 5.4 17.5 19.618.00-22.00 5.0 7.8 19.9 34.222.00-02.00 3.9 7.3 14.0 30.502.00-06.00 4.0 5.8 14.3 25.0
24 hour Average 54 133 24 39 4.6 6.0 15.9 23.3
64 118 24 39 4.8 5.9 17.9 21.7
2nd (14.00 - 22.00) 59 146
50 126
60
NO2
_ _
Time
SO2
80 80
24 39
ANNEXURE- I
AMBIENT AIR QUALITY MONITORING DATA - DEEPAVALI, 2020Guntur town
S. No.
1Terrace of Regional
Office, Navabharathnagar
Ist (06.00 - 14.00) 46 58
3rd (22.00 - 06.00) 43 106
Location Shift
RSPM (PM10) PM 2.5
All values are expressed in µg/M3
Remarks: Observed hike in the concentrations of PM10, PM2.5, SO2 and NO2 values during Deepavali day particularly in the seond shift between 14.00 to 22.00 hours in comparison with that of the normal day values and other two shifts on Deepavali day. This can be attributed to firing of crackers on Deepavali day in the second shift period.
2
Average values of Guntur townStandard (24 hour Average) 100
Municipal Travelers Bunglow
Ist (06.00 - 14.00) 52 86
2nd (14.00 - 22.00) 59 188
3rd (22.00 - 06.00)
99
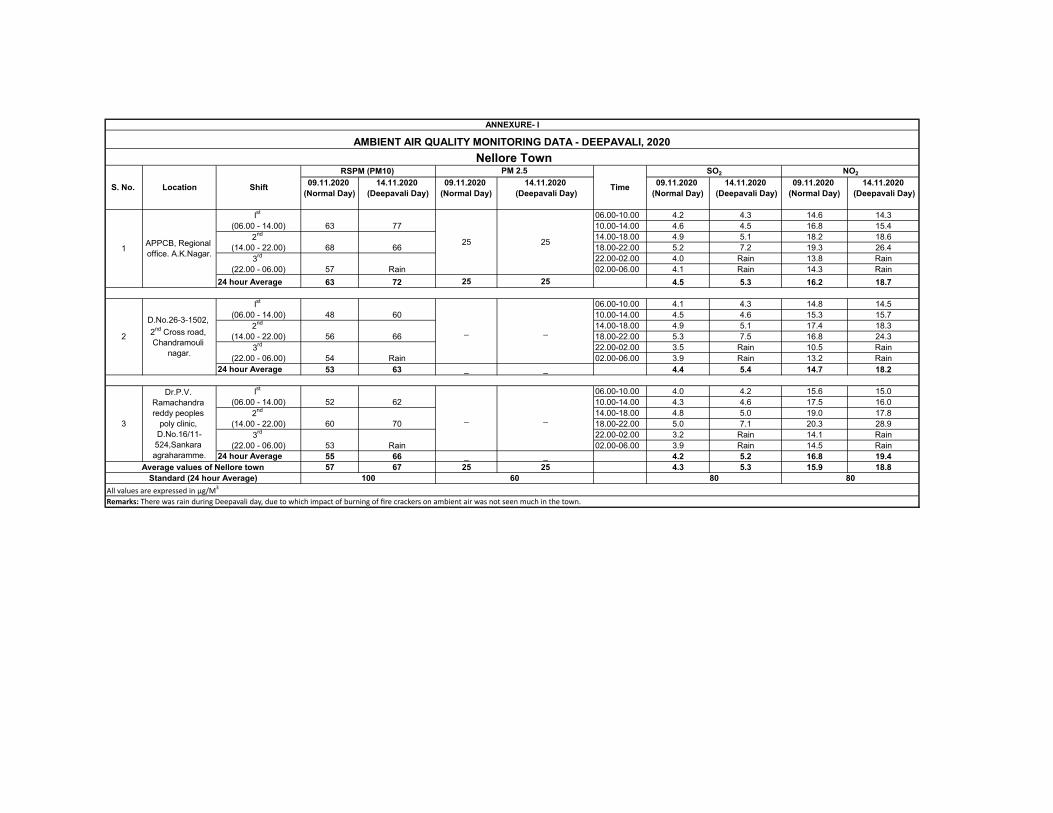
09.11.2020 (Normal Day)
14.11.2020 (Deepavali Day)
09.11.2020 (Normal Day)
14.11.2020 (Deepavali Day)
09.11.2020 (Normal Day)
14.11.2020 (Deepavali Day)
09.11.2020 (Normal Day)
14.11.2020 (Deepavali Day)
06.00-10.00 4.2 4.3 14.6 14.310.00-14.00 4.6 4.5 16.8 15.414.00-18.00 4.9 5.1 18.2 18.618.00-22.00 5.2 7.2 19.3 26.422.00-02.00 4.0 Rain 13.8 Rain02.00-06.00 4.1 Rain 14.3 Rain
24 hour Average 63 72 25 25 4.5 5.3 16.2 18.7
06.00-10.00 4.1 4.3 14.8 14.510.00-14.00 4.5 4.6 15.3 15.714.00-18.00 4.9 5.1 17.4 18.318.00-22.00 5.3 7.5 16.8 24.322.00-02.00 3.5 Rain 10.5 Rain02.00-06.00 3.9 Rain 13.2 Rain
24 hour Average 53 63 _ _ 4.4 5.4 14.7 18.2
06.00-10.00 4.0 4.2 15.6 15.010.00-14.00 4.3 4.6 17.5 16.014.00-18.00 4.8 5.0 19.0 17.818.00-22.00 5.0 7.1 20.3 28.922.00-02.00 3.2 Rain 14.1 Rain02.00-06.00 3.9 Rain 14.5 Rain
24 hour Average 55 66 _ _ 4.2 5.2 16.8 19.457 67 25 25 4.3 5.3 15.9 18.8
2nd (14.00 - 22.00) 68 66
Dr.P.V. Ramachandra reddy peoples
poly clinic, D.No.16/11-524,Sankara agraharamme.
Ist (06.00 - 14.00) 52 62
2nd (14.00 - 22.00) 60 70
3rd (22.00 - 06.00) 53 Rain
2
D.No.26-3-1502, 2nd Cross road, Chandramouli
nagar.
Time
SO2 NO2
25 25
_ _2nd (14.00 - 22.00) 56 66
3rd (22.00 - 06.00) 54 Rain
Ist (06.00 - 14.00) 48 60
ANNEXURE- I
AMBIENT AIR QUALITY MONITORING DATA - DEEPAVALI, 2020 Nellore Town
S. No.
1 APPCB, Regional office. A.K.Nagar.
Ist (06.00 - 14.00) 63 77
3rd (22.00 - 06.00) 57 Rain
Location Shift
RSPM (PM10) PM 2.5
Remarks: There was rain during Deepavali day, due to which impact of burning of fire crackers on ambient air was not seen much in the town.
3
Average values of Nellore townStandard (24 hour Average)
All values are expressed in µg/M380 80100 60
_ _
100
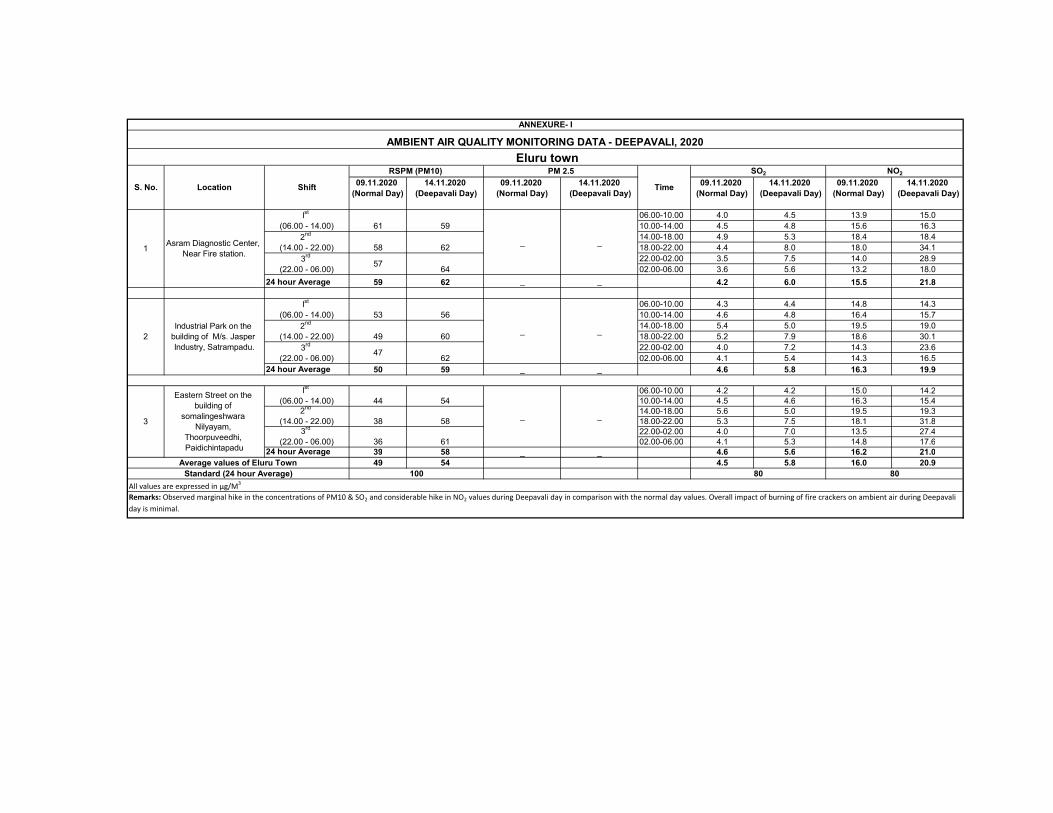
09.11.2020 (Normal Day)
14.11.2020 (Deepavali Day)
09.11.2020 (Normal Day)
14.11.2020 (Deepavali Day)
09.11.2020 (Normal Day)
14.11.2020 (Deepavali Day)
09.11.2020 (Normal Day)
14.11.2020 (Deepavali Day)
06.00-10.00 4.0 4.5 13.9 15.010.00-14.00 4.5 4.8 15.6 16.314.00-18.00 4.9 5.3 18.4 18.418.00-22.00 4.4 8.0 18.0 34.122.00-02.00 3.5 7.5 14.0 28.902.00-06.00 3.6 5.6 13.2 18.0
24 hour Average 59 62 _ _ 4.2 6.0 15.5 21.8
06.00-10.00 4.3 4.4 14.8 14.310.00-14.00 4.6 4.8 16.4 15.714.00-18.00 5.4 5.0 19.5 19.018.00-22.00 5.2 7.9 18.6 30.122.00-02.00 4.0 7.2 14.3 23.602.00-06.00 4.1 5.4 14.3 16.5
24 hour Average 50 59 _ _ 4.6 5.8 16.3 19.9
06.00-10.00 4.2 4.2 15.0 14.210.00-14.00 4.5 4.6 16.3 15.414.00-18.00 5.6 5.0 19.5 19.318.00-22.00 5.3 7.5 18.1 31.822.00-02.00 4.0 7.0 13.5 27.402.00-06.00 4.1 5.3 14.8 17.6
24 hour Average 39 58 _ _ 4.6 5.6 16.2 21.049 54 4.5 5.8 16.0 20.9
Time
SO2 NO2
Asram Diagnostic Center, Near Fire station.
Ist (06.00 - 14.00) 61 59
Location Shift
RSPM (PM10)
2nd (14.00 - 22.00) 58 62
3rd (22.00 - 06.00) 57 64
PM 2.5
_
47 62
_
38
80100
_ _
ANNEXURE- I
AMBIENT AIR QUALITY MONITORING DATA - DEEPAVALI, 2020 Eluru town
S. No.
3rd (22.00 - 06.00) 36 61
_ _
58
Industrial Park on the building of M/s. Jasper Industry, Satrampadu.
Ist (06.00 - 14.00) 53 56
2nd (14.00 - 22.00) 49
Standard (24 hour Average)All values are expressed in µg/M3
Remarks: Observed marginal hike in the concentrations of PM10 & SO2 and considerable hike in NO2 values during Deepavali day in comparison with the normal day values. Overall impact of burning of fire crackers on ambient air during Deepavali day is minimal.
1
2
3
Average values of Eluru Town
603rd
(22.00 - 06.00)
80
Eastern Street on the building of
somalingeshwara Nilyayam,
Thoorpuveedhi, Paidichintapadu
Ist (06.00 - 14.00) 44 54
2nd (14.00 - 22.00)
101
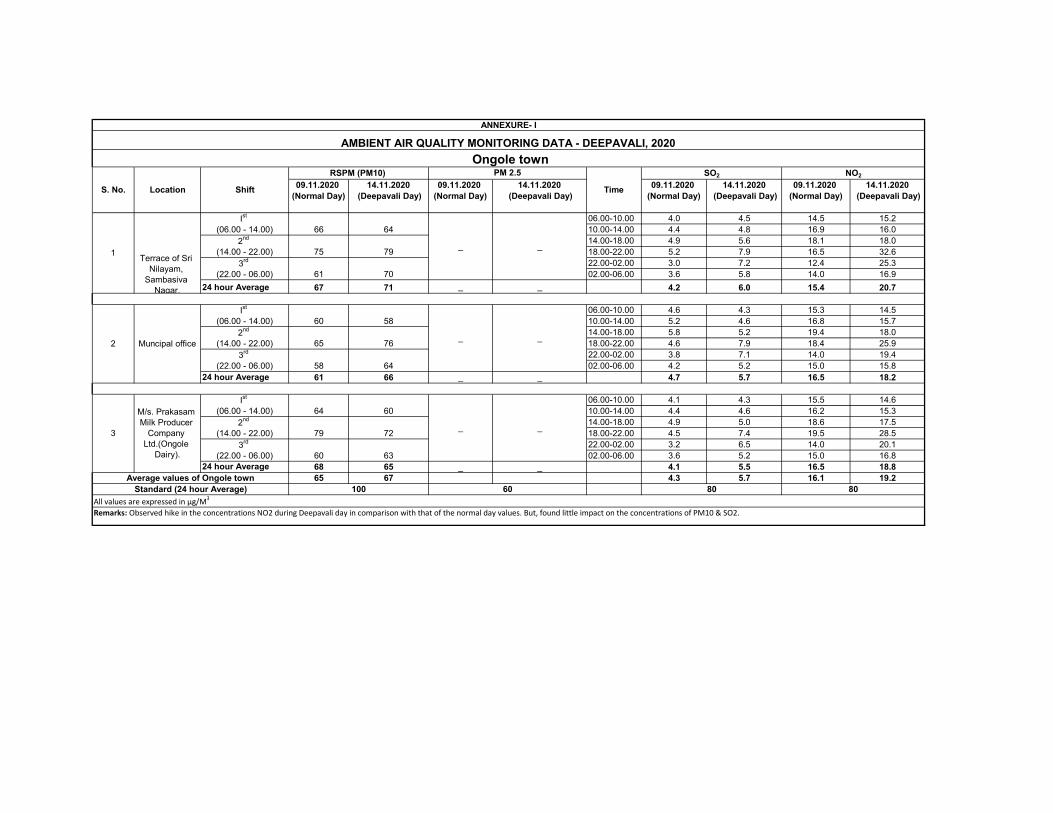
09.11.2020 (Normal Day)
14.11.2020 (Deepavali Day)
09.11.2020 (Normal Day)
14.11.2020 (Deepavali Day)
09.11.2020 (Normal Day)
14.11.2020 (Deepavali Day)
09.11.2020 (Normal Day)
14.11.2020 (Deepavali Day)
06.00-10.00 4.0 4.5 14.5 15.210.00-14.00 4.4 4.8 16.9 16.014.00-18.00 4.9 5.6 18.1 18.018.00-22.00 5.2 7.9 16.5 32.622.00-02.00 3.0 7.2 12.4 25.302.00-06.00 3.6 5.8 14.0 16.9
24 hour Average 67 71 _ _ 4.2 6.0 15.4 20.7
06.00-10.00 4.6 4.3 15.3 14.510.00-14.00 5.2 4.6 16.8 15.714.00-18.00 5.8 5.2 19.4 18.018.00-22.00 4.6 7.9 18.4 25.922.00-02.00 3.8 7.1 14.0 19.402.00-06.00 4.2 5.2 15.0 15.8
24 hour Average 61 66 _ _ 4.7 5.7 16.5 18.2
06.00-10.00 4.1 4.3 15.5 14.610.00-14.00 4.4 4.6 16.2 15.314.00-18.00 4.9 5.0 18.6 17.518.00-22.00 4.5 7.4 19.5 28.522.00-02.00 3.2 6.5 14.0 20.102.00-06.00 3.6 5.2 15.0 16.8
24 hour Average 68 65 _ _ 4.1 5.5 16.5 18.865 67 4.3 5.7 16.1 19.2
100 60 80 80
_ _
_ _2nd (14.00 - 22.00)
Terrace of Sri
Nilayam, Sambasiva
Nagar.
Ist (06.00 - 14.00)
65 763rd
(22.00 - 06.00) 58 64
3rd (22.00 - 06.00)
M/s. Prakasam Milk Producer
Company Ltd.(Ongole
Dairy).
Ist (06.00 - 14.00) 64 60
61 70
Muncipal office
Ist (06.00 - 14.00) 60 58
2nd (14.00 - 22.00) 79 72
3rd (22.00 - 06.00) 60 63
SO2 NO2
ANNEXURE- I
AMBIENT AIR QUALITY MONITORING DATA - DEEPAVALI, 2020 Ongole town
S. No. Location Shift
RSPM (PM10) PM 2.5
Time
Average values of Ongole townStandard (24 hour Average)
All values are expressed in µg/M3
Remarks: Observed hike in the concentrations NO2 during Deepavali day in comparison with that of the normal day values. But, found little impact on the concentrations of PM10 & SO2.
1
2
3
66 64
_ _2nd (14.00 - 22.00) 75 79
102
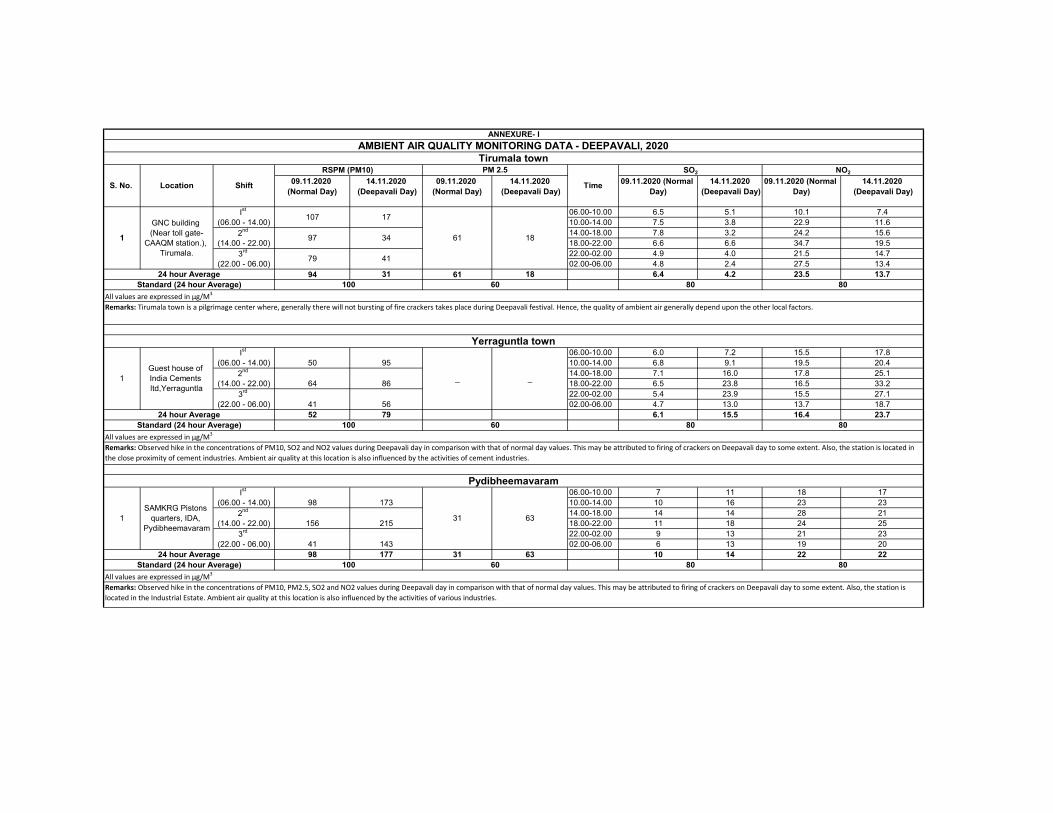
09.11.2020 (Normal Day)
14.11.2020 (Deepavali Day)
09.11.2020 (Normal Day)
14.11.2020 (Deepavali Day)
09.11.2020 (Normal Day)
14.11.2020 (Deepavali Day)
09.11.2020 (Normal Day)
14.11.2020 (Deepavali Day)
06.00-10.00 6.5 5.1 10.1 7.410.00-14.00 7.5 3.8 22.9 11.614.00-18.00 7.8 3.2 24.2 15.618.00-22.00 6.6 6.6 34.7 19.522.00-02.00 4.9 4.0 21.5 14.702.00-06.00 4.8 2.4 27.5 13.4
94 31 61 18 6.4 4.2 23.5 13.7
06.00-10.00 6.0 7.2 15.5 17.810.00-14.00 6.8 9.1 19.5 20.414.00-18.00 7.1 16.0 17.8 25.118.00-22.00 6.5 23.8 16.5 33.222.00-02.00 5.4 23.9 15.5 27.102.00-06.00 4.7 13.0 13.7 18.7
52 79 6.1 15.5 16.4 23.7
06.00-10.00 7 11 18 1710.00-14.00 10 16 23 2314.00-18.00 14 14 28 2118.00-22.00 11 18 24 2522.00-02.00 9 13 21 2302.00-06.00 6 13 19 20
98 177 31 63 10 14 22 2260 80 80
All values are expressed in µg/M3
Remarks: Observed hike in the concentrations of PM10, PM2.5, SO2 and NO2 values during Deepavali day in comparison with that of normal day values. This may be attributed to firing of crackers on Deepavali day to some extent. Also, the station is located in the Industrial Estate. Ambient air quality at this location is also influenced by the activities of various industries.
2153rd
(22.00 - 06.00) 41 14324 hour Average
Standard (24 hour Average) 100
Pydibheemavaram
1SAMKRG Pistons
quarters, IDA, Pydibheemavaram
Ist (06.00 - 14.00) 98 173
31 632nd (14.00 - 22.00) 156
60 80 80All values are expressed in µg/M3
Remarks: Observed hike in the concentrations of PM10, SO2 and NO2 values during Deepavali day in comparison with that of normal day values. This may be attributed to firing of crackers on Deepavali day to some extent. Also, the station is located in the close proximity of cement industries. Ambient air quality at this location is also influenced by the activities of cement industries.
863rd
(22.00 - 06.00) 41 5624 hour Average
Standard (24 hour Average) 100
Yerraguntla town
1Guest house of India Cements ltd,Yerraguntla
Ist (06.00 - 14.00) 50 95
_ _2nd (14.00 - 22.00) 64
60 80 80All values are expressed in µg/M3
Remarks: Tirumala town is a pilgrimage center where, generally there will not bursting of fire crackers takes place during Deepavali festival. Hence, the quality of ambient air generally depend upon the other local factors.
34
3rd (22.00 - 06.00) 79 41
24 hour AverageStandard (24 hour Average) 100
1
GNC building (Near toll gate-
CAAQM station.), Tirumala.
Ist (06.00 - 14.00) 107 17
61 182nd (14.00 - 22.00) 97
ANNEXURE- IAMBIENT AIR QUALITY MONITORING DATA - DEEPAVALI, 2020
Tirumala town
S. No. Location Shift
RSPM (PM10) PM 2.5
Time
SO2 NO2
103
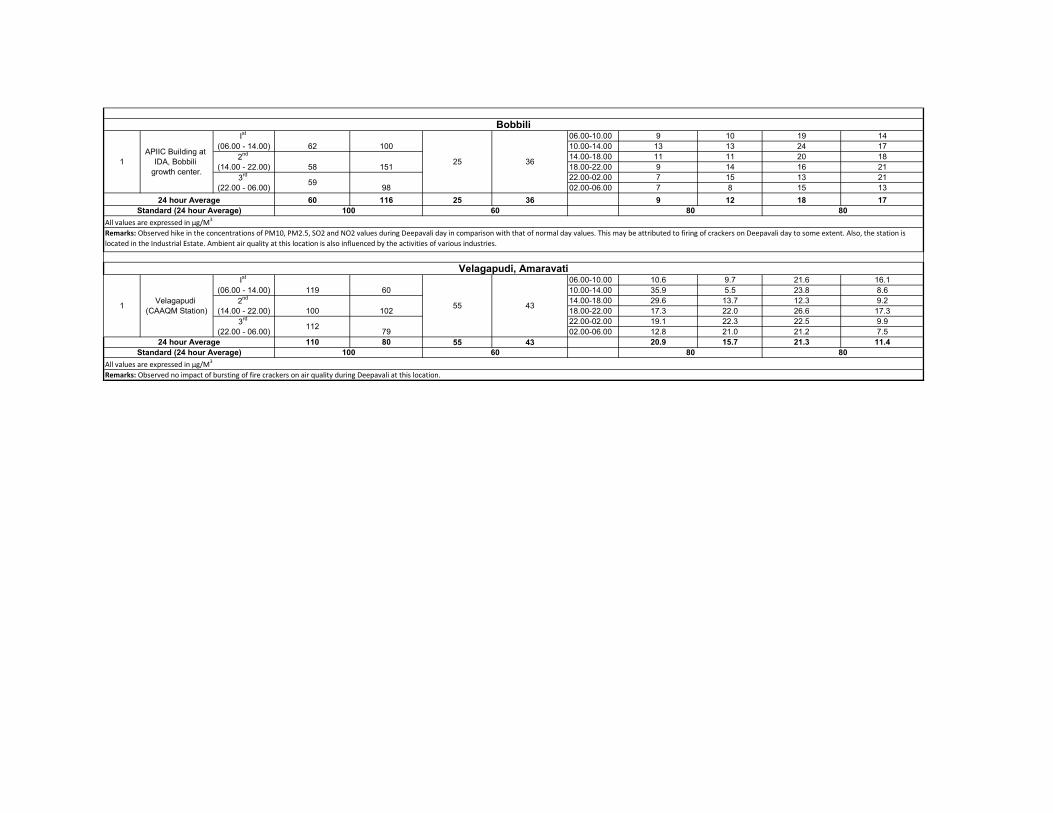
06.00-10.00 9 10 19 1410.00-14.00 13 13 24 1714.00-18.00 11 11 20 1818.00-22.00 9 14 16 2122.00-02.00 7 15 13 2102.00-06.00 7 8 15 13
60 116 25 36 9 12 18 17
06.00-10.00 10.6 9.7 21.6 16.110.00-14.00 35.9 5.5 23.8 8.614.00-18.00 29.6 13.7 12.3 9.218.00-22.00 17.3 22.0 26.6 17.322.00-02.00 19.1 22.3 22.5 9.902.00-06.00 12.8 21.0 21.2 7.5
110 80 55 43 20.9 15.7 21.3 11.460 80 80
All values are expressed in µg/M3
Remarks: Observed no impact of bursting of fire crackers on air quality during Deepavali at this location.
1023rd
(22.00 - 06.00) 112 7924 hour Average
Standard (24 hour Average) 100
Velagapudi, Amaravati
1 Velagapudi (CAAQM Station)
Ist (06.00 - 14.00) 119 60
55 432nd (14.00 - 22.00) 100
60 80 80All values are expressed in µg/M3
Remarks: Observed hike in the concentrations of PM10, PM2.5, SO2 and NO2 values during Deepavali day in comparison with that of normal day values. This may be attributed to firing of crackers on Deepavali day to some extent. Also, the station is located in the Industrial Estate. Ambient air quality at this location is also influenced by the activities of various industries.
1513rd
(22.00 - 06.00) 59 9824 hour Average
Standard (24 hour Average) 100
Bobbili
1APIIC Building at
IDA, Bobbili growth center.
Ist (06.00 - 14.00) 62 100
25 362nd (14.00 - 22.00) 58
104
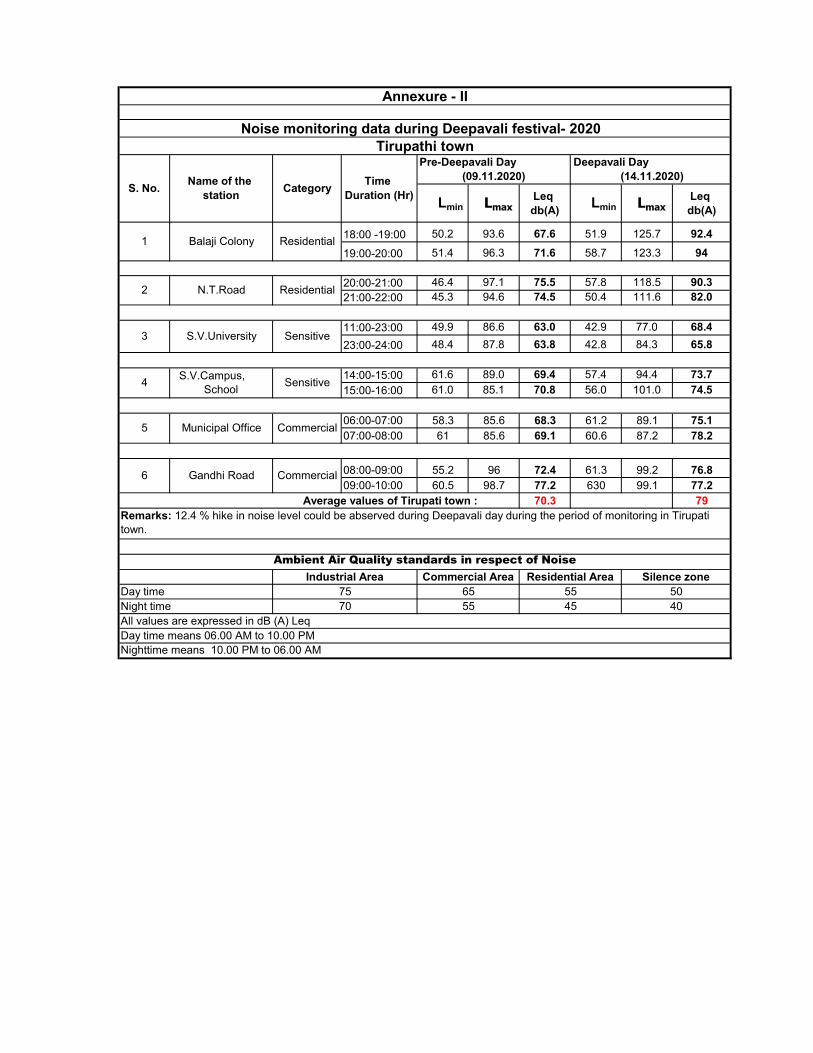
Lmin Lmax Leq
db(A) Lmin Lmax Leq
db(A)
18:00 -19:00 50.2 93.6 67.6 51.9 125.7 92.419:00-20:00 51.4 96.3 71.6 58.7 123.3 94
20:00-21:00 46.4 97.1 75.5 57.8 118.5 90.321:00-22:00 45.3 94.6 74.5 50.4 111.6 82.0
11:00-23:00 49.9 86.6 63.0 42.9 77.0 68.423:00-24:00 48.4 87.8 63.8 42.8 84.3 65.8
14:00-15:00 61.6 89.0 69.4 57.4 94.4 73.715:00-16:00 61.0 85.1 70.8 56.0 101.0 74.5
06:00-07:00 58.3 85.6 68.3 61.2 89.1 75.107:00-08:00 61 85.6 69.1 60.6 87.2 78.2
08:00-09:00 55.2 96 72.4 61.3 99.2 76.809:00-10:00 60.5 98.7 77.2 630 99.1 77.2
70.3 79
Night time
Remarks: 12.4 % hike in noise level could be abserved during Deepavali day during the period of monitoring in Tirupati town.
All values are expressed in dB (A) LeqDay time means 06.00 AM to 10.00 PMNighttime means 10.00 PM to 06.00 AM
Ambient Air Quality standards in respect of Noise
Day time4070
Commercial Area6555
Residential Area55
5
6
Average values of Tirupati town :
Municipal Office Commercial
Gandhi Road Commercial
Noise monitoring data during Deepavali festival- 2020 Tirupathi town
Annexure - II
S. No.
Pre-Deepavali Day (09.11.2020)
Deepavali Day (14.11.2020)Name of the
station Category Time Duration (Hr)
S.V.Campus, School
Balaji Colony
ResidentialN.T.Road
Residential
4 Sensitive
1
2
3 S.V.University Sensitive
45
Silence zoneIndustrial Area75 50
105
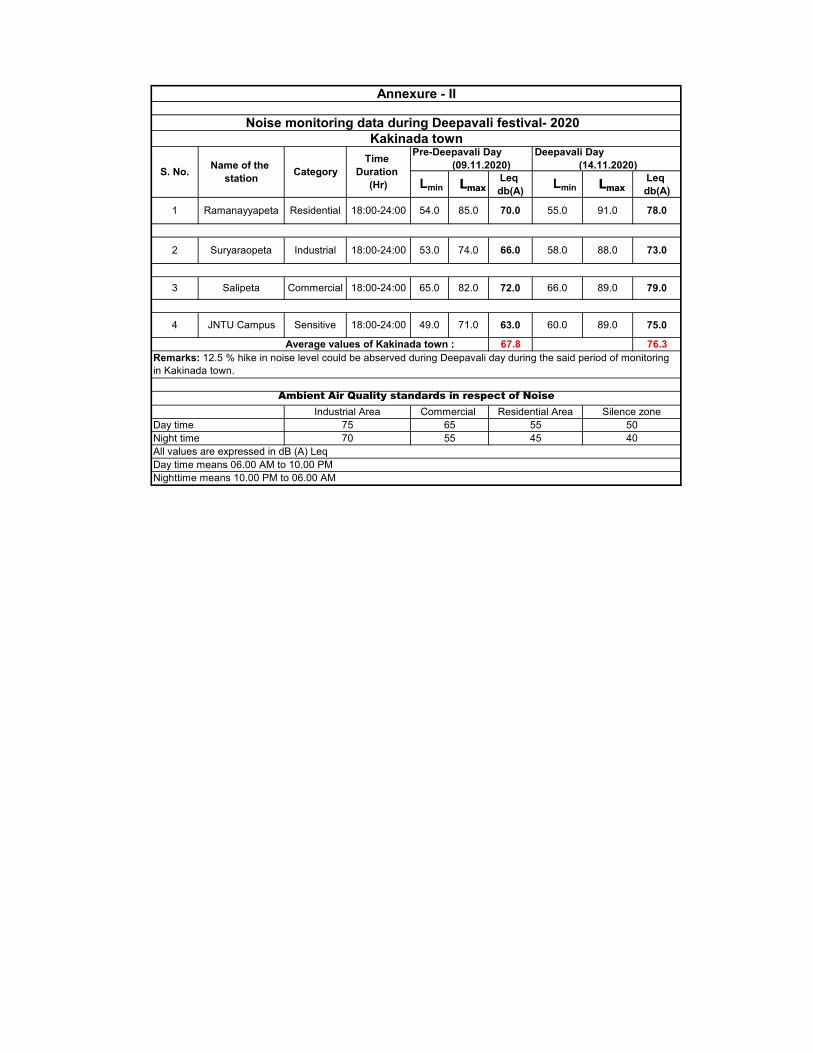
Lmin Lmax Leq
db(A) Lmin Lmax Leq
db(A)
67.8 76.3
All values are expressed in dB (A) LeqDay time means 06.00 AM to 10.00 PMNighttime means 10.00 PM to 06.00 AM
4
Average values of Kakinada town :Remarks: 12.5 % hike in noise level could be abserved during Deepavali day during the said period of monitoring in Kakinada town.
Ambient Air Quality standards in respect of Noise
JNTU Campus Sensitive 18:00-24:00 49.0 71.0 63.0 60.0
89.0 79.0
73.0Suryaraopeta Industrial 18:00-24:00 53.0 74.0
Salipeta Commercial 18:00-24:00 65.0 82.0
Annexure - II
Noise monitoring data during Deepavali festival- 2020 Kakinada town
S. No. Name of the station Category
Time Duration
(Hr)
Pre-Deepavali Day (09.11.2020)
Deepavali Day (14.11.2020)
1
2
3
65 55 50
54.0 85.0
66.0 58.0 88.0
70.0 55.0 91.0
89.0 75.0
72.0 66.0
Day timeNight time
78.0Ramanayyapeta Residential 18:00-24:00
70 55 45 40
Industrial Area Commercial Residential Area Silence zone75
106
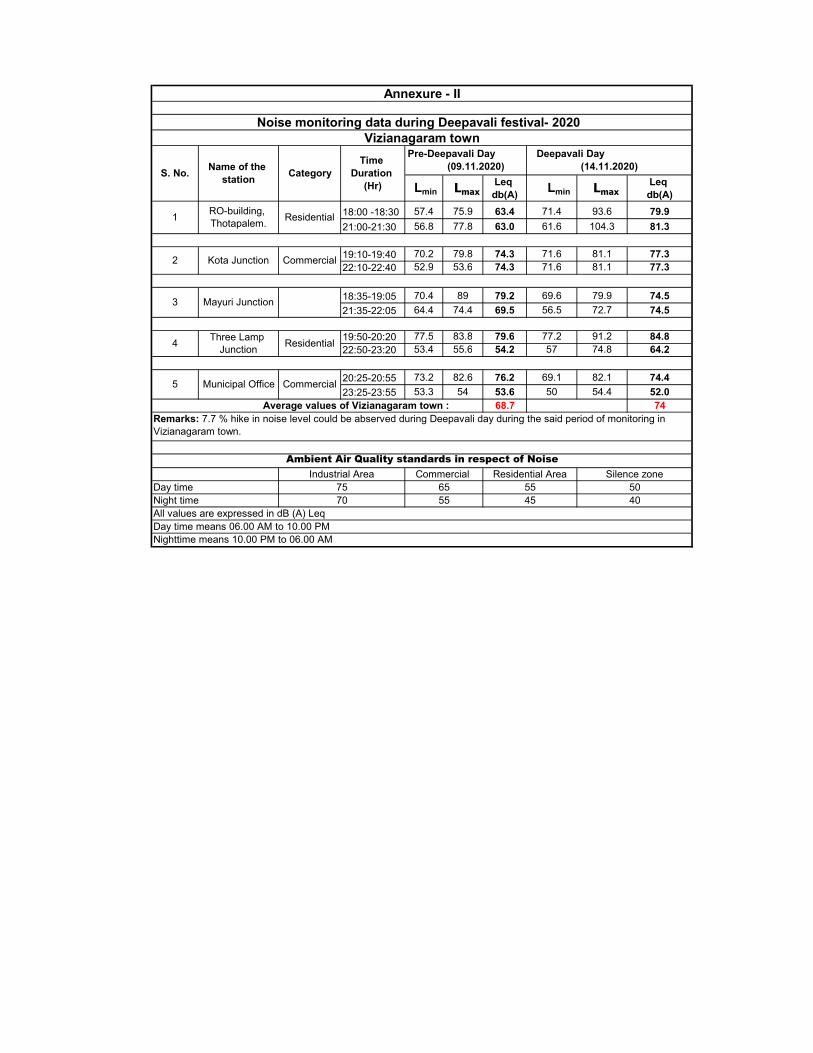
Lmin Lmax Leq
db(A) Lmin Lmax Leq
db(A)18:00 -18:30 57.4 75.9 63.4 71.4 93.6 79.921:00-21:30 56.8 77.8 63.0 61.6 104.3 81.3
19:10-19:40 70.2 79.8 74.3 71.6 81.1 77.322:10-22:40 52.9 53.6 74.3 71.6 81.1 77.3
18:35-19:05 70.4 89 79.2 69.6 79.9 74.521:35-22:05 64.4 74.4 69.5 56.5 72.7 74.5
19:50-20:20 77.5 83.8 79.6 77.2 91.2 84.822:50-23:20 53.4 55.6 54.2 57 74.8 64.2
20:25-20:55 73.2 82.6 76.2 69.1 82.1 74.423:25-23:55 53.3 54 53.6 50 54.4 52.0
68.7 74
Night timeAll values are expressed in dB (A) LeqDay time means 06.00 AM to 10.00 PMNighttime means 10.00 PM to 06.00 AM
5
Average values of Vizianagaram town :Remarks: 7.7 % hike in noise level could be abserved during Deepavali day during the said period of monitoring in Vizianagaram town.
Ambient Air Quality standards in respect of Noise
Municipal Office Commercial
70 55 45 40
1
2
3
RO-building, Thotapalem. Residential
Kota Junction Commercial
Mayuri Junction
Annexure - II
Noise monitoring data during Deepavali festival- 2020 Vizianagaram town
S. No. Name of the station Category
Time Duration
(Hr)
Pre-Deepavali Day (09.11.2020)
Deepavali Day (14.11.2020)
Three Lamp Junction Residential4
Silence zone75 65 55 50Day time
Industrial Area Commercial Residential Area
107
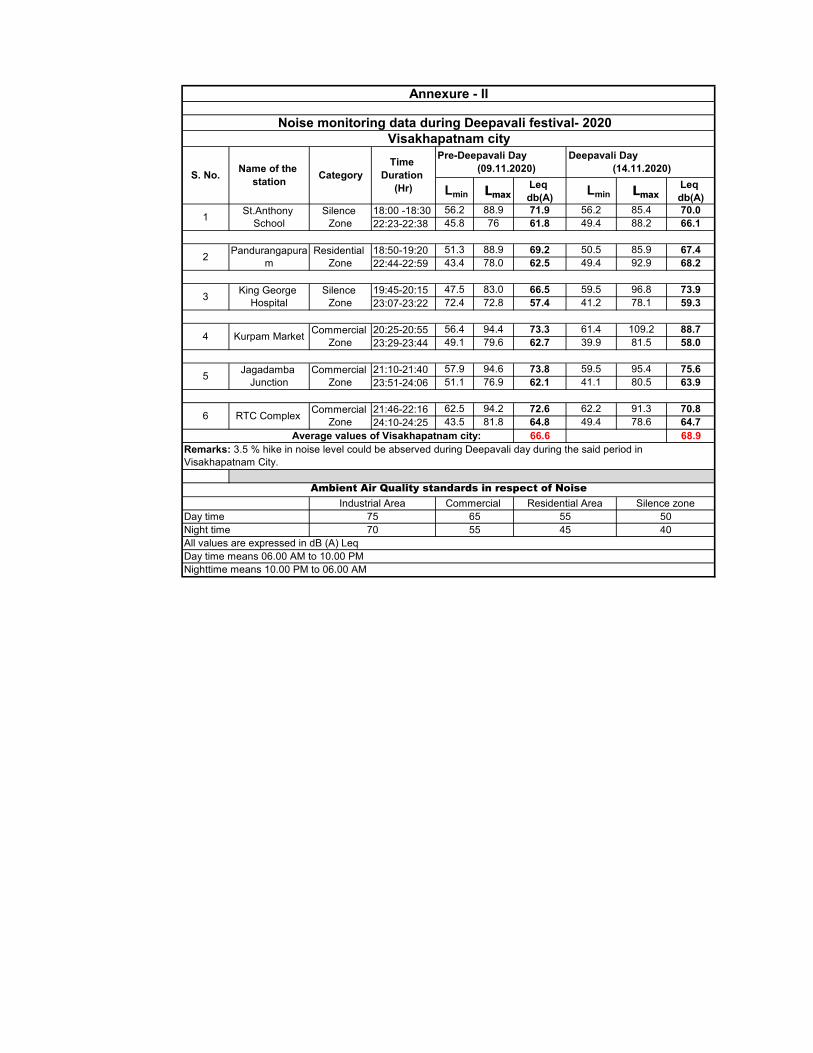
Lmin Lmax Leq
db(A) Lmin Lmax Leq
db(A)18:00 -18:30 56.2 88.9 71.9 56.2 85.4 70.022:23-22:38 45.8 76 61.8 49.4 88.2 66.1
18:50-19:20 51.3 88.9 69.2 50.5 85.9 67.422:44-22:59 43.4 78.0 62.5 49.4 92.9 68.2
19:45-20:15 47.5 83.0 66.5 59.5 96.8 73.923:07-23:22 72.4 72.8 57.4 41.2 78.1 59.3
20:25-20:55 56.4 94.4 73.3 61.4 109.2 88.723:29-23:44 49.1 79.6 62.7 39.9 81.5 58.0
21:10-21:40 57.9 94.6 73.8 59.5 95.4 75.623:51-24:06 51.1 76.9 62.1 41.1 80.5 63.9
21:46-22:16 62.5 94.2 72.6 62.2 91.3 70.824:10-24:25 43.5 81.8 64.8 49.4 78.6 64.7
66.6 68.9
Night timeAll values are expressed in dB (A) LeqDay time means 06.00 AM to 10.00 PMNighttime means 10.00 PM to 06.00 AM
Average values of Visakhapatnam city:Remarks: 3.5 % hike in noise level could be abserved during Deepavali day during the said period in Visakhapatnam City.
Ambient Air Quality standards in respect of Noise
Day time70 55 45 40
Industrial Area Commercial
1
2
3
Annexure - II
Noise monitoring data during Deepavali festival- 2020 Visakhapatnam city
S. No.
Pre-Deepavali Day (09.11.2020)
Deepavali Day (14.11.2020)
Commercial Zone
Jagadamba Junction
Commercial Zone
RTC Complex Commercial Zone6
King George Hospital
Name of the station Category
Time Duration
(Hr)
St.Anthony School
Silence Zone
Pandurangapuram
Residential Zone
Silence Zone
4
5
Kurpam Market
Residential Area Silence zone75 65 55 50
108
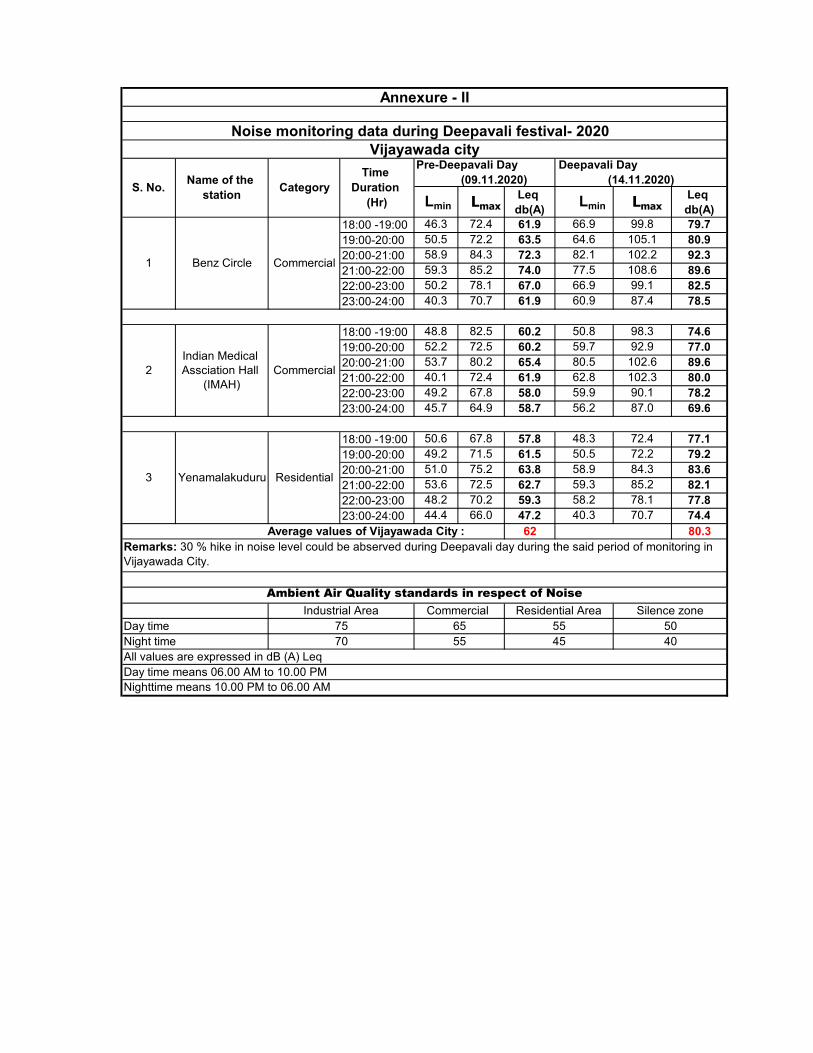
Lmin Lmax Leq
db(A) Lmin Lmax Leq
db(A)18:00 -19:00 46.3 72.4 61.9 66.9 99.8 79.719:00-20:00 50.5 72.2 63.5 64.6 105.1 80.920:00-21:00 58.9 84.3 72.3 82.1 102.2 92.321:00-22:00 59.3 85.2 74.0 77.5 108.6 89.622:00-23:00 50.2 78.1 67.0 66.9 99.1 82.523:00-24:00 40.3 70.7 61.9 60.9 87.4 78.5
18:00 -19:00 48.8 82.5 60.2 50.8 98.3 74.619:00-20:00 52.2 72.5 60.2 59.7 92.9 77.020:00-21:00 53.7 80.2 65.4 80.5 102.6 89.621:00-22:00 40.1 72.4 61.9 62.8 102.3 80.022:00-23:00 49.2 67.8 58.0 59.9 90.1 78.223:00-24:00 45.7 64.9 58.7 56.2 87.0 69.6
18:00 -19:00 50.6 67.8 57.8 48.3 72.4 77.119:00-20:00 49.2 71.5 61.5 50.5 72.2 79.220:00-21:00 51.0 75.2 63.8 58.9 84.3 83.621:00-22:00 53.6 72.5 62.7 59.3 85.2 82.122:00-23:00 48.2 70.2 59.3 58.2 78.1 77.823:00-24:00 44.4 66.0 47.2 40.3 70.7 74.4
62 80.3
Day timeNight timeAll values are expressed in dB (A) LeqDay time means 06.00 AM to 10.00 PMNighttime means 10.00 PM to 06.00 AM
75 65 55 5070 55 45 40
1
2
3
Benz Circle Commercial
Indian Medical Assciation Hall
(IMAH)Commercial
Yenamalakuduru Residential
Annexure - II
Noise monitoring data during Deepavali festival- 2020 Vijayawada city
S. No. Name of the station Category
Time Duration
(Hr)
Pre-Deepavali Day (09.11.2020)
Deepavali Day (14.11.2020)
Industrial Area Commercial Residential Area Silence zone
Average values of Vijayawada City :Remarks: 30 % hike in noise level could be abserved during Deepavali day during the said period of monitoring in Vijayawada City.
Ambient Air Quality standards in respect of Noise
109
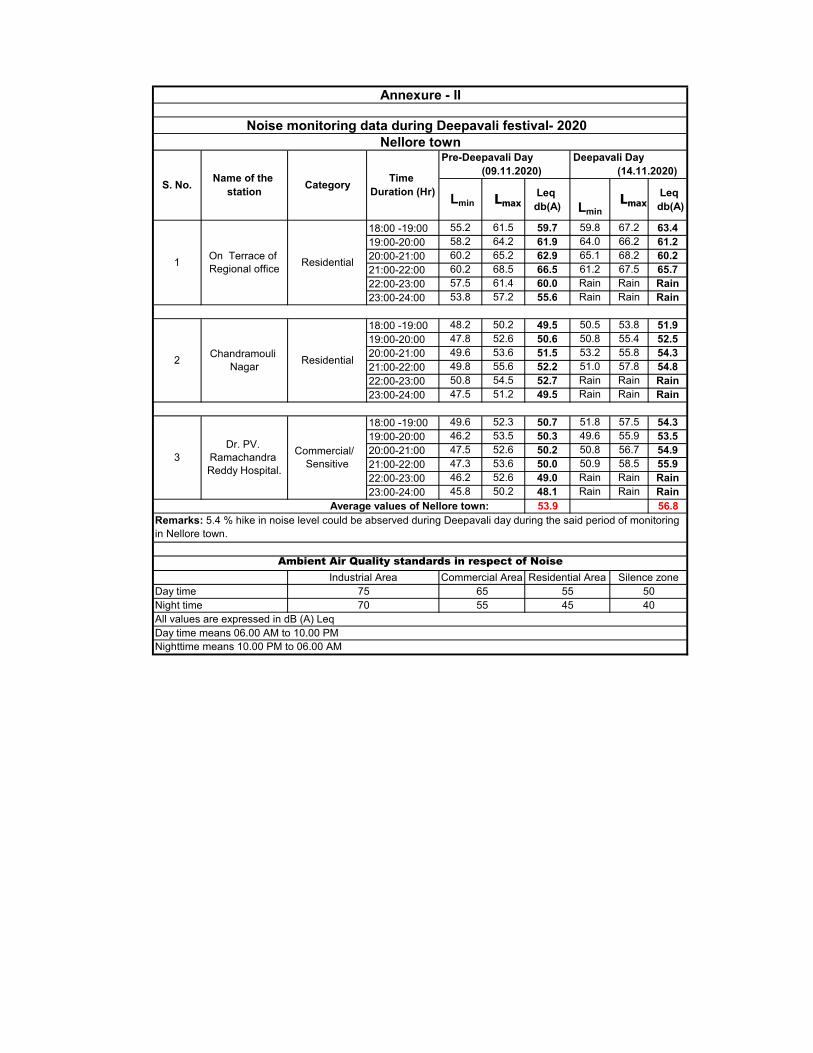
Lmin Lmax Leq
db(A)
Lmin Lmax
Leq db(A)
18:00 -19:00 55.2 61.5 59.7 59.8 67.2 63.419:00-20:00 58.2 64.2 61.9 64.0 66.2 61.220:00-21:00 60.2 65.2 62.9 65.1 68.2 60.221:00-22:00 60.2 68.5 66.5 61.2 67.5 65.722:00-23:00 57.5 61.4 60.0 Rain Rain Rain23:00-24:00 53.8 57.2 55.6 Rain Rain Rain
18:00 -19:00 48.2 50.2 49.5 50.5 53.8 51.919:00-20:00 47.8 52.6 50.6 50.8 55.4 52.520:00-21:00 49.6 53.6 51.5 53.2 55.8 54.321:00-22:00 49.8 55.6 52.2 51.0 57.8 54.822:00-23:00 50.8 54.5 52.7 Rain Rain Rain23:00-24:00 47.5 51.2 49.5 Rain Rain Rain
18:00 -19:00 49.6 52.3 50.7 51.8 57.5 54.319:00-20:00 46.2 53.5 50.3 49.6 55.9 53.520:00-21:00 47.5 52.6 50.2 50.8 56.7 54.921:00-22:00 47.3 53.6 50.0 50.9 58.5 55.922:00-23:00 46.2 52.6 49.0 Rain Rain Rain23:00-24:00 45.8 50.2 48.1 Rain Rain Rain
53.9 56.8
All values are expressed in dB (A) LeqDay time means 06.00 AM to 10.00 PMNighttime means 10.00 PM to 06.00 AM
1
2
3Dr. PV.
Ramachandra Reddy Hospital.
Commercial/ Sensitive
Average values of Nellore town:Remarks: 5.4 % hike in noise level could be abserved during Deepavali day during the said period of monitoring in Nellore town.
On Terrace of Regional office Residential
75 65
Annexure - II
Noise monitoring data during Deepavali festival- 2020 Nellore town
S. No. Name of the station Category Time
Duration (Hr)
Pre-Deepavali Day (09.11.2020)
Deepavali Day (14.11.2020)
55 50
Chandramouli Nagar Residential
70 55
Ambient Air Quality standards in respect of Noise
Day timeNight time 45 40
Industrial Area Commercial Area Residential Area Silence zone
110
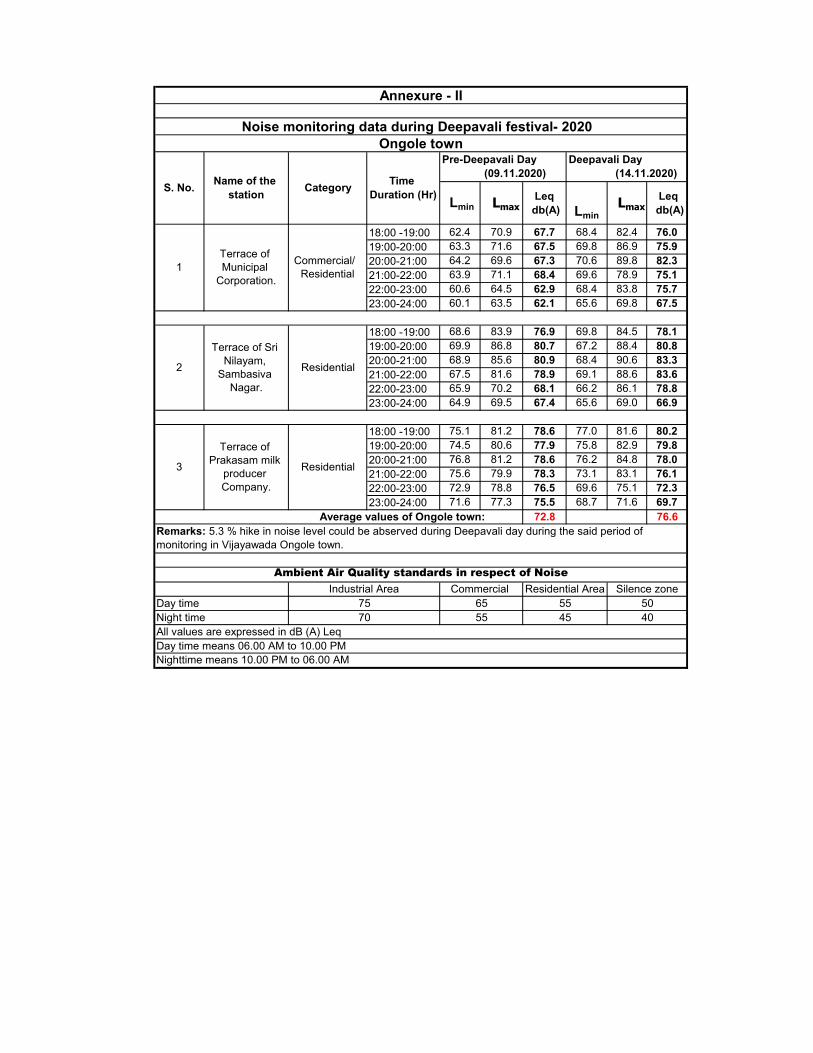
Lmin Lmax Leq db(A)
Lmin
Lmax Leq db(A)
18:00 -19:00 62.4 70.9 67.7 68.4 82.4 76.019:00-20:00 63.3 71.6 67.5 69.8 86.9 75.920:00-21:00 64.2 69.6 67.3 70.6 89.8 82.321:00-22:00 63.9 71.1 68.4 69.6 78.9 75.122:00-23:00 60.6 64.5 62.9 68.4 83.8 75.723:00-24:00 60.1 63.5 62.1 65.6 69.8 67.5
18:00 -19:00 68.6 83.9 76.9 69.8 84.5 78.119:00-20:00 69.9 86.8 80.7 67.2 88.4 80.820:00-21:00 68.9 85.6 80.9 68.4 90.6 83.321:00-22:00 67.5 81.6 78.9 69.1 88.6 83.622:00-23:00 65.9 70.2 68.1 66.2 86.1 78.823:00-24:00 64.9 69.5 67.4 65.6 69.0 66.9
18:00 -19:00 75.1 81.2 78.6 77.0 81.6 80.219:00-20:00 74.5 80.6 77.9 75.8 82.9 79.820:00-21:00 76.8 81.2 78.6 76.2 84.8 78.021:00-22:00 75.6 79.9 78.3 73.1 83.1 76.122:00-23:00 72.9 78.8 76.5 69.6 75.1 72.323:00-24:00 71.6 77.3 75.5 68.7 71.6 69.7
72.8 76.6
Night timeAll values are expressed in dB (A) LeqDay time means 06.00 AM to 10.00 PMNighttime means 10.00 PM to 06.00 AM
Remarks: 5.3 % hike in noise level could be abserved during Deepavali day during the said period of monitoring in Vijayawada Ongole town.
Ambient Air Quality standards in respect of Noise
Day time
1
2
3
Terrace of Municipal
Corporation.
Commercial/ Residential
Terrace of Sri Nilayam,
Sambasiva Nagar.
Residential
Annexure - II
Noise monitoring data during Deepavali festival- 2020 Ongole town
S. No. Name of the station Category Time
Duration (Hr)
Pre-Deepavali Day (09.11.2020)
Deepavali Day (14.11.2020)
Terrace of Prakasam milk
producer Company.
Residential
Average values of Ongole town:
70 55 45 40
Industrial Area Commercial Residential Area Silence zone75 65 55 50
111
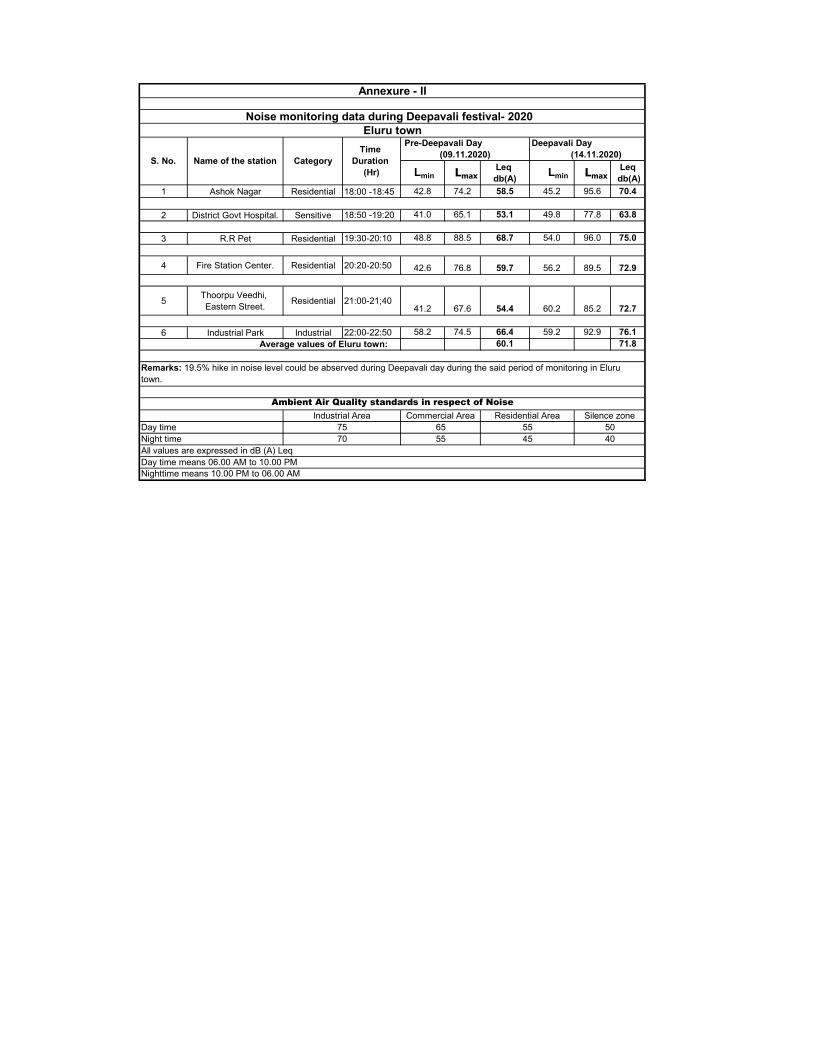
Lmin Lmax Leq
db(A) Lmin Lmax Leq db(A)
1 Ashok Nagar Residential 18:00 -18:45 42.8 74.2 58.5 45.2 95.6 70.4
2 District Govt Hospital. Sensitive 18:50 -19:20 41.0 65.1 53.1 49.8 77.8 63.8
3 R.R Pet Residential 19:30-20:10 48.8 88.5 68.7 54.0 96.0 75.0
4 Fire Station Center. Residential 20:20-20:50 42.6 76.8 59.7 56.2 89.5 72.9
5 Thoorpu Veedhi, Eastern Street. Residential 21:00-21;40
41.2 67.6 54.4 60.2 85.2 72.7
6 Industrial Park Industrial 22:00-22:50 58.2 74.5 66.4 59.2 92.9 76.160.1 71.8
All values are expressed in dB (A) LeqDay time means 06.00 AM to 10.00 PMNighttime means 10.00 PM to 06.00 AM
Average values of Eluru town:
Remarks: 19.5% hike in noise level could be abserved during Deepavali day during the said period of monitoring in Eluru town.
Day timeNight time
Annexure - II
Noise monitoring data during Deepavali festival- 2020 Eluru town
S. No. Name of the station CategoryTime
Duration (Hr)
Pre-Deepavali Day (09.11.2020)
Deepavali Day (14.11.2020)
70 55 45 40
Industrial Area Commercial Area Residential Area Silence zone75 65 55 50
Ambient Air Quality standards in respect of Noise
112
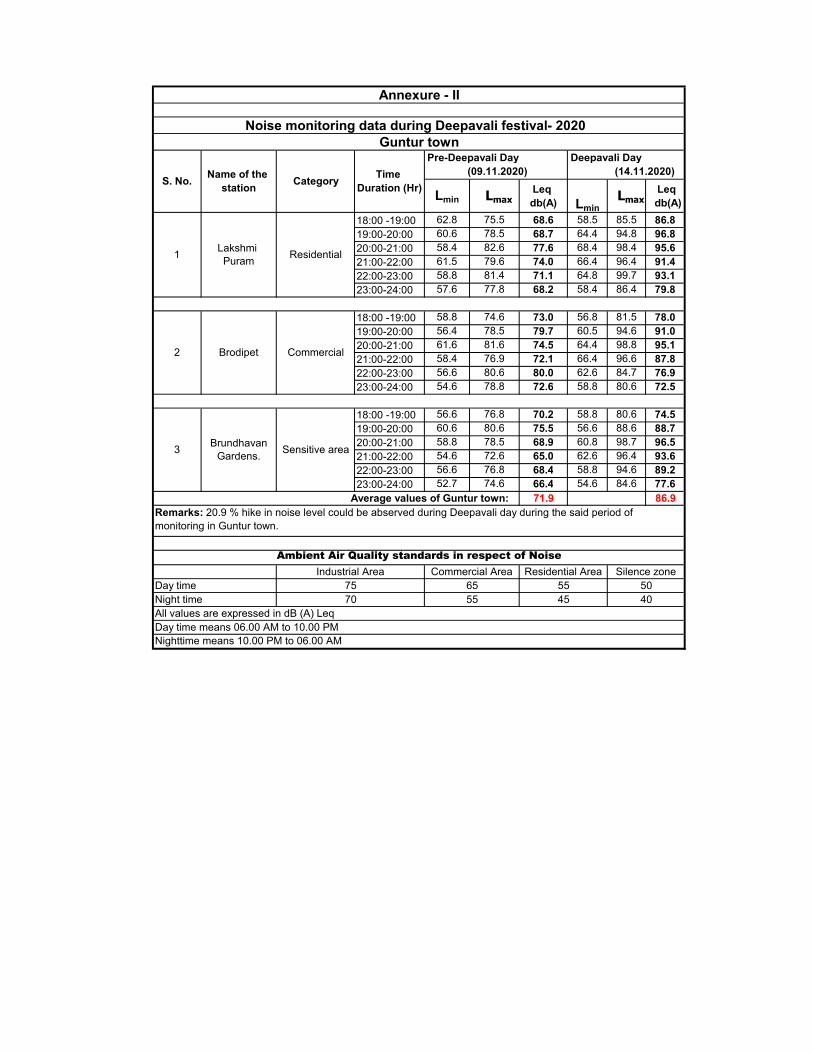
Lmin Lmax Leq
db(A)
Lmin Lmax
Leq db(A)
18:00 -19:00 62.8 75.5 68.6 58.5 85.5 86.819:00-20:00 60.6 78.5 68.7 64.4 94.8 96.820:00-21:00 58.4 82.6 77.6 68.4 98.4 95.621:00-22:00 61.5 79.6 74.0 66.4 96.4 91.422:00-23:00 58.8 81.4 71.1 64.8 99.7 93.123:00-24:00 57.6 77.8 68.2 58.4 86.4 79.8
18:00 -19:00 58.8 74.6 73.0 56.8 81.5 78.019:00-20:00 56.4 78.5 79.7 60.5 94.6 91.020:00-21:00 61.6 81.6 74.5 64.4 98.8 95.121:00-22:00 58.4 76.9 72.1 66.4 96.6 87.822:00-23:00 56.6 80.6 80.0 62.6 84.7 76.923:00-24:00 54.6 78.8 72.6 58.8 80.6 72.5
18:00 -19:00 56.6 76.8 70.2 58.8 80.6 74.519:00-20:00 60.6 80.6 75.5 56.6 88.6 88.720:00-21:00 58.8 78.5 68.9 60.8 98.7 96.521:00-22:00 54.6 72.6 65.0 62.6 96.4 93.622:00-23:00 56.6 76.8 68.4 58.8 94.6 89.223:00-24:00 52.7 74.6 66.4 54.6 84.6 77.6
71.9 86.9
Night timeAll values are expressed in dB (A) LeqDay time means 06.00 AM to 10.00 PMNighttime means 10.00 PM to 06.00 AM
1
2
3
Lakshmi Puram Residential
Brodipet Commercial
Brundhavan Gardens. Sensitive area
Annexure - II
Noise monitoring data during Deepavali festival- 2020 Guntur town
S. No. Name of the station Category Time
Duration (Hr)
Pre-Deepavali Day (09.11.2020)
Deepavali Day (14.11.2020)
70 55 45 40
Industrial Area Commercial Area Residential Area Silence zone75 65 55 50Day time
Average values of Guntur town:Remarks: 20.9 % hike in noise level could be abserved during Deepavali day during the said period of monitoring in Guntur town.
Ambient Air Quality standards in respect of Noise
113
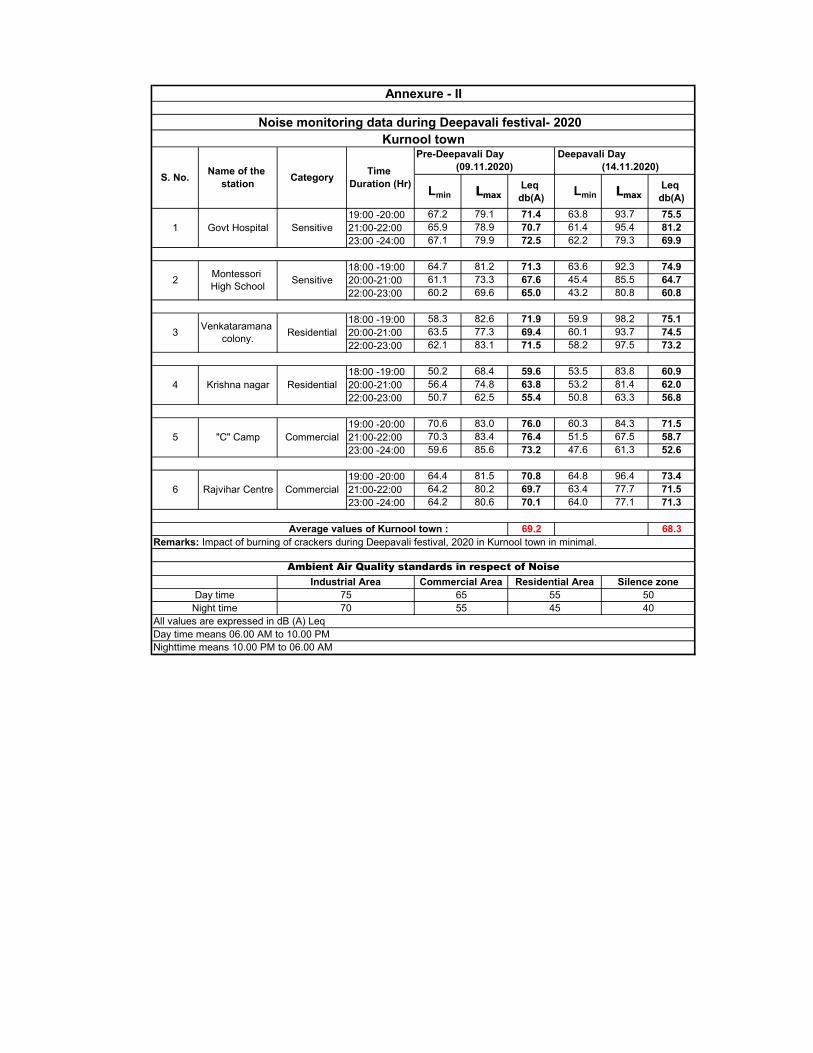
Lmin Lmax Leq
db(A) Lmin Lmax Leq
db(A)19:00 -20:00 67.2 79.1 71.4 63.8 93.7 75.521:00-22:00 65.9 78.9 70.7 61.4 95.4 81.223:00 -24:00 67.1 79.9 72.5 62.2 79.3 69.9
18:00 -19:00 64.7 81.2 71.3 63.6 92.3 74.920:00-21:00 61.1 73.3 67.6 45.4 85.5 64.722:00-23:00 60.2 69.6 65.0 43.2 80.8 60.8
18:00 -19:00 58.3 82.6 71.9 59.9 98.2 75.120:00-21:00 63.5 77.3 69.4 60.1 93.7 74.522:00-23:00 62.1 83.1 71.5 58.2 97.5 73.2
18:00 -19:00 50.2 68.4 59.6 53.5 83.8 60.920:00-21:00 56.4 74.8 63.8 53.2 81.4 62.022:00-23:00 50.7 62.5 55.4 50.8 63.3 56.8
19:00 -20:00 70.6 83.0 76.0 60.3 84.3 71.521:00-22:00 70.3 83.4 76.4 51.5 67.5 58.723:00 -24:00 59.6 85.6 73.2 47.6 61.3 52.6
19:00 -20:00 64.4 81.5 70.8 64.8 96.4 73.421:00-22:00 64.2 80.2 69.7 63.4 77.7 71.523:00 -24:00 64.2 80.6 70.1 64.0 77.1 71.3
69.2 68.3
All values are expressed in dB (A) LeqDay time means 06.00 AM to 10.00 PMNighttime means 10.00 PM to 06.00 AM
Average values of Kurnool town :Remarks: Impact of burning of crackers during Deepavali festival, 2020 in Kurnool town in minimal.
Day timeNight time 70 55 45 40
Industrial Area Commercial Area Residential Area Silence zone
6
Ambient Air Quality standards in respect of Noise
4
5
Rajvihar Centre Commercial
Annexure - II
Noise monitoring data during Deepavali festival- 2020
S. No.
1
Kurnool town
Name of the station Category Time
Duration (Hr)
Pre-Deepavali Day (09.11.2020)
Deepavali Day (14.11.2020)
Govt Hospital Sensitive
75 65 55 50
2
3
"C" Camp Commercial
Montessori High School Sensitive
Venkataramana colony. Residential
Krishna nagar Residential
114
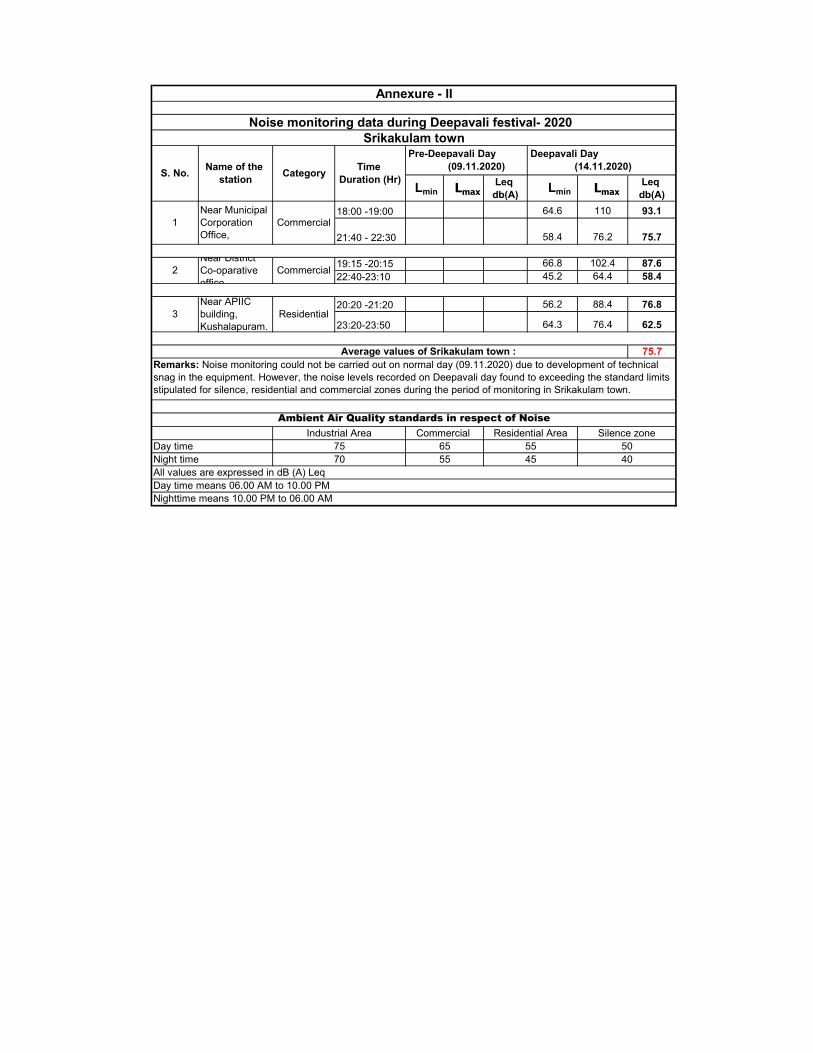
Lmin Lmax Leq
db(A) Lmin Lmax Leq
db(A)18:00 -19:00 64.6 110 93.1
21:40 - 22:30 58.4 76.2 75.7
19:15 -20:15 66.8 102.4 87.622:40-23:10 45.2 64.4 58.4
20:20 -21:20 56.2 88.4 76.8
23:20-23:50 64.3 76.4 62.5
75.7
All values are expressed in dB (A) LeqDay time means 06.00 AM to 10.00 PMNighttime means 10.00 PM to 06.00 AM
1
2
3
70 55 45 40
Industrial Area Commercial Day time
Annexure - II
Noise monitoring data during Deepavali festival- 2020 Srikakulam town
S. No. Name of the station Category Time
Duration (Hr)
Pre-Deepavali Day (09.11.2020)
Deepavali Day (14.11.2020)
Near Municipal Corporation Office,
Commercial
Night time75 65
Average values of Srikakulam town :Remarks: Noise monitoring could not be carried out on normal day (09.11.2020) due to development of technical snag in the equipment. However, the noise levels recorded on Deepavali day found to exceeding the standard limits stipulated for silence, residential and commercial zones during the period of monitoring in Srikakulam town.
Near APIIC building, Kushalapuram.
Residential
Near District Co-oparative office.
Commercial
55 50Residential Area Silence zone
Ambient Air Quality standards in respect of Noise
115
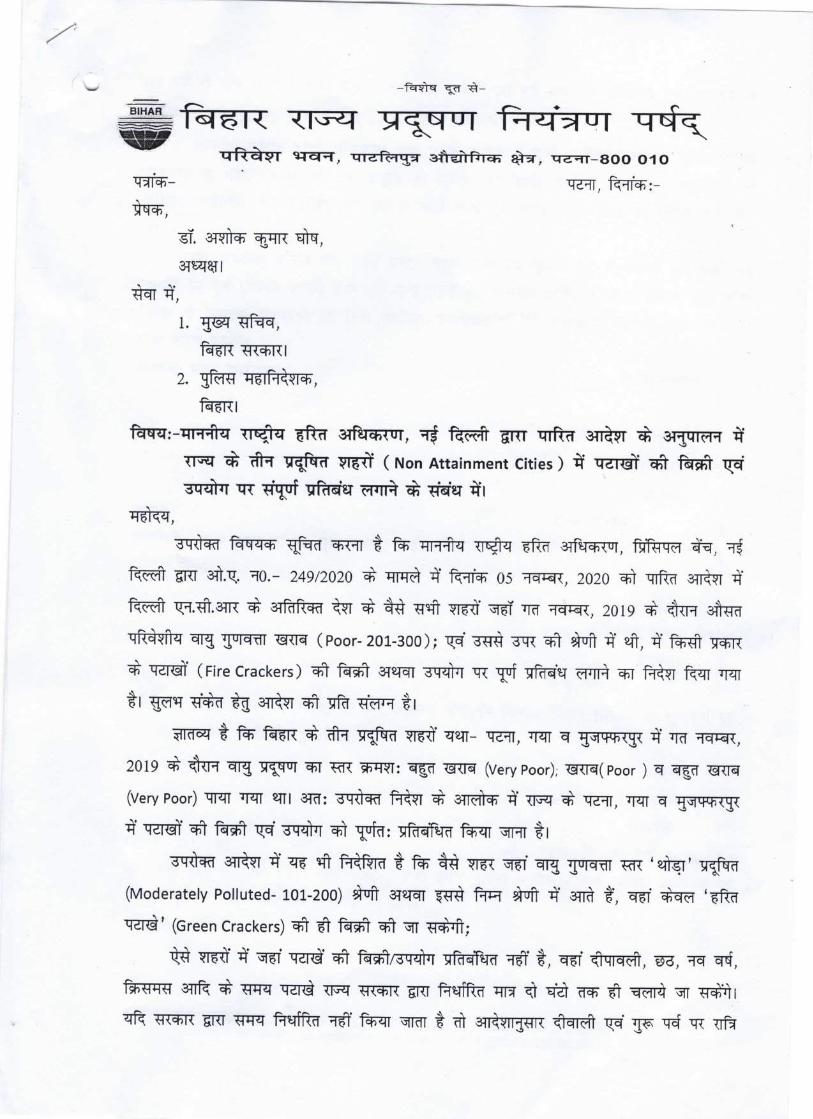
5iEffi
i5E5F
Trfe-ha,
`- -fact igr ia-
iin T{iq qiH--OT ii-i±LfFT TR~`+T`a¥i 9Tan, `+.cTt-i`±:I-. ai\€riT=]q. giv, u=TT-BOO Oio
ffl, fgiv:-
ffl-. wh Ir ch,3TeFerl
ch +.,1. Effl ffi,
fin i7RTI2. Tfed H6irii¥iq,,
faFTl
ffro:-TTrfu rty rfu 3TfeTam, * fca gin rfu 3rfu a a]=qTi]] a.iTF a} ffi Pst vri ( Non Attainment cities ) fi uETdi ch fan Tarfu qT tiTIf RET ch a fa.q a.I
qrfu,wh ffro giv 5i]T % fit FFTffi " rfu eTre]q{uT, fflfro ffi, T€
fen EiiT ch.i. qo.- 249;2020 a qma +. fas 05 iTffl, 2020 q} qrfu 3TTch a.
fca F.th.enT a 3Tfife ch i± ae Hth wh. ¢ET-TIT Tfa, 2019 a th 3haTftarfu qi¥ TOT5m aTTa ( poor-2oi-3oo) ; F. ed 3q{ qa an +. eft, +. fiRE rm{
E} TETch. (Fire crackers) th fan eTqqT wh tr{ tr qfir'g wh 5T ffu fin iiqT
%i gay rfu eE eTTdr qfr rfu th *i
5Tffl * fS fin t} ffi Fgiv wh. Fan- TE]T, maT a g5tFF{g{ +. iia ]qTE{,
2019 a th fflB TgrT ffl HT 5F¥T: qF HTTa (very poor); a{Tq( poor ) a qga g{Tq
(very poor) "T iF]T enl 3FT: wh ifro a eTTdr +. {[q S TTE]T, iTqT a IqtFtF{I{
i. wh. th fan F. wh al T]fa: ffim fin qii]T %1wh wh *. qE th fRE € f5 ae ¥TH i]ET. qTg Tmai]T tat ' efty' xp;pe
(Moderately polluted-ioi-200) an erelEIT ed fin rm +. 3Trd a., q8T. ha 'gffii
TETa' (Green crackers) # a fan # ffl ffi;
ti wh. +. i55T. TETa. th fanwh ffiTtza Ta. %, qET. anTqdi, ®6, ]q of ,ffro ut E} qFq wh TiGq HTffl{ BitT fieffi T]TF a ca fiiF a wl ffl whiqR HT5iT EiiT HFq ffirfRFT T@. fin rm € ch 3Tky an qq. :95 I:ri:i TR qfa
Annexure-VIII
116
08 rd a wh io rd air; 56 i. rm: 06 rd a 08 rd fiF F. ffro F. q qi afir FEE wh 11:55 a qtF rfu 12:30 TETa ifr± ffl qtS:}I
Frffi " rfu e7re]fftuT giTT FTRFT Grfu d. Hqfl qiirm wh. a gq ffird'F. Efed qETRE. al iH erTtw a wh te Fth ffiTrm fin Tof±Tffiri. qq.gil 3Tched., q} qgiv Th-ffi wl rd gr eTrfu wh 1:in+ ffl fiaffl fin TTqT%1
en: wh ffi ffi wh. Fen- iE]T, iraT F. =qffltg{ +. .qET5n: qft fiTffi F.wh H tr ffi.q wh wh F. e]iF wh. tE qTrfu ITi::giv rfu chqtF{uT gT{T qffifiiRT i} ereviH:: e]=vTen a fed ffiqiT qtharfu. q} e]Tqiqq7 3rfu qTfl ed qPr
Ir rm ailwh: Ten whi ffrorm,
I/-( 3Twh tFT ch)
3TapRT I
5"itFT pE]T, fifrorfufan: SIT IZH ffi, ng farm, fin qT5TI ch qF]Tti F. eyiq¥qEF rfurf ts
ifelE/-
t3wh Ir wh>3Tapeyl .
rfe iE]T, fasTfen: TenT ffi qrfu, ffl F. qaqi¥ qRch fa`]iiT, fir q{q5i{ q} qF]Tti qu
GTTqRE RE tE ffil
TFRTFF; /SIC/
E/-
(wh iFT ch)3Tapey I
rm, fgiv /a,r;, 2~2~urFRT: {li5q a Hth fin qlfi+Jnd / Fqft qth gil 3TgPreyay Hqfl gil 3Tcheyq7 q}
qFiTef TIT. 3ma¥qE RE eE ifei
EPABX: 061 2-2261 250/2262265, Fax
=-=--Ti=i=--3TtFer I
0612-2261050E-mail:[email protected],WebsliehttD://I;s-DjbTbliiTnl-c.in`
117
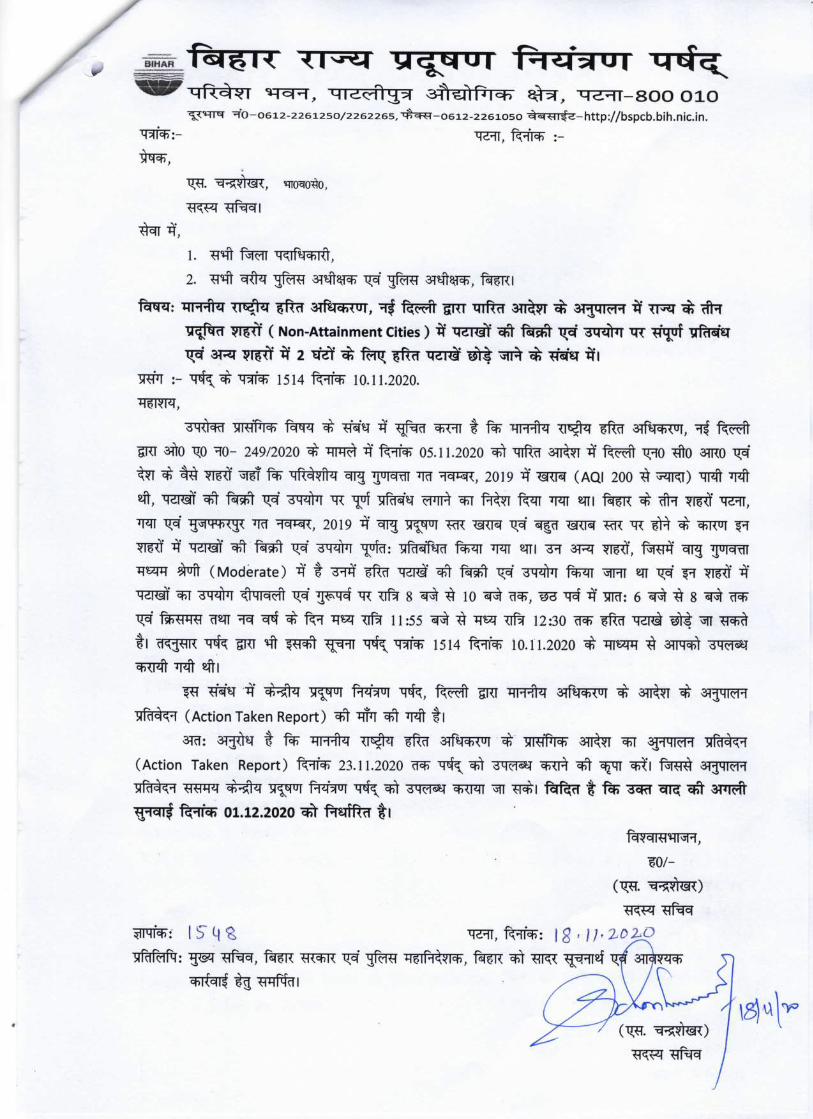
`,B!H&H L-aeTrfen qi=], TiEap 3fi± dr, i=|T-goo Oio`
i¥qm i.O-06i2-226i25O/2262265, the-06i2-226i05O -aqtliE.€-http://bspcb.bih.nic.in.
Trfu:- Tz]T, fffi :-ha,
N. ed, rmrodo,RT ffil
ch +.'1. Hth fin then,2. wi rfu gil 3TcherE F. gil 3Tcha75, fini
fin: TTrfu try gil 3Tfin, * fca giTT rfu wh tf ergrTan a. iT5q is ffiqst wh ( Nan-Attainment cities ) fi TETdi ch fan ¢ wh TIT riFT RE¢ 3]a wh a. 2 ffi a ft giv uETa. ae ch i± ffl Si
rd :-Tfa it Trfe 1514 fgiv io.ii.2020.H6,¥M,
wh TTffi fin i> wi.q a. giv iFITT * f* rfu uqu rfu 37firm, * fcagitr cho qo iro-249;2020 a nd +. fas 05.11.2020 ch qTRd rfu +. fca qFO two a]ro ngF.th i* tt wh. qETo iS TRarfu qTI ImaiTT ira ii]Et, 20]9 a. 5tia (AQI 200 a GqT=T) Th TTflch, wh. ch fan F. wh " Trf rfua.q wh 5T frfu fin Tin enl fin t} ffi wh. iz]T,Tin F. 55iiTiT5{ Ira TqTF{, 2019 +. qT= TgruT RI{ 5{ia F. qgr eni] iat " di a 5TquT iT
wh. +. TETch. ch fan F. wh ipfa: ffiTe7d fin TFT eni iIT 37q wh., fwh. i=ig grainqtF7T an (Moderate) *. € ch. rfu TETa. ch fan F. wh fin i@m in F. iT wh. *.TETch. 5T wh anT5di F. giv VI rfu 8 rd d io rd aq7, 55 Ta i. 3ma: 6 ri d 8 ri iiaTF. ffro ae7T i]a of i} fin qap rfu 1 I :55 rd a FtF rfu 12:30 aF rfu TZTa ae ffl wh€i a=IPITt Tte E[{r th EHqfr quiT Tit Trfu i5i4 fgiv io.11.2020 i* qrm a errs 3TaaTwh Tffi ch.I
EH ch.q `*. RE qgFUT fffl qii, fen gT{T rfu OfTe]q5{uT a rfu i* ergqTenffi (Action Taken Report) qPr rfu qPr TTfl ti
3Td: eratq a ft7 qTrfu ust rfu erfTeiERT j} TTRE rfu lit grqTen ffi(Action Taken Report) fth 23.11.2o2o tlqT TR ch ilqtliET ed # qEqT q*.I fife 3]gTlenTiro qHFq RE TgroT in Tit al 3qaaT 5rm ffl chi fafca * fa; 3aRT aia ch 3TTT@giv fiFTf5 01.12.202O ch fun €i
HEEEEE.€0/-
(w. qi¥`lts]{)RT ffi
\g,u\pe
fir li[q qi¥[gT fig.a uT pit
rfe:' i5-ii8 qz]T,fgiv: i8, j7,2Tffi: gr ffi, fir Elq=T{ F. gil H6irii¥iq,, fin ch HTR qE]Tti
RE tE rfui
D 2ic)
118
EI B€REEN t=\ . . -se± qq], TiEap 3fiE± dr, iE]T_goo Oioi¥qiT I.O-06i2-226i25O;2262265, Tfa-0612-226i05O aErrfe-http://bspcb.bih.njc.in.
Trfe:- tiE]T, fffi :-ha'
ngF. qi¥`its]`, ffloqcho,
RE ffilch i.'
1. Hth fin qlf",2. wh rfu gil 3Tcha7tFT F. gil 3Tcha7E, fini
fha: FTrfu TTqu rfu 3Tffu, i? fca 5TiT rfu chin a a]griaT fi ITq affi Pst wh ( Non-Attainment cities ) a. uETzjf qfr fan ¢ wh TITriFT Tfrfu Ta 3]a wh ti 2 da a fat rfu TETa ee wh i± ffieT fil
rd :-TR i} qrfe 1514 fas io.11.2020 H. 1548 fas 18.11.2020.
H6,¥M,
wh Trffi fin * wi.g +. giv 5T]T € fS RE qIFDT fin TtiL ftedERT TTffi tTgiv rfu ofTe75tuT, T€ fca EiiT cho qo ]0- 24972020 i} nd +. fgiv05.ii.2020 ch qTRd rfu a -cqr`Qi.qiqiTiich. a fang qPr TTfl RE qFT ffi fth24.11.2020 a5 i5iaiFT ed 5T ffu fin iiqT € fRE gri gi{r qF]Taj}. qFT ch qF{FTrfu giv rfu chq5{uT wl wh giv iffi oi.12.202o wl 3vfflaT 5rm ffl nil
3]fT: er5aq a fS rfu ffl 3]gqTen ffi (Action Taken Report) fas24.1 1.2020 qa 12 rd 3FTT5T aE fffi 5T a 5paise] ed qFT qFq .5t., fwh qife fflch 5{ HHFq RE TgFDT in Tfa fca q} gpqiseT q5{iqT ffl qi*i
fdr|TqqiF.uTiffiEfanqi€
rfu: i5-6M
finma,TO/-
(F. -qTS?`ltg{)
tTRT ffiTTan, fffi: rL3 +l|i -
Tffi: gen ffi, fin qt5iT F. gil q5ffidr, fin qa qTq{ qF]Tti T*_iEE
ifJFJE
qirfu)
3Traffl RE tE rfui
119
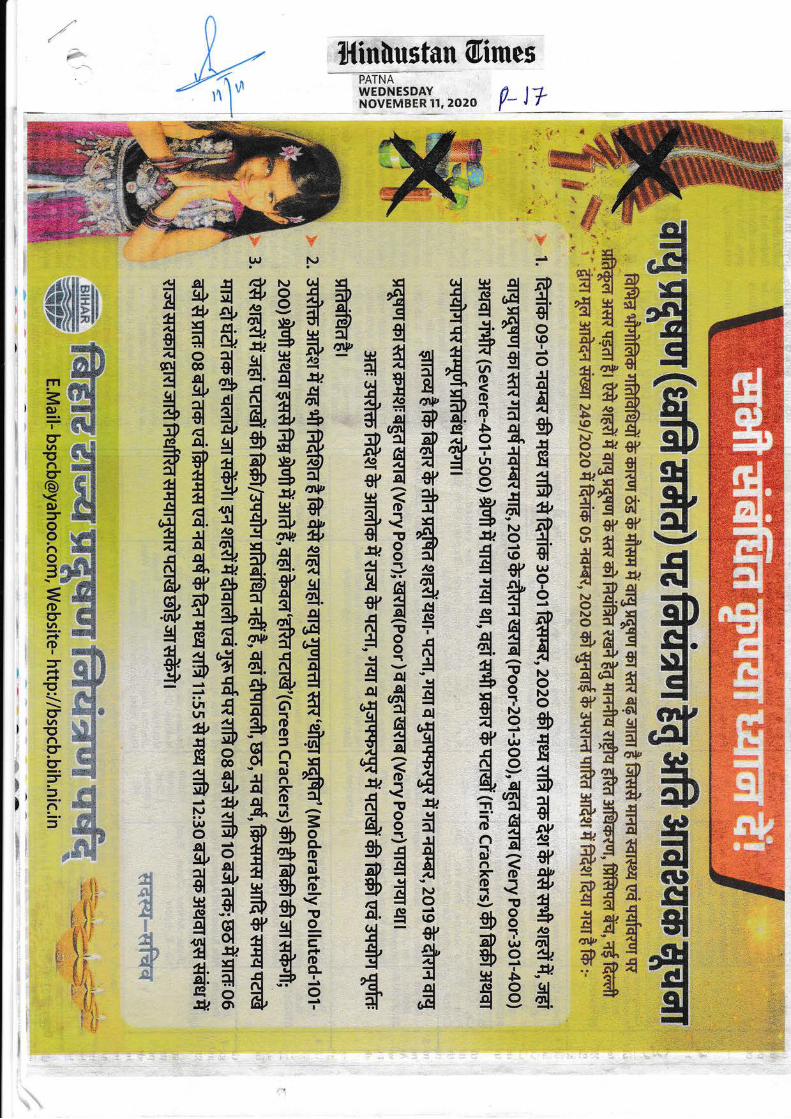
lllin[ustan @imes--:FmA-WEDNESDAY {) la
NOVEMBER 11, 2020 r* t t42
g,Ed
c,s$g€g,Ar**,EIEDtAI\.7fi5Ds{.IrIdrdfit,
€31..o&
5D(ll*rfl
ol(f,!,,gl,'
,sl#slH
r^'e+e € H,H€fl +*ry
fl$flHE fli{ n€ *$#$
A3flflE g=g ggft uff-
*fuiEEf frq$)i$t+:Er
I @ffi!T reffi
= esry
lar@
"ffiu-r, ffitrE Bw&affilr, mSo w#XMrffio:9ffinffiO e.$3ryeHk-#&#vt *"er. *ie(#-*.q.Drffi&= F"i:E
€ m,#\:.Hoi !'B:.8 evt +{I E, "--; *,1 +#-':,Cf .,m,,:4Lr 'es^'i
BWI"Ji..r = 'f.4) 6' F#.q' -' *u*
= "H&efl {s, ;&H, ,1'j
I l:'t:'l I
l' l:L; J:]l.i' lEi:' gl
i 1i'- il:,' ".
.:-,,"\'.:; i,. J.i' il
,i,, I i
i ri.
*
\120
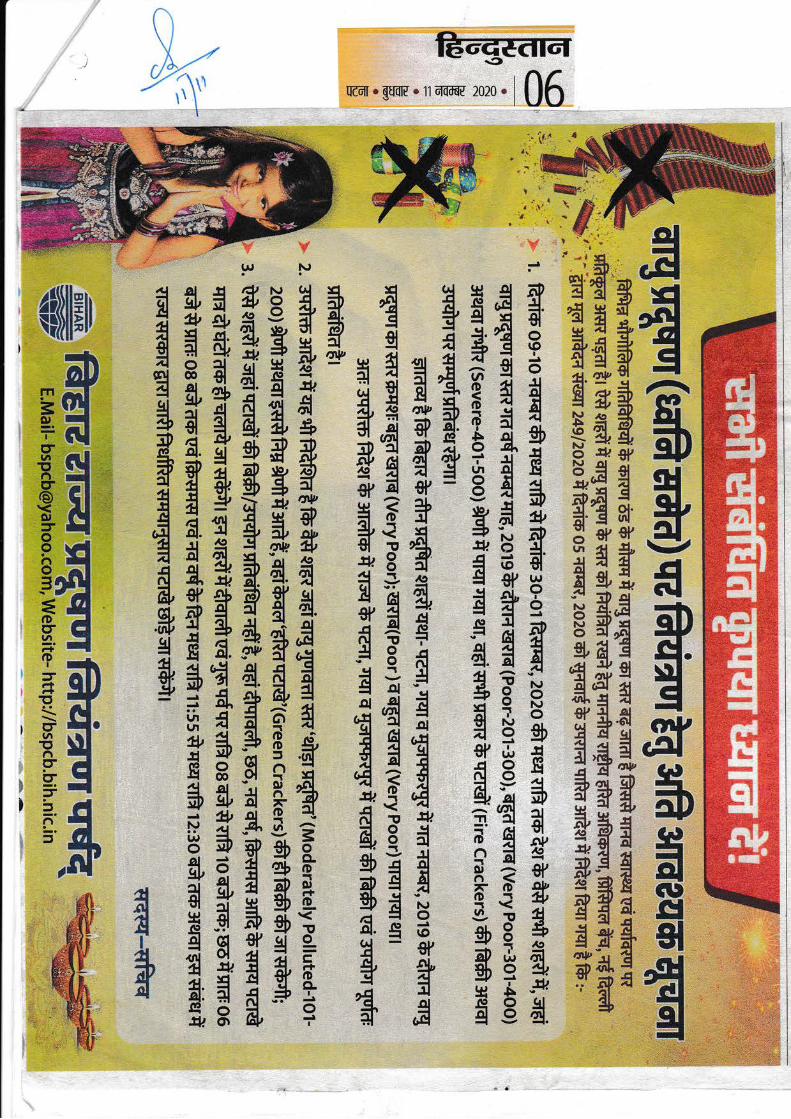
UrO.$ffir 11olilfil-{ rOrO. | 06
\
oldGgg{ drl
s5DIHstEI\J.CTcrl
5Dtl.SIg.*c9ls5Dart-Jc,(l) ",
Gl,,'$,,,
%.: _i;Efls"dHg
f,{ #.Ll CIW etfl.J
gn*
*#fld. S u,t
: sl8f
r+iBS(Ew raYsO al "nlg,a'a4 #qflEfli+fl
$BBsHr8f,figf,+,rrtr-rr €nH=
' ri}"/"-Y/\*r t\ \'
i
li,\
l'
f, fl$flgE flEg f,€ *
+ Hfl f,gE A=f, f,Bfl
mi'lqr.
l,lE'"!a!rl:}.:Cr.t6r
o,
o.oho=t-tJ
=(Dcrl/t
oI
EI
(tl.,l
15nIu:-
il
5
)
121
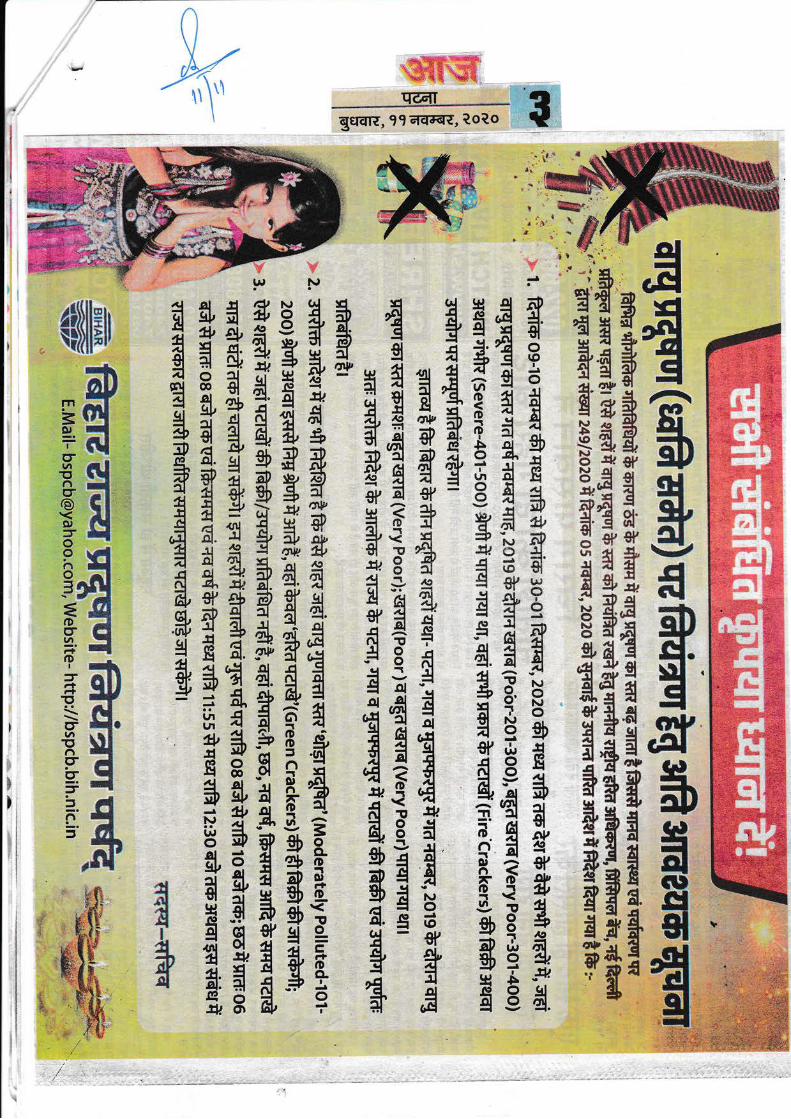
v, ,*,. :,5i:.;.:1 . r:Lii.,,i l:.:'* ti gssli
trETT
gqqE, 99 A€rert, Qo?o It'r ' i\t.$
'ry"
nilIJslorg
I
oIIolA4$lltl)Et.,ll
dfi,fil)cl
rJl{^}s
ioti)frd?NoNo$llca]I4)
od€lsv^)8rdvdtfls*cttl4J+,slfr!
(1l$l*tt
mEmIil-l1ft|Ent+q,5 f,lEflI \Flnfl
1**€-jq
ESS,fi.f;s(J tAtr **{
=4=.
f"!nfr=' ft,fiP
{, 'l*.:
L"iH_.tts
's5D!us,el\r'-cIf{I5Dfl.$Igfil,€lg5D
q s;Nrac:
E*.x*,:.r"d
$€iul .llt,u! *'iflTat!,
HS.o 3llg,H..al *lx aryal (9liilqtr+Cat{,EL-ad
3**$I,gsge'iasfldra,!r:lA)'{th;'fl
,anFl,at.L*r,t*'rf:rI
122
rfddr lEEIqR . 't 1 ;lrtEin . 2o2ok ar*q
atErTr*-
fur}'ffi*--#'-;.^*
* t.SH
gfi${
$a*g
Baaef, ** *lirE t€#q
"lHE1.*ilE'+
=D
g$1H
sa=g
?t'
cgEEilsfis te *? I
s AX $ 3t?E'4 flfi,sq i4gHE Ae.nl rW ? lJ AdEqEtrsr-BA1* E,H fl,,il ilts flfl e6d'^;
g {9w1, i +EE ETSi aHA3 s ? rJj * X od sX |i,g g8$fl i'e $
fl +,8*i ts fr;,r odea i6 #U aE s& *3 ?3 $H ?"fl fi9fl
!^, l-J
Btgf,$aaa-f,gaBfl c
g
il$$fi?f,E
1A$1$Ef,a
ED
flftlsfl
3Dd.\IId{.CI
,fr'
rn
=o,
crvlpncr6q,
oInoal--l€ocr9.o
I
E(ttE(tg
6'
123
k,*t _-4 ffi
, ffi.,i xl **s*'g*ffi
Ea#ffiffiffi#ffi
$$# ffin#fi ffi$s$ ffirr! *{ S, %#d
$&# ffiffitr$ Hffift,ffi"9 #*B$,fi ffiHtrffffi-#flffi tr##ry ffiffi
#$tr ffi$trs ffitr#Hffi
{,{F &$ryW
f,fl$fignsnEngf,gfl
flflfi$###€$*$n$
$n!*q ?$g $fi $n $#ggr *sn $6 *
$ flrgaE g=g #g fl
*s}}llxlr
EDU *!d6-d
=cq{ 6rt
$Hfr{sgSaIU
Ff,=q?*,Esilsg.f rllsc={
=.d=r#'1.,.t*
-.sii*.,{ b-
Bl;rd r
s ,{brt
$Fi1#,
-t-.ii
il,
124
Nz
ffiEd#ffi
#$*rs-Hffi#.qF}trc{*a
wffiffiffib*#
"#{et
ffi#-wffi
ffis*
M#*ww*qeffi&eryryffiffis-$ffi
ffiffiffiffiw
ggBnfl$$$$
g'+$Ea$#$-+
"fi fi8fl *,
fl+i#H\H 5,$1H$
E fi,+f,H ;,f,a *tr$fi*gfr,sg8Ef,#BqS
E,8fe}.d.ffst
ryg *#$'E$+t nf,E
fi rf; 6 flH'f,"3 I fSgHqlErs fl,{ +?J 1dra g
B $"St'Eft,d 4d*
H t+fl $[fi Es.l a$;
$ aflf,a[
ilg otlor-
" CrIg Gri
sf,3gi{*c={
Eils sl.f;NI$s="d=r#
tll:iA.sr..
€
e
e
'lt,'i':+. .'
:, &,.4.. 1-.t i;{'. t.4,1";..1:41,!r! |
':;-!:.1',sr,, i ;,.,,,:i,
.r ' '::i
a
EiE;wiffi!
125
frff
--.-p33gz->Ir
UTar+EO
--er-.T-?(etn
z=Ptfi721/l
HT
I,,NoN,,o
T5
=.
i
i
i
I
I
i
OIddg*rstnlstsl!ui$rlil\./.clCrI
scI.\IIslffifal' ix}ifr,il
tr}--IOI,fiI'4t
.g{
Ellfr$l
+l*3t,8t!asoptE18rE4aclot.(nlsu*il!*..oI
6dsfacst
fr4al.olgl
ilrnlr:
Bfrfl,l:lJnl6tUrlE
lll,4!l.5,.sg4
_gtfr
.sav'e8f
:3I:Eift4:
,.d ;
3l:i {,rt,'I eiIt{rll.{C:
iE,l:ulolPEP,EI.dItriflIg,til
i$,,3ll,t .{lrdr rl,,I orr'l
rtt["Ey+{{t{s['flbig
failsipterSiDgVL9SZs3IatI*,*rlirs's
.,' t ,';g';1t,
,s:l^, ,
otr.i,u;.,:q i
fi,t,a)
$:,v5to'*,at\,o.l,r0fr,l{-*'otr.lJolGI,Ll!\,6nroq,
{'frl1olr{rlh8rsgA)
{t ,
n*3It*,C{&*ilsyJ{0
d'*.II
E@ET
I
l,*'r1"t'
<ilill*lt
AD
=0{O,H- frlgnt
gH3vIldJss
t*f;rusc{=rq!.fi
=rfi'
#a
l;,
a
a
;it':'
ii.t I ;r lir,i .t
# ,i.;
i 1-i,i: j _-
?:: i $r ii, i:
j#.i u
1 riil'i-i .,,;.1 i
€1.;Fi:i:'
Y
126
Eql.H
}.JJal..e,I-4.1
t)a$O
#;&.
'ffi'*-4
ffim{4
g#H
*H.Hffi6f*SI
mfisf,[\-if.sIflr*rsss.SISIlrd
fFFfsItd
&&ftldlr*ffi{#ffiffiffi
"tr" r*I&*gI#T
$ * 3r# $efle.fl#
BBflffi$*$
fl#fl'gH fl *4 H
$EB $I$ Efl#
g{;{f,ng$tEei Hr[ $,il f,fffifl gsfi il ,;:l
?g-4 Efi + ii ,'fr6E i t fr X"i ii',rls;d 3E3;;i ri ii@E A +#;h i]'.r:,tfr#L qA fl, ,", ili 'l
sEE "Hg,lii;'$ $ $qq, *r,i
lr.d { H$-* :li a2'+ "fi fiEfi ir
^l9!lldxtsl
H il&H,g *H il *H5ilfiBilgE=a+rf;fitr4flfi',$g**tfl,$99"H
fl d'Bg$
E n*$tr#d,8f eb A gf sr
ryg *#$E$+? f,*fr
frrf;0flH'f,ff i gSBHAEs fl,i *?j fl)a gIY n 4aB t"JA
=ri.6 +l d *,*r ilea P$.ffi ul -r q r,'oE Esl ft$iT g q Srsl o
p H +f,9[qoH or1ro W ?
**$il*l}
sffio,#
snl
Effi8fl
EB
sffi}9"f;HIrdcr hE
=4i.H
=_ffi
;l
', a:
Ii..:
ii
127
x
.cl
llb! B*ESlETr-.,1 -
$nts
or:$$l
4,14d8{LI
3^Yfrl)91a18y8ltaJdol.url
*y*,?an
541olJ
6dlcl
,,4
8l
fi4at
.6rlgI
I(wo/Efr,EIIsl
fir),r ,t9
; ill,d.ol.4r -ClOI,alcl
ril
.s5Dr$l ,r
3t iH;fr4:
,.ff :3Ii.*'aifr., I
r(9itri.*:friOJ
.o.q
iat.d:srrfll4
l*3l)r d.,
I rl'r 3lltallYlrwl0CI.gv))i*l,erdlx:3Iil,S; attiflDgP'*9Stilarfitrtrrtr'31il, <,rh
:'il'at3t
'.1,r :ig;4.
d:{r,
fi$:fi.,tdH,wE,(o,'\,oi\,()*0fle8{OlJ'rloj
HLo
rlV,og,&llolr.(,lh
sr,H
{:4
)fllr,Np41
lrDtsvDEVf,rgidlewh.av- ":
d.lJ
slo(o5o.lJold4$,!toq.1)
dfl,ilIJslw
Ioilfra4LoNo$EAD
tr.1)
d3J
slsvA,
srOlu4,fi.5
.9/rlAlflslrrtl
e,lrr*ssH
4TII"Ardtrql
^lr*t Iulsss,3ihr#.cf;n{
sd.sdrlfrp(3l,s,:s
stfE
-lsu{t}s!
,sl#trImgIrril
III
II
E
e*\\\i}}
m=rdiqItUgHsslrrJ*c=El
Ess cl.fsl3cl=q
=str#
-ffi-ffi
f*
I
- i
128
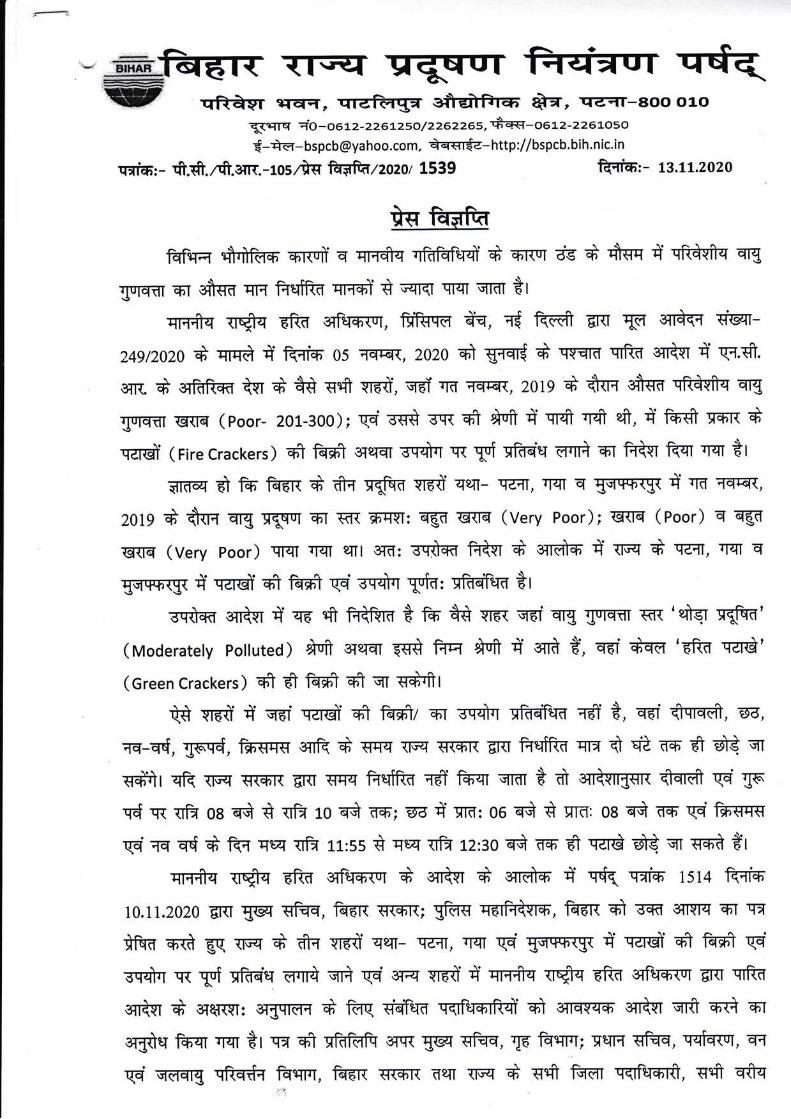
{rqqqilrrffiq+qqR+gr $IEI=T, rfraFdg.t effiFrfi' Ar, qaqr-aoo o1o
E{+Trs io - o a r z - z 2 6 tzs a / 22 6 22 G5,$ry- I 5 1 2- 22 6 tos o
€-*e- bspcb @ya hoo.com, ffi- http ://bspcb. bi h. nic. i n
qxiq: - *.fr.2fi.erm.-1os A{T ffizzozor 1539 ffiifr.- Lslt:ozo
+q tdfltufqfirq $lrilfffi-q.ruir q qm*q rrfoEnr4i * o'nq ds * fuq { qRfrfr-q qg
{wffir m,T *sd rTH frqiR'f, qnmi rt wrqr qrqr qmr ttq6fiq 11fi 6Rd sTftfihrut, frRrd tq, Ti ffi ERI {d olrdqq vqr-
z4gtzo2o * qrqa q ffi-fi s5 ;1tffir-{, zozo dr Vfiri * qq-qrfr qrFH sTt'ivr t q.S.
oTR * sTfrn!ffi tvr d'*S qfr yr6d, wI'ro rerEn, 2019 * frrq oflffi qRr+vfrq qrg
{ur*f,r Enrtt (poor- 201-300); qq ss$ s'qt 61 ffi t qrfr trfr efi, d ffi r*Tt *.rcrei (rirecrackers) q1 ffi ersrqr sr*rr vt ryi vfuq drni q,r Frtvr lEqr rqr tr
Ekral d tfi fdm d'tr{ yffi qrdt qrdr- qfiI, rrrlT q EjqTWfl i tra F[ER,
2019 * *tm qrg r$q ET Kt ih-ffT: {gf, rerrrl (very Poor); umr (poor) q qgd
Erttr (very poor) grqT rrqr eTt sitT: Eriffi t{kr + sTl!f,q. t qq d qeHI, rrqT g
EffiIr { Tcrd s1 ffi qd gq+r {oin, ftEn trsrffi o{rkr i qs sfr f{tfrm t m *C vr* qa qrg Xurffir Kt '*iV rg6'
(Moderatety poiluted) ffi erefqt V*rd f+e ]tufr { oTrfr t, Tdf *{d'6fr-d qerd'
(Green crackers) st fr M q1 qr +r*rfrt
E$ q6ii t q6i .rcrci q1 ffiz ffi sr*rr sfdqfim =16T +, Tdf ffi, B,Tq-q{, IFTd, f*q{s qTR * qq-q {ET s{fr'R Ur<r frqtRn ,rn t qt ,rm'd & qt
v*ir qR qrcq srsn Em qgrq frqiR( rdi tfiqr qmr t d qfuR qtqrm w T5.rd qr trH oa qq * uB ro q$ rq'; sa { Hfi: 06 qQ t etrT: 08 q$ r* * 35qqs
qq rq q{ d'fq{ qta nB tt:ss t qq nB tz:go q$ r*'El Tsrd @ v v*-i trqtrfrq {rqq ERE sTRrfi{q d sTrt{r + oTrfrfi { qq .mrm' $t4 ffi.fr
to.tt.202o Enr E@ qflqq, kdn tr(sn; gfms qrrf{krfi, fr6n q1 sm sTIqr{T sT wnNil s'd Eq {F?T d' frq qr6t qqr- sg;rl, rrrr gq UWf { Ysrd q1 M qq
sq+r vr ryi utrq Hrni qri ge erq yrflT t qmfrq {Tqq 6Rf, sftrfi{ur ERr qrR'f,
qTkr d erertvr: or{ercrT * fdq wdtr-d q<tfirsTFsi 61 eTrtrTfi snt{r qr<1 od mt
ergtu f*qr rrqr *r v* q1 yfdfufr s[w g@ \THq, Td frrTrtr; etlFT qlqq, q-qtflq, q{
w witatg qFwd{ Fril'rr, f{6R vrs'R HqT {ET d q$ fffi vqrFrfrrfr, qrfr qflq129
-e{RS sr$fiqw' / Hfr sTnqfl el*trm' H1 ifril s,qf gq qmfi-q {rqq Eftf, eTfirs{ur ERr
qrfr f{kr H'r Bqqttm Ef{Rqfr qd w erEtu fl*qr trqr tr
vS mq { nq qfq * sruTq sT. qds EqR dq i nq * vvrl rFrFrsT
t sTfrf, fuqI * rfi d qrflfrq rr$q 6Rf, 3TRrfi{ur d e[rkr sr 3r{cnff{ 5q rqr{rq
vtwr + yfr err+ 6dq si $d Ht ilfu qq d v$il q|6d d qR-ffiq q|-g {urTfl
d mt Ei {.6+ t fur qr vdt
*a;<* Fri--;I \3-.u .1o2-<,
(q{q qun)qq-qq.d qqrnrfrrfrt
130
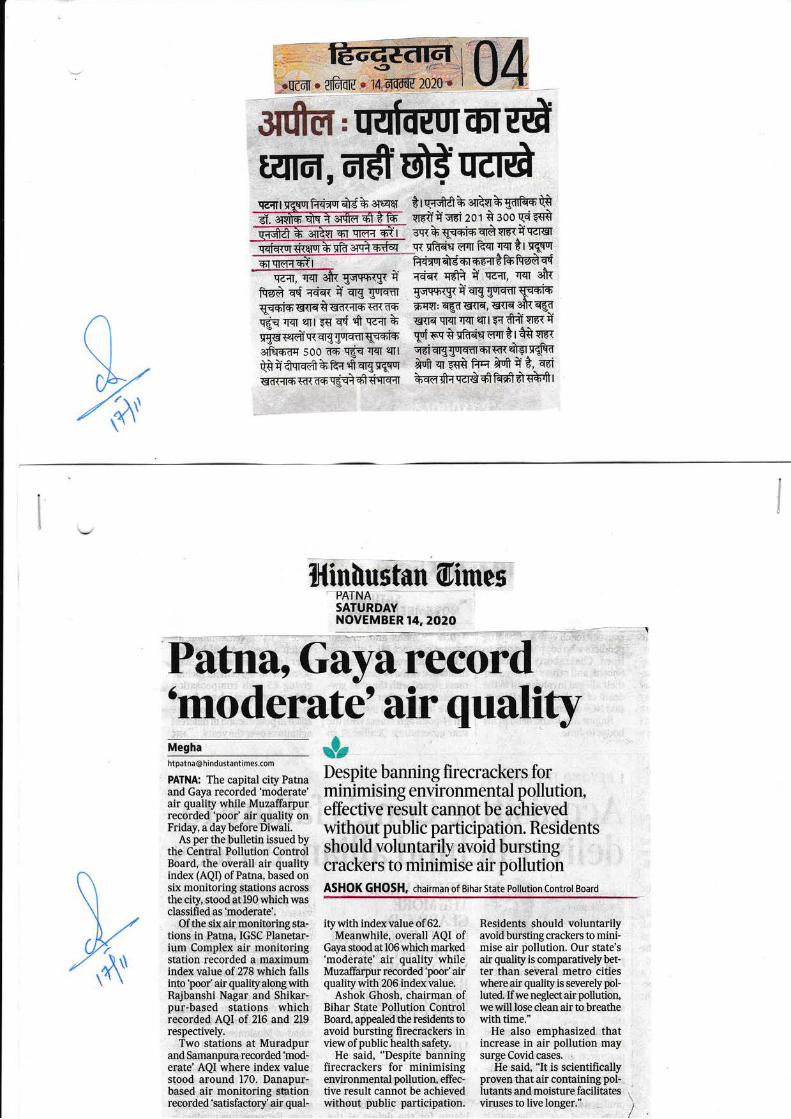
;r .dr . flfudE rt4.-,-{@ lozii
$frm:trqtrEIII iFrudErGr,dsdsrcrd
t+i*qqtd* s{Lqqi *r c{d6* gfltcr+5dltrsEtrrdtiiwi zor t soosi{q+sw * g++i+ er& vrt-qi qcrst
c{ si*iq w[ i<* rrqt Bt rqvor
*TecI, .m €ft gqffi{$ n rdq{ Ffrt t qe-+, Tqr 3It{
Frg-A e'd *iqt t qrq rroTq.f,i usffi'{g{tqggqq-drwsisgqffi{T{il6rqgqq-drqu-sisF-{et: Ef,Et{ltt, gns 3ft{gd
srg goTTdl
goeiounctqt-trFrKtn-srga.mr qrt gq q{ E1 T-{I +uguerdwaqgqs-drqE-6isqFffidq soo n-s c-fr trqr qlt
tiiftTq-6hFc+fraqrqn"t66566Htn.s'qgiqt+i{EIq-dT
t+trur*dqro-e+tf{FrgAs{
*-{QT: {6d Et{ltt, E{lttgtrq qrqr rrqr trr F{ il"il $6{ iwf sq t sidiq e,n t r *t srdr
*1 qq qur+flr +.r R{ rir.st q-S-d\^\.A
*urt qI ss€ FIq Su[ C 6, T6l
i;qefrqq{rgelffiraeHrr
lllintrustln @imesPATNASATURDAYNOVEMBER 14,2O2O
Patn&, Gayarecord'moderate'air qualify
Despiminin
ite banning firecrackers forminimising environmental pollution,effective result cannot be achievedwithout public participation. Residentsshould voluntarily avoid burstingcrackers to minimise air pollutionASHOK GHOSH, chairman of Bihar State Pollution Control Board
aldt
Ehq#Meghahtpatna@ hindustantimes.com
PATNA: The capital cityPatnaand Gaya recorded'moderate'air qualiff while Muzaffarpurrecorded 'poor' air quality onFriday, a daybefore Diwali.
As per the bulletin issued bythe Central Pollution ControlBoard, the overall air qualityindex (AQI) of Patna, based onsix monitoring stations acrossthe city, stood at 190 which wasclassilied as'moderate'.
Of the six air monitoring sta-tions in Patna, IGSC Planetar-ium Complex air monitoringstation recorded a maximumindex value of 278 which fallsinto'poor' at quality along withRajbanshi Nagar and Shikar-pur-based stations whichrecorded AQI of 216 and 219respectively.
Two stations at Muradpurand Samanpura recorded'mod-erate'AQI where index valuestood around 170. Danapur-based air monitoring stationrecorded'satisfactory' air qual-
itywith indexvalue of 62.Meanwhile, overall AQI of
Gaya stood at106which marked'moderate' air quality whileMuzaffarpur recorded'poor' airquality with 206 index value.
Ashok Ghosh, chairman ofBihar State Pollution ControlBoard, appealed the residents toavoid bursting firecrackers inview ofpublic health safety.
He said, "Despite banningfirecrackers for minimisingenvironmental pollution, effec-tive result cannot be achievedwithout public participation.
Resideots should voluntarilyavoid bursting crackers to mini-mise air pollution. Our state'sair quality is comparatively bet-ter than several metro citieswhere air quality is swerely pol-luted. If we neglect air pollution,we will lose clean air to breathewithtime."
He also emphasized thatincrease in air pollution maysurge Covid cases.
He said, "It is scientificallyproven that air containing pol-lutants and moisture facilitatesviruses to live longer."
W
k131
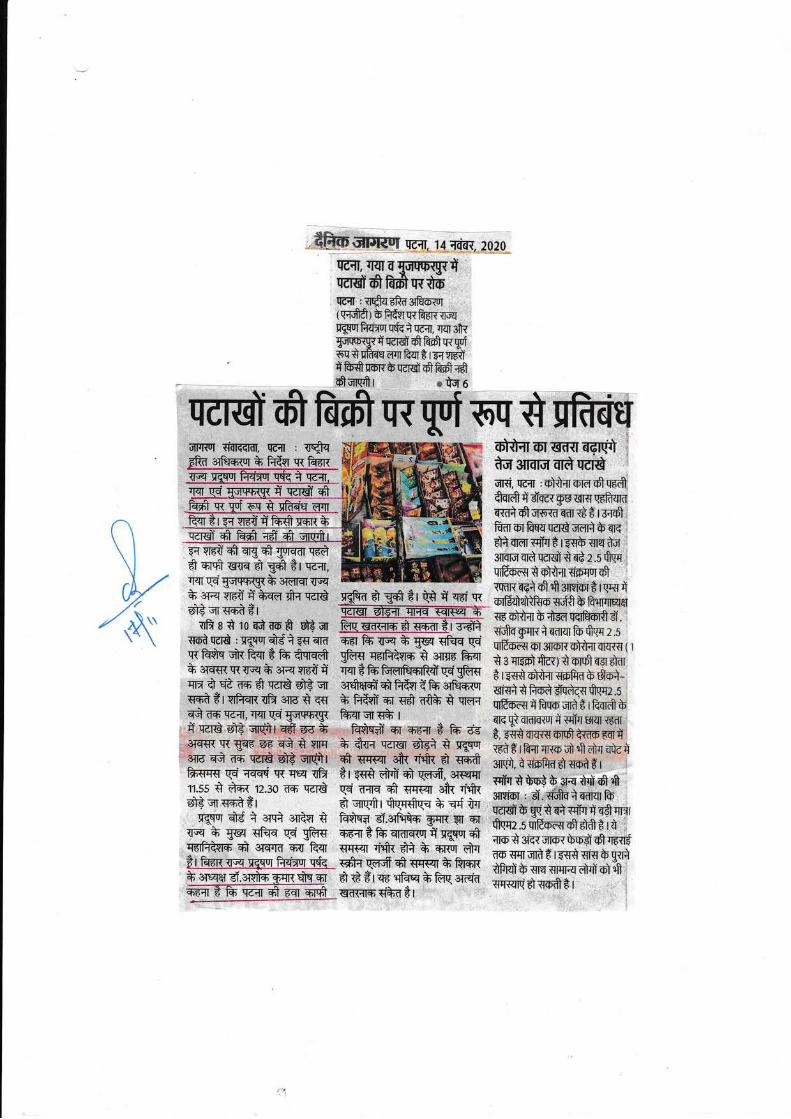
,"$fiogptwE rrc-.rT, 14 iiiw, 2o2o
T6II, TRIIATOWTW{
rcrgr o.r ffi wrroqC*:Ilqs6Rf,'3Ttro-iur
t \'{-fr& I b fi{qr q{ fr '6Tw-q
u-Eu fiuru ufc i u-c-a, * g1u
gowqrtu-adolMwqufoq t ufrqs mrTr frqI t r cq sr6-tr
dffiq'6'Rbq-cie}01ftfrcS
k
olurs$r *tqo
ffi Et€miq*-dlr
rilddfrm1 r{$EqtH"ffim;H#ffiffiffi#ffi
Hffiffi.**W$,ffiU**HffiffiHffifl-
qErfrM +1 sr-na mn-Rqr ernqr rt'frr 6f + onw * ##JiJ;#'##ffiBr fqin ry r.Wq nqzT qqq
_ @t SdqT dr Hqsr + RrsR id,; #"#"Eflit@i SW d€trqo qBq+frqorqn il#.i'.#;,
* :Fq cr6t g fr*e fr+ Tcrd y-*kr d.g*i *r N q q6f_T -&d1p--dfl66rn,rq,,oriarsoa*r @;*-d{"eil=-qErEmffii{.rfi a d ro cS a-o-fr ul$ ar leq gcrqo $ q-*-ar tl s-€f+ *nuo*"t**n*cqz.5q5'd:c$"r$giryqry ry ft vA & gw €rq1<a ,i6**;#siiilErq.q( r
c{ ms ft Rqr t tu ffi yk€ q6r{i{r-n ! yory f* i;ffid;eodq-srd.dr* er+sr q{ irq * sr< yr6t q rqr t fu ffif,rfrr*rndr qd_gfrs j,.*t ffi'ffi; d*i-_qrqsa r+ * yrd d$ w orrffif+itrt{rttu ry ilutq#.fit .ufl\rr.,v*i tryrFrsR{B ana t sq + frftif +r ir& rfrh t qrrc ffi;Edq1at,num6$q\T,,r+r.<aq1w..gr Aly$ ^ qrEstsrdrq{urq${tilqr-€drqTcrGdBeqirqSe-ofi ffii or +-e-* t.fu ae i,E*d-.*,.1traorfiqeiq-{R c{g-i€ EF Q A * + d{r ceq dsi ! ry, ,ffii1fr"ffi'aqranoE qero qq no ccrd S$ qSr ffi qqsl ft .i$r 6 s+-fr ffi\"idq6gf,d-fl-6ttrlm-{q-s cE i-aq{ qr qsq {h t r ses ffi *i @. *yI *m, J mt a ,* 1.i d firr.ss * t+r rz.Eo n-q qcrd qq n1e *1v'rt<r *:$ ;;;;',,}:os-iqomrtu*3qiv*ttr Elqrqrfrrffiqq+qdtu i*#'A*j#""f,,tn6*,r(sq dd i o{ci 3aq t idtq-n Ei.orFTq-n qcR Hr T fd;;Hil#;id;il''Sj-g1mLry TT_tms.lWS,*;.#;;+r*oa*u*
132
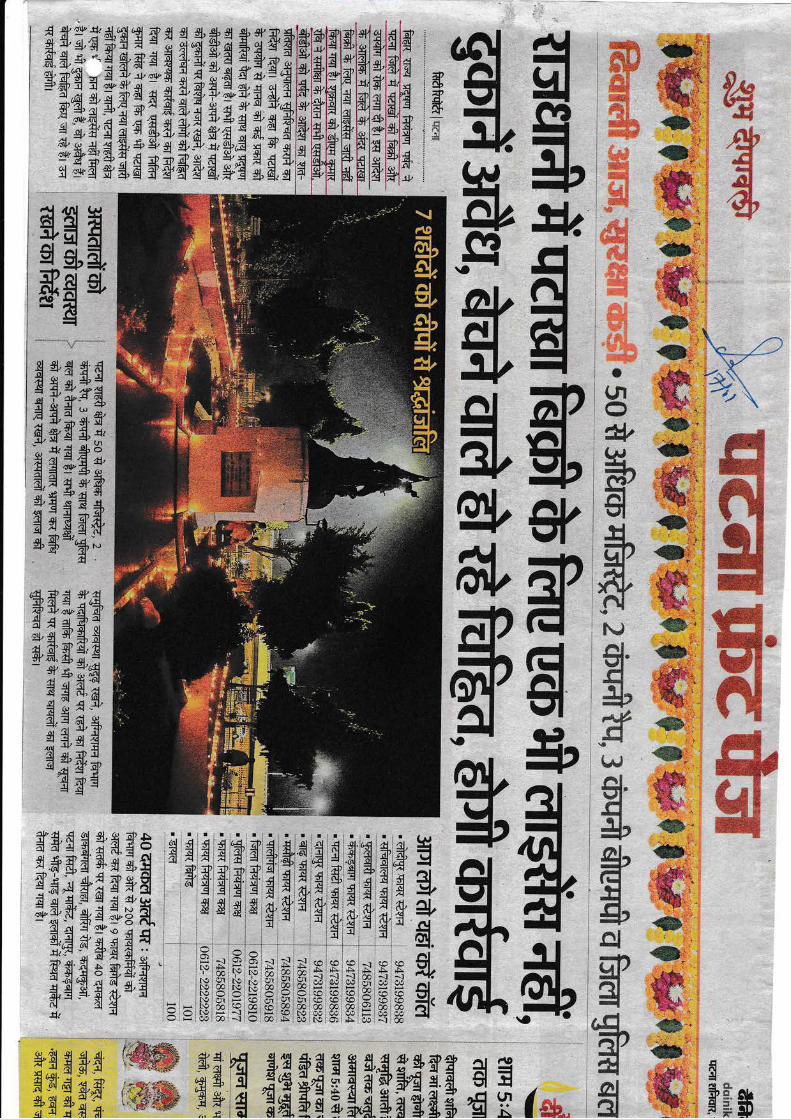
##ffitrffi
ffi.ffiffif;dtuffffi
-:a*ir:,:
:rt; I: .:',..:",,,-
,;+.il: lrnjtlfI ..^,:i ;:i&:11.i .:;r,; i'
i qrr,+r:j
' .1 |
, ,iiiii t'4: .'n:i;tl
, , a.i,
..::: .,: ?,.rillinilt:'i,fi:
,1r' it,I . -,'
::t-i
t'1:, ,,::.
.C(.r1,q\-,4t(aJ
:*l:+\-d,*
. d\l! r rt:E \lli ?.1x
r.*, *l.lrn{
r"lJ. "Al-AY*t, rrfI]ru
Al!#.t#ladEiAI
*&Ie4?€,,1\&'sagleq,w
i &&J:al
TJI*VIddBlqtrrHt
rra IJlfi.r
I dls,atbi,Qd' *ra
ffif-lrlEcE"-*l,I.';i
I :+'t*Jl/e{AIs Jti.d{eg
{red-gfal!*ffit TC'*r{f3lrdd
Ald
9J(Yi-d
:J,Et.clnlE
dr{d)EI:il)8r*f=l(EIalUIo,
=23Id4rt
*
.3J
FH?--,'
(,&*. l
06u,sf
-3hw?+f+1)
..-
?J,al*
AI-3bE,^lwar)H
6p3l
\a
4,\J-rl*
sl$I4rh
d)obt)g,nf;tl
(.,g
3l*+.dorl
sl,4,L
cld(
il*9alJA1uW#ilflflf,a*w1
ry,*.g.d.d4*,asf
*ldJ),J{
3{,Jll
+dd,
f,8t H+1f,#es-t ,4).\t
af,+TflH+*H**e*{1A nfrfl#"uS*?.
HL*X44 4 47)')
?#fl +4aJ 4 lct)JI ll, ro o4l
* # +anE1'3J,= d I,* 1{',9a*il+.g
4'r
W*aflfl
e:f*iiffi
nc
fr$qF *TtJ133
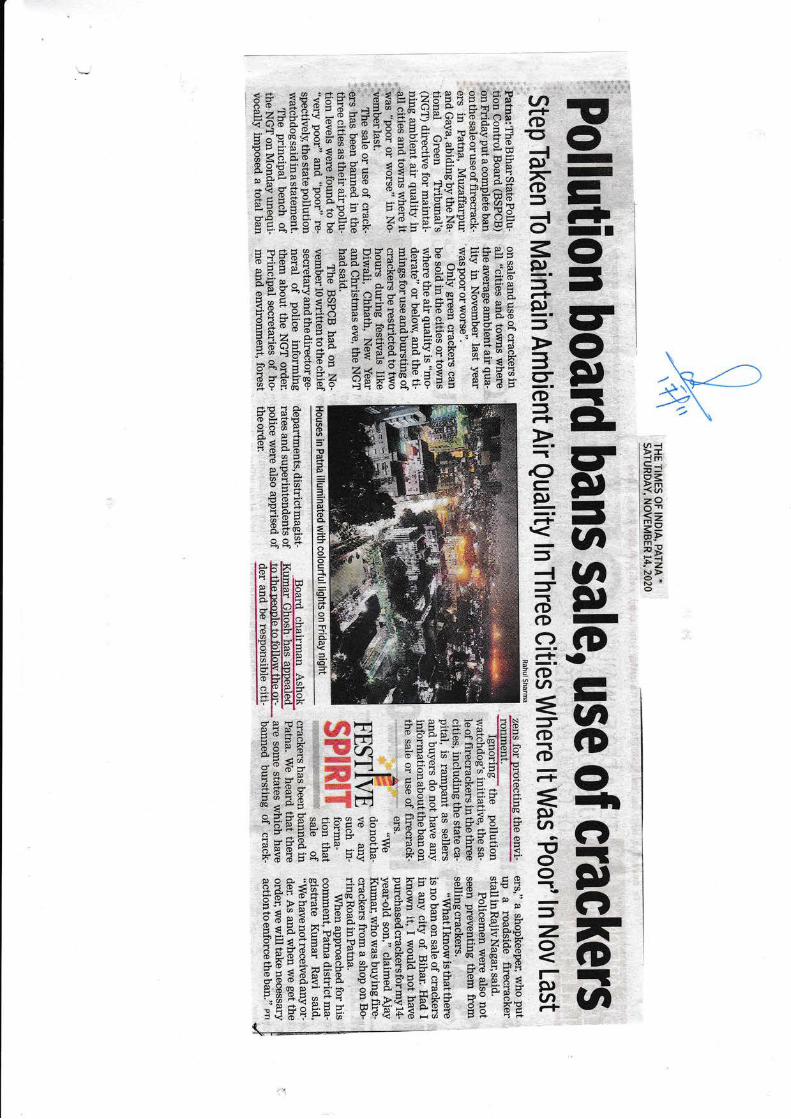
F
'E,oII
-LtIIoIJtrron,-ELtrrn,I
-Vtvtn,I.D
-EVt(DorhC?r:t,C?Ia(D-vt
BEEBEIIEII-AIEEEBEIEEE E
BEBEEEE-EEEBEEEIIE BSIB 1(D
EEE llreE
IEEEE\EE
EBHr ffi=-IBEEEIEd EEiF}ailHi;*u*[gEF$reF lg 3
EBIEiEEEEEi[EiISSBBE*E
=
iEEE[r* aBEEftBil }g-Bg h
(/, -l>--{ rf,
o?FfrzAOT<=ZY6Pm_r#"52u]>$*o
134
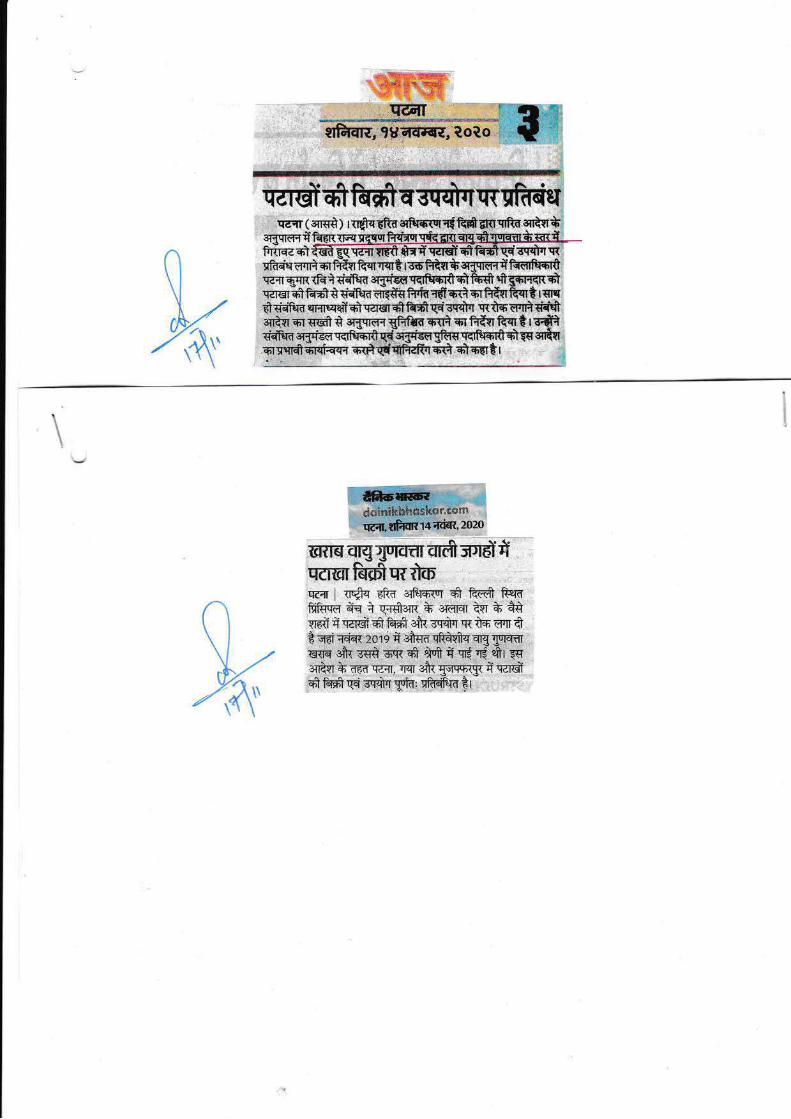
k\
k#krrmeB*{s**$qbk*lsks s"€*$}\
q7a, ffion la adm, 2o2o
ffiFrar{ry56rytrCTGT
q-.dr I {*q Ekd siFrs{ur +1 ffi RmFitrq-m afs t qr$sTr * ererqr. t{r + +0cl-6iifrc-dtii*eqfr efu Bq?irr c{ tm d,rql* qEt r.iqi 20r e ii sfrq6 qk*qrtq sE Sdwdrrqnq silr ss't ecr *1 4't fr cr$ .r$ ?fir qssEYr * ir6d rrcil, rrqr gifi qEffiiTr n ca€itqiffiqq sqrirrrTid: cfr+rc tsr-
135
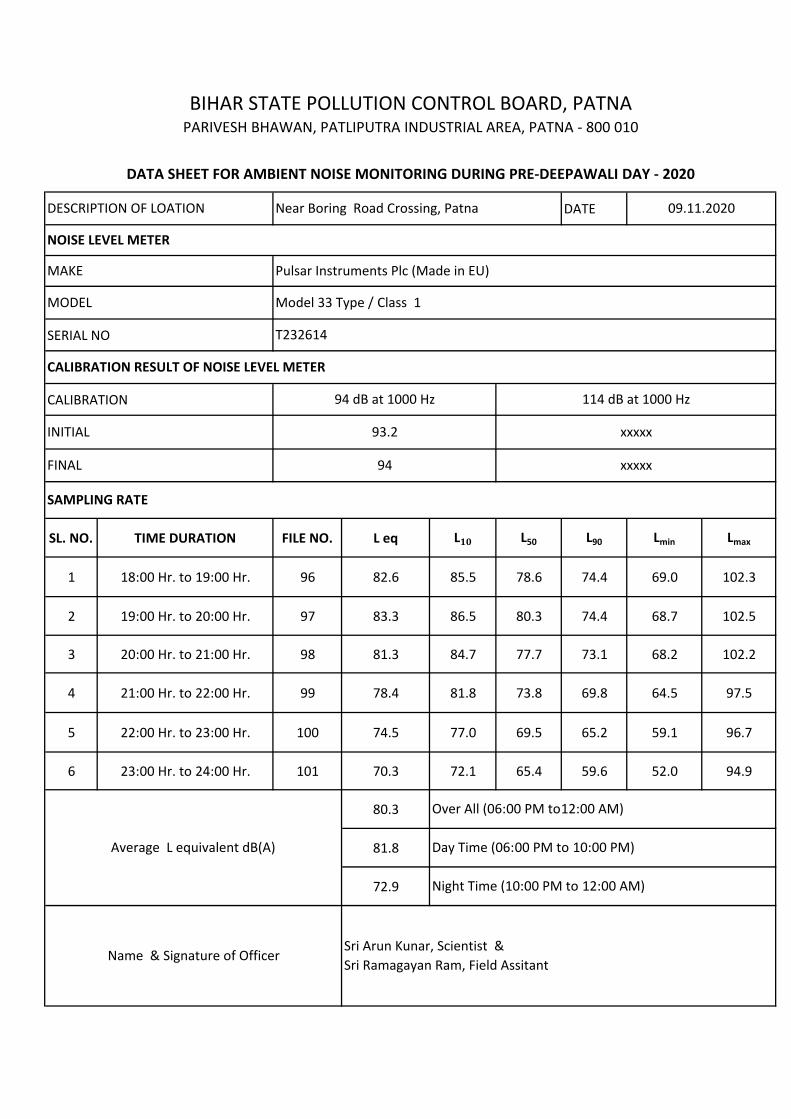
DATE
SERIAL NO
CALIBRATION
SL. NO. TIME DURATION FILE NO. L eq L10 L50 L90 Lmin Lmax
1 18:00 Hr. to 19:00 Hr. 96 82.6 85.5 78.6 74.4 69.0 102.3
2 19:00 Hr. to 20:00 Hr. 97 83.3 86.5 80.3 74.4 68.7 102.5
3 20:00 Hr. to 21:00 Hr. 98 81.3 84.7 77.7 73.1 68.2 102.2
4 21:00 Hr. to 22:00 Hr. 99 78.4 81.8 73.8 69.8 64.5 97.5
5 22:00 Hr. to 23:00 Hr. 100 74.5 77.0 69.5 65.2 59.1 96.7
6 23:00 Hr. to 24:00 Hr. 101 70.3 72.1 65.4 59.6 52.0 94.9
80.3
81.8
72.9
BIHAR STATE POLLUTION CONTROL BOARD, PATNAPARIVESH BHAWAN, PATLIPUTRA INDUSTRIAL AREA, PATNA - 800 010
DATA SHEET FOR AMBIENT NOISE MONITORING DURING PRE-DEEPAWALI DAY - 2020
DESCRIPTION OF LOATION
NOISE LEVEL METER
Near Boring Road Crossing, Patna 09.11.2020
SAMPLING RATE
Name & Signature of OfficerSri Arun Kunar, Scientist & Sri Ramagayan Ram, Field Assitant
Average L equivalent dB(A)
Over All (06:00 PM to12:00 AM)
Day Time (06:00 PM to 10:00 PM)
Night Time (10:00 PM to 12:00 AM)
CALIBRATION RESULT OF NOISE LEVEL METER
94 dB at 1000 Hz 114 dB at 1000 Hz
FINAL
Pulsar Instruments Plc (Made in EU)
Model 33 Type / Class 1
T232614
MAKE
93.2 xxxxx
94 xxxxx
MODEL
INITIAL
136
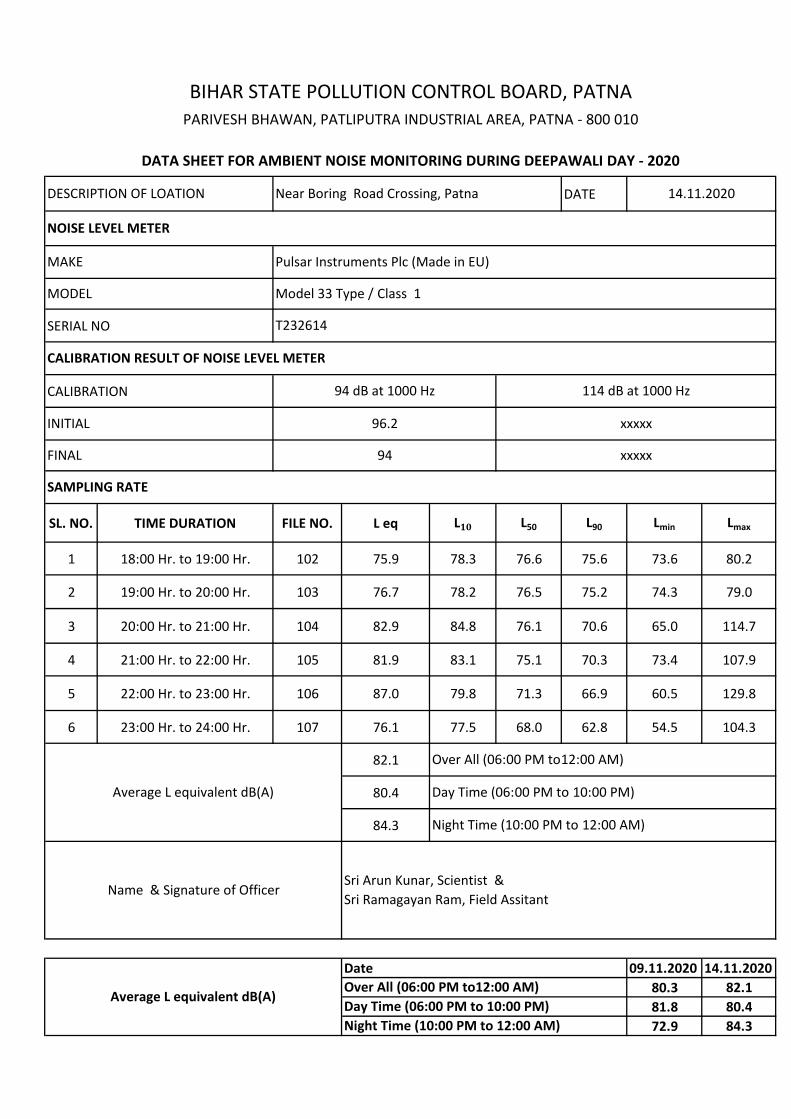
DATE
SERIAL NO
CALIBRATION
SL. NO. TIME DURATION FILE NO. L eq L10 L50 L90 Lmin Lmax
1 18:00 Hr. to 19:00 Hr. 102 75.9 78.3 76.6 75.6 73.6 80.2
2 19:00 Hr. to 20:00 Hr. 103 76.7 78.2 76.5 75.2 74.3 79.0
3 20:00 Hr. to 21:00 Hr. 104 82.9 84.8 76.1 70.6 65.0 114.7
4 21:00 Hr. to 22:00 Hr. 105 81.9 83.1 75.1 70.3 73.4 107.9
5 22:00 Hr. to 23:00 Hr. 106 87.0 79.8 71.3 66.9 60.5 129.8
6 23:00 Hr. to 24:00 Hr. 107 76.1 77.5 68.0 62.8 54.5 104.3
82.1
80.4
84.3
09.11.2020 14.11.202080.3 82.181.8 80.472.9 84.3
Name & Signature of OfficerSri Arun Kunar, Scientist & Sri Ramagayan Ram, Field Assitant
FINAL 94 xxxxx
CALIBRATION RESULT OF NOISE LEVEL METER
94 dB at 1000 Hz 114 dB at 1000 Hz
96.2 xxxxx
NOISE LEVEL METER
Average L equivalent dB(A)
Over All (06:00 PM to12:00 AM)
Day Time (06:00 PM to 10:00 PM)
Night Time (10:00 PM to 12:00 AM)
MODEL
INITIAL
SAMPLING RATE
BIHAR STATE POLLUTION CONTROL BOARD, PATNA
Model 33 Type / Class 1
T232614
MAKE Pulsar Instruments Plc (Made in EU)
PARIVESH BHAWAN, PATLIPUTRA INDUSTRIAL AREA, PATNA - 800 010
DATA SHEET FOR AMBIENT NOISE MONITORING DURING DEEPAWALI DAY - 2020
DESCRIPTION OF LOATION Near Boring Road Crossing, Patna 14.11.2020
Average L equivalent dB(A)
Night Time (10:00 PM to 12:00 AM)
Over All (06:00 PM to12:00 AM)Day Time (06:00 PM to 10:00 PM)
Date
137
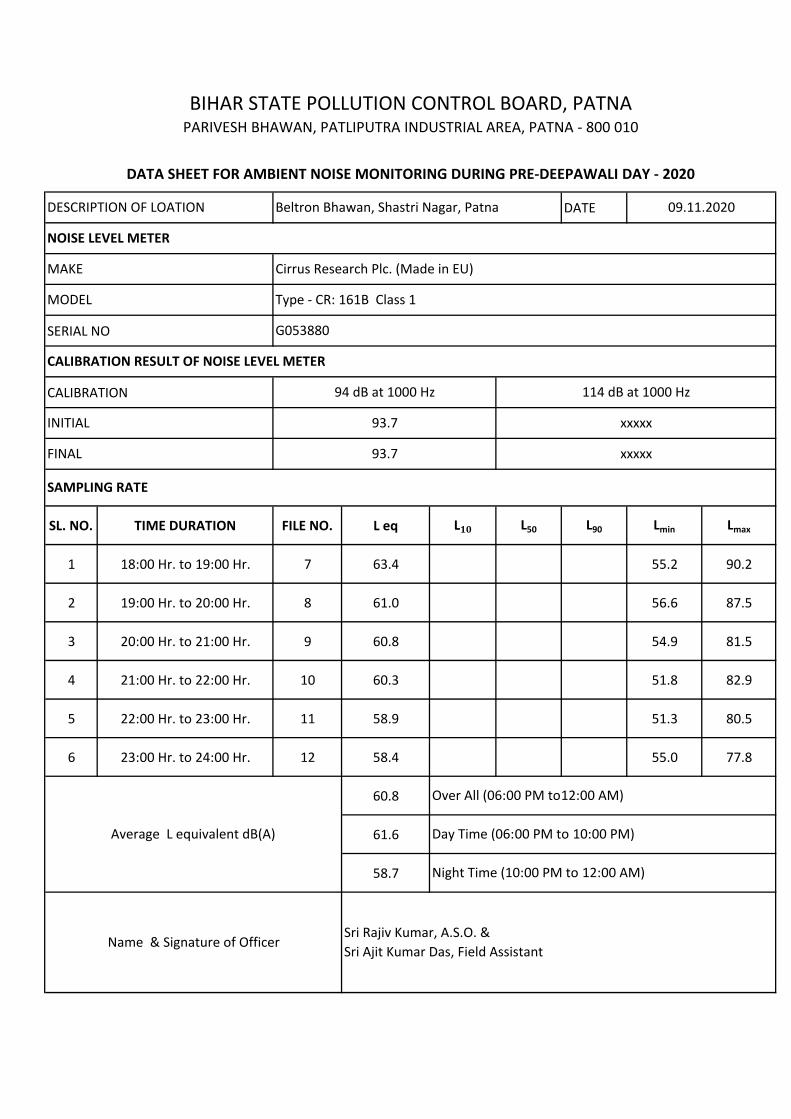
DATE
SERIAL NO
CALIBRATION
SL. NO. TIME DURATION FILE NO. L eq L10 L50 L90 Lmin Lmax
1 18:00 Hr. to 19:00 Hr. 7 63.4 55.2 90.2
2 19:00 Hr. to 20:00 Hr. 8 61.0 56.6 87.5
3 20:00 Hr. to 21:00 Hr. 9 60.8 54.9 81.5
4 21:00 Hr. to 22:00 Hr. 10 60.3 51.8 82.9
5 22:00 Hr. to 23:00 Hr. 11 58.9 51.3 80.5
6 23:00 Hr. to 24:00 Hr. 12 58.4 55.0 77.8
60.8
61.6
58.7
BIHAR STATE POLLUTION CONTROL BOARD, PATNAPARIVESH BHAWAN, PATLIPUTRA INDUSTRIAL AREA, PATNA - 800 010
DATA SHEET FOR AMBIENT NOISE MONITORING DURING PRE-DEEPAWALI DAY - 2020
DESCRIPTION OF LOATION Beltron Bhawan, Shastri Nagar, Patna 09.11.2020
G053880
CALIBRATION RESULT OF NOISE LEVEL METER
94 dB at 1000 Hz 114 dB at 1000 Hz
INITIAL 93.7 xxxxx
NOISE LEVEL METER
MAKE Cirrus Research Plc. (Made in EU)
MODEL Type - CR: 161B Class 1
Name & Signature of OfficerSri Rajiv Kumar, A.S.O. & Sri Ajit Kumar Das, Field Assistant
FINAL 93.7 xxxxx
SAMPLING RATE
Average L equivalent dB(A)
Over All (06:00 PM to12:00 AM)
Day Time (06:00 PM to 10:00 PM)
Night Time (10:00 PM to 12:00 AM)
138
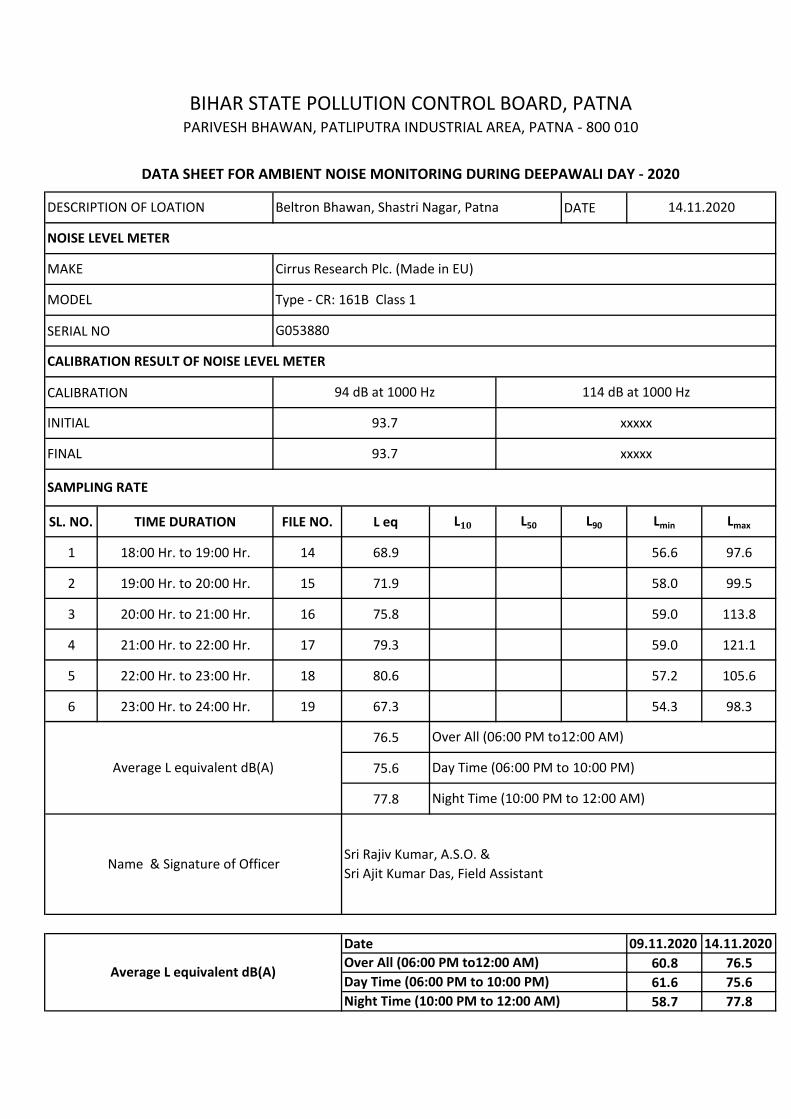
DATE
SERIAL NO
CALIBRATION
SL. NO. TIME DURATION FILE NO. L eq L10 L50 L90 Lmin Lmax
1 18:00 Hr. to 19:00 Hr. 14 68.9 56.6 97.6
2 19:00 Hr. to 20:00 Hr. 15 71.9 58.0 99.5
3 20:00 Hr. to 21:00 Hr. 16 75.8 59.0 113.8
4 21:00 Hr. to 22:00 Hr. 17 79.3 59.0 121.1
5 22:00 Hr. to 23:00 Hr. 18 80.6 57.2 105.6
6 23:00 Hr. to 24:00 Hr. 19 67.3 54.3 98.3
76.5
75.6
77.8
09.11.2020 14.11.202060.8 76.561.6 75.658.7 77.8
BIHAR STATE POLLUTION CONTROL BOARD, PATNAPARIVESH BHAWAN, PATLIPUTRA INDUSTRIAL AREA, PATNA - 800 010
MAKE Cirrus Research Plc. (Made in EU)
MODEL Type - CR: 161B Class 1
G053880
DATA SHEET FOR AMBIENT NOISE MONITORING DURING DEEPAWALI DAY - 2020
DESCRIPTION OF LOATION Beltron Bhawan, Shastri Nagar, Patna 14.11.2020
NOISE LEVEL METER
FINAL 93.7 xxxxx
SAMPLING RATE
Average L equivalent dB(A)
Over All (06:00 PM to12:00 AM)
Day Time (06:00 PM to 10:00 PM)
Night Time (10:00 PM to 12:00 AM)
CALIBRATION RESULT OF NOISE LEVEL METER
94 dB at 1000 Hz 114 dB at 1000 Hz
INITIAL 93.7 xxxxx
Name & Signature of OfficerSri Rajiv Kumar, A.S.O. & Sri Ajit Kumar Das, Field Assistant
Average L equivalent dB(A)
DateOver All (06:00 PM to12:00 AM)Day Time (06:00 PM to 10:00 PM)Night Time (10:00 PM to 12:00 AM)
139
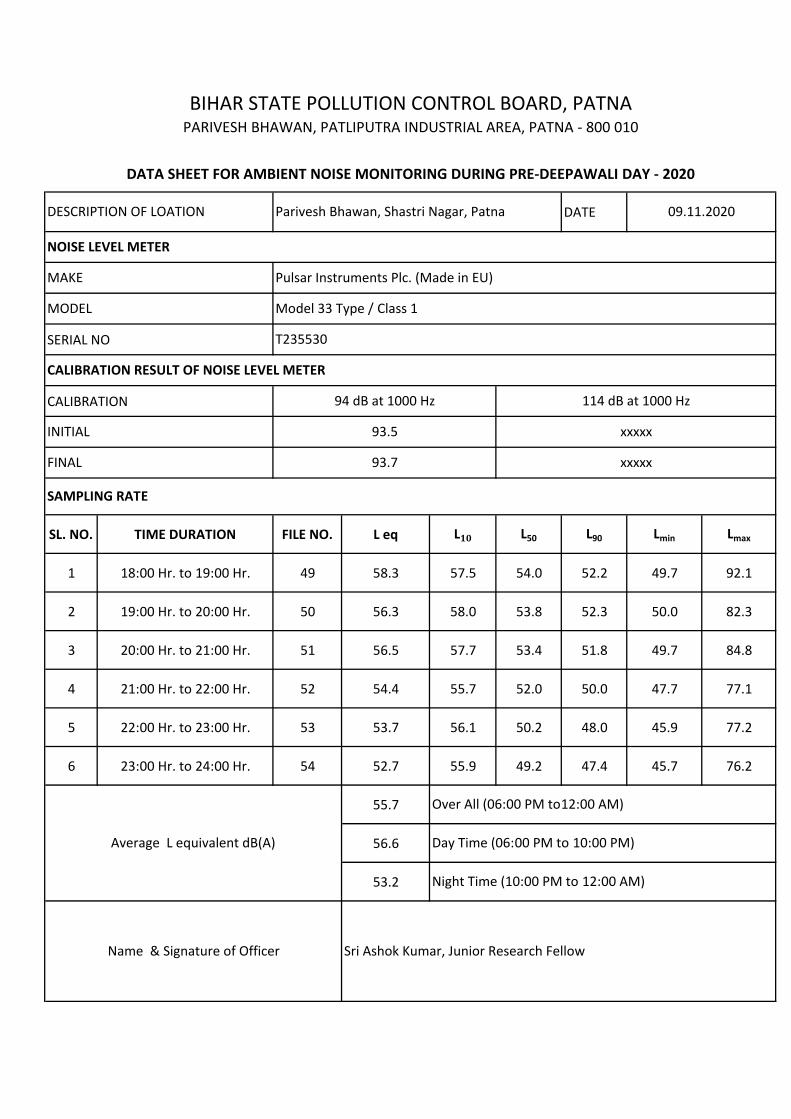
DATE
SERIAL NO
CALIBRATION
SL. NO. TIME DURATION FILE NO. L eq L10 L50 L90 Lmin Lmax
1 18:00 Hr. to 19:00 Hr. 49 58.3 57.5 54.0 52.2 49.7 92.1
2 19:00 Hr. to 20:00 Hr. 50 56.3 58.0 53.8 52.3 50.0 82.3
3 20:00 Hr. to 21:00 Hr. 51 56.5 57.7 53.4 51.8 49.7 84.8
4 21:00 Hr. to 22:00 Hr. 52 54.4 55.7 52.0 50.0 47.7 77.1
5 22:00 Hr. to 23:00 Hr. 53 53.7 56.1 50.2 48.0 45.9 77.2
6 23:00 Hr. to 24:00 Hr. 54 52.7 55.9 49.2 47.4 45.7 76.2
55.7
56.6
53.2
BIHAR STATE POLLUTION CONTROL BOARD, PATNAPARIVESH BHAWAN, PATLIPUTRA INDUSTRIAL AREA, PATNA - 800 010
DATA SHEET FOR AMBIENT NOISE MONITORING DURING PRE-DEEPAWALI DAY - 2020
DESCRIPTION OF LOATION Parivesh Bhawan, Shastri Nagar, Patna 09.11.2020
T235530
CALIBRATION RESULT OF NOISE LEVEL METER
94 dB at 1000 Hz 114 dB at 1000 Hz
INITIAL 93.5 xxxxx
NOISE LEVEL METER
MAKE Pulsar Instruments Plc. (Made in EU)
MODEL Model 33 Type / Class 1
Name & Signature of Officer Sri Ashok Kumar, Junior Research Fellow
FINAL 93.7 xxxxx
SAMPLING RATE
Average L equivalent dB(A)
Over All (06:00 PM to12:00 AM)
Day Time (06:00 PM to 10:00 PM)
Night Time (10:00 PM to 12:00 AM)
140
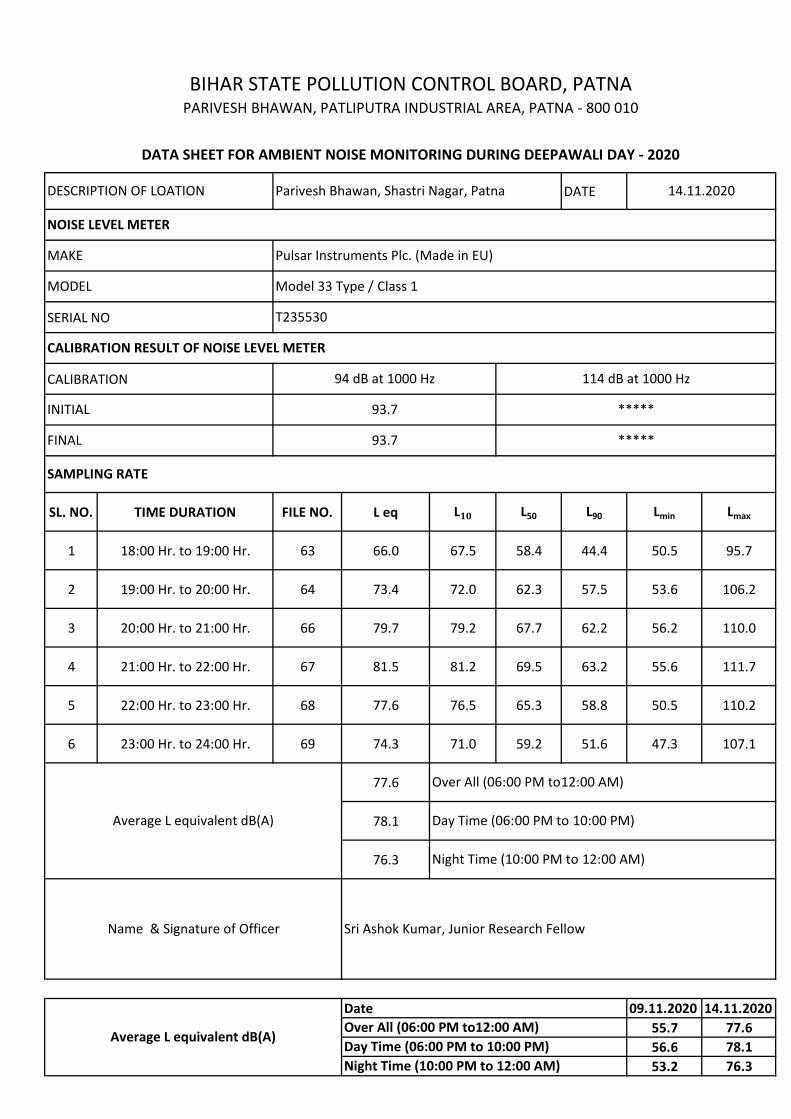
DATE
SERIAL NO
CALIBRATION
SL. NO. TIME DURATION FILE NO. L eq L10 L50 L90 Lmin Lmax
1 18:00 Hr. to 19:00 Hr. 63 66.0 67.5 58.4 44.4 50.5 95.7
2 19:00 Hr. to 20:00 Hr. 64 73.4 72.0 62.3 57.5 53.6 106.2
3 20:00 Hr. to 21:00 Hr. 66 79.7 79.2 67.7 62.2 56.2 110.0
4 21:00 Hr. to 22:00 Hr. 67 81.5 81.2 69.5 63.2 55.6 111.7
5 22:00 Hr. to 23:00 Hr. 68 77.6 76.5 65.3 58.8 50.5 110.2
6 23:00 Hr. to 24:00 Hr. 69 74.3 71.0 59.2 51.6 47.3 107.1
77.6
78.1
76.3
09.11.2020 14.11.202055.7 77.656.6 78.153.2 76.3
BIHAR STATE POLLUTION CONTROL BOARD, PATNAPARIVESH BHAWAN, PATLIPUTRA INDUSTRIAL AREA, PATNA - 800 010
MAKE Pulsar Instruments Plc. (Made in EU)
MODEL Model 33 Type / Class 1
T235530
DATA SHEET FOR AMBIENT NOISE MONITORING DURING DEEPAWALI DAY - 2020
DESCRIPTION OF LOATION Parivesh Bhawan, Shastri Nagar, Patna 14.11.2020
NOISE LEVEL METER
FINAL 93.7 *****
SAMPLING RATE
Average L equivalent dB(A)
Over All (06:00 PM to12:00 AM)
Day Time (06:00 PM to 10:00 PM)
Night Time (10:00 PM to 12:00 AM)
CALIBRATION RESULT OF NOISE LEVEL METER
94 dB at 1000 Hz 114 dB at 1000 Hz
INITIAL 93.7 *****
Name & Signature of Officer Sri Ashok Kumar, Junior Research Fellow
Average L equivalent dB(A)
DateOver All (06:00 PM to12:00 AM)Day Time (06:00 PM to 10:00 PM)Night Time (10:00 PM to 12:00 AM)
141

DATE
SERIAL NO
CALIBRATION
SL. NO. TIME DURATION FILE NO. L eq L10 L50 L90 Lmin Lmax
1 18:00 Hr. to 19:00 Hr. 65.3 49.8 91.3
2 19:00 Hr. to 20:00 Hr. 64.0 47.4 85.6
3 20:00 Hr. to 21:00 Hr. 62.9 48.2 87.1
4 21:00 Hr. to 22:00 Hr. 60.7 46.2 83.8
5 22:00 Hr. to 23:00 Hr. 58.4 42.8 83.5
6 23:00 Hr. to 24:00 Hr. 57.8 36.3 87.1
62.4
63.5
58.1
BIHAR STATE POLLUTION CONTROL BOARD, PATNAPARIVESH BHAWAN, PATLIPUTRA INDUSTRIAL AREA, PATNA - 800 010
DATA SHEET FOR AMBIENT NOISE MONITORING
DESCRIPTION OF LOATION Planetarium IGSC, Patna 09.11.2020
CALIBRATION RESULT OF NOISE LEVEL METER
94 dB at 1000 Hz 114 dB at 1000 Hz
INITIAL
NOISE LEVEL METER
MAKE Continuous Noise Monitoring Centre
MODEL
Name & Signature of Officer
FINAL
SAMPLING RATE
Average L equivalent dB(A)
Over All (06:00 PM to12:00 AM)
Day Time (06:00 PM to 10:00 PM)
Night Time (10:00 PM to 12:00 AM)
142
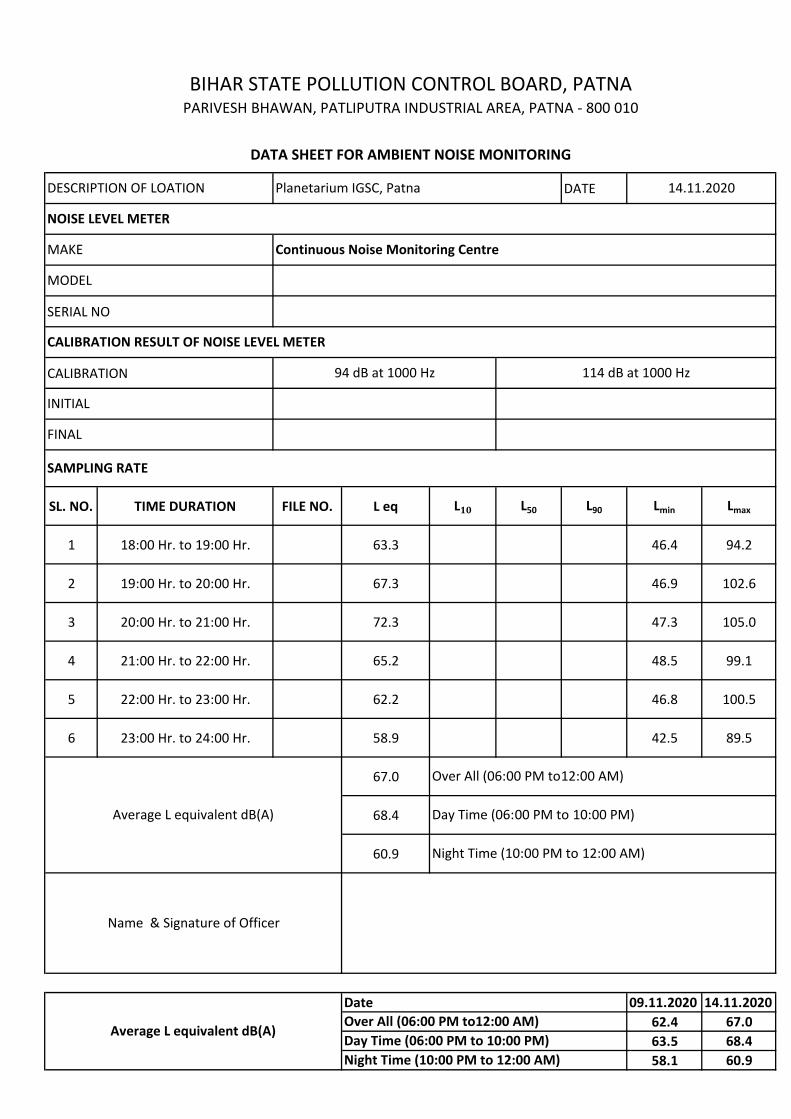
DATE
SERIAL NO
CALIBRATION
SL. NO. TIME DURATION FILE NO. L eq L10 L50 L90 Lmin Lmax
1 18:00 Hr. to 19:00 Hr. 63.3 46.4 94.2
2 19:00 Hr. to 20:00 Hr. 67.3 46.9 102.6
3 20:00 Hr. to 21:00 Hr. 72.3 47.3 105.0
4 21:00 Hr. to 22:00 Hr. 65.2 48.5 99.1
5 22:00 Hr. to 23:00 Hr. 62.2 46.8 100.5
6 23:00 Hr. to 24:00 Hr. 58.9 42.5 89.5
67.0
68.4
60.9
09.11.2020 14.11.202062.4 67.063.5 68.458.1 60.9
BIHAR STATE POLLUTION CONTROL BOARD, PATNAPARIVESH BHAWAN, PATLIPUTRA INDUSTRIAL AREA, PATNA - 800 010
MAKE Continuous Noise Monitoring Centre
MODEL
DATA SHEET FOR AMBIENT NOISE MONITORING
DESCRIPTION OF LOATION Planetarium IGSC, Patna 14.11.2020
NOISE LEVEL METER
FINAL
SAMPLING RATE
Average L equivalent dB(A)
Over All (06:00 PM to12:00 AM)
Day Time (06:00 PM to 10:00 PM)
Night Time (10:00 PM to 12:00 AM)
CALIBRATION RESULT OF NOISE LEVEL METER
94 dB at 1000 Hz 114 dB at 1000 Hz
INITIAL
Name & Signature of Officer
Average L equivalent dB(A)
DateOver All (06:00 PM to12:00 AM)Day Time (06:00 PM to 10:00 PM)Night Time (10:00 PM to 12:00 AM)
143
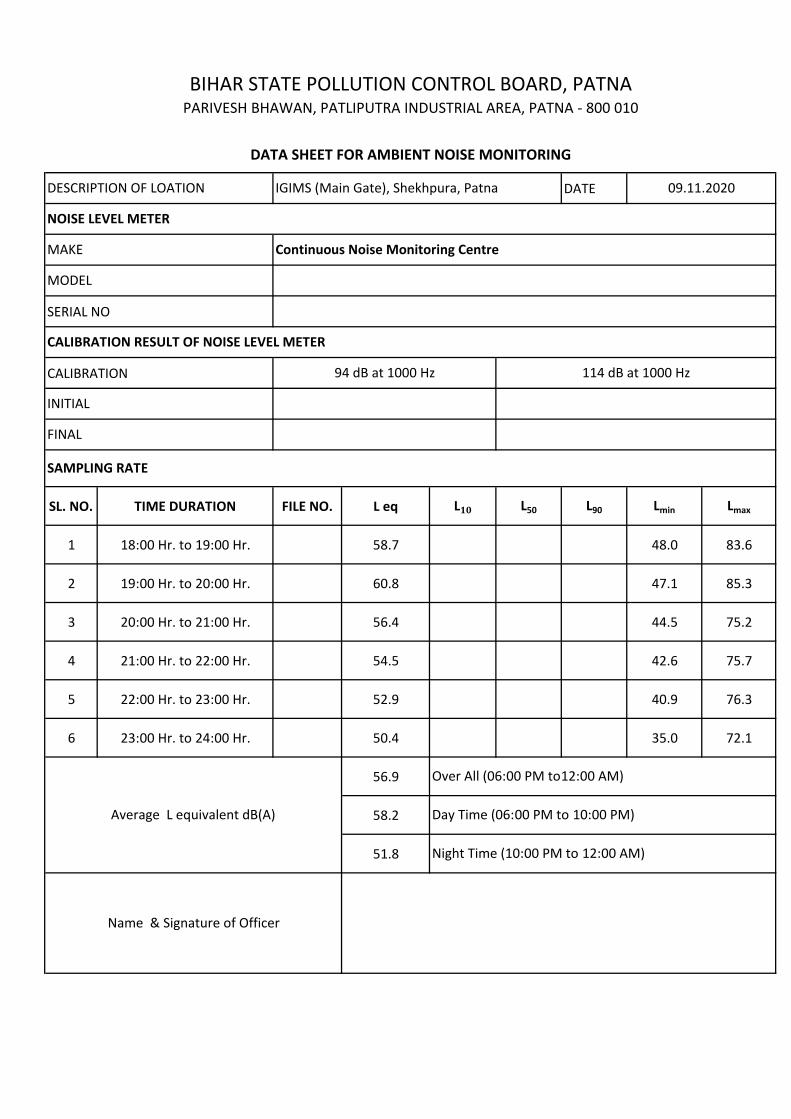
DATE
SERIAL NO
CALIBRATION
SL. NO. TIME DURATION FILE NO. L eq L10 L50 L90 Lmin Lmax
1 18:00 Hr. to 19:00 Hr. 58.7 48.0 83.6
2 19:00 Hr. to 20:00 Hr. 60.8 47.1 85.3
3 20:00 Hr. to 21:00 Hr. 56.4 44.5 75.2
4 21:00 Hr. to 22:00 Hr. 54.5 42.6 75.7
5 22:00 Hr. to 23:00 Hr. 52.9 40.9 76.3
6 23:00 Hr. to 24:00 Hr. 50.4 35.0 72.1
56.9
58.2
51.8
BIHAR STATE POLLUTION CONTROL BOARD, PATNAPARIVESH BHAWAN, PATLIPUTRA INDUSTRIAL AREA, PATNA - 800 010
DATA SHEET FOR AMBIENT NOISE MONITORING
DESCRIPTION OF LOATION IGIMS (Main Gate), Shekhpura, Patna 09.11.2020
CALIBRATION RESULT OF NOISE LEVEL METER
94 dB at 1000 Hz 114 dB at 1000 Hz
INITIAL
NOISE LEVEL METER
MAKE Continuous Noise Monitoring Centre
MODEL
Name & Signature of Officer
FINAL
SAMPLING RATE
Average L equivalent dB(A)
Over All (06:00 PM to12:00 AM)
Day Time (06:00 PM to 10:00 PM)
Night Time (10:00 PM to 12:00 AM)
144
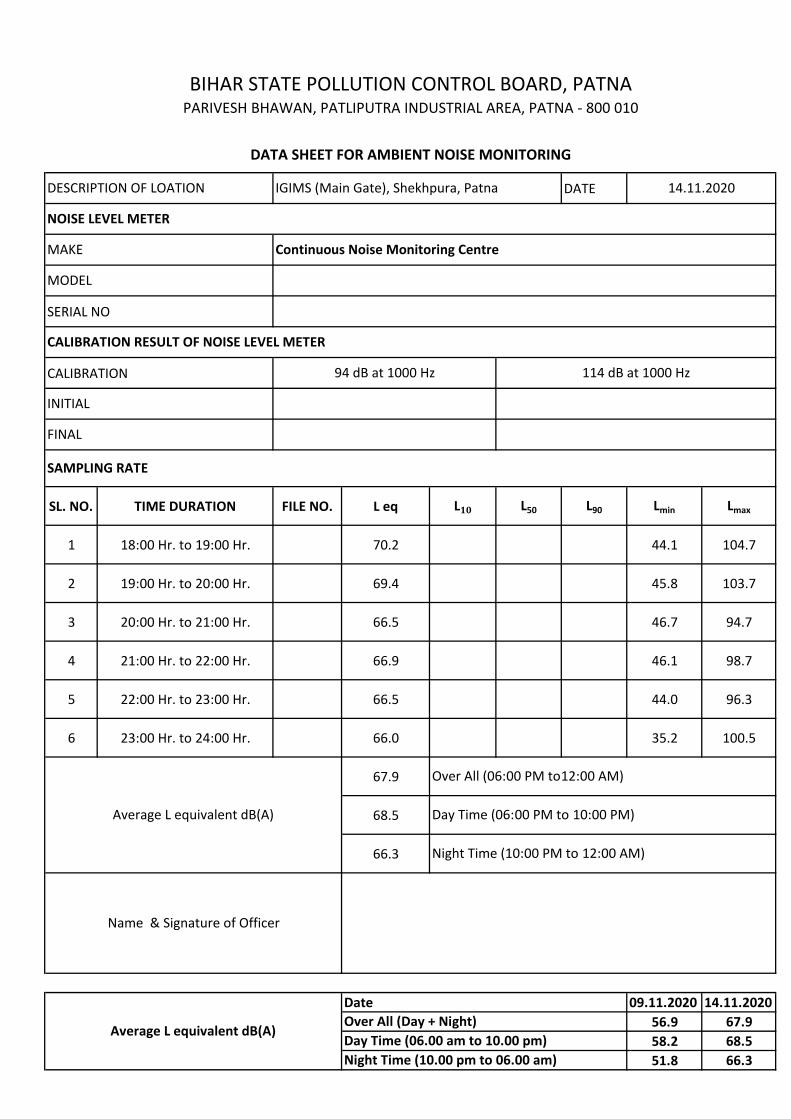
DATE
SERIAL NO
CALIBRATION
SL. NO. TIME DURATION FILE NO. L eq L10 L50 L90 Lmin Lmax
1 18:00 Hr. to 19:00 Hr. 70.2 44.1 104.7
2 19:00 Hr. to 20:00 Hr. 69.4 45.8 103.7
3 20:00 Hr. to 21:00 Hr. 66.5 46.7 94.7
4 21:00 Hr. to 22:00 Hr. 66.9 46.1 98.7
5 22:00 Hr. to 23:00 Hr. 66.5 44.0 96.3
6 23:00 Hr. to 24:00 Hr. 66.0 35.2 100.5
67.9
68.5
66.3
09.11.2020 14.11.202056.9 67.958.2 68.551.8 66.3
BIHAR STATE POLLUTION CONTROL BOARD, PATNAPARIVESH BHAWAN, PATLIPUTRA INDUSTRIAL AREA, PATNA - 800 010
MAKE Continuous Noise Monitoring Centre
MODEL
DATA SHEET FOR AMBIENT NOISE MONITORING
DESCRIPTION OF LOATION IGIMS (Main Gate), Shekhpura, Patna 14.11.2020
NOISE LEVEL METER
FINAL
SAMPLING RATE
Average L equivalent dB(A)
Over All (06:00 PM to12:00 AM)
Day Time (06:00 PM to 10:00 PM)
Night Time (10:00 PM to 12:00 AM)
CALIBRATION RESULT OF NOISE LEVEL METER
94 dB at 1000 Hz 114 dB at 1000 Hz
INITIAL
Name & Signature of Officer
Average L equivalent dB(A)
DateOver All (Day + Night)Day Time (06.00 am to 10.00 pm)Night Time (10.00 pm to 06.00 am)
145
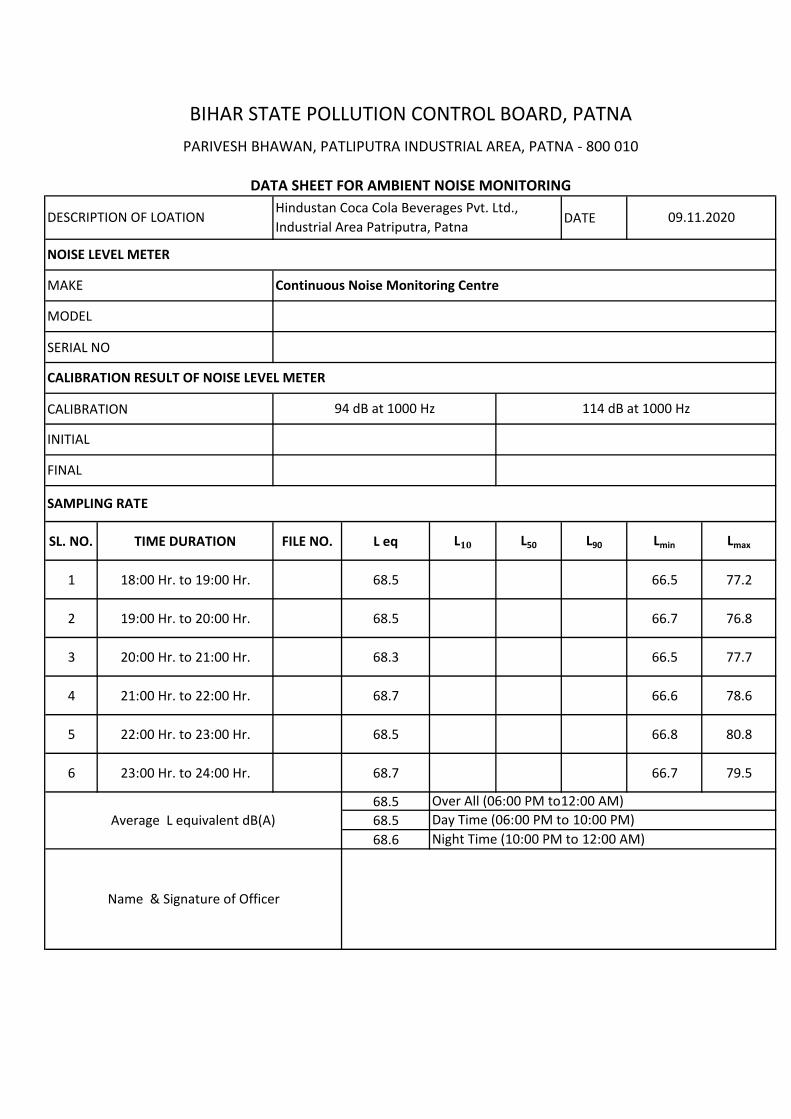
DATE
SERIAL NO
CALIBRATION
SL. NO. TIME DURATION FILE NO. L eq L10 L50 L90 Lmin Lmax
1 18:00 Hr. to 19:00 Hr. 68.5 66.5 77.2
2 19:00 Hr. to 20:00 Hr. 68.5 66.7 76.8
3 20:00 Hr. to 21:00 Hr. 68.3 66.5 77.7
4 21:00 Hr. to 22:00 Hr. 68.7 66.6 78.6
5 22:00 Hr. to 23:00 Hr. 68.5 66.8 80.8
6 23:00 Hr. to 24:00 Hr. 68.7 66.7 79.5
68.568.568.6
FINAL
SAMPLING RATE
Average L equivalent dB(A) Day Time (06:00 PM to 10:00 PM)Night Time (10:00 PM to 12:00 AM)
Hindustan Coca Cola Beverages Pvt. Ltd., Industrial Area Patriputra, Patna
09.11.2020
NOISE LEVEL METER
MAKE
MODEL
CALIBRATION RESULT OF NOISE LEVEL METER
INITIAL
Continuous Noise Monitoring Centre
94 dB at 1000 Hz 114 dB at 1000 Hz
Over All (06:00 PM to12:00 AM)
Name & Signature of Officer
PARIVESH BHAWAN, PATLIPUTRA INDUSTRIAL AREA, PATNA - 800 010
DATA SHEET FOR AMBIENT NOISE MONITORING
DESCRIPTION OF LOATION
BIHAR STATE POLLUTION CONTROL BOARD, PATNA
146
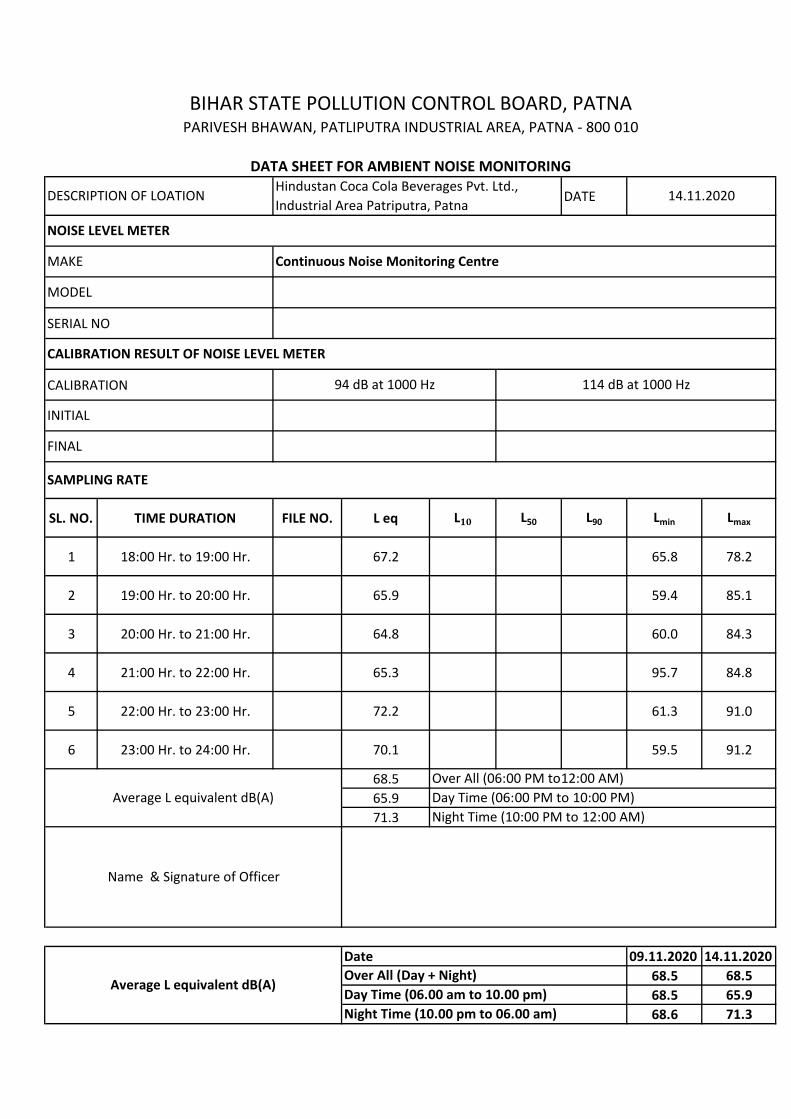
DATE
SERIAL NO
CALIBRATION
SL. NO. TIME DURATION FILE NO. L eq L10 L50 L90 Lmin Lmax
1 18:00 Hr. to 19:00 Hr. 67.2 65.8 78.2
2 19:00 Hr. to 20:00 Hr. 65.9 59.4 85.1
3 20:00 Hr. to 21:00 Hr. 64.8 60.0 84.3
4 21:00 Hr. to 22:00 Hr. 65.3 95.7 84.8
5 22:00 Hr. to 23:00 Hr. 72.2 61.3 91.0
6 23:00 Hr. to 24:00 Hr. 70.1 59.5 91.2
68.565.971.3
09.11.2020 14.11.202068.5 68.568.5 65.968.6 71.3
94 dB at 1000 Hz 114 dB at 1000 Hz
MAKE
Average L equivalent dB(A) Day Time (06.00 am to 10.00 pm)Night Time (10.00 pm to 06.00 am)
Over All (06:00 PM to12:00 AM)
DateOver All (Day + Night)
INITIAL
FINAL
SAMPLING RATE
Average L equivalent dB(A) Day Time (06:00 PM to 10:00 PM)Night Time (10:00 PM to 12:00 AM)
Name & Signature of Officer
MODEL
CALIBRATION RESULT OF NOISE LEVEL METER
PARIVESH BHAWAN, PATLIPUTRA INDUSTRIAL AREA, PATNA - 800 010
DATA SHEET FOR AMBIENT NOISE MONITORING
DESCRIPTION OF LOATION
NOISE LEVEL METER
BIHAR STATE POLLUTION CONTROL BOARD, PATNA
Hindustan Coca Cola Beverages Pvt. Ltd., Industrial Area Patriputra, Patna
14.11.2020
Continuous Noise Monitoring Centre
147
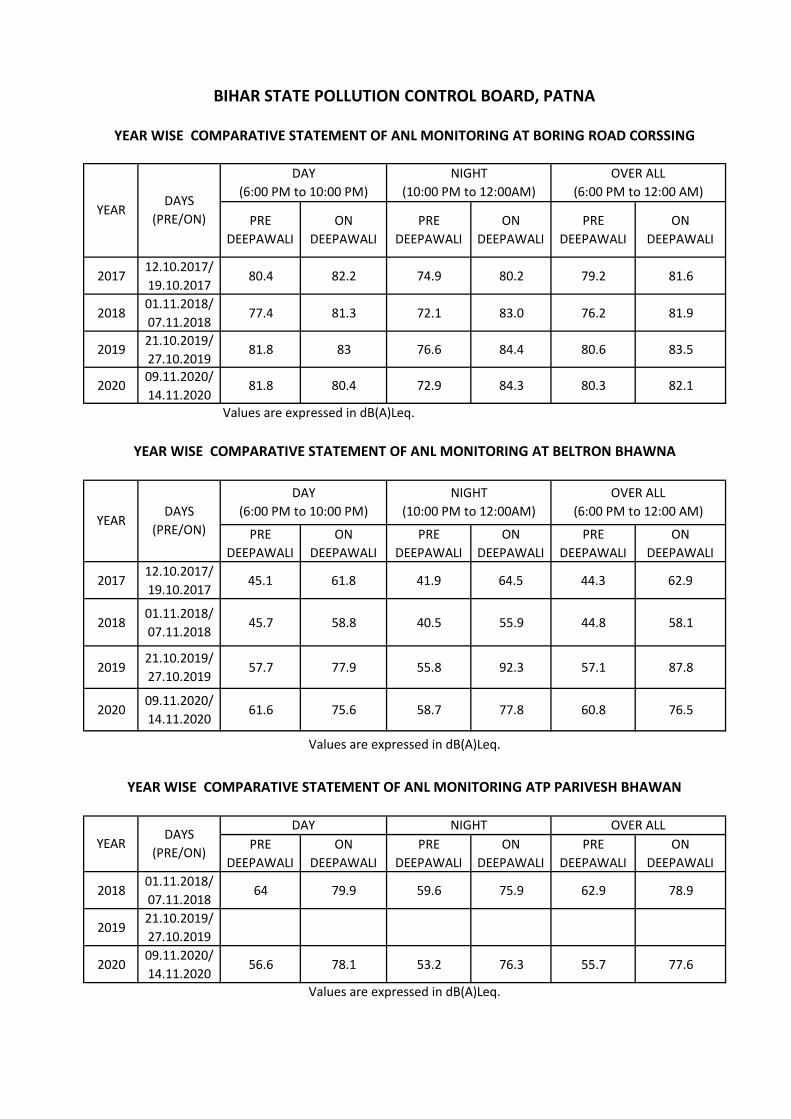
PRE DEEPAWALI
ON DEEPAWALI
PRE DEEPAWALI
ON DEEPAWALI
PRE DEEPAWALI
ON DEEPAWALI
201712.10.2017/ 19.10.2017
80.4 82.2 74.9 80.2 79.2 81.6
201801.11.2018/ 07.11.2018
77.4 81.3 72.1 83.0 76.2 81.9
201921.10.2019/ 27.10.2019
81.8 83 76.6 84.4 80.6 83.5
202009.11.2020/ 14.11.2020
81.8 80.4 72.9 84.3 80.3 82.1
Values are expressed in dB(A)Leq.
PRE DEEPAWALI
ON DEEPAWALI
PRE DEEPAWALI
ON DEEPAWALI
PRE DEEPAWALI
ON DEEPAWALI
201712.10.2017/ 19.10.2017
45.1 61.8 41.9 64.5 44.3 62.9
201801.11.2018/ 07.11.2018
45.7 58.8 40.5 55.9 44.8 58.1
201921.10.2019/ 27.10.2019
57.7 77.9 55.8 92.3 57.1 87.8
202009.11.2020/ 14.11.2020
61.6 75.6 58.7 77.8 60.8 76.5
PRE DEEPAWALI
ON DEEPAWALI
PRE DEEPAWALI
ON DEEPAWALI
PRE DEEPAWALI
ON DEEPAWALI
201801.11.2018/ 07.11.2018
64 79.9 59.6 75.9 62.9 78.9
201921.10.2019/ 27.10.2019
202009.11.2020/ 14.11.2020
56.6 78.1 53.2 76.3 55.7 77.6
Values are expressed in dB(A)Leq.
YEARDAYS
(PRE/ON)
DAY NIGHT OVER ALL
BIHAR STATE POLLUTION CONTROL BOARD, PATNA
YEAR WISE COMPARATIVE STATEMENT OF ANL MONITORING AT BORING ROAD CORSSING
DAY (6:00 PM to 10:00 PM)
NIGHT (10:00 PM to 12:00AM)
OVER ALL (6:00 PM to 12:00 AM)
DAYS (PRE/ON)
YEAR
Values are expressed in dB(A)Leq.
YEAR WISE COMPARATIVE STATEMENT OF ANL MONITORING AT BELTRON BHAWNA
YEARDAYS
(PRE/ON)
DAY (6:00 PM to 10:00 PM)
NIGHT (10:00 PM to 12:00AM)
OVER ALL (6:00 PM to 12:00 AM)
YEAR WISE COMPARATIVE STATEMENT OF ANL MONITORING ATP PARIVESH BHAWAN
148
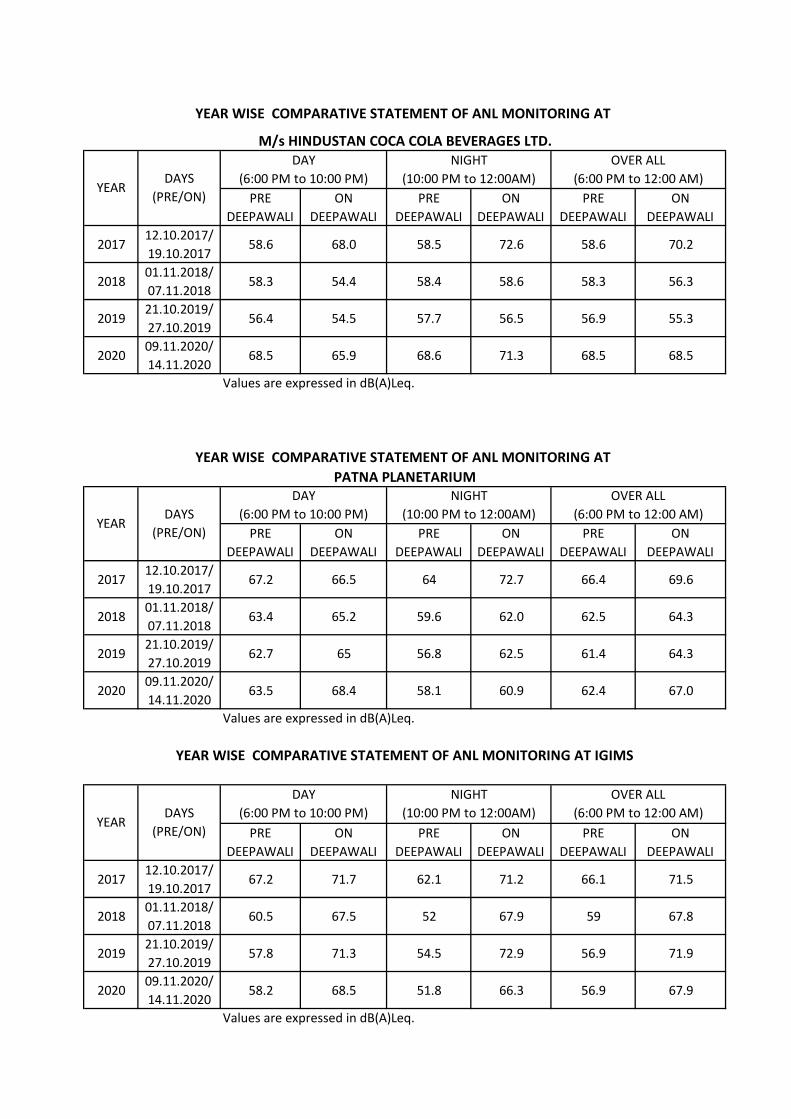
PRE DEEPAWALI
ON DEEPAWALI
PRE DEEPAWALI
ON DEEPAWALI
PRE DEEPAWALI
ON DEEPAWALI
201712.10.2017/ 19.10.2017
58.6 68.0 58.5 72.6 58.6 70.2
201801.11.2018/ 07.11.2018
58.3 54.4 58.4 58.6 58.3 56.3
201921.10.2019/ 27.10.2019
56.4 54.5 57.7 56.5 56.9 55.3
202009.11.2020/ 14.11.2020
68.5 65.9 68.6 71.3 68.5 68.5
Values are expressed in dB(A)Leq.
PRE DEEPAWALI
ON DEEPAWALI
PRE DEEPAWALI
ON DEEPAWALI
PRE DEEPAWALI
ON DEEPAWALI
201712.10.2017/ 19.10.2017
67.2 66.5 64 72.7 66.4 69.6
201801.11.2018/ 07.11.2018
63.4 65.2 59.6 62.0 62.5 64.3
201921.10.2019/ 27.10.2019
62.7 65 56.8 62.5 61.4 64.3
202009.11.2020/ 14.11.2020
63.5 68.4 58.1 60.9 62.4 67.0
Values are expressed in dB(A)Leq.
PRE DEEPAWALI
ON DEEPAWALI
PRE DEEPAWALI
ON DEEPAWALI
PRE DEEPAWALI
ON DEEPAWALI
201712.10.2017/ 19.10.2017
67.2 71.7 62.1 71.2 66.1 71.5
201801.11.2018/ 07.11.2018
60.5 67.5 52 67.9 59 67.8
201921.10.2019/ 27.10.2019
57.8 71.3 54.5 72.9 56.9 71.9
202009.11.2020/ 14.11.2020
58.2 68.5 51.8 66.3 56.9 67.9
Values are expressed in dB(A)Leq.
YEAR WISE COMPARATIVE STATEMENT OF ANL MONITORING AT IGIMS
YEARDAYS
(PRE/ON)
DAY (6:00 PM to 10:00 PM)
NIGHT (10:00 PM to 12:00AM)
OVER ALL (6:00 PM to 12:00 AM)
YEAR WISE COMPARATIVE STATEMENT OF ANL MONITORING AT PATNA PLANETARIUM
YEARDAYS
(PRE/ON)
DAY (6:00 PM to 10:00 PM)
NIGHT (10:00 PM to 12:00AM)
OVER ALL (6:00 PM to 12:00 AM)
YEAR WISE COMPARATIVE STATEMENT OF ANL MONITORING AT
YEARDAYS
(PRE/ON)
DAY (6:00 PM to 10:00 PM)
NIGHT (10:00 PM to 12:00AM)
OVER ALL (6:00 PM to 12:00 AM)
M/s HINDUSTAN COCA COLA BEVERAGES LTD.
149
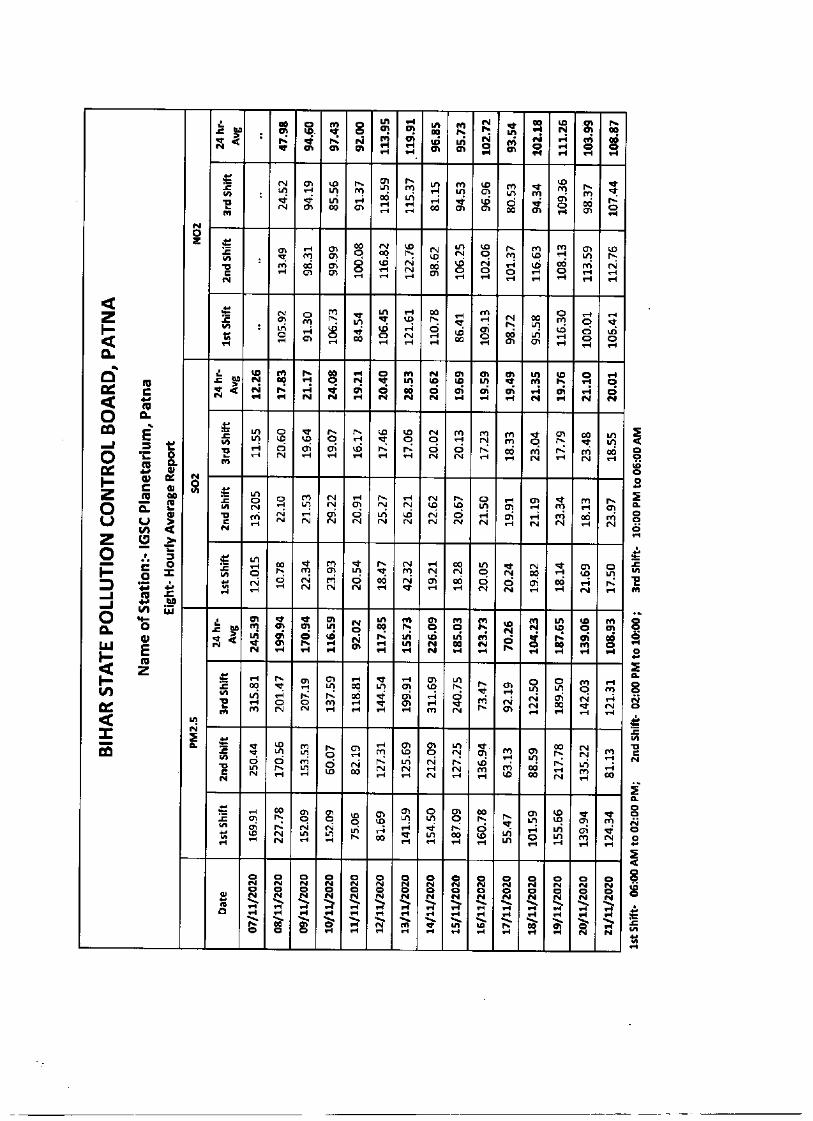
150
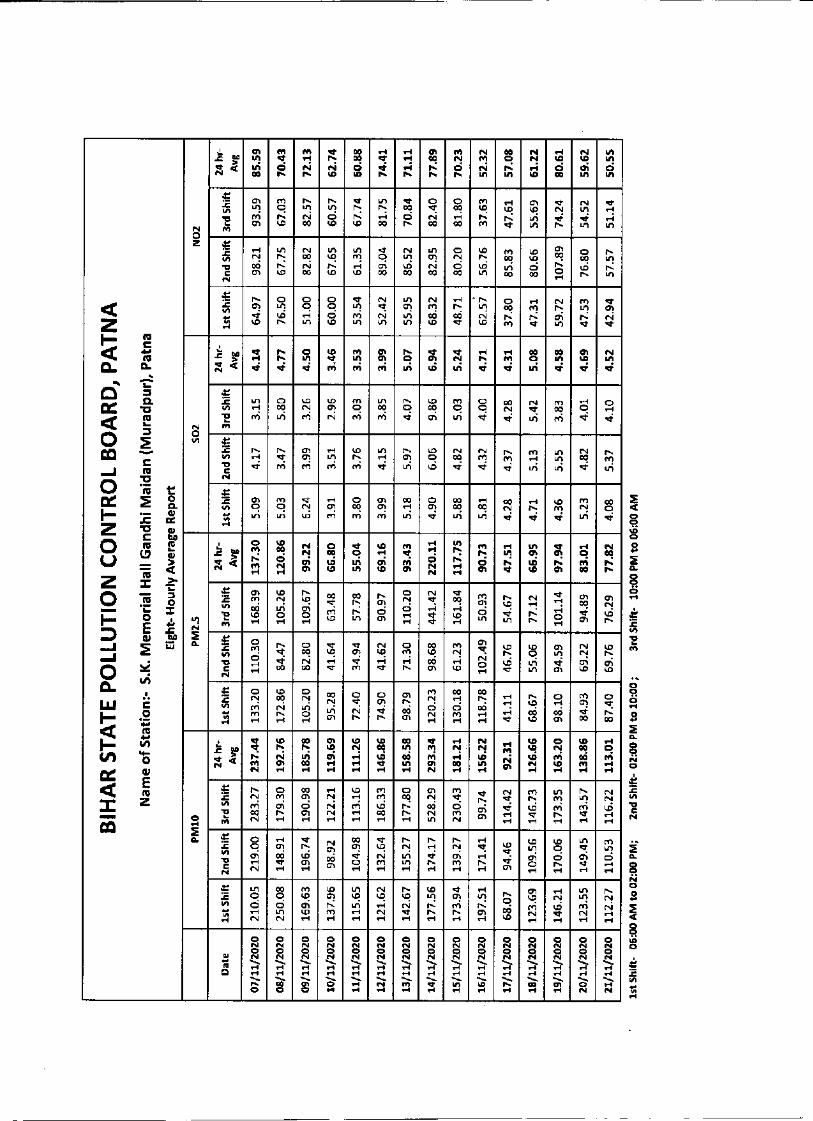
151
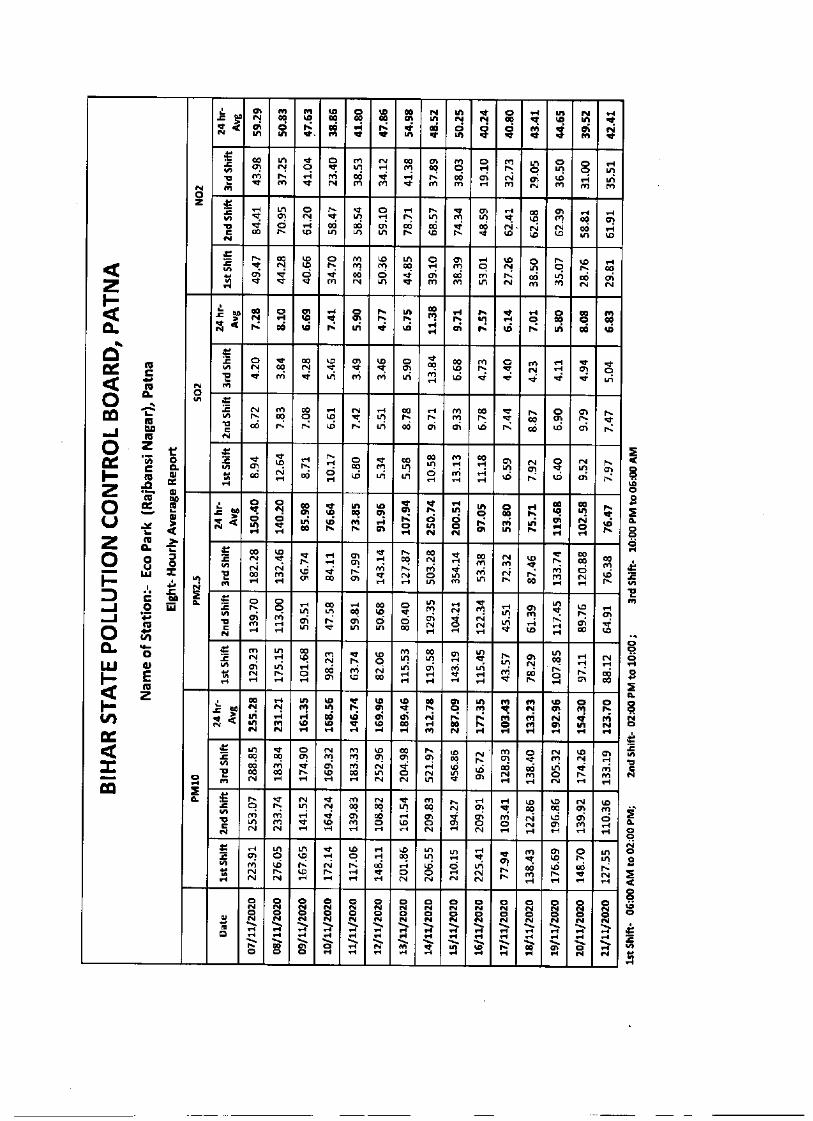
152
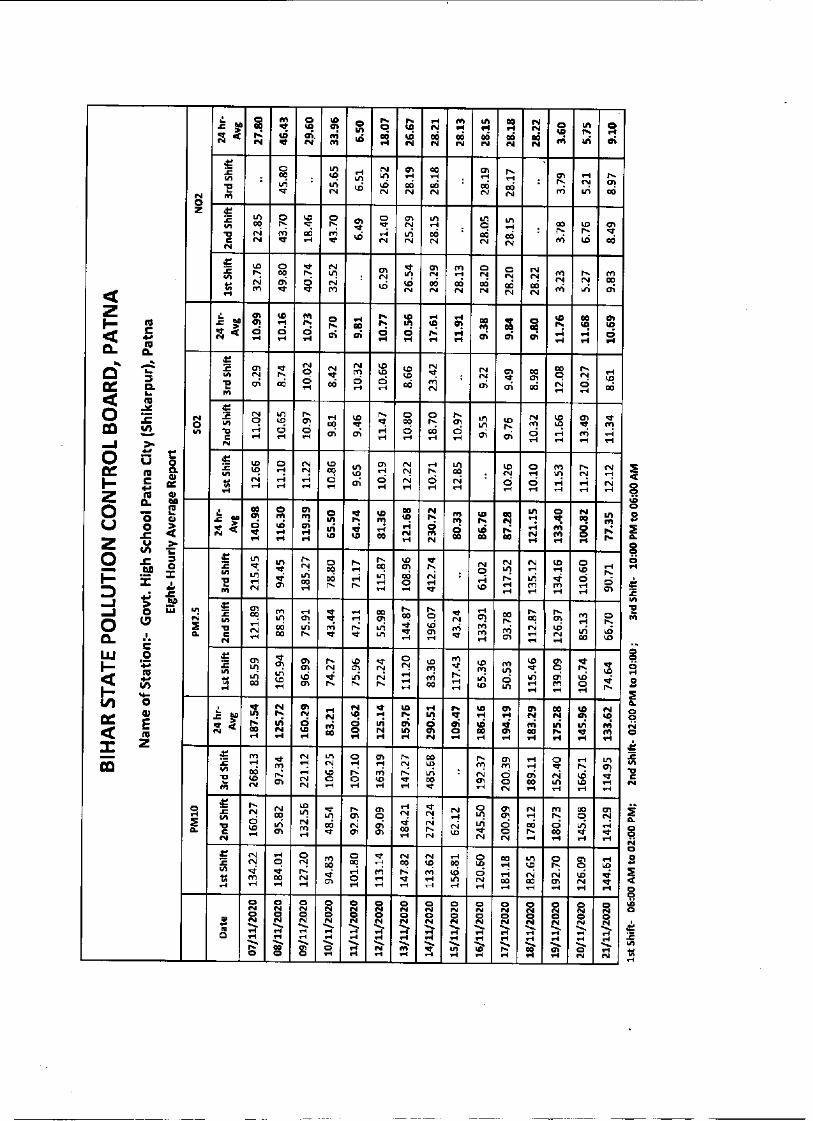
153
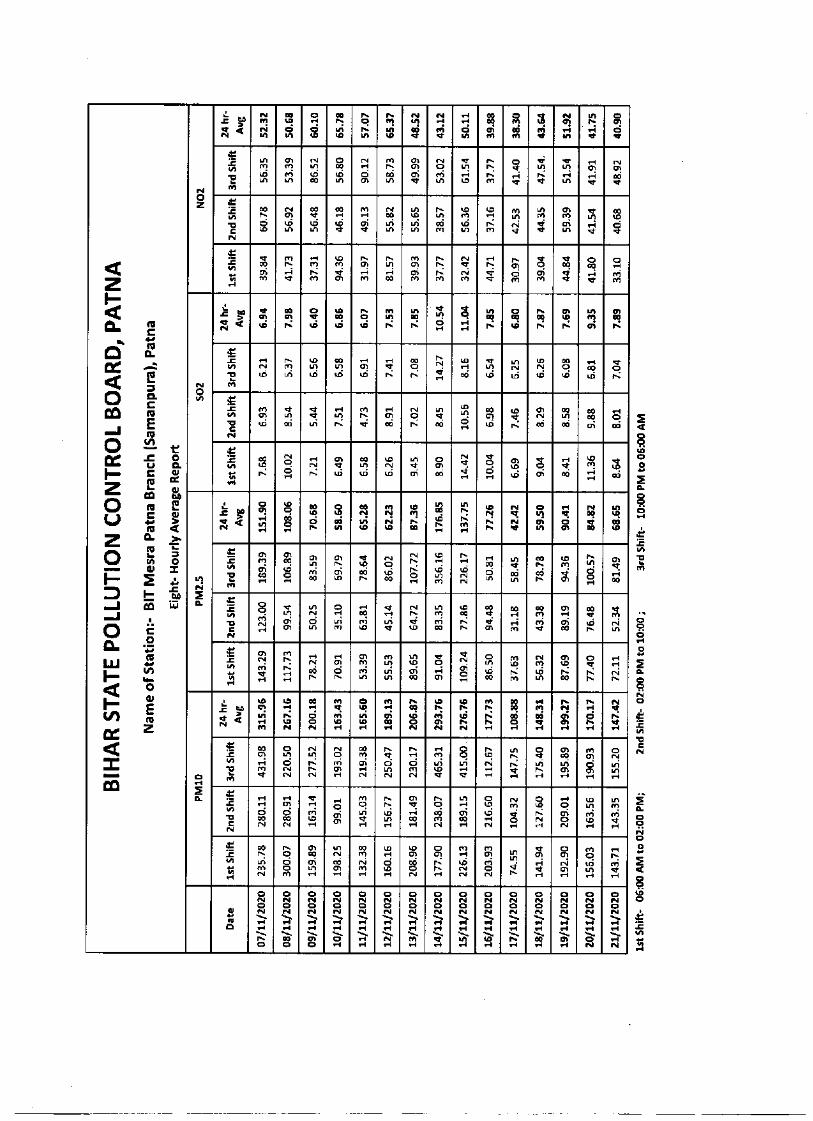
154
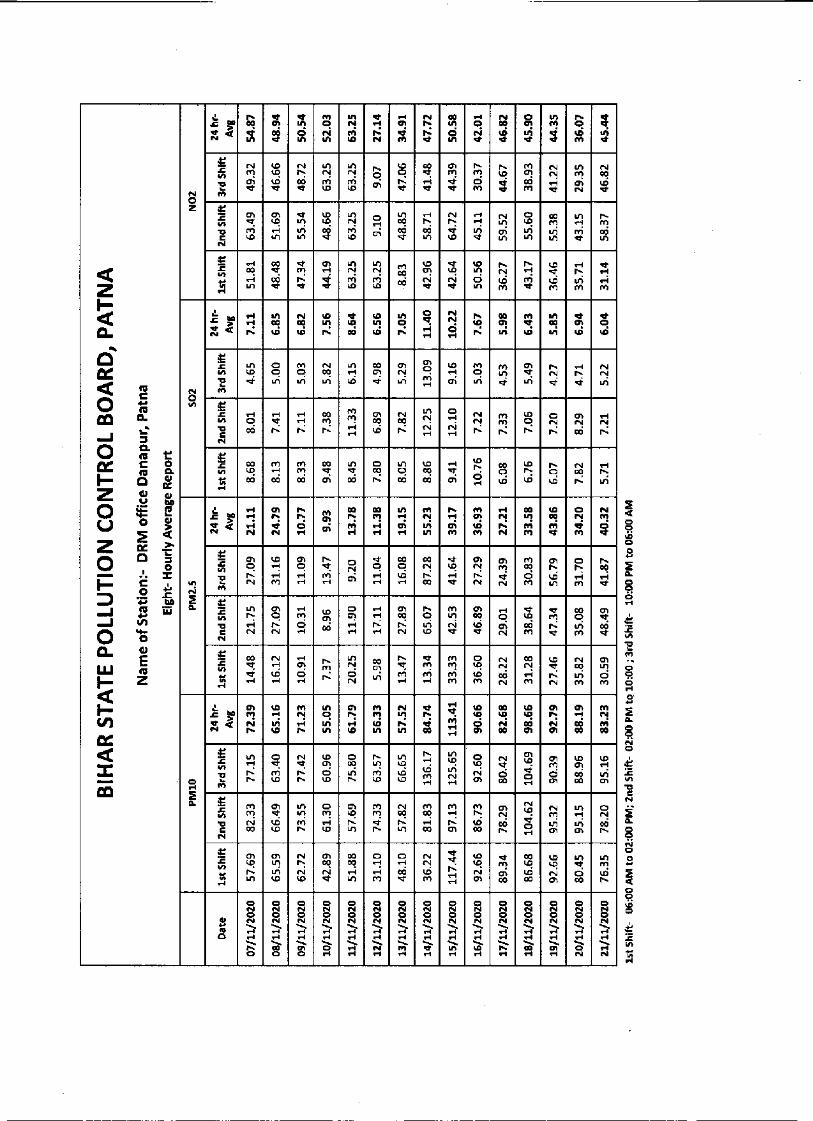
155
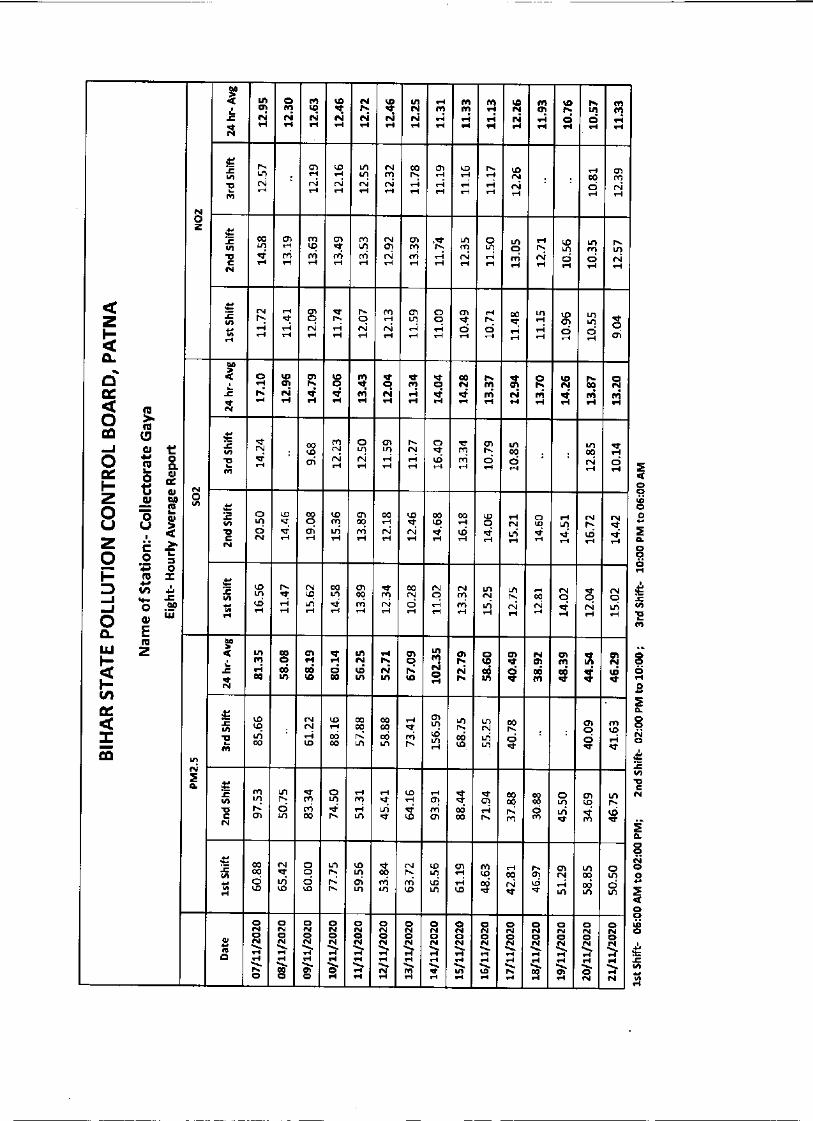
156
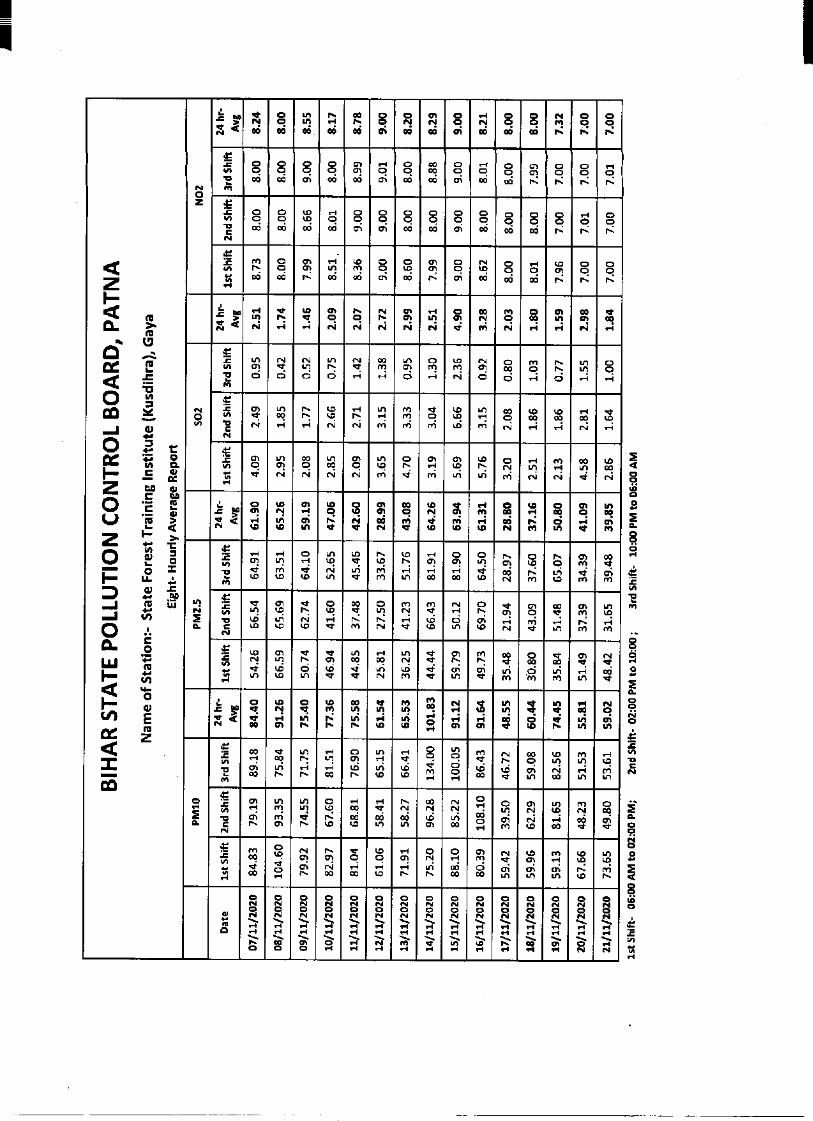
157
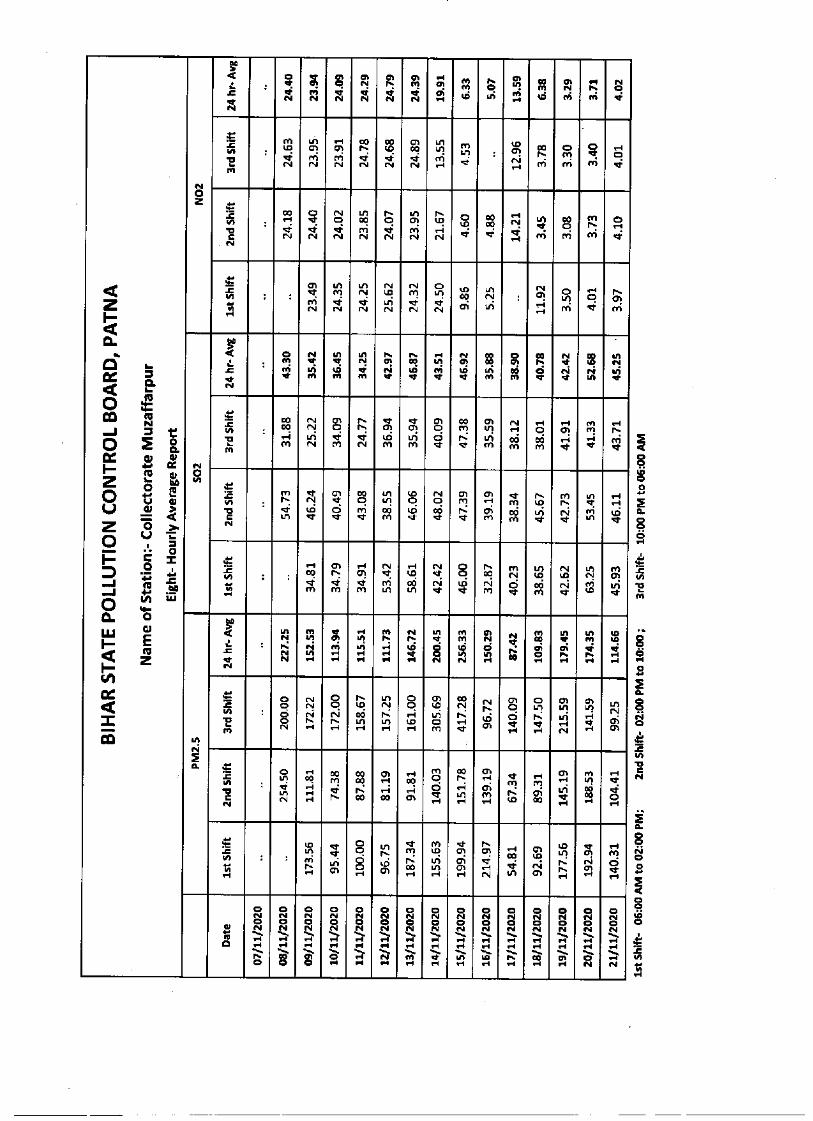
158
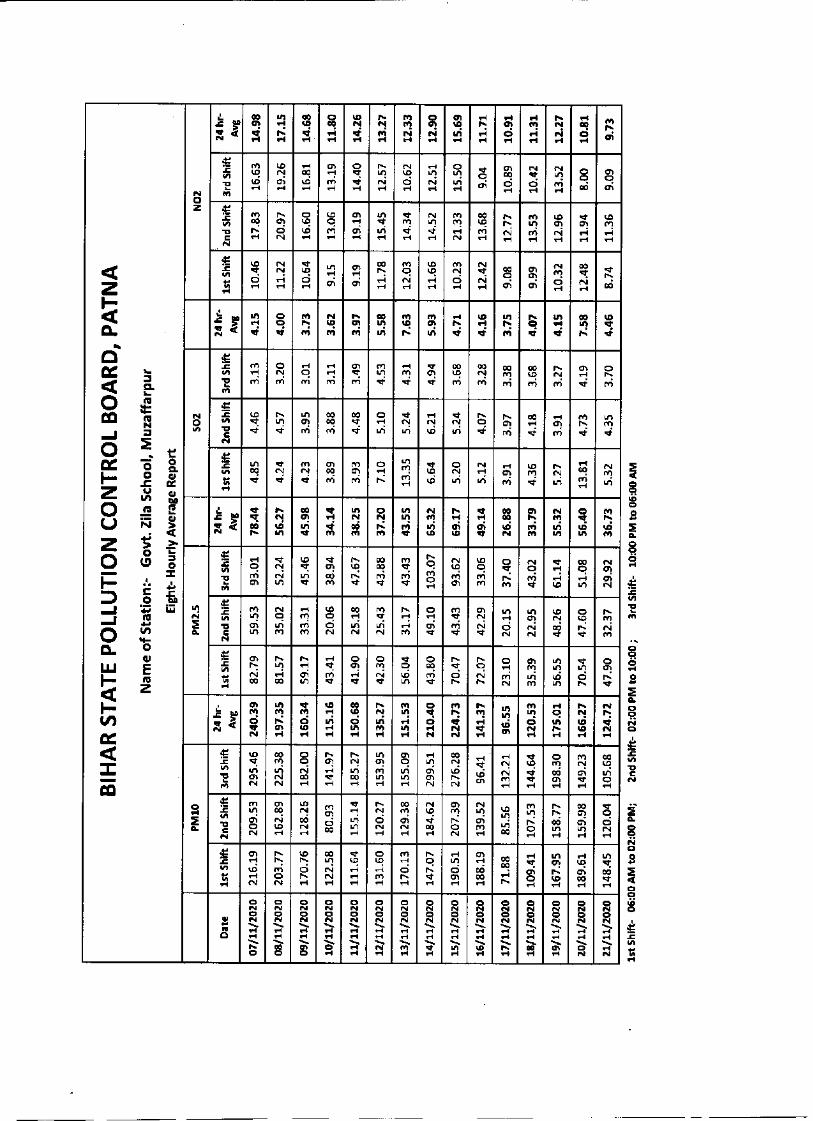
159
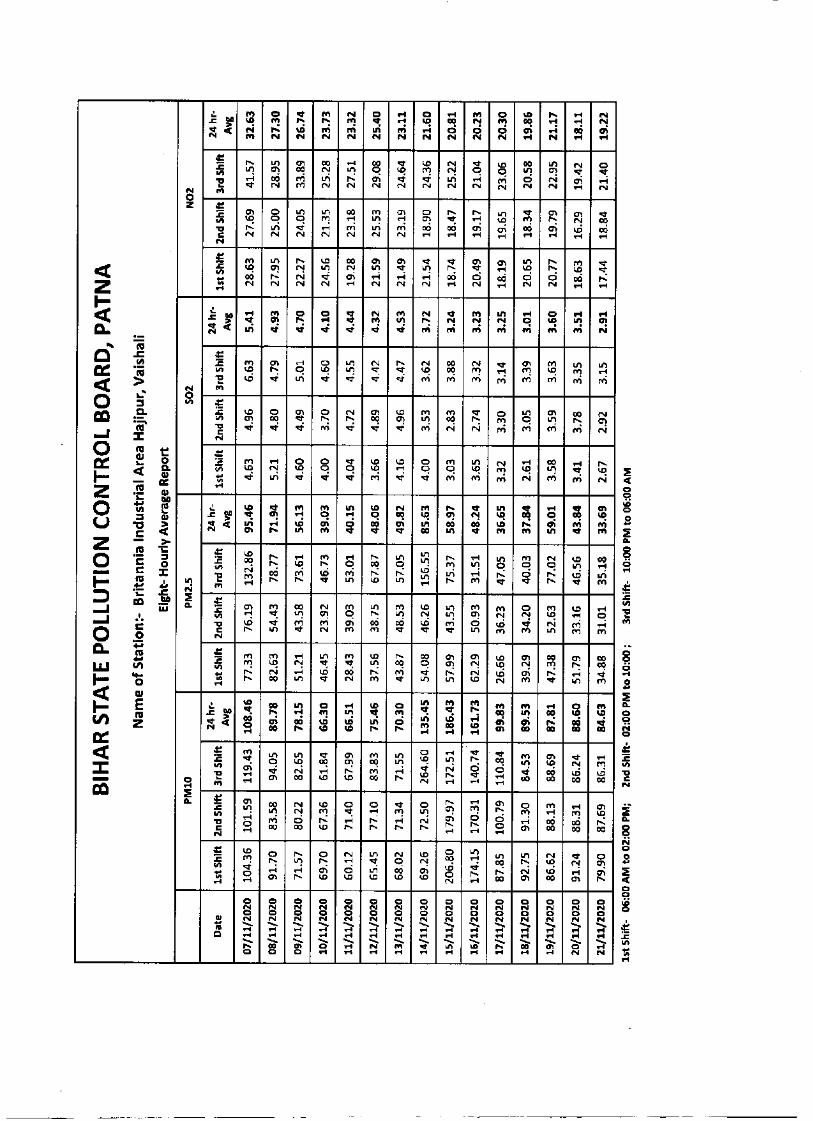
160
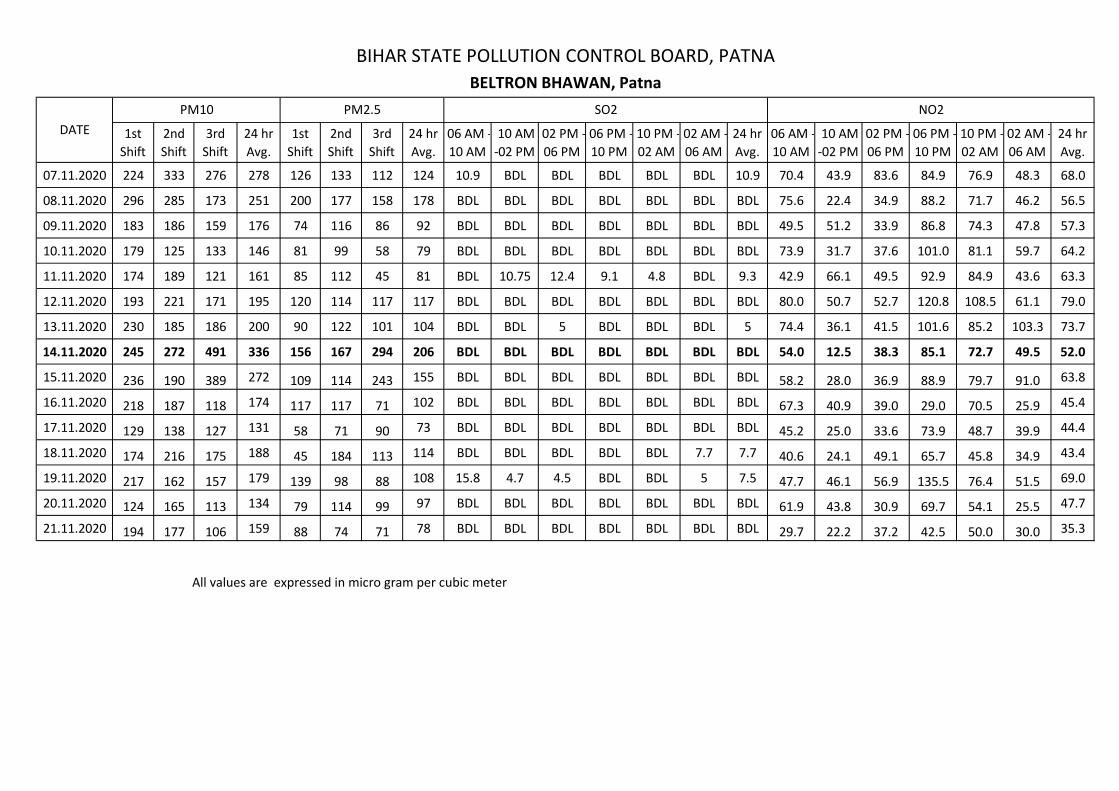
1st Shift
2nd Shift
3rd Shift
24 hr Avg.
1st Shift
2nd Shift
3rd Shift
24 hr Avg.
06 AM - 10 AM
10 AM -02 PM
02 PM - 06 PM
06 PM - 10 PM
10 PM - 02 AM
02 AM -06 AM
24 hr Avg.
06 AM - 10 AM
10 AM -02 PM
02 PM - 06 PM
06 PM - 10 PM
10 PM - 02 AM
02 AM -06 AM
24 hr Avg.
07.11.2020 224 333 276 278 126 133 112 124 10.9 BDL BDL BDL BDL BDL 10.9 70.4 43.9 83.6 84.9 76.9 48.3 68.0
08.11.2020 296 285 173 251 200 177 158 178 BDL BDL BDL BDL BDL BDL BDL 75.6 22.4 34.9 88.2 71.7 46.2 56.5
09.11.2020 183 186 159 176 74 116 86 92 BDL BDL BDL BDL BDL BDL BDL 49.5 51.2 33.9 86.8 74.3 47.8 57.3
10.11.2020 179 125 133 146 81 99 58 79 BDL BDL BDL BDL BDL BDL BDL 73.9 31.7 37.6 101.0 81.1 59.7 64.2
11.11.2020 174 189 121 161 85 112 45 81 BDL 10.75 12.4 9.1 4.8 BDL 9.3 42.9 66.1 49.5 92.9 84.9 43.6 63.3
12.11.2020 193 221 171 195 120 114 117 117 BDL BDL BDL BDL BDL BDL BDL 80.0 50.7 52.7 120.8 108.5 61.1 79.0
13.11.2020 230 185 186 200 90 122 101 104 BDL BDL 5 BDL BDL BDL 5 74.4 36.1 41.5 101.6 85.2 103.3 73.7
14.11.2020 245 272 491 336 156 167 294 206 BDL BDL BDL BDL BDL BDL BDL 54.0 12.5 38.3 85.1 72.7 49.5 52.0
15.11.2020 236 190 389 272 109 114 243 155 BDL BDL BDL BDL BDL BDL BDL 58.2 28.0 36.9 88.9 79.7 91.0 63.8
16.11.2020 218 187 118 174 117 117 71 102 BDL BDL BDL BDL BDL BDL BDL 67.3 40.9 39.0 29.0 70.5 25.9 45.4
17.11.2020 129 138 127 131 58 71 90 73 BDL BDL BDL BDL BDL BDL BDL 45.2 25.0 33.6 73.9 48.7 39.9 44.4
18.11.2020 174 216 175 188 45 184 113 114 BDL BDL BDL BDL BDL 7.7 7.7 40.6 24.1 49.1 65.7 45.8 34.9 43.4
19.11.2020 217 162 157 179 139 98 88 108 15.8 4.7 4.5 BDL BDL 5 7.5 47.7 46.1 56.9 135.5 76.4 51.5 69.0
20.11.2020 124 165 113 134 79 114 99 97 BDL BDL BDL BDL BDL BDL BDL 61.9 43.8 30.9 69.7 54.1 25.5 47.7
21.11.2020 194 177 106 159 88 74 71 78 BDL BDL BDL BDL BDL BDL BDL 29.7 22.2 37.2 42.5 50.0 30.0 35.3
SO2 NO2
BIHAR STATE POLLUTION CONTROL BOARD, PATNABELTRON BHAWAN, Patna
All values are expressed in micro gram per cubic meter
DATEPM10 PM2.5
161
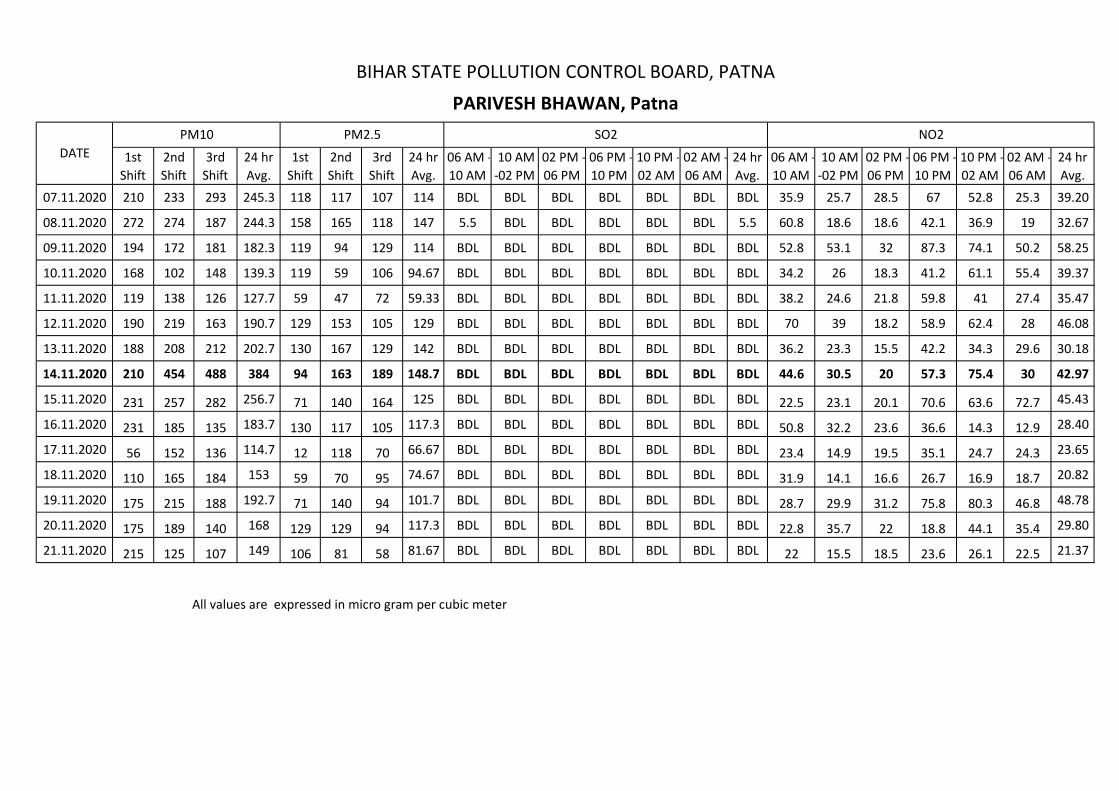
1st Shift
2nd Shift
3rd Shift
24 hr Avg.
1st Shift
2nd Shift
3rd Shift
24 hr Avg.
06 AM - 10 AM
10 AM -02 PM
02 PM - 06 PM
06 PM - 10 PM
10 PM - 02 AM
02 AM -06 AM
24 hr Avg.
06 AM - 10 AM
10 AM -02 PM
02 PM - 06 PM
06 PM - 10 PM
10 PM - 02 AM
02 AM -06 AM
24 hr Avg.
07.11.2020 210 233 293 245.3 118 117 107 114 BDL BDL BDL BDL BDL BDL BDL 35.9 25.7 28.5 67 52.8 25.3 39.20
08.11.2020 272 274 187 244.3 158 165 118 147 5.5 BDL BDL BDL BDL BDL 5.5 60.8 18.6 18.6 42.1 36.9 19 32.67
09.11.2020 194 172 181 182.3 119 94 129 114 BDL BDL BDL BDL BDL BDL BDL 52.8 53.1 32 87.3 74.1 50.2 58.25
10.11.2020 168 102 148 139.3 119 59 106 94.67 BDL BDL BDL BDL BDL BDL BDL 34.2 26 18.3 41.2 61.1 55.4 39.37
11.11.2020 119 138 126 127.7 59 47 72 59.33 BDL BDL BDL BDL BDL BDL BDL 38.2 24.6 21.8 59.8 41 27.4 35.47
12.11.2020 190 219 163 190.7 129 153 105 129 BDL BDL BDL BDL BDL BDL BDL 70 39 18.2 58.9 62.4 28 46.08
13.11.2020 188 208 212 202.7 130 167 129 142 BDL BDL BDL BDL BDL BDL BDL 36.2 23.3 15.5 42.2 34.3 29.6 30.18
14.11.2020 210 454 488 384 94 163 189 148.7 BDL BDL BDL BDL BDL BDL BDL 44.6 30.5 20 57.3 75.4 30 42.97
15.11.2020 231 257 282 256.7 71 140 164 125 BDL BDL BDL BDL BDL BDL BDL 22.5 23.1 20.1 70.6 63.6 72.7 45.43
16.11.2020 231 185 135 183.7 130 117 105 117.3 BDL BDL BDL BDL BDL BDL BDL 50.8 32.2 23.6 36.6 14.3 12.9 28.40
17.11.2020 56 152 136 114.7 12 118 70 66.67 BDL BDL BDL BDL BDL BDL BDL 23.4 14.9 19.5 35.1 24.7 24.3 23.65
18.11.2020 110 165 184 153 59 70 95 74.67 BDL BDL BDL BDL BDL BDL BDL 31.9 14.1 16.6 26.7 16.9 18.7 20.82
19.11.2020 175 215 188 192.7 71 140 94 101.7 BDL BDL BDL BDL BDL BDL BDL 28.7 29.9 31.2 75.8 80.3 46.8 48.78
20.11.2020 175 189 140 168 129 129 94 117.3 BDL BDL BDL BDL BDL BDL BDL 22.8 35.7 22 18.8 44.1 35.4 29.80
21.11.2020 215 125 107 149 106 81 58 81.67 BDL BDL BDL BDL BDL BDL BDL 22 15.5 18.5 23.6 26.1 22.5 21.37
PARIVESH BHAWAN, PatnaBIHAR STATE POLLUTION CONTROL BOARD, PATNA
All values are expressed in micro gram per cubic meter
PM10 PM2.5 SO2DATE
NO2
162
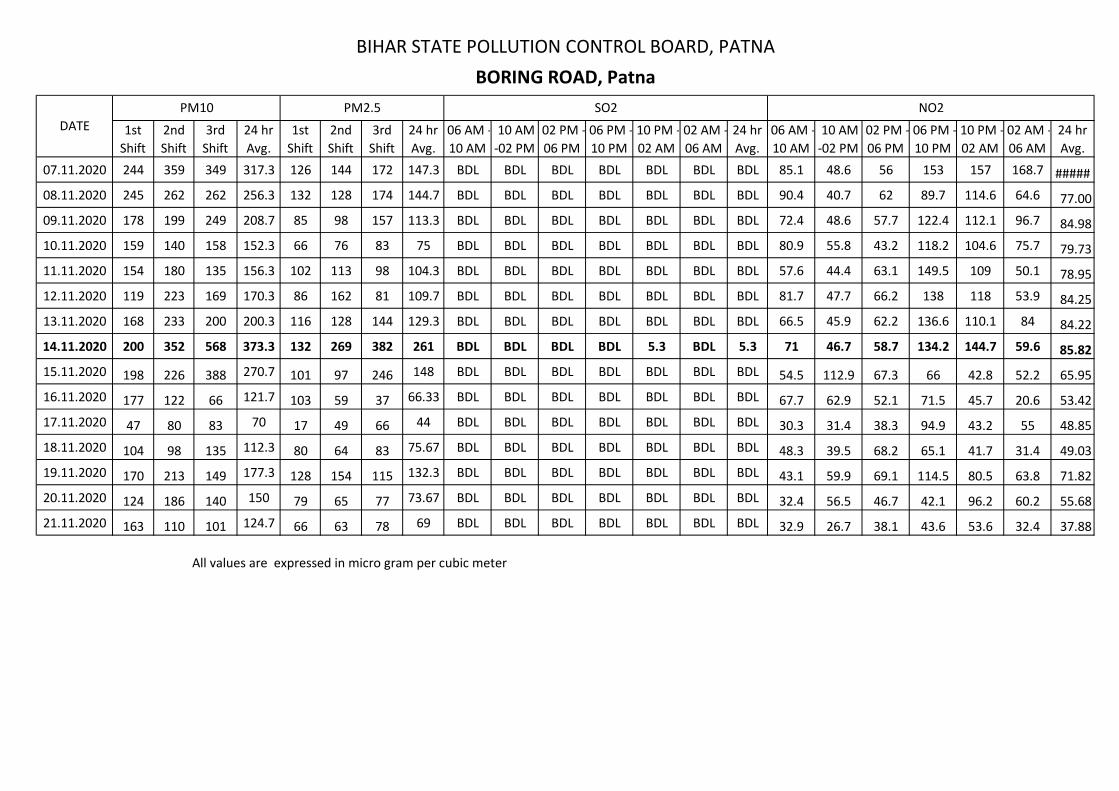
1st Shift
2nd Shift
3rd Shift
24 hr Avg.
1st Shift
2nd Shift
3rd Shift
24 hr Avg.
06 AM - 10 AM
10 AM -02 PM
02 PM - 06 PM
06 PM - 10 PM
10 PM - 02 AM
02 AM -06 AM
24 hr Avg.
06 AM - 10 AM
10 AM -02 PM
02 PM - 06 PM
06 PM - 10 PM
10 PM - 02 AM
02 AM -06 AM
24 hr Avg.
07.11.2020 244 359 349 317.3 126 144 172 147.3 BDL BDL BDL BDL BDL BDL BDL 85.1 48.6 56 153 157 168.7 #####08.11.2020 245 262 262 256.3 132 128 174 144.7 BDL BDL BDL BDL BDL BDL BDL 90.4 40.7 62 89.7 114.6 64.6 77.0009.11.2020 178 199 249 208.7 85 98 157 113.3 BDL BDL BDL BDL BDL BDL BDL 72.4 48.6 57.7 122.4 112.1 96.7 84.9810.11.2020 159 140 158 152.3 66 76 83 75 BDL BDL BDL BDL BDL BDL BDL 80.9 55.8 43.2 118.2 104.6 75.7 79.7311.11.2020 154 180 135 156.3 102 113 98 104.3 BDL BDL BDL BDL BDL BDL BDL 57.6 44.4 63.1 149.5 109 50.1 78.9512.11.2020 119 223 169 170.3 86 162 81 109.7 BDL BDL BDL BDL BDL BDL BDL 81.7 47.7 66.2 138 118 53.9 84.2513.11.2020 168 233 200 200.3 116 128 144 129.3 BDL BDL BDL BDL BDL BDL BDL 66.5 45.9 62.2 136.6 110.1 84 84.2214.11.2020 200 352 568 373.3 132 269 382 261 BDL BDL BDL BDL 5.3 BDL 5.3 71 46.7 58.7 134.2 144.7 59.6 85.8215.11.2020 198 226 388 270.7 101 97 246 148 BDL BDL BDL BDL BDL BDL BDL 54.5 112.9 67.3 66 42.8 52.2 65.9516.11.2020 177 122 66 121.7 103 59 37 66.33 BDL BDL BDL BDL BDL BDL BDL 67.7 62.9 52.1 71.5 45.7 20.6 53.4217.11.2020 47 80 83 70 17 49 66 44 BDL BDL BDL BDL BDL BDL BDL 30.3 31.4 38.3 94.9 43.2 55 48.8518.11.2020 104 98 135 112.3 80 64 83 75.67 BDL BDL BDL BDL BDL BDL BDL 48.3 39.5 68.2 65.1 41.7 31.4 49.0319.11.2020 170 213 149 177.3 128 154 115 132.3 BDL BDL BDL BDL BDL BDL BDL 43.1 59.9 69.1 114.5 80.5 63.8 71.8220.11.2020 124 186 140 150 79 65 77 73.67 BDL BDL BDL BDL BDL BDL BDL 32.4 56.5 46.7 42.1 96.2 60.2 55.6821.11.2020 163 110 101 124.7 66 63 78 69 BDL BDL BDL BDL BDL BDL BDL 32.9 26.7 38.1 43.6 53.6 32.4 37.88
BORING ROAD, PatnaBIHAR STATE POLLUTION CONTROL BOARD, PATNA
All values are expressed in micro gram per cubic meter
DATENO2SO2PM2.5PM10
163
Annexure-IX
164
165
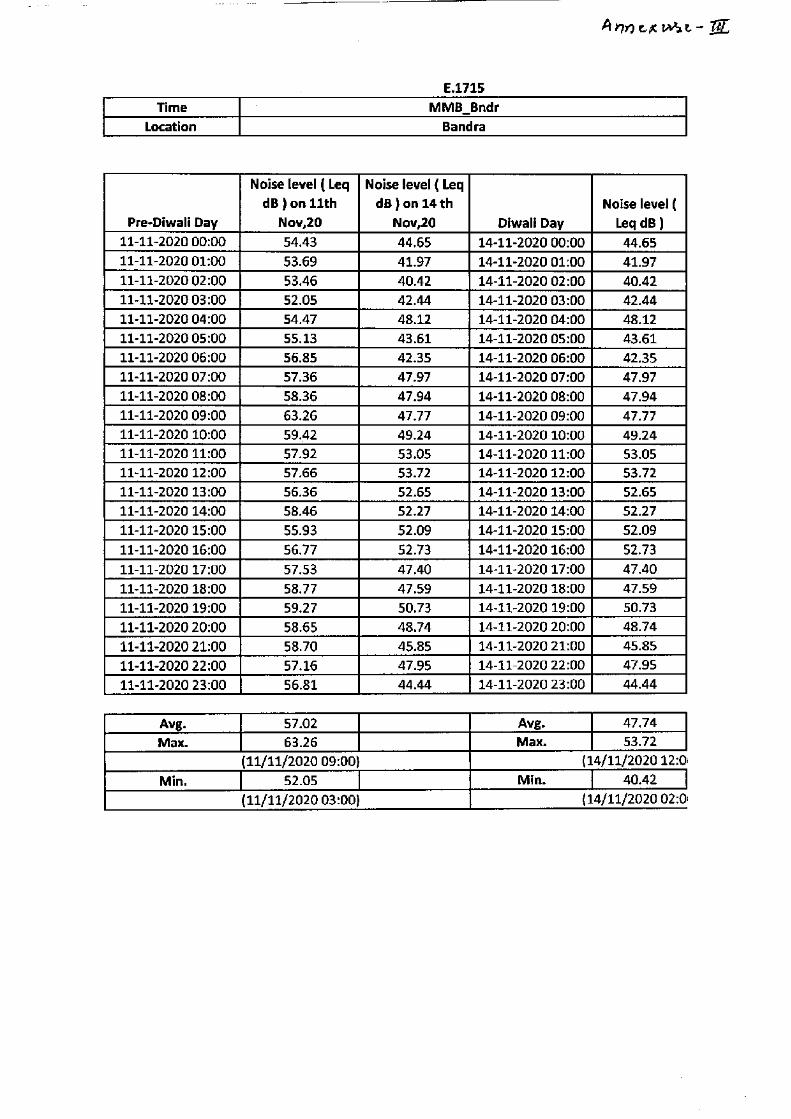
166
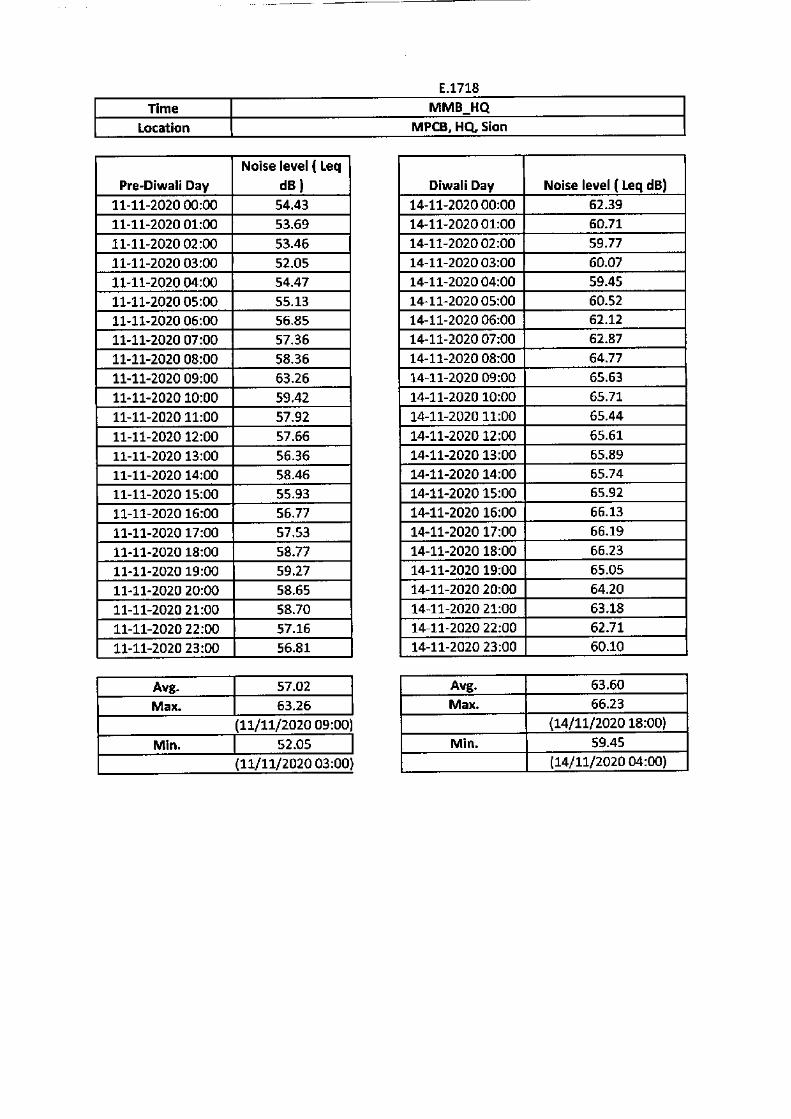
167
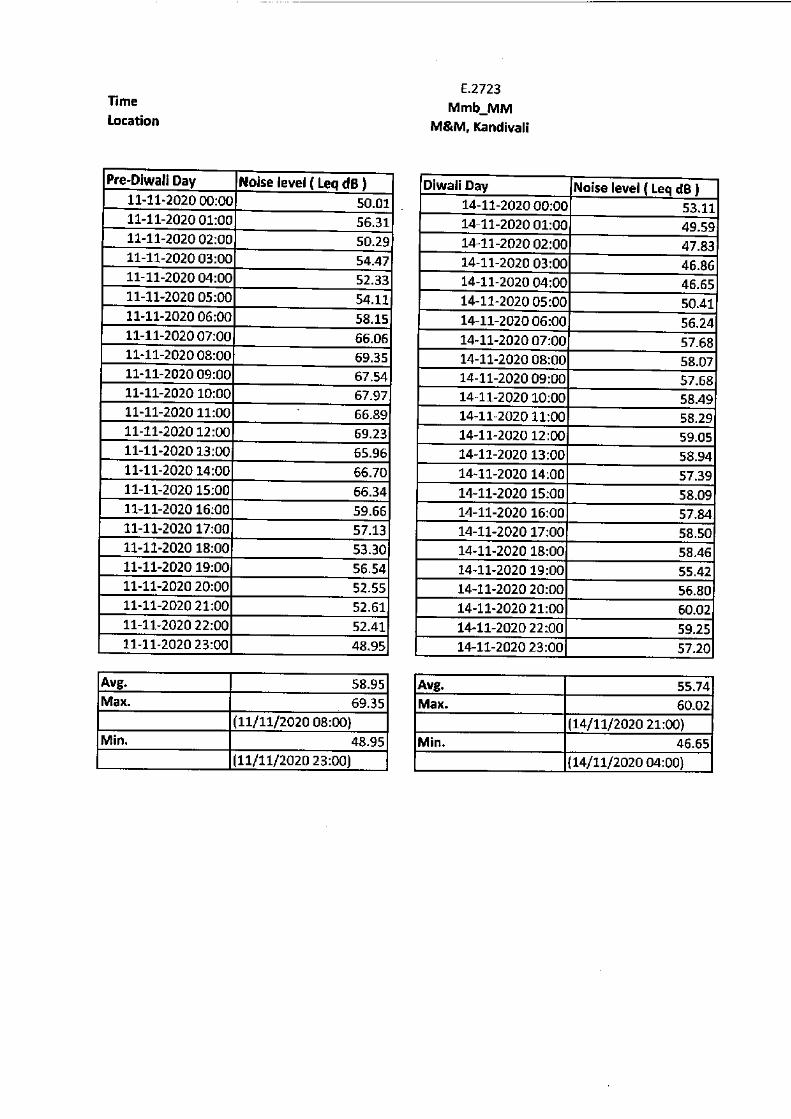
168
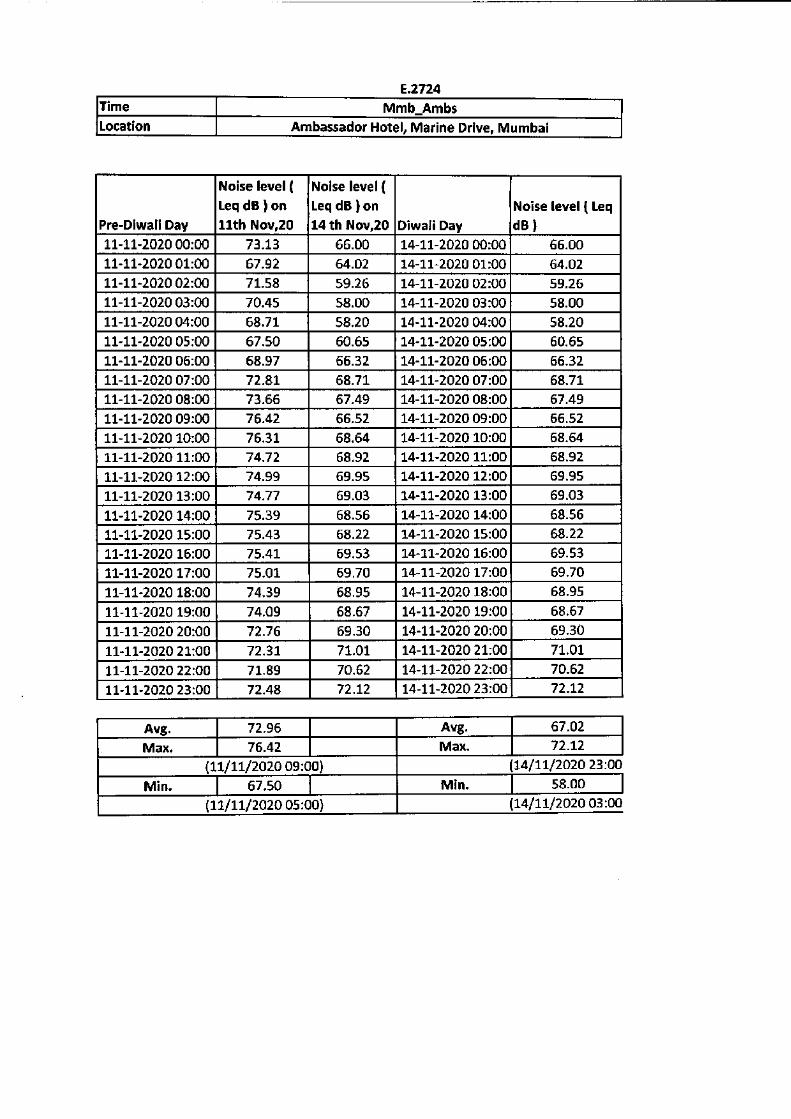
169
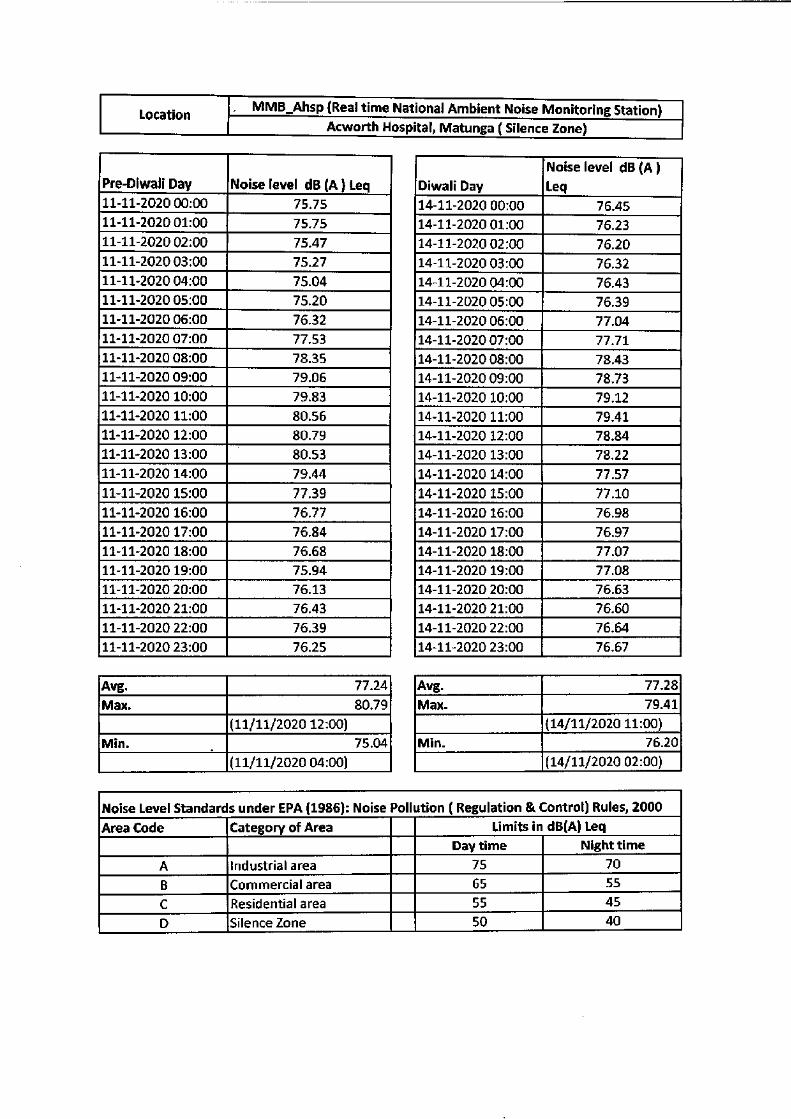
170
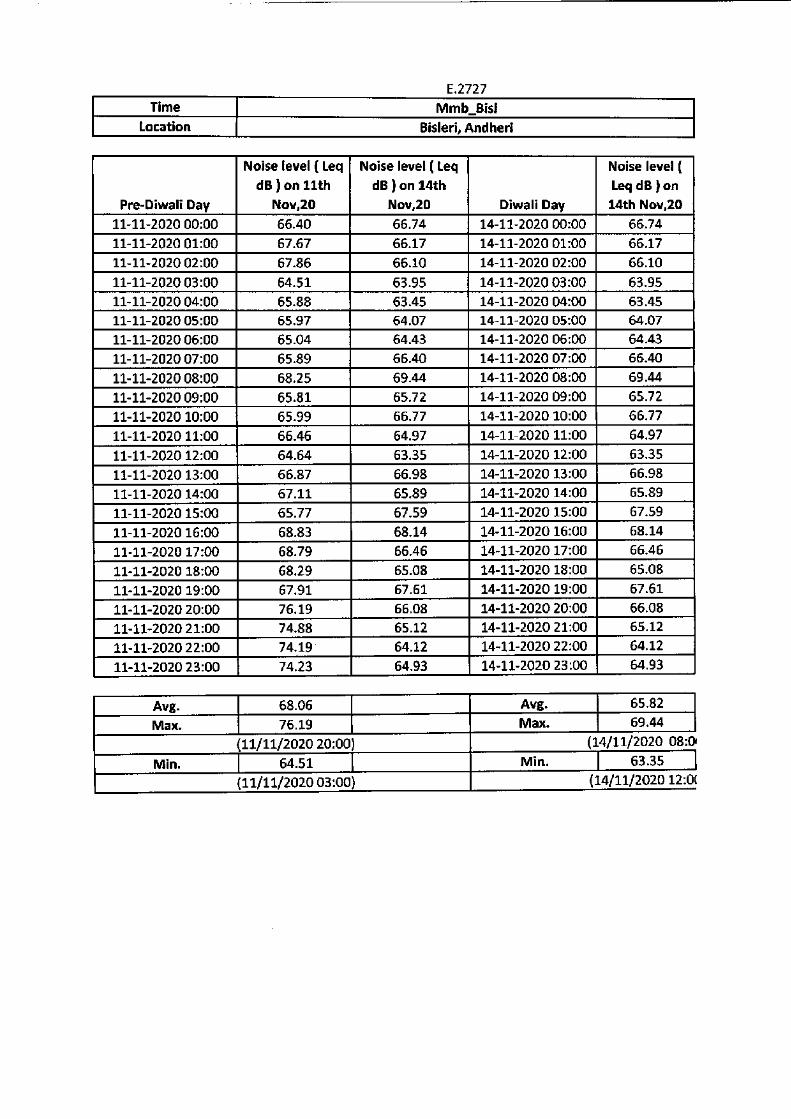
171
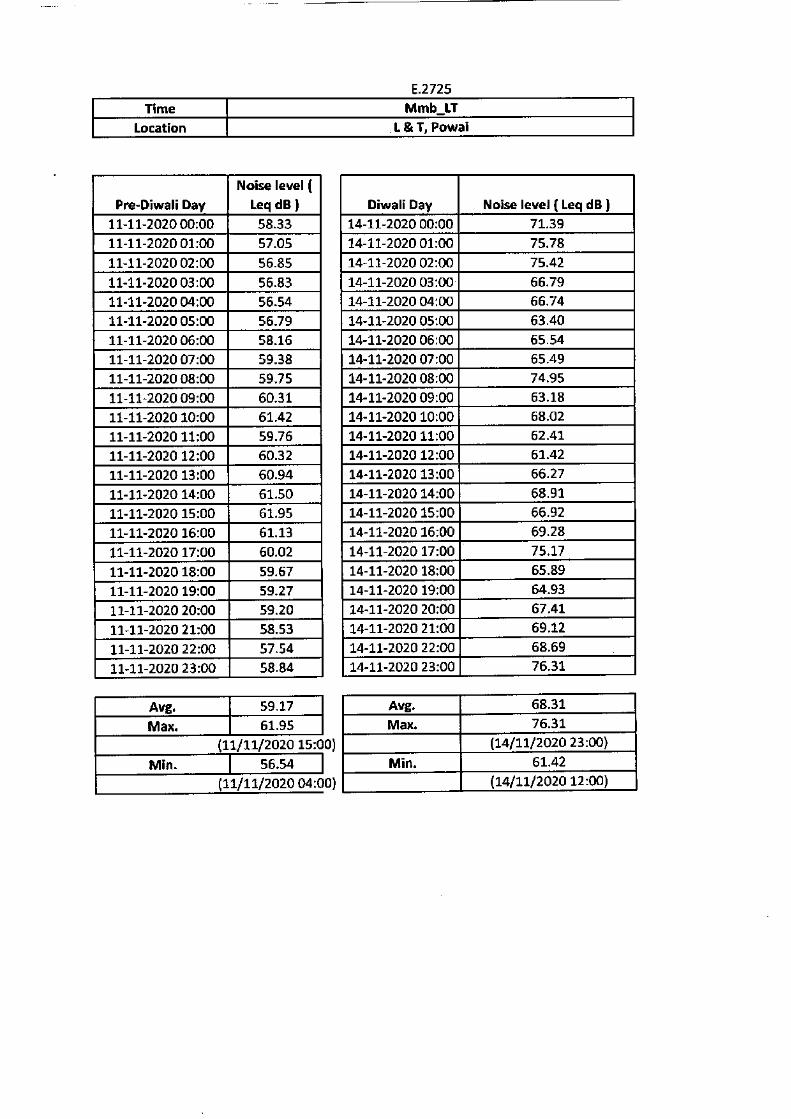
172

173
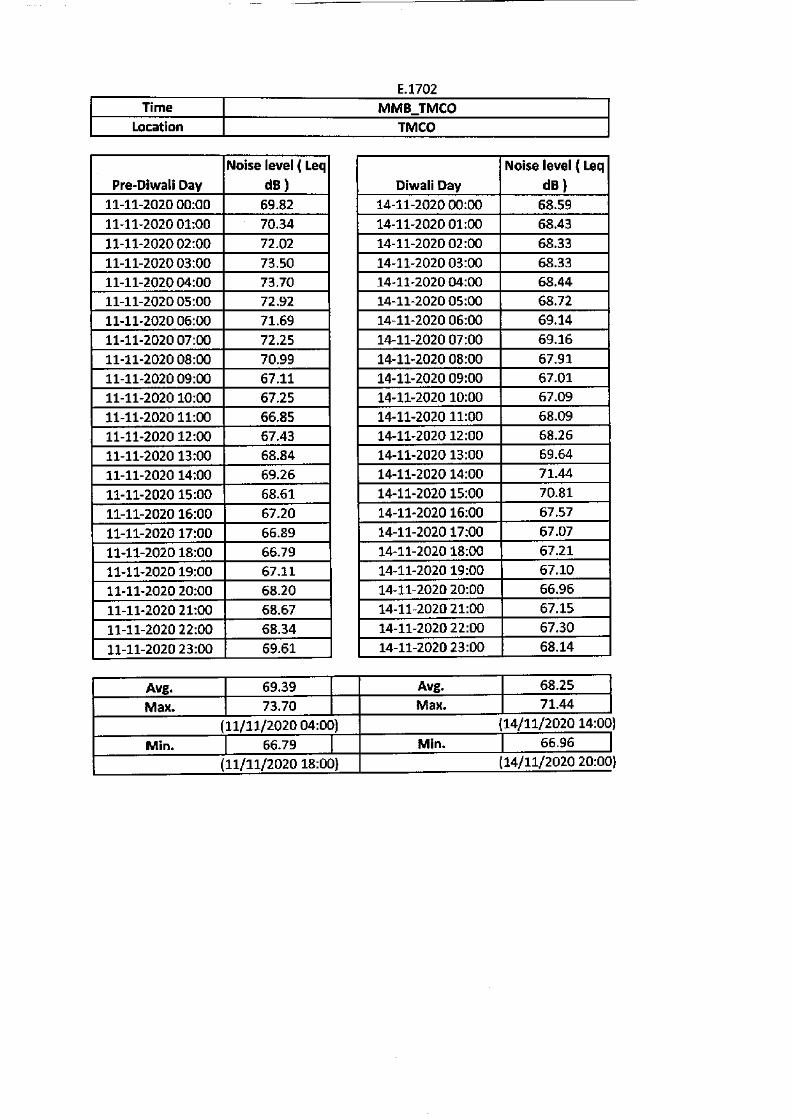
174
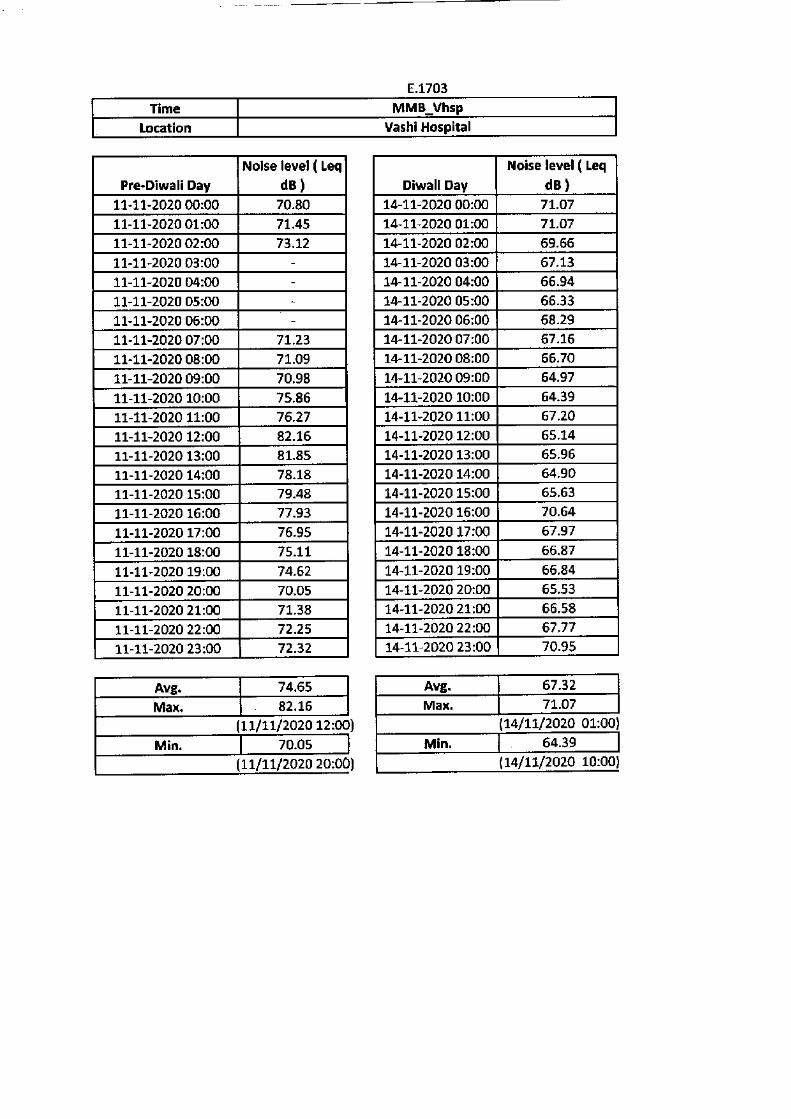
175
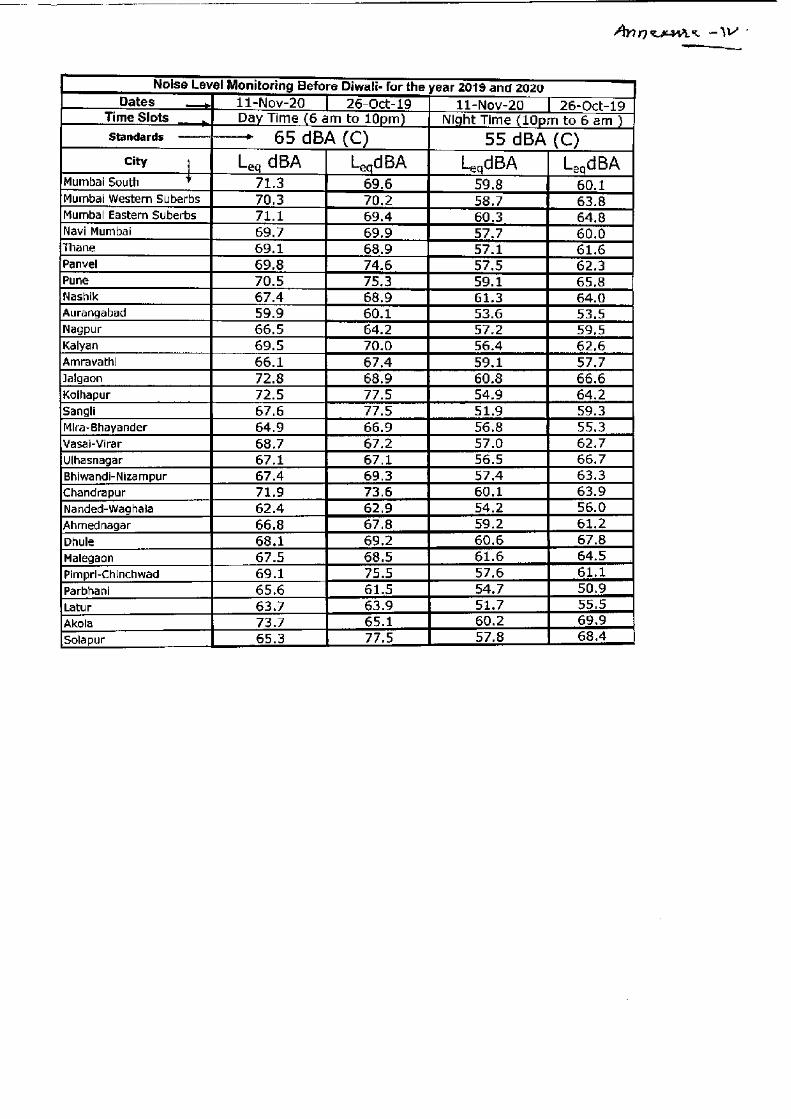
176
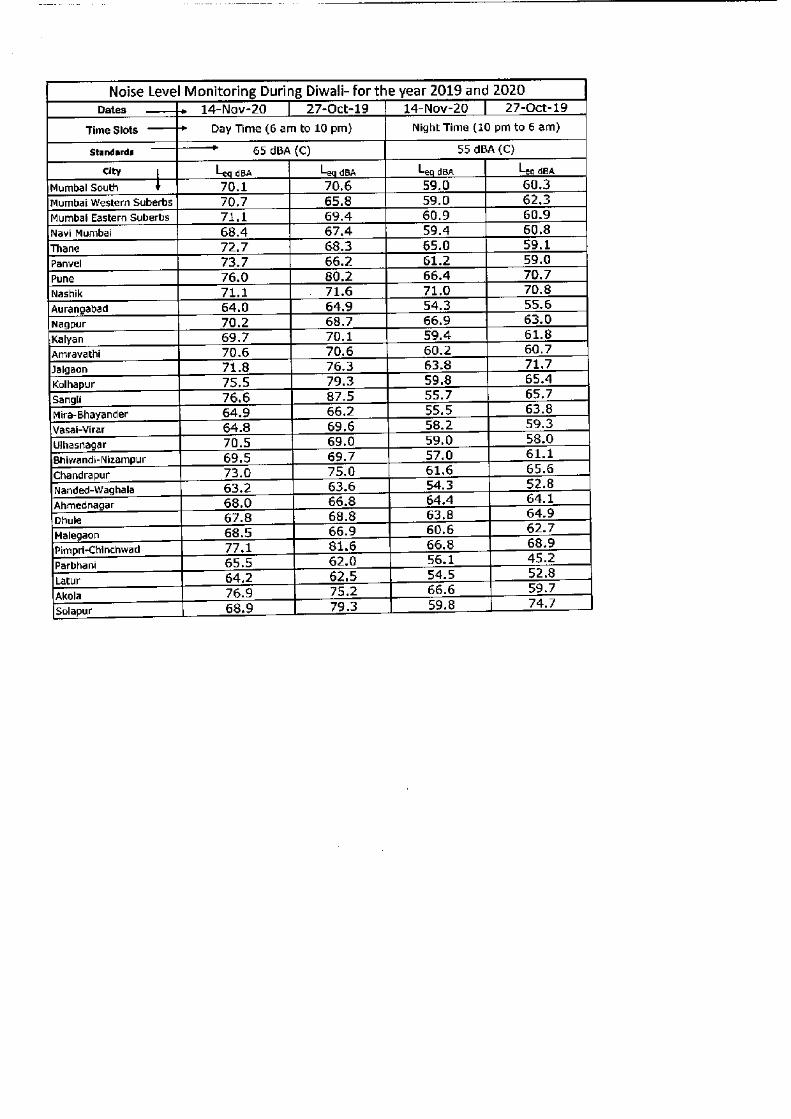
177
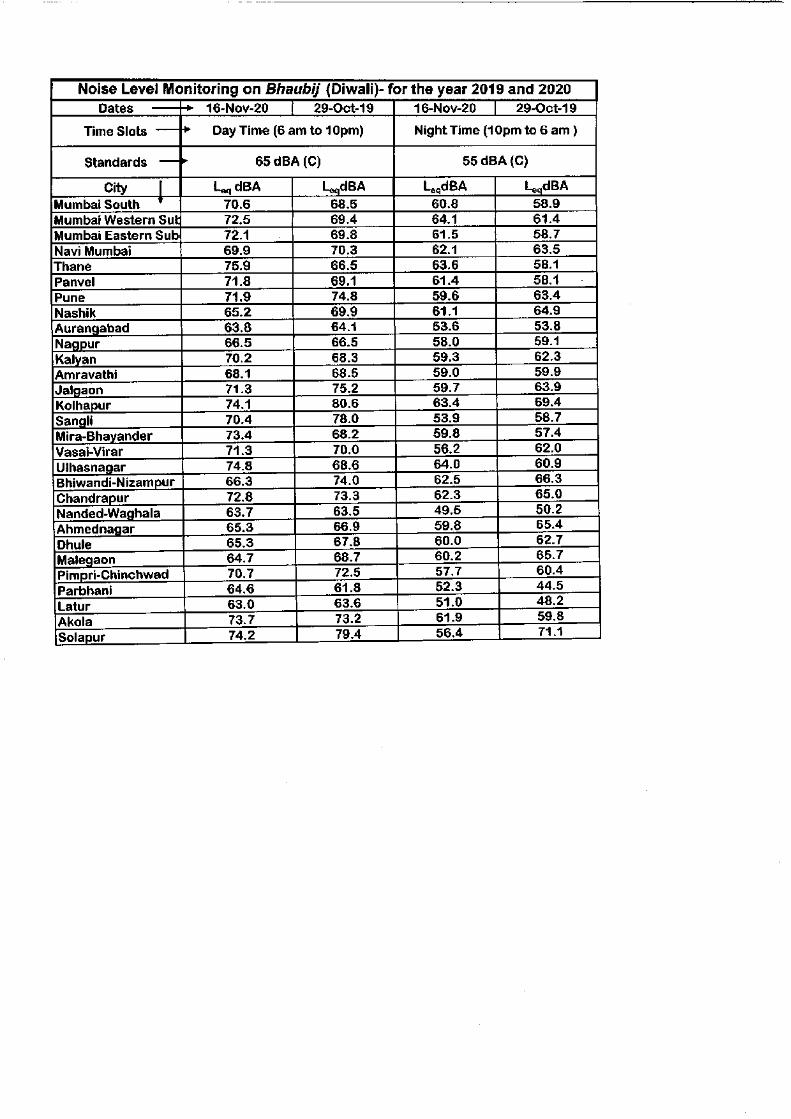
178
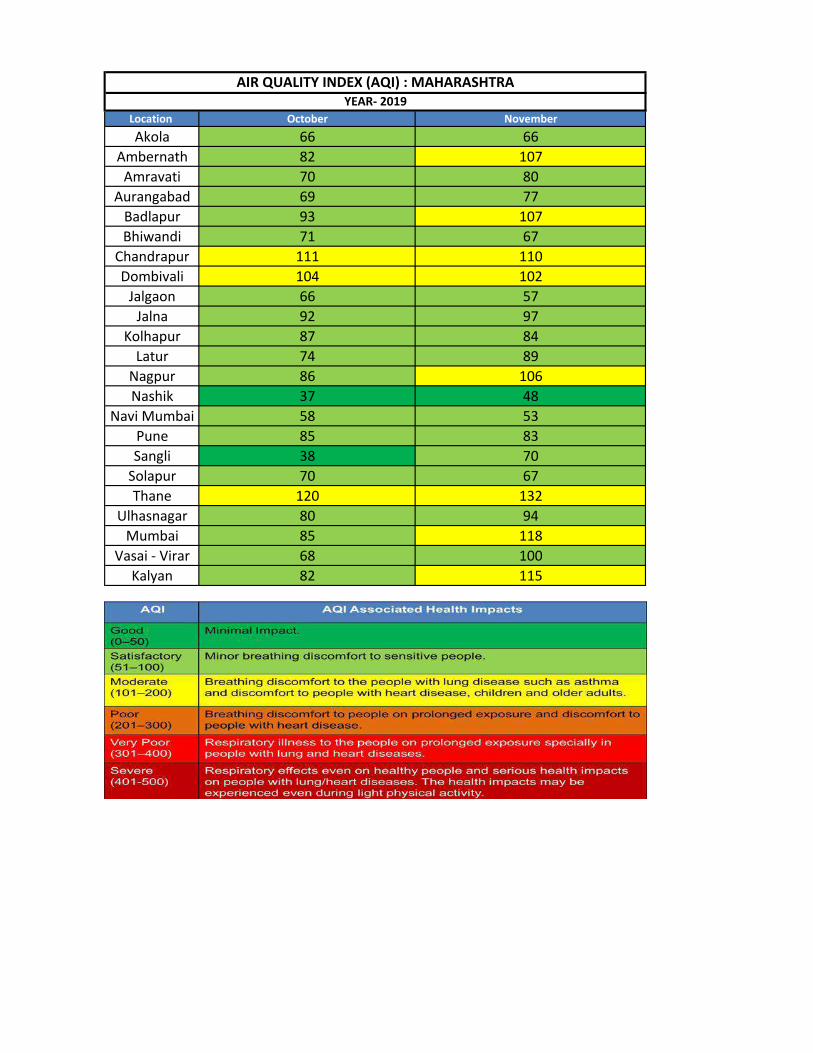
Location October November
Akola 66 66
Ambernath 82 107
Amravati 70 80
Aurangabad 69 77
Badlapur 93 107
Bhiwandi 71 67
Chandrapur 111 110
Dombivali 104 102
Jalgaon 66 57
Jalna 92 97
Kolhapur 87 84
Latur 74 89
Nagpur 86 106
Nashik 37 48
Navi Mumbai 58 53
Pune 85 83
Sangli 38 70
Solapur 70 67
Thane 120 132
Ulhasnagar 80 94
Mumbai 85 118
Vasai - Virar 68 100
Kalyan 82 115
YEAR- 2019
AIR QUALITY INDEX (AQI) : MAHARASHTRA
179
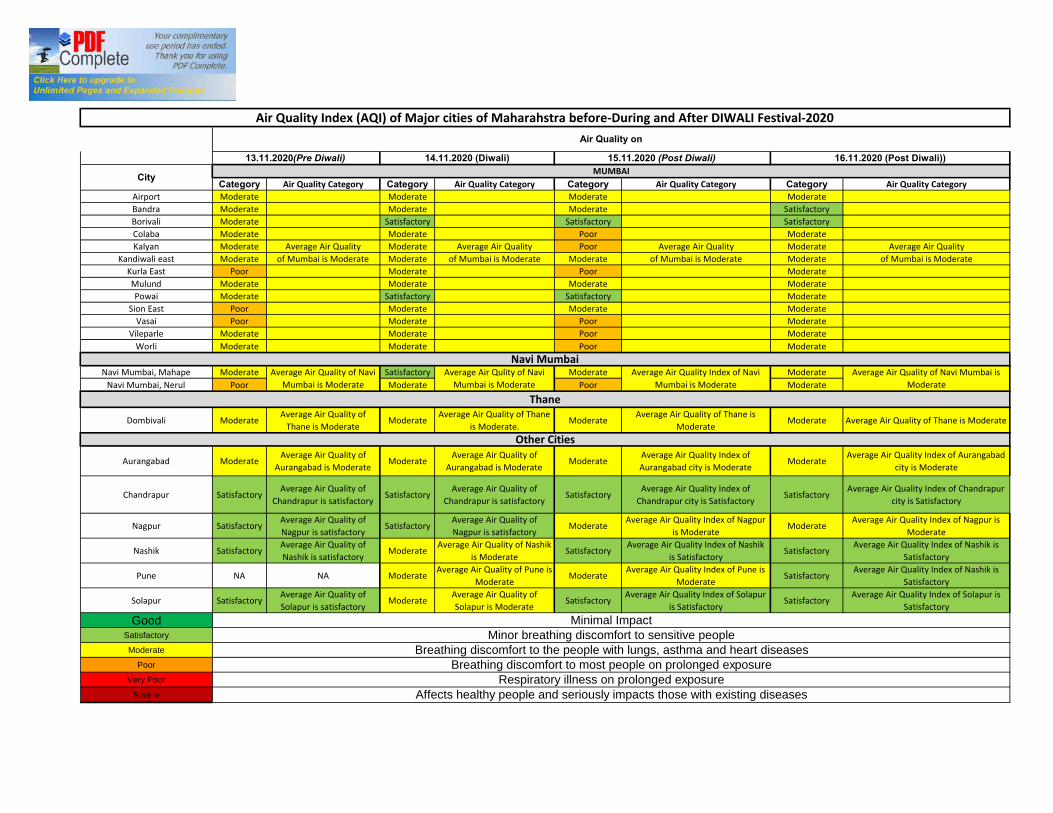
Category Air Quality Category Category Air Quality Category Category Air Quality Category Category Air Quality CategoryAirport Moderate Moderate Moderate ModerateBandra Moderate Moderate Moderate SatisfactoryBorivali Moderate Satisfactory Satisfactory SatisfactoryColaba Moderate Moderate Poor ModerateKalyan Moderate Average Air Quality Moderate Average Air Quality Poor Average Air Quality Moderate Average Air Quality
Kandiwali east Moderate of Mumbai is Moderate Moderate of Mumbai is Moderate Moderate of Mumbai is Moderate Moderate of Mumbai is ModerateKurla East Poor Moderate Poor ModerateMulund Moderate Moderate Moderate ModeratePowai Moderate Satisfactory Satisfactory Moderate
Sion East Poor Moderate Moderate ModerateVasai Poor Moderate Poor Moderate
Vileparle Moderate Moderate Poor ModerateWorli Moderate Moderate Poor Moderate
Navi Mumbai, Mahape Moderate Satisfactory Moderate ModerateNavi Mumbai, Nerul Poor Moderate Poor Moderate
Dombivali ModerateAverage Air Quality of
Thane is ModerateModerate
Average Air Quality of Thane is Moderate.
ModerateAverage Air Quality of Thane is
ModerateModerate Average Air Quality of Thane is Moderate
Aurangabad ModerateAverage Air Quality of
Aurangabad is ModerateModerate
Average Air Quality of Aurangabad is Moderate
ModerateAverage Air Quality Index of Aurangabad city is Moderate
ModerateAverage Air Quality Index of Aurangabad
city is Moderate
Chandrapur SatisfactoryAverage Air Quality of
Chandrapur is satisfactorySatisfactory
Average Air Quality of Chandrapur is satisfactory
SatisfactoryAverage Air Quality Index of
Chandrapur city is SatisfactorySatisfactory
Average Air Quality Index of Chandrapur city is Satisfactory
Nagpur SatisfactoryAverage Air Quality of Nagpur is satisfactory
SatisfactoryAverage Air Quality of Nagpur is satisfactory
ModerateAverage Air Quality Index of Nagpur
is ModerateModerate
Average Air Quality Index of Nagpur is Moderate
Nashik SatisfactoryAverage Air Quality of Nashik is satisfactory
ModerateAverage Air Quality of Nashik
is ModerateSatisfactory
Average Air Quality Index of Nashik is Satisfactory
SatisfactoryAverage Air Quality Index of Nashik is
Satisfactory
Pune NA NA ModerateAverage Air Quality of Pune is
ModerateModerate
Average Air Quality Index of Pune is Moderate
SatisfactoryAverage Air Quality Index of Nashik is
Satisfactory
Solapur SatisfactoryAverage Air Quality of Solapur is satisfactory
ModerateAverage Air Quality of Solapur is Moderate
SatisfactoryAverage Air Quality Index of Solapur
is SatisfactorySatisfactory
Average Air Quality Index of Solapur is Satisfactory
GoodSatisfactory
Moderate
Poor
Very Poor
Severe
Thane
Other Cities
Average Air Quality Index of Navi Mumbai is Moderate
Air Quality Index (AQI) of Major cities of Maharahstra before-During and After DIWALI Festival-2020Air Quality on
Average Air Qulity of Navi Mumbai is Moderate
14.11.2020 (Diwali) 15.11.2020 (Post Diwali)
Average Air Quality of Navi Mumbai is Moderate
MUMBAI
Navi Mumbai
Respiratory illness on prolonged exposure
16.11.2020 (Post Diwali))13.11.2020(Pre Diwali)
Average Air Quality of Navi Mumbai is Moderate
Affects healthy people and seriously impacts those with existing diseases
City
Minimal ImpactMinor breathing discomfort to sensitive people
Breathing discomfort to the people with lungs, asthma and heart diseasesBreathing discomfort to most people on prolonged exposure
180
Annexure-X
181
182
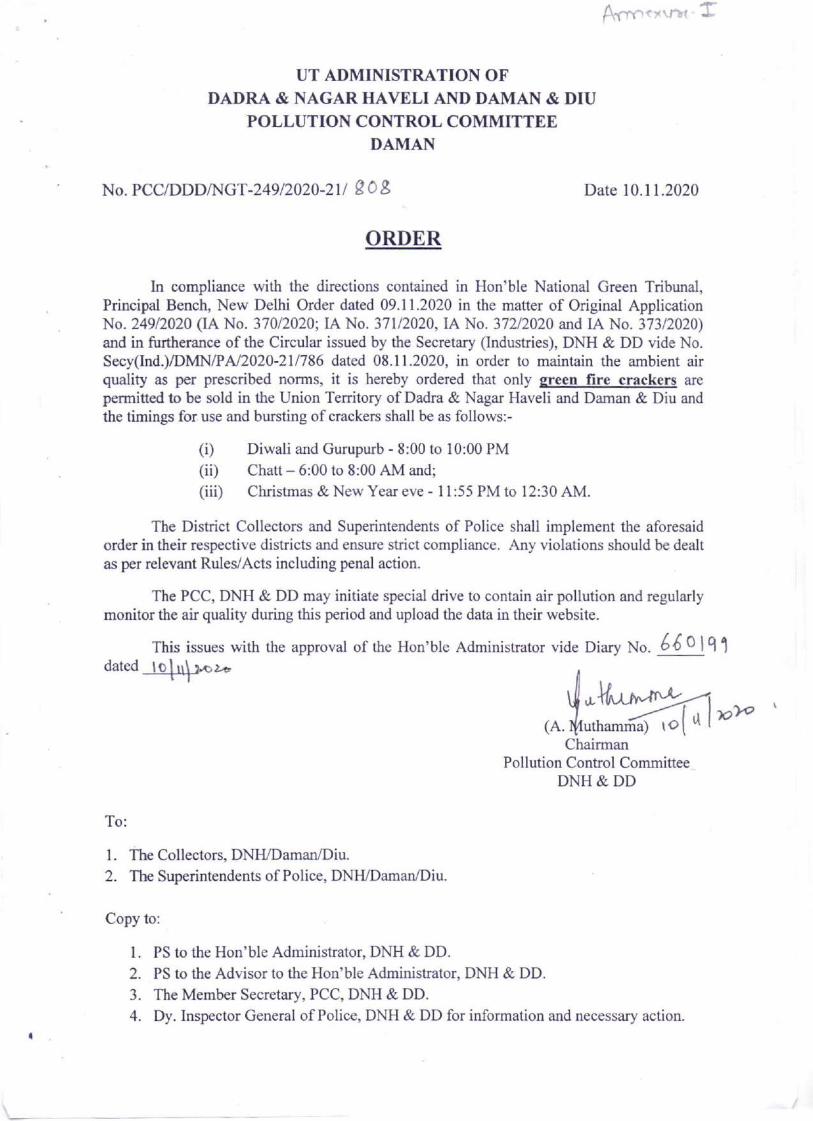
183
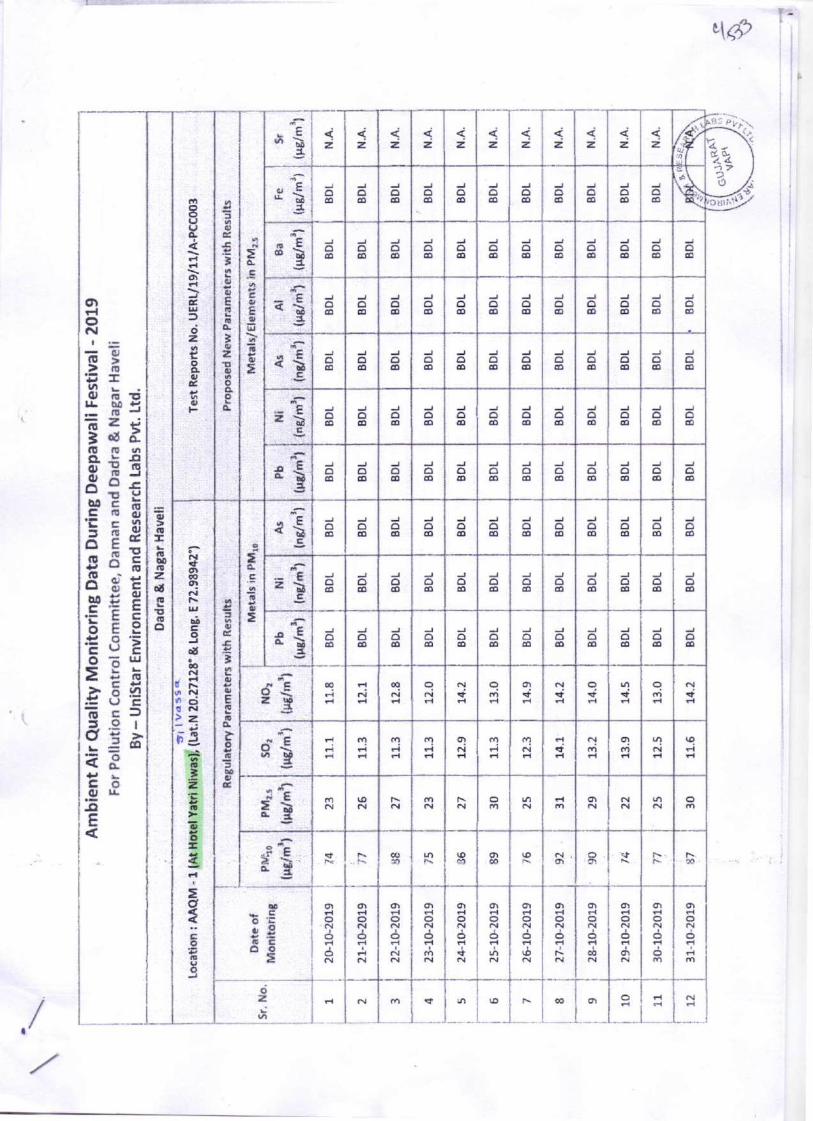
184
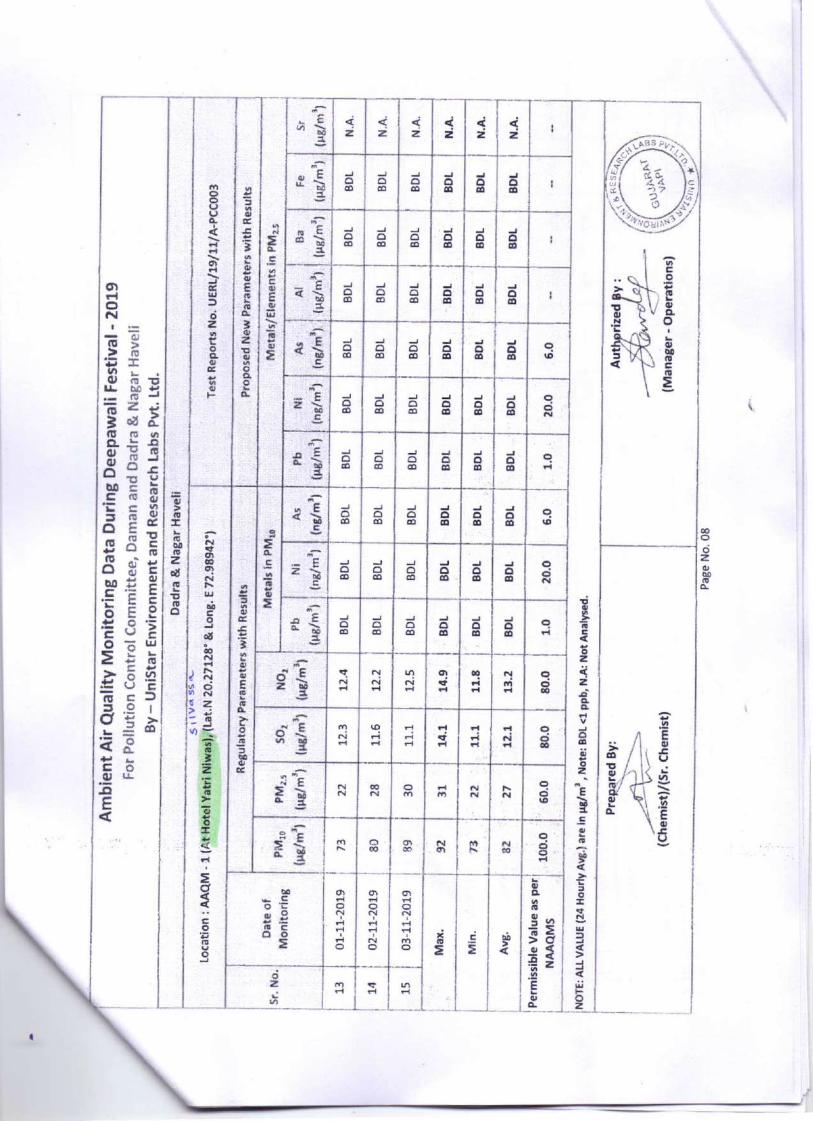
185
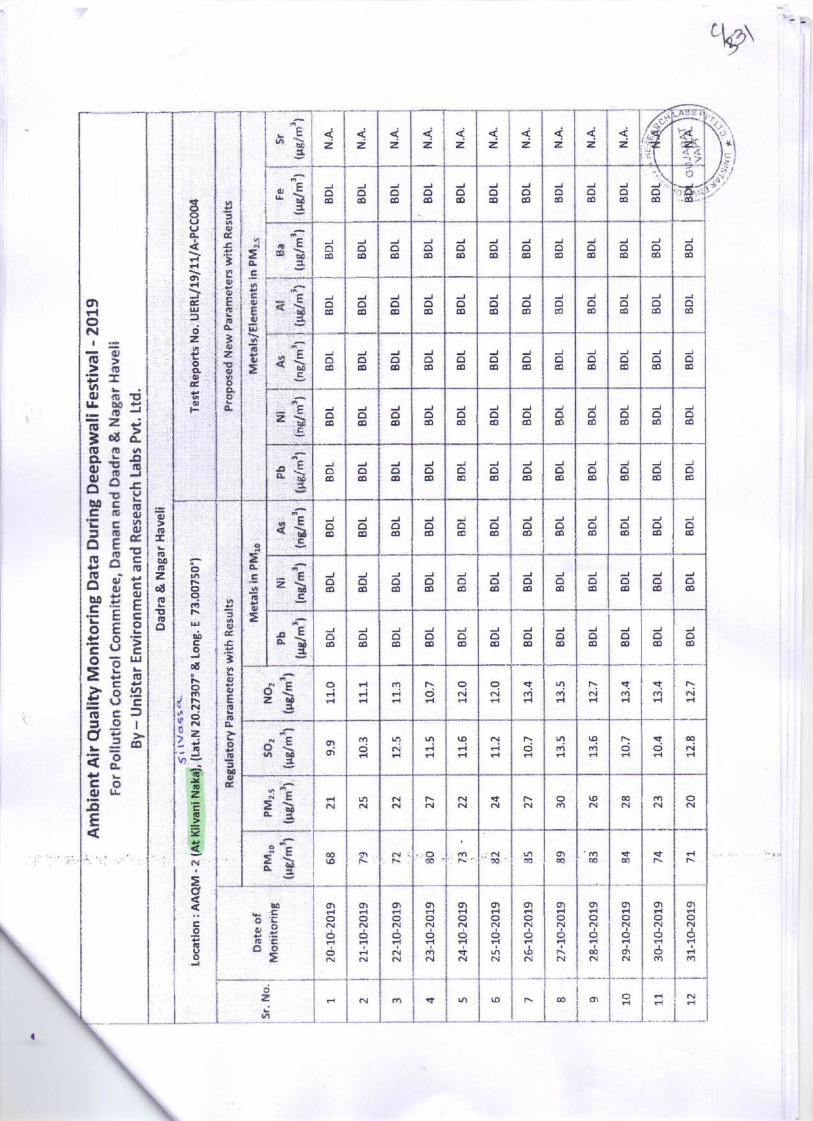
186
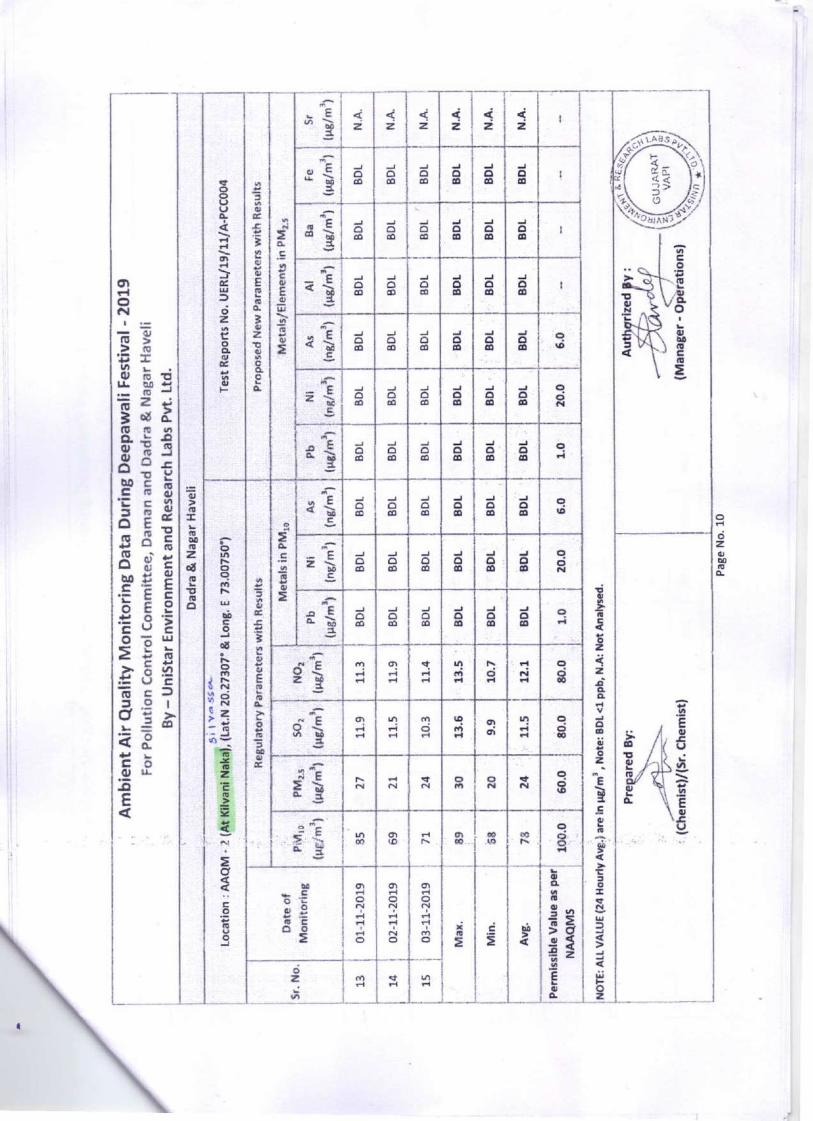
187
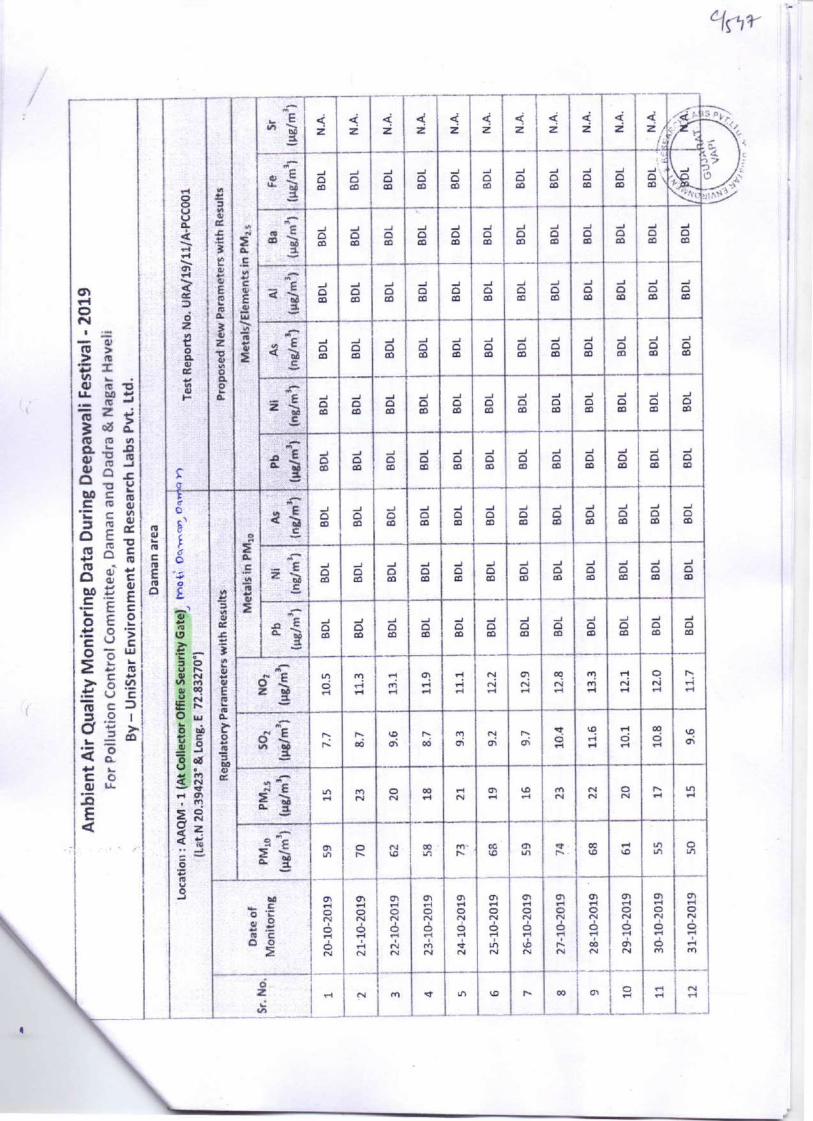
188
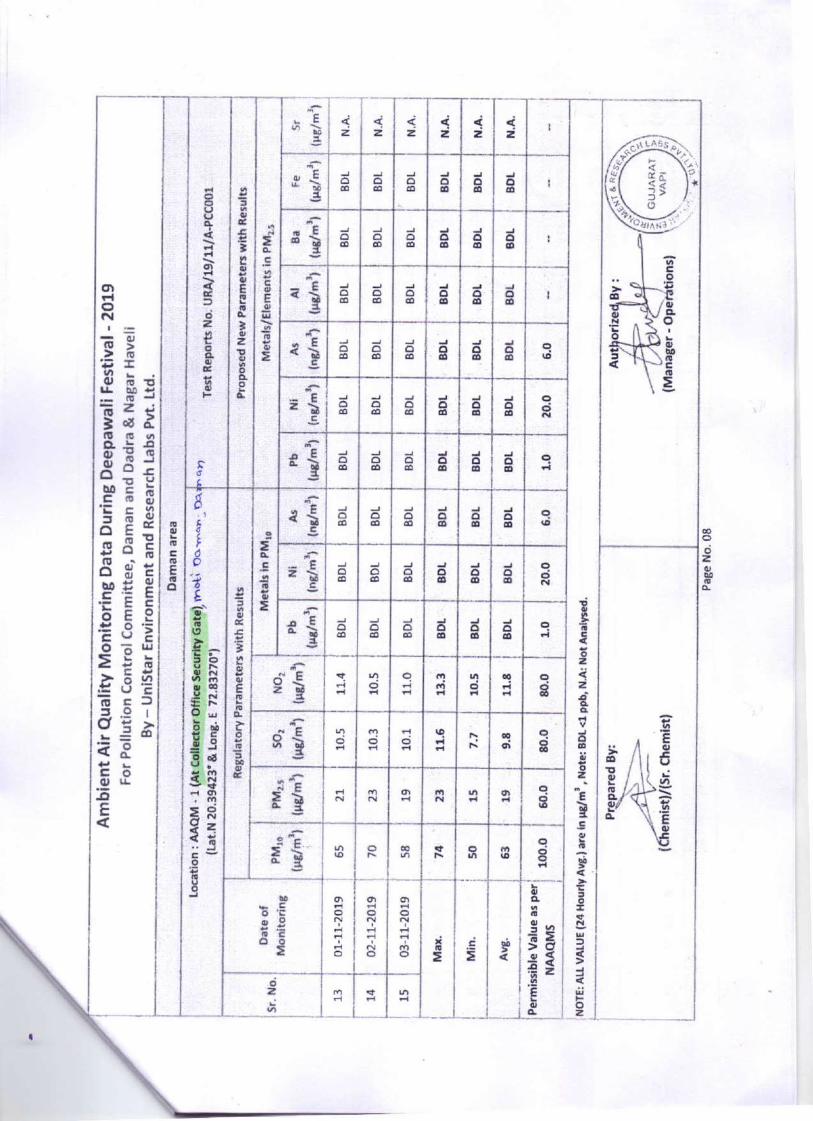
189
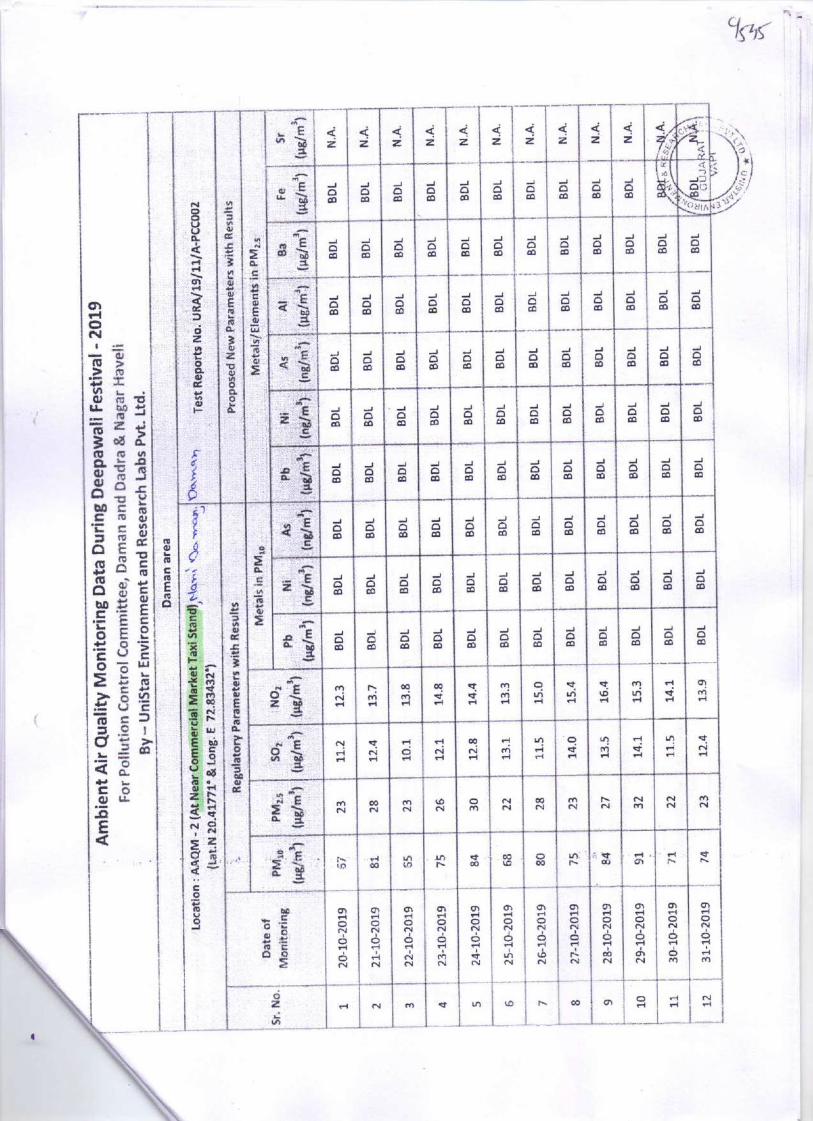
190
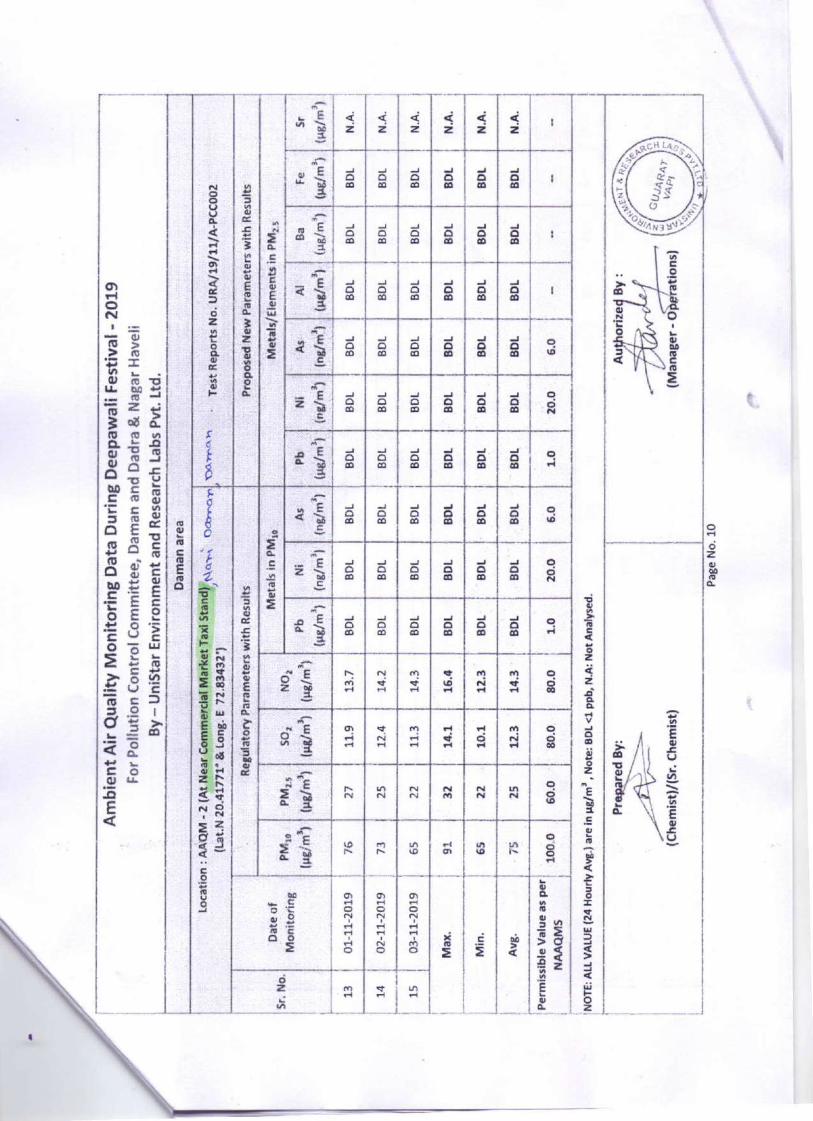
191
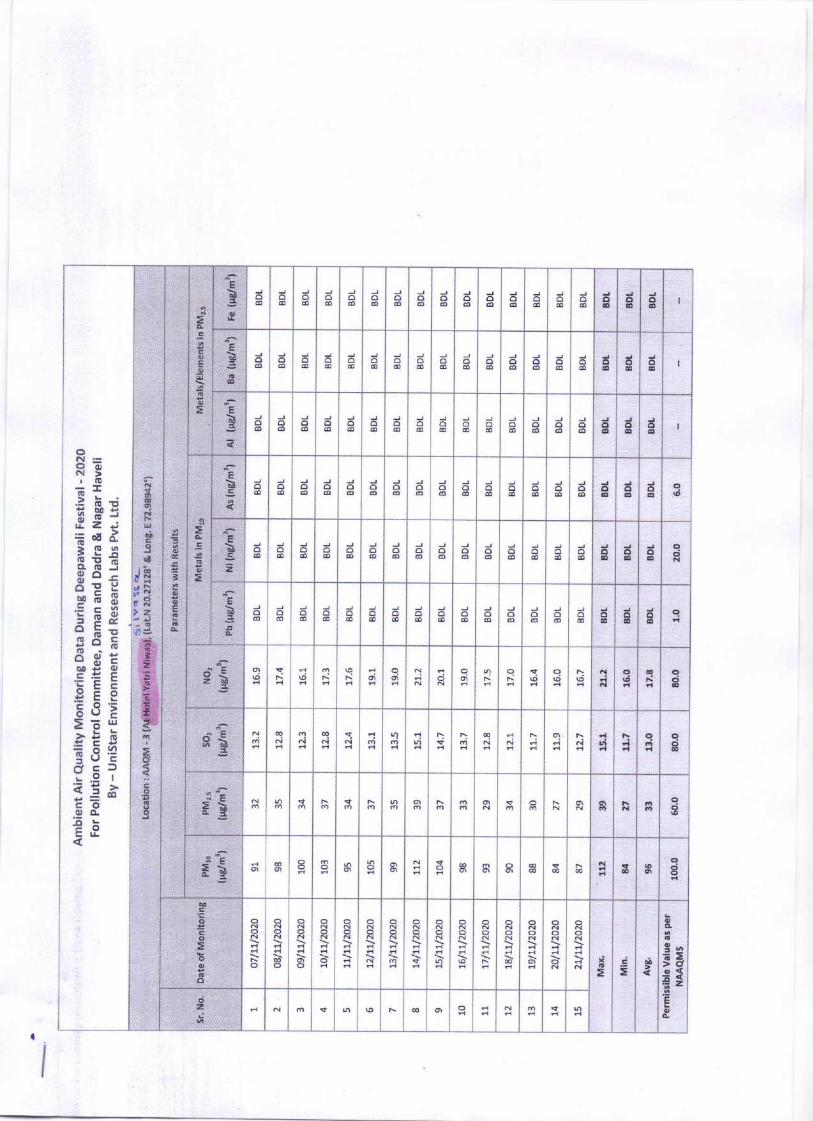
192
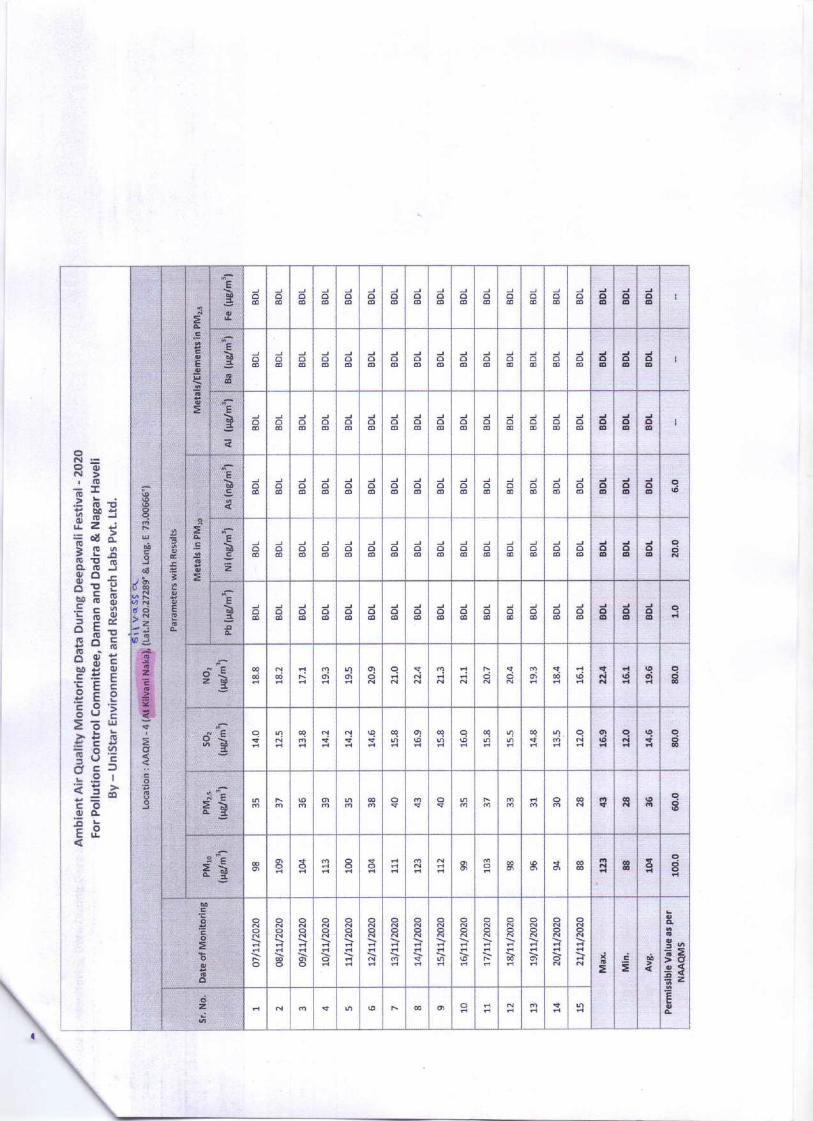
193
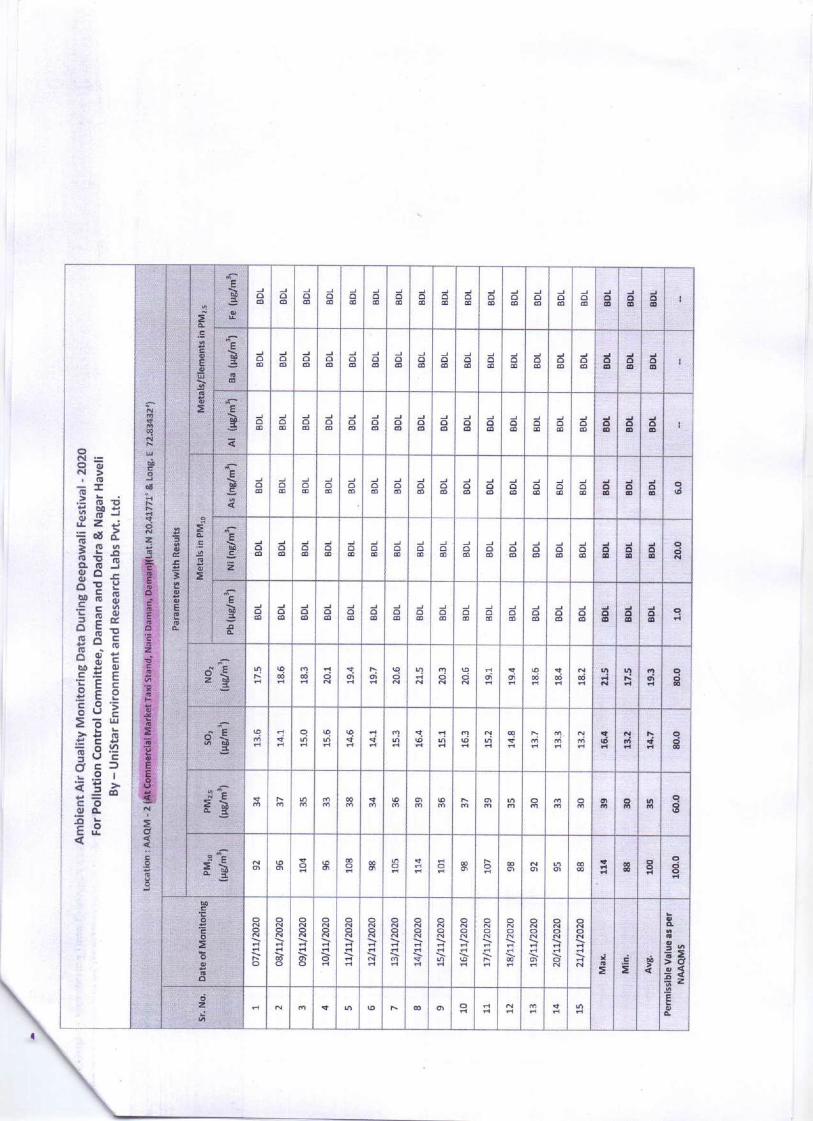
194
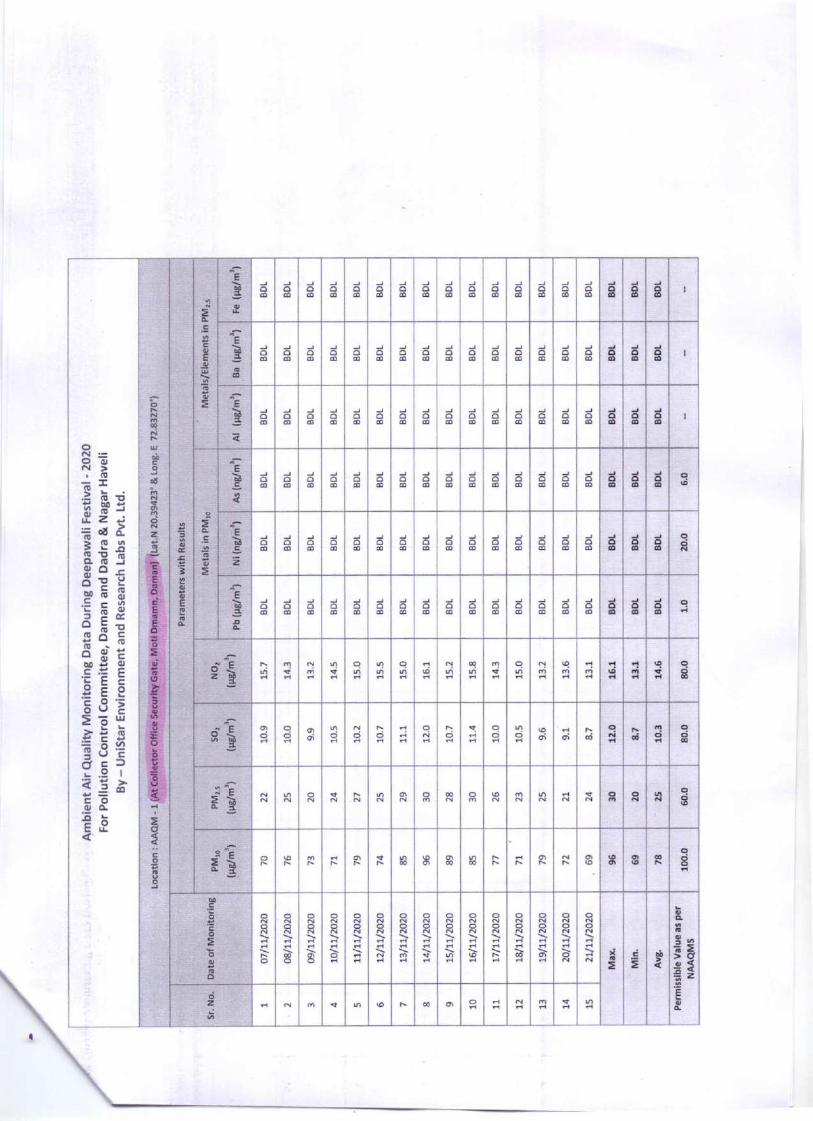
195
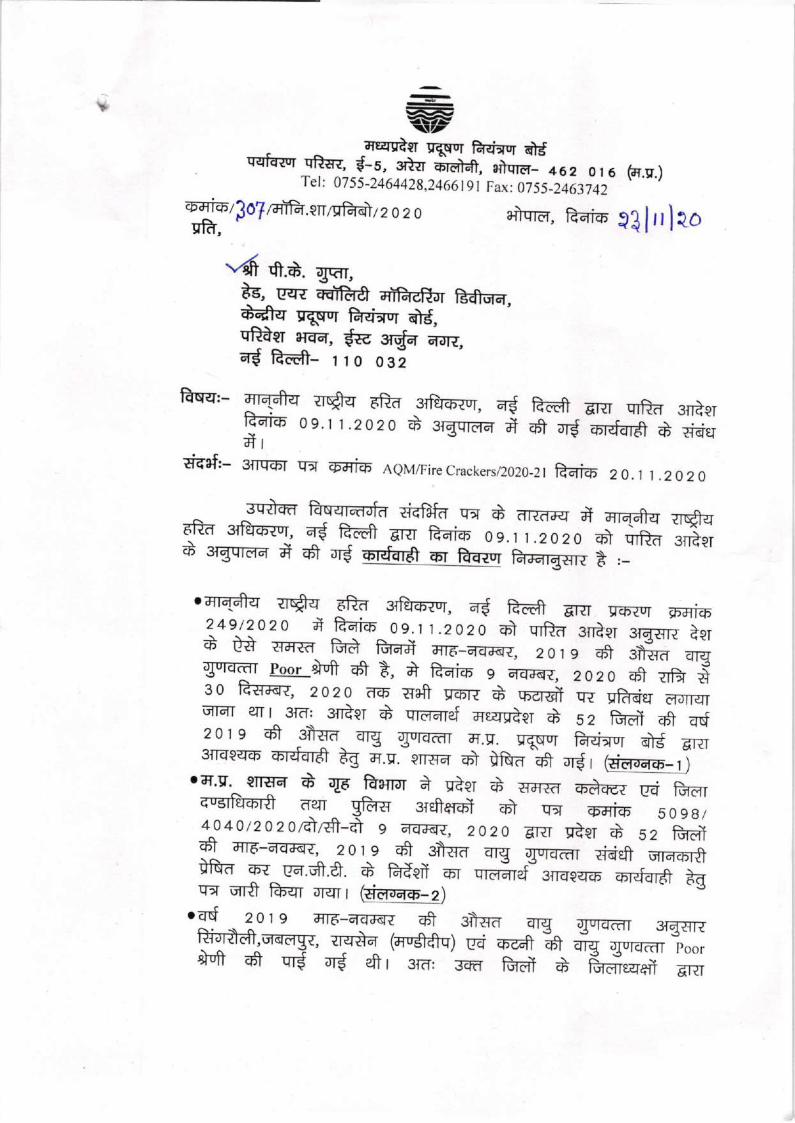
>
-H\rt-arqclsr s-$ur fui1q +Jq.Ilir{q ql}s{, S_s, srttr E'rdilff, s}qrd_ 462 ot6 fd.s.)T et: 07 5 5-2464428.2466 I 9 I r ax: Ot SS_Zqili q'2,
o-aioz3O?rffi.en/qftd/2 o 2 ocft, '
-t ft.+. g*,ts-s, cErE *fifr4-e affirr Fff-.t-d,d#+ u-qw h{iTur +9,qfraer erd, d= r{a a-or*,a-dffi- rro oei
ftqsr:- ffr{ffq zTqq 6trd :rldrs?ur, a-d ffi Bm uift6 .n;.,fraio 0s.11.2020 d ergqrmd # .+ "-S
*U.rA-'+ #i}Itd-<afr- sfrq.E'I tr* O-aio AeM/FireCrackers/2020_21 Faio. zo. 11.2020
3q+fi lMa d<f)fu qs t apa-q # mq#q iTSq{T jrfb6r1, S qS
-Em, trdi6 or., i.roro 6l qrtd silter6 $-gqra-d fr 6t rr$ offi or Fo-aq trargznr t ,_
oaq-fi-v ?TS-q 6Fd srfltrozq, a-d frd drzr srrzor o-fli6
=loKor.:._*31i-^0s.l1.2020 +) qrEd ,r,ae, .rgn; iu+ tS zrrra ffi ffi ara-a-Ere2, ;;'; ,' ; ;+*;'Wq$I Poor M 61 t, fr Eaio g acrep, 2o2o 61 gftso ft-trrilr, 2o2o d6 ureft u-on + Een;T w qftuirr E-arqruTr"tr fi I 3rd; 3il]QT d qr.ilaref aesqtgl * s z ftrd aff sd
aiura, tral-6 f J lrr lao
1Il "1 :\tra. *g guracir a.e. u-qqq H{iT"r dd #3rEIeq.E 6lE-drdf tsE au. engId 6) ifrd frt ar$r (eimd-+o_rJ.a.u^ensa I Ue Fr*, i qeer -.i zra-rd o.-+c-t ud fu_dTE'-sil€rolfi d:rT ^ gfr-fr erfreroJ an qr o_fi.i6 5 0 e I /4040/2ozod,,fi-d e "rc[krc, 2o2o aTT gaer d ur--C#of ara-aaryr, zors of sila-a arg .ora# ?iaieff Em-orffi&a o-r rra.fr.8. d h{ei o-r o**..f'.*.*
"d".e fuqe ur$ R-qr al+tt Ed-rd-6-Z)oqd 2ot s El-E-atren +1 sil-std qrg grrdmr 3rg?rru
Hi}quTi.tr, ?rs-Sd (du#d!') E?i 6-&ft h "lg {ur?kr, poor
8tuII dI qTg ur$ aftr 3r.r: Jftr BEil + ffieqefr drfl
Annexure-XI
196
ffiH snler qrs B+ ar$ r snter sfi sfr idd-4do-e
os+ft q-6]" .t- fuT _^+ fudrcseil anr arqaft+ ua.off.o. +snter d 3{Erurmd + ry *d -;
Hq'* s{d E_mr} }afurftrd frFr" am rrq-q_?ftdr #*- #_l-*t fu-} dr+, o,i*iEft qfr ?id-d-d-6_4 3rgz{n tr '-' -'rwrr u
.H ffiHi+d + q* o-oio zss Edi6. o4.tt.2o2o
qw, trd;; ;.IT#*RE"P#E3iltrue?E 6ff *a q+ ry-"* "*r'jfur).Aqkrd q-d + # !-dre] i ++ Er_& # * dg u_qsur 6y:i sler t frEra
^zramn q-m d ;ftrd 3rfi_d d arcqaI srrd-o-"rdr t agnu ** "*i f#i#or.4.s. u-{EUr F.i*r $_fl aqr"d: 2o2o * +u,aqftieftq Erg Ed esB r+r arqa d ziAE *. #q ewrrffi ffi
**mT oa* J ,ffi" or+ ororqr utrrgsilft;'.il"H# #'Hffi# ## *Ba-d-fir$d qz srqd)s H rr+r (.i_fi'r;"''""'
oar+ffq zrdFa qrqrmq- aI $. d srgqrild # r zs t#d_d* 3TFr6 €aH Er& q-drd. ffi"J;: #rr d ftt,ra ercsfr Eo.rd] o'r Hffaor oz qerei d a-{d} *, *A Fr arqao.rd frqfft-d uB-+r srEznr fueT;, #;; eafr mr arqaqFd+q-d dild-f6- 8 "f.* a,
r.iilrd '- 3qiadrgrTT
cfrftfr'-
e}ffq fr{ero,s-$ur H{iTUr +d (q-qf-d"uT
e-ron) uftier grqq, g-r,o.ffi fu i&ar
e,ei+q Etenaq (a*q)E-a uti d-"rdrg qFd?fra3Thr ol-d-ft, e+qrd +1
a+qrd, +ffiqdqraq, fiR-dsfu srrqeqo
197
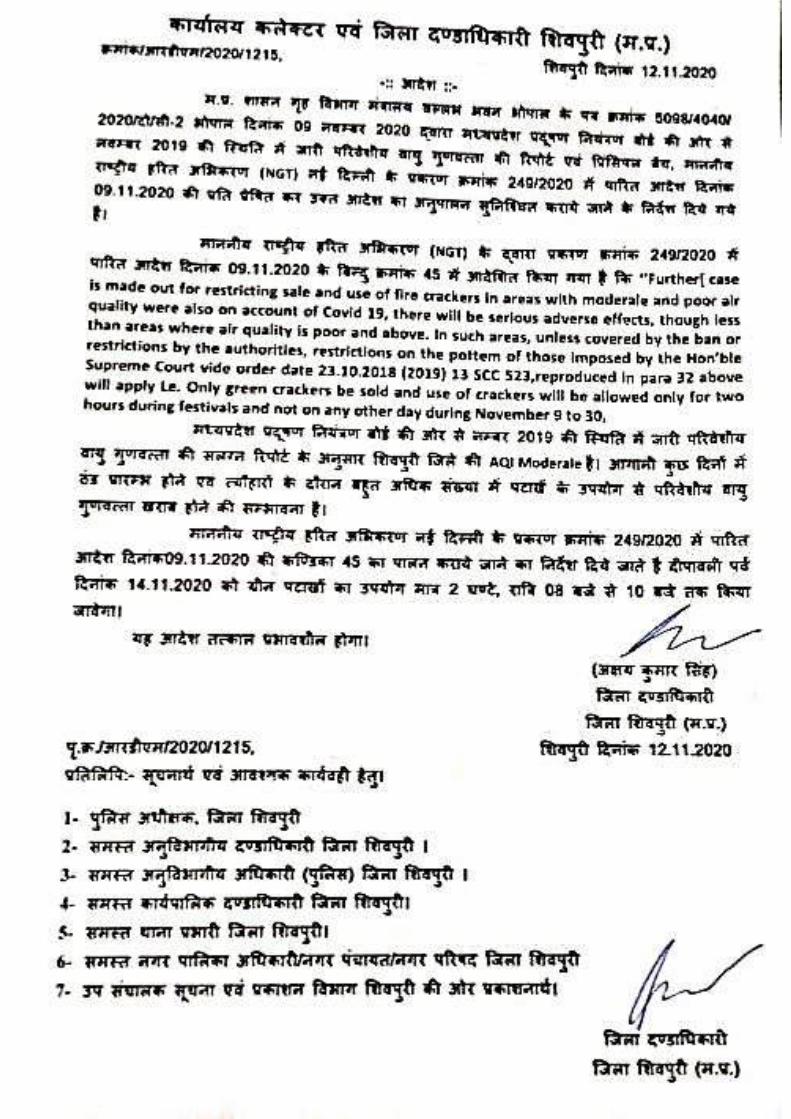
198
199
200
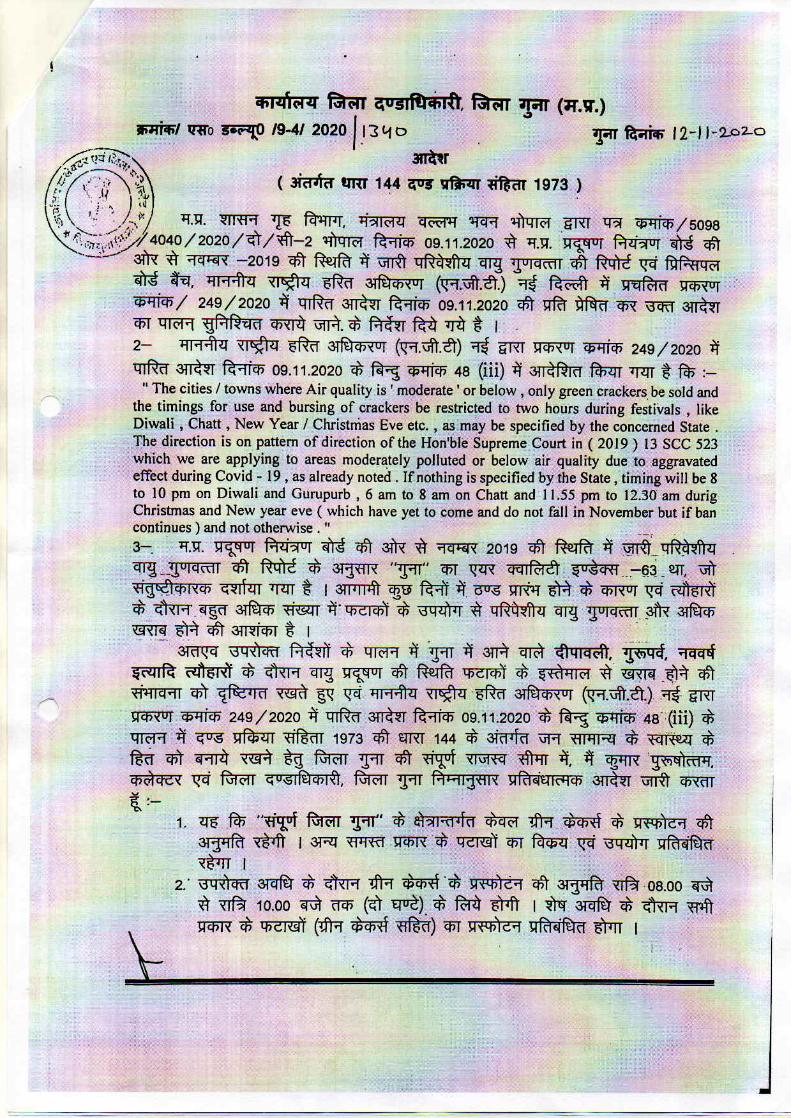
201
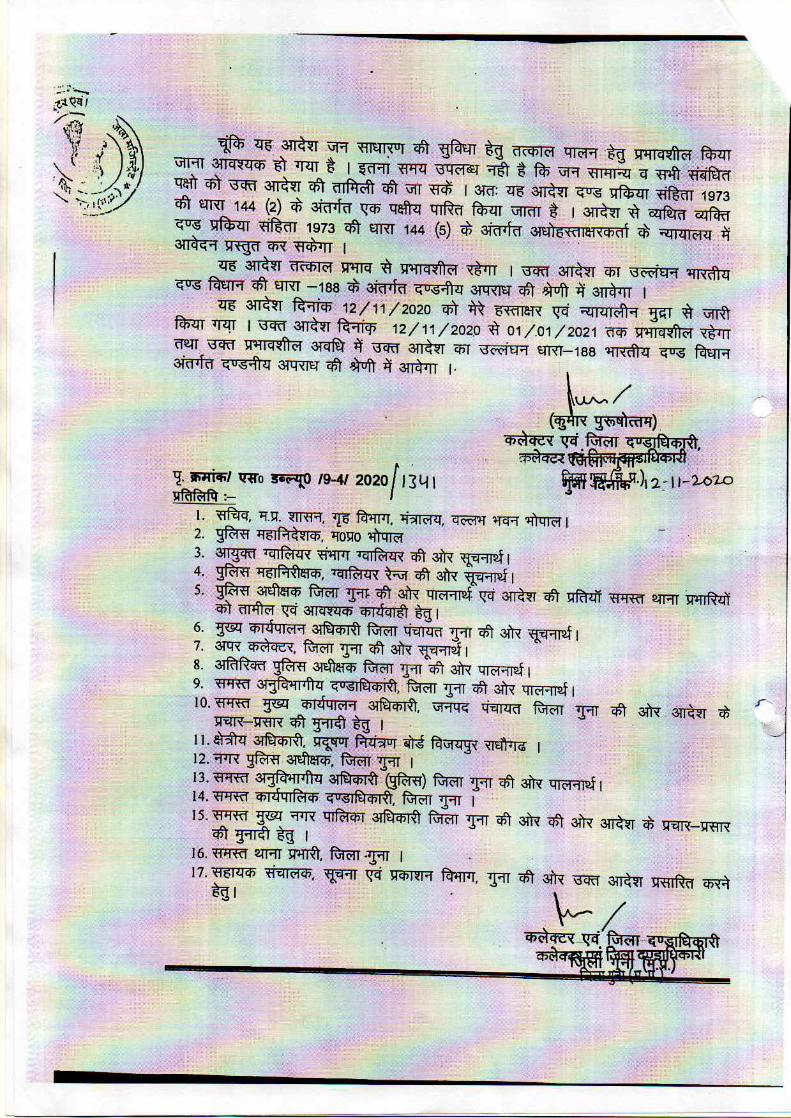
202
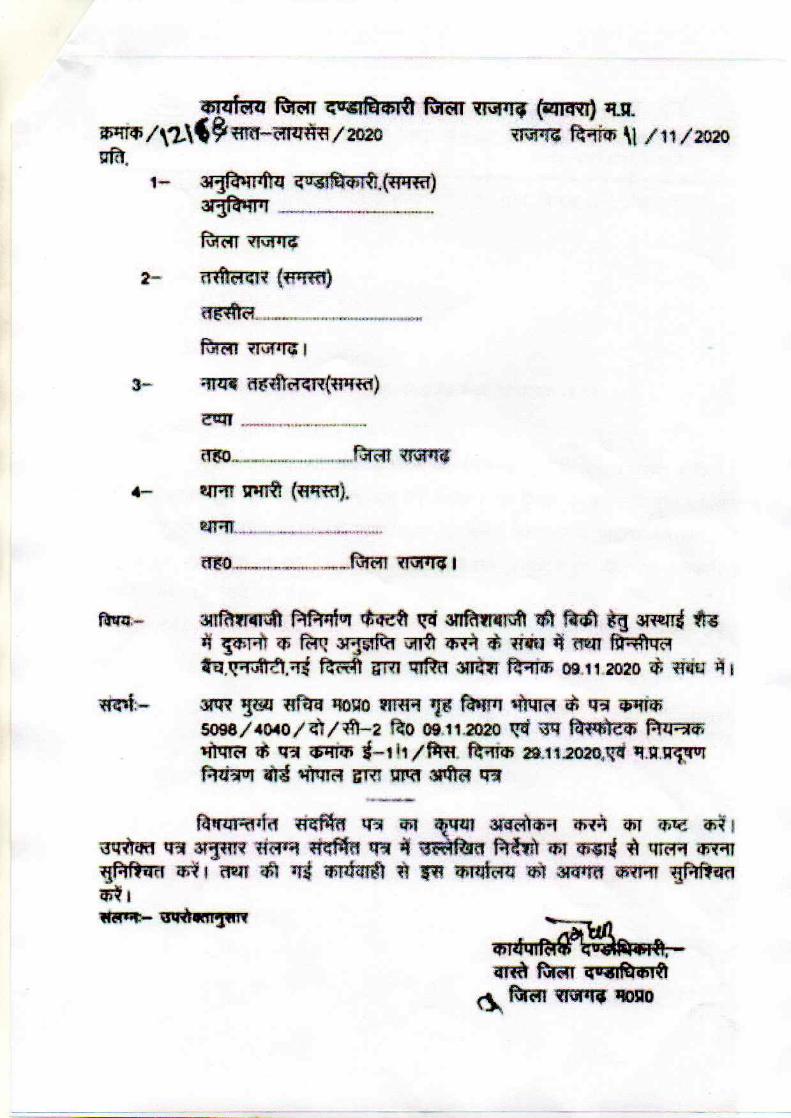
203
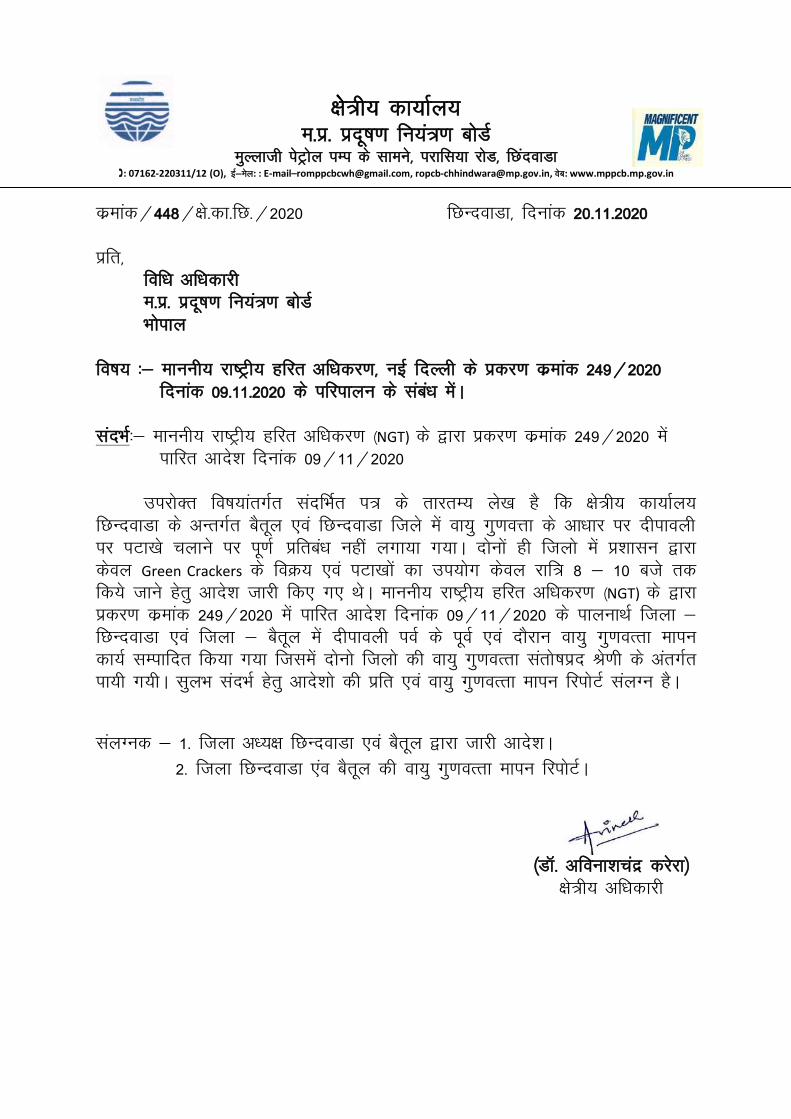
{kss=h; dk;kZy;
e-iz- iznw"k.k fu;a=.k cksMZ
eqYykth isVªksy iEi ds lkeus] ijkfl;k jksM] fNanokMk
: 07162-220311/12 (O), bZ&esy: : E-mail–[email protected], [email protected], osc: www.mppcb.mp.gov.in
dzekad@448@{ks-dk-fN-@2020 fNUnokMk] fnukad 20-11-2020
izfr]
fof/k vf/kdkjh
e-iz- iznw"k.k fu;a=.k cksMZ
Hkksiky
fo"k; %& ekuuh; jk"Vªh; gfjr vf/kdj.k] ubZ fnYyh ds izdj.k dzekad 249@2020
fnukad 09-11-2020 ds ifjikyu ds laca/k easA
lanHkZ%& ekuuh; jk"Vªh; gfjr vf/kdj.k ¼NGT) ds }kjk izdj.k dzekad 249@2020 esa
ikfjr vkns’k fnukad 09@11@2020
mijksDr fo"k;karxZr lanfHkZr i= ds rkjrE; ys[k gS fd {ks=h; dk;kZy;
fNUnokMk ds vUrxZr cSrwy ,oa fNUnokMk ftys esa ok;q xq.koÙkk ds vk/kkj ij nhikoyh
ij iVk[ks pykus ij iw.kZ çfrca/k ugha yxk;k x;kA nksuksa gh ftyks esa ç'kklu }kjk
dsoy Green Crackers ds foØ; ,oa iVk[kksa dk mi;ksx dsoy jkf= 8 & 10 cts rd
fd;s tkus gsrq vkns'k tkjh fd, x, FksA ekuuh; jk"Vªh; gfjr vf/kdj.k ¼NGT) ds }kjk
izdj.k dzekad 249@2020 esa ikfjr vkns’k fnukad 09@11@2020 ds ikyukFkZ ftyk &
fNUnokMk ,oa ftyk & cSrwy esa nhikoyh ioZ ds iwoZ ,oa nkSjku ok;q xq.koRrk ekiu
dk;Z lEikfnr fd;k x;k ftlesa nksuks ftyks dh ok;q xq.koRrk larks"kizn Js.kh ds varxZr
ik;h x;hA lqyHk lanHkZ gsrq vkns’kks dh izfr ,oa ok;q xq.koRrk ekiu fjiksVZ layXu gSA
layXud & 1- ftyk v/;{k fNUnokMk ,oa cSrwy }kjk tkjh vkns’kA
2- ftyk fNUnokMk ,ao cSrwy dh ok;q xq.koRrk ekiu fjiksVZA
¼MkW- vfouk’kpanz djsjk½
{ks=h; vf/kdkjh
204
YY o/32S/2020, T..H.1973 aT 144 3FsM
3HTT (TfRT f-Aia 12/11/2020)
HETyT TE fHTT AT
4040/2020/t/t-2 aTa fio9 Tq 2020 HE7u uqr7 fAria s siR 5098/ TRT
3tTrbU(NGT) T fr 7 Y HT 249/2020 ufR ATRT f&is 09/11/2020
09/11/2020 t HT5 48 à AITHR 3eAIa fyI 741
1. There will be total ban against sale or use of all kinds of fire crackers in the NCR from Midnight of November, 9-10, 2020 to the midnight of November 30 - December 1, 2020, to be
reviewed thereafter.
2. Direction (1) will also apply to all cities/ towns in the country where the average of ambient air quality during November (as per available data of last year) fall under "poor" and above
category.3. The cities/towns where air quality is 'moderate' or below, only green crackers be sold and the
timings for use and bursting of crackers be restricted to two hours during festivals, like Diwali, Chatt, New Year/Christmas Eve etc., as may be specified by the concerned State.
This direction is on pattern of direction of the Hon'ble Supreme Court in (2019) 13 SCC 523 which we are applying to areas moderately polluted or below air quality due to aggravated effect during Covid-19, as already noted. If nothing is specified by the State, timing will be 8 to 10 pm on Diwali and Gurupurb, 6 am to 8 am on Chatt and 11.55 pm to 12.30 am during Christmas and New year eve (which have yet to come and do not fall in November but if ban continues) and not otherwise.
249/2020 uifa srdT fHi 09/11/2020 7te1 48(ii) ukurea ATAN
atc
205
fdarsT f 12/11/2020 T./q20/HifA./2020 ufafaft 1
3
********************
10
11
12 *******************.****************.** ********************
13
206
' .I ------------------------------------~----------------------------.. cbcHicb1 ....... .. . 1.L.c. ... 1 /3os ~ ~ feo1icJS.J.Z. .alcld-dll 2 0 2 0
3TR~T cff~~T . ~TRfaf, <lJ6 fcra-TI<JT d-15IIC1ll cfcRa-T m aTTqrc;f &RT "Q'?J' cbcflicb
5098/4040/2020/c!TR:fi-2 :mi:iTcYf feciiicb ·-09 6-icld-dl-2, 2020 "R cfff.2TIR~T ~ f°cild-:>101 mi cB1' 3fR." -a o1clJ-a1-2 2 o 1 9 cB1' R~ ~ uiRl -qffi-~ftc:r ~ <!J 0 ,qm, ~ Rmi l!f-i RiRNe1 ~. <A,o1an~ -21~~ mer ~cB"l!:01 (NGn ~ -~ c5 !.lct>-2°1 q5(F,:·co 249;2020 ~ mfur 3-TR~T RciiicJS 0911112.fJ20 cB1'
;. gfu ~ qR' 3cffi' ~~T ct>T 311Qre16-i ~-m, clh:W ~ cf) ~~T ~ vrn i, d-lloiciftc.l -21~.!l mer 3-TTacJRUT (NGT) c5 &RT !.lch-201 cpa11cr.> 249/2020 ~ -mfuf ~~T- ffi6-iicB 09/11/2020 cf) ~ cbcflfcp 48 al' ~rc, fclmr cJRTT i fcfi, '
I. There will be total b,in against sale or use of all kinds of fire crackers in the NCR from Midnight of November, 9-10, 2020 to the midnight of November 30 - December l , 2020, to be reviewed thereafter. 2. Direction ( 1) will also apply to all cities / towns in the _.country where the average of ambient air quality during November (as per available data of last year) fall under "poor" and above category. 3. The cities/towns where air quality is 'moderate' or below, only green crackers be sold and the timings for use and bursting of crackers be restricted to two hours durir,5 festivals, ·like Diwali, Chatt, New Year/Christmas Eve etc., as may be specified by the concerned State.
This direction is on pattern of direction of the Hon'ble Supreme CourtJn (2019) 13 SCC 523 which we are applying to areas. moderately polluted or below air quality due t~ aggravated effect during Covid-19, as already noted. If nothing is specified hy the State, timing will be 8 to IO pm on Diwali and Gurupurb, 6 am to ·g am on Chatt and 11.55 pm to 12.30 am during Christmas and New .year eve (which have yet to come and do not fall in November but if ban continues·1 and not otherwise.
31fJ1fa4) '<[gU f~ CJl is '!.lrr-ffil ~ 1!ci° c'4~gm- . ~ mTaf ~ 3fm'cfS ~ a1 QclM ~ 3q~1J1 R ~~fRr ~ <!J0 rqm1 3fu- srraco m ~ q5T -~famraJT i 1 3fc=mcr ~ a) ~ \.1~151°1 ~ R~ cffi" <;_lZl<llci ~ ~ d-lro1citlc.1 -ll~c.l 6Rci 3TT~ (NOT), ~ ~ c5 \.145-2°1 ·q5cf1jq5 249 / 2020 -a) l:J1ITT' ~~T Ro1iq5 0911112020 ~ q5fosq51 4B(iii) ~ qRq1e1o1 ~ Ricfuilcj,-2.-11...,_ ~U lc'tfich ~~T iJTiit ~ ufm. i: 1 • ~ ~ ~ RJl:15 ~ Qcl&l "c15T ~ '(!ci- 3l.ld1Jr fcBm oo -l-lcfi<lll I m- Qc1&l ci5 ::tt@R® ~ craft m ~ Qcl& 'i "c15T @qxT 1!ci" 3 qci)J 1 ~ml ~ 1
207
/ . /
I . cflOlclc-ft ~ ~ ~ 1?1 J5 ~ol O? 0 () lflJc I lll~ (J E (JO i ! 1 0 : 0 0 ~ · (1q))
11. 85 mf c5 fee, 0 2 : 0 0 ~ (QTT'i : 0 6 : 0 0 R O 8 : 0 0 acif ?ftD 1 111. Rb-llcff-8 Q'ci ~ ml cimr 07 - 3 5 rnfoic RITTf 1 I : 5 5 <~
I 2: 3 0 ~ riq5)
~ ~~T 3ITT1 U101<TT cnl" ~f.@" ~ I -qfc5 dcicAlaf <B <JR <101~ l!W ~ ~ t , 3m cf ~ ~ ~ g fcn- ~ 3ff~~l <fl ~ ~ ~ c2ITTffi" cfil c!,- ~ I 3@: ~ 3fR~T "QcP q~ QTRcf rax:TT uITT'fl g I ~ 3ffe ~T cnT 3ci1tlai ~ cTTR ~ c5 ~ a-i1-2cft a c0s ~ c57 arn- 1 as cE 3Rfc}ffi cf>r4c11g) c5t uilclJft I ~ JfR~T 3wf Ra1i45 1 2 /1 l 12 0 2 0 cm m ~<ITT" l!ci Qc!1i:!I <l ufRT mx:rT <TTml
~ ,i)§i 3JR~T i1iilllc1 _ l!>llf(f~IIB ,mrr I ~ I J} ..,. mHcfe2, ~ ~
~ . 45cf!ict51 ......... .1!3.9..$; ~ Ra1icf>./dZc1a<R.a 202 0 s.,RIPctfQ::-1) 3nR ~ ~' vJ6' Rfa-TTJT, d1:>IIC1t'..l , m:-R:H :ITTTcf, ~ I 2) 3ff¥R, cfJR Qlrcicf> for.Jm, ~ I 3) cf! lcil aft <-1 ~ l!ci ID!" ~ili~T, ~ c5T 3n7 RITT" wrcncl ®fc1 I 4) ~ 3fcltcWJ5, ~ I 5) ~ cf>IJQiciai 3TTITTnRT, ~ Qill<.lci, ~ I 6 ) 3nR ~ cfffui-2{C::, l-lcff-2-ci 3~~ isrf~ (21uiN), 2-!d-l&i cnli!lQ lklch
cHM~c, ~I 7) 3i@Rchi ~ 3ftlr~, -llcH-2-a 2TTcfT -o-amt ~ ~ I 8) 3qfu~ 3ITITTnRT, ~ ) ~I 9) qQd,u1o11 3rf'OcPRT, ~IB-ft @cf>RI 3TT:HclRUT, ~ I 1 o) ~ lfme1cf>, ufcT RQc1§ ~ ctr 3ITT 3TR~T cET ~~l'Gi t.g 3wfuR 1 1 1) -o-~ 3ff'OcPRT, cf>Hcrc?i ~c::, ~.3~.m . ~ ctr 3ITT ~ !;I~ncra ~ cl csJ.2-1 I ~e, tR 3fqffi"s cf5Taf ~ I l 2) 9~ 3f~. ~c:1"l-T ~ ~. ~J'?[C"I I 1 3) ~ RlRh&ll t!zi TcrRW 3fllTc.15'W, clWf I 1 4 ) WcfT 9:Hffi, l-!Ji&i ~ ~ I 1 5) "Ref ~UR .. .. .. .. .. .. .. .. . .. .. .. .. . . .. .. .. l I a:1 R1 31Wl-hrJ1 cb1 3ft l {~t.l~ 10 (!a JmT$rr<..°f.. cf>tJa,g) ~ I
('
~ ; , - ~) ) -) ' (.ICOd ffi"g ' I) '""; ·"""'\
c1)8 cte~. FGr,~ ff~~ . I. f '
208
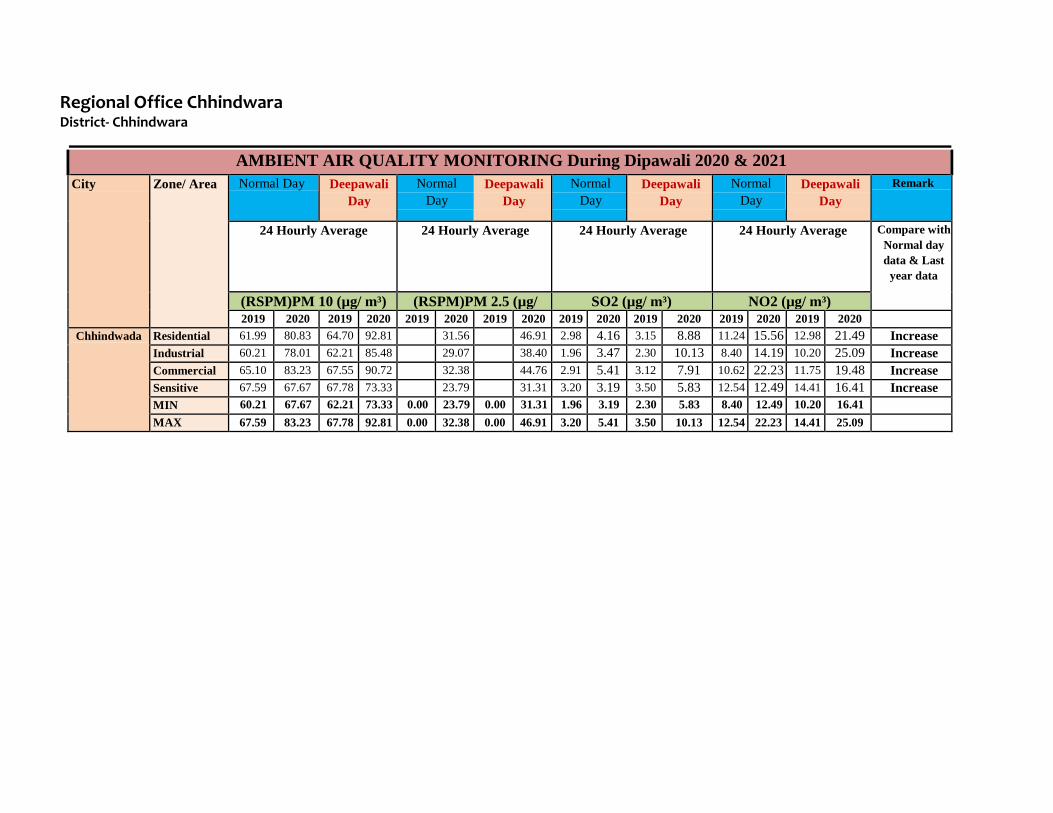
Regional Office Chhindwara District- Chhindwara
AMBIENT AIR QUALITY MONITORING During Dipawali 2020 & 2021
City Zone/ Area Normal Day Deepawali
Day
Normal
Day
Deepawali
Day
Normal
Day
Deepawali
Day
Normal
Day
Deepawali
Day
Remark
24 Hourly Average 24 Hourly Average 24 Hourly Average 24 Hourly Average Compare with
Normal day
data & Last
year data
(RSPM)PM 10 (µg/ m³) (RSPM)PM 2.5 (µg/ SO2 (µg/ m³) NO2 (µg/ m³)
2019 2020 2019 2020 2019 2020 2019 2020 2019 2020 2019 2020 2019 2020 2019 2020
Chhindwada Residential 61.99 80.83 64.70 92.81 31.56 46.91 2.98 4.16 3.15 8.88 11.24 15.56 12.98 21.49 Increase
Industrial 60.21 78.01 62.21 85.48 29.07 38.40 1.96 3.47 2.30 10.13 8.40 14.19 10.20 25.09 Increase
Commercial 65.10 83.23 67.55 90.72 32.38 44.76 2.91 5.41 3.12 7.91 10.62 22.23 11.75 19.48 Increase
Sensitive 67.59 67.67 67.78 73.33 23.79 31.31 3.20 3.19 3.50 5.83 12.54 12.49 14.41 16.41 Increase
MIN 60.21 67.67 62.21 73.33 0.00 23.79 0.00 31.31 1.96 3.19 2.30 5.83 8.40 12.49 10.20 16.41
MAX 67.59 83.23 67.78 92.81 0.00 32.38 0.00 46.91 3.20 5.41 3.50 10.13 12.54 22.23 14.41 25.09
209
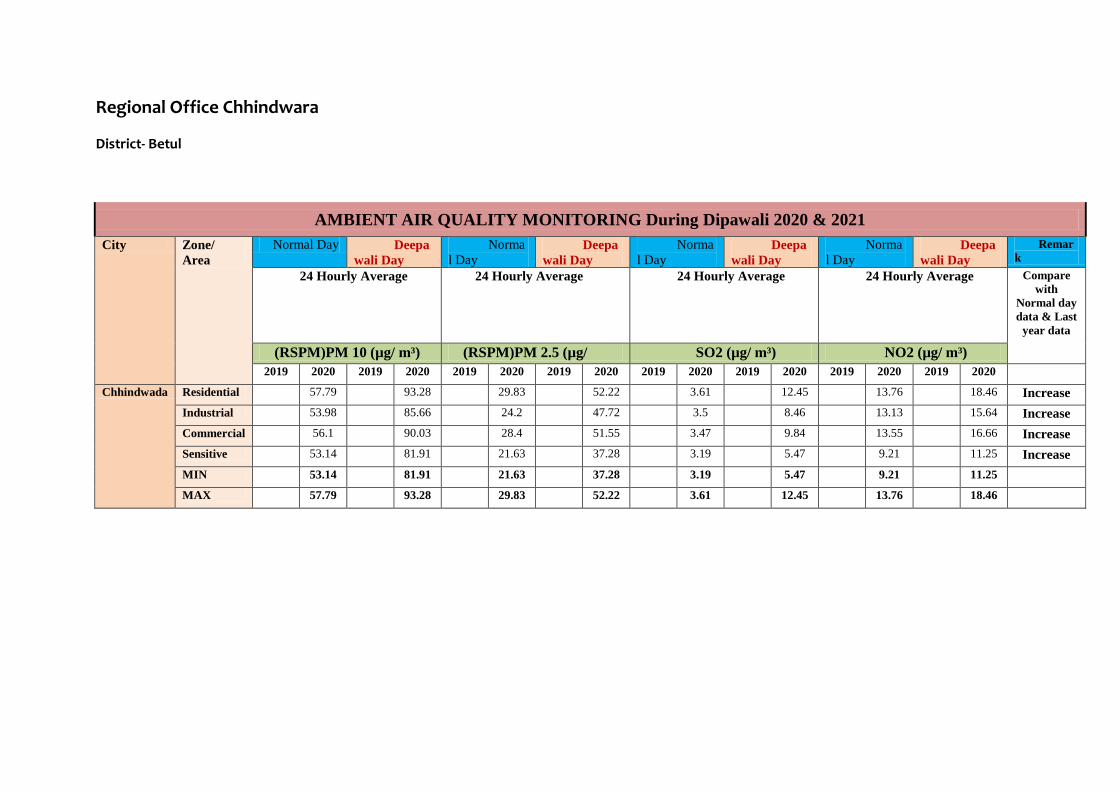
Regional Office Chhindwara
District- Betul
AMBIENT AIR QUALITY MONITORING During Dipawali 2020 & 2021
City Zone/
Area
Normal Day Deepa
wali Day
Norma
l Day Deepa
wali Day
Norma
l Day Deepa
wali Day
Norma
l Day Deepa
wali Day
Remar
k
24 Hourly Average 24 Hourly Average 24 Hourly Average 24 Hourly Average Compare
with
Normal day
data & Last
year data
(RSPM)PM 10 (µg/ m³) (RSPM)PM 2.5 (µg/ SO2 (µg/ m³) NO2 (µg/ m³)
2019 2020 2019 2020 2019 2020 2019 2020 2019 2020 2019 2020 2019 2020 2019 2020
Chhindwada Residential 57.79 93.28 29.83 52.22 3.61 12.45 13.76 18.46 Increase
Industrial 53.98 85.66 24.2 47.72 3.5 8.46 13.13 15.64 Increase
Commercial 56.1 90.03 28.4 51.55 3.47 9.84 13.55 16.66 Increase
Sensitive 53.14 81.91 21.63 37.28 3.19 5.47 9.21 11.25 Increase
MIN 53.14 81.91 21.63 37.28 3.19 5.47 9.21 11.25
MAX 57.79 93.28 29.83 52.22 3.61 12.45 13.76 18.46
210
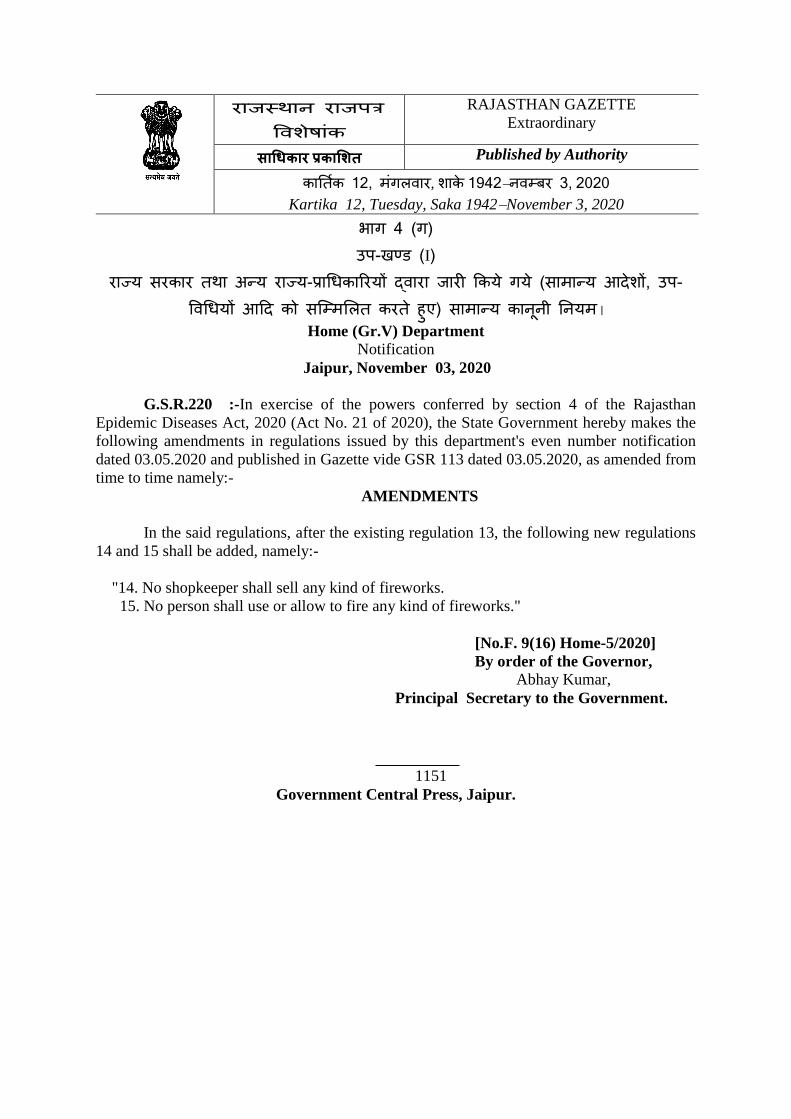
राजस्थान रराज्र
विशेष ांक
RAJASTHAN GAZETTE
Extraordinary
साधिकार प्रकाशित Published by Authority
कार्त िक12,मगंलवार, शाके 1942&न रवम्बर , 2020
Kartika 12, Tuesday, Saka 1942&November 3, 2020
भाग4(ग) उ्-खण्ड(I)
राज्यररकारतथान्यराज्य-प्राधिकाररयोंद्वाराजारीककयेगये(रामा्यदेेशों,उ्-ववधियोंददेकोरम्म्मललतकरतेहुए)रामा्यकान रनन र र्न रयमA
Home (Gr.V) Department
Notification
Jaipur, November 03, 2020
G.S.R.220 :-In exercise of the powers conferred by section 4 of the Rajasthan
Epidemic Diseases Act, 2020 (Act No. 21 of 2020), the State Government hereby makes the
following amendments in regulations issued by this department's even number notification
dated 03.05.2020 and published in Gazette vide GSR 113 dated 03.05.2020, as amended from
time to time namely:-
AMENDMENTS
In the said regulations, after the existing regulation 13, the following new regulations
14 and 15 shall be added, namely:-
"14. No shopkeeper shall sell any kind of fireworks.
15. No person shall use or allow to fire any kind of fireworks."
[No.F. 9(16) Home-5/2020]
By order of the Governor,
Abhay Kumar,
Principal Secretary to the Government.
1151
Government Central Press, Jaipur.
Annexure-XII
211
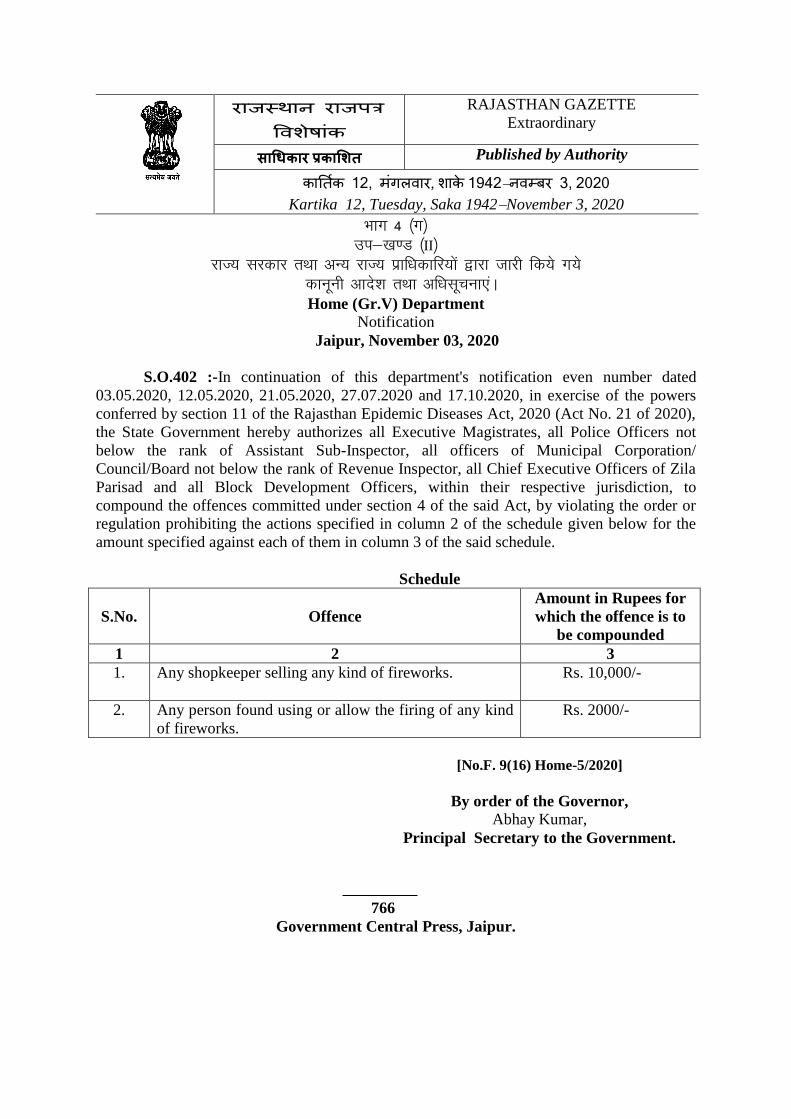
राजस्थान रराज्र
विशेष ांक
RAJASTHAN GAZETTE
Extraordinary
साधिकार प्रकाशित Published by Authority
कार्त िक12,मगंलवार, शाके 1942&न रवम्बर3, 2020 Kartika 12, Tuesday, Saka 1942&November 3, 2020
Hkkx 4 ¼x½
mi&[k.M ¼II½
jkT; ljdkj rFkk vU; jkT; izkf/kdkfj;ksa }kjk tkjh fd;s x;s
dkuwuh vkns’k rFkk vf/klwpuk, aA
Home (Gr.V) Department
Notification
Jaipur, November 03, 2020
S.O.402 :-In continuation of this department's notification even number dated
03.05.2020, 12.05.2020, 21.05.2020, 27.07.2020 and 17.10.2020, in exercise of the powers
conferred by section 11 of the Rajasthan Epidemic Diseases Act, 2020 (Act No. 21 of 2020),
the State Government hereby authorizes all Executive Magistrates, all Police Officers not
below the rank of Assistant Sub-Inspector, all officers of Municipal Corporation/
Council/Board not below the rank of Revenue Inspector, all Chief Executive Officers of Zila
Parisad and all Block Development Officers, within their respective jurisdiction, to
compound the offences committed under section 4 of the said Act, by violating the order or
regulation prohibiting the actions specified in column 2 of the schedule given below for the
amount specified against each of them in column 3 of the said schedule.
Schedule
S.No. Offence
Amount in Rupees for
which the offence is to
be compounded
1 2 3
1. Any shopkeeper selling any kind of fireworks.
Rs. 10,000/-
2. Any person found using or allow the firing of any kind
of fireworks.
Rs. 2000/-
[No.F. 9(16) Home-5/2020]
By order of the Governor,
Abhay Kumar,
Principal Secretary to the Government.
766
Government Central Press, Jaipur.
212
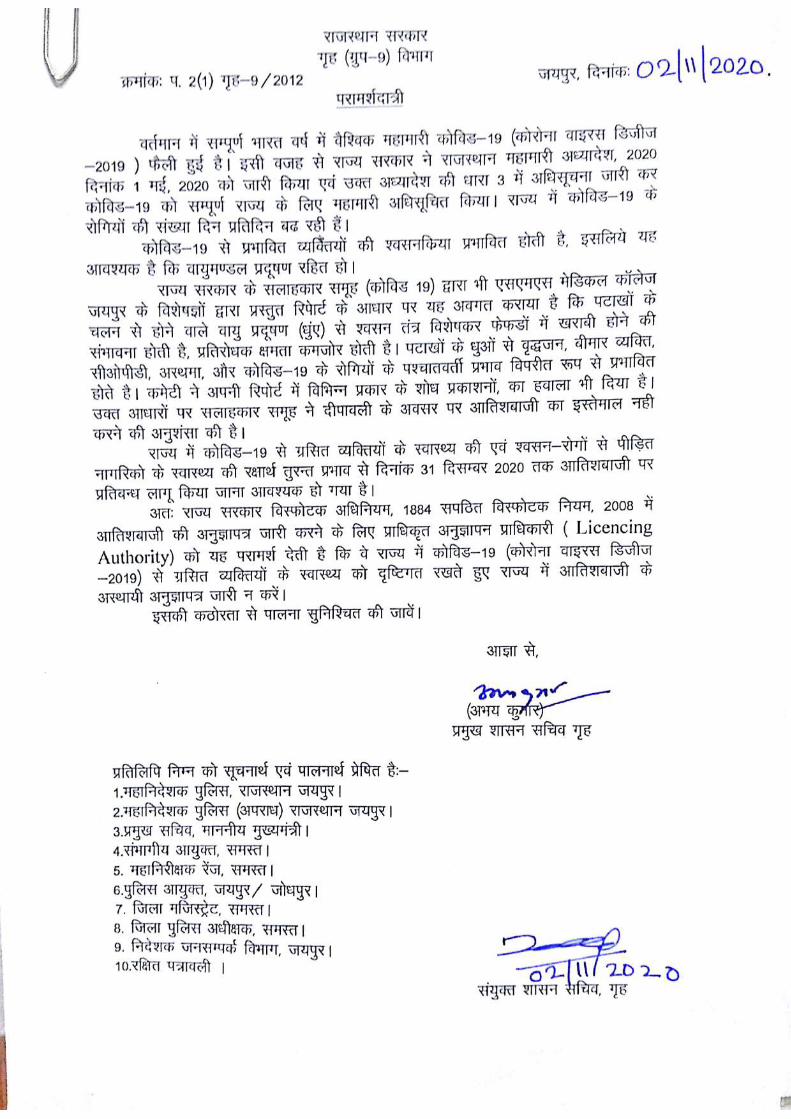
213
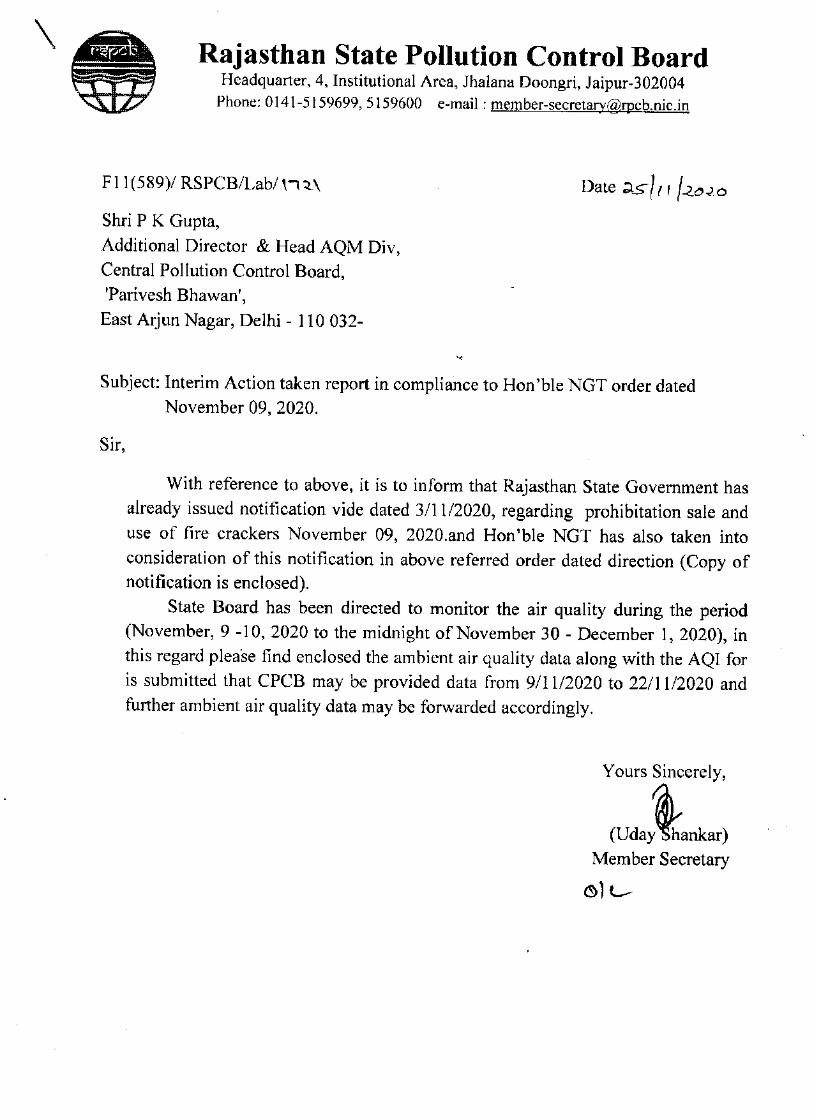
214
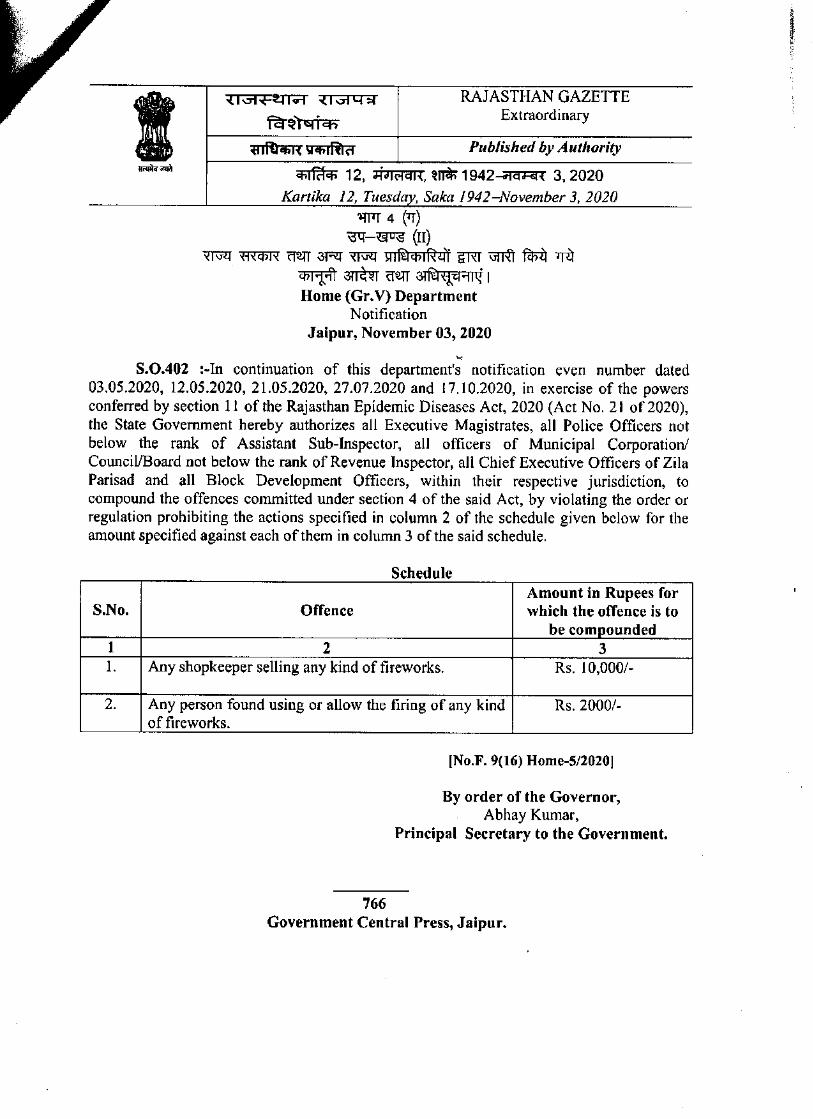
215
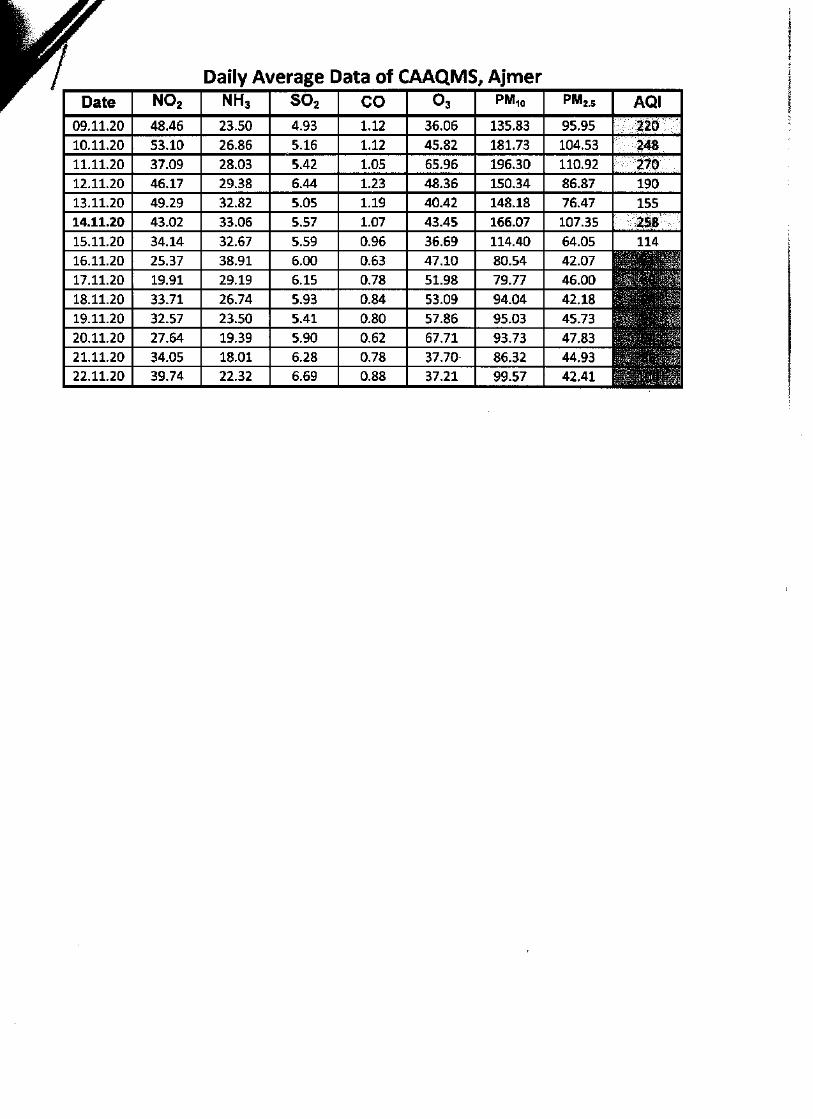
216
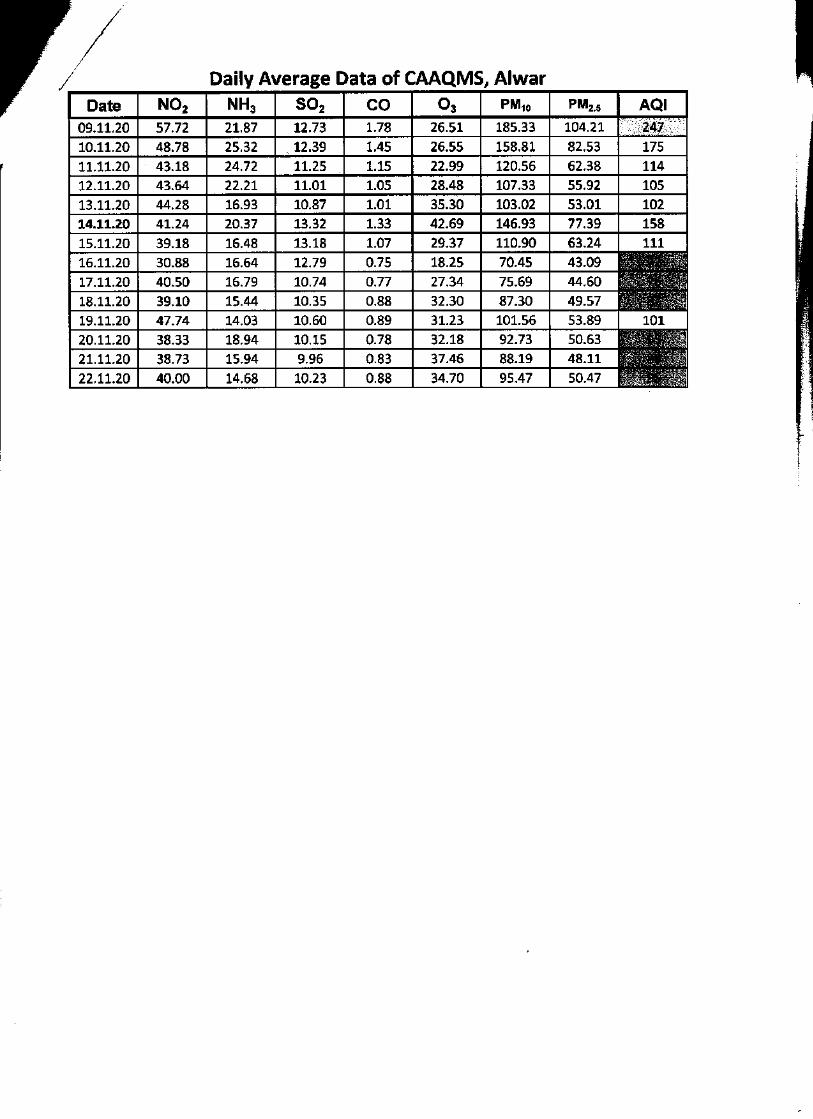
217
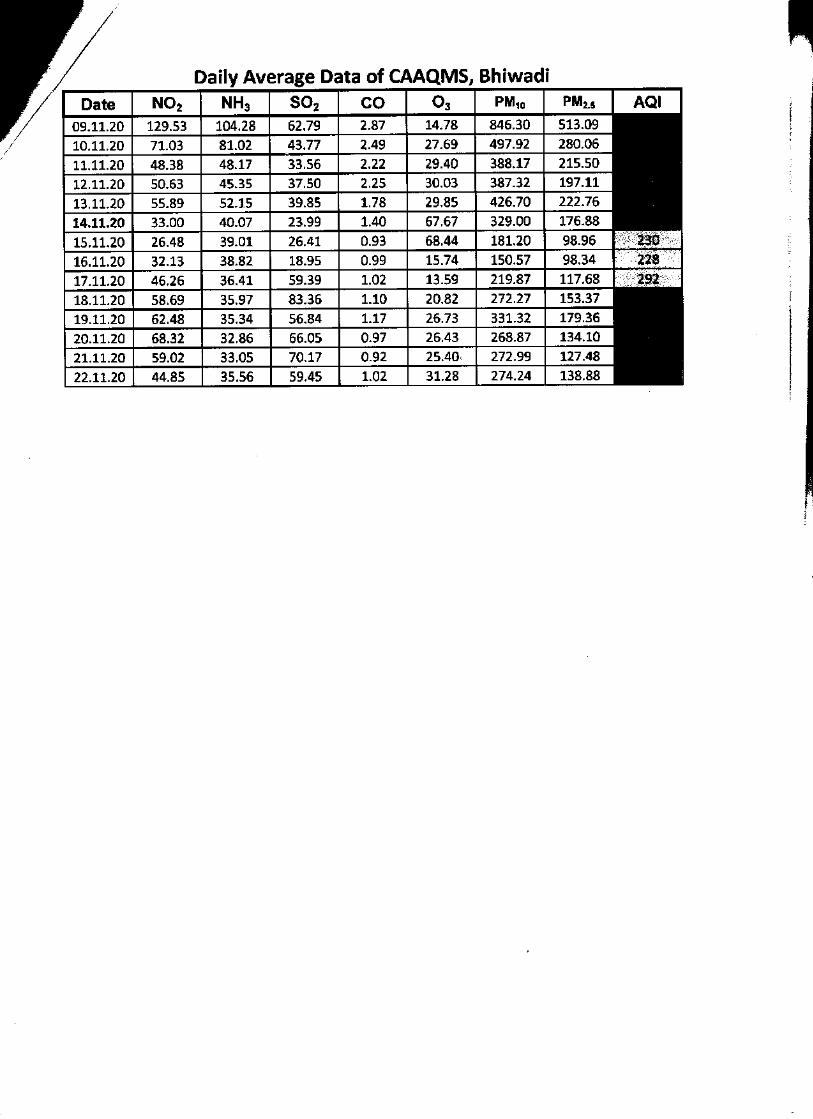
218
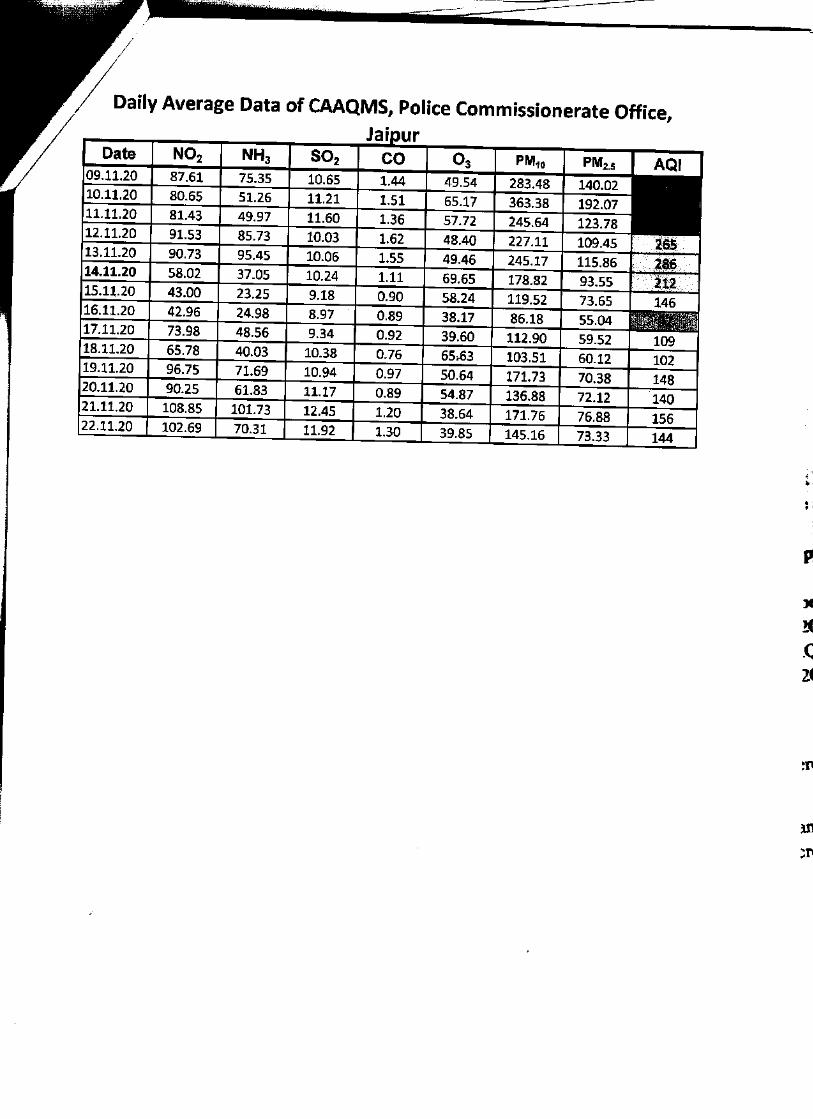
219
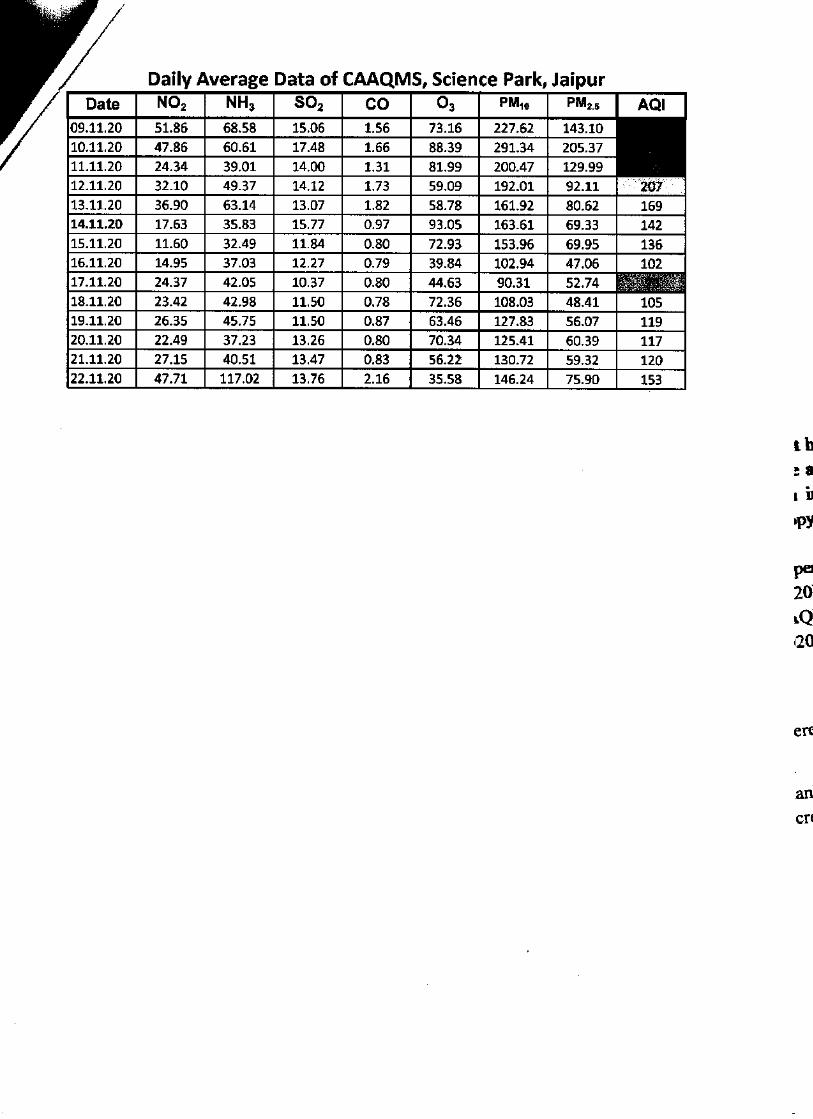
220
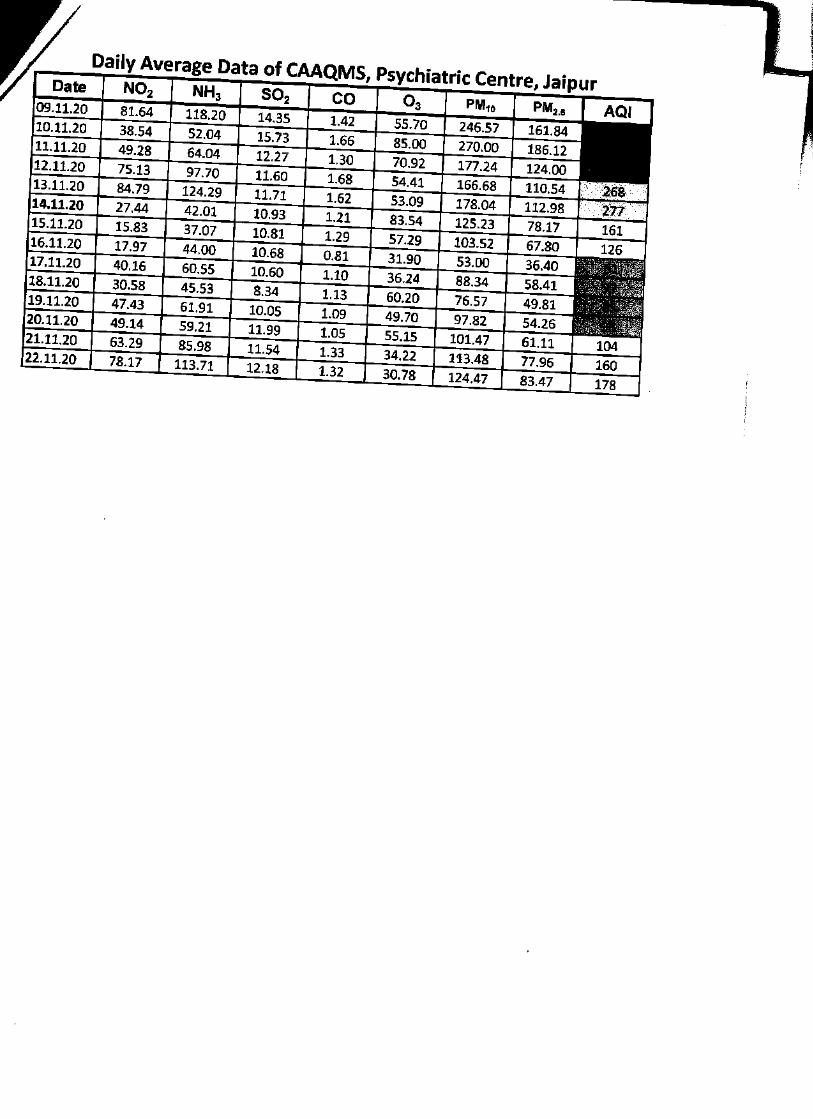
221
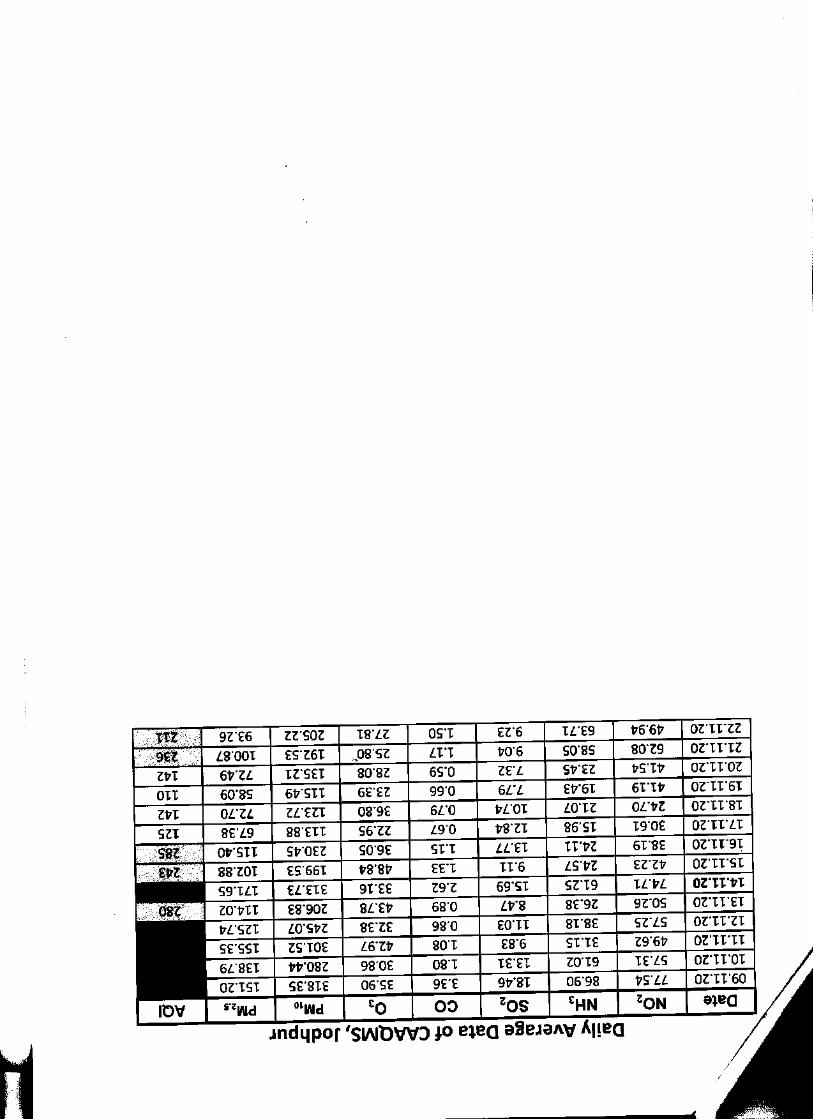
222
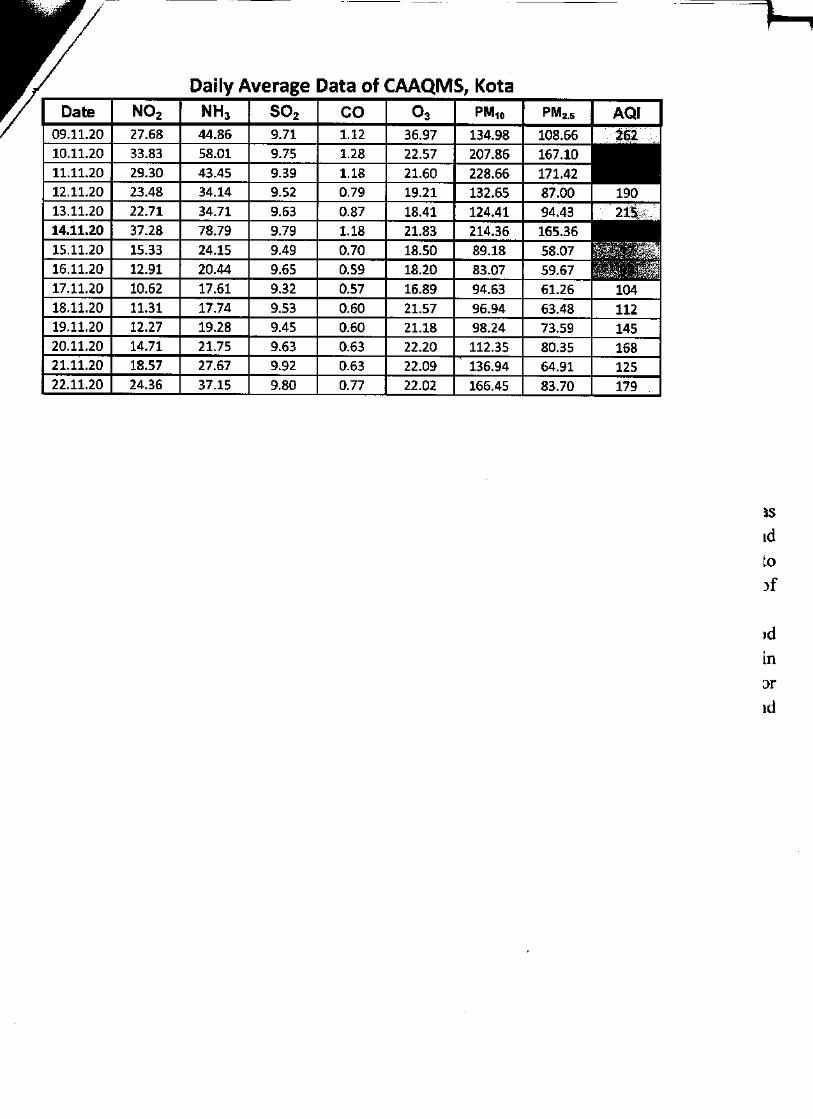
223
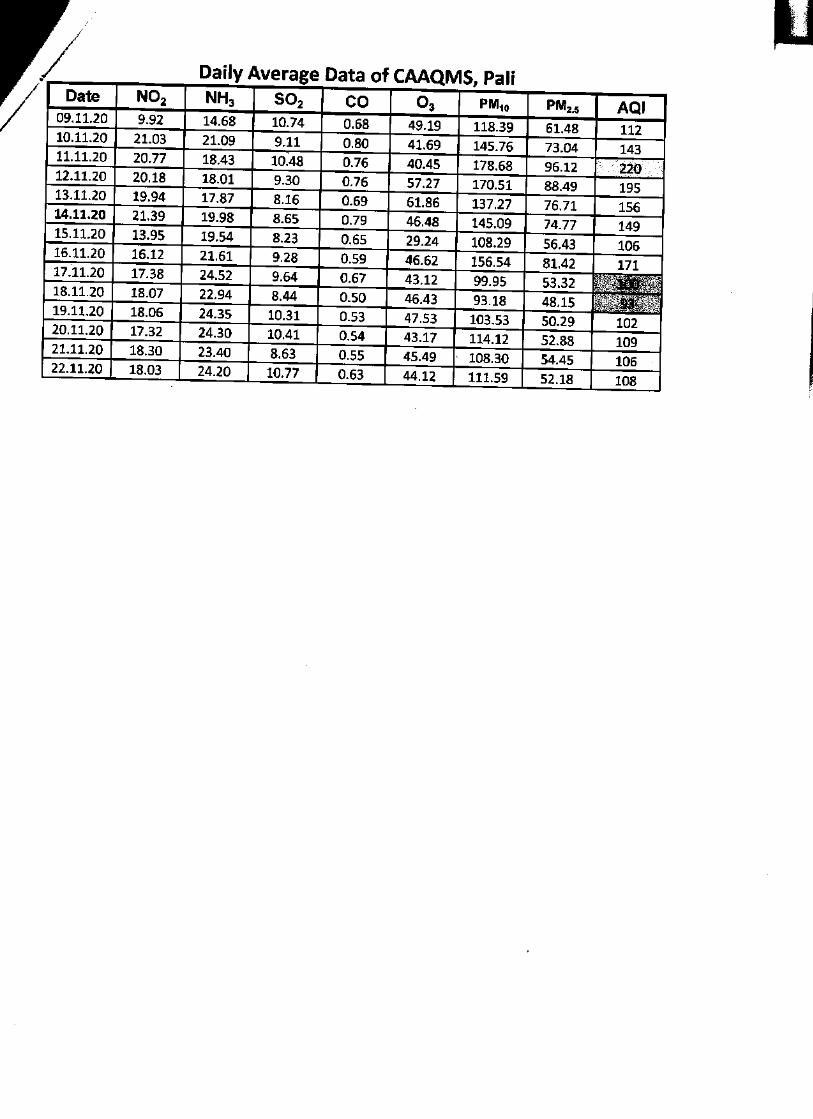
224
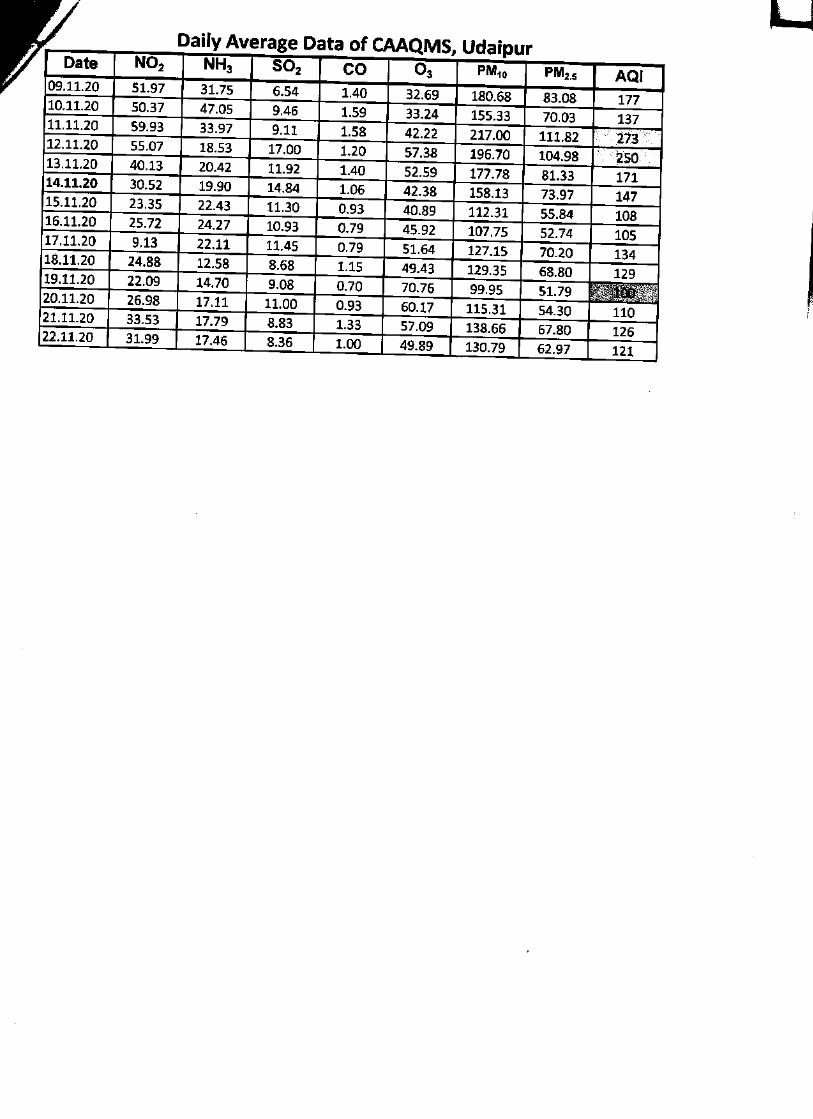
225
Deuvu Sharma <[email protected]>
Fwd: Campaign for "Pollution Free Deepawali, 2020" by RSPCB 1 message
P K GUPTA ADDITIONAL DIRECTOR <[email protected]> Thu, Nov 26, 2020 at 12:57 PMTo: deuvusharma <[email protected]>
From: "P K GUPTA ADDITIONAL DIRECTOR" <[email protected]> To: "SHARANDEEP SINGH" <[email protected]> Sent: Friday, November 13, 2020 6:15:00 PM Subject: Fwd: Campaign for "Pollution Free Deepawali, 2020" by RSPCB
From: "Member Secretary CPCB" <[email protected]> To: "P K GUPTA ADDITIONAL DIRECTOR" <[email protected]>, "Mantu Kumar Choudhury" <[email protected]> Cc: "Prashant Gargava" <[email protected]> Sent: Friday, November 13, 2020 2:45:08 PM Subject: Fwd: Campaign for "Pollution Free Deepawali, 2020" by RSPCB
From: [email protected] To: "Yashvir" <[email protected]>, "Urmila" <[email protected]>, "ENVIS Secretariat" <[email protected]>, [email protected],"SulabhENVIS" <[email protected]>, "CPCB-ENVIS" <[email protected]>, "Partha Kalyan Bhattacharya"<[email protected]>, "SPA ENVIS" <[email protected]>, "jnu-env" <[email protected]>, [email protected], [email protected],[email protected], "cms-env" <[email protected]>, [email protected], [email protected], "GEC ENVIS" <[email protected]>,"gcpcenv" <[email protected]>, "ENVIS-NIOH Ahmedabad" <[email protected]>, "ENVIS EE" <[email protected]>,"cerc-env" <[email protected]>, "Manas" <[email protected]>, "K Vanlalfamkima" <[email protected]>, "ENVIS Centre(GBPIHED), Almora" <[email protected]>, [email protected], "Dr. Ramachandra" <[email protected]>, "Omprakash"<[email protected]>, "frlht-env" <[email protected]>, "mp-env" <[email protected]>, "ori-env" <[email protected]>, "pun-env" <[email protected]>, "ENVIS Hub, Chandigarh" <[email protected]>, "ENVIS TN" <[email protected]>,[email protected], "dzum-env" <[email protected]>, "ENVIS Coordinator" <[email protected]>, "cpreec-env"<[email protected]>, "Goldin Quadros" <[email protected]>, [email protected], "utr-env" <[email protected]>, "FRI-ENVIS" <[email protected]>, "WII ENVIS" <[email protected]>, "ism-env" <[email protected]>, "ENVIS HUB SIKKIM"<[email protected]>, "ENVIS Ecotourism" <[email protected]>, [email protected], "ENVIS-Assam" <[email protected]>,"iict-env" <[email protected]>, "Dr.M.Suneela" <[email protected]>, "Dr. M. Suneela" <[email protected]>, "ENVIS Manipur"<[email protected]>, [email protected], "CAZRI ENVIS" <[email protected]>, "Dr Vizovol Mekro Coordinator"<[email protected]>, [email protected], "zsi-env" <[email protected]>, "up-env" <[email protected]>, "itrc-env"<[email protected]>, "Dr. Pankaj Kumar" <[email protected]>, "mah env" <[email protected]>, "bnhs-envis"<[email protected]>, "TKB" <[email protected]>, "NSWAI" <[email protected]>, "iip-env" <[email protected]>, "neeri-envis" <[email protected]>, "bh-env" <[email protected]>, [email protected], [email protected], "iitmenv"<[email protected]>, "Chhattisgarh ENVIS Centre" <[email protected]>, "jhar-env" <[email protected]>, "L.P. Singh"<[email protected]>, "ENVIS" <[email protected]>, "JK ENVIS" <[email protected]>, "ENVIS Kerala" <[email protected]>, "Dr.Paramjit Singh,BSI" <[email protected]>, "ENVIS CENRE ON ENVL BIOTECH" <[email protected]>, "MemberSecretary CPCB" <[email protected]>, "J Majumder NIOH" <[email protected]>, [email protected], "kamalesh sarkar"<[email protected]>, "Kamalesh Sarkar" <[email protected]>, [email protected],[email protected], [email protected], "ENVIS CASMB" <[email protected]>, [email protected],[email protected], "mohana skumar" <[email protected]>, [email protected], "KailashChandra" <[email protected]>, "hod ese" <[email protected]>, [email protected], "himenvis.gbpihed"<[email protected]>, [email protected], [email protected], "bsienvis" <[email protected]>, "bsi headquarter"<[email protected]>, "dir fri" <[email protected]>, [email protected], "barthwal santan"<[email protected]>, [email protected], [email protected], [email protected], [email protected],[email protected], [email protected], [email protected], [email protected], "ENVISCoordinator" <[email protected]>, [email protected], [email protected], "Director IICT" <[email protected]>,
226
"Pankaj Kumar" <[email protected]>, "Director, CSIR-NBRI" <[email protected]>, [email protected], "gcpcenv"<[email protected]>, "kausik mondal2007" <[email protected]>, [email protected], "SPA ENVIS" <[email protected]>, "m dhote" <[email protected]>, "jnu-env" <[email protected]>, "UMESH UMESH" <[email protected]>,[email protected], [email protected] Sent: Friday, November 13, 2020 2:21:10 PM Subject: Campaign for "Pollution Free Deepawali, 2020" by RSPCB
Dear all,
In order to create mass awareness on the occasion of Deepawali, the State Board is organizing acampaign for a “Pollution Free Deepawali”. The following activities are being carried out as partof the campaign:
· Broadcasting of spots on FM channels
· Broadcasting of spots on Television channels.
· Advertising through leading Newspapers
· Social Media Campaign on various platforms like Facebook, WhatsApp,Instagram, Twitter, You Tube.
· Advertising through Hoardings and banners
· Advertising through Video Walls
Please come join us in our campaign for a "Pollution Free Deepawali".
Diwali Wish -https://envisrspcb.blogspot.com/?bl=&m=1
https://envisrspcb.blogspot.com/?bl=&m=1
RSPCB on twitter
https://twitter.com/rspcb_official/status/1326777733880442886?s=21
https://twitter.com/rspcb_official/status/1326511004449009665?s=21
https://twitter.com/rspcb_official/status/1326488597889839105?s=21
https://twitter.com/rspcb_official/status/1326488169991213058?s=21
https://twitter.com/rspcb_official/status/1326487072035672066?s=21
227
https://twitter.com/rspcb_official/status/1326485763672862721?s=21
https://twitter.com/rspcb_official/status/1326405035518005249?s=21
https://twitter.com/rspcb_official/status/1326164061155807234?s=21
https://twitter.com/rspcb_official/status/1326142870638612480?s=21
RSPCB on instagram
https://www.instagram.com/p/CHc0rzAh9_X/?igshid=z5k5qe7oi54h
https://www.instagram.com/p/CHc0PYaB6eW/?igshid=5ylq9y9omb0i
https://www.instagram.com/p/CHczy0FhYez/?igshid=l6v2e663jw5s
https://www.instagram.com/p/CHczZUgBHlP/?igshid=1238y7q75bx1u
https://www.instagram.com/p/CHcysXhhSzE/?igshid=1thawyj5855h1
https://www.instagram.com/p/CHcycLDhT82/?igshid=dbym89uemhvh
https://www.instagram.com/p/CHcx56Xhhyl/?igshid=u900g1gzbi0t
https://www.instagram.com/p/CHcxusIBKtW/?igshid=hiokb4wyh4qv
https://www.instagram.com/p/CHcxR-Zh1XR/?igshid=1ghkm2mzlttly
https://www.instagram.com/p/CHcIuBqBcEX/?igshid=q0n9e24l5j1a
https://www.instagram.com/p/CHaTXCHhh5s/?igshid=nbs4y37oc6fz
https://www.instagram.com/p/CHZ9jvln6-h/?igshid=1ixqhwmdyx6g6
228
RSPCB on Facebook
https://www.facebook.com/233501317134334/posts/1005030193314772/?d=n
https://www.facebook.com/233501317134334/posts/1005204586630666/?d=n
https://www.facebook.com/233501317134334/posts/1005910819893376/?vh=e&d=n
https://www.facebook.com/233501317134334/posts/1005276669956791/?d=n
https://www.facebook.com/233501317134334/posts/1005108926640232/?d=n
https://www.facebook.com/233501317134334/posts/1004495723368219/?d=n
https://www.facebook.com/233501317134334/posts/1004449220039536/?d=n
https://www.facebook.com/233501317134334/posts/1003632843454507/?d=n
Bloggers :
https://www.facebook.com/639613539500570/posts/3478832965578599/?d=n
https://www.instagram.com/p/CHe_0nGjluK/?igshid=1hregpd83ac2n
https://www.instagram.com/p/CHfMUrpgabl/?igshid=y00nfw1hn4nz
229
www.facebook.com/profilepicframes/?selected_overlay_id=802281070686519
कोरोना है एक महामार� सभी �व�थ रहे है ये सबक� िज�मेदार�
�दवाल� क� शभुकामनाओ ंके साथ इस �दवाल� को �दषुण र�हत बनाने के �लए अपना समथ�न दे , नीचे �दए गए ३ �टेप फॉलो करे :
1 �लकं पे जाके अपनी profile picture update करे
2 . अपलोड क� हुई profile picture को सेव करके अपने Whatsapp , Twitter अथवा Instagram पर अपडटे करे |
ये �दवाल� द�य� - �मठास और �बना �दषूण वाल�, �यू�ँक जान है तो ज�न है |
www.facebook.com/profilepicframes/?selected_overlay_id=802281070686519
िजनके पास फेसबकु नह� ंहै वह संल�न �ट�कर को अपनी त�वीर पे लगा के अपनी whatsapp profile picture पर अपलोड करे |
राज�थान रा�य �दषूण �नयं�ण मंडल �वारा जन�हत म� जार�।
Best Wishes
ENVIS TEAM
RSPCB
230
5 attachments
WhatsApp Image 2020-11-13 at 11.58.50 AM.jpeg 26K
WhatsApp Image 2020-11-13 at 11.58.49 AM.jpeg 173K
WhatsApp Video 2020-11-13 at 11.58.25 AM.mp4 5172K
WhatsApp Video 2020-11-13 at 11.58.24 AM.mp4 6095K
WhatsApp Video 2020-11-13 at 11.58.15 AM.mp4 9688K
231
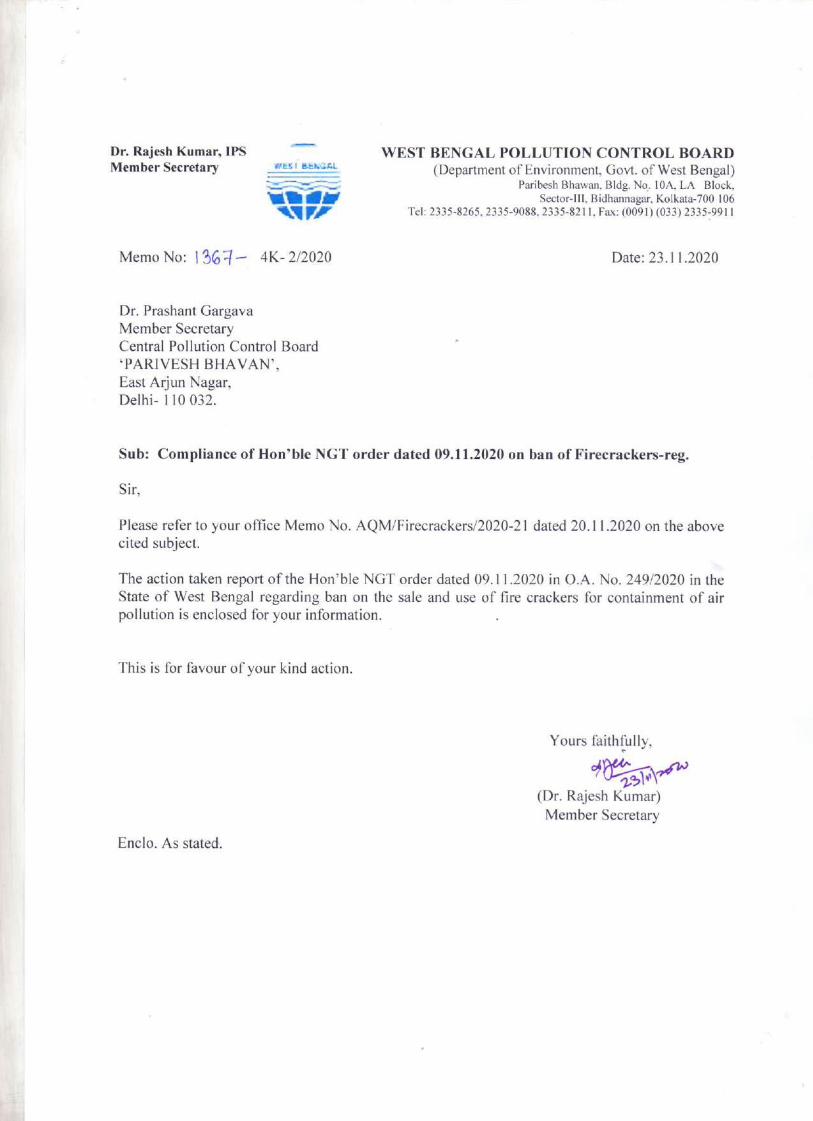
Annexure-XIII
232
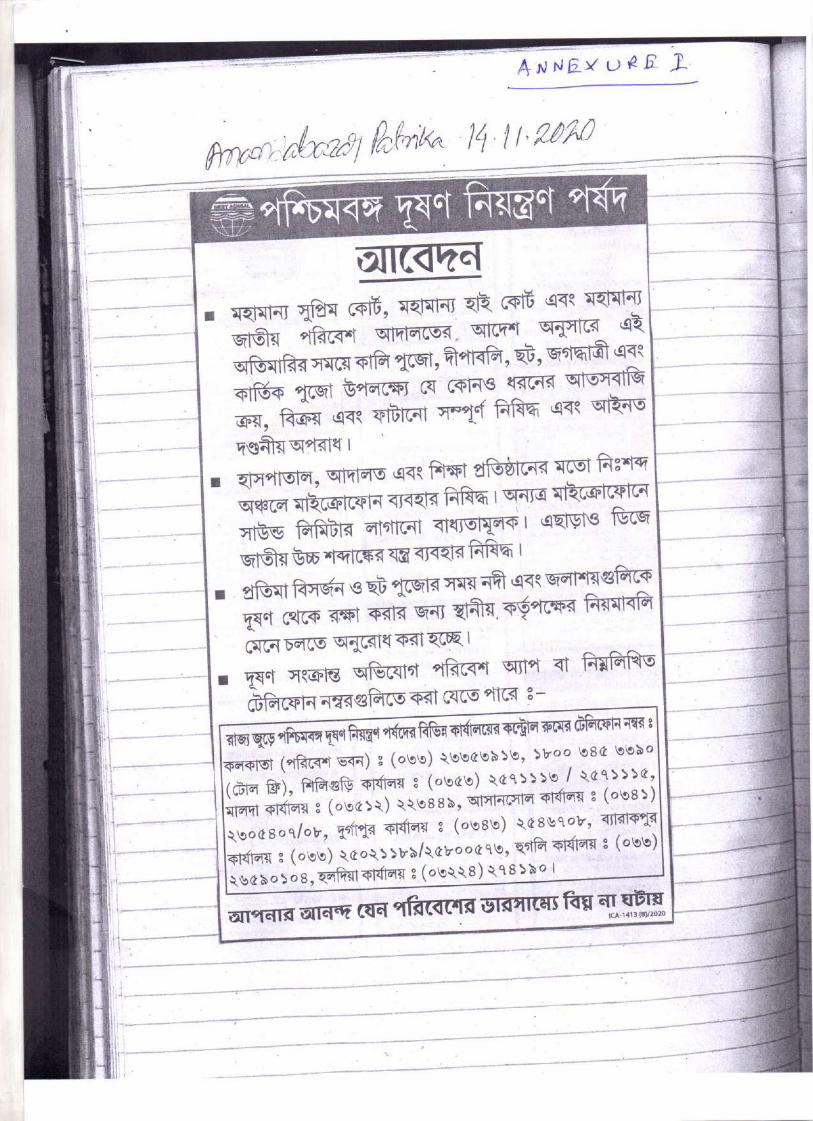
233
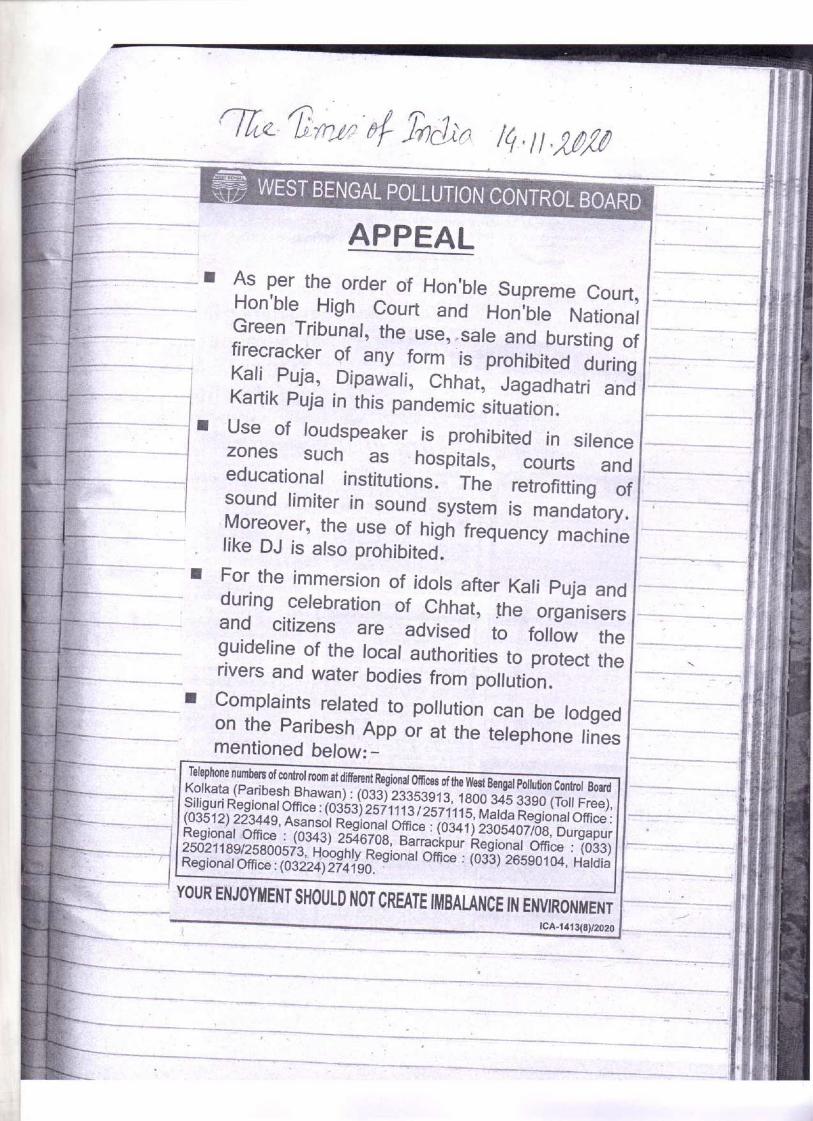
234
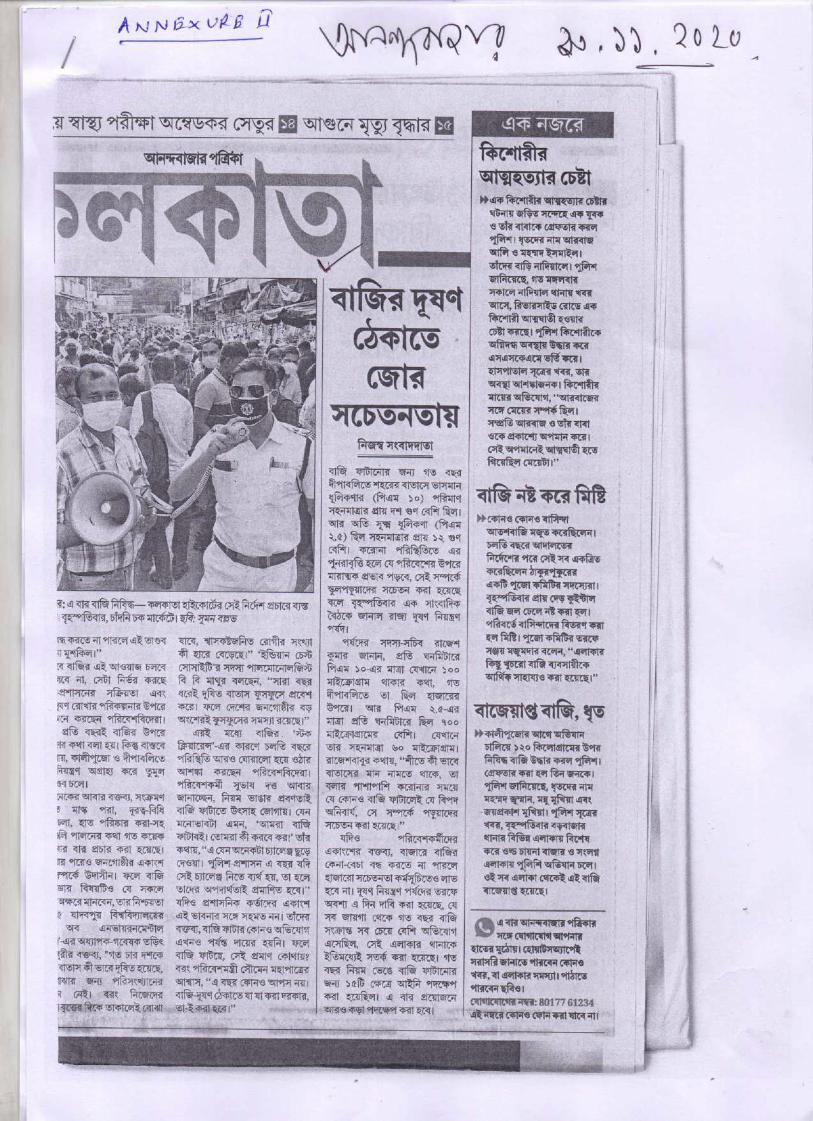
235
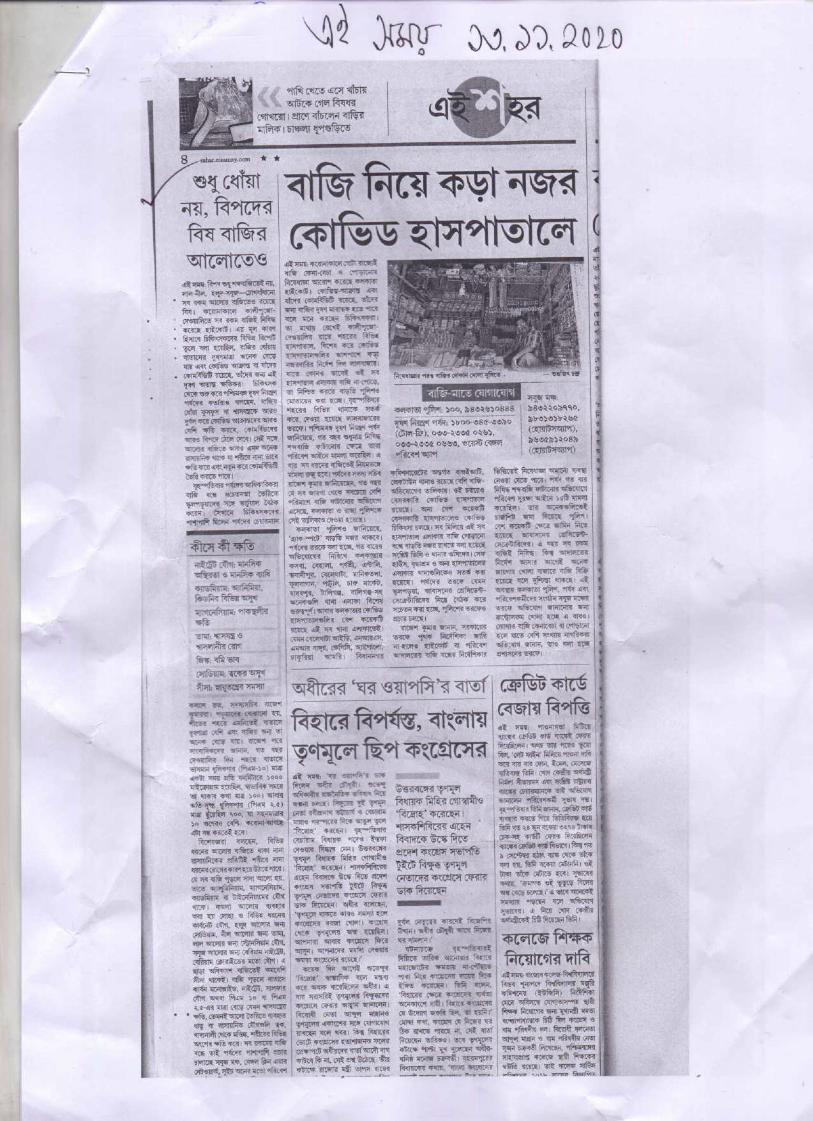
236
237
238
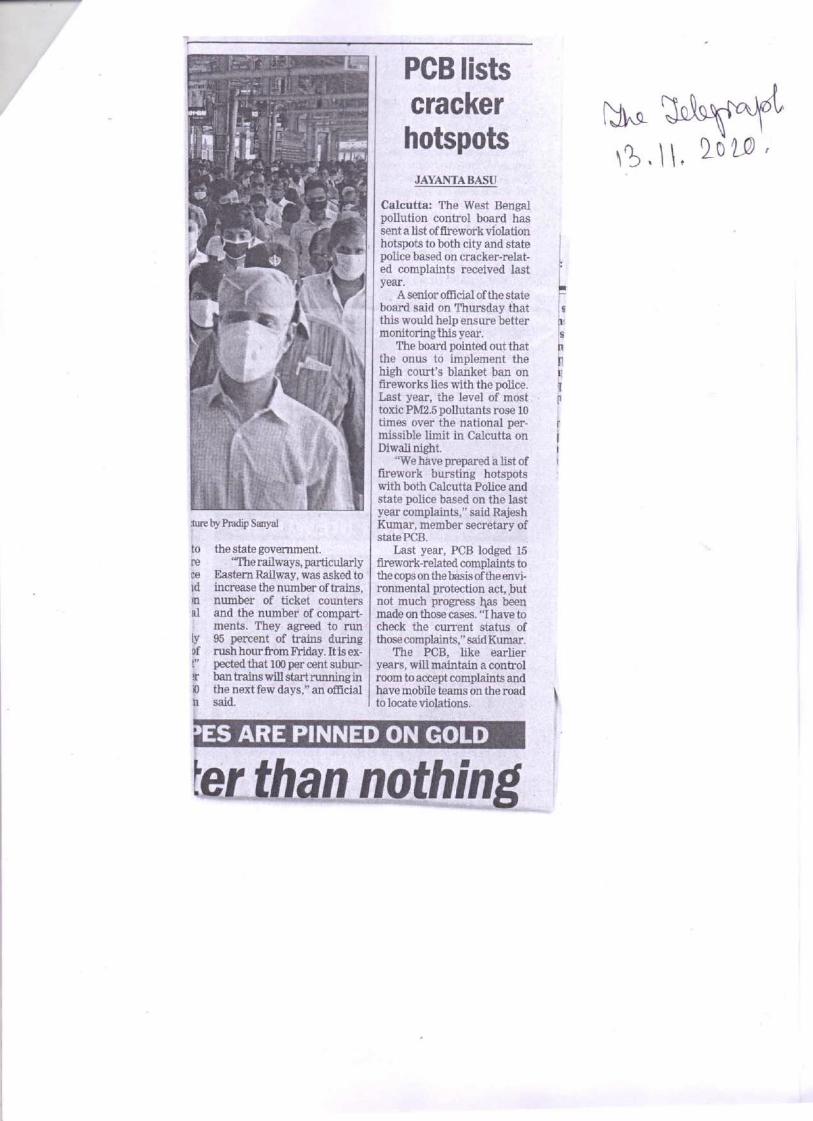
239
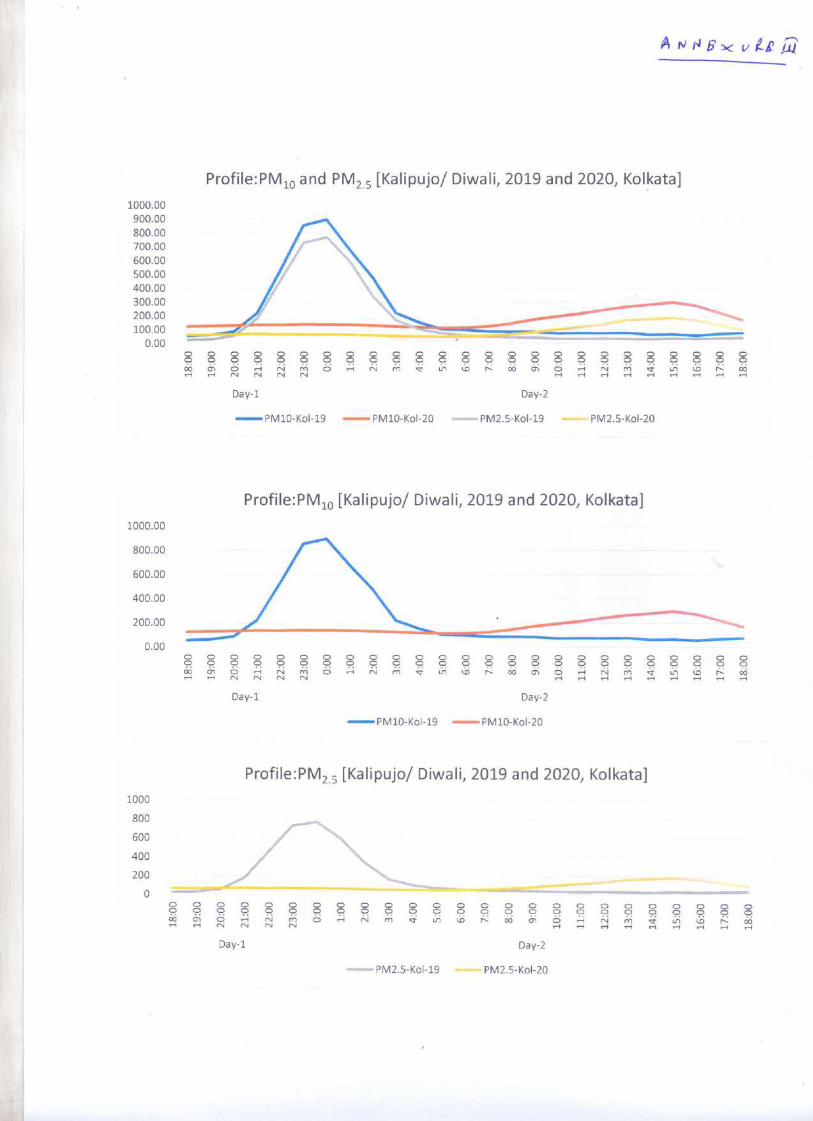
240
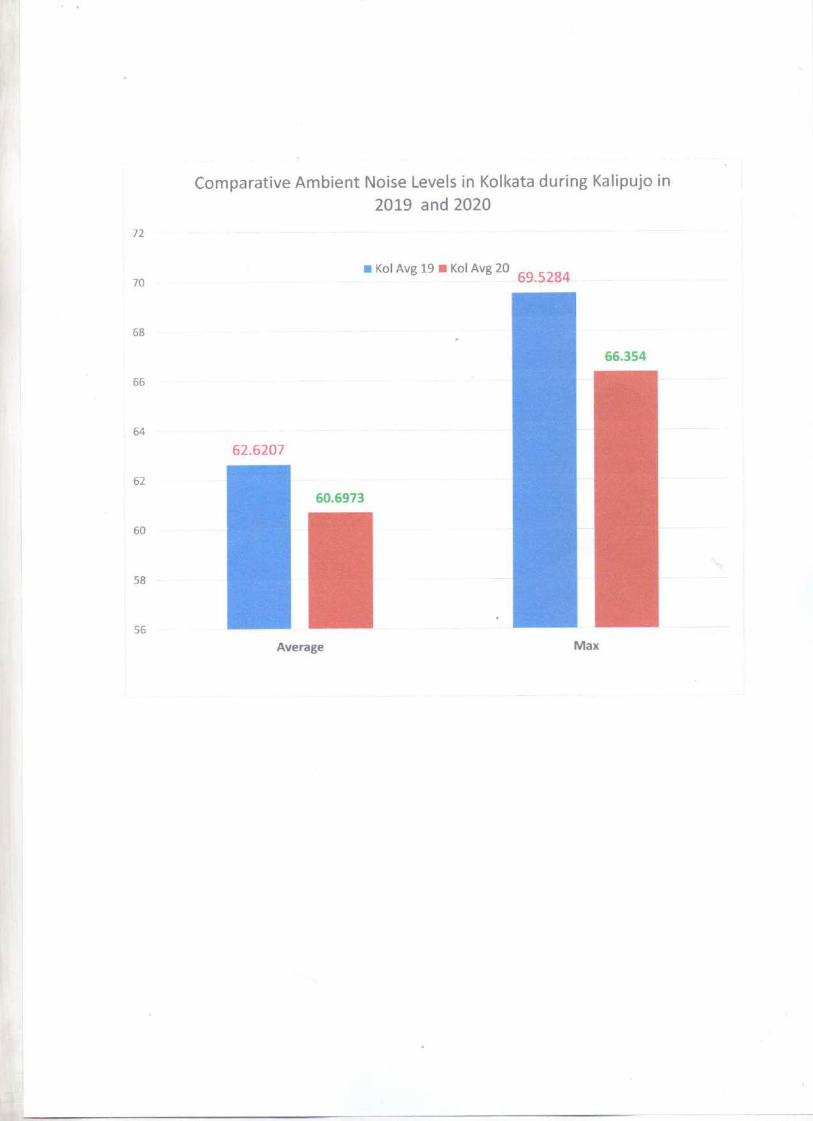
241
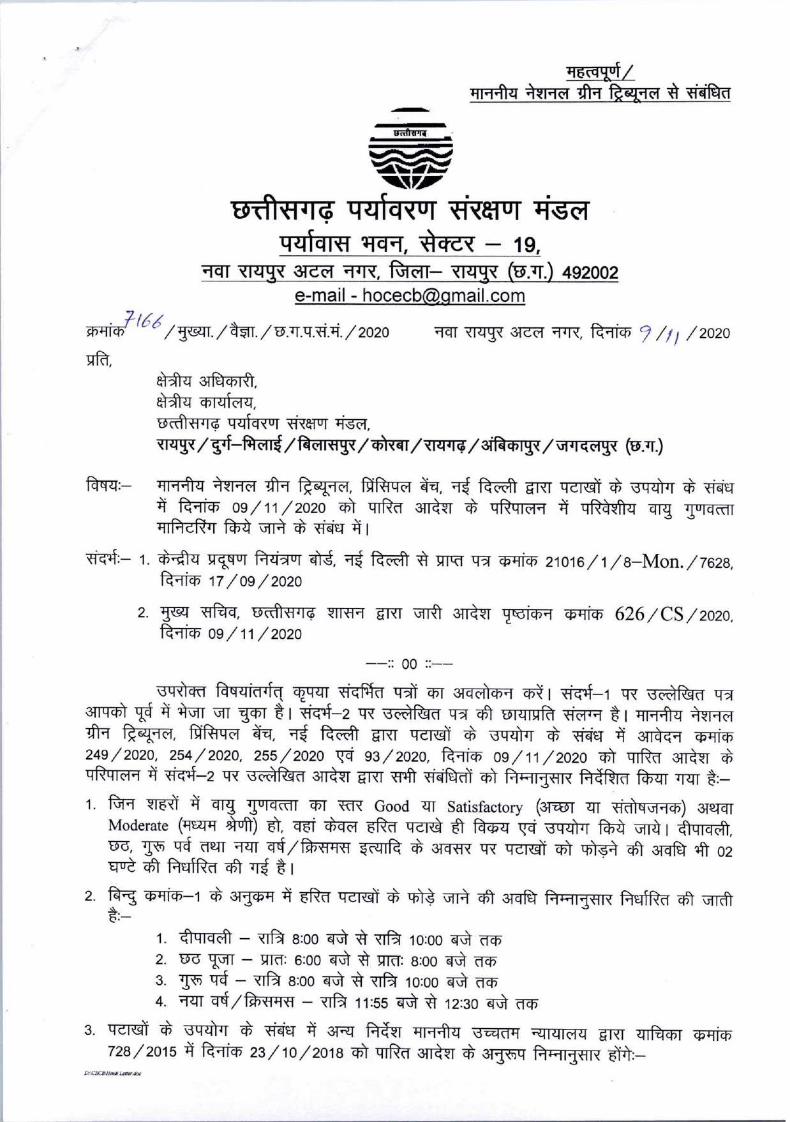
Annexure-XIV
242
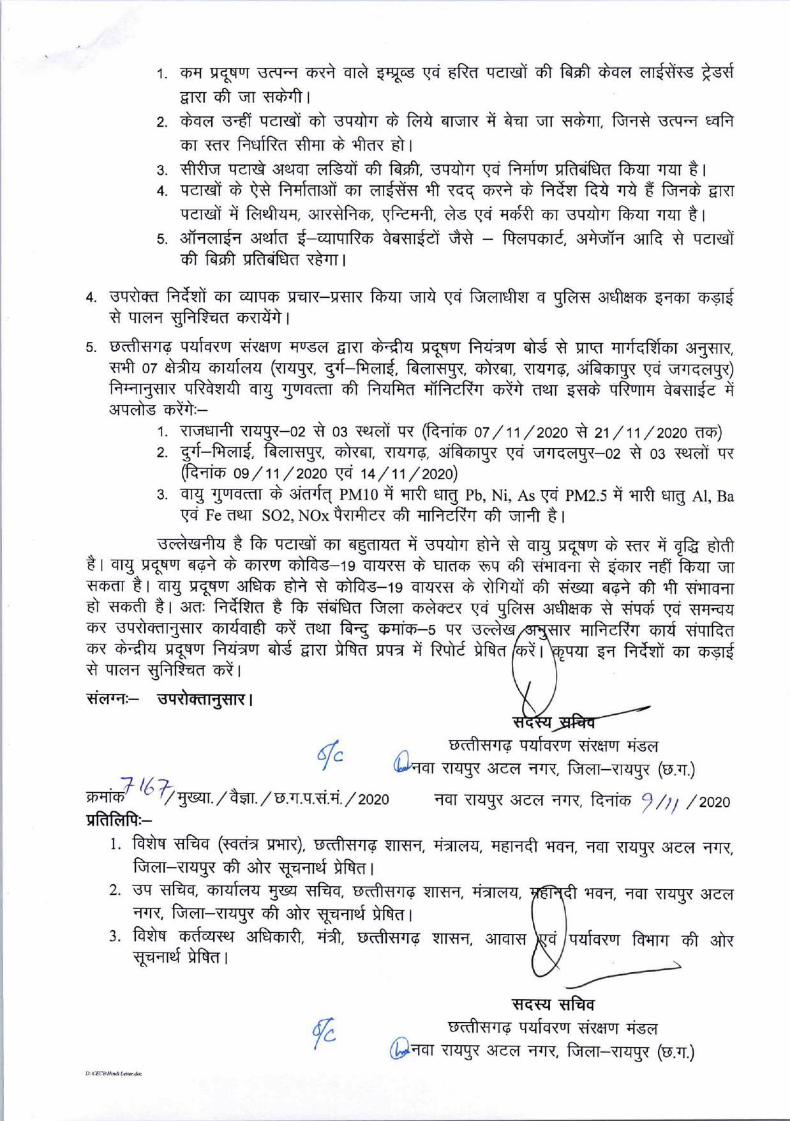
243
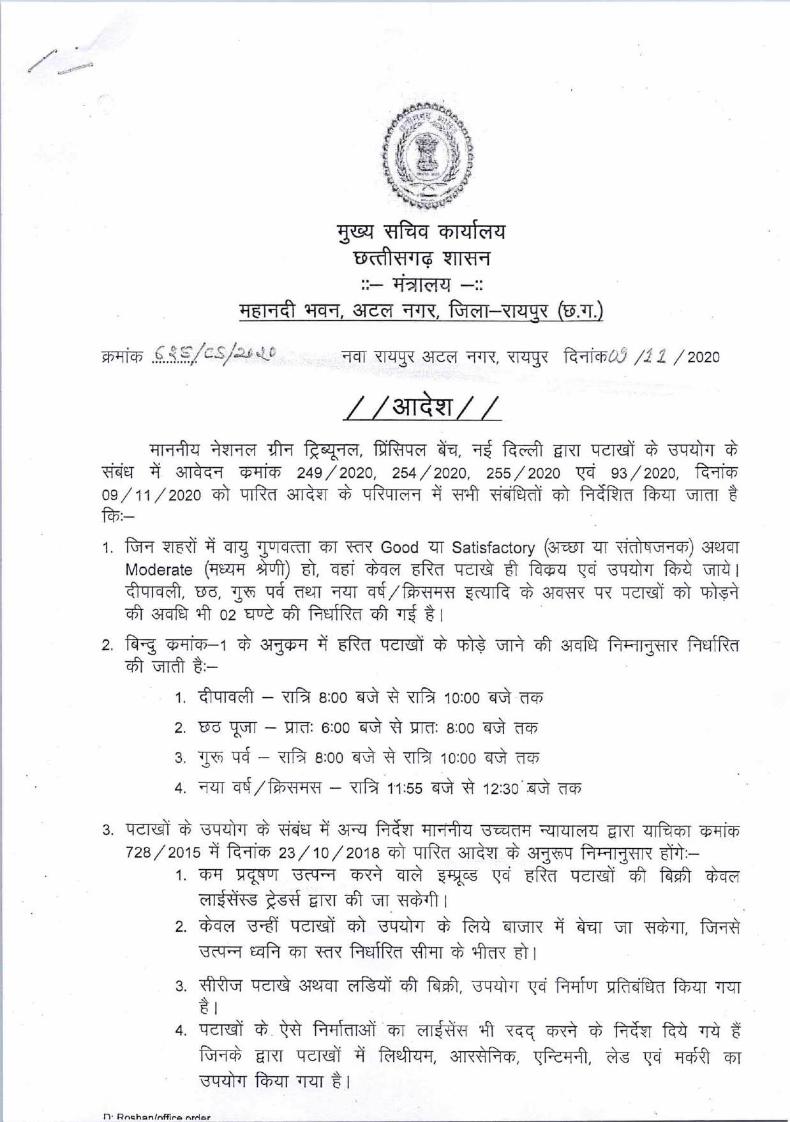
244
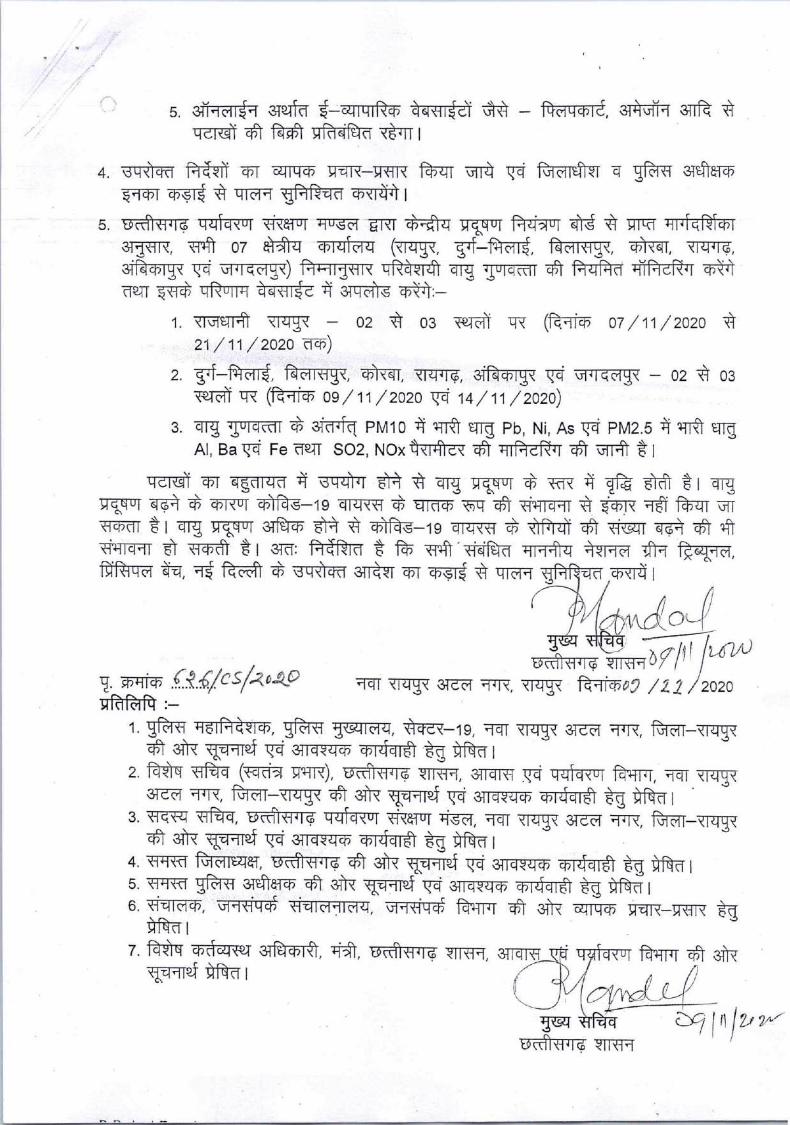
245
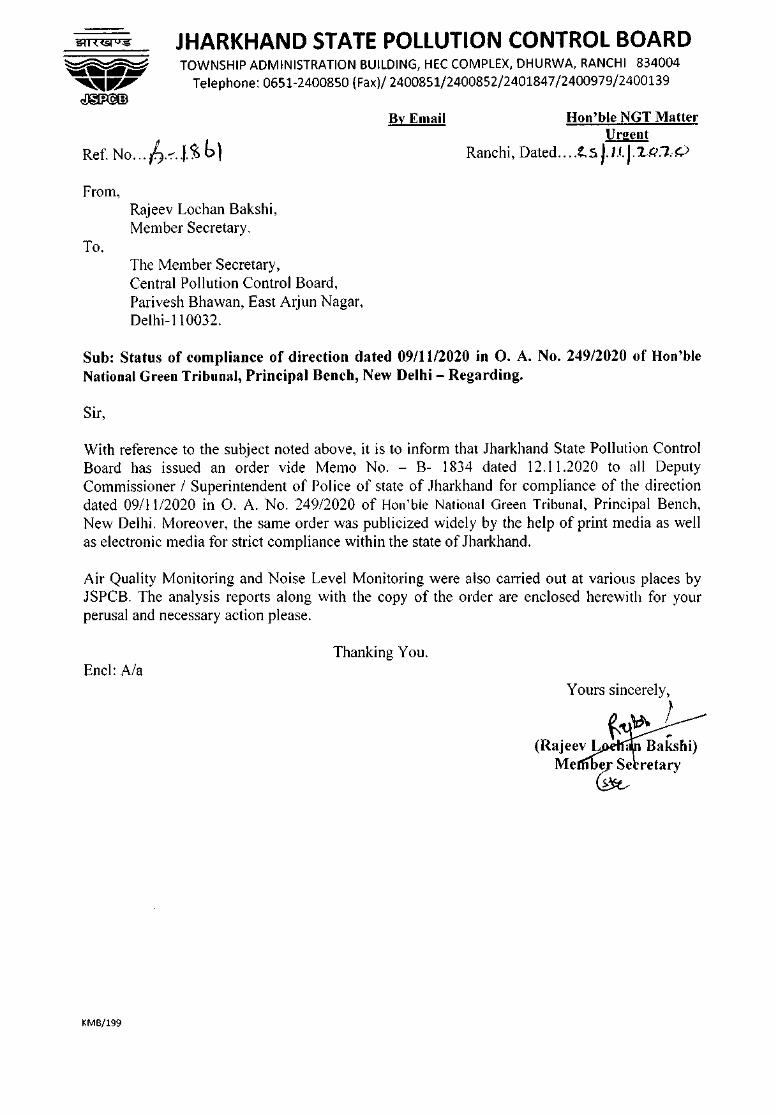
JHARKHAND STATE POLLUTION CONTROL BOARDTOWNSHIP ADMINISTRATION BUILDING, HECCOMPLEX, DHURWA, RANCHI 834004
Telephone: 0651-2400850 (Fax)/ 2400851/2400852/2401847/2400979/2400139
By Email Hon'ble NGT MatterUrgent
Ranchi, Dated .... !.s }.1.I.1. 2P.7..0Ref. No ...h.~..I.~b lFrom,
Rajeev Lochan Bakshi,Member Secretary.
To,The Member Secretary,Central Pollution Control Board,Parivesh Bhawan, East Arjun Nagar,Delhi-ll0032.
Sub: Status of compliance of direction dated 09/11/2020 in O. A. No. 24912020 of Hon'bleNational Green Tribunal, Principal Bench, New Delhi - Regarding.
Sir,
With reference to the subject noted above, it is to inform that Jharkhand State Pollution ControlBoard has issued an order vide Memo No. - B- 1834 dated 12.11.2020 to all DeputyCommissioner I Superintendent of Police of state of .Tharkhand for compliance of the directiondated 09111/2020 in O. A. No. 24912020 of Hou'ble National Green Tribunal, Principal Bench,New Delhi. Moreover, the same order was publicized widely by the help of print media as wellas electronic media for strict compliance within the state of .Tharkhand.
Air Quality Monitoring and Noise Level Monitoring were also carried out at various places by.TSPCB. The analysis reports along with the copy of the order are enclosed herewith for yourperusal and necessary action please.
Thanking You.Encl: Ala
KMB/199
Annexure-XV
246
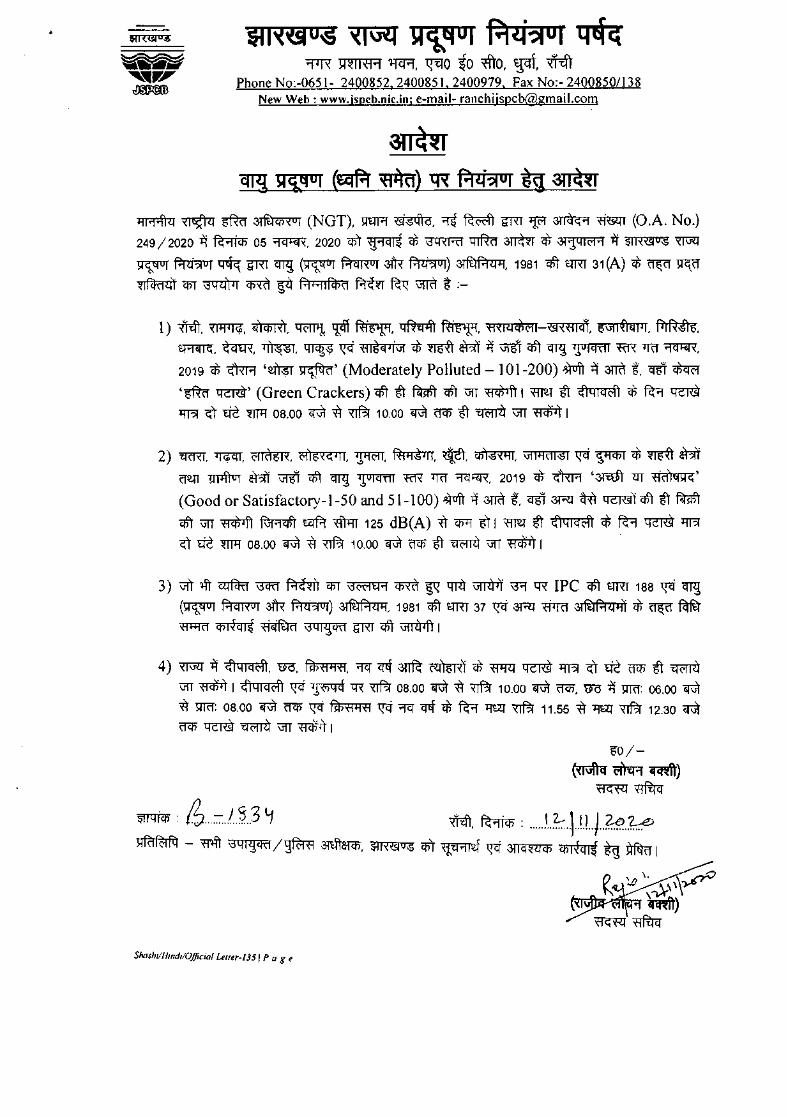
$I1,<6i°;S '<I\ilI JII Ci\q 01 Pt~?lOI ~"fiR l'l~II'fF1 ~, ~O ~O ~O, ~, ~
Phone No:-0651- 2400852,2400851, 2400979, Fax No:- 2400850/138New Web: www.jspcb.nic.inj [email protected]
3t1~~1"C!rl ~S!tUI (~~) ~ Pili?lUI E~
~ ~ mtcl ~ (NGT). >It:fR ~. ~ ~ ErRT"WI ~ ~ (O.A. No.)249/2020 ~ ~ 05~. 2020 em ~ ~ ~ ~ ~ ~ 31'jqlC'11 ~ $11'<\!Slv;S"<TiJ'a
~~~ErRT~ (~~~~)~, 1981 c#ltml31(A)~~~
~ C(iT ~ m sa f1hilFcPtl ~ ~ ~ t :-
1) ~. ~. ~. ~ ~ ~. ~~. flxlllcBC'1I \!Slxfllql, i5\Jll-flEjlll. fT1R1I5.~. ~. ~. ~ ~ fllgEjll\i1 ~ ~ atn ~ ~ c#I ~ lJOlCffiT "f(R lRf~.
2019 ct ~ '~~' (Moderately Polluted - 101-200) ~ ~ arm -g. cnIT m'mtcl ~' (Green Crackers) c#I tt fmIft mt \iTI ~ I ~ tt cfiqlqC11 ~ ~ ~~ cD ~ m+1 08.00 ~ ~ ~ 10.00 ~ 't1CP tt ~ \1fT ~ I
2) ~. ~. cmt.m. ('1'15,«lll, ~. ~li;glil. ~. ~. \i1llitll'$1 ~ ~ ~ ~ atn(1W 1J11'l'tuT ~ ~ mt ~ lJU1CR1T "f(R lRf '1'lRR. 2019 ct ~ '~ <H fii.11t>i>l<'(Good or Satisfactory-I-50 and 51-100) ~ +'{ arm -g_ cnIT 3R:l~ ~TctT tt futTctT \1fT ~ ~ ~ m+1T 125 dB(A) ~ qJT[ iT I ~ tt ~lqlqC11 ct ~ ~ lW-lm tR m+1 08.00 ~ ~ XTf?r 10.00 ~ C1cn tt ~ \1fT ~ I
3) '\ilt ~ ~ \3CRi ~) C(iT \3C"C'1t:11m ~ '4'T<) ~ \Yl tR IPC c#I urn 188 ~ ~
(~~~~)~. 1981 c#ltmT37 ~3R:lWm~ct~~"fI'l+!TI ~ ~ \3q I<:!Cffi&RT mt ~ I
4) "<TiJ'a it <n q 1q <'ft. uo. fThflli fl. -;::rcr ~ m~ ct 'fj'll1:f ~ ~ cD ~ crr.n it ~\1fT ~ I 0:<"1 q 1q c1'! ~ ~ tR XTf?r 08.00 'EI\i) ~ XTf?r 10.00 'EI\i) 't1C(i, uo ~ >ffij': 06.00 ~
~ >TTfT: 08.00 'EI\i) 't1CP ~ fThfllifl ~ -;::rcr qtf ct ~ ~ XTf?r 11.55 ~ ~ ill 12.30 ~C1cn ~ ~ \1fT ~it I
'60/~~m)
~~
~ :6...-:::./..5...3 ~ M. ~ : ....J...~ ..l..u..)..?1?.~~R1f(;jrq - ~ \3ql~Cffi/~ ~a:rcn. ~lx\!Slu;g em ~ ~ 3lfcfm ~ ~ >Wm I
~ ~ \':.k"\~1':l'T:":I'1'"..~:=r-r~)
~ 'f1filq
Shashi//fmdIIOfficial Lelle,-1351 P age
247
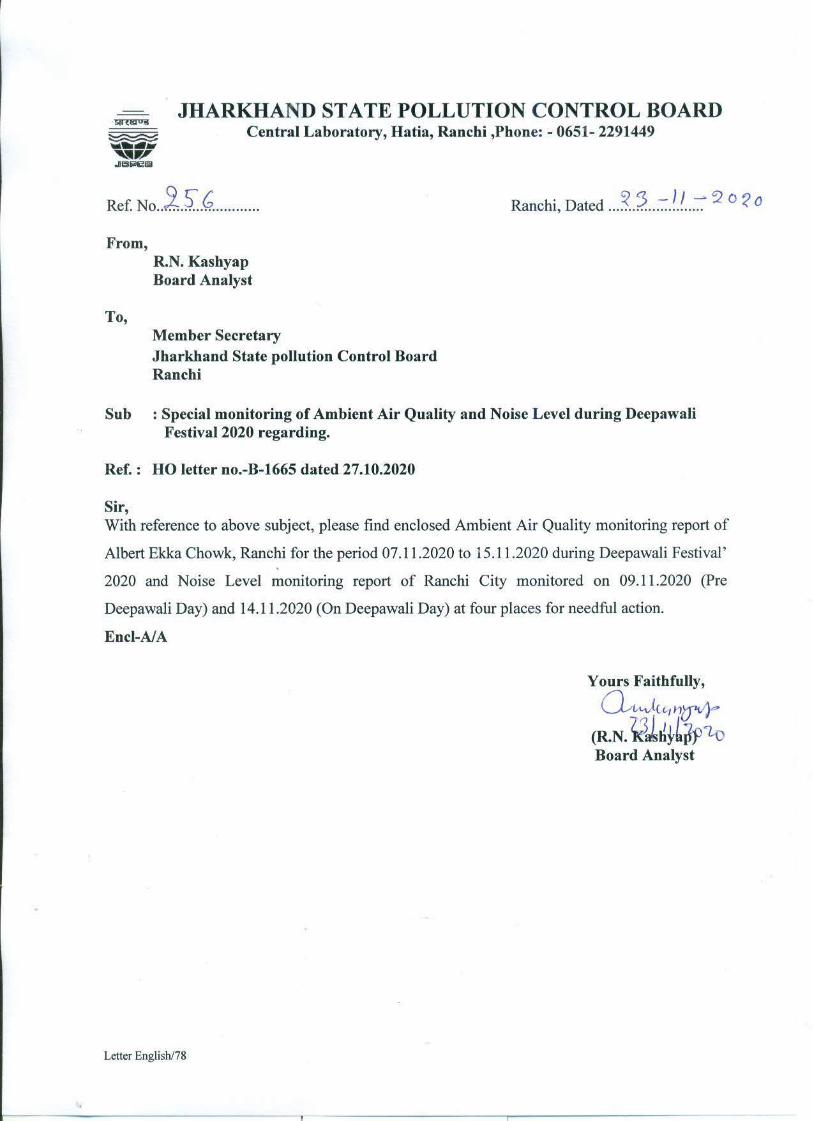
248
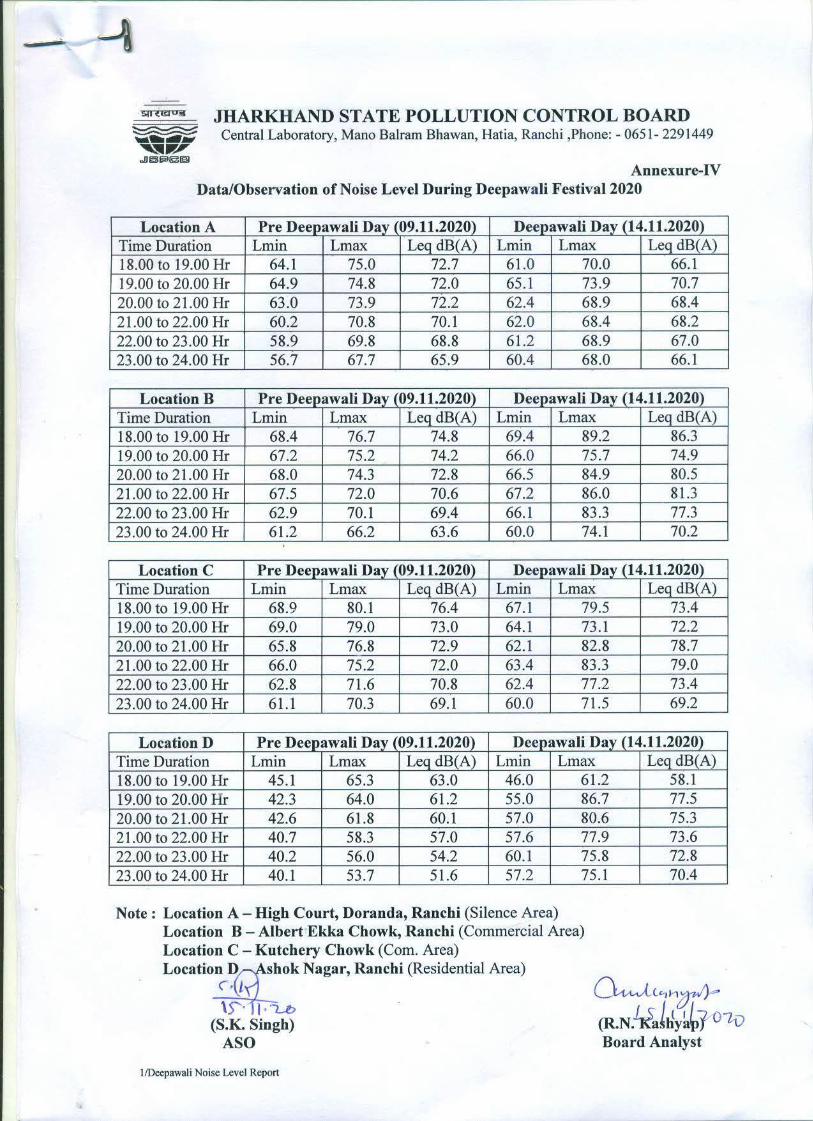
249
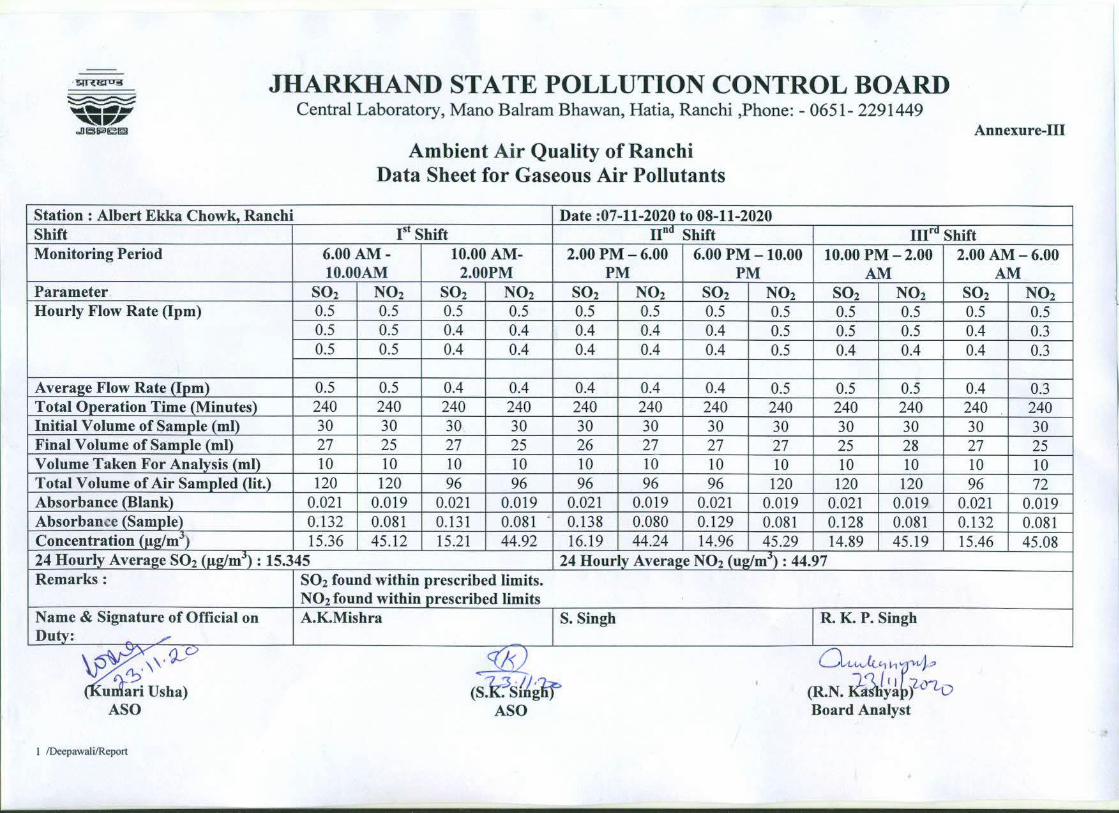
250
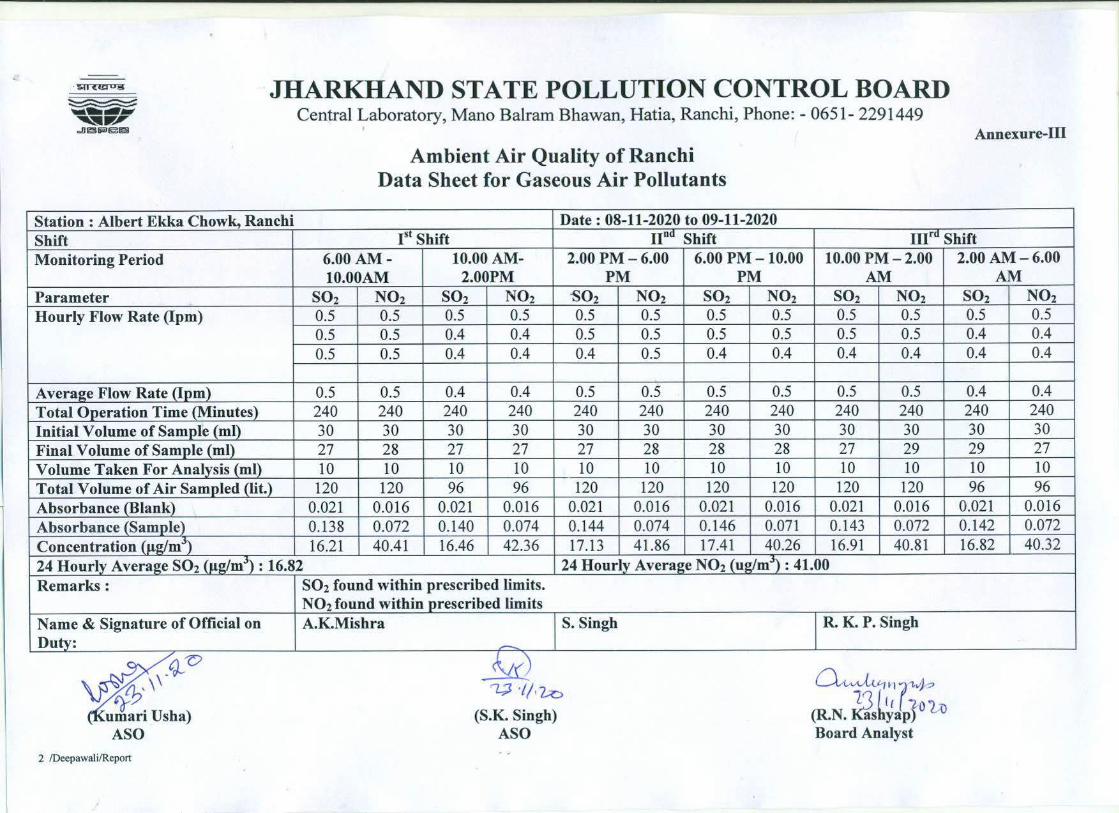
251
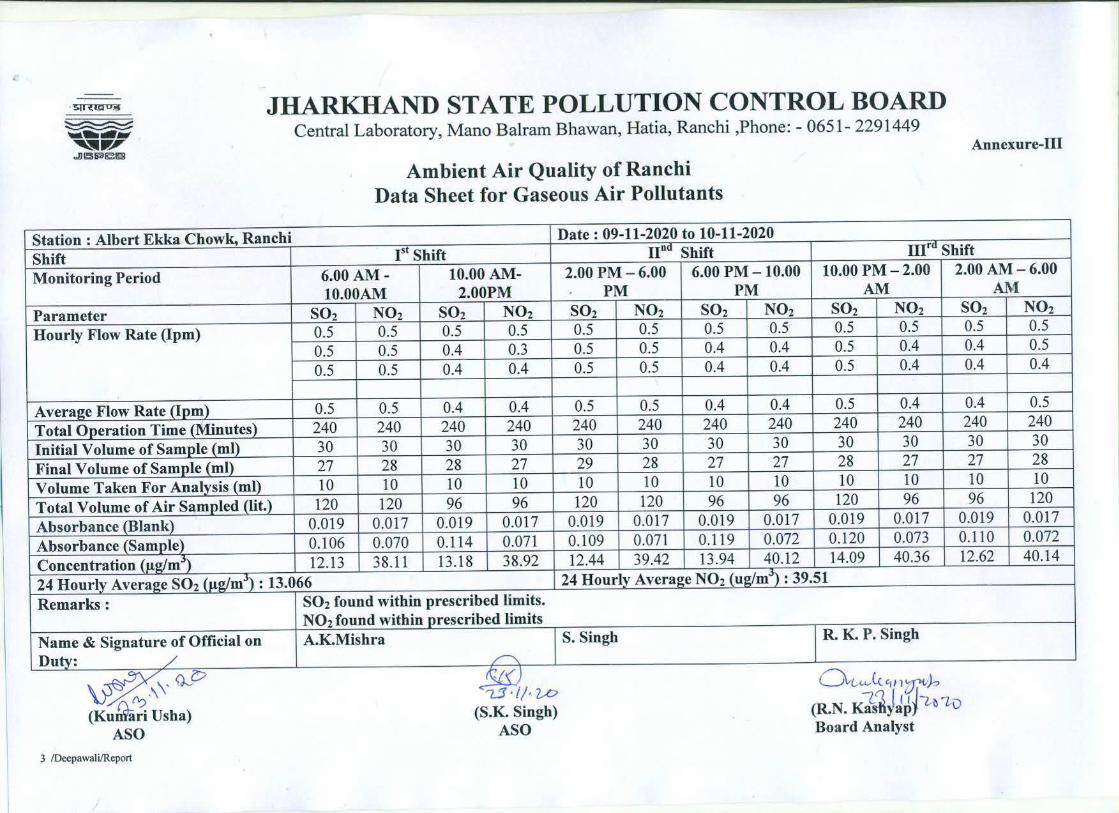
252
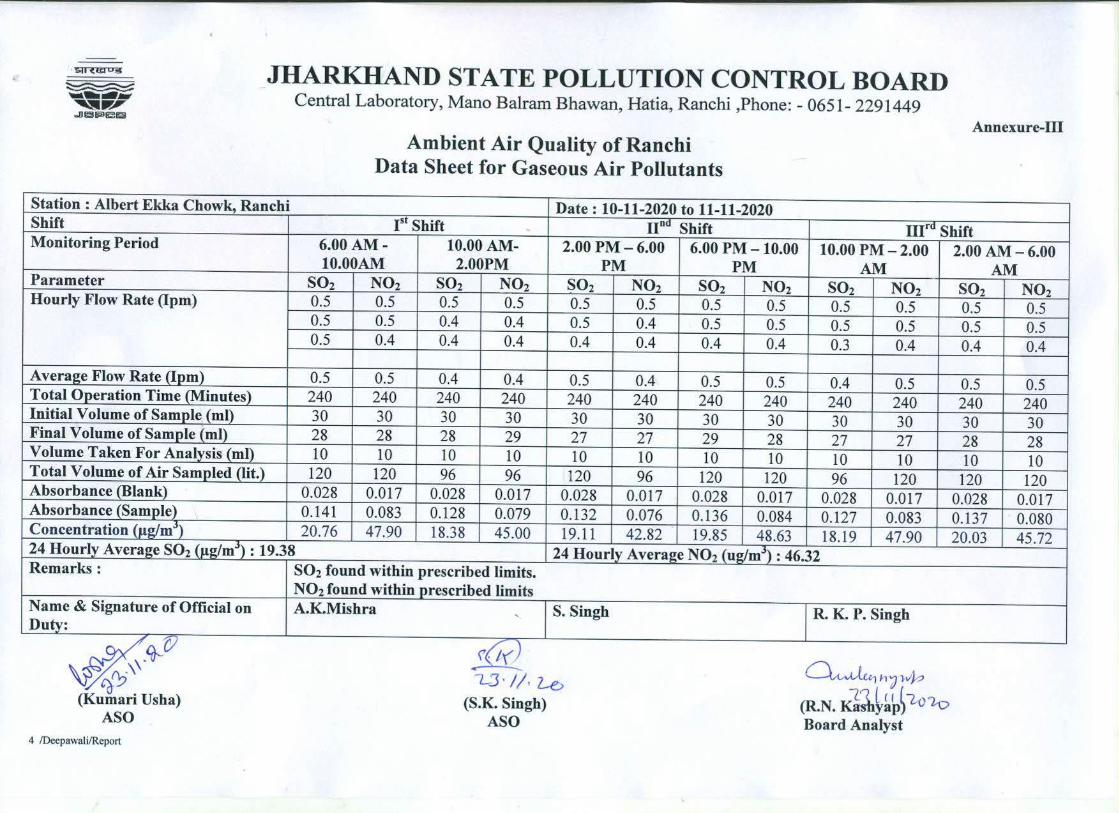
253
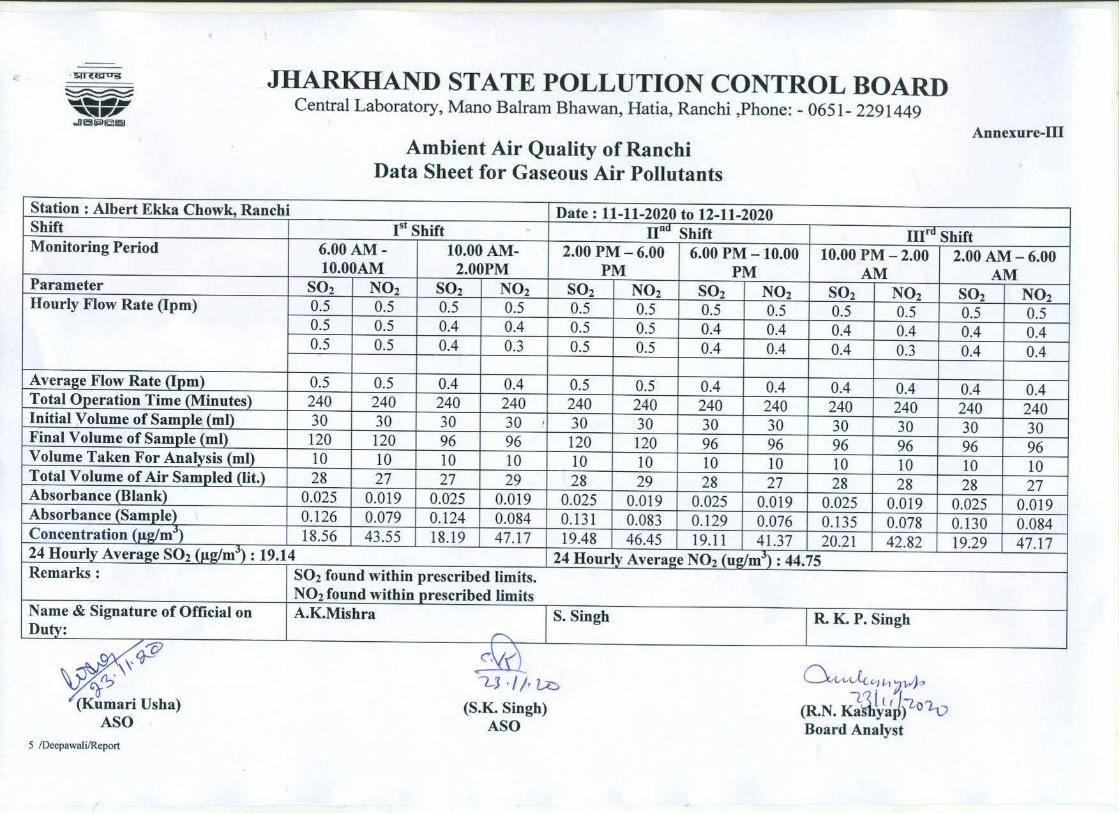
254
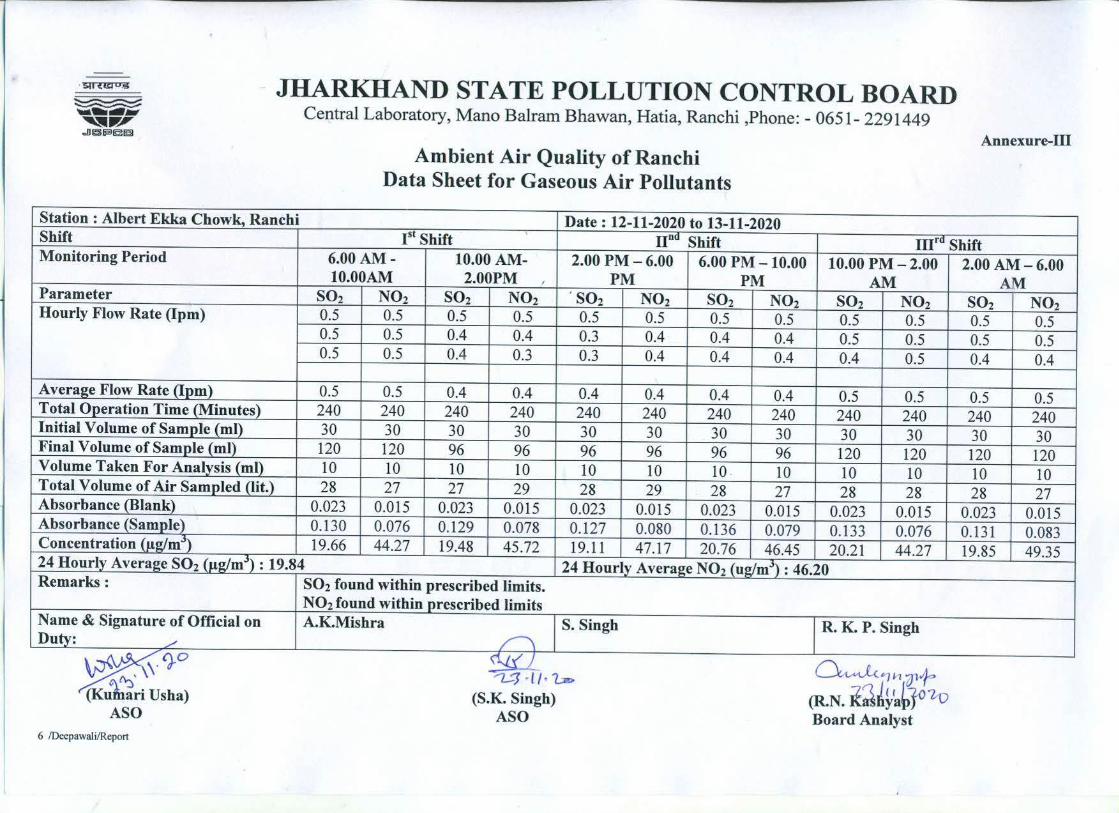
255
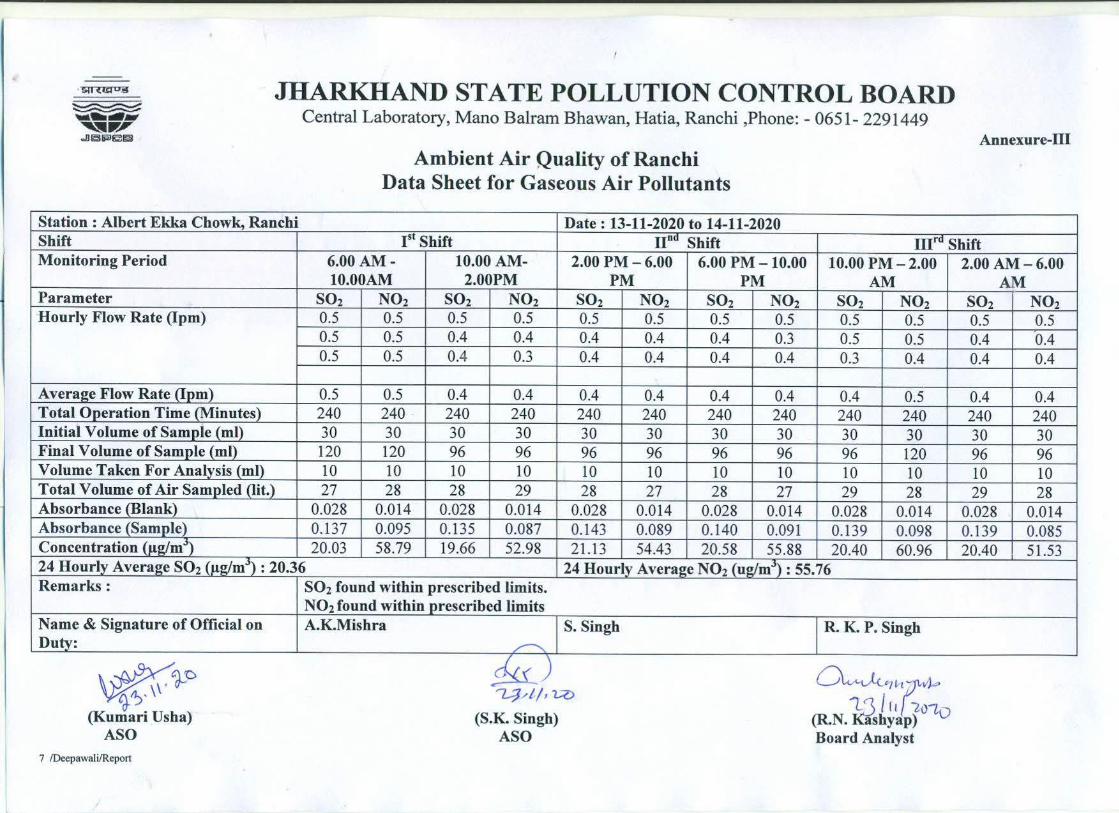
256
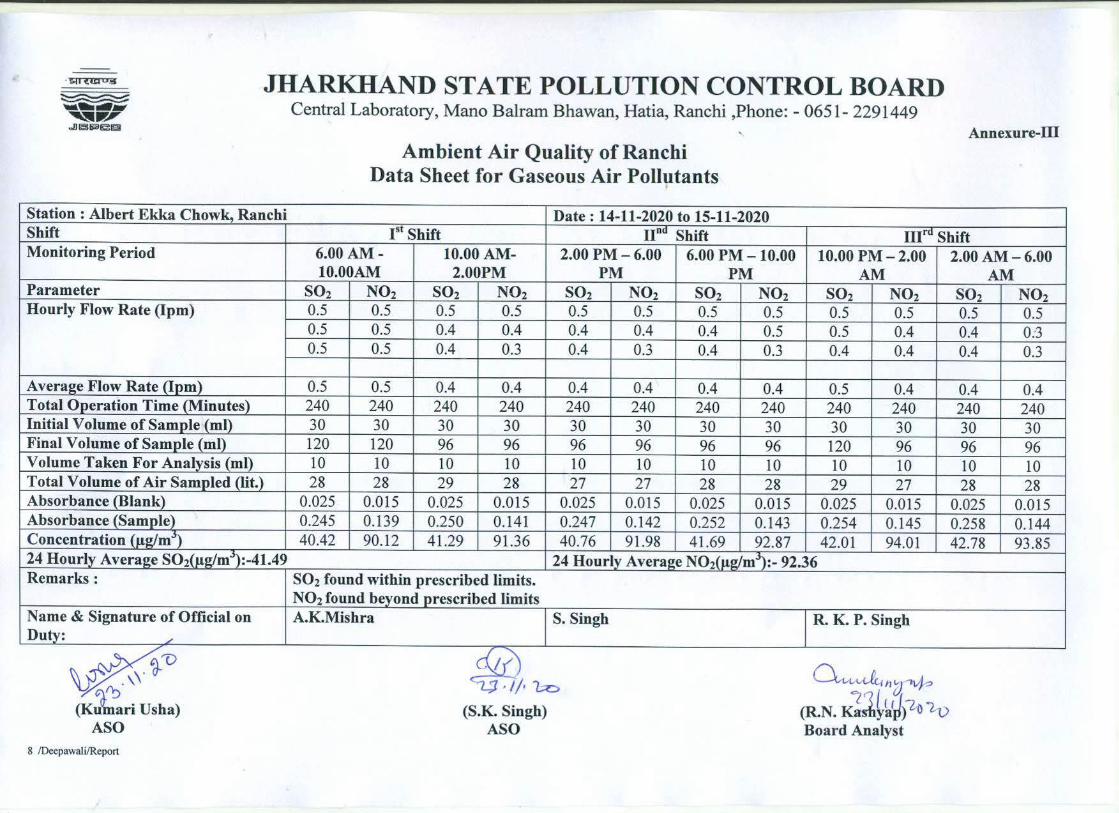
257
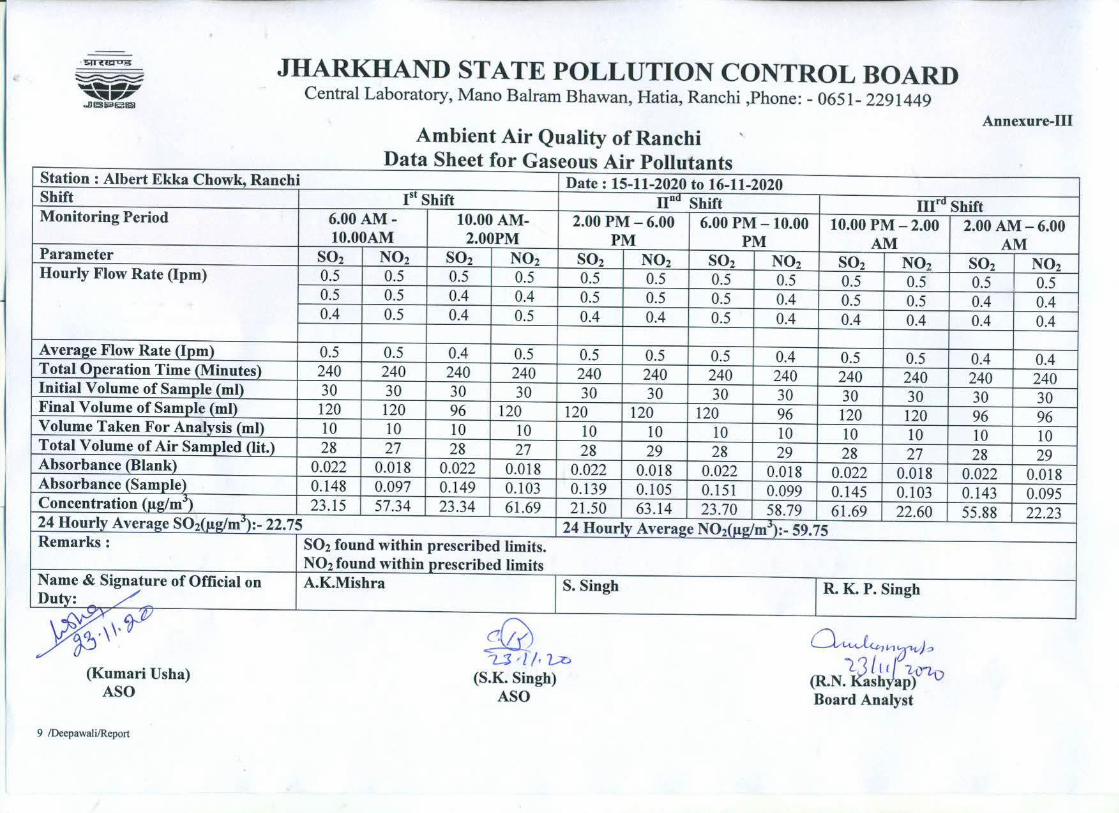
258
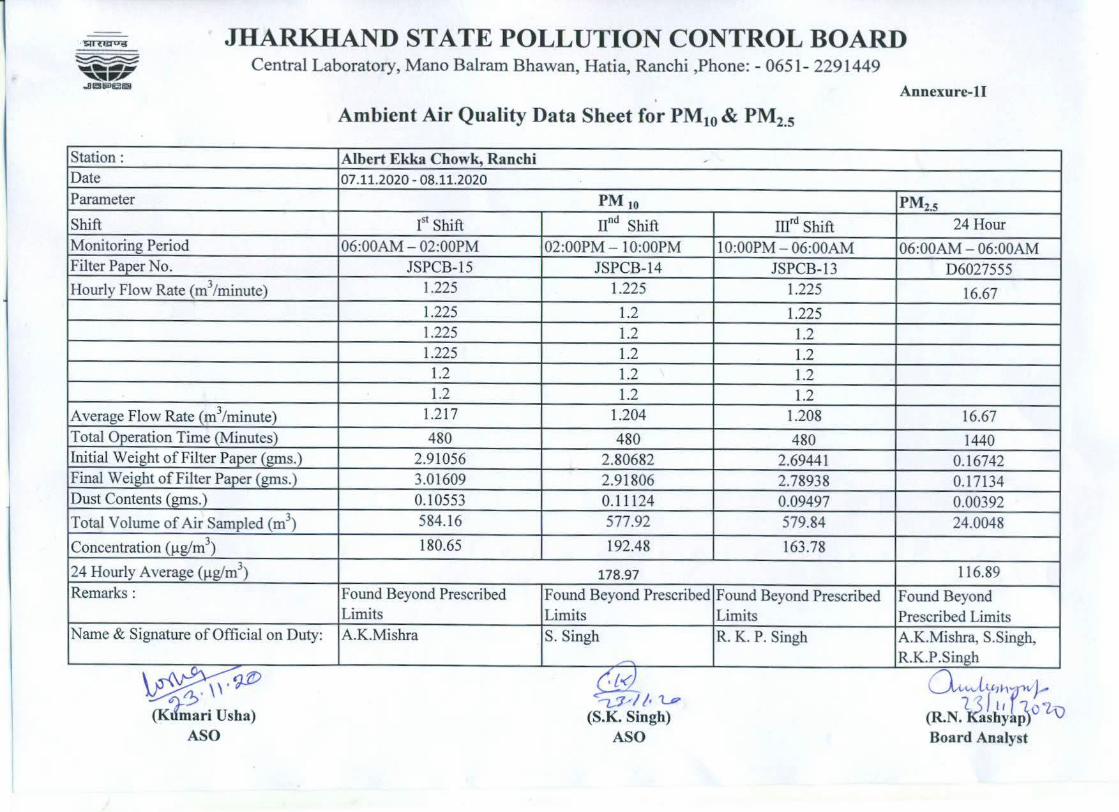
259
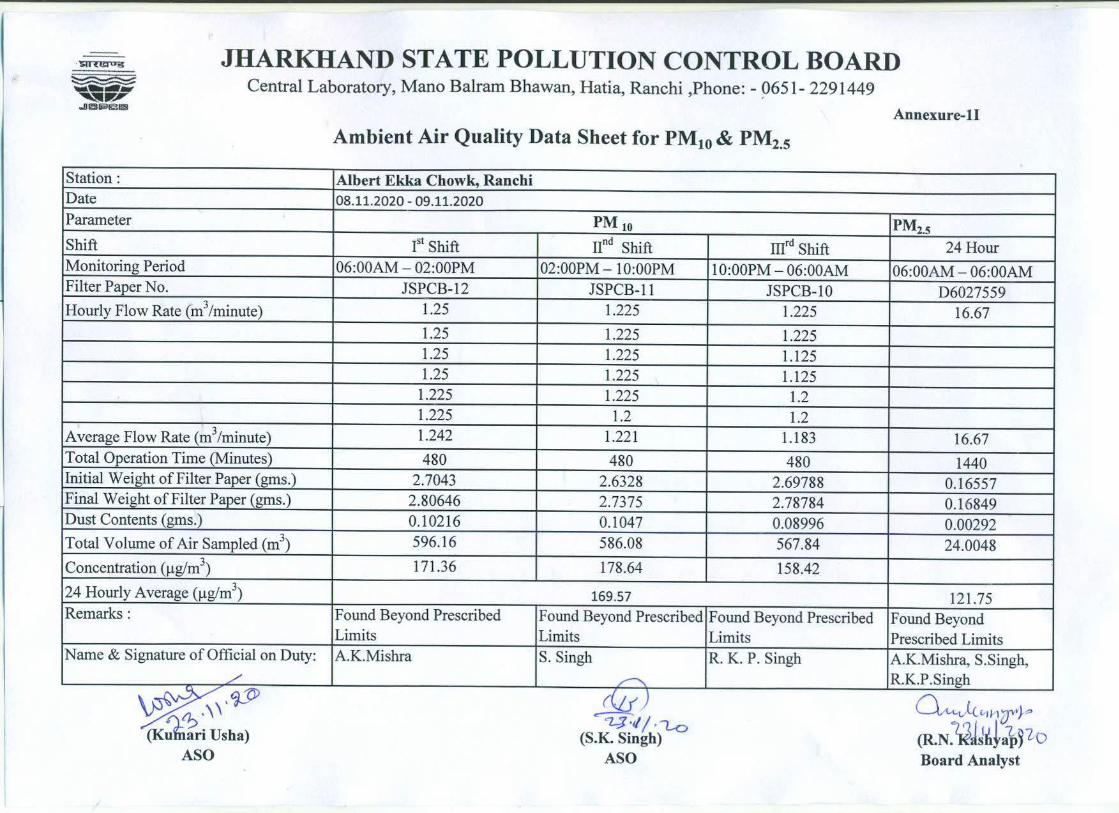
260
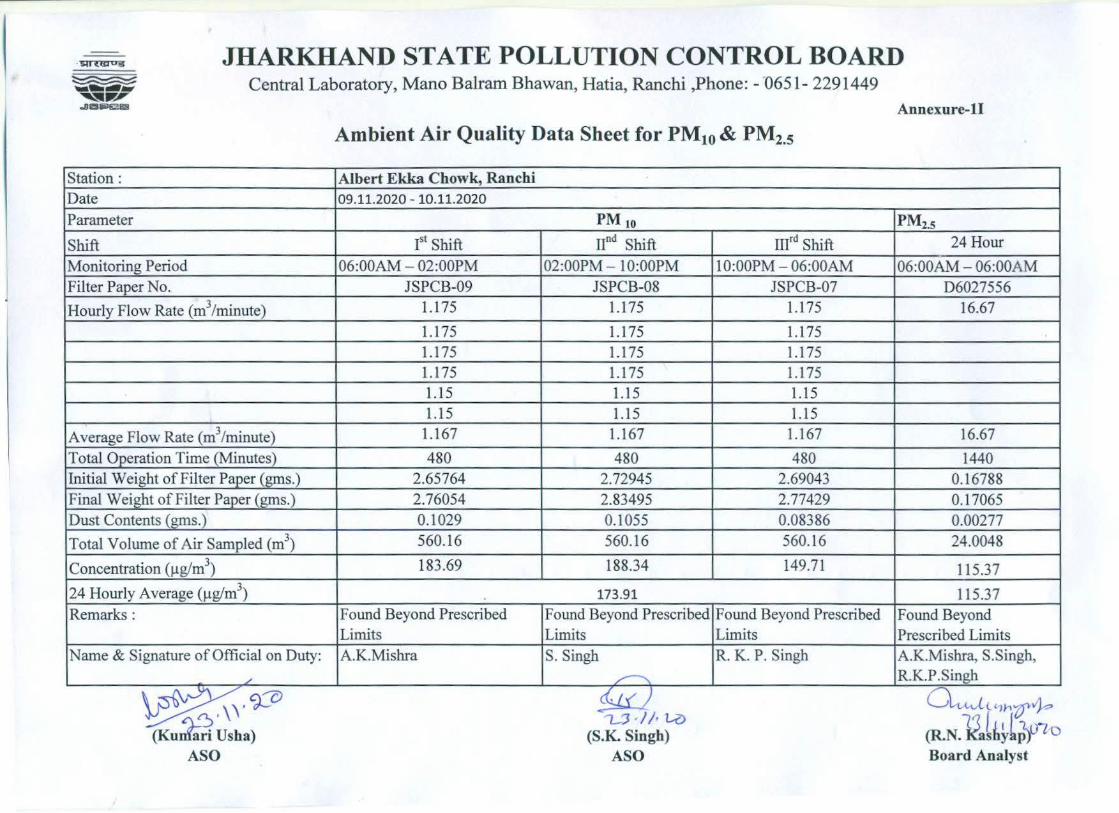
261
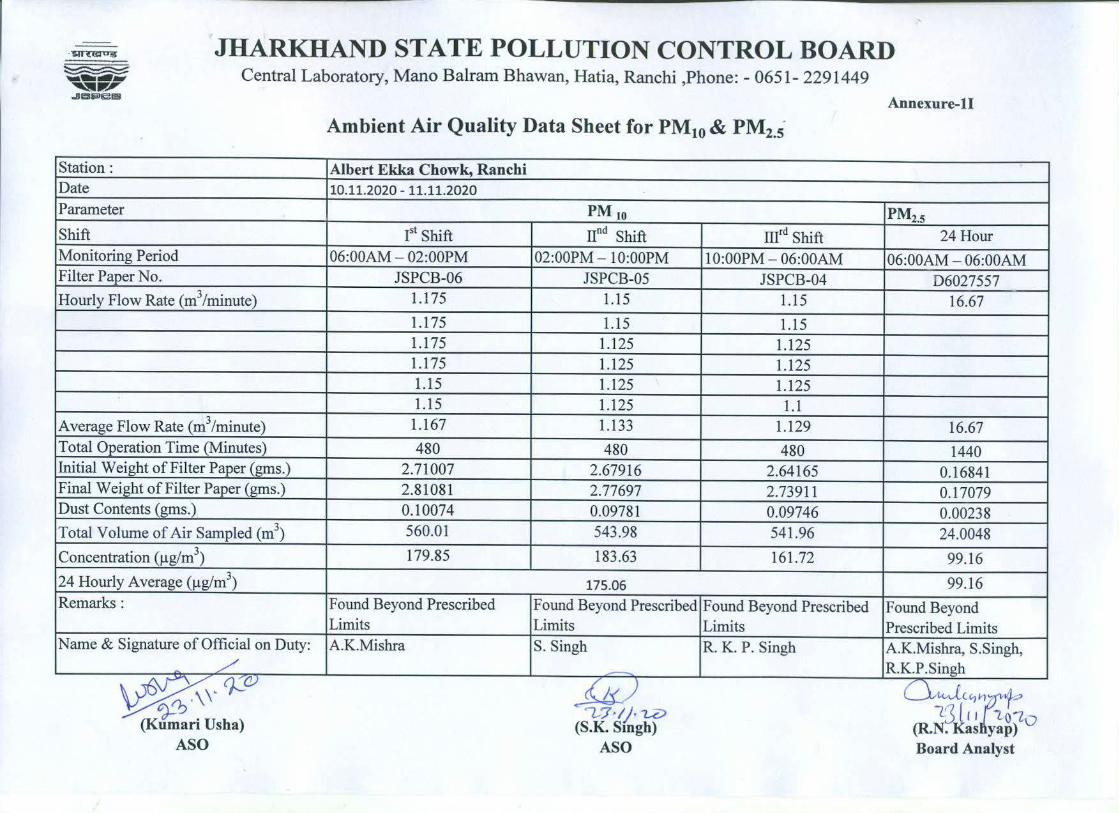
262
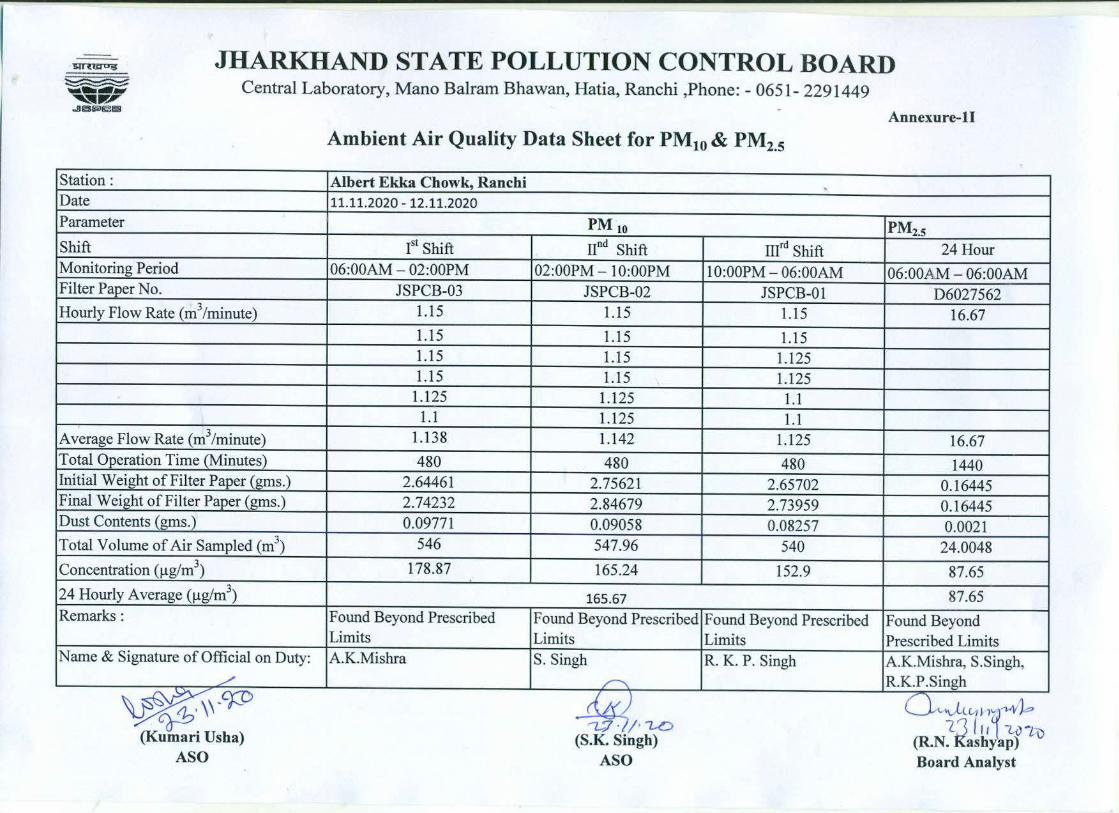
263
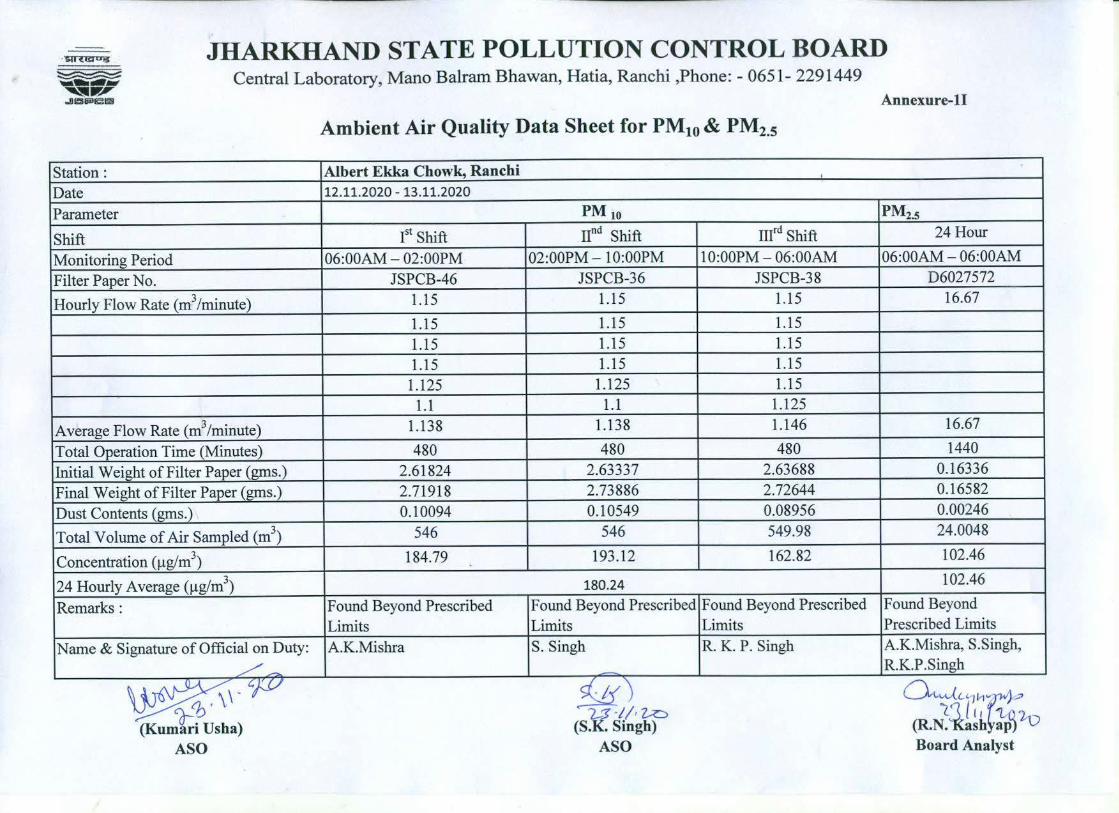
264
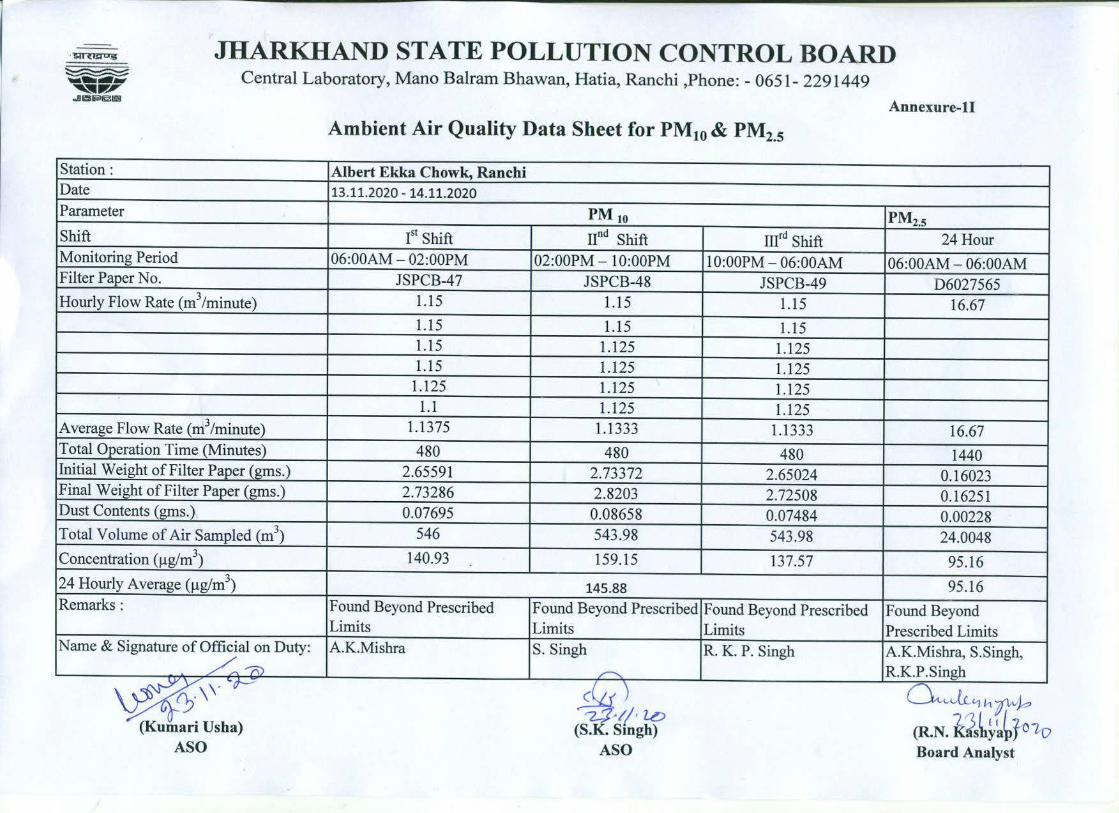
265
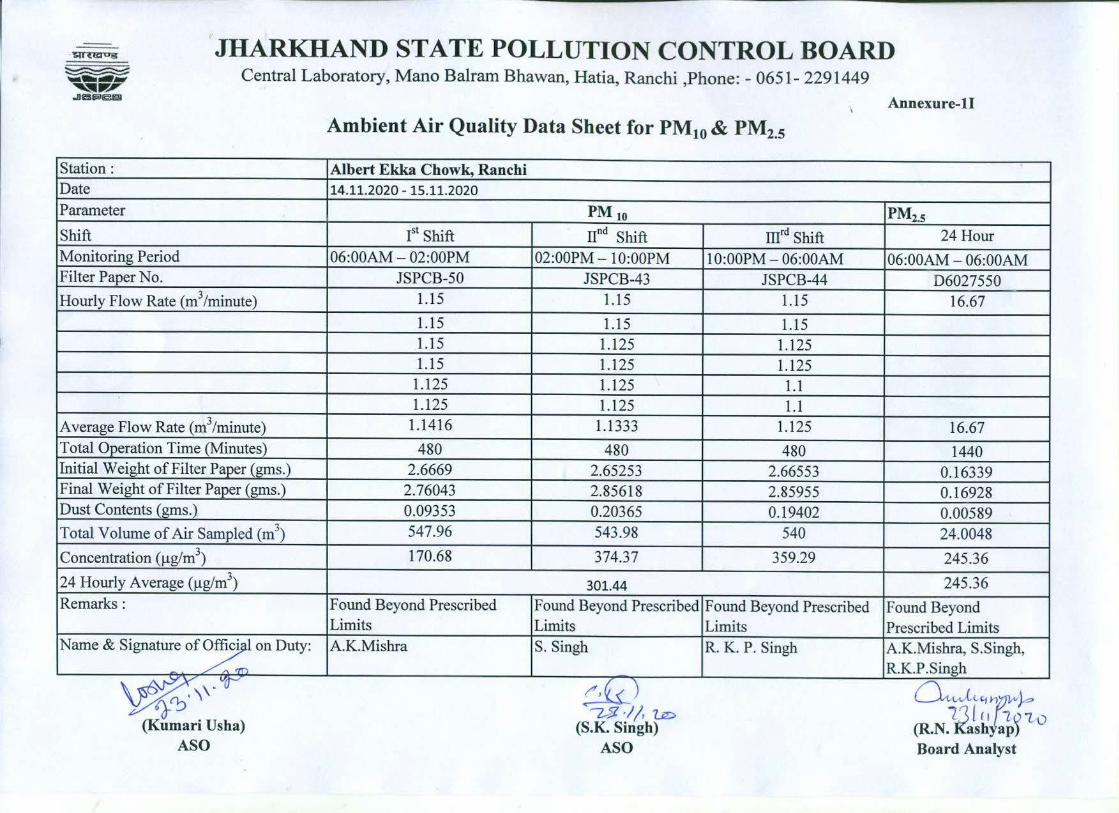
266
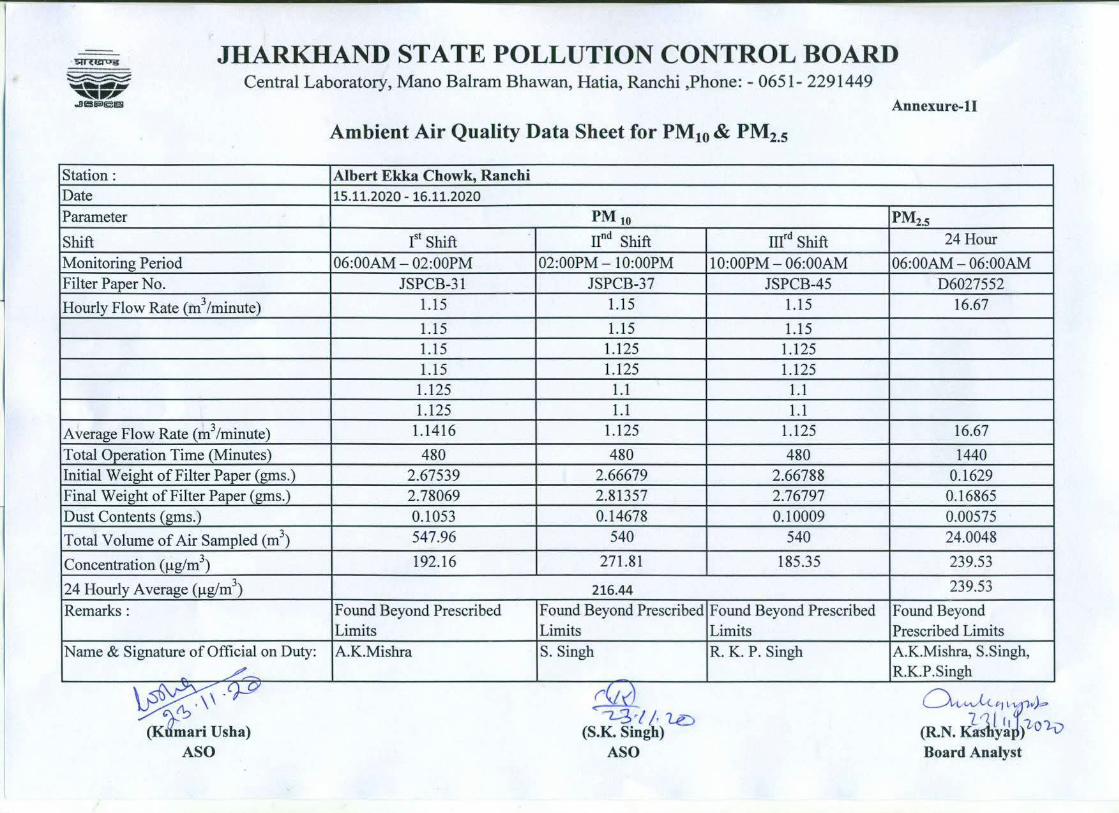
267
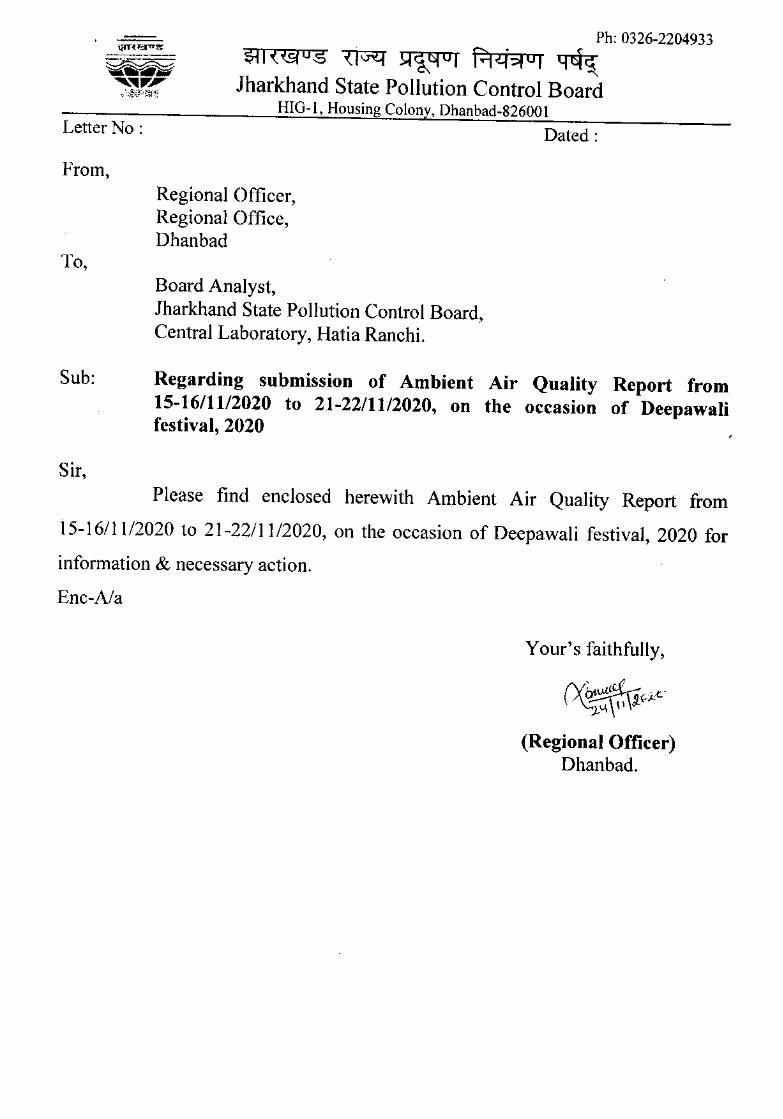
Ph: 0326-2204933~I '({91°$ ,(Icnq :Q~tSf01 r:'p:i?lOI ~Jharkhand State Pollution Control Board
HIG-l, Housing Colony, Dhanbad-826001Letter No: Dated:
From,Regional Officer,Regional Office,Dhanbad
To,Board Analyst,lharkhand State Pollution Control Board,Central Laboratory, Hatia Ranchi.
Sub: Regarding submission of Ambient Air Quality Report from15-16/1112020 to 21-22/1112020, on the occasion of Deepawalifestival, 2020
Sir,Please find enclosed herewith Ambient Air Quality Report from
15-1611112020 to 21-22/1112020, on the occasion of Deepawali festival, 2020 for
information & necessary action.
Ene-Ala
Your's faithfully,
rv~'9-fJ~\,/'0.9-l.\ \ \ I
(Regional Officer)Dhanbad.
268
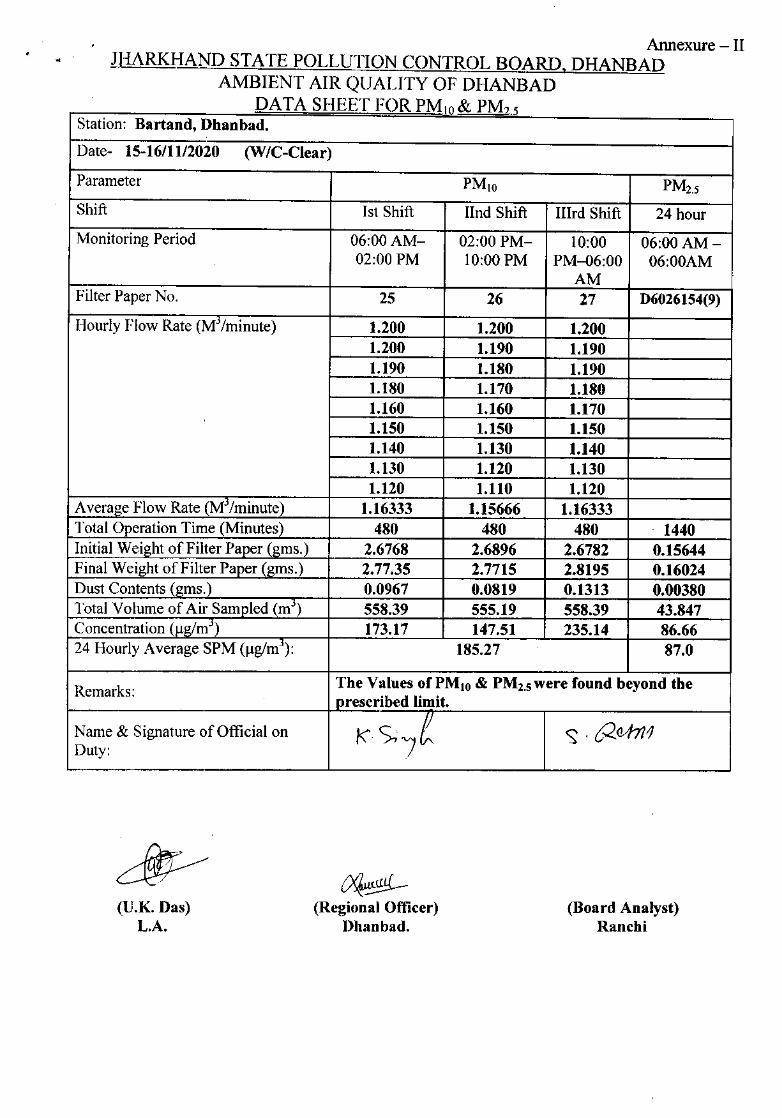
Annexure - II.. JHARKHAND STATE POLLUTION CONTROL BOARD, DHANBAD
AMBIENT AIR QUALITY OF DHANBADDATA SHEFT FOR PM10& PM?5J
Station: Bartand, Dhanbad.
Date- 15-16/1112020 (W/C-Clear)
Parameter PMIO PM2.5
Shift Ist Shift lInd Shift IIlrd Shift 24 hourMonitoring Period 06:00 AM- 02:00 PM- 10:00 06:00 AM-
02:00 PM 10:00 PM PM-06:00 06:00AMAM
Filter Paper No. 25 26 27 D6026154(9)
Hourly Flow Rate (Mj /minute) 1.200 1.200 1.2001.200 1.190 1.1901.190 1.180 1.1901.180 1.170 1.1801.160 1.160 1.1701.150 1.150 1.1501.140 1.130 1.1401.130 1.120 1.1301.120 1.110 1.120
Average Flow Rate (Mj Iminute) 1.16333 1.15666 1.16333-Total Operation Time (Minutes) 480 480 480 1440Initial Weight of Filter Paper (gms.) 2.6768 2.6896 2.6782 0.15644Final Weight of Filter Paper (gms.) 2.77.35 2.7715 2.8195 0.16024Dust Contents (gms.) 0.0967 0.0819 0.1313 0.00380Total Volume of Air Sampled (rrr') 558.39 555.19 558.39 43.847Concentration (ug/rrr') 173.17 147.51 235.14 86.6624 Hourly Average SPM (ug/m'): 185.27 87.0
Remarks: The Values ofPMlO & PM2•Swere found beyond theprescribed limit.
Name & Signature of Official on " s-;]e ~ , {20A721Duty:
(U.K. Das)L.A.
~~(Regional Officer)
Dhanbad.(Board Analyst)
Ranchi
269
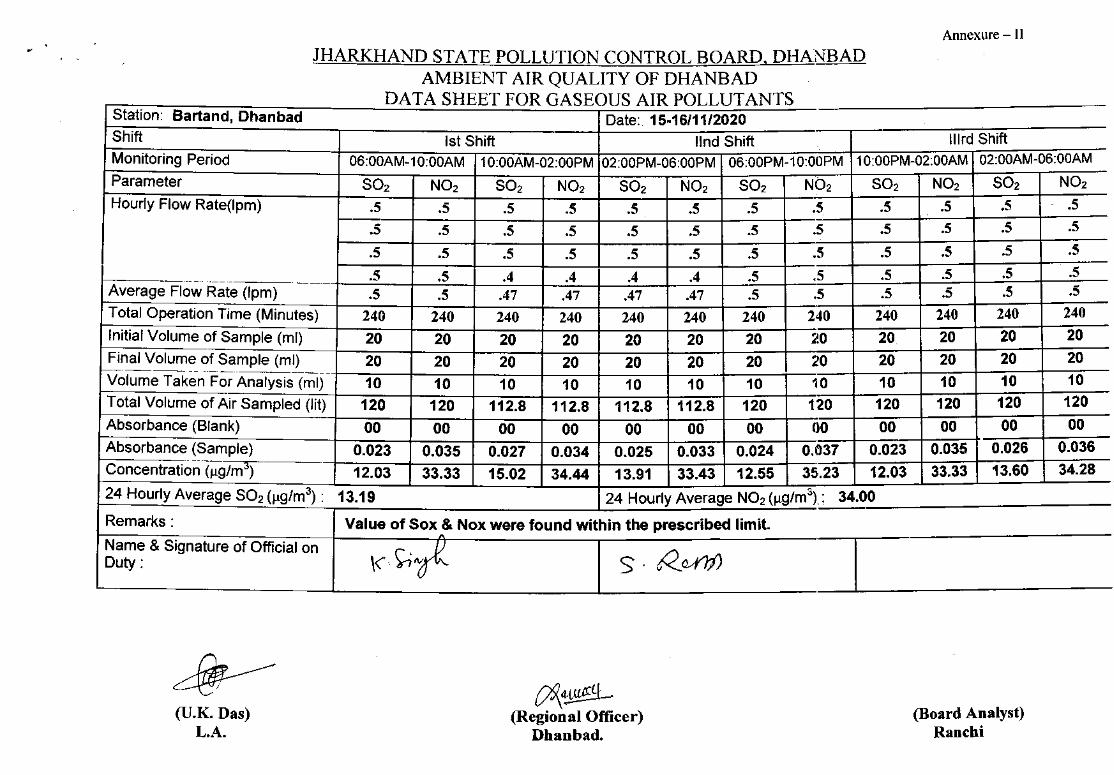
Annexure - 11JHARKHAND STATE POLLUTION CONTROL BOARD, DHANBAD
AMBIENT AIR QUALITY OF DHANBADDATA SHEET FOR GASEOUSAIR POLLUTANTS
Station: Bartand, Dhanbad Date: 15-16/11/2020Shift 1stShift lind Shift Illrd ShiftMonitoring Period 06:00AM-10:00AM 10:00AM-02:00PM02:00PM-06:00PM 06:00PM-10:00PM 10:00PM-02:00AM02:00AM-06:00AMParameter S02 N02 S02 N02 S02 N02 S02 N02 S02 N02 S02 N02Hourly Flow Rate(lpm) .5 .5 .5 .5 .5 .5 .5 .5 .5 .5 .5 .5
-- .5 .5.5 .5 .5 .5 .5 .5 .5 .5 .5 .5
.5 .5 .5 .5 .5 .5 .5 .5 .5 .5 .5 .5
.5 .5 .4 .4 .4 .4 .5 .5 .5 .5 .5 .5-_ ..- -~-- -."--_---Average Flow Rate (Ipm) .5 .5 .47 .47 .47 .47 .5 .5 .5 .5 .5 .5
Total Operation Time (Minutes) 240 240 240 240 240 240 240 240 240 240 240 240
Initial Volume of Sample (ml) 20 20 20 20 20 20 20 20 20 20 20 20Final Volume of Sample (ml) 20 20 20 20 20 20 20 20 20 20 20 20----_---- --------------
Volume Taken For Analysis (ml) 10 10 10 10 10 10 10 10 10 10 10 10Total Volume of Air Sampled (lit) 120 120 112.8 112.8 112.8 112.8 120 120 120 120 120 120Absorbance (Blank) 00 00 00 00 00 00 00 00 00 00 00 00Absorbance (Sample) 0.023 0.035 0.027 0.034 0.025 0.033 0.024 0.037 0.023 0.035 0.026 0.036Concentration (1l9/m3) 12.03 33.33 15.02 34.44 13.91 33.43 12.55 35.23 12.03 33.33 13.60 34.2824 Hourly Average S02 (1l9/m3): 13.19 24 Hourly Average N02 (1l9/m3)_: 34.00Remarks: Value of Sox & Nox were found within the prescribed limit.
"-
Name & Signature of Official on \('-~oK KaA1i)Duty : S'
(U.K.Das)L.A.
~~(Regional Officer)
Dhanbad.(Board Analyst)
Ranchi270
I271
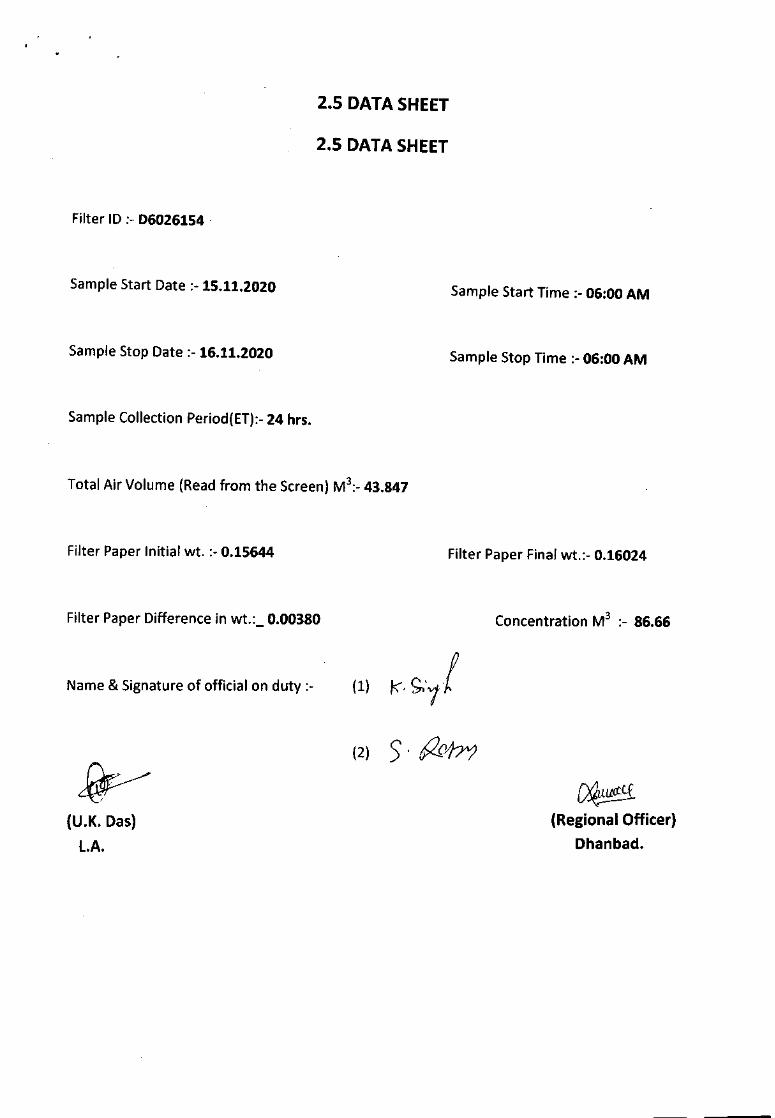
2.5 DATA SHEET
2.5 DATA SHEET
Filter ID ;- 06026154 .
SampleStart Date ;- 15.11.2020 SampleStart Time ;- 06:00 AM
SampleStop Date ;- 16.11.2020 SampleStop Time ;- 06:00 AM
SampleCollection Period{ET);-24 hrs.
Total Air Volume (Readfrom the Screen)M3;_ 43.847
Filter Paper Initial wt. ;- 0.15644 Filter Paper Finalwt.i- 0.16024
Filter PaperDifference in wt.;_ 0.00380 Concentration M3 ;- 86.66
Name& Signature of official on duty ;- (1)
(2)
~(Regional Officer)
Dhanbad.(U.K.Oas)L.A.
272
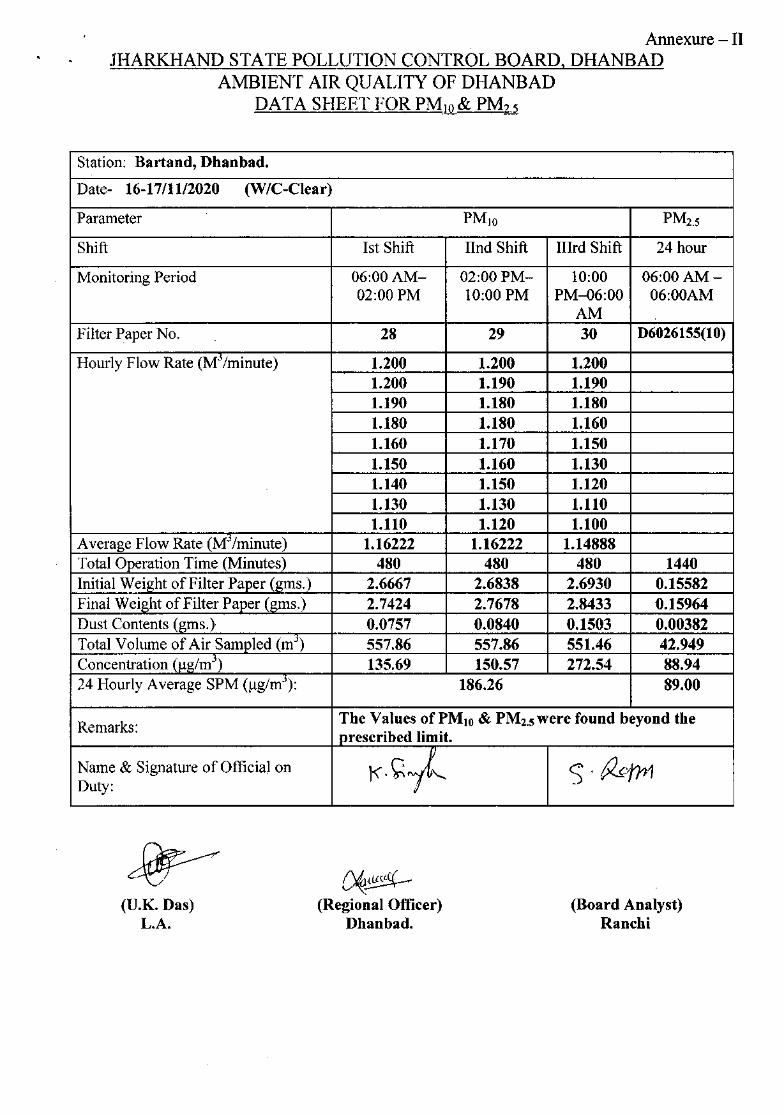
Annexure - IIJHARKHAND STATE POLLUTION CONTROL BOARD, DHANBAD
AMBIENT AIR QUALITY OF DHANBADDATA SHEET FOR PM10& PM2.5
Station: Bartand, Dhanbad.
Date- 16-17/1112020 (W/C-Clear)
Parameter PMIO PM2.5
Shift Ist Shift IInd Shift IIIrd Shift 24 hour
Monitoring Period 06:00 AM- 02:00 PM- 10:00 06:00 AM-02:00 PM 10:00 PM PM-06:00 06:00AM
AMFilter Paper No. 28 29 30 D6026155(10)
Hourly Flow Rate (Mj Iminute) 1.200 1.200 1.2001.200 1.190 1.1901.190 1.180 1.1801.180 1.180 1.1601.160 1.170 1.1501.150 1.160 1.1301.140 1.150 1.1201.130 1.130 1.1101.110 1.120 1.100
Average Flow Rate (MJIminute) 1.16222 1.16222 1.14888Total Operation Time (Minutes) 480 480 480 1440Initial Weight of Filter Paper (gms.) 2.6667 2.6838 2.6930 0.15582Final Weight of Filter Paper (gms.) 2.7424 2.7678 2.8433 0.15964Dust Contents (gms.) 0.0757 0.0840 0.1503 0.00382Total Volume of Air Sampled (m") 557.86 557.86 551.46 42.949Concentration (ug/m") 135.69 150.57 272.54 88.9424 Hourly Average SPM (ug/rrr'): 186.26 89.00
Remarks: The Values ofPMlO & PM2.Swere found beyond theprescribed limit.
Name & Signature of Official on \<.C;;tl S· ~ffYIDuty:
~(Regional Officer)
Dhanbad.(Board Analyst)
Ranchi(U.K.Das)
L.A.
273
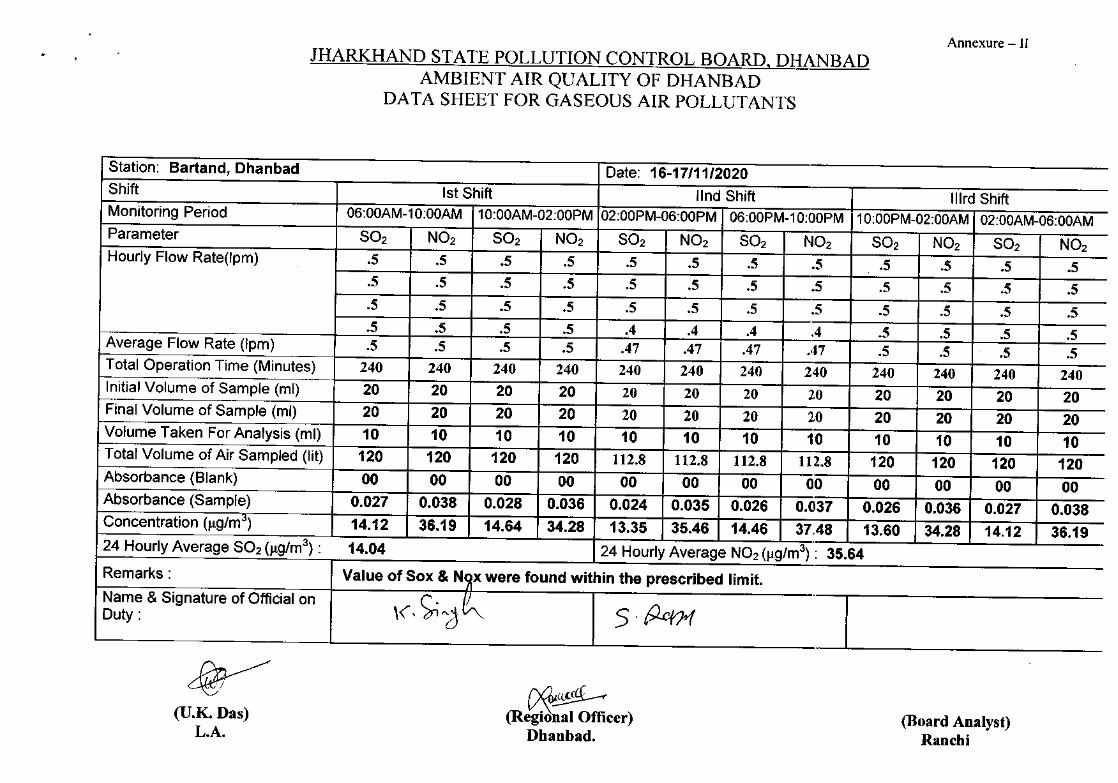
JHARKHAND STATE POLLUTION CONTROL BOARD, DHANBADAMBIENT AIR QUALITY OF DHANBAD
DATA SHEET FOR GASEOUS AIR POLLUTANTS
Annexure - II
Station: Bartand, Dhanbad Date: 16-17/11/2020Shift 1stShift lind Shift IIlrd ShiftMonitoring Period 06:00AM-10:00AM 10:00AM-02:00PM 02:00PM-06:00PM 06:00PM-10:00PM 10:00PM-02:00AM 02:00AM-06:00AMParameter S02 N02 S02 N02 S02 N02 S02 1'l02 S02 N02 S02 N02Hourly Flow Rate(lpm) .5 .5 .5 .5 .5 .5 .5 .5 .5 .5 .5 .5
.5 .5 .5 .5 .5 .5 .5 .5 .5 .5 .5 .5
.5 .5 .5 .5 .5 .5 .5 .5 .5 .5 .5 .5
.5 .5 .5 .5 .4 .4 .4 .4 .5 .5 .5 .5Average Flow Rate (Ipm) .5 .5 .5 .5 .47 .47 .47 .47 .5 .5 .5 .5Total Operation Time (Minutes) 240 240 240 240 240 240 240 240 240 240 240 240f--Initial Volume of Sample (ml) 20 20 20 20 20 20 20 20 20 20 20 20Final Volume of Sample (ml) 20 20 20 20 20 20 20 2,0 20 20 20 20Volume Taken For Analysis (ml) 10 10 10 10 10 10 10 10 10 10 10 10Total Volume of Air Sampled (lit) 120 120 120 120 112.8 112.8 112.8 112.8 120 120 120 120Absorbance (Blank) 00 00 00 00 00 00 00 00 00 00 00 00Absorbance (Sample) 0.027 0.038 0.028 0.036 0.024 0.035 0.026 0.037 0.026 0.036 0.027 0.038Concentration (jlg/m3) 14.12 36.19 14.64 34.28 13.35 35.46 14.46 37.48 13.60 34.28 14.12 36.1924 Hourly Average S02 (jlg/m3) : 14.04 24 Hourly Average N02 (jlg/m3): 35.64Remarks: Value of Sox & N~x were found within the prescribed limit.Name & Signature of Official on ,~,C;;'3.~ 5'PcrHDuty:
0r~(Regional Officer)
Dhanbad.(Board Analyst)
Ranchi
(U.K. Das)L.A.
274
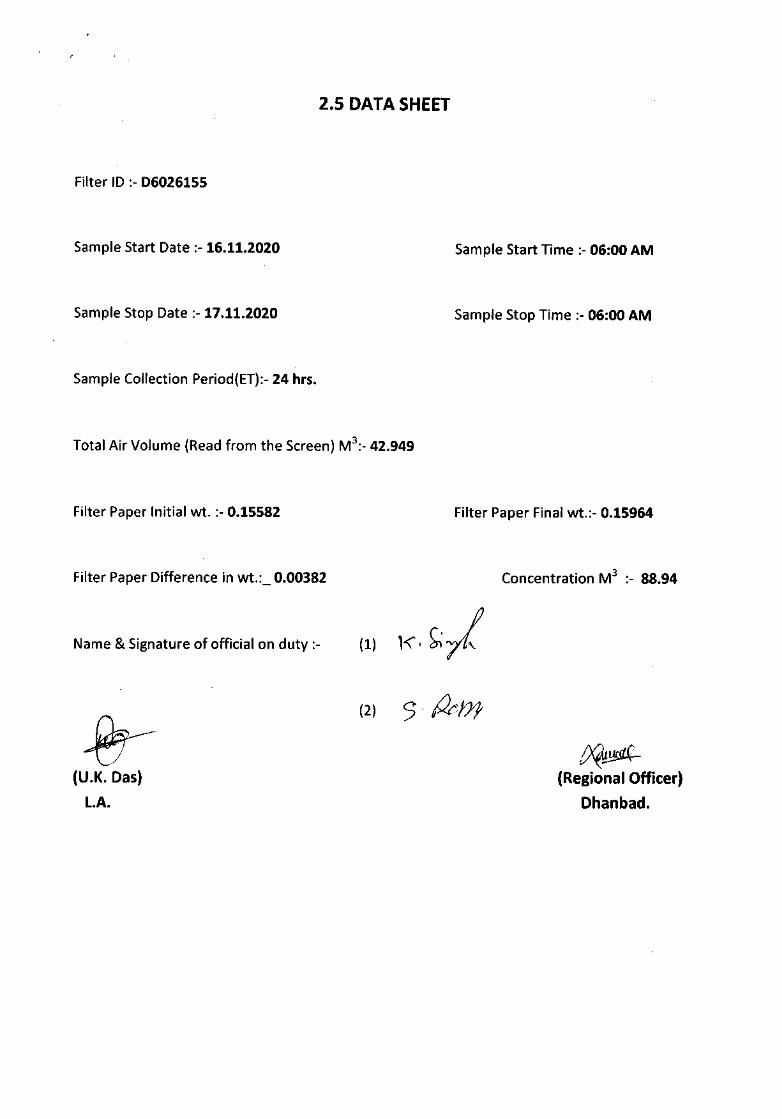
2.5 DATA SHEET
Filter ID :- 06026155
Sample Start Date :- 16.11.2020 Sample Start Time :- 06:00 AM
Sample Stop Date :- 17.11.2020 Sample Stop Time :- 06:00 AM
Sample Collection Period{ET}:- 24 hrs.
Total Air Volume {Read from the Screen} M3:_ 42.949
Filter Paper Initial wt. :- 0.15582 Filter Paper Final wt.:- 0.15964
Filter Paper Difference in wt.:_ 0.00382 Concentration M3 :- 88.94
Name & Signature of official on duty :- {1}
~(U.K. Das)l.A.
{2} 5' Ibm~~
(Regional Officer)Dhanbad.
275
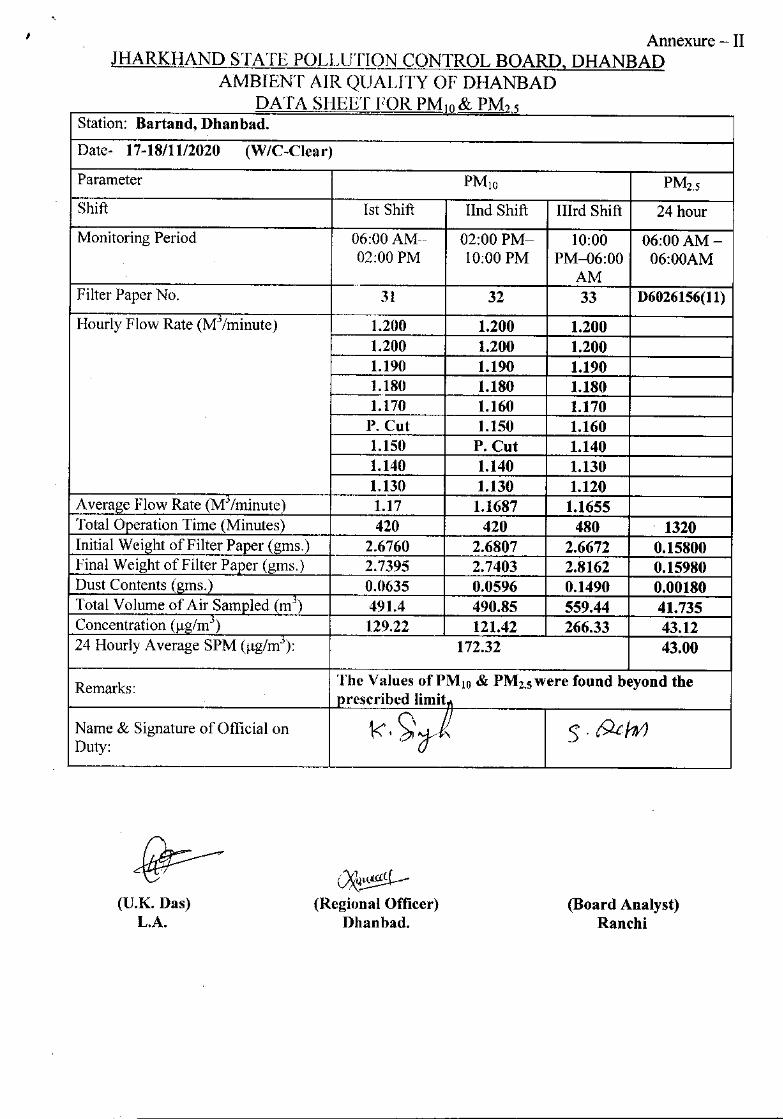
, Annexure - IIJHARKHAND STATE POLLUTION CONTROL BOARD, DHANBAD
AMBIENT AIR QUALITY OF DHANBADDATA SHFET FOR PM10& PM25"
Station: Bartand, Dhanbad.
Date- 17-18/1112020 (W/C-Clear)
Parameter PMIO PM2.5
Shift Ist Shift IInd Shift IIlrd Shift 24 hourMonitoring Period 06:00 AM--· 02:00 PM- 10:00 06:00 AM-
02:00 PM 10:00 PM PM-06:00 06:00AMAM
Filter Paper No, 31 32 33 D6026156(1l)
Hourly Flow Rate (M'zminute) 1.200 1.200 1.2001.200 1.200 1.2001.190 1.190 1.1901.180 1.180 1.1801.170 1.160 1.170P. Cut 1.150 1.1601.150 P. Cut 1.1401.140 1.140 1.130LBO 1.130 1.120
Average Flow Rate (M3/minute) 1.17 1.1687 1.1655Total Operation Time (Minutes) 420 420 480 1320Initial Weight of Filter Paper (gms.) 2.6760 2.6807 2.6672 0.15800Final Weight of Filter Paper (gms.) 2.7395 2.7403 2.8162 0.15980Dust Contents (gms.) 0.0635 0.0596 0.1490 0.00180Total Volume of Air Sampled (m') 491.4 490.85 559.44 41.735Concentration (ug/nr') 129.22 121.42 266.33 43.1224 Hourly Average SPM (ug/rrr'): 172.32 43.00
Remarks: The Values ofPMlO & PM2.Swere found beyond theprescribed limit"
Name & Signature of Official on 1<, >;;tR s .c9-thIJDuty:
(~(Regional Officer)
Dhanbad.(Board Analyst)
Ranchi(U.K.Das)
L.A.
276
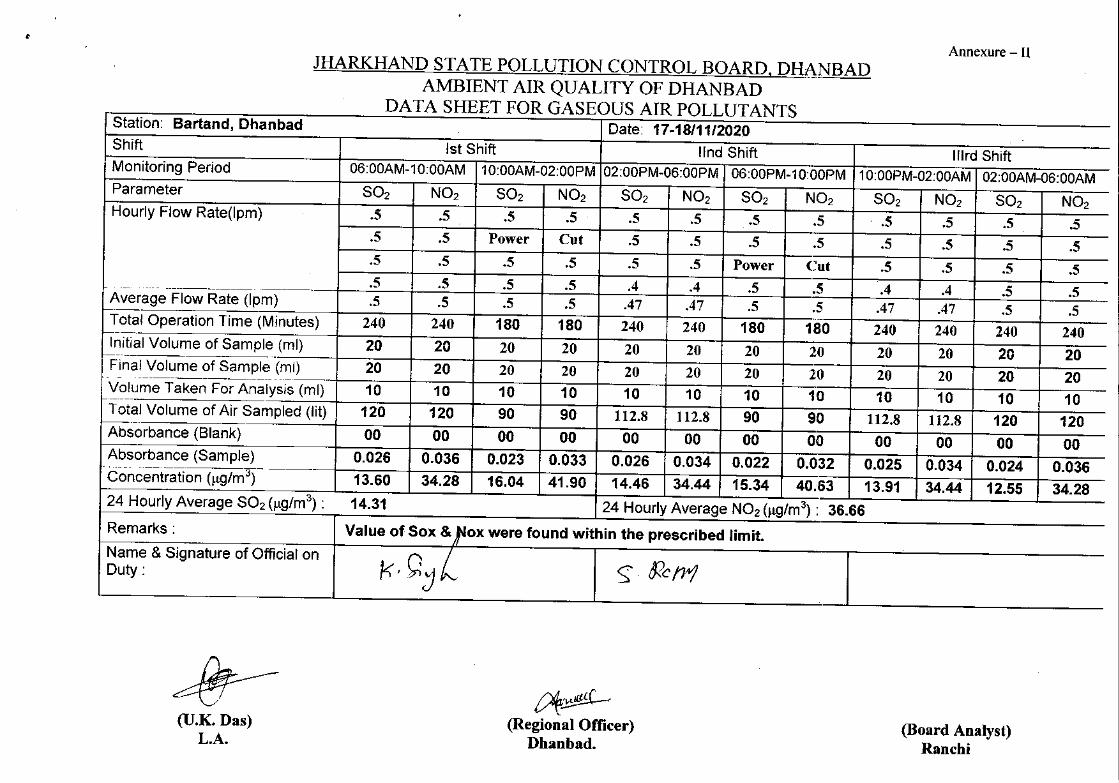
Station: Bartand, Dhanbad Date: 17-18/11/2020Shift 1stShift lind Shift Illrd ShiftMonitoring Period 06:00AM-10:OOAM 10:00AM-02:00PM 02:00PM-06:00PM 06:00PM-10:00PM 10:00PM-02:00AM 02:00AM-06:00AMParameter S02 N02 S02 N02 S02 N02 S02 N02 S02 N02 S02 N02Hourly Flow Rate(lpm) .5 .5 .5 .5 .5 .5 .5 .5 - .5 .5 .5 .5
.5 .5 Power Cut .5 .5 .5 .5 .5 .5 .5 .5
.5 .5 .5 .5 .5 .5 Power Cut .5 .5 .5 .5
.5 .5 .5 .5 .4 .4 .5 .5 .4 .4 .5 .5---,-- ----------~-.- ..--.,----- ..
Average Flow Rate (lpm) .5 .5 .5 .5 .47 .47 .5 .5 .47 .47 .5 .5._-..Total Operation Time (Minutes) 240 240 180 180 240 240 180 180 240 240 240 240f------
Initial Volume of Sample (ml) 20 20 20 20 20 20 20 20 20 20 20 20-_-_ .._ ...
Final Volume of Sample (ml) 20 20 20 20 20 20 20 20 20 20 20 20- -.-------------.---.- ..-.---~-
Volume Taken For Analysis (ml) 10 10 10 10 10 10 10 10 10 10 10 10.-
Total Volume of Air Sampled (lit) 120 120 90 90 112.8 112.8 90 90 112.8 112.8 120 120t----00 00 00 00 00 00Absorbance (Blank) 00 00 00 00 00 00
Absorbance (Sample) 0.026 0.036 0.023 0.033 0.026 0.034 0.022 0.032 0.025 0.034 0.024 0.036Concentration (1l9/m3) 13.60 34.28 16.04 41.90 14.46 34.44 15.34 40.63 13.91 34.44 12.55 34.2824 Hourly Average S02 (1l9/m3) : 14.31 24 Hourly Average N02 (1l9/m3): 36.66Remarks: Value of Sox &_1!oxwere found within the prescribed limit.Name & Signature of Official on 1<,9jL S'. 5{cn1Duty:
JHARKHAND STATE POLLUTION CONTROL BOARD, DHt\NBADAMBIENT AIR QUALITY OF DHANBAD
DATA SHEET FOR GASEOUS AIR POLLUTANTS
Annexure - 11
(U.K. Das)L.A.
pt~(Regional Officer)
Dhanbad.(Board Analyst)
Ranchi277
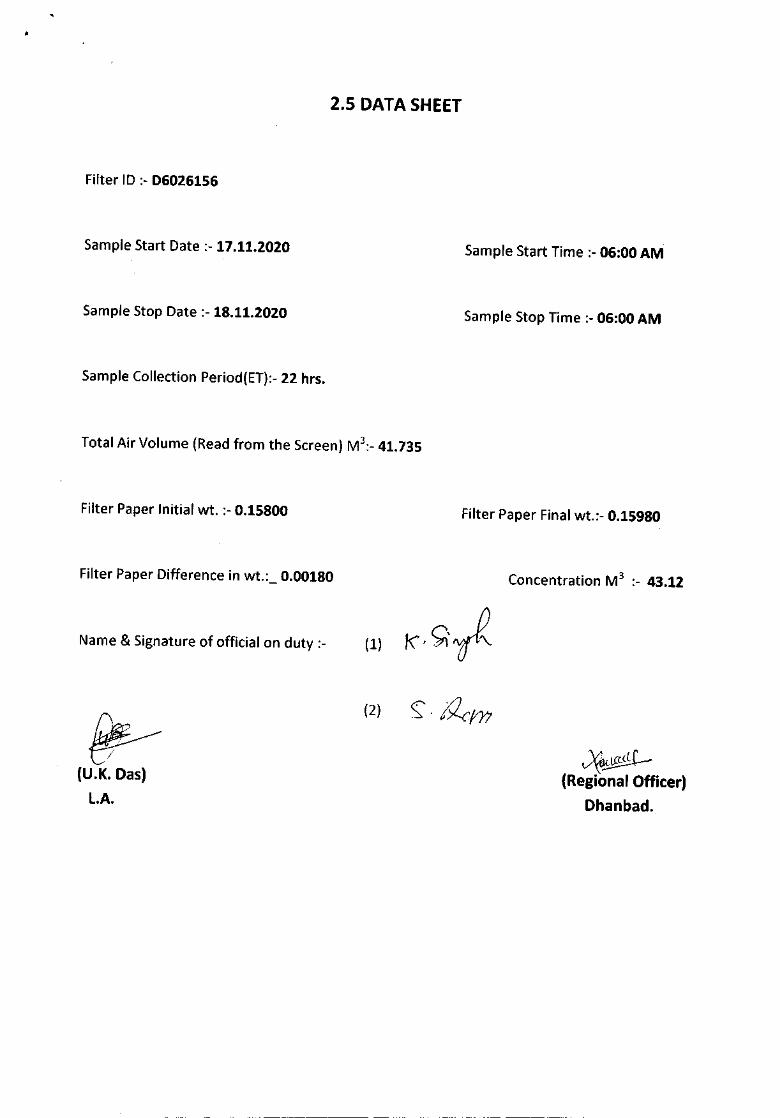
2.5 DATA SHEET
Filter ID :- 06026156
Sample Start Date :- 17.11.2020 Sample Start Time :- 06:00 AM
Sample Stop Date :- 18.11.2020 Sample Stop Time :- 06:00 AM
Sample Collection Period(ET):- 22 hrs.
Total Air Volume (Read from the Screen) M3:_ 41.735
Filter Paper Initial wt. :- 0.15800 Filter Paper Final wt.:- 0.15980
Filter Paper Difference in wt.:_ 0.00180 Concentration M3 :- 43.12
Name & Signature of official on duty :- (1)
~(U.K. Das)l.A.
(2)
~~(Regional Officer)
Dhanbad.
278
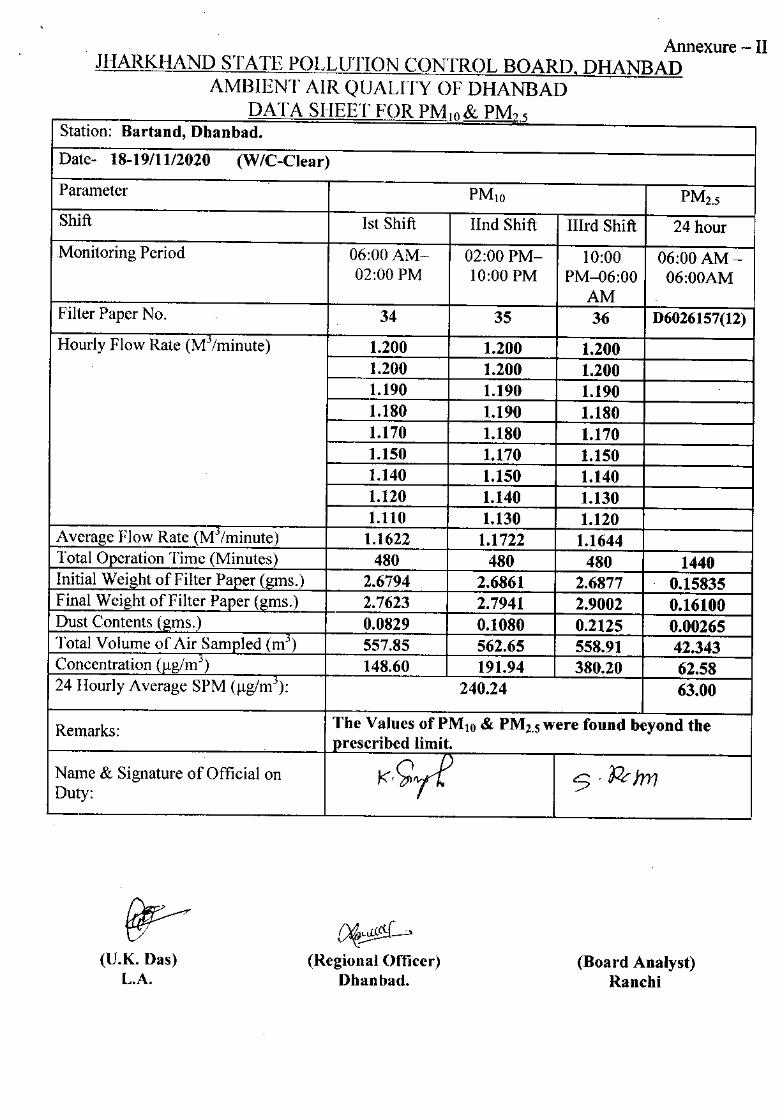
Annexure - IIJHARKHAND STATE POLLUTION CONTROL BOARD, DHANBAD
AMBIENT AIR QUALITY OF DHANBADDATA SHEET FOR PM 10& PM) 5
Station: Bartand, Dhanbad.
Date- 18-19/1112020 (WIC-Clear)
Parameter PMlO PM2.5
Shift 1st Shift lInd Shift IIlrd Shift 24 hourMonitoring Period 06:00 AM- 02:00 PM- 10:00 06:00 AM-
02:00 PM 10:00 PM PM-06:00 06:00AMAM
Filter Paper No. 34 35 36 D6026157(12)
Hourly Flow Rate (M''zminute) 1.200 1.200 1.2001.200 1.200 1.2001.190 1.190 1.1901.180 1.190 1.1801.170 1.180 1.1701.150 1.170 1.1501.140 1.150 1.1401.120 1.140 1.1301.110 1.130 1.120
Average Flow Rate (M'zrninute) 1.1622 1.1722 1.1644Total Operation Time (Minutes) 480 480 480 1440Initial Weight of Filter Paper (gms.) 2.6794 2.6861 2.6877 0.15835Final Weight of Filter Paper (gms.) 2.7623 2.7941 2.9002 0.16100Dust Contents (gms.) 0.0829 0.1080 0.2125 0.00265Total Volume of Air Samj)_led(m' 557.85 562.65 558.91 42.343Concentration (ug/rrr') 148.60 191.94 380.20 62.5824 IIourly Average SPM (ug/m'): 240.24 63.00
Remarks: The Values ofPM10 & PM2.Swere found beyond theprescribed limit.
Name & Signature of Official on k',~yf :;. PcJmDuty:
~(Regional Officer)
Dhanbad.(Board Analyst)
Ranchi(U.K. Das)
L.A.
279
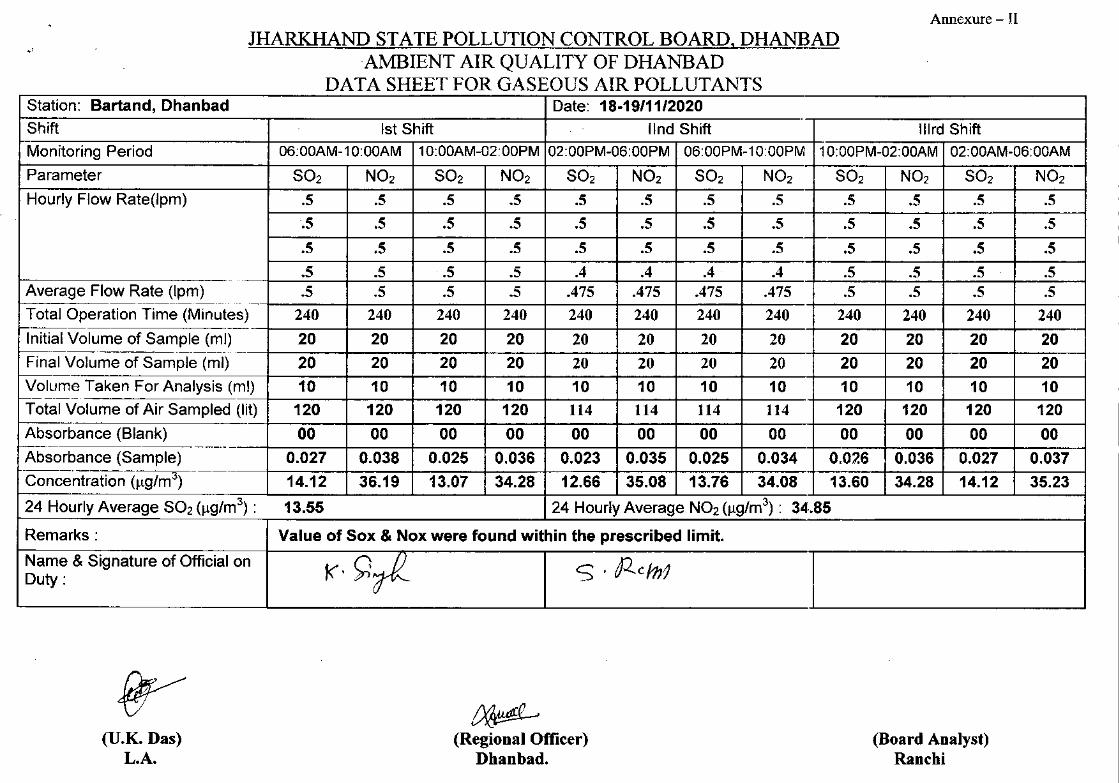
Annexure - II
.'JHARKHAND STATE POLLUTION CONTROL BOARD, DHANBAD
AMBIENT AIR QUALITY OF DHANBADDATA SHEET FOR GASEOUS AIR POLLUTANTS
Station: Bartand, Dhanbad Date: 18-19/11/2020Shift 1stShift lind Shift Illrd ShiftMonitoring Period 06:00AM-10:00AM 10:00AM-02:00PM 02:00PM-06:00PM 06:00PM-10:00PM 10:00PM-02:00AM 02:00AM-06:00AMParameter S02 N02 S02 N02 S02 N02 S02 N02 S02 N02 S02 N02Hourly Flow Rate(lpm) .5 .5 .5 .5 .5 .5 .5 .5 .5 .5 .5 .5
.5 .5 .5 .5 .5 .5 .5 .5 .5 .5 .5 .5
.5 .5 .5 .5 .5 .5 .5 .5 .5 .5 .5 .5
.5 .5 .5 .5 .4 .4 .4 .4 .5 .5 .5 .5Average Flow Rate (Ipm) .5 .5 .5 .5 .475 .475 .475 .475 .5 .5 .5 .5
---_.,_ .._----
Total Operation Time (Minutes) 240 240 240 240 240 240 240 240 240 240 240 240--
Initial Volume of Sample (ml) 20 20 20 20 20 20 20 20 20 20 20 201---------------------- -----
Final Volume of Sample (ml) 20 20 20 20 20 20 20 20 20 20 20 20r--Volume Taken For Analysis (ml) 10 10 10 10 10 10 10 10 10 10 10 10r----~-Total Volume of Air Sampled (lit) 120 120 120 120 114 114 114 114 120 120 120 120Absorbance (Blank) 00 00 00 00 00 00 00 00 00 00 00 00r----- ._---
Absorbance (Sample) 0.027 0.038 0.025 0.036 0.023 0.035 0.025 0.034 0.01.6 0.036 0.027 0.037Conce-ntration(J.Lg/m3)
--
14.12 36.19 13.07 34.28 12.66 35.08 13.76 34.08 13.60 34.28 14.12 35.2324 Hourly Average S02 (J.Lg/m3) : 13.55 24 Hourly Average N02 (J.Lg/m3) : 34.85
Remarks: Value of Sox & Nox were found within the prescribed limit.Name & Signature of Official on j(·9~ S .p-c!1J1Duty:
~(Regional Officer)
Dhanbad.(Board Analyst)
Ranchi(U.K. Das)
L.A. 280
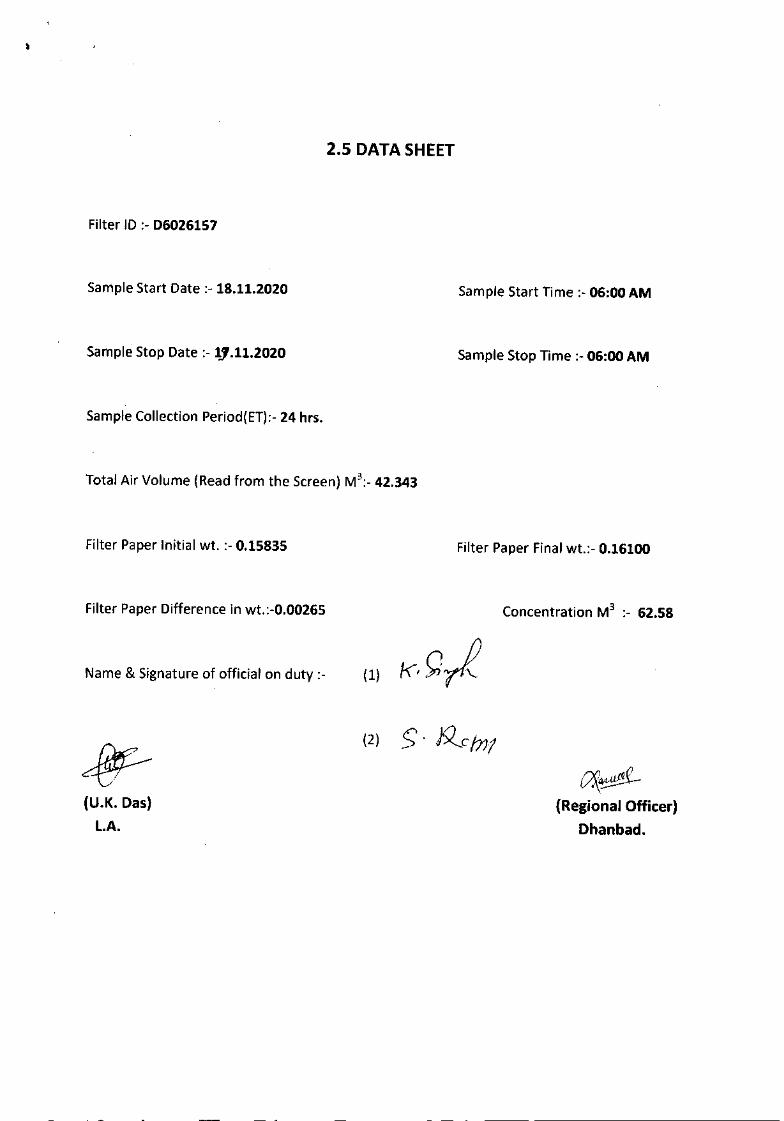
2.5 DATA SHEET
Filter ID :- D6026157
Sample Start Date :- 18.11.2020 Sample Start Time :- 06:00 AM
Sample Stop Date :-1;1.11.2020 Sample Stop Time :- 06:00 AM
Sample Collection Period(ET}:- 24 hrs,
Total Air Volume (Read from the Screen) M3:_ 42.343
Filter Paper Initial wt. :- 0.15835 Filter Paper Final wt.:- 0.16100
Filter Paper Difference in wt.:-0.00265 Concentration M3 :- 62.58
Name & Signature of official on duty :- (I)
(2) 5· iX_c /7)1
(U.K. Das)L.A.
W(~(Regional Officer)
Dhanbad.
281
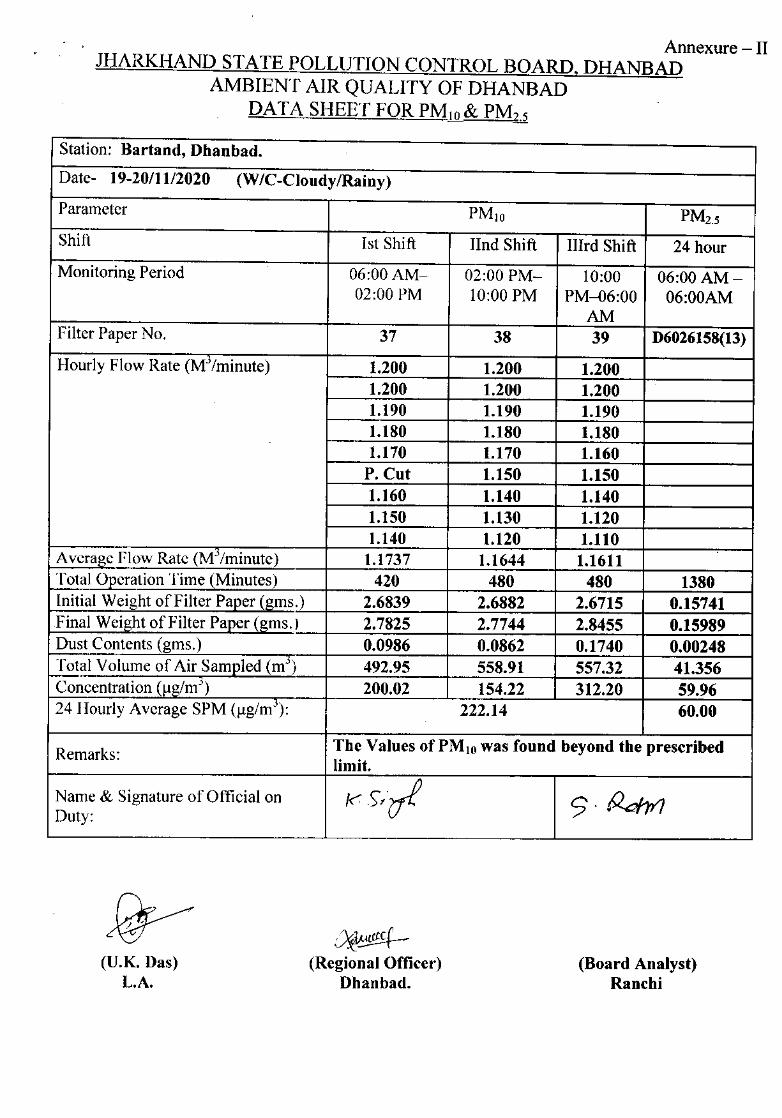
Annexure - IIJHARKHAND STATE POLLUTION CONTROL BOARD, DHANBAD
AMBIENT AIR QUALITY OFDHANBADDATA SHEET FOR PMIO & PM2,5
Station: Bartand, Dhanbad.Date- 19-20/1112020 (WIC-Cloudy/Rainy)
Parameter PMIO PM2.5
Shifl Ist Shift IInd Shift IIlrd Shift 24 hourMonitoring Period 06:00 AM- 02:00 PM- 10:00 06:00 AM-
02:00 PM 10:00 PM PM-06:00 06:00AMAM
Filter Paper No. 37 38 39 D6026158(13)
Hourly Flow Rate (M] Iminute) 1.200 1.200 1.2001.200 1.200 1.2001.190 1.190 1.1901.180 1.180 1.1801.170 1.170 1.160P. Cut 1.150 1.1501.160 1.140 1.1401.150 1.130 1.1201.140 1.120 1.110
Average Flow Rate (MJ Iminute) 1.1737 1.1644 1.1611Total Operation Time (Minutes) 420 480 480 1380Initial Weight of Filter Paper (gms.) 2.6839 2.6882 2.6715 0.15741Final Weight of Filter Paper (gms.) 2.7825 2.7744 2.8455 0.15989Dust Contents (gms.) 0.0986 0.0862 0.1740 0.00248Total Volume of Air Sampled (m') 492.95 558.91 557.32 41.356Concentration (ug/m ' 200.02 154.22 312.20 59.9624 Hourly Average SPM (J.lg/m\ 222.14 60.00
Remarks: The Values of PM 10was found beyond the prescribedlimit.
Name & Signature of Official on '0.)tcrf 5'~Duty:
:»~(Regional Officer)
Dhanbad.(Board Analyst)
Ranchi(U.K. Das)
L.A.
282
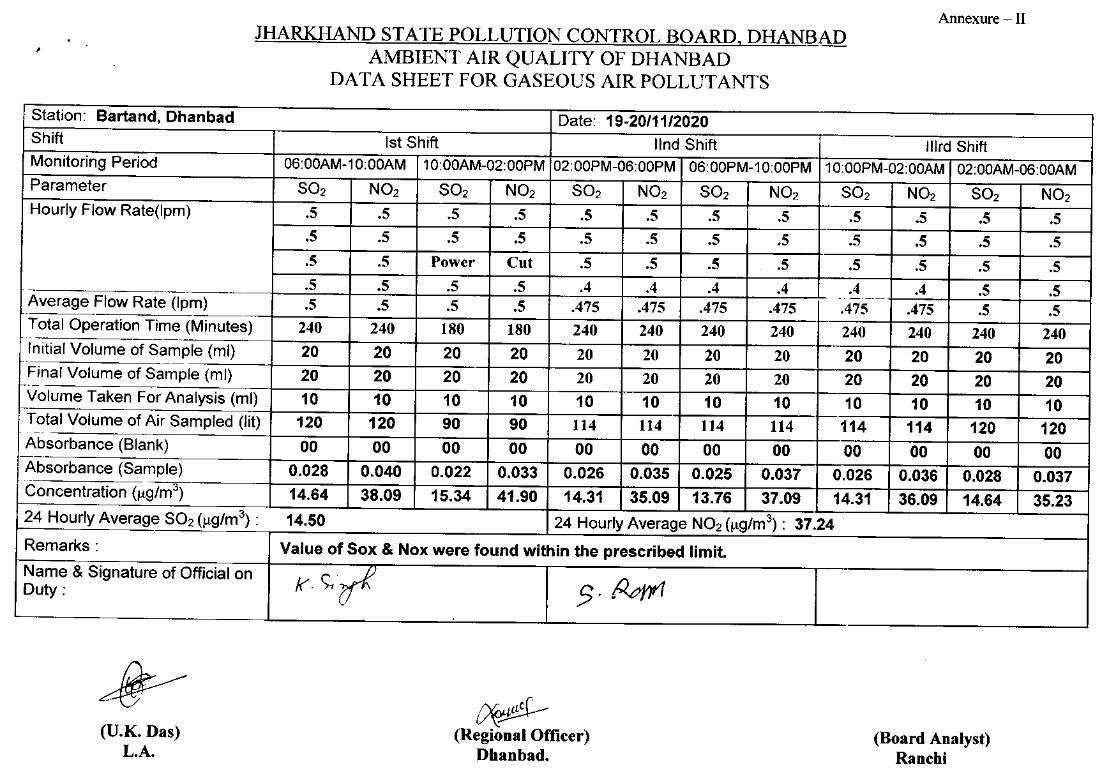
Annexure - II
I'
JHARKHAND STATE POLLUTION CONTROL BOARD, DHANBADAMBIENT AIR QUALITY OF DHANBAD
DATA SHEET FOR GASEOUS AIR POLLUTANTS
Station: Bartand, Dhanbad Date: 19-20/11/2020Shift 1stShift lind Shift '''rd ShiftMonitoring Period 06:00AM-10:00AM 10:00AM-02:00PM 02:00PM-06:00PM 06:00PM-10:00PM 10:00PM-02:00AM 02:00AM-06: OOAMParameter S02 N02 S02 N02 S02 N02 S02 N02 S02 N02 S02 N02Hourly Flow Rate(lpm) .5 .5 .5 .5 .5 .5 .5 .5 .5 .5 .5 .5
+-.5 .5 .5 .5 .5 .5 .5 .5 .5 .5 .5 .5.5 .5 Power Cut .5 .5 .5 .5 .5 .5 .5 .5.5 .5 .5 .5 .4 .4 .4 .4 .4 .4 .5 .5-- ~-- -_._-----_.Average Flow Rate (Ipm) .5 .5 .5 .5 .475 .475 .475 .475 .475 .475 .5 .5--
Total Operation Time (Minutes) 240 240 180 180 240 240 240 240 240 240 240 240Initial Volume of Sample (ml) 20 20 20 20 20 20 20 20 20 20 20 20Final Volume of Sample (ml) 20 20 20 20 20 20 20 20 20 20 20 20--.-
Volume Taken For Analysis (ml) 10 10 10 10 10 10 10 10 10 10 10 10Total Volume of Air Sampled (lit) 120 120 90 90 114 114 114 114 114 114 120 120-~
Absorbance (Blank) 00 00 00 00 00 00 00 00 00 00 00 00[Absorbance (Sample) _ 0.028 0.040 0.022 0.033 0.026 0.035 0.025 0.037 0.026 0.036 0.028 0.037Concentration (J..lg/m3) 14.64 38.09 15.34 41.90 14.31 35.09 13.76 37.09 14.31 36.09 14.64 35.2324 Hourly Average S02 (J..lg/m3) : 14.50 24 Hourly Average N02 (J..lg/m3) : 37.24Remarks: Valueof Sox & Noxwere found within the prescribed limit.Name & Signature of Official on
/r'. c;,crR -
5'Nyp1Duty:
(U.K. Das)L.A.
/~(Regional Officer)
Dhanbad.(Board Analyst)
Ranchi283
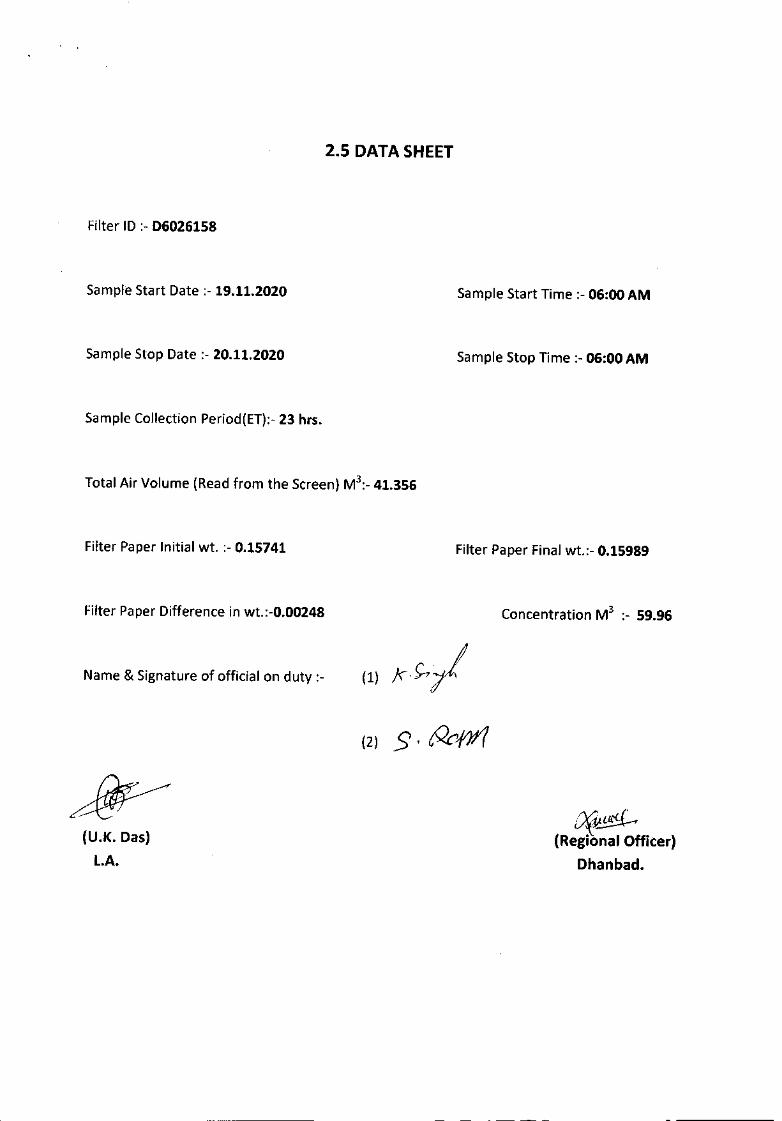
2.5 DATA SHEET
Filter ID :- 06026158
Sample Start Date :- 19.11.2020 Sample Start Time :- 06:00 AM
Sample Stop Date :- 20.11.2020 Sample Stop Time :- 06:00 AM
Sample Collection Period(ET):- 23 hrs.
Total Air Volume (Read from the Screen) M3:_ 41.356
Filter Paper Initial wt. :- 0.15741 Filter Paper Final wt.:- 0.15989
Filter Paper Difference in wt.:-0.00248 Concentration M3 :- 59.96
Name & Signature of official on duty :- (1) k c;,/(2) s cQcm
(U.K.Oas)LA.
/~~(Regional Officer)
Dhanbad.
284
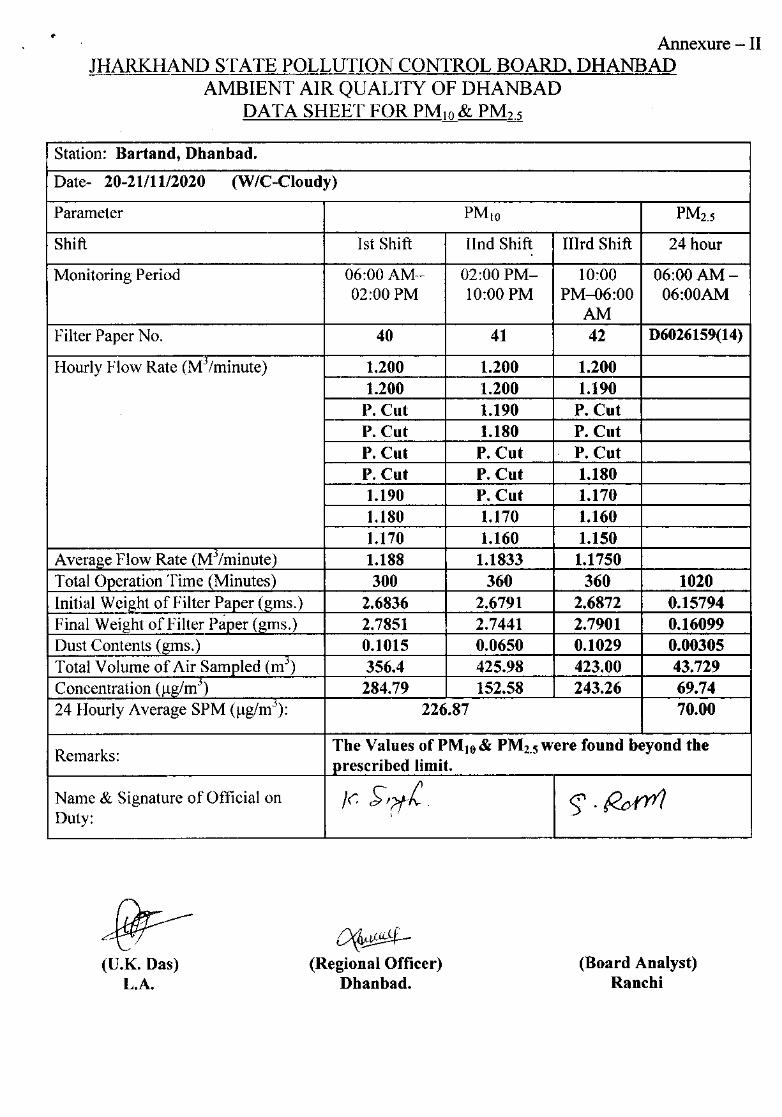
Annexure - IIJHARKHAND STATE POLLUTION CONTROL BOARD, DHANBAD
AMBIENT AIR QUALITY OF DHANBADDATA SHEET FOR PMlO & PM2.5
Station: Bartand, Dhanbad.
Date- 20-2111112020 (W/C-Cloudy)
Parameter PM to PM2.5
Shift Ist Shift IInd Shift IIIrd Shift 24 hour
Monitoring Period 06:00 AM-- 02:00 PM- 10:00 06:00 AM-02:00 PM 10:00 PM PM-06:00 06:00AM
AMFilter Paper No. 40 41 42 D6026159(14)
Hourly Flow Rate (MJ Iminute) 1.200 1.200 1.2001.200 1.200 1.190P. Cut 1.190 P. CutP. Cut 1.180 P. CutP. Cut P. Cut P. CutP. Cut P. Cut 1.1801.190 P. Cut 1.1701.180 1.170 1.1601.170 1.160 1.150
Average Flow Rate (M'zminute) 1.188 1.1833 1.1750Total Operation Time (Minutes) 300 360 360 1020Initial Weight of Filter Paper (gms.) 2.6836 2.6791 2.6872 0.15794Final Weight of Filter Paper (gms.) 2.7851 2.7441 2.7901 0.16099Dust Contents (gms.) 0.1015 0.0650 0.1029 0.00305Total Volume of Air Sampled (m') 356.4 425.98 423.00 43.729Concentration (ug/rrr') 284.79 152.58 243.26 69.7424 Hourly Average SPM (ug/m '): 226.87 70.00
Remarks:The Values ofPMIO& PM2.Swere found beyond theprescribed limit.
Name & Signature of Official on Ie [;'?tt-, ).f2on11Duty: \
(U.K.Das)L.A.
~~(Regional Officer)
Dhanbad.(Board Analyst)
Ranchi
285
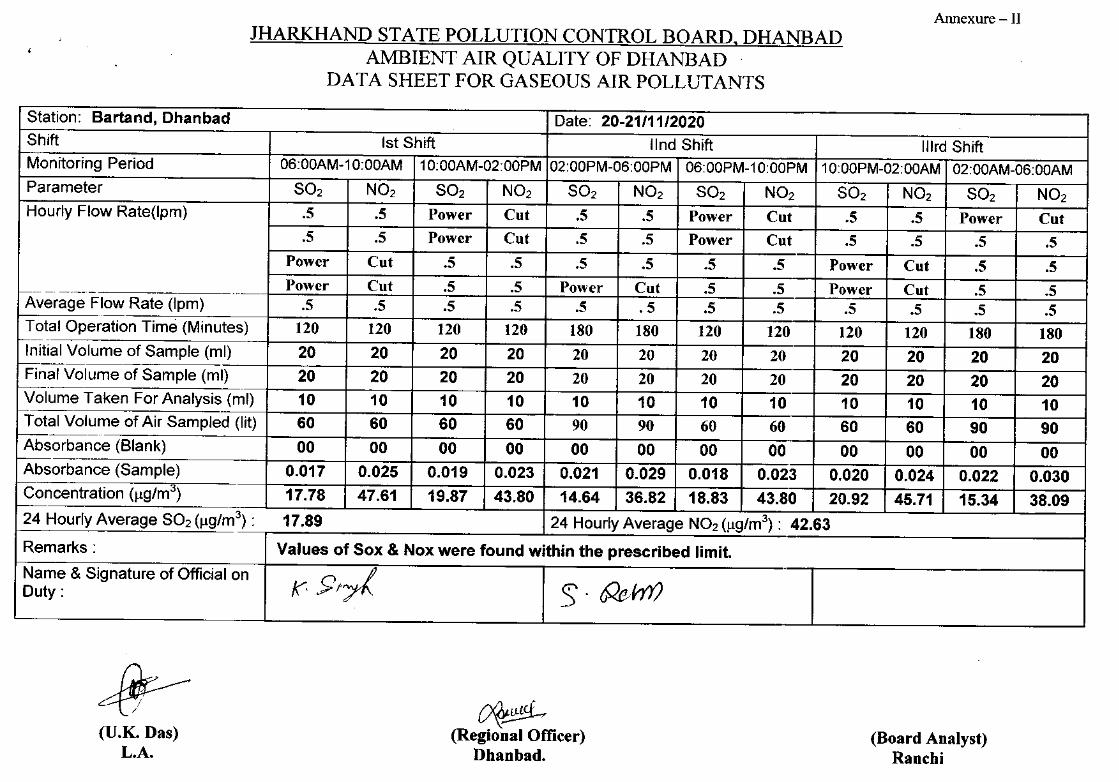
Annexure - IIJHARKHAND STATE POLLUTION CONTROL BOARD, DHANBAD
AMBIENT AIR QUALITY OF DHANBADDATA SHEET FOR GASEOUS AIR POLLUTANTS
Station: Bartand, Dhanbad Date: 20-21/11/2020Shift 1stShift lind Shift IIlrd ShiftMonitoring Period 06:00AM-10:00AM 10:00AM-02:00PM 02:00PM-06:00PM 06:00PM-10:00PM 10:00PM-02:00AM 02:00AM-06:00AMParameter S02 N02 S02 N02 S02 N02 S02 N02 S02 N02 S02 N02Hourly Flow Rate(lpm) .5 .5 Power Cut .5 .5 Power Cut .5 .5 Power Cut
.5 .5 Power Cut .5 .5 Power Cut .5 .5 .5 .5Power Cut .5 .5 .5 .5 .5 .5 Power Cut .5 .5Power Cut .5 .5 Power Cut .5 .5 Power Cut .5 .5------ -- -.-~--
Average Flow Rate (Ipm) .5 .5 .5 .5 .5 .5 .5 .5 .5 .5 .5 .5Total Operation Time (Minutes) 120 120 120 120 180 180 120 120 120 120 180 180----
Initial Volume of Sample (ml) 20 20 20 20 20 20 20 20 20 20 20 20~-
20 20 20Final Volume of Sample (ml) 20 20 20 20 20 20 20 20 20t-----Volume Taken For Analysis (ml) 10 10 10 10 10 10 10 10 10 10 10 10Total Volume of Air Sampled (lit) 60 60 60 60 90 90 60 60 60 60 90 90t------~- ..
Absorbance (Blank) 00 00 00 00 00 00 00 00 00 00 00 00t-------
Absorbance (Sample) 0.017 0.025 0.019 0.023 0.021 0.029 0.018 0.023 0.020 0.024 0.022 0.030Concentration (j.lg/m3) 17.78 47.61 19.87 43.80 14.64 36.82 18.83 43.80 20.92 45.71 15.34 38.0924 Hourly Average S02 (j.lg/m3): 17.89 24 Hourly Average N02 (j.lg/m3): 42.63Remarks: Values of Sox & Noxwere found within the prescribed limit.Name & Signature of Official on
K->t~ S. 62e/Vr1)Duty:
(U.K. Das)L.A.
~(Regional Officer)
Dhanbad.(Board Analyst)
Ranchi286
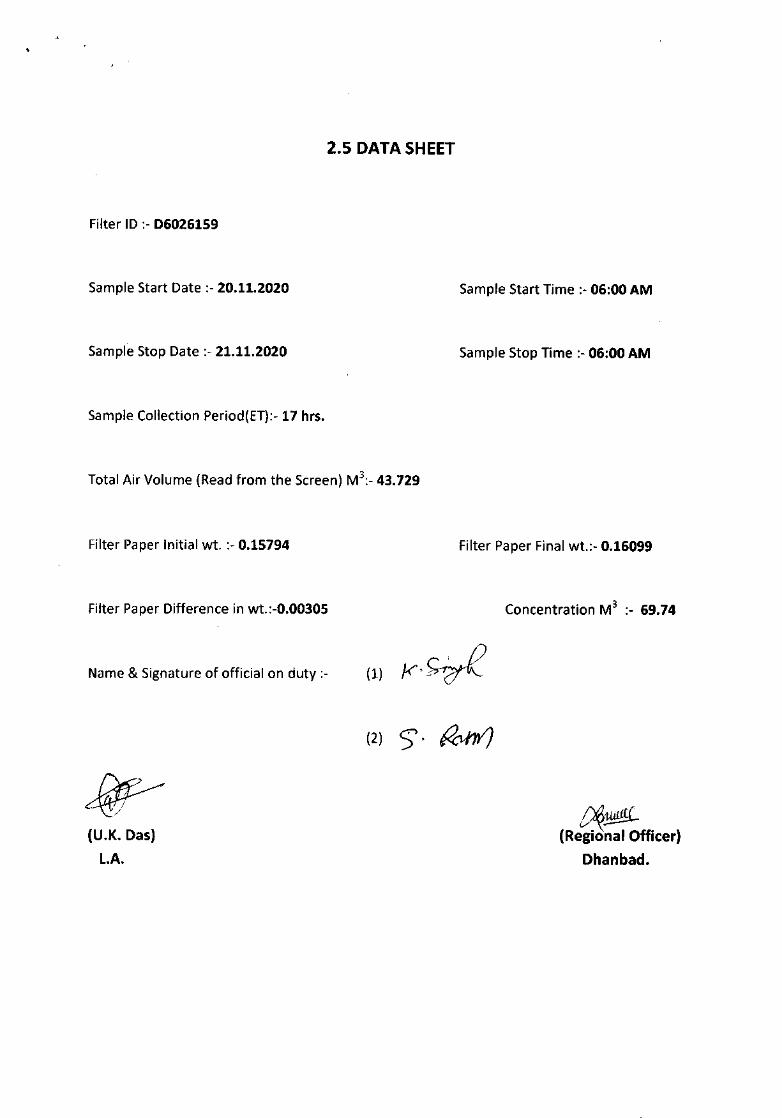
2.5 DATA SHEET
Filter ID :- 06026159
Sample Start Date :- 20.11.2020 Sample Start Time :- 06:00 AM
Sample Stop Date :- 21.11.2020 Sample Stop Time :- 06:00 AM
Sample Collection Period(ET):- 17 hrs.
Total Air Volume (Read from the Screen) M3:_ 43.729
Filter Paper Initial wt. :- 0.15794 Filter Paper Final wt.:- 0.16099
Filter Paper Difference in wt.:-0.00305 Concentration M3 :- 69.74
Name & Signature of official on duty :- (1)
(2) ~. f?o;rY)
(U.K. Das)L.A.
~~(Regional Officer)
Dhanbad.
--- ------------------
287
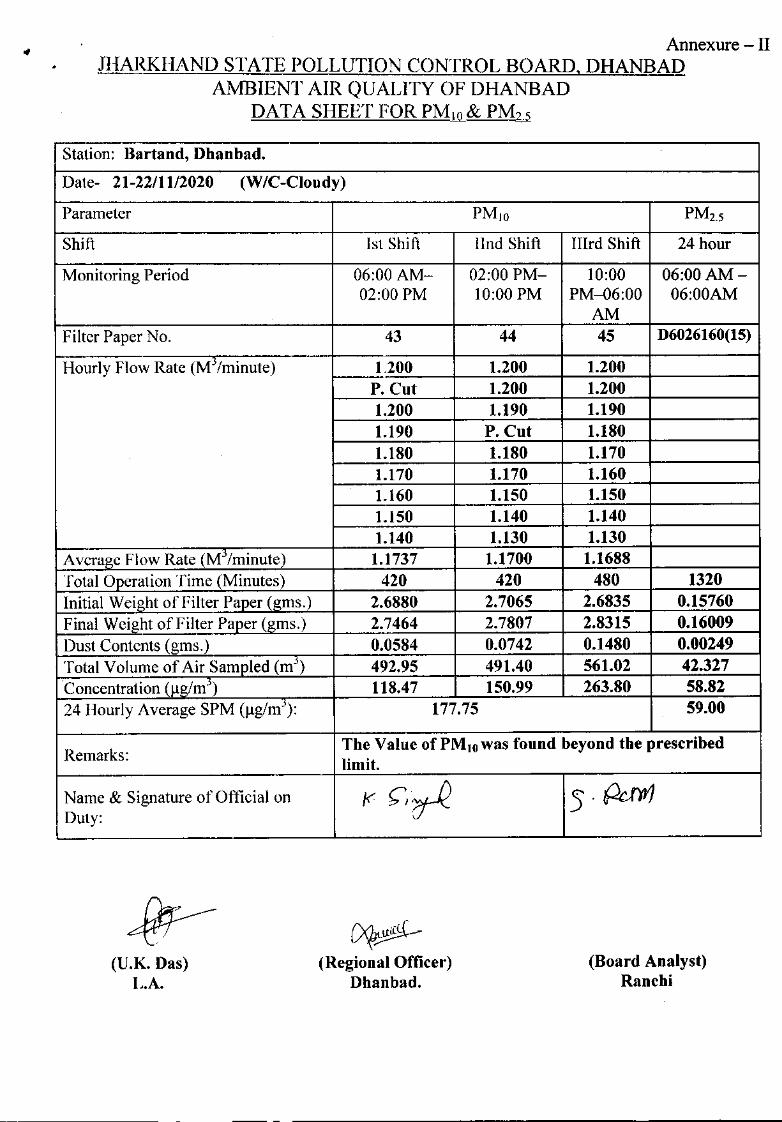
Annexure - IIJHARKHAND STATE POLLUTION CONTROLBOARD, DHANBAD
AMBIENT AIR QUALITYOF DHANBADDATA SHEET FOR PM10 & PM2.5
Station: Bartand, Dhanbad.
Date- 21,.22/1112020 (WIC-Cloudy)
Parameter PMIO PM2.5
Shift Ist Shift llnd Shift IIIrd Shift 24 hour
Monitoring Period 06:00 AM- 02:00 PM- 10:00 06:00 AM-02:00 PM 10:00 PM PM-06:00 06:00AM
AMFilter Paper No. 43 44 45 D6026160(15)
Hourly Flow Rate (M3 Iminute) 1.200 1.200 1.200P. Cut 1.200 1.2001.200 1.190 1.1901.190 P. Cut 1.1801.180 1.180 1.1701.170 1.170 1.1601.160 1.150 1.1501.150 1.140 1.1401.140 1.130 1.130
Average Flow Rate (MJ Iminute) 1.1737 1.1700 1.1688Total Operation Time (Minutes) 420 420 480 1320Initial Weight of Filter Paper (gms.) 2.6880 2.7065 2.6835 0.15760Final Weight of Filter Paper (gms.) 2.7464 2.7807 2.8315 0.16009Dust Contents (gms.) 0.0584 0.0742 0.1480 0.00249Total Volume of Air Sampled (m') 492.95 491.40 561.02 42.327Concentration (ug/rrr') 118.47 150.99 263.80 58.8224 Hourly Average SPM (ug/rrr'): 177.75 59.00
Remarks:The Value of PM lOW as found beyond the prescribedlimit.
Name & Signature of Official on r: ~J'~ S·PcMDuty:
Cxf~(Regional Officer)
Dhanbad.(Board Analyst)
Ranchi(U.K. Das)
L.A.
288
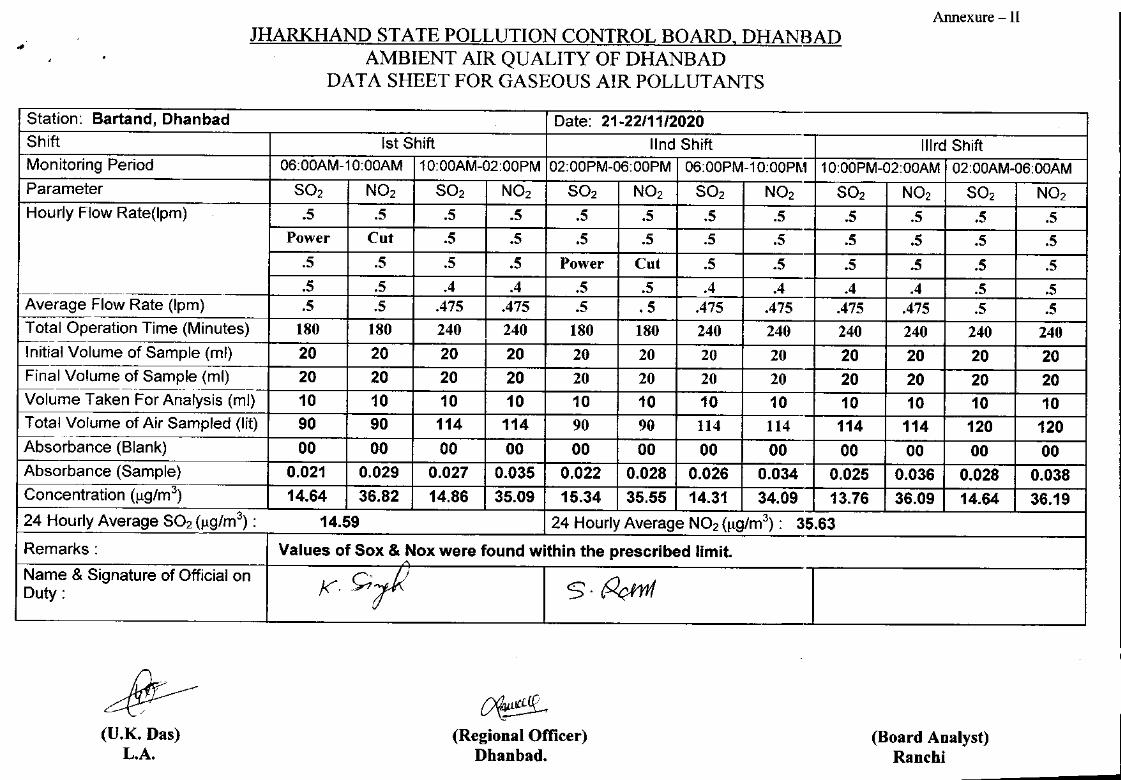
Annexure - IIJHARKHAND STATE POLLUTION CONTROL BOARD, DHANBAD
AMBIENT AIR QUALITY OF DHANBADDATA SHEET FOR GASEOUS AIR POLLUTANTS
..Station: Bartand, Dhanbad Date: 21-22/11/2020Shift 1stShift lind Shift Ilird ShiftMonitoring Period 06:00AM-10:00AM 10:00AM-02:00PM 02:00PM-06:00PM 06:00PM-10:00PM 10:00PM-02:00AM 02:00AM-06: OOAMParameter S02 N02 S02 N02 S02 N02 S02 N02 S02 N02 S02 N02Hourly Flow Rate(lpm) .5 .5 .5 .5 .5 .5 .5 .5 .5 .5 .5 .5
Power Cut .5 .5 .5 .5 .5 .5 .5 .5 .5 .5.5 .5 .5 .5 Power Cut .5 .5 .5 .5 .5 .5.5 .5 .4 .4 .5 .5 .4 .4 .4 .4 .5 .5-.-~---------.---- ..-----
Average Flow Rate (Ipm) .5 .5 .475 .475 .5 .5 .475 .475 .475 .475 .5 .5f----Total Operation Time (Minutes) 180 180 240 240 180 180 240 240 240 240 240 240'------
Initial Volume of Sample (ml) 20 20 20 20 20 20 20 20 20 20 20 20--.-~--
Final Volume of Sample (ml) 20 20 20 20 20 20 20 20 20 20 20 20-.
Volume Taken For Analysis (ml) 10 10 10 10 10 10 10 10 10 10 10 10Total Volume of Air Sampled (lit) 90 90 114 114 90 90 114 114 114 114 120 120f--- ._ -Absorbance (Blank) 00 00 00 00 00 00 00 00 00 00 00 00Absorbance (Sample) 0.021 0.029 0.027 0.035 0.022 0.028 0.026 0.034 0.025 0.036 0.028 0.038Concentration (llg/m3) 14.64 36.82 14.86 35.09 15.34 35.55 14.31 34.09 13.76 36.09 14.64 36.1924 Hourly Average S02 (1l9/m3) : 14.59 24 Hourly Average N02 (1l9/m3) : 35.63-Remarks: Values of Sox & Noxwere found within the prescribed limit.
A
Name & Signature of Official on rC;;1/ S·~Duty:
~(Regional Officer)
Dhanbad.(Board Analyst)
Ranchi(U.K. Das)
L.A. 289
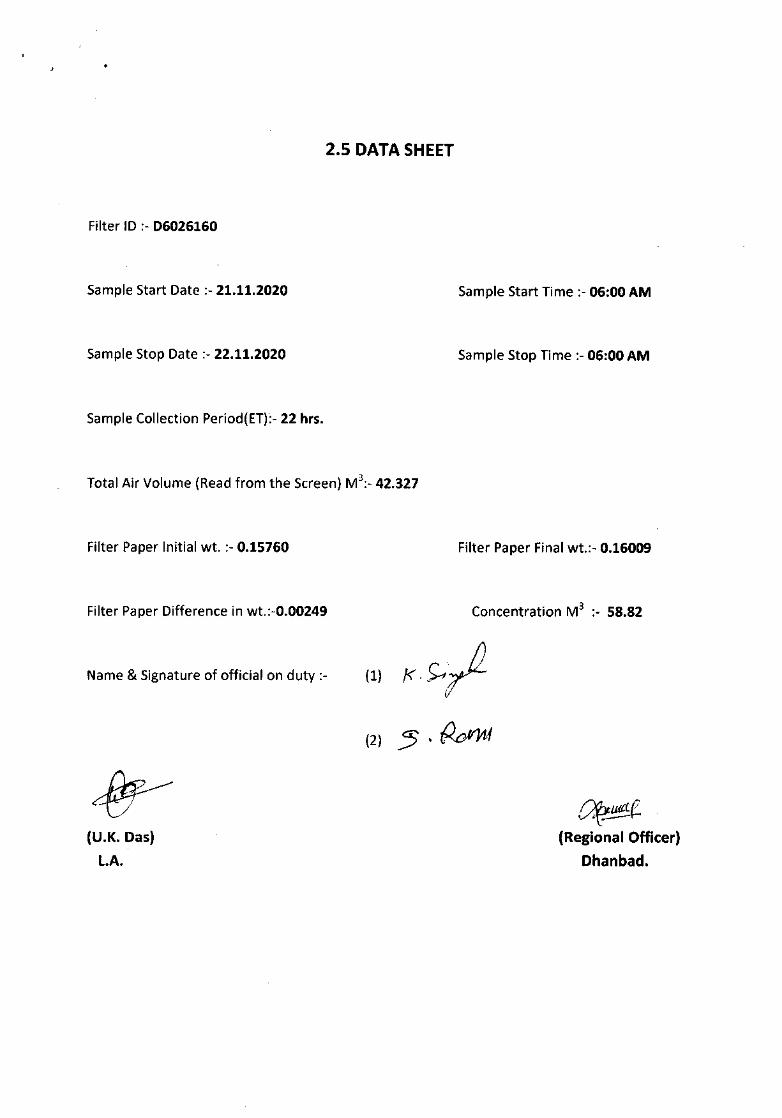
2.5 DATA SHEET
Filter ID :- 06026160
Sample Start Date :- 21.11.2020 Sample Start Time :- 06:00 AM
Sample Stop Date :- 22.11.2020 Sample Stop Time :- 06:00 AM
Sample Collection Period{ET):- 22 hrs.
Total Air Volume {Read from the Screen} M3:_ 42.327
Filter Paper Initial wt. :- 0.15760 Filter Paper Final wt.:- 0.16009
Filter Paper Difference in wt.:-0.00249 Concentration M3 :- 58.82
Name & Signature of official on duty :- {l}
{2}5'~
¥t(Regional Officer)
Dhanbad.(U.K. Das)L.A.
290
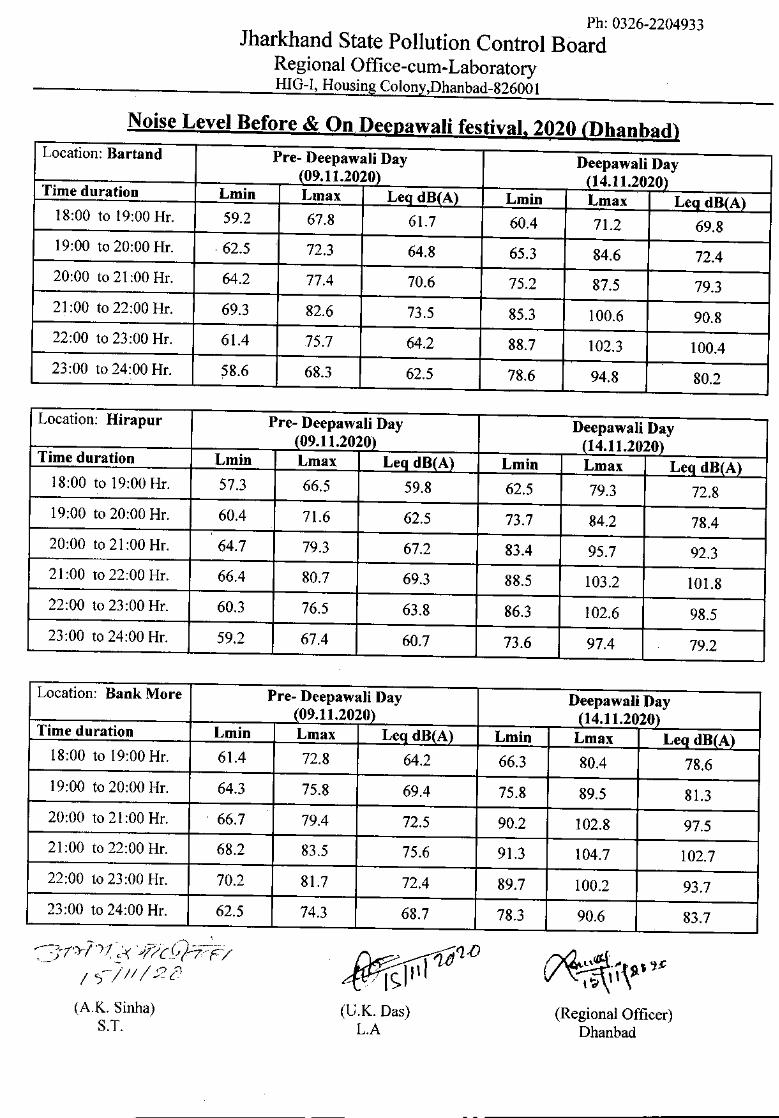
Ph: 0326-2204933Jharkhand State Pollution Control Board
RegionaIOffice-cum-LaboratoryHIG-I, Housing Colony,Dhanbad-826001
Location: Bartand Pre- Deepawali Day Deepawali Day(09.11.2020) 114.11.2020JTime duration Lmin Lmax Leq dB(A) Lmin Lmax L~dB(A)
18:00 to 19:00 Hr. 59.2 67.8 61.7 60.4 71.2 69.819:00 to 20:00 Hr. ,62.5 72.3 64.8 65.3 84.6 72.420:00 to 21 :00 Hr. 64.2 77.4 70.6 75.2 87.5 79.321:00 to 22:00 Hr. 69.3 82.6 73.5 85.3 100.6 90.822:00 to 23:00 Hr. 61.4 75.7 64.2 88.7 102.3 100.423:00 to 24:00 Hr. 58.6 68.3 62.5 78.6 94.8 80.2
Noise Level Before & On Deepawali festival, 2020 (Dhanbad)
Location: Hirapur Pre- Deepawali Day Deepawali Day(09.11.2020) (14.11.2020)
Time duration Lmin Lmax L~dB1Al Lmin Lmax L~dB1Al18:00 to 19:00 Hr. 57.3 66.5 59.8 62.5 79.3 72.819:00 to 20:00 Hr. 60.4 71.6 62.5 73.7 84.2 78.420:00 to 21 :00 Hr. 64.7 79.3 67.2 83.4 95.7 92.321 :00 to 22:00 Hr. 66.4 80.7 69.3 88.5 103.2 101.822:00 to 23:00 Hr. 60.3 76.5 63.8 86.3 102.6 98.523:00 to 24:00 Hr. 59.2 67.4 60.7 73.6 97.4 79.2
Location: Bank More Pre- Deepawali Day Deepawali Day(09.11.2020) (14.11.2020)
Time duration Lmin Lmax Leq dB(Al Lmin Lmax Leq dB_(_Al18:00 to 19:00 Hr. 61.4 72.8 64.2 66.3 80.4 78.619:00 to 20:00 Hr. 64.3 75.8 69.4 75.8 89.5 81.320:00 to 21:00 Hr. 66.7 79.4 72.5 90.2 102.8 97.521 :00 to 22:00 Hr. 68.2 83.5 75.6 91.3 104.7 102.722:00 to 23:00 Hr. 70.2 81.7 72.4 89.7 100.2 93.723:00 to 24:00 Hr. 62.5 74.3 68.7 78.3 90.6 83.7
(A.K. Sinha)S.T.
(u.K. Das)L.A
(Regional Officer)Dhanbad
291
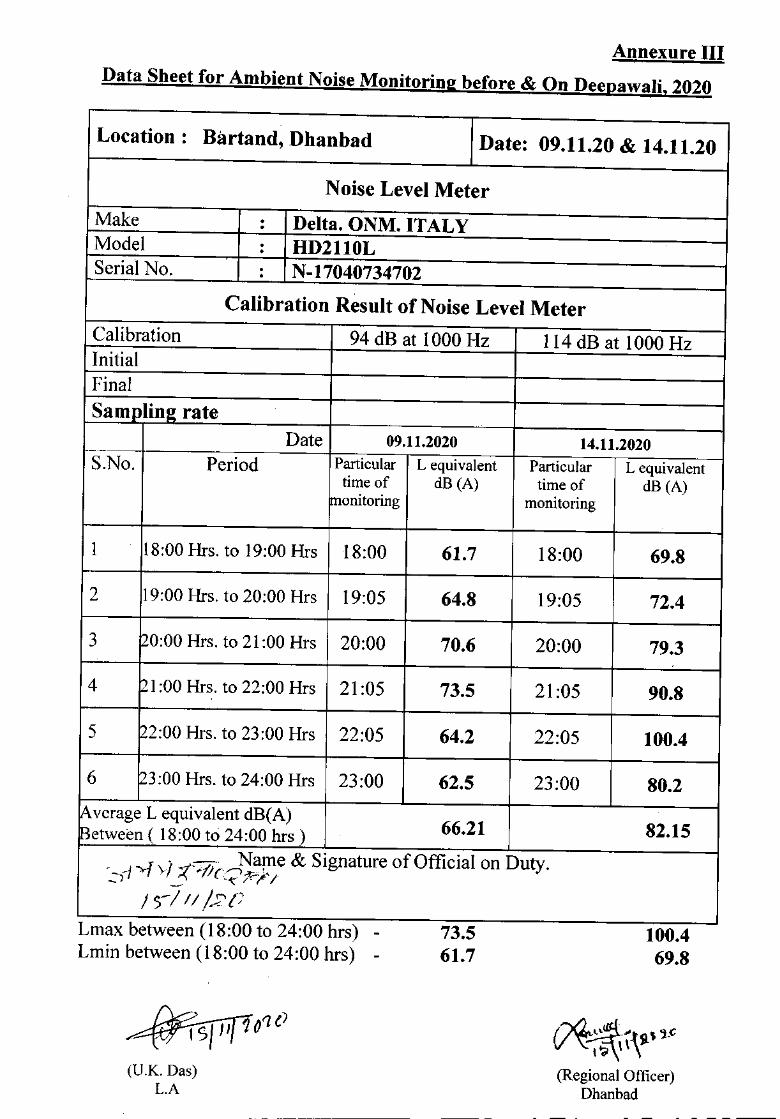
Annexure IIIData Sheet for Ambient Noise Monitoring before & On Deepawali, 2020
Location: Bartand, Dhanbad Date: 09.11.20 & 14.11.20
Noise Level MeterMake · Delta. ONM. ITALY·Model · HD2110L·Serial No. · N-17040734702·
Calibration Result of Noise Level MeterCalibration 94 dB at 1000 Hz 114 dB at 1000 HzInitialFinalSamplin_g rate
Date 09.11.2020 14.11.2020_.
S.No. Period Particular L equivalent Particular L equivalenttime of dB (A) time of dB (A)
monitoring monitoring
1 18:00Hrs.to 19:00Hrs 18:00 61.7 18:00 69.8
2 19:00Hrs. to 20:00 Hrs 19:05 64.8 19:05 72.4
3 ~O:OO Hrs. to 21:00 Hrs 20:00 70.6 20:00 79.3
4 ~1:00 Hrs. to 22:00 Hrs 21:05 73.5 21:05 90.8
5 ~2:00 Hrs. to 23:00 Hrs 22:05 64.2 22:05 100.4
6 ~3:00Hrs. to 24:00 Hrs 23:00 62.5 23:00 80.2Average L equivalent dB(A)
66.21 82.15Between ( 18:00 to 24:00 hrs )- . ..,.;f j ;()~'. Name & Signature of Official on Duty ..::,)1 ~ ~ '/( (~1<7'/'!5-/ II l~nl7
Lmax between (18:00 to 24:00 hrs) -Lmin between (18:00 to 24:00 hrs) -
73.561.7
100.469.8
(U.K. Das)L.A
~~i'~"C(Regional Officer)
Dhanbad292
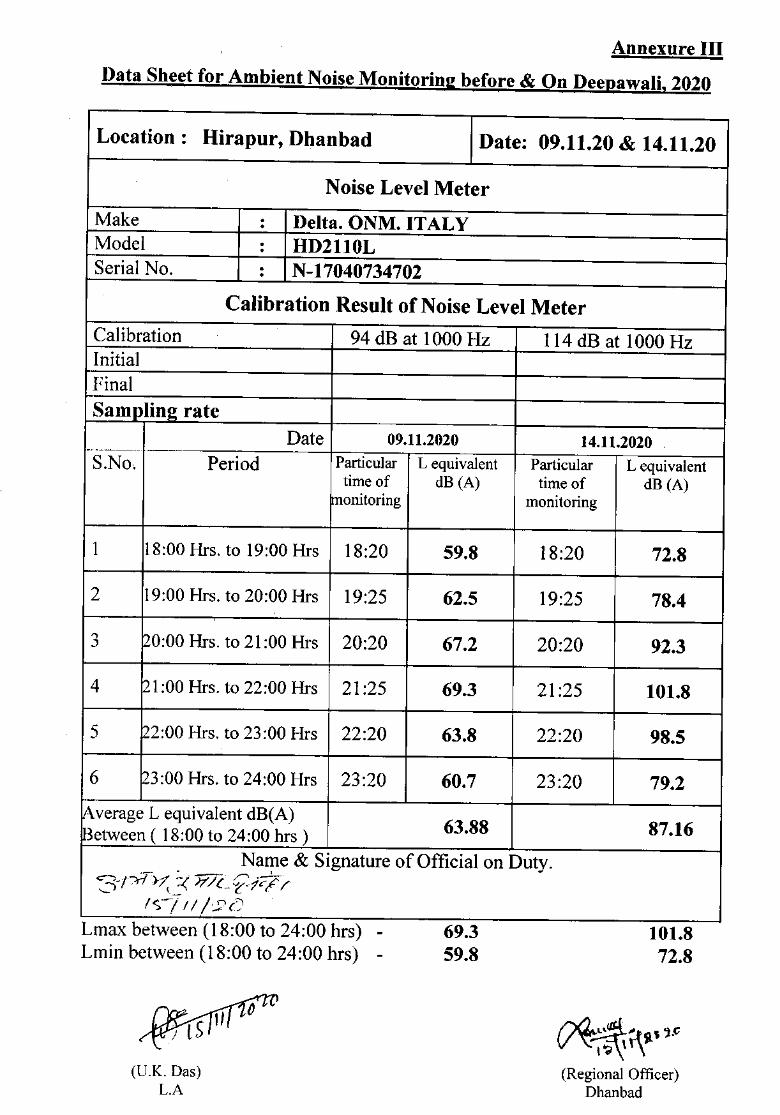
Annexure IIIData Sheet for Ambient Noise Monitoring before & On Deepawali, 2020
Location: Hirapur, Dhanbad Date: 09.11.20 & 14.11.20
Noise Level MeterMake · Delta. ONM. ITALY·Model · HD2110L·Serial No. · N-17040734702·
Calibration Result of Noise Level MeterCalibration 94 dB at 1000Hz 114 dB at 1000HzInitialFinalSampling rate
Date 09.11.2020 14.11.2020_ ...,-----_._.S.No. Period Particular L equivalent Particular L equivalent
time of dB (A) time of dB (A)monitoring monitoring
1 18:00 Hrs. to 19:00 Hrs 18:20 59.8 18:20 72.8
2 19:00 Hrs. to 20:00 Hrs 19:25 62.5 19:25 78.4
3 ~O:OOHrs. to 21 :00 Hrs 20:20 67.2 20:20 92.3
4 ~1:00 Hrs. to 22:00 Hrs 21:25 69.3 21:25 101.8
5 ~2:00 Hrs. to 23:00 Hrs 22:20 63.8 22:20 98.5
6 ~3:00 Hrs. to 24:00 Hrs 23:20 60.7 23:20 79.2V\verageL equivalent dB(A)
63.88 87.163etween( 18:00 to 24:00 hrs )Name & Signature of Official on Duty.
,~ - ,,' _._ ...,. ~ - __...!..-_-3-151};:~-<)//c'~'lc~ /'Is·-/ I / l-"l) (J
Lmax between (18:00 to 24:00 hrs) -Lmin between (18:00 to 24:00 hrs) -
69.359.8
101.872.8
(~~"'~Sl' j_t>V~,~" \(Regional Officer)
Dhanbad(U.K. Das)
L.A 293
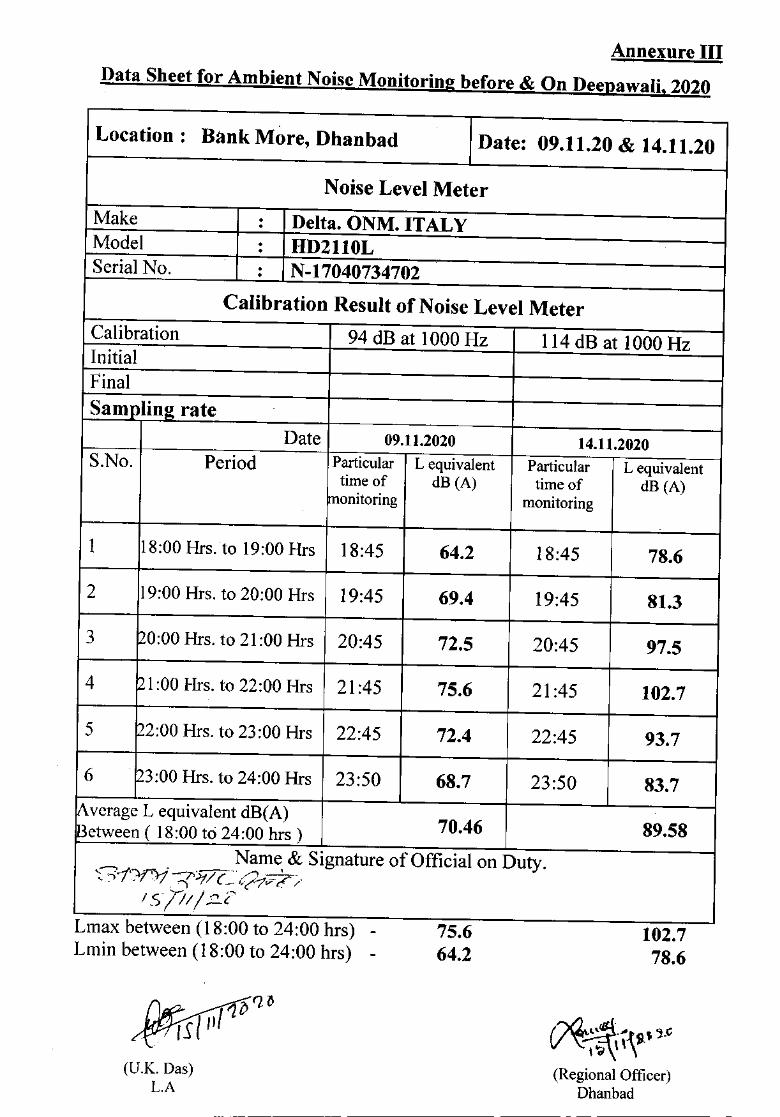
Annexure IIIData Sheet for Ambient Noise Monitoring before & On DeepawaIi, 2020
Location: Bank More, Dhanbad Date: 09.11.20 & 14.11.20
Noise Level MeterMake · Delta. ONM. ITALY·Model · HD2110L·Serial No. · N-17040734702·
Calibration Result of Noise Level MeterCalibration 94 dB at 1000 Hz 114 dB at 1000 HzInitialFinalSampling rate
Date 09.11.2020 14.11.2020r----L equivalent Particular L equivalentS.No. Period Particular
time of dB (A) time of dB (A)monitoring monitoring
1 18:00 Hrs. to 19:00 Hrs 18:45 64.2 18:45 78.6
2 19:00 Hrs. to 20:00 Hrs 19:45 69.4 19:45 81.3
3 ~O:OO Hrs. to 21 :00 Hrs 20:45 72.5 20:45 97.5
4 ~1:00 Hrs. to 22:00 Hrs 21:45 75.6 21:45 102.7
5 ~2:00 Hrs. to 23 :00 Hrs 22:45 72.4 22:45 93.7
6 ~3:00 Hrs. to 24:00 Hrs 23:50 68.7 23:50 83.7IAverage L equivalent dB(A)
70.46 89.58lBetween ( 18:00 to 24:00 hrs )Name & Signature of Official on Duty.'~i'~f'}j ~'y-- /...,~ ......"') - . . CJ .)t, (_ 1;~'1V ,f /
I5/'71/ ;2_(~Lmax between (18:00 to 24:00 hrs) -Lmin between (18:00 to 24:00 hrs) -
75.664.2
102.778.6
~~\~~'-<(Regional Officer)
Dhanbad
(U.K. Das)L.A 294
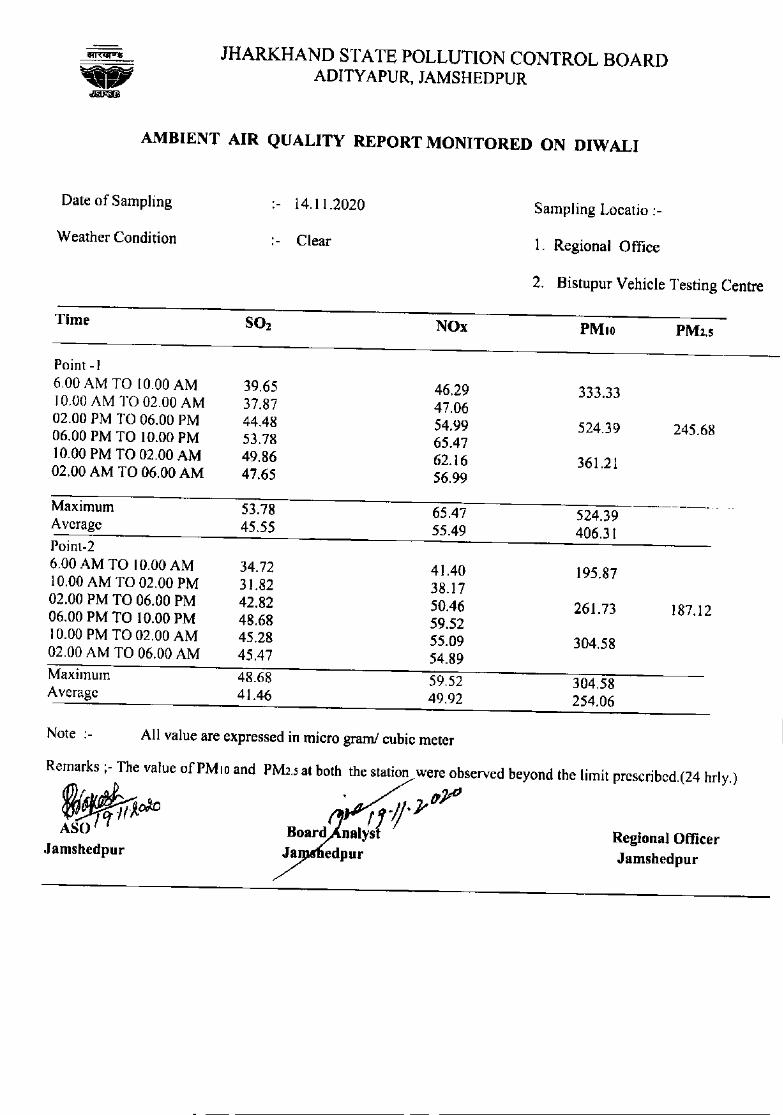
295
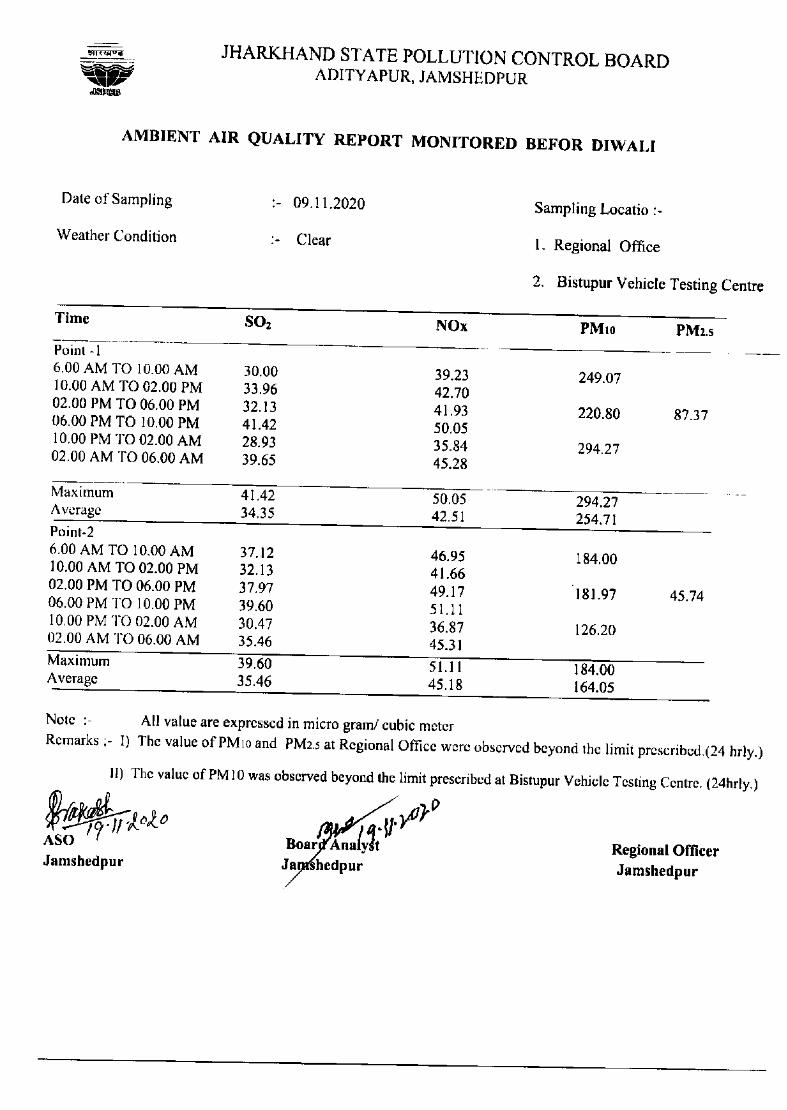
296
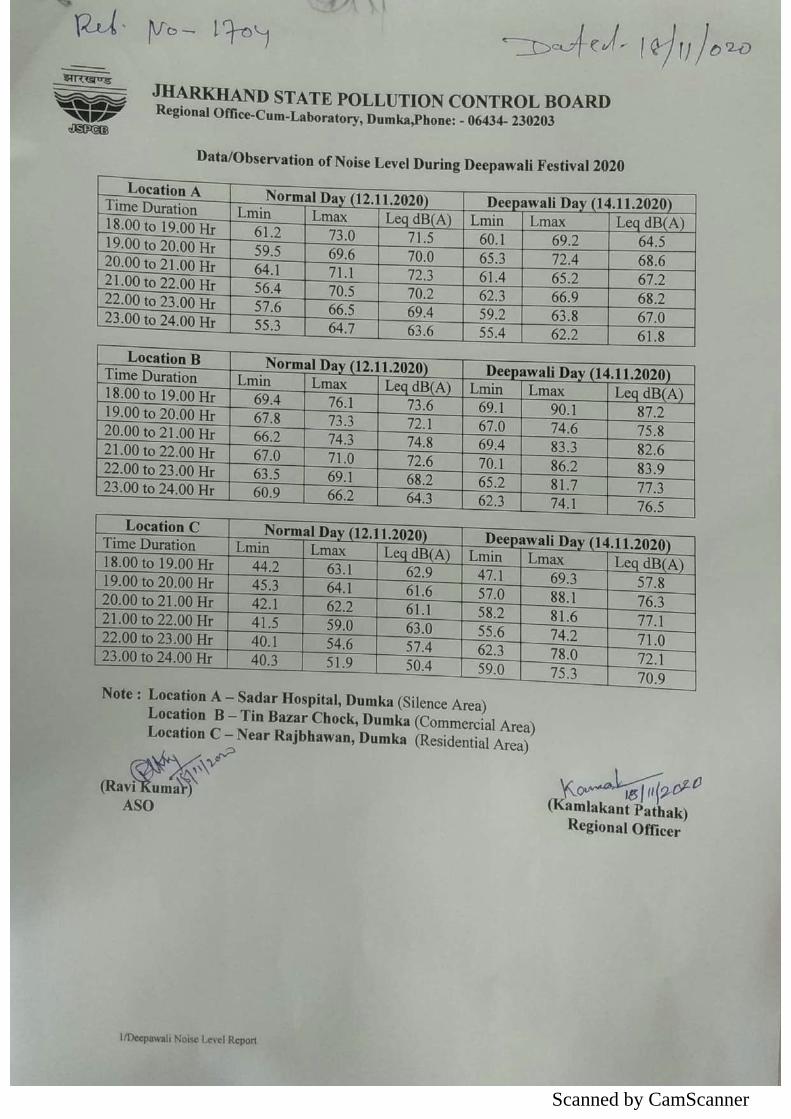
Scanned by CamScanner297
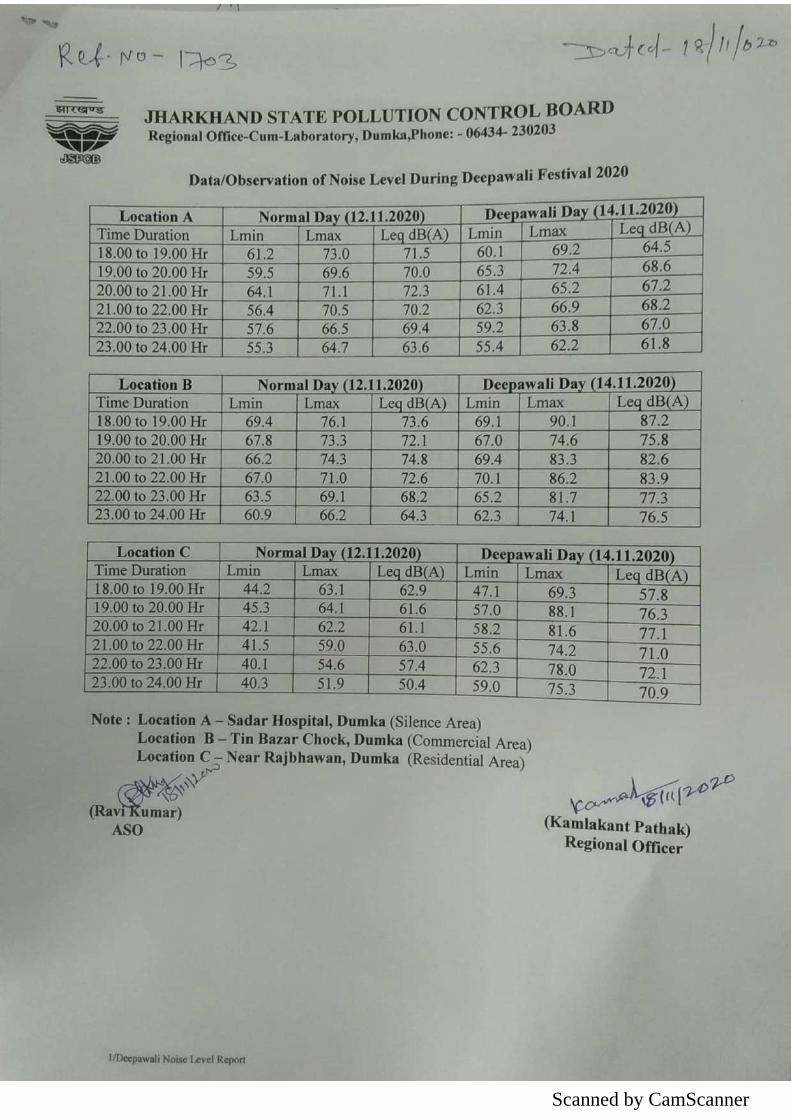
Scanned by CamScanner298
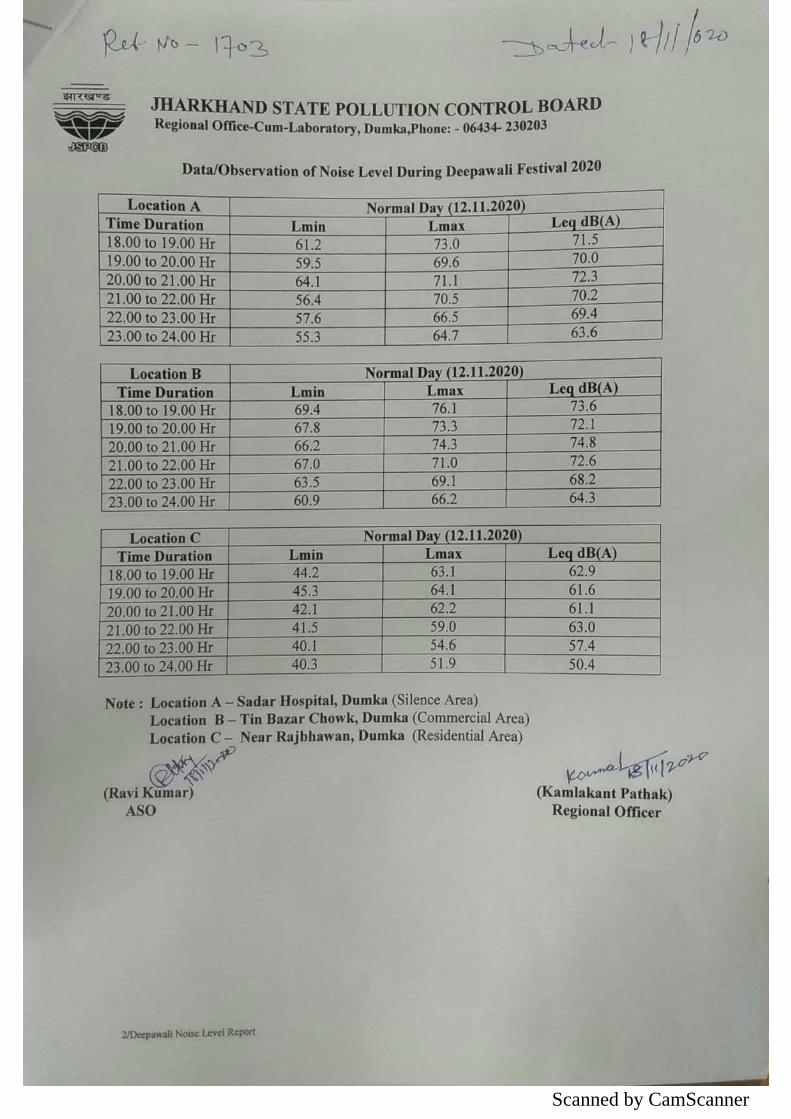
Scanned by CamScanner299
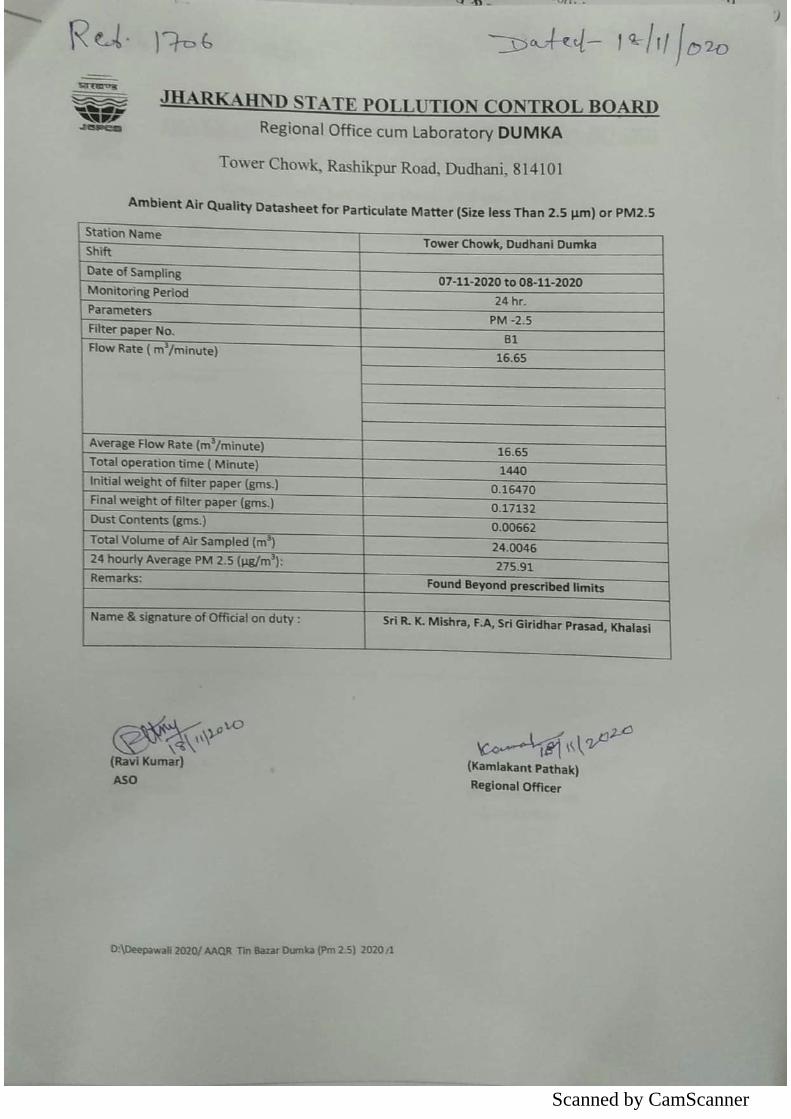
Scanned by CamScanner300
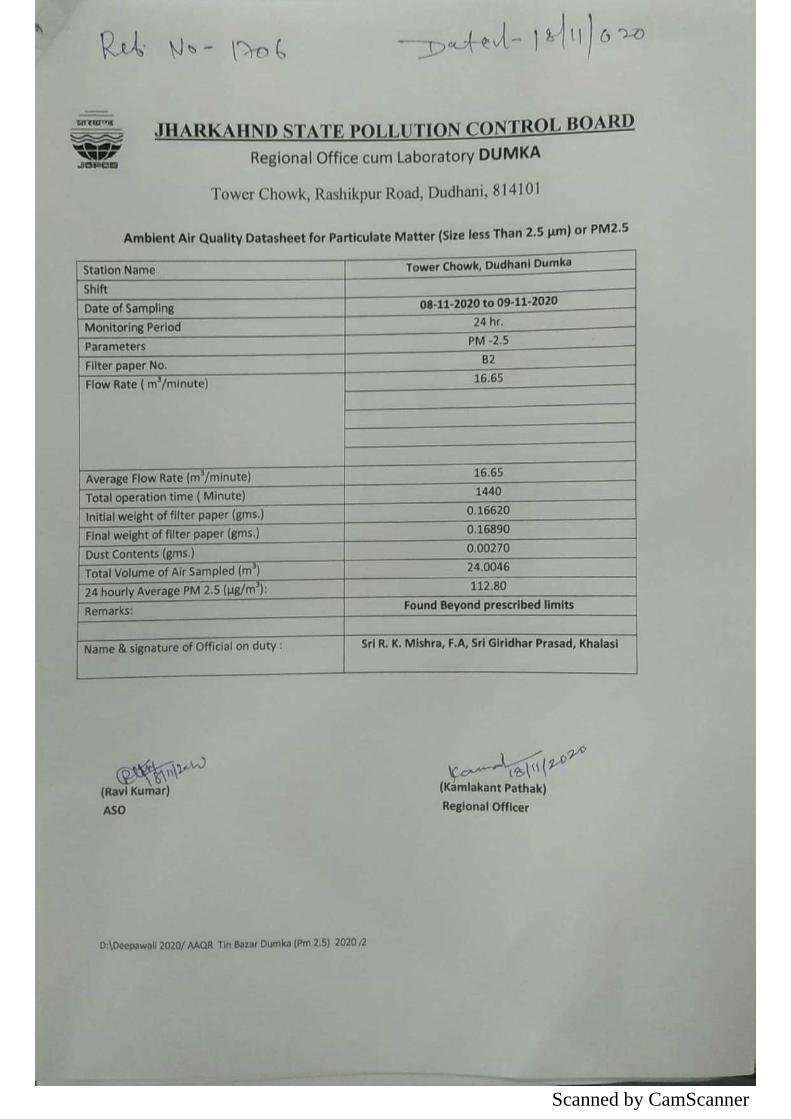
Scanned by CamScanner301
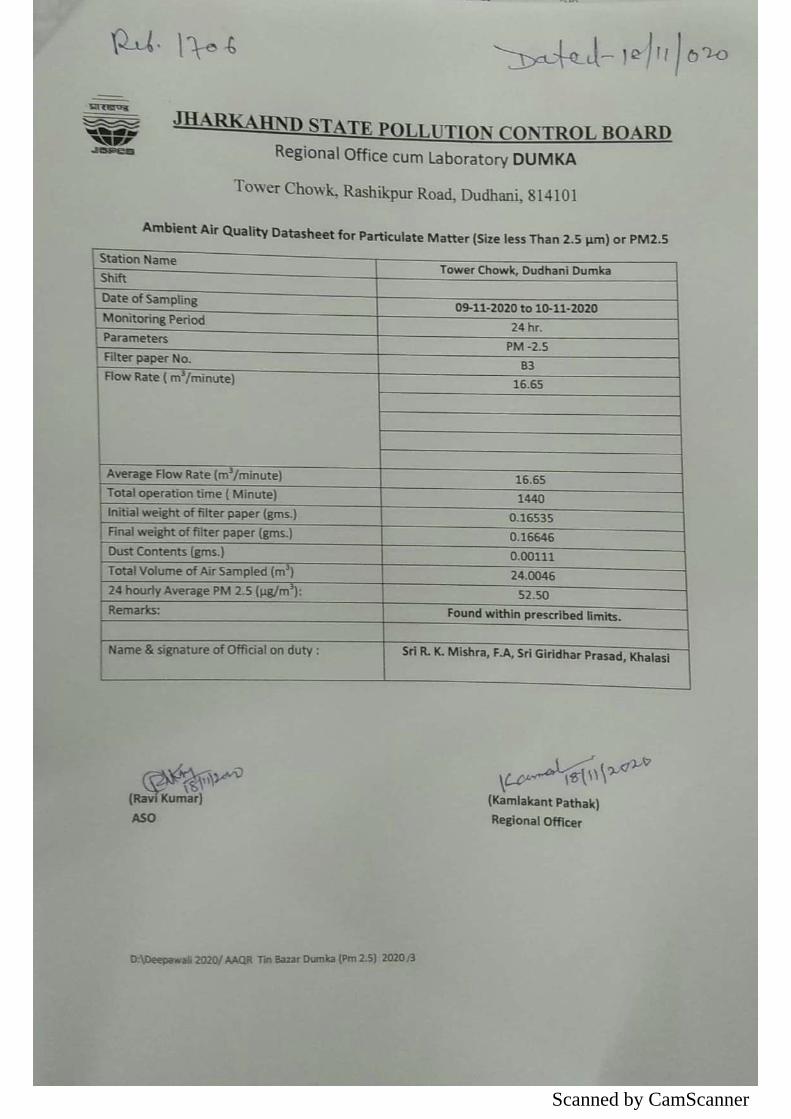
Scanned by CamScanner302
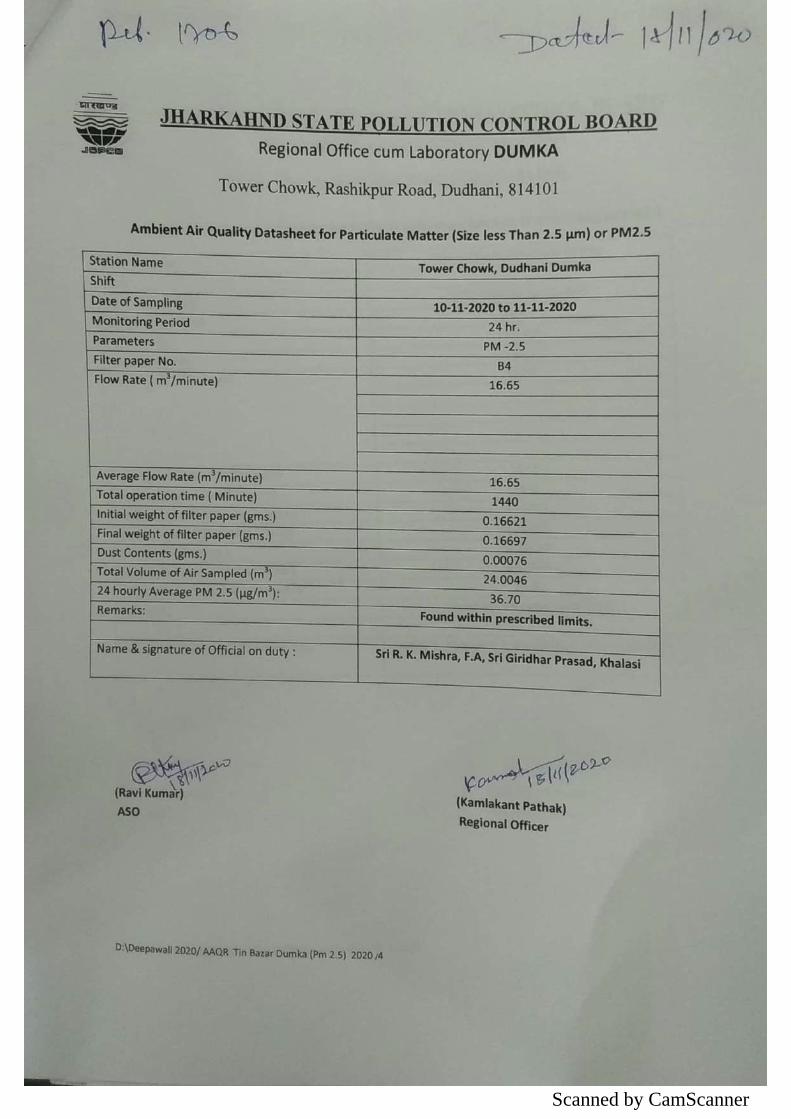
Scanned by CamScanner303
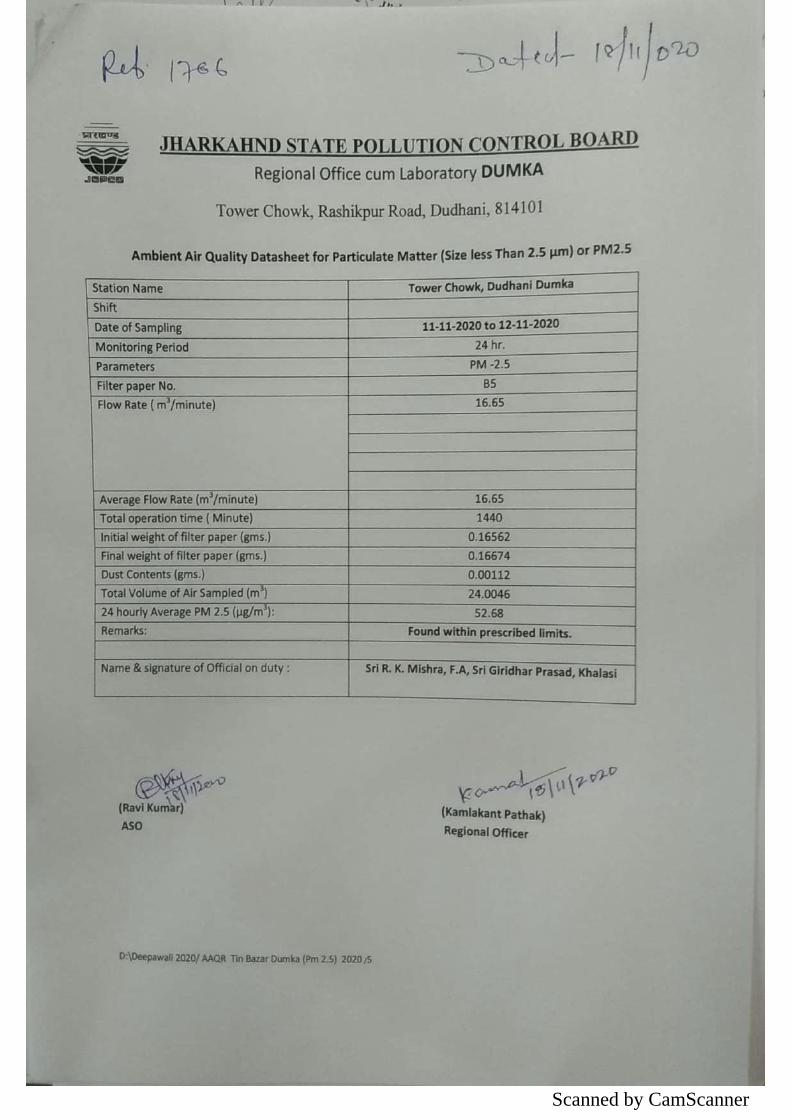
Scanned by CamScanner304
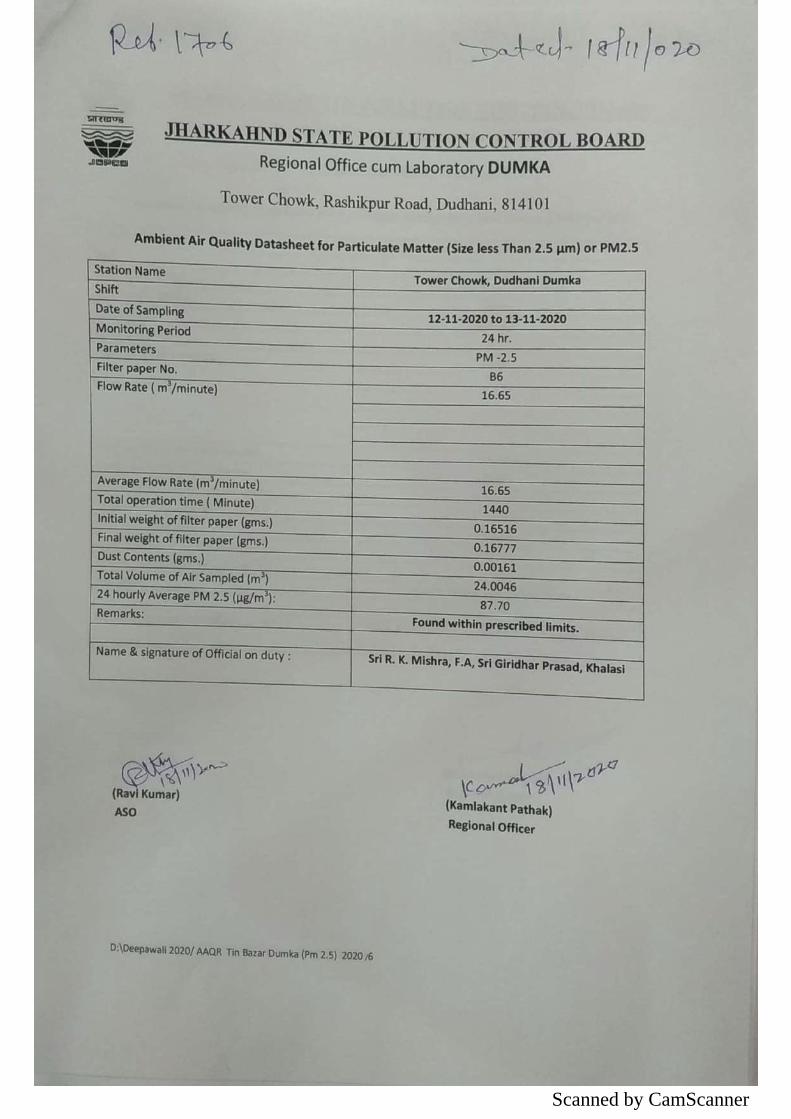
Scanned by CamScanner305
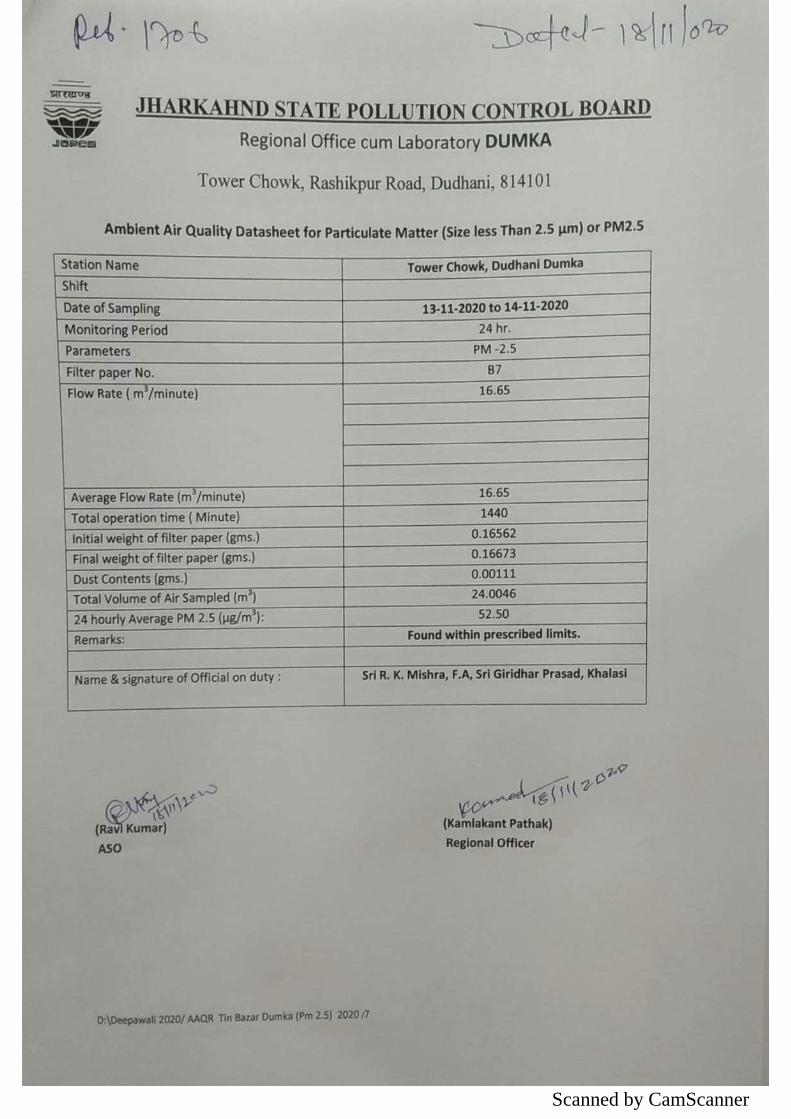
Scanned by CamScanner306
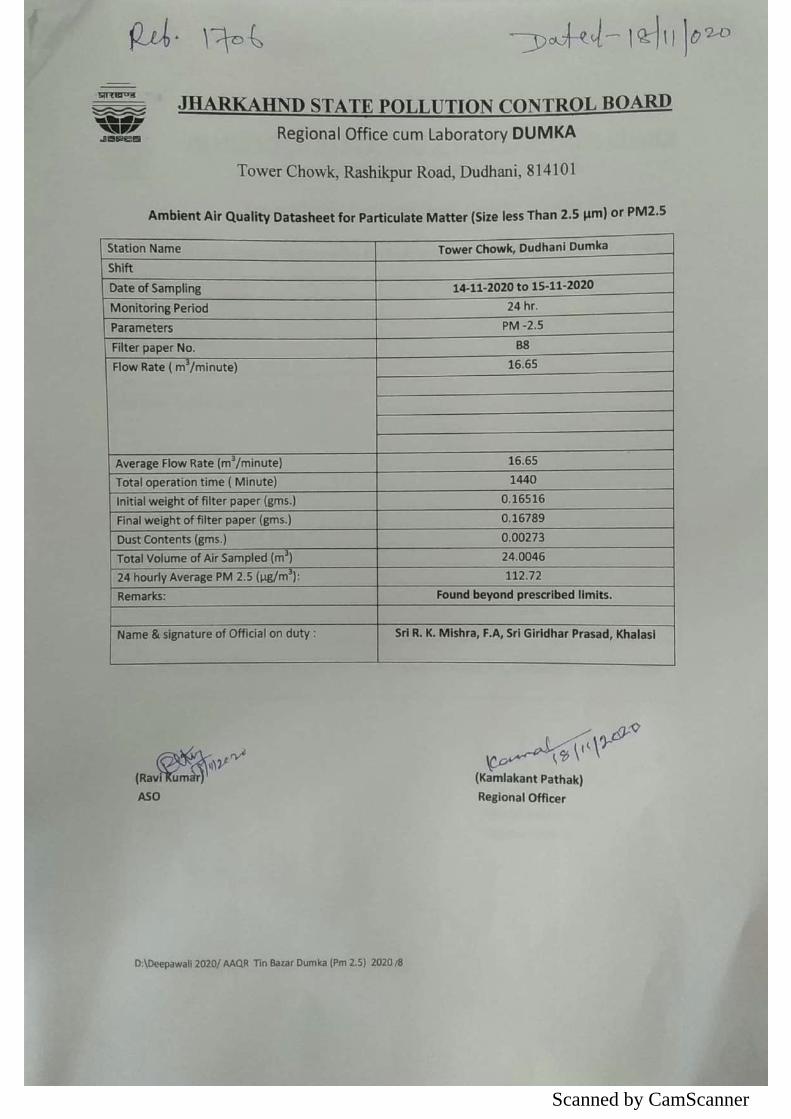
Scanned by CamScanner307
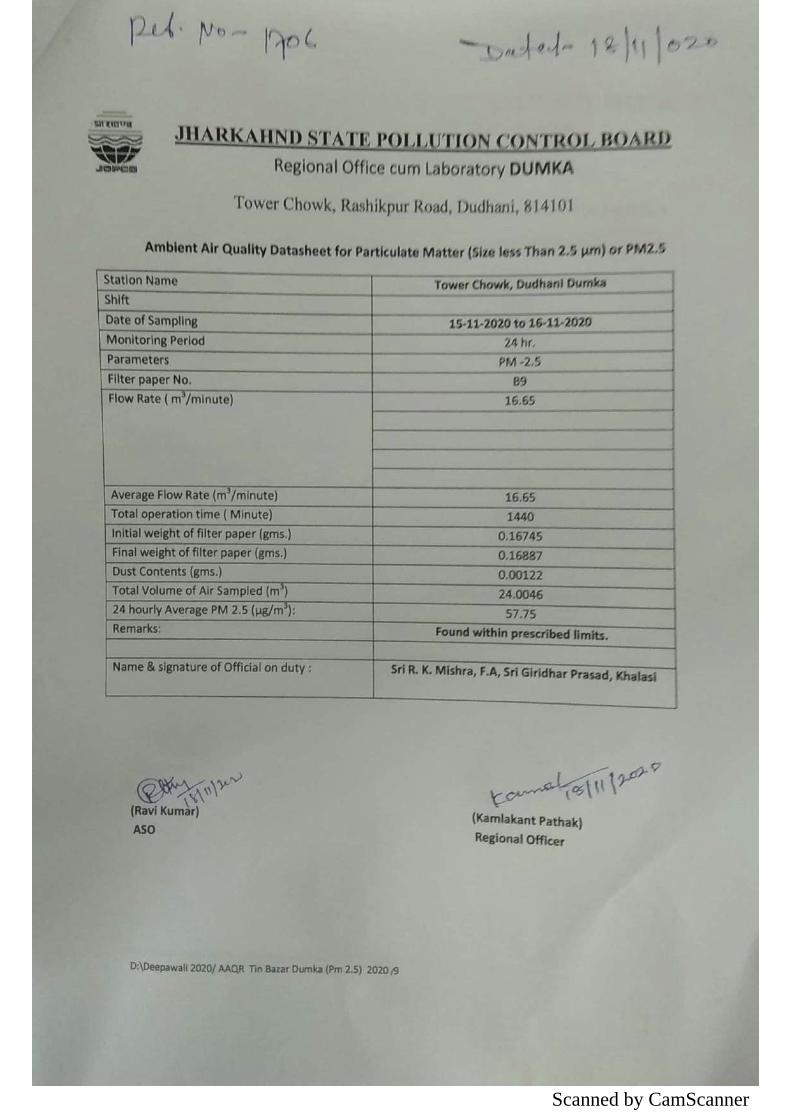
Scanned by CamScanner308
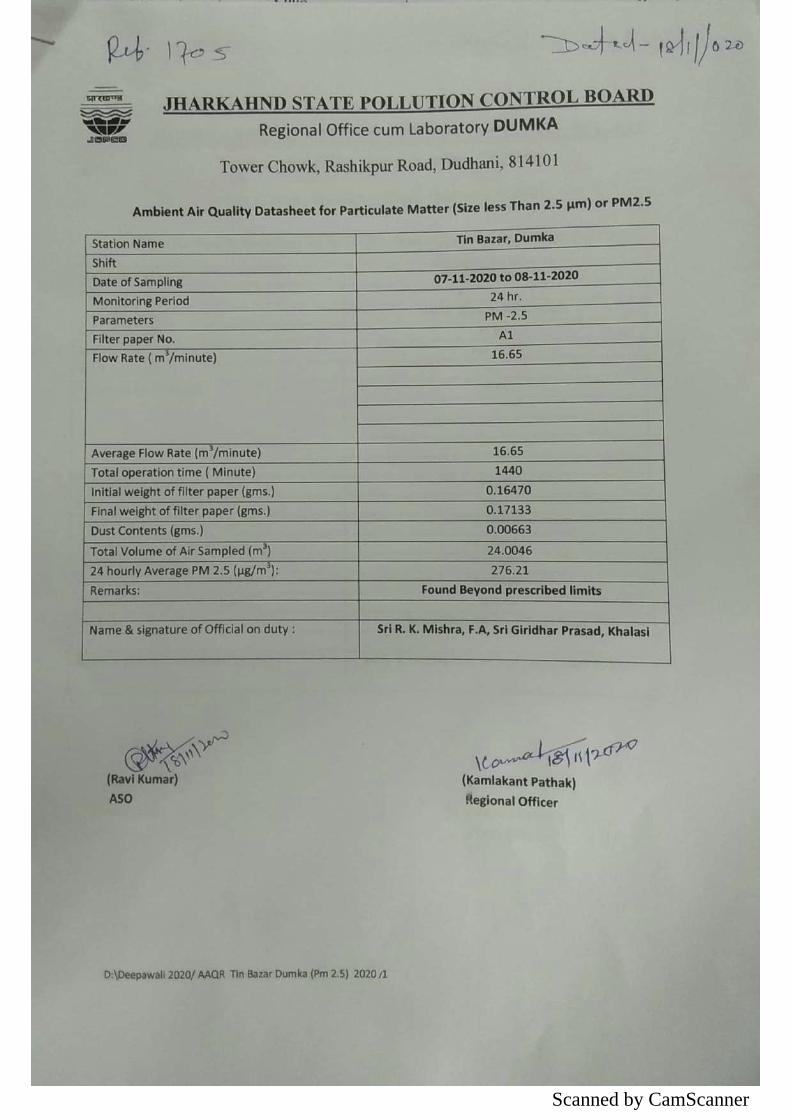
Scanned by CamScanner309
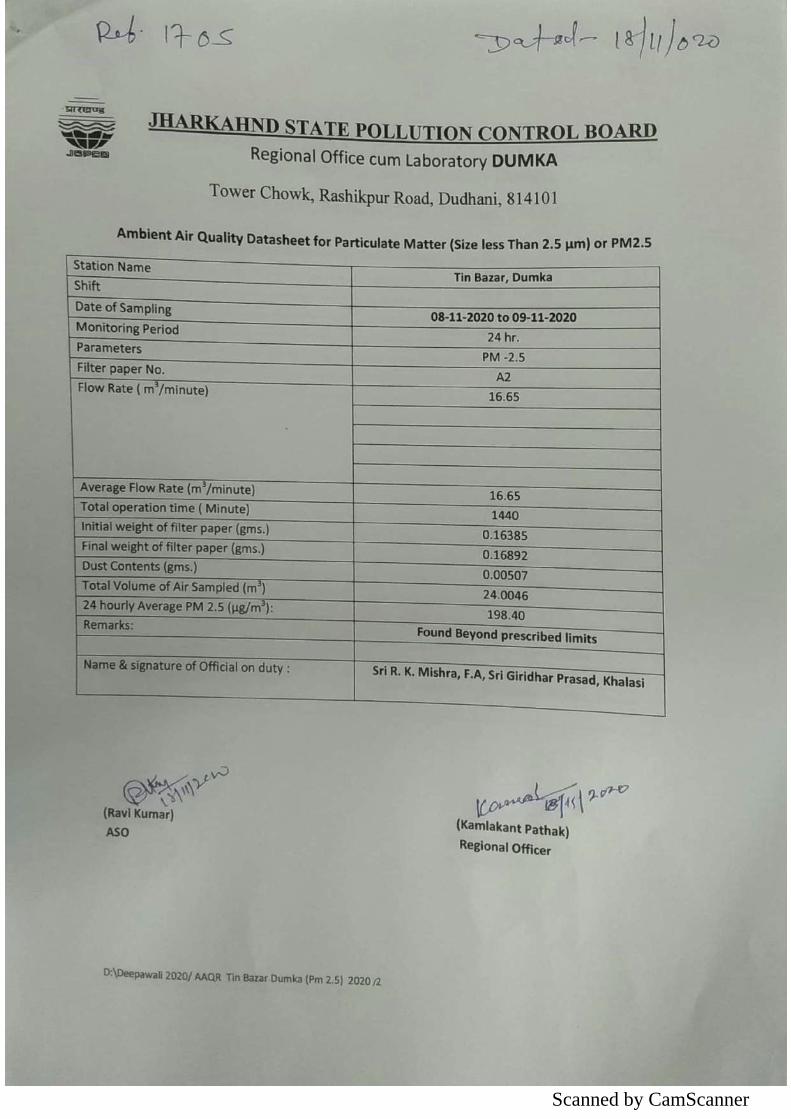
Scanned by CamScanner310
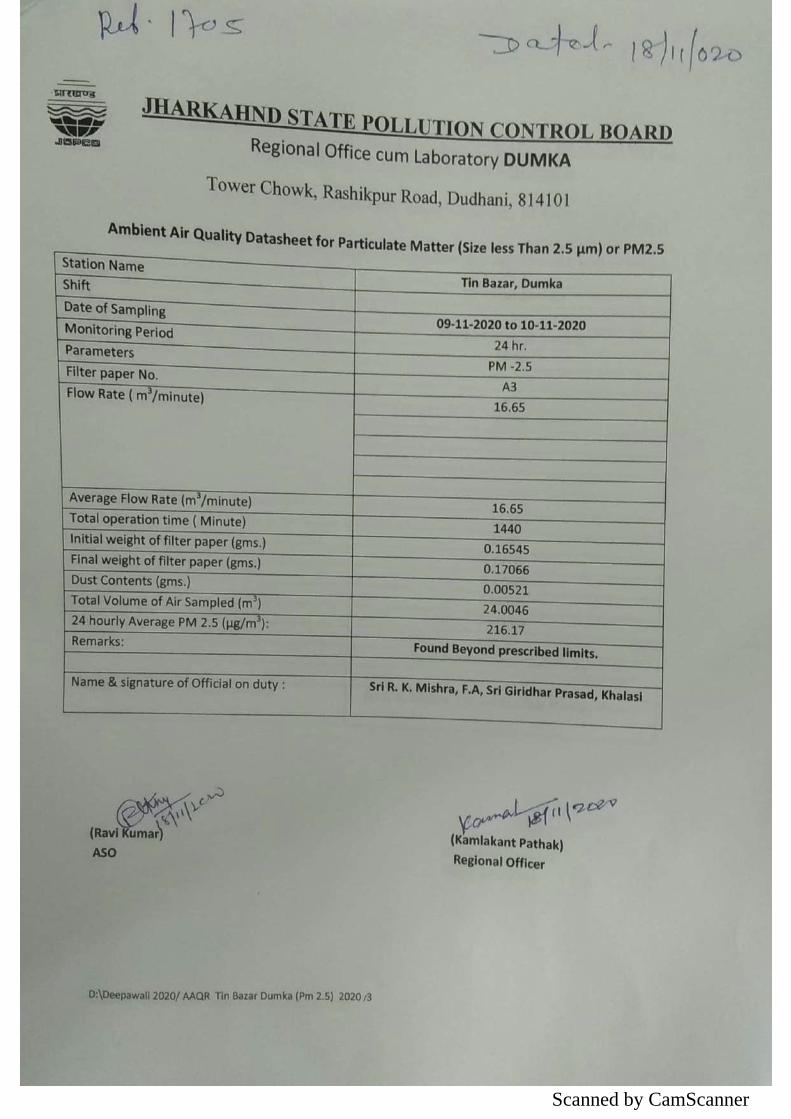
Scanned by CamScanner311
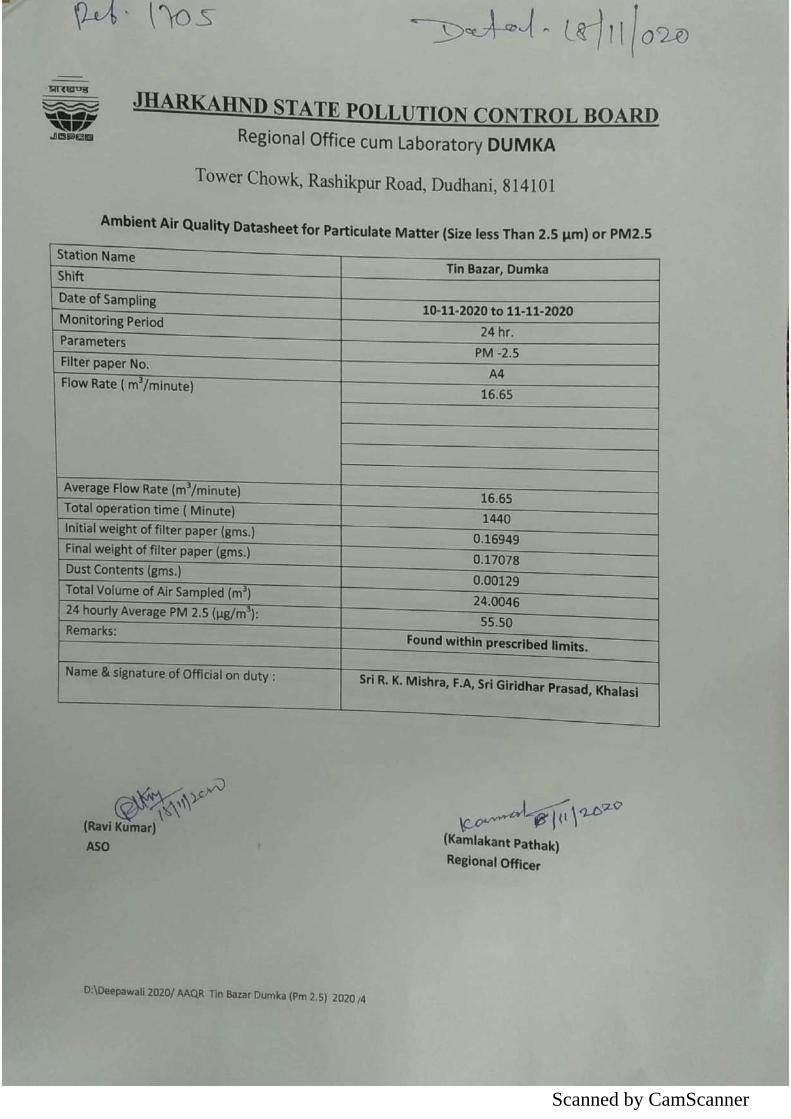
Scanned by CamScanner312
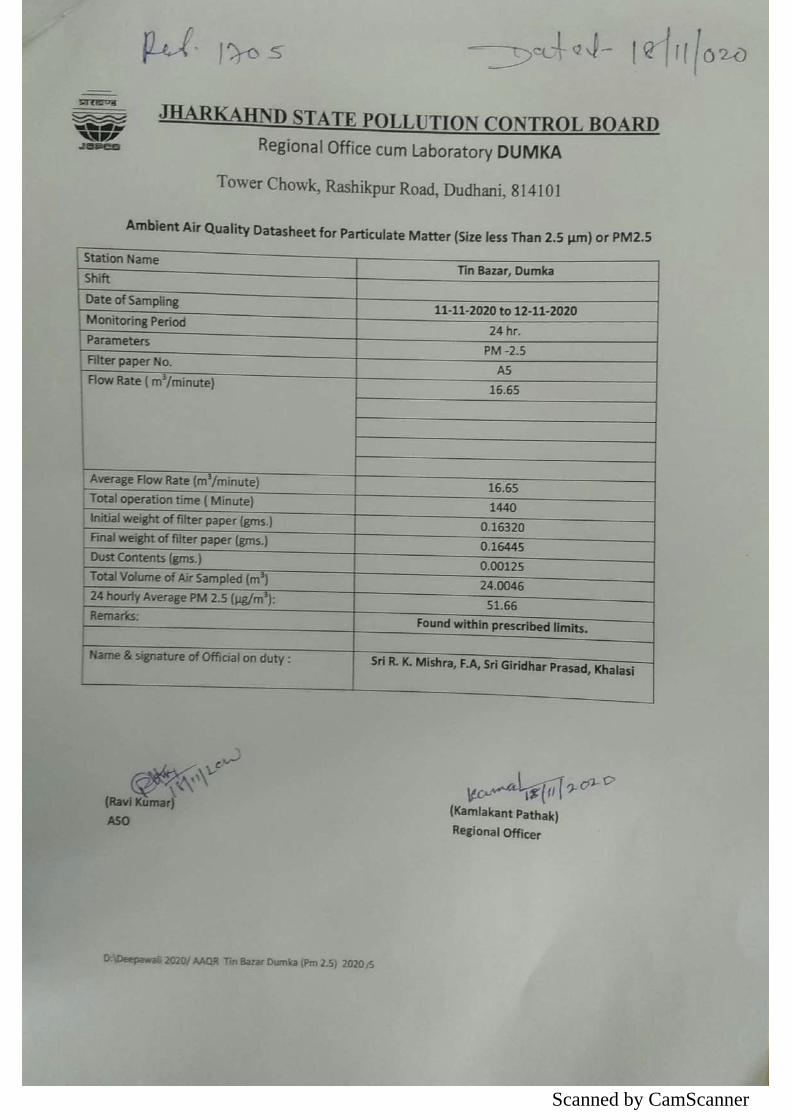
Scanned by CamScanner313
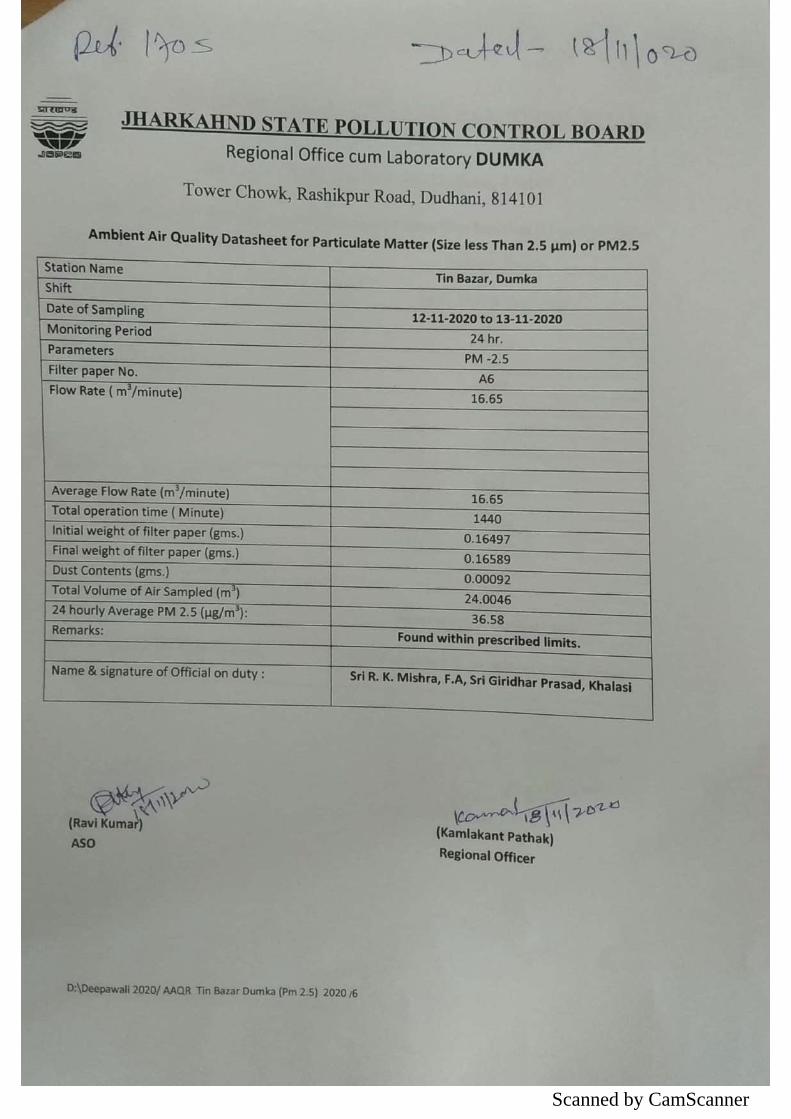
Scanned by CamScanner314
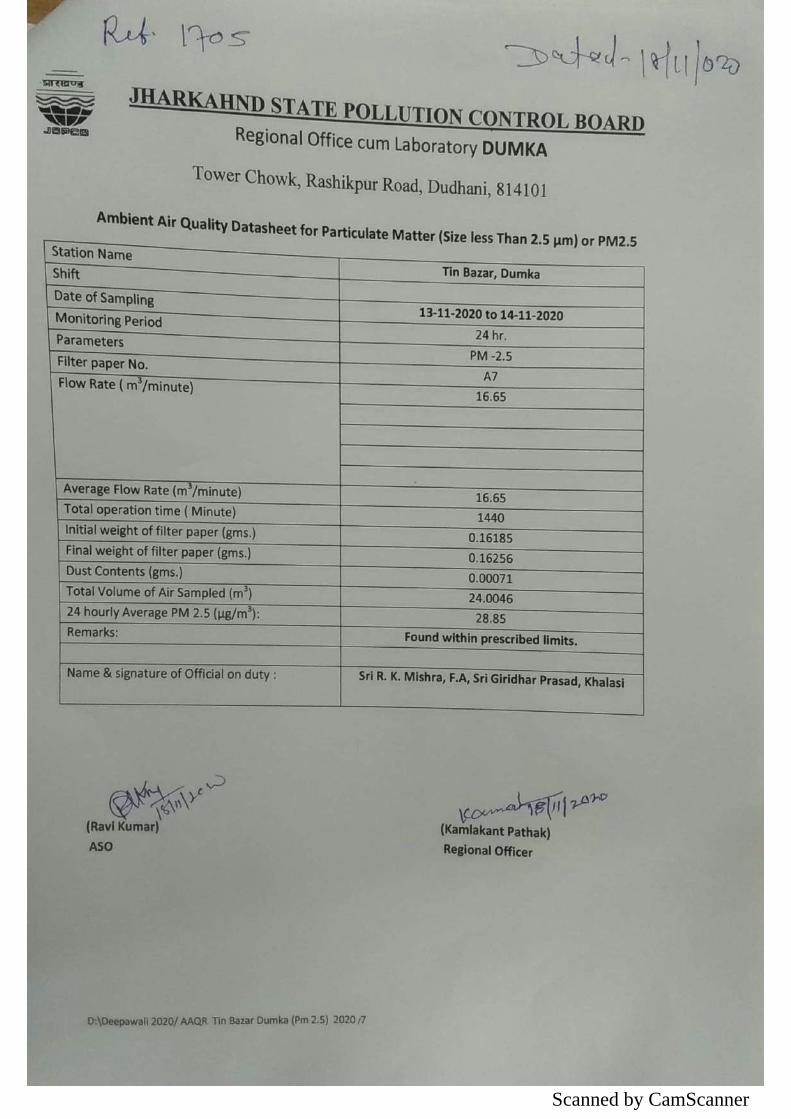
Scanned by CamScanner315
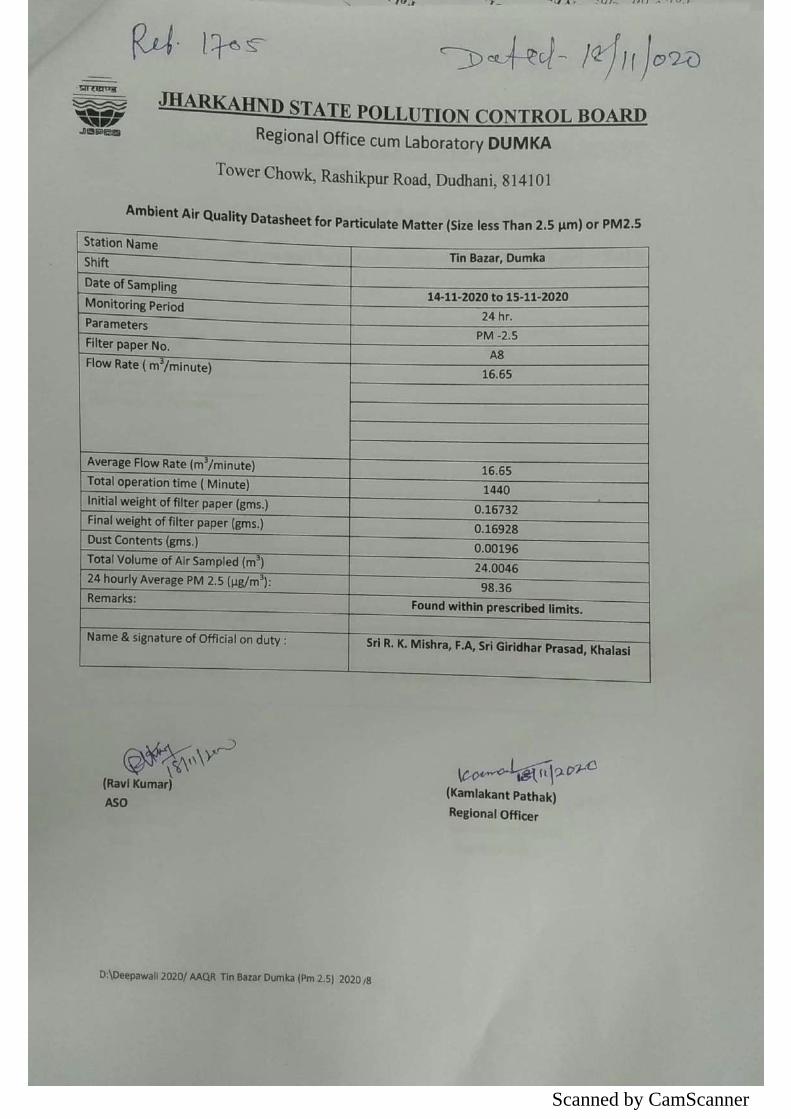
Scanned by CamScanner316
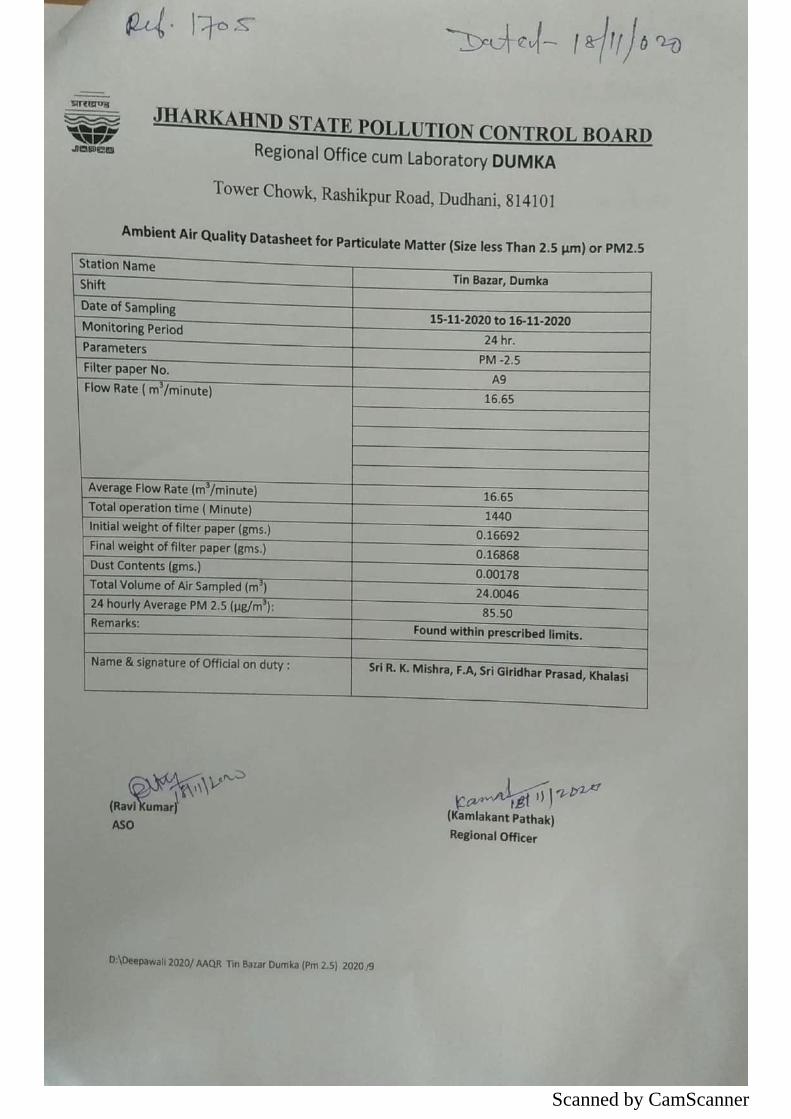
Scanned by CamScanner317
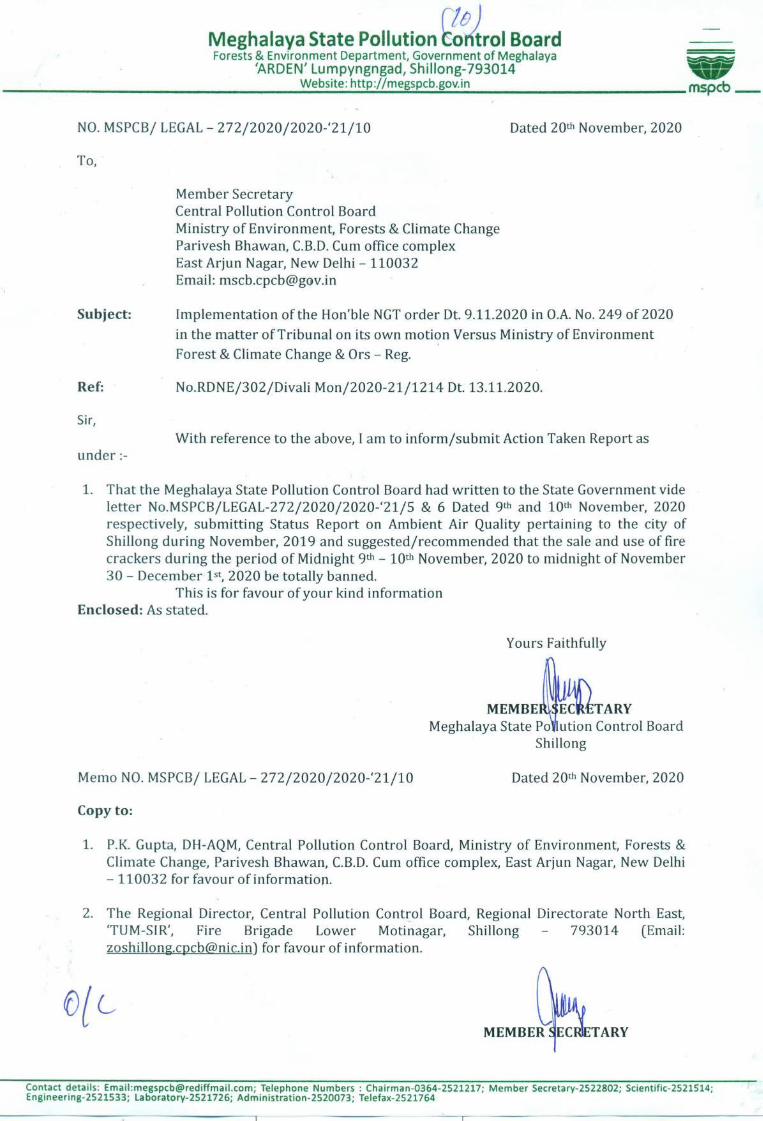
Annexure-XVI
318
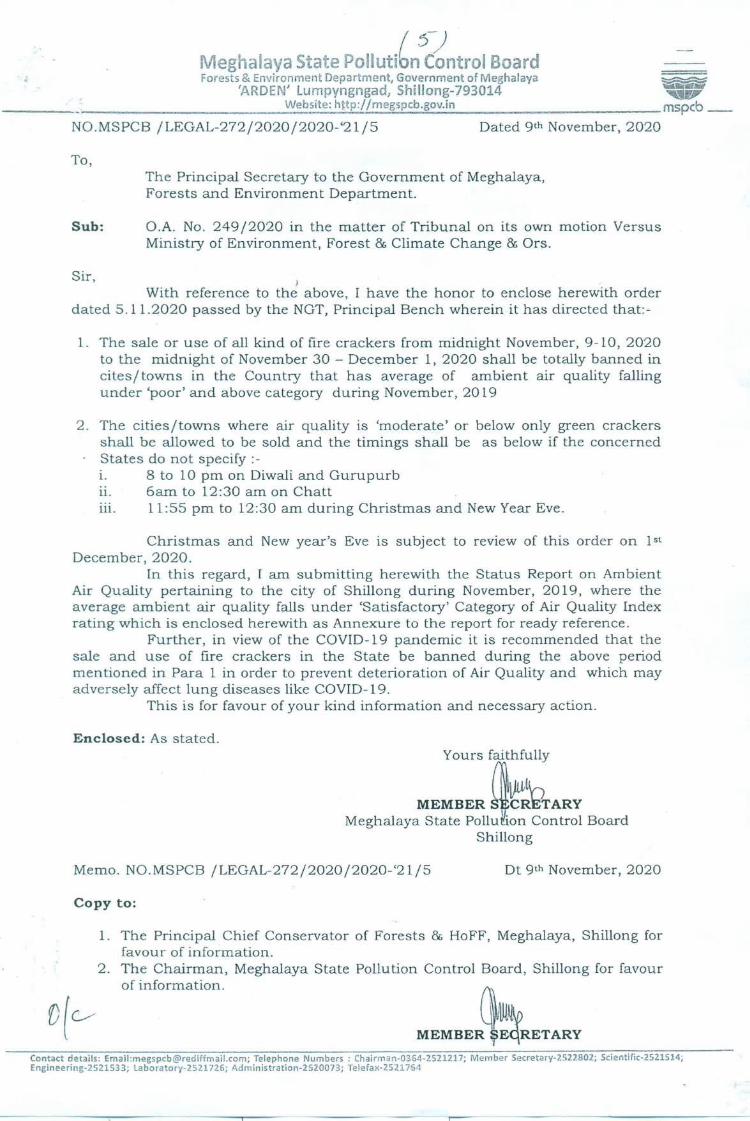
319
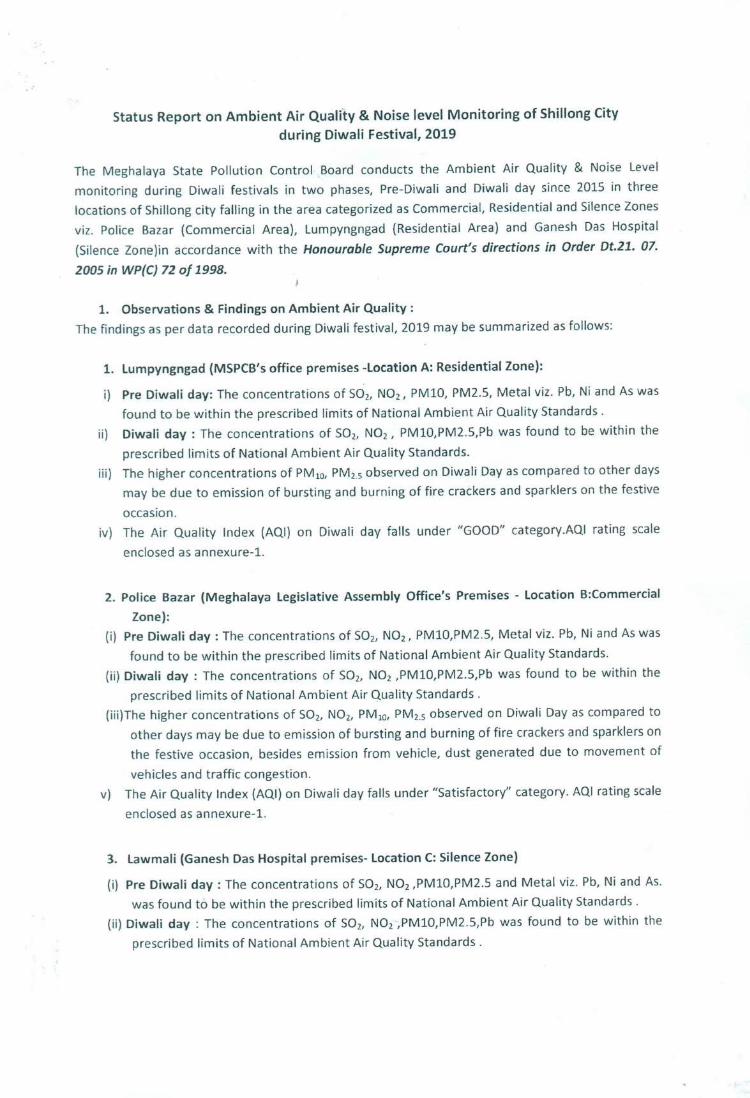
320
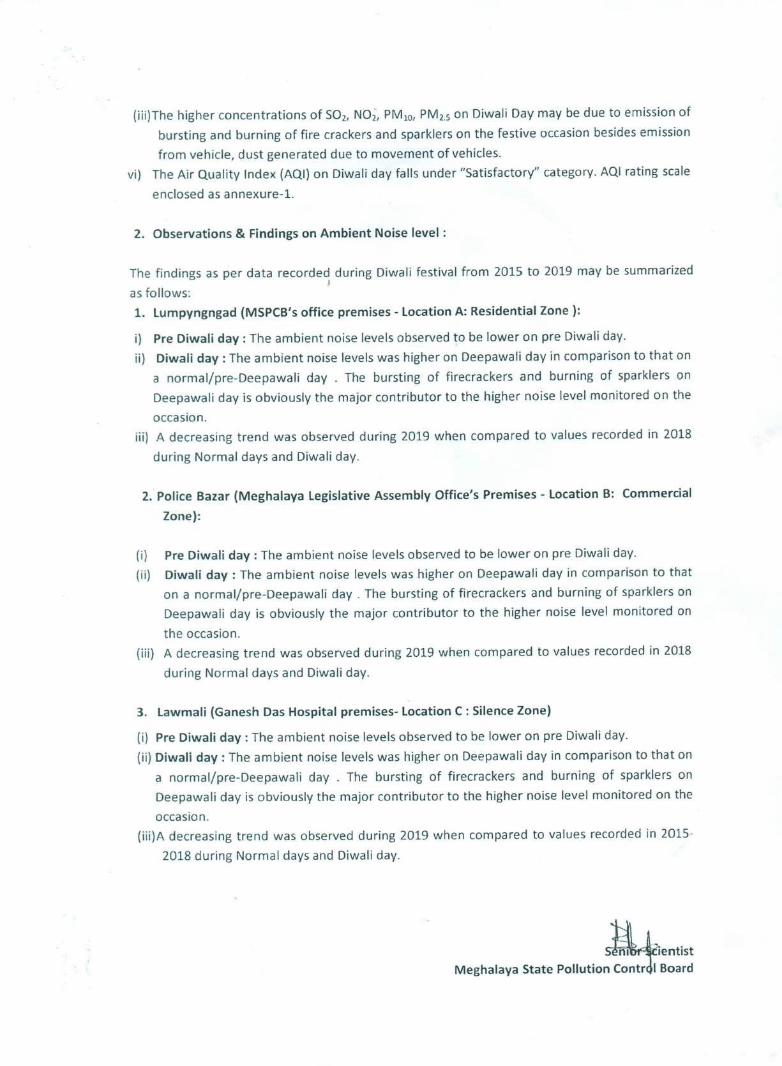
321
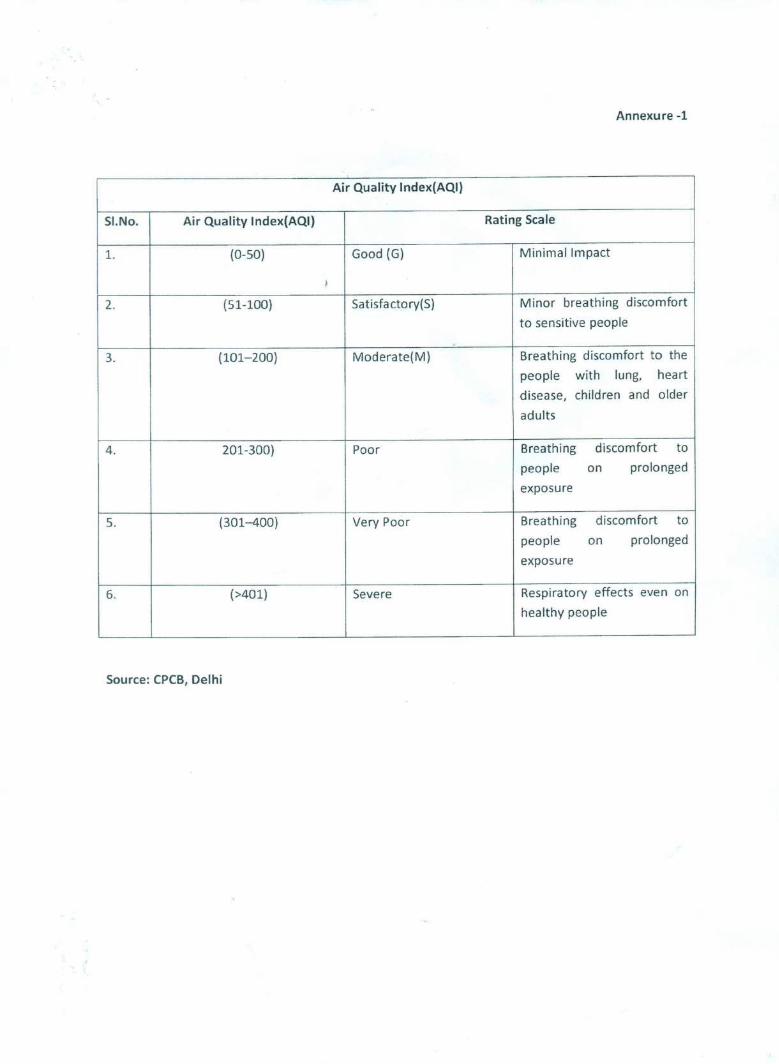
322
323
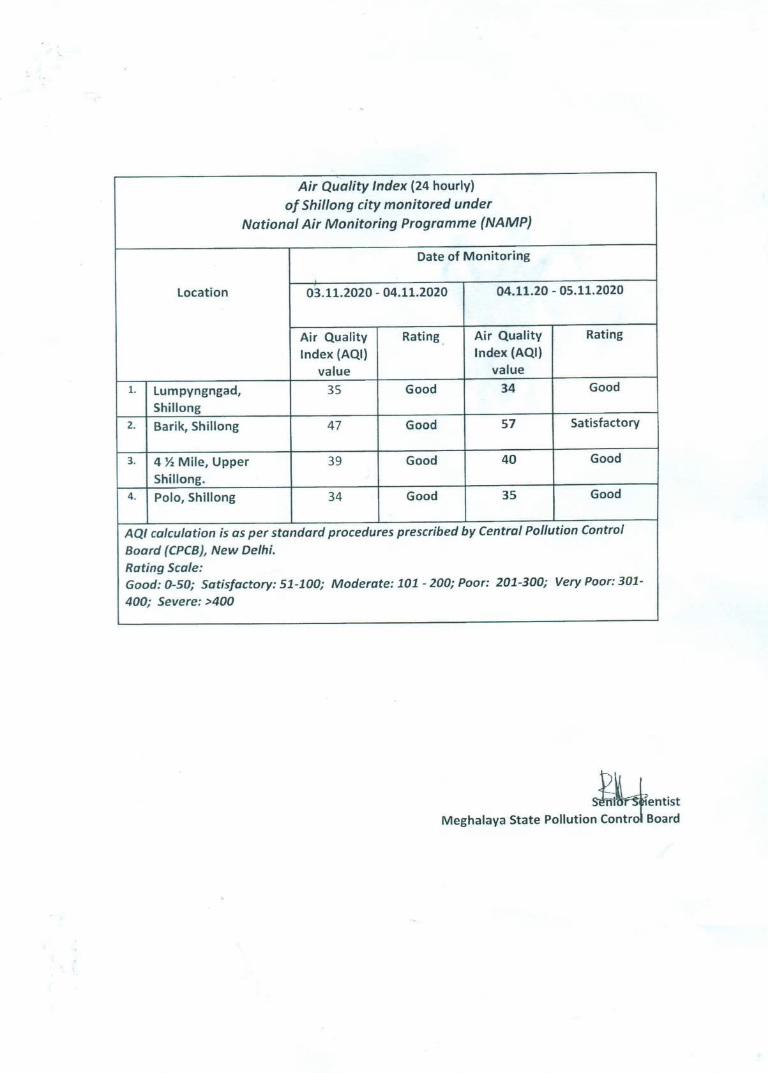
324
Deuvu Sharma <[email protected]>
Fwd: Compliance of NGT order dated Nov 09, 2020 on ban of firecrackers - reg. 1 message
CPCB K AQM Div <[email protected]> Thu, Nov 26, 2020 at 1:08 PMTo: deuvusharma <[email protected]>
From: "Vivek Pandey" <[email protected]> To: "CPCB K AQM Div" <[email protected]> Cc: "cf chandigarh" <[email protected]>, "pandey vivekcpcc" <[email protected]> Sent: Monday, November 23, 2020 4:07:55 PM Subject: Re: Compliance of NGT order dated Nov 09, 2020 on ban of firecrackers - reg.
Sir,
With reference to your email dated 13.11.2020 regarding compliance of the order of Hon'ble NGTw.r.t . ban on firecrackers dated 09.11.2020. It is here informed that keeping in view of order ofHon'ble NGT and present Corona Pandemic, Chandigarh Administration has banned the sale andbursting of fire crackers in U.T. Chandigarh The order of Chandigarh Administration is attachedherewith.
Further, it is hereby informed that as per results of monitoring conducted during the Diwali Festivalwhich is found that AQI is much less than the results of last year Diwali. The results of DiwaliMonitoring is also attached herewith.
Regards,Chandigarh Pollution Control CommitteeChandigarh
From: "cf chandigarh" <[email protected]> To: "Vivek Pandey" <[email protected]>, [email protected] Sent: Friday, November 13, 2020 12:12:36 PM Subject: Fwd: Compliance of NGT order dated Nov 09, 2020 on ban of firecrackers - reg.
---------- Forwarded message --------- From: CPCB K AQM Div <[email protected]> Date: Fri, 13 Nov 2020 at 12:00 Subject: Compliance of NGT order dated Nov 09, 2020 on ban of firecrackers - reg. To: <[email protected]>, <[email protected]>, <[email protected]>, <[email protected]>,<[email protected]>, Member Secretary GSPCB <[email protected]>, <[email protected]>,<[email protected]>, <[email protected]>, <[email protected]>, mspcb-hp <[email protected]>,<[email protected]>, <[email protected]>, Member Secretary Karnataka State Pollution ControlBoard <[email protected]>, Head office Karnataka State Pollution Control Board <[email protected]>, Sreekala S<[email protected]>, <[email protected]>, <[email protected]>, Pollution Control Board <[email protected]>,<[email protected]>, <[email protected]>, Jerold Hollis Nengnong <[email protected]>, MPCB<[email protected]>, K Vanlalfamkima <[email protected]>, <[email protected]>,
Annexure-XVII
325
<[email protected]>, <[email protected]>, <[email protected]>, Member Secretary <[email protected]>, <[email protected]>, <[email protected]>, TNPCB Chennai <[email protected]>, <[email protected]>, Neetu Kumari Prasad <[email protected]>,<[email protected]>, <[email protected]>, <[email protected]>, <[email protected]>,<[email protected]>, <[email protected]>, Gopal Krishna <[email protected]>, <[email protected]>,<[email protected]>, <[email protected]>, <[email protected]>, Member Secretary<[email protected]>, <[email protected]>, Director, S&T <[email protected]>, Pondicherry Pollution Control CommitteePondicherry <[email protected]> Cc: P K GUPTA ADDITIONAL DIRECTOR <[email protected]>, sharan chem <[email protected]>,SHARANDEEP SINGH <[email protected]>
Sir,
I am directed to enclose herewith the NGT order (OA No. 249/2020) dated November 09, 2020 on "ban of fire-crackers"for compliance and submission of Action taken report to CPCB latest by November 22, 2020.
Thanks & regards,PA to Head, AQM,CPCB
-- Use Solar Energy for Perpetuity & Save Mother Earth !
2 attachments
IMG-20201123-WA0000.jpg 97K
AQI_2016-2020_latest_Diwali_Results___Press_Release_2017_new_2___2_.docx 25K
326
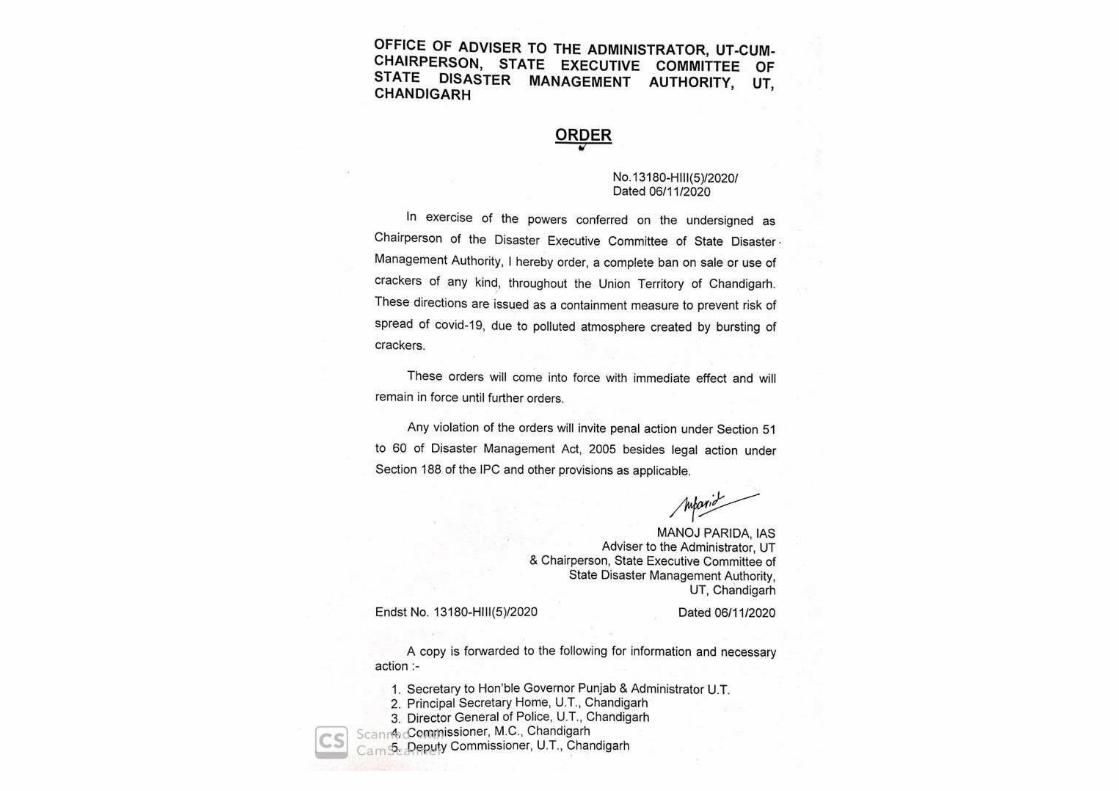
327
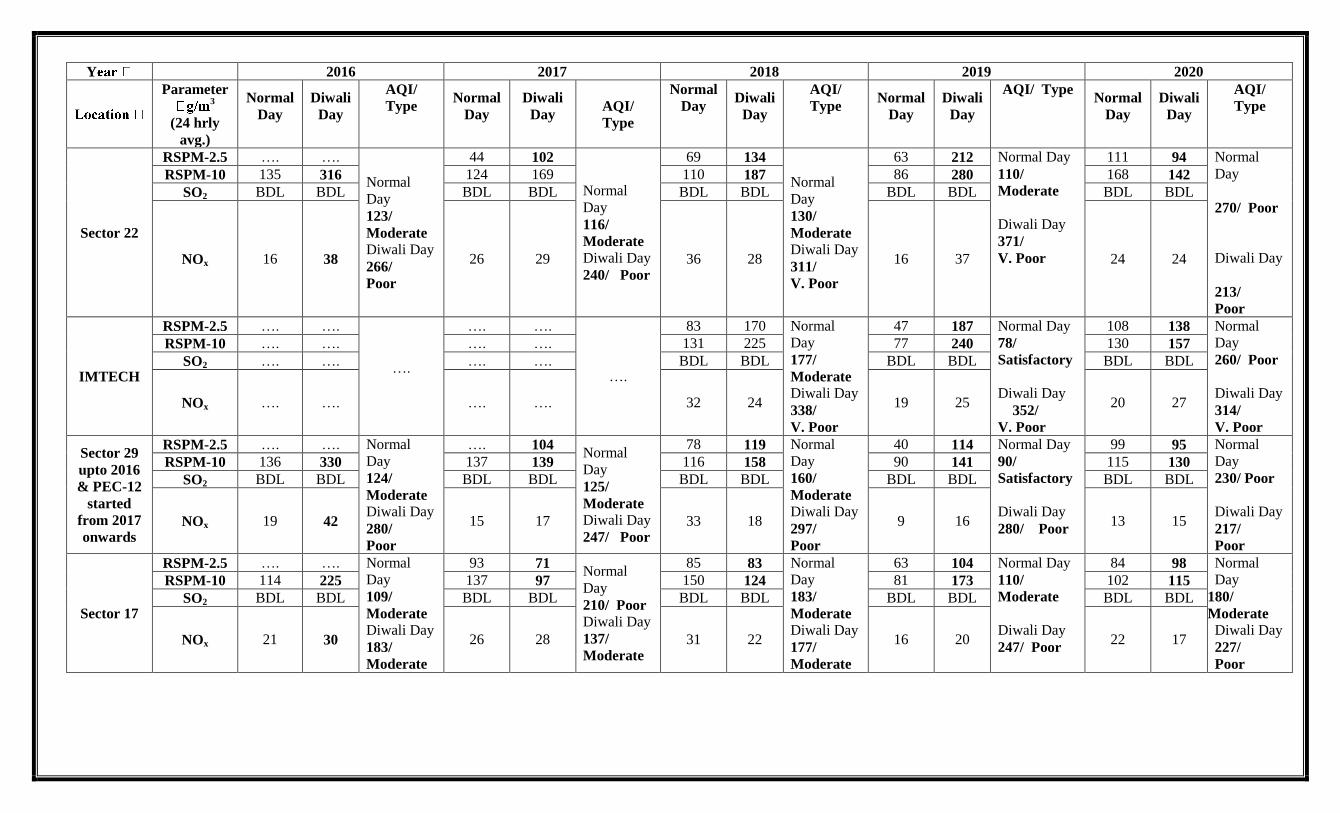
Y
2016 2017 2018 2019 2020
Parameter 3
(24 hrly
avg.)
Normal
Day
Diwali
Day
AQI/
Type Normal
Day
Diwali
Day
AQI/
Type
Normal
Day
Diwali
Day
AQI/
Type Normal
Day
Diwali
Day
AQI/ Type Normal
Day
Diwali
Day
AQI/
Type
Sector 22
RSPM-2.5 …. ….
Normal
Day
123/
Moderate
Diwali Day
266/
Poor
44 102
Normal
Day
116/
Moderate
Diwali Day
240/ Poor
69 134
Normal
Day
130/
Moderate
Diwali Day
311/
V. Poor
63 212 Normal Day
110/
Moderate
Diwali Day
371/
V. Poor
111 94 Normal
Day
270/ Poor
Diwali Day
213/
Poor
RSPM-10 135 316 124 169 110 187 86 280 168 142
SO2 BDL BDL BDL BDL BDL BDL BDL BDL BDL BDL
NOx 16 38 26 29 36 28 16 37 24 24
IMTECH
RSPM-2.5 …. ….
….
…. ….
….
83 170 Normal
Day
177/
Moderate
Diwali Day
338/
V. Poor
47 187 Normal Day
78/
Satisfactory
Diwali Day
352/
V. Poor
108 138 Normal
Day
260/ Poor
Diwali Day
314/
V. Poor
RSPM-10 …. …. …. …. 131 225 77 240 130 157
SO2 …. …. …. …. BDL BDL BDL BDL BDL BDL
NOx …. …. …. …. 32 24 19 25 20 27
Sector 29
upto 2016
& PEC-12
started
from 2017
onwards
RSPM-2.5 …. …. Normal
Day
124/
Moderate
Diwali Day
280/
Poor
…. 104 Normal
Day
125/
Moderate
Diwali Day
247/ Poor
78 119 Normal
Day
160/
Moderate
Diwali Day
297/
Poor
40 114 Normal Day
90/
Satisfactory
Diwali Day
280/ Poor
99 95 Normal
Day
230/ Poor
Diwali Day
217/
Poor
RSPM-10 136 330 137 139 116 158 90 141 115 130
SO2 BDL BDL BDL BDL BDL BDL BDL BDL BDL BDL
NOx 19 42 15 17 33 18 9 16 13 15
Sector 17
RSPM-2.5 …. …. Normal
Day
109/
Moderate
Diwali Day
183/
Moderate
93 71 Normal
Day
210/ Poor
Diwali Day
137/
Moderate
85 83 Normal
Day
183/
Moderate
Diwali Day
177/
Moderate
63 104 Normal Day
110/
Moderate
Diwali Day
247/ Poor
84 98 Normal
Day
180/
Moderate
Diwali Day
227/
Poor
RSPM-10 114 225 137 97 150 124 81 173 102 115
SO2 BDL BDL BDL BDL BDL BDL BDL BDL BDL BDL
NOx 21 30 26 28 31 22 16 20 22 17
328
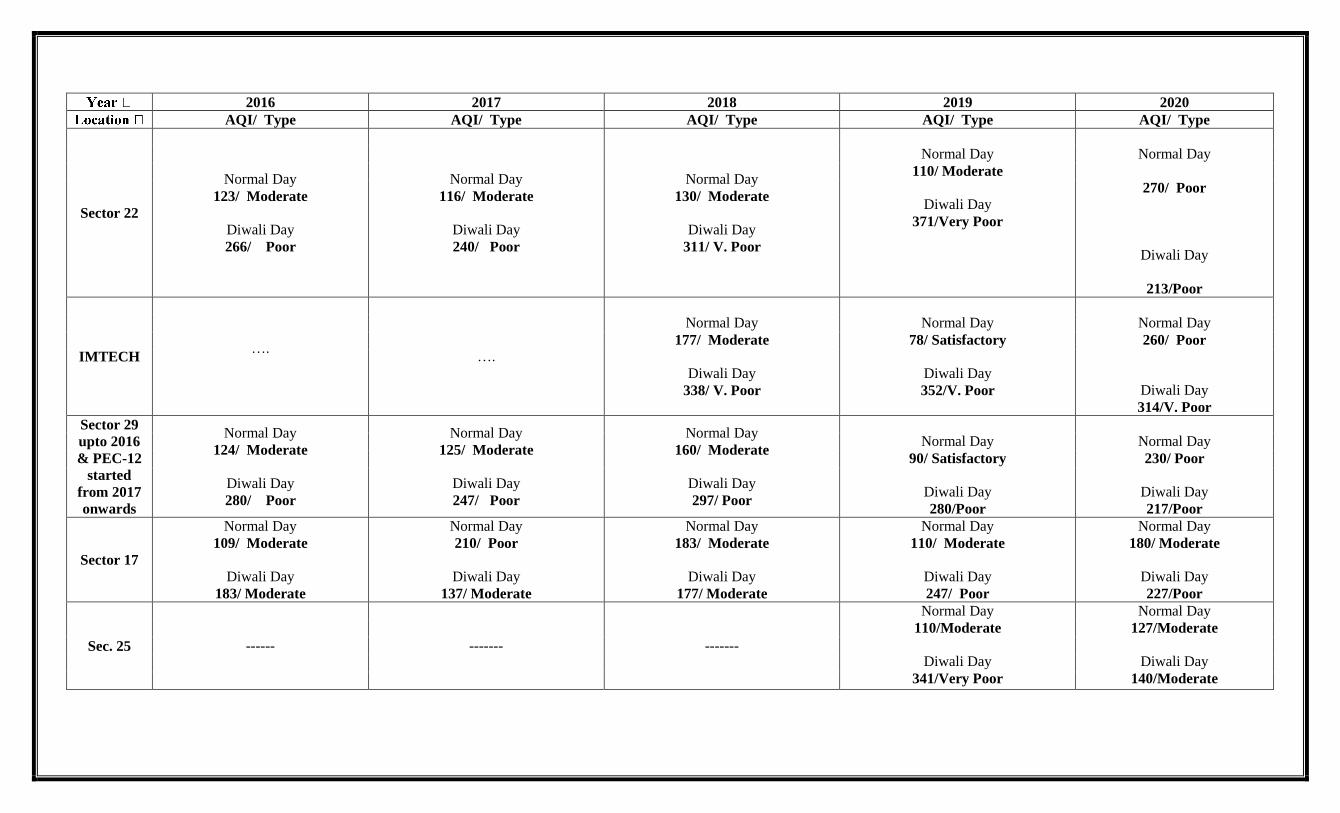
2016 2017 2018 2019 2020
AQI/ Type AQI/ Type AQI/ Type AQI/ Type AQI/ Type
Sector 22
Normal Day
123/ Moderate
Diwali Day
266/ Poor
Normal Day
116/ Moderate
Diwali Day
240/ Poor
Normal Day
130/ Moderate
Diwali Day
311/ V. Poor
Normal Day
110/ Moderate
Diwali Day
371/Very Poor
Normal Day
270/ Poor
Diwali Day
213/Poor
IMTECH ….
….
Normal Day
177/ Moderate
Diwali Day
338/ V. Poor
Normal Day
78/ Satisfactory
Diwali Day
352/V. Poor
Normal Day
260/ Poor
Diwali Day
314/V. Poor
Sector 29
upto 2016
& PEC-12
started
from 2017
onwards
Normal Day
124/ Moderate
Diwali Day
280/ Poor
Normal Day
125/ Moderate
Diwali Day
247/ Poor
Normal Day
160/ Moderate
Diwali Day
297/ Poor
Normal Day
90/ Satisfactory
Diwali Day
280/Poor
Normal Day
230/ Poor
Diwali Day
217/Poor
Sector 17
Normal Day
109/ Moderate
Diwali Day
183/ Moderate
Normal Day
210/ Poor
Diwali Day
137/ Moderate
Normal Day
183/ Moderate
Diwali Day
177/ Moderate
Normal Day
110/ Moderate
Diwali Day
247/ Poor
Normal Day
180/ Moderate
Diwali Day
227/Poor
Sec. 25 ------ ------- -------
Normal Day
110/Moderate
Diwali Day
341/Very Poor
Normal Day
127/Moderate
Diwali Day
140/Moderate
329
rnilne
tlbrt\rztspcb
TRIPURA STATE POLLUTION CONTROL BOARI)(A Statutory Organisation under Government of Tripura)
Department of Science Technology & Environment
No.F.18(281/TspcB l2oLsl2s4t t;456_ 6 o
ToSri P. K. GuptaHead, AQM DivisionCentral Pollution Control BoardMOEF & CC, Government of IndiaParivesh Bhawan, East ArJun Nagar, Delhi-llOOg2.
November 261 2O2O
sub': compliance report on action taken by the state of Tripura to comply withthe Hon'ble NGT order dated og.l-l.2o2o in oA No.24gtzozo with oANo'25412o2o with oA No. 255 t2o2o with oA No. 9ol2o2o in connectionwith remedial action against pollution caused by use of flre crackers-reg.Ref: Your letter No. AeM/Fire crackersl2o2o-2]- dated 20ltLl2o2o
Sir,This has reference to your mail and letter No. AQM/Fire Crackers/2O2O-21
dated 2o/L7/2o2o on the subject cited above. The consolidated Action TakenReport by the state of Tripura in compliance with the order dated 09.11 .2o2o ofHon'ble Nationa-l Green Tribunal in oA No.249/2020 (oA No.2s4/2o2o, oA No.255/2o2o , OA No' 93/2o2o ) in connection with remedial action against pollutioncaused by use of fire crackers is enclosed herewith for kind information &necessary action.
Enclosed: As statedYours Sincerely,
Member Secretary
Copy to:
1' PPS to the Chief secretar5r to the Govt of Tripura for kind information of theChief Secretary.PS to the Secretary to the Govt of Tripura, Science, Technologr & EnvironmentDepartment for kind information of the Secretary.The Director, Department of Science, Technologr & Environment for kindinformation.The Regional Director, Central Pollution Control Board, North East, Shillong-793014, for kind information.
2.
3.
4.
Address:PARIVESH BHAWANPandit Nehru Complex, GurkhabastiPO : Kunjaban, Agartala, West Tripura-7ggffi
Website: Contact:www.tspcb.tripura.gov.in / openivis.nic.in Chairman: O38l - 2322462
e-mail : Member Secretary: 0381 - 2325421
[email protected] / [email protected] Head of Office: 0381 - 2322455OCMS Help Desk: 03812328792
Annexure-XVIII
330
Action Taken Report on directions of Hon’ble
National Green Tribunal vide Order dated
05.11.2020 (Date of hearing 05.11.2020 and date of
uploading 09.11.2020) in the O.A. No.249/2020
with O.A. No.254/2020 with OA No.255/2020 with
OA No.93/2020 in connection with remedial action
against pollution caused by use of fire crackers
aggravating the menace of Covid-19.
Submitted by:
Tripura State Pollution Control Board
331
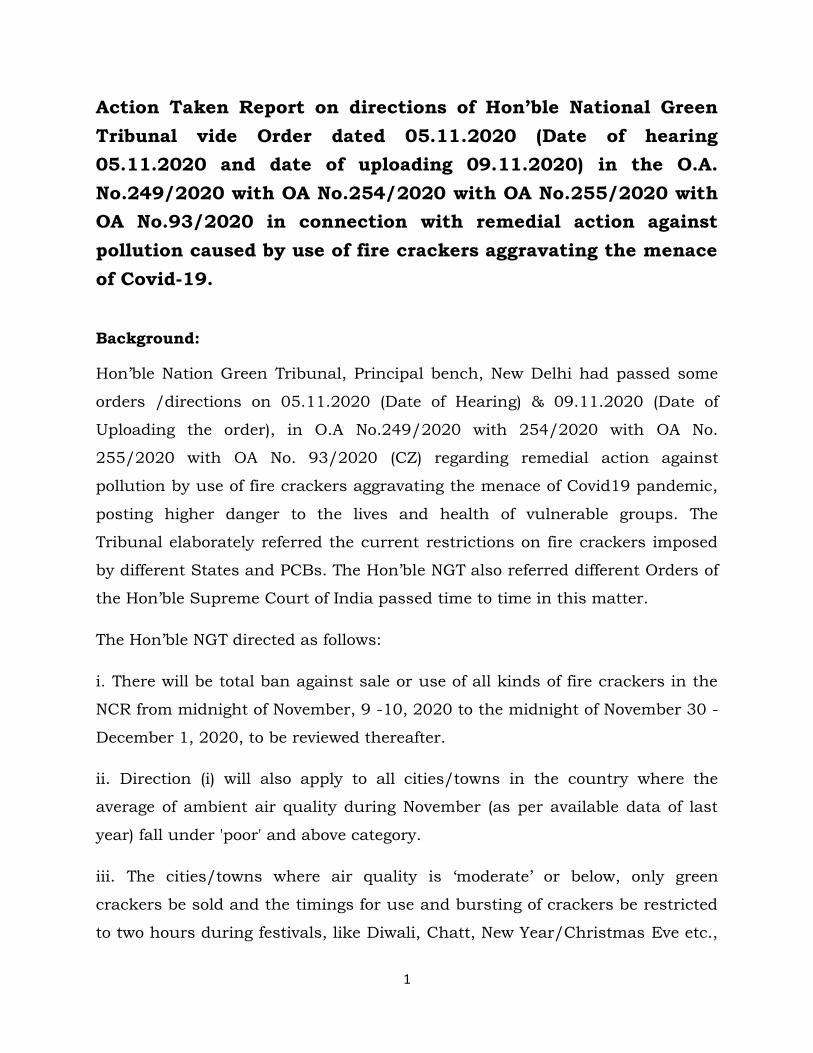
1
Action Taken Report on directions of Hon’ble National Green
Tribunal vide Order dated 05.11.2020 (Date of hearing
05.11.2020 and date of uploading 09.11.2020) in the O.A.
No.249/2020 with OA No.254/2020 with OA No.255/2020 with
OA No.93/2020 in connection with remedial action against
pollution caused by use of fire crackers aggravating the menace
of Covid-19.
Background:
Hon’ble Nation Green Tribunal, Principal bench, New Delhi had passed some
orders /directions on 05.11.2020 (Date of Hearing) & 09.11.2020 (Date of
Uploading the order), in O.A No.249/2020 with 254/2020 with OA No.
255/2020 with OA No. 93/2020 (CZ) regarding remedial action against
pollution by use of fire crackers aggravating the menace of Covid19 pandemic,
posting higher danger to the lives and health of vulnerable groups. The
Tribunal elaborately referred the current restrictions on fire crackers imposed
by different States and PCBs. The Hon’ble NGT also referred different Orders of
the Hon’ble Supreme Court of India passed time to time in this matter.
The Hon’ble NGT directed as follows:
i. There will be total ban against sale or use of all kinds of fire crackers in the
NCR from midnight of November, 9 -10, 2020 to the midnight of November 30 -
December 1, 2020, to be reviewed thereafter.
ii. Direction (i) will also apply to all cities/towns in the country where the
average of ambient air quality during November (as per available data of last
year) fall under 'poor' and above category.
iii. The cities/towns where air quality is ‘moderate’ or below, only green
crackers be sold and the timings for use and bursting of crackers be restricted
to two hours during festivals, like Diwali, Chatt, New Year/Christmas Eve etc.,
332
2
as may be specified by the concerned State. This direction is on pattern of
direction of the Hon’ble Supreme Court in (2019) 13 SCC 523 which we are
applying to areas moderately polluted or below air quality due to aggravated
effect during Covid-19, as already noted. If nothing is specified by the State,
timing will be 8 to 10 pm on Diwali and Gurupurb, 6 am to 8 am on Chatt and
11.55 pm to 12.30 am during Christmas and New year eve (which have yet to
come and do not fall in November but if ban continues) and not otherwise.
iv. At other places, ban/restrictions are optional for the authorities but if there
are more stringent measures under orders of the authorities, the same will
prevail.
v. All States/UTs/PCBs/PCCs may initiate special drives to contain air
pollution from all sources in view of potential of aggravation of Covid-19.
vi. The Chief Secretaries and DGPs of all the States/UTs may issue and
circulate an appropriate order in above terms with appropriate enforcement
guidelines to all the District Magistrates and Superintendents of Police,
PCBs/PCCs.
vii. The CPCB and the State PCBs/PCCs may regularly monitor the air quality
during this period which may be uploaded on their respective websites. CPCB
may compile information on the subject, including the status of compliance of
this order from all the States/UTs and file a consolidated report with data
compiled till filing of report, before the next date by e-mail at [email protected]
preferably in the form of searchable PDF/OCR Support PDF and not in the
form of Image PDF. Next date of hearing is on 1.12.2020.
333
3
The detail Action Taken Report are as follows:
A. Action Taken Report to restrict Fire Crackers:
1. The Department of Science, Technology & Environment, Government of
Tripura had issued Notification regarding restricted use of fire crackers
vide No.F. 8(14)/DSTE/ENV/Pt-II/7220-41 dated 30.10.2018 wherein it
was notified that the crackers with reduced emission/ green crackers
shall be permitted to be manufactured and sold in the state of Tripura. It
was also notified that on the Diwali or on the day of other festivals, when
such firecrackers generally takes place, the scheduled timing of such
fireworks, would strictly be from 8.00 pm till 10.00 pm only. On
Christmas eve and new year eve, when such fireworks start around
midnight midnight i.e. 12.00 am, timing of fireworks should be from
11.55 pm till 12.30 am only. Copy of said Notification is enclosed as
Annexure-I.
2. The Chief Secretary, Tripura also issued a Memorandum No.
F.1(4)/CS/As/Misc/2020 dated 10.11.2020 in compliance of the order
dated 9.11.2020 of Hon’ble National Green Tribunal to restrict the use of
Fire Crackers and also to contain the air/noise pollution during Diwali
and other festivals throughout the State. (Annexure-IA).
3. The Chief Secretary, Government of Tripura has issued guidelines for
celebration of Diwali and Kali Puja Festival, 2020 throughout the State
considering the pandemic situation due to COVID-19. In this guideline,
emphasis has also been given to avoid fire crackers during Diwali Utsav
and to follow the Notification No.F. 8(14)/DSTE/ENV/Pt-II/7220-41
dated 30.10.2018 issued by Department of Science, Technology &
Environment, Government of Tripura regarding firecrackers. Copy
enclosed as Annexure-II.
4. Awareness programmes have been conducted on ill effects of firecrackers
and various aspects of Noise Rules involving NGOs, ECO Clubs and other
334
4
electronic media to generate awareness among the people on the occasion
of Diwali festival 2020. (Annexure-III)
5. Raids have been conducted prior to festive occasion this year also jointly
by the officials of District Administration and Tripura State Pollution
Control Board for enforcing the restriction of sale as well as use of
banned fire crackers throughout the State of Tripura. Considerable
quantity of illegal fire crackers were seized from various markets and
the seized firecrackers were disposed off as per Waste Management
Rules. (Annexure-IV)
6. Surveillance team have been formed by the TSPCB to monitor the sale
and use/bursting of banned fire crackers during Diwali & Kali Puja
festival. The said team has monitored the sale and use/bursting of
banned fire crackers during Diwali & Kali Puja festival. (Annexure-V)
7. Advertisements have been published in the local newspapers in
vernacular languages in several occasions before and during Diwali Day
highlighting various aspects of Noise Rules as well as with a request to
the public to restrict themselves from bursting of illegal fire crackers.
(Annexure-VI)
B. Action Taken Report to Control Air Pollution:
7. As per the guideline of CPCB, the Ambient Air Quality Monitoring has
been conducted by TSPCB during 07.11.2020 to 21.11.2020 on the
occasion of Diwali festival, 2020 to assess the air quality status before,
during and after the Diwali festival. (Annexure-VII)
8. The ambient air monitoring data on the occasion of Diwali festival for the
State of Tripura is enclosed as Annexure-VIII.
9. The Tripura State Pollution Control Board has directed all the ULBs to
take necessary actions on the following issues to control air pollution:
335
5
i. Sprinkling of water on the roads during dry season twice a
day. Emphasis may be given to use the treated waste water
for road watering, if available.
ii. Covering of unpaved roadside using grass or by any other
means.
iii. Ensure that all construction & demolition works shall be
done following the Construction & Demolition Waste
Management Rules, 2016.
iv. Ensure that no person or body including local body, any
agency, organization, concessionaire etc. shall be allowed
open burning of waste on lands, including at landfill sites in
the State of Tripura as per the Notification issued by
Department of Science, Technology and Environment vide
No.F. 11(49)/DSTE/CC/Pt-I/3382-3414 dated 04.05.2017.
v. Road side plantation.
Copy of the said letter is enclosed as Annexure-IX.
10. The Tripura State Pollution Control Board has requested the Transport
Department, Government of Tripura to take necessary steps to minimize
& Control the vehicular emission and also to ensure that that no vehicle
shall run in the road without having valid PUC Certificate. Copy of the
said letter as enclosed as Annexure-X.
The Vehicles are being checked regularly for PUC certificates by the Traffic
Police and if found exceeding the emission limits, the registration of such
vehicle is suspended till satisfactory repairs are carried out. Penal
compounding fees are also being recovered from such defaulting vehicles.
Grant of PUC Renewal certificate is considered only after observing
satisfactory Performance of the vehicle.
336
6
11. The Government of Tripura vide Notification No.F.11(49)/DSTE/CC/Pt-
I/3382-3414 dated 04.05.2017 notified that no person or body including
local body, any agency, organization, concessionaire etc. shall be allowed
open burning of waste on lands, including at landfill sites in the whole
State of Tripura. And for each such default, the violators shall be liable to
pay Environmental compensation. This notification has been issued to
combat air pollution throughout the State. (Annexure-XI)
12. Two manual ambient air quality stations are being operated at Agartala
under National Ambient Air Quality Monitoring Programme (NAMP) of
Central Pollution Control Board (CPCB). The ambient air quality
monitoring is being carried out on regular basis as per the frequency of
NAMP. The ambient air quality data are being uploaded in the
Environmental Air Quality Data Entry system (E-AQ-DES) portal of CPCB
on regular basis.
13. One Continuous Ambient Air Quality Monitoring Station (CAAQMS)
funded by CPCB has been installed at Agartala to monitor the real time
ambient Air Quality status. The real time air quality data from Agartala air
monitoring station is now linked to the CPCB server. The real-time air
quality status of Agartala in terms of Air Quality Index can be viewed by
accessing “National Air Quality Index-CPCB”.
For setting up of another Continuous Ambient Air Quality Monitoring
Station (CAAQMS) at Agartala funded by MoEFCC, the Expression of
Interest has been floated through e-tender portal for selection of bidders
for installation of Continuous Ambient Air Quality Monitoring Station
(CAAQMS). The technical evaluation of Technical bids is going on.
14. TSPCB has also developed a public grievance portal similar to “Sameer”
app developed by CPCB. The name of the said app of Tripura is
“TRIPURAR PARIBESH”. The general public can submit complaints
337
7
regarding various environment related issues like Air, Water and Noise
pollution etc through this app. (Annexure-XII)
15. In Tripura Cleaner Fuels (CNG) has already been introduced. 04 nos. Of
CNG filling stations have been established in Tripura. CNG buses have
been introduced in Agartala towns.
16. E-rickshaw has already been introduced throughout the state since last 5
years.
17. All Urban Local Bodies are in action for cleaning of road dust at early
morning by spraying water.
18. All the Brick Kilns are operating their units with Fixed Chimney. Steps to
be taken to introduce cleaner technology in Brick Kilns to reduce the
emission level further. Educative campaign has been initiated for
commissioning of Fixed Chimney Bulls Trench kilns in to Zigzag kilns.
19. A Notification has been issued by AMC to use only treated water for the
water sprinkling at road and never to allow use of drinking water for
these activities AMC also confirms that presently no surface or ground
water is used for watering parks and gardens in the city. (Annexure 3)
20. Extensive road side plantation is being done by the Forest Department.
21. Regular enforcement drives are being conducted throughout the state
against the vehicles plying on road violating Motor Vehicle Acts
including emission norms.
22. With a view to minimize and control vehicular emission, registration of
BS-IV vehicles are not allowed as per the decision of the Hon’ble
Supreme Court of India, and only BS-VI vehicles are getting registration.
23. At present there are 51 (Fifty one) numbers of Emission Testing Centres
in the State of Tripura. Recently, approval has been given to open 17
(Seventeen) more Emission Testing Centres in the State.
338
8
24. Initiative has been taken to introduce the mobile PUC Van to cover
remote area people to get their vehicle tested easily.
25. It is mandatory to have valid PUC certificate of a vehicle to apply for
fitness certificate in VAHAN-4.
26. At present, 44 numbers of PUC centre’s have been integrated with
VAHAN-4 and the emission testing are done online at the PUC centre’s.
C. Action taken in respect of control of Noise Pollution:
27. The Ambient Noise Level Monitoring was conducted during festive
occasions (such as Diwali) this year also as per the Guidelines of Central
Pollution Control Board. (Annexure XIII)
28. The ambient noise data on the occasion of Diwali festival for the State of
Tripura is enclosed as Annexure-XIV.
29. In exercise of powers conferred under the Air (Prevention & Control of
Pollution) Act, 1981, Environment (Protection) Act, 1986 and on the
basis of the guidelines imposed by the Central Pollution Control Board,
Tripura State Pollution Control Board issued an Order on 17.09.1998
regarding maximum permissible noise level of the fireworks at the time of
bursting alongwith the list of banned fireworks. The District Magistrate &
Collector and Superintendent of Police have also been directed not to
allow sale or use of the banned firecrackers throughout the State.
(Annexure-XV)
30. In exercise of the power conferred by Rule 2 © of the Noise Pollution
(Control & Regulation) Rules, 2000, the Sub Divisional Police Officers
have been appointed as the ‘Authority’ for regulating the use of
loudspeaker or a public address system in his/her jurisdiction. The
SDPOs shall take necessary action under the overall supervision and
control of the District Magistrate of the District. The SDPOs are
339
9
authorised to grant permission for the use of loudspeaker or the public
address system. (Annexure-XVI)
31. In exercise of the power conferred by Rule 3(2) of the Noise Pollution
(Control & Regulation) Rules, 2000, various areas of the State of Tripura
have been categorised as Industrial/Commercial/Residential Areas and
Silence Zone. The Ambient Air Quality Standard in respect of Noise for
the said areas has also been notified. (Annexure-XVII)
32. As per the Noise Pollution (Control & Regulation) Rules, 2000, the
loudspeaker or the public address system shall not be used at night time
[10.00 p.m. to 6.00 a.m.] except the closed premises or during a public
emergency. The Government of Tripura issued a Notification regarding
permission of use of loudspeaker or the public address system between
10.00 pm to 12 hours midnight for the total 15 days in any calendar year
on account of celebration. (Annexure-XVIII)
33. As per the latest Judgement Order dated 16.08.2016 of the Hon’ble High
Court of Tripura, The District Magistrate & Collector shall constitute a
Committee for periodical review whether the order are being followed or
enforced with the following members:
(i) The District Magistrate & Collector of each district as the
Chairman.
(ii) The Superintendent of Police of the each district as member,
and
(iii) All the Sub-Division Magistrates and Sub-Divisional Police
Officers of the said district and one representative from the Tripura
State Pollution Control Board as member.
34. In compliance of the Order of Hon’ble NGT dated 03.10.2017 in
connection with OA No.158/2016/EZ, the Government of Tripura
issued Notification dated 29/12/2017 regarding mandatory use of
Sound Limiter(s) in all sound system/ public address system for
340
10
effective control of Noise Pollution in the whole State of Tripura.
(Annexure- XIX)
35. An advertisement was issued in local newspapers regarding the
mandatory use of sound limiters by the sellers, users and manufactures
of audio system and public address system. (Annexure-XX)
36. The Government of Tripura issued Notification No.F.
8(14)/DSTE/ENV/Pt-II/7220-41 dated 30.10.2018 regarding
restrictions on use of firecrackers/ fireworks during Diwali & all other
festivals with an objective to reduce Air & Noise Pollution including
minimization of Solid Waste generation.
37. TSPCB issued advertisement in local news papers and also in Souvenirs
in several occasions highlighting various aspect of Noise Rule to
generate awareness among common people to combat noise and air
pollution arising from fire crackers etc. (Annexure XXI)
38. TSPCB, General Administration of Sadar sub division and Police
Department jointly conducted special campaign against the
indiscriminate use of loud speaker on festive season this year.
341
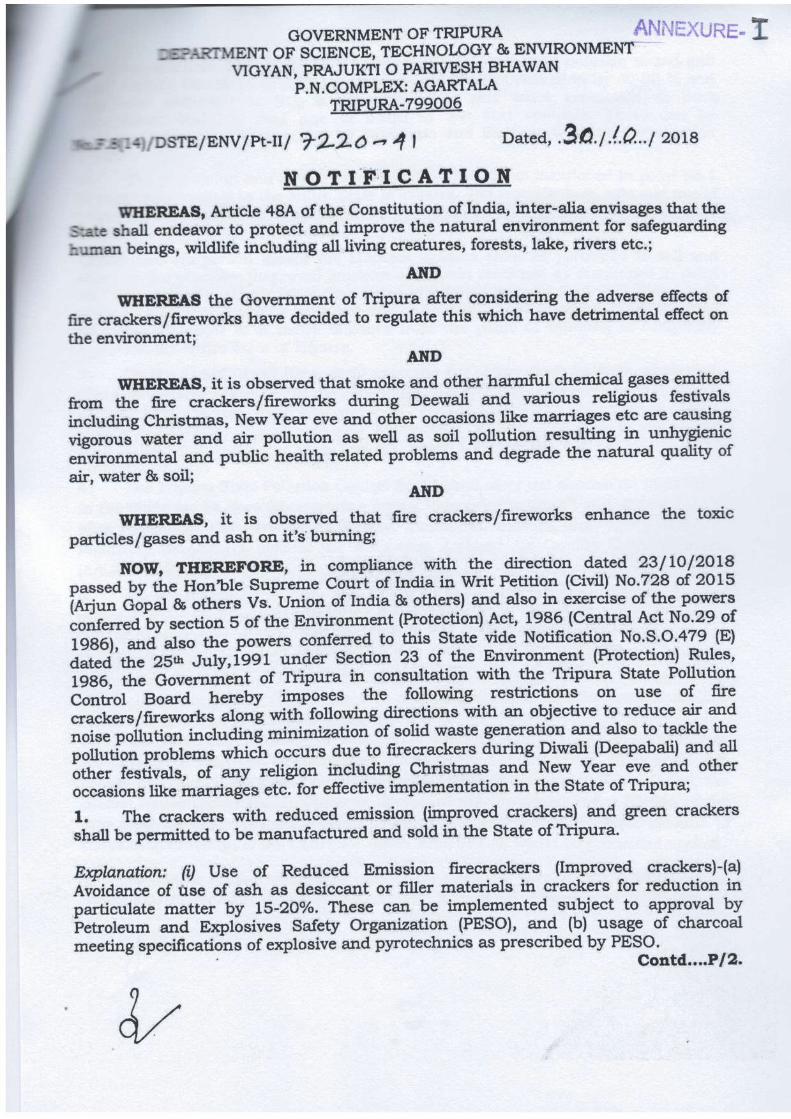
342
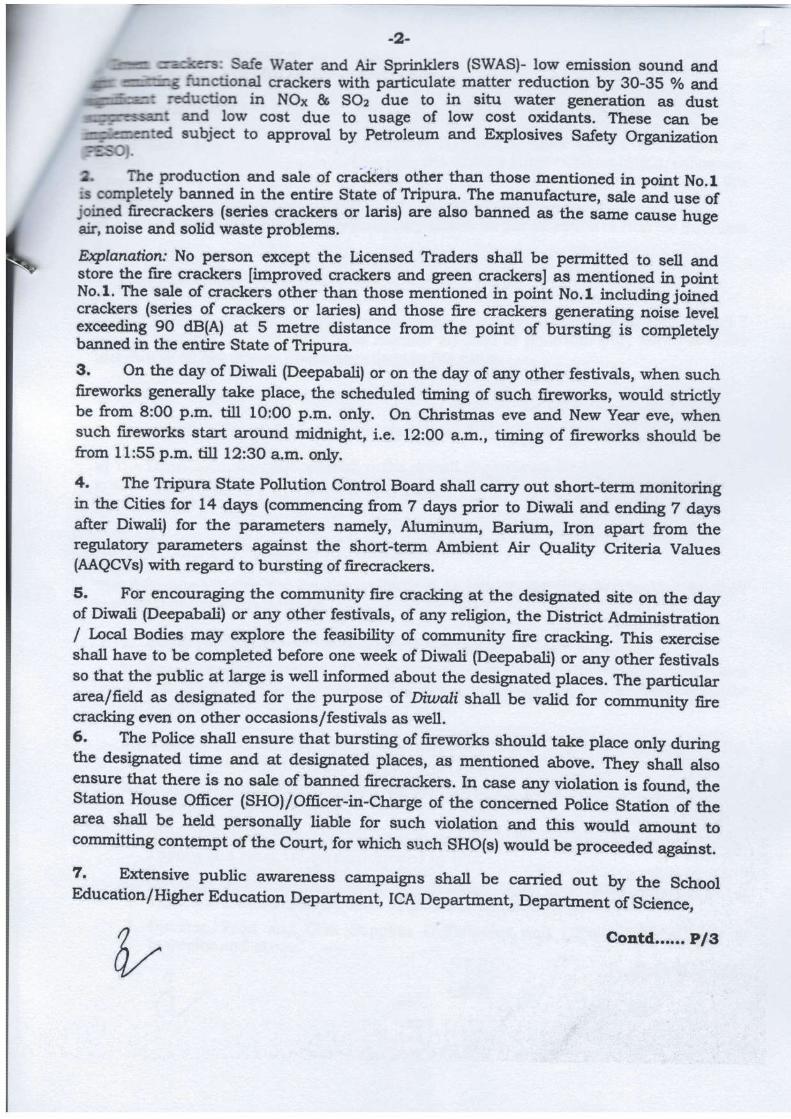
343
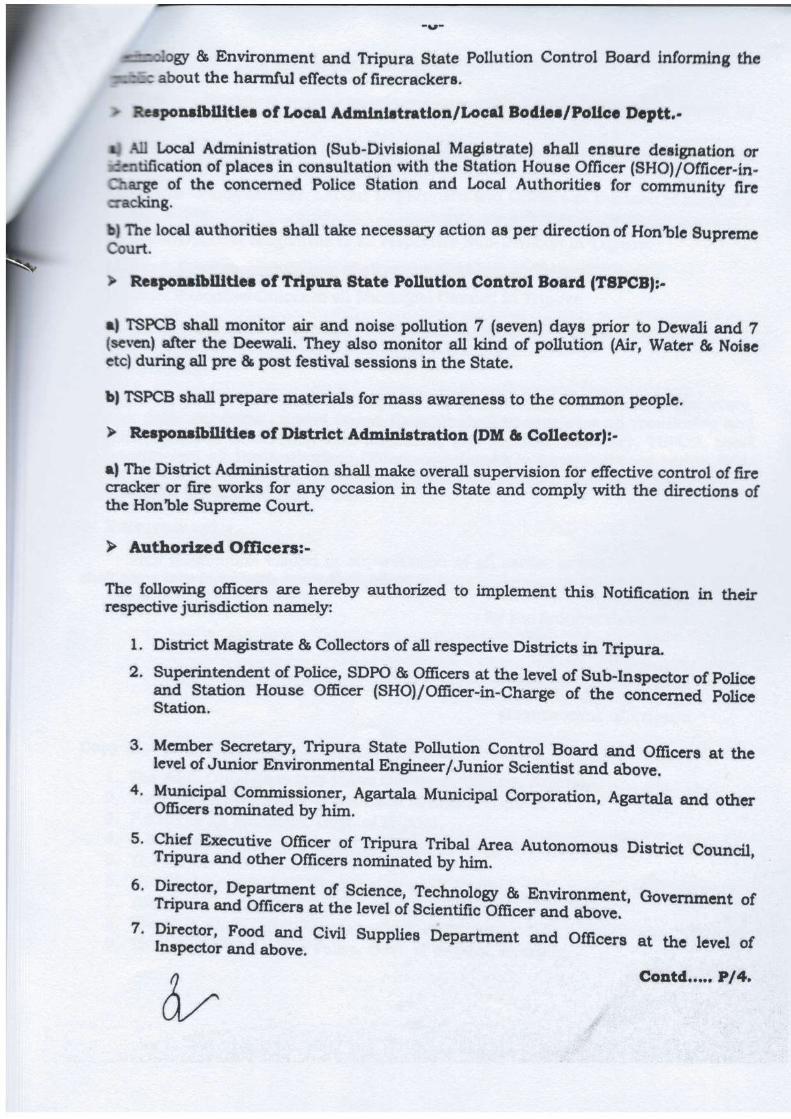
344
345
346
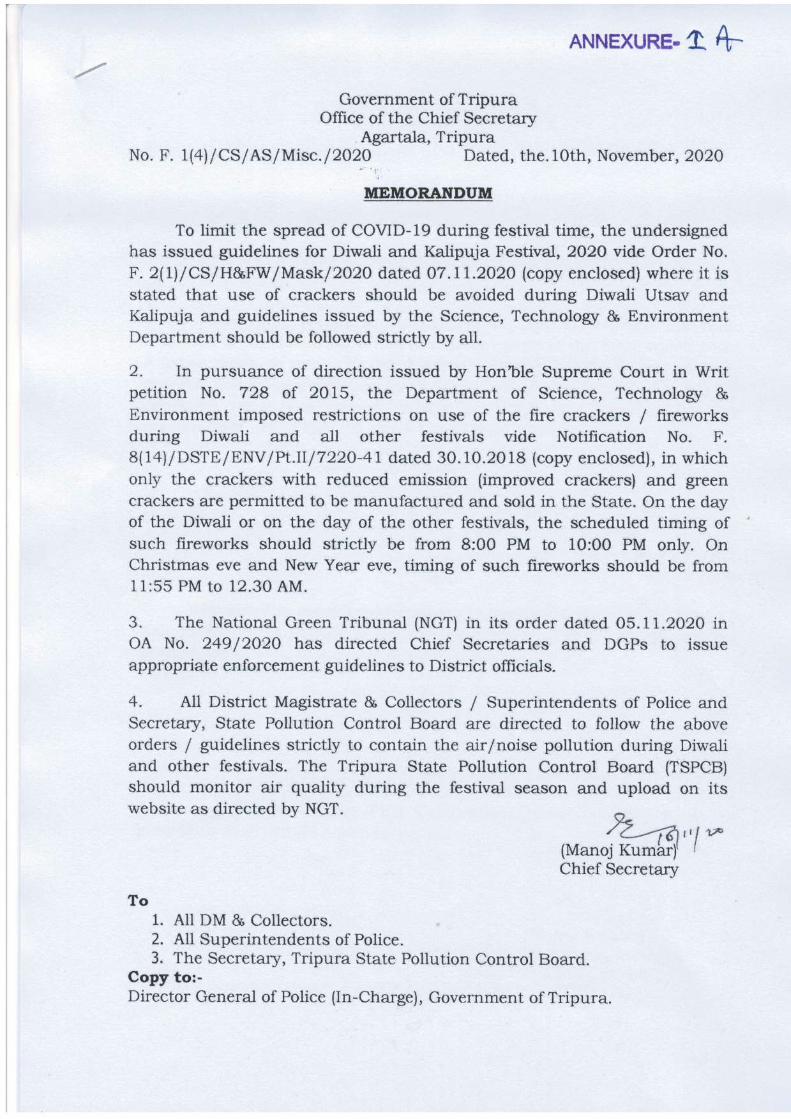
347
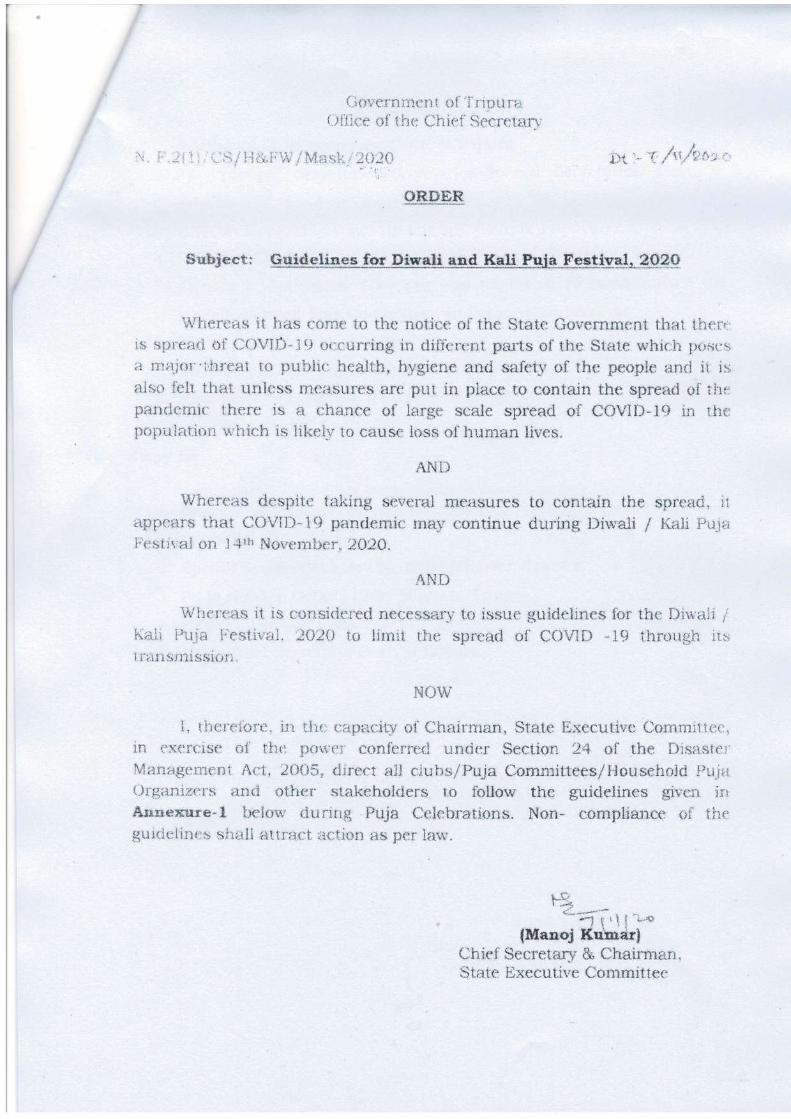
348
349
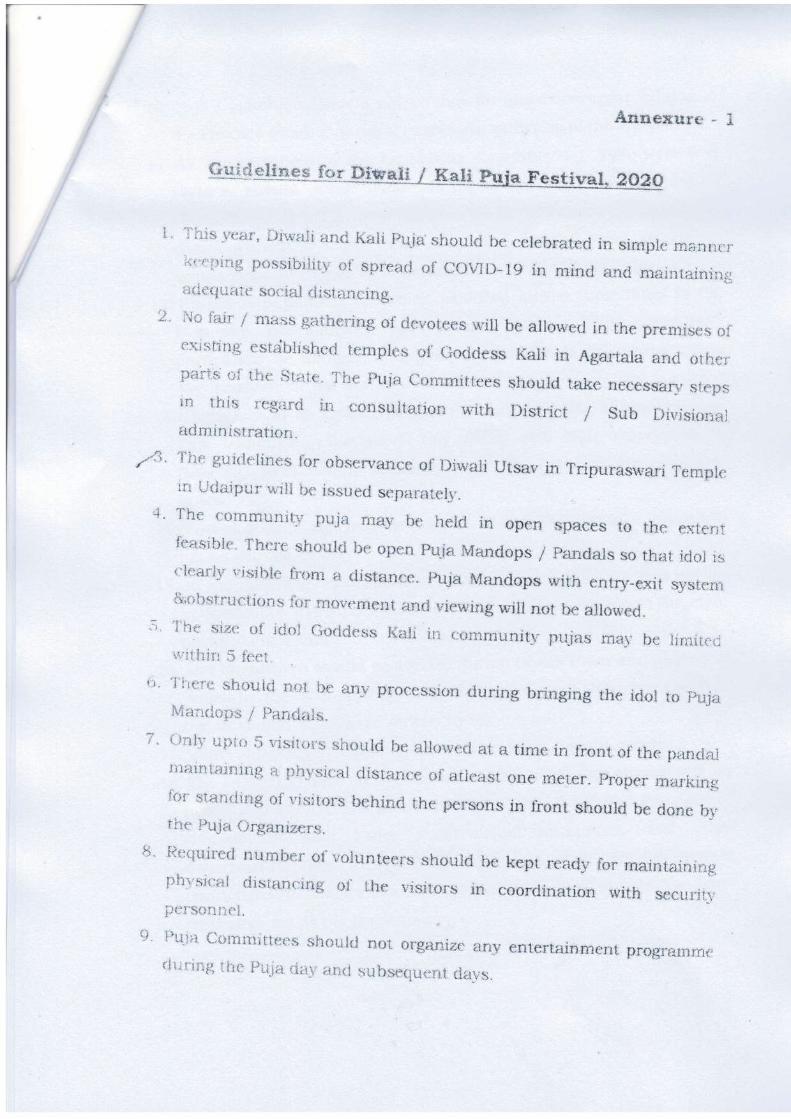
350
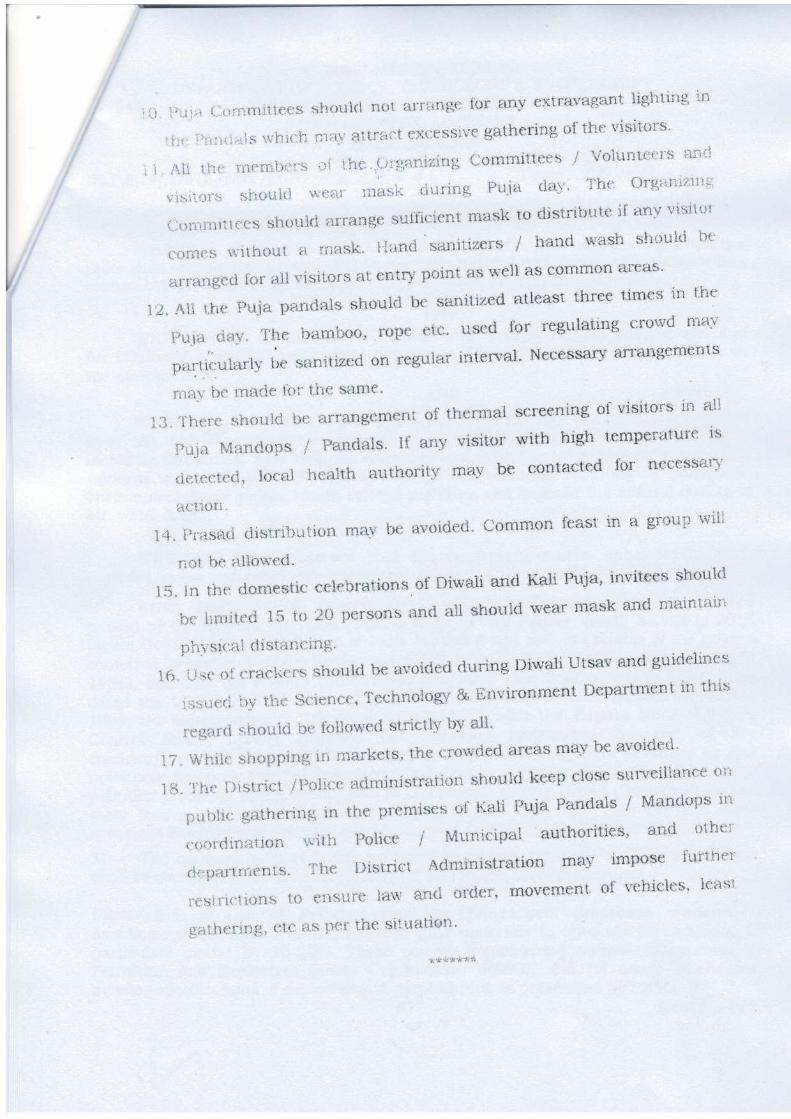
351
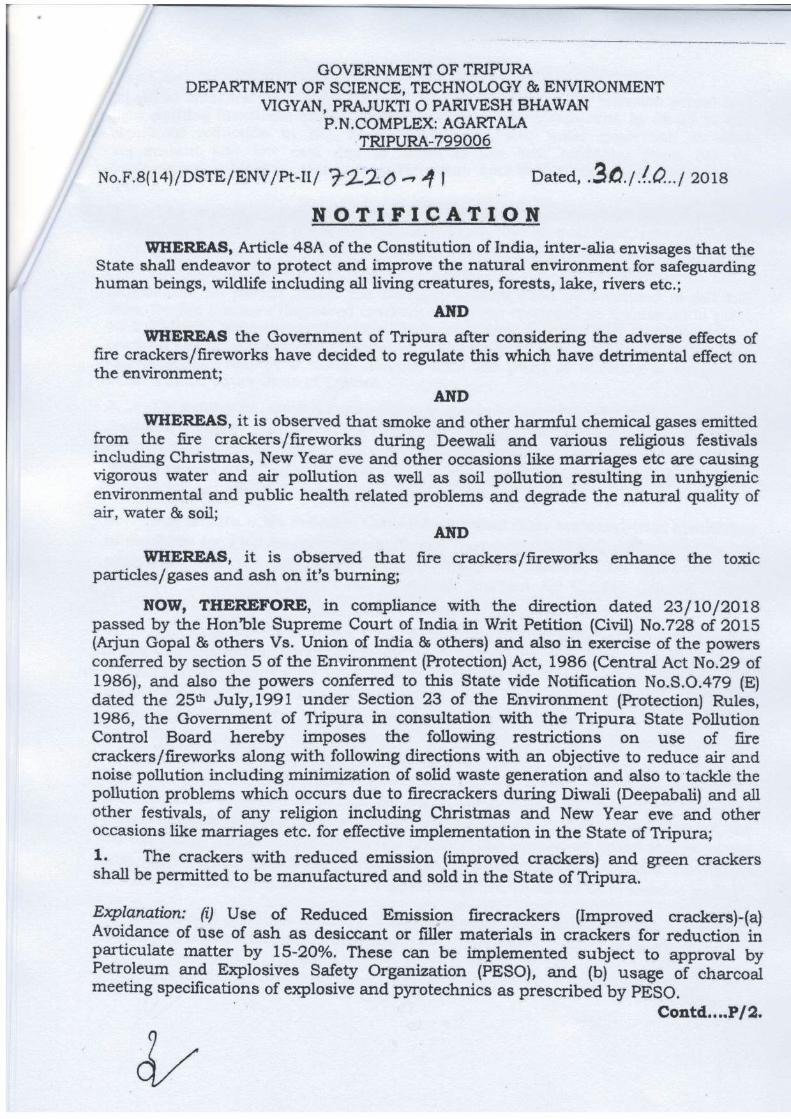
352
353
354
355
356
357
358
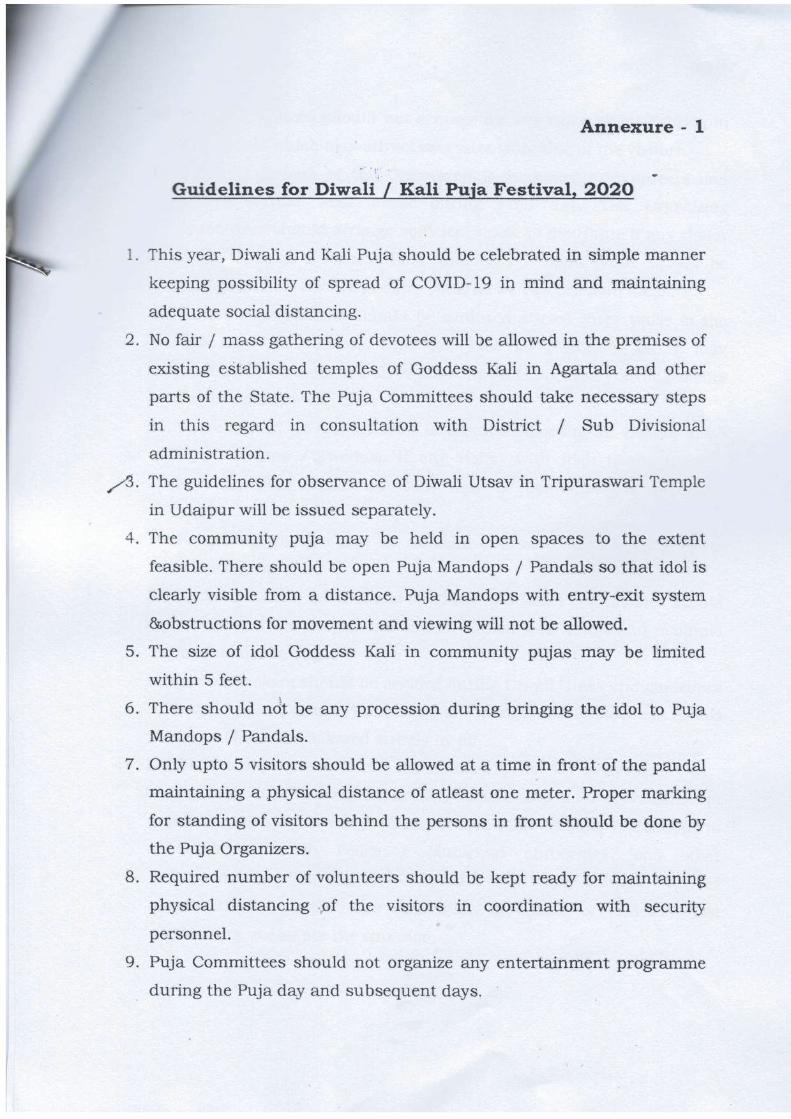
359
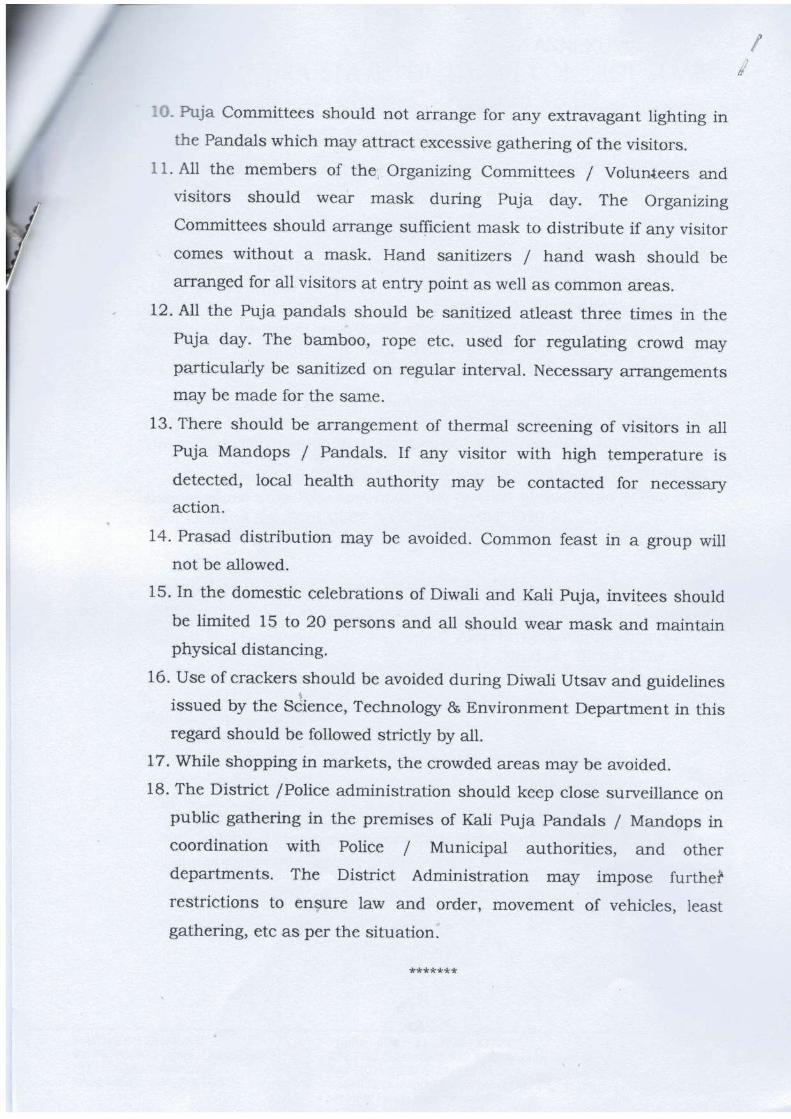
360
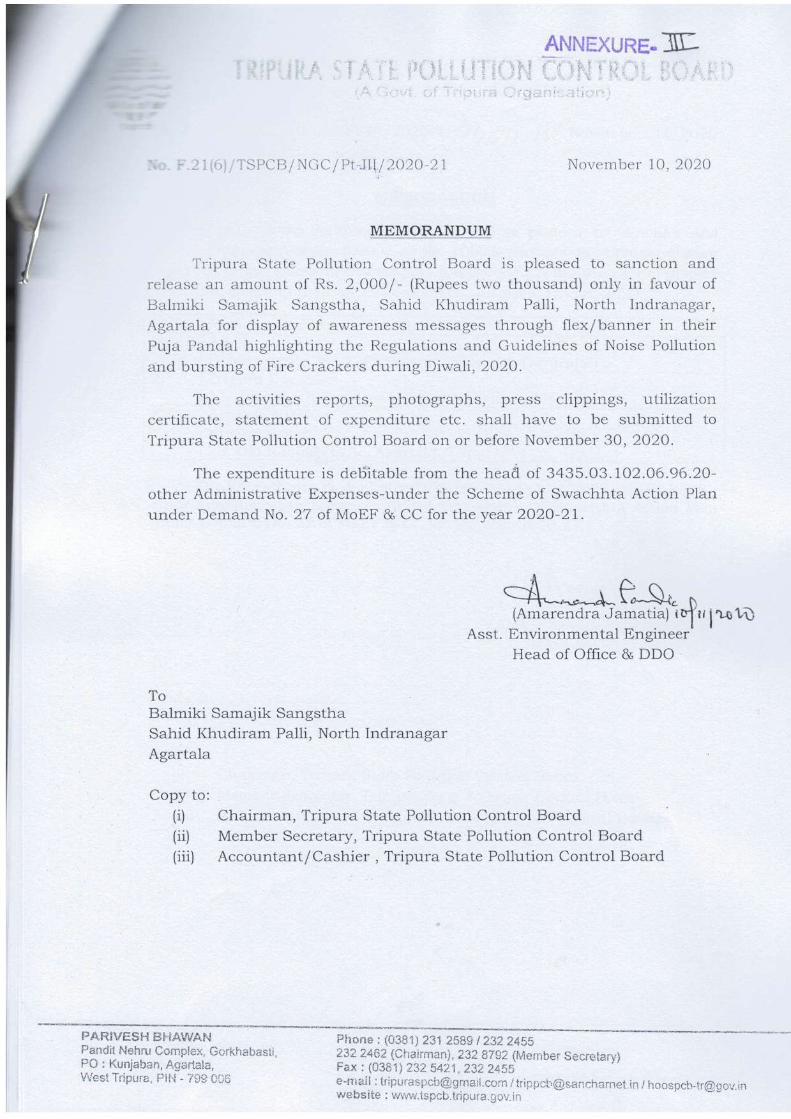
361
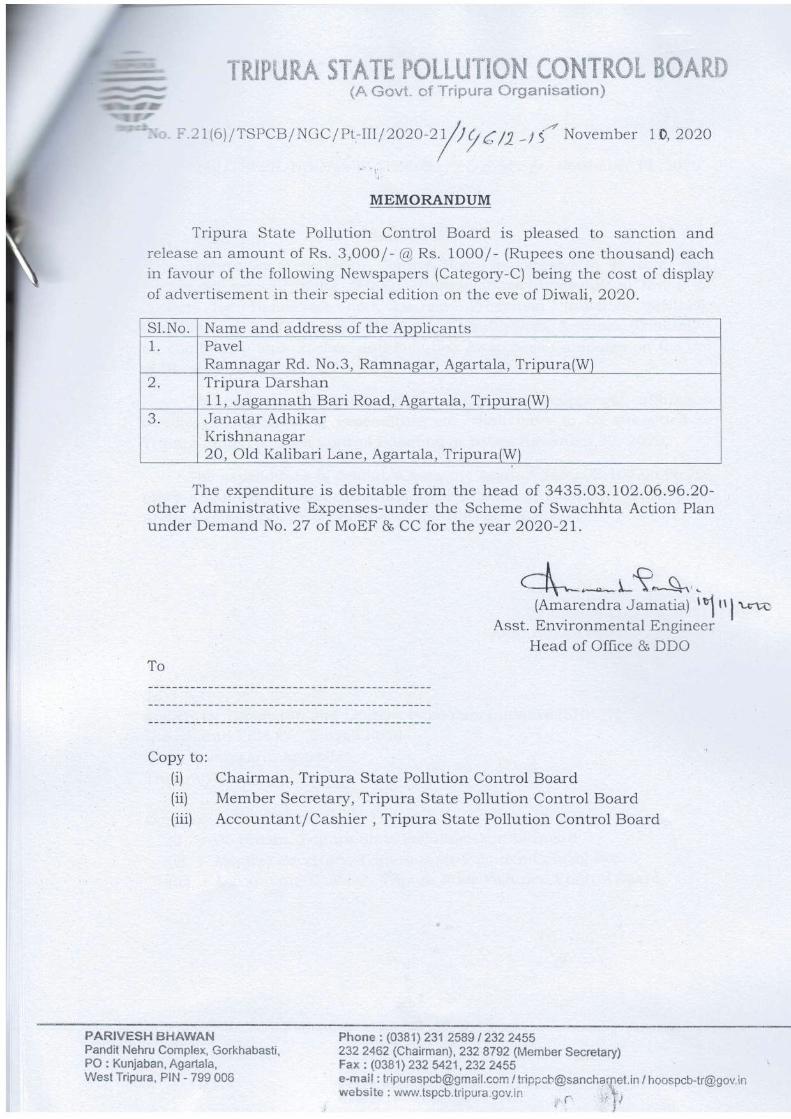
362
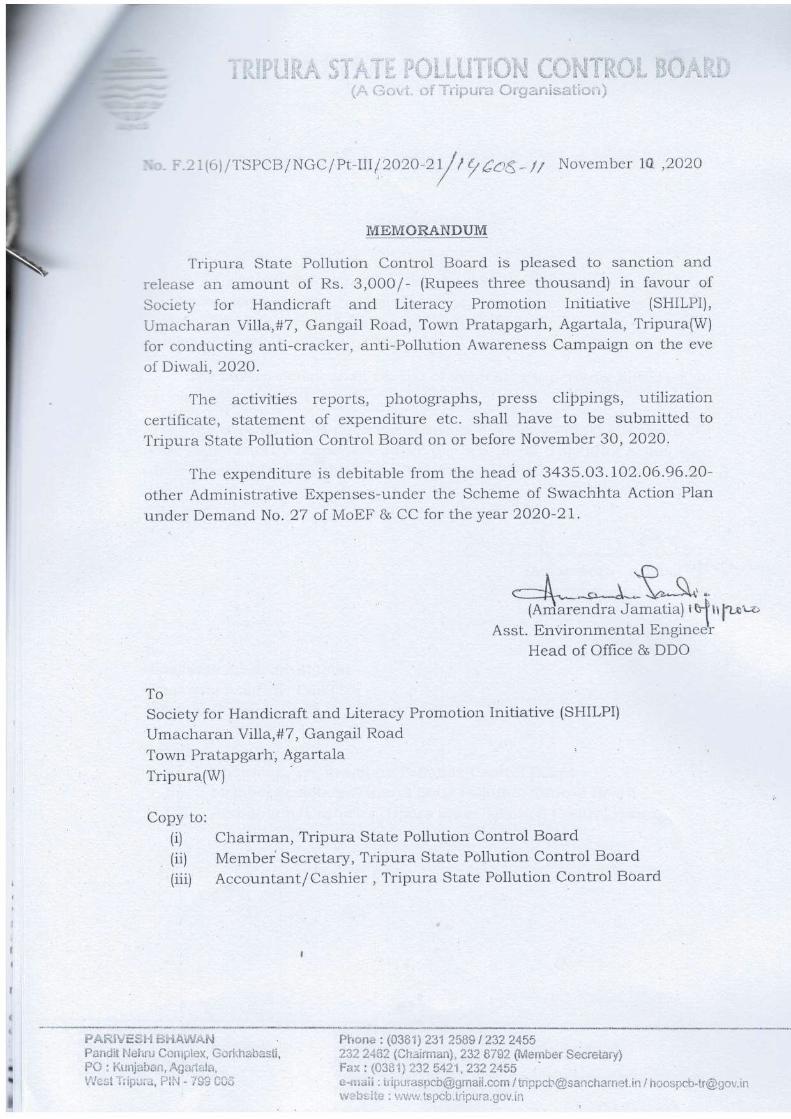
363
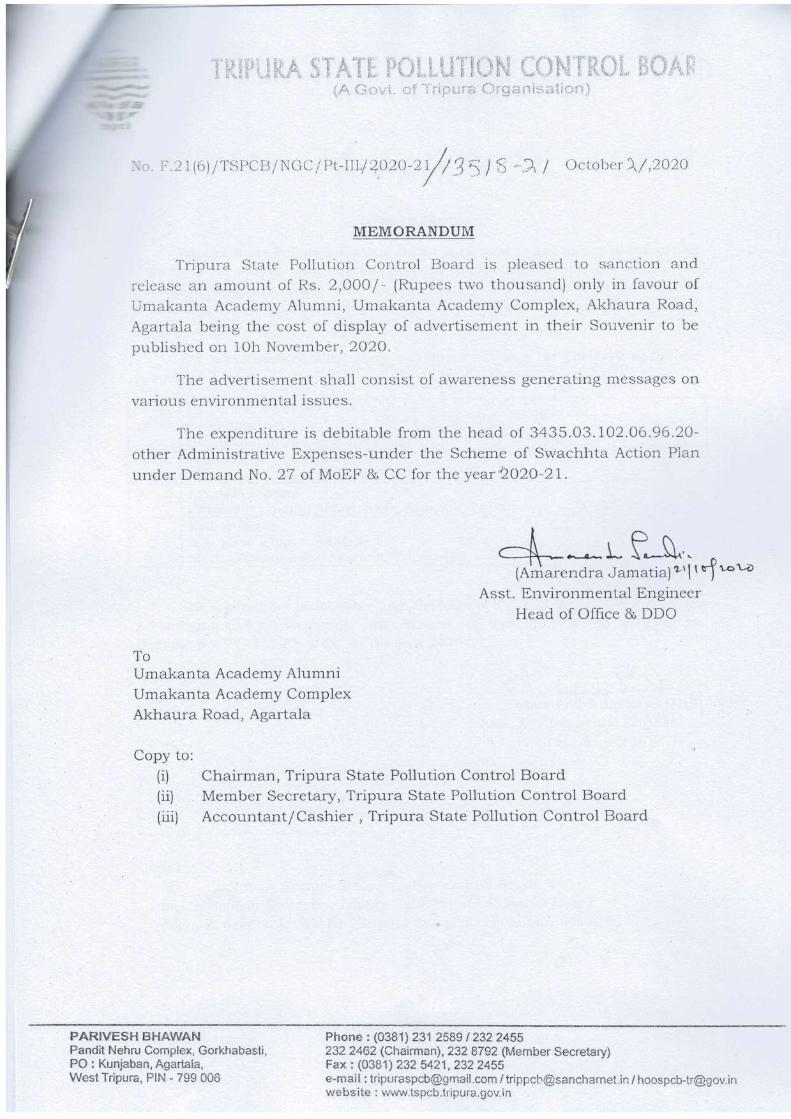
364
365
366
367
368
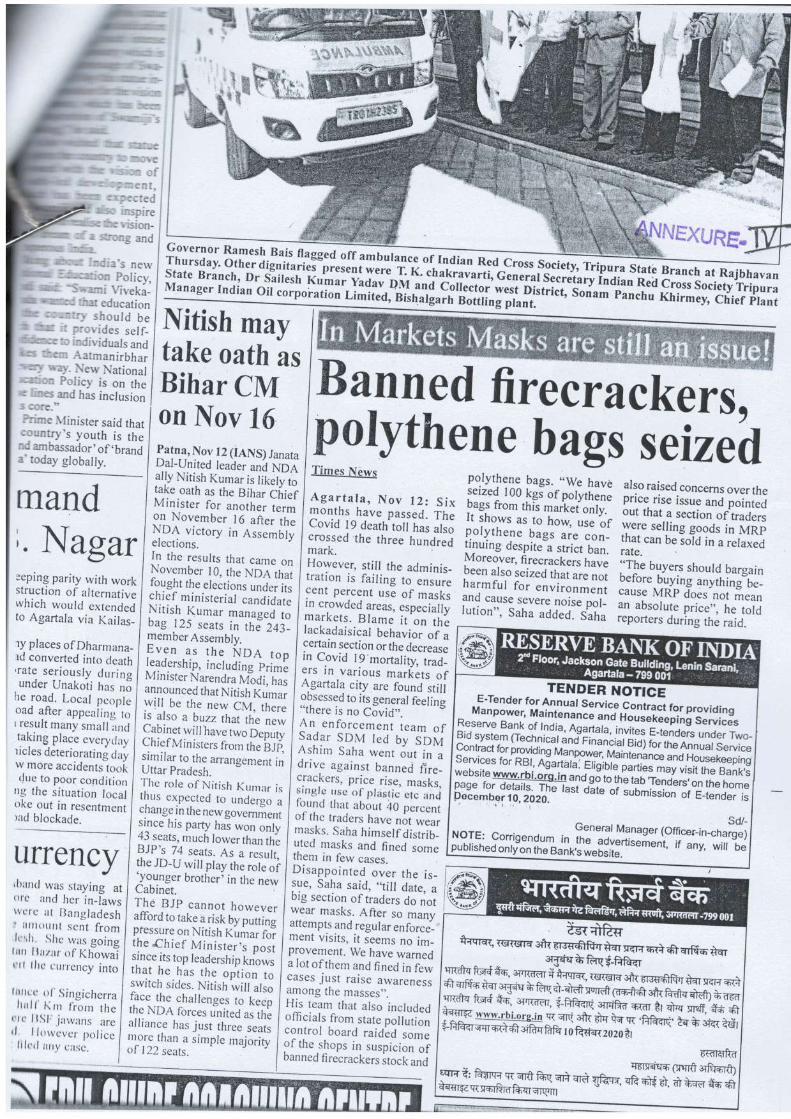
369
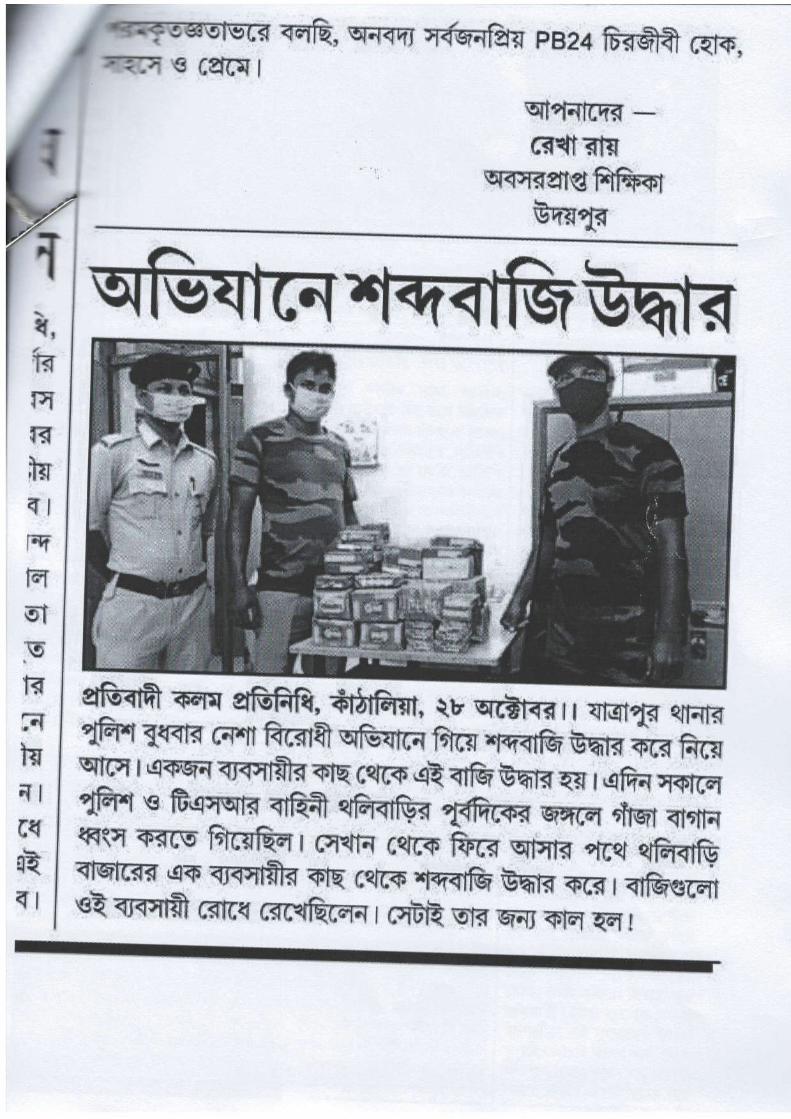
370
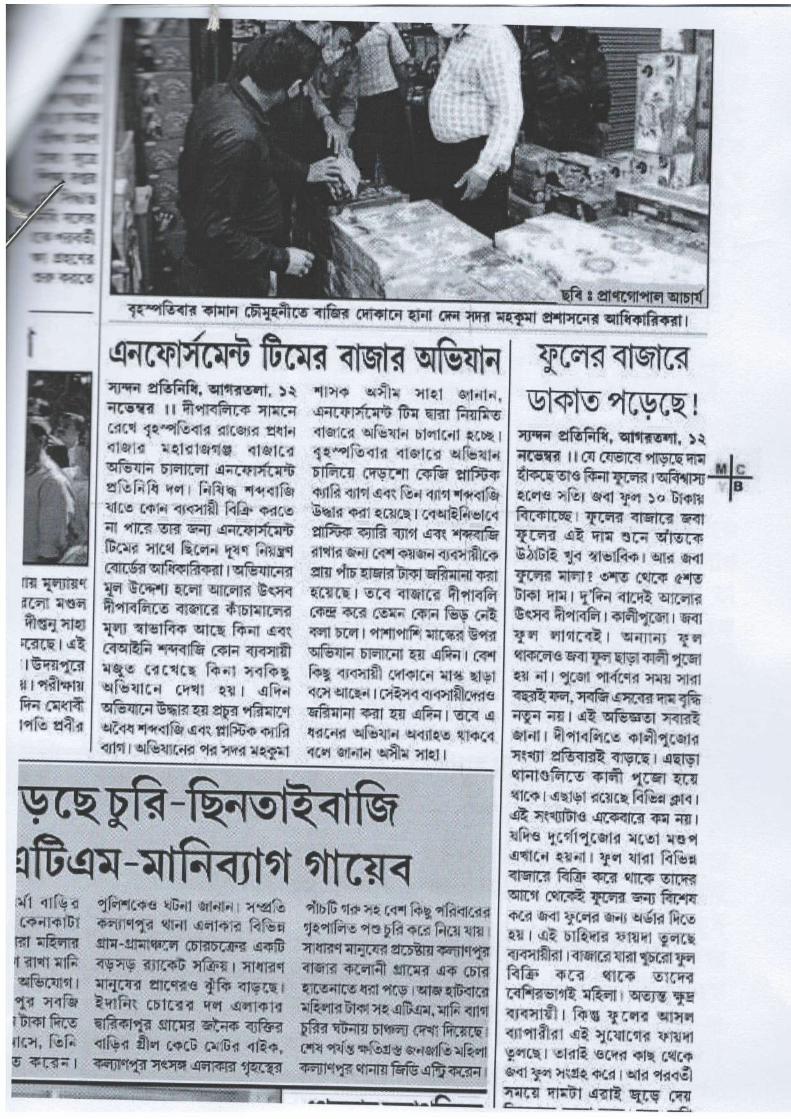
371
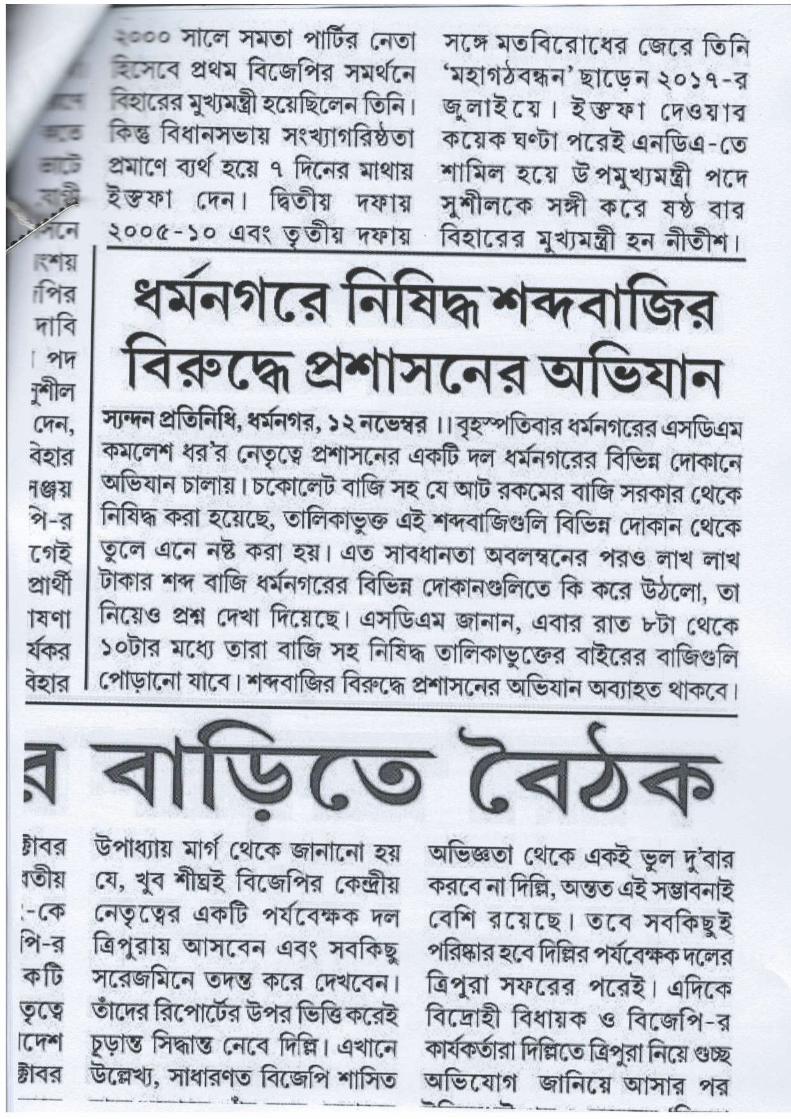
372
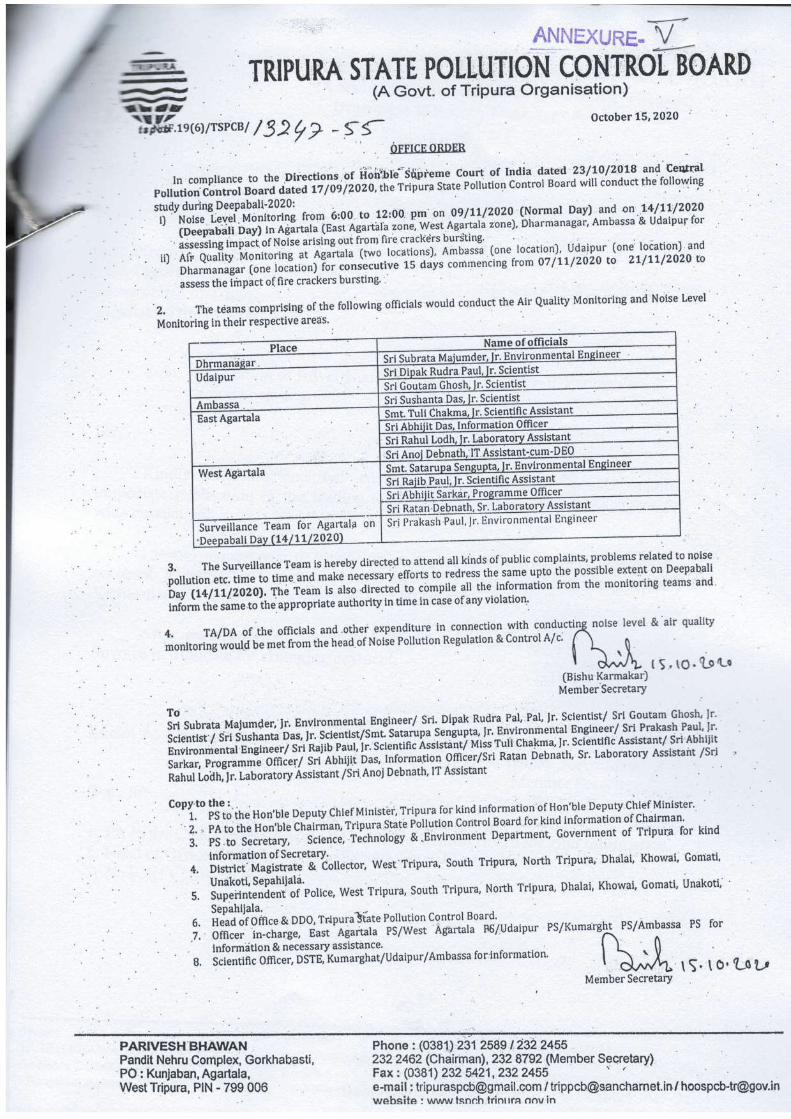
373
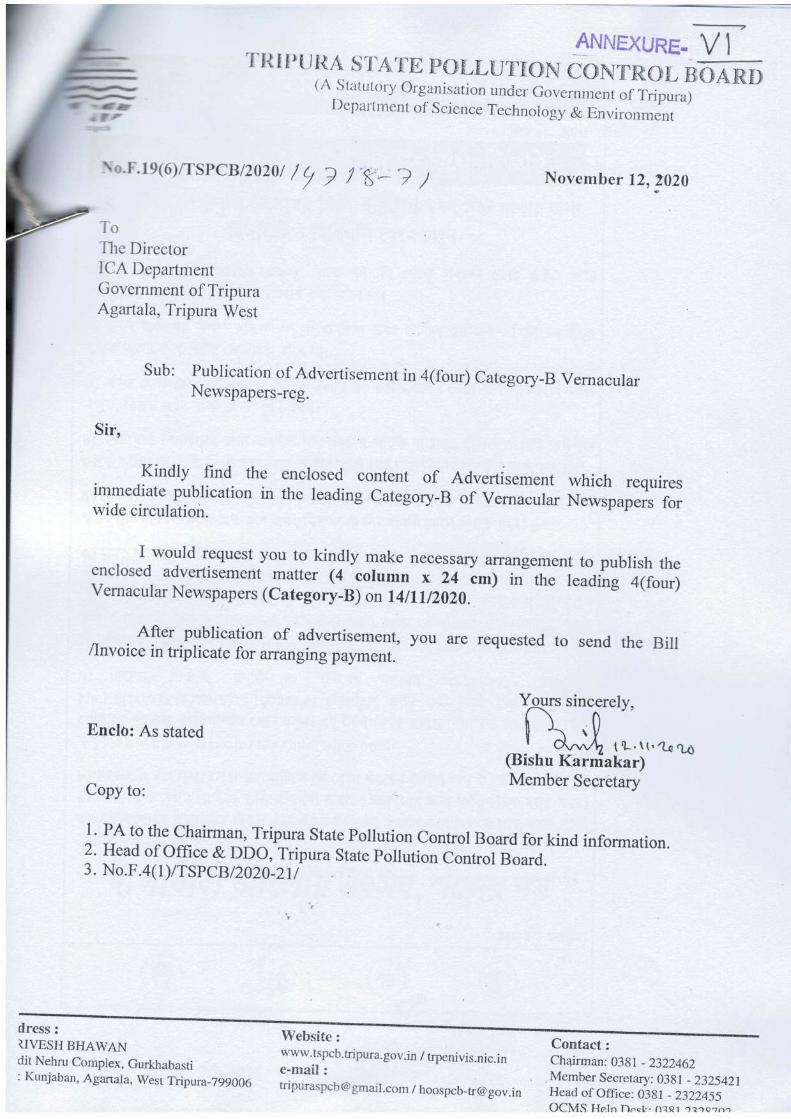
374
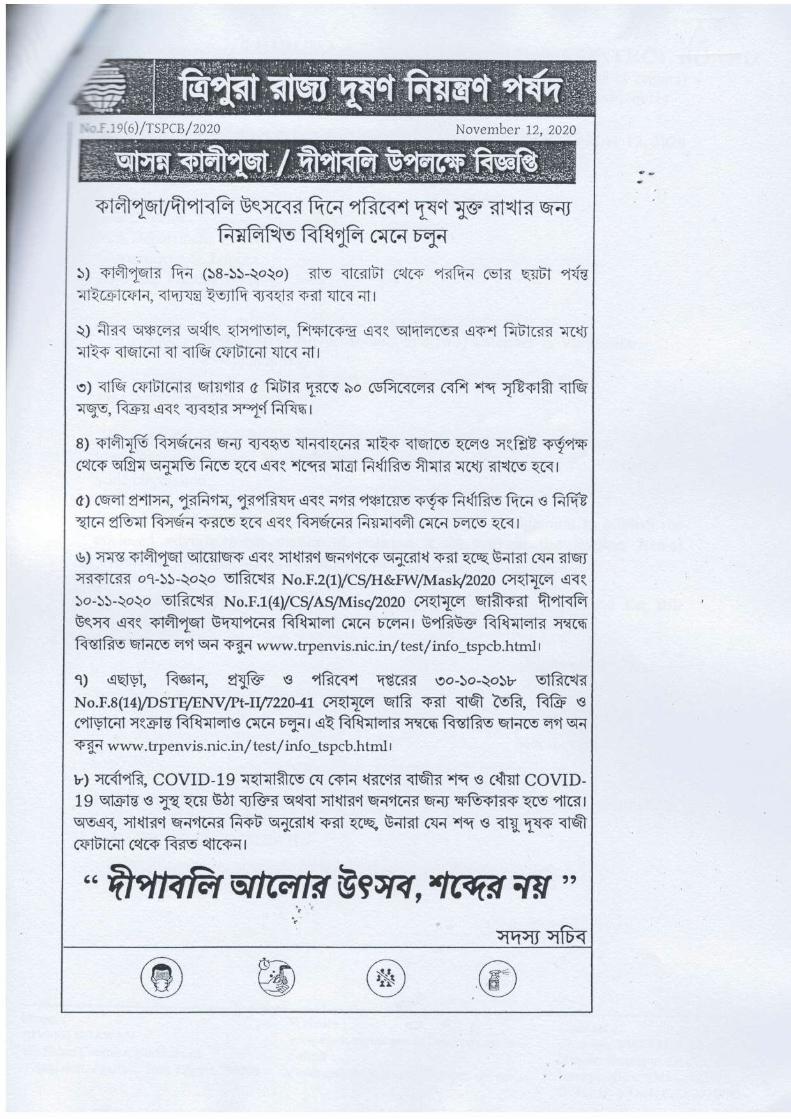
375
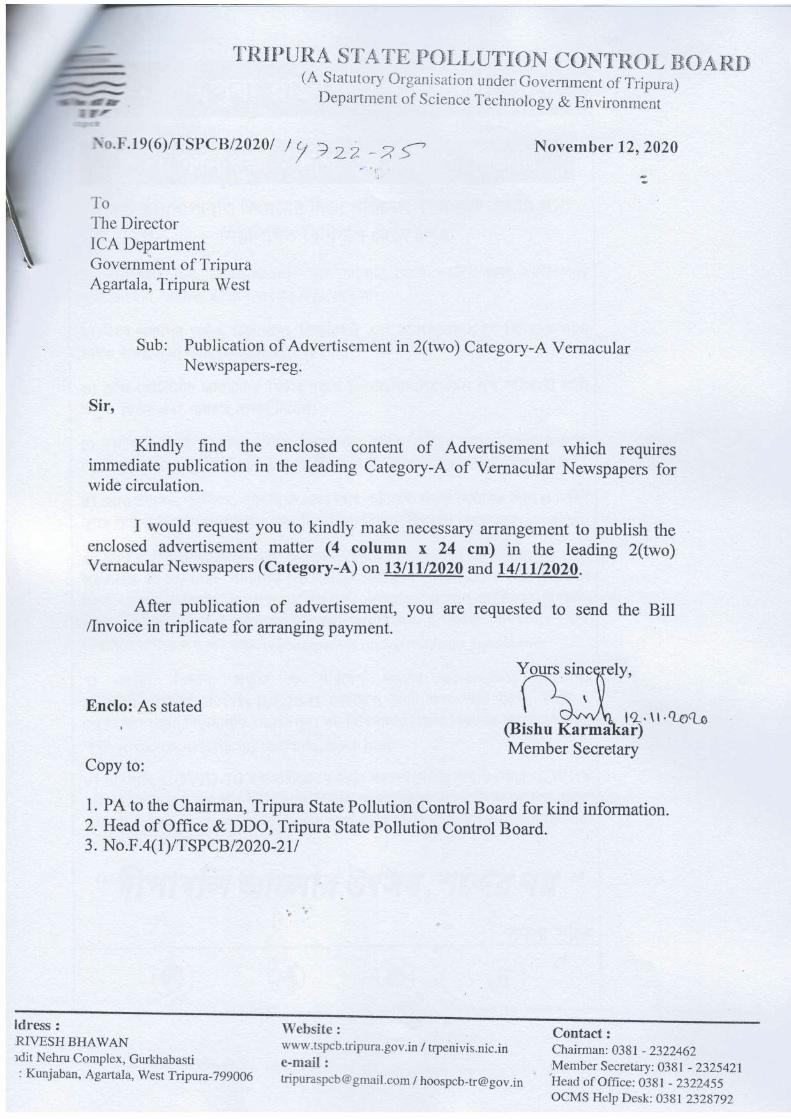
376
377
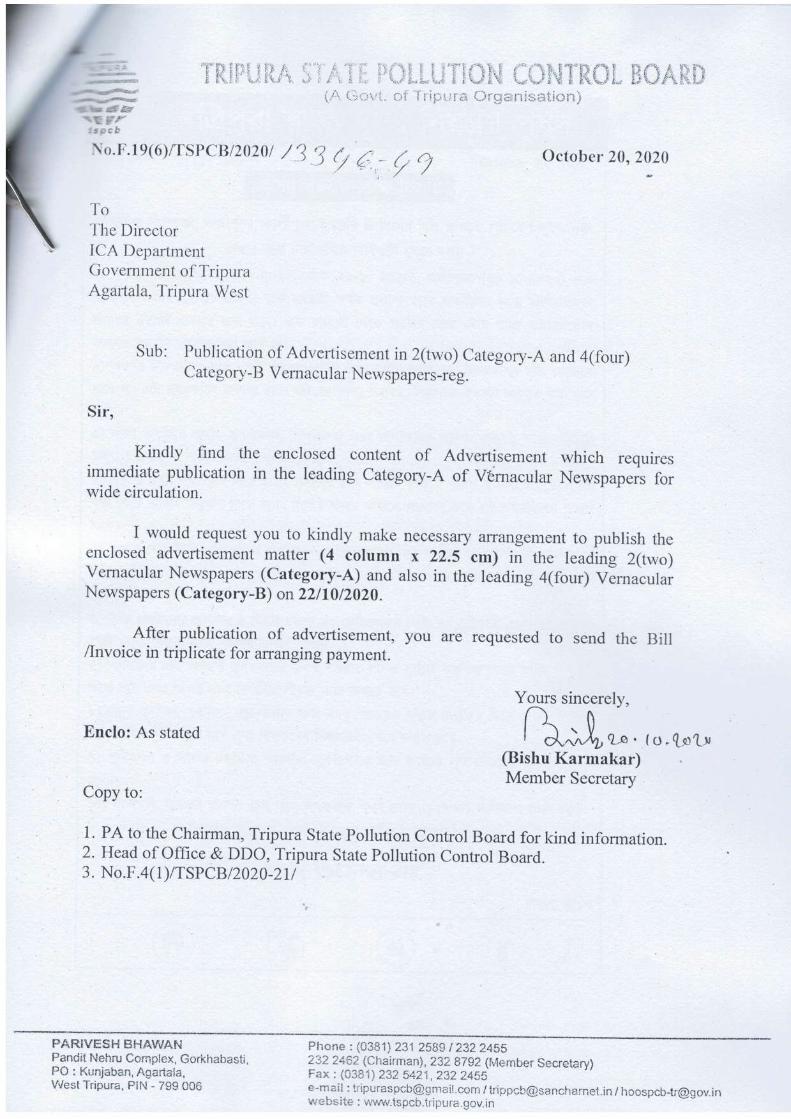
378
379
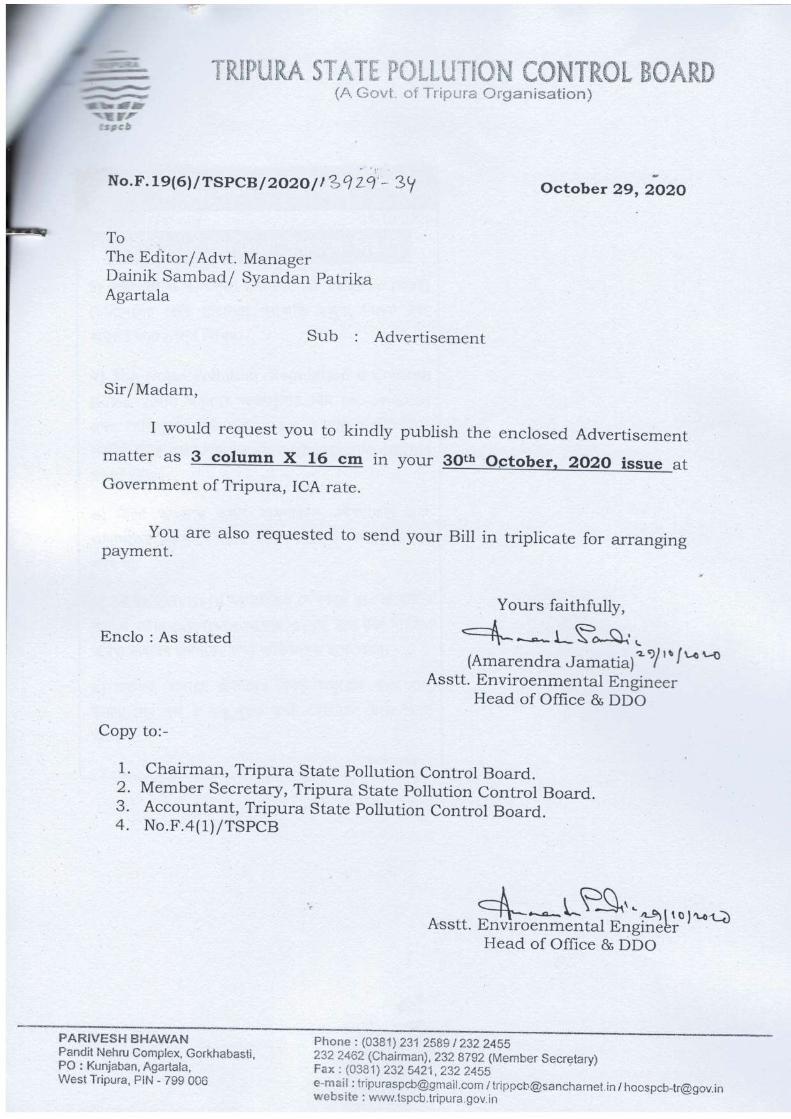
380
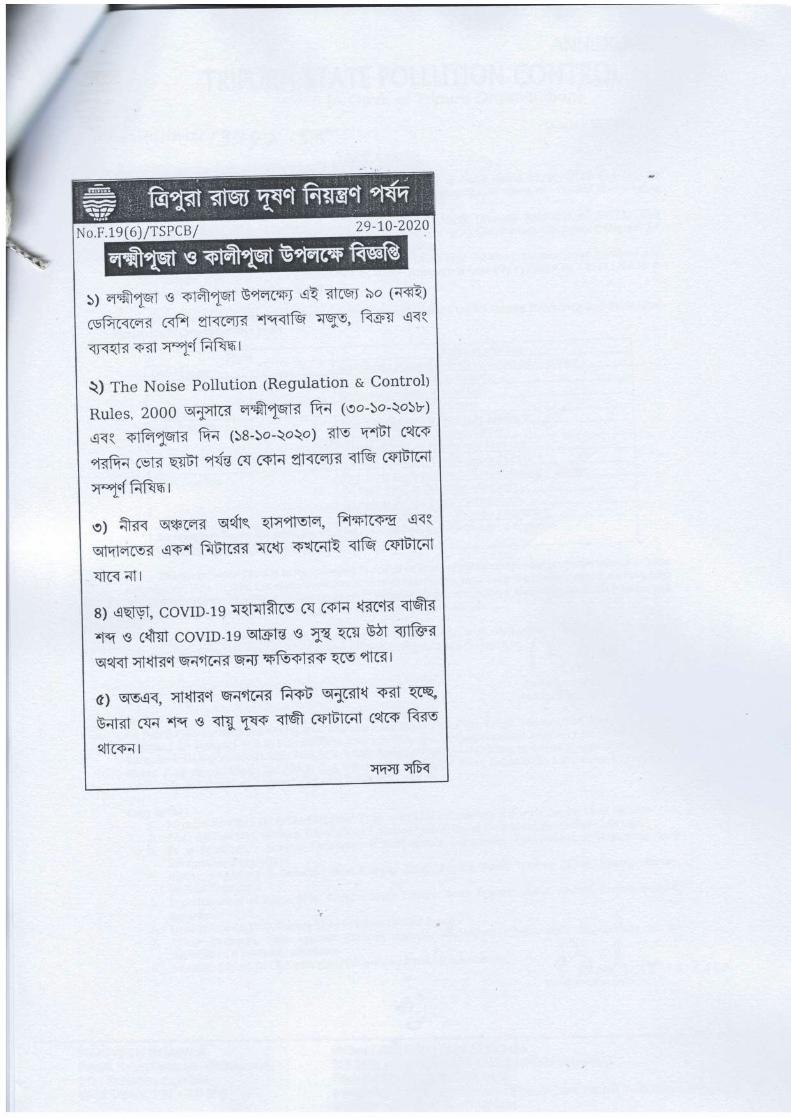
381
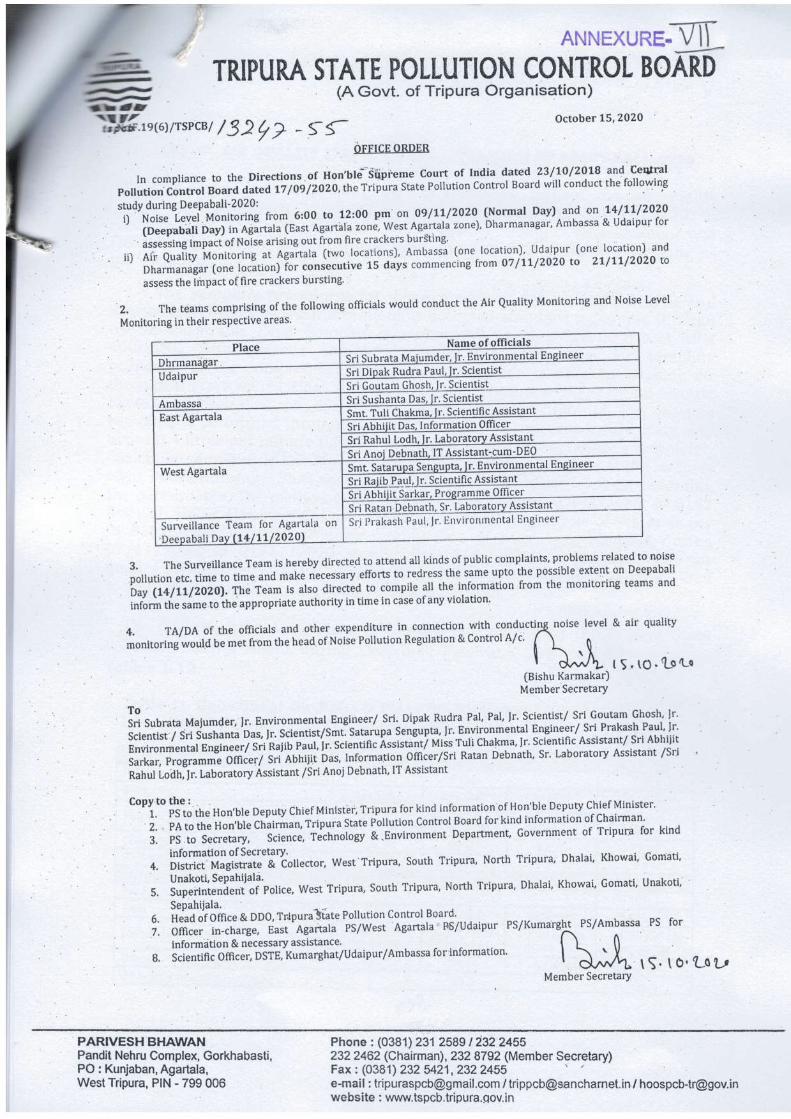
382
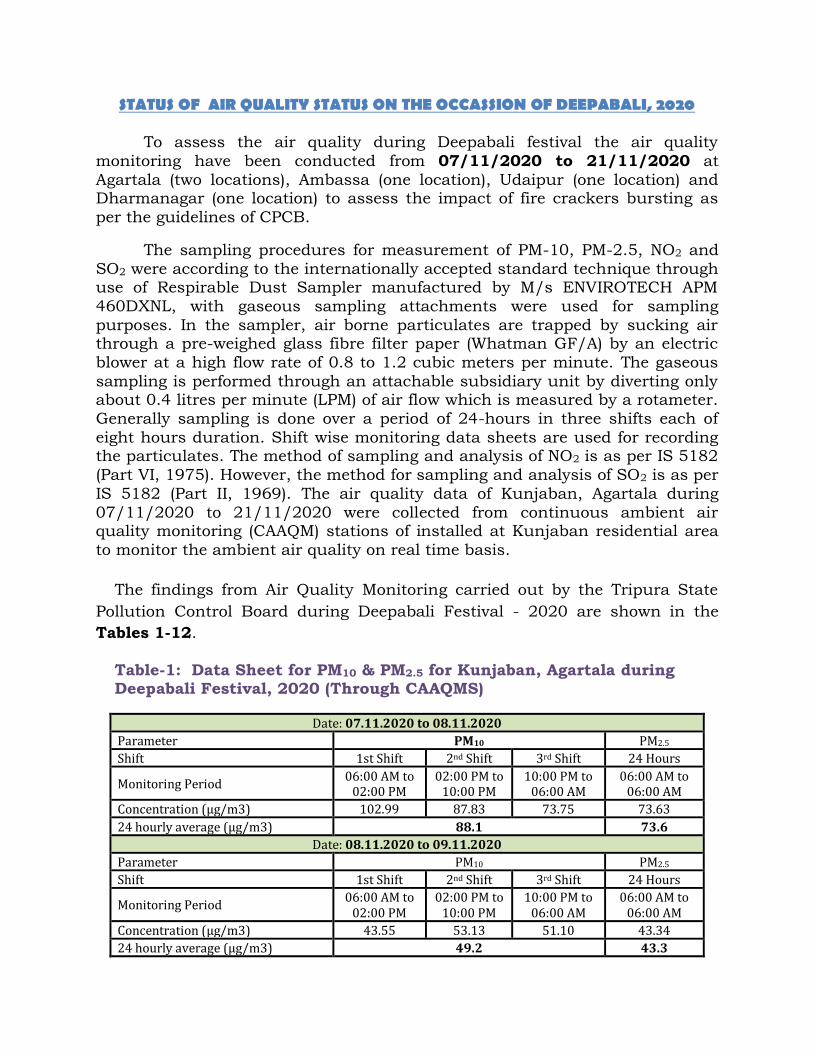
STATUS OF AIR QUALITY STATUS ON THE OCCASSION OF DEEPABALI, 2020
To assess the air quality during Deepabali festival the air quality
monitoring have been conducted from 07/11/2020 to 21/11/2020 at
Agartala (two locations), Ambassa (one location), Udaipur (one location) and Dharmanagar (one location) to assess the impact of fire crackers bursting as
per the guidelines of CPCB.
The sampling procedures for measurement of PM-10, PM-2.5, NO2 and
SO2 were according to the internationally accepted standard technique through use of Respirable Dust Sampler manufactured by M/s ENVIROTECH APM
460DXNL, with gaseous sampling attachments were used for sampling
purposes. In the sampler, air borne particulates are trapped by sucking air through a pre-weighed glass fibre filter paper (Whatman GF/A) by an electric
blower at a high flow rate of 0.8 to 1.2 cubic meters per minute. The gaseous
sampling is performed through an attachable subsidiary unit by diverting only about 0.4 litres per minute (LPM) of air flow which is measured by a rotameter.
Generally sampling is done over a period of 24-hours in three shifts each of
eight hours duration. Shift wise monitoring data sheets are used for recording the particulates. The method of sampling and analysis of NO2 is as per IS 5182
(Part VI, 1975). However, the method for sampling and analysis of SO2 is as per
IS 5182 (Part II, 1969). The air quality data of Kunjaban, Agartala during
07/11/2020 to 21/11/2020 were collected from continuous ambient air quality monitoring (CAAQM) stations of installed at Kunjaban residential area
to monitor the ambient air quality on real time basis.
The findings from Air Quality Monitoring carried out by the Tripura State
Pollution Control Board during Deepabali Festival - 2020 are shown in the
Tables 1-12.
Table-1: Data Sheet for PM10 & PM2.5 for Kunjaban, Agartala during Deepabali Festival, 2020 (Through CAAQMS)
Date: 07.11.2020 to 08.11.2020
Parameter PM10 PM2.5
Shift 1st Shift 2nd Shift 3rd Shift 24 Hours
Monitoring Period 06:00 AM to
02:00 PM 02:00 PM to
10:00 PM 10:00 PM to
06:00 AM 06:00 AM to
06:00 AM
Concentration (µg/m3) 102.99 87.83 73.75 73.63
24 hourly average (µg/m3) 88.1 73.6
Date: 08.11.2020 to 09.11.2020
Parameter PM10 PM2.5
Shift 1st Shift 2nd Shift 3rd Shift 24 Hours
Monitoring Period 06:00 AM to
02:00 PM 02:00 PM to
10:00 PM 10:00 PM to
06:00 AM 06:00 AM to
06:00 AM
Concentration (µg/m3) 43.55 53.13 51.10 43.34
24 hourly average (µg/m3) 49.2 43.3
383
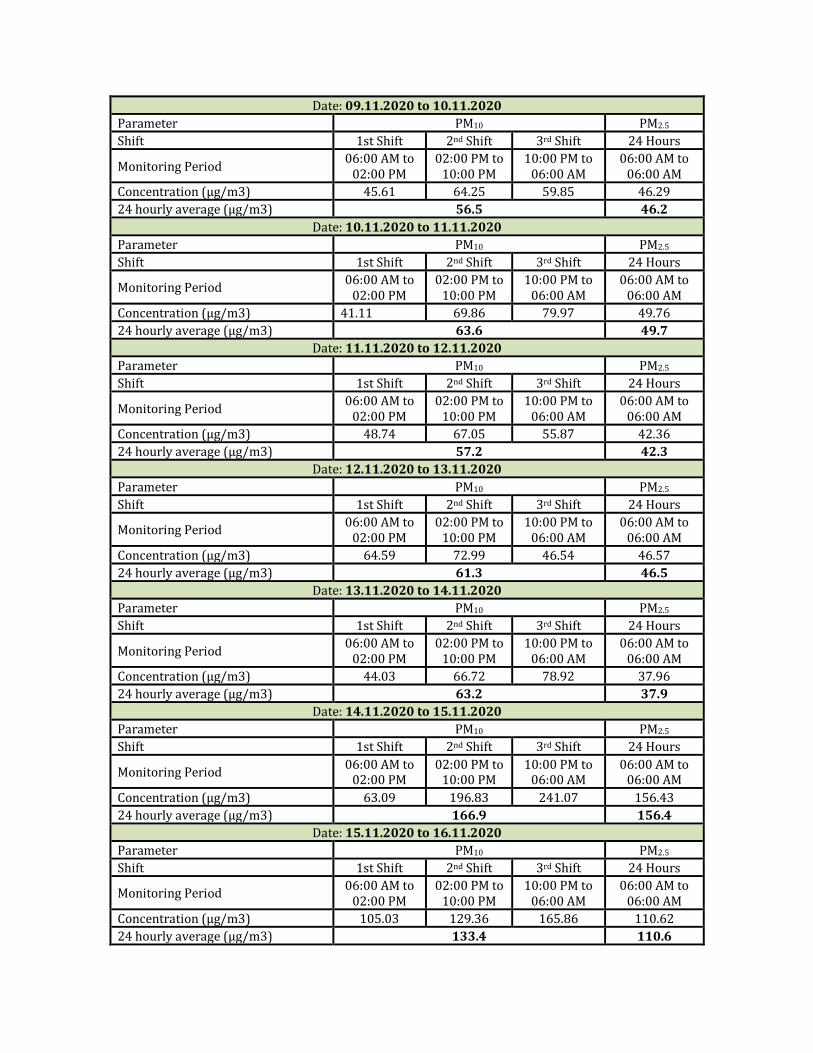
Date: 09.11.2020 to 10.11.2020
Parameter PM10 PM2.5
Shift 1st Shift 2nd Shift 3rd Shift 24 Hours
Monitoring Period 06:00 AM to
02:00 PM 02:00 PM to
10:00 PM 10:00 PM to
06:00 AM 06:00 AM to
06:00 AM
Concentration (µg/m3) 45.61 64.25 59.85 46.29
24 hourly average (µg/m3) 56.5 46.2
Date: 10.11.2020 to 11.11.2020
Parameter PM10 PM2.5
Shift 1st Shift 2nd Shift 3rd Shift 24 Hours
Monitoring Period 06:00 AM to
02:00 PM 02:00 PM to
10:00 PM 10:00 PM to
06:00 AM 06:00 AM to
06:00 AM
Concentration (µg/m3) 41.11 69.86 79.97 49.76
24 hourly average (µg/m3) 63.6 49.7
Date: 11.11.2020 to 12.11.2020
Parameter PM10 PM2.5
Shift 1st Shift 2nd Shift 3rd Shift 24 Hours
Monitoring Period 06:00 AM to
02:00 PM 02:00 PM to
10:00 PM 10:00 PM to
06:00 AM 06:00 AM to
06:00 AM
Concentration (µg/m3) 48.74 67.05 55.87 42.36
24 hourly average (µg/m3) 57.2 42.3
Date: 12.11.2020 to 13.11.2020
Parameter PM10 PM2.5
Shift 1st Shift 2nd Shift 3rd Shift 24 Hours
Monitoring Period 06:00 AM to
02:00 PM 02:00 PM to
10:00 PM 10:00 PM to
06:00 AM 06:00 AM to
06:00 AM
Concentration (µg/m3) 64.59 72.99 46.54 46.57
24 hourly average (µg/m3) 61.3 46.5
Date: 13.11.2020 to 14.11.2020
Parameter PM10 PM2.5
Shift 1st Shift 2nd Shift 3rd Shift 24 Hours
Monitoring Period 06:00 AM to
02:00 PM 02:00 PM to
10:00 PM 10:00 PM to
06:00 AM 06:00 AM to
06:00 AM
Concentration (µg/m3) 44.03 66.72 78.92 37.96
24 hourly average (µg/m3) 63.2 37.9
Date: 14.11.2020 to 15.11.2020
Parameter PM10 PM2.5
Shift 1st Shift 2nd Shift 3rd Shift 24 Hours
Monitoring Period 06:00 AM to
02:00 PM 02:00 PM to
10:00 PM 10:00 PM to
06:00 AM 06:00 AM to
06:00 AM
Concentration (µg/m3) 63.09 196.83 241.07 156.43
24 hourly average (µg/m3) 166.9 156.4
Date: 15.11.2020 to 16.11.2020
Parameter PM10 PM2.5
Shift 1st Shift 2nd Shift 3rd Shift 24 Hours
Monitoring Period 06:00 AM to
02:00 PM 02:00 PM to
10:00 PM 10:00 PM to
06:00 AM 06:00 AM to
06:00 AM
Concentration (µg/m3) 105.03 129.36 165.86 110.62
24 hourly average (µg/m3) 133.4 110.6
384
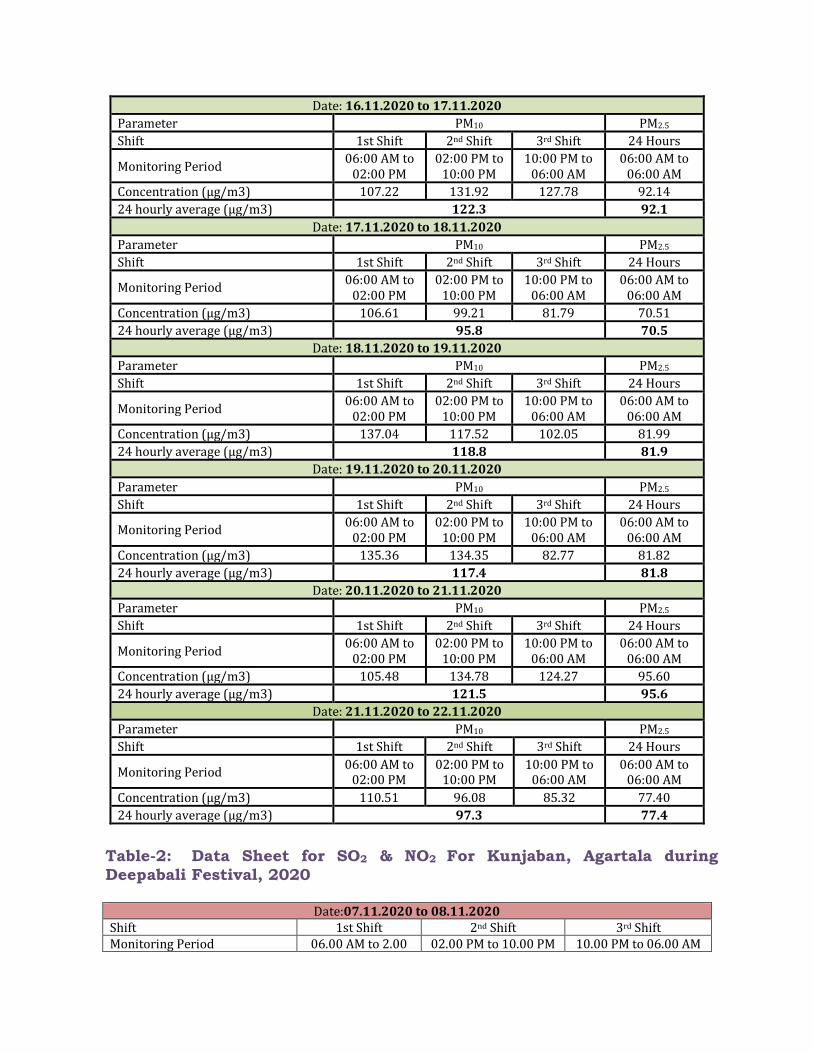
Date: 16.11.2020 to 17.11.2020
Parameter PM10 PM2.5
Shift 1st Shift 2nd Shift 3rd Shift 24 Hours
Monitoring Period 06:00 AM to
02:00 PM 02:00 PM to
10:00 PM 10:00 PM to
06:00 AM 06:00 AM to
06:00 AM
Concentration (µg/m3) 107.22 131.92 127.78 92.14
24 hourly average (µg/m3) 122.3 92.1
Date: 17.11.2020 to 18.11.2020
Parameter PM10 PM2.5
Shift 1st Shift 2nd Shift 3rd Shift 24 Hours
Monitoring Period 06:00 AM to
02:00 PM 02:00 PM to
10:00 PM 10:00 PM to
06:00 AM 06:00 AM to
06:00 AM
Concentration (µg/m3) 106.61 99.21 81.79 70.51
24 hourly average (µg/m3) 95.8 70.5
Date: 18.11.2020 to 19.11.2020
Parameter PM10 PM2.5
Shift 1st Shift 2nd Shift 3rd Shift 24 Hours
Monitoring Period 06:00 AM to
02:00 PM 02:00 PM to
10:00 PM 10:00 PM to
06:00 AM 06:00 AM to
06:00 AM
Concentration (µg/m3) 137.04 117.52 102.05 81.99
24 hourly average (µg/m3) 118.8 81.9
Date: 19.11.2020 to 20.11.2020
Parameter PM10 PM2.5
Shift 1st Shift 2nd Shift 3rd Shift 24 Hours
Monitoring Period 06:00 AM to
02:00 PM 02:00 PM to
10:00 PM 10:00 PM to
06:00 AM 06:00 AM to
06:00 AM
Concentration (µg/m3) 135.36 134.35 82.77 81.82
24 hourly average (µg/m3) 117.4 81.8
Date: 20.11.2020 to 21.11.2020
Parameter PM10 PM2.5
Shift 1st Shift 2nd Shift 3rd Shift 24 Hours
Monitoring Period 06:00 AM to
02:00 PM 02:00 PM to
10:00 PM 10:00 PM to
06:00 AM 06:00 AM to
06:00 AM
Concentration (µg/m3) 105.48 134.78 124.27 95.60
24 hourly average (µg/m3) 121.5 95.6
Date: 21.11.2020 to 22.11.2020
Parameter PM10 PM2.5
Shift 1st Shift 2nd Shift 3rd Shift 24 Hours
Monitoring Period 06:00 AM to
02:00 PM 02:00 PM to
10:00 PM 10:00 PM to
06:00 AM 06:00 AM to
06:00 AM
Concentration (µg/m3) 110.51 96.08 85.32 77.40
24 hourly average (µg/m3) 97.3 77.4
Table-2: Data Sheet for SO2 & NO2 For Kunjaban, Agartala during
Deepabali Festival, 2020
Date:07.11.2020 to 08.11.2020 Shift 1st Shift 2nd Shift 3rd Shift Monitoring Period 06.00 AM to 2.00 02.00 PM to 10.00 PM 10.00 PM to 06.00 AM
385
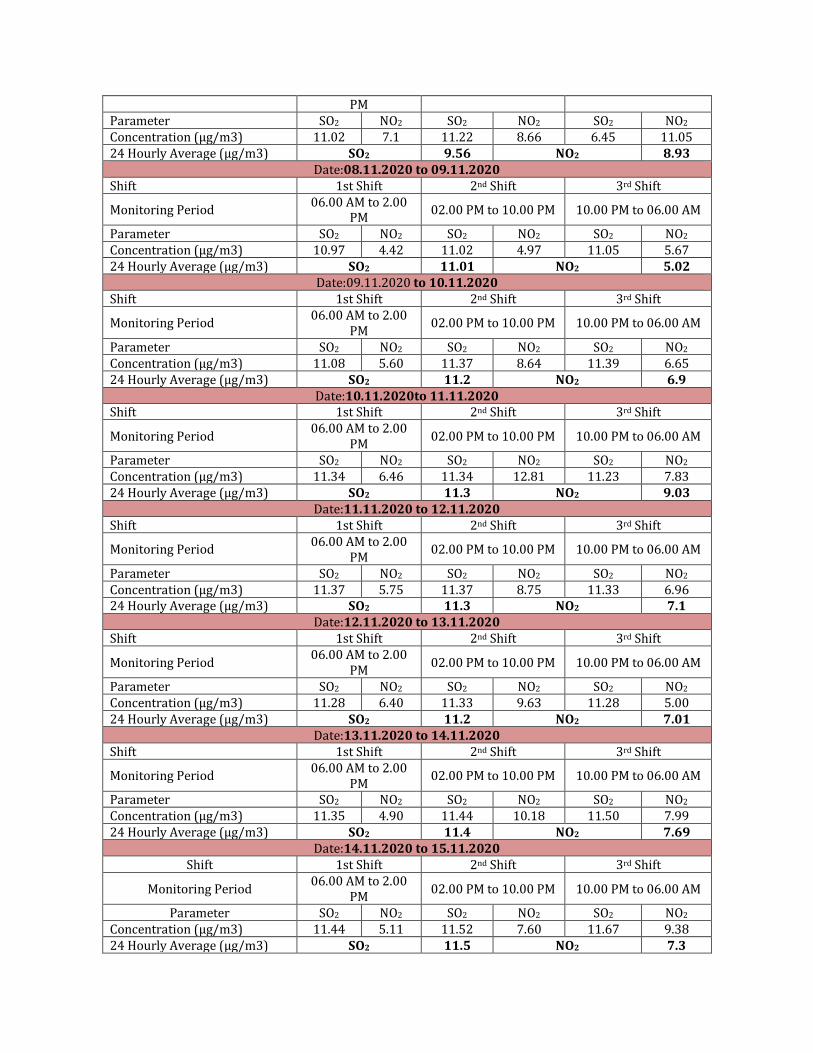
PM Parameter SO2 NO2 SO2 NO2 SO2 NO2 Concentration (µg/m3) 11.02 7.1 11.22 8.66 6.45 11.05 24 Hourly Average (µg/m3) SO2 9.56 NO2 8.93
Date:08.11.2020 to 09.11.2020 Shift 1st Shift 2nd Shift 3rd Shift
Monitoring Period 06.00 AM to 2.00
PM 02.00 PM to 10.00 PM 10.00 PM to 06.00 AM
Parameter SO2 NO2 SO2 NO2 SO2 NO2 Concentration (µg/m3) 10.97 4.42 11.02 4.97 11.05 5.67 24 Hourly Average (µg/m3) SO2 11.01 NO2 5.02
Date:09.11.2020 to 10.11.2020 Shift 1st Shift 2nd Shift 3rd Shift
Monitoring Period 06.00 AM to 2.00
PM 02.00 PM to 10.00 PM 10.00 PM to 06.00 AM
Parameter SO2 NO2 SO2 NO2 SO2 NO2 Concentration (µg/m3) 11.08 5.60 11.37 8.64 11.39 6.65 24 Hourly Average (µg/m3) SO2 11.2 NO2 6.9
Date:10.11.2020to 11.11.2020 Shift 1st Shift 2nd Shift 3rd Shift
Monitoring Period 06.00 AM to 2.00
PM 02.00 PM to 10.00 PM 10.00 PM to 06.00 AM
Parameter SO2 NO2 SO2 NO2 SO2 NO2 Concentration (µg/m3) 11.34 6.46 11.34 12.81 11.23 7.83 24 Hourly Average (µg/m3) SO2 11.3 NO2 9.03
Date:11.11.2020 to 12.11.2020 Shift 1st Shift 2nd Shift 3rd Shift
Monitoring Period 06.00 AM to 2.00
PM 02.00 PM to 10.00 PM 10.00 PM to 06.00 AM
Parameter SO2 NO2 SO2 NO2 SO2 NO2 Concentration (µg/m3) 11.37 5.75 11.37 8.75 11.33 6.96 24 Hourly Average (µg/m3) SO2 11.3 NO2 7.1
Date:12.11.2020 to 13.11.2020 Shift 1st Shift 2nd Shift 3rd Shift
Monitoring Period 06.00 AM to 2.00
PM 02.00 PM to 10.00 PM 10.00 PM to 06.00 AM
Parameter SO2 NO2 SO2 NO2 SO2 NO2 Concentration (µg/m3) 11.28 6.40 11.33 9.63 11.28 5.00 24 Hourly Average (µg/m3) SO2 11.2 NO2 7.01
Date:13.11.2020 to 14.11.2020 Shift 1st Shift 2nd Shift 3rd Shift
Monitoring Period 06.00 AM to 2.00
PM 02.00 PM to 10.00 PM 10.00 PM to 06.00 AM
Parameter SO2 NO2 SO2 NO2 SO2 NO2 Concentration (µg/m3) 11.35 4.90 11.44 10.18 11.50 7.99 24 Hourly Average (µg/m3) SO2 11.4 NO2 7.69
Date:14.11.2020 to 15.11.2020 Shift 1st Shift 2nd Shift 3rd Shift
Monitoring Period 06.00 AM to 2.00
PM 02.00 PM to 10.00 PM 10.00 PM to 06.00 AM
Parameter SO2 NO2 SO2 NO2 SO2 NO2 Concentration (µg/m3) 11.44 5.11 11.52 7.60 11.67 9.38 24 Hourly Average (µg/m3) SO2 11.5 NO2 7.3
386
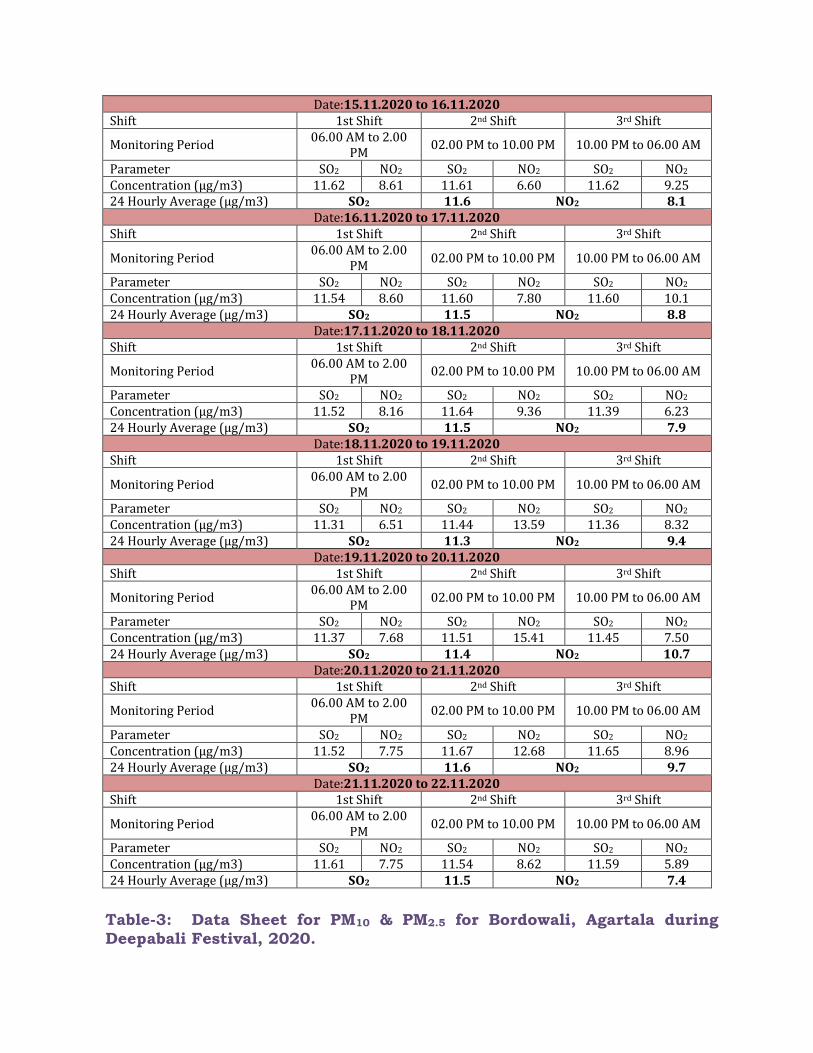
Date:15.11.2020 to 16.11.2020 Shift 1st Shift 2nd Shift 3rd Shift
Monitoring Period 06.00 AM to 2.00
PM 02.00 PM to 10.00 PM 10.00 PM to 06.00 AM
Parameter SO2 NO2 SO2 NO2 SO2 NO2 Concentration (µg/m3) 11.62 8.61 11.61 6.60 11.62 9.25 24 Hourly Average (µg/m3) SO2 11.6 NO2 8.1
Date:16.11.2020 to 17.11.2020 Shift 1st Shift 2nd Shift 3rd Shift
Monitoring Period 06.00 AM to 2.00
PM 02.00 PM to 10.00 PM 10.00 PM to 06.00 AM
Parameter SO2 NO2 SO2 NO2 SO2 NO2 Concentration (µg/m3) 11.54 8.60 11.60 7.80 11.60 10.1 24 Hourly Average (µg/m3) SO2 11.5 NO2 8.8
Date:17.11.2020 to 18.11.2020 Shift 1st Shift 2nd Shift 3rd Shift
Monitoring Period 06.00 AM to 2.00
PM 02.00 PM to 10.00 PM 10.00 PM to 06.00 AM
Parameter SO2 NO2 SO2 NO2 SO2 NO2 Concentration (µg/m3) 11.52 8.16 11.64 9.36 11.39 6.23 24 Hourly Average (µg/m3) SO2 11.5 NO2 7.9
Date:18.11.2020 to 19.11.2020 Shift 1st Shift 2nd Shift 3rd Shift
Monitoring Period 06.00 AM to 2.00
PM 02.00 PM to 10.00 PM 10.00 PM to 06.00 AM
Parameter SO2 NO2 SO2 NO2 SO2 NO2 Concentration (µg/m3) 11.31 6.51 11.44 13.59 11.36 8.32 24 Hourly Average (µg/m3) SO2 11.3 NO2 9.4
Date:19.11.2020 to 20.11.2020 Shift 1st Shift 2nd Shift 3rd Shift
Monitoring Period 06.00 AM to 2.00
PM 02.00 PM to 10.00 PM 10.00 PM to 06.00 AM
Parameter SO2 NO2 SO2 NO2 SO2 NO2 Concentration (µg/m3) 11.37 7.68 11.51 15.41 11.45 7.50 24 Hourly Average (µg/m3) SO2 11.4 NO2 10.7
Date:20.11.2020 to 21.11.2020 Shift 1st Shift 2nd Shift 3rd Shift
Monitoring Period 06.00 AM to 2.00
PM 02.00 PM to 10.00 PM 10.00 PM to 06.00 AM
Parameter SO2 NO2 SO2 NO2 SO2 NO2 Concentration (µg/m3) 11.52 7.75 11.67 12.68 11.65 8.96 24 Hourly Average (µg/m3) SO2 11.6 NO2 9.7
Date:21.11.2020 to 22.11.2020 Shift 1st Shift 2nd Shift 3rd Shift
Monitoring Period 06.00 AM to 2.00
PM 02.00 PM to 10.00 PM 10.00 PM to 06.00 AM
Parameter SO2 NO2 SO2 NO2 SO2 NO2 Concentration (µg/m3) 11.61 7.75 11.54 8.62 11.59 5.89 24 Hourly Average (µg/m3) SO2 11.5 NO2 7.4
Table-3: Data Sheet for PM10 & PM2.5 for Bordowali, Agartala during
Deepabali Festival, 2020.
387
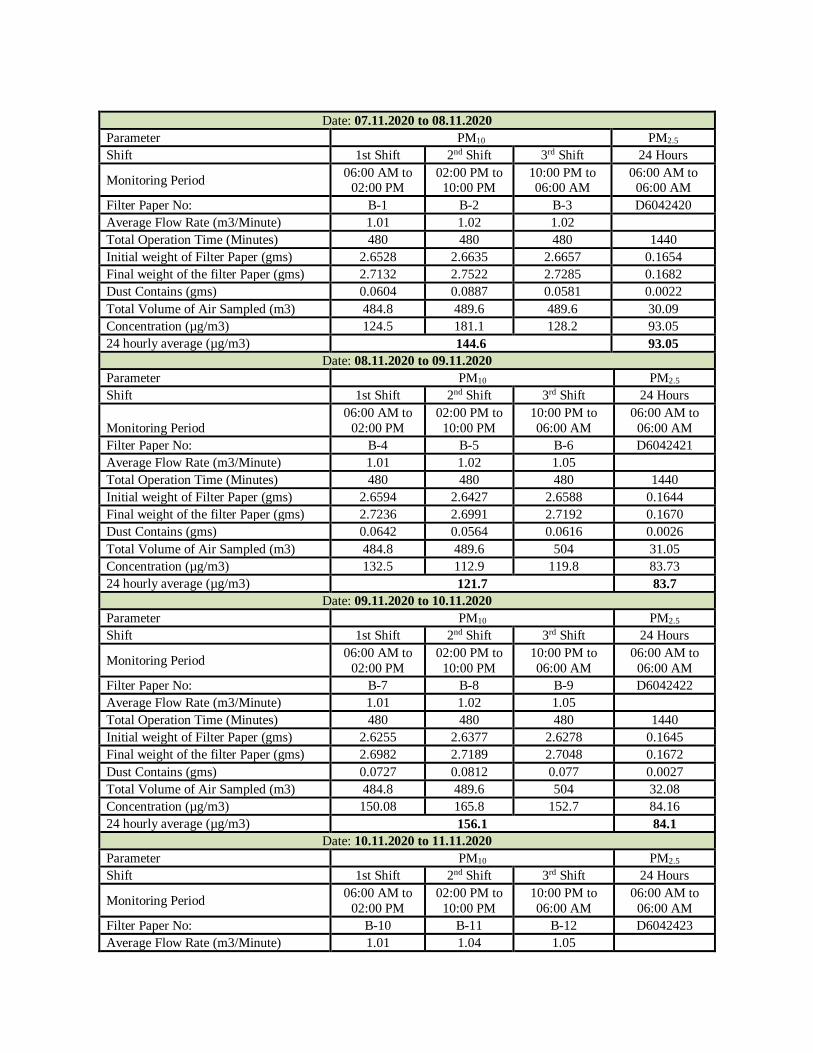
Date: 07.11.2020 to 08.11.2020
Parameter PM10 PM2.5
Shift 1st Shift 2nd Shift 3rd Shift 24 Hours
Monitoring Period 06:00 AM to
02:00 PM 02:00 PM to
10:00 PM 10:00 PM to 06:00 AM
06:00 AM to 06:00 AM
Filter Paper No: B-1 B-2 B-3 D6042420
Average Flow Rate (m3/Minute) 1.01 1.02 1.02
Total Operation Time (Minutes) 480 480 480 1440
Initial weight of Filter Paper (gms) 2.6528 2.6635 2.6657 0.1654
Final weight of the filter Paper (gms) 2.7132 2.7522 2.7285 0.1682
Dust Contains (gms) 0.0604 0.0887 0.0581 0.0022
Total Volume of Air Sampled (m3) 484.8 489.6 489.6 30.09
Concentration (µg/m3) 124.5 181.1 128.2 93.05
24 hourly average (µg/m3) 144.6 93.05
Date: 08.11.2020 to 09.11.2020
Parameter PM10 PM2.5
Shift 1st Shift 2nd Shift 3rd Shift 24 Hours
Monitoring Period
06:00 AM to
02:00 PM
02:00 PM to
10:00 PM
10:00 PM to
06:00 AM
06:00 AM to
06:00 AM
Filter Paper No: B-4 B-5 B-6 D6042421
Average Flow Rate (m3/Minute) 1.01 1.02 1.05
Total Operation Time (Minutes) 480 480 480 1440
Initial weight of Filter Paper (gms) 2.6594 2.6427 2.6588 0.1644
Final weight of the filter Paper (gms) 2.7236 2.6991 2.7192 0.1670
Dust Contains (gms) 0.0642 0.0564 0.0616 0.0026
Total Volume of Air Sampled (m3) 484.8 489.6 504 31.05
Concentration (µg/m3) 132.5 112.9 119.8 83.73
24 hourly average (µg/m3) 121.7 83.7
Date: 09.11.2020 to 10.11.2020
Parameter PM10 PM2.5
Shift 1st Shift 2nd Shift 3rd Shift 24 Hours
Monitoring Period 06:00 AM to
02:00 PM
02:00 PM to
10:00 PM
10:00 PM to
06:00 AM
06:00 AM to
06:00 AM
Filter Paper No: B-7 B-8 B-9 D6042422
Average Flow Rate (m3/Minute) 1.01 1.02 1.05
Total Operation Time (Minutes) 480 480 480 1440
Initial weight of Filter Paper (gms) 2.6255 2.6377 2.6278 0.1645
Final weight of the filter Paper (gms) 2.6982 2.7189 2.7048 0.1672
Dust Contains (gms) 0.0727 0.0812 0.077 0.0027
Total Volume of Air Sampled (m3) 484.8 489.6 504 32.08
Concentration (µg/m3) 150.08 165.8 152.7 84.16
24 hourly average (µg/m3) 156.1 84.1
Date: 10.11.2020 to 11.11.2020
Parameter PM10 PM2.5
Shift 1st Shift 2nd Shift 3rd Shift 24 Hours
Monitoring Period 06:00 AM to
02:00 PM
02:00 PM to
10:00 PM
10:00 PM to
06:00 AM
06:00 AM to
06:00 AM
Filter Paper No: B-10 B-11 B-12 D6042423
Average Flow Rate (m3/Minute) 1.01 1.04 1.05
388
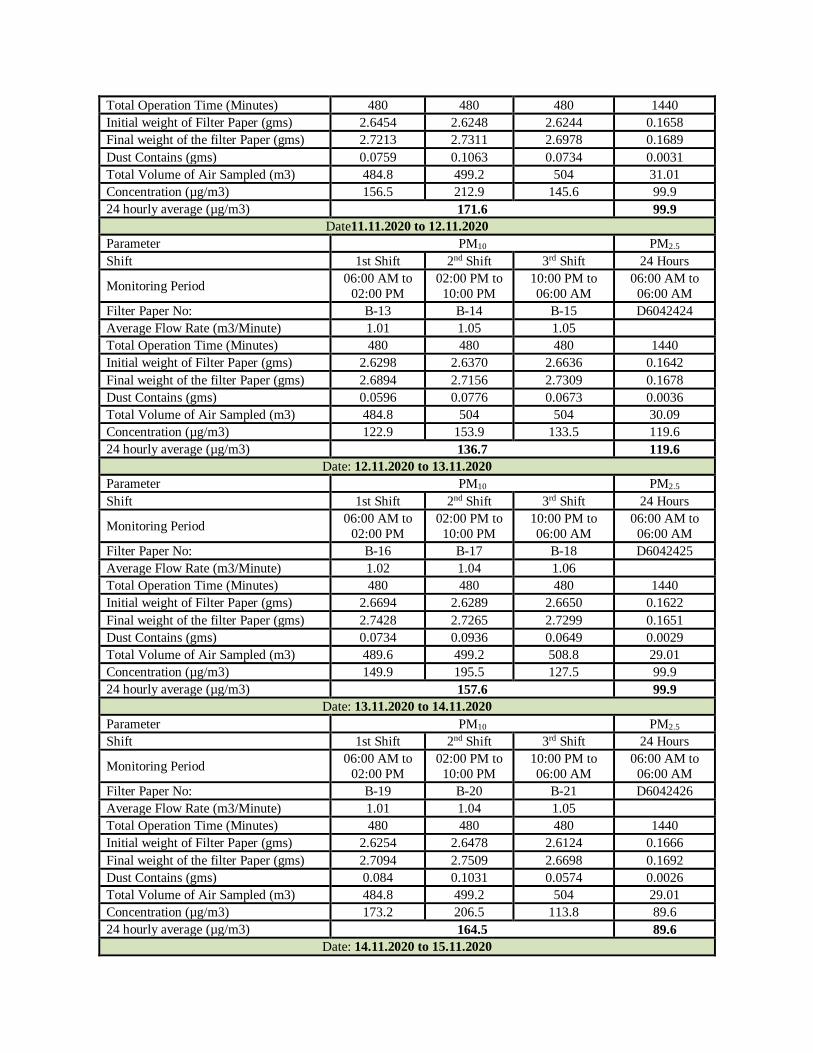
Total Operation Time (Minutes) 480 480 480 1440
Initial weight of Filter Paper (gms) 2.6454 2.6248 2.6244 0.1658
Final weight of the filter Paper (gms) 2.7213 2.7311 2.6978 0.1689
Dust Contains (gms) 0.0759 0.1063 0.0734 0.0031
Total Volume of Air Sampled (m3) 484.8 499.2 504 31.01
Concentration (µg/m3) 156.5 212.9 145.6 99.9
24 hourly average (µg/m3) 171.6 99.9
Date11.11.2020 to 12.11.2020
Parameter PM10 PM2.5
Shift 1st Shift 2nd Shift 3rd Shift 24 Hours
Monitoring Period 06:00 AM to
02:00 PM
02:00 PM to
10:00 PM
10:00 PM to
06:00 AM
06:00 AM to
06:00 AM
Filter Paper No: B-13 B-14 B-15 D6042424
Average Flow Rate (m3/Minute) 1.01 1.05 1.05
Total Operation Time (Minutes) 480 480 480 1440
Initial weight of Filter Paper (gms) 2.6298 2.6370 2.6636 0.1642
Final weight of the filter Paper (gms) 2.6894 2.7156 2.7309 0.1678
Dust Contains (gms) 0.0596 0.0776 0.0673 0.0036
Total Volume of Air Sampled (m3) 484.8 504 504 30.09
Concentration (µg/m3) 122.9 153.9 133.5 119.6
24 hourly average (µg/m3) 136.7 119.6
Date: 12.11.2020 to 13.11.2020
Parameter PM10 PM2.5
Shift 1st Shift 2nd Shift 3rd Shift 24 Hours
Monitoring Period 06:00 AM to
02:00 PM
02:00 PM to
10:00 PM
10:00 PM to
06:00 AM
06:00 AM to
06:00 AM
Filter Paper No: B-16 B-17 B-18 D6042425
Average Flow Rate (m3/Minute) 1.02 1.04 1.06
Total Operation Time (Minutes) 480 480 480 1440
Initial weight of Filter Paper (gms) 2.6694 2.6289 2.6650 0.1622
Final weight of the filter Paper (gms) 2.7428 2.7265 2.7299 0.1651
Dust Contains (gms) 0.0734 0.0936 0.0649 0.0029
Total Volume of Air Sampled (m3) 489.6 499.2 508.8 29.01
Concentration (µg/m3) 149.9 195.5 127.5 99.9
24 hourly average (µg/m3) 157.6 99.9
Date: 13.11.2020 to 14.11.2020
Parameter PM10 PM2.5
Shift 1st Shift 2nd Shift 3rd Shift 24 Hours
Monitoring Period 06:00 AM to
02:00 PM
02:00 PM to
10:00 PM
10:00 PM to
06:00 AM
06:00 AM to
06:00 AM
Filter Paper No: B-19 B-20 B-21 D6042426
Average Flow Rate (m3/Minute) 1.01 1.04 1.05
Total Operation Time (Minutes) 480 480 480 1440
Initial weight of Filter Paper (gms) 2.6254 2.6478 2.6124 0.1666
Final weight of the filter Paper (gms) 2.7094 2.7509 2.6698 0.1692
Dust Contains (gms) 0.084 0.1031 0.0574 0.0026
Total Volume of Air Sampled (m3) 484.8 499.2 504 29.01
Concentration (µg/m3) 173.2 206.5 113.8 89.6
24 hourly average (µg/m3) 164.5 89.6
Date: 14.11.2020 to 15.11.2020
389
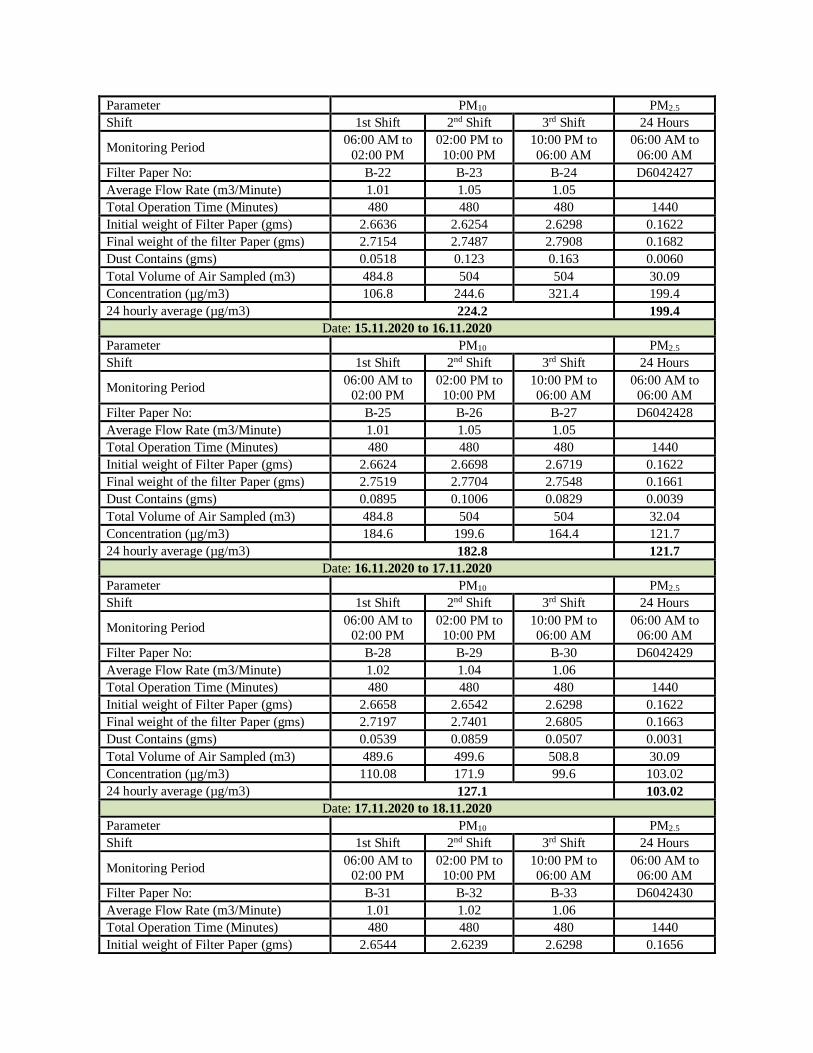
Parameter PM10 PM2.5
Shift 1st Shift 2nd Shift 3rd Shift 24 Hours
Monitoring Period 06:00 AM to
02:00 PM
02:00 PM to
10:00 PM
10:00 PM to
06:00 AM
06:00 AM to
06:00 AM
Filter Paper No: B-22 B-23 B-24 D6042427
Average Flow Rate (m3/Minute) 1.01 1.05 1.05
Total Operation Time (Minutes) 480 480 480 1440
Initial weight of Filter Paper (gms) 2.6636 2.6254 2.6298 0.1622
Final weight of the filter Paper (gms) 2.7154 2.7487 2.7908 0.1682
Dust Contains (gms) 0.0518 0.123 0.163 0.0060
Total Volume of Air Sampled (m3) 484.8 504 504 30.09
Concentration (µg/m3) 106.8 244.6 321.4 199.4
24 hourly average (µg/m3) 224.2 199.4
Date: 15.11.2020 to 16.11.2020
Parameter PM10 PM2.5
Shift 1st Shift 2nd Shift 3rd Shift 24 Hours
Monitoring Period 06:00 AM to
02:00 PM 02:00 PM to
10:00 PM 10:00 PM to 06:00 AM
06:00 AM to 06:00 AM
Filter Paper No: B-25 B-26 B-27 D6042428
Average Flow Rate (m3/Minute) 1.01 1.05 1.05
Total Operation Time (Minutes) 480 480 480 1440
Initial weight of Filter Paper (gms) 2.6624 2.6698 2.6719 0.1622
Final weight of the filter Paper (gms) 2.7519 2.7704 2.7548 0.1661
Dust Contains (gms) 0.0895 0.1006 0.0829 0.0039
Total Volume of Air Sampled (m3) 484.8 504 504 32.04
Concentration (µg/m3) 184.6 199.6 164.4 121.7
24 hourly average (µg/m3) 182.8 121.7
Date: 16.11.2020 to 17.11.2020
Parameter PM10 PM2.5
Shift 1st Shift 2nd Shift 3rd Shift 24 Hours
Monitoring Period 06:00 AM to
02:00 PM 02:00 PM to
10:00 PM 10:00 PM to 06:00 AM
06:00 AM to 06:00 AM
Filter Paper No: B-28 B-29 B-30 D6042429
Average Flow Rate (m3/Minute) 1.02 1.04 1.06
Total Operation Time (Minutes) 480 480 480 1440
Initial weight of Filter Paper (gms) 2.6658 2.6542 2.6298 0.1622
Final weight of the filter Paper (gms) 2.7197 2.7401 2.6805 0.1663
Dust Contains (gms) 0.0539 0.0859 0.0507 0.0031
Total Volume of Air Sampled (m3) 489.6 499.6 508.8 30.09
Concentration (µg/m3) 110.08 171.9 99.6 103.02
24 hourly average (µg/m3) 127.1 103.02
Date: 17.11.2020 to 18.11.2020
Parameter PM10 PM2.5
Shift 1st Shift 2nd Shift 3rd Shift 24 Hours
Monitoring Period 06:00 AM to
02:00 PM 02:00 PM to
10:00 PM 10:00 PM to 06:00 AM
06:00 AM to 06:00 AM
Filter Paper No: B-31 B-32 B-33 D6042430
Average Flow Rate (m3/Minute) 1.01 1.02 1.06
Total Operation Time (Minutes) 480 480 480 1440
Initial weight of Filter Paper (gms) 2.6544 2.6239 2.6298 0.1656
390
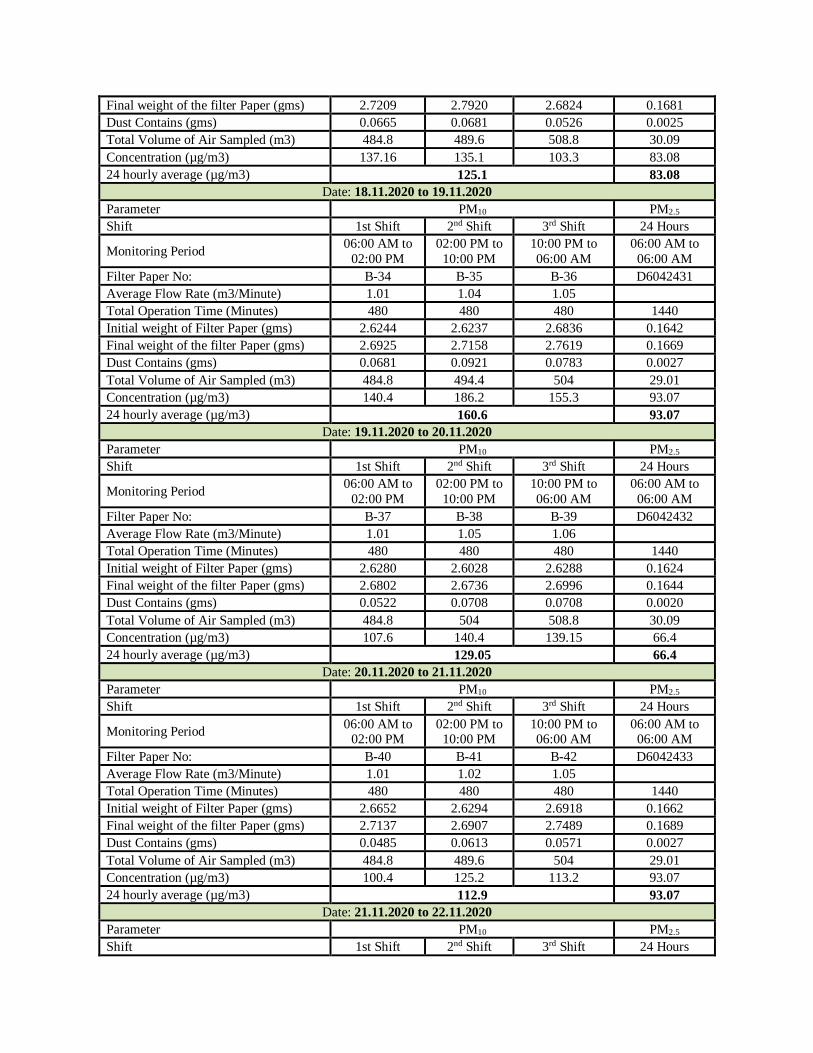
Final weight of the filter Paper (gms) 2.7209 2.7920 2.6824 0.1681
Dust Contains (gms) 0.0665 0.0681 0.0526 0.0025
Total Volume of Air Sampled (m3) 484.8 489.6 508.8 30.09
Concentration (µg/m3) 137.16 135.1 103.3 83.08
24 hourly average (µg/m3) 125.1 83.08
Date: 18.11.2020 to 19.11.2020
Parameter PM10 PM2.5
Shift 1st Shift 2nd Shift 3rd Shift 24 Hours
Monitoring Period 06:00 AM to
02:00 PM
02:00 PM to
10:00 PM
10:00 PM to
06:00 AM
06:00 AM to
06:00 AM
Filter Paper No: B-34 B-35 B-36 D6042431
Average Flow Rate (m3/Minute) 1.01 1.04 1.05
Total Operation Time (Minutes) 480 480 480 1440
Initial weight of Filter Paper (gms) 2.6244 2.6237 2.6836 0.1642
Final weight of the filter Paper (gms) 2.6925 2.7158 2.7619 0.1669
Dust Contains (gms) 0.0681 0.0921 0.0783 0.0027
Total Volume of Air Sampled (m3) 484.8 494.4 504 29.01
Concentration (µg/m3) 140.4 186.2 155.3 93.07
24 hourly average (µg/m3) 160.6 93.07
Date: 19.11.2020 to 20.11.2020
Parameter PM10 PM2.5
Shift 1st Shift 2nd Shift 3rd Shift 24 Hours
Monitoring Period 06:00 AM to
02:00 PM
02:00 PM to
10:00 PM
10:00 PM to
06:00 AM
06:00 AM to
06:00 AM
Filter Paper No: B-37 B-38 B-39 D6042432
Average Flow Rate (m3/Minute) 1.01 1.05 1.06
Total Operation Time (Minutes) 480 480 480 1440
Initial weight of Filter Paper (gms) 2.6280 2.6028 2.6288 0.1624
Final weight of the filter Paper (gms) 2.6802 2.6736 2.6996 0.1644
Dust Contains (gms) 0.0522 0.0708 0.0708 0.0020
Total Volume of Air Sampled (m3) 484.8 504 508.8 30.09
Concentration (µg/m3) 107.6 140.4 139.15 66.4
24 hourly average (µg/m3) 129.05 66.4
Date: 20.11.2020 to 21.11.2020
Parameter PM10 PM2.5
Shift 1st Shift 2nd Shift 3rd Shift 24 Hours
Monitoring Period 06:00 AM to
02:00 PM 02:00 PM to
10:00 PM 10:00 PM to 06:00 AM
06:00 AM to 06:00 AM
Filter Paper No: B-40 B-41 B-42 D6042433
Average Flow Rate (m3/Minute) 1.01 1.02 1.05
Total Operation Time (Minutes) 480 480 480 1440
Initial weight of Filter Paper (gms) 2.6652 2.6294 2.6918 0.1662
Final weight of the filter Paper (gms) 2.7137 2.6907 2.7489 0.1689
Dust Contains (gms) 0.0485 0.0613 0.0571 0.0027
Total Volume of Air Sampled (m3) 484.8 489.6 504 29.01
Concentration (µg/m3) 100.4 125.2 113.2 93.07
24 hourly average (µg/m3) 112.9 93.07
Date: 21.11.2020 to 22.11.2020
Parameter PM10 PM2.5
Shift 1st Shift 2nd Shift 3rd Shift 24 Hours
391
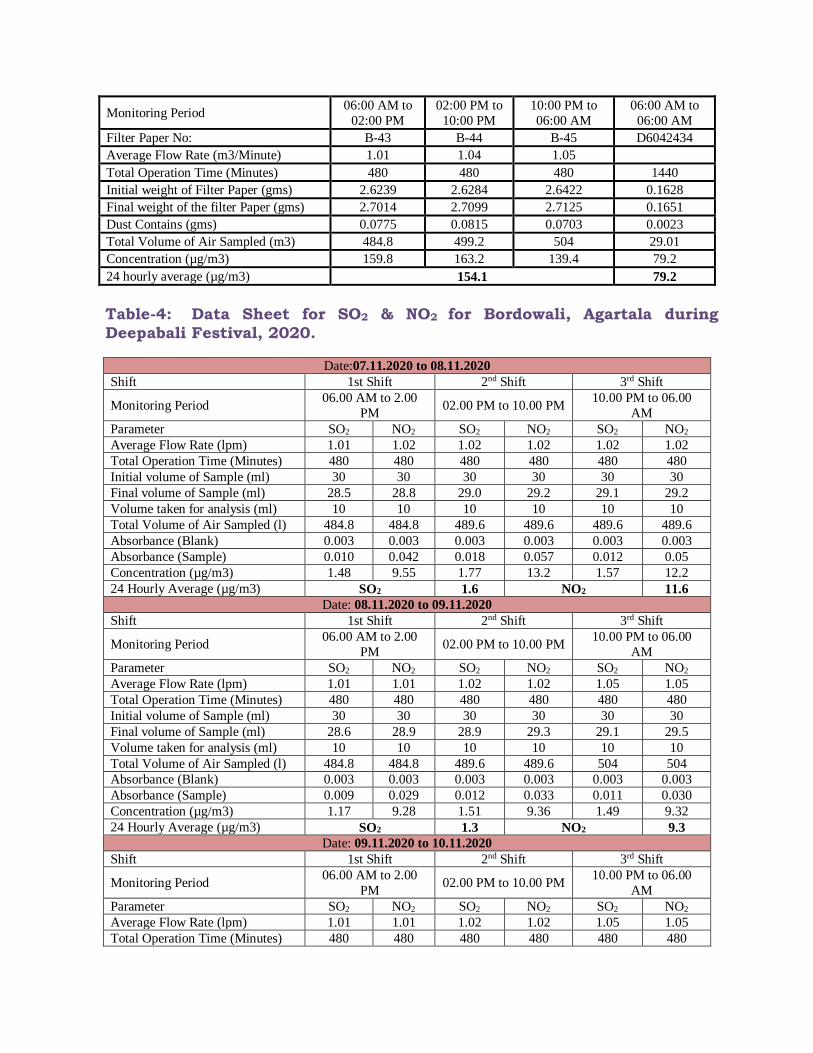
Monitoring Period 06:00 AM to
02:00 PM
02:00 PM to
10:00 PM
10:00 PM to
06:00 AM
06:00 AM to
06:00 AM
Filter Paper No: B-43 B-44 B-45 D6042434
Average Flow Rate (m3/Minute) 1.01 1.04 1.05
Total Operation Time (Minutes) 480 480 480 1440
Initial weight of Filter Paper (gms) 2.6239 2.6284 2.6422 0.1628
Final weight of the filter Paper (gms) 2.7014 2.7099 2.7125 0.1651
Dust Contains (gms) 0.0775 0.0815 0.0703 0.0023
Total Volume of Air Sampled (m3) 484.8 499.2 504 29.01
Concentration (µg/m3) 159.8 163.2 139.4 79.2
24 hourly average (µg/m3) 154.1 79.2
Table-4: Data Sheet for SO2 & NO2 for Bordowali, Agartala during
Deepabali Festival, 2020.
Date:07.11.2020 to 08.11.2020
Shift 1st Shift 2nd Shift 3rd Shift
Monitoring Period 06.00 AM to 2.00
PM 02.00 PM to 10.00 PM
10.00 PM to 06.00
AM
Parameter SO2 NO2 SO2 NO2 SO2 NO2
Average Flow Rate (lpm) 1.01 1.02 1.02 1.02 1.02 1.02
Total Operation Time (Minutes) 480 480 480 480 480 480
Initial volume of Sample (ml) 30 30 30 30 30 30
Final volume of Sample (ml) 28.5 28.8 29.0 29.2 29.1 29.2
Volume taken for analysis (ml) 10 10 10 10 10 10
Total Volume of Air Sampled (l) 484.8 484.8 489.6 489.6 489.6 489.6
Absorbance (Blank) 0.003 0.003 0.003 0.003 0.003 0.003
Absorbance (Sample) 0.010 0.042 0.018 0.057 0.012 0.05
Concentration (µg/m3) 1.48 9.55 1.77 13.2 1.57 12.2
24 Hourly Average (µg/m3) SO2 1.6 NO2 11.6
Date: 08.11.2020 to 09.11.2020
Shift 1st Shift 2nd Shift 3rd Shift
Monitoring Period 06.00 AM to 2.00
PM 02.00 PM to 10.00 PM
10.00 PM to 06.00
AM
Parameter SO2 NO2 SO2 NO2 SO2 NO2
Average Flow Rate (lpm) 1.01 1.01 1.02 1.02 1.05 1.05
Total Operation Time (Minutes) 480 480 480 480 480 480
Initial volume of Sample (ml) 30 30 30 30 30 30
Final volume of Sample (ml) 28.6 28.9 28.9 29.3 29.1 29.5
Volume taken for analysis (ml) 10 10 10 10 10 10
Total Volume of Air Sampled (l) 484.8 484.8 489.6 489.6 504 504
Absorbance (Blank) 0.003 0.003 0.003 0.003 0.003 0.003
Absorbance (Sample) 0.009 0.029 0.012 0.033 0.011 0.030
Concentration (µg/m3) 1.17 9.28 1.51 9.36 1.49 9.32
24 Hourly Average (µg/m3) SO2 1.3 NO2 9.3
Date: 09.11.2020 to 10.11.2020
Shift 1st Shift 2nd Shift 3rd Shift
Monitoring Period 06.00 AM to 2.00
PM 02.00 PM to 10.00 PM
10.00 PM to 06.00
AM
Parameter SO2 NO2 SO2 NO2 SO2 NO2
Average Flow Rate (lpm) 1.01 1.01 1.02 1.02 1.05 1.05
Total Operation Time (Minutes) 480 480 480 480 480 480
392
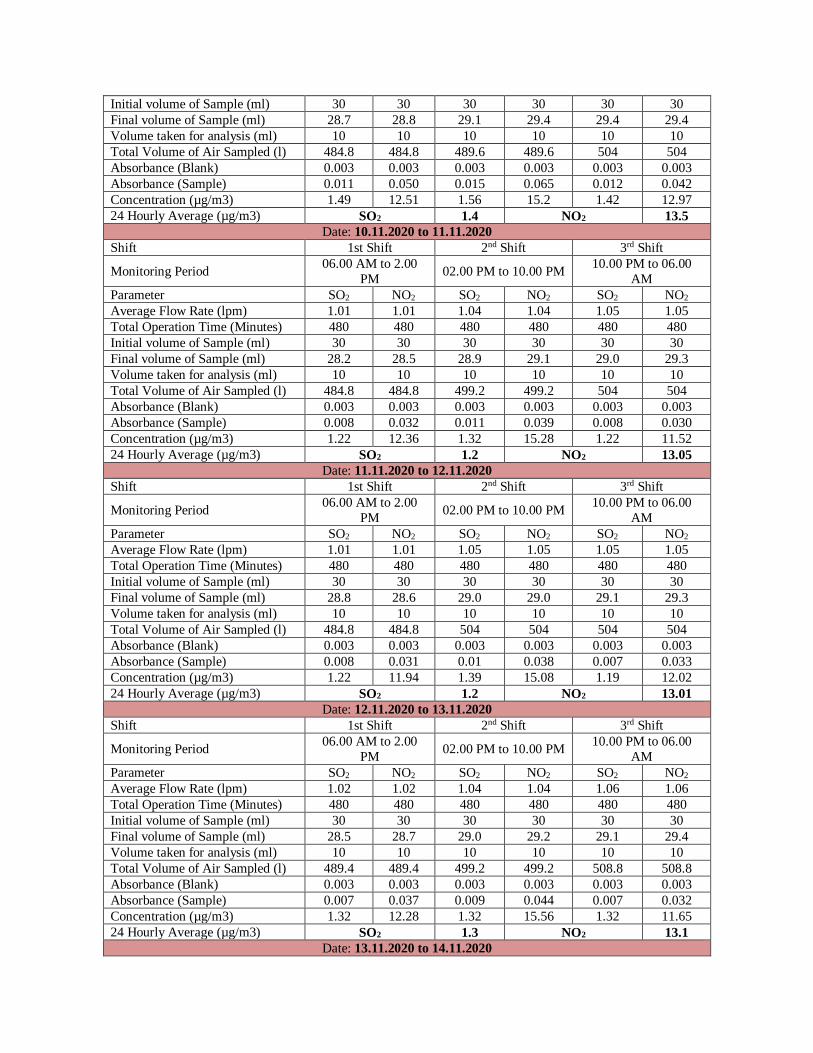
Initial volume of Sample (ml) 30 30 30 30 30 30
Final volume of Sample (ml) 28.7 28.8 29.1 29.4 29.4 29.4
Volume taken for analysis (ml) 10 10 10 10 10 10
Total Volume of Air Sampled (l) 484.8 484.8 489.6 489.6 504 504
Absorbance (Blank) 0.003 0.003 0.003 0.003 0.003 0.003
Absorbance (Sample) 0.011 0.050 0.015 0.065 0.012 0.042
Concentration (µg/m3) 1.49 12.51 1.56 15.2 1.42 12.97
24 Hourly Average (µg/m3) SO2 1.4 NO2 13.5
Date: 10.11.2020 to 11.11.2020
Shift 1st Shift 2nd Shift 3rd Shift
Monitoring Period 06.00 AM to 2.00
PM 02.00 PM to 10.00 PM
10.00 PM to 06.00
AM
Parameter SO2 NO2 SO2 NO2 SO2 NO2
Average Flow Rate (lpm) 1.01 1.01 1.04 1.04 1.05 1.05
Total Operation Time (Minutes) 480 480 480 480 480 480
Initial volume of Sample (ml) 30 30 30 30 30 30
Final volume of Sample (ml) 28.2 28.5 28.9 29.1 29.0 29.3
Volume taken for analysis (ml) 10 10 10 10 10 10
Total Volume of Air Sampled (l) 484.8 484.8 499.2 499.2 504 504
Absorbance (Blank) 0.003 0.003 0.003 0.003 0.003 0.003
Absorbance (Sample) 0.008 0.032 0.011 0.039 0.008 0.030
Concentration (µg/m3) 1.22 12.36 1.32 15.28 1.22 11.52
24 Hourly Average (µg/m3) SO2 1.2 NO2 13.05
Date: 11.11.2020 to 12.11.2020
Shift 1st Shift 2nd Shift 3rd Shift
Monitoring Period 06.00 AM to 2.00
PM 02.00 PM to 10.00 PM
10.00 PM to 06.00
AM
Parameter SO2 NO2 SO2 NO2 SO2 NO2
Average Flow Rate (lpm) 1.01 1.01 1.05 1.05 1.05 1.05
Total Operation Time (Minutes) 480 480 480 480 480 480
Initial volume of Sample (ml) 30 30 30 30 30 30
Final volume of Sample (ml) 28.8 28.6 29.0 29.0 29.1 29.3
Volume taken for analysis (ml) 10 10 10 10 10 10
Total Volume of Air Sampled (l) 484.8 484.8 504 504 504 504
Absorbance (Blank) 0.003 0.003 0.003 0.003 0.003 0.003
Absorbance (Sample) 0.008 0.031 0.01 0.038 0.007 0.033
Concentration (µg/m3) 1.22 11.94 1.39 15.08 1.19 12.02
24 Hourly Average (µg/m3) SO2 1.2 NO2 13.01
Date: 12.11.2020 to 13.11.2020
Shift 1st Shift 2nd Shift 3rd Shift
Monitoring Period 06.00 AM to 2.00
PM 02.00 PM to 10.00 PM
10.00 PM to 06.00
AM
Parameter SO2 NO2 SO2 NO2 SO2 NO2
Average Flow Rate (lpm) 1.02 1.02 1.04 1.04 1.06 1.06
Total Operation Time (Minutes) 480 480 480 480 480 480
Initial volume of Sample (ml) 30 30 30 30 30 30
Final volume of Sample (ml) 28.5 28.7 29.0 29.2 29.1 29.4
Volume taken for analysis (ml) 10 10 10 10 10 10
Total Volume of Air Sampled (l) 489.4 489.4 499.2 499.2 508.8 508.8
Absorbance (Blank) 0.003 0.003 0.003 0.003 0.003 0.003
Absorbance (Sample) 0.007 0.037 0.009 0.044 0.007 0.032
Concentration (µg/m3) 1.32 12.28 1.32 15.56 1.32 11.65
24 Hourly Average (µg/m3) SO2 1.3 NO2 13.1
Date: 13.11.2020 to 14.11.2020
393
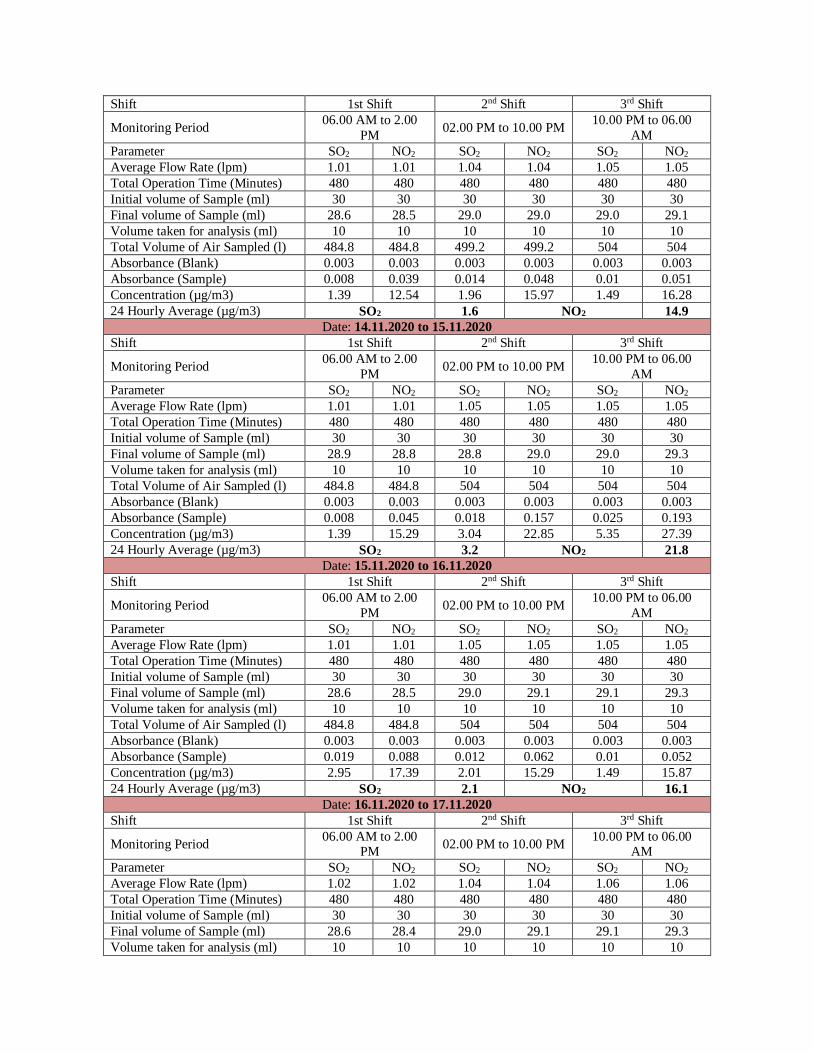
Shift 1st Shift 2nd Shift 3rd Shift
Monitoring Period 06.00 AM to 2.00
PM 02.00 PM to 10.00 PM
10.00 PM to 06.00
AM
Parameter SO2 NO2 SO2 NO2 SO2 NO2
Average Flow Rate (lpm) 1.01 1.01 1.04 1.04 1.05 1.05
Total Operation Time (Minutes) 480 480 480 480 480 480
Initial volume of Sample (ml) 30 30 30 30 30 30
Final volume of Sample (ml) 28.6 28.5 29.0 29.0 29.0 29.1
Volume taken for analysis (ml) 10 10 10 10 10 10
Total Volume of Air Sampled (l) 484.8 484.8 499.2 499.2 504 504
Absorbance (Blank) 0.003 0.003 0.003 0.003 0.003 0.003
Absorbance (Sample) 0.008 0.039 0.014 0.048 0.01 0.051
Concentration (µg/m3) 1.39 12.54 1.96 15.97 1.49 16.28
24 Hourly Average (µg/m3) SO2 1.6 NO2 14.9
Date: 14.11.2020 to 15.11.2020
Shift 1st Shift 2nd Shift 3rd Shift
Monitoring Period 06.00 AM to 2.00
PM 02.00 PM to 10.00 PM
10.00 PM to 06.00
AM
Parameter SO2 NO2 SO2 NO2 SO2 NO2
Average Flow Rate (lpm) 1.01 1.01 1.05 1.05 1.05 1.05
Total Operation Time (Minutes) 480 480 480 480 480 480
Initial volume of Sample (ml) 30 30 30 30 30 30
Final volume of Sample (ml) 28.9 28.8 28.8 29.0 29.0 29.3
Volume taken for analysis (ml) 10 10 10 10 10 10
Total Volume of Air Sampled (l) 484.8 484.8 504 504 504 504
Absorbance (Blank) 0.003 0.003 0.003 0.003 0.003 0.003
Absorbance (Sample) 0.008 0.045 0.018 0.157 0.025 0.193
Concentration (µg/m3) 1.39 15.29 3.04 22.85 5.35 27.39
24 Hourly Average (µg/m3) SO2 3.2 NO2 21.8
Date: 15.11.2020 to 16.11.2020
Shift 1st Shift 2nd Shift 3rd Shift
Monitoring Period 06.00 AM to 2.00
PM 02.00 PM to 10.00 PM
10.00 PM to 06.00
AM
Parameter SO2 NO2 SO2 NO2 SO2 NO2
Average Flow Rate (lpm) 1.01 1.01 1.05 1.05 1.05 1.05
Total Operation Time (Minutes) 480 480 480 480 480 480
Initial volume of Sample (ml) 30 30 30 30 30 30
Final volume of Sample (ml) 28.6 28.5 29.0 29.1 29.1 29.3
Volume taken for analysis (ml) 10 10 10 10 10 10
Total Volume of Air Sampled (l) 484.8 484.8 504 504 504 504
Absorbance (Blank) 0.003 0.003 0.003 0.003 0.003 0.003
Absorbance (Sample) 0.019 0.088 0.012 0.062 0.01 0.052
Concentration (µg/m3) 2.95 17.39 2.01 15.29 1.49 15.87
24 Hourly Average (µg/m3) SO2 2.1 NO2 16.1
Date: 16.11.2020 to 17.11.2020
Shift 1st Shift 2nd Shift 3rd Shift
Monitoring Period 06.00 AM to 2.00
PM 02.00 PM to 10.00 PM
10.00 PM to 06.00 AM
Parameter SO2 NO2 SO2 NO2 SO2 NO2
Average Flow Rate (lpm) 1.02 1.02 1.04 1.04 1.06 1.06
Total Operation Time (Minutes) 480 480 480 480 480 480
Initial volume of Sample (ml) 30 30 30 30 30 30
Final volume of Sample (ml) 28.6 28.4 29.0 29.1 29.1 29.3
Volume taken for analysis (ml) 10 10 10 10 10 10
394
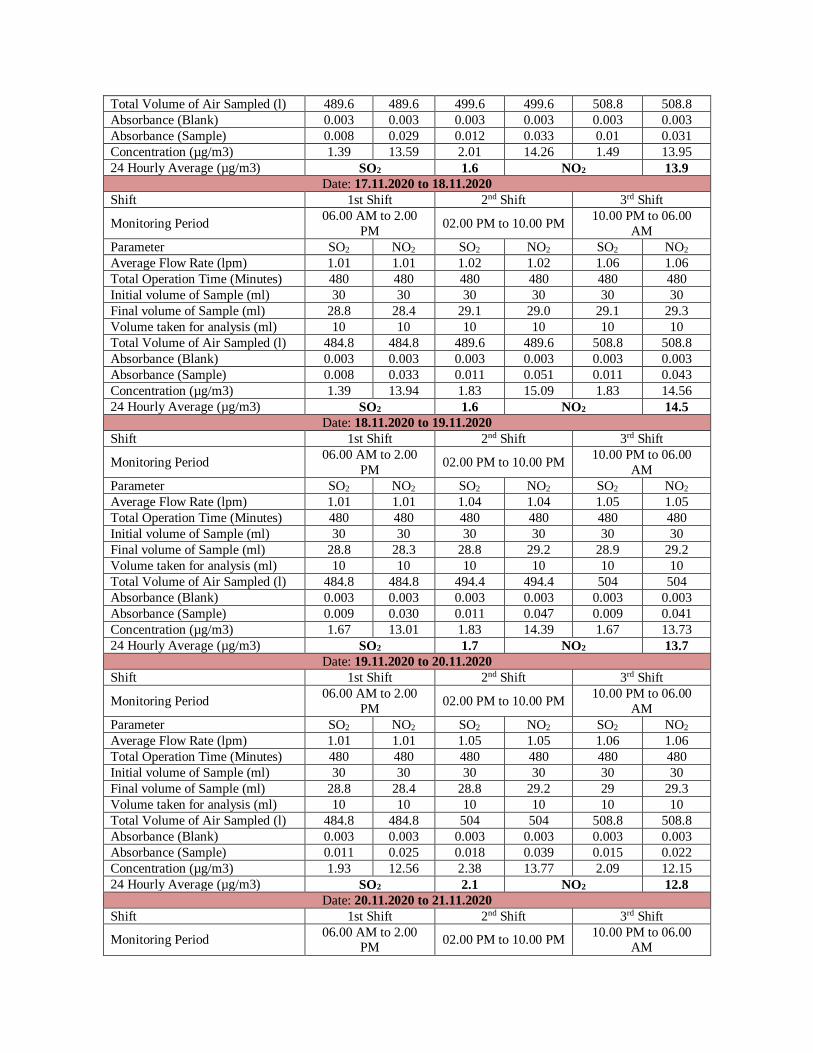
Total Volume of Air Sampled (l) 489.6 489.6 499.6 499.6 508.8 508.8
Absorbance (Blank) 0.003 0.003 0.003 0.003 0.003 0.003
Absorbance (Sample) 0.008 0.029 0.012 0.033 0.01 0.031
Concentration (µg/m3) 1.39 13.59 2.01 14.26 1.49 13.95
24 Hourly Average (µg/m3) SO2 1.6 NO2 13.9
Date: 17.11.2020 to 18.11.2020
Shift 1st Shift 2nd Shift 3rd Shift
Monitoring Period 06.00 AM to 2.00
PM 02.00 PM to 10.00 PM
10.00 PM to 06.00
AM
Parameter SO2 NO2 SO2 NO2 SO2 NO2
Average Flow Rate (lpm) 1.01 1.01 1.02 1.02 1.06 1.06
Total Operation Time (Minutes) 480 480 480 480 480 480
Initial volume of Sample (ml) 30 30 30 30 30 30
Final volume of Sample (ml) 28.8 28.4 29.1 29.0 29.1 29.3
Volume taken for analysis (ml) 10 10 10 10 10 10
Total Volume of Air Sampled (l) 484.8 484.8 489.6 489.6 508.8 508.8
Absorbance (Blank) 0.003 0.003 0.003 0.003 0.003 0.003
Absorbance (Sample) 0.008 0.033 0.011 0.051 0.011 0.043
Concentration (µg/m3) 1.39 13.94 1.83 15.09 1.83 14.56
24 Hourly Average (µg/m3) SO2 1.6 NO2 14.5
Date: 18.11.2020 to 19.11.2020
Shift 1st Shift 2nd Shift 3rd Shift
Monitoring Period 06.00 AM to 2.00
PM 02.00 PM to 10.00 PM
10.00 PM to 06.00
AM
Parameter SO2 NO2 SO2 NO2 SO2 NO2
Average Flow Rate (lpm) 1.01 1.01 1.04 1.04 1.05 1.05
Total Operation Time (Minutes) 480 480 480 480 480 480
Initial volume of Sample (ml) 30 30 30 30 30 30
Final volume of Sample (ml) 28.8 28.3 28.8 29.2 28.9 29.2
Volume taken for analysis (ml) 10 10 10 10 10 10
Total Volume of Air Sampled (l) 484.8 484.8 494.4 494.4 504 504
Absorbance (Blank) 0.003 0.003 0.003 0.003 0.003 0.003
Absorbance (Sample) 0.009 0.030 0.011 0.047 0.009 0.041
Concentration (µg/m3) 1.67 13.01 1.83 14.39 1.67 13.73
24 Hourly Average (µg/m3) SO2 1.7 NO2 13.7
Date: 19.11.2020 to 20.11.2020
Shift 1st Shift 2nd Shift 3rd Shift
Monitoring Period 06.00 AM to 2.00
PM 02.00 PM to 10.00 PM
10.00 PM to 06.00
AM
Parameter SO2 NO2 SO2 NO2 SO2 NO2
Average Flow Rate (lpm) 1.01 1.01 1.05 1.05 1.06 1.06
Total Operation Time (Minutes) 480 480 480 480 480 480
Initial volume of Sample (ml) 30 30 30 30 30 30
Final volume of Sample (ml) 28.8 28.4 28.8 29.2 29 29.3
Volume taken for analysis (ml) 10 10 10 10 10 10
Total Volume of Air Sampled (l) 484.8 484.8 504 504 508.8 508.8
Absorbance (Blank) 0.003 0.003 0.003 0.003 0.003 0.003
Absorbance (Sample) 0.011 0.025 0.018 0.039 0.015 0.022
Concentration (µg/m3) 1.93 12.56 2.38 13.77 2.09 12.15
24 Hourly Average (µg/m3) SO2 2.1 NO2 12.8
Date: 20.11.2020 to 21.11.2020
Shift 1st Shift 2nd Shift 3rd Shift
Monitoring Period 06.00 AM to 2.00
PM 02.00 PM to 10.00 PM
10.00 PM to 06.00 AM
395
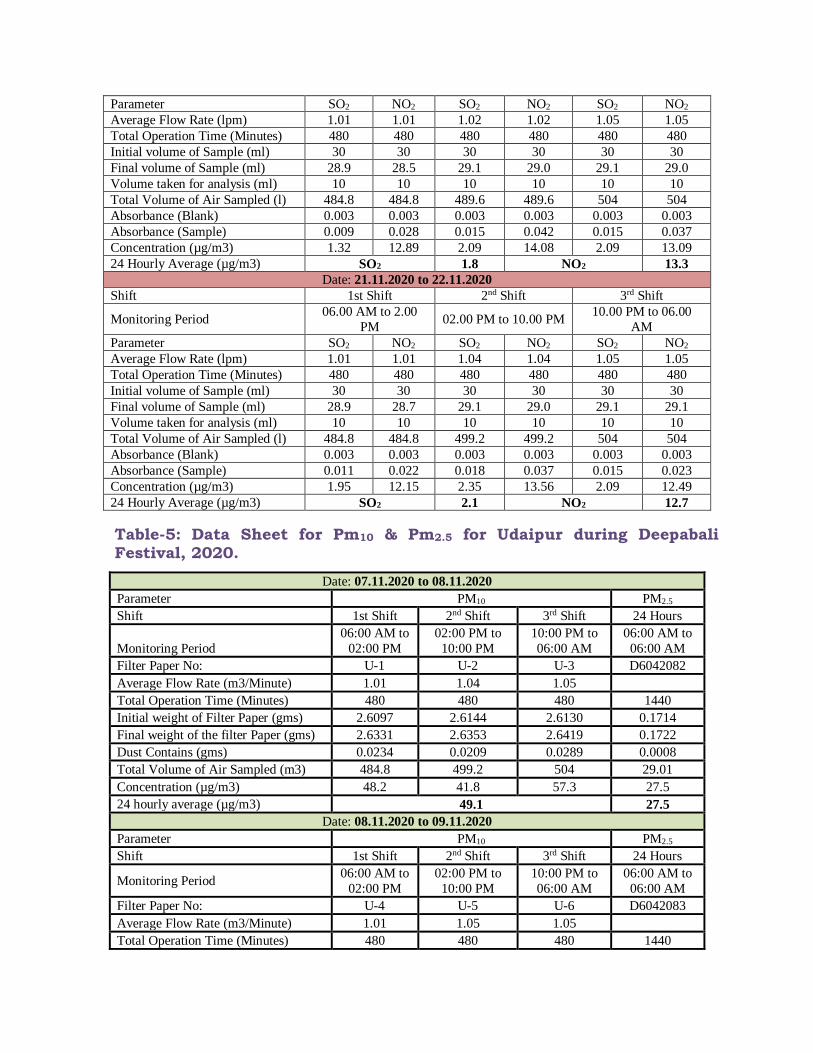
Parameter SO2 NO2 SO2 NO2 SO2 NO2
Average Flow Rate (lpm) 1.01 1.01 1.02 1.02 1.05 1.05
Total Operation Time (Minutes) 480 480 480 480 480 480
Initial volume of Sample (ml) 30 30 30 30 30 30
Final volume of Sample (ml) 28.9 28.5 29.1 29.0 29.1 29.0
Volume taken for analysis (ml) 10 10 10 10 10 10
Total Volume of Air Sampled (l) 484.8 484.8 489.6 489.6 504 504
Absorbance (Blank) 0.003 0.003 0.003 0.003 0.003 0.003
Absorbance (Sample) 0.009 0.028 0.015 0.042 0.015 0.037
Concentration (µg/m3) 1.32 12.89 2.09 14.08 2.09 13.09
24 Hourly Average (µg/m3) SO2 1.8 NO2 13.3
Date: 21.11.2020 to 22.11.2020
Shift 1st Shift 2nd Shift 3rd Shift
Monitoring Period 06.00 AM to 2.00
PM 02.00 PM to 10.00 PM
10.00 PM to 06.00
AM
Parameter SO2 NO2 SO2 NO2 SO2 NO2
Average Flow Rate (lpm) 1.01 1.01 1.04 1.04 1.05 1.05
Total Operation Time (Minutes) 480 480 480 480 480 480
Initial volume of Sample (ml) 30 30 30 30 30 30
Final volume of Sample (ml) 28.9 28.7 29.1 29.0 29.1 29.1
Volume taken for analysis (ml) 10 10 10 10 10 10
Total Volume of Air Sampled (l) 484.8 484.8 499.2 499.2 504 504
Absorbance (Blank) 0.003 0.003 0.003 0.003 0.003 0.003
Absorbance (Sample) 0.011 0.022 0.018 0.037 0.015 0.023
Concentration (µg/m3) 1.95 12.15 2.35 13.56 2.09 12.49
24 Hourly Average (µg/m3) SO2 2.1 NO2 12.7
Table-5: Data Sheet for Pm10 & Pm2.5 for Udaipur during Deepabali Festival, 2020.
Date: 07.11.2020 to 08.11.2020
Parameter PM10 PM2.5
Shift 1st Shift 2nd Shift 3rd Shift 24 Hours
Monitoring Period
06:00 AM to
02:00 PM
02:00 PM to
10:00 PM
10:00 PM to
06:00 AM
06:00 AM to
06:00 AM
Filter Paper No: U-1 U-2 U-3 D6042082
Average Flow Rate (m3/Minute) 1.01 1.04 1.05
Total Operation Time (Minutes) 480 480 480 1440
Initial weight of Filter Paper (gms) 2.6097 2.6144 2.6130 0.1714
Final weight of the filter Paper (gms) 2.6331 2.6353 2.6419 0.1722
Dust Contains (gms) 0.0234 0.0209 0.0289 0.0008
Total Volume of Air Sampled (m3) 484.8 499.2 504 29.01
Concentration (µg/m3) 48.2 41.8 57.3 27.5
24 hourly average (µg/m3) 49.1 27.5
Date: 08.11.2020 to 09.11.2020
Parameter PM10 PM2.5
Shift 1st Shift 2nd Shift 3rd Shift 24 Hours
Monitoring Period 06:00 AM to
02:00 PM
02:00 PM to
10:00 PM
10:00 PM to
06:00 AM
06:00 AM to
06:00 AM
Filter Paper No: U-4 U-5 U-6 D6042083
Average Flow Rate (m3/Minute) 1.01 1.05 1.05
Total Operation Time (Minutes) 480 480 480 1440
396
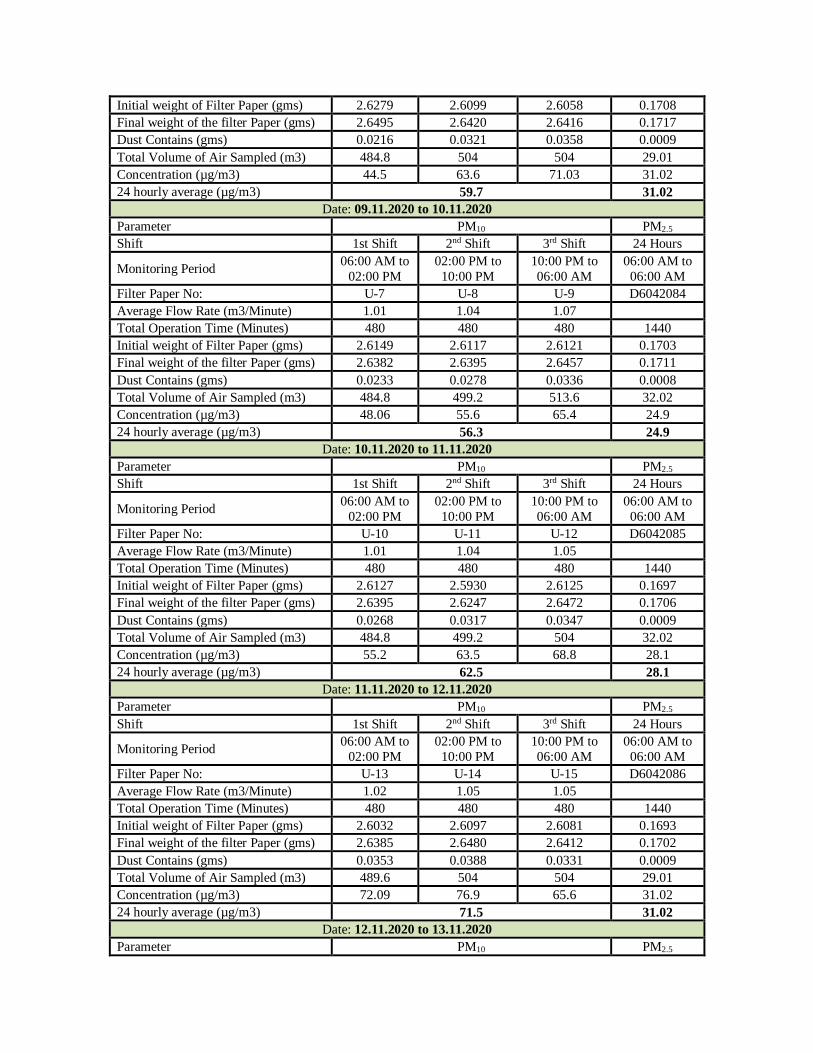
Initial weight of Filter Paper (gms) 2.6279 2.6099 2.6058 0.1708
Final weight of the filter Paper (gms) 2.6495 2.6420 2.6416 0.1717
Dust Contains (gms) 0.0216 0.0321 0.0358 0.0009
Total Volume of Air Sampled (m3) 484.8 504 504 29.01
Concentration (µg/m3) 44.5 63.6 71.03 31.02
24 hourly average (µg/m3) 59.7 31.02
Date: 09.11.2020 to 10.11.2020
Parameter PM10 PM2.5
Shift 1st Shift 2nd Shift 3rd Shift 24 Hours
Monitoring Period 06:00 AM to
02:00 PM
02:00 PM to
10:00 PM
10:00 PM to
06:00 AM
06:00 AM to
06:00 AM
Filter Paper No: U-7 U-8 U-9 D6042084
Average Flow Rate (m3/Minute) 1.01 1.04 1.07
Total Operation Time (Minutes) 480 480 480 1440
Initial weight of Filter Paper (gms) 2.6149 2.6117 2.6121 0.1703
Final weight of the filter Paper (gms) 2.6382 2.6395 2.6457 0.1711
Dust Contains (gms) 0.0233 0.0278 0.0336 0.0008
Total Volume of Air Sampled (m3) 484.8 499.2 513.6 32.02
Concentration (µg/m3) 48.06 55.6 65.4 24.9
24 hourly average (µg/m3) 56.3 24.9
Date: 10.11.2020 to 11.11.2020
Parameter PM10 PM2.5
Shift 1st Shift 2nd Shift 3rd Shift 24 Hours
Monitoring Period 06:00 AM to
02:00 PM
02:00 PM to
10:00 PM
10:00 PM to
06:00 AM
06:00 AM to
06:00 AM
Filter Paper No: U-10 U-11 U-12 D6042085
Average Flow Rate (m3/Minute) 1.01 1.04 1.05
Total Operation Time (Minutes) 480 480 480 1440
Initial weight of Filter Paper (gms) 2.6127 2.5930 2.6125 0.1697
Final weight of the filter Paper (gms) 2.6395 2.6247 2.6472 0.1706
Dust Contains (gms) 0.0268 0.0317 0.0347 0.0009
Total Volume of Air Sampled (m3) 484.8 499.2 504 32.02
Concentration (µg/m3) 55.2 63.5 68.8 28.1
24 hourly average (µg/m3) 62.5 28.1
Date: 11.11.2020 to 12.11.2020
Parameter PM10 PM2.5
Shift 1st Shift 2nd Shift 3rd Shift 24 Hours
Monitoring Period 06:00 AM to
02:00 PM
02:00 PM to
10:00 PM
10:00 PM to
06:00 AM
06:00 AM to
06:00 AM
Filter Paper No: U-13 U-14 U-15 D6042086
Average Flow Rate (m3/Minute) 1.02 1.05 1.05
Total Operation Time (Minutes) 480 480 480 1440
Initial weight of Filter Paper (gms) 2.6032 2.6097 2.6081 0.1693
Final weight of the filter Paper (gms) 2.6385 2.6480 2.6412 0.1702
Dust Contains (gms) 0.0353 0.0388 0.0331 0.0009
Total Volume of Air Sampled (m3) 489.6 504 504 29.01
Concentration (µg/m3) 72.09 76.9 65.6 31.02
24 hourly average (µg/m3) 71.5 31.02
Date: 12.11.2020 to 13.11.2020
Parameter PM10 PM2.5
397
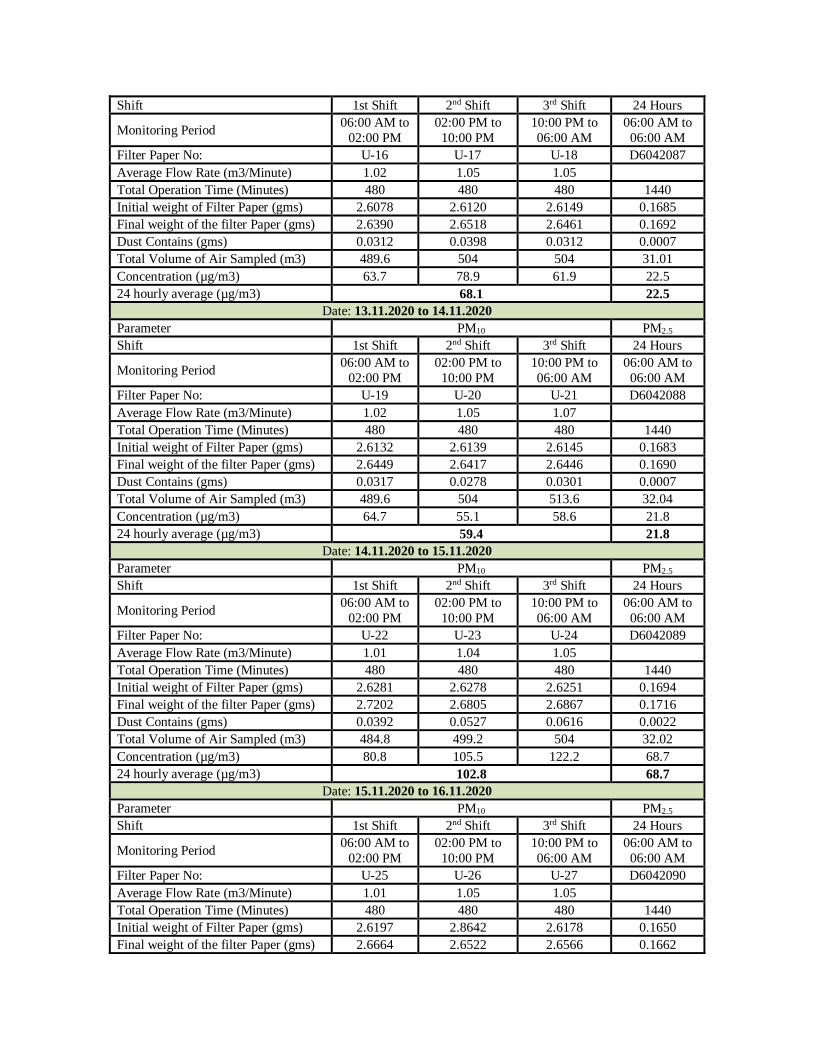
Shift 1st Shift 2nd Shift 3rd Shift 24 Hours
Monitoring Period 06:00 AM to
02:00 PM
02:00 PM to
10:00 PM
10:00 PM to
06:00 AM
06:00 AM to
06:00 AM
Filter Paper No: U-16 U-17 U-18 D6042087
Average Flow Rate (m3/Minute) 1.02 1.05 1.05
Total Operation Time (Minutes) 480 480 480 1440
Initial weight of Filter Paper (gms) 2.6078 2.6120 2.6149 0.1685
Final weight of the filter Paper (gms) 2.6390 2.6518 2.6461 0.1692
Dust Contains (gms) 0.0312 0.0398 0.0312 0.0007
Total Volume of Air Sampled (m3) 489.6 504 504 31.01
Concentration (µg/m3) 63.7 78.9 61.9 22.5
24 hourly average (µg/m3) 68.1 22.5
Date: 13.11.2020 to 14.11.2020
Parameter PM10 PM2.5
Shift 1st Shift 2nd Shift 3rd Shift 24 Hours
Monitoring Period 06:00 AM to
02:00 PM
02:00 PM to
10:00 PM
10:00 PM to
06:00 AM
06:00 AM to
06:00 AM
Filter Paper No: U-19 U-20 U-21 D6042088
Average Flow Rate (m3/Minute) 1.02 1.05 1.07
Total Operation Time (Minutes) 480 480 480 1440
Initial weight of Filter Paper (gms) 2.6132 2.6139 2.6145 0.1683
Final weight of the filter Paper (gms) 2.6449 2.6417 2.6446 0.1690
Dust Contains (gms) 0.0317 0.0278 0.0301 0.0007
Total Volume of Air Sampled (m3) 489.6 504 513.6 32.04
Concentration (µg/m3) 64.7 55.1 58.6 21.8
24 hourly average (µg/m3) 59.4 21.8
Date: 14.11.2020 to 15.11.2020
Parameter PM10 PM2.5
Shift 1st Shift 2nd Shift 3rd Shift 24 Hours
Monitoring Period 06:00 AM to
02:00 PM
02:00 PM to
10:00 PM
10:00 PM to
06:00 AM
06:00 AM to
06:00 AM
Filter Paper No: U-22 U-23 U-24 D6042089
Average Flow Rate (m3/Minute) 1.01 1.04 1.05
Total Operation Time (Minutes) 480 480 480 1440
Initial weight of Filter Paper (gms) 2.6281 2.6278 2.6251 0.1694
Final weight of the filter Paper (gms) 2.7202 2.6805 2.6867 0.1716
Dust Contains (gms) 0.0392 0.0527 0.0616 0.0022
Total Volume of Air Sampled (m3) 484.8 499.2 504 32.02
Concentration (µg/m3) 80.8 105.5 122.2 68.7
24 hourly average (µg/m3) 102.8 68.7
Date: 15.11.2020 to 16.11.2020
Parameter PM10 PM2.5
Shift 1st Shift 2nd Shift 3rd Shift 24 Hours
Monitoring Period 06:00 AM to
02:00 PM
02:00 PM to
10:00 PM
10:00 PM to
06:00 AM
06:00 AM to
06:00 AM
Filter Paper No: U-25 U-26 U-27 D6042090
Average Flow Rate (m3/Minute) 1.01 1.05 1.05
Total Operation Time (Minutes) 480 480 480 1440
Initial weight of Filter Paper (gms) 2.6197 2.8642 2.6178 0.1650
Final weight of the filter Paper (gms) 2.6664 2.6522 2.6566 0.1662
398
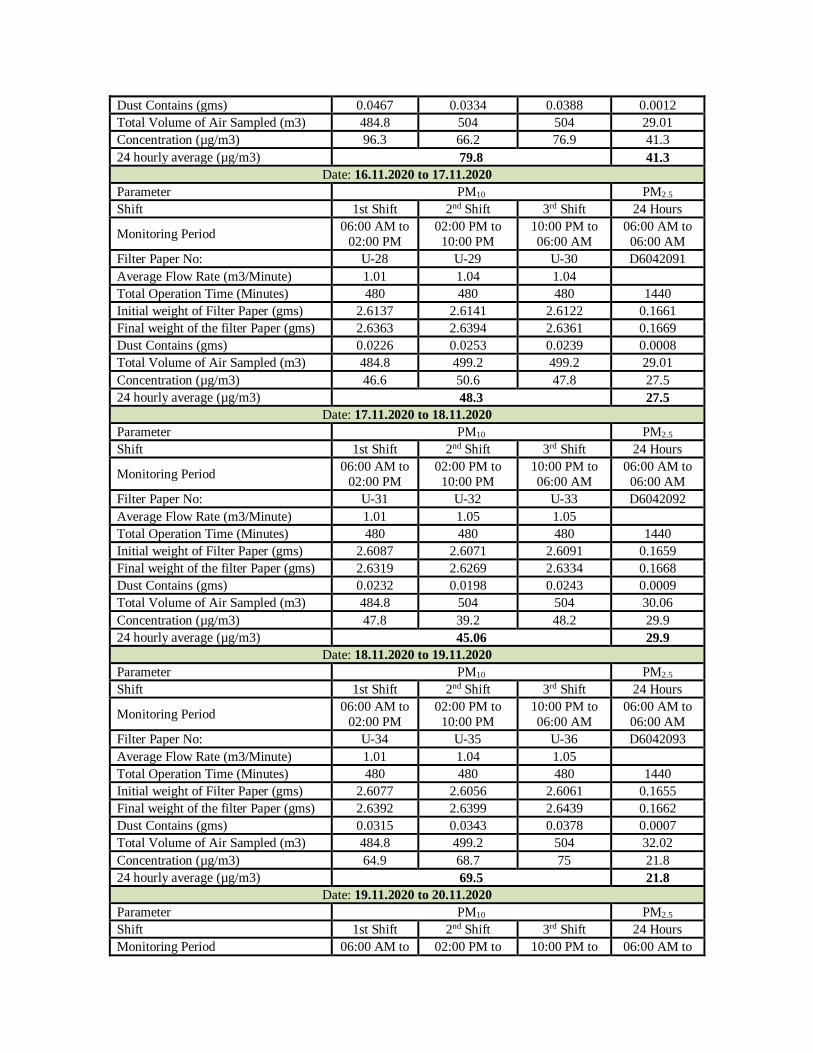
Dust Contains (gms) 0.0467 0.0334 0.0388 0.0012
Total Volume of Air Sampled (m3) 484.8 504 504 29.01
Concentration (µg/m3) 96.3 66.2 76.9 41.3
24 hourly average (µg/m3) 79.8 41.3
Date: 16.11.2020 to 17.11.2020
Parameter PM10 PM2.5
Shift 1st Shift 2nd Shift 3rd Shift 24 Hours
Monitoring Period 06:00 AM to
02:00 PM
02:00 PM to
10:00 PM
10:00 PM to
06:00 AM
06:00 AM to
06:00 AM
Filter Paper No: U-28 U-29 U-30 D6042091
Average Flow Rate (m3/Minute) 1.01 1.04 1.04
Total Operation Time (Minutes) 480 480 480 1440
Initial weight of Filter Paper (gms) 2.6137 2.6141 2.6122 0.1661
Final weight of the filter Paper (gms) 2.6363 2.6394 2.6361 0.1669
Dust Contains (gms) 0.0226 0.0253 0.0239 0.0008
Total Volume of Air Sampled (m3) 484.8 499.2 499.2 29.01
Concentration (µg/m3) 46.6 50.6 47.8 27.5
24 hourly average (µg/m3) 48.3 27.5
Date: 17.11.2020 to 18.11.2020
Parameter PM10 PM2.5
Shift 1st Shift 2nd Shift 3rd Shift 24 Hours
Monitoring Period 06:00 AM to
02:00 PM
02:00 PM to
10:00 PM
10:00 PM to
06:00 AM
06:00 AM to
06:00 AM
Filter Paper No: U-31 U-32 U-33 D6042092
Average Flow Rate (m3/Minute) 1.01 1.05 1.05
Total Operation Time (Minutes) 480 480 480 1440
Initial weight of Filter Paper (gms) 2.6087 2.6071 2.6091 0.1659
Final weight of the filter Paper (gms) 2.6319 2.6269 2.6334 0.1668
Dust Contains (gms) 0.0232 0.0198 0.0243 0.0009
Total Volume of Air Sampled (m3) 484.8 504 504 30.06
Concentration (µg/m3) 47.8 39.2 48.2 29.9
24 hourly average (µg/m3) 45.06 29.9
Date: 18.11.2020 to 19.11.2020
Parameter PM10 PM2.5
Shift 1st Shift 2nd Shift 3rd Shift 24 Hours
Monitoring Period 06:00 AM to
02:00 PM
02:00 PM to
10:00 PM
10:00 PM to
06:00 AM
06:00 AM to
06:00 AM
Filter Paper No: U-34 U-35 U-36 D6042093
Average Flow Rate (m3/Minute) 1.01 1.04 1.05
Total Operation Time (Minutes) 480 480 480 1440
Initial weight of Filter Paper (gms) 2.6077 2.6056 2.6061 0.1655
Final weight of the filter Paper (gms) 2.6392 2.6399 2.6439 0.1662
Dust Contains (gms) 0.0315 0.0343 0.0378 0.0007
Total Volume of Air Sampled (m3) 484.8 499.2 504 32.02
Concentration (µg/m3) 64.9 68.7 75 21.8
24 hourly average (µg/m3) 69.5 21.8
Date: 19.11.2020 to 20.11.2020
Parameter PM10 PM2.5
Shift 1st Shift 2nd Shift 3rd Shift 24 Hours
Monitoring Period 06:00 AM to 02:00 PM to 10:00 PM to 06:00 AM to
399
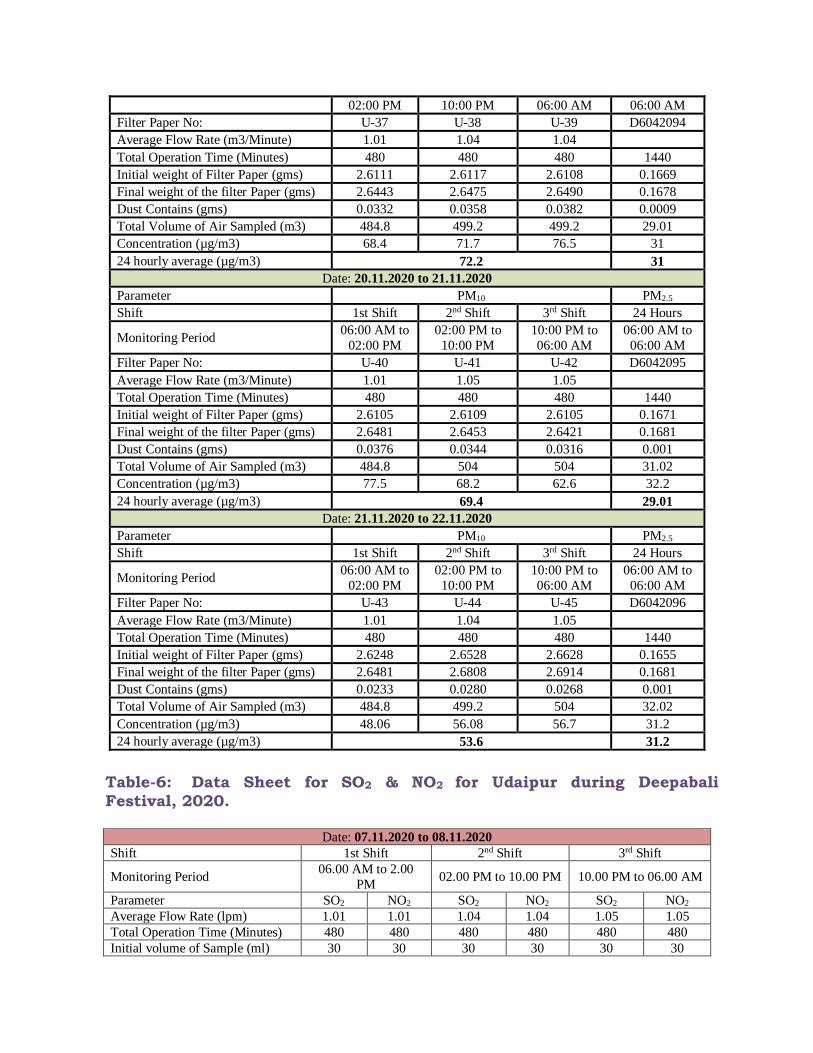
02:00 PM 10:00 PM 06:00 AM 06:00 AM
Filter Paper No: U-37 U-38 U-39 D6042094
Average Flow Rate (m3/Minute) 1.01 1.04 1.04
Total Operation Time (Minutes) 480 480 480 1440
Initial weight of Filter Paper (gms) 2.6111 2.6117 2.6108 0.1669
Final weight of the filter Paper (gms) 2.6443 2.6475 2.6490 0.1678
Dust Contains (gms) 0.0332 0.0358 0.0382 0.0009
Total Volume of Air Sampled (m3) 484.8 499.2 499.2 29.01
Concentration (µg/m3) 68.4 71.7 76.5 31
24 hourly average (µg/m3) 72.2 31
Date: 20.11.2020 to 21.11.2020
Parameter PM10 PM2.5
Shift 1st Shift 2nd Shift 3rd Shift 24 Hours
Monitoring Period 06:00 AM to
02:00 PM
02:00 PM to
10:00 PM
10:00 PM to
06:00 AM
06:00 AM to
06:00 AM
Filter Paper No: U-40 U-41 U-42 D6042095
Average Flow Rate (m3/Minute) 1.01 1.05 1.05
Total Operation Time (Minutes) 480 480 480 1440
Initial weight of Filter Paper (gms) 2.6105 2.6109 2.6105 0.1671
Final weight of the filter Paper (gms) 2.6481 2.6453 2.6421 0.1681
Dust Contains (gms) 0.0376 0.0344 0.0316 0.001
Total Volume of Air Sampled (m3) 484.8 504 504 31.02
Concentration (µg/m3) 77.5 68.2 62.6 32.2
24 hourly average (µg/m3) 69.4 29.01
Date: 21.11.2020 to 22.11.2020
Parameter PM10 PM2.5
Shift 1st Shift 2nd Shift 3rd Shift 24 Hours
Monitoring Period 06:00 AM to
02:00 PM
02:00 PM to
10:00 PM
10:00 PM to
06:00 AM
06:00 AM to
06:00 AM
Filter Paper No: U-43 U-44 U-45 D6042096
Average Flow Rate (m3/Minute) 1.01 1.04 1.05
Total Operation Time (Minutes) 480 480 480 1440
Initial weight of Filter Paper (gms) 2.6248 2.6528 2.6628 0.1655
Final weight of the filter Paper (gms) 2.6481 2.6808 2.6914 0.1681
Dust Contains (gms) 0.0233 0.0280 0.0268 0.001
Total Volume of Air Sampled (m3) 484.8 499.2 504 32.02
Concentration (µg/m3) 48.06 56.08 56.7 31.2
24 hourly average (µg/m3) 53.6 31.2
Table-6: Data Sheet for SO2 & NO2 for Udaipur during Deepabali
Festival, 2020.
Date: 07.11.2020 to 08.11.2020
Shift 1st Shift 2nd Shift 3rd Shift
Monitoring Period 06.00 AM to 2.00
PM 02.00 PM to 10.00 PM 10.00 PM to 06.00 AM
Parameter SO2 NO2 SO2 NO2 SO2 NO2
Average Flow Rate (lpm) 1.01 1.01 1.04 1.04 1.05 1.05
Total Operation Time (Minutes) 480 480 480 480 480 480
Initial volume of Sample (ml) 30 30 30 30 30 30
400
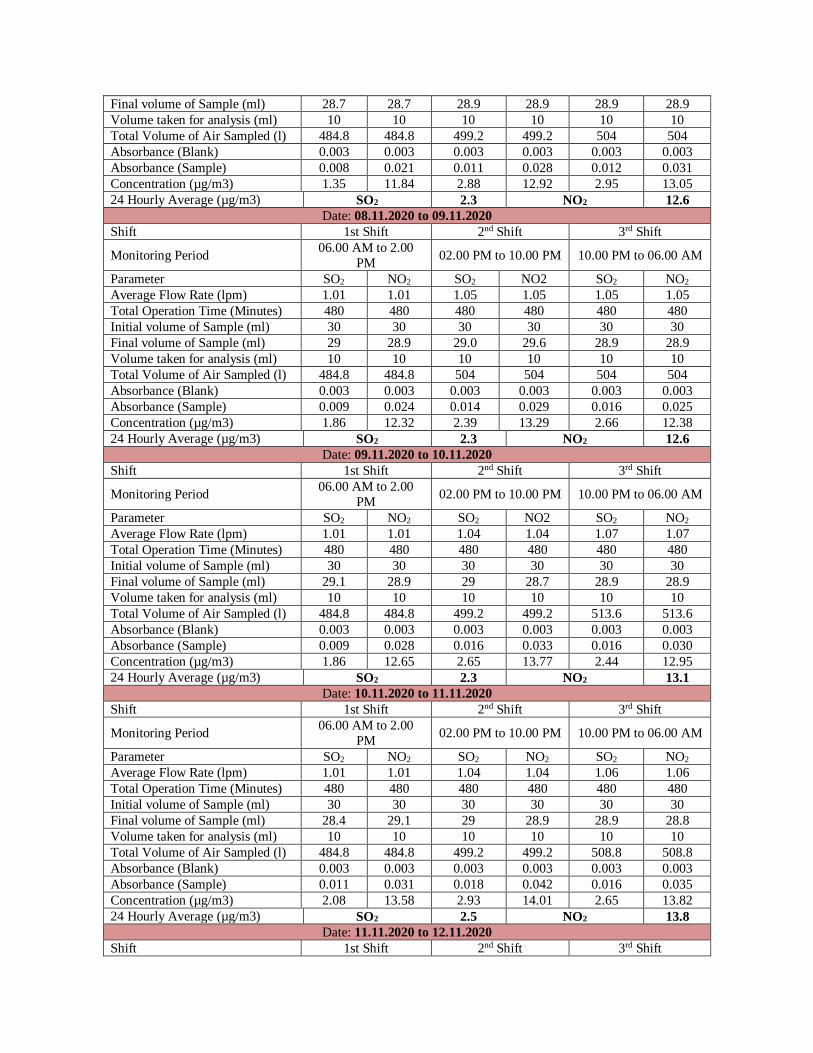
Final volume of Sample (ml) 28.7 28.7 28.9 28.9 28.9 28.9
Volume taken for analysis (ml) 10 10 10 10 10 10
Total Volume of Air Sampled (l) 484.8 484.8 499.2 499.2 504 504
Absorbance (Blank) 0.003 0.003 0.003 0.003 0.003 0.003
Absorbance (Sample) 0.008 0.021 0.011 0.028 0.012 0.031
Concentration (µg/m3) 1.35 11.84 2.88 12.92 2.95 13.05
24 Hourly Average (µg/m3) SO2 2.3 NO2 12.6
Date: 08.11.2020 to 09.11.2020
Shift 1st Shift 2nd Shift 3rd Shift
Monitoring Period 06.00 AM to 2.00
PM 02.00 PM to 10.00 PM 10.00 PM to 06.00 AM
Parameter SO2 NO2 SO2 NO2 SO2 NO2
Average Flow Rate (lpm) 1.01 1.01 1.05 1.05 1.05 1.05
Total Operation Time (Minutes) 480 480 480 480 480 480
Initial volume of Sample (ml) 30 30 30 30 30 30
Final volume of Sample (ml) 29 28.9 29.0 29.6 28.9 28.9
Volume taken for analysis (ml) 10 10 10 10 10 10
Total Volume of Air Sampled (l) 484.8 484.8 504 504 504 504
Absorbance (Blank) 0.003 0.003 0.003 0.003 0.003 0.003
Absorbance (Sample) 0.009 0.024 0.014 0.029 0.016 0.025
Concentration (µg/m3) 1.86 12.32 2.39 13.29 2.66 12.38
24 Hourly Average (µg/m3) SO2 2.3 NO2 12.6
Date: 09.11.2020 to 10.11.2020
Shift 1st Shift 2nd Shift 3rd Shift
Monitoring Period 06.00 AM to 2.00
PM 02.00 PM to 10.00 PM 10.00 PM to 06.00 AM
Parameter SO2 NO2 SO2 NO2 SO2 NO2
Average Flow Rate (lpm) 1.01 1.01 1.04 1.04 1.07 1.07
Total Operation Time (Minutes) 480 480 480 480 480 480
Initial volume of Sample (ml) 30 30 30 30 30 30
Final volume of Sample (ml) 29.1 28.9 29 28.7 28.9 28.9
Volume taken for analysis (ml) 10 10 10 10 10 10
Total Volume of Air Sampled (l) 484.8 484.8 499.2 499.2 513.6 513.6
Absorbance (Blank) 0.003 0.003 0.003 0.003 0.003 0.003
Absorbance (Sample) 0.009 0.028 0.016 0.033 0.016 0.030
Concentration (µg/m3) 1.86 12.65 2.65 13.77 2.44 12.95
24 Hourly Average (µg/m3) SO2 2.3 NO2 13.1
Date: 10.11.2020 to 11.11.2020
Shift 1st Shift 2nd Shift 3rd Shift
Monitoring Period 06.00 AM to 2.00
PM 02.00 PM to 10.00 PM 10.00 PM to 06.00 AM
Parameter SO2 NO2 SO2 NO2 SO2 NO2
Average Flow Rate (lpm) 1.01 1.01 1.04 1.04 1.06 1.06
Total Operation Time (Minutes) 480 480 480 480 480 480
Initial volume of Sample (ml) 30 30 30 30 30 30
Final volume of Sample (ml) 28.4 29.1 29 28.9 28.9 28.8
Volume taken for analysis (ml) 10 10 10 10 10 10
Total Volume of Air Sampled (l) 484.8 484.8 499.2 499.2 508.8 508.8
Absorbance (Blank) 0.003 0.003 0.003 0.003 0.003 0.003
Absorbance (Sample) 0.011 0.031 0.018 0.042 0.016 0.035
Concentration (µg/m3) 2.08 13.58 2.93 14.01 2.65 13.82
24 Hourly Average (µg/m3) SO2 2.5 NO2 13.8
Date: 11.11.2020 to 12.11.2020
Shift 1st Shift 2nd Shift 3rd Shift
401
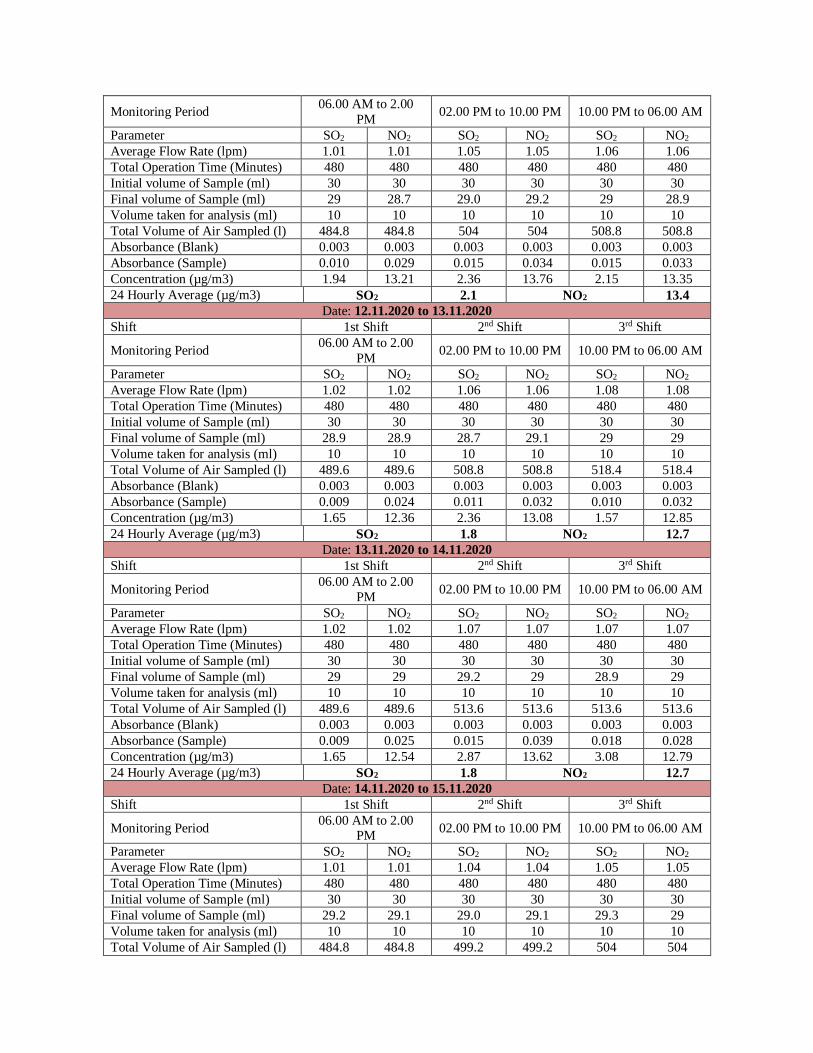
Monitoring Period 06.00 AM to 2.00
PM 02.00 PM to 10.00 PM 10.00 PM to 06.00 AM
Parameter SO2 NO2 SO2 NO2 SO2 NO2
Average Flow Rate (lpm) 1.01 1.01 1.05 1.05 1.06 1.06
Total Operation Time (Minutes) 480 480 480 480 480 480
Initial volume of Sample (ml) 30 30 30 30 30 30
Final volume of Sample (ml) 29 28.7 29.0 29.2 29 28.9
Volume taken for analysis (ml) 10 10 10 10 10 10
Total Volume of Air Sampled (l) 484.8 484.8 504 504 508.8 508.8
Absorbance (Blank) 0.003 0.003 0.003 0.003 0.003 0.003
Absorbance (Sample) 0.010 0.029 0.015 0.034 0.015 0.033
Concentration (µg/m3) 1.94 13.21 2.36 13.76 2.15 13.35
24 Hourly Average (µg/m3) SO2 2.1 NO2 13.4
Date: 12.11.2020 to 13.11.2020
Shift 1st Shift 2nd Shift 3rd Shift
Monitoring Period 06.00 AM to 2.00
PM 02.00 PM to 10.00 PM 10.00 PM to 06.00 AM
Parameter SO2 NO2 SO2 NO2 SO2 NO2
Average Flow Rate (lpm) 1.02 1.02 1.06 1.06 1.08 1.08
Total Operation Time (Minutes) 480 480 480 480 480 480
Initial volume of Sample (ml) 30 30 30 30 30 30
Final volume of Sample (ml) 28.9 28.9 28.7 29.1 29 29
Volume taken for analysis (ml) 10 10 10 10 10 10
Total Volume of Air Sampled (l) 489.6 489.6 508.8 508.8 518.4 518.4
Absorbance (Blank) 0.003 0.003 0.003 0.003 0.003 0.003
Absorbance (Sample) 0.009 0.024 0.011 0.032 0.010 0.032
Concentration (µg/m3) 1.65 12.36 2.36 13.08 1.57 12.85
24 Hourly Average (µg/m3) SO2 1.8 NO2 12.7
Date: 13.11.2020 to 14.11.2020
Shift 1st Shift 2nd Shift 3rd Shift
Monitoring Period 06.00 AM to 2.00
PM 02.00 PM to 10.00 PM 10.00 PM to 06.00 AM
Parameter SO2 NO2 SO2 NO2 SO2 NO2
Average Flow Rate (lpm) 1.02 1.02 1.07 1.07 1.07 1.07
Total Operation Time (Minutes) 480 480 480 480 480 480
Initial volume of Sample (ml) 30 30 30 30 30 30
Final volume of Sample (ml) 29 29 29.2 29 28.9 29
Volume taken for analysis (ml) 10 10 10 10 10 10
Total Volume of Air Sampled (l) 489.6 489.6 513.6 513.6 513.6 513.6
Absorbance (Blank) 0.003 0.003 0.003 0.003 0.003 0.003
Absorbance (Sample) 0.009 0.025 0.015 0.039 0.018 0.028
Concentration (µg/m3) 1.65 12.54 2.87 13.62 3.08 12.79
24 Hourly Average (µg/m3) SO2 1.8 NO2 12.7
Date: 14.11.2020 to 15.11.2020
Shift 1st Shift 2nd Shift 3rd Shift
Monitoring Period 06.00 AM to 2.00
PM 02.00 PM to 10.00 PM 10.00 PM to 06.00 AM
Parameter SO2 NO2 SO2 NO2 SO2 NO2
Average Flow Rate (lpm) 1.01 1.01 1.04 1.04 1.05 1.05
Total Operation Time (Minutes) 480 480 480 480 480 480
Initial volume of Sample (ml) 30 30 30 30 30 30
Final volume of Sample (ml) 29.2 29.1 29.0 29.1 29.3 29
Volume taken for analysis (ml) 10 10 10 10 10 10
Total Volume of Air Sampled (l) 484.8 484.8 499.2 499.2 504 504
402
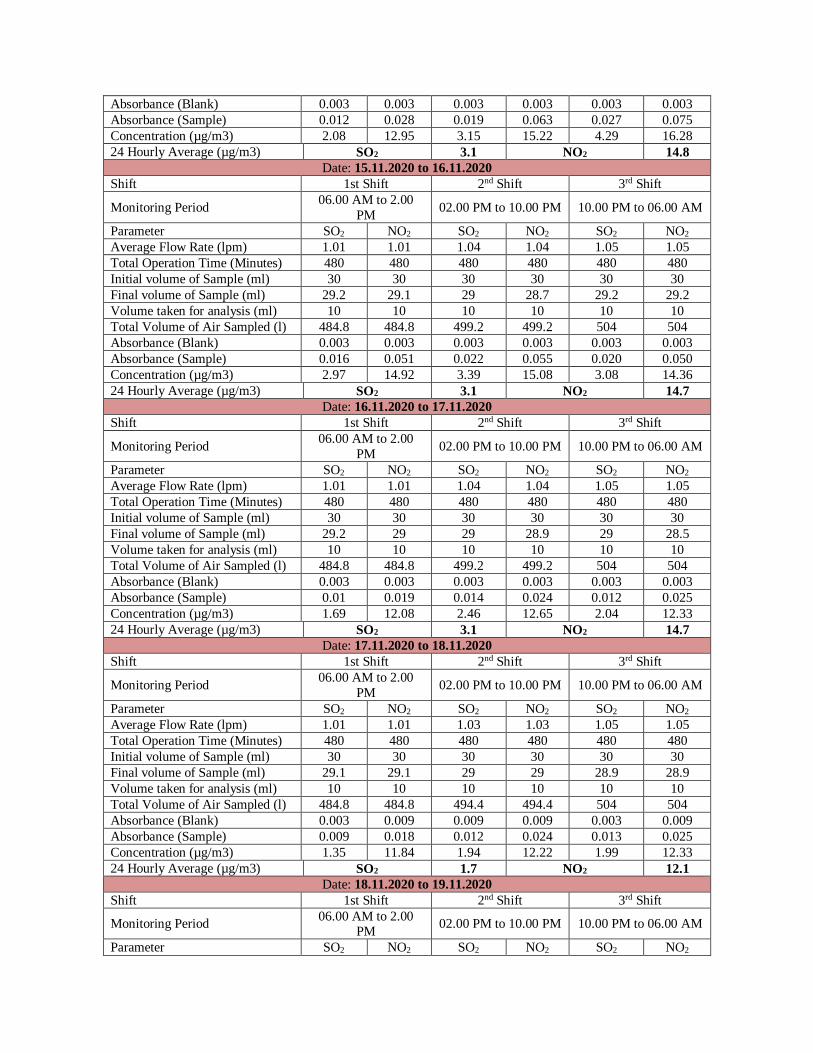
Absorbance (Blank) 0.003 0.003 0.003 0.003 0.003 0.003
Absorbance (Sample) 0.012 0.028 0.019 0.063 0.027 0.075
Concentration (µg/m3) 2.08 12.95 3.15 15.22 4.29 16.28
24 Hourly Average (µg/m3) SO2 3.1 NO2 14.8
Date: 15.11.2020 to 16.11.2020
Shift 1st Shift 2nd Shift 3rd Shift
Monitoring Period 06.00 AM to 2.00
PM 02.00 PM to 10.00 PM 10.00 PM to 06.00 AM
Parameter SO2 NO2 SO2 NO2 SO2 NO2
Average Flow Rate (lpm) 1.01 1.01 1.04 1.04 1.05 1.05
Total Operation Time (Minutes) 480 480 480 480 480 480
Initial volume of Sample (ml) 30 30 30 30 30 30
Final volume of Sample (ml) 29.2 29.1 29 28.7 29.2 29.2
Volume taken for analysis (ml) 10 10 10 10 10 10
Total Volume of Air Sampled (l) 484.8 484.8 499.2 499.2 504 504
Absorbance (Blank) 0.003 0.003 0.003 0.003 0.003 0.003
Absorbance (Sample) 0.016 0.051 0.022 0.055 0.020 0.050
Concentration (µg/m3) 2.97 14.92 3.39 15.08 3.08 14.36
24 Hourly Average (µg/m3) SO2 3.1 NO2 14.7
Date: 16.11.2020 to 17.11.2020
Shift 1st Shift 2nd Shift 3rd Shift
Monitoring Period 06.00 AM to 2.00
PM 02.00 PM to 10.00 PM 10.00 PM to 06.00 AM
Parameter SO2 NO2 SO2 NO2 SO2 NO2
Average Flow Rate (lpm) 1.01 1.01 1.04 1.04 1.05 1.05
Total Operation Time (Minutes) 480 480 480 480 480 480
Initial volume of Sample (ml) 30 30 30 30 30 30
Final volume of Sample (ml) 29.2 29 29 28.9 29 28.5
Volume taken for analysis (ml) 10 10 10 10 10 10
Total Volume of Air Sampled (l) 484.8 484.8 499.2 499.2 504 504
Absorbance (Blank) 0.003 0.003 0.003 0.003 0.003 0.003
Absorbance (Sample) 0.01 0.019 0.014 0.024 0.012 0.025
Concentration (µg/m3) 1.69 12.08 2.46 12.65 2.04 12.33
24 Hourly Average (µg/m3) SO2 3.1 NO2 14.7
Date: 17.11.2020 to 18.11.2020
Shift 1st Shift 2nd Shift 3rd Shift
Monitoring Period 06.00 AM to 2.00
PM 02.00 PM to 10.00 PM 10.00 PM to 06.00 AM
Parameter SO2 NO2 SO2 NO2 SO2 NO2
Average Flow Rate (lpm) 1.01 1.01 1.03 1.03 1.05 1.05
Total Operation Time (Minutes) 480 480 480 480 480 480
Initial volume of Sample (ml) 30 30 30 30 30 30
Final volume of Sample (ml) 29.1 29.1 29 29 28.9 28.9
Volume taken for analysis (ml) 10 10 10 10 10 10
Total Volume of Air Sampled (l) 484.8 484.8 494.4 494.4 504 504
Absorbance (Blank) 0.003 0.009 0.009 0.009 0.003 0.009
Absorbance (Sample) 0.009 0.018 0.012 0.024 0.013 0.025
Concentration (µg/m3) 1.35 11.84 1.94 12.22 1.99 12.33
24 Hourly Average (µg/m3) SO2 1.7 NO2 12.1
Date: 18.11.2020 to 19.11.2020
Shift 1st Shift 2nd Shift 3rd Shift
Monitoring Period 06.00 AM to 2.00
PM 02.00 PM to 10.00 PM 10.00 PM to 06.00 AM
Parameter SO2 NO2 SO2 NO2 SO2 NO2
403
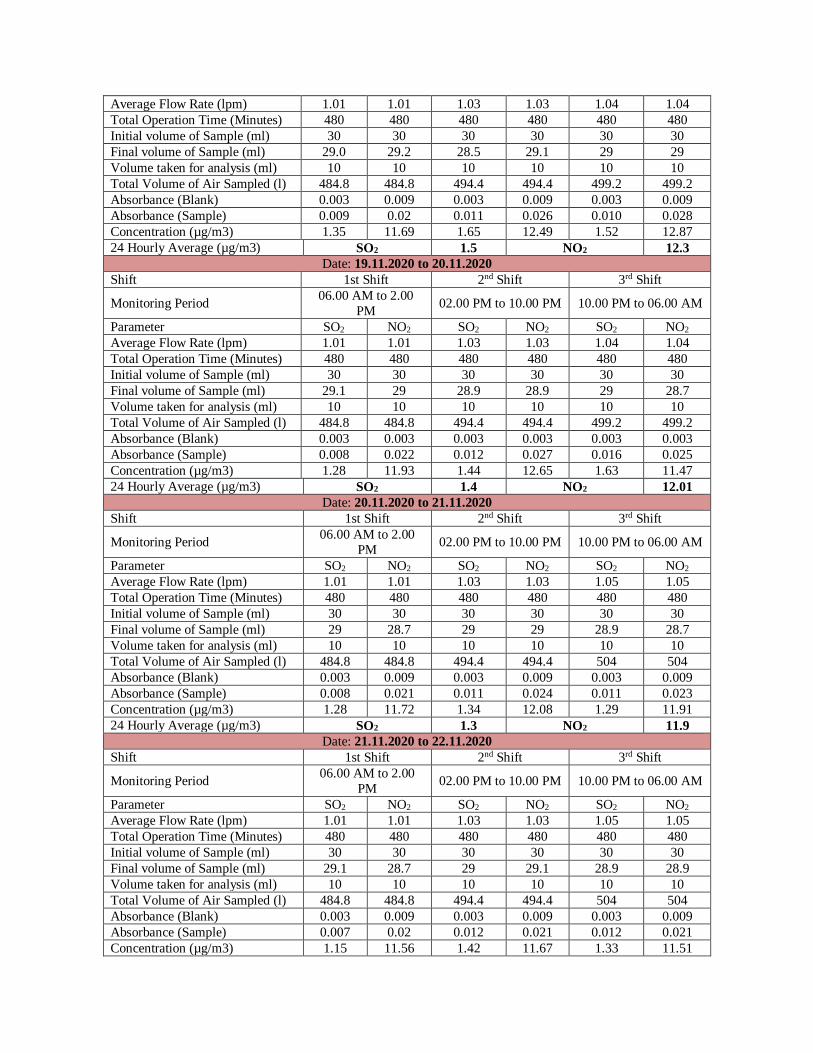
Average Flow Rate (lpm) 1.01 1.01 1.03 1.03 1.04 1.04
Total Operation Time (Minutes) 480 480 480 480 480 480
Initial volume of Sample (ml) 30 30 30 30 30 30
Final volume of Sample (ml) 29.0 29.2 28.5 29.1 29 29
Volume taken for analysis (ml) 10 10 10 10 10 10
Total Volume of Air Sampled (l) 484.8 484.8 494.4 494.4 499.2 499.2
Absorbance (Blank) 0.003 0.009 0.003 0.009 0.003 0.009
Absorbance (Sample) 0.009 0.02 0.011 0.026 0.010 0.028
Concentration (µg/m3) 1.35 11.69 1.65 12.49 1.52 12.87
24 Hourly Average (µg/m3) SO2 1.5 NO2 12.3
Date: 19.11.2020 to 20.11.2020
Shift 1st Shift 2nd Shift 3rd Shift
Monitoring Period 06.00 AM to 2.00
PM 02.00 PM to 10.00 PM 10.00 PM to 06.00 AM
Parameter SO2 NO2 SO2 NO2 SO2 NO2
Average Flow Rate (lpm) 1.01 1.01 1.03 1.03 1.04 1.04
Total Operation Time (Minutes) 480 480 480 480 480 480
Initial volume of Sample (ml) 30 30 30 30 30 30
Final volume of Sample (ml) 29.1 29 28.9 28.9 29 28.7
Volume taken for analysis (ml) 10 10 10 10 10 10
Total Volume of Air Sampled (l) 484.8 484.8 494.4 494.4 499.2 499.2
Absorbance (Blank) 0.003 0.003 0.003 0.003 0.003 0.003
Absorbance (Sample) 0.008 0.022 0.012 0.027 0.016 0.025
Concentration (µg/m3) 1.28 11.93 1.44 12.65 1.63 11.47
24 Hourly Average (µg/m3) SO2 1.4 NO2 12.01
Date: 20.11.2020 to 21.11.2020
Shift 1st Shift 2nd Shift 3rd Shift
Monitoring Period 06.00 AM to 2.00
PM 02.00 PM to 10.00 PM 10.00 PM to 06.00 AM
Parameter SO2 NO2 SO2 NO2 SO2 NO2
Average Flow Rate (lpm) 1.01 1.01 1.03 1.03 1.05 1.05
Total Operation Time (Minutes) 480 480 480 480 480 480
Initial volume of Sample (ml) 30 30 30 30 30 30
Final volume of Sample (ml) 29 28.7 29 29 28.9 28.7
Volume taken for analysis (ml) 10 10 10 10 10 10
Total Volume of Air Sampled (l) 484.8 484.8 494.4 494.4 504 504
Absorbance (Blank) 0.003 0.009 0.003 0.009 0.003 0.009
Absorbance (Sample) 0.008 0.021 0.011 0.024 0.011 0.023
Concentration (µg/m3) 1.28 11.72 1.34 12.08 1.29 11.91
24 Hourly Average (µg/m3) SO2 1.3 NO2 11.9
Date: 21.11.2020 to 22.11.2020
Shift 1st Shift 2nd Shift 3rd Shift
Monitoring Period 06.00 AM to 2.00
PM 02.00 PM to 10.00 PM 10.00 PM to 06.00 AM
Parameter SO2 NO2 SO2 NO2 SO2 NO2
Average Flow Rate (lpm) 1.01 1.01 1.03 1.03 1.05 1.05
Total Operation Time (Minutes) 480 480 480 480 480 480
Initial volume of Sample (ml) 30 30 30 30 30 30
Final volume of Sample (ml) 29.1 28.7 29 29.1 28.9 28.9
Volume taken for analysis (ml) 10 10 10 10 10 10
Total Volume of Air Sampled (l) 484.8 484.8 494.4 494.4 504 504
Absorbance (Blank) 0.003 0.009 0.003 0.009 0.003 0.009
Absorbance (Sample) 0.007 0.02 0.012 0.021 0.012 0.021
Concentration (µg/m3) 1.15 11.56 1.42 11.67 1.33 11.51
404
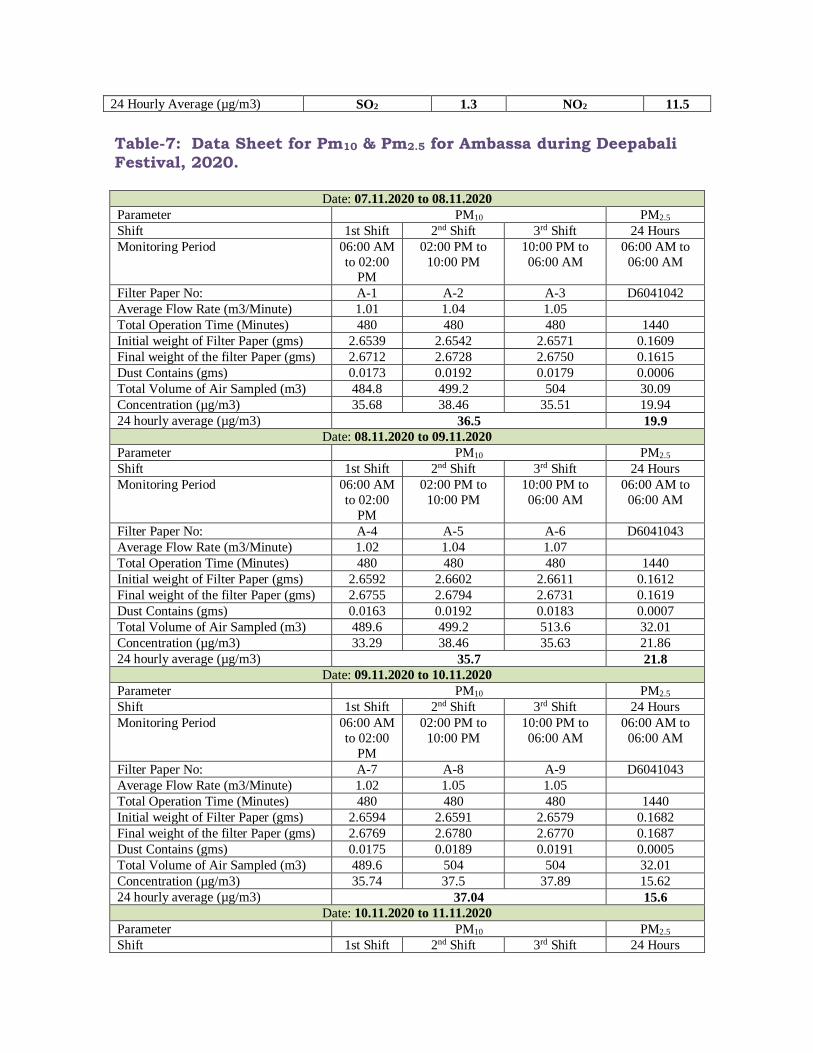
24 Hourly Average (µg/m3) SO2 1.3 NO2 11.5
Table-7: Data Sheet for Pm10 & Pm2.5 for Ambassa during Deepabali
Festival, 2020.
Date: 07.11.2020 to 08.11.2020
Parameter PM10 PM2.5
Shift 1st Shift 2nd Shift 3rd Shift 24 Hours
Monitoring Period 06:00 AM
to 02:00 PM
02:00 PM to
10:00 PM
10:00 PM to
06:00 AM
06:00 AM to
06:00 AM
Filter Paper No: A-1 A-2 A-3 D6041042
Average Flow Rate (m3/Minute) 1.01 1.04 1.05
Total Operation Time (Minutes) 480 480 480 1440
Initial weight of Filter Paper (gms) 2.6539 2.6542 2.6571 0.1609
Final weight of the filter Paper (gms) 2.6712 2.6728 2.6750 0.1615
Dust Contains (gms) 0.0173 0.0192 0.0179 0.0006
Total Volume of Air Sampled (m3) 484.8 499.2 504 30.09
Concentration (µg/m3) 35.68 38.46 35.51 19.94
24 hourly average (µg/m3) 36.5 19.9
Date: 08.11.2020 to 09.11.2020
Parameter PM10 PM2.5
Shift 1st Shift 2nd Shift 3rd Shift 24 Hours
Monitoring Period 06:00 AM
to 02:00
PM
02:00 PM to
10:00 PM
10:00 PM to
06:00 AM
06:00 AM to
06:00 AM
Filter Paper No: A-4 A-5 A-6 D6041043
Average Flow Rate (m3/Minute) 1.02 1.04 1.07
Total Operation Time (Minutes) 480 480 480 1440
Initial weight of Filter Paper (gms) 2.6592 2.6602 2.6611 0.1612
Final weight of the filter Paper (gms) 2.6755 2.6794 2.6731 0.1619
Dust Contains (gms) 0.0163 0.0192 0.0183 0.0007
Total Volume of Air Sampled (m3) 489.6 499.2 513.6 32.01
Concentration (µg/m3) 33.29 38.46 35.63 21.86
24 hourly average (µg/m3) 35.7 21.8
Date: 09.11.2020 to 10.11.2020
Parameter PM10 PM2.5
Shift 1st Shift 2nd Shift 3rd Shift 24 Hours
Monitoring Period 06:00 AM
to 02:00
PM
02:00 PM to
10:00 PM
10:00 PM to
06:00 AM
06:00 AM to
06:00 AM
Filter Paper No: A-7 A-8 A-9 D6041043
Average Flow Rate (m3/Minute) 1.02 1.05 1.05
Total Operation Time (Minutes) 480 480 480 1440
Initial weight of Filter Paper (gms) 2.6594 2.6591 2.6579 0.1682
Final weight of the filter Paper (gms) 2.6769 2.6780 2.6770 0.1687
Dust Contains (gms) 0.0175 0.0189 0.0191 0.0005
Total Volume of Air Sampled (m3) 489.6 504 504 32.01
Concentration (µg/m3) 35.74 37.5 37.89 15.62
24 hourly average (µg/m3) 37.04 15.6
Date: 10.11.2020 to 11.11.2020
Parameter PM10 PM2.5
Shift 1st Shift 2nd Shift 3rd Shift 24 Hours
405
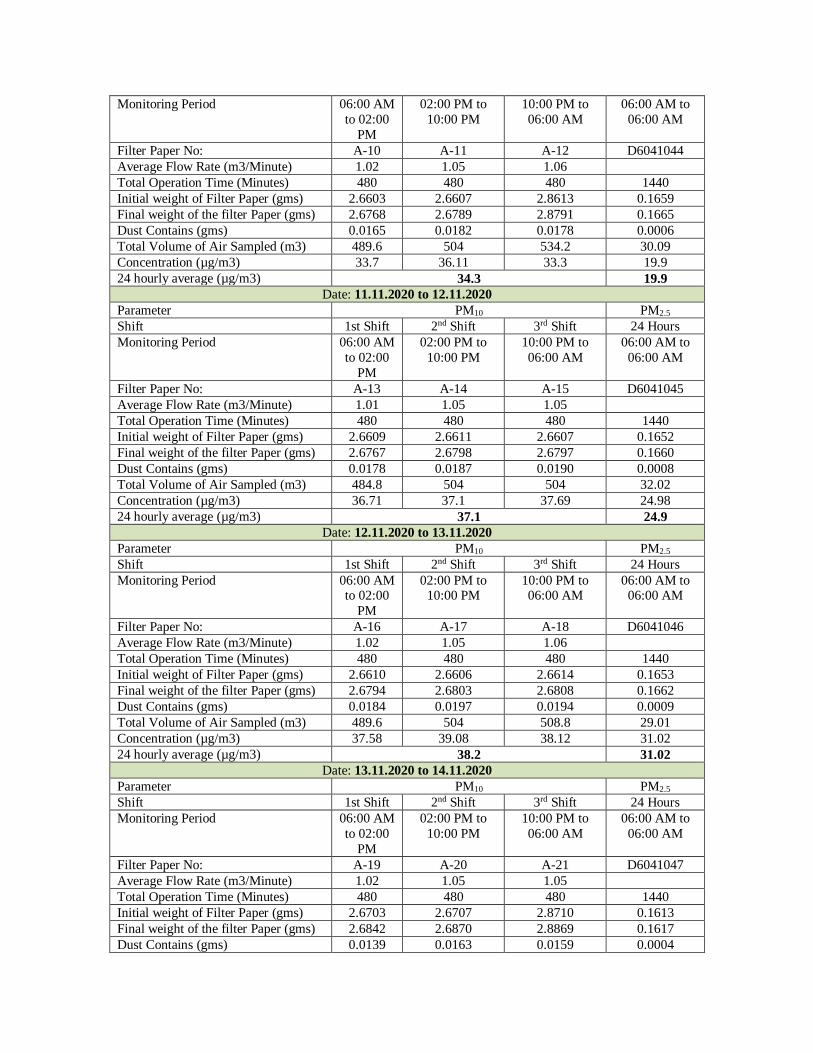
Monitoring Period 06:00 AM
to 02:00
PM
02:00 PM to
10:00 PM
10:00 PM to
06:00 AM
06:00 AM to
06:00 AM
Filter Paper No: A-10 A-11 A-12 D6041044
Average Flow Rate (m3/Minute) 1.02 1.05 1.06
Total Operation Time (Minutes) 480 480 480 1440
Initial weight of Filter Paper (gms) 2.6603 2.6607 2.8613 0.1659
Final weight of the filter Paper (gms) 2.6768 2.6789 2.8791 0.1665
Dust Contains (gms) 0.0165 0.0182 0.0178 0.0006
Total Volume of Air Sampled (m3) 489.6 504 534.2 30.09
Concentration (µg/m3) 33.7 36.11 33.3 19.9
24 hourly average (µg/m3) 34.3 19.9
Date: 11.11.2020 to 12.11.2020
Parameter PM10 PM2.5
Shift 1st Shift 2nd Shift 3rd Shift 24 Hours
Monitoring Period 06:00 AM
to 02:00
PM
02:00 PM to
10:00 PM
10:00 PM to
06:00 AM
06:00 AM to
06:00 AM
Filter Paper No: A-13 A-14 A-15 D6041045
Average Flow Rate (m3/Minute) 1.01 1.05 1.05
Total Operation Time (Minutes) 480 480 480 1440
Initial weight of Filter Paper (gms) 2.6609 2.6611 2.6607 0.1652
Final weight of the filter Paper (gms) 2.6767 2.6798 2.6797 0.1660
Dust Contains (gms) 0.0178 0.0187 0.0190 0.0008
Total Volume of Air Sampled (m3) 484.8 504 504 32.02
Concentration (µg/m3) 36.71 37.1 37.69 24.98
24 hourly average (µg/m3) 37.1 24.9
Date: 12.11.2020 to 13.11.2020
Parameter PM10 PM2.5
Shift 1st Shift 2nd Shift 3rd Shift 24 Hours
Monitoring Period 06:00 AM to 02:00
PM
02:00 PM to 10:00 PM
10:00 PM to 06:00 AM
06:00 AM to 06:00 AM
Filter Paper No: A-16 A-17 A-18 D6041046
Average Flow Rate (m3/Minute) 1.02 1.05 1.06
Total Operation Time (Minutes) 480 480 480 1440
Initial weight of Filter Paper (gms) 2.6610 2.6606 2.6614 0.1653
Final weight of the filter Paper (gms) 2.6794 2.6803 2.6808 0.1662
Dust Contains (gms) 0.0184 0.0197 0.0194 0.0009
Total Volume of Air Sampled (m3) 489.6 504 508.8 29.01
Concentration (µg/m3) 37.58 39.08 38.12 31.02
24 hourly average (µg/m3) 38.2 31.02
Date: 13.11.2020 to 14.11.2020
Parameter PM10 PM2.5
Shift 1st Shift 2nd Shift 3rd Shift 24 Hours
Monitoring Period 06:00 AM
to 02:00
PM
02:00 PM to
10:00 PM
10:00 PM to
06:00 AM
06:00 AM to
06:00 AM
Filter Paper No: A-19 A-20 A-21 D6041047
Average Flow Rate (m3/Minute) 1.02 1.05 1.05
Total Operation Time (Minutes) 480 480 480 1440
Initial weight of Filter Paper (gms) 2.6703 2.6707 2.8710 0.1613
Final weight of the filter Paper (gms) 2.6842 2.6870 2.8869 0.1617
Dust Contains (gms) 0.0139 0.0163 0.0159 0.0004
406
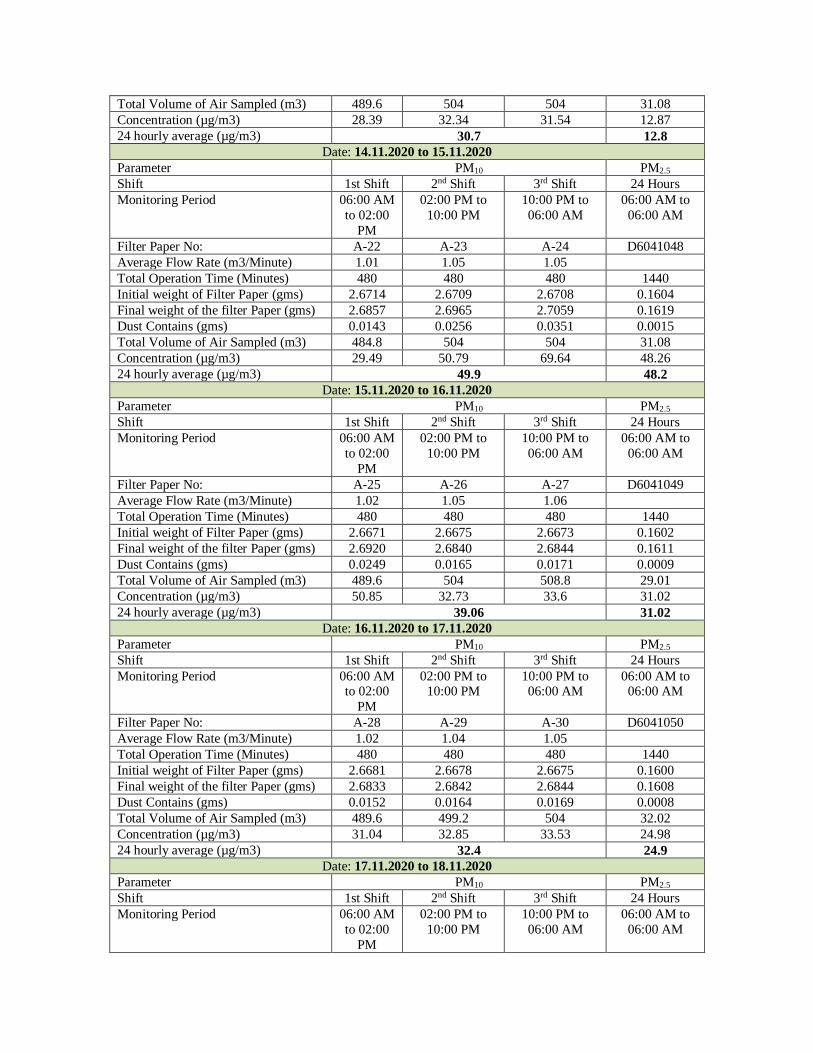
Total Volume of Air Sampled (m3) 489.6 504 504 31.08
Concentration (µg/m3) 28.39 32.34 31.54 12.87
24 hourly average (µg/m3) 30.7 12.8
Date: 14.11.2020 to 15.11.2020
Parameter PM10 PM2.5
Shift 1st Shift 2nd Shift 3rd Shift 24 Hours
Monitoring Period 06:00 AM
to 02:00
PM
02:00 PM to
10:00 PM
10:00 PM to
06:00 AM
06:00 AM to
06:00 AM
Filter Paper No: A-22 A-23 A-24 D6041048
Average Flow Rate (m3/Minute) 1.01 1.05 1.05
Total Operation Time (Minutes) 480 480 480 1440
Initial weight of Filter Paper (gms) 2.6714 2.6709 2.6708 0.1604
Final weight of the filter Paper (gms) 2.6857 2.6965 2.7059 0.1619
Dust Contains (gms) 0.0143 0.0256 0.0351 0.0015
Total Volume of Air Sampled (m3) 484.8 504 504 31.08
Concentration (µg/m3) 29.49 50.79 69.64 48.26
24 hourly average (µg/m3) 49.9 48.2
Date: 15.11.2020 to 16.11.2020
Parameter PM10 PM2.5
Shift 1st Shift 2nd Shift 3rd Shift 24 Hours
Monitoring Period 06:00 AM
to 02:00
PM
02:00 PM to
10:00 PM
10:00 PM to
06:00 AM
06:00 AM to
06:00 AM
Filter Paper No: A-25 A-26 A-27 D6041049
Average Flow Rate (m3/Minute) 1.02 1.05 1.06
Total Operation Time (Minutes) 480 480 480 1440
Initial weight of Filter Paper (gms) 2.6671 2.6675 2.6673 0.1602
Final weight of the filter Paper (gms) 2.6920 2.6840 2.6844 0.1611
Dust Contains (gms) 0.0249 0.0165 0.0171 0.0009
Total Volume of Air Sampled (m3) 489.6 504 508.8 29.01
Concentration (µg/m3) 50.85 32.73 33.6 31.02
24 hourly average (µg/m3) 39.06 31.02
Date: 16.11.2020 to 17.11.2020
Parameter PM10 PM2.5
Shift 1st Shift 2nd Shift 3rd Shift 24 Hours
Monitoring Period 06:00 AM to 02:00
PM
02:00 PM to 10:00 PM
10:00 PM to 06:00 AM
06:00 AM to 06:00 AM
Filter Paper No: A-28 A-29 A-30 D6041050
Average Flow Rate (m3/Minute) 1.02 1.04 1.05
Total Operation Time (Minutes) 480 480 480 1440
Initial weight of Filter Paper (gms) 2.6681 2.6678 2.6675 0.1600
Final weight of the filter Paper (gms) 2.6833 2.6842 2.6844 0.1608
Dust Contains (gms) 0.0152 0.0164 0.0169 0.0008
Total Volume of Air Sampled (m3) 489.6 499.2 504 32.02
Concentration (µg/m3) 31.04 32.85 33.53 24.98
24 hourly average (µg/m3) 32.4 24.9
Date: 17.11.2020 to 18.11.2020
Parameter PM10 PM2.5
Shift 1st Shift 2nd Shift 3rd Shift 24 Hours
Monitoring Period 06:00 AM
to 02:00
PM
02:00 PM to
10:00 PM
10:00 PM to
06:00 AM
06:00 AM to
06:00 AM
407
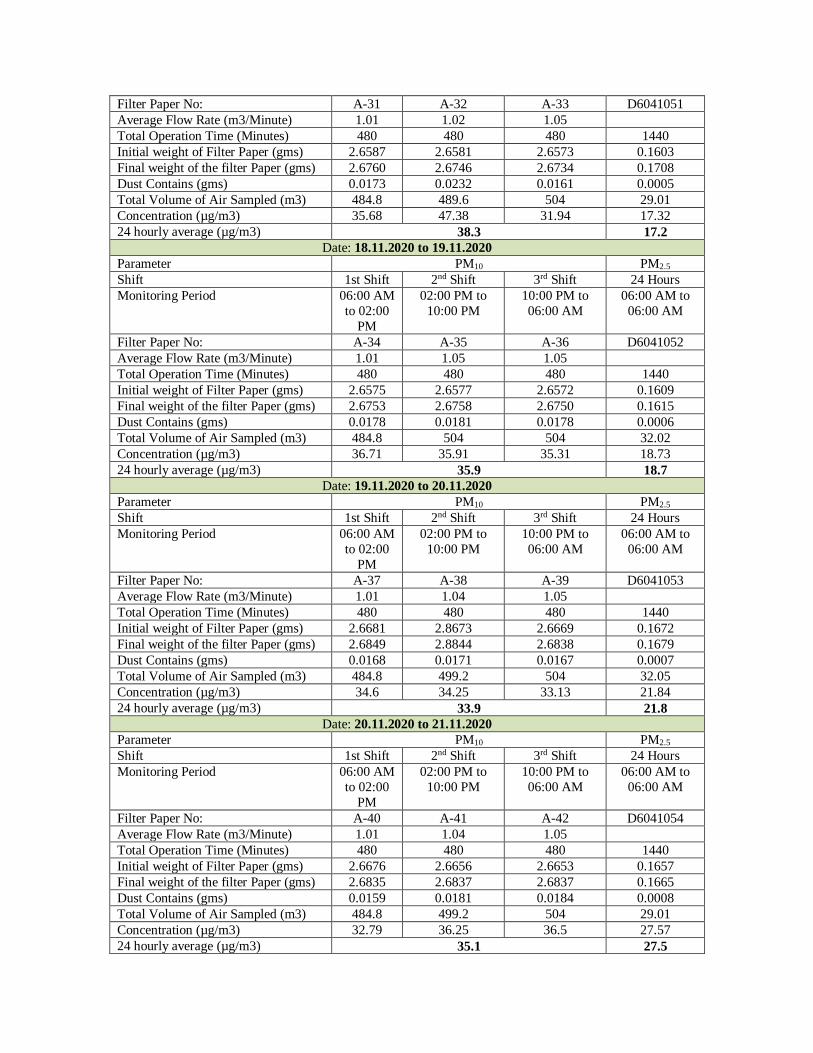
Filter Paper No: A-31 A-32 A-33 D6041051
Average Flow Rate (m3/Minute) 1.01 1.02 1.05
Total Operation Time (Minutes) 480 480 480 1440
Initial weight of Filter Paper (gms) 2.6587 2.6581 2.6573 0.1603
Final weight of the filter Paper (gms) 2.6760 2.6746 2.6734 0.1708
Dust Contains (gms) 0.0173 0.0232 0.0161 0.0005
Total Volume of Air Sampled (m3) 484.8 489.6 504 29.01
Concentration (µg/m3) 35.68 47.38 31.94 17.32
24 hourly average (µg/m3) 38.3 17.2
Date: 18.11.2020 to 19.11.2020
Parameter PM10 PM2.5
Shift 1st Shift 2nd Shift 3rd Shift 24 Hours
Monitoring Period 06:00 AM
to 02:00
PM
02:00 PM to
10:00 PM
10:00 PM to
06:00 AM
06:00 AM to
06:00 AM
Filter Paper No: A-34 A-35 A-36 D6041052
Average Flow Rate (m3/Minute) 1.01 1.05 1.05
Total Operation Time (Minutes) 480 480 480 1440
Initial weight of Filter Paper (gms) 2.6575 2.6577 2.6572 0.1609
Final weight of the filter Paper (gms) 2.6753 2.6758 2.6750 0.1615
Dust Contains (gms) 0.0178 0.0181 0.0178 0.0006
Total Volume of Air Sampled (m3) 484.8 504 504 32.02
Concentration (µg/m3) 36.71 35.91 35.31 18.73
24 hourly average (µg/m3) 35.9 18.7
Date: 19.11.2020 to 20.11.2020
Parameter PM10 PM2.5
Shift 1st Shift 2nd Shift 3rd Shift 24 Hours
Monitoring Period 06:00 AM
to 02:00
PM
02:00 PM to
10:00 PM
10:00 PM to
06:00 AM
06:00 AM to
06:00 AM
Filter Paper No: A-37 A-38 A-39 D6041053
Average Flow Rate (m3/Minute) 1.01 1.04 1.05
Total Operation Time (Minutes) 480 480 480 1440
Initial weight of Filter Paper (gms) 2.6681 2.8673 2.6669 0.1672
Final weight of the filter Paper (gms) 2.6849 2.8844 2.6838 0.1679
Dust Contains (gms) 0.0168 0.0171 0.0167 0.0007
Total Volume of Air Sampled (m3) 484.8 499.2 504 32.05
Concentration (µg/m3) 34.6 34.25 33.13 21.84
24 hourly average (µg/m3) 33.9 21.8
Date: 20.11.2020 to 21.11.2020
Parameter PM10 PM2.5
Shift 1st Shift 2nd Shift 3rd Shift 24 Hours
Monitoring Period 06:00 AM
to 02:00
PM
02:00 PM to
10:00 PM
10:00 PM to
06:00 AM
06:00 AM to
06:00 AM
Filter Paper No: A-40 A-41 A-42 D6041054
Average Flow Rate (m3/Minute) 1.01 1.04 1.05
Total Operation Time (Minutes) 480 480 480 1440
Initial weight of Filter Paper (gms) 2.6676 2.6656 2.6653 0.1657
Final weight of the filter Paper (gms) 2.6835 2.6837 2.6837 0.1665
Dust Contains (gms) 0.0159 0.0181 0.0184 0.0008
Total Volume of Air Sampled (m3) 484.8 499.2 504 29.01
Concentration (µg/m3) 32.79 36.25 36.5 27.57
24 hourly average (µg/m3) 35.1 27.5
408
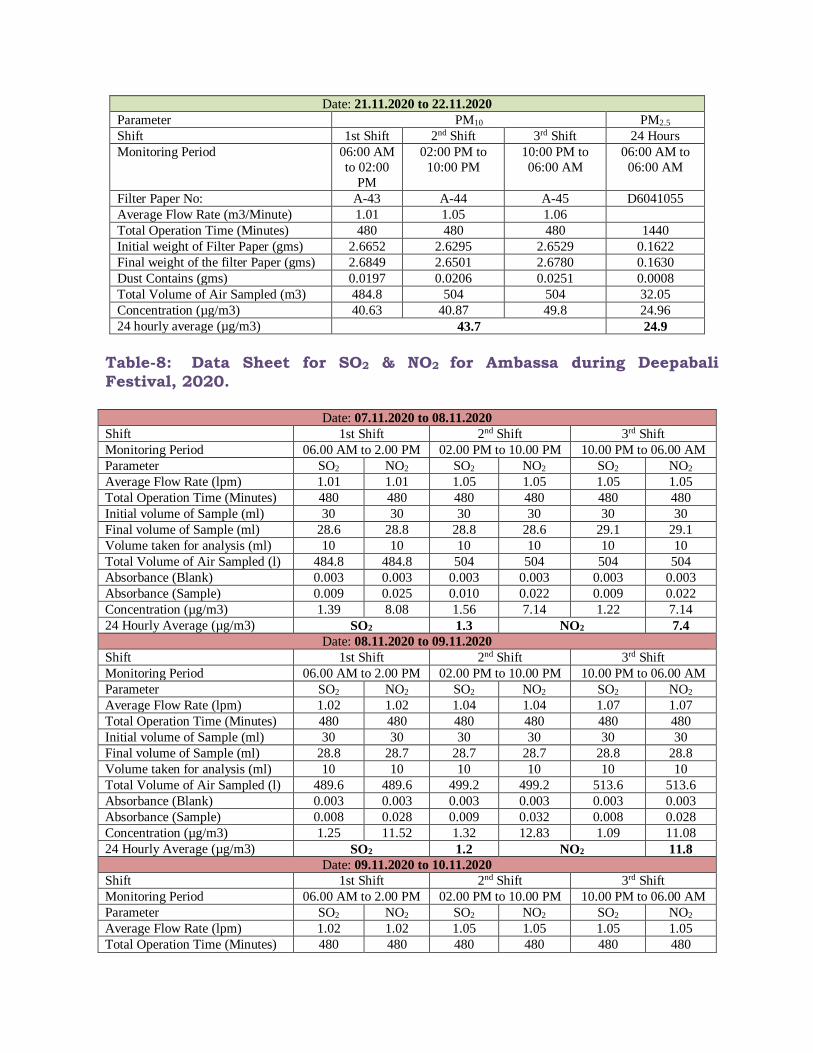
Date: 21.11.2020 to 22.11.2020
Parameter PM10 PM2.5
Shift 1st Shift 2nd Shift 3rd Shift 24 Hours
Monitoring Period 06:00 AM
to 02:00
PM
02:00 PM to
10:00 PM
10:00 PM to
06:00 AM
06:00 AM to
06:00 AM
Filter Paper No: A-43 A-44 A-45 D6041055
Average Flow Rate (m3/Minute) 1.01 1.05 1.06
Total Operation Time (Minutes) 480 480 480 1440
Initial weight of Filter Paper (gms) 2.6652 2.6295 2.6529 0.1622
Final weight of the filter Paper (gms) 2.6849 2.6501 2.6780 0.1630
Dust Contains (gms) 0.0197 0.0206 0.0251 0.0008
Total Volume of Air Sampled (m3) 484.8 504 504 32.05
Concentration (µg/m3) 40.63 40.87 49.8 24.96
24 hourly average (µg/m3) 43.7 24.9
Table-8: Data Sheet for SO2 & NO2 for Ambassa during Deepabali
Festival, 2020.
Date: 07.11.2020 to 08.11.2020
Shift 1st Shift 2nd Shift 3rd Shift
Monitoring Period 06.00 AM to 2.00 PM 02.00 PM to 10.00 PM 10.00 PM to 06.00 AM
Parameter SO2 NO2 SO2 NO2 SO2 NO2
Average Flow Rate (lpm) 1.01 1.01 1.05 1.05 1.05 1.05
Total Operation Time (Minutes) 480 480 480 480 480 480
Initial volume of Sample (ml) 30 30 30 30 30 30
Final volume of Sample (ml) 28.6 28.8 28.8 28.6 29.1 29.1
Volume taken for analysis (ml) 10 10 10 10 10 10
Total Volume of Air Sampled (l) 484.8 484.8 504 504 504 504
Absorbance (Blank) 0.003 0.003 0.003 0.003 0.003 0.003
Absorbance (Sample) 0.009 0.025 0.010 0.022 0.009 0.022
Concentration (µg/m3) 1.39 8.08 1.56 7.14 1.22 7.14
24 Hourly Average (µg/m3) SO2 1.3 NO2 7.4
Date: 08.11.2020 to 09.11.2020
Shift 1st Shift 2nd Shift 3rd Shift
Monitoring Period 06.00 AM to 2.00 PM 02.00 PM to 10.00 PM 10.00 PM to 06.00 AM
Parameter SO2 NO2 SO2 NO2 SO2 NO2
Average Flow Rate (lpm) 1.02 1.02 1.04 1.04 1.07 1.07
Total Operation Time (Minutes) 480 480 480 480 480 480
Initial volume of Sample (ml) 30 30 30 30 30 30
Final volume of Sample (ml) 28.8 28.7 28.7 28.7 28.8 28.8
Volume taken for analysis (ml) 10 10 10 10 10 10
Total Volume of Air Sampled (l) 489.6 489.6 499.2 499.2 513.6 513.6
Absorbance (Blank) 0.003 0.003 0.003 0.003 0.003 0.003
Absorbance (Sample) 0.008 0.028 0.009 0.032 0.008 0.028
Concentration (µg/m3) 1.25 11.52 1.32 12.83 1.09 11.08
24 Hourly Average (µg/m3) SO2 1.2 NO2 11.8
Date: 09.11.2020 to 10.11.2020
Shift 1st Shift 2nd Shift 3rd Shift
Monitoring Period 06.00 AM to 2.00 PM 02.00 PM to 10.00 PM 10.00 PM to 06.00 AM
Parameter SO2 NO2 SO2 NO2 SO2 NO2
Average Flow Rate (lpm) 1.02 1.02 1.05 1.05 1.05 1.05
Total Operation Time (Minutes) 480 480 480 480 480 480
409
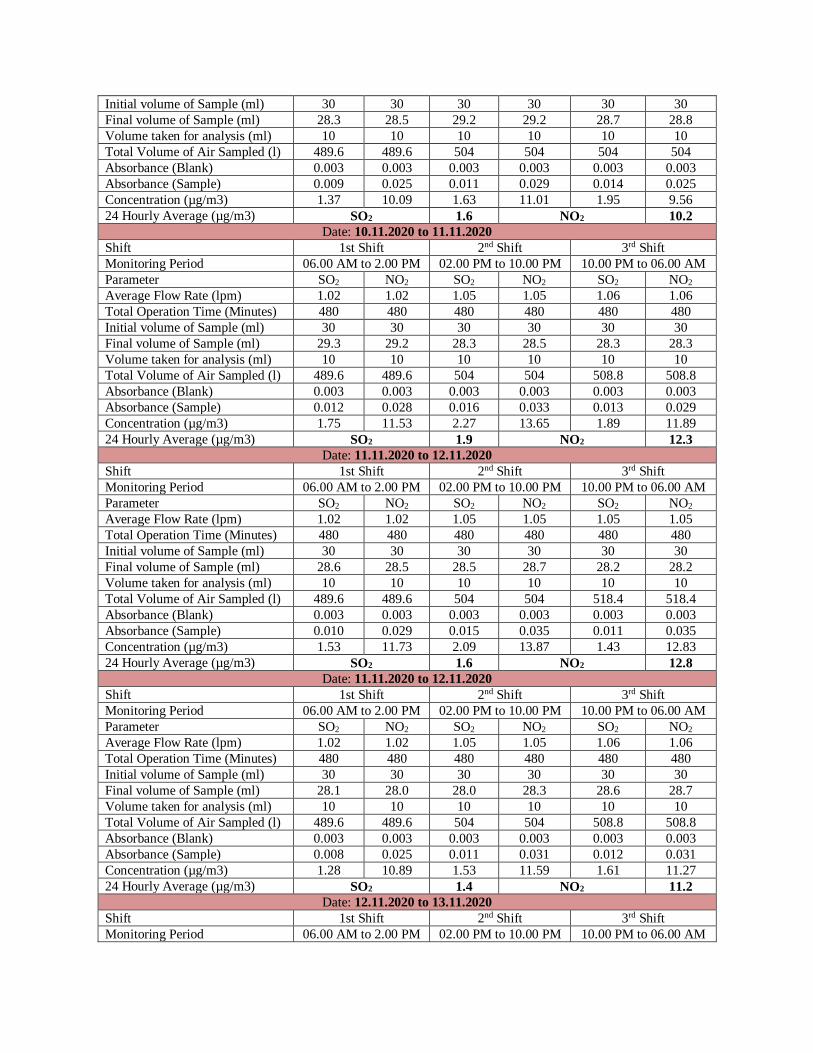
Initial volume of Sample (ml) 30 30 30 30 30 30
Final volume of Sample (ml) 28.3 28.5 29.2 29.2 28.7 28.8
Volume taken for analysis (ml) 10 10 10 10 10 10
Total Volume of Air Sampled (l) 489.6 489.6 504 504 504 504
Absorbance (Blank) 0.003 0.003 0.003 0.003 0.003 0.003
Absorbance (Sample) 0.009 0.025 0.011 0.029 0.014 0.025
Concentration (µg/m3) 1.37 10.09 1.63 11.01 1.95 9.56
24 Hourly Average (µg/m3) SO2 1.6 NO2 10.2
Date: 10.11.2020 to 11.11.2020
Shift 1st Shift 2nd Shift 3rd Shift
Monitoring Period 06.00 AM to 2.00 PM 02.00 PM to 10.00 PM 10.00 PM to 06.00 AM
Parameter SO2 NO2 SO2 NO2 SO2 NO2
Average Flow Rate (lpm) 1.02 1.02 1.05 1.05 1.06 1.06
Total Operation Time (Minutes) 480 480 480 480 480 480
Initial volume of Sample (ml) 30 30 30 30 30 30
Final volume of Sample (ml) 29.3 29.2 28.3 28.5 28.3 28.3
Volume taken for analysis (ml) 10 10 10 10 10 10
Total Volume of Air Sampled (l) 489.6 489.6 504 504 508.8 508.8
Absorbance (Blank) 0.003 0.003 0.003 0.003 0.003 0.003
Absorbance (Sample) 0.012 0.028 0.016 0.033 0.013 0.029
Concentration (µg/m3) 1.75 11.53 2.27 13.65 1.89 11.89
24 Hourly Average (µg/m3) SO2 1.9 NO2 12.3
Date: 11.11.2020 to 12.11.2020
Shift 1st Shift 2nd Shift 3rd Shift
Monitoring Period 06.00 AM to 2.00 PM 02.00 PM to 10.00 PM 10.00 PM to 06.00 AM
Parameter SO2 NO2 SO2 NO2 SO2 NO2
Average Flow Rate (lpm) 1.02 1.02 1.05 1.05 1.05 1.05
Total Operation Time (Minutes) 480 480 480 480 480 480
Initial volume of Sample (ml) 30 30 30 30 30 30
Final volume of Sample (ml) 28.6 28.5 28.5 28.7 28.2 28.2
Volume taken for analysis (ml) 10 10 10 10 10 10
Total Volume of Air Sampled (l) 489.6 489.6 504 504 518.4 518.4
Absorbance (Blank) 0.003 0.003 0.003 0.003 0.003 0.003
Absorbance (Sample) 0.010 0.029 0.015 0.035 0.011 0.035
Concentration (µg/m3) 1.53 11.73 2.09 13.87 1.43 12.83
24 Hourly Average (µg/m3) SO2 1.6 NO2 12.8
Date: 11.11.2020 to 12.11.2020
Shift 1st Shift 2nd Shift 3rd Shift
Monitoring Period 06.00 AM to 2.00 PM 02.00 PM to 10.00 PM 10.00 PM to 06.00 AM
Parameter SO2 NO2 SO2 NO2 SO2 NO2
Average Flow Rate (lpm) 1.02 1.02 1.05 1.05 1.06 1.06
Total Operation Time (Minutes) 480 480 480 480 480 480
Initial volume of Sample (ml) 30 30 30 30 30 30
Final volume of Sample (ml) 28.1 28.0 28.0 28.3 28.6 28.7
Volume taken for analysis (ml) 10 10 10 10 10 10
Total Volume of Air Sampled (l) 489.6 489.6 504 504 508.8 508.8
Absorbance (Blank) 0.003 0.003 0.003 0.003 0.003 0.003
Absorbance (Sample) 0.008 0.025 0.011 0.031 0.012 0.031
Concentration (µg/m3) 1.28 10.89 1.53 11.59 1.61 11.27
24 Hourly Average (µg/m3) SO2 1.4 NO2 11.2
Date: 12.11.2020 to 13.11.2020
Shift 1st Shift 2nd Shift 3rd Shift
Monitoring Period 06.00 AM to 2.00 PM 02.00 PM to 10.00 PM 10.00 PM to 06.00 AM
410
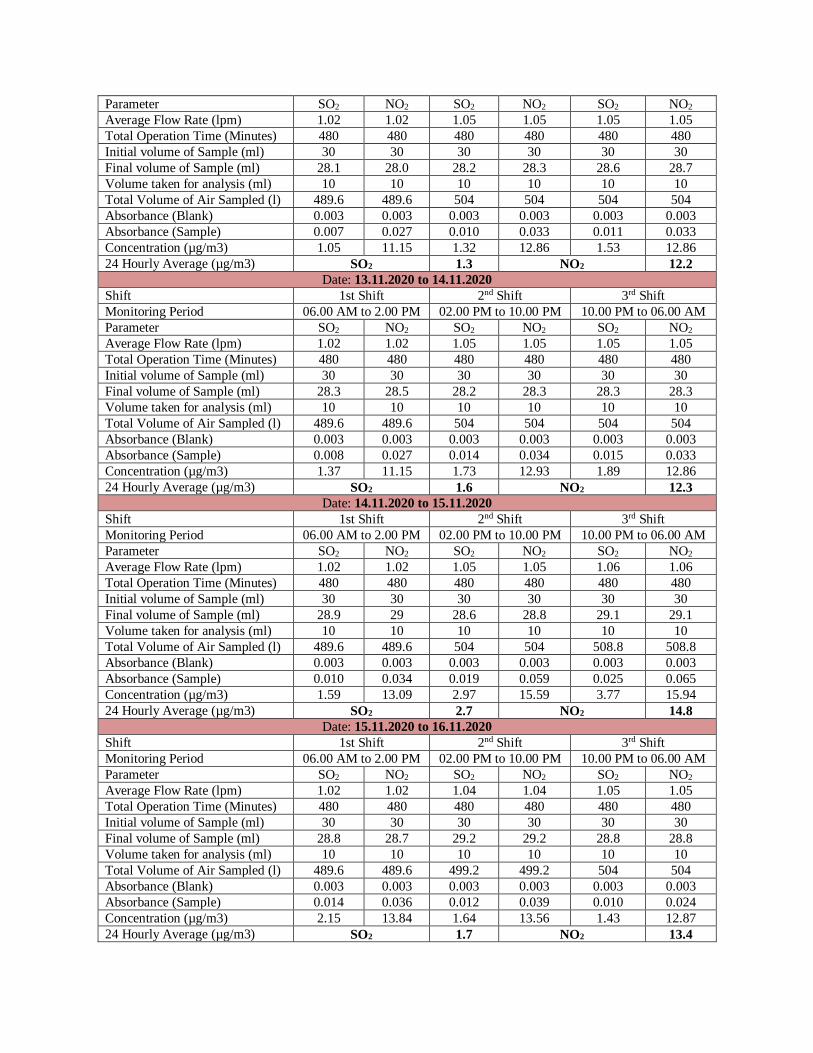
Parameter SO2 NO2 SO2 NO2 SO2 NO2
Average Flow Rate (lpm) 1.02 1.02 1.05 1.05 1.05 1.05
Total Operation Time (Minutes) 480 480 480 480 480 480
Initial volume of Sample (ml) 30 30 30 30 30 30
Final volume of Sample (ml) 28.1 28.0 28.2 28.3 28.6 28.7
Volume taken for analysis (ml) 10 10 10 10 10 10
Total Volume of Air Sampled (l) 489.6 489.6 504 504 504 504
Absorbance (Blank) 0.003 0.003 0.003 0.003 0.003 0.003
Absorbance (Sample) 0.007 0.027 0.010 0.033 0.011 0.033
Concentration (µg/m3) 1.05 11.15 1.32 12.86 1.53 12.86
24 Hourly Average (µg/m3) SO2 1.3 NO2 12.2
Date: 13.11.2020 to 14.11.2020
Shift 1st Shift 2nd Shift 3rd Shift
Monitoring Period 06.00 AM to 2.00 PM 02.00 PM to 10.00 PM 10.00 PM to 06.00 AM
Parameter SO2 NO2 SO2 NO2 SO2 NO2
Average Flow Rate (lpm) 1.02 1.02 1.05 1.05 1.05 1.05
Total Operation Time (Minutes) 480 480 480 480 480 480
Initial volume of Sample (ml) 30 30 30 30 30 30
Final volume of Sample (ml) 28.3 28.5 28.2 28.3 28.3 28.3
Volume taken for analysis (ml) 10 10 10 10 10 10
Total Volume of Air Sampled (l) 489.6 489.6 504 504 504 504
Absorbance (Blank) 0.003 0.003 0.003 0.003 0.003 0.003
Absorbance (Sample) 0.008 0.027 0.014 0.034 0.015 0.033
Concentration (µg/m3) 1.37 11.15 1.73 12.93 1.89 12.86
24 Hourly Average (µg/m3) SO2 1.6 NO2 12.3
Date: 14.11.2020 to 15.11.2020
Shift 1st Shift 2nd Shift 3rd Shift
Monitoring Period 06.00 AM to 2.00 PM 02.00 PM to 10.00 PM 10.00 PM to 06.00 AM
Parameter SO2 NO2 SO2 NO2 SO2 NO2
Average Flow Rate (lpm) 1.02 1.02 1.05 1.05 1.06 1.06
Total Operation Time (Minutes) 480 480 480 480 480 480
Initial volume of Sample (ml) 30 30 30 30 30 30
Final volume of Sample (ml) 28.9 29 28.6 28.8 29.1 29.1
Volume taken for analysis (ml) 10 10 10 10 10 10
Total Volume of Air Sampled (l) 489.6 489.6 504 504 508.8 508.8
Absorbance (Blank) 0.003 0.003 0.003 0.003 0.003 0.003
Absorbance (Sample) 0.010 0.034 0.019 0.059 0.025 0.065
Concentration (µg/m3) 1.59 13.09 2.97 15.59 3.77 15.94
24 Hourly Average (µg/m3) SO2 2.7 NO2 14.8
Date: 15.11.2020 to 16.11.2020
Shift 1st Shift 2nd Shift 3rd Shift
Monitoring Period 06.00 AM to 2.00 PM 02.00 PM to 10.00 PM 10.00 PM to 06.00 AM
Parameter SO2 NO2 SO2 NO2 SO2 NO2
Average Flow Rate (lpm) 1.02 1.02 1.04 1.04 1.05 1.05
Total Operation Time (Minutes) 480 480 480 480 480 480
Initial volume of Sample (ml) 30 30 30 30 30 30
Final volume of Sample (ml) 28.8 28.7 29.2 29.2 28.8 28.8
Volume taken for analysis (ml) 10 10 10 10 10 10
Total Volume of Air Sampled (l) 489.6 489.6 499.2 499.2 504 504
Absorbance (Blank) 0.003 0.003 0.003 0.003 0.003 0.003
Absorbance (Sample) 0.014 0.036 0.012 0.039 0.010 0.024
Concentration (µg/m3) 2.15 13.84 1.64 13.56 1.43 12.87
24 Hourly Average (µg/m3) SO2 1.7 NO2 13.4
411
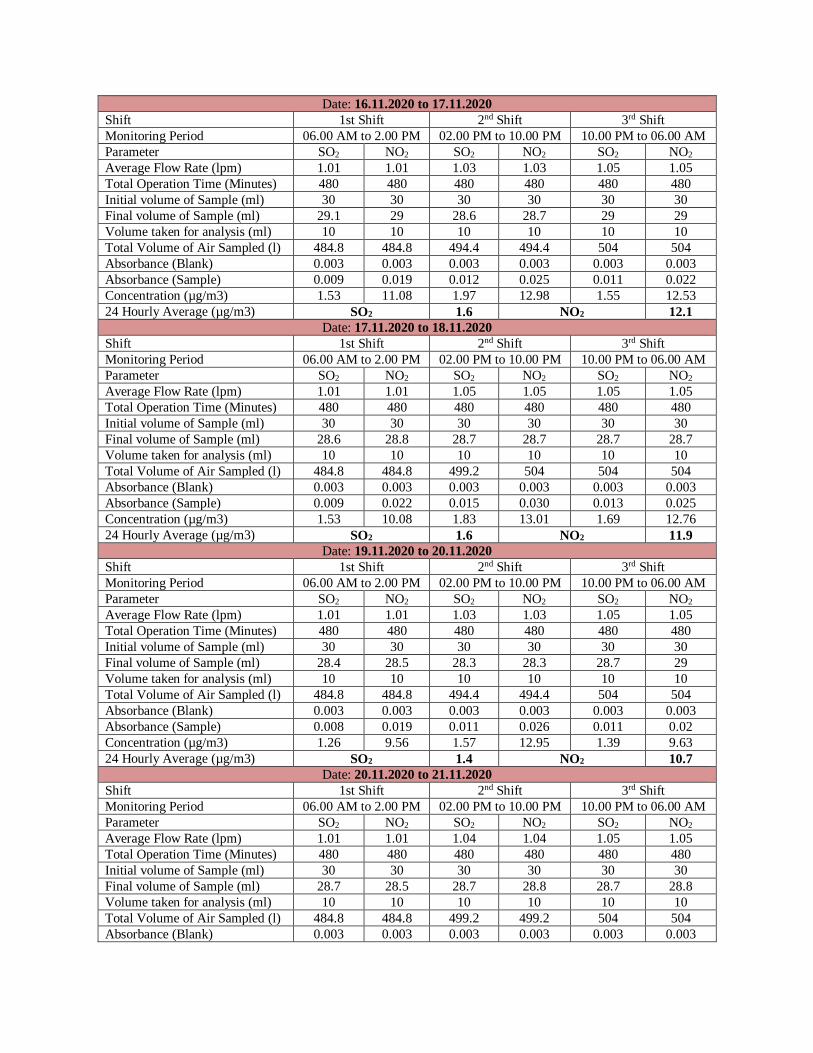
Date: 16.11.2020 to 17.11.2020
Shift 1st Shift 2nd Shift 3rd Shift
Monitoring Period 06.00 AM to 2.00 PM 02.00 PM to 10.00 PM 10.00 PM to 06.00 AM
Parameter SO2 NO2 SO2 NO2 SO2 NO2
Average Flow Rate (lpm) 1.01 1.01 1.03 1.03 1.05 1.05
Total Operation Time (Minutes) 480 480 480 480 480 480
Initial volume of Sample (ml) 30 30 30 30 30 30
Final volume of Sample (ml) 29.1 29 28.6 28.7 29 29
Volume taken for analysis (ml) 10 10 10 10 10 10
Total Volume of Air Sampled (l) 484.8 484.8 494.4 494.4 504 504
Absorbance (Blank) 0.003 0.003 0.003 0.003 0.003 0.003
Absorbance (Sample) 0.009 0.019 0.012 0.025 0.011 0.022
Concentration (µg/m3) 1.53 11.08 1.97 12.98 1.55 12.53
24 Hourly Average (µg/m3) SO2 1.6 NO2 12.1
Date: 17.11.2020 to 18.11.2020
Shift 1st Shift 2nd Shift 3rd Shift
Monitoring Period 06.00 AM to 2.00 PM 02.00 PM to 10.00 PM 10.00 PM to 06.00 AM
Parameter SO2 NO2 SO2 NO2 SO2 NO2
Average Flow Rate (lpm) 1.01 1.01 1.05 1.05 1.05 1.05
Total Operation Time (Minutes) 480 480 480 480 480 480
Initial volume of Sample (ml) 30 30 30 30 30 30
Final volume of Sample (ml) 28.6 28.8 28.7 28.7 28.7 28.7
Volume taken for analysis (ml) 10 10 10 10 10 10
Total Volume of Air Sampled (l) 484.8 484.8 499.2 504 504 504
Absorbance (Blank) 0.003 0.003 0.003 0.003 0.003 0.003
Absorbance (Sample) 0.009 0.022 0.015 0.030 0.013 0.025
Concentration (µg/m3) 1.53 10.08 1.83 13.01 1.69 12.76
24 Hourly Average (µg/m3) SO2 1.6 NO2 11.9
Date: 19.11.2020 to 20.11.2020
Shift 1st Shift 2nd Shift 3rd Shift
Monitoring Period 06.00 AM to 2.00 PM 02.00 PM to 10.00 PM 10.00 PM to 06.00 AM
Parameter SO2 NO2 SO2 NO2 SO2 NO2
Average Flow Rate (lpm) 1.01 1.01 1.03 1.03 1.05 1.05
Total Operation Time (Minutes) 480 480 480 480 480 480
Initial volume of Sample (ml) 30 30 30 30 30 30
Final volume of Sample (ml) 28.4 28.5 28.3 28.3 28.7 29
Volume taken for analysis (ml) 10 10 10 10 10 10
Total Volume of Air Sampled (l) 484.8 484.8 494.4 494.4 504 504
Absorbance (Blank) 0.003 0.003 0.003 0.003 0.003 0.003
Absorbance (Sample) 0.008 0.019 0.011 0.026 0.011 0.02
Concentration (µg/m3) 1.26 9.56 1.57 12.95 1.39 9.63
24 Hourly Average (µg/m3) SO2 1.4 NO2 10.7
Date: 20.11.2020 to 21.11.2020
Shift 1st Shift 2nd Shift 3rd Shift
Monitoring Period 06.00 AM to 2.00 PM 02.00 PM to 10.00 PM 10.00 PM to 06.00 AM
Parameter SO2 NO2 SO2 NO2 SO2 NO2
Average Flow Rate (lpm) 1.01 1.01 1.04 1.04 1.05 1.05
Total Operation Time (Minutes) 480 480 480 480 480 480
Initial volume of Sample (ml) 30 30 30 30 30 30
Final volume of Sample (ml) 28.7 28.5 28.7 28.8 28.7 28.8
Volume taken for analysis (ml) 10 10 10 10 10 10
Total Volume of Air Sampled (l) 484.8 484.8 499.2 499.2 504 504
Absorbance (Blank) 0.003 0.003 0.003 0.003 0.003 0.003
412
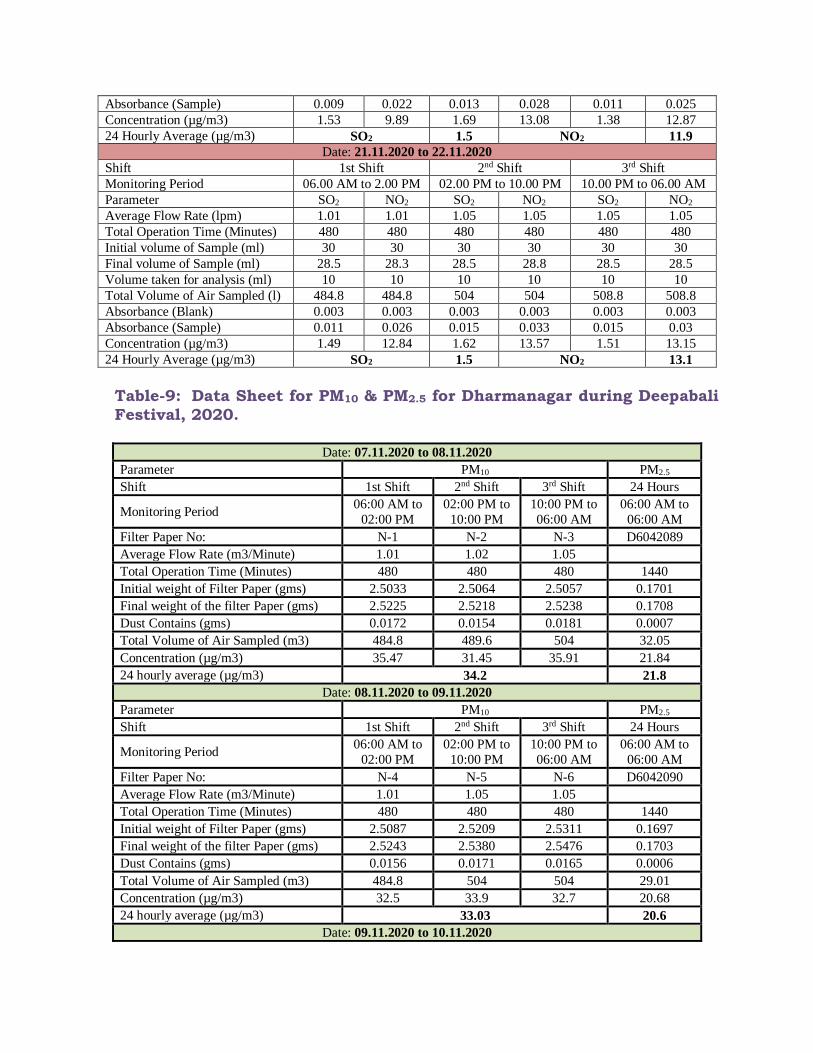
Absorbance (Sample) 0.009 0.022 0.013 0.028 0.011 0.025
Concentration (µg/m3) 1.53 9.89 1.69 13.08 1.38 12.87
24 Hourly Average (µg/m3) SO2 1.5 NO2 11.9
Date: 21.11.2020 to 22.11.2020
Shift 1st Shift 2nd Shift 3rd Shift
Monitoring Period 06.00 AM to 2.00 PM 02.00 PM to 10.00 PM 10.00 PM to 06.00 AM
Parameter SO2 NO2 SO2 NO2 SO2 NO2
Average Flow Rate (lpm) 1.01 1.01 1.05 1.05 1.05 1.05
Total Operation Time (Minutes) 480 480 480 480 480 480
Initial volume of Sample (ml) 30 30 30 30 30 30
Final volume of Sample (ml) 28.5 28.3 28.5 28.8 28.5 28.5
Volume taken for analysis (ml) 10 10 10 10 10 10
Total Volume of Air Sampled (l) 484.8 484.8 504 504 508.8 508.8
Absorbance (Blank) 0.003 0.003 0.003 0.003 0.003 0.003
Absorbance (Sample) 0.011 0.026 0.015 0.033 0.015 0.03
Concentration (µg/m3) 1.49 12.84 1.62 13.57 1.51 13.15
24 Hourly Average (µg/m3) SO2 1.5 NO2 13.1
Table-9: Data Sheet for PM10 & PM2.5 for Dharmanagar during Deepabali
Festival, 2020.
Date: 07.11.2020 to 08.11.2020
Parameter PM10 PM2.5
Shift 1st Shift 2nd Shift 3rd Shift 24 Hours
Monitoring Period 06:00 AM to
02:00 PM
02:00 PM to
10:00 PM
10:00 PM to
06:00 AM
06:00 AM to
06:00 AM
Filter Paper No: N-1 N-2 N-3 D6042089
Average Flow Rate (m3/Minute) 1.01 1.02 1.05
Total Operation Time (Minutes) 480 480 480 1440
Initial weight of Filter Paper (gms) 2.5033 2.5064 2.5057 0.1701
Final weight of the filter Paper (gms) 2.5225 2.5218 2.5238 0.1708
Dust Contains (gms) 0.0172 0.0154 0.0181 0.0007
Total Volume of Air Sampled (m3) 484.8 489.6 504 32.05
Concentration (µg/m3) 35.47 31.45 35.91 21.84
24 hourly average (µg/m3) 34.2 21.8
Date: 08.11.2020 to 09.11.2020
Parameter PM10 PM2.5
Shift 1st Shift 2nd Shift 3rd Shift 24 Hours
Monitoring Period 06:00 AM to
02:00 PM
02:00 PM to
10:00 PM
10:00 PM to
06:00 AM
06:00 AM to
06:00 AM
Filter Paper No: N-4 N-5 N-6 D6042090
Average Flow Rate (m3/Minute) 1.01 1.05 1.05
Total Operation Time (Minutes) 480 480 480 1440
Initial weight of Filter Paper (gms) 2.5087 2.5209 2.5311 0.1697
Final weight of the filter Paper (gms) 2.5243 2.5380 2.5476 0.1703
Dust Contains (gms) 0.0156 0.0171 0.0165 0.0006
Total Volume of Air Sampled (m3) 484.8 504 504 29.01
Concentration (µg/m3) 32.5 33.9 32.7 20.68
24 hourly average (µg/m3) 33.03 20.6
Date: 09.11.2020 to 10.11.2020
413
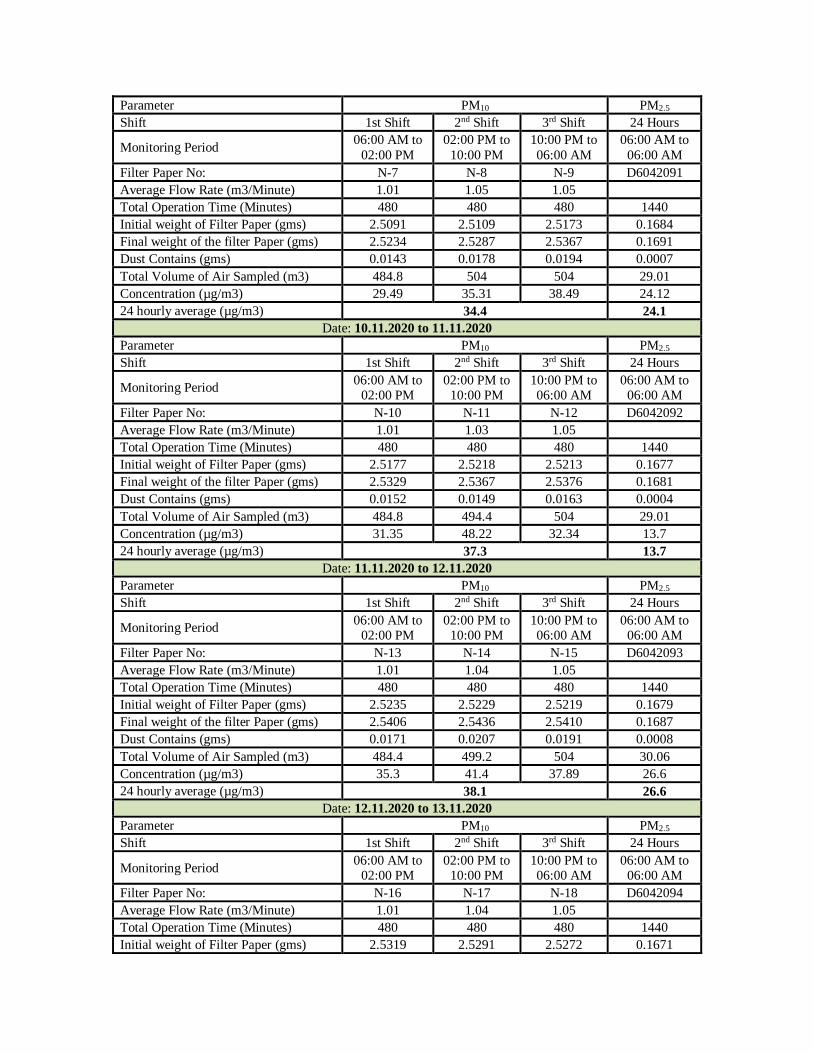
Parameter PM10 PM2.5
Shift 1st Shift 2nd Shift 3rd Shift 24 Hours
Monitoring Period 06:00 AM to
02:00 PM
02:00 PM to
10:00 PM
10:00 PM to
06:00 AM
06:00 AM to
06:00 AM
Filter Paper No: N-7 N-8 N-9 D6042091
Average Flow Rate (m3/Minute) 1.01 1.05 1.05
Total Operation Time (Minutes) 480 480 480 1440
Initial weight of Filter Paper (gms) 2.5091 2.5109 2.5173 0.1684
Final weight of the filter Paper (gms) 2.5234 2.5287 2.5367 0.1691
Dust Contains (gms) 0.0143 0.0178 0.0194 0.0007
Total Volume of Air Sampled (m3) 484.8 504 504 29.01
Concentration (µg/m3) 29.49 35.31 38.49 24.12
24 hourly average (µg/m3) 34.4 24.1
Date: 10.11.2020 to 11.11.2020
Parameter PM10 PM2.5
Shift 1st Shift 2nd Shift 3rd Shift 24 Hours
Monitoring Period 06:00 AM to
02:00 PM 02:00 PM to
10:00 PM 10:00 PM to 06:00 AM
06:00 AM to 06:00 AM
Filter Paper No: N-10 N-11 N-12 D6042092
Average Flow Rate (m3/Minute) 1.01 1.03 1.05
Total Operation Time (Minutes) 480 480 480 1440
Initial weight of Filter Paper (gms) 2.5177 2.5218 2.5213 0.1677
Final weight of the filter Paper (gms) 2.5329 2.5367 2.5376 0.1681
Dust Contains (gms) 0.0152 0.0149 0.0163 0.0004
Total Volume of Air Sampled (m3) 484.8 494.4 504 29.01
Concentration (µg/m3) 31.35 48.22 32.34 13.7
24 hourly average (µg/m3) 37.3 13.7
Date: 11.11.2020 to 12.11.2020
Parameter PM10 PM2.5
Shift 1st Shift 2nd Shift 3rd Shift 24 Hours
Monitoring Period 06:00 AM to
02:00 PM 02:00 PM to
10:00 PM 10:00 PM to 06:00 AM
06:00 AM to 06:00 AM
Filter Paper No: N-13 N-14 N-15 D6042093
Average Flow Rate (m3/Minute) 1.01 1.04 1.05
Total Operation Time (Minutes) 480 480 480 1440
Initial weight of Filter Paper (gms) 2.5235 2.5229 2.5219 0.1679
Final weight of the filter Paper (gms) 2.5406 2.5436 2.5410 0.1687
Dust Contains (gms) 0.0171 0.0207 0.0191 0.0008
Total Volume of Air Sampled (m3) 484.4 499.2 504 30.06
Concentration (µg/m3) 35.3 41.4 37.89 26.6
24 hourly average (µg/m3) 38.1 26.6
Date: 12.11.2020 to 13.11.2020
Parameter PM10 PM2.5
Shift 1st Shift 2nd Shift 3rd Shift 24 Hours
Monitoring Period 06:00 AM to
02:00 PM 02:00 PM to
10:00 PM 10:00 PM to 06:00 AM
06:00 AM to 06:00 AM
Filter Paper No: N-16 N-17 N-18 D6042094
Average Flow Rate (m3/Minute) 1.01 1.04 1.05
Total Operation Time (Minutes) 480 480 480 1440
Initial weight of Filter Paper (gms) 2.5319 2.5291 2.5272 0.1671
414
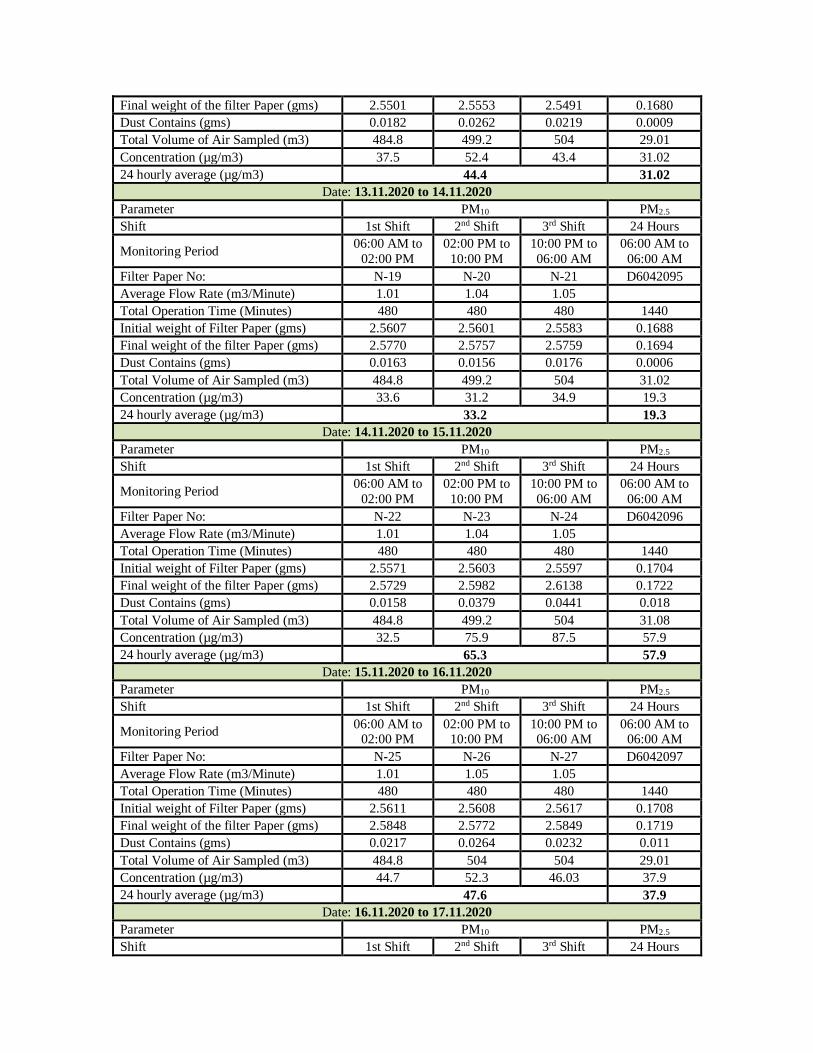
Final weight of the filter Paper (gms) 2.5501 2.5553 2.5491 0.1680
Dust Contains (gms) 0.0182 0.0262 0.0219 0.0009
Total Volume of Air Sampled (m3) 484.8 499.2 504 29.01
Concentration (µg/m3) 37.5 52.4 43.4 31.02
24 hourly average (µg/m3) 44.4 31.02
Date: 13.11.2020 to 14.11.2020
Parameter PM10 PM2.5
Shift 1st Shift 2nd Shift 3rd Shift 24 Hours
Monitoring Period 06:00 AM to
02:00 PM
02:00 PM to
10:00 PM
10:00 PM to
06:00 AM
06:00 AM to
06:00 AM
Filter Paper No: N-19 N-20 N-21 D6042095
Average Flow Rate (m3/Minute) 1.01 1.04 1.05
Total Operation Time (Minutes) 480 480 480 1440
Initial weight of Filter Paper (gms) 2.5607 2.5601 2.5583 0.1688
Final weight of the filter Paper (gms) 2.5770 2.5757 2.5759 0.1694
Dust Contains (gms) 0.0163 0.0156 0.0176 0.0006
Total Volume of Air Sampled (m3) 484.8 499.2 504 31.02
Concentration (µg/m3) 33.6 31.2 34.9 19.3
24 hourly average (µg/m3) 33.2 19.3
Date: 14.11.2020 to 15.11.2020
Parameter PM10 PM2.5
Shift 1st Shift 2nd Shift 3rd Shift 24 Hours
Monitoring Period 06:00 AM to
02:00 PM
02:00 PM to
10:00 PM
10:00 PM to
06:00 AM
06:00 AM to
06:00 AM
Filter Paper No: N-22 N-23 N-24 D6042096
Average Flow Rate (m3/Minute) 1.01 1.04 1.05
Total Operation Time (Minutes) 480 480 480 1440
Initial weight of Filter Paper (gms) 2.5571 2.5603 2.5597 0.1704
Final weight of the filter Paper (gms) 2.5729 2.5982 2.6138 0.1722
Dust Contains (gms) 0.0158 0.0379 0.0441 0.018
Total Volume of Air Sampled (m3) 484.8 499.2 504 31.08
Concentration (µg/m3) 32.5 75.9 87.5 57.9
24 hourly average (µg/m3) 65.3 57.9
Date: 15.11.2020 to 16.11.2020
Parameter PM10 PM2.5
Shift 1st Shift 2nd Shift 3rd Shift 24 Hours
Monitoring Period 06:00 AM to
02:00 PM 02:00 PM to
10:00 PM 10:00 PM to 06:00 AM
06:00 AM to 06:00 AM
Filter Paper No: N-25 N-26 N-27 D6042097
Average Flow Rate (m3/Minute) 1.01 1.05 1.05
Total Operation Time (Minutes) 480 480 480 1440
Initial weight of Filter Paper (gms) 2.5611 2.5608 2.5617 0.1708
Final weight of the filter Paper (gms) 2.5848 2.5772 2.5849 0.1719
Dust Contains (gms) 0.0217 0.0264 0.0232 0.011
Total Volume of Air Sampled (m3) 484.8 504 504 29.01
Concentration (µg/m3) 44.7 52.3 46.03 37.9
24 hourly average (µg/m3) 47.6 37.9
Date: 16.11.2020 to 17.11.2020
Parameter PM10 PM2.5
Shift 1st Shift 2nd Shift 3rd Shift 24 Hours
415
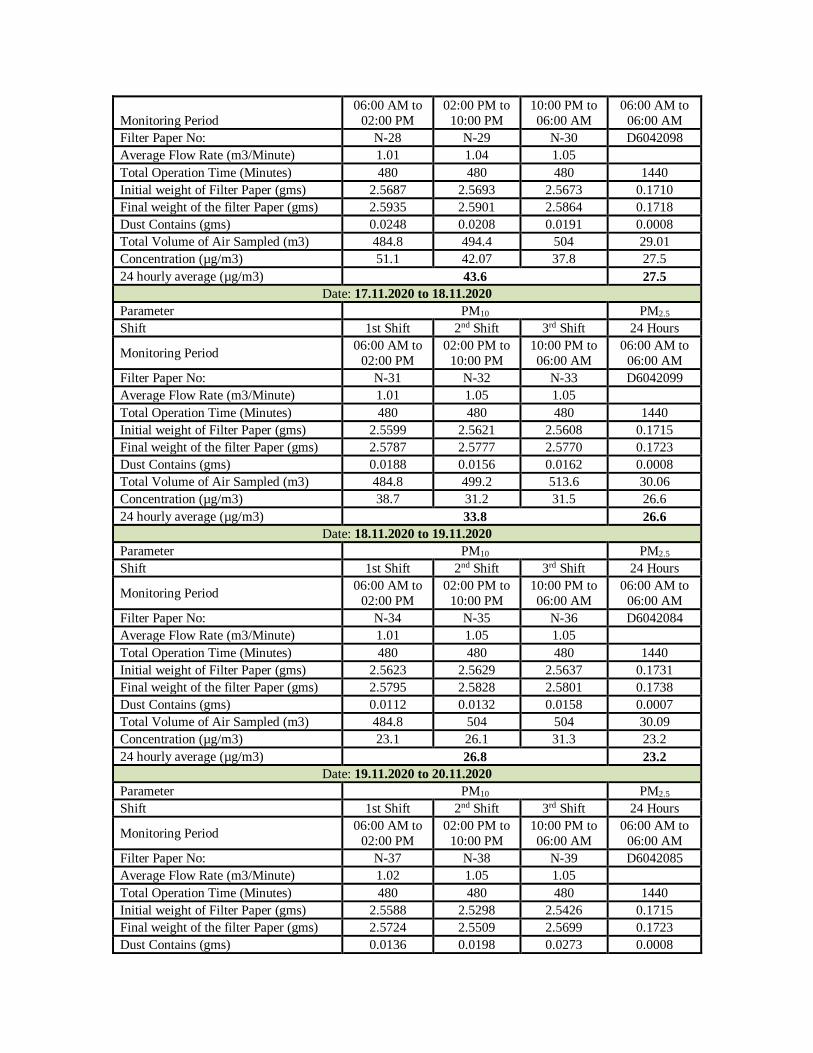
Monitoring Period
06:00 AM to
02:00 PM
02:00 PM to
10:00 PM
10:00 PM to
06:00 AM
06:00 AM to
06:00 AM
Filter Paper No: N-28 N-29 N-30 D6042098
Average Flow Rate (m3/Minute) 1.01 1.04 1.05
Total Operation Time (Minutes) 480 480 480 1440
Initial weight of Filter Paper (gms) 2.5687 2.5693 2.5673 0.1710
Final weight of the filter Paper (gms) 2.5935 2.5901 2.5864 0.1718
Dust Contains (gms) 0.0248 0.0208 0.0191 0.0008
Total Volume of Air Sampled (m3) 484.8 494.4 504 29.01
Concentration (µg/m3) 51.1 42.07 37.8 27.5
24 hourly average (µg/m3) 43.6 27.5
Date: 17.11.2020 to 18.11.2020
Parameter PM10 PM2.5
Shift 1st Shift 2nd Shift 3rd Shift 24 Hours
Monitoring Period 06:00 AM to
02:00 PM
02:00 PM to
10:00 PM
10:00 PM to
06:00 AM
06:00 AM to
06:00 AM
Filter Paper No: N-31 N-32 N-33 D6042099
Average Flow Rate (m3/Minute) 1.01 1.05 1.05
Total Operation Time (Minutes) 480 480 480 1440
Initial weight of Filter Paper (gms) 2.5599 2.5621 2.5608 0.1715
Final weight of the filter Paper (gms) 2.5787 2.5777 2.5770 0.1723
Dust Contains (gms) 0.0188 0.0156 0.0162 0.0008
Total Volume of Air Sampled (m3) 484.8 499.2 513.6 30.06
Concentration (µg/m3) 38.7 31.2 31.5 26.6
24 hourly average (µg/m3) 33.8 26.6
Date: 18.11.2020 to 19.11.2020
Parameter PM10 PM2.5
Shift 1st Shift 2nd Shift 3rd Shift 24 Hours
Monitoring Period 06:00 AM to
02:00 PM
02:00 PM to
10:00 PM
10:00 PM to
06:00 AM
06:00 AM to
06:00 AM
Filter Paper No: N-34 N-35 N-36 D6042084
Average Flow Rate (m3/Minute) 1.01 1.05 1.05
Total Operation Time (Minutes) 480 480 480 1440
Initial weight of Filter Paper (gms) 2.5623 2.5629 2.5637 0.1731
Final weight of the filter Paper (gms) 2.5795 2.5828 2.5801 0.1738
Dust Contains (gms) 0.0112 0.0132 0.0158 0.0007
Total Volume of Air Sampled (m3) 484.8 504 504 30.09
Concentration (µg/m3) 23.1 26.1 31.3 23.2
24 hourly average (µg/m3) 26.8 23.2
Date: 19.11.2020 to 20.11.2020
Parameter PM10 PM2.5
Shift 1st Shift 2nd Shift 3rd Shift 24 Hours
Monitoring Period 06:00 AM to
02:00 PM
02:00 PM to
10:00 PM
10:00 PM to
06:00 AM
06:00 AM to
06:00 AM
Filter Paper No: N-37 N-38 N-39 D6042085
Average Flow Rate (m3/Minute) 1.02 1.05 1.05
Total Operation Time (Minutes) 480 480 480 1440
Initial weight of Filter Paper (gms) 2.5588 2.5298 2.5426 0.1715
Final weight of the filter Paper (gms) 2.5724 2.5509 2.5699 0.1723
Dust Contains (gms) 0.0136 0.0198 0.0273 0.0008
416
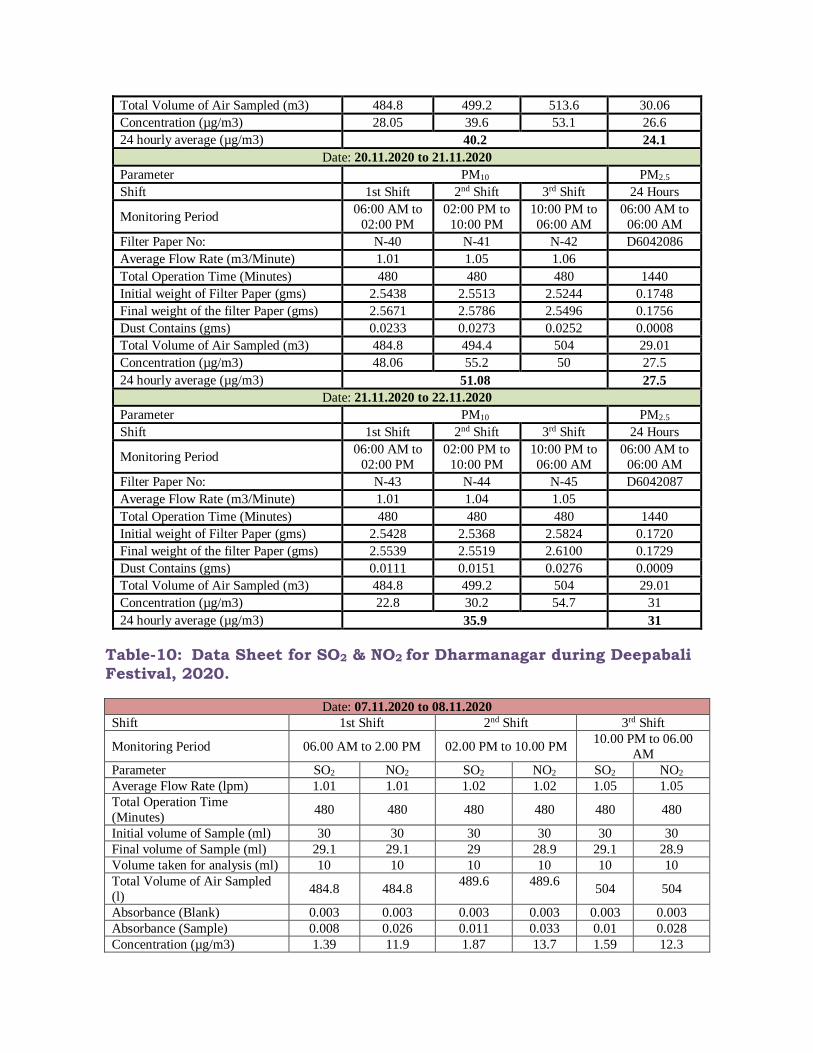
Total Volume of Air Sampled (m3) 484.8 499.2 513.6 30.06
Concentration (µg/m3) 28.05 39.6 53.1 26.6
24 hourly average (µg/m3) 40.2 24.1
Date: 20.11.2020 to 21.11.2020
Parameter PM10 PM2.5
Shift 1st Shift 2nd Shift 3rd Shift 24 Hours
Monitoring Period 06:00 AM to
02:00 PM
02:00 PM to
10:00 PM
10:00 PM to
06:00 AM
06:00 AM to
06:00 AM
Filter Paper No: N-40 N-41 N-42 D6042086
Average Flow Rate (m3/Minute) 1.01 1.05 1.06
Total Operation Time (Minutes) 480 480 480 1440
Initial weight of Filter Paper (gms) 2.5438 2.5513 2.5244 0.1748
Final weight of the filter Paper (gms) 2.5671 2.5786 2.5496 0.1756
Dust Contains (gms) 0.0233 0.0273 0.0252 0.0008
Total Volume of Air Sampled (m3) 484.8 494.4 504 29.01
Concentration (µg/m3) 48.06 55.2 50 27.5
24 hourly average (µg/m3) 51.08 27.5
Date: 21.11.2020 to 22.11.2020
Parameter PM10 PM2.5
Shift 1st Shift 2nd Shift 3rd Shift 24 Hours
Monitoring Period 06:00 AM to
02:00 PM
02:00 PM to
10:00 PM
10:00 PM to
06:00 AM
06:00 AM to
06:00 AM
Filter Paper No: N-43 N-44 N-45 D6042087
Average Flow Rate (m3/Minute) 1.01 1.04 1.05
Total Operation Time (Minutes) 480 480 480 1440
Initial weight of Filter Paper (gms) 2.5428 2.5368 2.5824 0.1720
Final weight of the filter Paper (gms) 2.5539 2.5519 2.6100 0.1729
Dust Contains (gms) 0.0111 0.0151 0.0276 0.0009
Total Volume of Air Sampled (m3) 484.8 499.2 504 29.01
Concentration (µg/m3) 22.8 30.2 54.7 31
24 hourly average (µg/m3) 35.9 31
Table-10: Data Sheet for SO2 & NO2 for Dharmanagar during Deepabali
Festival, 2020.
Date: 07.11.2020 to 08.11.2020
Shift 1st Shift 2nd Shift 3rd Shift
Monitoring Period 06.00 AM to 2.00 PM 02.00 PM to 10.00 PM 10.00 PM to 06.00
AM
Parameter SO2 NO2 SO2 NO2 SO2 NO2
Average Flow Rate (lpm) 1.01 1.01 1.02 1.02 1.05 1.05
Total Operation Time
(Minutes) 480 480 480 480 480 480
Initial volume of Sample (ml) 30 30 30 30 30 30
Final volume of Sample (ml) 29.1 29.1 29 28.9 29.1 28.9
Volume taken for analysis (ml) 10 10 10 10 10 10
Total Volume of Air Sampled
(l) 484.8 484.8
489.6 489.6 504 504
Absorbance (Blank) 0.003 0.003 0.003 0.003 0.003 0.003
Absorbance (Sample) 0.008 0.026 0.011 0.033 0.01 0.028
Concentration (µg/m3) 1.39 11.9 1.87 13.7 1.59 12.3
417
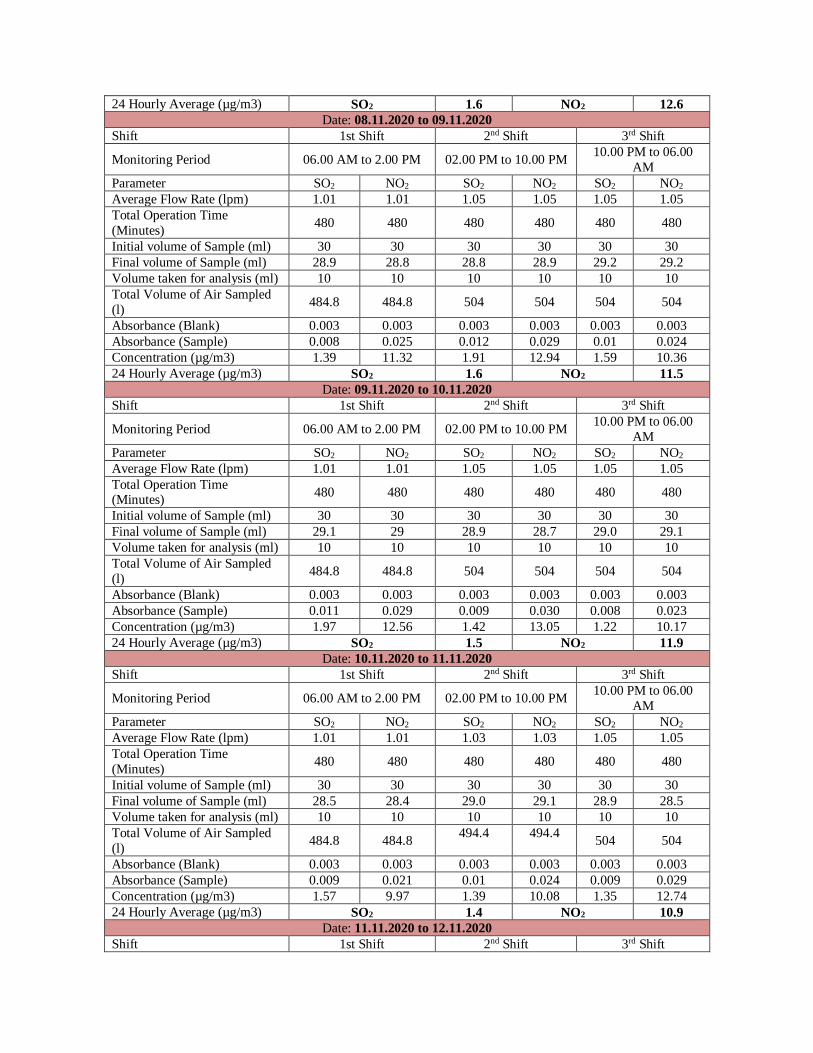
24 Hourly Average (µg/m3) SO2 1.6 NO2 12.6
Date: 08.11.2020 to 09.11.2020
Shift 1st Shift 2nd Shift 3rd Shift
Monitoring Period 06.00 AM to 2.00 PM 02.00 PM to 10.00 PM 10.00 PM to 06.00
AM
Parameter SO2 NO2 SO2 NO2 SO2 NO2
Average Flow Rate (lpm) 1.01 1.01 1.05 1.05 1.05 1.05
Total Operation Time
(Minutes) 480 480 480 480 480 480
Initial volume of Sample (ml) 30 30 30 30 30 30
Final volume of Sample (ml) 28.9 28.8 28.8 28.9 29.2 29.2
Volume taken for analysis (ml) 10 10 10 10 10 10
Total Volume of Air Sampled
(l) 484.8 484.8 504 504 504 504
Absorbance (Blank) 0.003 0.003 0.003 0.003 0.003 0.003
Absorbance (Sample) 0.008 0.025 0.012 0.029 0.01 0.024
Concentration (µg/m3) 1.39 11.32 1.91 12.94 1.59 10.36
24 Hourly Average (µg/m3) SO2 1.6 NO2 11.5
Date: 09.11.2020 to 10.11.2020
Shift 1st Shift 2nd Shift 3rd Shift
Monitoring Period 06.00 AM to 2.00 PM 02.00 PM to 10.00 PM 10.00 PM to 06.00
AM
Parameter SO2 NO2 SO2 NO2 SO2 NO2
Average Flow Rate (lpm) 1.01 1.01 1.05 1.05 1.05 1.05
Total Operation Time (Minutes)
480 480 480 480 480 480
Initial volume of Sample (ml) 30 30 30 30 30 30
Final volume of Sample (ml) 29.1 29 28.9 28.7 29.0 29.1
Volume taken for analysis (ml) 10 10 10 10 10 10
Total Volume of Air Sampled
(l) 484.8 484.8 504 504 504 504
Absorbance (Blank) 0.003 0.003 0.003 0.003 0.003 0.003
Absorbance (Sample) 0.011 0.029 0.009 0.030 0.008 0.023
Concentration (µg/m3) 1.97 12.56 1.42 13.05 1.22 10.17
24 Hourly Average (µg/m3) SO2 1.5 NO2 11.9
Date: 10.11.2020 to 11.11.2020
Shift 1st Shift 2nd Shift 3rd Shift
Monitoring Period 06.00 AM to 2.00 PM 02.00 PM to 10.00 PM 10.00 PM to 06.00
AM
Parameter SO2 NO2 SO2 NO2 SO2 NO2
Average Flow Rate (lpm) 1.01 1.01 1.03 1.03 1.05 1.05
Total Operation Time
(Minutes) 480 480 480 480 480 480
Initial volume of Sample (ml) 30 30 30 30 30 30
Final volume of Sample (ml) 28.5 28.4 29.0 29.1 28.9 28.5
Volume taken for analysis (ml) 10 10 10 10 10 10
Total Volume of Air Sampled
(l) 484.8 484.8
494.4 494.4 504 504
Absorbance (Blank) 0.003 0.003 0.003 0.003 0.003 0.003
Absorbance (Sample) 0.009 0.021 0.01 0.024 0.009 0.029
Concentration (µg/m3) 1.57 9.97 1.39 10.08 1.35 12.74
24 Hourly Average (µg/m3) SO2 1.4 NO2 10.9
Date: 11.11.2020 to 12.11.2020
Shift 1st Shift 2nd Shift 3rd Shift
418
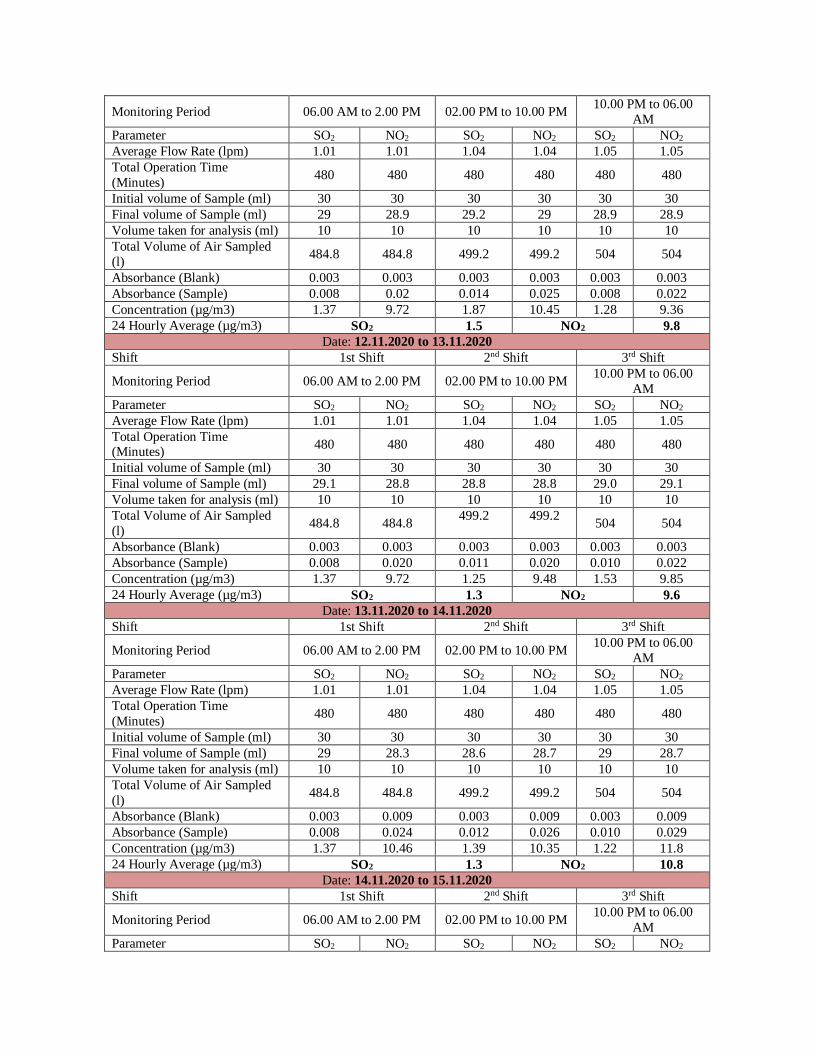
Monitoring Period 06.00 AM to 2.00 PM 02.00 PM to 10.00 PM 10.00 PM to 06.00
AM
Parameter SO2 NO2 SO2 NO2 SO2 NO2
Average Flow Rate (lpm) 1.01 1.01 1.04 1.04 1.05 1.05
Total Operation Time
(Minutes) 480 480 480 480 480 480
Initial volume of Sample (ml) 30 30 30 30 30 30
Final volume of Sample (ml) 29 28.9 29.2 29 28.9 28.9
Volume taken for analysis (ml) 10 10 10 10 10 10
Total Volume of Air Sampled
(l) 484.8 484.8 499.2 499.2 504 504
Absorbance (Blank) 0.003 0.003 0.003 0.003 0.003 0.003
Absorbance (Sample) 0.008 0.02 0.014 0.025 0.008 0.022
Concentration (µg/m3) 1.37 9.72 1.87 10.45 1.28 9.36
24 Hourly Average (µg/m3) SO2 1.5 NO2 9.8
Date: 12.11.2020 to 13.11.2020
Shift 1st Shift 2nd Shift 3rd Shift
Monitoring Period 06.00 AM to 2.00 PM 02.00 PM to 10.00 PM 10.00 PM to 06.00
AM
Parameter SO2 NO2 SO2 NO2 SO2 NO2
Average Flow Rate (lpm) 1.01 1.01 1.04 1.04 1.05 1.05
Total Operation Time (Minutes)
480 480 480 480 480 480
Initial volume of Sample (ml) 30 30 30 30 30 30
Final volume of Sample (ml) 29.1 28.8 28.8 28.8 29.0 29.1
Volume taken for analysis (ml) 10 10 10 10 10 10
Total Volume of Air Sampled
(l) 484.8 484.8
499.2 499.2 504 504
Absorbance (Blank) 0.003 0.003 0.003 0.003 0.003 0.003
Absorbance (Sample) 0.008 0.020 0.011 0.020 0.010 0.022
Concentration (µg/m3) 1.37 9.72 1.25 9.48 1.53 9.85
24 Hourly Average (µg/m3) SO2 1.3 NO2 9.6
Date: 13.11.2020 to 14.11.2020
Shift 1st Shift 2nd Shift 3rd Shift
Monitoring Period 06.00 AM to 2.00 PM 02.00 PM to 10.00 PM 10.00 PM to 06.00
AM
Parameter SO2 NO2 SO2 NO2 SO2 NO2
Average Flow Rate (lpm) 1.01 1.01 1.04 1.04 1.05 1.05
Total Operation Time
(Minutes) 480 480 480 480 480 480
Initial volume of Sample (ml) 30 30 30 30 30 30
Final volume of Sample (ml) 29 28.3 28.6 28.7 29 28.7
Volume taken for analysis (ml) 10 10 10 10 10 10
Total Volume of Air Sampled
(l) 484.8 484.8 499.2 499.2 504 504
Absorbance (Blank) 0.003 0.009 0.003 0.009 0.003 0.009
Absorbance (Sample) 0.008 0.024 0.012 0.026 0.010 0.029
Concentration (µg/m3) 1.37 10.46 1.39 10.35 1.22 11.8
24 Hourly Average (µg/m3) SO2 1.3 NO2 10.8
Date: 14.11.2020 to 15.11.2020
Shift 1st Shift 2nd Shift 3rd Shift
Monitoring Period 06.00 AM to 2.00 PM 02.00 PM to 10.00 PM 10.00 PM to 06.00
AM
Parameter SO2 NO2 SO2 NO2 SO2 NO2
419
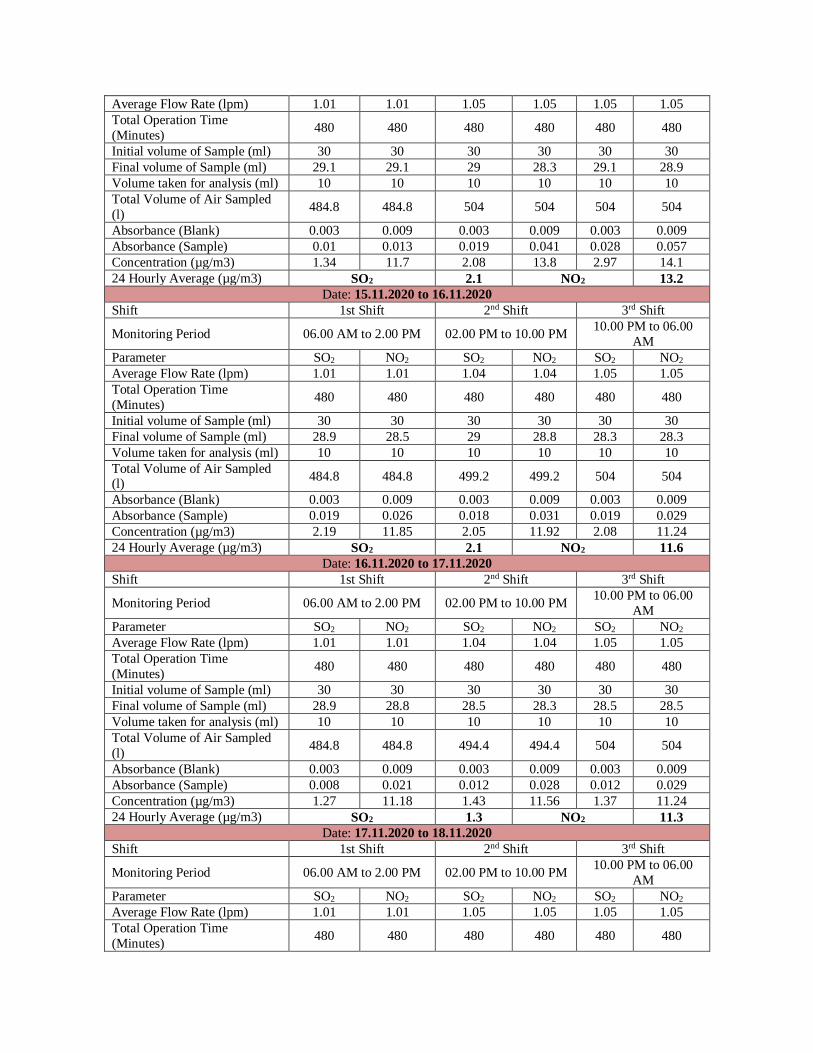
Average Flow Rate (lpm) 1.01 1.01 1.05 1.05 1.05 1.05
Total Operation Time
(Minutes) 480 480 480 480 480 480
Initial volume of Sample (ml) 30 30 30 30 30 30
Final volume of Sample (ml) 29.1 29.1 29 28.3 29.1 28.9
Volume taken for analysis (ml) 10 10 10 10 10 10
Total Volume of Air Sampled
(l) 484.8 484.8 504 504 504 504
Absorbance (Blank) 0.003 0.009 0.003 0.009 0.003 0.009
Absorbance (Sample) 0.01 0.013 0.019 0.041 0.028 0.057
Concentration (µg/m3) 1.34 11.7 2.08 13.8 2.97 14.1
24 Hourly Average (µg/m3) SO2 2.1 NO2 13.2
Date: 15.11.2020 to 16.11.2020
Shift 1st Shift 2nd Shift 3rd Shift
Monitoring Period 06.00 AM to 2.00 PM 02.00 PM to 10.00 PM 10.00 PM to 06.00
AM
Parameter SO2 NO2 SO2 NO2 SO2 NO2
Average Flow Rate (lpm) 1.01 1.01 1.04 1.04 1.05 1.05
Total Operation Time
(Minutes) 480 480 480 480 480 480
Initial volume of Sample (ml) 30 30 30 30 30 30
Final volume of Sample (ml) 28.9 28.5 29 28.8 28.3 28.3
Volume taken for analysis (ml) 10 10 10 10 10 10
Total Volume of Air Sampled (l)
484.8 484.8 499.2 499.2 504 504
Absorbance (Blank) 0.003 0.009 0.003 0.009 0.003 0.009
Absorbance (Sample) 0.019 0.026 0.018 0.031 0.019 0.029
Concentration (µg/m3) 2.19 11.85 2.05 11.92 2.08 11.24
24 Hourly Average (µg/m3) SO2 2.1 NO2 11.6
Date: 16.11.2020 to 17.11.2020
Shift 1st Shift 2nd Shift 3rd Shift
Monitoring Period 06.00 AM to 2.00 PM 02.00 PM to 10.00 PM 10.00 PM to 06.00
AM
Parameter SO2 NO2 SO2 NO2 SO2 NO2
Average Flow Rate (lpm) 1.01 1.01 1.04 1.04 1.05 1.05
Total Operation Time
(Minutes) 480 480 480 480 480 480
Initial volume of Sample (ml) 30 30 30 30 30 30
Final volume of Sample (ml) 28.9 28.8 28.5 28.3 28.5 28.5
Volume taken for analysis (ml) 10 10 10 10 10 10
Total Volume of Air Sampled
(l) 484.8 484.8 494.4 494.4 504 504
Absorbance (Blank) 0.003 0.009 0.003 0.009 0.003 0.009
Absorbance (Sample) 0.008 0.021 0.012 0.028 0.012 0.029
Concentration (µg/m3) 1.27 11.18 1.43 11.56 1.37 11.24
24 Hourly Average (µg/m3) SO2 1.3 NO2 11.3
Date: 17.11.2020 to 18.11.2020
Shift 1st Shift 2nd Shift 3rd Shift
Monitoring Period 06.00 AM to 2.00 PM 02.00 PM to 10.00 PM 10.00 PM to 06.00
AM
Parameter SO2 NO2 SO2 NO2 SO2 NO2
Average Flow Rate (lpm) 1.01 1.01 1.05 1.05 1.05 1.05
Total Operation Time
(Minutes) 480 480 480 480 480 480
420
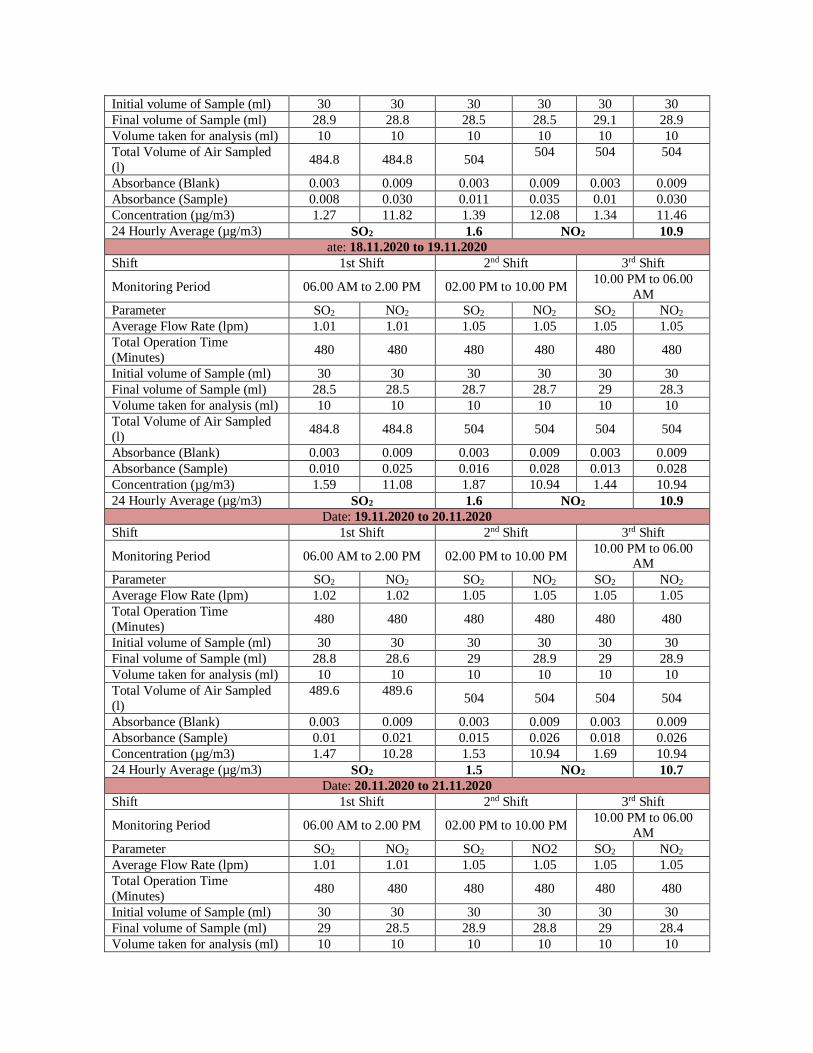
Initial volume of Sample (ml) 30 30 30 30 30 30
Final volume of Sample (ml) 28.9 28.8 28.5 28.5 29.1 28.9
Volume taken for analysis (ml) 10 10 10 10 10 10
Total Volume of Air Sampled
(l) 484.8 484.8 504
504 504 504
Absorbance (Blank) 0.003 0.009 0.003 0.009 0.003 0.009
Absorbance (Sample) 0.008 0.030 0.011 0.035 0.01 0.030
Concentration (µg/m3) 1.27 11.82 1.39 12.08 1.34 11.46
24 Hourly Average (µg/m3) SO2 1.6 NO2 10.9
ate: 18.11.2020 to 19.11.2020
Shift 1st Shift 2nd Shift 3rd Shift
Monitoring Period 06.00 AM to 2.00 PM 02.00 PM to 10.00 PM 10.00 PM to 06.00
AM
Parameter SO2 NO2 SO2 NO2 SO2 NO2
Average Flow Rate (lpm) 1.01 1.01 1.05 1.05 1.05 1.05
Total Operation Time
(Minutes) 480 480 480 480 480 480
Initial volume of Sample (ml) 30 30 30 30 30 30
Final volume of Sample (ml) 28.5 28.5 28.7 28.7 29 28.3
Volume taken for analysis (ml) 10 10 10 10 10 10
Total Volume of Air Sampled
(l) 484.8 484.8 504 504 504 504
Absorbance (Blank) 0.003 0.009 0.003 0.009 0.003 0.009
Absorbance (Sample) 0.010 0.025 0.016 0.028 0.013 0.028
Concentration (µg/m3) 1.59 11.08 1.87 10.94 1.44 10.94
24 Hourly Average (µg/m3) SO2 1.6 NO2 10.9
Date: 19.11.2020 to 20.11.2020
Shift 1st Shift 2nd Shift 3rd Shift
Monitoring Period 06.00 AM to 2.00 PM 02.00 PM to 10.00 PM 10.00 PM to 06.00
AM
Parameter SO2 NO2 SO2 NO2 SO2 NO2
Average Flow Rate (lpm) 1.02 1.02 1.05 1.05 1.05 1.05
Total Operation Time
(Minutes) 480 480 480 480 480 480
Initial volume of Sample (ml) 30 30 30 30 30 30
Final volume of Sample (ml) 28.8 28.6 29 28.9 29 28.9
Volume taken for analysis (ml) 10 10 10 10 10 10
Total Volume of Air Sampled
(l)
489.6 489.6 504 504 504 504
Absorbance (Blank) 0.003 0.009 0.003 0.009 0.003 0.009
Absorbance (Sample) 0.01 0.021 0.015 0.026 0.018 0.026
Concentration (µg/m3) 1.47 10.28 1.53 10.94 1.69 10.94
24 Hourly Average (µg/m3) SO2 1.5 NO2 10.7
Date: 20.11.2020 to 21.11.2020
Shift 1st Shift 2nd Shift 3rd Shift
Monitoring Period 06.00 AM to 2.00 PM 02.00 PM to 10.00 PM 10.00 PM to 06.00
AM
Parameter SO2 NO2 SO2 NO2 SO2 NO2
Average Flow Rate (lpm) 1.01 1.01 1.05 1.05 1.05 1.05
Total Operation Time
(Minutes) 480 480 480 480 480 480
Initial volume of Sample (ml) 30 30 30 30 30 30
Final volume of Sample (ml) 29 28.5 28.9 28.8 29 28.4
Volume taken for analysis (ml) 10 10 10 10 10 10
421
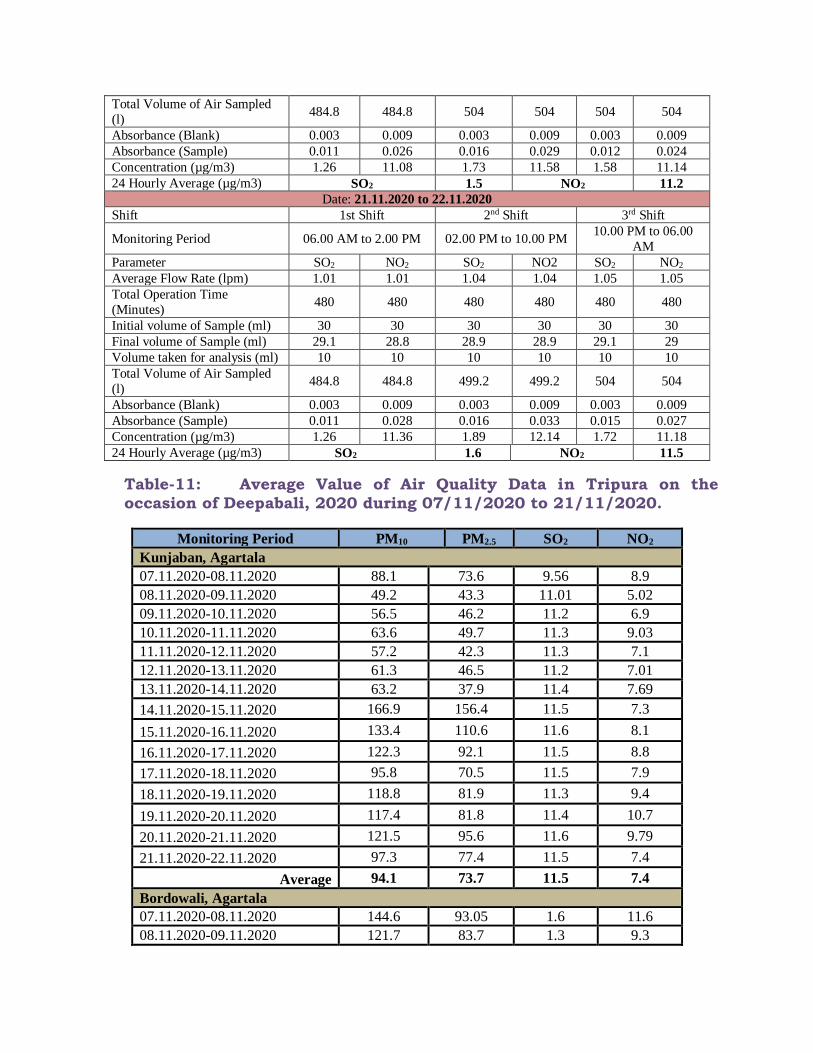
Total Volume of Air Sampled
(l) 484.8 484.8 504 504 504 504
Absorbance (Blank) 0.003 0.009 0.003 0.009 0.003 0.009
Absorbance (Sample) 0.011 0.026 0.016 0.029 0.012 0.024
Concentration (µg/m3) 1.26 11.08 1.73 11.58 1.58 11.14
24 Hourly Average (µg/m3) SO2 1.5 NO2 11.2
Date: 21.11.2020 to 22.11.2020
Shift 1st Shift 2nd Shift 3rd Shift
Monitoring Period 06.00 AM to 2.00 PM 02.00 PM to 10.00 PM 10.00 PM to 06.00
AM
Parameter SO2 NO2 SO2 NO2 SO2 NO2
Average Flow Rate (lpm) 1.01 1.01 1.04 1.04 1.05 1.05
Total Operation Time
(Minutes) 480 480 480 480 480 480
Initial volume of Sample (ml) 30 30 30 30 30 30
Final volume of Sample (ml) 29.1 28.8 28.9 28.9 29.1 29
Volume taken for analysis (ml) 10 10 10 10 10 10
Total Volume of Air Sampled
(l) 484.8 484.8 499.2 499.2 504 504
Absorbance (Blank) 0.003 0.009 0.003 0.009 0.003 0.009
Absorbance (Sample) 0.011 0.028 0.016 0.033 0.015 0.027
Concentration (µg/m3) 1.26 11.36 1.89 12.14 1.72 11.18
24 Hourly Average (µg/m3) SO2 1.6 NO2 11.5
Table-11: Average Value of Air Quality Data in Tripura on the
occasion of Deepabali, 2020 during 07/11/2020 to 21/11/2020.
Monitoring Period PM10 PM2.5 SO2 NO2
Kunjaban, Agartala
07.11.2020-08.11.2020 88.1 73.6 9.56 8.9
08.11.2020-09.11.2020 49.2 43.3 11.01 5.02
09.11.2020-10.11.2020 56.5 46.2 11.2 6.9
10.11.2020-11.11.2020 63.6 49.7 11.3 9.03
11.11.2020-12.11.2020 57.2 42.3 11.3 7.1
12.11.2020-13.11.2020 61.3 46.5 11.2 7.01
13.11.2020-14.11.2020 63.2 37.9 11.4 7.69
14.11.2020-15.11.2020 166.9 156.4 11.5 7.3
15.11.2020-16.11.2020 133.4 110.6 11.6 8.1
16.11.2020-17.11.2020 122.3 92.1 11.5 8.8
17.11.2020-18.11.2020 95.8 70.5 11.5 7.9
18.11.2020-19.11.2020 118.8 81.9 11.3 9.4
19.11.2020-20.11.2020 117.4 81.8 11.4 10.7
20.11.2020-21.11.2020 121.5 95.6 11.6 9.79
21.11.2020-22.11.2020 97.3 77.4 11.5 7.4
Average 94.1 73.7 11.5 7.4
Bordowali, Agartala
07.11.2020-08.11.2020 144.6 93.05 1.6 11.6
08.11.2020-09.11.2020 121.7 83.7 1.3 9.3
422
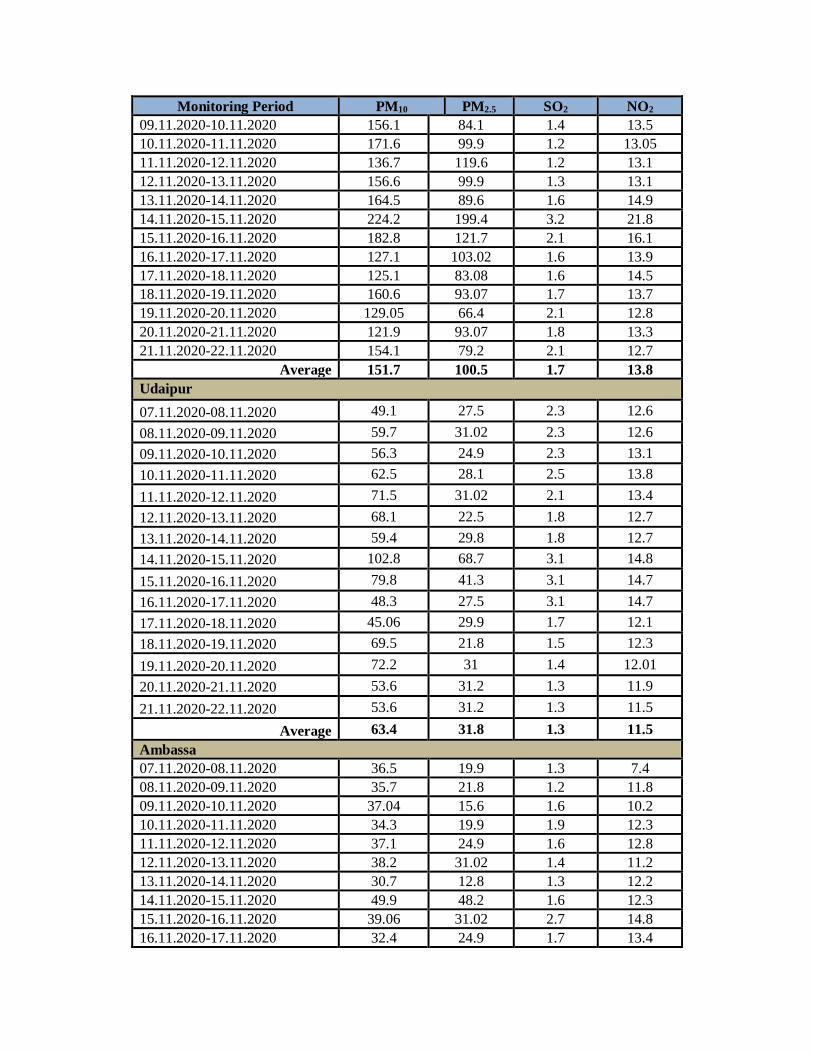
Monitoring Period PM10 PM2.5 SO2 NO2
09.11.2020-10.11.2020 156.1 84.1 1.4 13.5
10.11.2020-11.11.2020 171.6 99.9 1.2 13.05
11.11.2020-12.11.2020 136.7 119.6 1.2 13.1
12.11.2020-13.11.2020 156.6 99.9 1.3 13.1
13.11.2020-14.11.2020 164.5 89.6 1.6 14.9
14.11.2020-15.11.2020 224.2 199.4 3.2 21.8
15.11.2020-16.11.2020 182.8 121.7 2.1 16.1
16.11.2020-17.11.2020 127.1 103.02 1.6 13.9
17.11.2020-18.11.2020 125.1 83.08 1.6 14.5
18.11.2020-19.11.2020 160.6 93.07 1.7 13.7
19.11.2020-20.11.2020 129.05 66.4 2.1 12.8
20.11.2020-21.11.2020 121.9 93.07 1.8 13.3
21.11.2020-22.11.2020 154.1 79.2 2.1 12.7
Average 151.7 100.5 1.7 13.8
Udaipur
07.11.2020-08.11.2020 49.1 27.5 2.3 12.6
08.11.2020-09.11.2020 59.7 31.02 2.3 12.6
09.11.2020-10.11.2020 56.3 24.9 2.3 13.1
10.11.2020-11.11.2020 62.5 28.1 2.5 13.8
11.11.2020-12.11.2020 71.5 31.02 2.1 13.4
12.11.2020-13.11.2020 68.1 22.5 1.8 12.7
13.11.2020-14.11.2020 59.4 29.8 1.8 12.7
14.11.2020-15.11.2020 102.8 68.7 3.1 14.8
15.11.2020-16.11.2020 79.8 41.3 3.1 14.7
16.11.2020-17.11.2020 48.3 27.5 3.1 14.7
17.11.2020-18.11.2020 45.06 29.9 1.7 12.1
18.11.2020-19.11.2020 69.5 21.8 1.5 12.3
19.11.2020-20.11.2020 72.2 31 1.4 12.01
20.11.2020-21.11.2020 53.6 31.2 1.3 11.9
21.11.2020-22.11.2020 53.6 31.2 1.3 11.5
Average 63.4 31.8 1.3 11.5
Ambassa
07.11.2020-08.11.2020 36.5 19.9 1.3 7.4
08.11.2020-09.11.2020 35.7 21.8 1.2 11.8
09.11.2020-10.11.2020 37.04 15.6 1.6 10.2
10.11.2020-11.11.2020 34.3 19.9 1.9 12.3
11.11.2020-12.11.2020 37.1 24.9 1.6 12.8
12.11.2020-13.11.2020 38.2 31.02 1.4 11.2
13.11.2020-14.11.2020 30.7 12.8 1.3 12.2
14.11.2020-15.11.2020 49.9 48.2 1.6 12.3
15.11.2020-16.11.2020 39.06 31.02 2.7 14.8
16.11.2020-17.11.2020 32.4 24.9 1.7 13.4
423
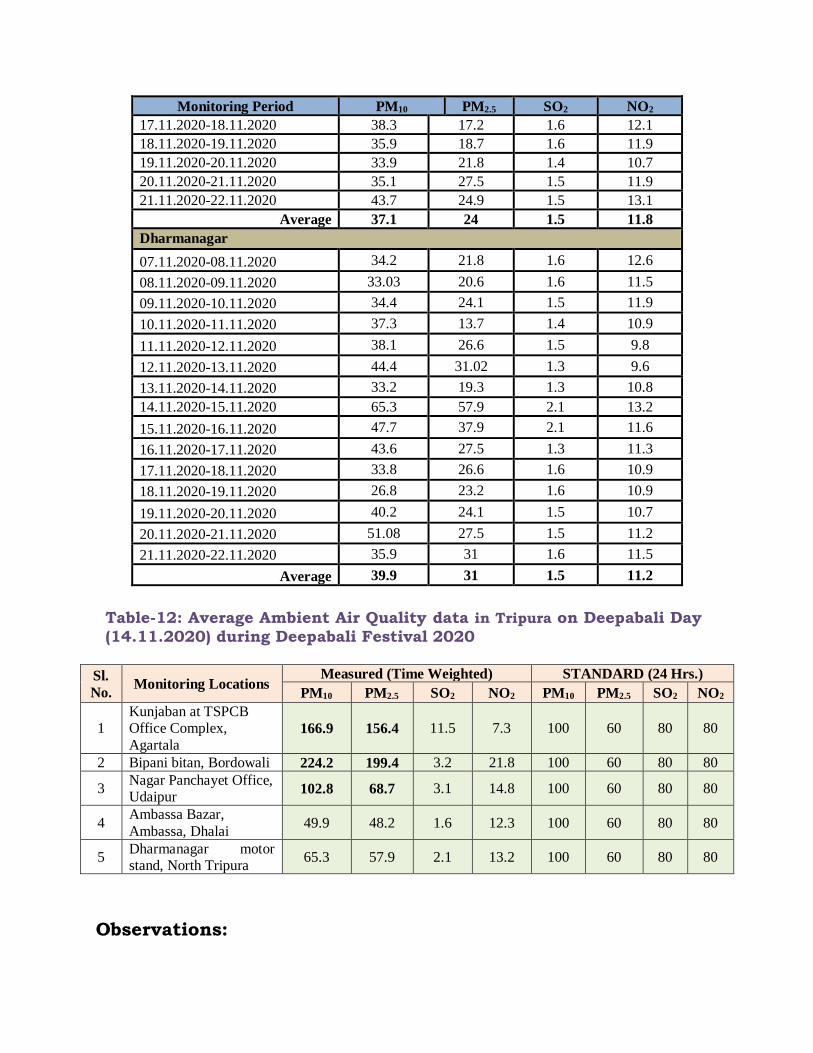
Monitoring Period PM10 PM2.5 SO2 NO2
17.11.2020-18.11.2020 38.3 17.2 1.6 12.1
18.11.2020-19.11.2020 35.9 18.7 1.6 11.9
19.11.2020-20.11.2020 33.9 21.8 1.4 10.7
20.11.2020-21.11.2020 35.1 27.5 1.5 11.9
21.11.2020-22.11.2020 43.7 24.9 1.5 13.1
Average 37.1 24 1.5 11.8
Dharmanagar
07.11.2020-08.11.2020 34.2 21.8 1.6 12.6
08.11.2020-09.11.2020 33.03 20.6 1.6 11.5
09.11.2020-10.11.2020 34.4 24.1 1.5 11.9
10.11.2020-11.11.2020 37.3 13.7 1.4 10.9
11.11.2020-12.11.2020 38.1 26.6 1.5 9.8
12.11.2020-13.11.2020 44.4 31.02 1.3 9.6
13.11.2020-14.11.2020 33.2 19.3 1.3 10.8
14.11.2020-15.11.2020 65.3 57.9 2.1 13.2
15.11.2020-16.11.2020 47.7 37.9 2.1 11.6
16.11.2020-17.11.2020 43.6 27.5 1.3 11.3
17.11.2020-18.11.2020 33.8 26.6 1.6 10.9
18.11.2020-19.11.2020 26.8 23.2 1.6 10.9
19.11.2020-20.11.2020 40.2 24.1 1.5 10.7
20.11.2020-21.11.2020 51.08 27.5 1.5 11.2
21.11.2020-22.11.2020 35.9 31 1.6 11.5
Average 39.9 31 1.5 11.2
Table-12: Average Ambient Air Quality data in Tripura on Deepabali Day
(14.11.2020) during Deepabali Festival 2020
Sl.
No. Monitoring Locations
Measured (Time Weighted) STANDARD (24 Hrs.)
PM10 PM2.5 SO2 NO2 PM10 PM2.5 SO2 NO2
1 Kunjaban at TSPCB Office Complex,
Agartala 166.9 156.4 11.5 7.3 100 60 80 80
2 Bipani bitan, Bordowali 224.2 199.4 3.2 21.8 100 60 80 80
3 Nagar Panchayet Office, Udaipur
102.8 68.7 3.1 14.8 100 60 80 80
4 Ambassa Bazar,
Ambassa, Dhalai 49.9 48.2 1.6 12.3 100 60 80 80
5 Dharmanagar motor stand, North Tripura
65.3 57.9 2.1 13.2 100 60 80 80
Observations:
424
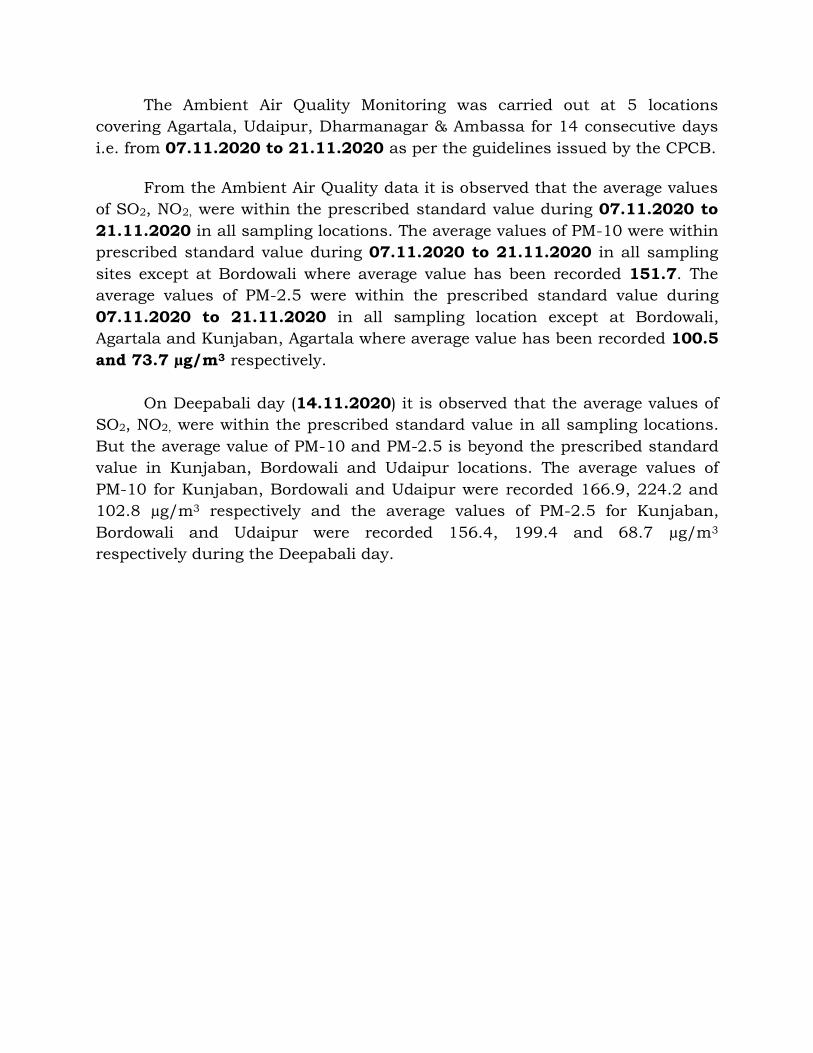
The Ambient Air Quality Monitoring was carried out at 5 locations
covering Agartala, Udaipur, Dharmanagar & Ambassa for 14 consecutive days
i.e. from 07.11.2020 to 21.11.2020 as per the guidelines issued by the CPCB.
From the Ambient Air Quality data it is observed that the average values
of SO2, NO2, were within the prescribed standard value during 07.11.2020 to
21.11.2020 in all sampling locations. The average values of PM-10 were within
prescribed standard value during 07.11.2020 to 21.11.2020 in all sampling
sites except at Bordowali where average value has been recorded 151.7. The
average values of PM-2.5 were within the prescribed standard value during
07.11.2020 to 21.11.2020 in all sampling location except at Bordowali,
Agartala and Kunjaban, Agartala where average value has been recorded 100.5
and 73.7 µg/m3 respectively.
On Deepabali day (14.11.2020) it is observed that the average values of
SO2, NO2, were within the prescribed standard value in all sampling locations.
But the average value of PM-10 and PM-2.5 is beyond the prescribed standard
value in Kunjaban, Bordowali and Udaipur locations. The average values of
PM-10 for Kunjaban, Bordowali and Udaipur were recorded 166.9, 224.2 and
102.8 µg/m3 respectively and the average values of PM-2.5 for Kunjaban,
Bordowali and Udaipur were recorded 156.4, 199.4 and 68.7 µg/m3
respectively during the Deepabali day.
425
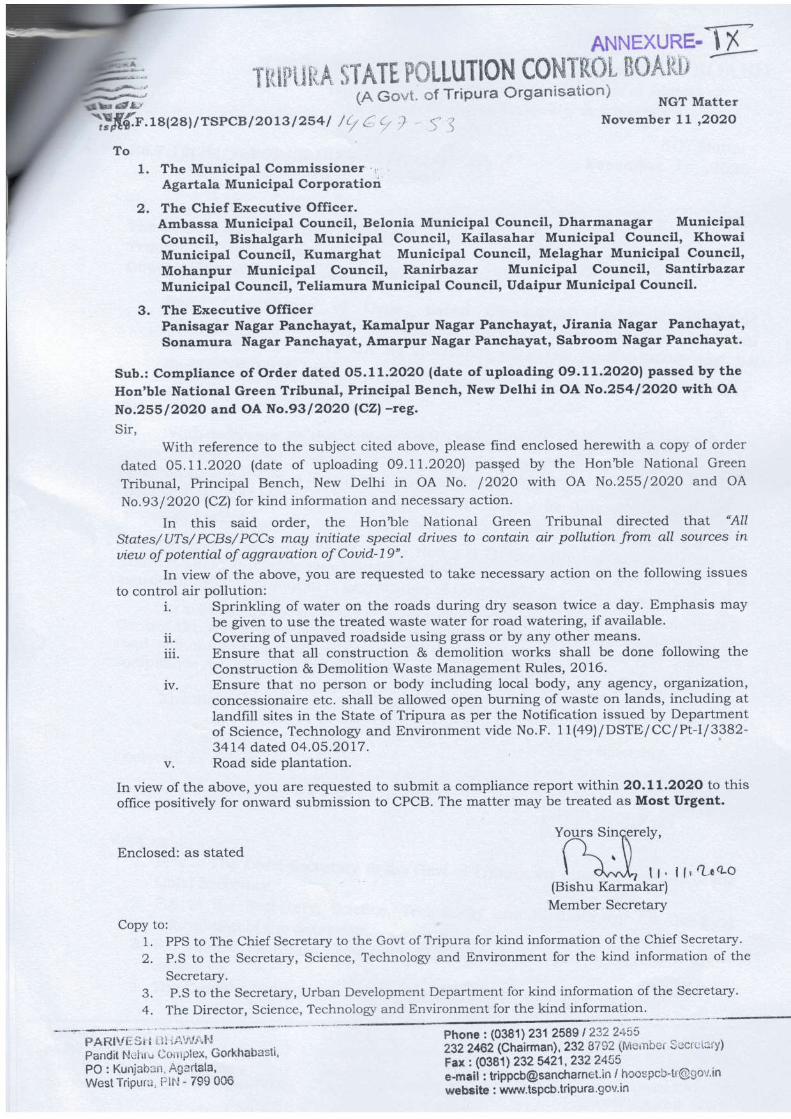
426
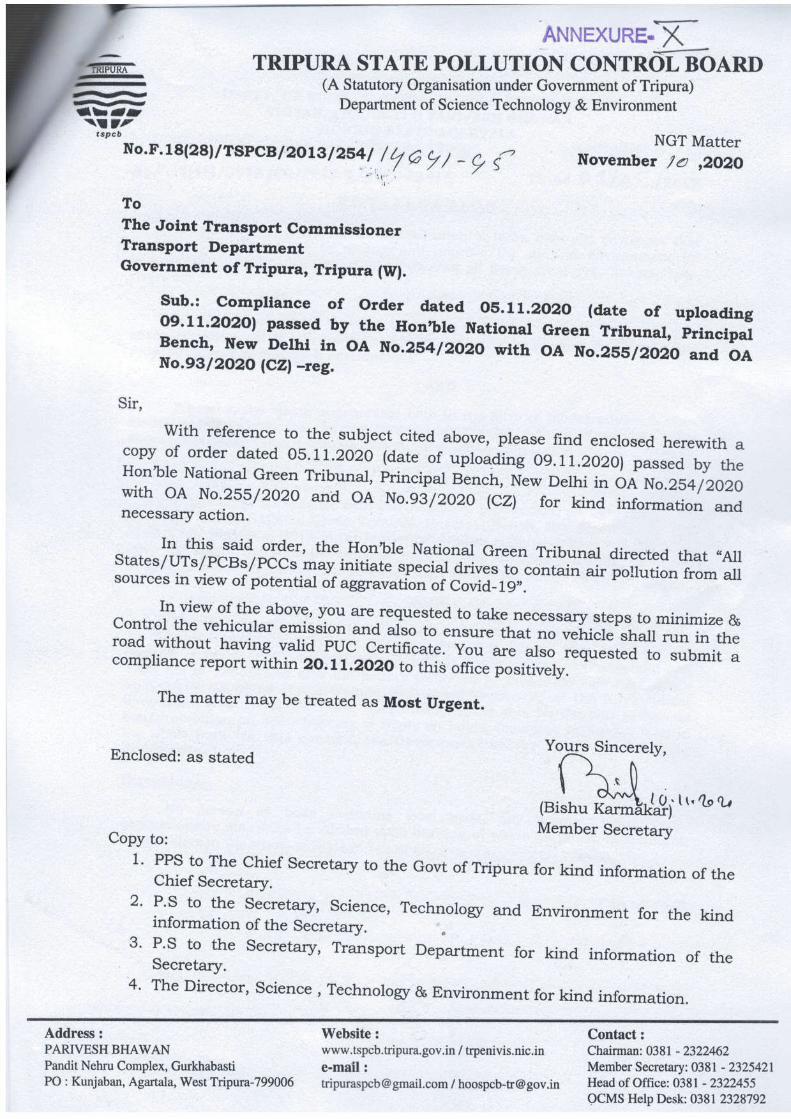
427
428
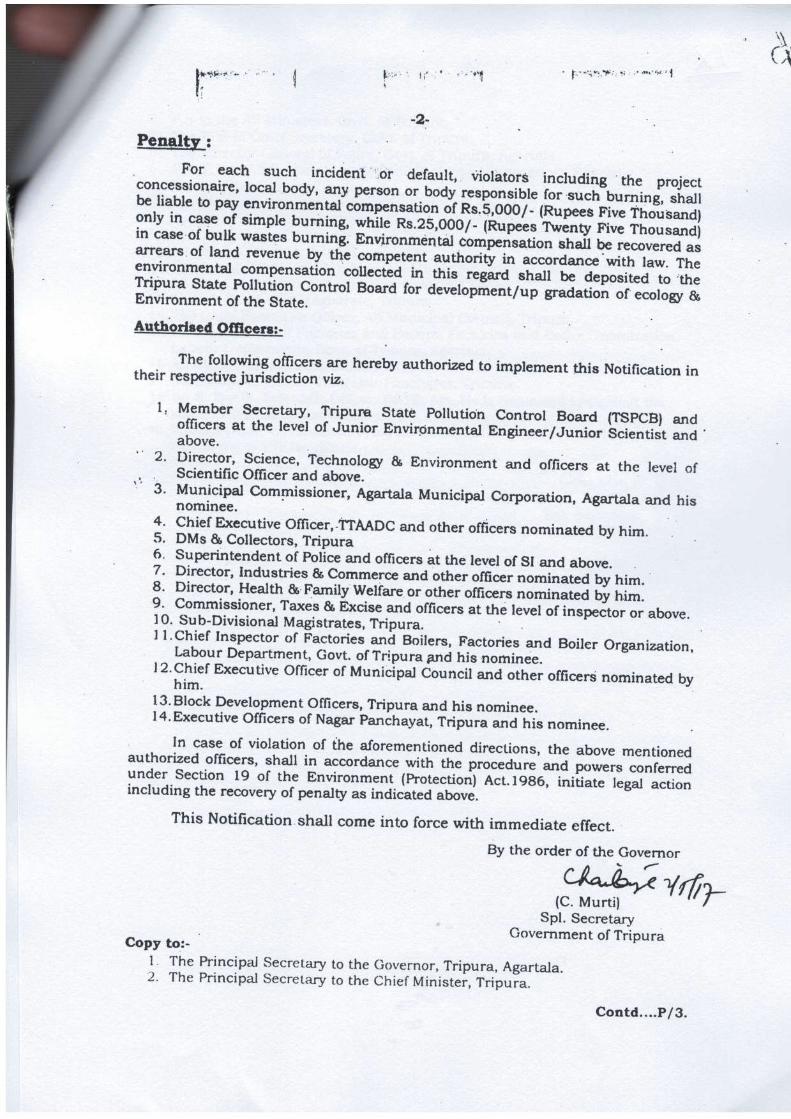
429
430
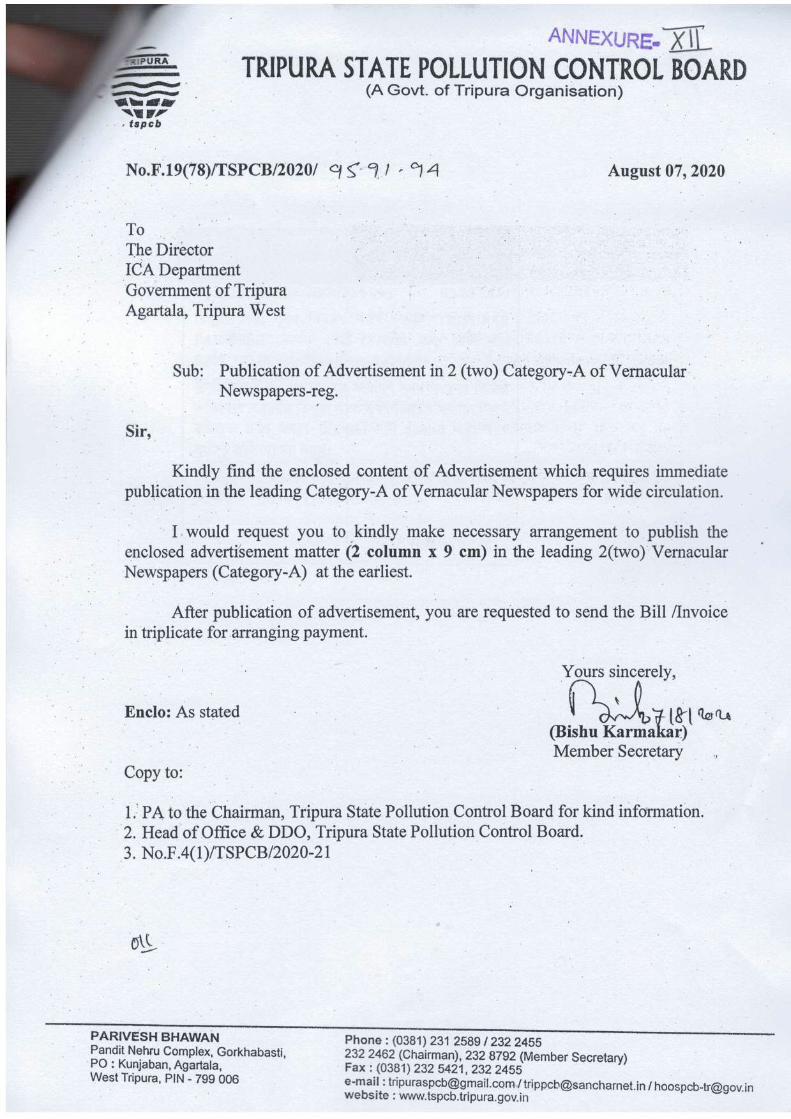
431
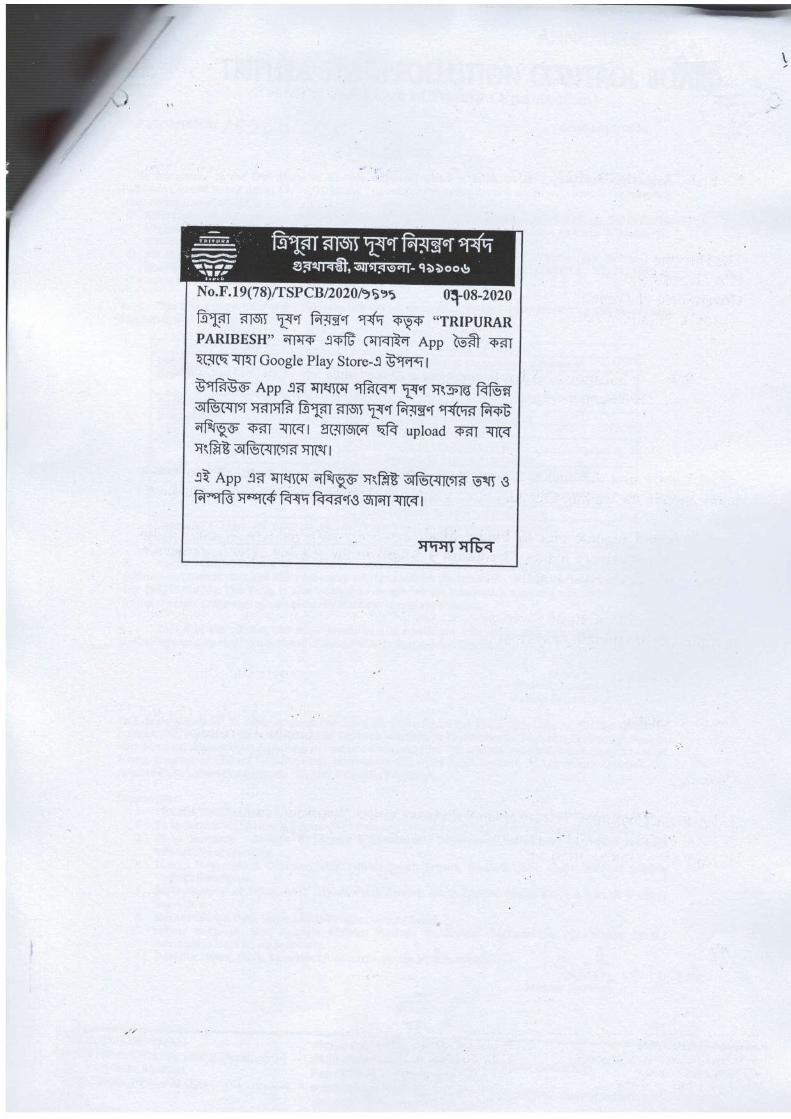
432
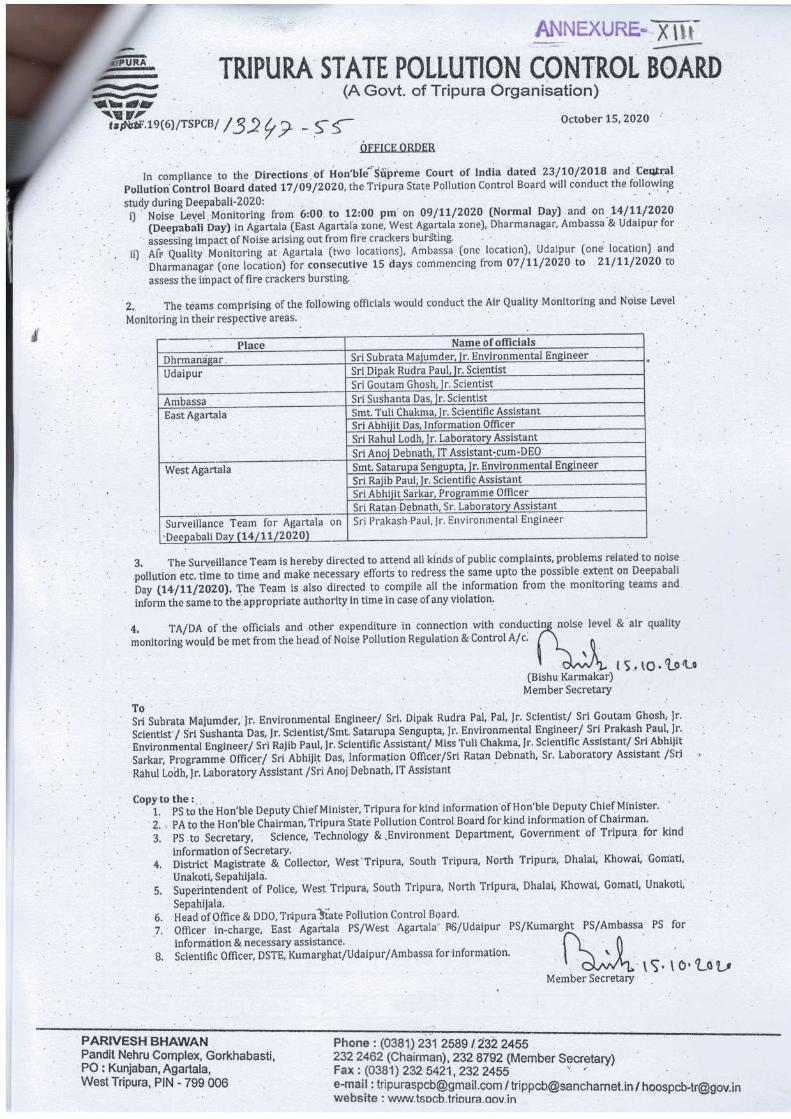
433
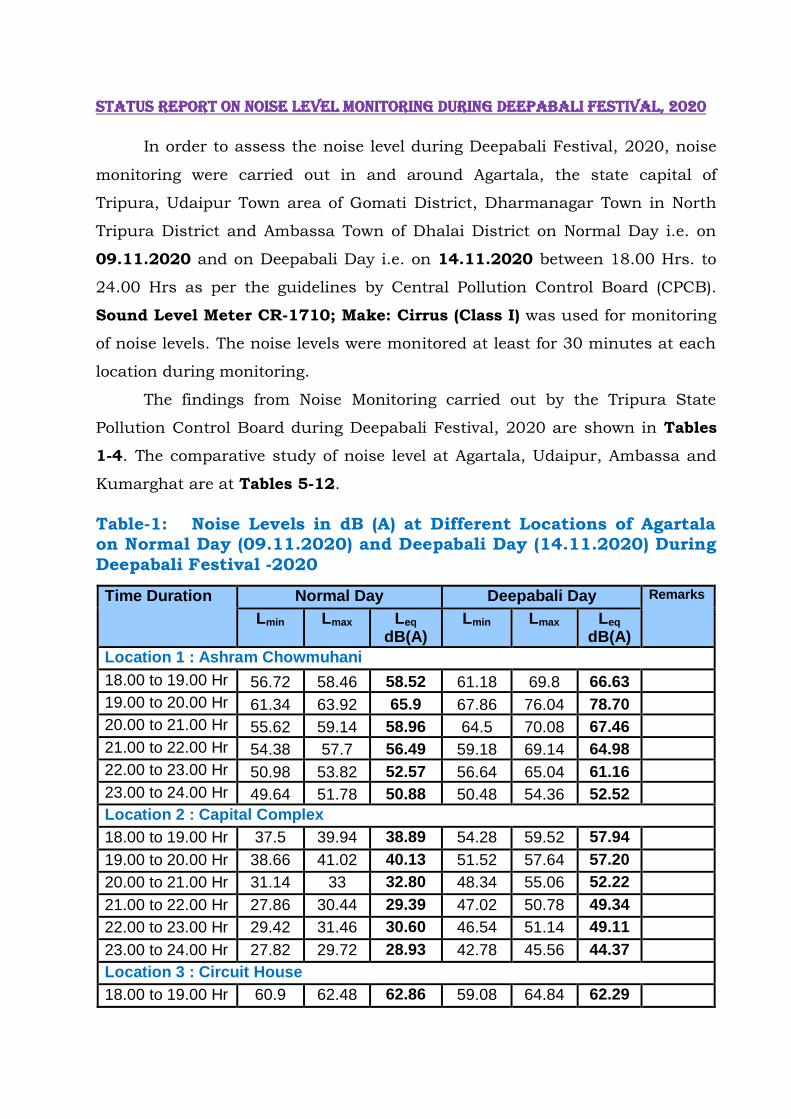
STATUS REPORT ON Noise Level Monitoring DURING DEEPABALI FESTIVAL, 2020
In order to assess the noise level during Deepabali Festival, 2020, noise
monitoring were carried out in and around Agartala, the state capital of
Tripura, Udaipur Town area of Gomati District, Dharmanagar Town in North
Tripura District and Ambassa Town of Dhalai District on Normal Day i.e. on
09.11.2020 and on Deepabali Day i.e. on 14.11.2020 between 18.00 Hrs. to
24.00 Hrs as per the guidelines by Central Pollution Control Board (CPCB).
Sound Level Meter CR-1710; Make: Cirrus (Class I) was used for monitoring
of noise levels. The noise levels were monitored at least for 30 minutes at each
location during monitoring.
The findings from Noise Monitoring carried out by the Tripura State
Pollution Control Board during Deepabali Festival, 2020 are shown in Tables
1-4. The comparative study of noise level at Agartala, Udaipur, Ambassa and
Kumarghat are at Tables 5-12.
Table-1: Noise Levels in dB (A) at Different Locations of Agartala on Normal Day (09.11.2020) and Deepabali Day (14.11.2020) During
Deepabali Festival -2020
Time Duration Normal Day Deepabali Day Remarks
Lmin Lmax Leq dB(A)
Lmin Lmax Leq
dB(A)
Location 1 : Ashram Chowmuhani
18.00 to 19.00 Hr 56.72 58.46 58.52 61.18 69.8 66.63
19.00 to 20.00 Hr 61.34 63.92 65.9 67.86 76.04 78.70
20.00 to 21.00 Hr 55.62 59.14 58.96 64.5 70.08 67.46
21.00 to 22.00 Hr 54.38 57.7 56.49 59.18 69.14 64.98
22.00 to 23.00 Hr 50.98 53.82 52.57 56.64 65.04 61.16
23.00 to 24.00 Hr 49.64 51.78 50.88 50.48 54.36 52.52
Location 2 : Capital Complex
18.00 to 19.00 Hr 37.5 39.94 38.89 54.28 59.52 57.94
19.00 to 20.00 Hr 38.66 41.02 40.13 51.52 57.64 57.20
20.00 to 21.00 Hr 31.14 33 32.80 48.34 55.06 52.22
21.00 to 22.00 Hr 27.86 30.44 29.39 47.02 50.78 49.34
22.00 to 23.00 Hr 29.42 31.46 30.60 46.54 51.14 49.11
23.00 to 24.00 Hr 27.82 29.72 28.93 42.78 45.56 44.37
Location 3 : Circuit House
18.00 to 19.00 Hr 60.9 62.48 62.86 59.08 64.84 62.29
434
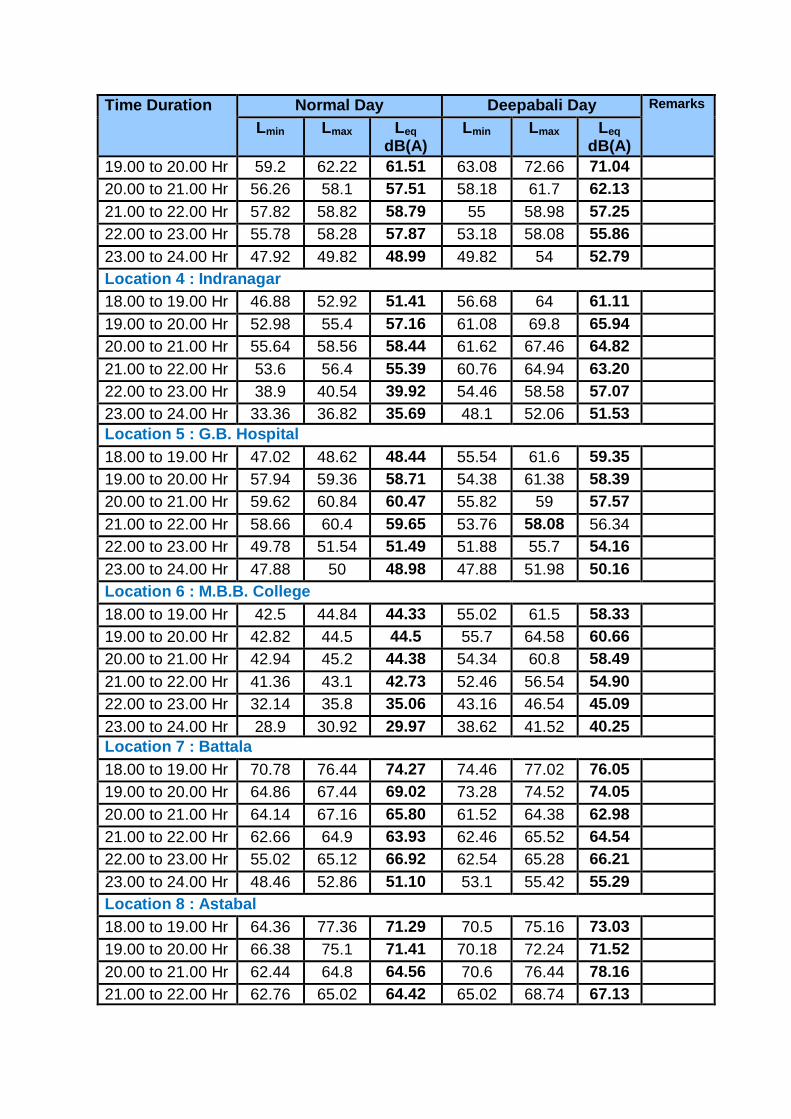
Time Duration Normal Day Deepabali Day Remarks
Lmin Lmax Leq dB(A)
Lmin Lmax Leq
dB(A)
19.00 to 20.00 Hr 59.2 62.22 61.51 63.08 72.66 71.04
20.00 to 21.00 Hr 56.26 58.1 57.51 58.18 61.7 62.13
21.00 to 22.00 Hr 57.82 58.82 58.79 55 58.98 57.25
22.00 to 23.00 Hr 55.78 58.28 57.87 53.18 58.08 55.86
23.00 to 24.00 Hr 47.92 49.82 48.99 49.82 54 52.79
Location 4 : Indranagar
18.00 to 19.00 Hr 46.88 52.92 51.41 56.68 64 61.11
19.00 to 20.00 Hr 52.98 55.4 57.16 61.08 69.8 65.94
20.00 to 21.00 Hr 55.64 58.56 58.44 61.62 67.46 64.82
21.00 to 22.00 Hr 53.6 56.4 55.39 60.76 64.94 63.20
22.00 to 23.00 Hr 38.9 40.54 39.92 54.46 58.58 57.07
23.00 to 24.00 Hr 33.36 36.82 35.69 48.1 52.06 51.53
Location 5 : G.B. Hospital
18.00 to 19.00 Hr 47.02 48.62 48.44 55.54 61.6 59.35
19.00 to 20.00 Hr 57.94 59.36 58.71 54.38 61.38 58.39
20.00 to 21.00 Hr 59.62 60.84 60.47 55.82 59 57.57
21.00 to 22.00 Hr 58.66 60.4 59.65 53.76 58.08 56.34
22.00 to 23.00 Hr 49.78 51.54 51.49 51.88 55.7 54.16
23.00 to 24.00 Hr 47.88 50 48.98 47.88 51.98 50.16
Location 6 : M.B.B. College
18.00 to 19.00 Hr 42.5 44.84 44.33 55.02 61.5 58.33
19.00 to 20.00 Hr 42.82 44.5 44.5 55.7 64.58 60.66
20.00 to 21.00 Hr 42.94 45.2 44.38 54.34 60.8 58.49
21.00 to 22.00 Hr 41.36 43.1 42.73 52.46 56.54 54.90
22.00 to 23.00 Hr 32.14 35.8 35.06 43.16 46.54 45.09
23.00 to 24.00 Hr 28.9 30.92 29.97 38.62 41.52 40.25
Location 7 : Battala
18.00 to 19.00 Hr 70.78 76.44 74.27 74.46 77.02 76.05
19.00 to 20.00 Hr 64.86 67.44 69.02 73.28 74.52 74.05
20.00 to 21.00 Hr 64.14 67.16 65.80 61.52 64.38 62.98
21.00 to 22.00 Hr 62.66 64.9 63.93 62.46 65.52 64.54
22.00 to 23.00 Hr 55.02 65.12 66.92 62.54 65.28 66.21
23.00 to 24.00 Hr 48.46 52.86 51.10 53.1 55.42 55.29
Location 8 : Astabal
18.00 to 19.00 Hr 64.36 77.36 71.29 70.5 75.16 73.03
19.00 to 20.00 Hr 66.38 75.1 71.41 70.18 72.24 71.52
20.00 to 21.00 Hr 62.44 64.8 64.56 70.6 76.44 78.16
21.00 to 22.00 Hr 62.76 65.02 64.42 65.02 68.74 67.13
435
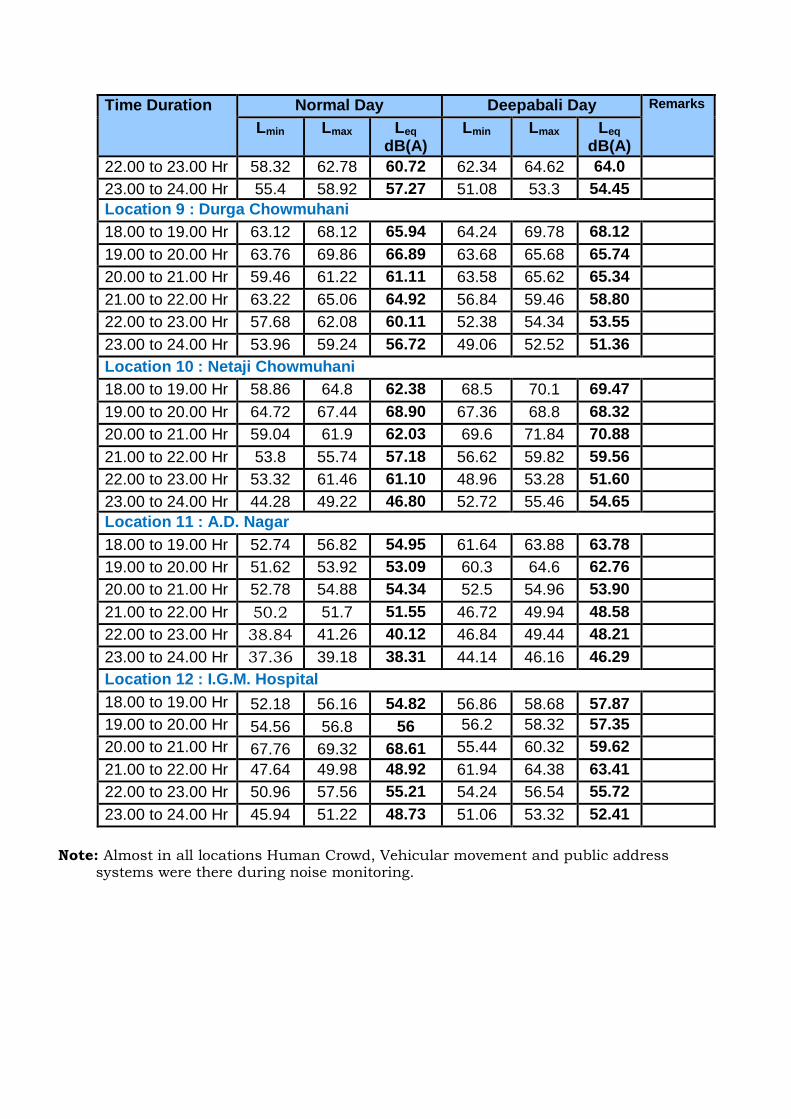
Time Duration Normal Day Deepabali Day Remarks
Lmin Lmax Leq dB(A)
Lmin Lmax Leq
dB(A)
22.00 to 23.00 Hr 58.32 62.78 60.72 62.34 64.62 64.0
23.00 to 24.00 Hr 55.4 58.92 57.27 51.08 53.3 54.45
Location 9 : Durga Chowmuhani
18.00 to 19.00 Hr 63.12 68.12 65.94 64.24 69.78 68.12
19.00 to 20.00 Hr 63.76 69.86 66.89 63.68 65.68 65.74
20.00 to 21.00 Hr 59.46 61.22 61.11 63.58 65.62 65.34
21.00 to 22.00 Hr 63.22 65.06 64.92 56.84 59.46 58.80
22.00 to 23.00 Hr 57.68 62.08 60.11 52.38 54.34 53.55
23.00 to 24.00 Hr 53.96 59.24 56.72 49.06 52.52 51.36
Location 10 : Netaji Chowmuhani
18.00 to 19.00 Hr 58.86 64.8 62.38 68.5 70.1 69.47
19.00 to 20.00 Hr 64.72 67.44 68.90 67.36 68.8 68.32
20.00 to 21.00 Hr 59.04 61.9 62.03 69.6 71.84 70.88
21.00 to 22.00 Hr 53.8 55.74 57.18 56.62 59.82 59.56
22.00 to 23.00 Hr 53.32 61.46 61.10 48.96 53.28 51.60
23.00 to 24.00 Hr 44.28 49.22 46.80 52.72 55.46 54.65
Location 11 : A.D. Nagar
18.00 to 19.00 Hr 52.74 56.82 54.95 61.64 63.88 63.78
19.00 to 20.00 Hr 51.62 53.92 53.09 60.3 64.6 62.76
20.00 to 21.00 Hr 52.78 54.88 54.34 52.5 54.96 53.90
21.00 to 22.00 Hr 50.2 51.7 51.55 46.72 49.94 48.58
22.00 to 23.00 Hr 38.84 41.26 40.12 46.84 49.44 48.21
23.00 to 24.00 Hr 37.36 39.18 38.31 44.14 46.16 46.29
Location 12 : I.G.M. Hospital
18.00 to 19.00 Hr 52.18 56.16 54.82 56.86 58.68 57.87
19.00 to 20.00 Hr 54.56 56.8 56 56.2 58.32 57.35
20.00 to 21.00 Hr 67.76 69.32 68.61 55.44 60.32 59.62
21.00 to 22.00 Hr 47.64 49.98 48.92 61.94 64.38 63.41
22.00 to 23.00 Hr 50.96 57.56 55.21 54.24 56.54 55.72
23.00 to 24.00 Hr 45.94 51.22 48.73 51.06 53.32 52.41
Note: Almost in all locations Human Crowd, Vehicular movement and public address
systems were there during noise monitoring.
436
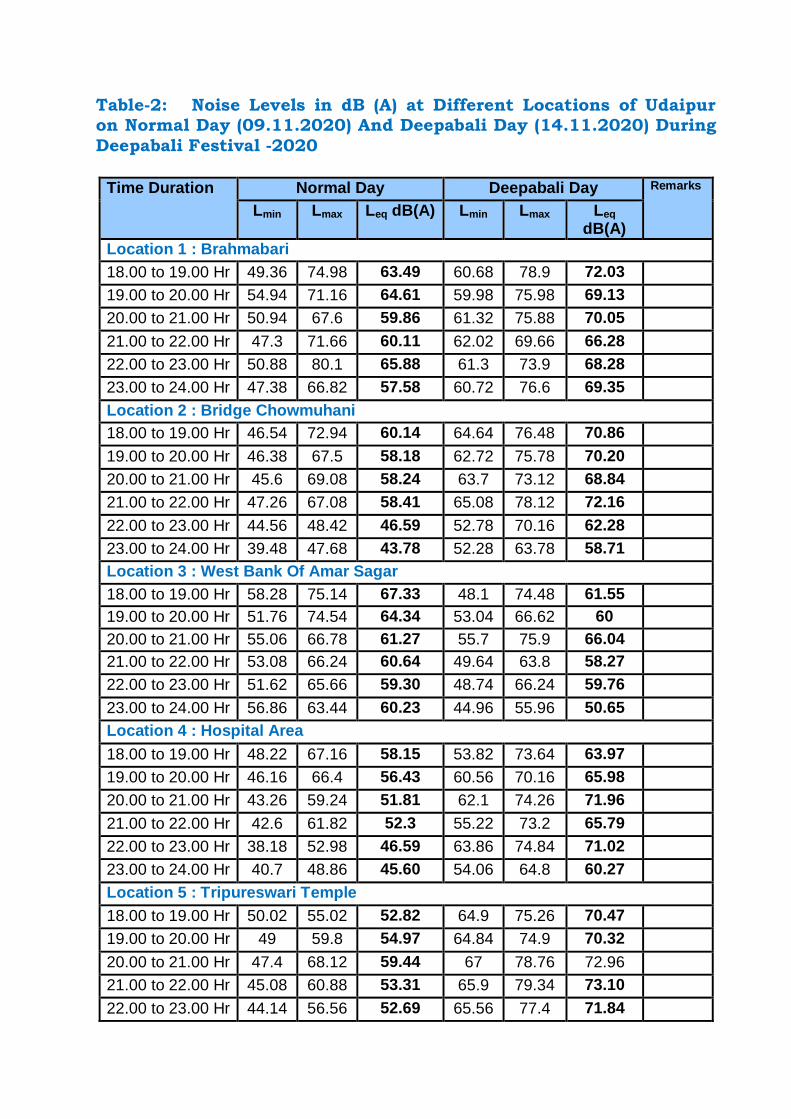
Table-2: Noise Levels in dB (A) at Different Locations of Udaipur on Normal Day (09.11.2020) And Deepabali Day (14.11.2020) During
Deepabali Festival -2020
Time Duration Normal Day Deepabali Day Remarks
Lmin Lmax Leq dB(A) Lmin Lmax Leq
dB(A)
Location 1 : Brahmabari
18.00 to 19.00 Hr 49.36 74.98 63.49 60.68 78.9 72.03
19.00 to 20.00 Hr 54.94 71.16 64.61 59.98 75.98 69.13
20.00 to 21.00 Hr 50.94 67.6 59.86 61.32 75.88 70.05
21.00 to 22.00 Hr 47.3 71.66 60.11 62.02 69.66 66.28
22.00 to 23.00 Hr 50.88 80.1 65.88 61.3 73.9 68.28
23.00 to 24.00 Hr 47.38 66.82 57.58 60.72 76.6 69.35
Location 2 : Bridge Chowmuhani
18.00 to 19.00 Hr 46.54 72.94 60.14 64.64 76.48 70.86
19.00 to 20.00 Hr 46.38 67.5 58.18 62.72 75.78 70.20
20.00 to 21.00 Hr 45.6 69.08 58.24 63.7 73.12 68.84
21.00 to 22.00 Hr 47.26 67.08 58.41 65.08 78.12 72.16
22.00 to 23.00 Hr 44.56 48.42 46.59 52.78 70.16 62.28
23.00 to 24.00 Hr 39.48 47.68 43.78 52.28 63.78 58.71
Location 3 : West Bank Of Amar Sagar
18.00 to 19.00 Hr 58.28 75.14 67.33 48.1 74.48 61.55
19.00 to 20.00 Hr 51.76 74.54 64.34 53.04 66.62 60
20.00 to 21.00 Hr 55.06 66.78 61.27 55.7 75.9 66.04
21.00 to 22.00 Hr 53.08 66.24 60.64 49.64 63.8 58.27
22.00 to 23.00 Hr 51.62 65.66 59.30 48.74 66.24 59.76
23.00 to 24.00 Hr 56.86 63.44 60.23 44.96 55.96 50.65
Location 4 : Hospital Area
18.00 to 19.00 Hr 48.22 67.16 58.15 53.82 73.64 63.97
19.00 to 20.00 Hr 46.16 66.4 56.43 60.56 70.16 65.98
20.00 to 21.00 Hr 43.26 59.24 51.81 62.1 74.26 71.96
21.00 to 22.00 Hr 42.6 61.82 52.3 55.22 73.2 65.79
22.00 to 23.00 Hr 38.18 52.98 46.59 63.86 74.84 71.02
23.00 to 24.00 Hr 40.7 48.86 45.60 54.06 64.8 60.27
Location 5 : Tripureswari Temple
18.00 to 19.00 Hr 50.02 55.02 52.82 64.9 75.26 70.47
19.00 to 20.00 Hr 49 59.8 54.97 64.84 74.9 70.32
20.00 to 21.00 Hr 47.4 68.12 59.44 67 78.76 72.96
21.00 to 22.00 Hr 45.08 60.88 53.31 65.9 79.34 73.10
22.00 to 23.00 Hr 44.14 56.56 52.69 65.56 77.4 71.84
437
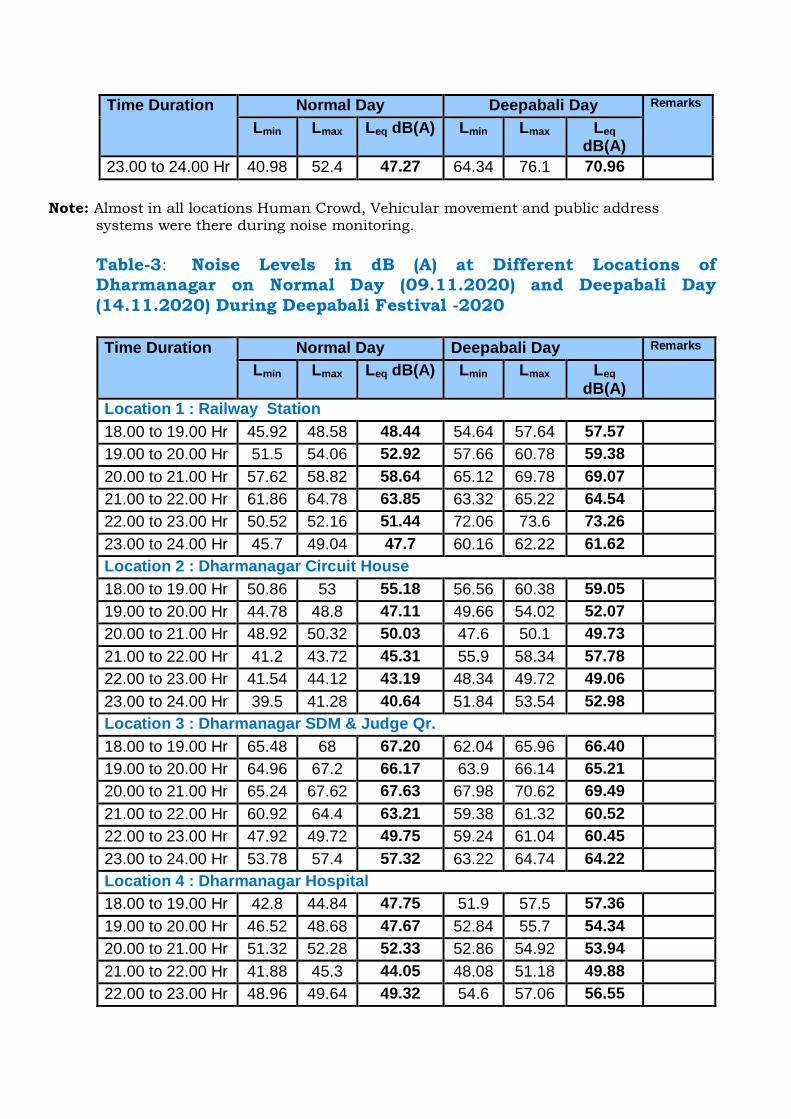
Time Duration Normal Day Deepabali Day Remarks
Lmin Lmax Leq dB(A) Lmin Lmax Leq
dB(A)
23.00 to 24.00 Hr 40.98 52.4 47.27 64.34 76.1 70.96
Note: Almost in all locations Human Crowd, Vehicular movement and public address
systems were there during noise monitoring.
Table-3: Noise Levels in dB (A) at Different Locations of Dharmanagar on Normal Day (09.11.2020) and Deepabali Day
(14.11.2020) During Deepabali Festival -2020
Time Duration Normal Day Deepabali Day Remarks
Lmin Lmax Leq dB(A) Lmin Lmax Leq
dB(A)
Location 1 : Railway Station
18.00 to 19.00 Hr 45.92 48.58 48.44 54.64 57.64 57.57
19.00 to 20.00 Hr 51.5 54.06 52.92 57.66 60.78 59.38
20.00 to 21.00 Hr 57.62 58.82 58.64 65.12 69.78 69.07
21.00 to 22.00 Hr 61.86 64.78 63.85 63.32 65.22 64.54
22.00 to 23.00 Hr 50.52 52.16 51.44 72.06 73.6 73.26
23.00 to 24.00 Hr 45.7 49.04 47.7 60.16 62.22 61.62
Location 2 : Dharmanagar Circuit House
18.00 to 19.00 Hr 50.86 53 55.18 56.56 60.38 59.05
19.00 to 20.00 Hr 44.78 48.8 47.11 49.66 54.02 52.07
20.00 to 21.00 Hr 48.92 50.32 50.03 47.6 50.1 49.73
21.00 to 22.00 Hr 41.2 43.72 45.31 55.9 58.34 57.78
22.00 to 23.00 Hr 41.54 44.12 43.19 48.34 49.72 49.06
23.00 to 24.00 Hr 39.5 41.28 40.64 51.84 53.54 52.98
Location 3 : Dharmanagar SDM & Judge Qr.
18.00 to 19.00 Hr 65.48 68 67.20 62.04 65.96 66.40
19.00 to 20.00 Hr 64.96 67.2 66.17 63.9 66.14 65.21
20.00 to 21.00 Hr 65.24 67.62 67.63 67.98 70.62 69.49
21.00 to 22.00 Hr 60.92 64.4 63.21 59.38 61.32 60.52
22.00 to 23.00 Hr 47.92 49.72 49.75 59.24 61.04 60.45
23.00 to 24.00 Hr 53.78 57.4 57.32 63.22 64.74 64.22
Location 4 : Dharmanagar Hospital
18.00 to 19.00 Hr 42.8 44.84 47.75 51.9 57.5 57.36
19.00 to 20.00 Hr 46.52 48.68 47.67 52.84 55.7 54.34
20.00 to 21.00 Hr 51.32 52.28 52.33 52.86 54.92 53.94
21.00 to 22.00 Hr 41.88 45.3 44.05 48.08 51.18 49.88
22.00 to 23.00 Hr 48.96 49.64 49.32 54.6 57.06 56.55
438
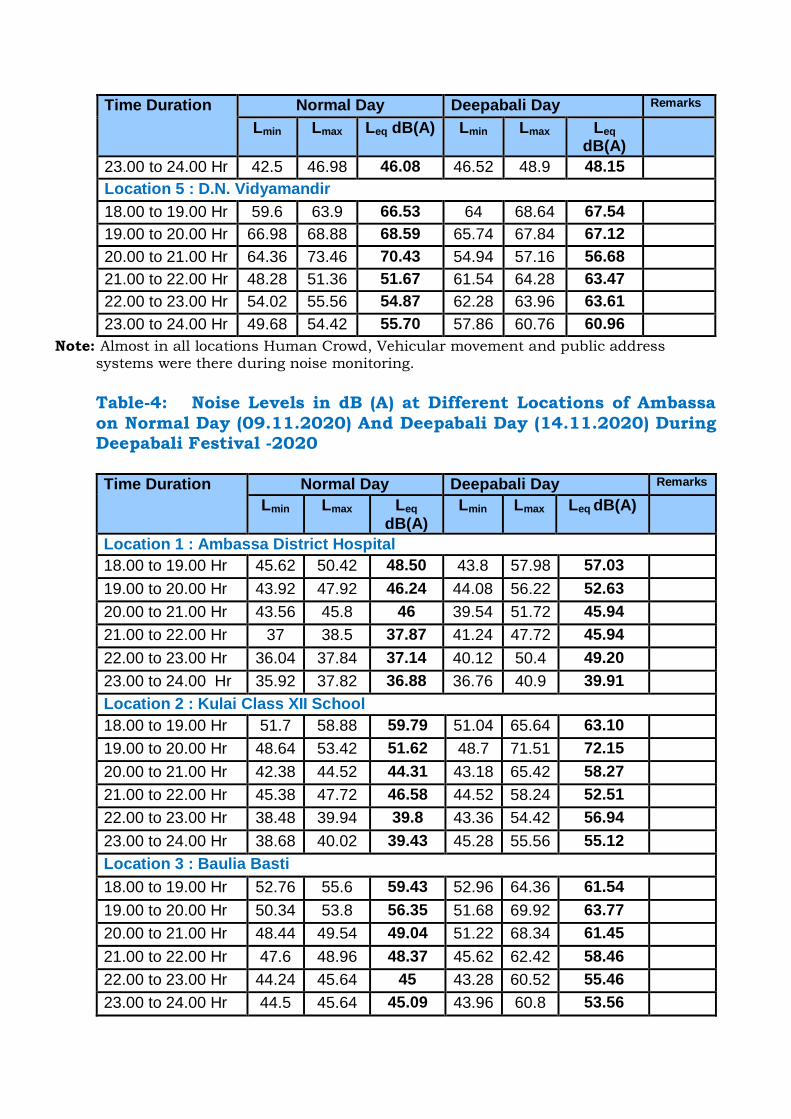
Time Duration Normal Day Deepabali Day Remarks
Lmin Lmax Leq dB(A) Lmin Lmax Leq
dB(A)
23.00 to 24.00 Hr 42.5 46.98 46.08 46.52 48.9 48.15
Location 5 : D.N. Vidyamandir
18.00 to 19.00 Hr 59.6 63.9 66.53 64 68.64 67.54
19.00 to 20.00 Hr 66.98 68.88 68.59 65.74 67.84 67.12
20.00 to 21.00 Hr 64.36 73.46 70.43 54.94 57.16 56.68
21.00 to 22.00 Hr 48.28 51.36 51.67 61.54 64.28 63.47
22.00 to 23.00 Hr 54.02 55.56 54.87 62.28 63.96 63.61
23.00 to 24.00 Hr 49.68 54.42 55.70 57.86 60.76 60.96
Note: Almost in all locations Human Crowd, Vehicular movement and public address systems were there during noise monitoring.
Table-4: Noise Levels in dB (A) at Different Locations of Ambassa
on Normal Day (09.11.2020) And Deepabali Day (14.11.2020) During Deepabali Festival -2020
Time Duration Normal Day Deepabali Day Remarks
Lmin Lmax Leq dB(A)
Lmin Lmax Leq dB(A)
Location 1 : Ambassa District Hospital
18.00 to 19.00 Hr 45.62 50.42 48.50 43.8 57.98 57.03
19.00 to 20.00 Hr 43.92 47.92 46.24 44.08 56.22 52.63
20.00 to 21.00 Hr 43.56 45.8 46 39.54 51.72 45.94
21.00 to 22.00 Hr 37 38.5 37.87 41.24 47.72 45.94
22.00 to 23.00 Hr 36.04 37.84 37.14 40.12 50.4 49.20
23.00 to 24.00 Hr 35.92 37.82 36.88 36.76 40.9 39.91
Location 2 : Kulai Class XII School
18.00 to 19.00 Hr 51.7 58.88 59.79 51.04 65.64 63.10
19.00 to 20.00 Hr 48.64 53.42 51.62 48.7 71.51 72.15
20.00 to 21.00 Hr 42.38 44.52 44.31 43.18 65.42 58.27
21.00 to 22.00 Hr 45.38 47.72 46.58 44.52 58.24 52.51
22.00 to 23.00 Hr 38.48 39.94 39.8 43.36 54.42 56.94
23.00 to 24.00 Hr 38.68 40.02 39.43 45.28 55.56 55.12
Location 3 : Baulia Basti
18.00 to 19.00 Hr 52.76 55.6 59.43 52.96 64.36 61.54
19.00 to 20.00 Hr 50.34 53.8 56.35 51.68 69.92 63.77
20.00 to 21.00 Hr 48.44 49.54 49.04 51.22 68.34 61.45
21.00 to 22.00 Hr 47.6 48.96 48.37 45.62 62.42 58.46
22.00 to 23.00 Hr 44.24 45.64 45 43.28 60.52 55.46
23.00 to 24.00 Hr 44.5 45.64 45.09 43.96 60.8 53.56
439
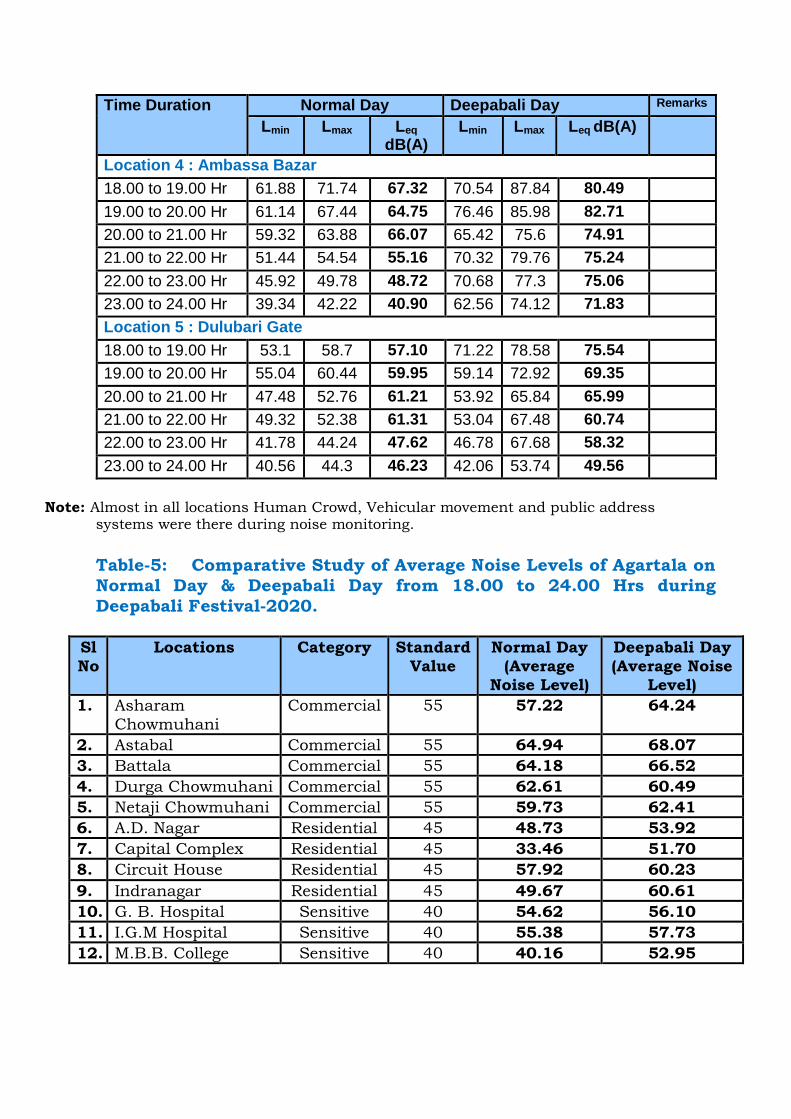
Time Duration Normal Day Deepabali Day Remarks
Lmin Lmax Leq dB(A)
Lmin Lmax Leq dB(A)
Location 4 : Ambassa Bazar
18.00 to 19.00 Hr 61.88 71.74 67.32 70.54 87.84 80.49
19.00 to 20.00 Hr 61.14 67.44 64.75 76.46 85.98 82.71
20.00 to 21.00 Hr 59.32 63.88 66.07 65.42 75.6 74.91
21.00 to 22.00 Hr 51.44 54.54 55.16 70.32 79.76 75.24
22.00 to 23.00 Hr 45.92 49.78 48.72 70.68 77.3 75.06
23.00 to 24.00 Hr 39.34 42.22 40.90 62.56 74.12 71.83
Location 5 : Dulubari Gate
18.00 to 19.00 Hr 53.1 58.7 57.10 71.22 78.58 75.54
19.00 to 20.00 Hr 55.04 60.44 59.95 59.14 72.92 69.35
20.00 to 21.00 Hr 47.48 52.76 61.21 53.92 65.84 65.99
21.00 to 22.00 Hr 49.32 52.38 61.31 53.04 67.48 60.74
22.00 to 23.00 Hr 41.78 44.24 47.62 46.78 67.68 58.32
23.00 to 24.00 Hr 40.56 44.3 46.23 42.06 53.74 49.56
Note: Almost in all locations Human Crowd, Vehicular movement and public address
systems were there during noise monitoring. Table-5: Comparative Study of Average Noise Levels of Agartala on
Normal Day & Deepabali Day from 18.00 to 24.00 Hrs during
Deepabali Festival-2020.
Sl
No
Locations Category Standard
Value
Normal Day
(Average
Noise Level)
Deepabali Day
(Average Noise
Level)
1. Asharam
Chowmuhani
Commercial 55 57.22 64.24
2. Astabal Commercial 55 64.94 68.07
3. Battala Commercial 55 64.18 66.52
4. Durga Chowmuhani Commercial 55 62.61 60.49
5. Netaji Chowmuhani Commercial 55 59.73 62.41
6. A.D. Nagar Residential 45 48.73 53.92
7. Capital Complex Residential 45 33.46 51.70
8. Circuit House Residential 45 57.92 60.23
9. Indranagar Residential 45 49.67 60.61
10. G. B. Hospital Sensitive 40 54.62 56.10
11. I.G.M Hospital Sensitive 40 55.38 57.73
12. M.B.B. College Sensitive 40 40.16 52.95
440
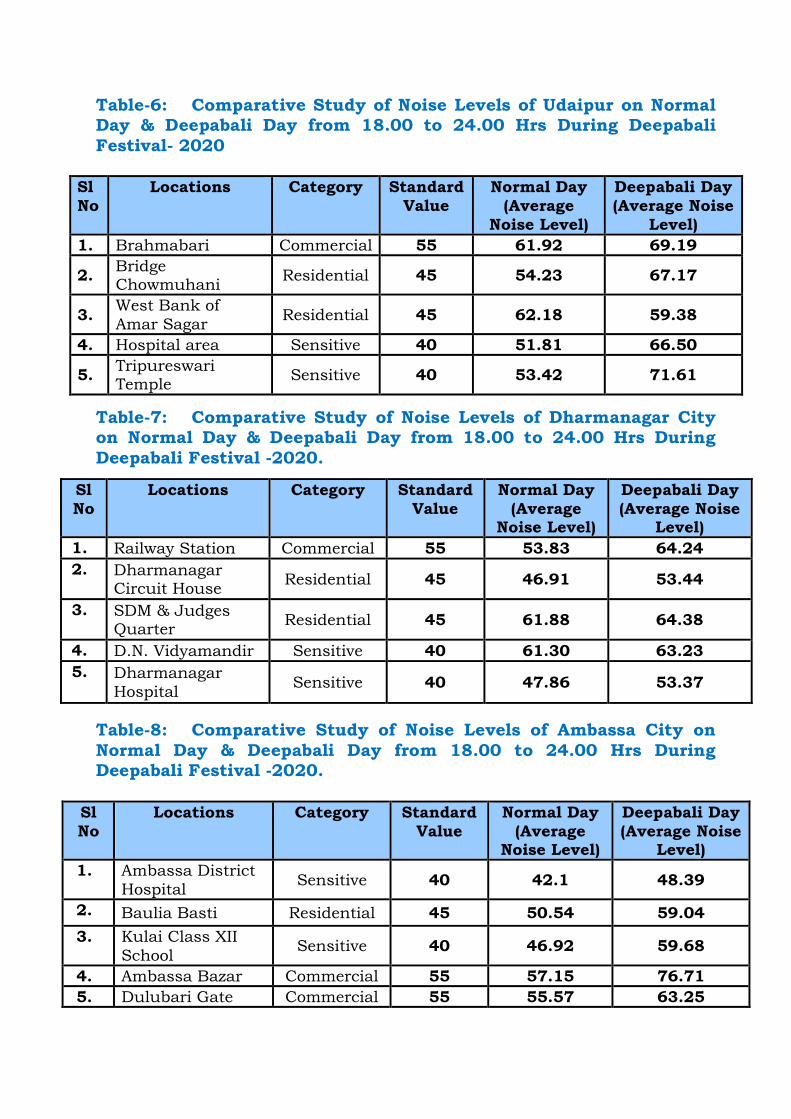
Table-6: Comparative Study of Noise Levels of Udaipur on Normal Day & Deepabali Day from 18.00 to 24.00 Hrs During Deepabali
Festival- 2020
Sl
No
Locations Category Standard
Value
Normal Day
(Average
Noise Level)
Deepabali Day
(Average Noise
Level)
1. Brahmabari Commercial 55 61.92 69.19
2. Bridge Chowmuhani
Residential 45 54.23 67.17
3. West Bank of
Amar Sagar Residential 45 62.18 59.38
4. Hospital area Sensitive 40 51.81 66.50
5. Tripureswari Temple
Sensitive 40 53.42 71.61
Table-7: Comparative Study of Noise Levels of Dharmanagar City on Normal Day & Deepabali Day from 18.00 to 24.00 Hrs During
Deepabali Festival -2020.
Sl
No
Locations Category Standard
Value
Normal Day
(Average Noise Level)
Deepabali Day
(Average Noise Level)
1. Railway Station Commercial 55 53.83 64.24
2. Dharmanagar Circuit House
Residential 45 46.91 53.44
3. SDM & Judges Quarter
Residential 45 61.88 64.38
4. D.N. Vidyamandir Sensitive 40 61.30 63.23
5. Dharmanagar
Hospital Sensitive 40 47.86 53.37
Table-8: Comparative Study of Noise Levels of Ambassa City on
Normal Day & Deepabali Day from 18.00 to 24.00 Hrs During Deepabali Festival -2020.
Sl
No
Locations Category Standard
Value
Normal Day
(Average Noise Level)
Deepabali Day
(Average Noise Level)
1. Ambassa District
Hospital Sensitive 40 42.1 48.39
2. Baulia Basti Residential 45 50.54 59.04
3. Kulai Class XII
School Sensitive 40 46.92 59.68
4. Ambassa Bazar Commercial 55 57.15 76.71
5. Dulubari Gate Commercial 55 55.57 63.25
441
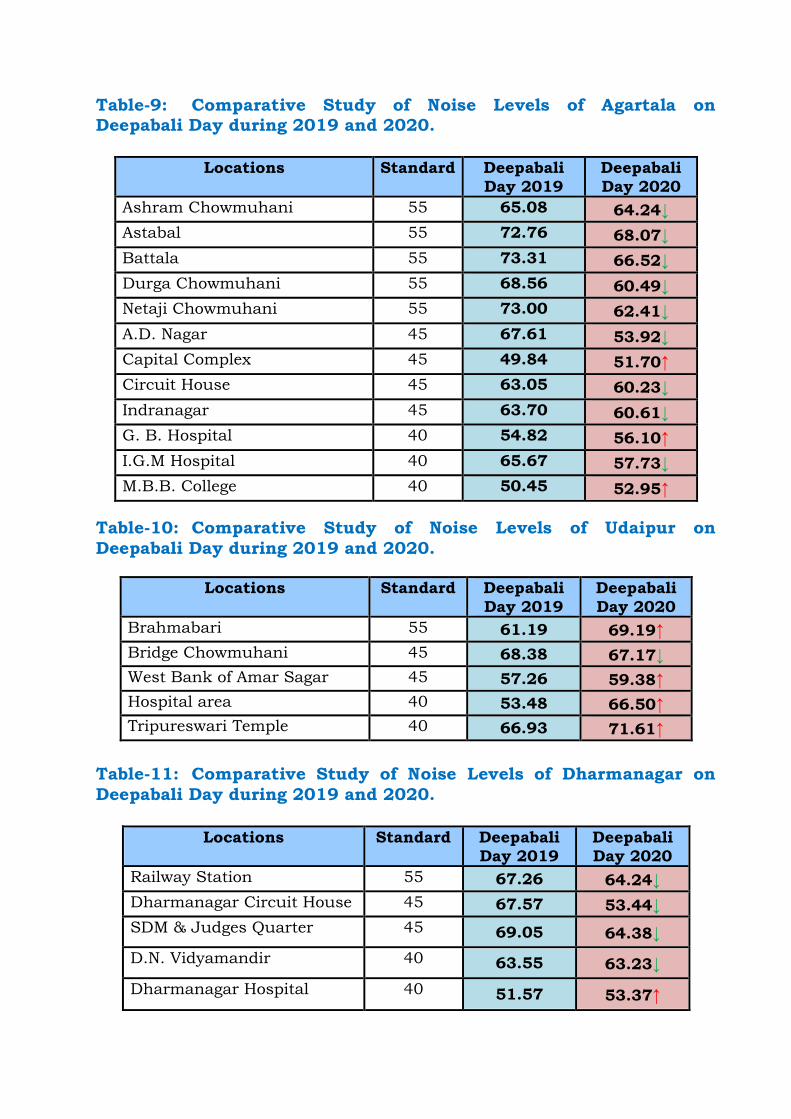
Table-9: Comparative Study of Noise Levels of Agartala on Deepabali Day during 2019 and 2020.
Locations Standard Deepabali
Day 2019
Deepabali
Day 2020
Ashram Chowmuhani 55 65.08 64.24↓
Astabal 55 72.76 68.07↓
Battala 55 73.31 66.52↓
Durga Chowmuhani 55 68.56 60.49↓
Netaji Chowmuhani 55 73.00 62.41↓
A.D. Nagar 45 67.61 53.92↓
Capital Complex 45 49.84 51.70↑
Circuit House 45 63.05 60.23↓
Indranagar 45 63.70 60.61↓
G. B. Hospital 40 54.82 56.10↑
I.G.M Hospital 40 65.67 57.73↓
M.B.B. College 40 50.45 52.95↑
Table-10: Comparative Study of Noise Levels of Udaipur on
Deepabali Day during 2019 and 2020.
Locations Standard Deepabali
Day 2019
Deepabali
Day 2020
Brahmabari 55 61.19 69.19↑
Bridge Chowmuhani 45 68.38 67.17↓
West Bank of Amar Sagar 45 57.26 59.38↑
Hospital area 40 53.48 66.50↑
Tripureswari Temple 40 66.93 71.61↑
Table-11: Comparative Study of Noise Levels of Dharmanagar on
Deepabali Day during 2019 and 2020.
Locations Standard Deepabali
Day 2019
Deepabali
Day 2020
Railway Station 55 67.26 64.24↓
Dharmanagar Circuit House 45 67.57 53.44↓
SDM & Judges Quarter 45 69.05 64.38↓
D.N. Vidyamandir 40 63.55 63.23↓
Dharmanagar Hospital 40 51.57 53.37↑
442
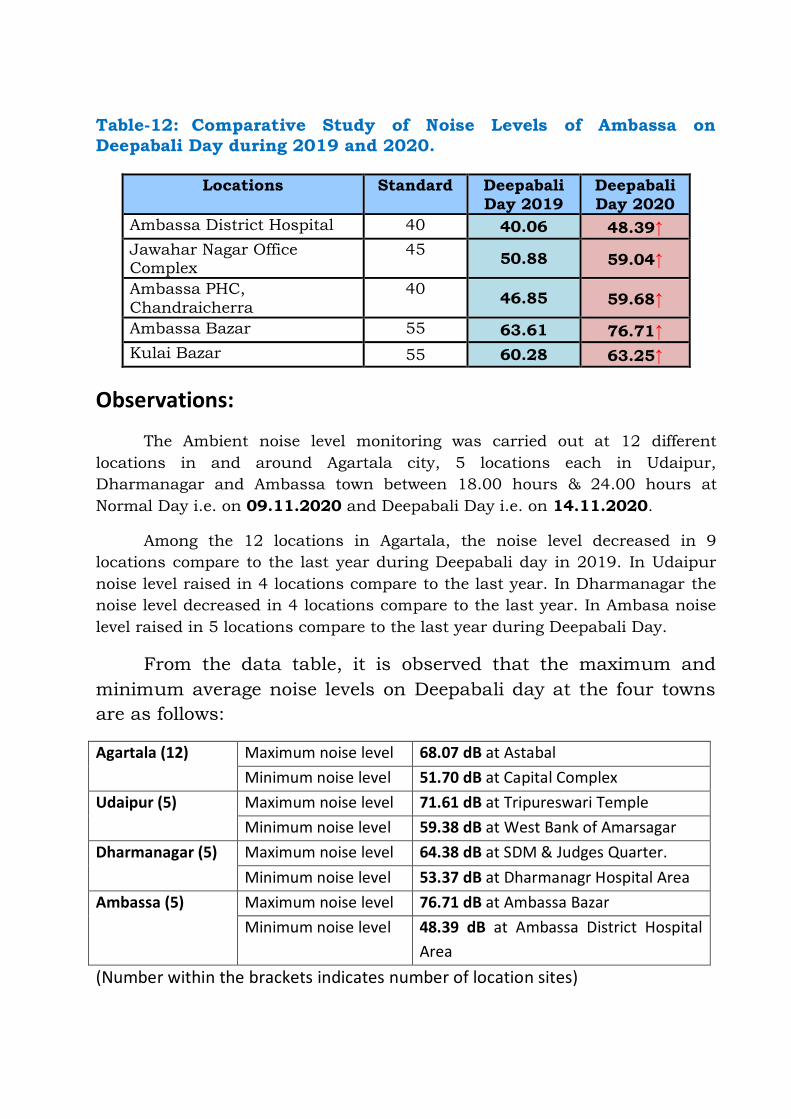
Table-12: Comparative Study of Noise Levels of Ambassa on
Deepabali Day during 2019 and 2020.
Locations Standard Deepabali
Day 2019
Deepabali
Day 2020
Ambassa District Hospital 40 40.06 48.39↑
Jawahar Nagar Office Complex
45 50.88 59.04↑
Ambassa PHC,
Chandraicherra
40 46.85 59.68↑
Ambassa Bazar 55 63.61 76.71↑
Kulai Bazar 55 60.28 63.25↑
Observations:
The Ambient noise level monitoring was carried out at 12 different
locations in and around Agartala city, 5 locations each in Udaipur,
Dharmanagar and Ambassa town between 18.00 hours & 24.00 hours at
Normal Day i.e. on 09.11.2020 and Deepabali Day i.e. on 14.11.2020.
Among the 12 locations in Agartala, the noise level decreased in 9
locations compare to the last year during Deepabali day in 2019. In Udaipur
noise level raised in 4 locations compare to the last year. In Dharmanagar the
noise level decreased in 4 locations compare to the last year. In Ambasa noise
level raised in 5 locations compare to the last year during Deepabali Day.
From the data table, it is observed that the maximum and
minimum average noise levels on Deepabali day at the four towns
are as follows:
Agartala (12) Maximum noise level 68.07 dB at Astabal
Minimum noise level 51.70 dB at Capital Complex
Udaipur (5) Maximum noise level 71.61 dB at Tripureswari Temple
Minimum noise level 59.38 dB at West Bank of Amarsagar
Dharmanagar (5) Maximum noise level 64.38 dB at SDM & Judges Quarter.
Minimum noise level 53.37 dB at Dharmanagr Hospital Area
Ambassa (5) Maximum noise level 76.71 dB at Ambassa Bazar
Minimum noise level 48.39 dB at Ambassa District Hospital
Area
(Number within the brackets indicates number of location sites)
443
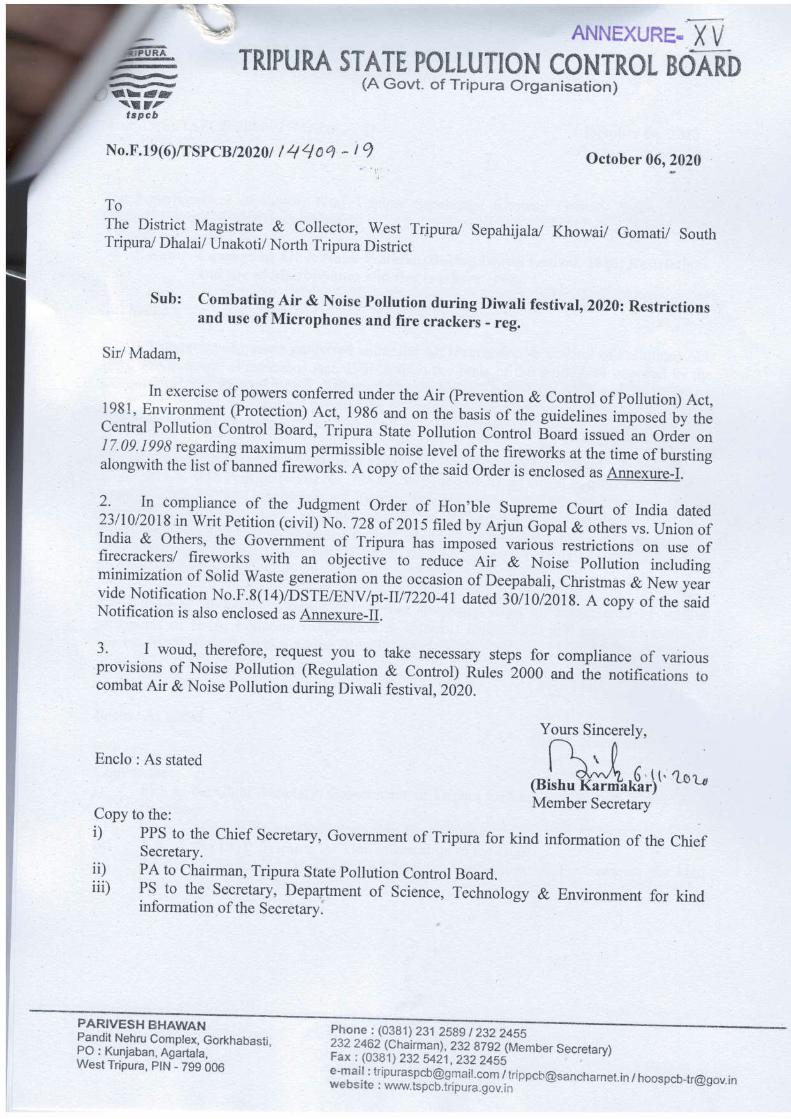
444
445
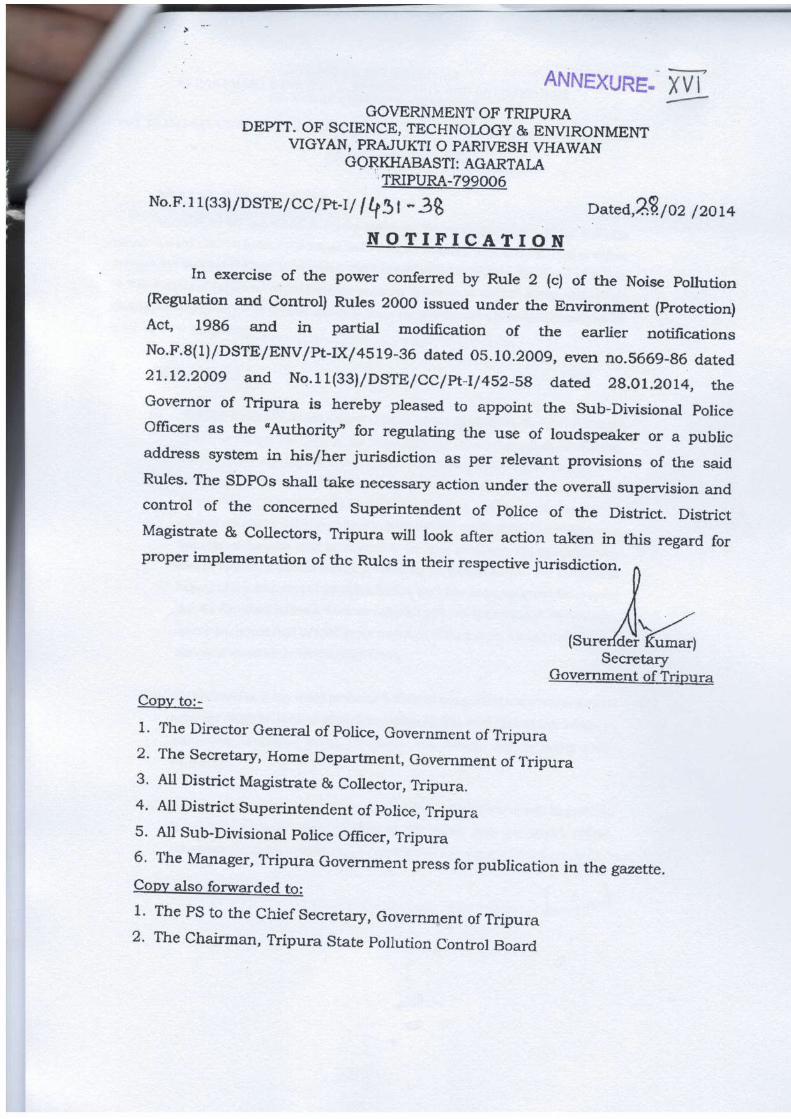
446
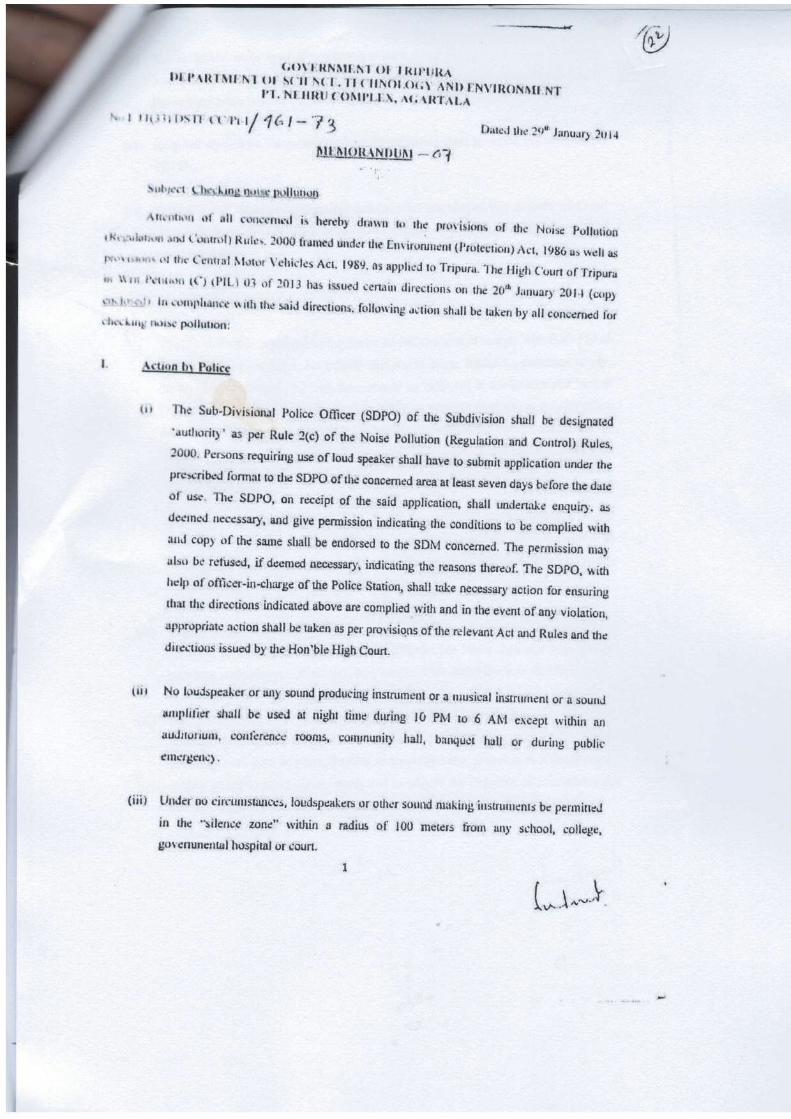
447
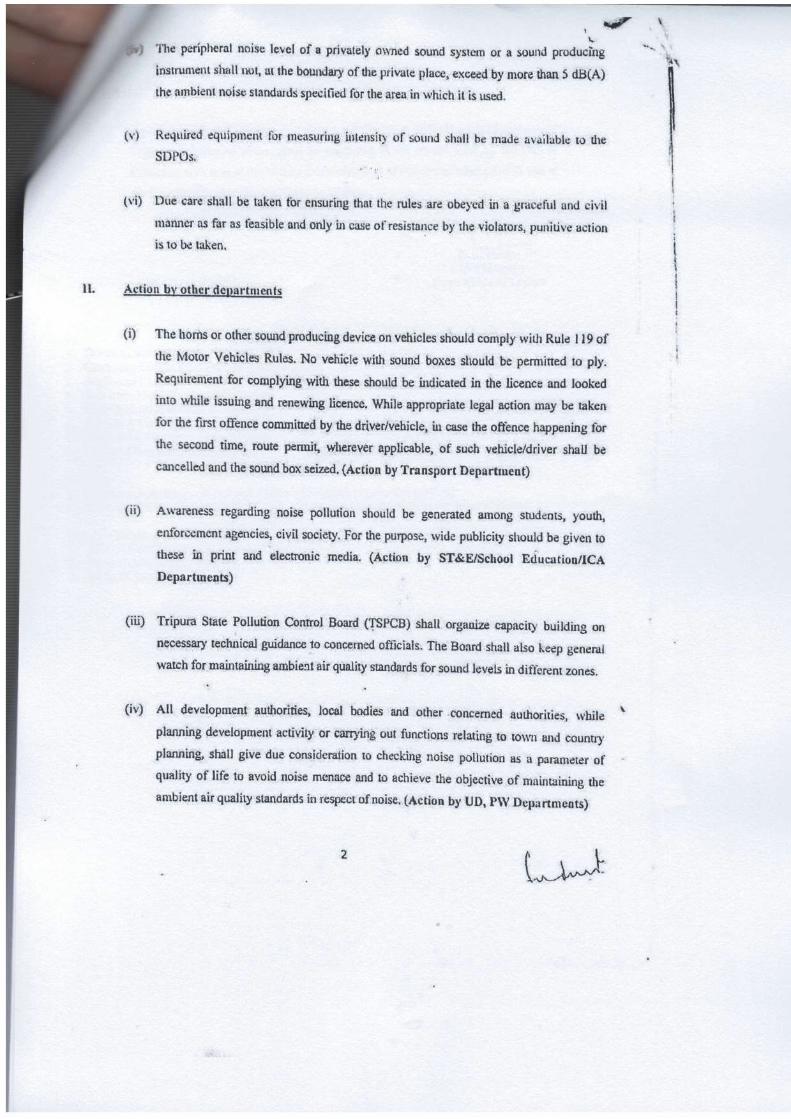
448
449
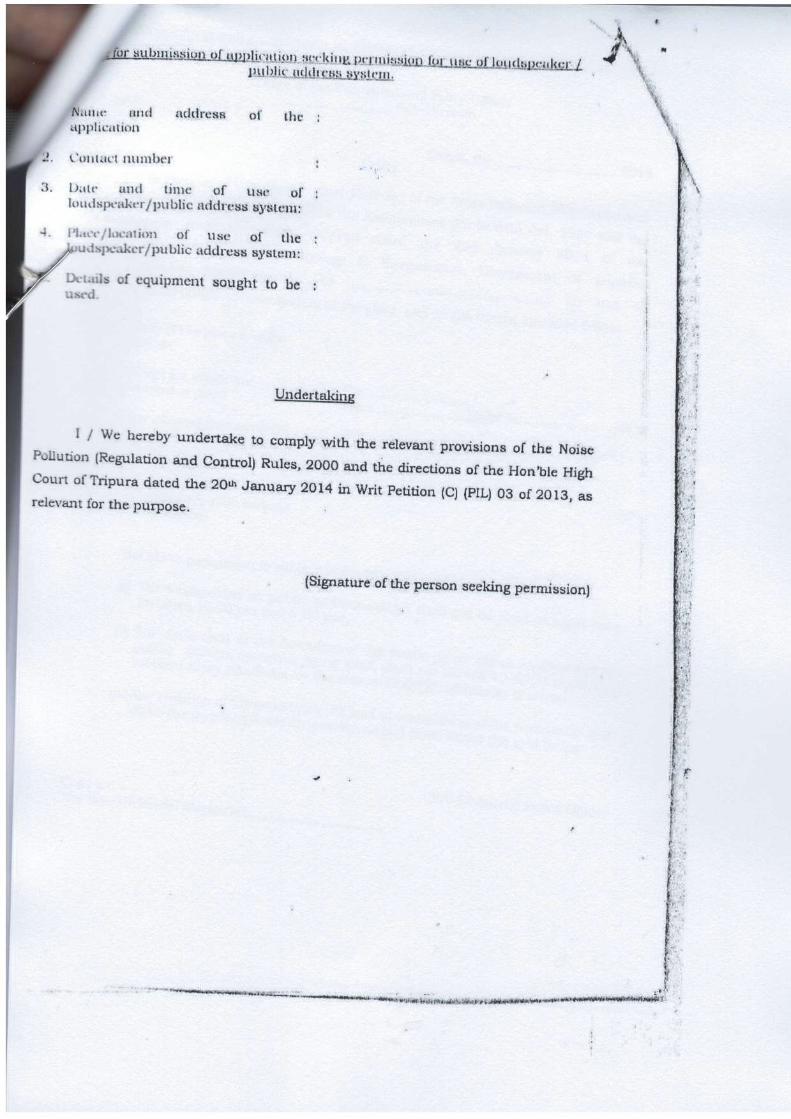
450
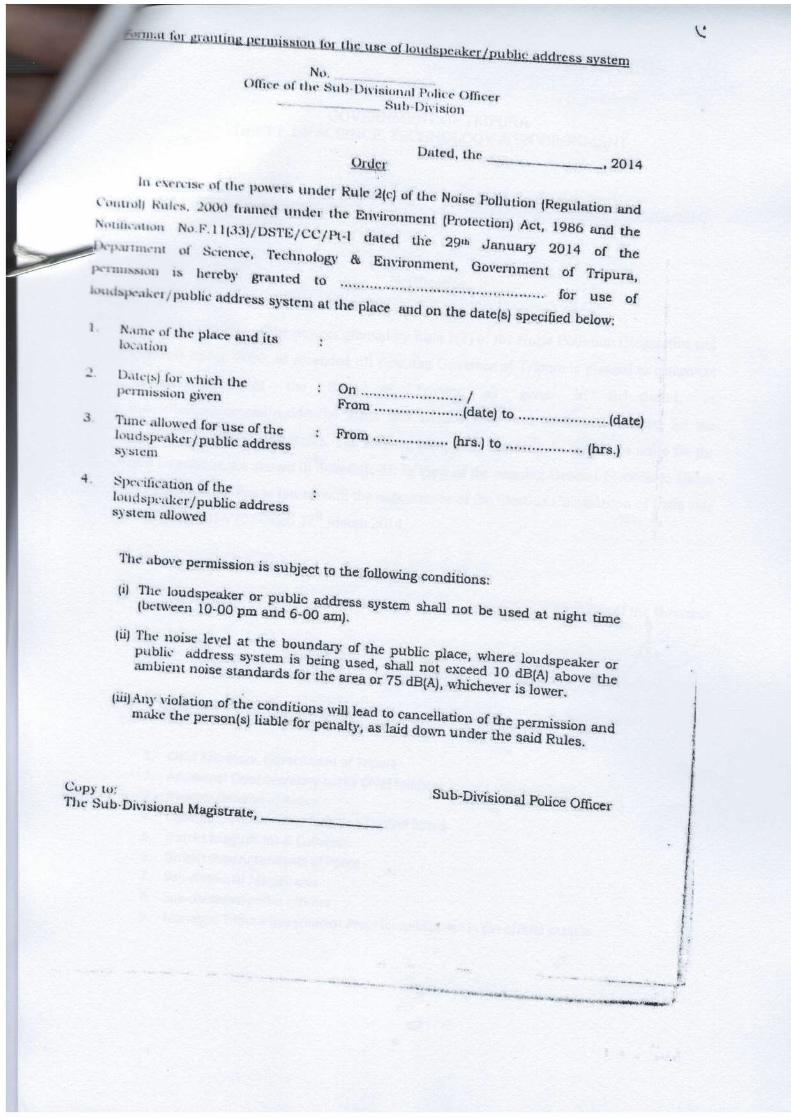
451
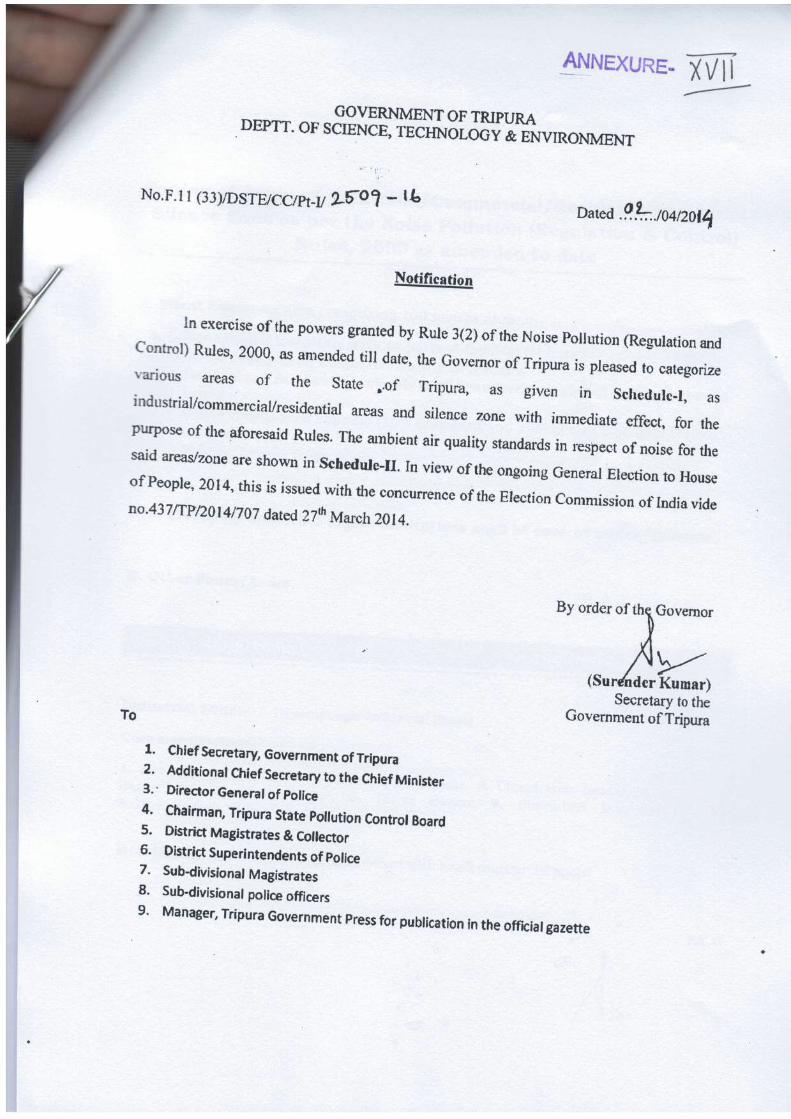
452
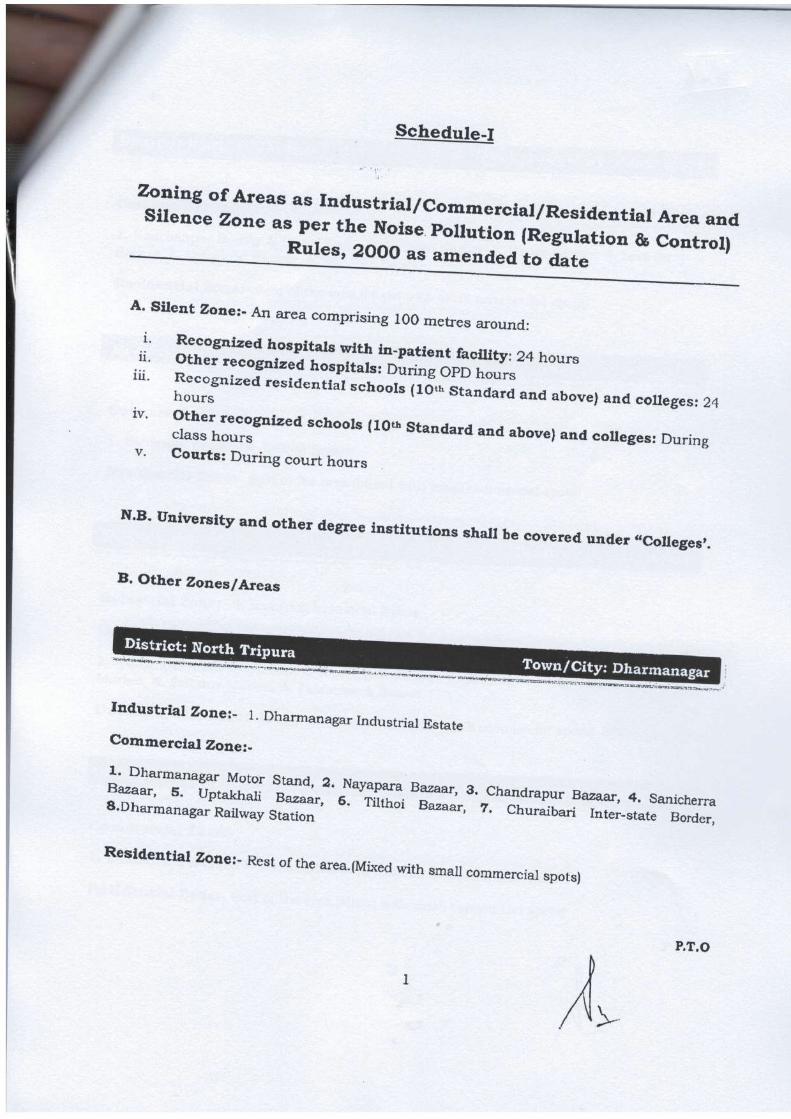
453
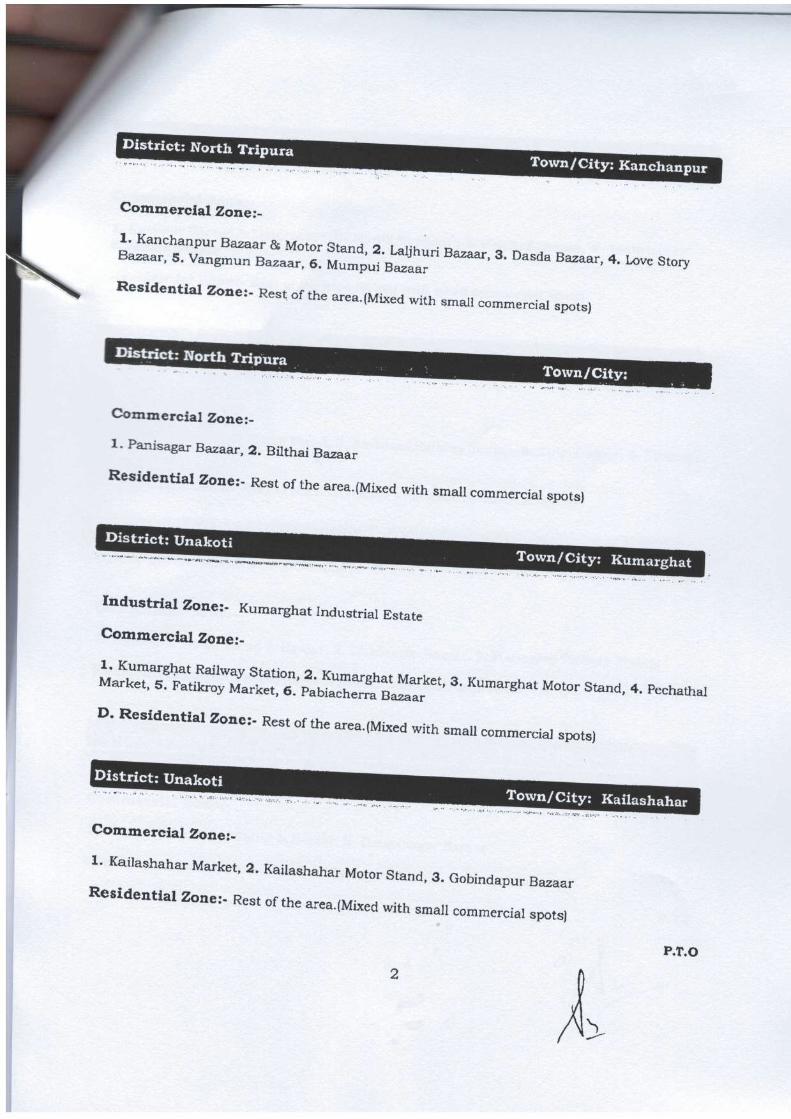
454
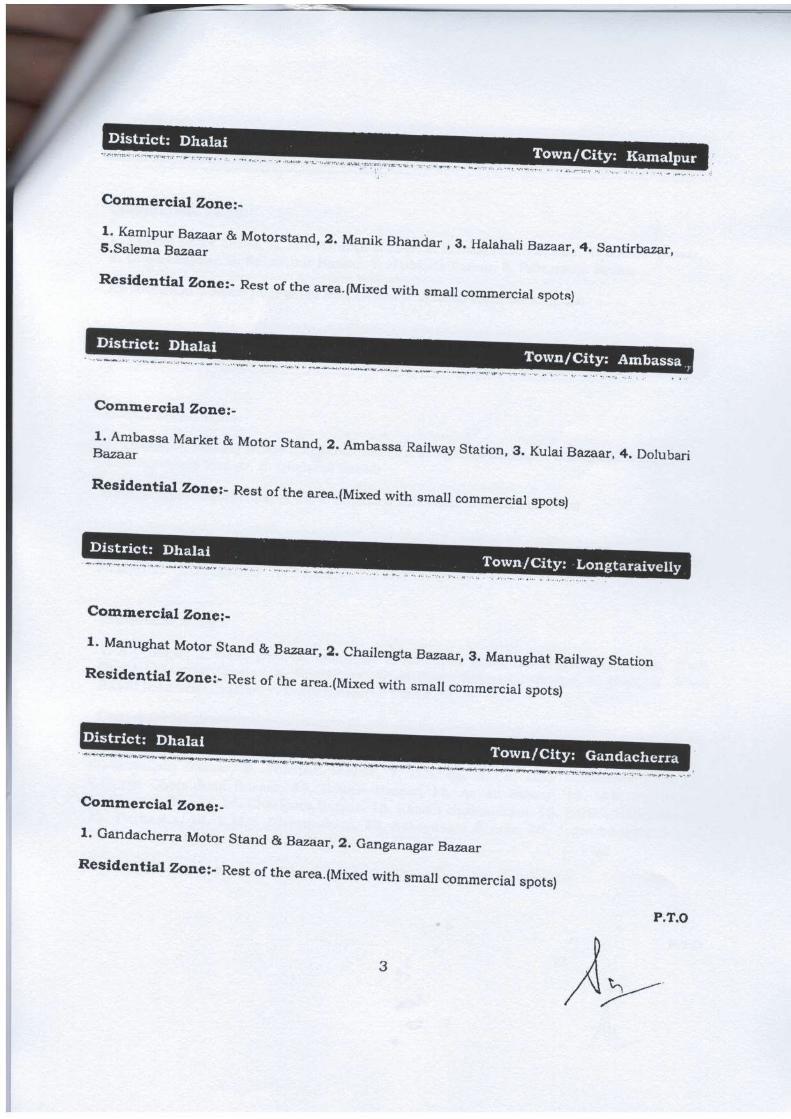
455
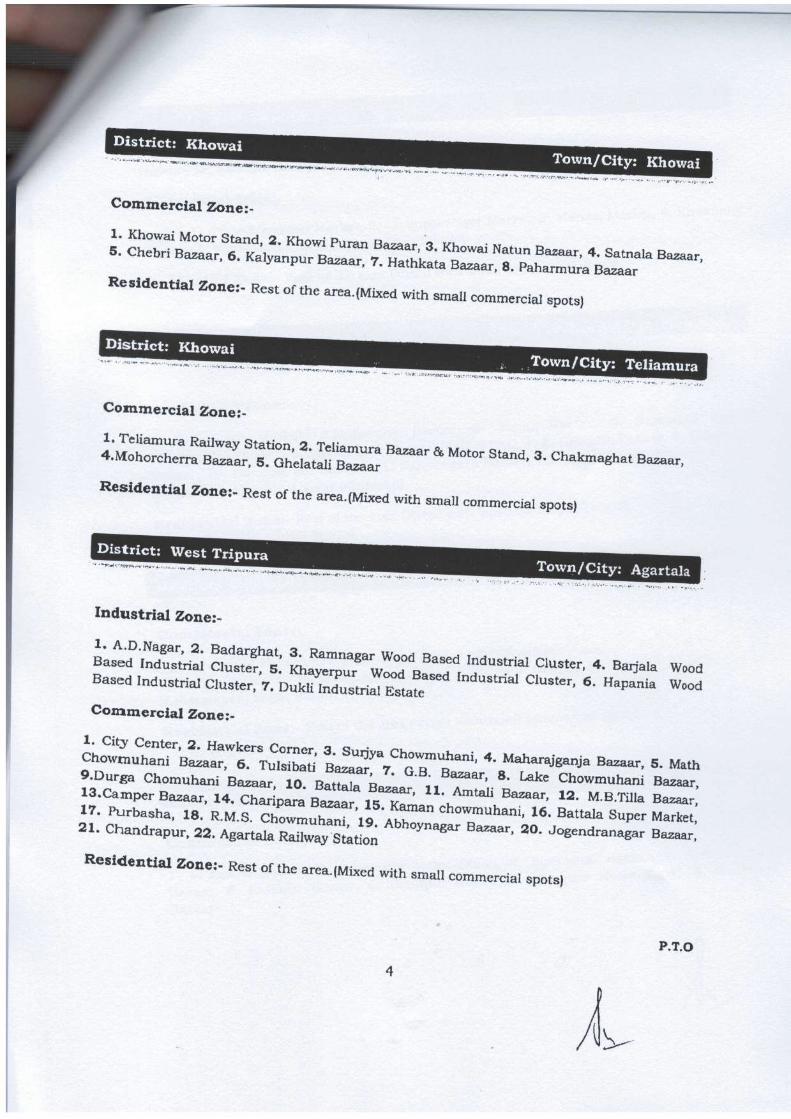
456
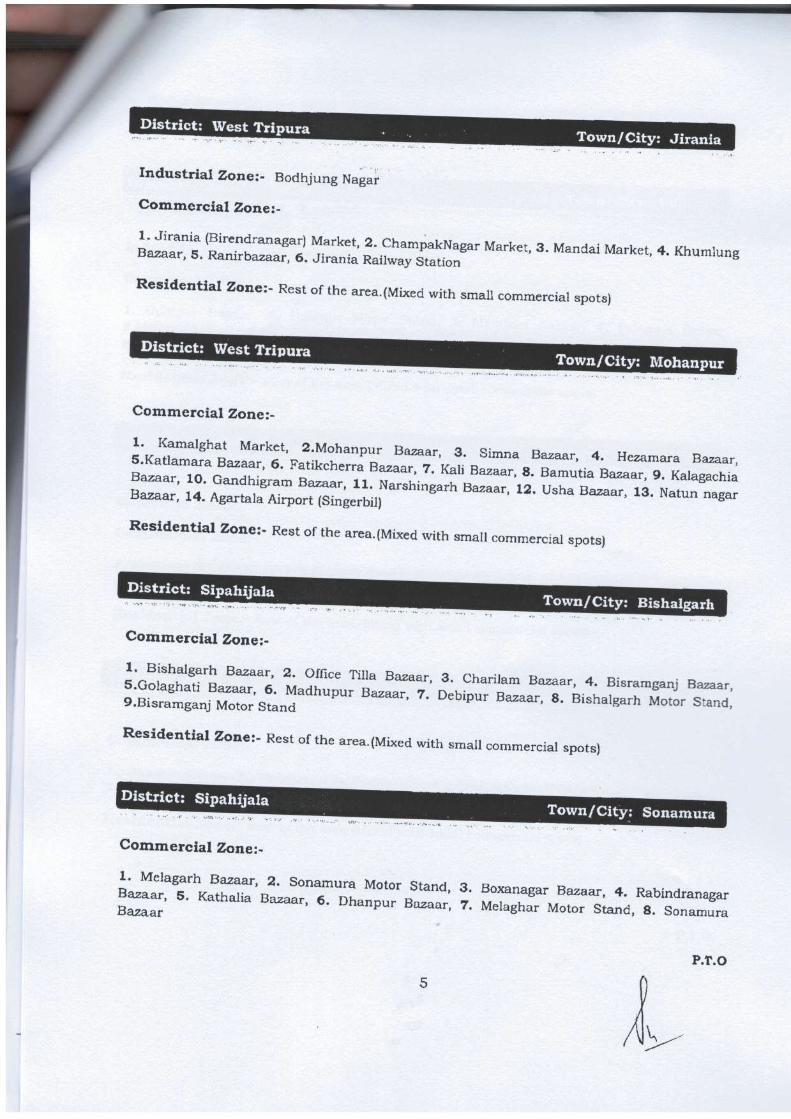
457
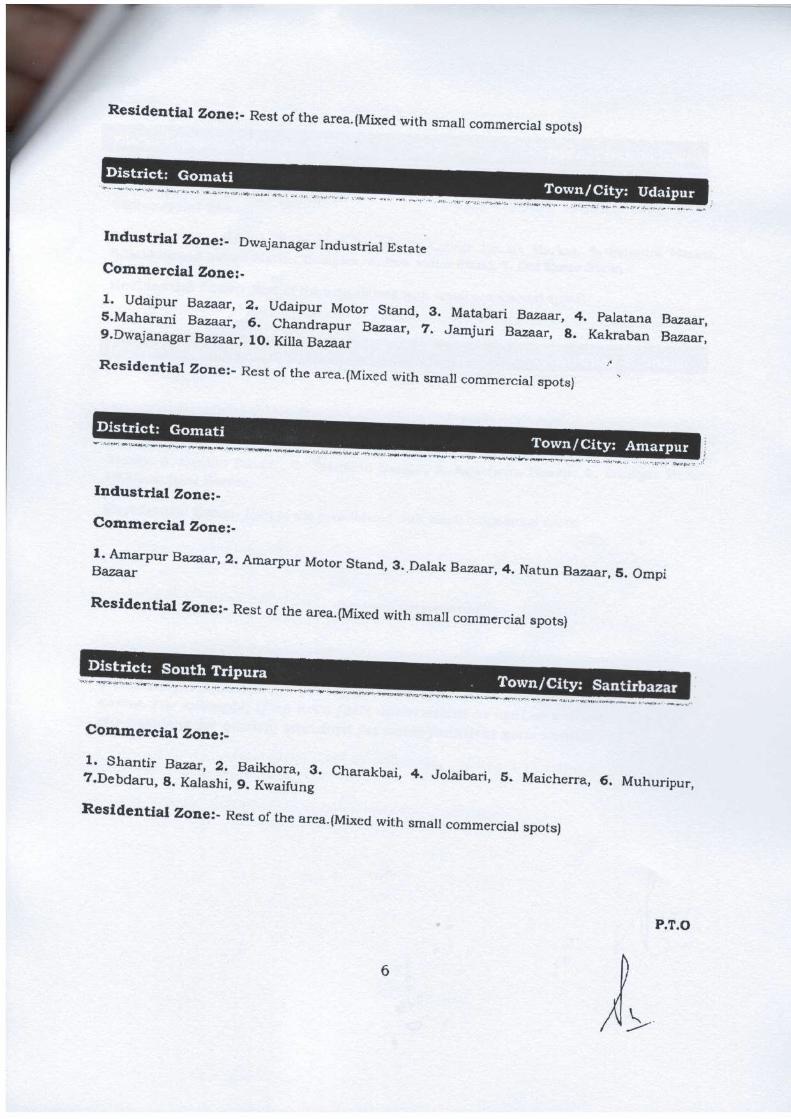
458
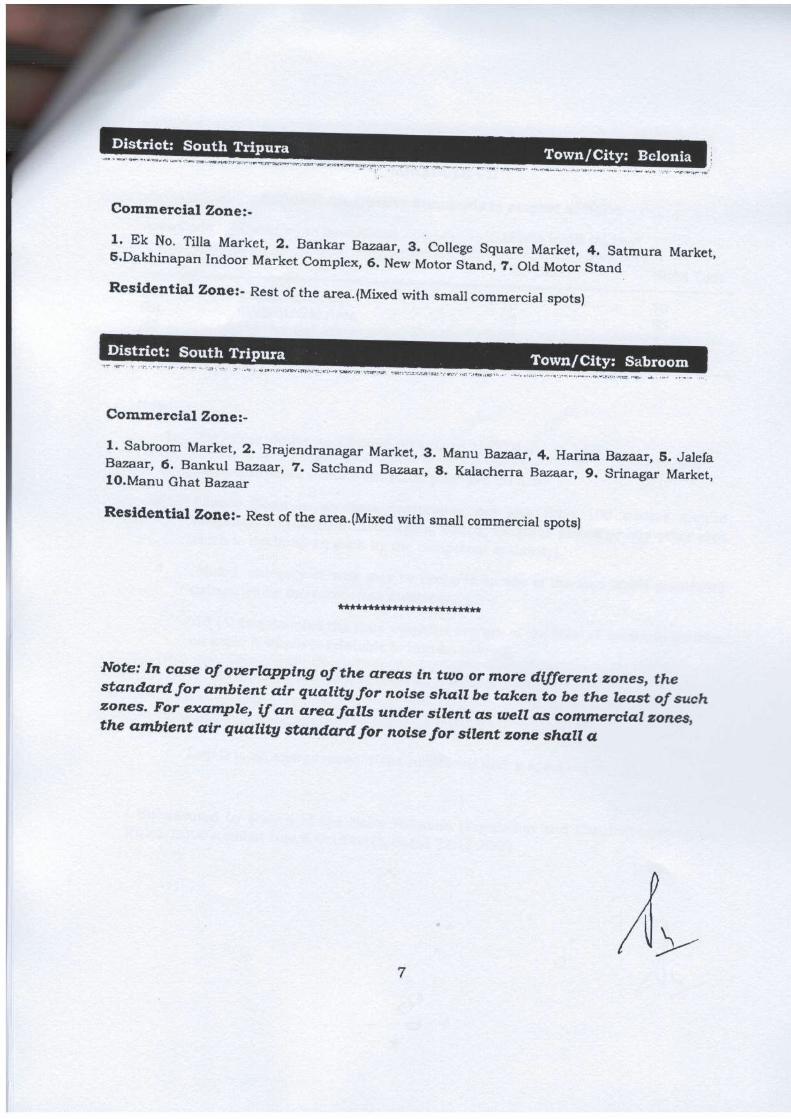
459
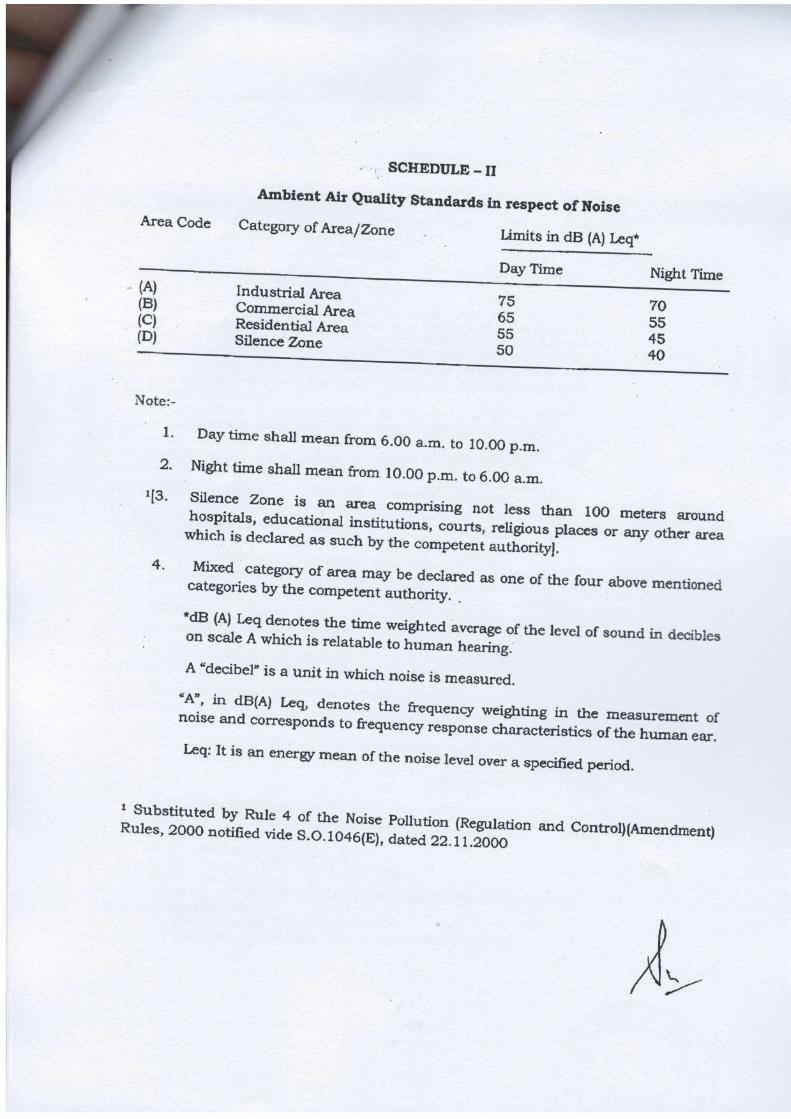
460
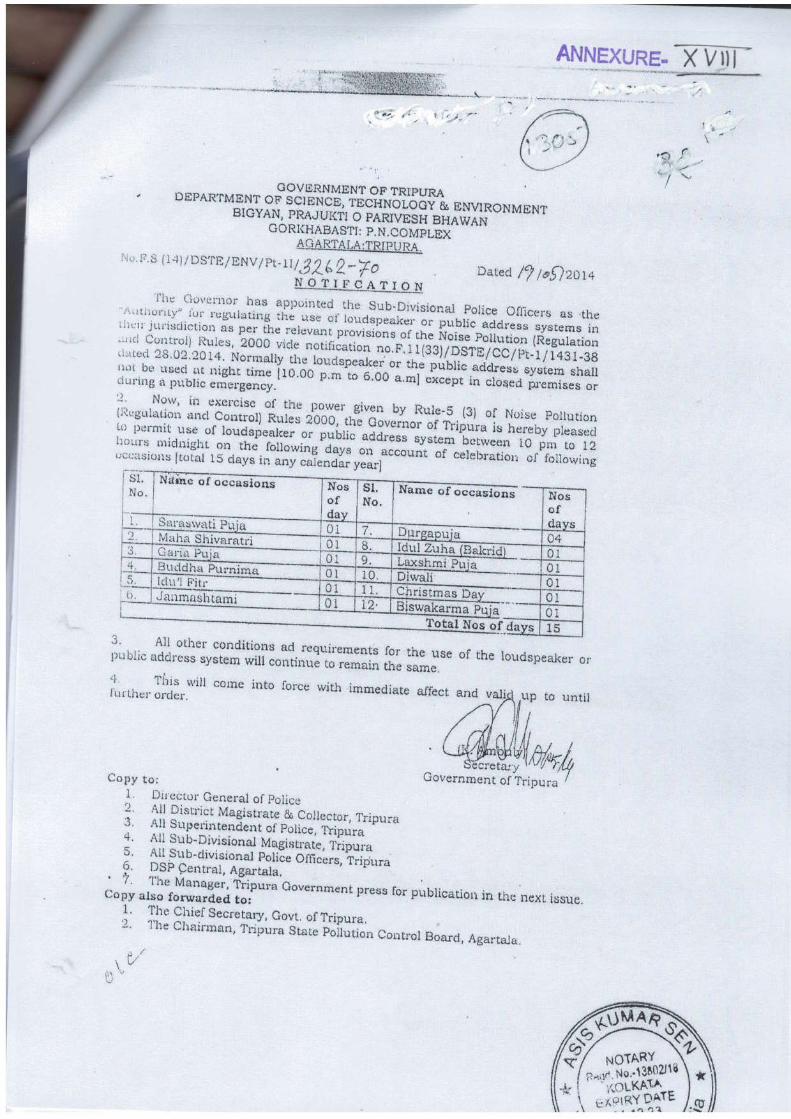
461
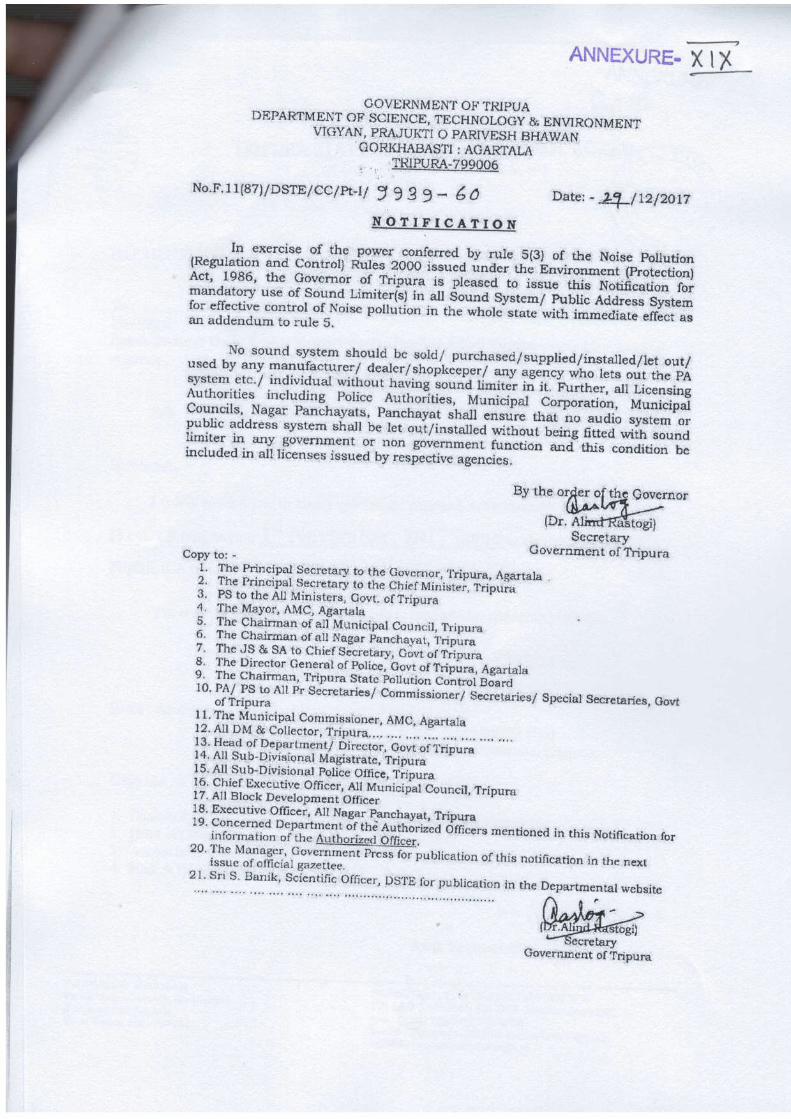
462
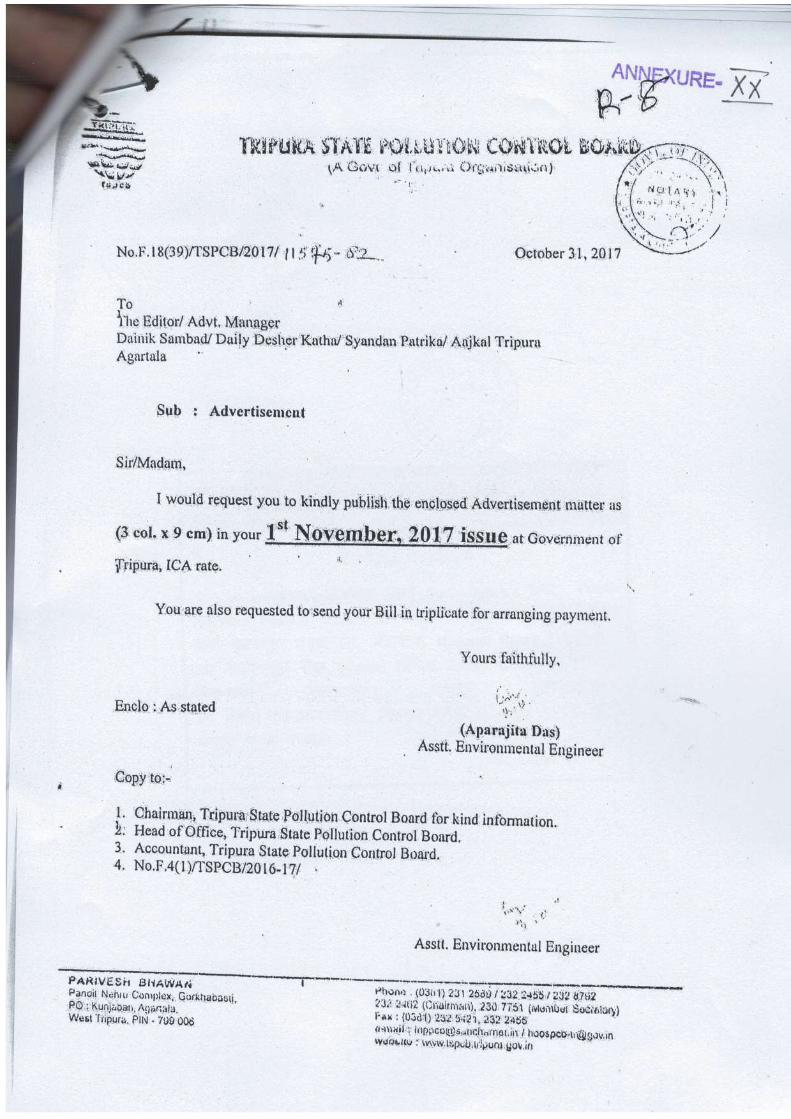
463
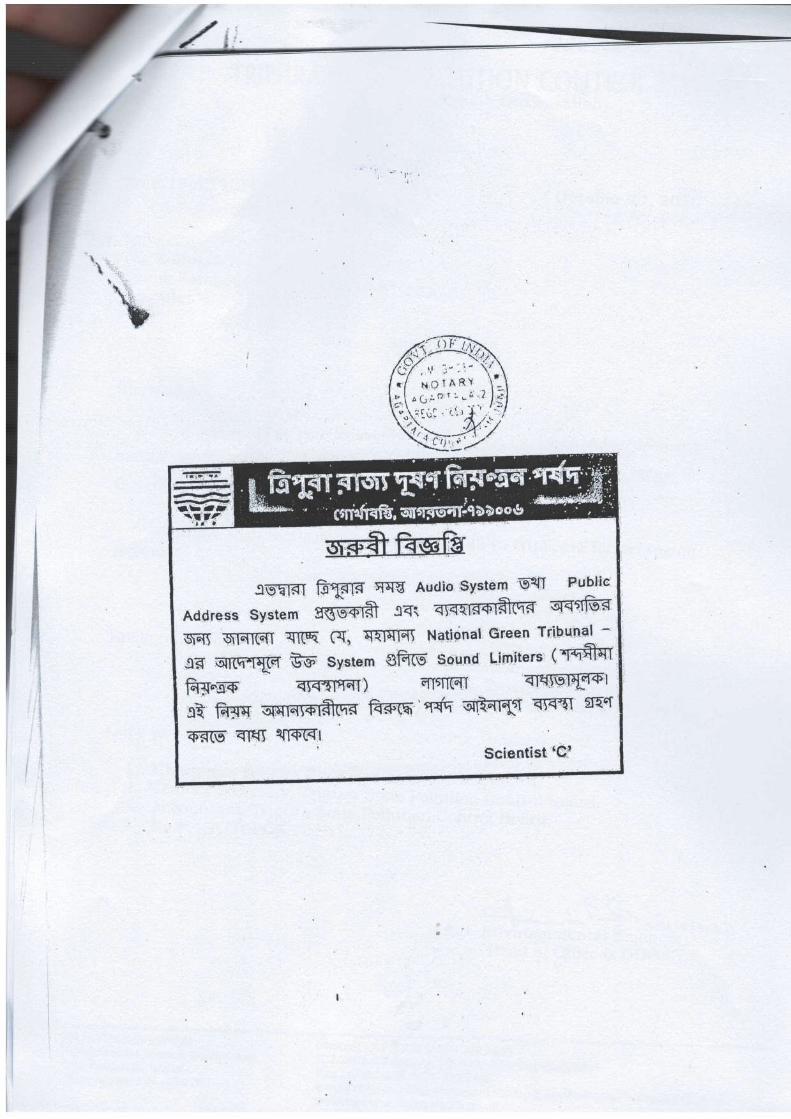
464
465
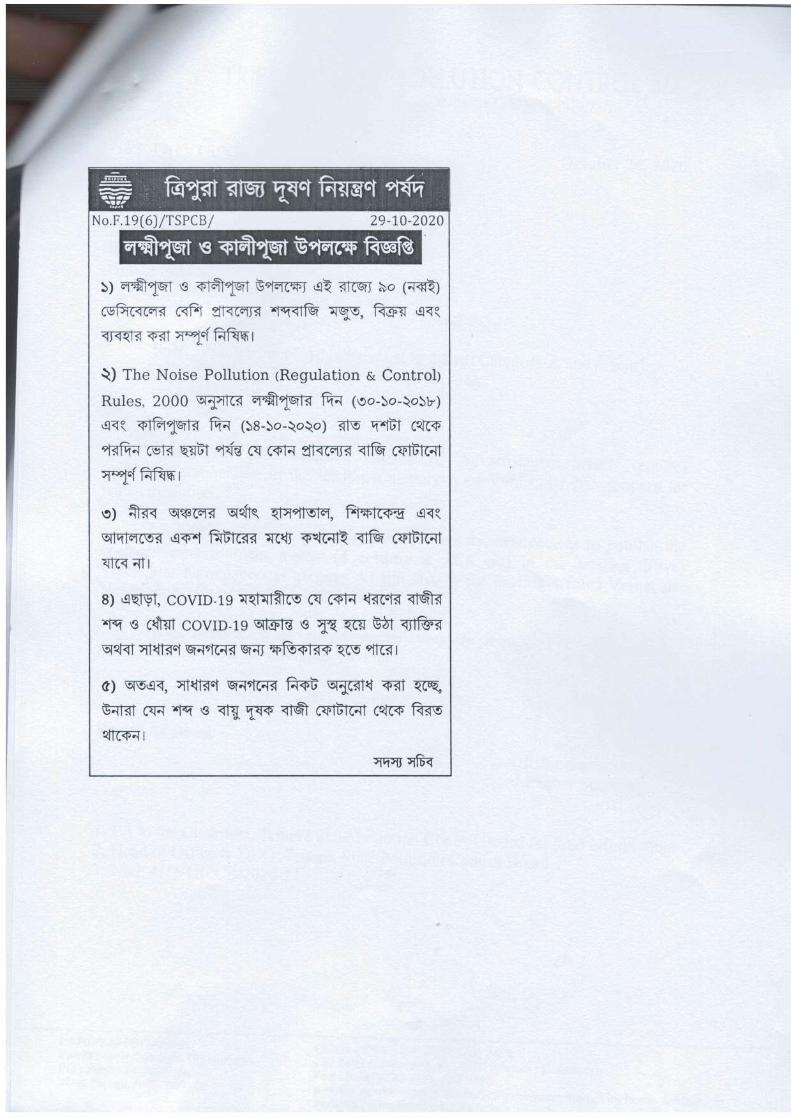
466
467
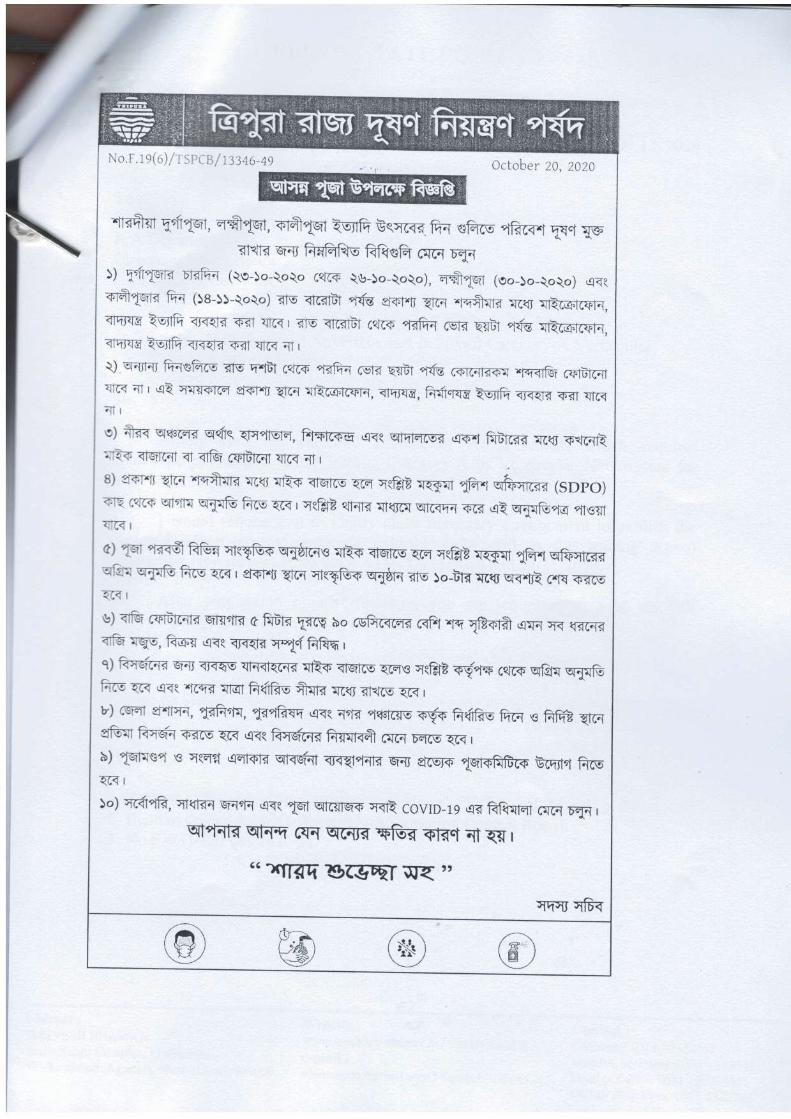
468
469
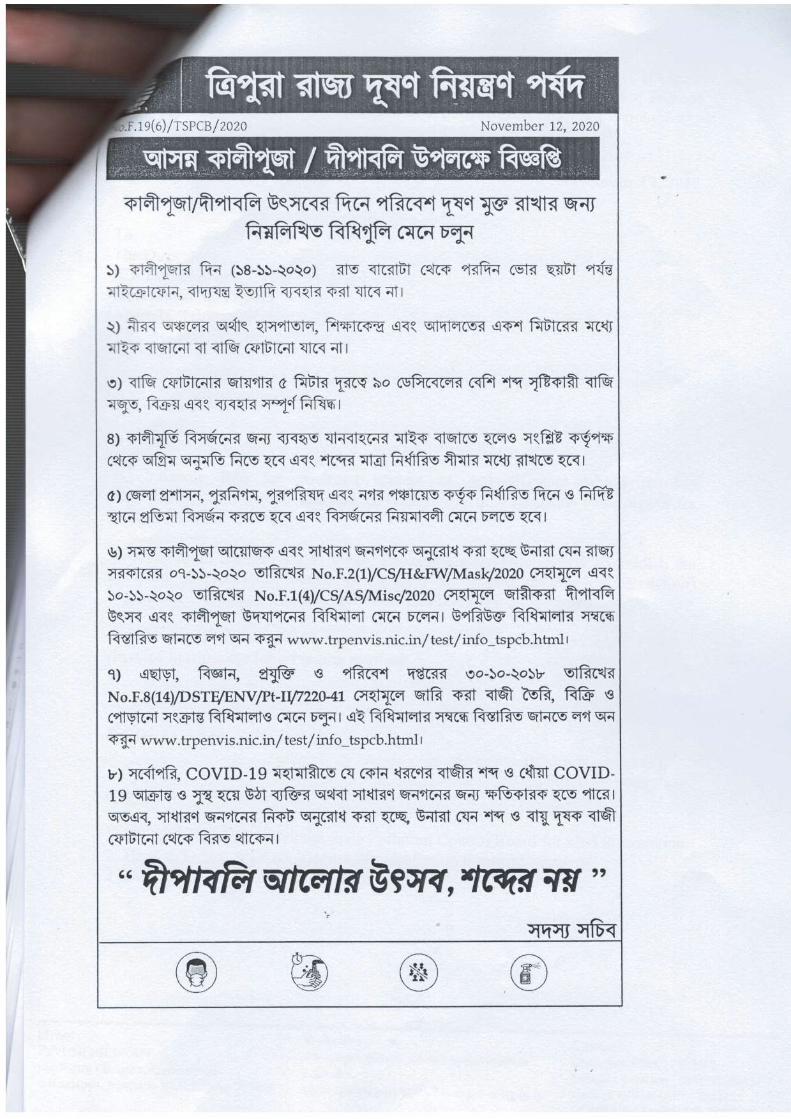
470
471
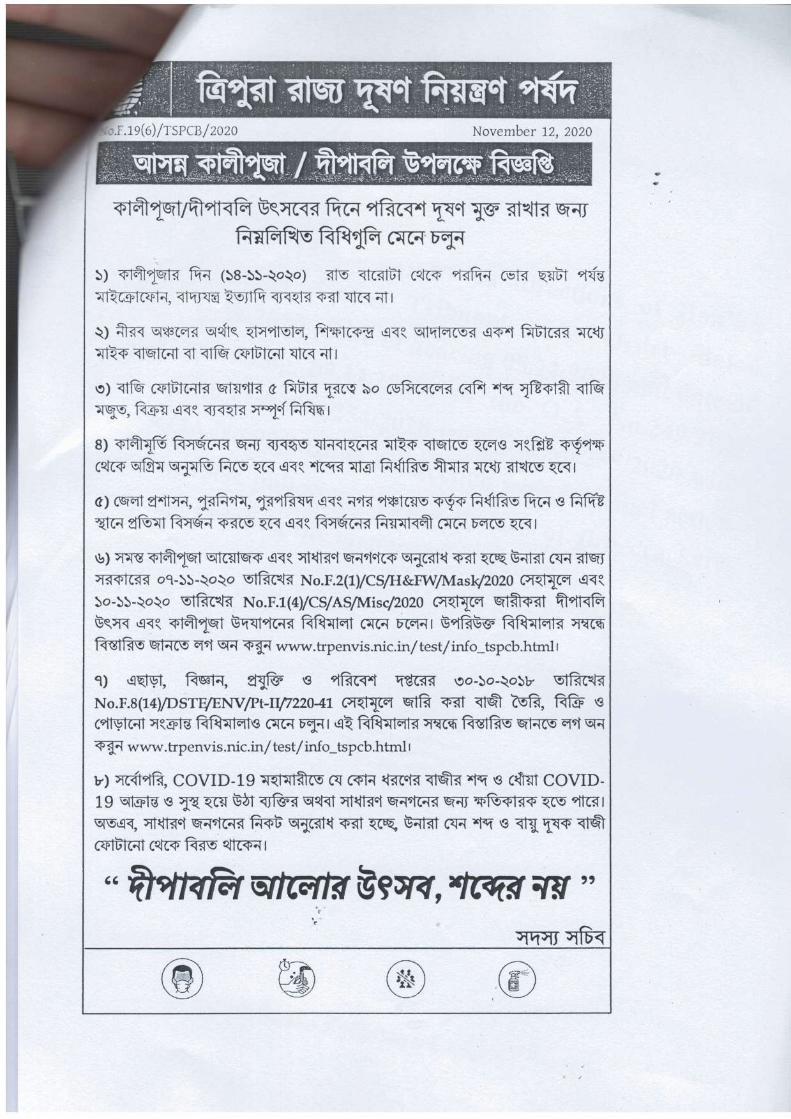
472
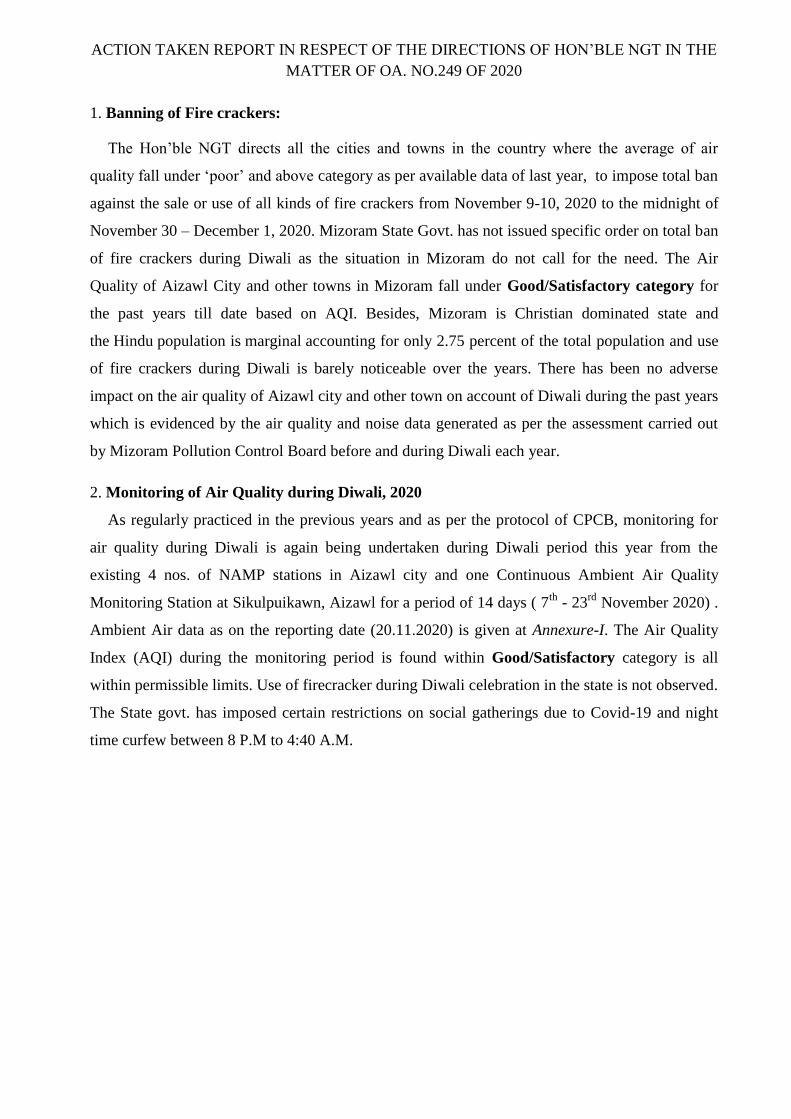
ACTION TAKEN REPORT IN RESPECT OF THE DIRECTIONS OF HON’BLE NGT IN THE
MATTER OF OA. NO.249 OF 2020
1. Banning of Fire crackers:
The Hon’ble NGT directs all the cities and towns in the country where the average of air
quality fall under ‘poor’ and above category as per available data of last year, to impose total ban
against the sale or use of all kinds of fire crackers from November 9-10, 2020 to the midnight of
November 30 – December 1, 2020. Mizoram State Govt. has not issued specific order on total ban
of fire crackers during Diwali as the situation in Mizoram do not call for the need. The Air
Quality of Aizawl City and other towns in Mizoram fall under Good/Satisfactory category for
the past years till date based on AQI. Besides, Mizoram is Christian dominated state and
the Hindu population is marginal accounting for only 2.75 percent of the total population and use
of fire crackers during Diwali is barely noticeable over the years. There has been no adverse
impact on the air quality of Aizawl city and other town on account of Diwali during the past years
which is evidenced by the air quality and noise data generated as per the assessment carried out
by Mizoram Pollution Control Board before and during Diwali each year.
2. Monitoring of Air Quality during Diwali, 2020
As regularly practiced in the previous years and as per the protocol of CPCB, monitoring for
air quality during Diwali is again being undertaken during Diwali period this year from the
existing 4 nos. of NAMP stations in Aizawl city and one Continuous Ambient Air Quality
Monitoring Station at Sikulpuikawn, Aizawl for a period of 14 days ( 7th
- 23rd
November 2020) .
Ambient Air data as on the reporting date (20.11.2020) is given at Annexure-I. The Air Quality
Index (AQI) during the monitoring period is found within Good/Satisfactory category is all
within permissible limits. Use of firecracker during Diwali celebration in the state is not observed.
The State govt. has imposed certain restrictions on social gatherings due to Covid-19 and night
time curfew between 8 P.M to 4:40 A.M.
Annexure-XIX
473
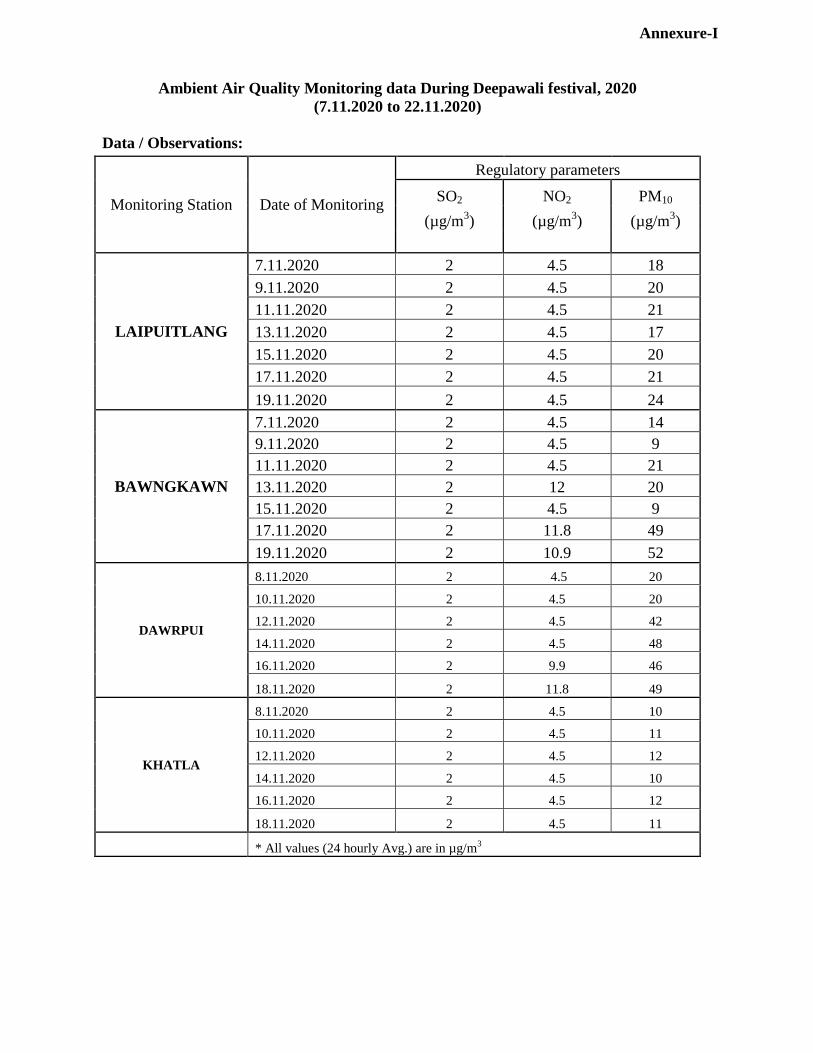
Annexure-I
Ambient Air Quality Monitoring data During Deepawali festival, 2020
(7.11.2020 to 22.11.2020)
Data / Observations:
Monitoring Station Date of Monitoring
Regulatory parameters
SO2 NO2 PM10
(µg/m3) (µg/m
3) (µg/m
3)
LAIPUITLANG
7.11.2020 2 4.5 18
9.11.2020 2 4.5 20
11.11.2020 2 4.5 21
13.11.2020 2 4.5 17
15.11.2020 2 4.5 20
17.11.2020 2 4.5 21
19.11.2020 2 4.5 24
BAWNGKAWN
7.11.2020 2 4.5 14
9.11.2020 2 4.5 9
11.11.2020 2 4.5 21
13.11.2020 2 12 20
15.11.2020 2 4.5 9
17.11.2020 2 11.8 49
19.11.2020 2 10.9 52
DAWRPUI
8.11.2020 2 4.5 20
10.11.2020 2 4.5 20
12.11.2020 2 4.5 42
14.11.2020 2 4.5 48
16.11.2020 2 9.9 46
18.11.2020 2 11.8 49
KHATLA
8.11.2020 2 4.5 10
10.11.2020 2 4.5 11
12.11.2020 2 4.5 12
14.11.2020 2 4.5 10
16.11.2020 2 4.5 12
18.11.2020 2 4.5 11
* All values (24 hourly Avg.) are in µg/m3
474
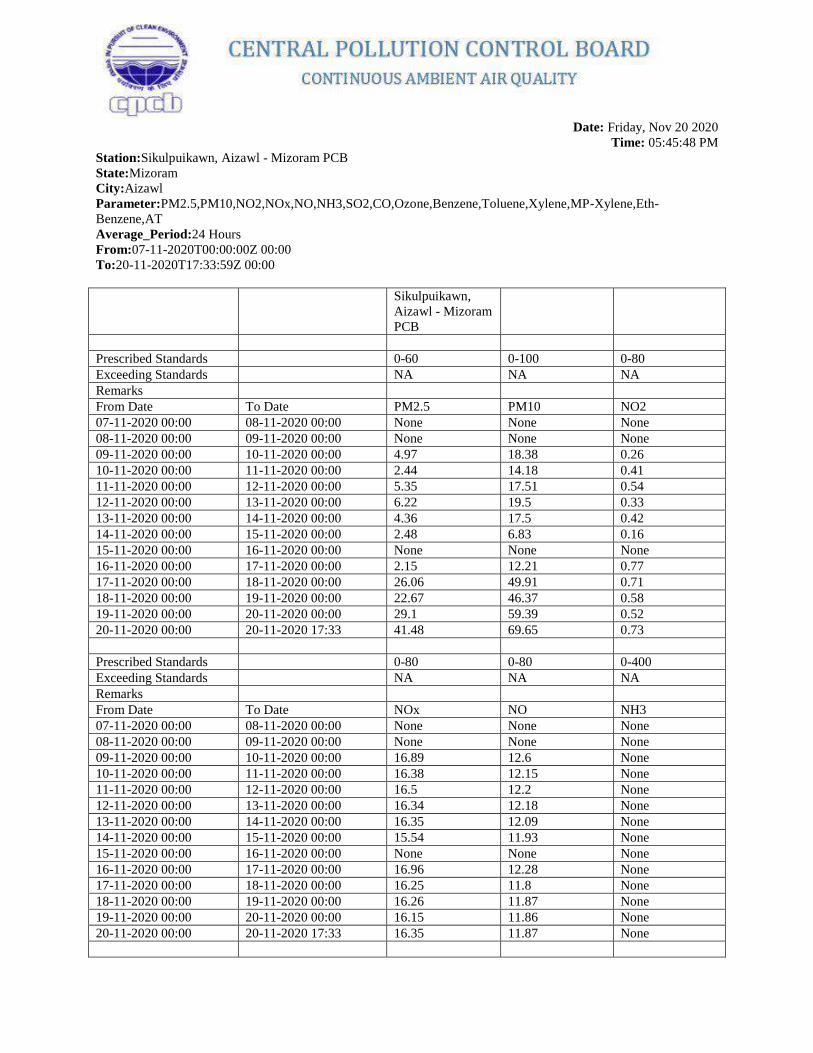
Date: Friday, Nov 20 2020
Time: 05:45:48 PM
Station:Sikulpuikawn, Aizawl - Mizoram PCB
State:Mizoram
City:Aizawl
Parameter:PM2.5,PM10,NO2,NOx,NO,NH3,SO2,CO,Ozone,Benzene,Toluene,Xylene,MP-Xylene,Eth-
Benzene,AT
Average_Period:24 Hours
From:07-11-2020T00:00:00Z 00:00
To:20-11-2020T17:33:59Z 00:00
Sikulpuikawn,
Aizawl - Mizoram
PCB
Prescribed Standards 0-60 0-100 0-80
Exceeding Standards NA NA NA
Remarks
From Date To Date PM2.5 PM10 NO2
07-11-2020 00:00 08-11-2020 00:00 None None None
08-11-2020 00:00 09-11-2020 00:00 None None None
09-11-2020 00:00 10-11-2020 00:00 4.97 18.38 0.26
10-11-2020 00:00 11-11-2020 00:00 2.44 14.18 0.41
11-11-2020 00:00 12-11-2020 00:00 5.35 17.51 0.54
12-11-2020 00:00 13-11-2020 00:00 6.22 19.5 0.33
13-11-2020 00:00 14-11-2020 00:00 4.36 17.5 0.42
14-11-2020 00:00 15-11-2020 00:00 2.48 6.83 0.16
15-11-2020 00:00 16-11-2020 00:00 None None None
16-11-2020 00:00 17-11-2020 00:00 2.15 12.21 0.77
17-11-2020 00:00 18-11-2020 00:00 26.06 49.91 0.71
18-11-2020 00:00 19-11-2020 00:00 22.67 46.37 0.58
19-11-2020 00:00 20-11-2020 00:00 29.1 59.39 0.52
20-11-2020 00:00 20-11-2020 17:33 41.48 69.65 0.73
Prescribed Standards 0-80 0-80 0-400
Exceeding Standards NA NA NA
Remarks
From Date To Date NOx NO NH3
07-11-2020 00:00 08-11-2020 00:00 None None None
08-11-2020 00:00 09-11-2020 00:00 None None None
09-11-2020 00:00 10-11-2020 00:00 16.89 12.6 None
10-11-2020 00:00 11-11-2020 00:00 16.38 12.15 None
11-11-2020 00:00 12-11-2020 00:00 16.5 12.2 None
12-11-2020 00:00 13-11-2020 00:00 16.34 12.18 None
13-11-2020 00:00 14-11-2020 00:00 16.35 12.09 None
14-11-2020 00:00 15-11-2020 00:00 15.54 11.93 None
15-11-2020 00:00 16-11-2020 00:00 None None None
16-11-2020 00:00 17-11-2020 00:00 16.96 12.28 None
17-11-2020 00:00 18-11-2020 00:00 16.25 11.8 None
18-11-2020 00:00 19-11-2020 00:00 16.26 11.87 None
19-11-2020 00:00 20-11-2020 00:00 16.15 11.86 None
20-11-2020 00:00 20-11-2020 17:33 16.35 11.87 None
475
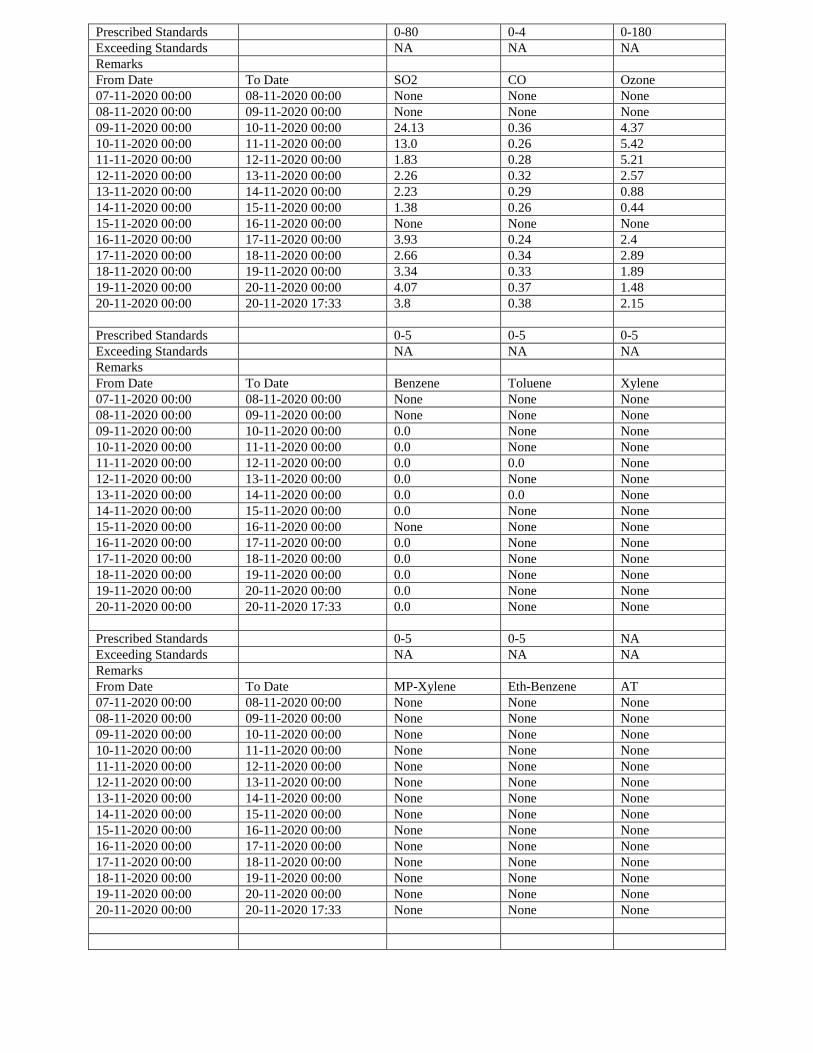
Prescribed Standards 0-80 0-4 0-180
Exceeding Standards NA NA NA
Remarks
From Date To Date SO2 CO Ozone
07-11-2020 00:00 08-11-2020 00:00 None None None
08-11-2020 00:00 09-11-2020 00:00 None None None
09-11-2020 00:00 10-11-2020 00:00 24.13 0.36 4.37
10-11-2020 00:00 11-11-2020 00:00 13.0 0.26 5.42
11-11-2020 00:00 12-11-2020 00:00 1.83 0.28 5.21
12-11-2020 00:00 13-11-2020 00:00 2.26 0.32 2.57
13-11-2020 00:00 14-11-2020 00:00 2.23 0.29 0.88
14-11-2020 00:00 15-11-2020 00:00 1.38 0.26 0.44
15-11-2020 00:00 16-11-2020 00:00 None None None
16-11-2020 00:00 17-11-2020 00:00 3.93 0.24 2.4
17-11-2020 00:00 18-11-2020 00:00 2.66 0.34 2.89
18-11-2020 00:00 19-11-2020 00:00 3.34 0.33 1.89
19-11-2020 00:00 20-11-2020 00:00 4.07 0.37 1.48
20-11-2020 00:00 20-11-2020 17:33 3.8 0.38 2.15
Prescribed Standards 0-5 0-5 0-5
Exceeding Standards NA NA NA
Remarks
From Date To Date Benzene Toluene Xylene
07-11-2020 00:00 08-11-2020 00:00 None None None
08-11-2020 00:00 09-11-2020 00:00 None None None
09-11-2020 00:00 10-11-2020 00:00 0.0 None None
10-11-2020 00:00 11-11-2020 00:00 0.0 None None
11-11-2020 00:00 12-11-2020 00:00 0.0 0.0 None
12-11-2020 00:00 13-11-2020 00:00 0.0 None None
13-11-2020 00:00 14-11-2020 00:00 0.0 0.0 None
14-11-2020 00:00 15-11-2020 00:00 0.0 None None
15-11-2020 00:00 16-11-2020 00:00 None None None
16-11-2020 00:00 17-11-2020 00:00 0.0 None None
17-11-2020 00:00 18-11-2020 00:00 0.0 None None
18-11-2020 00:00 19-11-2020 00:00 0.0 None None
19-11-2020 00:00 20-11-2020 00:00 0.0 None None
20-11-2020 00:00 20-11-2020 17:33 0.0 None None
Prescribed Standards 0-5 0-5 NA
Exceeding Standards NA NA NA
Remarks
From Date To Date MP-Xylene Eth-Benzene AT
07-11-2020 00:00 08-11-2020 00:00 None None None
08-11-2020 00:00 09-11-2020 00:00 None None None
09-11-2020 00:00 10-11-2020 00:00 None None None
10-11-2020 00:00 11-11-2020 00:00 None None None
11-11-2020 00:00 12-11-2020 00:00 None None None
12-11-2020 00:00 13-11-2020 00:00 None None None
13-11-2020 00:00 14-11-2020 00:00 None None None
14-11-2020 00:00 15-11-2020 00:00 None None None
15-11-2020 00:00 16-11-2020 00:00 None None None
16-11-2020 00:00 17-11-2020 00:00 None None None
17-11-2020 00:00 18-11-2020 00:00 None None None
18-11-2020 00:00 19-11-2020 00:00 None None None
19-11-2020 00:00 20-11-2020 00:00 None None None
20-11-2020 00:00 20-11-2020 17:33 None None None
476

477
Government of Jammu and KashmirJ&K Pollution Control Board
JammuWinter office: November-AprilParivesh Bhawan. Gladni,Transport Nagar, Narwal.Jammu. (J&K) 180006 .Ph.lFax.0191-2476925
Summer Office: May-OctoberSheikh-ul-Alam Campus.Behind GOVI. Silk Factory.Rajbagh. Srinagar (J&K) 190008Ph/Fax. 0194-2311165.
email: [email protected]
The Member Secretary,Central Pollution Control Board,Parivesh Bhawan,East Arjun Nagar,Delhi-110032.
No. PCBINGT/I02/20201 11-)S-~1-' Dt.~5 -11-2020.
Sub:- Implementation of directions of Hon'ble NGT vide order dt. 09-11-2020in'OA No. 249/2020 regarding restrictions on sale and use of fire crackersduring festive seasons.
Ref:-i) J&K Govt. order No. 89-JK (DMRRR) of 2020 dt. 10-11-2020.ii) CPCB no. AQM/Firecrackers/2020-2021 dt. 20-11-2020.
Sir,Kindly refer to the CPCB communication referred above on the subject quoted. In
this regard, it is to inform that the directions ofHon'ble NGT have been complied in letter
and spirit, with the issuance of Government Order No. 89 JK (DMRRR) of 2020
dt. 10-11-2020regulating the sale and use of fire crackers in J&K. The said Govt. order
has been issued on the basis of Air Quality Index (AQI) which was Moderate for Jammu
and Srinagar cities, on the basis of ambient air quality monitoring data for the month of
November 2019,which was compiled by J&K Board.
The Govt. order for regulation of use and sale of crackers has imposed the following
restrictions 1 regulations:-
i) Only "Green crackers" shall be permitted for sale and use in the Cities of
Jammu and Srinagar.
ii) The use / bursting of these green crackers shall be restricted to only two hours
during the festivals. The timing shall be 8 prn to 10 pm on Diwali and
Gurupurab;from 6 am to 8 am on Chhatt andfrom 11.55pm to 12.30 am on
eve of Christmas and New Year.
Page1 of 2
Annexure-XX
478
iii) All the Deputy Commissions shall execute extensive public awareness
campaigns regarding the above. The J&K State Pollution Control Board
shall carryout short-term monitoring in the cities for 14 days (Commencing
immediately)for theparameters namely, Aluminium, Barium, Iron apartfrom
the regulatory parameters against the short-term Ambient Air Quality
Criteria Values (AAQCVs) proposed by CPCB with regard to bursting of
firecrackers. This will help in generation of data on pollution caused by the
bursting of firecrackers and would be helpful for regulation and control of
quality of Aluminium, Barium and Iron used in the manufacture of
firecrackers.
Further, special awareness campaign was also launched by the joint inspection team
of Pollution Control Board, Revenue and Police department before I during Diwali
festival for the enforcement of Govt. Order and Hon'ble Tribunal directions. Print and
Electronic media (FM Radio) was also used extensively for the awareness of public on
impart of pollution caused due to bursting of crackers and its potential of aggravating
COVID-19 cases.
The Board has also taken up the special monitoring of ambient air quality for
15 days, i.e prior to Diwali 7 days and after Diwali 7 days and noise monitoring for two
days i.e on 9th and 14thNovember during Diwali festival-2020, as per CPCB guidelines
and up-loaded the monitored data of festival day on official website.
Yours faithfully,Encl:- i) Copy of Govt. Order dt. 10-11-2020.
ii) Awareness campaign photographs of joint teamof PCB, Revenue and Police deptt. During Diwali festival.
iii) News Paper cuttings.
(B.M. Sharma) IFSMember Secretary
. ~ PCB, JammuCopy to the:- ~ .
i) Additional Director and Head, AQM - Division, CPCB Delhi. ('ii) P.A to Chairman for information of the Chairman, JKPCB, Jammu.
Page2 of 2
479
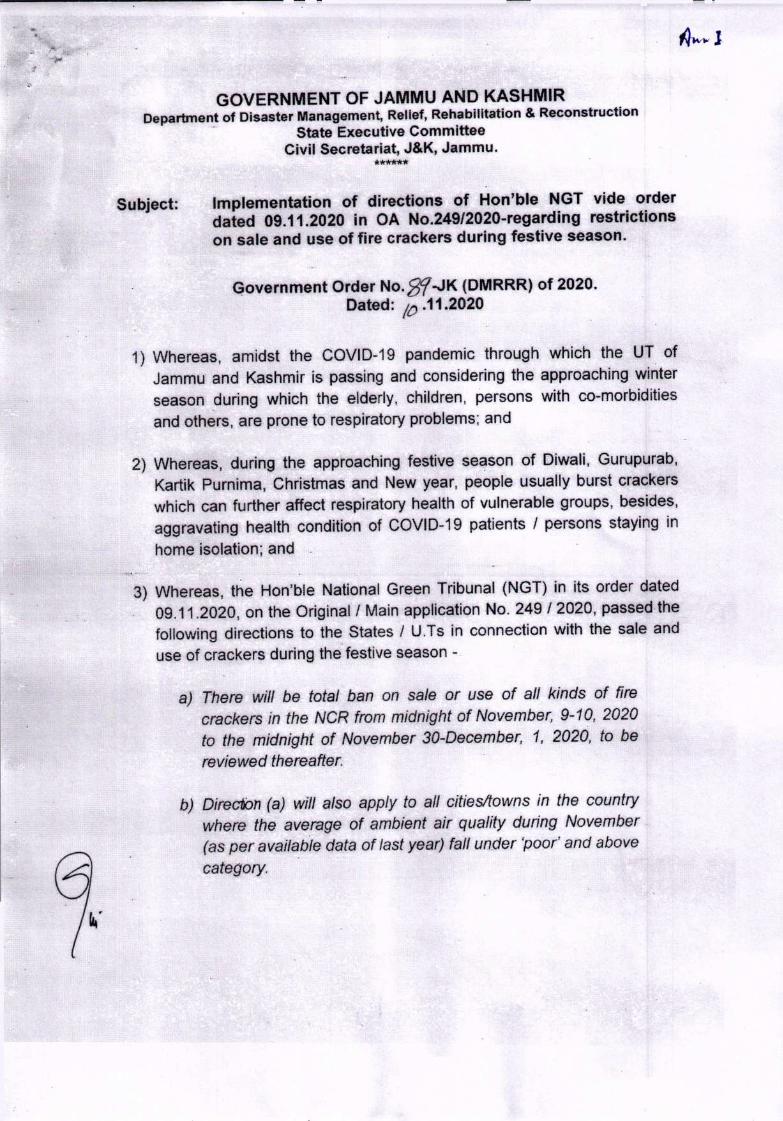
....
GOVERNMENT <OFJAMMU AND KASHMIR.Department of Disaster Management, Relief, Rehabilitation & Reconstruction
- State Executive CommitteeCivil Secretariat, J&K, Jammu.
***,'1<_
Subjeet: Implementation of directions of Hon'ble NGt vide orderdated 09.11.2020 in OA No.249/2020--regarding restrictionson sale and uS.eof fire crackers during festive season.
~overDment Order No. ff/-JK (DMRRR) of 2020.Dated: /{) .11.2020
1) Whefe~s, amidst the COVIO-19 pandemic Ulr0ugh Whlctl the UT ofJammu and Kashmir is passing and considering the approaching winterseason during which the elderly, children, persons with co-morbiditiesand ofhers, are prone to respiratory problems; and
2) Whereas, durin~ Wl.~appmachintl festive seasen .of Diwall, Gurupurab,.Karlik Pumima, Christmas and New year; people usually bOTstcrackerswhich can farther affect respiratory health of vulnerable groups, besides,aggravating health condition of COVID-19 patients I persons staying inhome isolation; anlil
3) Whereas, the Hon'ble National Green Tribunal (NGT) in its order dated09.11.2020, on the Original f Main application Nco.249 I 2020, passed thefollowing dlrectlons to the States J U.Ts in connection with the sale anduse of csacksrs dlJrihg the festive season -
a) There will be total- ban on sale or use of all kinds of firecrackers in the NCR from midnight of November, 9-10, 2020to the midnight of November 30-December, 1, 2020, to bereviewed thefflafter.
b) Direcbbn(a) will also apply to all cities/towns in the countryWhere the average of ambient air quality· during November.(as per available r.i()taof last veer) fall ullelef 'poor' and abovec'8tefjory.
480
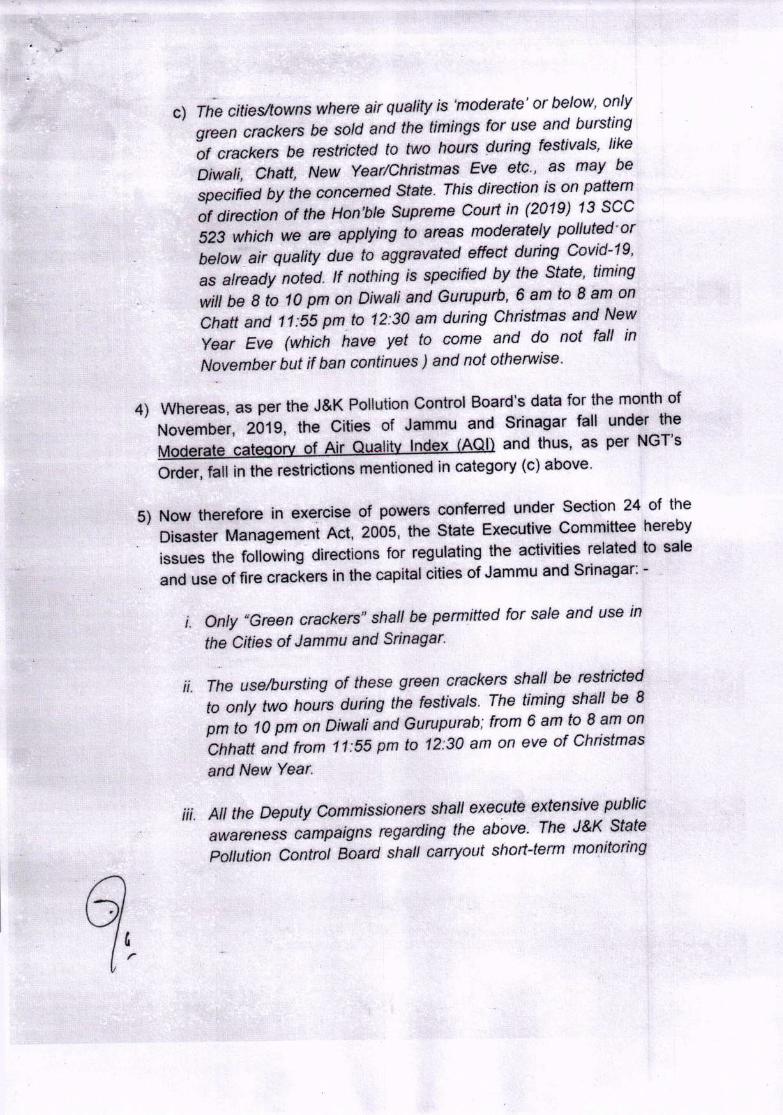
'.c) The cities/towns where air quality is 'moderate' or below, onlygreen crackers be sold and the timings fer use and burstingof crackers be restrtcted to two nours 'during festivals, likeDiwali, Chatt; New Year/Christmas Eve etc., as may Despeaified by th,a comilemed State, This direction is on pattern(£11directioTJ of the HOI? 'ble Supreme coutt in (2019) 13 sec5.23 which we are applying to erees moderately polfuted'orbelow. eir quality due to aggravated efte'ot during Covid-19,as already noted. If nothing is specified by the State, timingwill be 8 to 10 pm on Diwali and Gurupurb, (5 am to 8' am on'Chatt and 11:55 pm to 12:30 am during Christmas' and NewYear Eve (which have yet to come and do not fall inNovember but if ban continues) and not otherwise .
.4) Whereas, as per the J&K Potlutien Control Board's data for the month ofNovember, 2019, the Cltjes of Jammu ana Snnagar fall' under theModerate category of Air Quality IRdex (AOD and thus, as per NGT'sOrder, fan in thefestrictions mentioned in category (c) above.
5) Now therefore in exercise of powers oonferred under Section 24 of theDisaster Management Act" 2005, the State E~ecutive Committee herebyissues the following dlreeticns for regulating the actiVities related to saleand use of fire crackers injhe capital cities of Jammu and Srinagar: -
t. Only "Green craekers" shall be permitted for sale and use inthe Cities of Jammu and Srinaf:]ar.
ii. The use/bursting of these green crackers shafl be re'strictedto enly tw,o hours dwring the festivals. The timing shall be 8ptn to 10pm on Diwaliand Gurupurab; from 6 am to 8 am onChhatt and from 11:55 pm to 12:30 am on eve of Christmas
and New Year ..
iii. All the Deputy Commissioners shall execute extensive pl:lbUnaW;;lreness campaigns regarding the above. The J&K Statepollution Control Board shall cettyout snott-tetm monitoring
481
in the ciJ;ies, for 1·4 clays (ol!Jmmertr;/ng immediately) for theparamlillers namely) Aluminum}. Bal{ipm, Iron apart from theregula:fory p.arEmetefS against lite ~htiPrt...tetm ~mbient AirQuality CriterilJi.~4!i!1;1 (AAQCVs) proposed by cpes Wifhtegatd to ,f a:cikers, This will help in flIeneration
IW the bl,Jf$~IPJ.flIof firecrackers~fJl:Jratl(jfj .~.!'1td$(/)fj/:rbl or g;tiaNty of
sno·E Iron useoi .ffte ' maDiJ/facture. 'of
,$'~Any viol~tf.on ~f the abC5Ve direcUons Will invite ~mmediate penal actiona~l1f~tg.e~tiQn!;~to 'tID. at!' tJisamer Management Aot, 200.5. besides legala~lbFl·tJna:~f'ieQtiQt~E1as of tl!le IPC'~lndlothers ~rovisi(tns' as appno~d!).le.
Ilatecl:lo .11.2020
PiganGial Comrnj~siomer, Health, and' tion QepartroentPrin01p;atSe.cretary to. the LieuteA'ant GDvernDr, J&KJoint Secreta.ry, fJ ' istry of Home Affairs, Govemmeflt Df India.
~Oite "General.D , J&K 'KashmirJJammu, Kasht;n1r/Jammu .
. issloners,8. e nd~entsQf Pollee,9. r, Informatio(') and PR fDr wide publicity.10. Private Secretsr~dO Chief,Secretery.11. JndMarg.e>Wef':isite,G1'2. Government Onl ~oek file.
482
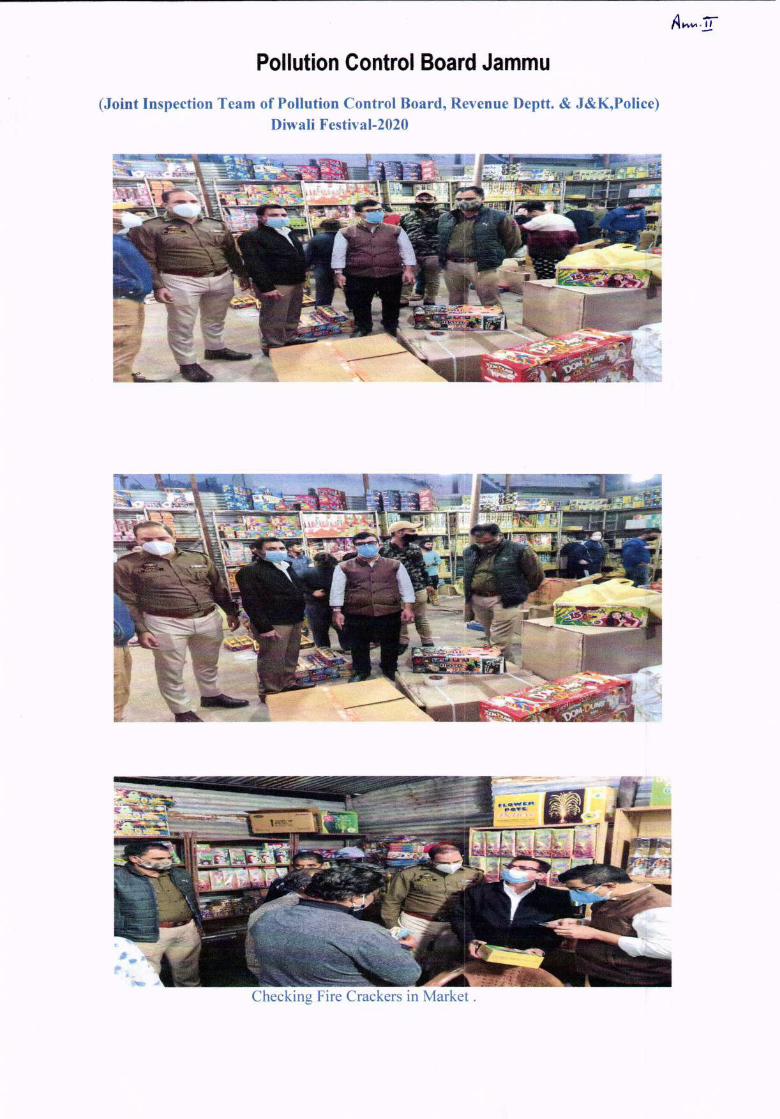
Pollution Control Board Jammu(Joint Inspection Team of Pollution Control Board, Revenue Deptt. & J&K,Police)
Diwali Festival-2020
Checking Fire Crackers in Market.
483
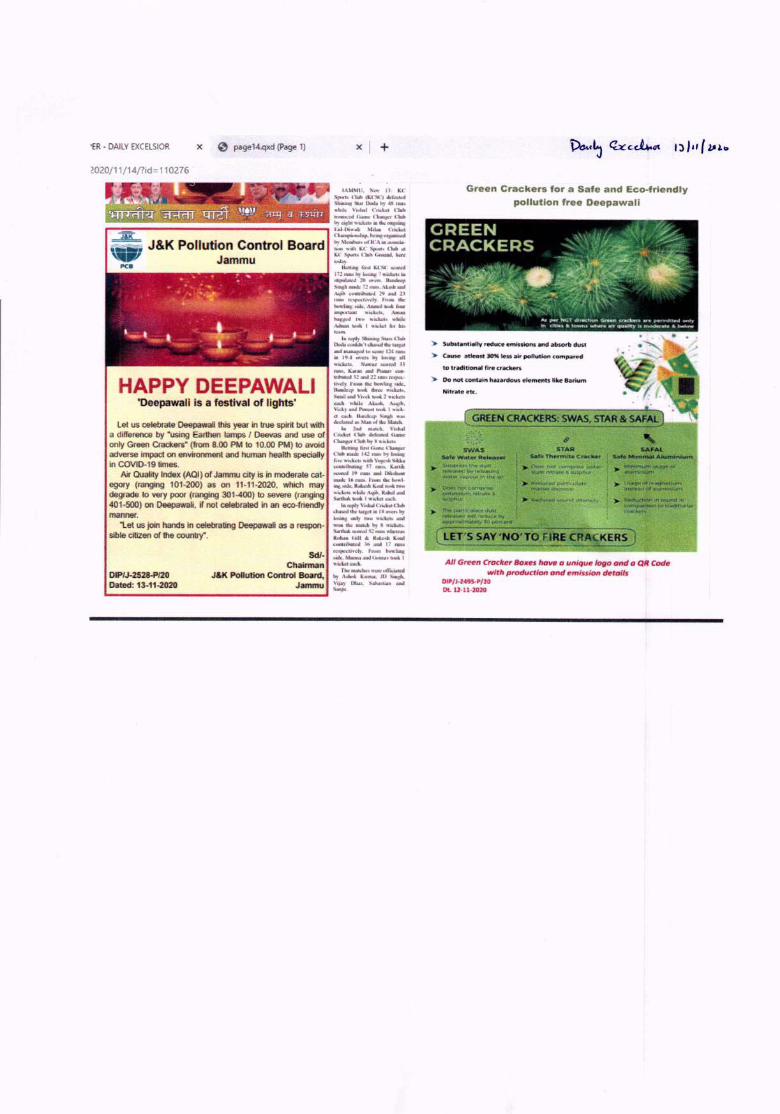
'ER - DAILY EXCELSIOR " page14.qxd (Page 1) x I +x
W20/11j14/?id=110276
jj'UAM Ntw 11: KCSpons {'I" {Kescl .:kf~uIShiDlIlI!!I~rllud .. b)·IISruru;'Iduk YbihaJ eriockL't l.luh.......'b;llIIiljIllAtCII.d~l.1.hy~~illh:{mpi~1tioI....f)iw-.ti Mi ... (..""rio;iwlC.h.'~II'f'I.IM:''''8''rsal'll:iOed~. M~'tIIIIKn.,flCA ill ,tlo-u.li<. wilh xc ~IIU ClYiIIIiKC .sp..w <1l1b (iRJI.IIIJ. hereonJ'Y_
IlillliQj: tiN KCSC ~l71lUM ~ '''I~ 1 wiCki!1S•• 1.JI~d2.n1lJl'ft'l,.~Siltyl_"111 ... ,U.,.;h,,1IdA.pb"~:l""~ N 11II1II1.\U.f n:>ipL"i:I.i'l'dy. I!ru.. lbLt.-:J~~A'_'tIKotto.inflKl'tADI "J;.:I~ .un_~o:\ll'II'U 'l!lO;kali 'll'lIti.k.\ ..... 1rJQII: I wa..:hl Ale hi,;-~
III "Ply Shi.t1llJ Sta.,. a ..D.lod..!«W "lc:..~_t;Mp::t:oodl~ I"'~ IJJrwl:r;In 19." U\'etf. by $Q5W1j all1rii::Uu... _·u 1iCfI1\.'II J3iWIj;, K.a- ... 1111011'r ..... \' UiIIIribumdJl mld2l: IlIlIJif\'5l!'.'C~
~'clJ-I'fOOIth,:"'y,li~~a.&.;P ..... 1ifrL'C ..,'idcb..SuDiIIlDdVi¥l:"kKIIM:2 ..icl;c~eilch ",ilil.; AkII",. t\;;:qib.\'icky ..,-.' "'".-0.1 """" I YIn..~I "",o,'tt.. O;moll...p S~ ...~
Let us celebrate Deepawali thiS year in true spir~ bul with ."~"'" ::...t.;.,~,~.:,a difference by 'using Earthen lamps I Oeevas and use Criili. ctu. d,...... G_
only Green Crackers· (from 8.00 PM to 10.00PM) to Ch'~~:~':a~~,:;"~adverse impact on envtronment and human health speciaUy c... _ok •., ._ ",. ,....
inCQVIO ..19 times. ~:':~:~;;I~~~Air Quality Index.(AQI) of JammuCi~ is in moderate ='ii1:~LI::~:'~:~~
ego,y (ranging 101.2(0) 'as ,on 11-11.2.020,which ""'....,_... ~h .... , .... ,_
degrade to very poor (ranging 301-400) to severe ;;.,": :::',-:.":,~~=~.'"401.5(0) 011Deepawati, if not celebrated in an eoo-lirlet'ldilil '."""r'C"".l>iobO"manner. =:..~:;a;:~~Il:
"el us join hands in ceJebra~ngDeepawali as a r~. =';!,~=h,,';'!=sible Citizenollhe colIntry". ._ om '" ....... ""'"
l:W'ltl'i""'IftI]"'ullli 11 run"
Sd/· ~t!~!'UII~';~:liI~~~I~Cha'irman lI'dxt~d.
The flJaKWt .. ~ O«,.:i"eciDIP/J·2528-P120 J&K Pollution Control :Board, ..,.,\,..~ K._ ,I) .. "Da'ted;13..11..2020 Jammu Yipyr)b,l(. s-..sllU. _ltdL. .J ~~
'Oeepawali is a festival of lights'
Green Crackers for a Safe and Eco-friendlypollution free Deepawali
>- Substaotlallv ,Huee e",Inlons and absorb dUll
.,. Cau.... tle:~$f~ 1"'lJ..i,. pollution ~Pilred
to traditionaltireulllcke,~
.. 00 not c:ontaln ha.:tardouselements like 8.rtum
Nitrate otr;:.
All Gre"" CrockerSoJl'''' halle a unique IOrioand a QRCodewithproductionand emf~jon dfttolI$
DIP/H495-P/1ODt. 12-11·2020
484
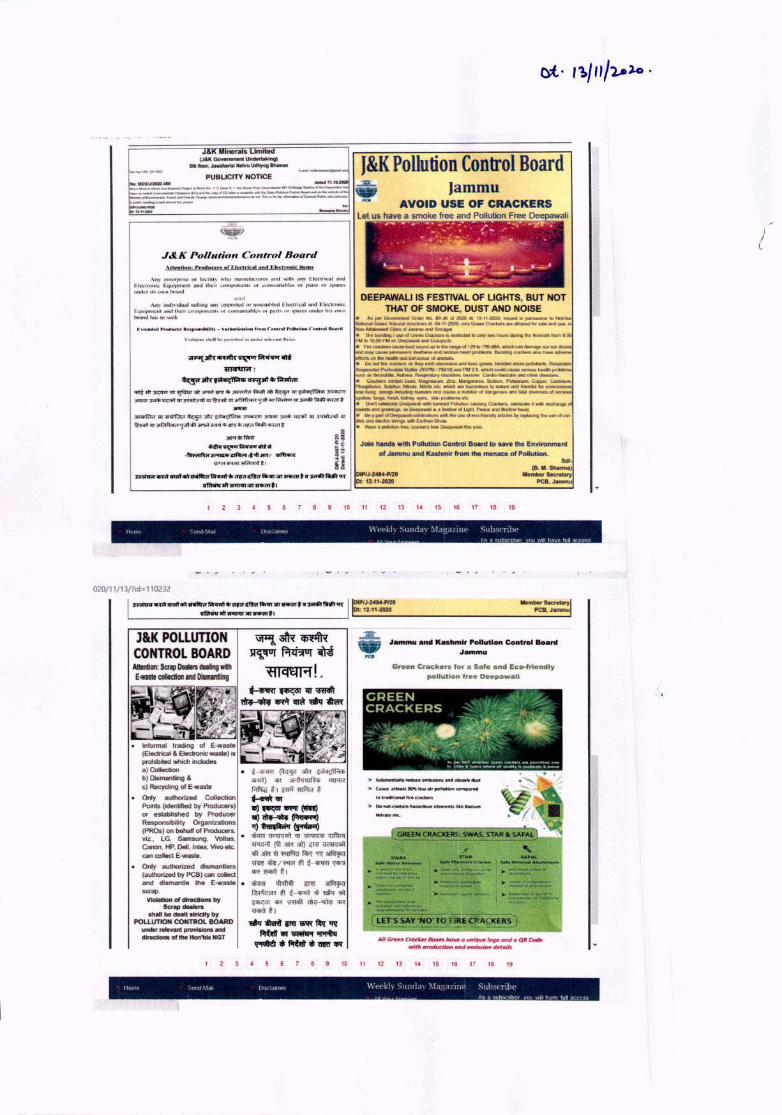
PUBUCITY NanCENa:MD~ ..,.u .._........._""!1';0 ... ·" ... ... "'._._~ ~__ c-4fCt_..._1It:c ...
... 1'__ ... _a.- OIl..... Ioo .. _ ...c-..._..
J&KPollution Control BoardJammu
AVOID USE OF CRACKER
J&K Polliltion ControlBoard
Any eenerprtse or l'it!;ilil)' whl.) manul'Dcllln:'!' p.ntl o;o.·l1~(lilY EI«lri-.-;)I tmdIiI(Xtmll~ F..quipnlC'nI !tIKI ItwiT cempoecms or coneumablcs 01' ('O.n"~\)1' !>I~I\.'SUllm., h:, <>v." brand
III1t1AB)' individual sclllng fin)' iDlt)OI1N er ass.:fOO)al EII.'(10C31(Inc! F.k.--ctl'llniC
Equirm'll..'111lind Ih.~"'fCU'tll'(oo'-"I1I'>01' «"IMIIl",hl ..."S .... IJa(I~ ,'r ,""""L"; unde' Iw. ,.ownbrnl1ll h.:1$ 1(.'~..-ck
DEEPAWAU IS FESTIVALOF UGHTS, BUT NOTTHATOF SMOKE, DUSTAND NOISE
• .II,po!if Gowrlimf!Il4 OliK..No. eg..JI( of mil dl. 11)..!1-2n2l)MueClIIJ pUI~ I!.I. ~e~C.eenllW1a1..,lIBC!iar'Is.df_09-'f·2Q.lI).orilyGrileflt:t8tl_ ... ~trx~.BirIIJ$6.."1b.~~oIJi!ItI'IIlIU..:lS...,~.• TheDUr!illnglIdea Green()~!l1:!o &!rtU!d tilptfy t'M)fl(i':d~ I)l!~.11S"Jna.OOM.llDlo.00""'''Dee~fIftd~........ tlftK:l;ers~tuI~I1PII:J. ... J'llDgIi!d125IbI55d1!A..ructoC<tndadMlgeQI.MeaFr:1rUInS¥.tfmoty.CiI!IOI$i:pellJ.'tlle"ol~-'daellDll!!ll:'li!3ft~l!lHlliriaillgCfat~dW~~
~(IfIlhi'ttllNllllllfldbe!'laYlo:ll.o'QI.~.. Oo.-o:lhr.~!I!o~tmt~.and:IDItoC!J.~~~kII:aflt5,l~.at.lt;~h~""~{HSI-'W/r"&olI0)1I!KI1)f42.5.~IlUuk!~~f:Oii&!ll!O!htJjlltl:t!m!l.o;.u&tt~!5KlnI:t)M..ASIh_~Jr.Ib)'~"~ ~dia'~liIWdntl_~• CRtdo._5c.vlfalAL_~!ftiUlll.~,Uiai~S6diJrlI.I~'um,Cqlpih~~, ~. NIb_. NIhrt I!Cv.wtndlllle fl3m:dtA5luntWt'll a.~ It8tnlU kir envwanm@nlandiHlng blmy5lnC1ldnglUm.l;)sftl'4C811SaftltlltlUatotOMgll-lOVf,lnIl:all~()f'_\1Ut15
~1W'(,i~htalt.~ ~ tNip'UIIlem1i;• ~,~~~-wc.'~'edf.'aIa&laft~'9~.ce6M>I"I{WI"~~$"'gi~QtDetpaw8liNata!w.llld\Jl,;lt.f>fti:ewId8totl ....·~• ee"I*I~~"(leH!:b~¥dI:iIhl!WlJr.de,oo~~tJfr~IbQU~~'catI.
s.ald eIK:lic1Imgt..,&rlbel'ltlNal...,• H&¥eft~~.~51f1l!8~1II!i ....... ,
"""llltt""JIR~-",*lI'I1ItI'T>I'!
~:Rk~1I'1'iJl'f*"-'"tRtJft~l:iT~:1It~.-rs'''~fflqfr·ft~m~~Jnr.JJ~~1'JT~7J'I~'lJT~'P"ilifnmrvrm~~~P'.......~1lT~~.)I'IT~~}(V'iD~m.;tllT~11T~~lII'~t'~c:ptd':r.)lq~~1:ia •• ;);e:t~~""~~~
..",..,-"'l""- ......_--- .."'_,._!lJ'7iTifir.:n.~tl
.loin hands with Pollution Conlt'Of Board to save the Environmentof Jammu and Kastimlt from the menace of Pollution .
MI·iBM.~1
Mem&or SecretaryPCB.Jammu
OJPIJ-24S4.Pi20Dt: 12-11..2020
~ __ ""~_"""''''''''''''';;rr...,...t'' ......_q'{wftniv 1ft1lP'tm:on~tl
H"Ie' 1 !'\ I l"~ "'1<1 \\t'i~l,h SlIlld,n \ I.-tCd 11111::' Sub ...crib-_ , ... if sunscnner Nl WI I t',(l"" f ~ :. cess
020/11/13/?id= 110232
I~~"""'-'~Q-.Rt"itTc'tltirfInT3TPiiIr ....3iPf:t'fW:rq"{ 11~~JJ-2,(J"-PnG Me",bo, s.cr.et.ryl. vfttIiUIftR'l'l'11naT ....... ~t • L.Dl_._"_"'_l_... _20 ;;_.....;,; _ _;;:..:.....:;;;_ __ P_C:,:B,;;.J:':"""""~::J
~ ~~~~
'elqmrr! .
J&K POLLUTIONCONTROL BOARDAIIInIIan: Smp Dealers dHling williE"RSIItoIledion and OismIn11ing
.Jammu and Kashmir Pollution Control BoardJammu
Green Crackers fOf a Safe and Eco-fricndlypollutfon free Deepawall
YJoIItion 01direction .. by5uap doII"~
shall bedoeIt tltrtcUybyPO~WTION CONTROL BOARD
undor ro1evant proviskms anddiracttons of tho Hon'bktNGT AllG,.." Crodt«r8cI.usJJtN.Quniqu.'ogo mtd a ORCOiR
wltlr III'OfIurihM tlnd t:m1uJott .roJls
10 11 12 13 14 15 16 17 18 19
t',I1' "",i" .., [)<" ,!til'''! \\+(:,d,]\ SU1H1.1\ \L1"d \Ih.' Suho..:(nhl'As" 3l!bs.cn[,{.':f lot" .'rel h<.Jl.c "uD ,LCl;':>
)l
485
Annexure-XXI
486

487
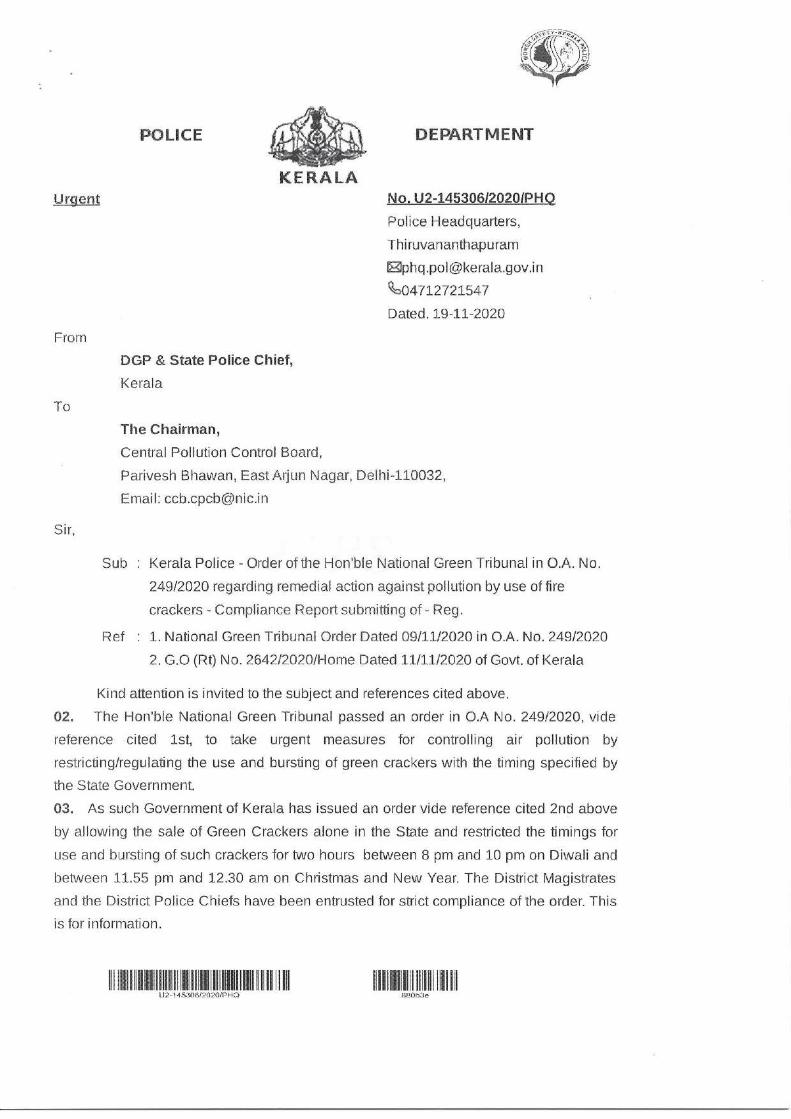
488
489
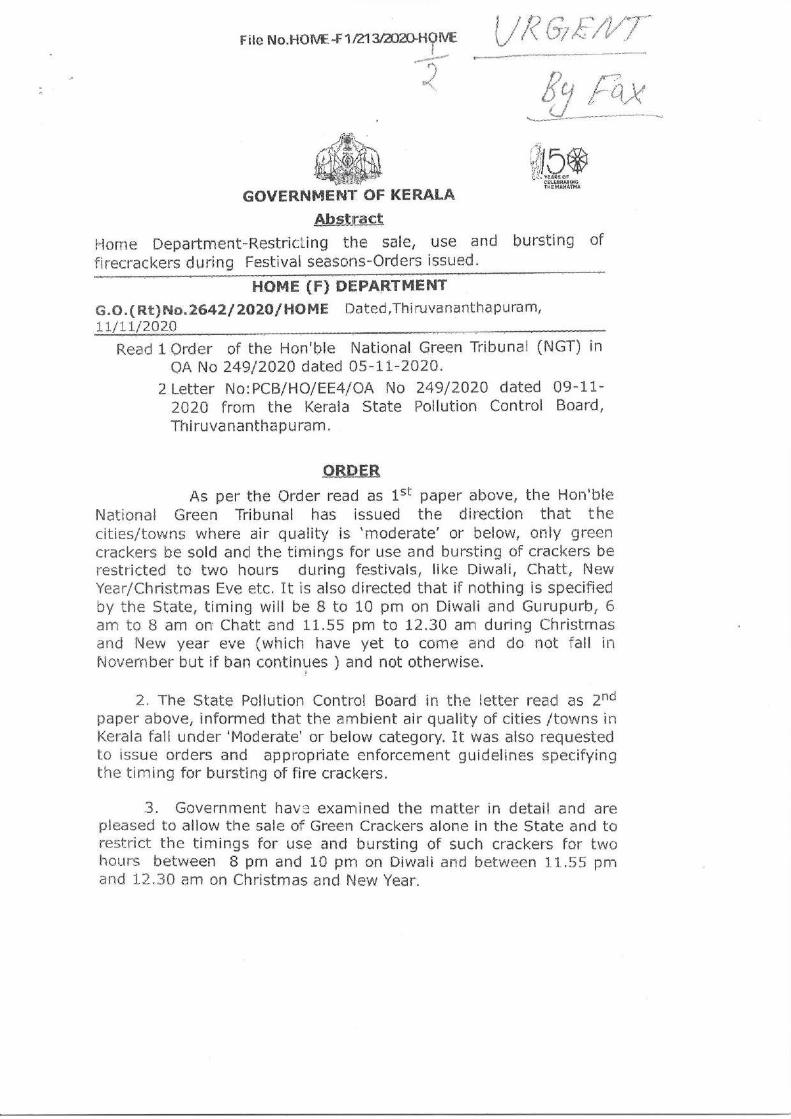
490
491
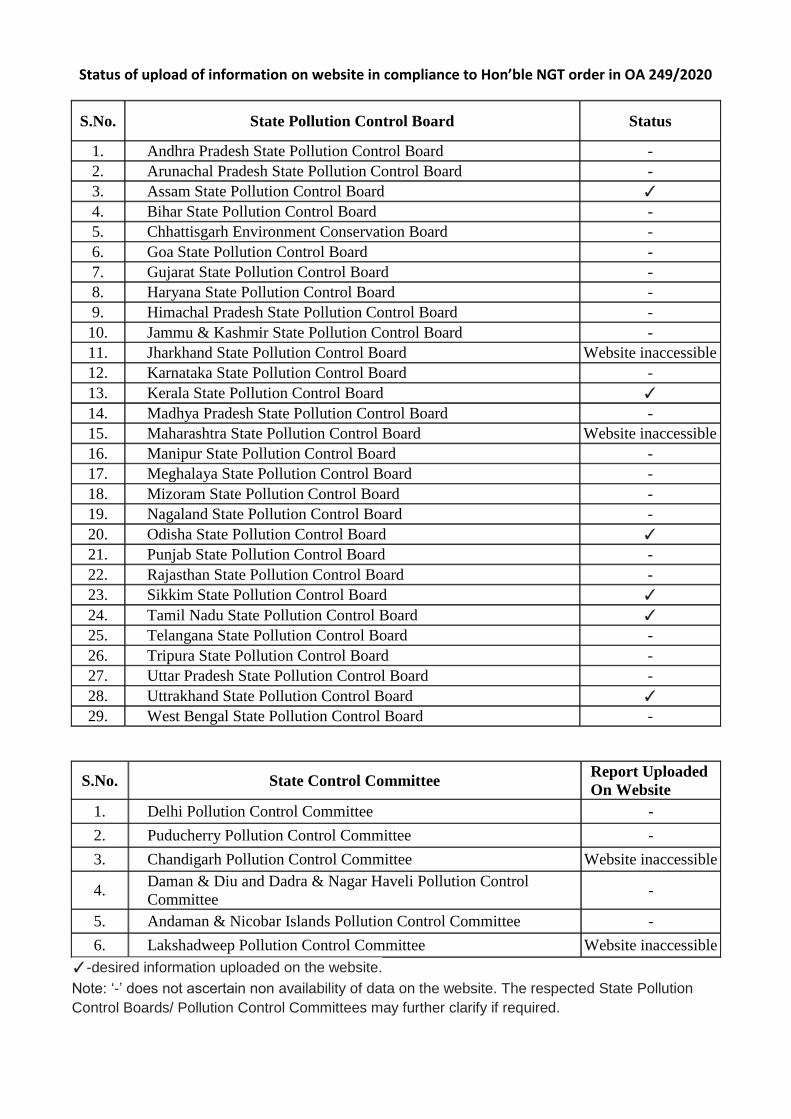
Status of upload of information on website in compliance to Hon’ble NGT order in OA 249/2020
S.No. State Pollution Control Board Status
1. Andhra Pradesh State Pollution Control Board -
2. Arunachal Pradesh State Pollution Control Board -
3. Assam State Pollution Control Board ✓
4. Bihar State Pollution Control Board -
5. Chhattisgarh Environment Conservation Board -
6. Goa State Pollution Control Board -
7. Gujarat State Pollution Control Board -
8. Haryana State Pollution Control Board -
9. Himachal Pradesh State Pollution Control Board -
10. Jammu & Kashmir State Pollution Control Board -
11. Jharkhand State Pollution Control Board Website inaccessible
12. Karnataka State Pollution Control Board -
13. Kerala State Pollution Control Board ✓
14. Madhya Pradesh State Pollution Control Board -
15. Maharashtra State Pollution Control Board Website inaccessible
16. Manipur State Pollution Control Board -
17. Meghalaya State Pollution Control Board -
18. Mizoram State Pollution Control Board -
19. Nagaland State Pollution Control Board -
20. Odisha State Pollution Control Board ✓
21. Punjab State Pollution Control Board -
22. Rajasthan State Pollution Control Board -
23. Sikkim State Pollution Control Board ✓
24. Tamil Nadu State Pollution Control Board ✓
25. Telangana State Pollution Control Board -
26. Tripura State Pollution Control Board -
27. Uttar Pradesh State Pollution Control Board -
28. Uttrakhand State Pollution Control Board ✓
29. West Bengal State Pollution Control Board -
S.No. State Control Committee Report Uploaded
On Website
1. Delhi Pollution Control Committee -
2. Puducherry Pollution Control Committee -
3. Chandigarh Pollution Control Committee Website inaccessible
4. Daman & Diu and Dadra & Nagar Haveli Pollution Control
Committee -
5. Andaman & Nicobar Islands Pollution Control Committee -
6. Lakshadweep Pollution Control Committee Website inaccessible
✓-desired information uploaded on the website.
Note: ‘-’ does not ascertain non availability of data on the website. The respected State Pollution
Control Boards/ Pollution Control Committees may further clarify if required.
Annexure-XXII
492
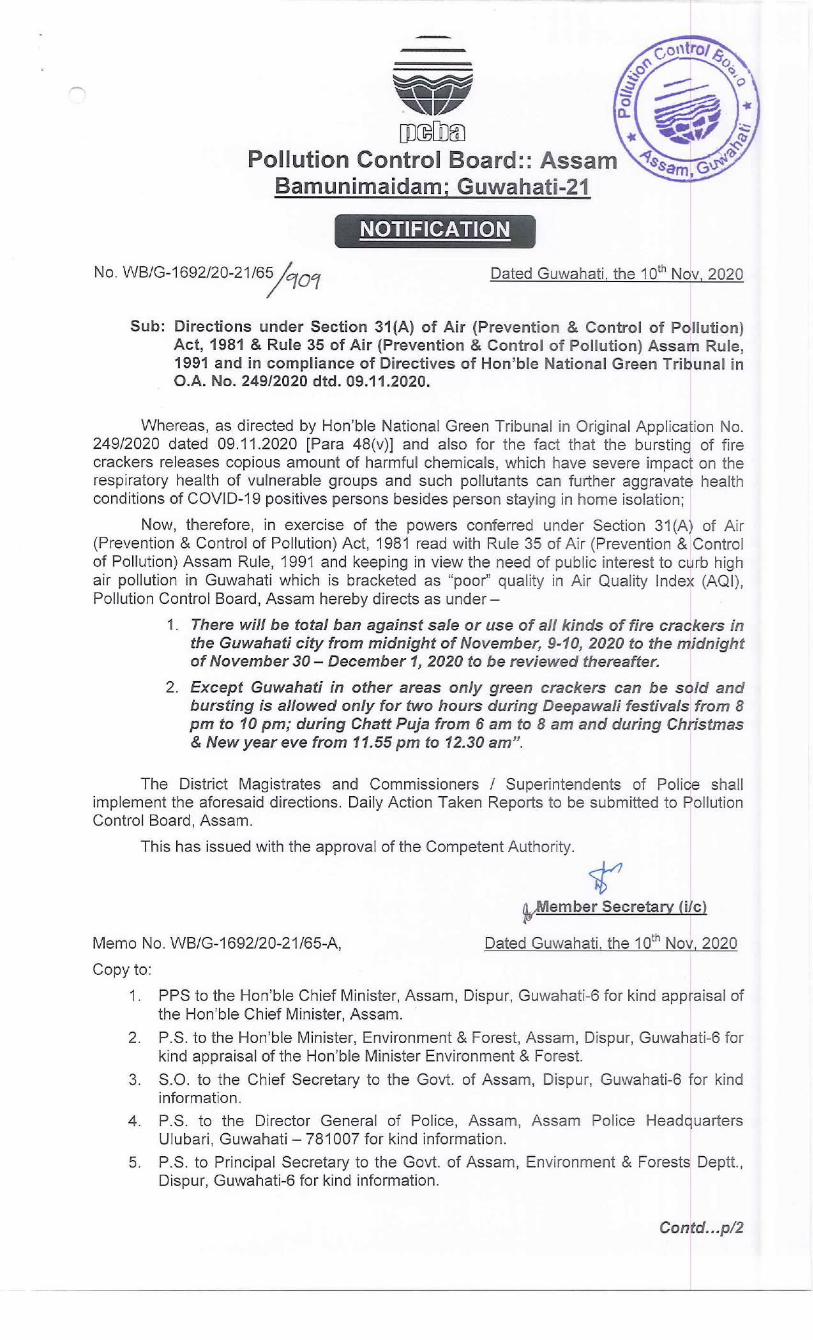
493
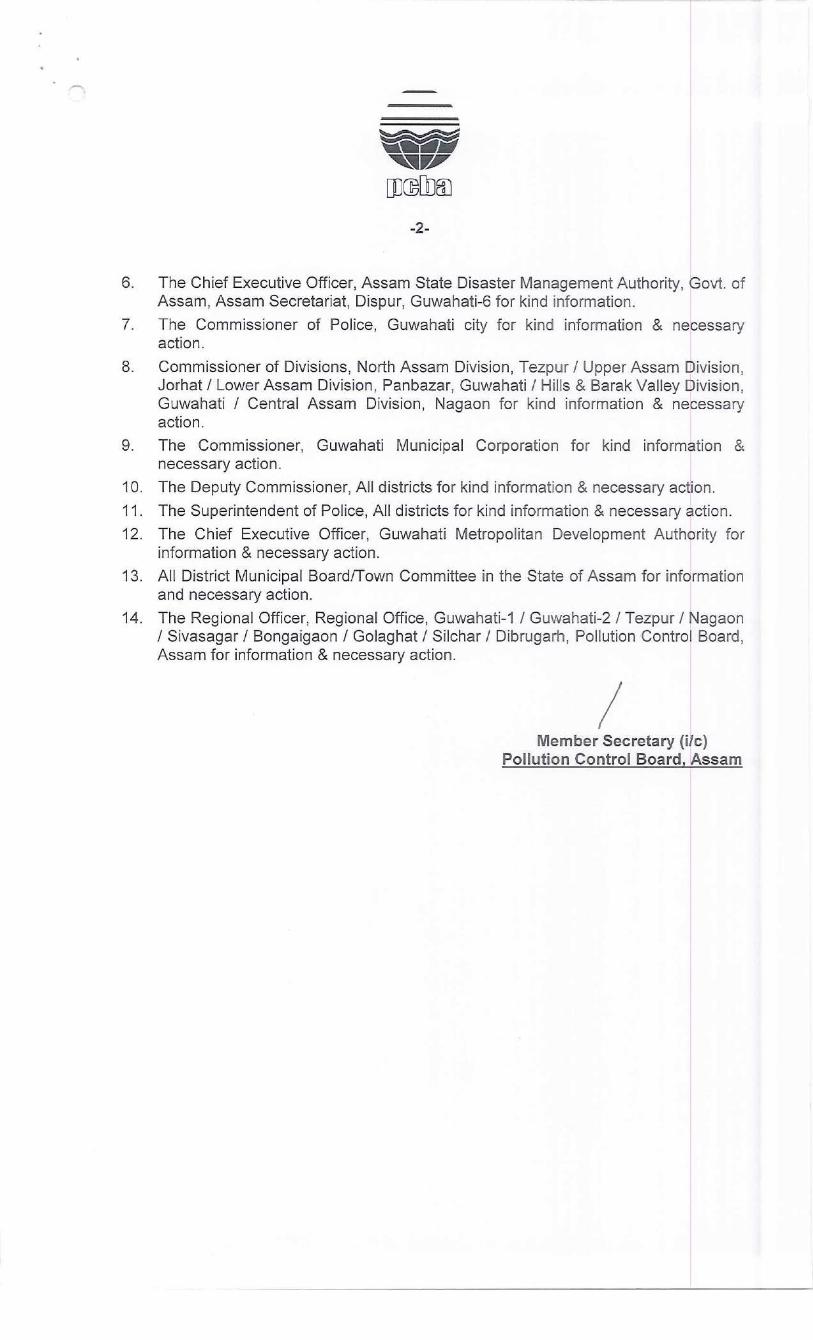
494
: General: 0471- 2312910, 2318153, 2318154, 2318155 Chairman: 2318150 Member Secretary: 2318151 e-mail: [email protected], FAX: 2318152 web: www.keralapcb.nic.in
KERALA STATE POLLUTION CONTROL BOARD tIcf kwØm\ aen-\o-I-cW \nb-{´W t_mÀUv
Pattom P.O., Thiruvananthapuram – 695 004 ]«w ]n.-H., Xncp-h-\-́ -]pcw þ 695 004
Date: 11/11/2020
PRESS RELEASE
As per the order of the Home department based on order of the Hon’ble National Green
Tribunal in OA No. 249/2020 dated 05/11/2020 and the advice of the Kerala State
Pollution Control Board, only ‘Green Crackers’ can be sold and used in the State on the
occasion of Diwali. The ‘Green Crackers’ can be used only between 8.00 pm and 10.00
pm on Diwali.
Usage of fire crackers are banned within 100 meters of silence zones such as hospitals,
courts, educational institutions and worship places.
Sd/- CHAIRMAN
495
General: 0471- 2312910, 2318153, 2318154, 2318155 Chairman: 2318150 Member Secretary: 2318151 e-mail: [email protected] FAX: 2318134, 2318152 web: www.keralapcb.org
KERALA STATE POLLUTION CONTROL BOARD tIcf kwØm\ aen-\o-I-cW \nb-{´W t_mÀUv
Pattom P.O., Thiruvananthapuram – 695 004 ]«w ]n.-H., Xncp-h-\-´-]pcw þ 695 004
XobXn : 11/11/2020
]{X ]ckyw
_lp. tZiob lcnX Sn_yqWensâ H.F.249/2020, 05/11/2020 - se D¯chpw
tIcf kwØm\ aen\oIcW\nb{´W t_mÀUnsâ \nÀt±ihpw
IW¡nseSp¯v ‘{Ko³ {Im¡dpIÄ’ am{Xta kwØm\¯v hn¡phm\pw
D]tbmKn¡phm\pw ]mSpÅq F¶pw ‘{Ko³ {Im¡dpIÄ’ D]tbmKn¡p¶
kabw Zo]mhen Znhkw cm{Xn 8 aWn apXÂ 10 aWn hsc B¡n
\nPs¸Sp¯nbncn¡p¶p F¶pw kwØm\ B`y´c hIp¸v
D¯chnd¡nbncn¡p¶p.
\ni_vZ taJeIfmb Bip]{XnIÄ, tImSXnIÄ, hnZym`ymk Øm]§Ä,
Bcm[\meb§Ä XpS§nbhbpsS 100 aoädn\pÅn ]S¡w s]m«n¡phm³
]mSpÅXÃ.
H¸v/þ sNbÀam³
496
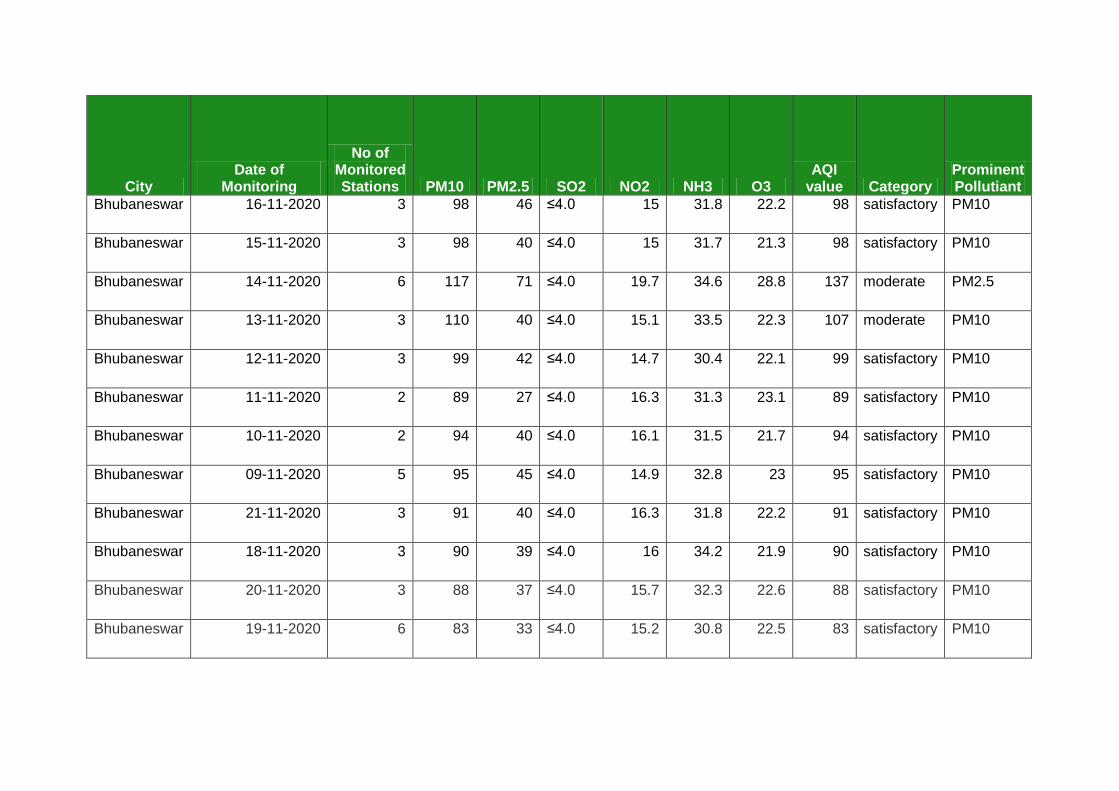
City Date of
Monitoring
No of Monitored Stations PM10 PM2.5 SO2 NO2 NH3 O3
AQI value Category
Prominent Pollutiant
Bhubaneswar 16-11-2020 3 98 46 ≤4.0 15 31.8 22.2 98 satisfactory PM10
Bhubaneswar 15-11-2020 3 98 40 ≤4.0 15 31.7 21.3 98 satisfactory PM10
Bhubaneswar 14-11-2020 6 117 71 ≤4.0 19.7 34.6 28.8 137 moderate PM2.5
Bhubaneswar 13-11-2020 3 110 40 ≤4.0 15.1 33.5 22.3 107 moderate PM10
Bhubaneswar 12-11-2020 3 99 42 ≤4.0 14.7 30.4 22.1 99 satisfactory PM10
Bhubaneswar 11-11-2020 2 89 27 ≤4.0 16.3 31.3 23.1 89 satisfactory PM10
Bhubaneswar 10-11-2020 2 94 40 ≤4.0 16.1 31.5 21.7 94 satisfactory PM10
Bhubaneswar 09-11-2020 5 95 45 ≤4.0 14.9 32.8 23 95 satisfactory PM10
Bhubaneswar 21-11-2020 3 91 40 ≤4.0 16.3 31.8 22.2 91 satisfactory PM10
Bhubaneswar 18-11-2020 3 90 39 ≤4.0 16 34.2 21.9 90 satisfactory PM10
Bhubaneswar 20-11-2020 3 88 37 ≤4.0 15.7 32.3 22.6 88 satisfactory PM10
Bhubaneswar 19-11-2020 6 83 33 ≤4.0 15.2 30.8 22.5 83 satisfactory PM10
497
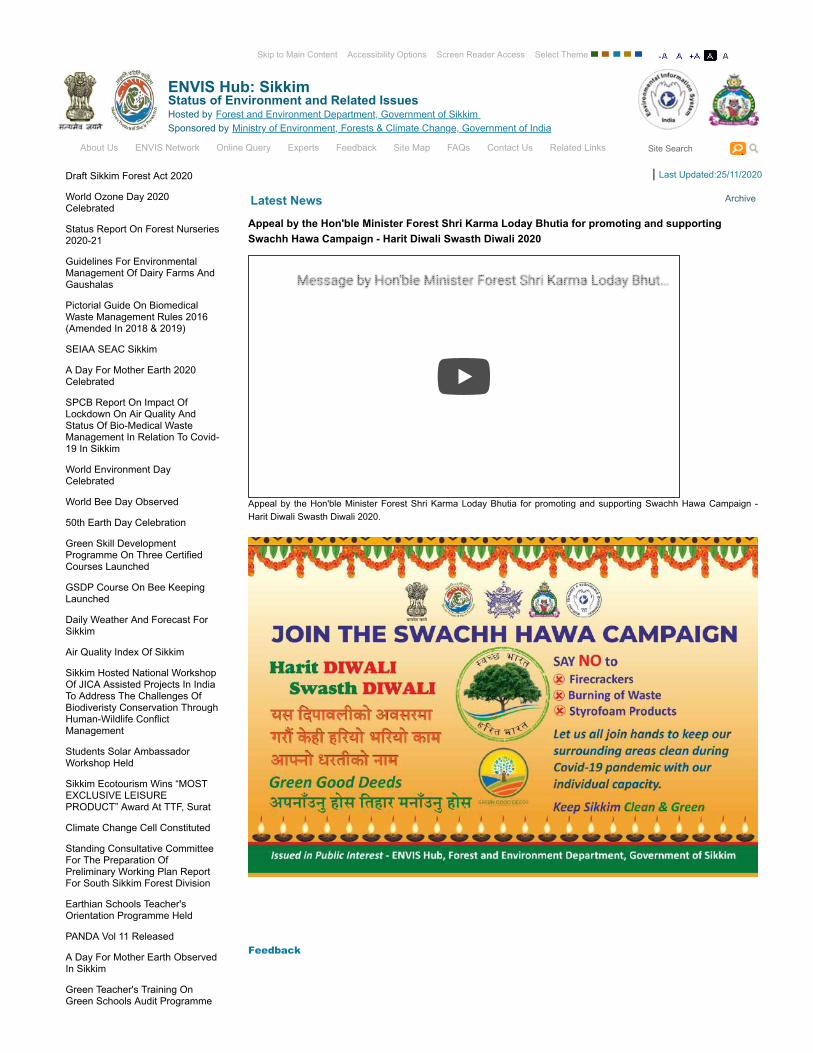
ENVIS Hub: Sikkim Status of Environment and Related IssuesHosted by Sponsored by
Draft Sikkim Forest Act 2020
World Ozone Day 2020Celebrated
Status Report On Forest Nurseries2020-21
Guidelines For EnvironmentalManagement Of Dairy Farms AndGaushalas
Pictorial Guide On BiomedicalWaste Management Rules 2016(Amended In 2018 & 2019)
SEIAA SEAC Sikkim
A Day For Mother Earth 2020Celebrated
SPCB Report On Impact OfLockdown On Air Quality AndStatus Of Bio-Medical WasteManagement In Relation To Covid-19 In Sikkim
World Environment DayCelebrated
World Bee Day Observed
50th Earth Day Celebration
Green Skill DevelopmentProgramme On Three CertifiedCourses Launched
GSDP Course On Bee KeepingLaunched
Daily Weather And Forecast ForSikkim
Air Quality Index Of Sikkim
Sikkim Hosted National WorkshopOf JICA Assisted Projects In IndiaTo Address The Challenges OfBiodiveristy Conservation ThroughHuman-Wildlife ConflictManagement
Students Solar AmbassadorWorkshop Held
Sikkim Ecotourism Wins “MOSTEXCLUSIVE LEISUREPRODUCT” Award At TTF, Surat
Climate Change Cell Constituted
Standing Consultative CommitteeFor The Preparation OfPreliminary Working Plan ReportFor South Sikkim Forest Division
Earthian Schools Teacher'sOrientation Programme Held
PANDA Vol 11 Released
A Day For Mother Earth ObservedIn Sikkim
Green Teacher's Training OnGreen Schools Audit Programme
| Last Updated:25/11/2020
Latest News Archive
Feedback
Appeal by the Hon'ble Minister Forest Shri Karma Loday Bhutia for promoting and supportingSwachh Hawa Campaign - Harit Diwali Swasth Diwali 2020
Appeal by the Hon'ble Minister Forest Shri Karma Loday Bhutia for promoting and supporting Swachh Hawa Campaign -Harit Diwali Swasth Diwali 2020.
Message by Hon'ble Minister Forest Shri Karma Loday BhutMessage by Hon'ble Minister Forest Shri Karma Loday Bhut……
Skip to Main Content Accessibility Options Screen Reader Access Select Theme
Forest and Environment Department, Government of Sikkim Ministry of Environment, Forests & Climate Change, Government of India
Site SearchAbout Us ENVIS Network Online Query Experts Feedback Site Map FAQs Contact Us Related Links
498
Held
GSP Award To Pelling School
World Wetlands Day 2019Celebrated
International Symposium OnEvergreen Oak Forests Of EasternHimalayas Held
EC To 1000 Bedded MultispecialityHospital At Sichey, Gangtok, EastSikkim
Mith Trees Or Mithini Relationship
Revised SoR For Logging AndConservion Works In Sikkim
Guidelines For DispensingCompensation For Life/ Property/Losses During Human WildlifeConflict - Sikkim
Total Visitor: 2343864
Privacy Policy Copyright Policy Terms & Conditions Hyperlinking Policy Help DisclaimerSite designed, developed and hosted by National Informatics Centre
Contents of this website is published and managed by ENVIS Hub: Sikkim Status of Environment and Related Issues
Copyright (c) 2011 by Ministry of Environment & Forests, Govt. of India. All rights reserved.
499
500
501
502
AQI During Diwali 2020
07.11.2020
08.11.2020
09.11.2020
10.11.2020
11.11.2020
12.11.2020
13.11.2020
14.11.2020
15.11.2020
16.11.2020
17.11.2020
18.11.2020
19.11.2020
20.11.2020
21.11.2020
Source : Uttarakhand Pollution Control Board Government Of Uttarakhand, Last Updated on 22-11-2020
" COVID 19 Bio Medical Waste Manage
503
1
Item Nos. 01 to 04 Court No. 1
BEFORE THE NATIONAL GREEN TRIBUNAL PRINCIPAL BENCH, NEW DELHI
Original Application No. 249/2020
(I.A. No. 370/2020, I.A. No. 371/2020, I.A. No. 372/2020& I.A. No.373/2020)
Tribunal on its own Motion Applicant(s)
Versus
Ministry of Environment, Forest & Climate Change & Ors. Respondent(s)
WITH
Original Application No. 254/2020
Shobhit Shukla Applicant(s)
Versus
Govt. of NCT of Delhi Respondent(s)
WITH
Original Application No. 255/2020
Chirag Jain Applicant(s)
Versus
Govt. of NCT of Delhi Respondent(s) WITH
Original Application No. 93/2020(CZ) Dr. P. G. Najpande & Anr. Applicant(s)
Versus
State of M. P. & Ors. Respondent(s)
Date of hearing: 05.11.2020 Date of uploading of order: 09.11.2020
CORAM: HON’BLE MR. JUSTICE ADARSH KUMAR GOEL, CHAIRPERSON HON’BLE MR. JUSTICE SHEO KUMAR SINGH, JUDICIAL MEMBER HON’BLE DR. SATYAWAN SINGH GARBYAL, EXPERT MEMBER HON’BLE DR. NAGIN NANDA, EXPERT MEMBER
ORDER
I. The Issue
1. Common question in these matters is remedial action against
pollution by use of fire crackers aggravating the menace of Covid-19
Annexure-XXIII
504
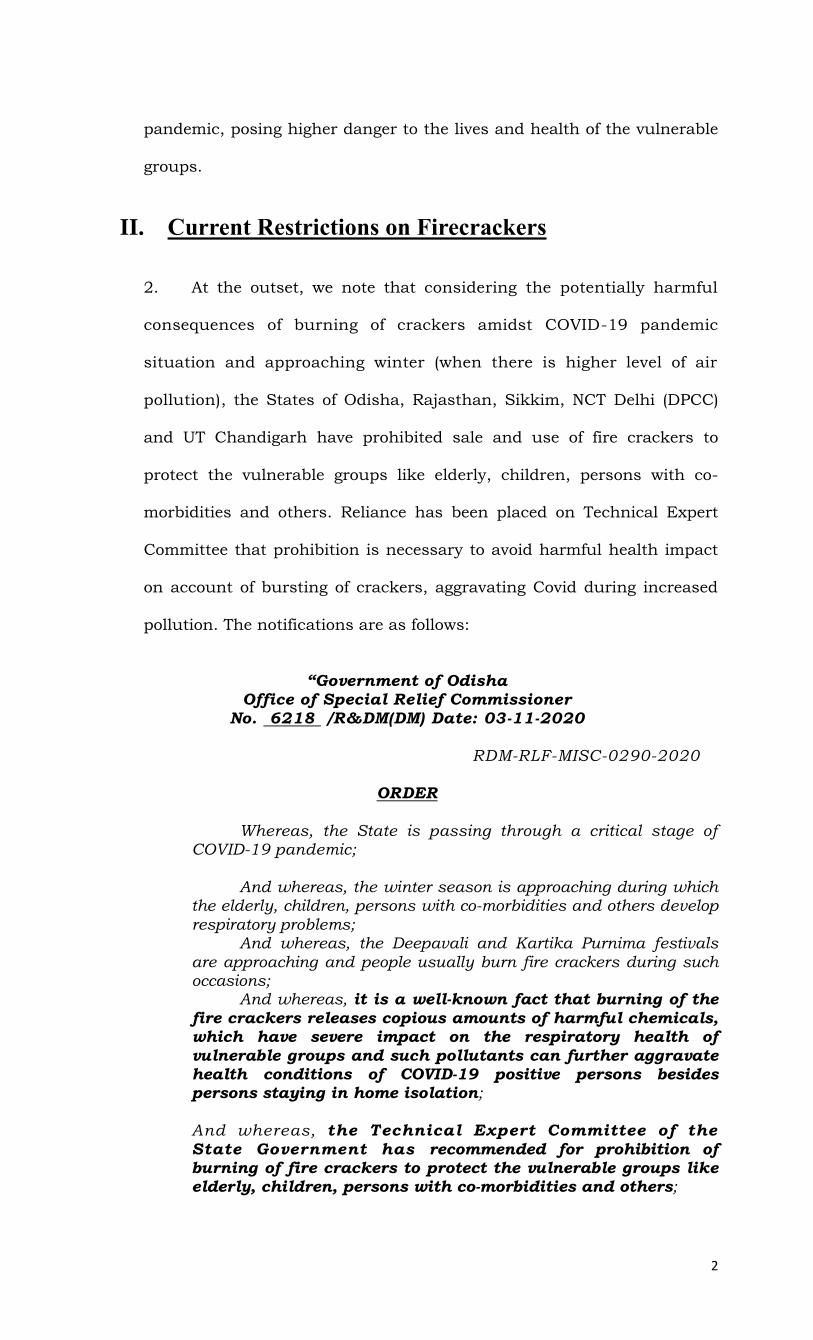
2
pandemic, posing higher danger to the lives and health of the vulnerable
groups.
II. Current Restrictions on Firecrackers
2. At the outset, we note that considering the potentially harmful
consequences of burning of crackers amidst COVID-19 pandemic
situation and approaching winter (when there is higher level of air
pollution), the States of Odisha, Rajasthan, Sikkim, NCT Delhi (DPCC)
and UT Chandigarh have prohibited sale and use of fire crackers to
protect the vulnerable groups like elderly, children, persons with co-
morbidities and others. Reliance has been placed on Technical Expert
Committee that prohibition is necessary to avoid harmful health impact
on account of bursting of crackers, aggravating Covid during increased
pollution. The notifications are as follows:
“Government of Odisha
Office of Special Relief Commissioner
No. 6218 /R&DM(DM) Date: 03-11-2020
RDM-RLF-MISC-0290-2020
ORDER
Whereas, the State is passing through a critical stage of COVID-19 pandemic;
And whereas, the winter season is approaching during which the elderly, children, persons with co-morbidities and others develop respiratory problems;
And whereas, the Deepavali and Kartika Purnima festivals are approaching and people usually burn fire crackers during such occasions;
And whereas, it is a well-known fact that burning of the
fire crackers releases copious amounts of harmful chemicals, which have severe impact on the respiratory health of
vulnerable groups and such pollutants can further aggravate health conditions of COVID-19 positive persons besides persons staying in home isolation;
And whereas, the Technical Expert Committee of the
State Government has recommended for prohibition of burning of fire crackers to protect the vulnerable groups like elderly, children, persons with co-morbidities and others;
505
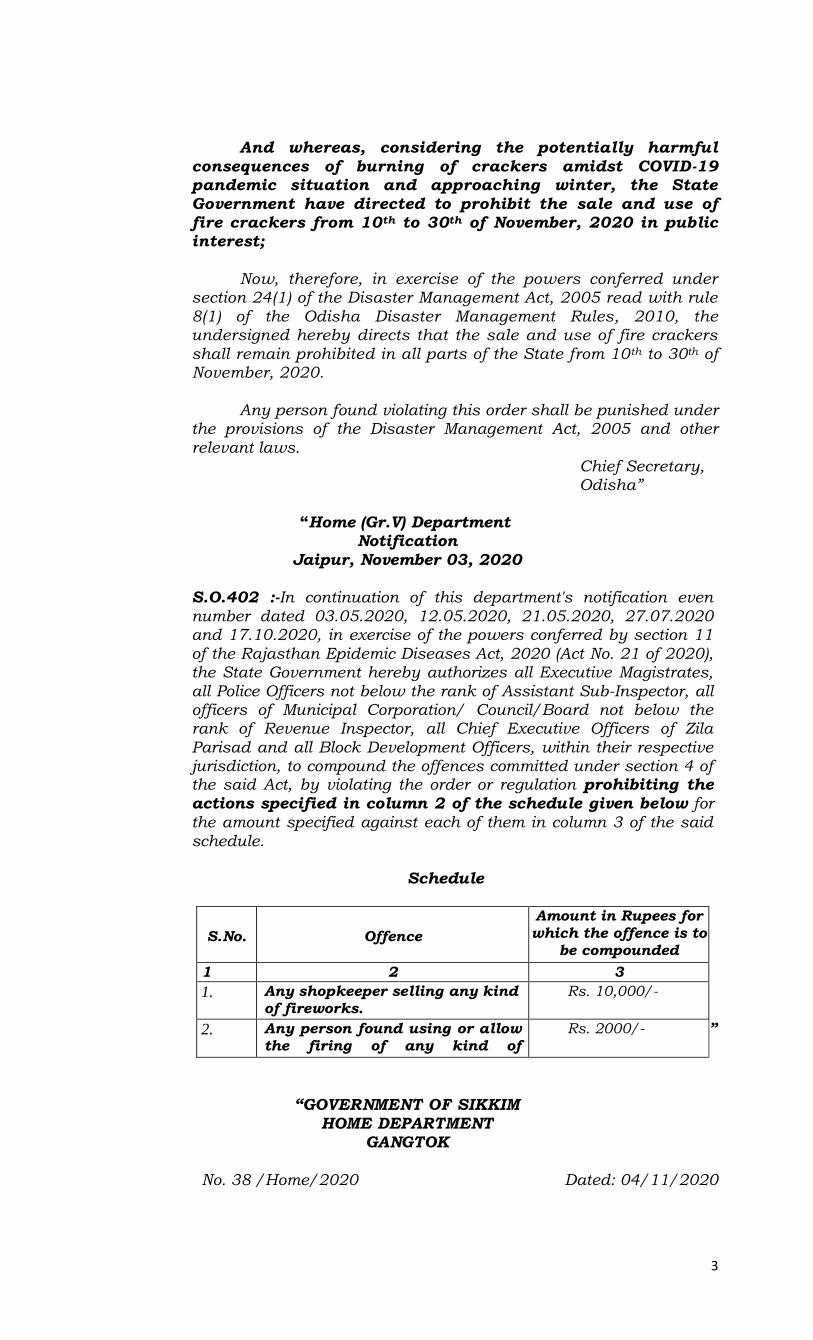
3
And whereas, considering the potentially harmful
consequences of burning of crackers amidst COVID-19 pandemic situation and approaching winter, the State
Government have directed to prohibit the sale and use of fire crackers from 10th to 30th of November, 2020 in public interest;
Now, therefore, in exercise of the powers conferred under
section 24(1) of the Disaster Management Act, 2005 read with rule 8(1) of the Odisha Disaster Management Rules, 2010, the undersigned hereby directs that the sale and use of fire crackers shall remain prohibited in all parts of the State from 10th to 30th of November, 2020.
Any person found violating this order shall be punished under
the provisions of the Disaster Management Act, 2005 and other relevant laws.
Chief Secretary, Odisha”
“Home (Gr.V) Department
Notification
Jaipur, November 03, 2020
S.O.402 :-In continuation of this department's notification even number dated 03.05.2020, 12.05.2020, 21.05.2020, 27.07.2020 and 17.10.2020, in exercise of the powers conferred by section 11 of the Rajasthan Epidemic Diseases Act, 2020 (Act No. 21 of 2020), the State Government hereby authorizes all Executive Magistrates, all Police Officers not below the rank of Assistant Sub-Inspector, all officers of Municipal Corporation/ Council/Board not below the rank of Revenue Inspector, all Chief Executive Officers of Zila Parisad and all Block Development Officers, within their respective jurisdiction, to compound the offences committed under section 4 of the said Act, by violating the order or regulation prohibiting the
actions specified in column 2 of the schedule given below for the amount specified against each of them in column 3 of the said schedule.
Schedule
S.No. Offence
Amount in Rupees for
which the offence is to
be compounded
1 2 3
1. Any shopkeeper selling any kind
of fireworks.
Rs. 10,000/-
2. Any person found using or allow
the firing of any kind of fireworks.
Rs. 2000/- ”
“GOVERNMENT OF SIKKIM
HOME DEPARTMENT GANGTOK
No. 38 /Home/2020 Dated: 04/11/2020
506
4
ORDER
Subject: Ban on bursting of fire crackers
Whereas, the active cases of Covid-19 are on the decline in the State and significant number of patients have recovered, increase in air pollution on account of
bursting of fire crackers may prove hazardous for recovered as well as active Covid-19 patients.
Now, therefore, in exercise of power conferred u/s 22 (2) (h) of the Disaster Management Act, 2005, the undersigned in his capacity as Chairperson, State Executive Committee hereby directs that there shall be a complete ban on bursting of fire
crackers in the State till further orders. The District Magistrates and Superintendents of Police shall take all measures and necessary action to ensure compliance of this order.
Sd- (S.C. Gupta, IAS)
Chief Secretary Govt. of Sikkim”
DPCC
“DELHI POLLUTION CONTROL COMMITTEE
F. No DPCC/(10)(10)( 01)/ leg-20151/144' ated:06.11.2020
Subject: Directions u/s 31 (A) of Air (Prevention and Control of Pollution) Act, 1981, read with Rule 20 (A) (6) of the Air
(Prevention and Control of Pollution) (Union Territories) Rules, 1983, to stop bursting and sale of all kind of fire crackers.
Whereas, Delhi Pollution Control Committee in view of the
Hon'ble Supreme Court directives dated 23.10.2018 in Writ Petition (Civil) No. 728/2015 titled as, " Arjun Gopal and Mother's Versus Union of India and Others" and in exercise of the powers conferred under section 31 (A) of Air (Prevention and Control of Pollution) Act, 1981, and keeping in view to curb high air pollution in Delhi, issued directions on 29.10.2020 prohibiting bursting of fire crackers and restricted the Licensed Traders only to sale/ store fire crackers with reduced emission (improved crackers) and Green Crackers. The fire crackers which were compliant with PESO prescribed standards, only to be manufactured, stored and sold through Licensed Traders. It was further directed that no e-commerce websites shall accept any online orders and effect online sales and on Diwali days or on any other festivals like Gurpurab etc., when such fireworks generally take place, it would strictly be from 8:00 PM to 10:00 PM only. On Christmas eve and New Year eve, it would be from 11:55 PM to 12:30 AM only and use of barium salts in the fireworks was also banned.
Whereas, Delhi faces grave air pollution particularly in winter season and level of pollutants like
Particulate Matter Concentration (PM2,5 and PM10) goes much beyond the prescribed standards for Ambient Air
Quality.
507
5
Whereas, air quality of Delhi is deteriorating day by day and as on 05.11.2020 at 6.00 PM, Air Quality Index
(AQI) reached 435, which is classified as "Severe" category warranting extreme measures to contain further worsening
and prevent hazards, as a result of air pollution, to public at large.
Whereas the city of Delhi is reeling under a third peak of out-break of COVIDI9 and large scale celebrations by bursting of fire crackers will result not only in agglomeration of people, in violation of social distancing norms, but also would result in high level of
air pollution leading to serious health issues in Delhi, which under the prevalent pandemic crisis situation is not
favourable for the cause of larger community health given the possible high level of exposure to air pollutants leading to short term and long term adverse health effects given the
significant relationship between air pollution and respiratory infections.
Whereas, when severe AQI levels reach such a dangerous level, the deadly air pollutants can make their way into lungs causing severe discomfort and health issues, and hazardous AQI levels can be highly unacceptable to health by aggravating to chronic health conditions caused by breathing poisonous air.
Whereas, burning of fire crackers would cause extensive air pollution and releases metal particles, dangerous toxins, harmful chemicals and noxious gases
which would form one of the main sources of air pollution particularly when AQI is already reeling under "Severe" category. The air quality in the severe category may cause
respiratory effects even on healthy people and severe health impact on people with lung /heart diseases. The
health impacts may be experienced even during light physical activity.
Now, therefore, in view of the above in suppression of directions issued vide even number dated 29.10.20220 and in exercise of the powers conferred under Section 31(A) of Air (Prevention and Control of Pollution) Act, 1981, read with Rule 20 (A) (6) of the Air (Prevention and Control of Pollution) (Union Territories) Rules, 1983, and keeping in view the need in public interest to curb high air pollution in Delhi, Delhi Pollution Control Committee hereby directs as under:
"There will be a 'Complete Ban' on bursting and
sale of all kinds of fire crackers from 07.11.2020 to 30.11.2020 in the territory of NCT of Delhi."
The District Magistrates and Deputy Commissioners of Police shall implement the aforesaid directions. Daily action taken reports are required to be submitted to Delhi Pollution Control Committee on email ID: [email protected].”
CHANDIGARH
“OFFICE OF ADVISER TO THE ADMINISTRATOR, UT-CUM-CHAIRPERSON, STATE EXECUTIVE COMMITTEE
OF STATE DISASTER MANAGEMENT AUTHORITY, UT, CHANDIGARH
ORDER
508
6
No.13180-HIII(5)2020/ Dated 06/11/2020
In exercise of the powers conferred on the undersigned as Chairperson of the Disaster Executive Committee of State Disaster. Management Authority, I hereby order, a complete ban on sale or use of crackers of any kind, throughout the Union Territory of Chandigarh. These directions are issued as a containment measure to prevent risk of spread of covid-19, due to
polluted atmosphere created by bursting of crackers. These orders will come into force with immediate effect and
will remain in force until further orders. Any violation of the orders will invite penal action under
Section 51 to 60 of Disaster Management Act, 2005 besides legal action under Section 188 of the IPC and other provisions as applicable.
MANOJ PARIDA, IAS Adviser
to the Administrator, UT & Chairperson, State Executive Committee of State Disaster Management Authority, UT,
Chandigarh”
3. We further note that the Calcutta High Court vide interim order
dated 5.11.2020 in WPA No. 1984 of 2020, Ms. Anasua Bhattacharya vs.
State of West Bengal & Ors. has banned fire crackers as follows:
“ …. …. … As far as the firecrackers are concerned, notwithstanding the pendency of the matter before the NGT, in view of the appeal issued by the State and the unique problem brought about by the pandemic, the State should ensure that there is no use or
display or bursting of firecrackers at all during the Kali Puja and Diwali celebrations. For this purpose, only wax or
oil-based diyas would have to suffice, for the greater good of the citizens and in the larger public interest. This direction as to firecrackers will be effective all over the State and will
cover not only the Kali Puja and Diwali celebrations, but also the Chhat Puja, Jagadhatri Puja and Guru Nanak’s birthday
celebrations thereafter.
The police should maintain a strict vigil to ensure that there is no sale or purchase of firecrackers of any form in the State between now and the end of the month. The police should make every effort to confiscate firecrackers and any kind of like material which have the potential to pollute the air. Immediate appropriate measures must be taken by the police against those seeking to act in contravention of these directions. The State will ensure that no firecrackers of any kind are brought into the State, except for immediate transit to another State.
509
7
The compendious word “firecrackers” is used in this order to include all types of sparklers and the like, whether or not the use or burning thereof involves any sound or light being generated.”
III. Procedural History 4. We now refer to the cases before the Tribunal. In OA 249/2020,
Indian Social Responsibility Network through Santosh Gupta vs. Ministry
of Environment, Forest & Climate Change & Ors., (the title later modified
on application of the applicant seeking to withdraw his name as Tribunal
on its own Motion vs. Ministry of Environment, Forest & Climate Change &
Ors.), the Tribunal considered the matter on 02.11.2020 and passed
following order:
“1. The issue raised in this application relates to remedial action against pollution by use of fire crackers in NCR during the time air quality is unsatisfactory with potential of severity of
Covid-19 pandemic. The application refers to the statement of the Union Health Minister and the Health Minister of Delhi that during festive season there will be rise of Covid cases due to air pollution. Increased pollution may further affect the vulnerable groups and increase the fatality rate. Covid cases in Delhi may go up to 15,000 per day, as against the current cases of about 5,000 per day. Use of green crackers will not remedy the situation. The smoke will choke and may create gas chamber like situation. It will lead to poor visibility, hazy conditions and asphyxia. 2. The issue of fire crackers has been dealt with by the Hon’ble Supreme Court by several orders. The matter has been considered in the light of right to clean environment and acknowledged adverse effect of bursting of crackers on health due to increased pollution. Particular reference may be made to the following:
(I) Vide order dated 11.11.2016, in Arjun Gopal v. Union of India, (2017) 1 SCC 412,1 it was noted that air quality
standards in Delhi are from ‘poor’ to ‘severe’ during winter resulting in potential of diseases. Following directions were issued: “We direct the Central Government to:
(i) Suspend all such licenses as permit sale of
fireworks, wholesale and retail, within the territory of NCR.
(ii) The suspension shall remain in force till further orders of this Court.
(iii) No such licenses shall be granted or renewed till further orders.”
1 Para 5, 19 & 20
510
8
(II) Vide order dated 12.09.2017, in Arjun Gopal v. Union of
India (2017) 16 SCC 280,2 it was noted that since under the law, the health of the people has to take precedence over any commercial or other interests, graded regulation of fire crackers was necessary which would eventually result in prohibition. Accordingly, directions were issued to restrict the temporary licenses to 50%, pending further consideration.
(III) Vide order dated 23.10.2018, in Arjun Gopal v. Union of India, (2019) 13 SCC 523,3 while banning certain categories of fire crackers and directing regulation of the remaining, it was inter-alia directed that on Diwali days or other festivals, fire crackers will be used strictly between 8 p.m. to 10 p.m. only with different timings for some other festivals. It was also directed that the Union of India, Government of NCT of Delhi and the State Governments of NCR would permit community fire crackers only (for Diwali and other festivals, etc. as mentioned above), wherever it can be done.
(IV) There are also directions of the Hon’ble Supreme Court with regard to the noise level of the crackers vide judgment In Re: Noise Pollution-implementation of the Laws for Restricting Use of Loudspeakers and High-Volume Producing Sound Systems, (2005) 5 SCC 733.
3. The above cases do not consider Covid-19 situation when the adverse effect may be so severe that number of
deaths of children, senior citizens and other vulnerable persons may increase. Number of diseases may also increase.
There are reports in public domain that air quality of Delhi is deteriorating and further deterioration may give rise to increase in Covid cases.4 It is well known that the Graded
Response Action Plan (GRAP) has been introduced envisaging prohibiting of polluting activities if the air quality deteriorates. The Air Quality Index (AQI) is reported to be
averaging between 410 and 450 i.e. ‘hazardous’ category. Fire crackers emit poisonous gases like SO2, NOX, CO as well
as the metal besides creating noise. In the given climatic conditions, this may result in respiratory/pulmonary diseases, diabetic, hypertension and other diseases.
2 Para 69 to 72 3 Para 48 4 (i). Festivals, Air Pollution Reasons for rise in Delhi Covid cases: Centre:
https://www.ndtv.com/india-news/festivals-air-pollution-reasons-for-rise-in-delhi-
covid-cases-centre-2317795
(ii). Covid-19 recoveries continue to surpass new cases; next two-and-a-half month period
crucial says Harsh Vardhan: https://www.firstpost.com/india/covid-19-recoveries-
continue-to-surpass-new-cases-next-two-and-a-half-month-crucial-says-harsh-vardhan-
8922691.html (iii). Covid cocktail: Why Delhi’s air pollution crises may deepen this winter:
https://www.indiatoday.in/news-analysis/story/covid-cocktail-why-delhi-air-pollution-
crisis-deepen-winter-coronavirus-lockdown-1722602-2020-09-17
(iv). Covid-19 and pollution: ‘Delhi staring at coronavirus disaster’:
https://www.bbc.com/news/world-asia-india-54596245
511
9
4. There are also expert views on clear nexus of air pollution with Covid-19.5 With increased air pollution, virus
can cause more damage.
5. In view of above, issue notice to the MoEF&CC, CPCB, DPCC, Police Commissioner, Delhi, Governments of Delhi, Haryana, Uttar Pradesh and Rajasthan on the question
whether the use of fire crackers may be banned for the period from 07.11.2020 to 30.11.2020 in the interest of public
health and environment.”
5. In O.A. No. 254/2020, Shobhit Shukla vs. Govt. of NCT of Delhi, the
applicant has stated as follows:
“That the applicant herein most respectfully submits that the use of fireworks in Delhi has posed a serious problem to the quality of the air during the week of Diwali, which followed by usage of crackers during the weddings in the winter season. That the quality of air in the months of October, November and December since the time the applicant has shifted to Delhi has deteriorated to catastrophic levels. With each passing year the issue of extreme smog in Delhi is becoming more and more deadly. It is essential to highlight here that on 02.11.2020, Delhi’s air quality was in the “very poor” category, as per the data from the Central Pollution Control Board (CPCB). The capital recorded an Air Quality Index (AQI) of 310 at 7 am. That in this regard, the, the situation has become more hazardous in 2020 because of the on-going corona pandemic. According to the Delhi state health department, 4,001 fresh cases were detected in Delhi in the last 24 hours, pushing the total tally more than 3.96 lakh. In fact, in the wake of the deadly coronavirus disease (Covid-19) pandemic and rising pollution in the national capital, the Delhi government has also launched an anti-firecracker campaign from November 3rd, 2020. Under the campaign, 11 special squads of the Delhi Pollution Control Committee (DPCC) and city police will inspect firecracker manufacturing units to ensure that there is no old stock left. The government has also urged people to not burn crackers at all this year as the city battle surge in Covid-19 cases. That however it is wishful and ideal that it is expected out of people that they shall themselves refrain from bursting crackers on the eve
5 "SARS-CoV-2 virus (COVID-19) is a member of the coronavirus family and is responsible for the
pandemic declared by the World Health Organization. A positive correlation has been observed between the spread of the virus and air pollution, one of the greatest challenges of our millennium. COVID-19 could have an air transmission and atmospheric particulate matter (PM) that could create a suitable environment for transporting the virus at greater distances than those considered for close contact. Moreover, PM induces inflammation in lung cells, and exposure to PM could increase the susceptibility and severity of the COVID-19 patient symptoms. The new coronavirus
has been shown to trigger an inflammatory storm that would be sustained in the case of pre-exposure to polluting agents. Given this state of affairs, the potential role of PM in the spread of COVID-19, focusing on Italian cities whose PM daily concentrations were found to be higher than the annual average allowed during the months preceding the epidemic. Furthermore, a positive correlation between the virus spread, PM, and angiotensin-converting enzyme 2 (ACE2), a receptor involved in the entry of the virus into pulmonary cells and inflammation was observed": https://www.ncbi.nlm.nih.gov/pmc/articles/PMC7345938/
512
10
of Diwali and other forthcoming festivities, it has been seen in the past years that the such voluntary restrictions do not translate into legitimate constraint on the usage of such fire crackers. This has shown extremely hazardous effects upon the air quality of the Delhi- NCR region.”
6. In O.A. No. 255/2020, Chirag Jain vs. Govt. of NCT of Delhi, the
applicant has stated as follows:
“That currently we are undergoing an unprecedented time in our country with the ongoing pandemic of COVID-19, cases of which are sure to rise with the advent of winters in Delhi. That it is now a common knowledge that the respiratory system is immensely adversely affected by the COVID-19 virus and that the same stress will increase manifold with the increase in the air pollution in the area of Delhi. It is also the view of the Government both of the NCT of Delhi as well as the Central Government. It has been stated in the media that the onset of winter season and rising air pollution in Delhi NCR shall aggravate the pandemic and may affect vulnerable groups and could lead to a drastic increase in the fatality rate in the country. Delhi is encircled by Haryana from three sides and Uttar Pradesh on its eastern side. Delhi is a bowl state, in sense that, thickly populated cities like Noida, Ghaziabad, Faridabad and Gurugram encircle it and that the wind cycle from the areas surrounding the city coagulate the wind of the city. With the ongoing burning of stubble in the northern regions of the country the downwind brings all the smoke residue into the city due to which the entire region which is referred as NCR is predominated with high background dust, intensified industrial activities, high vehicular density, issues of re-suspension of dust etc. that are some of the primary causes of the deteriorating air quality in Delhi NCR. The Air Quality Index (AQI) of Delhi and adjoining cities more or less is a testimony of the same. With the exception of monsoon season, AQI of the region more or less remains in the above 'Moderate' category. Therefore, there is an imminent need for actions to be taken for regulating various activities which have been identified as pollution contributors in the region. As per the statement of the Health Minister of Delhi, an expert panel had been constituted by the Government which gave an indication that the COVID-19 cases in Delhi may go up to 15000 per day. This has been attributed on account of the onset of festival season, harsh winter conditions and rising air pollution levels. AIIMS, a premier medical institution in the country has also issued advisories in view of anticipated conditions. Health Care Experts in other states have also released such medical advisories. With the onset of the festival season in the country, there shall be use of fire crackers in huge numbers that will aggravate the air
513
11
pollution concern in Delhi NCR. Using green crackers (also known as environmentally friendly crackers) is also futile since they are neither emission free and nor noise free. Hon'ble Supreme Court is reviewing the proceedings and adjudication is presently focusing on substitution of the ingredients to minimize pollution levels referring as Green Crackers. There is also no mention on the regulation of firecrackers in Graded Response Action Plan (GRAP) perhaps with the view that their use is for limited period. However, such a stand is not correct owing to the fact it is contrary to the Air Act and considering that post the Diwali Day, the sky is engulfed with smoke. Deepawali celebrations with Firecrackers is not an integral part of the traditional celebrations. Right to earning a livelihood at the cost of severe health risks and damage to the environment should not be treated as a constitutional right. There has been plethora of literature that is publicly available to show that air pollution leads to several diseases and discomfort. According to study from Harvard T.H. Chan School of Public Health, people who live in regions with high levels of air pollution are more likely to die from the disease than people who live in less polluted areas. Therefore, there exists a clear nexus between the rising air pollution and COVID-19 related deaths. Harsh winter periods in Delhi NCR also results in reduction in the mixing heights thereby locking the pollutants and leading to hazy and poor visibility conditions. The emissions from Delhi, Faridabad, Gurugram, Noida and Ghaziabad are almost identical and Delhi gets locked experiencing the most unbearable conditions. Undoubtedly, the community at large has to live under distressed conditions. It is a well-established fact that fire crackers emit poisonous gases like SO2, NOX, CO as well as the metal besides creating noise. The Government of India and the Government of Delhi have accepted in Media that air pollution and the winter conditions will lead to a surge in the COVID-19 cases and the most vulnerable groups will be the ones that could potentially suffer from respiratory/pulmonary diseases, hypertension and other such ailments. They might also lack the financial resources to seek the help of any medical institution. This also places an additional burden on the healthcare system of the country that is already struggling with shortage of beds, lack of PPE kits etc.”
7. In O.A. No. 93/2020(CZ), Dr. P.G. Najpande & Anr. v. State of MP &
Ors. which has been filed before the Bhopal Bench and transferred to
this Bench, to be heard with connected matters, it is stated as follows:
“Therefore, the main grievance of applicants it that this smoke filled air will increase in mortality rate of corona
patients, it will lead to increase in number of corona patients.
514
12
Those patients who have recovered from the corona infection diseases may again be put to hazardous situation.
All above effects will be because of huge air pollution causes
by bursting of crackers.
Hon'ble National Green Tribunal (CZ) Bhopal in OA No.113/2013 observed on 31.10.2013 to take necessary steps against bursting of crackers causing air pollution in Diwali Festival by State Pollution Control Board, District Administrations and State Govt. of Madhya Pradesh, Rajasthan and Chhattisgarh. A complaint regarding sale of substandard crackers causing air and noise pollution was filled before Hon'ble M.P. human Right Commission on 26.10.2018. Hon'ble Commission had directed to Inspector General of Police Bhopal on 05.10.2018 to take an necessary action. But neither the State Govt., State Pollution Control Board, Inspector General of Police, nor the District Administrative Department took appropriate action to curb the menace of crackers. This year a situation is still more disastrous, because of covid-19 situation, people are suffering and their "Rights to Life" enshrined under Article 21 of the Constitution of India is under threats and hence it will be hazardous if the bursting of crackers is not banned.”
8. Vide order dated 04.11.2020 on consideration of the above
matters, the Tribunal directed all the matters to be heard together and
observed:
“9. However, having regard to further developments such as grievance being raised for the State of MP and States of Odisha and Rajasthan have banned use of fire crackers in the wake of unsatisfactory air quality, the scope of proceedings may need to be extended beyond NCR so as to suggest that in all the concerned States where air quality is not satisfactory may
consider taking action on the pattern of action taken by the States of Odisha and Rajasthan. Further, with respect to
non-attainment cities (where air quality as per record maintained by the CPCB is generally beyond norms) which are 122 in number, as per record of CPCB, the Tribunal may
have to consider direction to prohibit use of fire crackers during the period air quality is beyond a threshold (and beyond the norms notified under the Air Act) to protect the
health of the vulnerable groups. The remedial action with regard to the said cities is being separately dealt with by this Tribunal in O.A. No. 681/2018, News item published in "The Times of India" Authored by Shri Vishwa Mohan titled "NCAP with multiple timelines to clean air in 102 cities to be released around August 15." List of the said cities is as follows:
“List of 122 Non-Attainment Cities (Air Pollution)
515
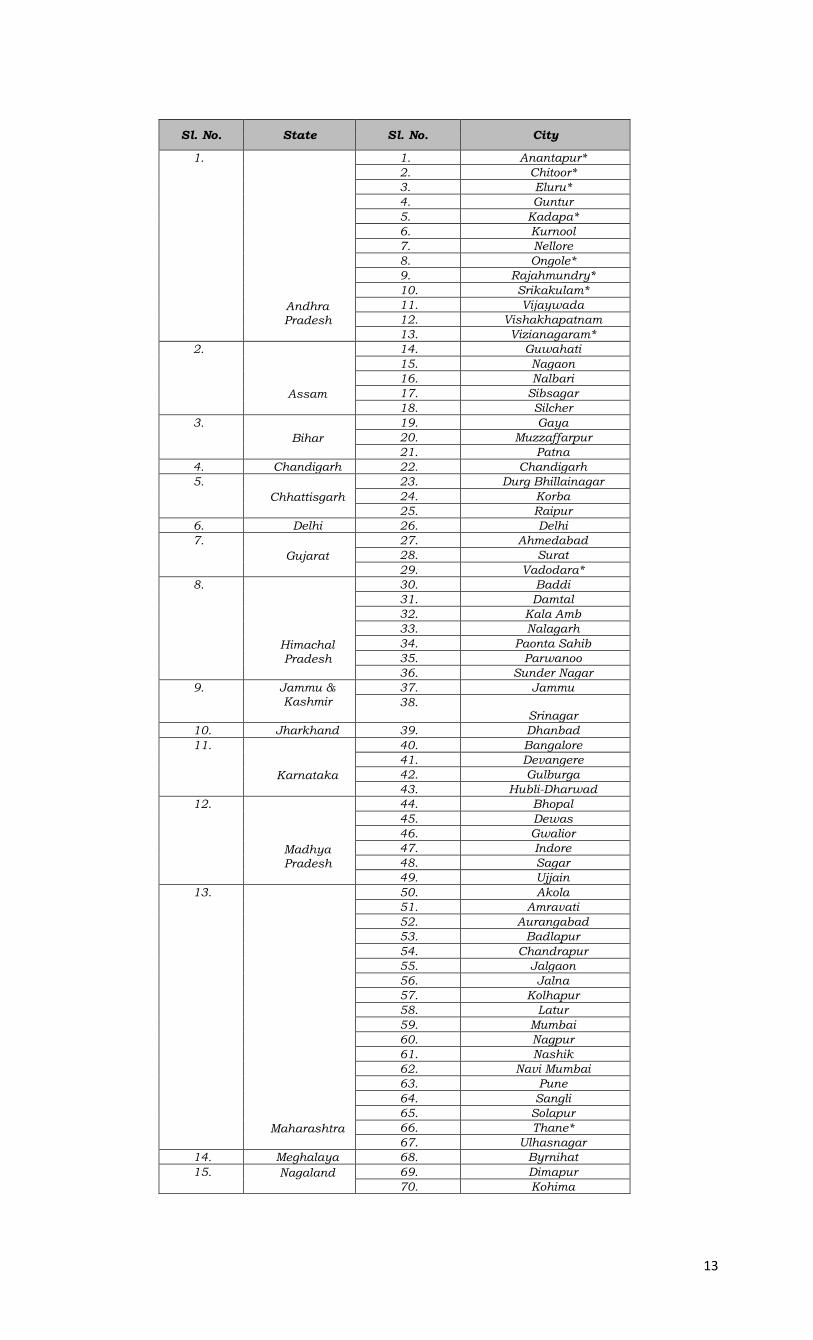
13
Sl. No. State Sl. No. City
1.
Andhra Pradesh
1. Anantapur*
2. Chitoor*
3. Eluru*
4. Guntur
5. Kadapa*
6. Kurnool
7. Nellore
8. Ongole*
9. Rajahmundry*
10. Srikakulam*
11. Vijaywada
12. Vishakhapatnam
13. Vizianagaram*
2.
Assam
14. Guwahati
15. Nagaon
16. Nalbari
17. Sibsagar
18. Silcher
3.
Bihar
19. Gaya
20. Muzzaffarpur
21. Patna
4. Chandigarh 22. Chandigarh
5.
Chhattisgarh
23. Durg Bhillainagar
24. Korba
25. Raipur
6. Delhi 26. Delhi
7.
Gujarat
27. Ahmedabad
28. Surat
29. Vadodara*
8.
Himachal Pradesh
30. Baddi
31. Damtal
32. Kala Amb
33. Nalagarh
34. Paonta Sahib
35. Parwanoo
36. Sunder Nagar
9. Jammu & Kashmir
37. Jammu
38. Srinagar
10. Jharkhand 39. Dhanbad
11.
Karnataka
40. Bangalore
41. Devangere
42. Gulburga
43. Hubli-Dharwad
12.
Madhya Pradesh
44. Bhopal
45. Dewas
46. Gwalior
47. Indore
48. Sagar
49. Ujjain
13.
Maharashtra
50. Akola
51. Amravati
52. Aurangabad
53. Badlapur
54. Chandrapur
55. Jalgaon
56. Jalna
57. Kolhapur
58. Latur
59. Mumbai
60. Nagpur
61. Nashik
62. Navi Mumbai
63. Pune
64. Sangli
65. Solapur
66. Thane*
67. Ulhasnagar
14. Meghalaya 68. Byrnihat
15. Nagaland
69. Dimapur
70. Kohima
516
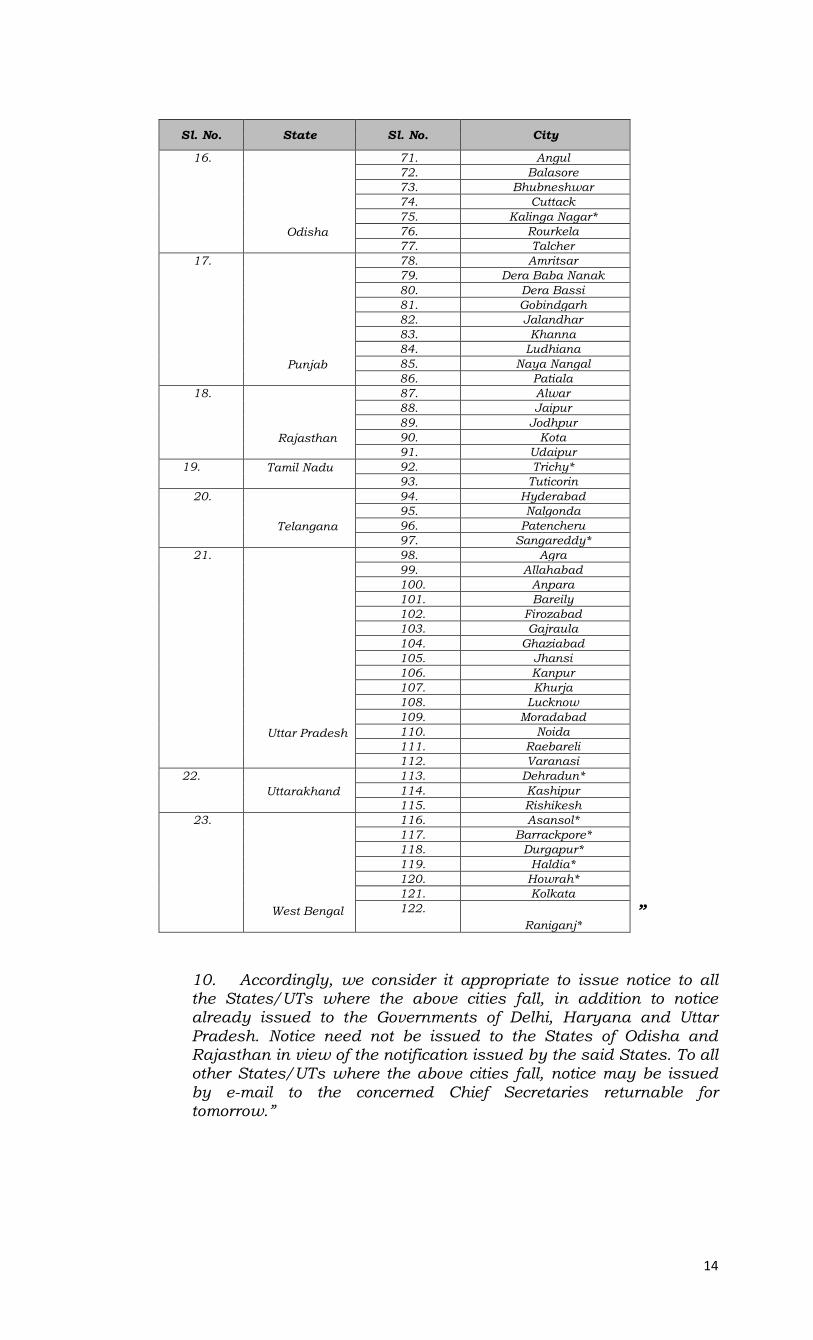
14
Sl. No. State Sl. No. City
16.
Odisha
71. Angul
72. Balasore
73. Bhubneshwar
74. Cuttack
75. Kalinga Nagar*
76. Rourkela
77. Talcher
17.
Punjab
78. Amritsar
79. Dera Baba Nanak
80. Dera Bassi
81. Gobindgarh
82. Jalandhar
83. Khanna
84. Ludhiana
85. Naya Nangal
86. Patiala
18.
Rajasthan
87. Alwar
88. Jaipur
89. Jodhpur
90. Kota
91. Udaipur
19. Tamil Nadu
92. Trichy*
93. Tuticorin
20.
Telangana
94. Hyderabad
95. Nalgonda
96. Patencheru
97. Sangareddy*
21.
Uttar Pradesh
98. Agra
99. Allahabad
100. Anpara
101. Bareily
102. Firozabad
103. Gajraula
104. Ghaziabad
105. Jhansi
106. Kanpur
107. Khurja
108. Lucknow
109. Moradabad
110. Noida
111. Raebareli
112. Varanasi
22.
Uttarakhand
113. Dehradun*
114. Kashipur
115. Rishikesh
23.
West Bengal
116. Asansol*
117. Barrackpore*
118. Durgapur*
119. Haldia*
120. Howrah*
121. Kolkata
122.
Raniganj* ”
10. Accordingly, we consider it appropriate to issue notice to all the States/UTs where the above cities fall, in addition to notice already issued to the Governments of Delhi, Haryana and Uttar Pradesh. Notice need not be issued to the States of Odisha and Rajasthan in view of the notification issued by the said States. To all other States/UTs where the above cities fall, notice may be issued by e-mail to the concerned Chief Secretaries returnable for tomorrow.”
517
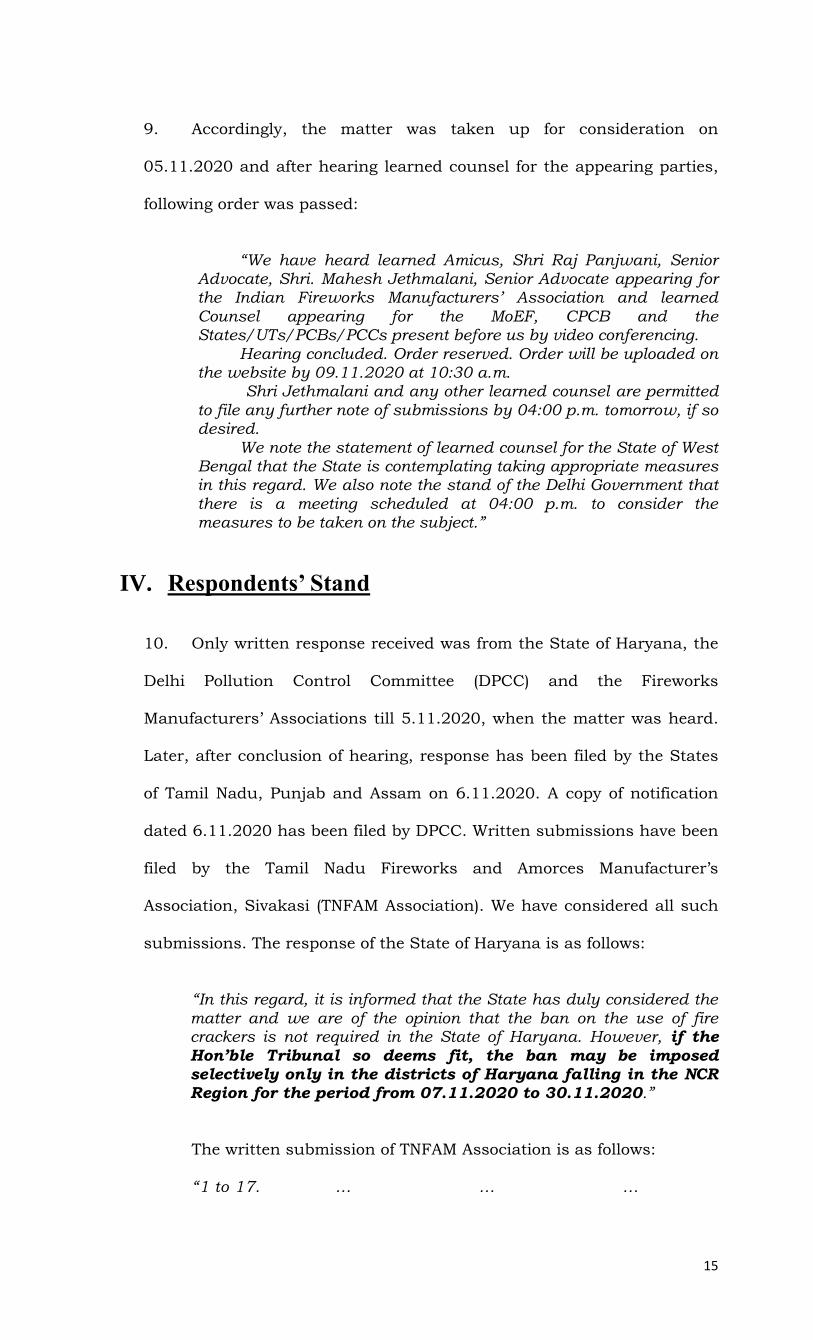
15
9. Accordingly, the matter was taken up for consideration on
05.11.2020 and after hearing learned counsel for the appearing parties,
following order was passed:
“We have heard learned Amicus, Shri Raj Panjwani, Senior Advocate, Shri. Mahesh Jethmalani, Senior Advocate appearing for the Indian Fireworks Manufacturers’ Association and learned Counsel appearing for the MoEF, CPCB and the States/UTs/PCBs/PCCs present before us by video conferencing. Hearing concluded. Order reserved. Order will be uploaded on the website by 09.11.2020 at 10:30 a.m.
Shri Jethmalani and any other learned counsel are permitted to file any further note of submissions by 04:00 p.m. tomorrow, if so desired. We note the statement of learned counsel for the State of West Bengal that the State is contemplating taking appropriate measures in this regard. We also note the stand of the Delhi Government that there is a meeting scheduled at 04:00 p.m. to consider the measures to be taken on the subject.”
IV. Respondents’ Stand
10. Only written response received was from the State of Haryana, the
Delhi Pollution Control Committee (DPCC) and the Fireworks
Manufacturers’ Associations till 5.11.2020, when the matter was heard.
Later, after conclusion of hearing, response has been filed by the States
of Tamil Nadu, Punjab and Assam on 6.11.2020. A copy of notification
dated 6.11.2020 has been filed by DPCC. Written submissions have been
filed by the Tamil Nadu Fireworks and Amorces Manufacturer’s
Association, Sivakasi (TNFAM Association). We have considered all such
submissions. The response of the State of Haryana is as follows:
“In this regard, it is informed that the State has duly considered the matter and we are of the opinion that the ban on the use of fire crackers is not required in the State of Haryana. However, if the
Hon’ble Tribunal so deems fit, the ban may be imposed selectively only in the districts of Haryana falling in the NCR Region for the period from 07.11.2020 to 30.11.2020.”
The written submission of TNFAM Association is as follows:
“1 to 17. … … …
518
16
18. That the proposed suggestive ban on the use of firecrackers has sent shivers down the spine of the sellers who are anyway facing acute financial hardship owing to the present pandemic. It is submitted that in a news article published online by Republic world on 05.11.2020, The sellers in the Delhi's Sadar Bazar, Delhi's largest firecracker market are requesting the National Green Tribunal (NGT) not to ban crackers ahead of the festival season. In recent times only 10 shops in Sadar Bazar have received the certificate to sell green crackers-that causes less pollution comparatively and are allowed by the Government. The number of shops dealing with firecrackers massively decreased from 70 to now just 10, over the last four years. A copy of the news article dated 05.11.2020 is annexed hereto and marked as Annexure R-12. 19. It is submitted that similarly, the decision of the Government of West Bengal to impose the ban on use of firecrackers may impact almost 4 lakh workers. This apprehension further stems from the fact that it would have been much better if the State Governments made the decision a few months ago and issued guidelines as it would have saved the manufacturers from the risk of sustaining huge losses at a time when they are yet recover from the impact of the lockdown. A copy of the article dated 04.11.2020 published in Deccan Herald is annexed hereto and marked as Annexure-R13. 20. That further complete ban on fire crackers the markets would be flooded with illegal crackers violating the noise limit of 90 decibels. In a situation like this where vocal for local and Atma-Nirbhar Bharat is echoing in the heart of every Indian, a ban on legal firecrackers will mean that the market will be flooded with illegal Chinese crackers which will serve no purpose both for the buyers, the sellers and the environment. 21. That it is wrong to presume that there is any correlation between bursting of firecrackers and the increase in the number of Covid cases. The primary concern will be that of air pollution which in effect is a concern already addressed by the introduction of Green Firecrackers. CPCB in its affidavit in 2017 filed before the Hon'ble Supreme Court in the aforesaid Writ petition have already given a report of Gangaram Hospital that no significant health hazard was noticed during Diwali because of fireworks. It is submitted that that special norms of social distancing and wearing masks in public were mandated in liquor and cigarette shops which are consumed daily. The Firecracker Industry will ensure that such social norms will be followed for selling and using of crackers. 22. That the European Society of Cardiology Report referred to by the amicus curie discusses the effect of air pollution on covid patients. However, same report also suggests that "attributable fraction does not imply a direct cause-effect relationship between air pollution and COVID-19 mortality (although it is possible). Instead it refer--; to relationships between two, direct and indirect, i.e. by
519
17
aggravating co-morbidities [other health conditions] that could lead to fatal health outcomes of the virus infection". 23. It is submitted that in the order dated 02.11.2020, this Hon'ble Tribunal has taken note of the orders dated 11.11.2016, 12.09.2017, 23.11.2018, passed by the Hon'ble Supreme Court in Writ Petition No. 728 of 2015 [Arjun Gopal v. Union of India]. However, the important orders in the aforesaid Writ Petition have been passed only on 05.03.2019, 11.04.2019 and 26.11.2019. Further, the Hon'ble Tribunal has not taken into consideration the status report filed by the MOEF dated 17.08.2019, 10.12.2019 and 26.10.2020 wherein the permission to manufacture green firecrackers in accordance with the guidelines of PESO was sought. It is submitted that banning the sale of firecrackers on the basis of a partial and myopic observation rather than a holistic approach is a case writ large of travesty of justice. 24. It is submitted that during the pooja for Ayodhya temple construction in Corona period, the whole state of Uttar Pradesh celebrated with fireworks. There was no increase of any covid cases because of bursting of fireworks. Further, in Sivakasi there are more than 1200 fireworks factories and more than 8 lakh people are directly or indirectly employed in the industry. The factories check quality of fireworks daily by bursting it. Though fireworks are burst daily the fresh covid cases on 05.11.2020 were only 15 cases in the entire district. Nowhere around the world has any country banned fireworks during this Covid situation during their festival celebrations. 25. That the Firecracker Industry wrote letters to all Chief Ministers of the states on 01.09.2020 September itself requesting to issue temporary license for fireworks shop forth coming Diwali. Many Governments replied that it will do the needful and started the process of issuing licenses. With this confidence fireworks were produced and sent to the wholesalers of all state. Huge loans were availed by Manufacturers and dealers for the production and purchase of the same. None of the governments said that fireworks will not be allowed this year as soon as they got the representation from the firecracker Industry. If the fireworks are banned at the last hour, nothing will be left of the Firecracker Industry or of the 8 lakh workers. 26. That Rediff news in an article dated 05.11.2020 has reported that 42% pollution is because of stubble burning, whereas IIT reported Fireworks accounts to less than 0.1%. Details of information availed from Rediff News are annexed hereto and marked as Annexure-R14.”
11. The stand of the State of Tamil Nadu is that banning of crackers
will affect livelihood of the manufactures and workers and the same is
520
18
not justified. The State of Punjab has claimed that air quality in its non-
attainment cities is satisfactory or moderate during certain months.
Similar is the stand of Assam PCB and State of Tamil Nadu. We
reproduce below the main averments in the stand of the said three
States:
“State of Punjab
1 to 3. … … … 4. As regards the State of Punjab, the matter has been considered by the State and it is apprised that the Air Quality Index (AQI) of the State in the non-attainment cities of Amritsar, Ludhiana, Mandi Gobindgarh, Patiala, Jalandhar, Khanna are cities where Continuous Ambient Air Quality Monitoring Stations (CAAQMS) have been installed and the Air Quality Index (AQI) had remained in the moderate range for the months of January and February, 2020, in the satisfactory range for the months March, April, May, June and July, 2020, in the range of good for the month August, 2020, satisfactory range in the month of September, 2020 and moderate in the month of October, 2020. The status relating to Air Quality Index (AQI) of the aforementioned non-attainment cities for the months of January to October, 2020 in a tabular form is enclosed herewith as "Annexure-A". 5. … … …. 6. In view of the above stated facts and after due consideration of the matter in the background of Covld-19 pandemic. It is respectfully apprised that ban on the use of Fire Crackers Is not required in the State of Punjab. It is further apprised that no part of the State falls in the National Capital Region (NCR). However, the State undertakes to abide by the directions of the Hon'ble National Green Tribunal, if issued otherwise in the case.”
“Assam PCB
1. … … … 2. As per Air Quality Monitoring from January to August, 2020, AQIs of Guwahati in January, February & March is Moderate, in April, June, July & August it is good and in May it is satisfactory.
In case of Nagaon, in January & February it was Moderate
and in other months it was good.
In Silchar all 8 (eight) months are good.
521
19
In Sivasagar, January, February & March - Satisfactory and other 5 (five) months are good.
In Nalbari January, February & March - Satisfactory and
other months are good.
3. As per air quality monitoring before & during Deepawali, 2019 only Particulate Matter (PM10) were found exceeded-in Guwahati and marginally exceeded in Sivasagar and in Nagaon and Silchar it was under limit. Other parameter such as SO2 & NO2 were under limit in all station in all occasions. 4. Notification issued to all Deputy Commissioners of Assam to ensure implementation of directives of the Hon'ble Supreme Court of India in WP(C) No. 72/1998 dtd. 18th July, 2005. 5. Complete ban of fire crackers may be considered for Guwahati city only. In other towns directives of the Hon'ble Supreme Court of India dtd. 18 th July, 2005 in WP(C) No. 72/1998 shall be implemented through Deputy Commissioners.”
“State of Tamil Nadu
1. to 4. … … … 5. It is respectfully submitted that in Tamil Nadu only green crackers are permitted to be sold/used and bursting of crackers is proposed only for two hours on Diwali day i.e., between 6.00 AM to 7.00 AM in the morning and 7.00 PM and 8.00 PM in the evening. Further, awareness is being continuously created among the public through various means including the mass media. 6. It is respectfully further submitted that the State of Tamil Nadu is a major cracker manufacturing State using raw materials with reduced emission levels and low decibels and the State contributes to about 90% of total manufacture of crackers in India, providing direct employment to around 4 lakh people and indirect employment to 4 lakh people, and that their livelihoods solely depends on the sale of crackers during Diwali season. All steps were religiously taken to curb the pollution caused by the crackers in accordance with the directions of Hon'ble Supreme Court. Besides, the State has been taking proper COVID-19 management steps and the results are evident. Besides, the State Pollution Control Board has been constantly monitoring the air quality across the State of Tamil Nadu and suggesting measures. 7. It has been decided that environment friendly green crackers would be allowed as per the recent Hon'ble Supreme Court directions with supervision from the pollution control authorities of the State and also local supervision by the Police and Revenue authorities.”
522
20
12. I.A. Nos. 370/2020 and 371/2020 have been filed by the Indian
Fireworks Manufacturers’ Association, Sivakasi, Tamil Nadu for being
impleaded and urgent hearing respectively. It is stated that the said
association is the largest association of fire cracker manufacturers in
Sivakasi. The crackers with reduced emissions and green crackers were
permitted under the order of the Hon’ble Supreme Court dated
23.10.2018 in Writ Petition No. 728/2015, Arjun Gopal v. Union of India
while others were banned. There is also ban on joined fire crackers and
for use of barium salts. Petroleum and Explosive Safety Organization
(PESO) is to review composition of the fireworks. There is also reference
to meetings of CSIR-NEERI to consider composition and standards of the
crackers on 27.02.2019 which was considered by the Hon’ble Supreme
Court on 05.03.2019 and 11.04.2019. MoEF&CC filed status report
before the Hon’ble Supreme Court on 17.08.2019 that there will be 90%
reduction of Barium in emissions with the new composition. The
MoEF&CC has filed further affidavit dated 10.12.2019 before the Hon’ble
Supreme Court mentioning the steps for implementing green crackers.
I.A. Nos. 372/2020 & I.A. No. 373/2020 have been filed by Tamil Nadu
Fireworks and Amorces Manufacturer’s Association, Sivakasi, Tamil
Nadu for being impleaded and for urgent hearing respectively.
V. Amicus Submissions
Research and Studies
13. Shri Panjwani, learned Amicus has filed written submissions. It is
submitted that air pollution increases the risk of mortality from Covid-
19. Reliance has been placed on the following studies:
523
21
i. ‘A. Pozzer et al, ‘Regional and global contributions of air pollution to the risk of death from COVID-19’ Cardiovascular Research revised on 3.10.2020.6
ii. Aparna Banerjea, ‘After studies, it’s clear that air pollution contributes to Covid mortality: ICMR’ Mint, 27 October 2020.7
iii. Sandipan Talukdar, ‘Air Pollution May Account for 15% of COVID-19 Deaths Worldwide, Says New Study’, News Click, 28 October 2020.8
iv. The CPCB report tilted ‘Report on Ambient Noise Levels & Ambient Air Quality during Deepawali Festival 2018 &
2019’.
v. ‘State of Global Air 2020’ report released by the Health
Effects Institute and the Institute for Health Metrics and Evaluation’s Global Burden of Disease Project.9
vi. Report: ‘India recorded highest infant deaths due to air
pollution in 2019, shows study’, Scroll.in, 21 October 2020.”10
14. Shri Panjwani referred to the articles referred to above during
hearing. In ‘A. Pozzer et al, ‘Regional and global contributions of air pollution
to risk of death from COVID-19’ Cardiovascular Research, which is an
article published by the European Society of Cardiology, revised on
03.10.2020, a study has been conducted about the nexus of Covid-19
and air pollution using relevant data and attributable fraction. It is
opined that both the air pollutant PM2.5 and the SARS-CoV-2 virus
enter the lungs via the bronchial system (portal organ), with
potential systemic health impacts through the blood circulation.
Both PM2.5 and SARS-CoV-2 cause vascular endothelial dysfunction,
oxidative stress, inflammatory responses, thrombosis, and an
increase in immune cells. The SARSCoV-2 infection facilitates the
6 https://academic.oup.com/cardiovascres/advance-article/doi/10.1093/cvr/cvaa288/5940460
7 https://www.livemint.com/news/india/after-studies-it-s-clear-that-air-pollution-contributes-to-covid-
mortality-icmr-11603799525870.html 8 https://www.newsclick.in/air-pollution-account-15-per-COVID-19-deaths-worldwide-new-study
9 https://www.stateofglobalair.org/
10 https://scroll.in/latest/976376/india-recorded-highest-infant-deaths-due-to-air-pollution-in-2019-shows-
study#:~:text=As%20many%20as%2016.67%20lakh,2019%2C%20according%20to%20the%20survey.&text=More%20than%201%2C16%2C000%20infants,2020%20report%20published%20on%20Wednesday.
524
22
induction of endothelial inflammation in several organs as a direct
consequence of viral cytotoxic effects and the host inflammatory
response, which can aggravate pre-existing chronic respiratory and
vascular (coronary) dysfunction, and cause lung injury by alveolar
damage, as well as stroke and myocardial infarction by inducing
plaque rupture. Potential common pathophysiological mechanisms
of increased risk thus relate to endothelial injury and pathways that
regulate immune function. Further, there are strong indications of
increased susceptibility to viral infections from exposure to air
pollution.
Lung injuries, including the life-threatening acute respiratory
distress syndrome and respiratory failure, as well as acute coronary
syndrome, arrhythmia, myocarditis, and heart failure, were shown to be
clinically dominant, leading to critical complications of COVID-19.
Recent studies in China, the USA, as well as Europe indicate that
patients with cardiovascular risk factors or established
cardiovascular disease and other comorbid conditions are
predisposed to myocardial injury during the course of COVID-19.
From the available information, it thus follows that air pollution-
induced inflammation leads to greater vulnerability and less
resiliency, and the pre-conditions increase the host vulnerability.
Air pollution causes adverse events through myocardial infarction
and stroke, and it is an additional factor capable of increasing blood
pressure, while there is emerging evidence for a link with type 2
diabetes and a possible contribution to obesity and enhanced insulin
resistance. Bronchopulmonary and cardiovascular pre-conditions,
including hypertension, diabetes, coronary artery disease,
cardiomyopathy, asthma, COPD, and acute lower respiratory illness,
525
23
all negatively influenced by air pollution, lead to a substantially
higher mortality risk in COVID-19. Furthermore, it seems likely that
fine particulates prolong the atmospheric lifetime of infectious
viruses, thus favouring transmission. It is possible that future
research will reveal additional pathways that mediate the relationship
between air pollution and the risk of death from COVID-19.
15. In article by Aparna Banerjea titled ‘After studies, it’s clear that
air pollution contributes to Covid mortality: ICMR’ Mint, 27 October
2020’, it is mentioned that the ICMR studies have proved that long-
term exposure to air pollution has been linked to an increased risk
of dying from Covid-19. It is further stated that there have been
studies from Europe and US, where they have looked at polluted
areas and have compared mortality during lockdown and correlation
with pollution. “It is found that pollution is contributing to
mortality in COVID, that's well established by studies," said Dr.
Balram Bhargava, DG ICMR, in a health ministry briefing today.
According to a study, published in Cardiovascular Research,
scientists estimated that about 15% of deaths worldwide from
COVID-19 could be attributed to long-term exposure to air pollution.
In Europe the proportion was about 19%, in North America it was
17%, and in East Asia about 27%.
…. …. ….
The study further mentions that the Air Quality Index (AQI) (as
on 04.11.2020) was recorded at 346 in Rohini, 329 in RK Puram,
377 in Anand Vihar, and 363 in Mundka, all four in the 'very poor'
category, as per Central Pollution Control Board (CPCB) data. In an
attempt to curb the increasing air pollution in the national capital,
the Delhi government recently launched the 'Red Light On, Gaadi
526
24
Off' campaign as part of its 'Yuddh Pradushan Ke Viruddh' (War
Against Pollution) initiative. Along with this, Delhi Environment
Minister Gopal Rai had also announced the launch of a campaign
starting on Monday to include the citizens of the capital in raising
awareness on air pollution.
16. In article by Sandipan Talukdar titled ‘Air Pollution May Account
for 15% of COVID-19 Deaths Worldwide, Says New Study’, News Click,
28 October 2020, similar observations have been made.
It is stated that Prof. Jos Lelieveld of Max Planck Institute of
Chemistry, Mainz, Germany, and a corresponding author of the study
said “Since the numbers of deaths from COVID-19 are increasing all the
time, it’s not possible to give exact or final numbers of COVID-19 deaths
per country that can be attributed to air pollution. However, as an
example, in the UK there have been over 44,000 coronavirus deaths and
we estimate that the fraction attributable to air pollution is 14%,
meaning that more than 6,100 deaths could be attributed to air
pollution. In the USA, more than 220,000 COVID deaths with a fraction
of 18% yields about 40,000 deaths attributable to air pollution.”
On the mechanism of how PM2.5 can aggravate the respiratory
disease, Prof. Thomas Munzel of Gutenberg University, Germany,
said “When people inhale polluted air, the very small polluting
particles, the PM2.5, migrate from the lungs to the blood and blood
vessels, causing inflammation and severe oxidative stress, which is
an imbalance between free radicals and oxidants in the body that
normally repair damage to cells. This causes damage to the inner
lining of arteries, the endothelium, and leads to the narrowing and
stiffening of the arteries. The COVID-19 virus also enters the body
527
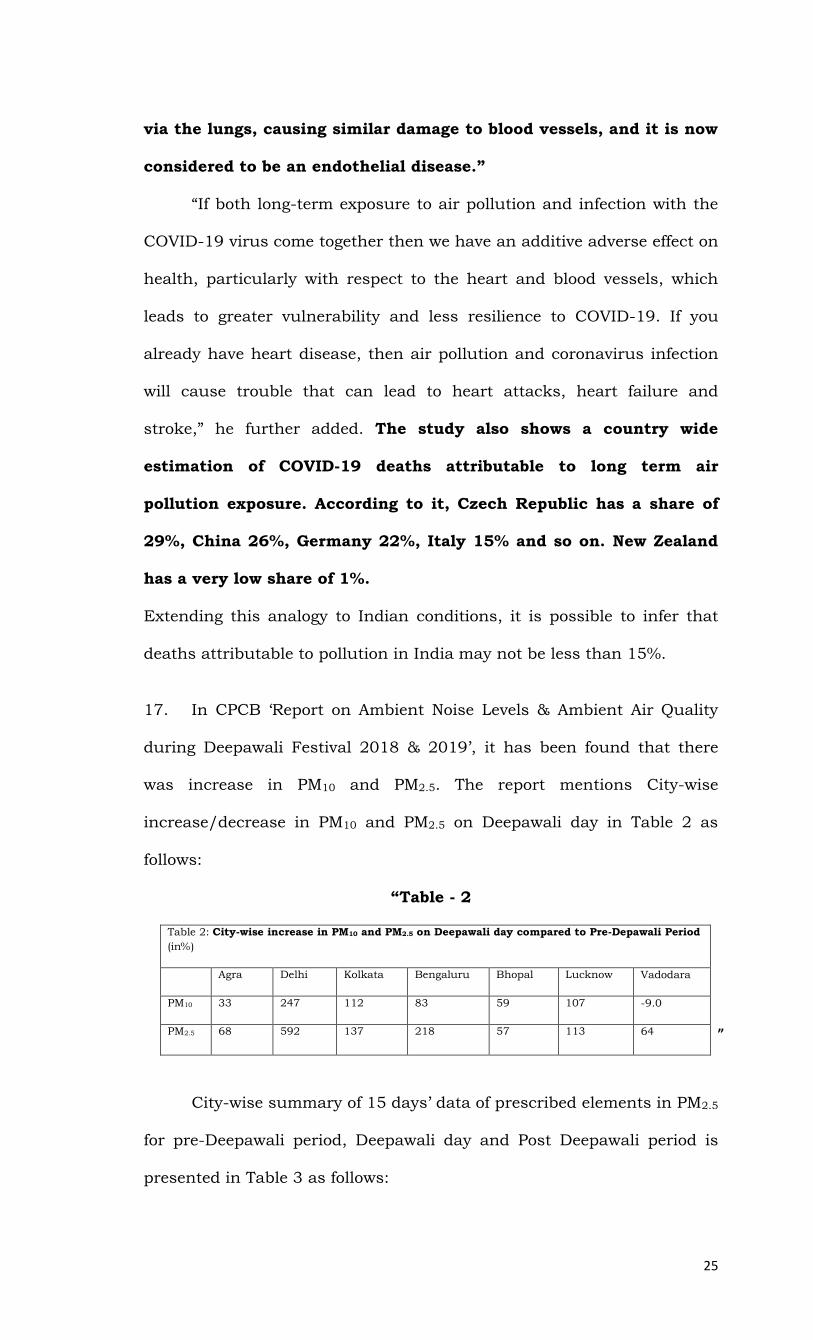
25
via the lungs, causing similar damage to blood vessels, and it is now
considered to be an endothelial disease.”
“If both long-term exposure to air pollution and infection with the
COVID-19 virus come together then we have an additive adverse effect on
health, particularly with respect to the heart and blood vessels, which
leads to greater vulnerability and less resilience to COVID-19. If you
already have heart disease, then air pollution and coronavirus infection
will cause trouble that can lead to heart attacks, heart failure and
stroke,” he further added. The study also shows a country wide
estimation of COVID-19 deaths attributable to long term air
pollution exposure. According to it, Czech Republic has a share of
29%, China 26%, Germany 22%, Italy 15% and so on. New Zealand
has a very low share of 1%.
Extending this analogy to Indian conditions, it is possible to infer that
deaths attributable to pollution in India may not be less than 15%.
17. In CPCB ‘Report on Ambient Noise Levels & Ambient Air Quality
during Deepawali Festival 2018 & 2019’, it has been found that there
was increase in PM10 and PM2.5. The report mentions City-wise
increase/decrease in PM10 and PM2.5 on Deepawali day in Table 2 as
follows:
“Table - 2
Table 2: City-wise increase in PM10 and PM2.5 on Deepawali day compared to Pre-Depawali Period
(in%)
Agra Delhi Kolkata Bengaluru Bhopal Lucknow Vadodara
PM10 33 247 112 83 59 107 -9.0
PM2.5 68 592 137 218 57 113 64 ”
City-wise summary of 15 days’ data of prescribed elements in PM2.5
for pre-Deepawali period, Deepawali day and Post Deepawali period is
presented in Table 3 as follows:
528
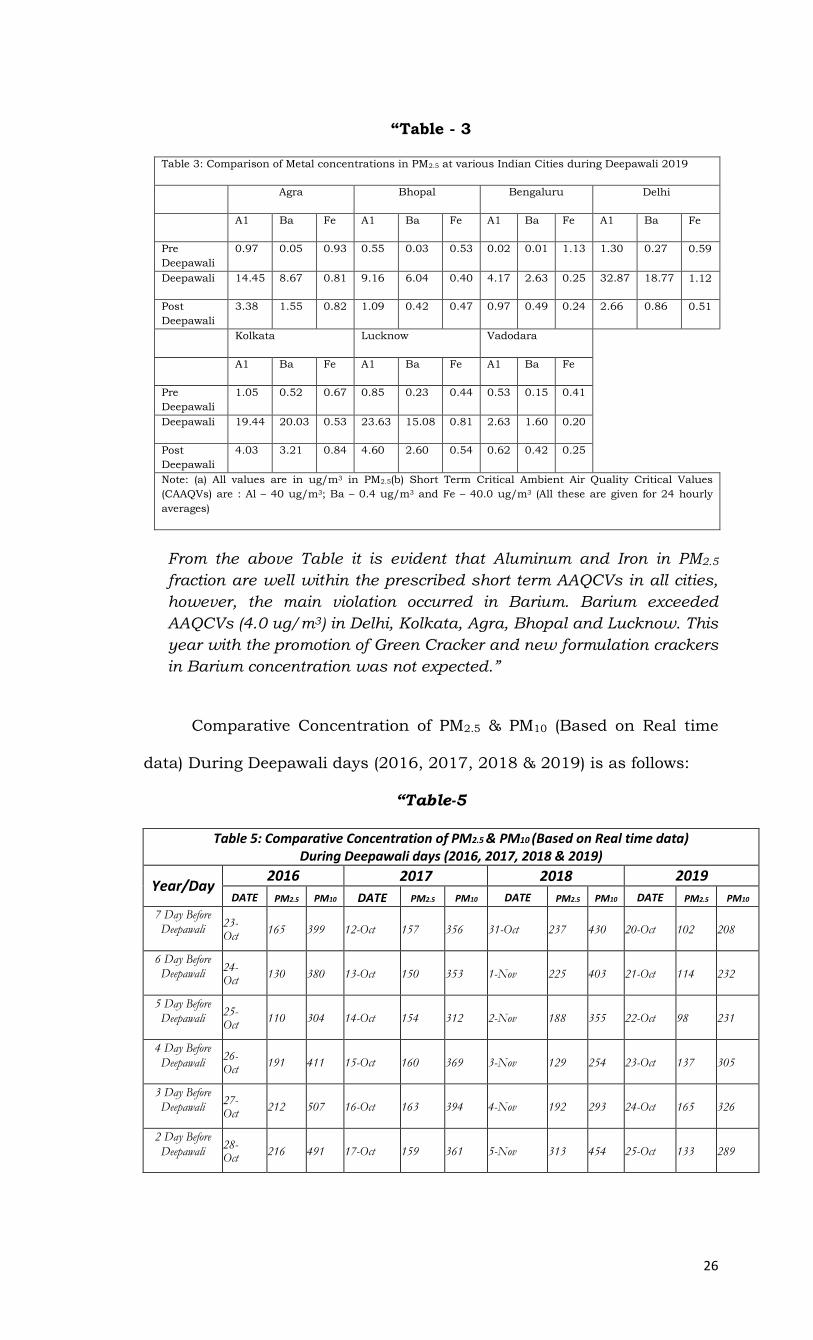
26
“Table - 3
Table 3: Comparison of Metal concentrations in PM2.5 at various Indian Cities during Deepawali 2019
Agra Bhopal Bengaluru Delhi
A1 Ba Fe A1 Ba Fe A1 Ba Fe A1 Ba Fe
Pre
Deepawali
0.97 0.05 0.93 0.55 0.03 0.53 0.02 0.01 1.13 1.30 0.27 0.59
Deepawali 14.45 8.67 0.81 9.16 6.04 0.40 4.17 2.63 0.25 32.87 18.77 1.12
Post
Deepawali
3.38 1.55 0.82 1.09 0.42 0.47 0.97 0.49 0.24 2.66 0.86 0.51
Kolkata Lucknow Vadodara
A1 Ba Fe A1 Ba Fe A1 Ba Fe
Pre
Deepawali
1.05 0.52 0.67 0.85 0.23 0.44 0.53 0.15 0.41
Deepawali 19.44 20.03 0.53 23.63 15.08 0.81 2.63 1.60 0.20
Post
Deepawali
4.03 3.21 0.84 4.60 2.60 0.54 0.62 0.42 0.25
Note: (a) All values are in ug/m3 in PM2.5(b) Short Term Critical Ambient Air Quality Critical Values
(CAAQVs) are : Al – 40 ug/m3; Ba – 0.4 ug/m3 and Fe – 40.0 ug/m3 (All these are given for 24 hourly
averages)
From the above Table it is evident that Aluminum and Iron in PM2.5
fraction are well within the prescribed short term AAQCVs in all cities,
however, the main violation occurred in Barium. Barium exceeded
AAQCVs (4.0 ug/m3) in Delhi, Kolkata, Agra, Bhopal and Lucknow. This
year with the promotion of Green Cracker and new formulation crackers
in Barium concentration was not expected.”
Comparative Concentration of PM2.5 & PM10 (Based on Real time
data) During Deepawali days (2016, 2017, 2018 & 2019) is as follows:
“Table-5
Table 5: Comparative Concentration of PM2.5 & PM10 (Based on Real time data) During Deepawali days (2016, 2017, 2018 & 2019)
Year/Day 2016 2017 2018 2019
DATE PM2.5 PM10 DATE PM2.5 PM10 DATE PM2.5 PM10 DATE PM2.5 PM10
7 Day Before
Deepawali 23- Oct
165 399 12-Oct 157 356 31-Oct 237 430 20-Oct 102 208
6 Day Before Deepawali
24- Oct
130 380 13-Oct 150 353 1-Nov 225 403 21-Oct 114 232
5 Day Before
Deepawali 25- Oct
110 304 14-Oct 154 312 2-Nov 188 355 22-Oct 98 231
4 Day Before
Deepawali 26- Oct
191 411 15-Oct 160 369 3-Nov 129 254 23-Oct 137 305
3 Day Before
Deepawali 27- Oct
212 507 16-Oct 163 394 4-Nov 192 293 24-Oct 165 326
2 Day Before
Deepawali 28- Oct
216 491 17-Oct 159 361 5-Nov 313 454 25-Oct 133 289
529
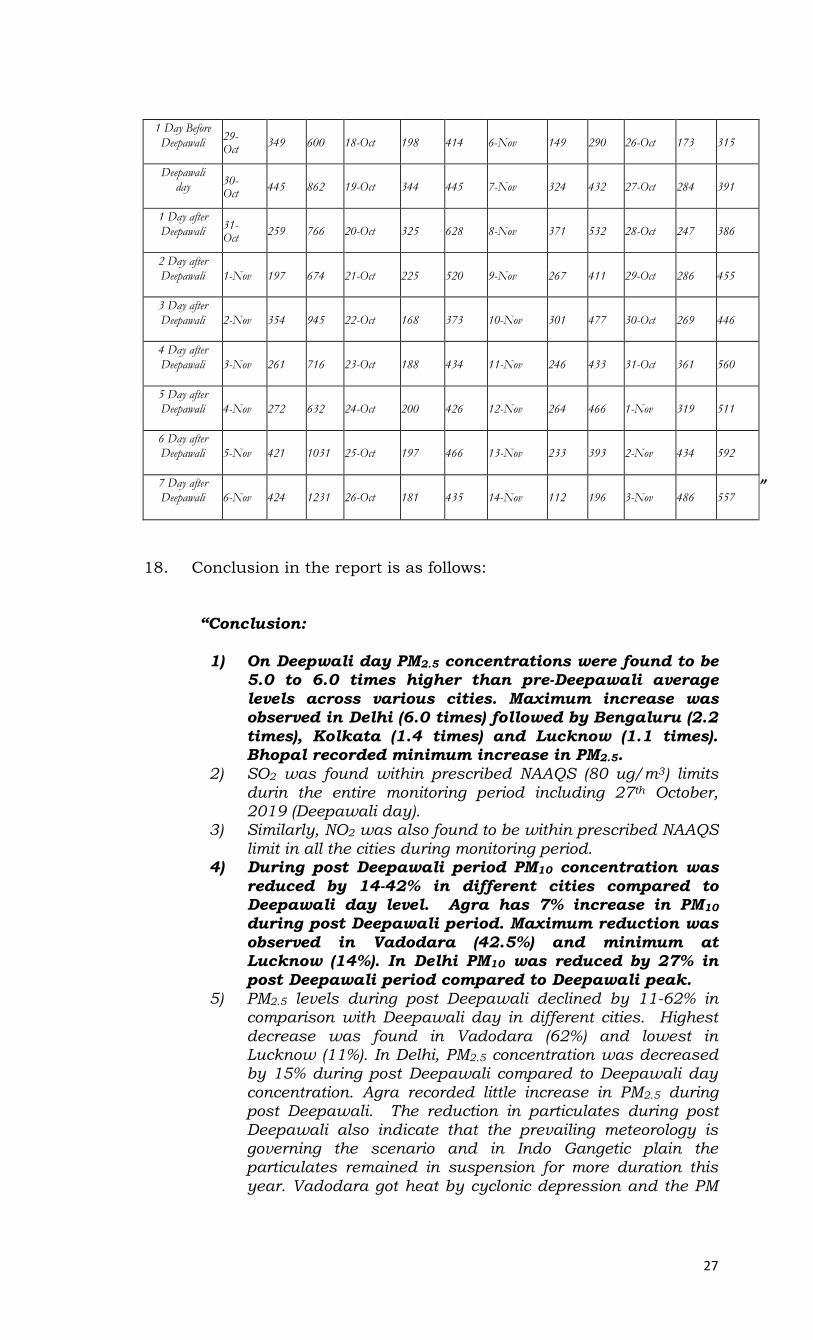
27
1 Day Before
Deepawali 29- Oct
349 600 18-Oct 198 414 6-Nov 149 290 26-Oct 173 315
Deepawali
day 30- Oct
445 862 19-Oct 344 445 7-Nov 324 432 27-Oct 284 391
1 Day after
Deepawali 31- Oct
259 766 20-Oct 325 628 8-Nov 371 532 28-Oct 247 386
2 Day after
Deepawali 1-Nov 197 674 21-Oct 225 520 9-Nov 267 411 29-Oct 286 455
3 Day after
Deepawali 2-Nov 354 945 22-Oct 168 373 10-Nov 301 477 30-Oct 269 446
4 Day after
Deepawali 3-Nov 261 716 23-Oct 188 434 11-Nov 246 433 31-Oct 361 560
5 Day after Deepawali 4-Nov 272 632 24-Oct 200 426 12-Nov 264 466 1-Nov 319 511
6 Day after
Deepawali 5-Nov 421 1031 25-Oct 197 466 13-Nov 233 393 2-Nov 434 592
7 Day after
Deepawali 6-Nov 424 1231 26-Oct 181 435 14-Nov 112 196 3-Nov 486 557 ”
18. Conclusion in the report is as follows:
“Conclusion:
1) On Deepwali day PM2.5 concentrations were found to be
5.0 to 6.0 times higher than pre-Deepawali average
levels across various cities. Maximum increase was observed in Delhi (6.0 times) followed by Bengaluru (2.2
times), Kolkata (1.4 times) and Lucknow (1.1 times). Bhopal recorded minimum increase in PM2.5.
2) SO2 was found within prescribed NAAQS (80 ug/m3) limits durin the entire monitoring period including 27th October, 2019 (Deepawali day).
3) Similarly, NO2 was also found to be within prescribed NAAQS limit in all the cities during monitoring period.
4) During post Deepawali period PM10 concentration was
reduced by 14-42% in different cities compared to Deepawali day level. Agra has 7% increase in PM10 during post Deepawali period. Maximum reduction was
observed in Vadodara (42.5%) and minimum at Lucknow (14%). In Delhi PM10 was reduced by 27% in
post Deepawali period compared to Deepawali peak.
5) PM2.5 levels during post Deepawali declined by 11-62% in comparison with Deepawali day in different cities. Highest decrease was found in Vadodara (62%) and lowest in Lucknow (11%). In Delhi, PM2.5 concentration was decreased by 15% during post Deepawali compared to Deepawali day concentration. Agra recorded little increase in PM2.5 during post Deepawali. The reduction in particulates during post Deepawali also indicate that the prevailing meteorology is governing the scenario and in Indo Gangetic plain the particulates remained in suspension for more duration this year. Vadodara got heat by cyclonic depression and the PM
530
28
concentrations reduced substantially due to high wind speed and rain.
6) Barium exceeded AAQCVs (4.0 ug/m3) in Delhi, Kolkata, Agra, Bhopal and Lucknow. This year with the
promotion of Green Cracker and new formulation crackers increase in Barium concentration was not expected.
7) The concentration of Iron in PM2.5 was found well within the AAQCVs (40 ug/m3) in all the cities monitored by CPCB.
8) Aluminium levels were also found within AAQCVs (40 ug/m3).
9) In Delhi Barium in PM2.5 got reduced by about three
times this year on Deepawali day. It is also pertinent to mention that with the introduction of Green Cracker and banning of Barium in fireworks as directed by
Hon’ble Supreme Court, Barium concentration was not supposed to be elevated from pre-Deepawali level in
Deepawali day.”
19. In ‘State of Global Air 2020’ report released by the Health Effects
Institute and the Institute for Health Metrics and Evaluation’s Global
Burden of Disease Project, it is stated that:
“Extensive evidence links exposure to air pollution with higher rates of respiratory and cardiovascular diseases including lower-respiratory infections. Could air pollution also increase a
person’s risk of developing a COVID-19 respiratory infection or suffering its most severe complications?
There is reason to believe it could SARS-CoV-2, the corona virus that causes COVID-19, is a respiratory virus that can affect the lungs, blood vessels, and many other parts of the
body. Exposure to air pollution has been shown to affect the body’s immune defense, making an individual more
susceptible to respiratory and other infections. In addition, many of the health conditions that have been associated with increased vulnerability to COVID-19-such as diabetes,
cardiovascular disease, and chronic obstructive lung diseases-are also caused by long-term exposure to air pollution.
What we learned from the SARS-CoV-1 outbreak in 2002-2004 offers some insight into the interaction between air pollution and the effects of COVID-19. Several studies reported an association between higher air pollution concentrations and higher than expected death rates from SARS-CoV-1 handful of early studies of COVID-19 appear to suggest that areas with higher air pollution concentrations-PM2.5 or NO2 in particular-might similarly experience either higher infection rates or higher case fatality rates. Investigators around the world are hard at work trying to understand fully the linkages between COVID-19 and air pollution, and how exposure to air pollution might affect rates of COVID-19 infection, the severity of disease, or the likelihood of dying.”
20. It has been concluded that:
531
29
“Air pollution – comprising ambient PM2.5 ozone and household air pollution is an increasingly important risk
factor contributing to death and disability worldwide. In 2019, air pollution ranked 4th among major mortality risk
factors globally, accounting for nearly 6.75 million early deaths and 213 million years of healthy life lost. Ambient PM2.5 accounted for 4.14 million deaths (118 million years of
healthy life lost); household air pollution accounted for 2.31 million deaths 365,000 early deaths (6.21 million years of healthy life lost). Taken together these forms of air pollution
accounted for more than 1 in 9 deaths worldwide in 2019.”
… … …
“Does Air Quality Affect COVID-19 Susceptibility?
The health effects of long-term exposure to air pollution have likely made some people more vulnerable to COVID-19. Here’s what we know about the possible connections so far:
Long-term exposure to air pollution can cause many of the health conditions associated with increased
vulnerability to COVID-19, such as diabetes, cardiovascular disease, and chronic obstructive lung diseases.
Exposure to air pollution has been shown to affect the body’s immune defense, increasing susceptibility to
respiratory and other infections.
Studies of the SARS-CoV-1 outbreak in 2002-2004
reported as association between higher air pollution levels and higher than expected death rates for that
disease.
A few early studies of COVID-19 similarly appear to
suggest that areas with higher air pollution levels experience higher rates of infection or of case fatalities.
Further Submissions of the amicus
21. Shri Panjwani submitted that Covid-19 issue has not been factored
in when the Hon’ble Supreme Court permitted limited use of green
crackers. In any case, even green crackers only partly reduce pollution.
With Covid-19, even reduced pollution becomes hazardous. What may be
permitted in normal time can also not be permitted during Covid-19.
That is the reason for the ban by the States which was never considered
without Covid. The States have gone by expert advice in doing so. There
is enough material indicting nexus between the pollution and the Covid
and that the increased pollution will increase Covid impact by reducing
immunity level rendering citizens susceptible to more diseases which
532
30
may affect lungs, heart and cause cancer. With co-morbidities Covid
impact may be higher in NCR and other areas where air quality is not
satisfactory. Air quality in Delhi in November is around 400 as per Air
Quality Index (AQI) and every feasible step is required to be taken to
reduce air pollution and prevent increase thereof.
It is further pointed out that the Hon’ble Supreme Court stipulated
community celebrations involving bursting of crackers which is not
permissible during Covid pandemic.
It is further submitted that even if conclusive scientific evidence is
not available, Precautionary principle need to be invoked, as per law laid
down by the Hon’ble Supreme Court in the orders referred to in the order
dated 2.11.2020.
Media Reports Referred
22. Following media reports have also been referred to by learned
Amicus:
“i. ‘Coronavirus: Delhi health minister blames pollution, winters, festive season for rise in cases’, Scroll.in, 31 October 202011
ii. Abantika Ghosh, ‘Covid virus found on pollution particles, masks & social distancing a must, say govt experts’, ThePrint, 27 October 2020.12
iii. Durgesh Nandan Jha, ‘From Record 5.9k Last Fri, City Cases Soar To 6,725’, The Times of India, 4 November 202013.”
The above media reports refer to the nexus between air pollution
and deaths and diseases particularly during winter and festive season
with reference to the statements of the Delhi Health Minister and the
Union Health Minister in support of the said statement. There is further
11
https://scroll.in/latest/977303/coronavirus-delhi-health-minister-blames-pollution-winters-festive-season-for-rise-in-cases
12 https://theprint.in/health/covid-virus-found-on-pollution-particles-masks-social-distancing-a-must-say-govt-
experts/531981/ 13
https://timesofindia.indiatimes.com/city/delhi/Covid-19-From-record-5900-last-Friday-Delhi-cases-soar-to-6725/articleshow/79031687.cms
533
31
reference to apprehended increase of Covid cases on account of air
increased pollution.
The news item in ‘Times of India’ dated 04.11.2020 mentions that
Delhi recorded 6,725 new cases of Covid-19 – its highest single-day tally
– on Tuesday, taking the total number of cases to over 4,00,000 even as
hospitals struggled to accommodate the critically ill patients due to
paucity of ICU beds. This is leading to increased demand for the hospital
beds and increased mortality figures. The increasing trend is clearly
attributable to the deteriorating air pollution level.
Other Media reports and Global Trends
23. Apart from the media reports relied upon by the learned Amicus,
there are other media reports to which reference may be made as follows:
a) ASRP Mukesh, ‘Ban firecrackers or prepare for Covid
disaster, warn docs’ Times of India, 30 October, 2020.14
b) Science, ‘Smoky firecrackers can spread coronavirus faster: Experts, Deccan Chronical, 4 November, 2020.15
c) Cole Sullivan, ‘COVID cancellations hit fireworks display companies hard’ 10 News, 11.06.2020.16
d) ‘BEFORE BURNING CRACKERS LOOK AT US AND BE
CONSIDERATE, SYMPATHETIC AND HUMANE’ URGES COVID RECOVERED PATIENTS “DEEPAVALI DOES NOT
MEAN BURNING CRACKERS FOR ENJOYMENT”- BISWAJIT MUKHERJEE 07.11.2020, PIB Kolkata.17
e) ‘After falling for 7 weeks, Covid-19 cases in India rise’, Times of India, 09.11.2020.18
f) Stephanie Pagones, ‘Coronavirus-prompted July 4th
cancellations leave fireworks display companies 'on life support', FOX Business, 02.07.2020.19
14
https://timesofindia.indiatimes.com/city/ranchi/ban-firecrackers-or-prepare-for-covid-disaster-warn-docs/articleshow/78941525.cms
15 https://www.deccanchronicle.com/nation/in-other-news/031120/smoky-firecrackers-can-spread-coronavirus-
faster-experts.html 16
https://www.wbir.com/article/news/health/coronavirus/covid-cancellations-hit-fireworks-display-companies-hard/51-f16191a3-fdbb-44a3-8447-de4454d761b5
17 https://pib.gov.in/PressReleasePage.aspx?PRID=1671145
18 https://timesofindia.indiatimes.com/india/after-falling-for-7-weeks-covid-19-cases-in-india-rise-
again/articleshow/79119707.cms
534
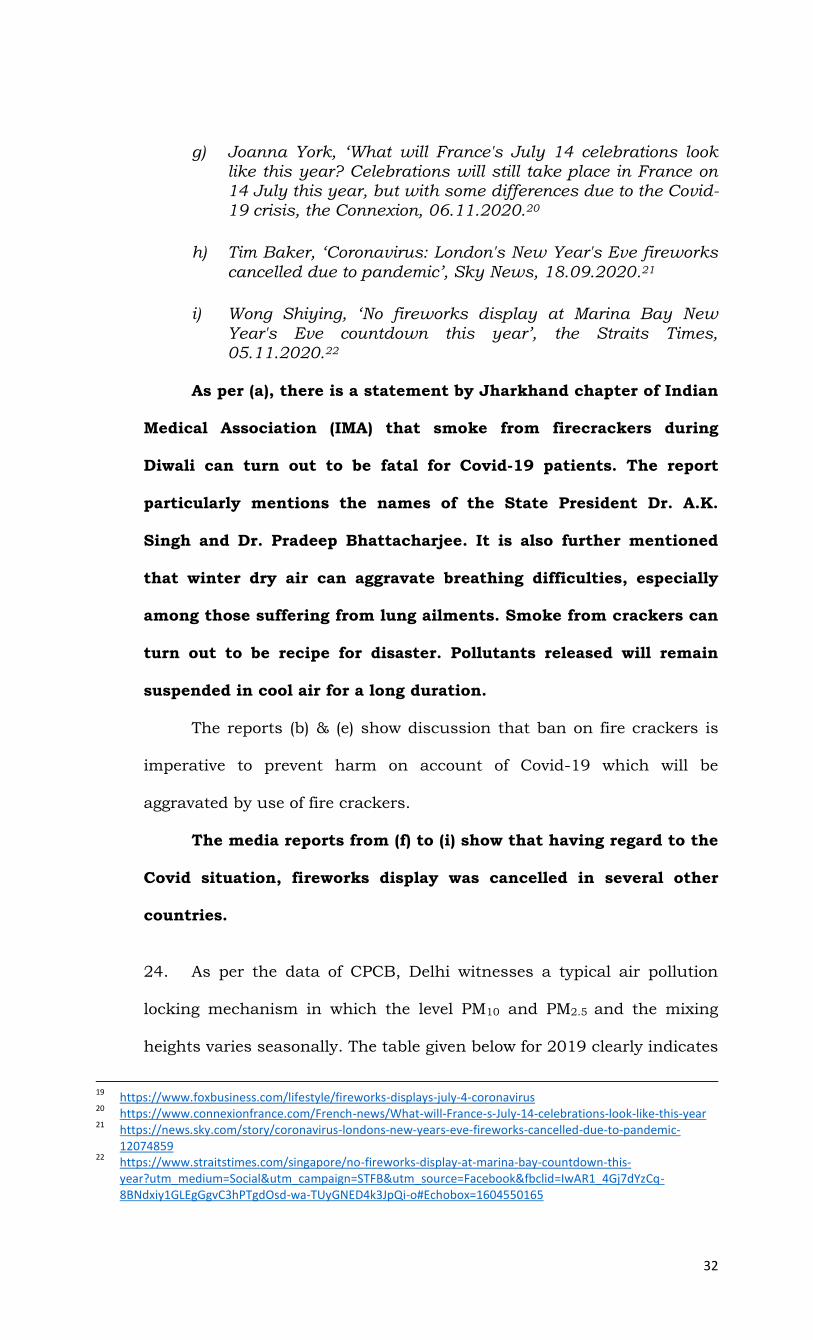
32
g) Joanna York, ‘What will France's July 14 celebrations look like this year? Celebrations will still take place in France on 14 July this year, but with some differences due to the Covid-19 crisis, the Connexion, 06.11.2020.20
h) Tim Baker, ‘Coronavirus: London's New Year's Eve fireworks
cancelled due to pandemic’, Sky News, 18.09.2020.21
i) Wong Shiying, ‘No fireworks display at Marina Bay New
Year's Eve countdown this year’, the Straits Times, 05.11.2020.22
As per (a), there is a statement by Jharkhand chapter of Indian
Medical Association (IMA) that smoke from firecrackers during
Diwali can turn out to be fatal for Covid-19 patients. The report
particularly mentions the names of the State President Dr. A.K.
Singh and Dr. Pradeep Bhattacharjee. It is also further mentioned
that winter dry air can aggravate breathing difficulties, especially
among those suffering from lung ailments. Smoke from crackers can
turn out to be recipe for disaster. Pollutants released will remain
suspended in cool air for a long duration.
The reports (b) & (e) show discussion that ban on fire crackers is
imperative to prevent harm on account of Covid-19 which will be
aggravated by use of fire crackers.
The media reports from (f) to (i) show that having regard to the
Covid situation, fireworks display was cancelled in several other
countries.
24. As per the data of CPCB, Delhi witnesses a typical air pollution
locking mechanism in which the level PM10 and PM2.5 and the mixing
heights varies seasonally. The table given below for 2019 clearly indicates
19
https://www.foxbusiness.com/lifestyle/fireworks-displays-july-4-coronavirus 20
https://www.connexionfrance.com/French-news/What-will-France-s-July-14-celebrations-look-like-this-year 21
https://news.sky.com/story/coronavirus-londons-new-years-eve-fireworks-cancelled-due-to-pandemic-12074859
22 https://www.straitstimes.com/singapore/no-fireworks-display-at-marina-bay-countdown-this-
year?utm_medium=Social&utm_campaign=STFB&utm_source=Facebook&fbclid=IwAR1_4Gj7dYzCq-8BNdxiy1GLEgGgvC3hPTgdOsd-wa-TUyGNED4k3JpQi-o#Echobox=1604550165
535
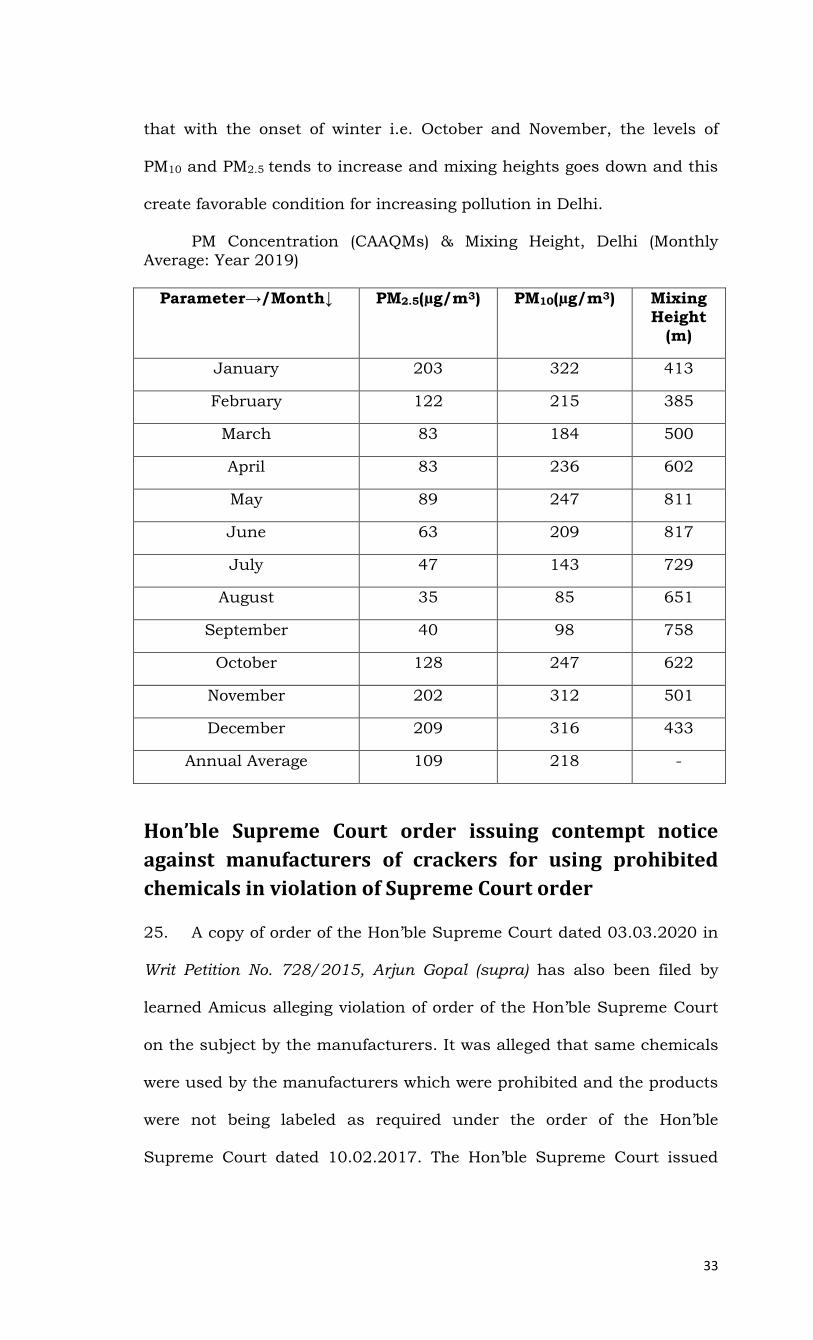
33
that with the onset of winter i.e. October and November, the levels of
PM10 and PM2.5 tends to increase and mixing heights goes down and this
create favorable condition for increasing pollution in Delhi.
PM Concentration (CAAQMs) & Mixing Height, Delhi (Monthly
Average: Year 2019)
Parameter→/Month↓ PM2.5(µg/m3) PM10(µg/m3) Mixing Height
(m)
January 203 322 413
February 122 215 385
March 83 184 500
April 83 236 602
May 89 247 811
June 63 209 817
July 47 143 729
August 35 85 651
September 40 98 758
October 128 247 622
November 202 312 501
December 209 316 433
Annual Average 109 218 -
Hon’ble Supreme Court order issuing contempt notice
against manufacturers of crackers for using prohibited
chemicals in violation of Supreme Court order
25. A copy of order of the Hon’ble Supreme Court dated 03.03.2020 in
Writ Petition No. 728/2015, Arjun Gopal (supra) has also been filed by
learned Amicus alleging violation of order of the Hon’ble Supreme Court
on the subject by the manufacturers. It was alleged that same chemicals
were used by the manufacturers which were prohibited and the products
were not being labeled as required under the order of the Hon’ble
Supreme Court dated 10.02.2017. The Hon’ble Supreme Court issued
536
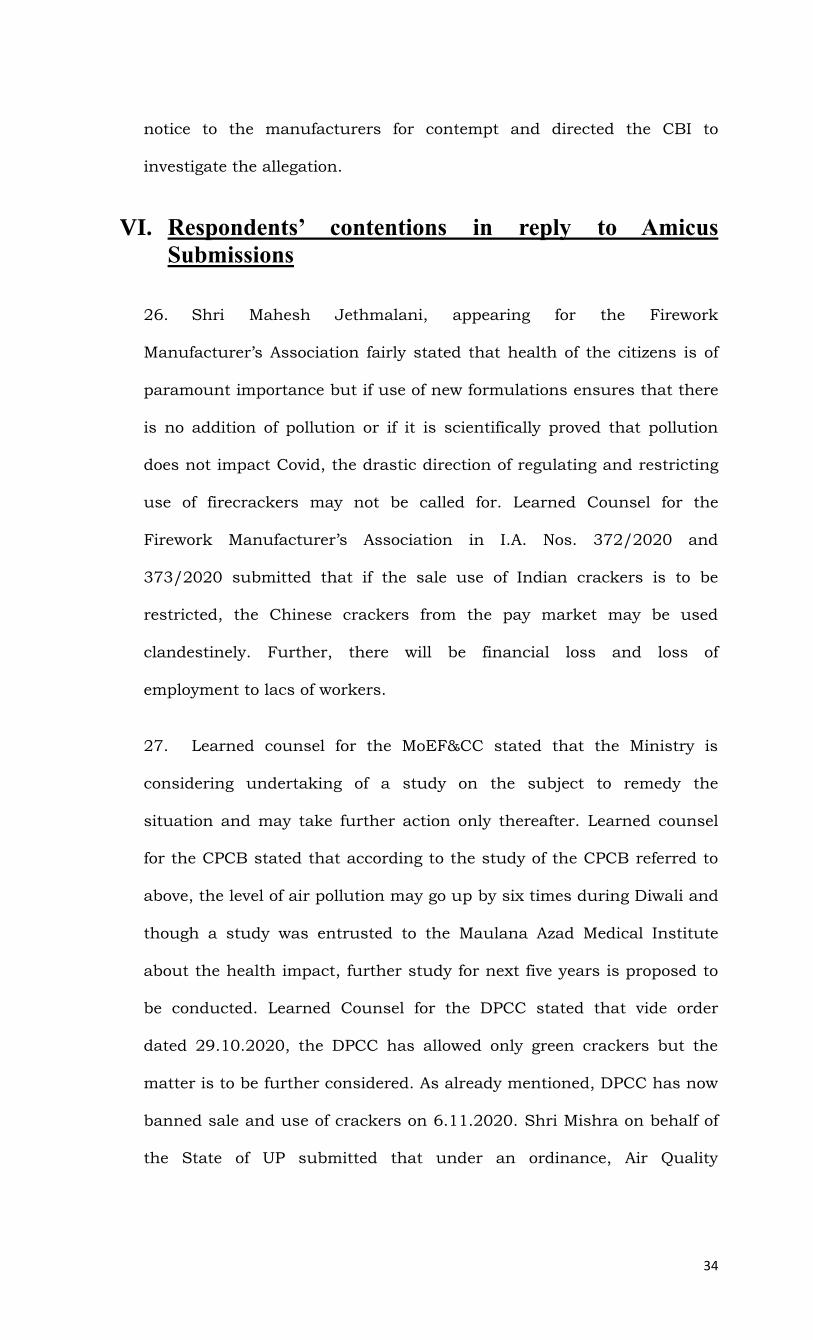
34
notice to the manufacturers for contempt and directed the CBI to
investigate the allegation.
VI. Respondents’ contentions in reply to Amicus
Submissions
26. Shri Mahesh Jethmalani, appearing for the Firework
Manufacturer’s Association fairly stated that health of the citizens is of
paramount importance but if use of new formulations ensures that there
is no addition of pollution or if it is scientifically proved that pollution
does not impact Covid, the drastic direction of regulating and restricting
use of firecrackers may not be called for. Learned Counsel for the
Firework Manufacturer’s Association in I.A. Nos. 372/2020 and
373/2020 submitted that if the sale use of Indian crackers is to be
restricted, the Chinese crackers from the pay market may be used
clandestinely. Further, there will be financial loss and loss of
employment to lacs of workers.
27. Learned counsel for the MoEF&CC stated that the Ministry is
considering undertaking of a study on the subject to remedy the
situation and may take further action only thereafter. Learned counsel
for the CPCB stated that according to the study of the CPCB referred to
above, the level of air pollution may go up by six times during Diwali and
though a study was entrusted to the Maulana Azad Medical Institute
about the health impact, further study for next five years is proposed to
be conducted. Learned Counsel for the DPCC stated that vide order
dated 29.10.2020, the DPCC has allowed only green crackers but the
matter is to be further considered. As already mentioned, DPCC has now
banned sale and use of crackers on 6.11.2020. Shri Mishra on behalf of
the State of UP submitted that under an ordinance, Air Quality
537
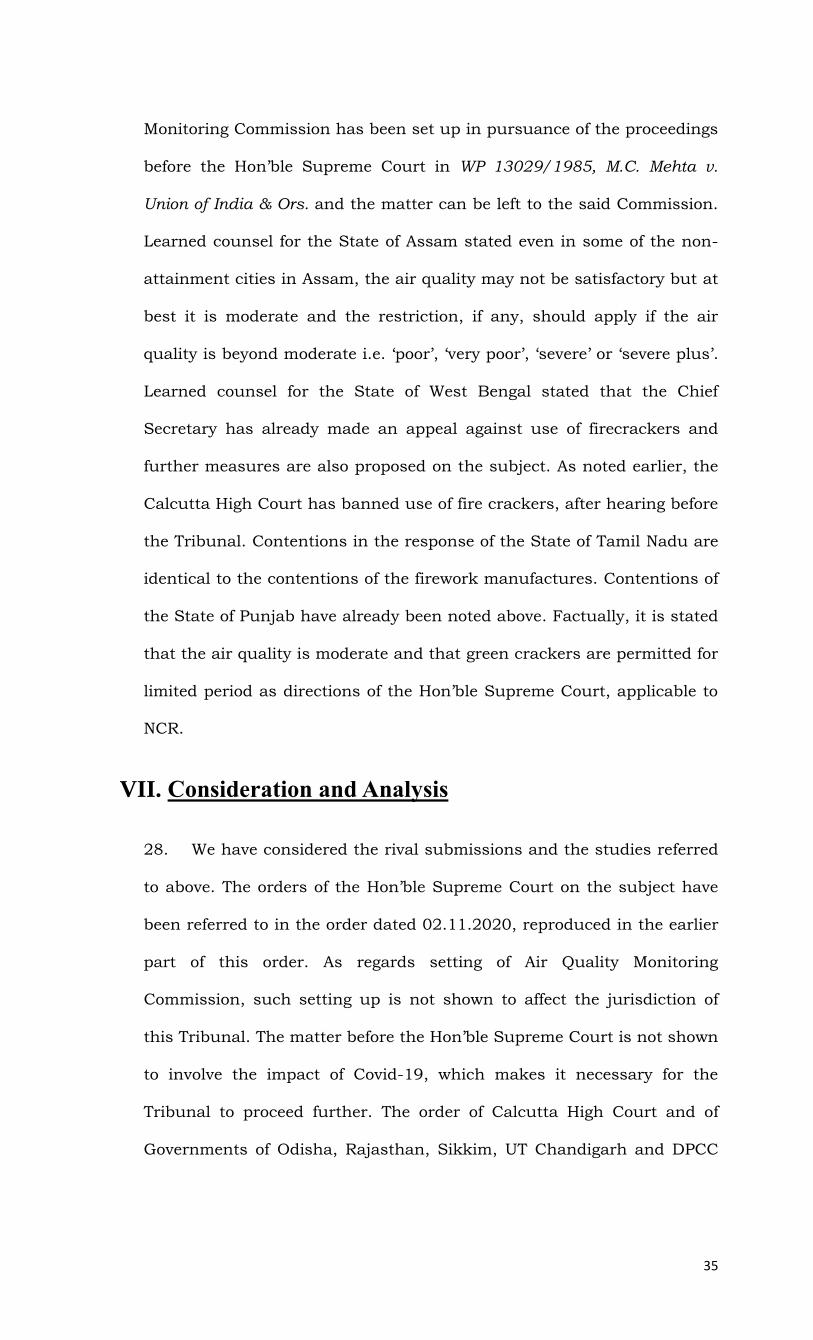
35
Monitoring Commission has been set up in pursuance of the proceedings
before the Hon’ble Supreme Court in WP 13029/1985, M.C. Mehta v.
Union of India & Ors. and the matter can be left to the said Commission.
Learned counsel for the State of Assam stated even in some of the non-
attainment cities in Assam, the air quality may not be satisfactory but at
best it is moderate and the restriction, if any, should apply if the air
quality is beyond moderate i.e. ‘poor’, ‘very poor’, ‘severe’ or ‘severe plus’.
Learned counsel for the State of West Bengal stated that the Chief
Secretary has already made an appeal against use of firecrackers and
further measures are also proposed on the subject. As noted earlier, the
Calcutta High Court has banned use of fire crackers, after hearing before
the Tribunal. Contentions in the response of the State of Tamil Nadu are
identical to the contentions of the firework manufactures. Contentions of
the State of Punjab have already been noted above. Factually, it is stated
that the air quality is moderate and that green crackers are permitted for
limited period as directions of the Hon’ble Supreme Court, applicable to
NCR.
VII. Consideration and Analysis
28. We have considered the rival submissions and the studies referred
to above. The orders of the Hon’ble Supreme Court on the subject have
been referred to in the order dated 02.11.2020, reproduced in the earlier
part of this order. As regards setting of Air Quality Monitoring
Commission, such setting up is not shown to affect the jurisdiction of
this Tribunal. The matter before the Hon’ble Supreme Court is not shown
to involve the impact of Covid-19, which makes it necessary for the
Tribunal to proceed further. The order of Calcutta High Court and of
Governments of Odisha, Rajasthan, Sikkim, UT Chandigarh and DPCC
538
36
are in the wake of Covid-19 and are relevant for consideration by this
Tribunal in the present context.
29. Financial loss or loss of employment cannot be a consideration not
to remedy the situation affecting lives and health of the citizens by
pollution, aggravated by Covid. While it is true that any restriction on
sale and use of crackers may affect the business and employment, at the
same time if use of crackers results in pollution and affects life and
health of the citizens and the environment, such use may have to be
restricted/prohibited to effectuate the ‘Sustainable Development’
principle of which ‘Precautionary’ principle is a part, as per mandate of
Section 20 read with Section 15 of the National Green Tribunal Act,
2010. Citizens are entitled to breathe fresh air which right cannot be
defeated on the ground that enforcement of such right will lead to closing
of such business activity. If authorities, do not take action, the Tribunal
has to exercise its jurisdiction.
30. The matter is no longer res integra. As rightly pointed out by
learned Amicus and not even disputed by learned senior advocate Shri
Jethmalani, right of trade is not absolute and is to be subject to the
‘Sustainable Development’ principle, which is part of right to life. In
emergency situation, emergency measures may be required in the
interest of life and health of the citizens.
Relevant Supreme Court Directions and Observations
31. The Hon’ble Supreme Court, vide order dated 11.11.201623, after
noting the air quality standard in Delhi and potential of diseases,
directed suspension of all licenses for sale of fireworks in NCR. It will be
appropriate to refer to the relevant observation:
23
(2017) 1 SCC 412
539
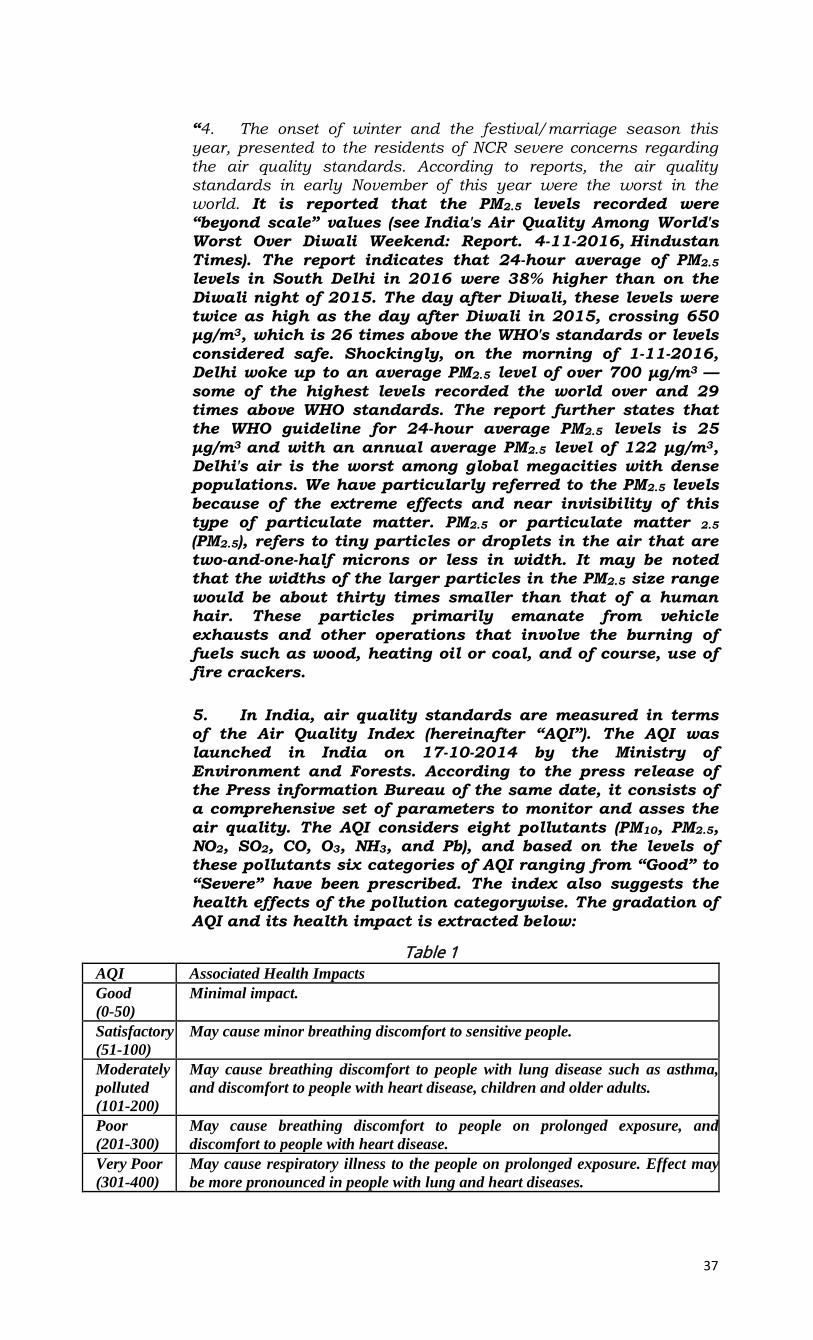
37
“4. The onset of winter and the festival/marriage season this year, presented to the residents of NCR severe concerns regarding the air quality standards. According to reports, the air quality standards in early November of this year were the worst in the world. It is reported that the PM2.5 levels recorded were “beyond scale” values (see India's Air Quality Among World's Worst Over Diwali Weekend: Report. 4-11-2016, Hindustan
Times). The report indicates that 24-hour average of PM2.5 levels in South Delhi in 2016 were 38% higher than on the
Diwali night of 2015. The day after Diwali, these levels were twice as high as the day after Diwali in 2015, crossing 650 μg/m3, which is 26 times above the WHO's standards or levels
considered safe. Shockingly, on the morning of 1-11-2016, Delhi woke up to an average PM2.5 level of over 700 μg/m3 —
some of the highest levels recorded the world over and 29 times above WHO standards. The report further states that the WHO guideline for 24-hour average PM2.5 levels is 25
μg/m3 and with an annual average PM2.5 level of 122 μg/m3, Delhi's air is the worst among global megacities with dense populations. We have particularly referred to the PM2.5 levels
because of the extreme effects and near invisibility of this type of particulate matter. PM2.5 or particulate matter 2.5
(PM2.5), refers to tiny particles or droplets in the air that are two-and-one-half microns or less in width. It may be noted that the widths of the larger particles in the PM2.5 size range
would be about thirty times smaller than that of a human hair. These particles primarily emanate from vehicle
exhausts and other operations that involve the burning of fuels such as wood, heating oil or coal, and of course, use of fire crackers.
5. In India, air quality standards are measured in terms of the Air Quality Index (hereinafter “AQI”). The AQI was launched in India on 17-10-2014 by the Ministry of
Environment and Forests. According to the press release of the Press information Bureau of the same date, it consists of a comprehensive set of parameters to monitor and asses the
air quality. The AQI considers eight pollutants (PM10, PM2.5, NO2, SO2, CO, O3, NH3, and Pb), and based on the levels of these pollutants six categories of AQI ranging from “Good” to
“Severe” have been prescribed. The index also suggests the health effects of the pollution categorywise. The gradation of
AQI and its health impact is extracted below:
Table 1 AQI Associated Health Impacts
Good
(0-50)
Minimal impact.
Satisfactory
(51-100)
May cause minor breathing discomfort to sensitive people.
Moderately
polluted
(101-200)
May cause breathing discomfort to people with lung disease such as asthma,
and discomfort to people with heart disease, children and older adults.
Poor
(201-300)
May cause breathing discomfort to people on prolonged exposure, and
discomfort to people with heart disease.
Very Poor
(301-400)
May cause respiratory illness to the people on prolonged exposure. Effect may
be more pronounced in people with lung and heart diseases.
540
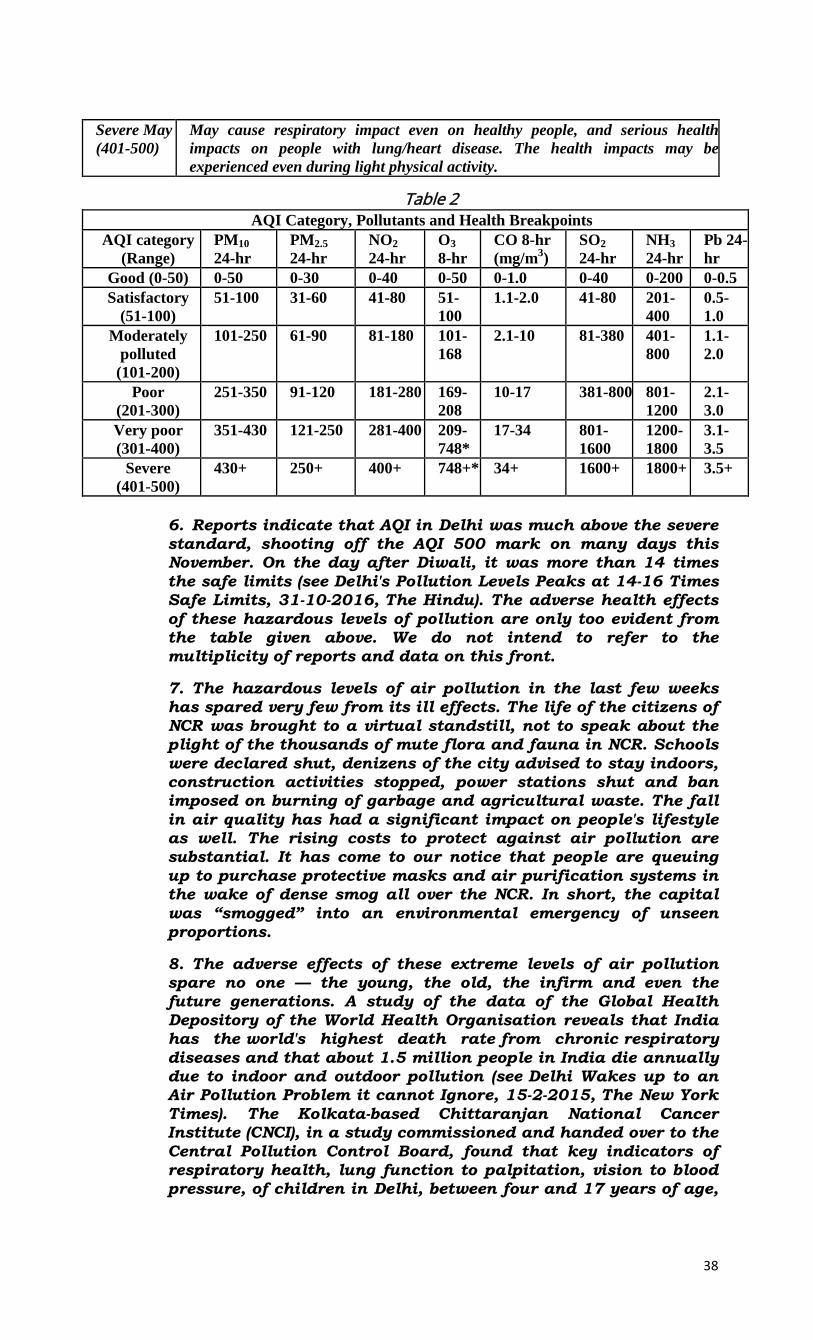
38
Severe May
(401-500)
May cause respiratory impact even on healthy people, and serious health
impacts on people with lung/heart disease. The health impacts may be
experienced even during light physical activity.
Table 2
AQI Category, Pollutants and Health Breakpoints
AQI category
(Range)
PM10
24-hr
PM2.5
24-hr
NO2
24-hr
O3
8-hr
CO 8-hr
(mg/m3)
SO2
24-hr
NH3
24-hr
Pb 24-
hr
Good (0-50) 0-50 0-30 0-40 0-50 0-1.0 0-40 0-200 0-0.5
Satisfactory
(51-100)
51-100 31-60 41-80 51-
100
1.1-2.0 41-80 201-
400
0.5-
1.0
Moderately
polluted
(101-200)
101-250 61-90 81-180 101-
168
2.1-10 81-380 401-
800
1.1-
2.0
Poor
(201-300)
251-350 91-120 181-280 169-
208
10-17 381-800 801-
1200
2.1-
3.0
Very poor
(301-400)
351-430 121-250 281-400 209-
748*
17-34 801-
1600
1200-
1800
3.1-
3.5
Severe
(401-500)
430+ 250+ 400+ 748+* 34+ 1600+ 1800+ 3.5+
6. Reports indicate that AQI in Delhi was much above the severe standard, shooting off the AQI 500 mark on many days this November. On the day after Diwali, it was more than 14 times
the safe limits (see Delhi's Pollution Levels Peaks at 14-16 Times Safe Limits, 31-10-2016, The Hindu). The adverse health effects
of these hazardous levels of pollution are only too evident from the table given above. We do not intend to refer to the multiplicity of reports and data on this front.
7. The hazardous levels of air pollution in the last few weeks has spared very few from its ill effects. The life of the citizens of
NCR was brought to a virtual standstill, not to speak about the plight of the thousands of mute flora and fauna in NCR. Schools
were declared shut, denizens of the city advised to stay indoors, construction activities stopped, power stations shut and ban imposed on burning of garbage and agricultural waste. The fall
in air quality has had a significant impact on people's lifestyle as well. The rising costs to protect against air pollution are substantial. It has come to our notice that people are queuing
up to purchase protective masks and air purification systems in the wake of dense smog all over the NCR. In short, the capital
was “smogged” into an environmental emergency of unseen proportions.
8. The adverse effects of these extreme levels of air pollution spare no one — the young, the old, the infirm and even the future generations. A study of the data of the Global Health
Depository of the World Health Organisation reveals that India has the world's highest death rate from chronic respiratory
diseases and that about 1.5 million people in India die annually due to indoor and outdoor pollution (see Delhi Wakes up to an Air Pollution Problem it cannot Ignore, 15-2-2015, The New York
Times). The Kolkata-based Chittaranjan National Cancer Institute (CNCI), in a study commissioned and handed over to the
Central Pollution Control Board, found that key indicators of respiratory health, lung function to palpitation, vision to blood pressure, of children in Delhi, between four and 17 years of age,
541
39
were worse off than their counterparts elsewhere. It also found that more than 40% of the school children suffer from lung
damage (see Landmark Study Lies Buried, 2-4-2015, The Indian Express). We note with apprehension that there are nascent
studies that suggest that pollution can lower children's IQ, hurt their test scores and increase the risks of autism, epilepsy, diabetes and even adult-onset diseases like multiple
sclerosis (see Holding Your Breath in India, 29-5-2015, The New York Times).
9. It has been brought to our notice that the severe air pollution in the NCR is leading to multiple diseases and other health
related issues amongst the people. It is said that the increase in respiratory diseases like asthma, lung cancer, bronchitis, etc. is primarily attributable to the worsening air quality in the NCR.
The damage being caused to people's lungs is said to be irreversible. Other health related issues like allergies, temporary deafness are also on the rise. Various experts have
pointed towards multiple adverse effects of air pollution on human health like premature deaths, rise in mortality rates,
palpitation, loss of vision, arthritis, heart ailments, cancer, etc.
10. When we refer to these extreme effects, we are not
merely referring to the inconvenience caused to people, but to abject deprivation of a range of constitutionally embedded rights that the residents of NCR ought to have enjoyed. Needless
to state, the grim situation of air quality adversely affected the right to education, work, health and ultimately, the right to life
of the citizens, and this Court is constitutionally bound to address their grave concerns. May we remind ourselves, that this is not the first time that this Court was impelled into
ensuring clean air for the citizens of the capital region (see M.C. Mehta v. Union of India [M.C. Mehta v. Union of India, (1998) 6
SCC 60] , [M.C. Mehta v. Union of India, (1998) 9 SCC 589] , M.C. Mehta v. Union of India [M.C. Mehta v. Union of India, (1998) 8 SCC 648] and M.C. Mehta v. Union of India [M.C. Mehta v. Union
of India, (1998) 8 SCC 206] ).”
32. After the above discussion, the Hon’ble Supreme Court directed
suspension of all licenses permitting sale of fireworks within the territory
of NCR. The direction was subsequently modified by orders dated
12.09.201724 and 23.10.201825 to the extent that only green crackers
were permitted for two hours on Diwali or other festivals, subject to
conditions laid down therein. Even in the said orders, it was observed
that health of the people had to take precedence over the commercial
interest and instead of straightaway prohibiting crackers, there has
24
(2017) 16 SCC 280 25
(2019) 13 SCC 523
542
40
be graded regulation, resulting in prohibition. It was also observed
that even when there are several sources of pollution, there is no bar to a
particular polluting activity being prohibited as there could be no right of
parity amongst the polluters. The ‘Precautionary’ principle was held to be
applicable even without a scientific study. Directions in order dated
23.10.2018, reported in Arjun Gopal v UOI, (2019) 13 Scc 523 are:
“48. We are of the opinion that the aforesaid suggestions strike a
nice balance between the two competing interests. We accept the aforesaid measures as suggested by the Union of India and direct the Union of India and other authorities concerned to implement the same with immediate effect. In view thereof, the following specific directions are issued: 48.1. The crackers with reduced emission (improved crackers) and green crackers, as mentioned in Suggestions II and III above only would be permitted to be manufactured and sold. 48.2. As a consequence, production and sale of crackers other than
those mentioned in Suggestions II and III is hereby banned. 48.3. The manufacture, sale and use of joined firecrackers (series
crackers or laris) is hereby banned as the same causes huge air, noise and solid waste problems. 48.4. The sale shall only be through licensed traders and it shall
be ensured that these licensed traders are selling those firecrackers which are permitted by this order. 48.5. No e-commerce websites, including Flipkart, Amazon, etc., shall accept any online orders and effect online sales. Any such e-commerce companies found selling crackers online will be hauled up for contempt of court and the Court may also pass, in that eventuality, orders of monetary penalties as well. 48.6. Barium salts in the fireworks is also hereby banned. 48.7. PESO is directed to review the clinical composition of
fireworks, particularly reducing Aluminium content, and shall submit its report in respect thereof within a period of two weeks from today. For undertaking this exercise, PESO would also associate FRDC. 48.8. Even those crackers which have already been produced and
they do not fulfil the conditions mentioned in Suggestions II and III above will not be allowed to be sold in Delhi and NCR. 48.9. PESO will ensure fireworks with permitted chemicals only to
be purchased/possessed/sold/used during Diwali and all other religious festivals, of any religion whatsoever, and other occasions like marriages, etc. It shall test and check for the presence of banned chemicals like lithium/arsenic/antimony/lead/mercury. 48.10. PESO will ensure suspension of the licences of
manufacturers of such fireworks items and appropriate disposal of such stock. 48.11. PESO will ensure that only those crackers whose decibel (sound) level are within the limits are allowed in the market and will ensure to take action by suspending the licences of the manufacturers on such violations and disposal of such lots. To add to it, as mentioned in the order dated 12-9-2017, the directions
543
41
issued and restrictions imposed in the order passed by this Court on 18-7-2005 in Noise Pollution shall continue to be in force. 48.12. Directions 4 to 9 and 11 contained in the order dated 12-9-
20175 shall continue to operate and are reiterated again. 48.13. Extensive public awareness campaigns shall be taken up by the Central Government/State Governments/Schools/Colleges informing the public about the harmful effects of firecrackers. 48.14. On Diwali days or on any other festivals like Gurupurab, etc., when such fireworks generally take place, it would strictly be from 8.00 p.m. till 10.00 p.m. only. On Christmas eve and New Year’s eve, when such fireworks start around midnight i.e. 12.00 a.m., it would be from 11.55 p.m. till 12.30 a.m. only. 48.15. The Union of India, Government of NCT of Delhi and the State Governments of NCR would permit community firecracking
only (for Diwali and other festivals, etc. as mentioned above), wherever it can be done. For this purpose, particular area/fields would be pre-identified and predesignated by the authorities concerned. This exercise shall be completed within a period of one week from today so that the public at large is informed about the designated places one week before Diwali. The areas designated now for the purpose of Diwali shall be valid for community firecracking on other occasions/festivals as well, as mentioned above. Even for marriages and other occasions, sale of improved crackers and green crackers is only permitted. Insofar as other States are concerned, an endeavour shall be made by them also to explore the feasibility of community firecracking. However, it is made clear that Direction 48.14 pertaining to the duration within which fireworks can take place on all such occasions would be applicable throughout India. Similarly, Direction 48.13 for extensive public awareness campaigns is also a pan India direction. 48.16. All the official respondents, and particularly the police, shall ensure that fireworks take place only during the designated time and at designated places, as mentioned above. They shall also ensure that there is no sale of banned firecrackers. In case any violation is found, the Station House Officer (SHO) of the police station of the area concerned shall be held personally liable for such violation and this would amount to committing contempt of the Court, for which such SHO(s) would be proceeded against. 48.17. CPCB and respective State Pollution Control
Boards/Pollution Control Committees (SPCBs/PCCs) of the States and Union Territories shall carry out short-term monitoring in their cities for 14 days (commencing from 7 days prior to Diwali and ending 7 days after Diwali) for the parameters namely, aluminium, barium, iron apart from the regulatory parameters against the short-term Ambient Air Quality Criteria Values (AAQCVs) proposed by CPCB with regard to bursting of firecrackers. This will help in generation of data on pollution caused by the bursting of firecrackers and would be helpful for regulation and control quantity of aluminium, barium and iron used in the manufacture of firecrackers. 49. One clarification needs to be given at this stage. Our discussion pertaining to the arguments based on Article 19(1)(g), Article 25 as well as the argument of loss of substantial revenue and unemployment, in cases the manufacture and sale of the firecrackers is totally banned, is prima facie and we have not given our conclusive determination. It is because of want of detailed studies on various aspects which have been mentioned and taken
544
42
note of during discussion in this order. However, we also make it clear that, prima facie, we do not find much merit in these arguments for which we have given our reasons in brief. 50. Having regard to the overall circumstances, we have decided
that, for the time being, a balanced approach to tackle this problem is needed, which may take care of the concerns of both the parties and, at the same time, provide a reasonable and adequate solution. When the picture would become clearer after the requisite studies/research is undertaken, more stringent measures can be adopted in future if the situation so warrants.”
33. In Arjun Gopal (supra)26, the scope of precautionary principle, even
in absence of scientific certainty, was considered, apart from the
contention of economic considerations, as bar to remedy pollution. It was
observed that it was desirable to err on safe side to enforce right of
pollution free environment even in absence of scientific study and right
to safe environment is not controlled by economic considerations. The
relevant observations from the judgment are:
“37 The aforesaid findings are sufficient to negate the
arguments of the opposite side that there is absence of scientific study about the adverse effect of firecrackers during Diwali. In environmental law, “precautionary
principle” is one of the well-recognised principles which is followed to save the environment. It is rightly argued by the
petitioners that this principle does not need exact studies/material. The very word “precautionary” indicates that such a measure is taken by way of precaution which
can be resorted to even in the absence of definite studies. In Vellore Citizens' Welfare Forum [Vellore Citizens' Welfare Forum v. Union of India, (1996) 5 SCC 647], this Court explained the principle in the following manner: (SCC pp. 658 & 660, paras 11 & 14-16)
“11. Some of the salient principles of “Sustainable Development”, as culled out from Brundtland Report and other international documents, are Inter-Generational Equity, Use and Conservation of Natural Resources, Environmental Protection, the Precautionary Principle, Polluter Pays Principle, Obligation to Assist and Cooperate, Eradication of Poverty and Financial Assistance to the developing countries. We are, however, of the view that “the precautionary principle” and “the polluter pays principle” are essential features of “Sustainable Development”. The “precautionary principle” — in the context of the municipal law — means:
(i) Environmental measures — by the State Government and the statutory authorities — must anticipate, prevent and attack the causes of environmental degradation.
26
(2019) 13 SCC 523
545
43
(ii) Where there are threats of serious and irreversible damage, lack of scientific certainty should
not be used as a reason for postponing measures to prevent environmental degradation.
(iii) The “onus of proof” is on the actor or the developer/industrialist to show that his action is environmentally benign.
***
14. In view of the abovementioned constitutional and statutory provisions we have no hesitation in holding that the precautionary principle and the polluter pays principle are part of the environmental law of the country.
15. Even otherwise once these principles are accepted as part of the Customary International Law there would be no difficulty in accepting them as part of the domestic law. It is almost an accepted proposition of law that the rules of Customary International Law which are not contrary to the municipal law shall be deemed to have been incorporated in the domestic law and shall be followed by the courts of law. To support we may refer to H.R. Khanna, J.s' opinion in ADM, Jabalpur v. Shivakant Shukla [ADM, Jabalpur v. Shivakant Shukla, (1976) 2 SCC 521] , Jolly George Varghese case [Jolly George Varghese v. Bank of Cochin, (1980) 2 SCC 360] and Gramophone Co. case [Gramophone Co. of India Ltd. v. Birendra Bahadur Pandey, (1984) 2 SCC 534 : 1984 SCC (Cri) 313] .
16. The constitutional and statutory provisions protect a person's right to fresh air, clean water and pollution-free environment, but the source of the right is the inalienable common law right of clean environment. …”
38. The precautionary principle accepted in the aforesaid judgment was further elaborated in A.P. Pollution Control Board case [A.P. Pollution Control Board v. M.V. Nayudu, (1999) 2 SCC 718] as under: (SCC pp. 732-34, paras 31-35)
“31. The “uncertainty” of scientific proof and its changing frontiers from time to time has led to great
changes in environmental concepts during the period between the Stockholm Conference of 1972 and the Rio
Conference of 1992. In Vellore Citizens' Welfare Forum v. Union of India [Vellore Citizens' Welfare Forum v. Union of India, (1996) 5 SCC 647] a three-Judge
Bench of this Court referred to these changes, to the “precautionary principle” and the new concept of
“burden of proof” in environmental matters. Kuldip Singh, J. after referring to the principles evolved in various international conferences and to the concept of
“sustainable development”, stated that the precautionary principle, the polluter pays principle and the special concept of onus of proof have now emerged
and govern the law in our country too, as is clear from Articles 47, 48-A and 51-A(g) of our Constitution and
that, in fact, in the various environmental statutes, such as the Water Act, 1974 and other statutes, including the Environment (Protection) Act, 1986, these
546
44
concepts are already implied. The learned Judge declared that these principles have now become part of
our law. The relevant observations in Vellore case [Vellore Citizens' Welfare Forum v. Union of India, (1996) 5 SCC 647] in this behalf read as follows: (SCC p. 660, para 14)
‘14. In view of the abovementioned constitutional and statutory provisions we have no hesitation in holding that the precautionary principle and the polluter pays principle are part of the environmental law of the country.’
The Court observed that even otherwise, the abovesaid principles are accepted as part of the customary international law and hence there should be no difficulty in accepting them as part of our domestic law. In fact, on the facts of the case before this Court, it was directed that the authority to be
appointed under Section 3(3) of the Environment (Protection) Act, 1986 shall implement the “precautionary principle” and the “polluter pays principle”’.
The learned Judges also observed that the new concept which places the burden of proof on the developer or industrialist who is proposing to alter the status quo, has also become part of our environmental law.
32. The Vellore [Vellore Citizens' Welfare Forum v. Union of India, (1996) 5 SCC 647] judgment has referred to these principles briefly but, in our view, it is necessary to explain their meaning in more detail, so that courts and tribunals or environmental authorities can properly apply the said principles in the matters which come before them.
33. A basic shift in the approach to environmental protection occurred initially between 1972 and 1982.
Earlier, the concept was based on the “assimilative capacity” rule as revealed from Principle 6 of the Stockholm Declaration of the U.N. Conference on Human
Environment, 1972. The said principle assumed that science could provide policy-makers with the
information and means necessary to avoid encroaching upon the capacity of the environment to assimilate impacts and it presumed that relevant technical
expertise would be available when environmental harm was predicted and there would be sufficient time to act in order to avoid such harm. But in the 11th Principle of
the U.N. General Assembly Resolution on World Charter for Nature, 1982, the emphasis shifted to the
“precautionary principle”, and this was reiterated in the Rio Conference of 1992 in its Principle 15 which reads as follows:
‘Principle 15. - In order to protect the environment, the precautionary approach shall be widely applied by States according to their capabilities. Where there are threats of serious or irreversible damage, lack of full scientific certainty shall not be used as a reason for proposing cost-effective measures to prevent environmental degradation.’
34. In regard to the cause for the emergence of this principle, Charmian Barton, in the article earlier referred to in “The Status of the Precautionary Principle in Australia” [(1998) 22 Harvard Environmental Law Review 509 at p. 547] says:
547
45
‘There is nothing to prevent decision-makers from assessing the record and concluding that there is inadequate information on which to reach a determination. If it is not possible to make a decision with “some” confidence, then it makes sense to err on
the side of caution and prevent activities that may cause serious or irreversible harm. An informed decision can be made at a later stage when additional data is available or resources permit further research. To ensure that greater caution is taken in environmental management, implementation of the principle through judicial and legislative means is necessary.’
In other words, the inadequacies of science is the real basis that has led to the precautionary principle of 1982. It is based on the theory that it is better to err on the side of caution and prevent environmental harm which may indeed become irreversible.
35. The principle of precaution involves the anticipation of environmental harm and taking measures to avoid it or to choose the least environmentally harmful activity. It is based on scientific uncertainty. Environmental protection should not only aim at protecting health, property and economic interest but also protect the environment for its own sake. Precautionary duties must not only be triggered by the suspicion of concrete danger but also by (justified) concern or risk potential. The precautionary principle was recommended by the UNEP Governing Council (1989). The Bomako Convention also lowered the threshold at which scientific evidence might require action by not referring to “serious” or “irreversible” as adjectives qualifying harm. However, summing up the legal status of the precautionary principle, one commentator characterised the principle as still “evolving” for though it is accepted as part of the international customary law, ‘the consequences of its application in any potential situation will be influenced by the circumstances of each case’. (See First Report of Dr. Sreenivasa Rao Pemmaraju — Special Rapporteur, International Law Commission dated 3-4-1998, paras 61 to 72.)”
(emphasis in original)
39. In such cases which pertain to the protection of environment, thrusting of “onus of proof” on the developer/industrialist in Vellore Citizens' Welfare Forum [Vellore Citizens' Welfare Forum v. Union of India, (1996) 5 SCC 647] was also elaborated by the Court in the following manner: (A.P. Pollution Control Board case [A.P. Pollution Control Board v. M.V. Nayudu, (1999) 2 SCC 718] , SCC pp. 734-35, paras 36-38)
“36. We shall next elaborate the new concept of burden of proof referred to in Vellore case [Vellore Citizens' Welfare Forum v. Union of India, (1996) 5 SCC 647] at p. 658. In that case, Kuldip Singh, J. stated as follows: (SCC p. 658, para 11)
‘(iii) The “onus of proof” is on the actor or the developer/industrialist to show that his action is environmentally benign.’
37. It is to be noticed that while the inadequacies of science have led to the “precautionary principle”, the said “precautionary principle” in its turn, has led to the special principle of burden of proof in environmental cases where burden as to the absence of injurious effect of the actions proposed, — is placed on those who want to change the status
548
46
quo (Wynne, “Uncertainty and Environmental Learning: Reconceiving Science and Policy in the Preventive Paradigm” [(1992) 2 Global Environmental Change 111 at p. 123] ). This is often termed as a reversal of the burden of proof, because otherwise in environmental cases, those opposing the change would be compelled to shoulder the evidentiary burden, a procedure which is not fair. Therefore, it is necessary that the party attempting to preserve the status quo by maintaining a less polluted state should not carry the burden of proof and the party who wants to alter it, must bear this burden. (See James M. Olson, “Shifting the Burden of Proof: How the Common Law can Safeguard Nature and Promote an Earth Ethic” [(1990) 20 Environmental Law 891 at p. 898] .) (Quoted in “The Status of the Precautionary Principle in Australia” [(1998) 22 Harvard Environmental Law Review 509 at p. 547] at pp. 519, 550.)
38. The precautionary principle suggests that where there is an identifiable risk of serious or irreversible harm, including, for example, extinction of species, widespread toxic pollution in major threats to essential ecological processes, it may be appropriate to place the burden of proof on the person or entity proposing the activity that is potentially harmful to the environment. (See Report of Dr Sreenivasa Rao Pemmaraju, Special Rapporteur, International Law Commission, dated 3-4-1998, Para 61.)”
(emphasis in original) The relevant observations from judgment in Arjun Gopal (supra)27,
are:
41. It may be stressed that in Vellore Citizens' Welfare Forum case [Vellore Citizens' Welfare Forum v. Union of India, (1996) 5 SCC 647] , this Court had banned the tanneries when it was found that they were causing immense damage to the environment. Thus, environment protection, which is a facet of Article 21, was given supremacy over the right to carry on business enshrined in Article 19(1)(g). We state at the cost of repetition that right to health, which is recognised as a facet of Article 21 of the Constitution and, therefore, is a fundamental right, assumes greater importance. It is not only the petitioners and other applicants who have intervened in support of the petitioners but the issue involves millions of persons living in Delhi and NCR, whose right to health is at stake. However, for the time being, without going into this debate in greater details, our endeavour is to strive at balancing of two rights, namely, right of the petitioners under Article 21 and right of the manufacturers and traders under Article 19(1)(g) of the Constitution.
44. Applying the aforesaid principle, in the first blush it may appear that the aforesaid argument has substantial force in it. However, that would be only one side of the picture as there are two contra-arguments which are sufficient to take the sheen
27
(2019) 13 SCC 523
549
47
out of the aforesaid plea. First aspect is that the argument of economic hardship is pitched against right to health and life. When the Court is called upon to protect the right to life, economic effect of a particular measure for the protection
of such right to health will have to give way to this fundamental right. Second factor, which is equally important, is that the economic loss to the State is
pitched against the economic loss in the form of cost of treatment for treating the ailments with which people suffer as a result of burning of these crackers. Health
hazards in the form of various diseases that are the direct result of burning of crackers have already been noted
above. It leads to asthma, coughing, bronchitis, retarded nervous system breakdown and even cognitive impairment. Some of the diseases continue on a prolonged
basis. Some of these which are caused because of high level of PM2.5 are even irreversible. In such cases, patients
may have to continue to get the medical treatment for much longer period and even for life. Though there are no statistics as to what would be the cost for treating such diseases which are as a direct consequence of fireworks on these occasions like Diwali, it can safely be said that this may also be substantial. It may be more than the revenue which is generated from the manufacturers of the crackers. However, we say no more for want of precise statistical data in this behalf.”
Relevant Orders of the Tribunal
34. The Tribunal, vide order dated 15.10.2020 in OA 1016/2019,
Utkarsh Panwar vs. Central Pollution Control Board & Ors., has recently
dealt with the issue invoking the precautionary principle in the context of
permissibility of brick kilns in NCR, adding to the air pollution.
Prohibiting brick kilns adding to the air pollution, even when affected
right to trade, it was observed:
“27. Thus, in view of report of the CPCB, at this stage it is not possible to vacate direction not to permit operation of brick kilns in NCR beyond the carrying capacity found by the CPCB. All applications of
the brick kiln owners seeking rejection of CPCB report and vacation of interim order against operation of brick kilns,
without air quality assimilative capacity permitting such activity will stand rejected subject to further exploring viable options, including
change to clean fuel like natural gas. We are conscious that brick kilns may be necessary. Object of this order is not to stop any legitimate business activity but to enforce the right to breathe fresh air which is right to file. The source apportionment studies, placed on record, show that brick kilns contribute 5-7% PM. Air pollution Control devices to be installed by the polluting sources including the brick kilns need to comply not only the consent standards but are also the Ambient Air Quality norms and available assimilative capacity of the region. If the right to fresh air is not enforced, the consequences of brick kilns beyond carrying capacity of the air quality in the area are disastrous in terms of deaths
550
48
and air borne diseases. This will be contrary to the mandate of the Constitution and the environmental law, particularly the principle of ‘Sustainable Development’. It is well established that deteriorated ambient air quality in terms of PM10 and PM2.5 affects respiratory system particularly, the lungs which may make individuals more vulnerable to get other related fatal diseases.”28
35. Vide order dated 21.08.2020 in O.A. No. 681/2018, News item
published in "The Times of India" Authored by Shri Vishwa Mohan
titled "NCAP with multiple timelines to clean air in 102 cities to be
released around August 15", the Tribunal considered the issue of
remedial action against air pollution in 102 non-attainment cities
(where air quality is generally found to be beyond norms) as per
monitoring by CPCB (number of cities is now 122). After referring to
earlier proceedings in the matter, it was observed:
“30. In view of the above, the directions are summed up as follows:
(i). to (ii). …………………….xxx……………………xxx (iii). Let further steps of prohibiting/shifting polluting
activities which are found unsustainable/non-conforming and beyond carrying capacity of NACs, as a consequence of SA/CC Studies or otherwise, to other
locations, in the interest of public health and protection of environment to give effect to ‘Sustainable
Development’ principle be taken by the States/UTs;
(iv). The States may take further steps to set up and operate PGRPs* expeditiously, within three months. The CPCB as well as State PCBs/PCCs may evaluate functioning of such portals on real time basis in the direction of protection of environment. In particular analysis may be undertaken about the number of complaints received, effective steps for redressal taken and improvement achieved and planned. Such exercise may be ongoing but in the first instance may be compiled as on 31.12.2020 and report filed by the State PCBs/PCCs with the CPCB within one month thereafter; (v). …………………….xxx……………………xxx (vi). All the concerned States/UTs may execute action
plans, including control of stubble burning, where ever necessary and bursting polluting and noise generating
28
https://airqualitynews.com/2020/08/13/the-link-between-air-pollution-and-covid-
19/http://www.babushahi.com/full-news.php?id=107487
551
49
fire crackers and give information about the status of compliance of action plans as on 31.12.2020 to CPCB
before 15.1.2021. They may also give information in a tabulated form about the extent of improvement achieved, if any, in terms of reduction in pollution load. Steps in terms of action plans completed, actions ongoing and actions incomplete; (vii) to (xiii) …………………….xxx……………………xxx (xiv). All the States/UTs and PCB/PCCs may take steps to coordinate with the State Disaster Management Authorities and Meteorological Departments. The observations of this Tribunal while dealing with the problem of frequent environmental disasters in order dated 23.07.2020 in OA 134/2020, News Item published on 13.07.2020 in daily “India Today” titled “Massive fire engulf Vizag chemical plant, explosions heard, injuries reported” may also be taken into account. Action taken reports be filed with the CPCB for submission of consolidated report to this Tribunal.” (*Public Grievance Redressal Portal)
36. As already noted, the Tribunal has the mandate to issue
appropriate directions in exercise of its jurisdiction under Section 15
read with Section 20 of the NGT Act, 2010. The scope of Section 15 has
been considered in a recent judgement in the Director General (Road
Development) NHAI v. Aam Aadmi Lok Manch & Ors.29 wherein it was
observed:
“1 to 70. …xxx………………………….xxx……………………xxx 71. The power and jurisdiction of the NGT under Sections 15(1)(b) and (c) are not restitutionary, in the sense of restoring the environment to the position it was before the practise impugned, or before the incident occurred. The NGT's jurisdiction in one sense
is a remedial one, based on a reflexive exercise of its powers. In another sense, based on the nature of the abusive practice, its powers can also be preventive.
72. As a quasi-judicial body exercising both appellate jurisdiction over regulatory bodies' orders and directions (under Section 16) and its original jurisdiction under Sections 14, 15 and 17 of the NGT Act, the tribunal, based on the cases and applications made before it, is an expert regulatory body. Its personnel include technically qualified and experienced members. The powers it exercises and
directions it can potentially issue, impact not merely those before it, but also state agencies and state departments whose views are heard, after which general directions to
prevent the future occurrence of incidents that impact the environment, are issued.
29
AIR 2020 SC 3471, Paras 71, 72 & 75
552
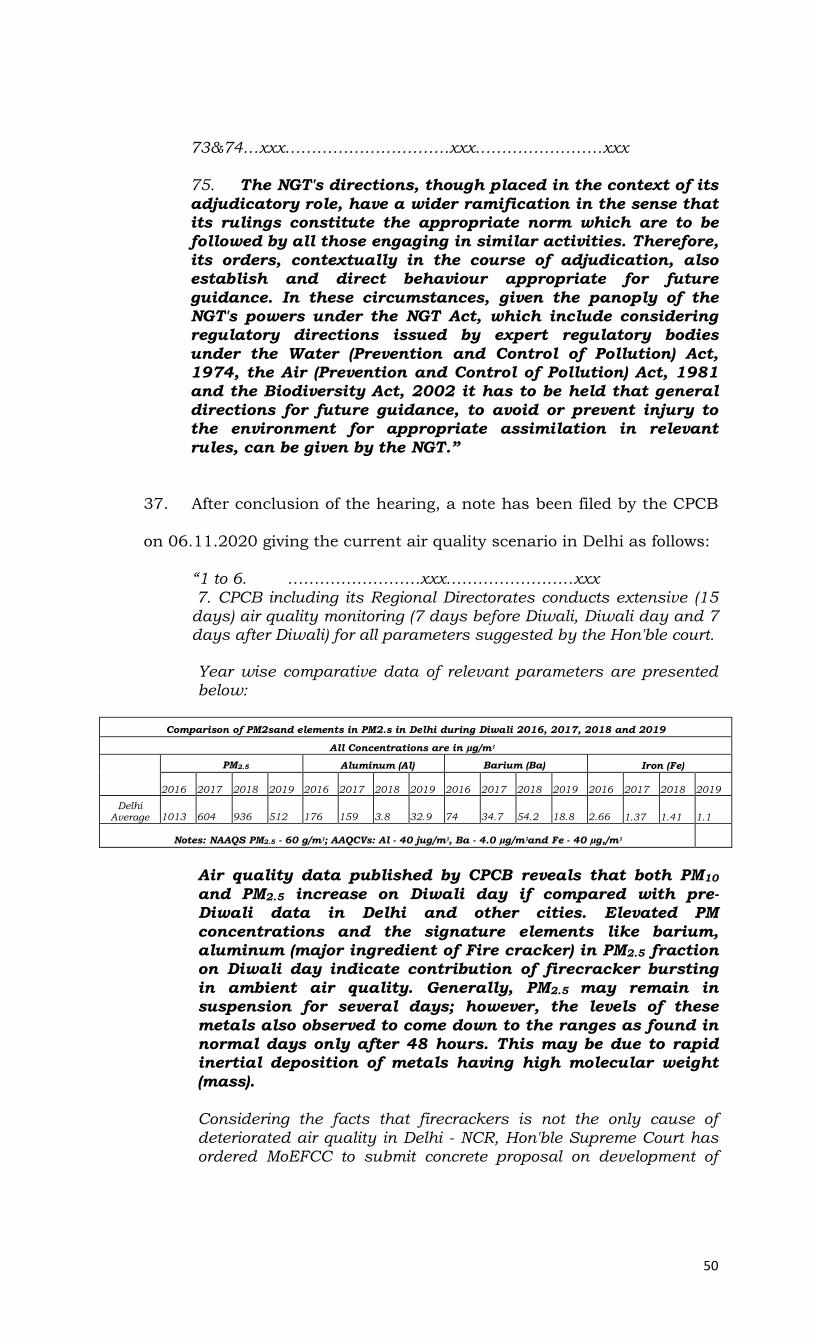
50
73&74…xxx………………………….xxx……………………xxx 75. The NGT's directions, though placed in the context of its
adjudicatory role, have a wider ramification in the sense that its rulings constitute the appropriate norm which are to be followed by all those engaging in similar activities. Therefore,
its orders, contextually in the course of adjudication, also establish and direct behaviour appropriate for future
guidance. In these circumstances, given the panoply of the NGT's powers under the NGT Act, which include considering regulatory directions issued by expert regulatory bodies
under the Water (Prevention and Control of Pollution) Act, 1974, the Air (Prevention and Control of Pollution) Act, 1981 and the Biodiversity Act, 2002 it has to be held that general
directions for future guidance, to avoid or prevent injury to the environment for appropriate assimilation in relevant
rules, can be given by the NGT.”
37. After conclusion of the hearing, a note has been filed by the CPCB
on 06.11.2020 giving the current air quality scenario in Delhi as follows:
“1 to 6. …………………….xxx……………………xxx 7. CPCB including its Regional Directorates conducts extensive (15 days) air quality monitoring (7 days before Diwali, Diwali day and 7 days after Diwali) for all parameters suggested by the Hon'ble court.
Year wise comparative data of relevant parameters are presented below:
Comparison of PM2sand elements in PM2.s in Delhi during Diwali 2016, 2017, 2018 and 2019
All Concentrations are in µg/m3
PM2.5 Aluminum (Al) Barium (Ba) Iron (Fe)
2016 2017 2018 2019 2016 2017 2018 2019 2016 2017 2018 2019 2016 2017 2018 2019
Delhi Average 1013 604 936 512 176 159 3.8 32.9 74 34.7 54.2 18.8 2.66 1.37 1.41 1.1
Notes: NAAQS PM2.5 - 60 g/m3; AAQCVs: Al - 40 jug/m3, Ba - 4.0 µg/m3and Fe - 40 µg,/m3
Air quality data published by CPCB reveals that both PM10
and PM2.5 increase on Diwali day if compared with pre-Diwali data in Delhi and other cities. Elevated PM
concentrations and the signature elements like barium, aluminum (major ingredient of Fire cracker) in PM2.5 fraction on Diwali day indicate contribution of firecracker bursting
in ambient air quality. Generally, PM2.5 may remain in suspension for several days; however, the levels of these
metals also observed to come down to the ranges as found in normal days only after 48 hours. This may be due to rapid inertial deposition of metals having high molecular weight
(mass).
Considering the facts that firecrackers is not the only cause of deteriorated air quality in Delhi - NCR, Hon'ble Supreme Court has ordered MoEFCC to submit concrete proposal on development of
553
51
"Green Crackers" besides banning Barium salts and joint crackers, instead of imposing complete ban on firecrackers. MoEF & CC has submitted consolidated proposal for implementation of Green crackers after thorough consultation with NEERI, CPCB, 11TB and PESO. Hon'ble court has raised the concern of quality control in manufacturing stage, which is already addressed and appraised to Hon'ble court for necessary direction. The matter is under consideration of the Hon'ble Supreme Court. Current air quality scenario in Delhi
The air quality of Delhi started worsening in terms of PM2.5
and PM10 since second week of October with changes in
meteorology. The increase in fire counts in stubble burning areas further aggravated the situation during last fortnight.
As per forecast from India Meteorology Department (IMD) and Indian Institute of Tropical Meteorology (IITM), PM2.5
concentrations are expected to decline slightly during 4-6th
November, 2020. The forecast for next l0 days will be available on 7th November, when the expected concentrations on Diwali day may be available.
The predicted mixing heights and ventilation coefficients
during 3 - 7th November will remain between 800 to 1200 m and 6000 to 9500 m2 /sec, respectively. Ventilation index with less than 6000 m2/sec is conducive for poor dispersion.
However, considering previous years' experience, with business as usual scenario on Diwali day (bursting crackers)
may increase PM2.5 concentrations and remain in air for about 48 hours if major changes in meteorology is not
observed. Meteorology and air quality forecast by IMD/IITM before Diwali may indicate likely ambient levels of PM2.5. In case of use of green crackers for limited duration with strict
enforcement, rise in ambient PM2.5 levels after Diwali may be comparatively low. It may also be flagged that minimizing
the impact of firecrackers on air pollution would give respite for limited period.
Impact due to COVID: COVID 19 related issues and its relationship with air quality perhaps is beyond the expertise domain of CPCB.”
However, it is stated that the CPCB does not have domain
expertise to comment on the relationship of air quality and Covid-19.
38. We may now deal with the stand of the States of Punjab, Assam
and Tamil Nadu. State of Punjab has claimed moderate air quality during
some period but the said period does not refer to month of November
554
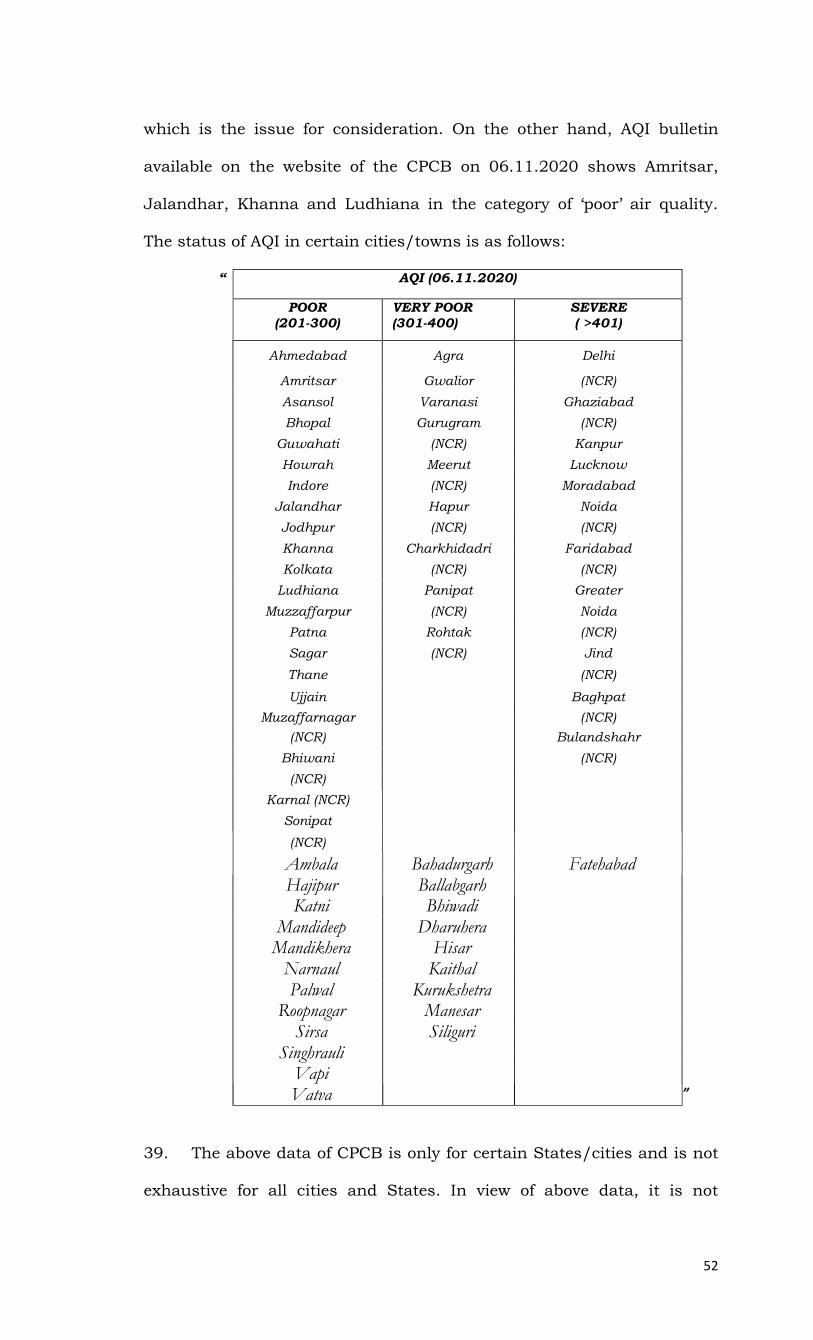
52
which is the issue for consideration. On the other hand, AQI bulletin
available on the website of the CPCB on 06.11.2020 shows Amritsar,
Jalandhar, Khanna and Ludhiana in the category of ‘poor’ air quality.
The status of AQI in certain cities/towns is as follows:
“ AQI (06.11.2020)
POOR
(201-300)
VERY POOR
(301-400)
SEVERE
( >401)
Ahmedabad Agra Delhi
Amritsar Gwalior (NCR)
Asansol Varanasi Ghaziabad
Bhopal Gurugram (NCR)
Guwahati (NCR) Kanpur
Howrah Meerut Lucknow
Indore (NCR) Moradabad
Jalandhar Hapur Noida
Jodhpur (NCR) (NCR)
Khanna Charkhidadri Faridabad
Kolkata (NCR) (NCR)
Ludhiana Panipat Greater
Muzzaffarpur (NCR) Noida
Patna Rohtak (NCR)
Sagar (NCR) Jind
Thane (NCR)
Ujjain Baghpat
Muzaffarnagar (NCR)
(NCR) Bulandshahr
Bhiwani (NCR)
(NCR)
Karnal (NCR)
Sonipat
(NCR)
Ambala Bahadurgarh Fatehabad Hajipur Ballabgarh
Katni Bhiwadi
Mandideep Dharuhera
Mandikhera Hisar
Narnaul Kaithal
Palwal Kurukshetra
Roopnagar Manesar
Sirsa Siliguri
Singhrauli
Vapi
Vatva ”
39. The above data of CPCB is only for certain States/cities and is not
exhaustive for all cities and States. In view of above data, it is not
555
53
possible to accept that in the State of Punjab air quality is satisfactory or
moderate everywhere in November. Moreover, apart from non-attainment
cities, there are other cities where air quality norms are not met. We have
to apply a uniform yardstick based on objective criteria of air quality in
the context of Covid-19 pandemic and associated adverse health impacts.
40. Tables 1 and 2 in Supreme Court judgement quoted in para 31
above show health impact and categories of air quality. For moderate and
above air quality, there are adverse health impact in normal times which
is aggravated by Covid. Contention that Covid does not add to the
adverse health impact due to pollution has to be rejected in view of
studies and decisions of some of the authorities themselves. For poor
and above air quality, health impacts are serious.
41. Thus, two categories of poor and above and moderate and below
need to be dealt with separately. While bursting of green fire crackers for
duration of two hours on festival days may be allowed in areas with
moderate and below air quality, where not otherwise prohibited by
authorities/Courts, there has to be total ban where air quality is poor
and above. The States who have filed response have not given the data of
November. They have stated that ban be not imposed throughout the
States or green crackers be allowed for two hours on festival days. This
request is justified where air quality is moderate and below but not
where air quality is poor and above which may result in deaths and
diseases which has to be avoided even if there is financial loss.
Celebration by crackers is for happiness. It is not to celebrate deaths and
diseases. Happiness of few at the cost of life of others is not the value in
Indian society which stands for happiness and well-being of all.
556
54
42. We find that though notice was not issued to all the States/UTs
but to States/UTs falling in NCR and where 122 non-attainment cities
are located, we propose to issue directions in rem applicable to all
States/UTs, we have to, in the interest of natural justice, make this order
subject to such States being at liberty to move this Tribunal to be heard,
if so desired. We note that MoEF and CPCB are at notice and the order
proposed is not individual State/City specific and absence of notice to
such State is only a matter of formality. The situation is grave and
emergent and it is not desirable that the order should not be passed pan
India once a clear case has been made out and rival viewpoints have
been considered.
43. We are also of the view that since we have taken the view that air
pollution aggravates Covid-19, not only crackers are to be
banned/restricted depending upon air quality, all States/UTs,
PCBs/PCCs must take special initiative to contain air pollution by
regulating all other sources to pollution, particularly during Covid-19. No
doubt pollution for crackers being seasonal source, particular focus is
required thereon.
VIII. Conclusion and Directions
44. In view of above, having regard to increased adverse health impact
of pollution by use of crackers on Covid-19, aggravating risk to lives and
health which has led to ban by the Governments of Odisha, Rajasthan,
Sikkim, UT Chandigarh, DPCC and by the Calcutta High Court on sale
and use of crackers,, applying the ‘Sustainable Development’ and
‘Precautionary’ principles, a case is made out for issuing directions for
banning sale and use of fire crackers during November 9 to 30 in areas
where air quality is ‘poor’, ‘very poor’ and ‘severe’.
557
55
45. Further, case is made out for restricting sale and use of fire
crackers in areas with moderate and poor air quality where also on
account of Covid19, there will be serious adverse effects, though less
than areas where air quality is poor and above. In such areas, unless
covered by the ban or restrictions by the authorities, restrictions on the
pattern of those imposed by the Hon’ble Supreme Court vide order dated
23.10.2018, (2019) 13 SCC 523, reproduced in para 32 above will apply
i.e. only green crackers be sold and use of crackers will be allowed only
for two hours during festivals and not on any other day during November
9 to 30.
46. It is well known that in NCR, this threshold is continuously
crossed during November. Thus, ban will be absolute in NCR.
47. Outside the NCR, where air quality standards are poor or more
than poor during November, the sale and use of fire cracker has to be
banned. It is not necessary to distinguish between non-attainment and
other cities. Even in non-attainment cities, though average air quality
may not be as per norms for five years, it may be poor or above during
November. On the other hand, even in non-attainment cities, air quality
may not be as per norms but may not be ‘poor’ or more than that. This is
demonstrated by the data from CPCB website in respect of certain cities
quoted above. In Haryana, there is no non-attainment cities in the list of
122, but as per air quality data of CPCB ‘Fatehabad’, falling outside NCR
has ‘severe’ air quality in November. Similarly, Hisar, Bahadurgarh,
Ballabgarh, Dharuhera, Kaithal, Kurukshetra and Manesar are falling
under ‘very poor’ category of air quality and Ambala, Narnaul, Palwal and
Sirsa in ‘poor’ air quality. Similarly, for the State of Punjab, only
Amritsar, Jalandhar, Khanna and Ludhiana are shown in the ‘poor’
558
56
category of air quality out of eight non-attainment cities. This will not be
read as debarring the authorities from taking more cautious approach in
prohibiting/restricting fire crackers to any other areas not covered by
prohibition or restrictions under this order, as has already been done by
some of the States.
48. Accordingly, we direct as follows:
i. There will be total ban against sale or use of all kinds of fire
crackers in the NCR from midnight of November, 9 -10, 2020 to
the midnight of November 30 - December 1, 2020, to be reviewed
thereafter.
ii. Direction (i) will also apply to all cities/towns in the country
where the average of ambient air quality during November (as per
available data of last year) fall under 'poor' and above category.
iii. The cities/towns where air quality is ‘moderate’ or below, only
green crackers be sold and the timings for use and bursting of
crackers be restricted to two hours during festivals, like Diwali,
Chatt, New Year/Christmas Eve etc., as may be specified by the
concerned State. This direction is on pattern of direction of the
Hon’ble Supreme Court in (2019) 13 SCC 523 which we are
applying to areas moderately polluted or below air quality due to
aggravated effect during Covid-19, as already noted. If nothing is
specified by the State, timing will be 8 to 10 pm on Diwali and
Gurupurb, 6 am to 8 am on Chatt and 11.55 pm to 12.30 am
during Christmas and New year eve (which have yet to come and
do not fall in November but if ban continues) and not otherwise.
iv. At other places, ban/restrictions are optional for the authorities
but if there are more stringent measures under orders of the
authorities, the same will prevail.
559
57
v. All States/UTs/PCBs/PCCs may initiate special drives to contain
air pollution from all sources in view of potential of aggravation of
Covid-19
vi. The Chief Secretaries and DGPs of all the States/UTs may issue
and circulate an appropriate order in above terms with
appropriate enforcement guidelines to all the District Magistrates
and Superintendents of Police, PCBs/PCCs.
vii. The CPCB and the State PCBs/PCCs may regularly monitor the
air quality during this period which may be uploaded on their
respective websites. CPCB may compile information on the
subject, including the status of compliance of this order from all
the States/UTs and file a consolidated report with data compiled
till filing of report, before the next date by e-mail at judicial-
[email protected] preferably in the form of searchable PDF/OCR
Support PDF and not in the form of Image PDF.
List for further consideration on 1.12.2020.
A copy of this order be forwarded to the MoEF&CC, CPCB, Chief
Secretaries and DGPs, State PCBs/PCCs and District Magistrates of all
the States/UTs and by e-mail for Compliance.
We place on record our sincere gratitude to learned Amicus Shri
Raj Panjwani, senior advocate and other learned counsel for the
assistance rendered in the matter.
Adarsh Kumar Goel, CP
S.K. Singh, JM
Dr. S.S. Garbyal, EM
560
58
Dr. Nagin Nanda, EM November 09, 2020
Original Application No. 249/2020 Original Application No. 254/2020
Original Application No. 255/2020 Original Application No. 93/2020(CZ) DV
561


