Embed Size (px)
Citation preview

RESEARCH ARTICLE Open Access
Relative entropy differences in bacterialchromosomes, plasmids, phages andgenomic islandsJon Bohlin1*, Mark WJ van Passel2, Lars Snipen3, Anja B Kristoffersen4, David Ussery5 and Simon P Hardy4
Abstract
Background: We sought to assess whether the concept of relative entropy (information capacity), could aid ourunderstanding of the process of horizontal gene transfer in microbes. We analyzed the differences in informationcapacity between prokaryotic chromosomes, genomic islands (GI), phages, and plasmids. Relative entropy wasestimated using the Kullback-Leibler measure.
Results: Relative entropy was highest in bacterial chromosomes and had the sequence chromosomes > GI >phage > plasmid. There was an association between relative entropy and AT content in chromosomes, phages,plasmids and GIs with the strongest association being in phages. Relative entropy was also found to be lower inthe obligate intracellular Mycobacterium leprae than in the related M. tuberculosis when measured on a shared setof highly conserved genes.
Conclusions: We argue that relative entropy differences reflect how plasmids, phages and GIs interact withmicrobial host chromosomes and that all these biological entities are, or have been, subjected to different selectivepressures. The rate at which amelioration of horizontally acquired DNA occurs within the chromosome is likely toaccount for the small differences between chromosomes and stably incorporated GIs compared to the transient orindependent replicons such as phages and plasmids.
BackgroundHorizontal gene transfer in microbial communities hasbeen recognized as a key driver of evolutionary change inmicrobes [1,2]. In addition to plasmids and phages,regions within the bacterial chromosomes are assumedto have been horizontally acquired [3]. Such putativelyhorizontally transferred regions are termed GenomicIslands (GI). GIs originate from different sources [4]including plasmids and phages (prophages) and carrytraits that have important biological phenotypes such asvirulence determinants and antibiotic resistance genes.Genetic material is most readily exchanged betweenrelated genetic elements, [5]i.e. chromosomes exchangeDNA with chromosomes, plasmids with plasmids, andphages with phages. However, this exchange is notentirely restrictive with low frequency transfer occurring
between chromosomes on one hand and plasmids andphages on the other [5]. Mathematical models predictplasmids to be the predominant means of genetic varia-tion among bacteria [5]. Based on findings from genomicsignatures (and analyses of CRISPSs in bacteria [6]),phages, and viruses in general, have been found to co-evolve with their hosts [7]. Plasmids on the other hand,although sharing some similarities with their hosts, havea more different DNA composition than what would beexpected compared to the hosts chromosome [8]. In fact,genomic signatures based methods reveal prokaryoticplasmid-host similarity to correlate with genomic GCcontent, i.e. the more GC rich an organism is the morecompositionally similar it tends to be with its plasmid(s)[9]. GC content has also been associated with genomewide rates of mutation, where organisms of low GC con-tent tend to have more random genomes than GC richones [10,11], i.e. the signal-to-noise ratio is lower in ATrich genomes. An organism’s DNA sequence that hasbeen subjected to numerous random mutations is
* Correspondence: [email protected] School of Veterinary Science, EpiCentre, Department of FoodSafety and Infection biology, Ullevålsveien 72, Oslo, NorwayFull list of author information is available at the end of the article
Bohlin et al. BMC Genomics 2012, 13:66http://www.biomedcentral.com/1471-2164/13/66
© 2012 Bohlin et al; licensee BioMed Central Ltd. This is an Open Access article distributed under the terms of the Creative CommonsAttribution License (http://creativecommons.org/licenses/by/2.0), which permits unrestricted use, distribution, and reproduction inany medium, provided the original work is properly cited.
assumed to possess less information than the DNA of anorganism under strong selective pressure. In other words,due to more accumulated mutations, it appears as if lessinformation is carried by the DNA sequences of AT richmicrobes compared to GC rich microbes. Thus, to testthe assertion that accumulated mutations lower theinformation capacity we explored the use of informationtheory as a means of measuring information capacity inDNA sequences.The concept of information theory was originally intro-
duced by Claude E. Shannon as a tool to systematicallyanalyze data flow in general communication systems [12].The theory has been extended and subsequently appliedto many fields including DNA sequence analysis [13-15].Methods of Information theory focusing on DNAsequence compression have found differences betweencoding and non-coding sequences as well as between pro-karyotic and eukaryotic organisms [16].These results led us to apply information theoretical
methods to examine the extent to which information con-tent differed between the genomes of bacterial chromo-somes, plasmids, phages and GIs, and whether suchdifferences could be related to distinct genomic propertiesof bacterial chromosomes and mobile genomic elements.We used the Kullback-Leibler divergence measure (DKL)of tetranucleotide frequencies within genomic DNAsequences, similar to that descried by Sadovsky [15], butusing tetranucleotide frequencies and a zero order Markovmodel instead of a second order Markov model. Thesealterations increase the sensitivity of detection [17]. Thezero order Markov model assumes the simplest possibledependence structure between neighboring nucleotides.This means that DKL will be higher than in models that doaccount for dependence between adjacent nucleotides, likethe first or second order Markov models [17]. Theexpected tetranucleotide frequencies, statistically speaking,are thus calculated from mononucleotide frequenciesimplying that the bases are independent of each other.Thus, DKL reflects relative entropy in the sense that thegenomic sequences are compared to a random sequencesharing only the same AT content. Low DKL means lowrelative entropy and high DKL means high relative entropy[18]. Since the DNA sequence from the biological entity iscompared to a random, 0th order Markov based sequence(sharing only total AT content), a lower DKL reflects agreater independence between nucleotides in the corre-sponding tetranucleotides, and hence that less informationis carried by the DNA sequence. Conversely, higher DKL istaken to mean that more information is carried by theDNA sequence since the adjacent nucleotides in the corre-sponding tetranucleotides are more dependent on eachother.We sought to use methods from information theory to
examine information capacity (relative entropy) in
chromosomes, plasmids, phages and GIs. We investi-gated possible influences affecting relative entropy in thedifferent types of DNA sequences and how relativeentropy varies along bacterial chromosomes, focusingparticularly on the AT rich Bacillus cereus, the mediumAT:GC Escherichia coli and the GC rich Mycobacteriumtuberculosis. We also examined the relative entropy ofhighly conserved genes in two closely related species(M.tuberculosis and M.leprae) of which one has presum-ably undergone considerable genome reduction [19,20].
ResultsA note on the calculation of DKL
The relative entropy of a DNA sequence, which we referto as DKL, is measured as the divergence betweenobserved tetranucleotide frequencies from approximatedtetranucleotide frequencies using a zero order Markovmodel. The zero order Markov model assumes that everybase in the sequence is occurring with a probability inde-pendent of all other neighboring bases. It is reasonable toassume that in regions of high mutation activity this is agood description [11]. We compare the computed tetra-nucleotide frequencies from the zero order Markovmodel to counted tetranucleotide frequencies from eachDNA sequence. So the information capacity in a DNAsequence is positively associated with the magnitude ofthe divergence from the approximated sequence. Hence,the higher the divergence between observed and expected(approximated) tetranucleotide frequencies the moreinformation potential in the DNA sequence, and viceversa.
DKL differences between chromosomes, GIs, phages andplasmidsWe examined whether information capacity variedbetween chromosomes and two potential ‘vectors’: i.e.phages and plasmids, as well as GIs. Figure 1 shows thatthe DKL was slightly lower amongst GIs than chromo-somes (p~0.004, see the Methods section for moredetails on the statistical methods). Phages were in turnfound to have a lower DKL than GIs (p < 0.001), andplasmids had slightly lower DKL than phages (p~0.004).Hence, the largest difference in DKL (the most divergenttetranucleotide frequencies compared to a randomsequence) was between chromosomes and plasmids (p <0.001). In other words, chromosomes were, on average,the most biased DNA sequences while the plasmids hadthe most random (least biased) DNA composition.
Relative entropy vs AT contentAn association between information capacity and ATcontent has been found for chromosomes in previousstudies using slightly different methods than thosedescribed here (see Methods section) [10,11]. Since
Bohlin et al. BMC Genomics 2012, 13:66http://www.biomedcentral.com/1471-2164/13/66
Page 2 of 12
there was a statistical significant difference in relativeentropy between vectors (plasmids and phages) andchromosomes we explored whether similar associationscould be found between the vectors and AT content.Figure 2 shows that relative entropy, DKL, in chromo-somes, plasmids, phages and GIs is negatively correlatedwith AT content: DKL tends to decrease with increasingAT content. Regression analyses with DKL as theresponse and AT content as the predictor gave R2 =0.33 for chromosomes, R2 = 0.21 for plasmids, R2 = 0.56for phages, and R2 = 0.22 for GIs. A likelihood ratio testbetween ANOVA models with size plus AT content ver-sus AT content alone did not improve the correlation.All statistical results mentioned were significant, p <0.001.
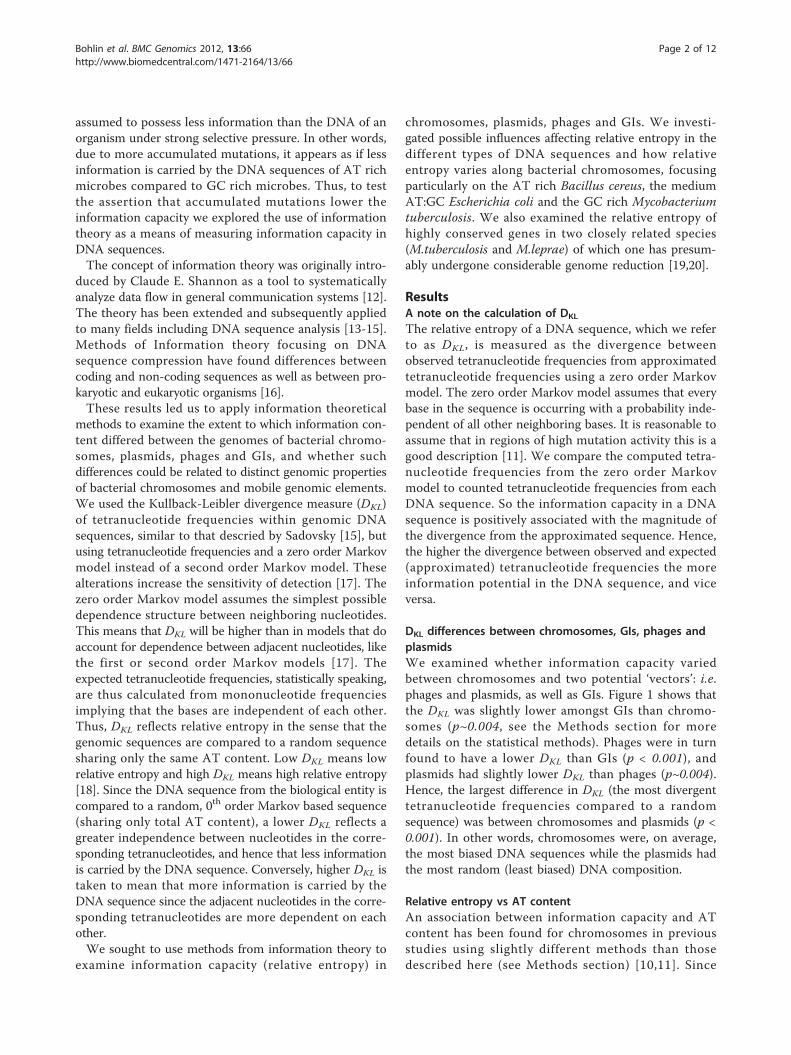
Relative entropy comparisons of shared genes betweenM. tuberculosis and M. lepraeIt has been shown that the genomes of intracellularmicrobes have a tendency to reduce in size due in partto more mutations and eventual loss of DNA repairgenes [21,22]. We examined whether these changes arereflected in relative entropy of the genomes of M. tuber-culosis, a facultative intracellular pathogen, and M.leprae, an obligate intracellular pathogen considered tobe in a transitional state between free living and intra-cellular lifestyles [19,20]. M. leprae has a smaller gen-ome than M. tuberculosis (3.3 mb vs. 4.4 mb) and it ismore AT rich (42.3% vs 24.4%). Figure 3 shows thatDKL taken from highly conserved coding regions wasalso lower in M. leprae than for M. tuberculosis, imply-ing that M. leprae has a more random base composition,possibly due to an increased number of accumulatedmutations. The fact that relative entropy was taken fromshared functional genes between the two organisms sup-ports the existing model of genome decay in intracellu-lar microbes [21] resulting in increased randomnessamongst the protein coding regions.
Phylogenetic influence on relative entropyUsing comparable methods to DKL, Reva and Tümmlerargued that DNA sequence bias appears to be a taxon-specific phenomenon within bacteria [10]. To assesswhether DKL was influenced by taxonomy (Figure 4) wepicked out one strain from each species to decrease biasfrom multiple strains, reducing the dataset to 709 chro-mosomes. We found that phylogenetic relationship didsignificantly influence DKL, but only slightly (R2 = 0.21)and comparable to that of GC content (R2 = 0.22). Thephyla and %GC factors did, however, not interact and amodel including both GC content and phyla as predic-tors explained approximately 40% (R2 = 0.4) of the
Chr
omos
omes
(n=1
373)
GIs
(n=1
5356
)
Pha
ges
(n=5
00)
Pla
smid
s (n
=160
1)
0.00
0.05
0.10
0.15
0.20
0.25
0.30
DKL Difference
Figure 1 Boxplot of DKL. The box and whisker plot shows DKL
differences between chromosomes, GIs, phages and plasmids. Theboxes contain 50% of the values surrounding the median (thickhorizontal line), while the lower and upper whiskers representapproximately the 25% lowest and highest DKL values, respectively.The open circles above the upper whiskers are considered asoutlying values. Although differences were small between the typesof DNA sequence families, chromosomes were found to be, onaverage, the most biased (highest information potential) whileplasmids the least.
Bohlin et al. BMC Genomics 2012, 13:66http://www.biomedcentral.com/1471-2164/13/66
Page 3 of 12

variance observed. All results were statistically signifi-cant with p < 0.001. No significant difference (p~0.87,Welch two-sample T test) in relative entropy was foundbetween archaea and bacteria.
DKL changes within genomesTo assess how relative entropy varied within bacterialchromosomes we examined the chromosomes of GC-rich Mycobacterium tuberculosis (65% GC), Escherichiacoli K-12 with approximately 50% AT/GC, and AT richBacillus cereus (65% AT) using a sliding window of 5kbp with DKL from each window compared to DKL for
the whole chromosome. The aim was to examinewhether DKL could be regarded as a stable measurewithin bacterial chromosomes, similar to the genomesignature [23]. Figure 5 shows how DKL changed withinthe three species compared to a randomly constructed50% GC chromosome of equivalent size to E.coli (5Mbp). Notice that although DKL varied within the chro-mosomes the level of variance was stable, indicating thataverage DKL is a robust property for the whole DNAsequence.In addition, Figure 5 shows that although M. tubercu-
losis and E. coli had similar DKL measures throughout
Figure 2 DKLvs AT content. Log-transformed DKL (vertical axis) is plotted against AT content (horizontal axis) with accompanying regressionlines and 99% prediction intervals for chromosomes, plasmids, phages, and GIs. A clear correlation can be observed for all DNA sequencesbetween (log-transformed) DKL and AT content meaning that randomness in DNA sequences increases with AT content. The highest correlationwas observed between relative entropy in phages and AT content.
Bohlin et al. BMC Genomics 2012, 13:66http://www.biomedcentral.com/1471-2164/13/66
Page 4 of 12
the chromosome, the B. cereus chromosome exhibitedconsiderably lower DKL. This was especially pronouncedin the middle of the chromosome. The accompanyingBLAST atlas (Figure 6) [24] shows that the DNA mole-cule in this area was more AT rich, had more pro-nounced intrinsic curvature, increased stacking energy(making the double stranded DNA string easier tomelt), higher position preference, and a higher occur-rence of quasi- and perfect palindromes.
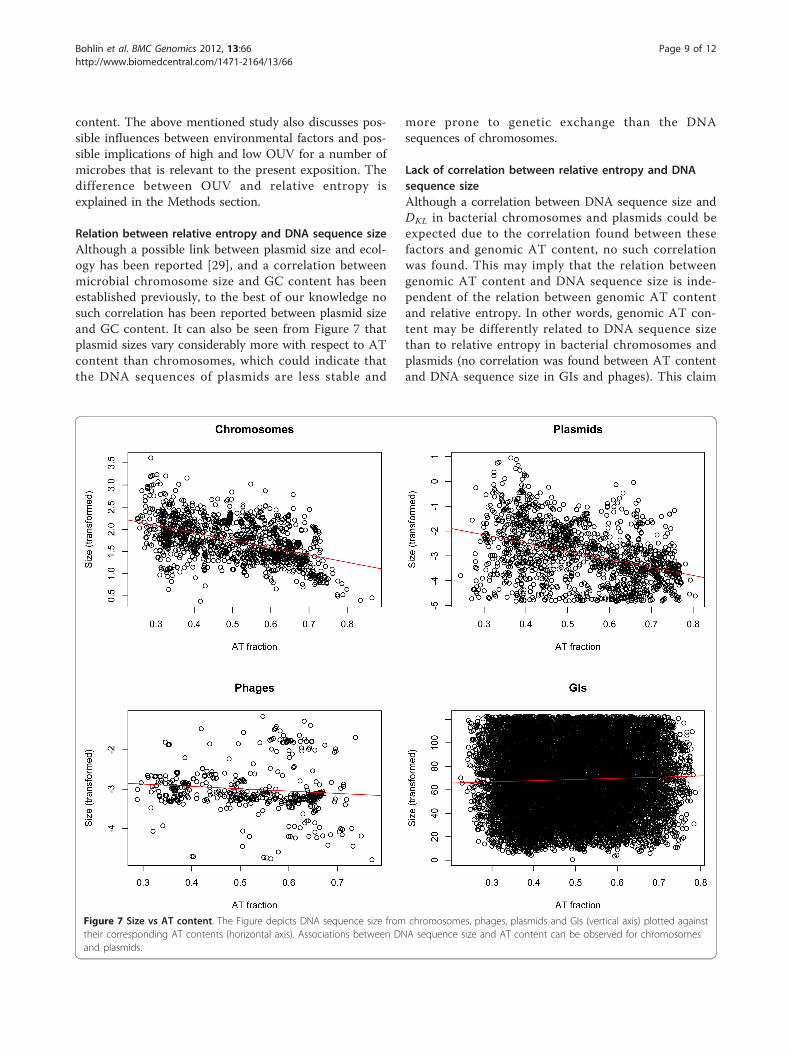
Size vs AT contentAlthough it has been demonstrated that AT content andchromosome sizes are inversely correlated in prokar-yotes, we carried out additional tests for plasmids,phages, GIs as well as chromosomes. From Figure 7 itcan be seen, as expected, that we found an associationbetween chromosome size and AT content R2~0.22, p <0.001. In addition, we found a significant associationbetween plasmid size and AT content, albeit low(R2~0.16), which could be due to the increased variance.With an R2~0.01 or less, the size of both phages and
GIs were not associated with AT content. All resultswere statistically significant (p < 0.001).
Size vs. relative entropySince the correlation between DNA sequence size andGC content is well established [25,26] we examinedwhether DKL was affected by DNA sequence size. Weperformed regression analyses with DKL of chromo-somes, GIs, phages and plasmids as the response andthe corresponding sequence size as the predictor vari-able, measuring, in effect, the correlation between DKL
and sequence size. In all instances R2 (the coefficient ofdetermination) was found to be lower than 0.05, mean-ing that less than 5% (p < 0.001) of the varianceobserved in the data was explained by the regressionmodels. A regression analysis with GC content as out-come indicated that variance explained increased addi-tively as DNA sequence size (21% and 15% (p < 0.001)for bacterial chromosomes and plasmids, respectively)and DKL (48% and 29% (p < 0.001) chromosomes andplasmids, respectively) was added to the model. Hence,AT content has an independent effect on DNAsequence size and relative entropy in bacterial chromo-somes and plasmids, while DKL was not affected byDNA sequence size regardless of DNA sequence typeexamined. It should be noted that for the combinedregression model including both DKL and DNAsequence size the %-variance explained metrics (i.e. R2)were slightly different from the individual models dis-cussed in the above sections due to the different typesof transformations used (see Materials section forfurther details).
DiscussionRelative entropy in chromosomes, plasmids, phages andGIsChromosomes were, on average, the most biasedsequences (i.e. least similar to a random sequence) andtherefore presumably the most subjected to selectivepressures of the sequences examined here. In terms ofDKL there was a small, but significant difference betweenGIs and chromosomes. This difference is expected sinceGIs are found within chromosomes and have amelio-rated over time, which, in base compositional terms,tend towards that of the host chromosome [27]. Hence,a number of studies indicate that GIs consist of horizon-tally acquired mobile genetic fragments [22,28], but ourdata does not identify what type of vector has broughtthese GIs to their respective chromosomes.The reduced DKL of phages compared to plasmids was
small but statistically significant. In contrast to phages,plasmids exist independently of the host chromosomeand are generally non-lethal [29]. When the phenotypicfeatures of the plasmid are not required for bacterial
Myc
obac
teriu
m le
prae
Br4
923
Myc
obac
teriu
m le
prae
TN
7
Myc
obac
teriu
m tu
berc
ulos
is F
11
Myc
obac
teriu
m tu
berc
ulos
is H
37R
a
0.11
0.13
DKL
Figure 3 DKLdifferences in M. leprae and M. tuberculosis. Thefigure show DKL (vertical axis) for shared highly conserved genes ofM. leprae and M. tuberculosis (horizontal axis).
Bohlin et al. BMC Genomics 2012, 13:66http://www.biomedcentral.com/1471-2164/13/66
Page 5 of 12

survival, the plasmid will exist only in a small minorityof the total microbial population [30]. In this way theforces of selective pressure are reduced compared to thehost chromosome. Phages also exist independently ofbacterial chromosomes but rely on the bacterial machin-ery for replication [29,30]. However, those phages thatare lytic will be under greater selective pressure thanplasmids. What particular features of phages that resultin the reduced information content remains to beclarified.It should be noted that the comparisons were between
all deposited DNA sequences, which means that theresults reflect the distributions of chromosomes, GIs,phages and plasmids that initially have been originallyselected and sequenced for a purpose. The effect of thisbias is not clear.
Association between DKL and AT contentFigure 2 shows that decreased relative entropy (DKL ) isassociated with increasing AT content. An example of
this was demonstrated in Figure 3, where the more ATrich M. leprae was found to have lower DKL in genesthat are also shared with the more GC rich M.tuberculosis.Although the coefficient of determination, R2, varied
between GIs, phages, plasmids and chromosomes, Figure2 shows that the trend remained for all DNA sequencesexamined. Phages obtained a surprisingly high coeffi-cient of determination, R2 = 0.56, implying that relativeentropy was more linked to changes in AT content inthese organisms.
DKL variation within chromosomesThe DKL profile of the B. cereus chromosome may implythat areas of low relative entropy (low DKL) might beindicators of genetic regions especially prone to rearran-gement. This propensity for re-arrangements may bedue to the increased stacking energy, position preferenceand amount of quasi-palindromes observed in theregion, all of which are determinants of genomic re-
Aci
doba
cter
ia (1
)
Act
inob
acte
ria (7
1)
Alp
ha-p
rote
obac
teria
(103
)
Aqu
ifica
e (5
)
Bac
tero
idet
es (2
9)
Bet
a-pr
oteo
bact
eria
(46)
Chl
amyd
iae
(7)
Chl
orof
lexi
(11)
Cre
narc
haeo
ta (2
1)
Cya
noba
cter
ia (2
1)
Dei
noco
ccus
-The
rmus
(8)
Del
ta-p
rote
obac
teria
(33)
Eps
ilon-
prot
eoba
cter
ia (1
5)
Eur
yarc
haeo
ta (3
8)
Firm
icut
es (1
19)
Fuso
bact
eria
(4)
Gam
ma-
prot
eoba
cter
ia (1
40)
Nan
oarc
haeo
ta (1
)
Oth
er a
rcha
ea (1
)
Oth
er b
acte
ria (1
1)
Pla
ncto
myc
etes
(1)
Spi
roch
aete
s (1
1)
Ther
mot
oga
(10)
0.00
0.05
0.10
0.15
0.20
0.25
DKL
Figure 4 DKL vs Phyla. The figure shows a boxplot of DKL (vertical axis) plotted against phylogenetic groups (horizontal axis, number ofgenomes from each phylogenetic group in parenthesis). The dashed horizontal red line is the average DKL for all groups.
Bohlin et al. BMC Genomics 2012, 13:66http://www.biomedcentral.com/1471-2164/13/66
Page 6 of 12

arrangement. The relatively high occurrence of bothpalindromes and quasi-palindromes in the region of B.cereus with low relative entropy may indicate that themechanisms leading to quasi palindrome correction
have not been operating properly in these regions ascompared to the chromosome in general [31] possiblyresulting also in a higher number of accumulated muta-tions [17]. A similar region has been found for all
Figure 5 Profiles of DKL differences within M. tuberculosis, E. coli and B. cereus. Profiles made from the DKL values of non-overlappingsliding windows in M. tuberculosis, E. coli and B. cereus. It can be seen that DKL values within the chromosomes are remarkably stable. B. cereushas noticeably lower DKL values than the other genomes indicating that the chromosome has a comparably more random base composition.The DKL values of a 50% GC content random genome are also included for comparison. For all chromosomes, the black horizontal linerepresents mean DKL.
Bohlin et al. BMC Genomics 2012, 13:66http://www.biomedcentral.com/1471-2164/13/66
Page 7 of 12
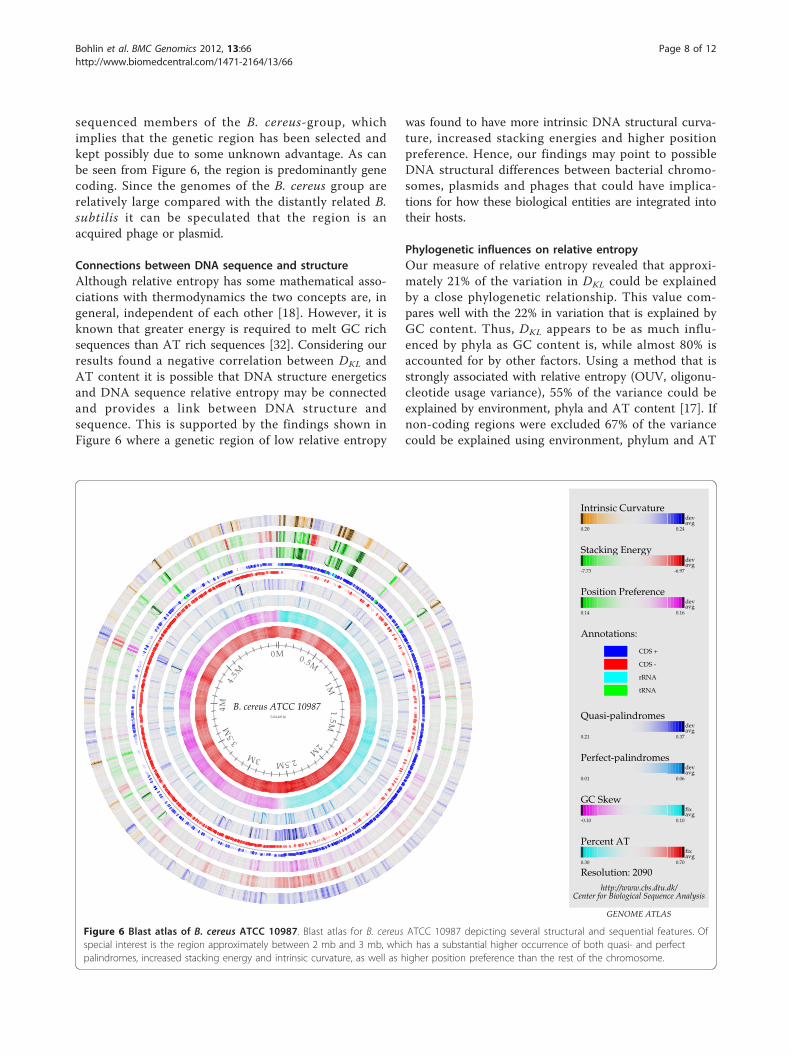
sequenced members of the B. cereus-group, whichimplies that the genetic region has been selected andkept possibly due to some unknown advantage. As canbe seen from Figure 6, the region is predominantly genecoding. Since the genomes of the B. cereus group arerelatively large compared with the distantly related B.subtilis it can be speculated that the region is anacquired phage or plasmid.
Connections between DNA sequence and structureAlthough relative entropy has some mathematical asso-ciations with thermodynamics the two concepts are, ingeneral, independent of each other [18]. However, it isknown that greater energy is required to melt GC richsequences than AT rich sequences [32]. Considering ourresults found a negative correlation between DKL andAT content it is possible that DNA structure energeticsand DNA sequence relative entropy may be connectedand provides a link between DNA structure andsequence. This is supported by the findings shown inFigure 6 where a genetic region of low relative entropy
was found to have more intrinsic DNA structural curva-ture, increased stacking energies and higher positionpreference. Hence, our findings may point to possibleDNA structural differences between bacterial chromo-somes, plasmids and phages that could have implica-tions for how these biological entities are integrated intotheir hosts.
Phylogenetic influences on relative entropyOur measure of relative entropy revealed that approxi-mately 21% of the variation in DKL could be explainedby a close phylogenetic relationship. This value com-pares well with the 22% in variation that is explained byGC content. Thus, DKL appears to be as much influ-enced by phyla as GC content is, while almost 80% isaccounted for by other factors. Using a method that isstrongly associated with relative entropy (OUV, oligonu-cleotide usage variance), 55% of the variance could beexplained by environment, phyla and AT content [17]. Ifnon-coding regions were excluded 67% of the variancecould be explained using environment, phylum and AT
0M 0.5M
1M1.5M
2M2.5M3M
3.5M
4M4 .
5M
B. cereus ATCC 10987 5,224,283 bp
GENOME ATLAS
Center for Biological Sequence Analysishttp://www.cbs.dtu.dk/
Intrinsic Curvaturedevavg
0.20 0.24
Stacking Energydevavg
-7.73 -6.97
Position Preferencedevavg
0.14 0.16
Annotations:
CDS +
CDS -
rRNA
tRNA
Quasi-palindromesdevavg
0.21 0.37
Perfect-palindromesdevavg
0.01 0.06
GC Skewfixavg
-0.10 0.10
Percent ATfixavg
0.30 0.70
Resolution: 2090
Figure 6 Blast atlas of B. cereus ATCC 10987. Blast atlas for B. cereus ATCC 10987 depicting several structural and sequential features. Ofspecial interest is the region approximately between 2 mb and 3 mb, which has a substantial higher occurrence of both quasi- and perfectpalindromes, increased stacking energy and intrinsic curvature, as well as higher position preference than the rest of the chromosome.
Bohlin et al. BMC Genomics 2012, 13:66http://www.biomedcentral.com/1471-2164/13/66
Page 8 of 12
content. The above mentioned study also discusses pos-sible influences between environmental factors and pos-sible implications of high and low OUV for a number ofmicrobes that is relevant to the present exposition. Thedifference between OUV and relative entropy isexplained in the Methods section.
Relation between relative entropy and DNA sequence sizeAlthough a possible link between plasmid size and ecol-ogy has been reported [29], and a correlation betweenmicrobial chromosome size and GC content has beenestablished previously, to the best of our knowledge nosuch correlation has been reported between plasmid sizeand GC content. It can also be seen from Figure 7 thatplasmid sizes vary considerably more with respect to ATcontent than chromosomes, which could indicate thatthe DNA sequences of plasmids are less stable and
more prone to genetic exchange than the DNAsequences of chromosomes.
Lack of correlation between relative entropy and DNAsequence sizeAlthough a correlation between DNA sequence size andDKL in bacterial chromosomes and plasmids could beexpected due to the correlation found between thesefactors and genomic AT content, no such correlationwas found. This may imply that the relation betweengenomic AT content and DNA sequence size is inde-pendent of the relation between genomic AT contentand relative entropy. In other words, genomic AT con-tent may be differently related to DNA sequence sizethan to relative entropy in bacterial chromosomes andplasmids (no correlation was found between AT contentand DNA sequence size in GIs and phages). This claim
Figure 7 Size vs AT content. The Figure depicts DNA sequence size from chromosomes, phages, plasmids and GIs (vertical axis) plotted againsttheir corresponding AT contents (horizontal axis). Associations between DNA sequence size and AT content can be observed for chromosomesand plasmids.
Bohlin et al. BMC Genomics 2012, 13:66http://www.biomedcentral.com/1471-2164/13/66
Page 9 of 12
was further strengthen by a linear regression analysis,which indicated that the variance explained increasedadditively with DNA sequence size and relative entropyadded as predictors. Hence, our models indicate that themechanisms connecting AT with DNA sequence sizeare unrelated and different to the mechanisms linkingAT content with relative entropy.
Connections to other studiesBy using BLAST and graph/network analyses it has beenfound that the different groups, i.e. chromosomes, plas-mids and phages, share, in the majority of cases, DNAamongst themselves. In other words, chromosomesshare DNA with chromosomes, plasmids share DNAwith plasmids and phages share DNA with phages [5].Variation among bacterial chromosomes however is pre-dominantly mediated by genetic exchange from plasmidsand only transiently so by phages [5]. Our results indi-cated that plasmids, on average, had significantly lowerDKL than any of the other types of DNA sequences.This could mean that plasmids are more tolerant togenetic alterations something that may be crucial tomaximize host range [33]. A previous study has reporteda correlation between plasmid-host similarity and GCcontent, i.e. the more similar the plasmids-hosts were interms of genomic signatures, the more GC rich theytended to be [9]. Phages have been found to have a nar-row host range, in fact even more so than plasmids [5]in spite of their larger numbers (estimations go as highas 5-10 phages for each bacterium on earth [34-36]),which may indicate that they have been subjected toincreased selective pressures resulting, in turn, in signifi-cantly higher DKL than for plasmids. Due to the possiblelink between relative entropy and DNA sequence muta-tions it can be speculated whether phages are more vul-nerable to genetic rearrangements than plasmids,resulting in higher DKL, on average in phages.
ConclusionsIn conclusion, we find that GIs and chromosomes havesimilar relative entropy (DKL), which may be due to ameli-oration of the foreign DNA towards the base compositionof the host chromosome. Both plasmids and phages hadsignificantly lower relative entropy than GIs and chromo-somes. Plasmids had the lowest DKL of all types of DNAsequences examined, meaning that plasmids contained, onaverage, the most mutated DNA sequences. Relativeentropy decreased in all types of DNA sequences in con-cordance with increasing AT content, possibly implyingthat the number of accumulated mutations appear toincrease with AT content regardless of the (prokaryotic)biological entity. This was also demonstrated on a sharedset of highly conserved genes from M. tuberculosis and M.leprae, of which the latter, known to have undergone
considerable genome reduction, was found to have signifi-cantly lower relative entropy (i.e. more random DNAsequences possibly due to mutation) in the protein codinggenes. AT content and DKL association was especially pro-nounced for phages, which may reflect an evolutionarystrategy that associates the number of accumulated muta-tions with AT content to a substantially larger extent inphages than bacteria.
MethodsChromosomes, plasmids and phages were downloadedfrom the NCBI website http://www.ncbi.nlm.nih.gov/genome/, while the GIs were downloaded from theIslandviewer website http://www.pathogenomics.sfu.ca/islandviewer/query.php. Only DNA sequences largerthan 10 kb were considered due to limitations of themethod. Single copy orthologs were assigned byOrthoMCL [37] for the genomes of Mycobacteriumtuberculosis F11 (CP000717.1), M. tuberculosis H37Ra(AL123456.2), M. leprae Br4923 (FM211192.1) and M.leprae TN7 (AL450380.1). Statistical analyses were car-ried out with R http://www.r-project.org/, which wasalso used to create all figures except the BLAST atlas(Figure 6). The BLAST atlas was made using CBS in-house software [24,38].The Kullback-Leibler divergence (DKL, also referred to
as the relative entropy) is a measure of differencebetween two discrete probability mass functions [18].Let s be a DNA sequence, and z1,...,z256 be all possibletetramers of the DNA alphabet (44 = 256). The observedfrequencies of tetranucleotides from DNA sequence s iswritten as O(zi|s). The expected frequencies of tetranu-cleotides from DNA sequence s found using a zeroorder Markov model is written as E(zi|s). The KL diver-gence for the sequence s is given as:
DKL (s) =256∑i=1
O (zi|s) log(
O(zi|s)E(zi|s)
)
A lower DKL is interpreted as lesser informationpotential is carried by the DNA sequence s due to lesserdependence between the nucleotides in the correspond-ing tetranucleotides. Conversely, a higher DKL is takento mean that higher information potential is carried bythe DNA sequence (higher relative entropy), since thenucleotides in the corresponding tetranucleotides aremore dependent on each other. The OUV measure [17]described in the Discussion section and compared torelative entropy is calculated as follows (O, E, zi and sare the same as above):
DOUV(s) =1
256
256∑i=1
O(zi|s)E(zi|s)
Bohlin et al. BMC Genomics 2012, 13:66http://www.biomedcentral.com/1471-2164/13/66
Page 10 of 12

Although the OUV measure is similar to relative entropy,we use the latter here due to the larger theoretical frame-work and tools available from information theory [12,18].Comparisons between DKL and factors such as phyla,
AT content, DNA sequence size, etc. were carried outusing linear regression with transformations applied tocorrect for non-normality where needed.DKL was computed for each DNA sequence (chromo-
some, plasmid, phage and GI) and compared to AT con-tent, size and phyla using linear regression:
Y = a + bX + ε
For comparisons between chromosome, plasmid, GIand phage size (Y = Ysize) versus DKL (XKL) no transfor-mation was used.To examine the relationship between DKL, DNA
sequence size and AT content for bacterial chromo-somes and plasmids, a linear regression model was usedwithout transformations on the response:
YAT = a + bXKL + cXSize + d(XSize)2 + ε
Linear regression between DKL as outcome (Y = YKL)and AT content as response (X = XAT) was log-trans-formed:
LogYKL = a + bXAT + ε
Several transformations were used to assess associa-tions between chromosome, plasmid, phage and GI size(YSize) vs AT content (XAT) using the following regres-sion equation:
YSize = a + bXAT + ε
A square root transform was used when the responsewas sequence sizes for chromosomes; log transforma-tions for both phage and plasmid sizes; and (1/ YSize)transform for GI sizes as outcome.Comparison of DKL between chromosomes, plasmids,
phages and GI, as seen in Figure 1, were carried outusing the non-parametric Wilcoxon (Mann-Whitney)test due to skewed (but similar) distributions.All statistical results presented as results were found
to be statistically significant with p < 0.001, if not other-wise stated in the text.All DKL measurements of DNA sequences were carried
out using in-house software. The profiles measuring DKL
changes within bacterial chromosomes as seen in Figure5 were performed using non-overlapping sliding windowsof 5 kbp compared to average chromosomal DKL.
AcknowledgementsThe authors wish to thank the referees as well as Hilde Mellegård andTorunn Dønsvik for their helpful comments. MWJvP is funded by theNetherlands Organization for Scientific Research (NWO) via a VENI grant.
Author details1Norwegian School of Veterinary Science, EpiCentre, Department of FoodSafety and Infection biology, Ullevålsveien 72, Oslo, Norway. 2Systems andSynthetic Biology, Wageningen University, Wageningen, the Netherlands.3Norwegian University of Life Sciences, Department of Chemistry,Biotechnology and Food Sciences, Ås, Norway. 4National Veterinary Institute,Ullevålsveien 68, Pb 750 Sentrum, N-0106 Oslo, Norway. 5Center forBiological Sequence Analysis, Department of Systems Biology, Comparativegenomics unit, Technical University of Denmark, DK-2800 Lyngby, Denmark.
Authors’ contributionsJB, LS and ABK carried out statistical analyses. JB, MWJvP, SPH, and DUcontributed to data analyses and discussion. All authors participated in thewriting of the manuscript. The study was initiated by JB. All authors haveread and approved the final manuscript.
Received: 15 November 2011 Accepted: 10 February 2012Published: 10 February 2012
References1. van Passel MW, Marri PR, Ochman H: The emergence and fate of
horizontally acquired genes in Escherichia coli. PLoS Comput Biol 2008,4(4):e1000059.
2. Roos TE, van Passel MW: A quantitative account of genomic islandacquisitions in prokaryotes. BMC Genomics 2011, 12:427.
3. Fournier PE, Drancourt M, Raoult D: Bacterial genome sequencing and itsuse in infectious diseases. 2007, 7(11):711-723.
4. Langille MG, Hsiao WW, Brinkman FS: Evaluation of genomic islandpredictors using a comparative genomics approach. BMC Bioinformatics2008, 9:329.
5. Halary S, Leigh JW, Cheaib B, Lopez P, Bapteste E: Network analysesstructure genetic diversity in independent genetic worlds. Proc Natl AcadSci USA 2010, 107(1):127-132.
6. Haerter JO, Trusina A, Sneppen K: Targeted bacterial immunity buffersphage diversity. J Virol 2011, 85(20):10554-10560.
7. Pride DT, Wassenaar TM, Ghose C, Blaser MJ: Evidence of host-virus co-evolution in tetranucleotide usage patterns of bacteriophages andeukaryotic viruses. BMC Genomics 2006, 7:8.
8. van Passel MW, Bart A, Luyf AC, van Kampen AH, van der EA:Compositional discordance between prokaryotic plasmids and hostchromosomes. BMC Genomics 2006, 7(1):26.
9. Bohlin J, Skjerve E, Ussery DW: Reliability and applications of statisticalmethods based on oligonucleotide frequencies in bacterial and archaealgenomes. BMC Genomics 2008, 9:104.
10. Reva ON, Tummler B: Global features of sequences of bacterialchromosomes, plasmids and phages revealed by analysis ofoligonucleotide usage patterns. BMC Bioinformatics 2004, 5:90.
11. Bohlin J, Skjerve E, Ussery DW: Investigations of oligonucleotide usagevariance within and between prokaryotes. PLoS Comput Biol 2008, 4(4):e1000057.
12. Shannon CE: The mathematical theory of communication. 1963. MDComput 1997, 14(4):306-317.
13. Yockey HP: Origin of life on earth and Shannon’s theory ofcommunication. Comput Chem 2000, 24(1):105-123.
14. Schneider TD: Information content of individual genetic sequences. JTheor Biol 1997, 189(4):427-441.
15. Sadovsky MG: Information capacity of nucleotide sequences and itsapplications. Bull Math Biol 2006, 68(4):785-806.
16. Menconi G, Marangoni R: A compression-based approach for codingsequences identification. I. Application to prokaryotic genomes. JComput Biol 2006, 13(8):1477-1488.
17. Bohlin J, Skjerve E: Examination of genome homogeneity in prokaryotesusing genomic signatures. PLoS One 2009, 4(12):e8113.
18. Cover TM, Thomas JA: Elements of Information Theory: Wiley; 1991.19. Vissa VD, Brennan PJ: The genome of Mycobacterium leprae: a minimal
mycobacterial gene set. Genome Biol 2001, 2(8):REVIEWS1023.20. Gomez-Valero L, Rocha EP, Latorre A, Silva FJ: Reconstructing the ancestor
of Mycobacterium leprae: the dynamics of gene loss and genomereduction. Genome Res 2007, 17(8):1178-1185.
21. Moran NA: Microbial minimalism: genome reduction in bacterialpathogens. Cell 2002, 108(5):583-586.
Bohlin et al. BMC Genomics 2012, 13:66http://www.biomedcentral.com/1471-2164/13/66
Page 11 of 12

22. Rocha EP, Danchin A: Base composition bias might result fromcompetition for metabolic resources. Trends Genet 2002, 18(6):291-294.
23. Karlin S, Campbell AM: Which bacterium is the ancestor of the animalmitochondrial genome? Proc Natl Acad Sci USA 1994, 91(26):12842-12846.
24. Hallin PF, Binnewies TT, Ussery DW: The genome BLASTatlas-a GeneWizextension for visualization of whole-genome homology. Mol Biosyst 2008,4(5):363-371.
25. Mitchell D: GC content and genome length in Chargaff compliantgenomes. Biochem Biophys Res Commun 2007, 353(0006-291; 1):207-210.
26. Musto H, Naya H, Zavala A, Romero H, varez-Valin F, Bernardi G: GenomicGC level, optimal growth temperature, and genome size in prokaryotes.Biochem Biophys Res Commun 2006, 347(0006-291; 1):1-3.
27. Lawrence JG, Ochman H: Amelioration of bacterial genomes: rates ofchange and exchange. J Mol Evol 1997, 44(4):383-397.
28. Langille MG, Hsiao WW, Brinkman FS: Detecting genomic islands usingbioinformatics approaches. Nat Rev Microbiol 2010, 8(5):373-382.
29. Slater FR, Bailey MJ, Tett AJ, Turner SL: Progress towards understandingthe fate of plasmids in bacterial communities. FEMS Microbiol Ecol 2008,66(1):3-13.
30. Bahl MI, Hansen LH, Sorensen SJ: Persistence mechanisms of conjugativeplasmids. Methods Mol Biol 2009, 532:73-102.
31. van Noort V, Worning P, Ussery DW, Rosche WA, Sinden RR: Strandmisalignments lead to quasipalindrome correction. Trends Genet 2003,19(7):365-369.
32. Sinden RR: DNA Structure and Function: Academic Press; 1994.33. Kirzinger MW, Stavrinides J: Host specificity determinants as a genetic
continuum. Trends Microbiol 2012, 20(2):88-93.34. Brussow H, Hendrix RW: Phage genomics: small is beautiful. Cell 2002,
108(1):13-16.35. Paul JH, Sullivan MB, Segall AM, Rohwer F: Marine phage genomics. Comp
Biochem Physiol B Biochem Mol Biol 2002, 133(4):463-476.36. Lima-Mendez G, Van Helden J, Toussaint A, Leplae R: Reticulate
representation of evolutionary and functional relationships betweenphage genomes. Mol Biol Evol 2008, 25(4):762-777.
37. Fischer S, Brunk BP, Chen F, Gao X, Harb OS, Iodice JB, Shanmugam D,Roos DS, Stoeckert CJ Jr: Using OrthoMCL to assign proteins toOrthoMCL-DB groups or to cluster proteomes into new ortholog groups.Curr Protoc Bioinformatics 2011, , Chapter 6: Unit 6.12.1-19.
38. Hallin PF, Ussery DW: CBS Genome Atlas Database: a dynamic storage forbioinformatic results and sequence data. Bioinformatics 2004,20(18):3682-3686.
doi:10.1186/1471-2164-13-66Cite this article as: Bohlin et al.: Relative entropy differences in bacterialchromosomes, plasmids, phages and genomic islands. BMC Genomics2012 13:66.
Submit your next manuscript to BioMed Centraland take full advantage of:
• Convenient online submission
• Thorough peer review
• No space constraints or color figure charges
• Immediate publication on acceptance
• Inclusion in PubMed, CAS, Scopus and Google Scholar
• Research which is freely available for redistribution
Submit your manuscript at www.biomedcentral.com/submit
Bohlin et al. BMC Genomics 2012, 13:66http://www.biomedcentral.com/1471-2164/13/66
Page 12 of 12