Embed Size (px)
Citation preview
RELATIONSHIP BETWEEN OPERATIONAL EFFICIENCY AND
GROWTH OF COMMERCIAL BANKS IN KENYA
BY
ERIC KANG’ETHE
RESEARCH PROJECT SUBMITTED IN PARTIAL FULFILMENT OF THE
REQUIREMENT FOR THE AWARD OF THE DEGREE OF MASTERS OF
BUSINESS ADMINISTRATION, SCHOOL OF BUSINESS, UNIVERSITY
OF NAIROBI
OCTOBER, 2009

DECLARATION
This research project report is my original work and has not been submitted for a
degree in any other University.
Signed
ERIC KANG'ETHE
D61/P/8463/04
This management research project has been submitted for examination with my
approval as University
NAME: MOHAMED N. MWACHITI
LECTURER, DEPARTMENT OF FINANCE AND ACCOUNTING
UNIVERSITY OF NAIROBI
i

DEDICATIO N
To all of you who made me what I am today
ii

ACKNOW LEDGEMENT
I thank the Almighty God for the life. Thank you for being with me all through.
I acknowledge my family for being beside me all the way. Your support and
encouragement has seen me this far.
I also acknowledge my supervisor, Mr. Mohamed Mwachiti, who guided me
throughout the research period.
I also acknowledge the entire staff and management of Central Bank of Kenya and
Capital Markets Authority and for allowing me to gather information concerning
organisations surveyed. Your contribution to this research cannot be
underestimated.
iii
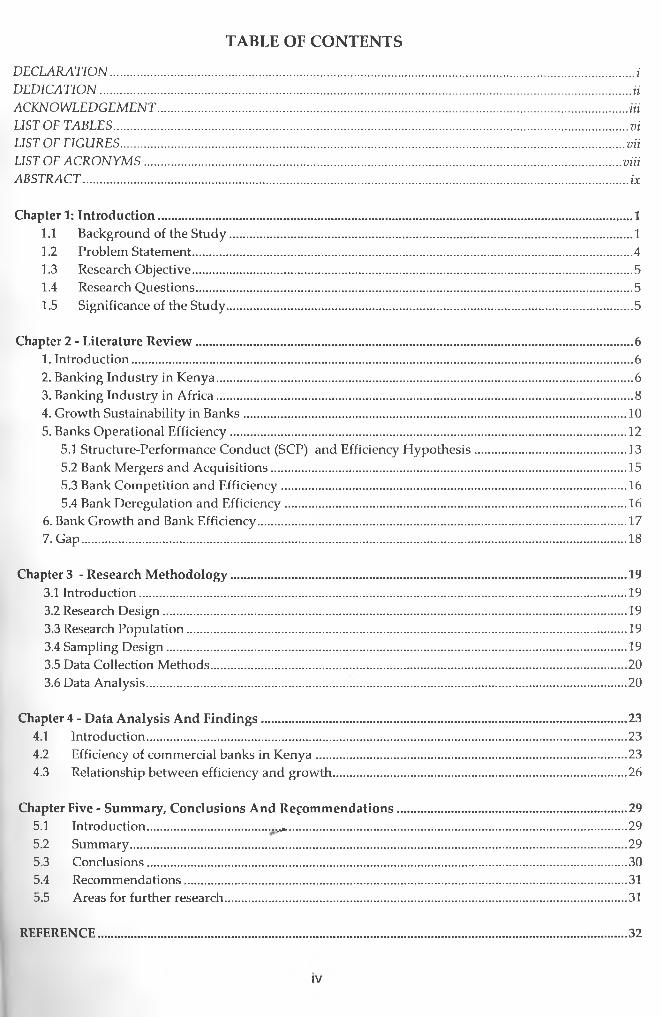
TABLE OF CONTENTS
DECLARATION ............................................................................................................................................................................................ iDED ICATIO N .............................................................................................................................................................................................. iiACKNO W LEDGEM ENT ........................................................................................................................................................................ iiiLIST OF TABLES ........................................................................................................................................................................................ viLIST OF FIGURES .....................................................................................................................................................................................viiLIST OF A C R O N Y M S ...........................................................................................................................................................................viiiABSTRACT ................................................................................................................................................................................................... ix
Chapter 1: Introduction..................................................................................................................................11.1 Background of the Study.............................................................................................................. 11.2 Problem Statement........................................................................................................................ 41.3 Research Objective........................................................................................................................ 51.4 Research Questions....................................................................................................................... 51.5 Significance of the Study............................................................................................................... 5
Chapter 2 - Literature Review........................................................................................................................61. Introduction......................................................................................................................................... 62. Banking Industry in Kenya..................................................................................................................63. Banking Industry in Africa..................................................................................................................84. Growth Sustainability in Banks.........................................................................................................105. Banks Operational Efficiency............................................................................................................ 12
5.1 Structure-Performance Conduct (SCP) and Efficiency Hypothesis..........................................135.2 Bank Mergers and Acquisitions................................................................................................. 155.3 Bank Competition and Efficiency...............................................................................................165.4 Bank Deregulation and Efficiency..............................................................................................16
6. Bank Growth and Bank Efficiency..................................................................................................... 177. Gap..................................................................................................................................................... 18
Chapter 3 - Research Methodology............................................................................................................ 193.1 Introduction..................................................................................................................................... 193.2 Research Design...............................................................................................................................193.3 Research Population........................................................................................................................ 193.4 Sampling Design.............................................................................................................................. 193.5 Data Collection Methods..................................................................................................................203.6 Data Analysis................................................................................................................................... 20
Chapter 4 - Data Analysis And Findings.................................................................................................... 234.1 Introduction................................................................................................................................... 234.2 Efficiency of commercial banks in Kenya...................................................................................... 234.3 Relationship between efficiency and growth................................................................................. 26
Chapter Five - Summary, Conclusions And Recommendations...............................................................295.1 Introduction................................ „v>»............................................................................................ 295.2 Summary........................................................................................................................................295.3 Conclusions................................................................................................................................... 305.4 Recommendations......................................................................................................................... 315.5 Areas for further research..............................................................................................................31
REFERENCE.................................................................................................................................................32
iV

APPENDICES............................................................................................................................................................... IAppendix 1: Bank Deposits......................................................................................................................... IAppendix 2: Bank Advances.....................................................................................................................IllAppendix 3: Interest Rates........................................................................................................................ VAppendix 4: Earning Assets.................................................................................................................... VII

LIST OF TABLES
Table 1: Efficiency and Growth of Commercial Banks in Kenya (1998-2007)...............48
Table 2: Regression statistics....................................................................................................50
Table 3: ANOVA.........................................................................................................................51
Table 4: Regression Coefficients..............................................................................................51
VI

LIST OF FIGURES
Figure 1: Growth Indicators 31
VII
LIST OF ACRONYMS
BBK - Barclays Bank of Kenya Limited.
CBA - Commercial Bank of Africa Limited
DEA - Data Envelopment Analysis
GDP - Gross Domestic Product
KCB - Kenya Commercial Bank Limited.
NIM - Net Interest Margin
NPL - Non Performing Loans
ROA - Return on Assets
ROE - Return on Equity
SCB - Standard Bank of Kenya Limited.
SSA - Sub Saharan Africa
TFA - Thick Frontier Approach
viii
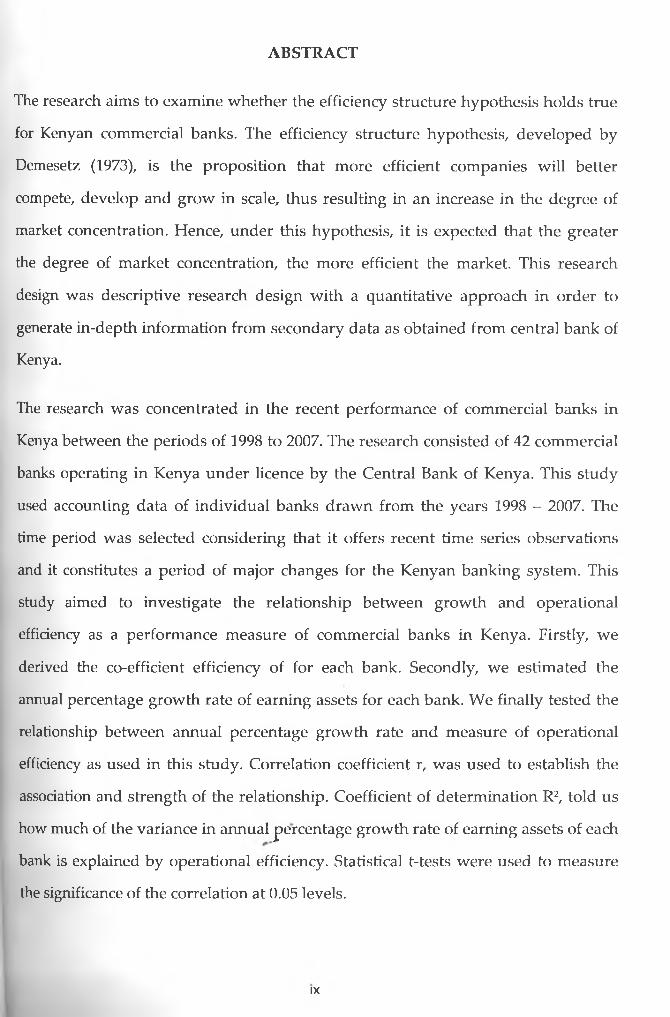
ABSTRACT
The research aims to examine whether the efficiency structure hypothesis holds true
for Kenyan commercial banks. The efficiency structure hypothesis, developed by
Demesetz (1973), is the proposition that more efficient companies will better
compete, develop and grow in scale, thus resulting in an increase in the degree of
market concentration. Hence, under this hypothesis, it is expected that the greater
the degree of market concentration, the more efficient the market. This research
design was descriptive research design with a quantitative approach in order to
generate in-depth information from secondary data as obtained from central bank of
Kenya.
The research was concentrated in the recent performance of commercial banks in
Kenya between the periods of 1998 to 2007. The research consisted of 42 commercial
banks operating in Kenya under licence by the Central Bank of Kenya. This study
used accounting data of individual banks drawn from the years 1998 - 2007. The
time period was selected considering that it offers recent time series observations
and it constitutes a period of major changes for the Kenyan banking system. This
study aimed to investigate the relationship between growth and operational
efficiency as a performance measure of commercial banks in Kenya. Firstly, we
derived the co-efficient efficiency of for each bank. Secondly, we estimated the
annual percentage growth rate of earning assets for each bank. We finally tested the
relationship between annual percentage growth rate and measure of operational
efficiency as used in this study. Correlation coefficient r, was used to establish the
association and strength of the relationship. Coefficient of determination R2, told us
how much of the variance in annual percentage growth rate of earning assets of each
bank is explained by operational efficiency. Statistical t-tests were used to measure
the significance of the correlation at 0.05 levels.
IX
The study found that there was a fairly weak positive correlation between efficiency
and growth of banks in Kenya. Efficiency of commercial banks explains only 9.4% of
the variance in bank growth as measured by annual percentage rate of growth of
earning assets. This implies that the more efficient commercial banks are, the more
they grow in terms of their annual growth of earning assets. The results point to the
fact that growth in commercial banks is significantly influenced by their efficiency in
advances. The study recommends that banks in Kenya can be more effective in
mobilising deposits when this is pursued with higher interest rates rather than
depending on administrative devices alone, such as more branches and more
personnel. The study also recommends that the strategies used by other efficient
banks in deposit mobilisation are recommended to the other banks which wish to
expand as rapidly as the more efficient ones.
x

CHAPTER ONE: INTRODUCTION
1.1 Background of the Study
The research aims to examine whether the efficiency structure hypothesis holds true for
Kenyan commercial banks. The efficiency structure hypothesis, developed by Demesetz
(1973), is the proposition that more efficient companies will better compete, develop and
grow in scale, thus resulting in an increase in the degree of market concentration. Hence,
under this hypothesis, it is expected that the greater the degree of market concentration, the
more efficient the market. The hypothesis posits that the relationship between market
structure and performance of any firm is defined by the efficiency of that firm. In cases where
a firm is highly efficient relative to the competitors, the firm can maximize profit by
maintaining its current size and pricing strategy or by reducing prices and expanding its
operations. If the firm chooses to expand its operations, it will eventually gain market share
and thus, concentration will be a consequence of efficiency. The efficiency hypothesis is
defined by a number of other sub branches such as the relative market power hypothesis. The
relative market power hypothesis argues that firm with large market shares and well
differentiated products will be able to able to exercise market power when pricing they
products and earn super normal profits. The efficient structure hypothesis states that only the
efficiency of firms can explain the positive relationship between profits and concentration or
profits and market share. The X-efficiency argument states that those firms with superior
management or production technologies have lower costs and therefore higher profits. By
extension, those more efficient firms will gain greater market shares, which may result in a
more concentrated market. In this context, efficiency influences the level of profit and market
structure. The efficiency hypothesis challenges the basic predictions of the scale efficiency
paradigm. The scale efficiency argument contends that firms may have comparable quality of
management and technology, but some firms produce at a more efficient scale than other
firms, thus they have lower unit costs and higher unit profits. Such firms are assumed to
acquire larger market shares, which may result in higher levels of concentration. In this
scenario, efficiency through an indirect proeess drives both profit and market structure.
The Kenyan banking sector has continued to mature, expanding its asset base from Kshs. 548
billion in 1999 to Kshs 1.2 trillion in 2008, an increase of more than 120% within ten years.
Competition is very stiff among banks. Over the past five years many banks have expanded
their branch networks to reach more people, targeting the lower end of the market. The size
1
of banks has become an important issue. Because of the deregulation in the banking industry,
there is a trend for banks to increase in size through addition of new branches or merging
with others and become larger in size. During the last 3 years, banking in Kenya has been
transformed from class banking to mass banking. In the next 2-5 years the growth process of
the banking system is likely to continue the same way.
The cost of banking intermediation in Kenya is higher and bank penetration is far lower than
in other markets. Kenya’s banking industry must strengthen itself significantly if it has to
support the modem and vibrant economy which Kenya aspires to be. The onus for this
change lies mainly with bank managements. In their attempts to improve performance, retail
banks do undertake substantial cost-reduction programs. Although such initiatives have
brought measurable benefits, some institutions may get to a point where further cost cutting
may weaken frontline sales capabilities and therefore hurt market share (Bennett, Brennand,
& Buchar, 2006). As a result, the key differentiator between market leaders and poor
performers will be growth, in particular, the generation of high-value, sustainable growth.
The analysis carried out by World Bank (2008) shows that overhead costs of government-
influenced banks remain high. High overhead costs and poor portfolio quality at state banks
represent a large opportunity cost, as the deposits and other liabilities of those banks could be
intermediated at lower costs and channelled to investments that are more productive.
The banking sector is currently facing a slowdown in economic growth. Kenya’s economy is
projected to grow by a dismal 2.5% in 2009. Almost all sectors of the economy are expected
to decline. Agriculture, tourism and manufacturing are all expected to bear the brunt of the
effects of dry weather, the post election crisis and the global recession. The decline in the real
economy is expected to impact on the banking sector. This could only be felt later in the year.
With the US government spending hundreds of billions of dollars bailing out some of the
biggest banks on Wall Street, one of the lessons learnt from the global financial crisis is that
there is no limit to the amount of capital that a bank should have. There is substantial
uncertainty regarding the future impacts of the crisis, which is a major deterrent to
investment, in turn a major driver of economic growth.
The issue of huge interest spreads continues to be a grave concern to many banks customers.
Banks in Kenya are enjoying spreads as high as 16% between what they pay for deposits and
what they charge for as interest on loans. It seems that this spread has not narrowed in spite
2
of the perceived competition in the banking sector. Banks rationalize these huge spreads by
saying the cost of doing business has increased over time. In order to compete with non-bank,
financial institutions, banks should be increasing their levels of efficiency.
Kenyan banks are presently under intense competition to improve efficiency and transform
banking service delivery into networks encompassing traditional branches, automated tellers,
telephone banking and the Internet. Banks must get a balance between in-sourcing and
outsourcing and build effective relationships with suppliers. They must remain vigilant
against financial crime, which can adversely affect the bottom line and their reputation in the
market. Whilst doing all this they must continue to improve customer satisfaction which
drives cost sales.
Small banks are coming under pressure as competitive pressures build up, especially as
supply of treasury bills continues to dry up as source of revenue. In addition, the banks’
reliance on government securities as a steady stream of revenues appears to have potentially
crowded out the private sector. This has lead to increased competition, as banks have had to
identify new lending opportunities and expand their customer base in order to generate
income. Addressing the corresponding high overhead costs is a major determinant of
operational efficiency in Kenyan commercial banks.
Other issues affecting the banking industry in Kenya are changes in the regulatory
framework, where liberalisation exists but the market still continues to be restrictive;
declining interest margins due to customer pressure, leading to mergers and reorganisations;
increased demand for non-traditional services including the automation of a large number of
services and a move towards emphasis on the customer rather than the product; and
introduction of non-traditional players, who now offer financial services products.
Greater efficiency is critical in the delivery of financial services to ensure that the costs of
services become increasingly affordable and that the range and quality of services better
caters to the needs of both savers and Investing businesses and improved access to financial
services and products for a much larger population of Kenyans. Growth sustainability of the
Kenyan banking sector will require that the commercial banks should achieve stability in the
retail banking sector to ensure that all banking institutions taking deposits safely handles the
pvtoWc’s savings and ensure that the chances of financial crises are minimized.
3
It is therefore important to establish if the quantitative enlargement currently being
experienced by Kenya Commercial banks is backed by bank’s management operational
efficiencies otherwise the growth sustainability cannot be assured.
1.2 Problem Statement
The research aims to examine whether the efficiency structure hypothesis holds true for
Kenyan commercial banks. The efficiency structure hypothesis, developed by Demesetz
(1973), is the proposition that more efficient companies will better compete, develop and
grow in scale, thus resulting in an increase in the degree of market concentration. Hence,
under this hypothesis, it is expected that the greater the degree of market concentration, the
more efficient the market.
Nearly four out of every ten Kenyan adults have no access even to a co-operative society.
The situation is worse when you consider that only two out of every ten adults have a bank
account, the others live out straight from the pocket. A weak banking structure has been
unable to fuel continued growth, which has harmed the long-term health of their economies,
(Irungu, 2007). In this research, the emphasis is in the need to act both decisively and quickly
to build an enabling, rather than a limiting, banking sector in Kenya.
The future impact of the global financial crisis and post election violence on Kenyan financial
system is still unclear particularly for Kenyan financial system. Kenya has not articulated a
strong view on how to handle the crisis. Growth of the Kenyan banking sector will require a
cautious approach to achieve stability. Competition is also likely to increase with the planned
entry of fully fledged Islamic banks after the Minister for Finance opened a window for
Sharia-compliant products in the budget speech for year 2007/08. It is not clear whether
banks have come up with efficient ways of achieving profitable growth against a backdrop of
rising customer expectations, reduced levels of consumer trust, unprecedented scrutiny from
regulators and the media and intense competition.
To date, there have been limited published studies to explore the relationship between
operational efficiency and growth, especially the commercial banks and more specifically in
Kenya and that is reason this study proposes that there are measurable linkages between these
two variables.
4
1.3 Research Objective
The purpose of the study is to determine whether the current rapid growth rate of earning
assets in Kenya Commercial banks is a result of an improved high operating efficiency.
1.4 Research Questions
The following hypotheses will be tested in the study:
Ho: There is no significant difference between banking operational efficiency and
banking growth of commercial banks in Kenya.
Hi: There is a significant difference between banking operational efficiency and
banking growth of commercial banks in Kenya.
1.5 Significance of the Study
• Given the fact that some programmes fail when they are adopted on a large scale even
though they yield positive results during the testing phase, the study enlightens one on
whether the recent growth in the banking sector is sustainable for long-term future.
• The research will highlight problems associated with empty growth in relation to
operation efficiency. The findings might help bank managers to understand the
underlying reasons for their banks’ inefficient performances.
• The study is important and beneficial to various parties involved in the banking system,
participants in policy making in a way that they come up with functional rules and
policies which will enhance stability in the financial sector and reduce costs of operations.
Further, elaborations are made to understand the market power of the sector.
• Academically, this study brings forth the importance of the banking industry in the
economy and the need to enhance growth through better management of bank portfolios
as this research tries to establish growth sustainability in banking industry.
5
CHAPTER TWO - LITERATURE REVIEW
1. Introduction
In this chapter the process involves locating reading and evaluating reports of
previous studies, observations and opinions related to the planned study. It is a continuous
process in a dynamic way, the review helps to clarify, strengthen and direct each stage
of the research from formulation of each topic to the mechanism for the dissemination
and utilization of the research findings. The research will look at the performance of
commercial banks and the ability to maintain positive growth by looking at global
experiences then further trickling down to Kenyan market. Majorly to the best knowledge
of the author, there is no research which has been done regarding to growth
sustainability within commercial banks which has been carried out.
2. Banking Industry in Kenya
Kenya has experienced banking problems since 1986 culminating in major bank failures (37
failed banks as at 1998) following the crises of; 1986-1989, 1993/1994 and 1998. The
number of banks absorbing their subsidiaries or merging has been experienced. In a banking
crisis; depositors, lenders to banks and owners of bank capital all lose confidence and seek to
simultaneously salvage their resources by withdrawing them (Irungu, 2007)
With the perspective experienced above, commercial banks in Kenya have been experiencing
a positive growth. The Kenyan banking sector has 41 financial institutions, which are
regulated by the Government of Kenya. These traditional banks are facing competition from
non-traditional competitors; like microfinance institutions and SACCOs. In contrast to the
traditional banks, there are over 3500 participants in the microfinance industry, not counting
the SACCOS. Traditional banks like Barclays, KCB, and Standard Chartered have focused
on higher end clients and have the highest market shares in the industry. In addition to this,
Barclays and Standard Chartered are multinational banks and KCB has a huge network in
Kenya. On the other hand, microfinance institutions like K-Rep and Equity Bank focus on
lower income clients that were traditionally considered un-bankable. These banks have been
growing tremendously over the past 3 years and have been taking over some of the market
share of the traditional banks, (Dyer & Blair Bank, 2007).
6
The growth experienced by the sector drew attention to stakeholders in the field to refocus on
how to avoid bank failures of crises, fierce competition from financial service providers
would see some banks fail while as others would be forced to merge or takeover. In such case
for example is when the government decided to increase the minimum statutory capital
requirements for Kenyan banks to Shi billion by 2010 but Bill was shot down by parliament,
the smaller banks could still shore up their capital base on their own initiative otherwise they
would be outpaced in market penetration, technology advancement and market shocks. The
banked population is still estimated at a paltry nine per cent or three million people, however
the banking industry is currently at a high growth rate phase as evidenced by the increase in
total assets held by banks from Sh330 billion in 1997 to Sh760 billion currently. Overall
credit extension to the private sector has risen from just under Sh200 billion in 1997 to about
Sh470 billion as at the close of last year (Irungu, 2007).
In her research, Okutoyi, P. G.(1988) came to the conclusion that the level, of strategic
marketing in a bank affects the overall level of profitability., However, she discovered that
the level of strategic marketing does not affect the level of deposits within the institutions. He
attributes this to the role of government in the Kenyan money market.
Nyamai (1989) examines the growth in lending and deposits during the 1980s and the looks
at the sectoral growths of each of these. He concludes that the big three banks, KCB, BBK
and Standard Chartered controlled the largest percentage of the branch network. He also
observed that branch banking was the most prevalent in the Kenyan financial system.
Several studies have been undertaken on evaluation of financial performance in Kenyan
Banking sector, but none has focussed on the sustainability of growth in banks based on the
impact the increase in earning assets has on operational efficiency. In his study Koros
(2001) focussed on financial performance of non banking Institutions that converted into
commercial banks in Kenya, Kitaka (2001) did a survey Of The use of Financial Performance
Indicators By Micro Finance Institutions In Kenya. Thuku (2002) established the relationship
between ownership structure and bank financial performance In Kenya. Kathanje (2000)
made an evaluation of Financial Performance of the Kenyan Banking Sector. Muthungu
(2003) also did an evaluation of Financial Performance Of Commercial Banks In Kenya
7
comparing local versus foreign banks. Kibe (2003) analysed the relationship between Interest
Rate Spread and profitability Of Commercial Banks In Kenya and Kimutai (2003)
3. Banking Industry in Africa
The banking industry in low-income SSA countries is generally not performing adequately.
The range of institutions is narrow, and most of the countries' assets are smaller than those
held by a single medium-sized bank in an industrial country. Most people do not have access
to even basic payment services or savings accounts, and the largest part of the productive
sector cannot obtain credit. Limited finance lowers welfare and hinders poverty alleviation,
and a lack of credit to the economy impedes growth. In addition, implementing monetary
policy in the context of shallow markets is costly and inefficient (Guide & Pattillo, 2006).
According to Guide & Pattillo (2006), the banking sector in Africa needs reforms so as to
create effective financial sectors which can mobilize and pool savings; produce information
on possible investments so that resources can be channelled to their most productive use;
monitor the use of funds; facilitate the trading, diversification, and management of risk; and
ease the exchange of goods and services. Because African countries are high-risk
environment exposed to terms of trade shocks and a volatile climate, it would benefit from
greater risk sharing through portfolio diversification, consumption smoothing, and insurance,
which are facilitated by financial development.
Africa’s banking systems have come a long way since the 1990s, when the region
experienced a number of crises. At that time, politically motivated lending to public
enterprises and political insiders, as well as non-committed supervisors, created the problem
of rampant nonperforming loans, insolvent banking systems, and financial crises. Now, most
of the region's banking systems are, on average, adequately capitalized and highly liquid.
However, some countries' financial systems and many individual banks are still weak, with
many banks failing to meet tests of basic capital adequacy, a sign of persistent problems in
banking supervision, (International Monetary Fund, 2002).
The underperformance of the banking system in Africa can be attributed to a weak legal
environment. Legal and institutional frameworks are generally poor in Sub-Saharan Africa,
and improvements have been slow. Legal systems are underfunded, and the public often has
8
little confidence that legal proceedings are objective and will take a reasonable amount of
time. A credit information index, measuring the ability of financial institutions to obtain
information on client creditworthiness, and a legal framework index are lower for SSA than
for other low-income countries. Studies have shown that improvements in these indices are
strongly associated with higher shares of private loans to GDP (Kaminsky & Reinhart, 1999)
The other impediment to poor banking system in Africa is the weak property rights and poor
contract enforceability. Financial institutions are reluctant to lend because of the difficulty of
securing collateral and seizing assets if loans default. Borrowers often have difficulty
presenting collateral because of unclear land titles as a result of inadequate documentation
and overlapping systems of rights and ownership. Registering titles of movable property
(such as cars and other durable goods) is also problematic. For example, when borrowers in
Rwanda and Senegal use movable property as collateral, they must often physically surrender
it for the duration of the loan (International Communications, 2007).
Supervision is constrained. In a big stride forward, SSA countries have brought many
regulatory and supervisory requirements into line with international norms. Actual
supervision, however, is often constrained. Supervisors tend to be subject to political pressure
and thus have little power to demand "prompt corrective actions." They also tend to exhibit
substantial discretion for tolerating violations of prudential rules. This forbearance often
reflects underlying pressures, such as banks' inability to meet prudential requirements (for
example, on loan concentration) given structural features of the economy (limited lending
opportunities) that are slow to change. Politically influenced supervisors also sometimes
worry about the possible fiscal costs of bank restructuring. Resource constraints in
supervisory agencies and the generally weak accounting and auditing systems in place also
hamper supervision (International Communications, 2007).
Rules-based monetary policy instruments impose costs on banks. Reserve ratios in SSA are
high and have been climbing since the mid-1990s. In 2004, the average reserve ratio was 11.3
percent and ranged from 0 percent in the Central African Republic to about 50 percent in
Zimbabwe. Increases in required reserves reflect the region's heightened focus on stabilizing
inflation and maintaining financial system stability. With many SSA countries only partially
remunerating required reserves, if at all, this instrument amounts to a heavy tax on banks.
9

Because of the lack of remuneration, banks do not have the incentive to seek deposits or to
develop products against which they must hold reserves. And empirical studies find that high
reserve requirements contribute to high interest rate spreads.
In the global picture, The Top 20 banks in Eastern Africa are smaller than those in West,
North or South Africa, indicating that the financial sectors across mainland Eastern Africa are
still relatively undeveloped. Of course, Eastern Africa does not boast the economic might of
South Africa, or the oil and gas riches of West and North Africa, which may help to explain
the lack of money washing around in the system. After many years of slow economic
development, the economy has begun to pick up over the past two years and despite ongoing
political instability and fears about financial irregularities, the country's economic prospects
look better today than for any time in the past decade. Yet Kenyan banks are not managing to
keep up with banks elsewhere on the continent(Intemational Communications, 2007).
4. Growth Sustainability in Banks
The sustainable growth rate of a bank is the maximum annual rate of increase in total assets
that can be supported by internally generated equity capital. This rate of growth is determined
by the return on assets, the retention rate and the equity multiplier of the bank. Dimitrios
Vasiliou and John Karkazis (2002)
One of the most frequent uses of a firm’s financial forecasts is the assessment of the
feasibility of its plans for growth. This assessment is necessary because most firms do not
have unlimited access to external sources of funds. Therefore, a large part of the funds that
are needed for the growth of a firm has to be generated internally. From the above it is
apparent the significance of a firm’s consistent and logical financial plan. Most of the firms
grow either rapidly or slowly, depending upon the stage of their development. It is well
known that the life-cycle of a firm is often portrayed as an S -shaped curve, which is divided
in four stages of development. The first stage is called the experimentation period, where
sales and profits grow slowly followingfhe introduction of a new product. During this period
of the firm’s life-cycle, external financing is not an important source of meeting the firm’s
financing requirements. The second phase is called the exploitation period, where the firm
experiences fast growth of sales and profits. At this stage the firm has an extraordinary need
for outside financing. The third phase is called the maturity period, where the rate of growth
10
of sales begins to slow down. During this period the company changes from absorbing
external financing to generating more cash than it can profitably reinvest. Finally, the fourth
stage is called the decline period, where the firm faces the appearance of substitute products,
technological obsolescence and decrease in the demand of its products. During this period,
the company generates more cash than it can invest internally and the firm must look for
investment opportunities in new products, or mergers with companies that are still in their
exploitation period. Thus, the hypothesis represented by the four-stage life-cycle concept
exhibit that the growth of a firm depends upon the stage of its development. Dimitrios
Vasiliou and John Karkazis (2002)
The prevailing notion among bank executives is that the growth of a bank should be
maximized. This perception is based upon the idea that a fast growth of a financial firm will
increase its market share and ultimately its earnings. From the financial point of view,
however, a fast growth is not always desirable. An increase in a bank’s assets must be
financed by some sources. Retained earnings and the ability of increasing borrowing that
accompanies them, generate a rather limited amount of funding. If the bank cannot raise new
equity, the previous constraint imposes a maximum boundary in the growth rate that the firm
can accomplish without depleting its financial resources. In other words, the increase in a
bank’s net worth (due to the increase in the retained earnings) permits the proportional
increase of liabilities, without altering the firm’s financial structure. In consequence, the
increase in the net worth and the liabilities determines the growth rate of its assets. Thus, the
growth rate of a bank, which can be maintained from internal financial sources, depends upon
the growth rate of its equity. From the above analysis it follows that the faster the growth rate
of a bank the more equity capital it needs, even if it is profitable. If the increase in equity
capital is ruled out for any reasons (e.g. for fear of loosing some measure of voting control),
the need for funds can be met by an increase in the leverage employed by the bank. However,
minimum capital-to-asset ratios imposed by regulators may restrict a bank’s ability to
increase leverage. This is the reason why a bank must know the maximum annual rate of
increase in total assets that can be supported by internally generated equity capital. Dimitrios
Vasiliou and John Karkazis (2002)
It is assumed that the sustainability of the banking industry can be composed of three stages
of development namely, slow growth, rapid growth and diminishing returns. The first stage ofr r -.c, rf ° r r ;
a L U t ' '
growth for a sustainable banking industry is characterised by Infrastructure, Intellectual
Capital, Institutions, Integrity, Interaction and Innovation which are usually poorly defined.
Investments in the inputs are low to result in significant development in the banking sector.
The second stage is characterized by rapid growth in financial development, where superior
products and services in the banking sector materialize. Improvements in the key drivers tend
to increase the marginal contribution to the development and growth of the banking sector
which is characterised by new innovation and new financial instruments which spur market
growth. Lastly in the third stage, the banking sector achieves a high level of maturity and
products and services become highly standardized and established in the market place. To
this end, the banking industry reaches a steady state of financial development (Vaithilingm,
Nair, & Samudram, 2004).
There is a great need for banks to monitor the performance of products and services and
ensure business objectives are being met. The banks also need to analyze the value of
individual customers in an effort to improve service and reduce chum with the view of
improving asset and this through designing a system which deduct costs from raw profit
figures and deliver the true value of a product or service. Through this, commercial banks can
then undertake in-depth analysis based on a range of performance parameters. The
availability of accurate profitability figures will enable commercial banks to keep existing
and potential investors abreast of its performance, and assist in a planned market
capitalisation. The bank owners are interested in minimisation of the own capital in order to
increase the capital profitability and indexes of assets growth while institutions supervising
the activity of banks require a greater part of the own capital with the purpose to reduce the
risk of bankruptcy and provide the growing stability of banking system and the task of risk
managers is to provide the conformity between the efficiency and growth in earning assets,
the objective of the bank management is to satisfy all three categories of the interested parties
(Scholtens, 2000).
5. Banks Operational Efficiency
Efficiency measurement is one aspect of investigating a firm’s performance. Efficiency can
be measured in three ways; maximisation of output, minimisation of cost, and maximisation
of profits. A firm is regarded as technically efficient if it is able to obtain maximum outputs
1
12
from given inputs or minimise inputs used in producing given outputs. The objective of
producers here is to avoid waste (Kumbhakar and Lovell, 2003).
According to Koopmans (1951) “ a producer is considered technically efficient if, and only if,
it is impossible to produce more of any output without producing less of some other output or
using more of some inputs.” On the other hand, allocative efficiency relates to the optimal
combination of inputs and outputs at a given price. The objective of producers might entail
the following: to produce given outputs at minimum costs; to utilise given inputs so as to
maximise revenue; and to allocate inputs and outputs so as to maximise profit. This technique
of production is widely known as economic efficiency where the objective of producers
becomes one of attaining a high degree of economic efficiency (cost, revenue or profit
efficiency).
5.1 Structure-Performance Conduct (SCP) and Efficiency Hypothesis
The SCP paradigm is the most used framework for the analysis of the performance of the
banking industry. While its theoretical foundations are well established in the industrial
organization literature (Stigler, 1964; Scherer, 1989), its applicability to the banking firm has
not always been rigorously justified. The SCP theory predicts that profits and output prices
would be higher the greater the level of concentration in a given market. This is due to the
greater ease of collusion in a more concentrated market. When applied to the banking
industry it predicts that profits, interest rates on each type of loan and services charges would
be higher in a more concentrated market. On the other hand deposit rates offered would vary
inversely with concentration (Gilbert 1984).
The efficiency hypothesis challenges the basic predictions of the SCP paradigm. The
efficiency hypothesis posits that the relationship between market structure and performance
of any firm is defined by the efficiency of that firm. In cases where a firm is highly efficient
relative to the competitors, the firm can maximize profit by maintaining its current size and
pricing strategy or by reducing prices and expanding its operations. If the firm chooses to
expand its operations, it will eventually gain market share and thus, concentration will be a
consequence of efficiency. The efficiency hypothesis is defined by a number of sub branches
such as the relative market power hypothesis and the efficient structure hypothesis.
13

The relative market power hypothesis argues that firm with large market shares and well
differentiated products will be able to exercise market power when pricing their products and
earn super normal profits. The efficient structure hypothesis states that only the efficiency of
firms can explain the positive relationship between profits and concentration or profits and
market share. The X-efficiency argument within this branch of literature states that those
firms with superior management or production technologies have lower costs and therefore
higher profits. By extension, those more efficient firms will gain greater market shares, which
may result in a more concentrated market. In this context, efficiency influences the level of
profit and market structure. The scale efficiency argument contends that firms may have
comparable quality of management and technology, but some firms produce at a more
efficient scale than other firms, thus they have lower unit costs and higher unit profits. Such
firms are assumed to acquire larger market shares, which may result in higher levels of
concentration. In this scenario, efficiency through an indirect process drives both profit and
market structure.
Demsetz (1973) argues that a positive relationship between profit rates and concentration
may reflect different levels of production efficiency among firms, rather than more effective
collusion, or higher concentration in the market.
Berger (1991) applied the relative efficiency hypothesis to US banking sector data. The
results indicated that once efficiency issues related to individual firms are accounted for,
levels of bank cost inefficiency exert greater influence on bank performance than market
concentration. In another application of the relative efficiency hypothesis, Berger (1993)
found that mergers and the degree of market overlap were generally statistically insignificant
in explaining bank performance.
Other researchers such as Gale and Branch (1982) have argued that the structure of an
industry may be due to superior production efficiency of firms. This is because production
efficiency allows firms to increase their market share, thus leading to higher market
concentration. This suggests that it not collusion or mergers that lead to higher than normal
profits, but rather economies of scale and scope.
14
Evanoff and Fortier (1988) argue that higher profits in concentrated markets could be the result of
greater productive efficiency. The existence of a link between market structure and efficiency was first proposed by Hicks (1935) and the quiet life hypothesis.
Hicks (1935) argued that monopoly power allows managers a quiet life free from competition and
therefore increased concentration should bring about a decrease in efficiency. Liebenstein (1966)
argues that inefficiencies are reduced by increased competition as managers respond to the challenge. The efficient structure hypothesis (Demsetz, 1974) on the other hand, posits a reverse
causality between competition and efficiency. According to the efficient structure hypothesis,
more efficient firms have lower costs, which in turn lead to higher profits. Therefore, the most
efficient firms are able to increase their market share, resulting in higher concentration. Firms may be exploiting greater Xefficiency (the so-called “efficiency hypothesis”) or greater scale
efficiency (the so-called “scale efficiency hypothesis”). Given that higher market concentration
lowers competition, according to the efficiency hypothesis there should be an inverse relationship between competition and efficiency, thus reversing the causality running from efficiency to
competition in the SCP paradigm. Berger (1995) finds some evidence that the efficiency hypothesis holds in US banking. In Europe, on the other hand, structural factors appear to be
more important and the SCP hypothesis seems to hold (Goddard et al., 2001).
5.2 Bank Mergers and Acquisitions
Several recent studies analyze bank mergers by looking at managerial efficiency (X-
efficiency) and profit efficiency. An overall benefit of mergers is mixed. Shaffer (1993) find
that mergers can potentially lower costs and increase profit efficiency, while another paper
(Berger and Humphrey 1992) concludes that mergers have not resulted in any significant post
merger improvements in efficiency.
Similarly, the corporate finance literature suggests that on average bank mergers and
acquisitions do not offer improvements in either efficiency measures or better stock market
returns. While evidence of efficiency gains within banks that have consolidated is not clear-
cut, a number of analyses suggest that banking consolidation tends to increase customer
welfare by improving lending rates and credit access for borrowers, as well as in the longer
run-raising deposit rates (Grillo, 2005).
15
5.3 Bank Competition and Efficiency
Theoretically, competition is good because it ensures that the costs of production are
minimised and at the same time it promotes efficiency. Increased competition could force
banks to operate more efficiently in order to survive. It forces the banks to produce products
and provide services that are most demanded by the customers. If they can provide services
demanded efficiently and with the least cost, there is no reason why they cannot make more
profits. Otherwise, they will make losses and possibly go out of business (Mickell, 1996).
The non-structural approach, on the other hand, posits that factors other than market structure and
concentration may affect competitive behaviour, such as entry/exit barriers and the general
contestability of the market. Relatively new research warns that bank size and types may affect
competitiveness differently and that using only one measure may not be sufficient for inferring on
the true degree of competition (Berger et ah, 2004).
The early bank efficiency literature shows that before deregulation banking markets were often
characterized by the presence of many institutions operating at a non optimal scale with relatively high excess capacity. Such banks could survive mainly because of the lack of competitive pressures and the fact that, in some cases, the domestic authorities, while acting as protectors of
their banking sectors, were keen on maintaining a large number of banks in their systems
(Nickell, 1996).
A more static approach to competition suggests that banks operating in a concentrated market may be induced to use their market power to gain extra profits in an attempt to offset the
inefficiencies derived by the lack of competitive pressures. Here the correlation between
profitability and efficiency should be either zero or negative because less efficient banks with
more market power will be able to gain extra profits. Banks typically encounter relatively large
scale diseconomies once they exceed a certain ‘optimar size (Amel et ai., 2004).
5.4Bank Deregulation and Efficiency
A few studies had been conducted to Investigate the impact of bank deregulation on
competition, efficiency and performance. The issues addressed were centred on whether
deregulation had increased competition, improved efficiency and performance. There is a
consensus view that deregulation had enhanced competition. But a mixed result was found on
efficiency and performance. In the case of the US banking industry, for example, there was
16
evidence that deregulation did not change efficiency (Elyasiani and Mehdian, 1995). A
number of studies on Spanish banks also focused on efficiency and performance during the
deregulation period. Among others are Grifell-Tatje and Lovell (1996, 1997), and Lozano
(1997, 1998). The most important finding that is worth highlighting is that the efficiency and
productivity of Spanish banks have not improved during the deregulated phase. Worse still,
after the deregulation phase, the studies showed a reduced efficiency among Spanish savings
banks (Khumbakar et al., 2001). The findings tend to suggest that the Spanish banks
performed badly in terms of efficiency because the banks found it difficult to adjust
themselves to the increased competition as a result of the deregulation.
A recent study by Isik and Hassan (2003) on Turkish banks also showed an increase in their
efficiency. They attributed the increase in efficiency to improved resources management
practices. In addition, the finding showed that the efficiency gaps between private banks and
public banks have also been narrowed..
Bhattacharya et al. (1997) focused their study on the efficiency of three different kinds of
ownership (private, public and foreign) of Indian commercial banks. Public-owned banks
were found to be the most efficient but somehow demonstrated temporal decline in
efficiency. This was followed by foreign banks, which had temporal increase in efficiency.
Privately owned banks were the least efficient banks and the pattern did not significantly
change over the 1986-1991 period.
6, Bank Growth and Bank Efficiency
A more efficient bank which, presumably, earns more, relative to some measure of its assets
or liabilities ought to have greater wherewithal for expansion and ought actually to grow
faster than other banks. The manner in which this linkage, between efficiency and growth,
occurs is as follows: When the banking system advances more credit, the less efficient banks
that do not mobilise deposits at a rapid rate, will soon experience a decline in their cash ratios
and liquidity ratios, and will be prevented Trom expansion as these ratios hit the prescribed
minimum ratios. The more efficient banks will not hit this constraint and will consequently
expand their earning assets further and faster. The annual percentage growth rate of
individual banks must thus bear some relation with the co-efficient of efficiency of the banks,
(Khusro, Raghavan, Khushi, Siddharthan, 1971).
17
7. Gap
Based on the above literature, we can say that there are some studies about banks’
performance across the board, however, no in depth study has ever been done in Kenya on
the relationship between growth and operational efficiency of commercial banks in Kenya.
The researches mostly done have focused mainly why banks fail such as (Malyutina &
Parilova, 1999) whom did a research on why banks go bankrupt after going trough a
transition period but they did not go further to discuss growth and it’s impact on operational
efficiency. This paper improves on the existing literature both in terms of econometric
technique and data. First, while (Levine, 2002) and (Kudinska, 2004) empirically assess the
connection between banking sector development and the sources of economic growth, they
do not explicitly confront the issue of banking sector growth and operational efficiency.
That is, findings of this study can add to the existing body of the literature and contribute to
filling the gap, and can serve as a starting point on which future studies can be done. On the
practical dimension, this study may help bank decision makers to focus on the major banking
activities that may increase the bank ranking and financial performance positions comparing
with other banks in terms of the sustenance in their growth both in customer base, branches
and profitability. Such information should help the management of commercial banks in
creating appropriate financial strategies for attaining the required planned financial
performance and maintaining the current growth.
18
CHAPTER THREE - RESEARCH METHODOLOGY
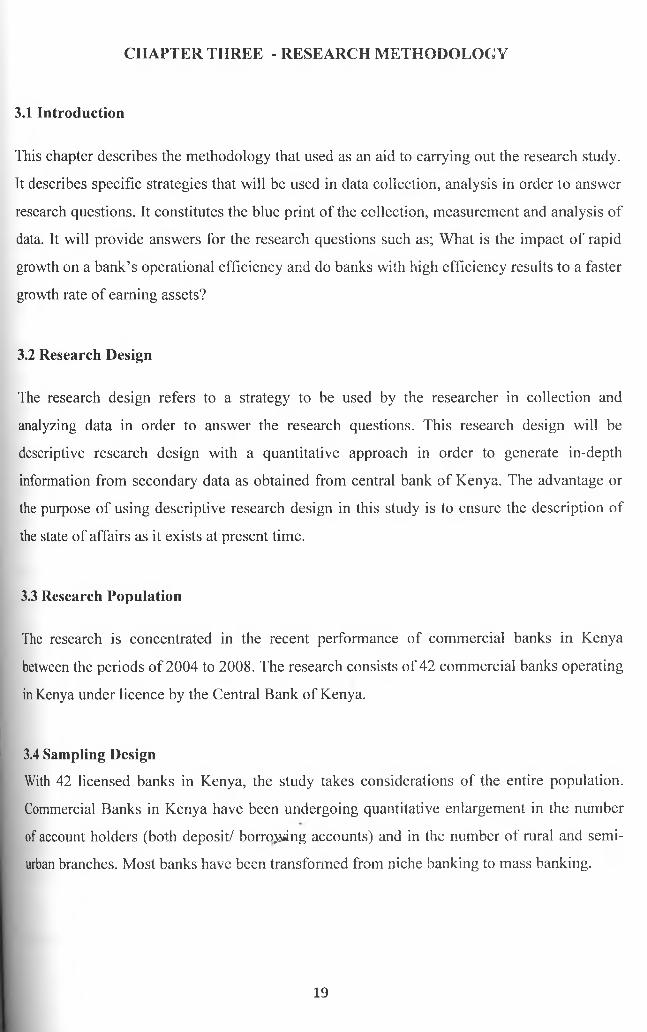
3.1 Introduction
This chapter describes the methodology that used as an aid to carrying out the research study.
It describes specific strategies that will be used in data collection, analysis in order to answer
research questions. It constitutes the blue print of the collection, measurement and analysis of
data. It will provide answers for the research questions such as; What is the impact of rapid
growth on a bank’s operational efficiency and do banks with high efficiency results to a faster
growth rate of earning assets?
3.2 Research Design
The research design refers to a strategy to be used by the researcher in collection and
analyzing data in order to answer the research questions. This research design will be
descriptive research design with a quantitative approach in order to generate in-depth
information from secondary data as obtained from central bank of Kenya. The advantage or
the purpose of using descriptive research design in this study is to ensure the description of
the state of affairs as it exists at present time.
3.3 Research Population
The research is concentrated in the recent performance of commercial banks in Kenya
between the periods of 2004 to 2008. The research consists of 42 commercial banks operating
in Kenya under licence by the Central Bank of Kenya.
3.4 Sampling DesignWith 42 licensed banks in Kenya, the study takes considerations of the entire population.
Commercial Banks in Kenya have been undergoing quantitative enlargement in the number
of account holders (both deposit/ borro,wing accounts) and in the number of rural and semi-
urban branches. Most banks have been transformed from niche banking to mass banking.
19
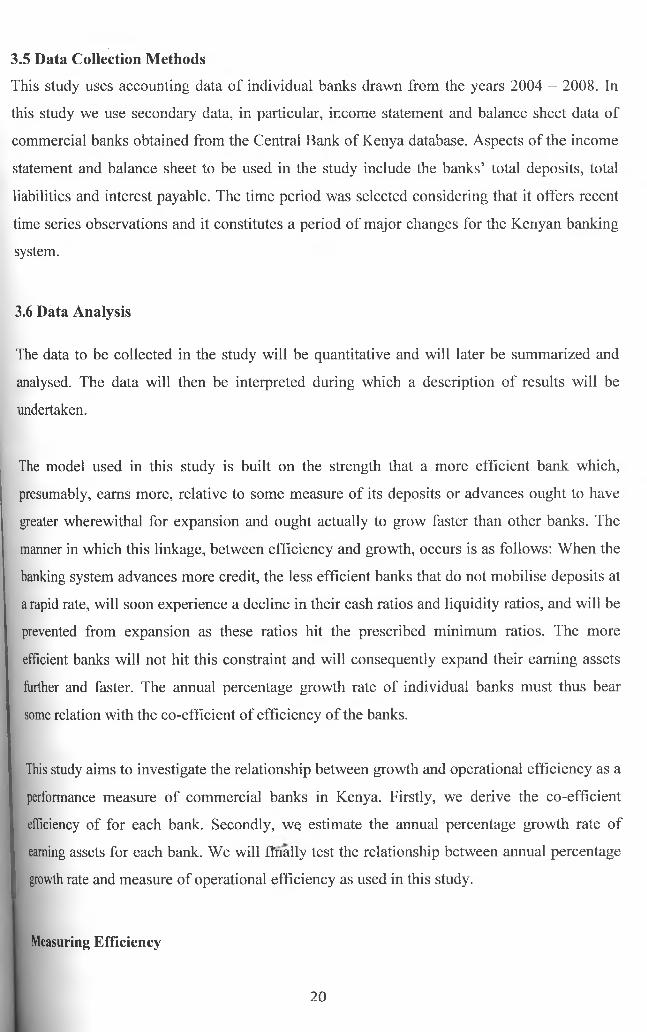
3.5 Data Collection MethodsThis study uses accounting data of individual banks drawn from the years 2004 -- 2008. In
this study we use secondary data, in particular, income statement and balance sheet data of
commercial banks obtained from the Central Bank of Kenya database. Aspects of the income
statement and balance sheet to be used in the study include the banks’ total deposits, total
liabilities and interest payable. The time period was selected considering that it offers recent
time series observations and it constitutes a period of major changes for the Kenyan banking
system.
3.6 Data Analysis
The data to be collected in the study will be quantitative and will later be summarized and
analysed. The data will then be interpreted during which a description of results will be
undertaken.
The model used in this study is built on the strength that a more efficient bank which,
presumably, earns more, relative to some measure of its deposits or advances ought to have
greater wherewithal for expansion and ought actually to grow faster than other banks. The
manner in which this linkage, between efficiency and growth, occurs is as follows: When the
banking system advances more credit, the less efficient banks that do not mobilise deposits at
a rapid rate, will soon experience a decline in their cash ratios and liquidity ratios, and will be
prevented from expansion as these ratios hit the prescribed minimum ratios. The more
efficient banks will not hit this constraint and will consequently expand their earning assets
further and faster. The annual percentage growth rate of individual banks must thus bear
some relation with the co-efficient of efficiency of the banks.
This study aims to investigate the relationship between growth and operational efficiency as a
performance measure of commercial banks in Kenya. Firstly, we derive the co-efficient
efficiency of for each bank. Secondly, we estimate the annual percentage growth rate of
earning assets for each bank. We will finally test the relationship between annual percentage
growth rate and measure of operational efficiency as used in this study.
Measuring Efficiency
20
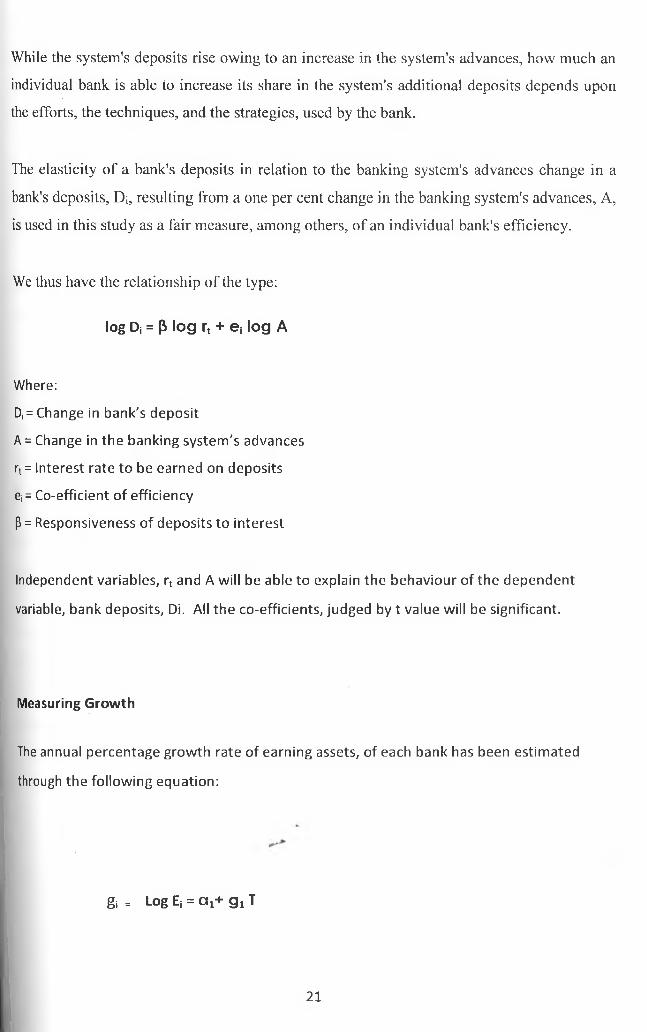
While the system's deposits rise owing to an increase in the system's advances, how much an
individual bank is able to increase its share in the system's additional deposits depends upon
the efforts, the techniques, and the strategies, used by the bank.
The elasticity of a bank's deposits in relation to the banking system's advances change in a
bank's deposits, Di, resulting from a one per cent change in the banking system's advances, A,
is used in this study as a fair measure, among others, of an individual bank's efficiency.
We thus have the relationship of the type:
log Dj = (5 lo g rt + ej lo g A
Where:
Di= Change in bank's deposit
A = Change in the banking system's advances
rt = Interest rate to be earned on deposits
ej = Co-efficient of efficiency
(3 = Responsiveness of deposits to interest
Independent variables, rt and A will be able to explain the behaviour of the dependent
variable, bank deposits, Di. All the co-efficients, judged by t value will be significant.
Measuring Growth
The annual percentage growth rate of earning assets, of each bank has been estimated
through the following equation:
gi = Log Ei = a x+ g i T
21

Where;
gi = Annual percentage growth rate of earning assets of each bank
E|= Annual percentage growth rate of earning assets
T= Time,
Relation b etw een Efficiency and Growth
In order to test the relationship between annual percentage growth rate and the co
efficient of efficiency we use the regression:
gi = a 2 + CD ej
Where;
gi= Annual percentage growth rate of earning assets of each bank
ej= Co-efficient of efficiency
Correlation coefficient r, will be used to establish the association and strength of the
relationship.
Coefficient of determination R2, will tell us how much of the variance in annual percentage
growth rate of earning assets of each bank is explained by operational efficiency.
Statistical t-tests will be used to measure the significance of the correlation at 0.05 levels.
2 2
CHAPTER FOUR : D A TA ANALYSIS A N D FIN D IN G S
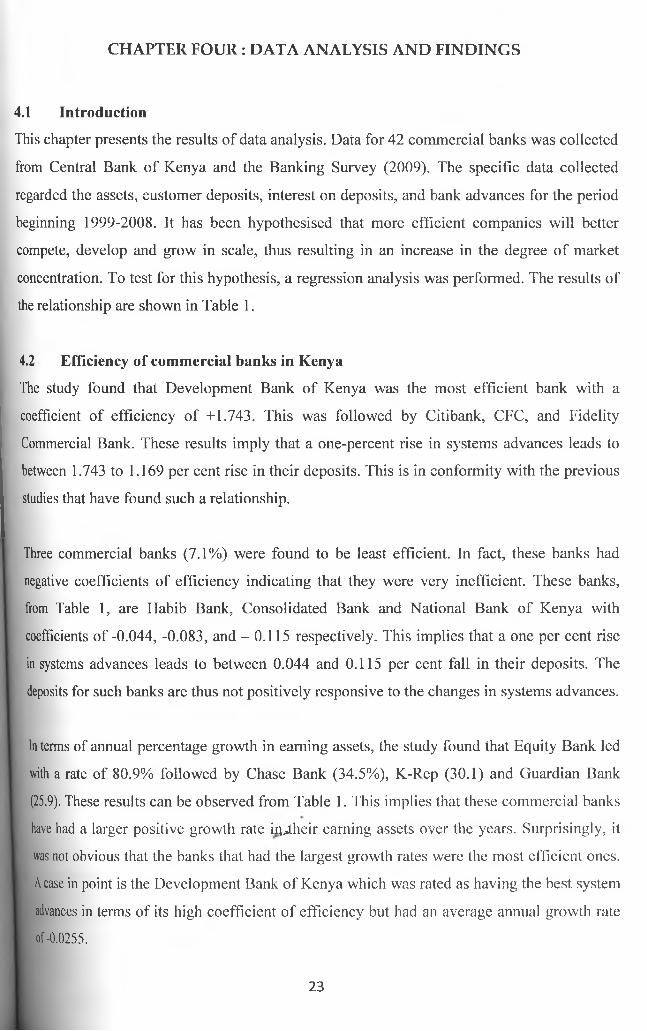
4.1 IntroductionThis chapter presents the results of data analysis. Data for 42 commercial banks was collected
from Central Bank of Kenya and the Banking Survey (2009). The specific data collected
regarded the assets, customer deposits, interest on deposits, and bank advances for the period
beginning 1999-2008. It has been hypothesised that more efficient companies will better
compete, develop and grow in scale, thus resulting in an increase in the degree of market
concentration. To test for this hypothesis, a regression analysis was performed. The results of
the relationship are shown in Table 1.
4.2 Efficiency of commercial banks in KenyaThe study found that Development Bank of Kenya was the most efficient bank with a
coefficient of efficiency of +1.743. This was followed by Citibank, CFC, and Fidelity
Commercial Bank. These results imply that a one-percent rise in systems advances leads to
between 1.743 to 1.169 per cent rise in their deposits. This is in conformity with the previous
studies that have found such a relationship.
Three commercial banks (7.1%) were found to be least efficient. In fact, these banks had
negative coefficients of efficiency indicating that they were very inefficient. These banks,
from Table 1, are Habib Bank, Consolidated Bank and National Bank of Kenya with
coefficients of -0.044, -0.083, and - 0.115 respectively. This implies that a one per cent rise
in systems advances leads to between 0.044 and 0.115 per cent fall in their deposits. The
deposits for such banks are thus not positively responsive to the changes in systems advances.
In terms of annual percentage growth in earning assets, the study found that Equity Bank led
with a rate of 80.9% followed by Chase Bank (34.5%), K-Rep (30.1) and Guardian Bank
(25.9). These results can be observed from Table 1. This implies that these commercial banks
have had a larger positive growth rate hijLheir earning assets over the years. Surprisingly, it
was not obvious that the banks that had the largest growth rates were the most efficient ones.
A case in point is the Development Bank of Kenya which was rated as having the best system
advances in terms of its high coefficient of efficiency but had an average annual growth rate
of-0.0255.
23
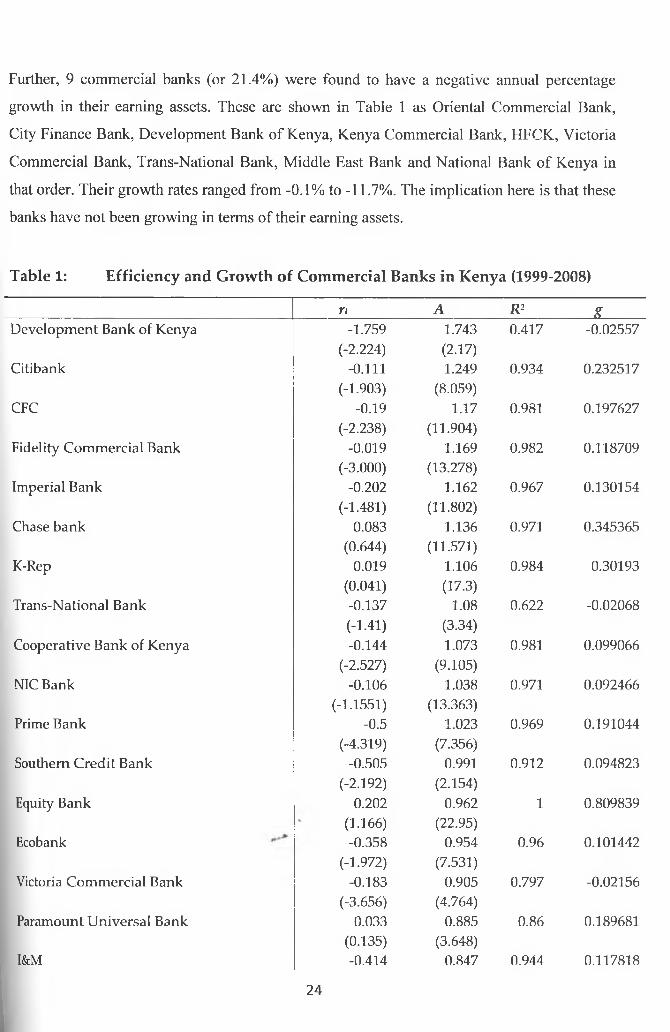
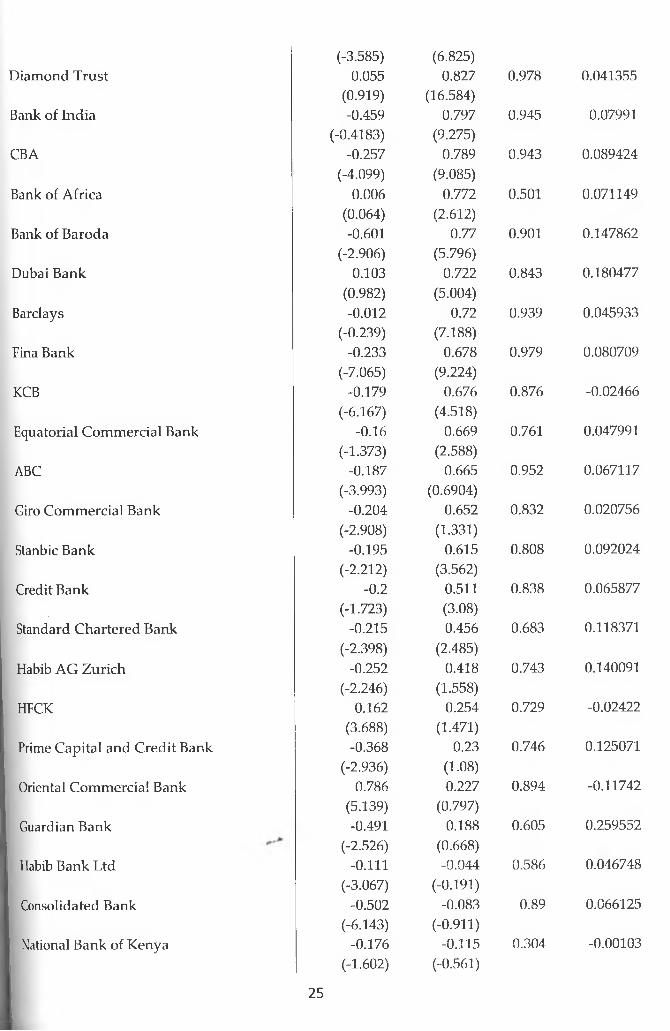
Further, 9 commercial banks (or 21.4%) were found to have a negative annual percentage
growth in their earning assets. These are shown in Table 1 as Oriental Commercial Bank,
City Finance Bank, Development Bank of Kenya, Kenya Commercial Bank, HFCK, Victoria
Commercial Bank, Trans-National Bank, Middle East Bank and National Bank of Kenya in
that order. Their growth rates ranged from -0.1% to -11.7%. The implication here is that these
banks have not been growing in terms of their earning assets.
Table 1: Efficiency and Growth of Commercial Banks in Kenya (1999-2008)
ri A R 2 XDevelopment Bank of Kenya -1.759
(-2.224)1.743(2.17)
0.417 -0.02557
Citibank -0 . 1 1 1
(-1.903)1.249
(8.059)0.934 0.232517
CFC -0.19(-2.238)
1.17(11.904)
0.981 0.197627
Fidelity Commercial Bank -0.019(-3.000)
1.169(13.278)
0.982 0.118709
Imperial Bank -0 . 2 0 2
(-1.481)1.162
(11.802)0.967 0.130154
Chase bank 0.083(0.644)
1.136(11.571)
0.971 0.345365
K-Rep 0.019(0.041)
1.106(17.3)
0.984 0.30193
Trans-National Bank -0.137(-1.41)
1.08(3.34)
0.622 -0.02068
Cooperative Bank of Kenya -0.144(-2.527)
1.073(9.105)
0.981 0.099066
NIC Bank -0.106(-1.1551)
1.038(13.363)
0.971 0.092466
Prime Bank -0.5(-4.319)
1.023(7.356)
0.969 0.191044
Southern Credit Bank -0.505(-2.192)
0.991(2.154)
0.912 0.094823
Equity Bank 0 . 2 0 2
(1.166)0.962
(22.95)1 0.809839
Ecobank -0.358(-1.972)
0.954(7.531)
0.96 0.101442
Victoria Commercial Bank -0.183(-3.656)
0.905(4.764)
0.797 -0.02156
Paramount Universal Bank 0.033(0.135)
0.885(3.648)
0 . 8 6 0.189681
I&M -0.414 0.847 0.944 0.117818
24
Diamond Trust(-3.585)
0.055(6.825)
0.827 0.978 0.041355
Bank of India(0.919)-0.459
(16.584)0.797 0.945 0.07991
CBA(-0.4183)
-0.257(9.275)
0.789 0.943 0.089424
Bank of Africa(-4.099)
0.006(9.085)
0.772 0.501 0.071149
Bank of Baroda(0.064)-0.601
(2.612)0.77 0.901 0.147862
Dubai Bank(-2.906)
0.103(5.796)
0.722 0.843 0.180477
Barclays(0.982)-0 . 0 1 2
(5.004)0.72 0.939 0.045933
Fina Bank(-0.239)
-0.233(7.188)
0.678 0.979 0.080709
KCB(-7.065)
-0.179(9.224)
0.676 0.876 -0.02466
Equatorial Commercial Bank(-6.167)
-0.16(4.518)
0.669 0.761 0.047991
ABC(-1.373)
-0.187(2.588)
0.665 0.952 0.067117
Giro Commercial Bank(-3.993)
-0.204(0.6904)
0.652 0.832 0.020756
Stanbic Bank(-2.908)
-0.195(1.331)
0.615 0.808 0.092024
Credit Bank(-2 .2 1 2 )
-0 . 2
(3.562)0.511 0.838 0.065877
Standard Chartered Bank(-1.723)
-0.215(3.08)0.456 0.683 0.118371
Habib AG Zurich(-2.398)
-0.252(2.485)
0.418 0.743 0.140091
HFCK(-2.246)
0.162(1.558)
0.254 0.729 -0.02422
Prime Capital and Credit Bank(3.688)-0.368
(1.471)0.23 0.746 0.125071
Oriental Commercial Bank(-2.936)
0.786(1.08)0.227 0.894 -0.11742
Guardian Bank(5.139)-0.491
(0.797)0.188 0.605 0.259552
Habib Bank Ltd(-2.526)
-0 . 1 1 1
(0 .6 6 8 )-0.044 0.586 0.046748
Consolidated Bank(-3.067)
-0.502(-0.191)
-0.083 0.89 0.066125
National Bank of Kenya(-6.143)
-0.176(-0.911)
-0.115 0.304 -0.00103(-1.602) (-0.561)
25
Middle East Bank -0.582 -1.612 0.793 -0.00671(-4.831) (-1.817)
City Finance Bank -0.611 -1.619 0.944 -0.04724(-2.55) (-4.64)
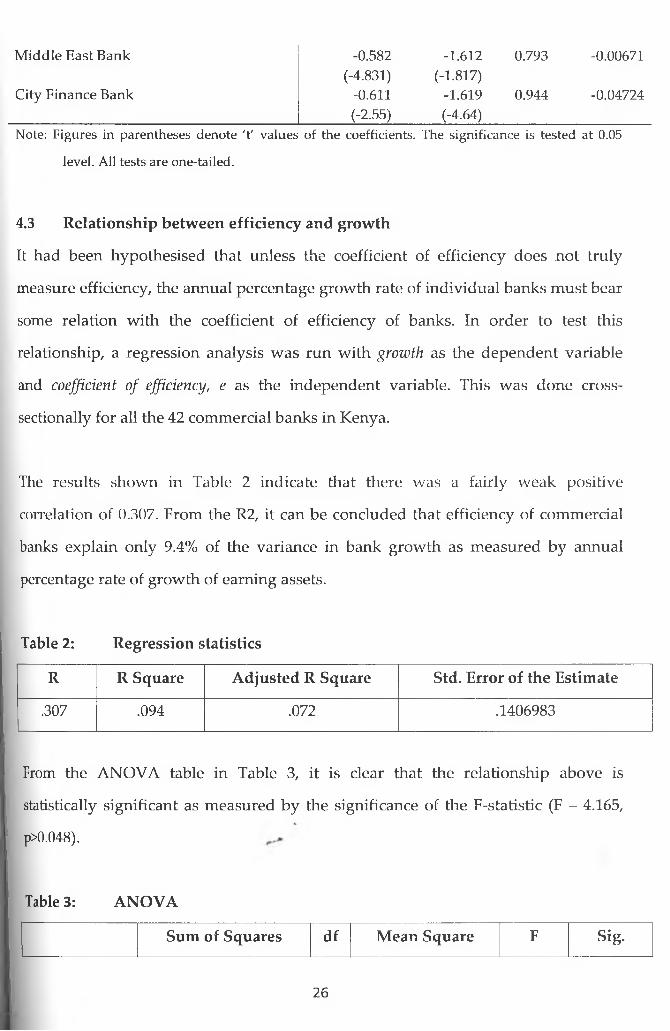
Note: Figures in parentheses denote 't' values of the coefficients. The significance is tested at 0.05
level. All tests are one-tailed.
4.3 Relationship between efficiency and growth
It had been hypothesised that unless the coefficient of efficiency does not truly
measure efficiency, the annual percentage growth rate of individual banks m ust bear
some relation with the coefficient of efficiency of banks. In order to test this
relationship, a regression analysis was run with growth as the dependent variable
and coefficient of efficiency, e as the independent variable. This was done cross-
sectionally for all the 42 commercial banks in Kenya.
The results shown in Table 2 indicate that there was a fairly weak positive
correlation of 0.307. From the R2, it can be concluded that efficiency of commercial
banks explain only 9.4% of the variance in bank growth as measured by annual
percentage rate of growth of earning assets.
Table 2: Regression statistics
R R Square Adjusted R Square Std. Error of the Estimate
.307 .094 .072 .1406983
From the ANOVA table in Table 3, it is clear that the relationship above is
statistically significant as measured by the significance of the F-statistic (F = 4.165,
p>0.048).
Table 3: ANOVA
Sum of Squares df Mean Square F Sig.
26
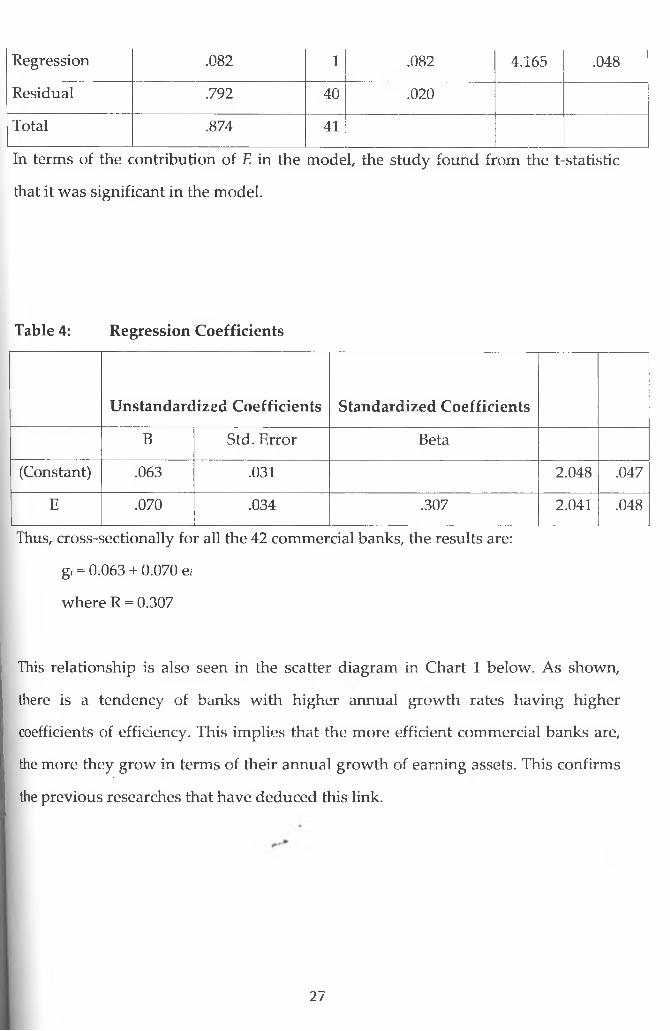
Regression .082 1 .082 4.165 .048
Residual .792 40 .020
Total .874 41
In terms of the contribution of E in the model, the study found from the t-statistic
that it was significant in the model.
Table 4: Regression Coefficients
Unstandardized Coefficients Standardized Coefficients
B Std. Error Beta
(Constant) .063 .031 2.048 .047
E .070 .034 .307 2.041 .048
Thus, cross-sectionally for all the 42 commercial banks, the results are:
gi = 0.063 + 0.070 e;
where R = 0.307
This relationship is also seen in the scatter diagram in Chart 1 below. As shown,
there is a tendency of banks with higher annual growth rates having higher
coefficients of efficiency. This implies that the more efficient commercial banks are,
the more they grow in terms of their annual growth of earning assets. This confirms
the previous researches that have deduced this link.
27
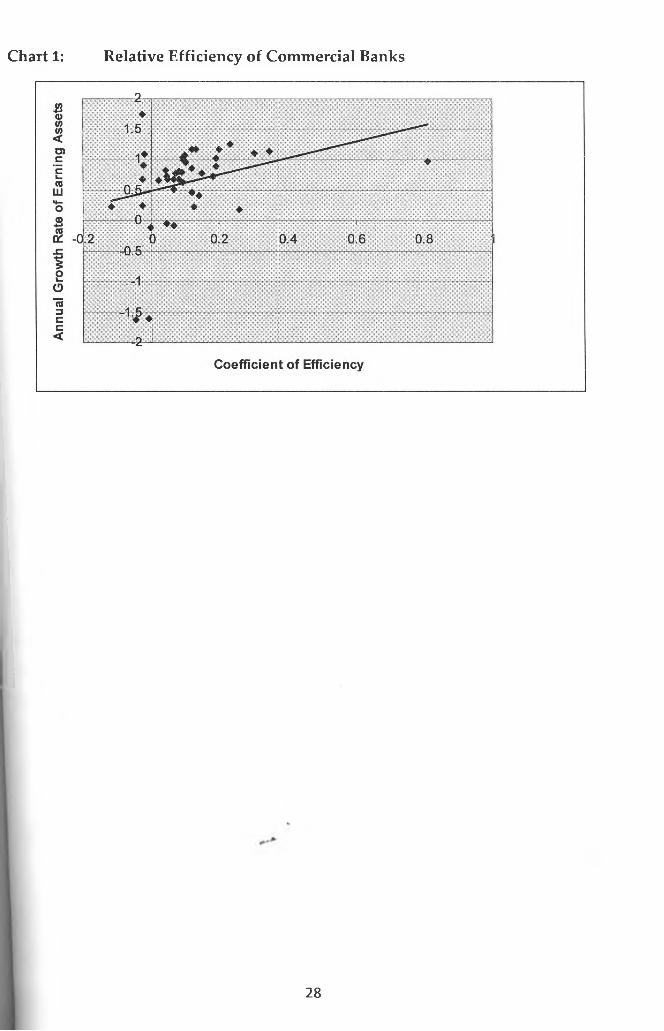
Chart 1: R elative E ffic ien cy o f C om m ercial B anks
28
C hapter 5: Sum m ary, C on clu sion s and R ecom m en d ation s
5.1 Introduction
The chapter presents a summary of results in chapter four. Further, conclusions of
the study are presented. The study then offers recommendations for policy and
research.
5.2 Summary
The study found that Development Bank of Kenya was the most efficient bank
(+1.743) followed by Citibank, CFC, and Fidelity Commercial Bank. These imply that
a one-percent rise in systems advances leads to per cent rise in their deposits. This is
in conformity with the previous studies that have found such a relationship. The
study found that 7.1% of the banks had negative coefficients of efficiency. These
banks are Habib Bank, Consolidated Bank and National Bank of Kenya. The
implication here is that a one per cent rise in systems advances leads to between
0.044 and 0.115 per cent fall in their deposits.
The study further found that in terms of bank growth, Equity Bank led w ith a rate of
80.9% followed by Chase Bank (34.5%), K-Rep (30.1) and Guardian Bank (25.9). It
was not obvious that the banks that had the largest growth rates were the most
efficient ones. For instance, Development Bank of Kenya, which was rated as having
the best system advances in terms of its high coefficient of efficiency, had an average
annual growth rate of -0.0255.
Further, 21.4% of commercial banks were found to have a negative annual
percentage growth in their earning assets. These are Oriental Commercial Bank, City
Finance Bank, Development Bank of Kenya, Kenya Commercial Bank, HFCK,
I Victoria Commercial Bank, Trans-National Bank, Middle East Bank and National
I Bank of Kenya in that order. Their growth rates ranged from -0.1% to -11.7%.
29
The results also indicate that there was a fairly weak positive correlation between
efficiency and growth of banks in Kenya. Efficiency of commercial banks explains
only 9.4% of the variance in bank growth as measured by annual percentage rate of
growth of earning assets. The study found the relationship to be statistically
significant as measured by the significance of the F-statistic (F = 4.165, p>0.048). This
relationship is also seen in the scatter diagram where it is seen that there is a
tendency of banks with higher annual growth rates having higher coefficients of
efficiency. This implies that the more efficient commercial banks are, the more they
grow in terms of their annual growth of earning assets.
5.3 Conclusions
The study sought to establish the link between banking efficiency and banking
growth. The link was to be established for all the 42 commercial banks currently
operating in Kenya.
As the study found out, there was a significant positive correlation between banking
efficiency and growth as measured by their annual percentage growth in earning
assets. In as much as the relationship was not very strong (R = 0.307), the results
point to the fact that growth in commercial banks is significantly influenced by their
efficiency in advances.
For most of the commercial banks, the study also found a positive correlation
between efficiency advances and deposits. As such, it can be concluded that the
more efficient banks in mobilising deposits usually see a rise in their cash ratios and
I liquidity ratios. This enables them to expand their earning assets faster and further.
30
5.4 R ecom m en d ation s
The study makes the following recommendations. First, banks in Kenya can be more
effective in mobilising deposits when this is pursued with higher interest rates rather
than depending on administrative devices alone, such as more branches and more
personnel.
Secondly, the strategies used by other efficient banks in deposit mobilisation are
recommended to the other banks which wish to expand as rapidly as the more
efficient ones.
5.5 Areas for further research
This study used a 10 year period to establish the link between banking efficiency and
growth of commercial banks. A longer period should be considered to smoothen out
the effects of business cycles.
Further, a study should be done targeting those banks that were owned by the
government but are now public so as to establish whether the change in efficiency of
their operations has had a significant influence on their growth.
This study used the elasticity of bank deposits in relation to the banking system's
advances as a measure of an individual bank's efficiency. This study can be
replicated in the future by focusing on other methods of measuring efficiency or
using multiple methods to establish the link.
31
REFERENCE
A. M. Khusro, S. N. Raghavan, Khushi Ram, N. S. Siddharthan (1971). Banking
Efficiency and Banking Growth. Economic and Political Weekly, Vol. 6, No. 23, pp.
1150-1152
Ash Demirgiig-Kunt and Harry Huizinga (1999). Determinants of Commercial Bank
Interest Margins and Profitability. The World Bank Economic Review, Vol. 13, No. 2,
pp. 379-408
Bauer, P.W., Berger, A.N. and Humphrey, D.B. (1993), "Efficiency and productivity
in US banking", in Fried, H.O., Lovell, C.A.K. and Schmidt, S.S. (Eds), The
Measurement of Productive Efficiency: Techniques and Applications, Oxford
University Press, New York, NY, pp. 386-413.
Bennett, T., Brennand, G., & Buchar, M. (2006). Striving for Organic Growth in Retail
Banking. Boston: Boston Consulting Group.
Bhattacharya, A., Lovell, C.A.K. and Sahay, P. (1997), "The impact of liberalisation
on the productive efficiency of Indian Commercial Bank", European Journal of
Operational Research, Vol. 98, pp. 332-45.
Central Bank of Kenya (2007), "Annual Report of the CBK for the Financial Year
2006/07" pp. 28-31
Charnes, A., Cooper, W., & Rhodes, E. (1993). "Measuring the efficiency of decision
making units. European Journal of Operational Research , 429-444.
Chesang C.J (2002). "Merger Restructuring and Financial Performance of
Commercial Banks In Kenya" Unpublished MBA-Thesis, University of Nairobi
32
Dimitrios Vasiliou and John Karkazis (2002). "The Sustainable Growth Model in
Banking: An Application to the National Bank of Greece" Athens University of
Economics and Business Athens, Greece
Dyer & Blair Bank. (2007). The Kenya Banking Sector. Nairobi: Dyer & Blair.
Elyasiani, E. and Mehdian, S. (1995), "The comparative efficiency performance of
small and large US commercial banks in the pre- and post-deregulation eras",
Applied Economics, Vol. 27, pp. 1069-79.
Farell M. J. (1957) "The measurement of productive efficiency", Journal of the Royal
Statistical Society, series A (General), Vol. 120, No 3, pp 253-290.
Guide, A.-M., & Pattillo, C. (2006). Adding Depth. Finance and Developm ent, 43-59.
h ttp \ \ www.investopedia.com" ( Septmeber 2008)
International Communications. (2007). Mauritius leads but Kenya shows strength in
depth. Africa Business, 8-11.
International Monetary Fund. (2002, September). World Economic Outlook.
Retrieved May 16, 2008, from IMF Website: www.imf.org
Irungu, G. (2007, December 11). The Future of Commercaal Banks in Kenya. The
Smart C om pany, p. 14.
Isik, I. and Hassan, M.K. (2003), "Financial disruption and bank productivity: the
1994 experience of Turkish bank", The Quarterly Review of Economics and Finance,
Vol. 43, pp. 291-320.
Kaminsky, G., & Reinhart, C. (1999). The Twin Crises: The Causes of Banking and
Balance-of-Payments Problems. Banking and Balance-of-Payments Problems 89 ,
473-498.
33
Kashyap, A. K., Raghuram, R. }., & Jeremy, C. (2002). Banks as Liquidity Providers:
An Explanation for the Co-existence of Lending and Deposit-Taking. Journal of
Finance57:l, 33-74.
Kathanje M.N. (2000). "An Evaluation of Financial Performance of the Kenyan
Banking Sector" Unpublished MBA-Thesis, University of Nairobi
Kibe M.M. (2003). "The Relationship between Interest Rate Spread and Profitability
of Commercial Banks In Kenya" Unpublished MBA-Thesis, University of Nairobi
Kimutai T.K. (2003). "An Empirical Analysis of Factors Contributing To High
Interest Rates Spreads In Kenya" Unpublished MBA-Thesis, University of Nairobi
Kitaka Peter (2001). "A Survey of The Use Of Financial Performance Indicators By
Micro Finance Institutions In Kenya" Unpublished MBA-Thesis, University of
Nairobi
Koopmans, T.C. (1951), "A n analysis of production as an efficient combination of
activities", in Koopmans, T.C. (Ed.), Activity Analysis of Production and Allocation,
Monograph No. 13, Cowles Commission for Research in Economics,Wiley, New
York, NY.
Koros Gideon (2001) "An Evaluation of The Financial Performance Of Non Banking
Institutions That Converted Into Commercial Banks In Kenya" Unpublished MBA-
Thesis, University of Nairobi
Kudinska, M. (2004). Commercial Bank Risk Value and its Conformity with the
Bank's Own Capital. Riga: University of Latvia.
Kumbhakar, S.C. and Lovell, C.A.K. (2003), Stochastic Frontier Analysis, Cambridge
University Press, Cambridge.
34
Lavine, R. (1996). Foreign Banks, Financial Development, and Economic Growth. In
B. Claude E, International Financial Markets: Harmonization versus Competition
(pp. 224-254). Washington DC: AEI Press.
Levine, R. (2002). Bank-Based or Market-Based Financial Systems: Which Is Better?
Journal of Financial Interm ediation, 11, 398-422.
Malyutina, M., & Parilova, S. (1999). Why do banks go bankrupt?; The determinants
of excessive risk taking by banks in transition. Russia: European Centre for
Economic Policy,.
M uthungu P. (2003). "Evaluation of Financial Performance Of Commercial Banks In
Kenya. Local Versus Foreign Banks" Unpublished MBA-Thesis, University of
Nairobi
Ndung'u, N. (2007). Recent Economic Development and Economic Directions for the
Banking Sector. Kenya Institute of Bankers Association Annual Conference (pp. 4-5).
Nairobi: Central Bank of Kenya.
Nickell, S.J. (1996), "Competition and corporate performance", Journal of Political
Economy, Vol. 104 No. 4, pp. 724-46.
Nyamai C.M.(1989). "A structure growth of the banking industry in Kenya"
Unpublished MBA-Thesis, University of Nairobi
Okutoyi P.G.O (1988). "The Relationship between the use of Strategic Marketing and
Bank Performance in Kenya" Unpublished MBA-Thesis, University of Nairobi
Oral, M. and Yolalan, R. (1990), "An empirical study on measuring operating
efficiency and profitability of bank branches", European Journal of Operational
Research, Vol. 46 No. 3, pp. 282-94.
«
LOWER35
Scholtens, B. (2000). Competition, Growth, and Performance. Groningen, The
Netherlands: University of Groningen.
Sherman, H.D. and Gold, F. (1985), "Bank branch operating efficiency", Journal of
Banking and Finance, Vol. 9 No. 2, pp. 297-315.
Thuku D.I. (2002). "Ownership Structure and Bank Financial Performance In Kenya"
Unpublished MBA-Thesis, University of Nairobi
Vaithilingm, S., Nair, M., & Samudram, M. (2004). Key Drivers For Soundness of the
Banking Sector; Lessons From Developing Economies. Kaula Lumpar: Monash
University.
World Bank (2007) "Financing Growth in the Banking Sector". Washington: World
Bank.
World Bank 2008). "Kenya Accelerating and Sustaining Inclusive Growth" World
Bank Report No. 42844-KE
36
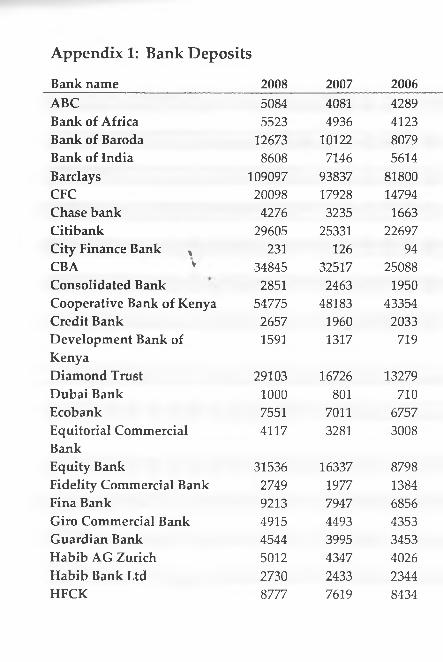
Appendix 1: Bank Deposits
Bank name 2008 2007 2006ABC 5084 4081 4289Bank of Africa 5523 4936 4123Bank of Baroda 12673 1 0 1 2 2 8079Bank of India 8608 7146 5614Barclays 109097 93837 81800CFC 20098 17928 14794Chase bank 4276 3235 1663Citibank 29605 25331 22697City Finance Bank , 231 126 94CBA v 34845 32517 25088Consolidated Bank 2851 2463 1950Cooperative Bank of Kenya 54775 48183 43354Credit Bank 2657 1960 2033Development Bank of Kenya
1591 1317 719
Diamond Trust 29103 16726 13279Dubai Bank 1 0 0 0 801 710Ecobank 7551 7011 6757Equitorial Commercial Bank
4117 3281 3008
Equity Bank 31536 16337 8798Fidelity Commercial Bank 2749 1977 1384Fina Bank 9213 7947 6856Giro Commercial Bank 4915 4493 4353Guardian Bank 4544 3995 3453Habib AG Zurich 5012 4347 4026Habib Bank Ltd 2730 2433 2344HFCK 8777 7619 8434
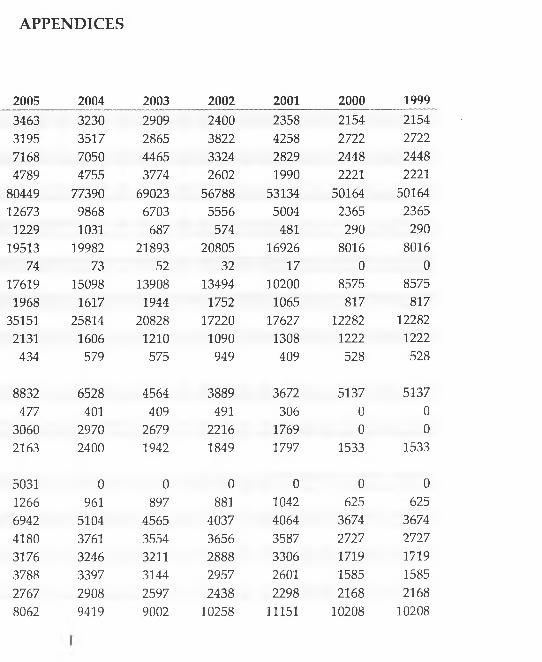
APPENDICES
2005 2004 2003 2002 2001 2000 19993463 3230 2909 2400 23583195 3517 2865 3822 42587168 7050 4465 3324 28294789 4755 3774 2602 1990
80449 77390 69023 56788 5313412673 9868 6703 5556 50041229 1031 687 574 481
19513 19982 21893 20805 1692674 73 52 32 17
17619 15098 13908 13494 1 0 2 0 0
1968 1617 1944 1752 106535151 25814 20828 17220 176272131 1606 1 2 1 0 1090 1308434 579 575 949 409
8832477
30602163
50311266694241803176378827678062
6528401
29702400
0961
510437613246339729089419
4564 409
26791942
0897
4565 3554 3211 3144 2597 9002
3889491
22161849
0881
40373656288829572438
10258
3672306
17691797
0104240643587330626012298
11151
2154272224482221
501642365290
80160
8575817
122821222528
513700
1533
0625
36742727171915852168
10208
2154272224482221
501642365290
80160
8575817
122821222528
513700
1533
0625
36742727171915852168
10208
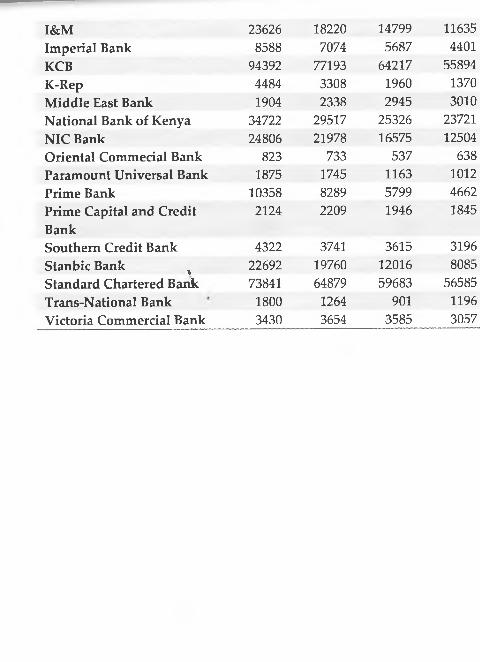
I&M 23626 18220 14799Imperial Bank 8588 7074 5687KCB 94392 77193 64217K-Rep 4484 3308 1960Middle East Bank 1904 2338 2945National Bank of Kenya 34722 29517 25326NIC Bank 24806 21978 16575Oriental Commecial Bank 823 733 537Paramount Universal Bank 1875 1745 1163Prime Bank 10358 8289 5799Prime Capital and Credit Bank
2124 2209 1946
Southern Credit Bank 4322 3741 3615Stanbic Bank % 22692 19760 12016Standard Chartered Bank 73841 64879 59683Trans-National Bank 1800 1264 901Victoria Commercial Bank 3430 3654 3585
116354401
5589413703010
2372112504
638101246621845
31968085
5658511963057
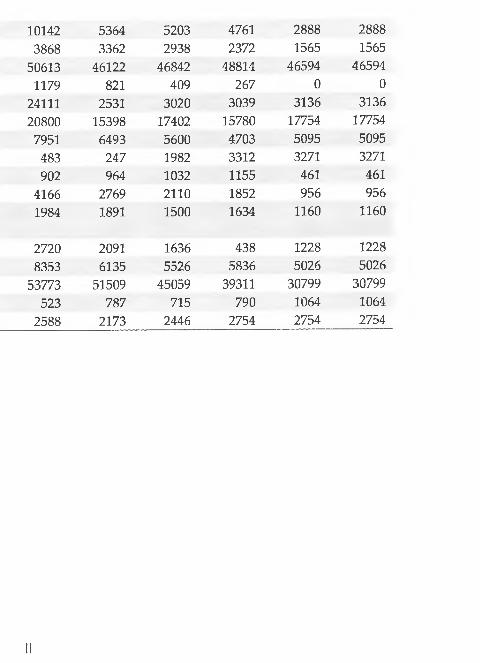
101423868
506131179
24111208007951483902
41661984
27208353
53773523
2588
II
5364 5203 4761 2888 28883362 2938 2372 1565 1565
46122 46842 48814 46594 46594821 409 267 0 0
2531 3020 3039 3136 313615398 17402 15780 17754 177546493 5600 4703 5095 5095247 1982 3312 3271 3271964 1032 1155 461 461
2769 2 1 1 0 1852 956 9561891 1500 1634 1160 1160
2091 1636 438 1228 12286135 5526 5836 5026 5026
51509 45059 39311 30799 30799787 715 790 1064 1064
2173 2446 2754 2754 2754
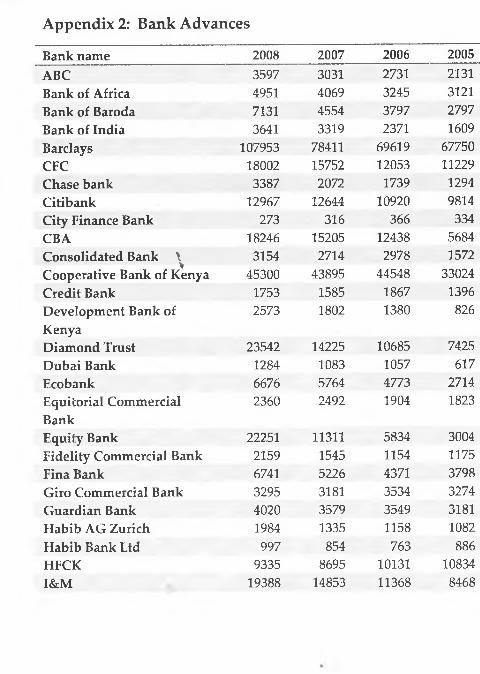
Appendix 2: Bank Advances
Bank name 2008 2007 2006 2005ABC 3597 3031 2731 2131Bank of Africa 4951 4069 3245 3121Bank of Baroda 7131 4554 3797 2797Bank of India 3641 3319 2371 1609Barclays 107953 78411 69619 67750CFC 18002 15752 12053 11229Chase bank 3387 2072 1739 1294Citibank 12967 12644 10920 9814City Finance Bank 273 316 366 334CBA 18246 15205 12438 5684Consolidated Bank \ 3154 2714 2978 1572
VCooperative Bank of Kenya 45300 43895 44548 33024Credit Bank 1753 1585 1867 1396Development Bank of 2573 1802 1380 826KenyaDiamond Trust 23542 14225 10685 7425Dubai Bank 1284 1083 1057 617Ecobank 6676 5764 4773 2714Equitorial Commercial 2360 2492 1904 1823BankEquity Bank 22251 11311 5834 3004Fidelity Commercial Bank 2159 1545 1154 1175Fina Bank 6741 5226 4371 3798Giro Commercial Bank 3295 3181 3534 3274Guardian Bank 4020 3579 3549 3181Habib AG Zurich 1984 1335 1158 1082Habib Bank Ltd 997 854 763 8 8 6
HFCK 9335 8695 10131 10834I&M 19388 14853 11368 8468
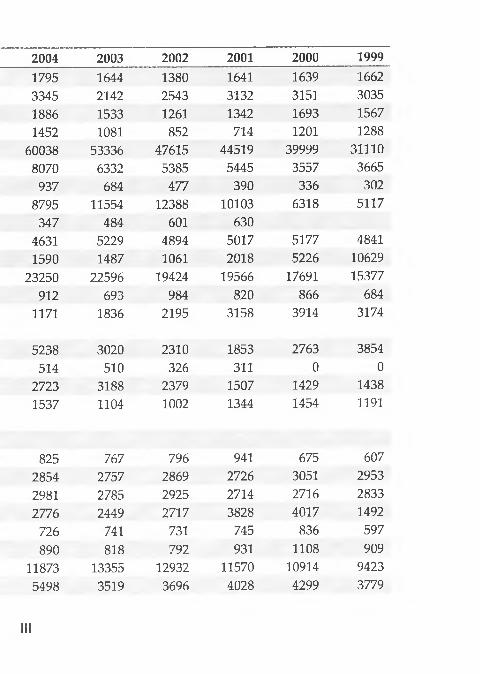
2004 2003 2002 2001 2000 1999
1795 1644 1380 1641 1639 16623345 2142 2543 3132 3151 30351886 1533 1261 1342 1693 15671452 1081 852 714 1 2 0 1 1288
60038 53336 47615 44519 39999 311108070 6332 5385 5445 3557 3665937 684 477 390 336 302
8795 11554 12388 10103 6318 5117347 484 601 630
4631 5229 4894 5017 5177 48411590 1487 1061 2018 5226 10629
23250 22596 19424 19566 17691 15377912 693 984 820 8 6 6 684
1171 1836 2195 3158 3914 3174
5238 3020 2310 1853 2763 3854514 510 326 311 0 0
2723 3188 2379 1507 1429 14381537 1104 1 0 0 2 1344 1454 1191
825 767 796 941 675 6072854 2757 2869 2726 3051 29532981 2785 2925 2714 2716 28332776 2449 2717 3828 4017 1492726 741 731 745 836 597890 818 792 931 1108 909
11873 13355 12932 11570 10914 94235498 3519 3696 4028 4299 3779
Ill
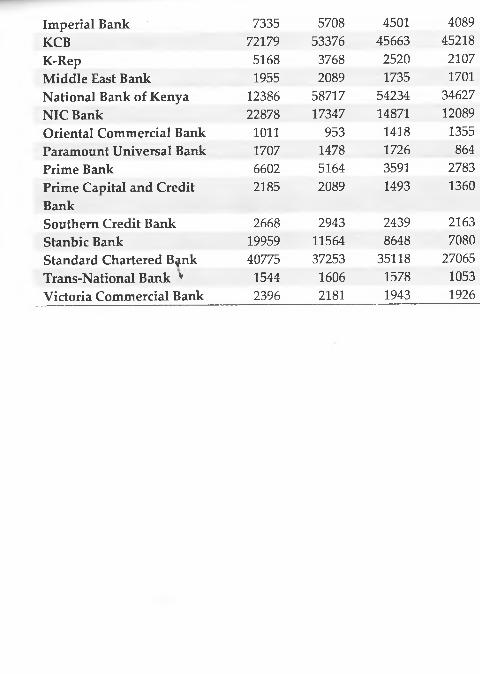
Imperial Bank 7335 5708 4501KCB 7 2 1 7 9 53376 45663K-Rep 5168 3768 2520Middle East Bank 1955 2089 1735National Bank of Kenya 12386 58717 54234NIC Bank 22878 17347 14871Oriental Commercial Bank 1 0 1 1 953 1418Paramount Universal Bank 1707 1478 1726Prime Bank 6602 5164 3591Prime Capital and Credit Bank
2185 2089 1493
Southern Credit Bank 2668 2943 2439Stanbic Bank 19959 11564 8648Standard Chartered B^nk 40775 37253 35118Trans-National Bank v 1544 1606 1578Victoria Commercial Bank 2396 2181 1943
40894521821071701
34627120891355864
27831360
21637080
2706510531926
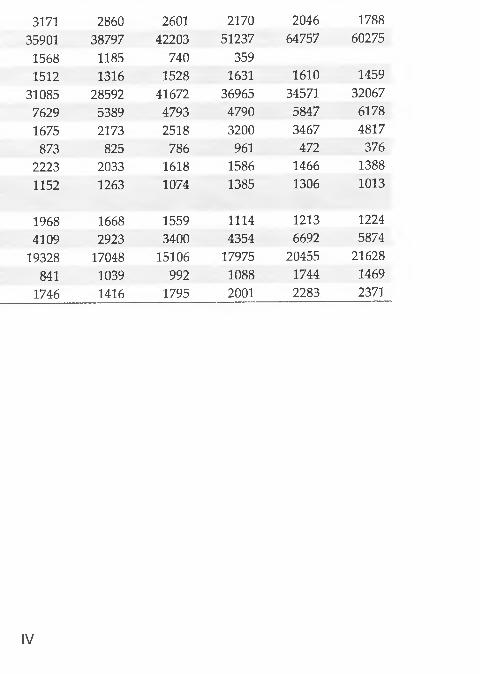
31713590115681512
3108576291675873
22231152
19684109
19328841
1746
IV
286038797
260142203
217051237
204664757
178860275
1185 740 3591316 1528 1631 1610 1459
28592 41672 36965 34571 320675389 4793 4790 5847 61782173 2518 3200 3467 4817825 786 961 472 376
2033 1618 1586 1466 13881263 1074 1385 1306 1013
1668 1559 1114 1213 12242923 3400 4354 6692 5874
17048 15106 17975 20455 216281039 992 1088 1744 14691416 1795 2 0 0 1 2283 2371
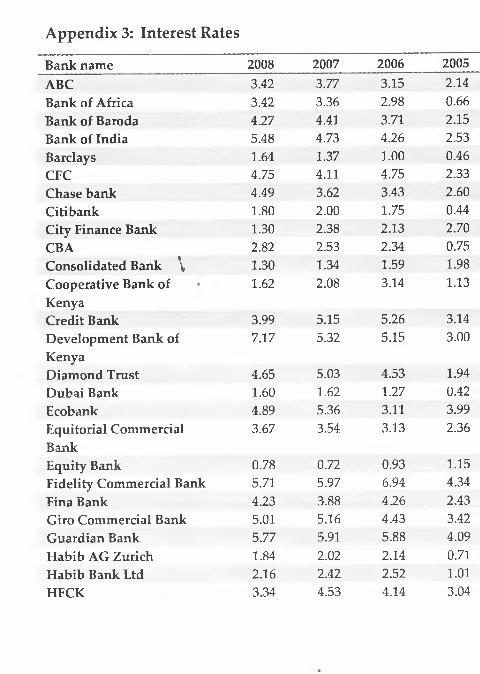
Appendix 3: Interest Rates
Bank name 2008 2007 2006 2005ABC 3.42 3.77 3.15 2.14Bank of Africa 3.42 3.36 2.98 0 . 6 6
Bank of Baroda 4.27 4.41 3.71 2.15Bank of India 5.48 4.73 4.26 2.53Barclays 1.64 1.37 1 . 0 0 0.46CFC 4.75 4.11 4.75 2.33Chase bank 4.49 3.62 3.43 2.60Citibank 1.80 2 . 0 0 1.75 0.44City Finance Bank 1.30 2.38 2.13 2.70CBA 2.82 2.53 2.34 0.75Consolidated Bank \ 1.30 1.34 1.59 1.98Cooperative Bank of Kenya
1.62 2.08 3.14 1.13
Credit Bank 3.99 5.15 5.26 3.14Development Bank of Kenya
7.17 5.32 5.15 3.00
Diamond Trust 4.65 5.03 4.53 1.94Dubai Bank 1.60 1.62 1.27 0.42Ecobank 4.89 5.36 3.11 3.99Equitorial Commercial Bank
3.67 3.54 3.13 2.36
Equity Bank 0.78 0.72 0.93 1.15Fidelity Commercial Bank 5.71 5.97 6.94 4.34Fina Bank 4.23 3.88 4.26 2.43Giro Commercial Bank 5.01 5.16 4.43 3.42Guardian Bank 5.77 5.91 5.88 4.09Flabib AG Zurich 1.84 2 . 0 2 2.14 0.71Habib Bank Ltd 2.16 2.42 2.52 1 . 0 1
HFCK 3.34 4.53 4.14 3.04
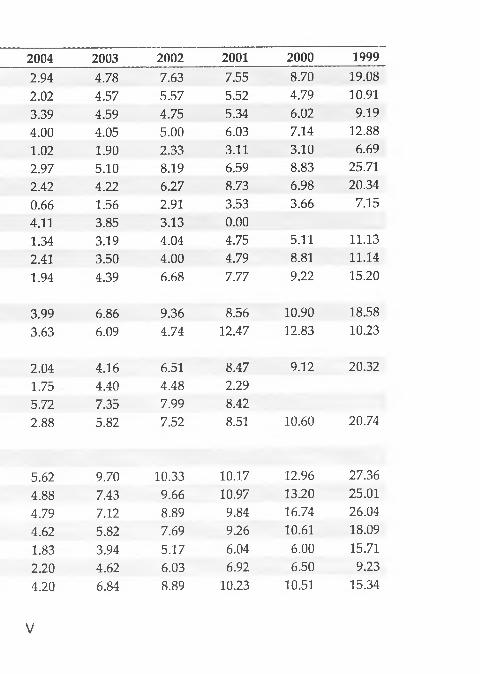
2004 2003 2002 2001 2000 1999
2.94 4.78 7.63 7.55 8.70 19.082 . 0 2 4.57 5.57 5.52 4.79 10.913.39 4.59 4.75 5.34 6 . 0 2 9.194.00 4.05 5.00 6.03 7.14 1 2 . 8 8
1 . 0 2 1.90 2.33 3.11 3.10 6.692.97 5.10 8.19 6.59 8.83 25.712.42 4.22 6.27 8.73 6.98 20.340 . 6 6 1.56 2.91 3.53 3.66 7.154.11 3.85 3.13 0 . 0 0
1.34 3.19 4.04 4.75 5.11 11.132.41 3.50 4.00 4.79 8.81 11.141.94 4.39 6 . 6 8 7.77 9.22 15.20
3.99 6 . 8 6 9.36 8.56 10.90 18.583.63 6.09 4.74 12.47 12.83 10.23
2.04 4.16 6.51 8.47 9.12 20.321.75 4.40 4.48 2.295.72 7.35 7.99 8.422 . 8 8 5.82 7.52 8.51 10.60 20.74
5.62 9.70 10.33 10.17 12.96 27.364.88 7.43 9.66 10.97 13.20 25.014.79 7.12 8.89 9.84 16.74 26.044.62 5.82 7.69 9.26 10.61 18.091.83 3.94 5.17 6.04 6 . 0 0 15.712 . 2 0 4.62 6.03 6.92 6.50 9.234.20 6.84 8.89 10.23 10.51 15.34
V
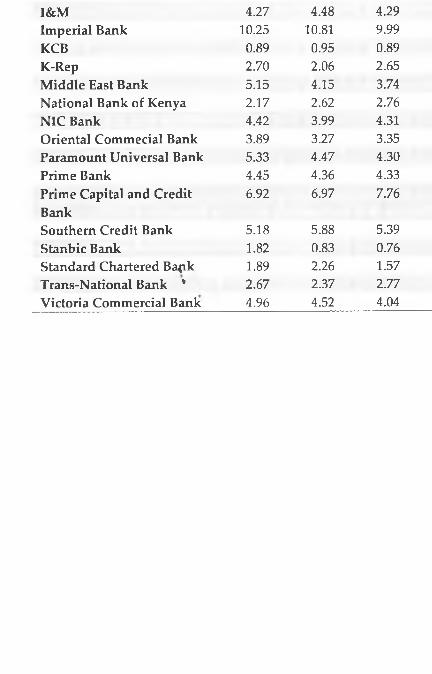
I&MImperial BankKCBK-RepMiddle East Bank National Bank of Kenya NIC BankOriental Commecial Bank Paramount Universal Bank Prime BankPrime Capital and Credit BankSouthern Credit Bank Stanbic Bank Standard Chartered Bapk Trans-National Bank y Victoria Commercial Bank
4.27 4.48 4.2910.25 10.81 9.990.89 0.95 0.892.70 2.06 2.655.15 4.15 3.742.17 2.62 2.764.42 3.99 4.313.89 3.27 3.355.33 4.47 4.304.45 4.36 4.336.92 6.97 7.76
5.18 5.88 5.391.82 0.83 0.761.89 2.26 1.572.67 2.37 2.774.96 4.52 4.04
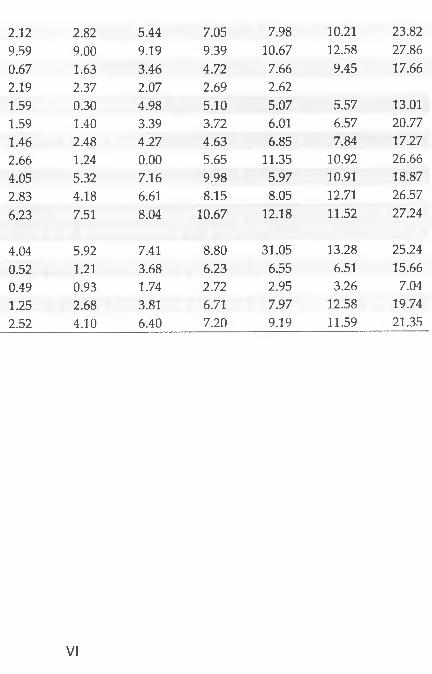
2 . 1 2 2.82 5.44 7.05 7.98 1 0 . 2 1 23.829.59 9.00 9.19 9.39 10.67 12.58 27.860.67 1.63 3.46 4.72 7.66 9.45 17.662.19 2.37 2.07 2.69 2.621.59 0.30 4.98 5.10 5.07 5.57 13.011.59 1.40 3.39 3.72 6 . 0 1 6.57 20.771.46 2.48 4.27 4.63 6.85 7.84 17.272 . 6 6 1.24 0 . 0 0 5.65 11.35 10.92 26.664.05 5.32 7.16 9.98 5.97 10.91 18.872.83 4.18 6.61 8.15 8.05 12.71 26.576.23 7.51 8.04 10.67 12.18 11.52 27.24
4.04 5.92 7.41 8.80 31.05 13.28 25.240.52 1 . 2 1 3.68 6.23 6.55 6.51 15.660.49 0.93 1.74 2.72 2.95 3.26 7.041.25 2 . 6 8 3.81 6.71 7.97 12.58 19.742.52 4.10 6.40 7.20 9.19 11.59 21.35
VI
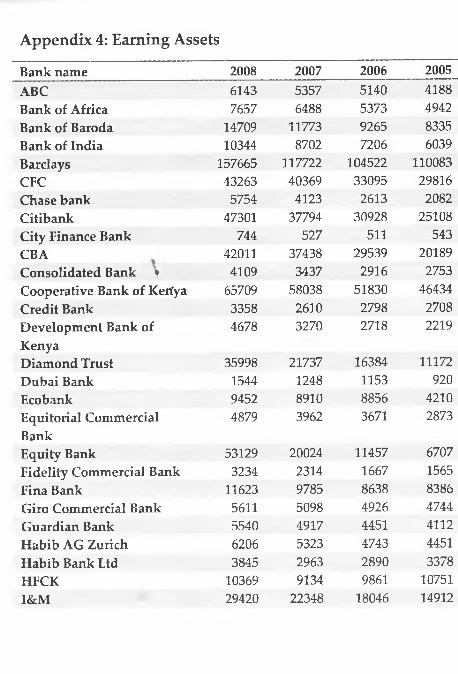
Appendix 4: Earning Assets
Bank name 2008 2007 2006 2005ABC 6143 5357 5140 4188Bank of Africa 7657 6488 5373 4942Bank of Baroda 14709 11773 9265 8335Bank of India 10344 8702 7206 6039Barclays 157665 117722 104522 110083CFC 43263 40369 33095 29816Chase bank 5754 4123 2613 2082Citibank 47301 37794 30928 25108City Finance Bank 744 527 511 543CBA 42011 37438 29539 20189Consolidated Bank v 4109 3437 2916 2753Cooperative Bank of Kerfya 65709 58038 51830 46434Credit Bank 3358 2610 2798 2708Development Bank of Kenya
4678 3270 2718 2219
Diamond Trust 35998 21737 16384 11172Dubai Bank 1544 1248 1153 920Ecobank 9452 8910 8856 4210Equitorial Commercial Bank
4879 3962 3671 2873
Equity Bank 53129 20024 11457 6707Fidelity Commercial Bank 3234 2314 1667 1565Fina Bank 11623 9785 8638 8386Giro Commercial Bank 5611 5098 4926 4744Guardian Bank 5540 4917 4451 4112Habib AG Zurich 6206 5323 4743 4451Habib Bank Ltd 3845 2963 2890 3378HFCK 10369 9134 9861 10751I&M 29420 22348 18046 14912
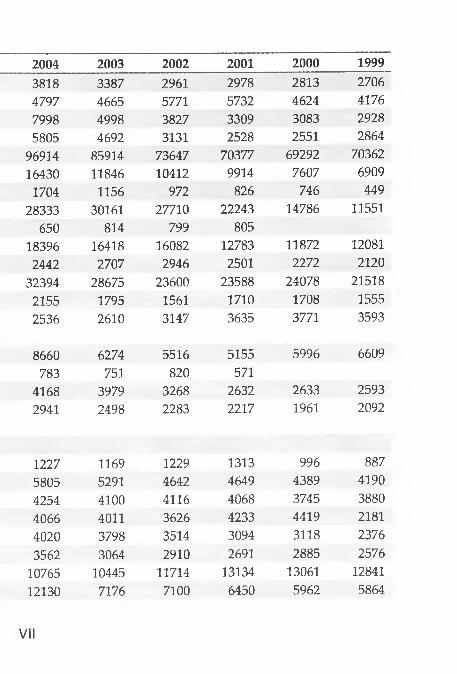
2004 2003 2 0 0 2 2 0 0 1 2 0 0 0 19993818 3387 2961 2978 2813 27064797 4665 5771 5732 4624 41767998 4998 3827 3309 3083 29285805 4692 3131 2528 2551 2864
96914 85914 73647 70377 69292 7036216430 11846 10412 9914 7607 69091704 1156 972 826 746 449
28333 30161 27710 22243 14786 11551650 814 799 805
18396 16418 16082 12783 11872 120812442 2707 2946 2501 2272 2 1 2 0
32394 28675 23600 23588 24078 215182155 1795 1561 1710 1708 15552536 2610 3147 3635 3771 3593
8660 6274 5516 5155 5996 6609783 751 820 571
4168 3979 3268 2632 2633 25932941 2498 2283 2217 1961 2092
1227 1169 1229 1313 996 8875805 5291 4642 4649 4389 41904254 4100 4116 4068 3745 38804066 4011 3626 4233 4419 21814020 3798 3514 3094 3118 23763562 3064 2910 2691 2885 2576
10765 10445 11714 13134 13061 1284112130 7176 7100 6450 5962 5864
VII
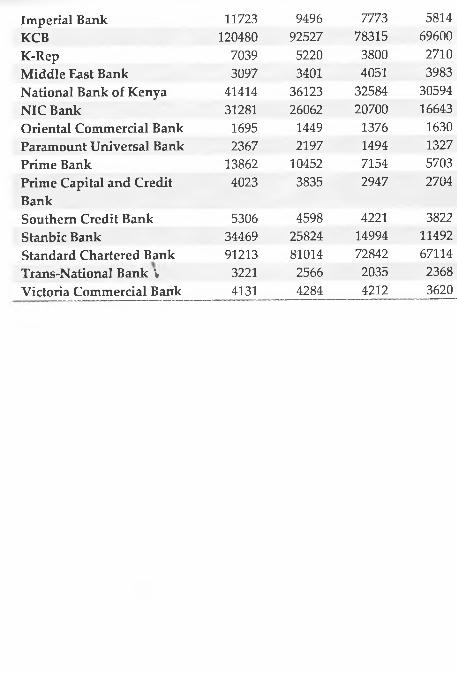
Imperial Bank 11723 9496 7773KCB 120480 92527 78315K-Rep 7039 5220 3800Middle East Bank 3097 3401 4051National Bank of Kenya 41414 36123 32584NIC Bank 31281 26062 20700Oriental Commercial Bank 1695 1449 1376Paramount Universal Bank 2367 2197 1494Prime Bank 13862 10452 7154Prime Capital and Credit 4023 3835 2947BankSouthern Credit Bank 5306 4598 4221Stanbic Bank 34469 25824 14994Standard Chartered Bank 91213 81014 72842Trans-National Bank \ 3221 2566 2035Victoria Commercial Bank 4131 4284 4212
58146960027103983
30594166431630132757032704
3822114926711423683620
49216048821743455
25919109902111120852262680
32649931
6411114753336
4181 3645 3014 2661 258459689 64984 73328 75260 790331674 1173 9633918 4075 4143 4271 4100
25231 24043 23960 25124 265419329 8396 7442 7212 73432245 2160 3623 4387 42711262 1360 1462 757 6733763 3163 2752 2138 19582426 2129 2495 2034 1658
2645 2892 777 1583 15608104 6503 7129 6930 6606
61650 54277 49188 44056 379421746 1588 1369 1374 17383102 2760 3021 3527 3619


