Embed Size (px)
Citation preview

Related titles
Physical Properties and Applications of Polymer Nanocomposites
(ISBN: 978-0-8493-9297-9)
Nanofibers and Nanotechnology in Textiles
(ISBN: 978-1-84569-105-9)
Nanotechnology in Eco-Efficient Construction: Materials, Processes and Applications
(ISBN: 978-0-85709-544-2)

Woodhead Publishing Series in Civil andStructural Engineering: Number 62
Innovative Developmentsof Advanced MultifunctionalNanocomposites in Civiland Structural Engineering
Edited by
Kenneth J. Loh and Satish Nagarajaiah
AMSTERDAM • BOSTON • CAMBRIDGE • HEIDELBERGLONDON • NEW YORK • OXFORD • PARIS • SAN DIEGOSAN FRANCISCO • SINGAPORE • SYDNEY • TOKYO
Woodhead Publishing is an imprint of Elsevier

Woodhead Publishing is an imprint of ElsevierThe Officers’ Mess Business Centre, Royston Road, Duxford, CB22 4QH, UK50 Hampshire Street, 5th Floor, Cambridge, MA 02139, USALangford Lane, Kidlington, OX5 1GB, UK
Copyright © 2016 Elsevier Ltd. All rights reserved.
No part of this publication may be reproduced or transmitted in any form or by any means,electronic or mechanical, including photocopying, recording, or any information storage andretrieval system, without permission in writing from the publisher. Details on how to seekpermission, further information about the Publisher’s permissions policies and ourarrangements with organizations such as the Copyright Clearance Center and the CopyrightLicensing Agency, can be found at our website: www.elsevier.com/permissions.
This book and the individual contributions contained in it are protected under copyright bythe Publisher (other than as may be noted herein).
NoticesKnowledge and best practice in this field are constantly changing. As new research andexperience broaden our understanding, changes in research methods, professional practices,or medical treatment may become necessary.
Practitioners and researchers must always rely on their own experience and knowledge inevaluating and using any information, methods, compounds, or experiments described herein.In using such information or methods they should be mindful of their own safety and the safetyof others, including parties for whom they have a professional responsibility.
To the fullest extent of the law, neither the Publisher nor the authors, contributors, or editors,assume any liability for any injury and/or damage to persons or property as a matter of productsliability, negligence or otherwise, or from any use or operation of any methods, products,instructions, or ideas contained in the material herein.
ISBN: 978-1-78242-326-3 (print)ISBN: 978-1-78242-344-7 (online)
British Library Cataloguing-in-Publication DataA catalogue record for this book is available from the British Library
Library of Congress Control Number: 2015951099
For information on all Woodhead Publishing publicationsvisit our website at http://store.elsevier.com/

List of contributors
Sergei M. Bachilo Rice University, Houston, TX, USA
Ellie Brown University of Texas at Arlington, Arlington, Texas, USA
Antonella D’Alessandro University of Perugia, Perugia, Italy
Siqi Ding School of Civil Engineering, Dalian University of Technology, Dalian,China
Sufen Dong School of Civil Engineering, Dalian University of Technology, Dalian,China; School of Architecture and Civil Engineering, Inner Mongolia University ofScience and Technology, Baotou, China
Branko Glisic Princeton University, Princeton, NJ, USA
Sumit Gupta University of California-San Diego, La Jolla, CA, USA
Baoguo Han School of Civil Engineering, Dalian University of Technology, Dalian,China
Tsung-Chin Hou National Cheng Kung University, Tainan, Taiwan
Simon Laflamme Iowa State University, Ames, IA, USA
Bo Mi Lee University of California-Davis, Davis, CA, USA
Hui Li Key Lab of Structures Dynamic Behavior and Control (Harbin Institute ofTechnology), Ministry of Education, Harbin, China; School of Civil Engineering,Harbin Institute of Technology, Harbin, China
Kenneth J. Loh University of California-Davis, Davis, CA, USA; University ofCalifornia-San Diego, La Jolla, CA, USA
Bryan R. Loyola Sandia National Laboratories, Livermore, CA, USA
Yi-Lung Mo University of Houston, Houston, TX, USA
Satish Nagarajaiah Rice University, Houston, TX, USA
Jinping Ou Key Lab of Structures Dynamic Behavior and Control (Harbin Instituteof Technology), Ministry of Education, Harbin, China; School of Civil Engineering,Harbin Institute of Technology, Harbin, China; School of Civil and HydraulicEngineering, Dalian University of Technology, Dalian, China

Rachel Howser Roberts Energo Engineering, KBR Company, Houston, TX, USA
Navid Sakhavand Rice University, Houston, TX, USA
Rouzbeh Shahsavari Rice University, Houston, TX, USA; Smalley Institute forNanoscale Science and Technology, Houston, TX, USA
Shengwei Sun School of Civil Engineering, Harbin Institute of Technology, Harbin,China
Peng Sun Rice University, Houston, TX, USA
Filippo Ubertini University of Perugia, Perugia, Italy
Naveen Verma Princeton University, Princeton, NJ, USA
R. Bruce Weisman Rice University, Houston, TX, USA
Huigang Xiao Key Lab of Structures Dynamic Behavior and Control (HarbinInstitute of Technology), Ministry of Education, Harbin, China; School of CivilEngineering, Harbin Institute of Technology, Harbin, China
Ning Xie School of Materials Science and Engineering and Shandong ProvincialKey Laboratory of Preparation and Measurement of Building Materials, Universityof Jinan, Jinan, Shandong, China; School of Civil Engineering, Harbin Institute ofTechnology, Harbin, China
Yongchao Yang Rice University, Houston, TX, USA
Hui Yao Michigan Technological University, Houghton, MI, USA; School ofTraffic and Transportation Engineering, Changsha University of Science andTechnology, China
Nur Yazdani University of Texas at Arlington, Arlington, Texas, USA
Zhanping You Michigan Technological University, Houghton, MI, USA
Xun Yu Department of Mechanical Engineering, New York Institute of Technology,New York, USA
Qiangqiang Zhang Key Lab of Structures Dynamic Behavior and Control (HarbinInstitute of Technology), Ministry of Education, Harbin, China; School of CivilEngineering, Harbin Institute of Technology, Harbin, China
Liqing Zhang School of Civil Engineering, Dalian University of Technology,Dalian, China
xii List of contributors

Woodhead Publishing Series in Civil andStructural Engineering
1 Finite element techniques in structural mechanicsC. T. F. Ross
2 Finite element programs in structural engineering and continuum mechanicsC. T. F. Ross
3 Macro-engineeringF. P. Davidson, E. G. Frankl and C. L. Meador
4 Macro-engineering and the earthU. W. Kitzinger and E. G. Frankel
5 Strengthening of reinforced concrete structuresEdited by L. C. Hollaway and M. Leeming
6 Analysis of engineering structuresB. Bedenik and C. B. Besant
7 Mechanics of solidsC. T. F. Ross
8 Plasticity for engineersC. R. Calladine
9 Elastic beams and framesJ. D. Renton
10 Introduction to structuresW. R. Spillers
11 Applied elasticityJ. D. Renton
12 Durability of engineering structuresJ. Bijen
13 Advanced polymer composites for structural applications in constructionEdited by L. C. Hollaway
14 Corrosion in reinforced concrete structuresEdited by H. B€ohni
15 The deformation and processing of structural materialsEdited by Z. X. Guo
16 Inspection and monitoring techniques for bridges and civil structuresEdited by G. Fu
17 Advanced civil infrastructure materialsEdited by H. Wu
18 Analysis and design of plated structures Volume 1: StabilityEdited by E. Shanmugam and C. M. Wang
19 Analysis and design of plated structures Volume 2: DynamicsEdited by E. Shanmugam and C. M. Wang

20 Multiscale materials modellingEdited by Z. X. Guo
21 Durability of concrete and cement compositesEdited by C. L. Page and M. M. Page
22 Durability of composites for civil structural applicationsEdited by V. M. Karbhari
23 Design and optimization of metal structuresJ. Farkas and K. Jarmai
24 Developments in the formulation and reinforcement of concreteEdited by S. Mindess
25 Strengthening and rehabilitation of civil infrastructures using fibre-reinforcedpolymer (FRP) compositesEdited by L. C. Hollaway and J. C. Teng
26 Condition assessment of aged structuresEdited by J. K. Paik and R. M. Melchers
27 Sustainability of construction materialsJ. Khatib
28 Structural dynamics of earthquake engineeringS. Rajasekaran
29 Geopolymers: Structures, processing, properties and industrial applicationsEdited by J. L. Provis and J. S. J. van Deventer
30 Structural health monitoring of civil infrastructure systemsEdited by V. M. Karbhari and F. Ansari
31 Architectural glass to resist seismic and extreme climatic eventsEdited by R. A. Behr
32 Failure, distress and repair of concrete structuresEdited by N. Delatte
33 Blast protection of civil infrastructures and vehicles using compositesEdited by N. Uddin
34 Non-destructive evaluation of reinforced concrete structures Volume 1: DeteriorationprocessesEdited by C. Maierhofer, H.-W. Reinhardt and G. Dobmann
35 Non-destructive evaluation of reinforced concrete structures Volume 2:Non-destructive testing methodsEdited by C. Maierhofer, H.-W. Reinhardt and G. Dobmann
36 Service life estimation and extension of civil engineering structuresEdited by V. M. Karbhari and L. S. Lee
37 Building decorative materialsEdited by Y. Li and S. Ren
38 Building materials in civil engineeringEdited by H. Zhang
39 Polymer modified bitumenEdited by T. McNally
40 Understanding the rheology of concreteEdited by N. Roussel
41 Toxicity of building materialsEdited by F. Pacheco-Torgal, S. Jalali and A. Fucic
42 Eco-efficient concreteEdited by F. Pacheco-Torgal, S. Jalali, J. Labrincha and V. M. John
43 Nanotechnology in eco-efficient constructionEdited by F. Pacheco-Torgal, M. V. Diamanti, A. Nazari and C. Goran-Granqvist
xiv Woodhead Publishing Series in Civil and Structural Engineering

44 Handbook of seismic risk analysis and management of civil infrastructure systemsEdited by F. Tesfamariam and K. Goda
45 Developments in fiber-reinforced polymer (FRP) composites for civil engineeringEdited by N. Uddin
46 Advanced fibre-reinforced polymer (FRP) composites for structural applicationsEdited by J. Bai
47 Handbook of recycled concrete and demolition wasteEdited by F. Pacheco-Torgal, V. W. Y. Tam, J. A. Labrincha, Y. Ding and J. de Brito
48 Understanding the tensile properties of concreteEdited by J. Weerheijm
49 Eco-efficient construction and building materials: Life cycle assessment (LCA),eco-labelling and case studiesEdited by F. Pacheco-Torgal, L. F. Cabeza, J. Labrincha and A. de Magalh~aes
50 Advanced composites in bridge construction and repairEdited by Y. J. Kim
51 Rehabilitation of metallic civil infrastructure using fiber-reinforced polymer (FRP)compositesEdited by V. Karbhari
52 Rehabilitation of pipelines using fiber-reinforced polymer (FRP) compositesEdited by V. Karbhari
53 Transport properties of concrete: Measurement and applicationsP. A. Claisse
54 Handbook of alkali-activated cements, mortars and concretesF. Pacheco-Torgal, J. A. Labrincha, C. Leonelli, A. Palomo and P. Chindaprasirt
55 Eco-efficient masonry bricks and blocks: Design, properties and durabilityF. Pacheco-Torgal, P. B. Lourenço, J. A. Labrincha, S. Kumar and P. Chindaprasirt
56 Advances in asphalt materials: Road and pavement constructionEdited by S.-C. Huang and H. Di Benedetto
57 Acoustic emission (AE) and related non-destructive evaluation (NDE) techniques inthe fracture mechanics of concrete: Fundamentals and applicationsEdited by M. Ohtsu
58 Nonconventional and vernacular construction materials: Characterisation,properties and applicationsEdited by K. A. Harries and B. Sharma
59 Science and technology of concrete admixturesEdited by P.-C. Aïtcin and R. J. Flatt
60 Textile fibre composites in civil engineeringEdited by T. Triantafillou
61 Corrosion of steel in concrete structuresEdited by A. Poursaee
62 Innovative developments of advanced multifunctional nanocomposites in civil andstructural engineeringEdited by K. J. Loh and S. Nagarajaiah
Woodhead Publishing Series in Civil and Structural Engineering xv

Introduction to advancednanocomposites in civil,structural, and constructionengineering
1
Kenneth J. Loh 1,2, Satish Nagarajaiah 3
1University of California-Davis, Davis, CA, USA; 2University of California-San Diego, La Jolla,CA, USA; 3Rice University, Houston, TX, USA
1.1 Historical perspectives
Advances in civil, structural, and construction engineering materials are one of thecrucial prerequisites for the growth and expansion of human civilizations. Ancient civ-ilizations transformed their knowledge of materials and engineering principles to buildsome of the greatest civil engineering marvels. The Egyptian Pyramids, Greek Templeof Artemis, Roman aqueducts, and Great Wall of China are just a few among a long listof impressive structures that mark the state of advancement and prosperity of theirtimes. It should be recognized that the discovery and development of appropriatebuilding materials (e.g., mortar, mud mixed with straw, and volcanic sand, amongothers) made these structures possible. In addition, technological and material ad-vancements were associated with every period of human history, such as during theMiddle Ages, Renaissance, and First and Second Industrial Revolutions, amongothers.
From the perspectives of civil, structural, and construction engineering, it can beargued that one of the key historical turning points of modern history dates back to1824 with the invention of Portland cement by Joseph Aspdin (Hewlett, 1998).It was found that this material hardens and crystallizes to give it impressive strength.The incorporation of aggregates thereafter to create concrete, which is characterizedby greater compression strengths, served as the foundation for building large-scalestructures. However, it was not until the mid-nineteenth century when reinforcedconcrete (RC) was invented; this composite material incorporated steel reinforcementbars that provided tensile load-carrying capacity to complement the surroundingconcrete’s high compressive strength (Slaton, 2001). The invention of RC and otherrelated civil, structural, and construction engineering advancements paved the wayfor the construction of various modern civil engineering marvels, such as the HooverDam and Panama Canal, to name just a few.
Innovative Developments of Advanced Multifunctional Nanocomposites in Civil and Structural Engineeringhttp://dx.doi.org/10.1016/B978-1-78242-326-3.00001-4Copyright © 2016 Elsevier Ltd. All rights reserved.

1.2 Multifunctional and multiscale cementitiouscomposites
As societal needs in the late twentieth century drove the demand for higher-performance,sustainable, and resilient infrastructure systems, engineers utilized multiscale designprinciples for developing innovative cementitious composites. Some notable examplesinclude the development of ultra-high-performance concrete (Wang et al., 2015),fiber-reinforced cementitious composites (FRCCs) (Brandt, 2008), and engineeringcementitious composites (ECCs) (Li, 2012), to name a few. These advances embodiedmultiscale composite material design principles so as to achieve enhanced material per-formance. In the case of FRCCs and ECCs, greater ductility and strain-hardeningbehavior were achieved by an improved understanding of micromechanics and theincorporation of microscale fibers in the cement matrix. Not only were mechanical prop-erties enhanced by controlling fiberematrix interactions, fiber geometries, and fiber ma-terials, but some studies also showed that FRCCs exhibited self-sensing and self-healingproperties (Li, 2012).
The advent of new materials and characterization tools in the nanotechnologydomain paved the way for the design of next-generation cementitious compositesthat not only were multiscale but also possessed multiple intrinsic engineeringfunctionalities (i.e., they were multifunctional). Nanotechnology, by definition, entailsthe incorporation, manipulation, and control of materials with at least one dimensionthat is less than 100 nm (Poole and Owens, 2003). In particular, since Iijima (Iijima,1991) discovered carbon nanotubes (CNTs) in 1991 and subsequent characterizationstudies revealed their impressive multifunctional properties (Baughman et al.,2002), it was only natural that the field shifted toward deriving innovative techniquesfor creating CNT-enhanced cementitious composites for civil, structural, and construc-tion engineering (Parveen et al., 2013; Sobolev et al., 2006; Konsta-Gdoutos et al.,2010a,b). Like FRCCs and ECCs, these CNT-based cementitious composites soughtto leverage the superior intrinsic material properties of CNTs (e.g., their Young’smodulus, tensile strength, electrical conductivity, and thermal properties). Althoughearly investigations focused on improving the bulk material’s mechanical and fractureproperties (Konsta-Gdoutos et al., 2010a,b), other studies explored the possibilities ofcreating multifunctional load-bearing cementitious composites that are also capable ofself-sensing and other relevant properties (Chung, 2012).
1.3 Book outline
This book is structured into three parts that coincide with how nanotechnology hasaffected three main application areas in civil and construction engineering since thedawn of the twenty-first century.
The first part presents the direct incorporation of carbon-based nanomaterials incementitious composites to obtain multifunctional construction materials that couldnot only resist but also self-sense the loads or deformations incurred by the structure.
2 Multifunctional Nanocomposites in Civil and Structural Engineering

Pioneering work by Sobolev et al. (2006) and Konsta-Gdoutos et al. (2010a,b) demon-strated the possibility of enhancing the properties of cementitious composites, such asconcrete, with nanomaterials. This research motivated many researchers to exploreother nanomaterials, such as nano-silica and nano-titanium dioxide, as additives fornanomodified concrete to improve the compressive strength and ductility of concrete.CNTs or carbon nanofibers were also used to improve the strength, modulus, andductility of concrete by modifying the cement properties through nanomodification.CNTs were also used to make the concrete multifunctional, namely, by nano-engineering them with self-sensing, deicing, sound absorption, or damping properties,in addition to their fundamental mechanical or load-bearing property. The chapterspresented in the first part of the book present recent developments in this field.
The second part is centered on pavements, which comprise one of the mostfrequently used civil constructions that is also often overlooked due to its pervasive-ness, as well as how they can be nanoengineered for improved performance, damagesensing, self-heating, and durability. Pioneering work by Li et al. (2006, 2007) demon-strated the possibility of using nanoparticles for enhancing the fatigue performance andabrasion resistance of concrete pavement. This research motivated the development ofnovel cementitious materials with nanoparticles, as well as the use of other nanomate-rials, for self-heating and enhanced fatigue properties of pavements. The chapters pre-sented in the second part of the book present recent developments in this field.
The third part of this book examines recent, cutting-edge, technological advance-ments in nanocomposites and coatings that can be applied onto existing in-service sys-tems or embedded within new civil infrastructure systems for sensing and structuralhealth monitoring (SHM). Pioneering work by Li et al. (2004) and Dharap et al.(2004) demonstrated that nanofilm strain sensors designed using CNTs could sensestructural strain response at the macroscale for SHM applications. This research moti-vated the development of strain-sensitive CNTepolymer nanofilms and nanocompo-sites that could be rapidly coated onto large structural surfaces or efficientlyembedded in infrastructure materials, such as in cement-based materials andfiber-reinforced polymer composite structures. Hou et al. (2007) and Loh (2008)showed that techniques such as electrical impedance tomography, when coupledwith multifunctional nanofilms, allowed for sensing strain at every location of thefilm and enabled damage detection and localization. These CNT-based nanofilmswere also utilized to efficiently and effectively modify the cementeaggregate interfaceof mortar and concrete while achieving spatial structural sensing (Gupta et al., 2015).Most recently, promising noncontact strain-sensing technology has been developedusing CNTs (less than 1% by weight), urethane coating (similar to most commercialpaints), and portable laser-based near-infrared spectroscopy (Withey et al., 2012Sun et al., 2005), which provides surface strain mapsebased, randomly positionedstrain measurements for detecting and locating regions of localized damage with anovel data analysis approach (Yang et al., 2015). The chapters presented in the thirdpart of the book present recent developments in this field.
The book concludes with a brief summary of future research challenges that need tobe addressed before nanotechnology and nanocomposites can be widely implementedin civil, structural, and construction engineering.
Introduction to advanced nanocomposites 3

References
Baughman, R.H., Zakhidov, A.A., de Heer, W.A., 2002. Carbon nanotubes-the route towardsapplications. Science 297, 787e792.
Brandt, A.M., 2008. Fibre reinforced cement-based composites after over 40 years of devel-opment in building and civil engineering. Composites Structures 86 (1e3), 3e9.
Chung, D.D.L., 2012. Carbon materials for structural self-sensing, electromagnetic shielding,and thermal interfacing. Carbon 50 (9), 3342e3353.
Dharap, P., Li, Z., Nagarajaiah, S., 2004. Nanotube film based on single-wall carbon nanotubesfor strain sensing. Nanotechnology 15, 378e382.
Gupta, S., Gonzalez, J., Loh, K.J., 2015. Damage detection using smart concrete engineered withnanocomposite cement-aggregate interfaces. In: Proceedings of the 10th InternationalWorkshop on Structural Health Monitoring, Stanford, CA.
Hewlett, P.C. (Ed.), 1998. Lea’s Chemistry of Cement, fourth ed. Elsevier, Oxford, London.Hou, T.-C., Loh, K.J., Lynch, J.P., 2007. Electrical impedance tomography of carbon nanotube
composite materials. In: Proceedings of SPIEe Sensors and Smart Structures Technologiesfor Civil, Mechanical, and Aerospace Systems, San Diego, CA.
Iijima, S., 1991. Helical microtubules of graphitic carbon. Nature 354, 56e58.Konsta-Gdoutos, M.S., Metaxa, Z.S., Shah, S.P., 2010a. Highly dispersed carbon nanotube
reinforced cement based materials. Cement and Concrete Research 40 (7), 1052e1059.Konsta-Gdoutos, M.S., Metaxa, Z.S., Shah, S.P., 2010b. Multi-scale mechanical and fracture
characteristics and early-age strain capacity of high performance carbon nanotube/cementnanocomposites. Cement and Concrete Composites 32 (2), 110e115.
Li, Z., Dharap, P., Nagarajaiah, S., 2004. Carbon nanotube film sensors. Advanced Materials 16,640e643.
Li, H., Zhang, M.-H., Ou, J.-P., 2006. Abrasion resistance of concrete containing nano-particlesfor pavement. Wear 260 (1e2), 1262e1266.
Li, H., Zhang, M.-H., Ou, J.-P., 2007. Flexural fatigue performance of concrete containingnano-particles for pavement. International Journal of Fatigue 29 (7), 1292e1301.
Li, V.C., 2012. Tailoring ECC for special attributes: a review. International Journal of ConcreteStructures and Materials 6 (3), 135e144.
Loh, K.J., 2008. Development of Multifunctional Carbon Nanotube Nanocomposite Sensors forStructural Health Monitoring (PhD thesis). Department of Civil & Environmental Engi-neering, University of Michigan, Ann Arbor, MI.
Parveen, S., Rana, S., Fangueiro, R., 2013. A review on nanomaterial dispersion, microstructure,and mechanical properties of carbon nanotube and nanofiber reinforced cementitiouscomposites. Journal of Nanomaterials 2013, 1e19, 710175.
Poole Jr., C.P., Owens, F.J., 2003. Introduction to Nanotechnology. John Wiley & Sons,Hoboken, NJ.
Slaton, A.E., 2001. Reinforced Concrete and the Modernization of American Building,1900e1930. The Johns Hopkins University Press, Baltimore, MD.
Sobolev, K., Flores, I., Hermosillo, R., Torres-Martinez, L.M., 2006. Nanomaterials andnanotechnology for high-performance cement composites. In: Proceedings of ACI Session,Denver, CO.
Sun, Peng, Bachilo, Sergei M., Bruce Weisman, R., Nagarajaiah, Satish, 2015. CarbonNanotubes as Non-Contact Optical Strain Sensors in Smart Skins. J. Strain Analysisfor Engineering Design. http://dx.doi.org/10.1177/0309324715597414 (web-published8/10/2015).
4 Multifunctional Nanocomposites in Civil and Structural Engineering

Wang, D., Shi, C., Wu, Z., Xiao, J., Huang, Z., Fang, Z., 2015. A review on ultra high per-formance concrete: Part II. hydration, microstructure and properties. Construction andBuilding Materials 96, 368e377.
Withey, P.A., Vemuru, V.A.M., Bachilo, S.M., Nagarajaiah, S., Weisman, R.B., 2012. Strainpaint: noncontact strain measurement using single-walled carbon nanotube compositecoatings. Nano Letters 12, 3497e3500.
Yang, Y., Sun, P., Nagarajaiah, S., Bachilo, S.M., Weisman, R.B., 2015. High-resolutiondetection of local structural damage from low-resolution random strain field measurements.(Journal paper in review).
Introduction to advanced nanocomposites 5

Development of carbon nanofiberaggregate for concrete strainmonitoring
2Rachel Howser Roberts 1, Yi-Lung Mo 2
1Energo Engineering, KBR Company, Houston, TX, USA; 2University of Houston, Houston,TX, USA
2.1 Introduction
The concept of using fibers to reinforce brittle materials is not novel. In fact, it can betraced back to ancient times when straw was added to mud bricks (ACI Committee544, 1996). The modern development of the use of fibers in the construction industrybegan in the 1960s with the addition of steel fibers to reinforced concrete structures.This was closely followed by the addition of polymeric fibers, glass fibers, and carbonfibers in the 1970s, 1980s, and 1990s, respectively (Li, 2002). Fibers improve brittlematerials such as concrete by enhancing conductivity, tensile strength, ductility, andtoughness (Chen and Chung, 1993a; Gao et al., 2009; Li et al., 2007b, 2004; Shahand Naaman, 1976).
Short-fiber composites are a type of strain sensor based on the concept of short elec-trically conducting fiber pull-out that accompanies slight and reversible crack opening.The electrical conductivity of the fibers enables the direct current (DC) electrical resis-tivity of the composites to change in response to strain damage or temperature, allow-ing sensing (Bontea et al., 2000; Chen and Chung, 1996; Chung, 1995; Gao et al.,2009; Li et al., 2004).
Fiber research in concrete construction is an ongoing field, and the self-sensingcapabilities of carbon nanofibers (CNFs) embedded within concrete is examined inthis chapter. Because of past success at the University of Houston (UH) demon-strating that self-consolidating CNF concrete (SCCNFC) can be used as a strainsensor (Gao et al., 2009; Howser et al., 2011), a CNF aggregate (CNFA) was devel-oped that can be used to determine localized damage in concrete structures. TheCNFA is 2.54 � 2.54 � 2.54 cm so that it is roughly the same size as a normalaggregate found in the concrete matrix. The development of a CNFA is significantin that it is possible to use the strain-sensing capabilities of SCCNFC with a greatlyreduced cost because only the CNFAs placed in the structure would contain CNFs.The CNFA is self-sensing and can be used to monitor early strength, determine thelocalized damage, and measure the temperature of the structure in which it isembedded. The CNFAs can be embedded in reinforced or prestressed concretestructures. This chapter will include test results in which CNFAs were embeddedin concrete cylinders and tested monotonically and cyclically in axial compression.
Innovative Developments of Advanced Multifunctional Nanocomposites in Civil and Structural Engineeringhttp://dx.doi.org/10.1016/B978-1-78242-326-3.00002-6Copyright © 2016 Elsevier Ltd. All rights reserved.

The section will also include test results in which a system of aggregates wereembedded in small-scale reinforced concrete beams.
2.2 Nanotechnology in concrete
Despite the fact that nanotechnology is a relatively recent development in scientificresearch, the concept was introduced in 1959 by Nobel Prize winner RichardFeynman’s lecture, “There’s Plenty of Room at the Bottom” (Feynman, 1960).Feynman spoke of the possibility of direct manipulation of individual atoms as apowerful form of synthetic chemistry, and decades later, the concept morphed intothe field of nanotechnology. According to the National Science Foundation andNational Nanotechnology Initiative, the definition of nanotechnology includes thefollowing (Roco, 2007):
• The size range of the material structures should be approximately 100 nm;• The nanotechnology should have the ability to measure or transform at the nanoscale; and• There should be properties that are specific to the nanoscale as compared to the macro- or
micro scale.
Following this definition, in the past 25 years nanotechnology has expanded fromFeynman’s idea and now finds applications in fields ranging from medical devices tonano-reinforced concrete.
While nanotechnology awareness is increasing in the construction industry, prac-tical widespread application is lacking. Bartos (2006) presents three reasons for thisphenomenon:
• The nature of the construction industry differs greatly from other industries researchingnanotechnology. Final construction industry products are typically not mass-produced andrequire relatively long service lives, differentiating them from the products from the micro-electronics, information technology, and automotive industries.
• Historically, there is a very low level of investment in construction research and development.• Research in nano-related research and development requires very high initial capital
investment.
Despite these difficulties, there have been significant advances in the nanoscienceof cementitious materials due to an increase in the understanding of basic phenomenain cement at the nanoscale, including structural and mechanical properties of thehydrate phases, origins of cement cohesion, cement hydration, interfaces in concrete,and mechanisms of degradation (Mondal et al., 2007; Sanchez and Sobolev, 2010). Amajor nanotechnology application, which is the focus of this chapter, is the inclusionof nanosized reinforcement in cement-based materials such as carbon nanotubes(CNTs) or CNFs.
2.2.1 Fiber-reinforced concrete
Concrete, composed of fine and coarse aggregates held together by a hydrated cementbinder, is one of the most important construction materials because of its diverse
10 Multifunctional Nanocomposites in Civil and Structural Engineering

application in project areas, including foundations, high-rise tower components, high-ways, and dams. Due to hydrated cement’s brittle nature and low tensile strength, rein-forcement consisting typically of rebar or fibers is added to the concrete. Fibers aretypically used in two forms: short randomly dispersed fibers in a cementitious matrixor a continuous mesh of fibers used in thin sheets.
Randomly dispersed fibers enhance material properties by bridging cracks. Thecracking process within concrete begins with the onset of isolated nanocracks. Thesenanocracks grow together to form localized microcracks, which lead to macrocracks.These macrocracks widen to form cracks visible with the naked eye. Fibers arrest thesecracks by forming bridges across them. With increasing tensile stress, a bond failureeventually occurs, and the fiber will pull out of the concrete, allowing the crack to widen.
2.2.2 Nano-reinforcement in cement-based materials
Since the discovery of CNTs in the 1990s (Iijima, 1991), implementation of the uniquemechanical, thermal, and electronic properties of carbon-based nano-reinforcement incement-based composites has been desirable. Single-wall CNTs (SWCNTs), multiwallCNTs (MWCNTs), and CNFs are graphene ring-based materials with aspect ratiosgreater than 1000 and large surface areas (Li et al., 2007a, 2005; Sanchez and Sobolev,2010). CNTs and CNFs are extremely stiff and strong with moduli of elasticity in therange of terapascals and tensile strength on the order of gigapascals (Makar andBeaudoin, 2004; Salvetat et al., 1999; Sanchez and Sobolev, 2010). SWCNTs consistof a single graphene sheet wrapped into a seamless cylinder, whereas, as the name sug-gests, MWCNTs are multiple concentric sheets of graphene wrapped around a hollowcore. CNFs are cylindrical nanostructures with graphene layers arranged as stackedcones, cups, or plates. CNFs are advantageous because their stacked structure presentsexposed edge planes not present in CNTs that introduce increased surface area and bet-ter bond characteristics. Because of their structure, CNFs are easier to produce and cost100 times less than SWCNTs (Kang et al., 2006). Due to the increased bond surfaceand lower cost, CNFs are more attractive than CNTs for application in cement-basedcomposites.
2.2.3 CNT and CNF dispersion
The majority of nano-reinforced composite research consists of polymers containingCNTs or CNFs (Coleman et al., 2006; Makar et al., 2005; Sanchez and Sobolev,2010). One key reason for this is because uniform dispersion is difficult incement-based materials. Well-dispersed CNFs result in a uniform calciumesilicateehydrate (CSH) gel formation, which improves the structural and electrical propertiesof the concrete (Chung, 2005). CNTs and CNFs are inherently hydrophobic andattracted to one another due to van der Waals forces, causing the fibers to agglomerateand hindering their dispersion in solvents (Baughman et al., 2002, 1999; Hilding et al.,2003; Makar and Beaudoin, 2004; Tzeng et al., 2004).
Several solutions have been proposed, including dispersing the fibers throughmilling, ultrasonification, high shear flow, elongational flow, functionalization, and
Development of carbon nanofiber aggregate for concrete strain monitoring 11

surfactant and chemical dispersement systems (Hilding et al., 2003; Konsta-Gdoutoset al., 2010; Woo et al., 2005; Yu and Kwon, 2012). These methods primarily fallinto two categories: mechanical and chemical dispersion. The mechanical dispersionmethods, such as ultrasonification, although effective in separating the fibers, canfracture them, decreasing their aspect ratio. Chemical methods use surfactants orfunctionalization to make the fibers less hydrophobic, reducing their tendency toagglomerate. However, many of the chemicals used can digest the fibers, reducingtheir effectiveness. The surfactants also often cause bubbles to form in the composite,negatively affecting the strength of the material.
Chen and his colleagues (Chen and Chung, 1993b; Chen et al., 1997) studieddispersion of carbon microfibers in cement paste. It was argued that the use of micro-scopy to assess the degree of fiber dispersion is tedious, difficult, and ineffective.Instead, Chen and his colleagues proposed studying the mechanical and electricalproperties because both properties are negatively affected by poor dispersion. Theystudied the mechanical and electrical properties of cement containing carbon microfib-ers when methylcellulose, methylcellulose plus silica fume, and latex were each in turnadded to the paste. Chen and his colleagues discovered that the addition of methylcel-lulose and silica fume enhanced both the electrical and mechanical properties of thematerial, thus aiding in the dispersion of the carbon microfibers.
Gao et al. (2009) proposed a dispersion method specifically for CNF/CNT dispersionin cement-based materials that eliminates the drawbacks mentioned here. In this method,a high-range water reducer (HRWR) is used to create a self-consolidating concrete(SCC). The American Concrete Institute (ACI) Committee 237 Self-Consolidating Con-crete offers the following definition for SCC (ACI Committee 318, 2011):“Self-consolidating concrete (SCC) is highly flowable, non-segregating concrete thatcan spread into place, fill the formwork, and encapsulate the reinforcement withoutany mechanical consolidation.”
SCC is a product of technological advancements in the field of underwater concretetechnology, where the mixtures must ensure high fluidity and high resistance towashout and segregation. Okamura originally advocated SCC in 1986, and the firstsuccess with SCC occurred in 1988 (PCI TR-6-03, 2003). The use of SCC gainedwide acceptance for savings in labor costs, shortened construction time, a better finish,and an improved work environment (Gaimster and Foord, 2000; Khayat et al., 1999;Okamura and Ozawa, 1995; Tanaka et al., 1993).
Advancement in SCC technology was due to the introduction of new chemicaladmixtures that improved and controlled the SCC rheological properties such as mel-amine, naphthalene, polycarboxylate, and acrylic-based HRWR superplasticizers andviscosity-modifying agents (VMAs).
Gao et al. (2009) proposed adding CNF to SCC because acceptable SCC is not onlyhighly flowable, but also highly stable and homogeneous on a macro scale. ThePrecast/Prestressed Concrete Institute (PCI) stipulates the following criteria for SCC(PCI TR-6-03, 2003):
• Filling ability: The property that determines how fast SCC flows under its own weight andcompletely fills intricate spaces with obstacles, such as reinforcement, without losing itsstability.
12 Multifunctional Nanocomposites in Civil and Structural Engineering

• Passing ability: The ability of SCC to pass through congested reinforcement and adhere to itwithout application of external energy.
• Stability: the ability of SCC to remain homogeneous by resisting segregation, bleeding, andair popping during transport and placing as well as after placement.
Gao et al. (2009) studied SCC containing CNFs to see if it was also homogeneouson the nanoscale. In Gao et al.’s mixing procedure, HRWR, water, and CNFs aremixed in a laboratory-grade blender while simultaneously fine aggregate, coarseaggregate, and cement are combined in a centrifugal mixer. The CNF mixture isthen slowly added to the mixer to gain a homogeneous mix. The fresh concrete wasused to create cylinders that were tested in compression. After the test, pieces of thecylinders were observed under a scanning electron microscope (SEM). The SEMshowed significant CNF clumping in specimens made of normal CNF concrete anduniform distribution in SCC containing CNFs.
2.2.4 Strain-sensing ability of CNT/CNF cement-based materials
Smart materials are materials that sense their environment and respond to changes instrain, temperature, moisture, pH, and/or electric or magnetic fields. CNT/CNF com-posites qualify as smart materials because they can measure strain and temperature(Chung, 2000, 1995; Gao et al., 2009; Howser et al., 2011; Li et al., 2007a, 2004;Yang and Chung, 1992). There are two types of strain sensing, reversible and irrevers-ible. The measurement of irreversible strain allows static structural health monitoring,whereas the sensing of reversible strain permits dynamic load monitoring. Structuralhealth monitoring is the process of implementing a damage detection and characteriza-tion strategy for engineering structures. Dynamic load monitoring can detect loadapplication and removal in real time. These are important technologies because theygauge the ability of a structure to perform its intended function despite aging, degra-dation, or disasters. Typically, monitoring reversible strain is more difficult because ofthe requirement of monitoring in real time. Additionally, reversible strain tends to besmaller than irreversible strain (Chen and Chung, 1996).
Strain sensing refers to the ability to measure an electrical or optical responsecorresponding to a strain. Chen and Chung (1996) give the following requirementsfor a structural sensor:
1. Wide strain and stress range of detection (from small strains up to failure)2. Response is reversible upon stimulus removal (necessary for repeated use of the sensor)3. Ease of measuring the response (without the need of expensive peripheral equipment)4. Presence of the sensor has no negative effect on the structural properties of the structure5. Chemical stability and durability6. Low cost
Current commonly used strain sensors include strain gauges, fiber-optic sensors,and piezoelectric sensors; all suffer from high cost, poor durability, and the need forexpensive peripheral equipment, including electronics and lasers. Due to these draw-backs, the use of sensors in civil structures is uncommon (Chen and Chung, 1996).CNT/CNF composites could become a better option as a reliable strain sensor because
Development of carbon nanofiber aggregate for concrete strain monitoring 13

the list points (1) through (5) are applicable. CNTs and CNFs are currently somewhatexpensive, CNTs more so than CNFs; however, technology may provide a way tomake them cheaper in the future.
Short-fiber composites were found to be a class of strain sensor based on theconcept of short electrically conducting fiber pull-out that accompanies slight andreversible crack opening. For a CNT/CNF composite to have strain-sensing ability,the fibers must be more conductive than their embedded matrix, of diameter smallerthan the crack length, and well dispersed. Their orientations can be random, andthey do not have to touch one another (Chung, 2000, 1998, 1995). The electricalconductivity of the fibers enables the direct current (DC) electrical resistivity of thecomposites to change in response to strain damage or temperature, allowing sensing(Chung, 2000, 1998, 1995; Gao et al., 2009; Howser et al., 2011; Li et al., 2004;Yang and Chung, 1992).
2.2.5 Carbon fiber cement and mortar self-sensing applications
Near the time that CNTs were discovered, researchers were adding carbon microfib-ers to cement-based materials and studying their mechanical properties. In 1992while studying the mechanical properties of carbon microfibers dispersed in mortar,Yang and Chung (1992) noted that the electrical resistivity of mortar containingthese fibers dramatically decreased by up to several orders of magnitude.
This idea of electrically conducting concrete led Chen and Chung (1993a) to pro-pose an intrinsically smart concrete containing carbon microfibers. Chen and Chungprepared mortar cubes containing carbon microfibers. While testing them cyclically,they discovered that the electrical resistivity of the concrete increased irreversiblyupon compressive loading up to approximately one-third the compressive strengthof the mortar. After this point, the resistance reversibly increased and decreasedupon loading and unloading of the specimens. Chen and Chung concluded that carbonfiberereinforced concrete serves as a smart structural material. Chen and Chung(1996) followed this experiment with a more detailed cyclic experiment on carbonmicrofiber mortar under cyclic loads. After this test, they concluded that the initialirreversible behavior is due to permanent damage associated with the fiberematrixinterface weakening. They attributed the reversible behavior to crack opening withfiber pull-out and crack closing with fibers pushing back in.
CNTs are the most conductive fibers presently known and are, therefore, more idealfor electrical applications than their microscale counterparts (Thess et al., 1996; Weiet al., 2001). CNTs and CNFs are also attractive for use in cement-based compositesbecause of strength and high aspect ratios (Makar and Beaudoin, 2004; Salvetat et al.,1999; Sanchez and Sobolev, 2010). Li et al. (2007a) proposed adding MWCNTs tomortar for improved mechanical properties and confirmed that the flexural andcompressive strength of the concrete was enhanced. The same group later studiedthe electrical volume resistivity of cement paste containing CNTs measured usingthe four-probe method (Narayan et al., 2004). They applied a cyclic compressiveload to a 40.0 � 40.0 � 160.0 mm rectangular prism made of the material. The
14 Multifunctional Nanocomposites in Civil and Structural Engineering

fractional change in the volume resistivity oscillated up to approximately 10% with theoscillation of the compressive load.
Gao et al. (2009) expanded the work on self-sensing cement-based materials bystudying 152.4 � 305 mm cylinders made of concrete, rather than cement or mortar,containing CNFs. Gao et al. crushed the cylinders monotonically and studied the elec-trical resistance variation. They observed electrical resistance variations up to 80% andconcluded that concrete-containing CNFs can be used for self-structural healthmonitoring.
Howser et al. (2011) continued Gao et al.’s work and extended it to a full-scale rein-forced concrete column containing CNFs. A SCCNFC column was built and tested un-der a reversed cyclic load. Howser et al. examined the structural behavior and theself-sensing ability of the material. The results were compared to the structuralbehavior and self-sensing ability of a traditional self-consolidating reinforced concrete(SCRC) and a self-consolidating steel fiber concrete (SCSFC) specimen. In Howseret al.’s test, the peaks and valleys in the electrical resistance readings of the SCCNFCmatch the peaks and valleys of the applied force and the strain in the concrete.Although the peaks and valleys in the electrical resistance readings of the SCRCand SCSFC specimens occasionally matched, there was not enough correspondenceto safely assume that these concretes could be used as a reversible strain sensor. Itwas concluded that when an appropriate dosage of CNFs is used, SCCNFC can beused for self-structural health monitoring.
From the tests performed by Gao et al. (2009) and Howser et al. (2011), it wasdetermined that SCCNFC follows the definition for nanotechnology set forth by theNational Science Foundation and National Nanotechnology Initiative (Roco, 2007).The size range of the CNFs is approximately 100 nm, the SCCNFC is able to measuredamage in the composite, and the CNFs have properties that are specific to thenanoscale.
2.3 Development of the carbon nanofiber aggregate
Despite past success at the UH demonstrating that SCCNFC can be used as a strainsensor (Gao et al., 2009; Howser et al., 2011), the use of the material for full-scaleinfrastructure is impractical due to the high cost of CNFs. SCCNFC costs nearly 20times as much as normal concrete. In response, a CNFA was developed to determinelocalized strain in concrete structures. The development of a CNFA is significantbecause it is possible to use the strain-sensing capabilities of SCCNFC with agreatly reduced cost because only the CNFAs placed in the structure wouldcontain CNFs.
2.3.1 Electrical resistance measurement technique
The four-probe method was chosen to measure the electrical resistance in the CNFAspecimens. In this method, current is supplied to a pair of current leads (1 and 4)and the voltage drop can be measured across the inner connections (2 and 3), as shown
Development of carbon nanofiber aggregate for concrete strain monitoring 15

in Figure 2.1. Since the resistance of CNFAs is much higher than the resistance of thewires, this method is quite accurate for determining the electrical resistance variationof the CNFAs.
The calculations required for this method are quite simple. One can determine theresistance using Ohm’s law,
V ¼ RI; (2.1)
where:
V: voltage (V),R: resistance (U), andI: current (A).
The electrical resistance variation (ERV) can be determined as
ERV ¼ Ri � R0
R0; (2.2)
where:
ERV: electrical resistance variation,Ri: resistance at Step I, andR0: initial resistance.
The four-probe method was accomplished by creating four steel meshes andembedding them inside of the CNFAs. Figure 2.2 shows a schematic of the CNFAwith the four embedded meshes.
2.3.2 CNFA size
For size optimization, the CNFA needed to be large enough to accommodate themeshes required for the four-probe method; however, it had to be appropriately sizedso that it did not cause casting problems when it was embedded in a larger structure.
1 2 3 4
I
V
Figure 2.1 Four-probe method for determining electrical resistance.
16 Multifunctional Nanocomposites in Civil and Structural Engineering

According to the American Concrete Institute (ACI) (ACI Committee 318, 2011), thenominal maximum size of coarse aggregates shall not be larger than:
1. One-fifth the narrowest dimension between sides of forms, nor2. One-third the depth of slabs, nor3. Three-fourths the minimum clear spacing between individual reinforcing bars or wires,
bundles of bars, individual tendons, bundled tendons, or ducts.
However, these limitations on maximum size of the aggregate may be waived if, inthe judgment of the licensed design professional, the workability and methods ofconsolidation of the concrete are such that the concrete can be placed without honey-combs or voids. The optimal CNFA size chosen was 2.54 � 2.54 � 2.54 cm. Thisallowed for both reasonable construction limitations as outlined by points (1) through(3) above and manageable space in which to place the four wire meshes needed for thefour-probe method.
2.3.3 Mortar mix design
The CNFA is made of a CNF mortar consisting of the typical mortar ingredients ofcement and fine aggregate as well as admixtures. A study was carried out to determinethe optimal mix design. The first admixture was an HRWR. It was proven by Gao et al.(2009) that an HRWR capable of creating SCC also aids in the dispersion of fibers. Themortar needed to be self-consolidating so that it would flow under its own weight,flowing around the meshes without creating voids with no mechanical vibration.The second admixture was silica fume. Chen and his colleagues (Chen and Chung,1993b; Chen et al., 1997) proved that silica fume also increases the dispersion of fibersin cement-based materials. The third admixture was the CNFs, which allow the mortar
CNFA Wire mesh
Electrical wire
Figure 2.2 CNFA schematic.
Development of carbon nanofiber aggregate for concrete strain monitoring 17

mixture to become self-sensing. The properties of the materials used in the mix are asfollows:
1. Cement: The cement used was ASTM Type III Portland cement. Type III was chosen for itsdecreased curing time for quicker CNFA manufacturing.
2. Fine aggregate: The fine aggregate used was Quikrete® Premium Play Sand, which is awashed, dried, and screened fine sand.
3. High-range water reducer (HRWR): Glenium® 3400 HES is a polycarboxylate admixturefrom BASF Chemical Co.
4. Silica fume: Rheomac® SF100 is a dry, densified silica fume admixture from BASFChemical Co.
5. Carbon nanofibers: Pyrograf Products, Inc., PR-19-XT-LHT-OX fibers were used in thisstudy. The specific gravity of the fibers is 0.0742. The diameter of the fibers is 149 nmand the length is 19 mm, resulting in an aspect ratio of 128. Gao et al. (2009) completedan extensive study on various CNFs and found PR-19-XT-LHT-OX fibers to have the bestself-sensing behavior in concrete.
Several researchers have studied CNF concentrations in cement-based mixtures.Chen and Chung (1993a) studied the electrical and mechanical properties of carbonmicrofibers in concentrations of 0.5% by weight of cement. They saw a decrease inelectrical resistivity of up to 83% when compared to normal concrete. Chen and Chung(1996) later studied carbon microfibers in concentrations of 0e4% by weight ofcement in mortar and 0.5e3% by weight of cement in concrete. Their results showedthat carbon microfibers in concrete and mortar created a reversible damage sensor bymeasuring the ERV. They found that increasing the fiber content in the mortar did nothave appreciable effects on the change in ERV. In concrete, they found that increasingthe fiber content increased the ERV. Gao et al. (2009) found that increasing the fibercontent in CNF concrete by more than 0.7% by weight of cement caused fiber clump-ing. They found 0.7% by weight of cement was the optimal concentration. Howseret al. (2011) successfully used 0.7% CNFs by weight of cement in a reinforcedconcrete column test.
A study on the fiber concentration in mortar was carried out to discover the optimalconcentration for the CNFAs (Howser and Mo, 2013). Over 100 CNFAs with varyingpercentages of CNFs were tested in compression, and the ERV was measured to findthe optimal percentage. Before the test began, the CNF dispersion, or lack thereof,could be observed at some concentrations with the naked eye. Figure 2.3 shows aseries of CNFAs with different CNF concentrations (i.e., 0.00%, 0.25%, 0.50%,0.75%, 1.00%, 1.25%, 1.50%, and 1.75% by weight of cement). It can easily beseen that the color of the mortar becomes darker with each increase of CNF concentra-tion up to 1.75%. This was caused by severe clumping of CNFs in the mortar mixture at1.75%. At this concentration, extreme fiber clumping was observed during the castingprocedure, and the CNFAs containing 1.75% by weight of cement were damagedbefore testing due to the clumping. Visible clumps were observed in tested CNFAscontaining 1.00% CNFs by weight of cement. From this visual inspection, it was clearthat the optimal concentration was likely less than 1.00% CNFs by weight of cement.
Over the course of a year, over 100 CNFAs were tested in monotonic compression.The manufacturing techniques used evolved over time, so the results from the tests are
18 Multifunctional Nanocomposites in Civil and Structural Engineering

not completely comparable; however, there is a clear trend between the concentrationof CNFs per weight of cement and the maximum ERV recorded, as show in Figure 2.4.The maximum ERVs recorded for each CNF concentration were averaged, and thestandard deviations were calculated. Figure 2.4 shows the average ERV plus andminus one standard deviation. Some of the variance in the results is due to the changein manufacturing practices. A CNF concentration with respect to the weight of cementof 0.70% exhibited the largest change in ERV, which matched the results found byGao et al. (2009).
Based on results from the tests completed to determine the optimal CNF dosage, amix design was developed to optimize the material and electrical properties. SeeTable 2.1 for the final CNFA mix design proportioned by the total weight of themortar.
CNFs by weight of cement
0.00% 0.25% 0.50% 0.75% 1.00% 1.25% 1.50% 1.75%
Figure 2.3 Color gradation of CNF mortar mixes.
0
0.2
0.4
0.6
0.8
1
1.2
0.00% 0.25% 0.50% 0.75% 1.00% 1.25% 1.50% 1.75% 2.00%CNF percentage by weight of cement
Max
imum
ER
V
AVG ERV + STD
AVG ERV – STD
AVG ERV
Figure 2.4 Relationship between CNF percentage and ERV.
Development of carbon nanofiber aggregate for concrete strain monitoring 19

2.4 Damage detection of CNFAs embedded in concretespecimens
The primary purpose for developing CNFAs is for strain monitoring. The CNF mortaris self-sensing and can be used to determine the damage in the CNFAs. The CNFAscan be embedded in reinforced or prestressed concrete structures and used to determinethe localized damage in a structure. For the purpose of compressive strain monitoring,the CNFAs were embedded in concrete cylinders and tested in compression to deter-mine a relationship between compressive strain and electrical resistance. A system ofembedded CNFAs was also used for the structural health monitoring of a small-scalebeam tested monotonically.
2.4.1 CNFA embedded in concrete cylinders testedin compression
2.4.1.1 Specimen construction
The goal of the experiment was to measure how the electrical resistance of an embeddedCNFA varies with strain. The CNFAs were embedded in 7.62 � 15.24 cm cylinders.Because the electrical resistance in the CNFAs is affected by both temperature andstrain, type K thermocouples were also embedded in the cylinders. A hole was drilledin the center of the cylinder molds to allow the CNFA and thermocouple wires toexit the concrete. Each mold was filled halfway with SCC, the CNFA was placed inthe fresh SCC, and more SCC was placed on top. A thermocouple was epoxied tothe top of the CNFAs. SCC was used because it required no mechanical vibrations.Vibrations may cause the orientation of the CNFA to change. Figure 2.5 shows aCNFA and thermocouple placed in fresh SCC.
2.4.1.2 Experimental setup
To measure the electrical resistance, the outer wires of the CNFA were connected inseries with a 5.6 kU resistor and a 10 V power supply. The voltage drops across the
Table 2.1 CNFA mix design
Material Total mortar weight (%)
Fine aggregate 52.9
Cement 28.6
Water 12.14
Silica fume 4.29
HRWR 1.957
CNFs 0.200
20 Multifunctional Nanocomposites in Civil and Structural Engineering

inner wires of the CNFA and resistor were measured using the data acquisition sys-tem dSpace. There was an impedance problem within the data acquisition system, sodifferential amplifiers were placed between each component of the circuit and thedata acquisition system. Figure 2.6 shows the electrical resistance measurementsetup.
Figure 2.5 CNFA and thermocouple in fresh SCC.
Data acquisitionsystem
CNFA
Resistor
Differential amplifier VR
10 V +
–
V
Figure 2.6 Electrical circuit and connection to data acquisition system for cylinder compressionexperiments.
Development of carbon nanofiber aggregate for concrete strain monitoring 21

The cylinders were tested in a Tinius Olsen Hydraulic Tester. The force wasmeasured directly from the hydraulic tester. The strain was monitored using an exten-someter, shown in Figure 2.7. The extensometer measured the smeared strain acrossthe center 50.8 mm of the cylinder. To ensure the failure occurred in this region, steelpipe clamps were used to confine each cylinder 25.4 mm from the top and bottom,as shown in Figure 2.7.
2.4.1.3 Group 1 experimental results
Three different experimental groups with varying temperatures and load types weretested in this experiment, as shown in Table 2.2. Group 1 consisted of 12 cylinderstested in monotonic compression at room temperature. The ERV showed severaldefinite trends across all of the cylinders. Typical stress versus time, strain versustime, ERV, and voltage variation (VV) versus time relationships for three cylindersare shown in Figure 2.8. VV is defined as the change in voltage divided by the originalvoltage. From the ERV curves, it is apparent when each cylinder began loading as theERV increases from 0 simultaneously with the stress and strain. The maximum ERVoccurs near a strain of 0.001 for each case. From the VV curves, failure is clearlyshown by a sudden drastic change in the negative direction.
Although the trends are similar, there is considerable variation in the ERVvalues. Figure 2.9 shows the mean ERV versus strain relationship for the 12 testedcylinders. The standard deviation of the raw data is so large that a model would beimpractical for use. A model and calibration factor were developed based on thelimited data to show promise in the future use of CNFAs with acceptable variationin the results.
Figure 2.7 Cylinder compression experimental setup.
22 Multifunctional Nanocomposites in Civil and Structural Engineering

Table 2.2 Cylinder compression experimental groups
Group Temperature range Load type
Group 1 Room temperature Monotonic compression
Group 2 Frozen Monotonic compression
Group 3 Room temperature Cyclic compression
6050
50
403020100
0–10
Stre
ss (M
Pa)
100 150 200 250 300 350
500 100 150 200 250 300 350
500 100 150 200 250 300 350
500 100 150 200 250 300 350
Time (s)
Time (s)
Time (s)
Time (s)
0.004
0.003
0.002
0.001
0.000
–0.001
Stra
in
–1.000
0.400
0.300
0.200
0.100
0.000
0.000
–0.100
0.200
–0.200–0.400
–0.600
–0.800
ERV
VV
A
B
C
Figure 2.8 Typical stress, strain, and voltage variation (VV) ERV results for cylinders tested incompression at room temperature.
Development of carbon nanofiber aggregate for concrete strain monitoring 23

Cornell’s Creative Machines Lab developed a free mathematical software, Eureqa,that determines mathematical equations that describe sets of data in their simplest form(Schmidt and Lipson, 2009). The mean ERV and strain data were entered into Eureqa,and an equation was developed with a coefficient of determination of 0.985:
ERV ¼ 7:59ffiffiffiε
p � 112ε; (2.3)
where:
ERV: electrical resistance variation, andε: strain.
The mathematical model is graphed in Figure 2.9.After testing, a calibration factor was developed to reduce the variation in the tested
results. The calibration factor is based from the initial slope of the ERV-versus-strainrelationship. For each tested cylinder, the strain and ERV were recorded at a stress of6.89 MPa. The calibration factor was determined as:
C ¼ ERVc1
εc1; (2.4)
where:
C: calibration factor;ERVc1: calibration ERV, the ERV at a stress of 6.89 MPa; andεc1: calibration strain, the strain at a stress of 6.89 MPa.
00
0.0005 0.001 0.0015 0.002 0.0025
0.05
0.1
0.15
0.2
0.25
Strain
ERV Mean ERV
Mean + std DevMean – std Dev
Model
Figure 2.9 Strain versus ERV for Group 1.
24 Multifunctional Nanocomposites in Civil and Structural Engineering

Equation (2.4) was used to find the mean calibration factor for the data, which was393. The calibration factor was added to Eqn (2.3),
ERVc ¼ C
393
�7:59
ffiffiffiε
p � 112ε�: (2.5)
The raw data can be calibrated for comparison as:
ERVc ¼ 393C
ERV; (2.6)
where ERVc is calibrated ERV.The calibrated ERV standard deviation for each CNFA was calculated for the
modeled behavior. Figure 2.10 shows the modeled behavior plus and minus one stan-dard deviation for the calibrated CNFAs. The average coefficient of variation reducedfrom 77.6% for the uncalibrated CNFAs to 9.8% for the calibrated CNFAs. This showsthat, in the future, CNFAs may be individually calibrated prior to embedment in con-crete to achieve more consistent ERV results.
2.4.1.4 Group 2 experimental results
Because it was found that ERV can be greatly affected by cold temperatures, aseries of cold to frozen cylinders was tested monotonically in compression. Themean temperature of each cylinder during testing is shown in Table 2.3. Pleasenote that Cylinder F, although cold, was not frozen during testing. Cylinder C’s
00
0.1
0.2
0.15
0.05
0.25
0.0005 0.0015 0.00250.001 0.002Strain
Cal
ibra
ted
ERV
ModelModel + std DevModel – std Dev
Figure 2.10 Strain versus calibrated ERV for Group 1.
Development of carbon nanofiber aggregate for concrete strain monitoring 25

temperature was nearly at the freezing point and was considered frozen for thepurposes of this experiment. The temperatures of the cylinders in Group 1 werealso recorded for comparison purposes. The cylinders in Group 1 were all testedat approximately 22 �C.
Research in the 1960s proved that concrete is brittle at low temperatures (Lentz andMonfore, 1966; Monfore and Lentz, 1962), and this phenomenon was observed duringthe cylinder tests. The stress-versus-strain relationships for Group 1 exhibited an initialelastic modulus, strain softening, and failure between a strain of 0.002 and 0.003. Thecylinders in Group 2 exhibited no strain softening and failed at similar stresses betweena strain of 0.0015 and 0.002.
A similar phenomenon was observed in the ERV-versus-strain relationship forGroup 2. The ERVs were calibrated using the same method developed for Group 1.Figure 2.11 shows the ERV-versus-strain relationships for the modeled behaviorfrom Group 1 and the six CNFAs tested in Group 2. The relationships in Group 1exhibited early softening behavior at a strain of about 0.0002. The five frozen cylindersmaintained their original slopes until softening behavior began near a strain of 0.001.Cylinder F, which was cold but not frozen, behaved more like the modeled behaviorfrom Group 1. Additional testing is required to extend the model to include strain andtemperature effects.
2.4.1.5 Group 3 experimental results
Group 3 consisted of three cylinders tested cyclically. Previous work has qualitativelyshown that carbon fiber cementebased composites have the potential for structuralhealth monitoring because when the strain versus time and electrical properties for acyclic test were plotted together, the peaks and valleys in the data sets occurred simul-taneously (Chung, 2000, 1995; Howser et al., 2011). Chung (2000) measured thechange in fractional resistivity, stress, and strain in a small-scale carbon fiber latexcement paste specimen. The specimen was tested cyclically in compression. Chungshowed that although the electrical properties were able to detect the peaks and valleys
Table 2.3 Group 2 cylinder temperatures
CylinderMean temperatureduring testing (8C)
A �8.24
B �8.64
C 0.978
D �7.41
E �5.44
F 6.55
26 Multifunctional Nanocomposites in Civil and Structural Engineering

in the strain, the electrical properties drifted during the experiment. Ideally, theembedded CNFAs will behave equally as well as the specimens made entirely of acarbon fiber cement composite material.
Displacement control was used to test the cylinders in Group 3. A base displace-ment of 0.0381 mm was chosen. Two cycles were applied at n times the base displace-ment, where n ¼ 1, 2, 3, and so on until failure. One cycle consists of loading thecylinder in compression to the desired displacement and returning the actuator tothe zero displacement position.
The results for the stresses, strains, and ERVs for Cylinders A, B, and C are shownin Figures 2.12e2.14, respectively. Qualitatively, the experiment was successful. Thepeaks and valleys of the stress, strain, and ERV coincide for all three cylinders. TheCNFAs had a difficult time detecting the first two cycles in each test, but the strainwas quite small for these cycles. The same drift behavior that was observed in Chung’sexperiment (2000) occurred in the present experiment.
Although three specimens were not enough to create a comprehensive model, somesimple modifications were made to the model found for Group 1 in an attempt topredict the cyclic behavior of embedded CNFAs. The model is shown graphicallyin Figure 2.15.
Following Figure 2.15, if the embedded CNFA is loaded monotonically incompression from Points A to B, it will follow the virgin curve, which correspondsto Eqn (2.5). If the CNFA is loaded and then unloaded, following Points A, C, andD, Section AC is modeled using Eqn (2.5), and Section CD is modeled as:
Ru ¼ ERVt � 23
C
393ð7:59 ffiffiffiffi
εtp � 112εtÞ; (2.7)
00 0.0005 0.001 0.0015 0.002
0.05
0.1
0.15
0.2
0.25
0.3
0.35
0.4
0.45
0.5
Model (22 ºC)A (–8 ºC)B (–9 ºC)C (1 ºC)D (–7 ºC)E (–5 ºC)F (7 ºC)
FModel
A
CBD
E
Strain
Cal
ibra
ted
ERV
Figure 2.11 Strain versus calibrated ERV for Group 2.
Development of carbon nanofiber aggregate for concrete strain monitoring 27

where:
Ru: unloading turning point factor,ERVt: calibrated ERV at the turning point,C: calibration factor calculated from Eqn (2.4), andεt: strain at turning point,
ERVu ¼ 23
C
393
�7:59
ffiffiffiε
p � 112ε�þ Ru; (2.8)
where:
ERVu: calibrated unloading ERV, andε: strain.
40
30
20
10
00 200 400 600 800 1000 1200 1400
0 200 400 600 800 1000 1200 1400
0 200 400 600 800 1000 1200 1400
–10Time (s)
Time (s)
Time (s)
ERV
Stra
inSt
ress
(MPa
)
0.003
0.002
0.001
–0.001
–0.001
0.000
0.400
0.300
0.200
0.100
0.000
Figure 2.12 Group 3 Cylinder A stress, strain, and ERV versus time.
28 Multifunctional Nanocomposites in Civil and Structural Engineering

If the CNFA is reloaded after being unloaded, such as from Point D to E, the sectionis modeled as:
Rr ¼ ERVt � C
393ð7:59 ffiffiffiffi
εtp � 112εtÞ; (2.9)
where:
Rr: reloading turning point factor
ERVr ¼ C
393
�7:59
ffiffiffiε
p � 112ε�þ Rr; (2.10)
where ERVr is calibrated reloading ERV.
40
30
20
10Stre
ss (M
Pa)
00 100 200 300 400 500 600 700 800
0 100 200 300 400 500 600 700 800
0 100 200 300 400 500 600 700 800
Time (s)
Time (s)
Time (s)
ERV
Stra
in
0.002
0.002
0.001
0.001
–0.001
0.000
2.000
1.500
1.000
0.500
0.000
–0.500
Figure 2.13 Group 3 Cylinder B stress, strain, and ERV versus time.
Development of carbon nanofiber aggregate for concrete strain monitoring 29

40
30
20
10
–10
Stre
ss (M
Pa)
00 200 400 600 800 1000
0 200 400 600 800 1000
0 200 400 600 800 1000
Time (s)
Time (s)
Time (s)
ERV
Stra
in
0.002
0.002
0.001
0.001
–0.001
0.000
0.000
0.100
0.200
0.300
0.400
Figure 2.14 Group 3 Cylinder C stress, strain, and ERV versus time.
Strain
Virgin curve
Unloading curve
Reloading curve
Cal
ibra
ted
ERV
A
C B
E
D
Figure 2.15 Cyclic compressive strain versus calibrated ERV model.
30 Multifunctional Nanocomposites in Civil and Structural Engineering

All subsequent loading and reloading are modeled using Eqns (2.7)e(2.10).The three cyclically tested CNFAs were modeled using the cyclic model with satis-
factory results. Figures 2.16 and 2.17 show the calibrated and modeled ERV forCylinder A versus time and strain, respectively. Figures 2.18e2.21 show the samerelationships for Cylinders B and C, respectively.
0 200 400 600 800 1000 1200 14000.00
0.10
0.20
0.30
0.40
Calibrated ERVModeled ERV
Time (s)
ERV
Figure 2.16 Group 3 Cylinder A calibrated and modeled ERV versus time.
0.00E + 00 1.00E – 03 2.00E – 03 3.00E – 03Strain
ERV
0.00
0.05
0.10
0.15
0.20
0.25
0.30
0.35
0.40
Calibrated ERVModeled ERV
Figure 2.17 Group 3 Cylinder A calibrated and modeled ERV versus strain.
Development of carbon nanofiber aggregate for concrete strain monitoring 31

1.20
1.00
0.80
0.60
0.40
0.20
0.00
–0.20
200 400 600 8000
Time (s)
ER
V Calibrated ERVModeled ERV
Figure 2.18 Group 3 Cylinder B calibrated and modeled ERV versus time.
1.20
1.00
0.80
0.60
0.40
0.20
0.00
–0.20Strain
ERV
0.00E + 00 1.00E – 03 2.00E – 03 3.00E – 03
Calibrated ERVModeled ERV
Figure 2.19 Group 3 Cylinder B calibrated and modeled ERV versus strain.
32 Multifunctional Nanocomposites in Civil and Structural Engineering

0 200 400 600 800 10000.00
0.05
0.10
0.15
0.20
0.25
0.30
0.35
0.40
0.45
Time (s)
ERV
Calibrated ERVModeled ERV
Figure 2.20 Group 3 Cylinder C calibrated and modeled ERV versus time.
0
0.05
0.1
0.15
0.2
0.25
0.3
0.35
0.4
0.45
0.00E + 00 1.00E – 03 2.00E – 03 3.00E – 03
ERV
Strain
Calibrated ERVModeled ERV
Figure 2.21 Group 3 Cylinder C calibrated and modeled ERV versus strain.
Development of carbon nanofiber aggregate for concrete strain monitoring 33

2.4.2 System of CNFAs embedded in reinforced concretebeam tested in flexure
2.4.2.1 Specimen construction
A small-scale beam was designed for the purpose of testing the application of CNFAsin a reinforced concrete structure. The cross-section of the beam was 152.4 mm squareand contained three United States (US) #3 longitudinal rebar in the tension region and2 US #2 rebar in the compression region. The beam also contained US #2 stirrups witha typical spacing of 63.5 mm. The stirrups in the central portion of the beam, wherethere was no shear, were placed to hold the CNFAs in place. The beam was533 mm long. The beam cross-section and elevation view are shown in Figures 2.22and 2.23, respectively. The beam was instrumented with six CNFAs as shown inFigures 2.22 and 2.23.
Because of the small rebar size, the stirrups were bent by hand and welded to thelongitudinal reinforcement. The rebar adjacent to the CNFA locations was coatedwith epoxy so that the electrical properties of the rebar did not affect the electricalproperties of the CNFAs. After the rebar cage was constructed, CNFAs were tiedinto place using zip ties. Figure 2.24 shows the installed CNFAs and the rebar cagewithin the formwork. SCC was used for the beam because of close rebar spacing.SCC is not as prone to honeycombing as normal concrete.
2.4.2.2 Experimental setup
To measure the electrical resistance, the outer wires of the six CNFAs were connectedin series with a 5.6 kU resistor and a 10 V power supply, as shown in Figure 2.25. Thevoltage drops across the inner wires of the CNFAs and resistor were measured usingthe data acquisition system dSpace, also shown in Figure 2.25. There was an imped-ance problem within the data acquisition system, so differential amplifiers were placedbetween each component of the circuit and the data acquisition system, as shown inFigure 2.25.
The beam was tested in a Tinius Olsen Hydraulic Tester using the four-pointbending method depicted in Figure 2.26. The four-point bending method was chosenbecause the moment is constant between the two loading points, where three CNFAs
152.40 114.30
152.40
#2 (TYP)
#2 (TYP)
#3 (TYP)
CNFA
Figure 2.22 Beam cross-section (units in millimeters).
34 Multifunctional Nanocomposites in Civil and Structural Engineering

533.40
114.30152.40
25.40
12.70 19.05
19.05 19.0563.50 63.50 63.50 63.50
482.60
50.80 50.8044.45 44.45
Figure 2.23 Beam elevation view (units in millimeters).
Developm
entof
carbonnano
fiberaggregate
forconcrete
strainmonitoring
35

Figure 2.24 Installed CNFAs and rebar cage in formwork.
Differential amplifier
Data acquisitionsystem
CNFA CCNFA F
CNFA BCNFA E
CNFA ACNFA D
10 V +
–
Resistor
VR
VDVEVF
VC VB VA
Figure 2.25 Electrical circuit and connection to data acquisition system for beam experiment.
36 Multifunctional Nanocomposites in Civil and Structural Engineering

were placed in both the compression and tension regions. In Figure 2.26, the span L is457 mm and P is the total force. The force was measured directly from the TiniusOlsen Hydraulic Tester. The displacement was monitored using two linear variable dif-ferential transformers (LVDTs). The experimental setup is shown in Figure 2.27.
2.4.2.3 Experimental results
The beam was expected to fail in flexure and crushing similarly to the previously testedsmall-scale reinforced concrete beam shown in Figure 2.28; however, the concretestrength was 70% higher than expected and the beam failed in shear, as shown inFigure 2.29. Figure 2.30 shows the force-versus-displacement relationship of thebeam.
The sensors were embedded in the flexure critical region rather than the shearcritical region, so the collected data were not ideal. For simplicity, the strains were
P/2 P/2
L/3 L/3
L
L/3
Figure 2.26 Four-point bending method.
Figure 2.27 Beam experimental setup.
Development of carbon nanofiber aggregate for concrete strain monitoring 37

calculated using EulereBernoulli beam theory (Timoshenko, 1953). The flexuralstrains were very low at failure, and the CNFAs are less stable at low strains. TheERVs were calibrated based on their initial ERV-versus-strain relationship. Figure 2.31shows the calibrated ERV-versus-strain relationship. The calibration factor specifiesthat the calibration factor should be calculated at a stress of 6.89 MPa; however, thethree CNFA in the compression region, CNFAs A, B, and C, did not reach a stressof 6.89 MPa during the test. Their maximum stress was 3.29 MPa. They were cali-brated at a stress of 2.07 MPa. The strain in the compression region was so smallthat no conclusions could be determined on the appropriateness of the compressionmodel. The three CNFAs in the tension region, CNFAs D, E, and F, were calibrated
Figure 2.28 Previously tested reinforced concrete beam with flexural and crushing failuremodes.
Figure 2.29 Tested reinforced concrete beam with shear failure mode.
38 Multifunctional Nanocomposites in Civil and Structural Engineering

at 6.89 MPa. They did not match the compression model well, which implies that thetension and compression behavior of the CNFAs is different. This was expectedbecause concrete is not isotropic. There were not enough data from the test to createa tension model.
35
30
25
20
15
10
5
00 0.001 0.002 0.003 0.004 0.005 0.006 0.007 0.008 0.009
Displacement (in.)
Forc
e (k
ips)
Figure 2.30 Beam force versus displacement.
0.6
0.5
0.4
0.2
0.1
00 0.0002 0.0004 0.0006 0.0008 0.001 0.0012
0.3
Strain
Model
ModelABCDEF
D
E
F
ABC
Cal
ibra
ted
ERV
Figure 2.31 Beam calibrated ERV versus strain.
Development of carbon nanofiber aggregate for concrete strain monitoring 39

The load-carrying capacity of the beam began to decrease after a sudden largecrack formed at one of the loading points, near CNFA A. Figure 2.32 shows thecrack with all of the loading equipment in place. Figure 2.33 shows the crack andits proximity to CNFA A (the wires closest to the crack), which was embedded12.7 mm below the surface of the concrete. At the exact time that the crack sud-denly opened, the ERV in CNFA A suddenly dropped. This occurred simulta-neously with the peak recorded load, as shown in Figure 2.34. This proves thatCNFAs are capable of detecting localized, catastrophic damage.
Figure 2.32 Crack at loading point with loading equipment in place.
Figure 2.33 Crack at loading point.
40 Multifunctional Nanocomposites in Civil and Structural Engineering

2.5 Conclusions and future trends
A carbon nanofiber aggregate (CNFA) was developed with self-sensing capabilities.The CNFA is a 2.54 � 2.54 � 2.54 cm cube of mortar containing 0.70% carbon nano-fibers (CNFs) by weight of cement. The electrical resistance is measured in the CNFAsthrough the embedding of four steel meshes and the use of the four-probe method.Preliminary testing was completed to prove that CNFAs are multifunctional sensorscapable of monitoring strain in concrete structures.
Three groups of cylinders with embedded CNFAs were tested in compression. Thefirst group was tested in monotonic compression at room temperature. The secondgroup was frozen, then tested monotonically. The third group was tested cyclicallyat room temperature. The following conclusions were made from the study:
• A qualitative assessment of the electrical data from a CNFA embedded in a cylinder canshow when loading began on the cylinder, a strain of approximately 0.001, and failure.
150
100
50
00 200 400 600 800 1000
0 200 400 600 800 1000
0 200 400 600 800 1000
Time (s)
0.25
1.000
0.500
0.000
–0.500
–1.000
0.15
0.05
0.2
0.1
0
Forc
e (k
N)
Def
lect
ion
(mm
)ER
V
Figure 2.34 Beam force, displacement, and ERV of CNFA A versus time.
Development of carbon nanofiber aggregate for concrete strain monitoring 41

• Although the raw ERV values have a large coefficient of variation from the mean ERVvalues, a calibration factor can be applied to the ERV value to obtain a reasonable coefficientof variation. A model was developed to estimate the ERV-versus-strain relationship.
• Frozen cylinders are brittle. The ERV-versus-strain behavior is similar to the stress-versus-strain behavior in the lack of strain softening for frozen cylinders.
• Qualitatively, cyclic stress and strain can be assessed from the ERV-versus-time relationship.The peaks and valleys of all three relationships coincide during cyclic loading. A model wasdeveloped to estimate the cyclic ERV-versus-strain relationship.
A small-scale reinforced concrete beam with six embedded CNFAs was testedmonotonically using the four-point bending method. The following conclusionswere made from the study:
• CNFAs behave differently if they are tested in tension rather than compression. This was ex-pected because concrete is not isotropic.
• CNFAs are capable of detecting localized catastrophic damage in reinforced concretestructures.
Many past researchers have shown that cement-based materials containing CNF arecapable of qualitative strain and damage monitoring. These test results show thatCNFAs are not only capable of qualitative monitoring but also on the brink of quan-titative monitoring. Factors such as improved CNFA construction techniques, imple-menting a correlation factor based on more test results, and determining therelationship between ERV and temperature should reduce the ERV variation to areasonable level for CNFA monitoring applications in industrial projects.
Acknowledgments
This chapter is based on research that Dr R. Howser Roberts conducted as a doctoral candidate atthe University of Houston.
References
ACI Committee 318, 2011. Building Code Requirements for Structural Concrete. AmericanConcrete Institute, Farmington Hills, Michigan.
ACI Committee 544, 1996. State-of-the-Art Report on Fiber Reinforced Concrete Reported byACI Committee 544. American Concrete Institute, Farmington Hills, Michigan.
Bartos, P., 2006. Nanotechnology in construction: a roadmap for development. In: Nanotech-nology of Concrete: Recent Developments and Future Perspective. American ConcreteInstitute, Denver, CO, pp. 1e14.
Baughman, R.H., Cui, C.X., Zakhidov, A.A., Iqbal, Z., Barisci, J.N., Spinks, G.M.,Wallace, G.G., Mazzoldi, A., de Rossi, D., Rinzler, A.G., Jaschinski, O., Roth, S.,Kertesz, M., 1999. Carbon nanotube actuators. Science 284, 1340e1344.
Baughman, R.H., Zakhidov, A.A., de Heer, W.A., 2002. Carbon nanotubesethe route towardapplications. Science 297, 787e792.
42 Multifunctional Nanocomposites in Civil and Structural Engineering

Bontea, D.-M., Chung, D.D.L., Lee, G.C., 2000. Damage in carbon fiber-reinforced concrete,monitored by electrical resistance measurement. Cem. Concr. Res. 30, 651e659.
Chen, P.-W., Chung, D.D.L., 1993a. Concrete reinforced with up to 0.2 vol% of short carbonfibres. Composites 24, 33e52.
Chen, P.-W., Chung, D.D.L., 1993b. Carbon fiber reinforced concrete for smart structurescapable of non-destructive flaw detection. Smart Mater. Struct. 2, 22e30.
Chen, P.-W., Chung, D.D.L., 1996. Concrete as a new strain/stress sensor. Compos. Part B Eng.27, 11e23.
Chen, P.-W., Fu, X., Chung, D.D.L., 1997. Microstructural and mechanical effects of latex,methylcellulose, and silica fume on carbon fiber reinforced cement. ACI Mater. J. 94,147e155.
Chung, D.D.L., 1995. Strain sensors based on the electrical resistance change accompanying thereversible pull-out of conducting short fibers in a less conducting matrix. Smart Mater.Struct. 4, 59e61.
Chung, D.D.L., 1998. Composite Material Strain/Stress Sensor. US Pat. 5817944.Chung, D.D.L., 2000. Cement reinforced with short carbon fibers: a multifunctional material.
Compos. Part B Eng. 31, 511e526.Chung, D.D.L., 2005. Dispersion of short fibers in cement. J. Mater. Civ. Eng. 17, 379e383.Coleman, J.N., Khan, U., Blau, W.J., Gun’ko, Y.K., 2006. Small but strong: a review of the
mechanical properties of carbon nanotubeepolymer composites. Carbon N.Y. 44,1624e1652.
Feynman, R., 1960. There’s plenty of room at the bottom. Eng. Sci. 23, 22e36.Gaimster, R., Foord, C., 2000. Self-compacting concrete. Concrete 34, 23e25.Gao, D., Sturm, M., Mo, Y.L., 2009. Electrical resistance of carbon-nanofiber concrete. Smart
Mater. Struct. 18.Hilding, J., Grulke, E.a., George Zhang, Z., Lockwood, F., 2003. Dispersion of carbon nano-
tubes in liquids. J. Disper. Sci. Technol. 24, 1e41.Howser, R.N., Dhonde, H.B., Mo, Y.L., 2011. Self-sensing of carbon nanofiber concrete col-
umns subjected to reversed cyclic loading. Smart Mater. Struct. 20, 085031.Howser, R.N., Mo, Y.L., 2013. Development of carbon nanofiber aggregate. In: Structures
Congress 2013. American Society of Civil Engineers, Pittsburgh, PA, p. 12.Iijima, S., 1991. Helical microtubules of graphitic carbon. Nature 354, 11e14.Kang, I., Heung, Y.Y., Kim, J.H., Lee, J.W., Gollapudi, R., Subramaniam, S.,
Narasimhadevara, S., Hurd, D., Kirikera, G.R., Shanov, V., Schulz, M.J., Shi, D.,Boerio, J., Mall, S., Ruggles-Wren, M., 2006. Introduction to carbon nanotube andnanofiber smart materials. Compos. Part B Eng. 37, 382e394.
Khayat, K.H., Hu, C., Monty, H., 1999. Stability of self-consolidating concrete, advantages, andpotential applications. In: First International RILEM Symposium on Self-CompactingConcrete. Stockholm, Sweden, pp. 143e152.
Konsta-Gdoutos, M.S., Metaxa, Z.S., Shah, S.P., 2010. Multi-scale mechanical and fracturecharacteristics and early-age strain capacity of high performance carbon nanotube/cementnanocomposites. Cem. Concr. Compos. 32, 110e115.
Lentz, A.E., Monfore, G.E., 1966. Thermal of Portland aggregate conductivities cement paste,and concrete down to very low temperatures. J. PCA Res. Dev. Lab. 8, 27e33.
Li, G.Y., Wang, P.M., Zhao, X., 2005. Mechanical behavior and microstructure of cementcomposites incorporating surface-treated multi-walled carbon nanotubes. Carbon N.Y. 43,1239e1245.
Li, G.Y., Wang, P.M., Zhao, X., 2007a. Pressure-sensitive properties and microstructure ofcarbon nanotube reinforced cement composites. Cem. Concr. Compos. 29, 377e382.
Development of carbon nanofiber aggregate for concrete strain monitoring 43

Li, H., Xiao, H., Yuan, J., Ou, J., 2004. Microstructure of cement mortar with nano-particles.Compos. Part B Eng. 35, 185e189.
Li, H., Zhang, M., Ou, J., 2007b. Flexural fatigue performance of concrete containingnano-particles for pavement. Int. J. Fatigue 29, 1292e1301.
Li, V.C., 2002. Large volume, high performance applications of fibers in civil engineering.J. Appl. Polym. Sci. 83, 660e686.
Makar, J., Beaudoin, J., 2004. Carbon nanotubes and their application in the constructionindustry. In: 1st International Symposium on Nanotechnology in Construction. NationalResearch Council Canada, Paisley, Scotland, pp. 331e341.
Makar, J., Margeson, J., Luh, J., 2005. Carbon nanotube/cement compositeseearly results andpotential applications. In: 3rd International Conference on Construction Materials:Performance, Innovations and Structural Implications. National Research Council Canada,Vancouver, British Columbia, Canada, pp. 1e10.
Mondal, P., Shah, S.P., Marks, L., 2007. A reliable technique to determine the local mechanicalproperties at the nanoscale for cementitious materials. Cem. Concr. Res. 37, 1440e1444.
Monfore, G.E., Lentz, A.E., 1962. Physical properties of concrete at very low temperatures.J. PCA Res. Dev. Lab. 4, 33e39.
Narayan, R.J., Kumta, P.N., Sfeir, C., Lee, D.-H., Choi, D., Olton, D., 2004. Nanostructuredceramics in medical devices: applications and prospects. J. Miner. Met. Mater. Soc. 56,38e43.
Okamura, H., Ozawa, K., 1995. Mix-design for self-compacting concrete. Concr. Libr. Jpn. Soc.Civil Eng. 25, 107e120.
PCI TR-6-03, 2003. Interim Guidelines for the Use of Self-Consolidating Concrete in Precast/Prestressed Concrete Institute Member Plants. Precast/Prestressed Concrete Institute,Chicago.
Roco, M., 2007. National nanotechnology initiative-past, present, future. In: Handbook onNanoscience, Engineering and Technology. CRC Press, Boco Raton, FL, pp. 3.1e3.26.
Salvetat, J.-P., Bonard, J.-M., Thomson, N.H., Kulik, A.J., Forr�o, L., Benoit, W., Zuppiroli, L.,1999. Mechanical properties of carbon nanotubes. Appl. Phys. A Mater. Sci. Process. 69,255e260.
Sanchez, F., Sobolev, K., 2010. Nanotechnology in concrete e a review. Constr. Build. Mater.24, 2060e2071.
Schmidt, M., Lipson, H., 2009. Distilling free-form natural laws. Science 324, 81e85.Shah, S.P., Naaman, A.E., 1976. Mechanical properties of glass and steel fiber reinforced
mortar. ACI J. Proc. 73, 50e53.Tanaka, K., Sato, K., Watanabe, S., Arima, I., Suenaga, K., 1993. Development and utilization
of high-performance concrete for the construction of the Akashi Kaikyo bridge. ACI Spec.Publ. 140 (140), 25e52.
Thess, A., Lee, R., Nikolaev, P., Dai, H., Petit, P., Robert, J., Xu, C., Lee, Y.H., Kim, S.G.,Rinzler, A.G., Colbert, D.T., Scuseria, G.E., Tomanek, D., Fischer, J.E., Smalley, R.E.,1996. Crystalline ropes of metallic carbon nanotubes. Science 273, 483e487.
Timoshenko, S., 1953. History of Strength of Materials. McGraw-Hill, New York.Tzeng, Y., Huang, T., Chen, Y., Liu, C., Liu, Y., 2004. Hydration properties of carbon nano-
tubes and their effects on electrical and biosensor applications. New Diam. Front. CarbonTechnol. 14, 193e201.
Wei, B.Q., Vajtai, R., Ajayan, P.M., 2001. Reliability and current carrying capacity of carbonnanotubes. Appl. Phys. Lett. 79, 1172.
44 Multifunctional Nanocomposites in Civil and Structural Engineering

Woo, L.Y., Wansom, S., Ozyurt, N., Mu, B., Shah, S.P., Mason, T.O., 2005. Characterizingfiber dispersion in cement composites using AC-Impedance Spectroscopy. Cem. Concr.Compos. 27, 627e636.
Yang, X., Chung, D.D.L., 1992. Latex-modified cement mortar reinforced by short carbon fi-bres. Composites 23, 453e460.
Yu, X., Kwon, E., 2012. Carbon Nanotube Based Self-sensing Concrete for Pavement StructuralHealth Monitoring. Washington, DC. http://ntl.bts.gov/lib/45000/45000/45066/3789.pdf.
Development of carbon nanofiber aggregate for concrete strain monitoring 45

Carbon nanofibers in cementcomposites: mechanicalreinforcement
3Nur Yazdani, Ellie BrownUniversity of Texas at Arlington, Arlington, Texas, USA
3.1 Introduction
Carbon nanofibers (CNFs) are defined as cylindrical nanostructures with graphenelayers constructed in the shape of cups, cones, or plates, with an average diameterof 70e200 nm and an average length of 50e200 mm (Yazdani and Mohanam,2014). Even though CNFs got their start within the field of physical chemistry, theynow have a wide range of applications and have received increased attention in recentyears in multiple disciplines within engineering and materials science (Hammel et al.,2004), medicine (Tran et al., 2009), geochemistry (Moura and Lago, 2009), energyresearch, electronics, and others. Currently, CNF is used in various applications withinthese disciplines. They can be constructed by various methods, such as thevapor-grown carbon nanofiber (VGCF) or the floating-catalyst process, and most oftencome in a powdered form (Figures 3.1 and 3.2).
The history of CNF can be traced back to over a century ago. CNF was first patentedin 1889 as carbon filaments grown from gases containing carbon, and then for the nexthalf century, their existence was considered a detriment to chemical research becauseof their capability to block reactors and deactivate catalysts in FishereTropsch synthe-sis and steam reforming processes, among others (Zhu et al., 2005). This negative
Figure 3.1 CNF in powdered form and a scanning electron microscopy image of CNF at 3 mm.Pyrograf.
Innovative Developments of Advanced Multifunctional Nanocomposites in Civil and Structural Engineeringhttp://dx.doi.org/10.1016/B978-1-78242-326-3.00003-8Copyright © 2016 Elsevier Ltd. All rights reserved.

association tied to these carbon filaments was what ultimately led to their characteriza-tion, for researchers wanted to find ways to inhibit their formation (De Jong and Geus,2000). This characterization has proved useful, because modern studies of CNF havebeen based on this early research.
CNF research came into the limelight in 1950 when the electron microscopebecame popular in analyzing specimens at the nanoscale level (Hughes and Chambers,1889). In 1970, Japanese researchers manufactured VGCFs with a diameter of 1 mmand a length greater than 1 mm (Koyama and Endo, 1973).
3.2 General properties
CNFs have high electrical conductivity, high thermal conductivity, and favorablechemical properties. CNFs possess exceptional mechanical properties, such as theelastic modulus, which can be as high as 600 GPa, and the tensile strength, whichcan be as high as 8.7 GPa. Basic physical properties of CNFs are presented inTable 3.1. Figure 3.3 shows the basic physical structure of CNFs. The core of the
Furnace
Fibers
Exhaust
1100 °C
Mullite tube
CH4NH3
Fe(CO)5
Air
H2S
Figure 3.2 Method for synthesizing VCGFs.Tibbetts et al. (2007).
Table 3.1 Properties of CNF-PR-24-XT-LHT
Fiber diameter, nm (average) 100
Fiber length, mm (average) 50e200
CVD carbon overcoat present on fiber No
Surface area, m2/g 43
Dispersive surface energy, mJ/m2 155
Moisture, wt% <5
Iron, ppm <14,000
Pyrograf.
48 Multifunctional Nanocomposites in Civil and Structural Engineering

nanofiber is hollow and is surrounded by a cylindrical fiber grown from a catalyst par-ticle. The fiber is composed of graphite basal planes stacked 25� from the longitudinalaxis of the fiber (Tibbetts et al., 2007).
CNFs are also highly adsorptive for organic materials (Morgan, 2005) and can with-stand temperatures up to 3000 �C due to their superior electrical properties. This makesthem excellent conductors of electricity as well as shielders of sources of electromag-netism. The conductivity values for VGCF composites are high, so they provide sig-nificant protection from electromagnetic interference. Reported values are a 45 dbshielding effectiveness at 200 MHz for 15 wt% heat-treated VGCFs in a vinyl estermatrix, with large differences found with varying composite preparation techniques(Figure 3.4) (Tibbetts et al., 2007). Approximate resistivity values required for staticdischarge, electrostatic painting, and radiofrequency interference shielding are indi-cated in Figure 3.4. Data from three different types of fibers are plotted and comparedto a superposition model for graphitized and as-grown fibers.
CNFs also have good dampening abilities. Composites with CNFs show an increasein dynamic modulus along with a decrease in damping losses associated with a 1e5%by weight inclusion of CNFs. As the material softens at around 100 �C, the dampingincreases with temperature, which is attributed to the enhanced thermal conductivity ofthe composites (Tibbetts et al., 2007).
3.3 Application in cement composites
The utilization of CNF in cement composites began in the 1990s, when carbon fiberswere first introduced in cement mortar (Chen and Chung, 1993). The amount of carbonfiber used for the study was 0.2% by weight of cement. This research produced a com-posite with increases of 85% in flexural strength, 205% in flexural toughness, and 22%in compressive strength, respectively.
Catalytic layer
Hollow core
CVD layer
Figure 3.3 Vapor-grown CNF.Pyrograf III.
Carbon nanofibers in cement composites: mechanical reinforcement 49

Chung (2000) presented research on cementematrix structural composites forsmart structures. The functions that were addressed were strain sensing, damagesensing, temperature sensing, vibration reduction, and electromagnetic radiationreflection, among others. The study revealed increased flexural strength and flexuraltoughness, improved impact resistance, reduced drying shrinkage, and enhancedfreezeethaw durability, as compared to composites without these structures. Fouryears later, Li et al. (2004) presented work on the microstructure of cement mortarwith nanoparticles. The compressive strength and flexural strength of the cementmortar with nanoparticles were higher than in plain cement paste. The scanning elec-tron microscopy images from this work suggested that the nanoparticles were not sim-ply acting as filler, but also as an activator to promote hydration (Figure 3.5).
Chung (2005) investigated the dispersion of CNFs in cement, which led to a majorbreakthrough in the usage of carbon fibers in cement paste. The dispersion of fibers wasdetermined by measuring the electrical resistivity of the cement, which is inversely pro-portional to the dispersion of fibers. This research concluded that the usage of silicafume (15% by weight of cement) and methyl cellulose (4% by weight of cement)caused lesser electrical resistivity and a higher tensile strength than in plain mortar.
A few years later, Li et al. (2006) studied the abrasive resistance of concrete con-taining nanoparticles. They found that the abrasive resistance of concrete wasimproved significantly by the addition of nanoparticles. The compressive strength
14
Static discharge
Electrostatic painting
“Clean” as-grown
“Best shot” graphitized
Long graphitized
Theory-graphitized
RFI
Theory-as-grown
12
10
8
6
4
2
0
–2
–40 5 10
Fiber volume fraction (%)
Log
(res
istiv
ity) (
Ohm
cm
)
15 20 25
Figure 3.4 Resistivity of VGCF composites.Tibbetts et al. (2007).
50 Multifunctional Nanocomposites in Civil and Structural Engineering

and flexural strength were also improved when the nanoparticles and the fiber contentwere 1% of the cement weight. These properties had a linear relationship, as depictedin Figure 3.6. This relationship was expressed by:
Ia ¼ fcuq1 fcu þ q2
where:
Ia is the index of abrasion resistance of concrete,fcu is the compressive strength, andq1 and q2 are constants that can be obtained by curve-fitting techniques.
In 2007, another study on the flexural fatigue performance of concrete with nano-particles indicated that concrete containing 1% of nanoTiO2 by the mass of cement hadthe best flexural fatigue strength (Li et al., 2007). Gao et al. (2009) performed testingon the mechanical and electrical properties of self-consolidating concrete with CNFs.The concrete containing 1% CNFs produced the best performance in terms ofcompressive strength as well as electrical resistivity.
Concrete and cement composite materials normally have to be reinforced with bars,rods, or steeleplastic fibers in order to compensate for their relative lack of tensilestrength. The introduction of CNFs in these materials has gained popularity in recent
Figure 3.5 Mixture with the highest flexural strength.Li et al. (2004).
Carbon nanofibers in cement composites: mechanical reinforcement 51

years due to their excellent mechanical properties. The strength of concrete is based oncertain factors, such as waterecement (w/c) ratio, size of pores in the cement, bindingbetween the aggregate and the cement, and micro cracking in the cement, amongothers. Introduction of CNFs in the cementitious materials provides extraordinarystrength increase, and controls cracks and forms bridge mechanisms within the cementmatrix at the nanoscale level (Mohanam, 2012).
CNFs are now cheaper and more easily available as compared to the early 2000s.Short fibers were used earlier as an admixture for reducing drying shrinkage, to increaseflexural toughness, and also to increase flexural strength. Introduction of CNFs incement-based materials was not initially successful because of the high aspect ratio,which ranges from 250 to 2000. If the aspect ratio is high, the dispersion of CNFs isdifficult due to van der Waals interactions, which tend to agglomerate them in bundles(Mohanam, 2012).
A research study in 2012 was conducted on the compressive strength of CNFcement composites at different w/c ratios and at 0.1% and 0.2% CNF ratios with superplasticizer (SP). The parameters were based on findings from a previous study (Manzurand Yazdani, 2010). A surfactant (plasticizer) was used at a 0.008 ratio to cement to geta homogeneous dispersion of CNFs in water. The CNFs were sonicated for 15 minusing a tip horn type sonicator with 12 mm size and an amplitude of 120 mm. The son-ication was done in 30 s cycle intervals to prevent overheating of the suspensions. TheASTM C109 test procedure was used to determine the compressive strength using50 mm cubes (ASTM, 2013a). The mortar consisted of 1 part of cement and 2.75 partsof graded sand. After sonication, the nanoparticles were mixed with cement and sandfor 4 min. After mixing, the mortar was placed in molds, demolded after 24 h, and
4.5
4.0
3.5
3.0
2.5
2.0
1.5
1.058 60 62
Surface index of abrasion resistance
r2 = 0.9876
r2 = 0.9929
Side index of abrasion resistance
64Compressive strength (MPa)
Inde
x of
abr
asio
n re
sist
ance
66 68 70 72
Figure 3.6 Abrasion resistance index of concrete with nanoparticles as a function ofcompressive strength.Li et al. (2006).
52 Multifunctional Nanocomposites in Civil and Structural Engineering

stored in a lime-saturated water tank. The samples were loaded to failure in a universaltesting machine at 7, 14, and 28 days of age. The loading rate was 890e1800 N/sec.The ASTM C348 test procedure was used to evaluate the flexural strength of themortar using a sample size of 40 � 40 � 160 mm (ASTM, 2014) and the same mixingtechnique. A three-point loading setup was used with a loading rate of 2640 þ 110 N.
The dosage rate of 0.1% CNF composites showed very high strength after 7 daysbecause CNF accelerates the hydration process (Figure 3.7). The w/c ratio of 0.4 dis-played maximum strength of 40 MPa and the w/c ratio of 0.50 yielded minimumstrength of 25 MPa at 7 days. Even at 28 days, the w/c ratio of 0.4 produced superiorstrength of 52 MPa. A w/c ratio of 0.4 achieved significant strength gain at all testedages compared to the other CNF composites. This mix proportion was found to be theoptimal combination for 0.1% CNF composites.
CNF cement composites of 0.2% ratio gave high early strength at 7 days comparedto 0.1% composites. The w/c ratio of 0.35 produced superior strength at 7, 14 and28 days. Maximum compressive strength of 54 MPa was observed for 0.2% CNFcomposites with a w/c ratio of 0.35 at 28 days, which was the maximum of all theCNF composites. When the dosage rate is high, CNF composites perform betterwith lower w/c ratios. However, the difficulty in having lower w/c ratios is the work-ability issue. At a lower w/c ratio, the agglomeration of the CNF was significant andthe mixing process more difficult. The workability was only qualitatively ascertainedin this study. Therefore, the optimum w/c ratio that gives maximum strength with goodworkability is the key for producing superior CNF cement composites. CNF compos-ites with a w/c ratio of 0.45 also achieved the highest strength gain as well as superiorworkability (Mohanam, 2012).
0
10
20
30
40
50
60
7 14 28
Com
pres
sive
str
engt
h (M
Pa)
Days
0.35 W/C controlmix0.1% CNF 0.35W/C + 0.008 SP0.40 W/C controlmix0.1% CNF 0.40W/C + 0.008 SP0.45 W/C controlmix0.1% CNF 0.45W/C + 0.008 SP0.50 W/C controlmix0.1% CNF 0.50W/C + 0.008 SP
Figure 3.7 Compressive strength of 0.1% CNF composites versus control samples.Mohanam (2012).
Carbon nanofibers in cement composites: mechanical reinforcement 53

The addition of CNF also caused an increase in flexural strength. The w/c ratio of0.45 yielded the maximum flexural strength for 0.1% CNF composites at both 7 and28 days. Again, the CNF composite exhibited high early strength due to an earlyhydration process. The flexural strength of 0.2% CNF composites at a w/c ratio of0.35 produced maximum strength at 7 days, whereas a w/c ratio of 0.45 gave higheststrength at 28 days (Figure 3.8). A maximum flexural strength of 9.7 MPa was ob-tained for 0.2% CNF composites, the highest of both dosage rates of CNFcomposites.
In the same study (Mohanam, 2012), the ASTM C1437 test procedure was used tocalculate the flow of the mortar (ASTM, 2013b). The flow value is an indicator of theworkability and ease of placement of cement mortars. The compressive strength ofCNF composites decreased in general with increasing flow values for both 0.1%and 0.2% mixing ratios. This pattern indicated that the CNF mortar with highercompressive strengths would be relatively more difficult to work with in the field.The bleeding tendency was evaluated using the ASTM C940 test procedure(ASTM, 2010), and the ASTM C807 test procedure was used to determine the settingtime of CNF composites using the vicat apparatus (ASTM, 2013c). None of the testedsamples exhibited any bleeding. The CNF composites set about 25 min faster onaverage than the plain-mortar control samples. CNF accelerates the mortar hydrationprocess, resulting in faster setting times.
3.4 Challenges
One of the major difficulties in the application of CNFs both within concrete compos-ites and in other materials is the tendency of CNFs and other nanomaterials to groupand entangle, attracting each other to form either bundles or ropes due to van der Waals
Flex
ural
str
engt
h (M
Pa)
12
10
8
6
4
2
07 28
Days
0.35 W/C controlmix0.2% CNT + 0.35 W/C+ 0.008 SP0.40 W/C controlmix0.2% CNT + 0.40 W/C+ 0.008 SP0.45 W/C controlmix0.2% CNT + 0.45 W/C+ 0.008 SP0.50 W/C controlmix0.2% CNT + 0.50 W/C+ 0.008 SP
Figure 3.8 Flexural strength of 0.2% CNT cement composites versus control samples.Mohanam (2012).
54 Multifunctional Nanocomposites in Civil and Structural Engineering

force (Figure 3.9). Ultrasonication, a method used to disperse the nanoparticles, is agood potential solution for this, but it needs further research (Mohanam, 2012).High-energy mixing machines have also been used in an attempt to further dispersenanoparticles of all kinds (Vera-Agullo et al., 2009).
Another research emphasis should be on the grain size of cement used in mixtureswith CNFs. CNFs do uniformly disperse in water with the help of a sonicator, but theyre-agglomerate when they are mixed with cement. To eradicate this difficulty, microcement could be used in place of ordinary cement (Mohanam, 2012).
CNFs also have a tendency to adsorb large amounts of water due to their high sur-face area. Since a major goal of applying CNFs in concrete materials is to reduce thecost and environmental impact of construction materials, this is an issue that will needto be addressed (Vera-Agullo et al., 2009).
(a)
1 µm
5 µm
(b)
Figure 3.9 The clumping tendency of CNFs.Tibbetts et al. (2007)
Carbon nanofibers in cement composites: mechanical reinforcement 55

3.5 The future of CNFs
CNFs have a broad range of potential uses. They have great potential in aviation asablation-resistant rocket motor insulation. Testing has determined that CNFs improvethe ablation resistance of multiple types of polymers due to their resistance to erosionand charring (Tibbetts et al., 2007). In order for this to be broadly applicable, the prob-lem of CNFs amalgamating must first be solved, as this will lower polymers’ mechan-ical properties, thermal resistivity, and retardation to fire. Aviation also has a need forconductive adhesives for the purpose of controlling and dissipating the buildup of elec-trostatic charges at key joints. Traditional electrically conductive composite adhesivesgenerally include silver or nickel, or other forms of carbon, but the issue with thesematerials is that these additives weaken the mechanical properties and bonding capa-bility of the adhesives. Because some CNFs have high electrical conductivity, recentefforts have been made to investigate how they could be incorporated into aeronauticaladhesives. CNFs also show promise in this field as good electromagnetic shields.When the CNFs were coated in nickel, they not only increased adhesion but alsocreated a highly effective electromagnetic interference shield over a large bandwidth(Figure 3.10) (Baur and Silverman, 2007).
The future of CNFs is bright for other industries as well. One of the most excitingadvances in medicine is the application of CNFs in supporting neural regeneration bydesigning an electrically conductive “scaffold” that would be able to hold bioactive ma-terials in order to support growth of neurons. Research has shown that neurons grownon CNFs coated in bioactive molecules have increased length and increased number ofneurite branches when compared to nanostructures that do not have the bioactivecoating. This would be beneficial for patients with diseases such as Parkinson’s,epilepsy, or mental illness (Tran et al., 2009). In geochemistry, CNFs have potentialas absorbents that have shown to be able to remove oil slicks on water (Figure 3.11)(Moura and Lago, 2009). Recent research in this field has also discovered that lava
1009080706050403020100
0 2 4 6 8Frequency (GHz)
Nanostrand spray paint
Nanostrand veil
Nanostrand veilBroad frequency test of ~100-µm-thick veil
20 vol% in epoxy matrix
High-frequency test of ~100-µm-thick veil15 vol% in epoxy matrix
Low-frequency test of two ~150-µm-thick layersEach layer 10 vol% nanostrands
Note increasing protection as frequency decreasesShi
eldi
ng e
ffect
iven
ess
(dB
)
10 12 14 16
Figure 3.10 Summary of shielding effectiveness for composites with nickel coating and anepoxy-infused nickel nanostrand veil of two different thicknesses.Baur and Silverman (2007).
56 Multifunctional Nanocomposites in Civil and Structural Engineering

has the ability to be a catalyst in the production of CNFs and carbon nanotubes, andsuggests that they may be a naturally occurring allotrope of carbon (Mracek et al.,2011). Further understanding of this phenomenon could lead to a greater understandingof these structures, their role in the genesis of geomaterials, and their potential uses incement composites.
References
American Society for Standard Testing and Materials (ASTM), 2010. Standard Test Method forExpansion and Bleeding of Freshly Mixed Grouts for Preplaced-aggregate Concrete in theLaboratory. ASTM C 940-10.
American Society for Testing and Materials (ASTM), 2013a. Standard Test Method forCompressive Strength of Hydraulic-Cement Mortars. ASTM C 109-13.
American Society for Standard Testing and Materials (ASTM), 2013b. Standard Test Methodfor Flow of Hydraulic Cement Mortar. ASTM C 1437-13.
American Society for Standard Testing andMaterials (ASTM), 2013c. Standard Test Method forTime of Setting of Hydraulic Cement Mortar by Modified Vicat Needle. ASTM C 807-13.
American Society for Standard Testing and Materials (ASTM), 2014. Standard Test Method forFlexural Strength of Hydraulic-cement Mortars. ASTM C 348-14.
Baur, J., Silverman, E., 2007. Challenges and opportunities in multifunctional nanocompositestructures for aerospace applications. MRS Bulletin 32, 328e334.
4.5WaterSoybeanMineral oilDiesel
Mod
ified
EV
Mod
ified
EV
4.0
3.5
3.0
2.5
2.0
1.5
1.0
0.5
g/g
verm
icul
ite
0.0
EV
Fe 1(M)
Fe 2(M)
Fe 1Mo 0.1
5
Fe 2Mo 0.3
0
Macha
do et
al.
(2006
)
Martins
(200
6)
Figure 3.11 Absorption of water and spilled oils by the hydrophobic vermiculite-nanostructuredcarbon composites and two other modified expanded vermiculite absorbents.Moura and Lago (2009).
Carbon nanofibers in cement composites: mechanical reinforcement 57

Chen, P.W., Chung, D.D.D.L., 1993. Concrete reinforced with up to 0.2 vol% of short carbonfibers. Composites 24 (1), 33e52.
Chung, D.D.L., 2000. Cement-matrix composites for smart structures. Smart Materials andStructures 9, 389e401.
Chung, D.D., 2005. Dispersion of short fibers in cement. Journal of Materials in Civil Engi-neering 17 (4), 379e383.
De Jong, K.P., Geus, J.W., 2000. Carbon nanofibers: catalytic synthesis and applications.Catalysis Reviews Science and Engineering 42 (4), 481e510.
Gao, D., Sturm, M., Mo, Y.L., 2009. Electrical resistance of carbon nanofiber concrete. SmartMaterials and Structures 18 (9), 095039.
Hammel, E., Tang, X., Trampert, M., Schmitt, T.T., Mauthner, K., Eder, A., Potschke, P., 2004.Carbon nanofibers for composite applications. Carbon 42 (5e6), 1153e1158.
Hughes, T.V., Chambers, C.R., 1889. Manufacture of Carbon Filaments. US Patent No. 405, 480.Koyama, T., Endo, M., 1973. Structure and growth process of vapor-grown carbon fibers. Oyo
Butsuri (Japan) 42, 690e696.Li, H., Xiao, H.G., Yuan, J., Ou, J., 2004. Microstructure of cement mortar with nano-particles.
Composites Part B: Engineering 35 (2), 185e189.Li, H., Zhang, M.H., Ou, J.P., 2006. Abrasion resistance of concrete containing nano-particles
for pavement. Wear 260 (11e12), 1262e1266.Li, H., Zhang, M.H., Ou, J.P., 2007. Flexural fatigue performance of concrete containing
nano-particles for pavement. International Journal of Fatigue 29 (7), 1292e1301.Machado, L.C.R., Lima, F.W.J., Paniago, R., 2006. Polymer coated vermiculite-iron compos-
ites: novel floatable magnetic adsorbents for water spilled contaminants. Applied ClayScience 31, 207e215.
Manzur, T., Yazdani, N., 2010. Strength enhancement of cement mortar with carbon nanotubes:early results and potential. Journal of Transportation Research Records 2 (2142), 102e108.
Martins, J., 2006. Upgraded Process for the Production of Hydrophobized Expanded Vermic-ulite Application thereof, Patent WO. 2006017919.
Mohanam, V., 2012. Comparative Application of Two Nanoparticles in Cement Mortar.University of Texas at Arlington (Thesis).
Morgan, P., 2005. Carbon fibers and their composites. CRC, 27(2005).Moura, F.C.C., Lago, R.M., 2009. Catalytic growth of carbon nanotubes and nanofibers on
vermiculite to produce floatable hydrophobic “nanosponges” for oil spill remediation.Applied Catalysis B-Environmental 90 (3e4), 436e440.
Mracek, J., Randall, D.F., Stengelin, R.M., Hesjedal, T., 2011. Are carbon nanotubes a naturallyoccurring material? hints from methane CVD using lava as a catalyst. Current Nanoscience7 (3), 294e296.
Tibbetts, G.G., Lake, M.L., Strong, K.L., Rice, B.P., 2007. A review of the fabrication andproperties of vapor-grown carbon nanofiber/polymer composites. Composites Science andTechnology 67 (7e8), 1709e1718.
Tran, P.A., Zhang, L., Webster, T.J., 2009. Carbon nanofibers and carbon nanotubes inregenerative medicine. Advanced Drug Delivery Reviews 61 (12), 1097e1114.
Vera-Agullo, J., Chozas-Ligero, V., Portillo-Rico, D., García-Casas,M.J.J., Gutiérrez-Martínez, A.,Mieres-Royo, J.M., Gr�avalos-Moreno, J., 2009. Mortar and concrete reinforced with nano-materials. Book Nanotechnology in Construction 3, 383e388.
Yazdani, N., Mohanam, V., 2014. Carbon nano-tube and nano-fiber in cement mortar: effect ofage and dosage rate. International Journal of Material Science 4 (2), 45e52.
Zhu, Y.A., Sui, Z.J., Zhao, T.J., Dai, Y.C., Cheng, Z.M., Yuan, W.K., 2005. Modeling offishbone-type carbon nanofibers: a theoretical study. Carbon 43 (8), 1694e1699.
58 Multifunctional Nanocomposites in Civil and Structural Engineering

Self-sensing of nano-carbon blackconcrete 4Huigang Xiao 1,2, Hui Li 1,2, Jinping Ou 1,2,3
1Key Lab of Structures Dynamic Behavior and Control (Harbin Institute of Technology),Ministry of Education, Harbin, China; 2School of Civil Engineering, Harbin Institute ofTechnology, Harbin, China; 3School of Civil and Hydraulic Engineering, Dalian Universityof Technology, Dalian, China
4.1 Introduction
Civil infrastructures usually suffer from fatigue load, environmental corrosion, and/ornatural disasters. To improve the safety of infrastructures, structural health monitoring(SHM) is becoming more and more important. SHM is normally performed bymeasuring the strain/stress of a structure’s critical zone with sensors; the health of thestructure can be evaluated based on the measured information, which can be usedwhen deciding whether or not to repair the structure (Scott et al., 1996). Traditionalstrain sensors (such as optical fiber sensors, electrical resistance strain gauges, and piezo-electric ceramics) have been widely used in SHM (Chen, 1995; Li et al., 2006; Austinet al., 1999; Claus et al., 1988). However, the cost and durability of traditional sensors,and the comparability between traditional sensors and concrete, are limited, motivatingus to develop a new generation of sensors that is more preferable for concrete structures.
The recently developed, multifunctional, nanomaterials-enabled concrete providesan efficient way to improve the safety of concrete structures. By incorporating someconductive nanomaterials (such as carbon nanofiber or carbon black) with concrete,the concrete can be conductive and piezoresistive (Li et al., 2006; Xiao et al.,2011a), which is so-called smart concrete. Smart concrete is a new generation of struc-ture materials that developed from carbon fiber reinforced concrete (CFRC) in the2000s and 2010s by utilizing the piezoresistivity for sensing strain (Wen and Chung,2001; Reza et al., 2003; Song et al., 2006; Han and Ou, 2007; Ou and Han, 2009; Yuand Kwon, 2009) or by utilizing the relation between damage and resistance forsensing damage (Chen and Liu, 2008; Wang et al., 1998). To improve the applicationof smart concrete in health monitoring, some approaches such as using smart concreteas surface coating (Wen and Chung, 2001) or as structural materials (Song et al., 2006;Chen and Liu, 2008) have been proposed. Recently, an advanced application approachthat uses smart concrete as an embedded strain sensor was proposed. In this approach,a standard cubic strain sensor was fabricated with smart concrete (Han and Ou, 2007;Ou and Han, 2009). The CBCC-based strain sensor is just this kind of embeddedcement-based sensor (Xiao and Li, 2006). The strain-sensing property, humidity insu-lation method, and piezoresistive model of CBCC-based strain sensor have been
Innovative Developments of Advanced Multifunctional Nanocomposites in Civil and Structural Engineeringhttp://dx.doi.org/10.1016/B978-1-78242-326-3.00004-XCopyright © 2016 Elsevier Ltd. All rights reserved.

studied to promote the application of CBCC-based strain sensors (Xiao et al., 2011b,2010; Li et al., 2008).
4.2 Piezoresistivity of nano-carbon black concrete
4.2.1 Materials and test methods
Carbon black (CB) of 120 nm came from Liaoning Tianbao Energy Co., Ltd (Liaoning,China). The specific gravity of CB was 1.98 g/cm3. CB in the amount of 5%, 10%, 12%,15%, 20%, and 25% by weight of cement (i.e., 3.11%, 6.04%, 7.22%, 8.79%, 11.39%,and 13.85% by volume of composite, respectively) was used, and the correspondingmixture types were called A-5, A-10, A-12, A-15, A-20, and A-25, respectively. Thecement used was Portland cement (P.O42.5) from Harbin Cement Company (Harbin,China). The waterecement ratio was 0.4 for all specimens. A water-reducing agent,UNF (one kind of naphthalene sulfonic acid and formaldehyde condensates), wasused in the amount of 1.5% by weight of cement. The water-reducing agent couldincrease the dispersion of CB particles and facilitate the workability of the mixture. Thedefoamer, tributyl phosphate (made in China), was used in the amount of 0.13 vol% todecrease the number of air bubbles.
Defoamer and UNF water-reducing agent were dissolved in water, then CB wasadded and stirred at high speed in a mortar mixer for 3 min. This mixture and thecement were mixed at high speed for 2 min. After this, the mix was poured into oiledmolds to form prisms of 30 � 40 � 50 mm for compressive testing. After pouring, anexternal vibrator was used to facilitate compaction and decrease the number of air bub-bles. The samples were demolded after 24 h and then cured in a moist room (relativehumidity 100%) for 28 days. Afterward, the specimens were dried in an oven at 60 �Cfor 2 days to extract redundant water to eliminate the polarization effect on resistancemeasurement. The dried specimens were then tested at ambient temperature.
DC electrical resistance measurement was made in the longitudinal axis, using thefour-probe method, in which copper nets served as electrical contacts. The copper netswere placed into the specimen when pouring the mix into molds. Four contacts wereplaced across the whole cross-section of 30 � 40 mm of the specimen; these were allperpendicular to the longitudinal axis and symmetrically positioned with respect to themidpoint along the height of the specimen (i.e., two contacts were in planes above themidpoint, and two contacts were in planes below the midpoint). The outer two contacts(36 mm apart) were for passing current. The inner two contacts (20 mm apart) were formeasuring the voltage (see Figure 4.1).
A DC circuit developed by Han (Han et al., 2007) was used to measure the resis-tance of the specimen as follows:
Ri ¼ Ui$Rr=Ur; (4.1)
where: Rr is the standard reference resistor,Ur is the voltage applied on the referenceresistor, and Ui and Ri are the voltage and resistance between the two inner contacts ofthe specimen, respectively; Ui and Ur were collected using the data acquisition board.
60 Multifunctional Nanocomposites in Civil and Structural Engineering

Compressive testing was performed on a 30 � 40 mm side of each specimen. Thestrain was measured by using strain gauges attached to the middle of the opposite sidesof a specimen and parallel to the stress axis. Compressive testing under force controlwas conducted using a hydraulic mechanical testing system with 120 kN maximumloading capacity. The scheme of monotonically static loading up to specimen failurewas arranged. During the loading process, DC electrical resistance measurementwas simultaneously made in the stress axis, using the four-probe method as describedin this chapter. Three specimens of each type of mixture were tested.
4.2.2 Piezoresistivity of CBCC under monotonicand cycle loading
Figure 4.2 shows the resistivity (r) as a function of CB volume content (V) of CB-filledcomposites. It can be observed from Figure 4.2 that the resistivity of the composites
Load
30
50 36 20
40
Dataacquisition
system
Inner contactOuter contact
Strain gauge
Ui Ur Rr
U
Figure 4.1 Schematic of the experimental setup (mm).
2 4 6 8 10 12 14
102
103
104
Res
istiv
ity (Ω
cm
)
Content (vol %)
A-10
A-15
A-20A-25
A-5 A-12
Figure 4.2 Logarithm of resistivity as a function of volume content of CB.
Self-sensing of nano-carbon black concrete 61

decreased dramatically with increasing CB content from 7.22 to 11.39 vol% (i.e., fromA-12 to A-20). The resistivity of the composites varied slightly outside the aboverange. The content range over which the resistivity varied precipitously was calledthe percolation threshold. Therefore, in this study, the percolation threshold zone ofthe composites was CB in the amount of 7.22w11.39 vol%.
According to the tunneling effect theory, the natural logarithm of resistivity of com-posites ln(r) is a linear function of potential barrier width (s) (i.e., the distance betweenCB particles). Furthermore, it is well accepted that distribution of CB particles is randomand the average distance between particles is proportional to V�1/3. Thus, ln(r) is a linearfunction of V�1/3. For clear observation, the V�1/3 and natural logarithm of resistivitywere, respectively, nominated as abscissa and ordinate, and the curve in Figure 4.2was redrawn in Figure 4.3. The curve can be divided into three stages according tothe variation of slope. The curve from 7.22 to 11.39 vol% in Figure 4.3 was just linear,so the tunneling effect dominated the conductivity and electromechanical properties ofthe composites in stage II.
Tunneling current is an exponential function of barrier width, implying a precipi-tous change of resistivity upon distance between CB particles. The distance betweenCB particles is shortened with increasing compressive strain on specimens. As a conse-quence, the resistivity of composites decreases with increasing compressive strain.
4.2.3 Resistivity of CBCC with various contents of CB
Figure 4.4 shows the fractional change in resistivity versus the compressive straincurves of A-15. Additionally, the distance between probes was shortened duringloading, which induced change in electrical resistance. However, it could beobserved from Figure 4.4 that the change in resistance induced by this factor wasvery small and negligible. The resistance was essentially proportional to the volumeresistivity that was selected as a measurement in this study. For A-15, the resistivity
1.8 2.0 2.2 2.4 2.6 2.8 3.0 3.2
e4
e5
e6
e7
e8
e9
Res
istiv
ity (Ω
cm
)
V –1/3
A-5A-10
A-15
A-25 A-20
A-12
Ι
ΙΙΙΙΙ
Figure 4.3 Natural logarithm of resistivity as a function of V�1/3.
62 Multifunctional Nanocomposites in Civil and Structural Engineering

decreased linearly with increasing compressive strain up to failure of the specimensexcept for a small perturbation over the strain range of [0.003e0.004], which indi-cated the occurrence of micro cracks. The three curves for the three specimens ofthis mixture were almost the same, indicating that the results were repeatable. Linearfit of the experimental data showed that the relationship between the fractionalchange in resistivity and compressive strain was nearly linear. The fractional changein resistivity per unit strain (i.e., the strain gauge factor) was 55.28, as shown inFigure 4.4.
Figure 4.5 presents the strainestress curves of A-15. It can be seen from Figure 4.4that the strength of the CB-filled composite could reach more than 40 MPa. Therefore,
0.000 0.001 0.002 0.003 0.004 0.005–0.30
–0.25
–0.20
–0.15
–0.10
–0.05
0.00
Δ/ρρ
0
Compressive strain (ε)
Linear fit of dataY = A + B * XParameter Value ErrorA –0.012 0.004B –55.28 1.94
Figure 4.4 Fractional change in resistivity of A-15 as a function of compressive strain.
0.000 0.001 0.002 0.003 0.004 0.0050
10
20
30
40
50
Com
pres
sive
stre
ss (M
Pa)
Compressive strain (ε)Figure 4.5 Stressestrain curves of A-15.
Self-sensing of nano-carbon black concrete 63

it can be used as a structural material like common concrete. Similar results have beenobtained for other mixtures. In the following text, CBCC denotes the cement-basedcomposites filled with 15% carbon black.
Figure 4.6 shows the piezoresistive behavior of three CBCC sensors under cyclicloading with an amplitude of 10 kN (i.e., the stress ratio, amplitude with respect tothe ultimate strength, is about 0.2). At this cyclic loading, the strain amplitudeswere about 800 mε. CBCC sensors exhibited stable and repeatable strain-sensing abil-ity during the whole cyclic loading process that the gauge factor did not change uponcycle number, and the initial resistances remained constant after each cycle, indicatingthat nearly no damage occurred in this cyclic loading. Figure 4.7 shows the piezoresis-tive behavior of three CBCC sensors under cyclic loading with an amplitude of 35 kN(i.e., the stress ratio, amplitude with respect to the ultimate strength, is about 0.7). Atthis cyclic loading, the strain amplitudes were about 2700 mε. The piezoresistivitycurves of each cycle were similar. However, the initial resistances of CBCC sensorsincreased after each cycle, expressing as the curves shifted upward upon cycle number.The results indicated that damage occurred and gradually accumulated with cyclicloading, because no remarkable time drift of the resistance occurred for the CBCCsensors (Li et al., 2008).
–0.05
–0.04
–0.03
–0.02
–0.01
0.00
ΔR
/R0
Compressive strain
Specimen-1
–0.05
–0.04
–0.03
–0.02
–0.01
0.00
ΔR
/R0
Compressive strain
Specimen-2
0.0000 0.00080.00060.00040.00020.0000 0.00080.00060.00040.0002
–0.05
–0.04
–0.03
–0.02
–0.01
0.00
ΔR
/R0
Compressive strain
Specimen-3
0.0000 0.00080.00060.00040.0002
Figure 4.6 Piezoresistivity of CBCC sensor under cyclic loading with an amplitude of 10 kN.
64 Multifunctional Nanocomposites in Civil and Structural Engineering

4.3 Modeling of piezoresistivity of cement-basedcomposite
According to tunneling effect theory (Simmons, 1963), current density in a tunnelingresistor formed by two adjacent CB particles at a low-voltage region can be depictedby the following equation:
J ¼h3ð2m4Þ1=2�2S0
iðe=hÞ2U$exp
h� ð4pS0=hÞð2m4Þ1=2
i; (4.2)
where: J is current density;m, e, and h are the electron mass, charge on an electron, andPlanck’s constant, respectively; and 4, S0, and U are the height of tunneling potentialbarrier, tunneling width, and voltage applied across the tunneling resistor, respectively.Rt0 denotes the tunneling resistor, and A and S0 denote the section area and length ofthe resistor, respectively. Then, the resistance of the resistor can be obtained as
Rt0 ¼ k1S0 expðk2S0Þ; (4.3)
where: k1 ¼ (2/3)(2m4)�1/2(e/h)�2A�1 and k2 ¼ (4p/h)(2m4)1/2.
–0.150
–0.125
–0.100
–0.075
–0.050
–0.025
0.000
0.025
ΔR
/R0
Compressive strain
Specimen-1
Increasing cycle number
–0.150
–0.125
–0.100
–0.075
–0.050
–0.025
0.000
0.025
ΔR
/R0
Compressive strain
Specimen-2
Increasing cycle number
0.0000 0.00240.00180.00120.00060.0000 0.00240.00180.00120.0006
–0.175
–0.150
–0.125
–0.100
–0.075
–0.050
–0.025
0.000
0.025
ΔR
/R0
Compressive strain
Specimen-3
Increasing cycle number
0.0000 0.0024 0.00300.00180.00120.0006
Figure 4.7 Piezoresistivity of CBCC sensor under cyclic loading with an amplitude of 35 kN.
Self-sensing of nano-carbon black concrete 65

For a given composite, k1 and k2 are constants. S0 can be obtained as follows:
S0 ¼ Dhðp=6Þ1=3V �1=3
c � 1i; (4.4)
where: Vc and D are the volume concentration and diameter of CB particles, respec-tively. Equation (4.2) indicates that even a slight change of S0 may cause a largechange of resistance. Conductive networks in CBCC are composed of a large numberof R0, and the change in resistance of CBCC is the integrated result of the change ofeach Rt0. Therefore, the piezoresistivity model of CBCC will be established based onthe resistance behavior of each Rt0. The resistance of each Rt0 under strain can bequantified with Eqn (4.3); hence, the key task of the modeling is to obtain thedeformation of each Rt0 under external strain.
The microstructure of CBCC was observed with scanning electron microscopy tostudy the characteristics of the conductive network of CBCC. Figure 4.8(a) showsthe microstructure of CBCC, in which the bright spherical objects and roundedhollowness denote CB particles. To see the pattern of conductive networks clearly,CB particles are emphasized in a white background, as shown in Figure 4.8(b). Theconductive path is formed by adjacent CB particles and is presented in Figure 4.8(b)by joining the CB particles. Based on the schematic characteristics of a conductivenetwork, a conductive model is proposed, as shown in Figure 4.8(c). First, Rt0 isconnected in series to form a resistor element R0. Then, R0 forms the conductivenetwork by connections in parallel and then series. It can be easily derived thatthe fractional change of resistance of CBCC is equal to that of R0. Therefore, piezor-esistivity modeling of CBCC is focused on the behavior of R0 under externalloading.
The resistance value of each Rt0 can be calculated based on Eqns (4.2) and (4.3). Theorientation direction of each Rt0 is assumed to be uniformly distributed by consideringthe infinite and randomly distributed CB particles in CBCC. Figure 4.9(a) and (b) showthe schematics of orientation and distribution of a tunnel resistor, respectively. Assume
R0
Rt0
(a) (b) (c)
Figure 4.8 Schematic of conductive network in CBCC. (a) SEM picture, (b) schematic picture,and (c) conductive network model.
66 Multifunctional Nanocomposites in Civil and Structural Engineering

that there are a total of 4 � 3(M þ 1)2 of Rt0 in the space and each 4(M þ 1)2 of Rt0 sur-rounds a coordinator. For example, 4(M þ 1)2 of Rt0 is first defined by qz and 4z, asshown in Figure 4.9(a). Both qz and 4z should be over the range of (0,2p); however,considering the symmetrical characteristic of Rt0 in each quadrant, qz, 4z ˛ [0,p/2] issufficient to represent the orientation character of Rt0 and is adopted in this chapter.Therefore, qz and 4z are in
qz;4z ¼ ½0;p=2M;p=M; 3p=2M;/;p=2ðM � 1Þ;p=2�; (4.5)
where: qx, 4x, and qy, 4y are defined in the same way as qz, 4z. Hence, the resistancebehavior of CBCC can be described by the 3(M þ 1)2 of Rt0. As shown inFigure 4.9(b), the distribution of CB particles defined by the above method is notuniform in space so that the distribution density is higher near each coordinate, but it isuniform in calculating the effect of multiaxial strain on resistance.
When CBCC is load free, the original length of Rt0 is S0, and R0 is the sum of3(M þ 1)2 of Rt0 as
R0 ¼ 3ðM þ 1Þ2k1S0 expðk2S0Þ: (4.6)
Then, assuming that CBCC is subjected to multiaxial strain of εmx, εmy, andεmz in each axis, the corresponding strain of Rt0 in each axis direction can be calcu-lated as
εx;y;z ¼ εmx;my;mz
VcðEm=EcÞ þ Vm; (4.7)
where: Vc and Vm are the ratio of volume occupied by CB and matrix to the wholevolume of composite, respectively; and Ec and Em are the modulus of CB and matrix,
θ
ϕ
0SzS
yS
xS
z
x
y
z
x
y
(a) (b)
Figure 4.9 Schematic of (a) orientation and (b) distribution of Rt0.
Self-sensing of nano-carbon black concrete 67

respectively. The length of Rt0 under multiaxial strain changes from S0 to Sεx, Sεy,
or Sεz as
Sεx ¼ S0
ffiffiffiffiffiffiffiffiffiffiffiffiffiffiffiffiffiffiffiffiffiffiffiffiffiffiffiffiffiffiffiffiffiffiffiffiffiffiffiffiffiffiffiffiffiffiffiffiffiffiffiffiffiffiffiffiffiffiffiffiffiffiffiffiffiffiffiffiffiffiffiffiffiffiffiffiffiffiffiffiffiffiffiffiffiffiffiffiffiffiffiffiffiffiffiffiffiffiffiffiffiffiffiffiffiffiffiffiffiffiffiffiffiffiffiffiffiffiffiffiffiffiffiffiffiffiffiffiffiffifficos2qxð1þ εxÞ2 þ sin2qx sin
24xð1þ εyÞ2 þ sin2qx cos24xð1þ εzÞ2
q;
Sεy ¼ S0
ffiffiffiffiffiffiffiffiffiffiffiffiffiffiffiffiffiffiffiffiffiffiffiffiffiffiffiffiffiffiffiffiffiffiffiffiffiffiffiffiffiffiffiffiffiffiffiffiffiffiffiffiffiffiffiffiffiffiffiffiffiffiffiffiffiffiffiffiffiffiffiffiffiffiffiffiffiffiffiffiffiffiffiffiffiffiffiffiffiffiffiffiffiffiffiffiffiffiffiffiffiffiffiffiffiffiffiffiffiffiffiffiffiffiffiffiffiffiffiffiffiffiffiffiffiffiffiffiffiffifficos2qyð1þ εyÞ2 þ sin2qy sin
24yð1þ εxÞ2 þ sin2qy cos24yð1þ εzÞ2
q;
Sεz ¼ S0
ffiffiffiffiffiffiffiffiffiffiffiffiffiffiffiffiffiffiffiffiffiffiffiffiffiffiffiffiffiffiffiffiffiffiffiffiffiffiffiffiffiffiffiffiffiffiffiffiffiffiffiffiffiffiffiffiffiffiffiffiffiffiffiffiffiffiffiffiffiffiffiffiffiffiffiffiffiffiffiffiffiffiffiffiffiffiffiffiffiffiffiffiffiffiffiffiffiffiffiffiffiffiffiffiffiffiffiffiffiffiffiffiffiffiffiffiffiffiffiffiffiffiffiffiffiffiffiffiffifficos2qzð1þ εzÞ2 þ sin2qz sin
24zð1þ εxÞ2 þ sin2qz cos24zð1þ εyÞ2
q:
(4.8)
Equation (4.8) indicates that even under the same external strain status, the strain ofeach Rt0 with a different orientation angle is different. Therefore, based on Eqns (4.6)and (4.8), the resistance of CBCC under multiaxial strain changes from R0 to R as
R ¼XMþ1
i¼1
XMþ1
j¼1
k1S0½Fx expðk2S0FxÞ þ Fy expðk2S0FyÞ þ Fz expðk2S0FzÞ�;
(4.9)
where:
Fx ¼
ffiffiffiffiffiffiffiffiffiffiffiffiffiffiffiffiffiffiffiffiffiffiffiffiffiffiffiffiffiffiffiffiffiffiffiffiffiffiffiffiffiffiffiffiffiffiffiffiffiffiffiffiffiffiffiffiffiffiffiffiffiffiffiffiffiffiffiffiffiffiffiffiffiffiffiffiffiffiffiffiffiffiffiffiffiffiffiffiffiffiffiffiffiffiffiffiffiffiffiffiffiffiffiffiffiffiffiffiffiffiffiffiffiffiffiffiffiffiffiffiffiffiffiffiffiffiffiffiffiffiffiffiffiffiffiffiffiffifficos2
�ði� 1Þp2M
�ð1þ εxÞ2 þ sin2
�ði� 1Þp2M
�sin2
�ð j� 1Þp2M
�ð1þ εyÞ2
þ sin2�ði� 1Þp
2M
�cos2
�ð j� 1Þp2M
�ð1þ εzÞ2;
vuuuuuuut
Fy ¼
ffiffiffiffiffiffiffiffiffiffiffiffiffiffiffiffiffiffiffiffiffiffiffiffiffiffiffiffiffiffiffiffiffiffiffiffiffiffiffiffiffiffiffiffiffiffiffiffiffiffiffiffiffiffiffiffiffiffiffiffiffiffiffiffiffiffiffiffiffiffiffiffiffiffiffiffiffiffiffiffiffiffiffiffiffiffiffiffiffiffiffiffiffiffiffiffiffiffiffiffiffiffiffiffiffiffiffiffiffiffiffiffiffiffiffiffiffiffiffiffiffiffiffiffiffiffiffiffiffiffiffiffiffiffiffiffiffiffifficos2
�ði� 1Þp2M
�ð1þ εyÞ2 þ sin2
�ði� 1Þp2M
�sin2
�ð j� 1Þp2M
�ð1þ εxÞ2
þ sin2�ði� 1Þp
2M
�cos2
�ð j� 1Þp2M
�ð1þ εzÞ2;
vuuuuuut
Fz ¼
ffiffiffiffiffiffiffiffiffiffiffiffiffiffiffiffiffiffiffiffiffiffiffiffiffiffiffiffiffiffiffiffiffiffiffiffiffiffiffiffiffiffiffiffiffiffiffiffiffiffiffiffiffiffiffiffiffiffiffiffiffiffiffiffiffiffiffiffiffiffiffiffiffiffiffiffiffiffiffiffiffiffiffiffiffiffiffiffiffiffiffiffiffiffiffiffiffiffiffiffiffiffiffiffiffiffiffiffiffiffiffiffiffiffiffiffiffiffiffiffiffiffiffiffiffiffiffiffiffiffiffiffiffiffiffiffiffiffifficos2
�ði� 1Þp2M
�ð1þ εzÞ2 þ sin2
�ði� 1Þp2M
�sin2
�ð j� 1Þp2M
�ð1þ εxÞ2
þ sin2�ði� 1Þp
2M
�cos2
�ð j� 1Þp2M
�ð1þ εyÞ2:
vuuuuuut
Hence, the change in resistance of CBCC can be calculated as
R
R0¼ 1
3ðM þ 1Þ2XMþ1
i¼1
XMþ1
j¼1
fFx exp½k2S0ðFx � 1Þ� þ Fy exp½k2S0ðFy � 1Þ�
þ Fz exp½k2S0ðFz � 1Þ�g:(4.10)
68 Multifunctional Nanocomposites in Civil and Structural Engineering

Conducting series expansion on the exponent function in Eqn (4.10), the followingequation can be obtained:
R
R0¼ 1
3ðM þ 1Þ2XMþ1
i¼1
XMþ1
j¼1ðFx þ Fy þ FzÞ
þ k2S0
3ðM þ 1Þ2XMþ1
i¼1
XMþ1
j¼1
�F2x � Fx þ F2
y � Fy þ F2z � Fz
�
þ ðk2S0Þ26ðM þ 1Þ2
XMþ1
i¼1
XMþ1
j¼1
hFxðFx � 1Þ2 þ FyðFy � 1Þ2 þ FzðFz � 1Þ2
iþ/
(4.11)
The first item of the right-hand side in Eqn (4.11) is the inherent behavior of theintegrated change in length of each Rt0 under external strain and is denoted as S=S0,which represents the resistance change trend of CBCC under multiaxial strain. k2S0is denoted as b, which represents the sensitivity factor of CBCC and is dependenton the intrinsic property of CBCC. Therefore, S=S0 and b represent the piezoresistivitycharacteristics (trend and sensitivity factor) of a composite. Considering the uncer-tainty in CBCC synthesis, b is best obtained from a simple uniaxial compressivetest and can then be utilized to predict the resistance behavior of CBCC under complexloading and environmental conditions. The applicability of obtaining b from a simplecompressive test will be validated by utilizing it in predicting resistance behavior underother effects (CB concentration and temperature). Orientation uniformity of Rt0 isdependent on the value of M. M � 30 can meet the precision requirement ofcalculation.
For CBCC, considering the strain gauge factor of 55.5 (Li et al., 2006), coeffi-cient b can be calculated as 337, and k2 is then obtained as 3.45 nm�1. Utilizingthese parameters, the model can predict the strain gauge factors of a compositeunder various complex strain statuses. Besides predicting the resistance behaviorof CBCC under various strain states, the model can be used to predict the resistancebehavior of CBCC under various ambient conditions by transforming such condi-tions into strain.
Thermal expansion will lead to a change in S0 that may cause a change in straingauge factor. By substituting thermal expansion strain into the proposed model, thestrain gauge factors under various temperatures can be predicted. Experiments wereconducted for CBCC. The thermal expansion coefficient (TEC) of CBCC in the lon-gitudinal direction and transverse direction was measured as 16.5 and 13.9, respec-tively. The slight discrepancy of TECs in different directions was caused by theembedded electrical probes. Taking the distance S0 under 20 �C as the baseline, theoriginal distances between each two adjacent CB particles under various temperaturescan be calculated based on the measured TEC. Then, based on the proposed model,strain gauge factors of CBCC under various temperatures were obtained, as shownin Figure 4.10. The theoretical strain gauge factors change slightly from 55.197
Self-sensing of nano-carbon black concrete 69

(�10 �C) to 55.249 (50 �C), indicating that the effect of temperature on strain gaugefactor is slight. The experimental measured strain gauge factors e 54.95 (�10 �C),55.23(20 �C), and 55.64 (50 �C), respectively, as shown in Figure 4.10 e also showa small dependence on temperature.
The strain gauge factor is dependent on the original distance S0 between each twoadjacent CB particles. Simultaneously, S0 is a function of CB concentration. Therefore,the strain gauge factor is dependent on CB concentration. By transforming the changein CB concentration into the change in original distance, S0, the effect of CB concen-tration on the strain gauge factor can be predicted with the proposed model. In addi-tion, the applicability of defining b from a simple piezoresistivity test can bevalidated in this section by comparative study between theoretical and experimentalresults.
The strain gauge factors of CBCC with various concentrations of CB are obtainedas shown in Figure 4.11. Because the model is proposed based on tunnel effecttheory, the CB concentration range is limited to a near-percolation threshold thatvaries from 8.79 to 11.39 vol% (Scott et al., 1996), and the experimental data ofsuch CB concentrations (i.e., 8.79 vol% and 11.39 vol%) are compared with thetheoretical results. As shown in Figure 4.11, the strain gauge factor decreases withCB concentration, which can be attributed to the decrease of the original S0 due toCB concentration. The theoretical strain gauge factor of CBCC with CB particlesin the amount of 11.39 vol% is 38.4, close to the experimental result of 37.71.The comparison between modeling and experimental results indicates that the modeland the defined b are applicable.
–10 0 10 20 30 40 5050
52
54
56
58S
train
gau
ge fa
ctor
Temperature (ºC)
Theoretical results
Experimental results
Figure 4.10 Effect of temperature on the strain gauge factors.
70 Multifunctional Nanocomposites in Civil and Structural Engineering

4.4 Self-sensing concrete structures
4.4.1 Materials and experimental methods
CBCC sensors were made with carbon blackefilled cement-based composite, which isa material with piezoresistivity that described in Section 4.2. The resistance of CBCCsensors was measured using the four-probe method in which copper nets served aselectrical contacts. The copper nets were placed into the specimen when pouring themix into molds. Four contacts were placed across the whole cross-section of30 � 40 mm. The two outer contacts (36 mm apart) were for passing the current.The inner two contacts (20 mm apart) measured the voltage. The parameters of freeCBCC sensors are shown in Table 4.1.
Concrete beams were made with C40 concrete. The cement used was Portlandcement P.O32.5. The fine aggregate was natural river sand with a fineness modulus
8.5 9.0 9.5 10.0 10.5 11.0 11.5
36
38
40
42
44
46
48
50
52
54
56
Stra
in g
auge
fact
or
CB content (vol%)
Theoretical results
Experimental results
Figure 4.11 Model and experimental results of the effect of CB concentration on strain gaugefactors.
Table 4.1 Properties of CBCC sensors
Strain-sensing properties Mechanical properties
Resistivity(U cm)
Gaugefactor
Strength(MPa)
Peak strain(mε)
Modulus(3104
MPa)Poissonratio
719.4 � 53.7 55.5 � 2.87 44.7 � 0.32 4400 � 136 1.44 � 0.06 �0.17 � 0.015
Self-sensing of nano-carbon black concrete 71

of 2.94. The coarse aggregate was crushed diabase with a maximum radius of 20 mm.A water-reducing agent (FDN) and silica fume (average radius is 100 nm) were used.The mix proportions are shown in Table 4.2. The configuration of concrete beam isshown in Figure 4.12. The width was 150 mm, depth was 300 mm, and clear spanof concrete beam was 240 mm (overall span was 270 mm). The upper constructionalbar was plain steel bar with yield stress of 235 MPa. The hooping bar was plain steelbar with yield strength of 235 MPa, spacing 100 mm at the two side one-third spans.The under-reinforcing bar was HRB335 (hot rolled ribbon steel bars) with yieldstrength of 345 MPa and Young’s modulus of 200 GPa.
As shown in Figure 4.12, a point load P was distributed into two equal point loadsbefore applying on the simple beam, dividing the clean span of beam into three equalspans. Based on the normal material mechanics, the resulted loading on the middlespan was pure flexion and on the two side spans was combined flexion and shear.Hence, three different stress states were generated in the beam (i.e., uniaxial compres-sion and uniaxial tension in the top and bottom of the middle span, respectively, andcombined compression and shear in the top of the side span). CBCC sensors werelocated at those three different stress zones and were named CBCC sensor-1 andCBCC sensor-2, respectively, as shown in Figure 4.12. The sides of CBCC sensorscoincided with those of concrete beams for a 30 mm side parallel to beam depth,40 mm side parallel to beam width, and 50 mm side parallel to beam span. Also,the CBCC sensor center was coincident with the beam width center. The distance ofCBCC sensor-1 center from the beam top was 30 mm, and that of CBCC sensor-2 cen-ter from the beam bottom was 60 mm. Because the resistance measurement of CBCC
Table 4.2 Mix proportions of concrete columns (kg/m3)
Strengthgrade Cement Water Sand
Coarseaggregate
C40 435 190 535 1240
150
30
60
800
400
P
CBCC sensor-2
CBCC sensor-1
800
400
800 150
Figure 4.12 Schematic of the loading arrangement and CBCC sensor locations (mm).
72 Multifunctional Nanocomposites in Civil and Structural Engineering

sensors was made along the 50 mm side, compressive or tensile strain along the spanwould be measured by CBCC sensors. Strain gauges, servicing as a reference, wereattached on the side surfaces of beams corresponding to the locations of CBCC sensorsfor evaluating the performance of CBCC sensors.
Three beams with embedded CBCC sensors were prepared. Load was applied witha jacking apparatus at step of 10 kN measured by a load cell as shown in Figure 4.13.First, cyclic load with amplitude of 20 kN was applied on the beams for three cycles,and then amplitude was increased to 30 kN for another three cycles. After that, mono-tonic load was applied until the reinforcing bar yield (marked by the phenomenon ofstrain continuous to increase under an approximately constant load) and then unload.During the loading and unloading procedure, strain was measured by embeddedCBCC sensors and strain gauges.
Three concrete cylinders were made with the same concrete when pouring concretebeams. After 28 days of curing at the same condition with concrete beams, a uniaxialcompressive test was conducted on these cylinders with a Materials Testing System(MTS) to get the basic mechanical properties of concrete.
4.4.2 Mechanical behavior of concrete beams
Because the main purpose of this article is to demonstrate the strain-sensing propertyof embedded CBCC sensors under different stress states, only a brief description of thebeams’ mechanical behavior is given here.
The compressive strength, modulus, and peak strain of C40 concrete obtained fromthe compressive test on cylinders are 35.3 MPa, 2.56 MPa, and 2016 mε, respectively.For the concrete beams, no cracks appeared during 20 kN amplitude of cyclic loading.In the procedure of 40 kN amplitude of cyclic loading, small upward-developingcracks were observed on the beam’s bottom. In the procedure of monotonic loading,
Figure 4.13 Experimental setup.
Self-sensing of nano-carbon black concrete 73

cracks progressively extended after 40 kN and speeded up after 90 kN. When the loadreached about 140 kN, cracks propagated sharply into the top portion of beams and thebeams entering the yielding region.
4.4.3 Compressive strain-sensing properties of CBCC sensor-1
Based on the performance of CBCC sensor-1, the compressive strain-sensing propertyof an embedded CBCC sensor under a uniaxial compression state was established,together with the previous studies on a free CBCC sensor to provide a comprehensiveunderstanding of this property. Strain measured by embedded CBCC sensors wascalculated based on the fractional change in resistance with a strain gauge factor of55.5 as shown in Table 4.1.
Figure 4.14 shows the compressive strain measured by CBCC sensor-1 and straingauge upon the load applied on a concrete beam by a jacking apparatus. As shownin Figure 4.14(a), under cyclic load with an amplitude of 20 kN, the measured strainof CBCC sensor-1 agrees well with that of the strain gauge. The strain amplitude isabout 90 mε. Nearly no residual strain occurs after each loadingeunloading cycle,
0 20 40 60 80 100 120
0
5
10
15
20
Load
(kN
)
Compressive strain (με)
SG-1 CBCC-1
Compressive strain (με)0 50 100 150 200 250
0
10
20
30
40
Load
(kN
)
SG-1 CBCC-1
Compressive strain (με)0 200 400 600 800 1000 1200
–200
20406080
100120140160
Load
(kN
)
SG-1 CBCC-1
(a) (b)
(c)
Figure 4.14 Strain-sensing property of CBCC sensor-1: (a) under cyclic loading with anamplitude of 20 kN, (b) under cyclic loading with an amplitude of 40 kN, and (c) undermonotonic loading until reinforcing bar yield followed by unloading.
74 Multifunctional Nanocomposites in Civil and Structural Engineering

indicating that no damage occurs in the top of pure flexion span. Figure 4.14(b) shows agood agreement between the measured strain of CBCC sensor-1 and that of strain gaugeunder 40 kN amplitude of cyclic load. The strain amplitude is about 240 mε. Themeasured strain amplitudes for 20 and 40 kN both agree well with the theoreticalvalues, indicating that embedded CBCC sensors have a repeatable and precise compres-sive strain-sensing ability. Figure 4.14(c) shows the measured strain under monotonicloading. Reinforcing bar enters the yield region after the load reaches about 130 kN(corresponding to 1000 mε, marked as the “shift” in the straineload curve), which meansthe concrete beam cannot bear further increasing load. Unload was then conducted afterreinforcing bar yield. Before reinforcing bar yields, the measured strain of CBCC sensoragrees well with that of strain gauge. In reinforcing bar yield region, the strain measuredby CBCC sensor becomes smaller than that measured by strain gauge. During theunloading procedure, strain measured by CBCC sensor-1 approaches that measuredby strain gauge quickly and then keeps agreement. A residual strain of about 400 mεwas measured by both CBCC sensor-1 and strain gauge at the end of unloading. Thereasonable measured strain of CBCC sensor-1 in whole testing procedures indicatesthat embedded CBCC sensors under uniaxial compression are competent for measuringcompressive strain of a reinforced concrete member.
The slight inaccuracy of CBCC sensors at the reinforcing bar yield region is attrib-uted to the Poisson ratio enhancement of concrete at that region. As measured by straingauge, the compressive strain of concrete reaches 1000 mε when the reinforcing baryields, meaning the concrete enters the plastic deformation stage that results in anincrease in Poisson ratio based on the normal knowledge of concrete. However, thepiezoresistivity of CBCC material is multiaxial strain dependent, and the strain gaugefactor will decrease upon Poisson ratio (Xiao et al., 2010). Therefore, the increasingPoisson ratio of concrete at the stage of reinforcing bar yield generates a bigger trans-verse deformation condition for the embedded CBCC sensors relative to a free CBCCsensor, resulting in the discrepancy between the real and being-used gauge factors.However, the gauge factor used here to calculate strain is still the calibrated gauge fac-tor, 55.5. Hence, the strain measured by CBCC sensors becomes lower than thatmeasured by the strain gauge. The experimental results indicate that a gauge factormodification method for CBCC sensors should be developed to get a precise sensingresult under all loading stages. Regardless, an embedded CBCC sensor under uniaxialcompression state appears to be competent for measuring the repeatable compressivestrain of concrete within a normal load level.
4.4.4 Compressive strain-sensing properties of CBCC sensor-2
Based on the performance of CBCC sensor-2, the tensile strain-sensing property of anembedded CBCC sensor under uniaxial tension was established. As shown inFigure 4.15(a), under 20 kN amplitude of cyclic load, the tensile strain amplitude isabout 140 mε. A residual strain of about 45 mε remains after the first cycle, indicatingthat micro cracks occur under this tensile strain level. As shown in Figure 4.15(b),under 40 kN amplitude of cyclic load, the strain increases sharply upon load afterexceeding 180 mε and a residual strain of 400 mε occurs after the first cycle, indicating
Self-sensing of nano-carbon black concrete 75

the continuous opening and accumulation of micro cracks in this region. Although thestrain amplitude measured by CBCC sensor-2 is a little higher than that measured bystrain gauge, the reasonable and approximately agreeing results indicate that CBCCsensors can be used to measure small tensile strain. Figure 4.15(c) shows that, afterabout 1400 mε, strain gauge outs work and CBCC sensor-2 outs work soon, meaningthat macro-cracks form in concrete beams and propagate through CBCC sensors. Theexperimental results indicate that CBCC sensors are competent for measuring a smalllevel of tensile strain.
4.5 Future of multifunctional nano-concrete
Concrete structures constitute a large portion of civil infrastructures, but their reli-ability is relatively low because of wide material discreteness and a complex serviceenvironment. Consequently, the safety of concrete structures is an important problemthat receives attention at all times in civil engineering. Therefore, it is necessary to takereasonable measures to monitor the state of concrete structures. In order to monitor theperformance and state of concrete structures during their service periods, informationon the structural state needs to be obtained by appropriate monitoring technologies.
0 20 40 60 80 100120140160180
0
5
10
15
20
Load
(kN
)
Tension strain (με)
SG-2 CBCC-2
Tension strain (με)0 200 400 600 800 1000 1200
0
10
20
30
40
Load
(kN
)
SG-2 CBCC-2
Tension strain (με)0 600 1200 1800 2400 3000
0
20
40
60
80
Load
(kN
)
SG-2 CBCC-2
(a) (b)
(c)
Figure 4.15 Strain-sensing property of CBCC sensor-2: (a) under cyclic loading with amplitudeof 20 kN, (b) under cyclic loading with amplitude of 40 kN, and (c) under monotonic loading.
76 Multifunctional Nanocomposites in Civil and Structural Engineering

Now, local monitoring for concrete structures is usually achieved by embeddingsuch sensors as electric-resistant strain gauges, optic sensors, piezoelectric ceramic,shape memory alloys, and fiber-reinforced polymer bars in key structural positions.However, these sensors have such drawbacks as poor durability, low sensitivity, highcost, and unfavorable compatibility with concrete structures. Smart concrete hasfavorable piezoresistivity, great durability, and good compatibility with concretestructures and so on, and it can therefore be used to develop retrofit or new installa-tions, including traffic monitoring, weighing in motion, corrosion monitoring ofrebar, and strain-sensing coating.
Acknowledgments
This work is financially supported by NSFC grants Nos. 51378159, 50238040, 50808059,50538020, and 50278029; the Ministry of Science and Technology grant Nos.2006BAJ03B05 and 2007AA04Z435; and the Outstanding Young Teachers in Harbin Instituteof Technology grant No. HITQNJS.2007.030.
References
Austin, T., Singh, M., Gregson, P.J., Dakin, J.P., Powell, P.M., 1999. Damage assessment inhybrid laminates using an array of embedded fiber optic sensors. In: Proc. The SPIEConference on Smart Systems for Bridges, Structures and Highways, Newport Beach,California, March SPIE. 3671, pp. 281e287.
Chen, B., Liu, J.Y., 2008. Damage in carbon fiber-reinforced concrete, monitored by bothelectrical resistance measurement and acoustic emission analysis. Construction andBuilding Materials 22, 2196e2201.
Chen, J.C., 1995. Intelligent monitoring system for suspension bridge damage detection. In:Proc. of Bridge into the 21st Century Conference, Hongkong, October, 25.
Claus, R.O., Mckeenman, J.C., May, R.G., et al., 1988. Opitical fiber sensors and signal pro-cessing for smart materials and structures ARO smart Materials. In: Structures andMathematical Issues Workshop Proceeding. Virginia Polytechnic Institute and stateUniversity Blacksburg, VA, pp. 15e16.
Han, B.G., Ou, J.P., 2007. Embedded piezoresistive cement-based stress/strain sensor. Sensorsand Actuators A 138, 294e298.
Han, B.G., Guan, X.C., Ou, J.P., 2007. Electrode design, measuring method and data acquisitionsystem of carbon fiber cement paste piezoresistive sensors. Sensors and Actuators A:Physical 135, 360e369.
Li, H., Ou, J.P., Zhao, X.F., 2006. Structural health monitoring system for the ShandongBinzhou Yellow river highway bridge. Computer-Aided Civil and Infrastructure Engi-neering 21 (4), 306e317.
Li, H., Xiao, H.G., Ou, J.P., 2006. Effect of compressive strain on electrical resistivity of carbonblack-filled cement-based composites. Cement and Concrete Composites 28, 824e828.
Li, H., Xiao, H.G., Ou, J.P., 2008. Electrical property of cement-based composites filled withcarbon black under long-term wet and loading condition. Composites Science and Tech-nology 68, 2114e2119.
Self-sensing of nano-carbon black concrete 77

Ou, J.P., Han, B.G., 2009. Piezoresistivie cement-based strain sensors and self-sensing concretecomponents. Journal of Intelligent Material Systems and Structures 20, 329e336.
Reza, F., Batson, G.B., Yamamuro, J.A., Lee, J.S., 2003. Resistance changes duringcompression of carbon fiber cement composites. Journal of Materials in Civil 15, 476e483.
Scott, W.D., Charles, R.F., Michael, B.P., Daniel, W.S., 1996. Damage Identification and HealthMonitoring of Structural and Mechanical Systems from Changes in Their VibrationCharacteristics: A Literature Review (Report of Los Almos Lab).
Simmons, J.G., 1963. Generalized formula for the electric tunnel effect between similar elec-trodes separated by a thin insulating film. Journal Applied Physics 34, 1793e1803.
Song, X.H., Zheng, L.X., Li, Z.Q., 2006. Temperature compensation in deformation testing forsmart concrete structures. Key Engineering Materials 326e328, 1503e1506.
Wang, S., Shui, X., Fu, X., Chung, D.D.L., 1998. Early fatigue damage in carbon-fibre com-posites observed by electrical resistance measurement. Journal of Materials Science 33,3875e3884.
Wen, S.H., Chung, D.D.L., 2001. Carbon fiber-reinforced cement as a strain-sensing coating.Cement and Concrete Research 31, 665e667.
Xiao, H.G., Li, H., March, 2006. A study on the application of CB-filled cement-based com-posites as a strain sensor for concrete structures. In: (SPIE)Nondestructive Evaluation andHealth Monitoring of Aerospace Materials, Composites, and Civil Infrastructure. SanDiego, CA, USA.
Xiao, H.G., Li, H., Ou, J.P., 2010. Modeling of piezoresistivity of carbon black filledcement-based composites under multi-axial strain. Sensors and Actuators A: Physical 160,87e93.
Xiao, H.G., Li, H., Ou, J.P., 2011a. Self-monitoring properties of concrete columns withembedded cement-based strain sensors. Journal of Intelligent Material Systems andStructures 22, 191e200.
Xiao, H.G., Li, H., Ou, J.P., 2011b. Strain sensing properties of cement-based sensors embeddedat various stress zones in a bending concrete beam. Sensors and Actuators A: Physical 167,581e587.
Yu, X., Kwon, E., 2009. A carbon nanotube/cement composite with piezoresistive properties.Smart Materials and Structures 18, 1e5.
78 Multifunctional Nanocomposites in Civil and Structural Engineering

Hybrid cementitious materials:nanoscale modeling andcharacterization
5Rouzbeh Shahsavari 1,2, Navid Sakhavand 1
1Rice University, Houston, TX, USA; 2Smalley Institute for Nanoscale Science andTechnology, Houston, TX, USA
5.1 Introduction
Cement paste owes its remarkable cohesive strength primarily to the calciumesilicateehydrate (C-S-H) gel, an amorphous-like gel with a clay-like backbone (Allenet al., 2007; Taylor, 1986). With the presence of zeolitic-type pores and water in inter-laminar distances (Pellenq et al., 2008), C-S-H has a very complex structure that makesit nontrivial to come up with unified strategies to improve and control the mechanicalproperties and performance of cementitious materials at larger scales (Pellenq et al.,2008; Alizadeh et al., 2011). Here, we review some of the efforts in nanoengineeringcement paste to enhance its mechanical properties. There are two venues leadingtoward material property improvement, and the first is engineering the nanoparticleforces within C-S-H. The less ordered layers in C-S-H are shown to be akin to tober-morite and jennite lamellae (Figure 5.1) (Muller et al., 2012; Richardson, 1999).The stacking defects in C-S-H are filled with highly mobile hydrated calcium ions
10 mm
Figure 5.1 Transmission electron microscopy (TEM) of C-S-H shows a tobermorite-likelayered structure (Merlin et al., 2002).
Innovative Developments of Advanced Multifunctional Nanocomposites in Civil and Structural Engineeringhttp://dx.doi.org/10.1016/B978-1-78242-326-3.00005-1Copyright © 2016 Elsevier Ltd. All rights reserved.

(Pellenq et al., 2008). The discontinuous lamellae of C-S-H provide an opportunity toincrease the individual lamellae bonding forces. This method will affect the strengthand stiffness of C-S-H but not its brittleness (Pellenq et al., 2008).
The second strategy is to improve the interparticle forces through incorporation of alow-concentration softer matrix. Many natural biocomposites that have adapted thismethod demonstrate an excellent balance of mechanical properties. For instance,despite being made of 95% brittle aragonite, nacre in abalone shell is w3000 timestougher than aragonite (Espinosa et al., 2009; Lin et al., 2006). Reinforcing the cementpaste with admixtures seems to be a more realistic method than increasing intrinsiccohesive forces. Therefore, understanding the complex mechanisms of biologicalstructures paves the road to mimic the structure of natural materials and synthesizecementitious composites with analogous or perhaps better mechanical properties.
5.1.1 Biomimetic hybrid materials design
Comparison of the synergy of mechanical properties in natural and synthetic compos-ites reveals important features. As shown in Figure 5.2, ceramics are highly stiff but arevery brittle. On the other hand, polymers are very ductile and flaw-tolerant but deformeasily with small forces (low stiffness and strength). Generally speaking, polymers andother softer fibers or particles are typically added to stiff materials to enhance theirductility (Corni et al., 2012). Composites are usually made combining two or more ma-terials with contrasting properties to achieve the desired level of synergistic properties.Although this strategy is executed poorly with synthetic materials, natural materials
0.01 0.1 11
10
10
100
100
1000
1000
Specific stiffness (GPa/(Mg/m3))
Spe
cific
stre
ngth
(MP
a/(M
g/m
3 ))
Figure 5.2 Materialeproperty relationship for natural and synthetic materials (Wegst et al.,2015). Unlike synthetic materials, natural materials reach their mechanical propertiesunder ambient conditions with a limited number of constituents.
80 Multifunctional Nanocomposites in Civil and Structural Engineering

have mastered this strategy over the course of thousands of millions of years ofevolution. For instance, the addition of a few percent of a soft biopolymer to a stiffcalcite yields a stiff and tough nacre, better known as the inner layer of abaloneseashell (Sakhavand and Shahsavari, 2015).
The success of natural materials in their superior mechanical properties is attributedto a number of different traits, including the presence of multiple contrasting materials;the particular architecture of the composite to channel, control, and arrest the cracks;and in some cases their hierarchical structure at the nano, micro, and macro levels.Over the years, different methods have been utilized to replicate the structure of naturalmaterials, such as nacre and nacre-like (plateletematrix) composites, in the lab envi-ronment. Launey et al. (2009) used freeze castingdentrapment of solutes between icecrystalsdto synthesize an alumina (Al2O3)epolymer composite and reported simul-taneous high strength and toughness (Figure 5.3). Chemical grafting of the interfacestrengthened the bonding at the interface of polymer and platelets, hence furtherincreasing both strength and toughness. Aluminaepolymer was also produced bygel casting and hot pressing, a simple and fast method with promising results inhigh-scale production of nacre-like composites (Bonderer et al., 2008). Ekiz et al.(2009) utilized hot-press-assisted slip casting (HASC) to produce an aluminaeepoxycomposite. The failure mechanism of their composite was mostly governed by debond-ing of the epoxyealumina interface rather than sliding of the alumina platelets on theepoxy matrix. Although similar strength values as those of nacre were reported for thiscomposite, the debonding behavior reveals inefficiency in the composite structure thatreduces its possible maximum properties.
Biomineralization is another technique in which hard platelet crystals are mineral-ized in a solution of soft biomolecules. Various plateletematrix composites such aspotassium sulfateepolymer (Oaki et al., 2006) and ZnOepolymer (Tseng et al.,2009) are synthesized with this method. The slow procedure and lower than expectedmechanical properties are the key drawbacks of this method. Other methods include
Figure 5.3 Scanning electron micrography (SEM) image of (Al2O3)epolymer shows thelayered nacre-like structure. Al2O3 is the ceramic platelets, and the polymer is the matrix(Launey et al., 2009).
Hybrid cementitious materials: nanoscale modeling and characterization 81

extrusion and roll compaction (Wang et al., 2000), layer-by-layer self-assembly (Tanget al., 2003a), centrifugation (Chen et al., 2008), evaporation (Bennadji-Gridi et al.,2006), and electrophoretic deposition (Lin et al., 2009). In brief, after using differenttechniques and various constituents, researchers have reported successful synthesis ofnacre-like composites that combines hard and soft materials for a tough and strongcomposite. In the next two sections, we focus on similar efforts to incorporate softmaterials into the cement paste to achieve material property enhancement.
5.2 Hybrid polymerecement composites
By combining platelet-like ceramic building blocks and organic polymer matrices,nature creates hybrid materials such as bone, teeth, and mollusk shells that have anoutstanding balance of stiffness, strength, and flaw tolerance (Espinosa et al., 2009;Fratzl et al., 2004; Gao, 2006). This has inspired fabrication of several advancedhuman-made polymer matrix composites with inorganic reinforcing materials suchas cement, clays, glass, graphite, SiC, and mica (Bonderer et al., 2008; Beaudoinet al., 2009a; Rexer and Anderson, 1979; Tang et al., 2003b). Polymer-incorporatedcement is one type of hybrid cement nanocomposite that has received extensive atten-tion since the release of a commercial polymereclay nanocomposite at Toyota Labs(Kojima et al., 1993). Experiments using X-ray diffraction (XRD), nuclear magneticresonance (NMR), and Fourier transform infrared spectroscopy (FTIR) techniqueson cementepolymer nanocomposites have revealed successful incorporation of poly-mer chains into the nanopores of C-S-H (Merlin et al., 2002; Okamoto, 2003;Mojumdar and Raki, 2005). Three possible thermodynamic forms for polymerelayered silicate composites have been proposed (Okamoto, 2003) (Figure 5.4): a) con-ventional microcomposites in which the polymer chains encompass layered clay-likestacks in two separate phases; b) intercalated nanocomposites in which the polymerpenetrates the interlayer of the silicate chains without destroying the layered structure
Figure 5.4 Possible composite materials through the interaction of polymer and layered silicate:(a) conventional composite, (b) intercalated nanocomposite, and (c) exfoliated nanocomposite.This chapter on the small interfacial region where polymer interacts with the surface of thecalciumesilicateehydrate system.
82 Multifunctional Nanocomposites in Civil and Structural Engineering

of the system; and c) exfoliated nanocomposites in which the silicate layers aredestroyed and separated in the polymer matrix.
In all such hybrid polymerecement composites, the interface is oftentimes thebottleneck to understand and improve the properties of the hybrid systems, as thebehavior of the bulk components of the composite is relatively more simple andpredictable. Given the complexity of the cement molecular structure and variety ofthe phenomena that govern mechanical properties of hybrid cementitious composites,understanding the interfacial interactions in hybrid cementitious materials is a keychallenge. In this regard, computational modeling at small scales is necessary to revealthe physics and chemistry of the interactions of the cement paste with other constitu-ents. This will be discussed in detail in the next section.
5.2.1 Nanoscale modeling
Advancements in computational technology and access to low-cost computationalfacilities have turned computational experiments into applicable means of studyingmaterials at submicro levels. The molecular dynamics method is a widely used compu-tational tool in this area. Unlike experiments, computational methods are able torapidly screen the various phenomena, model many systems, and replicate laboratorytests. Therefore, simulations can be utilized to predict interactions and properties ofmaterials, thus guiding experiments in a more cost-effective and timely manner. Therecent decoding of the molecular structure of cement hydrate (i.e., various combinato-rial C-S-H phases with a full spectrum of industrial stoichiometries) (Pellenq et al.,2009; Abdolhosseini Qomi et al., 2014) has elevated the field of computational cementscience at a completely different level, compared to years ago. In this context, thedevelopment of reliable potentials, so-called force field functions (Shahsavari et al.,2011) that describes complex interactions of the atoms in C-S-H, is a key towardany modeling and property evaluation in cement-based materials. Although manymodeling reports including molecular dynamics and first-principles quantum calcula-tions are available on the structure and mechanics of cementitious materials (Jalilvandand Shahsavari, 2014; Shahsavari et al., 2009; Shahsavari and Chen, 2015; Wu et al.,2011; Kalinichev et al., 2007), the simulation of hybrid cementitious materials such aspolymerecement composites is relatively rare.
Sakhavand et al. (2013) utilized molecular dynamics simulations to confirm astrong hydrogen bond (H-bond) network at the interface of a crystalline cement,known as tobermorite, and poly(vinyl alcohol) (PVA). They successfully identifiedand ranked the strength of various hydrogen bonds using potential of mean forceand time correlation functions (Figure 5.5). The same group concluded that interfacialhydrogen bonding between oxygens of PVA (Op) and nonbridging oxygens (Onb) ofsilicate chains in tobermorite is critical to adhesion of the polymer to cement.
Using more accurate modeling via first-principles quantum calculations, Sakhavandet al. (2013) also reported that intramolecular H-bonding in PVA increases the inter-molecular adhesion of PVA to tobermorite, a result that is not intuitive withoutadvanced modeling capabilities. By quantifying the strength of the interface by pullingthe polymer strand on the tobermorite, a slip-stick motion in PVAecement composites
Hybrid cementitious materials: nanoscale modeling and characterization 83

was observed, suggesting that polymer strands provide extra toughness for the hybridcomposite while bridging the particles under large deformations (Sakhavand et al.,2013). This interesting phenomenon was later verified via a systematic sizeeeffectstudy, indicating that in contrast to the common intuition, a finite optimum lengthof polymer strands provides the most efficient composite to exhibit maximummechan-ical properties (Sakhavand and Shahsavari, 2015; Sakhavand et al., 2013).
As an effort to simulate the failure of fiber-reinforced polymer concretes,B€uy€uk€ozt€urk et al. (2011) studied debonding of the epoxy polymers from the silicasurface in wet and dry environments. They were able to quantify the weakening pro-cesses of the interfacial interactions. However, the effects on mechanical properties of
0 20 40 60 80 100Time (ps)
Ow–OwOw–Op
Ow–ObOp–OwOw–Onb
Op–Op
Op–Onb1.0
0.8
0.6
0.4
55
5
5
–5–5
00
0
0
1010
10
12
864
Ow–ObOw–OnbOp–Onb
Ow–OwOp–OwOp–OwOp–Op
3.43.02.42.42.42.4 3.43.43.4 3.03.03.0
200–2–2–4–4–6
–6
80
80
60
60
40
40
20
20
A
D H
β β
r
(deg
)
β(d
eg)
–4.6 –4.3
–1.8 –1.1 –1.8
–4.16–6.29
–7.33
–7.46 –6.65–2.83
+2.4
+6.4 +0.2
r (Å) r (Å) r (Å) r (Å)
C(t)
Op
Ob
Onb
c
a b
SD ≈ 2.51 Å
SA ≈ 7.5 Å
(a)
(b)
(c)
Figure 5.5 (a) Close-up atomistic snapshot of the PVAetobermorite interface. Op refers tooxygen of PVA; and Ob and Onb denote, respectively, bridging and nonbridging oxygen atomsof silicates. (b) Potential of mean force plots for possible H-bonds in the PVAetobermoritesystem calculated fromMD simulations. In all cases, the magnitude of the global minima and thesaddle points are shown with a white color. The inset on the top left shows a schematic picture ofan H-bond denoted by an acceptor (A), a donor (D), and the hydrogen atom (H). (c) H-bondtime correlation functions for different types of H-bonds. In the legend, the first and secondatoms separated by the dash line indicate the donor and acceptor sites, respectively(Sakhavand et al., 2013).
84 Multifunctional Nanocomposites in Civil and Structural Engineering

the system are yet to be explored. In another study, Dai et al. (2011) also used molec-ular dynamics to confirm agglomeration of organic monomers in the C-S-H matrix(Figure 5.6).
In general, the ultimate goal of these simulations at the nanoscale is predicting theinteraction of polymer and cement and quantifying the hybrid properties of the systems,such as mechanical, thermal, and durability characteristics. Although in their infancy,these findings can provide guiding hypotheses for experiments to better synthesize,control, and characterize the properties of hybrid cementitious composites. The nextsection provides some of the high-level characterization attempts in polymerecementcomposites.
5.2.2 Characterization
Polymer-incorporated concrete is one common type of hybrid cementitious materialthat has received extensive attention. Matsuyama and Young (1998, 1999a,b) used awide range of anionic, cationic, and neutral polymers such as poly(methacrylic acid)(PMA), poly(4-vinyl benzyl trimethylammonium chloride), and PVA to examineintercalation of the polymer chains in the C-S-H interlayer. They achieved up to a1.5 nm (w100%) increase in the interlayer spacing of C-S-H. This is a significantobservation, because C-S-H is a low-swelling-capacity material.
In 2002, Van Damme and his colleagues (Merlin et al., 2002) attempted to synthe-size C-S-Hepolymer nanocomposites with water-soluble polymers. By using PVAand a variety of other polymers, they reported that, unlike smectite clays, intercalationof neutral or cationic polymers is a hard process. However, they did not study the me-chanical properties of their nanocomposite specimens. In another work, the samegroup prepared their mixture by adding trialkoxysilane and tetraethoxysilane toC-S-H. They proved the incorporation of organic groups in C-S-H without disruptingthe inorganic framework. Minet et al. (2006) proposed an alternative method todirectly link small-sized organic groups in the interlayer space of C-S-H (Figure 5.7).Their NMR plots of the C-S-H nanocomposite depict intense Q1 and Q2 peaks that are
Epoxy (DGEBA)
SiO2 substrate SiO2 substrate
Water molecules (H2O)
Figure 5.6 Schematic of molecular dynamics simulation of epoxyesilica in dry (left) and wet(right) environments (B€uy€uk€ozt€urk et al., 2011).
Hybrid cementitious materials: nanoscale modeling and characterization 85

not present in pure inorganic C-S-H. These peaks are a result of the Q species prox-imity to trialkoxysilanes. Their experimental results proved ethyl groups are close tothe silica tetrahedra.
Silva and Monteiro (2006) showed the effect of polymers on the hydration ofcement. In another study, they modified cement paste with 20% weight ofpoly(ethylene-co-vinyl acetate) (EVA) (Silva and Monteiro, 2005). However, theydid not report possible material properties enhancement in their work. Mojumdarand Raki (2005) reported hydrogen bonding in composites of C-S-H with varying con-centrations of PVA, a high-molecular-weight nonionic polymer (Figure 5.8). Theirscanning electron microscopy (SEM) images of the C-S-H polymer nanocompositeshowed initiation of PVA crystallites on the inorganic surface. Using FITR spectra,they depicted the shift of the (eOH) bond in PVA from 3421 cm�1 (Yu et al.,2003) to high frequencies of 3431e3411 cm�1 in the C-S-HePVA compound. Itwas later confirmed that hydrogen bonding occurred between the inorganic andorganic material nucleate PVA crystalline sites (Sakhavand et al., 2013). BecausePVA is a water-soluble polymer, its incorporation into C-S-H will remarkably increasethe water retention of C-S-H. This effect can potentially improve the cement work-ability, prevents dry-out, and can increase PVA’s adhesion to porous materials suchas concrete and ceramic (Ohama, 1995).
In another study, the same group incorporated poly(acrylic acid) (PAA) into C-S-H(Mojumdar and Raki, 2006) and reported intercalation of PAA as well as exfoliation ofC-S-H. Their differential scanning calorimetry (DSC) traces of C-S-Hepolymer nano-composite and individual PAA and C-S-H showed a higher glass transition tempera-ture compared to that of the bulk PAA. They claimed that these types of materials areuseful in corrosive and high-temperature environments.
Beaudoin et al. (2009b) performed a 29Si MAS NMR spectroscopy for differentC-S-Hepolymer nanocomposites to provide useful information on polymer interac-tions in C-S-H. They studied the incorporation of various entities such as polyethyleneglycol (PEG) (Beaudoin et al., 2009a), 18hexadecyltrimethylammonium (HDTMA)(Beaudoin et al., 2008), dimethyl sulfoxide (DMSO), and methylene blue (MB).They showed that the interaction of the organic entities with C-S-H increases the degreeof polymerization of the silicate chains. Their observation of the increase in the Q2eQ1
Q2Q1
T2 T1
Figure 5.7 Schematic of organic groups linked to the interlayer spacing of hybrid calciumsilicate materials. Q1 and Q2 correspond silicate tetrahedral species of C-S-H, bonded to eitherethyl or aminopropyl silanes. By incorporating trialkoxysilane species, T1 and T2, some of the Qspecies are replaced (Minet et al., 2006).
86 Multifunctional Nanocomposites in Civil and Structural Engineering

ratio of the C-S-Hepolymer nanocomposites indicated the chemical shift of the siliconnear the organic molecules. This proved the existence of some types of binding betweenthe polymer and C-S-H. Based on their observations, they suggested that, besides inter-calations, the polymer chains are mainly absorbed in the missing silica tetrahedral insilica chains, and thus bridge the gaps between them. However, they did not providesupporting results or insights regarding the types of interactions between C-S-H andorganic molecules. In a recent study, 29Si MAS NMR spectroscopy was again usedby Alizadeh et al. (2011) to show incorporation of polyaniline in C-S-H (Figure 5.9).
Considering the rheological behavior, polymeric dispersants are typically used toenhance the rheology of concentrate particle suspensions such as concrete. Popovaet al. (2000) were able to show adsorption of large amounts of superplasticizers onC-S-H. Because the ionic strength is high in concrete, comb copolymers with anadsorbing backbone and nonadsorbing side chains will be very effective for concrete.As another example, adsorption of copolymers onto C-S-H show that the superplasti-cizer adsorption cancels the strong ion correlation forces that exist between surfaces at
IRC 2.0 kV 8.00 mm × 20.0 k SEM 2.00 μm
IRC 2.0 kV 8.0 mm × 40.0 k SEM 9/16/2004 1.00 μm
(a)
(b)
Figure 5.8 SEM micrographs of (a) synthetic C-S-H (Mojumdar and Raki, 2006) and (b) purePVA (Mojumdar and Raki, 2005).
Hybrid cementitious materials: nanoscale modeling and characterization 87

close separation (Flatt et al., 2008). A model is proposed that can describe the adsorp-tion conformation of the utilized polymers (Flatt et al., 2008). Aside from polymersand soft materials, which have been studies for years, there is another emerging classof fillers known as low-dimensional materials that hold great promise for creating astep-change in various prosperities of hybrid cementitious materials. This area willbe the subject of our next discussion.
5.3 Cementitious composites reinforced withlow-dimensional materials and nanoparticles
Concrete is a quasi-material with a strong compression strength (>200 MPa), but rela-tively weak tension, flexural, and fracture toughness. Although reinforcing steel barscan partially overcome these issues, they are not able to prevent local cracking andallow the structure to resist high flexural loads. Low-dimensional materials such asone-dimensional (1D) carbon nanotubes (CNTs), 2D graphene, and hexagonal boronnitride (hBN) sheets have been (Figure 5.10) recently the subject of increasing interestas multifunctional additives to reinforce concrete at the nanolevel. These additives
(a) (b)
Figure 5.9 SEM images depicting the morphological differences between (a) C-S-H (C/S = 0.8)and (b) C-S-Hepolyaniline (C/S = 0.8). Each image is approximately 3 micrometers across.
500 nm
0.1 μm
(a) (b)200 nm
Figure 5.10 SEM images of multiwall carbon nanotubes (Li et al., 2005) (left) and boron nitridesheets (right) (Rafiee et al., 2013).
88 Multifunctional Nanocomposites in Civil and Structural Engineering

concurrently exhibit various superb properties such as ultrahigh strength, ultrahighthermal conductivity, and super hydrophobicity, which are highly desired for modernengineering of cementitious materials that can function in multiple ways. From a me-chanical standpoint, which is a key feature of structural cementitious materials, thesenanofillers with their huge surface areas can inhibit crack growth and increase tough-ness by a number of mechanisms, including crack bridging, crack bifurcations, andpulling out of matrix mechanisms (Rafiee et al., 2013) Various improvements in termsof strength, elastic behavior, and thermal and electrical advantages of such hybridcomposites have been reported, which are presented as follows.
5.3.1 Nanoscale modeling
Similar to polymerecement nanocomposites, nanoscale simulations of cementitiousmaterials modified by low-dimensional 1D and 2D fillers are relatively rare. In thiscontext, perhaps more efforts have been devoted to modeling CNTs andcement-based materials. For instance, simulations are used to investigate the effectof CNT weight percentage, chirality, and diameter on the Young’s modulus of thecementeCNT composite (Sindu et al., 2012). It was shown that there is an optimumpercentage of CNTs for incorporation in the cement. However, given that themolecular phases of C-S-H were only recently discovered (Pellenq et al., 2009;Abdolhosseini Qomi et al., 2014), the reliability of previous modeling efforts in infer-ring nanoscale phenomena suitable for hybrid C-S-Hebased materials is at stake.More recently, Rafiee et al. (2013) utilized molecular dynamics to confirm the exper-imental results on the effect of 2D superhydrophobic hBN sheets to enhance theabsorption capacity of cement paste for hydrocarbons (vs water). In this study, theyused tobermorite as a crystalline analog of cement hydrate (C-S-H), which is truefor C-S-H phases with calcium-to-silicon (C/S) ratios w1. However, such studiesmust be extended to more realistic C-S-H phases with various C/S ratios spanningw0.7 to w2.3, which is the typically observed stoichiometry of C-S-H incement-based materials. Compared to computational nanoscale modeling, there isgenerally more research on synthesis and characterization of low-dimensionalmaterials in cement, which will be discussed next.
5.3.2 Characterization
Since the discovery of graphene (a single layer of carbon atoms in graphite) less than adecade ago, low-dimensional materials have gained extensive attention for theirremarkable mechanical, thermal, and electrical properties. Recently, several attemptshave been made to incorporate them in cementitious materials, with some success inachieving high-performance composites.
The highest compressive strength of a CNTecement nanocomposite was reportedin 2008 (Cwirzen et al., 2008). Cwirzen et al. achieved a 50% increase in the compres-sive strength using a multiwall carbon nanotube (MWCNT) sample. For the same sam-ple, S�aez De Ibarra et al. (2006) achieved a 227% improvement in the Young’smodulus. In another study, over 600% improvement in Vicker’s hardness at early
Hybrid cementitious materials: nanoscale modeling and characterization 89

ages of hydration for a 2% single-wall carbon nanotube (SWCNT) with a low water-to-cement (w/c) ratio was reported (Makar et al., 2005). In contrast, samples with a 0.8w/c ratio showed reduction in strength in all the time periods. Makar and Chan(2009) suggested that the observed behavior improvement depended on both samplecomposition and hydration time. They showed that C-S-H nucleates on the entire sur-face of SWCNTs (Figure 5.11). Formation of such a dense C-S-H that is tightlybonded to SWCNTs provides reinforcing behavior for C-S-H.
Electrical properties of MWCNTecement nanocomposites have also been investi-gated. Significant improvement in DC electrical conductivity (on the order of130e170 U-cm) as compared to control samples have been reported (Li et al.,2005). Formation of C-S-H along MWCNTs was previously reported (Li et al.,2005). Makar and Chan (2009) claimed that the same phenomenon is dominant inSWCNTecement as well. Tyson et al. (2011) examined properties of CNTs and car-bon nanofibers (CNFs) incorporated in the cement paste. They reported a 150% in-crease in the ultimate displacement compared to pure cement paste, which provideshigher ductility for structures. Young’s modulus, fracture toughness, and flexuralstrength have been lower compared to pure cement paste at early stages. However,at 28 days, most of their composite samples had better properties than pure cementpaste. A recent atomic force microscopy (AFM) observation (Alkhateb and Cheng,2012) of grapheneecement nanocomposite has indicated promising results inimproving the elastic behavior and strength of cementitious nanocomposites. Theyalso carried out molecular dynamics simulations that revealed the interfacial bridgingrole of functionalizing graphene with improved overall strength of the nanocomposite.CNFs have been used to increase tension strength of the cement paste. However, theytypically reduce the compressive strength and ductility.
A recent study (Rafiee et al., 2013) reported successful incorporation of grapheneoxide (GO) and boron nitride (BN) sheets in the cement paste, thus improving bothmechanical properties and the ability to absorb hydrocarbons. They concluded thatBN sheets yield better results than GO and the combination of GO and BN(Figure 5.12). However, further studies are needed to confirm such effects in morecontrolled conditions and environments, for instance a direct impact on C-S-H.
1 μm
Figure 5.11 Single-wall carbon nanotubes (SWCNTs) pulling out of the hydrated SWCNTeC-S-H composite when cracked (Makar and Chan, 2009).
90 Multifunctional Nanocomposites in Civil and Structural Engineering

5.4 Discussion and summary
This chapter provided an overview of modeling, synthesis, and characterization ofvarious hybrid cementitious materials. Following the traces of natural and biologicalmaterials in combining multiple constituents to produce high-performance composites,several research groups have attempted to synthesize hybrid cementitious materialswith controlled structure and enhanced properties such as concurrent ductility, strength,and/or thermal conductivities. Irrespective of the final property and/or application, the“interface” in all hybrid materials is typically the bottleneck in understanding, control-ling, and improving various hybrid properties of the cementitious composites. In thiscontext, nanoscale modeling, although in its infancy, provides a key tool as an atomistic“lens” to fully understand and predict the behavior of hybrid cement-based materials.
Polymerecementitious composites are a key class of hybrid cementitious materialswith reported mechanical property enhancement. Most of the studies are focused onincorporation of polymer in C-S-H as the primary source of mechanical propertiesin cement-based materials. Via nanoscale modeling, it was shown that hydrogenbonding between polymer matrices and the C-S-H phase forms a strong interfacialnetwork that bridges hybrid polymerecement layers. More importantly, it was shownthat an existence of a finite polymer length is the key to creating high-strength,high-toughness cementepolymer composites (Sakhavand et al., 2013; Sakhavandand Shahsavari, 2015). Such computational modeling can provide significant informa-tion to guide synthesis and characterization experiments, which were extensively dis-cussed for hybrid polymerecement composites.
Low-dimensional materials such as CNTs, graphene, and hBN are another class ofnanomaterials that more recently have been considered as multifunctional filers forhybrid cementitious composites. With huge surface areas and a tendency towardagglomeration, the major challenge in this category of fillers seems to be their homo-geneous dispersion in the cement paste. Although some researchers reported increasedproperty enhancement, the underlying interfacial physics and chemistry are yet to befully explored. More precisely, understanding how a small percentage of such nano-materials yields considerable increase in hybrid properties of the composite can helpsynthesis of efficient composites with desired material properties.
30 μm5 μm
BN sheets
Figure 5.12 SEM images of the fractured surface of BNecement (left) and a BNeGOecementcomposite (right) (Rafiee et al., 2013).
Hybrid cementitious materials: nanoscale modeling and characterization 91

Nanoscale modeling is an underutilized method for investigating the structures andproperties of hybrid cementitious materials. Modeling on this scale provides a newmethod for developing physical insights and identifying design variables. Further-more, investigations via nanoscale modeling will inform processes and algorithmsfor synthesizing and characterizing hybrid cement-based materials in the future.Such studies can greatly benefit and contribute to emerging compositionestructureeproperty relationships recently being advanced for complex natural and biomimeticmaterials. As an example, Figure 5.13 shows a universal design map (Sakhavandand Shahsavari, 2015) that can be used for design and optimization of mechanicalproperties of various natural and synthetic plateletematrix composites, includinghybrid layered cementitious materials. Similar knowledge-based design approachesmay be applied to cementitious nanocomposites and can control their interfacialproperties and architectures through using particular constituents (polymer,low-dimensional materials, etc.), geometrical attributes (length scales, volume frac-tion, layer thickness, etc.), new synthesis methods (e.g., intercalation and exfoliation),and so on to expedite and advance the discovery of novel hybrid cementitious mate-rials. This research vision will place hybrid cementitious materials on equal footing
Strong
c' d' e' f'ba'
fedc
ab
Clay–PVA
Alumina–PMMA
Spider silk
GraphiteNacreGraphene paper
Collagen
Cement–PVA
Alumina–chitosan
hBN–Graphene
Graphene–MoS2
Silumin–alumina
MoS –Ti2
Graphene–3hBN
Graphene–MoS
Tough (T)0 0.5 1
Strong, tough (ST)Strong (S)Strong, stiff (SF)
0 0.5 1
'
Toug
h
Stro
ng&
toug
h
0 10 20 301
1.1
1.2
1.3
1.4
∞λL
k
Strong
& stiff
2
GMoS2
Figure 5.13 Compositionestructureeproperty diagram shows an interplay of mechanicalproperties (strength toughness, stiffness) with the microstructure of plateletematrix compositesfor natural and biomimetic composites. lL and k are dimensionless universal parametersapplicable to various constituents (Sakhavand and Shahsavari, 2015).
92 Multifunctional Nanocomposites in Civil and Structural Engineering

with crystalline systems and alloys in the current applications of structureepropertyrelationships in design, thereby providing an enormous impact in modern engineeringand applications of multifunctional infrastructure materials.
Acknowledgment
The preparation of this chapter was supported financially in part by the Department of Civil andEnvironmental Engineering at Rice University and in part by the National Science Foundationgrant number 1235522.
References
Abdolhosseini Qomi, M.J., et al., 2014. Combinatorial molecular optimization of cementhydrates. Nature Communication 5, 1e10.
Alizadeh, R., Beaudoin, J., Raki, L., Terskikh, V., 2011. CeSeH/polyaniline nanocompositesprepared by in situ polymerization. Journal of Material Science 46, 460e467.
Alkhateb, H., Al-Ostaz, A., Cheng, A., 2013. Material genome for graphene-cement nano-composites for infrastructure applications. ASCE Journal of Nanomechanics and Micro-mechanics 3 (3), 67e77.
Allen, A.J., Thomas, J.J., Jennings, H.M., 2007. Composition and density of nanoscalecalciumesilicateehydrate in cement. Nature Materials 6, 311e316.
Beaudoin, J.J., Dramé, H., Raki, L., Alizadeh, R., 2008. Formation and characterization ofcalcium silicate hydrateehexadecyltrimethylammonium nanostructure. Journal of Mate-rials Research 23, 2804e2815.
Beaudoin, J., Dramé, H., Raki, L., Alizadeh, R., 2009a. Formation and properties of C-S-HePEG nano-structures. Materials and Structures 42, 1003e1014.
Beaudoin, J.J., Raki, L., Alizadeh, R., 2009b. A 29Si MAS NMR study of modified CeSeHnanostructures. Cement and Concrete Composites 31, 585e590.
Bennadji-Gridi, F., Smith, A., Bonnet, J.-P., 2006. Montmorillonite based artificial nacre pre-pared via a drying process. Materials Science and Engineering: B 130, 132e136.
Bonderer, L.J., Studart, A.R., Gauckler, L.J., 2008. Bioinspired design and assembly of plateletreinforced polymer films. Science 319, 1069e1073.
B€uy€uk€ozt€urk, O., Buehler, M.J., Lau, D., Tuakta, C., 2011. Structural solution using moleculardynamics: fundamentals and a case study of epoxy-silica interface. International Journal ofSolids and Structures 48, 2131e2140.
Chen, R., Wang, C-A., Huang, Y., Le, H., 2008. An efficient biomimetic process for fabrication ofartificial nacre with ordered-nanostructure. Material Science Engineering, C 28, 218e222.
Corni, I., et al., 2012. A review of experimental techniques to produce a nacre-like structure.Bioinspiration and Biomimetics 7 (031001).
Cwirzen, A., Habermehl-Cwirzen, K., Penttala, V., 2008. Surface decoration of carbon nano-tubes and mechanical properties of cement/carbon nanotube composites. Advances inCement Research 20, 65e73.
Dai, W., Shui, Z., Duan, P., 2011. Molecular dynamics simulation on calcium silicate hydratedoped organic molecules. In: Chen, R. (Ed.), Intelligent Computing and InformationScience, vol. 134. Springer, Berlin Heidelberg, pp. 155e160.
Hybrid cementitious materials: nanoscale modeling and characterization 93

Ekiz,O.,Dericioglu,A.F.,Kakisawa,H., 2009.Anefficient hybrid conventionalmethod to fabricatenacre-like bulk nano-laminar composites. Material Science Engineering, C 29, 2050e2054.
Espinosa, H.D., Rim, J.E., Barthelat, F., Buehler, M.J., 2009. Merger of structure and material innacre and bone: perspectives on de novo biomimetic materials. Progress in Material Sci-ence 54, 1059e1100.
Flatt, R.J., Schober, I., Raphael, E., Plassard, C.d., Lesniewska, E., 2008. Conformation ofadsorbed comb copolymer dispersants. Langmuir 25, 845e855.
Fratzl, P., Burgert, I., Gupta, H.S., 2004. On the role of interface polymers for the mechanics ofnatural polymeric composites. Physical Chemistry Chemical Physics 6, 5575e5579.
Gao, H., 2006. Application of fracture mechanics concepts to hierarchical biomechanics of boneand bone-like materials. International Journal of Fracture 138, 101e137.
Jalilvand, S., Shahsavari, R., 2014. Molecular mechanistic origin of nanoscale contact, frictionand scratch in complex particulate systems. ACS Applied Materials and Interfaces.
Kalinichev, A.G., Wang, J., Kirkpatrick, R.J., 2007. Molecular dynamics modeling of thestructure, dynamics and energetics of mineralewater interfaces: application to cementmaterials. Cement and Concrete Research 37, 337e347.
Kojima, Y., Usuki, A., Kawasumi, M., Okada, A., Fukushima, Y., Kurauchi, T., Kamigaito, O.,1993. Mechanical properties of nylon 6-clay hybrid. Journal of Materials Research 8,1185e1189.
Launey, M.E., et al., 2009. Designing highly toughened hybrid composites through nature-inspired hierarchical complexity. Acta Materialia 57, 2919e2932.
Li, G.Y., Wang, P.M., Zhao, X., 2005. Mechanical behavior and microstructure of cementcomposites incorporating surface-treated multi-walled carbon nanotubes. Carbon 43,1239e1245.
Lin, A.Y.M., Meyers, M.A., Vecchio, K.S., 2006. Mechanical properties and structure ofStrombus gigas, Tridacna gigas, and Haliotis rufescens sea shells: a comparative study.Materials Science and Engineering: C 26, 1380e1389.
Lin, T.-H., Huang, W.-H., Jun, I.-K., Jiang, P., 2009. Electrophoretic co-deposition of bio-mimetic nanoplateletepolyelectrolyte composites. Electrochemistry Communications 11,1635e1638.
Makar, J.M., Chan, G.W., 2009. Growth of cement hydration products on single walled carbonnanotubes. Journal of the American Ceramic Society 92, 1303e1310.
Makar, J.M., Margeson, J.C., Luh, J., 2005. Carbon Nanotube/cement Composites - EarlyResults and Potential Applications. 3rd International Conference on Construction Mate-rials: Performance. Innovation and Structural Implications, Vancouver, B.C, pp. 1e10.
Matsuyama, H., Young, J.F., 1998. Intercalation of polymers in calcium silicate hydrate: a newsynthetic approach to biocomposites? Chemistry of Materials 11, 16e19.
Matsuyama, H., Young, J.F., 1999a. Synthesis of calcium silicate hydrate/polymer complexes:Part I. Anionic and nonionic polymers. Journal of Materials Research 14 (10).
Matsuyama, H., Young, J.F., 1999b. Synthesis of calcium silicate hydrate/polymer complexes:Part II. Cationic polymers and complex formation with different polymers. Journal ofMaterials Research 14 (8).
Merlin, F., et al., 2002. Cement-polymer and clay-polymer nano- and meso-composites: spottingthe difference. Journal of Materials Chemistry 12, 3308e3315.
Minet, J., et al., 2006. Organic calcium silicate hydrate hybrids: a new approach to cement basednanocomposites. Journal of Materials Chemistry 16, 1379e1383.
Mojumdar, S., Raki, L., 2006. Synthesis, thermal and structural characterization of nano-composites for potential applications in construction. Journal of Thermal Analysis andCalorimetry 86, 651e657.
94 Multifunctional Nanocomposites in Civil and Structural Engineering

Mojumdar, S.C., Raki, L., 2005. Characterization and properties of calcium silicate hydratepolymer nanocomposites. In: Proceedings of the American Ceramic Society 107th AnnualMeeting, pp. 1e10.
Muller, A.C.A., Scrivener, K.L., Gajewicz, A.M., McDonald, P.J., 2012. Densification ofCeSeH measured by 1H NMR relaxometry. The Journal of Physical Chemistry C 117,403e412.
Oaki, Y., Kotachi, A., Miura, T., Imai, H., 2006. Bridged nanocrystals in biominerals and theirbiomimetics: classical yet modern crystal growth on the nanoscale. Advanced FunctionalMaterials 16, 1633e1639.
Ohama, Y., 1995. Handbook of Polymer-modified Concrete and Mortars Properties and ProcessTechnology. NOYES publications, Park Ridge, New Jersey, USA.
Okamoto, M., 2003. Polymer/layered Silicate Nanocomposites. Rapra Technology Ltd.Pellenq, R.J.M., et al., 2009. A realistic molecular model of cement hydrates. Proceedings of the
National Academy of Sciences 106, 16102e16107.Pellenq, R.J.-M., Lequeux, N., Van Damme, H., 2008. Engineering the bonding scheme in
C-S-H: the iono-covalent framework. Cement and Concrete Research 38, 159e174.Popova, A., Geoffroy, G., Renou-Gonnord, M.-F., Faucon, P., Gartner, E., 2000. Interactions
between polymeric dispersants and calcium silicate hydrates. Journal of the AmericanCeramic Society 83, 2556e2560.
Rafiee, M.A., et al., 2013. Hexagonal boron nitride and graphite oxide reinforced multifunc-tional porous cement composites. Advanced Functional Materials 23, 5624e5630.
Rexer, J., Anderson, E., 1979. Composites with planar reinforcements (flakes, ribbons)dareview. Polymer Engineering and Science 19, 1e11.
Richardson, I.G., 1999. The nature of C-S-H in hardened cements. Cement and ConcreteResearch 29, 1131e1147.
S�aez De Ibarra, Y., Gaitero, J.J., Erkizia, E., Campillo, I., 2006. Atomic force microscopy andnanoindentation of cement pastes with nanotube dispersions. Physica Status Solidi A 203,1076e1081.
Sakhavand, N., Shahsavari, R., 2015. Universal compositionestructureeproperty maps fornatural and biomimetic plateletematrix composites and stacked heterostructures. NatureCommunication 6.
Sakhavand, N., Muthuramalingam, P., Shahsavari, R., 2013. Toughness governs the rupture ofthe interfacial H-bond assemblies at a critical length scale in hybrid materials. Langmuir 29,8154e8163.
Shahsavari, R., Chen, L., 2015. Screw dislocations in complex, low symmetry oxides: corestructures, energetics and impact on crystal growth. ACS Applied Materials and Interfaces.
Shahsavari, R., Buehler, M.J., Pellenq, R.J.M., Ulm, F.-J., 2009. First-principles study of elasticconstants and interlayer interactions of complex hydrated oxides: case study of tobermoriteand jennite. Journal of Amecian Ceramic Society 92, 2323e2330.
Shahsavari, R., Pellenq, R.J.M., Ulm, F.-J., 2011. Empirical force fields for complex hy-drated calcio-silicate layered materials. Physical Chemistry Chemical Physics 13,1002e1011.
Silva, D.A., Monteiro, P.J.M., 2005. ESEM analysis of polymeric film in EVA-modified cementpaste. Cement and Concrete Research 35, 2047e2050.
Silva, D.A., Monteiro, P.J.M., 2006. The influence of polymers on the hydration of portlandcement phases analyzed by soft X-ray transmission microscopy. Cement and ConcreteResearch 36, 1501e1507.
Sindu, B.S., Sasmal, S., Gopinath, S., 2012. Numerical simulation of CNT incorporated cement.World Academy of Science, Engineering and Technology.
Hybrid cementitious materials: nanoscale modeling and characterization 95

Tang, Z.-Y., Lu, Y., Hu, Q.-S., 2003a. Direct synthesis of ferrocenylmethylphosphines fromferrocenylmethyl alcohols and their application as ligands for room temperature Pd(0)-catalyzed Suzuki cross-couplings of aryl bromides. ChemInformatics 34, 297e300.
Tang, Z., Kotov, N.A., Magonov, S., Ozturk, B., 2003b. Nanostructured artificial nacre. NatureMaterials 2, 413e418.
Taylor, H.F.W., 1986. Proposed structure for calcium silicate hydrate gel. Journal of theAmerican Ceramic Society 69, 464e467.
Tseng, Y.-H., Lin, H.-Y., Liu, M.-H., Chen, Y.-F., Mou, C.-Y., 2009. Biomimetic synthesis ofnacrelike faceted mesocrystals of ZnO�Gelatin composite. Journal of Physical ChemistryC 113, 18053e18061.
Tyson, B.M., Al-Rub, R.K.A., Yazdanbakhsh, A., Grasley, Z., 2011. Carbon nanotubes andcarbon nanofibers for enhancing the mechanical properties of nanocomposite cementitiousmaterials. Journal of Materials in Civil Engineering 23, 1028e1035.
Wang, C.-A., Huang, Y., Zan, Q., Guo, H., Cai, S., 2000. Biomimetic structure designdapossible approach to change the brittleness of ceramics in nature. Material Science Engi-neering, C 11, 9e12.
Wegst, U.G.K., Bai, H., Saiz, E., Tomsia, A.P., Ritchie, R.O., 2015. Bioinspired structuralmaterials. Nature Materials 14, 23e36.
Wu, W., Al-Ostaz, A., Cheng, A., Song, C., 2011. Computation of elastic properties of Portlandcement using molecular dynamics. Journal of Nanomechanics and Micromechanics 1,84e90.
Yu, Y.H., Lin, C.Y., Yeh, J.M., Lin, W.H., 2003. Preparation and properties of poly(vinylalcohol)-clay nanocomposite materials. Polymer 44, 3553e3560.
96 Multifunctional Nanocomposites in Civil and Structural Engineering

Smart cement paste with carbonnanotubes 6Filippo Ubertini 1, Simon Laflamme 2, Antonella D’Alessandro 1
1University of Perugia, Perugia, Italy; 2Iowa State University, Ames, IA, USA
6.1 Introduction
We are living the beginning of a new industrial revolution based on the development ofa new level of scientific and technological progress. The application of complex the-ories based on quantum physics has enabled researchers to achieve nanoscale develop-ments in material science and electronics. Nanoscale modified materials possessmechanical, electrical, and thermal properties that are significantly improvedcompared to those at the micro and macro scales. This is due to the relatively largersurface area at the nano level, which can make materials more chemically activeand can affect their strength and/or electrical properties. Quantum effects can dominatethe behavior of matter at the nanoscale, affecting optical, electrical, and magneticbehavior of materials.
Similarly, many properties of cementitious materials, such as their electrical con-ductivity, are affected by their micro and nanobehavior (Mondal et al., 2008). Theaddition of micro- and nanofibers to cementitious matrices allows the modificationof materials’ properties (Li et al., 2007). In particular, carbon nanotubes (CNTs) areideal candidates for casting smart cementitious composites, because of their piezore-sistive characteristics that cause changes in electrical resistivity upon strain. Whenthe amount of CNTs in the composite matrix reaches a critical fraction, percolationstarts and the material becomes a conductor. In order to achieve a conductor, it iscrucial to properly disperse the conductive particles within the matrix. This new classof modified strain-sensitive cementitious materials, termed self-sensing, transducesmechanical strain acting upon them into variations in their electrical properties, suchas resistance and reactance. Thus, self-monitoring is achieved by correlating the vari-ation of the applied stresses with the variation of appropriate parameters and propertiesof the material, in particular the electrical resistance. The variation in the resistivity (orin the electrical resistance) can be measured to assess mechanical deformation, and thisinformation can be exploited for the purpose of structural diagnosis. For example, asmart cementitious material can be used to monitor the emergence and evolution ofdamage such as microfractures. Notable advantages of the sensing principle are thatthe electrical resistance requires a relatively simple instrumentation, provides direc-tional information on strain, and enables detection of microstructural changes (Chungand Wang, 2003). Also, using a cementitious matrix allows easy embedment of thesensor within concrete elements and can then transform structures into distributedsensor network systems.
Innovative Developments of Advanced Multifunctional Nanocomposites in Civil and Structural Engineeringhttp://dx.doi.org/10.1016/B978-1-78242-326-3.00006-3Copyright © 2016 Elsevier Ltd. All rights reserved.

6.2 State of the art
Until 1992, studies on monitoring concrete structures with nondestructive methodscentered on the embedment of various types of sensors (Measures, 1993). N. Muto(Muto et al., 1992) was the first to propose concrete with self-monitoring properties,using carbon fibers and glass. The advantage of the composite was a substantialgain in the bonding characteristics of the embedded agents. In related work to “smart”concrete, Chen and Chung researched in 1993 the addition of carbon fibers into con-crete admixtures. Carbon fibers were recognized as particularly suited to be used in thecase of cementitious materials as they could simply be added to the admixture asnormal aggregates. In their earliest publication on the topic, Chen and Chung(1993) analyzed the electrical properties and self-sensitivity of cementitious materialsfabricated with various types of additives. The effect of damage in the nanomodifiedcementitious materials was studied by measuring the electrical resistivity duringcompression cycles in elastic and plastic conditions. It was found that the cycleswere dominated by the formation and opening of cracks during loading and the partialclosure of cracks during unloading. They noted an opposite variation of the electricalresistance, and therefore of the resistivity, in elastic and plastic regimes and an increaseof background electrical resistance due to irreversible damage. Dispersion of the nano-particles was attained with methyl cellulose, latex, or silica fume. The addition ofconductive additives to the matrix resulted in improved conductivity of the compositeeven when the fraction of the nanoparticles was below the percolation threshold, asdiscussed in the Introduction. When the volume fraction was below the percolationthreshold, the electrical conductivity of the composite was found to be strongly depen-dent on the degree of dispersion of the fibers.
Correct and uniform dispersion of the nanotubes within the cement matrix is a pri-mary concern for achieving composites with good electrical properties. CNTs havetwo main geometrical characteristics: the nanometric size and a high specific surface.These two factors are responsible for the poor solubility and difficult dispersion ofnanotubes within the matrix. This difficulty is due to the fact that the increase of spe-cific surface area also increases the van der Waals attraction forces between the aggre-gates (Lourie and Wagner, 1998). Also, the nanosized particles tend to spontaneouslyagglomerate due to their nanoscale dimension.
There are three main approaches to disperse the nanotubes in water (Han et al., 2011):
1. Mechanical methods, based on the use of mechanical mixers;2. Physical methods, based on the use of dispersants that operate a non-covalent surface modi-
fication or on the use of ultrasounds;3. Chemical methods, through a covalent surface modification.
The presence of dispersants in an aqueous solution containing nanotubes is some-times crucial to avoid the presence of bundles (Konsta-Gdoutos et al., 2010). Ultra-sonic treatments are often used to obtain good dispersion.
Cementitious materials are subjected to polarization (Sihai and Chung, 2001), aphenomenon that commonly occurs in dielectric materials exposed to an electric field.The induced polarization is a result of the electric field, which is generated in the
98 Multifunctional Nanocomposites in Civil and Structural Engineering

opposite direction to the applied electric field and creates a current. The polarizationcauses an apparent increase in electrical resistance during the measurement process.A higher conductivity of the material will cause a faster polarization effect (Cao andChung, 2004).
The scientific literature in the last decade shows a growing interest for the use ofnanomaterials in the construction industry, especially regarding the use of nanopar-ticles with smart properties.
The most frequently used fillers for the electrical characterization of cementmatrices are nano-SiO2 and nano-Fe2O3 particles (Li et al., 2003), carbon nanofibers(CNFs) (Xu and Liu, 2007), carbon black (CB), single-walled CNTs (SWCNTs),and multiwalled CNTs (MWCNTs) (Gao et al., 2009; Coppola et al., 2011). Hybridmixes of different particles have also been studied, including CNTs and nickel pow-ders (Han et al., 2012.), or carbon fibers and CNTs (Azhari and Banthia, 2012). Nano-particles have been added to cement paste (Coppola et al., 2011; Han et al., 2007; Hanand Ou, 2007; Banthia, 2009), mortar (Li et al., 2003), conventional concrete (Xu andLiu, 2007), and self-compacting concrete (Gao et al., 2009).
The exploitation of the piezoresistivity of the composite materials for strain sensingwas addressed in Refs. (Han et al., 2007; Han and Ou, 2007; Banthia, 2009; Han et al.,2009; Yu and Kwon, 2009). In 2006, the first theoretical study on the self-sensitivity offiber-reinforced cement-based materials with carbon particles was published (Wen andChung, 2006). The model leveraged the concept that piezoresistivity was due to thepullout of the fibers that passed through the microcracks that formed during the open-ing of cracks. This provoked an increase in the electrical contact resistance of thefiberematrix interface. Most of the studies available in literature have focused sofar on the static response of nanotechnology-modified cement-based materials,whereas their dynamic response has been little investigated. The response of nanomo-dified strain-sensing composite materials to dynamic loads is almost unexplored (Donget al., 2011; Loh and Chang, 2011), with only a few studies devoted to cementitiousmaterials (Materazzi et al., 2013; Ubertini et al., 2014a,b; D’Alessandro et al., 2014).
6.3 Potential applications
Structural health monitoring systems provide information about the performance andstatus of the structures through the observation of their in-service behavior. By usingappropriate algorithms, it is possible to establish an automatic link between the exper-imental observation and the conditions of the structure, promptly recognizing anom-alies of behavior due to incipient damage. Traditional monitoring systems based onsensors wired to a central unit for collection and analog-to-digital conversion of thedata are difficult to apply to large structures. In particular, management and themaintenance of these systems limit large-scale applications. Also, the utilization ofoff-the-shelf sensors provides discrete point measurements only, thus providing par-tial information and limiting structural diagnosis capabilities. Instead, the technologyof self-sensing nanocomposite cement-based materials allows the integration ofself-sensing properties from biological systems into cementitious structures by
Smart cement paste with carbon nanotubes 99

transforming the surface of concrete structures into infinite sets of potential embeddedsensors with enhanced durability and ease of utilization.
Examples of possible applications include monitoring of concrete and asphalt pave-ments. For instance, experimental results showed a great capability of the material toreveal the presence of compressive and impulsive loads, like those resulting from pas-sage of vehicles. They also find great applicability to historic structures by supplement-ing mortar with sensing capabilities, enabling static and dynamic monitoring. Thus, anintegrated system of nanocomposite cement-based sensors could be used to monitorchanges in the vibration signature before and after a seismic event to quickly assessstructural condition. This state of the art demonstrates the growing interest of thescientific community in understanding the behavior and potential applications ofself-sensing cementitious materials. Many researchers worldwide are investigatingthe potential of nanostructured concrete and composite materials subjected to static,cyclic, and dynamic loads. Studies available in the literature indicate that the sensorsmade with nanomodified cementitious materials can be effectively used in structuralhealth monitoring.
6.4 Fabrication process of carbon nanotubecement paste sensors
This section describes the fabrication process of a CNT cement-paste sensor (CNTCS)as used in Materazzi et al. (2013), Ubertini et al. (2014a,b), and D’Alessandro et al.(2014). The cementitious matrix of the sensors is a cement paste. Cement paste ismore homogeneous and potentially more strain-sensitive than cement mortar or con-crete, because there is no sand or coarse aggregates. The cement paste consists of amixture of Portland cement type 42.5 with a waterecement ratio between 0.40 and0.43. The nanotubes dispersed in the composite are Arkema Multi-Wall Carbon Nano-tubes (MWCNTs), type Graphistrength C100. They are used in the amount of 2% bymass of cement. Sky 521 plasticizer, based on second-generation polycarboxylateether polymers, is added to the mix in the amount of 1% by mass of cement to increaseworkability. Physical dispersants are used to improve the dispersion of nanotubes. Forprisms of dimension 40 � 40 � 160 mm3 (Figure 6.1(bed)), the same Sky 521 is
Figure 6.1 Different models of CNTCS: parallelepipeds (a), prisms with wire (b), and netelectrodes (ced).
100 Multifunctional Nanocomposites in Civil and Structural Engineering

also used as a dispersant. For parallelepipeds of dimension 40 � 50 � 40 mm3
(Figure 6.1(a)), an acrylate copolymer ammonium salt solution (ByK154) is usedinstead. The electrodes are made using nets of stainless steel or copper wires,embedded in the center of the samples and placed symmetrically along the central axis.
6.4.1 Physical properties of MWCNTs and mix design
Table 6.1 summarizes the relevant properties of the carbon nanotubes used in thefabrication process. MWCNT were selected with a carbon content greater than90%. These MWCNTs have an outer mean diameter between 10 and 15 nm anda length between 0.1 and 10 mm. They are formed by multiple concentric cylindri-cal graphene sheets and characterized by an enhanced sensitivity to stress changescompared to SWCNTs due to the higher probability of forming contact points. Theutilization of MWCNTs results in a significant decrease of electrical resistivitywith strain.
Table 6.2 lists the mix design of the cement paste with CNTs and ammoniumpolyacrylateebased dispersant used in the fabrication of the CNTCSs. The third col-umn (content/sample) shows the quantities used for a single sample.
6.4.2 Dispersion of MWCNTs and casting of CNTCSs
As mentioned in this chapter, the dispersion of MWCNTs in a cementitious matrix israther delicate, because the nanoparticles tend to agglomerate in aqueous solutions. Inorder to create a bundle-free homogeneous three-dimensional net, MWCNTs aredispersed in the cement matrix in two stages. In stage 1, MWCNTs are spread in deion-ized water with a sequence of different types of subsequent mixing processes. In stage 2,cement powder is added to the water suspension along with the plasticizer.
Table 6.1 Properties of MWCNTs used in the experimentation
Components MWCNTs
Appearance Black powder
Apparent density 50e150 kg/m3
Mean agglomerate size 200e500 mm
Weight loss at 105 �C <1%
C content >90 wt%
Free amorphous carbon Not detectable (SEM/TEM)
Mean number of walls 5e15
Outer mean diameter 10e15 nm
Length 0.1e10 mm
Smart cement paste with carbon nanotubes 101

Figure 6.2 illustrates the fabrication process of CNTCSs. First, an aqueous solutionis obtained by mixing deionized water, the dispersant (Figure 6.2(a)), and theMWCNTs (Figure 6.2(b)). The mixing procedure consists of 10 min of magnetic stir-ring (Figure 6.2(c)), followed by 15 min of sonication (Figure 6.2(d)) and 15 min ofmechanical mixing at 1500 rpm (Figure 6.2(e)). The ultrasound device used in the son-ication process is a Vibra Cell Bioblock Scientific model 75,043 at 225 W. To avoidexcessive evaporation during sonication, the solution is kept immersed in a bath ofcooled water. After mixing nanotubes, cement is added to the aqueous solution tomake the paste (Figure 6.2(f)). A plasticizer is added to enhance workability. Then,the composite is manually stirred and poured into the molds (Figure 6.2(g)), and elec-trodes are embedded (Figure 6.2(h)). After solidification, the samples are unmolded forcuring (Figure 6.2(i)).
The control of the effective dispersion of CNTs is conducted using a scanning elec-tron microscope (SEM). Figure 6.3 shows a few representative micrographs. There is
Table 6.2 Cement paste mix design
Components Content/m3 Content/sample
MWCNTs 33.0 kg 3.9 g
Portland cement 42.5 1652.0 kg 195 g
Polycarboxylate ether-based plasticizer 16.5 kg 1.9 g
Ammonium polyacrylate-based dispersant 3.3 kg 0.4 g
Water 710.0 kg 84.0 g
W/c 0.43 0.43
Dispersant MWCNT
Deionizedwater
Preparation of solvent
(a) (b) (c) (d) (e)
(i) (h) (g) (f)
Addition ofnanotubes
Embeddingof electrodes
Pouring of thepaste into oiled molds
Addition of thesolution to cement
Curing ofthe samples
Mixing withmagnetic stirrer
Mechanicalmixing
Sonication
Cement Plasticizer
Figure 6.2 Fabricating process of CNTCSs.
102 Multifunctional Nanocomposites in Civil and Structural Engineering

good dispersion in the aqueous solution (Figure 6.3(a)) and in the hardened cementpaste (Figure 6.3(b)).
6.5 Electrical modeling of nanocomposite sensors
Cement paste has a dielectric behavior and consequently exhibits an electrical polari-zation effect. When a dielectric is subjected to an electrical field, the material polarizesby orienting the dipole moments of the molecules that have random orientations undernormal conditions. The result of this phenomenon is an electrical field in the directionopposite to the applied electrical field. This is due to the formation of dipoles. It fol-lows that the sensor cannot be modeled as a simple resistor, but as an interconnectedsystem of capacitors and resistors.
6.5.1 Unstrained response and polarization
Some authors (Han et al., 2007, 2012) suggest to model the electrical behavior ofcement-based composites doped with carbon fibers and CNTs by a capacitor and aresistor in parallel (Figure 6.4). Assuming a similar model for CNTCSs, the evolutionof the electrical current, I, produced by a constant voltage difference, DV, is governedby the following differential equation:
_I þ R0 þ R
CR0RI ¼ DV
CR0R(6.1)
where R0 is the contact resistance of the electrodes, and R and C are the internalresistance and capacitance of the sensor, respectively. In Eqn (6.1), the dot denotestime differentiation and Ið0Þ ¼ DV=ðRþ R0Þ. When the sensor is unstrained, all theelectrical parameters in Eqn (6.1) are treated as constants and the current is given by
I ¼ DV
Rþ R0
�R
R0exp
�� Rþ R0
CRR0t
�þ 1
�(6.2)
Figure 6.3 SEM images of dispersion of MWCNTs in water solution (a) and cement paste (b).
Smart cement paste with carbon nanotubes 103

6.5.2 Identification of sensors’ electrical properties
The electrical behavior of the sensors under a step change in the input voltage ismeasured to validate the equivalent circuit model schematized in Figure 6.4. Theexperimental setup for this test is shown in Figure 6.5. A National InstrumentsNI PXIe-1073 chassis is used for data acquisition (Figure 6.5(a)). The system hostsa module, model NI PXI-4130, which provides the stabilized potential difference
C R
I
R0
–
–
+
+
VΔ
Figure 6.4 Depiction of the proposed electrical model of a CNTCS using a coaxial cable fordata acquisition (the continuous line denotes the center core of the cable and the electrical paththrough the specimen, and the dashed line denotes the metallic shield of the cable).
(a) (b)
Figure 6.5 Experimental setup: data acquisition system (a), and detailed view of coaxial cablesattached to net electrodes of CNTCS (b).
104 Multifunctional Nanocomposites in Civil and Structural Engineering

applied to the electrodes of the specimens through coaxial cables (Figure 6.5(b)). Ahigh-speed digital multimeter, model (NI) PXI-4071, is used to acquire current inten-sity outputted by the sensor.
Step response tests are conducted for both wire electrodes and net electrodes placedat distances of 1, 2, and 4 cm. Output data are optimally fitted using Eqn (6.2) to identifysalient parameters (identification of R0, R, and C; Figure 6.4). Results are shown inFigure 6.6 for the case of net electrodes, and the identified parameters are summarizedin Table 6.3 for both specimens with wire electrodes and with net electrodes.
3.6 × 10⁴
3.2 × 10⁴
2.8 × 10⁴
2.4 × 10⁴
2.0 × 10⁴
1.6 × 10⁴
1.2 × 10⁴
0 200 400 600Time (s)
Time (s)
Time (s)
800 1000
0 200 400 600 800 1000
0
V/I
(V/A
)V/I
(V/A
)V/I
(V/A
)
200 400 600 800 1000
Electrodes' distance of 1 cm ExperimentalModel
ExperimentalModel
ExperimentalModel
Electrodes' distance of 3 cm
Electrodes' distance of 4 cm
5.0 × 10⁴
5.0 × 10⁴
4.0 × 10⁴
3.0 × 10⁴
2.0 × 10⁴
1.0 × 10⁴
6.0 × 10⁴
4.0 × 10⁴
3.0 × 10⁴
2.0 × 10⁴
1.0 × 10⁴
ΔΔ
Δ
(a)
(b)
(c)
Figure 6.6 Comparison between experimental results and analytical predictions for thepolarization tests on CNTCSs with net electrodes placed at distances of (a) 1 cm, (b) 2 cm, and(c) 4 cm, respectively.
Smart cement paste with carbon nanotubes 105

Correlation coefficients between theoretical predictions and experimental results arealso presented for completeness.
Results show a close match between model responses and experimental data. Ashypothesized, the contact resistance does not vary with the distance between elec-trodes. Conversely, both the internal resistance and the capacitance show a high depen-dence on the distance between electrodes.
6.6 Vibration monitoring
In this section, the capability of CNTCSs to monitor vibration signatures is exam-ined. First, experiments are conducted under quasi-static load cycles to obtainthe stressestrain constitutive relation in the elastic conditions. Second, an in-depthdynamic characterization of the sensors is conducted using a uniaxial test machineto apply harmonic compression loads.
6.6.1 Quasi-static response
The test setup for the quasi-static load cycle test is shown in Figure 6.7. The instrumen-tation consists of the acquisition systems of the loads and the strain gauges attached ontothe sensors, the electrometer, and the actuator. The application of the axial load to thecement paste samples is produced by a hydraulic press, typeMTSModel 243.40T, oper-ating under force control. Data of the applied load are acquired using a PC-controlleddata acquisition system for the MTS Force Transducer Model 661.23F-01. A digitalKeithley Electrometer, model 6517B, is used to induce voltage and conduct electricalmeasurements. A Spider8 device samples and records the axial deformation of thecement paste at midheight using off-the-shelf strain gauges positioned on the lateral sur-faces and on opposite faces. Figure 6.7(b) shows a specimen under test. The two internalelectrodes of the CNTCS, placed at a distance of 2 cm, are used in the experiment toprovide the voltage to the sensor and to measure the variation of electric current. Tolimit the effects of polarization on the results, a constant potential difference of 30 V,without load, is applied to the sensors during 1000 s prior to testing.
Table 6.3 Model parameters from polarization tests for specimen withwire and net electrodes (D’Alessandro et al., 2014)
Wire electrodes Net electrodes
1 cm 2 cm 4 cm 1 cm 2 cm 4 cm
R0 (kU) 101.8 83.4 56.7 85.6 79.2 95.1
R (kU) 17.7 31.7 128.8 27.0 30.9 14.6
C (mF) 53,600 39,400 3900 19,755 11,260 7125
Correlation 0.9996 0.9989 0.9764 0.9998 0.9990 0.9717
106 Multifunctional Nanocomposites in Civil and Structural Engineering

Figure 6.8 shows the stressestrain relationship measured from the test. The strain(average between the two strain gauges) is expressed in millistrain units. The stressestrain relation appears to be nonlinear in the very low stress-amplitude range. Thetangent Young’s modulus of the cement paste is estimated from a quadratic interpola-tion of the measured stressestrain curve (Figure 6.8(b)).
6.6.2 Dynamic characterization
The study of the dynamic behavior of the CNTCS is initiated by evaluating itsresponse to a cyclic load at (1) constant frequencies and (2) variable frequencies.
At constant frequencies, the individual responses in the range of 0.1e1.0 Hz withsteps of 0.1 Hz, 1.5e3.0 Hz with steps of 0.5 Hz, and 3.0e5.0 Hz with steps of 1 Hz
(a) (b)
Figure 6.7 (a) Experimental setup; and (b) positioning of the sample.
–2
(a) (b)10,000
8000
6000
4000
Strain (millistrain)
Tang
ent Y
oung
's m
odul
us (M
Pa)
Stre
ss (M
Pa)
Strain (millistrain)
–1.5
–0.5
–0.2 –0.3 –0.4 –0.2 –0.3 –0.40
–1
Figure 6.8 Measured stressestrain constitutive relationship of the sensors (a), and tangentYoung’s modulus versus strain (b).
Smart cement paste with carbon nanotubes 107

are investigated. Each load test consists of applying a force of 2 kN for 240 s, followedby a harmonic load ranging from 2 to 4 kN, which corresponds to axial stress of 1.25and 2.5 MPa, respectively. The load and the deformation are measured at a samplingfrequency of 10 Hz for frequencies �1 Hz, and 25 Hz for larger frequencies. Outputcurrent intensity is sampled with a frequency of 13.5 Hz.
At variable frequencies, the response is investigated by conducting a frequencysweep in the range of 0.1e5.0 Hz. The initial load of 2 kN is kept constant for 70 s.Ten load cycles with 14 different frequencies are performed: from 0.1 to 0.5 Hzwith steps of 0.1 Hz, 0.75 Hz, from 1.0 to 4.0 Hz with steps of 0.5 Hz, and 5.0 Hz.Tests are conducted with increasing frequencies (forward sweep test) and decreasingfrequencies (backward sweep test). Each test has an approximate duration of 340 s.The loads and the deformations are acquired at 25 Hz, and current intensity is sampledat 13.5 Hz. The electrical resistance is obtained by dividing the applied voltage of 30 Vby the measured current.
Figure 6.9 shows time histories of the applied load and of the corresponding elec-trical resistance for a few selected typical values of the loading frequency, along withthe corresponding normalized power spectral density (PSD) function. The applica-tion of a compressive load produces a decrease of the electrical resistance. Uponcompression, the MWCNTs get closer, which increases conductivity (Chen andChung, 1993; Azhari and Banthia, 2012). Another feature in the signal is the increasein electrical resistance during the initial application of the constant load, which is dueto the polarization of the cement paste. There is an excellent correlation between theaxial strain and the electric resistance during the application of the harmonic loads,even if the effect of sampling errors is greater for frequencies above 2.5 Hz.Figures 6.10 and 6.11 show the good fit between the waveforms of measured strainand electrical resistance.
Figure 6.12 shows the experimental setup of the tests for the dynamic validation.The actuator consists of a servo-controlled pneumatic universal testing machine(IPC Global UTM-14P) of 14 kN load capacity (Figure 6.12(a)). The sensing specimen(Figure 6.12(b)), precompressed at 1 kN, is subjected to harmonic loads with fre-quencies ranging from 0.25 to 15 Hz. The investigated frequency range covers thetypical natural frequencies of civil structures. The CNTCS specimen remains in thelinear elastic range of strain during the test. The tests are conducted by providing a sta-bilized voltage input of 2 V with a source unit NI PXI-4130. The output measurementsare performed with a high-speed digital multimeter, model NI PXI-4071, installed inan NI PXIe-1073 (Figure 6.12(c)) at a sampling rate of 1000 Hz.
The electrical current of the CNTCS (and the measured electrical resistance) varieswith strain and is affected by polarization. As discussed in Section 3.1, the electricalresistance asymptotically reaches the internal electrical resistance in unstrained condi-tions due to the polarization effect. Polarization can be eliminated using a high-passfilter. The relation between change in resistance and strain can be expressed in termsof a gauge factor:
DR
R0¼ lCNTCSDε (6.3)
108 Multifunctional Nanocomposites in Civil and Structural Engineering

where lCNTCS is the CNTCS gauge factor and R0 is the value of its unstrained internalelectrical resistance. Because CNTCSs are strain rate dependent, their strain-to-signal relationship is nonlinear. It follows that lCNTCS is not constant over wideranges of strain.
–0.25
0.5
0.49
0.48
–0.3
–0.35
–0.4
–0.45
–0.35
0.48
0.475
0.47
0.465
0.46
–0.4
–0.5
–0.55250 260 270
250 260 270
–0.45
–0.5250 275 300 325 350
250 275 300 325 350Time (s)
Stra
in (m
illis
train
)S
train
(mill
istra
in)
Res
ista
nce
(MΩ
)R
esis
tanc
e (M
Ω)
Time (s)
100
10–1
10–2
10–3
10–4
10–5
10–6
10–7
0 0.5 1 1.5 2
0 0.5 1 1.5 2
100
10–1
10–2
10–3
10–4
10–5
10–6
10–7
Resistance
Strain
Frequency (Hz)
Frequency (Hz)
Nor
mal
ized
PS
DN
orm
aliz
ed P
SD
(a)
(c) (d)
(b)
Figure 6.9 Time histories of strain and corresponding electrical resistance for frequencies of0.1 and 1.0 Hz (a, c) and relative normalized power spectral density (b, d).
Smart cement paste with carbon nanotubes 109
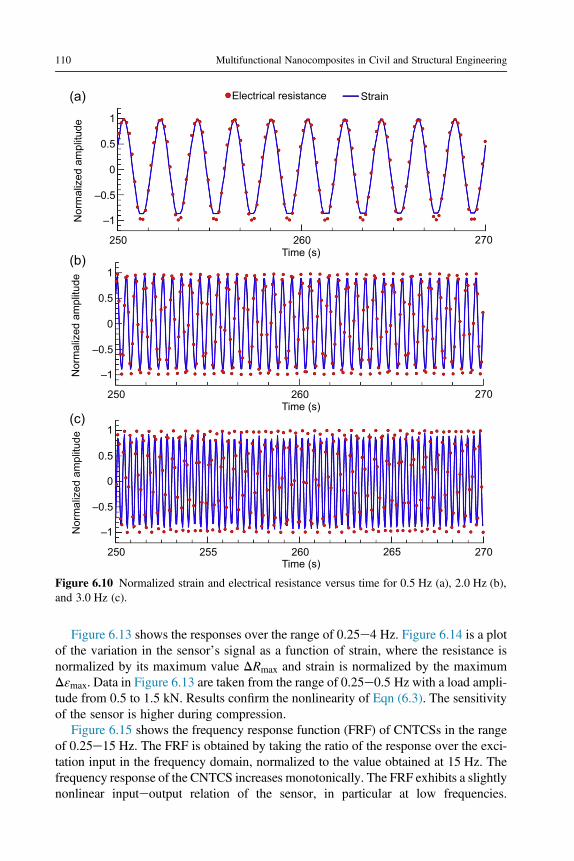
Figure 6.13 shows the responses over the range of 0.25e4 Hz. Figure 6.14 is a plotof the variation in the sensor’s signal as a function of strain, where the resistance isnormalized by its maximum value DRmax and strain is normalized by the maximumDεmax. Data in Figure 6.13 are taken from the range of 0.25e0.5 Hz with a load ampli-tude from 0.5 to 1.5 kN. Results confirm the nonlinearity of Eqn (6.3). The sensitivityof the sensor is higher during compression.
Figure 6.15 shows the frequency response function (FRF) of CNTCSs in the rangeof 0.25e15 Hz. The FRF is obtained by taking the ratio of the response over the exci-tation input in the frequency domain, normalized to the value obtained at 15 Hz. Thefrequency response of the CNTCS increases monotonically. The FRF exhibits a slightlynonlinear inputeoutput relation of the sensor, in particular at low frequencies.
1
0.5
–0.5
–1
250
(a)
(b)
(c)
260
Electrical resistance Strain
Nor
mal
ized
am
plitu
deN
orm
aliz
ed a
mpl
itude
Nor
mal
ized
am
plitu
de
Time (s)
Time (s)
Time (s)
270
250
250 255 260 265 270
260 270
0
1
0.5
–0.5
–1
0
1
0.5
–0.5
–1
0
Figure 6.10 Normalized strain and electrical resistance versus time for 0.5 Hz (a), 2.0 Hz (b),and 3.0 Hz (c).
110 Multifunctional Nanocomposites in Civil and Structural Engineering

At higher frequencies, the dynamic behavior is almost linear. This is due to thestrain-rate dependency of the fractional change in resistance of the nanomodifiedcomposite (Azhari and Banthia, 2012). The frequency dependence of the sensors iscurrently a limitation in sensing applications. This issue canbe resolvedby implementinga strain-rate-dependent electromechanical model. However, this behavior is notsignificant in modal identification studies.
6.7 Full-scale validation
In this section, the performance of CNTCSs at dynamic monitoring of a full-scale con-crete beam is investigated and benchmarked against off-the-shelf sensors. The labora-tory test setup is presented first, followed by the presentation of results obtained on afull-scale concrete beam.
6.7.1 Laboratory test setup
The performance of CNTCs at dynamic sensing is verified on a reinforced concrete beam.The beam is simply supported, with a span of 400 cm and a rectangular cross-section of20 � 30 cm2. Supports consist of vertical steel plates partially embedded in the beam.
–0.25
–0.3
–0.35
–0.4
–0.45
–0.25
–0.3
–0.35
–0.4
–0.45100
0.47
0.46
0.45
0.47
0.46
0.45
150 200 250 300 100 150 200 250 300Time (s)
100 150 200 250 300Time (s)
100 150 200 250 300Time (s)
Time (s)
Stra
in (m
illis
train
)
Stra
in (m
illis
train
)R
esis
tanc
e (M
Ω)
Res
ista
nce
(MΩ
)
(a) (b)
(c) (d)
Figure 6.11 Measured strain and corresponding measured electric resistance versus time: testwith forward sweep of the frequency from 0.1 to 5.0 Hz (a, c); and test with backward sweep ofthe frequency from 5.0 to 0.1 Hz (b, d).
Smart cement paste with carbon nanotubes 111

(a) (b)
(c)
Figure 6.12 Test setup for the dynamic validation: (a) uniaxial test machine with the sensor;(b) view of the tested CNTCS; and (c) view of the DAQ system for the CNTCS.
27,200
26,800
26,400
26,000
25,600
25,20020 40
40
Time (s)
Load
(kN
)
Res
ista
nce
(Ω)
Time (s)
–0.4
–0.8
–1.2
–1.620
60
60
80
80
100
Figure 6.13 Sensor’s response and applied load for the dynamic validation.
112 Multifunctional Nanocomposites in Civil and Structural Engineering

Boundary conditions allow rotation in the vertical plane while restraining rotation inthe horizontaletransverse plane. The beam is instrumented with seven accelerometers,model PCB 393C, equally spaced and deployed on the bottom surface of the beam.Seven electric strain gauges measure the strain on the top surface of the beam at thesame locations of the accelerometers. Strain gauges are 6 cm long, and they have a nom-inal resistance of 120 U and a gauge factor of 2.1.
The beam is dynamically excited through random hits exerted by means of an instru-mented hammer, model PCB 086D20C41. One CNTCS is applied to the top surface ofthe beam using a mechanical connection made of L-shaped steel elements connected tothe beam with four bolts. The purpose of the mechanical connection is to simulate
1
0.8
0.6
0.4
0.2
0
–0.2
–0.4
–0.6
–0.8
–1
Normalized strain
Nor
mal
ized
resi
stan
ce
–1 –0.8 –0.6 –0.4 –0.2 0 0.2 0.4 0.6 0.8 1
Figure 6.14 Normalized sensor’s output variations versus normalized strain.
1.2
1
0.8
0.6
0.4
0.2
0
Frequency (Hz)
Nor
mal
ized
FR
F
0 1 2 3 4 5 6 7 8 9 10 11 12 13 14 15
Measured response of CNTCS
Ideal linear response
Figure 6.15 Normalized frequency response function of CNTCS.
Smart cement paste with carbon nanotubes 113

embedment of the sensor while enabling full access for experimental purposes. Two po-sitions for the CNTCS are considered: at midspan and at quarter-span. The CNTCS isprecompressed at 1.5 kN using a digital load cell to control the load.
Data from hammer, strain gauges, accelerometers, and CNTCS are simultaneouslyacquired through an NI PXIe-1073 containing specific modules. A power source withstabilized potential difference is applied through a module within the DAQ system.The output of the CNTCS is sampled at 1000 Hz. Prior to conducting the test, a con-stant potential difference of 15 V is applied to the sensor for a total duration of 30 minto reduce the polarization effect.
Figure 6.16 is a schematic representation of the test setup, and Figure 6.17 shows aphotograph of the DAQ system, the hammer, and the test beam.
6.7.2 Results
Figure 6.18 shows the time history of the data acquired with the sensor placed at mid-span. The signal in Figure 6.18(a) corresponds to the raw data. Figure 6.18(b) showsthe result after using a high-pass filter above 10 Hz, which effectively eliminates theresidual polarization effect.
Hammer hits are observable in the timeehistory plot of the CNTCS’s output. Aclean signal is observed in the detailed view of Figure 6.18(c). It is worth noting bycomparing Figure 6.18(c) and (d) that the signal-to-noise ratio is high at small strainlevels. Comparison of these waveforms in Figure 6.18(c) and (d) also outlines thenonlinearity of the relation between variation in electrical resistance of the CNTCSand strain measured through the strain gauge. Another observation is that the noiselevel observed in the signal of the CNTCS is much smaller compared to results re-ported in the literature for cement-based sensors. This is due to the shielding effectof the coaxial cable connecting the power source, sensor, and data acquisition system.
Strain gauges
30 S1
A1 A2 A3 A4 A5 A6 A7
50 50 50 50 50430
Accelerometers
Copper electrodes
Detail view A
Load cell
Strain gauge CNTCS
50 50 50
S2 S3 S5 S7A A
Figure 6.16 Layout of the experimental setup and plans of the investigated RC beam(dimensions in centimeters).
114 Multifunctional Nanocomposites in Civil and Structural Engineering

Data acquired in the vibration tests are used for dynamic modal identification usingthe well-established technique of frequency domain decomposition (FDD). The resultsobtained using acceleration data allow one to clearly identify 12 modes of vibration inthe interval between 0 and 500 Hz. Those are five vertical modes (V1, V2A, V2B, V3,and V4), five lateral modes (L1eL5), and two additional lateral modes named LS1 andLS2. Similar results are obtained using data recorded from the strain gauges.
Natural frequencies predicted by analytical EulereBernoulli beam theory (assuminga simply supported elastic beam in the vertical plane and a clampedeclamped one in thehorizontal plane) and those identified using acceleration and strain data are summarizedin Table 6.4. High-order modes are not successfully identified using data recorded by thestrain gauges due to a higher measurement noise in comparison to data recorded by theaccelerometers.
Mode shapes resemble those frombeam theory.ModesV2A andV2B are similar anti-symmetric modes and conceivably represent a splitting ofmodeV2 due to cracking in thebeam, as observed in other studies (Zonta and Modena, 2001). Modes LS1 and LS2 areassociated with the lateral movement of the supports, slightly rolling over their bases.
Figure 6.19 shows a comparison between the normalized PSD of CNTCS’s outputand the first singular value of the PSD matrix of vertical acceleration data. Theseresults show that all the peaks corresponding to vertical modes in acceleration dataare visible in the PSD of CNTCS’s output. Some peaks associated with lateral modesare also visible in such a PSD plot, such as the two peaks around the frequency ofmode V1 and likely corresponding to modes LS2 and L1. The peak associatedwith mode LS1 is probably not visible because it is contained within the filteredregion. Peaks associated with modes L2, L3, L4, and L5 are also visible.
Accelerometers
Strain gaugemodule
Strain gauges
DAQ system
Power sourcemodule
Multimetermodule
Hammer
Accelerometermodule
Figure 6.17 Experimental setup: photo image of test beam, instrumented hammer, and DAQsystem.
Smart cement paste with carbon nanotubes 115

180,000
170,000
160,000
150,000
0.003
0.002
0.001
0
–0.001
–0.002
–0.003
3000
2000
1000
0
–1000
–2000
–3000Res
ista
nce
varia
tion
(Ω)
Res
ista
nce
varia
tion
(Ω)
Res
ista
nce
(Ω)
Time (s)36 36.2 36.4 36.6 36.8 37
Stra
in v
aria
tion
Stra
in v
aria
tion
0.002
0.001
0
–0.001
–0.002
Time (s)36 36.2 36.4 36.6 36.8 37
4000
2000
0
–2000
–4000
0 5 10 15 20 25 30 35 40
Time (s)
Time (s)
0 5 10 15 20 25 30 35 40Time (s)
0 5 10 15 20 25 30 35 40
(a)
(b)
(c)
(d) (e)
Figure 6.18 Vibration monitoring of the RC beam using CNTCS placed at midspan: sensoroutput before high-pass filtering (a); sensor output after high-pass filtering (b); output of thestrain gauge placed at the location of the CNTCS (c); blowup on sensor output (d); and detailedwindow plot of the output of the strain gauge (e).
116 Multifunctional Nanocomposites in Civil and Structural Engineering

Table 6.4 Identified (ID) natural frequencies (Hz) of the reinforcedconcrete beam using off-the-shelf accelerometers and strain gaugesby means of the FDD technique (D denotes the relative differencebetween analytical frequencies and frequencies identified fromacceleration data) (Ubertini et al., 2014a)
Mode Analytical ID (accel.) ID (strain) D (%)
LS1 e 5.13 e e
LS2 e 19.78 19.78 e
V1 25.22 27.10 27.10 7.4
L1 38.11 32.71 37.35 14.2
V2A 100.9 82.52 81.79 18.2
L2 105.1 93.75 93.75 10.8
V2B 100.9 113.5 113.5 12.5
V3 227.0 171.1 171.1 24.6
L3 206.0 192.1 192.6 6.7
L4 340.5 322.8 e 5.2
V4 403.5 431.4 e 6.9
L5 508.6 477.3 e 6.1
100
10–1
SV
/PS
D 10–2
10–3
10–4
0 50 100 150 200 250
PSD of CNTCS output1st SV of acceleration data
Frequency (Hz)300 350 400 450 500
L5V4L4
L3V3
V2BL2V2A
V1
Figure 6.19 Identification of natural frequencies with CNTCS: first normalized singular value(SV) of vertical acceleration data (dashed line); and normalized PSD of the output of CNTCS(continuous line; the gray area denotes a filtered region).
Smart cement paste with carbon nanotubes 117

Additional peaks are visible in the CNTCS output. They are likely attributed to super-harmonic components, whose presence is caused by the electromechanical behavior ofthe CNTCS.
A comparison between the frequencies of the vertical modes identified from accel-eration data and from the CNTCS’s output is listed in Table 6.5. The good agreementbetween the identified frequencies confirms the ability of the CNTCS to work as adynamic sensor for output-only modal identification.
6.8 Concluding remarks
This chapter presented an overview of a cement-based nanocomposite for strain sensing.The sensor, termed CNTCS, was fabricated using a cement paste doped with CNTs.
Starting from the state of the art, summarizing the evolution of knowledge sincethe first invention of strain-sensing cement-based composites, this chapter has dis-cussed the main difficulties in the material’s preparation, and presented an effectiveprocedure to achieve proper dispersion of the nanotubes in the composite material forthe fabrication of prismatic sensors. Experimental results from laboratory validationhave been presented. These results demonstrated that the electrical behavior can becharacterized by using a lumped electrical circuit model containing resistors andcapacitors. The model was effective at modeling the polarization effect of the cementpaste. Tests under compressive loading have shown the ability of the material towork as a strain gauge, owing to the piezoresistive nature of the nanocompositecement paste. The resulting gauge factor of the CNTCS was one order of magnitudegreater than those of typical resistive-based strain gauges. More importantly, thenovel sensor was capable of measuring strain at high sampling rates, which enablesvibration-based monitoring. This significantly enlarges the potential applications ofCNTCS in structural health monitoring.
This vibration-based monitoring capability has been investigated by conductingvibration tests on a full-scale reinforced concrete beam. Results from this test havedemonstrated that the novel sensor compares well against mature technologies at vibra-tion monitoring, such as accelerometers and strain gauges. In particular, the CNTCS is
Table 6.5 Identified (ID) natural frequencies (Hz) using accelerationdata and CNTCS’s output (D denotes the relative differencebetween the two classes of values) (Ubertini et al., 2014a)
Mode V1 V2A V2B V3 V4
ID (accel.) 27.10 82.52 113.5 171.1 431.4
ID (CNTCS) 27.10 81.05 113.3 172.9 423.6
D (%) 0.0 1.8 0.2 1.0 1.8
118 Multifunctional Nanocomposites in Civil and Structural Engineering

suitable for output-only modal identification of vibrating structures. It thus represents astep toward the realization of self-monitoring concrete structures, a revolutionary yetrealistic technology of the future.
References
Azhari, F., Banthia, N., 2012. Cement-based sensors with carbon fibers and carbon nanotubesfor piezoresistive sensing. Cement and Concrete Composites 34, 866e873.
Banthia, N., 2009. Fiber reinforced concrete for sustainable and intelligent infrastructure. In:SBIDCO e 1st Int. Conf. Sustainable Built Environ. Infrastructures Developing Countries.
Cao, J., Chung, D.D.L., 2004. Electric polarization and depolarization in cement-based mate-rials, studied by apparent electrical resistance measurement. Cement and ConcreteResearch 34, 481e485.
Chen, P.W., Chung, D.D.L., 1993. Carbon fiber reinforced concrete for smart structures capableof non-destructive flaw detection. Smart Materials and Structures 2, 22e30.
Chung, D.D.L., Wang, S., 2003. Self-sensing of damage and strain in carbon fiber polymer-matrixstructural composites by electrical resistance measurement. Polymers and Polymer Com-posites 11 (7), 515e525.
Coppola, L., Buoso, A., Corazza, F., 2011. Electrical properties of carbon nanotube cementcomposites for monitoring stress conditions in concrete structures. Applied MechanicsMaterials 82, 118e123.
D’Alessandro, A., Ubertini, F., Materazzi, A.L., Porfiri, M., 2014. Electrical modelling ofcarbon nanotube cement-based sensors for structural dynamic monitoring. Nanoforum2014-AIP Conference Proceeding 1603, 23e30.
Dong, B., Xing, F., Li, Z., 2011. Electrical response of cement-based piezoelectric ceramiccomposites under mechanical loadings. Smart Materials Research. 2011 (2011), Article ID236719, 7 pp. http://dx.doi.org/10.1155/2011/236719.
Gao, D., Sturm,M.S., Mo, Y.L., 2009. Development of carbon nanofiber self-consolidating concrete.In: Second Int. Symp. Des. Perform. Use Self-Consolidating Concrete, pp. 126e134.
Han, B., Ou, J., 2007. Embedded piezoresistive cement-based stress/strain sensors. Sensors andActuators A 138, 294e298.
Han, B., Guan, H., Ou, J., 2007. Electrode design, measuring method and data acquisition systemof carbon fiber cement paste piezoresistive sensors. Sensors and Actuators A 135, 360e369.
Han, B., Yu, X., Kwon, E., 2009. A self-sensing carbon nanotube/cement for traffic monitoring.Nanotechnology 20, 5 pp.
Han, B., Yu, X., Ou, J., 2011. Multifunctional and smart nanotube reinforced cement-basedmaterials. In: Gopalakrishnan, K., Birgisson, B., Taylor, P., Attoh-Okine, N. (Eds.), Nano-technology in Civil Infrastructure. A Paradigm Shift. Springer-Verlag, Berlin, Heidelberg,pp. 1e48.
Han, B., Zhang, K., Yu, X., Kwon, E., Ou, J., 2012. Electrical characteristics andpressure-sensitive response measurements of carboxyl MWCNY/cement composites.Cement and Concrete Composites 34, 794e800.
Han, B., Qiao, G., Jiang, H., 2012. Piezoresistive Response Extraction for Smart Cement-basedComposites/Sensors. Journal of Wuhan University of Technology-Mater. Sci. Ed. 27 (4),754e757.
Konsta-Gdoutos, M.S., Metexa, Z.S., Shah, S.P., 2010. Highly-dispersed carbon nanotubereinforced cement-based materials. Cement and Concrete Research 40 (7), 1052e1059.
Smart cement paste with carbon nanotubes 119

Li, H., Xiao, H., Ou, J., 2003. A study on mechanical and pressure-sensitive properties of cementmortar with nanophase materials. Cement and Concrete Research 34, 435e438.
Li, G.Y., Wang, P.M., Zhao, X., 2007. Pressure-sensitive and microstructure of carbon nanotubereinforced cement composites. Cement and Concrete Composites 29, 377e382.
Loh, K.J., Chang, D., 2011. Zinc oxide nanoparticle-polymeric thin films for dynamic strainsensing. Journal of Material Sciences 46, 228e237.
Lourie, O., Wagner, D.E., 1998. Buckling and collapse of embedded carbon nanotube. PhysicalReview Letters 81 (8), 1638e1641.
Materazzi, A.L., Ubertini, F., D’Alessandro, A., 2013. Carbon nanotube cement-based trans-ducers for dynamic sensing. Cement and Concrete Composites 37, 2e11.
Measures, R.M., 1993. Smart structure technology and its potential for civil engineering.Applications of Fiber Optic Sensors in Engineering Mechanics 17e38.
Mondal, P., Shah, S.P., Marks, L.D., 2008. Nanoscale characterization of cementitious mate-rials. ACI Materials Journal 105, 174e179.
Muto, N., Yanagida, H., Nakatsuji, T., Sugita, M., Ohtsuka, Y., Arai, Y., 1992. Design ofintelligent materials with self-diagnosing function for preventing fatal fracture. SmartMaterials and Structures 1 (4), 324e329.
Sihai, W., Chung, D.D.L., 2001. Electric polarization in carbon fiber-reinforced cement. Cementand Concrete Research 31, 141e147.
Ubertini, F., Materazzi, A.L., D’Alessandro, A., 2014a. Natural frequencies identification of areinforced concrete beam using carbon nano tube cement-based sensors. EngineeringStructures 60, 265e275.
Ubertini, F., Laflamme, S., Ceylan, H., Materazzi, A.L., Cerni, G., Saleem, H., D’Alessandro, A.,Corradini, A., 2014b. Novel nanocomposite technologies for dynamic monitoring of struc-tures: a comparison between cement-based embeddable and soft elastomeric surface sensors.Smart Materials and Structures 23 (4), 12 pp.
Wen, S., Chung, D.D.L., 2006. Model of piezoresistivity in carbon fiber cement. Cement andConcrete Research 36, 1879e1885.
Xu, Z., Liu, Z., 2007. Fatigue damage in smart carbon fiber Concrete by electrical resistancemeasurement. Key Engineering Materials 348e349, 435e438.
Yu, X., Kwon, E., 2009. A carbon nanotube/cement composite with piezoresistive properties.Smart Materials and Structures 18, 5 pp.
Zonta, D., Modena, C., 2001. Observations on the appearance of dispersive phenomena indamaged structures. Journal of Sound and Vibration 241, 925e933.
120 Multifunctional Nanocomposites in Civil and Structural Engineering

Tomographic imaging ofcementitious materials 7Tsung-Chin HouNational Cheng Kung University, Tainan, Taiwan
7.1 Introduction
Cracking in cement-based structures, such as those constructed of reinforced concrete,can result from a variety of factors, including externally applied loads, shrinkage, andpoor construction methods, among many others. When making an assessment of thegeneral state of the health of such structures, cracks must be reliably quantified andtheir significance determined. For example, small cracks affecting only the externalaesthetic of the structure should be differentiated from those that reduce its strength,stiffness, and long-term durability (ACI, 1998). Detailed visual inspection of the sur-face of the structure remains a common method for detecting cracks; systematic crackmapping allows inspectors to monitor the progression of cracks and to hypothesize thenature of their origins (Bungey et al., 2006). After suspicious cracks are encountered,nondestructive (e.g., ultrasonic inspection) and partially destructive (e.g., core holes)testing can be carried out by trained inspectors to determine crack features belowthe structural surface (ACI, 1998). However, all of these methods require the use oftrained personnel to execute, rendering them as tedious and expensive. In contrast,automated sensor technologies are needed for permanent installation so that accurateassessments of crack damage could be made without requiring a trained professionalto visually inspect the structure.
A variety of approaches have been proposed for automated structural health moni-toring of concrete structures. Generally, many of these approaches call for the instal-lation of external sensors to measure global and local structural responses to loading.Early work explored the use of vibration measurements (e.g., accelerations) to identifyglobal modal properties that change when structural damage is present. Particularly forcivil structures, environmental variability often hinders accurate correlation of modalproperty changes to damage (Doebling et al., 1998). Alternatively, local structuralmeasurements including strain and deformation have also been proposed for crackdetection. Based on the applied structural loading and the corresponding componentresponse, various damage index methods have been proposed for the quantification(often on a scale from 0 to 1) of cracking degree (Park and Ang, 1985; Kratziget al., 1989). Although damage index models perform well when predicting cracksin laboratory elements, the inability to precisely measure loads on full-scale concretestructures renders this approach difficult to apply in more practical settings.
Perhaps the best approach for automated structural health monitoring of concretestructures entails the adoption of the sensors available in the nondestructive
Innovative Developments of Advanced Multifunctional Nanocomposites in Civil and Structural Engineeringhttp://dx.doi.org/10.1016/B978-1-78242-326-3.00007-5Copyright © 2016 Elsevier Ltd. All rights reserved.

evaluation (NDE) field. In particular, passive and active stress wave approaches havebeen proposed for NDE evaluation of concrete structures. Acoustic emission (AE)sensing is foremost among the passive stress wave methods. AE employs piezoelec-tric elements to capture the stress waves generated by cracks (Ouyang et al., 1991;Shah and Choi, 1999); however, although AE has played a critical role in the labo-ratory, its success in the field has been limited to only a handful of applications(Mindess, 2004). In contrast, active stress wave methods have proven more accuratefor crack detection. Active sensing entails the use of piezoelectric transducers tointroduce short ultrasonic stress waves into a concrete element, and using the sametransducer, or another, to measure the stress waves after they have propagatedthrough the element. For example, pulseeecho (using one transducer) and pitchecatch (using two transducers) techniques are capable of characterizing cracks inactual concrete structures (Carino, 2004). In structural elements whose geometryguides the stress wave in a specific direction, the ultrasonic stress waves are termedguided waves (Raghavan and Cesnik, 2007); some examples of guided wave tech-niques to characterize damage in concrete include Na et al. (2002), Luangvilaiet al. (2002), and Jung et al. (2000). A direct extension of the active stress waveapproach is the electromechanical impedance spectra method in which the electrome-chanical impedance spectrum of a piezoelectric transducer is used to detect crackingin the vicinity of the transducer (Park et al., 2000, 2006). Some challenges associatedwith active sensing in cement-based materials include significant wave attenuationover long distances and internal heterogeneities causing wave scattering and complexultrasonic speckle patterns.
Compared to other NDE methods, utilization of the electrical properties ofcement-based materials for crack detection has garnered less attention from the civilengineering community. Historically, electrical properties have been investigated fortracking the formation of microstructural properties during hardening (Han et al.,2005) and to quantify the potential for corrosion of buried steel reinforcement (Lauer,2004). In contrast, this study will utilize the electrical properties of cementitiousmaterials as a novel approach to automated health monitoring of civil structures. First,the relationship between electrical conductivity and strain will be quantified so that itcan be established that cement-based materials are self-sensing. Because in theory ameasurement for strain can be made wherever the material is, a novel approach tomeasuring conductivity over spatial areas is introduced next. Termed electrical imped-ance tomography (EIT), this inverse tomographic approach offers 2D and 3D conduc-tivity maps for structural elements instrumented with electrodes upon their surface.Conceptually, the EIT approach is similar to the ultrasonic tomographic methods(Rose and Ditri, 1990) used to map wave attenuation properties of structural elementsusing dense arrays of surface-mounted piezoelectric transducers. As a result of cementbeing piezoresistive, EIT conductivity maps offer a direct measurement of strain fields.Furthermore, cracks can be imaged as conductivity reductions because cracks arenonconducting across their widths. Although applicable to any cement-based compos-ite, this chapter presents the experimental investigation of the application of EIT toimage strain fields and cracks in fiber-reinforced cementitious composite (FRCC)structural elements.
122 Multifunctional Nanocomposites in Civil and Structural Engineering

7.1.1 Electrical conduction in cementitious materials
Conductivity (s) is a fundamental material property that quantifies the ability of thematerial to carry a current when placed in an electrical field. Specifically, the currentflow density, J, is linearly proportional to the electric field, E, through conductivity(Mayer and Lau, 1990): J ¼ sE. Resistivity (r), the inverse of conductivity, is thevolumetric resistance, R, of a unit cube as measured across one dimension. Resistivityis reported in terms of U m, whereas conductivity is reported using the units S/m(U�1 m�1). With conductivities ranging from 10�3 to 10�6 S/cm, cementitious mate-rials are classified as semiconductors (Whiting and Nagi, 2003). In cement, the currentgenerated by an electric field is based on ionic conduction. The high concentration ofcalcium, potassium, and sodium salts within the pore water and waterecement gel aremobilized by the electric field to create electrical current (Hansson and Hansson,1983). Because the ions in water are the primary charge carrier, the conductivity ofcementitious materials naturally exhibits strong dependency on moisture content.
Considerable attention has been paid in recent years to measuring and interpretingthe electrical properties of cement composites, including reinforced concrete. Specif-ically, the electrical properties of cement can be used to assess the microstructural de-tails of the material (Han et al., 2005). For example, very early work in the fieldexplored correlations between direct current (DC) conductivity measurements andthe setting times of Portland cement composites (Calleja, 1953; Hammond andRobson, 1955). More profound insight to the hydration process has been gained sincethe 1990s through the use of electrical impedance spectroscopy (EIS). EIS measuresconductivity as a function of the angular frequency of an applied alternating current(AC) signal (McCarter and Brousseau, 1990). Impedance spectra obtained by EIScan be used to track hydration processes, identify the porosity of cured cement, andcharacterize interfacial properties (e.g., cementesteel or cementeaggregate inter-faces). The electrical properties of cement also serve as a basis for assessing the corro-sion potential of reinforced concrete (Lauer, 2004). When reinforcement steelcorrodes, the cement conductivity is a measure of how easy it is for ions to flow be-tween the anodic and cathodic sites on the buried reinforcement. It has not been untilvery recently that the electrical properties of cementitious materials have beenexplored for damage detection, including the identification of cracking (Peled et al.,2001; Chung, 2001; Hou and Lynch, 2005a).
7.1.2 Traditional electrical measurement techniques
Multiple measurement methods have been proposed for measuring the conductivity ofcement-based materials. In general, the measurement methods proposed can bebroadly classified as either two-point or four-point probe methods. In two-point probemethods (Figure 7.1(a)), two electrodes are used to apply an electrical current, I, and toalso measure the corresponding drop in voltage, V, across the cement specimen. Elec-trodes must be in intimate contact with the cement-based specimen to induce an ioniccurrent within the specimen. Metallic electrodes either can be surface mounted usingconductive gels and pastes, or can be embedded directly into the wet concrete prior to
Tomographic imaging of cementitious materials 123

hardening (Whiting and Nagi, 2003). If a DC is applied across the specimen area,conductivity can be calculated:
s ¼ 1V
L
wh(7.1)
where L, w, and h correspond to the electrode spacing, specimen width, andspecimen height, respectively. Although two-point DC probe measurements areeasy to take, they do suffer from two major drawbacks. First, contact impedance atthe electrodeecement interface in the two-point probe method introduces atime-dependent reduction in conductivity. Contact impedance originates from theelectrochemical reactions that naturally occur in the test specimen in the vicinity ofthe electrode (Vilhunen et al., 2002). For example, electrons flowing into a spec-imen at the electrode induce pore water to decompose into hydrogen (H2) andhydroxide ions (OH�) (Hansson and Hansson, 1983). Similarly, free hydroxide ionscan react at the other electrode to produce electrons (e�) that then flow into theelectrode as well as produce oxygen (O2) and water (H2O). These reaction
Figure 7.1 Conductivity measurement based upon the (a) 2-point and (b) 4-point probetechniques.
124 Multifunctional Nanocomposites in Civil and Structural Engineering

by-products accumulate at the electrodeespecimen interface, resulting in a backelectromagnetic field. The second drawback of DC two-point methods is themeasurement error introduced by polarization of the specimen. Polarization is theseparation of positive and negative ions trapped within the cement pores; as ionsseparate, less current is carried, resulting in a reduction in the conductivity mea-surement (Hansson and Hansson, 1983). As a result, AC is preferred becausecontact impedance and polarization effects do not have sufficient time to developunder an alternating field (Whiting and Nagi, 2003). When AC signals are used inthe two-point probe method, Eqn (7.1) is still valid using the amplitude of thecurrent and voltage.
The four-point probe method is the preferred approach for measuring the conduc-tivity of cement-based materials (Millard, 1991). As the name suggests, the methodemploys four independent electrodes along the length of a specimen (Figure 7.1(b)).The two outermost electrodes are used to drive an electric current (DC or AC) intothe medium, whereas the two inner electrodes are responsible for measuring the elec-trical potential developed over the length, L. Again, if it is assumed the cross-sectionalarea of the specimen is w by h, then Eqn (7.1) is still valid. In the four-point probemethod, the effects of contact impedance are minimized because the measurementand excitation electrodes are separated. As a result, four-point probe methods providea more consistent measurement of electrical conductivity when compared to two-pointprobe methods.
A specialized version of the four-point probe method is the Wenner technique(Gowers and Millard, 1999). Although this approach was originally developed forin situ measurement of soil conductivity, it has been widely applied to measurementsin cementitious materials. In the Wenner technique, four electrodes equally spaced(by a) along a straight line are applied to the surface of a cementitious specimen, asshown in Figure 7.2. If the specimen is assumed to be an infinite half-space, then con-ductivity can be calculated:
s ¼ 1V
12pa
(7.2)
Both DC and AC electrical excitations can be used, but generally AC excitationsgreater than 100 Hz are preferred (Han et al., 2005). Some care must be exercisedwhen using the Wenner technique. For example, test specimens must be sufficientlythick (generally, thicknesses four times greater than the electrode spacing) to ensurethat the assumption of an infinite half space is valid. Similarly, measurements mustbe made away from specimen edges and corners.
EIS is a more sophisticated electrical characterization technique based on ACsignals. Similar to the aforementioned four-point probe measurement method, twoprobes are employed to apply an AC signal to the specimen, whereas two inner elec-trodes measure voltage (Figure 7.3(a)). In EIS, a frequency response analyzer (FRA) isadopted to measure both the amplitude and phase of the voltage measurement relativeto the applied sinusoidal current (Barsoukov and Macdonald, 2005). Using amplitudeand phase, q, the complex-valued impedance of the material can be measured as a
Tomographic imaging of cementitious materials 125

function of applied AC frequency, u. The frequency is varied from low to highfrequencies with complex impedance,
Z ¼ VAsinðut þ qÞIAsinðutÞ ; (7.3)
plotted on the complex plane. The real and imaginary components are associated withthe conductivity and capacitive properties of the specimen, respectively. For manycementitious materials, the impedance plot consists of two semicircular traces asshown in Figure 7.3(b). The low-frequency semicircular trace corresponds to thebehavior of the electrode, whereas the high-frequency trace corresponds to that of thecementitious material (Han et al., 2005). Such distinctive impedance plots also permitthe use of equivalent parallel resistorecapacitor (RC) circuits (Figure 7.3(c)) to modelthe electrical behavior of the material.
7.1.3 Engineered cementitious composites
Because concrete is brittle in nature and cracks when subjected to tensile strain, engi-neered cementitious composites (ECCs) emerged recently to address the shortcomingsof concrete (as well as high-strength concrete). ECC is a family of engineered,high-performance, FRCCs. Featuring high tensile ductility, restrained crack width,
Figure 7.2 Wenner technique: a 4-point probe conductivity measurement based upon surfacecontact.Adapted from Millard (1991).
126 Multifunctional Nanocomposites in Civil and Structural Engineering

and strain-hardening capabilities, ECC is typically designed with low volume fraction(�2%) of randomly distributed fibers of a specific type and property. Perhaps acommonly seen version, ECC M45, best demonstrates the stressestrain relationshipof ECC (Wang, 2005). Specifically in that example, the tensile ductility of over 3%is achieved by developing multiple cracks, with the crack width limited to around60 mm. The features of multiple cracking as well as restrained crack width serve asa potential remedy for overcoming the brittle nature of normal concrete, particularlywhen structural ductility and durability (e.g., most infrastructure) are primaryconcerns.
Apart from the fundamental characteristicdthe high tensile ductility of ECCdmany other material functions associated with specific structural applications ofECC have also been studied recently. Challenges of exploring the extra functionalityof ECC are to incorporate the desired attributes into ECC such as light weight, high
Figure 7.3 Electrical impedance spectroscopy: (a) experimental setup; (b) typical impedanceplot on the complex plane (Adapted from Han et al. (2005)); and (c) equivalent circuit model.
Tomographic imaging of cementitious materials 127
early strength, self-healing, self-sensing, self-thermal control, impact and fire resis-tance, and so on without eliminating or even limiting its fundamental characteristic.Through the micromechanics-based analysis, systematic composition modificationand readjustment are proposed to achieve specific functions for structural applicationswhile preserving the ductile characteristic (Li, 2012). Wang and Li (2003) employedlightweight fillers to investigate lightweight ECC. The four types of fillers investigatedwere polymeric microform, hollow glass bubble, expanded perlite sand, and air bub-bles generated by air entrainment admixture. For the case of hollow glass bubbleinclusion, composites with a density of 1.45 g/cm3, tensile ultimate tensile strengthof 4.31 MPa, and tensile strain greater than 4% are achieved while restraining the crackwidth within 80 mm.
The repairing tasks of bridges and structures demand the use of high-early-strengthcementitious materials. According to the recommendations and requirements ofvarious Departments of Transportation and the US Federal Highway Administrationfor high-early-strength ECC (HES-ECC), the target minimum compressive strengthwas set at 17.2 MPa at 4 h and 48.3 MPa at 28 days (Li and Li, 2011). Several compo-sition modifications have been investigated to attain the high early strength, including:replacing Type I Portland cement with Type III, the exclusion of fly ash, lowing thewater-to-cement ratio to 0.36, the use of a polycarboxylate-based superplasticizer,and the use of a calcium nitriteebased accelerator. The HES-ECC studied by Wang(2005) has shown that over 25 MPa at 4 h was achieved while the tensile strain capac-ity was reduced to 1% due to reduced intrinsic natural flaws. By adding polystyrenebeads as artificial flaws to trigger the initiation of multiple cracks, the reengineeredHES-ECC showed a restoration of tensile strain capacity of around 3% after threedays (Yang, 2007; Li, 2009). Another featured function of ECC for structural applica-tion is the self-healing capability attributed to controlled crack widths and the resultinghigher degree of rehydration afterward. This function is achieved by using highvolumes of fly ash (HFA-ECC) that would result in tighter crack widths between 16and 55 mm, as compared to 27e95 mm with ECC M45 (Yang et al., 2007).
7.1.4 Self-sensing fiber-reinforced cementitious composites
Although concrete continues to be a dominant material used in the design of large civilstructures, the material is inherently brittle and prone to cracking when loaded intension. Short fibers have been proposed in lieu of coarse aggregates to enhance themechanical properties of the cement matrix (Balaguru and Shah, 1992). A variety offiber types have been proposed in the literature, including polymeric, metallic, and car-bon fibers. FRCC can be designed to exhibit strength and ductility in tension, therebyrendering them attractive for use in tension and shear-dominated structural elements.Optimization of the fiberematrix interface by mechanical (e.g., hooked fibers) orchemical means (e.g., fiber coatings) leads to energy dissipation by thin microcrackswhose formation is arrested by the fibers. This microscale behavior leads to tensilestrain-hardening and high damage tolerance in tension (Parra-Montesinos, 2005). Inrecent years, strain-hardening FRCC materials have found application in the designof coupling beams in shear walls (Wight et al., 2006), bridge decks (Kim et al.,
128 Multifunctional Nanocomposites in Civil and Structural Engineering

2004; Naaman and Chandrangsu, 2004), retaining walls (Kunieda and Rokugo, 2006),and extruded pipes (Stang and Pedersen, 1996).
Because of the growing importance of FRCC materials, this study will explore theirelectrical properties for sensing the mechanical behavior of FRCC structural elements.Other researchers have also begun to study the piezoresistivity (i.e., strain-inducedresistivity changes) of FRCC materials with the aim of using them as their own sensors(Chung, 2001; Reza et al., 2003; Hou and Lynch, 2005b; Li et al., 2006). The additionof sensing functionality with mechanical functionality has led to FRCC being classi-fied as a “multifunctional” material (Chung, 2003).
Prior to cracking, change in FRCC resistivity occurs linearly with strain in bothtension and compression. For example, the piezoresistive properties of FRCC plateelements employing polymeric and steel fibers have been studied by Hou and Lynch(2005b). As shown in Figure 7.4(a), the two-point probe method assisted by a digitalmultimeter is used to measure the change in material conductivity as tensile strainis applied to each FRCC element. The stressestrain curves (Figure 7.4(b)) for thetwo plates reveal ductile strain-hardening behavior. Resistivityestrain curves(Figure 7.4(c)) also reveal fairly linear trends for each fiber type.
7.1.5 Electrical impedance tomography
Two- and four-point probe methods suffer from inherent limitations when used tocharacterize the electrical properties of cementitious materials. For example, they donot provide a measurement of material conductivity at a given point; rather, they mea-sure the average conductivity between the electrodes. Therefore, if the electrodes arespaced too far apart, inhomogeneities that may exist between the electrodes are notdirectly observed because their influence on the conductivity measurement is averagedout. Should a mapping of conductivity over the area of a cement element be sought, theWenner technique can be employed. Numerous vendors sell handheld equipment tomake four-point probe conductivity measurements based on the Wenner technique(Bungey et al., 2006). However, repeated measurement across a structural elementcan be both labor-intensive and time-consuming.
Figure 7.4 (a) FRCC plate element loaded in monotonic axial tension as resistivity ismeasured by 2-point probing; (b) stress and (c) resistivity versus strain plots for polymericand steel fiber FRCC plates.
Tomographic imaging of cementitious materials 129

An autonomous means of measuring the spatial distribution of FRCC conductivityis sought. Because FRCC materials are piezoresistive, conductivity maps could beused to measure 2D strain fields within an FRCC structural element. Furthermore,cracks are physical inhomogeneities that block the flow of electricity; cracks wouldtherefore appear as regions of near-zero conductivity within the conductivity maps.EIT is proposed herein for mapping the spatial distribution of conductivity over struc-tural surfaces. EIT has been widely adopted for anomaly detection in geophysicalexploration (Zhdanov and Keller, 1994) and biomedical imaging (Webster, 1990).
EIT is a more sophisticated approach to measuring material conductivity than thetwo- and four-probe methods. Unlike the probe methods, EIT is a combination ofboth electrical probing and the use of analytical models describing the flow of electricityin the test specimen. Therefore, conductivity mapping by EIT can be broken down intothree major parts. First, the specimen under study is stimulated by a regulated currentwhile electrical voltages are measured along the specimen boundary. Second, an analyt-ical model that predicts the boundary voltages to the same AC stimulation is formulated;this model is often referred to as the forward problem because the distribution ofconductivity is assumed known. However, the conductivity distribution is unknown;hence, the inverse problem is solved by varying the assumed conductivity distributionof the forward problem until convergence between experiment and model is achieved.Figure 7.5 summarizes the EIT approach to conductivity determination.
7.1.6 Electrical stimulation and data collection
EIT employs measurement of voltages along the boundary of a test specimen. First,electrodes are affixed to the surface of the specimen as shown in Figure 7.5(a);the electrodes are used to introduce electrical currents and to measure voltage.Typically, electrodes are installed equidistant from one another to simplify theforward-problem model. In this study, the adjacent electrode protocol to data
Figure 7.5 (a) Experimental approach to data collection for EIT conductivity mapping; (b) finiteelement formulation of the forward problem.
130 Multifunctional Nanocomposites in Civil and Structural Engineering

collection is adopted (Heikkinen et al., 2002). In this approach, a regulated current (DCor AC) is applied to a pair of adjacent electrodes. On the remaining electrodes, theresulting voltage is measured and recorded. The process is repeated using the sameelectrical excitation until every combination of adjacent electrode pairs has beenemployed.
7.1.7 Formulation of the forward problem
The flow of electrical current within a 2D body, U, can be modeled by the 2D Laplaceequation:
V$½sðx; yÞVfðx; yÞ� ¼ Iðx; yÞ (7.4)
where s, f, and I are conductivity, electric potential, and current, respectively, at point(x, y). Assuming current is applied only on the boundary of the body, the right-hand sideof Eqn (7.4) is then set equal to zero. For a known distribution of conductivity, theforward problem allows the electrical potential to be uniquely calculated at every pointin the body based on the current applied at the body boundary, vU, if Dirichlet (voltageis continuously measurable on the body boundary) and Neumann (the integral of currentalong the boundary is zero) boundary conditions are assumed. Regardless, analyticalsolutions to the Laplace equation are not tractable except in cases of specimens definedby simple geometries and minimal conductivity variations (Lionheart et al., 2005).Hence, numerical solutions are generally pursued with finite difference, boundaryelement, and finite element methods (FEMs) all previously proposed. The FEM,though, is the most common numerical approach for modeling Eqn (7.4).
The FEM formulation adopted in this study is termed the complete electrode model(CEM). This approach begins by meshing the body into discrete triangular elements asshown in Figure 7.5(b). The conductivity of the jth element is assumed constant, sj.Variation of electric potential across the body is assumed to be a linear sum of electri-cal potential at element vertices, fi, multiplied by predefined shape functions, wi
(Lionheart et al., 2005):
fðx; yÞ ¼XN
1
fiwiðx; yÞ (7.5)
where the shape function takes the unit value at the ith vertex and zero at all othervertices. N corresponds to the number of nodes in the mesh. Along the elementboundaries, different shape functions can be employed, but second-order polynomialsare adopted in this study. Assuming voltages are measured on electrodes two at a timewith the first electrode held fixed as the reference electrode, then the vector of elec-trodes can be approximated as (Vauhkonen, 1997):
V ¼XL�1
1
Vjnj (7.6)
Tomographic imaging of cementitious materials 131

where nj ¼ [1, 0, 0,..., �1,..., 0]T (with �1 in the jth indexed term of the vector) and Vj
is the voltage of the jth element. Due to the lack of differentiability of the shapefunctions, w and n, variational methods are employed to yield the weak form of the 2DLaplace equation. The solution for each element is assembled into a global linearequation for the specimen:
A x ¼ b (7.7)
where A ∊ <(NþL�1)�(NþL�1) is the sparse system matrix calculated using the elementconductivities, x ¼ [VV]T, b ¼ [0 I]T, V ¼ [f1 f2 . fN]
T, V ¼ [V1 V2 .VL]T, and
I ¼ [1 0 0 . �1 . 0]T. For the example presented in Figure 7.5(b), 12 triangularelements, 12 vertices (N ¼ 12), and five electrodes (L ¼ 5) are used. Therefore,V ¼ [V1
V6 V7 V10 V12]T, and I ¼ [1�1 0 0 0]T. Although theoretically the forward problem can
be solved for x by x ¼ A�1 b, the sparsity of A requires more robust approaches toinversion such as the use of LU decomposition, among others. Numerical procedures forLU decomposition can be found in Chapra and Canale (2009), and many commerciallyavailable softwares including MATLAB offer ready to use tools.
7.1.8 Solution to the inverse problem
The EIT problem is the inverse of the forward problem; in other words, EIT finds theoptimal mapping of conductivity, s(x, y), based upon voltage measurements along theboundary. The solution of the inverse problem requires the forward problem to be runrepeatedly as the assumed distribution of conductivity is varied (s0 ¼ s þ Ds), so asto minimize the mean square error between the measured voltages and the modelpredicted electric potentials:
f ðs0Þ ¼ 12kfðs0Þ � Vk2 (7.8)
The changes in conductivity, Ds, between successive runs of the forward problemare based on the NewtoneRaphson iterative method and are expressed as:
Ds ¼ ��f0ðsÞTf0ðsÞ��1
f0ðsÞ½fðsÞ � V � (7.9)
where f0(s) is the Jacobian matrix of the FEM boundary potential.The Jacobian matrix, f0(s), represents the voltage changes at the electrodes due to
small perturbations in the assumed conductivity distribution. With boundary potentialsdepending on element conductivity nonlinearly, the ill-conditioned nature of theJacobian typically requires regularization techniques (e.g., Tikhonov regularization)to provide stable iterative convergence to the final conductivity distribution (Barber,1989; Lionheart et al., 2005).
Unfortunately, the ill-posed inverse problem is defined by an underdetermined set ofequations. As a result, a single set of boundary voltages corresponding to an applied cur-rent is insufficient to accurately map the body conductivity. Therefore, boundary voltage
132 Multifunctional Nanocomposites in Civil and Structural Engineering

measurements corresponding to multiple applied current distributions are needed toyield a stable and accurate solution. For this reason, the adjacent electrode approachapplies current to every combination of adjacent electrodes. Repeated boundary mea-surements provide sufficient data to render the EIT inverse problem overdetermined.
7.1.9 Experimental methods
ECCs, a unique strain-hardening FRCC designed using polymeric fibers (Li et al.,2002), are adopted to evaluate the application of EIT sensing for the measurement ofstrain and the identification of crack damage. ECCs are constructed using Type 1 Port-land cement, silica sand as a fine aggregate, fly ash, and short polyvinyl alcohol (PVA)fibers for reinforcement. To control the growth of cracks and to attain strain-hardeningbehavior in tension, the surface of the PVA fiber is chemically treated to tailor the micro-mechanical properties of the fiberematrix interface. Only a small amount of PVA fibersis necessary to attain optimal mechanical properties; in this study, a 2% volume fractionof PVA fibers is used. To build test specimens, a wet ECC mixture is poured into moldswhere they remain for seven days to harden. Once seven days have passed, the speci-mens are removed from the molds and cured until testing, which occurs no earlierthan 28 days after casting. The first set of test specimens constructed are ECC platesthat are 30.5 cm long and with cross-sectional areas of 7.6 � 1.3 cm2 (Figure 7.6(a)).The second specimen employed is an ECC beam, which is more representative of a real-istic structural element. The beam is 140 cm long, 15.2 cm deep, and 7.6 cm wide. Forboth sets of specimens, no steel reinforcement is employed.
7.1.10 Data acquisition
To conduct EIT sensing on the test specimens, each specimen is instrumented withcopper electrodes. Adhesive copper tape (6.3 mm wide and 0.7 mm thick) is attached
Figure 7.6 (a) ECC plate specimen under monotonic and cyclic axial loading; (b) ECC platespecimen loaded into the tensile load frame.
Tomographic imaging of cementitious materials 133

to the surface of the test specimens to serve as electrodes. To ensure the copperecement contact is conductive, additional silver colloidal paste is used to attach the elec-trodes. AC electrical signals are applied to an adjacent set of electrodes using ahigh-precision current generator (Keithly 6221). As the AC current is applied to theelement, electric potential (voltage) is measured at all of the other electrodes using astandard laboratory data acquisition system (National Instruments). Standard shieldedcoaxial wires, roughly 1 m in length, are used to attach the data acquisition system tothe copper electrodes. MATLAB is used to execute the tomographic reconstructionalgorithms. The FEM model of each test specimen is meshed with 384 triangularelements.
Strain is also measured by three traditional methods for many of the loaded speci-mens. First, metal foil strain gauges (Texas Measurements) with nominal resistance of120 U and a gauge factor of 2.1 are installed on the surface of the ECC specimensusing epoxy. An additional approach to measuring strain is by optical methods usingthe OptoTrak Certus motion capture system. The system consists of a 3020 OptoTrakcamera position sensor (111 � 31.5 � 21.5 cm), markers, and a system control unit.The markers are reflective nodes (approximate diameter 1 cm) that are attached tothe specimen surface using standard glue. 2D motion of the markers is accuratelymeasured by the 3020 OptoTrak camera position sensor with a resolution of50.01 mm. To achieve this resolution, the camera position sensor is placed 2 mfrom the instrumented test specimen. The last approach is to calculate strain usingthe actuator displacement as measured by the load frame’s linear variable differentialtransformer (LVDT).
7.1.11 Monotonic tensile loading
Four rectangular ECC plate specimens are prepared for monotonic tensile loading.First, 32 copper electrodes are attached to the sides of the plate as shown inFigure 7.6(a). On the long sides of the specimen, 12 electrodes are attached to eachside; the shorter sides each have four electrodes attached. The electrodes are installedto be equidistant from one another. The specimens are labeled as specimen MT1through MT4. Twelve OptoTrak markers are glued to the front surface of specimenMT1; the markers are oriented in two vertical rows and separated by 3 cm from oneanother. The marker orientation divides the plate specimen into five regions labeledas regions 1 through 5. Along the vertical center line of the specimen, five metalfoil strain gauges are attached; the gauges are separated such that each region hasits own strain gauge. Strain gauges and OptoTrak markers are not installed on speci-mens MT2 through MT4.
Specimen MT1 is gripped by an MTS load frame and monotonically loaded in ten-sion. Prior to the application of axial load, the copper electrodes are used to performEIT sensing of the specimen. These data will be used to derive a baseline conductivitymap of the unloaded plate specimen. The load frame is commanded to apply tensionload to the plate with the actuator displacement controlled. Applied force and actuatordisplacement are recorded from which stress and strain of the specimen can be calcu-lated. The actuator is paused at 0.05, 0.1, 0.2, 0.3, 0.4, 0.5, 0.75, 1, 1.25, and 1.5%
134 Multifunctional Nanocomposites in Civil and Structural Engineering

strain. When paused, EIT sensing is conducted to collect electrical data for reconstruc-tion of conductivity maps of the instrumented specimen. In addition, strain anddisplacement of the OptoTrak markers are measured. After 1.5% strain has beenachieved, the test is terminated.
Specimens MT2 through MT4 are loaded into the MTS load frame for monotonictensile loading. Again, before axial load is applied to the specimens, EIT sensing isconducted to obtain baseline tomographic data. Next, each specimen is loaded withthe actuator operated in displacement control mode to strain levels of 0.5, 1, and2.4% strain. At each strain level, the load is paused and EIT sensing conducted. After2.4% strain, each specimen is loaded until failure. At the point of failure, EIT sensing isagain performed.
7.1.12 Cyclic axial loading
Again, 32 copper electrodes are attached to the boundary of plate specimen CT1 in thesame configuration as specimens MT1 through MT4 (Figure 7.6(a)). Before the spec-imen is gripped in the MTS load frame, EIT sensing is performed to derive a baselineconductivity map of the unloaded specimen. The specimen is then gripped in the MTSload frame, and two tensionecompression cycles are applied. The specimen is cycli-cally loaded with the following peak strains: first, 0.32% strain in tension; second,0.5% strain in compression; third, 1.2% strain in tension; fourth, 1% strain in compres-sion; and then, finally, 2% strain in tension. After 2% tensile strain is achieved, thespecimen is monotonically loaded until failure. Along the two cycles of loading, theapplication and relaxation of axial load are paused and EIT conductivity maps arecalculated.
7.1.13 Monotonic three-point bending
The ECC beam is instrumented with 32 copper electrodes mounted to the bottom faceof the beam. A section roughly 38.1 cm long and 7.6 cm wide is delineated in the cen-ter of the beam by the electrodes (Figure 7.7). Twelve electrodes are attached alongeach of the long sides of this region, and four electrodes are attached on each of the
Figure 7.7 Unreinforced ECC beam loaded in 3-point bending with conductivity measured onthe bottom beam face.
Tomographic imaging of cementitious materials 135

shorter sides. The beam is placed upon the bed of an Instron general purpose loadframe; roller supports spaced 121.9 cm apart support the beam at two ends, and anactuator applies load at the center of the beam’s top face. An EIT conductivity mapis acquired prior to the application of load. Once load is applied, the test is pausedat displacements of 0.2 and 0.6 cm so that EIT conductivity maps of the beam’s lowerface can be acquired. After a displacement of 0.6 cm is achieved, the beam is loadedtill failure.
7.2 Results and discussion
7.2.1 Specimen MT1
Specimen MT1 is monotonically loaded in tension in order to estimate the sensitivityof the piezoresistive effect of ECC materials. The stressestrain curve of the monoton-ically loaded plate is presented in Figure 7.8(a). The plate initiates strain hardening at0.2% strain (as calculated from the load frame displacement). The application oftension is paused three times while the plate is elastic (denoted as P1, P2, and P3).After strain hardening, the test is again paused as denoted by points P4 throughP10. Each time the test is paused, an EIT conductivity map of the plate is obtained.The conductivity of the specimen is averaged across each of the specimen’s five re-gions (as delineated in Figure 7.6(a)) and compared to the average conductivity priorto the application of load (effectively at P0). The percentage change in average con-ductivity versus the average strain (as calculated from the load frame displacement)is plotted in Figure 7.8(b) for each specimen region. As can be seen in the plot,each region exhibits a nearly linear change in conductivity as a function of strain.
The strain calculated using the load frame displacement represents an average strainfor the entire specimen. In contrast, the OptoTrak sensor system can measure strain inlocalized regions of the specimen. Similarly, the EIT conductivity maps provide ameasurement of the ECC conductivity over the complete instrumentation area. As aresult, for each of the regions defined by the location of the OptoTrak markers (regions1 through 5), the localized strains measured by the OptoTrak camera are compared tothe average resistivity of the region. To calculate the average resistivity, the conduc-tivities of the triangular elements of the EIT conductivity map are averaged andinverted to yield the average resistivity. For each region of specimen MT1, the aver-aged resistivity is plotted versus the local strain as measured by the OptoTrak system inFigure 7.9. The piezoresistive effect is evident with resistivity increasing in tandemwith strain. Furthermore, the resistivity changes are fairly linear with gauge factorsof 15.0, 14.3, 15.6, 15.4, and 15.4 for regions 1 through 5, respectively.
7.2.2 Specimens MT2, MT3, and MT4
Specimens MT2, MT3, and MT4 are loaded monotonically in uniaxial tension untilfailure (damage localization). During loading, stressestrain responses are recordedas shown in Figures 7.10(a), 7.11(a), and 7.12(a), respectively. All three specimens
136 Multifunctional Nanocomposites in Civil and Structural Engineering

Figure 7.8 Monotonic tensile loading of specimen MT1: (a) stressestrain response;(b) percentage change of conductivity as a function of the average specimen strain.
Tomographic imaging of cementitious materials 137

Region 1 Region 2 Region 3
Region 4 Region 5
30
25
20
15
10
5
0
30
25
20
15
10
5
0
30
25
20
15
10
5
0
30
25
20
15
10
5
0
30
25
20
15
10
5
0
0 0.10.20.30.40.5 0.75 1.0 1.25 1.5 0 0.10.20.30.40.5 0.75 1.0 1.25 1.5
0 0.10.20.30.40.5 0.75 1.0 1.25 1.5 0 0.10.20.30.40.5 0.75 1.0 1.25 1.5
0 0.10.20.30.40.5 0.75 1.0 1.25 1.5
%Δ
(R
esis
tivity
)ρ
%Δ
(R
esis
tivity
)ρ
%Δ
(R
esis
tivity
)ρ
%Δ
(R
esis
tivity
)ρ
%Δ
(R
esis
tivity
)ρ
OptoTrak ε (%) OptoTrak ε (%) OptoTrak ε (%)
OptoTrak ε (%)OptoTrak ε (%)
Figure 7.9 Change in average resistivity of region 1 through 5 versus strain as measured by the OptoTrak optical sensors installed in that region.
138Multifunctional
Nanocom
positesin
Civil
andStructural
Engineering

(a)
(b)
(c)
Specimen MT25
4.5
4
3.5
3
2.5
2
1.5
1
00 0.5 1.5 2 2.5 3 3.51
0.5
Conductivity (nS cm–1)
(MP
a)
ε
–500 –400 –300 –200 –100 0 100
(%)
ε = 0.5%
ε = 1.0%
ε = 2.4%
ε = 3.1%
A
B C D
E
B
C
D
E
σ
Figure 7.10 Monotonic tensile loading of specimen MT2: (a) stressestrain response;(b) change in conductivity from the baseline for four levels of strain; (c) final specimenwith cracks highlighted.
Tomographic imaging of cementitious materials 139

(a)
(b)
(c)
Specimen MT35
4.5
4
3.5
3
2.5
2
1.5
1
00 0.5 1.5 2 2.5 3 3.51
0.5
Conductivity (nS cm–1)
(MP
a)
ε
–500 –400 –300 –200 –100 0 100
(%)
ε = 0.5%
ε = 1.0%
ε = 2.4%
ε = 2.9%
σ
Figure 7.11 Monotonic tensile loading of specimen MT3: (a) stressestrain response;(b) change in conductivity from the baseline for four levels of strain; (c) final specimenwith crack highlighted.
140 Multifunctional Nanocomposites in Civil and Structural Engineering

(a)
(b)
(c)
Specimen MT45
4.5
4
3.5
3
2.5
2
1.5
1
00 0.5 1.5 2 2.5 3 3.51
0.5
Conductivity (nS cm–1)
(MP
a)
ε
–500 –400 –300 –200 –100 0 100
(%)
ε = 0.5%
ε = 1.0%
ε = 2.4%
ε = 3.0%
σ
Figure 7.12 Monotonic tensile loading of specimen MT4: (a) stressestrain response;(b) change in conductivity from the baseline for four levels of strain; (c) final specimenwith crack highlighted.
Tomographic imaging of cementitious materials 141

undergo strain hardening after reaching 0.25% strain. The ultra-ductility of the ECCmaterial is evident by the ultimate strain levels reached by each of the three plates;specimens MT2, MT3, and MT4 all fail at strains in excess of 2.5%.
When the specimens achieve 0.5% strain, the application of load is paused and anEIT conductivity map is acquired. To observe a change in conductivity, the conductiv-ity map acquired at point A (i.e., unloaded) will be subtracted from those acquiredduring loading. As can be seen in Figures 7.10(b), 7.11(b), and 7.12(b), the maps ofthe change in conductivity of the specimens at point B reveal reductions in conductivityconsistent with strain (i.e., the piezoresistive effect). Furthermore, regions of micro-cracking that occur during strain hardening are evident in the conductivity maps. Forexample, in specimenMT2, a thin band of concentrated conductivity change in the cen-ter of the element reveals the strain-hardening microcracking. Specimens MT3 andMT4 also have regions of microcracking that are evident toward the left side of theirEIT conductivity maps.
Monotonic tensile loading of the specimens continues until 1% strain is achieved.At point C, the average conductivity for each specimen reduces consistently withstrain. However, regions of microcracking where conductivity reductions are greaterhave grown significantly. For example, for specimen MT4, the thin region of micro-cracking at 0.5% strain has grown to occupy nearly half of the specimen. Similarly,in specimen MT2, the region of microcracking is in the center of the specimen andoccupies nearly a quarter of the specimen length.
The tests are continued until damage localizes into large cracks (i.e., failure). Thelarge cracks can be seen in the EIT conductivity maps as major reductions in conduc-tivity, some as large as 500 nS cm. For example, in Figure 7.10(b), two large crackscan be seen in the EIT conductivity map at the two ends of the specimen. The cracksimaged in the EIT maps precisely capture the location and geometric orientation of thetrue damage state of the specimen as pictured in Figure 7.10(c). The locations of thecracks in the actual test specimen are highlighted using a red felt tip marker to enhancethe comparison. For specimen MT3, the macrocrack forms in the center of the spec-imen as can be seen in the final EIT conductivity map (Figure 7.11(b)) and the pictureof the final specimen (Figure 7.11(c)). Again, in specimen MT4, the ECC platedevelops a large crack toward the left side of the specimen (Figure 7.12(c)). This crackis successfully captured by the EIT conductivity map at 3.0% strain (Figure 7.12(b)).
7.2.3 Specimen CT1
Plate specimen CT1 is loaded cyclically in axial tension and compression. Again, thedistribution of change in specimen conductivity (i.e., conductivity minus the baselineconductivity) is mapped at multiple points along the cyclic loading profile. As can beobserved in Figure 7.13(a), the specimen is first loaded in tension until it reaches atensile strain of 0.32% (point B). At this strain level, a narrow band of microcrackingcan be observed toward the left side of the specimen as shown in the EIT conductivitymaps of Figure 7.13(b). As the specimen is unloaded back to 0% strain (point C), thechange in conductivity in the region of microcracking recovers, suggesting the closureof the cracks. The plate is then loaded in compression to 0.5% strain (point D). When
142 Multifunctional Nanocomposites in Civil and Structural Engineering

Figure 7.13 Cyclic axial loading of specimen CT1: (a) chronological application of tensile andcompressive strain; (b) mapping of conductivity changes at points B through L; (c) picture offailed specimen (point L) with close-up views of cracking fields and fibers bridging amacro-scale crack.
Tomographic imaging of cementitious materials 143

loaded in compression, the narrow crack field once again becomes evident, althoughthe conductivity reduction is less pronounced than when the element is loaded intension. Even though the cracks introduced in tension have closed, because they donot close perfectly, some reduction in conductivity is expected. When the specimenis reloaded in tension to 1% strain (point F), the microcracks from point B reopenand additional microcracks form, yielding a larger field of microcracking at the leftside of the specimen. As the ECC specimen is further loaded in tension to 1.3% strain(point G), a second field of microcracks emerges near the center of the specimen.Thereafter, the specimen is loaded to 1% strain in compression (point I). Again, themicrocracks present in the specimen can still be observed in the EIT conductivitymaps even though they have closed. This is likely due to their inexact closure andthe occurrence of some crushing at the crack surface. After achieving a peak compres-sive strain of 1%, the specimen is loaded in tension until failure, which occurs at 2.8%strain (point L). When loaded in tension, the microcracking field in the center of thespecimen continues to grow until a large millimeter-wide crack is introduced onthe right side of the specimen at 2.8% tensile strain. The location and geometry ofthe crack are evident in the EIT conductivity map. The EIT conductivity map compareswell with a photo of the failed specimen (Figure 7.13(c)).
At each point of cyclic loading, the percentage of change in conductivity is aver-aged over the entire specimen. This percentage change in conductivity is superimposedover the chronological plot of applied strain, as shown in Figure 7.14. The percentagechange in conductivity varies in linear proportion with strain when loaded in tension. Ifthe gauge factor of the specimen is calculated at the points of peak tension (points B,G, L), the gauge factor is found to be 8.5, 13.1, and 15.4, respectively. The increasein gauge factor is due to the accumulation of microcracking in the specimen. Whenthe specimen is unloaded between successive tensionecompression peaks, the
Figure 7.14 Average conductivity change for each load point superimposed with the appliedstrain pattern.
144 Multifunctional Nanocomposites in Civil and Structural Engineering

accumulation of microcracking prevents the specimen from fully recovering its initialconductivity. As can be seen, in Figure 7.14, the residual change in conductivity atpoints C, E, H, and J is 0.7, 1.0, 3.1, and 3.7%, respectively. When the element isplaced in compression, the specimen conductivity still reduces but at a much smallerrate in compression than when in tension. The effective gauge factor for the element iscalculated at points D and I as �3.0 and �5.2, respectively.
7.2.4 Beam specimen
In the last set of experiments, the ECC beam specimen is loaded in three-point bendingwhile EIT conductivity maps of the lower face of the beam are taken at four pointsalong the monotonically applied forceedisplacement curve (denoted as points A, B,C, and D in Figure 7.15(a)). The absolute EIT conductivity maps are presented inFigure 7.15(c). The formation of cracking initiates at point B with a field of micro-cracking observable in the center of the EIT conductivity map. The field of micro-cracking appears to resemble a “V” shape with one side of the beam experiencingmore microcracking than the other. As the load is applied, the beam begins to soften
Figure 7.15 Beam specimen one under 3-point bending: (a) load-deflection curves; (b) sideand bottom face damage with cracks highlighted; (c) absolute conductivity maps at pointsA through D.
Tomographic imaging of cementitious materials 145

at a deflection of 0.4 cm; softening is due to the formation of a macrocrack. At point C,the EIT conductivity map reveals the crack at the center of the beam; the crack width ismeasured using a crack gauge and is 3 mm wide. The crack is further widened by dis-placing the beam to 0.9 cm (point D). At this point, the change in absolute conductivityis significantly greater (a reduction of 1600 nS cm). With the load still applied, thecrack opening is 5 mm. Pictures of the final cracked specimen are presented inFigure 7.15(b).
7.3 Conclusions
The lasting contribution of this work is the introduction of EIT as a powerful new NDEtool for health monitoring of cementitious structures. EIT offers true multidimensionalsensing that can be automated for unattended long-term operation in actual concretestructures. In this study, EIT sensing is validated upon ECC specimens loaded in axialtension, axial compression, and bending. EIT conductivity maps reveal the piezoresis-tive nature of ECC structural elements loaded in tension. The tensile gauge factor ofECC, as determined by EIT conductivity mapping, is shown to be between 13 and15. Although the piezoresistivity of cementitious materials has been proposed forself-sensing strain, we are of the opinion that this approach would be challenging topractically apply in actual field structures. As witnessed in this work, microcrackingin the cementitious specimen alters the gauge factor; gauge factors are shown toincrease with the accumulation of cracking. Other challenges also exist, includingthe sensitivity of the material’s electrical properties with environmental influenceslike temperature and humidity.
The more likely use of EIT sensing is for damage characterization of cement-basedstructures. As one of the few truly distributed sensing approaches, EIT has the abilityto accurately locate cracks as well as quantify their geometric features. As this workhas shown, the geometric propagation of dense fields of microcracks, strain hard-ening, and crack localization in FRCC elements were all easily captured by theEIT conductivity maps. This work largely restricted its application to 2D surfacesof the ECC specimens. However, the EIT formulation is general and can be appliedto 3D. For example, electrodes mounted to the outer surface of structural elementswould be capable of imaging the element’s internal structure. This could be powerfulfor identifying cracks below the surface that are impossible to detect during visualinspection.
Although this work lays a firm foundation for EIT sensing in civil structures,additional work is needed to further develop this novel technique. This study onlyconsidered the use of ECC materials for EIT sensing; other cementitious materialsincluding concrete must be explored. The inclusion of conductive fibers in a cementmatrix opens new and exciting avenues of exploration because fiber interfaces andvolume fractions can be varied to adjust the nominal conductivity and piezoresistivegauge factor of the material. An additional advantage of conductive fibers is thatconductive fiber FRCC materials experience an increase in conductivity when loadedin compression (Chung, 2003). This is in contrast to the polymeric fibers employed in
146 Multifunctional Nanocomposites in Civil and Structural Engineering

this study; polymeric fibers are nonconducting, resulting in decreases in conductivitywhen specimens are loaded in compression. Another challenge envisioned for EITsensing is the inclusion of steel reinforcement in structural specimens. The presenceof reinforcement steel in the structure could alter the EIT map. However, the locationof reinforcement is generally known a priori and can therefore be included at theoutset of the EIT inverse solution. This would preserve the accuracy of the EITapproach when mapping the conductivity of just the cementitious material.
Acknowledgments
This research was partially funded by the National Science Foundation under GrantCMMIe0724022. The authors would like to express their gratitude to Professor Victor C. Li(University of Michigan) for offering unfettered access to ECC materials and for allowing usto use his MTS-810 load frame during the experimental phase of this study. For measurementof strain in the plate specimens by optical means, the assistance provided by Prof. GustavoParra-Montesinos (University of WisconsineMadison) and Mr Hai Dinh (GS E&C) was greatlyappreciated. Additional assistance was provided by Dr Shunzhi Qian (Nanyang TechnologicalUniversity) and Dr En-Hua Yang (Nanyang Technological University).
References
ACI, 1998. Causes, Evaluation and Repair of Cracks in Concrete Structures. Report NumberACI224.1R-93. American Concrete Institute, Farmington Hills, MI.
Balaguru, P.N., Shah, S.P., 1992. Fiber-reinforced Cement Composites. McGraw-Hill,New York, NY.
Barber, D.C., 1989. A review of image reconstruction techniques for electrical impedancetomography. Medical Physics 16, 162e169.
Barsoukov, E., Macdonald, J.R., 2005. In: Impedance Spectroscopy Theory, Experiment, andApplications. Wiley, Hoboken, NJ.
Bungey, J.H., Millard, S.G., Grantham, M.G., 2006. Testing of Concrete in Structures. Taylorand Francis, London, UK.
Calleja, J., 1953. Determination of setting and hardening time of high-alumina cements byelectrical resistance techniques. Journal of the American Concrete Institute 25, 249e256.
Carino, N.J., 2004. Stress wave propagation methods. In: Malhotra, V.M., Carino, N.J. (Eds.),Handbook on Nondestructive Testing of Concrete. CRC Press, Boca Raton, FL.
Chapra, S.C., Canale, R.P., 2009. Numerical Methods for Engineers (6e). McGraw-Hill, NewYork, NY.
Chung, D.D.L., 2001. Cement-based electronics. Journal of Electroceramics 6, 75e88.Chung, D.D.L., 2003. Multifunctional Cement-Based Materials. Marcel-Dekker, New York, NY.Doebling, S.W., Farrar, C.R., Prime, M.B., 1998. A summary review of vibration-based damage
identification methods. Shock and Vibration Digest 30, 91e105.Gowers, K.R., Millard, S.G., 1999. Measurement of concrete resistivity for assessment of
corrosion severity of steel using Wenner technique. ACI Materials Journal 96, 536e541.Hammond, E., Robson, T.D., 1955. Comparison of electrical properties of various cements and
concretes. The Engineer 199, 114e115.
Tomographic imaging of cementitious materials 147

Han, N., van Beek, A., Koenders, E.A.B., 2005. Electrical methods. In: Reinhardt, H.W.,Grosse, C.U. (Eds.), Advanced Testing of Cement Based Materials During Setting andHardening e Final Report of RILEM TC 185-ATC. RILEM, Bagneux, France. TechnicalReport 31.
Hansson, I.L.H., Hansson, C.M., 1983. Electrical resistivity measurement of Portland cementbased materials. Cement and Concrete Research 13, 675e683.
Heikkinen, L.M., Vilhunen, T., West, R.M., Vauhkonen, M., 2002. Simultaneous reconstructionof electrode contact impedances and internal electrical properties: II. Laboratory experi-ments. Measurement Science and Technology 13, 1855e1861.
Hou, T.C., Lynch, J.P., 2005a. Conductivity-based strain monitoring and damage character-ization of fiber reinforced cementitious structural components. In: Proceedings of theSPIE e The International Society for Optical Engineering, vol. 5765, pp. 419e429.
Hou, T.C., Lynch, J.P., 2005b. Monitoring strain in engineered cementitious composites usingwireless sensors. In: Proceedings of the 11th International Conference on Fracture,Turin, Italy.
Jung, Y.C., Na, W.B., Kundu, T., Ehsani, M., 2000. Damage detection in concrete using Lambwaves. In: Proceedings of SPIE e The International Society for Optical Engineering, vol.3995, pp. 448e458.
Kim, Y.Y., Fischer, G., Li, V.C., 2004. Performance of bridge deck link slabs designed withductile engineered cementitious composite. ACI Structural Journal 101, 792e801.
Kratzig, W.B., Meyer, I.F., Meskouris, K., 1989. Damage evolution in reinforced concretemembers under cyclic loading. In: Proceedings of the 5th International Conference onStructural Safety and Reliability, San Francisco, CA, pp. 795e802.
Kunieda, M., Rokugo, K., 2006. Recent progress on HPFRCC in Japan required performanceand applications. Journal of Advanced Concrete Technology 4, 19e33.
Lauer, K.R., 2004. Magnetic/Electrical methods. In: Malhotra, V.M., Carino, N.J. (Eds.),Handbook on Nondestructive Testing of Concrete. CRC Press, Boca Raton, FL.
Li, M., 2009. Durability of Concrete Repair through Ductility and Crack Width Control in ECC(PhD thesis). The University of Michigan.
Li, M., Li, V.C., 2011. High-early-strength ECC for rapid durable repair: material properties.ACI Materials Journal 108, 3e12.
Li, V.C., Wu, C., Wang, S., Ogawa, A., Saito, T., 2002. Interface tailoring for strain hardeningPVA-ECC. ACI Materials Journal 99, 463e472.
Li, V.C., 2012. Tailoring ECC for specific attributes: a review. International Journal of ConcreteStructures and Materials 6, 135e144.
Li, H., Xiao, H.G., Ou, J.P., 2006. Effect of compressive strain on electrical resistivity of carbonblack-filled cement-based composites. Cement and Concrete Composites 28, 824e828.
Lionheart, W., Polydorides, N., Borsic, A., 2005. The reconstruction problem. In: Holder, D.S.(Ed.), Electrical Impedance Tomography: Methods, History, and Applications. IoP,London, UK.
Luangvilai, K., Punurai, W., Jacobs, L.J., 2002. Guided wave technique to characterize repairedConcrete. In: AIP Conference Proceedings, pp. 1220e1226.
Mayer, J.W., Lau, S.S., 1990. Electronic Materials Science: For Integrated Circuits in Si andGaAs. Macmillan, New York, NY.
McCarter, W.J., Brousseau, R., 1990. The A.C. responses of hardened cement paste. Cementand Concrete Research 20, 891e900.
Millard, S.G., 1991. Reinforced Concrete resistivity measurement techniques. In: Proceedings ofthe Institution of Civil Engineers, Part 2: Research and Theory, vol. 91, pp. 71e88.
Mindess, S., 2004. Acoustic emission methods. In: Malhotra, V.M., Carino, N.J. (Eds.),Handbook on Nondestructive Testing of Concrete. CRC Press, Boca Raton, FL.
148 Multifunctional Nanocomposites in Civil and Structural Engineering

Na, W.B., Kundu, T., Ehsani, M.R., 2002. Ultrasonic guided waves for steel bar concreteinterface testing. Materials Evaluation 60, 437e444.
Naaman, A.E., Chandrangsu, K., 2004. Innovative bridge deck system using high-performancefiber-reinforced cement composites. ACI Structural Journal 101, 57e64.
Ouyang, C., Landis, E., Shah, S.P., 1991. Damage assessment in concrete using quantitativeacoustic emission. Journal of Engineering Mechanics 117, 2681e2698.
Park, S., Ahmad, S., Yun, C.B., Roh, Y., 2006. Multiple crack detection of concrete structuresusing impedance-based structural health monitoring techniques. Experimental Mechanics46, 609e618.
Park, Y.J., Ang, A.H.S., 1985. Mechanistic seismic damage model for reinforced concrete.Journal of Structural Engineering 111, 722e739.
Park, G., Cudney, H.H., Inman, D.J., 2000. Impedance-based health monitoring of civilstructural components. Journal of Infrastructure Systems 6, 153e160.
Parra-Montesinos, G.J., 2005. High-performance fiber-reinforced cement composites: analternative for seismic design of structures. ACI Structural Journal 102, 669e675.
Peled, A., Torrent, J.M., Mason, T.O., Shah, S.P., Garboczi, E.J., 2001. Electrical impedancespectra to monitor damage during tensile loading of cement composites. ACI MaterialJournal 98, 313e322.
Raghavan, A., Cesnik, C.E.S., 2007. Review of guided-wave structural health monitoring.Shock and Vibration Digest 39, 91e114.
Reza, F., Yamamuro, J.A., Batson, G.B., Lee, J.S., 2003. Smart behavior of carbon fiber cementcomposites in compact tension. In: Proceedings of the 16th ASCE Engineering MechanicsConference, Seattle, WA.
Rose, J.L., Ditri, J.J., 1990. Ultrasonic computed tomography considerations in the NDE of solidmaterials. In: IEEE 1990 Ultrasonics Symposium Proceedings, pp. 991e995.
Shah, S.P., Choi, S., 1999. Nondestructive techniques for studying fracture processes inconcrete. International Journal of Fracture 98, 351e359.
Stang, H., Pedersen, C., 1996. HPFRCC e extruded pipes. In: Proceedings of the 4th MaterialsEngineering Conference, Washington, DC, pp. 261e270.
Vauhkonen, M., 1997. Electrical Impedance Tomography and Prior Information (PhD thesis).Kuopio University, Kuopio, Finland.
Vilhunen, T., Kaipiom, J.P., Vauhkonen, P.J., Savolainen, T., Vauhkonen, M., 2002.Simultaneous reconstruction of electrode contact impedances and internal electricalproperties: I. Theory. Measurement Science and Technology 13, 1848e1854.
Wang, S., 2005. Micromechanics Based ECC Matrix Design (PhD thesis). The University ofMichigan.
Wang, S., Li, V.C., 2003. Material design of lightweight PVA-ECC. In: Naaman, A.E.,Reinhardt, H.W. (Eds.), Proceedings of HPFRCC, pp. 379e390 (Ann Arbor).
Webster, J.G., 1990. Electrical Impedance Tomography. Hilger, Bristol, England.Whiting, D.A., Nagi, M.A., 2003. Electrical Resistivity of Concrete e A Literature Review,
PCA R&D Serial No. 2457. Portland Cement Association, Skokie, IL.Wight, J., Parra-Montesinos, G., Canbolat, A., 2006. HPFRCC coupling beams for
earthquake-resistant wall structures. In: Proceedings of the IABSE Symposium onStructures and Extreme Events, Lisbon, Portugal, pp. 114e115.
Yang, E.H., 2007. Designing Functionalities into ECC Materials via Micromechanics(PhD thesis). The University of Michigan.
Yang, E.H., Yang, Y., Li, V.C., 2007. Use of high volumes of fly ash to improve ECCmechanical properties and material greenness. ACI Materials Journal 104, 303e311.
Zhdanov, M.S., Keller, G.V., 1994. Geoelectrical Methods in Geophysical Exploration.Elsevier, Amsterdam.
Tomographic imaging of cementitious materials 149

Nano carbon materialefilledcementitious composites:fabrication, properties, andapplication
8
Baoguo Han 1, Shengwei Sun 2, Siqi Ding 1, Liqing Zhang 1,Sufen Dong 1,3, Xun Yu 4
1School of Civil Engineering, Dalian University of Technology, Dalian, China; 2School of CivilEngineering, Harbin Institute of Technology, Harbin, China; 3School of Architecture andCivil Engineering, Inner Mongolia University of Science and Technology, Baotou, China;4Department of Mechanical Engineering, New York Institute of Technology, New York, USA
8.1 Introduction
Both nano-materials and carbon materials are attracting more and more attention in thefield of materials science and technology. Carbon materials with nanoscale structures,also called nano carbon materials or nano-carbon materials (NCMs), not only showbetter properties than conventional or microscale carbon materials but also exhibitnovel characteristics that conventional carbon materials do not have. They provide anew approach to develop composites with high-performance and multifunctionalproperties.
Cementitious materials are the second most used resource in the world after water.They have a direct and visible impact on the world’s resources, energy consumption,and carbon dioxide emissions. The development of high-performance and multifunc-tional cementitious materials is a sustainable direction. The potential benefits of thistechnology include improved infrastructure reliability and longevity, enhanced struc-tural performance and durability, improved safety against natural hazards and vibra-tions, and a reduction in life-cycle costs in operating and managing civil infrastructures.
Owing to their remarkable mechanical, chemical, electrical, and thermal properties;excellent nanoscale effects; low density; and excellent chemical and thermal stability,NCMs offer the possibility to develop a new generation of tailored, high-performance,and multifunctional cementitious composites. Extensive research endeavors demon-strated the potential of various NCMs, including carbon nanofibers (CNFs), carbonnanotubes (CNTs), and nano graphite platelets (NGPs), for enhancing cementitiousmaterials (Chen et al., 2011; Pacheco-Torgal and Jalali, 2011; Chyad, 1989; Sanchezand Sobolev, 2010; Chen and Poon, 2009; Raki et al., 2010; Sobolev and Gutiérrez,2005; Mukhopadhyay, 2011; Parveen et al., 2013; Li et al., 2005; Gao et al., 2009;Huang, 2012; Han et al., 2011a, 2013a).
Innovative Developments of Advanced Multifunctional Nanocomposites in Civil and Structural Engineeringhttp://dx.doi.org/10.1016/B978-1-78242-326-3.00008-7Copyright © 2016 Elsevier Ltd. All rights reserved.

The aim of this chapter is to provide a systematic review of the major progress andadvances in the fabrication, properties, and applications of NCM-filled cementitiouscomposites. The improvement mechanism of the NCMs to cementitious materials isalso discussed.
8.2 Introduction of NCMs
8.2.1 Introduction of CNTs
CNTs are carbon materials with a hollow cylindrical nanostructure. They are generallya few nanometers in diameter and several microns in length (as shown inFigure 8.1(a)). CNTs are categorized as single-walled CNTs (SWCNTs) and multi-walled CNTs (MWCNTs). In recent years, CNTs have been widely applied in a varietyof fields due to their excellent physical properties, such as high strength and Young’smodulus (the tensile strength and Young’s modulus of CNTs are, respectively, 20times and 10 times those of carbon fibers (CFs)), high bonding force with matrix(the interlaminar shear strength of CNT-reinforced epoxy materials is 10 times thatof CF-reinforced epoxy materials), large deformation and high ductility (the elonga-tion at break of CNTs is 18%, which is 18 times that of CFs), high aspect ratio
(a)
(b)
(c)
Figure 8.1 Photos of NCMs: (a) CNTs; (b) CNFs; and (c) NGPs.
154 Multifunctional Nanocomposites in Civil and Structural Engineering

(>500), and excellent electrical conductivity. The extremely high aspect ratio, hollowstructure, and low density of CNTs make them ideal to form a conductive and mechan-ical reinforcement network inside a concrete matrix with a CNT concentration level aslow as 0.05 wt%. CNTs also have interesting piezoresistive properties. When CNTsare subjected to stress or strain, their electrical properties will change with the levelof stress or strain, expressing a linear and reversible piezoresistive response even fora large strain of 3.4%. In addition, the small diameter and high aspect ratio of CNTsare very favorable for motivating field emission conduction. Because CNTs are supe-rior to CFs in many respects and can be used as reinforcements to transfer the rein-forcement behavior from the macroscale to the nanoscale level, it is promising todevelop high-performance and multifunctional cementitious materials without addingany additional weight and sacrificing other properties of cementitious materials.
8.2.2 Introduction of CNFs
Like CNTs, CNFs are also quasi-one-dimensional (1D) carbon materials, and theirdiameters are between those of CNTs and CFs (as shown in Figure 8.1 (b)). They canbe categorized as hollowCNFs or solidCNFs according to their structural characteristics.Their diameters are generally in the range of 10 to 500 nm, and their lengths range from0.5 to 200 mm. CNFs, having a higher degree of crystalline orientation, are preferred forelectrical and thermal conductivity. They not only possess low density, high modulus,high strength, high conductivity, and thermal stability the same as the CFs fabricatedwith a chemical vapor deposition growth method, but also have advantages such as asmall number of defects, large aspect ratio, large surface area, and compact structure(http://cnx.org/content/m22580/latest/?collection=col10700/latest).
8.2.3 Introduction of NGPs
NGPs are another type of carbon-based conductive nanoparticle that is produced fromgraphite (as shown in Figure 8.1 (c)). Graphene oxide (GO) is a single layer of NGPsthat have been oxidized to intersperse the carbon layers with oxygen molecules. Thestructure of NGPs is 2D platelets consisting of a few to several graphene layers with anoverall thickness in the nanometer scale and the particle diameter ranging from submi-cron size up to 100 mm (Huang, 2012; Geim and Novoselov, 2007; Nalla et al., 2010).
8.3 Dispersion of NCMs in cementitious composites
Because the strong van der Waals forces cause agglomeration of the nanoparticles, amajor issue in fabricating high-quality NCM-filled cementitious composites is tohomogeneously distribute NCMs in cementitious materials. Poor dispersion willlead to the formation of defects in the matrix and limit the nano-enhancement effect.
Research has been performed to improve the dispersion of NCMs in the cementi-tious composites. There are two common methods used to disperse NCMs. The firstmethod is to mechanically separate the NCMs by ultrasonic ball milling or
Nano carbon materialefilled cementitious composites 155

high-shear mixing. The second method involves chemically altering the surface of theNCMs by the creation of either covalent or noncovalent bonds (Xie et al., 2005). More-over, the mechanical method is often used in combination with the chemical methodmentioned in this chapter (Parveen et al., 2013; Han et al., 2011c, Fu et al., 2001;Hamon et al., 2002; Wong et al., 1998; Bahr and Tour, 2002; Moore et al., 2003;Sanchez and Ince, 2009; Sanchez, 2009). The dispersion methods of NCMs inprevious research are summarized in Tables 8.1, 8.2, and 8.3.
Recently, researchers have proposed novel approaches to solve the dispersion issueof CNTs. The primary approach is to adopt commonly used water-reducing admixtures(including plasticizers and superplasticizers) as surfactants. The National ResearchCouncil Canada (2009) has shown that a small amount of CNTs can be dispersedby ultrasonication in water containing 5% superplasticizer. Shah et al. (2009a) alsoachieved an effective dispersion of MWCNTs with different lengths and concentra-tions in cementitious materials by applying ultrasonic energy in combination withpolycarboxylate-based superplasticizers. Yazdanbakhsh et al. (2012) performed a3D simulation study, and stated that only when cement particles are also distributedhomogeneously without any agglomeration, the degradation effect of cement particleson the homogeneous distribution of CNTs within cementitious materials is negligible(Yazdanbakhsh and Grasley, 2012). Meanwhile, Han et al. (2011c) pointed out that theeffective dispersion of superplasticizers to CNTs and CNFs can contribute to theirdouble-dispersion effect on CNTs, CNFs, and cement particles. Huang also employeda superplasticizer to obtain proper dispersion of NGPs in cementitious materials(Huang, 2012). Therefore, dispersing NCMs with water-reducing admixtures is anexcellent method for fabricating NCM-filled cementitious composites.
In addition, Nasibulin et al., Cwirzen et al., Ludvig et al., and Dunens et al. pro-posed dispersing CNTs and CNFs in the cementitious composites by growing CNTsand CNFs directly on the surface of cement, fly ash (conventional admixtures for fabri-cating cementitious materials), or sand through in situ synthesis (as shown inFigure 8.2) (Han et al., 2011c, Nasibulin et al., 2013; Moisala et al., 2003; Nasibulinet al., 2007; Mudimela et al., 2009; Cwirzen et al., 2009a, Ludvig et al., 2011; Dunenset al., 2009).
8.4 Properties of NCM-filled cementitious composites
8.4.1 Properties of CNT-filled cementitious composites
8.4.1.1 Mechanical properties of CNT-filled cementitiouscomposites
Since early investigations showed that CNTs have strong effects on the hydration pro-cess and hardness of cementitious composites, so far much research has been per-formed on the mechanical properties of CNT-filled cementitious composites. Thedifferent concentrations of CNTs show different effects on the mechanical propertiesof cementitious composites. The use of 0.05 wt% CNTs as the reinforcement for pro-ducing and forming non-autoclave concrete can increase its compressive strength by
156 Multifunctional Nanocomposites in Civil and Structural Engineering

Table 8.1 Summary of dispersion methods of CNTs in cementitious materials
Researchers Morphology of CNTs
Categories of dispersion methods
Chemical treatment
Mechanical treatmentCovalent Noncovalent
Markar et al. (Markar et al., 2005) MWCNTs (diameter: 10 nm,length: 10 mm)
d Isopropanol Ultrasonication (4 h) þ mixing
Cwirzen et al. (Cwirzen et al.,2008)
MWCNTs Polyacrylic acidpolymers (2.1 wt%of water) andcarboxylation
Arabic gum (AG) (2%) Ultrasonication (2e15 min) þmixing
Shah et al. (Shah et al., 2011;Shah et al., 2009a;Konsta-Gdoutos et al., 2008)
SWCNTs (diameter < 2 nm,length < 20 mm)
d d Ultrasonication
Ibarra et al. (Saez De Ibarra et al.,2006)
Short MWCNTs (diameter:9.5 nm, length: 1.5 mm); longMWCNTs (diameter < 8 nm,length: 10e30 mm)
d AG (1.0 and 2.0 wt%) Mixing
Tyson et al. (Tyson et al., 2011;Abu Al-Rub et al., 2011;Yazdanbakhsh et al., 2009;Abu Al-Rub et al., 2012)
MWCNTs (diameter:10e30 nm, length:0.5e500 mm)
d Superplasticizer(1.25 wt%)
Ultrasonication (30 min) þmixing (7 min)
Li et al. (Li et al., 2005) MWCNTs (diameter:10e100 nm,length: 5e15 or 1e2 mm)
Sulfuric acid andnitric acid (3:1 byvolume)
d Mixing (15 min)
Continued

Table 8.1 Continued
Researchers Morphology of CNTs
Categories of dispersion methods
Chemical treatment
Mechanical treatmentCovalent Noncovalent
Collins et al. (Collins et al., 2012) MWCNTs (diameter:10e20 nm, length:10e30 mm); SWCNTs(diameter: 1e2 nm, length:5e30 mm)
d Polycarbonate,lignosulfonate
Magnetic stirring þultrasonication (12 min)
Azhari (Azhari, 2008; Azhari andBanthia, 2012)
MWCNTs (diameter:15e20 nm, length:0.1e10 mm)
d Methylcellulose(0.4 wt%);superplasticizer
Ultrasonication (1 h) þ mixing;high-speed hand mixer
Keriene et al. (Kerien _e et al.,2013)
MWCNTs (diameter:20e40 nm, length:10e30 mm)
d Carboxymethylcellulose Ultrasonication (3 min)
Konsta-Gdoutos et al.(Konsta-Gdoutos et al.,2010a,b; Metaxa et al., 2009,2012)
d d d Ultrasonication þ mixing;ultracentrifugation
Chaipanich et al. (Chaipanichet al., 2010)
MWCNTs d d Ultrasonication (10 min) þmixing
Yu et al. (Yu et al., 2007) MWCNTs (diameter:10e30 nm, length:10e30 mm)
d Sodium dodecylsulfate (SDS)
Ultrasonication
Mendoza et al. (Mendoza et al.,2013)
MWCNTs d Superplasticizer Ultrasonication
Singh et al. (Singh et al., 2013) MWCNTs (diameter: 8e25 nm,length: 120 nm)
d d Ball milling (6 h)

Bharj et al. (Bharj et al., 2014) MWCNTs (diameter:10e30 nm, length: 1e2 mm)
d d Stirring (15 min) þultrasonication (90 min) þmixing (3 min)
Hunashyal et al. (Hunashyal et al.,2011a)
MWCNTs d Ethanol Ultrasonication (90 min)
Yu et al. (Yu and Kwon, 2009) MWCNTs (diameter:10e80 nm, length:0.1e1000 mm)
Mixed solution ofH2SO4 and HNO3
SDS (0.2 wt%) Ultrasonication (1 h) þ mixing
Musso et al. (Musso et al., 2009) MWCNTs (diameter < 8 nm,length: 10e30 mm, eCOOHcontent 3.86 wt%)
d Acetone Ultrasonication (4 h) þ mixing
Han et al. (Han et al., 2009) MWCNTs (diameter:20e40 nm, length: 5e15 mm)
Carboxylation Sodium dodecylbenzenesulfonate (SDBS)(1.4 � 10�2 mol/L)
Magnetically stirring(3 min) þ ultrasonication(2 h) þ mixing (3 min)
Luo et al. (Luo, 2009; Luo et al.,2009)
CNTs (diameter: 12e40 nm,length: 10 mm)
d SDBS (0.15e0.2 g/mL),Triton X-100 (0.15 g/mL)
Magnetically stirring(10 min) þ ultrasonication(2 h, Power: 40 W) þ mixing(4 min)
Kim et al. (Kim et al., 2014) CNTs d Silica fume (0e30 wt%) Mixing (6 min)
Veedu (Veedu, 2011) MWCNTs (diameter:20e40 nm, length: 5e15 mm)
d Acetone or ethanol þmethylcellulose
Ultrasonication þ mixing
Guo et al. (Guo, 2013) MWCNTs(diameter: 10 nm, length:10 mm)
d AG (0.45 g/L) Ultrasonication (30 min,frequency: 40 kHz, power:180 W) þ mixing (6 min)
Note: Some information that references do not provide is not listed in the table.

Table 8.2 Summary of dispersion methods of CNFs in cementitious materials
Researchers Morphology of CNFs
Categories of dispersion methods
Chemical treatment Mechanical treatment
Tyson et al. (Tyson, 2013; Tyson et al.,2011; Abu Al-Rub et al., 2011,Yazdanbakhsh et al., 2009)
Diameter: 60e150 nm, length:30e100 mm
Superplasticizer (1.25 wt%) Ultrasonication (15 min) þ mixing(7 min)
Metaxa et al. (Metaxa et al., 2010,Metaxa et al., 2012)
Diameter: 100e150 nm, length:30e100 mm
d Ultrasonication þ mixing
Yazdanbakhsh et al. (Yazdanbakhshet al., 2010, Yazdanbakhsh et al.,2012; Shah et al., 2010)
Diameter: 60e150 nm, length:30e100 mm
Superplasticizer treatment Ultrasonication (15 min) þ mixing(7 min); ball milling (15 h)
Sanchez et al. (Sanchez and Ince, 2009;Gay and Sanchez, 2010)
Diameter: 70e200 nm, length:30e100 mm
Silica fume (10 wt%) Mixing (15 min); ultrasonication(30 min)
Howser et al. (Howser et al., 2011) d Superplasticizer Mixing (3 min)
Peyvandi et al. (Peyvandi et al.,2013a,b)
Diameter: 60e150 nm, length:30e100 mm
Polyacrylic acid Ultrasonication (30 min) þmicrowave radiation (10 min) þstirring (overnight)
Baeza et al. (Baeza et al., 2013) Diameter: 20e80 nm, length: �30 mm d Ultrasonication þ mixing
Zhao et al. (Zhao et al., 2009) Diameter: 20e100 nm AG Magnetically stirring; ultrasonication
Nasibulina et al. (Nasibulina et al.,2012, Nasibulina et al., 2010)
d Growing CNFs directly on cement(clinker) particles
d
Han et al. (Han et al., 2011c) Diameter: 100e150 nm, length:50e200 mm
Aqueous solution withsuperplasticizer (0.4e1 wt%)
Magnetically stirring (1 min) þultrasonication (2 h) þ mixing(5 min)
Gao et al. (Gao et al., 2009) d SDS Mixing (3 min)
Note: Some information that references dose not provide is not listed in the table.

70% (Yakovlev et al., 2006). The cementitious composites filled with small amountsof MWCNTs (0.048 and 0.08 wt%) exhibit a 15e55% increase in the Young’smodulus and an 8e40% increase in flexural strength. An over 45% increase in the28-day flexural strength is realized with the addition of 0.08 wt% MWCNTs(Konsta-Gdoutos et al., 2010a; Shah et al., 2009b). The addition of 0.05% and 0.1%SWCNTs and 0.1% and 0.2% MWCNTs provides a 10e90% increase in the Young’smodulus and hardness of cementitious composites (Saez De Ibarra et al., 2006). Low
Table 8.3 Summary of dispersion methods of NGPs in cementitiousmaterials
ResearchersMorphology ofNGPs
Categories of dispersion methods
Chemicaltreatment
Mechanicaltreatment
Huang (Huang,2012)
Size of 3e18 mm,thickness of3e70 nm
Superplasticizer(Darex super 20,0.4 wt%)
Ultrasonication(time: 2 h)
Singh et al. (Singhet al., 2011)
d d Mixing and ballmilling (time:5 h)
Note: Some information that references do not provide is not listed in the table.
Cement–mineraladmixtures
Cement–mineral
admixtures
CNTs/CNFs
Figure 8.2 CNTs and CNFs synthesized on cementemineral admixtures.
Nano carbon materialefilled cementitious composites 161

waterecement ratio cementitious composites with 2% SWCNTs show 600% improve-ment in hardness at early ages, but essentially have no improvement after 14 days ofhydration (Makar et al., 2005). The use of 0.5 and 1 wt% CNTs in fly ash (20% byweight of cement) cement paste results in higher compressive strength of the cemen-titious composites. The highest compressive strength of the cementitious composites at28 days is 54.7 MPa, which is almost 2 times of that of plain Portland cement paste(Chaipanich et al., 2010). Matthew J. Bolton et al. found that the use of 0.1 wt%CNTs can increase the tensile strength and reduce the compressive strength of theCNT-filled cementitious composites. When more than 0.2 wt% of CNTs is added,there are small increases in both compressive and tensile strength of the CNT-filledcementitious composites (MacKenzie and Bolton, 2009). Veedu observed that theflexural strength and compressive strength of CNT-filled cementitious compositesare 30% and 100% greater, respectively, than those of CF-filled cementitious compos-ites (Veedu, 2011). Hunashyal et al. investigated the behavior of MWCNT-filledcementitous-composite round bars and found that the tensile strength of the cementi-tious composites with 0.5 wt% CNTs increases by 19%. Tensile modulus of thecementitious composites with 0.5 wt% MWCNTs is increased by 70.9% comparedto that of plain ones (Hunashyal et al., 2011b). The flexural strength of the cementi-tious composite with 0.75 wt% MWCNTs is increased by 43.75% (Hunashyal et al.,2011a). Zuo et al. added 0.5 wt% CNTs to CFs and cementitious composites, resultingin the highest increases in the compressive and splitting tensile strengths (by 18.4%and 21.8%, respectively) (Zuo et al., 2014). Morsy et al. investigated the behaviorof cementitious composites made from MWCNTs and nanoclay materials. Thecompressive strength of the control specimen with 0e0.1% CNTs increases withthe increase of CNTs until it reaches an optimal amount of 0.02% and then starts todrop (Morsy et al., 2011; Siddique and Mehta, 2014).
The type and structure of CNTs were found to be very important with respect to themechanical properties. Adding 0.5 wt% as-grown and annealed MWCNTs to plaincement paste can induce an improvement in the flexural and compressive propertiesof the cementitious composites (Musso et al., 2009). The cement paste incorporatinghydroxyl-functionalized MWCNTs reveals an increase in the compressive strength ofnearly 50% even with only 0.045e0.15 wt% MWCNTs (Cwirzen et al., 2008).Carboxyl-functionalized MWCNTs can increase the compressive strength up to19%, and the flexural strength increases up to 25%. The use of CNTs can improvethe deformation ability of cement mortar, and it leads to a significant increase of thefailure strain (Li et al., 2005). The addition of 0.5% carboxyl-functionalized MWCNTscan obtain enhancements of 149.32% and 34.96% in fracture toughness and criticalopening displacement, respectively, compared to those obtained with the plain cementpaste (Luo et al., 2011). However, Musso et al. obtained a significant reduction in flex-ural and compressive strength of carboxyl-functionalized MWCNT-filled cementitiouscomposites compared to those of pristine cement paste (Musso et al., 2009).
The length of CNTs also affects their dispersion behavior and is therefore a con-trolling factor for the mechanical properties of cementitious composites. In particular,higher concentrations of short MWCNTs (10e30 mm) are required to achieve effec-tive reinforcement, whereas smaller amounts of longer MWCNTs (10e100 mm) are
162 Multifunctional Nanocomposites in Civil and Structural Engineering

needed to achieve the same level of mechanical properties (Konsta-Gdoutos et al.,2010a; Shah et al., 2009b).
Dispersion of CNTs has been identified as one of the principal factors that mostlyaffects the mechanical properties. The use of 0.2% MWCNTs with different surfac-tants can increase the flexural and compressive strength of the cementitious compositesby 35.45% and 29.5%, respectively. The fracture toughness and critical openingdisplacement of the CNT-filled cementitious composites with 0.5% MWCNTs canbe enhanced by 175.21% and 54.77%, respectively, compared to those with the plaincement paste (Luo, 2009). Nasibulin et al. (2009) found that the in situegrownCNT-filled cementitious composites reveal as high as two times increases in thecompressive strength compared with that of plain cement paste. Ludvig et al. (2009)achieved a 34.28% increase in the tensile strength by using an in situegrown cementeCNT hybrid containing 0.3% CNTs. Sobolkina et al. investigated the dispersion ofCNTs and its effect on the mechanical properties of the cement matrix. The applicationof sodium dodecyl sulfate (SDS) as a surfactant leads to a severe drop in the strength ofthe cementitious composites. No distinct increase in compressive strength is observedafter modifying the cement paste with CNTs in a concentration of 0.05% by weight ofcement in comparison with the reference composites (Sobolkina et al., 2012).
8.4.1.2 Electrical and sensing properties of CNT-filledcementitious composites
The CNT-filled cementitious composites can have good conductivity when the con-centration of CNTs reaches the percolation threshold. The electrical resistivity ofSPCNTs (cementitious composites with 0.5% carboxyl-functionalized CNTs) andPCNTs (cementitious composites with 0.5% unfunctionalized CNTs) is 149 and130 U cm, respectively (Li et al., 2005). Saafi (2009) found that there is a suddendecrease in the electrical resistance as the concentration of SWCNTs increases from0 to 0.5 vol%. The electrical resistance decreases when the concentration of SWCNTsincreases from 0.5 to 1 vol%. Azhari (2008) found that the addition of SWCNTs at 1%and MWCNTs at 1% or 3% slightly decreases the electrical resistivity of the cemen-titious composites, whereas a hybrid containing 3% MWCNTs and 15% CFs yields avery low electrical resistivity. Nasibulin et al. (2009) and Cwirzen et al. (2008, 2009b)studied electrical resistivity of CNT-filled cementitious composites made of cementeCNT hybrid. They found that the cementitious composites reveal as high as 40 timesincrease in the electrical conductivity compared to plain cement paste.
Li et al. (2007) observed the pressure-sensitive responses of cement paste withMWCNTs. The compressive sensitivity of SPCNTs is higher than that of PCNTs.Mohamed Saafi (2009) successfully fabricated self-sensing concrete by using SWCNTsas functional filler. The CNT-filled cementitious composites with an SWCNT volumeof 0.5% exhibited a low sensitivity to the applied stress compared to those with anSWCNT volume of 1%. Yu et al. (2007) found that the electrical resistance of thecementitious composites filled with 0.1% non-covalent surface modification MWCNTsby SDS changes synchronously with the compressive stress. The resistance changes ofthe cementitious composites filled with 0.1% carboxyl-functionalized MWCNTs also
Nano carbon materialefilled cementitious composites 163

correspond to the stress load levels. But the latter presents a stronger sensing responseand higher signal-to-noise ratio than the former (Yu et al., 2007).
Han et al. (2010a) also compared the sensing behaviors of MWCNT-filled cemen-titious composites with different water contents under uniaxial compression. Theyfound that the water content has a strong effect on the electrical and sensing propertiesof the cementitious composites. The electrical conductivity of the cementitious com-posites increases with water content, whereas the sensing sensitivities first increaseand then decrease with the increase of water content. Han et al. (2010b, 2012b) studiedthe variation of the electrical resistance of cement paste and cement mortar reinforcedwith carboxyl-functionalized MWCNTs under repeated compressive loading andimpulsive loading. They found that the change in electrical resistances of both cementpaste with 0.1%MWCNTs and cement mortar with 0.4%MWCNTs is strongly relatedto the repeated compressive loading in every cycle. It is worth noting that the additionof fine aggregates (i.e., sand) decreases the sensitivity of the sensing response of thecomposites, albeit at a higher CNT concentration (Han et al., 2010a,b, 2012b). In addi-tion, Han et al. (2009, 2010b, 2011b, 2012b) also studied the sensing properties of theCNT-filled cementitious composites with different concentration levels of CNTs,waterecement ratios, and types of dispersant under different stress amplitudes andloading rates (Han et al., 2012a,b, 2011b; Yu and Kwon, 2009).
8.4.1.3 Other properties of CNT-filled cementitious composites
Damping, thermal, electromagnetic interference (EMI), and other properties ofCNT-filled cementitious composites were also explored. For example, Luo observedthat the critical damping ratio of cementitious composites with 2% MWCNTs is 1.6times that of plain ones (Luo, 2009; Luo et al., 2013). Han et al. (2013a) found thateven a very small dosage of MWCNTs can help to decrease water absorptivity coef-ficient, water permeability coefficient, and gas permeability coefficient of cementitiouscomposites. This indicates that CNTs can effectively improve the transport propertiesand durability of cementitious composites. Yakovlev et al. (2006) observed that themodification of foam concretes by the addition of CNTs allows lowering the heat con-ductivity by 20% (from 0.07 to 0.056 W/m K). Veedu (2011) stated that the thermalperformance of CNT-filled cementitious composites is at least 35% and 85% greaterthan that of CF-filled and unmodified ones, respectively. Al-Rub et al. (2011) foundthat incorporation of CNTs treated by the functional groups (eCOOH and eOH) pro-duces an increase in workability of the cementitious composites. Shukla et al. (2012)studied the smoke detection property of cementitious composites with MWCNTs, andfound that the DC transient studies depicted an increase in electrical conductivity whenthe composites are exposed to smoke. Kerien _e et al. (2013) observed that thenon-autoclaved aerated concrete and autoclaved aerated concrete with MWCNTsare more stable during exploitation than those cementitious composites without theseadditions. In addition, Singh et al. (2013) and Guo (2013) found that the high value ofEMI shielding effectiveness (SE) of MWCNT-filled cementitious composites is domi-nated by absorption rather than reflection. Adding 0.6 wt% MWCNTs into cementi-tious materials can lead to a 27% decrease in electromagnetic wave reflectivity at afrequency of 2.9 GHz.
164 Multifunctional Nanocomposites in Civil and Structural Engineering

Gong et al. studied the effects of CNTs on the dielectric and piezoelectric propertiesof PZT cementitious composites. The dielectric constant and dielectric loss increasewith increasing CNT content. The piezoelectric strain factors and the piezoelectricvoltage factors are all increased with increasing CNT content up to 0.3 vol%. The high-est piezoelectric strain factor and piezoelectric voltage factor values are 62 pC/N and60 � 10�3 Vm/N, respectively, which are 41% and 28% higher than those of the com-posites without CNTs (Gong et al., 2011).
Zuo et al. (2014) employed 0.5 wt% CNTs to improve the positive thermoelectricpower of the CFecementitious composites, which leads to a 260% increase in the pos-itive thermoelectric power (from 8.8 to 22.6 mV/�C).
8.4.2 Properties of CNF-filled cementitious composites
8.4.2.1 Mechanical properties of CNF-filled cementitiouscomposites
The reinforcement effect of the CNFs on the cementitious composites had been studied,and sorts of properties of the cementitious composites had been improved. Gao et al.(2009) added 1% CNFs into concrete, which improves the compressive strength ofthe concrete by 42.7% compared to plain concrete when CNF concentration is 0.16%.
Tyson et al. observed that 0.2 wt% CNFs can result in a maximum increase of 150%in peak displacement of the cementitious composites. The largest increase in flexuralstrength and fracture toughness (which occurred at seven days) of the CNF-filledcementitious composites is 82% and 270%, respectively. This is most likely attributedto the higher aspect ratios of the CNFs (i.e., approximately 1000 for CNFs vs 150 forCNTs), which makes CNFs more effective as reinforcements because of their largerinteraction with the cement matrix (Tyson et al., 2011).
Yazdanbakhsh (2013) obtained a more than 250% increase in flexural strength ofthe cementitious composites with the concentration of 1.0 wt% CNFs in cement. Inaddition, the increase in Young’s modulus and resilience of the cementitious compos-ites are 68% and 430%, respectively.
Shah et al. (2010) studied the flexural strength rate of the nanocomposites incorpo-rating CNFs up to the 28th day of hydration. The composites filled with CNFs at allages exhibited higher flexural strength than plain cement paste. The use of CNFsresults in an up to 45% increase in the flexural strength.
Nasibulina et al. (2012) studied CNF-filled mortar with CNFeclinker hybrid mate-rial prepared by a direct synthesis of CNFs on the surface of clinker particles. The bestresults, which were an almost three times increase in compressive strength, wereobtained for the composites with the CNF concentration of 0.4%. However, theincrease in flexural strength is not so significant.
8.4.2.2 Electrical and sensing properties of CNF-filledcementitious composites
Researchers also investigated the electrical and sensing properties of CNF-filledcementitious composites. Gao et al. (2009) found that the electrical resistance of the
Nano carbon materialefilled cementitious composites 165

cementitious composites with 1% CNFs shows an 80% maximum reduction comparedto the plain ones. The cementitious composites have stable sensing property as theCNF concentration is between 1% and 2%. Han et al. (2011b) observed that the cemen-titious composites with CNFs present stable and repeatable sensing properties underrepeated compression. The sensing response sensitivity depends heavily on the typesand concentrations of CNFs. Galao et al. (2013) studied the sensing properties onCNF-filled cementitious composites. They found that all composites with differentCNF dosages show good strain-sensing capacities for curing periods of 28 days.
8.4.3 Properties of NGP-filled cementitious composites
Huang (2012) observed that the addition of NGPs increases the flexural strength ofcementitious composites by 82% compared to the plain ones. The electrical propertyof the composites is significantly modified, and the composites become highlyconductive. Pan et al. (2013) reported that only 0.05% GO can improve the flexuralstrength of cementitious composites from 41% to 59% and the compressive strengthfrom 15% to 33%. Lv et al. (2013) found that GO nanosheets can remarkably increasethe tensile/flexural strength of the corresponding cementitious composites. Espe-cially, when the content of GO is 0.03%, the tensile, flexural, and compressivestrength of cementitious composites increase by 78.6%, 60.7%, and 38.9%,respectively.
Du et al. (2013) studied the sensing behavior of NGP-filled cementitious compos-ites with different contents of NGPs (0e4.8 wt%), and observed that NGP-filledcementitious composites exhibit a decrease in electrical resistivity and good sensingproperty when NGP contents are in the range from 2.4 to 3.6 vol%. Singh et al.(2011) found that the SET (total SE) of the GOeferrofluidecementitious compositesis 46 dB, which is much higher than that of the pristine cementitious composites(4 dB). Peyvandi et al. (2013a,b) investigated the contributions of NGPs to the dura-bility of cementitious composites, and observed that NGPs significantly improve themoisture transport performance and acid resistance of composites at a low dosage(0.05 vol% of cementitious composites).
8.5 Enhancement mechanisms of NCMs on propertiesof cementitious composites
8.5.1 Enhancementmechanisms of CNTs and CNFs on propertiesof cementitious composites
The enhancement of CNTs and CNFs on the properties of cementitious compositesmainly results from the extensive distributing enhancement network of CNTs andCNFs in cementitious composites (as shown in Figure 8.3).
The following factors also contribute to the mechanical property: Simone Mussofound that the high-temperature annealing treatments remove lattice defects from
166 Multifunctional Nanocomposites in Civil and Structural Engineering

the walls of CNTs, hence obviously increasing CNTs’ and the cementitious compos-ites’ mechanical strength (Musso et al., 2009). Makar and Chan (2009) observed thatthe CNTs appeared to act as nucleating sites for the C3S hydration products, thus accel-erating the hydration reaction of the C3S and increasing the amount of high-stiffnessC-S-H (as shown in Figure 8.4) (Konsta-Gdoutos et al., 2010b). Vera-Agulloconcluded that either CNFs or CNTs accelerate the hydration process and the compres-sive strength at early ages, improving the flexural strength at 28 days (Vera-Agulloet al., 2009). Shah et al. found that the autogenous shrinkage in CNT-filled cementi-tious composites reduces at least 30% after 96 h compared to the same compositeswithout CNTs. Li et al. (2005), Konsta-Gdoutos et al. (2010b) and Chaipanich et al.proposed that the addition of CNTs/CNFs fines pore size distribution and decreases
C-S-H
Concrete
Cement pasteMortar
SandUnhydratedcementparticle
NCM
Aggregate
Figure 8.3 Structures of NCM-filled cementitious composites.
Unhydratedcement
Unhydratedcement
Unhydratedcement
Unhydratedcement
CNTs/CNFs Cement C-S-H Other hydration products
Hydration
Figure 8.4 Schematic presentation of nucleating effect of CNTs and CNFs. Before hydration,CNTs and CNFs are bundled on the surface of unhydrated cement particles. After hydration,CNTs and CNFs are coated with high-density C-S-H gel and other hydration products.
Nano carbon materialefilled cementitious composites 167

the porosity (or nanoporosity) of cementitious composites by filling the gaps (or pores)between the hydration products, such as C-S-H and ettringite (Han et al., 2011a;Nochaiya and Chaipanich, 2011). Makar et al. (2005) found that a dense C-S-H for-mation that appears to be tightly bonded to CNTs produces reinforcing behavior(Makar and Beaudoin, 2004). Li et al. (2005) and Cwirzen et al. (2008) concludedthat the interfacial interactions between the groups of functionalized CNTs’ surfacesand hydrations (e.g., C-S-H and calcium hydroxide) of cement will produce a highbonding strength, and increase the load transfer efficiency from cement matrix tothe reinforcement (as shown in Figure 8.5). Tyson et al. also proposed that the delayedenhancements in strength, ductility, and toughness, accompanied with a reduction instiffness, are likely because of a change in the bonding between the CNTs and thecement matrix. At early ages, more CNTs are pulled out, allowing for higher straincapacities. At the 28-day test, the bonding between CNTs and cement matrix increasesto the point at which the CNTs are more susceptible to breaking rather than graduallypulling out (Tyson et al., 2011). Makar et al. (2005) and Nasibulin et al. (2009)observed that CNTs are anchored well inside the hydration products and cross-crack.Makar et al. (2005) also proposed that the pinning effect and the efficient crack bridgingcan inhibit the crack growth at the very preliminary stage of crack propagation withincomposites, when the cracks in the matrix encounter distributed CNTs. Veedu (2011)observed that the CNTs form a stitching on fracture surfaces, diverting crack energyinto a matrix and inhibiting crack propagation. Li et al. (2005) concluded that the bridgecoupling effect of CNTs guarantees the load transfer across voids and cracks.
For the conductive property, Lu et al., Wang et al., Chen et al., Li et al., and Hanet al. proposed that the electrical resistance of CNT-filled cementitious compositescomes from two sources: the intrinsic resistances of nanotubes and matrix and the con-tact resistance (i.e., the resistance between connecting CNTs or the resistance of thematrix connecting the crossing nanotubes and through which electrical tunnelingoccurs) (as shown in Figure 8.6). The contact resistance at nanotube junctions is rathercomplicated and depends on the concentration and physical properties of nanotubes,tunneling gap at contact points, and conductive properties of matrix filling thetunneling gap (Li and Chou, 2008). Saafi (2009) and Azhari (2008) found that the
Matrix
Matrix Reaction process
O O
O O
O O OO O O
OH OH
OHOH
OHHO
OH OH OH
OHOO
OO
OH
OH
Si Si Si Si Si Si
Ca Ca Ca
Ca
Ca Ca Ca
Ca+ =
Figure 8.5 Schematic presentation of strength bonding between functionalized CNTs/CNFsand the matrix, and typical reaction process between functional groups (eCOOH) and thehydration products.
168 Multifunctional Nanocomposites in Civil and Structural Engineering

more contact points between CNTs, the lower the electric resistivity will be. Sun et al.proposed the mechanism of sensing properties through conductive model analysis andexperimental verification. They pointed out that both the change in intrinsic resistanceof CNTs and the change in contact resistance between adjacent CNTs have contributedto the sensing property of the composite, but the latter is the leading contributing factor(Sun et al., 2014). There are three basic types of conduction mechanisms (i.e., contact-ing conduction, tunneling conduction, and field emission conduction) contributing tothe contact resistance (Han et al., 2011a; Grujicic et al., 2003; Wang et al., 2009; Liand Chou, 2008). The above-mentioned conduction types coexist in composites andinterrelate with each other. One or several factors among these aspects may be domi-nant for a specific CNT/CNF-filled cementitious composite. In general, the conductivecharacteristic of CNT/CNF-filled cementitious composites can be described by thepercolation phenomenon.
In addition, the electrical resistivity of CNT/CNF-filled cementitious compositeswould change when the composites deform under loading. Several factors maycontribute to the sensing property: Li et al. proposed that the nanotube length anddiameter will alter, resulting in the change of nanotube intrinsic resistance, when theCNT-filled cementitious composites are deformed under external loading (Li et al.,2007). Li et al. (2007), Yu and Kwon (2009), Han et al. (2009), Saafi (2009), andAzhari (2008) concluded that the separation between CNTs will be reduced orincreased (i.e., the tunneling conduction is enhanced or weakened) when the nanocom-posites are deformed under compressive or tensile loading. This leads to the change ofelectrical resistivity of the nanocomposites under external load, expressing strongsensing responses (Azhari and Banthia, 2012). It should be noted that theabove-mentioned factors work together to contribute to the sensing property ofCNT/CNF-filled cementitious composites, but only one or several of them are leadingat certain percolation zones. Therefore, the percolation threshold is an importantparameter for designing and optimizing sensing property of CNT/CNF-filled cemen-titious composites. Generally, the CNT/CNF concentration above the percolationthreshold is beneficial for the sensing sensitivity under tension, whereas that below
Nano carbonmaterials
Intrinsicresistance
Contactresistance
Figure 8.6 Schematic diagram of basic conductive element in a conductive network ofNCM-filled cementitious composites.
Nano carbon materialefilled cementitious composites 169

the percolation threshold is beneficial for the sensing sensitivity under compression(Han et al., 2011a).
Singh et al. and Guo et al. proposed that the presence of conducting CNTs/CNFs inthe insulating cementitious matrix results in the formation of more interfaces and aheterogeneous system due to some space charge accumulating at the interface thatcontributes toward the higher microwave absorption in the composites (as shown inFigure 8.7). The dielectric constant increases with increase of MWCNT content, whichimproves the capability to shield electromagnetic waves. The increase in MWCNTleads to reduction of skin depth and increase in AC conductivity along with improve-ment of input impedance. This not only enhances the amount of electromagnetic radi-ation penetrating inside the shield but also increases the effective absorption capability.Therefore, the CNTs/CNFs embedded in concrete matrix increase the interfacial polar-ization and the effective anisotropy energy of composites, which lead to the high SE ofCNT/CNF-filled cementitious composites (Singh et al., 2013; Guo, 2013). Gong et al.(2011) concluded that the CNTs act as conductive filler dispersed in the cement matrix,improving the poling efficiency of the PZT cementitious composites and enabling thepoling process to be carried out at room temperature.
8.5.2 Enhancement mechanisms of NGPs on propertiesof cementitious composites
As a type of 2D nanoparticle, NGPs possess the “small size effect” that enables NGPsto serve as nuclei. For example, GO nanosheets can regulate formation of flower-like
EMI shielding
Reflection
Electromagnetic waves
Absorption Conversion
Transmission
CNTs/CNFs
Concrete with CNTs/CNFs
Figure 8.7 Schematic presentation of the EMI shielding of CNT/CNF-filled cementitiouscomposites.
170 Multifunctional Nanocomposites in Civil and Structural Engineering

crystals. Huang et al. concluded that the formed network structure of cement hydrationproducts around the NGPs can improve the homogeneity and compactness of the hard-ened cementitious composites. For example, the addition of 0.05% GO decreases thetotal porosity of cementitious composites from 32.6% to 28.2%. NGPs also have the“surface effect,” which leads to enormous interface areas. At the interface, NGPs canshow an intimate bonding with the cement matrix due to strong van der Waals forces.The large aspect ratio and plate shape of NGPs provide them with strong ability toblock and divert the microcracks, which can slow down crack propagation and forma-tion of the crack network. The bridge effect of NGPs can delay crack origination andprevent crack opening up. Besides, NGPs can enhance mechanical properties of thesecomposites via a crack-arresting effect and improvement in the interfacial transitionzone of NGP-filled cementitious composites (Huang, 2012).
For the electrical property of NGP-filled cementitious composites, Huang pro-posed several theories on the mechanism of the contributions of NGPs to cementi-tious materials based on the characteristics of NGPs. NGPs have pi electrons thatparticipate in interlayer pi bonding, which make them good electrical-conductingmaterials. Besides, the carbonation process with temperatures of up to 1050 �Cduring fabrication of NGPs left a large excess of holes in the valence band. Thischaracteristic of NGPs contributes to the electrical property of NGP-filled cementi-tious composites through the following paths: (1) electronic conduction and holeconduction through NGPs by tunneling effect; and (2) electronic conduction andhole conduction through contacting conduction of NGPs (as shown in Figure 8.8)(Huang, 2012). Both factors contribute to the electrical property of NGP-filledcementitious composites, and one of them may be dominant according to the contentof NGPs.
The mechanism of action of NGPs on the EMI property of NGP-filled cementitiouscomposites is similar to that of CNF/CNT-filled cementitious composites. Singh et al.(2011) concluded that the presence of conducting NGPs in the insulating matrix resultsin the formation of more interfaces and a heterogeneous system due to some spacecharge accumulating at the interface that contributes toward the higher microwaveabsorption in the composites.
(a) (b)
NGPs NGPs
Figure 8.8 Schematic presentation of the electrical conduction mechanisms of NGPs.(a) Tunneling effect and (b) contacting effect.
Nano carbon materialefilled cementitious composites 171
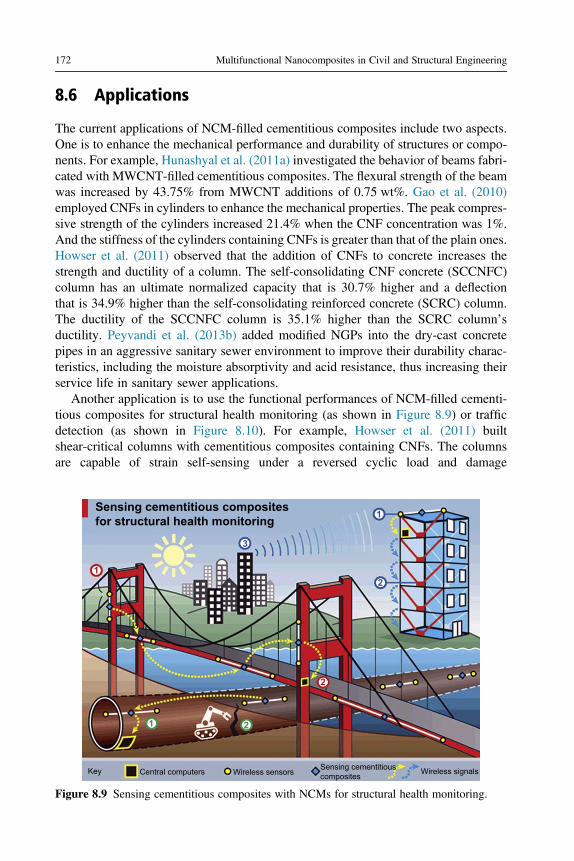
8.6 Applications
The current applications of NCM-filled cementitious composites include two aspects.One is to enhance the mechanical performance and durability of structures or compo-nents. For example, Hunashyal et al. (2011a) investigated the behavior of beams fabri-cated with MWCNT-filled cementitious composites. The flexural strength of the beamwas increased by 43.75% from MWCNT additions of 0.75 wt%. Gao et al. (2010)employed CNFs in cylinders to enhance the mechanical properties. The peak compres-sive strength of the cylinders increased 21.4% when the CNF concentration was 1%.And the stiffness of the cylinders containing CNFs is greater than that of the plain ones.Howser et al. (2011) observed that the addition of CNFs to concrete increases thestrength and ductility of a column. The self-consolidating CNF concrete (SCCNFC)column has an ultimate normalized capacity that is 30.7% higher and a deflectionthat is 34.9% higher than the self-consolidating reinforced concrete (SCRC) column.The ductility of the SCCNFC column is 35.1% higher than the SCRC column’sductility. Peyvandi et al. (2013b) added modified NGPs into the dry-cast concretepipes in an aggressive sanitary sewer environment to improve their durability charac-teristics, including the moisture absorptivity and acid resistance, thus increasing theirservice life in sanitary sewer applications.
Another application is to use the functional performances of NCM-filled cementi-tious composites for structural health monitoring (as shown in Figure 8.9) or trafficdetection (as shown in Figure 8.10). For example, Howser et al. (2011) builtshear-critical columns with cementitious composites containing CNFs. The columnsare capable of strain self-sensing under a reversed cyclic load and damage
Sensing cementitious compositesfor structural health monitoring
1
2
3
2
1
1 2
Key Central computers Wireless sensors Sensing cementitiouscomposites Wireless signals
Figure 8.9 Sensing cementitious composites with NCMs for structural health monitoring.
172 Multifunctional Nanocomposites in Civil and Structural Engineering

self-assessment. Saafi (2009) embedded cementitious composites with SWCNTs intothe tensile region of beams to set up the self-sensing structures subjected to monotonicand cyclic bending. The self-sensing structures can detect crack propagation and dam-age accumulation during loading. Baeza et al. (2013) embedded and bonded cementi-tious composites with CNFs into different service locations of reinforced beam. Thecementitious composites with CNFs can achieve elastic strain sensing of the compres-sion and tension regions of beams and are capable of measuring strains on the surfaceof a structural element (Han et al., 2011a; Howser et al., 2011; Saafi, 2009; Mo andRoberts, 2013). Han et al. developed self-sensing pavements with cementitious com-posites containing CNTs and investigated the feasibility of using the self-sensing pave-ments for traffic monitoring with vehicular loading experiments. The proposedself-sensing pavement system can accurately detect the passing of different vehiclesunder different vehicular speeds and test environments (Han et al., 2009, 2011a,2012b, 2013b). Materazzi et al. aimed to develop CNT-filled cementitious sensorsfor possible application in dynamic response measurements and structural healthmonitoring of concrete structures. Based on the results, the investigated specimenscan be considered available sensors that appear to be suitable for performing dynamicmeasurements in civil engineering concrete structures (Materazzi et al., 2013).
8.7 Conclusions
Ultra-miniature nano-materials are bringing tremendous change to the world,including the field of construction, expanding the horizon of research in multifunc-tional cementitious composites. Their extraordinary physical properties, size effect,and chemical and thermal stability are beneficial for enhancing the mechanical,
Figure 8.10 Sensing cementitious composites with NCMs for traffic detection.
Nano carbon materialefilled cementitious composites 173

electrical, thermal, electromagnetic-shielding, and corrosion resistance properties ofcementitious materials.
Although a number of research efforts have been conducted in this area in recentyears, many challenges still need to be addressed. Future work on NCM-filled cemen-titious composites may include investigations regarding the enhancement effect ofNCMs to concrete with coarse aggregate, other structural and functional propertiesof NCM-filled cementitious composites such as durability, thermoelectric and corro-sion resistance properties, the precise explanation of the enhancement mechanism ofNCMs to cementitious composites by numerical simulation or a new characterizationmethod, and the performance of the structure made of NGP-filled cementitiouscomposites.
NCM-filled cementitious composites can help us develop infrastructure withelegantly integrated excellent structural performance, high durability, and multifunc-tional capability, thus improving safety, serviceability, reliability, and durability ofinfrastructure. As a new generation of construction materials, they will promote sus-tainable development in the field of cementitious materials and structures.
Acknowledgments
The authors thank the funding supported from the National Science Foundation of China (grantNos. 51578110 and 51428801), the Program for New Century Excellent Talents in Universityof China (grant No. NCET-11e0798), the Ministry of Science and Technology of China (grantNo. 2011BAK02B01), and the Fundamental Research Funds for the Central Universities ofChina.
References
Abu Al-Rub, R.K., Ashour, A.I., Tyson, B.M., 2012. On the aspect ratio effect of multi-walledcarbon nanotube reinforcements on the mechanical properties of cementitious nano-composites. Construction and Building Materials 35, 647e655.
Abu Al-Rub, R.K., Tyson, B.M., Yazdanbakhsh, A., Grasley, Z., 2011. Mechanical propertiesof nanocomposite cement incorporating surface-treated and untreated carbon nanotubesand carbon nanofibers. Journal of Nanomechanics and Micromechanics 2, 1e6.
Azhari, F., 2008. Cement-Based Sensors for Structural Health Monitoring. University of BritishColumbia, Canada (Dissertation for the Degree of Master of Applied Science).
Azhari, F., Banthia, N., 2012. Cement-based sensors with carbon fibers and carbon nanotubesfor piezoresistive sensing. Cement and Concrete Composites 34, 866e873.
Baeza, F.J., Galao, O., Zornoza, E., Garcés, P., 2013. Multifunctional cement composites strainand damage sensors applied on reinforced concrete (RC) structural elements. Materials 6,841e855.
Bahr, J.L., Tour, J.M., 2002. Covalent chemistry of single-wall carbon nanotubes. Journal ofMaterials Chemistry 12, 1952e1958.
Bharj, J., Singh, S., Chander, S., Singh, R., 2014. Experimental study on compressive strength ofcement-CNT composite paste. Indian Journal of Pure & Applied Physics 52, 35e38.
174 Multifunctional Nanocomposites in Civil and Structural Engineering

Chaipanich, A., Nochaiya, T., Wongkeo, W., Torkittikul, P., 2010. Compressive strength andmicrostructure of carbon nanotubes-fly ash cement composites. Materials Science andEngineering: A 527, 1063e1067.
Chen, J., Poon, C., 2009. Photocatalytic construction and building materials: from fundamentalsto applications. Building and Environment 44, 1899e1906.
Chen, S., Collins, F., Macleod, A., Pan, Z., Duan, W., Wang, C., 2011. Carbon nanotube-cementcomposites: a retrospect. The IES Journal Part A: Civil and Structural Engineering 4,254e265.
Chyad, F.A., 1989. The Effects of Metastable Zirconia on the Properties of Ordinary PortlandCement. University of Bradford (Dissertation for the Degree of Doctor).
Collins, F., Lambert, J., Duan, W.H., 2012. The influences of admixtures on the dispersion,workability, and strength of carbon nanotube-OPC paste mixtures. Cement and ConcreteComposites 34, 201e207.
Cwirzen, A., Habermehl-Cwirzen, K., Penttala, V., 2008. Surface decoration of carbon nano-tubes and mechanical properties of cement/carbon nanotube composites. Advances inCement Research 20, 65e73.
Cwirzen, A., Habermehl-Cwirzen, K., Nasibulina, L.I., Shandakov, S.D., Nasibulin, A.G.,Kauppinen, E.I., Mudimela, P.R., Penttala, V., 2009a. CHH Cement Composite. Nano-technology in Construction 3. Springer, 181e185.
Cwirzen, A., Habermehl-Cwirzen, K., Shandakov, D., Nasibulina, L.I., Nasibulin, A.G.,Mudimela, P.R., Kauppinen, E.I., Penttala, V., 2009b. Properties of high yield synthesisedcarbon nano fibres/portland cement composite. Advances in Cement Research 21, 141e146.
Du, H., Quek, S.T., Dai Pang, S., 2013. Smart Multifunctional Cement Mortar ContainingGraphite Nanoplatelet. SPIE Smart Structures and MaterialsþNondestructive Evaluationand Health Monitoring. International Society for Optics and Photonics, 869238-869238-10.
Dunens, O.M., Mackenzie, K.J., Harris, A.T., 2009. Synthesis of multiwalled carbon nanotubeson fly ash derived catalysts. Environmental Science & Technology 43, 7889e7894.
Fu, K., Huang, W., Lin, Y., Riddle, L.A., Carroll, D.L., Sun, Y., 2001. Defunctionalization offunctionalized carbon nanotubes. Nano Letters 1, 439e441.
Galao, O., Baeza, F.J., Zornoza, E., Garcés, P., 2013. Strain and damage sensing properties onmultifunctional cement composites with CNF admixture. Cement and Concrete Compos-ites 46, 90e98.
Gao, D., Sturm, M., Mo, Y.L., 2009. Electrical resistance of carbon-nanofiber concrete. SmartMaterials and Structures 18, 095039.
Gao, D., Mo, Y.L., Peng, L.M., 2010. Mechanical and electrical properties of carbon-nanofiberself-consolidating concrete. In: Proceedings of the 12th International Conference onEngineering, Science, Construction, and Operation in Challenging Environments. USA:Honolulu, pp. 2577e2585.
Gay, C., Sanchez, F., 2010. Performance of carbon nanofiber-cement composites with ahigh-range water reducer. Transportation Research Record: Journal of the TransportationResearch Board 2142, 109e113.
Geim, A.K., Novoselov, K.S., 2007. The rise of graphene. Nature Materials 6, 183e191.Gong, H., Zhang, Y., Quan, J., Che, S., 2011. Preparation and properties of cement based
piezoelectric composites modified by CNTs. Current Applied Physics 11, 653e656.Grujicic, M., Cao, G., Gersten, B., 2003. Enhancement of field emission in carbon nanotubes
through adsorption of polar molecules. Applied Surface Science 206, 167e177.Guo, Z., 2013. Study on the Electromagnetic Wave Absorbing Properties of Multi-walled
Carbon Nanotube/cement Composites. Dalian University of Technology, Dalian, China(Dissertation for the Master Degree in Engineering).
Nano carbon materialefilled cementitious composites 175

Hamon, M.A., Hui, H., Bhowmik, P., Itkis, H., Haddon, R.C., 2002. Ester-functionalized sol-uble single-walled carbon nanotubes. Applied Physics A 74, 333e338.
Han, B., Yu, X., Kwon, E., 2009. A self-sensing carbon nanotube/cement composite for trafficmonitoring. Nanotechnology 20, 445501.
Han, B., Yu, X., Ou, J., 2010a. Effect of water content on the piezoresistivity of MWNT/cementcomposites. Journal of Materials Science 45, 3714e3719.
Han, B., Yu, X., Kwon, E., Ou, J., 2010b. Piezoresistive multi-walled carbon nanotubes filledcement-based composites. Sensor Letters 8, 344e348.
Han, B., Yu, X., Ou, J., 2011a. Multifunctional and Smart Carbon Nanotube ReinforcedCement-based Materials. Nanotechnology in Civil Infrastructure. Springer, 1e47.
Han, B., Yu, X., Zhang, K., Kwon, E., Ou, J., 2011b. Sensing properties of CNT-filledcement-based stress sensors. Journal of Civil Structural Health Monitoring 1, 17e24.
Han, B., Zhang, K., Yu, X., Kwon, E., Ou, J., 2011c. Fabrication of piezoresistive CNT/CNFcementitious composites with superplasticizer as dispersant. Journal of Materials in CivilEngineering 24, 658e665.
Han, B., Yu, X., Kwon, E., Ou, J., 2012a. Effects of CNT concentration level and water/cementratio on the piezoresistivity of CNT/cement composites. Journal of Composite Materials46, 19e25.
Han, B., Zhang, K., Yu, X., Kwon, E., Ou, J., 2012b. Electrical characteristics andpressure-sensitive response measurements of carboxylMWNT/cement composites. Cementand Concrete Composites 34, 794e800.
Han, B., Yang, Z., Shi, X., Yu, X., 2013a. Transport properties of carbon-nanotube/cementcomposites. Journal of Materials Engineering and Performance 22, 184e189.
Han, B., Zhang, K., Burnham, T., Kwon, E., Yu, X., 2013b. Integration and road tests of aself-sensing CNT concrete pavement system for traffic detection. Smart Materials andStructures 22, 015020.
Howser, R.N., Dhonde, H.B., Mo, Y.L., 2011. Self-sensing of carbon nanofiber concrete col-umns subjected to reversed cyclic loading. Smart Materials and Structures 20, 085031.
Huang, S., 2012. Multifunctional Graphite Nanoplatelets (GNP) Reinforced CementitiousComposites. National University of Singapore, Singapore (Dissertation for the Degree ofMaster of Engineering).
Hunashyal, A.M., Sundeep, G.V., Quadri, S.S., Banapurmath, N.R., 2011a. Experimental in-vestigations to study the effect of carbon nanotubes reinforced in cement-based matrixcomposite beams. Proceedings of the Institution of Mechanical Engineers, Part N: Journalof Nanoengineering and Nanosystems 225, 17e22.
Hunashyal, A.M., Tippa Sagar, V., Quadri, S.S., Banapurmath, N.R., 2011b. Experimentalinvestigation on effect of carbon nanotubes and carbon fibres on the behavior of plaincement mortar composite round bars under direct tension. ISRN Nanotechnology, 1, 6 pp.
Kerien _e, J., Kligys, M., Laukaitis, A., Yakovlev, G., �Spokauskas, A., Aleknevi�cius, M., 2013.The influence of multi-walled carbon nanotubes additive on properties of non-autoclavedand autoclaved aerated concretes. Construction and Building Materials 49, 527e535.
Kim, H.K., Nam, I.W., Lee, H.K., 2014. Enhanced effect of carbon nanotube on mechanical andelectrical properties of cement composites by incorporation of silica fume. CompositeStructures 107, 60e69.
Konsta-Gdoutos,M.S.,Metaxa, Z.S., Shah, S.P., Gettu, R., 2008.Nanoimaging of highly dispersedcarbon nanotube reinforced cement basedmaterials. In: Seventh Intl. RILEMSymp. On FiberReinforced Concrete: Design and Applications, Chennai, India, pp. 125e131.
176 Multifunctional Nanocomposites in Civil and Structural Engineering

Konsta-Gdoutos, M.S., Metaxa, Z.S., Shah, S.P., 2010a. Highly dispersed carbon nanotubereinforced cement based materials. Cement and Concrete Research 40, 1052e1059.
Konsta-Gdoutos, M.S., Metaxa, Z.S., Shah, S.P., 2010b. Multi-scale mechanical and fracturecharacteristics and early-age strain capacity of high performance carbon nanotube/cementnanocomposites. Cement and Concrete Composites 32, 110e115.
Li, C., Chou, T., 2008. Modeling of damage sensing in fiber composites using carbon nanotubenetworks. Composites Science and Technology 68, 3373e3379.
Li, G., Wang, P., Zhao, X., 2005. Mechanical behavior and microstructure of cement compositesincorporating surface-treated multi-walled carbon nanotubes. Carbon 43, 1239e1245.
Li, G., Wang, P., Zhao, X., 2007. Pressure-sensitive properties and microstructure of carbonnanotube reinforced cement composites. Cement and Concrete Composites 29, 377e382.
Ludvig, P., Ladeira, L., Calixto, J., 2009. In-situ synthesis of multiwall carbon nanotubes onportland cement clinker. In: 11th International Conference on Advanced Materials. Rio deJaneiro, Brazil.
Ludvig, P., Calixto, J.M., Ladeira, L.O., Gaspar, I.C., 2011. Using converter dust to produce lowcost cementitious composites by in situ carbon nanotube and nanofiber synthesis. Materials4, 575e584.
Luo, J., Duan, Z., Li, H., 2009. The influence of surfactants on the processing of multi-walledcarbon nanotubes in reinforced cement matrix composites. Physica Status Solidi (a) 206,2783e2790.
Luo, J., Duan, Z., Xian, G., Li, Q., Zhao, T., 2011. Fabrication and fracture toughness propertiesof carbon nanotube-reinforced cement composite. The European Physical Journal AppliedPhysics 53, 30402.
Luo, J., Duan, Z., Xian, G., Li, Q., Zhao, T., 2013. Damping performances of carbon nanotubereinforced cement composite. Mechanics of Advanced Materials and Structures 46, 90e98.
Luo, J., 2009. Fabrication and functional properties of multi-walled carbon nanotube/cementcomposites. Harbin Institute of Technology, Harbin, China (Dissertation for the DoctoralDegree in Engineering).
Lv, S., Ma, Y., Qiu, C., Sun, T., Liu, J., Zhou, Q., 2013. Effect of graphene oxide nanosheets ofmicrostructure and mechanical properties of cement composites. Construction and BuildingMaterials 49, 121e127.
Mackenzie, K.J., Bolton, M.J., 2009. Electrical and mechanical properties of aluminosilicateinorganic polymer composites with carbon nanotubes. Journal of Materials Science 44,2851e2857.
Makar, J.M., Beaudoin, J.J., 2004. Carbon nanotubes and their application in the constructionindustry. Special Publication-Royal Society of Chemistry 292, 331e342.
Makar, J.M., Chan, G.W., 2009. Growth of cement hydration products on single-walled carbonnanotubes. Journal of the American Ceramic Society 92, 1303e1310.
Makar, J.M., Margeson, J., Luh, J., 2005. Carbon nanotube/cement composites-early results andpotential applications. In: Proceedings of the 3rd International Conference on ConstructionMaterials: Performance, Innovations and Structural Implications, Vancouver, Canada,pp. 1e10.
Materazzi, A.L., Ubertini, F., Alessandro, A.D., 2013. Carbon nanotube cement-based trans-ducers for dynamic sensing of strain. Cement and Concrete Composites 37, 2e11.
Mendoza, O., Sierra, G., Tob�on, J.I., 2013. Influence of super plasticizer and Ca(OH)2 on thestability of functionalized multi-walled carbon nanotubes dispersions for cement com-posites applications. Construction and Building Materials 47, 771e778.
Nano carbon materialefilled cementitious composites 177

Metaxa, Z.S., Konsta-Gdoutos, M.S., Shah, S.P., 2009. Carbon Nanotubes Reinforced Concrete.ACI Special Publication, 267.
Metaxa, Z.S., Konsta-Gdoutos, M.S., Shah, S.P., 2010. Carbon nanofiber-reinforced cement-based materials. Transportation Research Record: Journal of the Transportation ResearchBoard 2142, 114e118.
Metaxa, Z.S., Konsta-Gdoutos, M.S., Shah, S.P., 2012a. Carbon nanofiber cementitious com-posites: effect of debulking procedure on dispersion and reinforcing efficiency. Cement andConcrete Composites 36, 25e32.
Metaxa, Z.S., Seo, J.T., Konsta-Gdoutos, M.S., Hersam, M.C., Shah, S.P., 2012b. Highlyconcentrated carbon nanotube admixture for nano-fiber reinforced cementitious materials.Cement and Concrete Composites 34, 612e617.
Mo, Y.L., Roberts, R.H., 2013. Carbon nanofiber concrete for damage detection of infrastruc-ture. In: Nanotechnology and Nanomaterials: Advances in Nanofibers (Chapter 5), ISBN978-953-51-1209-9, pp. 125e143. http://dx.doi.org/10.5772/57096.
Moisala, A., Nasibulin, A.G., Kauppinen, E.I., 2003. The role of metal nanoparticles in thecatalytic production of single-walled carbon nanotubes-a review. Journal of Physics:Condensed Matter 15, S3011.
Moore, V.C., Strano, M.S., Haroz, E.H., Hauge, R.H., Smalley, R.E., Schmidt, J., Talmon, Y.,2003. Individually suspended single-walled carbon nanotubes in various surfactants. NanoLetters 3, 1379e1382.
Morsy, M.S., Alsayed, S.H., Aqel, M., 2011. Hybrid effect of carbon nanotube and nano-clay onphysico-mechanical properties of cement mortar. Construction and Building Materials 25,145e149.
Mudimela, P.R., Nasibulina, L.I., Nasibulin, A.G., Cwirzen, A., Valkeap€a€a, M., Habermehl-Cwirzen, K., Malm, J.E., Karppinen, M.J., Penttala, V., Koltsova, T.S., 2009. Synthesisof carbon nanotubes and nanofibers on silica and cement matrix materials. Journal ofNanomaterials 2009 (29), 3pp.
Mukhopadhyay, A.K., 2011. Next-generation Nano-based Concrete Construction Products: AReview. Nanotechnology in Civil Infrastructur. Springer, pp. 207e223.
Musso, S., Tulliani, J., Ferro, G., Tagliaferro, A., 2009. Influence of carbon nanotubes structureon the mechanical behavior of cement composites. Composites Science and Technology69, 1985e1990.
Nalla, V., Polavarapu, L., Manga, K.K., Goh, B.M., Loh, K.P., Xu, Q., Ji, W., 2010. Transientphotoconductivity and femtosecond nonlinear optical properties of a conjugatedpolymer-graphene oxide composite. Nanotechnology 21, 415203.
Nasibulin, A.G., Pikhitsa, P.V., Jiang, H., Brown, D.P., Krasheninnikov, A.V., Anisimov, A.S.,Queipo, P., Moisala, A., Gonzalez, D., Lientschnig, G., 2007. A novel hybrid carbonmaterial. Nature Nanotechnology 2, 156e161.
Nasibulin, A.G., Shandakov, S.D., Nasibulina, L.I., Cwirzen, A., Mudimela, P.R.,Habermehl-Cwirzen, K., Grishin, D.A., Gavrilov, Y.V., Malm, J.E., Tapper, U., 2009.A novel cement-based hybrid material. New Journal of Physics 11, 023013.
Nasibulin, A.G., Koltsova, T., Nasibulina, L.I., Anoshkin, I.V., Semencha, A., Tolochko, O.V.,Kauppinen, E.I., 2013. A novel approach to composite preparation by direct synthesis ofcarbon nanomaterial on matrix or filler particles. Acta Materialia 61, 1862e1871.
Nasibulina, L.I., Anoshkin, I.V., Shandakov, S.D., Nasibulin, A.G., Cwirzen, A.,Mudimela, P.R.,Habermehl-Cwirzen, K., Malm, J.E., Koltsova, T.S., Tian, Y., 2010. Direct synthesis ofcarbon nanofibers on cement particles. Transportation Research Record: Journal of theTransportation Research Board 2142, 96e101.
178 Multifunctional Nanocomposites in Civil and Structural Engineering

Nasibulina, L.I., Anoshkin, I.V., Semencha, A.V., Tolochko, O.V., Malm, J.E., Karppinen, M.J.,Nasibulin, A.G., Kauppinen, E.I., 2012. Carbon nanofiber/clinker hybrid material as ahighly efficient modificator of mortar mechanical properties. Materials Physics andMechanics 13, 77e84.
Nochaiya, T., Chaipanich, A., 2011. Behavior of multi-walled carbon nanotubes on the porosityand microstructure of cement-based materials. Applied Surface Science 257, 1941e1945.
Pacheco-Torgal, F., Jalali, S., 2011. Nanotechnology: advantages and drawbacks in the field ofconstruction and building materials. Construction and Building Materials 25, 582e590.
Pan, Z., Duan, W., Li, D., Collins, F., 2013. Graphene Oxide Reinforced Cement and Concrete.Google Patents. WO2013096990 A1.
Parveen, S., Rana, S., Fangueiro, R., 2013. A review on nanomaterial dispersion, microstructureand mechanical properties of carbon nanotube and nanofiber reinforced cementitiouscomposites. Journal of Nanomaterials 80, 19 pp.
Peyvandi, A., Sbia, L.A., Soroushian, P., Sobolev, K., 2013a. Effect of the cementitious pastedensity on the performance efficiency of carbon nanofiber in concrete nanocomposite.Construction and Building Materials 48, 265e269.
Peyvandi, A., Soroushian, P., Balachandra, A.M., Sobolev, K., 2013b. Enhancement of thedurability characteristics of concrete nanocomposite pipes with modified graphite nano-platelets. Construction and Building Materials 47, 111e117.
Raki, L., Beaudoin, J., Alizadeh, R., Makar, J., Sato, T., 2010. Cement and concrete nanoscienceand nanotechnology. Materials 3, 918e942.
Saafi, M., 2009. Wireless and embedded carbon nanotube networks for damage detection inconcrete structures. Nanotechnology 20, 395502.
Saez De Ibarra, Y., Gaitero, J.J., Erkizia, E., Campillo, I., 2006. Atomic force microscopy andnanoindentation of cement pastes with nanotube dispersions. Physica Status Solidi (a) 203,1076e1081.
Sanchez, F., 2009. Carbon nanofibre/cement composites: challenges and promises as structuralmaterials. International Journal of Materials and Structural Integrity 3, 217e226.
Sanchez, F., Ince, C., 2009. Microstructure and macroscopic properties of hybrid carbonnanofiber/silica fume cement composites. Composites Science and Technology 69,1310e1318.
Sanchez, F., Sobolev, K., 2010. Nanotechnology in concrete-a review. Construction andBuilding Materials 24, 2060e2071.
Shah, S.P., Konsta-Gdoutos, M.S., Metaxa, Z.S., 2009a. Highly-Dispersed CarbonNanotube-Reinforced Cement-Based Materials. U.S. Patent Application 12/322,842.
Shah, S.P., Konsta-Gdoutos, M.S., Metaxa, Z.S., Mondal, P., 2009b. Nanoscale Modification ofCementitious Materials. Nanotechnology in Construction 3. Springer, pp. 125e130.
Shah, S.P., Konsta-Gdoutos, M.S., Metaxa, Z.S., 2010. Exploration of fracture characteristics,nanoscale properties and nanostructure of cementitious matrices with carbon nanotubes andcarbon nanofibers. In: Proceedings of the 7th International Conference on FractureMechanics of Concrete and Concrete Structures.
Shah, S.P., Konsta-Gdoutos, M.S., Metaxa, Z.S., 2011. Advanced Cement Based Nano-composites. Recent Advances in Mechanics. Springer, pp. 313e327.
Shukla, P., Bhatia, V., Gaur, V., Basniwal, R.K., Singh, B.K., Jain, V.K., 2012. Multiwalledcarbon nanotubes reinforced portland cement composites for smoke detection. Solid StatePhenomena 185, 21e24.
Siddique, R., Mehta, A., 2014. Effect of carbon nanotubes on properties of cement mortars.Construction and Building Materials 50, 116e129.
Nano carbon materialefilled cementitious composites 179

Singh, A.P., Mishra, M., Chandra, A., Dhawan, S.K., 2011. Graphene oxide/ferrofluid/cementcomposites for electromagnetic interference shielding application. Nanotechnology 22,465701.
Singh, A.P., Gupta, B.K., Mishra, M., Chandra, A., Mathur, R.B., Dhawan, S.K., 2013. Mul-tiwalled carbon nanotube/cement composites with exceptional electromagnetic interferenceshielding properties. Carbon 56 (5), 86e96.
Sobolev, K., Gutiérrez, M.F., 2005. How nanotechnology can change the concrete world.American Ceramic Society Bulletin 84, 14e18.
Sobolkina, A.,Mechtcherine, V., Khavrus, V.,Maier, D.,Mende,M., Ritschel,M., Leonhardt, A.,2012. Dispersion of carbon nanotubes and its influence on the mechanical properties of thecement matrix. Cement and Concrete Composites 34, 1104e1113.
Sun, S., Yu, X., Han, B., 2014. Sensing mechanism of self-monitoring CNT cementitiouscomposite. Journal of Testing and Evaluation 1e42.
Tyson, B.M., 2013. Carbon Nanotube and Nanofiber Reinforcement for Improving the FlexuralStrength and Fracture Toughness of Portland Cement Paste. Texas A&M University,Texas, America (Dissertation for the Degree of Master of Science).
Tyson, B.M., Al-Rub, R.K.A., Yazdanbakhsh, A., Grasley, Z., 2011. Carbon nanotubes andcarbon nanofibers for enhancing the mechanical properties of nanocomposite cementitiousmaterials. Journal of Materials in Civil Engineering 23, 1028e1035.
Veedu, V.P., 2011. Multifunctional Cementitious Nanocomposite Material and Methods ofMaking the Same. Google Patents. US7875211 B1.
Vera-Agullo, J., Chozas-Ligero, V., Portillo-Rico, D., García-Casas,M.J., Gutiérrez-Martínez, A.,Mieres-Royo, J.M., Gr�avalos-Moreno, J., 2009. Mortar and Concrete Reinforced withNanomaterials. Nanotechnology in Construction 3. Springer, pp. 383e388.
Wang, L., Ding, T., Wang, P., 2009. Influence of carbon black concentration on piezoresistivityfor carbon-black-filled silicone rubber composite. Carbon 47, 3151e3157.
Wong, S.S., Joselevich, E., Woolley, A.T., Cheung, C.L., Lieber, C.M., 1998. Covalentlyfunctionalized nanotubes as nanometre-sized probes in chemistry and biology. Nature 394,52e55.
Xie, X., Mai, Y., Zhou, X., 2005. Dispersion and alignment of carbon nanotubes in polymermatrix: a review. Materials Science and Engineering: R: Reports 49, 89e112.
Yakovlev, G., Kerien _e, J., Gailius, A., Girnien _e, I., 2006. Cement based foam concrete rein-forced by carbon nanotubes. Materials Science 12, 147e151.
Yazdanbakhsh, A., 2013. Production, Characterization, and Mechanical Behavior of Cemen-titious Materials Incorporating Carbon Nanofibers. Texas A&M University, Texas,America.
Yazdanbakhsh, A., Grasley, Z., 2012. The theoretical maximum achievable dispersion ofnanoinclusions in cement paste. Cement and Concrete Research 42, 798e804.
Yazdanbakhsh, A., Grasley, Z.C., Tyson, B., Al-Rub, R.A., 2009. Carbon Nano Filaments inCementitious Materials: Some Issues on Dispersion and Interfacial Bond. ACI SpecialPublication, 267.
Yazdanbakhsh, A., Grasley, Z., Tyson, B., Abu Al-Rub, R.K., 2010. Distribution of carbonnanofibers and nanotubes in cementitious composites. Transportation Research Record:Journal of the Transportation Research Board 2142, 89e95.
Yazdanbakhsh, A., Grasley, Z., Tyson, B., Al-Rub, R.A., 2012. Challenges and benefits of utilizingcarbon nanofilaments in cementitious materials. Journal of Nanomaterials 2012, 7 (3),4661e4677.
Yu, X., Kwon, E., 2009. A carbon nanotube/cement composite with piezoresistive properties.Smart Materials and Structures 18, 055010.
180 Multifunctional Nanocomposites in Civil and Structural Engineering

Yu, J., Grossiord, N., Koning, C.E., Loos, J., 2007. Controlling the dispersion of multi-wallcarbon nanotubes in aqueous surfactant solution. Carbon 45, 618e623.
Zhao, J., Shi, D., Lian, J., 2009. Small angle light scattering study of improved dispersion ofcarbon nanofibers in water by plasma treatment. Carbon 47, 2329e2336.
Zuo, J., Yao, W., Wu, K., 2014. Seebeck effect and mechanical properties of carbonnanotube-carbon fiber/cement nanocomposites. Fullerenes, Nanotubes and CarbonNanostructures 23 (5), 383e391.
Nano carbon materialefilled cementitious composites 181

Nanoclay modified asphalt 9Hui Yao 1,2, Zhanping You 1
1Michigan Technological University, Houghton, MI, USA; 2School of Traffic andTransportation Engineering, Changsha University of Science and Technology, China
9.1 Introduction
Nowadays, there are far more highways and expressways being constructed and main-tained in the world. Due to climate change and global warming, engineers are nowrequired to find a solution to the problem of how to modify and improve the qualityand lifespan of pavements. Nanomaterials have been introduced and used for pave-ment engineering to improve pavement performance.
Currently, two major kinds of modifiers are used in asphalt modification for roadconstruction. Fibers and polymers, such as styrene butadiene styrene (SBS), styrenebutadiene rubber (SBR), ethylvinyl acetate (EVA), crumb rubber, and carbon fibers,are also used. The performance of SBS-modified binder in asphalt mixtures hasbeen investigated by many researchers. The microstructure of SBS-modified asphaltbinder has also been studied in previous research. The SBS modifier significantlyimproved the low-temperature performance of the modified asphalt binder, andslightly enhanced the high-temperature performance, as well as the resistance to per-manent deformation (Ahmedzade et al., 2007; Al-Hadidy and Yi-qiu, 2010; Awantiet al., 2008; Cortizo et al., 2004; Fu et al., 2007; Iskender et al., 2012; Khodaii andMehrara, 2009; Larsen et al., 2009; Liu and Bao, 2007; Liu et al., 2007, 2010a;Ouyang et al., 2006a; Shang et al., 2011; Wu et al., 2009; Yildirim, 2007). Comparedto the base asphalt binder, the SBR-modified asphalt binder prevented the pavementfrom low-temperature cracking, and increased the low-temperature ductility. Theviscosity and elastic recovery ability of SBR-modified asphalt binder also increased(Yildirim, 2007; Li et al., 2011; Zhang et al., 2005, 2008, 2009; Zhang and Yu,2011). The addition of EVA into the base asphalt binder increased the high-temperature performance of modified asphalt mixture (Airey, 2002). Crumb rubberis widely used in road construction and research due to environmental protectionand the use of waste products. When the crumb rubber was added into the base asphaltbinder, the viscosity and rheological properties improved. The rutting resistance andthermal cracking of the modified asphalt mixtures significantly enhanced the baseasphalt mixture. The research results also show that the rubber type, content, bindertype, and mixing condition affect the performance of modified asphalt binders andmixtures (Abdelrahman and Carpenter, 1999; Bertollo et al., 2003; Huang andMohammad, 2002; Kim et al., 2001; Wang et al., 2013, 2012; Xiang et al., 2009;Xiao et al., 2009). The addition of carbon fibers into the base asphalt also showedimprovement of the adhesion characteristics and cracking resistance at low
Innovative Developments of Advanced Multifunctional Nanocomposites in Civil and Structural Engineeringhttp://dx.doi.org/10.1016/B978-1-78242-326-3.00009-9Copyright © 2016 Elsevier Ltd. All rights reserved.

temperatures. The enhanced network and high connectivity of fiber-modified asphaltbinder were shown in the microstructure at high magnifications (Jamal Khattaket al., 2013; Khattak et al., 2013, 2012; Yang et al., 2011; Yao et al., 2013).
Nanomaterials, are widely used and applied in the industry and research field asthey bring innovations. Nanomaterials are defined as materials with at least one dimen-sion that falls in the length scale of 1e100 nm. Nanomaterials are used in pavementengineering for their small size and large surface area. Recent research showed thatthe rutting and fatigue-cracking resistance of asphalt binders and mixtures improvedwith the addition of nanomaterials. Nanoclay and carbon nanofiber were used as addi-tives to modify the asphalt binder. The complex shear modulus of nanomodifiedasphalt binders increased relative to the control asphalt binder, as well as the failuretemperature and high-temperature performance grade. The rutting resistance perfor-mance of nanoclay and the carbon fiber modified asphalt mixtures was also enhanced(Goh et al., 2011; Ghile, 2006; Jahromi and Khodaii, 2009; You et al., 2011; Khattaket al., 2011; Xiao et al., 2011). Nanosized hydrated lime was selected as the additive toblend with a warm-mix-asphalt (WMA) mixture. The moisture susceptibility of theWMAmixture was investigated in the study (Cheng et al., 2011). In addition, the com-bination of nano-SiO2 and SBS was used to mix with the stone matrix asphalt, and thephysical and mechanical properties of asphalt binders and mixtures were show toimprove (Mojtaba et al., 2012). In this study, two kinds of nanoclay were used tomodify the asphalt, and the performance was evaluated.
9.2 Key problem and motivation
Pavement distresses are one of the main problems in maintaining the pavement life-cycle. To prevent the pavement from permanent deformation and low-temperaturecracking, modifications to the asphalt mixtures are needed. Nanomaterials havesome incredible features that can fundamentally change the properties of asphaltbinders and mixtures. The chemical reactions or physical dispersions between asphaltand nanomaterials can alter the microstructures and compositions of asphalt binders,and strengthen the elastic performance of an asphalt binder at high temperatures, aswell as the viscous property at low temperatures. Based on the literature review(You et al., 2011; Drozd et al., 2011; He and Shi, 2008; Simon et al., 2008), nanoclayhas been widely used and studied in the industry or research, and its layer structuremay be beneficial to the modification of asphalt binders. Therefore, two kinds of nano-clay have been selected to modify the control asphalt binder in this chapter.
9.3 Material properties and performance test plans
The materials used are nonmodified nanoclay (NMN) and polymer-modified nanoclay(PMN). The properties of raw nanoclay materials were examined by the HitachiS-4700 field emission scanning electron microscope (FE-SEM) and Fourier transforminfrared spectroscopy (FTIR). The microstructures and chemical compositions of
184 Multifunctional Nanocomposites in Civil and Structural Engineering

control NMN and PMN modified asphalt binders were also observed and tested byFE-SEM and FTIR. When the modified asphalt binders were prepared, the perfor-mance test plans were arranged to evaluate the properties of modified asphalt binders.(1) The rolling thin-film oven (RTFO) and pressure-aging vessel (PAV) test wasconducted to simulate the short-term and long-term aging processes; (2) the rotationalviscosity (RV) test of modified asphalt binders was conducted for the temperaturerange of mixing and testing; (3) the dynamic shear rheometer (DSR) test of modifiedasphalt binders was employed to obtain the complex shear modulus; (4) the bendingbeam rheometer (BBR) test was utilized to estimate the performance at low tempera-tures; and (5) the FTIR test was used to understand the molecular bonding in the modi-fied asphalt binder, as well as the aging index and rate.
9.4 Preparation of nanoclay-modified asphalt binders
9.4.1 Materials
Nanoclay, layered mineral silicates, have several classes according to the chemicalcomposition and morphology, such as montmorillonite, bentonite, kaolinite, etc.Montmorillonite is commonly used in industry and research. It can be modified bypolymers to improve the heat resistance, biodegradability, mechanical properties(You et al., 2011). The raw nanoclay (NMN) used in this chapter is montmorillonite,and it is a 2:1 layered smectite with a plate structure. The layer of NMN (NMN is hy-drophilic) is composed of sodium ions, and the high expansion pressure is shown in themicrostructure. The structure of NMN leads to an exfoliation structure or crystaldispersion when it is modified by polymer (Jahromi and Khodaii, 2009; Drozdet al., 2011). The NMN microstructure images are observed by the Hitachi S-4700FE-SEM (Figure 9.1). The composition of NMN or molecular bonding is examinedby FTIR, and the images are shown in Figure 9.2.
The PMNused in the chapter is normally produced from the hydrophilic nanoclaywiththe organic cation exchange. Montmorillonite can be dispersed in the polymer matrix toform PMN. The nanometer thickness in the nanocomposite can be transformed into theplate-like nanoparticles with the high (nm � mm) aspect ratio. Through the surface modi-fication of the clay layers, the permeability is reduced, and tear and compression strengthsimprove. The microstructure images of PMN (the PMN is hydrophobic and organophilicvia the modification by polysiloxane (Simon et al., 2008) are tested by FE-SEM and areshown in Figure 9.3. The composition of PMN or molecular bonding is examined by theFTIR, and the images are shown in Figure 9.4. The bulk densities of two nanoclay mate-rials are 0.251 g/cm3 (PMN) and 0.678 g/cm3 (NMN), and both materials feature amaximum size of 200e400 nm in terms of aspect ratio (He and Shi, 2008).
The asphalt graded PG 58-34 from a project site in Gladstone, Michigan, was usedas the control asphalt binder. The control asphalt was premodified with acrylonitrilebutadiene styrene (ABS) in order to improve the compatibility between the asphaltand polymers, and meet the low-temperature grade requirement. The microstructureof the control asphalt binder is tested by the FE-SEM, and the images are shown in
Nanoclay modified asphalt 185

Layered structure and it is different fromthe PMN material
(a)
Agglomeration phenomena,layered and flat structure compared to the PMN
(b)
Figure 9.1 FE-SEM microstructure images of nonmodified nanoclay (NMN): (a) 20,000�magnification image of NMN, (b) 3000� magnification image of NMN, and (c) 1500�magnification image of NMN.
186 Multifunctional Nanocomposites in Civil and Structural Engineering

(c)
Figure 9.1 Continued.
50010001500200025003000350040000.7
0.8
0.9
1.0
1.1
Wavenumber (cm–1)
Abs
orba
nce
(au)
Nonmodified nanoclay
Nonpolymer modified nanoclay
Figure 9.2 FTIR spectra of nonmodified nanoclay (NMN).
Nanoclay modified asphalt 187

(a)
(b)
Agglomeration phenomena, butthe surface shows the “circle”shape and it aggregates together.
Layered structure and its surface isdifferent from the NMN
Figure 9.3 SEM microstructure images of polymer-modified nanoclay (PMN): (a) 20,000�magnification image of PMN, (b) 3000� magnification image of PMN, and (c) 1500�magnification image of PMN.
188 Multifunctional Nanocomposites in Civil and Structural Engineering

(c)
Figure 9.3 Continued.
50010001500200025003000350040000.6
0.7
0.8
0.9
1.0
1.1
1.2
Wavenumber (cm–1)
Abs
orba
nce
(au)
Polymer-modified nanoclay
Figure 9.4 FTIR spectra of polymer-modified nanoclay (PMN).
Nanoclay modified asphalt 189

Figure 9.5. The ABS presented in the control asphalt binder is tested by the FTIRspectra (FTIR section) (Figure 9.6).
Figure 9.1 shows the microstructure of the NMN material, and the agglomerationphenomena that occur in the particles of NMN due to the surface effects of nanoma-terials when they are exposed to the air. The layer structure in the image is helpful forthe asphalt binder to coat and react with. The shapes of NMN particles are irregularcompared to the PMN particles, and the normal size ranges from 5 to 30 mm. Figure 9.3shows the microstructure of the PMN material, and the shapes of PMN particles arelike circles. This was caused by the size of the nanomaterials when they were exposedto the air under normal pressure. Due to the polysiloxane modification, the PMN par-ticles keep their circular shape and exfoliated layer, so the structure is beneficial to meltwith the base asphalt binder. The dispersion of PMN is slightly better, with an averageconglomerate size of around 2 mm, when compared to NMN. From the micro-imagesof NMN and PMN materials, it is apparent that the agglomeration phenomena ofmaterials occur, and some of the nanomaterials may stay at the nanometer-sizedrange. After the agglomeration of nanomaterials, the piece-shaped NMN and thecircle-shaped PMN particles are observed by SEM. Note that although the SEMmicrographs show particles of micron size, these nanoclay platelets (average spacingbetween platelets) still feature one of their dimensions at the nanometer level.
Figures 9.2 and 9.4 demonstrate the FTIR spectra of NMN and PMN materials. TheFTIR spectra of NMN display the SieO (Si) asymmetric stretching bonds (1085 cm�1),the asymmetric vibration of SieO (H) (near 975 cm�1), and the OeH stretching bonds(3594 and 3735 cm�1) in the NMN material. However, the peak areas (stretching CeCand CeO, and the bending CeH bonds located across 953e1180 cm�1) of PMN ma-terial are more than those of the NMN material.
Figure 9.5 shows the plain structure of the control asphalt binder. The unevensurface of the control asphalt binder in the images is probably caused by makingthe sample. The white powders in the matrix could be the ABS, which is premodifiedin the base asphalt binder, and also is detected by the FTIR (FTIR section). The terracestructure is present in the edge of the control asphalt sample due to the process of mak-ing the sample. The control asphalt structure is observed at different magnifications toprovide a comparison with the modified asphalt binders. Figure 9.6 shows the FTIRspectra of unaged, RTFO-aged, and PAV-aged control asphalt binders. The peakarea of chemical bonding, at 1700 cm�1 (bending C]O conjugated), is increasedintensively in the PAV-aged control asphalt binder relative to the unaged controlasphalt binder. The violent oxidation reactions of the control asphalt binder acceleratedsignificantly during the PAV aging process. It indirectly indicates that the carbonylindex ratio may be one of the aging indexes in the asphalt binder.
9.4.2 Modified asphalt binder sample
The NMN and PMN materials were weighted at concentrations of 2% and 4% by theweight of the control asphalt binder, and quickly added to the control asphalt binder.The NMN and PMN materials cannot be exposed to the air for too long to reduce theeffect of agglomeration phenomena of nanomaterials. The modified asphalt binder was
190 Multifunctional Nanocomposites in Civil and Structural Engineering

(a)
(b)
Flat structure for the most part
It may be due to the pre-modification by the ABS
Figure 9.5 SEM microstructure images of control asphalt binder: (a) 1000� magnificationimage of control asphalt binder, and (b) 100� magnification image of control asphalt binder.
Nanoclay modified asphalt 191

mixed using the high-shear mixing apparatus set at a 4000 rpm rotational speed and atemperature of around 135 �C. During the mixing of the modified asphalt binder,bubbles were floating to the surface of the asphalt binders, and the temperature ofthe modified asphalt binder increased. This might be due to chemical reactionsbetween the nanomaterials and the control asphalt binder. All of the samples weremixed for around 2 h prior to the Superpave™ binder tests. In addition, themicro-images of NMN and PMN-modified asphalt binders were also obtained usinga Hitachi SU6600 FE-SEM with a cryogenic stage, and the images are shown inFigures 9.7 and 9.8.
Figures 9.7 and 9.8 show the differences in the microstructures of NMN- andPMN-modified asphalt binders from the control asphalt binder. From these figures,it can be seen that agglomeration phenomena of nanomaterials has also happened inthe asphalt binder and that the nanomaterials were melted uniformly in the controlasphalt binder. Some large particles of NMN and PMN materials did not completelymelt with the asphalt binder through the mixing process. Considering the mixing pro-cess and the condition, the effects of mixing and reactions are acceptable, because mostof the particles melted and reacted with the asphalt binder. Based on the images of thecontrol asphalt binder, the structures around the particles show the effect of a platelayer structure of NMN and PMN. The asphalt was intercalated into the plate layerof NMN material, and this could be due to the microstructure of NMN-modifiedasphalt binder. Compared to the structure of the NMN-modified asphalt binder, the
50010001500200025003000350040000
0.5
1.0
1.5
2.0
2.5
Wavenumber (cm–1)
Abs
orba
nce
(au)
UnagedRTFO-agedPAV-aged
RTFO-aged
Unaged
PAV-aged
Control asphalt
Figure 9.6 FTIR spectra of control asphalt binder.
192 Multifunctional Nanocomposites in Civil and Structural Engineering

(a)
(b)
Physical dispersion of NMNin the modified asphalt andchemical effects in the edge ofNMN materials
Physical dispersion of NMN in theasphalt matrix
Intercalation effects of NMN in themodified asphalt
Figure 9.7 FE-SEM microstructure images of nonmodified nanoclay and NMN-modifiedasphalt binder: (a) 1500� magnification image of 4% NMN-modified asphalt binder, (b) 500�magnification image of 4% NMN-modified asphalt binder, and (c) 150�magnification image of4% NMN-modified asphalt binder.
Nanoclay modified asphalt 193

asphalt was exfoliated into the plate layer of the PMN material. In other words, theNMN-modified asphalt binder has the most intercalated structure and thePMN-modified asphalt binder shows the most exfoliated structure through asphaltmodification. Both structures hold the potential to improve the mechanical propertiesof modified asphalt binders.
9.5 Viscosity results of nanoclay-modifiedasphalt binders
The RV is the measurement of a fluid’s resistance to flow. The asphalt samples weremeasured with the Brookfield viscometer at 100, 125, 135, 150, 175, and 190 �C. The27# spindle was used in this test, and the test temperatures covered the range of mixingand compaction temperatures (AASHTO, 2006) in this chapter. The test results areshown in Figure 9.9.
Figure 9.9 shows the viscosity values of the control, NMN-modified, andPMN-modified asphalt binders. Compared to the control asphalt binder, the viscosityvalues of NMN-modified asphalt binders increase significantly, and the values of the4% NMN-modified asphalt binder are higher than those of the 2% NMN-modifiedasphalt binder. However, the viscosity values of PMN-modified asphalt binders arealmost on the same level with those of the control asphalt binder. The figure illustratesthat all the viscosity data of asphalt binders under 135 �C pass the specification of the
(c)
Physical dispersion and chemical reactions(intercalation and exfoliation) in the NMN-modified asphalt compared to the structure ofthe NMN material and the control asphalt. Thesurface of NMN-modified asphalt is differentfrom that of the PMN-modified asphalt
Figure 9.7 Continued.
194 Multifunctional Nanocomposites in Civil and Structural Engineering

The flat structure of PMN-modifiedasphalt is shown. It is likely that theeffects of physical dispersion andchemical intercalation of PMN occurcompared to the structure of PMN andcontrol asphalt. The surface of PMN inthe asphalt is different from the surfaceof PMN in the air.
(a)
(b)Physical dispersion, and the effects ofintercalation and exfoliation of PMNoccur in the PMN-modified asphaltbinder
Figure 9.8 FE-SEM microstructure images of polymer-modified nanoclay: (a) 1000�magnification image of 4% PMN-modified asphalt binder, (b) 450� magnification image of 4%PMN-modified asphalt binder, and (c) 100� magnification image of 4% PMN-modifiedasphalt binder.
Nanoclay modified asphalt 195

Superpave™ Standard, and are lower than the limit of 3 Pa s. The viscosity of asphaltbinders indicates the pumpability, mixability, and workability of binders. The high vis-cosity of asphalt binders leads to the high mixing and compaction temperatures, andmay also contribute to the resistance to rutting. The NMN-modified asphalt bindershold the potential for improvement of rutting resistance, and the PMN-modified asphaltbinder may lead to better fatigue cracking compared to the control asphalt binder.
(c)
Physical dispersion and chemicalreactions (intercalation and exfoliation)are shown in the PMN-modified asphaltcompared to the control asphalt; it is alsodifferent from the structure of NMN-modified asphalt
Figure 9.8 Continued.
0.0E+00
5.0E+03
1.0E+04
1.5E+04
2.0E+04
2.5E+04
80 100 120 140 160 180 200
Visc
osity
val
ues
(cP)
Temperature (°C)
2% NMN4% NMN2% PMN4% PMNControlExpon. (2% NMN)Expon. (4% NMN)Expon. (2% PMN)Expon. (4% PMN)Expon. (control)
Figure 9.9 Viscosity values of the control and nanomaterial-modified asphalt binders.
196 Multifunctional Nanocomposites in Civil and Structural Engineering

9.6 DSR results of nanoclay-modified asphalt binders
The DSR is used to characterize the viscous and elastic behavior of the asphalt binderat medium and high temperatures. The complex shear modulus (jG*j) and phaseangle (d) of asphalt binders are obtained from the tests. The modulus is used to eval-uate the rutting potential of the asphalt binder at an unaged or short-term agingcondition, and the phase angle represents the time lag between the applied shearstress and the resulting shear strain. When the phase angle is zero, the subject asphaltbinder is a purely elastic material, and when the phase angle is 90�, it is a purelyviscous material. A high modulus indicates that it is a stiffer asphalt binder at testtemperatures, and that it has the potential to resist permanent deformation. Theenergy calculation equation is shown in Eqn (9.1) for the dissipated work per loadcycle due to rutting.
Rutting: Wc ¼ ps20
�1
G�=sin d
�ðstress-controlledÞ (9.1)
And for dissipated work per load cycle due to fatigue cracking, the energy formulais shown in Eqn (9.2):
Fatigue cracking: Wc ¼ pε20ðG�sin dÞ ðstrain-controlledÞ (9.2)
where:
Wc ¼ work dissipated per load cycles ¼ stress applied during load cycleε ¼ strain during load cycleG* ¼ complex shear modulusd ¼ phase angle.
The test for the resistance to permanent deformation is conducted on the unaged andRTFO-aged asphalt binder, and the fatigue cracking test is tested on the PAV-agedasphalt binder. Furthermore, when the load is applied in each cycle, the work fromeach loading is transferred into the pavement. A portion of the work is absorbed bythe pavement and reflected as the elastic response. The remaining energy is convertedinto damage in the form of rutting, fatigue cracking, and crack propagation. Therefore,the low dissipated energies per load cycle indicate that the asphalt binder and mixturehave good resistance to rutting in the stress-controlled model. However, the high dissi-pated energies per load cycle lead to better rutting resistance in the asphalt binders andmixtures under the strain-controlled model. The stress-controlled model analyses areadopted in this chapter, and the results are shown below.
9.6.1 NMN-modified asphalt binder
Figure 9.10 demonstrates the complex shear modulus master curves of the NMN-modified asphalt binder and the control asphalt binder. From the figure, it can be
Nanoclay modified asphalt 197

deduced that the complex modulus values of the 2% and 4% NMN-modified asphaltbinder are higher than those of the control asphalt binder, and the complex shear modulusvalues of the 2% NMN-modified asphalt binder are close to those of the control asphaltbinder at low temperatures or at high frequencies. However, the values of the 2%NMN-modified asphalt binder are higher than those of control asphalt binder underhigh temperatures and low frequencies. With the addition of 4% NMN material intothe control asphalt binder, the complex shear modulus increases by an average of 170%whereas the 2% NMN-modified asphalt just increases by an average of 45%. Based onthe literature reviews (Jahromi and Khodaii, 2009; Simon et al., 2008), when the NMNmaterial is added into the control asphalt binder, it is likely that the ions and the layer ofNMN are intercalated and exfoliated partially in the asphalt binder due to the cationexchanges. Ca2þ, Mg2þ and ammonium in asphalt are the major exchangeable cationsin the reaction process. The layer intercalations and separations in the NMN result in ahigh surface energy thatmakes intensive interactionswith the asphalt binder (Figure 9.11).After the reactions, more dense and solid materials are melted, and a stable bondingframework is formed. Therefore, the asphalt binder microstructure causes improvementof the complex shearmodulus, and theNMN-modified asphalt binder has a potential resis-tance to rutting. Furthermore, the work dissipated per load cycle is calculated for theinfluence of rutting, and the results are shown in Figure 9.12.
Figure 9.12 shows that the amounts of work dissipated per loading cycle of the con-trol asphalt binder are higher than those of the 2% and 4% NMN-modified asphaltbinder, and the work dissipated per loading cycle of 2% NMN-modified asphalt binderis higher than that of the 4% NMN-modified asphalt binder. Moreover, the work dissi-pated per load cycle decreases by an average of 40% with the addition of 4% NMN in
1.0E+00
1.0E+01
1.0E+02
1.0E+03
1.0E+04
1.0E+05
1.0E–04 1.0E–03 1.0E–02 1.0E–01 1.0E+00 1.0E+01 1.0E+02
Com
plex
mod
ulus
G* (
Pa)
Reduced frequency (Hz)
2% NMN NMA fitted G*2% NMN NMA measurement G*4% NMN NMA fitted G*4% NMN NMA measurement G*Control asphalt fitted G*Control asphalt measurement G*
Low temperatures and high frequencies
Figure 9.10 Complex shear modulus (jG*j) master curves of control and NMN-modifiedasphalt binders.
198 Multifunctional Nanocomposites in Civil and Structural Engineering

the control asphalt binder, whereas the 2% NMN-modified asphalt binder decreases byan average of 10% relative to the control asphalt binder. However, the complex shearmodulus of the NMN-modified asphalt binder is increased relative to the controlasphalt in Figure 9.10. Furthermore, it indicates that the addition of NMN materialinto the control asphalt binder improves the resistance to rutting, and from the dissi-pated work perspective, the addition of NMN to the control asphalt binder enhancesthe resistance to permanent deformation of the modified asphalt binder. Therefore,the NMN-modified asphalt binder has a better resistance to rutting relative to the con-trol asphalt binder.
9.6.2 PMN-modified asphalt binder
Figure 9.13 presents the complex shear modulus master curves of the control andPMN-modified asphalt binders. The complex modulus (jG*j) values of the control
Exfoliated nanocompositeIntercalated nanocompositeNon-polymer modified nanoclay
Asphalt
Heat
Polymer
Na+
Na+
Na+ Na+ Na+ Na+ Na+ Na+
Na+ Na+ Na+ Na+ Na+
Na+ Na+ Na+ Na+ Na+
+
+
+
+
+
+
+
+
+
+
+
+
+
+
+
+
+
++
+
Figure 9.11 Schematic illustration of nonmodified nanoclay microstructure changing in theasphalt binder.
1.0E–02
1.0E–01
1.0E+00
1.0E+01
1.0E+02
1.0E+03
1.0E–03 1.0E–02 1.0E–01 1.0E+00 1.0E+01 1.0E+02
Wc
(wor
k di
ssip
ated
) (J)
Frequency (Hz)
46 °C 2% NMN58 °C 2% NMN70 °C 2% NMN46 °C 4% NMN58 °C 4% NMN70 °C 4% NMN46 °C control58 °C control70 °C control
Figure 9.12 Work dissipated per load cycle of the control and NMN-modified asphalt bindersunder different temperatures (rutting influence).
Nanoclay modified asphalt 199

asphalt binder are higher than those of the 4% PMN-modified asphalt binder, and themodulus of the control asphalt binder is almost the same as that of the 2%PMN-modified asphalt binder. With the addition of 4% PMN to the control asphaltbinder, the complex shear modulus of the modified asphalt decreases by an averageof 33%, and the average modulus values of the 2% PMN-modified asphalt binderdecrease by an average of 6%. In addition, it is noted that the PMN can disperse readilyin polymers, and has an excellent resistance to temperature and good resistance tocertain acids and solvents. In comparison with the NMN material, PMN is changedfrom a hydrophilic to a hydrophobic one. Based on the literature review (Jahromiand Khodaii, 2009; Simon et al., 2008), due to the mechanical shear force and the ther-modynamic driving force, the PMN layer structure can be easily exfoliated in theasphalt binder and the compatibility of the polymer improves. Considering the exfoli-ation of the layer, it is likely that the surface energy increases and the ion and cationexchanges in the asphalt binder become intensive (Figure 9.14). The PMN materialchanges the microstructure of the asphalt binder through chemical reactions, andcauses a lower complex shear modulus and a reduction of water permeability. Theamounts of work dissipated per loading cycle in the control and PMN-modified asphaltbinders are displayed in Figure 9.15.
Figure 9.15 illustrates that the 4% PMN-modified asphalt binder has the highestwork dissipated per loading cycle of rutting, whereas the control asphalt binder hasthe lowest dissipated work per loading cycle. In addition, the work of the 4%PMN-modified asphalt binder increases by an average of 25%, whereas that of the2% PMN-modified asphalt binder increases by an average of 10% compared to thecontrol asphalt binder. The PMN-modified asphalt binder has a higher work dissipated
1.0E+00
1.0E+01
1.0E+02
1.0E+03
1.0E+04
1.0E+05
1.0E–04 1.0E–03 1.0E–02 1.0E–01 1.0E+00 1.0E+01 1.0E+02
Com
plex
mod
ulus
G* (
Pa)
Reduced frequency (Hz)
2% PMN NMA fitted G*2% PMN NMA measurement G*4% PMN NMA fitted G*4% PMN NMA measurement G*Control asphalt fitted G*Control asphalt measurement G*
Low temperatures and high frequencies
Figure 9.13 Complex shear modulus (jG*j) master curves of control and PMN-modifiedasphalt binders.
200 Multifunctional Nanocomposites in Civil and Structural Engineering

per loading cycle relative to the NMN-modified asphalt binder. Because of thepolymer modification in the nanoclay, PMN has more potential to form the new micro-structures of an asphalt binder through chemical reactions to enhance the ability torecover. From the dissipated work standpoints, the resistance to rutting in thePMN-modified asphalt binder may not improve. Therefore, it can be deduced thatfatigue cracking of the PMN-modified asphalt binder might be better than that ofthe control asphalt binder at intermediate temperatures.
9.6.3 NMN-modified asphalt binder after the RTFO aging process
Figure 9.16 reveals the complex shear modulus master curves of the control andNMN-modified asphalt binders after RTFO aging. The figure shows that the complex
++
++
+
+
++
+
++
+ ++
++
++ +
++
++
++
++
++
++
++
+++
++
++
+ ++
+
++
Polymer-modified nanoclay
Asphalt
Heat
Exfoliated nanocomposite Intercalated nanocomposite
Polymer
Figure 9.14 Schematic illustration of a polymer-modified nanoclay microstructure changing inthe asphalt binder.
1.0E–02
1.0E–01
1.0E+00
1.0E+01
1.0E+02
1.0E+03
1.0E–03 1.0E–02 1.0E–01 1.0E+00 1.0E+01 1.0E+02
Wc
(wor
k di
ssip
ated
) (J)
Frequency (Hz)
46 °C 2% PMN58 °C 2% PMN70 °C 2% PMN46 °C 4% PMN58 °C 4% PMN70 °C 4% PMN46 °C control58 °C control70 °C control
Figure 9.15 Work dissipated per load cycle of the control and PMN-modified asphalt bindersunder different temperatures (rutting influence).
Nanoclay modified asphalt 201

shear modulus of the 4% NMN-modified asphalt binder is higher than that of the 2%NMN-modified asphalt binder and the control asphalt binder under different tempera-tures. Moreover, the complex shear modulus (jG*j) increases by an average of 15%,whereas the average values of the 2% PMN-modified asphalt binder increase by anaverage of 7% with the addition of 4% PMN to the control asphalt. The NMN wasdispersed well in the control asphalt, and a stable network was formed after theRTFO aging. The strength of the modified asphalt increased. Through the RTFOaging, the NMNmaterial had more time and conditions to react with the asphalt binder.The new stable structure is established during the process, and the performance of theNMN-modified asphalt binder is close to the condition when under construction. Theresistance to rutting of the NMN-modified asphalt binder improves at mediumand high temperatures compared to the control asphalt binder. Furthermore, thework dissipated per load cycle of rutting was performed. The results are shown inFigure 9.17.
Figure 9.17 shows the work dissipated per load cycle of the control and NMN-modified asphalt binder after RTFO aging. The work dissipated per load cycle ofrutting influence on the control asphalt binder is higher than those of the 2% and4% NMN-modified asphalt binder under different temperatures after RTFO aging.Additionally, with the addition of 4% NMN in the control asphalt binder, the dissi-pated work decreases by an average of 30%, whereas that of 2% NMN-modifiedasphalt binder increases by an average of 8% compared to the control asphalt binder.From the work-dissipated angle, with the addition of NMN into the control asphaltbinder, the binder’s resistance to rutting improves significantly after the RTFO agingprocess. Furthermore, the complex shear modulus of the NMN-modified asphalt
1.0E+00
1.0E+01
1.0E+02
1.0E+03
1.0E+04
1.0E+05
1.0E–04 1.0E–03 1.0E–02 1.0E–01 1.0E+00 1.0E+01 1.0E+02
Com
plex
mod
ulus
G* (
Pa)
Reduced frequency (Hz)
2% NMN NMA fitted G*2% NMN NMA measurement G*4% NMN NMA fitted G*4% NMN NMA measurement G*Control aspahlt fitted G*Control asphalt measurement G*
Low temperatures and high frequencies
Figure 9.16 Complex shear modulus (jG*j) master curves of control and NMN-modifiedasphalt binders after the RTFO aging process.
202 Multifunctional Nanocomposites in Civil and Structural Engineering

binder increases. The potential of rutting resistance increases. Therefore, theNMN-modified asphalt binder has a better rutting resistance at medium and high tem-peratures compared to the control one.
9.6.4 PMN-modified asphalt binder after theRTFO aging process
Figure 9.18 displays the complex shear modulus master curves of the control andPMN-modified asphalt binders after the RTFO aging. The figure shows that the com-plex shear modulus of the 4% PMN-modified asphalt binder is lower than that of the2% PMN-modified asphalt binder and the control asphalt binder under various temper-atures. The average values of the 2% PMN-modified asphalt binder are almostthe same as those of the control asphalt binder. With the addition of the 4% PMN ma-terial to the base asphalt binder, the complex shear modulus decreases by an average of13%, whereas the 2% PMN-modified asphalt binder decreases by an average of 8%.After the RTFO aging, due to its polymer modification and compatibility, the PMNwas sufficiently melted into the asphalt binder. The properties (high heat resistanceand lining application) of PMN are presented, and the new stable framework in themodified asphalt binder is formed. The complex shear modulus of the PMN-modified asphalt binder does not change much after the modification due to its micro-structure, but the modified asphalt binder does hold the potential for the improvementof resistance to fatigue cracking. Furthermore, the work dissipated per load cycle dueto rutting is calculated and shown in Figure 9.19.
1.0E–01
1.0E+00
1.0E+01
1.0E+02
1.0E+03
1.0E–03 1.0E–02 1.0E–01 1.0E+00 1.0E+01 1.0E+02
Wc
(wor
k di
ssip
ated
) (J)
Frequency (Hz)
46 °C 2% NMN58 °C 2% NMN70 °C 2% NMN46 °C 4% NMN58 °C 4% NMN70 °C 4% NMN46 °C control58 °C control70 °C control
Figure 9.17 Work dissipated per load cycle of the control and NMN-modified asphalt bindersafter RTFO aging (rutting influence).
Nanoclay modified asphalt 203

Figure 9.19 shows that the control asphalt binder and 2% PMN-modified asphaltbinder almost have the same amount of work dissipated per loading cycle after theRTFO aging, and the 4% PMN-modified asphalt binder has a higher work dissipateddue to the influence of rutting. With the addition of 4% PMN to the control asphalt, thedissipated work increases by an average of 9%, whereas that of the 2% PMN-modified
1.0E+00
1.0E+01
1.0E+02
1.0E+03
1.0E+04
1.0E+05
1.0E–04 1.0E–03 1.0E–02 1.0E–01 1.0E+00 1.0E+01 1.0E+02
Com
plex
mod
ulus
G* (
Pa)
Reduced frequency (Hz)
2% PMN NMA fitted G*2% PMN NMA measurement G*4% PMN NMA fitted G*4% PMN NMA measurement G*Control asphalt fitted G*Control asphalt measurement G*
Low temperatures and high frequencies
Figure 9.18 Complex shear modulus (jG*j) master curves of the control and PMN-modifiedasphalt binders after the RTFO aging process.
1.0E–01
1.0E+00
1.0E+01
1.0E+02
1.0E+03
1.0E–03 1.0E–02 1.0E–01 1.0E+00 1.0E+01 1.0E+02
Wc
(wor
k di
ssip
ated
) (J)
Frequency (Hz)
46 °C 2% PMN58 °C 2% PMN70 °C 2% PMN46 °C 4% PMN58 °C 4% PMN70 °C 4% PMN46 °C control58 °C control70 °C control
Figure 9.19 Work dissipated per load cycle of the control and PMN-modified asphalt bindersafter the RTFO aging (rutting influence).
204 Multifunctional Nanocomposites in Civil and Structural Engineering

asphalt binder increases by an average of 6%. Therefore, the addition of the 4%PMN material to the control asphalt binder may not enhance the rutting resistance ofthe modified asphalt binder. However, the fatigue cracking resistance of thePMN-modified asphalt binder may increase relative to the control asphalt binder.
9.7 BBR results of nanoclay-modified asphalt binders
According to the Superpave™ specification, the low-temperature performance of anasphalt binder is evaluated by the BBR test. The test evaluates the binder’s possibleabilities of stress relaxation and thermal cracking in the asphalt bending beam samples.From the standard test, the deflection curves can be drawn (Liu et al., 2009, 2010b;Lu and Redelius, 2007). Then, Eqn (9.3) is used to calculate the stiffness of the asphaltbinder. In this research, the test temperature is �24 �C, and the stiffnesses andm-values are shown in Figure 9.20 and in Table 9.1.
SðtÞ ¼ PL3
4bh3dðtÞ (9.3)
where:
P ¼ Applied constant load (100 g or 0.98 N)L ¼ Distance between beam supports (102 mm)b ¼ Beam width (12.5 mm)h ¼ Beam thickness (6.25 mm)S(t) ¼ Asphalt binder stiffness at a specific timed(t) ¼ Deflection at a specific time.
1.0E+00
1.0E+02
2.0E+02
3.0E+02
4.0E+02
5.0E+02
6.0E+02
7.0E+02
8.0E+02
0 50 100 150 200 250 300
Cre
ep s
tiffn
ess
(MPa
)
Loading time (s)
2% PMN NMA stiffness4% PMN NMA stiffness2% NMN NMA stiffness4% NMN NMA stiffnessControl asphalt stiffness
Figure 9.20 Creep stiffness of control and nanomodified asphalt binders.
Nanoclay modified asphalt 205

Table 9.1 m-values of control and nanomodified asphalt binders at 60 s
Asphalt binder type Time (s)Deflection(mm)
Measuredstiffness (MPa) m-value Remarks
Control asphalt binder 60.0 0.445 178 0.317 Passes the specification
2% NMN-modified asphalt binder 60.0 0.414 189 0.309 Passes the specification
4% NMN-modified asphalt binder 60.0 0.404 196 0.304 Passes the specification
2% PMN-modified asphalt binder 60.0 0.436 182 0.339 Passes the specification
4% PMN-modified asphalt binder 60.0 0.425 187 0.315 Passes the specification
206Multifunctional
Nanocom
positesin
Civil
andStructural
Engineering

Figure 9.20 shows that the control asphalt binder has higher deflections and lowerstiffnesses than the other asphalt binders during the loading time, and that thePMN-modified asphalt binder has lower stiffnesses than the NMN-modified asphaltbinder for the polymer modification in the nanoclay. This indicates that the controlasphalt binder has a better stress relaxation ability and low-temperature performance,and that the low-temperature performance of the PMN-modified asphalt binder is alsobetter than that of the NMN-modified asphalt binder. However, it is noticed that thedeflection and stiffness of the NMN and PMN-modified asphalt binders are close tothose of the control asphalt binder. In addition, according to the Superpave™ specifi-cation, all values at the 60 s loading time are lower than 300 MPa, and the m-values at60 s loading time are higher than 0.300 from Table 9.1. The low-temperature grades ofthe NMN and PMN-modified asphalt binders are the same as that of the control asphaltbinder. Therefore, the low-temperature performance and stress relaxation ability of theNMN and PMN-modified asphalt binders are the same as those of control asphalt fromthe specification.
9.8 FTIR results of nanoclay-modified asphalt binders
FTIR methodology can detect molecular vibrations that may be in the form of twoatoms in a diatomic molecule experiencing a simple coupled motion to each individualatom in a large polyfunctional molecule undergoing motion. From the infrared spectra,the material information for the chemical bonds and the structure of the materialsis obtained. The ethylene, sulfoxide, aliphatic branched, aliphatic, aromatic, andcarbonyl bonds, all in the infrared spectra, related to the performance of asphalt bindersare investigated. The wavenumbers of main bands are shown in Table 9.2. The siliconsubstrate with 350 mm thickness is used in this chapter, and the test results are shownin Figures 9.21 and 9.22.
Figures 9.21 and 9.22 show the FTIR trends of the control and nanoclay-modified asphalt. These trends are similar between the control and modified asphalt.There is no obvious new peak in the spectra of the modified asphalt compared to thecontrol one due to the fact that the related peaks are overlapped during the FTIRdetection. According to the bands of bonding in Table 9.2, the ratio changes ofchemical bonding will be calculated for the sake of avoiding the effect of samplesthickness (Ouyang et al., 2006b). Based on Eqns (9.4)e(9.9), the ratio changesin the modified asphalt binders before and after RTFO and PAV aging are shownin Figure 9.23.
ICH]CH ¼ Area of the ethylene band centered around 966 cm�1PArea of the spectral bands between 2000 and 600 cm�1 (9.4)
IS]O ¼ Area of the sulfoxide band centered around 1030 cm�1PArea of the spectral bands between 2000 and 600 cm�1 (9.5)
Nanoclay modified asphalt 207

ICeH of CH3¼ Area of the aliphatic branched band centered around 1376 cm�1P
Area of the spectral bands between 2000 and 600 cm�1
(9.6)
ICeH of eðCH2Þne ¼ Area of the aliphatic index band centered around 1460 cm�1PArea of the spectral bands between 2000 and 600 cm�1
(9.7)
IC]C ¼ Area of the aromatic band centered around 1600 cm�1PArea of the spectral bands between 2000 and 600 cm�1 (9.8)
IC]O ¼ Area of the carbonyl band centered around 1690 cm�1PArea of the spectral bands between 2000 and 600 cm�1 (9.9)
Figure 9.23 shows the ratio changes of chemical bonds in the control and modifiedasphalt binders before and after the RTFO and PAV aging processes. Based on theliterature review (Cortizo et al., 2004; Larsen et al., 2009; Wu et al., 2009; Ouyanget al., 2006b; Zhang et al., 2011; Xu and Huang, 2011b), the carbonyl index indicatesthe degree of oxidation in the asphalt binder. The carbonyl index (C]O) in the modi-fied asphalt binders decreases slightly after the RTFO aging process and increasessignificantly after the PAV aging process when compared with the ratios of unaged
Table 9.2 Assignations of the main bands of the FTIR spectra(Larsen et al., 2009)
Wavenumber (cmL1) Assignationsa
3594, 3735 n OeH
2924, 2853 n CeH aliphatic
1735 n C]O
1700 n C]O conjugated
1600 n C]C aromatic
1460 d CeH of e(CH2)ne (aliphatic index)
1376 d CeH of CH3 (aliphatic branched)
1030 n S]O sulfoxide
966 d CeH transdisubstituted eCH]CHe (butadiene block)
748, 690 d CeH aromatic monosubstitued (styrene block)
an ¼ stretching, d ¼ bending.
208 Multifunctional Nanocomposites in Civil and Structural Engineering

50010001500200025003000350040000
0.5
1.0
1.5
2.0
2.5
Wavenumber (cm–1)
Abs
orba
nce
(au)
2% NMN-modified asphalt
UnagedRTFO-agedPAV-aged
RTFO-aged
UnagedPAV-aged
50010001500200025003000350040000
0.5
1.0
1.5
2.0
2.5
Wavenumber (cm–1)
Abs
orba
nce
(au)
4% NMN-modified asphalt
UnagedRTFO-agedPAV-aged
RTFO-aged
PAV-aged
Unaged
(a)
(b)
Figure 9.21 FTIR spectra of NMN-modified asphalt binder: (a) 2% NMN-modified asphaltbinder, and (b) 4% NMN-modified asphalt binder.
Nanoclay modified asphalt 209

50010001500200025003000350040000
0.5
1.0
1.5
2.0
2.5
Wavenumber (cm–1)
Abs
orba
nce
(au)
2% PMN-modified asphalt
UnagedRTFO-agedPAV-aged
RTFO-aged
Unaged
PAV-aged
50010001500200025003000350040000
0.5
1.0
1.5
2.0
2.5
3.0
Wavenumber (cm–1)
Abs
orba
nce
(au)
4% PMN-modified asphalt
UnagedRTFO-agedPAV-aged
PAV-aged
RTFO-aged
Unaged
(a)
(b)
Figure 9.22 FTIR spectra of PMN-modified asphalt binder: (a) 2% PMN-modified asphaltbinder, and (b) 4% PMN-modified asphalt binder.
210 Multifunctional Nanocomposites in Civil and Structural Engineering

00.020.040.060.08
0.10.120.140.16
Rat
io o
f bon
ding
Original 2% NMN binderRTFO 2% NMN binderPAV 2% NMN binder
C—H of —(CH2)n— C—H of CH3C O—— C C——CH——CH S——O
(a)
0
0.02
0.04
0.06
0.08
0.1
0.12
0.14
Rat
io o
f bon
ding
Original 4% NMN binderRTFO 4% NMN binderPAV 4% NMN binder
CH S C—H of —(CH2)n— C C C—H of CH3—— —— C O—— ——CH O
(b)
00.020.040.060.08
0.10.120.140.16
Rat
io o
f bon
ding
Original 2% PMN binderRTFO 2% PMN binderPAV 2% PMN binder
CH S C—H of —(CH2)n— C C C—H of CH3—— —— C O—— ——CH O
(c)
Figure 9.23 Ratio of bonds in the control and modified asphalt binders: (a) Ratio of bonds in the2% NMN-modified asphalt binder, (b) ratio of bonds in the 4% NMN-modified asphalt binder,(c) ratio of bonds in the 2% PMN-modified asphalt binder, (d) ratio of bonds in the 4%PMN-modified asphalt binder, and (e) ratio of bonds in the control asphalt binder.
Nanoclay modified asphalt 211

asphalt binders. It is possible that the addition of the nanopowders to the asphalt bindercan delay and weaken the oxidation reaction. Meanwhile, the sulfoxide index (S]O)in the control and modified asphalt binders after the RTFO and PAV aging shows adifferent trend with the carbonyl index. From previous research results (Ouyanget al., 2006b), the sulfoxide index (S]O) ratio may decrease in the asphalt binder afterthe RTFO and PAV aging process, and the results in this study coincide with it. There-fore, the sulfoxide index is not mainly considered as an aging index in the asphaltbinder and can be a reference in the test.
The control asphalt was modified by ABS, and the butadiene index was observedfrom FTIR tests. Based on the research results of Cortizo et al. (Cortizo et al., 2004;Larsen et al., 2009), during the aging process of the asphalt binder, the terminal vinyl(bands 910 and 995 cm�1) reacted preferentially to the trans-double bonding(bending CeH of trans-disubstituted �CH]CH�, band 996 cm�1). Moreover,the addition of the ultrafine materials and reactions with the polymer (asphalt binder)may lead to the increase of bending CeH of trans-disubstituted eCH]CHe in themodified asphalt binder. However, when the aging reaction occurs in the modifiedasphalt binder, the ratio of band 996 cm�1 decreases in the asphalt binder. The trendsof bending CeH of trans-disubstituted eCH]CHe in the control and modifiedasphalt binders are shown in Figure 9.23.
0
0.05
0.1
0.15
0.2
Rat
io o
f bon
ding
Original 4% PMN binderRTFO 4% PMN binderPAV 4% PMN binder
C—H of —(CH2)n— C—H of CH3C O—— C C——CH——CH S——O
(d)
0
0.05
0.1
0.15
0.2
Rat
io o
f bon
ding
Original ControlRTFO ControlPAV Control
C—H of —(CH2)n— C—H of CH3C O—— C C——CH——CH S——O
(e)
Figure 9.23 Continued.
212 Multifunctional Nanocomposites in Civil and Structural Engineering

9.9 Discussions and conclusions
Based on the test results of the control and nanoclay-modified asphalt binders in thischapter, the following conclusions can be drawn:
1. With the addition of nanoclay to the control asphalt binder, the viscosity of the NMN-modified asphalt binder increases significantly; however, the viscosity of the PMN-modified asphalt binder maintains the same level as that of the control asphalt binder. Therutting resistance of the NMN-modified asphalt binder improves and the fatigue crackingresistance may enhance in comparison to those of the control asphalt binder. The viscositydata of asphalt at 135 �C pass the requirement set by the Superpave™ Standard, and thesedata indicate that the construction paving temperature is not affected.
2. The addition of NMN material into the control asphalt binder increases the complex shearmodulus. However, the addition of the PMN material into the control asphalt binderdecreases the complex shear modulus relative to the control asphalt binder before or afterthe RTFO and PAV aging processes. From the standpoint of the amount of work dissipated,with the addition of NMN to the control asphalt binder, the high-temperature properties ofunaged and RTFO-aged modified asphalt binders improve. However, the high-temperatureproperties of the PMN-modified asphalt under unaged and RTFO-aged states are not signif-icantly enhanced. Moreover, the addition of the PMN material into the control asphalt binderimproves the recovery ability of the asphalt binder.
3. The BBR test results show that the stiffnesses of NMN and PMN-modified asphalt bindersapproach that of the control asphalt binder. From the Superpave™ grade angle, the stressrelaxations and low-temperature performance of the NMN and PMN-modified asphaltbinders are the same as those of the control asphalt.
4. The FTIR data show that the oxidation reaction may be weakened in the modified asphaltbinder with the addition of nanoclay in the asphalt binder when they are exposed to thesunlight and heated.
In summary, the nanoclay in the asphalt binder enhances the resistance to ruttingand fatigue cracking, and also improves the antioxidation effect of the modifiedasphalt binders. Therefore, the nanomaterial application in pavement engineeringwould create a new way for asphalt modification and material industry. In addition,the performance tests for the nanoclay-modified asphalt mixtures are planned andused to thoroughly evaluate the effect of nanoclay in asphalt binders and asphalt mix-tures. The emission tests and cost management or life cycle assessment are potentialstudies for nanoclay applications in civil engineering, as well as the application ofother nanomaterials.
Acknowledgment
The authors would like to thank ShuWei Goh and Su Ting Lau for the laboratory work, and giveappreciation for the funding, materials, and laboratory supports from Michigan TechnologicalUniversity. The FTIR measurements (CHL and YKY) are supported by the U.S. Departmentof Energy, the Office of Basic Energy Sciences (Grant No. DE-FG02-06ER46294). The contentsused in this chapter are selected from a few published papers by the authors in construction andbuilding materials. One of the papers is in the Top 25 hottest articles list on construction and
Nanoclay modified asphalt 213

building materials. The authors sincerely appreciate Elsevier’s support. Any opinion, finding,and conclusion or recommendation expressed in this material are those of authors and do notnecessarily reflect the review of any organization.
References
Abdelrahman, M.A., Carpenter, S.H., 1999. Mechanism of Interaction of Asphalt Cement withCrumb Rubber Modifier. Transportation Research Board.
Ahmedzade, P., Tigdemir, M., Kalyoncuoglu, S.F., 2007. Laboratory investigation of theproperties of asphalt concrete mixtures modified with TOP-SBS. Construction andBuilding Materials 21 (3), 626e633.
Airey, G.D., 2002. Rheological evaluation of ethylene vinyl acetate polymer modified bitumens.Construction and Building Materials 16 (8), 473e487.
Al-Hadidy, A.I., Yi-qiu, T., 2010. Comparative performance of the SMAC made with the SBSand ST-modified binders. Journal of Materials in Civil Engineering, American Society ofCivil Engineering (ASCE) 22 (6), 580e587.
Awanti, S.S., Amarnath, M.S., Veeraragavan, A., 2008. Laboratory evaluation of SBS modifiedbituminous paving mix, 20 (4), 327e330.
Bertollo, S.A.M., Fernandes, J.L., Bernucci, L.L.B., Moura, A.V., 2003. Feasibility of the Useof Crumb Rubber as Asphalt Pavement Material. Universidade do Minho, Portugal.
Cheng, J., Shen, J., Xiao, F., 2011.Moisture susceptibility ofwarm-mix asphaltmixtures containingnanosized hydrated lime. Journal of Materials in Civil Engineering 23 (11), 1552e1559.
Cortizo, M.S., Larsen, D.O., Bianchetto, H., Alessandrini, J.L., 2004. Effect of the thermaldegradation of SBS copolymers during the ageing of modified asphalts. Polymer Degra-dation and Stability 86 (2), 275e282.
Drozd, D., Szczubialka, K., Nowakowska, M., 2011. Novel hybrid photosensitizers: photoactivepolymer-nanoclay. Journal of Photochemistry and Photobiology A: Chemistry 215 (2e3),223e228.
Fu, H., Xie, L., Dou, D., Li, L., Yu, M., Yao, S., 2007. Storage stability and compatibilityof asphalt binder modified by SBS graft copolymer. Construction and Building Materials21 (7), 1528e1533.
Ghile, D.B., 2006. Effects of Nanoclay Modification on Rheology of Bitumen and onPerformance of Asphalt Mixtures. Delft University of Technology, Delft, TheNetherlands (M.S. thesis).
Goh, S.W., Akin, M., You, Z., Shi, X., 2011. Effect of deicing solutions on the tensile strength ofmicro- or nano-modified asphalt mixture. Construction and Building Materials 25 (1),195e200.
He, X., Shi, X., 2008. Chloride permeability and microstructure of Portland cement mortarsincorporating nanomaterials. Transportation Research Record: Journal of the Trans-portation Research Board 2070 (1), 13e21.
Huang, B., Mohammad, L.N., 2002. Numerical Analysis of Crumb-rubber Modified AsphaltPavements at the Louisiana Accelerated Loading Facilities. University of Mississippi 1 (2),59e71.
Iskender, E., Aksoy, A., Ozen, H., 2012. Indirect performance comparison for styrene-butadiene-styrene polymer and fatty amine anti-strip modified asphalt mixtures. Construction andBuilding Materials 30, 117e124.
Jahromi, S.G., Khodaii, A., 2009. Effects of nanoclay on rheological properties of bitumenbinder. Construction and Building Materials 23 (8), 2894e2904.
214 Multifunctional Nanocomposites in Civil and Structural Engineering

Jamal Khattak, M., Khattab, A., Rizvi, H.R., 2013. Characterization of carbon nano-fibermodified hot mix asphalt mixtures. Construction and Building Materials 40, 738e745.
Khattak, M.J., Khattab, A., Rizvi, H.R., 2011. Mechanistic Characteristics of Asphalt Binderand Asphalt Matrix Modified with Nano-fibers, 41165 ed. ASCE, Dallas, TX, p. 492.
Khattak, M.J., Khattab, A., Rizvi, H.R., Zhang, P., 2012. The impact of carbon nano-fibermodification on asphalt binder rheology. Construction and Building Materials 30,257e264.
Khattak, M.J., Khattab, A., Zhang, P., Rizvi, H., Pesacreta, T., 2013. Microstructure and fracturemorphology of carbon nano-fiber modified asphalt and hot mix asphalt mixtures. Materialsand Structures 46 (12), 2045e2057.
Khodaii, A., Mehrara, A., 2009. Evaluation of permanent deformation of unmodified and SBSmodified asphalt mixtures using dynamic creep test. Construction and Building Materials23 (7), 2586e2592.
Kim, S., Loh, S.W., Zhai, H., Bahia, H.U., 2001. Advanced Characterization of CrumbRubber-Modified Asphalts, Using Protocols Developed for Complex Binders. TransportationResearch Record: Transportation Research Board, pp. 15e24.
Larsen, D.O., Alessandrini, J.L., Bosch, A., Cortizo, M.S., 2009. Micro-structural and rheologicalcharacteristics of SBS-asphalt blends during their manufacturing. Construction and BuildingMaterials 23 (8), 2769e2774.
Li, D., Xia, H., Peng, J., Zhai, M., Wei, G., Li, J., et al., 2011. Radiation preparation ofnano-powdered styrene-butadiene rubber (SBR) and its toughening effect for polystyreneand high-impact polystyrene. Radiation Physics and Chemistry 76 (11e12), 1732e1735.
Liu, D.-L., Bao, S.-Y., 2007. Research of improvement of SBS modified asphalt pavementperformance by organic monotmorillonite. Journal of Building Materials, China 10 (4),500e504.
Liu, D.-L., Yao, H.-B., Bao, S.-Y., 2007. Performance of nano-calcium carbonate and SBScompound modified asphalt. Zhongnan Daxue Xuebao (Ziran Kexue Ban)/Journal ofCentral South University (Science and Technology) 38 (3), 579e582.
Liu, S., Ma, C., Cao,W., Fang, J., 2009. Influence of aluminate coupling agent on low-temperaturerheological performance of asphalt mastic. Construction and Building Materials 24 (5),650e659.
Liu, G., Kai, Q., Ye, R., 2010a. Heat Reflectivity Properties of Asphalt Mixtures Modified withNano A/SBS-II: Prediction of Temperature in Asphalt Pavement, 41127 ed. ASCE,Beijing, China, p. 413.
Liu, S., Cao, W., Shang, S., Qi, H., Fang, J., 2010b. Analysis and application of relationshipsbetween low-temperature rheological performance parameters of asphalt binders.Construction and Building Materials 24 (4), 471e478.
Lu, X., Redelius, P., 2007. Effect of bitumen wax on asphalt mixture performance. Constructionand Building Materials 21 (11), 1961e1970.
Mojtaba Ghasemi, S.M.M., Tahmooresi, Majid, Jalal, RezaKamali, Reza, Taherzade, 2012.Modification of stone matrix asphalt with nano-SiO2. Journal of Basic and AppliedScientific Research 2 (2), 1338e1344.
Ouyang, C., Wang, S., Zhang, Y., Zhang, Y., 2006a. Improving the aging resistance ofstyrene-butadiene-styrene tri-block copolymer modified asphalt by addition of antioxidants.Polymer Degradation and Stability 91 (4), 795e804.
Ouyang, C., Wang, S., Zhang, Y., Zhang, Y., 2006b. Improving the aging resistance of asphaltby addition of zinc dialkyldithiophosphate. Fuel 85 (7e8), 1060e1066.
Shang, L., Wang, S., Zhang, Y., Zhang, Y., 2011. Pyrolyzed wax from recycled cross-linkedpolyethylene as warm mix asphalt (WMA) additive for SBS modified asphalt. Construc-tion and Building Materials 25 (2), 886e891.
Nanoclay modified asphalt 215

Simon, M., Stafford, K., Ou, D., 2008. Nanoclay reinforcement of liquid silicone rubber. Journalof Inorganic and Organometallic Polymers and Materials 18 (3), 364e373.
Wang, H., Dang, Z., You, Z., Cao, D., 2012. Effect of warm mixture asphalt (WMA) additiveson high failure temperature properties for crumb rubber modified (CRM) binders.Construction and Building Materials 35, 281e288.
Wang, H., Dang, Z., Li, L., You, Z., 2013. Analysis on fatigue crack growth laws for crumbrubber modified (CRM) asphalt mixture. Construction and Building Materials 47,1342e1349.
Wu, S.-p., Pang, L., Mo, L.-t., Chen, Y.-c., Zhu, G.-j., 2009. Influence of aging on the evolutionof structure, morphology and rheology of base and SBS modified bitumen. Constructionand Building Materials 23 (2), 1005e1010.
Xiang, L., Cheng, J., Que, G., 2009. Microstructure and performance of crumb rubber modifiedasphalt. Construction and Building Materials 23 (12), 3586e3590.
Xiao, F., Amirkhanian, S.N., Shen, J., Putman, B., 2009. Influences of crumb rubber size andtype on reclaimed asphalt pavement (RAP) mixtures. Construction and Building Materials23 (2), 1028e1034.
Xiao, F., Amirkhanian, A.N., Amirkhanian, S.N., 2011. Influence of carbon nanoparticles on therheological characteristics of short-term aged asphalt binders. Journal of Materials in CivilEngineering 23 (4), 423e431.
Xu, T., Huang, X., 2011a. Study on combustion mechanism of asphalt binder by using TG-FTIRtechnique. Fuel 89 (9), 2185e2190.
Xu, T., Huang, X., 2011b. A TG-FTIR investigation into smoke suppression mechanism ofmagnesium hydroxide in asphalt combustion process. Journal of Analytical and AppliedPyrolysis 87 (2), 217e223.
Yang, Z., Hollar, J., Shi, X., 2011. Surface-sulfonated polystyrene microspheres improve crackresistance of carbon microfiber-reinforced Portland cement mortar. Anglais 45 (13),3497e3505.
Yao, H., You, Z., Li, L., Goh, S.W., Mills-Beale, J., Shi, X., et al., 2013. Evaluation of asphaltblended with low percentage of carbon micro-fiber and nanoclay. Journal of Testing andEvaluation 41 (2), 278e288.
Yildirim, Y., 2007. Polymer modified asphalt binders. Construction and Building Materials21 (1), 66e72.
You,Z.,Mills-Beale, J., Foley, J.M.,Roy,S.,Odegard,G.M.,Dai,Q., et al., 2011.Nanoclay-modifiedasphalt materials: preparation and characterization. Construction and BuildingMaterials 25 (2),1072e1078.
Zhang, F., Yu, J., 2011. The research for high-performance SBR compound modified asphalt.Construction and Building Materials 24 (3), 410e418.
Zhang, H., Wang, Y., Wu, Y., Zhang, L., Yang, J., 2005. Study on flammability of montmo-rillonite/styrene-butadiene rubber (SBR) nanocomposites. Journal of Applied PolymerScience 97 (3), 844e849.
Zhang, J., Wang, J., Wu, Y., Wang, Y., Wang, Y., 2008. Preparation and properties of organicpalygorskite SBR/organic palygorskite compound and asphalt modified with the com-pound. Construction and Building Materials 22 (8), 1820e1830.
Zhang, B., Xi, M., Zhang, D., Zhang, H., Zhang, B., 2009. The effect of styrene-butadiene-rubber/montmorillonite modification on the characteristics and properties of asphalt.Construction and Building Materials 23 (10), 3112e3117.
Zhang, F., Yu, J., Han, J., 2011. Effects of thermal oxidative ageing on dynamic viscosity, TG/DTG, DTA and FTIR of SBS- and SBS/sulfur-modified asphalts. Construction andBuilding Materials 25 (1), 129e137.
216 Multifunctional Nanocomposites in Civil and Structural Engineering

Mechanical and environmentalresistance of nanoparticle-reinforced pavement materials
10Ning XieSchool of Materials Science and Engineering and Shandong Provincial Key Laboratory ofPreparation and Measurement of Building Materials, University of Jinan, Jinan, Shandong,China; School of Civil Engineering, Harbin Institute of Technology, Harbin, China
10.1 Introduction
Portland cement concrete is a commonly used building material in modern civilization.Portland cement, as the most important binder material of concrete, is the main compo-nent that determines the overall properties of the concrete infrastructures. With thedevelopment of global industrialization, the needs for cement concrete materialskeep increasing every year, especially in many developing countries. As a result,the amount of Portland cement production increases annually with the market expan-sion. However, Portland cement production is an extremely energy-intensive processand accounts for considerable greenhouse gases emissions; therefore, with the urgentneed to mitigate the negative environmental footprint of concrete production and main-tenance activities, there has been a steady increase in interest and research activityregarding improving the sustainability and durability of concrete infrastructures.
The durability of concrete infrastructures in service environments is of great interestto both scientific studies and practical applications (Richardson, 2008; Bullard et al.,2011; Jennings, 2008; Rozi�ere et al., 2009; Shi et al., 2010, 2012). Many approacheshave been implemented to improve the durability of concrete with a focus on modi-fying the performances of the cementitious binders (Nehdi et al., 2004; Shi et al.,2012; Bagheri et al., 2012; Pacheco-Torgal et al., 2012). Polymer modification, fiberreinforcement, and air entrainment were widely used approaches to enhance the per-formances of the concrete infrastructures. Although these methods have their meritsfor enhancing the properties of the concrete, all of them still have limitations whenthey are applied in the field.
The overall performances of any material are determined by their microstructures;therefore, how to control the microstructures of a material is the most importantissue to realize a high performance that can satisfy the critical requirements whenthe material is applied in the field. Currently, it is widely accepted that the hardenedcementitious binder is composed of complex nanosized crystals and amorphoushydration products (shown as the high-resolution transmission electron microscope(HRTEM) image in Figure 10.1). Therefore, how to precisely control the micro-structures of these phases from the nanoscale is the most effective way to realize
Innovative Developments of Advanced Multifunctional Nanocomposites in Civil and Structural Engineeringhttp://dx.doi.org/10.1016/B978-1-78242-326-3.00010-5Copyright © 2016 Elsevier Ltd. All rights reserved.

the performance enhancement of the concrete materials (Monteiro et al., 2009;Lim and Mondal, 2014). This is the most important reason why nanoparticlescan play a key role in helping with microstructure control from nanoscale andthus enhancing the durability of the concrete materials.
The nanostructure of the cement binder phase has been extensively investigated inrecent decades (Xu and Viehland, 1996; Allen et al., 2007a). It was found that theCa:Si ratio of the C-S-H phase in hardened cement paste generally varies from 1.2to 2.1, and has an average value of about 1.75 (Richardson, 1999). It was foundthat the nanoscale Ca(OH)2 phase could be calculated, and the formula of the solidC-S-H, (CaO)x(SiO2)(H2O)y, could be determined by the number of x and y (Thomaset al., 1998). Bernal (1952) thought that, in the cement paste, the SiO2 in the hydrationproducts can be divided into two types, namely, CSH(I) and C2SH(II). It was claimedthat the monomeric silicate anion [SiO2(OH)2]2
� exists in both phases with a generalformula expressed as Ca[SiO2(OH)2]Ca(OH)2]xH2Oy, where x would be 1 forC2SH(II) and between 0 and 0.5 for CSH(I). A few models have demonstrated thatthe C-S-H mainly fall into two types (Allen et al., 2007a). One is that the silicate anionsare thoroughly monomeric, and another one is that the linear silicate chain is present in1.4 nm tobermorite or some other minerals (Taylor, 1986).
Due to the nanostructures of the cement paste, it is not a surprise that the addition ofthe nanoparticles will largely change the hydration process of the concrete materials.So far, several types of nanomaterials have been widely used as additives to reinforceconcrete infrastructures, including titanium dioxide, iron oxide, alumina and silica
5 nm5 nm
Figure 10.1 High-resolution transmission electron microscope of complex nanosized crystalsand amorphous hydration products in hardened cement paste.
218 Multifunctional Nanocomposites in Civil and Structural Engineering

nanoparticles, nanoclay, and nanostructured carbon materials (Hanus and Harris,2013). Although the mechanisms of the concrete reinforced by nanoparticles are notyet crystal clear, there still are some hypotheses that are responsible for the benefitsof the modification. First, it was assumed that the nanosized particles will act as thenucleus to help the formation and growth of the cementitious hydration products(Li et al., 2006a); second, they can act as fillers to block the nanosized pores in theamorphous cementitious hydration products (Kim et al., 2014a; Hou et al., 2014);and, third, it will change the morphologies of the parallel packing C-S-H structureand form new types of C-S-H structures with higher density (Feng et al., 2013).
Some studies claimed that, with the addition of nano-TiO2 particles, the hydrationrate of the cement-based materials can be accelerated and thus result in early-agemechanical properties enhancement. It was believed that the nano-TiO2 particleswill accelerate both the peak reaction rate and the early-age hydration degree, andthe hydration products were formed on the surfaces of the TiO2 nanoparticles andthe C3S (Chen et al., 2012; Jayapalan et al., 2009). Meanwhile, the evening-agemechanical properties were reduced sharply, with the content of the nano-TiO2particles increased from 5 wt% to 10 wt% (Meng et al., 2012).
The effect of the TiO2 nanoparticle on the early-age hydration kinetics to the trical-cium silicate (C3S) was quantitatively presented by Lee and Kurtis (2010) via theAvrami model (Avrami, 1939, 1940, 1941), shown as:
X ¼ 1� exp½�ðkavrtÞn� (10.1)
where X is the transformed volume fraction as a function of time; and kavr is theeffective rate constant as a function of constant linear growth rate. Provided Eqn (10.1)is differentiated with respect to time; thus, the hydration rate can be expressed as:
R ¼ Anknavrðt � t0Þn�1 expf�½kavrðt � t0Þn�g (10.2)
where R is the hydration rate, A is a normalization constant to match the isothermalcalorimetry data, and t0 is the time delay between the time of mixing and the start ofnucleation and growth kinetics. A boundary nucleation model (BN model) wasmodified by Thomas (2007) to describe the hydration kinetics of C3S, shown as:
X ¼ 1� exp
24�2OB
V
ZGr
O
ð1� expð�YeÞÞdy35 (10.3)
where:
Ye ¼ pIB3
G2t3�1� 3y2
G2t2þ 2y3
G3t3
��if t >
y
G
�
Ye ¼ 0�if t <
y
G
�(10.4)
Mechanical and environmental resistance of nanoparticle-reinforced pavement materials 219

where y and Y e are temporary variables, which will disappear after integration; andX depends on three well-defined physical parameters: G, the linear growth rate oftransformed phase; IB, the nucleation rate per unit area of untransformed boundary;and OB
V, the boundary area per unit volume. These results demonstrate that the TiO2
nanoparticles can act as nucleation sites and accelerate the early hydration process.Unlike the nano-TiO2 particles, which only act as catalysts or inert additives, the
addition of the nano SiO2 and nanomontmorillonites will lead to a pozzolanic reactionbetween Portland cement paste and the nano SiO2 (He and Shi, 2008). The nanosheetsof montmorillonites distributed in a mortar or concrete matrix may also result in micro-structural regularity and act as a dense barrier and “fiber reinforcement.”
Single-walled carbon nanotubes (SWCNTs) also can accelerate the hydration reac-tion of C3S in cement and influence the morphology and location of both the initialC3S and the tricalcium aluminate (C3A) hydration products (Makar and Chan,2009). Vera-Agullo et al. (2009) reported that, with proper dispersion, the carbonnanofilaments (either multiwalled nanotubes or nanofibers) can accelerate the cementhydration process, and so do the nanosilica and nanoclays. The mortar bars, with theaddition of 0.125 wt% of carbon nanofiber, showed great performance derived fromboth physical and chemical mechanisms.
Currently, the research on nanotechnology-based concrete materials is still bur-geoning (He and Shi, 2008; Birgisson et al., 2010, 2012). In the past decade, rapidprogress, improved availability of advanced nanomaterials, and improved character-ization techniques have led to numerous engineering and mechanistic studies of nano-technology for concrete materials (Garcia-Luna and Bernal, 2006; Bittnar et al., 2009;Shi et al., 2010; Lee and Kurtis, 2010). Nanotechnology has demonstrated its clearbenefits in empowering the development of concrete with enhanced mechanical prop-erties and durability with exposure to aggressive environments (Birgisson et al., 2010,2012; Chang et al., 2007; Keyvani, 2007; Mondal et al., 2010; Sanchez and Sobolev,2010; Said et al., 2012; Metaxa et al., 2013; Zapata-Ord�uz et al., 2014).
10.2 Nanoparticle-reinforced pavement materials
Pavement is one of the most important infrastructures in our daily lives. There areseveral types of pavements that are currently used: highway pavements, sidewalkpavements, airport pavements, parking lots, and bridge decks. The properties ofthese pavements differ according to their specific application requirements. Asphaltconcrete pavements are largely used in highways, whereas concrete pavements arelargely applied in sidewalks and bridge decks. A considerable amount of airport pave-ments are using cement concrete pavement, and many parking lots are also paved withcement concrete.
As a promising technology in many industrial fields, nanotechnology has also beenapplied in the production of concrete and proven to enhance its intrinsic properties andenvironmental resistance (Madani et al., 2012; Sanchez and Sobolev, 2010;Pacheco-Torgal et al., 2013; Pachego-Torgal, 2014). A wide variety of nontoxic
220 Multifunctional Nanocomposites in Civil and Structural Engineering

nanomaterials, such as nanoclays, nano iron oxide, nano silica, nano titanium dioxide,nano alumina, and nano carbon materials, have been used to improve the mechanicalproperties, enhance the chemical resistance, and reduce the shrinkage and permeabilityof concrete, all of which contribute to extending the service life of concrete infrastruc-tures (Amirkhanian et al., 2011; Balaguru and Chong, 2006; Birgisson et al., 2010,2012). In addition, with the development of nanotechnology in many industrial areas,the production capability of nanomaterials has greatly increased in recent decades,which leads to a dramatic cost reduction of nanomaterials; this trend is expected tocontinue. The future is bright to achieve the wide application of nanotechnologiesin infrastructure construction and maintenance activities.
10.2.1 Asphalt materials modified by nanomaterials
The study of asphalt materials modified by nanomaterials has sparked great interest inrecent years. It was found that the overall performance of the asphalt materials can bemodified by the addition of various nanomaterials (You et al., 2011; Merusi et al.,2012; Yang and Tighe, 2013; Shafabakhsh et al., 2014). Parviz (2011) summarizedthe types of nanomaterials and the benefits of the asphalt pavements modified withthem. Fang et al. (2013) demonstrated the mechanisms of the nanomodificationfrom the compatibility, stability, and aging resistance perspectives. The mechanicalproperties of asphalt materials modified by nanoclay were investigated by El-Shafieet al. (2012). It was found that the addition of small amount of nanoclay particleshas evidently positive effects on the mechanical performances of asphalt material.Carbon nanofibers, as another important additives, have been added into the neatasphalt to enhance the viscoelastic and fatigue performance (Khattak et al., 2012),and the microstructures were characterized by SEM analysis. Dry and wet processeswere applied for investigation. It was found that, with the addition of some nanomate-rials, both the viscoelastic and rutting resistance can be improved (Khattak et al., 2013).
In addition to the neat asphalt materials, the polymer-modified asphalt materialswith the addition of nanoclay were investigated (Sureshkumar et al., 2010; Golestaniet al., 2012; Yao et al., 2012). It was found that the nanoclay is helpful for compati-bility between the poly ethylene-co-vinyl acetate (EVA) and the asphalt binder. Thelinear and branch styrene-butadiene-styrene (SBS)-modified asphalt materials withor without addition of nanoclay were prepared, and their physical, mechanical, rheo-logical, and storage stability were compared. The results showed that the linear SBSenanocomposite modified asphalt is willing to form an exfoliated structure, whereas thebranch SBSenanocomposite modified asphalt is willing to form an intercalated struc-ture. The nanoclay has positive effects on enhancing the physical properties, rheolog-ical behaviors, and storage stability of the polymer-modified asphalt. The softeningpoints and viscosity increased, whereas the penetration decreased. The ductility andelastic recovery were largely influenced by the addition of the nanoclay, and thebest rutting resistance was obtained with the ratio of SBS to nanoclay of 100:25.
Apart from the basic pavement mechanical and durability properties evaluation,other merits of the nanomodified asphalt pavements were introduced. The additionof the nanoclay used as the flame retardants on fire reaction was investigated
Mechanical and environmental resistance of nanoparticle-reinforced pavement materials 221

(Bonati et al., 2013). In this study, the fire behavior and the smoke release proper-ties of the nano organo-clay modified asphalt mixtures were evaluated. It was foundthat with the synergic use of aluminum hydroxide, magnesium hydroxide, andnanoclay, the fire-resistant behavior of the asphalt mixture can be considerablyimproved.
The durability of asphalt materials modified by nanomaterials exposed to variousdeicing solutions (NaCl, MgCl2, and CaCl2) and water environments was evaluated(Goh et al., 2011). In this study, the mixtures were prepared with various amountsof nanoclay and/or nanofibers. The moisture susceptibility and deicer impacts wereassessed. The results indicated that after seven freezeethaw cycles, the addition ofnanoclay and nanofibers would enhance the moisture susceptibility performance,which is helpful to reduce the moisture damage potential of the pavements. Ameriet al. (2013) used zycosoil as a nano-organosilane antistripping additive to modifythe moisture resistance of the hot mixed asphalt (HMA) under freezeethaw environ-ments. It was found that the resilient modulus ratio of the mixtures was enhanced, andthe adhesion bond between the aggregates and the asphalt binders increased as well.Similar results were obtained by Nejad et al. (2012).
10.2.2 Cement concrete materials modified by nanomaterials
For cement concrete materials, nano SiO2 particles are the most widely used materialas the reinforcement additive (Madini et al., 2012; Tob�on et al., 2012; Singh et al.,2013; Aleem et al., 2014; Hou et al., 2014). It has been proven that both the sustain-ability and mechanical properties can be evidently improved with a small amount ofnano SiO2 particles (Senff et al., 2009, 2010). In addition to SiO2 nanoparticles,TiO2 nanoparticles are another important additive to modify the performance ofcement concrete pavements (Jalal et al., 2013; Feng et al., 2013; Li et al., 2014). UnlikeSiO2 nanoparticles, which acts only as the reinforcement additives of the concrete,TiO2 nanoparticles can also play a self-cleaning role due to their photocatalytic capa-bility (Ballari et al., 2011; Chen et al., 2011; Mat�ejka et al., 2012; Guo et al., 2013;Sugra~nez et al., 2013; Yousefi et al., 2013; Essawy and Aleem, 2014; Karapatiet al., 2014; Senff et al., 2014). In addition, due to the specific high solar reflectivecapability of TiO2 nanoparticles, they are also used to mitigate the heat island effectin urban areas (Santamouris, 2013). Another important nanomaterial used as the rein-forcement is carbon nanotubes (Li et al., 2013, 2014), which were used to prepareself-deicing pavements, or self-sensing concrete to monitor the stress and strain onconcrete infrastructures.
Most recently, the effects of the types, sizes, shapes, and pore distribution of nano-particles on the reinforcement were investigated (Givi et al., 2010, 2013; Hou et al.,2013; Quercia et al., 2012, 2013, 2014). It has been proven that the specific surfacearea, the volume of the micropores, and the average size of the primary nanoparticlesare key factors determining the final properties of the reinforced concrete materials.This is a good start to help optimizing the modification process, and more microstruc-ture characterization methods should be applied to elucidate the real mechanisms of thereinforcement in future studies.
222 Multifunctional Nanocomposites in Civil and Structural Engineering

10.3 Mechanical and environmental resistance
The requirements of concrete pavements are much more critical than those of concretebuildings, because pavements have to face multiple effects, including the wear fromthe interaction between the vehicle tires and the pavements, the mechanical forcesfrom the traffic loading, the deicing chemical attacks, and the wetedry and freezeethaw damage cycles. These influencing factors largely affect the durability of concretepavements. Therefore, the mechanical and environmental resistance of concrete has tobe enhanced to satisfy the critical requirements due to the aggressive applicationenvironments.
10.3.1 Mechanical performance
The mechanical performance of the pavement materials modified by nanoparticles hasgreatly interested in recent years (Rashad, 2013a). The most widely used nanomateri-als are nano SiO2, nano TiO2, nanoclay, carbon nanotubes, and nanofibers (Morsyet al., 2011; Nazari and Riahi, 2011a,b; Kawashima et al., 2012; Santagata et al.,2012; Beigi et al., 2013; Shakhmenko et al., 2013; Kim et al., 2014b; Aleem et al.,2014). Some researchers also reported the mechanical-performance modification ofcementitious materials with the addition of nano Fe2O3, Al2O3, ZrO2, ZnO/ZnO2,and other oxide nanoparticles (Nazari and Riahi, 2011a,c; Riahi and Nazari, 2011;Bhuvaneshwari et al., 2012; Oltulu and Sahin, 2011, 2013, 2014; Yuan et al., 2013;Rashad, 2013b; Safiuddin et al., 2014; Senff et al., 2014; Barbhuiya et al., 2014;Hosseini et al., 2014; Senff et al., 2014).
In 2004, Li and her coauthors studied the compressive and flexural strengths of thecement mortar modified by TiO2, SiO2, and Fe2O3 nanoparticles. It was found that themechanical properties were evidently enhanced with addition of the nanoparticles(Li et al., 2004). In 2006, they reported the wear-resistance performance of the concretepavement materials modifiedwith TiO2 and SiO2 nanoparticles (Li et al., 2006a). The re-sults showed that the abrasion resistance of the concrete containing nanoparticles ismuchlarger than that containing polypropylene fibers or plain concrete. In addition, the perfor-mance of the concretemodified by nano TiO2 is better than thosemodified by nano SiO2.
Similar results were obtained recently (Ltifi et al., 2011; Stefanidou and Papayianni,2012; Behfarnia and Salemi, 2013). The compressive strength of the cement concretematerials modified by nano SiO2 or nano Al2O3 was studied by Behfarnia and Salemi(2013). It was found that the 28 and 120 d compressive strengths of the concrete mixedwith 5 wt% of nano SiO2 increased 30% and 45%, respectively. The positive modifi-cation effect of the compressive strength by adding nano Al2O3 particles was alsoproven by Li et al. (2006b). In this study, it was found that, with addition of 7 wt%Al2O3 nanoparticles, the 7 d compressive strength of the modified cement mortarincreased by 30%, and with addition of 5 wt% Al2O3 nanoparticles, the 28 d elasticmodulus increased by 143%.
Other than the chemical composition of the nanoparticles, the effects of theparticle size on the mechanical properties of the concrete were analyzed as well(Haruehansapong et al., 2014). In this study, the chosen particle size of the nano
Mechanical and environmental resistance of nanoparticle-reinforced pavement materials 223

SiO2 were about 12, 20, and 40 nm. The compressive strength-testing resultsdemonstrated that the performance of the samples modified with the particle size of40 nm is higher than that of the other two due to the agglomerations and ineffectivedispersion of the smaller-sized nanoparticles.
Recently, the effects of the dispersion condition of the nanoparticles on the proper-ties of cement concrete were investigated (Kong et al., 2012, 2013; Wang et al., 2013;Horszczaruk et al., 2014). In Horszczaruk’s study, acetone and water were used asthe dispersants to compare the effects of nanoparticles dispersion on the mechanicalproperties of the cement composites. It was found that the addition of the mesoporousnano SiO2 spheres in the acetone has higher modification efficiency on mechanicalproperties than those dispersed in water.
Unlike the results presented above, Senff reported a different phenomenon of thecompressive strength of the cement mortar modified by nano SiO2 and nano TiO2.It was claimed that the compressive strength was not sensitively increased, whereasthe rheological behavior and plastic viscosity performances were enhanced signifi-cantly, with the addition of the nanoparticles (Senff et al., 2012).
Another interesting study reported that the compressive strength enhancement ofthe cement concrete modified by nano SiO2 was not evident if using slump ratherthan weight content as reference, because the addition of nano silica will largelychange the workability performance of the concrete materials (Berra et al., 2012).
It must be noted here that, so far, little study was focused on the low dosage of thenanoparticles, especially doses lower than 1 wt%. Many of the investigations gave thetesting results with the weight fraction from 3 wt% to 10 wt%. Therefore, it is neces-sary to find out if the low dosage works as well as the high dosage in cement concrete.Our recent study (Feng et al., 2013) presented the mechanical performance of thecement paste with a low-dosage addition of TiO2 nanoparticle (less than 1%).Figure 10.2 presents the 28-day three-point flexural strength as a function of thenano-TiO2 content by the weight fraction of the cement paste, with the water/cementratio fixed at 0.4. It reveals that mixing a small amount (0.1 wt%) of nano TiO2 into thecement can increase its flexural strength by 4.5% (from 11.53 to 12.05 MPa). Howev-er, the benefits diminished with further increase of the nano-TiO2 nanoparticles. Theflexural strength of cement paste reached a peak value of 12.48 MPa, with mixing1.0 wt% of nano-TiO2 particles.
10.3.2 Environmental resistance
The durability of pavements exposed to various aggressive environments has substan-tial economic, social, and environmental implications. The issue is exacerbated in coldregions, where the pavement material is at risk of freezeethaw cycling and physicaland chemical attack by deicing chemicals (Pigeon and Pleau, 1995). Physical attackby deicing chemicals can lead to the damage of pavements in the common forms ofscaling, map cracking, or paste disintegration (Sutter et al., 2008). Deicing chemicalsmay also pose fatal effects on concrete pavement materials through their reactions withcement binder and aggregates, and thus lead to the reduction of the integrity andstrength of the concrete pavement materials (Sutter et al., 2008; Shi et al., 2009,
224 Multifunctional Nanocomposites in Civil and Structural Engineering

2010, 2011). Finally, roadway deicers often use chlorides to decrease the freezingpoint, and the chloride anions’ ingression into the pavement materials can introducethe rebar or dowel bar corrosion in concrete and results in premature deteriorationof the reinforced concrete (Shi et al., 2012; Liu and Shi, 2012; Yu et al., 2010).
To the best of our knowledge, only limited studies have been conducted to evaluatethe environmental resistance of pavement materials modified by nanoparticles tofreezeethaw damage or salt scaling. As a result, there is a need to focus on understand-ing the modification mechanisms from the nanoscale for preserving pavements in thepresence of deicing chemicals and to reveal the main characteristics of the nanomodi-fication that protects the pavement from aggressive environments. Although studies ofthe durability of the nanoparticle-modified pavement exposed to aggressive environ-ments have not been very fruitful, some studies have demonstrated that the durabilityof both the asphalt pavements and cement concrete pavements is able to be improvedby adding nanomaterials (Li et al., 2007; Zhang and Li, 2011; Givi et al., 2013).
The freezeethaw resistance of the cement concrete materials modified by nanosilica and nano alumina was investigated by Behfarnia and Salemi (2013). In thisstudy, the cement concrete modified with nano silica and nano alumina experiencedup to 300 freezeethaw cycles in water and was compared with normal cementconcrete as control. Figure 10.3 shows the external dimensions of the testedsamples. As can be seen in Figure 10.3, the freezeethaw resistance of the concreteis considerably improved with the addition of nanoparticles. The strength loss of theconcrete mixed with 5 wt% of nano silica was only 16%, whereas the controlledone showed 100% strength loss after 300 freezeethaw cycles.
12.6
12.4
12.2
12.0
11.8
11.6
11.4–0.2 0.0 0.2 0.4 0.6 0.8
TiO2 content (wt%)1.0 1.2 1.4 1.6
Flex
ural
stre
ngth
(MP
a)
Figure 10.2 Three-point flexural strength as a function of nano TiO2 dosage in cement paste.Feng et al. (2013). Reprinted with permission from Industrial & Engineering ChemistryResearch. Copyright (2013) American Chemical Society.
Mechanical and environmental resistance of nanoparticle-reinforced pavement materials 225

Salemi also proved that the nano SiO2 has a considerably positive effect on thefreezeethaw resistance of the concrete pavement (Salemi and Behfarnia, 2013).With the addition of 5 wt% nano SiO2 or nano Al2O3, the mechanical properties ofthe concrete increased by 8%, whereas the freezeethaw resistance increased byover 80% comparing with the plain concrete.
Most recently, a similar study has been investigated by Le�on et al. (2014). In thisstudy, four types of cement mortarsdcontrol, 5% nano SiO2, 5% nano Al2O3, anda mix of 2.5% n-SiO2 and 2.5% n-Al2O3dwere prepared, and their mechanical prop-erties, abrasion resistance, and freezeethaw resistance were tested. In addition, theporosity and pore distribution were investigated by mercury intrusion porosimetry(MIP), and the relationship between the C-S-H gel and Ca(OH)2 was characterizedby thermal gravimetric analysis (TGA).
However, unlike the results of the former studies (Behfarnia and Salemi, 2013;Salemi and Behfarnia, 2013), in which the freezeethaw resistance of the cementconcrete modified with nano Al2O3 is better than that modified with nano SiO2, Le�on’sstudy claimed that the addition of the nano Al2O3 has little or negative effects on thefreezeethaw resistance of the cement mortar. Two possible reasonsmight be the originsof the disagreement. First, the average size of the nano Al2O3 used in Behfarnia’s studywas about 8 nm, whereas in Le�on’s study, it was about 260e550 nm. Second, thedosage of the nano Al2O3 particles was different. Behfarnia’s dosage is up to 3 wt%,whereas Le�on’s is 5 wt%. Although the effect of the nano Al2O3 modification wasnot the same, both these studies agreed that the nano SiO2 has a positive effect onthe anti-freezeethaw performances of cement matrix composites.
10.4 Microstructures of nanoparticle-reinforcedcement-based composites
As we mentioned in this chapter, the overall performances of all engineering materialsare determined by their microstructures. Therefore, the appropriate microstructurecharacterization of the pavement materials modified by nanoparticles is the most
(a) (b) (c)
Figure 10.3 Concrete samples experienced 300 F/T cycles of (a) control sample, (b) with 5 wt%nano SiO2, and (c) with 3 wt% nano Al2O3.Behfarnia and Salemi (2013). Reprinted with permission from Construction and BuildingMaterials. Copyright (2013) Elsevier.
226 Multifunctional Nanocomposites in Civil and Structural Engineering

important approach that not only sheds lights on the potential mechanisms of the modi-fication, but also helps optimize the designation process of the pavement materials withrespect to the overall performance.
In the past decade, thanks to the rapid progress and improved availability ofadvanced characterization techniques, numerous engineering and mechanistic studiesof nanotechnology for cementitious materials have been presented (Ye et al., 2007;Li et al., 2007; Han et al., 2013). Recently, to demonstrate the microstructure of thecement paste from nanoscale, many technologies such as nuclear magnetic resonance(NMR) (Kim et al., 2013; Edwards et al., 2007), small-angle X-ray (SAXS) (Haeussleret al., 2009), small-angle neutron scattering (SANS) (Allen and Thomas, 2007b), andpair distribution function (PDF) approaches have been utilized (Skinner et al., 2010).Scanning electron microscope with energy dispersive spectrometer (SEM/EDS) (Chenet al., 2010) and transmission electron microscope (TEM) (Xu and Viehland, 1996)have been used for observing the microstructure and analyzing the chemical compo-sition of cement-based materials; atomic force microscope (AFM) has been used forobserving the morphology and evaluating mechanical properties from nanoscale(S�aez de Ibarra et al., 2006); and differential scanning calorimetry (DSC) (Weiet al., 2012) and X-ray diffraction (XRD) (Scrivener et al., 2004; Kim et al., 2013)have also been used to analyze the composition of the hydration products and crystal-line structures of Portland cement paste, respectively.
Currently, the most widely used tool for the microstructure analysis of the concretemodified by nanomaterials is SEM (Qing et al., 2007; Kong et al., 2012; Meng et al.,2012; Lv et al., 2014). The microstructures of Portland cement paste modified by SiO2and Fe2O3 nanoparticles and by carbon nanotubes have been reported (Li et al., 2004).Figure 10.4 shows the SEM images of the fracture surfaces of the cement modified withFe2O3 and SiO2 nanoparticles, respectively. As demonstrated in Figure 10.4, there areseveral typical phases shown with clear morphologies, including layer-shapedCa(OH)2, amorphous C-S-H phase, and pores, shown as areas 1, 2, and 3, respectively.
3wt% Nano Fe2O3 3 wt% Nano SiO20%
(a) (b) (c)
Figure 10.4 SEM images of the crack surfaces of the cement modified with Fe2O3 and SiO2
nanoparticles.Li et al. (2004).
Mechanical and environmental resistance of nanoparticle-reinforced pavement materials 227

The SEM images of the fracture surfaces of the nano Al2O3 modified cement mortarhave been shown in Figure 10.5. The authors claimed that the interfaces between theaggregates and the cement binder will largely be affected by the nano Al2O3 particlesthat were absorbed on the surfaces of the aggregates.
Figure 10.6(a) and (b) shows the comparison of the SEM images of the fracturesurfaces of the hardened Portland cement paste with and without the addition ofTiO2 nanoparticles (at 1.0 wt%). In the low-magnification mode (shown inFigure 10.6(a)), some microcracks perpendicular to the fracture surface of the samplecan be observed (area A). The flat areas represent the microcrack surfaces that are par-allel to the fracture surface of the sample (area B). Furthermore, some areas with clearinternal defects and micropores (area C) can be observed as well. With the TiO2 nano-particles, the hydration products were distributed more homogeneously than the plaincement paste (shown as area D in Figure 10.6(b)), and the density and size of themicrocracks and micropores were evidently reduced. Meanwhile, some nanosizedneedle-shaped new type of hydration products can be observed (area E).
In former studies, it has been proven that the nanoparticles can act as nuclei to grownanotubes, nanobelts, or nanowires with proper external conditions. In cementitiousmaterials, it is also believed that the nanosized particles can act as nuclei to formnew types of needle-shaped (or wire-shaped) hydration products. Figure 10.6(c)and (d) demonstrates the high-magnification image with the EDS results of theneedle-shaped hydration products in area E (Figure 10.6(b)). As illustrated from theEDS results, the chemical composition of the needle-shaped hydration products wasdifferent from that of the other phase adjacent to it. Despite the Ca contents, theneedle-shaped products featured a CaeSi ratio of 5:1 and AleSi ratio of 3:5, whereasthe other phase near the needle-shaped products featured a CaeSi ratio of 2:1 and anAleSi ratio of 1:6. Compared with the normal hydrate products, these in situ grownnanosized needle-shaped products can fill the submicron pores and cracks in the pastemore efficiently, and reinforce the paste by bridging the cracks.
This needle-shaped hydration products were also observed by other studies (Menget al., 2012). However, it is still a tough challenge to directly elucidate the fine micro-structures and the chemical compositions of this new type of hydration products.
(a) (b)
Figure 10.5 SEM images of the crack surfaces of the cement modified (a) without and (b) withAl2O3 nanoparticles.Li et al. (2006). Reprinted with permission from Materials Letters. Copyright (2006) Elsevier.
228 Multifunctional Nanocomposites in Civil and Structural Engineering

(a)
(b)
Figure 10.6 SEM morphology of the fracture surfaces: (a) low magnification of regular cementpaste; (b) low magnification of cement paste modified by nano TiO2; and (c, d) highmagnification of cement paste modified by nano TiO2 (insert: EDS data).Feng et al. (2013). Reprinted with permission from Industrial & Engineering ChemistryResearch. Copyright (2013) American Chemical Society.
Mechanical and environmental resistance of nanoparticle-reinforced pavement materials 229

There is an argument that the needle-like hydration products are ettringite; seeFigures 10.6 and 10.7 (Pourjavadi et al., 2012; Feng et al., 2013). Pourjavadi believesthat the needle-shaped hydration products are ettringite, whereas Feng thinks that theneedle-like hydration products are new types of C-S-H that were grown with the helpof the nanoparticles as the nucleus. Figure 10.6(c) gives the EDS analysis of theneedle-shaped phases. As can be seen in the EDS results, it was found that theneedle-shaped phases were composed of Ca, Al, and O; large amounts of Si and
1.5
1.2
0.9
0.6
0.3
0.00.00 2.00 4.00 6.00
Energy (keV)8.00 10.00 12.00 14.00
0.00 2.00 4.00 6.00Energy (keV)
8.00 10.00 12.00 14.00
C
C
Al
Au
Ca
FeFe
Si
Ca
O
Al
Si
Au
O
1.5
1.2
0.9
0.6
0.3
0.0
CaElementCK 04.93 13.92
50.7403.2404.7606.9019.6900.75ZAF
23.9402.5803.9440.1023.2701.24Correction
04.30 11.0349.3201.6211.6704.6121.3000.45ZAF
25.6301.4210.6529.4627.7300.82Correction
OKAlKSiKAuMCaKFeKMatrix
CKOKAlKSiKAuMCaKFeKMatrix
Wt% At%
Element Wt% At%
Ca
FeFe
(c)
(d)
Figure 10.6 Continued.
230 Multifunctional Nanocomposites in Civil and Structural Engineering

little S were observed. As a result, it was claimed by the authors that the needle-shapedphase is not only the ettringite phase.
TEM is another effective tool to analyze the phase structure and their chemical com-positions. Although a few studies demonstrated the microstructure of the hydrationproducts via TEM (Xu and Viehland, 1996), very limited studies were quantitativelyinvestigated from the chemical composition and crystallography perspective. Recently,the microstructures of the hydration products were investigated in our lab via TEM/EDS at the nanoscale (to avoid the damage of microstructures during the preparationprocess, the samples for TEM analysis were carefully cut from hardened cement pasteand followed by sandpaper polishing and ionic sputtering, rather than using the groundpowders of the hardened cement). Corresponding to the SEM results, the TEM image ofthe needle-shaped hydration product phase in cement after being modified with nanoTiO2 particles is shown in Figure 10.8(a). In addition, Figure 10.8(b) and (c)
(a) (b)
(c) (d)
Figure 10.7 SEM images of pastes cured at room condition for 28 days: (a) mix Z-0 (control);(b) mix O-0 (1 wt% NS); (c) mix Z-3 (0.3 wt% SAP); and (d) mix O-3 (1 wt% NS þ 0.3 wt%SAP). 1 ¼ CASAH; 2 ¼ Ca(OH)2; 3 ¼ ettringite; and 4 ¼ pores.Pourjavadi et al. (2012). Reprinted with permission from Materials and Design. Copyright(2012) Elsevier.
Mechanical and environmental resistance of nanoparticle-reinforced pavement materials 231

demonstrates the selected area electron diffraction (SAED) pattern and the quantitativeEDS analysis result corresponding to the area of Figure 10.8(a). As can be seen inFigure 10.8(a), the diameters of the needle-shaped hydration products range from 50to 200 nm, and the SAED pattern shows little typical diffraction rings or spots. TheEDS results show that the chemical compositions of the needle-shaped phase are Si,Ca, Al, and a small amount of S. As a result, it can be claimed that thisneedle-shaped hydration product should not be considered as ettringite due to thefollowing two reasons. First, the ettringite is a crystal with a chemical compositionof 3CaO$Al2O3$3CaSO4$32H2O, which means that little Si should be detected in
(a)
(c)
250
200
150
100
50OFe
FeFe Na
Mg
AlAl
Si
S
SCa
Ca
Acquire EDX
MnMn
FeFe
Si
Mg
Cou
nts
(b)
0.0 2 4Energy (keV)
6 8 10
Figure 10.8 (a) TEM image of the needle-shaped hydration product phase in cement aftermodified with nano TiO2 particles. (b, c) These demonstrate the selected area electron diffraction(SAED) pattern and the quantitative EDS analysis result corresponding to the area of (a).
232 Multifunctional Nanocomposites in Civil and Structural Engineering

the EDS analysis results. Second, the diffraction spots of the ettringite could have beenevidently observed in the SAED pattern corresponding to the TEM images. These twoconditions were both not satisfied in our TEM analysis results. The details and themechanisms of this product still need further investigation in our future studies.
Apart from SEM and TEM analysis, XRD has been widely used to characterize thecrystal phases of the hardened cement (Qing et al., 2007; Feng et al., 2013; Aleemet al., 2014). Figure 10.9 shows an XRD pattern comparison of the ordinary Portlandcement paste with and without modification of nanoparticles at various weight con-tents. By using Portlandite as the reference, it further proves that the hydration processof the cement pastes has been changed with the addition of TiO2 or SiO2 nanoparticles.As mentioned, the amount of Ca(OH)2 is not a constant value during the hydration pro-cess, and it is inversely proportional to the quantity of the C-S-H gels. As can be seenin the XRD results, the main characteristic Portlandite peaks were reduced by about20e30% with the addition of TiO2 nanoparticles (Figure 10.9(a)), confirming therole of nano TiO2 in consuming Portlandite crystals via the pozzolanic reaction.Such consumption of Portlandite leads to a denser microstructure and formation ofdesirable C-S-H gel, contributing to high mechanical properties of the cement mate-rials. Similar results were observed in nano SiO2 modification samples (Aleemet al., 2014), in which the crystal peaks of Ca(OH)2 were considerably decreasedwith the addition of nano SiO2 particles.
With the addition of the TiO2 nanoparticles, during the hydration process, the O2�
in eOeTieOe bonding will be changed with the appearance of OH� and form anHeOeTieOeH structure, and the Hþ in OeH will be replaced by Ca2þ to form an
1800
a
a
a
b
c
b
c
Ca(OH)2 crystals
Regular cement paste
Cement paste incorporatedwith TiO2 nano particles
bc
1600140012001000800600400200
18001600140012001000800600400200
12001000800600400200
00.0 10.0 20.0 30.0 40.0 50.0 60.0 70.0 80.0 90.0 10 20 30
2-theta (degrees)40 50
0% NS
1% NS
2% NS
3% NS
4% NS
5% NS
6% NS(a)(b)
CH
CH
CH
C3S
-C2S
β
CC
C-S
-H
–
-C2S
β
Figure 10.9 XRD patterns of the nano-TiO2 modified Portland cement paste versus the regularPortland cement paste and Portlandite (a) nano TiO2 modification (Feng et al. (2013). Reprintedwith permission from Industrial & Engineering Chemistry Research. (Copyright (2013)American Chemical Society) and (b) nano SiO2 modification (Aleem (2014). Reprinted withpermission from Construction and Building Materials. (Copyright (2014) Elsevier).
Mechanical and environmental resistance of nanoparticle-reinforced pavement materials 233

OeCae bond, which leads to the formation of a nanosized eCaeOeTieOeCaestructure. However, because the quantity of the eOeTieOe is relatively small,once the small amount of eCaeOeTieOeCae structure has been formed, the restof the Ca2þ will react with Si4þ and OH� and form the needle-shaped morphologyby using the nanosized eCaeOeTieOeCaestructure as the seed. In addition, therequirement of the reaction condition between the Ca(OH)2 and TiO2 to form CaTiO3
is very critical, and normally needs the reaction temperature to be as high as 1000 K;therefore, the CaTiO3 crystal is hard to form during the hydration process. It can befurther seen from the XRD pattern of the cement paste with the addition of TiO2 nano-particles that no CaTiO3 peaks can be detected. Based on the results of previous inves-tigations, in the cement-based materials, the crystallized nano TiO2 should beconsidered as an inert additive (Feng et al., 2013; Chen et al., 2012).
In the hardened cement paste modified by nanoparticles, during the crack propaga-tion process, the needle-shaped hydration products can act as fibers that will bridge thecracks and thus effectively reinforce the cement paste by pulling out or deforming.Unlike the directly mixed fibers in the cement matrix, with the addition of the TiO2nanoparticles, the needle-shaped hydration products could be considered as in situgrown fibers that have relatively higher bonding strength in the matrix than the directlymixed fibers. This is both a physical and a chemical bonding on the cement matrix.Therefore, the increase of the crack propagation resistance provided by the in situneedle-shaped hydration products could be obtained. Unlike the mixed fibers incement pastes, however, the quantity, length, and mechanical properties of theneedle-shaped hydration products still cannot be obtained directly; therefore, it is stillhard to precisely predict the final properties of the cement concrete modified by nano-particles. As a result, the development of the micromechanical models for predictingthe properties of this in situ growing fiber-reinforced cementitious materials is a newresearch topic for future studies.
Other than SEM, TEM, and XRD, AFM is another effective tool to characterize thenanostructure of the cement paste modified by nanoparticles (Feng et al., 2013). InFeng’s study, AFM was applied to demonstrate the roughness and morphologicalinformation of the cement paste modified by TiO2 nanoparticles. The as-fabricatedbottom surface without further polishing was used for the AFM observation to avoidany potential changes of the surface condition by polishing process. The AFM heightand deflection images were obtained in contact mode, and the phase images were ob-tained under the tapping mode. Figure 10.10 presents the AFM surface morphology ofthe normal cement paste and the cement paste modified with TiO2 nanoparticles with1.0 wt%, in a 1 � 1 mm2 area. As can be seen in this figure, the regular normal cementpaste and cement paste modified by TiO2 nanoparticles feature a microstructure withdistinct characteristics. Although the microstructure of the normal cement paste wasvery rough (Figure 10.10(a)), the nanomodified cement paste appeared much flatter(Figure 10.10(b)). It can be observed, from Figure 10.10(c) and (d), that the stepheights of the normal cement paste and the nanomodified cement paste were 2.882and 1.006 nm, respectively.
The roughness testing results demonstrate the microstructure uniformity of thecement pastes. In general, a lower roughness value, which means a more uniform
234 Multifunctional Nanocomposites in Civil and Structural Engineering

0.20.4
0.60.8
Stepheight Stepheightnm
450
–450
0
0 0.25 0.50 0.75
Roughness analysis Roughness analysis
Image statisticImage statisticImg. Z rangeImg. Z range 406.60 92.851
1.00
0.75
0.50
0.25
00 0.25 0.50 0.75 1.00
1.00
0.75
0.50
0.25
00 0.25 0.50 0.75 1.00
1.00 0
nm
–95
095
0.25 0.50 0.75 1.00
Step height2.882 nm
Step height1.006 nm
Level RestoreMeasure Level RestoreMeasure
0.20.4
0.60.8
(a) (b)
(d)(c)
(f)(e)
Figure 10.10 AFM observations of (a) height image of regular cement paste; (b) height imageof cement paste modified by nano TiO2 particles; (c) step height of; (d) step height of;(e) roughness of regular cement paste; and (f) roughness of cement paste modified by nano TiO2;in 1 � 1 mm2 area.Feng et al. (2013). Reprinted with permission from Industrial & Engineering ChemistryResearch. Copyright (2013) American Chemical Society.
Mechanical and environmental resistance of nanoparticle-reinforced pavement materials 235

and dense microstructure, represents higher mechanical properties and lower perme-ability of the cement paste. Figure 10.10(e) and (f) shows the roughness analysisresults of the normal cement paste and the nano-TiO2 modified cement paste. As canbe seen in this figure, the cement paste modified by TiO2 nanoparticles has a muchlower roughness value (92.851 nm) than the normal cement paste (406.60 nm), sug-gesting the pore refinement by nanomodification. Similar results were obtained byanalyzing the pore structure of the cement paste modified by various nanoparticles(Oltulu and Sahin, 2014).
Figure 10.11 presents the AFM data of the height and phase images of the normalcement paste and the cement paste modified with TiO2 nanoparticles with 0.1 wt%, ina 10 � 10 mm2 area. By comparing the height images of these two types of cementpaste (Figure 10.11(a) and 10.11(b)), it can be concluded that the addition of TiO2
24
68
24
68
(a) (b)
(c) (d)
24
68
24
68
Figure 10.11 AFM observations of (a) height image of regular cement paste; (b) height imageof cement paste modified by nano TiO2; (c) phase image of regular cement paste; and(d) phase image of cement paste modified by nano TiO2; in 10 � 10 mm2 area.Feng et al. (2013). Reprinted with permission from Industrial & Engineering ChemistryResearch. Copyright (2013) American Chemical Society.
236 Multifunctional Nanocomposites in Civil and Structural Engineering

nanoparticles can lead to a flatter surface. Similarly, by comparing the phase imagesof the cement paste with and without adding TiO2 nanoparticles (Figure 10.11(c)and (d)), it can be concluded that the phases of the paste modified by nano TiO2
particles have much finer microstructures than the normal cement paste.In a hydration process of normal Portland cement, the chemical reaction can be
expressed as:
2Ca3SiO5 þ 6H2O/ 3(CaO)$2(SiO2)$4(H2O) þ 3Ca(OH)2 (10.5)
After the addition of the TiO2 nanoparticles, the reaction environment has beenchanged because of the variation of the Ca2þ concentration; therefore, the chemicalreaction will be changed as:
2Ca3SiO5 þ 6H2O/ x(CaO)$2(SiO2)$y(H2O) þ (6-x)Ca(OH)2 (10.6)
In this equation, the value of x varies with the Ca2þ concentration, which is a func-tion of the content of the TiO2 nanoparticles. This means the quantity of the Ca(OH)2is no longer a constant value. Due to the Ca content being a constant, based onEqn (10.6), Ca can exist either as C-S-H gel or Ca(OH)2 in a hardened cement paste.In other words, the lower amount of Portlandite, the higher amount of C-S-H gel. It isthus desirable to convert the noncementitious Portlandite into cementitious C-S-H gel.Any increase in the C-S-H amount or decrease in the Portlandite amount in cementpaste will lead to higher performance of the hardened concrete.
10.5 Future trends
Future studies on the mechanical and environmental resistance of nanoparticle-reinforced pavement materials should focus on the following parts. First, investigationof the dispersion approaches of the nanoparticles in the cement or asphalt matrix is themost important factor that determines the final performance of pavements. Second,dosage optimization is still a challenge to obtain a stable and cost-effective pavementconstruction. Third, the mechanisms of nanoparticle reinforcement should be furtherstudied from the microstructure characterization perspective. Fourth, how to chooseappropriate nanoparticle types is another important issue that has to be considered.Fifth, the durability of the pavement materials modified by nanoparticles under syner-gistic aggressive environments, such as freezeethaw cycles, deicing chemicals, andoverweight loadings, should be systematically investigated. And, finally, microme-chanical models for predicting the properties of the nanoparticle-reinforced pavementmaterials are new research topics for future studies.
The dispersion condition of the nanoparticles in the cement or asphalt matrixis the most important factor that determines the reinforcement effects. Althoughthe dispersion approaches of the nanoparticles in various solutions have been inves-tigated systematically in recent decades, it is still a very challenging topic if oneconsiders the cost and the specific requirements of the cement or asphalt matrix.So far, it is still not very easy to obtain a stable and optimized dispersion conditionof the nanoparticles in the cement or asphalt matrix.
Mechanical and environmental resistance of nanoparticle-reinforced pavement materials 237

Disagreement of the modification results according to the dosage is always the topchallenge. Many studies have found that the mechanical properties of the pavementmaterials modified by nanoparticles were not linearly increased with increasing weightcontent of the nanoparticles. It reduces when the dosage reaches a critical value. There-fore, how to effectively optimize the dosage has to be systematically investigated fromboth the cost and performance perspectives. In addition, in the past decade, the dosageof the nanoparticles in the pavement materials, including asphalt and cement, rangedfrom 3 wt% to 10 wt% (and some were as high as 20 wt%). In those studies, theperformance of the reinforcement effect was not very stable. The optimized dosageof various nanoparticles is still not well agreed. Furthermore, few studies focusedon the modification effect of the low dosage (below 1 wt%) or ultralow dosage (below0.1 wt%), which is an effective way to minimize the cost and benefit the dispersion ofthe nanoparticles.
The mechanisms of the pavement materials modified with various nanoparticles arestill not very clear. Further studies from the microstructure characterization perspectiveshould be applied systematically. Although SEM, XRD, DSC, and AFM were used toanalyze the microstructure of the nanoparticle-modified pavement materials, thedetails or a quantitative characterization from nanoscale is still necessary to elucidatethe modification mechanisms. In situ HRTEM, PDF, NMR, SAXS, and SANSapproaches could be utilized to shed more light on the microstructure changes thatoccur with the addition of various nanoparticles.
Currently, although most of the studies agreed that the nanoparticles have positiveeffects on the performance of the pavement materials, the modification effects withvarious nanoparticles is not well agreed, especially with the addition of Al2O3 orFe2O3 nanoparticles. In addition, even with the same chemical composition, themodification effects largely count on the shape, size distribution, pore structures,and different crystallization degrees of the nanoparticles. This is another importantresearch direction for future studies.
Most importantly, study on the durability of nanoparticle-modified pavement mate-rials under synergistic aggressive environments, including freezeethaw cycle damage,deicing chemical attacks, and overweight loading, is still very limited. The mecha-nisms of durability enhancement of the nanomodification is the first priority to realizesustainability. However, to investigate this topic, the critical requirements for thetesting devices have largely limited a deep understanding of this topic; therefore, itis necessary to design and develop some specific testing devices to investigate environ-mental resistance of nanomodified pavement materials under synergistic aggressiveconditions.
Acknowledgments
The authors sincerely thank Prof. Jinping Ou and Prof. Hui Li from the School of Civil Engi-neering, Harbin Institute of Technology for their valuable suggestions and comments. Thiswork was financially supported by the National High Technology Research and DevelopmentProgram (863 Program) (2015AA034701).
238 Multifunctional Nanocomposites in Civil and Structural Engineering

References
Aleem Abd El, S., Heikal, M., Morsi, W.M., 2014. Hydration characteristic, thermal expansionand microstructure of cement containing nano-silica. Construction and Building Materials59, 151e160.
Ameri, M., Kouchaki, S., Roshani, H., 2013. Laboratory evaluation of the effect ofnano-organosilane anti-stripping additive on the moisture susceptibility of HMA mixturesunder freezeethaw cycles. Construction and Building Materials 48, 1009e1016.
Amirkhanian, A.N., Xiao, F., Amirkhanian, S.N., 2011. Characterization of unaged asphaltbinder modified with carbon nano particles. International Journal of Pavement Researchand Technology 4 (5), 281e286.
Allen, A.J., Thomas, J.J., Jennings, H.M., 2007. Composition and density of nanoscalecalcium-silicate-hydrate in cement. Nature Materials 6, 311e316.
Allen, A.J., Thomas, J.J., 2007. Analysis of C-S-H gel and cement paste by small-angle neutronscattering. Cement and Concrete Research 37, 319e324.
Avrami, M., 1939. Kinetics of phase change I-general theory. Journal of Chemical Physics7, 1103e1112.
Avrami, M., 1940. Kinetics of phase change II-Transformation-time relations for randomdistribution of nuclei. Journal of Chemical Physics 8, 212e224.
Avrami, M., 1941. Granulation, phase change, and microstructure-kinetics of phase change III.Journal of Chemical Physics 9, 177e184.
Balaguru, P., Chong, K., 2006. Nanotechnology and concrete: research opportunities.In: Proceedings of ACI Session on “Nanotechnology of Concrete: Recent Developmentsand Future Perspectives” Nov. 7, Denver, USA.
Bagheri, A.R., Zanganeh, H., Moalemi, M.M., 2012. Mechanical and durability properties ofternary concretes containing silica fume and low reactivity blast furnace slag. Cement andConcrete Composites 34 (5), 663e670.
Ballari, M.M., Yu, Q.L., Brouwers, H.J.H., 2011. Experimental study of the NO and NO2
degradation by photocatalytically active concrete. Catalysis Today 161 (1), 175e180.Barbhuiya, S., Mukherjee, S., Nikraz, H., 2014. Effects of nano-Al2O3 on early-age
microstructural properties of cement paste. Construction and Building Materials 52,189e193.
Behfarnia, K., Salemi, N., 2013. The effects of nano-silica and nano-alumina on frost resistanceof normal concrete. Construction and Building Materials 48, 580e584.
Beigi, M.H., Berenjian, J., Lotfi Omran, O., Sadeghi Nik, A., Nikbin, I.M., 2013. An experi-mental survey on combined effects of fibers and nanosilica on the mechanical, rheological,and durability properties of self-compacting concrete. Materials and Design 50,1019e1029.
Bernal, J.D., 1952. The structure of cement hydration compounds. In: Proceedings of the 3rdInternational Symposium on Chemistry of Cement. London, pp. 216e236.
Berra, M., Carassiti, F., Mangialardi, T., Paolini, A.E., Sebastiani, M., 2012. Effects ofnanosilica addition on workability and compressive strength of Portland cement pastes.Construction and Building Materials 35, 666e675.
Bhuvaneshwari, B., Sasmal, S., Baskaran, T., Iyer, N.R., 2012. Role of nano oxides for improvingcementitious building materials. Journal of Civil Engineering and Science 1 (2), 52e58.
Birgisson, B., Taylor, P., Armaghani, J., Shah, S., 2010. American road map for research fornanotechnology-based concrete materials. Transportation Research Record: Journal of theTransportation Research Board 2142, 130e137.
Mechanical and environmental resistance of nanoparticle-reinforced pavement materials 239

Birgisson, B., Mukhopadhyay, A.K., Geary, G., Khan, M., Sobolev, K., 2012. Nanotechnologyin Concrete Materials: A Synopsis. Transportation Research E-Circular (E-C170).
Bittnar, Z., Bartos, P.J., Nemecek, J., Smilauer, V., Zeman, J. (Eds.), 2009. Nanotechnology inConstruction: Proceedings of the NICOM3. Springer Science & Business Media.
Bonati, A., Merusi, F., Bochicchio, G., Tessadri, B., Polacco, G., Filippi, S., Giuliani, F., 2013.Effect of nanoclay and conventional flame retardants on asphalt mixtures fire reaction.Construction and Building Materials 47, 990e1000.
Bullard, J.W., et al., 2011. Mechanisms of cement hydration. Cement and Concrete Research41, 1208e1223.
Chang, T.P., Shih, J.Y., Yang, K.M., Hsiao, T.C., 2007. Material properties of Portland cementpaste with nano-montmorillonite. Journal of Materials Science 42 (17), 7478e7487.
Chen, J., Sorelli, L., Vandamme, M., 2010. A coupled Nanoindentation/SEM-EDS study on lowwater/cement ratio Portland cement paste: evidence for C-S-H/Ca(OH)2 nanocomposites.Journal of the American Ceramic Society 93, 1484e1493.
Chen, J., Kou, S.C., Poon, C.S., 2011. Photocatalytic cement-based materials: comparison ofnitrogen oxides and toluene removal potentials and evaluation of self-cleaning perfor-mance. Building and Environment 46 (9), 1827e1833.
Chen, J., Kou, S.C., Poon, C.S., 2012. Hydration and properties of nano-TiO2 blended cementcomposites. Cement and Concrete Composites 34 (5), 642e649.
Edwards, C.L., Alemany, L.B., Barron, A.R., 2007. Solid-state Si-29 NMR analysis of cements:comparing different methods of relaxation analysis for determining spin-lattice relaxationtimes to enable determination of the C3S/C2S ratio. Industrial and Engineering ChemistryResearch 46, 5122e5130.
El-Shafie, M., Ibrahim, I.M., Abd El Rahman, A.M.M., 2012. The addition effects of macro andnano clay on the performance of asphalt binder. Egyptian Journal of Petroleum 21 (2),149e154.
Essawy, A.A., Aleem, S.A.E., 2014. Physicoemechanical properties, potent adsorptive andphotocatalytic efficacies of sulfate resisting cement blends containing micro silica andnano-TiO2. Construction and Building Materials 52, 1e8.
Fang, C., Yu, R., Liu, S., Li, Y., 2013. Nanomaterials applied in asphalt modification: a review.Journal of Materials Science and Technology 29 (7), 589e594.
Feng, D., Xie, N., Gong, C., Leng, Z., Xiao, H., Li, H., Shi, X., 2013. Portland cement pastemodified by TiO2 nanoparticles: a microstructure perspective. Industrial and EngineeringChemistry Research 52 (33), 11575e11582.
Garcia-Luna, A., Bernal, D.R., 2006. High strength micro/nano fine cement. In: de Miguel, Y.,Porro, A., Bartos, P.J.M. (Eds.), NICOM 2: 2nd International Symposium on Nanotech-nology in Construction. RILEM Publications SARL.
Givi, A.N., Rashid, S.A., Aziz, F.N.A., Salleh, M.A.M., 2010. Experimental investigation of thesize effects of SiO2 nano-particles on the mechanical properties of binary blended concrete.Composites Part B: Engineering 41 (8), 673e677.
Givi, A.N., Rashid, S.A., Aziz, F.N.A., Salleh, M.A.M., 2013. Influence of 15 and 80 nano-SiO2
particles addition on mechanical and physical properties of ternary blended concreteincorporating rice husk ash. Journal of Experimental Nanoscience 8 (1), 1e18.
Goh, S.W., Akin, M., You, Z., Shi, X., 2011. Effect of deicing solutions on the tensile strength ofmicro-or nano-modified asphalt mixture. Construction and Building Materials 25 (1),195e200.
Golestani, B., Moghadas Nejad, F., Sadeghpour Galooyak, S., 2012. Performance evaluationof linear and nonlinear nanocomposite modified asphalts. Construction and BuildingMaterials 35, 197e203.
240 Multifunctional Nanocomposites in Civil and Structural Engineering

Guo, M.Z., Ling, T.C., Poon, C.S., 2013. Nano-TiO2-based architectural mortar for NO removaland bacteria inactivation: influence of coating and weathering conditions. Cement andConcrete Composites 36, 101e108.
Haeussler, F., Tritthart, J., Amenitsch, H., 2009. Time-resolved combined SAXS and WAXSstudies on hydrating tricalcium silicate and cement. Advances in Cement Research 21,101e111.
Hanus, M.J., Harris, A.T., 2013. Nanotechnology innovations for the construction industry.Progress in Materials Science 58 (7), 1056e1102.
Han, B., Yang, Z., Shi, X., Yu, X., 2013. Transport properties of carbon-nanotube/cementcomposites. Journal of Materials Engineering and Performance 22, 184e189.
Haruehansapong, S., Pulngern, T., Chucheepsakul, S., 2014. Effect of the particle size ofnanosilica on the compressive strength and the optimum replacement content of cementmortar containing nano-SiO2. Construction and Building Materials 50, 471e477.
He, X., Shi, X., 2008. Chloride permeability and microstructure of Portland cement mortarsincorporating nanomaterials. Transportation Research Record: Journal of the Trans-portation Research Board 2070, 13e21.
Horszczaruk, E., Mijowska, E., Cendrowski, K., Mijowska, S., Sikora, P., 2014. Effect ofincorporation route on dispersion of mesoporous silica nanospheres in cement mortar.Construction and Building Materials 66, 418e421.
Hosseini, P., Hosseinpourpia, R., Pajum, A., Khodavirdi, M.M., Izadi, H., Vaezi, A.,2014. Effect of nano-particles and aminosilane interaction on the performances ofcement-based composites: an experimental study. Construction and Building Materials 66,113e124.
Hou, D., Ma, H., Li, Z., 2014. Morphology of calcium silicate hydrate (CSH) gel: a moleculardynamic study. Advances in Cement Research 27 (3), 135e146.
Hou, P., Kawashima, S., Kong, D., Corr, D.J., Qian, J., Shah, S.P., 2013. Modification effectsof colloidal nanoSiO2 on cement hydration and its gel property. Composites Part B:Engineering 45 (1), 440e448.
Jalal, M., Fathi, M., Farzad, M., 2013. Effects of fly ash and TiO2 nanoparticles on rheological,mechanical, microstructural and thermal properties of high strength self compactingconcrete. Mechanics of Materials 61, 11e27.
Jayapalan, A.R., Lee, B.Y., Kurtis, K.E., 2009. Effect of nano-sized titanium dioxide on earlyage hydration of Portland cement. Nanotechnology in Construction 3, 267e273.
Jennings, H.M., 2008. Refinements to colloid model of C-S-H in cement: CM-II. Cement andConcrete Research 38, 275e289.
Karapati, S., Giannakopoulou, T., Todorova, N., Boukos, N., Antiohos, S., Papageorgiou, D.,Trapalis, C., 2014. Functionalization for efficient NOx removal in photoactive cement.Applied Surface Science 319, 29e36.
Kawashima, S., Kim, J.H., Corr, D.J., Shah, S.P., 2012. Study of the mechanisms underlying thefresh-state response of cementitious materials modified with nanoclays. Construction andBuilding Materials 36, 749e757.
Keyvani, A., 2007. Huge opportunities for industry of nanofibrous concrete technology. Inter-national Journal of Nanoscience and Nanotechnology 3 (1), 3e12.
Khattak, M.J., Khattab, A., Rizvi, H.R., Zhang, P., 2012. The impact of carbon nano-fibermodification on asphalt binder rheology. Construction and Building Materials 30,257e264.
Khattak, M.J., Khattab, A., Rizvi, H.R., 2013. Characterization of carbon nano-fiber modifiedhot mix asphalt mixtures. Construction and Building Materials 40, 738e745.
Mechanical and environmental resistance of nanoparticle-reinforced pavement materials 241

Kim, K.M., Heo, Y.S., Kang, S.P., Lee, J., 2014a. Effect of sodium silicate-and ethylsilicate-based nano-silica on pore structure of cement composites. Cement and ConcreteComposites 49, 84e91.
Kim, J.J., Rahman, M.K., Al-Majed, A.A., Al-Zahrani, M.M., Reda Taha, M.M., 2013.Nanosilica effects on composition and silicate polymerization in hardened cement pastecured under high temperature and pressure. Cement and Concrete Composites 43, 78e85.
Kim, H.S., Song, M., Seo, J.W., Shin, U.S., 2014b. Preparation of electrically conductivebucky-sponge using CNT-cement: conductivity control using room temperature ionicliquids. Synthetic Metals 196, 92e98.
Kong, D., Du, X., Wei, S., Zhang, H., Yang, Y., Shah, S.P., 2012. Influence of nano-silicaagglomeration on microstructure and properties of the hardened cement-based materials.Construction and Building Materials 37, 707e715.
Kong, D., Su, Y., Du, X., Yang, Y., Wei, S., Shah, S.P., 2013. Influence of nano-silicaagglomeration on fresh properties of cement pastes. Construction and Building Materials43, 557e562.
Lee, B.Y., Kurtis, K.E., 2010. Influence of TiO2 nanoparticles on early C3S hydration. Journalof the American Ceramic Society 93, 3399e3405.
Le�on, N., Massana, J., Alonso, F., Moragues, A., S�anchez-Espinosa, E., 2014. Effect ofnano-SiO2 and nano-Al2O3 on cement mortars for use in agriculture and livestockproduction. Biosystems Engineering 123, 1e11.
Li, H., Xiao, H.G., Yuan, J., Ou, J., 2004. Microstructure of cement mortar with nano-particles.Composites Part B: Engineering 35 (2), 185e189.
Li, H., Zhang, M.H., Ou, J.P., 2006a. Abrasion resistance of concrete containing nano-particlesfor pavement. Wear 260 (11), 1262e1266.
Li, Z., Wang, H., He, S., Lu, Y., Wang, M., 2006b. Investigations on the preparation andmechanical properties of the nano-alumina reinforced cement composite. Materials Letters60 (3), 356e359.
Li, H., Zhang, M.H., Ou, J.P., 2007. Flexural fatigue performance of concrete containingnano-particles for pavement. International Journal of Fatigue 29 (7), 1292e1301.
Li, H., Zhang, Q., Xiao, H., 2013. Self-deicing road system with a CNFP high-efficiency thermalsource and MWCNT/cement-based high-thermal conductive composites. Cold RegionsScience and Technology 86, 22e35.
Li, H., Zhang, Q., Xiao, H., 2014. Analytic investigations of CNFP-based self-deicing roadsystem on the deicing performance. Cold Regions Science and Technology 103,123e132.
Lim, S., Mondal, P., 2014. Micro-and nano-scale characterization to study the thermal degra-dation of cement-based materials. Materials Characterization 92, 15e25.
Liu, Y., Shi, X., 2012. Stochastic modeling of service life of concrete structures in chloride-ladenenvironments. Journal of Materials in Civil Engineering 24 (4), 381e390.
Ltifi, M., Guefrech, A., Mounanga, P., Khelidj, A., 2011. Experimental study of the effect ofaddition of nano-silica on the behaviour of cement mortars. Procedia Engineering 10,900e905.
Lv, S., Liu, J., Sun, T., Ma, Y., Zhou, Q., 2014. Effect of GO nanosheets on shapes of cementhydration crystals and their formation process. Construction and Building Materials 64,231e239.
Madani, H., Bagheri, A., Parhizkar, T., 2012. The pozzolanic reactivity of monodispersednanosilica hydrosols and their influence on the hydration characteristics of Portland cement.Cement and Concrete Research 42 (12), 1563e1570.
242 Multifunctional Nanocomposites in Civil and Structural Engineering

Makar, J.M., Chan, G.W., 2009. Growth of cement hydration products on single-walled carbonnanotubes. Journal of the American Ceramic Society 92, 1303e1310.
Mat�ejka, V., Mat�ejkov�a, P., Kov�a�r, P., Vl�cek, J., P�rikryl, J., �Cervenka, P., Kukutschov�a, J.,2012. Metakaolinite/TiO2 composite: photoactive admixture for building materials basedon Portland cement binder. Construction and Building Materials 35, 38e44.
Meng, T., Yu, Y., Qian, X., Zhan, S., Qian, K., 2012. Effect of nano-TiO2 on the mechanicalproperties of cement mortar. Construction and Building Materials 29, 241e245.
Merusi, F., Giuliani, F., Polacco, G., 2012. Linear viscoelastic behaviour of asphalt bindersmodified with polymer/clay nanocomposites. Procedia-Social and Behavioral Sciences53, 335e345.
Metaxa, Z.S., Konsta-Gdoutos, M.S., Shah, S.P., 2013. Carbon nanofiber cementitious com-posites: effect of debulking procedure on dispersion and reinforcing efficiency. Cement andConcrete Composites 36, 25e32.
Mondal, P., Shah, S., Marks, L., Gaitero, J., 2010. Comparative study of the effects ofmicrosilica and nanosilica in concrete. Transportation Research Record: Journal of theTransportation Research Board 2141, 6e9.
Monteiro, P.J.M., Kirchheim, A.P., Chae, S., Fischer, P., MacDowell, A.A., Schaible, E.,Wenk, H.R., 2009. Characterizing the nano and micro structure of concrete to improve itsdurability. Cement and Concrete Composites 31 (8), 577e584.
Morsy, M.S., Alsayed, S.H., Aqel, M., 2011. Hybrid effect of carbon nanotube and nano-clay onphysicoemechanical properties of cement mortar. Construction and Building Materials25 (1), 145e149.
Nazari, A., Riahi, S., 2011a. The effects of SiO2 nanoparticles on physical and mechanicalproperties of high strength compacting concrete. Composites Part B: Engineering 42 (3),570e578.
Nazari, A., Riahi, S., 2011b. TiO2 nanoparticles effects on physical, thermal and mechanicalproperties of self compacting concrete with ground granulated blast furnace slag as binder.Energy and Buildings 43 (4), 995e1002.
Nazari, A., Riahi, S., 2011c. The effects of zinc dioxide nanoparticles on flexural strength ofself-compacting concrete. Composites Part B: Engineering 42 (2), 167e175.
Nehdi, M., Pardhan, M., Koshowski, S., 2004. Durability of self-consolidating concreteincorporating high-volume replacement composite cements. Cement and ConcreteResearch 34 (11), 2103e2112.
Nejad, F.M., Azarhoosh, A.R., Hamedi, G.H., Azarhoosh, M.J., 2012. Influence of usingnonmaterial to reduce the moisture susceptibility of hot mix asphalt. Construction andBuilding Materials 31, 384e388.
Oltulu, M., Sahin, R., 2011. Single and combined effects of nano-SiO2, nano-Al2O3 andnano-Fe2O3 powders on compressive strength and capillary permeability of cementmortar containing silica fume. Materials Science and Engineering-A-Structural Materials528 (22), 7012.
Oltulu, M., Sahin, R., 2013. Effect of nano-SiO2, nano-Al2O3 and nano-Fe2O3 powders oncompressive strengths and capillary water absorption of cement mortar containing fly ash:a comparative study. Energy and Buildings 58, 292e301.
Oltulu, M., Sahin, R., 2014. Pore structure analysis of hardened cement mortars containing silicafume and different nano-powders. Construction and Building Materials 53, 658e664.
Pacheco-Torgal, F., Ding, Y., Jalali, S., 2012. Properties and durability of concrete containingpolymeric wastes (tyre rubber and polyethylene terephthalate bottles): an overview.Construction and Building Materials 30, 714e724.
Mechanical and environmental resistance of nanoparticle-reinforced pavement materials 243

Pacheco-Torgal, F., Miraldo, S., Ding, Y., Labrincha, J.A., 2013. Targeting HPC with the helpof nanoparticles: an overview. Construction and Building Materials 38, 365e370.
Pacheco-Torgal, F., 2014. Eco-efficient construction and building materials research under theEU framework programme horizon 2020. Construction and Building Materials 51,151e162.
Parviz, A., 2011. Nano materials in asphalt and tar. Australian Journal of Basic and AppliedSciences 5 (12), 3270e3273.
Pigeon, M., Pleau, R., 1995. Durability of Concrete in Cold Climates. E and FN Spon,New York, NY.
Pourjavadi, A., Fakoorpoor, S.M., Khaloo, A., Hosseini, P., 2012. Improving the performanceof cement-based composites containing superabsorbent polymers by utilization ofnano-SiO2 particles. Materials and Design 42, 94e101.
Qing, Y., Zenan, Z., Deyu, K., Rongshen, C., 2007. Influence of nano-SiO2 addition on prop-erties of hardened cement paste as compared with silica fume. Construction and BuildingMaterials 21 (3), 539e545.
Quercia, G., H€usken, G., Brouwers, H.J.H., 2012. Water demand of amorphous nano silica andits impact on the workability of cement paste. Cement and Concrete Research 42 (2),344e357.
Quercia, G., Lazaro, A., Geus, J.W., Brouwers, H.J.H., 2013. Characterization of morphologyand texture of several amorphous nano-silica particles used in concrete. Cement andConcrete Composites 44, 77e92.
Quercia, G., Spiesz, P., H€usken, G., Brouwers, H.J.H., 2014. SCC modification by use ofamorphous nano-silica. Cement and Concrete Composites 45, 69e81.
Rashad, A.M., 2013a. A synopsis about the effect of nano-Al2O3, nano-Fe2O3, nano-Fe3O4 andnano-clay on some properties of cementitious materialseA short guide for civil engineer.Materials and Design 52, 143e157 (complete).
Rashad, A.M., 2013b. Effects of ZnO2, ZrO2, Cu2O3, CuO, CaCO3, SF, FA, cement andgeothermal silica waste nanoparticles on properties of cementitious materialseA shortguide for civil engineer. Construction and Building Materials 48, 1120e1133 (complete).
Riahi, S., Nazari, A., 2011. Physical, mechanical and thermal properties of concrete in differentcuring media containing ZnO2 nanoparticles. Energy and Buildings 43 (8), 1977e1984.
Richardson, I.G., 1999. The nature of C-S-H in hardened cements. Cement and ConcreteResearch 29, 1131e1147.
Richardson, I.G., 2008. The calcium silicate hydrates. Cement and Concrete Research 38,137e158.
Rozi�ere, E., Loukili, A.R., Hachem, E., Grondin, F., 2009. Durability of concrete exposed toleaching and external sulphate attacks. Cement and Concrete Research 39, 1188e1198.
S�aez de Ibarra, Y., Gaitero, J.J., Erkizia, E., Campillo, I., 2006. Atomic force microscopy andnanoindentation of cement pastes with nanotube dispersions. Physica Status Solidi A 203,1076e1081.
Safiuddin, M., Gonzalez, M., Cao, J., Tighe, S.L., 2014. State-of-the-art report on use ofnano-materials in concrete. International Journal of Pavement Engineering 1e10(ahead-of-print).
Said, A.M., Zeidan, M.S., Bassuoni, M.T., Tian, Y., 2012. Properties of concrete incorporatingnano-silica. Construction and Building Materials 36, 838e844.
Salemi, N., Behfarnia, K., 2013. Effect of nano-particles on durability of fiber-reinforcedconcrete pavement. Construction and Building Materials 48, 934e941.
Sanchez, F., Sobolev, K., 2010. Nanotechnology in concreteea review. Construction andBuilding Materials 24 (11), 2060e2071.
244 Multifunctional Nanocomposites in Civil and Structural Engineering

Santagata, E., Baglieri, O., Tsantilis, L., Dalmazzo, D., 2012. Rheological characterization ofbituminous binders modified with carbon nanotubes. Procedia-Social and BehavioralSciences 53, 546e555.
Santamouris, M., 2013. Using cool pavements as a mitigation strategy to fight urban heatislandda review of the actual developments. Renewable and Sustainable Energy Reviews26, 224e240.
Scrivener, K.L., F€ullmann, T., Gallucci, E., Walenta, G., Bermejo, E., 2004. Quantitative studyof Portland cement hydration by X-Ray diffraction/rietveld analysis and independentmethods. Cement and Concrete Research 34, 1541e1547.
Senff, L., Labrincha, J.A., Ferreira, V.M., Hotza, D., Repette, W.L., 2009. Effect of nano-silicaon rheology and fresh properties of cement pastes and mortars. Construction and BuildingMaterials 23 (7), 2487e2491.
Senff, L., Hotza, D., Repette, W.L., Ferreira, V.M., Labrincha, J.A., 2010. Mortars withnano-SiO2 and micro-SiO2 investigated by experimental design. Construction and BuildingMaterials 24 (8), 1432e1437.
Senff, L., Hotza, D., Lucas, S., Ferreira, V.M., Labrincha, J.A., 2012. Effect of nano-SiO2 andnano-TiO2 addition on the rheological behavior and the hardened properties of cementmortars. Materials Science and Engineering: A 532, 354e361.
Senff, L., Tobaldi, D.M., Lemes-Rachadel, P., Labrincha, J.A., Hotza, D., 2014. The influenceof TiO2 and ZnO powder mixtures on photocatalytic activity and rheological behavior ofcement pastes. Construction and Building Materials 65, 191e200.
Shafabakhsh, G., Mirabdolazimi, S.M., Sadeghnejad, M., 2014. Evaluation the effect ofnano-TiO2 on the rutting and fatigue behavior of asphalt mixtures. Construction andBuilding Materials 54, 566e571.
Shakhmenko, G., Juhnevica, I., Korjakins, A., 2013. Influence of sol-gel nanosilica onhardening processes and physically-mechanical properties of cement paste. ProcediaEngineering 57, 1013e1021.
Shi, X., Akin, M., Pan, T., Fay, L., Liu, Y., Yang, Z., 2009. Deicer impacts on pavementmaterials: introduction and recent developments. The Open Civil Engineering Journal3, 16e27.
Shi, X., Fay, L., Peterson, M.M., Yang, Z., 2010. Freeze-thaw damage and chemical change ofa Portland cement concrete in the presence of diluted deicers. Materials and Structures43, 933e946.
Shi, X., Fay, L., Peterson, M.M., Berry, M., Mooney, M., 2011. A FESEM/EDX investigationinto how continuous deicer exposure affects the chemistry of Portland cement concrete.Construction and Building Materials 25 (2), 957e966.
Shi, X., Xie, N., Fortune, K., Gong, J., 2012. Durability of steel reinforced concrete in chlorideenvironments: an overview. Construction and Building Materials 30, 125e138.
Singh, L.P., Karade, S.R., Bhattacharyya, S.K., Yousuf, M.M., Ahalawat, S., 2013. Beneficialrole of nanosilica in cement based materialseA review. Construction and BuildingMaterials 47, 1069e1077.
Skinner, L.B., Chae, S.R., Benmore, C.J., Wenk, H.R., Monteiro, P.J.M., 2010. Nanostructureof calcium silicate hydrates in cements. Physical Review Letters 104, 195502.
Stefanidou, M., Papayianni, I., 2012. Influence of nano-SiO2 on the Portland cement pastes.Composites Part B: Engineering 43 (6), 2706e2710.
Sugra~nez, R., �Alvarez, J.I., Cruz-Yusta, M., M�armol, I., Morales, J., Vila, J., S�anchez, L.,2013. Enhanced photocatalytic degradation of NOx gases by regulating the micro-structure of mortar cement modified with titanium dioxide. Building and Environment69, 55e63.
Mechanical and environmental resistance of nanoparticle-reinforced pavement materials 245

Sureshkumar, M.S., Filippi, S., Polacco, G., Kazatchkov, I., Stastna, J., Zanzotto, L., 2010.Internal structure and linear viscoelastic properties of EVA/asphalt nanocomposites.European Polymer Journal 46 (4), 621e633.
Sutter, L., Peterson, K., Julio-Betancourt, G., Hooton, D., Van Dam, T., Smith, K., 2008. TheDeleterious Chemical Effects of Concentrated Deicing Solutions on Portland CementConcrete. South Dakota Department of Transportation (Final Report SD2002-01-F, April).
Taylor, H.F.W., 1986. Proposed structure for calcium silicate hydrate gel. Journal of theAmerican Ceramic Society 69, 464e467.
Tob�on, J.I., Pay�a, J.J., Borrachero, M.V., Restrepo, O.J., 2012. Mineralogical evolution ofPortland cement blended with silica nanoparticles and its effect on mechanical strength.Construction and Building Materials 36, 736e742.
Thomas, J.J., Jennings, H.M., Allen, A.J., 1998. Determination of the neutron scattering contrastof hydrated Portland cement paste using H2O/D2O exchange. Advanced Cement BasedMaterials 7, 119e122.
Thomas, J.J., 2007. A new approach to modeling the nucleation and growth kinetics of trical-cium silicate hydration. Journal of the American Ceramic Society 90, 3282e3288.
Vera-Agullo, J., et al., 2009. Mortar and concrete reinforced with nanomaterials. Nanotech-nology in Construction 3, 383e388.
Wang, B., Han, Y., Liu, S., 2013. Effect of highly dispersed carbon nanotubes on the flexuraltoughness of cement-based composites. Construction and Building Materials 46, 8e12.
Wei, Y.Q., Yao, W., Xing, X.M., Wu, M.J., 2012. Quantitative evaluation of hydrated cementmodified by silica fume using QXRD, 27Al MAS NMR, TG-DSC and selective dissolutiontechniques. Construction and Building Materials 36, 925e932.
Xu, Z., Viehland, D., 1996. Observation of a mesostructure in calcium silicate hydrate gels ofPortland cement. Physical Review Letters 77, 952e955.
Yang, J., Tighe, S., 2013. A review of advances of nanotechnology in asphalt mixtures.Procedia-Social and Behavioral Sciences 96, 1269e1276.
Yao, H., You, Z., Li, L., Shi, X., Goh, S.W., Mills-Beale, J., Wingard, D., 2012. Performance ofasphalt binder blended with non-modified and polymer-modified nanoclay. Constructionand Building Materials 35, 159e170.
Ye, Q., Zhang, Z.N., Kong, D.Y., 2007. Influence of nano-SiO2 addition on properties ofhardened cement paste as compared with silica fume. Construction and Building Materials21, 539e545.
You, Z., Mills-Beale, J., Foley, J.M., Roy, S., Odegard, G.M., Dai, Q., Goh, S.W., 2011.Nanoclay-modified asphalt materials: preparation and characterization. Construction andBuilding Materials 25 (2), 1072e1078.
Yousefi, A., Allahverdi, A., Hejazi, P., 2013. Effective dispersion of nano-TiO2 powder forenhancement of photocatalytic properties in cement mixes. Construction and BuildingMaterials 41, 224e230.
Yu, H., Shi, X., Hartt, W.H., Lu, B., 2010. Laboratory investigation of reinforcement corrosioninitiation and chloride threshold content for self-compacting concrete. Cement andConcrete Research 40, 1507e1516.
Yuan, H., Shi, Y., Xu, Z., Lu, C., Ni, Y., Lan, X., 2013. Influence of nano-ZrO2 on themechanical and thermal properties of high temperature cementitious thermal energy storagematerials. Construction and Building Materials 48, 6e10.
Zapata-Ord�uz, L.E., Portela, G., Su�arez, O.M., 2014. Weibull statistical analysis of splittingtensile strength of concretes containing class F fly ash, micro/nano-SiO2. CeramicsInternational 40 (5), 7373e7388.
Zhang, M.H., Li, H., 2011. Pore structure and chloride permeability of concrete containingnano-particles for pavement. Construction and Building Materials 25 (2), 608e616.
246 Multifunctional Nanocomposites in Civil and Structural Engineering

The self-heating carbon nanofiberpolymer composite and itsapplications in deicing and snowthawing of pavement
11
Hui Li 1,2, Qiangqiang Zhang 1,2, Huigang Xiao 1,2
1Key Lab of Structures Dynamic Behavior and Control (Harbin Institute of Technology),Ministry of Education, Harbin, China; 2School of Civil Engineering, Harbin Institute ofTechnology, Harbin, China
11.1 Preface
In this chapter, we discuss the self-heating performance of an electrically conductivecarbon nanofiber polymer (CNFP) composite and its applications on pavement deicingand snow thawing based on remarkable electrothermal properties. There are four sec-tions in this chapter: (1) introduction of CNFP composites: their necessity, objective,and purpose will be elaborated as comprehensively as possible. In addition, theresearch progress on conductive composites, carbon nanomaterials, and correspondingdeicing/snow thawing in the past two decades will be overviewed concisely. (2) Theone-dimensional (1D) CNFP-based paper-like conductive composite and its applica-tions on pavement deicing/snow thawing. Thereinto, the corresponding investigationinvolves the fabrication process, the thermally and electrically conductive characteris-tics, the electrothermal properties, the temperature-dependent effect of resistivity, andthe applications on pavement deicing/snow thawing (including the conceptual config-uration and technological construction of self-heating pavement, the operation system,and the evaluation of working efficiency). Particularly, various parameter-associatedstudies during the deicing performance of the CNFP-based system were systematicallyconducted in this section; these involved parameters such as ambient temperature,input power (heat flux density), ice and snow thickness, and optimal index of timeand energy efficiency. Next presented are (3) the conclusion, followed by (4) theacknowledgments and references.
11.2 Introduction
On many occasions in winter, the ice accretion and snow falling often lead to tremen-dous economic losses and safety hazards for many important infrastructures, such asaerodynamic stall of aircrafts and wind turbines, galloping of power lines, instability
Innovative Developments of Advanced Multifunctional Nanocomposites in Civil and Structural Engineeringhttp://dx.doi.org/10.1016/B978-1-78242-326-3.00011-7Copyright © 2016 Elsevier Ltd. All rights reserved.

of marine structures, possibly shutting down traffic for a long time (pavement, bridgedecks, highways, airport grounds, etc.), or even the tragedy of human casualties.Accordingly, the official statistics have indicated that snow and ice are the cause of10e15% of traffic accidents annually (Yehia et al., 2000; Feng and Li, 2009; Houet al., 2002). Despite the fact that certain amounts of either deicing or anti-icing ap-proaches have been developed, such as mechanical tools, chimerical salts (Wanget al., 2006; Shi et al., 2009), terrestrial heat or solar-energy-heating instruments(Ferrara and Haslett, 1975; Long and Baldwin, 1981; Tanaka, 1981; Lee, 1984;Fridman, 2009), conductive concretes, or other heating candidates (Yehia et al.,2000; Hou et al., 2002; Chung, 2001; 2004a,b; Tuan and Yehia, 2004; Zhao et al.,2010, 2011; Zhang et al., 2015), they are still far from optimal and extensively appli-cable due to such fatal or detrimental shortages as lower heating efficiency, environ-mental pollution and concrete/steel bar erosions (Litvan, 1976; Harnick et al., 1980;Lee et al., 2000; Wang et al., 2006; Novotny et al., 2008; Shi et al., 2009; Kim andKoretsky, 2013), high electric resistivity and degeneration of electrothermal perfor-mance (Yehia et al., 2000), and low thermal conductivity (Zhao et al., 2010, 2011).
Delightfully, the unprecedented prosperities of material markets stimulate the ever-lasting developments of advanced technologies or authorized science research. Herein,one amazing member of the carbon nanomaterial familydcarbon nanofibers and car-bon nanotubes (CNFs/CNTs)dhas been miraculous in various technological revolu-tions and progress reports on research in multidisciplinary fields since Lijimareported his successful fabrication in 1991 (Lijima, 1991), including physics, materialscience, electronics, communication, and chemistry. This hollow and rodlike materialis formed by curling graphene nanosheets with a certain chiral and sp2esp3 hybridbonds; due to this special structure, it presents several distinguishing characteristicsin chemical, physical, and mechanical properties, such as an extraordinary Young’smodulus, higher fracture strength, excellent thermal conductivity, outstandingmobility of charge carriers, and larger specific surface area. These remarkable proper-ties make it promising to develop serials of novel functional materials or specific de-vices, such as CNT/CNF-based polymer composites, field effect devices, energystorage materials, and new generations of electrical conductors (Lin et al., 2014; Xuet al., 2015; Zhang et al., 2015). Especially, based on the excellent electrical conduc-tivity of individual CNT/CNFs, one promising application is to develop paper-likebulk with expected electrothermal properties to implement deicing applications.
Therefore, CNFP composites made from CNFs exhibit low resistance, high thermalconductivity, and high temperature stability and can be incorporated into a self-deicingpavement system as a highly efficient heating element based on its remarkable electro-thermal performance. Additionally, the unique thermally conductive properties ofCNTs make them promising heat transfer candidates (Chang et al, 2009; Chung,1994, 2001; Peebles, 1994; Hone et al., 1999; Moisala et al., 2006; Saito et al., 1998).
In this section, based on its good electrothermal properties, the CNFP-basedself-heating system for pavements consisting of a thermally insulated epoxy sub-strate, a CNFP high-efficiency heating element, an AlNeceramic wafer insulated cap-sulation layer, and a multiwalled carbon nanotube (MWCNT)/cement-based highlythermoconductive layer, is proposed in this study. The high efficiency, repeatability,
248 Multifunctional Nanocomposites in Civil and Structural Engineering

low cost, and feasibility of this CNFP-based pavement self-heating system for bothdeicing and snow-thawing applications are validated through this study. The electricand thermoelectric properties of CNFPs, which is composed of individual carbon nano-fibers (10e200 nm), are tested. The property of high thermoelectric efficiency is veri-fied, and the resistivity of the CNFP exhibited piecewise linear temperature-dependentcharacteristics within a certain temperature range (0e280 �C). To ensure the efficientoperation of the CNFP, an AlNeceramic wafer (0.5 mm) is employed as the electroin-sulated layer because of its favorable insulating and thermoconductive properties. Theconstructed system is applied in deicing and field snow-thawing studies, in which theeffects of ambient temperature, heat flux density, and ice thickness on the deicing andsnow-thawing performance of the self-heating system are investigated. The efficiency,repeatability, cost, and feasibility of the self-heating pavement system in both deicingand snow-thawing applications are analyzed. Indices for evaluating the deicing andsnow-thawing efficiency of the self-heating pavement system are proposed, and theoptimal values for each parameter are presented.
11.3 CNFP film
11.3.1 The fabrication process
As shown in Figure 11.1, the fabrication process of CNFPs is divided by five steps:Firstly, the CNFs with a diameter range of 10e100 nm are synthesized by the chemicalvapor deposition method (CVD). Secondly, 1 g CNF powder is dispersed into 5 gTriton X-100 to form a paste-like mixture, and then the mixture is dissolved into
Figure 11.1 The fabrication process of carbon nanofiber polymer (CNFP) film.
The self-heating carbon nanofiber polymer composite and its applications 249

5 L deionized water to obtain the uniform solution. Thirdly, the CNF solution isfiltered through a filter membrane with a pore size of 1 mm under the vacuum condi-tions of 20 Pa for about 10 min. Fourthly, the filtered-formed CNF film with filtermembrane is treated under 80 �C for 24 h to form the tight interface bonding amongCNFs. Finally, the solidified CNF film is separated from filter membrane in the wettingcondition of acetone; eventually, the 0.38-mm-thick paper-like CNFP film is obtained.
11.3.2 The property investigation of CNFPs
11.3.2.1 The characteristics of microstructures
It is well known that the microstructure at the nanoscale is the critical factor domi-nating the physical performance of the material, including its mechanical, thermal,and electrical properties. To investigate the effects of the microelement distribu-tion in CNFPs on the electrothermal properties, it is necessary to survey themicro-morphologies of the CNFP. As shown in Figure 11.2(aef), scanning electronmicroscope (SEM) images of a CNFP show its particular micro-morphologies andconsistent distributions of CNFs. The larger diameter CNFs (200e50 nm) overlapand joint mutually to build the dominating skeleton of structure and form the conduc-tive pathways for the rapid mobility of charger carriers, which is revealed by an SEMimage in the form of chessboard-like bounded nodes. In addition, the small-diameterCNFs alternatively wrap around the large elements to form strong bounded
Figure 11.2 SEM images of CNFPs in varied magnifications: (a) 1 mm, (b) 100 mm, (c) 50 mm,(d) a node, (e) fiber in a node (1 mm), and (f) fiber connection in a node (3 mm).Reprinted with permission from Li et al. (2013) Copyright 2013: Elsevier.
250 Multifunctional Nanocomposites in Civil and Structural Engineering

interactions, enrich the connection among the large elements, and even further perfectthe conductive networks, with more possible channels for the mobility of chargercarriers.
The corresponding versions of CNFs are investigated by transmission electronmicroscopy (TEM) to detect the layer information and typical characteristics of singleCNFs, as shown in Figure 11.3(a); the connection feathers of large- and small-diameterCNFs in SEM images are further confirmed by TEM micrographs. Figure 11.3(b) and(c) illuminate the typical characteristics of CNFs (bamboo joint, center hollow, andbracket bright spots of selected area electron diffraction (SAED)).
11.3.2.2 The mechanical properties of CNFP
As shown in Figure 11.4, a CNFP with the dimensions 50 � 25 � 0.38 mm is pre-pared for the test of mechanically uniaxial static tension, and the tensile test is
Figure 11.3 Transmission electron microscope (TEM) images of CNFs: (a) a TEM imageof 20 nm, (b) a single CNF TEM image of 10 nm, and (c) a typical selected area electrondiffraction (SAED) of CNF.
0.00.51.01.52.02.53.03.54.04.55.05.5
Stre
ss (M
Pa)
1200 2400
CNFPs
E = Δσ/Δε = 625 MPa
3600 4800 60 00 7200
3600 4000 4400 4800 5200 5600 6000
Strain (με)
Stre
ss (M
Pa)
8400 9600
Strain (με)
Δ
(a) (b)
CNFPs
1.82.02.22.42.62.83.03.2
ε = 2400 με
Δσ = 1.5 ΜP
a
12,00010,800
Figure 11.4 The investigation of mechanical properties of CNFPs by uniaxial static tensiletest. (a) The test schematic and sample dimensions setup and (b) the strainestressrelationship curve.
The self-heating carbon nanofiber polymer composite and its applications 251

conducted by an electrical universal material testing machine (Instron-5569, UK) witha loading rate of 0.5 mm/min. The result of strain versus stress reveals a desirableYoung’s modulus and a tensile strength of 0.625 GPa and 5.0 MPa, respectively.Obviously, CNFP as a paper-like material can resist possible mechanical formationduring applications with those promising mechanical properties. Additionally, the ul-timate tensile strain (w10,000 mε) is almost three times larger than that of the normalcement-based composite (w3500 mε), which implies that, as a heating element, CNFPwould not be mechanically tensioned to break as long as the fracture of slab does notoccur. The fundamental reason for this is due to the strong bounded pep interactionand alternatively wrapping among the CNFs, as seen in the SEM images shown inFigure 11.2, this kind of connection style would be not only beneficial to desirable me-chanical properties but also greatly essential for CNFPs to inherit the excellent electri-cal and thermal properties from individual CNFs.
11.3.2.3 The electrically conductive properties of CNFPs
CNFP specimens with dimensions of 20 � 40 � 0.38, 20 � 60 � 0.38, and20 � 80 � 0.38 mm (considering the size effect) are used for measuring the resistivity.Firstly, all samples are sandwiched between two glass plates (100 � 100 mm) toremove the absorbed water at 150 �C for 2 h; DAD-87 is then printed transverselyon the dried CNFP samples to form the electrodes with the width of 3 mm. Finally,DAD-40, which consists of two components, is mixed at a ratio of 1:1 and used to con-nect the copper wires to the formed electrodes. The fabricated CNFP samples areshown in Figure 11.5(b).
To incorporate a CNFP into a self-heating pavement system as a heating element, it isnecessary to investigate its temperature-dependent electrical resistivity under varioustemperature conditions. As shown in Figure 11.5(a), the four-probe method is adoptedto measure the longitudinal resistance of the CNFP samples under ambient temperatureconditions (�30 w 300 �C) in a refrigerator or in a temperature-controllable oven.A DC current, Iout, is applied at the two outer contacts, and the two inner contacts are
Rout DCData acquisition system
Ll
a
DAD–87 electrode
CNFP 1 2 3
Uout
DAD–87 electrode
(a) (b)
Uinner
Figure 11.5 The four-probe method schematic of CNFP specimens used for investigatingelectrically conductivity: (a) the schematic of the DC circuit for the temperature-dependentresistivity, with n equal to 1:1, 1:2, and 1:3 and (b) measuring the resistivity with three differentspecimen sizes of ➀ 20 � 40 � 0.38, ➁ 20 � 60 � 0.38, and ➂ 20 � 80 � 0.38 mm.Reprinted with permission from Li et al. (2013) Copyright 2013: Elsevier.
252 Multifunctional Nanocomposites in Civil and Structural Engineering

used for measuring the voltage Uinner. A DC circuit, developed by Han et al. (Li et al.,2008), is used to measure the resistance of the CNFP sample as follows:
R ¼ Uinner � Rref
Uout¼ Uinner
Iout(11.1)
where Rref is the standard reference resistor, as shown in Figure 11.5(a); Uout is thevoltage applied to Rout; R and Uinner are the resistance and voltage of the two innercontacts of the CNFP sample, respectively; and Iout is the current flowing through Rref.Iout and Uinner are measured simultaneously to calculate R in series in the circuit.
Based on Ohm’s law, the longitudinal resistivity of each CNFP specimen is calcu-lated as follows:
r ¼ R$S
l¼ Uinner � Rref
Uout
S
l¼ Uinner
Iout
Dh0
n(11.2)
where S and l are, respectively, the cross-sectional area and the distance between theinner contacts of the CNFP sample, as shown in Figure 11.5(b); Dh and a are thethickness and width of the sample; and n ¼ l/a is the ratio of l to the width a, which isn ¼ 1:1, 1:2, and 1:3 in this study.
The temperature-dependent resistivity of CNFP is shown in Figure 11.6. The resis-tivity of CNFP exhibits distinctly temperature-dependent characteristics. The curve ofthe resistivity to the surrounding temperature can be categorized into three regimes. Inregime 1 (over the range of�30w 0 �C), the resistivity remains constant (0.72 U mm).In regime 2 (over the range of 0e280 �C), the resistivity of CNFP decreases linearlywith an increase in temperature, exhibiting strongly temperature-dependent character-istics. It is well known that the resistivity of isolated CNFs is dependent on temperaturebecause of the increased possibility of thermal excitation of hot electrons with anincrease in temperature (Kane et al., 1998). Similarly, as a monolith of individualCNFs, the resistivity of CNFP decreases linearly as the temperature increasesfrom 0 to 280 �C due to the thermal excitation of hot electrons and even thethermal-expansion-enhanced interface bonding between CNFs, which corresponds
–50 0 50 100 150 200 250 3000.4
0.5
0.6
0.7
0.8
Res
istiv
ity ( Ω
mm
)
Temperature (ºC)–50 0 50 100 150 200 250 300 350
Temperature (ºC)
1:1 1:2 1:3
(a) (b)
0.55
0.60
0.65
0.70
0.75
A(280, 0.6)
Average resistivity Linear fit of resistivity
Res
istiv
ity (Ω
mm
)
Slope = –4.28*10–4
A(0,0.72)
Figure 11.6 The temperature-dependent resistivity of CNFP: (a) resistivity with three n ratiosequal to 1:1, 1:2, and 1:3 and (b) the average resistivity and linear curve fit.Reprinted with permission from Li et al. (2013) Copyright 2013: Elsevier.
The self-heating carbon nanofiber polymer composite and its applications 253

to an improvement in the electrical properties of CNFP. In regime 3 (over 280 �C), theresistivity of CNFP remains constant (0.6 U mm) and is again independent of the sur-rounding temperature. Statistically, the resistivity of CNFP is independent of the spec-imen size.
Based on the temperature dependence of the resistivity as shown in Figure 11.6,a piecewise linear model of the resistivity of CNFP is proposed in the followingform (units are U mm):
rCNFP ¼
8>>><>>>:
0:72
0:72� 4:28� 10�4 T
0:6
T < 0 �C
0 �C � T � 280 �C
T � 280 �C
(11.3)
11.3.2.4 The electrothermal properties of CNFP
ACNFP sample with the dimensions of 35� 70 � 0.38 mm is used for investigating theelectrothermal properties, and the similar procedures asmentioned in this chapter for elec-trical resistivity study are also implemented to prepare the sample here (Figure 11.7).CNFP specimens are placed in a refrigerator or in a temperature-controllable oven tosimulate changeable ambient temperatures, and then DC power is applied between thetwo electrodes to heat the specimens. The temperature is monitored using a Center 309thermometer with a constant applied voltage under a certain ambient temperature. Theapplied voltages are 4, 6, 8, and 10 V, and the ambient temperature is varied in the rangeof �30 to 100 �C.
The increase in the temperature of the CNFP as a function of time and appliedvoltage under various ambient temperatures is shown in Figure 11.8 and Table 11.1.It can be seen that the electrothermal properties of CNFP greatly depend on ambienttemperature. The temperature dramatically increases with time over the first 100 sand then approaches a stable temperature after 600 s. This equilibrium temperaturedepends on the surrounding temperature; for example, the equilibrium temperatureis 22.8 �C for an ambient temperature of �30 �C, but it is approximately 55 �Cfor 0 �C. When the ambient temperature is higher than 0 �C, the equilibrium temper-ature becomes over 88 �C for a surrounding temperature of 20 and 40 �C, 100e120 �Cfor a surrounding temperature of 60 and 80 �C, and approximately 145.8 �C for a
DAD–87 electrode
Thermocouple
Copper wire
DAD–87 electrode
CN
FP
Figure 11.7 The schematic for investigation of electrothermal properties.Reprinted with permission from Li et al. (2013) Copyright 2013: Elsevier.
254 Multifunctional Nanocomposites in Civil and Structural Engineering

surrounding temperature of 100 �C. The temperature dependence of the electrothermalproperties of CNFPs can be attributed to the quantized transition of electronic energy,which determines electron transport activity in CNFs. Furthermore, CNFPs can reachthe same stable temperature over 25 �C at an ambient temperature of �30 to 0 �C,which indicates that CNFPs are good candidates for the highly efficient heatingelement required for deicing in winter (below 0 �C). Due to the unique electron trans-port mechanism of a single CNF and the microtopography of CNFPs, as shown by theSEM picture in Figure 11.3, electron transport in the material can be highly efficient,which leads to the high efficiency of the electrothermal property of CNFPs.
11.4 Application of CNFP-based self-heating pavementsystem on deicing and snow thawing
11.4.1 Integration of CNFP-based self-heatingpavement system
Based on their remarkable electrothermal properties, CNFPs can be employed as heat-ing elements to develop a novel self-heating deicing and snow-thawing pavement
0 100 200 300 400 500 600–50
0
50
100
150
Tem
pera
ture
(o C)
Time (s)
–30 0 60 oC –20 20 80 oC–10 40 100 oC
Figure 11.8 The electrothermal investigation of CNFPs at various ambient temperatures withan applied voltage of 4 V.Reprinted with permission from Li et al. (2013) Copyright 2013: Elsevier.
Table 11.1 Equilibrium temperature of a CNFP under variousambient temperatures and applied voltages (8C)
Appliedvoltage (V)
Ambient temperatures (8C)
L30 L20 L10 0 20 40 60 80 100
4 22.8 42 49 55 88 92 108 120 145.8
6 81 105 109 118 147 157 162 147 196
8 140 155 170 177 210 215 220 225 246
10 191 210 221 230 235 240 245 263 270
The self-heating carbon nanofiber polymer composite and its applications 255

system. Conceptually, CNFP-based self-heating pavement consists of four functionalelements: a heating element, a thermal transfer layer, an electro-insulated layer, and athermally insulated substrate. The configuration of the CNFP-based self-heating pave-ment developed in this study is shown in Figure 11.9. CNFP is selected as a heatingelement. An epoxy sandwich layer is chosen as a thermal insulation substrate andplaced between the soil and the CNFP layer to make sure the heat energy flows up-ward. In terms of the mechanical requirements of a pavement, the cement-based com-posite is designed to be the thermal conduction layer and is placed over the CNFPheating element. This is particularly to further enhance the thermal transferring capac-ity and enforce the mechanical properties of a cement-based thermal conduction layer.MWCNTs are adopted to improve thermal conductivity and mechanical propertiesof cement-based composites. According to the optimized experimental results in liter-ature of Li et al. (2013), the optimal percentage of MWCNTs for improving thethermal conductivity of cement-based composites filled with MWCNTs is 3%; thethermal conductivity coefficient corresponding to this percentage is 2.83 W/(m K).Cement-based composites filled with MWCNTs would be qualified for incorporationinto the CNFP-based self-deicing pavement system. Practically, when the MWCNT/cement-based composite is covered by ice or snow, an AlNeceramic wafer is usedfor encapsulating the CNFP heating element layer to guarantee electrical insulationand to simultaneously ensure efficient heat transfer upward. In summary, an epoxythermal insulation substrate, a CNFP heating element, an AlNeceramic wafer insu-lated encapsulation layer, and an MWCNT/cement-based thermal conductive layerare integrated into a self-heating pavement that can be used for deicing and snow thaw-ing, as shown in Figure 11.9.
The operation of the CNFP-based self-heating pavement system is illuminated asfollows: An external DC power source is firstly applied at the CNFP layer; in thisstudy, the power source is supplied by solar energy or normal power grid and couldbe automatically selected. Then, an anemoscope, temperature sensors, and K-typethermocouples are used to measure the wind, the ambient temperature, and thetemperature in the deicing system. These analog signals eventually are collected bysensors and are transformed to a digital signal by digital-to-analog/analog-to-digital(DA/AD) boards, and then transported to a PC to determine the optimal heat fluxdensity input (Li et al., 2014).
Overlay ice layer
Thermal conductive layer
Electro-insulation layer
Thermal insulation substrate
Thermal source
Figure 11.9 The configuration of the CNFP-based self-heating pavement system.Reprinted with permission from Li et al. (2013) Copyright 2013: Elsevier.
256 Multifunctional Nanocomposites in Civil and Structural Engineering

11.4.2 The applications of deicing and snow thawing
The setup for the deicing and snow-thawing experiment is shown in Figure 11.10. Theheat flux density, ice and snow thickness, and ambient temperature are selected as thethree critical factors to be investigated in this experiment. The heat flux densities usedin this experiment are 600, 1000, 1400, and 1800 W/m2. The ice is formed in a refrig-erator with sizes of 100 � 100 � 10, 100 � 100 � 15, and 100 � 100 � 20 mm. Theambient temperatures are �30, �20, and �10 �C. The temperature distribution in thesystem is monitored by the embedded K-type thermocouples (Center 309 thermom-eter); in total, four K-type thermocouples are used in the system. Two of them areembedded at the interface between the thermal conduction layer and the ice layer; atthe upper surface of the ice layer, a third one is embedded at 12.5 mm above the bottomof the thermal conduction layer, and the last one is placed on the side wall of the sys-tem to monitor the surrounding temperature. The anemoscope and caliper are fixed atthe experiment site for measuring the wind and the ice thickness. The correspondingcomprehensive deicing efficiency is evaluated using the proposed indices, which aredescribed later in this chapter. For the snow-thawing application, the applied heatflux densities are 600, 800, and 1000 W/m2 with snow thicknesses of 20, 30, 40,and 50 mm. However, the snow-thawing process is affected by multiple factors,such as wind speed, ambient temperature, heat flux density, and snow thickness, soit is difficult to quantify the effect of the individual factors on the performance ofthe system for melting snow.
11.4.2.1 Deicing application
From a practical point of view, the most important impacts for this system are the deic-ing time and the energy consumption. Therefore, the time cost and energy consump-tion are proposed as the relevant performance indices and are used to evaluate thedeicing efficiency.
Firstly, the temperature distribution is obtained from the embedded thermocouples.The temperature is recorded at the interface of the cement-based thermal conductionlayer, and the ice is shown in Figure 11.11 for an ambient temperature of �10 �C;ice thicknesses of 10, 15, and 20 mm; and four heat flux densities. Figure 11.11 shows
Ice
Ice
Electrodes
Snow
Ice layer
Thermocouples
Figure 11.10 The experiment setup schematic of deicing and snow-thawing experiments.Reprinted with permission from Li et al. (2013) Copyright 2013: Elsevier.
The self-heating carbon nanofiber polymer composite and its applications 257

that the temperature-versus-time curves can be divided into three stages: an ice-specificheat stage (<0 �C), an ice-phase change stage (z0 �C), and a water-specific heat stage(>0 �C). During the ice-specific heat stage, the temperature rapidly increases up to0 �C, the phase change begins, the ice begins to melt, and the temperature is fixed untilthe completion of ice melting. The total duration of these two stages is referred to as thetime cost for ice deicing. After the ice phase change is completed, the temperature atthe upper surface of the ice layer has reached the freezing point, as the third region inFigure 11.11 shows.
The results show that a higher heat flux density corresponds to a steeper heatinggradient and a lower time cost for deicing. However, for the same heat flux densityand ambient temperature, thicker ice requires more time for deicing. The first stageof the curve represents many of the characteristics associated with the heat flux density,such as the start of deicing and the speed of the temperature rise. The time consumptionand energy expenditure related to the latent heat of the ice (335 kJ/kg) for deicing canbe obtained from the second stage.
For the other ambient temperatures of �20 and �30 �C, the times of the initiationand completion of deicing in the temperature curves are listed in Table 11.2. The en-ergy consumption is calculated by multiplying the heat flux density qw (W/m2) by thetime required to finish the deicing process (E ¼ qwt); the results are listed in Table 11.3.The effect of the heat flux density and ice thickness on the deicing time is the same asfor an ambient temperature of �10 �C. Additionally, a lower ambient temperature
–10
–5
0
5
Tem
pera
ture
(°C
)
Tem
pera
ture
(°C
)
Tem
pera
ture
( °C
)
(a)
–10
–5
0
5 (b)
–10
–5
0
5 (c)
Time (s)
Time (s)
Time (s)
1800 W/m2
1400 W/m2
1000 W/m2
600 W/m2
1800 W/m2
1400 W/m2
1000 W/m2
600 W/m2
1800 W/m2
1400 W/m2
1000 W/m2
600 W/m2
0 2000 4000 6000 8000 10,000 0 3000 6000 9000 12,000 15,000
0 4000 8000 12,000 16,000
Figure 11.11 The temperature distribution at the interface between the ice layer and thecement-based thermal conduction layer at an ambient temperature of �10 �C and for an icethickness of (a) 10 mm, (b) 15 mm, and (c) 20 mm.Reprinted with permission from Li et al. (2013) Copyright 2013: Elsevier.
258 Multifunctional Nanocomposites in Civil and Structural Engineering

Table 11.2 Times of initiation and completion of deicing
Temperature(8C)
Thickness(mm)
Time (s)
600 (W/m2) 1000 (W/m2) 1400 (W/m2) 1800 (W/m2)
Start Finish Start Finish Start Finish Start Finish
�10 10 3240 8970 2460 6450 1920 5130 1230 3360
15 3810 13,020 2670 8970 2190 5820 1530 4830
20 4800 16,500 2880 10,230 2700 7650 1650 5820
�20 10 4830 14,460 2730 7500 2580 6750 1830 5430
15 5160 15,750 3330 9930 2760 7590 2550 6750
20 5490 17,130 3660 11,130 2970 8130 3000 7500
�30 10 6180 16,880 4410 8670 2880 7230 2670 6120
15 6630 20,100 4920 11,250 3540 9120 3180 8190
20 7200 22,920 5580 14,010 3990 10,080 4110 9300
Reprinted with permission from Li et al. (2013) Copyright 2013: Elsevier.
The
self-heatingcarbon
nanofiber
polymer
composite
andits
applications259

corresponds to a longer deicing time. Of most interest is that, for most of the caseslisted in Table 11.2, the energy consumption for deicing is lower with a smallerheat flux density, whereas the time for deicing is longer.
The effect of ice thicknessThe data in Tables 11.2 and 11.3 are depicted in Figure 11.12. At a specific ambienttemperature, both the energy and time required to deice a certain amount of ice in-crease approximately linearly with the ice thickness for heat flux densities of 600,1000, 1400, and 1800 W/m2. This trend occurs because the energy consumed by iceheating and phase change are linear functions of ice thickness and account for morethan 90% of the effective energy. Other energy expenditures, such as dissipationand system heating, are independent of the thickness of the ice at the same ambienttemperature. Therefore, the approximate linear relationship between both deicingtime and energy consumption and ice thickness is acceptable and reasonable.
The effect of ambient temperatureFor a certain amount of ice, the latent heat expenditure is fixed, and the specific heatenergy consumption is a linear function of the ambient temperature. Moreover, a lowerambient temperature results in a higher temperature gradient and increased energytransfer between the system and the surroundings. Therefore, the energy and timerequired to deice a certain amount of ice for heat flux densities of 600, 1000, 1400,and 1800 W/m2 reduce with the increase in ambient temperature, as shown inFigure 11.13. Based on the effective insulation measurements for the surrounding sys-tem and the bottom layer (PVC insulated plates, >0.14 W/m K, purchased in Harbin,China), the energy that dissipates to the environment is only a small portion of the
Table 11.3 Energy consumption for deicing
Temperature(8C)
Ice thickness(mm)
Energy (kJ)
600 (W/m2) 1000 (W/m2) 1400 (W/m2) 1800 (W/m2)
�10 10 53.82 64.5 71.82 60.48
15 78.12 89.7 81.48 86.94
20 99 102.3 107.1 104.76
�20 10 86.76 75 94.5 97.74
15 94.5 99.3 106.26 121.5
20 102.78 111.3 113.82 135
�30 10 101.28 86.7 101.22 110.16
15 120.6 112.5 127.68 147.42
20 137.52 140.1 141.12 167.4
Reprinted with permission from Li et al. (2013) Copyright 2013: Elsevier.
260 Multifunctional Nanocomposites in Civil and Structural Engineering

10 15 20406080
100120140160
Ene
rgy
(kJ)
10 15 206080
100120140160
Ener
gy (k
J)Thickness of ice (mm) Thickness of ice (mm) Thickness of ice (mm) Thickness of ice (mm)
10 15 206080
100120140160
Ene
rgy
(kJ)
10 15 206080
100120140160180
Ene
rgy
(kJ)
–10 °C –10 °C –20 °C –20 °C –30 °C
–10 °C –20 °C –30 °C
–10 °C –20 °C –30 °C
–30 °C
Thickness of ice (mm) Thickness of ice (mm) Thickness of ice (mm) Thickness of ice (mm) 10 15 20
10
15
20
25
10 15 2068
101214
10 15 20456789
1011
Tim
e (s
× 1
03 )
Tim
e (s
× 1
03 )
Tim
e (s
× 1
03 )
Tim
e (s
× 1
03 )
–10 °C –20 °C –30 °C
–10 °C –20 °C –30 °C
–10 °C –20 °C
–30 °C
–10 °C –20 °C –30 °C
10 15 202
4
6
8
10
(a) (b) (c) (d)
Figure 11.12 The effect of ice thickness on the energy and time required to deice a certain amount of ice under specified conditions (heat flux densityand ambient temperature): (a) 600 W/m2, (b) 1000 W/m2, (c) 1400 W/m2, and (d) 1800 W/m2.Reprinted with permission from Li et al. (2013) Copyright 2013: Elsevier.
The
self-heatingcarbon
nanofiber
polymer
composite
andits
applications261

–30 –20 –108
12162024
Tim
e (s
× 1
03 )
Tim
e (s
× 1
03 ) 10 mm 15 mm 20 mm
–30 –20 –1068
10121416 10 mm
15 mm 20 mm
–30 –20 –10
6
8
10
Tim
e (s
)
10 mm 15 mm 20 mm
-30 -20 -104
6
8
10
Tim
e (s
)
10 mm 15 mm 20 mm
–30 –20 –106080
100120140
Ener
gy (k
J)
10 mm 15 mm 20 mm
–30 –20 –106080
100120140160
Ene
rgy
(kJ)
10 mm 15 mm 20 mm
–30 –20 –1080
100
120
140
Ene
rgy
(kJ)
10 mm 15 mm 20 mm
–30 –20 –106080
100120140160180
Ene
rgy
(kJ)
10 mm 15 mm 20 mm
Ambient temperature (°C)Ambient temperature (°C)
Ambient temperature (°C) Ambient temperature (°C)
Ambient temperature (°C) Ambient temperature (°C)
Ambient temperature (°C) Ambient temperature (°C)
(a) (b) (c) (d)
Figure 11.13 The effect of ambient temperature on the energy and time required to deice a certain amount of ice with applied heat flux densitiesof (a) 600 W/m2, (b) 1000 W/m2, (c) 1400 W/m2, and (d) 1800 W/m2.Reprinted with permission from Li et al. (2013) Copyright 2013: Elsevier.
262Multifunctional
Nanocom
positesin
Civil
andStructural
Engineering

entire energy. Consequently, it is reasonable to conclude that the consumptions of timeand energy for deicing are approximately linear functions of the ambient temperature.
The effect of heat flux densityFor fixed conditions (ice thickness and ambient temperature), the energy and time re-quirements for the deicing process are constant. The heat flux density refers to the en-ergy input to a unit area per unit time and essentially dictates the heating rate andtemperature gradient, as shown in Figure 11.11. A higher heat flux density results ina faster heating rate and a smaller time expenditure for deicing. As shown inFigure 11.14, the deicing time decreases with the increase in heat flux density, witha very fast decay at the beginning followed by a relatively slower decay. The resultsindicate that increasing the heat flux density is effective for deicing in the range of600e1000 W/m2 but that the effectiveness increases little when the heat flux densityexceeds 1000 W/m2. The energy is the product of the heat flux density and the timeused for deicing; the higher the heat flux density, the less the expenditure of time,so a minimum energy consumption value (optimal value) should exist, as shown inFigure 11.14. For example, 1000 W/m2 is the optimal heat flux density for ice witha thickness of 10 mm at an ambient temperature of �20 �C.
11.4.2.2 Snow-thawing application
The performance of the CNFP-based self-heating pavement system for thawing snowin a natural environment is also investigated as the same experimental setup describedin Figure 11.10. As shown in Figure 11.15, at the beginning the temperature increasedrapidly from the initial state to the freezing point (0 �C). The snow then absorbedenough energy to achieve its latent heat, began to melt, and formed a moving interfacebetween the melted water and the rest of the snow; the temperature at the melting inter-face is stable at 0 �C until the snow vanished. As shown in Figure 11.15(a), for thesame initial temperature of �12 �C, the gray line for a snow thickness of 30 mmhas a steeper gradient, and snow melting began earlier. This result is the same asthat of the black line and the black dashed line for the 40- and 50-mm-thick snowat an initial temperature of �22 �C. Although melting the thicker snow requiresmore energy, because of the lower thermal conductivity of snow (w0.1 W/(m K)for new snow), the thicker snow layer actually played a more active role in heat pres-ervation as a porous medium and prevented heat loss into the surrounding air. Asimilar phenomenon is also present in other cases, as shown in Figure 11.15, exceptfor the cases with 40- and 50-mm-thick snow at an initial temperature of �23 �C,as shown in Figure 11.15(b). The results for these cases are different because of therelatively lower heat flux density input and the extremely low surrounding temperatureexceeding the heat preservation capability of the specimen. Therefore, the time cost formelting the snow is determined by a combination of the energy requirement and theheat preservation effect.
As shown in Figure 11.16, with a heat flux density of 600 W/m2, it took approxi-mately 6000, 6500, 7500, and 6800 s to melt snow with thicknesses of 20, 30, 40,and 50 mm with a surrounding temperature of �9.1, �9.2, �9.7, and �10 �C,
The self-heating carbon nanofiber polymer composite and its applications 263

600 800 1000 1200 1400 1600 18003
6
9
12
15
18Ti
me
(s ×
103 )
Tim
e (s
× 1
03 )
Heat flux density (W/m2) Heat flux density (W/m2) Heat flux density (W/m2)
Heat flux density (W/m2)Heat flux density (W/m2)Heat flux density (W/m2)
10 mm 15 mm 20 mm
600 800 1000 1200 1400 1600 18003
6
9
12
15
18 10 mm 15 mm 20 mm
600 800 1000 1200 1400 1600 1800
8
12
16
20
24
Tim
e (s
)
10 mm 15 mm 20 mm
600 800 1000 1200 1400 1600 1800
60
80
100
120
Ene
rgy
(kJ)
10 mm 15 mm 20 mm
60
80
100
120
140
Ene
rgy
(kJ)
10 mm 15 mm 20 mm
600 800 1000 1200 1400 1600 1800600 800 1000 1200 1400 1600 1800
80
100
120
140
160
180
Ene
rgy
(kJ)
10 mm 15 mm 20 mm
(a) (b) (c)
Figure 11.14 The effect of heat flux density on the energy and time required to deice a certain amount of ice at ambient temperatures of (a) �10 �C,(b) �20 �C, and (c) �30 �C.Reprinted with permission from Li et al. (2013) Copyright 2013: Elsevier.
264Multifunctional
Nanocom
positesin
Civil
andStructural
Engineering

0 1000 2000 3000 4000 5000
–20
–10
0
10
Time (s) Time (s)
Tem
pera
ture
(°C
)
Tem
pera
ture
(°C
)
Tem
pera
ture
( °C
)
20 mm 30 mm 40 mm 50 mm
0 1500 3000 4500 6000 7500Time (s)
0 1500 3000 4500 6000 7500–25–20–15–10–5
05
10
20 mm 30 mm 40 mm 50 mm
–10
–5
0
5
10
20 mm 30 mm 40 mm 50 mm
(a) (b) (c)
Figure 11.15 The change in temperature with time at the interface between the thermal conductive layer and the snow layer for four different snowthicknesses and heat flux densities of (a) 1000 W/m2, (b) 800 W/m2, and (c) 600 W/m2.Reprinted with permission from Li et al. (2013) Copyright 2013: Elsevier.
The
self-heatingcarbon
nanofiber
polymer
composite
andits
applications265

20 25 30 35 40 45 5020003000400050006000700080009000
Tim
e (s
)
Snow thickness (mm)20 25 30 35 40 45 50
Snow thickness (mm)20 25 30 35 40 45 50
Snow thickness (mm)
600 W/m2
800 W/m2
1000 W/m2
600 W/m2
800 W/m2
1000 W/m2
600 W/m2
800 W/m2
1000 W/m2
–30
–24
–18
–12
–6
0
Tem
pera
ture
(o C)
0.9
1.0
1.1
1.2
1.3
Ene
rgy
(kW
h/m
2 )
(a) (b) (c)
Figure 11.16 Effect of multiple factors on the snow-thawing process: (a) time cost, (b) the corresponding surrounding temperature, and (c) energyexpenditure per unit area (kWh/m2).Reprinted with permission from Li et al. (2013) Copyright 2013: Elsevier.
266Multifunctional
Nanocom
positesin
Civil
andStructural
Engineering

respectively; the corresponding energy consumption for these cases is 1.0, 1.12, 1.28,and 1.10 kWh/m2. In contrast with the other results, a heat flux density of 600 W/m2 ismost efficient and profitable for 30-mm-thick snow at a normal low temperature(�10 �C), with a minimum consumption of time and energy that results from the jointeffect of heat preservation and dissipation under similar surrounding conditions.
Similarly, because of the previously mentioned heat preservation effect, 800 W/m2
is more efficient and preferable for thicker snow (30 mm) at extreme ambient temper-ature conditions (�17 �C). Overall, it makes sense that the time and energy costsincrease as the snow thickness increases for similar ambient conditions.
In contrast to the lower heat flux densities, 1000 W/m2 is more efficient and pref-erable for thicker snow (40 mm) at the extreme ambient temperature conditions(�23 �C) because of the relatively longer melting time but higher efficiency, whichis also a result of the heat preservation effect associated with thicker snow.
11.4.3 The evaluation of efficiency based on the priorityof time and energy options
Considering the time and energy consumption efficiency associated with deicing, theoptimal heat flux density option may not coincide with the other parameters being spec-ified, which require that the least energy and the shortest time expenditure be used todeice a certain amount of ice. However, it is impossible to optimize both time and en-ergy because the shortest time cost does not usually accompany the most economic en-ergy requirement. Therefore, three evaluation indices could be used to determine theexpected options for the heat flux density for a certain amount of ice. The first choiceis defined as a comprehensive index, b, which accounts for the optimal time and energyefficiency as follows (a balance between time and energy consumption):
b ¼ ðT=TmaxÞ þ�Ec�Ec;max
�(11.4)
where T and Ec are the time and energy used for deicing; and Tmax and Ec,max are thelongest time and maximum energy required for deicing a certain amount of ice withvarying heat flux density under the same ambient conditions. To minimize theconfusion regarding the equation working conditions, the heat flux cannot be zero andshould be in a reasonable range to ensure that the deicing process is finished in a finitetime period. The second index considers only the energy concerned (i.e., therequirement of minimum power consumption). The last index considers only theshortest time expenditure for an emergency case.
As shown in Table 11.4 and Figure 11.17, at an ambient temperature of�10 �C, theoptimal heat flux densities are 1800, 1400 or 1800, and 1800 W/m2 for ice with thick-nesses of 10, 15, and 20 mm, where the minimum timeeenergy indices are 1.217, 1.34,and 1.331, respectively. These optimal values are reasonable because for the heat fluxdensity of 1800 W/m2, the time efficiency is much higher than the increase in energyconsumption. At an ambient temperature of�20 �C, the most appropriate heat flux den-sities are 1000, 1000, and 1400 W/m2 for ice with thicknesses of 10, 15, and 20 mm,where the minimum time-energy indices of 1.286, 1.356, and 1.318, respectively,
The self-heating carbon nanofiber polymer composite and its applications 267

represent the optimal balance between the time efficiency and the energy consumption.Furthermore, 1000 and 1400 W/m2 could be the best choices for ice thicknesses of 10and 20 mm. There are two acceptable heat flux densities, 1000 and 1400 W/m2, fordeicing 15-mm-thick ice because of their similar indices of 1.323 and 1.320, butwhen the efficiency of time is also considered, 1400 W/m2 should be the first choice.
When a single index is considered (i.e., the least energy consumption or the shortesttime expenditure at an ambient temperature of �10 �C, as shown in Figure 11.18 andTables 11.2 and 11.3), a heat flux density of 600 W/m2 is the optimal choice for the10-mm-thick ice by virtue of having the lowest energy consumption (53.82 kJ). How-ever, in an emergency situation, 1800 W/m2 could be selected because it requires theleast time. For ice of thicknesses of either 15 or 20 mm, a heat flux density of600 W/m2 is a reasonable choice if time is not a limitation because it has the lowestenergy requirement. In an emergency situation, 1800 W/m2 must be applied to meetthe minimum time requirement, although more energy is consumed.
Figure 11.19 presents the time and energy consumption for deicing a certainamount of ice at an ambient temperature of �20 �C. The trends in the curves shownin Figure 11.18 imply the existence of the critical phenomenon, which is that the sec-ond optimal solution is more practical than the absolute optimal solution. For ice withthicknesses of 10, 15, and 20 mm, although the time is slightly longer when the heatflux density is 1000, 1400, and 1400 W/m2 than when it is 1800 W/m2, the energy con-sumption is much smaller at these heat flux densities than at 1800 W/m2. These valuesare consistent with the timeeenergy index shown in Figure 11.15. Therefore, theoptimal solution is that the regular heat flux density (1000e1400 W/m2) would beoffered for ambient temperatures of �20 w �10 �C with the anticipated associatedgood energy and time efficiency.
Table 11.4 Comprehensive index of timeeenergy for the evaluationof deicing efficiencyTemperature(8C)
Ice thickness(mm) 600 W/m2 1000 W/m2 1400 W/m2 1800 W/m2
�10 10 1.749 1.617 1.572 1.217
15 1.871 1.689 1.355 1.340
20 1.924 1.575 1.464 1.331
�20 10 1.888 1.286 1.434 1.376
15 1.778 1.448 1.356 1.429
20 1.761 1.474 1.318 1.438
�30 10 1.919 1.301 1.347 1.363
15 1.818 1.323 1.320 1.407
20 1.822 1.448 1.283 1.406
Reprinted with permission from Li et al. (2013) Copyright 2013: Elsevier.
268 Multifunctional Nanocomposites in Civil and Structural Engineering

600 800 1000 1200 1400 1600 1800
1.2
1.4
1.6
1.8
2.0
Tim
e–en
ergy
inde
x
Tim
e–en
ergy
inde
x
Tim
e–en
ergy
inde
x
Heat flux density (W/m2) Heat flux density (W/m2)Heat flux density (W/m2)
10 mm 15 mm 20 mm
10 mm 15 mm 20 mm
10 mm 15 mm 20 mm
600 800 1000 1200 1400 1600 18001.2
1.4
1.6
1.8
2.0
600 800 1000 1200 1400 1600 18001.2
1.4
1.6
1.8
2.0(a) (b) (c)
Figure 11.17 Index of timeeenergy in deicing for ambient temperatures of (a) �10 �C, (b) �20 �C, and (c) �30 �C.Reprinted with permission from Li et al. (2013) Copyright 2013: Elsevier.
The
self-heatingcarbon
nanofiber
polymer
composite
andits
applications269

2
4
6
8
10
54
60
66
72
78
4
6
8
10
12
14
70
75
80
85
90
95
100
4
6
8
10
12
14
16
18
98
100
102
104
106
108
110
112
600 800 1000 1200 1400 1600 1800 600 800 1000 1200 1400 1600 1800 600 800 1000 1200 1400 1600 1800
Time-10 mmEnergy-10 mm
Heat flux density (W/m2) Heat flux density (W/m2) Heat flux density (W/m2)
Tim
e (s
× 1
03 )
Ene
rgy
(kJ)
Time-15 mmEnergy-15 mm
Tim
e (s
× 1
03 )
Tim
e (s
× 1
03 )
Ene
rgy
(kJ)
Ene
rgy
(kJ)
Time-20 mmEnergy-20 mm
(a) (b) (c)
Figure 11.18 The evaluation of the prior options for time and energy consumption on deicing efficiency at an ambient temperature of �10 �C for icethicknesses of (a) 10 mm, (b) 15 mm, and (c) 20 mm.Reprinted with permission from Li et al. (2013) Copyright 2013: Elsevier.
270Multifunctional
Nanocom
positesin
Civil
andStructural
Engineering

4
6
8
10
12
14
16
707580859095100105110
4
6
8
10
12
14
16
18
90
100
110
120
130
6
8
10
12
14
16
18
100
110
120
130
140
150
600 800 1000 1200 140016001800
Time-10 mmEnergy-10 mm
Tim
e (s
× 1
03 )
Ene
rgy
(kJ)
600 800 1000 1200 140016001800 600 800 1000 1200 140016001800
Time-15 mmEnergy-15 mm
Tim
e (s
× 1
03 )
Tim
e (s
× 1
03 )
Ene
rgy
(kJ)
Ene
rgy
(kJ)
Time-20 mmEnergy-20 mm
(a) (b) (c)
Heat flux density (W/m2) Heat flux density (W/m2) Heat flux density (W/m2)
Figure 11.19 The evaluation of the prior options for time and energy consumption on deicing efficiency at an ambient temperature of �20 �C for icethicknesses of (a) 10 mm, (b) 15 mm, and (c) 20 mm.Reprinted with permission from Li et al. (2013) Copyright 2013: Elsevier.
The
self-heatingcarbon
nanofiber
polymer
composite
andits
applications271

Similar to the results shown in Figure 11.19, the second optimal point is more prac-tical for the ambient temperature of �30 �C, as shown in Figure 11.20. The optimalheat flux density for an ice thickness of 10 mm is 1000 W/m2 (smallest energy require-ment with a relatively short time requirement); the optimal heat flux densities for icethicknesses of 15 and 20 mm are, respectively, 1000 and 1400 W/m2.
Moreover, for 20-mm-thick ice at �30 �C, the energy requirement increasedslightly with the increase of heat flux density from 600 to 1400 W/m2, but the timeis significantly reduced. If there is no limitation for time cost, the 600, 1000, and1400 W/m2 heat flux densities could be used, but the optimal density is 1400 W/m2
because of the combined efficiency of time and energy, with a minimum timeeenergyindex of 1.283 as presented in Table 11.4. Generally, 1400 W/m2 is an appropriateoption that could be widely applied in severely harsh weather for deicing.
11.4.4 The evaluation of economic expense
The price for electric power in China is currently 0.083 $/(kW h). The cost of deicingper unit area using the proposed technology is calculated and is listed in Table 11.5.For the low-temperature case (�10 to 0 �C), 0.11e0.22 $/m2 is sufficient for deicingice in the thickness range of 10e20 mm. For lower temperature conditions (�20to �10 �C), the cost is 0.15e0.28 $/m2, which is much lower than the other currenttechniques listed in Table 11.6 (Lee et al., 2000; Litvan, 1976; Harnick et al., 1980;George and Charles, 2011). The cost is calculated based on the present economic costsand the operating efficiency of various deicing methods. The estimated expense ofeach mechanical method includes the labor costs (>11.00 Ұ/h in China, http://finace.sina.com.cn/g/20100809/07058444689.shtml) and the work efficiency. Forthe chemical methods, the cost depends on the market price (NaCl, 0.31 $/kg;CMA, 3.1 $/kg) and the amount consumed (NaCl, 0.3e0.6 kg/m2; CMA,0.56e1.13 kg/m2).
As shown in Table 11.6, for similar situations, the cost of using conductive concreteto deice the same amount of ice (Yehia et al., 2000) is almost four times the cost ofthe approach proposed in this chapter. Common salt (sodium chloride) is notrecommended due to the severe environmental pollution and corrosion of reinforcedconcrete associated with its use, even though it is only half the cost of the approachproposed in this study (Lee et al., 2000; Litvan, 1976; Harnick et al., 1980; Georgeand Charles, 2011). Moreover, the application of some nonpolluting chemical salts(e.g., calcium chloride and acetic acid calcium magnesium) is also limited becauseof their much higher cost (0.26e0.7 $/m2, 1.75e3.51 $/m2). The proposed deicingtechnique is an excellent option, especially for the extremely low-temperature case(w�30 �C), because at a maximum cost of no more than 0.29 $/m2 the deicing costis much lower. The solar energy used as the power source in this study is an abundantsource of energy, increasing the feasibility of this proposed deicing system for prac-tical applications.
Furthermore, the cost of the self-heating technique (0.05e0.11 $/m2) proposed inthis study is approximately half that of the snow-thawing method developed byHou et al. (2002) based on conductive concrete filled with CF (1.85%). The technique
272 Multifunctional Nanocomposites in Civil and Structural Engineering

600 800 1000 1200 140016001800
6
9
12
15
18Time-10 mmEnergy-10 mm
Tim
e (s
× 1
03 )
80
90
100
110
120
Ene
rgy
(kJ)
600 800 1000 1200 140016001800
6
9
12
15
18Time-10 mmEnergy-10 mm
Tim
e (s
× 1
03 )80
90
100
110
120
Ene
rgy
(kJ)
(a) (b)
600 800 1000 1200 140016001800
Tim
e (s
× 1
03 )
Ene
rgy
(kJ)
6
9
12
15
18
21
100
110
120
130
140
150
160Time-15 mmEnergy-15 mm
(c)
Heat flux density (W/m2) Heat flux density (W/m2) Heat flux density (W/m2)
Figure 11.20 The evaluation of the prior options for time and energy consumption on deicing efficiency at an ambient temperature of�30 �C with icethicknesses of (a) 10 mm, (b) 15 mm, and (c) 20 mm.Reprinted with permission from Li et al. (2013) Copyright 2013: Elsevier.
The
self-heatingcarbon
nanofiber
polymer
composite
andits
applications273

proposed in this study is also verified as being only 1/10e1/6 of the cost calculated byYehia et al. (2000) in the bridge snow-thawing study based on conductive concretefilled with steel fiber. In summary, the investigations of deicing and snow melting veri-fied that the self-heating/snow-thawing technique proposed in this study offers the ad-vantages of less time, lower energy consumption, feasible operation, intelligentcontrol, and environmental protection. This system can be widely used in pavements,pavement, highways, and bridges. In addition, the integration of a self-energy harvest-ing system with this self-heating/snow-thawing system will be competitive in thefuture.
Table 11.5 Economic expenditure per unit area for deicinga certain thickness of iceAmbienttemperature(8C)
Ice thickness(mm)
Economic expenditure ($/m2)
600 W/m2 1000 W/m2 1400 W/m2 1800 W/m2
�10 10 0.11 0.14 0.15 0.12
15 0.15 0.18 0.17 0.18
�20 20 0.21 0.22 0.22 0.22
10 0.18 0.15 0.20 0.20
15 0.20 0.20 0.22 0.25
20 0.22 0.23 0.23 0.28
�30 10 0.22 0.18 0.22 0.23
15 0.25 0.23 0.26 0.31
20 0.29 0.29 0.29 0.35
Reprinted with permission from Li et al. (2013) Copyright 2013: Elsevier.
Table 11.6 Cost of deicing using different approaches at anambient temperature of L20 8C
Icethickness(mm)
Economic expenditure ($/m2)
NaCl CaCl CMAConductiveconcrete Mechanical CNFP
10 0.09 0.26e0.35 1.75 >0.56 >0.1 0.15e0.2
15 0.13 0.40e0.53 2.65 >0.56 >0.1 0.2e0.25
20 0.18 0.53e0.70 3.51 >0.73 >0.1 0.22e0.28
Reprinted with permission from Li et al. (2013) Copyright 2013: Elsevier.
274 Multifunctional Nanocomposites in Civil and Structural Engineering

11.5 Conclusion
A self-heating pavement system based on a CNFP electroheating element is proposed.The feasibility and efficiency of the self-heating pavement system are validatedthrough experiments. This study resulted in the following conclusions.
CNFP provides good electrothermal properties at ambient temperatures below0 �C, with a rapid heating reaction and stable resistivity (0.72 U mm). These proper-ties indicate that CNFP can be employed as a highly efficient heating element togenerate a stable heat flux density for a self-heating pavement system. For example,a stable heat flux density of 1000 W/m2 can be generated by CNFP with an appliedcurrent of 2.3 A.
The high deicing efficiency and low energy consumption of the proposedself-heating pavement system with electrothermal materials have been validated.The deicing performance is affected by the thickness of the ice layer, the surroundingtemperature, the heat flux density, and the wind speed. The experimental results indi-cate that the deicing time and energy consumption increase with an increase in icethickness but decrease with an increase in the surrounding temperature. As anotheressential factor affecting the deicing performance, a larger heat flux density resultsin a decreased time cost as a hyperbolic function but has an uncertain influence on en-ergy consumption. Therefore, the optimal option for the heat flux density is determinedby an evaluation of the timeeenergy index, b, as the most rational power affordance.For example, with an ambient temperature of �10 �C, the optimal heat flux density is1800, 1400 or 1800, and 1800 W/m2 for ice with thicknesses of 10, 15, and 20 mm,which corresponds to minimum indices of 1.217, 1.34, and 1.331, respectively. Thehigh performance of the CNFP-based self-heating pavement system for snow meltingis also validated through an experimental study.
In terms of the evaluation criteria of efficiency, time, energy supply, cost, and envi-ronmental impacts, the deicing and snow-melting investigation verified that the pro-posed self-heating pavement system is a competitive and promising deicing andsnow-thawing technique. It may have the potential to be widely used in bridges, high-ways, pavement, and airport infrastructures.
Acknowledgments
This study was financially supported by project grant No. 2011BAK02B02, NSFC grant No.50808059, and grant No. HIT.NSRIF.2010019.
References
Chang, C., Michelle, H., Song, G., Yi-Lungand, M., Li, H., 2009. A feasibility study ofself-heating concrete utilizing carbon nanofiber heating elements. Smart Materials Struc-tures 18, 127001e127005.
Chung, D.D.L., 1994. Carbon Fiber Composites. Butterworth-Heinemann, Boston, US.
The self-heating carbon nanofiber polymer composite and its applications 275
Chung, D.D.L., 2001. Comparison of submicron-diameter carbon filaments and conventionalcarbon fibers as fillers in composites materials. Carbon 39, 1119e1125.
Chung, D.D.D., 2004a. Electrically conductive cement-based composites. Advances in CementResearch 16, 176.
Chung, D.D.D., 2004b. Self-heating structural materials. Smart Materials and Structures 13,562e565.
Feng, J.H., Li, H., 2009. Development of self-heating concrete using carbon nano-fiber paper.In: Tomizuka, M. (Ed.), Proc. of SPIE. (San Diego California, US 9e12 March 2009) (TheInternational Society for Optical Engineering, Sensors and Smart Structures Technologiesfor Civil, Mechanical, and Aerospace Systems) Vol. 7292. (CA: San Diego).
Ferrara, A.A., Haslett, R., 1975. Prevention of Preferential Bridge Icing Using Heat Pipes.Federal Highway Administration, Washington, D.C. FHWA-RA-75e111.
Fridman, P.L., 2009. Assessing the impact of pavement deicing products on aircraft and airfieldinfrastructure. Airport Management 3, 223e237.
George, G.K., Charles, C.R., 2011. An investigation of infrared deicing through experimenta-tion. Cold Regions Science and Technology 65, 79e87.
Harnick, A.B., Meier, V., Rosli, A., 1980. Combined influence of freezing and deicing salt onconcrete: physical aspects durability of building materials and components. ASTMSTP691, 474e484.
Hone, J., Whitney, M., Piskoti, C., Zettl, A., 1999. Thermal conductivity of single-walled carbonnanotubes. Physical Review B 59, 2514e2516.
Hou, Z.F., Li, Z.Q., Tang, Z.Q., 2002. Research on making and application of carbon fiberelectrically concrete for deicing and snow-thawing. Journal of Wuhan Institute of Tech-nology (Natural Journal Edition) 24, 32e34.
Kane, C.L., Mele, E.J., Lee, R.S., Fischer, J.E., Petit, P., Dai, H., Thess, A., Smalley, R.E.,Verschueren, A.R.M., Tans, S.J., Dekker, C., 1998. Temperature-dependent resistivity ofsingle-wall carbon nanotubes. EPL 41, 683e688.
Kim, S.Y., Koretsky, C., 2013. Effects of pavement salt deicers on sediment biogeochemistry.Biogeochemistry 112 (1e3), 343e358.
Litvan, G.G., 1976. Frost action in cement in the presence of deicers. Cement and ConcreteResearch 6, 351e356.
Lee, R.C., 1984. Bridge heating using ground source heat pipes. Transportation Research 962,51e57.
Lee, H., Cody, R.D., Cody, A.M., Spry, P.G., 2000. Effects of various deicing chemicals onpavement concrete deterioration. In: Proc. Mid-continent Transportation Symp. Iowa,Ames, pp. 151e155.
Li, H., Xiao, H., Ou, J., 2008. Electrical property of cement-based composites filled with carbonblack under long-term wet and loading condition. Composites Science and Technology 68,2114e2119.
Li, H., Zhang, Q., Xiao, H., 2013. Self-deicing pavement system with a CNFP high-efficiencythermal source and MWCNT/cement-based high-thermal conductive composites. ColdRegions Sciences and Technology 86, 22e35.
Li, H., Zhang, Q., Xiao, H., 2014. Analytic investigations of CNFP-based self-deicing pavementsystem on the deicing performance. Cold Regions Science and Technology 103, 123e132.
Lijima, 1991. Helical microtubes of graphitic carbon. Nature 354, 56e58.Lin, D., et al., 2014. Three-dimensional printing of complex structures: man made or toward
nature? ACS Nano 8, 9710e9715.Long, D.C., Baldwin, J.S., 1981. Snow and Ice Removal from Pavement Using Stored Earth
Energy. Federal Highway Administration. FHWA-TS-80e227, 78.
276 Multifunctional Nanocomposites in Civil and Structural Engineering

Moisala, A., Li, Q., Kinloch, I.A., Windle, A.H., 2006. Thermal electrical conductivity of singleand multi-walled carbon nanotube-epoxy composites. Composites Science and Technology66, 1285e1288.
Novotny, E.V., Murphy, D., Stefan, H.G., 2008. Increase of urban lake salinity by pavementdeicing salt. Science of the Total Environment 406 (1e2), 131e144.
Peebles, L.H., 1994. Carbon Fibers: Formation, Structure, and Properties. CRC Press, BocaRaton, FL, US.
Saito, R., Dresselhaus, G., Dresselhaus, M.S., 1998. Physical Properties of Carbon Nanotubes.Imperial College Press, London, UK.
Shi, X., et al., 2009. Deicer impacts on pavement materials: introduction and recent de-velopments. The Open Civil Engineering Journal 3, 16e27.
Tanaka, O., 1981. Snow melting using heat pipes. Advances in Heat Pile Technology 25,2272e2284.
Tuan, C.Y., Yehia, S., 2004. Evaluation of electrically conductive concrete containing carbonproducts for deicing. ACI Materials Journal 101, 287e293. M32.
Wang, K., Nelsen, D.E., Nixon, W.A., 2006. Damaging effects of deicing chemicals on concretematerials. Cement and Concrete Composites 28, 173e188.
Xu, X., et al., 2015. Self-sensing, ultralight, and conductive 3D graphene/iron oxide aerogelelastomer deformable in a magnetic field. ACS Nano 9, 3969e3977.
Yehia, S., Tuan, C.Y., Ferdon, D., Bing, C., 2000. Conductive concrete overlay for bridge deckdeicing: mixture proportioning, optimization and properties. ACI Materials Journal 97,172e181.
Zhang, Q., et al., 2015. Mechanically robust honeycomb graphene aerogel multifunctionalpolymer composites. Carbon. http://dx.doi.org/10.1016/j.carbon.2015.05.102.
Zhao, H., Wang, S., Wu, Z., Che, G., 2010. Concrete slab installed with carbon fiber heatingwire for bridge deck deicing. Journal of Transportation Engineering 136, 500e509.
Zhao, H., Wu, Z., Wang, S., Zheng, J., Che, G., 2011. Concrete pavement deicing with carbonfiber heating wires. Cold Regions Science and Technology 65, 413e420.
The self-heating carbon nanofiber polymer composite and its applications 277

Sensing sheets based onlarge-area electronics andintegrated circuits
12Branko Glisic, Naveen VermaPrinceton University, Princeton, NJ, USA
12.1 Introduction
Traditional strain-monitoring approaches are mostly based on discrete point sensors,which provide one with sparse detection of strain field anomalies. However, reliableand robust identification of damage calls for dense sensor arrays that cover large areasof structure. The main challenge for implementation of such a sensor network is scal-ability to the size of civil structures in terms of cost, ease of installation, spatial reso-lution, and data management and analysis. Emerging electronic technologies canaddress this challenge by providing flexible-form-factor, low-cost, ultra-low-energycomputation and precise instrumentation necessary for smart sensing. Patternedlarge-area electronics (LAE) is an emerging technology that allows the dense integra-tion of sensors and energy harvesters on an inexpensive (plastic) substrate (e.g., kap-ton) that can cover large areas of structures (Parashkov et al., 2005). In addition tosensors, this technology can enable large-area interconnect and semiconductor de-vices, which are useful for specific circuit functionality. However, the latter havesignificantly lower performance and energy efficiency compared to commonly avail-able silicon devices. This challenge can be overcome by hybrid systems that combineand exploit the energy-efficient instrumentation and processing provided by silicon in-tegrated circuits (ICs) and the large-area connectivity and distributed sensing capabil-ities of LAE. As a result, a strain sensing sheet based on LAE and ICs is being createdat Princeton University, enabling robust and reliable detection of minute strain fieldanomalies, determination of their position and extent with centimeter resolution, andquantification of anomalies using probabilistic approaches. The concept of the hybridsensing sheet and its current state of advancement are presented in this chapter.
12.2 Concept of direct sensing
The initialization of damage in structures frequently has a local character and occurs inthe form of strain-field anomalies. Typical examples include local buckling (bowing)in steel as a consequence of loss of local stability microcracks in steel, which are earlyindicators of fatigue; and cracks in concrete, which are early indicators of damage
Innovative Developments of Advanced Multifunctional Nanocomposites in Civil and Structural Engineeringhttp://dx.doi.org/10.1016/B978-1-78242-326-3.00012-9Copyright © 2016 Elsevier Ltd. All rights reserved.

caused by frost, alkali reaction, or corrosion in reinforcing bars. Early damage identi-fication (i.e., detection, localization, and quantification) can greatly aid preservationand maintenance activities, and significantly improve structural safety.
The primary challenge in traditional strain-monitoring approaches, based on discretesensors, is that their spatial resolution is limited (i.e., the sensors are sparsely placed atmutually distant locations over the structure). Consequently, damage detection atpoints distant from sensors is unreliable. To support this statement, early-age strainmeasurements collected from the Streicker Bridge at the Princeton University campususing embedded long-gauge fiber-optic sensors are given in Figure 12.1 (Yao andGlisic, 2012). The sensors with a gauge length of 60 cm (labeled P10h11U,P10h11D, and P10h11L; see Figure 12.1) were embedded in a cross section of thebridge during pouring of concrete. Early-age cracking occurred in the cross sectionand involved the locations P10h11U and P10h11D, and thus the corresponding sensorswere directly activated. The crack created a strain field anomaly that was reliably iden-tified as a large change in the strain, which was at least one order of magnitude higherthan the noise (uncertainty) of the monitoring system combined with noise from usualstrain sources, such as temperature variations and live load. The sensor P10h11L,which was installed less than a meter away from the two other sensors (see Figure 12.1),did not cross the crack, and thus it was indirectly affected by the crack. It measured onlya small change in the strain magnitude (as shown in the figure), which is comparableand thus extremely difficult to distinguish from usual strain sources. Other sensors inthe bridge that were at distances of 2 m or more did not register any relevant changein the strain (Hubbell and Glisic, 2013).
The error limits of the monitoring system were 4 mε (Hubbell and Glisic, 2013), butthe tiny crack of w0.1 mm (Abdel-Jaber and Glisic, 2015) would be detected by thedirectly affected sensors even if the precision of the monitoring system was an order ofmagnitude lower. This demonstrates that direct contact of sensors with the damage(i.e., the concept of direct sensing) not only provides high reliability and sensitivity,but also enables very high robustness to conditions found in real-life settings.
Hence, full reliability in damage detection can be achieved only if the strain sensoris in direct contact with the damage. If that is not the case, the damage detection is
P10h11LP10h11U
P10h11D
P10h11U
P10h11D
P10h11L
Cra
ck
10/23/09
Threshold= 40 με
Threshold = 40 με
10/24/09 10/25/09 10/26/09
Date and time
10/27/09 10/28/09 10/29/09
100
50
–50
–100
–150
–200
–250
–300
0
Aver
age
stra
in (μ
ε)
Cra
ck
Figure 12.1 Left: Position of discrete fiber-optic sensors within a cross section of theStreicker bridge; right: direct crack detection versus indirect crack detection in the Streickerbridge (Yao and Glisic, 2012).
282 Multifunctional Nanocomposites in Civil and Structural Engineering

either simply impossible or must be performed indirectly, requiring complex dataanalysis algorithms whose reliability is in general challenged by strain-field perturba-tions caused by the usual variability of influences found in real-life settings (live loadfluctuations, temperature and humidity variations, etc.).
Discrete strain sensors can have short or long gauge length. Typical examples of theformer are resistive strain gauges, vibrating-wire sensors, and fiber Bragg-grating sen-sors (FBGs); typical examples of the latter are interferometric fiber-optic sensors(SOFOs) and specially packaged FBGs (Glisic and Inaudi, 2007). Althoughlong-gauge sensors have better spatial coverage and thus are more suitable for directsensing, general key shortcomings of both types of discrete sensors are (1) their insen-sitivity to the anomalies that do not occur in the close proximity of the sensors (Wipfet al., 2007), and, importantly, (2) the number of sensors required to cover large areasof structures, thereby imposing tedious installation, complex cabling, and challengingdata management and analysis (Heise, 1965).
Distributed fiber-optic sensing technologies (Glisic and Inaudi, 2007) offer signif-icant improvements with respect to discrete sensing technologies. A distributed sensor(sensing cable) is continuous and sensitive at each point along its length. Thus, it prac-tically enables one-dimensional (1D) strain-field monitoring. Nevertheless, thedamage occurring in areas far from sensors is not directly detected. The reliabilityin damage detection for various types of sensors is schematically presented andcompared in Figure 12.2 (modified from Glisic and Adriaenssens, 2010).
Figure 12.2 shows that if the exact location of the damage occurrence is not knownat the time of installation of sensors (which is frequently the case in real-life settings),
Direct detection of “E” by 2D “sheet” sensor
E1
Short-gauge
Damage “A”
Direct, reliabledetection
Direct, reliabledetection
Direct, reliabledetection
Direct, reliabledetection
Direct, reliabledetection
Indirect orimpossible
Indirect orimpossible
Indirect orimpossible
Indirect orimpossible
Indirect orimpossible
Indirect orimpossible
Direct, reliabledetection
Direct, reliabledetection
Direct, reliabledetection
Direct, reliabledetection
Direct, reliabledetection
Damage “B” Damage “C” Damage “E”
Long-gauge
Distributed
2D sensor
E3 C1 A1 A2B1 C2 B2
E2
Figure 12.2 Schematic comparison between damage detection capabilities of short-gauge,long-gauge, and 1D distributed sensors, and 2D distributed sheet sensor.Modified from Glisic and Adriaenssens (2010).
Sensing sheets based on large-area electronics and integrated circuits 283

only a 2D distributed sensor or a 2D array of densely spaced sensors can provide reli-able damage detection based on direct sensing. The main challenge of the technologythat may potentially enable 2D direct sensing is scalability to the size of civil struc-tures, as it has to address conformability to irregular surfaces, physical robustness toenvironmental influences, big data management and analysis, and practical power sup-ply. A hybrid solution combining the best performances of LAE and ICs into strainsensing sheets is one way to successfully address the challenge of large-scale 2D directsensing.
12.3 LAE and ICs
LAE and silicon complementary metaleoxide semiconductor (CMOS) ICs providehighly disparate characteristics in terms of electrical operation, form factor, andcost. The motivation behind a hybrid system that combines the two technologies isto exploit their respective strengths to enable systems for very large-scale sensingand monitoring. The two technologies derive their characteristics, and thus theirstrengths and weaknesses, from the associated methods of fabrication. Here, an over-view is provided. Following this, the complementary strengths of the technologies areidentified for realizing the various system functions required for embeddedstructural-health-monitoring applications.
Silicon ICs represent the dominant technology used for electronic devices today.The basic device on which these are based is the metaleoxide semiconducting fieldeffect transistor (MOSFET). The MOSFET forms the basis for implementing thevast majority of functions within state-of-the-art ICs in use today. The functionsthat have been of primary focus include computation, instrumentation, communica-tion, and so on. To drive the advancement of these functions (in terms of performance,scale/complexity, and accessibility), the IC semiconductor industry has focused onimproving the performance and cost of the MOSFET. Over the last 50 years, thewell-known trend referred to as Moore’s law has been the primary means for achievingthis improvement. An important characteristic of silicon MOSFETs is that they requirehigh-temperature processing (w1000 �C) to achieve the desired electrical characteris-tics. This restricts the materials that can be employed during fabrication, in turnlimiting the types of devices and types of substrates that are possible for fabricatingdevices. From an application perspective, this translates into limitations in terms of di-versity of functions and form factor.
LAE is a technology whose fabrication differs from that of silicon CMOS in thatLAE is based on processing thin films of materials at low temperatures (w200 �C).This has the important characteristic of being compatible with a wide range of differentmaterials and substrates. From an application perspective, this translates into the abilityto form diverse types of devices, especially for sensing and energy harvesting, and theability to integrate these onto substrates such as glass or plastics, which can be phys-ically large and conformal. As a result, over the last 10 years, research in LAE has ledto demonstrations of an extremely rich set of transducers for sensing, actuation, and
284 Multifunctional Nanocomposites in Civil and Structural Engineering

energy harvesting (Someya et al., 2008). Examples have included sensors for strain(Zhou et al., 2006), pressure (Someya et al., 2004), and vibrations; actuators for visualdisplay, mechanical force (Jafferis and Sturm, 2013), and audio; and energy harvestersfor solar, thermal, and mechanical (Qi et al., 2010).
However, the use of such devices within systems inevitably requires supportingfunctionality for instrumentation, power management, embedded computation, andcommunication. Generally speaking, the implementation of such functionality is basedon transistors. Indeed, thin-film transistors (TFTs) are possible in LAE. In fact, theseare in widespread use today in flat-panel display applications, where transistors onglass are required to distribute signals to drive pixels. Thanks to this application, whichhas given rise to a $100 billion/year industry, TFT manufacturing on glass hasbenefitted from its own scaling trends, resulting in larger substrates and lower costper area. Today, manufacturing is done on glass substrates of nearly 10 m2 at a costof roughly $200/m2.
Despite such scaling and such success in display applications, LAE TFTs pose sub-stantial challenges for realizing generalized sensing systems. The reason is that theirperformance and energy efficiency are orders of magnitude below those of the bench-mark transistors used in electronic devices today, namely, silicon MOSFETs. Thereason for discrepancy is low-temperature processing, which yields the benefits interms of sensing and energy harvesting for LAE (as mentioned in this chapter) butalso leads to low electrical performance. For quantitative comparison, Table 12.1(Hu et al., 2014a) compares key electrical parameters for silicon MOSFETs (at the130 nm technology generation) with those for LAE TFTs (based on amorphous silicon(a-Si), the dominant technology used today in flat-panel displays).
The mobility for electrical current (me) indicates how fast electrical charge canmove through a material across which an electric field exists (i.e., due to applicationof a voltage); the capacitances (CGD=GS) indicate how much charge is required togenerate a voltage change; the gate-dielectric thickness (tdielectric) indicates how
Table 12.1 Comparison of the electrical parameters of LAE thin-filmtransistors (based on low-temperature processed amorphoussilicon (a-Si) and silicon MOSFETs (at the 130 nm technologygeneration) (Hu et al., 2014a)
LAE TFT (a-Si) Silicon IC (130 nm)
Mobility (me) me: 2 cm2/Vs me: 1000 cm2/Vs
tdielectric 280 nm 2.2 nm
VDD 6 V 1.2 V
CGD=GS 3.3 fF/mm 0.34 fF/mm
fT 1 MHz 150 GHz
Sensing sheets based on large-area electronics and integrated circuits 285

many current-causing carriers are generated as a result of a voltage applied to the tran-sistor’s input electrode (gate); and the unityecurrentegain frequency ( fT) indicates thesignal frequency beyond which a transistor’s output current falls below its input cur-rent, thus negating the ability to amplify input signals. Their orders-of-magnitude infe-rior parameter values suggest that TFTs alone cannot viably enable the supportingfunctionality necessary for the large-scale sensing made possible by LAE. Thus, thereis a need to explore hybrid systems that combine LAE with silicon ICs.
To motivate hybrid systems on a high level, Table 12.2 (Hu et al., 2014a) considersthe core system functions required: sensing, power management, communication, andcomputation. The complementary strengths of the two technologies toward realizingthese functions in the context of large-scale sensing are summarized. For sensing,LAE enables the formation of diverse and expansive sensor arrays, whereas siliconICs enable precision instrumentation and signal acquisition. For power management,LAE enables physically large energy harvesters capable of harvesting substantialpower from ambient sources, and silicon ICs enable efficient (low-loss) control andpower conversion circuitry. For communication, LAE enables large-area interconnectsfor low-energy wired communication among distributed sensing subsystems aswell as the possibility of large-dimensioned antennas for improving the efficiency ofwireless communication, whereas silicon ICs enable high-speed, energy-efficientdata transceiver circuitry. Computation is a function that has particularly benefittedfrom Moore’s law scaling, enabling silicon ICs to provide high-performance,energy-efficient operations on a very large scale. LAE, on the other hand, does not pro-vide comparable performance for computation.
From this discussion, it follows that hybrid systems represent an appropriate choice,whereby the highly complementary strengths of LAE and silicon ICs can be jointlyexploited. Practically, the challenge with hybrid systems arises due to the interfacingthat is required between the two technologies. In particular, the interfaces pose the
Table 12.2 Summary of the respective strengths of LAE and siliconICs for realizing core system functions (Hu et al., 2014a)
Silicon ICs LAE
Sensing þ Precision instrumentation þ Diverse transducers, largesubstrates
Power management þ (Dynamic) control, DC/DCconversion, regulation
þ Large-dimensioned energyharvesters
Communication þ Physical-layer transceivers(wired/wireless)
þ Low-loss interconnect for1 cme10 m telemetry
þ Large-dimensionedantennas
Computation þ >1B high-performancelogic gates
� Low-power performance/density/efficiency devices
286 Multifunctional Nanocomposites in Civil and Structural Engineering

primary limitation to system scalability and efficiency. Thus, the primary focus for en-gineering practical hybrid systems is developing architectures for the various systemfunctions that are built around scalable and low-cost strategies for interfacing thetwo technologies. Although LAE TFTs are not preferred for implementing the coresystem functions, they can play an important role in enhancing the use and operationof the interfaces. A prototype system taking this approach is described in further detailin Section 12.4.2.
12.4 LAE/IC sensing sheets
12.4.1 General
LAE/IC sensing sheets consist of the following main components (Glisic and Verma,2011), as shown in Figure 12.3:
1. 2D distributed array of strain sensors patterned on inner layer of kapton (polyimide) substratecombined with the patterned interconnect and functional LAE;
2. ICs, which serve as intelligence units, interfaced to the sheet via scalable noncontact inter-faces for sensor readout, data management and analysis, power management, and communi-cation; and
3. Protective outer layer with integrated flexible solar-energy harvester (photovoltaic); the latteris combined with power converters and batteries patterned in the LAE sheet to power the fullsystem.
The individual sensor patterned on the sensing sheet is actually a full-bridge resis-tive strain gauge. It consists of four resistors, two oriented in the measuring directionand two perpendicular to that direction, as shown in Figure 12.4 (Tung et al., 2014),
Figure 12.3 Schematic concept of the sensing sheet: its components and its application(Tung et al., 2014).
Sensing sheets based on large-area electronics and integrated circuits 287

and mutually connected to form an (electrical) Wheatstone bridge (Perry and Lissner,1955). The full-bridge configuration is chosen for sensors because of its capability fordifferential sensing. This significantly improves robustness against nondesiredexternal and internal interferences (e.g., makes sensors virtually insensitive to temper-ature and humidity variations, and to inherent shrinkage of concrete) and enables thealternating-current readout scheme to be applied to the sensors by avoiding large sinu-soidal baseline signals (Glisic and Verma, 2011).
The flexible kapton (polyimide) substrate allows conformability to the surface ofthe monitored structure. Each IC is responsible for a group of sensors, as indicatedby dashed lines in Figure 12.3. It reads the attributed sensors sequentially, processesthe collected data, and analyzes the data. IC communicates with the sensors vianoncontact links and with neighboring ICs wirelessly. This flexible scheme allowsfor independent reading of individual sensors, and thus damage or malfunction ofone or several sensors does not affect the functioning of the reminder of the sensingsheet. This also allows tailor-cutting the sensing sheet in order to fit it to the shapeof a monitored area (see Figure 12.3). In addition, an appropriate pattern of the inter-connect makes sensors accessible to multiple neighboring ICs, so in the event of dam-age or malfunctioning of one IC, the neighboring ICs can access the group of sensorsoriginally attributed to that IC and keep the sensing sheet operational.
All ICs communicate with the master node, which in turns communicates with amonitoring center using wired or wireless communication. The network of ICs enablesdistributed data management and analysis, and transmits the data to the monitoringcenter, in general, only on demand or when damage is detected. In this manner, effi-cient data management and flow are established, and only a relatively modest amountof critical data is transmitted to the monitoring center, as opposed to traditional ap-proaches where large amounts of raw data would be transmitted to the monitoring cen-ter and then analyzed.
Assuming that the damage is detected, the location and spatial extent of the damagecan then simply be determined by identifying the locations (coordinates) of sensorsactivated by the damage. An example in Figure 12.3 illustrates this concept: the dam-age is represented by a solid line, and activated sensors by shaded color. Figure 12.3also shows that accuracy in damage localization and extent depends on the size andspatial arrangement of sensors. Thus, the design of the sensing sheet, which includesthe size and spatial arrangement of sensors, depends on the level of reliability in
Figure 12.4 Left: Configuration of the full-bridge sensor with strain measurement directionindicated by arrows; right: corresponding Wheatstone bridge scheme for sensor readout(Tung et al., 2014).
288 Multifunctional Nanocomposites in Civil and Structural Engineering

damage detection and accuracy in damage localization that is to be achieved, and onthe strain distribution in the monitored structure. For example, for uniform probabilityof damage occurrence in terms of damage position, extent, and orientation, it can beshown that the use of a large number of smaller sensors uniformly distributed withinthe sheet provides better performance than using a smaller amount of larger sensorsthat are not uniformly distributed (Yao and Glisic, 2014).
The sensing sheet is currently available only in the form of a prototype (i.e., it is notcommercially available at the time of writing of this book); nevertheless, its compo-nents and the concept are proven at the experimental level, as shown in the followingsubsections.
12.4.2 Hardware components
As mentioned in Section 12.3, the primary challenge when it comes to realizing hybridLAE/IC systems is the interfacing required between the two technologies. With siliconICs having a physically small and rigid form factor and LAE having a large andconformal form factor, a challenge arises because no high-volume process exists todayfor robust electrical bonding of small, rigid devices to large, flexible sheets. To over-come this challenge, the sensing-sheet architecture (Hu et al., 2014a,b) employsnoncontact electrical interfacing through inductors and capacitors. Inductors generatea magnetic field and capacitors generate an electric field, both of which enable electri-cal signal coupling at a distance. Generally, the strength of the coupling depends on thephysical sizes of the inductors and the capacitors as well as the distance over which thesignal is being coupled. Thus, the interfaces necessitate careful engineering and newinnovations for enabling the subsystem architectures.
Figure 12.5 shows a system-level block diagram of a prototype described in Huet al. (2014a). To realize the interfaces, the small silicon ICs are bonded to acredit-card-sized flexible carrier, on which planar inductors and capacitors arepatterned. This process is similar to that used for high-volume radiofrequency IDtag assembly today. Coupling inductors and capacitors are then also patterned onthe LAE sheet, and system assembly of multiple such IC patches with multipleLAE-sheet sites is achieved through low-cost sheet lamination. The resulting inductorand capacitors have dimensions of 2e3 cm, and the lamination requires roughly100-mm-thick adhesive, enabling efficient proximity coupling.
With such interfaces, the system can distribute functionality as preferred betweenthe LAE and silicon IC technologies. For the power management subsystem, LAE per-forms photovoltaic energy harvesting and DC-to-AC power inversion using TFT cir-cuits, whereas the silicon ICs perform power rectification and voltage conversion, toenable full-system self-powering. For the sensing subsystem, LAE performs strainsensing and individual sensor accessing via TFT circuits, whereas the silicon ICsperform signal acquisition and readout for sensing over the large-scale array. Forcommunication, LAE provides long wired interconnects, and the silicon ICs provideself-calibrating data transceivers.
Figure 12.6 illustrates details of the hybrid sensing subsystem (Hu et al., 2014b).Switches in the LAE domain select the strain gauges one at a time. To enable use
Sensing sheets based on large-area electronics and integrated circuits 289

Figure 12.5 Block diagram of prototyped self-power strain-sensing hybrid system(Hu et al., 2014a).
Figure 12.6 Hybrid sensing subsystem (Hu et al., 2014b).
290 Multifunctional Nanocomposites in Civil and Structural Engineering

of noncontact interfaces, the selected strain gauge is biased using an AC signal pro-vided by the CMOS IC through an inductive interface. The differential voltage outputthat results from the strain gauge is thus AC modulated, enabling it to then be coupledback to the CMOS IC through a capacitive interface. To readout the strain signal, theCMOS IC demodulates the differential voltage using a synchronous integrator, whichdemodulates the strain signal back to DC, filtering stray noise through integration.
Figure 12.7 illustrates details of the hybrid power management subsystem(Hu et al., 2014a). DC power harvested from solar modules must be converted toAC power for transmission to the CMOS IC via noncontact interfaces. To accomplishthis, the subsystem employs a TFT oscillator, wherein oscillations are achieved bymeeting a resonance condition between inductors patterned on the LAE sheet andthe capacitors inherent to the TFTs. Such an oscillator presents advantages for LAE,as its performance depends largely on the quality of inductors, which can be compar-atively high, as compared to the performance of the transistors, which is comparativelylow. Once transmitted to the CMOS IC, the AC power is rectified, monitored, andregulated to three different voltage levels (0.6, 1.2, and 2.4 V) in order to power theentire system.
Figure 12.8 illustrates details of the hybrid communication subsystem for transmit-ting data between ICs distributed on the LAE sheet (Hu et al., 2014b). In the trans-mitter, digital data are modulated to the resonant frequency of the LAE interconnectnetwork; this makes the drive-point impedance appear large, reducing the power con-sumption of the transmitter. Generally, the precise resonant frequency is hard to knowa priori. For this reason, the transmitter employs a calibration phase, wherein the mod-ulation frequency is swept using a digitally controlled oscillator (DCO). The localreceiver monitors the transmitted signal level such that the frequency peak,
Figure 12.7 Hybrid power management subsystem (Hu et al., 2014a).
Sensing sheets based on large-area electronics and integrated circuits 291

corresponding to the resonant point, can be identified. During normal operation, thereceiver then senses the transmitted signal and demodulates it to baseband digitalpulses using a peak detector followed by a comparator.
A photograph of the prototyped system is shown in Figure 12.9. The LAE compo-nents are fabricated in-house at Princeton University on 50-mm-thick polyimide, andthe silicon IC is designed at Princeton University and fabricated using standardfoundry services provided by IBM in 130 nm technology generation. Detailed charac-terization of all subsystems has been performed, and operation of the system applied toa cantilever beam in the lab has been demonstrated. All results are described inHu et al. (2014a). Future plans for deployment on an in-use structure are beingdeveloped.
LAE CMOS
Transmitter
Receiver
Duty-cycledpower amplifier
Pre-amplifier
3 μA
3 μA
3 pF
Peak-detector CLK
Dataout
DCO code
290
280
270
260110 120 130 140
AD
C c
ode
8-bit DCO
ADC
Calibrationlogic
Data In
Voltagestep down
Voltagestep up
Figure 12.8 Hybrid communication subsystem (Hu et al., 2014b).
Figure 12.9 Photographs of integrated prototype system (Hu et al., 2014a).
292 Multifunctional Nanocomposites in Civil and Structural Engineering

12.4.3 Interpretation of a measurement of an individual sensor
The strain-field anomaly manifests as either a perturbation in a continuous strain field(e.g., yielding or bowing of steel) or a discontinuity in a strain field (e.g., cracking insteel or concrete). The former will be accurately measured by individual sensorsmaking part of the LAE/IC sensing sheet as a high strain change, yet within the ul-timate limit of strain of the monitored material. However, the latter will generate avery high strain in the individual sensors, and consequently either the sensors willfail or their individual readings will not represent exact strain in monitored material(i.e., around the location of crack), but rather the strain within the sensor body gener-ated by the crack opening. Moreover, in sensors that did not fail, quantitatively equalcrack openings will generate different strain outputs due to stress concentration in thesensors and adhesive (used to attach the sensing sheet to the structure), irregularcrack shape, and degradation of the material at location of the crack (degradationof crack mouths is typical for concrete). Figure 12.10 shows results of 10 tests per-formed on a specimen of cracked concrete (Tung et al., 2014). In order to keep thecost of tests low, the sensor used in the test was a commercially availablefull-bridge strain gauge.
The test results show dispersion in relation (regression lines) between crack open-ing and sensor reading. This implies that the crack width cannot be evaluated determin-istically, but rather probabilistically. The experiments indicate that the regression lineshave log-normal distribution, and consequently for a given reading of the sensor theevaluation of the crack opening should be interpreted in terms of expected valueand confidence intervals. For example, if a sudden strain change of 3000 mε(1 mε ¼ 10�6 m/m) is registered by an individual sensor, one can conclude that a crackoccurred (typical tensional ultimate strain in concrete is 60e200 mε, that is, muchsmaller than 3000 mε). Based on log-normal distribution shown in Figure 12.10, the
Cra
ck o
peni
ng (m
icro
met
ers)
400
350
300
250
200
150
100
50
0
Strain (microstrain)0 1000 2000 3000 4000 5000 6000
Type 1 (all)MeanMean + stdMean – std
Figure 12.10 Crack opening versus strain for full-bridge strain sensor. Mean � onestandard deviation and log-normal distribution for the calibration coefficient shown (Tung et al.,2014).
Sensing sheets based on large-area electronics and integrated circuits 293

expected crack opening is 121 mm, but the most likely value of the crack opening is95 mm. In addition, there is 73% confidence that the crack opening ranges between70 and 173 mm (� one standard deviation from the mean) and 96% confidence itranges between 18 and 224 mm (� two standard deviations from the mean). Althoughthis nondeterministic approach may seem inconclusive at first instance, it should beobserved at a larger (i.e., sensing-sheet) scale: a crack occurrence will certainly acti-vate several neighboring individual sensors in the sensing sheet (see Figure 12.3),and the probabilistic information about crack opening obtained from multiple individ-ual sensors is combined to narrow down the confidence intervals and determine thesize of the crack opening.
12.4.4 Laboratory testing
A series of reduced-scale tests were performed in the laboratory to assess and validatethe concept of the sensing sheet. The tests involved cyclic loading of four steel platesinstrumented with sensing-sheet prototypes. Each plate had a deep notch on the bound-ary, which induced stress concentration that generated fatigue crack. The crack’s occur-rence, propagation, and extent were monitored using the sensing sheets. Although intotal four plates were tested using two different designs of sensing sheet, only onerepresentative test is presented in this section, to keep it concise and informative.More detail about the other tests can be found in Yao and Glisic (2015).
The arrangement of sensors within the sensing sheet was determined based on theknown point of the crack occurrence (at the notch) and its approximate propagationdirection (perpendicular to the applied force). The arrangement consisted of a primary“grid” of equidistantly spaced sensors (see Figure 12.11(a)) whose aim was to be indirect contact with the crack, and a secondary “grid” whose aim was to assess the in-fluence of the crack on the sensors that are in close proximity to the damage, but notdirectly intersecting it. The size of the sensing sheet was 150 � 150 mm, and the totalnumber of sensors within the sheet was 31 (11 � 14 mm each). To decrease the cost ofthe tests while keeping the focus on the test aims, the sensing sheets consisted of inter-connect and sensors only. The acquisition of sensor measurements was performed us-ing a commercially available strain-gauge reading unit. This resulted in a setup thatenabled key experiments and provided good representation of the sensing sheet con-ceptual performance. A steel plate instrumented with the sensing sheet and placedin the testing machine is shown in Figure 12.11(a).
(a)(a) (b)(b) (c)(c)(a) (b) (c)
Figure 12.11 (a) Testing setup; (b) initiation of crack (encircled); and (c) failed plate.Modified from Yao and Glisic (2015).
294 Multifunctional Nanocomposites in Civil and Structural Engineering

The machine enabled cycling loading with a typical range between 53 and 125 kNapplied until the plate failed (i.e., until the displacement between the arms of the ma-chine reached 25.4 mm). The initiation of the crack in each plate occurred before40,000 cycles were achieved. Further cycling did not cause immediately a significantpropagation of the crack; however, the crack propagation abruptly accelerated whenthe plate was close to failure. Figure 12.11(b) and (c) shows crack initiation and afailed plate, respectively.
To present the general response of the sensing sheets to crack initiation and prop-agation, three typical time series of strain registered by individual sensor are shownin Figure 12.12. The selected sensors are denoted with C4, D5, and G4 inFigure 12.11(c). The crack propagated from right toward left (see Figure 12.11),and consequently it first met the sensor C4, then propagated toward the sensors D5and G4. It is important to highlight that in the case of tests on concrete (see Section12.4.3), the sensor could function properly even if exposed to a crack opening offew millimeters, mostly due to concrete degradation around crack mouths, whichallowed stress relaxation in the sensor. However, that was not the case for cracks insteel, which would immediately damage an intersecting sensor due to lack of degrada-tion of crack mouths and the consequent lack of stress relaxation in the sensor.
The following patterns were identified in diagrams in Figure 12.12: (1) if there is nocrack in proximity of the sensor, then there is no significant change in the strain output;(2) if the crack approaches the sensor, then strain significantly increases and this indi-cates that the damage is in the neighborhood of the sensor; (3) steel yields at approx-imately 2000 mε, and strain increases with a higher rate; (4a) if the crack tip intersectsthe sensor at any stage in phases (2) or (3), the sensor fails and this fact (failure ofsensor) is used to detect and localize the damage (see sensor C4 in Figure 12.12(a)and sensor G4 in Figure 12.12(c)); and (4b) if the crack “passes” nearby the sensor,the strain output decreases significantly and damage is detected and localized basedon this decrease (see sensor D5 in Figure 12.12(b)). Note that although the patternsin phases (4a) and (4b) are important for damage detection and localization, those inphases (2) and (3) are also important as they can be used to predict the propagationof the crack, and thus they can be used to alert the responsible engineers on a poten-tially escalating structural safety issue.
Sensor C4 was the first to be intersected by the propagating crack at approximately7850 s from the beginning of the test, and it failed as soon as it was “touched” by thecrack tip (see Figure 12.12(a)). Consequently, the crack was detected at that locationthrough the damaging of the sensor. Sensor D5 was the next sensor affected by thepropagating crack at approximately 9770 s from the beginning of the test (seeFigure 12.12(b)); however, this sensor was not directly intersected by the crack andthus was not damaged. Crack was detected at that location indirectly as a decreasein the strain output. Finally, sensor G4 was affected by the crack at approximately9860 s from the beginning of the test, and because its location was on the crack prop-agation line, it failed when the crack tip reached it (see Figure 12.12(c)); in otherwords, the crack was detected at that location through the damage of the sensor (similarto sensor C4).
Due to manufacturing defects, some sensors lost electrical contact during tests andcould not provide strain measurements. Based on the strain time-series collected fromall functioning sensors (shown as black dots in Figure 12.13), real-time 2D strain-field
Sensing sheets based on large-area electronics and integrated circuits 295

(a)
Stra
in (μ
ε)
Sensor C4
(I) No crackin proximityof the sensor
(II) crackapproachingthe sensor
Ste
elyi
elds
(III) crackclosersteel inplasticregime
(IVa)
Cra
ck ti
p re
ache
s an
dda
mag
es th
e se
nsor
s
40,000
30,000
20,000
10000
–10,000
0
Stra
in (μ
ε)
10,000
8000
6000
4000
2000
–2000
0 Ste
elyi
elds
Sensor D5
(IVb) Crack tip passes nearby the sensor,strain relaxes the sensors
(I) No crack inproximity of the sensor
(II) Crackapproachingthe sensor
(III)
Cra
ck c
lose
r, st
eel
in p
last
ic re
gim
e
(b)
Stra
in (μ
ε)
Ste
el y
ield
s
12,000
10,000
8000
6000
4000
2000
0
–20000 2000 4000 6000 8000 10000
Time (s)
Sensor G4
(IVa) Crack tip reachesand damages the sensor
(II) Crackapproachingthe sensor
(I) No crack in proximity of the sensor
(III)
Cra
ck c
lose
r,st
eel i
n pl
astic
(c)
Figure 12.12 Typical sensor readings: (a) Sensor C4; (b) Sensor D5; and (c) Sensor G4.Note: Scale for strain is not the same for the three graphs.Modified from Yao and Glisic (2015).
296 Multifunctional Nanocomposites in Civil and Structural Engineering

t = 0035:26 X 104
5
4.5
3.5
2.5
1.5
0.5
–0.5
4
3
2
1
0
150
100
50
00 50 100 150x (m)
y (m
)
Stra
in (μ
ε)
t = 02:42:47 X 104
5
4.5
3.5
2.5
1.5
0.5
–0.5
4
3
2
1
0
x (m)50 100 1500
150
100
50
0
y (m
)
Stra
in (μ
ε)
t = 02:45:00 X 104
5
4.5
3.5
2.5
1.5
0.5
–0.5
4
3
2
1
0
x (m)50 100 1500
150
100
50
0
y (m
)
Stra
in (μ
ε)
(a) (b) (c)
Figure 12.13 Strain field in plate evaluated by the sensing sheet at various stages of the test: (a) crack initiation; (b) crack propagation; and(c) final extent of crack.Modified from Yao and Glisic (2015).
Sensing
sheetsbased
onlarge-area
electronicsand
integratedcircuits
297

history graphs have been created (Yao and Glisic, 2015). Three illustrative examples areshown in Figure 12.13. The strain values at points not directly equippedwith sensorswerederived using linear interpolation. The diagram in Figure 12.13(a) shows the strainfield atthe crack initiation, the diagram in Figure 12.13(b) shows the strain field during crackpropagation, and the diagram in Figure 12.13(c) shows the strainfield atfinal crack exten-sion (i.e., at the conclusion of the test). Two important conclusions are derived fromFigure 12.13: (1) the sensing sheet was able to detect the crack initiation, follow its prop-agation, and evaluate its extension; and (2) even though some sensors malfunctioned, theremainder of the sensorswas sufficient to capture the critical characteristics of the damage.This demonstrates inherent redundancy and robustness of the sensing sheet.
In conclusion, the tests validated the sensing sheet as a reliable 2D distributedsensor for damage detection, localization, and evaluation of its extent. Moreover,the tests confirmed that direct sensing is an effective and viable approach for damageidentification.
12.5 Future trends
The future trends in LAE/IC sensing sheets are already emerging. They can be roughlyclassified in three areas, presented as follows.
A logical suite for LAE/IC sensing sheets is enabling multifunctional and multi-sensing capabilities for more comprehensive structural health monitoring. Several in-dividual sensor types were proven to be enabled by LAE such as pressure sensors(Someya et al., 2004), temperature sensors (Graz et al., 2009), and sensors based onpiezoelectric principles (Seminara et al., 2013). All these sensors can be combinedwith strain sensors either within the same layer of the substrate or within differentlayers, with the aim of creating multisensing capabilities for the sensing sheet. Inparticular, piezoelectric transducers could be used for acoustic emission sensing andactive wave propagation monitoring, and provide detection of subsurface damage,extending the sensing sheet’s distributed sensing capabilities from 2D to 3D. More-over, piezoelectric transducers can provide for additional power harvesting in struc-tures exposed to extensive vibrations (e.g., bridges, wind turbines, and aircrafts),which will add to the multifunctional nature of the sensing sheet.
Another direction is development of strain-sensing sheets containing individualsensors manufactured of different materials (e.g., conductive polymers) and basedon different physical sensing principles (e.g., capacitance). One example is a softelastomeric capacitor consisting of (1) a thermoplastic elastomer matrix ofpolystyreneeco-ethyleneeco-butyleneeco-styrene (SEBS), which is (2) doped withtitanium dioxide (TiO2) and placed between two electrodes made of SEBS mixedwith carbon black particles (Laflamme et al., 2013). This type of individual sensor fea-tures identical sensitivity to strain in both directions. Thus, it has great promise fordamage detection in surface structures (plates and shells) loaded in both directions,where the strain field anomalies have similar probability of occurrence in both direc-tions. In addition, its measurement range can reach 200,000 mε (20%), which makes it
298 Multifunctional Nanocomposites in Civil and Structural Engineering

particularly suitable for detection of large strain-field anomalies. Another exampleis strain sensors based on water-dispersible, polymer acidedoped polyaniline,PANI-PAAMPSA (Yoo et al., 2007), which after certain treatments can exhibit nega-tive resistance when exposed to tension, and vice versa (i.e., positive resistance whensubjected to compression). This makes them particularly suitable for the identificationof various strain components combined within regular strain measurement, such asshrinkage and thermal strain (Sezen et al., 2015).
Stretchable LAE is a recent revolutionary extension of flexible LAE. While flexibleLAE, used in LAE/IC sensing sheets, permits for limited conformity and small revers-ible deformation, stretchable LAE is printed on elastomeric substrates that allows forlarge yet reversible (elastic) deformation of the patterned electronics (Wagner andBauer, 2012). The Young’s modulus of individual components of stretchable LAEcan span 12 orders of magnitude (Wagner and Bauer, 2012); however, they aremade compatible by appropriate architecture and patterning of electronics. The prin-cipal applications of stretchable LAE are currently found in the biomedical industry.Nevertheless, large deformation allowed by stretchable LAE can be beneficial increating a new generation of sensing sheets, which can actually be renamed “sensingskins” due to their high elasticity. In particular, large allowable strain in sensing skincan prevent malfunction of sensors and circuits due to local structural damage(e.g., crack opening), which can generate large local strains in the substrate. Further-more, it can allow for tailor-made deployment without sacrificing or cutting out thesensors or ICs. Finally, it can allow for full conformity of sensing skin to geometricallycomplex parts of structures. The principal functional components of stretchable elec-tronics such as ICs (Sekitani and Someya, 2012), conformable sensors (Kim et al.,2012) and power harvesters (Kornbluh et al., 2012) are already proven. Transitionto SHM applications has not yet happened, but the pioneering works in that directionare very promising (Salowitz et al., 2014).
12.6 Sources of further information and advice
More information concerning LAEs and ICs can be found in the journals and confer-ences listed here.
Journals• Applied Physics Letters• IEEE Electron Device Letters• IEEE Journal of Solid-State Circuits• IEEE Transactions on Electron Devices• Proceedings of the IEEE
Conferences• Materials Research Society Meeting• International Solid-State Circuits Conference• VLSI Symposia on Circuits and Technology• International Thin-film Transistor Conference
Sensing sheets based on large-area electronics and integrated circuits 299

General information concerning structural health monitoring can be found in thefollowing books:• Wenzel, H., 2009. Health Monitoring of Bridges, John Wiley & Sons, Inc, Chichester, UK.• Karbhari, V.M., Ansari, F. (Eds.), 2009. Structural Health Monitoring of Civil Infrastructure
Systems, Woodhead Publishing in Materials, Sawston, Cambridge, UK.• Glisic, B., Inaudi, D., 2007. Fiber Optic Methods for Structural Health Monitoring, John
Wiley & Sons, Inc, Chichester, UK.• Balageas, D., Fritzen, C.P., G€uemes, A. (Eds.), 2006. Structural Health Monitoring, John
Wiley & Sons, Inc, Chichester, UK.• Andersen, J.E., Fustinoni, M., 2006. Structural Health Monitoring Systems, COWI-Futurec,
L&S S.r.l.Servizi Grafici, Milano, Italy.• Ansari, F. (Ed.), 2005. Sensing Issues in Civil Structural Health Monitoring, Springer,
Dordrecht, Netherlands.• Wenzel, H., Pichler, D., 2005. Ambient Vibration Monitoring, John Wiley & Sons, Inc,
Chichester, UK.
More information on specific sensing technology development and applications instructural health monitoring can be found in papers published in specialized journalsand conferences. A nonexhaustive list is given below.
Journals• IEEE Sensors Journal• Measurement Science and Technology• Sensors and Actuators A: Physical• Smart Materials and Structures• Structural Health Monitoring: An International Journal• Journal of Civil Structural Health Monitoring• Structural Control and Health Monitoring• Structural Monitoring & Maintenance
Conferences• International Conference on Structural Health Monitoring of Intelligent Infrastructure
(SHMII)• International Workshop of Structural Health Monitoring (IWSHM)• European Workshop of Structural Health Monitoring (EWSHM)• Damage Assessment of Structures (DAMAS)• SPIE Smart Structures/NDE
Acknowledgments
The research on LAE/IC sensing sheets was in part supported by the Princeton Institute for theScience and Technology of Materials (PRISM), Princeton’s Keller Center, and USDOT-RITAUTC Program grants Nos. DTRT12-G-UTC16 and DTRT13-G-UTC28, enabled through theCenter for Advanced Infrastructure and Transportation (CAIT) at Rutgers University.
The authors would like to thank Professors J. C. Sturm, S. Wagner, and L. Loo; students Y.Yao, M. Sezan, S-T. (E.) Tung, D. Smith, Y. Hu, L. Huang, N. Lin, W. Rieutort-Louis, J.Sanz-Robinson, and T. Liu; and senior technical support staff J. Vocaturo for their precious help.
300 Multifunctional Nanocomposites in Civil and Structural Engineering

References
Abdel-Jaber, H., Glisic, B., 2015. Analysis of the status of pre-release cracks in prestressedconcrete structures using long-gauge sensors. Smart Materials and Structures 24, art. no.025038, 12 pp.
Glisic, B., Adriaenssens, S., 2010. Streicker Bridge: Initial evaluation of life-cycle cost benefitsof various structural health monitoring approaches. In: Bridge Maintenance, Safety,Management and Life-cycle Optimization e Proceedings of the 5th International Confer-ence on Bridge Maintenance, Safety and Management, pp. 2112e2118.
Glisic, B., Inaudi, D., 2007. Fibre Optic Methods for Structural Health Monitoring. John Wiley &Sons, Inc, Chichester, UK.
Glisic, B., Verma, N., 2011. Very dense arrays of sensors for SHM based on large areaelectronics. In: Structural Health Monitoring 2011: Condition-Based Maintenance andIntelligent Structurese Proceedings of the 8th International Workshop on Structural HealthMonitoring, 2, pp. 1409e1416.
Graz, I., Krause, M., Bauer-Gogonea, S., Bauer, S., Lacour, S.P., Ploss, B., Zirkl, M.,Stadlober, B., Wagner, S., 2009. Flexible active-matrix cells with selectively poledbifunctional polymerceramic nanocomposite for pressure and temperature sensing skin.Journal of Applied Physics 106, 034503e034511.
Heise Jr., R.E., 1965. Low-cycle fatigue-crack indications by strain gages operating in elasticstrain fields. Journal of Experimental Mechanics 5, 19Ae24A.
Hu, Y., Huang, L., Rieutort-Louis, W., Sanz Robinson, J., Sturm, J.C., Wagner, S., Verma, N.,2014a. Self-powered system for large-scale strain sensing by combining CMOS ICs withlarge-area electronics. IEEE Journal of Solid-State Circuits (JSSC) 49 (4), 838e850.
Hu, Y., Rieutort-Louis, W., Sanz Robinson, J., Huang, L., Glisic, B., Sturm, J.C., Wagner, S.,Verma, N., 2014b. Large-scale sensing system combining large-area electronics andCMOS ICs for structural health monitoring. IEEE Journal of Solid-State Circuits (JSSC) 49(2), 513e523.
Hubbell, D., Glisic, B., 2013. Detection and characterization of early-age thermal cracks inhigh-performance concrete. ACI Materials Journal 110, 323e330.
Jafferis, N.T., Sturm, J.C., 2013. Fundamental and experimental conditions for the realization oftraveling-wave-induced aerodynamic propulsive forces by piezoelectrically deformedplastic substrates. Journal of Microelectromechanical Systems 22 (2), 495e505.
Kim, D.-H., Lu, N., Huang, Y., Rogers, J.A., 2012. Materials for stretchable electronics inbioinspired and biointegrated devices. MRS Bulletin 37 (3), 226e235.
Kornbluh, R.D., Pelrine, R., Prahlad, H., Wong-Foy, A., McCoy, B., Kim, S., Eckerle, J.,Low, T., 2012. Dielectric elastomers: stretching the capabilities of energy harvesting. MRSBulletin 37 (3), 246e253.
Laflamme, S., Saleem, H.S., Vasan, B.K., Geiger, R.L., Chen, D., Kessler, M.R., Rajan, K.,2013. Soft elastomeric capacitor network for strain sensing over large surfaces. IEEE/ASME Transactions on Mechatorincs 18, 1647e1654.
Parashkov, R., Becker, E., Riedl, T., Johannes, H.-H., Kowalsky, W., 2005. Large area elec-tronics using printing methods. Proceedings of the IEEE 93, 1321e1329.
Perry, C.C., Lissner, H.R., 1955. The Strain Gage Primer. McGraw-Hill Book Company, Inc.,New York, NY, USA.
Qi, Y., Jafferis, N.T., Lyons Jr., K., Lee, C.M., Ahmad, H., McAlpine, M.C., 2010. Piezoelectricribbons printed onto rubber for flexible energy conversion. Nano Letters 10, 524e528.
Salowitz, N., Guo, Z., Roy, S., Nardari, R., Li, Y.-H., Kim, S.-J., Kopsaftopoulos, F.,Chang, F.-K., 2014. Recent advancements and vision toward stretchable bio-inspirednetworks for intelligent structures. Structural Health Monitoring 13 (6), 609e620.
Sensing sheets based on large-area electronics and integrated circuits 301

Sekitani, T., Someya, T., 2012. Stretchable organic integrated circuits for large-area electronicskin surface. MRS Bulletin 37 (3), 236e245.
Seminara, L., Pinna, L., Valle, M., Basiric�o, L., Loi, A., Cosseddu, P., Bonfiglio, A., Ascia, A.,Biso, M., Ansaldo, A., Ricci, D., Metta, G., 2013. Piezoelectric polymer transducer arraysfor flexible tactile sensors. IEEE Sensors Journal 13, 4022e4029.
Sezen, M., Register, J.T., Yao, Y., Glisic, B., Loo, Y.L., 2015. Exploiting the Different Polarityin Piezoresistive Characteristics of Conducting Polymers for Strain Gauge Applications.American Physical Society March Meeting 2015 (abstract).
Someya, T., Sekitani, T., Iba, S., Kato, Y., Kawaguchi, H., Sakurai, T., 2004. A large-area,flexible pressure sensor matrix with organic field-effect transistors for artificial skin ap-plications. Proceedings of the National Academy of Science 101, 9966e9970.
Someya, T., Pal, B., Huang, J., Katz, H.E., 2008. Organic semiconductor devices with enhancedfield and environmental responses for novel applications. MRS Bulletin 33, 690e696.
Tung, S.-T., Yao, Y., Glisic, B., 2014. Sensing sheet: the sensitivity of thin-film full-bridgestrain sensors for crack detection and characterization. Measurement Science and Tech-nology 25, 075602, 14pp.
Wagner, S., Bauer, S., 2012. Materials for stretchable electronics. MRS Bulletin 37 (3),207e213.
Wipf, T.J., Phares, B.M., Doornink, J.D., Griemann, L.F., Wood, D.L., 2007. Evaluation ofSteel Bridges (Volume I): Monitoring the Structural Condition of Fracture-critical BridgesUsing Fiber Optic Technology. Final Report. Bridge Engineering Center, Center forTransportation Research and Education (CTRE), Iowa State University, Ames, Iowa, USA.
Yao, Y., Glisic, B., 2012. Reliable damage detection and localization using direct strain sensing.In: Bridge Maintenance, Safety, Management, Resilience and Sustainabilitye Proceedingsof the Sixth International Conference on Bridge Maintenance, Safety and Management,pp. 714e721.
Yao, Y., Glisic, B., 2014. Probabilistic damage detection based on large area electronicssensing sheets. In: Proceedings of the 7th European Workshop on Structural HealthMonitoring e EWSHM 2014, on USB Memory Stick.
Yao, Y., Glisic, B., 2015. Detection of steel fatigue cracks with strain sensing sheets based onlarge area electronics. Sensors 15, 8088e8108.
Yoo, J.E., Cross, J.L., Bucholz, T.L., Lee, K.S., Espe, M.P., Loo, Y.-L., 2007. Improving theelectrical conductivity of polymer acid-doped polyaniline by controlling the templatemolecular weight. Journal of Materials Chemistry 17, 1268e1275.
Zhou, L., Jung, S., Brandon, E., Jackson, T., 2006. Flexible substrate micro-crystalline siliconand gated amorphous silicon strain sensors. IEEE Transactions on Electron Devices 53 (2),380e385.
302 Multifunctional Nanocomposites in Civil and Structural Engineering

Strain sensing and structuralhealth monitoring usingnanofilms and nanocomposites
13Bo Mi Lee 1, Sumit Gupta 2, Kenneth J. Loh 1,2, Satish Nagarajaiah 3
1University of California-Davis, Davis, CA, USA; 2University of California-San Diego, La Jolla,CA, USA; 3Rice University, Houston, TX, USA
13.1 Introduction
Civil infrastructure systems, including building, bridges, pipelines, dams, and powerplants, among others, can experience damage during their operational service life-times. Damage can occur due to structures being subjected to excessive loading,fatigue, environmental deterioration, blast, and extreme events. In general, damageis defined as undesired abnormalities occurring in the material or geometry of thestructural system, namely fatigue cracks and corrosion, which have the potential toadversely affect its behavior, performance, and safety (Farrar and Worden, 2007).When initial damage takes place, it often does not immediately reduce or affect struc-tural functionality. However, if defects or flaws go undetected for long periods of timeand are allowed to grow, they can jeopardize system performance and safety. In theworst case, catastrophic structural failure can occur.
In order to enhance the ability to detect and quantify damage, one approach is tomount sensors (e.g., strain gages or accelerometers) onto structural surfaces and tomeasure their response to ambient or forced excitations (Wang et al., 2007). Becausethese sensors can only measure response at their instrumented position, denselydistributed sensors need to be installed so as to capture their complete behavior(Loh et al., 2009). However, their high costs, the difficulty in installing and maintain-ing the long lengths of coaxial cables that connect sensors to a centralized data repos-itory, and power requirements often prohibit such an approach (Cho et al., 2008).Consequently, most real-world structural health monitoring (SHM) applications utilizea limited number of sensors installed per structure. The result of this is that only globalstructural behavior could be captured, and the measured response might not revealcomponent-level structural damage that has the potential to rapidly propagate to causefailure.
More recently, a new SHM paradigm using continuous thin films coated onto struc-tural surfaces has been proposed (Kanoun et al., 2014a; Obitayo and Liu, 2012). Thesefilms, engineered using specific nanomaterials to give them sensitivity to a particularexternal stimulus, are unique in that every location of the material’s electrical proper-ties is sensitive to some damage feature. In that regard, they are inherently densely
Innovative Developments of Advanced Multifunctional Nanocomposites in Civil and Structural Engineeringhttp://dx.doi.org/10.1016/B978-1-78242-326-3.00013-0Copyright © 2016 Elsevier Ltd. All rights reserved.

distributed sensors, provided that one could map the distribution of electrical proper-ties in an efficient and reliable fashion. To date, various types of nanomaterials (e.g.,carbon nanotubes (CNTs) (Baughman et al., 2002), carbon black (CB) (Knite et al.,2004), graphene (Bae et al., 2013; Tian et al., 2014), and nanoparticles (Loh andChang, 2011; Suri et al., 2002)), have been employed for fabricating nanofilm sensors.
In particular, CNT-based nanocomposites and nanofilms have garnered significantattention since the discovery of CNTs by Iijima (1991). The unique electrical,mechanical, thermal, and optoelectronic properties of CNTs have motivated many re-searchers to develop novel pressure (Stampfer et al., 2006), thermal (Fung et al., 2004),chemical (Wei et al., 2006), electrochemical (Wang, 2005), and mechanical sensors(Alamusi et al., 2011). This chapter will focus on CNT-based strain sensors, becausestrain measurements provide valuable information regarding the deformation andstress state of the structure being monitored. To assemble these CNT-based nanofilmstrain sensors, various fabrication methods have been employed, including buckypaper(vacuum filtration), in situ polymerization, evaporation, spin coating, layer-by-layer(LbL) (Stampfer et al., 2006), and spraying, among many others (Loh and Azhari,2012). Although each of these fabrication techniques offers pros and cons suitablefor different applications, it’s even more important to realize that the electrical, me-chanical, and coupled electromechanical properties of CNT-based nanocompositescan be influenced by how they are assembled (Alamusi et al., 2011).
The objective of this chapter is not to provide an exhaustive review of CNT-basednanofilm strain sensors but, rather, to highlight current research progress regardingCNT-based strain sensors fabricated using different techniques. Section 13.2 presentsbuckypaper nanofilms, followed by LbL nanofilm fabrication in Section 13.3. Thechapter continues with a discussion of electrical impedance tomography (EIT) inSection 13.4, which enables one to map the spatial conductivity distribution of nano-films so that they can be used for sensing distributed strain or damage in structures.Section 13.5 describes another different nanofilm fabrication approach using spray-coating, and the integration of these sprayed films with cementitious composites isdiscussed in Section 13.6. Section 13.7 presents an overview of other fabrication meth-odologies suitable for manufacturing CNT-based strain sensors. Finally, this chapterconcludes with a brief summary and discussion of future research directions.
13.2 Buckypaper
Early efforts to develop CNT-based nanofilms employed a vacuum filtrationebasedfabrication method (Dharap et al., 2004a). Since the composite is made of aggregatesof buckytubes (i.e., CNTs) composed of 60 carbon fullerene, it is referred to as bucky-paper (Wikipedia contributors, 2014). The general process to fabricate buckypaper isas follows: dispersion of CNTs in solution, vacuum filtration of the suspension throughthe porous membrane, drying filtered contents, and peeling off the freestandingnanotube-based film. Initial work performed by Baughman et al. (1999) introducedsingle-walled carbon nanotube (SWCNT)-based buckypaper as an actuator, where it
304 Multifunctional Nanocomposites in Civil and Structural Engineering

was shown that large strains (w1%) could be achieved by using small excitation volt-ages (within 1 V), especially in contrast to ferroelectric material-based actuators thatcould only generate w0.1%.
In addition to using buckypaper for actuation, researchers have investigated theiruse as strain sensors (Dharap et al., 2004a; Kang et al., 2006). Dharap et al. (2004a)pioneered early research for producing SWCNT-based buckypaper strain sensors byfirst mixing unpurified SWCNTs in N,N-dimethylformamide (DMF) at a concentrationof 0.25 mg/mL. The SWCNTeDMF solution was then filtered using 0.2 mm Teflonmembrane, followed by peeling off the buckypaper from the filter membrane after dry-ing. Additional heating in a vacuum oven was performed for 24 h. It was observed byscanning electron microscopy that nanotubes were randomly oriented in the buckypa-per (Figure 13.1(a)), and the film thickness was uniform andw10 mm (Figure 13.1(b)).Its percolated morphology was important for achieving an electrically conductivebuckypaper thin film.
The thin film was affixed onto a 30.48 � 3.81 � 0.17 mm3 brass specimen with apoly(vinyl chloride) (PVC) film in between the two. Bonding of the film was achievedby using high-strength epoxy and a vacuum bonding method, which would ensure per-fect strain transfer and electrical insulation (Figure 13.2(a)). Uniaxial tensile andcompressive strains to �400 mε were applied to the specimen, and voltage wasmeasured using a four-point probe method (i.e., by interrogating the film using a con-stant amplitude direct current (DC) input). The two outer electrodes were used for inject-ing DC, whereas the voltage response was measured using the two inner electrodes.
Upon conducting these tests, a linear change in voltage was detected, whichresulted from two possible different effects (i.e., a change in dimension and changein resistivity of the buckypaper). When applied tensile strain was increased from0 to 400 mε, the change in voltage was about 170 mV. It was found that the main contri-bution to cause the change in voltage was the buckypaper’s resistivity response(149 mV, w88%), as opposed to changes in the film dimensions (21 mV, w12%)(Dharap et al., 2004a). Continued work (Dharap et al., 2004b) evaluated the flexuralstrain-sensing properties of these buckypapers by applying four-point bending
Figure 13.1 Scanning electron microscope (SEM) image of an SWCNT-based buckypapershowing (a) a random orientation of nanotube bundles and (b) the film is 10 mm thick (Dharapet al., 2004a).
Strain sensing and structural health monitoring using nanofilms and nanocomposites 305

(i.e., pure bending; and see Figure 13.3(a)). Similar to the previous tests, it was foundthat the voltage increased linearly from 0 to 200 mV when flexural strain increasedfrom 0% to 0.06% (Figure 13.3(b)). In order to explain the nanoscale mechanismsresponsible for enabling strain sensitivity in buckypapers, and to explore non-contactstrain sensing at the macro-scale, Raman spectroscopy was employed to measure thevibrational properties of individual CNTs as the buckypaper was strained (Li et al.,2004). It was found that the Raman peaks of the G-band (which was indicative ofcarbonecarbon bonds stretching in tangential modes) shifted downward by 2 cm�1
when the tensile strain was increased from 0.03% to 0.094% (Figure 13.4(a)) (Liet al., 2004). Also, Raman wavenumber data of various tensile strain conditionswere collected, and it was observed that the Raman wavenumber shifted downwardwhen tensile strain increased (Figure 13.4(b)). Although Raman spectroscopy is nota practical tool for SHM applications (since it requires a bulky and elaborate setup),the data obtained helped explain that individual CNTs were being stretched when ten-sion was applied to the nanofilm; also, the investigations showed the feasibility of non-contact strain sensing using nanofilms and laser-based Raman spectroscopy at themacro-scale for the first time.
It should be mentioned that other groups have also investigated the use ofSWCNT-based buckypaper nanofilms for strain sensing. For example, Kang et al.(2006) also constructed 100% SWCNT-buckypaper and SWCNT/poly(methyl methac-rylate) (PMMA)ecasted thin films and conducted quasistatic and dynamic cantileveredbeam tests. During fabrication, additional high-temperature annealing (320 �C) was per-formed to remove residual solvents and contaminants. Although SWCNT-buckypapershowed higher strain sensitivity (S), namely w7 versus w5.5 for SWCNT/PMMAecasted nanofilms, it exhibited nonlinear behavior after applied strains exceeded 500 mε.
Besides SWCNT-based buckypaper nanofilms, multiwalled carbon nanotubes(MWCNTs) were also employed for their metallic electrical properties and lowercosts (Vemuru et al., 2009). Vemuru et al. (2009) applied static loads to anMWCNT-buckypaper specimen, and the nanofilm was characterized by linear
200
150
100
50
0
–50
–100
–150
–200
Nanosensor
(a) (b)
Cha
nge
in v
olta
ge (μ
V)
Strain in brass specimen (μm/m)–300 –200 –100 0 100 200 300 400
Figure 13.2 (a) An SWCNT-buckypaper was attached to a brass specimen forelectromechanical testing. (b) The change in voltage of an SWCNT-buckypaper respondedlinearly when subjected to tensile and compressive strains (Dharap et al., 2004a).
306 Multifunctional Nanocomposites in Civil and Structural Engineering

piezoresistive response until tensile strain reached 1000 mε with a gage factor of 0.35.In addition, quasistatic tensile cyclic-load tests revealed that the MWCNT-buckypapers exhibited fully reversible electromechanical properties (Vemuru et al.,2009). In addition to varying the type of CNTs used (i.e., SWCNTs or MWCNTs),other parameters such as the polymer and loading profile can also affect thestrain-sensing properties of the bulk film (Rein et al., 2011). For example, differentCNTs were embedded in three different types of epoxy matrices, and it was found
(a) (b)
0.2
1.2
1
0.8
0.6
0.4
0
Raman shift (1/cm)
0.094% tension strain
0.030% tension strain 514.5 nm1588.00
1587.00
1586.00
1585.00
1584.00
Strain (μm)
Wav
enum
ber (
1/cm
)
Inte
nsity
(arb
. uni
ts)
0 200 400 600 800 10001525 1545 1565 1585 1605 1625
Figure 13.4 (a) The Raman shift in G-band modes of the SWCNT-based buckypaper wasplotted when subjected to 0.094% and 0.030% tensile strains. (b) The G-band position ofSWCNTs in the nanofilms decreased with increasing tensile strains (Li et al., 2004).
L/3 L/3 L/3
P
Brass specimen
Carbon nanotube film
250
200
150
100
50
0
Nanosensor
(a)
(b)
Flexural strain (μm/m)
Cha
nge
in v
olta
ge (μ
V)
0 100 200 300 400 500 600 700
Figure 13.3 (a) An SWCNT-buckypaper was attached to a brass specimen, and four-pointbending tests were conducted. (b) The voltage response of the SWCNT-buckypaper confirms itslinear piezoresistive performance with respect to applied flexural strains (Dharap et al., 2004b).
Strain sensing and structural health monitoring using nanofilms and nanocomposites 307

that SWCNTs in the brittle epoxy matrix had the highest strain sensitivity(S w2.2). In contrast, for large strains (w30%), MWCNT-based strain sensorsshowed the most consistent sensitivity as compared to the nonlinear response ofSWCNT-based strain sensors. Recent experimental work found that the film aspectratio can also affect the electromechanical behavior of SWCNTeepoxy buckypa-pers (Zhang et al., 2015). At low strains (ε < 2000 mε), the strain sensitivity oflow-aspect-ratio thin films (3:1) exhibited lower strain sensitivity (S ¼ 1.93) thanother cases (S ¼ 2.33, 2.14, 3.88, and 3.61 for film aspect ratios of 6:1, 9:1, 12:1,and 15:1, respectively); the strain-sensing response was also nonlinear. For higherstrains, the strain sensitivity was about the same (w6), and it was linear for allspecimens with different aspect ratios. Furthermore, the damage detection capabilityof the SWCNTeepoxy thin film was validated by introducing a V-notch to thecomposite, and a dramatic increase in resistance was observed when tensile strainwas w1000 mε.
In general, many researchers have investigated the use of CNT-based buckypapernanofilms for strain sensing. Since vacuum filtration allows one to precisely controlthe concentration of various components in the buckypaper (e.g., CNTs and surfac-tants), the technique was employed to study how component densities influence thephysical properties of the film; examples include percolation phenomena and temper-ature- and frequency-dependent properties (Hu et al., 2010). In addition, this nanofilmassembly methodology can produce highly uniform and reproducible thin films.Despite these advantages, buckypaper is fabricated directly on top of the filter mem-brane, and an additional transfer step after filtration is usually necessary. The transferprocess can be cumbersome and difficult, especially since the film may be damagedwhen it is peeled off (Hu et al., 2010).
13.3 LbL nanofilm fabrication
The LbL nanofilm fabrication method was initially proposed to assemble polymericmultilayered thin films, one monolayer at a time, by leveraging the van der Waalsattraction and electrostatic force interactions between polyanion and polycation spe-cies dissolved in aqueous solutions (Decher, 1997). Because this technique isamenable to integrating monolayers of many different materials within one thin-filmstructure, complicated film architectures can be designed by simply varying the typeand deposition sequence of different materials (Decher, 1997). For instance, Mamedovet al. (2002) fabricated LbL CNT-based nanocomposites that exhibited remarkablemechanical properties. To be specific, the tensile strength of the LbL SWCNTepolyelectrolyte (PE) films was as high as 325 MPa, which was considerably higherthan that of carbon fiber composites (w53 MPa) and several times higher than thatof SWCNTepoly(vinyl alcohol) (PVA) ribbons (w150 MPa). In addition, this tech-nique ensured homogeneous nanocomposites with minimal structural defects due tophase segregation (Mamedov et al., 2002; Loh et al., 2007, 2008; Hou et al., 2007;Loyola et al., 2013a).
308 Multifunctional Nanocomposites in Civil and Structural Engineering

In addition to achieving outstanding mechanical reinforcement, LbL was alsoemployed for designing CNT-based thin films with electromechanical properties suit-able for strain sensing. For example, Loh et al. (2007) assembled CNTePE nanofilmsby sequentially dipping a charged glass substrate in positively charged polycationic PEsolution (i.e., PVA or polyaniline (PANI)), followed by a negatively charged polya-nionic solution with CNTs dispersed in poly(sodium 4-styrenesulfonate) (PSS) solu-tion (dipping time was 5 min in each solution). Here, uniform dispersion of CNTsolutions was achieved by 180 min of bath ultrasonication, followed by 90 min ofhigh-powered probe sonication. The substrate and its adsorbed film were rinsed in18 MU deionized water for 3 min and dried in air for 15 min after the assembly ofeach monolayer. This LbL cycle created a film with one bilayer and was then repeated(n times) until the desired number of bilayers was obtained. Films can be denoted as(CNT-PSS/PVA)n or (CNT-PSS/PANI)n, which indicates its constituents and the num-ber of bilayers (Loh et al., 2007).
Using the aforementioned procedure, homogeneous LbL nanofilms with uniformthicknesses were obtained (Figure 13.5) (Loh et al., 2007). Similar to the aforemen-tioned works on buckypaper, a main goal was to evaluate the strain-sensing perfor-mance of these LbL nanofilms. To do so, 20 � 10 mm2 LbL films were affixed ontoPVC coupons. Second, a variety of different types of films were investigated, namelythe type of CNTs (i.e., unpurified SWCNTs (u-SWCNTs) and purified SWCNTs(p-SWCNTs), as well as purified double-walled carbon nanotubes (p-DWCNTs)),and these films were fabricated using different concentrations of solutions. The filmand PVC coupon specimens were subjected to tensile-compressive cyclic tests usingan MTS-810 load frame. The applied load, the cross-head displacement, and the film’selectrical resistance were recorded simultaneously.
Figure 13.5 (a) An SEM image of an (SWCNT-PSS/PVA)200 LbL nanofilm showed thedeposition of dispersed nanotubes and exceeded the percolation threshold. (b) The SEM imageof the film cross section demonstrated the nanofilm’s uniformity (Zhao et al., 2011).
Strain sensing and structural health monitoring using nanofilms and nanocomposites 309

First, among the three different types of film tested, p-SWCNT-PSS/PVA andp-DWCNT-PSS/PVA thin films exhibited clear piezoresistive responses (Figure 13.6)(Loh et al., 2007). The lower performance of u-SWCNT-PSS/PVA may be due to im-purities inherent to the u-SWCNTs, as well as poor dispersion of the u-SWCNT-PSSsolution. Despite this, the results presented in Figure 13.6 clearly demonstrated that thefilms could be used as strain sensors. Their strain sensitivity was also sensitive to initialfabrication parameters, where higher CNT concentrations and better dispersion(enabled by higher concentrations of PSS) improved bulk film strain sensitivity. How-ever, it should be mentioned that these films exhibited nominal resistance drifts thatcould be fitted using an exponential decay model. The results shown in Figure 13.6reflect the films’ strain-sensing response after drift has been numerically removed dur-ing postprocessing of the collected data (Loh et al., 2007). From Figure 13.6, one canalso observe that the films’ electrical response was characterized by rounded peaks atthe maximum and minimum applied strains, despite the fact that the films were sub-jected to sawtooth tensile-compressive cyclic-load patterns. Continued electricalimpedance spectroscopy (EIS) studies demonstrated that the phenomena observed inFigure 13.6 were due to the films’ electrical impedance sensitivity to applied strains(Loh et al., 2008). In fact, the electrical properties of these LbL nanofilms not onlywere resistive but also were better characterized by a parallel resistorecapacitor equiv-alent circuit.
The ability to impose nanoscale control during film fabrication and the ease oftranslating nanomaterial properties to the macroscale are important and attractive fea-tures of LbL assembly. As was demonstrated by Mamedov et al. (2002), SWCNT-PELbL nanofilms exhibited impressive mechanical properties. Similarly, Loh et al.(2007) showed that LbL thin films were characterized by linear piezoresistivity upto 10,000 mε, as compared to buckypaper whose linear response was demonstratedup to w500 mε (Dharap et al., 2004a; Kang et al., 2006). In addition, LbL enablesone to design nanofilms with specific material properties or engineering functional-ities, simply by changing film constituents during deposition or by modifying the orderin which different nanomaterial or PE species are deposited. This flexibility duringfabrication allowed the incorporation of other PE species, such as polyaniline, fordesigning nanofilm pH sensors for biosensing or for monitoring corrosion in structuralcomponents (Loh et al., 2007). Despite these advantages, LbL is not compatible withroll-to-roll fabrication, which means that its production is time-consuming and limitedto relatively small films.
(a) (b)146514641463146214611460
(p–DWNT–PSS/PVA)50 normalizedstrain sensing response
(p–SWNT–PSS/PVA)100 normalizedstrain sensing response
0 50 100 150 200 250 300
1712
1711
1710
1709
Time (s)Time (s)
Res
ista
nce
(Ω)
Res
ista
nce
(Ω)
0 100 200 300 400 500 600 700
Figure 13.6 The electromechanical response of (a) p-DWCNT-PSS/PVA and (b)p-SWCNT-PSS/PVA thin films confirmed that their electrical properties were highly sensitiveto tensile-compressive cyclic loads (Loh et al., 2007).
310 Multifunctional Nanocomposites in Civil and Structural Engineering

13.4 Spatial structural sensing enabled by EIT
Unlike conventional mechanical and electrical-based sensors, CNT-based nanofilmsare unique in that the entire material is sensitive to strain (or other damage stimuli).Therefore, one could manually probe and measure resistance at discrete locations onthe nanofilm to determine structural strains at every location in the film, so as togenerate a two-dimensional (2D) strain map. However, this approach of manual prob-ing is neither practical nor scalable for large-scale SHM applications.
An alternative technique is to employanEITalgorithm,whichallowsone to reconstructthe spatial conductivity (or resistivity) distribution of a conductive body, such as the afore-mentioned strain-sensitive nanofilms (Loh et al., 2009; Hou et al., 2007). In short, EIT is awell-known soft-field tomography technique that originated from and found extensive ap-plications in the biomechanics and biomedical domains (Saulnier et al., 2001). Instead ofdirectlymeasuring the electrical properties at every location in the conductivebody, a set ofelectrodes is establishedalong the peripheryof and to enclose the conductivebody, therebydefining the sensing area. Electrical current is injected through a pair of boundary elec-trodes and allowed to flow through the conductive body, while boundary voltages aremeasured at the remaining pairs. The conductivity distribution of the sensing area of thebody can be estimated by solving the inverse problem and by using currentevoltagedata. For conductive bodies such as nanofilms, they are assumed to be 2D.
Before one could solve the EIT inverse problem, the forward problem must bedefined. The 2D Laplace’s equation relates the conductivity distribution of the body(s) and voltage distribution (u), and it is expressed in Cartesian (x, y) coordinates here:
V$½sðx; yÞVuðx; yÞ� ¼ 0 (13.1)
Equation (13.1) assumes that electrical current is only supplied and grounded atthe boundaries, and that current is neither generated nor grounded within the sensingarea. This second-order differential equation represents the strong form of an EITproblem. For practical purposes, the finite element method is adopted (Holder,2004; Polydorides, 2002; Vauhkonen, 1997). The weak form can then be derivedusing the weighted residual method to obtain:
ZZUsVfVudxdy ¼ 0 (13.2)
where f is the finite-element shape function. The voltage distribution, u, can beapproximated (uh) as a linear combination of shape functions (fi):
uh ¼Xni¼1
uifi (13.3)
where ui is the values of voltage at the ith node in the finite element domain. Acomplete electrode model also can be adopted to implement the boundary conditions,
Strain sensing and structural health monitoring using nanofilms and nanocomposites 311

especially considering that the voltage drops at the electrodes due to contact imped-ance (Holder, 2004; Vauhkonen, 1997). In doing so, given a known conductivitydistribution and applied electrical current, the forward problem can be solved to revealthe theoretical boundary voltages at the electrodes.
From an experimental standpoint, the EIT inverse problem needs to be solved,where the conductivity distribution needs to be estimated using applied current injec-tions and the corresponding experimental boundary voltage measurements (umeasured).Although different optimization schemes can be employed, Loh et al. (2009) used theGausseNewton algorithm. During each iteration, the conductivity distribution isupdated, and the forward problem is solved to obtain the corresponding voltage distri-bution (ucomputed). The error (e) between umeasured and ucomputed is calculated at everyiteration, and the inverse problem is iterated and solved until e, as defined in Eqn(13.4), is less than or equal to the specified threshold value:
e ¼ kumeasured � ucomputedk2.kumeasuredk � 0:05% (13.4)
In that case, the converged solution or the estimated conductivity distribution isassumed to closely represent that of the actual conductive body. An overview of thecomputational steps as part of the EIT spatial conductivity reconstruction process isdepicted in Figure 13.7.
Φstep
v15 v3
v4
v5
v6
v7
v1
Boundaryvoltage
measurements
ACl(ω)
Φm = (vl...vn)Tv2
Sensing skinwith inherentσ-distribution
Predictedboundaryvoltageoutput
Minimize costfunctionf (σ) =
1/2║ φFEM(σ)-v║2
v14
v13
v12
v11
v10 v9 v8
Yesoutputσ-map
Noupdate
Δσ
PAUSE
Convergence?error < 0.05%
Finiteelement
formulation
IterateForwardProblem
Figure 13.7 The electrical impedance tomography spatial conductivity reconstruction process isillustrated (Loh et al., 2009).
312 Multifunctional Nanocomposites in Civil and Structural Engineering

Numerous experiments were conducted to validate the EIT spatial conductivitymapping algorithm applied to LbL CNT-based thin films for SHM applications. Inparticular, the objective was to use the nanofilms as distributed sensors for identifyingthe severity and location of damage due to strain, impact, pH, and corrosion, amongothers. Early work by Hou et al. (2007) demonstrated that EIT was able to identifydefects in SWCNTePE LbL thin films. Using the LbL fabrication method describedin Section 13.3 and by Loh et al. (2007), 25 � 25 mm2 SWCNT-PSS/PVA thin filmswere made and then instrumented with eight boundary electrodes along each edge ofthe nanofilm. EIT was performed to reconstruct the conductivity map of the pristine orundamaged nanofilms. Then, select regions of films were etched away to form defectsin the shape of two slits (Figure 13.8(a)), a straight line (Figure 13.8(c)), and anL-shape (Figure 13.8(e)). EIT was performed again to obtain the spatial conductivitydistributions of the damaged cases. The differences between the damaged and undam-aged EIT conductivity maps are shown in Figure 13.8(b), (d), and (f). It is clear fromthe results shown in Figure 13.8 that there is good correlation between the pictures ofthe damaged films and the spatial conductivity distributions, thereby successfully vali-dating EIT for locating defects due to conductivity changes occurring in the nanofilms.
Likewise, Loh et al. (2009) deposited (SWCNT-PSS/PVA)50 LbL nanofilms ontoglass substrates, instrumented them with 32 boundary electrodes, and attached thefilms to PVC coupons for tensile-compressive load tests to �2000 mε. During loadingand unloading, the load frame was commanded to pause at 1000 mε intervals to allow
–300 –250 –200 –150 –100 –50 0 50 100
–250 –200 –150 –100 –50 0 50
(a) (b) (c) (d)
(e) (f)
Pattern conductivity (S/cm)
Pattern conductivity (S/cm) Pattern conductivity (S/cm)–250 –200 –150 –100 –50 0
Figure 13.8 LbL (SWCNT-PSS/PVA)50 thin films were subjected to mechanical etching toform different patterns and regions of zero electrical conductivity. Pictures of the etched filmwith (a) a double slash, (c) a straight line, and (e) an L-shaped pattern are shown, along with thecorresponding EIT spatial conductivity maps for the (b) double slash, (d) line, and (f) L-shape(Hou et al., 2007).
Strain sensing and structural health monitoring using nanofilms and nanocomposites 313

time for EIT data acquisition. A representative result is summarized in Figure 13.9, andit can be observed that the specimen’s conductivity decreased uniformly as appliedstrain was increased. These results were consistent with those reported in Section13.3, where the resistance of LbL CNT-based thin films increased in tandem withincreasingly applied strains. In addition, to better quantify sensing performance, theaverage conductivity of each EIT map was computed, and the results are plotted inFigure 13.10. It’s clear that the negative percentage change in average spatial conduc-tivity (i.e., similar to the percentage change in resistivity) was well correlated with theapplied load pattern.
In addition to strain sensing, LbL nanofilms were engineered with pH-sensing prop-erties by incorporating polyaniline (PANI) in lieu of PVA (Loh et al., 2007). Loh et al.(2007) showed that SWCNT-PSS/PANI films would exhibit an increase in electricalresistance as the nanofilm was subjected to more alkaline pH buffer solutions. There-fore, in order to demonstrate that EIT can be coupled with SWCNT-PSS/PANI films torealize an electrochemical spatial sensor, nanofilms were fabricated and instrumentedwith boundary electrodes (Hou et al., 2007). Five circular plastic wells were mountedon the surface of an (SWCNT-PSS/PANI)100 thin film (using vacuum grease), and thewells were used for pipetting in and out different pH buffer solutions. The first testinvolved pipetting in pH 7, 7.5, 8, 8.5, and 9 solutions, one in each well. After EITdata acquisition was finished, the buffer solutions were removed and replaced withmildly acidic solutions (i.e., pH 7, 6.5, 6, 5.5, and 5). The spatial conductivity maps(i.e., by calculating the conductivity difference between the pH buffereexposed filmand the pristine film to reveal the change in conductivity) are shown in Figure 13.11.
(a) 0 με
(f) –1000 με
(b) 1000 με
(g) –2000 με
(c) 2000 με
(h) –1000 με
(d) 1000 με
(i) 0 με
(e) 0 με
–1.5 –1 –0.5 0 0.5 1 1.5–% Δσ
Figure 13.9 A one-cycle tensile-compressive load pattern (to �2000 mε, pausing every1000 mε) was applied to an (SWCNT-PSS/PVA)50 thin film deposited on a glass substrate andepoxy-mounted to a PVC coupon. The EIT spatial conductivity maps show that the films couldmeasure uniform strain distributions and the magnitude of strain applied to the specimen (Lohet al., 2009).
314 Multifunctional Nanocomposites in Civil and Structural Engineering

0
30002000
1000
–1000
–2000
–3000
0
1.51
0.50
–0.5–1
–1.5
1 2 3 4 5 6 7 8
Test number
Skin 1
% –
ΔσA
pplie
d st
rain
(μm
)
0 1 2 3 4 5 6 7 8
Figure 13.10 A one-cycle tensile-compressive loading pattern (�2000 mε, pausing every1000 mε) was applied to an (SWCNT-PSS/PVA)100 thin film. The film’s average conductivitywas computed using each EIT result, and the negative percentage change in conductivityvaried in tandem with the magnitude of applied strain (Loh et al., 2009).
Conductivity (S/cm)
(a)
(b) (c)
–500 –400 –300 –200 –100 0 100 200 300 400 500
7 7 6.5 6
55.5
7.5 8
8.5 9
Figure 13.11 (a) Five plastic wells were mounted to the surface of an (SWCNT-PSS/PANI)100nanofilm pH sensor and were exposed to nine different pH buffer solutions. The EIT spatialconductivity maps show that the film was able to detect changes in localized conductivity dueto the film being simultaneously exposed to buffer solutions of (b) pH 7, 7.5, 8, 8.5, and 9 and(c) pH 7, 6.5, 6, 5.5, and 5 (Loh, 2008).
Strain sensing and structural health monitoring using nanofilms and nanocomposites 315

As expected, regions exposed to more alkaline solutions decreased in conductivity,and the opposite was true when acidity increased (Figure 13.11). All in all, althoughEIT is a technique with longstanding roots in the biomedical field, this work is the firsttime when EIT has been integrated with the unique sensing attributes of nanofilms torealize a true densely distributed sensor capable of sensing the severity and location ofstructural damage.
13.5 Spray coating
Although the LbL technique enables the multiscale design of nanofilms (e.g.,nano-engineered films with unique sensing or mechanical attributes), it istime-consuming and difficult to create films with large dimensions, as mentioned inSection 13.3. Instead, spray coating is a powerful tool that can deposit materialsover large spatial areas in a short time. For example, early work by Kaempgen et al.(2005) employed an airbrush to deposit CNTesodium dodecyl sulfate (SDS) solutionsto form transparent CNT coatings. During spray fabrication, the temperature of thesubstrate was maintained at 100 �C to accelerate coating drying. It should be notedthat the density of CNTs was controlled by the number of sprayed layers, ratherthan by the material used. Depending on the solvent, the drying temperature can beadjusted accordingly too (Hu et al., 2010).
Likewise, CNT-based strain sensors can be cost-effective and extended tolarge-scale applications if they can be sprayed easily onto structural surfaces. Kanget al. (Kang et al., 2006) deposited MWCNT-based thin films onto a rotorcraft bladeto form a long, continuous neuron sensor. EIS was employed to derive an equivalentcircuit model that characterized the electrical properties of the nanofilm sensor.Dynamic tests showed that the amplitude of voltage of the damaged cantileverbeam decreased w25% as compared to the intact case. The MWCNTeneuron wasalso sensitive to corrosion, such that the equivalent circuit’s capacitance changed byorders of magnitude due to electrochemical oxidation.
More recently, Loyola et al. (2013b) developed an MWCNTepolyvinylidene fluo-ride (PVDF) latex-based ink formulation, and high-quality thin films could be sprayed(using an airbrush) onto virtually any substrate, including glass fiberereinforced poly-mer composite structures. The MWCNT-based ink formulation consisted of two parts:an MWCNTePSS suspension and a PVDF latex solution. The first part was obtainedby dispersing MWCNTs in a 2 wt.% PSS solution with small quantities of N-methyl-2-pyroolidone added. Dispersion was achieved by bath ultrasonication andhigh-energy tip sonication. The second solution consisted of a Kynar Aquatec latexsolution, which was based on a dispersion of 150 nm PVDF particles. The two-partsolution was mixed together immediately prior to film fabrication, and spraying wasperformed using a Paasche airbrush. The specimens were air dried or thermallyannealed in a vacuum oven.
Continued work by Mortensen et al. (2013) used the aforementioned airbrushingtechnique for creating MWCNTelatex strain sensors, which were then cut to form1.7 � 75 mm2 specimens. Freestanding films were mounted in a Test Resources
316 Multifunctional Nanocomposites in Civil and Structural Engineering

150R load frame, and the films were subjected to numerous cycles of tensile loading upto 10,000 mε. The electrical resistance of the film was measured simultaneously, and arepresentative overlay of the resistance and applied-strain time histories is presented inFigure 13.12(a). In addition, the normalized change in resistance of the nanofilm wasplotted with respect to its applied strain to reveal its linear piezoresistive performance.Strain sensitivity of the bulk films was estimated by fitting a linear least-squares line, asshown in Figure 13.12(b). Strain sensitivity was equivalent to the slope of the linearbest-fit line and was w0.77. It was also shown that postfabrication thermal annealingcould be used to improve nanofilm electrical, mechanical, and electromechanical prop-erties (Mortensen et al., 2013). Despite these advances, great care was needed duringmanual spraying to ensure that nanofilms were uniformly deposited. Future work inautomated or robotic spray fabrication tools would address this issue and facilitatescaling up of this technology.
13.6 Nanofilm-enhanced cementitious composites
Although CNT-based nanofilms (particularly those that are sprayed) can be appliedonto structural surfaces for SHM and damage detection applications, damage can orig-inate from within the structural material. In that regard, nanofilms would not be able todirectly detect damage until that damage propagated to reach the surface. In particular,concrete and cement composites are susceptible to internal damage that often is notdetectable by measuring structural response parameters on their surface. As mentionedin previous chapters of this book, this is one of the main reasons why many researchersmodified cement composites with different types of nanofillers and conductive addi-tives, so as to enable them to become self-sensing and multifunctional materials.For example, Chen and Chung (1996) demonstrated that, when carbon fibers wereembedded in the cement matrix, the electrical resistance of concrete varied in responseto applied cyclic loads. Although its change in resistance was reversible in response to
(a) (b)
0
15,000
10,000
5000
–5000
Time (min)
Load pattern 1st cycle2nd cycle3rd cycleLinear fit
Resistivity
Res
istiv
ity (Ω
mm
)
Nor
mal
ized
resi
stiv
ity
Tens
ile s
train
(με)
0 1 2 3 4 5 6
5.05
5.03
5.01
4.99
4.97
0.008
0.006
0.004
0.002
–0.001
0
Tensile strain (με)0 4000 8000 12,000
Figure 13.12 (a) The resistivity time history of a freestanding MWCNTelatex nanofilm(fabricated by airbrushing) was overlaid with the applied tensile cyclic pattern. (b) Thenormalized change in resistivity of the specimen increased in tandem with applied tensilestrain, thereby confirming its linear piezoresistive properties (Mortensen et al., 2013).
Strain sensing and structural health monitoring using nanofilms and nanocomposites 317

cyclic loading, cracks or hole-like damage caused irreversible changes in resistance.Similarly, others utilized CNTs as conductive fillers for enhancing the self-sensingcharacteristics of cement composites (Han et al., 2009; Sui and Liu, 2005; Willeand Loh, 2010; Kang et al., 2009). Despite these advancements, directly incorporatingnanomaterials (such as CNTs) within cement matrices leads to numerous limitationsthat prevent their adoption in real-world applications. These challenges include poordispersion, poor workability of the concrete mix, changes in casting procedures, andextremely high costs.
A new nanotechnology-enabled cement composite design approach was proposedand demonstrated by Loh and Gonzalez (2015). Instead of dispersing large quantitiesof CNTs within the cementitious matrix to form a percolated morphology, the newapproach aimed at modifying the cementitious matrixeaggregate interface withCNT-based nanofilms. The procedure began by airbrushing MWCNT-based inksdirectly on top of fine and/or coarse aggregates, where the nanofilm preparation andfabrication procedures followed those presented by Loyola et al. (2013b) and Mortensenet al. (2013). Upon coating the aggregates, the film-coated aggregates were initiallyair dried, followed by additional drying in a vacuum oven. The coated aggregateswere then used to cast nanofilm-enhanced mortar and concrete plates with a size of45 � 45 � 10 mm3. It should be mentioned that copper mesh electrodes wereembedded to form leads for two-point probe resistance measurements, or multipleboundary electrodes were included for EIT spatial sensing. Most EIT spatial-sensingtests employed 16 boundary electrodes arranged in a 4 � 4 pattern (Figure 13.13).
Similar to Section 13.4, spatial damage detection tests were conducted using cemen-titious composite specimens instrumented with an array of boundary electrodes. First,specimens were interrogated by commanding a Keithley 6221 current source to inject1 mA of DC across a pair of boundary electrodes. Second, an Agilent 34980A multi-function switch with an embedded digital multimeter (DMM) was used for measuringthe voltages among the remaining non-current-carrying electrode pairs. A sample currentinjection and voltage measurement pattern is depicted in Figure 13.13. Then, the Agilent34980Awould switch the current injection electrode while taking the appropriate bound-ary voltage measurements. The hardware system is fully automated and controlled usinga MATLAB program. In another example, the same EIT algorithm described in Section13.4 was employed, but for this case, the algorithm and finite element formulation weremodified to include bilinear quadrilateral elements.
Damage detection validation tests were then conducted for evaluating the sensingcapabilities of these nanofilm-enhanced cementitious composites. As an example, ananofilm-enhanced mortar plate was subjected to artificial damage by sequentially dril-ling holes (using a 6.5 mm masonry drill bit) near the four corners of the plate. Beforedamage was imposed on the specimen, an EIT spatial resistivity map of the undamagedplate was obtained, which served as the baseline. EIT measurements were then ob-tained after each additional drilled hole. Figure 13.14 shows pictures taken aftereach hole was drilled through the plate, as well as the corresponding resistivity distri-butions determined by solving the EIT inverse problem. For instance, Figure 13.14(a)shows the nanofilm-enhanced plate with a hole drilled near the bottom-left corner.The corresponding EIT results shown in Figure 13.14(b) clearly indicate localized
318 Multifunctional Nanocomposites in Civil and Structural Engineering

increases in resistance (or resistivity) near the location of the damage. The remainingparts of Figure 13.14 confirm that damage location can be accurately identified usingEIT and the nanofilm-enhanced mortar plates.
Aside from drilling holes, a crack-like damage was simulated on the backside of ananofilm-enhanced mortar plate (Figure 13.15). The artificial crack had an averagedepth ofw2.5 mm. Similarly, EIT was conducted before and after the crack was intro-duced, and Figure 13.15(a) shows the picture of the damaged specimen along with thecorresponding EIT spatial resistivity distribution. It is clear from Figure 13.15(b) thatthe length, geometry, and severity of the crack-like damage were successfullyresolved. Overall, these results validated the fact that nanofilm-enhanced cementitiouscomposites, when coupled with EIT, can be used for spatial damage detection. Evenmore impressive was that the amount of CNTs used and its costs were orders of magni-tude lower than the current state of the art, which relied on dispersing CNTs directly inthe cementitious matrix. The nanofilm-coated aggregates could still enhance electricalconductivity and damage sensitivity. In addition, workability, casting procedures, andcosts were not impacted due to the use of these nanofilm-coated aggregates. Thus,there is great potential for scaling this technology for constructing and monitoringlarge-scale civil infrastructure systems.
Smart mortar plate
iout iin
V
V
VV V V V
V
V
VVV
Figure 13.13 Smart mortar plate specimens (45 � 45 mm2) were casted with 16 embeddedcopper mesh boundary electrodes. The schematic shows a sample EIT current injection pattern,in which two electrodes were used for current injection, and the voltage was measured at theremaining boundary electrodes.
Strain sensing and structural health monitoring using nanofilms and nanocomposites 319

13.7 Other nanofilm fabrication methodologies
CNT-based nanofilms can also be dispersed using in situ polymerization (Kang et al.,2009; Park et al., 2002; Hu et al., 2008), spin coating (Kanoun et al., 2014a; Jo et al.,2010; Hellstrom et al., 2009), dip coating (Hu et al., 2010), and inkjet printing
–500 0 500 1000 1500 2000 2500Change in resistivity (Ω-m)
(a) (b) (c) (d)
(e) (f) (g) (h)
Figure 13.14 Four holes were drilled near the four corners using a 6.5 mm masonry drill bit atthe (a) bottom left, (b) top right, (c) top left, and (d) bottom right corners. Subsequent changesin resistivity distribution are shown in (eeh), respectively.
(a) (b) 2500
2000
1500
1000
500
Cha
nge
in re
sist
ivity
(Ω-m
)
Figure 13.15 (a) A crack-like damage was introduced to a nanofilm-enhanced mortar plate bycutting a slit on the backside of the specimen. (b) The corresponding EIT result and thelocalized change in resistivity confirm that damage location and severity can be detected usingthis technique.
320 Multifunctional Nanocomposites in Civil and Structural Engineering

(Kord�as et al., 2006), among many others. In situ polymerization (Kang et al., 2009;Park et al., 2002) relies on dispersing CNTs in a liquid monomer or precursor poly-mers of low molecular weight prior to full polymerization. Because of this, higherinterfacial strength between CNTs and the polymer matrix can be realized. Forinstance, Kang et al. (2009) assembled SWCNTepolyimide nanocomposites usingin situ polymerization. Electromechanical tests were performed, and the resultsyielded strain sensitivities of 4.21 and 0.89 for 0.05 and 10 wt.% SWCNTepolyimide nanofilms, respectively. Hu et al. (2008) deposited MWCNTs in an epoxymatrix, and the nanofilm exhibited nonlinear piezoresistive responses when low CNTconcentrations (1 and 2 wt.%) were used, whereas linear responses were obtainedwith higher CNT concentrations (3, 4, and 5 wt.%). Pham et al. (2008) used twodifferent fabrication methods (i.e., dry blending and solution casting) for embeddingMWCNTs in a PMMA matrix. Uniaxial tensile strain tests (ε < 10,000 mε) revealedthat MWCNTePMMA nanofilms assembled by dry blending were more sensitive toapplied strains than those made with solution casting Kanoun et al. (2014a) andDinh-Trong et al. (2009) drop-casted three different types of MWCNT-based nano-films with different polymer matrices: SDS, deoxycholic acid, and polyethylene ox-ide. Among the three polymers, SDS offered stable mechanical behavior underlow-tensile-strain conditions up to w3500 mε. Spin coating was also employed forbuilding CNT-based nanocomposites, especially for extremely thin films (rangingfrom a few nanometers to hundreds of nanometers) (Kanoun et al., 2014a; Joet al., 2010; Hellstrom et al., 2009). Spin coating was performed by pipetting afew drops of CNT-based solution onto the center of substrate, and the substratewas spun at selected speeds and times to control film thickness. Jo et al. (2010)assembled SWCNT-based thin film using an amphiphilic surfactant and concludedthat transparent electrodes could be created using spin coating; the films were char-acterized by high optical transmittance (71%) and low surface resistivity (59 U/sq).Kord�as et al. (2006) inkjet-printed functionalized MWCNTe(CO2H)n on two diffe-rent substrates (i.e., paper and plastic). Regardless of the type of substrate, sheetresistivity decreased as the number of printed layers increased, similar to whatRyu et al. (2014) had found. In general, inkjet printing is beneficial due to itscost-effectiveness, ease of use, low cost, direct patterning, and versatility (Kanounet al., 2014a; Kord�as et al., 2006). Nanocomposite and Zinc oxide based strainsensing has also been investigated successfully (Srivastava et al., 2011; Hemtejet al., 2010).
Most recently promising noncontact strain sensing using SWCNT and urethanecoating and portable laser based near infrared spectroscopy has been developed(Withey et al., 2012, Sun et al., 2015). More details of this new approach can be foundin Chapter 15 of this book.
13.8 Summary
This chapter presented a general overview of the historical developments and recentresearch on CNT-based nanofilm strain sensors. The aim of the chapter was not to pre-sent an exhaustive review on this subject matter but, rather, to showcase the breadth of
Strain sensing and structural health monitoring using nanofilms and nanocomposites 321

work. The chapter began with a discussion of CNT-based buckypapers that were fabri-cated by vacuum filtration of dispersed CNT solutions. This was one of the earliestworks in creating CNT-based nanofilm strain sensors that sought to leverage theimpressive electrical properties of individual nanotubes and yet be able to translatetheir nanoscale properties to the macro scale. The second part of this chapter transi-tioned into the broad area of LbL nanofilms, in which CNT-based films were shownto exhibit improved electromechanical properties suitable for sensing and SHM. Thesefilms were mechanically strong yet flexible and exhibited linear piezoresistive proper-ties up to 10,000 mε. Even more important was that LbL enabled the seamless integra-tion of different nanomaterial and polyelectrolyte species in a highly controlled fashionwith nanoscale resolution, simply by controlling fabrication solution constituents, con-centrations, and the deposition sequence. An example was presented in which polyani-line could be incorporated in LbL CNT-based nanofilms for the design of pH sensorssuitable for environmental or corrosion monitoring.
Despite these advances, fabrication techniques such as buckypaper and LbL sufferfrom a major limitation, namely, their difficulty in transitioning this technology fromthe laboratory to large-scale manufacturing and implementation. These films were typi-cally very small in size and were time-consuming to fabricate. An alternative solutionwas presented in which airbrushing was employed for depositing MWCNT-basedthin films. It was shown that MWCNTelatex strain sensors could be deposited in a shorttime, at low cost, and onto virtually any structural surface. Furthermore, to scale thistechnology for large-scale civil infrastructure SHM applications, a novel solution wasproposed that entailed spraying MWCNTelatex thin films onto aggregates and then us-ing film-coated aggregates for casting cementitious composites. It was found that thesenanofilm-enhanced cementitious composites exhibited significantly improved damagesensitivity and can be produced at very reasonable costs.
Beyond the development of the various types of multifunctional nanofilms pre-sented in this chapter, EIT permitted mapping of the 2D spatial conductivity (or resis-tivity) distribution of nanofilms and nanofilm-enhanced cementitious composites.Since these nanofilms were sensitive to damage at every location and were already pre-calibrated to strain (or other stimuli), EIT spatial conductivity mapping allowed one touse the nanofilms as true densely distributed sensors. The results, whether they werefor LbL nanofilms, airbrushed MWCNTelatex films, or nanofilm-enhanced cementi-tious composites, successfully demonstrated that EIT was able to assess damageseverity and location.
Despite these advances, there still remain numerous research challenges that lieahead in order to realize CNT-based sensing systems for SHM of real-world civil infra-structure systems. The ability to exercise precise nanoscale control and to scale nano-material properties up to the bulk scale continues to be one of the toughest researchquestions that need to be solved. In addition, there is a dire need to innovate in tech-niques for manufacturing nanofilms, particularly deriving roll-to-roll and scalablenanomanufacturing techniques, so that their large-scale production can be realizedat low costs. Finally, techniques for encoding different engineering functionalitieswithin a material architecture to realize multifunctional and nanostructured systemsare direly needed.
322 Multifunctional Nanocomposites in Civil and Structural Engineering

References
Alamusi, Hu, N., Fukunaga, H., Atobe, S., Liu, Y., Li, J., 2011. Piezoresistive strain sensorsmade from carbon nanotubes based polymer nanocomposites. Sensors 11 (11), 10691.
Baughman, R.H., Zakhidov, A.A., de Heer, W.A., 2002. Carbon nanotubes-the route towardapplications. Science 297 (5582), 787e792.
Bae, S.-H., Lee, Y., Sharma, B.K., Lee, H.-J., Kim, J.-H., Ahn, J.-H., 2013. Graphene-basedtransparent strain sensor. Carbon 51 (0), 236e242.
Baughman, R.H., Cui, C., Zakhidov, A.A., Iqbal, Z., Barisci, J.N., Spinks, G.M., Wallace, G.G.,Mazzoldi, A., De Rossi, D., Rinzler, A.G., Jaschinski, O., Roth, S., Kertesz, M., 1999.Carbon nanotube actuators. Science 284 (5418), 1340e1344.
Chen, P.-W., Chung, D., 1996. Carbon fiber reinforced concrete as an intrinsically smart con-crete for damage assessment during static and dynamic loading. Materials Journal 93 (4),341e350.
Cho, S., Yun, C.-B., Lynch, J.P., Zimmerman, A.T., Spencer Jr., B.F., Nagayama, T., 2008.Smart wireless sensor technology for structural health monitoring of civil structures. SteelStructures 8 (4), 267e275.
Dharap, P., Li, Z., Nagarajaiah, S., Barrera, E.V., 2004a. Nanotube film based on single-wallcarbon nanotubes for strain sensing. Nanotechnology 15 (3), 379.
Dharap, P., Li, Z., Nagarajaiah, S., Barrera, E.V., 2004b. Flexural strain sensing using carbonnanotube film. Sensor Review 24 (3), 271e273.
Decher, G., 1997. Fuzzy nanoassemblies: toward layered polymeric multicomposites. Science277 (5330), 1232e1237.
Dinh-Trong, N., Steitz, J., Lei, B., Kanoun, O., 2009. Influence of the composition of MWCNTslayers on the properties of strain gauges. Nanotechnology 477e480. IEEE-NANO 2009.9th IEEE Conference on.
Farrar, C.R., Worden, K., 2007. An introduction to structural health monitoring. PhilosophicalTransactions of the Royal Society of London A 365 (1851), 303e315.
Fung, C.K.M., Wong, V.T.S., Chan, R.H.M., Li, W.J., 2004. Dielectrophoretic batch fabricationof bundled carbon nanotube thermal sensors. Nanotechnology, IEEE Transactions on 3 (3),395e403.
Hu, L., Hecht, D.S., Gr€uner, G., 2010. Carbon nanotube thin films: fabrication, properties, andapplications. Chemical Reviews 110 (10), 5790e5844.
Hou, T.-C., Loh, K.J., Lynch, J.P., 2007. Spatial conductivity mapping of carbon nanotubecomposite thin films by electrical impedance tomography for sensing applications.Nanotechnology 18 (31), 315501.
Holder, D.S., 2004. Electrical Impedance Tomography: Methods, History and Applications.CRC Press, London.
Han, B., Yu, X., Kwon, E., 2009. A self-sensing carbon nanotube/cement composite for trafficmonitoring. Nanotechnology 20 (44), 445501.
Hu, N., Karube, Y., Yan, C., Masuda, Z., Fukunaga, H., 2008. Tunneling effect in a polymer/carbon nanotube nanocomposite strain sensor. Acta Materialia 56 (13), 2929e2936.
Hellstrom, S.L., Lee, H.W., Bao, Z., 2009. Polymer-assisted direct deposition of uniform carbonnanotube bundle networks for high performance transparent electrodes. ACS Nano 3 (6),1423e1430.
Hemtej, G., Vemuru, V.S.M., Kumar, A., Botello-Mendez, A., Vajtai, R., Terrones, M.,Nagarajaiah, S., Ajayan, P.M., 2010. Flexible piezoelectric ZnO-paper nanocompositestrain sensor. Small 6 (15), 1641e1646. http://dx.doi.org/10.1002/smll.201000254.
Strain sensing and structural health monitoring using nanofilms and nanocomposites 323

Iijima, S., 1991. Helical microtubules of graphitic carbon. Nature 354 (6348), 56e58.Jo, J.W., Jung, J.W., Lee, J.U., Jo, W.H., 2010. Fabrication of highly conductive and transparent
thin films from single-walled carbon nanotubes using a new non-ionic surfactant via spincoating. ACS Nano 4 (9), 5382e5388.
Kanoun, O., M€uller, C., Benchirouf, A., Sanli, A., Dinh, T.N., Al-Hamry, A., Bu, L.,Gerlach, C., Bouhamed, A., 2014. Flexible carbon nanotube films for high performancestrain sensors. Sensors 14 (6), 10042e10071.
Knite, M., Teteris, V., Kiploka, A., Kaupuzs, J., 2004. Polyisoprene-carbon black nano-composites as tensile strain and pressure sensor materials. Sensors and Actuators a:Physical 110 (1e3), 142e149.
Kang, I., Schulz, M.J., Kim, J.H., Shanov, V., Shi, D., 2006. A carbon nanotube strain sensor forstructural health monitoring. Smart Materials and Structures 15 (3), 737.
Kaempgen, M., Duesberg, G.S., Roth, S., 2005. Transparent carbon nanotube coatings. AppliedSurface Science 252 (2), 425e429.
Kang, I.P., Lee, J.W., Choi, G.R., Jung, J.Y., Hwang, S.H., Choi, Y.S., Yoon, K.J., Schulz, M.J.,2006. Structural health monitoring based on electrical impedance of a carbon nanotubeneuron. Key Engineering Materials 321, 140e145.
Kang, J.H., Park, C., Scholl, J.A., Brazin, A.H., Holloway, N.M., High, J.W., Lowther, S.E.,Harrison, J.S., 2009. Piezoresistive characteristics of single wall carbon nanotube/poly-imide nanocomposites. Journal of Polymer Science Part B: Polymer Physics 47 (10),994e1003.
Kord�as, K., Mustonen, T., T�oth, G., Jantunen, H., Lajunen, M., Soldano, C., Talapatra, S.,Kar, S., Vajtai, R., Ajayan, P.M., 2006. Inkjet printing of electrically conductive patterns ofcarbon nanotubes. Small 2 (8e9), 1021e1025.
Li, Z., Dharap, P., Nagarajaiah, S., Barrera, E., Kim, J.D., 2004. Carbon nanofilm sensor.Advanced Materials Journal 16 (7), 640e643. http://dx.doi.org/10.1002/adma.200306310.
Loh, K., Hou, T.-C., Lynch, J., Kotov, N., 2009. Carbon nanotube sensing skins for spatial strainand impact damage identification. Journal of Nondestructive Evaluation 28 (1), 9e25.
Loh, K., Chang, D., 2011. Zinc oxide nanoparticle-polymeric thin films for dynamic strainsensing. Journal of Materials Science 46 (1), 228e237.
Loh, K.J., Azhari, F., 2012. Recent advances in skin-inspired sensors enabled by nanotech-nology. JOM 64 (7), 793e801.
Loh, K.J., Lynch, J.P., Shim, B.S., Kotov, N.A., 2008. Tailoring piezoresistive sensitivity ofmultilayer carbon nanotube composite strain sensors. Journal of Intelligent Material Sys-tems and Structures 19 (7), 747e764.
Loh, K.J., Kim, J., Lynch, J.P., Kam, N.W.S., Kotov, N.A., 2007. Multifunctional layer-by-layercarbon nanotubeepolyelectrolyte thin films for strain and corrosion sensing. SmartMaterials and Structures 16 (2), 429.
Loyola, B.R., Zhao, Y., Loh, K.J., Saponara, V.L., 2013a. The electrical response of carbonnanotube-based thin film sensors subjected to mechanical and environmental effects. SmartMaterials and Structures 22 (2), 025010.
Loyola, B.R., Saponara, V.L., Loh, K.J., Briggs, T.M., O’Bryan, G., Skinner, J.L., 2013b.Spatial sensing using electrical impedance tomography. Sensors Journal, IEEE 13 (6),2357e2367.
Loh, K.J., Gonzalez, J., 2015. Cementitious composites engineered with embedded carbonnanotube thin films for enhanced sensing performance. Journal of Physics: ConferenceSeries 628, 012042.
Loh, K.J.-H., 2008. Development of Multifunctional Carbon Nanotube Nanocomposite Sensorsfor Structural Health Monitoring. University of Michigan.
324 Multifunctional Nanocomposites in Civil and Structural Engineering

Mamedov, A.A., Kotov, N.A., Prato, M., Guldi, D.M., Wicksted, J.P., Hirsch, A., 2002.Molecular design of strong single-wall carbon nanotube/polyelectrolyte multilayercomposites. Nature Materials 1 (3), 190e194.
Mortensen, L.P., Ryu, D.H., Zhao, Y.J., Loh, K.J., 2013. Rapid assembly of multifunctional thinfilm sensors for wind turbine blade monitoring. Key Engineering Materials 569, 515e522.
Obitayo, W., Liu, T., 2012. A Review: carbon nanotube-based piezoresistive strain sensors.Journal of Sensors 2012, 1e15.
Polydorides, N., 2002. Image Reconstruction Algorithms for Soft-field Tomography. Universityof Manchester, UMIST.
Park, C., Ounaies, Z., Watson, K.A., Crooks, R.E., Smith Jr., J., Lowther, S.E., Connell, J.W.,Siochi, E.J., Harrison, J.S., Clair, T.L.S., 2002. Dispersion of single wall carbon nanotubesby in situ polymerization under sonication. Chemical Physics Letters 364 (3e4), 303e308.
Pham, G.T., Park, Y.-B., Liang, Z., Zhang, C., Wang, B., 2008. Processing and modeling ofconductive thermoplastic/carbon nanotube films for strain sensing. Composites Part B:Engineering 39 (1), 209e216.
Rein, M.D., Breuer, O., Wagner, H.D., 2011. Sensors and sensitivity: carbon nanotubebuckypaper films as strain sensing devices. Composites Science and Technology 71 (3),373e381.
Ryu, D., Meyers, F.N., Loh, K.J., 2014. Inkjet-printed, flexible, and photoactive thin film strainsensors. Journal of Intelligent Material Systems and Structures 1e12. http://dx.doi.org/10.1177/1045389X14546653.
Suri, K., Annapoorni, S., Sarkar, A.K., Tandon, R.P., 2002. Gas and humidity sensors based oniron oxideepolypyrrole nanocomposites. Sensors and Actuators B: Chemical 81 (2e3),277e282.
Stampfer, C., Helbling, T., Obergfell, D., Sch€oberle, B., Tripp, M.K., Jungen, A., Roth, S.,Bright, V.M., Hierold, C., 2006. Fabrication of single-walled carbon-nanotube-basedpressure sensors. Nano Letters 6 (2), 233e237.
Saulnier, G.J., Blue, R.S., Newell, J.C., Isaacson, D., Edic, P.M., 2001. Electrical impedancetomography. IEEE Signal Processing Magazine 18 (6), 31e43.
Sui, L.L., Liu, T.-J., 2005. State-of-the-art of multifunctional and smart concrete. Key Engi-neering Materials 302, 424e431.
Sun, P., Bachilo, S.M., Weisman, R.B., Nagarajaiah, S. (web-published 8/10/2015). Carbonnanotubes as non-contact optical strain sensors in smart skins. Journal of Strain Analysis forEngineering Design. http://dx.doi.org/10.1177/0309324715597414.
Srivastava, R.K., Vemuru, V.S.M., Zeng, Y., Vajtai, R., Nagarajaiah, S., Ajayan, P.M.,Srivastava, A., 2011. The strain sensing and thermalemechanical behavior of flexiblemulti-walled carbon nanotube polystyrene composite films. Carbon 49 (12), 3928e3936.http://dx.doi.org/10.1016/j.carbon.2011.05.031.
Tian, H., Shu, Y., Cui, Y.-L., Mi, W.-T., Yang, Y., Xie, D., Ren, T.-L., 2014. Scalable fabri-cation of high-performance and flexible graphene strain sensors. Nanoscale 6 (2),699e705.
Vemuru, S., Wahi, R., Nagarajaiah, S., Ajayan, P., 2009. Strain sensing using a multiwalledcarbon nanotube film. Journal of Strain Analysis for Engineering Design 44 (7), 555e562.
Vauhkonen, M., 1997. Electrical Impedance Tomography and Prior Information. University ofKuopio.
Wang, Y., Lynch, J.P., Law, K.H., 2007. A wireless structural health monitoring system withmultithreaded sensing devices: design and validation. Structure and Infrastructure Engi-neering 3 (2), 103e120.
Strain sensing and structural health monitoring using nanofilms and nanocomposites 325

Wei, C., Dai, L., Roy, A., Tolle, T.B., 2006. Multifunctional chemical vapor sensors of alignedcarbon nanotube and polymer composites. Journal of the American Chemical Society 128(5), 1412e1413.
Wang, J., 2005. Carbon-nanotube based electrochemical biosensors: a review. Electroanalysis17 (1), 7e14.
Wikipedia contributors, 2014. Buckypaper. The Free Encyclopedia. https://en.wikipedia.org/w/index.php?title¼Buckypaper&oldid¼637009327.
Wille, K., Loh, K., 2010. Nanoengineering ultra-high-performance concrete with multiwalledcarbon nanotubes. Transportation Research Record: Journal of the Transportation ResearchBoard 2142, 119e126.
Withey, P.A., Vemuru, V.S.M., Bachilo, S.M., Nagarajaiah, S., Weisman, R.B., 2012. Strainpaint: noncontact strain measurement using single-walled carbon nanotube compositecoatings. Nano Letters 12 (2), 3497e3500. http://dx.doi.org/10.1021/nl301008m.
Zhang, Z., Wei, H., Liu, Y., Leng, J., 2015. Self-sensing properties of smart composite based onembedded buckypaper layer. Structural Health Monitoring 1e10. http://dx.doi.org/10.1177/1475921714568405.
Zhao, Y., Loyola, B.R., Loh, K.J., 2011. Characterizing the viscoelastic properties of layer-by-layer carbon nanotubeepolyelectrolyte thin films. Smart Materials and Structures 20 (7),075020.
326 Multifunctional Nanocomposites in Civil and Structural Engineering

In situ sensing in glassfiber-reinforced polymercomposites via embedded carbonnanotube thin films
14
Bryan R. LoyolaSandia National Laboratories, Livermore, CA, USA
14.1 Introduction
The use of fiber-reinforced composite materials has drastically increased in the pastseveral decades. Due to this, an increased interest in long-term structural performanceand monitoring of these materials has led to several methods to perform in-serviceassessments. This chapter covers the recent research in the area of embedding carbonnanotube (CNT)-based thin films into glass fiber-reinforced polymer (GFRP) compos-ites. Significant detail is given on the manufacturing process and measurement strate-gies of the research that has been conducted in this field. Finally, typical results aredescribed for the methods discussed pertaining to sensing strain and detecting damagein GFRP composites.
14.1.1 Chapter outline
To best divulge the details in performing structural health monitoring (SHM) usingembedded CNT-based thin films in GFRP composites, this chapter is distributedinto four sections: background, fabrication of embedded CNT-based thin films,methods for sensing strain and damage with embedded CNT-based thin films, andtypical results developed from these methods. Extensive background on embeddedsensing methods for fiber-reinforced polymer (FRP) composites is presented to givethe reader perspective on the current state of the field. Next, the fabrication methodsare described; those appearing in this chapter are, to the author’s knowledge, theonly methods previously reported in the reviewed literature. The methods for usingthe CNT-based thin films for sensing purposes consist of direct current (DC) resistancemeasurements, which are more commonly known, and electrical impedance spectros-copy and electrical impedance tomography, which are more recently employedmethods. Finally, typical results from these aforementioned methods are presentedfrom embedded CNT thin films in GFRP structures. Future thrust areas resultingfrom the current state of the art are presented as a guide to readers desiring to enterthis field of SHM.
Innovative Developments of Advanced Multifunctional Nanocomposites in Civil and Structural Engineeringhttp://dx.doi.org/10.1016/B978-1-78242-326-3.00014-2Copyright © 2016 Elsevier Ltd. All rights reserved.

14.2 Background
Structural engineers are continually finding ways to incorporate higher performingmaterials into structures to increase safety, efficiency, and manufacturability in aircraft,automobiles, civil structures, pressure tanks, and spacecraft. One of these newer ma-terials is fiber-reinforced polymer composites, using primarily glass (GFRP) or carbon(CFRP) fiber reinforcement. Specifically, these materials have high strength-to-weightratios, resistance to fatigue, and high conformability in the manufacturing process.However, there materials are still susceptible to damage from a multitude of avenues,such as impact, high levels of mechanical strain, chemical penetration, and multiaxialfatigue. These events can lead to damage modes such as delamination, matrixcracking, fiber breakage, and matrix blistering, to name a few. These tend to occurinternal to the laminate structure, rendering the damage nearly undetectable to visualinspection. As visual inspection is the prominent means for damage detection innumerous industries, this poses a tremendous problem. In fact, unexpected structuralfailure in composite structures has already occurred in some Airbus A310 seriesaircraft involving the GFRP sandwich structure of the rudders. Hydraulic fluid wasfound to leak into the rudder, causing delamination or disbonding of the GFRP inthe rudder, which grew over time from continued loading and hydraulic fluid exposure.Specifically, Air Transat Flight 961 from Varadero, Cuba, to Quebec, Canada, expe-rienced full rudder detachment near Miami, Florida, causing it to make a return toVaradero. A joint investigation between the Canadian and American transportationsafety organizations made the determination that this could have been prevented hadthe delaminations been detected at an earlier stage (Rosenker, 2006).
For this reason, numerous operator-based methods have been applied to this prob-lem, such as using ultrasonics, X-ray, thermography, and dye penetrant methods.These have all been demonstrated to detect some if not all of the damage modes spec-ified previously with high resolution. However, these all require a skilled technician toperform these measurements by hand, or to use very expensive automated equipmentto scan large structures like aircraft wings. The field of SHM has shifted focus to applydistributed sensors across or throughout structures. A handful of sensors have been thepredominant focus for detecting damage in FRP composites: strain gages, opticalfibers, and wave-based methods, which are used to detect strain fields, cracking, or dis-continuities in the FRP composites. Distributed strain gages (Haksoo et al., 2008;Kesavan et al., 2006, 2008; Rumsey and Paquette, 2008) and optical fiber Bragg grat-ings (Amano et al., 2007; Antunes et al., 2011; Betz et al., 2002; Kersey et al., 1997;Sohn et al., 2001) are distributed across a surface to sense for changes in a structure’sstrain field due to the presence of damage with reference to a known baseline to a typeof mechanical loading. Small-diameter optical fibers without incorporated sensorshave been embedded within FRP composites that allow for the use of optical methodsto detect the length of the fiber. When the detection method measures a drastic decreasein the fiber length, it can indicate that the fiber has been broken, potentially indicating acrack (Bastianini et al., 2005; Kuang and Cantwell, 2003). Finally, wave-basedmethods including acoustic emission and ultrasonic sensing have also been usedthat were distributed across a structure. In the case of acoustic emission, the system
328 Multifunctional Nanocomposites in Civil and Structural Engineering

detects acoustic waves generated from damage events, such as delamination or fiberbreakage (Beattie, 1997; Ciampa and Meo, 2012; Ian et al., 2002; Wenger et al.,1996; Yun, 2011). Using the emission characteristics (i.e., frequency, duration, andamplitude), several papers have demonstrated the ability to distinguish between thesetypes of damage. Ultrasonic-based methods use piezoelectric transducers to emit anultrasonic pulse, which propagates across the structure (Chambers et al.; Choi andChang, 1994; Kessler and Raghavan; Lin and Chang, 2002; Tang et al., 2011). If thewave encounters any discontinuities in the structure, then the wave is scattered, whichis then detected by the same piezoelectric sensor or another one. To protect the sensors,allow for better coupling to the structure, and increase sensitivity, it is desired to embedthese sensors. However, it has been found that embedding optical fibers with diameterslarger than 100 mm (Tsutsui et al., 2004) and embedding piezoelectric sensor/actuatordisks (Winkelmann et al., 2008) lead to decreased fatigue life of the composite struc-tures. In addition, most of these methods require expensive and heavy equipment toperform these types of sensing, which will require some miniaturizing on their partto be usable in weight- and/or size-restrictive environments such as aircraft.
An orthogonal approach to damage detection from the previously describedmethods is to monitor the electrical properties of the FRP composites. With a fiberthat is already conductive (i.e., carbon fibers), this is readily done by measuring theelectrical conductivity or impedance of the composite as it is loaded or before and afterdamage. This is done by injecting a DC or alternating current (AC) and making somesort of voltage measurements. Like strain gages, the resistance of a material willchange due to strain, which has been shown in the literature (Wang and Chung,2000, 2007; Wang et al., 1999). In addition, if the conductive materials are damaged,the resistance of the region will increase due to a disruption in the conductive pathways(Irving and Thiagarajan, 1998; Todoroki, 2008; Todoroki et al., 2002; Wangand Chung, 2006; Wang et al., 2005). However, GFRP is highly nonconductive,requiring a conductive material be introduced to the system to enable electricalconductivity-based damage detection methods. This has been accomplished in twodistinct ways: by incorporating conductive particles directly into the epoxy matrixof the GFRP composites, or embedding a thin film of nanoparticles directly on orbetween the layers of fibers. The former method is discussed in another section ofthis book. The latter approach typically utilizes CNTs, which were first reported byIijima (1991). CNTs are one or more concentrically structured wrapped tubes of gra-phene, which exhibit high mechanical, thermal, and electrical properties (Baughmanet al., 2002). In fact, CNTs were determined to be a very effective filler material fornonconductive materials to impart higher levels of conductivity into what has cometo be called a nanocomposite (Thostenson et al., 2001). As for thin films based onCNTs, numerous researchers have investigated these structures either as pure CNTthin films (i.e., buckypapers) (Dharap et al., 2004; Rein et al., 2011) or as incorporatedwith a polymer matrix and called CNT nanocomposites (De et al., 2009; Hu et al.,2010; Kang et al., 2006; Loh et al., 2007; Shindo et al., 2011; Vemuru et al., 2009;Zhao et al., 2011). The reported characterization of these materials has demonstratedthe strain sensitivity of the resistance of these thin films. To this point, only threeexamples of CNT thin films have been reported to have been embedded in the structure
In situ sensing in glass fiber-reinforced polymer composites 329

of a GFRP composite. First, multiwalled carbon nanotube (MWCNT)epolyelectrolytethin films were directly deposited onto glass fiber weaves that were infused with anepoxy resin to complete the GFRP composite (Loyola et al., 2010a). Second, anMWCNTepolyvinylidene fluoride (PVDF) thin film was spray deposited into unidi-rectional glass fiber weaves, which were then infused with epoxy, creating embeddedsensing layers in the GFRP composite (Loyola et al., 2013a,b). Finally, Sureeyatana-pas and Young (2009) incorporated single-walled carbon nanotubes (SWCNTs) intoan amine silane coupling agent and directly applied it to a glass fiber surface for useas a strain sensor. As will be shown in this chapter, embedding CNT thin films intoa GFRP composite for strain- and damage-sensing applications demonstrates a lotof promise for this sensing avenue.
14.3 Embedded CNT thin films
Over the next section, three distinct methods for embedding CNT thin films into thestructure of GFRP composites are discussed.
14.3.1 Layer-by-layer deposited MWCNTePSS/PVAthin films
The first method for CNT thin film deposition is based on a layer-by-layer (LbL)polyelectrolyte deposition methodology. The basis for this depositional process isthe electrostatic attraction between deposited layers of polycationic poly(vinyl alcohol)(PVA) and polyanionic poly(4-sodium styrene sulfonate) (PSS), which combine tocreate a robust film that is controllable on the nanoscale (Decher and Schlenoff,2003). The MWCNTs are incorporated into the film via polymer wrapping by thePSS chains, which also enable a stable solution of MWCNTePSS. Despite being ofa discrete iterative nature, this process yields highly isotropic thin films of carbonnanotubes of high mechanical performance mainly due to the strong hydrogen bondingbetween the two polyelectrolytes (Kozlov et al., 2003).
The embedded thin films start off with a unidirectional glass fiber weave (type7715, Applied Vehicle Technology) as the depositional substrate. These substratesare then immersed in a solution of 0.5 wt% of PVA that has been dissolved into deion-ized (DI) water at 100 �C and cooled to room temperatures. The substrates areimmersed for 5 min, ideally being spun in the liquid to enhance the polyanionic depo-sition across the surface (Decher and Schlenoff, 2003). The substrate is then rinsed for1 min in DI water for a total of three times to remove any unbound PVA solution anddried for 5 min with dry nitrogen. The substrate is then immersed in the MWCNTePSS solution for 5 min. This solution is created by a 1 wt% solution of PSS with1 mg/mL MWCNTs stably dispersed in it using 30 min of ultrasonic power using a1/8-in tip sonicator at 135 W and 5 s on/off pulses. PSS has been shown to wrap itselfaround CNTs, thus disallowing rebonding to other CNTs causing agglomeration(Yang et al., 2010). This is the mechanism that ensures a stable dispersion of theMWCNTs is obtained. Once the substrate has been submerged and spun in the
330 Multifunctional Nanocomposites in Civil and Structural Engineering

solution, the substrates are again rinsed three times at 1 min apiece. This is followed bydrying for 5 min under dry nitrogen. The deposition of both PVA and MWCNTePSSequates to one bilayer of the film. The deposition process is continued until the desirednumber of bilayers have been deposited, resulting in a film that is indicated by[MWCNTePSS/PVA]n, where n is the number of bilayers in the film. A pictorialof this process is available in Figure 14.1.
The resulting films from the LbL process are highly uniform, as illustrated by thescanning electron microscopy (SEM) image in Figure 14.2(a). The dense networkof MWCNTs is held together by a web of the polyelectrolytes. In addition, the filmsare shown to conformally coat the glass fibers of the weave in the SEM image inFigure 14.2(b), which will hopefully lead to good strain transfer between the fiberand the film. With the thin films deposited on the woven fabric, the fabric was cutinto rectangles with dimensions of 3 mm by 70 mm with the long dimension in the di-rection of the fibers. To electrically connect to the thin films during testing, two elec-trodes were placed 15 mm apart with the bottom electrode placed 10 mm from thebottom of the specimen. To electrically connect the specimen to external electricalmeasurement equipment, 30 AWG wires were stripped slightly longer than the widthof the specimens and then positioned at the location of each electrode and adhered withsilver paint for electrical connection to the MWCNTePSS/PVA thin film. The weaveswere then infused with a two-part epoxy system (Pro-Set 125/237) using a wet layupprocess, then fully cured for 15 h at room temp and 8 h at 80 �C. At this point, theMWCNTePSS/PVA film is fully embedded within the GFRP structure of thespecimen.
Glass fibersubstrates
H2O(3 min) ×3
H2O(3 min) ×3
N2(5 min)
N2(5 min)
MWCNT-PSS(5 min)
PVA(5 min)
Figure 14.1 Schematic of the layer-by-layer thin film deposition process.
In situ sensing in glass fiber-reinforced polymer composites 331

The LbL deposition process allows for nanoscale control of the thickness of thefilms, which leads to control of the resistance of the films. The full characterizationof the response to strain and other environmental stimuli has been reported (Loyolaet al., 2013c). The main drawback of the LbL process is the requirement for thesubstrate to be immersed in the polyelectrolyte solutions. This drastically reducesthe area over which the films can be deposited.
14.3.2 Spray-deposited MWCNTePVDF thin films
A spray-deposited MWCNTepolyvinylidene fluoride (PVDF) film has been devel-oped to allow for deposition of a conductive MWCNT thin film across large regions,like an aircraft wing or sections of a bridge. The paint is based on a latex paint system,which is an emulsion of PVDF nanoparticles that when coalesced together create arobust film. By using a latex formulation, a segregated network of MWCNTs is createdas the MWCNTs cannot penetrate the PVDF spheres, which allows the PVDF nano-particles to act as a guide for creating the MWCNT network. A schematic of this isshown in Figure 14.3(a). It is believed that this configuration allows for a lowerpercolation threshold in these MWCNTePVDF nanocomposites.
To incorporate the MWCNTs into the latex paint system, a two-part formulationwas developed. The first part contained the stably dispersed MWCNTs, using PSSas a polymer wrapping dispersal agent. An appropriate amount of MWCNTs wereadded to a 2 wt% solution of PSS to result in a 5 wt% loading of MWCNTs in the finalfilm. The polar solvent N-methyl-2-pyrrolidone (NMP) is added as a coalescing agentfor the PVDF latex particles. NMP has a twofold role as it also aids in the dispersal ofthe MWCNTs during the deagglomeration step. Next, this solution was tip sonicated(Branson S-450D) with a 1/4 -in tip at 30% amplitude for 30 min with 5 s on/off pulsingto deagglomerate the MWCNTs into a stable solution with the PSS and NMP calledthe MWCNT ink. After the first part of the formulation is complete, the second part
Figure 14.2 Scanning electron microscope image of a representative MWCNTePSS/PVA LbLfilm on a glass slide (a) and covering a glass fiber (b).
332 Multifunctional Nanocomposites in Civil and Structural Engineering

of the formulation contains the PVDF latex formulation (Arkema Kynar Aquatec) andenough water to ensure that the total solid content in the combined paint formulation isat 13 wt%. This will ensure a formulation that is sprayable. The Kynar and water arecombined in a large container, and the ink was added to the Kynar solution and thor-oughly mixed. Within 20 min, the paint solution is spray deposited onto glass fiberweaves (Vectorply E-LR 0908) that have been cleaned using ethanol and driedusing nitrogen. The film is spray deposited using an airbrush attached to a dry nitrogenline. The wet spray-deposited film is then placed in a 60 �C convection oven for15 min or until completely dry. After the film is fully dry, the fiber weave with depos-ited thin film can be infused with epoxy to create a GFRP structure. An image of theMWCNTePVDF thin film spray deposited on an aluminum substrate is presented inFigure 14.3(b). In this image, the MWCNTs are clearly visible as the light worm-likestructures, which are clearly evenly distributed across the thin film. As presented laterin this chapter, this will allow for a fully percolated network of MWCNTs enabling aconductive nanocomposite.
Once the thin film is deposited on the glass fiber weave, it is ready to be infusedwith epoxy to make into a GFRP composite with an embedded sensor. To measurethe resistance response to strain, the same 3 � 70 mm specimens are fabricated withthe applied electrodes and wiring prior to the wet layup manufacturing of the compos-ite. To fabricate the specimens for the distributed sensing methodology discussed inSection 14.4.3, a different approach is taken. The GFRP composite in the distributedsensing case will be several glass fiber weave plies thick. The glass fiber weaves withthe deposited thin films will only be on the outer facing layers. To allow for direct elec-trical connection to these embedded films, single-sided copper tape with a protectivepaper backing is used to prevent the epoxy from coating the electrode and maintainingelectrical contact with the film. A copper tape (3M) was cut into 3 � 3 mm squares toact as the electrodes. The MWCNTePVDF film was coated with conductive silverpaint at the point where the electrode was to be positioned. The tape is placed copper
Figure 14.3 Schematic (a) and scanning electron microscope image (b) of the MWCNTePVDFlatex-based paint.
In situ sensing in glass fiber-reinforced polymer composites 333

side down, or sticky side with protective paper facing upward. The rest of the glassfiber weaves were stacked in the desired stack sequence and infused with a two-partepoxy (Pro-Set 117LV/237) using a vacuum-assisted resin transfer molding(VARTM) process. The composite is cured for 15 h at room temperature and at80 �C for 8 h. Once the composite has been cured, a razor blade is used to cut aroundthe electrodes, and the protecting backing of the tape is removed, exposing the elec-trode. The specific number and positions of the electrodes will be discussed in Section14.4.4. For further details on the fabrication process of these embedded MWCNTePVDF GFRP composites, please refer to these works from Loyola et al. (2013a,b).
14.3.3 Sizing-based SWCNT glass fiber coatings
The final example of an embedded thin film sensor was created by Sureeyatanapas andYoung (2009). Their method focused on incorporating SWCNTs into the amino-silanecoupling agent, which is then deposited onto the surface of individual fibers. A solu-tion of SWCNTs 0.1 wt% in ethanol was produced using 120 min of sonication. Tothis mixture, enough amino-silane (3-aminopropyl-triethoxysilane) coupling agentwas added to raise the silane concentration of the SWCNT solution to 1.5 vol%.The amino-silane was then mixed and hydrolyzed over a period of 15 min. Finally,the deposition of the SWCNTeamino-silane solution onto the fiber surface was per-formed by immersing the fibers in the solution and heating it in an oven to 120 �Cfor 120 min. The fibers could then be infused with epoxy, which will adhere to theamino-silane coupling agent that is bonded to the fiber surface and the SWCNTs.The cross-section of a single fiber with deposited SWCNTeamino-silane coatingand infused epoxy is shown in Figure 14.4. As commented on by Suryeeatanna and
Figure 14.4 Glass fiber with deposited SWCNTeamino-silane coating and epoxy encapsulationlayer.Reprinted from Sureeyatanapas and Young (2009) with permission from Elsevier.
334 Multifunctional Nanocomposites in Civil and Structural Engineering

Young, the SWCNTeamino-silane layer is too thin to identify in this SEM image, butit is indeed present. This approach could easily be implemented for depositing the thinfilms onto larger glass fiber weaves. Afterward, either the strain sensitivity specimenapproach or distributed electrode approach discussed over the past two subsectionscould be applied. Once prepared, GFRP composites can be fabricated with a wet layupor VARTM approach.
14.4 Electrical sensing measurements ofembedded CNT thin films
Once the CNT-based sensors have been embedded within a GFRP composite, thechange in the electrical properties as a function of applied strain and induced damagemust be characterized. Three main methods for performing this electrical characteriza-tion have been performed in the literature. The methods include direct current (DC)electrical resistance, electrical impedance spectroscopy (EIS), and electrical imped-ance tomography (EIT). The first two methods are discrete electrical measurementsin the time and frequency domains, respectively. On the other hand, EIT enablesspatially distributed electrical measurements within a predefined sensing area. Thesethree methods will be described in detail throughout this section.
14.4.1 DC resistance
The most frequently reported values for CNT thin-film-based strain sensing are DCresistance measurements. This time-domain electrical measurement method involvesinjecting an electrical current and measuring the corresponding voltage across thespecimen. In general, there are two different configurations of DC resistance measure-ments: two-point and four-point DC resistance measurements. As indicated in thename, two-point resistance measurements are made by connecting to the conductivematerial using only two electrodes. Typically, these electrodes are fabricated suchthat they are across the width of a rectangular sample to enable a uniform currentdistribution. In one electrode, a specified current is injected and the other is set toground. The voltage between these two electrodes is then measured. A schematic ofthis measurement is presented in Figure 14.5(a). The resistance is then calculated usingEqn (14.1):
R ¼ V
I(14.1)
The drawback to two-point resistance measurements is that the measurementincludes the contact resistance between the electrodes and the specimen, whichcan lead to misconceptions regarding the material’s electrical properties if the con-tact resistance is high. In order to remove the contact resistance from the resistancemeasurement, the four-point method is used. This method involves four electrodes,
In situ sensing in glass fiber-reinforced polymer composites 335

which either are placed across the width of a rectangular sample in four places orare four points that are aligned. The latter configuration is commonly used for sheetresistance measurements on wafers in the semiconductor industry and calledfour-point probe resistance measurements. The current is injected between the outerelectrodes, and the voltage is measured between the inner electrodes. The samecalculation is used for these four-point resistance measurements as for thetwo-point resistance measurements. In this case, the calculated resistance value isfor the region between the two inner electrodes. In order to perform these measure-ments, a current source and voltage meter are necessary, or a digital multimeter(DMM) is used with a two-point or four-point resistance setting. Some examplesof commercially available DMMs that can take these measurements are a Keithley2100 or an Agilent 34,411A.
14.4.2 Electrical impedance spectroscopy
EIS is an electrical measurement of the electrical impedance of a material over thefrequency domain. These measurements are performed much like the DC resistancemeasurements, except that an alternating current (AC) is injected across the materialsbetween two electrodes, and the complex AC voltage is measured at those two elec-trodes or at two electrodes located between the current electrodes. The AC currentis injected with a frequency that is increased from the minimum specified frequencyto the maximum specified frequency in a number of specified increments. How thecomplex AC voltage is measured is covered in several EIS texts in great detail(Barsoukov and Macdonald, 2005; Lvovich, 2012), and this complete measurement
Figure 14.5 Schematics of the setup for a two-point (a) and four-point (b) resistancemeasurement.
336 Multifunctional Nanocomposites in Civil and Structural Engineering

is usually conducted by an impedance analyzer like Agilent’s 4294A. Using ananalogous equation to that of Ohm’s law, one can calculate the complex electricalimpedance for each frequency measured by an impedance analyzer (Eqn (14.2)).
~ZðuÞ ¼~VðuÞ~IðuÞ ¼ Z 0 þ iZ 00 ¼ jZjeif ¼ jZj:f (14.2)
The complex impedance is typically written in complex notation, Euler notation,or polar notation, shown respectively in Eqn (14.2). A typical EIS measurement foran MWCNTePSS/PVA thin film is plotted in a ColeeCole plot in Figure 14.7(a),which plots the real component of the complex impedance on the x-axis andthe negative complex component of the impedance on the y-axis. Typically, theEIS measurements are fit to an equivalent circuit, like the one illustrated inFigure 14.7(b). The calculated complex impedance for this circuit is presented inEqn (14.3).
~ZðuÞ ¼ Z0ðuÞ þ iZ00ðuÞ ¼ Rs þ
R�1p
R�2p þ u2C2
p
!� i
uCp
R�2p þ u2C2
p
!(14.3)
This equivalent circuit yields an impedance response that is a half circle that is posi-tively offset from the y-axis when plotted in a ColeeCole plot, just like that from theEIS measurements of the MWCNTePSS/PVA thin films. It should be noted that thisequivalent circuit is nonunique and there are other equivalent circuits that will renderthe same impedance spectra (Barsoukov and Macdonald, 2005). This particular
3
2.5
2
1.5
1
0.5
0DataFit
–0.57 8 9 10 11 12 13
Rs
Rp
Cp
Z′ (kΩ)
–Z″ (
kΩ)
(a)
(b)
Figure 14.6 Example of an EIS measurement of an MWCNTePSS/PVA thin film and the fitequivalent circuit typically used to fit EIS responses to applied strain in MWCNTePSS/PVAthin films (a) and a diagram of the equivalent circuit used to model the film impedance (b).
In situ sensing in glass fiber-reinforced polymer composites 337

equivalent circuit was chosen due to the fact that it was originally used to model theEIS response from zirconiaeyttria electrolyte thin films (Bauerle, 1969). Furthermore,these thin films were intended to detect transverse cracking in a GFRP compositeunder high levels of tensile loads, so the capacitive term was thought to be sensitiveto these cracks by demonstrating an increase in capacitance (Loyola et al., 2010a).To fit the EIS measurements to this equivalent circuit, a nonlinear least squaresmethods can be implemented, like the function “lsqnonlin” in MATLAB (TheMathworks Inc, 2010). The nonlinear least squares fit to the data in Figure 14.7(a)(gray dots) is presented in the same figure as the black dashed line. The resultingequivalent circuit elements are presented in Table 14.1. It is these equivalent circuitvalues that are normally measured as a function of strain, damage, or environmentalfactor when using EIS measurements for electrical characterization.
Appl
ied
stra
in(με)
0
10,000
20,000
30,000
40,000
50,000
60,000
70,000
Time (s)0 500 1000 150019 mm
(a) (b)
Figure 14.7 Example of a GFRP composite with embedded LbL thin film tensile coupon (a)and an example of a stepped strain test profile to which the specimens are subjected (b).Reprinted from Loyola et al. (2010a) with permission from Springer.
Table 14.1 Equivalent circuit element values for theEIS measurement illustrated in Figure 14.6(a)
Rs Rp Cp
7105.6 Ohms 5327.6 Ohms 80.95 pF
338 Multifunctional Nanocomposites in Civil and Structural Engineering

14.4.3 Characterization of electrical property responseto applied tensile strain
In order to couple these time-domain resistance and frequency-domain EIS measure-ments with mechanical testing, a few accommodations need to be made in the testsetup to allow for both simultaneously. Assuming the specimens are configured inthe same fashion as described in Section 14.3.1, the electrodes will be located in thesame location where the load frame grips will engage the specimen in a tensile config-ured test. To protect the electrodes and ensure the load frame grips have solid contactwith the specimen, tabs are attached to the specimen in the grip region. One example ofthese tabs is GFRP squares that are adhesively bonded to the GFRP composite withan embedded CNT thin film. Specifically, in the case of the specimens discussed inSection 14.3.1, the specimens were tabbed with four 1-in squares of G10/FR4 thatare adhesively bonded to the GFRP specimen using Hysol 907, which was cured at60 �C for 2 h. The finished specimen looks like the one shown in Figure 14.6(a).
Once the specimens are prepared, the tensile test must be configured to allow for theresistance measurements and any other measurements that are to be taken. Typically,the DMM is configured to take the resistance measurements continuously while themechanical test is occurring. As DMMs can typically measure at rates into thekilohertz range, it is prudent to sample at a frequency at least that of the sample rateat which load frame is sampling the displacement, load, and/or strain. To obtain accu-rate strain measurements, strain gages or laser extensometers are typically employedand sampled at the same rate as the load frame. By sampling the resistance at thesame rate or higher than the load frame, the linear interpolation can be employed totime-sync the load frame (load, displacement, and strain) to the resistance measure-ments for easy data analysis. However if several electrical measurements need to betaken, as in the case of taking concurrent electrical impedance spectroscopy (EIS)and DC resistance measurements, then a stepped strain profile is needed. The resis-tance and EIS measurements discussed in Section 14.5.1 and Section 14.5.2 weretaken with this strategy. In general, the electrical measurements are taking with mono-tonically increasing strain. As there is interest in the electrical response to strain in theelastic and the postelastic regimes, two sampling frequencies were adopted. First,in the lower strain regime of 0e10,000 mε, the load frame was paused in stepsof 1000 mε to have a higher resolution understanding of the response in the elasticregime as well as the transition point to the postelastic regime. From 10,000 mε to fail-ure, the load frame is commanded to pause in increments of 10,000 mε. The size ofthese steps was to nominally ensure that the tensile tests lasted less than 10 min, asmandated by the ASTM D3039 standard (ASTM International, 2008). Each pausewas held for 60 s to allow for a DC resistance and an EIS measurement.
14.4.4 Electrical impedance tomography
Electrical impedance tomography (EIT) is an electrical soft-tomographic method thatis capable of reconstructing the impedance or conductivity across a surface or volume.EIT measurements are based on a sensing region that is defined by a set of boundary
In situ sensing in glass fiber-reinforced polymer composites 339

electrodes. A current is propagated between two of these electrodes, and the resultingvoltage distribution is measured at the remaining boundary electrodes. In the work pre-sented here, the sensing area is defined to be a square that is bordered by eight equallyspaced electrodes on each side, totaling 32 electrodes. An illustration of this scheme ispresented in Figure 14.8(a), where current is injected at electrode 2 and electrode 15 isgrounded. This measurement is performed several times for different current injectionpairs to build a large set of voltage measurements. One such current injection pattern isillustrated in Figure 14.8(b) for a thin film deposited on a unidirectional glass fiber mataligned in the vertical direction. Electrical conductivity and voltage are linked throughLaplace’s equation:
V$sVu ¼ 0 (14.4)
Typically, one knows the conductivity distribution across a surface or volume; and,using the boundary conditions, the voltage can be calculated. As EIT involves mappingboundary measurements to area or volume conductivity values, which leads to solvingan ill-posed inverse problem. This problem is somewhat easy to understand if one looksat the finite element method approach to these reconstructions. Typically, analyticalsolutions to Laplace’s equation (Eqn (14.4)) are not known or possible for mostgeometries, so a numerical solution is required in the form of the finite element method.
The finite element method is implemented using the weak form of Laplace’sequation, which is an integral form of Eqn (14.4). This new formulation is presentedin Eqn (14.5):ZZ
U
Vf$sU$Vudxdy ¼ 0 (14.5)
0 20 40 60 780
20
40
60
78
(mm)
(a) (b)
Figure 14.8 Illustration of an EIT measurement scheme (a) and a proposed current injectionpattern for sensing with embedded MWCNTePVDF thin films on unidirectional glass fiberweaves (b).Figure 14.8(b) reprinted from Loyola et al. (2013a) with permission from SAGE.
340 Multifunctional Nanocomposites in Civil and Structural Engineering

In Eqn (14.5), f is the linear shape function for a given node, sU is the conductivityin element U, and u is the voltage value at a node around element U. Equation (14.5)governs the physics of all nonelectrode node relations. As most of the glass fiber matsthat the thin films will be deposited upon have a directionality of the weave, theconductivity can be highly anisotropic. To accommodate this, the scalar electricalconductivity is replaced with a matrix value, as shown in Eqn (14.6).
~s ¼"sx 0
0 sy
#¼
264 1 0
0sy
sx
375sx (14.6)
To implement the boundary conditions associated with the electrodes, Eqns (14.7)and (14.8) are used to account for the current injection, ground condition, and voltagemeasurements.
ZEl
svu
vyds ¼ Il (14.7)
uþ zlsvu
vy¼ Vl (14.8)
Equation (14.7) is used to account for the current that is injected into electrode l.To account for the grounded electrode and to calculate the voltage at the remainingelectrodes, Eqn (14.8) is used where Vl is the voltage at electrode l.
As stated previously, this application of the finite element method to the Laplaceequation is just performing the forward problem, or measuring the voltage distributionacross a known conductive material. However, if the boundary voltage measurementsare known for a set current pattern, then the inverse problem must be solved to deter-mine the conductivity distribution. Due to the awkwardness of the inverse problem, ittook until 1980 for a solution to be found by Calderon (2006). After 1980, several newsolution strategies have been developed, including a linear method developed by Adlerand Guardo called maximum a posteriori (MAP) (Adler and Guardo, 1996). MAP lin-earizes the EIT inverse problem by reconstructing changes in electrical conductivity asa function of changes in the voltage measurements for an identical current injectionpattern. The approach taken is given in Eqn (14.9).
Ds
s0¼ �
HTWH þ lR��1
HTW
�DV
V0
�(14.9)
The MAP approach solves for the normalized change in conductivity using thenormalized change in voltage, primarily using the sensitivity matrix (H). The sensi-tivity matrix calculates how an infinitesimally small change in conductivity in asingle element changes the boundary voltage measurements, otherwise known as
In situ sensing in glass fiber-reinforced polymer composites 341

the Jacobian. One of the benefits to performing normalized differential imaging is thatthe calculation is insensitive to the specified current amplitudes and specified conduc-tivity distribution during the sensitivity matrix calculation. During the EIT measure-ment, replicate voltage measurements are taken to gain a distribution for each of thevoltage measurements. Typically, these distributions are Gaussian and these relatedstatistics are taken into account using the variance matrix W, calculated as shown inEqn (14.10).
Wi;i ¼ 1ai; Wi;j ¼ 0 for isj (14.10)
The variance matrix is constructed using the variance of voltage measurement i,which is specified as ai.
As the inverse calculation is ill-posed, a way to stabilize the solution is necessary,and this is typically done through regularization. The regularization implemented withthe MAP algorithm is based on a smoothing approach, implemented via a high-passfilter. This exact approach is defined via the regularization matrix R and is a Gaussianhigh-pass filter (Adler and Guardo, 1996). The regularization hyperparameter governsthe amount of smoothness in the reconstruction solution. Adler and Guardo havedeveloped a metric called the noise figure (NF), which is the ratio of the signal-to-noiseratio (SNR) of the voltage measurements and the signal-to-noise ratio of the recon-struction using those voltage measurements as the specified hyperparameter value(Adler and Guardo, 1996; Graham and Adler, 2006). The exact equation is given inEqn (14.11):
NF ¼ SNRV
SNRsðlÞ (14.11)
The hyperparameter that leads to the SNR for the voltage measurements equalingthat of the reconstructed conductivity distribution is chosen, which corresponds toan NF of 1. Once the hyperparameter is determined, the reconstruction of any differ-ential EIT measurements can be made assuming the same geometry, current injectionpattern, and current magnitude between the two measurements and the FEM modelused to determine the sensitivity matrix and hyperparameter values.
14.5 Typical results from in situ electrical measurementsof CNT thin films exposed to mechanical strainor damage
This section presents several examples of strain sensing and damage detection thathave been performed with embedded thin films in GFRP composites. These showthe promise of this emerging field that will allow for the implementation of smartGFRP structures.
342 Multifunctional Nanocomposites in Civil and Structural Engineering

14.5.1 DC resistance
Numerous researchers have focused on using CNT-based thin films applied to a struc-ture to perform strain measurements using DC resistance (Dharap et al., 2004; Vemuruet al., 2009; Loh et al., 2008; Loyola et al., 2010b, 2011; Rein et al., 2011). These thinfilms have been generally found to be strain sensitive, much in the manner thatfoil-based strain gages are. Due to their direct deposition and distributed nature, thesefilms also tend to be sensitive to damage on the substrate as well (Loyola et al., 2013c).This is also the case for embedded films. As an example, Figure 14.9 contains the plotof the DC resistance strain response of an MWCNTePVDF thin film embedded on aquasi-unidirectional glass fiber weave, as described in Section 14.3.1. The specimenwas subjected to a monotonically increasing stepped displacement profile, as describedin Section 14.4.3. As shown in Figure 14.9, the response of the DC resistance isnonlinear, and is indicative of a quadratic-type response. It is believed that thesenonlinear responses are due to traverse cracking of the GFRP, which causes tearingin the CNT thin films. This has been seen in surface-mounted CNT-based thin films(Loyola et al., 2013c; Thostenson and Chou, 2006), and it is assumed that this occursin embedded films as well. However, there has yet to be a journal article to prove this.
Typically, the nonlinear region is preceded by a linear region that is due to elasticdeformation of the thin film and responds much like a strain gage. Such an examplecan be found among the EIS equivalent circuit element responses in Figure 14.10(b)for an MWCNTePSS/PVA thin film embedded on an identical quasi-unidirectionalglass fiber fabric. In this case, there is a linear region that extends to 10,000 mε before
35
30
25
20
15
10
5
00 10,000 20,000 30,000
Strain (με)
Res
ista
nce
chan
ge (%
)
Figure 14.9 Resistance response to applied strain of a 5 wt% MWCNTePVDF thin film.
In situ sensing in glass fiber-reinforced polymer composites 343

transitioning to a nonlinear response to strain. Within this linear strain responseregime, the normalized change in resistance and hence the strain sensitivity (S) aregiven in Eqns (14.12) and (14.13).
DR
R0¼ Sε ¼ ð1þ 2yÞε (14.12)
S ¼ 1þ 2y (14.13)
Most solid materials have a poison ratio (n) from 0.3 to 0.5, which corresponds tostrain sensitivities from 1.6 to 2 for purely geometric strain sensitivities. From thework performed by Loyola et al., it was shown that the strain sensitivity for MWCNTePSS/PVA films embedded in GFRP composites on average ranges from 0.55 to 1.37. Itis thought that these lower than expected strain sensitivities are due to changes in theresistivity of the MWCNTePSS/PVA thin films from reorganization of the MWCNTs.This phenomenon is not well understood, but it could also be a contributing factor inthe nonlinear response seen in high-strain regimes. This is an area of research thatwould be valuable to progress the use of this sensing method.
14.5.2 Electrical impedance spectroscopy
In addition to focusing on DC resistance strain sensitivity, EIS strain sensitivity canyield additional information obtained from the frequency domain. MWCNTePSS/PVA specimens were fabricated in the fashion specified in Section 14.4.3. These spec-imens were subjected to monotonically increasing strain with pauses as specified in thesame section. An example of the effect of the applied strain on the EIS measurements
0 10 20 30 400
5
10
15
Z′ (kΩ)
–Z′′ (
kΩ)
0 με25,000 με35,000 με45,000 με55,000 με65,000 με
× 104Strain (με)N
orm
aliz
ed e
lem
ent c
hang
e Rs
RpCp
RDC
(a) (b)
–0.2
0
0.2
0.4
0.6
0.8
0 2 4 6
Figure 14.10 EIS response to applied strain of an embedded MWCNTePSS/PVA thin film.Reprinted from Loyola et al. (2010a) with permission from Springer.
344 Multifunctional Nanocomposites in Civil and Structural Engineering

is apparent in the ColeeCole plot in Figure 14.10 of the EIS spectra taken at severalapplied strain levels. As the applied strain increases, the high-frequency region of theimpedance spectrum increases in real impedance while the negative value of the com-plex impedance decreases. In order to understand how these spectra changes affect theequivalent circuit elements, each EIS spectrum was fit to the equivalent circuit model,given in Eqn (14.3). Once these values were determined for each level of strain, theycan be plotted as a function of applied strain as done in Figure 14.10(b). From thesedata, it is determined that the DC resistance value matches that of the Rs element ofthe EIS equivalent circuit model.
The parallel components of the equivalent circuit strain response are more complexto interpret. A significant response from Rp and Cp does not occur until the high-strainregime in which the DC resistance and Rs are nonlinear. As the response in this strainregime is suspected to be due to cracking within the film transmitted from the substrate,it is assumed that these responses in the parallel circuit elements are in fact due to theseeffects, but hypotheses of effects of the Poisson effect compressing the MWCNTstogether have also been made (Loyola et al., 2010a, 2013c; Thostenson and Chou,2006). It would stand to reason that it is the inter-CNT interactions that are governingthis response, as this would be analogous to the work that Bauerle performed withzirconiaeyttria electrolyte thin films (Bauerle, 1969). In the case of those thin films,the parallel components captured the grain boundary effects to the electrical imped-ance spectra.
14.5.3 Electrical impedance tomography
Using DC resistance or EIS measurements for strain or damage sensing yields discreteor averaged results between the two or four electrodes of the measurement. However, itis extremely valuable to obtain spatial information as well. This would allow for a loca-tion, size, and severity determination, which would allow technicians to quickly findand repair damage to a structure. Specimens that were fabricated using the approachspecified in Section 14.3.2 were subjected to two kinds of damage, and EIT measure-ments were taken before and after each damage event for differential EIT reconstruc-tions. To demonstrate the ability of the embedded MWCNTePVDF sensor in a GFRPcomposite used in conjunction with differential EIT measurements to detect definedamounts of damage, the EIT specimens were drilled with 6.35 mm holes at nine placesdistributed across the sensing area. The example given in Figure 14.11(a) is a specimenthat has been drilled three times in a diagonal pattern. The corresponding EIT recon-struction is presented in Figure 14.11(b). The conductivity change due to the two holesdrilled near the electrodes is easily discernible. This is because the resolution andsensitivity of the EIT method are highest near the electrodes and decrease as the dam-age gets farther from the electrodes. Typically, the total conductivity change across thesensing area from any point of damage has the same total integrated effect, but it maybe spread out over a larger area, making it harder to see in contrast to more isolatedareas of conductivity change.
As these damage detection methods need to be able to detect damage fromreal-world events, EIT sensing specimens of the same configuration were subjected
In situ sensing in glass fiber-reinforced polymer composites 345

to drop-weight impact events of 20, 60, 100, and 140 J using a 38.1 mm hemisphericaltup. Figure 14.12(a) shows the back side of one of these specimens that was subjectedto 100 J of energy. In the center of the sensing area, the GFRP has blown out, which isa typical damage mode above the perforation threshold. The corresponding change in
78
60
40
20
00 20 40 60 78
0
–20
–40
–60
–80
–100
ΔσN
(%)
X (mm)
Y (m
m)
(a) (b)
Figure 14.11 Photographic image of a drilled EIT specimen (a) and the corresponding EITreconstruction (b).Reprinted from Loyola et al. (2013a) with permission from SAGE.
78
60
40
20
0
X (mm)
Y (m
m)
0 20 40 60 78
ΔσN
(%
)
0
–40
–80
(a) (b)
Figure 14.12 Photographic image of an impacted GFRP specimen with embeddedMWCNTePVDF thin film and EIT sensing region (a) and corresponding EIT reconstruction (b).
346 Multifunctional Nanocomposites in Civil and Structural Engineering

conductivity as captured by the EIT method is presented in Figure 14.12(b). The con-ductivity change is distributed vertically across the reconstruction area, which is mostlikely due to not capturing the anisotropy of the conductivity of the MWCNTePVDFthin film from the underlying unidirectional glass fiber mat, which is aligned vertically.As the electrical network is completely broken in the perforated area, the responseexpected would be a 100 percent decrease in that area. However, due to the spreadingof the conductivity change by the EIT reconstruction, it is reconstructed at only amagnitude of 80 percent. These aspects should be considered whenever analyzingEIT reconstructed data.
14.6 Present challenges and future directions
Embedding CNT-based thin films is still in its infancy, and it has several importanthurdles that must be surmounted to make this a viable option for structural healthmonitoring in most GFRP structures. For use as a strain sensor, the biggest challengewill be identifying the phenomenological reason for the nonlinear response at higherstrain values. As the thin films are embedded, determining which phenomenon isthe cause of this response will be embedded as well. To fully understand theseresponses will most likely require a research group employing micro-X-Ray computedtomography concurrent with DC resistance or EIS measurements while a specimen isunder uniaxial tension. Furthermore, a more systematic approach to implementing EISas an analytical tool is necessary. Hypothetically, the equivalent circuit used to fit theEIS responses is a very reasonable approach. However, that equivalent circuit responseis not unique, as other equivalent circuits can reproduce the same impedance spectra.It may be that a modeling approach will need to be taken to evaluate these responses. Ifa research group can understand the resistance and inductance of each CNT, the resis-tance and capacitance of each CNT junction, and the effect of the electrodes, then a fullunderstanding of these may be possible.
Electrical impedance tomography has been a field in medical imaging sinceCalderon developed the solution to the EIT inverse problem. Although a number ofalgorithms to solve a variety of the EIT problems exist, the method for taking thesemeasurements is still in its infancy for structures. How does one conduct multilayersensing in an FRP composite? The electrodes or wiring can easily contribute to adegradation of the performance of a structure. Second, the sensitivity and resolutionof EIT are much lower at the center of a sensing area, which is another hurdle thatwill have to be tackled. Finally, the speed with which EIT measurements are takenwill need to be improved. The EIT measurements included in this chapter all tookabout 90 s apiece. This is prohibitively long for an in situ strain-sensing or damagedetection device if monitoring is required at a rate to catch the damage mode develop-ment in progress, such as cracking, delamination, and fiber breakage during alow-velocity impact event.
There are plenty of new topics that are left to understand within the disciplinesencompassed by the methods used for embedded damage detection using CNT-basedthin films in GFRP composites.
In situ sensing in glass fiber-reinforced polymer composites 347

14.7 Key sources of information
As of July 26, 2014, Google Scholar reports that there are about 702,000 referencesfocused on CNTs. Although most of these do not focus on CNT thin films, thereare still a significant number of journal articles focused on this research. There are afew very good review articles that outline how CNTs are being used for SHM aswell as other purposes (Baughman et al., 2002; Li et al., 2008; Thostenson et al.,2001). In addition, it would be extremely difficult to include here the number of booksdedicated to this subject as well. However, a book dedicated to using CNT nanocom-posites for SHM has been edited by Paipetus and Kostopoulos entitled “CarbonNanotube Enhanced Aerospace Composite Materials,” which focuses on variousapproaches that have been taken that utilize CNTs in aerospace-related compositestructures (Paipetis and Kostopoulos, 2013). Prior to embarking on any research asso-ciated with CNTs, it is wise to perform a thorough literature search, as undoubtedly agroup has performed research similar to any new ideas. However, with the number ofCNT sensors that are available, novel applications are still possible.
As for EIT, the best resource is in the form of an EIT script library called EIDORS:Electrical Impedance Tomography and Diffuse Optical Tomography ReconstructionSoftware (EIDORS Collaboration, 2012). This is a collaborative software packagethat runs on MATLAB (The Mathworks Inc, 2010) or Octave (Octave Collaboration,2014), and can perform all of the reconstruction steps required to perform EIT mea-surements and reconstructions. Secondly, a textbook edited by David Holder entitled“Electrical Impedance Tomography: Methods, History, and Applications” gives manyexamples of data collection methods, reconstruction strategies, and medical applica-tions that have been performed using EIT (Holder, 2010). Finally, only a handful ofpapers have been released on using EIT for SHM purposes. These papers have focusedon strain sensing (Loyola et al., 2013b; Loh et al., 2009), crack detection (Lazarovitchet al., 2002), corrosion detection (Pyo et al., 2011; Hou et al., 2007), pH sensing (Lohet al., 2007), impact detection (Loyola et al., 2013a; Loh et al., 2009), and tactilesensing (Alirezaei et al., 2007, 2009).
Acknowledgments
Sandia National Laboratories is a multiprogram laboratory managed and operated bySandia Corporation, a wholly owned subsidiary of Lockheed Martin Corporation, for theUS. Department of Energy’s National Nuclear Security Administration under contractDE-AC04-94AL85000.
References
Amano, M., Okabe, Y., Takeda, N., Ozaki, T., December 1, 2007. Structural health monitoringof an advanced grid structure with embedded fiber bragg grating sensors. Structural HealthMonitoring 6 (4), 309e324.
348 Multifunctional Nanocomposites in Civil and Structural Engineering

Antunes, P., Lima, H., Alberto, N., Bilro, L., Pinto, P., Costa, A., Rodrigues, H., Pinto, J.L.,Nogueira, R., Varum, H., André, P.S., 2011. Optical sensors based on fiber bragg gratingsfor structural health monitoring new developments in sensing technology for structuralhealth monitoring. In: Mukhopadhyay, S.C. (Ed.), Lecture Notes in Electrical Engineering.Springer, Berlin Heidelberg, pp. 253e295.
ASTM International, 2008. ASTM D3039/D3039M - 08 Standard Test Method for TensileProperties of Polymer Matrix Composite Materials. ASTM Standard D3039.
Adler, A., Guardo, R., 1996. Electrical impedance tomography: regularized imaging andcontrast detection. IEEE Transactions on Medical Imaging 15 (2), 170e179.
Alirezaei, H., Nagakubo, A., Kuniyoshi, Y., 2007. A highly stretchable tactile distributionsensor for smooth surfaced humanoids. In: 7th IEEE-RAS International Conference onHumanoid Robots, Pittsburgh, Pennsylvania, USA, pp. 167e173.
Alirezaei, H., Nagakubo, A., Kuniyoshi, Y., 2009. A tactile distribution sensor which enablesstable measurement under high and dynamic stretch. In: IEEE Symposium on 3D UserInterfaces, Lafayette, Louisiana, USA, pp. 87e93.
Betz, D., Staudigel, L., Trutzel, M.N., 2002. Test of a fiber Bragg grating sensor network forcommercial aircraft structures. In: Optical Fiber Sensors Conference Technical Digest,Portland, Oregon, USA vol. 1, pp. 55e58.
Bastianini, F., Corradi, M., Borri, A., Tommaso, A., 2005. Retrofit and monitoring of anhistorical building using “Smart” CFRP with embedded fibre optic Brillouin sensors.Construction and Building Materials 19 (7), 525e535.
Beattie, A., 1997. Acoustic emission monitoring of a wind turbine blade during a fatigue test.In: American Society of Mechanical Engineers Wind Energy Symposium, Reno, NV,USA, pp. 239e248.
Baughman, R., Zakhidov, A., De Heer, W., 2002. Carbon nanotubesethe route toward appli-cations. Science 297 (5582), 787.
Barsoukov, E., Macdonald, J., 2005. Impedance Spectroscopy: Theory, Experiment, andApplications. Wiley-Interscience, Hoboken, NJ, USA.
Bauerle, J., 1969. Study of solid electrolyte polarization by a complex admittance method.Journal of Physics and Chemistry of Solids 30 (12), 2657e2670.
Ciampa, F., Meo, M., January 1, 2012. Impact detection in anisotropic materials using a timereversal approach. Structural Health Monitoring 11 (1), 43e49.
Chambers, J., Wardle, B., and Kessler, S., Durability Assessment of Lamb Wave-BasedStructural Health Monitoring Nodes. In: 47th AIAA/ASME/ASCE/AHS/ASC Structures,Structural Dynamics, and Materials Conference, Newport, Rhode Island, USA.
Choi, K., Chang, F., 1994. Identification of foreign object impact in structures using distributedsensors. Journal of Intelligent Material Systems and Structures 5 (6), 864.
Calderon, A.P., 2006. On an inverse boundary value problem. Computational and AppliedMathematics 25 (2e3), 133e138.
Dharap, P., Li, Z., Nagarajaiah, S., Barrera, E., 2004. Nanotube film based on single-wall carbonnanotubes for strain sensing. Nanotechnology 15, 379e382.
Decher, G., Schlenoff, J.B., 2003. Multilayer Thin Films. Wiley-VCH, Weinheim, Germany.De, S., Lyons, P.E., Sorel, S., Doherty, E.M., King, P.J., Blau, W.J., Nirmalraj, P.N.,
Boland, J.J., Scardaci, V., Joimel, J., 2009. Transparent, flexible, and highly conductivethin films based on polymer�nanotube composites. ACS Nano 3 (3), 714e720.
EIDORS Collaboration, 2012. Electrical Impedance Tomography and Diffuse OpticalTomography Reconstruction Software.
Graham, B., Adler, A., 2006. Objective selection of hyperparameter for EIT. PhysiologicalMeasurement 27 (S65).
In situ sensing in glass fiber-reinforced polymer composites 349

Haksoo, C., Sukwon, C., Hojung, C., 2008. Structural health monitoring system based on straingauge enabled wireless sensor nodes. In: 5th International Conference on NetworkedSensing Systems. Kanazawa, Japan, pp. 211e214.
Hu, N., Karube, Y., Arai, M., Watanabe, T., Yan, C., Li, Y., Liu, Y., Fukunaga, H., 2010.Investigation on sensitivity of a polymer/carbon nanotube composite strain sensor. Carbon48 (3), 680e687.
Holder, D.S., 2010. Electrical Impedance Tomography: Methods, History and Applications.Institute of Physics Publishing, London, United Kingdom.
Hou, T., Loh, K., Lynch, J., 2007. Spatial conductivity mapping of carbon nanotube compositethin films by electrical impedance tomography for sensing applications. Nanotechnology18 (31), 315501.
Ian, R., Peter, F., Stuart, M., 2002. Optical fibre acoustic emission sensor for damage detection incarbon fibre composite structures. Measurement Science and Technology 13 (1), N5.
Irving, P., Thiagarajan, C., 1998. Fatigue damage characterization in carbon fibre compositematerials using an electrical potential technique. Smart Materials and Structures 7 (4),456e466.
Iijima, S., 1991. Helical microtubules of graphitic carbon. Nature 354 (6348), 56e58.Kesavan, A., Deivasigamani, M., John, S., Herszberg, I., 2006. Damage detection in T-joint
composite structures. Composite Structures 75 (1e4), 313e320.Kesavan, A., John, S., Herszberg, I., September 1, 2008. Strain-based structural health moni-
toring of complex composite structures. Structural Health Monitoring 7 (3), 203e213.Kersey, A., Davis, M., Berkoff, T., Dandridge, A., Jones, R., Tsai, T., Cogdell, G., Wang, G.,
Havsgaard, G., Pran, K., 1997. Transient load monitoring on a composite hull ship usingdistributed fiber optic Bragg grating sensors. In: Smart Structures and Materials 1997:Smart Sensing, Processing, and Instrumentation. San Diego, CA, USA, pp. 421e430.
Kuang, K., Cantwell, W., 2003. Use of conventional optical fibers and fiber Bragg gratings fordamage detection in advanced composite structures: a review. Applied Mechanics Reviews56, 493.
Kessler, S., Raghavan, A., 2009. Vector-based damage localization for anisotropic compositelaminates. In: Proceedings of the International Workshop on Structural Health Monitoring.Stanford, CA, USA.
Kang, I., Schulz, M.J., Kim, J.H., Shanov, V., Shi, D., 2006. A carbon nanotube strain sensor forstructural health monitoring. Smart Materials and Structures 15, 737.
Kozlov, M., Quarmyne, M., Chen, W., McCarthy, T., 2003. Adsorption of poly (vinyl alcohol)onto hydrophobic substrates. A general approach for hydrophilizing and chemicallyactivating surfaces. Macromolecules 36 (16), 6054e6059.
Li, C., Thostenson, E.T., Chou, T.-W., 2008. Sensors and actuators based on carbon nanotubesand their composites: a review. Composites Science and Technology 68 (6), 1227e1249.
Lin, M., Chang, F., 2002. The manufacture of composite structures with a built-in network ofpiezoceramics. Composites Science and Technology 62 (7e8), 919e939.
Loh, K.J., Kim, J., Lynch, J.P., Kam, N.W.S., Kotov, N.A., 2007. Multifunctional layer-by-layercarbon nanotube polyelectrolyte thin films for strain and corrosion sensing. Smart Materialsand Structures 16 (2), 429e438.
Loyola, B.R., La Saponara, V., Loh, K.J., 2010a. In situ strain monitoring of fiber-reinforcedpolymers using embedded piezoresistive nanocomposites. Journal of Material Science45 (24), 6786e6798.
Loyola, B.R., Briggs, T.M., Arronche, L., Loh, K.J., Saponara, V.L., O’Bryan, G., Skinner, J.L.,2013a. Detection of spatially distributed damage in fiber-reinforced polymer composites.Structural Health Monitoring 12 (3), 225e239.
350 Multifunctional Nanocomposites in Civil and Structural Engineering

Loyola, B.R., Saponara, V.L., Loh, K.J., Briggs, T.M., O’Bryan, G., Skinner, J.L., 2013b.Spatial sensing using electrical impedance tomography. IEEE Sensors Journal 13 (6),2357e2367.
Loyola, B.R., Zhao, Y., Loh, K.J., Saponara, V.L., 2013c. The electrical response of carbonnanotube-based thin film sensors subjected to mechanical and environmental effects. SmartMaterials and Structures 22 (2).
Lvovich, V.F., 2012. Impedance Spectroscopy: Applications to Electrochemical and DielectricPhenomena. John Wiley & Sons, Hoboken, New Jersey, USA.
Loh, K.J., Lynch, J.P., Shim, B.S., Kotov, N.A., 2008. Tailoring piezoresistive sensitivityof multilayer carbon nanotube composite strain sensors. Journal of Intelligent MaterialSystems and Structures 19 (7), 747e764.
Loyola, B.R., La Saponara, V., Loh, K.J., 2010b. Characterizing the self-sensing performance ofcarbon nanotube-enhanced fiber-reinforced polymers. In: Nondestructive Characterizationfor Composite Materials, Aerospace Engineering, Civil Infrastructure, and HomelandSecurity 2010, San Diego, CA, USA, pp. 76490Fe76512F.
Loyola, B.R., La Saponara, V., Loh, K.J., 2011. Investigating the electromechanicalperformance of carbon nanotube strain sensors embedded in GFRP composites. In:Nondestructive Characterization for Composite Materials, Aerospace Engineering, CivilInfrastructure, and Homeland Security 2011, San Diego, CA, USA.
Loh, K.J., Hou, T.C., Lynch, J.P., Kotov, N.A., 2009. Carbon nanotube sensing skins forspatial strain and impact damage identification. Journal of Nondestructive Evaluation28 (1), 9e25.
Lazarovitch, R., Rittel, D., Bucher, I., 2002. Experimental crack identification using electricalimpedance tomography. NDT and E International 35 (5), 301e316.
Octave Collaboration, 2014. GNU Octave.Paipetis, A., Kostopoulos, V., 2013. Carbon Nanotube Enhanced Aerospace Composite
Materials. Springer, Dordrecht, Netherlands.Pyo, S., Loh, K.J., Hou, T.C., Jarva, E., Lynch, J.P., 2011. A wireless impedance analyzer for
automated tomographic mapping of a nanoengineered sensing skin. Smart Structures andSystems 8 (1), 139e155.
Rosenker, M.V., 2006. Safety recommendation A-06-27 and -28. In: National TransportationSafety Board.
Rumsey, M.A., Paquette, J.A., 2008. Structural health monitoring of wind turbine blades. In:SPIE Smart Structures/NDE, San Diego, CA, USA.
Rein, M.D., Breuer, O., Wagner, H.D., February 7, 2011. Sensors and sensitivity: carbonnanotube buckypaper films as strain sensing devices. Composites Science and Technology71 (3), 373e381.
Sohn, H., Farrar, C., Hunter, N., Worden, K., 2001. Applying the LANL Statistical PatternRecognition Paradigm for Structural Health Monitoring to Data from a Surface-Effect FastPatrol Boat. Los Alamos National Laboratory vol. LA-13761-MS.
Shindo, Y., Kuronuma, Y., Takeda, T., Narita, F., Fu, S.Y., 2011. Electrical resistance changeand crack behavior in carbon nanotube/polymer composites under tensile loading.Composites Part B: Engineering 39e43.
Sureeyatanapas, P., Young, R.J., 2009. SWNT composite coatings as a strain sensor on glassfibres in model epoxy composites. Composites Science and Technology 69 (10),1547e1552.
Tang, H.-Y., Winkelmann, C., Lestari, W., La Saponara, V., 2011. Composite structural healthmonitoring through use of embedded PZT sensors. Journal of Intelligent Material Systemsand Structures 22 (8), 739e755.
In situ sensing in glass fiber-reinforced polymer composites 351

Tsutsui, H., Kawamata, A., Sanda, T., Takeda, N., December 2004. Detection of impact damageof stiffened composite panels using embedded small-diameter optical fibers. Smart Mate-rials and Structures 13 (6), 1284e1290.
Todoroki, A., 2008. Delamination monitoring analysis of CFRP structures using multi-probeelectrical method. Journal of Intelligent Material Systems and Structures 19 (3),291e298.
Todoroki, A., Tanaka, Y., Shimamura, Y., 2002. Delamination monitoring of graphite/epoxylaminated composite plate of electric resistance change method. Composites Science andTechnology 62 (9), 1151e1160.
Thostenson, E., Ren, Z., Chou, T.-W., 2001. Advances in the science and technology of carbonnanotubes and their composites: a review. Composites Science and Technology 61 (13),1899e1912.
The Mathworks Inc, 2010. MATLAB 2014a.Thostenson, E.T., Chou, T.-W., 2006. Carbon nanotube networks: sensing of distributed strain
and damage for life prediction and self healing. Advanced Materials 18 (21), 2837e2841.Vemuru, S., Wahi, R., Nagarajaiah, S., Ajayan, P., 2009. Strain sensing using a multiwalled
carbon nanotube film. The Journal of Strain Analysis for Engineering Design 44 (7),555e562.
Wenger, M.P., Blanas, P., Shuford, R.J., Das-Gupta, D.K., 1996. Acoustic emission signaldetection by ceramic/polymer composite piezoelectrets embedded in glass-epoxy lami-nates. Polymer Engineering and Science 36 (24), 2945e2954.
Winkelmann, C., Tang, H.-Y., La Saponara, V., 2008. Influence of embedded structural healthmonitoring sensors on the mechanical performance of glass/epoxy composites. In: SAMPE2008, Long Beach, CA, USA.
Wang, S., Chung, D., 2000. Piezoresistivity in continuous carbon fiber polymer-matrixcomposite. Polymer Composites 21 (1), 13e19.
Wang, S., Chung, D., 2007. Negative piezoresistivity in continuous carbon fiber epoxy-matrixcomposite. Journal of Materials Science 42 (13), 4987e4995.
Wang, X., Fu, X., Chung, D., 1999. Strain sensing using carbon fiber. Journal of MaterialsResearch 14 (3), 790e802.
Wang, S., Chung, D.D.L., 2006. Self-sensing of flexural strain and damage in carbon fiberpolymer-matrix composite by electrical resistance measurement. Carbon 44 (13),2739e2751.
Wang, S., Chung, D.D.L., Chung, J.H., 2005. Impact damage of carbon fiber polymerematrixcomposites, studied by electrical resistance measurement. Composites Part A: AppliedScience and Manufacturing 36 (12), 1707e1715, 12.
Yun, J., 2011. Development of Structural Health Monitoring Systems Incorporating AcousticEmission Detection for Spacecraft and Wind Turbine Blades. Electrical and ComputerEngineering, Virginia Tech.
Yang, W., Wang, Y., Li, J., Yang, X., 2010. Polymer wrapping technique: an effective routeto prepare Pt nanoflower/carbon nanotube hybrids and application in oxygen reduction.Energy & Environmental Science 3 (1), 144e149.
Zhao, Y., Loyola, B.R., Loh, K.J., 2011. Mechanical and viscoelastic characterization oflayer-by-layer carbon nanotube-polyelectrolyte thin films. Smart Materials and Structures20 (7), 075020.
352 Multifunctional Nanocomposites in Civil and Structural Engineering

Strain-sensing smart skin: anoncontact optical strain sensorusing single-walled carbonnanotubes
15
Satish Nagarajaiah, R. Bruce Weisman, Peng Sun,Sergei M. Bachilo, Yongchao YangRice University, Houston, TX, USA
15.1 Introduction
In structural engineering, routine inspection and maintenance are vital to ensure safeoperation and optimized service life of critical structures. Strain measured on the sur-face of any structure provides direct firsthand information about its condition. Tradi-tional technologies used for measuring strain, such as resistance strain gages andfiber Bragg grating (FBG) sensors (Hill and Meltz, 1997), can monitor only at discretelocations and along specific directions, and have limited ability to measure strains onsmall length scales (Obitayo and Liu, 2012).
By exploiting the dependence of the electronic properties of carbon nanotubes(CNTs) on their atomic structure, Peng and Cho (2000) discovered that surface straincan modulate the conductance of CNTs quantitatively and predictably. Dharap et al.(2004) reported a nanotube-based film sensor based on strain-induced changes in elec-trical transport properties. For many years, piezoelectric strain sensors have been suc-cessfully used as vibration sensors in smart structures, providing the benefits of simpleinterface circuitry and high sensitivity (Yong, 2013). Recently, microelectromechani-cal system (MEMS) double-ended tuning fork (DETF) strain gauges (Myers, 2010)have been investigated as sensors, based on the dependence of their resonant frequencyon strain. Although these newer strain-sensing approaches can achieve high spatial res-olution and strain sensitivity, they still require electrical connections to the sensor el-ements in order to obtain strain readings.
Aside from the aforementioned pointwise strain gauge techniques, various full-fieldnoncontact optical methods have also been developed. The existing noncontact opticalmethods can be classified into two types (Pan et al., 2009): (1) interferometric tech-niques, such as holography interferometry, speckle interferometry, Moire interferometry,and photoelasticity; and (2) noninterferometric techniques, such as the grid method(Goldrein et al., 1995), digital image correlation (DIC) (Pan, 2007; Hamada et al.,2014), and digital volume correlation (DVC) with X-ray microcomputed tomography(Germaneau et al., 2008). The interferometric techniques have been proposed anddeveloped over the past few decades. They identify material changes based on variations
Innovative Developments of Advanced Multifunctional Nanocomposites in Civil and Structural Engineeringhttp://dx.doi.org/10.1016/B978-1-78242-326-3.00015-4Copyright © 2016 Elsevier Ltd. All rights reserved.

in transmission intensities, phase changes, diffraction properties, or interference fringepatterns (Ajovalasit et al., 2010). Although they can provide full-field strain measure-ments without physical contact, they usually require a model of actual structure, tediouscalculations to separate the values of principal stresses, and expensive equipment. Thenoninterferometric techniques have been extensively investigated and improved forreducing computation complexity, achieving high accuracy measurements of deforma-tions. However, the DIC or DVC methods suffer some disadvantages, such as the re-quirements for a random gray intensity distribution or speckle pattern distribution,heavy dependence on the quality of the imaging system, relatively low strain measure-ment accuracy in small deformation measurements, and inability to measure strainsinduced when the object is in service and not under direct observation by the imagingsystem (Pan et al., 2009).
Over the past two decades, Raman spectroscopy has been used as a standard char-acterization tool for carbon nanostructures. Tensile or compressive stress applied tosingle-walled carbon nanotubes (SWCNTs) induces strains and measurably perturbsthe nanotube Raman spectrum. Probing such shifts in phonon frequencies is an effec-tive way to assess the degree of load transfer to the nanoparticle when the surroundingmaterial is under an applied stress. In this way, Raman spectroscopy has been exploredby several researchers as a method to monitor nanotube films in strain-sensing appli-cations (Zhao et al., 2002; Li et al., 2004b; Mu et al., 2009; De la Vega et al., 2011).Raman spectroscopy has also been used to detect the strain on graphene flakesembedded in grapheneepolymer composite coatings (Raju et al., 2014). However,the main drawback of Raman-based strain measurement approaches is the weaknessof the Raman scattering signals. As a result, the acquisition times needed to achieveadequate signal-to-noise ratios are impractically long for real field applications.
We describe here a novel noncontact method for strain monitoring based on thespectral properties of SWCNTs. In our method, SWCNTs are unobtrusively embeddedin a thin polymeric coating applied to the substrate of interest. Strain in the substrate istransmitted through the coating, deforming the embedded nanotubes and causing pre-dictable changes in their electronic structure. These changes are detected optically,without physical contact, as strain-induced spectral shifts of the characteristic SWCNTfluorescence peaks in the near-IR spectral region. Substrate strains can be quantita-tively deduced at any location on the surface and along any direction simply by posi-tioning the excitation beam and orienting its polarization plane. The use of suchcoatings containing nanoscale sensors promises improved simplicity and versatilityfor an important tool in structural health monitoring.
15.1.1 Background
SWCNTs are a family of highly elongated tubular structures composed of carbon atomscovalently bonded into specific ordered forms. Each form has a well-defined diameterand roll-up angle, and is uniquely labeled by a pair of integers, (n,m) (Reich et al.,2004). Among the remarkable properties of SWCNTs are their well-defined spectraltransitions that vary systematically with physical structure (O’Connell et al., 2002),reflecting the quantum confinement of p-electrons perpendicular to the tube axis. Asshown in Figure 15.1, most SWCNT structural species are semiconducting and show
354 Multifunctional Nanocomposites in Civil and Structural Engineering

robust photoluminescence (fluorescence emission) at distinct near-infrared (IR)wavelengths corresponding to their semiconducting band gaps (O’Connell et al.,2002; Weisman and Bachilo, 2003; Yang and Han, 2000).
It is known from theory and experiment that axial stretching or compression ofSWCNTs causes predictable changes in electronic structure that systematically shift theirspectral transitions (Yang and Han, 2000; Minot et al., 2003; Li et al., 2004a; Maki et al.,2007; Leeuw et al., 2008; Huang et al., 2008; Valavala et al., 2008). Previous studies onindividual nanotubes have confirmed that these shifts occur in opposite directions formod 1 andmod 2 nanotubes (for whichmod(n � m,3) ¼ 1 or 2), as shown in Figure 15.2,and that the magnitudes of the spectral shifts are proportional to cos(3q) (where q is the
6,4 9,1 8,3 6,5 7,3 7,5 10,2 8,4 7,6 9,2
Em
issi
on in
tens
ity
Emission wavelength
Figure 15.1 Different nanotube species correspond to different characteristic emission peaks.
900 1000 1100 1200 1300 1400 1500 1600
900
800
700
600
500
E11 emission wavelength (nm)
E22
abs
orpt
ion
wav
elen
gth
(nm
)
mod 2
mod 1
9,1
6,46,5
7,3
8,1
8,4
7,6
9,2
9,5
8,7
12,211,4
11,7
10,9
12,5
13,3
14,110,6
9,8
10,0
10,3
11,1
5,4
8,3
11,010,2
12,111,3
10,5
13,212,4 11,6
15,114,3 13,5 12,7
10,8
9,7
9,4 8,6
7,5
Figure 15.2 Absorption and emission peak wavelengths for various (n,m) SWCNT structuralspecies. Nanotubes with mod 1 character are in the blue (lower) shaded region; those withmod 2 character are in the pink (upper) shaded region. The red and blue arrows show thedirections of mod-dependent shifts in spectral peak positions caused by axial stretching.
Strain-sensing smart skin 355

nanotube roll-up angle), as shown in Figure 15.3. These shifts in SWCNT fluorescencespectra are large enough to reveal axial strains below 0.1%, suggesting the possibility ofa practical noncontact optical method to measure strains in large-scale objects usingembedded SWCNTs as the sensors. This approach represents an attractive alternativeto CNT-based sensors based on strain-induced changes in electrical transport propertiesor Raman spectra (Li et al., 2004b; Dharap et al., 2004; Vemuru et al., 2009; Srivastavaet al., 2011) because fluorescence spectroscopy requires no electrical connections andprovides stronger signals and faster data acquisition than Raman.
In the scheme that is described in this chapter, the structural surface of interest iscoated with a thin polymer-based film embedded with dilute, individualized SWCNTs.If the coating adheres strongly both to the substrate and to the embedded nanotubes,then load transfer will be efficient, strain in the coating will match that of the substrate,and the embedded nanotubes will be axially deformed proportionally to the spatial pro-jection of the coating strain along the nanotube axis. One can then quantitativelymonitor the nanotube strain at any position of interest by irradiating that spot with avisible laser of suitable wavelength and capturing the resulting near-IR fluorescencefor spectral interpretation.
15.2 First-generation S4 films(Withey et al., 2012; Sun et al., 2014)
15.2.1 Formulation, application, and mechanical testing
Raw SWCNTs from the Rice University high-pressure carbon monoxide (HiPco)reactor were added to a consumer-grade exterior varnish at a weight percent of approx-imately 0.02% and dispersed by ultrasonic agitation. The mixture was spin-coatedseveral times onto a roughened poly(methyl methacrylate) (PMMA) test substrateand allowed to cure. The final coating thickness was approximately 25 mm. The
750
500
250
–500
–750
–250
0
mod 1mod 2Linear fit
11,312,1
10,2
7,5
8,6
8,7
9,5
10,3
7,68,4
–1.0 –0.5 0.0 0.5 1.0(–1)k+1cos(3 )
|ΔE11|ε
⎯| |= 3t0(1+ν)cos 3θ
ΔE11
/ (c
m–1
/%)
ε
θ
Figure 15.3 Strain-induced spectral shifts of near-IR fluorescence peaks of different (n,m)species of SWCNTs (Leeuw et al., 2008).
356 Multifunctional Nanocomposites in Civil and Structural Engineering

specimen was tested using a custom-built four-point bending jig, while strain wasmonitored by resistive foil strain gages on the S4 film and the PMMA substrate bar.Strain values on the bar surface and in the polymer film were found to be nearly equal.We adjusted the strain in steps of 0.05% (500 mε) during loading and unloading.
15.2.2 Optical strain measurement
Fluorescence of the embedded SWCNTs was excited with polarized 660 nm lightfrom a 70 mW diode laser. As shown in Figure 15.4, the laser beam was filteredto remove near-IR components. A rotatable half-wave plate allowed adjustment ofthe beam’s polarization plane before focusing onto the specimen. Sample fluores-cence was collected by the focusing lens, reflected by a dichroic mirror, passedthrough a long-pass filter to block stray excitation light, and focused into a multimodeoptical fiber that led to a near-IR spectrometer. The multichannel InGaAs detector inthe spectrometer captured the sample’s full emission spectrum by integrating for afew seconds without scanning. To deduce strain, we analyzed the spectrum to findpeak emission wavelengths of (7,5) and (7,6) SWCNTs in the film by fitting localGaussian functions to their known emission bands.
15.2.3 Results and discussion
We made a series of measurements to test the feasibility of noncontact strain mea-surement using films with randomly oriented, structurally unsorted SWCNTs.Figure 15.5 shows typical SWCNT emission spectra measured from the specimenwhen unstrained and when strained in tension to 5500 mε along a direction parallelto the excitation laser’s polarization axis. The insets show that the peaks attributedmainly to (7,5) and (7,6) SWCNTs shift in opposite directions with strain, as ex-pected (see Figures 15.2 and 15.3), because of their different mod categories. Weexploited this effect by monitoring the difference between (7,6) and (7,5) peak wave-lengths as the test plate was loaded and unloaded. The results (Figure 15.6) showlinear dependences during loading and unloading, with an average hysteresis
Computer
NIRspectrometer
Fibercollimator
Strain gagereadout Strain Strain
Lensmirror
Coupling
Excitationlaser
Attenuationfilter
Half-waveretardation plate
Fibercollimator
Sample slide
Smart skin
Lens
Coupling mirror
Emission
Figure 15.4 Schematic diagram of the first-generation test apparatus (Sun et al., 2014).
Strain-sensing smart skin 357

3000
2500
2000
1500
1000
500
0900 1000 1100 1200 1300
Emission wavelength (nm)
Em
issi
on in
tens
ity (a
.u.)
0 strain0.55% strain
(7,6)
(7,5)
Figure 15.5 Emission spectra from an S4 film with substrate strains of 0 (black solid line) and5550 mε (red dashed line). Insets illustrate the opposite shifts in peak positions for featuresdominated by (7,5) and (7,6) SWCNTs (Withey et al., 2012).
100
98
96
94
92
90
880.0 0.1 0.2 0.3 0.4 0.5
LoadingUnloading
Substrate strain (%)
(7,6
)–(7
,5) p
eak
sepa
ratio
n (n
m)
Figure 15.6 Strain variation of differential spectral shift. The difference in peak emissionwavelengths of (7,6) and (7,5) nanotubes in a polymeric coating is plotted versus strain readingsfrom a resistive strain gage on the substrate. Black circles show loading data; red triangles aresubsequent unloading data. Straight lines show linear fits to the data (Withey et al., 2012).
358 Multifunctional Nanocomposites in Civil and Structural Engineering

corresponding to 400 mε on the strain axis. At high strain values, we would expectnonlinearities and large irreversible behaviors similar to those observed insingle-nanotube studies, as SWCNTs may slip within the polymer film (Leeuwet al., 2008). However, we instead attribute the small uniform hysteresis seen inFigure 15.6 to mechanical relaxation of the strained polymer film.
When the S4 film is exposed with linearly polarized light, those nanotubes alignedalong the polarization axis will be selectively excited and will therefore dominate theemission spectrum, because the strongest spectral transitions of nanotubes are highlyanisotropic (Miyauchi et al., 2006; Lefebvre et al., 2004; Casey et al., 2008). Thisshould allow one to determine the strain axis by optical means. To test, we measuredthe dependence of the (7,6)e(7,5) peak separation on the polarization angle of theexcitation laser relative to the applied strain axis, under fixed specimen strain. Theresulting data (see Figure 15.7) can be fit well by the function:
Dl ¼ A cos2ða� a0Þ þ C (15.1)
where a and a0 are the laboratory angles of the laser polarization and the fixed strainaxis, respectively; C is the peak separation with no strain; and A is an amplitude equalto the peak-to-valley difference in Figure 15.8. The large measured modulationamplitude confirms that our method can selectively resolve and measure strains alongdifferent directions of a substrate by polarization control.
99
98
97
96
95
94
93
92
91
90
0 20 40 60 80 100 120 140 160 180Polarization angle (degrees)
(7,6
)–(7
,5) p
eak
sepa
ratio
n (n
m)
0% strain
0.2% strain
0.5% strain
Figure 15.7 Polarization selectivity of differential spectral shift. The difference in peakemission wavelengths of (7,6) and (7,5) nanotubes in an S4 film is plotted against the anglebetween the applied strain axis and the excitation laser polarization axis. Applied strainmagnitudes were 0 (open squares), 2000 mε (triangles), and 5000 mε (circles). The solid curvesshow cos2 fits (Withey et al., 2012).
Strain-sensing smart skin 359

Properties of the polymeric film material will be important in practical implemen-tations of this noncontact strain-sensing method. The material must be reasonablytransparent for the red and near-IR wavelengths of nanotube excitation and emission,and it should not significantly quench the intrinsic fluorescence of embeddedSWCNTs. It also needs to support dispersions of individualized SWCNTs, havegood interfacial adhesion, and display mechanical and environmental durability.Our initial studies found that a consumer-grade polyurethane-based varnish seemsto be a promising host material for S4 films. Properties of the SWCNTs used in thefilm are also important. The nanotubes should be nearly pristine and unbundled togive bright near-IR fluorescence, and should have a good abundance of those specific(n,m) species used in the spectral analysis. Ideally, customized SWCNT formulationscould be prepared by enriching the desired (n,m) species through advanced sortingmethods such as density-gradient ultracentrifugation (Arnold et al., 2006; Ghoshet al., 2010).
Unlike our prior microscopic study of individual SWCNTs in a strained polymer(Leeuw et al., 2008), each spectral measurement on the coated test plate probes anensemble of embedded SWCNTs that have random in-plane angles f (Figure 15.8).The distribution in polar angle q is not known a priori. In principle, it might varyfrom a uniform (random) distribution to a delta function at q ¼ 90�, depending on
z
xStrain axis
α
φ
θ
y
Polarization plane
Figure 15.8 Diagram showing relevant axes and angles (Withey et al., 2012).
360 Multifunctional Nanocomposites in Civil and Structural Engineering

forces exerted on nanotubes during film curing. We can write the orientationaldistribution function as f ðq;fÞ ¼ ð1=2pÞf ðqÞ. The relative probability that an individ-ual SWCNT in the film (see Figure 15.8) will absorb light from a plane-polarized exci-tation beam propagating along the z-axis with the polarization plane intersecting thexey plane at an angle a to the x-axis is sin2ðqÞ cos2ðf� aÞ. For strain applied parallelto the x-axis, the angular dependence of D, the resulting spectral shift in nanotubefluorescence, will be Dðq;f;aÞ ¼ Dmaxðcos2 b� h sin2 bÞ, where Dmax is the shiftfor that (n,m) species when the strain is applied parallel to the tube axis,b ¼ arccosðsinq cosf cosaþ sinq sinf sinaÞ equals the angle between the nanotubeaxis and the strain axis, and h is Poisson’s ratio for the host polymer. The two termsin Dðq;f;aÞ express nanotube axial strains caused by the host’s x-axis and transverse(Poisson effect) deformations, respectively. The measured emission spectrum fromeach (n,m) species will actually be a superposition of peaks from nanotubes havingvarious orientations, with corresponding variations in intensities and strain-inducedspectral shifts. We can express S(D), the intensity-weighted distribution of spectralshifts, as
SðDÞ ¼Z2p
0
Zp
0
f ðq;fÞ Dðq;f;aÞ sin2ðqÞcos2ðf� aÞ sinðqÞdq df; (15.2)
or
SðDÞ ¼ 12p
Z2p
0
Zp
0
f ðqÞ Dðq;f;aÞ sin3ðqÞcos2ðf� aÞ dq df: (15.3)
This describes how an ensemble of orientationally distributed SWCNTs in astrained environment gives an overall emission spectrum that is broadened and lessshifted in peak position than would be observed from the same nanotubes if theywere aligned parallel to the strain axis and parallel to the surface. By evaluatingEqn (15.3) using the Dmax values found from theory and prior experiments andcomparing the result with some other experimental data, we deduce that SWCNTsare preferentially aligned parallel to the surface, presumably through application andcuring of the polymer film.
The results obtained from first-generation S4 tests demonstrate proof-of-principlefor the method. It should be feasible to measure a strain field over a wide area simplyby moving the optical system to each point of interest and capturing emission spectrafor several polarization settings of the excitation beam. The measurement grid can beas coarse or fine as desired, because the SWCNT sensors are present throughout thecoating. To obtain absolute strain values, one can apply empirical calibrations deter-mined for the specific strain paint formulations and application methods that wereused. Of course, for real field applications, it is also necessary to have a strain readersystem that is small and lightweight enough to be readily portable.
Strain-sensing smart skin 361

15.3 Second-generation S4 films (Sun et al., 2015)
In this section, we will describe more recent progress toward our noncontact opticalstrain measurement technology that is based on spectral shifting of SWCNT fluores-cence peaks under axial strain. As was described in this chapter in our proof-of-principle demonstrations (Withey et al., 2012; Sun et al., 2014), SWCNTs areembedded in a thin polymer film that is applied to the surface of interest to give athin “strain-sensing smart skin” or “S4.” Surfaces might include aircraft wings andfuselages, helicopter body and rotors, building beams and columns, bridge beamsand piers, pressure vessels, and pipelines. Each SWCNT in the film acts as an indepen-dent sensor, and strain can be measured anywhere on the surface by irradiating thatpoint with an interrogating laser beam and collecting and analyzing the resulting nano-tube fluorescence spectrum. The strain axis can also be found by rotating the polariza-tion plane of the laser beam to selectively interrogate SWCNTs oriented in differentdirections. Furthermore, we envision the S4 films as multifunctional, because theymay provide mechanical and chemical protection to the surface in addition to servingas strain sensors.
There are several challenges to practical implementation of the S4 method. One istailoring the SWCNT composition and dispersion in the composite film to optimize theprecision with which fluorescence peak positions can be found (Sun et al., 2014).Another is developing instrumentation that can efficiently generate, capture, and inter-pret fluorescence spectra from the S4 film, yet remain small and light enough for hand-held field use. Progress toward both of these goals is described further in this section.
15.3.1 Second-generation smart skin formulationand application
We begin with raw Rice University HiPco SWCNT product that, in addition to thedesired individualized nanotubes, contains carbonaceous and metallic impurities aswell as bundled SWCNTs. For improved strain-sensing performance, this materialshould be processed to disaggregate the bundled SWCNTs (O’Connell et al., 2002),remove impurities, and select a subset of (n,m) structures to simplify the S4 fluores-cence spectrum and allow more precise determination of peak wavelengths. Weaddress these goals with a combination of selective dispersion and centrifugation.
Dispersion is achieved using the organic polymer poly(9,9-dioctylfluorenyl-2,7-diyl), or PFO, which is known to selectively coat and solubilize a small subsetof SWCNT structures. We dissolve the PFO in toluene, add raw SWCNTs, apply ul-trasonic agitation to disperse the nanotubes, and centrifuge to remove impurities. Thesupernatant then contains disaggregated, selected SWCNTs coated with PFO. Selec-tive extraction by PFO significantly simplifies the sample’s emission spectrum, asillustrated in Figure 15.9. This extract is ultrasonically mixed with a consumer-grade commercial exterior varnish under controlled conditions to obtain the compositethat is applied to surfaces to form S4 films.
Proper application of a smooth polymeric film containing well-dispersed SWCNTsis essential for accurate strain measurements. For testing, we spin coat the composite
362 Multifunctional Nanocomposites in Civil and Structural Engineering

containing SWCNTs, PFO, toluene, and urethane varnish onto a test bar that has beencleaned to remove organic surface contaminants. The applied film is then allowedto cure under ambient conditions. In order to increase the measured fluorescence inten-sities, we sometimes apply additional layers by repeating the spin-coating process,allowing several hours of room temperature curing between coats. The resulting films,shown in Figure 15.10, are typically c. 15e20 mm thick. Figure 15.11 shows short-waveIR (SWIR) fluorescence microscope images of such S4 films. The right-panel image il-lustrates the excellent dispersion and individualization that can be achieved using
900 1000 1100 1200 1300 14000.00
0.17
0.34
0.51
0.68
0.85
1.02
1.19
(8,7)
(8,6)
(7,6)
(7,5)
Nor
mal
ized
em
issi
on in
tens
ity
Emission wavelength (nm)
PFO-extracted Unsorted
Figure 15.9 Fluorescence spectra from an unsorted dispersion of HiPco SWCNTs (red dashedline) and a HiPco sample extracted into a toluene solution of PFO (black solid line). Peaks fromthe PFO-extracted sample are labeled with the corresponding (n,m) indices (Sun et al., 2015).
Figure 15.10 S4 film on a steel test plate (Sun et al., 2015).
Strain-sensing smart skin 363

the PFO-based protocol described here. Industrial scale use of the S4 method will, ofcourse, need to rely on application methods such as brush or spray coating.
15.3.2 Second-generation S4 measurements
Figure 15.12 shows the schematic diagram of our second-generation optical strainreader. A compact diode laser emitting at 660 nm provides light that efficiently excites
20 μm 20 μm
Figure 15.11 Short-wave IR fluorescence microscopy images of smart skin films. The leftframe shows unevenly dispersed SWCNTs (unsorted) in PMMA; the right frame showswell-dispersed, randomly oriented SWCNTs (PFO-extracted) in urethane (Sun et al., 2015).
Optical fiber
Fibercollimator
Long-passfilterShort-pass
filterClean-up
filter
Beamcoupler Lens
Motorized half-wave plate(polarization control) Test specimen
Resistive strain gage(for calibration)
In-planestrain SWCNTs in
polymer film(smart skin)
SWIRspectrometer
Computer
Excitationlaser
Figure 15.12 Schematic diagram of prototype S4 strain probe (Sun et al., 2015).
364 Multifunctional Nanocomposites in Civil and Structural Engineering

(7,5) and (7,6) SWCNT structures, which are among those extracted by PFO. The laserbeam passes through a short-pass filter and a half-wave retardation plate on acomputer-controlled polar rotation mount that allows automated adjustment of its po-larization plane. Then the excitation beam passes through a small hole in a couplingmirror before being focused onto the sample by an aspheric lens. Fluorescence emittedfrom the S4 film is captured and collimated by the same aspheric lens. It is then re-flected by the coupling mirror into a fiber collimator that focuses into an optical fiberleading to a spectrometer designed for sensitive multichannel detection of near-IRspectra. The footprint of our second-generation optical reader is only 4 � 600(102 � 152 mm), not including the relatively small spectrometer module. It thereforeseems clear that optical strain readers can be made compact and light enough for hand-held field use (as shown in Fig 15.13).
To make calibrated S4 performance tests on PMMA test specimens, we use refer-ence readings from two conventional resistive foil strain gages: one bonded on topof the S4 film close to the optical measurement point, and the other mounted at the cor-responding location on the opposite surface of the specimen bar. Readings from thosetwo strain gages are compared in real time to check the efficiency of load transfer fromsubstrate to polymer. We find that for S4 films thinner than c. 20 mm, the applied strainsmeasured on the opposite surface of the bar nearly match the strains measured at thesurface of the film.
We determined the fluorescence peak positions from (7,5), (7,6), and (8,6)SWCNTs in S4 films by fitting separate local Gaussian functions to the emission peaksnear 1050, 1140, and 1200 nm, as illustrated in Figures 15.14 and 15.15. This fitting ismore reliable and precise than with first-generation S4 films because SWCNT samplesselectively extracted with PFO give far simpler emission spectra.
Resolution is one key factor defining the performance of a sensor system. Strainresolution is the smallest measurable change in strain, and in our S4 method it is
(a) (b)
Figure 15.13 Photographs of the prototype second-generation S4 strain probe head: (a) Probehead on its 4 � 600 base; and (b) probe head with handle (Sun et al., 2015).
Strain-sensing smart skin 365

determined with precision by measuring fluorescence peak wavelengths. This is inturn controlled by the spectral resolution of the spectrometer, the spectral width ofthe fluorescence peak, and the signal-to-noise ratio of the measured spectrum.Because our spectrometer’s resolution of 2 nm is significantly sharper than the widthof SWCNT fluorescence features, spectral resolution is not a limiting factor forresolution. The signal-to-noise ratio depends on excitation laser intensity, SWCNT
9000
7200
5400
3600
1800
01000 1050 1100 1150 1200 1250
Wavelength (nm)
Em
issi
on in
tens
ity (a
.u.)
(7,5)
(7,6)1140.07 ± 0.052 nm
(8,6)
Figure 15.14 Fluorescence spectrum from a second-generation S4 film made with sortedSWCNTs. Note the high precision with which peak positions can be found by curve fitting(Sun et al., 2015).
1050 1100 1150 1200 12500.0
0.2
0.4
0.6
0.8
1.0
(8,6)
(7,6)
Nor
mal
ized
em
issi
on in
tens
ity
Emission wavelength (nm)
Polycarbonatefast-drying polyurethane2 layers, PFO SWCNT20 micron thickness strain = 0 and 4550 με2.5 s inte. time
(7,5)
Figure 15.15 Strain-induced spectral shifts in SWCNT fluorescence spectra from asecond-generation S4 film (Sun et al., 2015).
366 Multifunctional Nanocomposites in Civil and Structural Engineering

concentration in the film, SWCNT fluorescence quantum yield, optical collectionefficiency, detector sensitivity and noise, data acquisition time, and data averaging.For the dominant (7,6) peak, we find that approximately 20 s of data acquisition froma typical S4 film allows us to determine the peak wavelength with a standard devia-tion near 0.052 nm. The theoretically predicted (7,6) strain coefficient (slope of peakposition with strain
dlð7;6Þdε ), is approximately 1.2 nm/mε, predicting a standard devia-
tion in strain measurement of c. 45 mε. Actual strain uncertainties can exceed thisvalue because the effective strain coefficient of an ensemble of randomly orientedSWCNTs is smaller than that of a single aligned nanotube, and slippage of nanotubeswithin the polymer film can also reduce the coefficient. However, one can improvestrain resolution by combining peak position measurements from different SWCNT(n,m) structures, because the strain coefficients have signs and magnitudes thatdepend on (n,m). For example, we generally monitor the difference between the(7,5) and (7,6) peak positions, which has a predicted net coefficient of 3.5 nm/mε,or nearly three times that of (7,6) alone. The spatial resolution, or gage length, ofthe S4 method is intrinsically small because it equals the diameter of the excitationbeam at the film surface. This dimension is normally approximately 0.1 mm, butwith tighter focusing it can readily be reduced to a few micrometers, if necessary.On the other hand, the gage length can be increased as needed by scanning the laserprobe over the desired range during the period of spectral acquisition to obtain aspatially averaged strain value.
For testing, we subjected PMMA specimens coated with the second-generationSWCNT smart skin to tensile deformation over the strain range from 0 to 1500 mε us-ing a custom-built four-point bending jig. Figure 15.16 shows the sequence of applied
0
1000
2000
1050
1051
1140
1141
0 5 10 15 20 25 30 351202
1203
1204
Stra
in (μ
ε) Loading Unloading
Peak
wav
elen
gth
(nm
)
(7,5)
(7,6)
Steps
(8,6)
Figure 15.16 Response of SWCNT peak positions to cyclic tensile strain in specimen(Sun et al., 2015).
Strain-sensing smart skin 367

deformations and the resulting changes in three spectral peak positions. We observethat the (7,5), (7,6), and (8,6) peaks shifted systematically with the applied strain,thus confirming efficient and reversible load transfer from the PMMA bar to the poly-meric coating to the embedded SWCNTs.
The spectral peak positions are plotted as a function of tensile strain in Figure 15.17.This figure omits data from the first cycle, in which there is apparently some relaxationof initial nanotube strains induced by shrinkage forces during curing of the S4 film. Theobserved strain coefficient for the (7,5)e(7,6) peak separation for loading and unload-ing curves is less than the theoretical prediction for nanotubes aligned with the strainaxis. We attribute this to the random distribution of SWCNT orientations in the filmand some slippage of nanotubes in the polymer host because of imperfect adhesion.
(7,5)
(8,6)
1051.0
1050.5
1050.0
1203.5
1203.0
1202.5
1202.0
15.5
15.0
14.5
14.0
13.5
13.0
12.5
1141.5
1141.0
1140.5
1140.0
91.0
90.5
90.0
89.5
89.0
2254
2253
2252
0 500 1000 1500 0 500 1000 1500Strain (µε) Strain (µε)
Pea
k sh
ift (n
m)
Pea
k po
sitio
n (n
m)
Pea
k po
sitio
n (n
m)
(7,6) – [(7,5) + (8,6)]/2
(7,6)
(7,6) – (7,5)
(7,5) + (8,6)
Cycle 2 Loading UnloadingUnloadingLoadingCycle 3
Figure 15.17 SWCNT peak positions and shifts versus tensile strain on specimen (Sun et al.,2015).
368 Multifunctional Nanocomposites in Civil and Structural Engineering

As the test specimen underwent deformation cycles with strains up to 3000 mε, theloading and unloading curves diverged, leading to a visible hysteresis loop (seeFigure 15.18). We hypothesize that this reflects molecular-level damage at thenanotubeepolymer interface in the smart skin. Further investigations on this subjectare needed.
Figure 15.19 shows the spectral response of the three major SWCNT peaks duringcyclic tensile deformation. Apart from relaxation processes in the first cycle, our datasuggest that the coating shows nearly elastic deformation behavior. The zero-strainpeak positions for the remaining eight cycles agree closely, suggesting no furtherrelaxation of residual strain. The downward drift of the (8,6) peak position at5000 mε during the first five loadingeunloading cycles is likely due to further relaxa-tion of initial strains and friction at the interface between the polymer and nanotube.However, the drift appears to stabilize after the fifth cycle. Further optimization ofthe S4 film formulation and application may reduce the observed drift effects.
13.2
12.1
11.0
9.9
8.8
0 500 1000 1500 2000 2500 3000
(7,6) – [(7,5) + (8,6)]/2
Net
pea
k sh
ift (n
m)
Net
pea
k sh
ift (n
m)
Strain (με)
0 500 1000 1500 2000 2500 3000
Strain (με)
Cycle 2Cycle 3
Loading UnloadingUnloadingLoading
2258
2256
2254
(7,6) + (8,6)
Figure 15.18 Combinations of SWCNT peak positions versus tensile strain on specimen.The spectral peaks used for each frame are listed. Data for the first cycle have been omitted forthe same reason as described in the text for Figure 15.17 (Sun et al., 2015).
Strain-sensing smart skin 369

15.4 Damage detection strategy
A major application of the S4 method in structural health monitoring will be to findlocalized damage in surfaces of interest. This involves constructing a surface strainmap based on many sequential strain measurements made individually at different po-sitions on the surface. To minimize the time and effort of inspections, it is thereforeimportant to be able to find localized damage with as few strain measurements aspossible. In this section, we describe a multiscale computational scheme for rapiddetection of damage from a full two-dimensional (2D) strain map that has beendeduced from a sparse (highly undersampled) set of randomly positioned strain mea-surements. Figure 15.20 illustrates the difference between uniform and random under-sampling. This process involves an ill-posed (not well-defined) inverse mathematical
4000
2000
1053.4
1051.1
1048.8
1143.1
1140.8
1138.5
1205.2
1202.9
1200.6
0
0 2 4 6 8 10Cycle number
Pea
k po
sitio
n (n
m)
Stra
in (µ
ε)
(8,6)
(7,6)
(7,5)
Figure 15.19 Response of SWCNT peak positions to cyclic tensile strain from 0 to 5000 mε inan S4-coated PMMA specimen (Sun et al., 2015).
Available
Missing
Figure 15.20 The uniform undersampling method (left); and the random undersamplingmethod (right).
370 Multifunctional Nanocomposites in Civil and Structural Engineering

problem without an analytical solution; it is necessary for us to infer the whole matrixand detect irregularity from only relatively few randomly distributed measurements.
Starting with implicit knowledge of the data structure of the strain matrix, we makea general mathematical assumption that the matrix is low rank. Then, we can use opti-mization methods to recover a matrix that is as low rank as possible, while beingconsistent with the available measurements, to approach the original (true) strain ma-trix. The strategy developed exploits the intrinsic data structure of the true strain field:typically, it is highly correlated without many edges and hence has a low-rank struc-ture, unless damage (manifested as sparse innovation in the 2D measurement) occursand destroys the low-rank structure. Therefore, taking advantage of the implicitlow-rank structure, the new theory of matrix completion enables global recovery ofthe full measurement from few randomly sampled (strain) measurements. The recov-ered strain field measurement is further decomposed, by principal component pursuit,into a superposition of a low-rank background component and a sparse innovationcomponent. This isolates the region of local damage, which can then be probedwith finer spatial resolution in subsequent measurements.
When acquiring strain data in order to detect damage, one strategy (global randomsampling) is to use as few measurement points as possible to speed the inspection pro-cess. If no damage is detected with high undersampling, one would then make addi-tional measurements at positions selected randomly (nonbiased sampling) from theremaining region of the whole structure, until the density of measured points is suffi-cient to detect any damage region that may be present. This type of iterative procedurecan be implemented automatically.
A preferred alternative strategy involves local or biased sampling. Because damageis a local, sparse phenomenon, if the first iteration with a high undersampling factor orvery few measurements identifies a suspect damage region, then further measurementsare made only within the suspect region until the damage is well localized. In practice,such an alternative procedure requires an expert to pick the suspect damage region atthe first iteration, while the rest of the steps can be automatically implemented.Figure 15.21 schematically illustrates these two different iterative schemes, and
MeasuredMissingIncreased
Crack
Suspect region
Figure 15.21 The iterative procedure by increasing the random measurements to improve thedamage detection accuracy: (left) Global random sampling to additionally increasemeasurements; and (right) local random sampling to additionally increase measurement onlywithin the suspect damage region, which is picked at the first iteration.
Strain-sensing smart skin 371

Figure 15.22 and Figure 15.23 illustrate the computational framework and theflowchart of the proposed damage detection method, respectively.
Our new scheme is based on the implicit sparse and low-rank data structure of thestrain field (2D) measurement. The advantages of the method are that it is purelydata-driven without using any model or prior knowledge with regard to the structure;it is implemented blindly, without relying on operator expertise; and it executes effi-ciently (usually within a very few seconds).
15.5 Conclusions and outlook
In this chapter, we have described our progress toward the practical implementation ofa novel noncontact optical strain measurement method that uses CNTs in polymeric
= +
B X* L S
Figure 15.22 The computational framework of the proposed two-step damage detection methodusing a set of partial random strain measurements (the strains at nonsampled positions areshown as light green). The first step, matrix completion, recovers the full matrix; and the secondstep, low-rank plus sparse decomposition, separates into a superposition of a low-rankbackground component plus a sparse innovation component that indicates damage.
Set of strains atrandom positions
Global strainmatrix completion
Separate thelow-rank and
sparse component
Is sparsecomponentlocalized?
YesNoDamage successfully detected
Randomly increasemeasurements in
suspect region
Figure 15.23 The flowchart implementing the iterative procedure of the proposed damagedetection method using partial random strain measurements and a two-step computationalframework.
372 Multifunctional Nanocomposites in Civil and Structural Engineering

films as nanoscale sensors. Strain can be measured anywhere on the surface by irradi-ating that point with an interrogating laser beam and collecting and analyzing theresulting nanotube fluorescence spectrum. The strain axis can also be found by rotatingthe polarization plane of the laser beam to selectively interrogate SWCNTs oriented indifferent directions. Our first-generation smart skin composite (“S4”) was prepared bydispersing raw SWCNTs into commercial polyurethane varnish. Promising resultsobtained with this material led to the development of a second-generation compositein which the SWCNTs were preprocessed by structural selection and purification.Second-generation S4 films display strong, well-structured fluorescence spectra thatallow improved optical strain determinations. Test results show promising repeat-ability for the S4 method, although distortions from imperfect interfacial adhesionbetween polymer film and SWCNTs can be seen, especially at higher strain levels.We expect that the fidelity of these optical strain measurements will improve as furtherrefinements are made in the formulation and application of the composite films.We also described a multiscale computational scheme intended to improve the effi-ciency of detecting damaged regions on surfaces. The scheme exploits the implicitdata structure of the 2D strain map and can be implemented for automated damagedetection using a small number of local strain measurements. We expect that noncon-tact optical strain measurement using SWCNT smart skins will evolve into a robusttechnology with widespread practical applications.
References
Ajovalasit, A., Petrucci, G., Scafidi, M., 2010. RGB photoelasticity: review and improvements.Strain 46 (2), 137e147. Available at: http://onlinelibrary.wiley.com/doi/10.1111/j.1475-1305.2008.00571.x/abstract (accessed 18.02.15.).
Arnold, M.S., et al., October 2006. Sorting carbon nanotubes by electronic structure usingdensity differentiation. Nature Nanotechnology 1, 60e65.
Casey, J.P., et al., 2008. Chirality-resolved length analysis of single-walled carbon nanotubesamples through shear-aligned photoluminescence anisotropy. ACS Nano 2 (8),1738e1746.
De la Vega, A., et al., 2011. Simultaneous global and local strain sensing in SWCNTeepoxycomposites by Raman and impedance spectroscopy. Composites Science and Technology 71(2), 160e166. Available at: http://linkinghub.elsevier.com/retrieve/pii/S0266353810004239(accessed 18.02.15.).
Dharap, P., et al., 2004. Nanotube film based on single-wall carbon nanotubes for strain sensing.Nanotechnology 15 (3), 379e382. Available at: http://stacks.iop.org/0957-4484/15/i¼3/a¼026?key¼crossref.9ff9fe25ca793555c85d976f863a8924 (accessed 18.02.15.).
Germaneau, A., Doumalin, P., Dupré, J.-C., 2008. Comparison between X-ray micro-computedtomography and optical scanning tomography for full 3D strain measurement by digitalvolume correlation. NDT and E International 41 (6), 407e415. Available at: http://linkinghub.elsevier.com/retrieve/pii/S0963869508000339 (accessed 18.02.15.).
Ghosh, S., Bachilo, S.M., Weisman, R.B., 2010. Advanced sorting of single-walled carbonnanotubes by nonlinear density-gradient ultracentrifugation. Nature Nanotechnology 5 (6),443e450. Available at: http://dx.doi.org/10.1038/nnano.2010.68.
Strain-sensing smart skin 373

Goldrein, H., Palmer, S., Huntley, J., 1995. Automated fine grid technique for measurement oflarge-strain deformation maps. Optics and Lasers in Engineering 23 (195), 305e318.Available at: http://www.sciencedirect.com/science/article/pii/014381669500036N(accessed 18.02.15.).
Hamada, S., et al., 2014. Strain mapping with high spatial resolution across a wide observationrange by digital image correlation on plastic replicas. Materials Characterization 98,140e146. Available at: http://linkinghub.elsevier.com/retrieve/pii/S1044580314003027(accessed 21.01.15.).
Hill, K., Meltz, G., 1997. Fiber Bragg grating technology fundamentals and overview. Journal ofLightwave Technology 15 (8), 1263e1276. Available at: http://132.248.12.175/jhcordero/Cursos/Facultad_Ingenieria/Articulos/fiber_gratings_fundamentals.pdf (accessed 18.02.15.).
Huang, M., et al., April 2008. Direct measurement of strain-induced changes in the bandstructure of carbon nanotubes. Physical Review Letters 100, 1e4.
Leeuw, T.K., et al., 2008. Strain measurements on individual single-walled carbon nanotubes ina polymer host: structure-dependent spectral shifts and load transfer. Nano Letters 8 (3),826e831. Available at: http://www.ncbi.nlm.nih.gov/pubmed/18298093.
Lefebvre, J., et al., 2004. Photoluminescence from an individual single-walled carbon nanotube.Physical Review B 69, 1e5.
Li, L.-J., et al., October 2004a. Chirality assignment of single-walled carbon nanotubes withstrain. Physical Review Letters 93, 6e9. Available at: http://link.aps.org/doi/10.1103/PhysRevLett.93.156104.
Li, Z., et al., 2004b. Carbon nanotube film sensors. Advanced Materials 16 (7), 640e643.Available at: http://doi.wiley.com/10.1002/adma.200306310 (accessed 18.02.15.).
Maki, H., Sato, T., Ishibashi, K., 2007. Direct observation of the deformation and the band gapchange from an individual single-walled carbon nanotube under uniaxial strain. NanoLetters 7, 890e895.
Minot, E.D., et al., April 2003. Tuning carbon nanotube band gaps with strain. Physical ReviewLetters 90, 156401.
Miyauchi, Y., Oba, M., Maruyama, S., 2006. Cross-polarized optical absorption of single-wallednanotubes by polarized photoluminescence excitation spectroscopy. Physical Review B eCondensed Matter and Materials Physics 74, 1e6.
Mu, M., et al., 2009. An in situ Raman spectroscopy study of stress transfer between carbonnanotubes and polymer. Nanotechnology 20 (33), 335703. Available at: http://www.ncbi.nlm.nih.gov/pubmed/19636105 (accessed 18.02.15.).
Myers, D., 2010. MEMS Resonant Strain Sensor Integration. University of California, Berkeley.Available at: https://escholarship.org/uc/item/11v8j97m.pdf (accessed 18.02.15.).
O’Connell, M.J., et al., 2002. Band gap fluorescence from individual single-walled carbonnanotubes. Science 297 (5581), 593e596.
Obitayo, W., Liu, T., 2012. A review: carbon nanotube-based piezoresistive strain sensors.Journal of Sensors 2012, 1e15. Available at: http://www.hindawi.com/journals/js/2012/652438/ (accessed 02.02.14.).
Pan, B., et al., 2009. Two-dimensional digital image correlation for in-plane displacement and strainmeasurement: a review. Measurement Science and Technology 20 (6), 062001. Available at:http://stacks.iop.org/0957-0233/20/i¼6/a¼062001?key¼crossref.37cf26a6947e54eb5498e67742a4e2ad (accessed 23.01.14.).
Pan, B., 2007. Full-field strain measurement using a two-dimensional Savitzky-Golay digitaldifferentiator in digital image correlation. Optical Engineering 46 (3), 033601. Availableat: http://opticalengineering.spiedigitallibrary.org/article.aspx?doi¼10.1117/1.2714926(accessed 13.02.14.).
374 Multifunctional Nanocomposites in Civil and Structural Engineering

Peng, S., Cho, K., 2000. Chemical control of nanotube electronics. Nanotechnology 11 (2), 57.Available at: http://iopscience.iop.org/0957-4484/11/2/303 (accessed 18.02.15.).
Raju, A.P.A., et al., 2014. Wide-area strain sensors based upon graphene-polymer compositecoatings probed by Raman spectroscopy. Advanced Functional Materials 24 (19),2865e2874. Available at: http://doi.wiley.com/10.1002/adfm.201302869 (accessed11.02.15.).
Reich, S., Thomsen, C., Maultzsch, J., 2004. Carbon Nanotubes: Basic Concepts and PhysicalProperties. Wiley-VCH, Weinheim.
Srivastava, R.K., et al., 2011. The strain sensing and thermal-mechanical behavior of flexiblemulti-walled carbon nanotube/polystyrene composite films. Carbon 49 (12), 3928e3936.Available at: http://dx.doi.org/10.1016/j.carbon.2011.05.031.
Sun, P., et al., 2014. “Smart Skin” optical strain sensor using single wall carbon nanotubes. In:Lynch, J.P., Wang, K.-W., Sohn, H. (Eds.), SPIE 9061, Sensors and Smart StructuresTechnologies for Civil, Mechanical, and Aerospace Systems. San Diego, USA,pp. 906113e906120. Available at: http://dx.doi.org/10.1117/12.2046539.
Sun, P., et al., 2015. Carbon nanotubes as non-contact optical strain sensors in smart skins. TheJournal of Strain Analysis for Engineering Design 1e8. Available at: http://sdj.sagepub.com/lookup/doi/10.1177/0309324715597414.
Valavala, P.K., et al., 2008. Self-consistent calculations of strain-induced band gap changes insemiconducting (n,0) carbon nanotubes. Physical Review B e Condensed Matter andMaterials Physics 78, 1e6.
Vemuru, S.M., et al., 2009. Strain sensing using a multiwalled carbon nanotube film. TheJournal of Strain Analysis for Engineering Design 44, 555e562.
Weisman, R., Bachilo, S., 2003. Dependence of optical transition energies on structure forsingle-walled carbon nanotubes in aqueous suspension: an empirical Kataura plot. NanoLetters 3 (9), 1235e1238. Available at: http://pubs.acs.org/doi/abs/10.1021/nl034428i(accessed 30.01.14.).
Withey, P.A., et al., 2012. Strain paint: noncontact strain measurement using single-walledcarbon nanotube composite coatings. Nano Letters 12 (7), 3497e3500. Available at:http://www.ncbi.nlm.nih.gov/pubmed/22694748.
Yang, L., Han, J., 2000. Electronic structure of deformed carbon nanotubes. Physical ReviewLetters 85 (1), 154e157.
Yong, Y., 2013. A novel piezoelectric strain sensor for simultaneous damping and trackingcontrol of a high-speed nanopositioner. IEEE/ASME Transactions 18 (3), 1113e1121.Available at: http://ieeexplore.ieee.org/xpls/abs_all.jsp?arnumber¼6202343 (accessed18.02.15.).
Zhao, Q., Frogley, M.D., Wagner, H.D., 2002. Direction-sensitive strain-mapping with carbonnanotube sensors. Composites Science and Technology 62 (1), 147e150. Available at:http://linkinghub.elsevier.com/retrieve/pii/S0266353801001877.
Strain-sensing smart skin 375

Future trends and directions 16Kenneth J. Loh 1,2, Satish Nagarajaiah 3
1University of California-Davis, Davis, CA, USA; 2University of California-San Diego, LaJolla, CA, USA; 3Rice University, Houston, TX, USA
16.1 Summary
This book summarizes some of the latest mainstream research efforts toward theapplications of nanotechnology for the development of advanced materials for civil,construction, and structural engineering. The goal is to transition conventional civilengineering materials (whose main purpose is to bear and resist loads) to createnext-generation multifunctional nanocomposites that incorporate properties such assensing, damage tolerance, and deicing, among many others. Of particular interest ishow nanotechnology, specifically nanomaterials, can be incorporated and effectivelyused for elucidating multiple engineering functionalities in civil engineering materialssuch as cementitious composites and pavements.
The book is not meant to be an exhaustive literature review of the subject matter,but instead focuses on showcasing the diversity and breadth of this multidisciplinaryfield that intersects civil engineering, materials science, chemistry, electricalengineering, and construction practices. A large body of work presented in thisbook is aimed at incorporating nanomaterials such as nanotubes, nanofibers, andnanoparticles during the construction of infrastructure materials. For example, carbonnanotubes have been used extensively as conductive additives for cementitious com-posites. An objective of mixing these conductive additives is to enhance the electricalproperties of the pristine cement paste, mortar, and/or concrete and to enableself-sensing. In doing so, one could measure changes in the material’s electricalproperties and correlate them to structural damage, thereby enabling in situ structuralhealth monitoring.
Besides modifying the design of construction materials, another emerging approachis to design nanocomposite coatings or nanofilms that can be applied onto orembedded underneath structural surfaces. Part III of this book starts with some ofthe earliest developments in this area with the discussion of surface-mounted strainsensors based on carbon nanotubeebased buckypapers. Since then, others haveadvanced manufacturing techniques to allow for large-scale deposition of these nano-films onto a variety of different structural surfaces. Damage detection and localizationusing these films are also possible.
Innovative Developments of Advanced Multifunctional Nanocomposites in Civil and Structural Engineeringhttp://dx.doi.org/10.1016/B978-1-78242-326-3.00016-6Copyright © 2016 Elsevier Ltd. All rights reserved.

16.2 Future trends
Despite these aforementioned recent advances in multifunctional nanocomposites forcivil and structural engineering, several grand challenges still need to be resolvedbefore these innovative materials can be adopted for practice. The first grand challengeis scalabilitydhow can nanomaterials be effectively incorporated at reasonableamounts and costs so that the desired material attribute is achieved without sacrificingthe original properties of the pristine host material? For example, much research con-ducted on smart cementitious composites requires the use of 0.1e0.5% carbon nano-tubes by weight of cement. Assuming that 1 m3 of concrete requires at least 250 kg ofcement and that multiwalled carbon nanotubes (MWNTs) cost $1000/kg, this amountsto $1250 additional costs for a 1 m3 batch of 0.5% (MWNT-based) smart concrete.Thus, more effective techniques (e.g., by modifying the composite’s cementeaggregate interface with nanomaterials or nanofilms) are direly needed.
The second grand challenge is multifunctionalitydhow can one encode specificengineering functionalities or material properties? The majority of research todayhas shown that cementitious composites, asphalt, and even fiber-reinforced polymercomposites can be engineered to possess self-sensing capabilities and/or improvedmechanical properties. However, research is needed for investigating how otherfunctionalities can be incorporated, such as for sensing chloride ingress (for corrosionmonitoring), self-healing, energy dissipation, and/or power harvesting, among others.Similar to the previous grand challenge, achieving these functionalities should notcome at the cost of the other desirable attributes of civil engineering materials.
Lastly, when these advanced nanoengineered materials are ready for large-scalevalidation or real-world implementation, their construction procedures need to beaddressed. Unlike small-scale specimens that are fabricated in highly controlled labo-ratory environments and with very specialized equipment, these conditions are notavailable (or practical) when multifunctional nanocomposites are casted in the field.As such, these innovative materials need to be designed within the framework ofacceptable construction practices. Either current construction practices can continueto be used or only slight (and low-cost) modifications are necessary.
378 Multifunctional Nanocomposites in Civil and Structural Engineering

Index
‘Note: Page numbers followed by “f” indicate figures, “t” indicate tables.’.
AAcrylonitrile butadiene styrene (ABS),
185e190AFM. See Atomic force microscope
(AFM)Ambient temperature effect, 260e263,
262fAmerican Concrete Institute (ACI), 16e17Atomic force microscope (AFM), 227,
236e237, 236f
BBeam specimen, 145e146, 145fBending beam rheometer (BBR) test,
184e185, 205e207, 205f, 206tBiomineralization, 81e82Boundary nucleation model (BN model),
219e220BuckypaperCNT-based buckypaper nanofilms, 308general process, 304e305multiwalled carbon nanotubes (MWCNTs),
306e308poly(methyl methacrylate) (PMMA), 306Raman shift, in G-band modes, 305e306,
307fscanning electron microscope (SEM)
image, 305, 305fSWCNT-buckypaper, 305, 306fe307f
CCalciumesilicateehydrate (C-S-H) gel,
79e80, 79fCarbon fiber reinforced concrete (CFRC),
59e60Carbon nanofiber (CNF), 155cement composites, application in, 49e54,
51fe54fchallenges, 54e55, 55f
electrical and sensing properties, 165e166enhancement mechanisms, 166e170,
167fe169ffuture of, 56e57, 56fe57fgeneral properties, 48e49, 48t, 49fe50fhistory, 47e48mechanical properties, 165scanning electron microscopy, 47, 47fvapor-grown carbon nanofiber (VGCF),
47e48, 48fCarbon nanofiber aggregate (CNFA)concrete, nanotechnology in, 10e15carbon fiber cement and mortar self-sensing applications, 14e15
cement-based materials, nano-reinforcement in, 11
CNT and CNF dispersion, 11e13CNT/CNF cement-based materials,strain-sensing ability of, 13e14
fiber-reinforced concrete, 10e11concrete specimens, damage detection of,
20e40compression, concrete cylinders testedin. See Compression, concretecylinders tested in
flexure, reinforced concrete beam testedin. See Reinforced concrete (RC)
development of, 15e19electrical resistance measurementtechnique, 15e16, 16fe17f
mortar mix design, 17e19, 19f, 20tsize, 16e17, 17f
Carbon nanofiber polymer (CNFP), 247CNF/CNT, 248economic expense, evaluation of,
272e274, 274tfilmproperties investigation. See Film,properties investigation

Carbon nanofiber polymer (CNFP)(Continued)
multiwalled carbon nanotube (MWCNT),248e249
self-heating pavement systemdeicing application, 257e267,257fe258f, 259te260t
integration, 255e256, 256fsnow-thawing application, 263e267,265fe266f
time and energy options priority, efficiencybased on, 267e272, 268t, 269fe271f,273f
Carbon nanotubes (CNTs), 2e3, 154e155.See also Structural health monitoring(SHM)
electrical and sensing properties,163e164
enhancement mechanisms, 166e170,167fe169f
mechanical properties, 156e163,157te159t
Carbon nanotube cement-paste sensor(CNTCS)
cementitious materials, 98e99electrical modeling, 103e106sensors electrical properties,identification of, 104e106,104fe105f, 106t
unstrained response and polarization,103, 104f
fabrication process, 100e103, 100fMWCNT and casting, dispersion of,101e103, 102fe103f
MWCNT and mix design, physicalproperties of, 101, 101te102t
full-scale validation, 111e118laboratory test setup, 111e114,114f
results, 114e118, 116fe117f,117te118t
potential applications, 99e100state of art, 98e99SWCNT and MWCNT, 99vibration monitoring, 106e111dynamic characterization, 107e111,109fe113f
quasi-static response, 106e107, 107fwater, disperse in, 98
Cement composites, application in, 49e54,51fe54f
Cementitious materialsbeam specimen, 145e146, 145fcyclic axial loading, 135data acquisition, 133e134electrical conduction, 123electrical impedance tomography,
129e130, 130felectrical stimulation and data collection,
130e131engineered cementitious composites,
126e128experimental methods, 133, 133fforward problem, formulation of, 131e132four-point probe method, 125, 126ffrequency response analyzer (FRA),
125e126inverse problem, solution to, 132e133monotonic tensile loading, 134e135monotonic three-point bending, 135e136,
135fnondestructive evaluation (NDE),
121e122self-sensing fiber-reinforced cementitious
composites, 128e129, 129fspecimenCT1, 142e145, 143fe144fMT1, 136, 137fe138fMT2/MT3 and MT4, 136e142,139fe141f
traditional electrical measurementtechniques, 123e126, 124f
Cement-matrix structural composites, 50CFRC. See Carbon fiber reinforced concrete
(CFRC)CNF. See Carbon nanofiber (CNF)CNF-filled cementitious composites, 160telectrical and sensing properties, 165e166mechanical properties, 165
CNFP. See Carbon nanofiber polymer(CNFP)
CNT-filled cementitious composites,157te159t
electrical and sensing properties, 163e164mechanical properties, 156e163,
157te159tother properties, 164e165
Complete electrode model (CEM), 131e132
380 Index

Compression, concrete cylinders tested inexperimental setup, 20e22, 21fe22fgroup 1 experimental results, 22e25, 23f,
23t, 24fe25fgroup 2 experimental results, 25e26, 26t,
27fgroup 3 experimental results, 26e31,
28fe33fspecimen construction, 20, 21f
Compressive testing, 61Concrete, nanotechnology in, 10e15carbon fiber cement and mortar self-sensing
applications, 14e15cement-based materials, nano-
reinforcement in, 11CNT and CNF dispersion, 11e13CNT/CNF cement-based materials, strain-
sensing ability of, 13e14fiber-reinforced concrete, 10e11
Coupling inductors, 289Crumb rubber, 183e184CT1 specimen, 142e145, 143fe144fCyclic axial loading, 135
DDamage, defined, 303Data acquisition, 133e134Defoamer, 60Deicing application, 257e267, 257fe258f,
259te260tambient temperature, effect of, 260e263,
262fheat flux density, effect of, 263, 264fice thickness, effect of, 260, 261f
Digital image correlation (DIC), 353e354Digitally controlled oscillator (DCO),
291e292Digital multimeter (DMM), 335e336Digital volume correlation (DVC), 353e354Displacement control, 27Distributed fiber-optic sensing technologies,
283Double-ended tuning fork (DETF), 353Dynamic shear rheometer (DSR) test,
184e185, 197e205NMN-modified asphalt binder, 197e199,
198fe199fPMN-modified asphalt binder, 199e201,
200fe201f
RTFO aging processNMN-modified asphalt binder after,201e203, 202fe203f
PMN-modified asphalt binder after,203e205, 204f
EEIS. See Electrical impedance spectroscopy
(EIS)EIT. See Electrical impedance tomography
(EIT)Electrical conduction, 123Electrical impedance spectroscopy (EIS), 123,
336e338, 338f, 338t, 344e345, 344fElectrical impedance tomography (EIT),
122, 129e130, 130f, 339e342,340f, 345e347, 346f
structural health monitoring (SHM)2D Laplace’s equation, 311defined, 311EIT spatial conductivity reconstructionprocess, 312, 312f
five plastic wells, 314e316, 315fGausseNewton algorithm, 312LbL (SWCNT-PSS/PVA)50 thin films,
313, 313fone-cycle tensile-compressive loadpattern, 313, 314fe315f
pH-sensing properties, 314e316weighted residual method, 311e312
Electrically conductive properties, CNFP,252e254, 252fe253f
Electrical modeling, 103e106sensors electrical properties, identification
of, 104e106, 104fe105f, 106tunstrained response and polarization, 103,
104fElectrical resistance measurement
technique, 15e16, 16fe17fElectrical resistance variation (ERV), 16, 22Electrical sensing measurementschallenges, 347CNT thin films, in situ electrical
measurements of, 342e347DC resistance, 343e344, 343felectrical impedance spectroscopy (EIS),344e345, 344f
electrical impedance tomography (EIT),345e347, 346f
Index 381

Electrical sensing measurements (Continued)DC resistance, 335e336, 336felectrical impedance spectroscopy (EIS),
336e338, 338f, 338telectrical impedance tomography (EIT),
339e342, 340ftensile strain, electrical property response
to, 337f, 339Electrical stimulation, data collection,
130e131Electrothermal properties, CNFP, 254e255,
254fe255f, 255tEmbedded CNT thin films, 330e335
electrical sensing measurements, 335e342layer-by-layer deposited MWCNTePSS/
PVA thin films, 330e332, 331fe332fsizing-based SWCNT glass fiber coatings,
334e335, 334fspray-deposited MWCNTePVDF thin
films, 332e334, 333fEngineering cementitious composites
(ECCs), 2, 126e128Ethylene-co-vinyl acetate (EVA), 221Ethylvinyl acetate (EVA), 183e184
FFabrication process, 100e103, 100f
MWCNTcasting, dispersion of, 101e103,102fe103f
mix design, physical properties of, 101,101te102t
Fiber Bragg-grating sensors (FBGs), 283Fiber-reinforced cementitious composite
(FRCC), 2, 122Fiber reinforcement, 220Field emission scanning electron
microscope (FE-SEM), 184e185Filling ability, 12Film, properties investigation
CNFPelectrically conductive properties of,252e254, 252fe253f
electrothermal properties, 254e255,254fe255f, 255t
mechanical properties of, 251e252, 251ffabrication process, 249, 249fmicrostructures, characteristics of,
250e251, 250fe251f
Finite element method (FEM), 131e132First-generation S4 filmsformulation/application and mechanical
testing, 356e357optical strain measurement, 357, 357fresults, 357e361, 358fe360f
FishereTropsch synthesis, 47e48Flexible kapton, 288Fourier transform infrared spectroscopy
(FTIR), 82e83, 184e185,207e212, 208t, 209fe211f
Four-point probe method, 125, 126fFour-probe method, 15e16FRA. See Frequency response analyzer
(FRA)FRCC. See Fiber-reinforced cementitious
composite (FRCC)Freezeethaw resistance, 225Frequency response analyzer (FRA),
125e126Frequency response function (FRF),
110e111, 113fFTIR results, 207e212, 208t, 209fe211fFull-bridge resistive strain gauge, 287e288,
288fFull-scale validation, 111e118laboratory test setup, 111e114, 114fresults, 114e118, 116fe117f,
117te118t
GGausseNewton algorithm, 312Glass fiber-reinforced polymer (GFRP)background, 328e330embedded CNT thin films, 330e335electrical sensing measurements,335e342
layer-by-layer deposited MWCNTePSS/PVA thin films, 330e332, 331fe332f
sizing-based SWCNT glass fibercoatings, 334e335, 334f
spray-deposited MWCNTePVDF thinfilms, 332e334, 333f
structural health monitoring (SHM), 327
HHardware components, 289e292, 290f,
292fHeat flux density effect, 263, 264f
382 Index

18Hexadecyltrimethylammonium(HDTMA), 86e87
High-energy mixing machines, 54e55High-pressure carbon monoxide (HiPco),
356e357High-range water reducer (HRWR), 12Hot mixed asphalt (HMA), 222Hot-press-assisted slip casting (HASC), 81Hybrid cementitious materials, 92fbiomimetic hybrid materials design,
80e82, 80fe81flow-dimensional materials and
nanoparticles, composites reinforcedwith, 88e90, 88f
characterization, 89e90, 90fe91fnanoscale modeling, 89
polymerecement composites, 82e88, 82fcharacterization, 85e88, 86fe88fnanoscale modeling, 83e85, 84fe85f
Hybrid communication subsystem,291e292, 292f
Hybrid sensing subsystem, 289e291
IIC. See Integrated circuit (IC)Ice thickness effect, 260, 261fIndividual sensor, measurement
interpretation, 293e294, 293fIntegrated circuit (IC), 284e287, 285te286tcomponents, 287flexible kapton, 288full-bridge resistive strain gauge, 287e288,
288ffuture trends, 298e299hardware components, 289e292, 290f, 292findividual sensor, measurement
interpretation of, 293e294, 293flaboratory testing, 294e298, 294f,
296fe297fInverse problem, solution to, 132e133
JJacobian matrix, 132
LLAE. See Large-area electronics (LAE)Large-area electronics (LAE), 284e287,
285te286tcomponents, 287
flexible kapton, 288full-bridge resistive strain gauge, 287e288,
288ffuture trends, 298e299hardware components, 289e292, 290f,
292findividual sensor, measurement
Interpretation of, 293e294, 293flaboratory testing, 294e298, 294f,
296fe297fLayer-by-layer (LbL) nanofilm fabrication
method, 308polycationic polyelectrolyte (PE), 309p-SWCNT-PSS/PVA and p-DWCNT-PSS/
PVA thin films, 310, 310fscanning electron microscope (SEM)
image, 309, 309fu-SWCNT-PSS/PVA, 310
Low-dimensional materials/nanoparticles,composites reinforced with, 88e90,88f
characterization, 89e90, 90fe91fnanoscale modeling, 89
MMaterials Testing System (MTS), 73MATLAB, 133e134Mechanical properties, CNFP, 251e252,
251fMechanical reinforcement. See Carbon
nanofiber (CNF)Metaleoxide semiconducting field effect
transistor (MOSFET), 284, 285tMicroelectromechanical system (MEMS),
353Microstructures, nanoparticle-reinforced
pavement materials, 227fe229f,231fe233f
AFM, 227, 236e237, 236fEDS analysis, 230e231, 232fselected area electron diffraction (SAED),
231e233, 232fSEM, 227e228, 227fe228fsmall-angle X-ray (SAXS), 227TEM, 230e231, 232fXRD, 233
Monotonic tensile loading, 134e135, 142Monotonic three-point bending, 135e136,
135f
Index 383

Montmorillonite, 185Mortar mix design, 17e19, 19f, 20tMOSFET. SeeMetaleoxide semiconducting
field effect transistor (MOSFET)MT2/MT3 and MT4 specimens, 136e142,
139fe141fMT1 specimen, 136, 137fe138fMultiple measurement methods, 123e125Multiwalled carbon nanotube (MWCNT),
11, 89e90, 248e249, 306e308, 378MWCNT. See Multiwalled carbon nanotube
(MWCNT)
NNano-carbon black concrete
carbon fiber reinforced concrete (CFRC),59e60
cement-based composite, 65e70, 66fe67f,70fe71f
multifunctional nano-concrete, future of,76e77
piezoresistivitycarbon black, various contents of,62e64, 63fe65f
materials and test methods, 60e61, 61fmonotonic and cycle loading, 61e62,61fe62f
self-sensing concrete structuresconcrete beams, mechanical behaviorof, 73e74
materials and experimental methods,71e73, 71t, 72f, 72t, 73f
sensor-1, compressive strain-sensingproperties, 74e75, 74f
sensor-2, compressive strain-sensingproperties, 75e76, 76f
SHM, 59Nano-carbon materials (NCMs). See NCM-
filled cementitious compositesNanoclay-modified asphalt binders
BBR results, 205e207, 205f, 206tDSR results of, 197e205NMN-modified asphalt binder,
197e199, 198fe199fPMN-modified asphalt binder, 199e201,200fe201f
RTFO aging process, NMN-modifiedasphalt binder after, 201e203,202fe203f
RTFO aging process, PMN-modifiedasphalt binder after, 203e205, 204f
FTIR results, 207e212, 208t, 209fe211fmaterial properties and performance test
plans, 184e185preparationmaterials, 185e190, 186fe189f,191fe192f
modified asphalt binder sample,190e194, 193f, 195f
problem and motivation, 184viscosity results, 194e196, 196f
Nanocomposite cement-based sensors, 100Nano graphite platelet (NGP), 155, 161tenhancement mechanisms, 170e171, 171f
Nanoparticle-reinforced pavement materialscement binder phase, nanostructure
of, 218concrete infrastructures, durability of, 217defined, 220e222environmental resistance, 224e226, 226ffiber reinforcement, 220high-resolution transmission electron
microscope (HRTEM), 217e218,218f
mechanical performance, 223e226, 225fmicrostructures, 227fe229f, 231fe233fAFM, 227, 236e237, 236fEDS analysis, 230e231, 232fselected area electron diffraction(SAED), 231e233, 232f
SEM, 227e228, 227fe228fsmall-angle X-ray (SAXS), 227TEM, 230e231, 232fXRD, 233
nanomaterialsasphalt materials modified by, 221e222cement concrete materials modified by,222
nano-TiO2 particles, 219single-walled carbon nanotube (SWCNT),
220Nanoscale modeling, 83e85, 84fe85f, 89Nanotechnology, concrete, 10e15carbon fiber cement and mortar self-sensing
applications, 14e15cement-based materials, nano-
reinforcement in, 11CNT and CNF dispersion, 11e13
384 Index

CNT/CNF cement-based materials, strain-sensing ability of, 13e14
fiber-reinforced concrete, 10e11NCM-filled cementitious compositesapplications, 172e173, 172fe173fCNF, 155CNT, 154e155dispersion of NCMs, 155e156enhancement mechanisms
CNT and CNF on, 166e170, 167fe169fNGP on properties, 170e171, 171f
NGP, 155properties, 156e166
CNF-filled cementitious composites. SeeCNF-filled cementitious composites
CNT-filled cementitious composites. SeeCNT-filled cementitious composites
NGP-filled cementitious composites,166
NDE. See Nondestructive evaluation (NDE)NGP. See Nano graphite platelet (NGP)NMN. See Nonmodified nanoclay (NMN)Nondestructive evaluation (NDE), 121e122Nonmodified nanoclay (NMN), 184e185,
197e199, 198fe199fNuclear magnetic resonance (NMR),
82e83
OOhm’s law, 16Optical strain measurement, 357, 357f
PPassing ability, 13Piezoresistivitycarbon black, various contents of, 62e64,
63fe65fmaterials and test methods, 60e61, 61fmonotonic and cycle loading, 61e62,
61fe62fPlateletematrix composites, 81e82PMN. See Polymer-modified nanoclay
(PMN)Poly(4-sodium styrene sulfonate) (PSS),
330e332Poly(methyl methacrylate) (PMMA),
356e357, 364fPoly(vinyl alcohol) (PVA), 83e84, 84f,
330e332
Polymerecement composites, 82e88, 82fcharacterization, 85e88, 86fe88fnanoscale modeling, 83e85, 84fe85f
Polymer-modified nanoclay (PMN),184e185, 199e201, 200fe201f
Polyvinylidene fluoride (PVDF),332e334
Power spectral density (PSD) function,108
Pressure-aging vessel (PAV) test, 184e185Prototyped system, 292PSS. See Poly(4-sodium styrene sulfonate)
(PSS)PVA. See Poly(vinyl alcohol) (PVA)PVDF. See Polyvinylidene fluoride (PVDF)
QQuasi-static load cycle test, 106
RReinforced concrete (RC), 1structureexperimental results, 37e40, 38fe41fexperimental setup, 34e37, 36fe37fspecimen construction, 34, 34fe36f
Resistor-capacitor (RC) circuits, 125e126Rolling thin-film oven (RTFO) aging
processNMN-modified asphalt binder after,
201e203, 202fe203fPMN-modified asphalt binder after,
203e205, 204fRotational viscosity (RV), 184e185
SSAED. See Selected area electron diffraction
(SAED)Scanning electron microscopy (SEM),
331Second-generation S4 films, 362e369
second-generation S4 measurements,364e369, 365fe370f
smart skin formulation and application,362e364, 363fe364f
Selected area electron diffraction (SAED),231e233, 232f, 251
Self-consolidating concrete (SCC), 12Self-consolidating reinforced concrete
(SCRC), 15
Index 385

Self-consolidating steel fiber concrete(SCSFC), 15
Self-heating pavement systemdeicing application, 257e267, 257fe258f,
259te260tambient temperature, effect of, 260e263,262f
heat flux density, effect of, 263, 264fice thickness, effect of, 260, 261f
integration, 255e256, 256fsnow-thawing application, 263e267,
265fe266fSelf-sensing concrete structures
concrete beams, mechanical behavior of,73e74
materials and experimental methods,71e73, 71t, 72f, 72t, 73f
sensor-1, compressive strain-sensingproperties, 74e75, 74f
sensor-2, compressive strain-sensingproperties, 75e76, 76f
Self-sensing fiber-reinforced cementitiouscomposites, 128e129, 129f
Self-sensing nanocomposite cement-basedmaterials, 99e100
SEM. See Scanning electron microscopy(SEM)
Sensing sheetsdirect sensing concept, 281e284,
282fe283fLAE and IC, 284e287, 285te286tcomponents, 287flexible kapton, 288full-bridge resistive strain gauge,287e288, 288f
future trends, 298e299hardware components, 289e292, 290f,292f
individual sensor, measurementInterpretation of, 293e294, 293f
laboratory testing, 294e298, 294f,296fe297f
Sensor C4, 295, 296fSensor D5, 295, 296fSensor G4, 295, 296fSHM. See Structural health monitoring
(SHM)Short-fiber composites, 9Signal-to-noise ratio, 365e367
Single-walled carbon nanotube (SWCNT),11, 89e90, 90f, 220
background, 354e356, 355fe356fdamage detection strategy, 370e372,
370fe372ffirst-generation S4 films
formulation/application and mechanicaltesting, 356e357
optical strain measurement, 357, 357fresults, 357e361, 358fe360f
second-generation S4 films, 362e369second-generation S4 measurements,364e369, 365fe370f
smart skin formulation and application,362e364, 363fe364f
Small-angle neutron scattering (SANS), 227Small-angle X-ray (SAXS), 227Snow-thawing application, 263e267,
265fe266fSpecimensCT1, 142e145, 143fe144fMT1, 136, 137fe138fMT2/MT3 and MT4, 136e142, 139fe141f
Spectral peak positions, 368e369Stability, 13Step response tests, 105e106Strain gauge factor, 70Strain resolution, 365e367Strain sensing. See Structural health
monitoring (SHM)Structural health monitoring (SHM), 3, 59,
320e321, 327buckypaperCNT-based buckypaper nanofilms, 308general process, 304e305multiwalled carbon nanotubes(MWCNTs), 306e308
poly(methyl methacrylate) (PMMA),306
Raman shift, in G-band modes,305e306, 307f
scanning electron microscope (SEM)image, 305, 305f
SWCNT-buckypaper, 305, 306fe307felectrical impedance tomography (EIT)2D Laplace’s equation, 311defined, 311EIT spatial conductivity reconstructionprocess, 312, 312f
386 Index

five plastic wells, 314e316, 315fGausseNewton algorithm, 312LbL (SWCNT-PSS/PVA)50 thin films,313, 313f
one-cycle tensile-compressive loadpattern, 313, 314fe315f
pH-sensing properties, 314e316weighted residual method, 311e312
LbL nanofilm fabrication method, 308polycationic polyelectrolyte (PE), 309p-SWCNT-PSS/PVA and p-DWCNT-
PSS/PVA thin films, 310, 310fscanning electron microscope (SEM)image, 309, 309f
u-SWCNT-PSS/PVA, 310mount sensors, 303nanofilm-enhanced cementitious
composites, 317e318crack-like damage, 319, 320ffour holes drilled, four corners,318e319, 320f
smart mortar plate specimens, 318, 319fspray coating, 316e317, 317f
Styreneebutadieneerubber (SBR),183e184
Styreneebutadieneestyrene (SBS),183e184, 221
Superpave�, 190e192, 194e196, 205, 207,213
TTEM. See Transmission electron microscope
(TEM)Temperature-dependent resistivity,
253e254Temperature distribution, 257e258, 258fTensile strain, electrical property response
to, 337f, 339
Thermal expansion coefficient (TEC),69e70
Thin-film transistor (TFT), 285Tinius Olsen Hydraulic Tester, 22Traditional electrical measurement
techniques, 123e126, 124fTraditional monitoring systems,
99e100Transmission electron microscope (TEM),
227, 230e231, 232f, 251, 251fTunneling current, 62Tunneling effect theory, 65
UUltra-high-performance concrete
(UHPC), 2Ultrasonication method, 54e55
VVapor-grown carbon nanofiber (VGCF),
47e49, 48f, 48t, 49fe50fVGCF. See Vapor-grown carbon nanofiber
(VGCF)Vibration monitoring, 106e111dynamic characterization, 107e111,
109fe113fquasi-static response, 106e107, 107f
Viscosity-modifying agents (VMA), 12
WWarm-mix-asphalt (WMA) mixture, 184Wenner technique, 125, 126f
XX-ray diffraction (XRD), 82e83, 227,
233XRD. See X-ray diffraction (XRD)
Index 387


