Embed Size (px)
Citation preview

Reinventing High Density Area Departure Traffic Management
Dr. Lixia SongDr. Christine Taylor
Tudor Masek Hilton Bateman
Digital Avionics Systems ConferenceOctober 19, 2011

Key challenges for departure traffic management
2
� With today’s tools and operations, it is difficult to allocate the right route to the right flight at the right time� Lack of integrated information leads to inefficient, reactive operations� The point of action is too far removed from the point of decision making, which puts
the wrong flight in the wrong place at the wrong time

Proposed concept: High Density Departure and Arrival Management (HDDAM)
3
� HDDAM ensures the right flight at the right place at the right time� Empowered decision maker at each facility� Simplified Coordination and Communication� Increased predictability of event impact on each flight
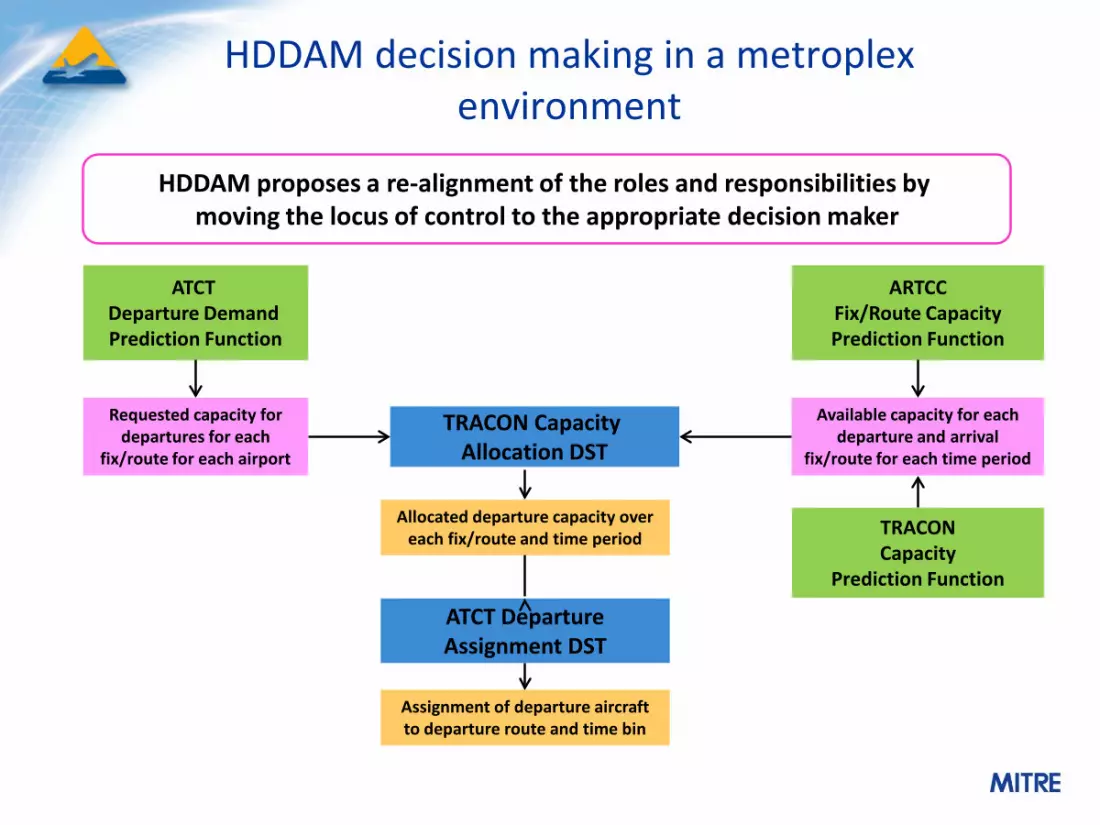
ARTCC Fix/Route Capacity Prediction Function
Available capacity for each departure and arrival
fix/route for each time period
TRACONCapacity
Prediction Function
ATCT Departure Demand Prediction Function
Requested capacity for departures for each
fix/route for each airport
ATCT Departure Assignment DST
Allocated departure capacity over each fix/route and time period
Assignment of departure aircraft to departure route and time bin
HDDAM decision making in a metroplex environment
TRACON CapacityAllocation DST
HDDAM proposes a re-alignment of the roles and responsibilities by moving the locus of control to the appropriate decision maker

HDDAM Benefits
� Facilitates communication and coordination� Improves situational awareness of current and future
operating conditions� Increases efficient use of resources, reduces delays� Quantifying benefits by comparison
– Describe HDDAM model for TRACON and ATCT departure planning
– Present Current Operations Model (COM) illustrating departure planning in today’s operations environment
– Compare delays under nominal and stressed operating conditions
5

HDDAM: TRACON capacity allocation DST
6
� Inputs:– Aggregate demand from each
ATCT for each en-route resource
– Aggregate capacity for en-route and surface resources
– Costs for allocating a route or time bin other than requested
� Modeling:– Use a time expanded network to
capture en-route constraints directly
� Outputs:– Optimal Allocation of en-route
slots to each ATCT

TRACON objective function
7
� Capacity utilization metric: Maximizes available capacity� Route change metric: Feasibility of TRACON reroute
(specific to each request)� Time change penalty
– Late allocation: Number of minutes of delay– Early allocation: Large penalty

Flight assignment DST
8
� Inputs:– Flight requests for en-route resources,
preferences, constraints
– TRACON-allocated route-time bins
– Flight-specific costs for allocating a route or time other than requested
– Additional schedule change cost
� Modeling:– Use a time expanded network to
capture en-route allocations as capacities
� Outputs:– Optimal Allocation of en-route bins to
each ATCT

Current Operations Model (COM)
� Current Operations Model (COM) illustrates nominal behavior of departure management today
– First come, first serve; measured by estimated fix crossing time
� Flights in excess of available fix capacity queue and accrue delay
– Limited rerouting allowed and only after a certain amount of delay is accumulated
� All flights have a maximum delay threshold of 2 hours, after which they must return to the gate
� Compliance with FAA tarmac rule
� Virtual Queue for Route X
Virtual Queue for Route Y��
�
���
Flight ARoute X
Flight A’Route Y
Current time: 12:00Current time: 13:00Current time: 13:15
�

Departure Ordering Algorithm� A departure ordering algorithm is employed to compute each flight’s
departure delay– Based on assigned departure bin, proposed departure time, required inter-
departure spacing
� Formulated as a Constraint Satisfaction Problem (CSP) using a depth-first search of a decision tree
– Each variable is a departure order position (1st departure, 2nd, etc.)
– The values that each variable can take are the actual flights that could feasibly occupy that position in the order
� Provides a minimum-delay ordering of departures
Flight A
Start
Flight B Flight C
Flight B Flight C Flight A Flight C Flight B
1st departure
2nd departure
Etc.
Flight A
Feasible Dep. Windows 18
:00
18:0
5
18:1
0
18:1
5
18:2
0
18:2
5
Flight A
Flight B
Flight C

The Potomac TRACON: An example
11

Potomac TRACON Example
� 6 hour time horizon (600EST – 1200EST)
� 306 total departures out of BWI, DCA, & IAD
� Two capacity scenarios– Nominal: 3 departures per route per 15 minutes
– Reduced: FLUKY capacity reduced as shown below
� Compare outcomes using HDDAM and COM
06:0
006
:15
06:3
006
:45
07:0
007
:15
07:3
007
:45
08:0
008
:15
08:3
008
:45
09:0
009
:15
09:3
009
:45
10:0
010
:15
10:3
010
:45
11:0
011
:15
11:3
011
:45
DAILY 0 2 4 0 0 2 2 2 6 3 4 1 3 1 1 3 1 1 3 2 1 2 0 1HAFNR 0 0 2 1 1 1 3 3 9 6 4 3 0 1 1 1 7 1 0 1 0 1 0 4FLUKY 0 0 3 2 0 2 2 5 2 3 2 2 1 2 3 3 2 2 1 1 3 0 2 1
LDN 0 3 1 6 4 2 5 5 6 3 2 2 4 0 0 5 2 0 1 3 3 2 5 2AML 0 1 3 6 3 0 3 0 3 1 0 2 3 2 0 2 3 1 0 0 1 4 0 1
BUFFR 3 3 4 0 1 0 2 1 6 3 0 3 1 2 2 0 2 0 1 1 0 0 1 1JERES 0 2 0 0 1 0 2 2 0 3 1 1 0 1 1 2 1 1 1 1 2 2 1 0
Demand vs. capacity for Nominal case:
0
1
2
3
06:0
006
:15
06:3
006
:45
07:0
007
:15
07:3
007
:45
08:0
008
:15
08:3
008
:45
09:0
009
:15
09:3
009
:45
10:0
010
:15
10:3
010
:45
11:0
011
:15
11:3
011
:45
FLUKY Capacity
FLUKY capacity profile for Reduced case:
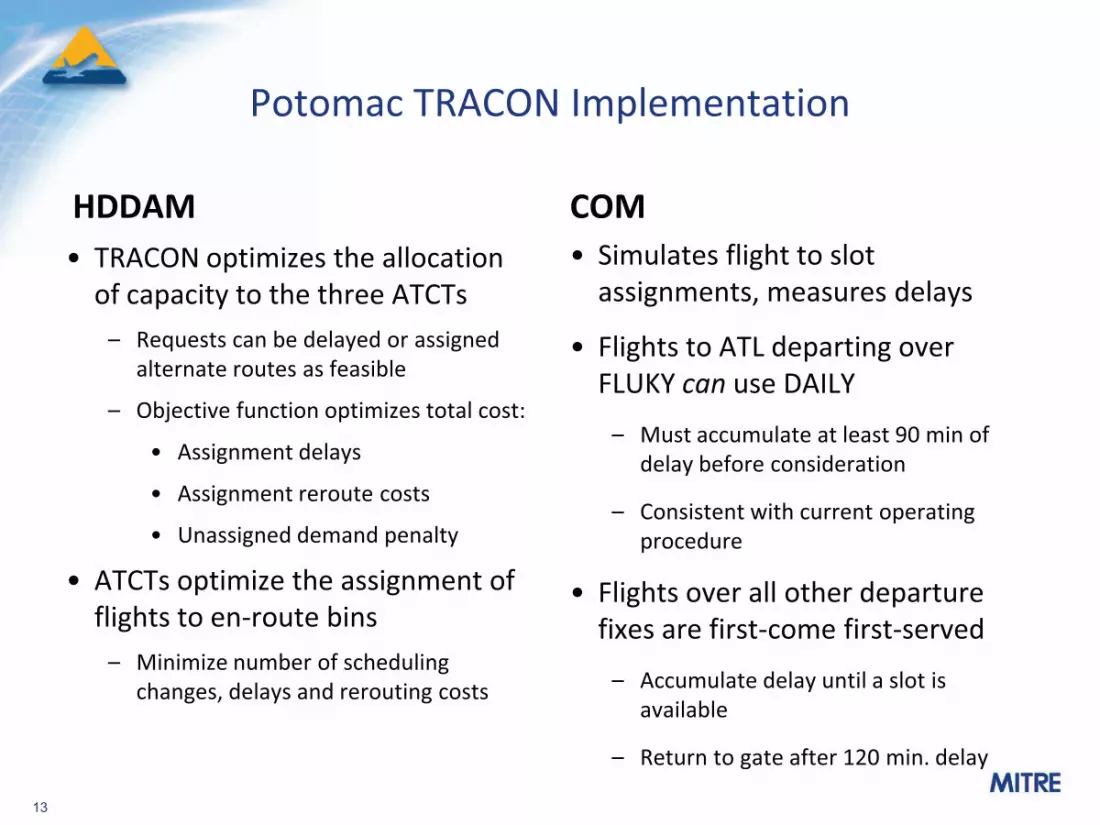
Potomac TRACON Implementation
HDDAM� TRACON optimizes the allocation
of capacity to the three ATCTs– Requests can be delayed or assigned
alternate routes as feasible
– Objective function optimizes total cost:
� Assignment delays
� Assignment reroute costs
� Unassigned demand penalty
� ATCTs optimize the assignment of flights to en-route bins
– Minimize number of scheduling changes, delays and rerouting costs
COM� Simulates flight to slot
assignments, measures delays
� Flights to ATL departing over FLUKY can use DAILY
– Must accumulate at least 90 min of delay before consideration
– Consistent with current operating procedure
� Flights over all other departure fixes are first-come first-served
– Accumulate delay until a slot is available
– Return to gate after 120 min. delay
13
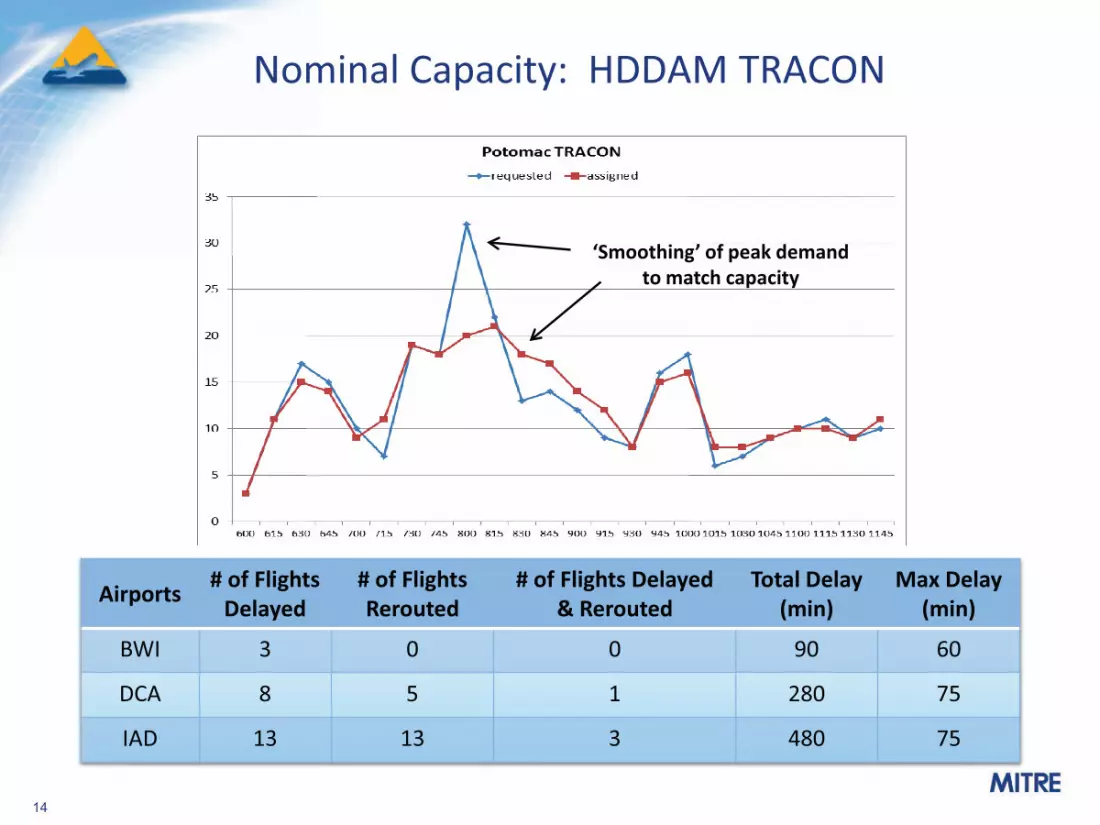
Nominal Capacity: HDDAM TRACON
14
Airports # of Flights Delayed
# of Flights Rerouted
# of Flights Delayed & Rerouted
Total Delay (min)
Max Delay (min)
BWI 3 0 0 90 60
DCA 8 5 1 280 75
IAD 13 13 3 480 75
‘Smoothing’ of peak demand to match capacity

Comparison of HDDAM and COM under Nominal Capacity
Metrics HDDAM Current Operations
Number of Flights Modified 46 105
Number of Flights Rerouted Only 19 0
Number of Flights Delayed Only 24 105
Number of Flights Rerouted & Delayed 3 0
Total Delay Minutes based on Bin Assignments 632 1869
Total Delay Minutes from Ordering 205.5 221
Number of Flights Deferred 0 2

Reduced Capacity: HDDAM
16
Airports # of Flights Delayed
# of Flights Rerouted
# of Flights Delayed & Rerouted
Total Delay (min)
Max Delay (min)
BWI 5 3 1 210 75
DCA 9 10 1 285 75
IAD 17 16 4 735 90
Reduced capacity at FLUKYNo capacity at FLUKY
Longer period to ‘smooth’ peak demand

Comparison of HDDAM and COM under Reduced FLUKY Capacity
Metrics HDDAM Current Operations
Number of Flights Modified 66 143
Number of Flights Rerouted Only 30 0
Number of Flights Delayed Only 31 142
Number of Flights Rerouted & Delayed 5 1
Total Delay Minutes based on Bin Assignments 1063 5107
Total Delay Minutes from Ordering 155 296
Number of Flights Deferred 0 5

Comparison of Performance under Reduced Capacity
18
Metrics HDDAM Current Operations
Increase in Number of Flights Modified 43% 36%
Number of Flights Rerouted Only 58% 0%
Number of Flights Delayed Only 29% 35%
Number of Flights Rerouted & Delayed 67% Increase of 1
Total Delay Minutes based on Bin Assignments 68% 173%
Total Delay Minutes from Ordering -25% 34%
Number of Flights Deferred 0% 150%
Reduction in Ordering delay a result of the ‘smoothed’ demand from HDDAM allocation/assignment
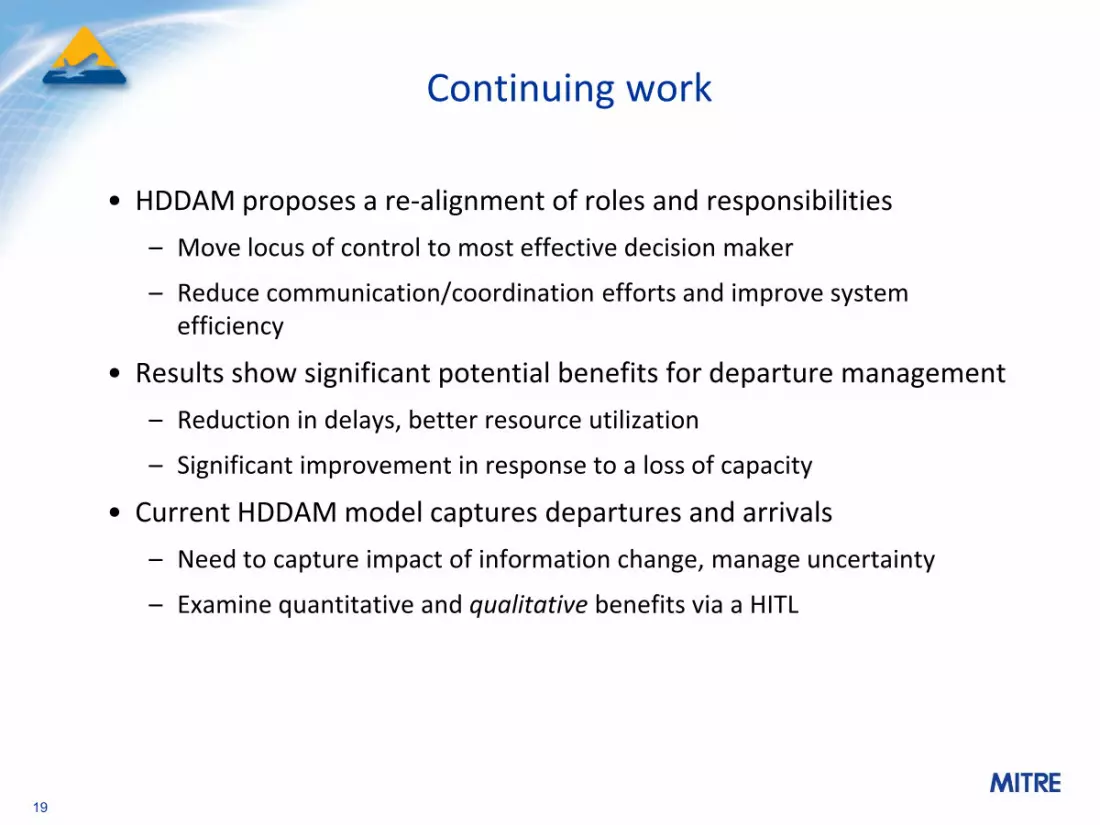
Continuing work
� HDDAM proposes a re-alignment of roles and responsibilities– Move locus of control to most effective decision maker
– Reduce communication/coordination efforts and improve system efficiency
� Results show significant potential benefits for departure management– Reduction in delays, better resource utilization
– Significant improvement in response to a loss of capacity
� Current HDDAM model captures departures and arrivals– Need to capture impact of information change, manage uncertainty
– Examine quantitative and qualitative benefits via a HITL
19


