Embed Size (px)
Citation preview
Resources, Conservation and Recycling
35 (2002) 243–257
Recycling inorganic domestic solid wastes:results from a pilot study in Dar es Salaam
City, Tanzania
M.E. Kaseva *, S.E. Mbuligwe, G. KassengaDepartment of En�ironmental Engineering, Faculty of Lands and En�ironmental Engineering,
Uni�ersity College of Lands and Architectural Studies, PO Box 35176, Dar es Salaam, Tanzania
Received 3 April 2001; accepted 6 December 2001
Abstract
Solid waste recycling and recovery approach can be a sustainable and effective wastemanagement system in many growing cities of the least developed countries. In the course ofachieving proper solid waste management, a lot of efforts in these countries have, however,been focused more on collection and disposal and ignored waste recycling which can resultinto income generation, employment creation and reduction of the waste quantities that willfinally require disposal in the existing municipal landfills or disposal sites. This paper reportsthe findings of a study on solid waste recycling in a selected semi-planned settlement in Dares Salaam City, Tanzania. The objective of the study was to describe the existing solid wastemanagement in the study area with a view to identifying the waste generation rates, types ofthe wastes and determine the amount of waste from the settlement that can be recycled forthe purpose of income generation and reduction of the total amount of waste to be disposedof. Findings from this study revealed that waste generation rate in the study area was 0.36kg per person per day, and that out of the 14 600 kg of recyclable waste generated per year,8030 kg or 55% can be recycled and generate a per capita income of Tsh 834 000 for wasterecyclists which is more than twice the official minimum annual wage (Tsh 360 000) inTanzania at the time of the study. The study also revealed that effective waste recycling inthe study area would result in the reduction of the total waste that need to be transportedfor final disposal by 11%. © 2002 Elsevier Science B.V. All rights reserved.
Keywords: Scavengers; Waste management; Re-use and recycling; Dar es Salaam
www.elsevier.com/locate/resconrec
* Corresponding author.E-mail address: m–[email protected] (M.E. Kaseva).
0921-3449/02/$ - see front matter © 2002 Elsevier Science B.V. All rights reserved.
PII: S0921 -3449 (02 )00004 -6
M.E. Kase�a et al. / Resources, Conser�ation and Recycling 35 (2002) 243–257244
1. Introduction
Management of solid wastes has continued to be a major problem and a bigchallenge in most urban centers particularly the rapidly growing cities in leastdeveloped countries. According to Anjum and Deshazo (Anjum and Deshazo,1996) most cities and municipalities in developing countries spend between 20 and50% of their revenue on the collection, transportation and disposal of solid wastes.However, service levels in many cities remain only between 50 and 70% of theresidents. A study carried out in Dar es Salaam City, Tanzania (Kaseva and Gupta,1996) indicated that out of the 2000 tones of the wastes generated daily only 10%of the waste was collected and disposed of at the Vingunguti dump site, which is theonly official solid waste disposal site for the city. Findings from another study(Flintoff et al., 1994) have indicated that efforts to solve solid waste managementproblems in developing countries have focused more on the technical aspects suchas collection and disposal. These efforts normally ignore solid waste recycling whichaccording to Seik (Seik, 1997) is one component of a more comprehensive wastemanagement strategy, that usually includes solid waste collection, storage andtransportation as well as solid waste disposal options such as waste reduction, reuseand recycling besides incineration and final disposal in landfill sites. The situationin developing countries is different from the developed world, where severalgovernments had greatly initiated increased recycling of the domestic solid wastesby the end of the last millennium (Poulsen et al., 1995).
In order to enhance waste recycling and thus promote a more sustainableapproach towards solid waste management, various studies on solid waste recyclingand reuse have been carried out and reported in various countries in developingworld. Some of the recent studies include those carried out in Tanzania (Kasevaand Gupta, 1996; Kaseva and Mbuligwe, 2000; Mbuligwe and Kasenga, 1998);Pakistan (Anjum and Deshazo, 1996); India (Sudhir et al., 1996; Patra et al., 2000;Haque et al., 2000); Singapore (Seik, 1997) and Taiwan (Lee et al., 1998). In allthese studies, solid waste recycling has been found out to be currently acceptable asa sustainable approach towards solid waste management, desirable from environ-mental, economic and social points of view. According to Diamadopoulos (Dia-madopoulos et al., 1995), if solid wastes are not recycled, the landfills will very fastbe exhausted and necessitate the construction of new ones. Seik (Seik, 1997) andKaseva and Gupta (Kaseva and Gupta, 1996), have also reported that solid wasterecycling reduces environmental damage and is an import-substitution economicactivities which also saves energy, conserves resources and saves waste collectionand disposal costs. The conventional approach to waste management in many ofthe developing countries has normally singled out local authorities as the soleagencies responsible for service delivery. This is despite the fact that participatoryand a partnership arrangement that involves coordination of various stakeholderscan be adopted as a new way to operate waste management in urban centers. Thissystem has been successfully experimented in Greece (Lekkas et al., 1997; Andrewset al., 1999), Taiwan (Haque et al., 2000) and Hong Kong (Chun et al., 1999) andhas been reported to have created employment and generated income throughwaste collection and recycling.
M.E. Kase�a et al. / Resources, Conser�ation and Recycling 35 (2002) 243–257 245
The aim of this paper is to report on the findings of similar endeavors that werecarried out through a pilot study in a selected urban community in Sinza B, whichis one of the wards in Kinondoni district in Dar es Salaam City, Tanzania. Thebroad objective of the study was to initiate a demonstration project on small scalesolid waste recycling in an urban settlement with a view to give advice on futurestructuring and setup of sustainable solid waste management through recycling andreuse of wastes in urban centers. The paper is, however, more focused on thespecific objectives of the study namely, identification and description of the existingsolid waste management in the study area, determination of waste generation andgeneration rates, determination of recyclable waste materials in the identifiedsettlement, determination of the market demand and the economic value forrecycled materials and prediction of the impact of recycling on the city wastecollection and disposal system.
In order to be able to compare the findings of the study and correlate them withthe existing situation in the city, a brief review on the existing solid waste recyclingpractices and marketing of the recyclables in Dar es Salaam City was carried outprior to the undertaking of the actual fieldwork activities in the selected settlement.
2. Brief review of solid waste recycling and reuse in Dar es Salaam City
Solid waste recycling and reuse is a relatively new approach in waste manage-ment in Tanzania and very limited studies in this area especially in Dar es SalaamCity have been carried out (Kaseva and Gupta, 1996; Kaseva and Mbuligwe, 2000).Kaseva and Gupta (Kaseva and Gupta, 1996) concluded that in 1993 only about11% (220 ton per day) of the total waste generated in the city (2000 tonnes per day)was recycled. However, the potential for waste recycling could be expanded toabout 55% (1100 tonnes per day) of the total waste generated in the city. Accordingto Kaseva and Mbuligwe (Kaseva and Mbuligwe, 2000), solid waste recycling inDar es Salaam takes place at the generation, collection, illegal dumping sites and atthe final disposal point. Although there is currently no formal body or organiza-tion, which coordinates this activity, a large number of individuals, businessorganization and industries, has been involved. A survey on scavengers and wasterecyclists attendance at the Vingunguti dumpsite in Dar es Salaam established anumber of waste scavengers operating daily only at the dumpsite to be 60, while thetotal number of the scavengers in the city has been estimated to be 646 (Kaseva andGupta, 1996). Table 1 below details out the type of materials, percentage ofscavengers collecting them and the probable number of the scavengers collectingthose recyclable materials in the city.
Table 1 indicates that of all the recyclable materials in the city, paper is recycledby most of the scavengers (40.1%), while textile materials are recycled least (9.1%).This can be explained by the fact that after the organic materials (59.8%), papermaterials are ranked second highest by weight (8.7%) of the total waste componentsgenerated in the city (Kaseva and Gupta, 1996), and therefore, are easily accessibleby many scavengers. The current study has also established that middlemen who
M.E. Kase�a et al. / Resources, Conser�ation and Recycling 35 (2002) 243–257246
normally buy the recyclables from the scavengers and sell them to big industriesoffer better prices for papers as compared with the other materials as detailed in theTable 2 below.
Table 2 describes the major recycled items and the corresponding end userindustries as reported in Kaseva and Mbuligwe (2000). The current study has alsoidentified some industries in the city, which practice solid waste recycling in orderto save energy and foreign exchange for the importation of raw materials. Table 3below gives a summary of the recycling processes for various materials by largeindustries in the Dar es Salaam City.
3. Selection and description of the study area
3.1. Selection of the area
Two settlements in Dar es Salaam City namely Kimara Matangini and Sinza B,
Table 1Number of scavengers sorting different items in Dar es Salaam City in the year 1995
Percentage of total scavengersMaterial Probable number of scavengers
Paper 24140.1Metal 28.5 171Plastics 7712.8Glass 10217.0
9.1 55Textiles
Source: Kaseva and Gupta (1996).
Table 2Major recycled items and the corresponding end user industries in Dar es Salaam City
Type of waste Waste recycling industryCategory ofindustry
Dasico, UMIDAPaper Micro-industryKibo paper, Tanpak industriesLarge industry
Metal Micro-industry Dasico, Mwananyamala, UMATA, Kilulumo, Mburuhati,Mbagala, Kizinga, Mtambani market
Large industry Steel cast Tazara, M.M. integrated steel mills Ltd, Mikocheniiron and steel Ltd, ALUCO, NECO, Tazara workshop
Glass Micro-industry –Large industry KIOO, Pepsi Ltd., Tanzania breweries LtdMicro-industry –Plastics
Simba plastics, Tegry plasticsLarge industryMicro-industryTyres Rashidi Kawawa road, Mshimbula EnterprisesLarge industry NAS tyre service, Ltd
Source: Kaseva and Mbuligwe (2000).
M.E. Kase�a et al. / Resources, Conser�ation and Recycling 35 (2002) 243–257 247
Table 3Summary of the recycling process for various materials in large industries in Dar es Salaam City
Product/recycled materials Recycling processesIndustry
The recyclable Aluminium isAluminiumALAF (ALUCO)compacted and fed in a meltingfurnace. After melting, it is purifiedand cast into ingots ready for sale tothe next production unit which makesslabs and finally circles and sheets.
Steel bars Steel scraps are melted in anM.M Integrated Steelinduction furnace to liquid formmills Ltd.which is cast into ingots and thenrolled into different sizes ofreinforcement bars
Tanpack tissues Ltd. The recycled paper materials areToilet tissues and craft paperslashed, pulped, processed throughcleaning, refining, screening and thenmanufacturing the paper.
Plastics containers, lid caps, sheets The recycled plastic is thoroughlySimba Plasticscleaned manually, dried grinded intoand pipesgranules, fed into pelltizer followed byextruding or molding.
were selected and identified as potential study areas. Both of these areas wereselected after reconnaissance surveys and preliminary deskwork, which indicatedthat the two settlements were prone to domestic solid waste collection and disposalproblems and that the waste they produced, contain large amounts of recyclablematerials. Detailed survey and discussion with the respective local governmentofficials revealed that problems were more acute in Sinza B area because thissettlement has a relatively dense population and is more built up compared withKimara Matangini. Accordingly, Sinza B was found to be more relevant and thusselected for undertaking this study.
3.2. Location and description of the study area
Sinza B is a semi-planned residential area, which is categorized as a middle-incomearea characterized by poor roads with mostly natural storm water drains. Its aerialcoverage is about 52.5 ha and it lies to the North of the Dar es Salaam City. It is35 m above mean sea level and the annual mean temperature is 26 °C while the annualrainfall is over 1000 mm and the absolute humidity ranges between 67 and 96%.
4. Study methodology
The methodologies adopted in this study were, site visits, physical observations,interviews and questionnaire survey, public meetings and field operations runs.
M.E. Kase�a et al. / Resources, Conser�ation and Recycling 35 (2002) 243–257248
Through these methodologies, baseline information especially in relation to data onthe social–economic status and existing solid waste management in the study area,was identified. Field operations involved sorting of the waste at the generationpoint in order to identify and segregate different types of wastes. To facilitatesorting of the waste at the source, three plastic bags were distributed to each of the80 households in the study area. The bags had different colors for easy recognitionand the households were given instructions on how to use them as outlined in theTable 4 below.
The amount of waste generated by each household was weighed and alongsidethe number of the people in the corresponding household was recorded. Theamount of waste and the corresponding generation rates in the study area werecomputed. This facilitated the establishment of the amount and types of recyclablematerials in the study area as detailed under Section 5. The methodology used inthis study is similar to the one adopted by Anjum and Deshazo (Anjum andDeshazo, 1996) in a household demand for improved solid waste managementsurvey carried out in Gujranwala, Pakistan and another one (Andrews et al., 1999)carried out in Guangzhou in a survey on attitude and opinion of the citizens onseparation of domestic waste, waste recovery and waste collection services.
5. Results and discussion
5.1. Existing situation and sur�ey results in the study area
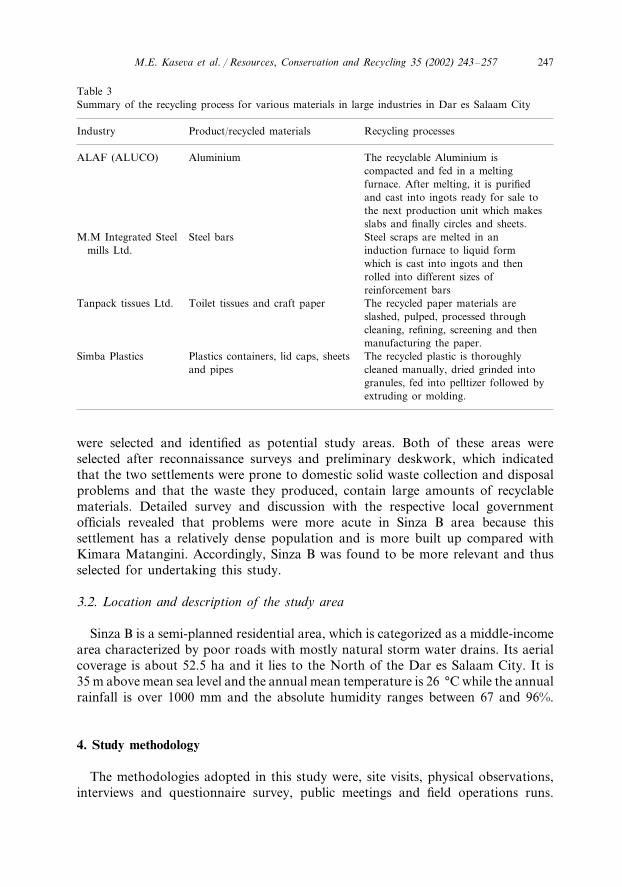
5.1.1. Size of the household, socio-economic status and monthly incomeThe analysis of the survey results coupled with questionnaire information
indicated that the population in the study area was 560 people and the average size
Table 4Segregation and storage of wastes in the study area
Color of the plastic bagType of waste Remarks
The compostables included:BlackCompostables�Food left over�Remains of food preparations:�Tree leaves
Recyclables included:Recyclables Yellow�Metallic items�Hard plastics�Glass
These included:Others Blue�Paper materials�Soft plastics�Rugs/textiles
M.E. Kase�a et al. / Resources, Conser�ation and Recycling 35 (2002) 243–257 249
Fig. 1. Size of the households in the study area.
Fig. 2. Resident’s occupational profile in the study area.
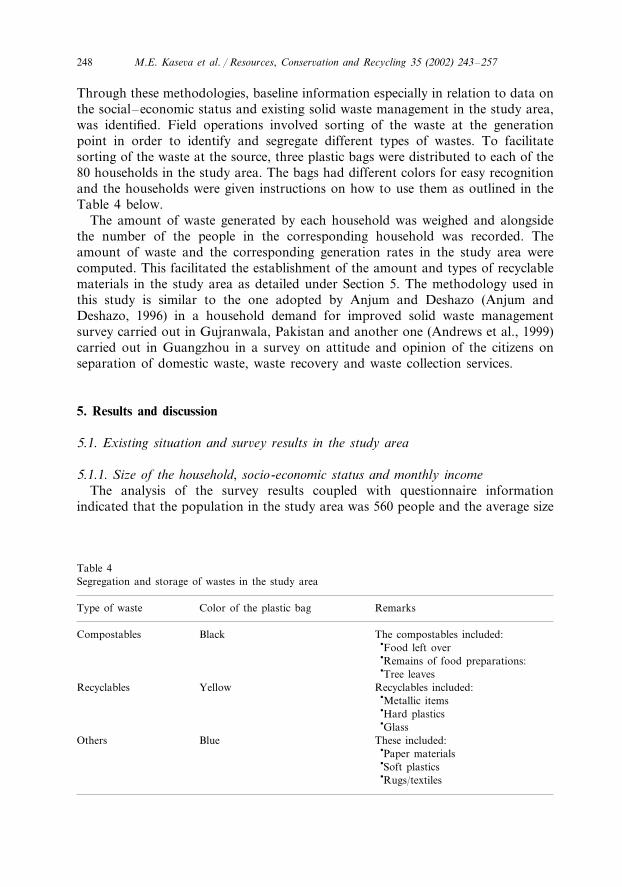
of household was seven people. Findings on the household sizes in the study areaare presented in Fig. 1. In respect to occupation, the respondents revealed theoccupational profile shown in Fig. 2. The category referred to as ‘others’ in Fig. 2,include housewives, self-employed and small-scale farmers engaged in urbanagriculture. The household survey gave information comparable with the householdsize estimates done during the pre-field survey.
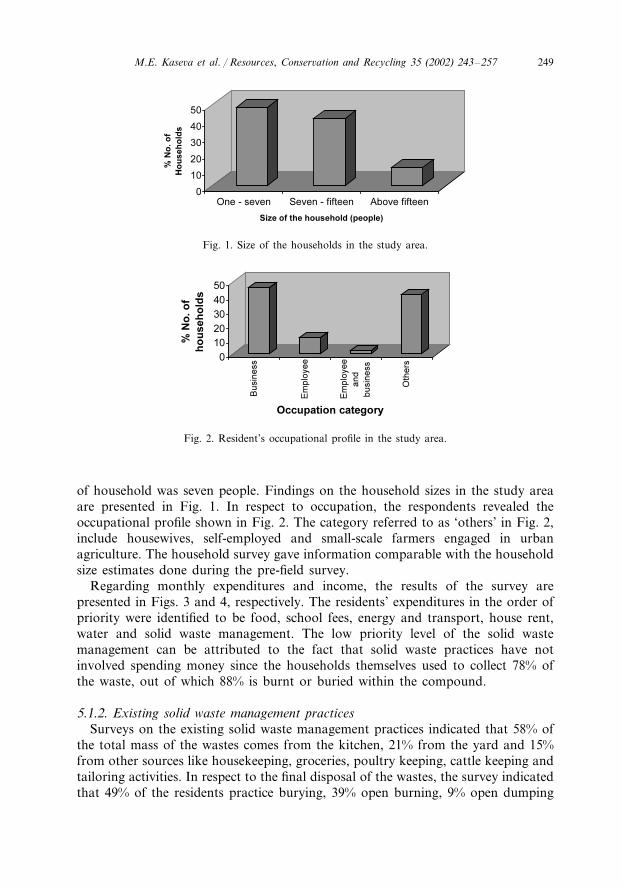
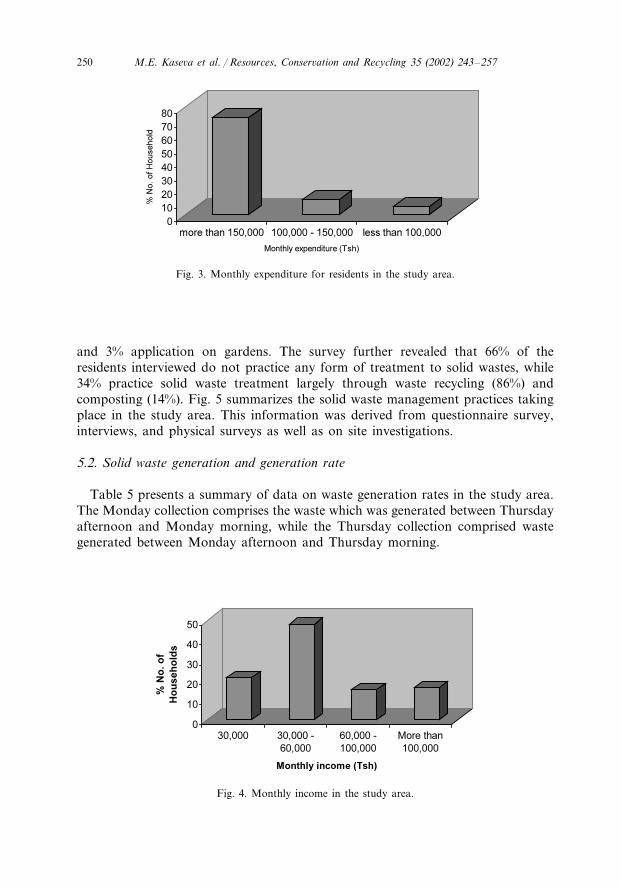
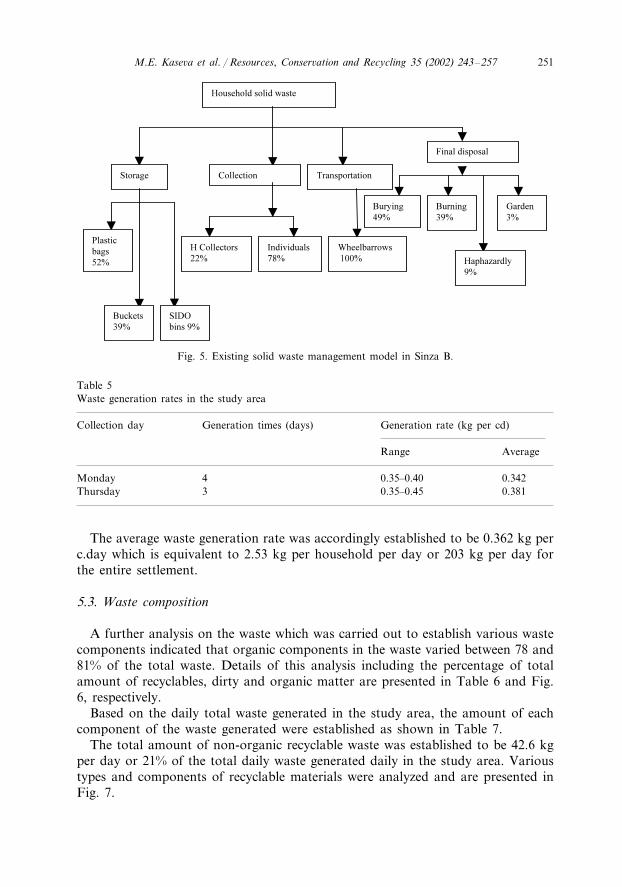
Regarding monthly expenditures and income, the results of the survey arepresented in Figs. 3 and 4, respectively. The residents’ expenditures in the order ofpriority were identified to be food, school fees, energy and transport, house rent,water and solid waste management. The low priority level of the solid wastemanagement can be attributed to the fact that solid waste practices have notinvolved spending money since the households themselves used to collect 78% ofthe waste, out of which 88% is burnt or buried within the compound.
5.1.2. Existing solid waste management practicesSurveys on the existing solid waste management practices indicated that 58% of
the total mass of the wastes comes from the kitchen, 21% from the yard and 15%from other sources like housekeeping, groceries, poultry keeping, cattle keeping andtailoring activities. In respect to the final disposal of the wastes, the survey indicatedthat 49% of the residents practice burying, 39% open burning, 9% open dumping
M.E. Kase�a et al. / Resources, Conser�ation and Recycling 35 (2002) 243–257250
Fig. 3. Monthly expenditure for residents in the study area.
and 3% application on gardens. The survey further revealed that 66% of theresidents interviewed do not practice any form of treatment to solid wastes, while34% practice solid waste treatment largely through waste recycling (86%) andcomposting (14%). Fig. 5 summarizes the solid waste management practices takingplace in the study area. This information was derived from questionnaire survey,interviews, and physical surveys as well as on site investigations.
5.2. Solid waste generation and generation rate
Table 5 presents a summary of data on waste generation rates in the study area.The Monday collection comprises the waste which was generated between Thursdayafternoon and Monday morning, while the Thursday collection comprised wastegenerated between Monday afternoon and Thursday morning.
Fig. 4. Monthly income in the study area.
M.E. Kase�a et al. / Resources, Conser�ation and Recycling 35 (2002) 243–257 251
Fig. 5. Existing solid waste management model in Sinza B.
Table 5Waste generation rates in the study area
Collection day Generation rate (kg per cd)Generation times (days)
AverageRange
0.35–0.404 0.342Monday0.3810.35–0.45Thursday 3
The average waste generation rate was accordingly established to be 0.362 kg perc.day which is equivalent to 2.53 kg per household per day or 203 kg per day forthe entire settlement.
5.3. Waste composition
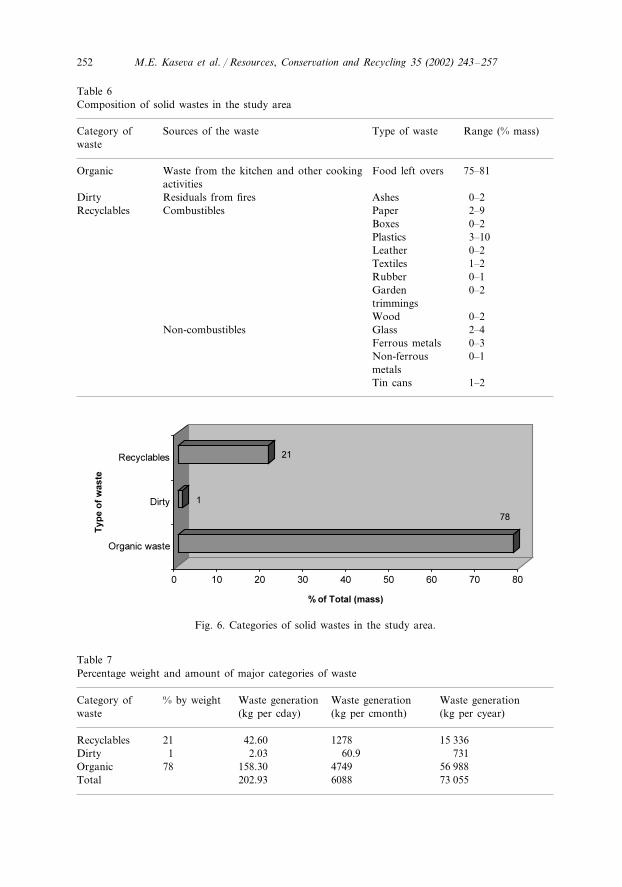
A further analysis on the waste which was carried out to establish various wastecomponents indicated that organic components in the waste varied between 78 and81% of the total waste. Details of this analysis including the percentage of totalamount of recyclables, dirty and organic matter are presented in Table 6 and Fig.6, respectively.
Based on the daily total waste generated in the study area, the amount of eachcomponent of the waste generated were established as shown in Table 7.
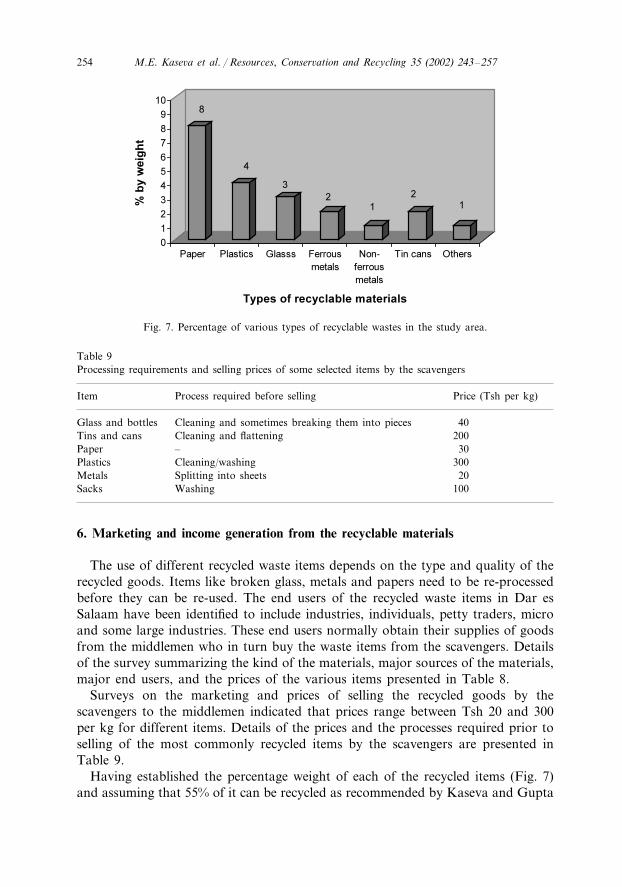
The total amount of non-organic recyclable waste was established to be 42.6 kgper day or 21% of the total daily waste generated daily in the study area. Varioustypes and components of recyclable materials were analyzed and are presented inFig. 7.
M.E. Kase�a et al. / Resources, Conser�ation and Recycling 35 (2002) 243–257252
Table 6Composition of solid wastes in the study area
Type of waste Range (% mass)Category of Sources of the wastewaste
Food left overs 75–81Organic Waste from the kitchen and other cookingactivities
0–2AshesDirty Residuals from firesCombustibles PaperRecyclables 2–9
Boxes 0–2Plastics 3–10Leather 0–2
1–2TextilesRubber 0–1
0–2GardentrimmingsWood 0–2
2–4GlassNon-combustibles0–3Ferrous metals0–1Non-ferrous
metalsTin cans 1–2
Fig. 6. Categories of solid wastes in the study area.
Table 7Percentage weight and amount of major categories of waste
Waste generationWaste generation% by weightCategory of Waste generation(kg per cday) (kg per cyear)waste (kg per cmonth)
1278 15 336Recyclables 21 42.602.03 731Dirty 60.91
56 98878 158.30 4749Organic73 055202.93Total 6088
M.E. Kase�a et al. / Resources, Conser�ation and Recycling 35 (2002) 243–257 253
Tab
le8
Sour
ces,
mar
ket
and
pric
esof
vari
ous
type
sof
recy
clab
lem
ater
ials
Item
Maj
orso
urce
Mar
ket/
user
indu
stry
Pri
ce(T
sh)
Hou
seho
lds,
rest
aura
nts,
20.0
0pe
rbo
ttle
Gla
ssP
utw
aan
dSo
nsin
dust
ry,
Sunv
ita,
Vir
ani
indu
stry
,ba
rs,
hote
lslo
cal
brew
deal
ers
Veg
etab
leoi
lco
ntai
ners
Hou
seho
lds,
rest
aura
nts,
500
000–
600
000
Indi
vidu
als,
smal
lsc
ale
indu
stri
es,
Mar
ina
met
alin
dust
ries
and
Shir
azpe
rto
nho
tels
Alu
min
ium
Afr
ica
indu
stri
es,
Mar
ina
met
alB
eer
cans
,ca
nsfo
rin
sect
repe
llant
,ol
dco
okin
gH
ouse
hold
s,ho
tels
and
500
000–
600
00in
dust
ries
and
Shir
azut
ensi
lspe
rto
nre
stau
rant
sH
ouse
hold
sM
arin
am
etal
indu
stri
esan
dSh
iraz
300
000
per
ton
Cas
tA
lum
iniu
mfr
omT
Van
dra
dio
sets
Wor
ksho
psC
ast
iron
Mar
ina
met
alin
dust
ries
and
Shir
az,
Ada
man
d20
000
0pe
rto
nco
mpa
nyIn
dust
ry,
Nat
iona
lE
ngin
eeri
ng,
SID
O,
TA
ZA
RA
,T
RC
Alu
min
ium
shee
ts,
win
dow
fram
es,
AC
back
cove
rs,
300
000
per
ton
Con
stru
ctio
nsi
tes,
Alu
min
ium
Afr
ica
wor
ksho
ps,
gara
ges
bus
win
dow
fram
esH
ouse
hold
s,ho
tels
and
50pe
rbo
ttle
Pla
stic
cont
aine
rsP
utw
aan
dso
nsin
dust
ries
,in
divi
dual
sre
stau
rant
s
(1U
S$=
Tsh
s63
0at
the
tim
eof
stud
y).
M.E. Kase�a et al. / Resources, Conser�ation and Recycling 35 (2002) 243–257254
Fig. 7. Percentage of various types of recyclable wastes in the study area.
Table 9Processing requirements and selling prices of some selected items by the scavengers
Item Price (Tsh per kg)Process required before selling
Cleaning and sometimes breaking them into piecesGlass and bottles 40Tins and cans Cleaning and flattening 200
30–PaperPlastics 300Cleaning/washing
20Metals Splitting into sheetsSacks Washing 100
6. Marketing and income generation from the recyclable materials
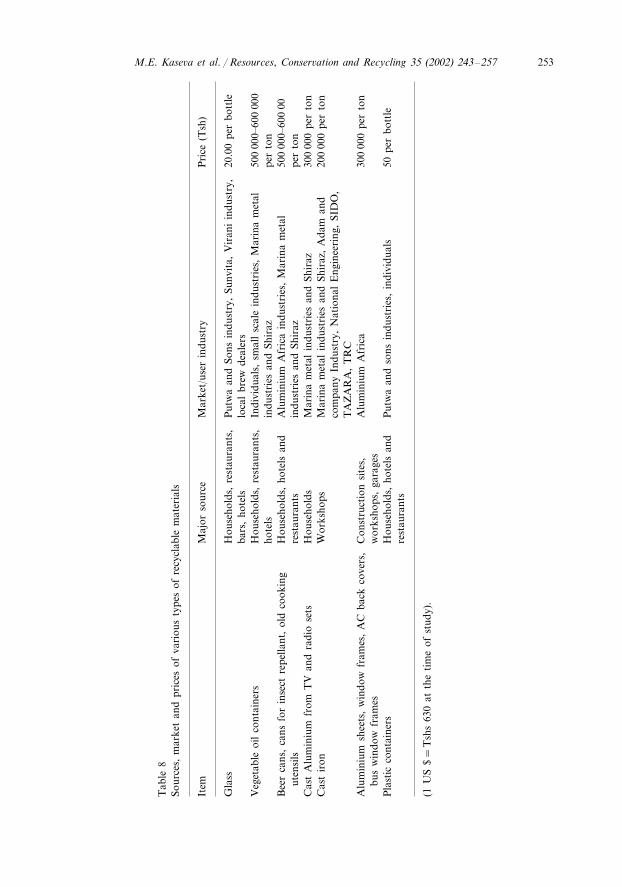
The use of different recycled waste items depends on the type and quality of therecycled goods. Items like broken glass, metals and papers need to be re-processedbefore they can be re-used. The end users of the recycled waste items in Dar esSalaam have been identified to include industries, individuals, petty traders, microand some large industries. These end users normally obtain their supplies of goodsfrom the middlemen who in turn buy the waste items from the scavengers. Detailsof the survey summarizing the kind of the materials, major sources of the materials,major end users, and the prices of the various items presented in Table 8.
Surveys on the marketing and prices of selling the recycled goods by thescavengers to the middlemen indicated that prices range between Tsh 20 and 300per kg for different items. Details of the prices and the processes required prior toselling of the most commonly recycled items by the scavengers are presented inTable 9.
Having established the percentage weight of each of the recycled items (Fig. 7)and assuming that 55% of it can be recycled as recommended by Kaseva and Gupta
M.E. Kase�a et al. / Resources, Conser�ation and Recycling 35 (2002) 243–257 255
Tab
le10
Inco
me
gene
rati
onan
dre
cove
rabl
ew
aste
sin
the
stud
yar
ea
Am
ount
ofre
cyal
able
sA
mou
ntth
atca
nbe
recy
cled
Item
Am
ount
ofre
cycl
able
sto
bedi
spos
edP
rice
Tot
al(T
shpe
rkg
)(k
gpe
rye
ar)
(Tsh
per
year
)(5
5%)
(kg
per
year
)(k
gpe
rye
ar)
5843
3214
Pap
er30
9642
026
2929
1416
03P
last
ics
300
480
900
1311
2193
1206
Gla
ss40
4824
098
7M
etal
s21
9312
0620
4824
098
7T
in/c
ans
1457
801
200
160
200
656
1460
080
30T
otal
834
000
6570
M.E. Kase�a et al. / Resources, Conser�ation and Recycling 35 (2002) 243–257256
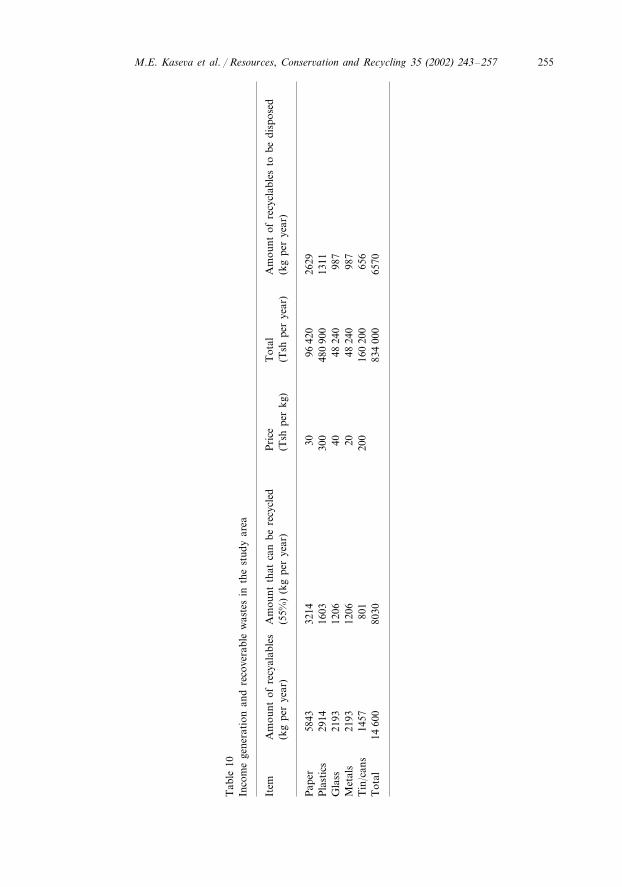
(Kaseva and Gupta, 1996), the total amount of the income that can be earned andthe total quantity of waste that will remain for disposal were established as detailedin the Table 10.
From this table, it can be seen that the total income that can be generated fromonly 55% of the non-organic recycle goods in Sinza B is Tsh 834 000 per year. Thisamount is more than twice the annual official minimum wage (Tsh 360 000) inTanzania at the time of study. Similarly as a result of recycling 8030 kg of waste peryear out of the total waste generated in Sinza B only 65 025 kg per year, which is89% of the total waste will remain for further disposal. However, this amount doesnot take into account organic waste materials which constitute 78% of the totalwaste generation in the settlement and which can be recycled further throughcomposting.
7. Conclusion
Solid waste management in developing countries should no longer be viewedfrom a narrow perspective of collection and disposal, but instead should be seen asa part of issues arising out of rapid urbanization due to natural growth as well asrural to urban migration. In light of success stories in various solid waste recyclingprograms and studies, solid waste management strategies in many developingcountries ought to be reorganized to include a separate collection and processingsystem for waste recycling that can work parallel with the conventional systemsoperated by municipal bodies which are responsible for waste collection transporta-tion and final disposal. This approach can result into not only the reduction ofquantities of wastes to be disposed of, but can also create employment and thusincome for the disadvantaged urban poor.
References
Andrews SS, Lohr L, Cabrera ML. A bioeconomic decios model comparing composted and fresh litterfor winter squash. Agricultural Systems 1999;61:165–78.
Anjum MA, Deshazo JR. Household demand for improved solid waste management: a case study ofGujranwala, Pakistan. Water Development 1996;24(5):857–68.
Chun S, Poon C. The attitude of Guangzhou citizens on waste reduction and environmental issues.Resource Conservation and Recycling 1999;24:35–59.
Diamadopoulos E, Koutsantonakis Y, Zaglara V. Optimal design of municipal solid waste recyclingsystems. Resource Conservation and Recycling 1995;14:21–34.
Flintoff F. Management of solid wastes in developing countries. Regional publications South-East Asiaseries No. 1. Second edition. New Delhi: World Health Organisation, 1994.
Haque A, Mujtaba IM, Bell JN. A simple model for complex waste recycling scenarios in developingeconomies. Waste Management 2000;20:625–31.
Kaseva ME, Gupta SK. Recycling—an environmentally friendly and income generating activity-to-wards sustainable solid wastes management, a case study—Dar es Salaam City, Tanzania. ResourcesConservation and Recycling 1996;17:299–309.

M.E. Kase�a et al. / Resources, Conser�ation and Recycling 35 (2002) 243–257 257
Kaseva ME, Mbuligwe SE. Ramification of solid waste disposal site relocation in urban areas ofdeveloping countries: a case study in Tanzania. Resource Conservation and Recycling 2000;28:147–61.
Lee C-H, Chang C-H, Tsai S-L. Development and implementation of producer responsibility recyclingsystem. Resourse Conservation and Recycling 1998;24:121–35.
Lekkas TD, Razis Y, Filis E. First results of a project for packaging waste recycling in Maroussi andVrilissia Greece. Waste Management & Resource 1997;15:495–506.
Mbuligwe SE, Kasenga GR. Review of solid waste management in Dar es Salaam City and study forimplementation of the Taka Gase Project. (Unpublished report prepared for the EnvironmentalResources Ltd.), Dar es Salaam 1998.
Patra DD, Anwar M, Chaud S. Integrated nutrient management and waste recycling for restoring soilfertility and productivity in Japanese mint and Mustard sequence in Utter Pradesh, India. Agricul-ture Ecosystems and Environment 2000;80:267–75.
Poulsen OM, Breum NO, Ebbehoj N, Hansen AM, Ivens U, van Lelieveld D, Malmros P, MatthiasenL, Nielsen B, Nielsen E, Schibye B, Skov T, Stenbaelc E, Wlkins K. Sorting and recycling ofdomestic waste. Review of occupational health problems and their possible causes. The Science ofTotal Environmental 1995;168:33–56.
Seik FT. Recycling of domestic waste: early experiences in Singapore. Habitat International1997;21(3):277–89.
Sudhir S, Muraleedharan VR, Srinivasan G. Integrated solid waste management in urban India: acritical operational research framework. Socio-Economic Planning Science 1996;30(3):163–81.


