Embed Size (px)
Citation preview
lable at ScienceDirect
Journal of Archaeological Science 54 (2015) 23e30
Contents lists avai
Journal of Archaeological Science
journal homepage: http : / /www.elsevier .com/locate/ jas
Reconstituting community: 3D visualization and early Iron Age socialorganization in the Heuneburg mortuary landscape
Kevin Garstki a, *, Bettina Arnold a, 1, Matthew L. Murray b, 2
a University of Wisconsin-Milwaukee, Department of Anthropology, 290 Sabin Hall, P.O. Box 413, 3413 N. Downer Ave., Milwaukee, WI 53201, USAb University of Mississippi, Department of Sociology and Anthropology, P.O. Box 1848, University, MS 38677, USA
a r t i c l e i n f o
Article history:Received 4 July 2014Received in revised form6 November 2014Accepted 22 November 2014Available online 29 November 2014
Keywords:3D visualizationBurial moundsSpatial analysisIron Age Germany
* Corresponding author. Tel.: þ1 847 977 2905.E-mail addresses: [email protected] (K. G
(B. Arnold), [email protected] (M.L. Murray).1 Tel.: þ1 414 229 4583.2 Tel.: þ1 662 915 3995.
http://dx.doi.org/10.1016/j.jas.2014.11.0280305-4403/© 2014 Elsevier Ltd. All rights reserved.
a b s t r a c t
3-dimensional visualizations are becoming a very useful tool in various archaeological contexts, fromrepresentations of individual artifacts to complex sites and architectural reconstructions. Useful as theseapplications are, what is often missing is the ability to illuminate detailed intra-site patterning. Here, weprovide background on a pilot project that uses data derived from excavation records to create a 3Dvisualization focused on identifying new burial patterns within a single site. This project digitized burialdata (location and artifact) from Tumulus 18 in the Speckhau mound group associated with the early IronAge (700e400 BC) Heuneburg hillfort in Baden-Württemberg, Germany. Based on the spatial data ob-tained from digitized excavation maps, topographic and locational data were entered into Esri's ArcSceneto construct a 3D model of the mound prior to excavation as well as schematic representations of in-dividual burials within the tumulus. Spatial and attribute data for both graves and artifacts were used toidentify preliminary patterns of deposition and social relationships. We address the potential of thismethod of visualization for highlighting spatiotemporal patterns within burial mounds, and for gener-ating research questions that have not been previously recognized using conventional mortuary analysismethods.
© 2014 Elsevier Ltd. All rights reserved.
1. Introduction
Recent applications of 3D visualizations in archaeologicalinterpretation have mainly focused on site reconstructions,particularly of long destroyed architectural features. As computerimaging technology has become more powerful, the past decadehas seen expansive, multi-disciplinary projects attempting tocreate immersive high quality 3D models of sites and site contexts(e.g. http://mayaarch3d.unm.edu; http://romereborn.frischerconsulting.com). Some of these reconstructions have alsobeen important in further developing the field of heritage man-agement (Bruno et al., 2010; El-Hakim et al., 2004; Stojakovic andTepavecic, 2011). Increasingly, projects have the specific goal ofincorporating 3D visualizations into their excavations, going intothe field with equipment for high quality photogrammetry and
arstki), [email protected]
laser scanning, allowing extremely realistic models and maps to becreated in the field rather than after the fact (Lambers et al., 2007;Lerma et al., 2010; Smith and Levy, 2012). Some have even taken tousing 3D models for intra-site analysis of stratigraphy and depo-sitional processes (Katsianis et al., 2008; Losier et al., 2007). Theexcavations at Çatalh€oyük (Forte et al., 2012) and Tel Akko (Olsonet al., 2013) have been at the forefront of utilizing in-the-field 3Drecording, creating complex models to reconstruct not only pre-historic life but the destructive process of excavation. The output ofall of these undertakings has allowed for significant digital inte-gration with archaeological contexts.
Whatmost of these projects have in common is that they benefitfrom beginning with an initial goal of integrating these types ofdigital tools with the archaeological data, something that is notpossible for most excavations. The approach discussed in this paperaims to move beyond both the visualization of monuments on thelandscape and creative reconstructions of those monuments toillustrate how 3D visualization may be used as a tool to illuminateotherwise unseen spatial and temporal patterns between individ-ual burials in prehistoric burial mounds, specifically utilizing datathat were never intended to be used for this purpose. These pat-terns are then expanded to encompass larger scales of
K. Garstki et al. / Journal of Archaeological Science 54 (2015) 23e3024
investigation, opening up new avenues for analysis and generatingpreviously unrecognized research questions.
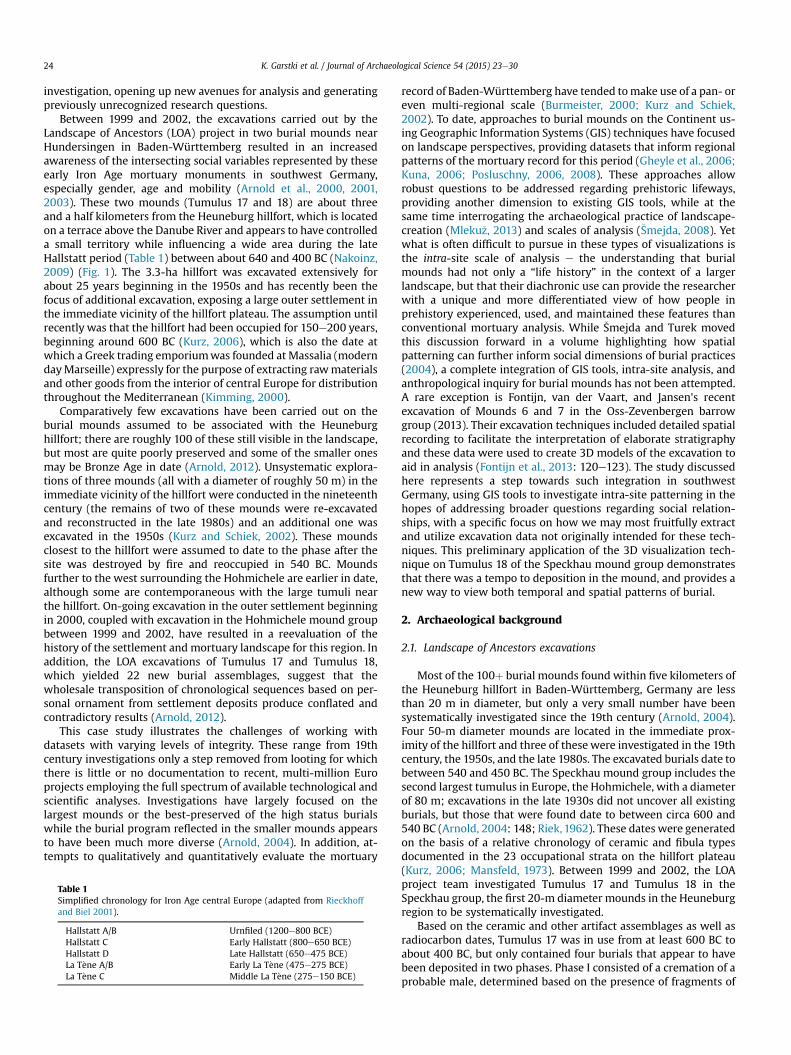
Between 1999 and 2002, the excavations carried out by theLandscape of Ancestors (LOA) project in two burial mounds nearHundersingen in Baden-Württemberg resulted in an increasedawareness of the intersecting social variables represented by theseearly Iron Age mortuary monuments in southwest Germany,especially gender, age and mobility (Arnold et al., 2000, 2001,2003). These two mounds (Tumulus 17 and 18) are about threeand a half kilometers from the Heuneburg hillfort, which is locatedon a terrace above the Danube River and appears to have controlleda small territory while influencing a wide area during the lateHallstatt period (Table 1) between about 640 and 400 BC (Nakoinz,2009) (Fig. 1). The 3.3-ha hillfort was excavated extensively forabout 25 years beginning in the 1950s and has recently been thefocus of additional excavation, exposing a large outer settlement inthe immediate vicinity of the hillfort plateau. The assumption untilrecently was that the hillfort had been occupied for 150e200 years,beginning around 600 BC (Kurz, 2006), which is also the date atwhich a Greek trading emporiumwas founded at Massalia (moderndayMarseille) expressly for the purpose of extracting rawmaterialsand other goods from the interior of central Europe for distributionthroughout the Mediterranean (Kimming, 2000).
Comparatively few excavations have been carried out on theburial mounds assumed to be associated with the Heuneburghillfort; there are roughly 100 of these still visible in the landscape,but most are quite poorly preserved and some of the smaller onesmay be Bronze Age in date (Arnold, 2012). Unsystematic explora-tions of three mounds (all with a diameter of roughly 50 m) in theimmediate vicinity of the hillfort were conducted in the nineteenthcentury (the remains of two of these mounds were re-excavatedand reconstructed in the late 1980s) and an additional one wasexcavated in the 1950s (Kurz and Schiek, 2002). These moundsclosest to the hillfort were assumed to date to the phase after thesite was destroyed by fire and reoccupied in 540 BC. Moundsfurther to the west surrounding the Hohmichele are earlier in date,although some are contemporaneous with the large tumuli nearthe hillfort. On-going excavation in the outer settlement beginningin 2000, coupled with excavation in the Hohmichele mound groupbetween 1999 and 2002, have resulted in a reevaluation of thehistory of the settlement and mortuary landscape for this region. Inaddition, the LOA excavations of Tumulus 17 and Tumulus 18,which yielded 22 new burial assemblages, suggest that thewholesale transposition of chronological sequences based on per-sonal ornament from settlement deposits produce conflated andcontradictory results (Arnold, 2012).
This case study illustrates the challenges of working withdatasets with varying levels of integrity. These range from 19thcentury investigations only a step removed from looting for whichthere is little or no documentation to recent, multi-million Europrojects employing the full spectrum of available technological andscientific analyses. Investigations have largely focused on thelargest mounds or the best-preserved of the high status burialswhile the burial program reflected in the smaller mounds appearsto have been much more diverse (Arnold, 2004). In addition, at-tempts to qualitatively and quantitatively evaluate the mortuary
Table 1Simplified chronology for Iron Age central Europe (adapted from Rieckhoffand Biel 2001).
Hallstatt A/B Urnfiled (1200e800 BCE)Hallstatt C Early Hallstatt (800e650 BCE)Hallstatt D Late Hallstatt (650e475 BCE)La T�ene A/B Early La T�ene (475e275 BCE)La T�ene C Middle La T�ene (275e150 BCE)
record of Baden-Württemberg have tended tomake use of a pan- oreven multi-regional scale (Burmeister, 2000; Kurz and Schiek,2002). To date, approaches to burial mounds on the Continent us-ing Geographic Information Systems (GIS) techniques have focusedon landscape perspectives, providing datasets that inform regionalpatterns of the mortuary record for this period (Gheyle et al., 2006;Kuna, 2006; Posluschny, 2006, 2008). These approaches allowrobust questions to be addressed regarding prehistoric lifeways,providing another dimension to existing GIS tools, while at thesame time interrogating the archaeological practice of landscape-creation (Mleku�z, 2013) and scales of analysis (�Smejda, 2008). Yetwhat is often difficult to pursue in these types of visualizations isthe intra-site scale of analysis e the understanding that burialmounds had not only a “life history” in the context of a largerlandscape, but that their diachronic use can provide the researcherwith a unique and more differentiated view of how people inprehistory experienced, used, and maintained these features thanconventional mortuary analysis. While �Smejda and Turek movedthis discussion forward in a volume highlighting how spatialpatterning can further inform social dimensions of burial practices(2004), a complete integration of GIS tools, intra-site analysis, andanthropological inquiry for burial mounds has not been attempted.A rare exception is Fontijn, van der Vaart, and Jansen's recentexcavation of Mounds 6 and 7 in the Oss-Zevenbergen barrowgroup (2013). Their excavation techniques included detailed spatialrecording to facilitate the interpretation of elaborate stratigraphyand these data were used to create 3D models of the excavation toaid in analysis (Fontijn et al., 2013: 120e123). The study discussedhere represents a step towards such integration in southwestGermany, using GIS tools to investigate intra-site patterning in thehopes of addressing broader questions regarding social relation-ships, with a specific focus on how we may most fruitfully extractand utilize excavation data not originally intended for these tech-niques. This preliminary application of the 3D visualization tech-nique on Tumulus 18 of the Speckhau mound group demonstratesthat there was a tempo to deposition in the mound, and provides anew way to view both temporal and spatial patterns of burial.
2. Archaeological background
2.1. Landscape of Ancestors excavations
Most of the 100þ burial mounds found within five kilometers ofthe Heuneburg hillfort in Baden-Württemberg, Germany are lessthan 20 m in diameter, but only a very small number have beensystematically investigated since the 19th century (Arnold, 2004).Four 50-m diameter mounds are located in the immediate prox-imity of the hillfort and three of these were investigated in the 19thcentury, the 1950s, and the late 1980s. The excavated burials date tobetween 540 and 450 BC. The Speckhau mound group includes thesecond largest tumulus in Europe, the Hohmichele, with a diameterof 80 m; excavations in the late 1930s did not uncover all existingburials, but those that were found date to between circa 600 and540 BC (Arnold, 2004: 148; Riek, 1962). These dates were generatedon the basis of a relative chronology of ceramic and fibula typesdocumented in the 23 occupational strata on the hillfort plateau(Kurz, 2006; Mansfeld, 1973). Between 1999 and 2002, the LOAproject team investigated Tumulus 17 and Tumulus 18 in theSpeckhau group, the first 20-m diameter mounds in the Heuneburgregion to be systematically investigated.
Based on the ceramic and other artifact assemblages as well asradiocarbon dates, Tumulus 17 was in use from at least 600 BC toabout 400 BC, but only contained four burials that appear to havebeen deposited in two phases. Phase I consisted of a cremation of aprobable male, determined based on the presence of fragments of
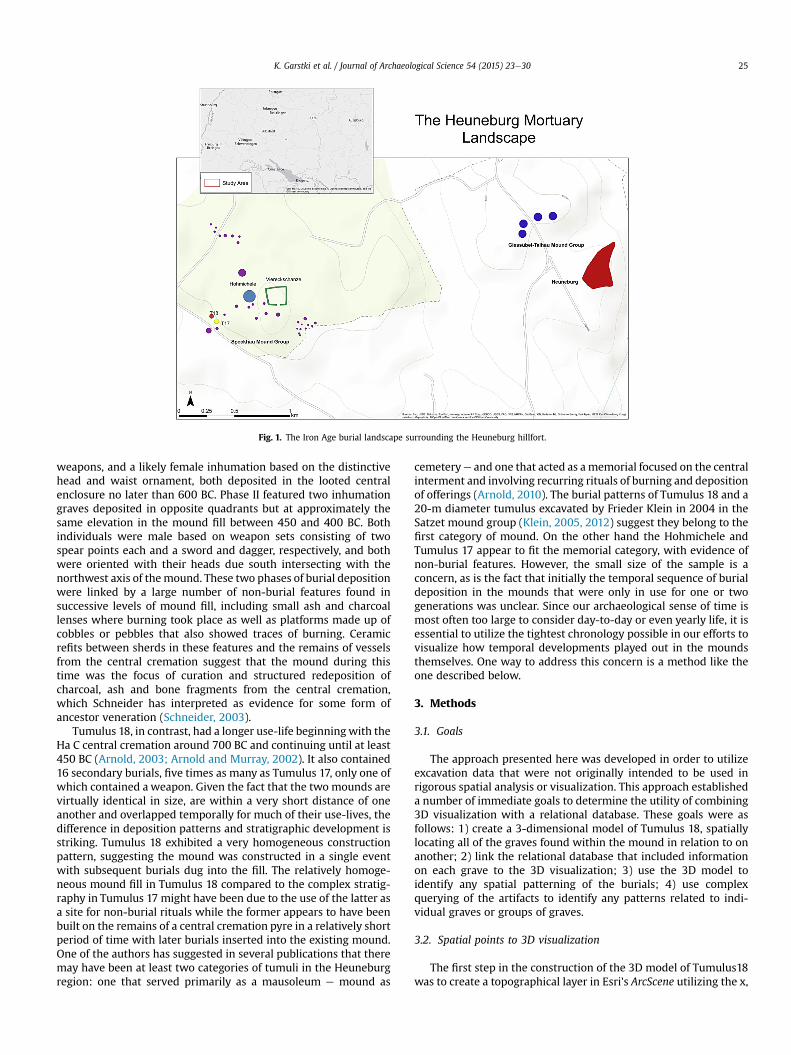
Fig. 1. The Iron Age burial landscape surrounding the Heuneburg hillfort.
K. Garstki et al. / Journal of Archaeological Science 54 (2015) 23e30 25
weapons, and a likely female inhumation based on the distinctivehead and waist ornament, both deposited in the looted centralenclosure no later than 600 BC. Phase II featured two inhumationgraves deposited in opposite quadrants but at approximately thesame elevation in the mound fill between 450 and 400 BC. Bothindividuals were male based on weapon sets consisting of twospear points each and a sword and dagger, respectively, and bothwere oriented with their heads due south intersecting with thenorthwest axis of themound. These two phases of burial depositionwere linked by a large number of non-burial features found insuccessive levels of mound fill, including small ash and charcoallenses where burning took place as well as platforms made up ofcobbles or pebbles that also showed traces of burning. Ceramicrefits between sherds in these features and the remains of vesselsfrom the central cremation suggest that the mound during thistime was the focus of curation and structured redeposition ofcharcoal, ash and bone fragments from the central cremation,which Schneider has interpreted as evidence for some form ofancestor veneration (Schneider, 2003).
Tumulus 18, in contrast, had a longer use-life beginningwith theHa C central cremation around 700 BC and continuing until at least450 BC (Arnold, 2003; Arnold and Murray, 2002). It also contained16 secondary burials, five times as many as Tumulus 17, only one ofwhich contained a weapon. Given the fact that the two mounds arevirtually identical in size, are within a very short distance of oneanother and overlapped temporally for much of their use-lives, thedifference in deposition patterns and stratigraphic development isstriking. Tumulus 18 exhibited a very homogeneous constructionpattern, suggesting the mound was constructed in a single eventwith subsequent burials dug into the fill. The relatively homoge-neous mound fill in Tumulus 18 compared to the complex stratig-raphy in Tumulus 17 might have been due to the use of the latter asa site for non-burial rituals while the former appears to have beenbuilt on the remains of a central cremation pyre in a relatively shortperiod of time with later burials inserted into the existing mound.One of the authors has suggested in several publications that theremay have been at least two categories of tumuli in the Heuneburgregion: one that served primarily as a mausoleum e mound as
cemeterye and one that acted as amemorial focused on the centralinterment and involving recurring rituals of burning and depositionof offerings (Arnold, 2010). The burial patterns of Tumulus 18 and a20-m diameter tumulus excavated by Frieder Klein in 2004 in theSatzet mound group (Klein, 2005, 2012) suggest they belong to thefirst category of mound. On the other hand the Hohmichele andTumulus 17 appear to fit the memorial category, with evidence ofnon-burial features. However, the small size of the sample is aconcern, as is the fact that initially the temporal sequence of burialdeposition in the mounds that were only in use for one or twogenerations was unclear. Since our archaeological sense of time ismost often too large to consider day-to-day or even yearly life, it isessential to utilize the tightest chronology possible in our efforts tovisualize how temporal developments played out in the moundsthemselves. One way to address this concern is a method like theone described below.
3. Methods
3.1. Goals
The approach presented here was developed in order to utilizeexcavation data that were not originally intended to be used inrigorous spatial analysis or visualization. This approach establisheda number of immediate goals to determine the utility of combining3D visualization with a relational database. These goals were asfollows: 1) create a 3-dimensional model of Tumulus 18, spatiallylocating all of the graves found within the mound in relation to onanother; 2) link the relational database that included informationon each grave to the 3D visualization; 3) use the 3D model toidentify any spatial patterning of the burials; 4) use complexquerying of the artifacts to identify any patterns related to indi-vidual graves or groups of graves.
3.2. Spatial points to 3D visualization
The first step in the construction of the 3D model of Tumulus18was to create a topographical layer in Esri's ArcScene utilizing the x,
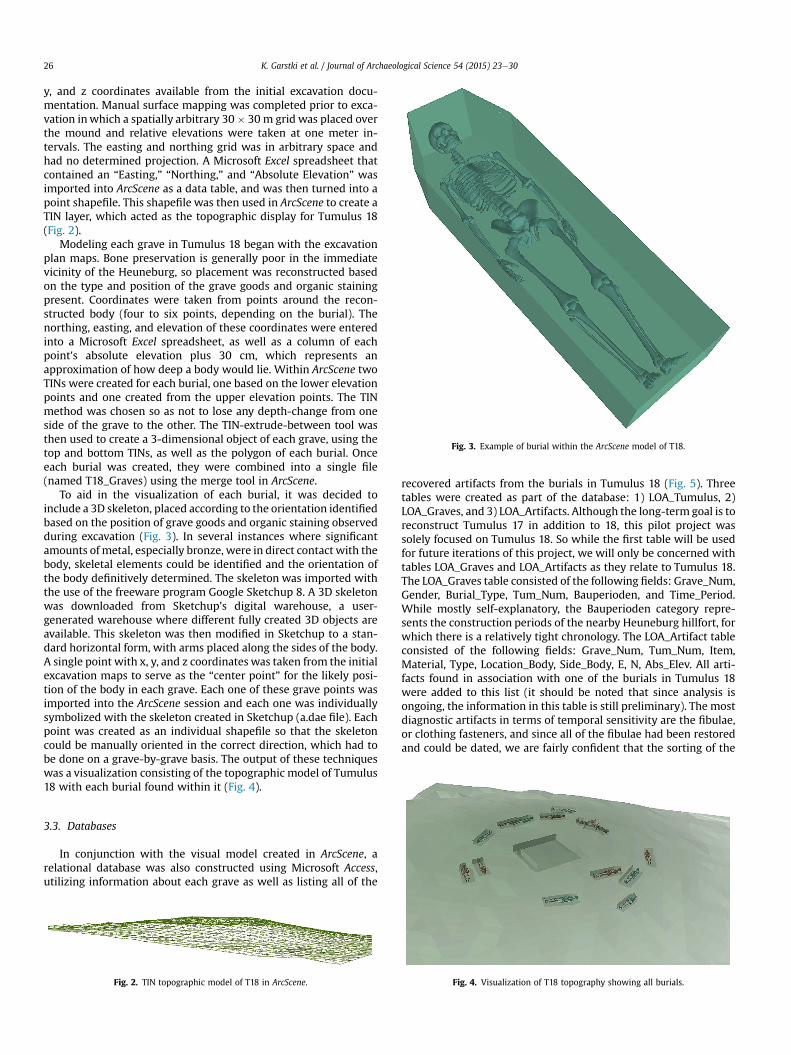
Fig. 3. Example of burial within the ArcScene model of T18.
K. Garstki et al. / Journal of Archaeological Science 54 (2015) 23e3026
y, and z coordinates available from the initial excavation docu-mentation. Manual surface mapping was completed prior to exca-vation inwhich a spatially arbitrary 30� 30 m grid was placed overthe mound and relative elevations were taken at one meter in-tervals. The easting and northing grid was in arbitrary space andhad no determined projection. A Microsoft Excel spreadsheet thatcontained an “Easting,” “Northing,” and “Absolute Elevation” wasimported into ArcScene as a data table, and was then turned into apoint shapefile. This shapefile was then used in ArcScene to create aTIN layer, which acted as the topographic display for Tumulus 18(Fig. 2).
Modeling each grave in Tumulus 18 began with the excavationplan maps. Bone preservation is generally poor in the immediatevicinity of the Heuneburg, so placement was reconstructed basedon the type and position of the grave goods and organic stainingpresent. Coordinates were taken from points around the recon-structed body (four to six points, depending on the burial). Thenorthing, easting, and elevation of these coordinates were enteredinto a Microsoft Excel spreadsheet, as well as a column of eachpoint's absolute elevation plus 30 cm, which represents anapproximation of how deep a body would lie. Within ArcScene twoTINs were created for each burial, one based on the lower elevationpoints and one created from the upper elevation points. The TINmethod was chosen so as not to lose any depth-change from oneside of the grave to the other. The TIN-extrude-between tool wasthen used to create a 3-dimensional object of each grave, using thetop and bottom TINs, as well as the polygon of each burial. Onceeach burial was created, they were combined into a single file(named T18_Graves) using the merge tool in ArcScene.
To aid in the visualization of each burial, it was decided toinclude a 3D skeleton, placed according to the orientation identifiedbased on the position of grave goods and organic staining observedduring excavation (Fig. 3). In several instances where significantamounts of metal, especially bronze, were in direct contact with thebody, skeletal elements could be identified and the orientation ofthe body definitively determined. The skeleton was imported withthe use of the freeware program Google Sketchup 8. A 3D skeletonwas downloaded from Sketchup's digital warehouse, a user-generated warehouse where different fully created 3D objects areavailable. This skeleton was then modified in Sketchup to a stan-dard horizontal form, with arms placed along the sides of the body.A single point with x, y, and z coordinates was taken from the initialexcavation maps to serve as the “center point” for the likely posi-tion of the body in each grave. Each one of these grave points wasimported into the ArcScene session and each one was individuallysymbolized with the skeleton created in Sketchup (a.dae file). Eachpoint was created as an individual shapefile so that the skeletoncould be manually oriented in the correct direction, which had tobe done on a grave-by-grave basis. The output of these techniqueswas a visualization consisting of the topographic model of Tumulus18 with each burial found within it (Fig. 4).
3.3. Databases
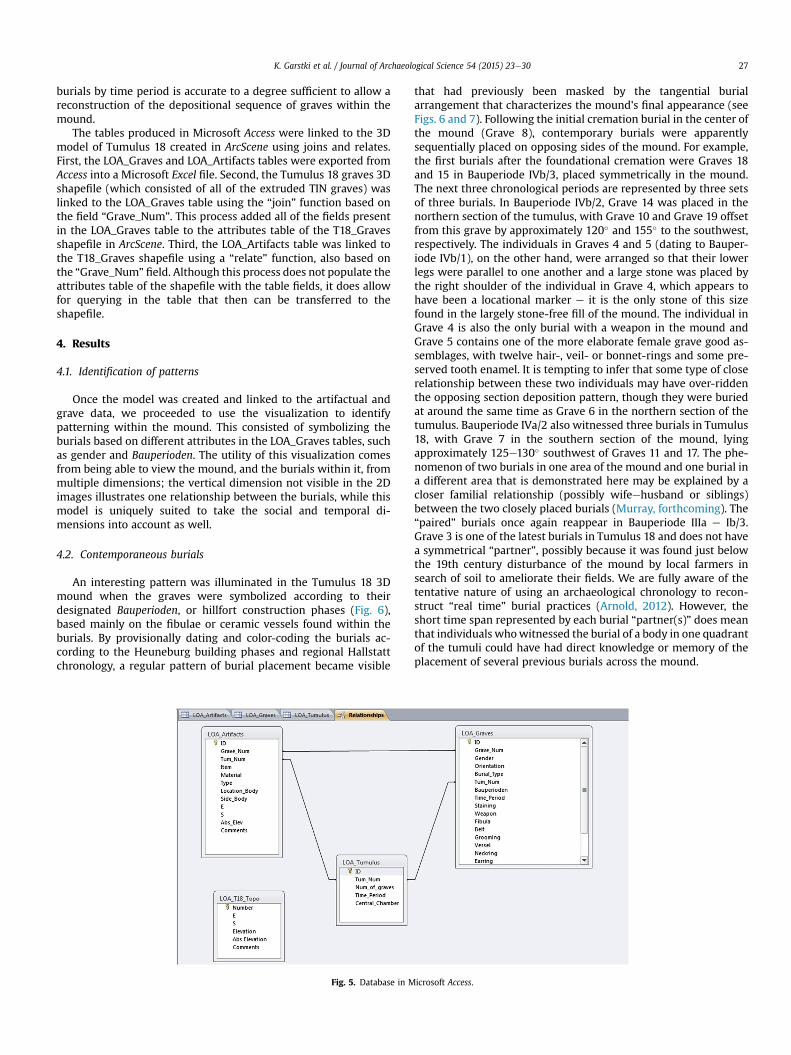
In conjunction with the visual model created in ArcScene, arelational database was also constructed using Microsoft Access,utilizing information about each grave as well as listing all of the
Fig. 2. TIN topographic model of T18 in ArcScene.
recovered artifacts from the burials in Tumulus 18 (Fig. 5). Threetables were created as part of the database: 1) LOA_Tumulus, 2)LOA_Graves, and 3) LOA_Artifacts. Although the long-term goal is toreconstruct Tumulus 17 in addition to 18, this pilot project wassolely focused on Tumulus 18. So while the first table will be usedfor future iterations of this project, we will only be concerned withtables LOA_Graves and LOA_Artifacts as they relate to Tumulus 18.The LOA_Graves table consisted of the following fields: Grave_Num,Gender, Burial_Type, Tum_Num, Bauperioden, and Time_Period.While mostly self-explanatory, the Bauperioden category repre-sents the construction periods of the nearby Heuneburg hillfort, forwhich there is a relatively tight chronology. The LOA_Artifact tableconsisted of the following fields: Grave_Num, Tum_Num, Item,Material, Type, Location_Body, Side_Body, E, N, Abs_Elev. All arti-facts found in association with one of the burials in Tumulus 18were added to this list (it should be noted that since analysis isongoing, the information in this table is still preliminary). The mostdiagnostic artifacts in terms of temporal sensitivity are the fibulae,or clothing fasteners, and since all of the fibulae had been restoredand could be dated, we are fairly confident that the sorting of the
Fig. 4. Visualization of T18 topography showing all burials.
K. Garstki et al. / Journal of Archaeological Science 54 (2015) 23e30 27
burials by time period is accurate to a degree sufficient to allow areconstruction of the depositional sequence of graves within themound.
The tables produced in Microsoft Access were linked to the 3Dmodel of Tumulus 18 created in ArcScene using joins and relates.First, the LOA_Graves and LOA_Artifacts tables were exported fromAccess into a Microsoft Excel file. Second, the Tumulus 18 graves 3Dshapefile (which consisted of all of the extruded TIN graves) waslinked to the LOA_Graves table using the “join” function based onthe field “Grave_Num”. This process added all of the fields presentin the LOA_Graves table to the attributes table of the T18_Gravesshapefile in ArcScene. Third, the LOA_Artifacts table was linked tothe T18_Graves shapefile using a “relate” function, also based onthe “Grave_Num” field. Although this process does not populate theattributes table of the shapefile with the table fields, it does allowfor querying in the table that then can be transferred to theshapefile.
4. Results
4.1. Identification of patterns
Once the model was created and linked to the artifactual andgrave data, we proceeded to use the visualization to identifypatterning within the mound. This consisted of symbolizing theburials based on different attributes in the LOA_Graves tables, suchas gender and Bauperioden. The utility of this visualization comesfrom being able to view the mound, and the burials within it, frommultiple dimensions; the vertical dimension not visible in the 2Dimages illustrates one relationship between the burials, while thismodel is uniquely suited to take the social and temporal di-mensions into account as well.
4.2. Contemporaneous burials
An interesting pattern was illuminated in the Tumulus 18 3Dmound when the graves were symbolized according to theirdesignated Bauperioden, or hillfort construction phases (Fig. 6),based mainly on the fibulae or ceramic vessels found within theburials. By provisionally dating and color-coding the burials ac-cording to the Heuneburg building phases and regional Hallstattchronology, a regular pattern of burial placement became visible
Fig. 5. Database in M
that had previously been masked by the tangential burialarrangement that characterizes the mound's final appearance (seeFigs. 6 and 7). Following the initial cremation burial in the center ofthe mound (Grave 8), contemporary burials were apparentlysequentially placed on opposing sides of the mound. For example,the first burials after the foundational cremation were Graves 18and 15 in Bauperiode IVb/3, placed symmetrically in the mound.The next three chronological periods are represented by three setsof three burials. In Bauperiode IVb/2, Grave 14 was placed in thenorthern section of the tumulus, with Grave 10 and Grave 19 offsetfrom this grave by approximately 120� and 155� to the southwest,respectively. The individuals in Graves 4 and 5 (dating to Bauper-iode IVb/1), on the other hand, were arranged so that their lowerlegs were parallel to one another and a large stone was placed bythe right shoulder of the individual in Grave 4, which appears tohave been a locational marker e it is the only stone of this sizefound in the largely stone-free fill of the mound. The individual inGrave 4 is also the only burial with a weapon in the mound andGrave 5 contains one of the more elaborate female grave good as-semblages, with twelve hair-, veil- or bonnet-rings and some pre-served tooth enamel. It is tempting to infer that some type of closerelationship between these two individuals may have over-riddenthe opposing section deposition pattern, though they were buriedat around the same time as Grave 6 in the northern section of thetumulus. Bauperiode IVa/2 also witnessed three burials in Tumulus18, with Grave 7 in the southern section of the mound, lyingapproximately 125e130� southwest of Graves 11 and 17. The phe-nomenon of two burials in one area of the mound and one burial ina different area that is demonstrated here may be explained by acloser familial relationship (possibly wifeehusband or siblings)between the two closely placed burials (Murray, forthcoming). The“paired” burials once again reappear in Bauperiode IIIa e Ib/3.Grave 3 is one of the latest burials in Tumulus 18 and does not havea symmetrical “partner”, possibly because it was found just belowthe 19th century disturbance of the mound by local farmers insearch of soil to ameliorate their fields. We are fully aware of thetentative nature of using an archaeological chronology to recon-struct “real time” burial practices (Arnold, 2012). However, theshort time span represented by each burial “partner(s)” does meanthat individuals whowitnessed the burial of a body in one quadrantof the tumuli could have had direct knowledge or memory of theplacement of several previous burials across the mound.
icrosoft Access.
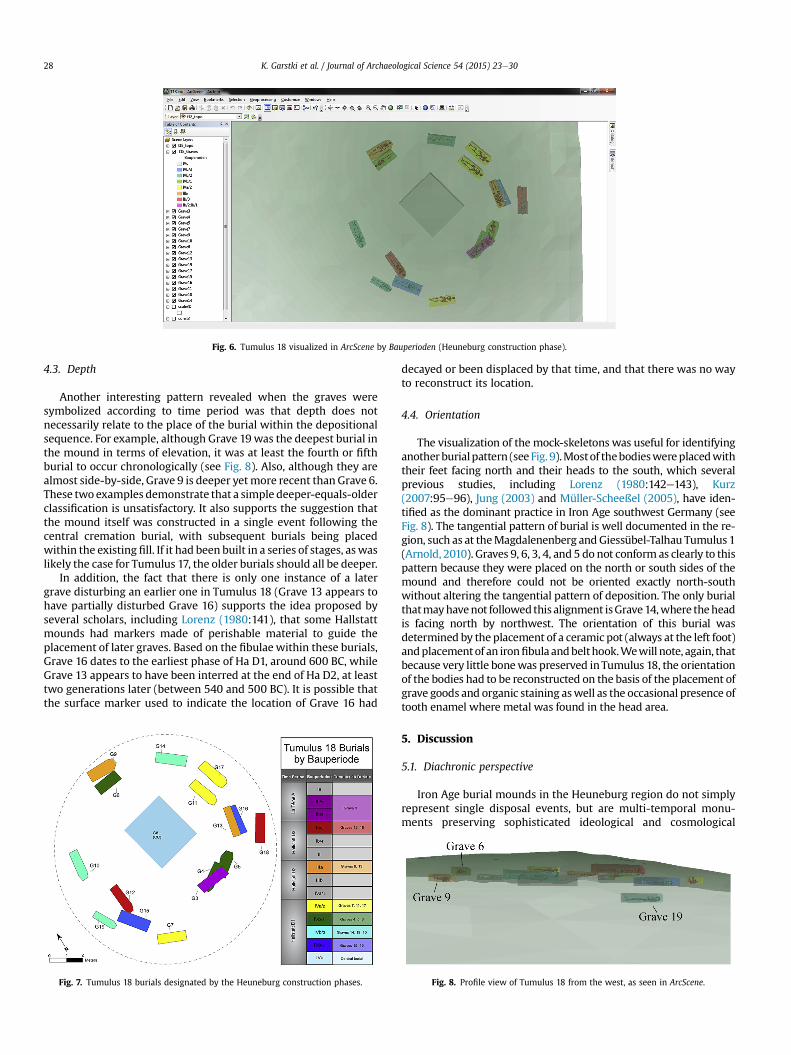
Fig. 6. Tumulus 18 visualized in ArcScene by Bauperioden (Heuneburg construction phase).
K. Garstki et al. / Journal of Archaeological Science 54 (2015) 23e3028
4.3. Depth
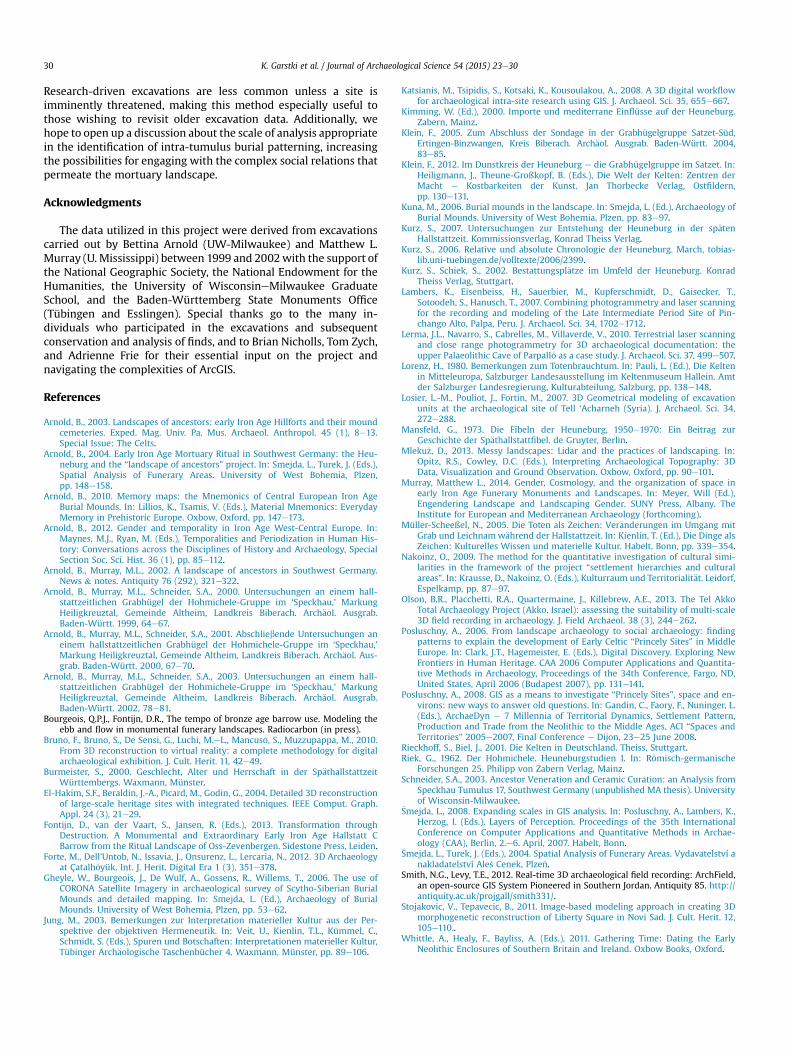
Another interesting pattern revealed when the graves weresymbolized according to time period was that depth does notnecessarily relate to the place of the burial within the depositionalsequence. For example, although Grave 19was the deepest burial inthe mound in terms of elevation, it was at least the fourth or fifthburial to occur chronologically (see Fig. 8). Also, although they arealmost side-by-side, Grave 9 is deeper yetmore recent than Grave 6.These two examples demonstrate that a simple deeper-equals-olderclassification is unsatisfactory. It also supports the suggestion thatthe mound itself was constructed in a single event following thecentral cremation burial, with subsequent burials being placedwithin the existing fill. If it had been built in a series of stages, aswaslikely the case for Tumulus 17, the older burials should all be deeper.
In addition, the fact that there is only one instance of a latergrave disturbing an earlier one in Tumulus 18 (Grave 13 appears tohave partially disturbed Grave 16) supports the idea proposed byseveral scholars, including Lorenz (1980:141), that some Hallstattmounds had markers made of perishable material to guide theplacement of later graves. Based on the fibulae within these burials,Grave 16 dates to the earliest phase of Ha D1, around 600 BC, whileGrave 13 appears to have been interred at the end of Ha D2, at leasttwo generations later (between 540 and 500 BC). It is possible thatthe surface marker used to indicate the location of Grave 16 had
Fig. 7. Tumulus 18 burials designated by the Heuneburg construction phases.
decayed or been displaced by that time, and that there was no wayto reconstruct its location.
4.4. Orientation
The visualization of the mock-skeletons was useful for identifyinganotherburialpattern (see Fig. 9).Mostof thebodieswereplacedwiththeir feet facing north and their heads to the south, which severalprevious studies, including Lorenz (1980:142e143), Kurz(2007:95e96), Jung (2003) and Müller-Scheeßel (2005), have iden-tified as the dominant practice in Iron Age southwest Germany (seeFig. 8). The tangential pattern of burial is well documented in the re-gion, such as at theMagdalenenberg andGiessübel-Talhau Tumulus 1(Arnold, 2010). Graves 9, 6, 3, 4, and 5 do not conform as clearly to thispattern because they were placed on the north or south sides of themound and therefore could not be oriented exactly north-southwithout altering the tangential pattern of deposition. The only burialthatmayhavenot followedthis alignment isGrave14,where theheadis facing north by northwest. The orientation of this burial wasdetermined by the placement of a ceramic pot (always at the left foot)andplacementof an ironfibulaandbelthook.Wewill note, again, thatbecause very little bonewas preserved inTumulus 18, the orientationof the bodies had to be reconstructed on the basis of the placement ofgrave goods and organic staining aswell as the occasional presence oftooth enamel where metal was found in the head area.
5. Discussion
5.1. Diachronic perspective
Iron Age burial mounds in the Heuneburg region do not simplyrepresent single disposal events, but are multi-temporal monu-ments preserving sophisticated ideological and cosmological
Fig. 8. Profile view of Tumulus 18 from the west, as seen in ArcScene.
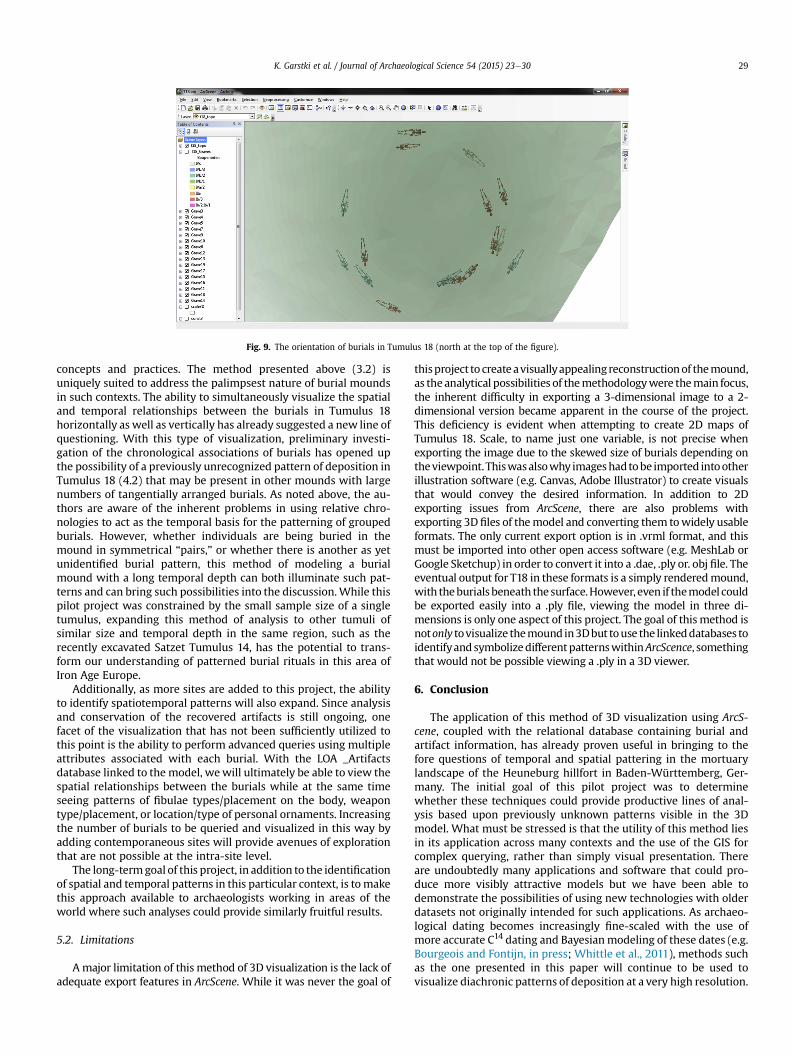
Fig. 9. The orientation of burials in Tumulus 18 (north at the top of the figure).
K. Garstki et al. / Journal of Archaeological Science 54 (2015) 23e30 29
concepts and practices. The method presented above (3.2) isuniquely suited to address the palimpsest nature of burial moundsin such contexts. The ability to simultaneously visualize the spatialand temporal relationships between the burials in Tumulus 18horizontally as well as vertically has already suggested a new line ofquestioning. With this type of visualization, preliminary investi-gation of the chronological associations of burials has opened upthe possibility of a previously unrecognized pattern of deposition inTumulus 18 (4.2) that may be present in other mounds with largenumbers of tangentially arranged burials. As noted above, the au-thors are aware of the inherent problems in using relative chro-nologies to act as the temporal basis for the patterning of groupedburials. However, whether individuals are being buried in themound in symmetrical “pairs,” or whether there is another as yetunidentified burial pattern, this method of modeling a burialmound with a long temporal depth can both illuminate such pat-terns and can bring such possibilities into the discussion.While thispilot project was constrained by the small sample size of a singletumulus, expanding this method of analysis to other tumuli ofsimilar size and temporal depth in the same region, such as therecently excavated Satzet Tumulus 14, has the potential to trans-form our understanding of patterned burial rituals in this area ofIron Age Europe.
Additionally, as more sites are added to this project, the abilityto identify spatiotemporal patterns will also expand. Since analysisand conservation of the recovered artifacts is still ongoing, onefacet of the visualization that has not been sufficiently utilized tothis point is the ability to perform advanced queries using multipleattributes associated with each burial. With the LOA _Artifactsdatabase linked to the model, wewill ultimately be able to view thespatial relationships between the burials while at the same timeseeing patterns of fibulae types/placement on the body, weapontype/placement, or location/type of personal ornaments. Increasingthe number of burials to be queried and visualized in this way byadding contemporaneous sites will provide avenues of explorationthat are not possible at the intra-site level.
The long-termgoal of this project, in addition to the identificationof spatial and temporal patterns in this particular context, is tomakethis approach available to archaeologists working in areas of theworld where such analyses could provide similarly fruitful results.
5.2. Limitations
Amajor limitation of this method of 3D visualization is the lack ofadequate export features in ArcScene. While it was never the goal of
thisproject to createavisuallyappealingreconstructionof themound,as the analytical possibilities of themethodologywere themain focus,the inherent difficulty in exporting a 3-dimensional image to a 2-dimensional version became apparent in the course of the project.This deficiency is evident when attempting to create 2D maps ofTumulus 18. Scale, to name just one variable, is not precise whenexporting the image due to the skewed size of burials depending ontheviewpoint.Thiswasalsowhy imageshadtobe imported intootherillustration software (e.g. Canvas, Adobe Illustrator) to create visualsthat would convey the desired information. In addition to 2Dexporting issues from ArcScene, there are also problems withexporting 3Dfiles of themodel and converting them towidely usableformats. The only current export option is in .vrml format, and thismust be imported into other open access software (e.g. MeshLab orGoogle Sketchup) in order to convert it into a .dae, .ply or. obj file. Theeventual output for T18 in these formats is a simply renderedmound,with theburialsbeneath thesurface.However, even if themodel couldbe exported easily into a .ply file, viewing the model in three di-mensions is only one aspect of this project. The goal of this method isnotonly tovisualize themound in3Dbut touse the linkeddatabases toidentifyandsymbolizedifferentpatternswithinArcScence, somethingthat would not be possible viewing a .ply in a 3D viewer.
6. Conclusion
The application of this method of 3D visualization using ArcS-cene, coupled with the relational database containing burial andartifact information, has already proven useful in bringing to thefore questions of temporal and spatial pattering in the mortuarylandscape of the Heuneburg hillfort in Baden-Württemberg, Ger-many. The initial goal of this pilot project was to determinewhether these techniques could provide productive lines of anal-ysis based upon previously unknown patterns visible in the 3Dmodel. What must be stressed is that the utility of this method liesin its application across many contexts and the use of the GIS forcomplex querying, rather than simply visual presentation. Thereare undoubtedly many applications and software that could pro-duce more visibly attractive models but we have been able todemonstrate the possibilities of using new technologies with olderdatasets not originally intended for such applications. As archaeo-logical dating becomes increasingly fine-scaled with the use ofmore accurate C14 dating and Bayesianmodeling of these dates (e.g.Bourgeois and Fontijn, in press; Whittle et al., 2011), methods suchas the one presented in this paper will continue to be used tovisualize diachronic patterns of deposition at a very high resolution.
K. Garstki et al. / Journal of Archaeological Science 54 (2015) 23e3030
Research-driven excavations are less common unless a site isimminently threatened, making this method especially useful tothose wishing to revisit older excavation data. Additionally, wehope to open up a discussion about the scale of analysis appropriatein the identification of intra-tumulus burial patterning, increasingthe possibilities for engaging with the complex social relations thatpermeate the mortuary landscape.
Acknowledgments
The data utilized in this project were derived from excavationscarried out by Bettina Arnold (UW-Milwaukee) and Matthew L.Murray (U. Mississippi) between 1999 and 2002with the support ofthe National Geographic Society, the National Endowment for theHumanities, the University of WisconsineMilwaukee GraduateSchool, and the Baden-Württemberg State Monuments Office(Tübingen and Esslingen). Special thanks go to the many in-dividuals who participated in the excavations and subsequentconservation and analysis of finds, and to Brian Nicholls, Tom Zych,and Adrienne Frie for their essential input on the project andnavigating the complexities of ArcGIS.
References
Arnold, B., 2003. Landscapes of ancestors: early Iron Age Hillforts and their moundcemeteries. Exped. Mag. Univ. Pa. Mus. Archaeol. Anthropol. 45 (1), 8e13.Special Issue: The Celts.
Arnold, B., 2004. Early Iron Age Mortuary Ritual in Southwest Germany: the Heu-neburg and the “landscape of ancestors” project. In: Smejda, L., Turek, J. (Eds.),Spatial Analysis of Funerary Areas. University of West Bohemia, Plzen,pp. 148e158.
Arnold, B., 2010. Memory maps: the Mnemonics of Central European Iron AgeBurial Mounds. In: Lillios, K., Tsamis, V. (Eds.), Material Mnemonics: EverydayMemory in Prehistoric Europe. Oxbow, Oxford, pp. 147e173.
Arnold, B., 2012. Gender and temporality in Iron Age West-Central Europe. In:Maynes, M.J., Ryan, M. (Eds.), Temporalities and Periodization in Human His-tory: Conversations across the Disciplines of History and Archaeology, SpecialSection Soc. Sci. Hist. 36 (1), pp. 85e112.
Arnold, B., Murray, M.L., 2002. A landscape of ancestors in Southwest Germany.News & notes. Antiquity 76 (292), 321e322.
Arnold, B., Murray, M.L., Schneider, S.A., 2000. Untersuchungen an einem hall-stattzeitlichen Grabhügel der Hohmichele-Gruppe im ‘Speckhau,’ MarkungHeiligkreuztal, Gemeinde Altheim, Landkreis Biberach. Arch€aol. Ausgrab.Baden-Württ. 1999, 64e67.
Arnold, B., Murray, M.L., Schneider, S.A., 2001. Abschliebende Untersuchungen aneinem hallstattzeitlichen Grabhügel der Hohmichele-Gruppe im ‘Speckhau,’Markung Heiligkreuztal, Gemeinde Altheim, Landkreis Biberach. Arch€aol. Aus-grab. Baden-Württ. 2000, 67e70.
Arnold, B., Murray, M.L., Schneider, S.A., 2003. Untersuchungen an einem hall-stattzeitlichen Grabhügel der Hohmichele-Gruppe im ‘Speckhau,’ MarkungHeiligkreuztal, Gemeinde Altheim, Landkreis Biberach. Arch€aol. Ausgrab.Baden-Württ. 2002, 78e81.
Bourgeois, Q.P.J., Fontijn, D.R., The tempo of bronze age barrow use. Modeling theebb and flow in monumental funerary landscapes. Radiocarbon (in press).
Bruno, F., Bruno, S., De Sensi, G., Luchi, M.eL., Mancuso, S., Muzzupappa, M., 2010.From 3D reconstruction to virtual reality: a complete methodology for digitalarchaeological exhibition. J. Cult. Herit. 11, 42e49.
Burmeister, S., 2000. Geschlecht, Alter und Herrschaft in der Sp€athallstattzeitWürttembergs. Waxmann, Münster.
El-Hakim, S.F., Beraldin, J.-A., Picard, M., Godin, G., 2004. Detailed 3D reconstructionof large-scale heritage sites with integrated techniques. IEEE Comput. Graph.Appl. 24 (3), 21e29.
Fontijn, D., van der Vaart, S., Jansen, R. (Eds.), 2013. Transformation throughDestruction. A Monumental and Extraordinary Early Iron Age Hallstatt CBarrow from the Ritual Landscape of Oss-Zevenbergen. Sidestone Press, Leiden.
Forte, M., Dell’Untob, N., Issavia, J., Onsurenz, L., Lercaria, N., 2012. 3D Archaeologyat Çatalh€oyük. Int. J. Herit. Digital Era 1 (3), 351e378.
Gheyle, W., Bourgeois, J., De Wulf, A., Gossens, R., Willems, T., 2006. The use ofCORONA Satellite Imagery in archaeological survey of Scytho-Siberian BurialMounds and detailed mapping. In: Smejda, L. (Ed.), Archaeology of BurialMounds. University of West Bohemia, Plzen, pp. 53e62.
Jung, M., 2003. Bemerkungen zur Interpretation materieller Kultur aus der Per-spektive der objektiven Hermeneutik. In: Veit, U., Kienlin, T.L., Kümmel, C.,Schmidt, S. (Eds.), Spuren und Botschaften: Interpretationen materieller Kultur,Tübinger Arch€aologische Taschenbücher 4. Waxmann, Münster, pp. 89e106.
Katsianis, M., Tsipidis, S., Kotsaki, K., Kousoulakou, A., 2008. A 3D digital workflowfor archaeological intra-site research using GIS. J. Archaeol. Sci. 35, 655e667.
Kimming, W. (Ed.), 2000. Importe und mediterrane Einflüsse auf der Heuneburg.Zabern, Mainz.
Klein, F., 2005. Zum Abschluss der Sondage in der Grabhügelgruppe Satzet-Süd,Ertingen-Binzwangen, Kreis Biberach. Arch€aol. Ausgrab. Baden-Württ. 2004,83e85.
Klein, F., 2012. Im Dunstkreis der Heuneburg e die Grabhügelgruppe im Satzet. In:Heiligmann, J., Theune-Großkopf, B. (Eds.), Die Welt der Kelten: Zentren derMacht e Kostbarkeiten der Kunst. Jan Thorbecke Verlag, Ostfildern,pp. 130e131.
Kuna, M., 2006. Burial mounds in the landscape. In: Smejda, L. (Ed.), Archaeology ofBurial Mounds. University of West Bohemia, Plzen, pp. 83e97.
Kurz, S., 2007. Untersuchungen zur Entstehung der Heuneburg in der sp€atenHallstattzeit. Kommissionsverlag, Konrad Theiss Verlag.
Kurz, S., 2006. Relative und absolute Chronologie der Heuneburg. March, tobias-lib.uni-tuebingen.de/volltexte/2006/2399.
Kurz, S., Schiek, S., 2002. Bestattungspl€atze im Umfeld der Heuneburg. KonradTheiss Verlag, Stuttgart.
Lambers, K., Eisenbeiss, H., Sauerbier, M., Kupferschmidt, D., Gaisecker, T.,Sotoodeh, S., Hanusch, T., 2007. Combining photogrammetry and laser scanningfor the recording and modeling of the Late Intermediate Period Site of Pin-chango Alto, Palpa, Peru. J. Archaeol. Sci. 34, 1702e1712.
Lerma, J.L., Navarro, S., Cabrelles, M., Villaverde, V., 2010. Terrestrial laser scanningand close range photogrammetry for 3D archaeological documentation: theupper Palaeolithic Cave of Parpall�o as a case study. J. Archaeol. Sci. 37, 499e507.
Lorenz, H., 1980. Bemerkungen zum Totenbrauchtum. In: Pauli, L. (Ed.), Die Keltenin Mitteleuropa, Salzburger Landesausstellung im Keltenmuseum Hallein. Amtder Salzburger Landesregierung, Kulturabteilung, Salzburg, pp. 138e148.
Losier, L.-M., Pouliot, J., Fortin, M., 2007. 3D Geometrical modeling of excavationunits at the archaeological site of Tell ‘Acharneh (Syria). J. Archaeol. Sci. 34,272e288.
Mansfeld, G., 1973. Die Fibeln der Heuneburg, 1950e1970: Ein Beitrag zurGeschichte der Sp€athallstattfibel. de Gruyter, Berlin.
Mleku�z, D., 2013. Messy landscapes: Lidar and the practices of landscaping. In:Opitz, R.S., Cowley, D.C. (Eds.), Interpreting Archaeological Topography: 3DData, Visualization and Ground Observation. Oxbow, Oxford, pp. 90e101.
Murray, Matthew L., 2014. Gender, Cosmology, and the organization of space inearly Iron Age Funerary Monuments and Landscapes. In: Meyer, Will (Ed.),Engendering Landscape and Landscaping Gender. SUNY Press, Albany. TheInstitute for European and Mediterranean Archaeology (forthcoming).
Müller-Scheeßel, N., 2005. Die Toten als Zeichen: Ver€anderungen im Umgang mitGrab und Leichnamw€ahrend der Hallstattzeit. In: Kienlin, T. (Ed.), Die Dinge alsZeichen: Kulturelles Wissen und materielle Kultur. Habelt, Bonn, pp. 339e354.
Nakoinz, O., 2009. The method for the quantitative investigation of cultural simi-larities in the framework of the project “settlement hierarchies and culturalareas”. In: Krausse, D., Nakoinz, O. (Eds.), Kulturraum und Territorialit€at. Leidorf,Espelkamp, pp. 87e97.
Olson, B.R., Placchetti, R.A., Quartermaine, J., Killebrew, A.E., 2013. The Tel AkkoTotal Archaeology Project (Akko, Israel): assessing the suitability of multi-scale3D field recording in archaeology. J. Field Archaeol. 38 (3), 244e262.
Posluschny, A., 2006. From landscape archaeology to social archaeology: findingpatterns to explain the development of Early Celtic “Princely Sites” in MiddleEurope. In: Clark, J.T., Hagemeister, E. (Eds.), Digital Discovery. Exploring NewFrontiers in Human Heritage. CAA 2006 Computer Applications and Quantita-tive Methods in Archaeology, Proceedings of the 34th Conference, Fargo, ND,United States, April 2006 (Budapest 2007), pp. 131e141.
Posluschny, A., 2008. GIS as a means to investigate “Princely Sites”, space and en-virons: new ways to answer old questions. In: Gandin, C., Faory, F., Nuninger, L.(Eds.), ArchaeDyn e 7 Millennia of Territorial Dynamics, Settlement Pattern,Production and Trade from the Neolithic to the Middle Ages, ACI “Spaces andTerritories” 2005e2007, Final Conference e Dijon, 23e25 June 2008.
Rieckhoff, S., Biel, J., 2001. Die Kelten in Deutschland. Theiss, Stuttgart.Riek, G., 1962. Der Hohmichele. Heuneburgstudien I. In: R€omisch-germanische
Forschungen 25. Philipp von Zabern Verlag, Mainz.Schneider, S.A., 2003. Ancestor Veneration and Ceramic Curation: an Analysis from
Speckhau Tumulus 17, Southwest Germany (unpublished MA thesis). Universityof Wisconsin-Milwaukee.
�Smejda, L., 2008. Expanding scales in GIS analysis. In: Posluschny, A., Lambers, K.,Herzog, I. (Eds.), Layers of Perception. Proceedings of the 35th InternationalConference on Computer Applications and Quantitative Methods in Archae-ology (CAA), Berlin, 2.e6. April, 2007. Habelt, Bonn.
�Smejda, L., Turek, J. (Eds.), 2004. Spatial Analysis of Funerary Areas. Vydavatelství anakladatelství Ale�s Cenek, Plze�n.
Smith, N.G., Levy, T.E., 2012. Real-time 3D archaeological field recording: ArchField,an open-source GIS System Pioneered in Southern Jordan. Antiquity 85. http://antiquity.ac.uk/projgall/smith331/.
Stojakovic, V., Tepavecic, B., 2011. Image-based modeling approach in creating 3Dmorphogenetic reconstruction of Liberty Square in Novi Sad. J. Cult. Herit. 12,105e110..
Whittle, A., Healy, F., Bayliss, A. (Eds.), 2011. Gathering Time: Dating the EarlyNeolithic Enclosures of Southern Britain and Ireland. Oxbow Books, Oxford.


