Embed Size (px)
Citation preview

Aeolian Research 2 (2011) 215–220
Contents lists available at ScienceDirect
Aeolian Research
journal homepage: www.elsevier .com/locate /aeol ia
Recognising terrestrially-derived salt (NaCl) in SE Australian dust
Y. Shiga a,⇑, R.S.B. Greene a, K.M. Scott b,c, E. Stelcer d
a The Fenner School of Environment and Society, The Australian National University, Canberra ACT 0200, Australiab Research School of Earth Sciences, The Australian National University, Canberra ACT 0200, Australiac CSIRO Earth Science & Resource Engineering, P.O. Box 136, North Ryde, NSW 1670, Australiad ANSTO Institute for Environmental Research, Locked Bag 2001, Kirrawee DC, NSW 2232, Australia
a r t i c l e i n f o
Article history:Received 20 September 2010Revised 9 February 2011Accepted 9 February 2011Available online 4 March 2011
Keywords:Aeolian dustTerrestrial saltSoilIon beam analysisBack trajectory
1875-9637/$ - see front matter � 2011 Elsevier B.V. Adoi:10.1016/j.aeolia.2011.02.003
⇑ Corresponding author.E-mail address: [email protected] (Y. Shiga).
a b s t r a c t
The terrestrial and oceanic salt (NaCl) components in 39 dust samples from eight sites across southeastern Australia have been calculated from chemical data derived by ion beam analysis (IBA). Forsamples identified as having a positive terrestrial salt ratio (TSR; i.e., the abundance of terrestrial saltrelative to total salt expressed as a percentage), back trajectory analysis (estimation of the path of thewind affecting the site) was used to verify the likelihood of a terrestrial source for such salt. Thisprocedure indicated that the terrestrial salt input to south eastern Australia is non-negligible comparedto that of sea salt and the most likely sources of the terrestrial salt deposited in such area are the inlandsaline regions of the Lake Eyre and Murray Darling Basins. Terrestrial salt ratio values readily screen outthe majority of samples for which a terrestrial salt component is unlikely. Thus, calculating the ratios toidentify samples which are potentially influenced by terrestrial salt (e.g., prior to conducting a backtrajectory analysis on such samples) appears to be useful, especially since such determinations can bedone with small sample sets for which statistical analysis is not appropriate.
� 2011 Elsevier B.V. All rights reserved.
1. Introduction
The occurrence of aeolian dust storms across the Australiancontinent leads to the loss of considerable amounts of soil andreduces productivity (Williams and Young, 1999; Forward et al.,2004). Furthermore, such dust may also be an insidious carrier ofsalts which, when deposited, cause salinisation and/or sodificationof the soil (Acworth et al., 1997; Jankowski and Acworth, 1997;Bierwirth and Brodie, 2008; Cattle et al., 2009). Although there isconsiderable evidence that one of the major sources of Australiandust is from the Lake Eyre Basin of South Australia, where generallydry terrestrial salt lakes occur (Bonython, 1956; Gunn and Fleming,1984; Hesse and McTainsh, 2003; Greene et al., 2004; Hesse, 2004),co-transportation and co-deposition of terrestrial soil and terres-trial salts from such inland saline basins are not fully discerned.Other authors (e.g., Dart et al., 2007) have emphasised the signifi-cance of the oceanic component in dust deposited in south easternAustralia. In Western Australia, Hingston and Gailitis (1976) havefound that contributions from terrestrial sources from salt lakesand occluded drainage regions can be at least of equal importanceto oceanic sources. Thus, the purpose of this paper is to investigatethe link between saline sources and aeolian deposition with partic-ular focus on the south eastern Australia where salt input can lead
ll rights reserved.
to serious agricultural issues. In addition, this paper proposesa method to calculate the terrestrial component of saltdeposited (terrestrial salt ratio) and evaluates the robustness ofsuch results relative to independently determined back trajectoryanalysis.
2. Samples
During the period May 2007–April 2008, 39 rainfall sampleswere collected on a monthly basis at eight different sites acrosssouth eastern Australia (Fig. 1 and Table 1). These samples arepart of a larger set being gathered by the Australian Bureau ofMeteorology and CSIRO to document rainfall chemistry through-out Australia (Cresswell et al., 2006). The sampling locations(Fig. 1) were chosen to represent diverse areas of south easternAustralia (including remote areas) and includes both locationswhere incorporation of a terrestrial salt component would notbe expected (e.g., Cape Grim) and inland areas (e.g., WaggaWagga) for which terrestrial salt input might be expected. Sinceanalysis done in CSIRO required approximately 50 ml ofrainwater (F. Leaney, e-mail comm., 9 May 2008), samples wereavailable for this study if only rainwater was left after thisamount has been sub-sampled at CSIRO.
The collection area of the sampling device was 314 cm2 (i.e.,radius of the funnel = 10 cm) for most of the sites, but therewere some with only 78.5 cm2 collection area (i.e., radius of
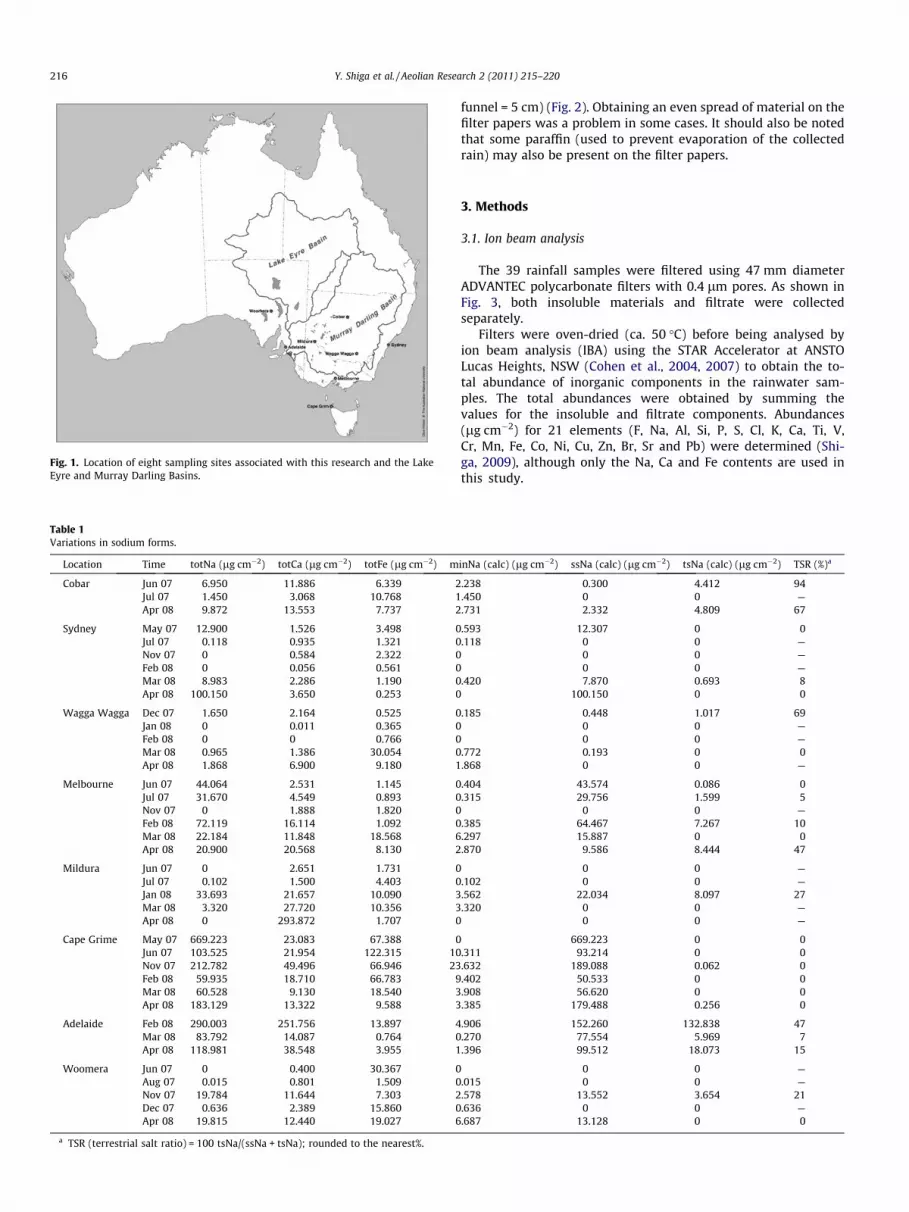
Fig. 1. Location of eight sampling sites associated with this research and the LakeEyre and Murray Darling Basins.
Table 1Variations in sodium forms.
Location Time totNa (lg cm�2) totCa (lg cm�2) totFe (lg cm�2) m
Cobar Jun 07 6.950 11.886 6.339 2Jul 07 1.450 3.068 10.768 1Apr 08 9.872 13.553 7.737 2
Sydney May 07 12.900 1.526 3.498 0Jul 07 0.118 0.935 1.321 0Nov 07 0 0.584 2.322 0Feb 08 0 0.056 0.561 0Mar 08 8.983 2.286 1.190 0Apr 08 100.150 3.650 0.253 0
Wagga Wagga Dec 07 1.650 2.164 0.525 0Jan 08 0 0.011 0.365 0Feb 08 0 0 0.766 0Mar 08 0.965 1.386 30.054 0Apr 08 1.868 6.900 9.180 1
Melbourne Jun 07 44.064 2.531 1.145 0Jul 07 31.670 4.549 0.893 0Nov 07 0 1.888 1.820 0Feb 08 72.119 16.114 1.092 0Mar 08 22.184 11.848 18.568 6Apr 08 20.900 20.568 8.130 2
Mildura Jun 07 0 2.651 1.731 0Jul 07 0.102 1.500 4.403 0Jan 08 33.693 21.657 10.090 3Mar 08 3.320 27.720 10.356 3Apr 08 0 293.872 1.707 0
Cape Grime May 07 669.223 23.083 67.388 0Jun 07 103.525 21.954 122.315 10Nov 07 212.782 49.496 66.946 23Feb 08 59.935 18.710 66.783 9Mar 08 60.528 9.130 18.540 3Apr 08 183.129 13.322 9.588 3
Adelaide Feb 08 290.003 251.756 13.897 4Mar 08 83.792 14.087 0.764 0Apr 08 118.981 38.548 3.955 1
Woomera Jun 07 0 0.400 30.367 0Aug 07 0.015 0.801 1.509 0Nov 07 19.784 11.644 7.303 2Dec 07 0.636 2.389 15.860 0Apr 08 19.815 12.440 19.027 6
a TSR (terrestrial salt ratio) = 100 tsNa/(ssNa + tsNa); rounded to the nearest%.
216 Y. Shiga et al. / Aeolian Research 2 (2011) 215–220
funnel = 5 cm) (Fig. 2). Obtaining an even spread of material on thefilter papers was a problem in some cases. It should also be notedthat some paraffin (used to prevent evaporation of the collectedrain) may also be present on the filter papers.
3. Methods
3.1. Ion beam analysis
The 39 rainfall samples were filtered using 47 mm diameterADVANTEC polycarbonate filters with 0.4 lm pores. As shown inFig. 3, both insoluble materials and filtrate were collectedseparately.
Filters were oven-dried (ca. 50 �C) before being analysed byion beam analysis (IBA) using the STAR Accelerator at ANSTOLucas Heights, NSW (Cohen et al., 2004, 2007) to obtain the to-tal abundance of inorganic components in the rainwater sam-ples. The total abundances were obtained by summing thevalues for the insoluble and filtrate components. Abundances(lg cm�2) for 21 elements (F, Na, Al, Si, P, S, Cl, K, Ca, Ti, V,Cr, Mn, Fe, Co, Ni, Cu, Zn, Br, Sr and Pb) were determined (Shi-ga, 2009), although only the Na, Ca and Fe contents are used inthis study.
inNa (calc) (lg cm�2) ssNa (calc) (lg cm�2) tsNa (calc) (lg cm�2) TSR (%)a
.238 0.300 4.412 94
.450 0 0 —
.731 2.332 4.809 67
.593 12.307 0 0
.118 0 0 —0 0 —0 0 —
.420 7.870 0.693 8100.150 0 0
.185 0.448 1.017 690 0 —0 0 —
.772 0.193 0 0
.868 0 0 —
.404 43.574 0.086 0
.315 29.756 1.599 50 0 —
.385 64.467 7.267 10
.297 15.887 0 0
.870 9.586 8.444 47
0 0 —.102 0 0 —.562 22.034 8.097 27.320 0 0 —
0 0 —
669.223 0 0.311 93.214 0 0.632 189.088 0.062 0.402 50.533 0 0.908 56.620 0 0.385 179.488 0.256 0
.906 152.260 132.838 47
.270 77.554 5.969 7
.396 99.512 18.073 15
0 0 —.015 0 0 —.578 13.552 3.654 21.636 0 0 —.687 13.128 0 0

Fig. 2. A sampling device and an example of placement at a CSIRO sampling site(Source: Cresswell et al., 2006).
Filter to collect mineral (insoluble) materials
Filter to collect soluble materials
Fig. 3. A schematic diagram of the filtration procedure. The arrow indicates theflow of the rainfall sample. Both the insoluble and soluble materials were collectedseparately for samples reported in this study by using two sets of filters and a petridish.
Y. Shiga et al. / Aeolian Research 2 (2011) 215–220 217
3.2. Calculation of sea–salt, non-sea–salt and terrestrial salt fractions
The Na and Ca salts in aeolian dust reflect contributions fromboth oceanic (sea–salt) and terrestrial (non-sea–salt) sources, i.e.,totNa = ssNa + nssNa and totCa = ssCa + nssCa.
Globally, oceanic Na and Ca abundances are related to seawaterabundances, i.e., ssCa/ssNa = (Ca/Na)sea water = 0.038 (Bowen, 1979).
Thus;nssCa ¼ totCa� ssCa ¼ totCa� ð0:038ÞssNa ð1Þ
Further, terrestrial Na and Ca contributions in dust are relatedto crustal abundances (Benassai et al., 2005), i.e., nssNa/nssCa =(Na/Ca)crust = 0.560 (Bowen, 1979).
Thus;ssNa ¼ totNa� nssNa ¼ totNa� ð0:560ÞnssCa ð2Þ
Simultaneously solving Eqs. (1) and (2), nssCa can be deter-mined as:
nssCa ¼ ð1:022ÞtotCa� ð0:039ÞtotNa ð3Þ
During this study, if the calculated nssCa value was larger thanthe totCa, nssCa was assumed to equal the determined totCa value.In contrast, if the calculated nssCa value was negative, the nssCavalue was assumed to be zero.
After determining nssCa, ssNa and nssNa values were calculatedusing Eq. (2). nssNa has two possible components: a soluble formconsisting of terrestrially derived Na in salt (tsNa) and an insolublemineral form consisting of Na (minNa) in minerals like feldsparand micas. Therefore, the Na component of terrestrial salt (tsNa)can be calculated by subtracting the insoluble minNa componentfrom the non-sea–salt Na (nssNa).
tsNa ¼ nssNa�minNa ð4Þ
However, minNa cannot be directly calculated by subtractingthe amount of Na as NaCl from totNa because Cl is commonlydepleted during aerosol transport (Ayers et al., 1999; Newberget al., 2005). Thus, minNa was calculated by using global averagefor the Na/Fe ratio of mineral dust, i.e., minNa/totFe = (Na/Fe)mineral
dust = 0.353 (Pye, 1987). (See Discussion for the implications of thisassumption for Australian dust.) If minNa was larger than nssNa,then tsNa was assumed to be zero.
minNa ¼ ð0:353ÞtotFe ð5Þ
From the chemical analyses for the rainfall samples, and usingEqs. (1)–(5), the following parameters were calculated: insolublemineral Na (minNa), terrestrial salt (ts) and the sea–salt (ss) frac-tions of Na, and sea–salt (ss) and the non-sea–salt (nss) fractionsof Ca. Then, using the ratio of the terrestrial salt Na (tsNa) to thetotal salt content of a sample (tsNa + ssNa), terrestrial salt ratios(TSR) were obtained for the 39 samples.
3.3. Back trajectory analysis
The potential sources of aeolian dusts were evaluated by backtrajectory analysis using the HYSPLIT (HYbrid Single-ParticleLagrangian Integrated Trajectory) program, which depends onwind speed and direction data to calculate the likely origin of a cer-tain atmospheric environment (Draxler and Hess, 1998; Draxlerand Rolph, 2003; Rolph, 2003). Back trajectory analysis was carriedout for weekly periods within each month to determine the char-acteristics of the passage of wind during the 48 h period prior toarrival at the collection site. The back trajectories were calculatedevery 2 h at 500 m above ground level at each site. Where possiblepassage over terrestrial salt source areas was likely, the passage ofthat wind was plotted back for 7 days to more fully evaluate itspassage.
4. Results
4.1. Chemical characterisation of dust
Table 1 lists the complete 39 samples analysed in this re-search. Approximately one-thirds (12 samples) was identified aspotentially containing some terrestrial salt (i.e., TSR > 0%). Amongthese, the Cobar (June 2007 and April 2008), Wagga Wagga(December 2007), Melbourne (April 2008) and Adelaide (February2008) samples appear to have approximately 50% or more oftheir salt load terrestrially derived. Table 1 also demonstrateshow TSR values vary with time at inland sites, e.g., at WaggaWagga (where a terrestrial component would be expected) com-pared to coastal sites, e.g., Cape Grim (where a terrestrial compo-nent would not be expected) and intermediate locations e.g.,Melbourne. As expected, TSR for Wagga Wagga and Melbournevary with month but values at Cape Grim are consistently zero(Table 1). Furthermore, seven out of 12 samples identified aspotentially containing terrestrial salt (TSR > 0%) was found con-centrated in 3 months of the year – February–April. This was con-sistent with the known dust active months of Australia (Prosperoet al., 2002).
4.2. Back trajectory analysis
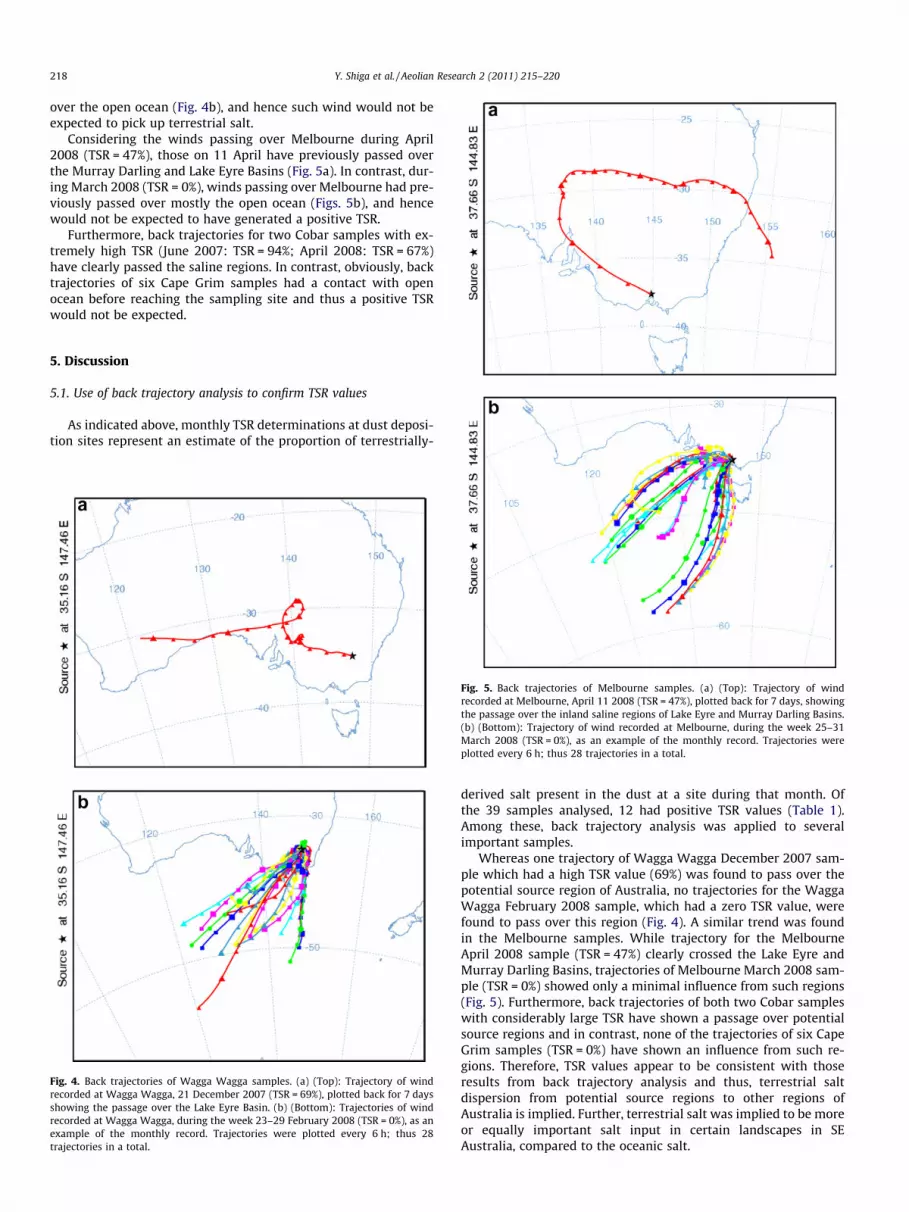
Back trajectory analysis was applied to Wagga Wagga and Mel-bourne samples to determine the difference in source regions be-tween a sample with high (Wagga Wagga: December 2007;Melbourne: April 2008) and those with low (i.e., zero) TSR values(Wagga Wagga: February 2008; Melbourne: March 2008). In addi-tion, back trajectory analysis was also conducted for those sampleswhich have shown outstanding TSR values; that is, two Cobarsamples (June 2007: TSR = 94%; and, April 2008: TSR = 67%) andCape Grim samples which consistently had a low TSR.
The Wagga Wagga (December 2007) sample has TSR = 69% andFig. 4a shows that wind which passed over Wagga Wagga on 21December had previously passed over potential terrestrial saltsources, i.e., the inland saline regions of Lake Eyre and Murray Dar-ling Basins. On the other hand, the trajectories for wind passingover Wagga Wagga during February 2008 (TSR = 0%) mostly pass
218 Y. Shiga et al. / Aeolian Research 2 (2011) 215–220
over the open ocean (Fig. 4b), and hence such wind would not beexpected to pick up terrestrial salt.
Considering the winds passing over Melbourne during April2008 (TSR = 47%), those on 11 April have previously passed overthe Murray Darling and Lake Eyre Basins (Fig. 5a). In contrast, dur-ing March 2008 (TSR = 0%), winds passing over Melbourne had pre-viously passed over mostly the open ocean (Figs. 5b), and hencewould not be expected to have generated a positive TSR.
Furthermore, back trajectories for two Cobar samples with ex-tremely high TSR (June 2007: TSR = 94%; April 2008: TSR = 67%)have clearly passed the saline regions. In contrast, obviously, backtrajectories of six Cape Grim samples had a contact with openocean before reaching the sampling site and thus a positive TSRwould not be expected.
5. Discussion
5.1. Use of back trajectory analysis to confirm TSR values
As indicated above, monthly TSR determinations at dust deposi-tion sites represent an estimate of the proportion of terrestrially-
Fig. 4. Back trajectories of Wagga Wagga samples. (a) (Top): Trajectory of windrecorded at Wagga Wagga, 21 December 2007 (TSR = 69%), plotted back for 7 daysshowing the passage over the Lake Eyre Basin. (b) (Bottom): Trajectories of windrecorded at Wagga Wagga, during the week 23–29 February 2008 (TSR = 0%), as anexample of the monthly record. Trajectories were plotted every 6 h; thus 28trajectories in a total.
Fig. 5. Back trajectories of Melbourne samples. (a) (Top): Trajectory of windrecorded at Melbourne, April 11 2008 (TSR = 47%), plotted back for 7 days, showingthe passage over the inland saline regions of Lake Eyre and Murray Darling Basins.(b) (Bottom): Trajectory of wind recorded at Melbourne, during the week 25–31March 2008 (TSR = 0%), as an example of the monthly record. Trajectories wereplotted every 6 h; thus 28 trajectories in a total.
derived salt present in the dust at a site during that month. Ofthe 39 samples analysed, 12 had positive TSR values (Table 1).Among these, back trajectory analysis was applied to severalimportant samples.
Whereas one trajectory of Wagga Wagga December 2007 sam-ple which had a high TSR value (69%) was found to pass over thepotential source region of Australia, no trajectories for the WaggaWagga February 2008 sample, which had a zero TSR value, werefound to pass over this region (Fig. 4). A similar trend was foundin the Melbourne samples. While trajectory for the MelbourneApril 2008 sample (TSR = 47%) clearly crossed the Lake Eyre andMurray Darling Basins, trajectories of Melbourne March 2008 sam-ple (TSR = 0%) showed only a minimal influence from such regions(Fig. 5). Furthermore, back trajectories of both two Cobar sampleswith considerably large TSR have shown a passage over potentialsource regions and in contrast, none of the trajectories of six CapeGrim samples (TSR = 0%) have shown an influence from such re-gions. Therefore, TSR values appear to be consistent with thoseresults from back trajectory analysis and thus, terrestrial saltdispersion from potential source regions to other regions ofAustralia is implied. Further, terrestrial salt was implied to be moreor equally important salt input in certain landscapes in SEAustralia, compared to the oceanic salt.

Y. Shiga et al. / Aeolian Research 2 (2011) 215–220 219
However, although this study utilised a fine temporal resolution(i.e., every 2 h) for back trajectory analysis and trajectories ap-peared to show some trend in direction (cf. Figs. 4b and 5b), itshould be noted that in some cases, wind conditions can changedrastically on a scale of minutes (Raupach et al., 1994).
Furthermore, seasonal variations are expected because soil andterrestrial salt are more likely to be mobilised during the summermonths when such materials are drier and vegetation binding islower (Greene et al., 2009). In fact, seven out of 12 samples identi-fied as potentially containing terrestrial salt was found in the sum-mer–early autumn (February–April) which is known as the dustactive months in Australia (Prospero et al., 2002). Nevertheless,systematic collection is warranted to confirm such seasonal terres-trial salt contribution to aeolian material.
5.2. Implications of results to salt deposition in SE Australia
Despite the complexity of the mechanism for aeolian dust gen-eration and transportation (Joeckel et al., 2010) and the approxi-mations used in this paper for calculating the terrestrial saltcomponent within a monthly dust sample, calculated TSR appearto be consistent with the results from back trajectory analysis. Fur-ther, terrestrial salt appears to be derived from potential source re-gions, such as the inland saline regions of the Lake Eyre and MurrayDarling Basins where large amounts of soil with a conspicuouslyhigh proportion of terrestrial salt are present (Bonython, 1956;Gunn and Fleming, 1984; Greene et al., 2004). Aeolian transportof salt with dust and its subsequent deposition can cause seriousproblems such as salinisation and/or sodification of soil profilesin leeward regions which can further damage agricultural produc-tivity (Acworth et al., 1997; Jankowski and Acworth, 1997;Acworth and Jankowski, 2001; Melis and Acworth, 2001; Smithson,2004). Although absolute amount of salt was not able to be calcu-lated in this study, very high TSR depicted in several samples im-plied the non-negligible impacts of aeolian derived terrestrial saltin the SE Australian landscape compared to sea salt – nearly halfor more than half of salt input in some sites, such as Cobar June2007 (94%) and Cobar April 2008 (67%), Wagga Wagga December2007 (69%), Melbourne April 2008 (47%) and Adelaide February2008 (47%), was estimated to be terrestrial origin.
5.3. Recommendations for further studies
Reheis (2003) measured the dust composition downwind fromthe Owens Lake playa in California, USA, and demonstrated that upto 60% of the dust is comprised of soluble salts. However, in thiscurrent study, the absolute amount of terrestrial salt depositioncould not be accurately calculated because: (i) the IBA methoddoes not account for major components such as carbon and boundwater i.e., only an incomplete composition of the dust was deter-mined; (ii) the possible presence of some paraffin in samples;and, (iii) precipitation of very small amounts of insoluble materialonto the filter papers may have resulted in inhomogeneity in thesample being analysed, thus leading to inaccurate estimates ofsome of the elements. Nevertheless, terrestrial salt ratios, such asthe one for Wagga Wagga December 2007 (TSR = 69%) imply thatmore than half of the salt associated with dust is terrestrially de-rived, with similar or higher proportions calculated for other in-land sites. Furthermore, back trajectory analysis implied that theinland saline regions of the Lake Eyre and Murray Darling Basinsare potential sources for such a high terrestrial salt content. How-ever, additional studies are needed to more adequately documentthe absolute variation in terrestrial salt contributions with sea-son/time of year. In particular, further work using additional col-lection sites is needed to better estimate the actual abundance of
salt deposition in the agriculturally important regions includingMurray Darling Basin in SE Australia.
Despite the consistency between TSR results and BTA, the meth-odology could be improved by using: (i) a better filtration systemto ensure a more homogeneous precipitation on filter papers (cf.Karlson et al., 2009); and, (ii) (Na/Ca)crust and (Na/Fe)mineral dust
compositions derived from actual source material rather than theglobal averages used in Eqs. 2 and 5, respectively. In particular,the high Fe content in Australian dust (Kamber et al., 2005; Rahdiet al., 2009) means that the utilised global average can be higherthan the (Na/Fe)mineral dust for the inland Australia-derived dust.However, simple analysis utilising Australian (Na/Fe)sediment calcu-lated from Kamber et al. (2005), have indicated TSR difference isminimal (approximately 5%), and have shown that such variancein (Na/Fe)mineral dust would not have a major impact on the resultsof this study.
6. Conclusions
Of the 39 samples studied, 12 samples implied the presence ofterrestrial salt. Several samples were calculated to have similar ormore input of salt (NaCl) from terrestrial sources than oceanicsources. For example, Cobar June 2007 sample showed TSR of94%. Therefore, terrestrial salt input to the landscapes of the southeastern Australia by means of aeolian transportation appeared tobe non-negligible compared to that of sea salt. Furthermore, whileresults from back trajectory analysis indicated that the passageover potential salt sources in arid/semi-arid areas of Australia didoccur for samples with high TSR, back trajectories of sampleswhich showed low TSR value, including those from Cape Grim, ap-peared to have no influence from such potential terrestrial saltsources. Thus, TSR seemed to be consistent with results from backtrajectory analysis and hence, terrestrial salt dispersion from po-tential source regions to other regions of Australia was implied.
Back trajectory analysis on monthly dust samples based on TSRvalues provides a useful screening technique to readily identifysingle samples likely to be affected by terrestrial salt contributionswithout utilising the large data sets.
Acknowledgements
This work formed part of a Master of Geographical Sciencesstudy undertaken by the senior author at the Australian NationalUniversity. The study was financially supported by grants fromFrank Valzano and AINSE (AINGRA07062). Richard Cresswell (CSIROLand and Water) is thanked for making the samples used in thisstudy available. Clive Hilliker helped with the preparation of somediagrams. Discussions with Ross Mitchell (CSIRO Land and Water),Emlyn Williams (ANU Statistical Consulting Unit) and colleagueswithin the ANU Fenner School of Environment and Society aregratefully acknowledged.
References
Acworth, R.I., Jankowski, J., 2001. Salt source for dry land salinity-evidence from anupland catchment on the Southern Tablelands of New South Wales. Aust. J. SoilRes. 39 (1), 39–59.
Acworth, R.I., Broughton, A., Jankowski, J., 1997. The role of debris-flow deposits inthe development of dryland salinity in the Yass Catchment, New South Wales,Australia. Hydrogeol. J. 5 (1), 22–36.
Ayers, G.P., Gillett, R.W., Cainey, J.M., Dick, A.L., 1999. Chloride and bromide lossfrom sea–salt particles in Southern Ocean air. J. Atmos. Chem. 33 (3), 299–319.
Benassai, S., Becagli, S., Gragnani, R., Magand, O., Proposito, M., Fattori, I., Traversi,R., Udisti, R., 2005. Sea-spray deposition in Antarctic coastal and plateau areasfrom ITASE traverses. Ann. Glaciol. 41 (1), 32–40.
Bierwirth, P.N., Brodie, R.S., 2008. Gamma-ray remote sensing of aeolian salt sourcesin the Murray-Darling Basin, Australia. Remote Sens. Environ. 112 (2), 550–559.
Bonython, C.W., 1956. The salt of Lake Eyre – its occurrence in Madigan Gulf and itspossible origin. T. Roy. Soc. South Aust. 79, 66–92.
220 Y. Shiga et al. / Aeolian Research 2 (2011) 215–220
Bowen, H.J.M., 1979. Environmental Chemistry of the Elements. Academic Press,London.
Cattle, S.R., Greene, R.S.B., McPherson, A.A., 2009. The role of climate and localregolith-landscape processes in determining the pedological characteristics ofæolian dust deposits across south-eastern Australia. Quatern. Int. 209 (1–2),95–106.
Cohen, D.D., Garton, D., Stelcer, E., Hawas, O., Zahorowski, W., 2004. Long rangetransport of fine particulate soil, sulphate and black carbon across the eastAsian region and beyond during 2001–03 13th World Clean Air andEnvironmental Protection Congress, 22–27 August 2004. London, UK.
Cohen, D.D., Stelcer, E., Bac, V.T., 2007. Quantification of Fine Particle Composition,Sources and Transboundary Transport in Hanoi, Vietnam from 2001 to 2006.ANSTO, Sydney.
Cresswell, R., Dighton, J., Herczeg, A., Turner, J., Walder, G., Gillett, R., 2006. MD311:Australia-wide network to measure rainfall chemistry and isotopiccomposition. CSIRO Land and Water.
Dart, R.C., Barovich, K.M., Chittleborough, D.J., Hill, S.M., 2007. Calcium in regolithcarbonates of central and southern Australia: its source and implications for theglobal carbon cycle. Palaeogeogr. Palaeoecl. 249 (3–4), 322–334.
Draxler, R.R., Hess, G.D., 1998. An overview of the HYSPLIT_4 modelling systemfor trajectories, dispersion and deposition. Aust. Meteorol. Mag. 47, 295–308.
Draxler, R. R., Rolph, G. D., 2003. HYSPLIT (HYbrid Single-Particle LagrangianIntegrated Trajectory) Model. NOAA Air Resources Laboratory, Silver Spring,MD. Available from: http://www.arl.noaa.gov/ready/hysplit4.html (Accessed 31October 2009).
Forward, G., Payne, R., Bright, M., 2004. The estimated cost of wind erosion in SouthAustralia’s agricultural lands. Proceedings of Wind-blown Dust Workshop, 8–10November 2004. Melbourne, CSIRO Marine and Atmospheric Research,Melbourne. pp. 93–97.
Greene, R.S.B., McPherson, A., Eldridge, D., Murphy, B., Rankin, M., 2004. Recentaeolian dust activity in Australia: implications of land management for dustsources and their control. Proceeding of Wind-blown Dust Workshop, 8–10November 2004. Melbourne, CSIRO Marine and Atmospheric Research,Melbourne. pp. 57–63.
Greene, R.S.B., Cattle, S.R., McPherson, A.A., 2009. The role of aeolian dust deposits inlandscape development and soil degradation in Southeastern Australia. Aust. J.Earth Sci. 56, 55–65.
Gunn, R.H., Fleming, P.M., 1984. The estimated store of soluble salts in Lake EyreCatchment in Queensland and their possible transport in stream flow to thelake. Aust. J. Soil Res. 22 (2), 119–134.
Hesse, P.P., 2004. The late Quaternary records of dust in Australia: source areacontrols–downstream impacts. Proceedings of Wind-blown Dust Workshop, 8–10 November 2004. CSIRO Marine and Atmospheric Research, Melbourne,Melbourne. pp. 76–80.
Hesse, P.P., McTainsh, G.H., 2003. Australian dust deposits: modern processes andthe Quaternary record. Quaternary Sci. Rev. 22 (18–19), 2007–2035.
Hingston, F.J., Gailitis, V., 1976. The geographic variation of salt precipitated overWestern Australia. Aust. J. Soil Res. 14 (3), 319–335.
Jankowski, J., Acworth, R.I., 1997. Impact of debris-flow deposits onhydrogeochemical processes and the development of dry land salinityin the Yass River Catchment, New South Wales, Australia. Hydrogeol. J. 5 (4),71–88.
Joeckel, R.M., Greene, R.S.B., Mason, J.A., 2010. The role of clay mineralogy andelectrolytes in determining the stability of clay pellets in dry saline lakebeds ofthe USA and SE Australia. Extended Abstracts–21st Australian Clay MineralsConference–Brisbane, August 2010, 117–118.
Kamber, B.S., Greig, A., Collerson, K.D., 2005. A new estimate for the composition ofweathered young upper continental crust from alluvial sediments, Queensland,Australia. Geochim. Cosmochim. Acta 69 (4), 1041–1058.
Karlson, L. R., Greene, R. S. B., Reilly, R., Scott, K. M., Stelcer, E., Atanacio, A. J.,Cresswell, R., 2009. Application of IBA and refined sample preparationtechniques to the study of aeolian dust samples from Northwest Australia.Proceedings 16th AINSE Conference on Nuclear and ComplementaryTechniques of Analysis. 25-27 November 2009, Lucas Hts. Available from:http://www.ainse.edu.au/__data/assets/pdf_file/0007/41893/NCTA-41-Karlson.pdf (Accessed 6 July 2010).
Melis, M.I., Acworth, R.I., 2001. An aeolian component in Pleistocene and Holocenevalley aggradation: evidence from Dicks Creek catchment, Yass, New SouthWales. Aust. J. Soil Res. 39 (1), 13–38.
Newberg, J.T., Mattew, B.M., Anastasio, C., 2005. Chloride and bromide depletions insea–salt particles over the northeastern Pacific Ocean. J. Geophys. Res. 110,D06209. doi:10.1029/2004JD005446.
Prospero, J.M., Ginoux, P., Torres, O., Nicholson, S.E., Gill, T.E., 2002. Environmentalcharacterization of global sources of atmospheric soil dust identified with theNIMBUS 7 Total Ozone Mapping Spectrometer (TOMS) absorbing aerosolproduct. Rev. Geophys. 40 (1), 1002. doi:10.1029/2000RG000095.
Pye, K., 1987. Aeolian Dust and Dust Deposits. Academic Press, London.Rahdi, M., Box, M., Box, G.P., Mitchell, R.M., Cohen, D.D., Stelcer, E., 2009. Optical,
physical and chemical characteristics of Australian desert dust aerosols: resultsfrom a field experiment. Atmos. Chem. Phys. Discuss. 9, 25085–25125.
Raupach, M., McTainsh, G.H., Leys, J.F., 1994. Estimates of dust mass in recent majorAustralian dust storms. Aust. J. Soil Water Conserv. 7 (3), 20–24.
Reheis, M. C., 2003. Dust deposition in Nevada, California, and Utah, 1984–2002. USGeological Survey Open-File Report 03-138.
Rolph, G. D., 2003. Real-time environmental applications and display system(READY) website, NOAA Air Resources Laboratory, Silver Spring, MD. Availablefrom: http://www.arl.noaa.gov/ready/hysplit4.html. (Accessed 31 October2009).
Shiga, Y., 2009. Dust and Terrestrial Salt (NaCl) in SE Australia: Implications forAeolian Co-Transport and Co-Deposition. Master of Geographical SciencesThesis, ANU.
Smithson, A., 2004. Evidence of aeolian Quaternary sediments as a salt source fordryland salinity in Central New South Wales. The Ninth Murray-Darling BasinGroundwater Workshop, 17–19 February 2004, Bendigo.
Williams, P., Young, M., 1999. Costing dust – How much does wind erosion cost thepeople of South Australia? Available from: http://www.clw.csiro.au/publications/consultancy/1999/costing_dust.pdf (Accessed 31 October 2009).


