Embed Size (px)
Citation preview

Data-driven Dialectology
John NerbonneAlfa-informatica, University of Groningen
P.O.Box 716, NL9700 AS Groningen, NetherlandsTel. +31 50 363 58 15, FAX +31 50 363 68 55
October 30, 2008
Abstract Most studies of language variation proceed from the geographicor social distribution of single elements (features), and find it difficult toproceed further. Data-driven dialectology, and more generally, data-drivenvariationist studies, begin instead from an aggregate view of language vari-ation and reap immediate benefits in dealing with well-known exceptions inthe distributions of single features and in avoiding the need to select whichfeatures to use as the basis of characterizations. But the major advance isthe opportunity to characterize general tendencies in linguistic variation.
Keywords Language variation, dialectology, sociolinguistics, data-drivenlinguistics
1

1 Introduction
The Gershwins celebrated linguistic variation famously in Let’s call the wholething off : “You say tomato [t@."meI.RoÚ], and I say tomahto [t@."ma.toÚ],You say potato [p@."teI.RoÚ], and I say potahto [p@."ta.toÚ].” The systematicstudy of linguistic variation profits in popularity from the fascination for“accents” and dialects, but it also interacts with historical linguists, who seein variation the pool of mutations from which language change arises, andwith theoretical linguists in search of a broader base of material to test theirideas. Variationist linguistics proceeds from this natural fascination to solidand well-documented scholarship (Chambers & Trudgill 1998, [11980], Milroy& Gordon 2003, Niebaum & Macha 2006).
Variationist linguistics studies the differences in a single language as it isused in different areas (dialectology), or by people of different classes, occu-pations, sexes, or races (sociolinguistics). The name “variationist linguistics”has become popular as more and more attention has come to be paid to themany non-geographic factors which determine differences.
Most work in variationist linguistics focuses on the geographic or socialdistribution of single features or small numbers of single features. The Gersh-wins’ lyrics mention about five varying sounds in nine different words,1 andmany linguistics articles study even smaller numbers of varying elements.This article presents a data-driven alternative which has developed underthe name dialectometry in which large numbers of features are aggreg-ated when varieties are characterized (Seguy 1973, Goebl 1984). We arguebelow that students of linguistic variation implicitly accept the need to ag-gregate over many linguistic differences but differ on the level of abstractionat which aggregation is to be employed. Seen from this perspective, thefocused contribution of present essay is to reflect on why higher levels ofaggregation make sense.
We summarize the arguments for employing aggregating techniques inthis introductory section, and elaborate on them in the following severalsections. Before launching into the arguments, we clarify what we see as theissue.
1.1 Feature-Based Variation Studies
Linguists normally analyze variation in one element—i.e., feature—at atime, whether the elements (or features) be sounds, words, morphemes, con-
1For the cultural historians, we note that the others were ‘either’ and ‘neither’, ‘pajama’and ‘after’, ‘vanilla’ and ‘parilla, and ‘oyster’.
2

structions, or whatever. Linguists have for example studied the pronunci-ation of /r/ in the 1960’s in New York City, the folk words for ‘dragonfly’in Pennsylvania, the realization of the German diminutive suffix along theRhine, and the orders of auxiliary verbs in continental West Germanic (seenote 3 for references). We refer to such characterizations based on individualfeatures as (single)-feature based,2 and we emphasize that we use theterm ‘feature’ not only to refer to phonological features such as [+round] ormorphosyntactic features such as [+plural], but more broadly. As a passagefrom Judges suggests (see note), single features are often sufficient for thedetection of signals of social and geographical belonging. There are moreovercountless single-feature-based studies; an immense amount is known aboutthe geographic and social distribution of individual linguistic features; andthis information has often been organized into fascinating dialect atlases.
We nonetheless argue that aggregating techniques supplement the exist-ing feature-based analytic arsenal significantly and enable answers to somefundamental questions of variationist linguistics that are inaccessible to single-feature studies. Having said that, we need of course to explain what we see asthe fundamental questions of variationist linguistics. We turn to this directly.
Speakers employ overlays of variation in form in order to signal geo-graphic and social provenance (even if they speak primarily to communic-ate). The study of linguistic variation focuses on this variation and howit signals provenance. By using syllable-final [r] in New York City in the1960’s, speakers signaled their membership in the middle classes; by callinga dragonfly a darning needle, Pennsylvanians signaled their northern proven-ance in the mid-twentieth century; and by using auxiliary verbs before mainverbs in subordinate clauses, German speakers identify themselves as Swissor, at least, Southern.3
Without presuming to define variationist linguistics, we proceed uncon-troversially from the assumption that one of its tasks is to characterize thesignals of provenance language users provide.4 One way of re-stating our
2They might less neutrally be referred to as shibboleth-based as the earliest com-mentary on linguistic variation is Judges (12:6), which focuses on a single feature:
[...] Then said they unto him, Say now Shibboleth: and he said Sibboleth:for he could not frame to pronounce it right. Then they took him, and slewhim at the passages of Jordan: and there fell at that time of the Ephraimitesforty and two thousand.
3Labov (2006) analyzed New York city’s loss of syllable-final /r/, LAMSAS providesthe documentation of the lexicalization of ’dragonfly’ (Kretzschmar 1994), and Abraham(2008) discusses the German verb clusters.
4Of course we realize that some speakers consciously modify their pronunciation so as
3

main thesis is that these signals need to be studied in the aggregate. Athigher levels of aggregation, signals become more reliable, signals may becompared to one another with respect to their relative strength, and, lastbut not least, general laws of linguistic variation may be stated.
1.2 Structure
Section 2 presents an archive of dialect data, demonstrating the enormousamount of variation often left unmentioned in textbooks and even in scholarlyarticles on language variation, which normally abstract away from this tosome extent, implicitly introducing aggregation at a very low level.
Section 3 develops the argument that single features inevitably contradicteach other, at least in detail, and that they tend to have exceptions and sparsedistributions (like all linguistic distributions). The point of discussing thisadmittedly well-known point in more detail here is two-fold. First, in ourexperience linguists underestimate how large and genuine the problem is. Tomake the point concrete, we continue the analysis begun in Section 2. Second,the problematic status of single-feature distributions motivates moving tohigher levels of aggregation.
Section 4 below is devoted to the criticism that single-feature studiesare methodologically weak in allowing too much freedom of choice concern-ing which features are said to figure in the definition of dialect areas.5 Wecontrast this with a view which aggregates over a large number of features,which views aggregate differences as characterizing the relations among lin-guistic varieties. Section 5 presents the case that an aggregated perspectiveenables the formulation of more general laws. Finally Section 6 discusses howthe present view vis-a-vis aggregation differs from earlier views inter alia on“bundling isoglosses” and on attention to structural effects.
Our primary point is that linguistic variation ought to be studied in theaggregate. Our approach is massively indebted to the dialectometry ofSeguy (1973) and Goebl (1984), as noted above, and we are pleased to re-gard it as dialectometry, but we focus here neither on measurement nor onprinciples of classification, the common focus in dialectometry, but rather onthe aggregating step which both Seguy and Goebl use to great advantage.
to mask their real provenance, but we regard them too as providing signals of provenance,only misleading ones, and will not take care to consider them separately in what follows.
5And we claim that the problem of the choice of features re-emerges even if oneinterprets the data as signaling, not areas, but rather dialect continua (Heeringa &Nerbonne 2001) or membership in another extralinguistic group. We wish to remainjudiciously vague about the nature of the extralinguistic provenance which is signaled.
4

2 Low-Level Aggregation
By focusing exclusively on single features or small combinations of these,variationists, including dialectologists, sometimes fail to isolate signals ofprovenance clearly. The signals are often so complex, even misleading, thatthey resist analysis using simple, single-featured methodologies. This is onereason to employ the aggregating techniques of dialectometry. This and thefollowing section follows aggregating steps from very specific to quite generallevels.
The main point of this section is to show how abstraction leads to moresatisfying characterizations of how provenance is signaled in linguistic vari-ation, and to reflect on this. This step of abstraction naturally implies ag-gregating data into the more abstract categories. This section follows thedata from large collections (the archives on which dialect atlases are based)to characterizations of its distribution in maps. The purpose of following theanalysis this way is to emphasize how common certain steps of abstractingand aggregating are. We hope to make more ambitious aggregating stepsmore palatable in this way.
Inspecting the archive of linguistic material behind an atlas, one is struckby the amount of variation that never makes it to the beautiful pages of theatlas itself. We examine material from a dialect data collection in order todrive home the point that the data is extremely varied. In what follows we usematerial from the Phonetischer Atlas Deutschlands (PAD), material collec-ted between 1965 and 1991 by Marburg dialectologists under the supervisionof Prof. Joachim Goschel. 201 words from the famous Wenkersatze were re-corded in 186 sites throughout Germany (Goschel 1992). The pronunciationsin these recordings were subsequently transcribed by a team of professionalphoneticians, including Prof. Angelika Braun of Marburg. They used amethodology in which two phoneticians transcribed each pronunciation in-dependently, and later compared results to obtain consensus transcriptions.Researchers from the University of Groningen digitized the handwritten IPAmaterial in X-SAMPA notation in 2003 (Nerbonne & Siedle 2005). Thematerial exclusively concerns pronunciation, but we maintain that other lin-guistic levels will show similar patterns vis-a-vis exception and conflictingindications.
Our second reason for wishing to review this material is to drive home thepoint that dialectology already makes use of a number of steps of abstrac-tion that implicitly aggregate. In doing this we wish to sharpen the debateabout the need for aggregation: in general, dialectology and other variation-ist studies accept many aggregating steps. The issue is thus not whether toaggregate, rather on what scale.
5

Table 1: 87 pronunciations of ich at the 201 different collection sites of thePAD. Twelve transcriptions are omitted since they seemed to violate IPAspecifications, almost all involving what appeared to be the trailing diacrit-ics [-] and [+], presumably denoting retraction and advancement. [Ic] wasrecorded 17 times, [Ik] 13 times, and [i] nine times, but no other pronunciationwas recorded more than five times.
1 5Ic 5Ic˜
5¯Ic QI–k QIk @IS >@
˜Ig c EI–S
¯Ec˜k E–g E
˙Icff E
˙IS¯E
˙Ik Ek Ekh I I: IP Ic Icff Ic
¯IG IGff IS ISff IS
¯I¯c I
¯c¯
I¯G I
¯g I
¯k I
¯k. I
¯C I
¯ý I
˚k I–c I–g I–g. I–j I–k
I–C I–x I˙
I˙c¯
I˙: I
˙:c I
˙c I
˙X I
˙g I
˙g. I
˙k I
˙C I
˙ý Ig
Ij Ij˜
Ik Ikh IC Ixff Yc¯
Yý e >e¯IG e–
>Pk e–c e–g e
˙S—
e˙
>cj e
˙c e
˙G e
˙g e
˙j e
˙C eg ek e
>kx
˜i i: i:c i:c
˜ic
i– i–:>jc i–k
2.1 Phonetic Tokens in Single Words
The PAD is similar to most linguistic atlases in being recorded in dauntingphonetic detail. One of the simplest words in the atlas is ich, (/Ix/, [Ic]in standard German). The final consonant is pronounced [c] in standardGerman, and normally analyzed as palatal allophone of the velar fricative/x/, so that we sometimes refer to the stop/fricative distinction as a ‘k/x’distinction, when perhaps we should always note that the /x/ may be real-ized as [x(c)], i.e., as [x] or as [c]. We find eighty-seven different phonetictranscriptions for this word at the 201 different data collection sites, whichwe present in Table 1. We note that there are 28 different renderings of thefinal consonant and 29 different renderings of the vowel. A small number ofthe transcriptions are distinguished only in that one records a syllable breakfollowing the consonant while the other does not, and we do not suppose thatthis distinction is dialectologically relevant. But eliminating these would notchange the overall situation significantly: phonetic atlases contain so great avariety of material that the analyst is forced to categorize to make any senseof the material.
It is worth emphasizing that the example of ich is not exceptional. Forexample, 34 different vowels were recorded in the word Eis in the PAD, evenif only three different consonants were recorded. This sort of detail is frequentin dialect atlases. For an example from another data collection, the publiclyavailable LAMSAS dataset contains over 1.100 different vowels at 450 sites(http://hyde.park.uga.edu/lamsas/).
6

We shall characterize the variation in the final consonant of ich in thestandard way, as a difference between stops and fricatives. Although this isthe form normally presented in textbooks on linguistics or on dialectology, anontrivial step is needed to categorize the approximately 28 variants of thevariable found in just this one word. [k, g, c, kh, kj, and gj] and [g
˚] are clearly
stops, and [x, c, G, J, X, K, C] and [ý] are clearly fricative and plausible resultsof frication applied to [k], but there remain fricative allophones which arenot straightforward frications of the velar stop ([S, S
¯] etc.), the non-fricative
approximant [j], and, finally, cases where no final consonant is realized. Sincethe problematic cases are in some sense interpretable as lenitions of thevelar stop, we in fact opt to class all of these with the clear cases of fricatives.
The degree of phonetic detail in Table 1, and that in most dialect at-las collections,6 suggests that we shall always need to move from low-levelcharacterizations to more abstract levels. The move to a higher level ofabstraction involves classifying the different recordings along one or moreparameters. And this is what dialectologists have in fact always done withthis sort of data, for example, focusing on two sets of variants. While onemay always explore alternative abstractions (classifications), it is clear thatthe step to a more abstract view of the data promises to liberate the analysisto allow more room for insight. But let us note that the classification stepis effectively a step in aggregation: many observations are grouped into asingle class. With an eye toward future aggregating steps we note that thisstep is always taken with respect to a single paradigmatic dimension. Thusit involves aggregating among the pronunciations of the final consonant inich or the initial vowel in Eis, but it does not require aggregating across suchcategories.
2.2 What is signaled?
We turn to an examination of the geographic distribution of the final stopvariants found in ich /Ix/. Figure 1 shows the relative concentrations of stopversus fricative variants in the pronunciation of ich. We obtained this by firstdividing the map of Germany into polygons surrounding collection sites, andthen coloring each polygon darker in proportion with the stop variants of the
6One may ask whether the practice of atlas compilers to transcribe in such narrowdetail is sensible. On the other hand Ton Goeman measured the consistency of the twomain transcribers for the recent, very large (> 106 word/phrase transcriptions) Goeman-Taledeman-van Reenen project (GTRP) at r ≈ 0.95 for consonants, r ≈ 0.9 for vowels, andr ≈ 0.8 for diacritics (Goeman 1999, Ch. 3). Perhaps the atlases are faithful renderings ofspeech, which, however contains a great deal of sub-dialectal as well as dialectal variation.But this is a point about which serious criticism is certainly possible.
7

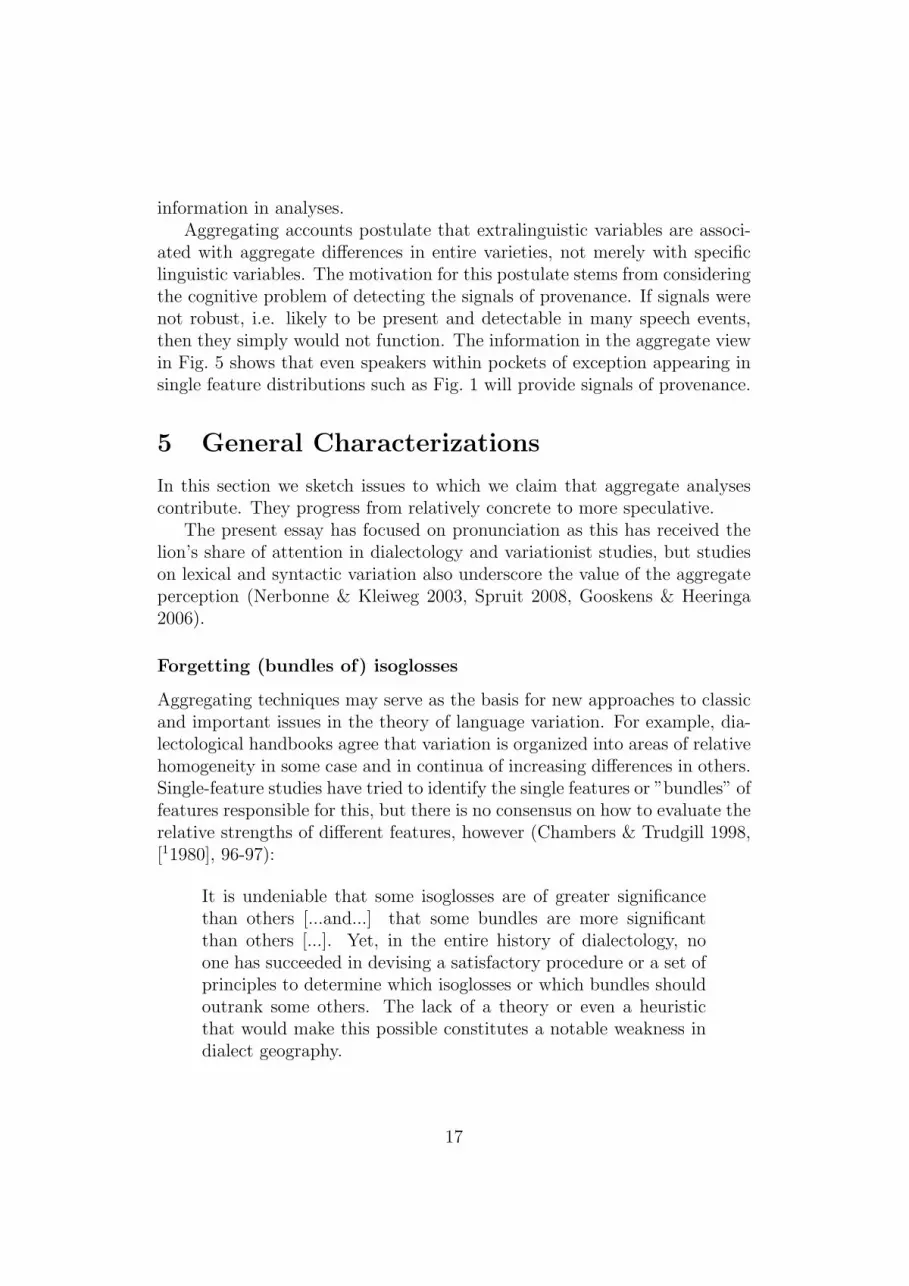
Figure 1: The [k/x(c)] distinction in the word ich in the PAD. The darkerthe polygon, the greater the concentration of stop variants. There was nodata available for the polygons with diagonal lines.
final consonant in ich. Once we aggregate over the many subvariants of stopsand fricatives, a relatively clear pattern emerges, but one with prominentpockets of exceptions. This is the normal result obtained when mapping anysingle linguistic feature, even after abstracting over a great deal of detail invariation.
The pockets of exceptions in distributions such as that in Figure 1 hasoften been remarked on in dialectology. The geographic distributions ofindividual linguistic elements—be they phonological features, lexicalizations,allophones, or case restrictions—are never smooth, but rather always fraughtwith exception. This is the source of the complaint echoed by Bloomfield(1933), that “every word has its own history” (p.328). Variationist linguisticshas advanced a great deal since Bloomfield, but still remains focused onindividual linguistic features whose distributions are inevitably rough.
We sum up this section by noting that good dialectological practice hasalways aggregated in this fashion, abstracting from extremely detailed re-cordings to more abstract renderings of selected differences. We do not arguetendentiously that this aggregating step justifies all others, only that dialect-ology has made extensive use of this sort of aggregation in any case. Thisdoes not mean that all aggregation is sound, but it certainly does mean thatsome aggregation is standard practice. Far from criticizing this practice, weargue below that good dialectological analysis needs to adopt techniques of
8

aggregation more extensively.
2.3 Phonetic Tokens in Multiple Words
In fact, a second step of aggregation is likewise standard, that of aggregatingover the occurrences of variables in different words. To continue using the ex-ample we began in Section 2 above, we need to collect various words in whichthe variable occurs and aggregate over the variants used in their pronunci-ations. In our data collection, this includes the words ich /Ix/ (standardlypronounced [Ic]), dich /dIx/, auch /aux/, and gleich /glaIx/. (In fact welikewise have schlechte /SlExt@/ and schlechten /SlExt@n/ in the dataset, butthese – etymologically different – tokens of /x/ are never pronounced altern-atively with a /k/, so they are not used in the present example.) The increasein scope complicates the set of variants in that we now find not only the pal-atovelar stops and fricatives noted above in Table 1, but also the rhotics [r,ö, ö] and the voiced alveolar fricative [Z]. We have again opted to classifythese with the fricatives because they might be understood as lenitions.
It is useful to compare increasingly inclusive patterns of variation, rep-resenting increasingly more inclusive aggregations, and this is presented inFig. 2. The leftmost map is identical to the map in Fig. 1 and is based onthe final consonant in the single word ich. The middle map includes thevariation in the final consonant of a second word, gleich, and the addition ofthis word immediately “smoothes” the distribution a bit, for example, fillingin the sites marked by diagonal lines where data was missing. The third andrightmost map is based on all five words in which we find variation. Therightmost map shows clearly that the lenis variants completely dominate thesouth, but also that the north is quite variable. The darkest areas have highconcentrations of plosive variants ([k], etc.), and the lighter ones are mixed.Ideally, we would extend such a series to include as many words as possible,benefiting from the statistical stability of large data sets. We contend thatsuch maximally comprehensive maps best indicate what the linguistic vari-ation is signaling, in this case whether the speaker comes from the north ofGermany or not.
To return to our main argument, note that none of this makes sensewithout a second sort of aggregation, namely the sort which classifies thevariants not only of a single segment of a single word, but also the sort whichclassifies variants of a single variable (phoneme) as it occurs in multiplewords. This sort of aggregation, too, is common throughout dialectology.
We note nonetheless that this aggregating step risks historical confusion,that of confusing etymologically different elements such as the phoneme /x/as in ich vs. schlecht. So while we illustrate various aggregates based on
9

ich [k] vs. [c/x] ich, gleich all five occurrences
Figure 2: The stop/affricate for the variation [x(c)/k] ([c] in High German),stop variants darker than affricates. Occurrences of the variable increasefrom left to right, yielding more regular depictions of the distribution.
standard German pronunication, we restrict our general technique to thecomparison of single words (etymologically unassailable), and then aggreg-ates across the entire vocabulary sample. We could imagine that signals ofprovenance are detectable across etymologically different elements, but thetopic cannot be pursued here.
2.4 Phonological Features
In the search for more robust generalizations, one may look to increasinglyabstract characterizations, e.g. the well-known characterization of variationinvolving a single phonological feature, such as the famous “second soundshift” in German, the distinction between [p/
>pf, t/
>ts] (where we shall include
[s] as a variant of the affricate [>ts] and [k/x(c)]. These are all instances of
[stop/affricate], and it is striking that such a simple linguistic distinctioncharacterizes German dialect areas as reliably as it does. Figure 3 comparesthe distribution of these three distinctions.
Indeed the commonality is striking, so that the characterization of dialectareas which aggregates over these three variations is quite good. Even if weinclude words such as zwei ‘two’ and zwolf ‘twelve’ which varied in the past,but for which the southern variant dominates to the complete exclusion ofthe expected variant in [t], we obtain a fairly clear delineation.
Naturally, the step toward the abstracter characterization aggregates overmore linguistic material, and so it is not surprising that the signal of proven-ance associated with it is more reliable. We return to this in Sec. 5 below.
10

[p] vs. [>pf] [t] vs. [
>ts] [k] vs. [x(c)] aggregate view
Figure 3: The stop/affricate distinction resulting from the second sound shift,where the relative frequency of stops is shown in darker shading. Althoughthe patterns are similar, they certainly do not overlap perfectly. The simpleaggregation on the right depicts the degree of overall differences in Germanvarieties more faithfully.
3 Two, Three, Many “Features”
But there is a great deal more systematic geographic variation which furtheraggregating steps may incorporate. We extract a number of features fromthe PAD and sketch their geographic distribution in Figure 4. We select well-discussed features of German dialectology (Konig 1994, Niebaum & Macha2006), including the characterization of the stop/affricate series examinedabove (for reference). In addition, we include maps sketching the distributionof the following:
palatalization of non-initial /s/ in words such as Wurst ‘sausage’, fest‘firm’, gestern ‘yesterday’, ist ‘is’ and selbst ‘self’. Top row, middle inFig. 4.
s/z word initially in words such as Sonntag ‘Sunday’, selbst ‘self’, Seife‘soap’, sie ‘she’, sieben ‘seven’, so ‘so’ and sollen ‘should’. Top row,right column.
t,d → ∅ / n /t/ and /d/ are not always pronounced after /n/;thus we find many pronunciations of unten ‘underneath’, anderen ‘oth-ers’ and gefunden ‘found (part.)’ with no traces of a medial alveolarstop. The same phonological environment is present in Winter ‘winter’,but the t/d is only rarely suppressed when Winter is pronounced. Seemiddle row, left column in Fig. 4.
apical vs. dorsal pronunciations of /r/ i.e., [r,R] vs. [ö] in words
11

aggregate 2nd shift [S] (dark) vs. s [z] (dark) vs. [s](non-initially) (initially)
post-nasal d/t (dark) apical [r] (dark) final [n] deletion (dark)vs. deletion vs. uvular [ö] vs. retention
medial [t] vs. s initially lenited /g/ front or low V in Haus
Figure 4: The distribution of a range of pronunciation features, clearly geo-graphically conditioned, but overlapping only imperfectly. See text for fur-ther explanation.
12
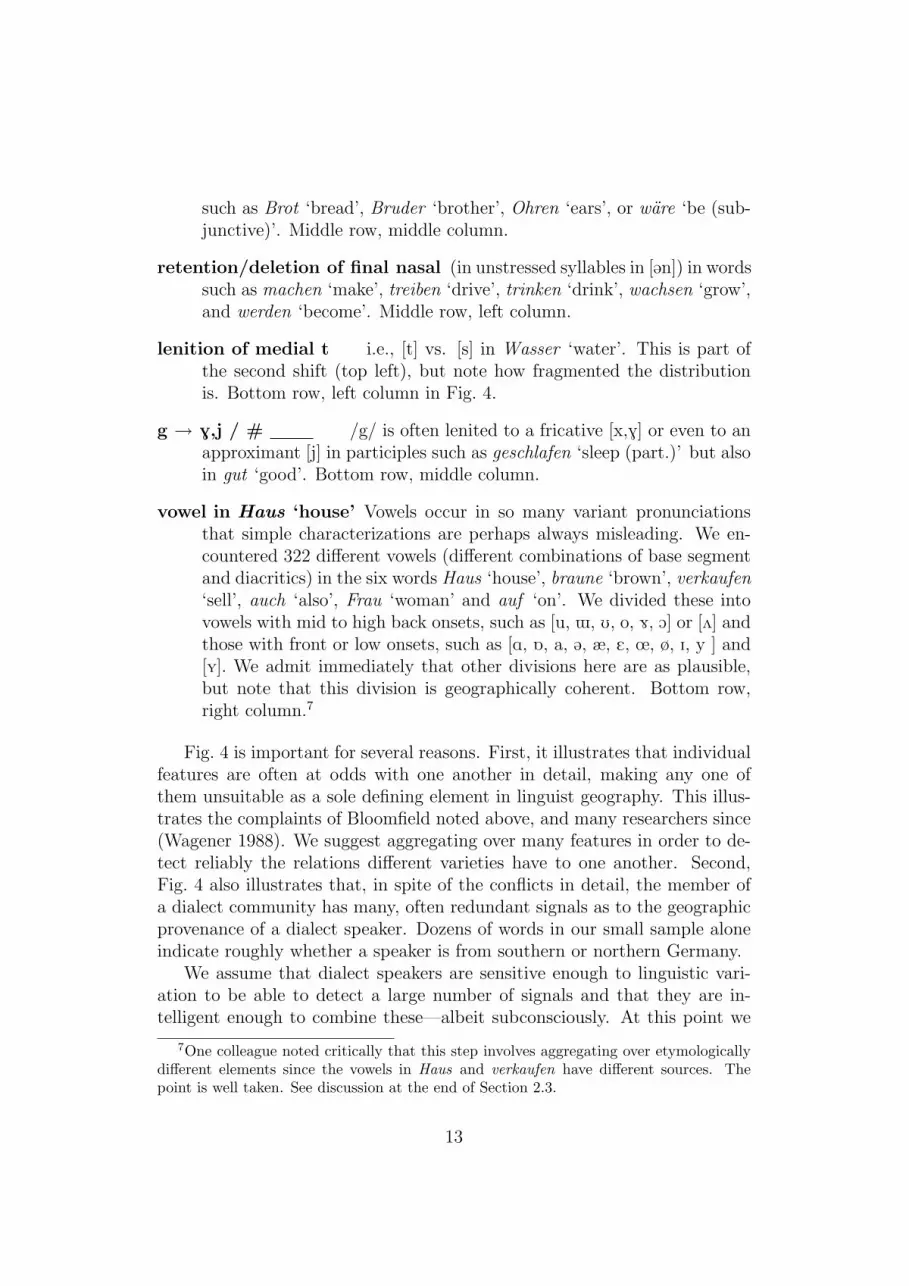
such as Brot ‘bread’, Bruder ‘brother’, Ohren ‘ears’, or ware ‘be (sub-junctive)’. Middle row, middle column.
retention/deletion of final nasal (in unstressed syllables in [@n]) in wordssuch as machen ‘make’, treiben ‘drive’, trinken ‘drink’, wachsen ‘grow’,and werden ‘become’. Middle row, left column.
lenition of medial t i.e., [t] vs. [s] in Wasser ‘water’. This is part ofthe second shift (top left), but note how fragmented the distributionis. Bottom row, left column in Fig. 4.
g → G,j / # /g/ is often lenited to a fricative [x,G] or even to anapproximant [j] in participles such as geschlafen ‘sleep (part.)’ but alsoin gut ‘good’. Bottom row, middle column.
vowel in Haus ‘house’ Vowels occur in so many variant pronunciationsthat simple characterizations are perhaps always misleading. We en-countered 322 different vowels (different combinations of base segmentand diacritics) in the six words Haus ‘house’, braune ‘brown’, verkaufen‘sell’, auch ‘also’, Frau ‘woman’ and auf ‘on’. We divided these intovowels with mid to high back onsets, such as [u, W, U, o, È, O] or [2] andthose with front or low onsets, such as [A, 6, a, @, æ, E, œ, ø, I, y ] and[Y]. We admit immediately that other divisions here are as plausible,but note that this division is geographically coherent. Bottom row,right column.7
Fig. 4 is important for several reasons. First, it illustrates that individualfeatures are often at odds with one another in detail, making any one ofthem unsuitable as a sole defining element in linguist geography. This illus-trates the complaints of Bloomfield noted above, and many researchers since(Wagener 1988). We suggest aggregating over many features in order to de-tect reliably the relations different varieties have to one another. Second,Fig. 4 also illustrates that, in spite of the conflicts in detail, the member ofa dialect community has many, often redundant signals as to the geographicprovenance of a dialect speaker. Dozens of words in our small sample aloneindicate roughly whether a speaker is from southern or northern Germany.
We assume that dialect speakers are sensitive enough to linguistic vari-ation to be able to detect a large number of signals and that they are in-telligent enough to combine these—albeit subconsciously. At this point we
7One colleague noted critically that this step involves aggregating over etymologicallydifferent elements since the vowels in Haus and verkaufen have different sources. Thepoint is well taken. See discussion at the end of Section 2.3.
13

suppress a full explanation of alignment software which automatically alignscorresponding phonetic segments as this work has been presented in detailelsewhere (Kruskal 1999, Nerbonne, Heeringa & Kleiweg 1999).8
It would take us too far afield to present the workings and the analysis ofthe alignment algorithm in detail, but the overall effect is readily sketched.For each pair of field work collection sites (varieties), we align the pronunci-ations of each word in the list of words (or phrases) elicited. The result ofalignment is illustrated as follows:
k œ s t @ ‘crust’k O r s t
1 1 1 (sum = 3)
We note especially the non-aligning points, as these contribute to the pro-nunciation distance between the two varieties. The alignment algorithm issensitive enough to find the optimal alignment, i.e. the one in which the sumof differences is minimal, after which it is child’s play to total up the numberof non-aligning points (Kruskal 1999). If we have a great deal of material, itis sufficient to use exactly this rough measure. Refining the alignment pro-cedure to use phonetically more sensitive measures of segment distance is thesubject of ongoing research (Heeringa, Kleiweg, Gooskens & Nerbonne 2006),but the very simplest measure assays pronunciation distances reliably.
The procedure is applied to all(1862
)= 17.390 pairs of sites, comparing
201 words in each site comparison, resulting in 3, 5 × 10⁶ word comparis-ons. Since the mean length of words (in phonetic segments) is 5, the overallcomparison is based on 1, 75 × 107 segment-pairs in this procedure (in fact,the algorithm examines many non-corresponding segments as well, which weignore at present). It is this very comprehensive comparison which allows usto obtain reliable results using rough comparisons.9
The mean distance between varieties is obtained from the pronunciationdistances of the words in the two samples, yielding a large distance table. Atthis point, there are several techniques available for analyzing the resultingdistance table. We note two here. First, we may apply clustering to seekgroups in the data. In fact we apply clustering using a bootstrap procedure(or equivalent) in order to ensure stability in results. The borders whichthen emerge are sketched on a map (Nerbonne, Kleiweg & Manni 2007) (see
8In particular Heeringa (2004) provides a detailed presentation of the analytical andaggregating techniques that are needed to combine the information in the many vari-ables present in an atlas such as the PAD, and Nerbonne & Kretzschmar (2006) providereferences to more recent developments.
9We discuss the validation of our measurements below briefly, and at more length in(Nerbonne & Heeringa to appear).
14

Figure 5: Two visualizations of aggregate pronunciation variation in thePAD. On the left, darker lines correspond to better founded distinctions. Onthe right, the major dimensions of a multi-dimensional scaling analysis ofthe aggregate pronunciation differences are represented as intensities of red,green and blue (in order of significance).
Fig. 5, left). Alternatively, we apply multi-dimensional scaling (MDS) toobtain a low-dimensional representation of the data set. It turns out that athree-dimensional solution represents the input data well, in the sense thatthe distances between sites in the input matrix correlate well with distancesmeasured between the sites as given by their coordinates in the three dimen-sions inferred by MDS (r ≈ 0.89). We therefore use the three-dimensionalsolution, and sketch the map by associating each dimension with an intensityin the red, green and blue color scheme. Fig. 5 (right) presents these visual-izations of the results of the alignment-based comparison as well. These aredifferent visualizations of the same aggregate view of the pronunciation dif-ferences within Germany based on the assessment of proportion of matchingsegments, as just described.
It is important to add, however, that there are many aggregating tech-niques, and that there are debates about the best techniques of analysis(Nerbonne & Kretzschmar 2006). The purpose of the present essay is to de-fend the need for aggregation, but neither to present aggregating techniquesin detail, nor to take a stand on which are best.
15

4 Keeping it Simple
A second reason to proceed beyond single features or shibboleths is meth-odological. Languages are large and complex, and there are easily tens ofthousands, probably hundreds of thousands or more ways for language vari-eties to differ. If dialectological or variationist theory says only that somelinguistic feature distinguishes areas (or social groups), then that theory iswildly underdetermined — it has hundreds of thousands of features to choosefrom. If combinations of features are appealed to, for example by referenceto “bundles of isoglosses”, the range of possibilities rises enormously (seeSection 6.1 below for a discussion of isogloss bundles).
In this section we charge single-feature variationist studies with discrim-inating too little in the features they are willing to entertain. Given thecurrent state of the art, in which researchers choose arbitrarily among lin-guistic features that are hypothesized to be associated with extralinguisticvariables, very little is shown when some variable or other can be shown toassociate strongly with some extralinguistic property.
If this seems exaggerated, consider that there are 20 to 100 phonemesin a typical variety, each of which typically has five to ten allophones, de-pending on the level of detail one is willing to examine. The distribution ofallophones is governed by 20 or more phonological processes. Varieties maydiffer in their phoneme inventories, their range of allophones, and in the rulesgoverning the distribution of the allophones, and of course, in combinations ofthese. Nor is the situation simpler at other linguistic levels: Miller estimatesthat adults have vocabularies of approximately 50,000 lexemes (Miller 1991).Even in morphologically poor languages such as English, these lexemes aresubject to modification by 100 or more bound morphemes, some of whichhave effects in combination which may be peculiar to certain varieties. Largesyntactic descriptions typically contain hundreds of phrasal rules, and theor-ists increasingly concede that a great deal of syntactic structure requires evenmore specific licensing of constructions (Fillmore & Kay 1999), i.e. phrasalpatterns with often idiosyncratic restrictions to specific (combinations of)lexical items.
Sociolinguistics introduced the use of frequency in examining variation,esp. in its well-known “varb-rule” (variable rule, or logistic regression ana-lyses, see Paolillo (2002)). In frequency-based accounts, we do not need todemonstrate that the presence or absence of a feature is associated perfectlywith the extralinguistic variable, we may instead appeal to the frequencywith which the feature occurs, allowing us to smooth over some exceptions,but it also allows additional degrees of freedom to the analysis. The numberof possible hypotheses is multiplied again by the incorporation of frequency
16
information in analyses.Aggregating accounts postulate that extralinguistic variables are associ-
ated with aggregate differences in entire varieties, not merely with specificlinguistic variables. The motivation for this postulate stems from consideringthe cognitive problem of detecting the signals of provenance. If signals werenot robust, i.e. likely to be present and detectable in many speech events,then they simply would not function. The information in the aggregate viewin Fig. 5 shows that even speakers within pockets of exception appearing insingle feature distributions such as Fig. 1 will provide signals of provenance.
5 General Characterizations
In this section we sketch issues to which we claim that aggregate analysescontribute. They progress from relatively concrete to more speculative.
The present essay has focused on pronunciation as this has received thelion’s share of attention in dialectology and variationist studies, but studieson lexical and syntactic variation also underscore the value of the aggregateperception (Nerbonne & Kleiweg 2003, Spruit 2008, Gooskens & Heeringa2006).
Forgetting (bundles of) isoglosses
Aggregating techniques may serve as the basis for new approaches to classicand important issues in the theory of language variation. For example, dia-lectological handbooks agree that variation is organized into areas of relativehomogeneity in some case and in continua of increasing differences in others.Single-feature studies have tried to identify the single features or ”bundles” offeatures responsible for this, but there is no consensus on how to evaluate therelative strengths of different features, however (Chambers & Trudgill 1998,[11980], 96-97):
It is undeniable that some isoglosses are of greater significancethan others [...and...] that some bundles are more significantthan others [...]. Yet, in the entire history of dialectology, noone has succeeded in devising a satisfactory procedure or a set ofprinciples to determine which isoglosses or which bundles shouldoutrank some others. The lack of a theory or even a heuristicthat would make this possible constitutes a notable weakness indialect geography.
17
It should not be surprising that we suggest that aggregating techniquesshould be brought to bear. The purpose of identifying (bundles of) isoglossesis to identify dialect areas or dialect continua, more generally the geographicelements that are associated with linguistic variation. If the aggregate per-spective is correct, we should seek evidence for this sort of geographic in-fluence on variation in the aggregate of many variables. So we maintainthat Fig. 5 represents the geography of German linguistic variation. See alsoSec. 6.1 below for further discussion.
Identifying important features
But using the aggregate to identify the important geographic parametersdoes not mean that we should ignore the importance of some features vis-a-vis others. Single-feature based dialectology fails to interpret individualfeatures with respect to global patterns and is therefore unable to assessthe importance of the individual signals it studies. Aggregation is the keystep needed if one is to assess which features most reliably indicate globalpatterns.10
For example, in the German example we developed above, let us calculatea place × place distance matrix for each of the 201 words in the PAD sample.We then examine which word matrices correlated most strongly with eachdimension of the multi-dimensional scaling analysis (Fig. 5, right). It turnsout that Zeiten ‘times’, sein ‘be (inf.)’, bleib ‘stay (imp.)’ and weisse ‘white(infl.)’ are at the top of the list, all showing strong correlations (r > 0.5),suggesting that the variation in the stressed vowel (standard German [aI],but South [i]) is the single strongest indicator of provenance among the 201words in our sample. Prokic (2007) explores more systematic analysis ofthe aligned segments with the goals of identifying the linguistic factors inaggregate analysis.
There are more sophisticated techniques in use as well. Shackleton (2005)use principal component analysis in an aggregate analysis to sketch the re-lations between English and American dialects, and Nerbonne (2006) usesfactor analysis to identify the recurrent features in a phonological analysis of
10Kretzschmar (2006, 400) sounds a bit disparaging about one prominent dialectologisthe collaborated with extensively when he reports that the colleague “[...] could affordto ignore interpretation of the data because he already knew what it meant,” but Kretz-schmar’s respectfully intended point is that this researcher was so familiar with the datathat he easily identified the signals correctly. We suspect that many other experienced col-leagues have such excellent intuitive sense of the variation they study that they judge thesignificance of individual features quite well. Nonetheless, relying on informed intuitionrather than analytic technique provides no foundation for more abstract questions.
18

LAMSAS (Kretzschmar 1994). Hyvonen, Leino & Salmenkivi (2007) applyindependent component analysis to Finnish lexical data.
Linguistic distance as a function of geography
If there are larger, simpler trends present in linguistic variation, then single-feature based approaches seem ill-equipped to search for them. This is dueboth to the variety of features and to the fact that there are exceptions, butespecially because such accounts characterize only the relations among vari-eties ‘with respect to a single feature’. There is no attempt to aggregate overa large number of such relations. But this means that the notion “linguisticvariety” simpliciter — the collection of speech patterns used in a community— plays no role in standard analyses. Aggregate analyses proceed, on thecontrary, by assaying the relations between varieties based on a sample ofspeech habits.
Another reason to aggregate more vigorously in variationist linguisticsis the opportunity to formulate more general characterizations of variation.Variationist linguistics has been aware of the difficulty of working from single-feature distributions to more general characterizations of varieties, dialects,sociolects, dialect areas and the like, and there are numerous discussionsof how single-feature studies are related to more general characterizations.These discussions falter universally on the usual complexity of distributionsof single features, which inevitably have exceptions, and normally contradicteach other, at least in detail.
As an example of a general theoretical question in dialectology which ag-gregate studies are poised to answer, consider the relation of geography tolinguistic variation. In particular Peter Trudgill has been at pains to pointout that dialectology should strive toward more general accounts of how vari-ation is distributed geographically (Trudgill 1974), but single-feature stud-ies have a decidedly mixed record in this regard (Bailey, Wikle, Tillery &Sand 1993, Wikle & Bailey 1997, Boberg 2000, Horvath & Horvath 2001)—most of the literature consists only of criticisms that Trudgill’s “gravity hypo-thesis” needs to consider not only geography (and population size), but alsosocial and political relations. The criticisms are well taken, but sidestep thequestion of how geography influences variation. We suggest that the problemis the level of analysis, in particular that previous studies have focused on asmall number of variants.
Aggregating analyses such as Seguy (1971) have long noted a simple, law-like relation between geographic distance and linguistic variation of exactlythe sort Trudgill sought, and about which the other authors cited have beenskeptical (arguing that the relation is more complex than Trudgill postulated)
19

0 200 400 600 800
0.04
0.06
0.08
0.10
0.12
0.14
Germany
geographic distance in km
dial
ect d
iffer
ence
a + b log x
Figure 6: The Seguy curve. Linguistics variation is a sublinear function ofgeographic distance just as Seguy (1971) demonstrated, but the characteriz-ation requires an aggregating step. The curve is based on the German datain this paper, and shows a logarithmic model. The sublinear curve explainsabout 30% of the variation in the data (r ≈ 0.56), essentially replicatingSeguy’s analysis on a novel data set.
(Nerbonne & Heeringa 2007). In general linguistic variation increases as asublinear function of geographic distance, as Fig. 6 illustrates.11
Reliability and Validation
Working with a large aggregate also allows us to analyze the reliability of dataformally, and we have done this for several large data sets. The reliabilityof the German data set as analyzed by Cronbach’s α is at least 0.95. A
11We exclude exceptional ”breaks” in the linguistic landscape such as those due emig-ration or colonization. The only exception thus far is to the sublinear pattern is Spruit(2008), who finds that a linear model gives a slightly better fit than a sublinear modelwhen examining syntactic distance.
20

common threshold in the social sciences in 0.7. See Heeringa et al. (2006) forexplanation of the statistical calculations.
Aggregating views likewise offer new perspectives on the validation ofclaims in variationist linguistics, which Gooskens & Heeringa (2004) have in-deed already initiated. Whoever claims to characterize signals of provenanceshould be prepared to test whether the signals are genuine and effective (i.e.,whether they are perceived as such), and Gooskens and Heeringa validate theaggregate pronunciation measure used in this article using perceptual data,focusing on Norwegian data. There is of course other work with validatingaims (Clopper, Levi & Pisoni 2006), but with less general measures of varietaldifference.
All accounts of variation — aggregating or not — should in principle besubjected to some sort of behavioral validation. The criticisms in Section 4 aswell as the more complicated analyses associated with aggregating analysesconvince us that we should not be content with just fitting models to data.
New Vistas
Other questions include the nature of the geographic influence. Are areas(or regions) the organizing elements in dialectology, leading us to expect apartition of sites, or should one rather analyze variationist data in termsof continua? Are human families important mediating factors in transmit-ting variation (Manni, Heeringa & Nerbonne 2006)? These sorts of questionsagain require general characterizations of variation, which single-feature stud-ies have not produced.
6 Previous Aggregate Views
There has certainly been a good deal of attention paid to aggregating ap-proaches, most notably by Goebl (1984), who has pursued this work for threedecades (Goebl 2006). In fact the techniques are also found in the handbooks(Chambers & Trudgill 1998, [11980], § 9.4.1). But Goebl’s focus is generallyon the the taxonomic methodology he has developed and applied so extens-ively, and Chambers and Trudgill focus on the issue of “quantifying linguisticvariables”, rather than on the opportunity for aggregation, which is at theheart of the benefits of dialectometry. There does not seem to be a singlework attempting to defend the need for aggregation in a focused way, whichhas been our goal here.
21

6.1 Bundling Isoglosses
Haag (1898) (discussed by Schiltz (1996)) proposed a quantitative techniquein which the darkness of a border between two adjacent sites was reflected bythe number of differences counted in a given sample, and similar maps havebeen in use since. This appears to be the first published proposal of how onemight operationalize the idea of “bundling isoglosses”, and it clearly impliesaggregating over a variety of features, so it is an important early recognitionof the need for aggregation.
Since for many dialectologists, the search for isogloss bundles is the fi-nal methodological wisdom in seeking geographic determinants of variation(dialect borders and areas), let us emphasize that our plea here is more gen-eral in several ways (pace Seguy, 1973:14). We note that isogloss bundling,strictly speaking, only makes sense for geographic variation, whereas aggreg-ating makes sense for many sorts of variation. But we take the counting offeatures that are different to constitute the essential insight. While this wasa step forward, it is clear that more had to be done.
The most important difference is that we do not rely on a specific, poten-tially biased choice of which isoglosses to bundle. Instead, we envisage usingall available material ideally in a randomly chosen sample.12 After all, thereis an enormous number of potential subsets of features for bundles to consistof. Without the discipline of working with an independently specified set offeatures, the “isogloss bundling” technique runs the risk of being even lessrestrictive about its admissible hypotheses than the single-feature approach.
Second, we should not restrict the application of aggregation to situationsin which clear borders exist. Aggregation is a very useful step in character-izing dialect continua as well (Heeringa & Nerbonne 2001). Third, there aremany ways to operationalize aggregation that are unlike counting isoglosses.For example, we have quantified the occurrence of contrasting elements in themaps above, using a numerical characterization of pronunciation difference.In the simplest versions of the alignment technique, the results are more orless counts of isogloss differences. But in many more complex versions, forexample those where segment differences are specified via phonetic differ-ences (derived from phonetic feature systems), or whether they are weightedby frequency, this interpretation is impossible. Fourth, there are technicaladvances in pattern recognition and classification which enable us to seekborders even in cases where the local differences between two sites do notsuggest them (Nerbonne, Kleiweg & Manni 2007). In these cases isoglossesmay e.g. run on the one or on the other side of a given data collection
12Bolognesi & Heeringa (2005) worked with a randomly chosen subset of Sardinian wordsin a new survey of Sardinian variation. This is not a common tack, however.
22
site (or set of sites). But we are still capable of detecting similar groups.For example, clustering can take non-local differences into account and thusdetect borders even where differences are gradual. For a second example,Monmonier analysis seeks borders only after discounting the general effect ofgeography on linguistic distances (Manni, Heeringa & Nerbonne 2006).
6.2 Martinet and Labov
We have not discussed Martinet’s and Labov’s work on the complicatedchains of vowel shifts which often occur in series (Labov 1994), a body ofwork with the admirable ambition of seeking very general laws. Like theapproach we argue for here, it attempts to seek characterizations at a higherlevel of aggregation. But the focus of Martinet’s and Labov’s work is his-torical, whereas ours is synchronic. Further, we have a much less structurednotion of aggregation in mind in this essay.
Labov is also the one of the developers of variable rule analysis, a majorstep forward in sociolinguistic analysis (Paolillo 2002). It should be clear,however, that variable rules are a means of conducting analyses of singlefeatures or small numbers of features.
7 Conspectus and Prospectus
The essential aggregating steps are common only up to a certain degreein variationist linguistics, but we have argued here that its more generalapplication solves important analytical problems. The key problem is theproblem of extracting a reliable signal of provenance from variationist data.Single-feature studies risk being overwhelmed by noise, i.e., missing data,exceptions, and conflicting tendencies, which are common in this and mostareas of linguistics. We aggregate in order to obtain a more reliable signal.
We repeat here the qualification that “aggregation” is a very generalterm which needs to be operationalized carefully. We have not attempted inthis essay to identify features that are particularly suitable, nor to addresstechnical issues such as weighting data, how much data is needed or whichtechniques are most suitable for analysis. We refer interested readers toHeeringa (2004) for examples of this sort of work.
Not only does aggregation enable an answer to the problem of rebarbat-ive data, but it also enables us as dialectologists to reduce the hypothesisspace within which associations between linguistic and extralinguistic vari-ables must be found. While existing practice seems to allow any single vari-able or small subset of variables to serve as the putative linguistic base of
23
an extralinguistic association, we have postulated that linguistic signals ofprovenance should be detected and analyzed in the aggregate, reducing, wehope significantly, the number of potential hypotheses.
Finally, we claim that aggregate analyses provide a level at which verygeneral laws concerning linguistic variation might be formulated. This sectionwas quite programmatic, but dialectology is in sore need of more generaltheoretical work, and aggregating analyses are promising.
There are innumerable future tasks, as always. We certainly need to con-tinue to hone techniques, both with respect to linguistic sensitivity and withrespect to isolating the most important linguistic components in aggregatetendencies. We have been deliberately vague about the many different sortsof aggregates which may be examined, and we should prefer to restrict thehypotheses we entertain. A major further challenge lies in confronting ag-gregate analyses aimed at identifying historical and typological relatedness(Nerbonne 2007) and developing techniques capable of separating the differ-ent sorts of effects.
There are intriguing opportunities to use aggregate analyses in conjunc-tion with the detection of other signals of cultural and genetic relations.Which cultural and linguistic signals tend to be associated with each other,and to what degree? We are just now catching glimpses of what might bepossible (Manni, Heeringa & Nerbonne 2006).
The work behind the wonderfully large data collections that dialectolo-gists have bequeathed us has unfortunately not been continued in other areasof variationist linguistics, meaning that it is difficult to obtain enough data totest hypotheses outside of geographic variation. If we are correct in arguingfor the importance of aggregate analyses, we need much more comprehensivecollections of variationist data for which other potential correlates of vari-ation are noted. It would be fantastic to see larger collections compiled andmade available.
Acknowledgments
An earlier version of this paper appeared as “Variation in the Aggregate: AnAlternative Perspective in Variationist Linguistics” in K. Dekker, A. Mac-Donald and H. Niebaum (eds.) Northern Voices: Essays on Old Germanicand Related Topics Offered to Prof. Tette Hofstra, Leuven: Peters, 2008,365–382.
We thank Peter Kleiweg for programming and graphics (http://www.let.rug.nl/kleiweg/L04/), and Jack Chambers, Charlotte Gooskens, JackHoeksema, Stephan Kleiner, Sebastian Kurschner, Therese Leinonen, Alas-dair MacDonald, Hermann Niebaum, Jelena Prokic, and Martijn Wieling for
24

critical discussion and suggestions for improvements. As usual, they shouldget credit, but deserve no blame for remaining errors and problems.
References
Abraham, Werner. 2008. Gradience in the V-cluster. In Describing andModelling Variation in Grammar, ed. Andreas Dufter, Jorg Fleischer& Guido Seiler. Berlin: Mouton De Gruyter p. to appear.
Bailey, Guy, Tom Wikle, Jan Tillery & Lori Sand. 1993. “Some Patterns ofLinguistic Diffusion.” Language Variation and Change 3(3):241–264.
Bloomfield, Leonard. 1933. Language. New York: Holt, Rhinehart and Win-ston.
Boberg, Charles. 2000. “Geolinguistic Diffusion and the U.S.-Canada Bor-der.” Language Variation and Change 12(1):1–24.
Bolognesi, Roberto & Wilbert Heeringa. 2005. Sardegna fra tante lingue. IlContatto linguistico in Sardegna dal Medioevo a oggi. Cagliari: Conda-ghes.
Chambers, J.K. & Peter Trudgill. 1998, [11980]. Dialectology. Cambridge:Cambridge University Press.
Clopper, Cynthia, Susannah V. Levi & David Pisoni. 2006. “Perceptual simil-arity of regional varieties of American English.” Journal of the AcousticalSociety of America 119:566–574.
Fillmore, Charles & Paul Kay. 1999. “Grammatical Constructions and Lin-guistic Generalizations: the What’s X Doing Y? Construction.” Lan-guage 75(1):1–33.
Goebl, Hans. 1984. Dialektometrische Studien: Anhand italoromanischer,ratoromanischer und galloromanischer Sprachmaterialien aus AIS undALF. 3 Vol. Tubingen: Max Niemeyer.
Goebl, Hans. 2006. “Recent Advances in Salzburg Dialectometry.” Literaryand Linguistic Computing 21(4):411–436. Spec. Issue, Progress in Dia-lectometry: Toward Explanation ed. J. Nerbonne & W. Kretzschmar,Jr.
Goeman, Antonie. 1999. T-deletie in Nederlandse dialecten PhD thesis Uni-versity of Amsterdam.
25
Gooskens, Ch. & W. Heeringa. 2006. “The Relative Contribution of Pro-nunciational, Lexical and Prosodic Differences to the Perceived Dis-tances between Norwegian Dialects.” Literary and Linguistic Computing21(4):477–492.
Gooskens, Charlotte & Wilbert Heeringa. 2004. “Perceptual Evaluation ofLevenshtein Dialect Distance Measurements using Norwegian DialectData.” Language Variation and Change 16(3):189–207.
Goschel, Joachim. 1992. Das Forschungsinstitut fur Deutsche Sprache“Deutscher Sprachatlas”. Wissenschaftlicher Bericht Das Forschungsin-stitut fur Deutsche Sprache Marburg: .
Haag, Karl. 1898. Die Mundarten des oberen Neckar- und Donaulandes(schwabisch-alemannisches Grenzgebiet: Baarmundarten). Reutlingen:Buchdruckerei Egon Hutzler.
Heeringa, Wilbert. 2004. Measuring Dialect Pronunciation Differences usingLevenshtein Distance PhD thesis Rijksuniversiteit Groningen.
Heeringa, Wilbert & John Nerbonne. 2001. “Dialect Areas and Dialect Con-tinua.” Language Variation and Change 13(3):375–400.
Heeringa, Wilbert, Peter Kleiweg, Charlotte Gooskens & John Nerbonne.2006. Evaluation of String Distance Algorithms for Dialectology. InLinguistic Distances, ed. John Nerbonne & Erhard Hinrichs. Shrouds-burg, PA: ACL pp. 51–62. Proc. of a workshop held at the joint meetingof ACL and COLING, Sydney, July, 2006.
Horvath, Barbara M. & Ronald J. Horvath. 2001. “A Multilocality Study of aSound Change in Progress: The Case of /l/ Vocalization in New Zealandand Australian English.” Language Variation and Change 13(1):37–57.
Hyvonen, Saara, Antti Leino & Marko Salmenkivi. 2007. “Multivariate Ana-lysis of Finnish Dialect Data—An Overview of Lexical Variation.” Lit-erary and Linguistic Computing 22(2):271–290.
Konig, Werner. 1994. DTV Atlas zur deutschen Sprache. Munchen:Deutscher Taschenbuch Verlag. 11978.
Kretzschmar, William A. 2006. “Art and Science in Computational Dia-lectology.” Literary and Linguistic Computing 21(4):399–410. SpecialIssue, J.Nerbonne & W.Kretzschmar (eds.), Progress in Dialectometry:Toward Explanation.
26

Kretzschmar, William A., ed. 1994. Handbook of the Linguistic Atlas of theMiddle and South Atlantic States. Chicago: The University of ChicagoPress.
Kruskal, Joseph. 1999. An Overview of Sequence Comparison. In TimeWarps, String Edits and Macromolecules: The Theory and Practice ofSequence Comparison, ed. David Sankoff & Joseph Kruskal. Stanford:CSLI pp. 1–44. 11983.
Labov, William. 1994. Principles of Linguistic Change. Vol. 1: InternalFactors. Oxford: Blackwell.
Labov, William. 2006. The Social Stratification of English in New York City.Cambridge: Cambridge University Press. (1st ed., 1966).
Manni, Franz, Wilbert Heeringa & John Nerbonne. 2006. “Are Family Namesjust Words? Comparing Geographic Patterns of Surnames and Dia-lect Variation in the Netherlands.” Literary and Linguistic Computing21(4):507–528. Special Issue, J.Nerbonne & W.Kretzschmar (eds.), Pro-gress in Dialectometry: Toward Explanation.
Miller, George. 1991. The Science of Words. New York: Scientific AmericanLibrary.
Milroy, Lesley & Matthew Gordon. 2003. Sociolinguistics: Method and In-terpretation. Oxford: Blackwell.
Nerbonne, John. 2006. “Identifying Linguistic Structure in Aggregate Com-parison.” Literary and Linguistic Computing 21(4):463–476. Special Is-sue, J.Nerbonne & W.Kretzschmar (eds.), Progress in Dialectometry:Toward Explanation.
Nerbonne, John. 2007. “Review of April McMahon & Robert McMahonLanguage Classification by Numbers. Oxford: OUP, 2005.” LinguisticTypology 11.
Nerbonne, John & Christine Siedle. 2005. “Dialektklassifikation aufder Grundlage aggregierter Ausspracheunterschiede.” Zeitschrift furDialektologie und Linguistik 72(2):129–147.
Nerbonne, John & Peter Kleiweg. 2003. “Lexical Variation in LAMSAS.”Computers and the Humanities 37(3):339–357. Special Iss. on Compu-tational Methods in Dialectometry ed. by John Nerbonne and WilliamKretzschmar, Jr.
27

Nerbonne, John, Peter Kleiweg & Franz Manni. 2007. Projecting DialectDifferences to Geography: Bootstrapping Clustering vs. Clustering withNoise. In Data Analysis, Machine Learning, and Applications. Proc. ofthe 31st Annual Meeting of the German Classification Society, ed. LarsSchmidt-Thieme, Hans Burkhardt & Reinhold Decker. Berlin: Springer.Accepted. Prepubl avail. at http://www.let.rug.nl/nerbonne/papers/.
Nerbonne, John & Wilbert Heeringa. 2007. Geographic Distributions of Lin-guistic Variation Reflect Dynamics of Differentiation. In Roots: Linguist-ics in Search of its Evidential Base, ed. Sam Featherston & WolfgangSternefeld. Berlin: Mouton De Gruyter. Accepted to appear. Prepub.avail. at http://www.let.rug.nl/nerbonne/papers/.
Nerbonne, John & Wilbert Heeringa. to appear. Measuring Dialect Differ-ences. In Theories and Methods, ed. Jurgen Erich Schmidt & JoachimHerrgen. Language and Space Berlin: Mouton De Gruyter.
Nerbonne, John, Wilbert Heeringa & Peter Kleiweg. 1999. Edit Distance andDialect Proximity. In Time Warps, String Edits and Macromolecules:The Theory and Practice of Sequence Comparison, 2nd ed., ed. DavidSankoff & Joseph Kruskal. Stanford, CA: CSLI pp. v–xv.
Nerbonne, John & William Kretzschmar, eds. 2006. Progress in Dialecto-metry: Toward Explanation. Vol. 21(4) Oxford University Press. SpecialIssue of Literary and Linguistic Computing.
Niebaum, Hermann & Jurgen Macha. 2006. Einfuhrung in die Dialektologiedes Deutschen, 2te, neubearbeitete Auflage. Tubingen: Niemeyer. 11999.
Paolillo, John C. 2002. Analyzing Linguistic Variation: Statistical Modelsand Methods. Stanford: CSLI.
Prokic, Jelena. 2007. Identifying Linguistic Structure in a Quantitative Ana-lysis of Dialect Pronunciation. In Proceedings of the ACL 2007 StudentResearch Workshop. Prague: Association for Computational Linguisticspp. 61–66.
Schiltz, Guillaume. 1996. German Dialectometry. In Data Analysis andInformation Systems: Statistical and Conceptual Approaches. Proc. of19th Meeting of the Gesellschaft fur Klassifikation, Basel, March 8–10,1995, ed. Hans-Hermann Bock & Wolgang Polasek. Berlin: Springerpp. 526–539.
28

Seguy, Jean. 1971. “La relation entre la distance spatiale et la distancelexicale.” Revue de Linguistique Romane 35(138):335–357.
Seguy, Jean. 1973. “La dialectometrie dans l’Atlas linguistique de Gascogne.”Revue de Linguistique Romane 37(145):1–24.
Shackleton, Jr., Robert G. 2005. “English-American Speech Relationships:A Quantitative Approach.” Journal of English Linguistics 33(2):99–160.
Spruit, Marco Rene. 2008. Quantitative Perspectives on Syntactic VariationPhD thesis University of Amsterdam.
Trudgill, Peter. 1974. “Linguistic Change and Diffusion: Description andExplanation in Sociolinguistic Dialect Geography.” Language in Society2:215–246.
Wagener, Peter. 1988. Untersuchungen zur Methodologie und Methodik derDialektologie. Marburg: N.G. Elwert.
Wikle, Thomas & Guy Bailey. 1997. “The Spatial Diffusion of Linguistic Fea-tures in Oklahoma.” Proceedings of the Oklahoma Academy of Science77:1–15. avail. at digital.library.okstate.edu/OAS/.
29


