Embed Size (px)
Citation preview
Journal of
Imaging
Article
Real-Time Quality Control of Heat Sealed Bottles UsingThermal Images and Artificial Neural Network
Samuel Cruz 1,†, António Paulino 2,†, Joao Duraes 1,3,† and Mateus Mendes 1,4,*,†
�����������������
Citation: Cruz, S.; Paulino, A.;
Duraes, J.; Mendes, M. Real-Time
Quality Control of Heat Sealed
Bottles Using Thermal Images and
Artificial Neural Network. J. Imaging
2021, 7, 24. https://doi.org/10.3390/
jimaging7020024
Received: 29 November 2020
Accepted: 27 January 2021
Published: 3 February 2021
Publisher’s Note: MDPI stays neu-
tral with regard to jurisdictional clai-
ms in published maps and institutio-
nal affiliations.
Copyright: © 2021 by the authors. Li-
censee MDPI, Basel, Switzerland.
This article is an open access article
distributed under the terms and con-
ditions of the Creative Commons At-
tribution (CC BY) license (https://
creativecommons.org/licenses/by/
4.0/).
1 Polytechnic of Coimbra, Coimbra Engineering Academy, R. Pedro Nunes, 3030-199 Coimbra, Portugal;[email protected] (S.C.); [email protected] (J.D.)
2 Polytechnic of Coimbra, Higher School of Technology and Management, R. General Santos Costa,3400-124 Oliveira do Hospital, Portugal; [email protected]
3 Centre for Informatics and Systems, Uiversity of Coimbra, Polo II, Pinhal de Marrocos,3030-290 Coimbra, Portugal
4 Institute of Systems and Robotics, University of Coimbra, Rua Silvio Lima, Polo II,3030-290 Coimbra, Portugal
* Correspondence: [email protected]† These authors contributed equally to this work.
Abstract: Quality control of heat sealed bottles is very important to minimize waste and in somecases protect people’s health. The present paper describes a case study where an automated noninvasive and non destructive quality control system was designed to assess the quality of the seals ofbottles containing pesticide. In this case study, the integrity of the seals is evaluated using an artificialneural network based on images of the seals processed with computer vision techniques. Becausethe seals are not directly visible from the bottle exterior, the images are infrared pictures obtainedusing a thermal camera. The method is non invasive, automated, and can be applied to commonconveyor belts currently used in industrial plants. The results show that the inspection process iseffective in identifying defective seals with a precision of 98.6% and a recall of 100% and because it isautomated it can be scaled up to large bottle processing plants.
Keywords: quality-control; machine learning; computer vision; thermal images; artificial neural networks
1. Introduction
The control of the quality of bottle sealing is a very important step during bottledproduct’s processing line to assure that the products are safe to transport and store. Thisapplies to numerous products, including food, beverages, detergents, disinfectants andpesticides among other examples. The assurance of the seal effectiveness is particularlyrelevant when products are potentially harmful to humans or the environment. Thus,processes to automate the bottle seal quality are very important and many techniques havebeen proposed, using various approaches.
The present paper describes an approach to assess the quality of bottle seals usinginfrared technology and machine learning. An InfraRed (IR) camera is used to take athermal picture of the cap after the bottle passes the thermal camera where the bottle capis sealed. Image processing techniques are used to extract the circle corresponding to thehottest area of the cap, and an Artificial Neural Network (ANN) is used to classify the circleand thus determine the quality of the seal. Bottles having defective seals are identified asthey are coming out of the production line and rejected later in the conveyor belt where theyare transported. This approach can be implemented using commonly available technologyand components and has a low operational costs.
1.1. Case Study
We applied our approach to a bottled pesticide production plant. The bottles are filledand sealed in a conveyor belt following a process common to most mass production lines:
J. Imaging 2021, 7, 24. https://doi.org/10.3390/jimaging7020024 https://www.mdpi.com/journal/jimaging
J. Imaging 2021, 7, 24 2 of 22
1. The bottle goes through a liquid filling machine where it is filled with a given sub-stance (in our case it is a toxic pesticide;
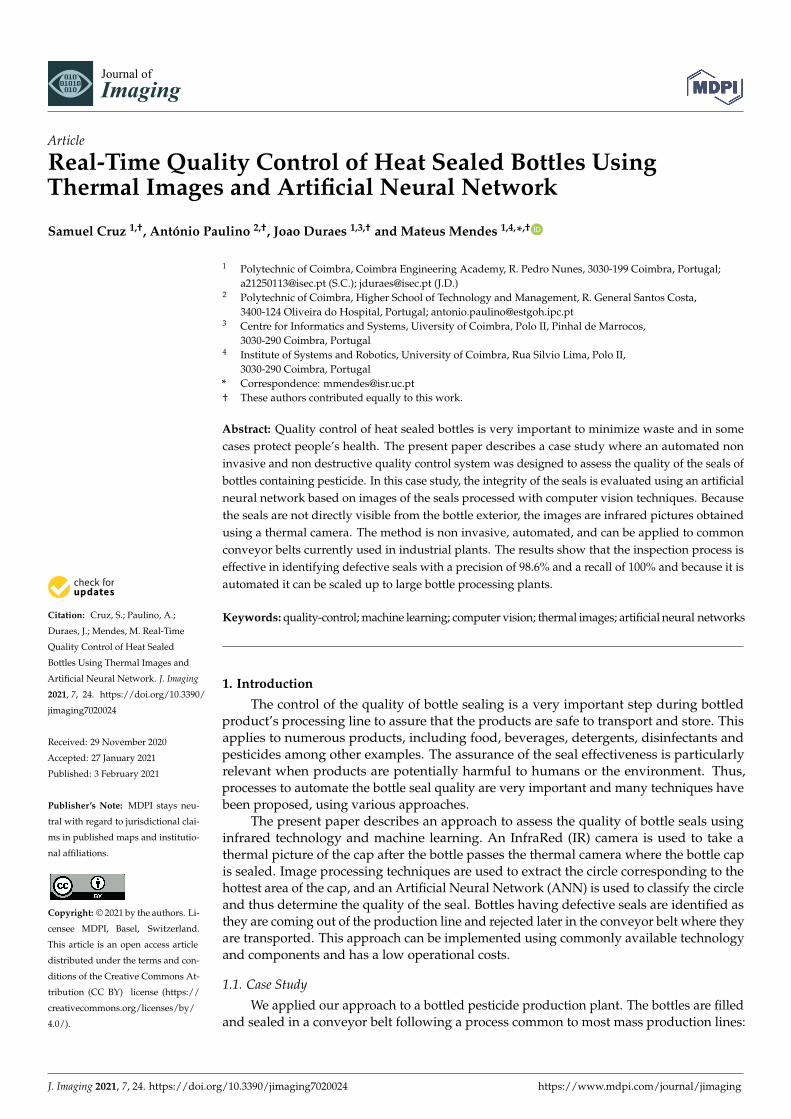
2. The bottle goes through a capping machine, where a robotic arm places and attachesthe cap to the bottle. Inside the cap there is a thin aluminium circle covered with hotglue, as shown in red in Figure 1a;
3. The capped bottle goes through a thermal camera where the glue is hotted and meltedbinding the aluminium sheet to the bottle, effectively sealing it, as shown in Figure 1b.
Figure 1a shows the position of the aluminium seal inside the lid as it is being placedon top of the bottle opening to close it. Once closed (as shown in Figure 1b), the seal is fixedand the glue should be evenly spread across the sealing surface. Once the bottle is closed,the seal is unreachable to direct inspection because the lid is made from opaque plastic(Figure 1c). The aluminium seal must remain in place even if the plastic cap is removed, asshown in Figure 1d.
Version January 28, 2021 submitted to J. Imaging 2 of 22
(a) (b) (c) (d)
Figure 1. Details of the sealing process. a) The plastic cap contains an aluminium sheet with glue. b)After the bottle is capped, the aluminium circle is glued to the bottle opening. c) Both the seal and thecap should remain in place until the bottle is opened for use. d) Once the plastic cap is removed, thealuminium seal should remain in place until broken.
1. The bottle goes through a liquid filling machine where it is filled with a given substance (in our31
case it is a toxic pesticide;32
2. The bottle goes through a capping machine, where a robotic arm places and attaches the cap to33
the bottle. Inside the cap there is a thin aluminium circle covered with hot glue, as shown in red34
in Figure 1a;35
3. The capped bottle goes through a thermal camera where the glue is hotted and melted binding36
the aluminium sheet to the bottle, effectively sealing it, as shown in Figure 1b.37
Figure 1a shows the position of the aluminium seal inside the lid as it is being placed on top of38
the bottle opening to close it. Once closed (as shown in Figure 1b), the seal is fixed and the glue should39
be evenly spread across the sealing surface. Once the bottle is closed, the seal is unreachable to direct40
inspection because the lid is made from opaque plastic (Figure 1c). The aluminium seal must remain41
in place even if the plastic cap is removed, as shown in Figure 1d.42
The plastic cap can appear in its correct place even if the seal underneath in broken or incorrectly43
placed. Because once the bottle is capped the seal is invisible to a human observer, it is difficult to44
visually inspect the bottle and assess the quality of the seal. However, since the sealing process uses45
hot glue, it is possible to obtain an infrared image that can be used to infer the state of the seal.46
1.2. Method Proposed47
Our method to assess the quality of the sealing is based on classifying the geometry of the circle48
imprinted in the thermal image taken right after the bottle leaves the thermal camera that melts the49
hot glue.50
After being cleaned of the background noise, we create sums of the horizontal and vertical51
image lines to assemble an image signature. Then the signatures are fed to a classifier trained using52
a machine learning algorithm. The output of the classifier is either good or bad, determining the53
acceptance/rejection of that particular bottle.54
The results of the classification are logged and the logs can later be analysed by the user to inspect55
the results, or, more important, to improve the classifier, should that need arise. The user is given56
the option to improve the classifier by selecting wrongly classified images and reclassify them, so57
the algorithm can be adjusted in order to increase its performance over time. The entire process is58
controlled by a system that includes a database of the images for analysis and possible retraining,59
a user interface, the interface to the image processing libraries, the logic for later interfacing with a60
rejection actuator for online control during the operation of the conveyor belt, and the interface to61
the machine learning module implementing the classifier. The most relevant part of the system is the62
image processing and the machine learning model, which is implemented using a neural network.63
Figure 1. Details of the sealing process. (a) The plastic cap contains an aluminium sheet with glue. (b) After the bottle iscapped, the aluminium circle is glued to the bottle opening. (c) Both the seal and the cap should remain in place until thebottle is opened for use. (d) Once the plastic cap is removed, the aluminium seal should remain in place until broken.
The plastic cap can appear in its correct place even if the seal underneath in brokenor incorrectly placed. Because once the bottle is capped the seal is invisible to a humanobserver, it is difficult to visually inspect the bottle and assess the quality of the seal.However, since the sealing process uses hot glue, it is possible to obtain an infrared imagethat can be used to infer the state of the seal.
1.2. Method Proposed
Our method to assess the quality of the sealing is based on classifying the geometryof the circle imprinted in the thermal image taken right after the bottle leaves the thermalcamera that melts the hot glue.
After being cleaned of the background noise, we create sums of the horizontal andvertical image lines to assemble an image signature. Then the signatures are fed to aclassifier trained using a machine learning algorithm. The output of the classifier is eithergood or bad, determining the acceptance/rejection of that particular bottle.
The results of the classification are logged and the logs can later be analysed by the userto inspect the results, or, more important, to improve the classifier, should that need arise.The user is given the option to improve the classifier by selecting wrongly classified imagesand reclassify them, so the algorithm can be adjusted in order to increase its performanceover time. The entire process is controlled by a system that includes a database of theimages for analysis and possible retraining, a user interface, the interface to the imageprocessing libraries, the logic for later interfacing with a rejection actuator for online controlduring the operation of the conveyor belt, and the interface to the machine learning module
J. Imaging 2021, 7, 24 3 of 22
implementing the classifier. The most relevant part of the system is the image processingand the machine learning model, which is implemented using a neural network.
1.3. Paper Structure
Section 2 presents an overview of the state of the art and related work. In Section 4 thearchitecture of the system is detailed. Section 3 presents a description of the methodology.Section 5 explains how the data are collected, the essential steps of the process, and how itis used in the present study. Section 6 describes the machine learning algorithm. Section 7presents the results. Section 8 further analyzes the results when compared to the state ofart and presents a discussion on the merits and flaws of the methodology and proposedsystem. Section 9 summarizes and concludes the paper.
2. Literature Review
In this section we address the concepts and the works most relating to our own. Theseinclude infrared spectroscopy, condition monitoring, classification, non-destructive testing,sealing checking, machine learning, monitoring systems ad architectures, and currentquality control systems.
2.1. Spectroscopy
Infrared spectroscopy and Near-Infrared Spectroscopy are techniques that analyze theinfrared radiation emitted by warm objects that enable the identification of the materialproperties based on the energy emitted. The basis of these techniques is the fact thatmaterials radiate energy differently accordingly to their specific physical properties.
Asaduzzaman et al. [1] used infrared technology to assess the quality of milk samples.The goal of that work was to identify milk that was falsely labeled as having been pro-duced in ecologically clean mountain areas. That work used raw milk samples from threedifferent farms located in the same geographical region but with different properties suchas altitude and farming methods, meaning that the characteristics of the samples differone from another. After the samples were warmed, their infrared emission wavelengthswere analyzed and it was possible to identify the component characteristics and theirconcentration in the milk. A machine learning algorithm based on k-nearest neighbor wasthen used to classify the samples based on the characteristics identified.
M. Boiret & F. Chauchard [2] used near-infrared spectroscopy multipoint measure-ments to control both the distribution and the content of active pharmaceutical ingredientswithin final drug products [2], in order to create a real-time quality control system. Thattechnology was chosen because it can perform at high speed, it is free from pollution, andit doesn’t require reagents nor sample preparation, plus it is non-destructive and capableof providing information about components existing in Active Pharmaceutical Ingredients(API) tablets [2]. The study used two different batches of tablets manufactured with thesame pharmaceutical processes but with different batches of API [2]. Those measure-ments were done at high-speed, using a conveyor belt system which allowed the analysisof multiple tablets and the data obtained were then analyzed according to their quality(API distribution per tablet) and quantity (quantity of the API content within the finaldrug products).
2.2. Condition Monitoring
Pontes et al. [3] used infrared technology to detect hot locations on a motor in orderto identify situations of probable overheating. The goal was to raise the lifespan of theequipment by monitoring changes in the materials’ properties, aiming to detect and fixproblems as soon as possible. The images were first preprocessed, filtered and convertedto grayscale. Image signatures were created using image line and column sums and theresulting two vectors were then fed to the neural network. Through the comparison ofsignatures it was possible to evaluate the state of the motor—if the image presented highervalues on the signature it meant the motor was overheating. The authors also mention that
J. Imaging 2021, 7, 24 4 of 22
the whole process required low computing power, thus being possible to implement in asmall industrial computer or a raspberry pi.
Elgargni et al. [4] proposed a system that assesses the condition of cutting tools beforetheir use. The authors retrieved multiple visible wavelength and infrared images of thecutting tools and then, after using image processing functions and algorithms to isolateand extract the features, the images were classified using principal component analysisand an artificial neural network. They concluded that the infrared data, combined withsuitable image processing and artificial intelligence, could be a very efficient method foron-line condition monitoring of cutting tools.
Haider et al. [5] present another use of infrared to monitor the condition of electriccomponents. In their work the infrared technology is used to obtain images of electricalsystems to identify problems in order to reduce maintenance costs, improve productivityand increase machine availability. The method is based on the fact that most componentstend to show an increase in temperature while malfunctioning. In that method, insteadof using gray scale images, the infrared images are converted to HSV (Hue, Saturation,Value) and processed with different threshold methods such as Roberts Edge Thresholding,Prewitt Edge Thresholding and Otsu Thresholding. Linear Discriminant Analysis (LDA) isthen used for the classification and feature dimension reduction. In their experiments theyused infrared images of switches, circuits, fuses, and other electrical equipment of theirown institution building. A total of 40 sample images were captured, from which 60%were used for training and the remainder for testing. Approximately 55% of the imagescorresponded to equipment in abnormal condition and 45% in healthy condition. From thetests, the authors concluded that 0.70 was the suitable threshold and then were able to geta model with 100% accuracy.
2.3. Object Classification
Zheng et al. [6] propose the implementation of infrared technology to detect andidentify battle targets such as cars, trucks and tanks. Despite methods already existingto process images, some army infrared sensors can only obtain a low-resolution imagethat, once used as input, causes small targets to disappear from the image. The solutionto this problem was to design a new model based on the You Only Look Once (YOLO)Convolution Neural Network (CNN), which is a real-time object detection deep learningmodel (YOLO Official Website: https://pjreddie.com/darknet/yolo/). YOLO, in its thirdversion YOLOv3 uses a 53 layer neural network trained on Imagenet (Darknet-53). It isdesigned for visible light image detection and recognition and requires a higher resolution,so the authors designed a new model based on this structure. Three models were built:the first one was trained using only visible light images, the second one using infraredimages and the last one was first trained with visible images and then fine-tuned withinfrared images. The third model not only presented the best results from the group butalso presented better results when comparing with the YOLOv3.
2.4. Non-Destructive Testing
Dua & Mulaveesala [7] use Infrared Thermal Wave Imaging (ITWI) to evaluate thecondition of reinforced concrete in structures. Reinforced concrete is commonly used inthe building industry due to its low cost, high strength, robustness and sustainability,along with the ready availability of raw materials. But it also has some drawbacks suchas poor tensile strength and ductility [7]. Those drawbacks can lead to the formation ofcracks where over time, the ingress of chloride ions and carbon dioxide in the steel surfaceoriginates corrosion and leads to the decrease of the cross-section in the material. Whenthat happens, the safety and stability of the structure can be compromised. ITWI is used tomeasure the heat emitted by the surface of an object. In that study, the object is the surfaceof the reinforced concrete It is analyzed using ITWI and the images obtained are thenprocessed in order to generate an image where the faults in the material are clearly visible.
J. Imaging 2021, 7, 24 5 of 22
2.5. Sealing Checking
Al-Habaibeh et al. [8] developed a new mechatronic approach to assure food iscorrectly sealed inside containers using a laser sealing process, and used infrared ther-mography combined with image processing to verify the quality of the seal. The infraredcamera obtains images of the seal during and after the sealing process. The heat pattern isclearly visible in the resulting images. The thermographical properties are analyzed and ifany abnormal area is detected, then the seal is compared to previous faults/problems cases,so that the laser properties can be adjusted. The system is capable not only of detecting thelocalized heat pattern but also the contamination between the film and the container, aswell as the cooling behavior of the materials.
Al-Habaibeh & Parkin [9] use a low-cost infrared sensor to obtain images of severalmanufacturing processes such as drilling, grinding, welding and soldering. The imagescontain the distribution of heat in the working machine used in the process and arethen evaluated using a novel detection algorithm which is a self-learning approach thatdistinguishes between normal and faulty conditions of the manufacturing processes. Afaulty process will overheat the machine and it can be detected using infrared technology.The systems aims to distinguish between a machine working in normal conditions andoverheating machines. This approach was then tested in the four processes mentionedabove and the authors concluded that it is most successful with the grinding process andthe welding process was the least successful.
D’huys et al. [10] present a pulsed-type active thermography experiment to detectsolid contaminants in between seals of heat-sealed flexible food packages. In the study,the authors prepared 30 seal samples contaminated with ground coffee particles that wererecorded shortly after sealing. The system obtains high resolution digital images usingactive IR thermography. These images are then processed using six methods:
1. A method based on a single frame;2. A method based on a first order polynomial fit of the cooling profiles in the logarith-
mic domain;3. A method based on thermal signal reconstruction;4. A method based on pulsed phase thermography;5. A method based on principal component thermography;6. A method based on a 3D matched filter.
The method based on a fit of the cooling profiles presented the lower detection limitmeaning that particles with an equivalent diameter of 0.60 mm were detected with aprobability of 95%. Also, the detection capabilities of this method do not depend stronglyon the time after sealing at which recording of the thermal images was started, making it arobust and generally applicable method.
Shuangyang [11] present a high-speed and high accuracy quality inspection of foodpacking seals. At the end of a correct sealing process, continuous sealing lines can be seenon the package. First, an image of the seal is taken and then the second step is to thresholdthe seal zone, making it a black and white image where the continuous seal lines should behighlighted. The authors then use a template to match the image and by comparing thenumber of pixels matched the system classifies the seal as faulty or acceptable. The systempresents an average inspection accuracy of 93.6%.
2.6. Machine Learning
Multi-layer perceptron (MLP) neural networks have been used before for imageclassification. Del Frate et al. [12] assess and optimize neural networks’ performance forpixel-based classification of high resolution satellite images. The images were obtainedfrom two sources: Quickbird data, characterized by very high spatial resolution, and theLandsat data characterized by high spatial resolution. The study aims to distinguish amongareas made of artificial coverage (sealed surfaces), including asphalt or buildings, and openspaces such as bare soil or vegetation. The feature extraction and information discovery onurban areas can be used to monitor changes and urban growth over time, which is helpful
J. Imaging 2021, 7, 24 6 of 22
to improve the environment and safety measures. The neural network obtained presenteda satisfactory performance, with the overall accuracy of 87% for Quickbird and 82% forLandsat subareas.
Del Frate et al. [13] describe the application of m-arcsinh, a modified version of theinverse hyperbolic sine function in machine learning algorithms distributed in the Pythonlibrary scikit-learn. The algorithms used were Support Vector Machines (SVM) and MLPArtificial Neural Networks. The study used six datasets from the scikit-learn and ninedatasets from The University of California at Irvine (UCI) ML repository. The aim of thestudy was to develop a novel computationally efficient and reliable kernel and activationfunction and evaluate it against the standard functions available in the Python library scikit-learn. The accuracy score and f1 measure were the metrics used to assess the classifiers’performance. The results showed that using the m-arcsinh kernel and activation functionthe MLP presented the best classification performance on 10 out of 15 datasets evaluated.The MLP performed better than the SVM, except for two out of 15 datasets. The models’reliability was higher and better than some standard functions.
Subhadip Basu et al. [14] present a Multi Layer Perceptron based classifier for recog-nition of handwritten Bangla alphabet. The Bangla alphabet is the second most popularwritten and spoken language in the Indian subcontinent. The MLP based classifier needsto distinguish between 76 elements. The variations in writing styles of individuals makerecognition of handwritten characters difficult and demand the development of a classifierthat has generalization abilities. 10,000 alphabetic characters were collected from 200subjects with different sex and age from which 80% were used as training set and 20%as testing set. The images were scaled to 64 × 64 pixels and converted to binary throughthresholding. Only one hidden layer, with 60 neurons, was used, in order to keep a lowcomputational power requirement. The classifier showed performances of 86.46% in thetraining set and 75.05% in the test set.
2.7. Monitoring System Architectures
Dimitris Mourtzis et al. [15] propose an approach for condition-based preventivemaintenance of machine tools and cutting tools, based on real-time shop floor monitoring.The data used in the study come from two data sources:
• The multi-sensory system—hardware used to monitor the tools.• The machine tool operator input—information collected from the operators through
reports made on mobile devices.
The data are stored in a database in a cloud service and then the variables under analy-sis are calculated. The result can be accessed by the maintenance department through a webapplication. The communication between the operator and the maintenance departmentis facilitated through the cloud. The use of mobile technology leads to a reduction of thetime it usually takes to solve maintenance problems on the factory floor. The authors testedthe approach on five milling machines that over a month raised 20 reported problems,which were solved in 4 man hours instead of the predicted 10 man hours, according to themaintenance department.
P. Vithu & J.A. Moses [16] review methods of evaluating the quality of pre-processedfood grains using a machine vision system that, using image processing and image analysistechniques, will perform a physical inspection that gives the most information about thecondition of the grain. It reviews non-destructive, non-contact and non-invasive methodsto evaluate the existence of foreign matters, insect infestations, microbial infections, orgrain grain discolouration. Those systems identify and classify the grain according to typeand variety. The paper also clarifies the limitations of the use of machine vision, such as:
• It is hard to understand the grain composition;• It requires high quality images, so the grains and their details can be easily identified;• The authors suggest the use of combined learning techniques and a variety of spectral
ranges which will detect information that the visual range is unable reach.
J. Imaging 2021, 7, 24 7 of 22
Saez-Mas, A. et al. [17] detail a 4-layers architecture and adapt it to two specific casestudies. The first case is moving car bodies from the paint plant to the assembly line andthe second is analysing a layout of a section used to assemble the engine and transmissionset. The 4-layers previously mentioned are:
1. Network Layer—includes the machines, buffers, paths and products to be transformed.2. Logic Layer—includes decision-making processes that may activate other decision
procedures, or even elements in the Network Layer.3. Database Layer—feeds simulations with the data needed to perform activities and to
make decisions. It also stores the results.4. Visual Layer—eases communication with users and stakeholders.
The architecture promotes separation of the physical system and the logical system,thus allowing a better understanding of the problem, and the reuse of layers in futuremodels that have similarities. It also facilitates exporting the information to be used instatistic tools, because of the Logic and Database layer separation.
2.8. Quality Control Systems
The following are quality control systems already available in the market sharingsome aspects with our own work.
The European enterprise Qipack (Qipack Official Website: https://www.qipack.com)assures the quality control in packing processes that are based on detailed real-time anal-ysis of each heat sealed product. This system performs a continuous, real-time and non-destructive monitoring, using a high definition camera to record the seal immediately afterits production. The system analyzes the pixels received from the camera and search forabnormalities in order to remove products with defect. It is used by industry players suchas Capri-Son, Danone, Heineken, Heinz, among others.
TheSealCheck™ (TheSealCheck Official Website: https://www.thesealcheck.com/) isa USA based enterprise is the market leader for thermal-imaging based automated heatseal inspection solutions and presents numerous applications for its software from caps,bags, packages, plastic trays, etc.
Also based in the USA, the PECO-InspX (PECO-InspX Official Website: https://www.peco-inspx.com/) develops solutions for food inspection using mainly X-ray systems. Thesolution behaviour is similar but it is oriented to detect different defects. The X-ray are notsuited to detect lower density objects. The enterprise solutions focus on detecting metal,glass, stone, rubber, and many high-density plastics.
The systems described in the present subsection are commercial, customized systems,and the the accuracy and real-time performance are not made available by the manufactur-ers to the general public.
3. Overview of the Methodology
The methodology proposed allows for the online and continuous assessment of bottleseals, i.e., it is able to inspect and classify the quality of the seals as the bottles are comingout in the conveyor, checking the caps at exit of the thermal camera. The following are themain aspects of the system:
• As bottles are coming out on the production line, thermal pictures of the caps aretaken, using an infrared camera mounted above the conveyor belt.
• Single-frame pictures portraying each bottle are extracted. Each frame shows thedistribution of heat of the seal inside the cap of a bottle, representing the temperaturedispersion of the hot glue used in the sealing.
• After a frame is extracted, it is cleaned to remove noise and binarized. An image signatureis then created, through the cumulative sum of the pixels along each row and column.The image signature is then sent to a machine learning-based classifier. Image signaturesare explained in more detail in Section 6.2, Figure 7.
• When a defective seal is identified by the classifier, a signal is sent to a mechanicalactuator that removes the bottle from the conveyor belt.
J. Imaging 2021, 7, 24 8 of 22
• The result of each seal classification is stored in a database, regardless of being defec-tive or not. All pictures analyzed are also stored. This allows for later inspection andretraining the classifier if needed. It also allows for an incremental improvement ofthe system performance over time.
• Poorly predicted images—either correctly sealed bottles classified as unsealed (FalseNegatives) or poorly sealed bottles classified as sealed (False Positives)—can beused for retraining of the machine learning model, in order to improve the classifierover time.
The main focus of the present work at this point is the classifier, which is detailed inSection 6. Following are the requirements for a system to support the methodology. Anarchitecture for its implementation is given in the next section.
The main functional requirements of the system are:
• Interact with an infrared camera and process the video output to extract images ofindividual bottles;
• Process pictures of the bottles to remove noise, binarize and create image signatureswith the sum of the rows and columns;
• Store pictures in a database and retrieve them for inspection and retraining of the classifier;• Control interaction with the classifier to (i) send pictures for classification; (ii) obtain
classification results, and (iii) retrain the classifier;• Interact with the user to control the system, to: (i) start and shut down; (ii) query and
manually update the database; (iii) inspect the classifier predictions; and (iv) retrainthe classifier;
• Control a mechanical actuator and signal it to remove a bottle with a defective seal.
To enable application of the system to different industrial scenarios, the implementa-tion should be modular and independent from specific hardware vendors. Thus, interactionwith the infrared camera and with an actuator should be implemented in modules inde-pendent from the database and classifiers.
4. Architecture
The architecture of the system was based requirements provided by the specificcase-study plant:
• The system should be self-contained in a single computer to minimize space andmaintenance requirements;
• All classification decisions must be logged to enable manual inspection for validationand refinement purposes;
• The user interface must me remotely accessible, both inside and outside the plantlocal network via web browser.
The architecture of the system comprises the following specialized components: theimage acquisition module; the classifier module; a database; and lastly the user interfacemodule. All are contained in the same machine, located at the production line. Thisarchitecture has the following properties:
• Use a small number of components, in order to reduce the number of equipment andparts needed. A single computer is sufficient to run the software;
• A single machine means that problems are most likely easier to identify and lessphysical space is needed to store the equipment.
• The communication between modules can all be done inside the computer, whichprevents the existence of delays that could make the system miss the removal of anunsealed bottle;
• The architecture is, however, modular and scalable. So the system can be scaled up inorder to monitor one or more production lines, or the software modules distributed inorder to run in different computers.
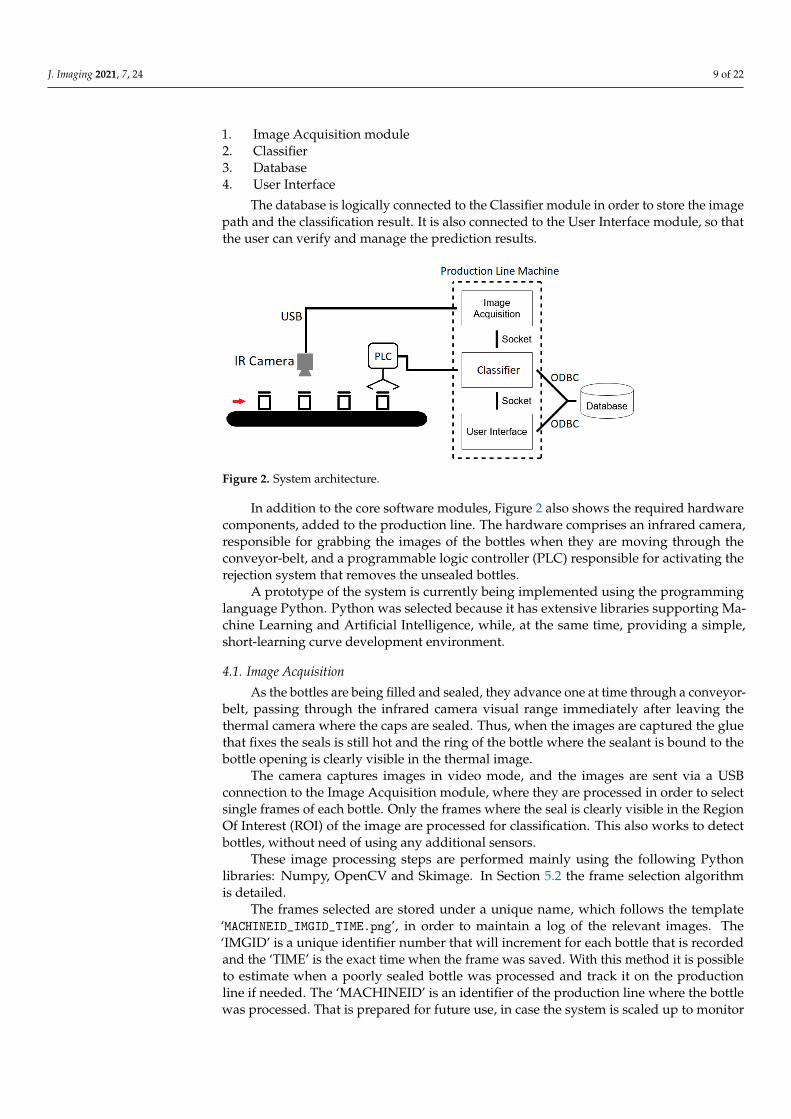
Figure 2 shows a graphical representation of the modular architecture proposed forthe system. The four essential software elements are:
J. Imaging 2021, 7, 24 9 of 22
1. Image Acquisition module2. Classifier3. Database4. User Interface
The database is logically connected to the Classifier module in order to store the imagepath and the classification result. It is also connected to the User Interface module, so thatthe user can verify and manage the prediction results.
Figure 2. System architecture.
In addition to the core software modules, Figure 2 also shows the required hardwarecomponents, added to the production line. The hardware comprises an infrared camera,responsible for grabbing the images of the bottles when they are moving through theconveyor-belt, and a programmable logic controller (PLC) responsible for activating therejection system that removes the unsealed bottles.
A prototype of the system is currently being implemented using the programminglanguage Python. Python was selected because it has extensive libraries supporting Ma-chine Learning and Artificial Intelligence, while, at the same time, providing a simple,short-learning curve development environment.
4.1. Image Acquisition
As the bottles are being filled and sealed, they advance one at time through a conveyor-belt, passing through the infrared camera visual range immediately after leaving thethermal camera where the caps are sealed. Thus, when the images are captured the gluethat fixes the seals is still hot and the ring of the bottle where the sealant is bound to thebottle opening is clearly visible in the thermal image.
The camera captures images in video mode, and the images are sent via a USBconnection to the Image Acquisition module, where they are processed in order to selectsingle frames of each bottle. Only the frames where the seal is clearly visible in the RegionOf Interest (ROI) of the image are processed for classification. This also works to detectbottles, without need of using any additional sensors.
These image processing steps are performed mainly using the following Pythonlibraries: Numpy, OpenCV and Skimage. In Section 5.2 the frame selection algorithmis detailed.
The frames selected are stored under a unique name, which follows the template‘MACHINEID_IMGID_TIME.png’, in order to maintain a log of the relevant images. The‘IMGID’ is a unique identifier number that will increment for each bottle that is recordedand the ‘TIME’ is the exact time when the frame was saved. With this method it is possibleto estimate when a poorly sealed bottle was processed and track it on the productionline if needed. The ‘MACHINEID’ is an identifier of the production line where the bottlewas processed. That is prepared for future use, in case the system is scaled up to monitor
J. Imaging 2021, 7, 24 10 of 22
more than one production line at the same time. The frames captured and selected forclassification are then sent to the classifier module.
4.2. Classifier
The classifier module comprises the classification algorithm and a connection to adatabase. Once received in this module, an image is classified, in order to decide if thebottle should be removed from the production line (in case it is poorly sealed). Thisclassification is done using a multilayer perceptron implemented in Python using the scipySklearn library.
This module is also responsible to emit a signal that will activate a PLC whose functionis remove the bottle whose seal was predicted by the classifier as defective. The conveyor-belt moves at a constant velocity, so the time period that a bottle takes to go from theinfrared camera visual range to the location where it will be removed is fixed and known,allowing for the activation the PLC to actuate the bottle removal mechanism at the righttime to remove the intended bottle. The direct connection between the Server module andthe PLC prevents delays in the process and assures the right bottle is removed. The imagelocation and the result of its classification are stored in the database for each image that issent to the classification module.
4.3. User Interface
The web interface has several advantages. One is the reduction of the operator physicalpresence at the production plant, which is very much in line with the trend experienced inthe new Industry 4.0. Through the web interface, any manager or employee can check thelogs, make adjustments and train the system no matter where they are in the world, as longas they have access to an Internet connection. That increases people safety and reduces theprobability of work accidents, cross contamination or similar problems that may occur inthe factory environment. Another advantage is that the web interface facilitates checkingthe production line at different hours of the day or days of the week.
The user interface allows the user to improve of the classifier at any time. By analyzingthe classifications results the users can validate the operations and, in case the neural netmade a wrong prediction, they can select that image in order to improve the classifier. Thisis achieved using the Sklearn MLP Classifier partial_ fit() function. This functionality allowsthis system to continuous learn without having to retrain using the entire dataset.
The use of web-base interface bring the risk of excessive exposure to unauthorizedusers, in particular from the outside of the plant network environment, creating securityconcerns. The use of encryption on data transfers, the identification of clients throughSecure Sockets Layer/Transport Layer Security (SSL/TLS) protocol used in parallel with asecure database authentication system, and Virtual Private Network (VPN) technology [15]are recommended countermeasures against threats and can be used with our proposedsystem. Although it is a subject outside the scope of the present paper, we propose theuse of those security measures to regulate the access from outside of the company intranetto the system and its user interface, reducing the risk of unauthorized access to dataand functionality.
5. Image Processing5.1. Data Acquisition
In order to test the algorithms, a total of four videos were grabbed in the produc-tion line. While the camera was recording videos, bottles with different sealing defectswere put in the conveyor belt and passed through the thermal camera. The camera usedwas an Optris Pi with an adaptive scale and the resolution of the images obtained is382 × 289 pixels.
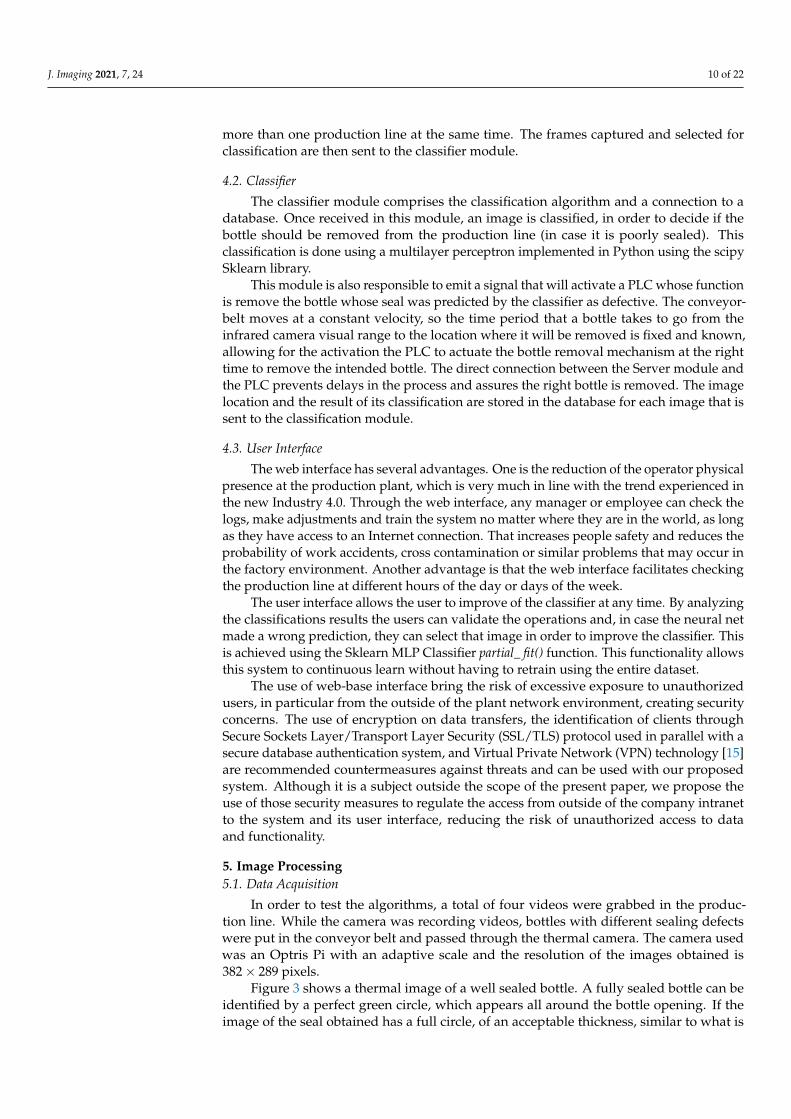
Figure 3 shows a thermal image of a well sealed bottle. A fully sealed bottle can beidentified by a perfect green circle, which appears all around the bottle opening. If theimage of the seal obtained has a full circle, of an acceptable thickness, similar to what is
J. Imaging 2021, 7, 24 11 of 22
shown in the figure, then the sealing is defect-free and the bottle can be moved forwardfor distribution.
Figure 3. Example of thermal image showing the sealing process done right. In this infrared colorscheme, hot locations are represented by the green color while the purple color represents thebackground environment temperature. The green circle represents the hot area where the sealadhered to the bottle opening.
In Figure 3 another hot location can be identified (the small green color dot shown inthe picture). This is caused by a motor that is running near to the conveyor belt and in thefield of view of the thermal camera. This is the most concerning noise because because itpresents itself with the same color as the seal. However, since it is a constant spot, it canbe easily identified and removed during image preprocessing. The green circle related tothe seal contains a small pink hole in its rim. This hole is a colder area and is caused by aplastic pin that comes in all the bottle caps.However, this has no significant effect on theresulting image signature.
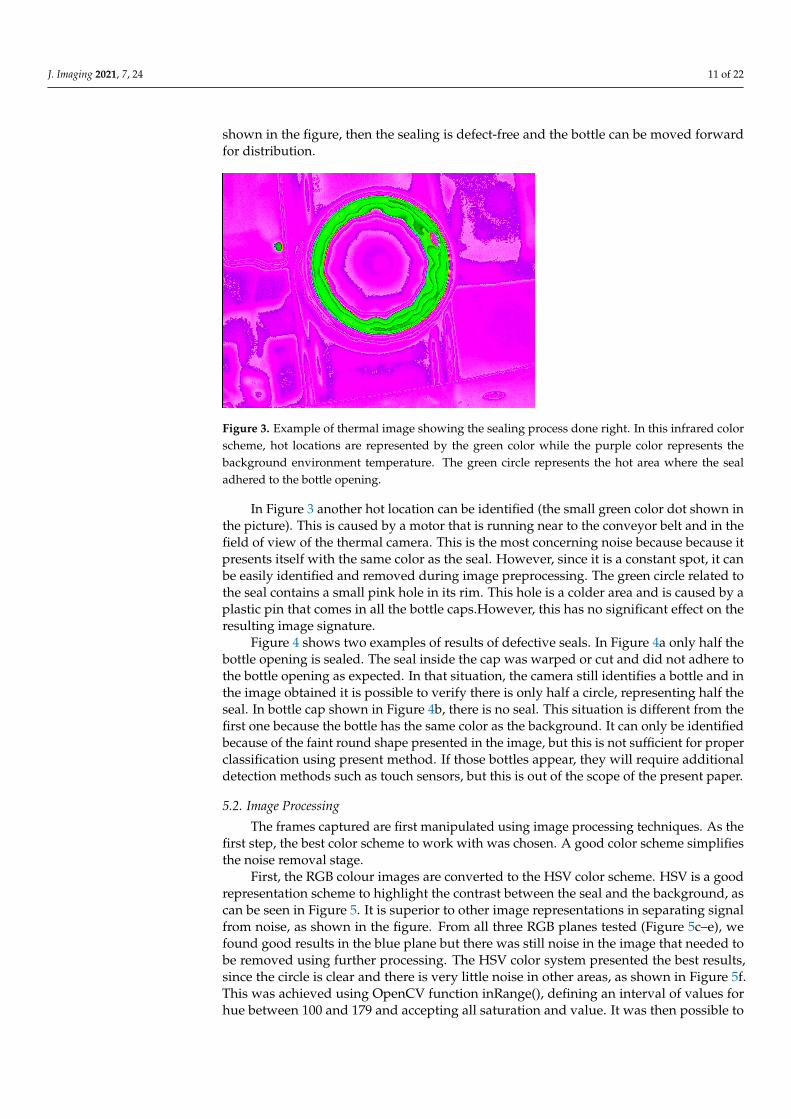
Figure 4 shows two examples of results of defective seals. In Figure 4a only half thebottle opening is sealed. The seal inside the cap was warped or cut and did not adhere tothe bottle opening as expected. In that situation, the camera still identifies a bottle and inthe image obtained it is possible to verify there is only half a circle, representing half theseal. In bottle cap shown in Figure 4b, there is no seal. This situation is different from thefirst one because the bottle has the same color as the background. It can only be identifiedbecause of the faint round shape presented in the image, but this is not sufficient for properclassification using present method. If those bottles appear, they will require additionaldetection methods such as touch sensors, but this is out of the scope of the present paper.
5.2. Image Processing
The frames captured are first manipulated using image processing techniques. As thefirst step, the best color scheme to work with was chosen. A good color scheme simplifiesthe noise removal stage.
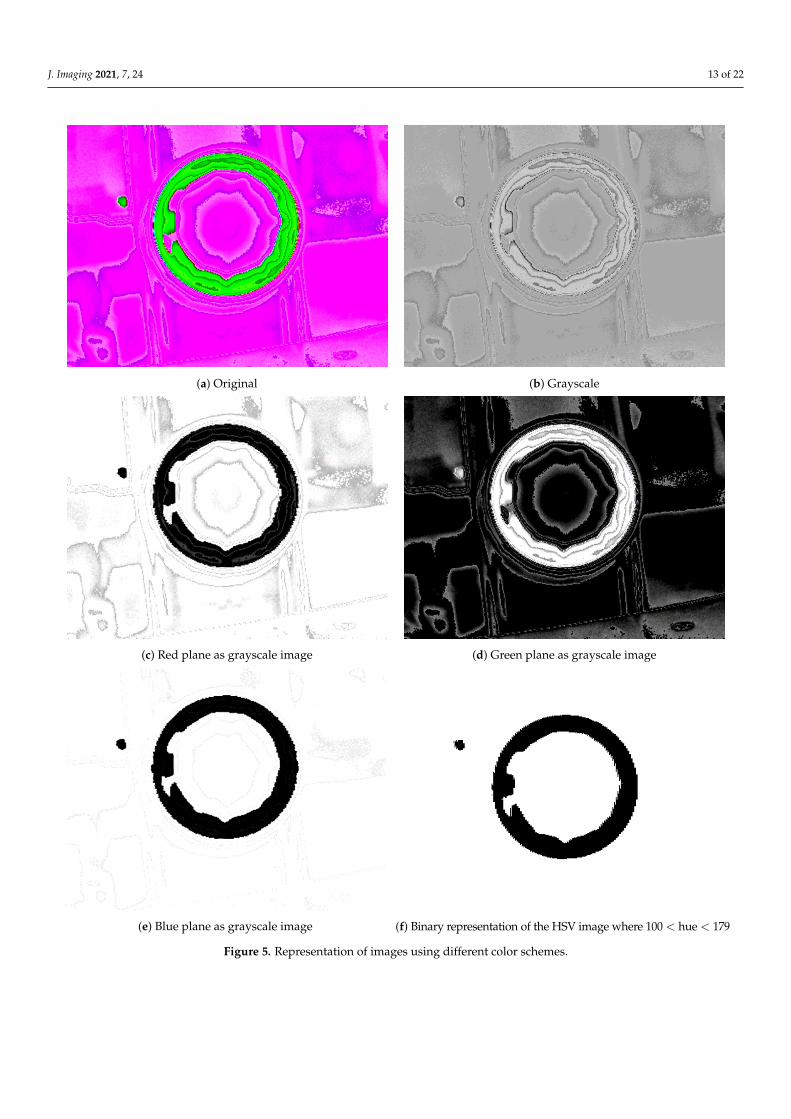
First, the RGB colour images are converted to the HSV color scheme. HSV is a goodrepresentation scheme to highlight the contrast between the seal and the background, ascan be seen in Figure 5. It is superior to other image representations in separating signalfrom noise, as shown in the figure. From all three RGB planes tested (Figure 5c–e), wefound good results in the blue plane but there was still noise in the image that needed tobe removed using further processing. The HSV color system presented the best results,since the circle is clear and there is very little noise in other areas, as shown in Figure 5f.This was achieved using OpenCV function inRange(), defining an interval of values forhue between 100 and 179 and accepting all saturation and value. It was then possible to
J. Imaging 2021, 7, 24 12 of 22
isolate the seal presented in the original image. Thus, we selected the HSV color systembecause it highlighted the seal but also removed most of the image noise.
(a) Bottle half-sealed (b) Bottle not capped
Figure 4. Images of two bottles with problems. The half sealed bottle must be detected and rejected.
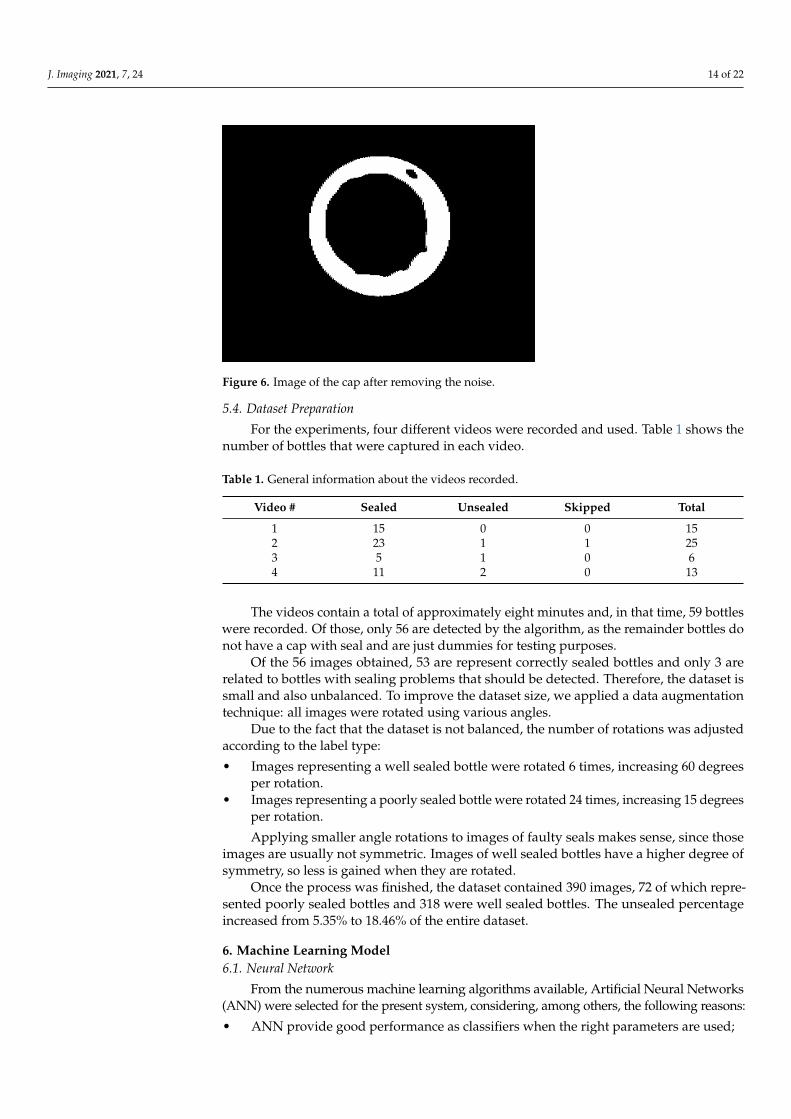
After the HSV representation of the image is obtained, the next step is to remove thenoise left on the image such as the small black dot presented in Figure 5f. The dot is areminiscent of the green dot seen in Figure 3, caused by the heat of the motor that is nearthe conveyor belt and inside the field of view of the thermal camera. The HSV picture isconverted to a binary image where white pixels are mapped to value 1 and black pixelsare mapped to 0. Then, the area of each group of black pixels is calculated by counting thenumber of black pixels in the neighborhood, and groups with pixel count lower than adefined threshold are removed from the image, since they are too small to represent anymeaningful seal circle. After the steps described above, the image is usually a white framewith a black circle in it representing the bottle seal. Finally, the colors are inverted in orderto assure the background value is 0, which simplifies the process of creating the imagesignature as the sum of the lines and rows. The result will be similar to what is shown inFigure 6.
5.3. Frame Selection
The camera frame rate is approximately 25 frames per second. However, the produc-tion line serves no more than one bottle every two seconds, and most of the images can besafely ignored.
Only one image of each bottle is necessary for classification. The frame selected musthave the seal clearly visible and will then be used to generate the signature that will beinput to the neural network.
To determine if a frame is relevant, a Region Of Interest (ROI) was defined, and oneline of the ROI is checked for white pixels to determine if it is likely to have a circle or not.A simple but effective method is used to achieve this. A vertical line at mid width of theimage is checked pixel by pixel, from the top border of the image and until a quarter of theimage height. When a pixel in that line is 1, it means there is a high probability the imagehas a circle and the frame should proceed for further processing. The next 30 frames areassumed to belong to the same bottle and therefore ignored. If no white pixels are found inthat vertical line then the image is very unlikely to contain any relevant information anddoes not deserve further processing.
J. Imaging 2021, 7, 24 13 of 22
(a) Original (b) Grayscale
(c) Red plane as grayscale image (d) Green plane as grayscale image
(e) Blue plane as grayscale image (f) Binary representation of the HSV image where 100 < hue < 179
Figure 5. Representation of images using different color schemes.
J. Imaging 2021, 7, 24 14 of 22
Figure 6. Image of the cap after removing the noise.
5.4. Dataset Preparation
For the experiments, four different videos were recorded and used. Table 1 shows thenumber of bottles that were captured in each video.
Table 1. General information about the videos recorded.
Video # Sealed Unsealed Skipped Total
1 15 0 0 152 23 1 1 253 5 1 0 64 11 2 0 13
The videos contain a total of approximately eight minutes and, in that time, 59 bottleswere recorded. Of those, only 56 are detected by the algorithm, as the remainder bottles donot have a cap with seal and are just dummies for testing purposes.
Of the 56 images obtained, 53 are represent correctly sealed bottles and only 3 arerelated to bottles with sealing problems that should be detected. Therefore, the dataset issmall and also unbalanced. To improve the dataset size, we applied a data augmentationtechnique: all images were rotated using various angles.
Due to the fact that the dataset is not balanced, the number of rotations was adjustedaccording to the label type:
• Images representing a well sealed bottle were rotated 6 times, increasing 60 degreesper rotation.
• Images representing a poorly sealed bottle were rotated 24 times, increasing 15 degreesper rotation.
Applying smaller angle rotations to images of faulty seals makes sense, since thoseimages are usually not symmetric. Images of well sealed bottles have a higher degree ofsymmetry, so less is gained when they are rotated.
Once the process was finished, the dataset contained 390 images, 72 of which repre-sented poorly sealed bottles and 318 were well sealed bottles. The unsealed percentageincreased from 5.35% to 18.46% of the entire dataset.
6. Machine Learning Model6.1. Neural Network
From the numerous machine learning algorithms available, Artificial Neural Networks(ANN) were selected for the present system, considering, among others, the following reasons:
• ANN provide good performance as classifiers when the right parameters are used;
J. Imaging 2021, 7, 24 15 of 22
• They are well supported by the Python library Sklearn, which offers simple andeffecient methods to implement shallow ANN;
• ANN models are easy to train and adapt, so they can evolve over time if needed, oradapted if the bottle caps change.
The model implemented in our system is the Sklearn Multi-layer Perceptron (MLP)classifier. It learns using LBFGS or stochastic gradient descent (SGD) (MLP Classifier Offi-cial Documentation: https://scikit-learn.org/stable/modules/generated/sklearn.neural_network.MLPClassifier.html) algorithms. The LBFGS optimization, however, is not stochas-tic, so it cannot learn without training the whole dataset. For that reason, the SGD methodwas used, since it allows the use of the sklearn partial_ fit() function that is essential to solvethis requirement.
6.2. Input Data
After the images are processed and selected as described in Section 5, image signaturesare calculated as follows. There are several steps when preparing the images for inputto the neural network. The first step is to convert the image to an appropriate size. Theoriginal images contain a total of 110,016 pixels, so they are too large to use and can bedown-sampled [18]. The higher the quality of the image the easier it is to identify flawsin the sealing process, but down-sampling the image to a size that still keeps most of theinformation allows for faster processing in real time. The present case uses thermal cameraswhich already have low resolution, so they were fast to process and were not downsized.
Additionally, instead of using every pixel in each image as an input to the neuralnetwork, we computed the sum of white pixels in each row and in each column resultingin two arrays, one for the lines and one for the columns. These arrays are column and rowsignatures of the binary image. The second array is appended to the first and the resultingvector is the image signature used as input on the neural network.
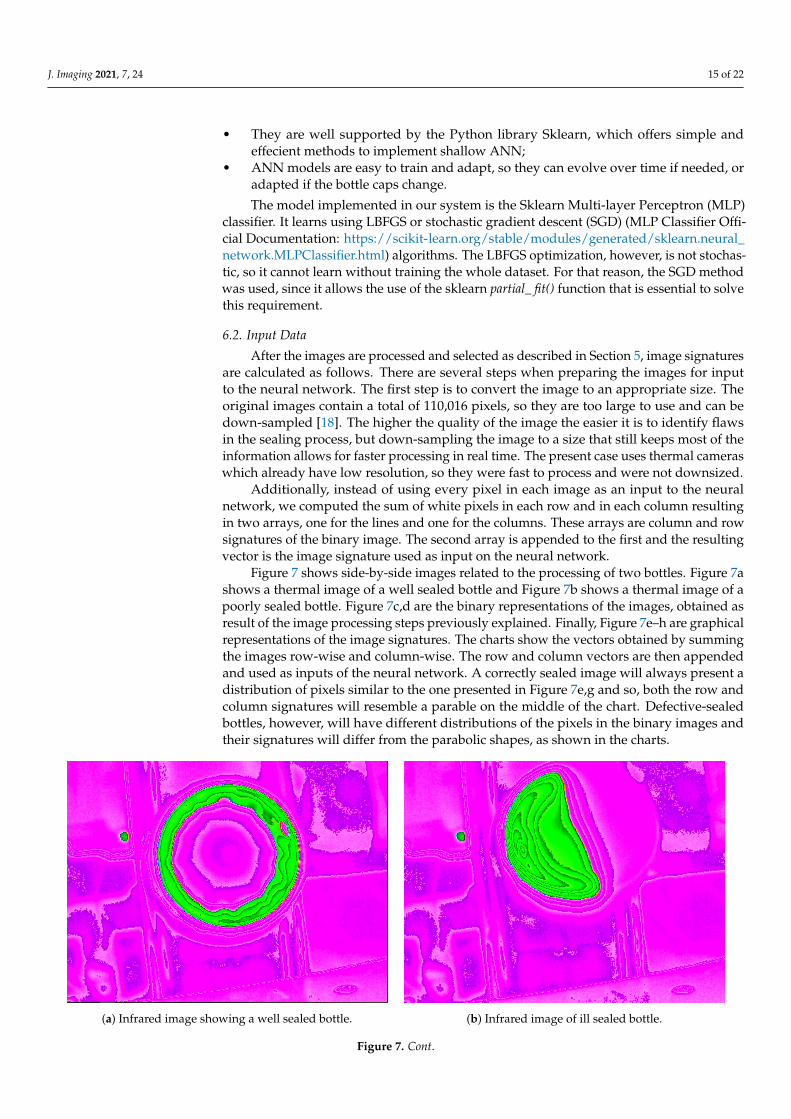
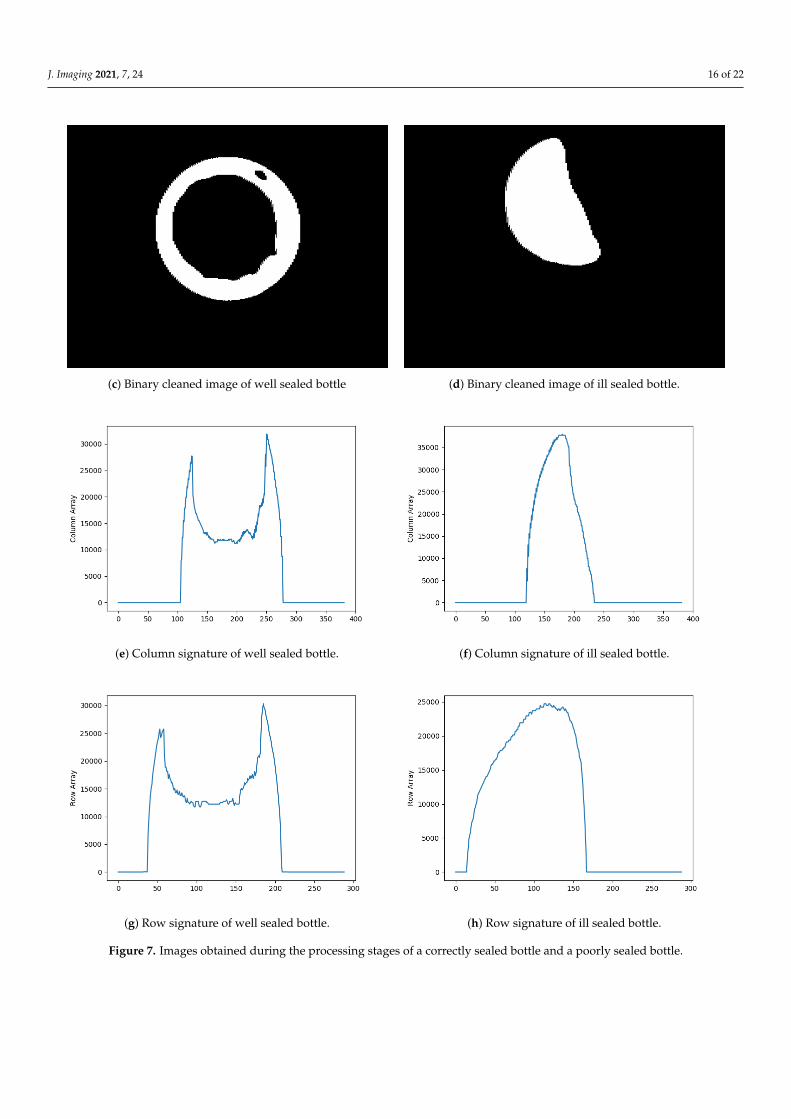
Figure 7 shows side-by-side images related to the processing of two bottles. Figure 7ashows a thermal image of a well sealed bottle and Figure 7b shows a thermal image of apoorly sealed bottle. Figure 7c,d are the binary representations of the images, obtained asresult of the image processing steps previously explained. Finally, Figure 7e–h are graphicalrepresentations of the image signatures. The charts show the vectors obtained by summingthe images row-wise and column-wise. The row and column vectors are then appendedand used as inputs of the neural network. A correctly sealed image will always present adistribution of pixels similar to the one presented in Figure 7e,g and so, both the row andcolumn signatures will resemble a parable on the middle of the chart. Defective-sealedbottles, however, will have different distributions of the pixels in the binary images andtheir signatures will differ from the parabolic shapes, as shown in the charts.
(a) Infrared image showing a well sealed bottle. (b) Infrared image of ill sealed bottle.
Figure 7. Cont.
J. Imaging 2021, 7, 24 16 of 22
(c) Binary cleaned image of well sealed bottle (d) Binary cleaned image of ill sealed bottle.
(e) Column signature of well sealed bottle. (f) Column signature of ill sealed bottle.
(g) Row signature of well sealed bottle. (h) Row signature of ill sealed bottle.
Figure 7. Images obtained during the processing stages of a correctly sealed bottle and a poorly sealed bottle.

J. Imaging 2021, 7, 24 17 of 22
6.3. Hyper Parameter Optimization
The classifier includes multiple parameters such as hidden layer size, activationfunction, solver, learning rate and others. Those parameters were optimized using theGridSearch algorithm.
The first parameter studied was the number of perceptrons in the first hidden layer.Figure 8 presents results of this phase. Figure 8a shows the model best loss variation whenincreasing the number of perceptrons in the first hidden layer. Figure 8b shows the modelperformance when applied to the training set and Figure 8c shows the performance whenapplied to the test set. The figure shows that above 60 perceptrons the change in the modelbehavior is small.
When selecting the top values presented in Figure 8c, the GridSearchCV() wouldalways select the higher value in range until it capped at 130 perceptrons. However, sincethe change in the model is small, only 100 perceptrons were used in the final model. Thereason that led to this choice is to decrease the chance of overfitting and to reduce thecomputing power needed to test and train the models in the production line.
(a) Iteration best loss (b) Training set F1 score and accuracy
(c) Test set F1 score and accuracy
Figure 8. Model behavior when changing the number of perceptrons in the first hidden layer.
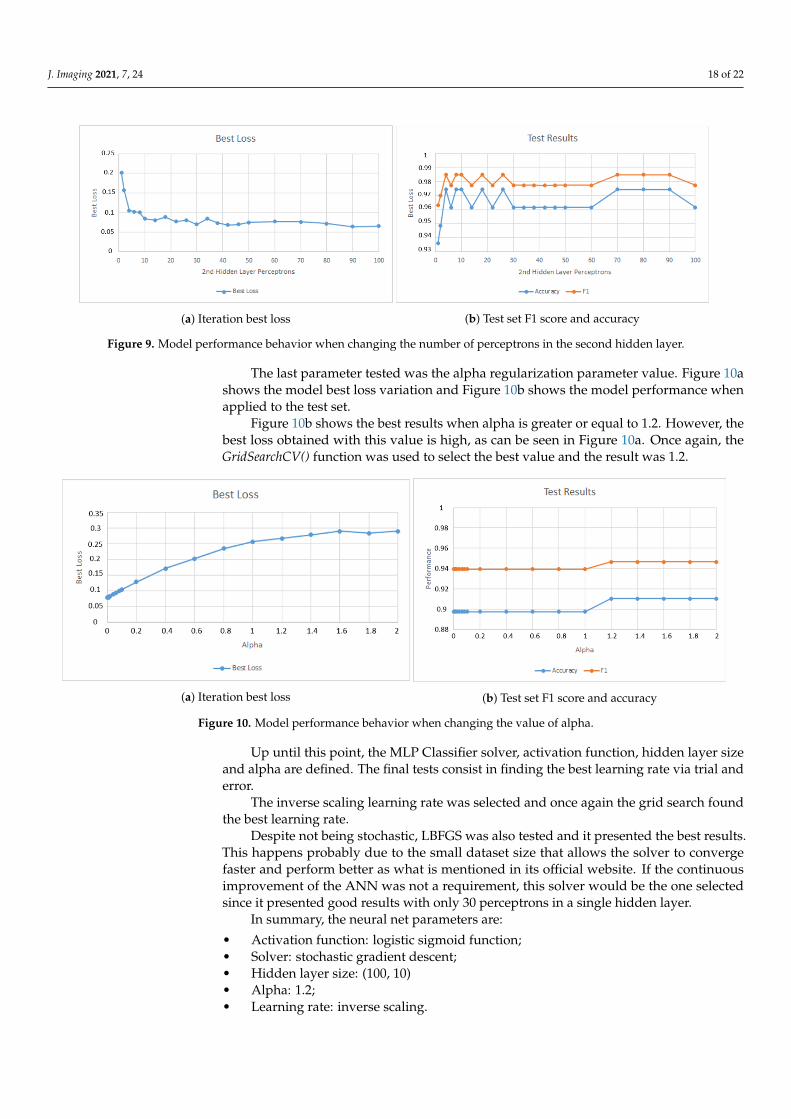
The second parameter tested was the number of perceptrons in the second hiddenlayer. Figure 9a presents the model best loss variation and Figure 9b presents the modelperformance when applied to the test set.
Figure 9b shows that the model accuracy and F1 score are capped around 0.986 and0.975 respectively. Based on Figure 9a, the value selected was 10 perceptrons since it marksthe point where the model loss becomes almost constant.
J. Imaging 2021, 7, 24 18 of 22
(a) Iteration best loss (b) Test set F1 score and accuracy
Figure 9. Model performance behavior when changing the number of perceptrons in the second hidden layer.
The last parameter tested was the alpha regularization parameter value. Figure 10ashows the model best loss variation and Figure 10b shows the model performance whenapplied to the test set.
Figure 10b shows the best results when alpha is greater or equal to 1.2. However, thebest loss obtained with this value is high, as can be seen in Figure 10a. Once again, theGridSearchCV() function was used to select the best value and the result was 1.2.
(a) Iteration best loss (b) Test set F1 score and accuracy
Figure 10. Model performance behavior when changing the value of alpha.
Up until this point, the MLP Classifier solver, activation function, hidden layer sizeand alpha are defined. The final tests consist in finding the best learning rate via trial anderror.
The inverse scaling learning rate was selected and once again the grid search foundthe best learning rate.
Despite not being stochastic, LBFGS was also tested and it presented the best results.This happens probably due to the small dataset size that allows the solver to convergefaster and perform better as what is mentioned in its official website. If the continuousimprovement of the ANN was not a requirement, this solver would be the one selectedsince it presented good results with only 30 perceptrons in a single hidden layer.
In summary, the neural net parameters are:
• Activation function: logistic sigmoid function;• Solver: stochastic gradient descent;• Hidden layer size: (100, 10)• Alpha: 1.2;• Learning rate: inverse scaling.
J. Imaging 2021, 7, 24 19 of 22
7. Tests and Results
The model was trained with 312 images of the augmented dataset. The model wasthen tested using the test set, which contains the remainder 78 images.
There is one important aspect to consider when creating the neural net and that is, thenumber of false negatives must be as low as possible. Each time there is a false negative,an unsealed bottle goes to the distribution. In our case study, the bottles contain pesticidewhich makes it quite dangerous to the public having defective-sealed bottles going todistribution. Therefore, the model was developed with the ability to be learn over time andreceive additional train, in a way that false negatives are avoided.
The maximum training iterations was set to 200. However, the results shown inthe present paper were obtained with a model that required only 57 iterations in thetraining phase.
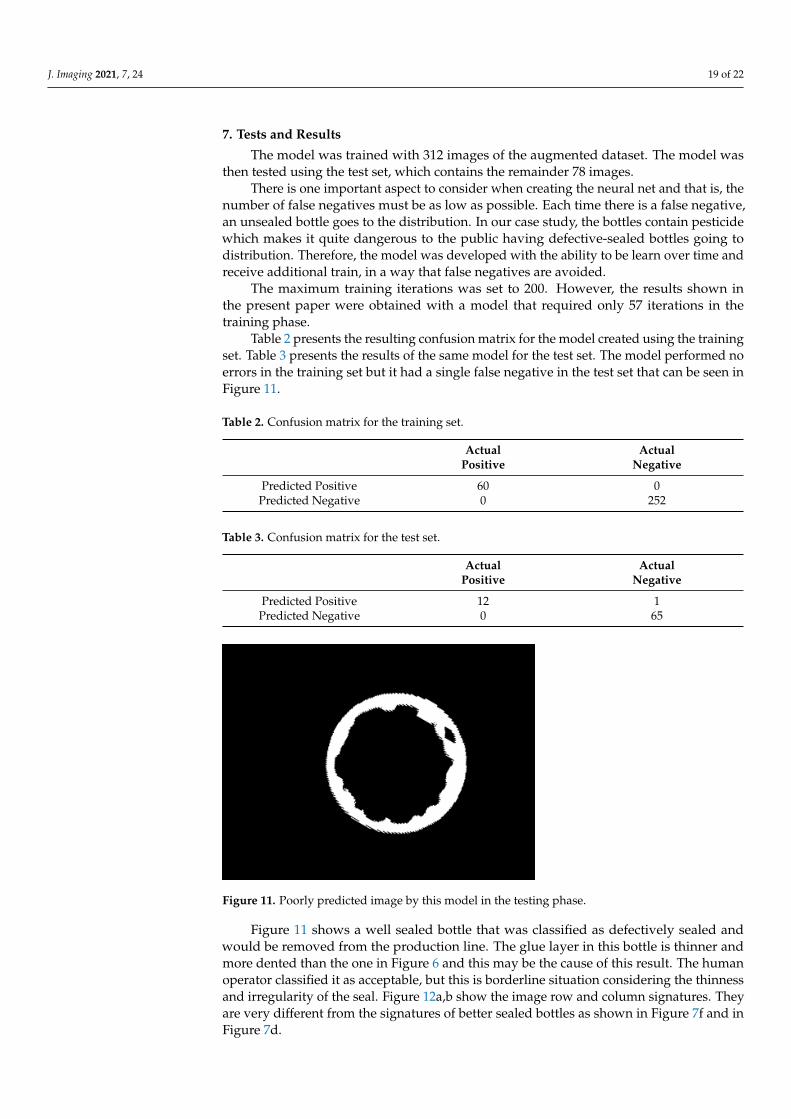
Table 2 presents the resulting confusion matrix for the model created using the trainingset. Table 3 presents the results of the same model for the test set. The model performed noerrors in the training set but it had a single false negative in the test set that can be seen inFigure 11.
Table 2. Confusion matrix for the training set.
Actual ActualPositive Negative
Predicted Positive 60 0Predicted Negative 0 252
Table 3. Confusion matrix for the test set.
Actual ActualPositive Negative
Predicted Positive 12 1Predicted Negative 0 65
Figure 11. Poorly predicted image by this model in the testing phase.
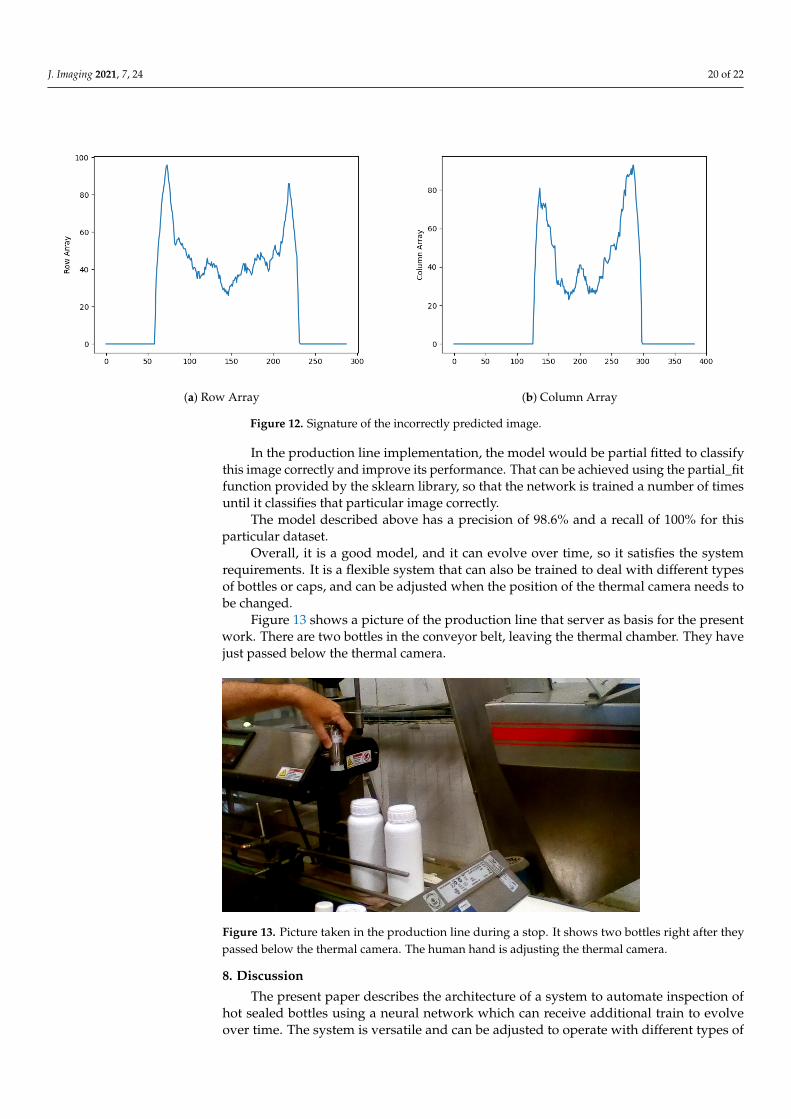
Figure 11 shows a well sealed bottle that was classified as defectively sealed andwould be removed from the production line. The glue layer in this bottle is thinner andmore dented than the one in Figure 6 and this may be the cause of this result. The humanoperator classified it as acceptable, but this is borderline situation considering the thinnessand irregularity of the seal. Figure 12a,b show the image row and column signatures. Theyare very different from the signatures of better sealed bottles as shown in Figure 7f and inFigure 7d.
J. Imaging 2021, 7, 24 20 of 22
(a) Row Array (b) Column Array
Figure 12. Signature of the incorrectly predicted image.
In the production line implementation, the model would be partial fitted to classifythis image correctly and improve its performance. That can be achieved using the partial_fitfunction provided by the sklearn library, so that the network is trained a number of timesuntil it classifies that particular image correctly.
The model described above has a precision of 98.6% and a recall of 100% for thisparticular dataset.
Overall, it is a good model, and it can evolve over time, so it satisfies the systemrequirements. It is a flexible system that can also be trained to deal with different typesof bottles or caps, and can be adjusted when the position of the thermal camera needs tobe changed.
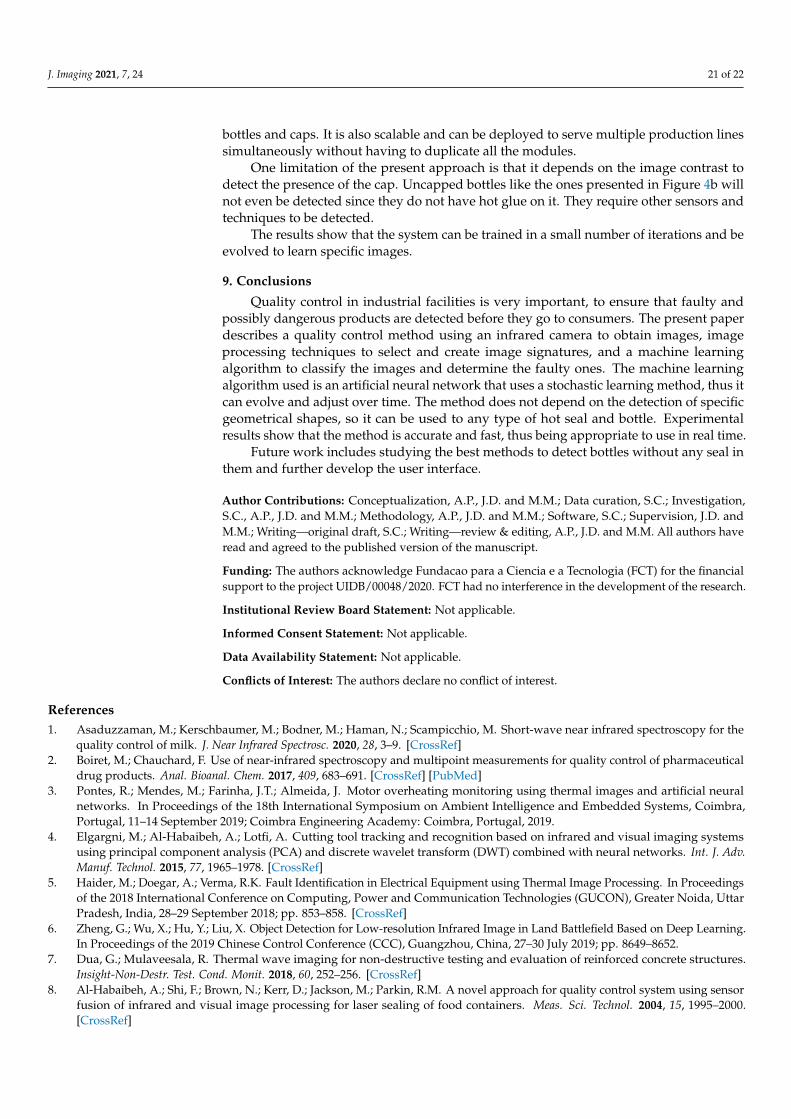
Figure 13 shows a picture of the production line that server as basis for the presentwork. There are two bottles in the conveyor belt, leaving the thermal chamber. They havejust passed below the thermal camera.
Figure 13. Picture taken in the production line during a stop. It shows two bottles right after theypassed below the thermal camera. The human hand is adjusting the thermal camera.
8. Discussion
The present paper describes the architecture of a system to automate inspection ofhot sealed bottles using a neural network which can receive additional train to evolveover time. The system is versatile and can be adjusted to operate with different types of
J. Imaging 2021, 7, 24 21 of 22
bottles and caps. It is also scalable and can be deployed to serve multiple production linessimultaneously without having to duplicate all the modules.
One limitation of the present approach is that it depends on the image contrast todetect the presence of the cap. Uncapped bottles like the ones presented in Figure 4b willnot even be detected since they do not have hot glue on it. They require other sensors andtechniques to be detected.
The results show that the system can be trained in a small number of iterations and beevolved to learn specific images.
9. Conclusions
Quality control in industrial facilities is very important, to ensure that faulty andpossibly dangerous products are detected before they go to consumers. The present paperdescribes a quality control method using an infrared camera to obtain images, imageprocessing techniques to select and create image signatures, and a machine learningalgorithm to classify the images and determine the faulty ones. The machine learningalgorithm used is an artificial neural network that uses a stochastic learning method, thus itcan evolve and adjust over time. The method does not depend on the detection of specificgeometrical shapes, so it can be used to any type of hot seal and bottle. Experimentalresults show that the method is accurate and fast, thus being appropriate to use in real time.
Future work includes studying the best methods to detect bottles without any seal inthem and further develop the user interface.
Author Contributions: Conceptualization, A.P., J.D. and M.M.; Data curation, S.C.; Investigation,S.C., A.P., J.D. and M.M.; Methodology, A.P., J.D. and M.M.; Software, S.C.; Supervision, J.D. andM.M.; Writing—original draft, S.C.; Writing—review & editing, A.P., J.D. and M.M. All authors haveread and agreed to the published version of the manuscript.
Funding: The authors acknowledge Fundacao para a Ciencia e a Tecnologia (FCT) for the financialsupport to the project UIDB/00048/2020. FCT had no interference in the development of the research.
Institutional Review Board Statement: Not applicable.
Informed Consent Statement: Not applicable.
Data Availability Statement: Not applicable.
Conflicts of Interest: The authors declare no conflict of interest.
References1. Asaduzzaman, M.; Kerschbaumer, M.; Bodner, M.; Haman, N.; Scampicchio, M. Short-wave near infrared spectroscopy for the
quality control of milk. J. Near Infrared Spectrosc. 2020, 28, 3–9. [CrossRef]2. Boiret, M.; Chauchard, F. Use of near-infrared spectroscopy and multipoint measurements for quality control of pharmaceutical
drug products. Anal. Bioanal. Chem. 2017, 409, 683–691. [CrossRef] [PubMed]3. Pontes, R.; Mendes, M.; Farinha, J.T.; Almeida, J. Motor overheating monitoring using thermal images and artificial neural
networks. In Proceedings of the 18th International Symposium on Ambient Intelligence and Embedded Systems, Coimbra,Portugal, 11–14 September 2019; Coimbra Engineering Academy: Coimbra, Portugal, 2019.
4. Elgargni, M.; Al-Habaibeh, A.; Lotfi, A. Cutting tool tracking and recognition based on infrared and visual imaging systemsusing principal component analysis (PCA) and discrete wavelet transform (DWT) combined with neural networks. Int. J. Adv.Manuf. Technol. 2015, 77, 1965–1978. [CrossRef]
5. Haider, M.; Doegar, A.; Verma, R.K. Fault Identification in Electrical Equipment using Thermal Image Processing. In Proceedingsof the 2018 International Conference on Computing, Power and Communication Technologies (GUCON), Greater Noida, UttarPradesh, India, 28–29 September 2018; pp. 853–858. [CrossRef]
6. Zheng, G.; Wu, X.; Hu, Y.; Liu, X. Object Detection for Low-resolution Infrared Image in Land Battlefield Based on Deep Learning.In Proceedings of the 2019 Chinese Control Conference (CCC), Guangzhou, China, 27–30 July 2019; pp. 8649–8652.
7. Dua, G.; Mulaveesala, R. Thermal wave imaging for non-destructive testing and evaluation of reinforced concrete structures.Insight-Non-Destr. Test. Cond. Monit. 2018, 60, 252–256. [CrossRef]
8. Al-Habaibeh, A.; Shi, F.; Brown, N.; Kerr, D.; Jackson, M.; Parkin, R.M. A novel approach for quality control system using sensorfusion of infrared and visual image processing for laser sealing of food containers. Meas. Sci. Technol. 2004, 15, 1995–2000.[CrossRef]
J. Imaging 2021, 7, 24 22 of 22
9. Al-Habaibeh, A.; Parkin, R. An autonomous low-Cost infrared system for the on-line monitoring of manufacturing processesusing novelty detection. Int. J. Adv. Manuf. Technol. 2003, 22, 249–258. [CrossRef]
10. D’huys, K.; Saeys, W.; Ketelaere, B.D. Active Infrared Thermography for Seal Contamination Detection in Heat-Sealed FoodPackaging. J. Imaging 2016, 2, 33. [CrossRef]
11. Shuangyang, Z. Fast Inspection of Food Packing Seals Using Machine Vision. In Proceedings of the 2010 International Conferenceon Digital Manufacturing Automation, Changsha, China, 18–20 December 2010; Volume 1, pp. 724–726. [CrossRef]
12. Del Frate, F.; Pacifici, F.; Schiavon, G.; Solimini, C. Use of Neural Networks for Automatic Classification From High-ResolutionImages. IEEE Trans. Geosci. Remote Sens. 2007, 45, 800–809. [CrossRef]
13. Parisi, L. m-arcsinh: An Efficient and Reliable Function for SVM and MLP in scikit-learn. arXiv 2020, arXiv:2009.07530.14. Basu, S.; Das, N.; Sarkar, R.; Kundu, M.; Nasipuri, M.; Basu, D.K. Handwritten Bangla Alphabet Recognition using an MLP Based
Classifier. arXiv 2012, arXiv:1203.0882.15. Dimitris, M.; Ekaterini, V.; Milas, N.; Xanthopoulos, N. A Cloud-based Approach for Maintenance of Machine Tools and
Equipment Based on Shop-floor Monitoring. Procedia CIRP 2016, 41, 655–660. [CrossRef]16. Vithu, P.; Moses, J. Machine vision system for food grain quality evaluation: A review. Trends Food Sci. Technol. 2016, 56, 13–20.
[CrossRef]17. Saez-Mas, A.; Sabater, J.P.G.; Llorca, J.M. Using 4-layer architecture to simulate product and information flows in manufacturing
systems. Int. J. Simul. Model. 2018, 17, 30–41. [CrossRef]18. Xu, Y.; Jin, Z. Down-Sampling Face Images and Low-Resolution Face Recognition. In Proceedings of the 2008 3rd International
Conference on Innovative Computing Information and Control, Dalian, China, 18–20 June 2008; pp. 392–392.


