Embed Size (px)
Citation preview
Reaction-Induced Phase Separation in Epoxy/Polysulfone/Poly(ether imide) Systems. I. Phase Diagrams
M. I. GIANNOTTI,1 M. L. FORESTI,1 I. MONDRAGON,2 M. J. GALANTE,1 P. A. OYANGUREN1
1Institute of Materials Science and Technology (INTEMA), University of Mar del Plata and National Research Council(CONICET), J. B. Justo 4302, 7600 Mar del Plata, Argentina
2Materials and Technologies Group, Escuela Ingenierıa Tecnica Industrial, Universidad Paıs Vasco/Euskal HerrikoUnibertsitatea, Avda. Felipe IV, 1 B. 20011 San Sebastian, Donostia, Spain
Received 6 June 2003; revised 12 April 2004; accepted 9 May 2004DOI: 10.1002/polb.20192Published online in Wiley InterScience (www.interscience.wiley.com).
ABSTRACT: Epoxy–aromatic diamine formulations are simultaneously modified withtwo immiscible thermoplastics (TPs), poly(ether imide) (PEI) and polysulfone (PSF).The epoxy monomer is based on diglycidyl ether of bisphenol A and the aromaticdiamines (ADs) are either 4,4�-diaminodiphenylsulfone or 4,4�-methylenebis(3-chloro 2,6-diethylaniline). The influence of the TPs on the epoxy–amine kinetics isinvestigated. It is found that PSF can act as a catalyst. The presence of the TPprovokes an increase of the gel times. Cloud-point curves (temperature vs. compo-sition) are shown for epoxy/PSF/PEI and epoxy/PSF/PEI/AD initial mixtures. Phaseseparation conversions are reported for the reactive mixtures with various TPcontents and PSF/PEI proportions. On the basis of phase separation and gelationcurves, conversion– composition phase diagrams at constant temperature are gen-erated for both systems. These diagrams can be used to design particular cure cyclesto generate different morphologies during the phase separation process, which isdiscussed in the second part of this series. © 2004 Wiley Periodicals, Inc. J Polym Sci PartB: Polym Phys 42: 3953–3963, 2004Keywords: reaction-induced phase separation; poly(ether imide); polysulfone; modi-fied epoxies; morphology
INTRODUCTION
Studies on polymeric mixtures comprising a highmolecular weight thermoplastic (TP)1–11 and re-active thermosetting resins have significantly in-creased because of the development of complexmorphology as the cure reaction progresses. Var-ious types of TPs, such as poly(ether sulfone)(PES),1,2 poly(ether imide) (PEI),3,4,6 poly(etherether ketone),3 and polysulfone (PSF),7–11 have
been explored to modify epoxy resins. The modi-fier is initially dissolved in the monomers of thesystem to be modified; it then phase separatesbecause of an increase in the molecular weight ofthe thermosetting resin during isothermal cure.These systems represent typical examples of re-action-induced phase separation during step po-lymerization. Because the performance of themodified material depends on the morphologiesgenerated and their relationships with the re-quired properties, it is important to analyze thethermodynamic and kinetic factors involved inthe phase separation process.
Another possibility for modification can be thesimultaneous addition of two polymers to the
Correspondence to: P. A. Oyanguren (E-mail: [email protected])Journal of Polymer Science: Part B: Polymer Physics, Vol. 42, 3953–3963 (2004)© 2004 Wiley Periodicals, Inc.
3953
thermosetting resin before curing. Few studieshave been reported on ternary blends involving athermoset precursor and two linear poly-mers.12–15
The present study is intended to discuss the si-multaneous modification of an epoxy matrix withtwo TPs. The selected TPs show different phasebehavior of epoxy–TP mixtures with the tempera-ture and are completely immiscible among them.The main objectives of the work reported here are toinvestigate the effect of modifiers on the thermosetchemistry using two different curing agents, to an-alyze the phase separation process, and to deter-mine the corresponding phase diagrams. The use ofthese diagrams to produce different morphologies isreported in Part II.
EXPERIMENTAL
Materials
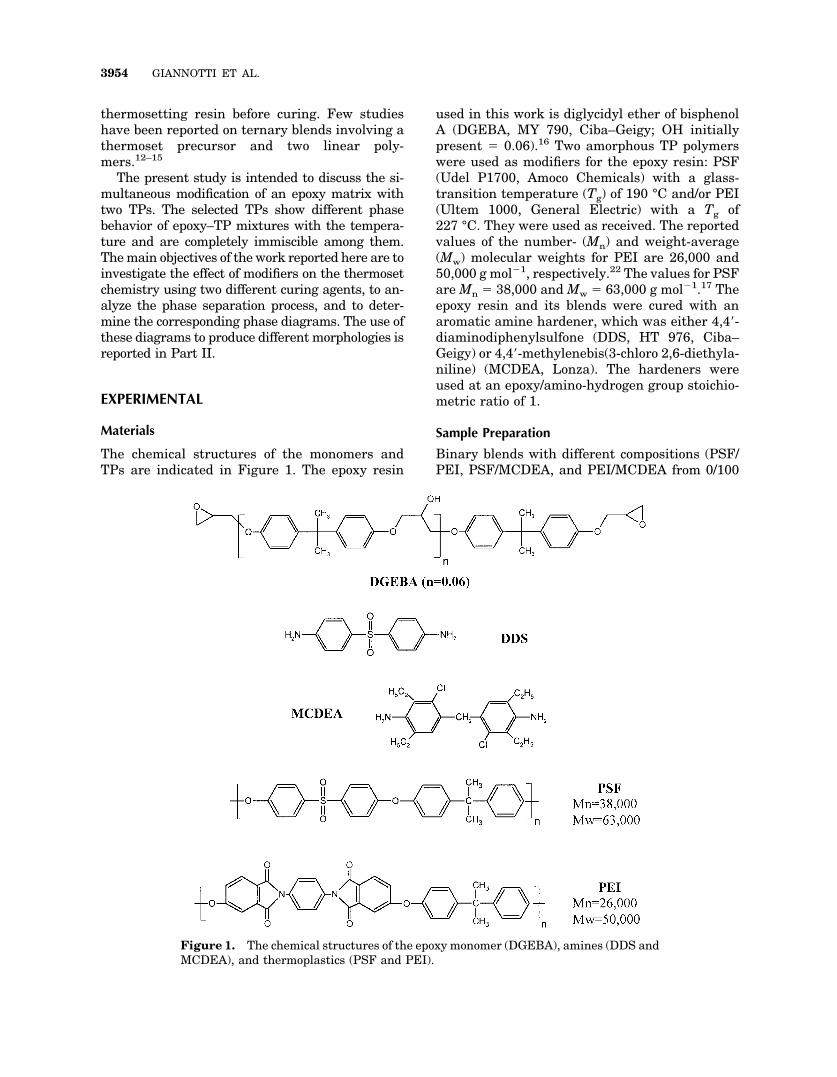
The chemical structures of the monomers andTPs are indicated in Figure 1. The epoxy resin
used in this work is diglycidyl ether of bisphenolA (DGEBA, MY 790, Ciba–Geigy; OH initiallypresent � 0.06).16 Two amorphous TP polymerswere used as modifiers for the epoxy resin: PSF(Udel P1700, Amoco Chemicals) with a glass-transition temperature (Tg) of 190 °C and/or PEI(Ultem 1000, General Electric) with a Tg of227 °C. They were used as received. The reportedvalues of the number- (Mn) and weight-average(Mw) molecular weights for PEI are 26,000 and50,000 g mol�1, respectively.22 The values for PSFare Mn � 38,000 and Mw � 63,000 g mol�1.17 Theepoxy resin and its blends were cured with anaromatic amine hardener, which was either 4,4�-diaminodiphenylsulfone (DDS, HT 976, Ciba–Geigy) or 4,4�-methylenebis(3-chloro 2,6-diethyla-niline) (MCDEA, Lonza). The hardeners wereused at an epoxy/amino-hydrogen group stoichio-metric ratio of 1.
Sample Preparation
Binary blends with different compositions (PSF/PEI, PSF/MCDEA, and PEI/MCDEA from 0/100
Figure 1. The chemical structures of the epoxy monomer (DGEBA), amines (DDS andMCDEA), and thermoplastics (PSF and PEI).
3954 GIANNOTTI ET AL.
to 100/0) were prepared by casting at room tem-perature from dichloromethane (CH2Cl2) solu-tions. Thin polymer films were obtained byspreading of the solution onto different surfaces.
Modified epoxy resins containing 0–15 wt % TPwere prepared using a standard procedure. Wefound that 15 wt % TP in the total mass repre-sented the maximum content possible because theviscosity increased rapidly at increased loading ofthe TP. The TP was dissolved in CH2Cl2 andmixed with the resin at room temperature. Mostof the solvent was evaporated at room tempera-ture, and the residual amount was eliminated byheating at 80 °C for 24 h. In a second step, astoichiometric amount of aromatic diamine (AD)was dissolved at 135 °C for DDS or 90 °C forMCDEA.
Measurements
Conversion versus time curves at 135 and 200 °Cfor pure and TP-modified epoxy–AD formulationswere obtained by heating a set of tubes in an oilbath, removing one at a time at selected intervals,quenching it in ice, and determining the conver-sion by size exclusion chromatography (SEC).
From the analysis of the soluble products, SECwas employed to estimate the extent of reaction.A Waters chromatograph was used, which wasprovided with a UV detector (� � 254 nm) andStyragel columns (HR0.5, HR1, and HR3). Theseparation was carried out using tetrahydrofuran(THF) as an eluent at a flow rate of 1 mL min�1.From the height of the DGEBA peak, the conver-sion could be obtained as18
x � 1 � �h/h0� 1/2
(1)
where h is the height of the peak at any conver-sion and h0 is its initial value in the unreactedmixture.
The gelation time was considered to be thetime at which the presence of an insoluble frac-tion in THF was first observed.
The cloud-point temperatures (Tcp) of epoxy/PEI, epoxy/PSF/PEI, and epoxy/PSF/PEI/AD un-reacted mixtures, containing different PSF/PEIrelations and concentrations, were determinedusing transmission optical microscopy (TOM). ALeica DMLB microscope provided with a videocamera (Leica DC 100) and a hot stage (LinkamTHMS 600) was used for this purpose. The tem-
perature was increased until a homogeneous so-lution was obtained, kept constant for 1 min, andthen decreased at a cooling rate of 1 K min�1,until the temperature at which a second phasewas first observed. This procedure was repeateduntil a constant value was obtained.
SEC confirmed the absence of an epoxy–aminereaction during the experimental determinationsof the Tcp. TOM was also used to determine thefirst phase separation times in reactive mixtures.Both phase separation and gel times were ex-pressed as the corresponding conversion values,xps and xgel, using the polymerization kinetics de-termined by SEC.
Differential scanning calorimetry (DSC) wasperformed with a Shimadzu DSC-50 under nitro-gen flow to measure the heat of reaction of un-cured mixtures and the Tg’s of PSF/PEI, PSF/MCDEA, PEI/MCDEA, and PSF/PEI/MCDEAblends. The heating rate used was 10 K min�1 inall DSC tests.
RESULTS AND DISCUSSION
Nonreactive Systems
For a satisfactory interpretation of the influenceof both TP polymers in epoxy–AD mixtures, bi-nary blends of the components were investigatedfirst. The miscibility of the blends was judged byobservation of one or two Tg’s in the DSC scans.
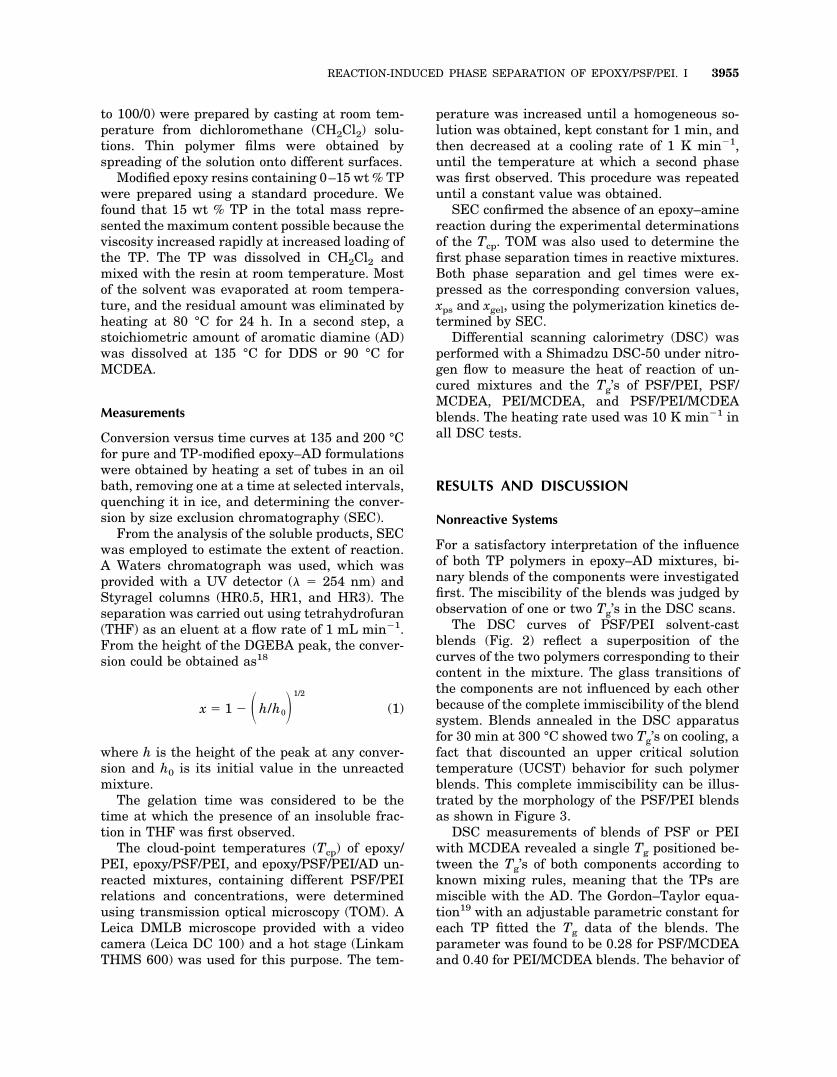
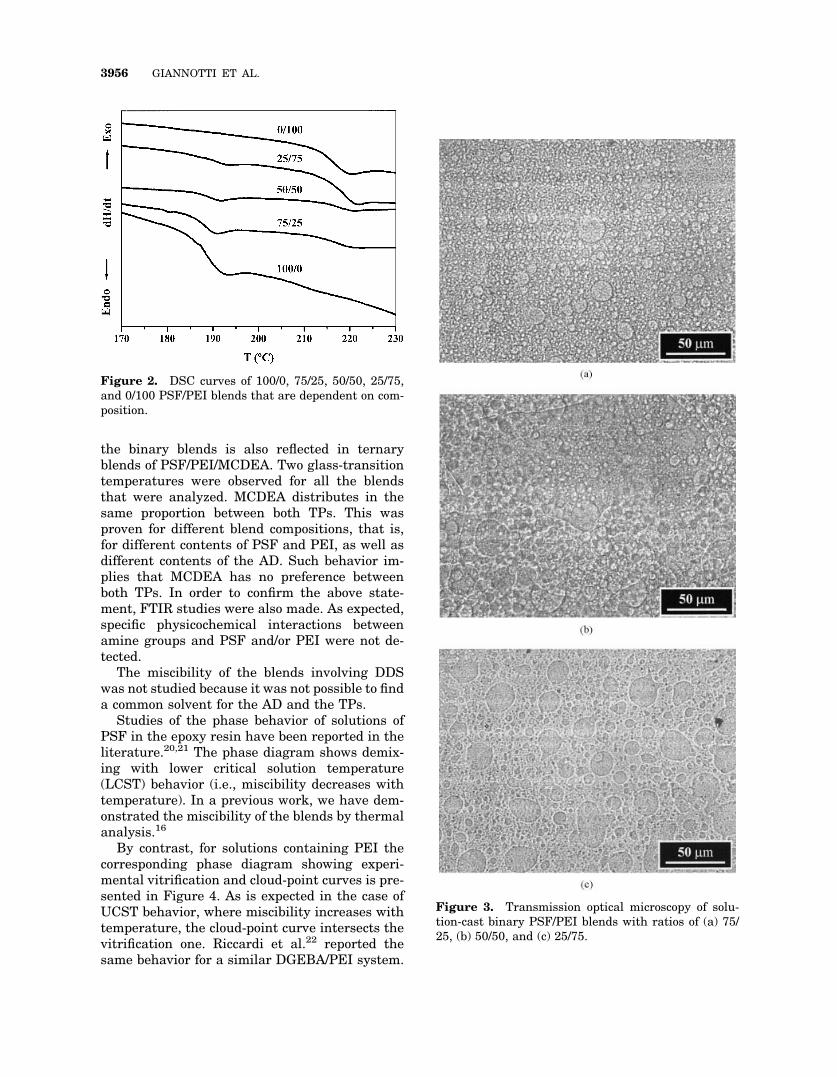
The DSC curves of PSF/PEI solvent-castblends (Fig. 2) reflect a superposition of thecurves of the two polymers corresponding to theircontent in the mixture. The glass transitions ofthe components are not influenced by each otherbecause of the complete immiscibility of the blendsystem. Blends annealed in the DSC apparatusfor 30 min at 300 °C showed two Tg’s on cooling, afact that discounted an upper critical solutiontemperature (UCST) behavior for such polymerblends. This complete immiscibility can be illus-trated by the morphology of the PSF/PEI blendsas shown in Figure 3.
DSC measurements of blends of PSF or PEIwith MCDEA revealed a single Tg positioned be-tween the Tg’s of both components according toknown mixing rules, meaning that the TPs aremiscible with the AD. The Gordon–Taylor equa-tion19 with an adjustable parametric constant foreach TP fitted the Tg data of the blends. Theparameter was found to be 0.28 for PSF/MCDEAand 0.40 for PEI/MCDEA blends. The behavior of
REACTION-INDUCED PHASE SEPARATION OF EPOXY/PSF/PEI. I 3955
the binary blends is also reflected in ternaryblends of PSF/PEI/MCDEA. Two glass-transitiontemperatures were observed for all the blendsthat were analyzed. MCDEA distributes in thesame proportion between both TPs. This wasproven for different blend compositions, that is,for different contents of PSF and PEI, as well asdifferent contents of the AD. Such behavior im-plies that MCDEA has no preference betweenboth TPs. In order to confirm the above state-ment, FTIR studies were also made. As expected,specific physicochemical interactions betweenamine groups and PSF and/or PEI were not de-tected.
The miscibility of the blends involving DDSwas not studied because it was not possible to finda common solvent for the AD and the TPs.
Studies of the phase behavior of solutions ofPSF in the epoxy resin have been reported in theliterature.20,21 The phase diagram shows demix-ing with lower critical solution temperature(LCST) behavior (i.e., miscibility decreases withtemperature). In a previous work, we have dem-onstrated the miscibility of the blends by thermalanalysis.16
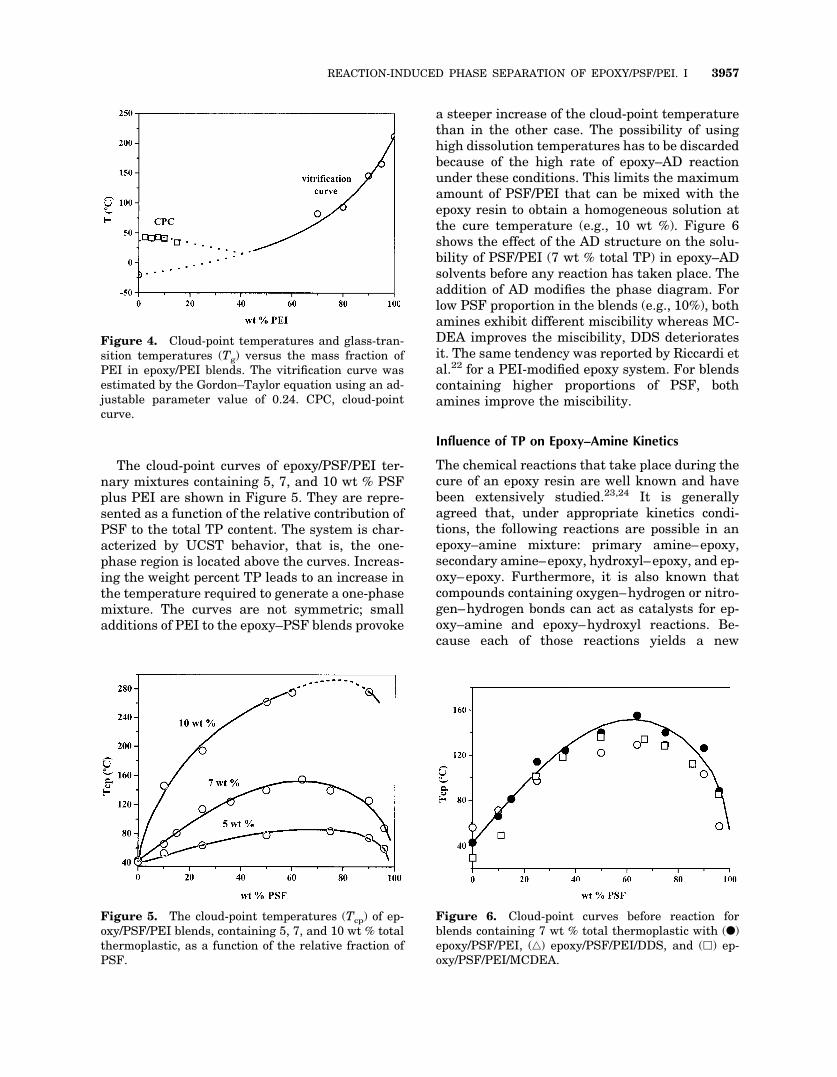
By contrast, for solutions containing PEI thecorresponding phase diagram showing experi-mental vitrification and cloud-point curves is pre-sented in Figure 4. As is expected in the case ofUCST behavior, where miscibility increases withtemperature, the cloud-point curve intersects thevitrification one. Riccardi et al.22 reported thesame behavior for a similar DGEBA/PEI system.
Figure 3. Transmission optical microscopy of solu-tion-cast binary PSF/PEI blends with ratios of (a) 75/25, (b) 50/50, and (c) 25/75.
Figure 2. DSC curves of 100/0, 75/25, 50/50, 25/75,and 0/100 PSF/PEI blends that are dependent on com-position.
3956 GIANNOTTI ET AL.
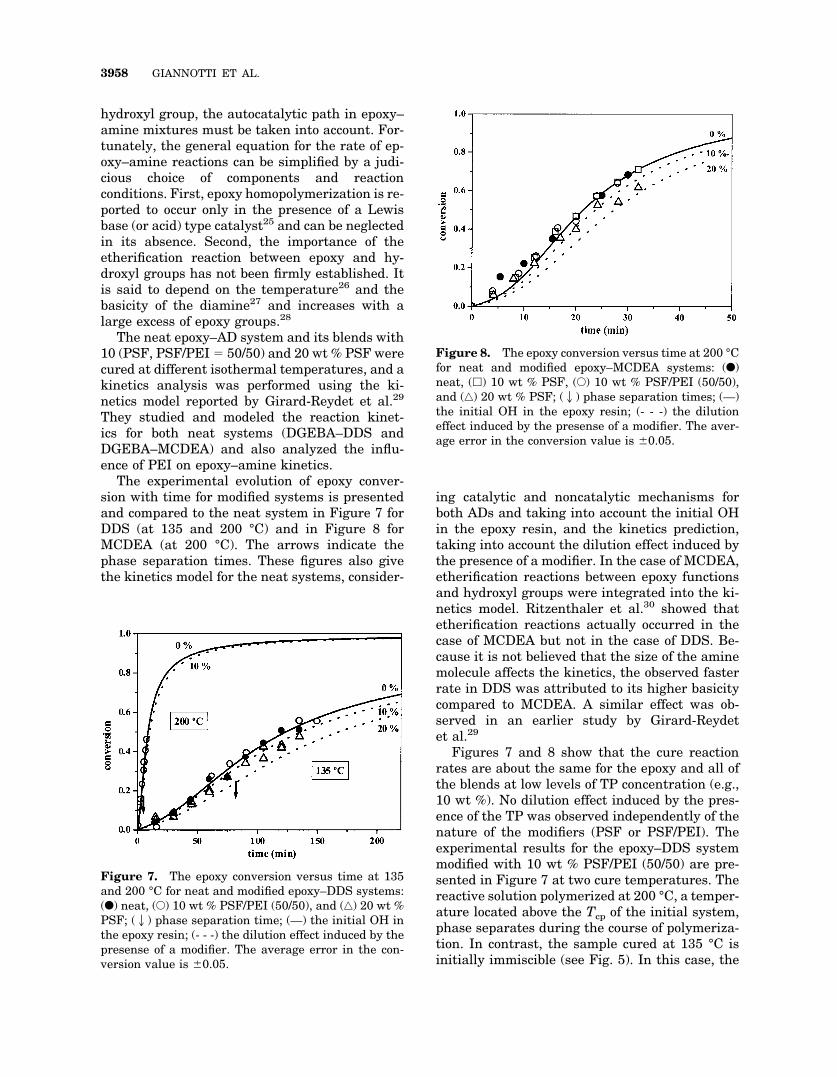
The cloud-point curves of epoxy/PSF/PEI ter-nary mixtures containing 5, 7, and 10 wt % PSFplus PEI are shown in Figure 5. They are repre-sented as a function of the relative contribution ofPSF to the total TP content. The system is char-acterized by UCST behavior, that is, the one-phase region is located above the curves. Increas-ing the weight percent TP leads to an increase inthe temperature required to generate a one-phasemixture. The curves are not symmetric; smalladditions of PEI to the epoxy–PSF blends provoke
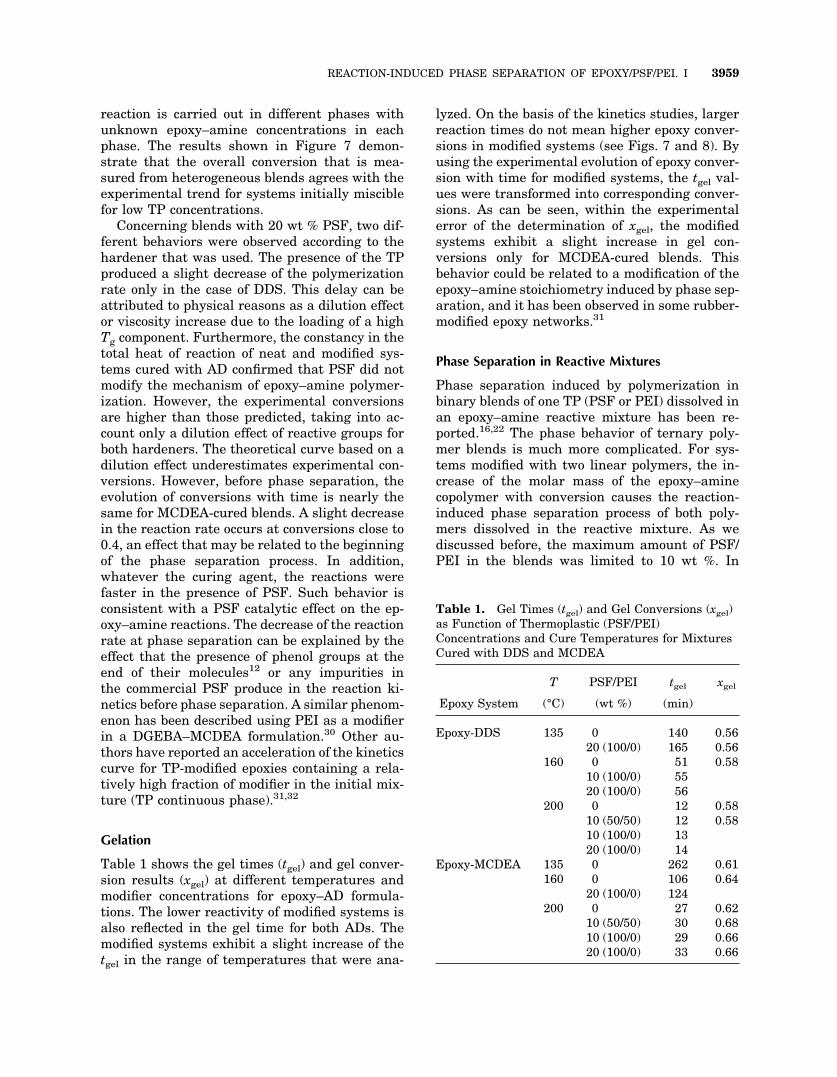
a steeper increase of the cloud-point temperaturethan in the other case. The possibility of usinghigh dissolution temperatures has to be discardedbecause of the high rate of epoxy–AD reactionunder these conditions. This limits the maximumamount of PSF/PEI that can be mixed with theepoxy resin to obtain a homogeneous solution atthe cure temperature (e.g., 10 wt %). Figure 6shows the effect of the AD structure on the solu-bility of PSF/PEI (7 wt % total TP) in epoxy–ADsolvents before any reaction has taken place. Theaddition of AD modifies the phase diagram. Forlow PSF proportion in the blends (e.g., 10%), bothamines exhibit different miscibility whereas MC-DEA improves the miscibility, DDS deterioratesit. The same tendency was reported by Riccardi etal.22 for a PEI-modified epoxy system. For blendscontaining higher proportions of PSF, bothamines improve the miscibility.
Influence of TP on Epoxy–Amine Kinetics
The chemical reactions that take place during thecure of an epoxy resin are well known and havebeen extensively studied.23,24 It is generallyagreed that, under appropriate kinetics condi-tions, the following reactions are possible in anepoxy–amine mixture: primary amine–epoxy,secondary amine–epoxy, hydroxyl–epoxy, and ep-oxy–epoxy. Furthermore, it is also known thatcompounds containing oxygen–hydrogen or nitro-gen–hydrogen bonds can act as catalysts for ep-oxy–amine and epoxy–hydroxyl reactions. Be-cause each of those reactions yields a new
Figure 6. Cloud-point curves before reaction forblends containing 7 wt % total thermoplastic with (F)epoxy/PSF/PEI, (‚) epoxy/PSF/PEI/DDS, and (�) ep-oxy/PSF/PEI/MCDEA.
Figure 4. Cloud-point temperatures and glass-tran-sition temperatures (Tg) versus the mass fraction ofPEI in epoxy/PEI blends. The vitrification curve wasestimated by the Gordon–Taylor equation using an ad-justable parameter value of 0.24. CPC, cloud-pointcurve.
Figure 5. The cloud-point temperatures (Tcp) of ep-oxy/PSF/PEI blends, containing 5, 7, and 10 wt % totalthermoplastic, as a function of the relative fraction ofPSF.
REACTION-INDUCED PHASE SEPARATION OF EPOXY/PSF/PEI. I 3957
hydroxyl group, the autocatalytic path in epoxy–amine mixtures must be taken into account. For-tunately, the general equation for the rate of ep-oxy–amine reactions can be simplified by a judi-cious choice of components and reactionconditions. First, epoxy homopolymerization is re-ported to occur only in the presence of a Lewisbase (or acid) type catalyst25 and can be neglectedin its absence. Second, the importance of theetherification reaction between epoxy and hy-droxyl groups has not been firmly established. Itis said to depend on the temperature26 and thebasicity of the diamine27 and increases with alarge excess of epoxy groups.28
The neat epoxy–AD system and its blends with10 (PSF, PSF/PEI � 50/50) and 20 wt % PSF werecured at different isothermal temperatures, and akinetics analysis was performed using the ki-netics model reported by Girard-Reydet et al.29
They studied and modeled the reaction kinet-ics for both neat systems (DGEBA–DDS andDGEBA–MCDEA) and also analyzed the influ-ence of PEI on epoxy–amine kinetics.
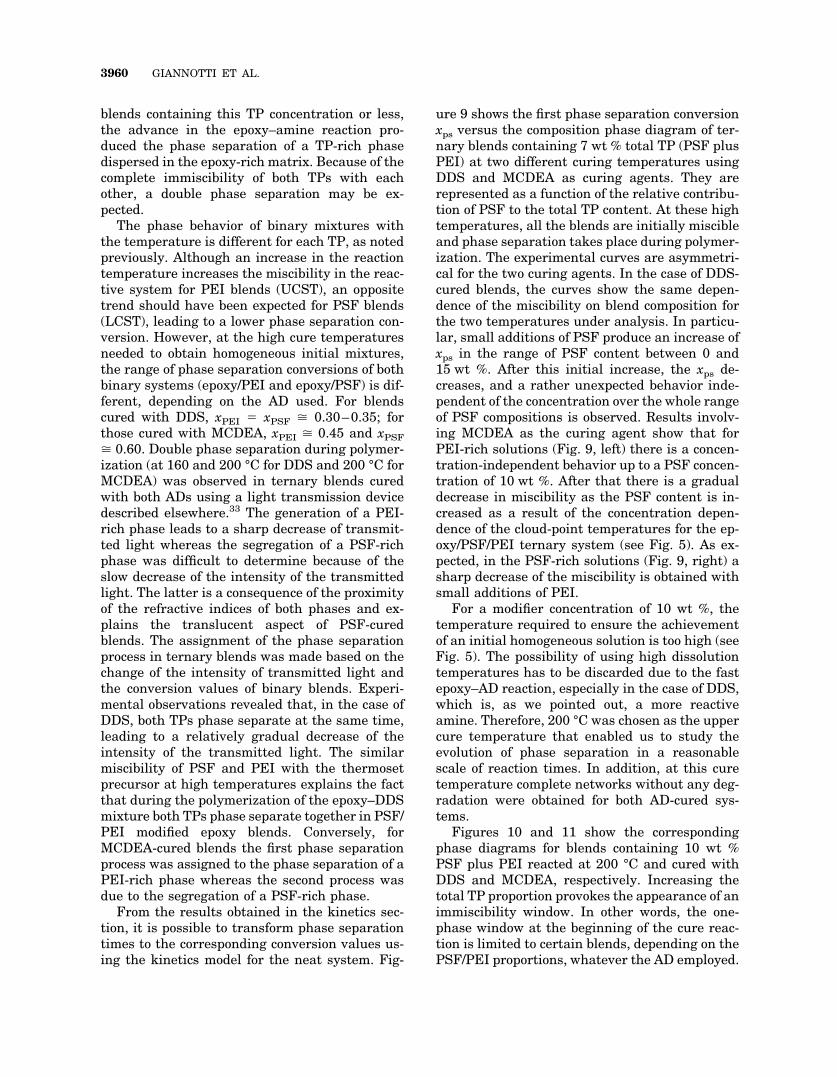
The experimental evolution of epoxy conver-sion with time for modified systems is presentedand compared to the neat system in Figure 7 forDDS (at 135 and 200 °C) and in Figure 8 forMCDEA (at 200 °C). The arrows indicate thephase separation times. These figures also givethe kinetics model for the neat systems, consider-
ing catalytic and noncatalytic mechanisms forboth ADs and taking into account the initial OHin the epoxy resin, and the kinetics prediction,taking into account the dilution effect induced bythe presence of a modifier. In the case of MCDEA,etherification reactions between epoxy functionsand hydroxyl groups were integrated into the ki-netics model. Ritzenthaler et al.30 showed thatetherification reactions actually occurred in thecase of MCDEA but not in the case of DDS. Be-cause it is not believed that the size of the aminemolecule affects the kinetics, the observed fasterrate in DDS was attributed to its higher basicitycompared to MCDEA. A similar effect was ob-served in an earlier study by Girard-Reydetet al.29
Figures 7 and 8 show that the cure reactionrates are about the same for the epoxy and all ofthe blends at low levels of TP concentration (e.g.,10 wt %). No dilution effect induced by the pres-ence of the TP was observed independently of thenature of the modifiers (PSF or PSF/PEI). Theexperimental results for the epoxy–DDS systemmodified with 10 wt % PSF/PEI (50/50) are pre-sented in Figure 7 at two cure temperatures. Thereactive solution polymerized at 200 °C, a temper-ature located above the Tcp of the initial system,phase separates during the course of polymeriza-tion. In contrast, the sample cured at 135 °C isinitially immiscible (see Fig. 5). In this case, the
Figure 7. The epoxy conversion versus time at 135and 200 °C for neat and modified epoxy–DDS systems:(F) neat, (E) 10 wt % PSF/PEI (50/50), and (‚) 20 wt %PSF; (2) phase separation time; (—) the initial OH inthe epoxy resin; (- - -) the dilution effect induced by thepresense of a modifier. The average error in the con-version value is �0.05.
Figure 8. The epoxy conversion versus time at 200 °Cfor neat and modified epoxy–MCDEA systems: (F)neat, (�) 10 wt % PSF, (E) 10 wt % PSF/PEI (50/50),and (‚) 20 wt % PSF; (2) phase separation times; (—)the initial OH in the epoxy resin; (- - -) the dilutioneffect induced by the presense of a modifier. The aver-age error in the conversion value is �0.05.
3958 GIANNOTTI ET AL.
reaction is carried out in different phases withunknown epoxy–amine concentrations in eachphase. The results shown in Figure 7 demon-strate that the overall conversion that is mea-sured from heterogeneous blends agrees with theexperimental trend for systems initially misciblefor low TP concentrations.
Concerning blends with 20 wt % PSF, two dif-ferent behaviors were observed according to thehardener that was used. The presence of the TPproduced a slight decrease of the polymerizationrate only in the case of DDS. This delay can beattributed to physical reasons as a dilution effector viscosity increase due to the loading of a highTg component. Furthermore, the constancy in thetotal heat of reaction of neat and modified sys-tems cured with AD confirmed that PSF did notmodify the mechanism of epoxy–amine polymer-ization. However, the experimental conversionsare higher than those predicted, taking into ac-count only a dilution effect of reactive groups forboth hardeners. The theoretical curve based on adilution effect underestimates experimental con-versions. However, before phase separation, theevolution of conversions with time is nearly thesame for MCDEA-cured blends. A slight decreasein the reaction rate occurs at conversions close to0.4, an effect that may be related to the beginningof the phase separation process. In addition,whatever the curing agent, the reactions werefaster in the presence of PSF. Such behavior isconsistent with a PSF catalytic effect on the ep-oxy–amine reactions. The decrease of the reactionrate at phase separation can be explained by theeffect that the presence of phenol groups at theend of their molecules12 or any impurities inthe commercial PSF produce in the reaction ki-netics before phase separation. A similar phenom-enon has been described using PEI as a modifierin a DGEBA–MCDEA formulation.30 Other au-thors have reported an acceleration of the kineticscurve for TP-modified epoxies containing a rela-tively high fraction of modifier in the initial mix-ture (TP continuous phase).31,32
Gelation
Table 1 shows the gel times (tgel) and gel conver-sion results (xgel) at different temperatures andmodifier concentrations for epoxy–AD formula-tions. The lower reactivity of modified systems isalso reflected in the gel time for both ADs. Themodified systems exhibit a slight increase of thetgel in the range of temperatures that were ana-
lyzed. On the basis of the kinetics studies, largerreaction times do not mean higher epoxy conver-sions in modified systems (see Figs. 7 and 8). Byusing the experimental evolution of epoxy conver-sion with time for modified systems, the tgel val-ues were transformed into corresponding conver-sions. As can be seen, within the experimentalerror of the determination of xgel, the modifiedsystems exhibit a slight increase in gel con-versions only for MCDEA-cured blends. Thisbehavior could be related to a modification of theepoxy–amine stoichiometry induced by phase sep-aration, and it has been observed in some rubber-modified epoxy networks.31
Phase Separation in Reactive Mixtures
Phase separation induced by polymerization inbinary blends of one TP (PSF or PEI) dissolved inan epoxy–amine reactive mixture has been re-ported.16,22 The phase behavior of ternary poly-mer blends is much more complicated. For sys-tems modified with two linear polymers, the in-crease of the molar mass of the epoxy–aminecopolymer with conversion causes the reaction-induced phase separation process of both poly-mers dissolved in the reactive mixture. As wediscussed before, the maximum amount of PSF/PEI in the blends was limited to 10 wt %. In
Table 1. Gel Times (tgel) and Gel Conversions (xgel)as Function of Thermoplastic (PSF/PEI)Concentrations and Cure Temperatures for MixturesCured with DDS and MCDEA
Epoxy System
T PSF/PEI tgel xgel
(°C) (wt %) (min)
Epoxy-DDS 135 0 140 0.5620 (100/0) 165 0.56
160 0 51 0.5810 (100/0) 5520 (100/0) 56
200 0 12 0.5810 (50/50) 12 0.5810 (100/0) 1320 (100/0) 14
Epoxy-MCDEA 135 0 262 0.61160 0 106 0.64
20 (100/0) 124200 0 27 0.62
10 (50/50) 30 0.6810 (100/0) 29 0.6620 (100/0) 33 0.66
REACTION-INDUCED PHASE SEPARATION OF EPOXY/PSF/PEI. I 3959
blends containing this TP concentration or less,the advance in the epoxy–amine reaction pro-duced the phase separation of a TP-rich phasedispersed in the epoxy-rich matrix. Because of thecomplete immiscibility of both TPs with eachother, a double phase separation may be ex-pected.
The phase behavior of binary mixtures withthe temperature is different for each TP, as notedpreviously. Although an increase in the reactiontemperature increases the miscibility in the reac-tive system for PEI blends (UCST), an oppositetrend should have been expected for PSF blends(LCST), leading to a lower phase separation con-version. However, at the high cure temperaturesneeded to obtain homogeneous initial mixtures,the range of phase separation conversions of bothbinary systems (epoxy/PEI and epoxy/PSF) is dif-ferent, depending on the AD used. For blendscured with DDS, xPEI � xPSF � 0.30–0.35; forthose cured with MCDEA, xPEI � 0.45 and xPSF� 0.60. Double phase separation during polymer-ization (at 160 and 200 °C for DDS and 200 °C forMCDEA) was observed in ternary blends curedwith both ADs using a light transmission devicedescribed elsewhere.33 The generation of a PEI-rich phase leads to a sharp decrease of transmit-ted light whereas the segregation of a PSF-richphase was difficult to determine because of theslow decrease of the intensity of the transmittedlight. The latter is a consequence of the proximityof the refractive indices of both phases and ex-plains the translucent aspect of PSF-curedblends. The assignment of the phase separationprocess in ternary blends was made based on thechange of the intensity of transmitted light andthe conversion values of binary blends. Experi-mental observations revealed that, in the case ofDDS, both TPs phase separate at the same time,leading to a relatively gradual decrease of theintensity of the transmitted light. The similarmiscibility of PSF and PEI with the thermosetprecursor at high temperatures explains the factthat during the polymerization of the epoxy–DDSmixture both TPs phase separate together in PSF/PEI modified epoxy blends. Conversely, forMCDEA-cured blends the first phase separationprocess was assigned to the phase separation of aPEI-rich phase whereas the second process wasdue to the segregation of a PSF-rich phase.
From the results obtained in the kinetics sec-tion, it is possible to transform phase separationtimes to the corresponding conversion values us-ing the kinetics model for the neat system. Fig-
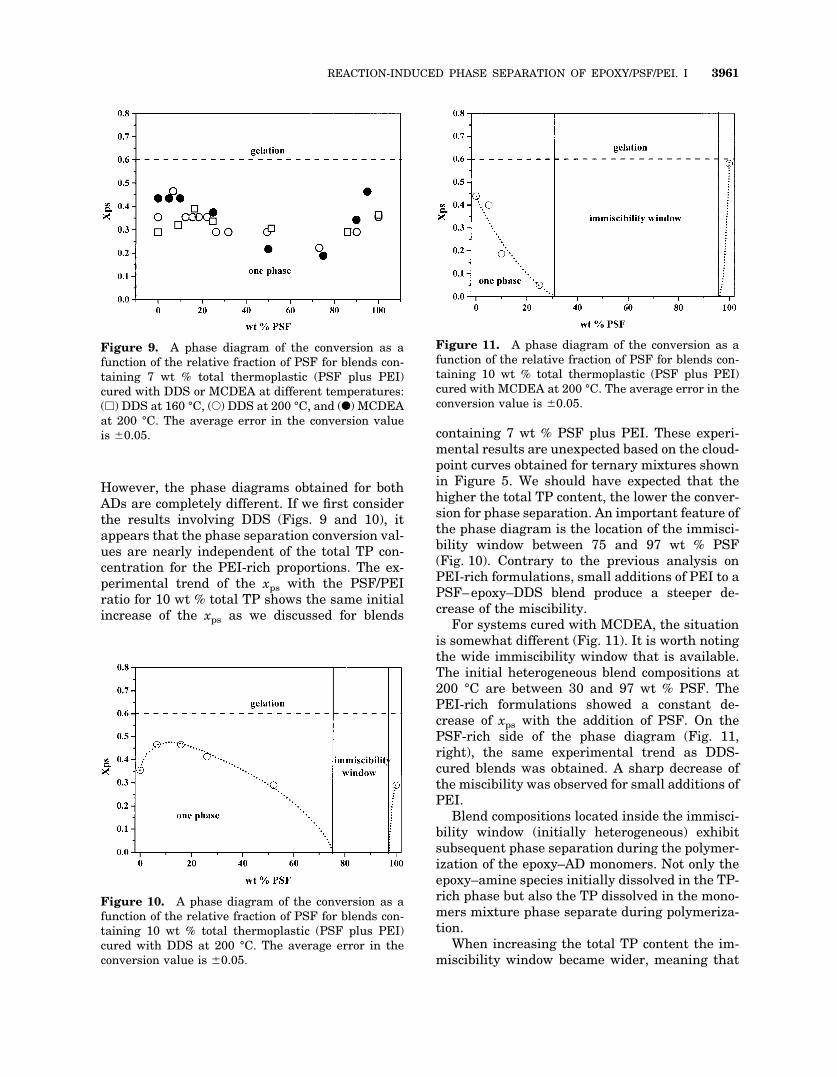
ure 9 shows the first phase separation conversionxps versus the composition phase diagram of ter-nary blends containing 7 wt % total TP (PSF plusPEI) at two different curing temperatures usingDDS and MCDEA as curing agents. They arerepresented as a function of the relative contribu-tion of PSF to the total TP content. At these hightemperatures, all the blends are initially miscibleand phase separation takes place during polymer-ization. The experimental curves are asymmetri-cal for the two curing agents. In the case of DDS-cured blends, the curves show the same depen-dence of the miscibility on blend composition forthe two temperatures under analysis. In particu-lar, small additions of PSF produce an increase ofxps in the range of PSF content between 0 and15 wt %. After this initial increase, the xps de-creases, and a rather unexpected behavior inde-pendent of the concentration over the whole rangeof PSF compositions is observed. Results involv-ing MCDEA as the curing agent show that forPEI-rich solutions (Fig. 9, left) there is a concen-tration-independent behavior up to a PSF concen-tration of 10 wt %. After that there is a gradualdecrease in miscibility as the PSF content is in-creased as a result of the concentration depen-dence of the cloud-point temperatures for the ep-oxy/PSF/PEI ternary system (see Fig. 5). As ex-pected, in the PSF-rich solutions (Fig. 9, right) asharp decrease of the miscibility is obtained withsmall additions of PEI.
For a modifier concentration of 10 wt %, thetemperature required to ensure the achievementof an initial homogeneous solution is too high (seeFig. 5). The possibility of using high dissolutiontemperatures has to be discarded due to the fastepoxy–AD reaction, especially in the case of DDS,which is, as we pointed out, a more reactiveamine. Therefore, 200 °C was chosen as the uppercure temperature that enabled us to study theevolution of phase separation in a reasonablescale of reaction times. In addition, at this curetemperature complete networks without any deg-radation were obtained for both AD-cured sys-tems.
Figures 10 and 11 show the correspondingphase diagrams for blends containing 10 wt %PSF plus PEI reacted at 200 °C and cured withDDS and MCDEA, respectively. Increasing thetotal TP proportion provokes the appearance of animmiscibility window. In other words, the one-phase window at the beginning of the cure reac-tion is limited to certain blends, depending on thePSF/PEI proportions, whatever the AD employed.
3960 GIANNOTTI ET AL.
However, the phase diagrams obtained for bothADs are completely different. If we first considerthe results involving DDS (Figs. 9 and 10), itappears that the phase separation conversion val-ues are nearly independent of the total TP con-centration for the PEI-rich proportions. The ex-perimental trend of the xps with the PSF/PEIratio for 10 wt % total TP shows the same initialincrease of the xps as we discussed for blends
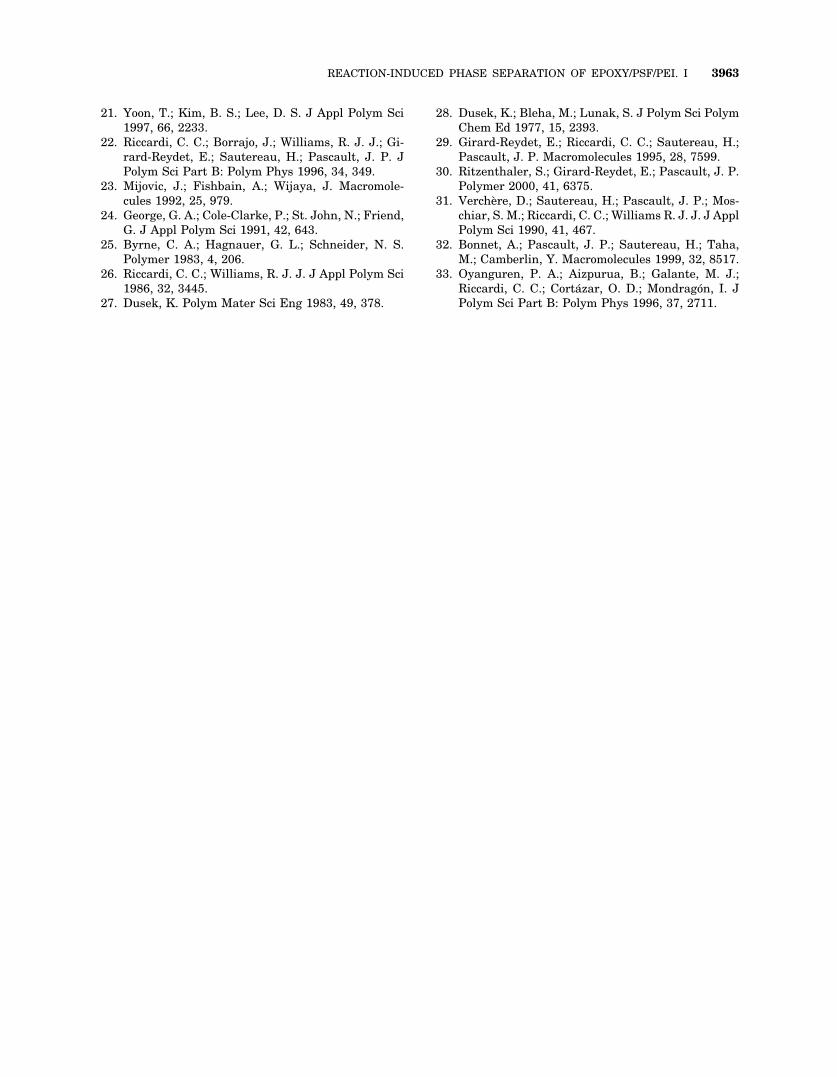
containing 7 wt % PSF plus PEI. These experi-mental results are unexpected based on the cloud-point curves obtained for ternary mixtures shownin Figure 5. We should have expected that thehigher the total TP content, the lower the conver-sion for phase separation. An important feature ofthe phase diagram is the location of the immisci-bility window between 75 and 97 wt % PSF(Fig. 10). Contrary to the previous analysis onPEI-rich formulations, small additions of PEI to aPSF–epoxy–DDS blend produce a steeper de-crease of the miscibility.
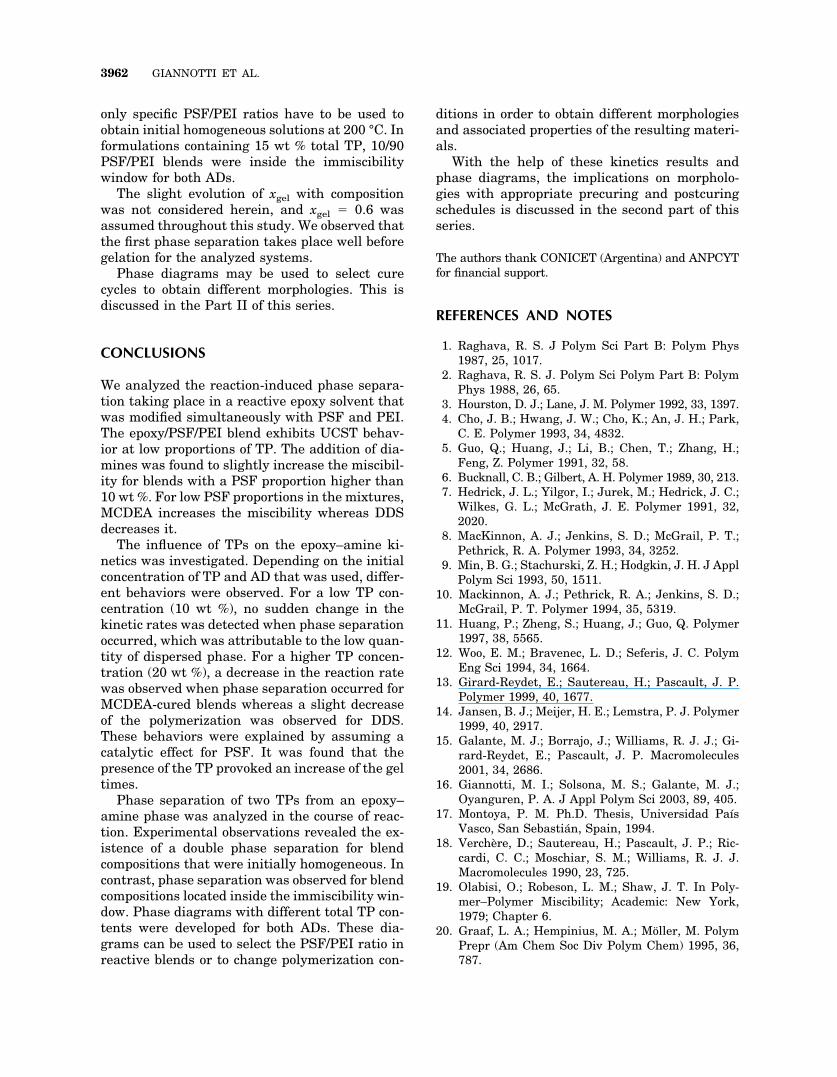
For systems cured with MCDEA, the situationis somewhat different (Fig. 11). It is worth notingthe wide immiscibility window that is available.The initial heterogeneous blend compositions at200 °C are between 30 and 97 wt % PSF. ThePEI-rich formulations showed a constant de-crease of xps with the addition of PSF. On thePSF-rich side of the phase diagram (Fig. 11,right), the same experimental trend as DDS-cured blends was obtained. A sharp decrease ofthe miscibility was observed for small additions ofPEI.
Blend compositions located inside the immisci-bility window (initially heterogeneous) exhibitsubsequent phase separation during the polymer-ization of the epoxy–AD monomers. Not only theepoxy–amine species initially dissolved in the TP-rich phase but also the TP dissolved in the mono-mers mixture phase separate during polymeriza-tion.
When increasing the total TP content the im-miscibility window became wider, meaning that
Figure 9. A phase diagram of the conversion as afunction of the relative fraction of PSF for blends con-taining 7 wt % total thermoplastic (PSF plus PEI)cured with DDS or MCDEA at different temperatures:(�) DDS at 160 °C, (E) DDS at 200 °C, and (F) MCDEAat 200 °C. The average error in the conversion valueis �0.05.
Figure 10. A phase diagram of the conversion as afunction of the relative fraction of PSF for blends con-taining 10 wt % total thermoplastic (PSF plus PEI)cured with DDS at 200 °C. The average error in theconversion value is �0.05.
Figure 11. A phase diagram of the conversion as afunction of the relative fraction of PSF for blends con-taining 10 wt % total thermoplastic (PSF plus PEI)cured with MCDEA at 200 °C. The average error in theconversion value is �0.05.
REACTION-INDUCED PHASE SEPARATION OF EPOXY/PSF/PEI. I 3961
only specific PSF/PEI ratios have to be used toobtain initial homogeneous solutions at 200 °C. Informulations containing 15 wt % total TP, 10/90PSF/PEI blends were inside the immiscibilitywindow for both ADs.
The slight evolution of xgel with compositionwas not considered herein, and xgel � 0.6 wasassumed throughout this study. We observed thatthe first phase separation takes place well beforegelation for the analyzed systems.
Phase diagrams may be used to select curecycles to obtain different morphologies. This isdiscussed in the Part II of this series.
CONCLUSIONS
We analyzed the reaction-induced phase separa-tion taking place in a reactive epoxy solvent thatwas modified simultaneously with PSF and PEI.The epoxy/PSF/PEI blend exhibits UCST behav-ior at low proportions of TP. The addition of dia-mines was found to slightly increase the miscibil-ity for blends with a PSF proportion higher than10 wt %. For low PSF proportions in the mixtures,MCDEA increases the miscibility whereas DDSdecreases it.
The influence of TPs on the epoxy–amine ki-netics was investigated. Depending on the initialconcentration of TP and AD that was used, differ-ent behaviors were observed. For a low TP con-centration (10 wt %), no sudden change in thekinetic rates was detected when phase separationoccurred, which was attributable to the low quan-tity of dispersed phase. For a higher TP concen-tration (20 wt %), a decrease in the reaction ratewas observed when phase separation occurred forMCDEA-cured blends whereas a slight decreaseof the polymerization was observed for DDS.These behaviors were explained by assuming acatalytic effect for PSF. It was found that thepresence of the TP provoked an increase of the geltimes.
Phase separation of two TPs from an epoxy–amine phase was analyzed in the course of reac-tion. Experimental observations revealed the ex-istence of a double phase separation for blendcompositions that were initially homogeneous. Incontrast, phase separation was observed for blendcompositions located inside the immiscibility win-dow. Phase diagrams with different total TP con-tents were developed for both ADs. These dia-grams can be used to select the PSF/PEI ratio inreactive blends or to change polymerization con-
ditions in order to obtain different morphologiesand associated properties of the resulting materi-als.
With the help of these kinetics results andphase diagrams, the implications on morpholo-gies with appropriate precuring and postcuringschedules is discussed in the second part of thisseries.
The authors thank CONICET (Argentina) and ANPCYTfor financial support.
REFERENCES AND NOTES
1. Raghava, R. S. J Polym Sci Part B: Polym Phys1987, 25, 1017.
2. Raghava, R. S. J. Polym Sci Polym Part B: PolymPhys 1988, 26, 65.
3. Hourston, D. J.; Lane, J. M. Polymer 1992, 33, 1397.4. Cho, J. B.; Hwang, J. W.; Cho, K.; An, J. H.; Park,
C. E. Polymer 1993, 34, 4832.5. Guo, Q.; Huang, J.; Li, B.; Chen, T.; Zhang, H.;
Feng, Z. Polymer 1991, 32, 58.6. Bucknall, C. B.; Gilbert, A. H. Polymer 1989, 30, 213.7. Hedrick, J. L.; Yilgor, I.; Jurek, M.; Hedrick, J. C.;
Wilkes, G. L.; McGrath, J. E. Polymer 1991, 32,2020.
8. MacKinnon, A. J.; Jenkins, S. D.; McGrail, P. T.;Pethrick, R. A. Polymer 1993, 34, 3252.
9. Min, B. G.; Stachurski, Z. H.; Hodgkin, J. H. J ApplPolym Sci 1993, 50, 1511.
10. Mackinnon, A. J.; Pethrick, R. A.; Jenkins, S. D.;McGrail, P. T. Polymer 1994, 35, 5319.
11. Huang, P.; Zheng, S.; Huang, J.; Guo, Q. Polymer1997, 38, 5565.
12. Woo, E. M.; Bravenec, L. D.; Seferis, J. C. PolymEng Sci 1994, 34, 1664.
13. Girard-Reydet, E.; Sautereau, H.; Pascault, J. P.Polymer 1999, 40, 1677.
14. Jansen, B. J.; Meijer, H. E.; Lemstra, P. J. Polymer1999, 40, 2917.
15. Galante, M. J.; Borrajo, J.; Williams, R. J. J.; Gi-rard-Reydet, E.; Pascault, J. P. Macromolecules2001, 34, 2686.
16. Giannotti, M. I.; Solsona, M. S.; Galante, M. J.;Oyanguren, P. A. J Appl Polym Sci 2003, 89, 405.
17. Montoya, P. M. Ph.D. Thesis, Universidad PaısVasco, San Sebastian, Spain, 1994.
18. Verchere, D.; Sautereau, H.; Pascault, J. P.; Ric-cardi, C. C.; Moschiar, S. M.; Williams, R. J. J.Macromolecules 1990, 23, 725.
19. Olabisi, O.; Robeson, L. M.; Shaw, J. T. In Poly-mer–Polymer Miscibility; Academic: New York,1979; Chapter 6.
20. Graaf, L. A.; Hempinius, M. A.; Moller, M. PolymPrepr (Am Chem Soc Div Polym Chem) 1995, 36,787.
3962 GIANNOTTI ET AL.
21. Yoon, T.; Kim, B. S.; Lee, D. S. J Appl Polym Sci1997, 66, 2233.
22. Riccardi, C. C.; Borrajo, J.; Williams, R. J. J.; Gi-rard-Reydet, E.; Sautereau, H.; Pascault, J. P. JPolym Sci Part B: Polym Phys 1996, 34, 349.
23. Mijovic, J.; Fishbain, A.; Wijaya, J. Macromole-cules 1992, 25, 979.
24. George, G. A.; Cole-Clarke, P.; St. John, N.; Friend,G. J Appl Polym Sci 1991, 42, 643.
25. Byrne, C. A.; Hagnauer, G. L.; Schneider, N. S.Polymer 1983, 4, 206.
26. Riccardi, C. C.; Williams, R. J. J. J Appl Polym Sci1986, 32, 3445.
27. Dusek, K. Polym Mater Sci Eng 1983, 49, 378.
28. Dusek, K.; Bleha, M.; Lunak, S. J Polym Sci PolymChem Ed 1977, 15, 2393.
29. Girard-Reydet, E.; Riccardi, C. C.; Sautereau, H.;Pascault, J. P. Macromolecules 1995, 28, 7599.
30. Ritzenthaler, S.; Girard-Reydet, E.; Pascault, J. P.Polymer 2000, 41, 6375.
31. Verchere, D.; Sautereau, H.; Pascault, J. P.; Mos-chiar, S. M.; Riccardi, C. C.; Williams R. J. J. J ApplPolym Sci 1990, 41, 467.
32. Bonnet, A.; Pascault, J. P.; Sautereau, H.; Taha,M.; Camberlin, Y. Macromolecules 1999, 32, 8517.
33. Oyanguren, P. A.; Aizpurua, B.; Galante, M. J.;Riccardi, C. C.; Cortazar, O. D.; Mondragon, I. JPolym Sci Part B: Polym Phys 1996, 37, 2711.
REACTION-INDUCED PHASE SEPARATION OF EPOXY/PSF/PEI. I 3963


