Embed Size (px)
Citation preview

RCCPL Private Limited (formerly Reliance Cement Company Private Limited)
Registered Office; Industry House, 2nd Floor
159, Churchgate Reclamation Mumbai – 400 020 India
P: +91 22 2204 8467 / 8468
F: +91 22 2204 3615
Corporate Office: 1, Shakespeare Sarani, A.C. Market, Kolkata – 700 071, India. | CIN: U26940MH2007PTC173458 | www.birlacorporation .com P: +9133 66033300-02 | F: +91 33 2288 4426
Ref No: RCCPL/Persoda/MH/MoEF&CC/05 Date: 07.04.2021
To The Member Secretary Expert Appraisal Committee (Non-Coal Mining) Ministry of Environment, Forest & Climate Change Indira Paryavaran Bhavan,3rd Floor, Vayu Wing Jorbagh Road, Aliganj,New Delhi-110003 Sub: Environmental Clearance of proposed Persoda Limestone Mining with 2.0 MTPA
capacity at villages Persoda, Kothada Khurd, Kothoda Buzurg and Govindpur with ML area: 756.14 ha, Tehsil: Korpana, Chandrapur District, Maharashtra by M/s. RCCPL Private Limited
Ref: Additional information sought by EAC vide MOM of 24th EAC (Non-coal mining) held
on 9th – 10th December, 2020 [Proposal no: IA/MH/MIN/89273/2018; File No.J-110105/22/2019-IA.III(M)]
Sir, With reference captioned subject and reference, additional details have been sought by EAC vide MOM of 24th EAC (Non-coal mining) held on 9th – 10th December, 2020. In this regard, we are herewith submitting/uploading point wise response/clarifications with corresponding enclosures for ADS.
Sr. No
ADS Sought Response
1 Detailed Hydrogeology study needs to be carried out by PP by NABET Accredited under Ground Water Consultant Organization (GWCO) along with impact of mine on surface water bodies and impact of surface water body on mine
Detailed hydrogeology study carried out by NABET Accredited under Ground Water Consultant Organization (GWCO) including impact of mine on surface water bodies and impact of surface water body on mine is attached as Annexure – 1A and 1B.
2 PP needs to submit the design of the embankment and its efficacy and details of the flow simulation model carried out.
The design of the embankment and its efficacy and details of the flow simulation model is carried out by Visvesvaraya National Institute of Technology (VNIT), Nagpur, Maharashtra. The report is attached as Annexure – 2.
3 PP should obtain the NOC from CGWA for ground water withdrawal.
Process of obtaining NOC from CGWA is on progress. Copy of submission of application and recommendation by CGWB Nagpur Regional Office are attached as Annexure – 3.

RCCPL Private Limited (formerly Reliance Cement Company Private Limited)
Registered Office; Industry House, 2nd Floor
159, Churchgate Reclamation Mumbai – 400 020 India
P: +91 22 2204 8467 / 8468
F: +91 22 2204 3615
Corporate Office: 1, Shakespeare Sarani, A.C. Market, Kolkata – 700 071, India. | CIN: U26940MH2007PTC173458 | www.birlacorporation .com P: +9133 66033300-02 | F: +91 33 2288 4426
4 PP needs to submit the incremental noise level and the impact of noise and ground vibration on habitation and surface water bodies.
The report on incremental noise level and the impact of noise and ground vibration on habitation and surface water bodies is attached as Annexure – 4.
5 PP needs to submit the periodic monitoring plan to sustain the mine with environment safeguards.
The periodic monitoring plan as per CPCB regulations to sustain the mine with environment safeguards is attached as Annexure – 5.
6 PP needs to clearly bring out the use of explosives, quantity of explosives to be used, storage of explosives at site and necessary approvals to be obtained from Competent Authority.
Use of explosives, quantity of explosives to be used, storage of explosives at site and necessary approvals to be obtained from competent authority is given in Annexure – 6.
7 PP should also submit the letter from the Principal Chief Conservator of Forests, Telangana for no involvement of forest land in the mine lease area and national parks, sanctuaries, Biosphere Reserves, Wildlife corridors, Ramsar Site Tiger/Elephant Reserves within 10 km radius.
Letter from PCCF and Chief Wildlife Warden, Hyderabad along with authenticated maps are attached as Annexure – 7.
8 PP informed the Committee that the land affected families are 584 and they are going to be affected through land acquisition only and not going to be disturbed. Hence, PP should submit the undertaking in this regard.
The copy of undertaking regarding no displacement of 584 land affected families is attached as Annexure – 8.
9 PP should submit the document showing the validity of the lease
The validity of LoI has been extended upto 24th July 2021. LoI extension letter no. MMN-1010/C.R.3338/Ind-9 dated 02nd December 2020 is attached as Annexure – 9.
10 PP accorded TOR for mining of minerals only whereas in EC proposal it is observed that the crusher is proposed to install within the mining lease area. A proper clarification with detailed risk assessment on the local environment be submitted
Proposal for installing crusher (700 TPH) within mining lease area was included in Form-1, pre-feasibility report, brief summary of the project etc. submitted during ToR application. The same has also been included in EC proposal and risk assessment and mitigative measures due to installation of crusher is included in EIA report.
RCCPL Private Limited (formerly Reliance Cement Company Private Limited)
Registered Office; Industry House, 2nd Floor
159, Churchgate Reclamation Mumbai – 400 020 India
P: +91 22 2204 8467 / 8468
F: +91 22 2204 3615
Corporate Office: 1, Shakespeare Sarani, A.C. Market, Kolkata – 700 071, India. | CIN: U26940MH2007PTC173458 | www.birlacorporation .com P: +9133 66033300-02 | F: +91 33 2288 4426
The impact due to emission from crusher operation was captured while executing the modelling predictions of mining operations. The copy of the same attached as Annexure-10.
11 PP should submit the copy of the Attendance Sheet of the participants participated in the Public Hearing.
Attendance Sheet of the participants of public hearing is attached as Annexure – 11.
12 PP should clarify the Distance of Public Hearing Venue from the Proposed Project.
Public hearing was conducted at Niyojan Bhavan, Collector Office, Chandrapur, which is 87 Km. by road from project site. Detailed note is attached as Annexure – 12.
13 The Project Proponent shall submit the time- bound action plan to the concerned regional office of the Ministry within 6 months from the date of issuance of environmental clearance for undertaking the activities committed during public consultation by the project proponent and as discussed by the EAC, in terms of the provisions of the MoEF&CC Office Memorandum No.22-65/2017-IA.III dated 30 September, 2020.
Time-bound action plan for undertaking the activities committed during public consultation will be submitted to the concerned regional office of the Ministry within 6 months from the date of issuance of environmental clearance.
14 PP should submit the breakup of the budget of the Environment management plan.
The breakup of the budget of the environment management plan is attached as Annexure – 13.
We request your good self to kindly consider the documents/information and arrange to issue us Environment Clearance at the earliest.
Yours sincerely,
For RCCPL Private Limited
(Dr. Ashok Kumar Singh) Authorized Signatory

Annexure-1A
Hydrogeology Report
Prepared by :
RCCPL Private LimitedPersoda, Chandrapur, Maharashtra
Vimta Labs Limited
142, IDA, Phase-II, Cherlapally,
Hyderabad–500 051, Telangana State
www.vimta.com, [email protected]
MOEF&CC, New Delhi Recognised Laboratory
NABET Accredited Category A Consultant
NABET Accreditation No. : QCI/NABET/ENV/ACO/19/0957 date 16.04.2019
COMPREHENSIVE REPORT ON GROUND WATER CONDITIONS
IN BOTH CORE AND BUFFER ZONES OF LIMESTONE MINE
OF M/S RCCPL PRIVATE LTD., PERSODA, KOTHODA KHURD,
KOTHODA BUZURG AND GOVINDPUR VILLAGES,
CHANDRAPUR DISTRICT, MAHARASHTRA
Project Proponent
FINAL REPORT
February, 2021
For and on behalf of Hydro-Geosurvey Consultant Pvt Ltd
Approved by : Dr. V.B.Khilnani
Position : Project Coordinator
Date : 9th April, 2021
Reviewed and approved by
Hydro-Geosurvey Consultants Pvt. Ltd,
QCI-NABET accredited Ground Water Consultant Organization
NABET /GWCO/IA/GW003
PREFACE
COMPREHENSIVE REPORT ON GROUND WATER
CONDITIONS IN BOTH CORE AND BUFFER ZONES OF
LIMESTONE MINE OF M/S RCCPL PRIVATE LTD.,
PERSODA, KOTHODA KHURD, KOTHODA BUZURG
AND GOVINDPUR VILLAGES, CHANDRAPUR DISTRICT,
MAHARASHTRA
RCCPL Private Limited
Persoda, Chandrapur, Maharashtra
Prepared by:
Vimta Labs Limited, Hyderabad
UNDERTAKING LETTER
M/s. Hydro-Geosurvey Consultants Private Limited have been
approved by NABET-CGWO reviewed and approved the
“Comprehensive Report on Ground Water conditions in both Core
and Buffer Zones of Limestone Mine” M/s RCCPL Private Ltd.,
Persoda, Kothoda Khurd, Kothoda Buzurg and Govindpur Villages,
Chandrapur District, Maharashtra.
This report is prepared by Vimta Labs Limited, Hyderabad.
For Hydro-Geosurvey Consultants Private Limited
V.B. Khilnani
Project Coordinator


S.No Name Qualified for Impact Assessment Report
Qualified for Modelling StudiesQualified for Hydrogeological Report for mining projects
Mobile Number email id
1 Dr.Narendra Kumar Rana Yes NO NO 8901523692 [email protected] Dr. Arijit Dey Yes NO NO 9166919424 [email protected] Upendra Shrivastava Yes Yes NO 8840657920 [email protected] Y.B.Kaushik Yes NO NO 8447557844 [email protected] Sunil Kumar Saigal yes NO NO 9316114531 [email protected] T.Rajendiran Yes NO NO 8892070904 [email protected] 7 Dr. Nallathambi Varadaraj Yes Yes Yes 9444912028 [email protected] Awani Kumar Budhaulia Yes NO NO 9424439321 [email protected] Diwaspati Jamloki Yes NO NO 9412412564 [email protected] 10 Mohammed Khaja Rafiuddin Yes NO NO 9704813738 [email protected] Shreeram Paranjpe Yes NO NO 8103062430 [email protected] V. Pugazhendi Yes NO NO 044-23763050 /
13 Ganji Sudarshan Yes NO Yes 9441258253 [email protected] Durga Pada Pati Yes NO NO 9438133084 [email protected] Tapan talukdar Yes Yes NO 9433801182/
16 Gulab Prasad Yes NO NO 9437480754 / 8637263394
[email protected][email protected]
17 Nawal Kishore Prasad Yes NO Yes 9423104901 [email protected] Asis Kumar Chattopadhyay Yes NO NO 8902689981 [email protected] Baddela Jaya Kumar Yes Yes Yes 9225582801 [email protected] K.Balakrishnan Yes NO NO 9847476178,
21 Vinod Sharma Yes NO NO 9419185643, 7006640624
22 Shailendra Nath Sinha Yes NO NO 9430789865 [email protected] Gurinder Paul Singh Yes NO NO 9814397089 [email protected] Dr.Dilip Singh Chundawat Yes NO NO 9314441705, 0141-
25 Dr. Muhammad Ali Farooqi Yes NO NO 9448465720 / 6362813081
26 Dr. Muhammad Najeeb.K Yes NO NO 9448324368 / 9901948735
27 Prakash Ramchandra Gupte Yes NO NO 9998765403 / 9810876542
28 M.C.Reddy Yes Yes Yes 8048521486/ 9448864873
29 C.P.Srivastava Yes NO NO 9754263306 [email protected] R. Chakrapani Yes NO NO 9444152286 [email protected] Alaparthi Sreenivas Yes NO NO 9677043798 sreenivasalaparthi:@gmail.com32 Raj Pal Singh Yes Yes No 9412941256,
33 K.Kumaresan Yes NO NO 81442 25458 [email protected] Gyanchand Bohra Yes NO NO 7767877331,
8830150024 [email protected]
35 Vijay Rajkumar Yadav Yes NO NO 960 127 6885 [email protected] [email protected]
37 Dr. M. Sriiman Narayana Yes NO NO 9444971525/ 9989514488
38 Mukesh Suroliya Yes NO NO 9269028299 [email protected], [email protected]
39 Sh.Nirad Chandra Nayak Yes Yes Yes 7381068977 [email protected]
S.No Name Qualified for Impact Assessment Report
Qualified for Modelling StudiesQualified for Hydrogeological Report for mining projects
Mobile Number rmail id Contact Person
1 Environ Techno Consultants YES YES YES 9301011914 [email protected] Mrs. Monika Agrawal2 NEER YES NO YES 0120-4107278;
9123390505 & 9213713121
[email protected] Deepak Jain
3 Vardan Environet YES NO YES 9953147268 [email protected] Mr. R.S. Yadav4 Vimta Labs Limited YES NO YES 040-27264141 [email protected] Harita Vasireddi5 Geoclimate Risk solutions YES YES YES 9810708901 [email protected] G. Prasad Babu 6 S R K Mining Services (India) YES NO YES +91 33 82740 88317 [email protected] Rijumon Dasgupta 7 Ground Water & Mineral Investigation
Consultancy centreYES NO NO 9829067474 [email protected] Dr. S. K. Jain, M.D.,
8 Thrust geoconsultants Private Limited YES NO NO 91-44-26580622 / 72999 83696
[email protected]@thrustgeo.com
0
9 Hydrominviron Consultancy Pvt. Ltd. Yes NO YES 1412210341/2218832 [email protected] P N Bhargava10 Associate Engineers & Consultants YES YES YES 0141-4116394,
[email protected] Pawan Kumar Gupta
11 Water Solutions YES NO YES 9811025140 [email protected] Baldev Raj Chugh12 Royal Environment Auditing &
Consultancy ServicesNO NO YES 98790 76543 [email protected] Shri. Digvijay Jadeja
13 Central Mine Planning and Design Institute Limited (CMPDIL)
NO NO YES 0651-2792395 [email protected] Shekhar Saran
S.No Name Qualified for Impact Assessment Report
Qualified for Modelling StudiesQualified for Hydrogeological Report for mining projects
Mobile Number email id
1 Sh. A.K.Bhatia 8427979679 [email protected] Dr. Anil Kumar Jain 9427005184 [email protected] Dr. Ratan Chand Jain 7927560037/
4 Dr. K.R.Sooryanarayana 9448328259, 6360683360
5 Dr.Pradeep Kumar Parchure 9414044747 [email protected] Dr. P.N.Rao 9490596699 [email protected]
Result of the Interaction held between the Accreditation Board and Individuals / Institutions(Accreditation Validity Period 15/2/2021 to 14/2/2026)
Accredited Individual
Accredited Institution
Following have been Accredited for 5 years as mentioned above. However, they will be able to use the accreditation for CGWA purposes after they quit/ completion of the present assignment.

Comprehensive Report on Ground Water Conditions in both Core and Buffer Zones of Limestone Mine
of M/s RCCPL Private Ltd., Persoda, Kothoda Khurd, Kothoda Buzurg and Govindpur villages,
Chandrapur district, Maharashtra
! "
# $ %& $ '!
( )!$ !
!!*
" +$,
$ - ! $-
.!$//
0 //
1
' +
+ 23
+ 43
'
5 6-)+
&
3-% !/ *
+$ $-% $+
$7$ * 8
+$ %7!7!*
"
&$ "
5 $ -
%+$! * 9
+$- %:!7!* ;
< 9 =- /$/ ;
" # /$ /$ /
-! !
!/ $&!
/$ /$ /
!) !0! 5

Comprehensive Report on Ground Water Conditions in both Core and Buffer Zones of Limestone Mine
of M/s RCCPL Private Ltd., Persoda, Kothoda Khurd, Kothoda Buzurg and Govindpur villages,
Chandrapur district, Maharashtra
" # +
,+$!/ )
$, 5
' + % ?@62A
0 ! !!!
?64A* 5
+='!B 5
5" 3 4 59
5 C$! D !
59
" !$!$, 5;
9" ! !!$
!, )
!! !
! "
9 .!$ "
9 # D %!/$
: ,* "
9 % E !*
9 E
9 .!$
9 3! !
) /$
/
9 3! ) ! ! $
) /$
/
F ,
,
9 2:6!3
9 2 ! !,
9 #$%/:*
9 +$%?!!/
$A$ * 9
Comprehensive Report on Ground Water Conditions in both Core and Buffer Zones of Limestone Mine
of M/s RCCPL Private Ltd., Persoda, Kothoda Khurd, Kothoda Buzurg and Govindpur villages,
Chandrapur district, Maharashtra
9 .! ! 5 )
!(G 9
95 .!D, !!%/
?!/$) )
!!!!* 9
8" ! $$/!$
$ 9
;" 4/$ $
! $/
//! $ $
!/ 9
; 1$ $ $2$!
6 ! !/6 !
D$, 8
; # $ !/
$ 8
; '$& , 9"
; 3 ' 9
; $/ $$
95
"" 3 , 95
Comprehensive Report on Ground Water Conditions in both Core and Buffer Zones of Limestone Mine
of M/s RCCPL Private Ltd., Persoda, Kothoda Khurd, Kothoda Buzurg and Govindpur villages,
Chandrapur district, Maharashtra
443 237")!'3, 423 5 #423 ;5 !+74 ' &B 9 + 23 58 + 43 8;?A + 243 ;;?/A + 243 "" & 23 !E' #3 9?A = 7:4 "?/A = 74 = &+=14= #'. 95 4 2$= # 4
2 ; =2! 5 9 #!7+= 9 8 $3/=
0!=& 4 5 ; 16 ' ?6'A 5 " 2!#!4+!=/ 5; ''$& 4 9 '$& !G34 9 4 3 '1=
& 9 H $2$=!=+
' 95
Comprehensive Report on Ground Water Conditions in both Core and Buffer Zones of Limestone Mine
of M/s RCCPL Private Ltd., Persoda, Kothoda Khurd, Kothoda Buzurg and Govindpur villages,
Chandrapur district, Maharashtra
223
4 #.4#?;9:"""A
' #!"""87B
' 22
5 !#
' # 9
9 !' 3 ' 9
8 +=1= 4#
; # = . 23 5
" '. 4#:$ 8
=2! "
?A +=I 7:4"8
?/A +=I 7:4";
.#/+= 8
2=I 5"
5 4,='-! 5
# +=3/ 5
9 ' )# !6 ' ?6'A 5
8 +='B 59
; C=42 58
" # != 5;
43#2
#/ ,3@
#/ /2 2
,3@ 5
#/,3@ 5
5 G 2,3@
# 1= 43 9
9 ' 3 / '$& '43 9"
8 '=3! 4 9


Comprehensive Report on Ground Water Conditions in both Core and Buffer Zones of Limestone Mine of M/s RCCPL Private Ltd., Persoda, Kothoda Khurd, Kothoda Buzurg and Govindpur villages,
Chandrapur District, Maharashtra
Vimta Labs Limited, Hyderabad & J Rajendra Prasad, Empanelled Expert, Hyderabad 1
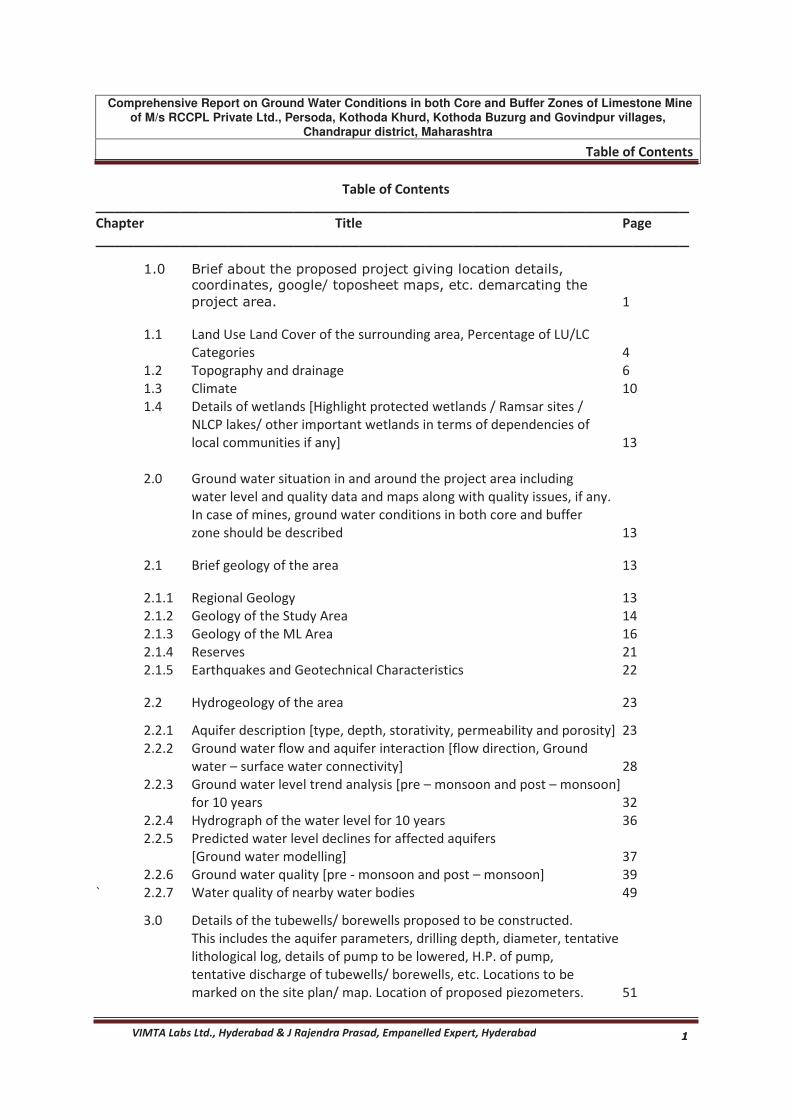
1.0 Brief about the proposed project giving location details, coordinates, google/ toposheet
maps, etc. demarcating the project area
RCCPL Private Limited is the manufacturer of leading cement brands. RCCPL Pvt. Ltd has an
operating Integrated Unit of 3.6 MTPA clinker capacity at Maihar in Satna district in Madhya
Pradesh along with satellite grinding units at Kundanganj in UP and Butibori in Maharashtra.
Company is also executing an Integrated Unit of 2.9 MTPA Clinker Capacity at Mukutban in
Maharashtra state.
To supplement the raw material demand of limestone for Mukutban cement plant,
Government of Maharashtra issued Letter of Intent (LOI) for grant of Mining Lease (ML)
around Persoda, Kothoda Khurd, Kothoda Buzurg and Govindpur villages, Korpana tehsil in
Chandrapur district for an area of 756.14 ha land being both private and Government. It is
proposed to produce 2.0 MTPA of limestone by opencast mechanized method of mining.
The life of mine based on the mineable reserve will be 23 years up to a maximum working
depth of 64.40 m. The life of the mine may increase by 33 years after converting resources
into reserve.
The Persoda ML area is located at villages Persoda, Kothoda Khurd, Kothoda Buzurg and
Govindpur, tehsil Korpana, district Chandrapur, state Maharashtra spread over an area of
756.14 ha. Of the total ML area, 11% is government land which is waste and grazing land and
89% is private agriculture land.
The ML area lies between latitudes 19°43'54.10"N to 19°46'03.57"N and longitudes
78°51'18.37"E to 78°52'20.71"E. The area is covered by Survey of India toposheet no E44A13
(56I/13) and E44A14 (56I/14) on the scale 1:50000.
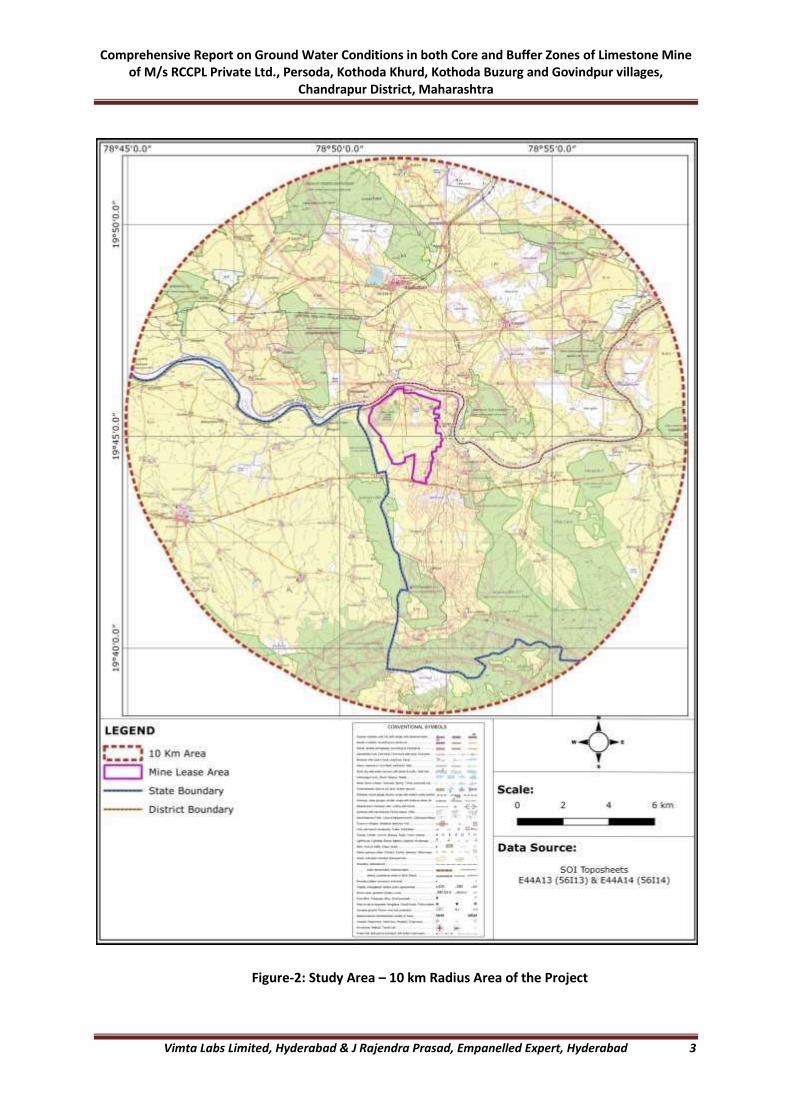
Geographically, the 10 km study area lies between 19°38'27.88"N to 19°51'34.05"N latitudes
and 78°44'57.33"E to 78°58'08.90"E longitudes and is covered by Survey of India toposheet
nos E44A13 (56I/13) and E44A14 (56I/14) on the scale 1:50000. The study area encompasses
the geographical area of Korpana tehsil of Chandrapur district and Jari-Jamani tehsil of
Yavatmal district of Maharashtra and Bela mandal of Adilabad district, Telangana.
The ML area is approachable from Nagpur airport via Warora-Wani by National Highway No
6 up to Jam over 60 km and then by State Highway No 264 up to Warora at a distance of 45
km followed by State Highway No 233 up to Wani over a distance of 26 km, a Tehsil town of
Yavatmal district. From Wani, the Persoda ML area is approachable by State Highway no 265
up to Korpana, a tehsil town in Chandrapur district over a distance of 46 km by crossing
Penganga river road bridge. From Korpana, the ML area is 20 km by a tar road.
Persoda is about 71 km by road from Chandrapur, district head quarter. All the villages of ML
area are very well connected by metalled and/or Kuchha roads. The nearest railway station
is about 47 km at Kayar in Yavatmal district on the northern side of Penganga River. Rajura
railway station is 60 km in Chandrapur district.
Location map of the study area is shown in Figure-1 and the study area is presented in
Figure-2.

Comprehensive Report on Ground Water Conditions in both Core and Buffer Zones of Limestone Mine of M/s RCCPL Private Ltd., Persoda, Kothoda Khurd, Kothoda Buzurg and Govindpur villages,
Chandrapur District, Maharashtra
Vimta Labs Limited, Hyderabad & J Rajendra Prasad, Empanelled Expert, Hyderabad 2
19°44'24.45"N, 78°51'26.33"E
19°45'32.84"N, 78°51'06.75"E
Figure-1: Location Map of Persoda ML Area
Comprehensive Report on Ground Water Conditions in both Core and Buffer Zones of Limestone Mine of M/s RCCPL Private Ltd., Persoda, Kothoda Khurd, Kothoda Buzurg and Govindpur villages,
Chandrapur District, Maharashtra
Vimta Labs Limited, Hyderabad & J Rajendra Prasad, Empanelled Expert, Hyderabad 3
Figure-2: Study Area – 10 km Radius Area of the Project
Comprehensive Report on Ground Water Conditions in both Core and Buffer Zones of Limestone Mine of M/s RCCPL Private Ltd., Persoda, Kothoda Khurd, Kothoda Buzurg and Govindpur villages,
Chandrapur District, Maharashtra
Vimta Labs Limited, Hyderabad & J Rajendra Prasad, Empanelled Expert, Hyderabad 4
1.1 Land Use Land Cover of the Surrounding Area, Percentage of LULC Categories
IRS Resourcesat 2 L4FMX satellite image of 15-Oct-2018 of 5.8 m resolution was acquired
from National Remote Sensing Centre (NRSC), Hyderabad and used for the mapping and
interpretation of land use and land cover in the study area. Besides, other collateral data as
available in the form of maps, charts, census records, other reports and especially Survey of
India (SOI) topographical maps were used. In addition to this, ground truth verification was
also conducted to verify and confirm the ground features. Taking the help of topo sheets,
geology, geomorphology and by using the image elements, the features are identified and
delineated the boundaries roughly. Each feature is identified on image by their image
elements like tone, texture, color, shape, size, pattern and association. A tentative legend in
terms of land cover and land use was formulated. Detailed field observations and
investigations were carried out and preliminary interpreted land use and land cover
features were modified in light of field information and the final thematic map was
cartographed. The cartographic map was colored with standard color coding and detailed
description of feature with standard symbols. Land use and land cover details in the area are
presented in Table-1 and land use and land cover map prepared from satellite image is
shown as Figure-3.
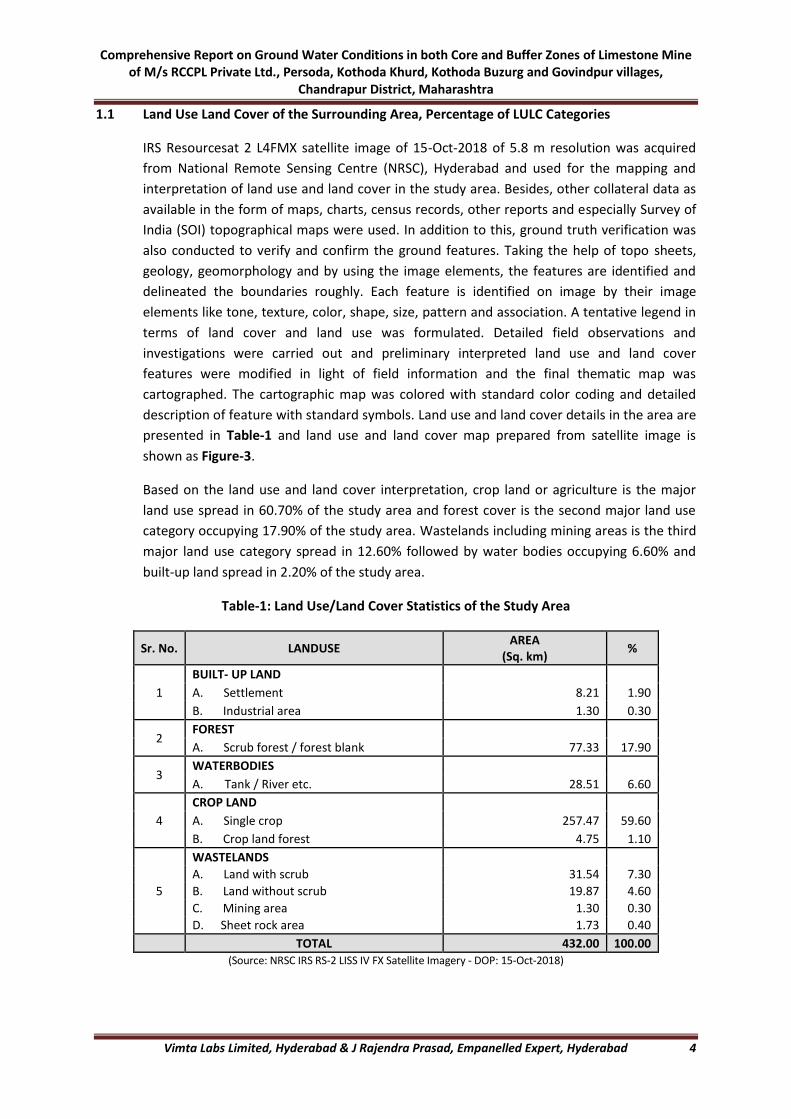
Based on the land use and land cover interpretation, crop land or agriculture is the major
land use spread in 60.70% of the study area and forest cover is the second major land use
category occupying 17.90% of the study area. Wastelands including mining areas is the third
major land use category spread in 12.60% followed by water bodies occupying 6.60% and
built-up land spread in 2.20% of the study area.
Table-1: Land Use/Land Cover Statistics of the Study Area
Sr. No. LANDUSE AREA
(Sq. km) %
1
BUILT- UP LAND
A. Settlement 8.21 1.90
B. Industrial area 1.30 0.30
2 FOREST
A. Scrub forest / forest blank 77.33 17.90
3 WATERBODIES
A. Tank / River etc. 28.51 6.60
4
CROP LAND
A. Single crop 257.47 59.60
B. Crop land forest 4.75 1.10
5
WASTELANDS
A. Land with scrub 31.54 7.30
B. Land without scrub 19.87 4.60
C. Mining area 1.30 0.30
D. Sheet rock area 1.73 0.40
TOTAL 432.00 100.00
(Source: NRSC IRS RS-2 LISS IV FX Satellite Imagery - DOP: 15-Oct-2018)

Comprehensive Report on Ground Water Conditions in both Core and Buffer Zones of Limestone Mine of M/s RCCPL Private Ltd., Persoda, Kothoda Khurd, Kothoda Buzurg and Govindpur villages,
Chandrapur District, Maharashtra
Vimta Labs Limited, Hyderabad & J Rajendra Prasad, Empanelled Expert, Hyderabad 5
Figure-3: Land Use/Land Cover Map of the Study Area

Comprehensive Report on Ground Water Conditions in both Core and Buffer Zones of Limestone Mine of M/s RCCPL Private Ltd., Persoda, Kothoda Khurd, Kothoda Buzurg and Govindpur villages,
Chandrapur District, Maharashtra
Vimta Labs Limited, Hyderabad & J Rajendra Prasad, Empanelled Expert, Hyderabad 6
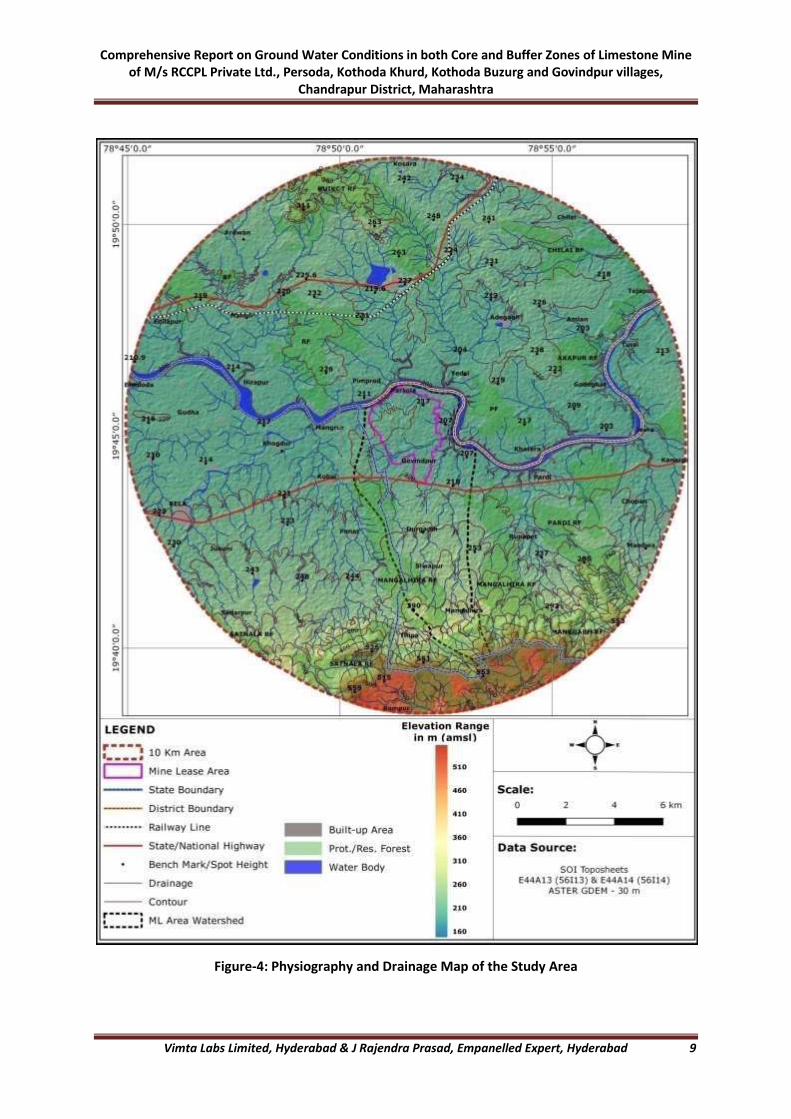
1.2 Topography and Drainage
The study area can be divided into two physiographic regions i.e., plane region in valleys of
Penganga River and upland hilly region. The plane region is made up of widely spread and
flat terrain occurring mostly along Penganga River. The lowest and highest topographic
elevations of the area are 200 m above mean sea level (amsl) along Penganga River in the NE
and 559 m amsl in Satnala RF on a hilly terrain in the south. General slope in major part of
the study area is towards NE following Penganga River except in south towards south in a
small area.
Satnala RF, Manikgarh RF and Pardi RF towards south and SE of project site, Akapur RF and
Chilai RF towards NE of project site, Ruikot RF towards N of project site are major forest
covers in the study area.
According to River Basin Atlas of India, Ministry of Water Resources, major part of the study
area forms part of C03WAR32 and 33 watersheds in Wardha Sub-basin and a small area in
the south fall in C03PRA45 watershed in Pranhita and Others Sub-basin of Godavari Basin.
Drainage in the Wardha Sub-basin area is controlled by Penganga River and its tributaries –
Vidarbha River drainage in the NE and other streams. Hilly terrain in the southern part forms
drainage divide of two sub-basins and the drainage south of the divide joins Persi Kuder
which flows into Pedda Vagu further downstream.
Penganga or Painganga River originates in the Ajantha ranges in Aurangabad district in
Maharashtra and is a major tributary of the Wardha River. It then flows through Buldhana
district and Washim district. It flows through Risod tehsil of Washim where it gets Kas river
as the tributary near Shelgaon Rajgure village and then flows through the border of Washim
and Hingoli district. Then it acts as a boundary between Yavatmal, Chandrapur and Nanded
districts. It then flows along the state border between Maharashtra and Telangana. The
small Vidarbha river merges with Penganga river at Deurwada, Wani, Yavatmal district and
Kodsi village, Korpana taluka, Chandrapur district. Penganga converges into Wardha River
near a small village called Wadha in Chandrapur taluka of Chandrapur district. The river gets
flooded in rainy and winter season and partially flooded or has partial flows in summer.
Other tributaries of Penganga River are Adan river, Arunavati river, Kayadhu river, Pus river
etc.
The drainage network presents an ideal dendritic pattern, a result of uniform lithology and
inadequate structural control. The study area is having a drainage density of 1.81 km/sq km.
There are a few small to medium water bodies which gets filled during rainy season in the
study area. Mukutban tank is the largest tank in the study area which is reported to have at
least small water spread even during summer. There are number of check dams constructed
on stream courses in the study area. Physiography and drainage network of the study area is
presented in Figure-4.
As per ML area Surface Plan, elevation in the ML area ranges from 196 m amsl towards
Penganga River to 219 m amsl in the central part. The general slopes are towards north and
east towards Penganga River. There are a few 1st order drains in the northern part and a

Comprehensive Report on Ground Water Conditions in both Core and Buffer Zones of Limestone Mine of M/s RCCPL Private Ltd., Persoda, Kothoda Khurd, Kothoda Buzurg and Govindpur villages,
Chandrapur District, Maharashtra
Vimta Labs Limited, Hyderabad & J Rajendra Prasad, Empanelled Expert, Hyderabad 7
third order seasonal nallah running across the southern part of ML area, all of them joining
Penganga River. The drainage network of nallah running across the southern part of ML area
originates 3.00 km SSW near Durgadih. Watershed area covering the drainage network
contributing run-off to and from ML area is spread in 41.83 sq km (Figure-4). Check dams
were constructed at 5 locations on this nallah within the ML area.
To understand the availability of water and flow during different seasons in Penganga River,
flow monitoring data of Central Water Commission (CWC) monitoring station near PG Bridge
between Adilabad and Bori (40 km upstream of project site) is presented below:
Latitude 19°49'03"N
Longitude 78°34'40"E
Drainage Area (km²) 18441
Zero of Gauge (m amsl) 198.63
Peak Water Level (m amsl) 217.92
Date of Occurrence 07.08.2006
Maximum Discharge (Cumecs) 13881
Minimum Water Level 197.168
Date of Occurrence 06.07.1969
Minimum Discharge (Cumecs) 0
Based on the historical flow observations at PG Bridge station, maximum water level was
recorded on 07.08.2006 with peak water level of 217.92 m amsl and maximum discharge of
13,881 cumecs. Minimum discharge of “0.00” cumecs or “no flow” was recorded on
06.07.1969. A review of seasonal water flow in Penganga River between 2002-03 and 2010-
11 indicate that maximum and minimum flow recorded during monsoon season are 7978
MCM during 2002-03 and 442 MCM during 2009-10 respectively and maximum and
minimum flow recorded during non-monsoon season are 144 MCM during 2002-03 and 3
MCM during 2009-10 respectively. The average monsoon and non-monsoon flows are 3933
MCM and 83 MCM. The annual dependable flow of water based on 6/1965 to 5/2011
observations range from 444.64 MCM with 100% dependability to 8197.75 MCM with 10%
dependability.
Flow of Water by Season in MCM (2002-2011)
2002-03 2003-04 2004-05 2005-06 2006-07 2007-08 2008-09 2009-10 2010-11 Average
Monsoon 7978 3533 260 5067 8232 1667 1088 442 7126 3933
Non-Monsoon 144 50 6 112 142 63 5 3 225 83
Annual 8122 3583 266 5179 8374 1730 1093 445 7351 3614
Comprehensive Report on Ground Water Conditions in both Core and Buffer Zones of Limestone Mine of M/s RCCPL Private Ltd., Persoda, Kothoda Khurd, Kothoda Buzurg and Govindpur villages,
Chandrapur District, Maharashtra
Vimta Labs Limited, Hyderabad & J Rajendra Prasad, Empanelled Expert, Hyderabad 8
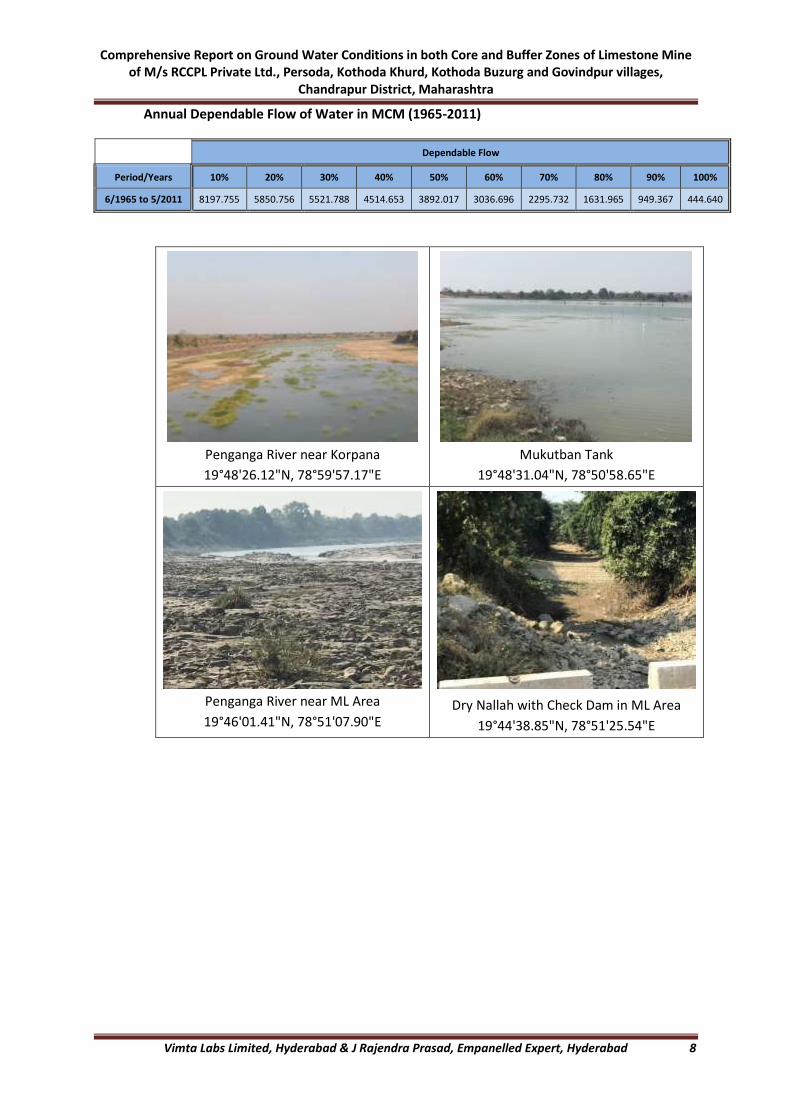
Annual Dependable Flow of Water in MCM (1965-2011)
Dependable Flow
Period/Years 10% 20% 30% 40% 50% 60% 70% 80% 90% 100%
6/1965 to 5/2011 8197.755 5850.756 5521.788 4514.653 3892.017 3036.696 2295.732 1631.965 949.367 444.640
Penganga River near Korpana
19°48'26.12"N, 78°59'57.17"E
Mukutban Tank
19°48'31.04"N, 78°50'58.65"E
Penganga River near ML Area
19°46'01.41"N, 78°51'07.90"E
Dry Nallah with Check Dam in ML Area
19°44'38.85"N, 78°51'25.54"E
Comprehensive Report on Ground Water Conditions in both Core and Buffer Zones of Limestone Mine of M/s RCCPL Private Ltd., Persoda, Kothoda Khurd, Kothoda Buzurg and Govindpur villages,
Chandrapur District, Maharashtra
Vimta Labs Limited, Hyderabad & J Rajendra Prasad, Empanelled Expert, Hyderabad 9
Figure-4: Physiography and Drainage Map of the Study Area
Comprehensive Report on Ground Water Conditions in both Core and Buffer Zones of Limestone Mine of M/s RCCPL Private Ltd., Persoda, Kothoda Khurd, Kothoda Buzurg and Govindpur villages,
Chandrapur District, Maharashtra
Vimta Labs Limited, Hyderabad & J Rajendra Prasad, Empanelled Expert, Hyderabad 10
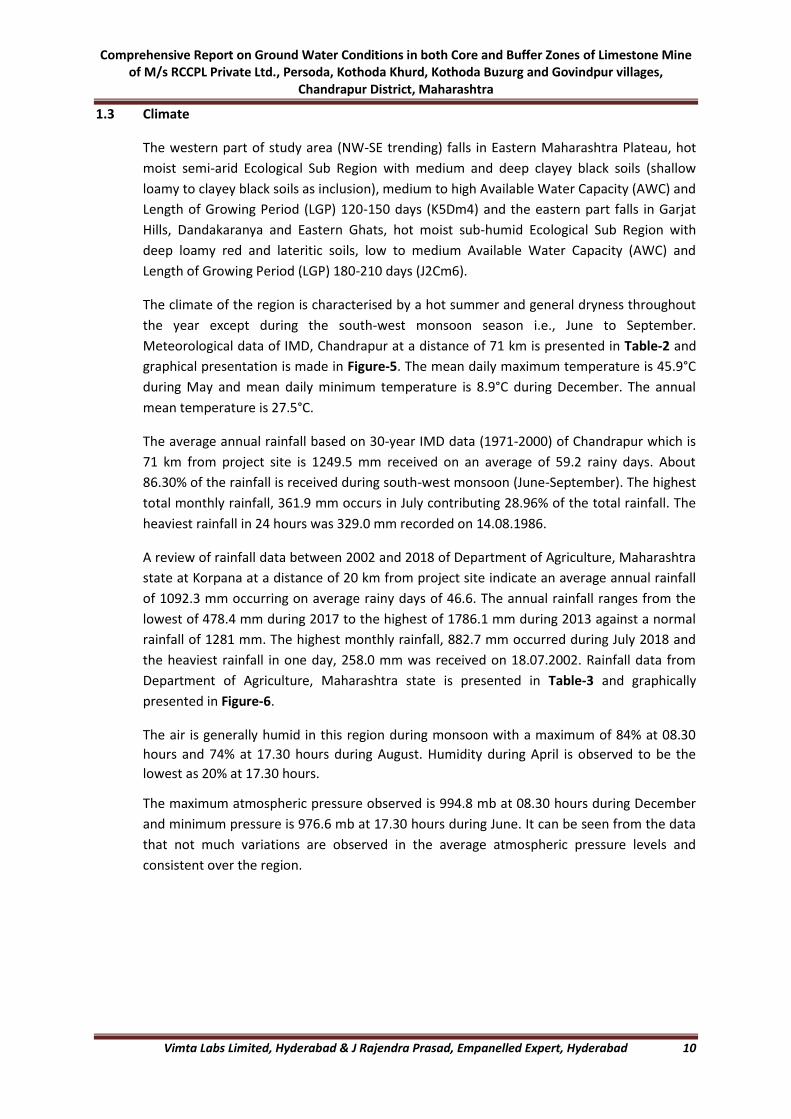
1.3 Climate
The western part of study area (NW-SE trending) falls in Eastern Maharashtra Plateau, hot
moist semi-arid Ecological Sub Region with medium and deep clayey black soils (shallow
loamy to clayey black soils as inclusion), medium to high Available Water Capacity (AWC) and
Length of Growing Period (LGP) 120-150 days (K5Dm4) and the eastern part falls in Garjat
Hills, Dandakaranya and Eastern Ghats, hot moist sub-humid Ecological Sub Region with
deep loamy red and lateritic soils, low to medium Available Water Capacity (AWC) and
Length of Growing Period (LGP) 180-210 days (J2Cm6).
The climate of the region is characterised by a hot summer and general dryness throughout
the year except during the south-west monsoon season i.e., June to September.
Meteorological data of IMD, Chandrapur at a distance of 71 km is presented in Table-2 and
graphical presentation is made in Figure-5. The mean daily maximum temperature is 45.9°C
during May and mean daily minimum temperature is 8.9°C during December. The annual
mean temperature is 27.5°C.
The average annual rainfall based on 30-year IMD data (1971-2000) of Chandrapur which is
71 km from project site is 1249.5 mm received on an average of 59.2 rainy days. About
86.30% of the rainfall is received during south-west monsoon (June-September). The highest
total monthly rainfall, 361.9 mm occurs in July contributing 28.96% of the total rainfall. The
heaviest rainfall in 24 hours was 329.0 mm recorded on 14.08.1986.
A review of rainfall data between 2002 and 2018 of Department of Agriculture, Maharashtra
state at Korpana at a distance of 20 km from project site indicate an average annual rainfall
of 1092.3 mm occurring on average rainy days of 46.6. The annual rainfall ranges from the
lowest of 478.4 mm during 2017 to the highest of 1786.1 mm during 2013 against a normal
rainfall of 1281 mm. The highest monthly rainfall, 882.7 mm occurred during July 2018 and
the heaviest rainfall in one day, 258.0 mm was received on 18.07.2002. Rainfall data from
Department of Agriculture, Maharashtra state is presented in Table-3 and graphically
presented in Figure-6.
The air is generally humid in this region during monsoon with a maximum of 84% at 08.30
hours and 74% at 17.30 hours during August. Humidity during April is observed to be the
lowest as 20% at 17.30 hours.
The maximum atmospheric pressure observed is 994.8 mb at 08.30 hours during December
and minimum pressure is 976.6 mb at 17.30 hours during June. It can be seen from the data
that not much variations are observed in the average atmospheric pressure levels and
consistent over the region.
Comprehensive Report on Ground Water Conditions in both Core and Buffer Zones of Limestone Mine of M/s RCCPL Private Ltd., Persoda, Kothoda Khurd, Kothoda Buzurg and Govindpur villages,
Chandrapur District, Maharashtra
Vimta Labs Limited, Hyderabad & J Rajendra Prasad, Empanelled Expert, Hyderabad 11
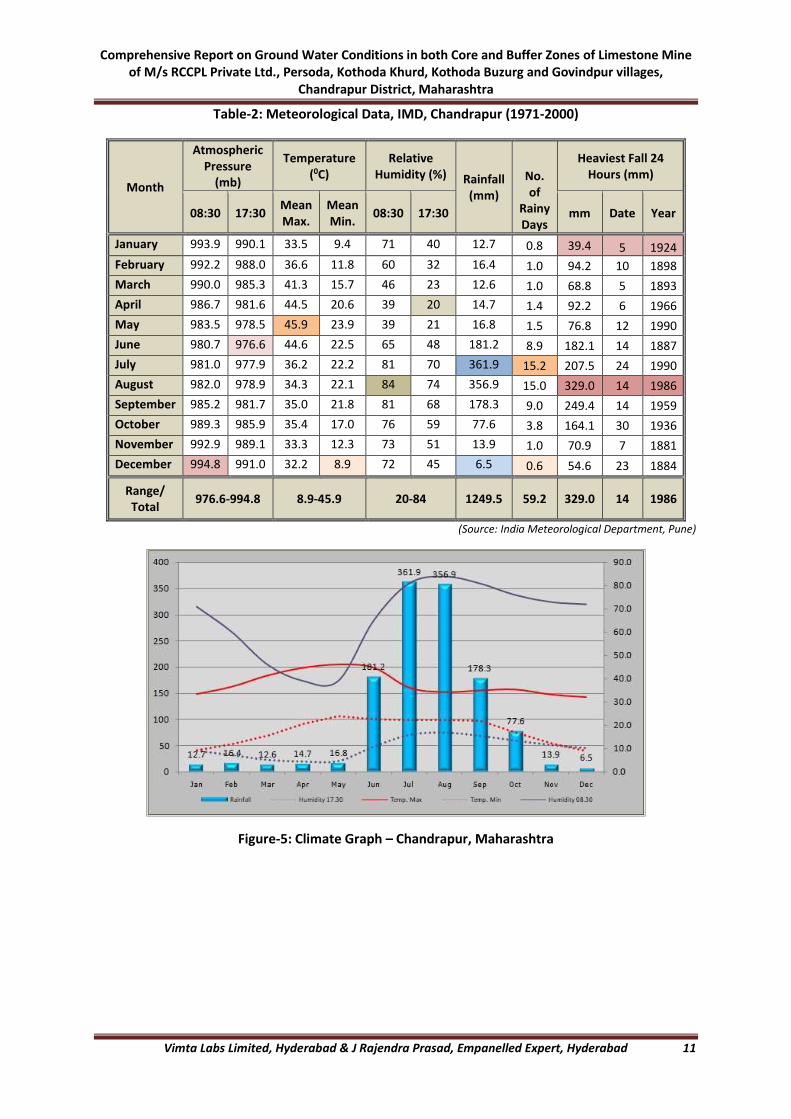
Table-2: Meteorological Data, IMD, Chandrapur (1971-2000)
Month
Atmospheric Pressure
(mb)
Temperature (0C)
Relative Humidity (%) Rainfall
(mm)
No. of
Rainy Days
Heaviest Fall 24 Hours (mm)
08:30 17:30 Mean Max.
Mean Min.
08:30 17:30 mm Date Year
January 993.9 990.1 33.5 9.4 71 40 12.7 0.8 39.4 5 1924
February 992.2 988.0 36.6 11.8 60 32 16.4 1.0 94.2 10 1898
March 990.0 985.3 41.3 15.7 46 23 12.6 1.0 68.8 5 1893
April 986.7 981.6 44.5 20.6 39 20 14.7 1.4 92.2 6 1966
May 983.5 978.5 45.9 23.9 39 21 16.8 1.5 76.8 12 1990
June 980.7 976.6 44.6 22.5 65 48 181.2 8.9 182.1 14 1887
July 981.0 977.9 36.2 22.2 81 70 361.9 15.2 207.5 24 1990
August 982.0 978.9 34.3 22.1 84 74 356.9 15.0 329.0 14 1986
September 985.2 981.7 35.0 21.8 81 68 178.3 9.0 249.4 14 1959
October 989.3 985.9 35.4 17.0 76 59 77.6 3.8 164.1 30 1936
November 992.9 989.1 33.3 12.3 73 51 13.9 1.0 70.9 7 1881
December 994.8 991.0 32.2 8.9 72 45 6.5 0.6 54.6 23 1884
Range/ Total
976.6-994.8 8.9-45.9 20-84 1249.5 59.2 329.0 14 1986
(Source: India Meteorological Department, Pune)
Figure-5: Climate Graph – Chandrapur, Maharashtra

Comprehensive Report on Ground Water Conditions in both Core and Buffer Zones of Limestone Mine of M/s RCCPL Private Ltd., Persoda, Kothoda Khurd, Kothoda Buzurg and Govindpur villages,
Chandrapur District, Maharashtra
Vimta Labs Limited, Hyderabad & J Rajendra Prasad, Empanelled Expert, Hyderabad 12
Table-3: Rainfall Data from 2002 to 2018 – Korpana
Year
Rainfall in mm Total Rain for Year
Jan Feb Mar Apr May Jun Jul Aug Sep Oct Nov Dec Normal
Rain Actual Rain
Rainy Days
2002 0.0 0.0 0.0 0.0 0.0 205.2 339.5 360.4 56.2 0.0 0.0 0.0 1281 961.3 25
2003 0.0 0.0 0.0 0.0 15.0 143.0 835.2 527.6 167.0 64.0 0.0 0.0 1281 1751.8 54
2004 0.0 0.0 0.0 0.0 0.0 191.0 213.0 151.0 48.0 0.0 0.0 0.0 1281 603.0 29
2005 90.0 8.0 8.0 0.0 0.0 205.9 599.9 164.7 101.0 77.9 0.0 0.0 1281 1255.4 54
2006 0.0 0.0 0.0 0.0 35.0 142.3 410.0 303.6 223.3 92.8 14.4 0.0 1281 1221.4 48
2007 0.0 0.0 0.0 0.0 0.0 224.7 289.2 158.8 202.1 35.1 9.2 0.0 1281 919.1 51
2008 0.0 0.0 39.0 9.6 0.0 87.5 305.5 418.2 158.2 17.8 0.0 0.0 1281 1035.8 49
2009 0.0 0.0 0.0 0.0 0.0 32.4 186.9 203.3 51.8 32.0 41.4 0.0 1281 547.8 36
2010 0.0 0.0 0.0 0.0 0.0 99.6 377.6 431.0 223.0 97.6 0.0 2.0 1281 1230.8 49
2011 0.0 0.0 0.0 0.0 0.0 170.0 149.0 437.6 146.4 0.0 0.0 0.0 1281 903.0 50
2012 0.0 0.0 0.0 0.0 0.0 190.8 476.4 274.6 265.4 65.6 14.2 0.0 1281 1287.0 51
2013 0.0 0.0 0.0 0.0 0.0 412.6 723.3 291.2 159.3 199.7 0.0 0.0 1281 1786.1 63
2014 0.0 0.0 2.3 0.0 0.0 19.6 226.4 231.5 298.7 23.9 0.0 0.0 1281 802.4 41
2015 45.8 0.0 74.2 27.9 0.0 281.4 91.7 175.7 365.0 10.2 0.0 0.0 1281 1071.9 41
2016 0.0 0.0 13.0 0.0 0.0 200.6 359.5 122.0 303.3 99.2 0.0 0.0 1281 1097.6 53
2017 0.0 0.0 0.0 0.0 5.2 48.3 151.0 143.4 87.1 43.4 0.0 0.0 1281 478.4 45
2018 0.0 0.0 4.6 4.7 46.9 136.1 882.7 435.1 92.6 0.0 0.0 13.6 1281 1616.3 53
Average 8.0 0.5 8.3 2.5 6.0 164.2 389.2 284.1 173.4 50.5 4.7 0.9 1281 1092.3 46.6
Average Monthly Rainfall 2002-2018
Average Annual Rainfall 2002-2018
Figure-6: Rainfall Hydrographs of Korpana

Comprehensive Report on Ground Water Conditions in both Core and Buffer Zones of Limestone Mine of M/s RCCPL Private Ltd., Persoda, Kothoda Khurd, Kothoda Buzurg and Govindpur villages,
Chandrapur District, Maharashtra
Vimta Labs Limited, Hyderabad & J Rajendra Prasad, Empanelled Expert, Hyderabad 13
1.4 Details of wetlands [Highlight protected wetlands / Ramsar sites / NLCP lakes/ other
important wetlands in terms of dependencies of local communities if any]
There are no wetlands in the study area.
2.0 Ground water situation in and around the project area including water level and quality
data and maps along with quality issues, if any. In case of mines, ground water conditions
in both core and buffer zone should be described
2.1 Brief Geology of the Area
2.1.1 Regional Geology
Rock formations ranging in age from Archaean to Quaternary are exposed in the district.
Bengpal Group of Archaean age (4000-2500 m.y) occupies the south-eastern part and
comprises granitic and migmatites with basic intrusive, amphibolites schist, hornblende
schist and banded ferruginous quartzite. Amgaon Gneissic Complex of Archaean to Palaeo
Proterozoic age (<2500-2200 m.y) occupies north-eastern part and the area around
Chargaon N and Chandai N in the north-western part. It comprises granitic gneisses and
granite with enclaves of hornblende schist, amphibolites, ultramafic and quartz/pegmatite
veins. Bailadila Group of Palaeo Proterozoic age (2500-2100 m.y) comprising quartzite,
banded-haematite quartzite with lenses of iron ores occurs as isolated outcrops in the north-
western part. Pakhal Group of Meso Proterozoic age (2000-1600 m.y) occurs in the south-
eastern part and comprises dolomitic limestone, shale, qauartzite and sandstone. Penganga
Group of Neo Proterozoic age (undifferentiated) (1600-570 m.y) occupies the south-western
part and north-western parts and comprises limestone and shale. Sullavai Group of Neo
Proterozoic age comprises quartzitic sandstone with few chert bands and occurs in the
southern part. Vindhyan Supergroup (equivalent) of Neo Proterozoic age occupies the north-
eastern part and comprises sandstone and shale.
A faulted contact marks the boundary of Gondwana Supergroup with different rock
formations of Archaean-Proterozoic age. The Gondwana Supergroup includes Talchir,
Barakar, Barren measures and Kamthi Formations whereas Upper Gondwana sequence
includes undifferentiated Dharmaram, Yerrapalli and Kota Formations. Talchir Formation of
Carboniferous to Permian age (345-230 m.y) is exposed in the southwestern and northern
parts and comprises sandstone, shale, pebble beds and tillites. Barakar Formation of
Permian age (280-230 m.y) comprises felspathic sandstone, carbonaceous shale and is a
storehouse of coal deposits. It is exposed in the southern, western and northern parts as
isolated outcrops. Barren Measure of Permian age comprises sandstone, sub-ordinate
micaceous siltstone and clay. Kamthi Formation of Permian to Triassic age (280-195 m.y)
comprises sandstone and variegated shale. Undifferentiated Dharmaram and Yerrapalli
Formation of middle to late Triassic age (230-195 m.y) comprise mudstone, calcareous
bands, ferruginous to calcareous sandstone and occur along Wardha River in the
southwestern part of the district. Kota Formation of Jurassic age (195-136 m.y) comprises
sandstone, clay and limestone. Lameta Group of Cretaceous age (136-65 m.y) comprises

Comprehensive Report on Ground Water Conditions in both Core and Buffer Zones of Limestone Mine of M/s RCCPL Private Ltd., Persoda, Kothoda Khurd, Kothoda Buzurg and Govindpur villages,
Chandrapur District, Maharashtra
Vimta Labs Limited, Hyderabad & J Rajendra Prasad, Empanelled Expert, Hyderabad 14
cherty limestone, clay, sandstone and conglomerate and has a rich dinosaurian fossil
assemblage.
Deccan basalts of Sahyadri Group of Cretaceous to Palaogene age (62-68 m.y) occupies the
southwestern and north-western parts and are classified under Ajanta, Chikhli and Karanja
Formations. These formations comprise simple and compound basaltic lava flows which are
sparsely to moderately porphyritic. Isolated laterite cappings with thickness ranging from a
few cm to 8 m over Deccan basalts and gneisses are observed in the southwestern and
north-eastern parts. Alluvium deposits of Quaternary age (<1 m.y) are noticed in the
southern, north-western and north-eastern parts.
Limestone deposits of cement and flux grade associated with Penganga and Pakhal Group
and are found near Soita-Niljai, Gojoli-Somanpale, Awarpur-Bakhardi, Sangoda, Naokari-
Kusumbi, Chandur-Thutra-Sonapur, Chedvai and Nadgaon-Ekodi.
The regional stratigraphic succession based on Geological Survey of India (GSI) publication,
1997 is given in Table-4.
Table-4: Regional Stratigraphic Succession
Lithology Stratigraphic
Status Age
Alluvia and soil Recent
Basalt, Individual flows numbered where mapped, Inter-trappean beds
Deccan Trap Upper Cretaceous to Eocene
Infra-trappean beds Upper Cretaceous
Kamthi Formation Gondwana Supergroup
Permian
Talchir Formation Upper Carboniferous-Permian
a. Bhimsari sandstone, b. Jamaldari Limestone, c. Toyaguda shale, d. Goatkur limestone, e. Bela shale, f. Mangurda limestone and dolomite, g. Tirmalapur shale, h. Ara limestone
Penganga Group Upper Proterozoic
a. Pebbly sandstone, b. Limestone Pakhal Group
Dolerite dyke; Quartz vein Lower to Middle Proterozoic (Pink and grey) Granite
Banded Ferruginous Quartzite and schists Lower Proterozoic
Granite, granite gneiss
Archaean
(Source: Geological Survey of India (GSI) publication, 1997)
2.1.2 Geology of the Study Area
Of the total study area of 465.35 sq km, limestone and shale belonging to Penganga Group
are the major geological formations occupying 371.61 sq km (79.86%). Deccan Trap basalts
occupy 54.35 sq km (11.68%) in south and north of the study area followed by Kamthi and
Talchir formations of Gondwana Supergroup occupying 39.39 sq km (8.47%) in the north and
northwest. Geology of the study area based on Geological Survey of India (GSI) publication,
1997 is presented in Figure-7.
The study area does not show any major tectonic evidences except few geomorphic
lineaments parallel to drainage courses and minor fractures in the Kamthi Formation in

Comprehensive Report on Ground Water Conditions in both Core and Buffer Zones of Limestone Mine of M/s RCCPL Private Ltd., Persoda, Kothoda Khurd, Kothoda Buzurg and Govindpur villages,
Chandrapur District, Maharashtra
Vimta Labs Limited, Hyderabad & J Rajendra Prasad, Empanelled Expert, Hyderabad 15
north and Deccan Trap basalts in the south. Lineaments mapped based on Geomorphology
and Lineament Theme, Bhuvan, National Remote Sensing Centre (NRSC) are shown in
Figure-7.
Figure-7: Geology of the Study Area
Comprehensive Report on Ground Water Conditions in both Core and Buffer Zones of Limestone Mine of M/s RCCPL Private Ltd., Persoda, Kothoda Khurd, Kothoda Buzurg and Govindpur villages,
Chandrapur District, Maharashtra
Vimta Labs Limited, Hyderabad & J Rajendra Prasad, Empanelled Expert, Hyderabad 16
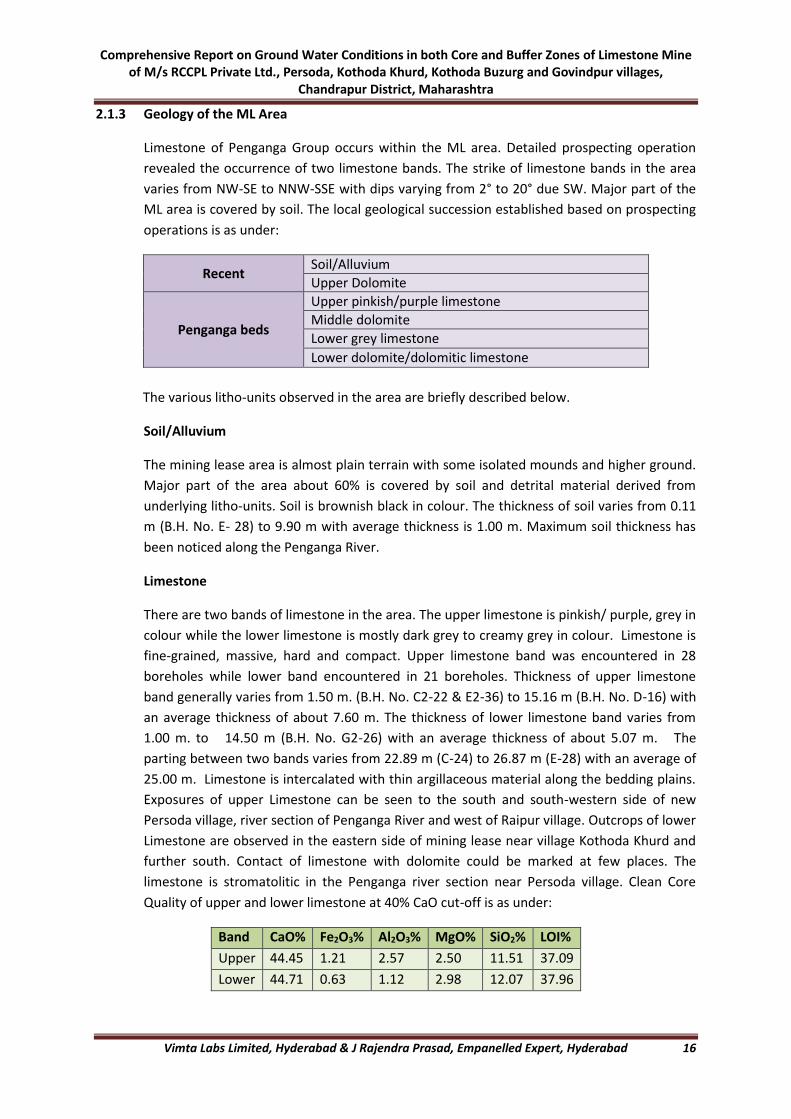
2.1.3 Geology of the ML Area
Limestone of Penganga Group occurs within the ML area. Detailed prospecting operation
revealed the occurrence of two limestone bands. The strike of limestone bands in the area
varies from NW-SE to NNW-SSE with dips varying from 2° to 20° due SW. Major part of the
ML area is covered by soil. The local geological succession established based on prospecting
operations is as under:
Recent Soil/Alluvium
Upper Dolomite
Penganga beds
Upper pinkish/purple limestone
Middle dolomite
Lower grey limestone
Lower dolomite/dolomitic limestone
The various litho-units observed in the area are briefly described below.
Soil/Alluvium
The mining lease area is almost plain terrain with some isolated mounds and higher ground.
Major part of the area about 60% is covered by soil and detrital material derived from
underlying litho-units. Soil is brownish black in colour. The thickness of soil varies from 0.11
m (B.H. No. E- 28) to 9.90 m with average thickness is 1.00 m. Maximum soil thickness has
been noticed along the Penganga River.
Limestone
There are two bands of limestone in the area. The upper limestone is pinkish/ purple, grey in
colour while the lower limestone is mostly dark grey to creamy grey in colour. Limestone is
fine-grained, massive, hard and compact. Upper limestone band was encountered in 28
boreholes while lower band encountered in 21 boreholes. Thickness of upper limestone
band generally varies from 1.50 m. (B.H. No. C2-22 & E2-36) to 15.16 m (B.H. No. D-16) with
an average thickness of about 7.60 m. The thickness of lower limestone band varies from
1.00 m. to 14.50 m (B.H. No. G2-26) with an average thickness of about 5.07 m. The
parting between two bands varies from 22.89 m (C-24) to 26.87 m (E-28) with an average of
25.00 m. Limestone is intercalated with thin argillaceous material along the bedding plains.
Exposures of upper Limestone can be seen to the south and south-western side of new
Persoda village, river section of Penganga River and west of Raipur village. Outcrops of lower
Limestone are observed in the eastern side of mining lease near village Kothoda Khurd and
further south. Contact of limestone with dolomite could be marked at few places. The
limestone is stromatolitic in the Penganga river section near Persoda village. Clean Core
Quality of upper and lower limestone at 40% CaO cut-off is as under:
Band CaO% Fe2O3% Al2O3% MgO% SiO2% LOI%
Upper 44.45 1.21 2.57 2.50 11.51 37.09
Lower 44.71 0.63 1.12 2.98 12.07 37.96

Comprehensive Report on Ground Water Conditions in both Core and Buffer Zones of Limestone Mine of M/s RCCPL Private Ltd., Persoda, Kothoda Khurd, Kothoda Buzurg and Govindpur villages,
Chandrapur District, Maharashtra
Vimta Labs Limited, Hyderabad & J Rajendra Prasad, Empanelled Expert, Hyderabad 17
The general strike of limestone varies from NW-SE to NNW –SSE with dips varies from 2 to
20 due south west. Beds of Limestone with easterly dip are also noticed.
Dolomite
Alternating bands of dolomite and limestone are encountered in the boreholes. Dolomite is
hard, compact fine grained to crystalline at places. Colour of dolomite varies from greyish
white to yellowish grey in colour. Dolomite exhibit characteristic elephant skin weathering.
Outcrops of dolomite are noticed near highway, along road to Persoda village, western part
of the block. Exposures of dolomite are also seen in the cultivated land near State Highway,
west & south of Kothoda Khurd.
Upper dolomite band is underlain by upper limestone. Outcrops of upper dolomite are seen
in the western part of the block. Thickness of upper dolomite encountered generally varies
from 2.00 m (C-28) to 39.20 m (E-28). Average quality of upper dolomite is furnished below:
Band CaO% Fe2O3% Al2O3% MgO% SiO2% LOI%
Upper Dolomite 30.43 0.90 2.00 16.60 7.74 41.52
Middle dolomite has been intersected in 21 boreholes however full thickness of middle
dolomite band was encountered only in 6 boreholes only. The minimum and maximum
thickness encountered based on 6 boreholes ranges from 22.89 (C-24) and 26.87 (E-28)
respectively. Dolomite is grading into dolomitic limestone at few places. Average quality of
middle dolomite is furnished below:
Band CaO% Fe2O3% Al2O3% MgO% SiO2% LOI%
Middle Dolomite 29.92 0.58 1.62 18.88 5.50 42.97
Lower most dolomite occurs below lower limestone band and it is mostly dolomitic
limestone having < 15% MgO. Overburden comprises of topsoil & detrital material derived
from parent rocks & dolomite. Average limestone to overburden ratio is 1: 0.45.
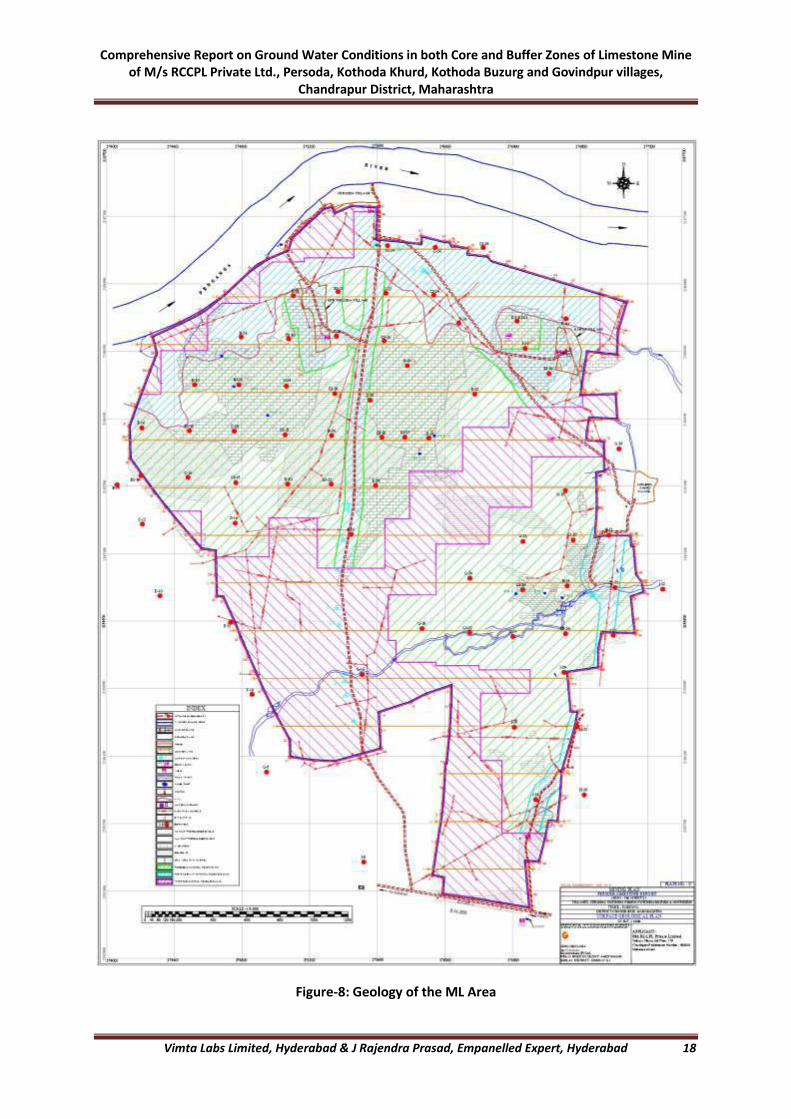
Geological map of the ML area depicting the limestone/dolomite outcrops and soil covered
area together with other relevant details like borehole locations, surface features etc., is
given in Figure-8. Geological cross sections of ML area based on exploratory drilling are
presented in Figure-9a and 9b.
Comprehensive Report on Ground Water Conditions in both Core and Buffer Zones of Limestone Mine of M/s RCCPL Private Ltd., Persoda, Kothoda Khurd, Kothoda Buzurg and Govindpur villages,
Chandrapur District, Maharashtra
Vimta Labs Limited, Hyderabad & J Rajendra Prasad, Empanelled Expert, Hyderabad 18
Figure-8: Geology of the ML Area

Comprehensive Report on Ground Water Conditions in both Core and Buffer Zones of Limestone Mine of M/s RCCPL Private Ltd., Persoda, Kothoda Khurd, Kothoda Buzurg and Govindpur villages,
Chandrapur District, Maharashtra
Vimta Labs Limited, Hyderabad & J Rajendra Prasad, Empanelled Expert, Hyderabad 19
Figure-9[a]: Geological Cross Sections of the ML Area

Comprehensive Report on Ground Water Conditions in both Core and Buffer Zones of Limestone Mine of M/s RCCPL Private Ltd., Persoda, Kothoda Khurd, Kothoda Buzurg and Govindpur villages,
Chandrapur District, Maharashtra
Vimta Labs Limited, Hyderabad & J Rajendra Prasad, Empanelled Expert, Hyderabad 20
Figure-9[b]: Geological Cross Sections of the ML Area
Comprehensive Report on Ground Water Conditions in both Core and Buffer Zones of Limestone Mine of M/s RCCPL Private Ltd., Persoda, Kothoda Khurd, Kothoda Buzurg and Govindpur villages,
Chandrapur District, Maharashtra
Vimta Labs Limited, Hyderabad & J Rajendra Prasad, Empanelled Expert, Hyderabad 21
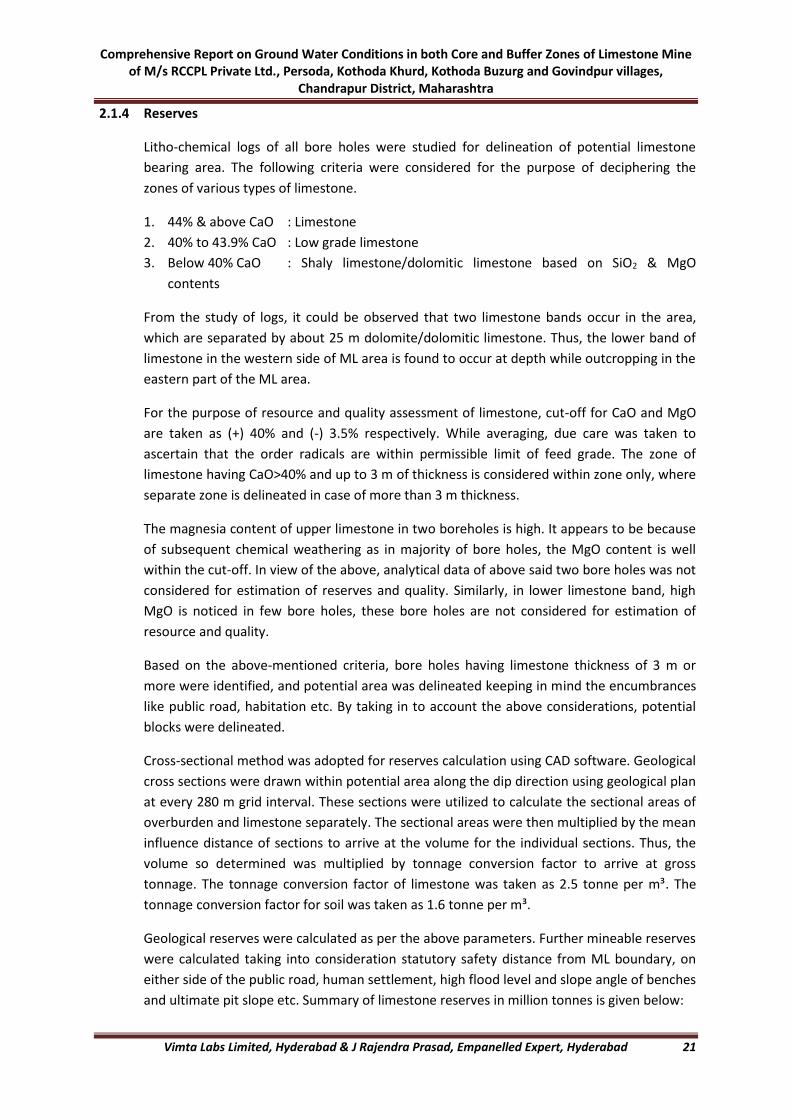
2.1.4 Reserves
Litho-chemical logs of all bore holes were studied for delineation of potential limestone
bearing area. The following criteria were considered for the purpose of deciphering the
zones of various types of limestone.
1. 44% & above CaO : Limestone
2. 40% to 43.9% CaO : Low grade limestone
3. Below 40% CaO : Shaly limestone/dolomitic limestone based on SiO2 & MgO
contents
From the study of logs, it could be observed that two limestone bands occur in the area,
which are separated by about 25 m dolomite/dolomitic limestone. Thus, the lower band of
limestone in the western side of ML area is found to occur at depth while outcropping in the
eastern part of the ML area.
For the purpose of resource and quality assessment of limestone, cut-off for CaO and MgO
are taken as (+) 40% and (-) 3.5% respectively. While averaging, due care was taken to
ascertain that the order radicals are within permissible limit of feed grade. The zone of
limestone having CaO>40% and up to 3 m of thickness is considered within zone only, where
separate zone is delineated in case of more than 3 m thickness.
The magnesia content of upper limestone in two boreholes is high. It appears to be because
of subsequent chemical weathering as in majority of bore holes, the MgO content is well
within the cut-off. In view of the above, analytical data of above said two bore holes was not
considered for estimation of reserves and quality. Similarly, in lower limestone band, high
MgO is noticed in few bore holes, these bore holes are not considered for estimation of
resource and quality.
Based on the above-mentioned criteria, bore holes having limestone thickness of 3 m or
more were identified, and potential area was delineated keeping in mind the encumbrances
like public road, habitation etc. By taking in to account the above considerations, potential
blocks were delineated.
Cross-sectional method was adopted for reserves calculation using CAD software. Geological
cross sections were drawn within potential area along the dip direction using geological plan
at every 280 m grid interval. These sections were utilized to calculate the sectional areas of
overburden and limestone separately. The sectional areas were then multiplied by the mean
influence distance of sections to arrive at the volume for the individual sections. Thus, the
volume so determined was multiplied by tonnage conversion factor to arrive at gross
tonnage. The tonnage conversion factor of limestone was taken as 2.5 tonne per m³. The
tonnage conversion factor for soil was taken as 1.6 tonne per m³.
Geological reserves were calculated as per the above parameters. Further mineable reserves
were calculated taking into consideration statutory safety distance from ML boundary, on
either side of the public road, human settlement, high flood level and slope angle of benches
and ultimate pit slope etc. Summary of limestone reserves in million tonnes is given below:
Comprehensive Report on Ground Water Conditions in both Core and Buffer Zones of Limestone Mine of M/s RCCPL Private Ltd., Persoda, Kothoda Khurd, Kothoda Buzurg and Govindpur villages,
Chandrapur District, Maharashtra
Vimta Labs Limited, Hyderabad & J Rajendra Prasad, Empanelled Expert, Hyderabad 22
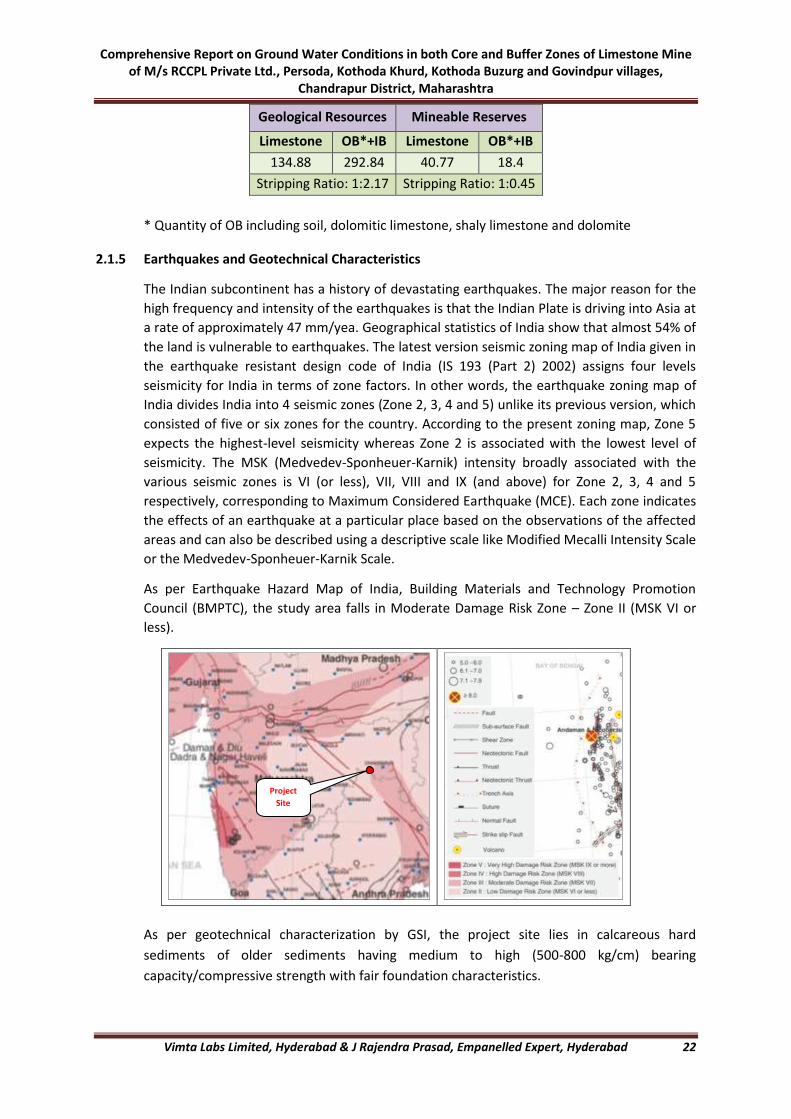
Geological Resources Mineable Reserves
Limestone OB*+IB Limestone OB*+IB
134.88 292.84 40.77 18.4
Stripping Ratio: 1:2.17 Stripping Ratio: 1:0.45
* Quantity of OB including soil, dolomitic limestone, shaly limestone and dolomite
2.1.5 Earthquakes and Geotechnical Characteristics
The Indian subcontinent has a history of devastating earthquakes. The major reason for the
high frequency and intensity of the earthquakes is that the Indian Plate is driving into Asia at
a rate of approximately 47 mm/yea. Geographical statistics of India show that almost 54% of
the land is vulnerable to earthquakes. The latest version seismic zoning map of India given in
the earthquake resistant design code of India (IS 193 (Part 2) 2002) assigns four levels
seismicity for India in terms of zone factors. In other words, the earthquake zoning map of
India divides India into 4 seismic zones (Zone 2, 3, 4 and 5) unlike its previous version, which
consisted of five or six zones for the country. According to the present zoning map, Zone 5
expects the highest-level seismicity whereas Zone 2 is associated with the lowest level of
seismicity. The MSK (Medvedev-Sponheuer-Karnik) intensity broadly associated with the
various seismic zones is VI (or less), VII, VIII and IX (and above) for Zone 2, 3, 4 and 5
respectively, corresponding to Maximum Considered Earthquake (MCE). Each zone indicates
the effects of an earthquake at a particular place based on the observations of the affected
areas and can also be described using a descriptive scale like Modified Mecalli Intensity Scale
or the Medvedev-Sponheuer-Karnik Scale.
As per Earthquake Hazard Map of India, Building Materials and Technology Promotion
Council (BMPTC), the study area falls in Moderate Damage Risk Zone – Zone II (MSK VI or
less).
As per geotechnical characterization by GSI, the project site lies in calcareous hard
sediments of older sediments having medium to high (500-800 kg/cm) bearing
capacity/compressive strength with fair foundation characteristics.
Project
Site
Comprehensive Report on Ground Water Conditions in both Core and Buffer Zones of Limestone Mine of M/s RCCPL Private Ltd., Persoda, Kothoda Khurd, Kothoda Buzurg and Govindpur villages,
Chandrapur District, Maharashtra
Vimta Labs Limited, Hyderabad & J Rajendra Prasad, Empanelled Expert, Hyderabad 23
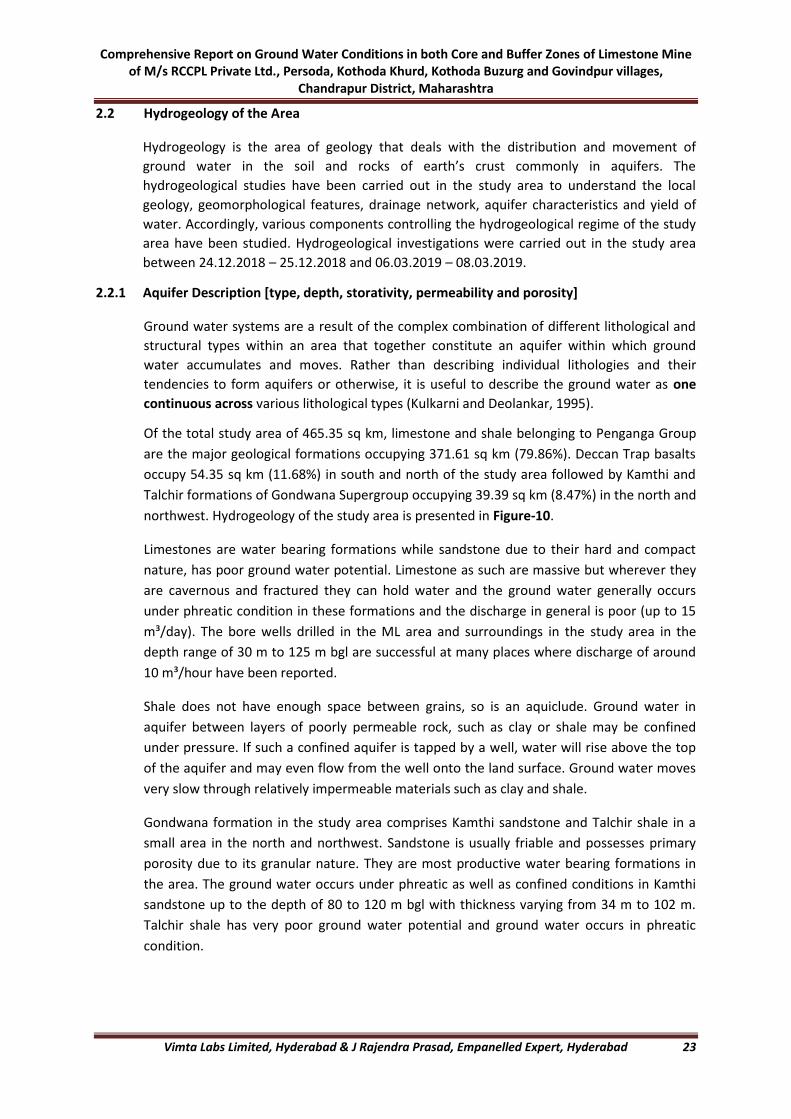
2.2 Hydrogeology of the Area
Hydrogeology is the area of geology that deals with the distribution and movement of
ground water in the soil and rocks of earth’s crust commonly in aquifers. The
hydrogeological studies have been carried out in the study area to understand the local
geology, geomorphological features, drainage network, aquifer characteristics and yield of
water. Accordingly, various components controlling the hydrogeological regime of the study
area have been studied. Hydrogeological investigations were carried out in the study area
between 24.12.2018 – 25.12.2018 and 06.03.2019 – 08.03.2019.
2.2.1 Aquifer Description [type, depth, storativity, permeability and porosity]
Ground water systems are a result of the complex combination of different lithological and
structural types within an area that together constitute an aquifer within which ground
water accumulates and moves. Rather than describing individual lithologies and their
tendencies to form aquifers or otherwise, it is useful to describe the ground water as one
continuous across various lithological types (Kulkarni and Deolankar, 1995).
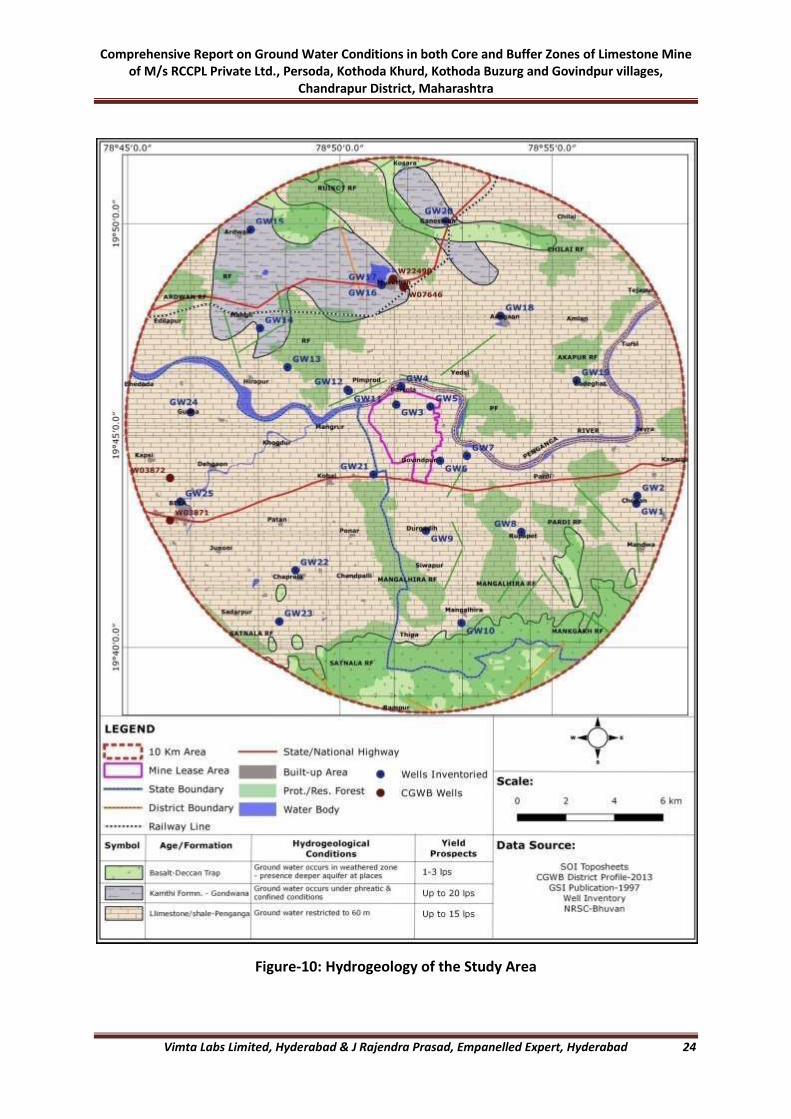
Of the total study area of 465.35 sq km, limestone and shale belonging to Penganga Group
are the major geological formations occupying 371.61 sq km (79.86%). Deccan Trap basalts
occupy 54.35 sq km (11.68%) in south and north of the study area followed by Kamthi and
Talchir formations of Gondwana Supergroup occupying 39.39 sq km (8.47%) in the north and
northwest. Hydrogeology of the study area is presented in Figure-10.
Limestones are water bearing formations while sandstone due to their hard and compact
nature, has poor ground water potential. Limestone as such are massive but wherever they
are cavernous and fractured they can hold water and the ground water generally occurs
under phreatic condition in these formations and the discharge in general is poor (up to 15
m³/day). The bore wells drilled in the ML area and surroundings in the study area in the
depth range of 30 m to 125 m bgl are successful at many places where discharge of around
10 m³/hour have been reported.
Shale does not have enough space between grains, so is an aquiclude. Ground water in
aquifer between layers of poorly permeable rock, such as clay or shale may be confined
under pressure. If such a confined aquifer is tapped by a well, water will rise above the top
of the aquifer and may even flow from the well onto the land surface. Ground water moves
very slow through relatively impermeable materials such as clay and shale.
Gondwana formation in the study area comprises Kamthi sandstone and Talchir shale in a
small area in the north and northwest. Sandstone is usually friable and possesses primary
porosity due to its granular nature. They are most productive water bearing formations in
the area. The ground water occurs under phreatic as well as confined conditions in Kamthi
sandstone up to the depth of 80 to 120 m bgl with thickness varying from 34 m to 102 m.
Talchir shale has very poor ground water potential and ground water occurs in phreatic
condition.
Comprehensive Report on Ground Water Conditions in both Core and Buffer Zones of Limestone Mine of M/s RCCPL Private Ltd., Persoda, Kothoda Khurd, Kothoda Buzurg and Govindpur villages,
Chandrapur District, Maharashtra
Vimta Labs Limited, Hyderabad & J Rajendra Prasad, Empanelled Expert, Hyderabad 24
Figure-10: Hydrogeology of the Study Area
Comprehensive Report on Ground Water Conditions in both Core and Buffer Zones of Limestone Mine of M/s RCCPL Private Ltd., Persoda, Kothoda Khurd, Kothoda Buzurg and Govindpur villages,
Chandrapur District, Maharashtra
Vimta Labs Limited, Hyderabad & J Rajendra Prasad, Empanelled Expert, Hyderabad 25
Deccan Trap basalt in the area does not form a promising aquifer. Weathered, jointed and
fractured massive and vesicular basalt forms the aquifer in the area. Ground water occurs in
phreatic conditions within the depth of 10-15 m, however, bore wells drilled have shown
presence of fracture zones and thus forming deeper confined and semi-confined aquifers at
places. The dug wells yield varies from 15-30 m³/day when favourably located, whereas bore
wells yield 80 to 250 m³/day.
Aquifer Characteristics Based on Pumping & Recovery Tests
Pumping tests are conducted to determine the performance characteristics of a well and to
determine the hydraulic properties of the aquifer such as permeability/hydraulic
conductivity, transmissivity and storage coefficient. Permeability is the ease with which
water can flow in a soil mass or a rock. These properties determine how easily water moves
through the aquifer, how much water is stored, and how efficiently it produces water.
During an aquifer test, the hydraulic head decline or drawdown allows for the estimation of
aquifer hydraulic properties. There are many pumping test solution methods, but most
commonly used for different aquifers and conditions have some general assumptions: a)
aquifer extends radially and infinitely, b) single pumping well, c) fully penetrating well
(except for Neuman method).
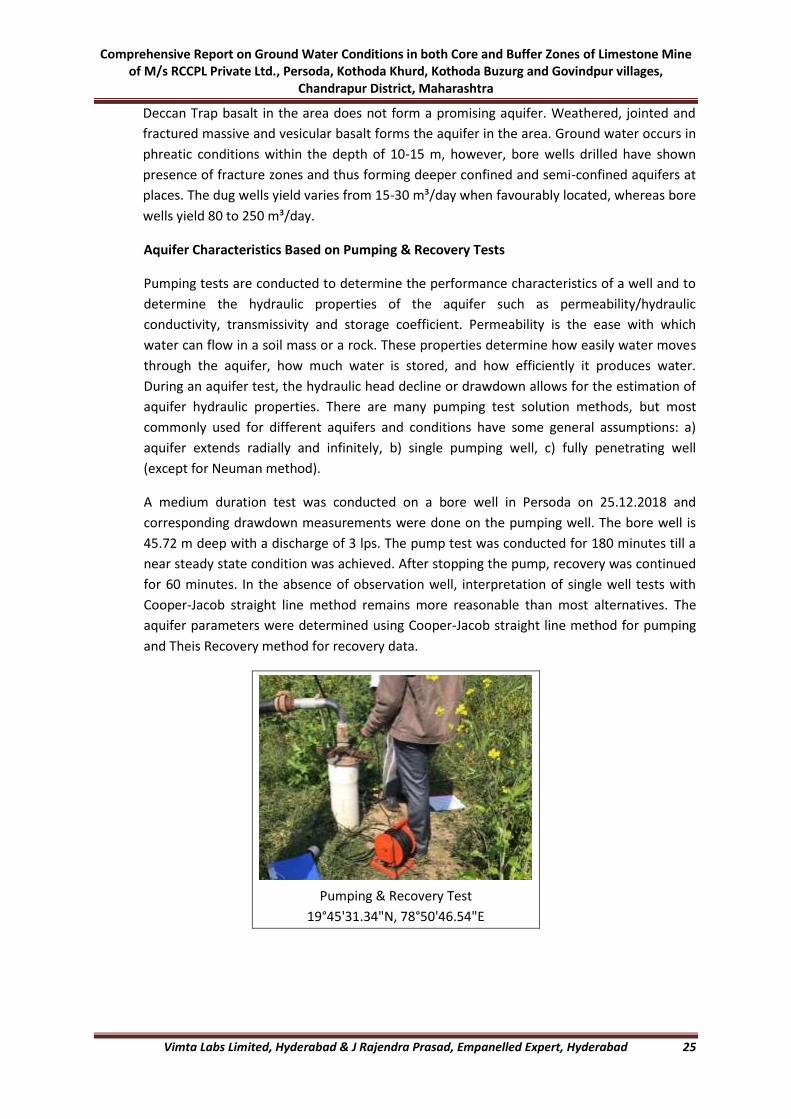
A medium duration test was conducted on a bore well in Persoda on 25.12.2018 and
corresponding drawdown measurements were done on the pumping well. The bore well is
45.72 m deep with a discharge of 3 lps. The pump test was conducted for 180 minutes till a
near steady state condition was achieved. After stopping the pump, recovery was continued
for 60 minutes. In the absence of observation well, interpretation of single well tests with
Cooper-Jacob straight line method remains more reasonable than most alternatives. The
aquifer parameters were determined using Cooper-Jacob straight line method for pumping
and Theis Recovery method for recovery data.
Pumping & Recovery Test
19°45'31.34"N, 78°50'46.54"E

Comprehensive Report on Ground Water Conditions in both Core and Buffer Zones of Limestone Mine of M/s RCCPL Private Ltd., Persoda, Kothoda Khurd, Kothoda Buzurg and Govindpur villages,
Chandrapur District, Maharashtra
Vimta Labs Limited, Hyderabad & J Rajendra Prasad, Empanelled Expert, Hyderabad 26
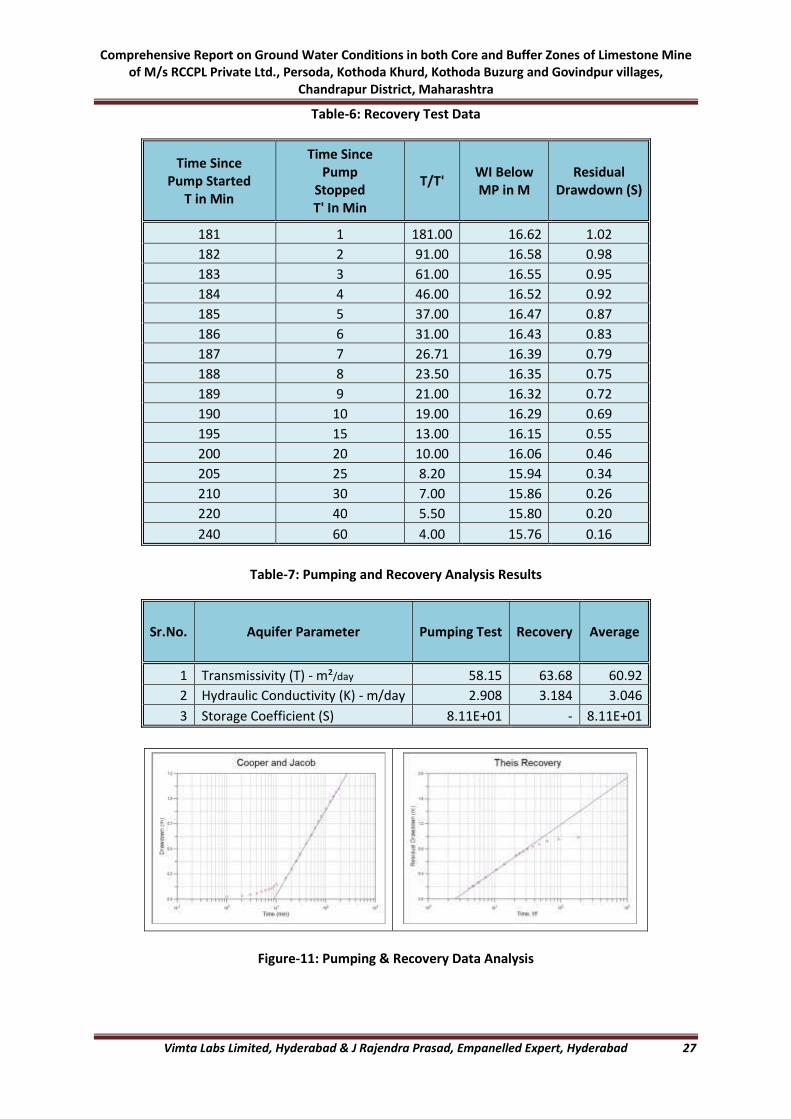
Pumping and recovery data are presented in Table-5 and Table-6 respectively and flows are
shown in Figure-11. The results of pumping and recovery analysis are presented in Table-7.
The average transmissivity is found as 60.92 m²/day while storage coefficient is 8.11E+01
and hydraulic conductivity is found as 3.046 m/day.
The yields of wells are functions of the permeability and transmissivity of aquifer
encountered and vary with location, diameter and depth etc. During ground water
exploration by CGWB, pumping tests were conducted at Mahakali and Durgapur well field
tapping Kamthi and Barakar sandstone. It was observed that the transmissivity varied from
18.00 to 700.00 m²/day and storage coefficient varied from 3.6x10⁻² to 9.4x10⁻⁵.
Table-5: Pumping Test Data
Project: Persoda ML Well Type: Bore Well
Location: Persoda Well Dia: 6.5"
Date: 25.12.2018 Well Depth: 45.72 m
Time of Test Start: 11.00 AM Static Water Level: 15.60 m
Lat: 19°45'31.34"N Long: 78°50'46.54"E
Time Since Pump Started
T in Min
WL Below MP in M
Draw Down S in M
Discharge (Q) in Lps
1 15.62 0.02 3.00
2 15.63 0.03 ‘’
3 15.64 0.04 ‘’
4 15.65 0.05 ‘’
5 15.67 0.07 ‘’
6 15.68 0.08 ‘’
7 15.69 0.09 ‘’
8 15.70 0.10 ‘’
9 15.72 0.12 ‘’
10 15.74 0.14 ‘’
15 15.80 0.20 ‘’
20 15.88 0.28 ‘’
25 15.96 0.36 ‘’
30 16.02 0.42 ‘’
40 16.13 0.53 ‘’
50 16.21 0.61 ‘’
60 16.28 0.68 ‘’
70 16.34 0.74 ‘’
80 16.39 0.79 ‘’
100 16.46 0.86 ‘’
120 16.53 0.93 ‘’
140 16.58 0.98 ‘’
160 16.62 1.02 ‘’
180 16.65 1.05 ‘’
Comprehensive Report on Ground Water Conditions in both Core and Buffer Zones of Limestone Mine of M/s RCCPL Private Ltd., Persoda, Kothoda Khurd, Kothoda Buzurg and Govindpur villages,
Chandrapur District, Maharashtra
Vimta Labs Limited, Hyderabad & J Rajendra Prasad, Empanelled Expert, Hyderabad 27
Table-6: Recovery Test Data
Time Since Pump Started
T in Min
Time Since Pump
Stopped T' In Min
T/T' WI Below MP in M
Residual Drawdown (S)
181 1 181.00 16.62 1.02
182 2 91.00 16.58 0.98
183 3 61.00 16.55 0.95
184 4 46.00 16.52 0.92
185 5 37.00 16.47 0.87
186 6 31.00 16.43 0.83
187 7 26.71 16.39 0.79
188 8 23.50 16.35 0.75
189 9 21.00 16.32 0.72
190 10 19.00 16.29 0.69
195 15 13.00 16.15 0.55
200 20 10.00 16.06 0.46
205 25 8.20 15.94 0.34
210 30 7.00 15.86 0.26
220 40 5.50 15.80 0.20
240 60 4.00 15.76 0.16
Table-7: Pumping and Recovery Analysis Results
Sr.No. Aquifer Parameter Pumping Test Recovery Average
1 Transmissivity (T) - m²/day 58.15 63.68 60.92
2 Hydraulic Conductivity (K) - m/day 2.908 3.184 3.046
3 Storage Coefficient (S) 8.11E+01 - 8.11E+01
Figure-11: Pumping & Recovery Data Analysis

Comprehensive Report on Ground Water Conditions in both Core and Buffer Zones of Limestone Mine of M/s RCCPL Private Ltd., Persoda, Kothoda Khurd, Kothoda Buzurg and Govindpur villages,
Chandrapur District, Maharashtra
Vimta Labs Limited, Hyderabad & J Rajendra Prasad, Empanelled Expert, Hyderabad 28
2.2.2 Ground Water flow and Aquifer Interaction [flow direction, Ground water – surface water
connectivity]
Ground Water Flow
Ground water movement mainly takes place through the fractures and joints of the
crystalline rocks and the ground water is transmitted through voids and interstitial openings
in sedimentary rocks and unconsolidated formations. In other words, movement of ground
water is controlled by the hydraulic conductivity of the aquifer and hydraulic gradient.
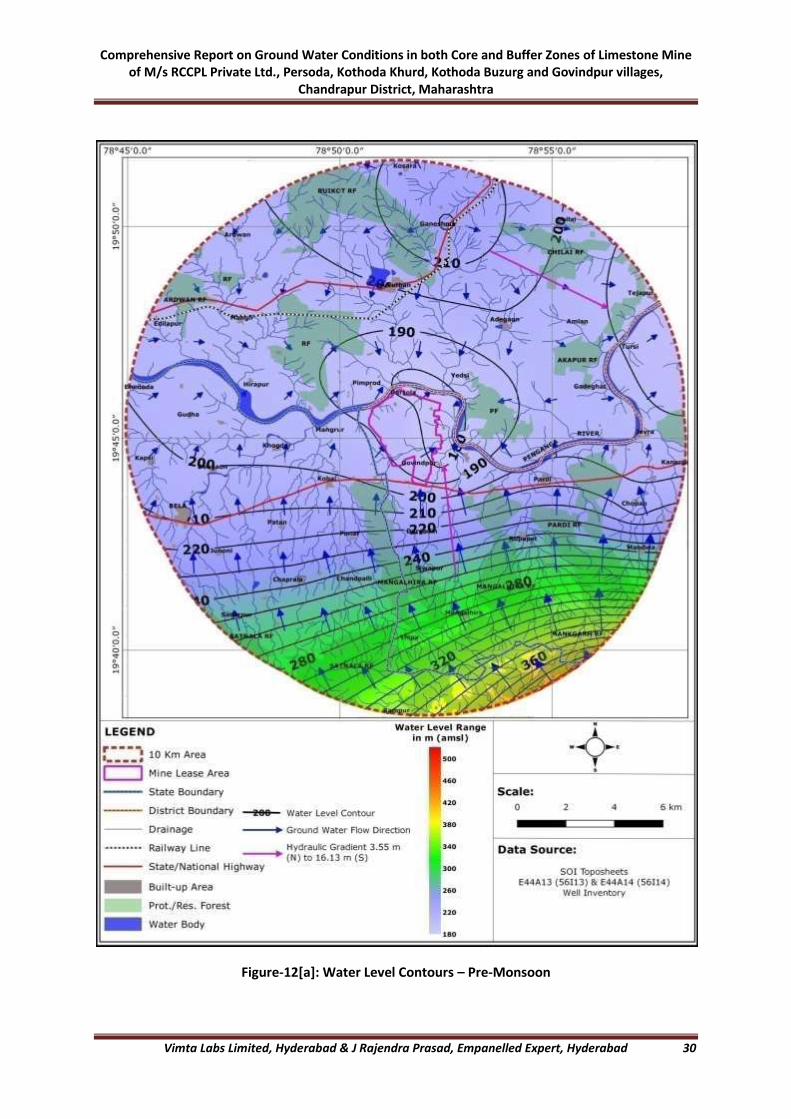
Based on the water level data during field visit, ground water level contour maps have been
prepared for pre and post monsoon seasons considering water levels reduced to mean sea
level and presented in Figure-12a and 12b. The reduced water levels in the study area range
from 177 m near project site to 392 m amsl in the SSE during pre-monsoon and 183 near
project site to 458 m amsl in the SSE during post monsoon. The reduced water levels in the
project site range from 177 m to 193 m amsl during pre-monsoon and 183 m to 197 m amsl
during post monsoon.
A review of the topography and drainage pattern reveals that the regional slope in the study
area is towards NE. The water table contours almost follow the topography of the study area
showing the flow direction towards Penganga River with local variations following the
drainage system and topography. The local depressions around project site may be
attributed to a) either piezometric head of the aquifer is not reaching the general water
table in the area or 2) higher rate of ground water draft in these areas. The ground water
flow in the ML area is towards northeast. The hydraulic gradient in the study area ranges
from 3.55 m/km in the northeast to 16.13 m/km near project site during March 2019 and
from 3.40 m/km in the northeast to 15.08 m/km near project site during post monsoon.
Aquifer Interaction
Traditionally, management of water resources has focused on surface water or ground water
as if they were separate entities. As development of land and water resources increases, it is
apparent that development of either of these resources affects the quantity and quality of
the other. Nearly all surface water features (streams, lakes, reservoirs, wetlands and
estuaries) interact with ground water. These interactions take many forms. In many
situations, surface water bodies gain water and solutes from ground water systems and in
others the surface water body is a source of ground water recharge and causes changes in
ground water quality. As a result, withdrawal of water from streams can deplete ground
water or conversely, pumpage of ground water can deplete water in streams, lakes, or
wetlands. Pollution of surface water can cause degradation of ground water quality and
conversely pollution of ground water can degrade surface water. Thus, effective land and
water management requires a clear understanding of the linkages between ground water
and surface water as it applies to any given hydrologic setting.
Interaction of ground water with surface water include interaction with all types of surface
water, such as streams, lakes and wetlands in many different terrains from the mountains to
the oceans. Penganga River running WNW to NE is the major stream and Mukutban tank is

Comprehensive Report on Ground Water Conditions in both Core and Buffer Zones of Limestone Mine of M/s RCCPL Private Ltd., Persoda, Kothoda Khurd, Kothoda Buzurg and Govindpur villages,
Chandrapur District, Maharashtra
Vimta Labs Limited, Hyderabad & J Rajendra Prasad, Empanelled Expert, Hyderabad 29
the largest tank in the study area which is reported to have at least small water spread even
during summer. There are no wetlands in the study area.
Streams interact with ground water in all in all types of landscapes and the interaction takes
place in three basic ways: streams gain water from inflow of ground water through the
streambed (gaining stream), they lose water to ground water by outflow through the
streambed (losing stream) or they do both, gaining some reaches and losing in other
reaches. For ground water to discharge into a stream channel, the altitude of the water table
in the vicinity of the stream must be higher than the altitude of the stream water surface.
Conversely, for surface water to seep to ground water, the altitude of water table in the
vicinity of the stream must be lower than altitude of the stream water surface. Contour of
water table elevation indicate gaining streams by pointing in an upstream direction and they
indicate losing streams by pointing in a downstream direction in the immediate vicinity of
the stream.
Losing streams can be connected to the ground water system by a continuous saturated
zone or can be discontinuous from the ground water system by an unsaturated zone. Where
the stream is disconnected from the ground water system by an unsaturated zone, the water
table may have a discernible mound below the stream if the rate of recharge through the
streambed and unsaturated zone is greater than the rate of lateral ground water flow away
from the water table mound. An important feature of streams that are disconnected from
ground water is that pumping shallow ground water near the stream does not affect the
flow of the stream near the pumped wells.
Lakes interact with ground water in three basic ways: some receive ground water inflow
throughout their entire bed; some have seepage loss to ground water throughout their
entire bed; but perhaps most lakes receive ground water inflow through part of their bed
and have seepage loss to ground water through other parts. Although these basic
interactions are the same for lakes as they are for streams, the interactions differ in several
ways.
Water level data and contours of the study area indicate that Penganga River in the study
area is mainly a losing stream. Around Persoda, Raipur, Govindpur and other few villages
around ML area, Penganga River is disconnected from the ground water system by
unsaturated zone. The water table has a discernible mound below the stream indicating the
rate of recharge through the streambed and unsaturated zone greater than the rate of
lateral ground water flow away from the water table mound.
Comprehensive Report on Ground Water Conditions in both Core and Buffer Zones of Limestone Mine of M/s RCCPL Private Ltd., Persoda, Kothoda Khurd, Kothoda Buzurg and Govindpur villages,
Chandrapur District, Maharashtra
Vimta Labs Limited, Hyderabad & J Rajendra Prasad, Empanelled Expert, Hyderabad 30
Figure-12[a]: Water Level Contours – Pre-Monsoon

Comprehensive Report on Ground Water Conditions in both Core and Buffer Zones of Limestone Mine of M/s RCCPL Private Ltd., Persoda, Kothoda Khurd, Kothoda Buzurg and Govindpur villages,
Chandrapur District, Maharashtra
Vimta Labs Limited, Hyderabad & J Rajendra Prasad, Empanelled Expert, Hyderabad 31
Figure-12[b]: Water Level Contours – Post Monsoon
Comprehensive Report on Ground Water Conditions in both Core and Buffer Zones of Limestone Mine of M/s RCCPL Private Ltd., Persoda, Kothoda Khurd, Kothoda Buzurg and Govindpur villages,
Chandrapur District, Maharashtra
Vimta Labs Limited, Hyderabad & J Rajendra Prasad, Empanelled Expert, Hyderabad 32
2.2.3 Ground Water Level Trend Analysis [pre – monsoon and post – monsoon] for 10 Years
Secondary Data
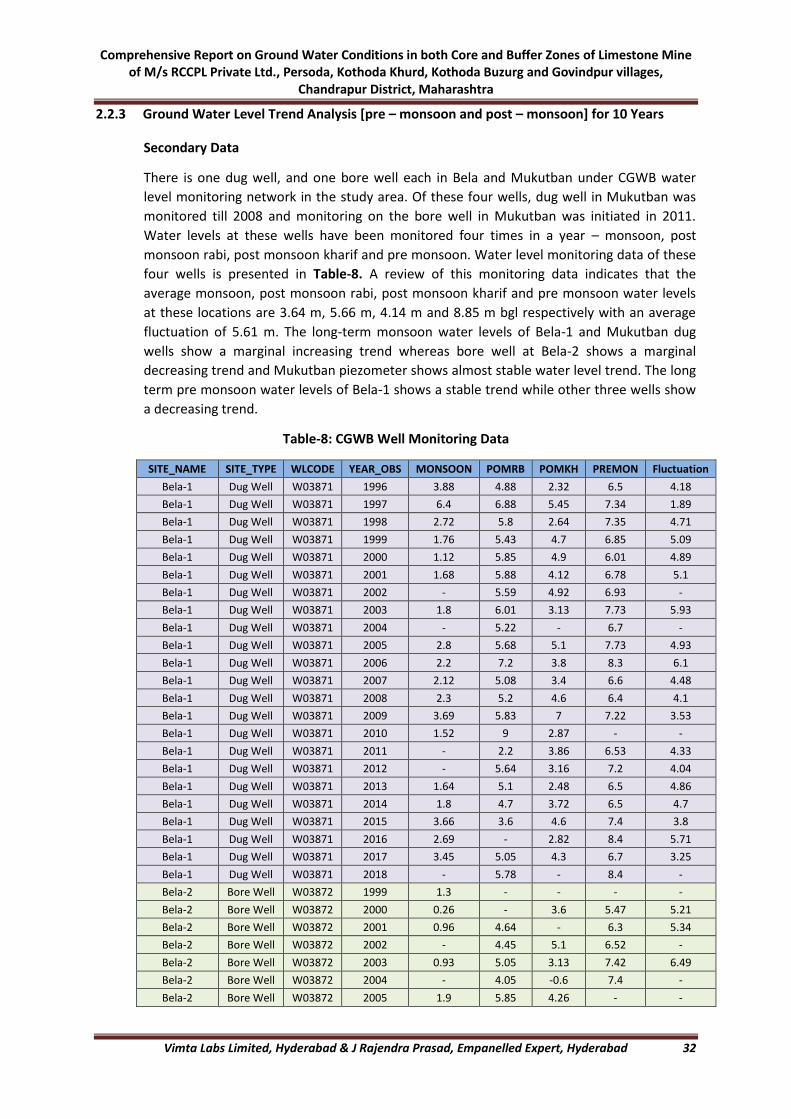
There is one dug well, and one bore well each in Bela and Mukutban under CGWB water
level monitoring network in the study area. Of these four wells, dug well in Mukutban was
monitored till 2008 and monitoring on the bore well in Mukutban was initiated in 2011.
Water levels at these wells have been monitored four times in a year – monsoon, post
monsoon rabi, post monsoon kharif and pre monsoon. Water level monitoring data of these
four wells is presented in Table-8. A review of this monitoring data indicates that the
average monsoon, post monsoon rabi, post monsoon kharif and pre monsoon water levels
at these locations are 3.64 m, 5.66 m, 4.14 m and 8.85 m bgl respectively with an average
fluctuation of 5.61 m. The long-term monsoon water levels of Bela-1 and Mukutban dug
wells show a marginal increasing trend whereas bore well at Bela-2 shows a marginal
decreasing trend and Mukutban piezometer shows almost stable water level trend. The long
term pre monsoon water levels of Bela-1 shows a stable trend while other three wells show
a decreasing trend.
Table-8: CGWB Well Monitoring Data
SITE_NAME SITE_TYPE WLCODE YEAR_OBS MONSOON POMRB POMKH PREMON Fluctuation
Bela-1 Dug Well W03871 1996 3.88 4.88 2.32 6.5 4.18
Bela-1 Dug Well W03871 1997 6.4 6.88 5.45 7.34 1.89
Bela-1 Dug Well W03871 1998 2.72 5.8 2.64 7.35 4.71
Bela-1 Dug Well W03871 1999 1.76 5.43 4.7 6.85 5.09
Bela-1 Dug Well W03871 2000 1.12 5.85 4.9 6.01 4.89
Bela-1 Dug Well W03871 2001 1.68 5.88 4.12 6.78 5.1
Bela-1 Dug Well W03871 2002 - 5.59 4.92 6.93 -
Bela-1 Dug Well W03871 2003 1.8 6.01 3.13 7.73 5.93
Bela-1 Dug Well W03871 2004 - 5.22 - 6.7 -
Bela-1 Dug Well W03871 2005 2.8 5.68 5.1 7.73 4.93
Bela-1 Dug Well W03871 2006 2.2 7.2 3.8 8.3 6.1
Bela-1 Dug Well W03871 2007 2.12 5.08 3.4 6.6 4.48
Bela-1 Dug Well W03871 2008 2.3 5.2 4.6 6.4 4.1
Bela-1 Dug Well W03871 2009 3.69 5.83 7 7.22 3.53
Bela-1 Dug Well W03871 2010 1.52 9 2.87 - -
Bela-1 Dug Well W03871 2011 - 2.2 3.86 6.53 4.33
Bela-1 Dug Well W03871 2012 - 5.64 3.16 7.2 4.04
Bela-1 Dug Well W03871 2013 1.64 5.1 2.48 6.5 4.86
Bela-1 Dug Well W03871 2014 1.8 4.7 3.72 6.5 4.7
Bela-1 Dug Well W03871 2015 3.66 3.6 4.6 7.4 3.8
Bela-1 Dug Well W03871 2016 2.69 - 2.82 8.4 5.71
Bela-1 Dug Well W03871 2017 3.45 5.05 4.3 6.7 3.25
Bela-1 Dug Well W03871 2018 - 5.78 - 8.4 -
Bela-2 Bore Well W03872 1999 1.3 - - - -
Bela-2 Bore Well W03872 2000 0.26 - 3.6 5.47 5.21
Bela-2 Bore Well W03872 2001 0.96 4.64 - 6.3 5.34
Bela-2 Bore Well W03872 2002 - 4.45 5.1 6.52 -
Bela-2 Bore Well W03872 2003 0.93 5.05 3.13 7.42 6.49
Bela-2 Bore Well W03872 2004 - 4.05 -0.6 7.4 -
Bela-2 Bore Well W03872 2005 1.9 5.85 4.26 - -
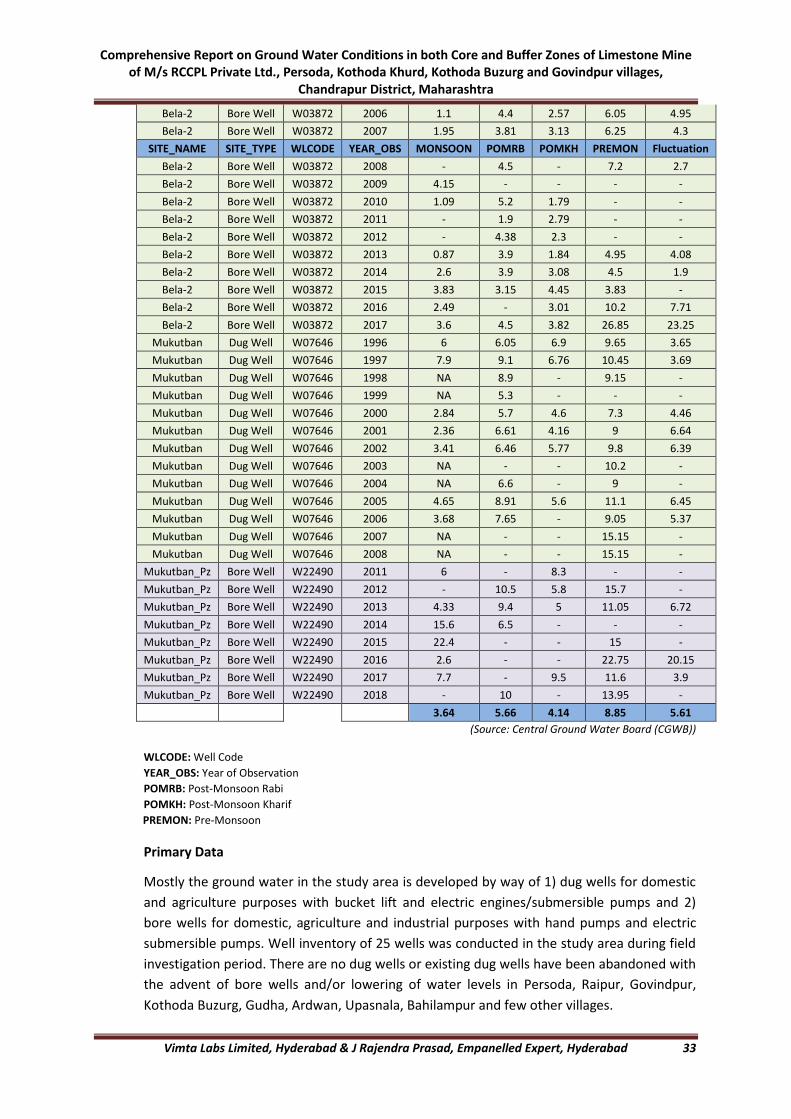
Comprehensive Report on Ground Water Conditions in both Core and Buffer Zones of Limestone Mine of M/s RCCPL Private Ltd., Persoda, Kothoda Khurd, Kothoda Buzurg and Govindpur villages,
Chandrapur District, Maharashtra
Vimta Labs Limited, Hyderabad & J Rajendra Prasad, Empanelled Expert, Hyderabad 33
Bela-2 Bore Well W03872 2006 1.1 4.4 2.57 6.05 4.95
Bela-2 Bore Well W03872 2007 1.95 3.81 3.13 6.25 4.3
SITE_NAME SITE_TYPE WLCODE YEAR_OBS MONSOON POMRB POMKH PREMON Fluctuation
Bela-2 Bore Well W03872 2008 - 4.5 - 7.2 2.7
Bela-2 Bore Well W03872 2009 4.15 - - - -
Bela-2 Bore Well W03872 2010 1.09 5.2 1.79 - -
Bela-2 Bore Well W03872 2011 - 1.9 2.79 - -
Bela-2 Bore Well W03872 2012 - 4.38 2.3 - -
Bela-2 Bore Well W03872 2013 0.87 3.9 1.84 4.95 4.08
Bela-2 Bore Well W03872 2014 2.6 3.9 3.08 4.5 1.9
Bela-2 Bore Well W03872 2015 3.83 3.15 4.45 3.83 -
Bela-2 Bore Well W03872 2016 2.49 - 3.01 10.2 7.71
Bela-2 Bore Well W03872 2017 3.6 4.5 3.82 26.85 23.25
Mukutban Dug Well W07646 1996 6 6.05 6.9 9.65 3.65
Mukutban Dug Well W07646 1997 7.9 9.1 6.76 10.45 3.69
Mukutban Dug Well W07646 1998 NA 8.9 - 9.15 -
Mukutban Dug Well W07646 1999 NA 5.3 - - -
Mukutban Dug Well W07646 2000 2.84 5.7 4.6 7.3 4.46
Mukutban Dug Well W07646 2001 2.36 6.61 4.16 9 6.64
Mukutban Dug Well W07646 2002 3.41 6.46 5.77 9.8 6.39
Mukutban Dug Well W07646 2003 NA - - 10.2 -
Mukutban Dug Well W07646 2004 NA 6.6 - 9 -
Mukutban Dug Well W07646 2005 4.65 8.91 5.6 11.1 6.45
Mukutban Dug Well W07646 2006 3.68 7.65 - 9.05 5.37
Mukutban Dug Well W07646 2007 NA - - 15.15 -
Mukutban Dug Well W07646 2008 NA - - 15.15 -
Mukutban_Pz Bore Well W22490 2011 6 - 8.3 - -
Mukutban_Pz Bore Well W22490 2012 - 10.5 5.8 15.7 -
Mukutban_Pz Bore Well W22490 2013 4.33 9.4 5 11.05 6.72
Mukutban_Pz Bore Well W22490 2014 15.6 6.5 - - -
Mukutban_Pz Bore Well W22490 2015 22.4 - - 15 -
Mukutban_Pz Bore Well W22490 2016 2.6 - - 22.75 20.15
Mukutban_Pz Bore Well W22490 2017 7.7 - 9.5 11.6 3.9
Mukutban_Pz Bore Well W22490 2018 - 10 - 13.95 -
3.64 5.66 4.14 8.85 5.61
(Source: Central Ground Water Board (CGWB))
WLCODE: Well Code
YEAR_OBS: Year of Observation
POMRB: Post-Monsoon Rabi
POMKH: Post-Monsoon Kharif
PREMON: Pre-Monsoon
Primary Data
Mostly the ground water in the study area is developed by way of 1) dug wells for domestic
and agriculture purposes with bucket lift and electric engines/submersible pumps and 2)
bore wells for domestic, agriculture and industrial purposes with hand pumps and electric
submersible pumps. Well inventory of 25 wells was conducted in the study area during field
investigation period. There are no dug wells or existing dug wells have been abandoned with
the advent of bore wells and/or lowering of water levels in Persoda, Raipur, Govindpur,
Kothoda Buzurg, Gudha, Ardwan, Upasnala, Bahilampur and few other villages.

Comprehensive Report on Ground Water Conditions in both Core and Buffer Zones of Limestone Mine of M/s RCCPL Private Ltd., Persoda, Kothoda Khurd, Kothoda Buzurg and Govindpur villages,
Chandrapur District, Maharashtra
Vimta Labs Limited, Hyderabad & J Rajendra Prasad, Empanelled Expert, Hyderabad 34
Depth of dug wells inventoried ranges from 4.00 m to 26.00 m bgl and of bore wells ranges
from 32.61 m to 121.92 m bgl. Depth of bore wells in the study area ranges from 30.00 m to
137.00 m bgl, deeper bore wells reported Tejapur and Ardwan. Submersible pumps of 0.5 -
1HP for domestic to 3.0 - 7.5 HP for agriculture purpose have been installed on bore wells
for abstracting ground water in the study area.
Water levels during the field visit (2nd week of March, 2019) were recorded measuring depth
to standing water and post monsoon water levels were recorded up to the moisture
indication in the dug wells. Pre monsoon water levels were recorded through interaction
with well owner or local person available at the site. The depth to water level in dug wells
during field visit ranges from 3.00 m to 21.00 m bgl whereas the depth to water level in bore
wells range from 5.20 m to 34.05 m bgl. Deepest bore well water level was recorded in
Bahilampur. Dug well having a depth of 8.85 m bgl near temple located at the verge of water
spread area of Mukutban tank was dry. Pre monsoon water levels in dug wells range from
3.50 m to 12.00 m bgl. Dug wells of depth ranging between 5.50 m to 26.00 m bgl in Mangli,
Bahilampur, Mangalhira, Durgadih and Mukutban were reported to go dry during summer.
The depth to water level in dug wells during post monsoon ranges from 0.40 m in Chaprala
to 15.00 m in Durgadih. The average water levels in dug wells during field visit, pre and post
monsoon are 7.84 m, 8.53 m and 3.66 m bgl respectively with a water level fluctuation of
4.98 m. Well inventory data is furnished in Table-9.
Agri. Bore Well with Submersible Pump
19°44'42.85"N, 78°51'25.51"E
Bore Well with Hand Pump-Public Domestic
19°45'49.95"N, 78°51'17.79"E
Dug Well-Public Domestic : 19°43'34.86"N, 78°57'00.37"E

Comprehensive Report on Ground Water Conditions in both Core and Buffer Zones of Limestone Mine of M/s RCCPL Private Ltd., Persoda, Kothoda Khurd, Kothoda Buzurg and Govindpur villages,
Chandrapur District, Maharashtra
Vimta Labs Limited, Hyderabad & J Rajendra Prasad, Empanelled Expert, Hyderabad 35
Table-9: Details of Well Inventory in Study Area
Sr.No. Well No
Village Lat Long Well Type
Purpose Total
Depth (m)
Dia (m)
Lining (Dug Well) (m)
Static Water Level (m) Fluctuation
(m) Aquifer Mar-
19 Pre
Monsoon Post-
Monsoon
1 GW1 Chopan 19°43'23.6" 78°56'59.1" Dug Agriculture 12.30 5.00 4.80 10.80 12.00 8.50 3.25 Penganga limestone/shale
2 GW2 Chopan 19°43'34.7" 78°57'00.3" Dug Domestic 12.00 5.00 6.50 7.60 7.40 1.00 6.40 Penganga limestone/shale
3 GW3 Persoda 19°45'43.9" 78°51'19.7" BW Domestic 45.72 0.15 4.57 18.29 - - - Penganga limestone/shale
4 GW4 Bada Persoda 19°46'09.4" 78°51'26.7" BW Domestic 39.62 0.15 6.10 27.43 - - - Penganga limestone/shale
5 GW5 Raipur 19°45'41.1" 78°52'08.0" BW Domestic 32.61 0.15 7.62 27.43 - - - Penganga limestone/shale
6 GW6 Govindpur 19°44'24.4" 78°52'21.6" BW Domestic 36.58 0.15 6.10 24.38 - - - Penganga limestone/shale
7 GW7 Kothoda Buzurg 19°44'31.3" 78°52'59.6" BW Domestic 40.84 0.15 4.57 21.34 - - - Penganga limestone/shale
8 GW8 Rupapet 19°42'43.7" 78°54'16.5" Dug Domestic 5.50 3.60 3.00 3.00 - 1.80 - Penganga limestone/shale
9 GW9 Durgadih 19°42'45.2" 78°52'01.6" Dug Domestic 26.00 4.00 5.00 21.00 - 15.00 - Penganga limestone/shale
10 GW10 Margalhira 19°40'34.6" 78°52'51.9" Dug Domestic 15.24 3.50 4.00 11.58 - 2.00 - Penganga limestone/shale
11 GW11 Bahilampur 19°46'03.2" 78°50'12.7" BW Domestic 114.30 0.15 6.10 32.47 - - - Penganga limestone/shale
12 GW12 Bahilampur 19°46'05.0" 78°50'10.9" BW Domestic 121.92 0.15 6.10 34.05 - - - Penganga limestone/shale
13 GW13 Bahilampur 19°46'36.8" 78°48'46.1" Dug Agriculture 9.45 2.55 4.50 7.84 - 1.04 - Penganga limestone/shale
14 GW14 Mangli 19°47'32.1" 78°48'07.1" Dug Agriculture 7.80 4.90 7.80 5.40 - 1.65 - Gondwana sandstone/shale
15 GW15 Ardwan 19°49'51.7" 78°47'54.0" BW Agriculture 106.68 0.15 18.90 28.23 - - - Gondwana sandstone/shale
16 GW16 Mukutban 19°48'33.4" 78°50'59.0" Dug Domestic 8.85 2.60 5.40 - - 1.60 - Gondwana sandstone/shale
17 GW17 Mukutban 19°48'33.1" 78°50'59.1" BW Domestic 57.91 0.15 27.43 9.60 - - - Gondwana sandstone/shale
18 GW18 Adegaon 19°47'49.6" 78°53'46.9" Dug Domestic 15.05 3.70 11.00 9.90 12.00 5.50 6.50 Penganga limestone/shale
19 GW19 Gadeghat 19°46'18.1" 78°55'34.7" Dug Agriculture 13.80 5.40 4.20 5.80 11.90 2.60 9.30 Penganga limestone/shale
20 GW20 Ganeshpur 19°50'03.7" 78°52'29.9" Dug Domestic 7.50 2.55 5.80 4.95 6.35 1.80 4.55 Gondwana sandstone/shale
21 GW21 Upasnala 19°44'05.0" 78°50'47.7" BW Domestic 106.68 0.15 - 19.30 - - - Penganga limestone/shale
22 GW22 Chaprala 19°41'49.2" 78°48'57.1" Dug Domestic 4.00 1.22 Nil 3.30 3.90 0.40 3.50 Penganga limestone/shale
23 GW23 Sonkhas 19°40'36.8" 78°48'34.5" Dug Agriculture 7.00 5.25 2.35 4.60 3.50 2.00 1.50 Penganga limestone/shale
24 GW24 Gudha 19°45'33.0" 78°46'29.2" BW Domestic 45.72 0.15 - 5.20 - - - Penganga limestone/shale
25 GW35 Bela 19°43'26.6" 78°46'14.4" Dug Agriculture 12.20 5.00 9.00 9.00 11.15 6.35 4.80 Penganga limestone/shale
Average 36.21 2.24 7.31 14.7 8.86 3.87 5.14
Dug Well 11.19 3.88 5.64 8.15 8.86 3.87 5.14
Bore Well 68.05 0.15 9.72 22.61 - - -

Comprehensive Report on Ground Water Conditions in both Core and Buffer Zones of Limestone Mine of M/s RCCPL Private Ltd., Persoda, Kothoda Khurd, Kothoda Buzurg and Govindpur villages,
Chandrapur District, Maharashtra
Vimta Labs Limited, Hyderabad & J Rajendra Prasad, Empanelled Expert, Hyderabad 36
2.2.4 Hydrograph of the Water Level for 10 Years
Well Hydrograph – Bela-1 (Dug Well)
Well Hydrograph – Bela-2 (Bore Well)
Well Hydrograph – Mukutkban (Dug Well)
Well Hydrograph – Mukutkban-Pz (Bore Well)
Figure-13: Well Hydrographs of CGWB Monitoring Wells
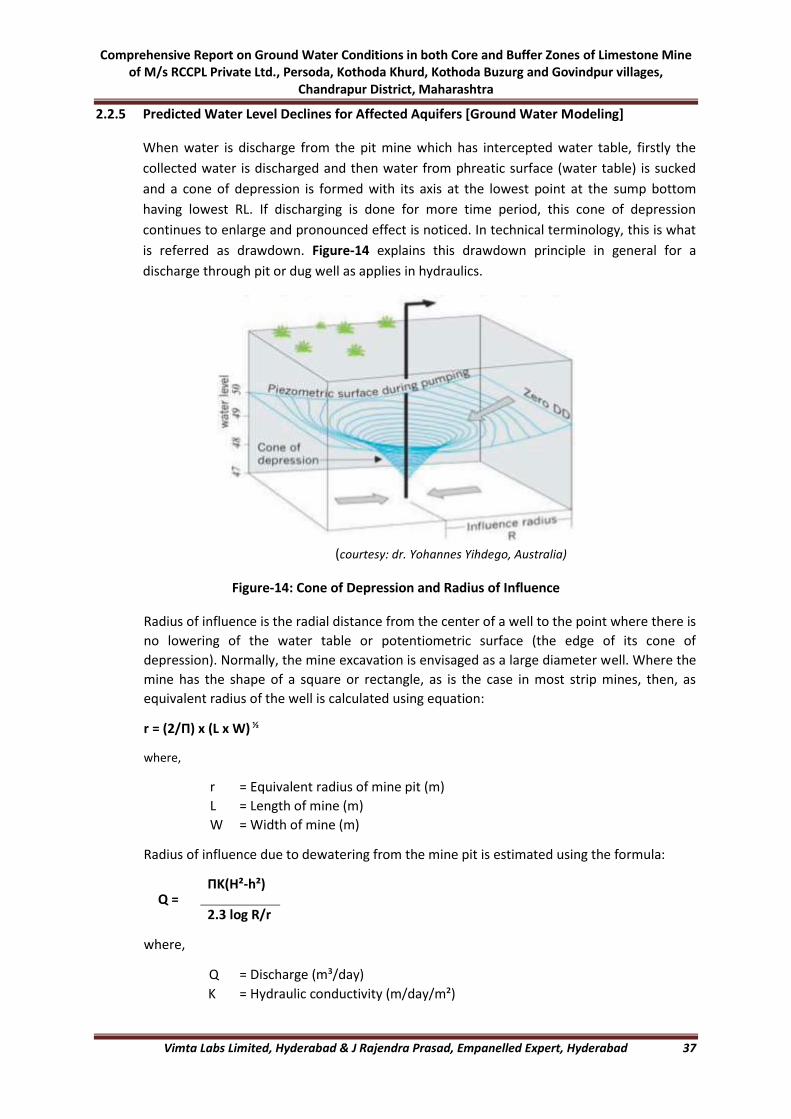
Comprehensive Report on Ground Water Conditions in both Core and Buffer Zones of Limestone Mine of M/s RCCPL Private Ltd., Persoda, Kothoda Khurd, Kothoda Buzurg and Govindpur villages,
Chandrapur District, Maharashtra
Vimta Labs Limited, Hyderabad & J Rajendra Prasad, Empanelled Expert, Hyderabad 37
2.2.5 Predicted Water Level Declines for Affected Aquifers [Ground Water Modeling]
When water is discharge from the pit mine which has intercepted water table, firstly the
collected water is discharged and then water from phreatic surface (water table) is sucked
and a cone of depression is formed with its axis at the lowest point at the sump bottom
having lowest RL. If discharging is done for more time period, this cone of depression
continues to enlarge and pronounced effect is noticed. In technical terminology, this is what
is referred as drawdown. Figure-14 explains this drawdown principle in general for a
discharge through pit or dug well as applies in hydraulics.
(courtesy: dr. Yohannes Yihdego, Australia)
Figure-14: Cone of Depression and Radius of Influence
Radius of influence is the radial distance from the center of a well to the point where there is
no lowering of the water table or potentiometric surface (the edge of its cone of
depression). Normally, the mine excavation is envisaged as a large diameter well. Where the
mine has the shape of a square or rectangle, as is the case in most strip mines, then, as
equivalent radius of the well is calculated using equation:
r = (2/Π) x (L x W) ½
where,
r = Equivalent radius of mine pit (m)
L = Length of mine (m)
W = Width of mine (m)
Radius of influence due to dewatering from the mine pit is estimated using the formula:
Q = ΠK(H²-h²)
2.3 log R/r
where,
Q = Discharge (m³/day)
K = Hydraulic conductivity (m/day/m²)
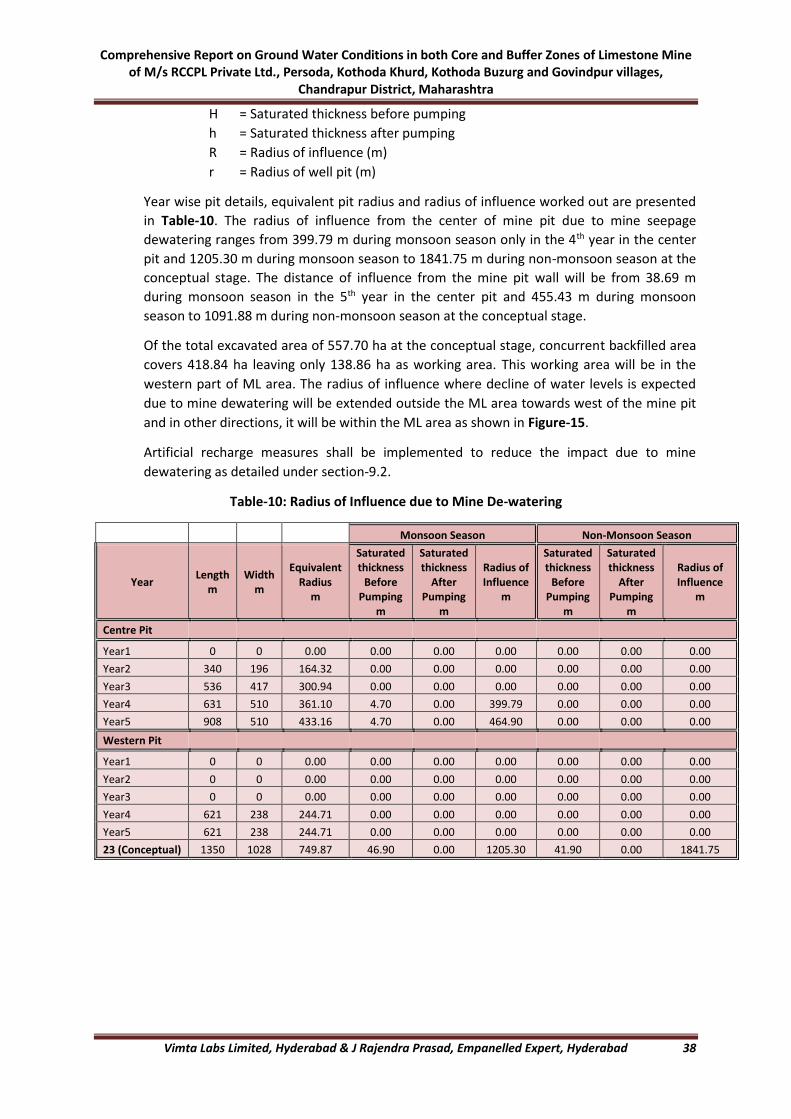
Comprehensive Report on Ground Water Conditions in both Core and Buffer Zones of Limestone Mine of M/s RCCPL Private Ltd., Persoda, Kothoda Khurd, Kothoda Buzurg and Govindpur villages,
Chandrapur District, Maharashtra
Vimta Labs Limited, Hyderabad & J Rajendra Prasad, Empanelled Expert, Hyderabad 38
H = Saturated thickness before pumping
h = Saturated thickness after pumping
R = Radius of influence (m)
r = Radius of well pit (m)
Year wise pit details, equivalent pit radius and radius of influence worked out are presented
in Table-10. The radius of influence from the center of mine pit due to mine seepage
dewatering ranges from 399.79 m during monsoon season only in the 4th year in the center
pit and 1205.30 m during monsoon season to 1841.75 m during non-monsoon season at the
conceptual stage. The distance of influence from the mine pit wall will be from 38.69 m
during monsoon season in the 5th year in the center pit and 455.43 m during monsoon
season to 1091.88 m during non-monsoon season at the conceptual stage.
Of the total excavated area of 557.70 ha at the conceptual stage, concurrent backfilled area
covers 418.84 ha leaving only 138.86 ha as working area. This working area will be in the
western part of ML area. The radius of influence where decline of water levels is expected
due to mine dewatering will be extended outside the ML area towards west of the mine pit
and in other directions, it will be within the ML area as shown in Figure-15.
Artificial recharge measures shall be implemented to reduce the impact due to mine
dewatering as detailed under section-9.2.
Table-10: Radius of Influence due to Mine De-watering
Monsoon Season Non-Monsoon Season
Year Length
m Width
m
Equivalent Radius
m
Saturated thickness
Before Pumping
m
Saturated thickness
After Pumping
m
Radius of Influence
m
Saturated thickness
Before Pumping
m
Saturated thickness
After Pumping
m
Radius of Influence
m
Centre Pit
Year1 0 0 0.00 0.00 0.00 0.00 0.00 0.00 0.00
Year2 340 196 164.32 0.00 0.00 0.00 0.00 0.00 0.00
Year3 536 417 300.94 0.00 0.00 0.00 0.00 0.00 0.00
Year4 631 510 361.10 4.70 0.00 399.79 0.00 0.00 0.00
Year5 908 510 433.16 4.70 0.00 464.90 0.00 0.00 0.00
Western Pit
Year1 0 0 0.00 0.00 0.00 0.00 0.00 0.00 0.00
Year2 0 0 0.00 0.00 0.00 0.00 0.00 0.00 0.00
Year3 0 0 0.00 0.00 0.00 0.00 0.00 0.00 0.00
Year4 621 238 244.71 0.00 0.00 0.00 0.00 0.00 0.00
Year5 621 238 244.71 0.00 0.00 0.00 0.00 0.00 0.00
23 (Conceptual) 1350 1028 749.87 46.90 0.00 1205.30 41.90 0.00 1841.75
Comprehensive Report on Ground Water Conditions in both Core and Buffer Zones of Limestone Mine of M/s RCCPL Private Ltd., Persoda, Kothoda Khurd, Kothoda Buzurg and Govindpur villages,
Chandrapur District, Maharashtra
Vimta Labs Limited, Hyderabad & J Rajendra Prasad, Empanelled Expert, Hyderabad 39
Figure-15: Model Showing Water Level Decline Around Mine Pit at Conceptual Stage
2.2.6 Ground Water Quality [pre - monsoon and post – monsoon]
Drinking water is water intended for human consumption for drinking and cooking purposes
from any source. It includes water (treated or untreated) supplied by any means for human
consumption. IS 10500:2012, Indian Standard was formulated with the objective of assessing
the quality of water resources and specified the acceptable and the permissible limits in the
absence of alternate source. It is recommended that the acceptable limit is to be
implemented. Values in excess of those mentioned under ”acceptable” render the water not
suitable. Such value may, however, be tolerated in the absence of an alternate source.
Sampling and analysis of ground water samples for physical, chemical and heavy metals have
been undertaken during post-monsoon 2018 and pre-monsoon 2019 seasons. Ground water
samples were collected from 8 locations covering ML area, Upasnala, Khogdur, Pimprod,
Mukutban, Yedsi, Pardi and Durgadih villages. These samples were collected as grab samples
and were analysed for 37 water quality parameters. The location details of ground water
samples collected, and results of the samples analysed at VIMTA Labs Ltd., Hyderabad are
presented in Table-11, 12a and 12b respectively. Locations of samples are shown in Figure-
16.

Comprehensive Report on Ground Water Conditions in both Core and Buffer Zones of Limestone Mine of M/s RCCPL Private Ltd., Persoda, Kothoda Khurd, Kothoda Buzurg and Govindpur villages,
Chandrapur District, Maharashtra
Vimta Labs Limited, Hyderabad & J Rajendra Prasad, Empanelled Expert, Hyderabad 40
Table-11: Water Sampling Locations
Sample Code Location Distance from
Project Site (km) Direction
Surface Water
SWS1 Penganga River near Pardi 4.82 E
SWS2 Penganga River near Khogdur 4.63 W
SWS3 Mukutban Tank 4.12 NNW
Ground Water
GWS1 Mine Site - -
GWS2 Upasnala 0.52 SW
GWS3 Khogdur 4.41 W
GWS4 Pimprod 1.59 NW
GWS5 Mukutban 4.39 N
GWS6 Yedsi 1.42 NE
GWS7 Pardi 4.83 SW
GWS8 Durgadih 2.05 S
Post-monsoon 2018
The analysis of ground water samples indicate that these are mild alkaline with pH values
ranging between 7.1 and 7.5 and found to be within drinking water standard (IS
10500:2012).
Turbidity and TDS ranging from 2 to 3 and 635 mg/l to 1750 mg/l respectively of ML area,
Upasnala, Pimprod, Mukutban, Yedsi, Pardi and Durgadih samples, Total hardness (380 mg/l
to 446 mg/l) of Upasnala and Khogdur, Total alkalinity (231 mg/l to 451 mg/l) of Upasnala,
Khogdur, Mukutban and Yedsi, Calcium (80 mg/l to 180 mg/l) of ML area, Upasnala and
Pardi, Magnesium (35.1 mg/l to 45.6 mg/l) of ML area, Pimprod, Yedsi and Pardi, Chlorides
(303.1 mg/l to 312.4 mg/l) of ML area and Yedsi and Aluminium (0.04 mg/l to 0.07 mg/l) of
all samples shows slightly higher values than acceptable limits but are within permissible
limits.
Total hardness (610 mg/l to 774 mg/l) of ML area, Pimprod, Mukutban, Yedsi, Pardi and
Durgadih, Calcium (202 mg/l to 242 mg/l) of Pimprod,, Mukutban, Yedsi and Durgadih and
Nitrates (48.6 mg/l to 55.2 mg/l) of ML area, Pimprod, Mukutban, Yedsi, Pardi and Durgadih
samples show higher values than permissible limits.
Cyanide, Cadmium, Arsenic, Lead, Chromium and Mercury, parameters concerning toxic
substance and all other parameters are well within acceptable limits. A review of ground
water sample analysis indicates that the ground water quality in the study area in general is
poor.
Pre-monsoon 2019
The analysis of ground water samples indicate that these are mild alkaline with pH values
ranging between 7.2 and 7.8 and found to be within drinking water standard (IS
10500:2012).
Comprehensive Report on Ground Water Conditions in both Core and Buffer Zones of Limestone Mine of M/s RCCPL Private Ltd., Persoda, Kothoda Khurd, Kothoda Buzurg and Govindpur villages,
Chandrapur District, Maharashtra
Vimta Labs Limited, Hyderabad & J Rajendra Prasad, Empanelled Expert, Hyderabad 41
Turbidity ranging from 2 to 3 of ML area, Khogdur, Pimprod, Pardi and Durgadih samples,
TDS ranging from 500.68 mg/l to 1198.08 mg/l of all samples except Khogdur, Total hardness
(249 mg/l to 588 mg/l) of all samples, Total alkalinity (208.6 mg/l to 346.8 mg/l) of Mine site,
Upasnala, Khogdur, Mukutban, Yedsi and Durgadih, Calcium (81.3 mg/l to 183.4 mg/l) of ML
area, Upasnala and Pardi, Magnesium (36.3 mg/l to 46.2 mg/l) of ML area, Pimprod, Yedsi
and Pardi, Chlorides (362.8 mg/l to 492.3 mg/l) of ML area, Pimprod, Mukutban, Yedsi, Pardi
and Durgadih samples and Aluminium (0.04 mg/l to 0.07 mg/l) of all samples except Pardi
shows slightly higher values than acceptable limits but are within permissible limits.
Calcium (207.2 mg/l to 246.2 mg/l) of Pimprod,, Mukutban, Yedsi and Durgadih and Nitrates
(49.8 mg/l to 57.3 mg/l) of ML area, Pimprod, Mukutban, Yedsi, Pardi and Durgadih samples
show higher values than permissible limits.
Cyanide, Cadmium, Arsenic, Lead, Chromium and Mercury, parameters concerning toxic
substance and all other parameters are well within acceptable limits. A review of ground
water sample analysis indicates that the ground water quality in the study area in general is
poor.
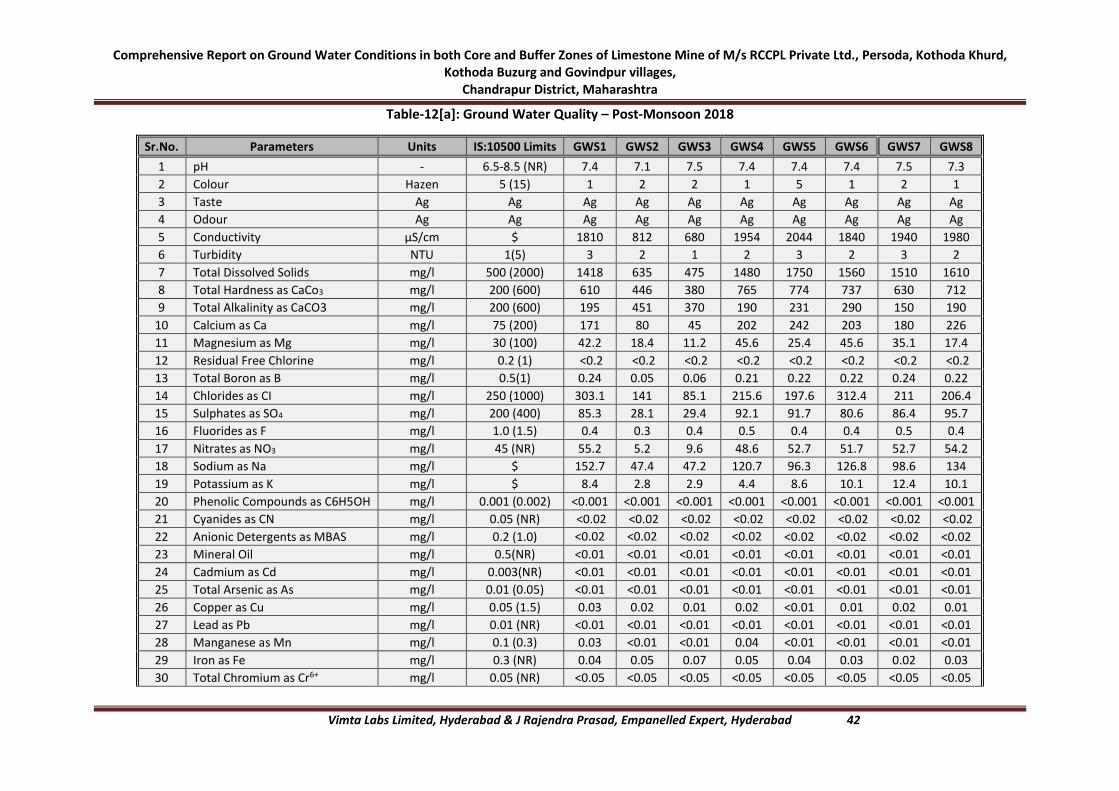
Comprehensive Report on Ground Water Conditions in both Core and Buffer Zones of Limestone Mine of M/s RCCPL Private Ltd., Persoda, Kothoda Khurd, Kothoda Buzurg and Govindpur villages,
Chandrapur District, Maharashtra
Vimta Labs Limited, Hyderabad & J Rajendra Prasad, Empanelled Expert, Hyderabad 42
Table-12[a]: Ground Water Quality – Post-Monsoon 2018
Sr.No. Parameters Units IS:10500 Limits GWS1 GWS2 GWS3 GWS4 GWS5 GWS6 GWS7 GWS8
1 pH - 6.5-8.5 (NR) 7.4 7.1 7.5 7.4 7.4 7.4 7.5 7.3
2 Colour Hazen 5 (15) 1 2 2 1 5 1 2 1
3 Taste Ag Ag Ag Ag Ag Ag Ag Ag Ag Ag
4 Odour Ag Ag Ag Ag Ag Ag Ag Ag Ag Ag
5 Conductivity µS/cm $ 1810 812 680 1954 2044 1840 1940 1980
6 Turbidity NTU 1(5) 3 2 1 2 3 2 3 2
7 Total Dissolved Solids mg/l 500 (2000) 1418 635 475 1480 1750 1560 1510 1610
8 Total Hardness as CaCo3 mg/l 200 (600) 610 446 380 765 774 737 630 712
9 Total Alkalinity as CaCO3 mg/l 200 (600) 195 451 370 190 231 290 150 190
10 Calcium as Ca mg/l 75 (200) 171 80 45 202 242 203 180 226
11 Magnesium as Mg mg/l 30 (100) 42.2 18.4 11.2 45.6 25.4 45.6 35.1 17.4
12 Residual Free Chlorine mg/l 0.2 (1) <0.2 <0.2 <0.2 <0.2 <0.2 <0.2 <0.2 <0.2
13 Total Boron as B mg/l 0.5(1) 0.24 0.05 0.06 0.21 0.22 0.22 0.24 0.22
14 Chlorides as CI mg/l 250 (1000) 303.1 141 85.1 215.6 197.6 312.4 211 206.4
15 Sulphates as SO4 mg/l 200 (400) 85.3 28.1 29.4 92.1 91.7 80.6 86.4 95.7
16 Fluorides as F mg/l 1.0 (1.5) 0.4 0.3 0.4 0.5 0.4 0.4 0.5 0.4
17 Nitrates as NO3 mg/l 45 (NR) 55.2 5.2 9.6 48.6 52.7 51.7 52.7 54.2
18 Sodium as Na mg/l $ 152.7 47.4 47.2 120.7 96.3 126.8 98.6 134
19 Potassium as K mg/l $ 8.4 2.8 2.9 4.4 8.6 10.1 12.4 10.1
20 Phenolic Compounds as C6H5OH mg/l 0.001 (0.002) <0.001 <0.001 <0.001 <0.001 <0.001 <0.001 <0.001 <0.001
21 Cyanides as CN mg/l 0.05 (NR) <0.02 <0.02 <0.02 <0.02 <0.02 <0.02 <0.02 <0.02
22 Anionic Detergents as MBAS mg/l 0.2 (1.0) <0.02 <0.02 <0.02 <0.02 <0.02 <0.02 <0.02 <0.02
23 Mineral Oil mg/l 0.5(NR) <0.01 <0.01 <0.01 <0.01 <0.01 <0.01 <0.01 <0.01
24 Cadmium as Cd mg/l 0.003(NR) <0.01 <0.01 <0.01 <0.01 <0.01 <0.01 <0.01 <0.01
25 Total Arsenic as As mg/l 0.01 (0.05) <0.01 <0.01 <0.01 <0.01 <0.01 <0.01 <0.01 <0.01
26 Copper as Cu mg/l 0.05 (1.5) 0.03 0.02 0.01 0.02 <0.01 0.01 0.02 0.01
27 Lead as Pb mg/l 0.01 (NR) <0.01 <0.01 <0.01 <0.01 <0.01 <0.01 <0.01 <0.01
28 Manganese as Mn mg/l 0.1 (0.3) 0.03 <0.01 <0.01 0.04 <0.01 <0.01 <0.01 <0.01
29 Iron as Fe mg/l 0.3 (NR) 0.04 0.05 0.07 0.05 0.04 0.03 0.02 0.03
30 Total Chromium as Cr6+ mg/l 0.05 (NR) <0.05 <0.05 <0.05 <0.05 <0.05 <0.05 <0.05 <0.05
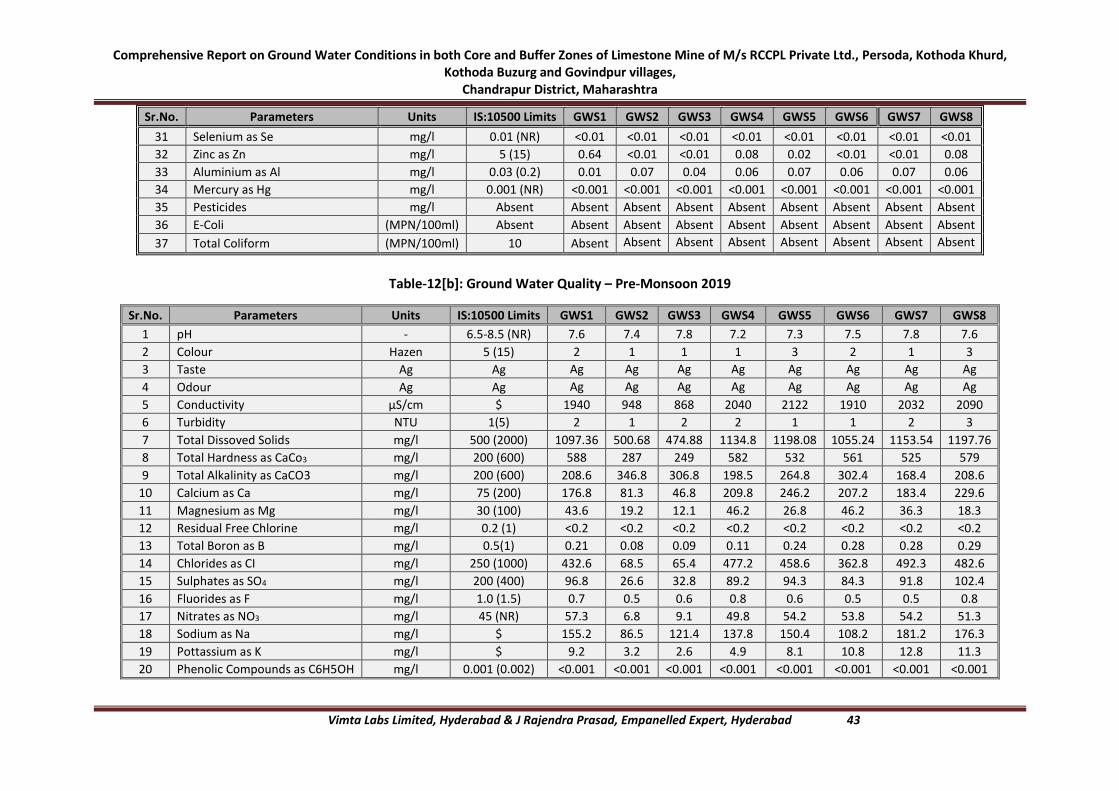
Comprehensive Report on Ground Water Conditions in both Core and Buffer Zones of Limestone Mine of M/s RCCPL Private Ltd., Persoda, Kothoda Khurd, Kothoda Buzurg and Govindpur villages,
Chandrapur District, Maharashtra
Vimta Labs Limited, Hyderabad & J Rajendra Prasad, Empanelled Expert, Hyderabad 43
Sr.No. Parameters Units IS:10500 Limits GWS1 GWS2 GWS3 GWS4 GWS5 GWS6 GWS7 GWS8
31 Selenium as Se mg/l 0.01 (NR) <0.01 <0.01 <0.01 <0.01 <0.01 <0.01 <0.01 <0.01
32 Zinc as Zn mg/l 5 (15) 0.64 <0.01 <0.01 0.08 0.02 <0.01 <0.01 0.08
33 Aluminium as Al mg/l 0.03 (0.2) 0.01 0.07 0.04 0.06 0.07 0.06 0.07 0.06
34 Mercury as Hg mg/l 0.001 (NR) <0.001 <0.001 <0.001 <0.001 <0.001 <0.001 <0.001 <0.001
35 Pesticides mg/l Absent Absent Absent Absent Absent Absent Absent Absent Absent
36 E-Coli (MPN/100ml) Absent Absent Absent Absent Absent Absent Absent Absent Absent
37 Total Coliform (MPN/100ml) 10 Absent Absent Absent Absent Absent Absent Absent Absent
Table-12[b]: Ground Water Quality – Pre-Monsoon 2019
Sr.No. Parameters Units IS:10500 Limits GWS1 GWS2 GWS3 GWS4 GWS5 GWS6 GWS7 GWS8
1 pH - 6.5-8.5 (NR) 7.6 7.4 7.8 7.2 7.3 7.5 7.8 7.6
2 Colour Hazen 5 (15) 2 1 1 1 3 2 1 3
3 Taste Ag Ag Ag Ag Ag Ag Ag Ag Ag Ag
4 Odour Ag Ag Ag Ag Ag Ag Ag Ag Ag Ag
5 Conductivity µS/cm $ 1940 948 868 2040 2122 1910 2032 2090
6 Turbidity NTU 1(5) 2 1 2 2 1 1 2 3
7 Total Dissoved Solids mg/l 500 (2000) 1097.36 500.68 474.88 1134.8 1198.08 1055.24 1153.54 1197.76
8 Total Hardness as CaCo3 mg/l 200 (600) 588 287 249 582 532 561 525 579
9 Total Alkalinity as CaCO3 mg/l 200 (600) 208.6 346.8 306.8 198.5 264.8 302.4 168.4 208.6
10 Calcium as Ca mg/l 75 (200) 176.8 81.3 46.8 209.8 246.2 207.2 183.4 229.6
11 Magnesium as Mg mg/l 30 (100) 43.6 19.2 12.1 46.2 26.8 46.2 36.3 18.3
12 Residual Free Chlorine mg/l 0.2 (1) <0.2 <0.2 <0.2 <0.2 <0.2 <0.2 <0.2 <0.2
13 Total Boron as B mg/l 0.5(1) 0.21 0.08 0.09 0.11 0.24 0.28 0.28 0.29
14 Chlorides as CI mg/l 250 (1000) 432.6 68.5 65.4 477.2 458.6 362.8 492.3 482.6
15 Sulphates as SO4 mg/l 200 (400) 96.8 26.6 32.8 89.2 94.3 84.3 91.8 102.4
16 Fluorides as F mg/l 1.0 (1.5) 0.7 0.5 0.6 0.8 0.6 0.5 0.5 0.8
17 Nitrates as NO3 mg/l 45 (NR) 57.3 6.8 9.1 49.8 54.2 53.8 54.2 51.3
18 Sodium as Na mg/l $ 155.2 86.5 121.4 137.8 150.4 108.2 181.2 176.3
19 Pottassium as K mg/l $ 9.2 3.2 2.6 4.9 8.1 10.8 12.8 11.3
20 Phenolic Compounds as C6H5OH mg/l 0.001 (0.002) <0.001 <0.001 <0.001 <0.001 <0.001 <0.001 <0.001 <0.001

Comprehensive Report on Ground Water Conditions in both Core and Buffer Zones of Limestone Mine of M/s RCCPL Private Ltd., Persoda, Kothoda Khurd, Kothoda Buzurg and Govindpur villages,
Chandrapur District, Maharashtra
Vimta Labs Limited, Hyderabad & J Rajendra Prasad, Empanelled Expert, Hyderabad 44
Sr.No. Parameters Units IS:10500 Limits GWS1 GWS2 GWS3 GWS4 GWS5 GWS6 GWS7 GWS8
21 Cyanides as CN mg/l 0.05 (NR) <0.02 <0.02 <0.02 <0.02 <0.02 <0.02 <0.02 <0.02
22 Anionic Detergents as MBAS mg/l 0.2 (1.0) <0.2 <0.2 <0.2 <0.2 <0.2 <0.2 <0.2 <0.2
23 Mineral Oil mg/l 0.5(NR) <0.01 <0.01 <0.01 <0.01 <0.01 <0.01 <0.01 <0.01
24 Cadmium as Cd mg/l 0.003(NR) <0.01 <0.01 <0.01 <0.01 <0.01 <0.01 <0.01 <0.01
25 Total Arsenic as As mg/l 0.01 (0.05) <0.01 <0.01 <0.01 <0.01 <0.01 <0.01 <0.01 <0.01
26 Copper as Cu mg/l 0.05 (1.5) <0.01 0.01 <0.01 0.01 <0.01 0.01 0.01 <0.01
27 Lead as Pb mg/l 0.01 (NR) <0.01 <0.01 <0.01 <0.01 <0.01 <0.01 <0.01 <0.01
28 Manganese as Mn mg/l 0.1 (0.3) 0.02 0.01 0.02 <0.01 <0.01 <0.01 <0.01 <0.01
29 Iron as Fe mg/l 0.3 (NR) 0.03 0.06 0.05 0.04 0.05 0.04 0.02 0.05
30 Total Chromium as Cr6+ mg/l 0.05 (NR) <0.05 <0.05 <0.05 <0.05 <0.05 <0.05 <0.05 <0.05
31 Selenium as Se mg/l 0.01 (NR) <0.01 <0.01 <0.01 <0.01 <0.01 <0.01 <0.01 <0.01
32 Zinc as Zn mg/l 5 (15) 0.36 0.22 0.08 0.11 0.24 0.16 0.08 0.09
33 Aluminum as Al mg/l 0.03 (0.2) 0.02 0.04 0.05 0.07 0.04 0.04 0.03 0.04
34 Mercury as Hg mg/l 0.001 (NR) <0.001 <0.001 <0.001 <0.001 <0.001 <0.001 <0.001 <0.001
35 Pesticides mg/l Absent Absent Absent Absent Absent Absent Absent Absent Absent
36 E-Coli (MPN/100ml) Absent Absent Absent Absent Absent Absent Absent Absent Absent
37 Total Coliform (MPN/100ml) 10 Absent Absent Absent Absent Absent Absent Absent Absent
Note Ϯ: Limits in parenthesis are permissible limits in absence of alternate source
$: Limits not specified NR: No relaxation specified
UO: Un-Objectionable Ag: Agreeable
NTU: Nephelometric Turbidity Unit
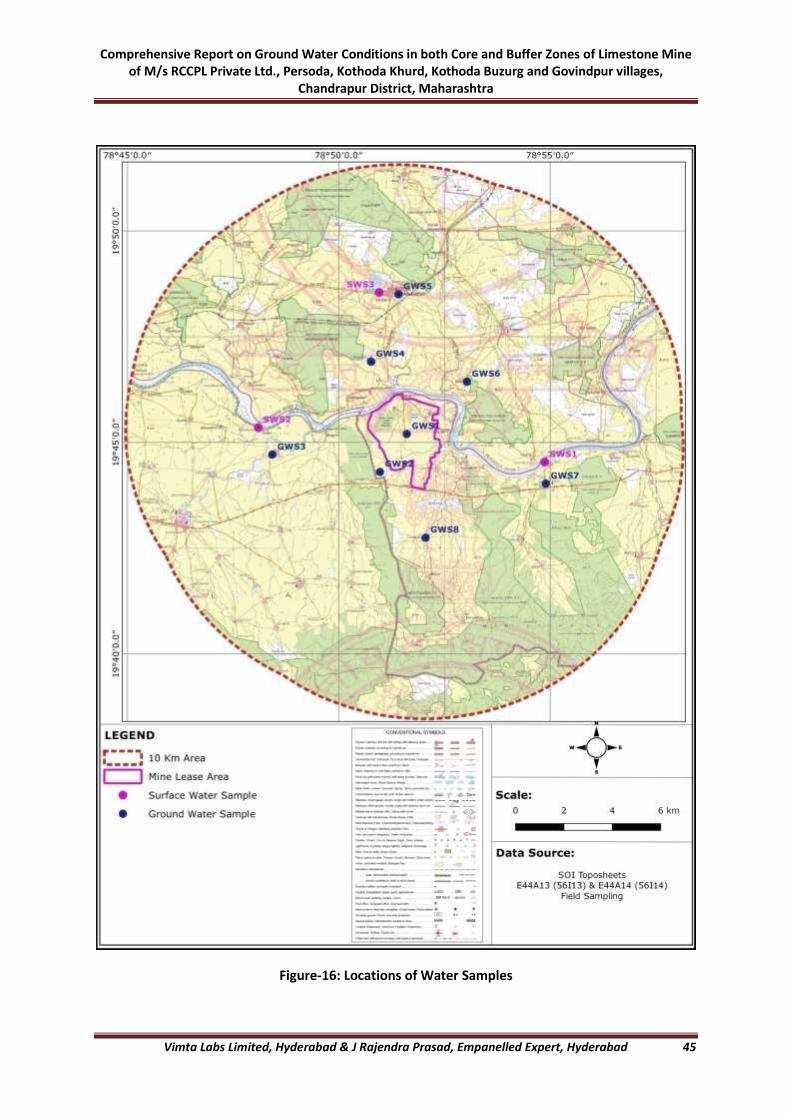
Comprehensive Report on Ground Water Conditions in both Core and Buffer Zones of Limestone Mine of M/s RCCPL Private Ltd., Persoda, Kothoda Khurd, Kothoda Buzurg and Govindpur villages,
Chandrapur District, Maharashtra
Vimta Labs Limited, Hyderabad & J Rajendra Prasad, Empanelled Expert, Hyderabad 45
Figure-16: Locations of Water Samples

Comprehensive Report on Ground Water Conditions in both Core and Buffer Zones of Limestone Mine of M/s RCCPL Private Ltd., Persoda, Kothoda Khurd, Kothoda Buzurg and Govindpur villages,
Chandrapur District, Maharashtra
Vimta Labs Limited, Hyderabad & J Rajendra Prasad, Empanelled Expert, Hyderabad 46
Ion Distribution and Water Types
Since the chemistry of water directly hints the quality of water for various purposes, its
monitoring and assessment gained substantial importance in the country. Water
type/hydro-chemical facies evaluation is extremely useful in providing a preliminary idea
about the complex hydro-chemical processes in the sub-surface. Determination of hydro-
chemical facies was extensively used in the chemical assessment of ground water and
surface water of several decades. This method is able to provide sufficient information on
the chemical quality of water, particularly the origin.
The first attempt in this direction was made by Hill (1940) and which is modified by Piper
(1944), Duroy (1948) further improved the Piper plot. Piper diagrams are made in such a way
that the milli-equivalent percentages of the major cations and anions are plotted in separate
triangle. These plotted points in the triangular fields are projected further into the central
diamond field, which provides the overall character of the water. In general, the sample
points in Piper diagram can be classified into 6 major fields. They are 1. Calcium Magnesium
Chloride, 2. Calcium Bicarbonate, 3. Sodium Chloride, 4. Calcium Sodium Bicarbonate, 5.
Calcium Chloride and 6. Sodium Bicarbonate types. Details of Ion distribution and water type
classification based on major anion and cation variation are presented in Table-13 and Piper
diagram with Ion distribution of ground water samples is presented in Figure-17.
In the present study, water types during post-monsoon 2018 and pre-monsoon 2019 are
confined to 2 and 3 types respectively - Calcium Chloride and Calcium Bicarbonate types
during post-monsoon 2018 and Calcium Chloride, Sodium Bicarbonate and Calcium
Bicarbonate. Of the total 8 samples 6 samples (75%) represent Calcium Chloride and 2
samples (25%) represent Calcium Bicarbonate during post-monsoon 2018 and Kodgur
sample of Calcium Bicarbonate is changed to Sodium Bicarbonate type during pre-monsoon
2019. Review of ground water quality based on water types indicates that Calcium and
Sodium are the dominant cations and Chloride and Bicarbonate are the dominant anions in
ground water samples. Chloride as dominant anion is seen in ML area, Pimprod, Mukutban,
Yedsi, Pardi and Durgadih samples and Bicarbonate as dominant anion is seen in Upasnala
and Khogdur samples.
Chloride is a naturally occurring element that is common in most natural waters and is most
often found as a component of salt (sodium chloride) or in some cases in combination with
potassium or calcium. The presence of chloride in ground water can result from several
sources including the weathering of soils, road salt storage and application, industrial
wastes, sewage, fertilizers, water softener discharge, salt-bearing geological formations,
proximity to saltwater etc. In the present case, the higher chloride levels may be attributed
to local geological formations and fertilizer application to some extent.
All water in contact with the atmosphere absorb carbon dioxide, and as these waters come
into contact with rocks and sediments, they acquire metal ions, most commonly Calcium and
Magnesium, so most natural waters that come from streams, lakes and especially wells, can
be regarded as dilute solutions of bicarbonates. As water containing carbon dioxide
(including extra CO2 acquired from soil organisms) passes through limestone or other

Comprehensive Report on Ground Water Conditions in both Core and Buffer Zones of Limestone Mine of M/s RCCPL Private Ltd., Persoda, Kothoda Khurd, Kothoda Buzurg and Govindpur villages,
Chandrapur District, Maharashtra
Vimta Labs Limited, Hyderabad & J Rajendra Prasad, Empanelled Expert, Hyderabad 47
calcium carbonate containing minerals, it dissolves part of the calcium carbonate, hence
becomes richer in bicarbonates.
Sodium and Potassium are dissolved from many rocks and soil, also occur in ancient brines,
sea water, industrial brines and sewage. Large concentrations, in combination with chloride,
give a salty taste. Moderate concentrations have little effect on the usefulness of water for
most purposes. A large sodium concentration may limit the use of water for irrigation.
Post-monsoon 2018
Pre-monsoon 2019
Figure-17: Piper Trilinear Diagram – Ground Water
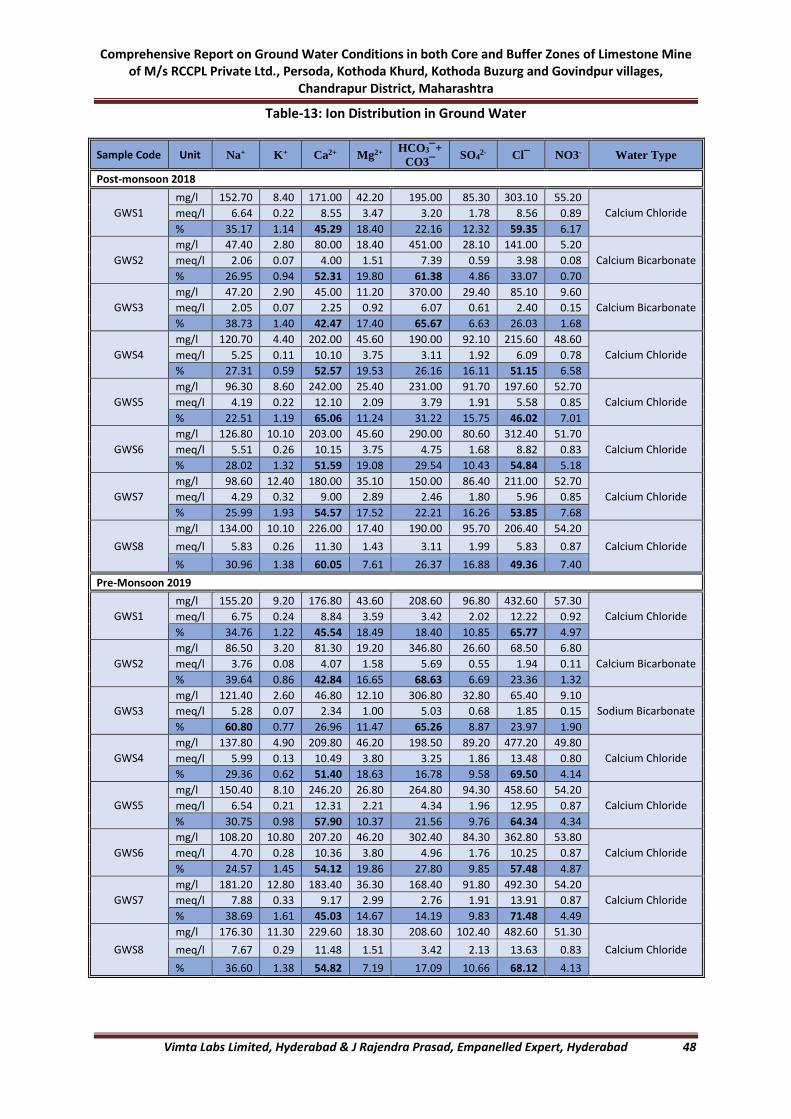
Comprehensive Report on Ground Water Conditions in both Core and Buffer Zones of Limestone Mine of M/s RCCPL Private Ltd., Persoda, Kothoda Khurd, Kothoda Buzurg and Govindpur villages,
Chandrapur District, Maharashtra
Vimta Labs Limited, Hyderabad & J Rajendra Prasad, Empanelled Expert, Hyderabad 48
Table-13: Ion Distribution in Ground Water
Sample Code Unit Na+ K+ Ca2+ Mg2+ HCO3¯+
CO3¯ SO4
2- Cl¯ NO3- Water Type
Post-monsoon 2018
GWS1
mg/l 152.70 8.40 171.00 42.20 195.00 85.30 303.10 55.20
Calcium Chloride meq/l 6.64 0.22 8.55 3.47 3.20 1.78 8.56 0.89
% 35.17 1.14 45.29 18.40 22.16 12.32 59.35 6.17
GWS2
mg/l 47.40 2.80 80.00 18.40 451.00 28.10 141.00 5.20
Calcium Bicarbonate meq/l 2.06 0.07 4.00 1.51 7.39 0.59 3.98 0.08
% 26.95 0.94 52.31 19.80 61.38 4.86 33.07 0.70
GWS3
mg/l 47.20 2.90 45.00 11.20 370.00 29.40 85.10 9.60
Calcium Bicarbonate meq/l 2.05 0.07 2.25 0.92 6.07 0.61 2.40 0.15
% 38.73 1.40 42.47 17.40 65.67 6.63 26.03 1.68
GWS4
mg/l 120.70 4.40 202.00 45.60 190.00 92.10 215.60 48.60
Calcium Chloride meq/l 5.25 0.11 10.10 3.75 3.11 1.92 6.09 0.78
% 27.31 0.59 52.57 19.53 26.16 16.11 51.15 6.58
GWS5
mg/l 96.30 8.60 242.00 25.40 231.00 91.70 197.60 52.70
Calcium Chloride meq/l 4.19 0.22 12.10 2.09 3.79 1.91 5.58 0.85
% 22.51 1.19 65.06 11.24 31.22 15.75 46.02 7.01
GWS6
mg/l 126.80 10.10 203.00 45.60 290.00 80.60 312.40 51.70
Calcium Chloride meq/l 5.51 0.26 10.15 3.75 4.75 1.68 8.82 0.83
% 28.02 1.32 51.59 19.08 29.54 10.43 54.84 5.18
GWS7
mg/l 98.60 12.40 180.00 35.10 150.00 86.40 211.00 52.70
Calcium Chloride meq/l 4.29 0.32 9.00 2.89 2.46 1.80 5.96 0.85
% 25.99 1.93 54.57 17.52 22.21 16.26 53.85 7.68
GWS8
mg/l 134.00 10.10 226.00 17.40 190.00 95.70 206.40 54.20
Calcium Chloride meq/l 5.83 0.26 11.30 1.43 3.11 1.99 5.83 0.87
% 30.96 1.38 60.05 7.61 26.37 16.88 49.36 7.40
Pre-Monsoon 2019
GWS1
mg/l 155.20 9.20 176.80 43.60 208.60 96.80 432.60 57.30
Calcium Chloride meq/l 6.75 0.24 8.84 3.59 3.42 2.02 12.22 0.92
% 34.76 1.22 45.54 18.49 18.40 10.85 65.77 4.97
GWS2
mg/l 86.50 3.20 81.30 19.20 346.80 26.60 68.50 6.80
Calcium Bicarbonate meq/l 3.76 0.08 4.07 1.58 5.69 0.55 1.94 0.11
% 39.64 0.86 42.84 16.65 68.63 6.69 23.36 1.32
GWS3
mg/l 121.40 2.60 46.80 12.10 306.80 32.80 65.40 9.10
Sodium Bicarbonate meq/l 5.28 0.07 2.34 1.00 5.03 0.68 1.85 0.15
% 60.80 0.77 26.96 11.47 65.26 8.87 23.97 1.90
GWS4
mg/l 137.80 4.90 209.80 46.20 198.50 89.20 477.20 49.80
Calcium Chloride meq/l 5.99 0.13 10.49 3.80 3.25 1.86 13.48 0.80
% 29.36 0.62 51.40 18.63 16.78 9.58 69.50 4.14
GWS5
mg/l 150.40 8.10 246.20 26.80 264.80 94.30 458.60 54.20
Calcium Chloride meq/l 6.54 0.21 12.31 2.21 4.34 1.96 12.95 0.87
% 30.75 0.98 57.90 10.37 21.56 9.76 64.34 4.34
GWS6
mg/l 108.20 10.80 207.20 46.20 302.40 84.30 362.80 53.80
Calcium Chloride meq/l 4.70 0.28 10.36 3.80 4.96 1.76 10.25 0.87
% 24.57 1.45 54.12 19.86 27.80 9.85 57.48 4.87
GWS7
mg/l 181.20 12.80 183.40 36.30 168.40 91.80 492.30 54.20
Calcium Chloride meq/l 7.88 0.33 9.17 2.99 2.76 1.91 13.91 0.87
% 38.69 1.61 45.03 14.67 14.19 9.83 71.48 4.49
GWS8
mg/l 176.30 11.30 229.60 18.30 208.60 102.40 482.60 51.30
Calcium Chloride meq/l 7.67 0.29 11.48 1.51 3.42 2.13 13.63 0.83
% 36.60 1.38 54.82 7.19 17.09 10.66 68.12 4.13
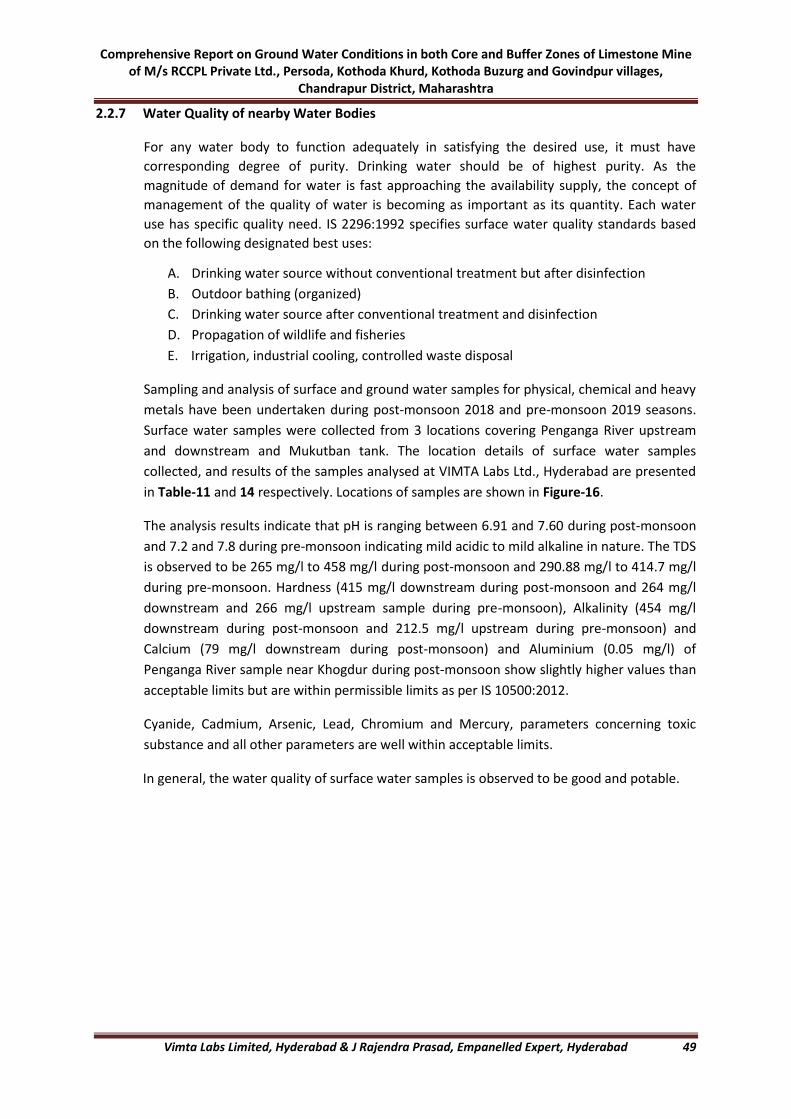
Comprehensive Report on Ground Water Conditions in both Core and Buffer Zones of Limestone Mine of M/s RCCPL Private Ltd., Persoda, Kothoda Khurd, Kothoda Buzurg and Govindpur villages,
Chandrapur District, Maharashtra
Vimta Labs Limited, Hyderabad & J Rajendra Prasad, Empanelled Expert, Hyderabad 49
2.2.7 Water Quality of nearby Water Bodies
For any water body to function adequately in satisfying the desired use, it must have
corresponding degree of purity. Drinking water should be of highest purity. As the
magnitude of demand for water is fast approaching the availability supply, the concept of
management of the quality of water is becoming as important as its quantity. Each water
use has specific quality need. IS 2296:1992 specifies surface water quality standards based
on the following designated best uses:
A. Drinking water source without conventional treatment but after disinfection
B. Outdoor bathing (organized)
C. Drinking water source after conventional treatment and disinfection
D. Propagation of wildlife and fisheries
E. Irrigation, industrial cooling, controlled waste disposal
Sampling and analysis of surface and ground water samples for physical, chemical and heavy
metals have been undertaken during post-monsoon 2018 and pre-monsoon 2019 seasons.
Surface water samples were collected from 3 locations covering Penganga River upstream
and downstream and Mukutban tank. The location details of surface water samples
collected, and results of the samples analysed at VIMTA Labs Ltd., Hyderabad are presented
in Table-11 and 14 respectively. Locations of samples are shown in Figure-16.
The analysis results indicate that pH is ranging between 6.91 and 7.60 during post-monsoon
and 7.2 and 7.8 during pre-monsoon indicating mild acidic to mild alkaline in nature. The TDS
is observed to be 265 mg/l to 458 mg/l during post-monsoon and 290.88 mg/l to 414.7 mg/l
during pre-monsoon. Hardness (415 mg/l downstream during post-monsoon and 264 mg/l
downstream and 266 mg/l upstream sample during pre-monsoon), Alkalinity (454 mg/l
downstream during post-monsoon and 212.5 mg/l upstream during pre-monsoon) and
Calcium (79 mg/l downstream during post-monsoon) and Aluminium (0.05 mg/l) of
Penganga River sample near Khogdur during post-monsoon show slightly higher values than
acceptable limits but are within permissible limits as per IS 10500:2012.
Cyanide, Cadmium, Arsenic, Lead, Chromium and Mercury, parameters concerning toxic
substance and all other parameters are well within acceptable limits.
In general, the water quality of surface water samples is observed to be good and potable.
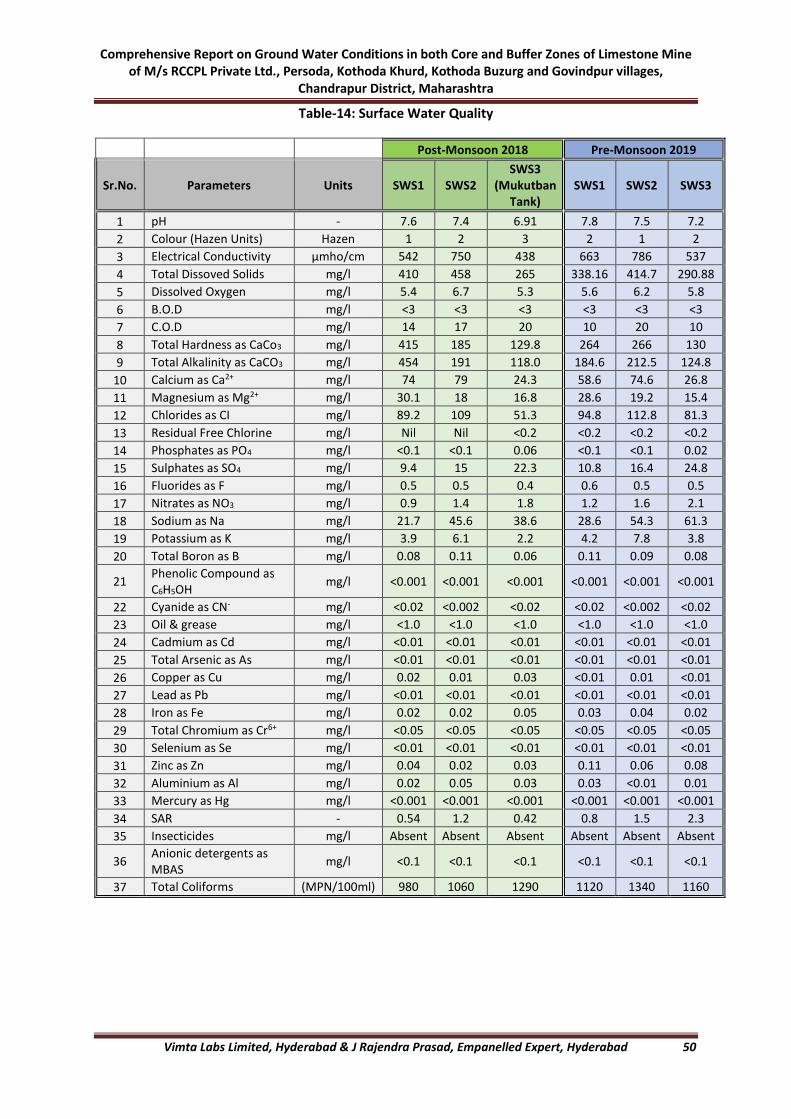
Comprehensive Report on Ground Water Conditions in both Core and Buffer Zones of Limestone Mine of M/s RCCPL Private Ltd., Persoda, Kothoda Khurd, Kothoda Buzurg and Govindpur villages,
Chandrapur District, Maharashtra
Vimta Labs Limited, Hyderabad & J Rajendra Prasad, Empanelled Expert, Hyderabad 50
Table-14: Surface Water Quality
Post-Monsoon 2018 Pre-Monsoon 2019
Sr.No. Parameters Units SWS1 SWS2 SWS3
(Mukutban Tank)
SWS1 SWS2 SWS3
1 pH - 7.6 7.4 6.91 7.8 7.5 7.2
2 Colour (Hazen Units) Hazen 1 2 3 2 1 2
3 Electrical Conductivity µmho/cm 542 750 438 663 786 537
4 Total Dissoved Solids mg/l 410 458 265 338.16 414.7 290.88
5 Dissolved Oxygen mg/l 5.4 6.7 5.3 5.6 6.2 5.8
6 B.O.D mg/l <3 <3 <3 <3 <3 <3
7 C.O.D mg/l 14 17 20 10 20 10
8 Total Hardness as CaCo3 mg/l 415 185 129.8 264 266 130
9 Total Alkalinity as CaCO3 mg/l 454 191 118.0 184.6 212.5 124.8
10 Calcium as Ca2+ mg/l 74 79 24.3 58.6 74.6 26.8
11 Magnesium as Mg2+ mg/l 30.1 18 16.8 28.6 19.2 15.4
12 Chlorides as CI mg/l 89.2 109 51.3 94.8 112.8 81.3
13 Residual Free Chlorine mg/l Nil Nil <0.2 <0.2 <0.2 <0.2
14 Phosphates as PO4 mg/l <0.1 <0.1 0.06 <0.1 <0.1 0.02
15 Sulphates as SO4 mg/l 9.4 15 22.3 10.8 16.4 24.8
16 Fluorides as F mg/l 0.5 0.5 0.4 0.6 0.5 0.5
17 Nitrates as NO3 mg/l 0.9 1.4 1.8 1.2 1.6 2.1
18 Sodium as Na mg/l 21.7 45.6 38.6 28.6 54.3 61.3
19 Potassium as K mg/l 3.9 6.1 2.2 4.2 7.8 3.8
20 Total Boron as B mg/l 0.08 0.11 0.06 0.11 0.09 0.08
21 Phenolic Compound as C6H5OH
mg/l <0.001 <0.001 <0.001 <0.001 <0.001 <0.001
22 Cyanide as CN- mg/l <0.02 <0.002 <0.02 <0.02 <0.002 <0.02
23 Oil & grease mg/l <1.0 <1.0 <1.0 <1.0 <1.0 <1.0
24 Cadmium as Cd mg/l <0.01 <0.01 <0.01 <0.01 <0.01 <0.01
25 Total Arsenic as As mg/l <0.01 <0.01 <0.01 <0.01 <0.01 <0.01
26 Copper as Cu mg/l 0.02 0.01 0.03 <0.01 0.01 <0.01
27 Lead as Pb mg/l <0.01 <0.01 <0.01 <0.01 <0.01 <0.01
28 Iron as Fe mg/l 0.02 0.02 0.05 0.03 0.04 0.02
29 Total Chromium as Cr6+ mg/l <0.05 <0.05 <0.05 <0.05 <0.05 <0.05
30 Selenium as Se mg/l <0.01 <0.01 <0.01 <0.01 <0.01 <0.01
31 Zinc as Zn mg/l 0.04 0.02 0.03 0.11 0.06 0.08
32 Aluminium as Al mg/l 0.02 0.05 0.03 0.03 <0.01 0.01
33 Mercury as Hg mg/l <0.001 <0.001 <0.001 <0.001 <0.001 <0.001
34 SAR - 0.54 1.2 0.42 0.8 1.5 2.3
35 Insecticides mg/l Absent Absent Absent Absent Absent Absent
36 Anionic detergents as MBAS
mg/l <0.1 <0.1 <0.1 <0.1 <0.1 <0.1
37 Total Coliforms (MPN/100ml) 980 1060 1290 1120 1340 1160
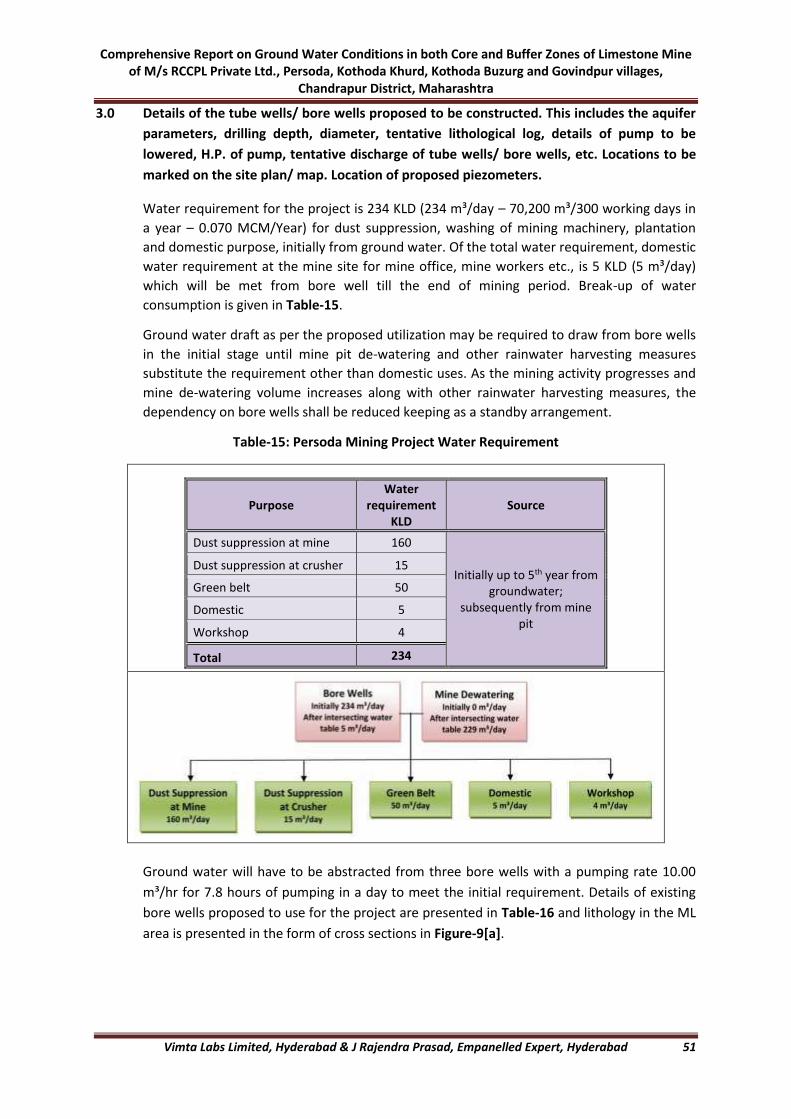
Comprehensive Report on Ground Water Conditions in both Core and Buffer Zones of Limestone Mine of M/s RCCPL Private Ltd., Persoda, Kothoda Khurd, Kothoda Buzurg and Govindpur villages,
Chandrapur District, Maharashtra
Vimta Labs Limited, Hyderabad & J Rajendra Prasad, Empanelled Expert, Hyderabad 51
3.0 Details of the tube wells/ bore wells proposed to be constructed. This includes the aquifer
parameters, drilling depth, diameter, tentative lithological log, details of pump to be
lowered, H.P. of pump, tentative discharge of tube wells/ bore wells, etc. Locations to be
marked on the site plan/ map. Location of proposed piezometers.
Water requirement for the project is 234 KLD (234 m³/day – 70,200 m³/300 working days in
a year – 0.070 MCM/Year) for dust suppression, washing of mining machinery, plantation
and domestic purpose, initially from ground water. Of the total water requirement, domestic
water requirement at the mine site for mine office, mine workers etc., is 5 KLD (5 m³/day)
which will be met from bore well till the end of mining period. Break-up of water
consumption is given in Table-15.
Ground water draft as per the proposed utilization may be required to draw from bore wells
in the initial stage until mine pit de-watering and other rainwater harvesting measures
substitute the requirement other than domestic uses. As the mining activity progresses and
mine de-watering volume increases along with other rainwater harvesting measures, the
dependency on bore wells shall be reduced keeping as a standby arrangement.
Table-15: Persoda Mining Project Water Requirement
Ground water will have to be abstracted from three bore wells with a pumping rate 10.00
m³/hr for 7.8 hours of pumping in a day to meet the initial requirement. Details of existing
bore wells proposed to use for the project are presented in Table-16 and lithology in the ML
area is presented in the form of cross sections in Figure-9[a].
Purpose Water
requirement KLD
Source
Dust suppression at mine 160
Initially up to 5th year from groundwater;
subsequently from mine pit
Dust suppression at crusher 15
Green belt 50
Domestic 5
Workshop 4
Total 234

Comprehensive Report on Ground Water Conditions in both Core and Buffer Zones of Limestone Mine of M/s RCCPL Private Ltd., Persoda, Kothoda Khurd, Kothoda Buzurg and Govindpur villages,
Chandrapur District, Maharashtra
Vimta Labs Limited, Hyderabad & J Rajendra Prasad, Empanelled Expert, Hyderabad 52
Table-16: Details of Ground Water Abstraction
Sr.No. Type of Structure
Name/Year of Construction
Depth (m)/Diameter
(mm)
Depth to
Water Level
(Meters below ground level)
Discharge (m³/Hour)
Operational Hours
(Day)/Days/Year
Quantity of
Pumping (m³/Day)
Mode of Lift Name Horsepower
of Pump
1 Bore Well/2011 61.00/150 18.00 10.00 7.8/300 78.00 Submersible Pump 5
2 Bore Well/2011 60.00/150 23.00 10.00 7.8/300 78.00 Submersible Pump 5
3 Bore Well/2014 60.00/150 21.00 10.00 7.8/300 78.00 Submersible Pump 5
Total/Average 60.00/150 20.67 30.00 7.8/300 234.00 Submersible Pump 5
There are 85 running bore wells with 5 HP submersible pumps in the ML area being used for
agriculture in private lands. Three bore wells at convenient locations (well nos. MLW13, 22,
27, 28, 29, 30, 31, 32, 33, 66, 65, 67, 71 & 95) may be used to meet the project requirement.
Details of bore wells in ML area are enclosed as Appendix-I. Existing bore wells proposed to
use for the project and as piezometers for monitoring are shown in Figure-18.
Though, ground water quantity proposed to abstract for the project will not have adverse
impact on water regime, suitable rainwater harvesting, and artificial recharge measures shall
be taken up to minimize the impact on ground water regime that may arise on a long-term
basis.
Well Type Pump Purpose No. of Wells
Bore Well Submersible/Centrifugal Domestic 6
Bore Well Submersible Agriculture 85
Bore Well Submersible Domestic/Agriculture 2
Bore Well Hand Pump Domestic 12
Bore Well Abandoned/No Pump - 4
Total 109
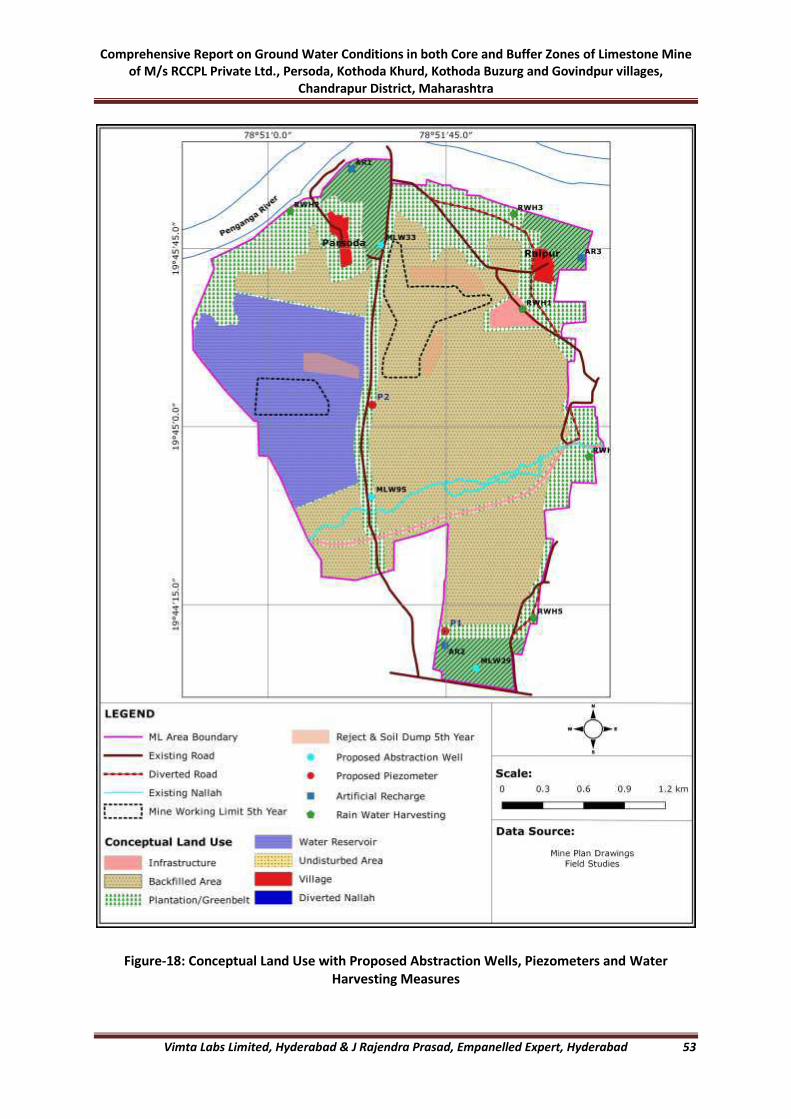
Comprehensive Report on Ground Water Conditions in both Core and Buffer Zones of Limestone Mine of M/s RCCPL Private Ltd., Persoda, Kothoda Khurd, Kothoda Buzurg and Govindpur villages,
Chandrapur District, Maharashtra
Vimta Labs Limited, Hyderabad & J Rajendra Prasad, Empanelled Expert, Hyderabad 53
Figure-18: Conceptual Land Use with Proposed Abstraction Wells, Piezometers and Water Harvesting Measures
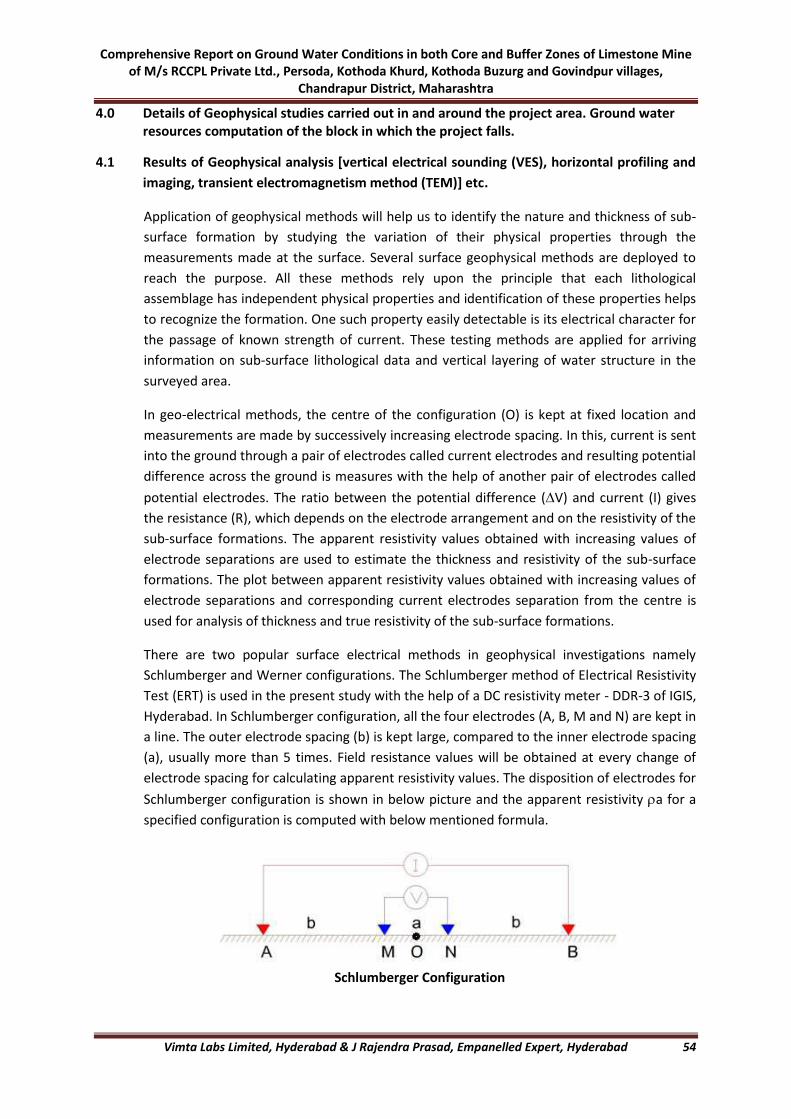
Comprehensive Report on Ground Water Conditions in both Core and Buffer Zones of Limestone Mine of M/s RCCPL Private Ltd., Persoda, Kothoda Khurd, Kothoda Buzurg and Govindpur villages,
Chandrapur District, Maharashtra
Vimta Labs Limited, Hyderabad & J Rajendra Prasad, Empanelled Expert, Hyderabad 54
4.0 Details of Geophysical studies carried out in and around the project area. Ground water resources computation of the block in which the project falls.
4.1 Results of Geophysical analysis [vertical electrical sounding (VES), horizontal profiling and
imaging, transient electromagnetism method (TEM)] etc.
Application of geophysical methods will help us to identify the nature and thickness of sub-
surface formation by studying the variation of their physical properties through the
measurements made at the surface. Several surface geophysical methods are deployed to
reach the purpose. All these methods rely upon the principle that each lithological
assemblage has independent physical properties and identification of these properties helps
to recognize the formation. One such property easily detectable is its electrical character for
the passage of known strength of current. These testing methods are applied for arriving
information on sub-surface lithological data and vertical layering of water structure in the
surveyed area.
In geo-electrical methods, the centre of the configuration (O) is kept at fixed location and
measurements are made by successively increasing electrode spacing. In this, current is sent
into the ground through a pair of electrodes called current electrodes and resulting potential
difference across the ground is measures with the help of another pair of electrodes called
potential electrodes. The ratio between the potential difference (V) and current (I) gives
the resistance (R), which depends on the electrode arrangement and on the resistivity of the
sub-surface formations. The apparent resistivity values obtained with increasing values of
electrode separations are used to estimate the thickness and resistivity of the sub-surface
formations. The plot between apparent resistivity values obtained with increasing values of
electrode separations and corresponding current electrodes separation from the centre is
used for analysis of thickness and true resistivity of the sub-surface formations.
There are two popular surface electrical methods in geophysical investigations namely
Schlumberger and Werner configurations. The Schlumberger method of Electrical Resistivity
Test (ERT) is used in the present study with the help of a DC resistivity meter - DDR-3 of IGIS,
Hyderabad. In Schlumberger configuration, all the four electrodes (A, B, M and N) are kept in
a line. The outer electrode spacing (b) is kept large, compared to the inner electrode spacing
(a), usually more than 5 times. Field resistance values will be obtained at every change of
electrode spacing for calculating apparent resistivity values. The disposition of electrodes for
Schlumberger configuration is shown in below picture and the apparent resistivity a for a
specified configuration is computed with below mentioned formula.
Schlumberger Configuration

Comprehensive Report on Ground Water Conditions in both Core and Buffer Zones of Limestone Mine of M/s RCCPL Private Ltd., Persoda, Kothoda Khurd, Kothoda Buzurg and Govindpur villages,
Chandrapur District, Maharashtra
Vimta Labs Limited, Hyderabad & J Rajendra Prasad, Empanelled Expert, Hyderabad 55
Apparent Resistivity ρa = πkR
where, ‘k’ is the constant = π/a(AB/2²-MN/2²) ‘AB’ is current electrode spacing and ‘MN’ is potential electrode spacing R = ΔV/I
Electrical Resistivity Tests (ERT) were conducted at 5 different locations following
Schlumberger configuration with maximum AB/2 separation of 121.5 m. Location for
conducting ERTs were selected considering topography & space to run electrodes up to
121.5 m on either side, site conditions including surface moisture etc. These Locations are
designated as ERT1 to ERT5 and shown in below figure.
ERT No. Latitude Longitude
ERT1 19°45'01.40"N 78°51'24.60"E
ERT2 19°45'45.50"N 78°51'15.40"E
ERT3 19°45'35.30"N 78°52'00.60"E
ERT4 19°44'57.90"N 78°52'17.00"E
ERT5 19°44'09.60"N 78°52'02.20"E
The resistivity data obtained is interpreted in terms of physical parameters viz., resistivity
and thickness of the formations and these parameters in-turn, along with the geological
information are used to interpret the aquifer status. In the present study, Inverse Slope
method of interpretation is used to interpret the data acquired from the field. Details of ERT
interpretation are presented in Table-17 and ERT logs are shown in Figure-19.
Based on resistivity and local geological information, layers having resistivity ranges of 15 to
20 Ωm, 30 to 80 Ωm, 80 to 300 Ωm and >300 Ωm have been designated as topsoil,
weathered zone, fractured rock and hard rock respectively. The thickness of topsoil varies
from negligible (0.4 m) at ERT4 to 2.0 m at ERT1 and ERT5. A review of ERT interpretation
indicate a wide variation in aquifer geometry and the depth to aquifer ranges from 28.00 m
bgl at ERT3 to 90.00 m bgl at ERT1. Hard rock in the area is reported to have minor fractures
which are low yielding in few cases.
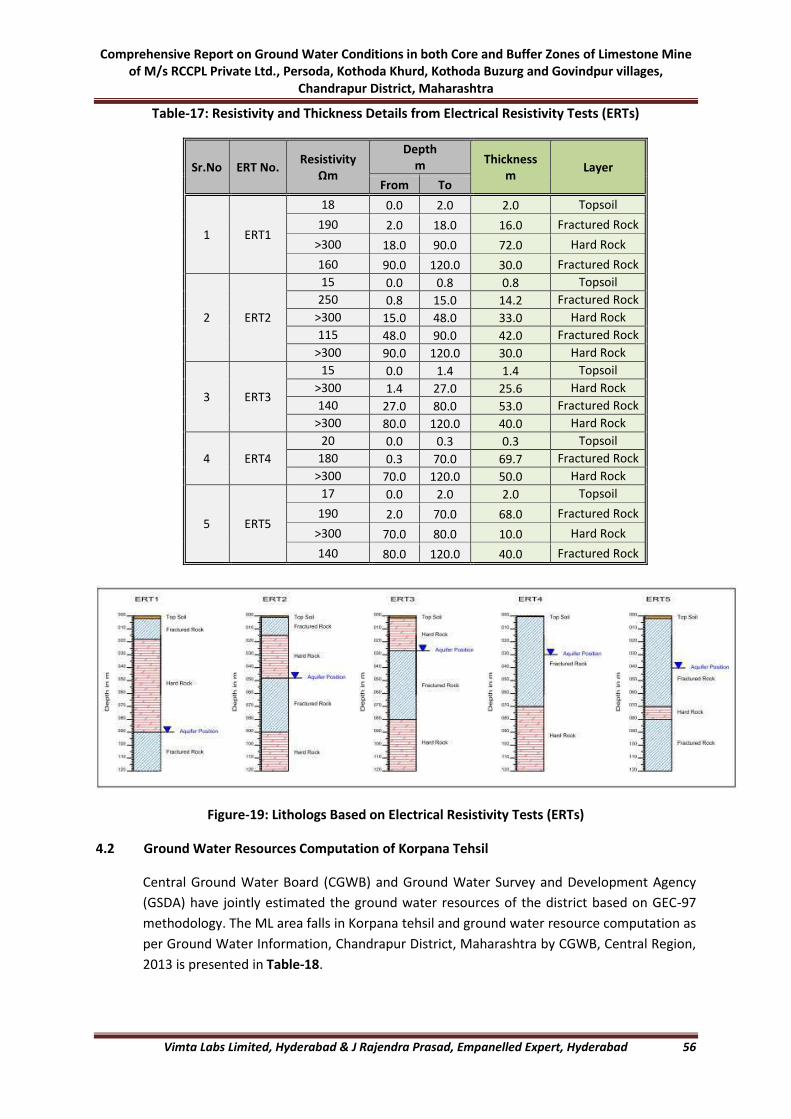
Comprehensive Report on Ground Water Conditions in both Core and Buffer Zones of Limestone Mine of M/s RCCPL Private Ltd., Persoda, Kothoda Khurd, Kothoda Buzurg and Govindpur villages,
Chandrapur District, Maharashtra
Vimta Labs Limited, Hyderabad & J Rajendra Prasad, Empanelled Expert, Hyderabad 56
Table-17: Resistivity and Thickness Details from Electrical Resistivity Tests (ERTs)
Sr.No ERT No. Resistivity
Ωm
Depth m Thickness
m Layer
From To
1 ERT1
18 0.0 2.0 2.0 Topsoil
190 2.0 18.0 16.0 Fractured Rock
>300 18.0 90.0 72.0 Hard Rock
160 90.0 120.0 30.0 Fractured Rock
2 ERT2
15 0.0 0.8 0.8 Topsoil
250 0.8 15.0 14.2 Fractured Rock
>300 15.0 48.0 33.0 Hard Rock
115 48.0 90.0 42.0 Fractured Rock
>300 90.0 120.0 30.0 Hard Rock
3 ERT3
15 0.0 1.4 1.4 Topsoil
>300 1.4 27.0 25.6 Hard Rock
140 27.0 80.0 53.0 Fractured Rock
>300 80.0 120.0 40.0 Hard Rock
4 ERT4
20 0.0 0.3 0.3 Topsoil
180 0.3 70.0 69.7 Fractured Rock
>300 70.0 120.0 50.0 Hard Rock
5 ERT5
17 0.0 2.0 2.0 Topsoil
190 2.0 70.0 68.0 Fractured Rock
>300 70.0 80.0 10.0 Hard Rock
140 80.0 120.0 40.0 Fractured Rock
Figure-19: Lithologs Based on Electrical Resistivity Tests (ERTs)
4.2 Ground Water Resources Computation of Korpana Tehsil
Central Ground Water Board (CGWB) and Ground Water Survey and Development Agency
(GSDA) have jointly estimated the ground water resources of the district based on GEC-97
methodology. The ML area falls in Korpana tehsil and ground water resource computation as
per Ground Water Information, Chandrapur District, Maharashtra by CGWB, Central Region,
2013 is presented in Table-18.
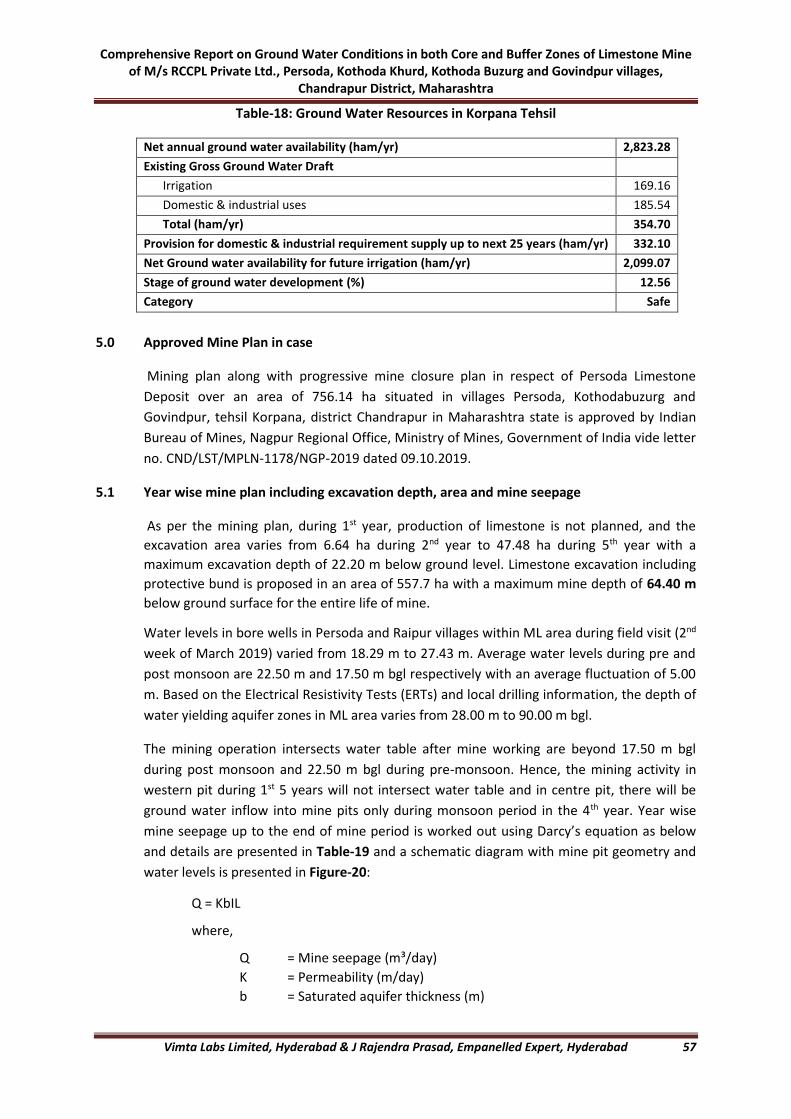
Comprehensive Report on Ground Water Conditions in both Core and Buffer Zones of Limestone Mine of M/s RCCPL Private Ltd., Persoda, Kothoda Khurd, Kothoda Buzurg and Govindpur villages,
Chandrapur District, Maharashtra
Vimta Labs Limited, Hyderabad & J Rajendra Prasad, Empanelled Expert, Hyderabad 57
Table-18: Ground Water Resources in Korpana Tehsil
Net annual ground water availability (ham/yr) 2,823.28
Existing Gross Ground Water Draft
Irrigation 169.16
Domestic & industrial uses 185.54
Total (ham/yr) 354.70
Provision for domestic & industrial requirement supply up to next 25 years (ham/yr) 332.10
Net Ground water availability for future irrigation (ham/yr) 2,099.07
Stage of ground water development (%) 12.56
Category Safe
5.0 Approved Mine Plan in case
Mining plan along with progressive mine closure plan in respect of Persoda Limestone
Deposit over an area of 756.14 ha situated in villages Persoda, Kothodabuzurg and
Govindpur, tehsil Korpana, district Chandrapur in Maharashtra state is approved by Indian
Bureau of Mines, Nagpur Regional Office, Ministry of Mines, Government of India vide letter
no. CND/LST/MPLN-1178/NGP-2019 dated 09.10.2019.
5.1 Year wise mine plan including excavation depth, area and mine seepage
As per the mining plan, during 1st year, production of limestone is not planned, and the
excavation area varies from 6.64 ha during 2nd year to 47.48 ha during 5th year with a
maximum excavation depth of 22.20 m below ground level. Limestone excavation including
protective bund is proposed in an area of 557.7 ha with a maximum mine depth of 64.40 m
below ground surface for the entire life of mine.
Water levels in bore wells in Persoda and Raipur villages within ML area during field visit (2nd
week of March 2019) varied from 18.29 m to 27.43 m. Average water levels during pre and
post monsoon are 22.50 m and 17.50 m bgl respectively with an average fluctuation of 5.00
m. Based on the Electrical Resistivity Tests (ERTs) and local drilling information, the depth of
water yielding aquifer zones in ML area varies from 28.00 m to 90.00 m bgl.
The mining operation intersects water table after mine working are beyond 17.50 m bgl
during post monsoon and 22.50 m bgl during pre-monsoon. Hence, the mining activity in
western pit during 1st 5 years will not intersect water table and in centre pit, there will be
ground water inflow into mine pits only during monsoon period in the 4th year. Year wise
mine seepage up to the end of mine period is worked out using Darcy’s equation as below
and details are presented in Table-19 and a schematic diagram with mine pit geometry and
water levels is presented in Figure-20:
Q = KbIL
where,
Q = Mine seepage (m³/day)
K = Permeability (m/day)
b = Saturated aquifer thickness (m)

Comprehensive Report on Ground Water Conditions in both Core and Buffer Zones of Limestone Mine of M/s RCCPL Private Ltd., Persoda, Kothoda Khurd, Kothoda Buzurg and Govindpur villages,
Chandrapur District, Maharashtra
Vimta Labs Limited, Hyderabad & J Rajendra Prasad, Empanelled Expert, Hyderabad 58
I = Hydraulic gradient
L = Length of aquifer exposed in mine pit (m)
The permeability, which synonymously known as hydraulic conductivity is taken from
pumping and recovery test analysis (3.05 m/day). The saturated thickness of the aquifer has
been estimated based on water table in ML area and mine pit depth along the strike
direction, which varies from 0.00 m in the centre pit to 4.70 m during monsoon period in the
5th year in the western pit during ensuing proposal period of 5 years. The saturated thickness
of the aquifer at the conceptual stage will be 27.50 m to 32.50 m bgl during non-monsoon
and monsoon periods respectively. Since the gradient will become much steeper than the
normal gradient over the ML area due to exposure of aquifer, the value of hydraulic gradient
at mine face is taken as 0.1.
The mine seepage rate ranges from 0.00 m³/day in the western pit to 903.00 m³/day during
monsoon period only in the 4th year in the centre pit during ensuing proposal period to
17,229 m³/day to 19,285 m³/day during non-monsoon and monsoon periods respectively at
the conceptual stage. Of the total excavated area of 557.70 ha at the conceptual stage,
concurrent backfilled area covers 418.84 ha leaving only 138.86 ha as working area.
Table-19: Year Wise Mine Seepage
Monsoon Season Non Monsoon Season
Year
Length of Pit along strike (m)
L
Depth of Pit (m)
Saturated thickness
(m) b
Mine Seepage m³/day
Mine Seepage
MCM
Saturated thickness
(m) b
Mine Seepage m³/day
Mine Seepage
MCM
Centre Pit
1 0.00 0.00 0.00 0.00 0.000 0.00 0.00 0.000
2 340.00 5.86 0.00 0.00 0.000 0.00 0.00 0.000
3 536.00 17.35 0.00 0.00 0.000 0.00 0.00 0.000
4 631.00 22.20 4.70 903.00 0.135 0.00 0.00 0.000
5 908.00 22.20 4.70 1300.00 0.195 0.00 0.00 0.000
Western Pit
1 0.00 0.00 0.00 0.00 0.000 0.00 0.00 0.000
2 0.00 0.00 0.00 0.00 0.000 0.00 0.00 0.000
3 0.00 0.00 0.00 0.00 0.000 0.00 0.00 0.000
4 621.00 8.21 0.00 0.00 0.000 0.00 0.00 0.000
5 621.00 12.67 0.00 0.00 0.000 0.00 0.00 0.000
23 (Conceptual) 1350.00 64.40 46.90 19285.00 2.893 41.90 17229.00 3.704

Comprehensive Report on Ground Water Conditions in both Core and Buffer Zones of Limestone Mine of M/s RCCPL Private Ltd., Persoda, Kothoda Khurd, Kothoda Buzurg and Govindpur villages,
Chandrapur District, Maharashtra
Vimta Labs Limited, Hyderabad & J Rajendra Prasad, Empanelled Expert, Hyderabad 59
Figure-20: Schematic Diagram of Mine Pit Geometry and Water Table
6.0 Proposed usage of Pumped Water in case of Mine Dewatering Projects
Excess water from mine seepage from 4th year onwards after meeting the project
requirement will be supplied to nearby villages for domestic and agriculture purposes.
Details of pumped out seepage water utilization during 4th and 5th year are presented in
Table-20. Total water quantity from bore wells and mine seepage during 4th and 5th years are
2,05,650 m³/year and 2,65,200 m³/year respectively. After meeting the non-domestic water
requirement of the project, 30,000 m³/year towards water supply for approximately 2000
population and 67,500 m³/year towards agriculture usage in Persoda, Raipur and Govindpur
villages is proposed during 5th year. An amount of 97,500 m³/year will be available for
recharge through recharge wells. After 5th year, only drinking water requirement for the
project of 1,500 m³/year will be met from one bore well and other project requirements will
be met from mine seepage.
Table-20: Details of Proposed Usage of Pumped Water
Sr.No. Usage 4th Year 5th Year
1 Drinking (project) 1,500 1,500
2 Drinking (water supply) 30,000 30,000
3 Green belt 15,000 15,000
4 Dust suppression 52,500 52,500
5 Others (workshop) 1,200 1,200
6 Irrigation 37,725 67,500
7 Recharge 67,725 97,500
8 Discharge to stream 0 0
2,05,650 2,65,200

Comprehensive Report on Ground Water Conditions in both Core and Buffer Zones of Limestone Mine of M/s RCCPL Private Ltd., Persoda, Kothoda Khurd, Kothoda Buzurg and Govindpur villages,
Chandrapur District, Maharashtra
Vimta Labs Limited, Hyderabad & J Rajendra Prasad, Empanelled Expert, Hyderabad 60
7.0 Comprehensive assessment of the impact on the ground water regime in and around the
project area highlighting the risks and proposed management strategies proposed to
overcome any significant environmental issues
The construction, commissioning and expansion of any type of developmental projects have
significant influence on the existing physical, biological and social components of
environment.
In case of mining projects, impact on biodiversity, air pollution, water pollution, waste
management and social issues are significant, and the site has little relevance since it is
mainly guided by mineral deposits. Open cast mines, which are more preferred now for
rapid increase in mineral production and safety reasons, the significant impacts, are on land
use, drainage, air quality, ecology, noise etc. Allied operations such as transport of material,
operation of workshop, drilling, blasting etc., affect the air, water and noise environment.
Clearance of natural vegetation adversely affects the flora and fauna of the areas due to
changed environment.
Mining activities are normally carried out over a long period (about 25 years or more). This
also encourages downstream industrial development in the area which adds to
environmental degradation. Positive impacts on socio-economic environment are expected
due to creation of employment opportunities and development of infrastructure such as
roads, schools, hospitals etc.
7.1. Impact on Surface Water Sources
There are a few 1st order drains in the northern part and a third order seasonal nallah
running across the southern part of ML area, all of them joining Penganga River. The
drainage network of nallah running across the southern part of ML area originates 3.00 km
SSW near Durgadih. Watershed area covering the drainage network contributing run-off to
and from ML area is spread in 41.83 sq km (Figure-5). Check dams were constructed at 5
locations on this nallah within the ML area.
7.1.1 Diversion of Existing Channels [constructed dam/barrages/weir/canals/hydro-electric
projects]
The nallah diversion will be done on the backfilled area. Firstly, the mining will be done from
south side and the pit will be simultaneously backfilled. Then, a nallah will be constructed on
the backfilled area parallel to the existing nallah. Then the original nallah will be connected
to the diverted nallah and after that, mining will be done over the original nallah (refer
Figure-21).
A stone embankment along Penganga River within the lease area will be constructed to
control any surface flooding or infiltration into mine pits. Schematic sectional diagram of the
proposed embankment is given below:
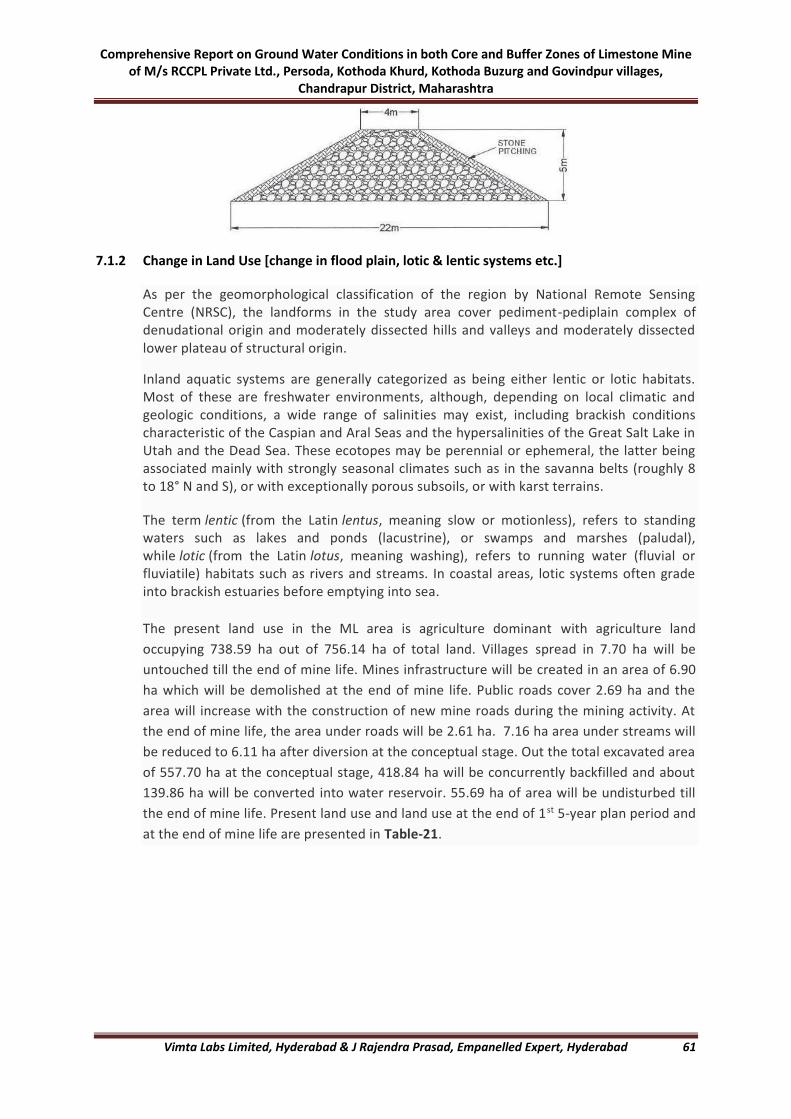
Comprehensive Report on Ground Water Conditions in both Core and Buffer Zones of Limestone Mine of M/s RCCPL Private Ltd., Persoda, Kothoda Khurd, Kothoda Buzurg and Govindpur villages,
Chandrapur District, Maharashtra
Vimta Labs Limited, Hyderabad & J Rajendra Prasad, Empanelled Expert, Hyderabad 61
7.1.2 Change in Land Use [change in flood plain, lotic & lentic systems etc.]
As per the geomorphological classification of the region by National Remote Sensing Centre (NRSC), the landforms in the study area cover pediment-pediplain complex of denudational origin and moderately dissected hills and valleys and moderately dissected lower plateau of structural origin.
Inland aquatic systems are generally categorized as being either lentic or lotic habitats. Most of these are freshwater environments, although, depending on local climatic and geologic conditions, a wide range of salinities may exist, including brackish conditions characteristic of the Caspian and Aral Seas and the hypersalinities of the Great Salt Lake in Utah and the Dead Sea. These ecotopes may be perennial or ephemeral, the latter being associated mainly with strongly seasonal climates such as in the savanna belts (roughly 8 to 18° N and S), or with exceptionally porous subsoils, or with karst terrains.
The term lentic (from the Latin lentus, meaning slow or motionless), refers to standing waters such as lakes and ponds (lacustrine), or swamps and marshes (paludal), while lotic (from the Latin lotus, meaning washing), refers to running water (fluvial or fluviatile) habitats such as rivers and streams. In coastal areas, lotic systems often grade into brackish estuaries before emptying into sea.
The present land use in the ML area is agriculture dominant with agriculture land
occupying 738.59 ha out of 756.14 ha of total land. Villages spread in 7.70 ha will be
untouched till the end of mine life. Mines infrastructure will be created in an area of 6.90
ha which will be demolished at the end of mine life. Public roads cover 2.69 ha and the
area will increase with the construction of new mine roads during the mining activity. At
the end of mine life, the area under roads will be 2.61 ha. 7.16 ha area under streams will
be reduced to 6.11 ha after diversion at the conceptual stage. Out the total excavated area
of 557.70 ha at the conceptual stage, 418.84 ha will be concurrently backfilled and about
139.86 ha will be converted into water reservoir. 55.69 ha of area will be undisturbed till
the end of mine life. Present land use and land use at the end of 1st 5-year plan period and
at the end of mine life are presented in Table-21.

Comprehensive Report on Ground Water Conditions in both Core and Buffer Zones of Limestone Mine of M/s RCCPL Private Ltd., Persoda, Kothoda Khurd, Kothoda Buzurg and Govindpur villages,
Chandrapur District, Maharashtra
Vimta Labs Limited, Hyderabad & J Rajendra Prasad, Empanelled Expert, Hyderabad 62
Table-21: Land Use of ML Area at Different Stages
Sr. No. Land Use Category Pre-
Operational (Present)
Operational (At the end of
1st 5-year plan)
Post-Operational
(At the end of Life of Mine)
1 Soil Dump 0.00 2.00 0.00
2 Waste Dump 0.00 16.74 0.00
3 Excavation including protective bund 0.00 47.48 557.70
4 Mine pit backfilled and utilized for community farming
0.00 0.00 418.84
5 Mine pit converted to water reservoir and utilized for community use
0.00 0.00 138.86
6 Public roads & mine road 2.69 3.59 2.61
7 Infrastructure (Crusher, office, workshop etc.)
0.00 6.90 0.00
8 Water streams 7.16 7.16 6.11
9 Built-up area (village, farm, colony, school etc.) 7.70 7.70 7.70
10 Mineral Storage (Sub-grade/mineral) 0.00 1.00 0.00
11 Plantation & Greenbelt on safety barriers, along lease, road and other areas
0.00 20.00 126.33
12 Undisturbed area 738.59 643.57 55.69
(excluding Sr.No. 4 and 5, which are included in Sr.No.3)
756.14 756.14 756.14
7.1.3 Current & Potential Threats
Though the nallah running across the southern part of ML area is seasonal, it is
observed to be a good recharge source during monsoon and post monsoon seasons
with check dams constructed on it. These check dams have been silted up and lost
their original capacity thereby reducing the storage and recharge potential.
If diversion of this nallah as described under Section 7.1.1 is not implemented
properly, natural surface water flow and storage potential in the area will be
disturbed.
7.2 Impact on Groundwater Sources
7.2.1 A description of the impacts on environmental values that have occurred, or are likely to
occur, because of any past ground water abstraction
Agriculture practiced in and around ML area is water intensive and dependent on ground
water through bore wells. The number of bore wells has drastically increased during last
three decades resulting in water level decline around the areas having dense bore well
numbers. Associated fertilizer and pesticide application in heavy doses further deteriorated
ground water quality.
Comprehensive Report on Ground Water Conditions in both Core and Buffer Zones of Limestone Mine of M/s RCCPL Private Ltd., Persoda, Kothoda Khurd, Kothoda Buzurg and Govindpur villages,
Chandrapur District, Maharashtra
Vimta Labs Limited, Hyderabad & J Rajendra Prasad, Empanelled Expert, Hyderabad 63
Water levels in bore wells in Persoda, Raipur and Govindpur villages within ML area during
field visit (2nd week of March 2019) varied from 18.29 m to 27.43 m. Average water levels
during pre and post monsoon are 22.50 m and 17.50 m bgl respectively with an average
fluctuation of 5.00 m. A review of ground water sample analysis indicates that the ground
water quality in the study area in general is poor.
7.2.2 An assessment of the likely impacts on environmental that will occur, or are likely to occur,
because of the ground water abstraction for a five years period starting on the
consultation day for the report; and over the projected life of the resource project area,
affected area and radius of influence
Limestone mining can affect ground water conditions. Limestone deposits often occur in
association with karst, a topography where limestone slowly dissolves away underground.
The deposits result in sinkholes, caves and areas of rock fractures that form underground
drainage areas. When mining occurs in karst, disruption to natural aquifers, or flows of
underground water, can result. Often, mining operations remove ground water to expose
the quarrying site, which can lower the water table and change how water flow through the
rock formations.
As water and rock are removed from mines, the support they give to underground features
is gone. Sinkholes can develop, where the roofs of underground caverns are weakened or
collapse. Collapse can be gradual or sudden. Although natural sinkholes develop over time,
man-made ones predominate in mine areas. Sinkhole formation can cease after mine
dewatering is stopped and the water table is allowed to return to normal levels.
Limestone mines use two types of blasting. Small explosive charges set along drilled lines
free blocks of stone to be removed for construction. Large charges reduce whole areas of
limestone to rubble, which is removed for use as crushed stone. The noise, dust and impact
from explosions can result in noise pollution and dust. Underground forces from the blasts
can cause sinkholes or change the drainage and water quality of underground aquifers.
Construction equipment, such as large trucks, crushing machines and earth-moving
equipment also contribute to noise and dust.
The radius of influence from the center of mine pit due to mine seepage dewatering ranges
from 399.79 m during monsoon season only in the 4th year in the center pit and 1205.30 m
during monsoon season to 1841.75 m during non-monsoon season at the conceptual stage.
The distance of influence from the mine pit wall will be from 38.69 m during monsoon
season in the 5th year in the center pit and 455.43 m during monsoon season to 1091.88 m
during non-monsoon season at the conceptual stage.
Of the total excavated area of 557.70 ha at the conceptual stage, concurrent backfilled area
covers 418.84 ha leaving only 138.86 ha as working area. This working area will be in the
western part of ML area. The radius of influence where decline of water levels is expected
due to mine dewatering will be extended outside the ML area towards west of the mine pit
and in other directions, it will be within the ML area as shown in Figure-15.

Comprehensive Report on Ground Water Conditions in both Core and Buffer Zones of Limestone Mine of M/s RCCPL Private Ltd., Persoda, Kothoda Khurd, Kothoda Buzurg and Govindpur villages,
Chandrapur District, Maharashtra
Vimta Labs Limited, Hyderabad & J Rajendra Prasad, Empanelled Expert, Hyderabad 64
7.3 Socio-Economic Aspects
7.3.1 Settlements and Population Dynamics around Project Area
As per the primary survey all the villages affected due to the proposed Limestone Mine
Lease consisted of 3107 persons inhabited. The distribution of population in the study area
is shown in Table-22.
TABLE-22: DISTRIBUTION OF POPULATION IN PROJECT AFFECTED VILLAGES
1 Total Households 748
2 Total Population 3107
3 Male Population 1580
4 Female Population 1527
5 Total Population 0 to 6 years 341
6 Male :Population 0 to 6 years 178
7 Female Population 0 to 6 years 163
8 % of 0 to 6 years Population 10.98
9 Ave HH size 4.15
10 % of Males to the total Population 50.85
11 % of Females to the total Population 49.15
12 Total Males Pop (Excluding 0 to 6 years Males) 1402
13 Total Females Pop (Excluding 0 to 6 years Females) 1364
14 Total Population (Excluding 0 to 6 years Pop) 2766
15 Child Sex Ratio (No of Female Children per 1000 Male Children) 916
16 Sex Ratio (Number of Females per 1000 Males) 973
Source: Primary survey
The males and females constitute to about 50.85% and 49.15% of the proposed limestone
Mine Lease project affected villages.
Average Household Size
The study area had an average family size of 4.15 persons per household as per the primary
survey in the project affected villages.
Sex Ratio
The project villages have on an average 973 females per 1000 males as per primary survey. It
is indirectly revealing that the certain sociological aspects related with female births,
discrimination attached to female existence in the family and in local areas such as dowry
and less girl child education.
Social Structure
In the project affected villages, as per primary survey10.78% of the total population belongs
to Scheduled Castes (SC) and 49.31% to the Scheduled Tribes (ST). Both SC’s and ST’s put
together constitute 60.09% of the total population in the project affected area. The detailed
distribution of population by social structure has been presented in Table-23.

Comprehensive Report on Ground Water Conditions in both Core and Buffer Zones of Limestone Mine of M/s RCCPL Private Ltd., Persoda, Kothoda Khurd, Kothoda Buzurg and Govindpur villages,
Chandrapur District, Maharashtra
Vimta Labs Limited, Hyderabad & J Rajendra Prasad, Empanelled Expert, Hyderabad 65
TABLE-23: DISTRIBUTION OF POPULATION BY SOCIAL STRUCTURE OF THE PROJECT AFFECTED VILLAGES
Sr. No Particulars Nos. / %
1 SC Population 335
2 % of SC to the Total Population 10.78
3 ST Population 1532
4 % of ST's to the Total Population 49.31
5 Total SC & ST's Population 1867
6 % of SC's & ST's to the Total Population 60.09
7 Total Population 3107
Source: Primary survey
Literacy Levels
The data of project affected villages reveals that, the literacy rate of 89.02% as per the
primary survey, which is found to be little better than the total literacy rate of the
Chandrapur District (88.22%) and Maharashtra State 75.87%. The distribution of literates and
literacy rate in the project area is given in Table-24.
TABLE-24: DISTRIBUTION OF LITERATES AND LITERACY OF PROJECT AFFECTED VILLAGES
Sr. No Particulars Nos. / %
1 Male Population 1580
2 Female Population 1527
3 Total Population 3107
4 Male Population (0-6 Years) 178
5 Female Population (0-6 Years 163
6 Total Population (0-6 Years) 341
7 Total Population 7+ Years 2766
8 Male Literates7+Years 1402
9 Female Literates7+Yeasrs 1364
10 Total Literates (7+ Years) 2766
11 Male literacy rate (%) to the total Literates 50.69
12 Female literacy rate (%) to the total literates 49.31
13 Average Male Literacy to the Total Population (%) 45.12
14 Average Female Literacy to the total Population (%) 43.90
15 Total Literacy Rate (%) to the total Population 89.02
Source: Primary survey
The male literacy i.e. the percentage of literate males to the total literates of the project
affected area works out to be 50.69%. The female literacy rate, which is an important indicator
for social change, is observed to be only 49.31% in the project affected villages as per the
primary survey.
Occupational Structure of Project Affected
The occupational structure of people in the project affected villages is studied with
reference to main workers, marginal workers and non-workers. The main workers include 10
categories of workers defined by the Census Department, which consists of cultivators,
agricultural laborers, those engaged in live-stock, forestry, fishing, mining and quarrying;
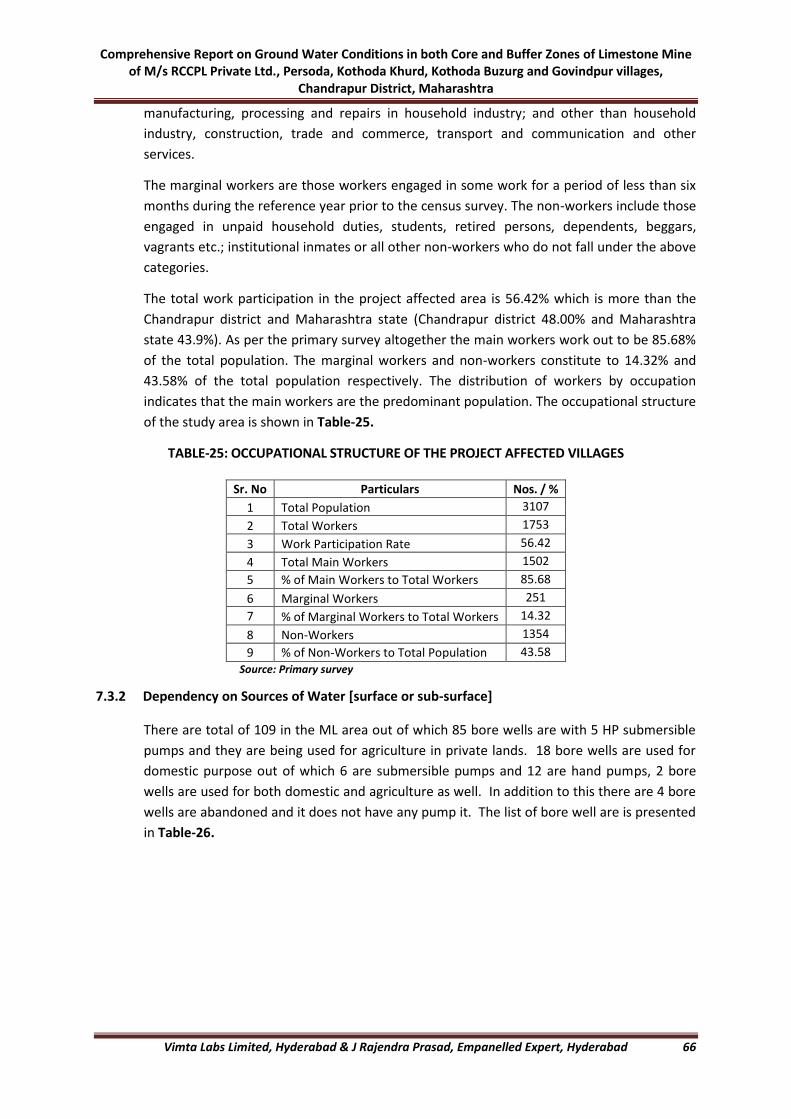
Comprehensive Report on Ground Water Conditions in both Core and Buffer Zones of Limestone Mine of M/s RCCPL Private Ltd., Persoda, Kothoda Khurd, Kothoda Buzurg and Govindpur villages,
Chandrapur District, Maharashtra
Vimta Labs Limited, Hyderabad & J Rajendra Prasad, Empanelled Expert, Hyderabad 66
manufacturing, processing and repairs in household industry; and other than household
industry, construction, trade and commerce, transport and communication and other
services.
The marginal workers are those workers engaged in some work for a period of less than six
months during the reference year prior to the census survey. The non-workers include those
engaged in unpaid household duties, students, retired persons, dependents, beggars,
vagrants etc.; institutional inmates or all other non-workers who do not fall under the above
categories.
The total work participation in the project affected area is 56.42% which is more than the
Chandrapur district and Maharashtra state (Chandrapur district 48.00% and Maharashtra
state 43.9%). As per the primary survey altogether the main workers work out to be 85.68%
of the total population. The marginal workers and non-workers constitute to 14.32% and
43.58% of the total population respectively. The distribution of workers by occupation
indicates that the main workers are the predominant population. The occupational structure
of the study area is shown in Table-25.
TABLE-25: OCCUPATIONAL STRUCTURE OF THE PROJECT AFFECTED VILLAGES
Sr. No Particulars Nos. / %
1 Total Population 3107
2 Total Workers 1753
3 Work Participation Rate 56.42
4 Total Main Workers 1502
5 % of Main Workers to Total Workers 85.68
6 Marginal Workers 251
7 % of Marginal Workers to Total Workers 14.32
8 Non-Workers 1354
9 % of Non-Workers to Total Population 43.58
Source: Primary survey
7.3.2 Dependency on Sources of Water [surface or sub-surface]
There are total of 109 in the ML area out of which 85 bore wells are with 5 HP submersible
pumps and they are being used for agriculture in private lands. 18 bore wells are used for
domestic purpose out of which 6 are submersible pumps and 12 are hand pumps, 2 bore
wells are used for both domestic and agriculture as well. In addition to this there are 4 bore
wells are abandoned and it does not have any pump it. The list of bore well are is presented
in Table-26.

Comprehensive Report on Ground Water Conditions in both Core and Buffer Zones of Limestone Mine of M/s RCCPL Private Ltd., Persoda, Kothoda Khurd, Kothoda Buzurg and Govindpur villages,
Chandrapur District, Maharashtra
Vimta Labs Limited, Hyderabad & J Rajendra Prasad, Empanelled Expert, Hyderabad 67
TABLE–26: DETAILS OF BORE WELLS IN MINE LEASE AREA
WELL TYPE PUMP TYPE PURPOSE OF USE NO OF WELLS
Bore Well Submersible/Centrifugal Domestic 6
Bore Well Submersible Agriculture 85
Bore Well Submersible Domestic/Agriculture 2
Bore Well Hand Pump Domestic 12
Bore Well Abandoned/No Pump - 4
Total 109
Source: Primary Survey
7.3.3 Ground Water uses [e.g. irrigation (irrigation method, number of watering) water supply
etc.]
There are 85 bore wells with 5 HP submersible pumps and they are being used for
agriculture in private lands and 2 bore wells are used for both domestic and agriculture as
well.
7.3.4 Improvement / decline in agricultural yield in last 5 years and likely impact after NOC
As per the interaction with the farming communities at the core and buffer zone,
they said that the agricultural produce is stable in last 5 years. However, there
are slight fluctuations in cotton production due to duplicate seeds supplied by
local vendors.
7.3.5 Impact of proposed / existing project on local communities [based on local interactions
(interactions must be with stakeholders like fishermen community, farmers etc.]
As per the primary consultations with the Project Affected Families and other
stakeholders at the core and buffer zone the following concerns raised.
Expecting that there will be financial assistance to increase the animal husbandry in
the study area.
Project Affected Families can able to purchase suitable agricultural land at nearby
locations to continue their previous profession and they have scope to adopt the
innovative management approaches.
The suitable compensation will help the agricultural families to cultivate their lands by
modern equipment.
8.0 Proposed measures for disposal of waste water by mine drawing saline water
The proposed limestone mine will not draw any saline water.
9.0 Measures to be adopted for water conservation which include recycling, reuse, treatment,
etc. This includes the water balance chart being adopted by the firm along with details of
water conservation methods to be adopted
Efficient management of water resources in an area is the key of long-term sustainability.
Artificial recharge is becoming increasingly necessary in some mining operations. Driving
Comprehensive Report on Ground Water Conditions in both Core and Buffer Zones of Limestone Mine of M/s RCCPL Private Ltd., Persoda, Kothoda Khurd, Kothoda Buzurg and Govindpur villages,
Chandrapur District, Maharashtra
Vimta Labs Limited, Hyderabad & J Rajendra Prasad, Empanelled Expert, Hyderabad 68
factors for this are firstly, the required protection of aquifers from contamination and
depletion; secondly, the convenience of water storage to meet the demands for different
uses. The mining industry requires water for many of its activities. However, it is the only
industry that produces water as a real by-product. Indeed, the need to excavate in the
ground hundreds of meters deep, extending the excavations under the ground for
kilometres, or the need to excavate an open pit of many thousands of square meters, and
hundreds of meters depth, generally entails finding ground water.
Mining operations are generally conducted in “dry” conditions or at least with a minimum
amount of water in the working area. Therefore, incoming water must be abstracted
through drainage wells, pumping stations and galleries. Part of this water can meet supply
requirements of mining and related activities, while the rest can be used to meet other
demands. In order to adequately meet these requirements and many others, it is necessary
that the pumped water attains the best possible quality.
While it is necessary to depress the water level in the mine, this often results in lowering of
the ground water levels in the vicinity. An ideal way to avoid this problem may be the
artificial recharge of the aquifer concerned with water abstraction. Another specific reason
for artificial recharge with water from mine drainage may be store the water in aquifers, to
meet a demand that does not have the same rhythm as the drainage of the mine.
9.1 Brief write up along with capacity and flow chart of Sewage Treatment Plants / Effluent
Treatment Plants / Combined Effluent Treatment Plants existing/ proposed within the
project
Impact on water quality during construction and operation of any project may be due to
sewage generated from the domestic facilities, wastewater generated from different
operations, waste and oil spillage from the workshop, ash or other waste disposal etc. It is
important to ensure that the water discharged from the project meet the relevant disposal
norms and water used in the project meets the relevant national standards.
There will not be any process effluent generation from the mine lease area. However,
effluent generated from mine workshop will be treated using oil-grease separator and
reused. Only domestic wastewater will be generated and against 5 m³/day of domestic
usage. The sewage generated will be negligible and septic tank/soak pits will be provided to
handle the sewage.
9.2 Details of water conservation measures to be adopted to reduce/ save the ground water
As per the conceptual land use of ML area indicated in mine plan, Persoda and Raipur
villages remain untouched, mine site office and other buildings with a roof area of 20,000 sq
m is available as infrastructure, 126.33 ha of area will be with plantation and green belt and
undisturbed area will be 55.69 ha (refer Figure-18).
A permanent rainwater harvesting, and artificial recharge shall be implemented during
establishment phase i.e., 1st year keeping the conceptual land use in view to support project
water requirement and long-term sustainability of ground water scenario in the region.
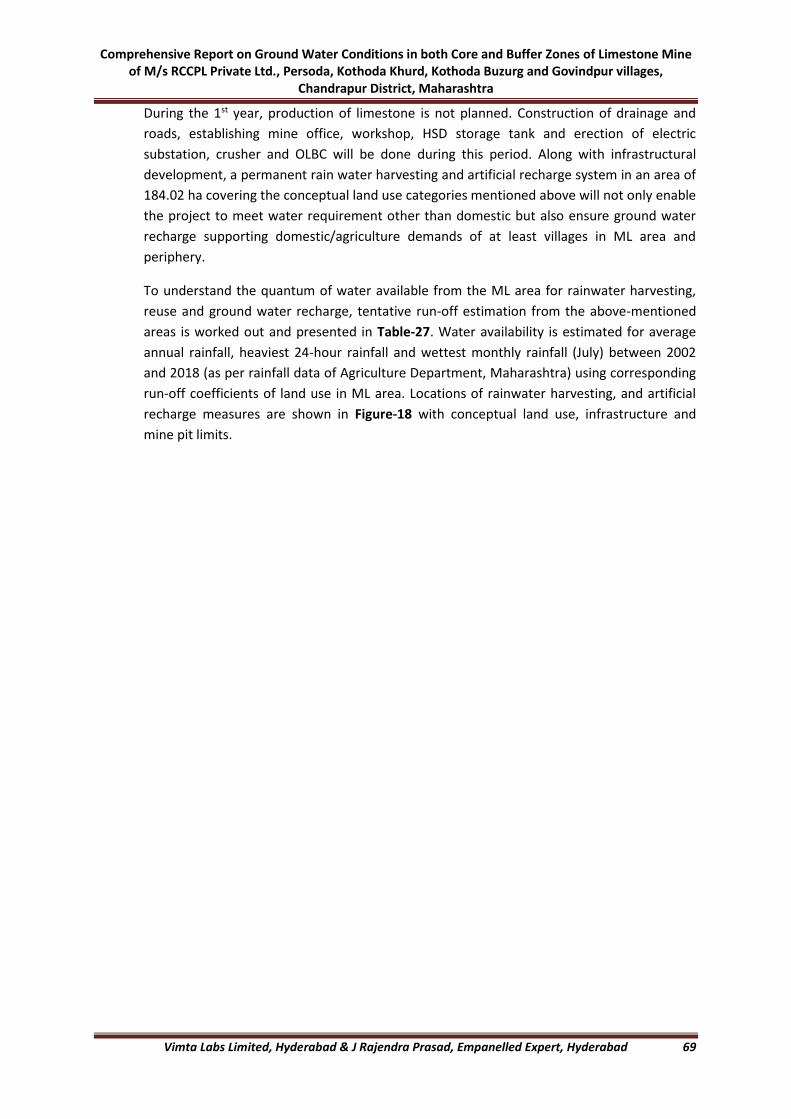
Comprehensive Report on Ground Water Conditions in both Core and Buffer Zones of Limestone Mine of M/s RCCPL Private Ltd., Persoda, Kothoda Khurd, Kothoda Buzurg and Govindpur villages,
Chandrapur District, Maharashtra
Vimta Labs Limited, Hyderabad & J Rajendra Prasad, Empanelled Expert, Hyderabad 69
During the 1st year, production of limestone is not planned. Construction of drainage and
roads, establishing mine office, workshop, HSD storage tank and erection of electric
substation, crusher and OLBC will be done during this period. Along with infrastructural
development, a permanent rain water harvesting and artificial recharge system in an area of
184.02 ha covering the conceptual land use categories mentioned above will not only enable
the project to meet water requirement other than domestic but also ensure ground water
recharge supporting domestic/agriculture demands of at least villages in ML area and
periphery.
To understand the quantum of water available from the ML area for rainwater harvesting,
reuse and ground water recharge, tentative run-off estimation from the above-mentioned
areas is worked out and presented in Table-27. Water availability is estimated for average
annual rainfall, heaviest 24-hour rainfall and wettest monthly rainfall (July) between 2002
and 2018 (as per rainfall data of Agriculture Department, Maharashtra) using corresponding
run-off coefficients of land use in ML area. Locations of rainwater harvesting, and artificial
recharge measures are shown in Figure-18 with conceptual land use, infrastructure and
mine pit limits.

Comprehensive Report on Ground Water Conditions in both Core and Buffer Zones of Limestone Mine of M/s RCCPL Private Ltd., Persoda, Kothoda Khurd, Kothoda Buzurg and Govindpur villages,
Chandrapur District, Maharashtra
Vimta Labs Limited, Hyderabad & J Rajendra Prasad, Empanelled Expert, Hyderabad 70
Table-27: Rainfall Available for Rainwater Harvesting and Recharge in ML Area
Sr.No. Details Area (Ha)
Run-off Coefficient
Run-off Volume
from Average Annual Rainfall
(m³)
Run-off Volume
from 24
Hour rainfall
(m³)
Run-off Volume
from July
rainfall (m³)
No. of Structures
Rainwater Harvesting and Use
1 Facilities area (Roof top at conceptual stage)
2.00 0.85 18569 4386 6617 1
2 Plantation & Greenbelt on safety barriers, along lease, road and other areas
126.33 0.15 206985 48890 73756 4
Total/Average 128.33 0.50 225554 53276 80373 5
Artificial Recharge
3 Undisturbed area (present agriculture land)
55.69 0.15 91245 21552 32514 3
Total/Average 55.69 0.15 91245 21552 32514 3
Grand Total/Average 184.02 0.38 316800 74828 112887 8
(Source: Runoff coefficients-CGWB Manual on Artificial Recharge, Rainfall - Agri. Dept., Maharashtra)
9.2.1 Rainwater Harvesting for Project Use
Roof top areas in infrastructure area, plantation and green belt area covering 128.33 ha are
found to be feasible for taking up rainwater harvesting measures and use for project needs
other than domestic.
Roof Top Harvesting
Facilities in the infrastructure area include mines office, stores, workshop etc., and roof top
area of these facilities is 2.00 ha which will remain as social infrastructure at the conceptual
stage. Annual average rainfall for the period from 2002 to 2018 at Korpana as per
Agriculture Department, Government of Maharashtra is 1092.3 mm. The amount of rainfall
available from these concrete roof tops estimated using run-off coefficients suggested by
Manual on Artificial Recharge of Ground Water, CGWB for average annual rainfall is 18,569
m³.
The components of roof top harvesting will include the following:
Coarse mesh at the roof to prevent the passage of debris
Drain pipes that carry rainwater from the roof top area to the harvesting system
First flushing that ensures that run-off from the first spell of rain is flushed out and
does not enter the system
Filter to remove suspended pollutants from rainwater collected over the roof
Storage structure
Pumping arrangement for abstraction and use

Comprehensive Report on Ground Water Conditions in both Core and Buffer Zones of Limestone Mine of M/s RCCPL Private Ltd., Persoda, Kothoda Khurd, Kothoda Buzurg and Govindpur villages,
Chandrapur District, Maharashtra
Vimta Labs Limited, Hyderabad & J Rajendra Prasad, Empanelled Expert, Hyderabad 71
Considering only 80% of the run-off as available volume after evaporation, spillage and first
flush wastage and a further 80% efficient rainwater harvesting system, 11,884 m³ (0.012
MCM) is the run-off volume estimated as available for project activities. The capacity of
storage structure for the heaviest rainfall received in 24 hours (258.0 mm) shall be 4,400 m³
whereas for the rainfall received during the wettest month of July (389.22 mm) shall be
6,650 m³. Any overflow from the storage tanks shall be diverted to the nearest storm water
drain to reach the natural surface flow. A typical roof top water harvesting model is
presented in Figure-21.
Figure-21: Typical Roof Top Rainwater Harvesting Model
Rainwater Harvesting in Green Belt & Open Area
Run-off from the proposed plantation and green belt area of 126.33 ha will be routed
through storm water drains to designated storage facilities at 4 locations. The components
of this rainwater harvesting system will include the following:
Storm water drains to route run-off
Silt trap to filter silt and suspended matter from rainwater diverted from the
catchment
Storage structure
Inlet for diverting the run-off into the storage structure in a controlled manner
Outlet at a lower level than inlet to avoid any backwater effect and safely discharge
excess run-off during peak events from the storage structure
Pumping arrangement for abstraction and use
The bottom and sides of these water harvesting measures shall be lined to avoid any
seepage into the mine working areas. The amount of rainfall available from proposed
plantation and green belt area estimated using run-off coefficients suggested by Manual on
Artificial Recharge of Ground Water, CGWB for annual average rainfall of 1092.3 mm is
2,06,985 m³. Considering only 80% of the run-off as available volume after evaporation,
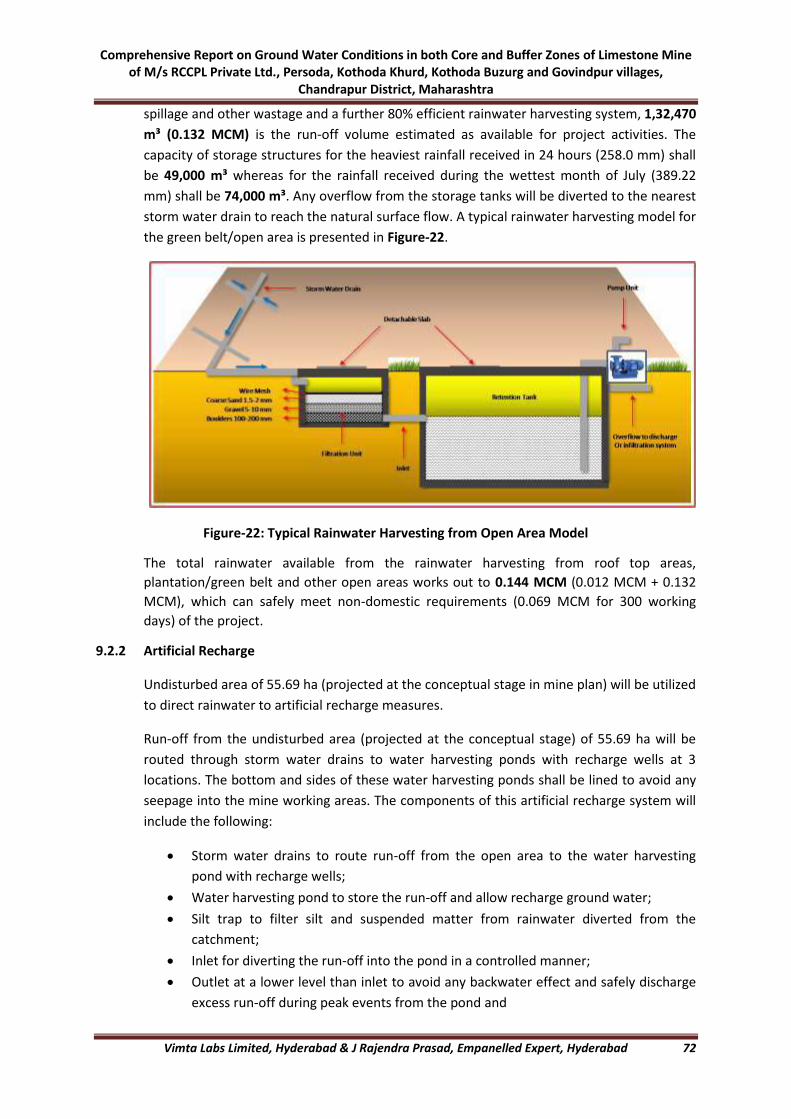
Comprehensive Report on Ground Water Conditions in both Core and Buffer Zones of Limestone Mine of M/s RCCPL Private Ltd., Persoda, Kothoda Khurd, Kothoda Buzurg and Govindpur villages,
Chandrapur District, Maharashtra
Vimta Labs Limited, Hyderabad & J Rajendra Prasad, Empanelled Expert, Hyderabad 72
spillage and other wastage and a further 80% efficient rainwater harvesting system, 1,32,470
m³ (0.132 MCM) is the run-off volume estimated as available for project activities. The
capacity of storage structures for the heaviest rainfall received in 24 hours (258.0 mm) shall
be 49,000 m³ whereas for the rainfall received during the wettest month of July (389.22
mm) shall be 74,000 m³. Any overflow from the storage tanks will be diverted to the nearest
storm water drain to reach the natural surface flow. A typical rainwater harvesting model for
the green belt/open area is presented in Figure-22.
Figure-22: Typical Rainwater Harvesting from Open Area Model
The total rainwater available from the rainwater harvesting from roof top areas,
plantation/green belt and other open areas works out to 0.144 MCM (0.012 MCM + 0.132
MCM), which can safely meet non-domestic requirements (0.069 MCM for 300 working
days) of the project.
9.2.2 Artificial Recharge
Undisturbed area of 55.69 ha (projected at the conceptual stage in mine plan) will be utilized
to direct rainwater to artificial recharge measures.
Run-off from the undisturbed area (projected at the conceptual stage) of 55.69 ha will be
routed through storm water drains to water harvesting ponds with recharge wells at 3
locations. The bottom and sides of these water harvesting ponds shall be lined to avoid any
seepage into the mine working areas. The components of this artificial recharge system will
include the following:
Storm water drains to route run-off from the open area to the water harvesting
pond with recharge wells;
Water harvesting pond to store the run-off and allow recharge ground water;
Silt trap to filter silt and suspended matter from rainwater diverted from the
catchment;
Inlet for diverting the run-off into the pond in a controlled manner;
Outlet at a lower level than inlet to avoid any backwater effect and safely discharge
excess run-off during peak events from the pond and

Comprehensive Report on Ground Water Conditions in both Core and Buffer Zones of Limestone Mine of M/s RCCPL Private Ltd., Persoda, Kothoda Khurd, Kothoda Buzurg and Govindpur villages,
Chandrapur District, Maharashtra
Vimta Labs Limited, Hyderabad & J Rajendra Prasad, Empanelled Expert, Hyderabad 73
Recharge well as an induced recharge measure to allow water from the pond by
gravity to the deeper aquifer.
The amount of rainfall available from the undisturbed area of 55.69 ha estimated using run-
off coefficients suggested by Manual on Artificial Recharge of Ground Water, CGWB for
average annual rainfall is 91,245 m³. Heaviest rainfall in 24 hours duration as per Agriculture
Department, Government of Maharashtra rainfall data is 258.00 mm and the maximum
amount of rainfall that can be collected from the open area in 24 hours is 21,552 m³. Water
harvesting ponds are designed to hold at least run-off from heaviest 24 hours rainfall. This
run-off from the undisturbed open area will be collected and recharged through 3 Water
harvesting ponds with recharge wells. A typical artificial recharge system from undisturbed
area is presented in Figure-23.
Figure-23: Typical Model of Artificial Recharge through Bore Well in Harvesting Pond
Mine Pit Sumps
In open cast mining, surface and ground water seeping into mine pits must be controlled to
allow efficient mining operations. Run-off from the surrounding land surface must be
diverted away from the mine, for example by using collector drains and diversion bunds.
Within a mine, any surface water and ground water seepage must be controlled by the
drains and sumps to collect the water away from working areas. This method involves
allowing surface water falling from the rainfall within mine pit and ground water to enter the
pit, then directing it to sumps to temporarily store via drains and ditches, from where it is
pumped away to the surface.
The entire water diverted from the mine working areas and ground water seepage after the
mine pit intersecting ground water will not be pumped at a stretch and there will be a
minimum water column in the mine water collection sump. This will act as recharge
structure through porous media in the side walls and pit bottom. Details of surface water
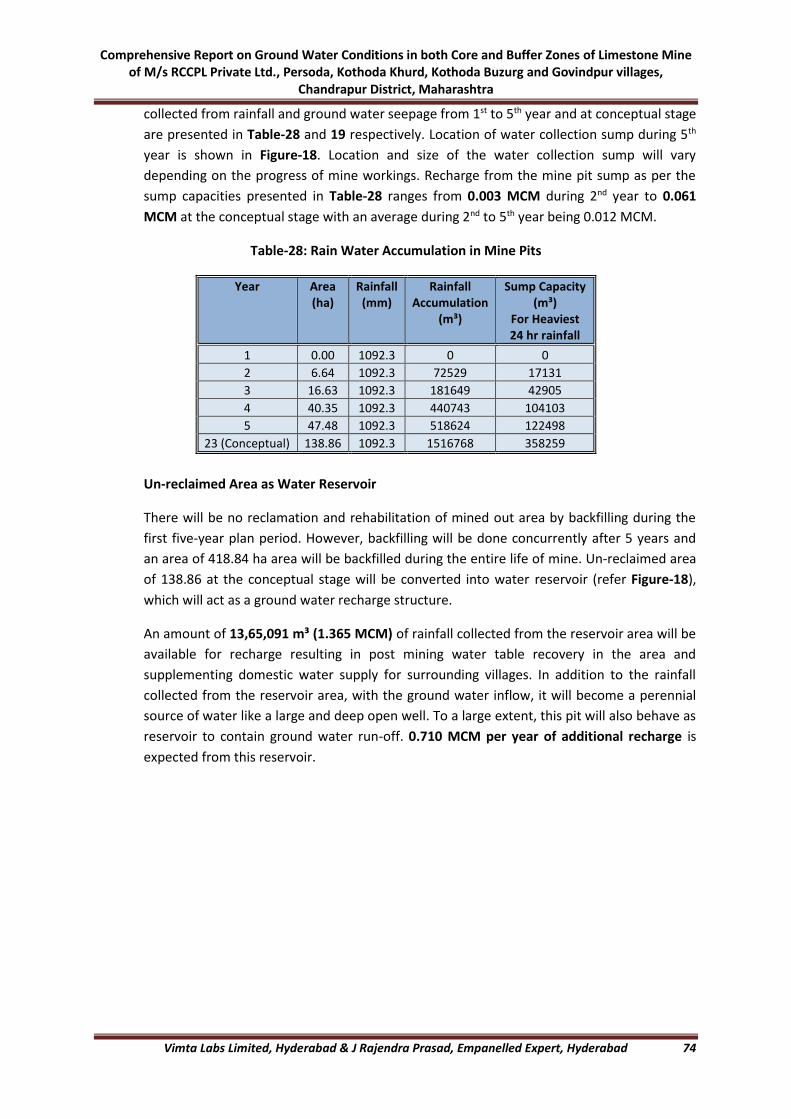
Comprehensive Report on Ground Water Conditions in both Core and Buffer Zones of Limestone Mine of M/s RCCPL Private Ltd., Persoda, Kothoda Khurd, Kothoda Buzurg and Govindpur villages,
Chandrapur District, Maharashtra
Vimta Labs Limited, Hyderabad & J Rajendra Prasad, Empanelled Expert, Hyderabad 74
collected from rainfall and ground water seepage from 1st to 5th year and at conceptual stage
are presented in Table-28 and 19 respectively. Location of water collection sump during 5th
year is shown in Figure-18. Location and size of the water collection sump will vary
depending on the progress of mine workings. Recharge from the mine pit sump as per the
sump capacities presented in Table-28 ranges from 0.003 MCM during 2nd year to 0.061
MCM at the conceptual stage with an average during 2nd to 5th year being 0.012 MCM.
Table-28: Rain Water Accumulation in Mine Pits
Year Area (ha)
Rainfall (mm)
Rainfall Accumulation
(m³)
Sump Capacity (m³)
For Heaviest 24 hr rainfall
1 0.00 1092.3 0 0
2 6.64 1092.3 72529 17131
3 16.63 1092.3 181649 42905
4 40.35 1092.3 440743 104103
5 47.48 1092.3 518624 122498
23 (Conceptual) 138.86 1092.3 1516768 358259
Un-reclaimed Area as Water Reservoir
There will be no reclamation and rehabilitation of mined out area by backfilling during the
first five-year plan period. However, backfilling will be done concurrently after 5 years and
an area of 418.84 ha area will be backfilled during the entire life of mine. Un-reclaimed area
of 138.86 at the conceptual stage will be converted into water reservoir (refer Figure-18),
which will act as a ground water recharge structure.
An amount of 13,65,091 m³ (1.365 MCM) of rainfall collected from the reservoir area will be
available for recharge resulting in post mining water table recovery in the area and
supplementing domestic water supply for surrounding villages. In addition to the rainfall
collected from the reservoir area, with the ground water inflow, it will become a perennial
source of water like a large and deep open well. To a large extent, this pit will also behave as
reservoir to contain ground water run-off. 0.710 MCM per year of additional recharge is
expected from this reservoir.
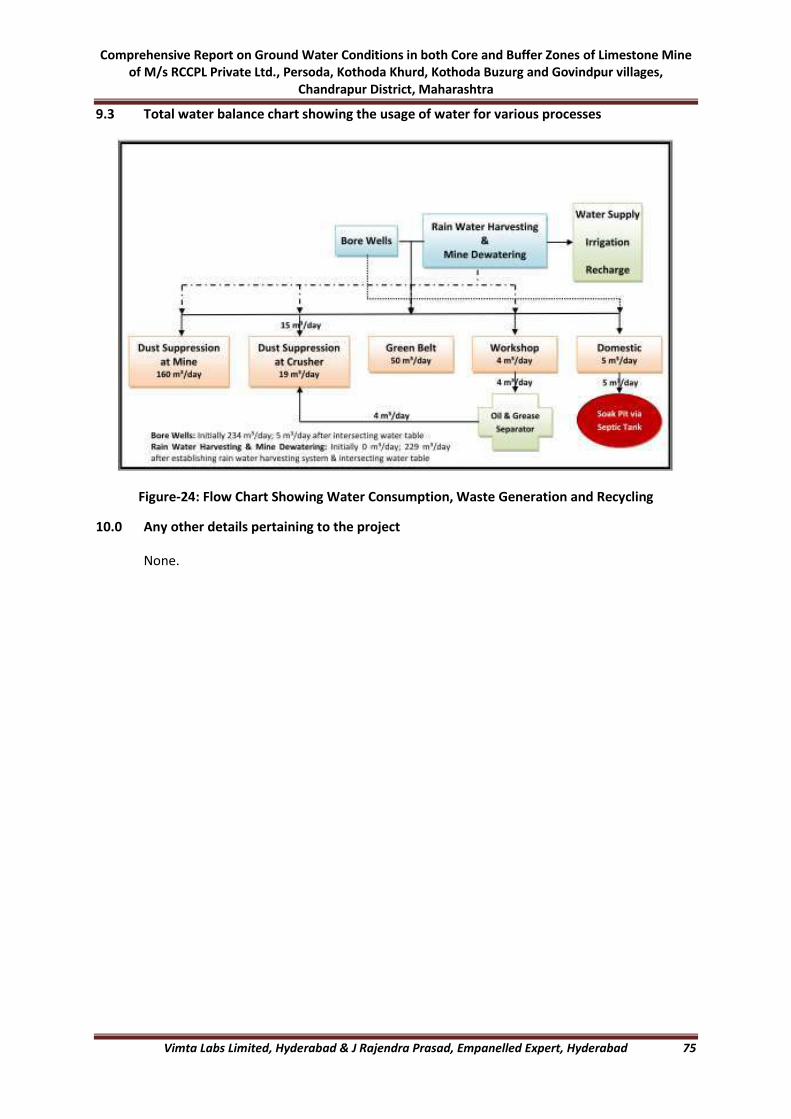
Comprehensive Report on Ground Water Conditions in both Core and Buffer Zones of Limestone Mine of M/s RCCPL Private Ltd., Persoda, Kothoda Khurd, Kothoda Buzurg and Govindpur villages,
Chandrapur District, Maharashtra
Vimta Labs Limited, Hyderabad & J Rajendra Prasad, Empanelled Expert, Hyderabad 75
9.3 Total water balance chart showing the usage of water for various processes
Figure-24: Flow Chart Showing Water Consumption, Waste Generation and Recycling
10.0 Any other details pertaining to the project
None.

Appendix-I
Details of Wells in ML Area
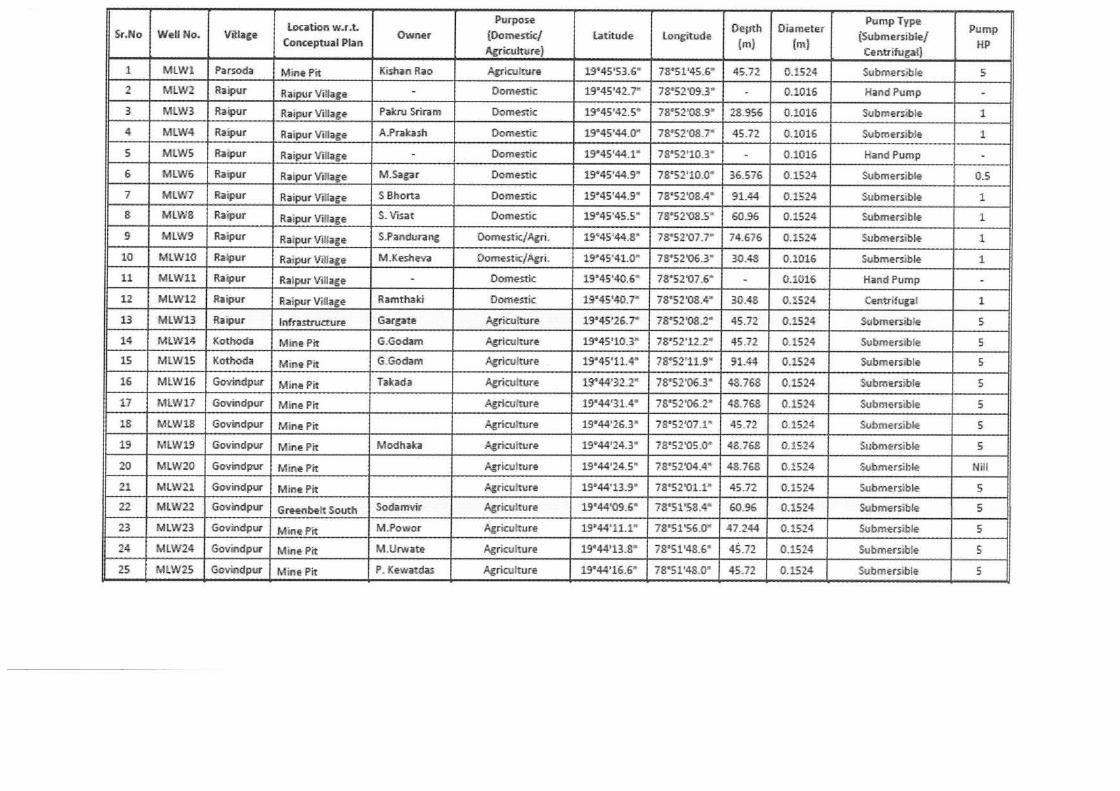


Appendix-II
Water Quality Post-Monsoon, 2018
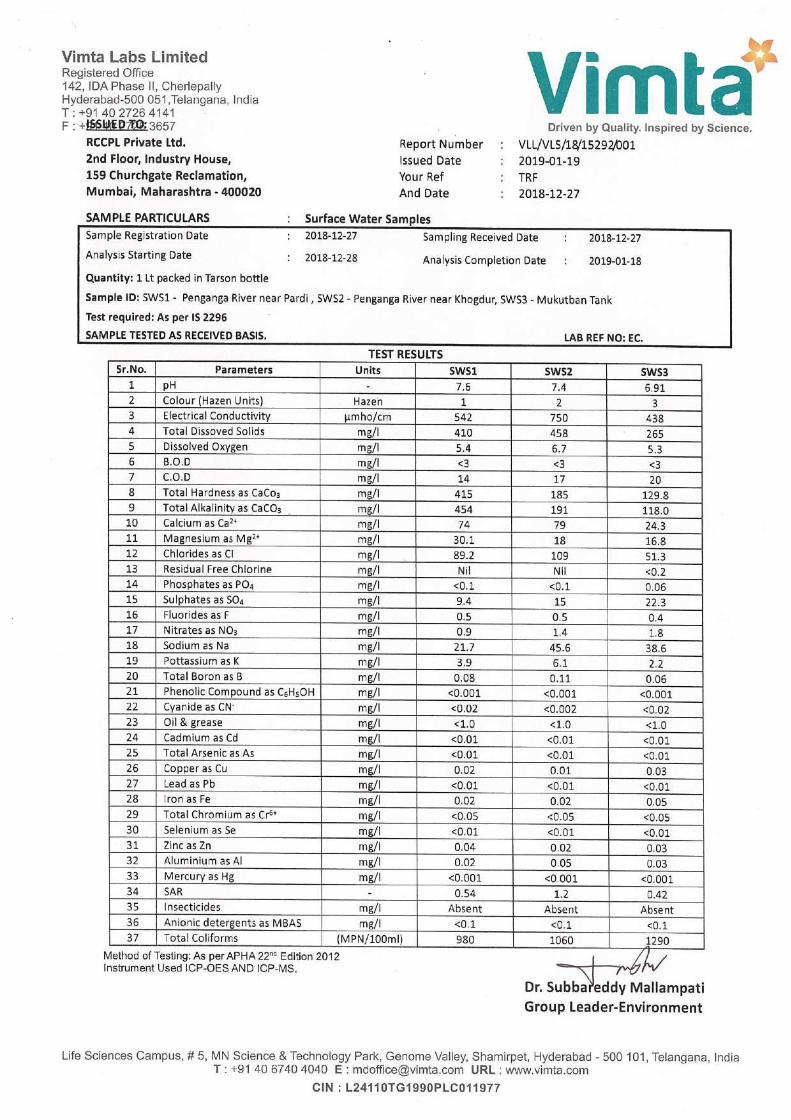

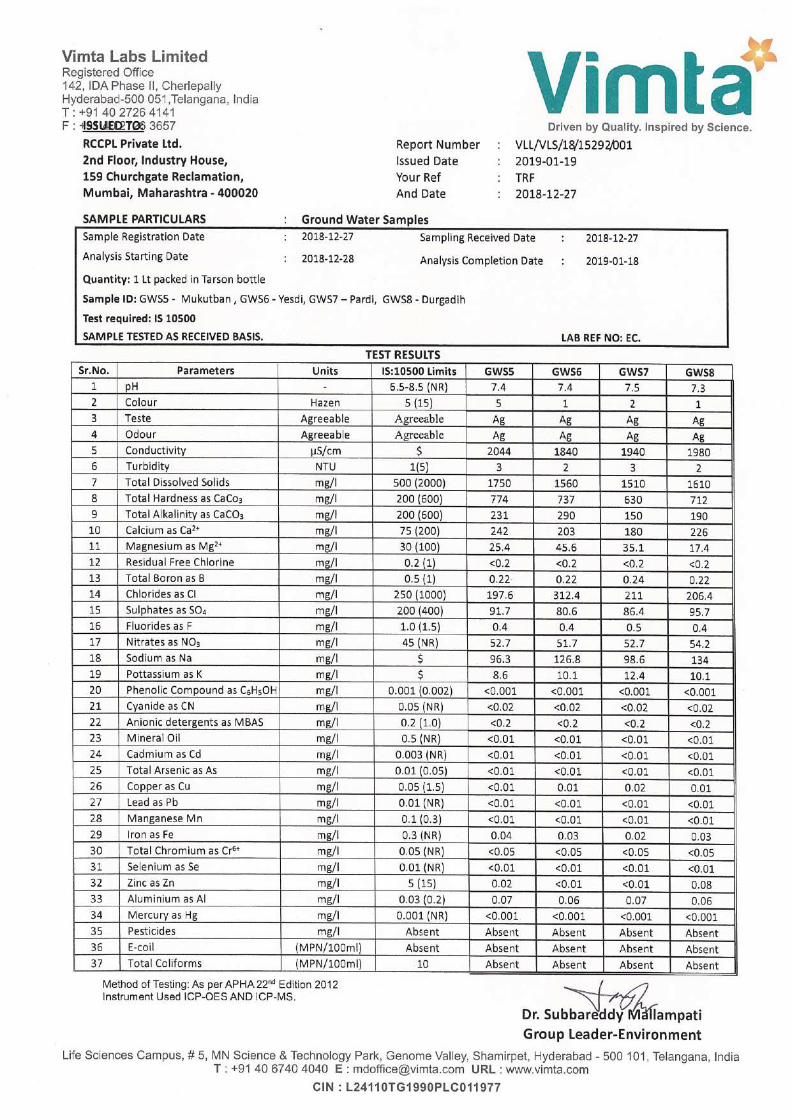

Appendix-III
Water Quality Pre-Monsoon, 2019
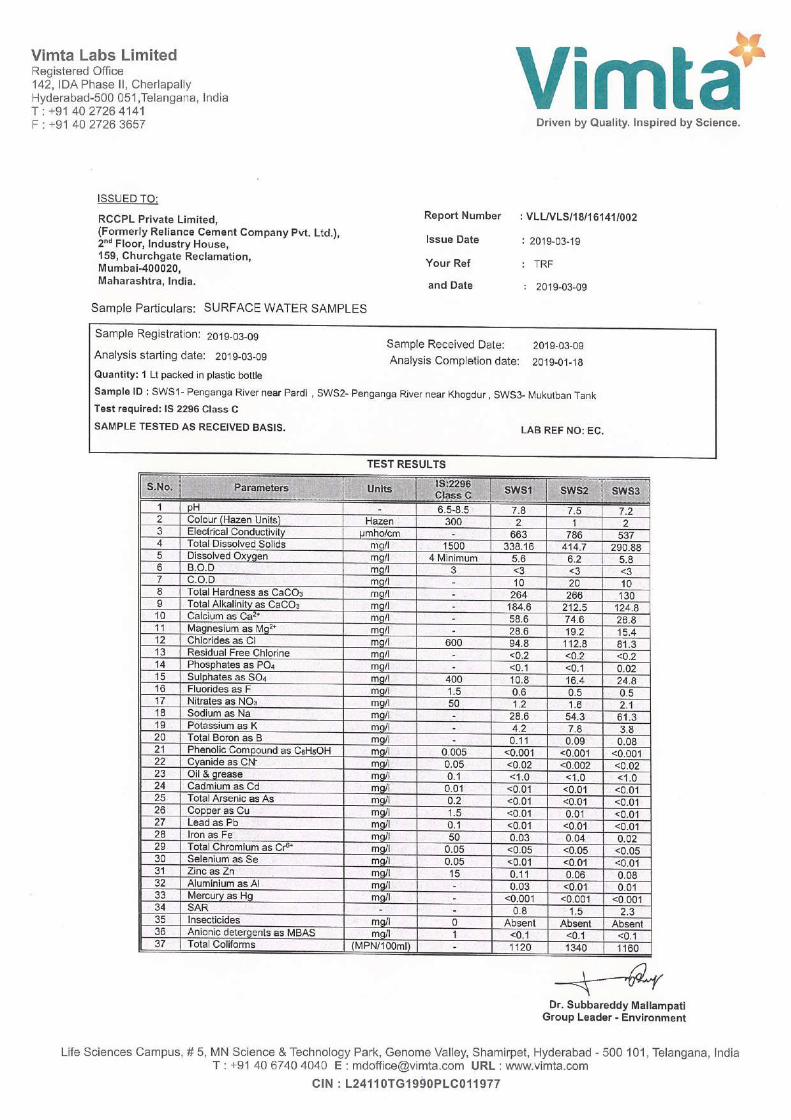
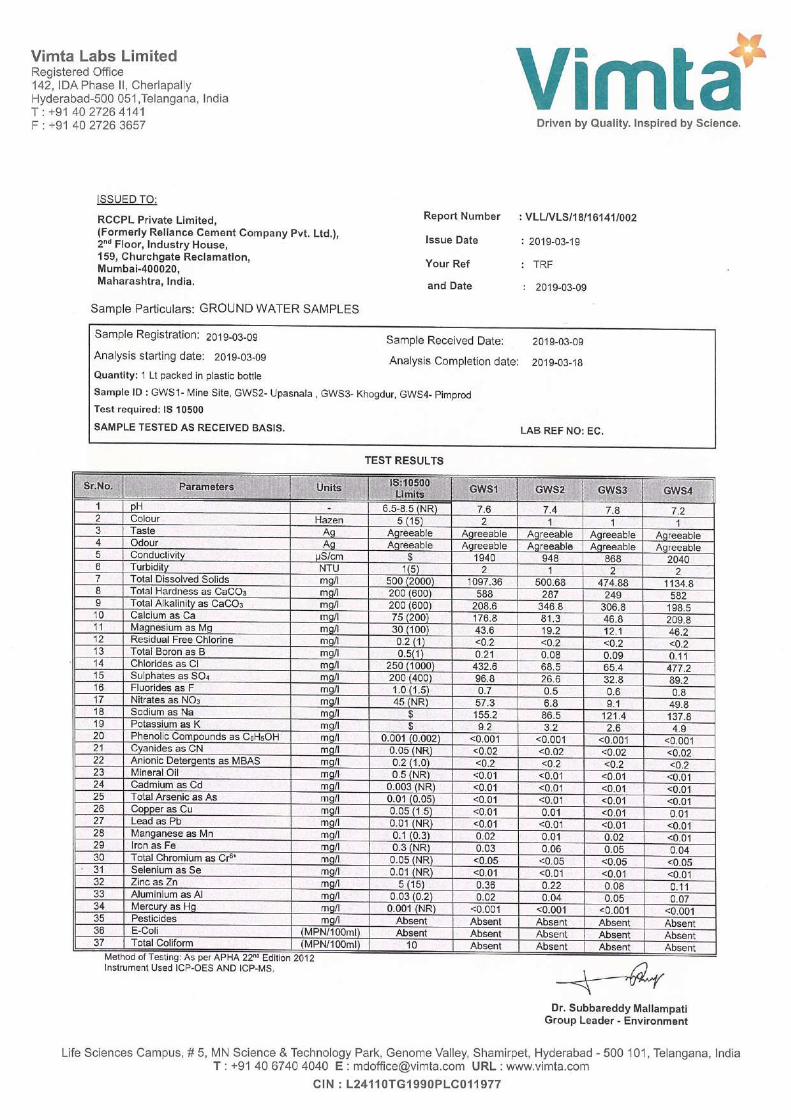
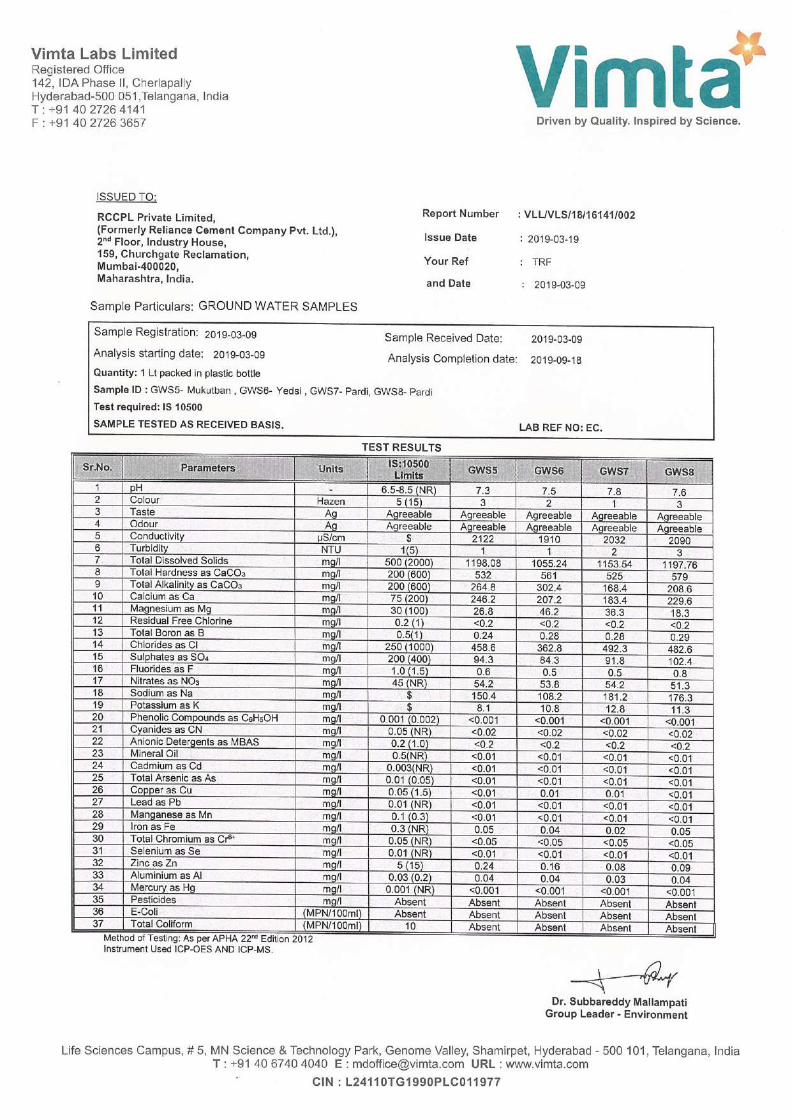

Appendix-IV
Water Quality ML Area Post Monsoon, 2020

Annexure-1B
Impact of Mining on Surface Water Bodies
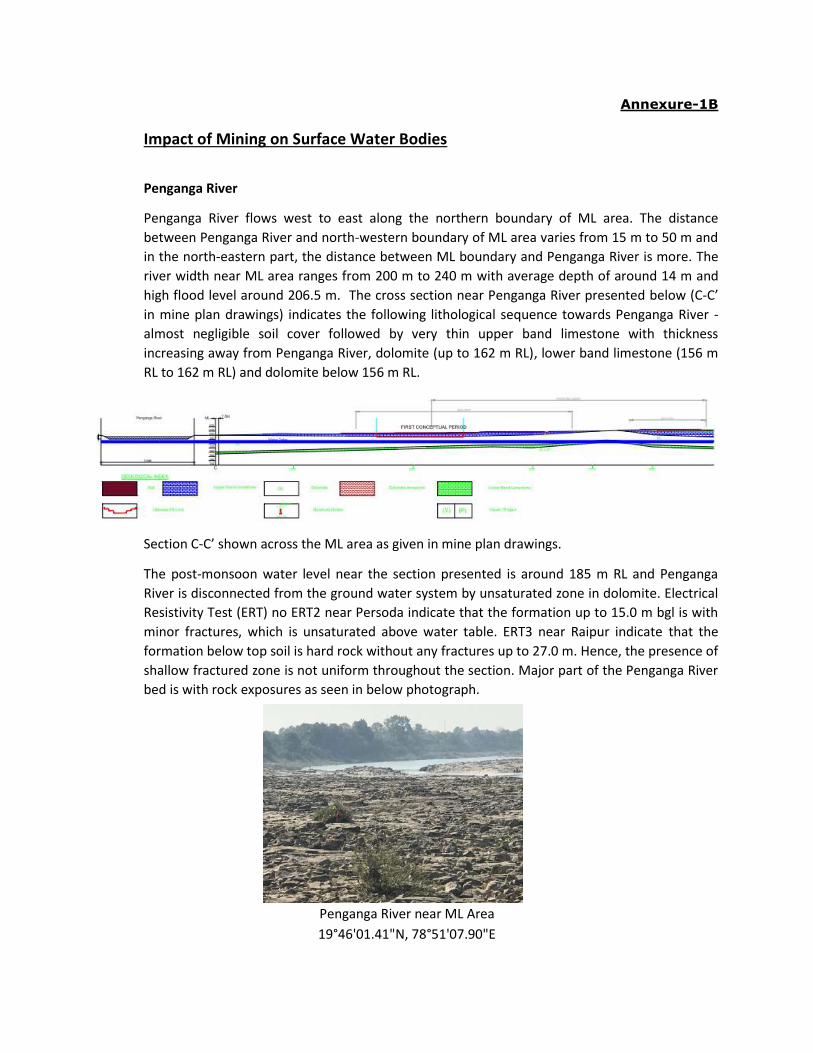
Annexure-1B
Impact of Mining on Surface Water Bodies
Penganga River
Penganga River flows west to east along the northern boundary of ML area. The distance
between Penganga River and north-western boundary of ML area varies from 15 m to 50 m and
in the north-eastern part, the distance between ML boundary and Penganga River is more. The
river width near ML area ranges from 200 m to 240 m with average depth of around 14 m and
high flood level around 206.5 m. The cross section near Penganga River presented below (C-C’
in mine plan drawings) indicates the following lithological sequence towards Penganga River -
almost negligible soil cover followed by very thin upper band limestone with thickness
increasing away from Penganga River, dolomite (up to 162 m RL), lower band limestone (156 m
RL to 162 m RL) and dolomite below 156 m RL.
Section C-C’ shown across the ML area as given in mine plan drawings.
The post-monsoon water level near the section presented is around 185 m RL and Penganga
River is disconnected from the ground water system by unsaturated zone in dolomite. Electrical
Resistivity Test (ERT) no ERT2 near Persoda indicate that the formation up to 15.0 m bgl is with
minor fractures, which is unsaturated above water table. ERT3 near Raipur indicate that the
formation below top soil is hard rock without any fractures up to 27.0 m. Hence, the presence of
shallow fractured zone is not uniform throughout the section. Major part of the Penganga River
bed is with rock exposures as seen in below photograph.
Penganga River near ML Area
19°46'01.41"N, 78°51'07.90"E

Very thin soil cover followed by hard rock and absence of weathered zone will not envisage any
inflow from Penganga River into the mine pit. However, any seepage through minor fractures in
dolomite after excavation below the Penganga River stage is estimated using Darcy’s law for one
dimensional inflow during peak flow period assuming an average 2 m water depth in the river as
below:
Q = KA Δh/Δx
where
Q is inflow rate, expressed as cubic feet per day or cubic feet per second, as indicated;
K is hydraulic conductivity in m/day;
A is the cross-sectional area through which flow occurs, determined as the product of
the saturated thickness multiplied by the width of the area in m²;
Δh is change in hydraulic head in m; and
Δx is distance over which the change in hydraulic head is determined in m.
Q = 3.046 x 2927 x (2/436)
= 40.90 m³/day
Seepage below from the zone water table is already estimated and above flow from Penganga
River will be added to the seepage estimation. An embankment along Penganga River within the
lease area will be constructed to control any surface flooding or infiltration into mine pits.
Rainfall Accumulation
A review of rainfall data between 2002 and 2018 of Department of Agriculture, Maharashtra
state at Korpana at a distance of 20 km from project site indicate an average annual rainfall of
1092.3 mm occurring on average rainy days of 46.6. The annual rainfall ranges from the lowest
of 478.4 mm during 2017 to the highest of 1786.1 mm during 2013 against a normal rainfall of
1281 mm. The highest monthly rainfall, 882.7 mm occurred during July 2018 and the heaviest
rainfall in one day, 258.0 mm was received on 18.07.2002.
Total volume of surface water run-off from the rainfall is calculated by applying the annual
rainfall at Korpana and run-off coefficient over the mine pit area. The heaviest fall in 24 hours is
used to size the pit surface water management system and to assess the required duration of
dewatering of the pit bottom following a storm. Details of run-off volumes and sump sizes are
presented in below table.
Mine workings will be planned in such a way that working faces and haul roads will remain dry
as far as possible. Suitable gradient along mine pit floor and benches will be provided to
facilitate diversion of water to collection sump. Water accumulated in the sump will be directly
pumped out of the mine to the diversion channels along the periphery after meeting the project
requirement.
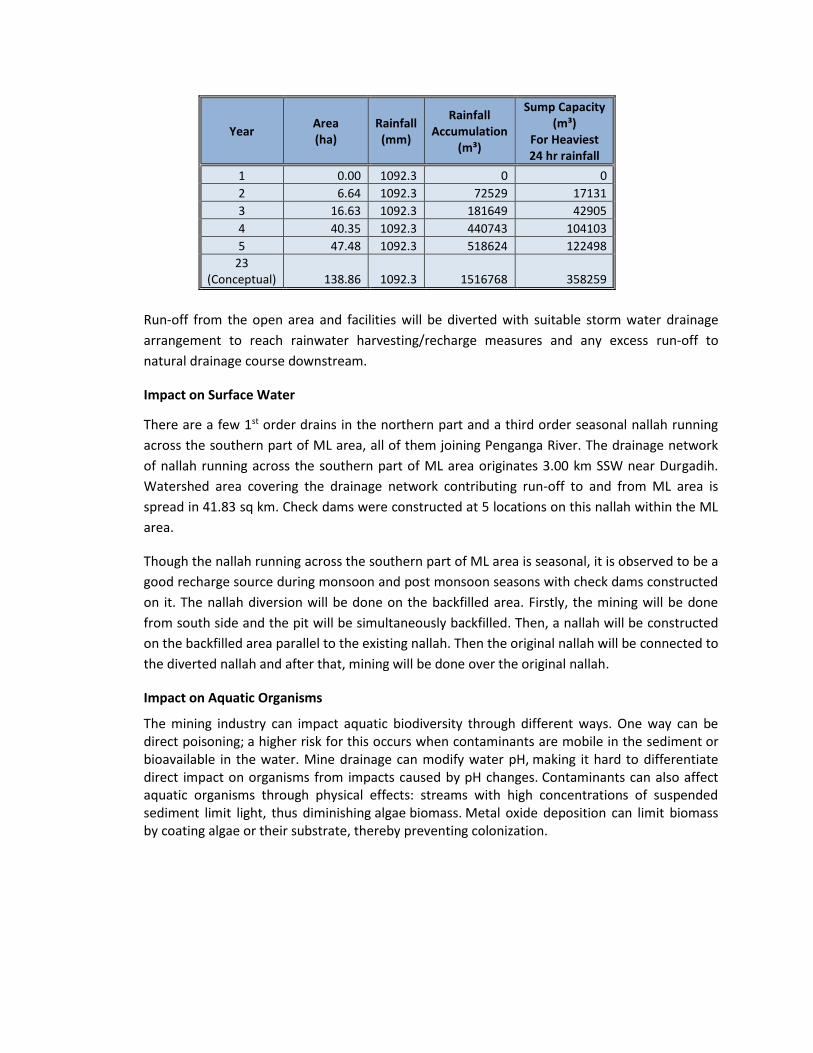
Year Area (ha)
Rainfall (mm)
Rainfall Accumulation
(m³)
Sump Capacity (m³)
For Heaviest 24 hr rainfall
1 0.00 1092.3 0 0
2 6.64 1092.3 72529 17131
3 16.63 1092.3 181649 42905
4 40.35 1092.3 440743 104103
5 47.48 1092.3 518624 122498
23 (Conceptual) 138.86 1092.3 1516768 358259
Run-off from the open area and facilities will be diverted with suitable storm water drainage
arrangement to reach rainwater harvesting/recharge measures and any excess run-off to
natural drainage course downstream.
Impact on Surface Water
There are a few 1st order drains in the northern part and a third order seasonal nallah running
across the southern part of ML area, all of them joining Penganga River. The drainage network
of nallah running across the southern part of ML area originates 3.00 km SSW near Durgadih.
Watershed area covering the drainage network contributing run-off to and from ML area is
spread in 41.83 sq km. Check dams were constructed at 5 locations on this nallah within the ML
area.
Though the nallah running across the southern part of ML area is seasonal, it is observed to be a
good recharge source during monsoon and post monsoon seasons with check dams constructed
on it. The nallah diversion will be done on the backfilled area. Firstly, the mining will be done
from south side and the pit will be simultaneously backfilled. Then, a nallah will be constructed
on the backfilled area parallel to the existing nallah. Then the original nallah will be connected to
the diverted nallah and after that, mining will be done over the original nallah.
Impact on Aquatic Organisms
The mining industry can impact aquatic biodiversity through different ways. One way can be direct poisoning; a higher risk for this occurs when contaminants are mobile in the sediment or bioavailable in the water. Mine drainage can modify water pH, making it hard to differentiate direct impact on organisms from impacts caused by pH changes. Contaminants can also affect aquatic organisms through physical effects: streams with high concentrations of suspended sediment limit light, thus diminishing algae biomass. Metal oxide deposition can limit biomass by coating algae or their substrate, thereby preventing colonization.
Emissions to Waters from Mining Operation:
Estimate direct emissions off-site (pumping of excess water from a pit to a water course); Estimate the volume of run-off of contaminated waters (from activities such as road
watering and general dust suppression) that is not routed to a suitable containment facility Estimate volumes of run-off from waste rock dumps and other site areas to estimate the
mass of suspended solids transported off-site; and Estimate leachate emissions off-site. Where appropriate, include leachate that carries
suspended solids loading.
Direct emissions estimated from available data that will include pumping rates. The facility nominate appropriate and realistic pumping rates that take head losses, leaks, and availability into account. When pumping rates have not been determined, it should be assumed that the rate is 80% of the rated capacity for the particular pump and that the availability is equal to the operating hours for that pump.
Recommendations:
Mining and extraction operations should not be allowed to artificially raise or lower the
groundwater table beyond the perimeter of the mine site.
Mining and extraction operations should not significantly increase or decrease base flows
into surface waters so as to threaten naturally occurring fish, wildlife, or aquatic life.
Water discharged from mining and extraction operations into surface waters should be
restricted to assure that increased flow will not exacerbate in stream erosion nor cause
downstream degradation.
Impact of Penganga River on Mine
A detailed study has been carried out by VNIT, Nagpur. According, to the study observations, no
seepage water flow is expected on downstream side of the embankment. It is proposed to have
sufficient drainage at the downstream side toe to the embankment. This drainage provision will
be planned maintaining the integrity with existing natural stream towards the river. The capacity
of the drain must be sufficient to carry the surface run-off from the mine area.
From the flood model study, carried out by VNIT, the inundation on right bank i.e. towards mine
side is most unlikely situation in the present context. An embankment along the Penganga river
is proposed to be constructed to control any surface flooding or infiltration into the mine pits
following the ground contour of high flood level. Considering the highest flood level (HFL i.e.
Reduced Level of 206.50 m) of the project area, the maximum height of the embankment is
expected to be around 2.5 m having top Reduced Level (RL) of 209.00 with required freeboard.
However, considering the unforeseen event to protect the mine areas from local flood level and
to channelize the surface runoff, construction of embankment may be considered in phased
manner as per the advancement of mining excavation.

Annexure-2
Embankment Study Report


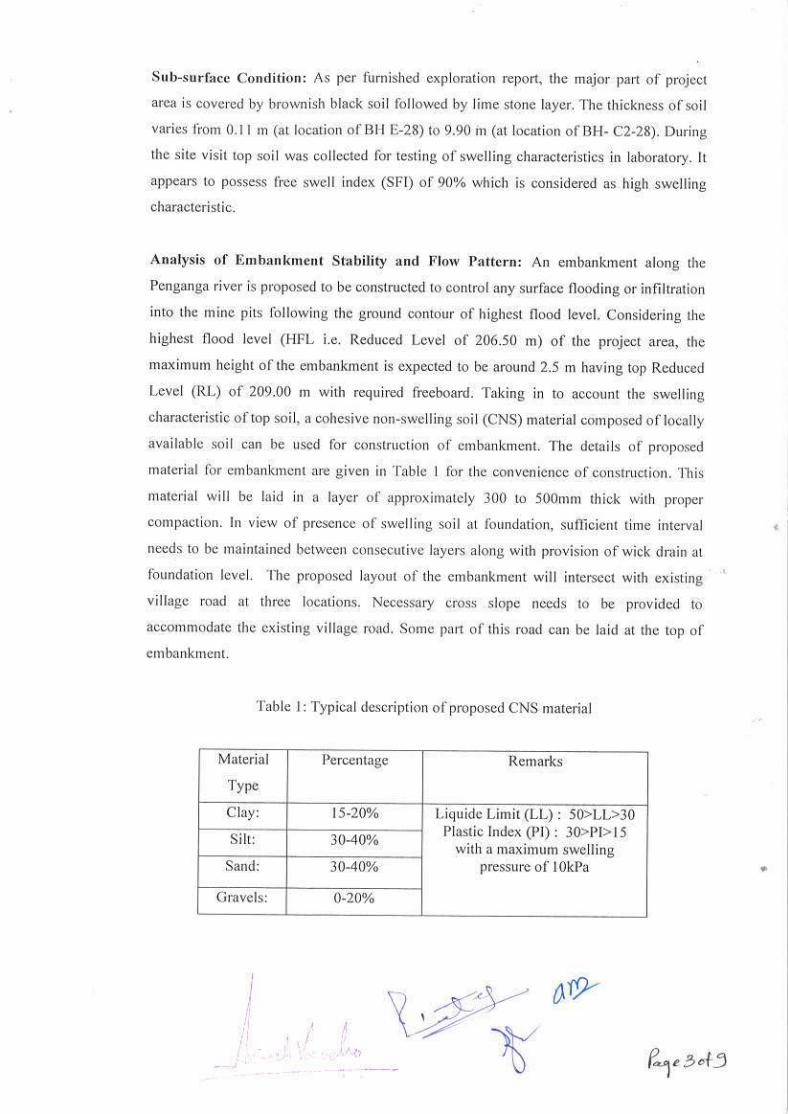

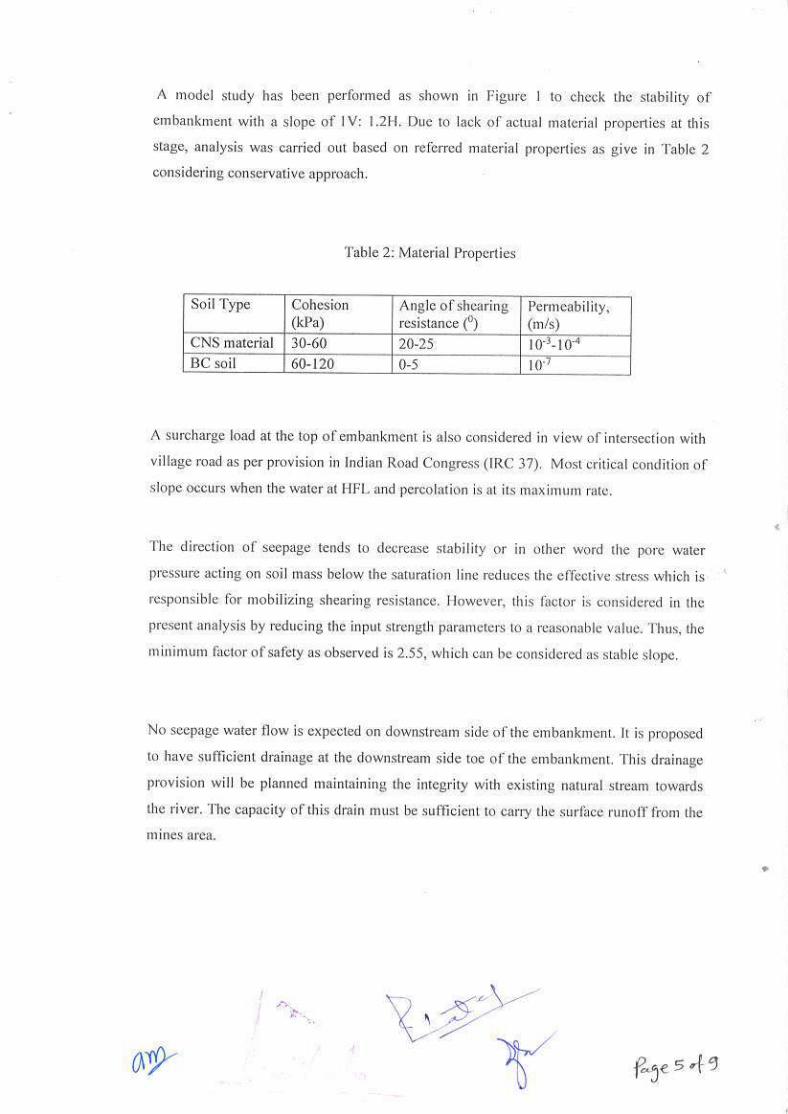

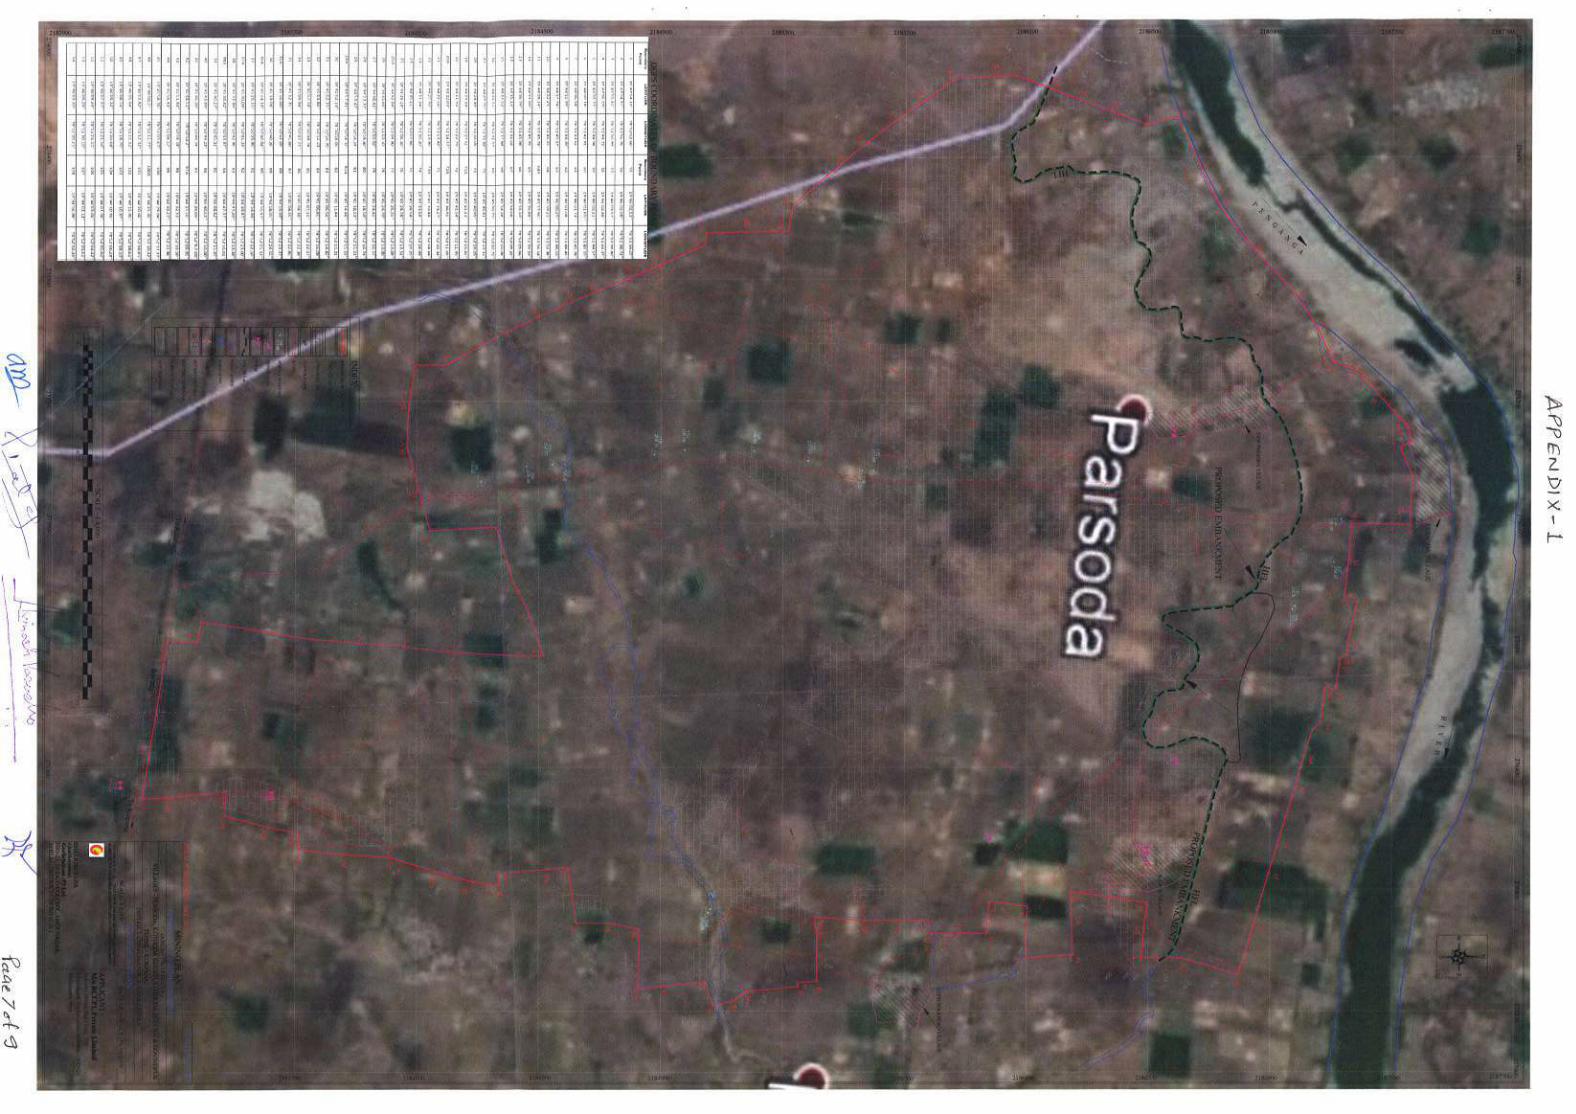


Annexure-3
CGWA NOC Recommendation
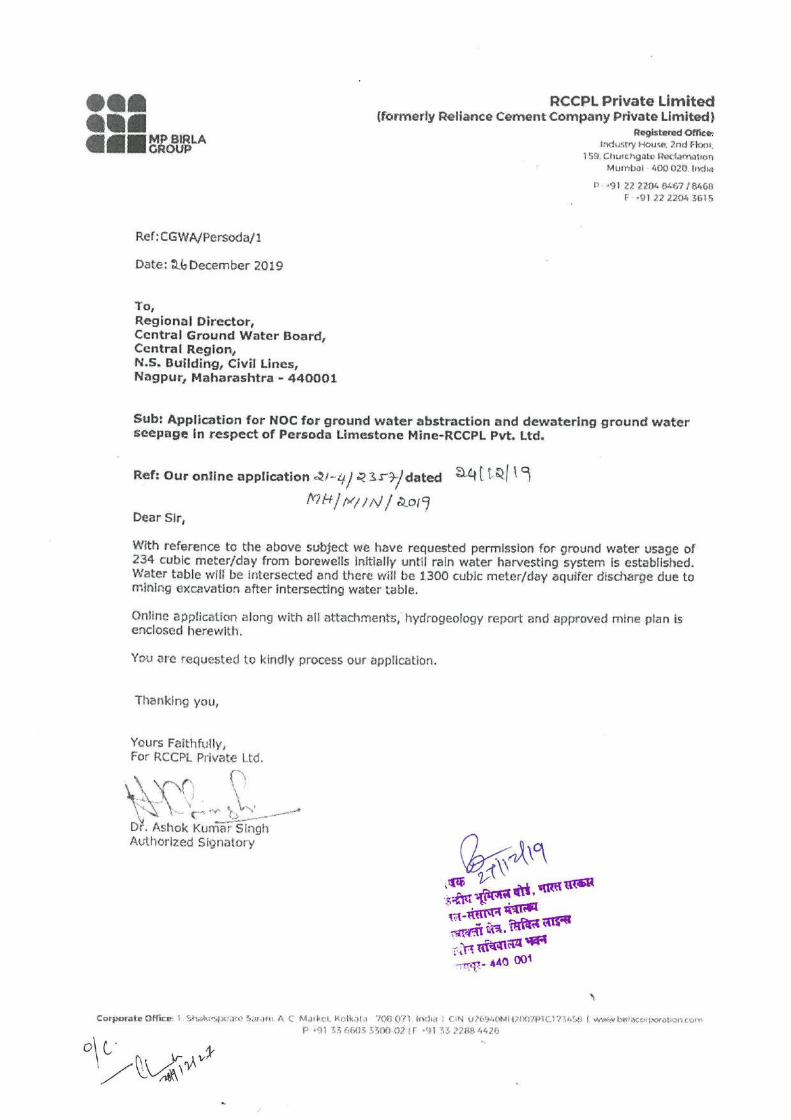

2/8/2021 NOCAP
cgwa-noc.gov.in/ExternalUser/ApplicantHome.aspx 1/3
Information
Guidelines
Steps for Filling Online
Application
DocumentsRequired
Documents Required
for Online Application
Industrial
Infrastructure
Mining
Track Status
Application Status
Online
Location
Area Type
Segment-B Area Type
Regional office
Location
CGWA Headquarters
Know Your
Environmental
Compensation(EC)
Know Your Penalty
Ground Water
Abstraction/Restoration
Charges
Reports
Applied for NOC -
Online
NOC Issued-Online
Contact Us
Contact
Government of IndiaMinistry of Jal Shakti
Department of Water Resources, River Development and Ganga RejuvenationCentral Ground Water Authority (CGWA)
Application for Issue of NOC to Abstract Ground Water (NOCAP)Welcome : RCCPL Previous Login Date Time: 02/02/2021 17:15:02 PM , IP Address: 223.31.114.66 Logout
Application Status
Application No : 21-4/2357/MH/MIN/2019
Receive Date : 03/02/2021
Name of Mining : PERSODA LIMESTONE MINE
Application Processing
Fee :
Rs. 1000.00/- (Rupees One Thousand Only) (Submitted: Yes)
Ground Water
Abstraction/Restoration
Charge :
Ground Water Quality Approved
Ground Water Charge Required: Not Define
Charge: No Charge
Arear: No Arear
Current Stage : Application Processing Stage
Current Status : In Process
Address :
Current StatusApplication Verification
Receive DateFrom User
NameTo User Name
Forwarded
User NameAction Date
Action
Internal
Status
Action
Comment
Copy of
Application
Received On
24/12/2019 (Evaluation
Officer)
Central
Ground Water
Board Central
Region
(Evaluation
Officer)
Central
Ground Water
Board Central
Region
29/01/2021 Approved Recommended
for dewatering
from proposed
Mining Pit of
1300 cmd water
for 150 days
(Annual Draft
195000 m3 per
yr), and
groundwater
withdrawal of
234 cmd from 3
existing BWs for
300 days
(Annual Draft
70200 m3 per
yr). Total Annual
requirement
28/01/2020
Central Ground Water Authority West Block-IIR K Puram SOUTH WEST DELHI
Applicant Home Apply Feedback Change Password Profile
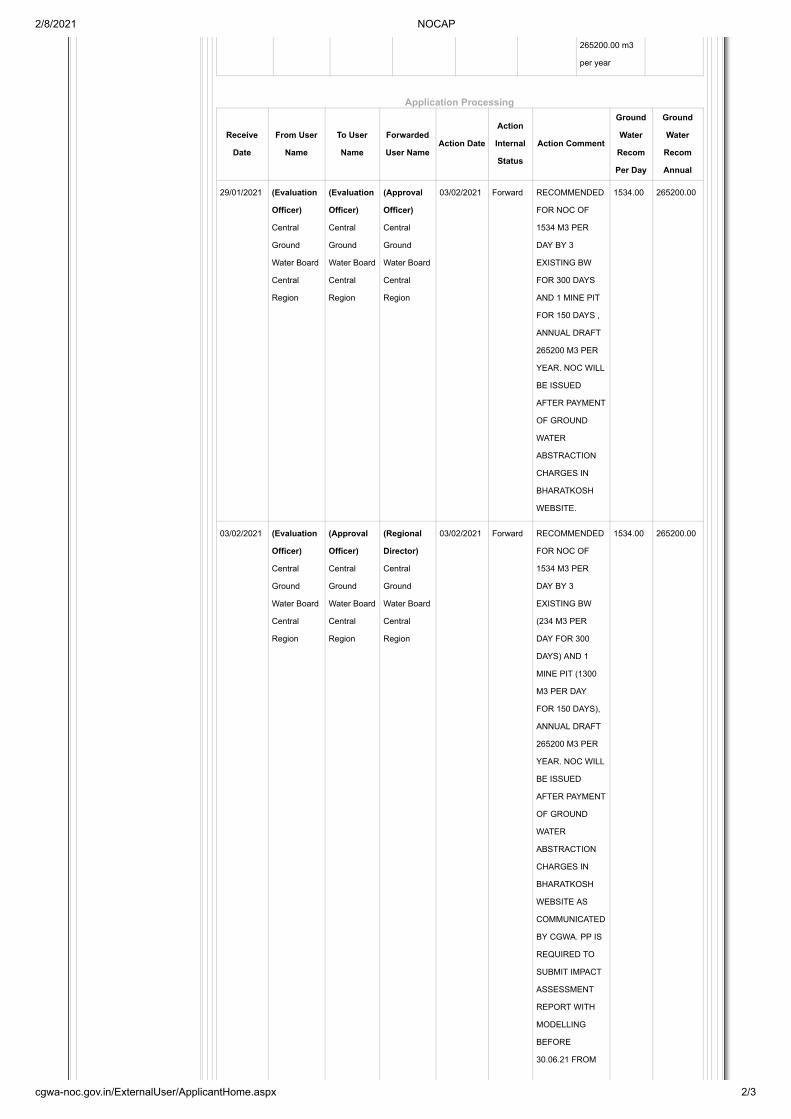
2/8/2021 NOCAP
cgwa-noc.gov.in/ExternalUser/ApplicantHome.aspx 2/3
265200.00 m3
per year
Application Processing
Receive
Date
From User
Name
To User
Name
Forwarded
User NameAction Date
Action
Internal
Status
Action Comment
Ground
Water
Recom
Per Day
Ground
Water
Recom
Annual
29/01/2021 (Evaluation
Officer)
Central
Ground
Water Board
Central
Region
(Evaluation
Officer)
Central
Ground
Water Board
Central
Region
(Approval
Officer)
Central
Ground
Water Board
Central
Region
03/02/2021 Forward RECOMMENDED
FOR NOC OF
1534 M3 PER
DAY BY 3
EXISTING BW
FOR 300 DAYS
AND 1 MINE PIT
FOR 150 DAYS ,
ANNUAL DRAFT
265200 M3 PER
YEAR. NOC WILL
BE ISSUED
AFTER PAYMENT
OF GROUND
WATER
ABSTRACTION
CHARGES IN
BHARATKOSH
WEBSITE.
1534.00 265200.00
03/02/2021 (Evaluation
Officer)
Central
Ground
Water Board
Central
Region
(Approval
Officer)
Central
Ground
Water Board
Central
Region
(Regional
Director)
Central
Ground
Water Board
Central
Region
03/02/2021 Forward RECOMMENDED
FOR NOC OF
1534 M3 PER
DAY BY 3
EXISTING BW
(234 M3 PER
DAY FOR 300
DAYS) AND 1
MINE PIT (1300
M3 PER DAY
FOR 150 DAYS),
ANNUAL DRAFT
265200 M3 PER
YEAR. NOC WILL
BE ISSUED
AFTER PAYMENT
OF GROUND
WATER
ABSTRACTION
CHARGES IN
BHARATKOSH
WEBSITE AS
COMMUNICATED
BY CGWA. PP IS
REQUIRED TO
SUBMIT IMPACT
ASSESSMENT
REPORT WITH
MODELLING
BEFORE
30.06.21 FROM
1534.00 265200.00

2/8/2021 NOCAP
cgwa-noc.gov.in/ExternalUser/ApplicantHome.aspx 3/3
ACCREDITED
CONSULTANT.
03/02/2021 (Approval
Officer)
Central
Ground
Water Board
Central
Region
(Regional
Director)
Central
Ground
Water Board
Central
Region
(Evaluation
Officer)
Central
Ground
Water
Authority
03/02/2021 Forward RECOMMENDED
FOR NOC OF
1534 M3 PER
DAY BY 3
EXISTING BW
(234 M3 PER
DAY FOR 300
DAYS) AND 1
MINE PIT (1300
M3 PER DAY
FOR 150 DAYS),
ANNUAL DRAFT
265200 M3 PER
YEAR. NOC WILL
BE ISSUED
AFTER PAYMENT
OF GROUND
WATER
ABSTRACTION
CHARGES IN
BHARATKOSH
WEBSITE AS
COMMUNICATED
BY CGWA. PP IS
REQUIRED TO
SUBMIT IMPACT
ASSESSMENT
REPORT WITH
MODELLING
BEFORE
30.06.21 FROM
ACCREDITED
CONSULTANT.
1534.00 265200.00
03/02/2021 (Regional
Director)
Central
Ground
Water Board
Central
Region
(Evaluation
Officer)
Central
Ground
Water
Authority
1534.00 265200.00
NOC Processing
Receive Date From User Name To User NameForwarded User
NameAction Date
Action Internal
StatusAction Comment
No Record for this Stage.
NOC Disbursement
Receive Date From User Name To User NameForwarded User
NameAction Date
Action Internal
StatusAction Comment
No Record for this Stage.
Go Back
Annexure-4
Noise and vibration study Report
ANNEXURE-4
NOISE AND GROUND VIBRATION IMPACT
1.0 IMPACT DUE TO NOISE
High noise levels are generated due to the use of machineries like excavators and
during drilling and blasting; loading and unloading operations. The cumulative impact
of all the noise created in the mining site can affect humans as well as the
biodiversity. The distribution and impact of noise in the mine lease area depend on
the sources of noise generation as well as on geographical attributes of a region.
Meteorological factors like rain and storm add to the propagation of noise levels
(Manwar et al. 2016). The mine workers are the most affected due to the high noise
levels, followed by residents of settlements surrounding the mine lease area.
1.1 Noise Level Predictions
Anticipated noise levels at mine lease boundary resulting from operation of the
various machinery have been computed using point source model. Computation of
cumulative noise levels at the ML boundary is based on the assumption that there
are no attenuation paths between the source and the boundary.
Basic phenomenon of the model is the geometric attenuation of sound. Noise at a
point generates spherical waves, which are propagated outwards from the source
through the air at a speed of 1,100 ft/sec, with the first wave making an ever-
increasing sphere with time. As the wave spreads the intensity of noise diminishes as
the fixed amount of energy is spread over an increasing surface area of the sphere.
The assumption of the model is based on point source relationship i.e. for every
doubling of the distance of noise levels are decreased by 6 dB(A). Point source
propagation is defined by the following equation.
Lp2=LP1-20 log R2/R1
Where, Lp1 and LP2 are sound pressure levels at points located at distances R1 and
R2 respectively from the source.
The noise levels were predicted considering operation of high noise generating
machinery within the lease area. The predictions are carried out without considering
any attenuation in noise levels due to noise barriers such as plantation, etc. In order
to assess the impacts on nearby habitation due to mining, Noise modelling has been
carried out using Dhwani Software and the results are presented below in Table-1.
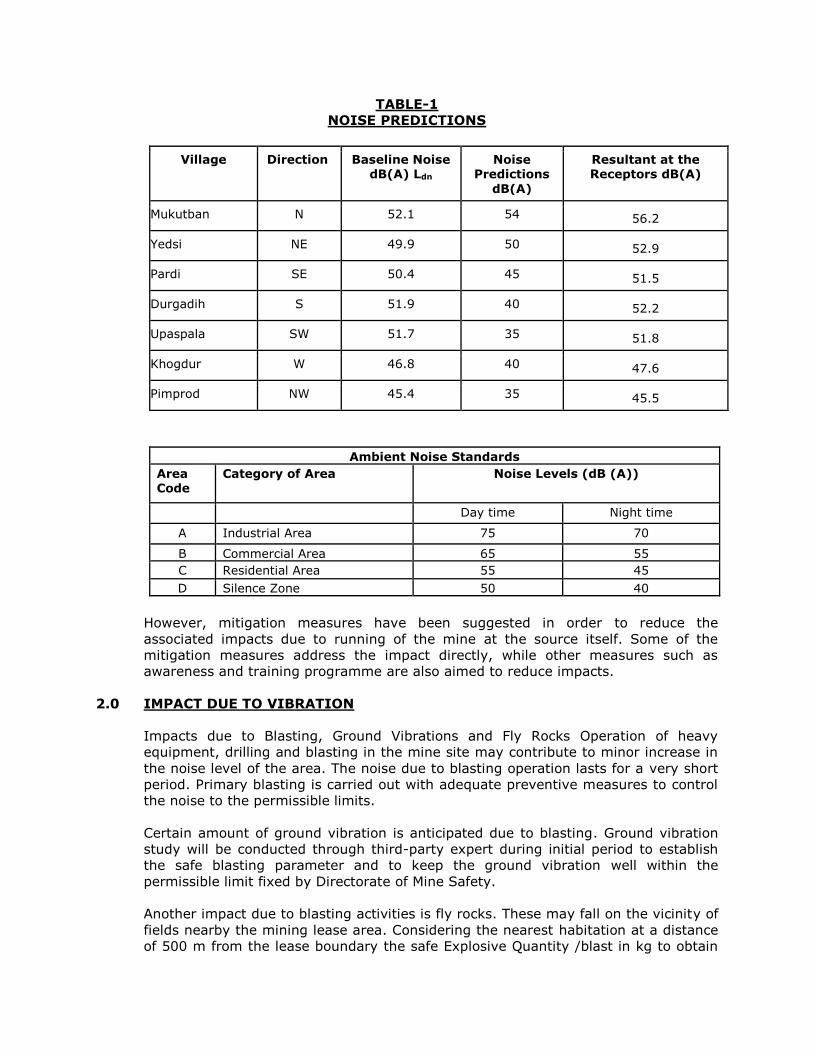
TABLE-1
NOISE PREDICTIONS
Village Direction Baseline Noise dB(A) Ldn
Noise Predictions
dB(A)
Resultant at the Receptors dB(A)
Mukutban N 52.1 54 56.2
Yedsi NE 49.9 50 52.9
Pardi SE 50.4 45 51.5
Durgadih S 51.9 40 52.2
Upaspala SW 51.7 35 51.8
Khogdur W 46.8 40 47.6
Pimprod NW 45.4 35 45.5
Ambient Noise Standards
Area Code
Category of Area Noise Levels (dB (A))
Day time Night time
A Industrial Area 75 70
B Commercial Area 65 55
C Residential Area 55 45
D Silence Zone 50 40
However, mitigation measures have been suggested in order to reduce the
associated impacts due to running of the mine at the source itself. Some of the
mitigation measures address the impact directly, while other measures such as
awareness and training programme are also aimed to reduce impacts.
2.0 IMPACT DUE TO VIBRATION
Impacts due to Blasting, Ground Vibrations and Fly Rocks Operation of heavy
equipment, drilling and blasting in the mine site may contribute to minor increase in
the noise level of the area. The noise due to blasting operation lasts for a very short
period. Primary blasting is carried out with adequate preventive measures to control
the noise to the permissible limits.
Certain amount of ground vibration is anticipated due to blasting. Ground vibration
study will be conducted through third-party expert during initial period to establish
the safe blasting parameter and to keep the ground vibration well within the
permissible limit fixed by Directorate of Mine Safety.
Another impact due to blasting activities is fly rocks. These may fall on the vicinity of
fields nearby the mining lease area. Considering the nearest habitation at a distance
of 500 m from the lease boundary the safe Explosive Quantity /blast in kg to obtain
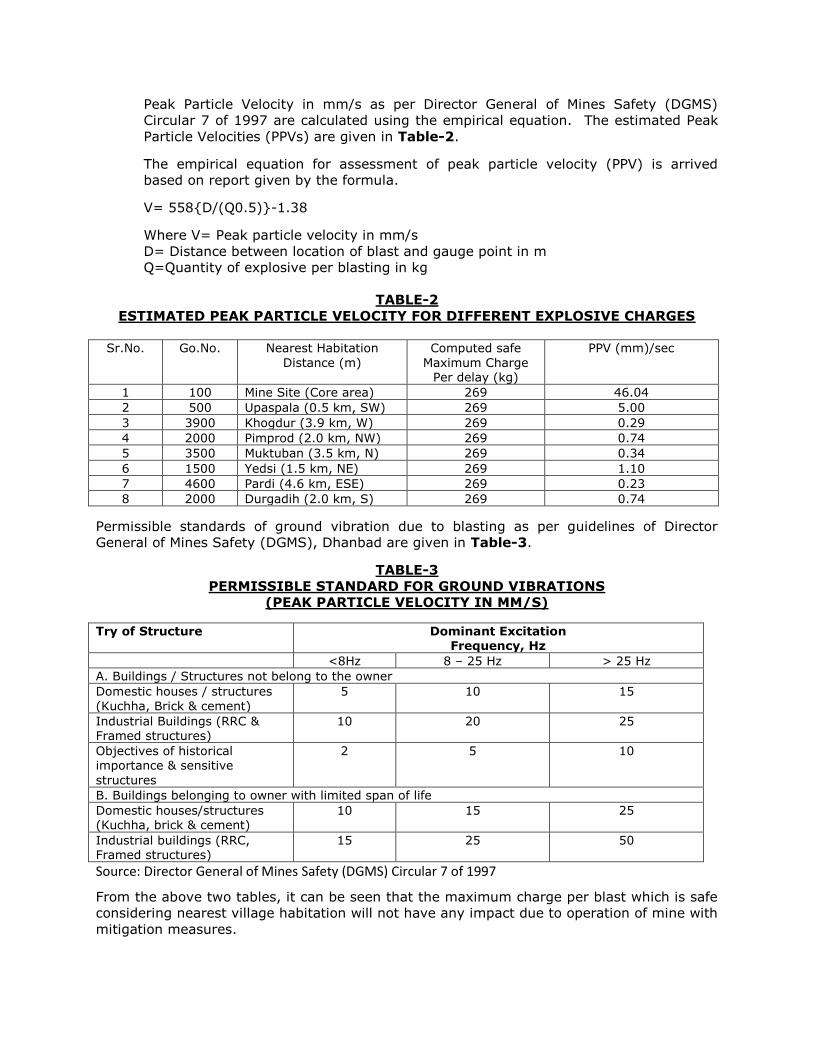
Peak Particle Velocity in mm/s as per Director General of Mines Safety (DGMS)
Circular 7 of 1997 are calculated using the empirical equation. The estimated Peak
Particle Velocities (PPVs) are given in Table-2.
The empirical equation for assessment of peak particle velocity (PPV) is arrived
based on report given by the formula.
V= 558D/(Q0.5)-1.38
Where V= Peak particle velocity in mm/s
D= Distance between location of blast and gauge point in m
Q=Quantity of explosive per blasting in kg
TABLE-2
ESTIMATED PEAK PARTICLE VELOCITY FOR DIFFERENT EXPLOSIVE CHARGES
Sr.No. Go.No. Nearest Habitation
Distance (m)
Computed safe
Maximum Charge Per delay (kg)
PPV (mm)/sec
1 100 Mine Site (Core area) 269 46.04
2 500 Upaspala (0.5 km, SW) 269 5.00
3 3900 Khogdur (3.9 km, W) 269 0.29
4 2000 Pimprod (2.0 km, NW) 269 0.74
5 3500 Muktuban (3.5 km, N) 269 0.34
6 1500 Yedsi (1.5 km, NE) 269 1.10
7 4600 Pardi (4.6 km, ESE) 269 0.23
8 2000 Durgadih (2.0 km, S) 269 0.74
Permissible standards of ground vibration due to blasting as per guidelines of Director
General of Mines Safety (DGMS), Dhanbad are given in Table-3.
TABLE-3
PERMISSIBLE STANDARD FOR GROUND VIBRATIONS
(PEAK PARTICLE VELOCITY IN MM/S)
Try of Structure Dominant Excitation Frequency, Hz
<8Hz 8 – 25 Hz > 25 Hz
A. Buildings / Structures not belong to the owner
Domestic houses / structures
(Kuchha, Brick & cement)
5 10 15
Industrial Buildings (RRC & Framed structures)
10 20 25
Objectives of historical importance & sensitive
structures
2 5 10
B. Buildings belonging to owner with limited span of life
Domestic houses/structures (Kuchha, brick & cement)
10 15 25
Industrial buildings (RRC, Framed structures)
15 25 50
Source: Director General of Mines Safety (DGMS) Circular 7 of 1997
From the above two tables, it can be seen that the maximum charge per blast which is safe
considering nearest village habitation will not have any impact due to operation of mine with
mitigation measures.

Apart from this, additional control measures like wet drilling, avoiding blasting during high
wind speed and development of green belt within the safety barrier of the mine will ensure
that there is no impact of blasting activity in the mine area over the habitation.
Annexure-5
Periodic Monitoring Plan
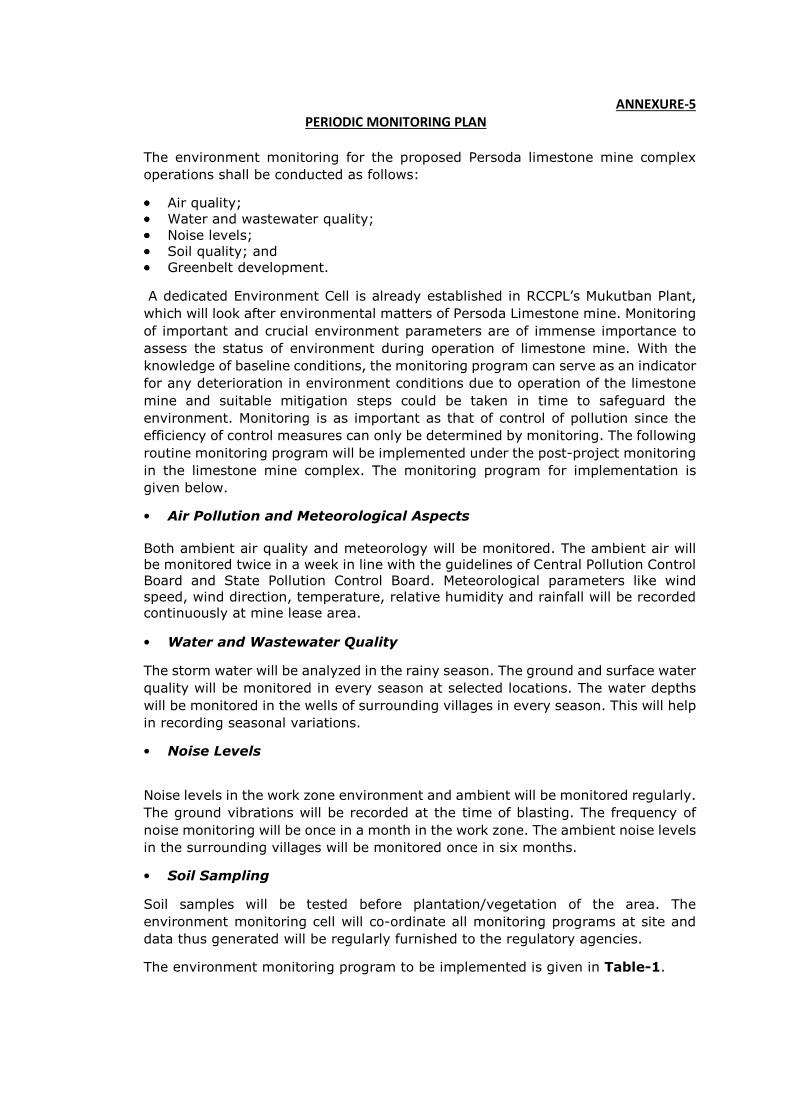
ANNEXURE-5
PERIODIC MONITORING PLAN
The environment monitoring for the proposed Persoda limestone mine complex
operations shall be conducted as follows:
•••• Air quality;
•••• Water and wastewater quality;
•••• Noise levels;
•••• Soil quality; and
•••• Greenbelt development.
A dedicated Environment Cell is already established in RCCPL’s Mukutban Plant,
which will look after environmental matters of Persoda Limestone mine. Monitoring
of important and crucial environment parameters are of immense importance to
assess the status of environment during operation of limestone mine. With the
knowledge of baseline conditions, the monitoring program can serve as an indicator
for any deterioration in environment conditions due to operation of the limestone
mine and suitable mitigation steps could be taken in time to safeguard the
environment. Monitoring is as important as that of control of pollution since the
efficiency of control measures can only be determined by monitoring. The following
routine monitoring program will be implemented under the post-project monitoring
in the limestone mine complex. The monitoring program for implementation is
given below.
• Air Pollution and Meteorological Aspects
Both ambient air quality and meteorology will be monitored. The ambient air will
be monitored twice in a week in line with the guidelines of Central Pollution Control
Board and State Pollution Control Board. Meteorological parameters like wind
speed, wind direction, temperature, relative humidity and rainfall will be recorded
continuously at mine lease area.
• Water and Wastewater Quality
The storm water will be analyzed in the rainy season. The ground and surface water
quality will be monitored in every season at selected locations. The water depths
will be monitored in the wells of surrounding villages in every season. This will help
in recording seasonal variations.
• Noise Levels
Noise levels in the work zone environment and ambient will be monitored regularly.
The ground vibrations will be recorded at the time of blasting. The frequency of
noise monitoring will be once in a month in the work zone. The ambient noise levels
in the surrounding villages will be monitored once in six months.
• Soil Sampling
Soil samples will be tested before plantation/vegetation of the area. The
environment monitoring cell will co-ordinate all monitoring programs at site and
data thus generated will be regularly furnished to the regulatory agencies.
The environment monitoring program to be implemented is given in Table-1.
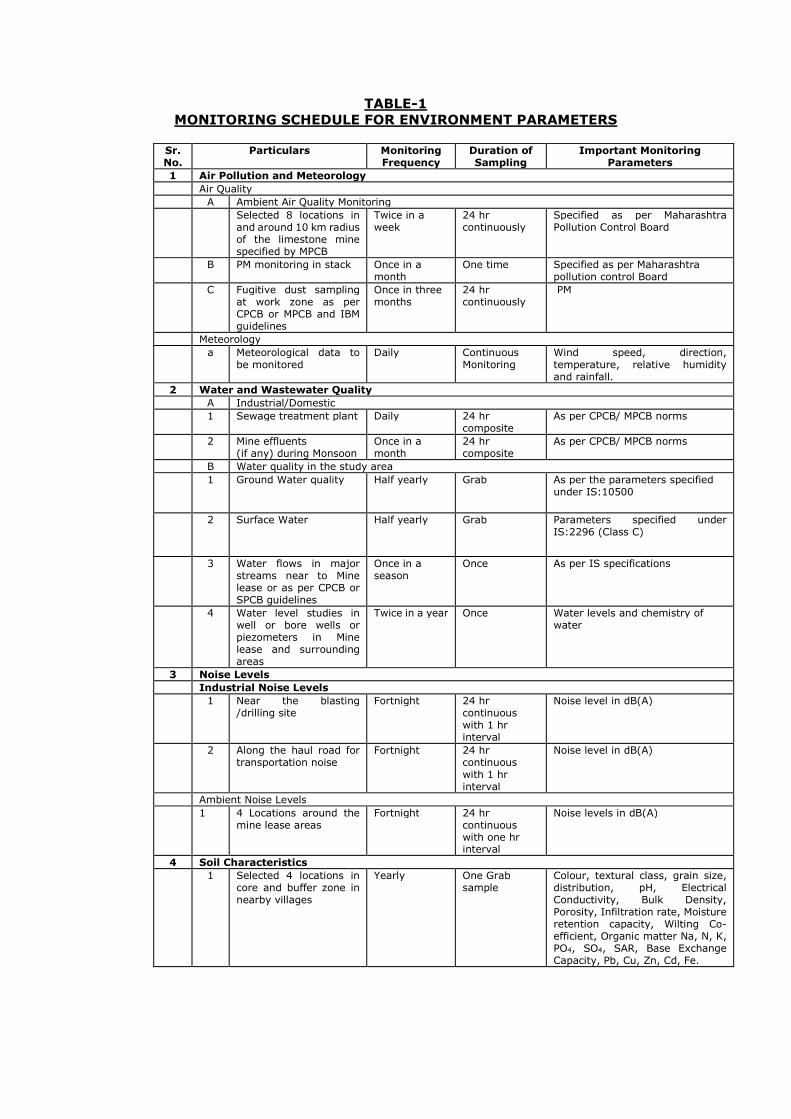
TABLE-1
MONITORING SCHEDULE FOR ENVIRONMENT PARAMETERS
Sr. No.
Particulars Monitoring Frequency
Duration of Sampling
Important Monitoring Parameters
1 Air Pollution and Meteorology
Air Quality
A Ambient Air Quality Monitoring
Selected 8 locations in and around 10 km radius of the limestone mine specified by MPCB
Twice in a week
24 hr continuously
Specified as per Maharashtra Pollution Control Board
B PM monitoring in stack Once in a month
One time Specified as per Maharashtra pollution control Board
C Fugitive dust sampling at work zone as per CPCB or MPCB and IBM guidelines
Once in three months
24 hr continuously
PM
Meteorology
a Meteorological data to be monitored
Daily Continuous Monitoring
Wind speed, direction, temperature, relative humidity and rainfall.
2 Water and Wastewater Quality
A Industrial/Domestic
1 Sewage treatment plant Daily 24 hr composite
As per CPCB/ MPCB norms
2 Mine effluents (if any) during Monsoon
Once in a month
24 hr composite
As per CPCB/ MPCB norms
B Water quality in the study area
1 Ground Water quality
Half yearly
Grab
As per the parameters specified under IS:10500
2
Surface Water Half yearly Grab Parameters specified under IS:2296 (Class C)
3 Water flows in major streams near to Mine lease or as per CPCB or SPCB guidelines
Once in a season
Once As per IS specifications
4 Water level studies in well or bore wells or piezometers in Mine lease and surrounding areas
Twice in a year Once Water levels and chemistry of water
3 Noise Levels
Industrial Noise Levels
1 Near the blasting /drilling site
Fortnight 24 hr continuous with 1 hr interval
Noise level in dB(A)
2 Along the haul road for transportation noise
Fortnight 24 hr continuous with 1 hr interval
Noise level in dB(A)
Ambient Noise Levels
1 4 Locations around the mine lease areas
Fortnight 24 hr continuous with one hr interval
Noise levels in dB(A)
4 Soil Characteristics
1
Selected 4 locations in core and buffer zone in nearby villages
Yearly One Grab sample
Colour, textural class, grain size, distribution, pH, Electrical Conductivity, Bulk Density, Porosity, Infiltration rate, Moisture retention capacity, Wilting Co-efficient, Organic matter Na, N, K, PO4, SO4, SAR, Base Exchange Capacity, Pb, Cu, Zn, Cd, Fe.

Annexure-6
Use of Explosives
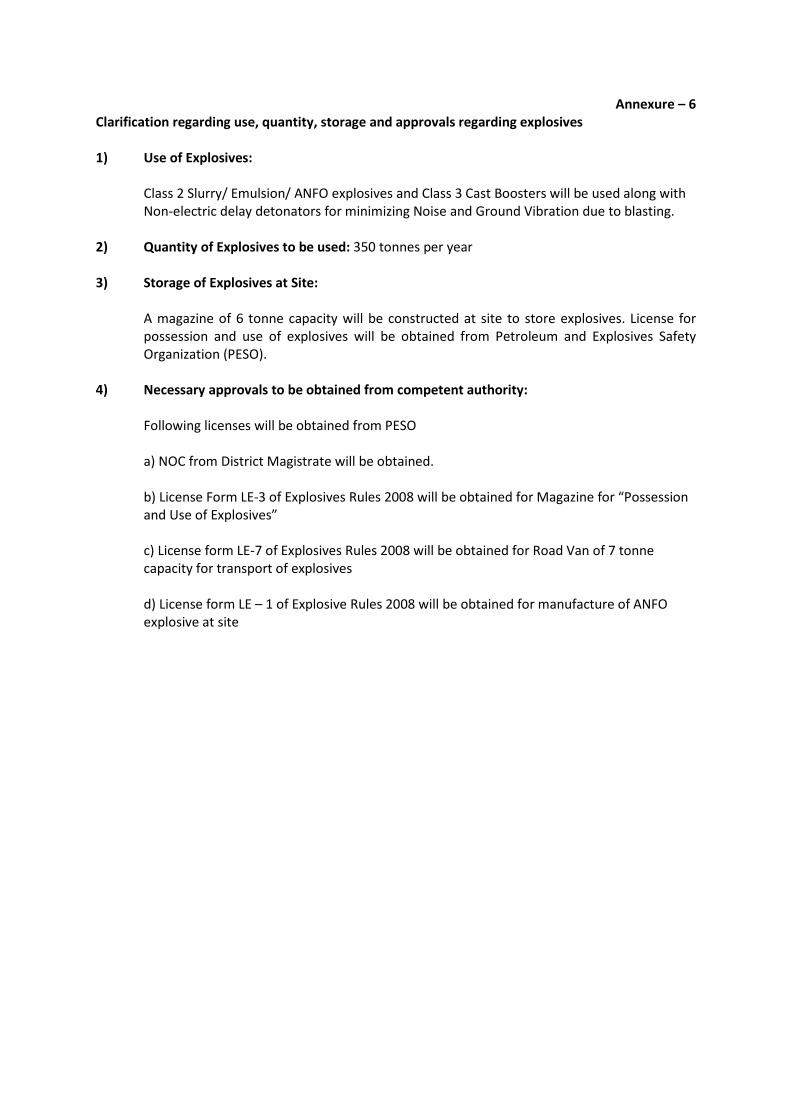
Annexure – 6
Clarification regarding use, quantity, storage and approvals regarding explosives
1) Use of Explosives:
Class 2 Slurry/ Emulsion/ ANFO explosives and Class 3 Cast Boosters will be used along with
Non-electric delay detonators for minimizing Noise and Ground Vibration due to blasting.
2) Quantity of Explosives to be used: 350 tonnes per year
3) Storage of Explosives at Site:
A magazine of 6 tonne capacity will be constructed at site to store explosives. License for
possession and use of explosives will be obtained from Petroleum and Explosives Safety
Organization (PESO).
4) Necessary approvals to be obtained from competent authority:
Following licenses will be obtained from PESO
a) NOC from District Magistrate will be obtained.
b) License Form LE-3 of Explosives Rules 2008 will be obtained for Magazine for “Possession
and Use of Explosives”
c) License form LE-7 of Explosives Rules 2008 will be obtained for Road Van of 7 tonne
capacity for transport of explosives
d) License form LE – 1 of Explosive Rules 2008 will be obtained for manufacture of ANFO
explosive at site

Annexure-7
Letter from PCCF and Chief Wildlife Warden
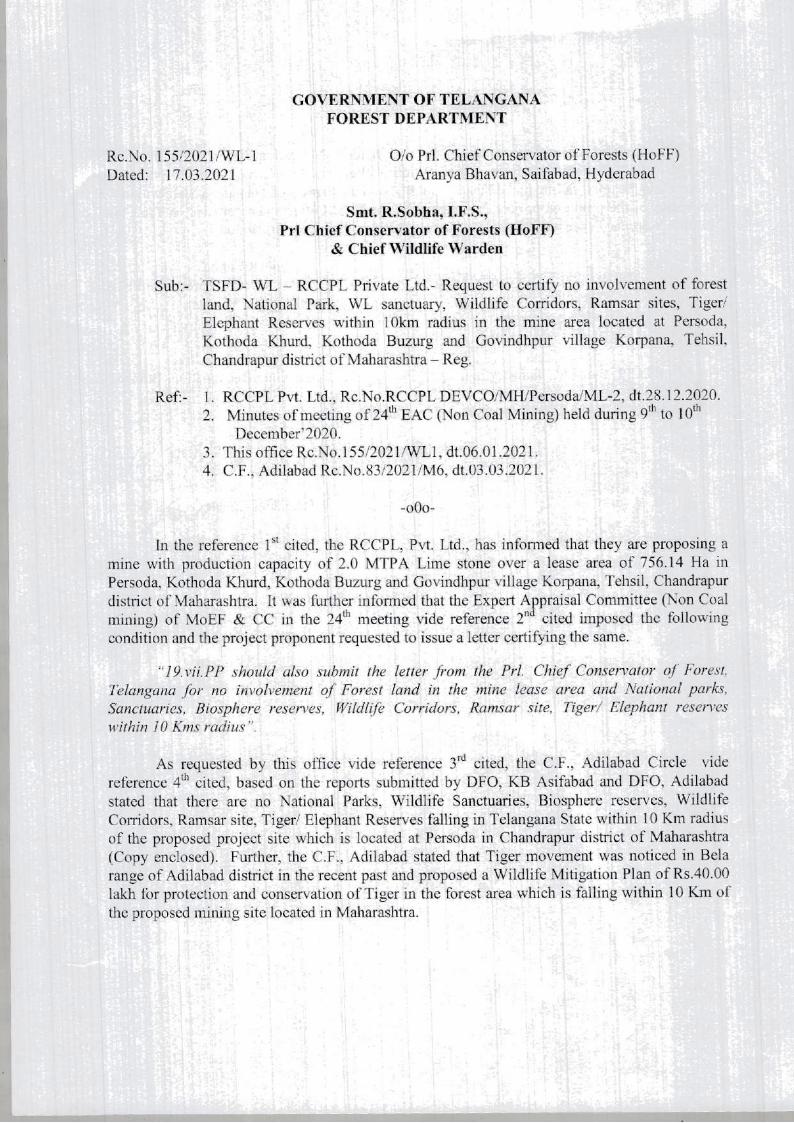
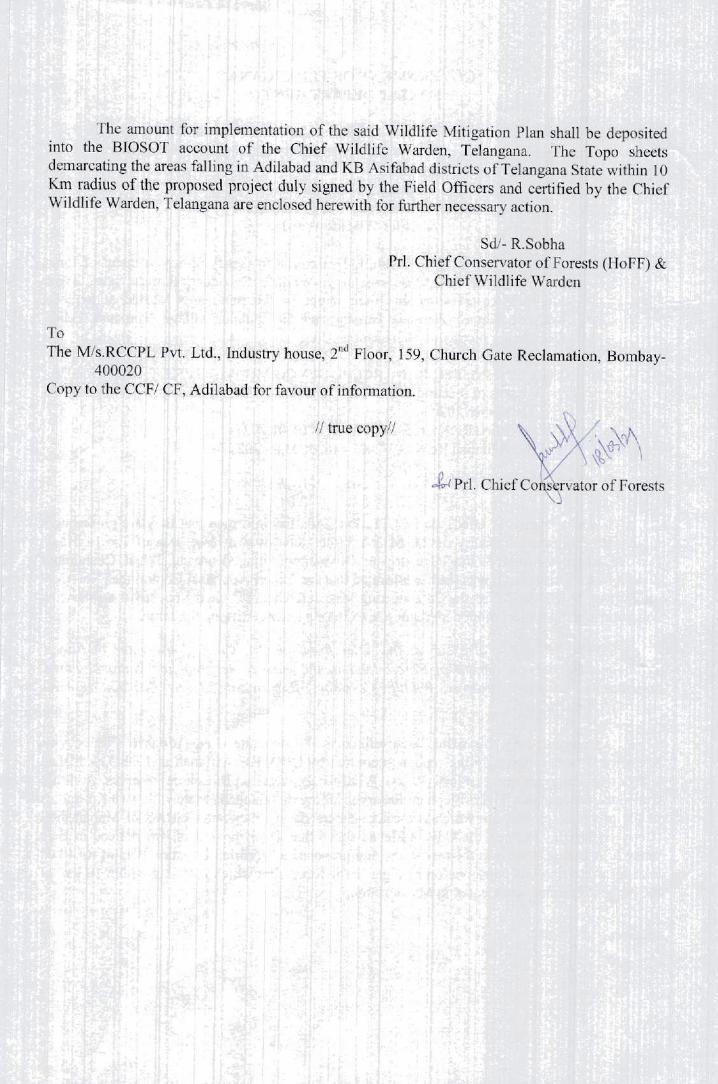

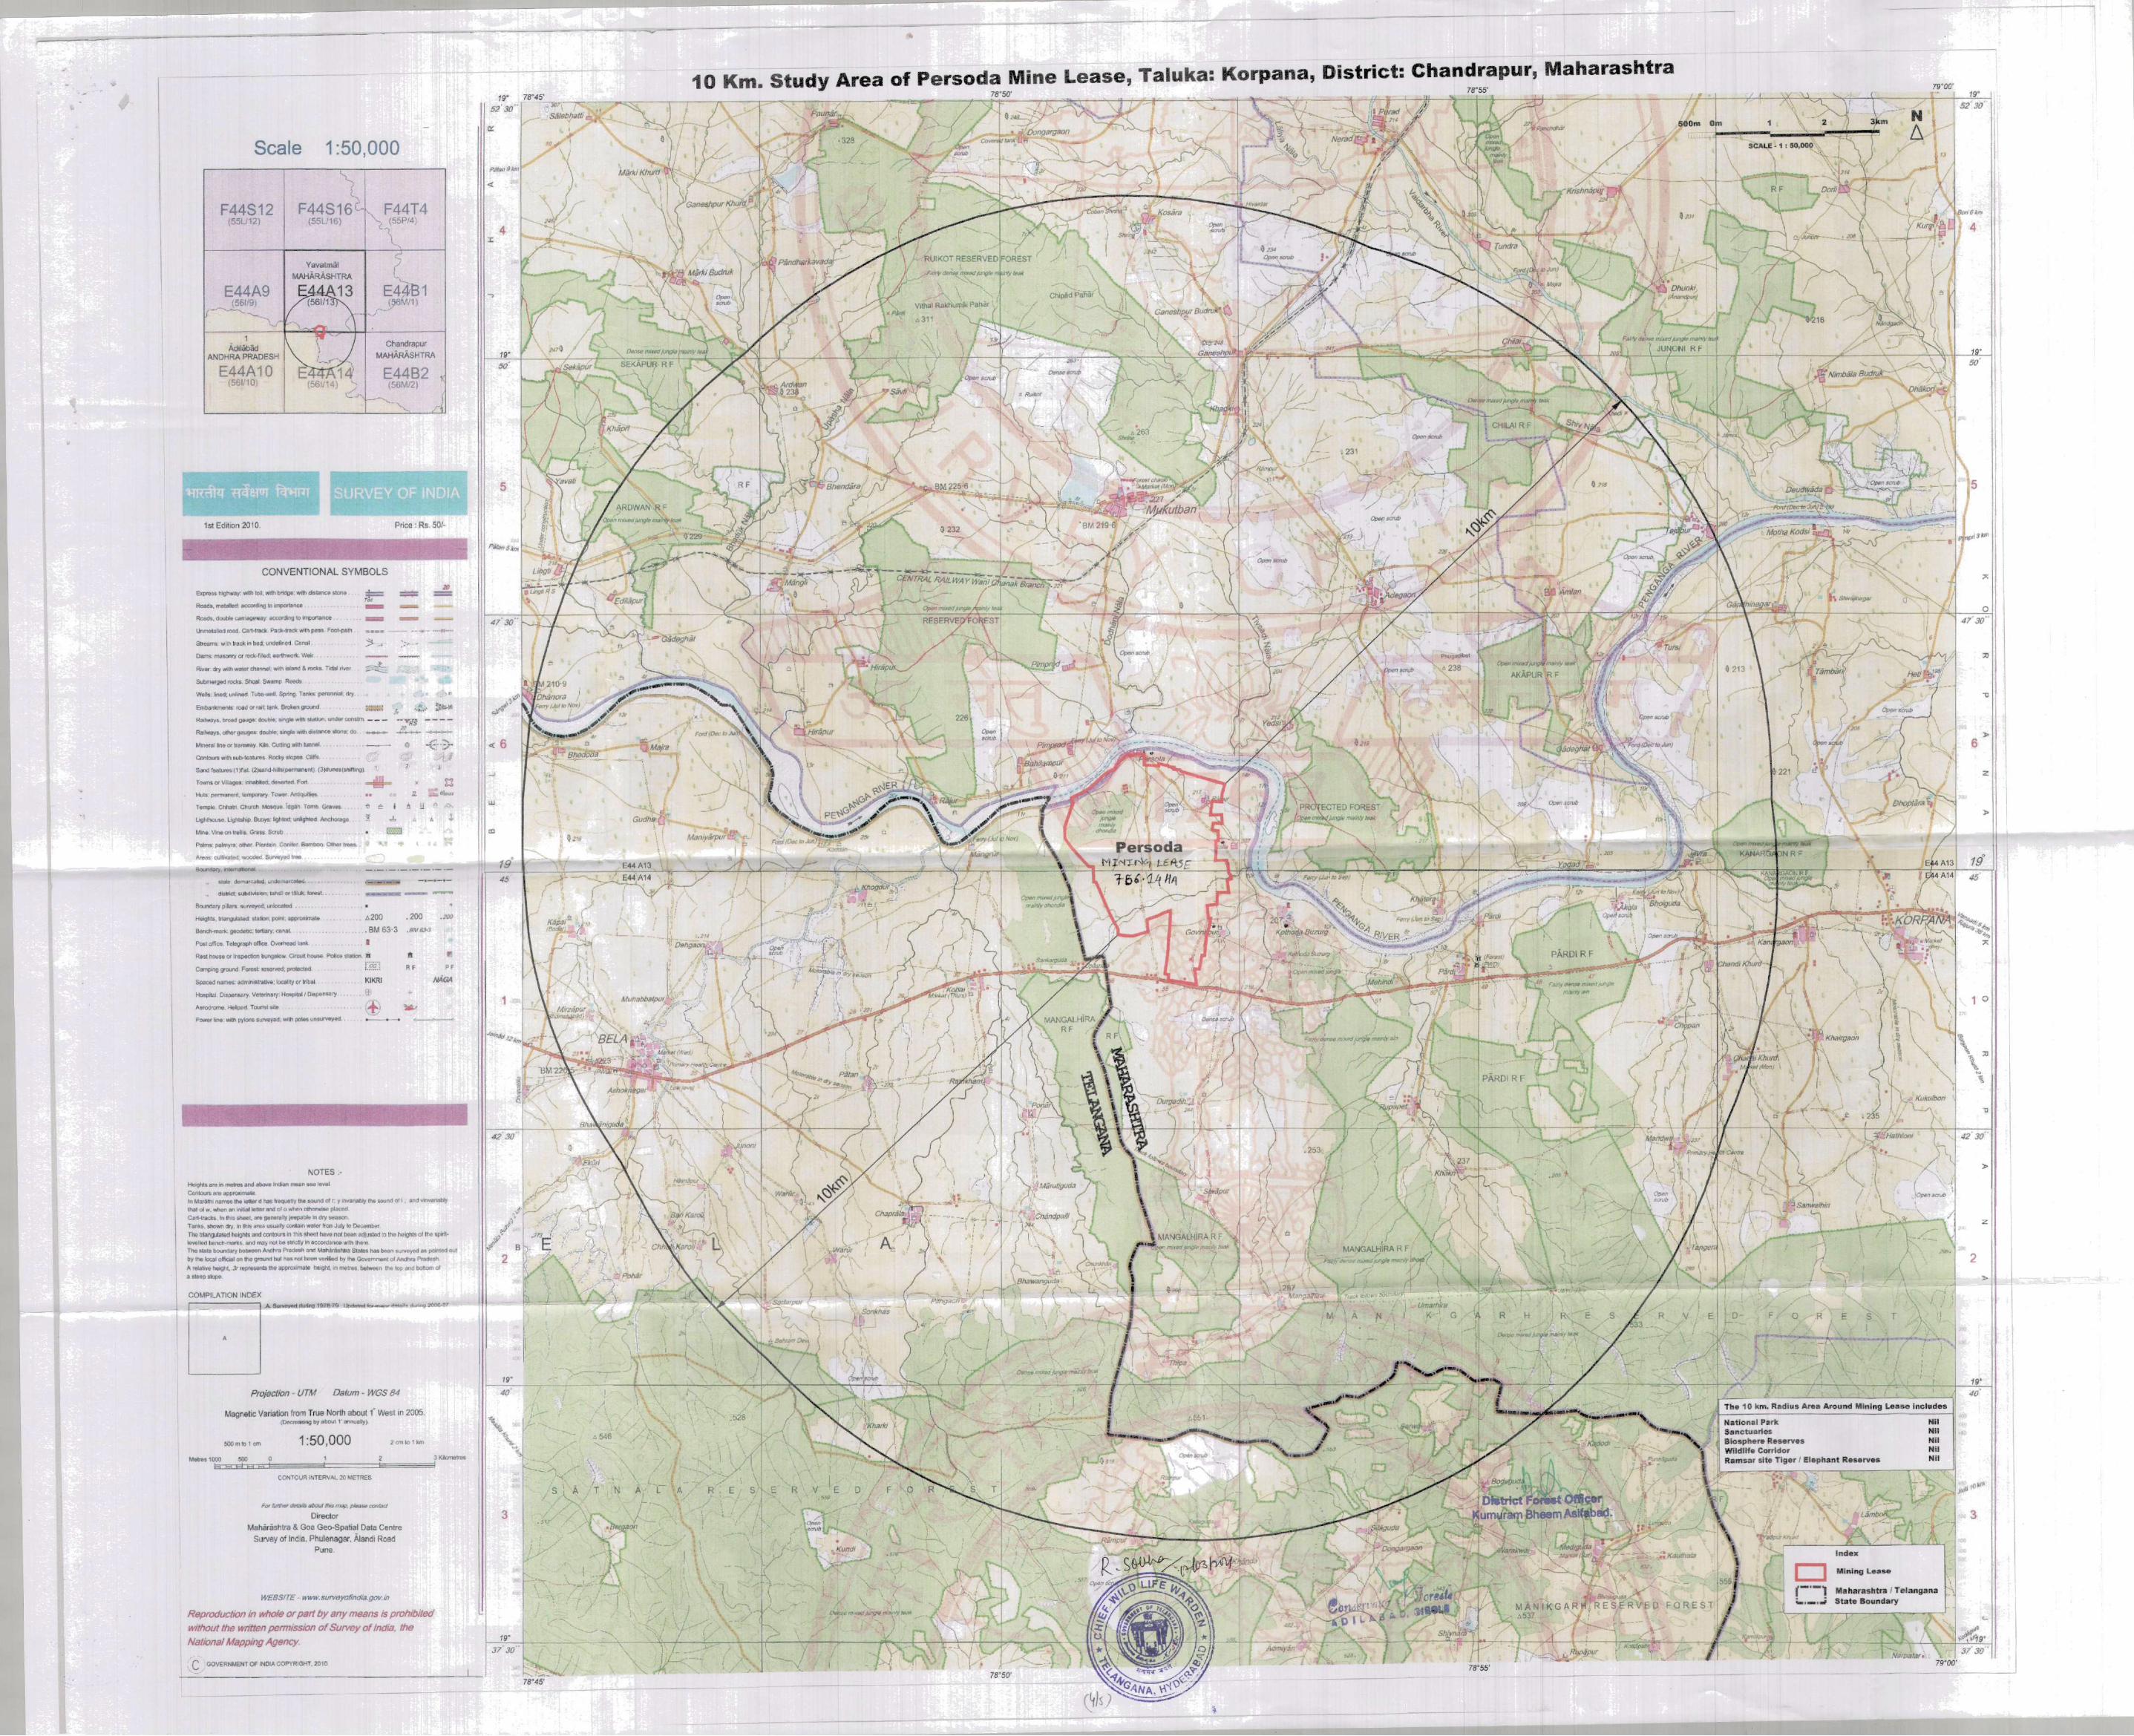

Annexure-8
Undertaking Letter


Annexure-9
LOI Extension Letter
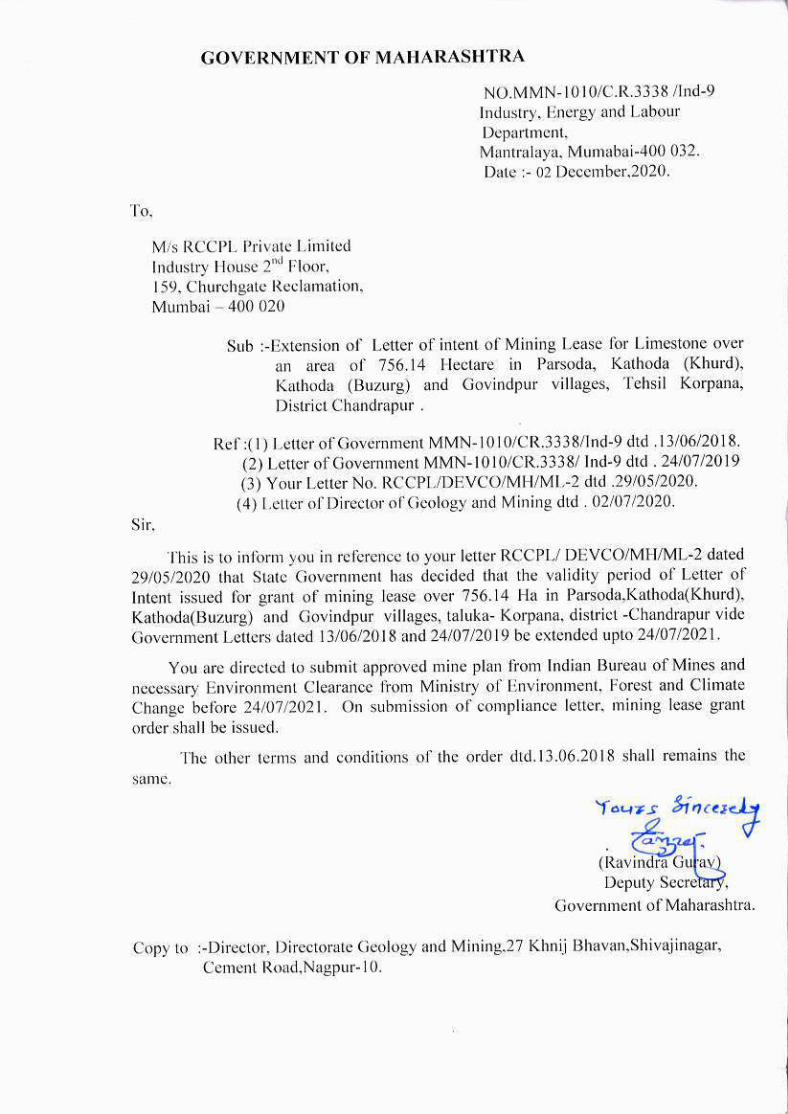

Annexure-10
Impact of Crusher Operation
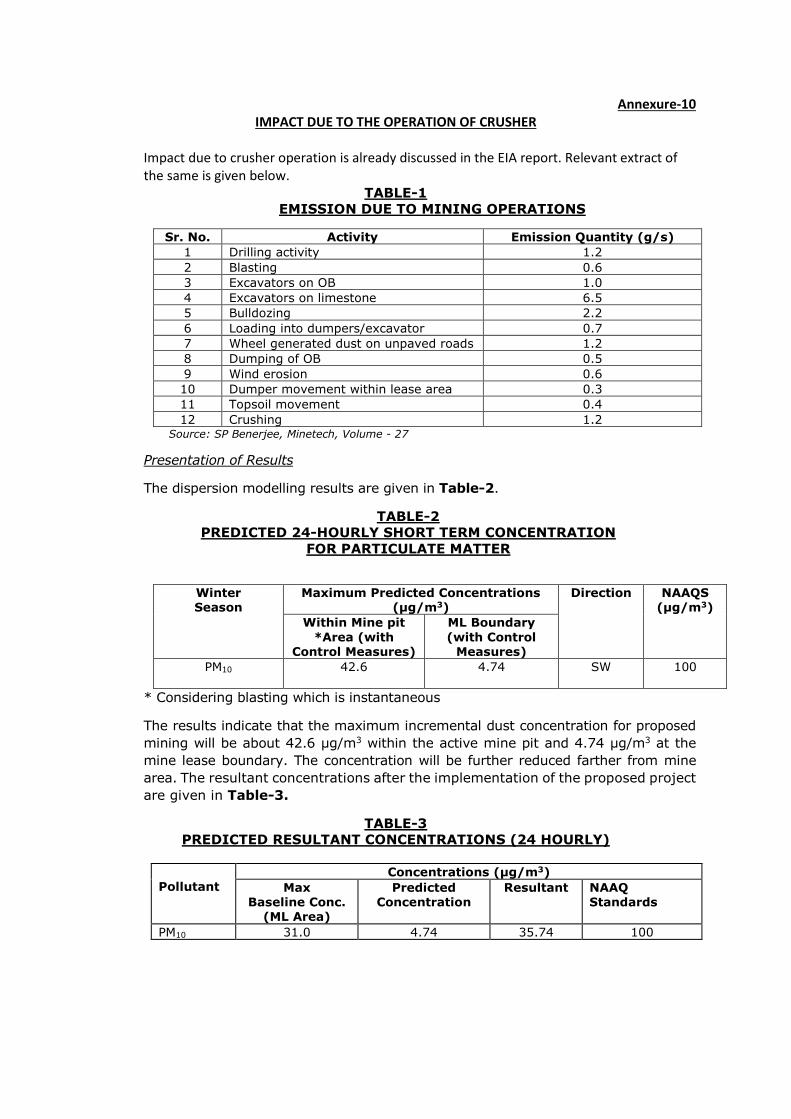
Annexure-10
IMPACT DUE TO THE OPERATION OF CRUSHER
Impact due to crusher operation is already discussed in the EIA report. Relevant extract of
the same is given below.
TABLE-1
EMISSION DUE TO MINING OPERATIONS
Sr. No. Activity Emission Quantity (g/s)
1 Drilling activity 1.2
2 Blasting 0.6
3 Excavators on OB 1.0
4 Excavators on limestone 6.5
5 Bulldozing 2.2
6 Loading into dumpers/excavator 0.7
7 Wheel generated dust on unpaved roads 1.2
8 Dumping of OB 0.5
9 Wind erosion 0.6
10 Dumper movement within lease area 0.3
11 Topsoil movement 0.4
12 Crushing 1.2 Source: SP Benerjee, Minetech, Volume - 27
Presentation of Results
The dispersion modelling results are given in Table-2.
TABLE-2
PREDICTED 24-HOURLY SHORT TERM CONCENTRATION
FOR PARTICULATE MATTER
Winter Season
Maximum Predicted Concentrations (µg/m3)
Direction NAAQS (µg/m3)
Within Mine pit
*Area (with Control Measures)
ML Boundary
(with Control Measures)
PM10 42.6 4.74 SW 100
* Considering blasting which is instantaneous
The results indicate that the maximum incremental dust concentration for proposed
mining will be about 42.6 µg/m3 within the active mine pit and 4.74 µg/m3 at the
mine lease boundary. The concentration will be further reduced farther from mine
area. The resultant concentrations after the implementation of the proposed project
are given in Table-3.
TABLE-3
PREDICTED RESULTANT CONCENTRATIONS (24 HOURLY)
Pollutant
Concentrations (µg/m3)
Max Baseline Conc.
(ML Area)
Predicted Concentration
Resultant NAAQ Standards
PM10 31.0 4.74 35.74 100

TABLE-4
IMPACT ON NEAREST HABITATION (1.0 KM)
(Expressed in µg/m3)
Sr. No. Village Name (Nearest AAQ
Station)
AAQ (PM10) Resultant Concentrations
NAAQ Norms
Predicted
GLCs Resultant
Conc.
1 Persoda (AAQ1) 31.00 4.74 35.74
100
2 Raipur near AAQ6, 1.5 km, NE )
34.60 0.53 35.13
3
Kothodakhurd – nearest location Upaspala (AAQ2 0.5 km, SW)
27.60
3.82 31.44
4 Govindpur nearest location Upaspala (AAQ2 0.5 km, SW)
27.60 4.74 32.34
TABLE-5
IMPACT ON HABITATION IN STUDY AREA REPRESENTING 10 KM RADIUS
(Expressed in µg/m3)
Sr. No.
Village Name
Distance/ Direction
AAQ (PM10)
Predicted GLCs
Resultant Concentrations
NAAQ Norms
1 Mine Site
(boundary) - 31.0 4.74 35.7
100
2 Upaspala 0.5 km, SW 27.6 9.73 37.3
3 Khogdur 3.9 km, W 27.5 4.74 32.2
4 Pimprod 2.0 km, NW 41.3 0.50 41.8
5 Muktuban 3.5 km, N 47.7 0.50 48.2
6 Yedsi 1.5 km, NE 34.6 1.00 35.6
7 Pardi 4.6 km, ESE 24.9 0.50 25.4
8 Durgadih 2.0 km, S 34.3 4.74 39.0
TABLE-6
IMPACTS OF MINING ON AIR QUALITY NEAR SENSITIVE AREAS
(Expressed in µg/m3)
Sr. No. Title Distance (km)
from ML
Baseline (PM10)
Predicted GLCs
Resultant Concentr
ation
NAAQS 2009
1 Mangalhira RF 0.8, SW 34.6 4.74 39.3 100
2 PF near Yedsi 0.8, E 34.6 1.00 35.6
3 RF near Pimprod 1.7, NW 41.3 4.74 46.0
4 Pardi RF 4.4, E 24.9 1.00 25.9
5 Akapur RF 4.8, NE 47.7 0.50 48.2
6 Ruikot RF 6.2, N 47.7 0.50 48.2
7 Manikgarh RF 6.2, SSE 24.9 1.10 26.0
8 Satnala RF 6.3, S 34.3 1.10 35.4
9 Chilai RF 6.6, N 47.7 0.50 48.2
10 Ardwan RF 7.8, NW 41.3 0.50 41.8
11 Kannargoan RF 8.8, E 24.9 0.50 25.4
12 Sekarpur RF 9.5, NW 27.5 0.10 27.6

Risk Management Measures:
Dust is the major widespread significant hazard during crushing. Airborne rock dust
can cause serious lung disease, as well as giving rise to visibility and environmental
problems. Lung diseases are caused by very fine particles known as respirable dust
that penetrate deep into the lung.
Bag filters, fog type water spraying system at feed hopper will be provided.
Elimination and isolation of harmful dust by engineering and administrative controls
and respiratory protection masks will be provided.

Annexure-11
Signed PH Participants
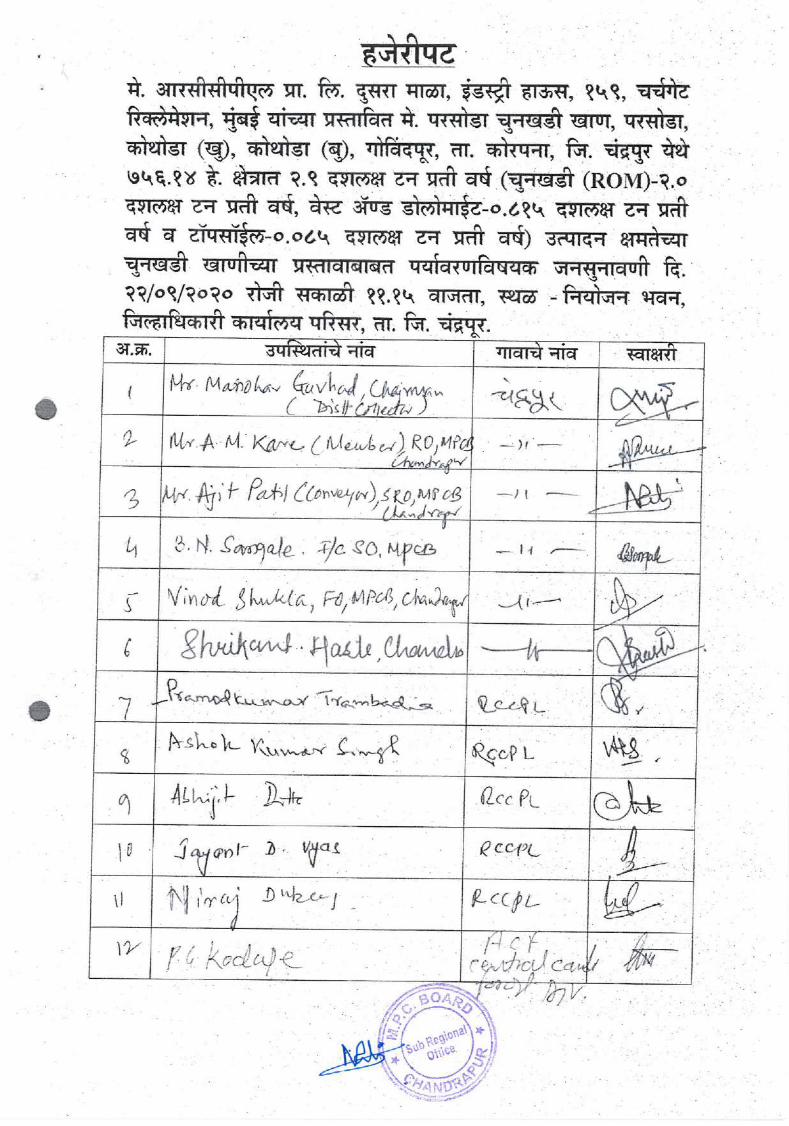
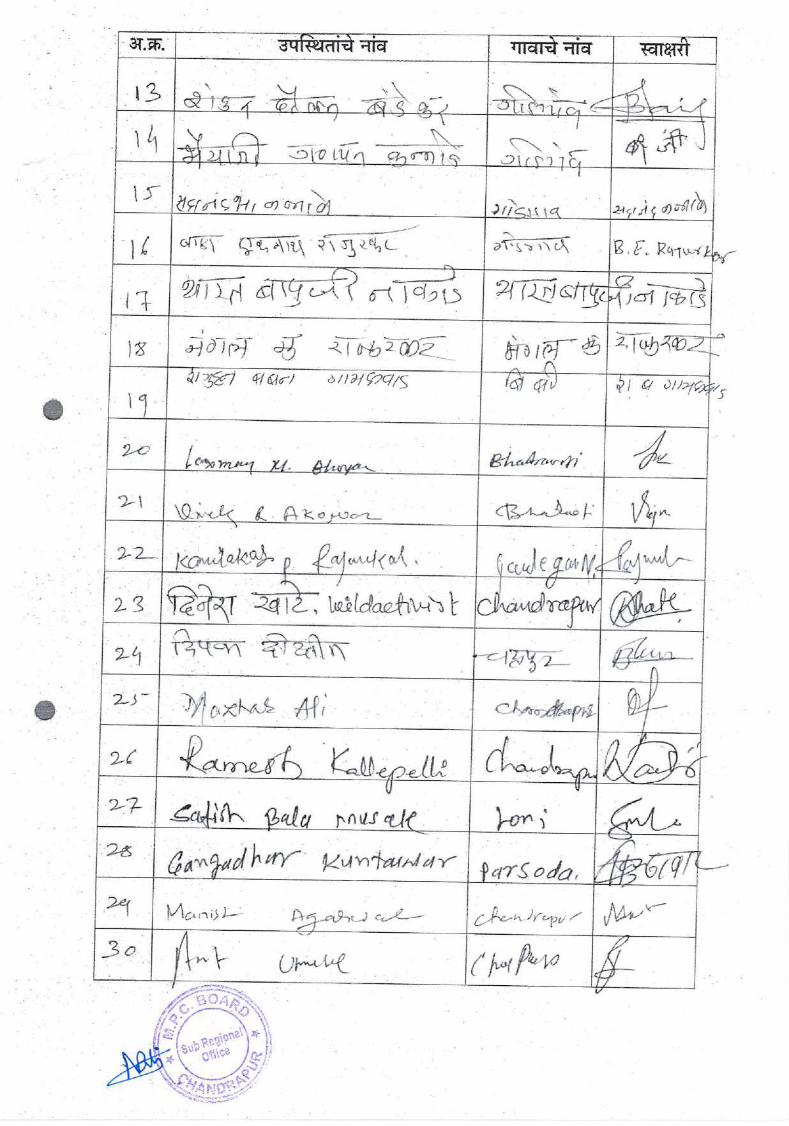


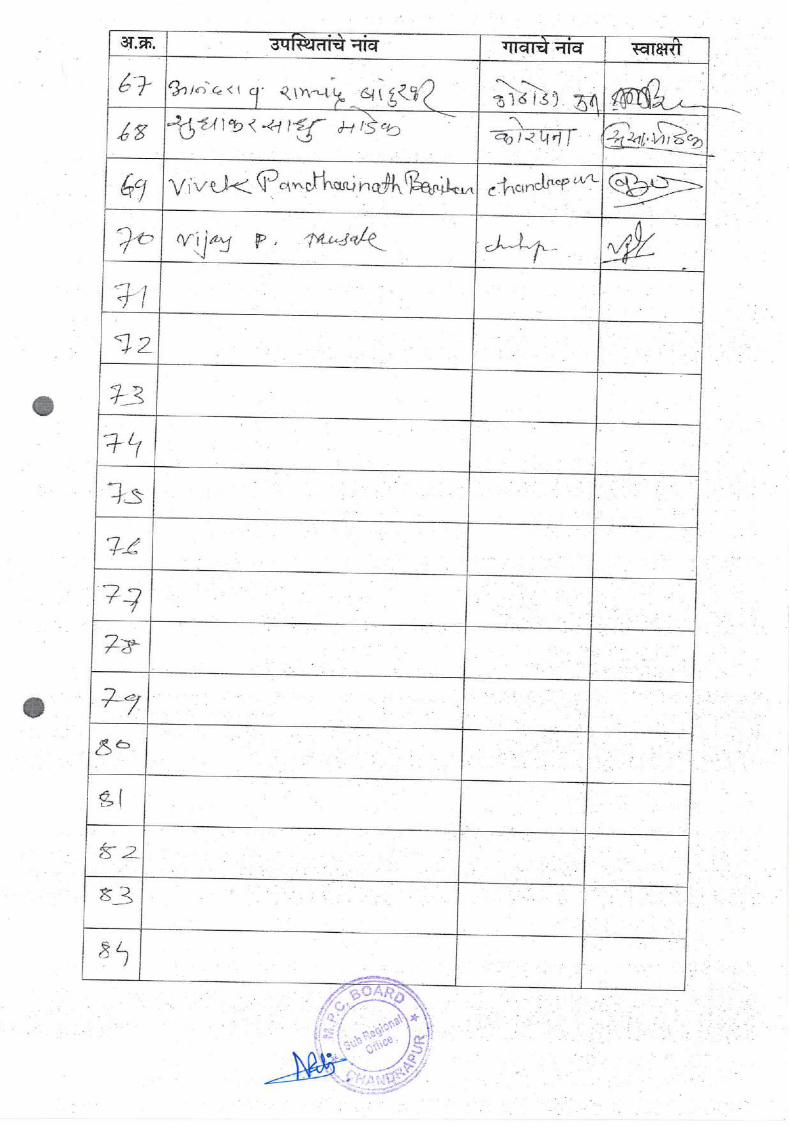

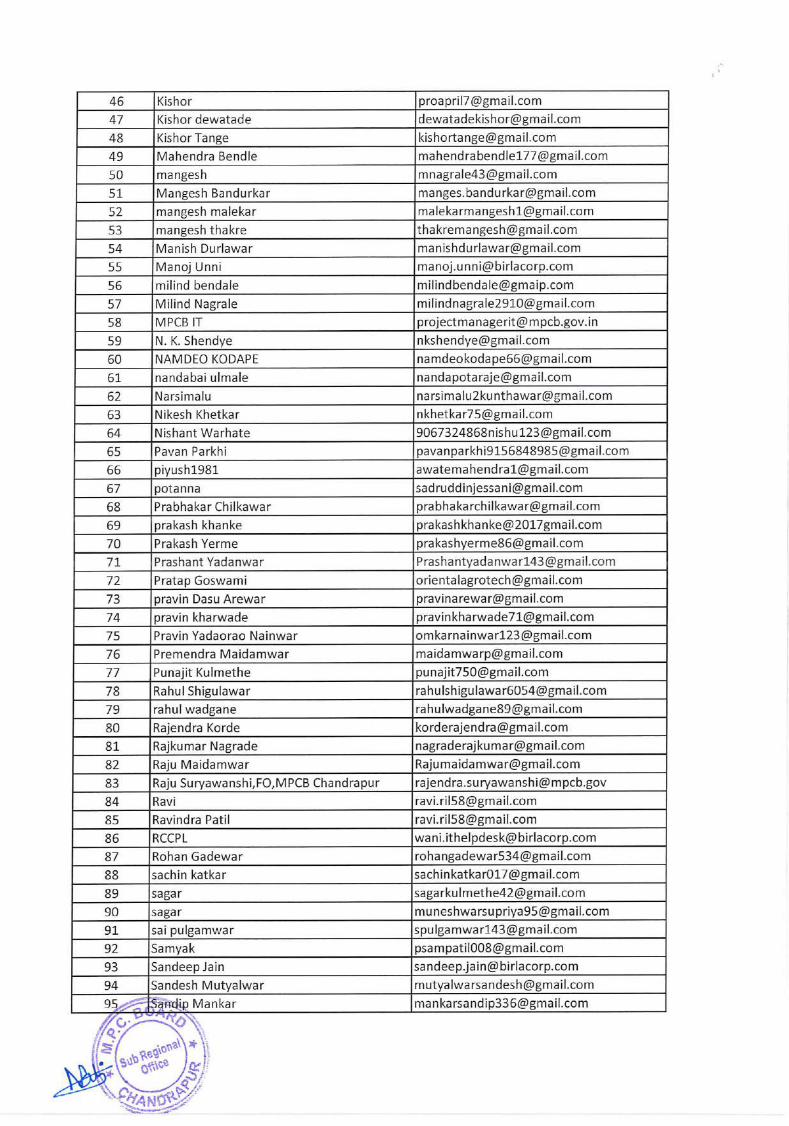


Annexure-12
Public Hearing Venue

Annexure – 12
Clarification Regarding Distance of Public Hearing Venue from the
Proposed Project
Maharashtra Pollution Control Board (MPCB) decided to hold the Public Hearing of
the project near Gram Panchayat office of village Persoda on 24/04/2020 in
consultation with District Collector, Chandrapur.
However, due to nationwide lockdown declared from 22/03/2020 for Covid-19
pandemic, the scheduled hearing had to be postponed.
Subsequently, MPCB in consultation with District Collector, Chandrapur decided to
hold public hearing for the said project on 22/09/2020 at Niyojan Bhavan,
Collector Office, Chandrapur, which is 87 Km by road from the project site.
The reason for changing the venue of public consultation from Gram Panchayat
Office, Persoda to Niyojan Bhavan, Collector Office, Dist: Chandrapur,
Maharashtra were as under:
• As per Covid-19 guidelines, large gathering in small place like Gram
Panchayat office was prohibited. It was mandatory necessity to follow the
Govt. guidelines of Covid-19.
• Ongoing rainy season
• Continuous rainfall in Persoda before the scheduled date
• Water logging around the Gram Panchayat Office, Persoda which might
restrict people for access to the venue
The MoEF&CC, Govt. of India issued an office memorandum no. F.no.22-25/2020-
IA.III dated 14/09/2020 which states that “Use of Virtual platform/online facilities
may also be employed in addition to the physical Public Hearing Process” as per
point no. 3(iii) of the said memorandum. To comply with this notification, Public
Hearing was conducted through online and offline mode at District Head Quarter,
Chandrapur. Online access to the participants was given through CISCO WEBEX
by the MPCB.

To facilitate the participation of project affected villages, RCCPL Private Limited
arranged laptop and high-speed internet facility so that local habitants could
participate in public consultation and could submit their comments/suggestions.
These arrangements were made at Gram Panchayat office at Persoda and Kothoda
Buzurg.
Few snapshots of arrangements at the Panchayat Office are given below:

Annexure-13
EMP Budget

Annexure – 13
Break-up of Environment Management Plan Budget
Description Initial Capital
Cost
(Rs in Lakhs)
Recurring Cost per
year
(Rs in Lakhs)
A Air Environment
Purchasing of AAQMS monitor 5 0.4
Dust suppression 10 0.4
CAQMS 54 0.4
Truck / vehicle washing system 5 0.4
Blasting monitoring equipment 1 0.4
Total (A) 75 2.0
B Water Environment
Garland drain construction 10 0.2
Embankment design and construction 25 0.4
Water meter installation 5 0.3
Piezometer installation 5 0.3
Oil and grease trap 5 0.3
Total (B) 50 1.5
C Greenbelt and Plantation Development
Purchase of saplings 25 0.4
Fencing and safety zone development and
maintenance
25 0.3
Water supply 25 0.1
Total (C) 75 1.5
D Grand Total of EMP Budget [A+B+C] 200 5.0
E CSR Activities 75 20


