Embed Size (px)
Citation preview

Title Rapamycin and CCI-779 inhibit the mammalian target ofrapamycin signalling in hepatocellular carcinoma
Author(s) Hui, ICF; Tung, EKK; Sze, KMF; Ching, YP; Ng, IOL
Citation Liver International, 2010, v. 30 n. 1, p. 65-75
Issue Date 2010
URL http://hdl.handle.net/10722/126709
Rights The definitive version is available atwww3.interscience.wiley.com

For Peer Review
Rapamycin and CCI-779 inhibit mammalian target of rapamycin (mTOR) signaling in hepatocellular carcinoma
Journal: Liver International
Manuscript ID: LIVint-09-00146
Manuscript Type: Original Articles
Date Submitted by the Author:
04-Mar-2009
Complete List of Authors: Hui, Ivan Chun-Fai; The University of Hong Kong, Pathology Tung, Edmund Kwok-Kwan; The University of Hong Kong,
Pathology Sze, Karen Man-Fong; The University of Hong Kong, Pathology Ching, Yick-Pang; The University of Hong Kong, Pathology Ng, Irene; The University of Hong Kong, Pathology
Keywords: mTOR, Rapamycin, CCI-779, tumour suppression, p70S6K, hepatocellular carcinoma
Liver International
For Peer Review
1
Rapamycin and CCI-779 inhibit mammalian target of rapamycin (mTOR) signaling in
hepatocellular carcinoma
Ivan Chun-Fai Hui, Edmund Kwok-Kwan Tung, Karen Man-Fong Sze, Yick-Pang Ching,
Irene Oi-Lin Ng#
Liver Cancer and Hepatitis Research Laboratory and S.H. Ho Foundation Research
Laboratories, Department of Pathology, LKS Faculty of Medicine, The University of Hong
Kong, Pokfulam, Hong Kong
#To whom correspondence should be addressed:
Prof. Irene O.L. Ng, Room 127B, University Pathology Building, Department of Pathology,
The University of Hong Kong, Queen Mary Hospital, Pokfulam, Hong Kong.
Tel: (852) 2855-3967; Fax: (852) 2872-5197; Email: [email protected]
Key words: mTOR, Rapamycin, CCI-779, tumour suppression, p70S6K, hepatocellular
carcinoma.
Financial support: The study was funded by an RGC Collaborative Research Fund (HKU
1/06C). IOL Ng is Loke Yew Professor in Pathology.
Page 1 of 31 Liver International
123456789101112131415161718192021222324252627282930313233343536373839404142434445464748495051525354555657585960

For Peer Review
2
Abstract
Background: Mammalian target of rapamycin (mTOR), which phosphorylates p70S6K and
4EBP1 and activates the protein translation process, is upregulated in cancers and its
activation may be involved in cancer development.
Aims: In this study, we investigated the tumour suppressive effects of rapamycin and its new
analog CCI-779 on HCC.
Methods: Rapamycin and its new analog CCI-779 were applied to treat HCC cells. Cell
proliferation, cell cycle profile and tumorigencity were analyzied.
Results: In human HCCs, we observed frequent (67%, 37/55) overexpression of mTOR
transcripts using real-time RT-PCR. Upon drug treatment, PLC/PRF/5 showed the greatest
reduction in cell proliferation using colony formation assay, as compared with HepG2, Hep3B,
and HLE. Rapamycin was a more potent anti-proliferative agent than CCI-779 in HCC cell
lines. Proliferation assays by cell counting revealed that the IC50 value of rapamycin was lower
than that of CCI-779 in PLC/PRF/5 cells. Furthermore, flow cytometric analysis showed that
both drugs could arrest HCC cells in G1 phase but did not induce apoptosis of these cells,
suggesting that these mTOR inhibitors are cytostatic rather than cytotoxic. Upon rapamycin
and CCI-779 treatment, the phosphorylation level of p70S6K in HCC cell lines was
significantly reduced, indicating that both drugs can suppress mTOR activity in HCC cells. In
addition, both drugs significantly inhibited the growth of xenografts of PLC/PRF/5 cells in
nude mice.
Conclusions: Our findings indicate that rapamycin and its clinical analog CCI-779 possess
tumour suppressive functions towards HCC cells.
Page 2 of 31Liver International
123456789101112131415161718192021222324252627282930313233343536373839404142434445464748495051525354555657585960
For Peer Review
3
Introduction
mTOR is a serine/threonine protein kinase of 289 kDa and sensitive to growth factors, amino
acids and energy status of the cell (1-3). It can be activated via the phosphatidylinositol
3-kinase (PI3K)/Akt pathway (3). The downstream targets of mTOR, p70 S6 kinase (p70S6K)
and eukaryotic initiation factor-4E binding protein (4EBP) are crucial for protein translation (1,
2). mTOR phosphorylates p70S6K at T389, and the activated p70S6K phosphorylates several
targets crucial for protein translation and RNA splicing. 4EBP1 binds and suppresses the
activity of eukaryotic initiation factor 4E (eIF4E), which recognizes the 5’-7-Me-GTP cap of
mRNAs for cap-dependent translation. When mTOR signaling is activated, multi-site
phosphorylation of 4EBP1 occurs and this releases eiF4E and activates protein translation
initiation. Reversely, mTOR inhibition leads to reduced protein synthesis (3).
Rapamycin is both immunosuppressive and tumour suppressive in nature. Apart from
inhibiting the activation and proliferation of T and B cells (3), rapamycin possesses tumour
suppressive effects against many human cancer cell lines such as breast cancer, prostate cancer
and renal cell carcinoma (4). Rapamycin binds to its intracellular receptor, FK506 binding
protein (FKBP12) (5), and subsequently this complex binds to mTOR (6, 7). After this ternary
complex is formed, the kinase activity of mTOR towards p70S6K and 4EBP is attenuated
(8-11). Besides regulating protein synthesis, mTOR signaling is important in cell cycle control,
as the expression of c-myc and different cyclins such as cyclin D1 was suppressed in the
presence of rapamycin (3). Also, mTOR inhibition brings about increased levels of p27, an
inhibitor of cell cycle progression from G1 to S phase (12, 13). p27 induction has been
implicated in the reduction of cell proliferation both in vitro and in vivo in response to
rapamycin and its analogues (13, 14).
Page 3 of 31 Liver International
123456789101112131415161718192021222324252627282930313233343536373839404142434445464748495051525354555657585960
For Peer Review
4
CCI-779, or temsirolimus, is an ester derivative of rapamycin (Wyeth, Pearl River, NY).
CCI-779 is more water soluble than rapamycin, and is a prodrug metabolized to rapamycin in
the body (15). Formulated for intravenous use, CCI-779 has been demonstrated to suppress the
growth of cancers such as breast cancer (16), multiple myeloma (17) and prostate cancer (18,
19) in preclinical models. Several clinical trials concerning this novel mTOR inhibitor, used
alone or in combination with other agents, have been performed. For instance, in phase III
clinical trials, CCI-779 was used alone in renal cell carcinoma (20); in breast cancer, the
inhibitor was used together with the oral non-steroidal aromatase inhibitor letrozole (21).
Hepatocellular carcinoma (HCC) is the fifth most common cancer worldwide and is the third
leading cause of cancer-related death (22). One of the current treatment modalities for HCC is
liver transplantation (23). Surgical resection of HCC is associated with a high rate of cancer
recurrence (as high as 70%) (24), either because of occult metastases which may also exist in
the remnant liver at the time of resection or because of second primary as a result of ‘field’
effect in the remnant liver. Therefore, total hepatectomy followed by liver transplantation is
considered a better option when the tumour is small and has not metastasized (25). At the same
time, to prevent rejection of the liver graft after liver transplantation, there is a need for
life-long immunosuppression by appropriate drugs such as FK506 (23).
It is therefore important to study drugs with both immunosuppressive and tumour suppressive
effects, and rapamycin and its analogs are good candidates for this purpose. Since mTOR
signaling is often activated in cancers (3, 15), the mTOR signaling in HCC was investigated in
this study, and its specific inhibitors, rapamycin and its clinical derivative, CCI-779, were
chosen for the investigation of their tumour suppressive effects on HCC in vitro and in vivo.
Page 4 of 31Liver International
123456789101112131415161718192021222324252627282930313233343536373839404142434445464748495051525354555657585960

For Peer Review
5
Materials and Methods
Patient samples
Paired samples of primary HCCs and the corresponding nontumourous liver tissues from 55
Chinese patients who had had surgical resection at Queen Mary Hospital, The University of
Hong Kong, were randomly selected for study. All specimens were immediately snap-frozen
in liquid nitrogen after surgical resection and kept at -80°C. Frozen sections were cut from the
tumourous and nontumourous liver blocks and examined histologically to ensure
homogeneous cell populations of the tissues.
Reagents and antibodies
Rapamycin was purchased from Sigma (St. Louis, MO) and CCI-779 was from Wyeth
Research (Pearl River, NY). Both drugs were dissolved in DMSO. Anti-p70S6K,
anti–phospho-p70S6K (Thr389), anti-mTOR antibodies were obtained from Cell Signaling
Technology (Beverly, MA). Anti-β-actin antibody was from Sigma. Chemicals were
purchased from Sigma unless otherwise stated.
Cell lines and cell culture
The human HCC cell lines PLC/PRF/5, HepG2, Hep3B, HLE, Huh7 and CL48 used in this
study were obtained from the American Type Culture Collection (ATCC). Other human HCC
cell lines, SMMC-7721 and BEL-7402, and immortalized liver cell line LO2 were obtained
from the Shanghai Institute of Cell Biology. PLC/PRF/5, HepG2, Hep3B, HLE, SMMC-7721
and BEL-7402 cells were maintained in Dulbecco’s modified Eagle’s medium (GIBCOBRL,
Grand Island, NY ) supplemented with 10% (v/v) fetal bovine serum (GIBCOBRL), 1 mM
sodium pyruvate, 100 units penicillin, and 100 µg streptomycin (Sigma) at 37oC in a
humidified incubator with 5% CO2 in air.
Page 5 of 31 Liver International
123456789101112131415161718192021222324252627282930313233343536373839404142434445464748495051525354555657585960

For Peer Review
6
Quantitative and semi-quantitative reverse-transcription polymerase chain reactions
(RT-PCR)
Total RNA was extracted from HCC tissue samples and cell lines by TRIzol reagent
(Invitrogen, Gaithersburg, MD) according to manufacturer’s instruction. First-strand cDNA
was synthesized from 1 µg total RNA using random hexamers with GeneAmp RNA PCR kit
(Applied Biosystems, Foster City, CA, USA). Quantitative real-time PCR was performed in
an ABI 7700 system with TaqMan Gene Expression Assays (Applied Biosystems) in triplicate,
using a TaqMan probe of mTOR (5’-AGAGACTGCAGGGCTGCCAGCGTAT-3’).
Expression of 18S rRNA was used as an internal control. The ratio of the paired tumourous to
nontumourous liver tissues from the same patient was defined as the mTOR
tumour/nontumour (T/NT) ratio. A T/NT ratio greater or equal to 2.0 was defined as
overexpression in tumour tissue.
Expression of mTOR mRNA in HCC cell lines was assessed by semi-quantitative PCR. PCR
amplification of mTOR cDNA was performed using a set of primers (forward:
5’-AGTGGACCAGTGGAAACAGG-3’ and reverse: 5’-TTCAGCGATGTCTTGTGAGG-3’)
to give a product of 318 bp. The reaction was done under the following condition: 94oC for 12
minutes, then 28 cycles of 94oC for 30 seconds, 60
oC for 30 seconds, and 72
oC for 30 seconds
followed by a final extension at 72oC for 5 minutes. For normalization, a fragment of β-actin
was amplified as an internal control. Specific forward and reverse primers for β-actin were
used: forward: 5’-GTGGGGCGCCCCAGGCACCA-3’; reverse:
5’-CTCCTTAATGTCACGCACGATTTC-3’.
Western blot analysis
Page 6 of 31Liver International
123456789101112131415161718192021222324252627282930313233343536373839404142434445464748495051525354555657585960
For Peer Review
7
HCC and LO2 cell lines, and PLC/PRF/5 and HepG2 cells treated with rapamycin and
CCI-779 (1nM and 20nM), were harvested into radioimmunoprecipitation assay lysis buffer
[50 mmol/L Tris-HCL (pH 7.4), 1% NP40, 0.25% sodium deoxycholate, 150 mmol/L NaCl, 1
mmol/L EDTA, 5 mmol/L sodium fluoride, 1 mmol/L DTT] with freshly added 1 × Complete
EDTA-free Protease Inhibitor Cocktail (Antithrombin III, Aprotinin, 3,4-dichloroisocoumarin,
APMSF, Pefabloc SC, Leupeptin and PMSF) (Roche, Mannheim, Germany). The cell lysate
was cleared by centrifugation at 4oC and the supernatant was stored in small aliquots at -80
oC.
Normally, 20 µg sample was loaded into each lane, separated by SDS-PAGE, transferred to
polyvinylidene difluoride membrane. The membrane was blocked with 5% BSA and then
incubated with a 1: 1000 dilution of primary antibodies (anti-mTOR, anti-p70S6K and
anti-p-p70S6K) overnight at 4 oC. The membrane was washed and incubated with a secondary
peroxidase-conjugated antibody for 1 hour after washing. Antibody binding was detected by
the enhanced chemiluminescence detection system.
Colony formation assay
5 x 10³ PLC/PRF/5, HepG2, Hep3B, HLE, SMMC-7721 and BEL-7402 cells were seeded
onto 6-well culture plates. After 24 hours, rapamycin or CCI-779 was added at 1 nM and 20
nM, and the cells were grown for 7 days. Colonies were fixed with 3.7% formaldehyde and
stained with crystal violet (Sigma).
Cell proliferation assay
Each well of 6-well culture plates was seeded with 1.5 x 10⁴ PLC/PRF/5 cells in triplicate and
maintained in 2 ml full medium. After 24 hours, rapamycin (0.1, 0.25, 0.5, 1 and 2 nM) or
CCI-779 (0.25, 0.5, 1, 2 and 4 nM) was added into the culture medium. Cell number was
counted with a hematocytometer at 24-hour intervals for 6 consecutive days. Means and
Page 7 of 31 Liver International
123456789101112131415161718192021222324252627282930313233343536373839404142434445464748495051525354555657585960

For Peer Review
8
standard deviations of the triplicates were calculated and plotted against time.
Flow cytometry
PLC/PRF/5 cells were seeded at a density of 1.5 x 10⁵ onto 6-well plates. After 24 hours, cells
were treated with 1 nM rapamycin or CCI-779. 24 and 48 hours after treatment, cells were
harvested by trypsinization and the reaction was stopped by fresh medium. Cells were washed
twice in cold PBS and fixed with cold 80% ethanol. Fixation was performed at 4 oC for 1 hour.
After washing with PBS, cells were stained with propidium iodide (PI, 50 ug/ml) with RNase
A (20 ug/ml) treatment. DNA profile of cell populations was determined by flow cytometry
analysis using BD FACSCalibur System (BD Biosciences).
Nude mice injection assay
PLC/PRF/5 cells were harvested and resuspended in PBS. Cells (1 x 10⁷) were inoculated
subcutaneously into the right flank of 6-week-old male BALB/c nude mice using a 25-gauge
needle (5 mice for each group). When xenografts grew to a size of around 5 mm in diameter,
animals were assorted randomly into 3 groups of 5 mice. Each group was treated with vehicle
solution, rapamycin (10 mg per kg per day) or CCI-779 (10 mg per kg per day) by
intraperitoneal injection for 10 days. Tumour size was monitored every 5 days by measuring
the largest and smallest diameters of tumour and estimated according to the formula: volume =
1/2 x (largest diameter) x (smallest diameter)2. This experiment was performed following the
Animals (Control of Experiments) Ordinance (Hong Kong) and Institute’s guidance on animal
experiments. Tumour lysates were prepared for Western blot analysis.
Pathological analysis
The clinicopathological features of HCC patients included sex, tumour size, cellular
Page 8 of 31Liver International
123456789101112131415161718192021222324252627282930313233343536373839404142434445464748495051525354555657585960

For Peer Review
9
differentiation, tumour encapsulation, presence of venous invasion, direct invasion into the
adjacent liver parenchyma, tumour microsatellite formation, tumour stage (pTNM stage),
serum hepatitis B surface antigen (HBsAg) and the number of tumour nodules. They were
analyzed as previously described (26).
Statistical analysis
SPSS 16.0 for Windows (SPSS Inc., Chicago, IL, USA) was used for statistical analysis.
Categorical data were analyzed by Fisher’s exact test, whereas Student’s unpaired t-test was
used for continuous data. Kaplan-Meier plots and Log Rank tests were used for survival
analysis. Disease free survival (DFS) times were calculated from the date of curative surgery to
HCC recurrence, death, or the last follow-up date; overall survival time was calculated from
the date of surgery to death or last follow-up date. Tests results were considered significant
when the P value was less than 0.05.
Results
Expression of mTOR in human HCCs and HCC cell lines
In an attempt to define the role of mTOR in HCC, we performed real-time quantitative
RT-PCR to quantify the mRNA expression level of mTOR in 55 pairs of HCCs and their
corresponding nontumourous livers. The housekeeping gene 18S rRNA was used as an
internal control for normalization. Of the 55 cases, 37 (67%) HCCs showed at least two-fold
increase in mTOR mRNA expression level when compared to their corresponding
nontumourous livers, while only 3 (5%) HCCs showed underexpression.
Page 9 of 31 Liver International
123456789101112131415161718192021222324252627282930313233343536373839404142434445464748495051525354555657585960

For Peer Review
10
We also compared the mRNA and protein levels of mTOR in our HCC cell lines (PLC/PRF/5,
Huh7, SMMC-7721, HepG2, HLE, Hep3B, CL48 and BEL-7402) and immortalized normal
liver cell line (LO2) using semi-quantitative RT-PCR (Figure 1A) and Western blotting
(Figure 1B). Our result indicated that mTOR mRNA and protein were expressed in all the cell
lines tested, and the expression level among them had no significant difference.
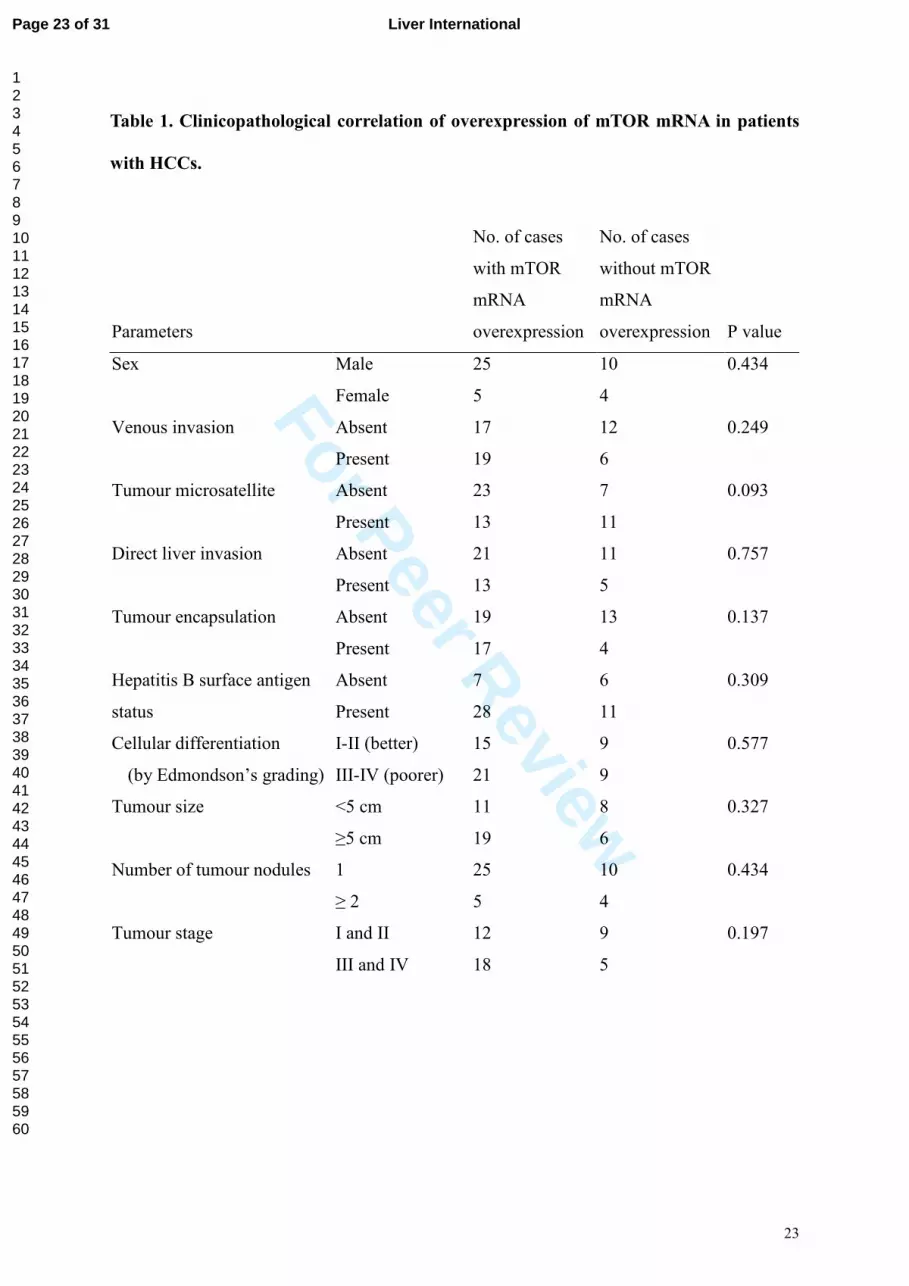
Clinicopathological correlation and survival analysis
However, there was no significant correlation between the overexpression at the mRNA level
in HCC samples and the pathological parameters, including tumour size, number of tumour
nodules, tumour invasiveness in terms of venous invasion and tumour microsatellite formation
(Table 1). The overall survival rates of the 55 patients were 82.7%, 59.1%, and 51.2% at 1, 3,
and 5 years, respectively. There was no significant difference in the overall survival rates
between patients with mTOR overexpression and those without (median, 63.7 and 57.4
months, respectively; P = 0.840). There was also no significant difference in the DFS rates
between patients with mTOR overexpression and those without (median, 20.0 and 26.8
months, respectively; P = 0.990).
Effects of rapamycin and CCI-779 on the proliferation of human HCC cell lines
To assess the effects of rapamycin and CCI-779 on the proliferation of HCC cell lines, colony
formation assays with drug treatment were performed on PLC/PRF/5, HepG2, Hep3B, HLE,
SMMC-7721 and BEL-7402 cells. These cells were treated with vehicle solution alone, 1 nM
and 20 nM rapamycin or CCI-779. After 7 days, rapamycin and CCI-779 caused growth
retardation in PLC/PRF/5, HepG2, HLE and Hep3B cells, even at a concentration as low as 1
nM (Figure 2). This growth suppressive effect was most conspicuous in PLC/PRF/5 cells.
Moreover, in these four cell lines, rapamycin was more potent in suppressing growth than
Page 10 of 31Liver International
123456789101112131415161718192021222324252627282930313233343536373839404142434445464748495051525354555657585960

For Peer Review
11
CCI-779. Interestingly, given that SMMC-7721 and BEL-7402 had similar level of mTOR as
the other HCC cell lines, they did not show any significant reduction in cell proliferation rate
after drug treatment, suggesting that the regulation of mTOR signaling pathways in these cells
may be inactivated.
Rapamycin and CCI-779 inhibited the growth of PLC/PRF/5 cells in a dose-dependent
manner
Since PLC/PRF/5 cells were more sensitive to rapamycin and CCI-779 treatments than other
HCC cell lines tested, the proliferation rate of PLC/PRF/5 cells was monitored for 6 days to
compare the efficacy of these drugs. In this proliferation assay, different dosages of rapamycin
(0.1, 0.25, 0.5, 1 and 2 nM) and CCI-779 (0.25, 0.5, 1, 2 and 4 nM) were used. Both rapamycin
and CCI-779 potently caused a dose-dependent growth inhibition of PLC/PRF/5 cells (Figure
3A). On day 5, as shown in Figure 3B, the IC50 value of rapamycin was lower than that of
CCI-779, suggesting that rapamycin used in the experiment was more powerful in growth
suppression than CCI-779.
Rapamycin and CCI-779 caused cell cycle arrest at G1 phase and no apoptosis in
PLC/PRF/5 cells
Since rapamycin inhibits mTOR, which is sensitive to the nutrient level, rapamycin is thought
to mimic nutrient starvation, leading to cell cycle arrest (27). To explore if cell cycle arrest was
one of the mechanisms behind the growth suppression caused by rapamycin and CCI-779,
flow cytometric analysis was performed to analyze the cell cycle profile of PLC/PRF/5 cells
exposed to these drugs. 1 nM rapamycin and CCI-779 were able to block the serum-induced
entry of cell cycle from G1 to S phase, resulting in G1 arrest, as around 10% cells demonstrated
cell cycle arrest at G1 phase 24 hours after treatment (Figure 4). Moreover, the absence of
Page 11 of 31 Liver International
123456789101112131415161718192021222324252627282930313233343536373839404142434445464748495051525354555657585960

For Peer Review
12
sub-G1 phase as shown by the flow cytometry indicated that these drugs did not cause
apoptosis in PLC/PRF/5 cells. Apoptosis was still not observed at higher concentrations (100
nM and 200 nM) of both drugs (data not shown). These results indicate that both rapamycin
and CCI-779 caused growth retardation in PLC/PRF/5 cells via induction of G1 arrest but not
apoptosis, and that these mTOR inhibitors are cytostatic, rather than cytotoxic.
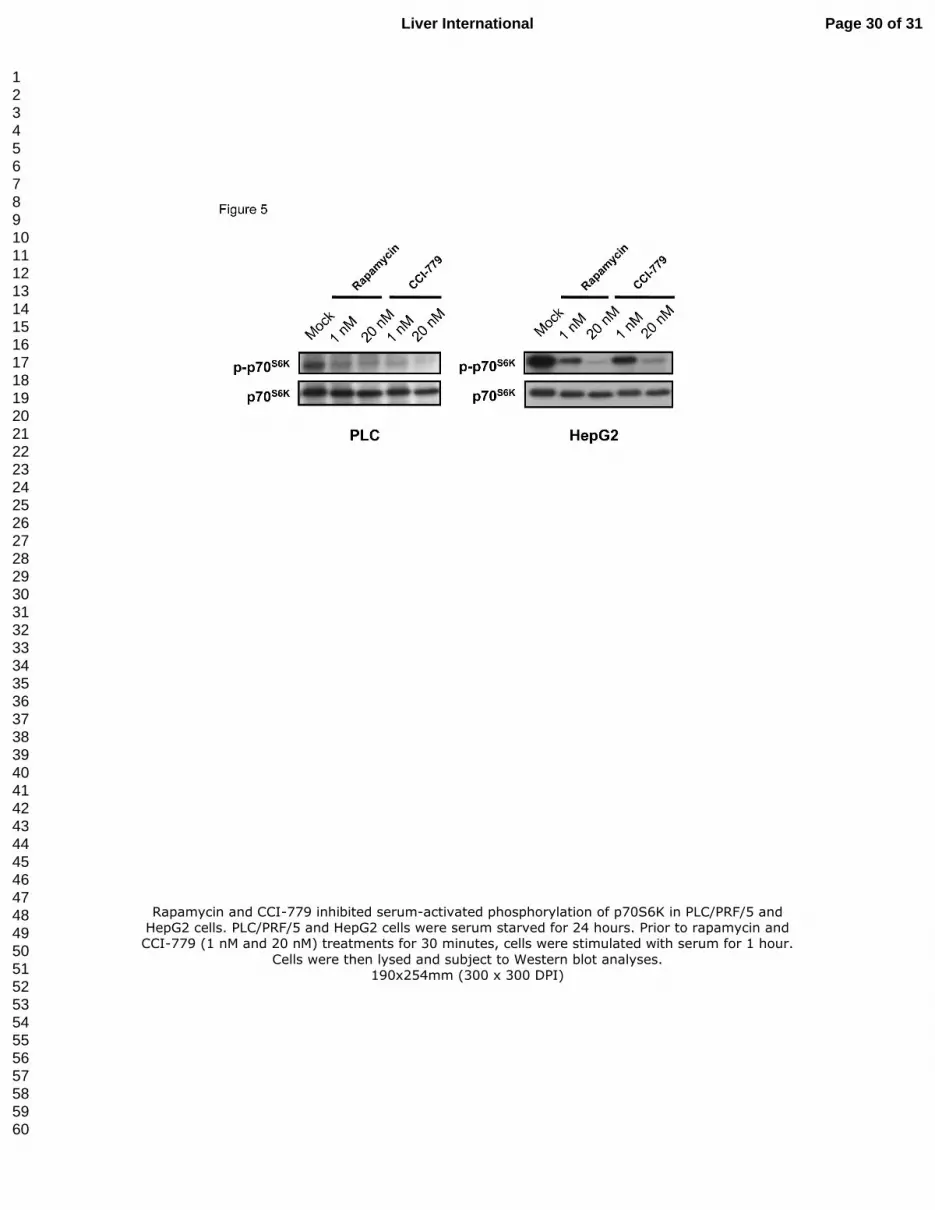
Rapamycin and CCI-779 inhibited the serum-activated phosphorylation of p70S6K in
PLC/PRF/5 and HepG2 cells
To investigate the molecular pathway perturbed by rapamycin and CCI-779, p70S6K, a
well-known downstream target of mTOR important in protein translation (3, 28), was
examined. As shown in Figure 5, the serum-induced phosphorylation of p70S6K at T389 in
PLC/PRF/5 cells was remarkably diminished after treatment of 1 nM and 20 nM rapamycin or
CCI-779 for 30 minutes. No significant change in the level of total p70S6K was detected.
Inhibition of the pathway by these drugs was also demonstrated in HepG2 cells. This indicates
that the mTOR/p70S6K pathway was suppressed in HCC cells treated with rapamycin and
CCI-779.
Rapamycin and CCI-779 suppressed the growth of subcutaneous tumours in nude mice
We observed that the growth suppressive effects were quite drastic in our in vitro experiments,
as demonstrated by the colony formation and cell proliferation assays. Flow cytometric
analysis and Western blotting also indicated the mechanism and the molecular pathway
involved to bring about the growth suppression. Next, we sought to determine the effects of
rapamycin and CCI-779 in vivo by establishing subcutaneous xenografts in nude mice.
PLC/PRF/5 cells (1 x 10⁷) were inoculated into the right flanks of 15 nude mice. When the
average diameter of these tumours reached 5 mm, intraperitoneal injection of vehicle,
Page 12 of 31Liver International
123456789101112131415161718192021222324252627282930313233343536373839404142434445464748495051525354555657585960
For Peer Review
13
rapamycin and CCI-779 (10 mg/kg/day) was performed. After 10 injections, the tumours were
harvested, with their volumes and weights determined (Figure 6A). The volumes and weights
of tumours treated with both rapamycin and CCI-779 exhibited significant reduction
compared to the vehicle controls. The level of phospho-p70S6K was also determined in these
tumours by Western blot analysis (Figure 6B). As expected, the phosphorylation of p70S6K
was inhibited in tumours exposed to the drugs. This data demonstrates that rapamycin and
CCI-779 are effective in suppressing the growth of xenografts in vivo.
Discussion
mTOR is an important protein kinase in controlling cell growth by regulating protein synthesis
and cell cycle progression. In the present study, we demonstrated that mTOR inhibitors
rapamycin and its clinical analog CCI-779 could potently inhibit the growth of HCC cell lines.
The data presented herein indicated that the growth suppressive effects of rapamycin and
CCI-779 on PLC/PRF/5 cells were achieved through inactivation of mTOR kinase activity,
and subsequently phosphorylation of the downstream target p70S6K, as well as induction of
cell cycle arrest at G1 phase. Our mouse model also demonstrated that the mTOR inhibitors
administered via intraperitoneal injection were efficacious in suppressing subcutaneous
tumour growth significantly, with reduction of phospho-p70S6K level in tumours exposed to
the drugs, further confirming the importance of mTOR signaling for HCC tumour growth.
Our real-time RT-PCR experiment showed that mTOR mRNA was overexpressed in our
human HCC clinical samples, consistent with previous reports that mTOR signaling is
deregulated in many cancers (3, 15). However, the mTOR mRNA overexpression in HCC
Page 13 of 31 Liver International
123456789101112131415161718192021222324252627282930313233343536373839404142434445464748495051525354555657585960

For Peer Review
14
patients did not correlate with the pathological features and had no correlation with patients’
survival rates. There has not been any previous report on the survival rates (overall survival
and DFS) of mTOR overexpression in HCC; therefore the prognostic role of mTOR in patients
with HCC requires further exploration in the future.
Among the HCC cell lines showing growth inhibition in the presence of the mTOR inhibitors,
the effect on PLC/PRF/5 was the most conspicuous. Proliferation assays by cell counting were
performed to monitor cell growth. A dose-dependent inhibition of growth was observed, and
both rapamycin and CCI-779 could bring about observable growth-inhibitory phenomenon at
relatively low concentrations, even at 0.1 nM and 0.25 nM. The IC50 values of both drugs on
day 5 were around 0.5 nM and 1.5 nM respectively. These findings demonstrated that the
mTOR inhibitors could potently inhibit the growth of PLC/PRF/5 cells.
Since rapamycin has been demonstrated to induce cell cycle arrest at G1 phase and apoptosis
(3), we would like to find out if rapamycin and CCI-779 caused the proliferation inhibition via
these two processes. Our flow cytometric analysis indicated that 24 hours of rapamycin and
CCI-779 treatments at 1 nM arrested around 10% of cells at G1 of the cell cycle, and there was
no induction of apoptosis, as revealed by the absence of sub-G1 phase of the cell cycle. This is
consistent with a previous study on MHCC97H, a metastatic HCC cell line, stating that
rapamycin caused cell cycle arrest at G1 but not apoptosis (29).
In an attempt to look into the molecular pathway perturbed by these mTOR inhibitors, we
examined the level of phospho-p70S6K as a read-out of mTOR kinase activity in PLC/PRF/5
and HepG2 cells. As expected, the phosphorylation status of p70S6K was reduced in the
presence of the mTOR inhibitors, and this could explain the reduced proliferation rate
Page 14 of 31Liver International
123456789101112131415161718192021222324252627282930313233343536373839404142434445464748495051525354555657585960
For Peer Review
15
observed in our colony formation and proliferation assays. The effects of rapamycin and
CCI-779 on phospho-p70S6K were consistent with a previous study on HepG2 and Hep3B
cells using only rapamycin at the same concentrations (i.e. 1 nM and 20 nM) (30).
Although our in vitro assays demonstrated that rapamycin and CCI-779 were potent
anti-proliferative agents, it is crucial to examine their efficacies and potential toxicities in vivo
using animal models. In our subcutaneous tumour model in nude mice, intraperitoneal
injection of rapamycin and CCI-779 resulted in significant reduction in tumour volume and
weight, which was consistent with the in vitro assays that cultured PLC/PRF/5 cells grew
poorly in response to these inhibitors. The in vivo growth inhibition was accounted for by the
drop in phospho-p70S6K in tumours exposed to the drugs, leading to diminished protein
synthesis and consequently decrease in tumour size and weight. However, the reason why the
cytostatic nature of the mTOR inhibitors resulted in reduction in tumour size remained elusive.
One possible reason is that mTOR is an upstream activator of hypoxia-inducible factor 1
(HIF-1), and its activation leads to increased level of HIF-1 in cancer cells (31). This is
consistent with the findings that rapamycin inhibited the proliferation of vascular endothelial
cells in response to vascular endothelial growth factor (VEGF) (32), and suppressed the
induction of HIF-1 by growth factors and oncogenes (33-35). Inactivated mTOR signaling
may culminate in the dysregulation of HIF-1-dependent expression of VEGF and inhibits
tumour angiogenesis and progression. The relationship between mTOR inhibitors and
angiogenesis in HCC awaits further investigation.
In our study, rapamycin and CCI-779 were administered at 10 mg/kg/day via intraperitoneal
injection. The route of administration and dosages of the mTOR inhibitors were based on
previous reports (19, 36-38). In this study, rapamycin and CCI-779 could effectively suppress
Page 15 of 31 Liver International
123456789101112131415161718192021222324252627282930313233343536373839404142434445464748495051525354555657585960
For Peer Review
16
the growth of HCC subcutaneous tumours, consistent with the effects of these mTOR
inhibitors on pancreatic cancer (39), prostate cancer (19, 38), and squamous cell carcinomas of
the head and neck (37) in animal models, and this is the first report on the effective
suppression of HCC tumour growth by CCI-779.
Apart from binding with raptor and GβL to form a complex called mTORC1 (mTOR complex
1), mTOR has recently been shown to bind to other partners, rictor (rapamycin insensitive
companion of mTOR) and mSin1, but not raptor, to form mTORC2 (40). As discussed
previously, mTORC1 regulates cell growth via p70S6K and 4EBP1. However, mTORC2
regulates Akt by phosphorylation at Ser473 (41). Rapamycin directly binds to mTORC1 and
inhibits its kinase activity, whereas prolonged treatment of the drug, though it does not bind to
mTORC2, disrupts the assembly of mTORC2 and thus suppresses its kinase activity towards
Akt (38). Apart from Akt, Rho and Rac, which are well characterized Rho family members of
GTPases regulating actin polymerization and membrane ruffling (42), have also been shown
to be the downstream targets of mTORC2 (40). Therefore, it is possible that prolonged
rapamycin treatment, via disruption of mTORC2 assembly, can influence Rho- and
Rac-mediated cell movement, and in the case of cancer cells, cell migration and metastasis. As
previously reported, the metastatic potential of MHCC97H, a highly metastatic HCC cell line,
was reduced in the presence of rapamycin (29), and the inhibition of mTORC2-Rho/Rac
pathway may contribute to this phenomenon. The relationship among rapamycin, mTORC2
and metastasis in HCC remain to be elucidated in the future. Studies concerning the effect of
CCI-779 on mTORC2 and HCC metastasis may derive insights into the prevention of
intrahepatic and extrahepatic metastases observed in HCC patients.
Rapamycin and CCI-779 have been investigated in clinical trials for different types of cancers
Page 16 of 31Liver International
123456789101112131415161718192021222324252627282930313233343536373839404142434445464748495051525354555657585960
For Peer Review
17
for several years, with some success and limited toxicity (3, 15, 43, 44), yet clinical trials
involving CCI-779 and HCC have not been conducted so far. In our study, we have just
compared the anti-proliferative and anti-tumour activity of rapamycin and CCI-779 on HCC
cells. However, it is also important to address if the immunosuppressor activity of these drugs
are different. So far, our work suggests that the clinically used rapamycin analog CCI-779 can
potentially be used as a useful therapeutic agent for the treatment of HCC, especially as both
an immunosuppressant and a tumour suppressant after liver transplantation.
Page 17 of 31 Liver International
123456789101112131415161718192021222324252627282930313233343536373839404142434445464748495051525354555657585960
For Peer Review
18
Acknowledgement
The authors wish to thank the technical advice and assistance on animal work of Dr. Tai-On
Yau.
Page 18 of 31Liver International
123456789101112131415161718192021222324252627282930313233343536373839404142434445464748495051525354555657585960
For Peer Review
19
Reference
1. GINGRAS A C, RAUGHT B, SONENBERG N. Regulation of translation initiation by
FRAP/mTOR. Genes & development 2001; 15(7): 807-26.
2. HAY N, SONENBERG N. Upstream and downstream of mTOR. Genes & development
2004; 18(16): 1926-45.
3. LAW B K. Rapamycin: an anti-cancer immunosuppressant? Critical reviews in
oncology/hematology 2005; 56(1): 47-60.
4. BJORNSTI M A, HOUGHTON P J. The TOR pathway: a target for cancer therapy.
Nature reviews 2004; 4(5): 335-48.
5. BIERER B E, MATTILA P S, STANDAERT R F, HERZENBERG L A, BURAKOFF S J,
CRABTREE G, et al. Two distinct signal transmission pathways in T lymphocytes are
inhibited by complexes formed between an immunophilin and either FK506 or rapamycin.
Proceedings of the National Academy of Sciences of the United States of America 1990;
87(23): 9231-5.
6. BROWN E J, ALBERS M W, SHIN T B, ICHIKAWA K, KEITH C T, LANE W S, et al.
A mammalian protein targeted by G1-arresting rapamycin-receptor complex. Nature 1994;
369(6483): 756-8.
7. SABATINI D M, ERDJUMENT-BROMAGE H, LUI M, TEMPST P, SNYDER S H.
RAFT1: a mammalian protein that binds to FKBP12 in a rapamycin-dependent fashion and is
homologous to yeast TORs. Cell 1994; 78(1): 35-43.
8. BRUNN G J, WILLIAMS J, SABERS C, WIEDERRECHT G, LAWRENCE J C, JR.,
ABRAHAM R T. Direct inhibition of the signaling functions of the mammalian target of
rapamycin by the phosphoinositide 3-kinase inhibitors, wortmannin and LY294002. The
EMBO journal 1996; 15(19): 5256-67.
9. BRUNN G J, HUDSON C C, SEKULIC A, WILLIAMS J M, HOSOI H, HOUGHTON P
J, et al. Phosphorylation of the translational repressor PHAS-I by the mammalian target of
rapamycin. Science (New York, NY 1997; 277(5322): 99-101.
10. WITHERS D J, OUWENS D M, NAVE B T, VAN DER ZON G C, ALARCON C M,
CARDENAS M E, et al. Expression, enzyme activity, and subcellular localization of
mammalian target of rapamycin in insulin-responsive cells. Biochemical and biophysical
research communications 1997; 241(3): 704-9.
11. BURNETT P E, BARROW R K, COHEN N A, SNYDER S H, SABATINI D M. RAFT1
phosphorylation of the translational regulators p70 S6 kinase and 4E-BP1. Proceedings of the
National Academy of Sciences of the United States of America 1998; 95(4): 1432-7.
12. NOURSE J, FIRPO E, FLANAGAN W M, COATS S, POLYAK K, LEE M H, et al.
Interleukin-2-mediated elimination of the p27Kip1 cyclin-dependent kinase inhibitor
prevented by rapamycin. Nature 1994; 372(6506): 570-3.
13. LAW B K, CHYTIL A, DUMONT N, HAMILTON E G, WALTNER-LAW M E,
Page 19 of 31 Liver International
123456789101112131415161718192021222324252627282930313233343536373839404142434445464748495051525354555657585960

For Peer Review
20
AAKRE M E, et al. Rapamycin potentiates transforming growth factor beta-induced growth
arrest in nontransformed, oncogene-transformed, and human cancer cells. Molecular and
cellular biology 2002; 22(23): 8184-98.
14. BARATA J T, CARDOSO A A, NADLER L M, BOUSSIOTIS V A. Interleukin-7
promotes survival and cell cycle progression of T-cell acute lymphoblastic leukemia cells by
down-regulating the cyclin-dependent kinase inhibitor p27(kip1). Blood 2001; 98(5):
1524-31.
15. EASTON J B, HOUGHTON P J. mTOR and cancer therapy. Oncogene 2006; 25(48):
6436-46.
16. YU K, TORAL-BARZA L, DISCAFANI C, ZHANG W G, SKOTNICKI J, FROST P, et
al. mTOR, a novel target in breast cancer: the effect of CCI-779, an mTOR inhibitor, in
preclinical models of breast cancer. Endocrine-related cancer 2001; 8(3): 249-58.
17. FROST P, MOATAMED F, HOANG B, SHI Y, GERA J, YAN H, et al. In vivo antitumor
effects of the mTOR inhibitor CCI-779 against human multiple myeloma cells in a xenograft
model. Blood 2004; 104(13): 4181-7.
18. ASANO T, YAO Y, ZHU J, LI D, ABBRUZZESE J L, REDDY S A. The rapamycin
analog CCI-779 is a potent inhibitor of pancreatic cancer cell proliferation. Biochemical and
biophysical research communications 2005; 331(1): 295-302.
19. WU L, BIRLE D C, TANNOCK I F. Effects of the mammalian target of rapamycin
inhibitor CCI-779 used alone or with chemotherapy on human prostate cancer cells and
xenografts. Cancer Res 2005; 65(7): 2825-31.
20. HUDES G, CARDUCCI M, TOMCZAK P, DUTCHER J, FIGLIN R, KAPOOR A, et al.
Temsirolimus, interferon alfa, or both for advanced renal-cell carcinoma. The New England
journal of medicine 2007; 356(22): 2271-81.
21. CHOLLET P, ABRIAL C, TACCA O, MOURET-REYNIER M A, LEHEURTEUR M,
DURANDO X, et al. Mammalian target of rapamycin inhibitors in combination with letrozole
in breast cancer. Clinical breast cancer 2006; 7(4): 336-8.
22. PARKIN D M, BRAY F, FERLAY J, PISANI P. Global cancer statistics, 2002. CA: a
cancer journal for clinicians 2005; 55(2): 74-108.
23. CHUI A K. Liver transplantation in Hong Kong. Hong Kong medical journal =
Xianggang yi xue za zhi / Hong Kong Academy of Medicine 2002; 8(4): 232-3.
24. SHAH S A, WEI A C, CLEARY S P, YANG I, MCGILVRAY I D, GALLINGER S, et al.
Prognosis and results after resection of very large (>or=10 cm) hepatocellular carcinoma. J
Gastrointest Surg 2007; 11(5): 589-95.
25. O'GRADY J G, POLSON R J, ROLLES K, CALNE R Y, WILLIAMS R. Liver
transplantation for malignant disease. Results in 93 consecutive patients. Annals of surgery
1988; 207(4): 373-9.
26. NG I O, LAI E C, FAN S T, NG M M, SO M K. Prognostic significance of pathologic
Page 20 of 31Liver International
123456789101112131415161718192021222324252627282930313233343536373839404142434445464748495051525354555657585960

For Peer Review
21
features of hepatocellular carcinoma. A multivariate analysis of 278 patients. Cancer 1995;
76(12): 2443-8.
27. PENG T, GOLUB T R, SABATINI D M. The immunosuppressant rapamycin mimics a
starvation-like signal distinct from amino acid and glucose deprivation. Molecular and cellular
biology 2002; 22(15): 5575-84.
28. YOUNG D A, NICKERSON-NUTTER C L. mTOR--beyond transplantation. Current
opinion in pharmacology 2005; 5(4): 418-23.
29. WANG Z, FAN J, ZHOU J, WU Z Q, QIU S J, YU Y, et al. [Inhibition of growth and
metastasis of hepatocellular carcinoma by rapamycin: experiment with mice]. Zhonghua yi
xue za zhi 2006; 86(24): 1666-70.
30. SAHIN F, KANNANGAI R, ADEGBOLA O, WANG J, SU G, TORBENSON M. mTOR
and P70 S6 kinase expression in primary liver neoplasms. Clin Cancer Res 2004; 10(24):
8421-5.
31. HUDSON C C, LIU M, CHIANG G G, OTTERNESS D M, LOOMIS D C, KAPER F, et
al. Regulation of hypoxia-inducible factor 1alpha expression and function by the mammalian
target of rapamycin. Molecular and cellular biology 2002; 22(20): 7004-14.
32. YU Y, SATO J D. MAP kinases, phosphatidylinositol 3-kinase, and p70 S6 kinase
mediate the mitogenic response of human endothelial cells to vascular endothelial growth
factor. J Cell Physiol 1999; 178(2): 235-46.
33. ZHONG H, CHILES K, FELDSER D, LAUGHNER E, HANRAHAN C, GEORGESCU
M M, et al. Modulation of hypoxia-inducible factor 1alpha expression by the epidermal
growth factor/phosphatidylinositol 3-kinase/PTEN/AKT/FRAP pathway in human prostate
cancer cells: implications for tumor angiogenesis and therapeutics. Cancer Res 2000; 60(6):
1541-5.
34. MAYERHOFER M, VALENT P, SPERR W R, GRIFFIN J D, SILLABER C. BCR/ABL
induces expression of vascular endothelial growth factor and its transcriptional activator,
hypoxia inducible factor-1alpha, through a pathway involving phosphoinositide 3-kinase and
the mammalian target of rapamycin. Blood 2002; 100(10): 3767-75.
35. TREINS C, GIORGETTI-PERALDI S, MURDACA J, SEMENZA G L, VAN
OBBERGHEN E. Insulin stimulates hypoxia-inducible factor 1 through a
phosphatidylinositol 3-kinase/target of rapamycin-dependent signaling pathway. J Biol Chem
2002; 277(31): 27975-81.
36. LEE L, SUDENTAS P, DABORA S L. Combination of a rapamycin analog (CCI-779)
and interferon-gamma is more effective than single agents in treating a mouse model of
tuberous sclerosis complex. Genes, chromosomes & cancer 2006; 45(10): 933-44.
37. AMORNPHIMOLTHAM P, PATEL V, SODHI A, NIKITAKIS N G, SAUK J J,
SAUSVILLE E A, et al. Mammalian target of rapamycin, a molecular target in squamous cell
carcinomas of the head and neck. Cancer Res 2005; 65(21): 9953-61.
Page 21 of 31 Liver International
123456789101112131415161718192021222324252627282930313233343536373839404142434445464748495051525354555657585960
For Peer Review
22
38. SARBASSOV D D, ALI S M, SENGUPTA S, SHEEN J H, HSU P P, BAGLEY A F, et al.
Prolonged rapamycin treatment inhibits mTORC2 assembly and Akt/PKB. Molecular cell
2006; 22(2): 159-68.
39. ITO D, FUJIMOTO K, MORI T, KAMI K, KOIZUMI M, TOYODA E, et al. In vivo
antitumor effect of the mTOR inhibitor CCI-779 and gemcitabine in xenograft models of
human pancreatic cancer. International journal of cancer 2006; 118(9): 2337-43.
40. JACINTO E, LOEWITH R, SCHMIDT A, LIN S, RUEGG M A, HALL A, et al.
Mammalian TOR complex 2 controls the actin cytoskeleton and is rapamycin insensitive.
Nature cell biology 2004; 6(11): 1122-8.
41. SARBASSOV D D, GUERTIN D A, ALI S M, SABATINI D M. Phosphorylation and
regulation of Akt/PKB by the rictor-mTOR complex. Science (New York, NY 2005;
307(5712): 1098-101.
42. ETIENNE-MANNEVILLE S, HALL A. Rho GTPases in cell biology. Nature 2002;
420(6916): 629-35.
43. ROWINSKY E K. Targeting the molecular target of rapamycin (mTOR). Current opinion
in oncology 2004; 16(6): 564-75.
44. CHAN S. Targeting the mammalian target of rapamycin (mTOR): a new approach to
treating cancer. British journal of cancer 2004; 91(8): 1420-4.
Page 22 of 31Liver International
123456789101112131415161718192021222324252627282930313233343536373839404142434445464748495051525354555657585960
For Peer Review
23
Table 1. Clinicopathological correlation of overexpression of mTOR mRNA in patients
with HCCs.
Parameters
No. of cases
with mTOR
mRNA
overexpression
No. of cases
without mTOR
mRNA
overexpression
P value
Sex Male 25 10 0.434
Female 5 4
Venous invasion Absent 17 12 0.249
Present 19 6
Tumour microsatellite Absent 23 7 0.093
Present 13 11
Direct liver invasion Absent 21 11 0.757
Present 13 5
Tumour encapsulation Absent 19 13 0.137
Present 17 4
Absent 7 6 0.309 Hepatitis B surface antigen
status Present 28 11
I-II (better) 15 9 0.577 Cellular differentiation
(by Edmondson’s grading) III-IV (poorer) 21 9
Tumour size <5 cm 11 8 0.327
≥5 cm 19 6
Number of tumour nodules 1 25 10 0.434
≥ 2 5 4
Tumour stage I and II 12 9 0.197
III and IV 18 5
Page 23 of 31 Liver International
123456789101112131415161718192021222324252627282930313233343536373839404142434445464748495051525354555657585960
For Peer Review
24
Legend for figures
Figure 1. mTOR expression in human HCC and immortalized liver cell lines. (A) mRNA
expression of mTOR was determined by semi-quantitative RT-PCR. Amplification of mTOR
cDNA was performed using a pair of specific primers for mTOR. The quantity of cDNA was
assessed by amplification of β-actin. mTOR mRNA was expressed in all cell lines tested. (B)
Protein expression of mTOR was assessed by Western blot analysis using an anti-mTOR
antibody. Anti-β-actin antibody was used to ensure equal loading of samples in the experiment.
All cell lines expressed mTOR protein.
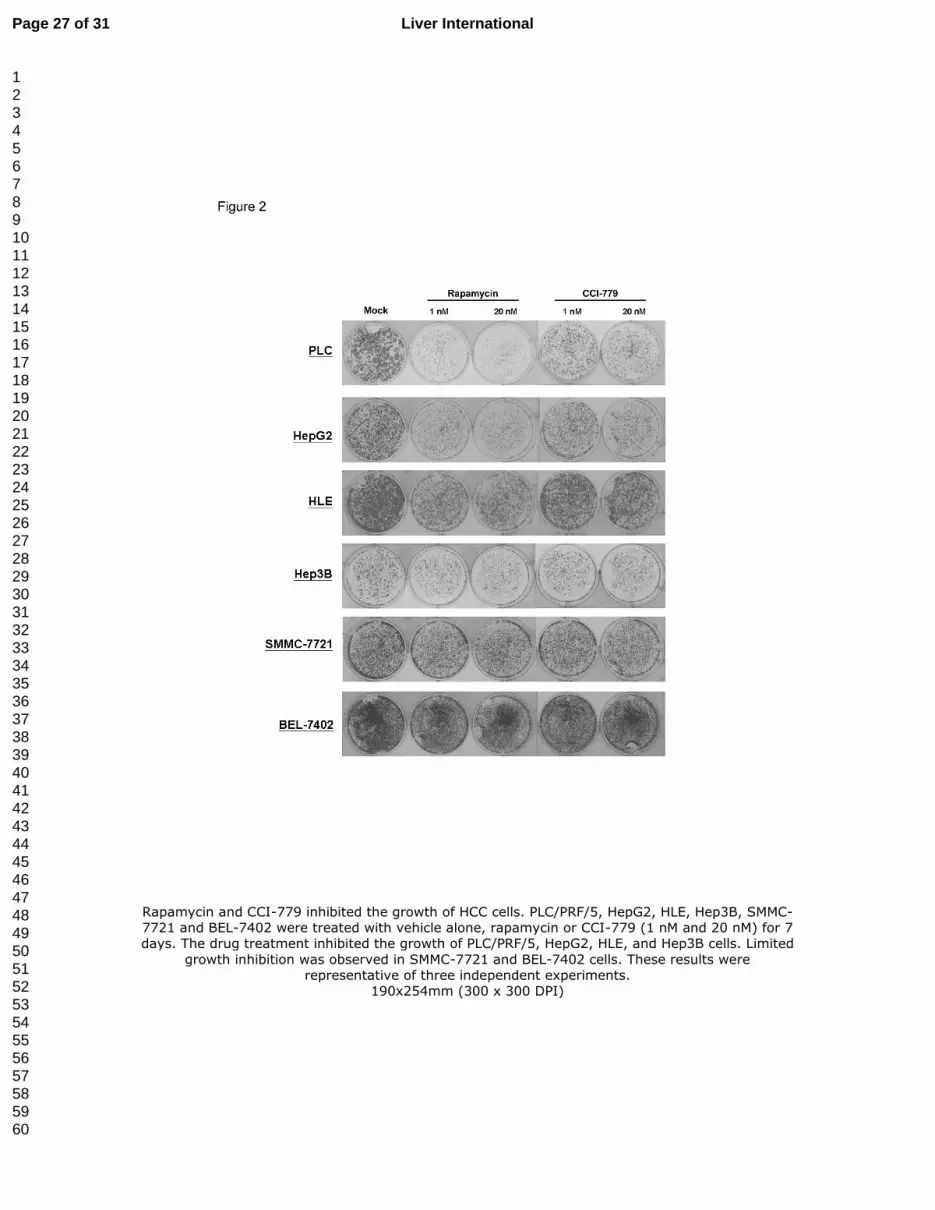
Figure 2. Rapamycin and CCI-779 inhibited the growth of HCC cells. PLC/PRF/5, HepG2,
HLE, Hep3B, SMMC-7721 and BEL-7402 were treated with vehicle alone, rapamycin or
CCI-779 (1 nM and 20 nM) for 7 days. The drug treatment inhibited the growth of PLC/PRF/5,
HepG2, HLE, and Hep3B cells. Limited growth inhibition was observed in SMMC-7721 and
BEL-7402 cells. These results were representative of three independent experiments.
Figure 3. Rapamycin and CCI-779 inhibited PLC/PRF/5 cell proliferation. (A) Rapamycin and
CCI-779 inhibited the growth of PLC/PRF/5 cells in a dose-dependent manner. PLC/PRF/5
cells were treated with various concentrations of rapamycin or CCI-779 as indicated. Cells
were harvested and counted at 24-hour intervals for 6 days. Points, mean of triplicates; bars,
SD. (B) Rapamycin had a lower IC50 value than CCI-779 in PLC/PRF/5 cells, as indicated by
the arrows. (Only the data on Day 5 are shown.)
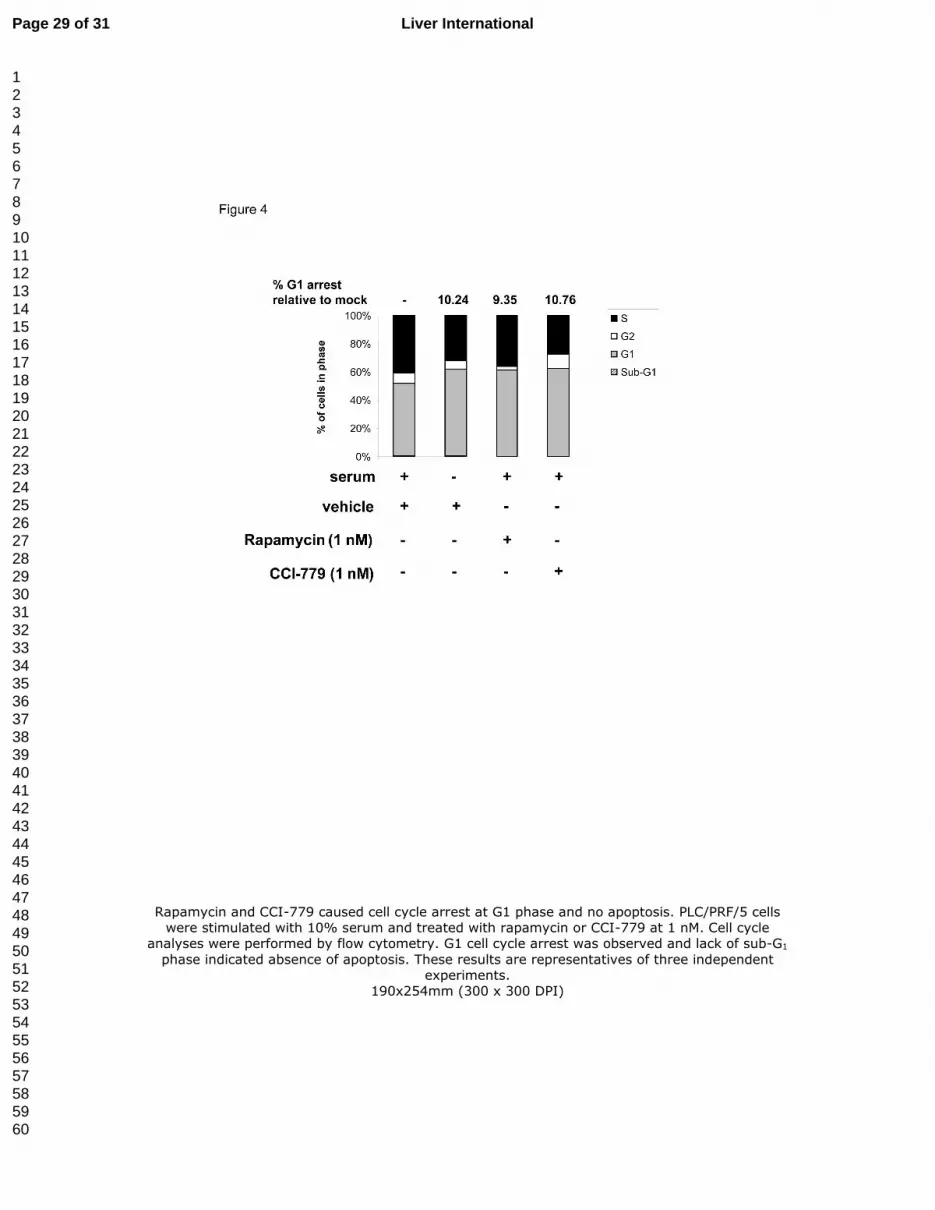
Figure 4. Rapamycin and CCI-779 caused cell cycle arrest at G1 phase and no apoptosis.
PLC/PRF/5 cells were stimulated with 10% serum and treated with rapamycin or CCI-779 at 1
nM. Cell cycle analyses were performed by flow cytometry. G1 cell cycle arrest was observed
Page 24 of 31Liver International
123456789101112131415161718192021222324252627282930313233343536373839404142434445464748495051525354555657585960

For Peer Review
25
and lack of sub-G1 phase indicated absence of apoptosis. These results are representatives of
three independent experiments.
Figure 5. Rapamycin and CCI-779 inhibited serum-activated phosphorylation of p70S6K in
PLC/PRF/5 and HepG2 cells. PLC/PRF/5 and HepG2 cells were serum starved for 24 hours.
Prior to rapamycin and CCI-779 (1 nM and 20 nM) treatments for 30 minutes, cells were
stimulated with serum for 1 hour. Cells were then lysed and subject to Western blot analyses.
Figure 6. Intraperitoneal injection of rapamycin and CCI-779 suppressed the growth of
subcutaneous tumours in nude mice. (A) PLC/PRF/5 cells (1 x 10⁷) were inoculated
subcutaneously into the right flank of 6-week-old male BALB/c nude mice (5 mice for each
group). Intraperitoneal administration of rapamycin or CCI-779 (10 mg/kg) for 10 days
significantly suppressed PLC/PRF/5 tumour volume and weight. (B) Tumour samples were
harvested and lysed for Western blot analyses. Tumours treated with rapamycin or CCI-779
showed lower level of p-p70S6K.
Page 25 of 31 Liver International
123456789101112131415161718192021222324252627282930313233343536373839404142434445464748495051525354555657585960

For Peer Review
mTOR expression in human HCC and immortalized liver cell lines. (A) mRNA expression of mTOR was determined by semi-quantitative RT-PCR. Amplification of mTOR cDNA was performed using a pair of specific primers for mTOR. The quantity of cDNA was assessed by amplification of b-actin.
mTOR mRNA was expressed in all cell lines tested. (B) Protein expression of mTOR was assessed by Western blot analysis using an anti-mTOR antibody. Anti-b-actin antibody was used to ensure equal
loading of samples in the experiment. All cell lines expressed mTOR protein. 190x254mm (300 x 300 DPI)
Page 26 of 31Liver International
123456789101112131415161718192021222324252627282930313233343536373839404142434445464748495051525354555657585960
For Peer Review
Rapamycin and CCI-779 inhibited the growth of HCC cells. PLC/PRF/5, HepG2, HLE, Hep3B, SMMC-7721 and BEL-7402 were treated with vehicle alone, rapamycin or CCI-779 (1 nM and 20 nM) for 7 days. The drug treatment inhibited the growth of PLC/PRF/5, HepG2, HLE, and Hep3B cells. Limited
growth inhibition was observed in SMMC-7721 and BEL-7402 cells. These results were representative of three independent experiments.
190x254mm (300 x 300 DPI)
Page 27 of 31 Liver International
123456789101112131415161718192021222324252627282930313233343536373839404142434445464748495051525354555657585960

For Peer Review
Rapamycin and CCI-779 inhibited PLC/PRF/5 cell proliferation. (A) Rapamycin and CCI-779 inhibited the growth of PLC/PRF/5 cells in a dose-dependent manner. PLC/PRF/5 cells were treated with
various concentrations of rapamycin or CCI-779 as indicated. Cells were harvested and counted at
24-hour intervals for 6 days. Points, mean of triplicates; bars, SD. (B) Rapamycin had a lower IC50 value than CCI-779 in PLC/PRF/5 cells, as indicated by the arrows. (Only the data on Day 5 are
shown.) 190x254mm (300 x 300 DPI)
Page 28 of 31Liver International
123456789101112131415161718192021222324252627282930313233343536373839404142434445464748495051525354555657585960
For Peer Review
Rapamycin and CCI-779 caused cell cycle arrest at G1 phase and no apoptosis. PLC/PRF/5 cells were stimulated with 10% serum and treated with rapamycin or CCI-779 at 1 nM. Cell cycle
analyses were performed by flow cytometry. G1 cell cycle arrest was observed and lack of sub-G1
phase indicated absence of apoptosis. These results are representatives of three independent experiments.
190x254mm (300 x 300 DPI)
Page 29 of 31 Liver International
123456789101112131415161718192021222324252627282930313233343536373839404142434445464748495051525354555657585960
For Peer Review
Rapamycin and CCI-779 inhibited serum-activated phosphorylation of p70S6K in PLC/PRF/5 and HepG2 cells. PLC/PRF/5 and HepG2 cells were serum starved for 24 hours. Prior to rapamycin and CCI-779 (1 nM and 20 nM) treatments for 30 minutes, cells were stimulated with serum for 1 hour.
Cells were then lysed and subject to Western blot analyses. 190x254mm (300 x 300 DPI)
Page 30 of 31Liver International
123456789101112131415161718192021222324252627282930313233343536373839404142434445464748495051525354555657585960

For Peer Review
Intraperitoneal injection of rapamycin and CCI-779 suppressed the growth of subcutaneous tumours in nude mice. (A) PLC/PRF/5 cells (1 x 10⁷) were inoculated subcutaneously into the right flank of 6-week-old male BALB/c nude mice (5 mice for each group). Intraperitoneal administration of
rapamycin or CCI-779 (10 mg/kg) for 10 days significantly suppressed PLC/PRF/5 tumour volume and weight. (B) Tumour samples were harvested and lysed for Western blot analyses. Tumours
treated with rapamycin or CCI-779 showed lower level of p-p70S6K. 190x254mm (300 x 300 DPI)
Page 31 of 31 Liver International
123456789101112131415161718192021222324252627282930313233343536373839404142434445464748495051525354555657585960