Embed Size (px)
Citation preview

African Journal of Agricultural Research Vol. 7(6), pp. 1011-1022, 12 February, 2012 Available online at http://www.academicjournals.org/AJAR DOI: 10.5897/AJAR11.1314 ISSN 1991-637X ©2012 Academic Journals
Full Length Research Paper
Quick numerical assessment of plant communities and land use change of Oti prefecture protected areas
(North Togo)
Fousseni Folega1,2, Xiuhai Zhao1*, Komlan Batawila2, Chunyu Zhang1, Huaguo Huang1, Kangbeni Dimobe2, Hodabalo Pereki2, Anissou Bawa2, Kperkouma Wala2 and
Koffi Akpagana2
1The Key Laboratory for Silviculture and Conservation of Ministry of Education, Beijing Forestry University, Beijing
100083, People’s Republic of China. 2Laboratoire de botanique et écologie végétale, Faculté des sciences, Université de Lomé, BP 1515, Lomé, Togo.
Accepted 30 January, 2012
In this paper, the analysis of Land sat images and plant ecological assessment were used to determine the land use change, plant diversity and the main plant community patterns in most environmentally disturbed areas of northern Togo. Floristic data in the survey areas were collected using transect and sampling methods which were both based on Braun Blanquet phytosociology concept. Several numerical processes were then retained to analyze the floristic data such as Detrended Correspondence Analysis (DCA), Hierarchical Clustering and Indicator Value (INDIVAL). The first two analyses were to define the plant groupings while the third was to name the plant communities found. The logical technique of RGB-NDVI suggested by Sader and Winne as an essential tool for land use assessment was applied to remote sensed data covering three time periods (1987, 2000 and 2007). The Normalized Difference Vegetation Index (NDVI) was then applied to both images after atmospheric correction before stacking them to obtain a RGB_NDVI composite image. Finally an unsupervised classification followed by post-classification process was applied to the RGB_NDVI image. All the results from these analyses show that seven plant groupings can be found in this area which mostly represents the physiognomy of shrubby savanna. The most frequent, abundant and typical plant species to Sudanian area are Terminalia laxiflora, Crotalaria graminicola, Vitellaria paradoxa. Great mutations in land use change are well perceptible after analysis. In overall the harvest of plant resources was higher between 1987 and 2000 while the regrowth of biomass was limited and unequal. The areas characterized with biomass clean and or regrowth is well represented in term of superficies, which denote the level of anthropogenous disturbance factors prevailing in this zone. However, there are certain zones where changes have not happened yet such as a few dimensions in riparian forests, though according to the field observations these riparian forests and their neighboring wooded vegetation are very disturbed. The rivers, pounds, barren lands and the scattered villages are also considered as no change areas. Key words: Normalized difference vegetation index (NDVI), land use change, biodiversity, plant community, Togo.
INTRODUCTION The land use assessments in the sustainable management of the ecosystems in Africa became an important tool for landscape planners. In West Africa the ecological conditions have been dramatically modified
during the last decade (Wittig et al., 2007). Land use change is more likely to continue rapidly in the near future according to most projections for the global economy and population growth (Tilman et al., 2001).

1012 Afr. J. Agric. Res. These ecological changes were followed by the land use change with a decline in plant resources. The land planners, in spite of their effort to protect and/or restore the biodiversity through the creation and maintenance of certain zones as protected areas, show some limits to multiple disturbances factors (Wang et al., 2006). Though pressure from the local population on these protected areas is still increasing, agroforestry practices are highly encouraged. The main factors affecting landscape change dynamics are overpopulation (Fousseni et al., 2011) and none optimization of the areas previously occupied by the population. This situation induced the protected areas invasion by the bordering people, who are perpetually looking for new croplands, pasture, and forest non ligneous products.
The moderate resolution of Landsat images is suitable for mapping the status of land cover features (Julien and Catherine, 2008; Baldyga et al., 2007). Land change maps at moderate scales can enable planners to determine spatial distribution of land patterns. It also quantifies the pattern of land cover changes that have occurred over time. Actually, in Togo the map of land use change can serve as baseline data for future land use, ecology, and landscape assessment, but the insufficiency of these kinds of data becomes a preoccupation for land planners and scientists.
For northern Togo, only very few investigations exist on land use changes and on the vegetation resources which evolve there. To remedy this lack or insufficiency, it is fundamental to carry out some scientific research in order to make objective data available for future management of these drought areas.
This research paper, however, serves as a contribution to the project which aims to update and enhance database of Togo protected areas though it has other objectives such as to present the composition of the flora, the main plant communities and the land use dynamism of the Tropical Sudanian zone.
MATERIALS AND METHODS
Study area
The area is situated in the Eco–floristic region 1 (Northern plain) (Ern, 1979). It is located between 11°N and 10°N and between 0°E and 1°E and the main relief is formed by a vast plain with an altitude of 100 m (Roland, 1996). Its south east edge is occupied by Dahomeyid chain. The Northern plain (Oti plain) which belong to Volta basin is constituted of sandstones, pelites and silica tillite, carbonates, chert and shales. The region is dominated by leached ferruginous soils covering hardpan. The plain is drained by many rivers such as Oti, Koumongou, Wapoti Yaweni, Komkoumbou and Gambara (Figure 1).
The region has a Sudanese tropical climate influenced by the alternation of a long dry season and short rain season.
*Corresponding author. E-mail: [email protected]. Tel: 008613488679682.
Temperatures vary between 20 and 35°C with an annual average of 28.5°C for Mango meteorological station (Moussa, 2008) (Figure 2). The region has a strong anthropogenous influence. The major human activities are agriculture, transhumance, harvest of forest products and bush fires. The main crops species are sorghum, millet, groundnuts, cowpeas, maize and yams. Livestock include poultries, caprine and sheep. The ethnic groups living in the study area include the following: Ngamgam, Tchokossi, Lamba, Fulani, Tamberma, Gnande, Moba, and Yanga. The survey area covers: 1. The Forest Reserve of Barkoissi (2000 ha) classified as protected area on 01 January 1954 and labeled in category IV of IUCN list.
2. The Nature Reserve of Galangashi (7500 ha) requalified as a classified forest by Order No. 006/MERF / case of 02-02-2005 and is labeled in category III of IUCN list. 3. The protected area of Oti-Keran (179550 ha) requalified as National Park by the decree No 77-117 of 25 April 1977, is labeled in category II of IUCN list and classified as RAMSAR site (IUCN/PACO, 2008).
Floristic data processing and analysis
To collect the floristic data, both transect and plot sampling techniques were employed. The technique of sampling adopted is based on the Braun-Blanquet (Westhoff and van der Maarel, 1978) phytosociological concepts. The floristic plots of 30 m × 30 m spaced at least by 100 m are placed along the transects previously defined, but the linear structure of plants formations along the rivers
led us to opt for more stretched plots (50 m × 10 m) (Natta, 2003) to take into account more diversity.
In a given sample, the species met were recorded and named using the nomenclature of Hutchinson and Dalziel (1972), then a coefficient of abundance / dominance as suggested Braun-Blanquet (Westhoff and van der Maarel, 1978) was affected to the species (Table 1).
For qualitative ecological characterization, edaphic variables, topographic attributes, and disturbance level were recorded along with the geographic coordinates. Three multivariate analyses were employed to determine the main plant communities.
The first one was, the Detrended Correspondence Analysis (DCA) which is an ordination of the samples in indirect gradient (Hill, 1979b) in order to discriminate the plants groupings and to deduce which environmental factor influenced more the flora distribution. For the five plant grouping determined through the DCA, the first four (4) axes expresses 9.2% of the original variance and 12.87%
of total inertia (Table 2). Among the five groupings identified (Figure 5), G3 is
heterogeneous. In that regard, the 94 samples of G3 were subjected to a cluster analysis according to Ward method (1963).
After the ordination and clustering, the species characterizing the plant communities formed were given by using Indicator Value (INDVAL) method (Legendre and Legendre, 1998). The indicator value was calculated from the formula below for each plant community.
100 FrArINDVAL
aaiAr /
Where Ar is relative abundance, ai a number of individuals of the species and a a total number of individuals of the plant community.
nniFr /

Folega et al. 1013
Figure 1. The survey areas.
Precipitation (mm) Precipitation (mm)
Pre
cip
itat
ion
(m
m)
Pre
cip
itat
ion
(m
m)
Pre
cip
itat
ion
(m
m)
Precipitation (mm) Temperature (°C) 1.2
1
0.8
0.6
0.4
0.2
0 0
1.2
1
0.8
0.6
0.4
0.2
Tem
per
atu
re (
°C)
Tem
per
atu
re (
°C)
Tem
per
atu
re (
°C)
Months Months Months Figure 2. Climographs of the three meteorological stations around the study area.
Table 1. Significance of species covering coefficient.
Class of covering Significance van der Maarel scale
r An individual 1
+ Unimportant covering 2
1 Less than 5% 3
2 5-25% 5
3 25-50% 7
4 50-75% 8
5 More than 75% 9

1014 Afr. J. Agric. Res.
Table 2. Statistical summary of the DCA ordination.
Axes 1 2 3 4 Total inertia
Eigenvalues 0.390 0.319 0.262 0.218 12.878
Lengths of gradient 3.748 3.757 3.674 3.219
Cumulative percentage variance of species data 3.0 5.5 7.5 9.2
Where Fr is a relative frequency, ni the number of relevés where the species occurs and n the total number of samples.
To achieve this part CAP 2.1(Community Analysis Package) and Statistica 7.0 software’s were used.
Remote sensed data analysis
The method suggested by Sader and Winne (1992) was chosen because this method in land change detection is found to be more
accurate and efficient in analyzing multi-temporal Landsat TM and ETM+ imagery than principal component analysis and images differencing (Wilson and Sader, 2002).
For this, fast and quick technique of land cover changing studies several analysis were needed. Firstly Haze reduction method was applied to both images (TM_1987, ETM+_2000 and ETM+_2007) in order to reduce the effect of atmospheric scattering on the data. Haze correction algorithms are recommended when calculating
band ratios or when comparing data from different dates (Chavez, 1996) and (Andy and Dhari, 1996).
Then the normalized difference vegetation index (NDVI) (Tucker, 1979) was calculated for the three images using the following equation:
(NIR: Near Infra-Red; R: Red)
Theoretically, NDVI values are represented as a ratio ranging in value from -1 to 1 but in practice extreme negative values represent water; values closed to zero refer to barren areas of rock, sand, or snow however, low and high positive values indicate biomass leaf (Wilson and Sader, 2002), represented by grassland, shrublands, temperate and tropical rainforests.
The three NDVI images (NDVI_87, NDVI_00 and NDVI_07) were integrated as red, green and blue component after the stacking process.
There are several different unsupervised classification algorithms commonly used in remote sensing. However the ISODATA (Interactive Self-Organizing Data Analysis Algorithm Technology)
algorithm is similar to the k-means algorithm, it is more flexible than the K-mean method. The ISODATA clustering algorithm was preferred because it has also some further refinements by splitting and merging of clusters (Jensen, 2005).
For these reasons, the resulting new NDVI color composition map (RGB_NDVI_870107) was subject to an unsupervised classification with ISODATA algorithm (Lillesand et al., 2008).
Finally, the image was post-classified. The standard (Ola, 2008)
post-classification include, class recoding, filtering, class identification and class areas computation. Erdas 9.2 and Arcgis 9.2 were used to analyze the data (Figure 3).
RESULTS AND DISCUSSION
Numerical assessment of plants resources
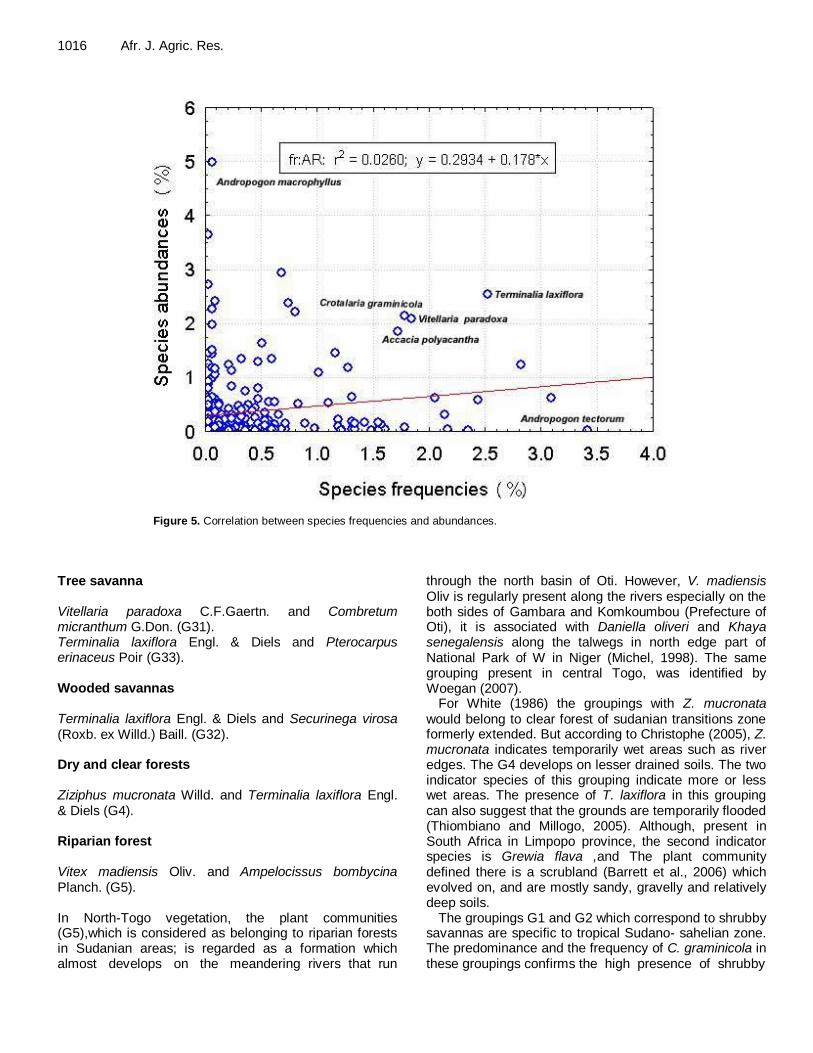
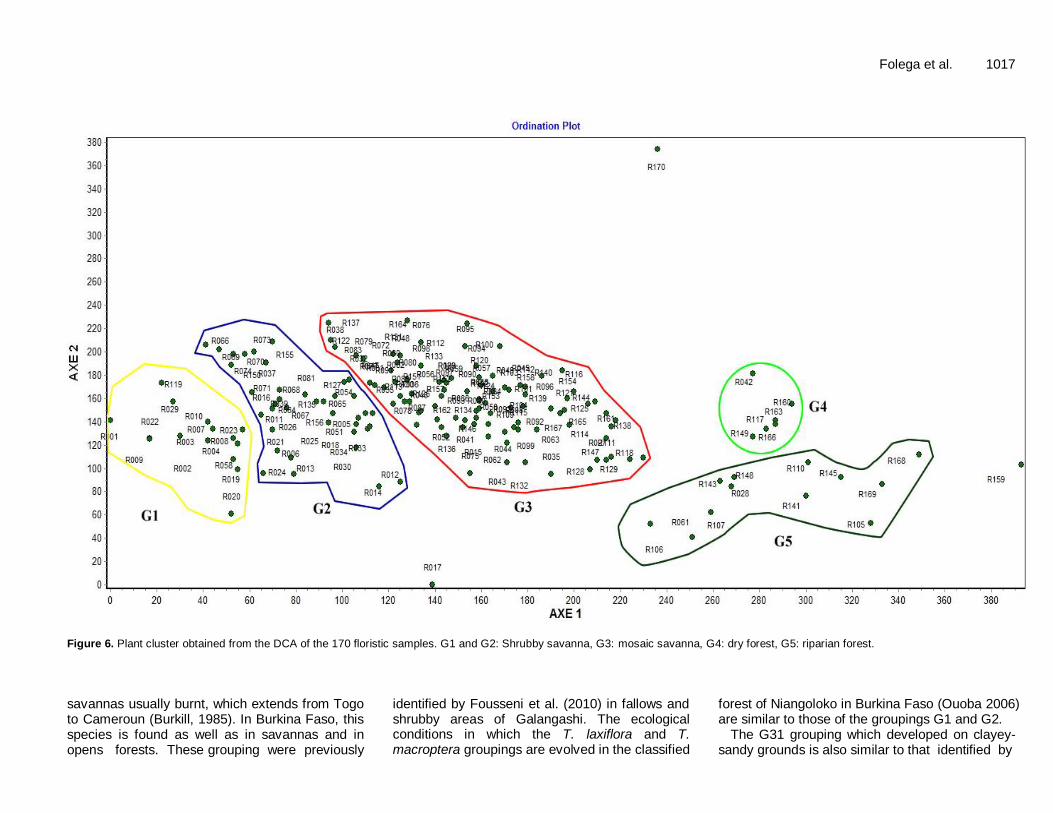
1) For the whole field investigation work, 274 plant species, grouped into 247 genera and 63 families, have been identified. This number represented the double of species recorded by Dimobe (2009) in the fauna reserve of Oti-Mandouri in the same region .But twice lower than those recorded by Woegan (2007) and Wala (2004) respectively in the Fazao-Malfakassa national park and the fauna reserve of Aledjo (central part of the chain of Atakora) (617 species) and in the septentrional part of the same chain (Benin) (663 species). This wide variation might have been due to climatic differences because the Atakora Mountain chain belongs to Guinean tropical climate which is more humid than Sudanian one. 2) Six families are represented by at least 10 species: Fabaceae (36 sp), Poaceae (28 sp), Combretaceae (18 sp), Rubiaceae (13 sp), Caesalpiniaceae (11 sp), Mimosaceae (11 sp) and Euphorbiaceae (10 sp) (Figure 4). The third of families consists of one species each; Terminalia laxiflora, Crotalaria graminicola, Vitellaria paradoxa and Acacia polyacantha are both the most frequent and the most abundant species in the landscapes (Figure 5). Although more species were identified in Niangoloko forest (Burkina Faso) (Ouoba, 2006) than in this study, Fabaceae and Poaceae still are the most represented families in these two areas. These two families aside, Rubiaceae, Combretaceae, Caesalpiniaceae and Mimosaceae are also well represented in the studies of the above mentioned authors. 3. For all plant species recorded, one is new to Togo flora. This new specie concern Strelizia reginae Banks ex Aiton which was introduced in Togo. 4. The 170 floristic samples and the 282 plants species are grouped in 7 plant groupings after DCA (Detrended Correspondence Analysis) and hierarchical classification process (Figure 6 and 7). The 7 groupings are presented as: Shrubby savanna
Crotalaria graminicola Taub. ex Bak.f. and Terminalia macroptera Guill. & Perr. (G1). Crotalaria graminicola Taub. ex Bak.f. and Terminalia laxiflora Engl. & Diels (G2).

Folega et al. 1015
Experience Scheme
Map of Land change
RGB_NDVI_Unsupcl_870007 Post-classification
processing
NDVI_Images layers stacking
RGB_NDVI_8700
07
Unsupervised classification
(iso-data algorithm)
Images NDVI Calculation
NDVI_1987 NDVI_2000 NDVI_2007
Images preprocessing (Radiometric enhancement –
mosaic images –subset study area)
TM 1987 ETM + 2000 ETM + 2007
Field work
Plant species inventory
Numerical ecological
assessment of collected
data
Flora features (Diversity and
phytosociology)
Figure 3. Experience scheme.
Figure 4. Distribution of species per families.
1016 Afr. J. Agric. Res.
Figure 5. Correlation between species frequencies and abundances.
Tree savanna Vitellaria paradoxa C.F.Gaertn. and Combretum micranthum G.Don. (G31). Terminalia laxiflora Engl. & Diels and Pterocarpus erinaceus Poir (G33). Wooded savannas Terminalia laxiflora Engl. & Diels and Securinega virosa (Roxb. ex Willd.) Baill. (G32). Dry and clear forests Ziziphus mucronata Willd. and Terminalia laxiflora Engl. & Diels (G4). Riparian forest Vitex madiensis Oliv. and Ampelocissus bombycina Planch. (G5). In North-Togo vegetation, the plant communities (G5),which is considered as belonging to riparian forests in Sudanian areas; is regarded as a formation which almost develops on the meandering rivers that run
through the north basin of Oti. However, V. madiensis Oliv is regularly present along the rivers especially on the both sides of Gambara and Komkoumbou (Prefecture of Oti), it is associated with Daniella oliveri and Khaya senegalensis along the talwegs in north edge part of National Park of W in Niger (Michel, 1998). The same grouping present in central Togo, was identified by Woegan (2007).
For White (1986) the groupings with Z. mucronata would belong to clear forest of sudanian transitions zone formerly extended. But according to Christophe (2005), Z. mucronata indicates temporarily wet areas such as river edges. The G4 develops on lesser drained soils. The two indicator species of this grouping indicate more or less wet areas. The presence of T. laxiflora in this grouping can also suggest that the grounds are temporarily flooded (Thiombiano and Millogo, 2005). Although, present in South Africa in Limpopo province, the second indicator species is Grewia flava ,and The plant community defined there is a scrubland (Barrett et al., 2006) which evolved on, and are mostly sandy, gravelly and relatively deep soils.
The groupings G1 and G2 which correspond to shrubby savannas are specific to tropical Sudano- sahelian zone. The predominance and the frequency of C. graminicola in these groupings confirms the high presence of shrubby
Folega et al. 1017
Figure 6. Plant cluster obtained from the DCA of the 170 floristic samples. G1 and G2: Shrubby savanna, G3: mosaic savanna, G4: dry forest, G5: riparian forest.
savannas usually burnt, which extends from Togo to Cameroun (Burkill, 1985). In Burkina Faso, this species is found as well as in savannas and in opens forests. These grouping were previously
identified by Fousseni et al. (2010) in fallows and shrubby areas of Galangashi. The ecological conditions in which the T. laxiflora and T. macroptera groupings are evolved in the classified
forest of Niangoloko in Burkina Faso (Ouoba 2006) are similar to those of the groupings G1 and G2.
The G31 grouping which developed on clayey-sandy grounds is also similar to that identified by

1018 Afr. J. Agric. Res.
Figure 7. Hierarchical classification of 94 samples of mosaic cluster G3 (G31 and G33: Tree
savanna, G32: wooded savanna).

Christophe (2005) in Ségou region (Mali), but the latter can be also found on argillaceous, muddy and sandy substrates. The Combretum micranthum plant community was also identified by the same author, but associated to other species included: Feretia canthioides, Diospyros mespiliformis, Acacia seyal and Acacia macrostachya. This group seems to be a transition one, often composed of shrubby, woody or clear forest and located between 7 and 9 north latitude (Georges et al., 2001).
The G32 grouping of T. laxiflora and Securinega virosa which develops on hydromorphic grounds would be closer to that defined in the classified forest of Niangoloko (Ouoba, 2006), however that identified by Kadeba (2009) in the Ecological et Cultural Site of Koro (province de houet/Burkina Faso) presents a preference for the plateau with outcrop of bed rock. But for Thiombiano (2005) the plant formations with T. laxiflora are ubiquists to all the wet edaphic substrates. The G32 which is associated to the areas considered as medio Sudanian (8°40’N) in Republic of Central Africa is a heterogeneous plant formation and consists of T. laxiflora, Grewia mollis and Combretum hypopilinum (Yves, 2004). Land covers change over the past 20 years The results for land cover and land use dynamism of the three protected areas are clearly shown in Table 4 and Figure 8. The different colors displayed in Figure 8 visually represent the level of change in NDVI values, while Table 4 shows the changes in NDVI values, in terms of the nine colors from which the RGB_NDVI image is composed, and in vegetation cover over twenty years.
Figure 8 also clearly shows and quantifies major decreases or increases in green biomass associated with forest harvest or regrowth (Donatien, 2008). Red and yellow areas represent a decrease in NDVI values (Table 4). These colors indicate biomass loss, usually due to the harvest of plant resources. Biomass loss between 1987 and 2000 was estimated to be 30220.1403 ha, while between 2000 and 2007 it was 11659.5526 ha (Table 4). Vegetation loss between 1987 and 2000 was probably the result of social, economic and political disorder from 1990 (Folega et al., 2011). From observations made in the field, this vegetation loss has continued after 2000 until the present day, and this may be due to the lack of or insufficient monitoring and protection in these areas.
Zones with minor or no change in vegetation (Figure 8, Table 4) are represented by black, gray and white colors on the map. Here the dynamics in vegetation are stable. However, negative NDVI values in black zones indicate water, barren soil and villages. In gray and white areas, there is biomass. In gray areas, biomass is low, but in white areas it is very high. These few white areas correspond in particular to Riparian Forest and to Wooded Savanna. Clearing of Riparian Forest and
Folega et al. 1019 neighboring Wooded Savanna such as dry forest is clearly seen in the western part of the Oti-Keran protected area along the Koumongou River. Barren land and flooded areas (characterized by black) increase in this part of the reserve. From Table 4, the small extent of Riparian Forest and undisturbed vegetation is apparent.
Cyan, blue, green and magenta areas represent zones showing dynamic fluctuation (Figure 8). Interpretation of areas of these colors allows the analysis of vegetation clearing, no-change, and regrowth classes in a time series (Hayes and Sader, 2002; Sader et al., 2003). Based on the semi-military management of the protected areas in Togo (Folega et al., 2011) before 1990 and the loss of vegetation apparent before that date, it is likely that much more vegetation harvesting occurred after 1990.
Among the anthropogenic disturbances observed in the field in this study, farming was the most common, followed by tree cutting and burning (Figure 9). The high pressure of these unceasing and increasing disturbances between 1990 and 2000, corroborate well with the high levels of vegetation loss during the same period.
Both the ecosystems represented in the study area hold human activities impact. The savannas, especially the shrubby and tree savannas are less disturbed while the riparian forest and neighboring dry forest are more influenced in dry season. The predominance of shrubby savanna in this area is a consequence of socio-economic activities practiced there. Moreover, transhumance and grazing is higher in this region compared to other regions and where savanna burnings are used as a tool to manage the continuous production of grass for cattle (Winston and Lynne, 2004, Bucini and Lambin, 2001). Farming occupies more than 80% of the local resident activities and contributes to savanna establishment as well as the growth of grassland areas. On the other hand, the limitation of fallow periods due to the over population of the area associated to the lost of soil fertility push local resident to look for new farmlands. In most cases the installation of new farms is followed by a systematic clearing and burning of wooded areas, which is another way for peasants to fertilize the soil through the mineralization of organic matter (Mahesh et al., 2008).
The Barkoissi protected area illustrates this loss of vegetation well. Based on the results of ethno-botanical research, the people on the borders of the protected area invaded the area over a period of nineteen years for farming and harvesting. In this traditional system of land exploitation (Folega et al., 2011; Kperkouma et al., 2005), local residents deliberately preserved perennial, multipurpose, woody plants in association with their crops and breeding in a dispersed spatial arrangement. Today, this reserve appears more like an enormous range of parkland than a protected forest area.
However, estimation of loss and regrowth of vegetation is difficult in these fluctuating areas. Plant species regeneration in these protected areas has been higher

1020 Afr. J. Agric. Res.
Figure 8. RGB-NDVI classified map showing the dynamic in land cover change.
than vegetation loss since the consensual rehabilitation of protected areas project was established (UICN/PACO, 2008). The Galangashi protected area provides better information on regrowth. Field studies here found that old fallow areas showed a progressive succession into shrubby and tree savanna.
The RGB-NDVI classification provided distinct change/ no-change cluster classes and was a simple, fast and
effective change detection technique. It should be a useful accessory for ecological monitoring programs. Conclusion The knowledge about the land resources in terms of its evaluation and assessment is quite important for

Folega et al. 1021
Figure 9. Pictures showing the main anthropogenous activities observed in the study area.
sustainable management. It is essential to explore the available potentiality and the optimization of resource use. The research attempts to define the most important plant communities as well as help understand the land use dynamism of the study areas over the past 20 years. The modest information provided by this study can be vital in this period of consensual management of protected areas. More so, evaluations of anthropogenous disturbance factors are also needed to complete and get a synoptic view of this drought zone land features which are constantly threatened by transhumance.
ACKNOWLEDGEMENTS The research is supported by the special fund of forestry industry for public welfare projects (200904022). We gratefully acknowledges Prof. Zhao Xiu Hai and Prof. Akpagana for their unconditional assistance during this research. REFERENCES
Andy YK, Dhari AA (1996). Using Landsat Thematic Mapper Data
toDetect and Map Vegetation Changes in Kuwait. Int. Arch.
Photogramm. Remote Sens., 31(B7): 398-405.
Baldyga TJ, Miller SN, Driese KL, Maina GC (2007). Land cover change assessment within Kenya’s Mau forest region using remotely sensed
data. Afr. J. Ecol., doi: 10.1111/j.1365-2028.2007.00806.x. Barrett AS, Brown LR, Barrett L, Henzi SP (2006). Phytosociology and
plant community utilisation by vervet monkeys of the Blydeberg
Conservancy, Limpopo Province. Koedoe, 49(1): 49-68. Pretoria. ISSN 0075-6458.
Bucini G, Lambin FE (2001) Fire impacts on vegetation in Central Africa:
a remote-sensing-based statistical analysis. Appl. Geogr., 22(2002): 27-48.
Burkill HM (1985). The useful plants of west tropical Africa,
Vol3.http://plants.jstor.org/action/doSearch?type=advanced&searchText=Crotalaria+graminicola&submit=View+Results&sa=api&sa=lapi.
Chavez PS (1996). Image-based atmospheric corrections—revisited
and revised. Photogramm. Eng. Remote Sens., 62(9): 1025-1036. Christophe R, Julien B, Amadou N, Bocary K, Nicole S (2005). Specific
ligneous Biodiversity :which relations? The case of three village of
Segou region (Mali). Bois et forêts des tropiques, 283(1): 33-49. Dimobe K (2009). Analysis of the spatial dynamics of different forms of
human pressure on the reserve of the Oti-Mandouri. Master
dissertation, plant biology, Appli. Univ. Lomé, Togo. Donatien N (2008). Mapping deforestation in the Congo basin forest
using multi-temporal spot-vgt imagery from 2000 to 2004. EARSeL
eProceedings, 7: 1/2008. Ern H (1979). The Vegetation of Togo. Gliederrung, Gefährdung,
Erhaltung. Willdenowia, 9: 295-312.
Folega F, Zhao XH, Zhang CY, Kperkouma W, Koffi A (2010). Ecological and numerical analyses of plant communities of the most conserved protected area in North-Togo. Int. J. Biodivers. Conserv.,
2(11): 359-369. Folega F, Zhang CY, Kperkouma W, Zhao X H, Koffi A (2011). Wooded
vegetation of protected areas in Northern Togo. Case of Barkoissi,
Galangashi and Oti-Keran: Ecological and Structure Analysis of Plant
1022 Afr. J. Agric. Res.
Communities. For. Stud. China, 13(1): 23-35. Folega F, Huang HG, Zhao XH, Jean LS, Seyf-Laye AM (2011) .Urban
area vegetation changing assessment over the last 20 years based
on NDVI. Energy Procedia, 1: 2449-2454 Folega F, Zhang CY, Samake G, Kperkouma W, Batawila K, Zhao XH,
Koffi A (2011). Evaluation of agroforestry species in potential fallows
of areas gazetted as protected areas in north-Togo. Afr. J. Agric. Res., 6(12): 2828-2834.
Georges A, Nestor S, Orou GG (2001). State of Forest Genetic
Resources in Benin. FAO, IPGRI/SAFORGEN, le DFSC et l’ICRAF. 36. http://www.fao.org/DOCREP/004/AB395F/AB395F00.HTM.
Hayes DJ, Sader SA (2002). Analyzing a forest conversion history
database to explore the spatial and temporal characteristics of forest change. Landsc. Ecol., 17: 299-314.
Hill MO (1979b). DECORNA- A FORTAN program for Detrended
correspondence analysis and reciprocal averaging. Ecology and Systematics. Cornell University, Ithaca, N.Y., p. 52.
Hutchinson J, Dalziel JM (1958, 1963, 1968, 1972). Flora of West
Tropical Africa. Crown Agents for Overseas Governments and Administrations, Londres: vol. 1, tomes 1 et 2, 828 p., vol. 2, 544 p; vol. 3, tomes 1 et 2, 852 p.
Jensen JR (2005). Introductory Digital Image Processing: A Remote Sensing Perspective. 3rd Edition, Upper Saddle River: Prentice-Hall, 526.
Julien A, Catherine M (2008). Mapping by remote sensing of land cover change on the coastal strip of West Africa: the example of rivers south of the Saloum Delta (Senegal) in the Rio Gêba (Guinée-
Bissau). Revue Télédétection, 8(2): 93-118. Kadeba A (2009). Flora and vegetation of the ecological site and
cultural of Koro (province du Houet/ Burkina Faso) Master
dissertation, Botany and Phytoecology, Univ. Ouagadougou, p. 71. Kperkouma W, Brice S, Kudzo AG, Kouami K, Koffi A (2005). Typology
and structure of parkland in the prefecture of Doufelgou (Togo).
Sécheresse, 2005; 16(3): 209-216 Legendre P, Legendre L (1998). Numerical ecology. Elsevier,
Amsterdam, 2nd ed., 853 pp. (347,348,349,368,369,370,371).
Lillesand T, Kiefer R, Chipman J (2008). Remote Sensing and Image Interpretation. 6th edition. John Wiley & Sons, NY., p. 756.
Mahesh S, Jayashree R, Niall H (2008).Woody cover in African
savannas: the role of resources, fire and herbivory. Glob. Ecol. Biogeogr. (Glob. Ecol. Biogeogr.), 17: 236-245. DOI: 10.1111/j.1466-8238.2007.00360.x
Moussa A (2008). Climate classification based on vegetation, rainfall and temperature (Togo). Mem Master of Geography, Université de Lomé, 30 pp.
Michel B (1998). Contribution to the study of the natural medium and plant resources of the Township of Tamou and of the Park « W ».ORTSTOM Paris, p. 41.
Natta AK (2003). Ecological assessment of riparian forests in Benin:
phytodiversity, phytosociology and spatial distribution of tree species. Ph.D. Thesis Wageningen University, Netherlands, p. 222.
Ola A (2008). Extending post-classification change detection using
semantic similarity metric to overcome class heterogeneity: A study of 1992 and 2001 US National Land Cover Databases changes. Remote Sens. Environ., 112: 1226-1241.
Ouoba P (2006). Flora and vegetation Niangoloko classified forest,
south west of Burkina Faso. PhD dissertation, Université de Ouagadougou, p. 140.
Roland P (1996). Morphopedologic study of northern Togo at 1/500 O00. ORSTOM, Paris, p. 145.
Sader SA, Winne JC (1992). RGB-NDVI colour composites for
visualizing forest change dynamics. Int. J. Remote Sens., 13(16): 3055-3067.
Sader SA, Bertrand M, Wilson EH (2003). Satellite change detection of
forest harvest patterns on an industrial forest landscape, For. Sci., 49(3): 341-353.
Tilman D, Fargione J, Wolff B, D’Antonio C, Dobson A, Howarth R,
Schindler D, Schlesinger WH, Simberloff D, Swackhamer D (2001). Forecasting agriculturally driven global environmental change. Science, 292: 281-284.
Thiombiano A, Millogo RJ (2005). Initiation to the phytocoenology, elements de T.D & T.P., p. 38
Tucker CJ (1979). Red and photographic infrared linear combinations
for monitoring vegetation. Remote Sens. Environ., 8: 127-150. UICN/PACO (2008). Evaluation of effectiveness management of
protected areas: protected areas in Togo. ISBN: 978-2-8317-1130-
0.44p. Wala K (2004). The vegetation the Atakora chain in Benin: Floristic
diversity , Phytosociology and human impact. PhD dissertation,
Université de Lomé, p. 138. Wang A, Price DT, Arora V (2006). Estimating changes in global
vegetation cover (1850–2100) for use in climate models. Glob.
Biogeochem. Cycles, 20, GB3028, doi: 10.1029/2005GB002514. Ward J (1963). Hierarchical grouping to optimize an objective function.
J. Am. Stat. Assoc., 58: 236-244.
Westhoff V, van der Maarel E (1978). The Braun-Blanquet approach, 2nd ed. In: Whittaker R.H. (ed.).Classification of plant communities. Junk, The Hague, pp. 287-399.
Wilson EF, Sader SA (2002). Detection of forest type using multiple dates of Landsat TM imagery. Remote Sens. Environ., .80: 385-396.
Winston SWT, Lynne AT (2004). Prescribed burning in African
grasslands and savannas for wildlife management. Fire Ecol., No. 55 Wittig R, König K, Schmidt M, Szarzynski J (2007). A Study of Climate
Change and Anthropogenic Impacts in West Africa. Environ. Sci.
Pollut. Res., 14 (3): 182-189. White F (1986). The vegetation of Africa. Memory Map of the vegetation
in Africa. UNESCO/AETFA/UNSO.
Woegan YA (2007). Diversity of woody vegetation National Park Fazao-Malfakassa and Wildlife Reserve of Aledjo (Togo). PhD dissertation, Université de Lomé, 142 pp.
Yves Y (2004). State of forest genetic resources of the Central African Republic. FAO, Rome, Italie. 44. http://www.fao.org/forestry/fgr.


