Embed Size (px)
Citation preview
Quarterly Financial Supplement
For the three months ended
March 31, 2002
Investor Relations Department3300 Enterprise Parkway • Beachwood, Ohio 44122
(216) 755-5500 • (216) 755-1500 (fax)www.ddrc.com
Developers Diversified Realty Quarterly Financial Supplement For the three months ended March 31, 2002
Developers Diversified Realty Corporation considers portions of this information to be forward-looking statements within the meaning of Section 27A of the Securities Exchange Act of 1933 and Section 21E of the Securities Exchange Act of 1934, both as amended, with respect to the Company’s expectation for future periods. Although the Company believes that the expectations reflected in such forward-looking statements are based upon reasonable assumptions, it can give no assurance that its expectations will be achieved. For this purpose, any statements contained herein that are not historical fact may be deemed to be forward-looking statements. There are a number of important factors that could cause the results of the Company to differ materially from those indicated by such forward-looking statements, including among other factors, local conditions such as oversupply of space or a reduction in demand for real estate in the area, competition from other available space, dependence on rental income from real property or the loss of a major tenant and other matters described in the Management’s Discussion and Analysis section of the Company’s Form 10-K for the year ended December 31, 2001.
Developers Diversified Realty Quarterly Financial Supplement For the three months ended March 31, 2002
TABLE OF CONTENTS
Section Page Earnings Release & Financial Statements . . . . . . . . . . . . 1.
Financial Summary . . . . . . . . . . . . . . . . . . . . . . . . . 11.
• Financial Highlights 12. • Market Capitalization and Financial Ratios 13. • Market Capitalization Summary 16. • Significant Accounting Policies 17.
Consolidated and Wholly Owned Financial Operations . . . . . 19.
• Summary of Capital Transactions 20. • Acquisitions, Dispositions, Expansions and Developments 21. • Summary of Consolidated Debt 25. • Summary of Consolidated Mortgage Principal Payments 27.
& Corporate Debt Maturities Joint Venture Summaries . . . . . . . . . . . . . . . . . . . . . 29.
• Joint Venture Financials 30. • Joint Venture Partnership Summaries 34.
Joint Venture Financial Operations . . . . . . . . . . . . . . . . 60.
• Summary of Capital Transactions 61. • Acquisitions, Dispositions, Expansions and Developments 62. • Summary of Joint Venture Debt 66. • Summary of Pro Rata Joint Venture Debt 68. • Summary of Joint Venture Mortgage Principal Payments 69.
Portfolio Statistics . . . . . . . . . . . . . . . . . . . . . . . . . . 70. Appendix . . . . . . . . . . . . . . . . . . . . . . . . . . . . . . . 80.
• Property Listing 81. • Investor Information 96.

Earnings Release & Financial Statements
DEVELOPERS DIVERSIFIED REALTY CORPORATION For Immediate Release: Contact: Scott A. Wolstein Michelle A. Mahue Chairman Director of Investor Relations Chief Executive Officer 216-755-5455 216-755-5500
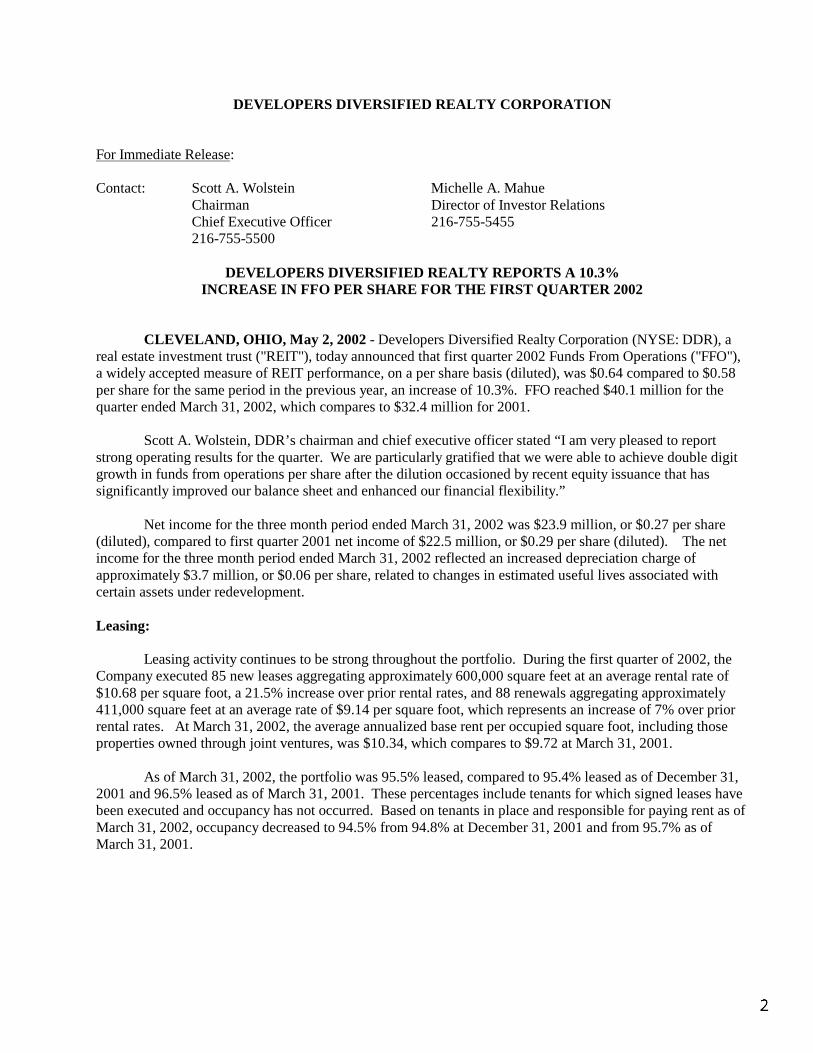
DEVELOPERS DIVERSIFIED REALTY REPORTS A 10.3% INCREASE IN FFO PER SHARE FOR THE FIRST QUARTER 2002
CLEVELAND, OHIO, May 2, 2002 - Developers Diversified Realty Corporation (NYSE: DDR), a real estate investment trust ("REIT"), today announced that first quarter 2002 Funds From Operations ("FFO"), a widely accepted measure of REIT performance, on a per share basis (diluted), was $0.64 compared to $0.58 per share for the same period in the previous year, an increase of 10.3%. FFO reached $40.1 million for the quarter ended March 31, 2002, which compares to $32.4 million for 2001. Scott A. Wolstein, DDR’s chairman and chief executive officer stated “I am very pleased to report strong operating results for the quarter. We are particularly gratified that we were able to achieve double digit growth in funds from operations per share after the dilution occasioned by recent equity issuance that has significantly improved our balance sheet and enhanced our financial flexibility.” Net income for the three month period ended March 31, 2002 was $23.9 million, or $0.27 per share (diluted), compared to first quarter 2001 net income of $22.5 million, or $0.29 per share (diluted). The net income for the three month period ended March 31, 2002 reflected an increased depreciation charge of approximately $3.7 million, or $0.06 per share, related to changes in estimated useful lives associated with certain assets under redevelopment. Leasing: Leasing activity continues to be strong throughout the portfolio. During the first quarter of 2002, the Company executed 85 new leases aggregating approximately 600,000 square feet at an average rental rate of $10.68 per square foot, a 21.5% increase over prior rental rates, and 88 renewals aggregating approximately 411,000 square feet at an average rate of $9.14 per square foot, which represents an increase of 7% over prior rental rates. At March 31, 2002, the average annualized base rent per occupied square foot, including those properties owned through joint ventures, was $10.34, which compares to $9.72 at March 31, 2001. As of March 31, 2002, the portfolio was 95.5% leased, compared to 95.4% leased as of December 31, 2001 and 96.5% leased as of March 31, 2001. These percentages include tenants for which signed leases have been executed and occupancy has not occurred. Based on tenants in place and responsible for paying rent as of March 31, 2002, occupancy decreased to 94.5% from 94.8% at December 31, 2001 and from 95.7% as of March 31, 2001.
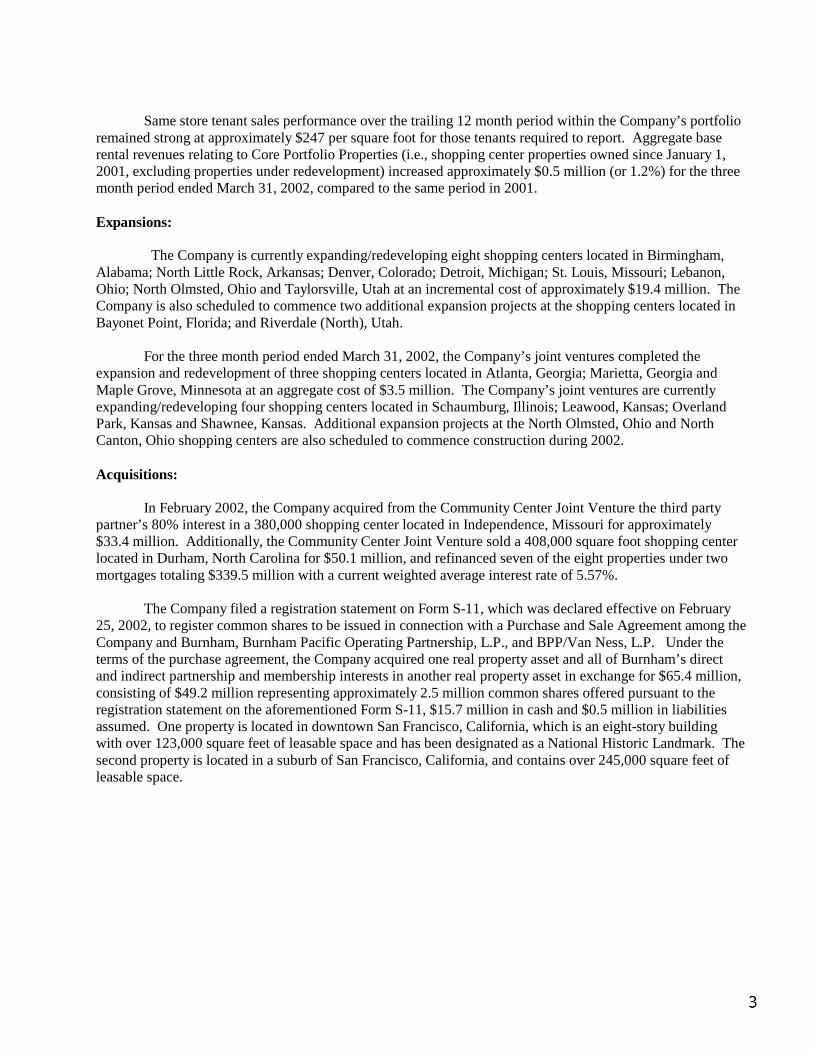
Same store tenant sales performance over the trailing 12 month period within the Company’s portfolio remained strong at approximately $247 per square foot for those tenants required to report. Aggregate base rental revenues relating to Core Portfolio Properties (i.e., shopping center properties owned since January 1, 2001, excluding properties under redevelopment) increased approximately $0.5 million (or 1.2%) for the three month period ended March 31, 2002, compared to the same period in 2001. Expansions:
The Company is currently expanding/redeveloping eight shopping centers located in Birmingham, Alabama; North Little Rock, Arkansas; Denver, Colorado; Detroit, Michigan; St. Louis, Missouri; Lebanon, Ohio; North Olmsted, Ohio and Taylorsville, Utah at an incremental cost of approximately $19.4 million. The Company is also scheduled to commence two additional expansion projects at the shopping centers located in Bayonet Point, Florida; and Riverdale (North), Utah.
For the three month period ended March 31, 2002, the Company’s joint ventures completed the
expansion and redevelopment of three shopping centers located in Atlanta, Georgia; Marietta, Georgia and Maple Grove, Minnesota at an aggregate cost of $3.5 million. The Company’s joint ventures are currently expanding/redeveloping four shopping centers located in Schaumburg, Illinois; Leawood, Kansas; Overland Park, Kansas and Shawnee, Kansas. Additional expansion projects at the North Olmsted, Ohio and North Canton, Ohio shopping centers are also scheduled to commence construction during 2002. Acquisitions: In February 2002, the Company acquired from the Community Center Joint Venture the third party partner’s 80% interest in a 380,000 shopping center located in Independence, Missouri for approximately $33.4 million. Additionally, the Community Center Joint Venture sold a 408,000 square foot shopping center located in Durham, North Carolina for $50.1 million, and refinanced seven of the eight properties under two mortgages totaling $339.5 million with a current weighted average interest rate of 5.57%. The Company filed a registration statement on Form S-11, which was declared effective on February 25, 2002, to register common shares to be issued in connection with a Purchase and Sale Agreement among the Company and Burnham, Burnham Pacific Operating Partnership, L.P., and BPP/Van Ness, L.P. Under the terms of the purchase agreement, the Company acquired one real property asset and all of Burnham’s direct and indirect partnership and membership interests in another real property asset in exchange for $65.4 million, consisting of $49.2 million representing approximately 2.5 million common shares offered pursuant to the registration statement on the aforementioned Form S-11, $15.7 million in cash and $0.5 million in liabilities assumed. One property is located in downtown San Francisco, California, which is an eight-story building with over 123,000 square feet of leasable space and has been designated as a National Historic Landmark. The second property is located in a suburb of San Francisco, California, and contains over 245,000 square feet of leasable space.
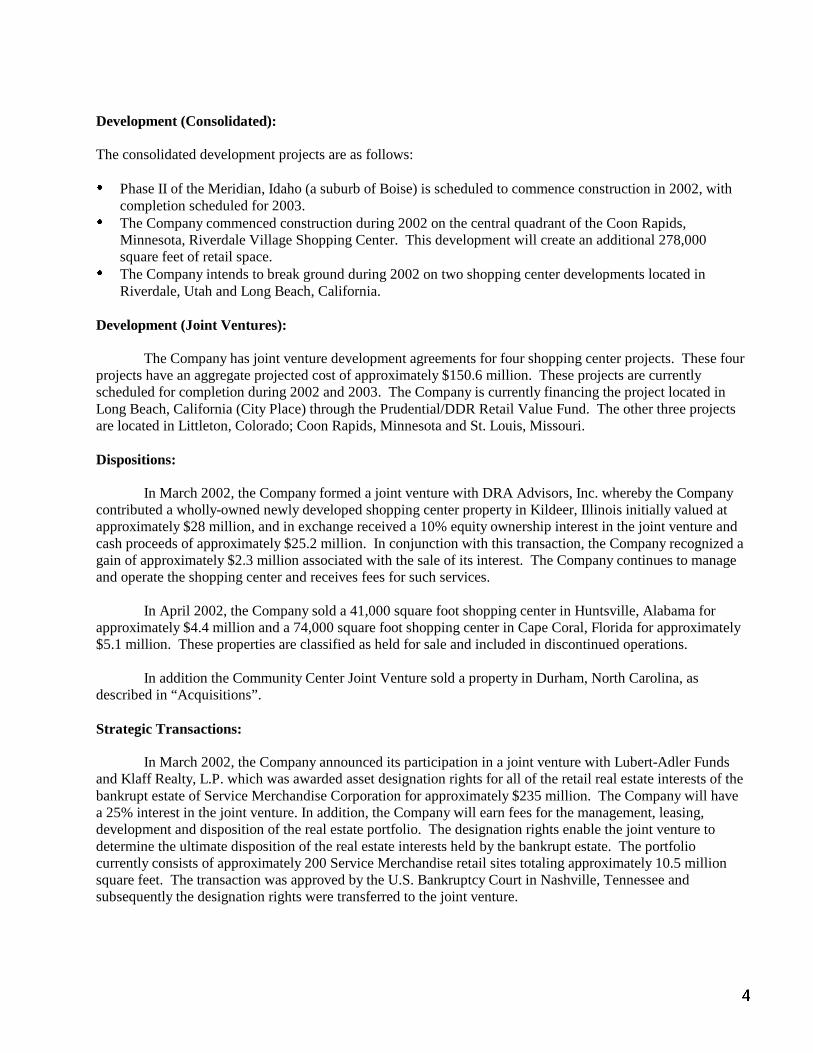
Development (Consolidated): The consolidated development projects are as follows: é Phase II of the Meridian, Idaho (a suburb of Boise) is scheduled to commence construction in 2002, with
completion scheduled for 2003. é The Company commenced construction during 2002 on the central quadrant of the Coon Rapids,
Minnesota, Riverdale Village Shopping Center. This development will create an additional 278,000 square feet of retail space.
é The Company intends to break ground during 2002 on two shopping center developments located in Riverdale, Utah and Long Beach, California.
Development (Joint Ventures): The Company has joint venture development agreements for four shopping center projects. These four projects have an aggregate projected cost of approximately $150.6 million. These projects are currently scheduled for completion during 2002 and 2003. The Company is currently financing the project located in Long Beach, California (City Place) through the Prudential/DDR Retail Value Fund. The other three projects are located in Littleton, Colorado; Coon Rapids, Minnesota and St. Louis, Missouri. Dispositions:
In March 2002, the Company formed a joint venture with DRA Advisors, Inc. whereby the Company contributed a wholly-owned newly developed shopping center property in Kildeer, Illinois initially valued at approximately $28 million, and in exchange received a 10% equity ownership interest in the joint venture and cash proceeds of approximately $25.2 million. In conjunction with this transaction, the Company recognized a gain of approximately $2.3 million associated with the sale of its interest. The Company continues to manage and operate the shopping center and receives fees for such services. In April 2002, the Company sold a 41,000 square foot shopping center in Huntsville, Alabama for approximately $4.4 million and a 74,000 square foot shopping center in Cape Coral, Florida for approximately $5.1 million. These properties are classified as held for sale and included in discontinued operations. In addition the Community Center Joint Venture sold a property in Durham, North Carolina, as described in “Acquisitions”. Strategic Transactions: In March 2002, the Company announced its participation in a joint venture with Lubert-Adler Funds and Klaff Realty, L.P. which was awarded asset designation rights for all of the retail real estate interests of the bankrupt estate of Service Merchandise Corporation for approximately $235 million. The Company will have a 25% interest in the joint venture. In addition, the Company will earn fees for the management, leasing, development and disposition of the real estate portfolio. The designation rights enable the joint venture to determine the ultimate disposition of the real estate interests held by the bankrupt estate. The portfolio currently consists of approximately 200 Service Merchandise retail sites totaling approximately 10.5 million square feet. The transaction was approved by the U.S. Bankruptcy Court in Nashville, Tennessee and subsequently the designation rights were transferred to the joint venture.
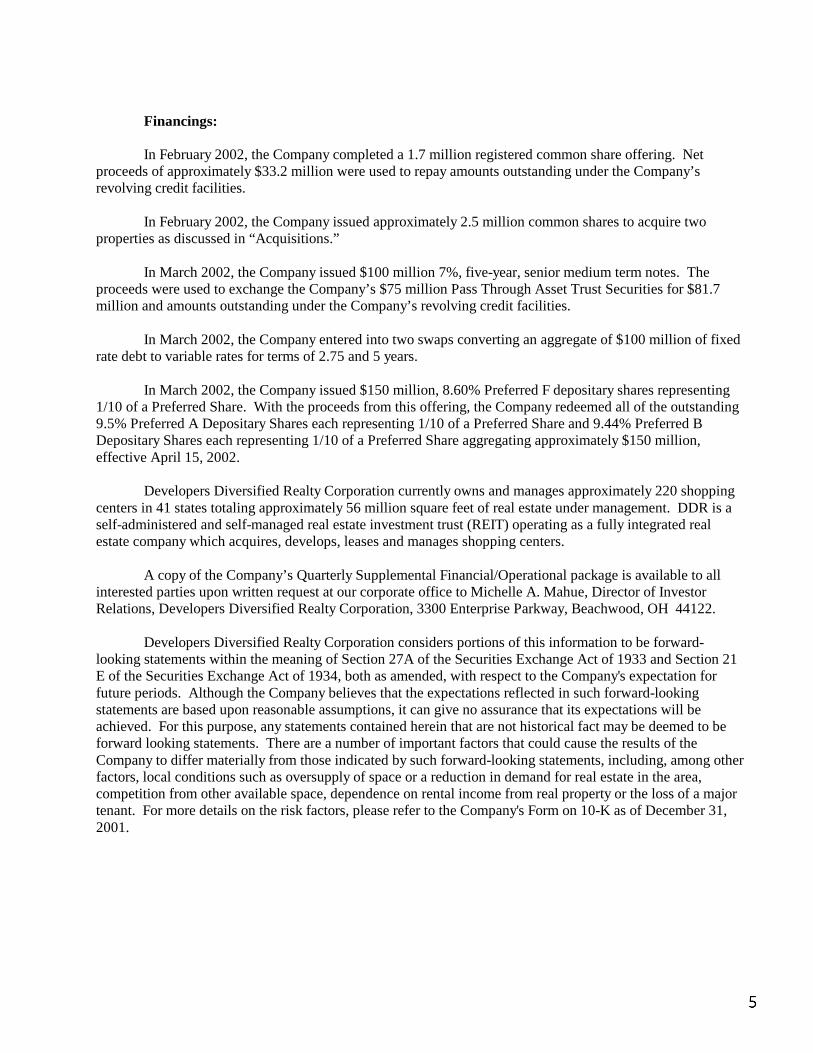
Financings:
In February 2002, the Company completed a 1.7 million registered common share offering. Net proceeds of approximately $33.2 million were used to repay amounts outstanding under the Company’s revolving credit facilities. In February 2002, the Company issued approximately 2.5 million common shares to acquire two properties as discussed in “Acquisitions.” In March 2002, the Company issued $100 million 7%, five-year, senior medium term notes. The proceeds were used to exchange the Company’s $75 million Pass Through Asset Trust Securities for $81.7 million and amounts outstanding under the Company’s revolving credit facilities. In March 2002, the Company entered into two swaps converting an aggregate of $100 million of fixed rate debt to variable rates for terms of 2.75 and 5 years. In March 2002, the Company issued $150 million, 8.60% Preferred F depositary shares representing 1/10 of a Preferred Share. With the proceeds from this offering, the Company redeemed all of the outstanding 9.5% Preferred A Depositary Shares each representing 1/10 of a Preferred Share and 9.44% Preferred B Depositary Shares each representing 1/10 of a Preferred Share aggregating approximately $150 million, effective April 15, 2002. Developers Diversified Realty Corporation currently owns and manages approximately 220 shopping centers in 41 states totaling approximately 56 million square feet of real estate under management. DDR is a self-administered and self-managed real estate investment trust (REIT) operating as a fully integrated real estate company which acquires, develops, leases and manages shopping centers. A copy of the Company’s Quarterly Supplemental Financial/Operational package is available to all interested parties upon written request at our corporate office to Michelle A. Mahue, Director of Investor Relations, Developers Diversified Realty Corporation, 3300 Enterprise Parkway, Beachwood, OH 44122. Developers Diversified Realty Corporation considers portions of this information to be forward-looking statements within the meaning of Section 27A of the Securities Exchange Act of 1933 and Section 21 E of the Securities Exchange Act of 1934, both as amended, with respect to the Company's expectation for future periods. Although the Company believes that the expectations reflected in such forward-looking statements are based upon reasonable assumptions, it can give no assurance that its expectations will be achieved. For this purpose, any statements contained herein that are not historical fact may be deemed to be forward looking statements. There are a number of important factors that could cause the results of the Company to differ materially from those indicated by such forward-looking statements, including, among other factors, local conditions such as oversupply of space or a reduction in demand for real estate in the area, competition from other available space, dependence on rental income from real property or the loss of a major tenant. For more details on the risk factors, please refer to the Company's Form on 10-K as of December 31, 2001.
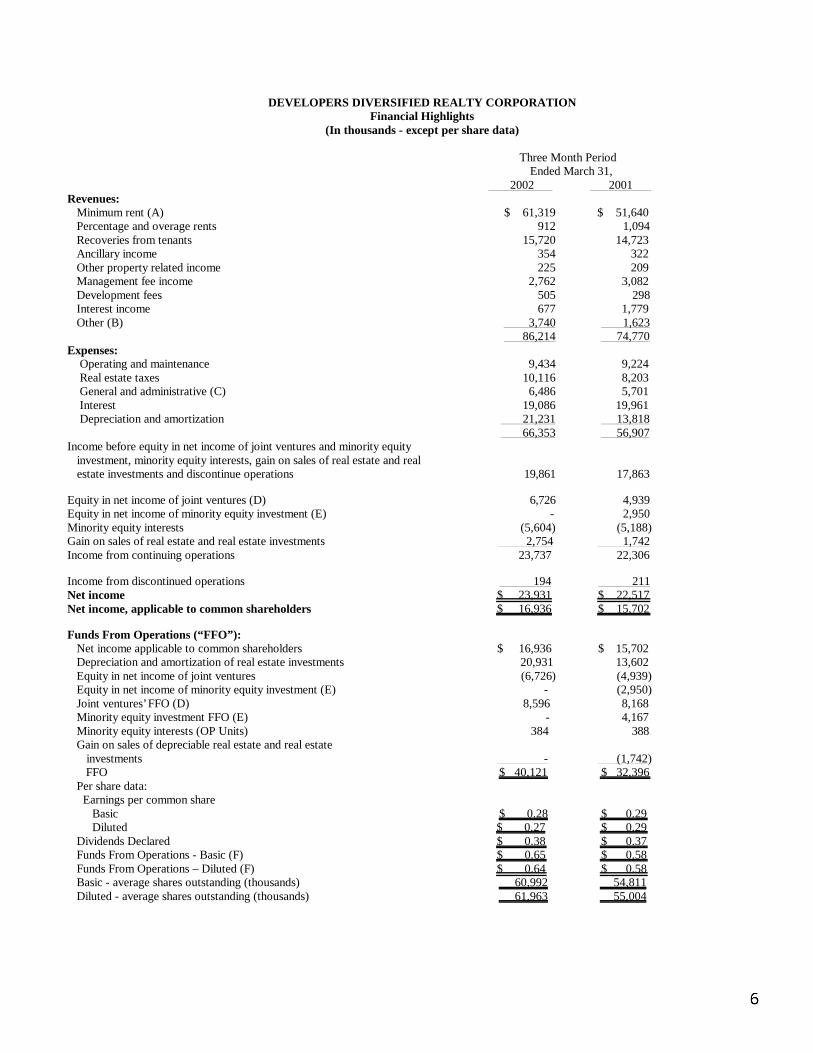
DEVELOPERS DIVERSIFIED REALTY CORPORATION Financial Highlights
(In thousands - except per share data)
Three Month Period Ended March 31, 2002 2001
Revenues: Minimum rent (A) $ 61,319 $ 51,640 Percentage and overage rents 912 1,094 Recoveries from tenants 15,720 14,723 Ancillary income 354 322 Other property related income 225 209 Management fee income 2,762 3,082 Development fees 505 298 Interest income 677 1,779 Other (B) 3,740 1,623 86,214 74,770 Expenses: Operating and maintenance 9,434 9,224 Real estate taxes 10,116 8,203 General and administrative (C) 6,486 5,701 Interest 19,086 19,961 Depreciation and amortization 21,231 13,818
66,353 56,907 Income before equity in net income of joint ventures and minority equity
investment, minority equity interests, gain on sales of real estate and real estate investments and discontinue operations
19,861
17,863 Equity in net income of joint ventures (D) Equity in net income of minority equity investment (E)
6,726 -
4,939 2,950
Minority equity interests (5,604) (5,188) Gain on sales of real estate and real estate investments 2,754 1,742 Income from continuing operations 23,737 22,306 Income from discontinued operations 194 211 Net income $ 23,931 $ 22,517 Net income, applicable to common shareholders $ 16,936 $ 15,702 Funds From Operations (“FFO”): Net income applicable to common shareholders $ 16,936 $ 15,702 Depreciation and amortization of real estate investments 20,931 13,602 Equity in net income of joint ventures (6,726) (4,939) Equity in net income of minority equity investment (E) - (2,950) Joint ventures’ FFO (D) 8,596 8,168 Minority equity investment FFO (E) - 4,167 Minority equity interests (OP Units) 384 388 Gain on sales of depreciable real estate and real estate
investments
-
(1,742) FFO $ 40,121 $ 32,396 Per share data: Earnings per common share Basic $ 0.28 $ 0.29 Diluted $ 0.27 $ 0.29 Dividends Declared $ 0.38 $ 0.37 Funds From Operations - Basic (F) $ 0.65 $ 0.58 Funds From Operations – Diluted (F) $ 0.64 $ 0.58 Basic - average shares outstanding (thousands) 60,992 54,811 Diluted - average shares outstanding (thousands) 61,963 55,004
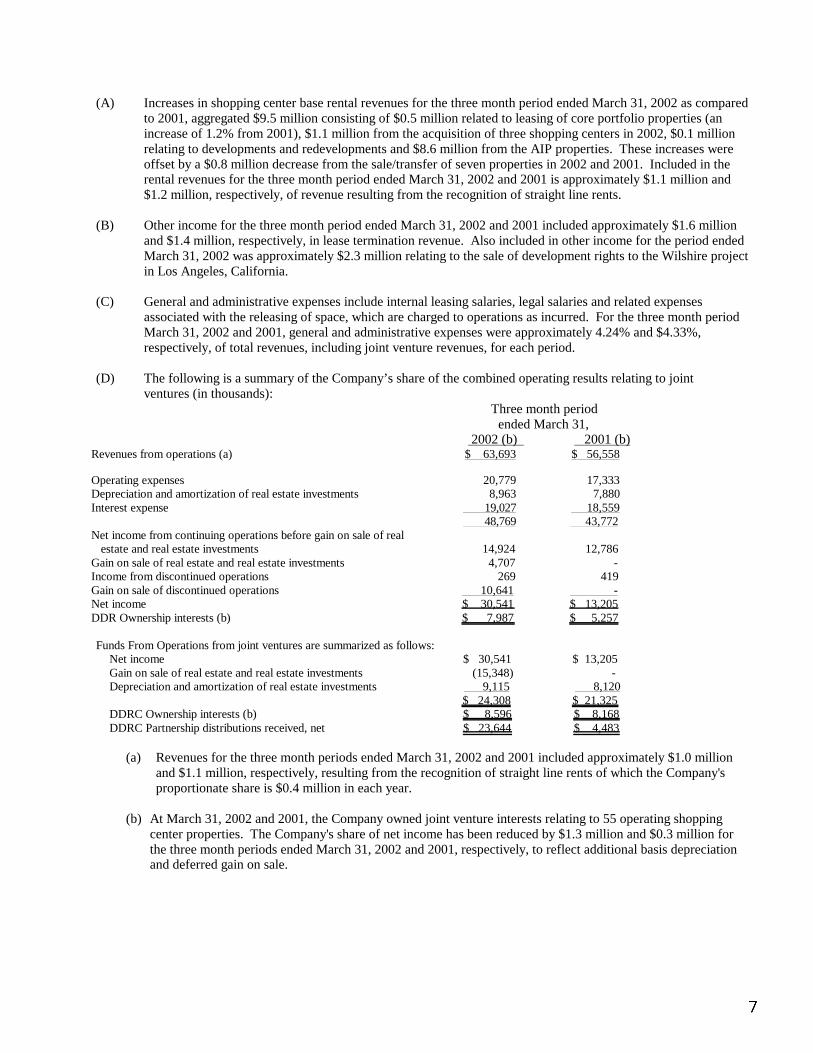
(A) Increases in shopping center base rental revenues for the three month period ended March 31, 2002 as compared to 2001, aggregated $9.5 million consisting of $0.5 million related to leasing of core portfolio properties (an increase of 1.2% from 2001), $1.1 million from the acquisition of three shopping centers in 2002, $0.1 million relating to developments and redevelopments and $8.6 million from the AIP properties. These increases were offset by a $0.8 million decrease from the sale/transfer of seven properties in 2002 and 2001. Included in the rental revenues for the three month period ended March 31, 2002 and 2001 is approximately $1.1 million and $1.2 million, respectively, of revenue resulting from the recognition of straight line rents.
(B) Other income for the three month period ended March 31, 2002 and 2001 included approximately $1.6 million and $1.4 million, respectively, in lease termination revenue. Also included in other income for the period ended March 31, 2002 was approximately $2.3 million relating to the sale of development rights to the Wilshire project in Los Angeles, California.
(C) General and administrative expenses include internal leasing salaries, legal salaries and related expenses
associated with the releasing of space, which are charged to operations as incurred. For the three month period March 31, 2002 and 2001, general and administrative expenses were approximately 4.24% and $4.33%, respectively, of total revenues, including joint venture revenues, for each period.
(D) The following is a summary of the Company’s share of the combined operating results relating to joint ventures (in thousands):
Three month period ended March 31, 2002 (b) 2001 (b)
Revenues from operations (a) $ 63,693 $ 56,558 Operating expenses 20,779 17,333 Depreciation and amortization of real estate investments 8,963 7,880 Interest expense 19,027 18,559 48,769 43,772 Net income from continuing operations before gain on sale of real
estate and real estate investments
14,924
12,786 Gain on sale of real estate and real estate investments 4,707 - Income from discontinued operations 269 419 Gain on sale of discontinued operations 10,641 - Net income $ 30,541 $ 13,205 DDR Ownership interests (b) $ 7,987 $ 5,257 Funds From Operations from joint ventures are summarized as follows:
Net income $ 30,541 $ 13,205 Gain on sale of real estate and real estate investments (15,348) - Depreciation and amortization of real estate investments 9,115 8,120 $ 24,308 $ 21,325 DDRC Ownership interests (b) $ 8,596 $ 8,168 DDRC Partnership distributions received, net $ 23,644 $ 4,483
(a) Revenues for the three month periods ended March 31, 2002 and 2001 included approximately $1.0 million
and $1.1 million, respectively, resulting from the recognition of straight line rents of which the Company's proportionate share is $0.4 million in each year.
(b) At March 31, 2002 and 2001, the Company owned joint venture interests relating to 55 operating shopping
center properties. The Company's share of net income has been reduced by $1.3 million and $0.3 million for the three month periods ended March 31, 2002 and 2001, respectively, to reflect additional basis depreciation and deferred gain on sale.
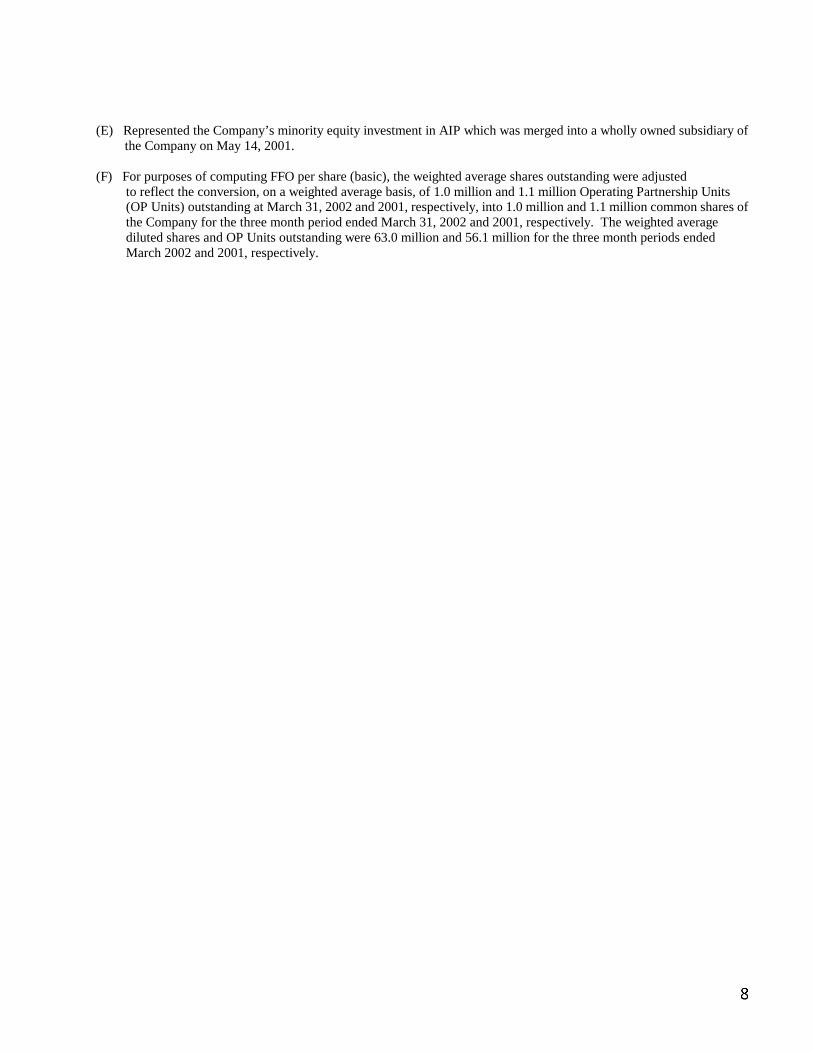
(E) Represented the Company’s minority equity investment in AIP which was merged into a wholly owned subsidiary of the Company on May 14, 2001.
(F) For purposes of computing FFO per share (basic), the weighted average shares outstanding were adjusted
to reflect the conversion, on a weighted average basis, of 1.0 million and 1.1 million Operating Partnership Units (OP Units) outstanding at March 31, 2002 and 2001, respectively, into 1.0 million and 1.1 million common shares of the Company for the three month period ended March 31, 2002 and 2001, respectively. The weighted average diluted shares and OP Units outstanding were 63.0 million and 56.1 million for the three month periods ended March 2002 and 2001, respectively.
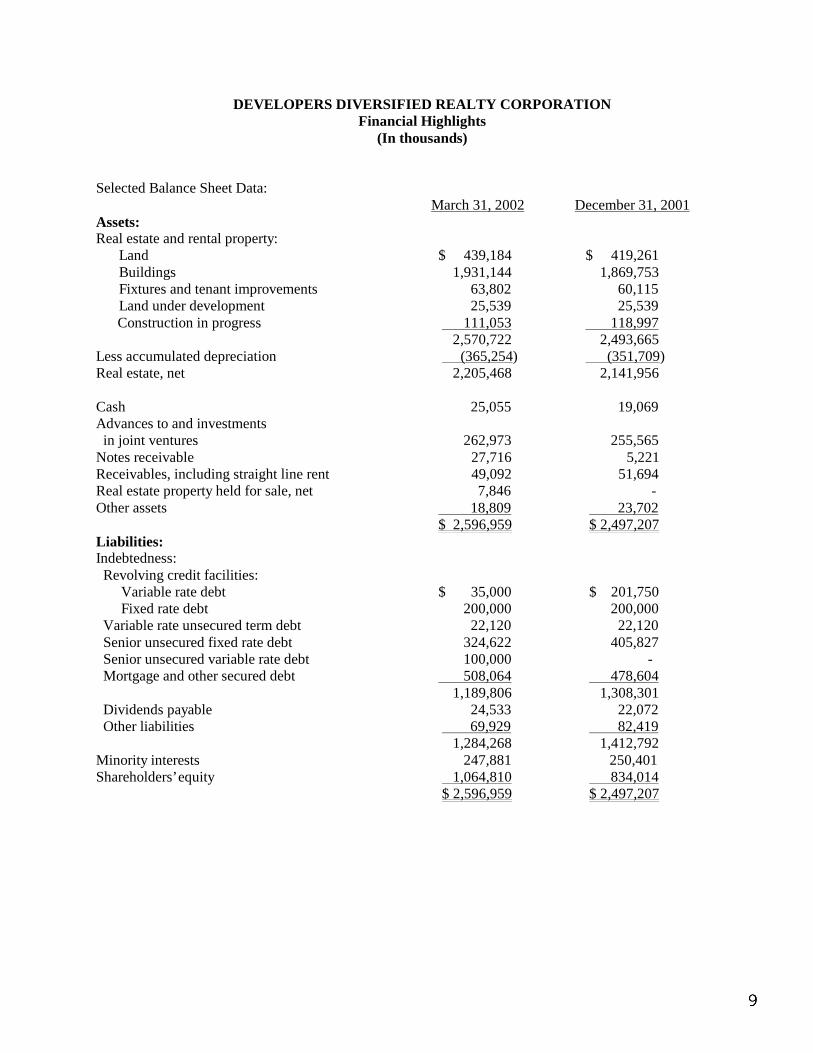
DEVELOPERS DIVERSIFIED REALTY CORPORATION Financial Highlights
(In thousands) Selected Balance Sheet Data: March 31, 2002 December 31, 2001 Assets: Real estate and rental property:
Land $ 439,184 $ 419,261 Buildings 1,931,144 1,869,753 Fixtures and tenant improvements 63,802 60,115 Land under development 25,539 25,539
Construction in progress 111,053 118,997 2,570,722 2,493,665 Less accumulated depreciation (365,254) (351,709) Real estate, net 2,205,468 2,141,956 Cash 25,055 19,069 Advances to and investments in joint ventures 262,973 255,565 Notes receivable 27,716 5,221 Receivables, including straight line rent 49,092 51,694 Real estate property held for sale, net 7,846 - Other assets 18,809 23,702 $ 2,596,959 $ 2,497,207 Liabilities: Indebtedness: Revolving credit facilities: Variable rate debt $ 35,000 $ 201,750 Fixed rate debt 200,000 200,000 Variable rate unsecured term debt 22,120 22,120 Senior unsecured fixed rate debt 324,622 405,827 Senior unsecured variable rate debt 100,000 - Mortgage and other secured debt 508,064 478,604 1,189,806 1,308,301 Dividends payable 24,533 22,072 Other liabilities 69,929 82,419 1,284,268 1,412,792 Minority interests 247,881 250,401 Shareholders’ equity 1,064,810 834,014 $ 2,596,959 $ 2,497,207
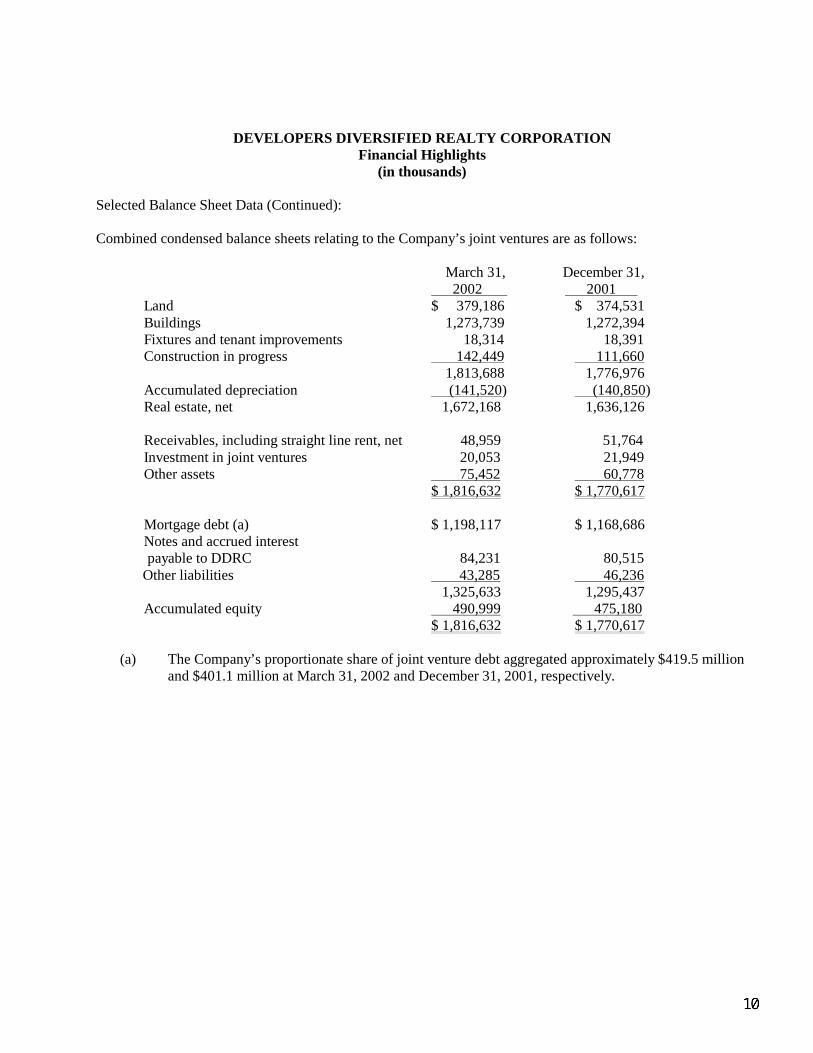
DEVELOPERS DIVERSIFIED REALTY CORPORATION Financial Highlights
(in thousands) Selected Balance Sheet Data (Continued): Combined condensed balance sheets relating to the Company’s joint ventures are as follows: March 31, December 31,
2002 2001 Land $ 379,186 $ 374,531 Buildings 1,273,739 1,272,394 Fixtures and tenant improvements 18,314 18,391 Construction in progress 142,449 111,660
1,813,688 1,776,976 Accumulated depreciation (141,520) (140,850) Real estate, net 1,672,168 1,636,126
Receivables, including straight line rent, net 48,959 51,764 Investment in joint ventures 20,053 21,949 Other assets 75,452 60,778
$ 1,816,632 $ 1,770,617
Mortgage debt (a) $ 1,198,117 $ 1,168,686 Notes and accrued interest
payable to DDRC 84,231 80,515 Other liabilities 43,285 46,236 1,325,633 1,295,437 Accumulated equity 490,999 475,180 $ 1,816,632 $ 1,770,617
(a) The Company’s proportionate share of joint venture debt aggregated approximately $419.5 million and $401.1 million at March 31, 2002 and December 31, 2001, respectively.

Financial Summary
Developers Diversified Realty Quarterly Financial SupplementFor The Three Months Ended March 31, 2002
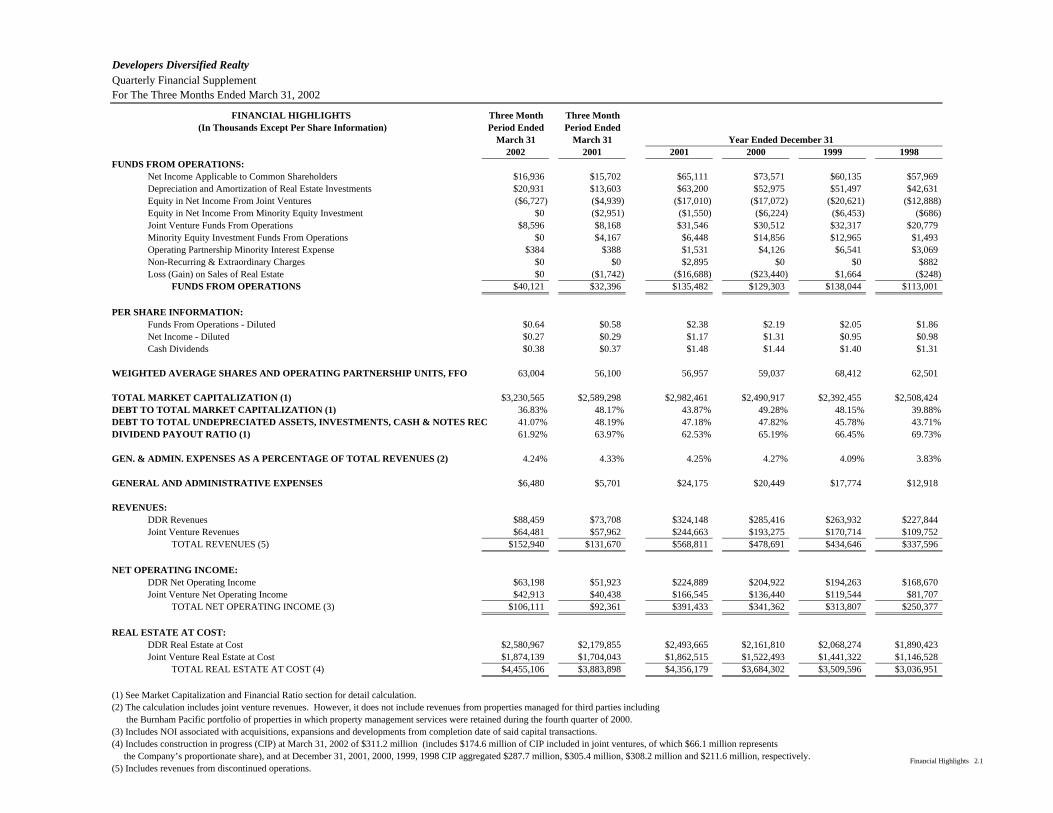
FINANCIAL HIGHLIGHTS Three Month Three Month(In Thousands Except Per Share Information) Period Ended Period Ended
March 31 March 31 Year Ended December 312002 2001 2001 2000 1999 1998
FUNDS FROM OPERATIONS: Net Income Applicable to Common Shareholders $16,936 $15,702 $65,111 $73,571 $60,135 $57,969 Depreciation and Amortization of Real Estate Investments $20,931 $13,603 $63,200 $52,975 $51,497 $42,631 Equity in Net Income From Joint Ventures ($6,727) ($4,939) ($17,010) ($17,072) ($20,621) ($12,888) Equity in Net Income From Minority Equity Investment $0 ($2,951) ($1,550) ($6,224) ($6,453) ($686) Joint Venture Funds From Operations $8,596 $8,168 $31,546 $30,512 $32,317 $20,779 Minority Equity Investment Funds From Operations $0 $4,167 $6,448 $14,856 $12,965 $1,493 Operating Partnership Minority Interest Expense $384 $388 $1,531 $4,126 $6,541 $3,069 Non-Recurring & Extraordinary Charges $0 $0 $2,895 $0 $0 $882 Loss (Gain) on Sales of Real Estate $0 ($1,742) ($16,688) ($23,440) $1,664 ($248) FUNDS FROM OPERATIONS $40,121 $32,396 $135,482 $129,303 $138,044 $113,001
PER SHARE INFORMATION: Funds From Operations - Diluted $0.64 $0.58 $2.38 $2.19 $2.05 $1.86 Net Income - Diluted $0.27 $0.29 $1.17 $1.31 $0.95 $0.98 Cash Dividends $0.38 $0.37 $1.48 $1.44 $1.40 $1.31
WEIGHTED AVERAGE SHARES AND OPERATING PARTNERSHIP UNITS, FFO 63,004 56,100 56,957 59,037 68,412 62,501
TOTAL MARKET CAPITALIZATION (1) $3,230,565 $2,589,298 $2,982,461 $2,490,917 $2,392,455 $2,508,424DEBT TO TOTAL MARKET CAPITALIZATION (1) 36.83% 48.17% 43.87% 49.28% 48.15% 39.88%DEBT TO TOTAL UNDEPRECIATED ASSETS, INVESTMENTS, CASH & NOTES REC 41.07% 48.19% 47.18% 47.82% 45.78% 43.71%DIVIDEND PAYOUT RATIO (1) 61.92% 63.97% 62.53% 65.19% 66.45% 69.73%
GEN. & ADMIN. EXPENSES AS A PERCENTAGE OF TOTAL REVENUES (2) 4.24% 4.33% 4.25% 4.27% 4.09% 3.83%
GENERAL AND ADMINISTRATIVE EXPENSES $6,480 $5,701 $24,175 $20,449 $17,774 $12,918
REVENUES: DDR Revenues $88,459 $73,708 $324,148 $285,416 $263,932 $227,844 Joint Venture Revenues $64,481 $57,962 $244,663 $193,275 $170,714 $109,752 TOTAL REVENUES (5) $152,940 $131,670 $568,811 $478,691 $434,646 $337,596
NET OPERATING INCOME: DDR Net Operating Income $63,198 $51,923 $224,889 $204,922 $194,263 $168,670 Joint Venture Net Operating Income $42,913 $40,438 $166,545 $136,440 $119,544 $81,707 TOTAL NET OPERATING INCOME (3) $106,111 $92,361 $391,433 $341,362 $313,807 $250,377
REAL ESTATE AT COST: DDR Real Estate at Cost $2,580,967 $2,179,855 $2,493,665 $2,161,810 $2,068,274 $1,890,423 Joint Venture Real Estate at Cost $1,874,139 $1,704,043 $1,862,515 $1,522,493 $1,441,322 $1,146,528 TOTAL REAL ESTATE AT COST (4) $4,455,106 $3,883,898 $4,356,179 $3,684,302 $3,509,596 $3,036,951
(1) See Market Capitalization and Financial Ratio section for detail calculation.(2) The calculation includes joint venture revenues. However, it does not include revenues from properties managed for third parties including the Burnham Pacific portfolio of properties in which property management services were retained during the fourth quarter of 2000.(3) Includes NOI associated with acquisitions, expansions and developments from completion date of said capital transactions.(4) Includes construction in progress (CIP) at March 31, 2002 of $311.2 million (includes $174.6 million of CIP included in joint ventures, of which $66.1 million represents the Company’s proportionate share), and at December 31, 2001, 2000, 1999, 1998 CIP aggregated $287.7 million, $305.4 million, $308.2 million and $211.6 million, respectively. (5) Includes revenues from discontinued operations.
Financial Highlights 2.1
Developers Diversified Realty Quarterly Financial SupplementFor The Three Months Ended March 31, 2002
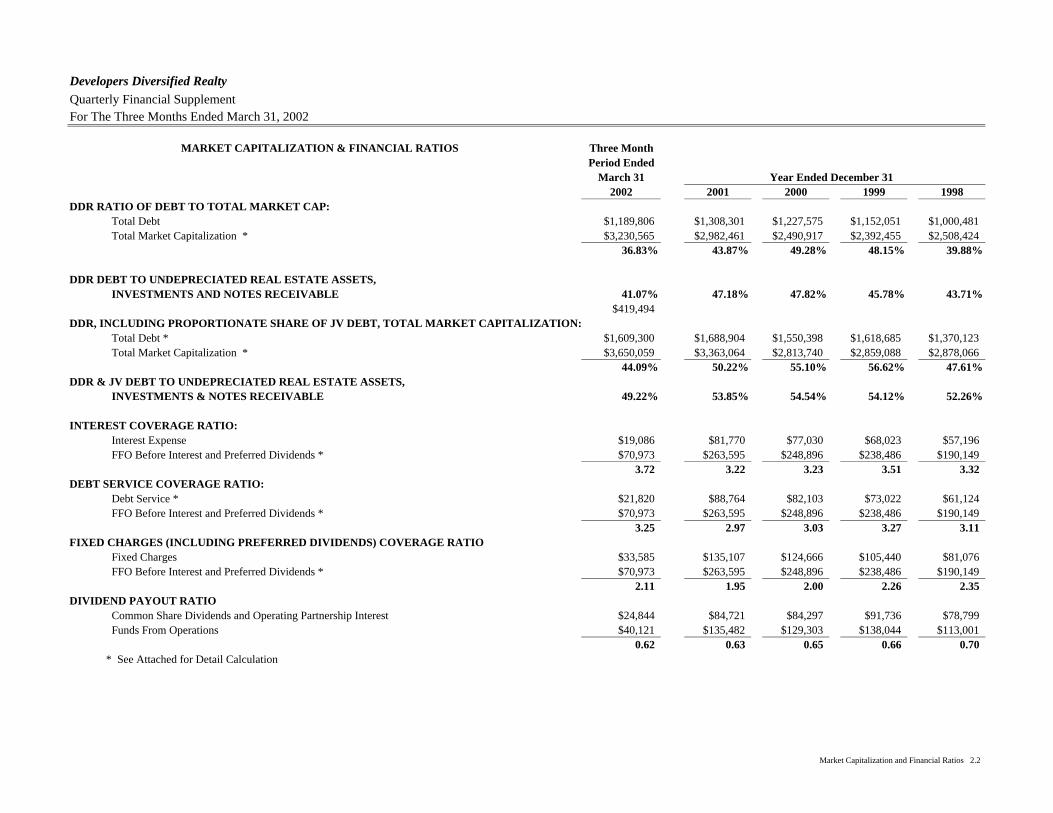
MARKET CAPITALIZATION & FINANCIAL RATIOS Three MonthPeriod Ended
March 31 Year Ended December 312002 2001 2000 1999 1998
DDR RATIO OF DEBT TO TOTAL MARKET CAP: Total Debt $1,189,806 $1,308,301 $1,227,575 $1,152,051 $1,000,481 Total Market Capitalization * $3,230,565 $2,982,461 $2,490,917 $2,392,455 $2,508,424
36.83% 43.87% 49.28% 48.15% 39.88%
DDR DEBT TO UNDEPRECIATED REAL ESTATE ASSETS, INVESTMENTS AND NOTES RECEIVABLE 41.07% 47.18% 47.82% 45.78% 43.71%
$419,494DDR, INCLUDING PROPORTIONATE SHARE OF JV DEBT, TOTAL MARKET CAPITALIZATION: Total Debt * $1,609,300 $1,688,904 $1,550,398 $1,618,685 $1,370,123 Total Market Capitalization * $3,650,059 $3,363,064 $2,813,740 $2,859,088 $2,878,066
44.09% 50.22% 55.10% 56.62% 47.61%DDR & JV DEBT TO UNDEPRECIATED REAL ESTATE ASSETS, INVESTMENTS & NOTES RECEIVABLE 49.22% 53.85% 54.54% 54.12% 52.26%
INTEREST COVERAGE RATIO: Interest Expense $19,086 $81,770 $77,030 $68,023 $57,196 FFO Before Interest and Preferred Dividends * $70,973 $263,595 $248,896 $238,486 $190,149
3.72 3.22 3.23 3.51 3.32DEBT SERVICE COVERAGE RATIO: Debt Service * $21,820 $88,764 $82,103 $73,022 $61,124 FFO Before Interest and Preferred Dividends * $70,973 $263,595 $248,896 $238,486 $190,149
3.25 2.97 3.03 3.27 3.11FIXED CHARGES (INCLUDING PREFERRED DIVIDENDS) COVERAGE RATIO Fixed Charges $33,585 $135,107 $124,666 $105,440 $81,076 FFO Before Interest and Preferred Dividends * $70,973 $263,595 $248,896 $238,486 $190,149
2.11 1.95 2.00 2.26 2.35DIVIDEND PAYOUT RATIO Common Share Dividends and Operating Partnership Interest $24,844 $84,721 $84,297 $91,736 $78,799 Funds From Operations $40,121 $135,482 $129,303 $138,044 $113,001
0.62 0.63 0.65 0.66 0.70 * See Attached for Detail Calculation
Market Capitalization and Financial Ratios 2.2
Developers Diversified Realty Quarterly Financial SupplementFor The Three Months Ended March 31, 2002
Three MonthPeriod Ended
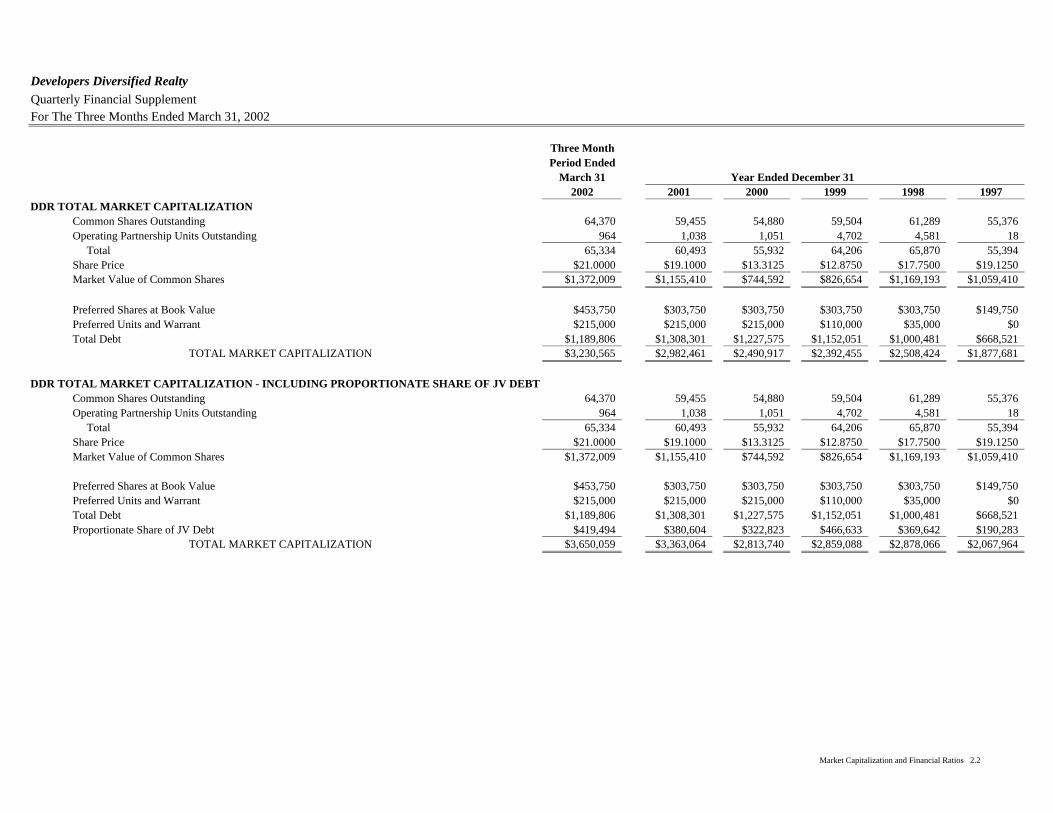
March 31 Year Ended December 312002 2001 2000 1999 1998 1997
DDR TOTAL MARKET CAPITALIZATION Common Shares Outstanding 64,370 59,455 54,880 59,504 61,289 55,376 Operating Partnership Units Outstanding 964 1,038 1,051 4,702 4,581 18 Total 65,334 60,493 55,932 64,206 65,870 55,394 Share Price $21.0000 $19.1000 $13.3125 $12.8750 $17.7500 $19.1250 Market Value of Common Shares $1,372,009 $1,155,410 $744,592 $826,654 $1,169,193 $1,059,410
Preferred Shares at Book Value $453,750 $303,750 $303,750 $303,750 $303,750 $149,750 Preferred Units and Warrant $215,000 $215,000 $215,000 $110,000 $35,000 $0 Total Debt $1,189,806 $1,308,301 $1,227,575 $1,152,051 $1,000,481 $668,521
TOTAL MARKET CAPITALIZATION $3,230,565 $2,982,461 $2,490,917 $2,392,455 $2,508,424 $1,877,681
DDR TOTAL MARKET CAPITALIZATION - INCLUDING PROPORTIONATE SHARE OF JV DEBT Common Shares Outstanding 64,370 59,455 54,880 59,504 61,289 55,376 Operating Partnership Units Outstanding 964 1,038 1,051 4,702 4,581 18 Total 65,334 60,493 55,932 64,206 65,870 55,394 Share Price $21.0000 $19.1000 $13.3125 $12.8750 $17.7500 $19.1250 Market Value of Common Shares $1,372,009 $1,155,410 $744,592 $826,654 $1,169,193 $1,059,410
Preferred Shares at Book Value $453,750 $303,750 $303,750 $303,750 $303,750 $149,750 Preferred Units and Warrant $215,000 $215,000 $215,000 $110,000 $35,000 $0 Total Debt $1,189,806 $1,308,301 $1,227,575 $1,152,051 $1,000,481 $668,521 Proportionate Share of JV Debt $419,494 $380,604 $322,823 $466,633 $369,642 $190,283
TOTAL MARKET CAPITALIZATION $3,650,059 $3,363,064 $2,813,740 $2,859,088 $2,878,066 $2,067,964
Market Capitalization and Financial Ratios 2.2
Developers Diversified Realty Quarterly Financial SupplementFor The Three Months Ended March 31, 2002
Three MonthPeriod Ended
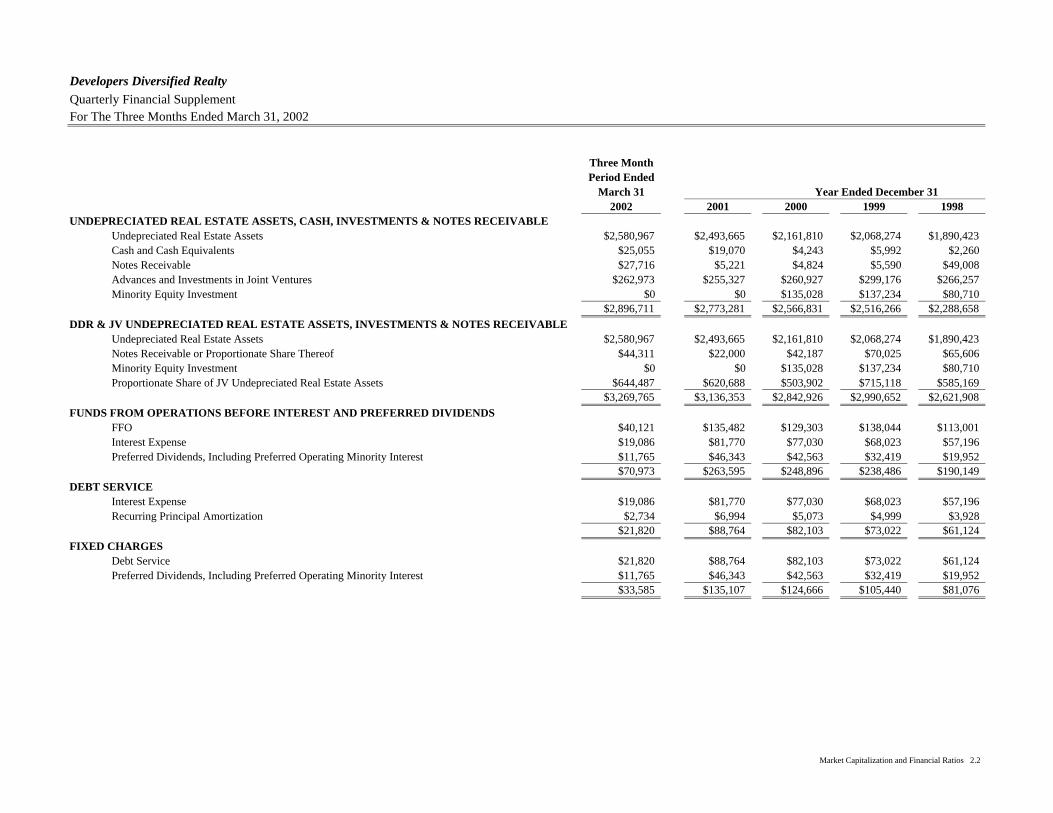
March 31 Year Ended December 312002 2001 2000 1999 1998
UNDEPRECIATED REAL ESTATE ASSETS, CASH, INVESTMENTS & NOTES RECEIVABLE Undepreciated Real Estate Assets $2,580,967 $2,493,665 $2,161,810 $2,068,274 $1,890,423 Cash and Cash Equivalents $25,055 $19,070 $4,243 $5,992 $2,260 Notes Receivable $27,716 $5,221 $4,824 $5,590 $49,008 Advances and Investments in Joint Ventures $262,973 $255,327 $260,927 $299,176 $266,257 Minority Equity Investment $0 $0 $135,028 $137,234 $80,710
$2,896,711 $2,773,281 $2,566,831 $2,516,266 $2,288,658
DDR & JV UNDEPRECIATED REAL ESTATE ASSETS, INVESTMENTS & NOTES RECEIVABLE Undepreciated Real Estate Assets $2,580,967 $2,493,665 $2,161,810 $2,068,274 $1,890,423 Notes Receivable or Proportionate Share Thereof $44,311 $22,000 $42,187 $70,025 $65,606 Minority Equity Investment $0 $0 $135,028 $137,234 $80,710 Proportionate Share of JV Undepreciated Real Estate Assets $644,487 $620,688 $503,902 $715,118 $585,169
$3,269,765 $3,136,353 $2,842,926 $2,990,652 $2,621,908
FUNDS FROM OPERATIONS BEFORE INTEREST AND PREFERRED DIVIDENDS FFO $40,121 $135,482 $129,303 $138,044 $113,001 Interest Expense $19,086 $81,770 $77,030 $68,023 $57,196 Preferred Dividends, Including Preferred Operating Minority Interest $11,765 $46,343 $42,563 $32,419 $19,952
$70,973 $263,595 $248,896 $238,486 $190,149
DEBT SERVICE Interest Expense $19,086 $81,770 $77,030 $68,023 $57,196 Recurring Principal Amortization $2,734 $6,994 $5,073 $4,999 $3,928
$21,820 $88,764 $82,103 $73,022 $61,124
FIXED CHARGES Debt Service $21,820 $88,764 $82,103 $73,022 $61,124 Preferred Dividends, Including Preferred Operating Minority Interest $11,765 $46,343 $42,563 $32,419 $19,952
$33,585 $135,107 $124,666 $105,440 $81,076
Market Capitalization and Financial Ratios 2.2
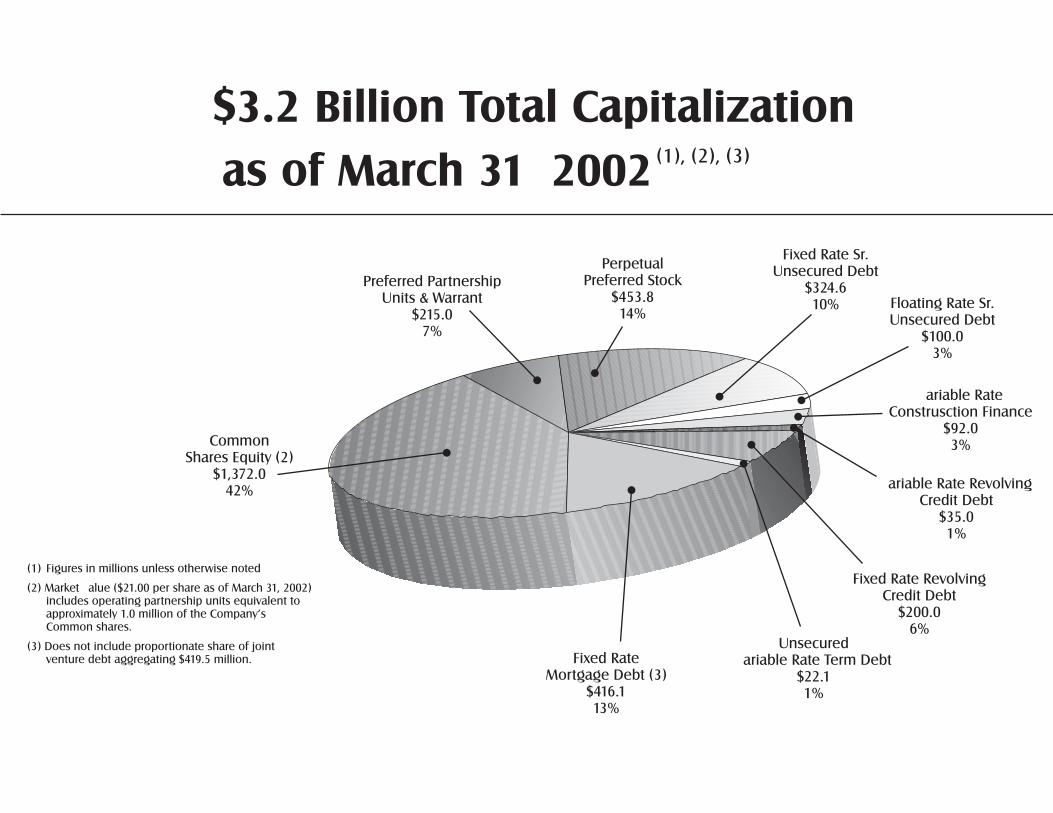
(1), (2), (3)
CommonShares Equity (2)
$1,372.042%
Preferred PartnershipUnits & Warrant
$215.07%
PerpetualPreferred Stock
$453.814%
Fixed Rate Sr.Unsecured Debt
$324.610% Floating Rate Sr.
Unsecured Debt$100.0
3%
Variable Rate RevolvingCredit Debt
$35.01%
Fixed RateMortgage Debt (3)
$416.113%
(1) Figures in millions unless otherwise noted
(2) Market Value ($21.00 per share as of March 31, 2002)includes operating partnership units equivalent toapproximately 1.0 million of the Company’sCommon shares.
(3) Does not include proportionate share of jointventure debt aggregating $419.5 million.
Fixed Rate RevolvingCredit Debt
$200.06%
3.2 Billion Total Capitalization
as of March 31, 2002
UnsecuredVariable Rate Term Debt
$22.11%
Variable RateConstrusction Finance
$92.03%
Developers Diversified Realty Quarterly Financial Supplement For the three months ended March 31, 2002
Significant Accounting Policies 2.4
Significant Accounting Policies
Revenues • Percentage and overage rents are recognized after the tenants reported sales have exceeded the applicable
sales breakpoint.
• Revenues associated with tenant reimbursements are recognized in the period in which the expenses are incurred based upon the provision of tenants’ leases.
• Lease termination fees are included in other income and recognized upon termination of a tenant’s lease, which generally coincides with the receipt of cash.
General and Administrative Expenses • General and administrative expenses include internal leasing salaries, legal salaries and related expenses
associated with the leasing of space which are charged to operations as incurred. All indirect internal costs associated with acquisitions are expensed as incurred.
Deferred Financing Costs • Costs incurred in obtaining long-term financing are included in deferred charges and are amortized over the
terms of the related debt agreements; such amortization is reflected as interest expense in the consolidated statements of operations.
Real Estate • Real estate assets are stated at cost less accumulated depreciation, which, in the opinion of management, is
not in excess of the individual property's estimated undiscounted future cash flows, including estimated proceeds from disposition.
• Depreciation and amortization are provided on a straight-line basis over the estimated useful lives of the
assets as follows: Buildings 18 to 31 years Furniture/Fixtures Useful lives, which approximate lease and Tenant Improvements terms, where applicable
Developers Diversified Realty Quarterly Financial Supplement For the three months ended March 31, 2002
Significant Accounting Policies 2.4
Significant Accounting Policies (Continued) • Expenditures for maintenance and repairs are charged to operations as incurred. Renovations that improve or
extend the life of the asset are capitalized.
• Included in land is undeveloped real estate, generally outlots or expansion pads adjacent to the shopping centers and enclosed malls owned by the Company.
• Construction in progress includes shopping center developments and significant expansions and re-
developments. Capitalization • The Company capitalizes interest on funds used for the construction or expansion of shopping centers.
Capitalization of interest ceases when construction activities are completed and the property is available for occupancy by tenants.
• For the three month period ended March 31, 2002 and the years ended December 31, 2001, 2000, 1999 and
1998, the Company capitalized interest of $2.3 million, $12.9 million, $18.2 million, $13.4 million, $9.9 million and $4.0 million, respectively.
• In addition, the Company capitalized certain construction administration costs of $1.3 million for the three
month period ended March 31, 2002 and $3.3 million, $3.2 million, $2.4 million and $1.8 million for the years ended December 31, 2001, 2000, 1999 and 1998, respectively.
• Interest and real estate taxes incurred during the construction period are capitalized and depreciated over the
building life. Gain on Sales of Real Estate • Gain on sales of real estate generally related to the sale of outlots and land adjacent to existing shopping
centers is recognized at closing when the earnings process is deemed to be complete.
Consolidated and Wholly Owned Financial Operations
Developers Diversified RealtyQuarterly Financial SupplementFor the three months ended March 31, 2002
Three MonthsEnded Year Ended Year Ended Year Ended Year Ended
March 31, December 31, December 31, December 31, December 31,2002 2001 2000 1999 1998
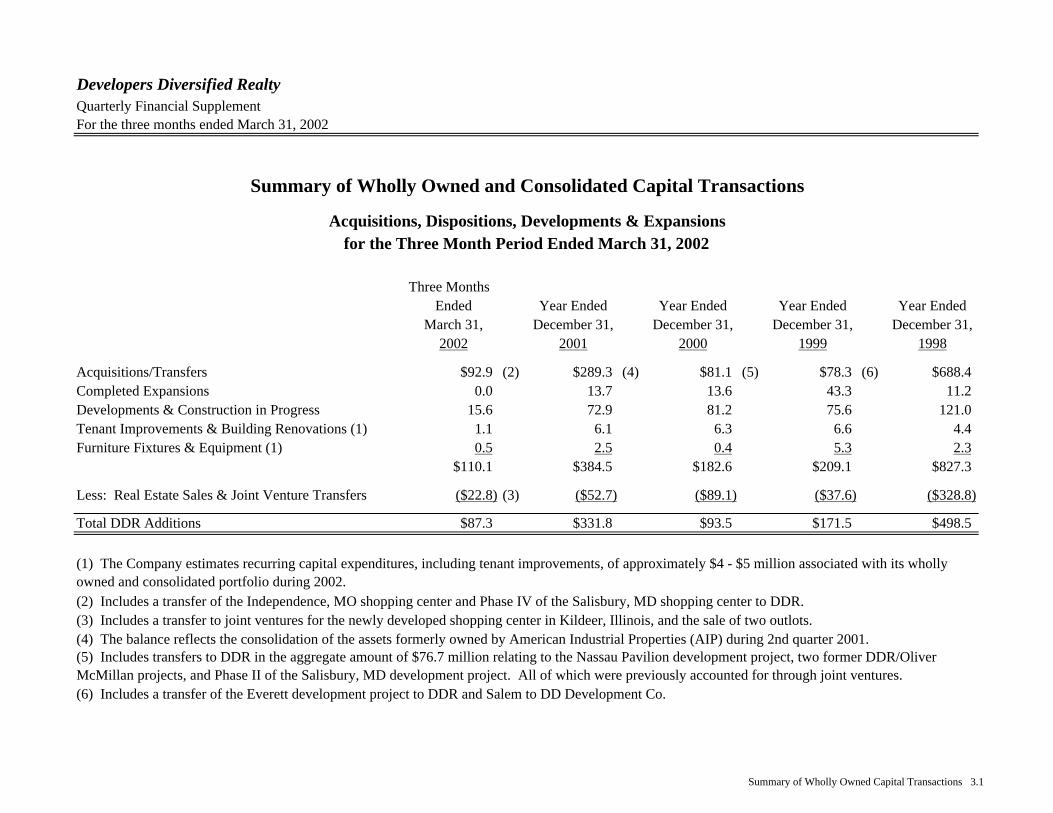
Acquisitions/Transfers $92.9 (2) $289.3 (4) $81.1 (5) $78.3 (6) $688.4Completed Expansions 0.0 13.7 13.6 43.3 11.2Developments & Construction in Progress 15.6 72.9 81.2 75.6 121.0Tenant Improvements & Building Renovations (1) 1.1 6.1 6.3 6.6 4.4Furniture Fixtures & Equipment (1) 0.5 2.5 0.4 5.3 2.3
$110.1 $384.5 $182.6 $209.1 $827.3
Less: Real Estate Sales & Joint Venture Transfers ($22.8) (3) ($52.7) ($89.1) ($37.6) ($328.8)
Total DDR Additions $87.3 $331.8 $93.5 $171.5 $498.5
(6) Includes a transfer of the Everett development project to DDR and Salem to DD Development Co.
(5) Includes transfers to DDR in the aggregate amount of $76.7 million relating to the Nassau Pavilion development project, two former DDR/Oliver McMillan projects, and Phase II of the Salisbury, MD development project. All of which were previously accounted for through joint ventures.
(2) Includes a transfer of the Independence, MO shopping center and Phase IV of the Salisbury, MD shopping center to DDR.(3) Includes a transfer to joint ventures for the newly developed shopping center in Kildeer, Illinois, and the sale of two outlots.
Summary of Wholly Owned and Consolidated Capital Transactions
Acquisitions, Dispositions, Developments & Expansionsfor the Three Month Period Ended March 31, 2002
(1) The Company estimates recurring capital expenditures, including tenant improvements, of approximately $4 - $5 million associated with its wholly owned and consolidated portfolio during 2002.
(4) The balance reflects the consolidation of the assets formerly owned by American Industrial Properties (AIP) during 2nd quarter 2001.
Summary of Wholly Owned Capital Transactions 3.1
Developers Diversified RealtyQuarterly Financial SupplementFor the three months ended March 31, 2002
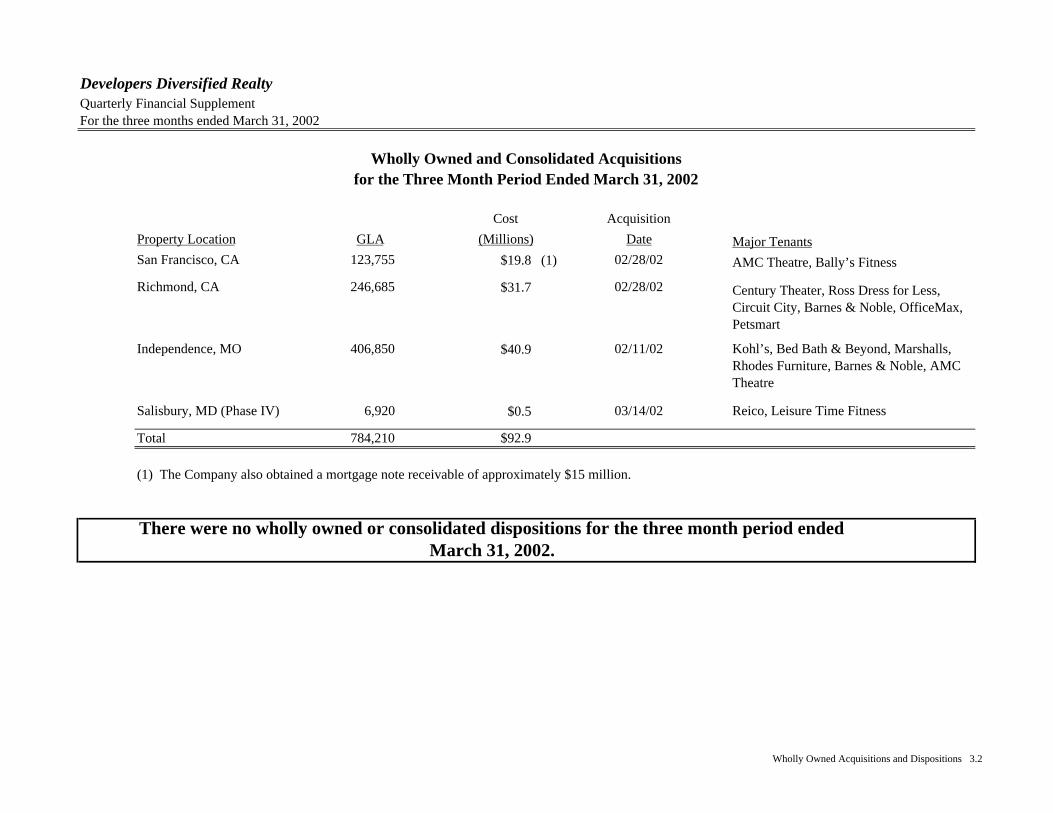
Cost Acquisition
Property Location GLA (Millions) Date Major TenantsSan Francisco, CA 123,755 $19.8 (1) 02/28/02 AMC Theatre, Bally’s Fitness
Richmond, CA 246,685 $31.7 02/28/02
Independence, MO 406,850 $40.9 02/11/02
Salisbury, MD (Phase IV) 6,920 $0.5 03/14/02
Total 784,210 $92.9
(1) The Company also obtained a mortgage note receivable of approximately $15 million.
There were no wholly owned or consolidated dispositions for the three month period ended March 31, 2002.
Kohl’s, Bed Bath & Beyond, Marshalls, Rhodes Furniture, Barnes & Noble, AMC Theatre
Reico, Leisure Time Fitness
Wholly Owned and Consolidated Acquisitionsfor the Three Month Period Ended March 31, 2002
Century Theater, Ross Dress for Less, Circuit City, Barnes & Noble, OfficeMax, Petsmart
Wholly Owned Acquisitions and Dispositions 3.2
Developers Diversified Realty Quarterly Financial SupplementFor the three months ended March 31, 2002
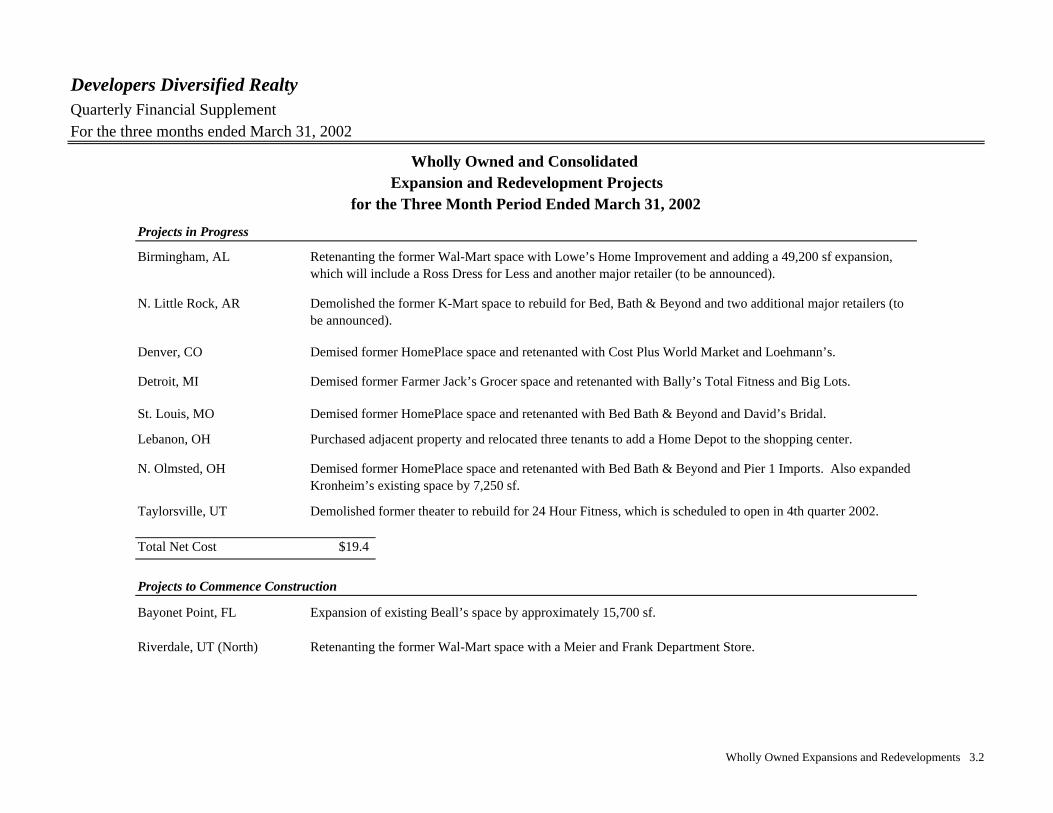
Projects in Progress
Birmingham, AL
N. Little Rock, AR
Denver, CO
Detroit, MI
St. Louis, MO
Lebanon, OH
N. Olmsted, OH
Taylorsville, UT
Total Net Cost $19.4
Projects to Commence Construction
Bayonet Point, FL Expansion of existing Beall’s space by approximately 15,700 sf.
Riverdale, UT (North) Retenanting the former Wal-Mart space with a Meier and Frank Department Store.
Demolished former theater to rebuild for 24 Hour Fitness, which is scheduled to open in 4th quarter 2002.
Purchased adjacent property and relocated three tenants to add a Home Depot to the shopping center.
Demolished the former K-Mart space to rebuild for Bed, Bath & Beyond and two additional major retailers (to be announced).
Demised former HomePlace space and retenanted with Bed Bath & Beyond and David’s Bridal.
Demised former Farmer Jack’s Grocer space and retenanted with Bally’s Total Fitness and Big Lots.
Demised former HomePlace space and retenanted with Bed Bath & Beyond and Pier 1 Imports. Also expanded Kronheim’s existing space by 7,250 sf.
Demised former HomePlace space and retenanted with Cost Plus World Market and Loehmann’s.
Retenanting the former Wal-Mart space with Lowe’s Home Improvement and adding a 49,200 sf expansion, which will include a Ross Dress for Less and another major retailer (to be announced).
Wholly Owned and Consolidated
for the Three Month Period Ended March 31, 2002Expansion and Redevelopment Projects
Wholly Owned Expansions and Redevelopments 3.2
Developers Diversified RealtyQuarterly Financial SupplementFor the three months ended March 31, 2002
SubstantialNet Cost Completion
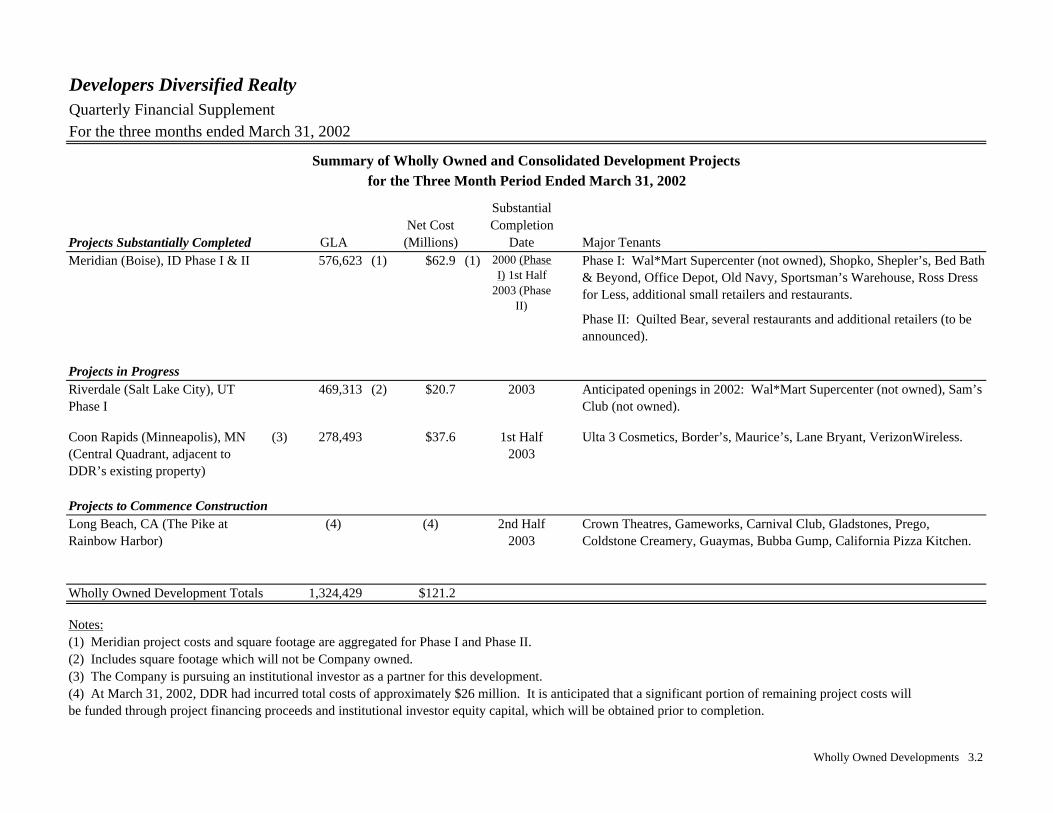
Projects Substantially Completed GLA (Millions) Date Major Tenants576,623 (1) $62.9 (1)
Projects in Progress469,313 (2) $20.7 2003
(3) 278,493 $37.6 1st Half 2003
Projects to Commence Construction(4) (4) 2nd Half
2003
Wholly Owned Development Totals 1,324,429 $121.2
Notes:(1) Meridian project costs and square footage are aggregated for Phase I and Phase II.(2) Includes square footage which will not be Company owned.(3) The Company is pursuing an institutional investor as a partner for this development.
Coon Rapids (Minneapolis), MN (Central Quadrant, adjacent to DDR’s existing property)
Long Beach, CA (The Pike at Rainbow Harbor)
Crown Theatres, Gameworks, Carnival Club, Gladstones, Prego, Coldstone Creamery, Guaymas, Bubba Gump, California Pizza Kitchen.
Riverdale (Salt Lake City), UT Phase I
Anticipated openings in 2002: Wal*Mart Supercenter (not owned), Sam’s Club (not owned).
Ulta 3 Cosmetics, Border’s, Maurice’s, Lane Bryant, VerizonWireless.
Phase II: Quilted Bear, several restaurants and additional retailers (to be announced).
Summary of Wholly Owned and Consolidated Development Projects
Phase I: Wal*Mart Supercenter (not owned), Shopko, Shepler’s, Bed Bath & Beyond, Office Depot, Old Navy, Sportsman’s Warehouse, Ross Dress for Less, additional small retailers and restaurants.
for the Three Month Period Ended March 31, 2002
2000 (Phase I) 1st Half
2003 (Phase II)
Meridian (Boise), ID Phase I & II
(4) At March 31, 2002, DDR had incurred total costs of approximately $26 million. It is anticipated that a significant portion of remaining project costs will be funded through project financing proceeds and institutional investor equity capital, which will be obtained prior to completion.
Wholly Owned Developments 3.2
Developers Diversified RealtyQuarterly Financial SupplementFor the three months ended March 31, 2002
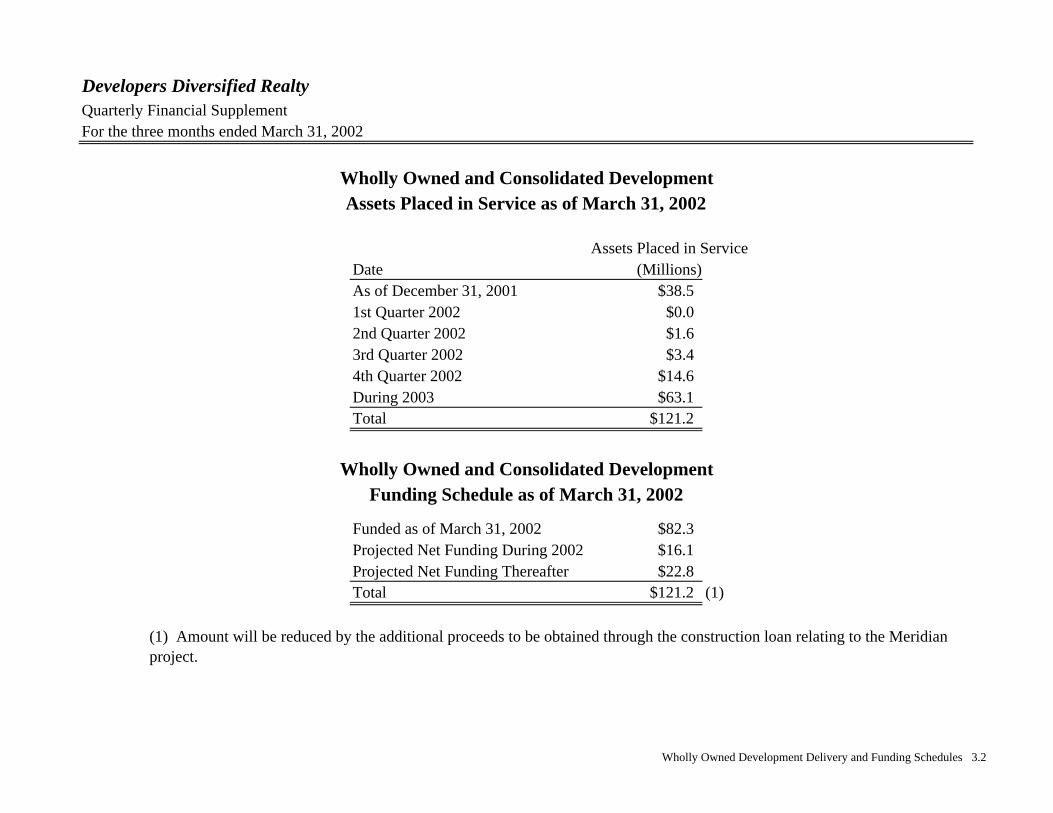
Assets Placed in ServiceDate (Millions)As of December 31, 2001 $38.51st Quarter 2002 $0.02nd Quarter 2002 $1.63rd Quarter 2002 $3.44th Quarter 2002 $14.6During 2003 $63.1Total $121.2
Funded as of March 31, 2002 $82.3Projected Net Funding During 2002 $16.1Projected Net Funding Thereafter $22.8Total $121.2 (1)
(1) Amount will be reduced by the additional proceeds to be obtained through the construction loan relating to the Meridian project.
Wholly Owned and Consolidated Development
Wholly Owned and Consolidated DevelopmentFunding Schedule as of March 31, 2002
Assets Placed in Service as of March 31, 2002
Wholly Owned Development Delivery and Funding Schedules 3.2
Developers Diversified Realty Quarterly Financial SupplementFor the three months ended March 31, 2002
Mortgage Maturity Interest
Balance Date Rate (1)
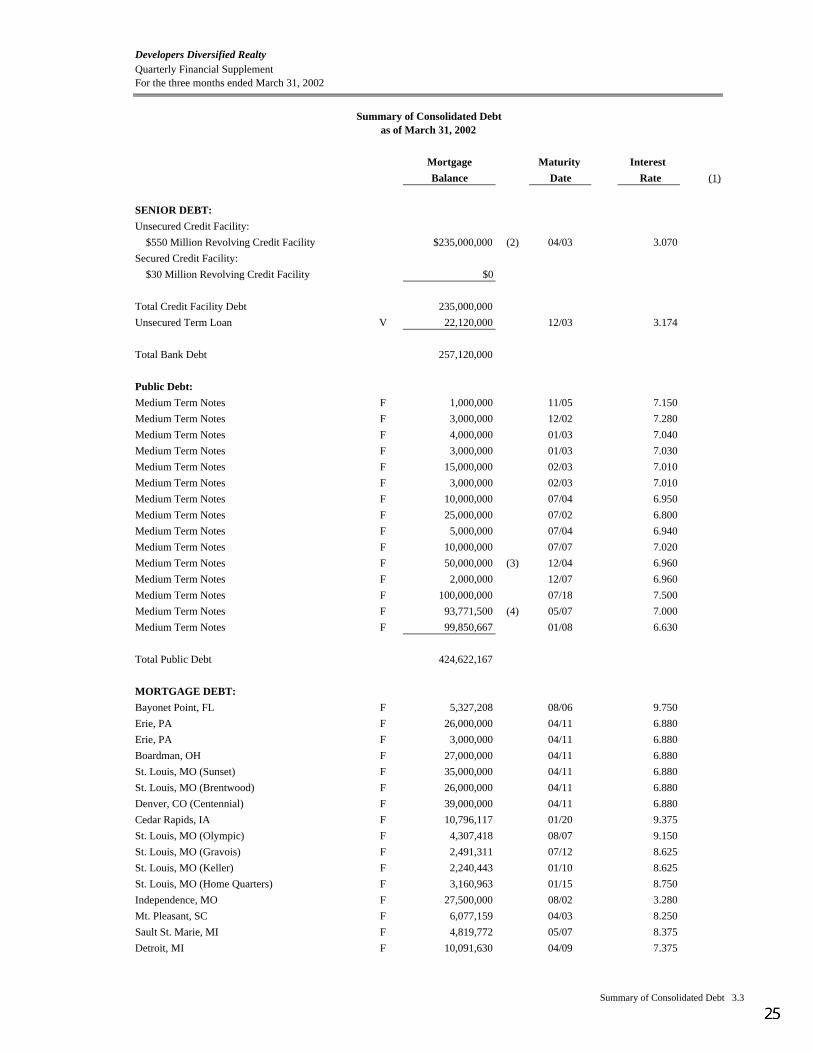
SENIOR DEBT:
Unsecured Credit Facility:
$550 Million Revolving Credit Facility $235,000,000 (2) 04/03 3.070
Secured Credit Facility:
$30 Million Revolving Credit Facility $0
Total Credit Facility Debt 235,000,000
Unsecured Term Loan V 22,120,000 12/03 3.174
Total Bank Debt 257,120,000
Public Debt:
Medium Term Notes F 1,000,000 11/05 7.150
Medium Term Notes F 3,000,000 12/02 7.280
Medium Term Notes F 4,000,000 01/03 7.040
Medium Term Notes F 3,000,000 01/03 7.030
Medium Term Notes F 15,000,000 02/03 7.010
Medium Term Notes F 3,000,000 02/03 7.010
Medium Term Notes F 10,000,000 07/04 6.950
Medium Term Notes F 25,000,000 07/02 6.800
Medium Term Notes F 5,000,000 07/04 6.940
Medium Term Notes F 10,000,000 07/07 7.020
Medium Term Notes F 50,000,000 (3) 12/04 6.960
Medium Term Notes F 2,000,000 12/07 6.960
Medium Term Notes F 100,000,000 07/18 7.500
Medium Term Notes F 93,771,500 (4) 05/07 7.000
Medium Term Notes F 99,850,667 01/08 6.630
Total Public Debt 424,622,167
MORTGAGE DEBT:
Bayonet Point, FL F 5,327,208 08/06 9.750
Erie, PA F 26,000,000 04/11 6.880
Erie, PA F 3,000,000 04/11 6.880
Boardman, OH F 27,000,000 04/11 6.880
St. Louis, MO (Sunset) F 35,000,000 04/11 6.880
St. Louis, MO (Brentwood) F 26,000,000 04/11 6.880
Denver, CO (Centennial) F 39,000,000 04/11 6.880
Cedar Rapids, IA F 10,796,117 01/20 9.375
St. Louis, MO (Olympic) F 4,307,418 08/07 9.150
St. Louis, MO (Gravois) F 2,491,311 07/12 8.625
St. Louis, MO (Keller) F 2,240,443 01/10 8.625
St. Louis, MO (Home Quarters) F 3,160,963 01/15 8.750
Independence, MO F 27,500,000 08/02 3.280
Mt. Pleasant, SC F 6,077,159 04/03 8.250
Sault St. Marie, MI F 4,819,772 05/07 8.375
Detroit, MI F 10,091,630 04/09 7.375
Summary of Consolidated Debtas of March 31, 2002
Summary of Consolidated Debt 3.3
Developers Diversified Realty CorporationQuarterly Financial SupplementFor the three months ended March 31, 2002
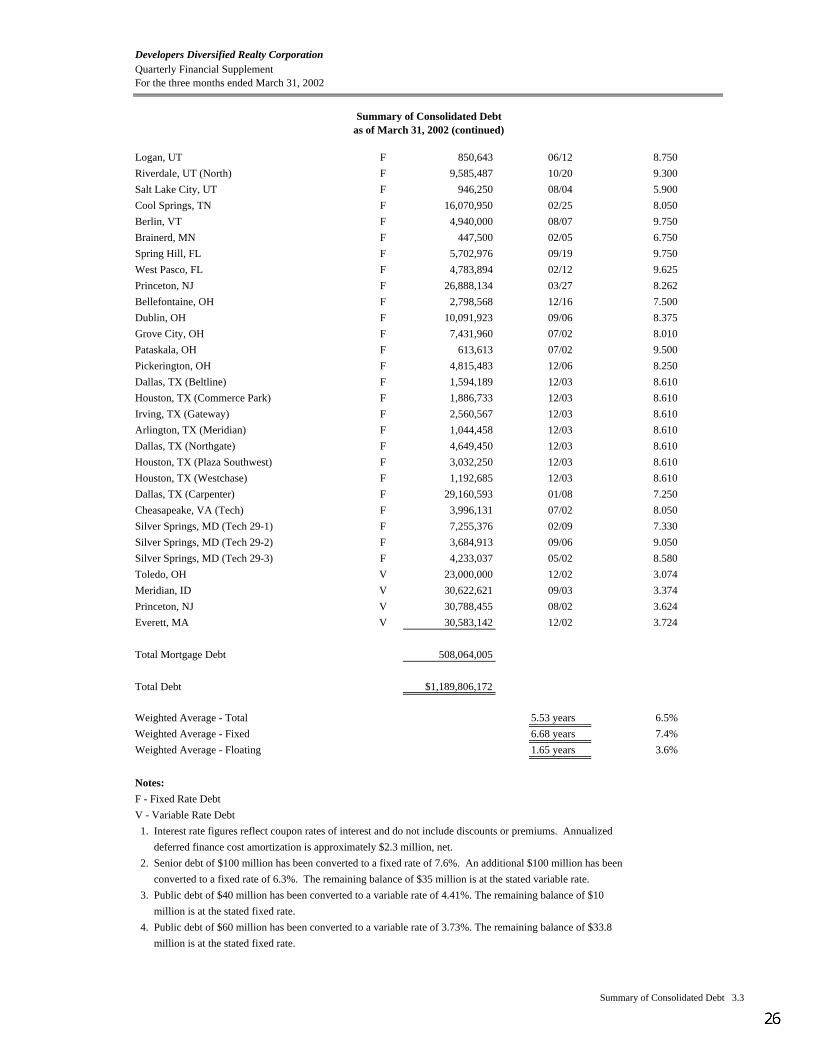
Logan, UT F 850,643 06/12 8.750
Riverdale, UT (North) F 9,585,487 10/20 9.300
Salt Lake City, UT F 946,250 08/04 5.900
Cool Springs, TN F 16,070,950 02/25 8.050
Berlin, VT F 4,940,000 08/07 9.750
Brainerd, MN F 447,500 02/05 6.750
Spring Hill, FL F 5,702,976 09/19 9.750
West Pasco, FL F 4,783,894 02/12 9.625
Princeton, NJ F 26,888,134 03/27 8.262
Bellefontaine, OH F 2,798,568 12/16 7.500
Dublin, OH F 10,091,923 09/06 8.375
Grove City, OH F 7,431,960 07/02 8.010
Pataskala, OH F 613,613 07/02 9.500
Pickerington, OH F 4,815,483 12/06 8.250
Dallas, TX (Beltline) F 1,594,189 12/03 8.610
Houston, TX (Commerce Park) F 1,886,733 12/03 8.610
Irving, TX (Gateway) F 2,560,567 12/03 8.610
Arlington, TX (Meridian) F 1,044,458 12/03 8.610
Dallas, TX (Northgate) F 4,649,450 12/03 8.610
Houston, TX (Plaza Southwest) F 3,032,250 12/03 8.610
Houston, TX (Westchase) F 1,192,685 12/03 8.610
Dallas, TX (Carpenter) F 29,160,593 01/08 7.250
Cheasapeake, VA (Tech) F 3,996,131 07/02 8.050
Silver Springs, MD (Tech 29-1) F 7,255,376 02/09 7.330
Silver Springs, MD (Tech 29-2) F 3,684,913 09/06 9.050
Silver Springs, MD (Tech 29-3) F 4,233,037 05/02 8.580
Toledo, OH V 23,000,000 12/02 3.074
Meridian, ID V 30,622,621 09/03 3.374
Princeton, NJ V 30,788,455 08/02 3.624
Everett, MA V 30,583,142 12/02 3.724
Total Mortgage Debt 508,064,005
Total Debt $1,189,806,172
Weighted Average - Total 5.53 years 6.5%
Weighted Average - Fixed 6.68 years 7.4%
Weighted Average - Floating 1.65 years 3.6%
Notes:
F - Fixed Rate Debt
V - Variable Rate Debt
1. Interest rate figures reflect coupon rates of interest and do not include discounts or premiums. Annualized
deferred finance cost amortization is approximately $2.3 million, net.
2. Senior debt of $100 million has been converted to a fixed rate of 7.6%. An additional $100 million has been
converted to a fixed rate of 6.3%. The remaining balance of $35 million is at the stated variable rate.
3. Public debt of $40 million has been converted to a variable rate of 4.41%. The remaining balance of $10
million is at the stated fixed rate.
4. Public debt of $60 million has been converted to a variable rate of 3.73%. The remaining balance of $33.8
million is at the stated fixed rate.
Summary of Consolidated Debtas of March 31, 2002 (continued)
Summary of Consolidated Debt 3.3
Developers Diversified Realty Quarterly Financial SupplementFor the three months ended March 31, 2002
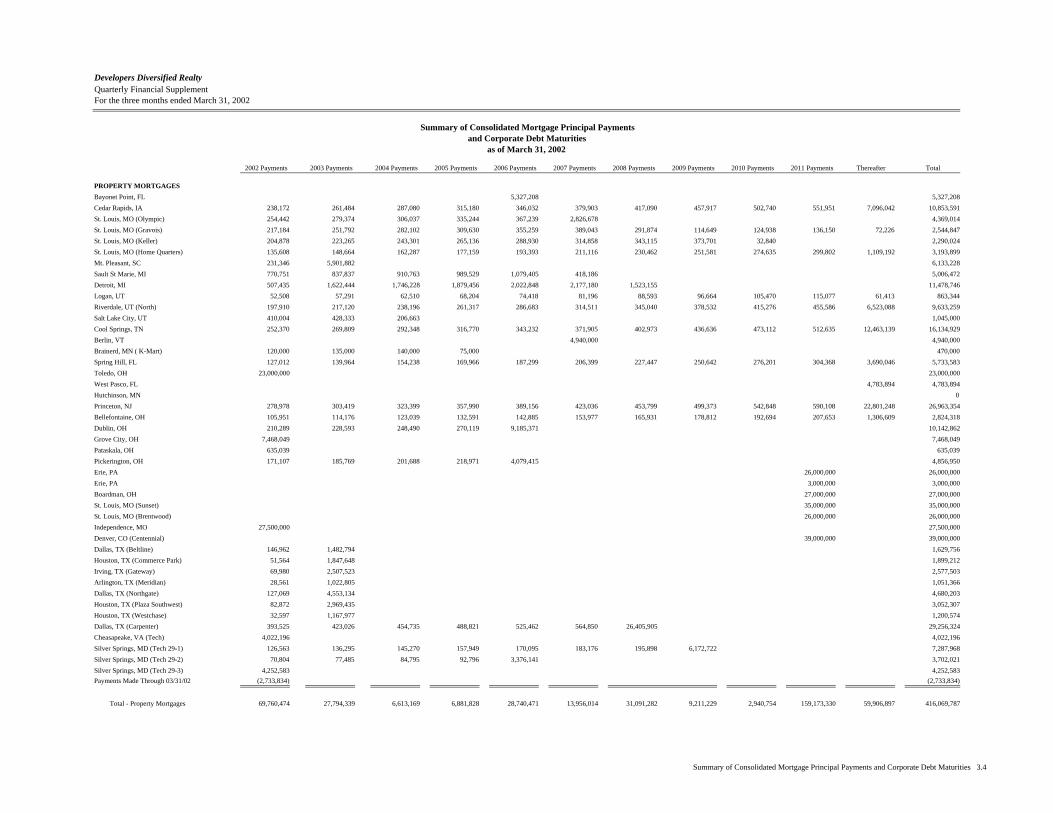
2002 Payments 2003 Payments 2004 Payments 2005 Payments 2006 Payments 2007 Payments 2008 Payments 2009 Payments 2010 Payments 2011 Payments Thereafter Total
PROPERTY MORTGAGES
Bayonet Point, FL 5,327,208 5,327,208
Cedar Rapids, IA 238,172 261,484 287,080 315,180 346,032 379,903 417,090 457,917 502,740 551,951 7,096,042 10,853,591
St. Louis, MO (Olympic) 254,442 279,374 306,037 335,244 367,239 2,826,678 4,369,014
St. Louis, MO (Gravois) 217,184 251,792 282,102 309,630 355,259 389,043 291,874 114,649 124,938 136,150 72,226 2,544,847
St. Louis, MO (Keller) 204,878 223,265 243,301 265,136 288,930 314,858 343,115 373,701 32,840 2,290,024
St. Louis, MO (Home Quarters) 135,608 148,664 162,287 177,159 193,393 211,116 230,462 251,581 274,635 299,802 1,109,192 3,193,899
Mt. Pleasant, SC 231,346 5,901,882 6,133,228
Sault St Marie, MI 770,751 837,837 910,763 989,529 1,079,405 418,186 5,006,472
Detroit, MI 507,435 1,622,444 1,746,228 1,879,456 2,022,848 2,177,180 1,523,155 11,478,746
Logan, UT 52,508 57,291 62,510 68,204 74,418 81,196 88,593 96,664 105,470 115,077 61,413 863,344
Riverdale, UT (North) 197,910 217,120 238,196 261,317 286,683 314,511 345,040 378,532 415,276 455,586 6,523,088 9,633,259
Salt Lake City, UT 410,004 428,333 206,663 1,045,000
Cool Springs, TN 252,370 269,809 292,348 316,770 343,232 371,905 402,973 436,636 473,112 512,635 12,463,139 16,134,929
Berlin, VT 4,940,000 4,940,000
Brainerd, MN ( K-Mart) 120,000 135,000 140,000 75,000 470,000
Spring Hill, FL 127,012 139,964 154,238 169,966 187,299 206,399 227,447 250,642 276,201 304,368 3,690,046 5,733,583
Toledo, OH 23,000,000 23,000,000
West Pasco, FL 4,783,894 4,783,894
Hutchinson, MN 0
Princeton, NJ 278,978 303,419 323,399 357,990 389,156 423,036 453,799 499,373 542,848 590,108 22,801,248 26,963,354
Bellefontaine, OH 105,951 114,176 123,039 132,591 142,885 153,977 165,931 178,812 192,694 207,653 1,306,609 2,824,318
Dublin, OH 210,289 228,593 248,490 270,119 9,185,371 10,142,862
Grove City, OH 7,468,049 7,468,049
Pataskala, OH 635,039 635,039
Pickerington, OH 171,107 185,769 201,688 218,971 4,079,415 4,856,950
Erie, PA 26,000,000 26,000,000
Erie, PA 3,000,000 3,000,000
Boardman, OH 27,000,000 27,000,000
St. Louis, MO (Sunset) 35,000,000 35,000,000
St. Louis, MO (Brentwood) 26,000,000 26,000,000
Independence, MO 27,500,000 27,500,000
Denver, CO (Centennial) 39,000,000 39,000,000
Dallas, TX (Beltline) 146,962 1,482,794 1,629,756
Houston, TX (Commerce Park) 51,564 1,847,648 1,899,212
Irving, TX (Gateway) 69,980 2,507,523 2,577,503
Arlington, TX (Meridian) 28,561 1,022,805 1,051,366
Dallas, TX (Northgate) 127,069 4,553,134 4,680,203
Houston, TX (Plaza Southwest) 82,872 2,969,435 3,052,307
Houston, TX (Westchase) 32,597 1,167,977 1,200,574
Dallas, TX (Carpenter) 393,525 423,026 454,735 488,821 525,462 564,850 26,405,905 29,256,324
Cheasapeake, VA (Tech) 4,022,196 4,022,196
Silver Springs, MD (Tech 29-1) 126,563 136,295 145,270 157,949 170,095 183,176 195,898 6,172,722 7,287,968
Silver Springs, MD (Tech 29-2) 70,804 77,485 84,795 92,796 3,376,141 3,702,021
Silver Springs, MD (Tech 29-3) 4,252,583 4,252,583
Payments Made Through 03/31/02 (2,733,834) (2,733,834)
Total - Property Mortgages 69,760,474 27,794,339 6,613,169 6,881,828 28,740,471 13,956,014 31,091,282 9,211,229 2,940,754 159,173,330 59,906,897 416,069,787
Summary of Consolidated Mortgage Principal Paymentsand Corporate Debt Maturities
as of March 31, 2002
Summary of Consolidated Mortgage Principal Payments and Corporate Debt Maturities 3.4
Developers Diversified Realty Quarterly Financial SupplementFor the three months ended March 31, 2002
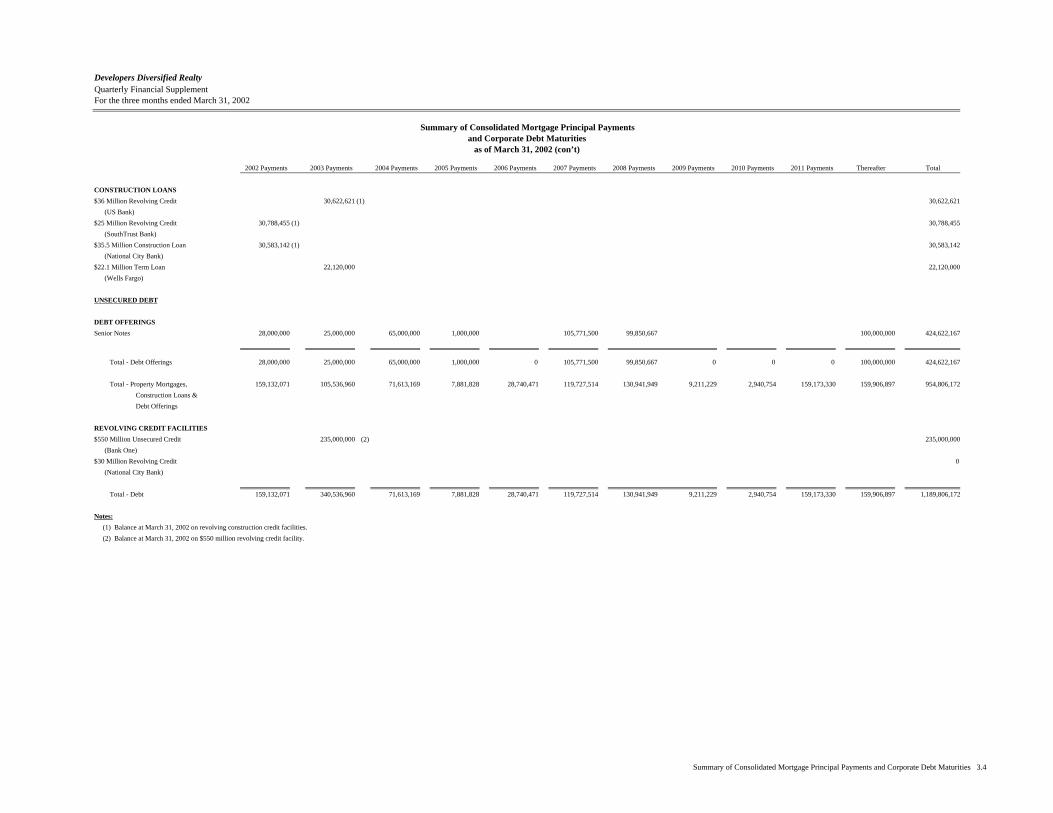
2002 Payments 2003 Payments 2004 Payments 2005 Payments 2006 Payments 2007 Payments 2008 Payments 2009 Payments 2010 Payments 2011 Payments Thereafter Total
CONSTRUCTION LOANS
$36 Million Revolving Credit 30,622,621 (1) 30,622,621
(US Bank)
$25 Million Revolving Credit 30,788,455 (1) 30,788,455
(SouthTrust Bank)
$35.5 Million Construction Loan 30,583,142 (1) 30,583,142
(National City Bank)
$22.1 Million Term Loan 22,120,000 22,120,000
(Wells Fargo)
UNSECURED DEBT
DEBT OFFERINGS
Senior Notes 28,000,000 25,000,000 65,000,000 1,000,000 105,771,500 99,850,667 100,000,000 424,622,167
Total - Debt Offerings 28,000,000 25,000,000 65,000,000 1,000,000 0 105,771,500 99,850,667 0 0 0 100,000,000 424,622,167
Total - Property Mortgages, 159,132,071 105,536,960 71,613,169 7,881,828 28,740,471 119,727,514 130,941,949 9,211,229 2,940,754 159,173,330 159,906,897 954,806,172
Construction Loans &
Debt Offerings
REVOLVING CREDIT FACILITIES
$550 Million Unsecured Credit 235,000,000 (2) 235,000,000
(Bank One)
$30 Million Revolving Credit 0
(National City Bank)
Total - Debt 159,132,071 340,536,960 71,613,169 7,881,828 28,740,471 119,727,514 130,941,949 9,211,229 2,940,754 159,173,330 159,906,897 1,189,806,172
Notes:
(1) Balance at March 31, 2002 on revolving construction credit facilities.
(2) Balance at March 31, 2002 on $550 million revolving credit facility.
and Corporate Debt Maturitiesas of March 31, 2002 (con’t)
Summary of Consolidated Mortgage Principal Payments
Summary of Consolidated Mortgage Principal Payments and Corporate Debt Maturities 3.4
Joint Venture Summaries
Developers Diversified RealtyQuarterly Financial SupplementFor the three months ended March 31, 2002
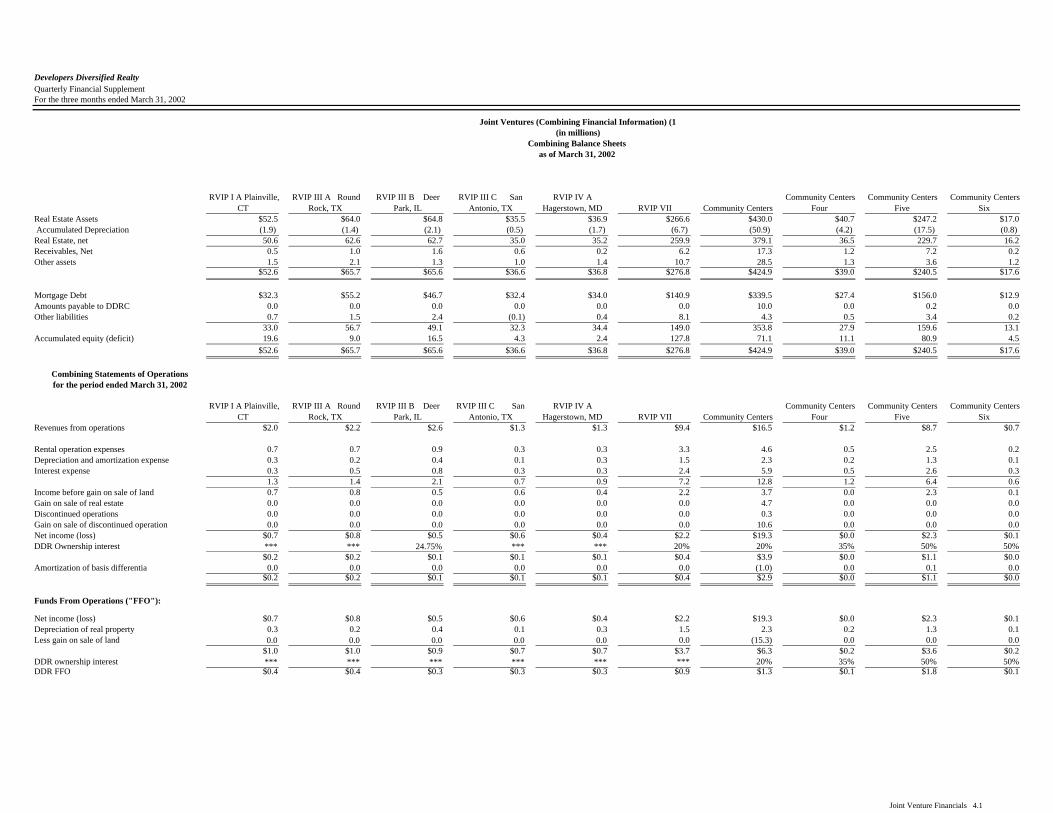
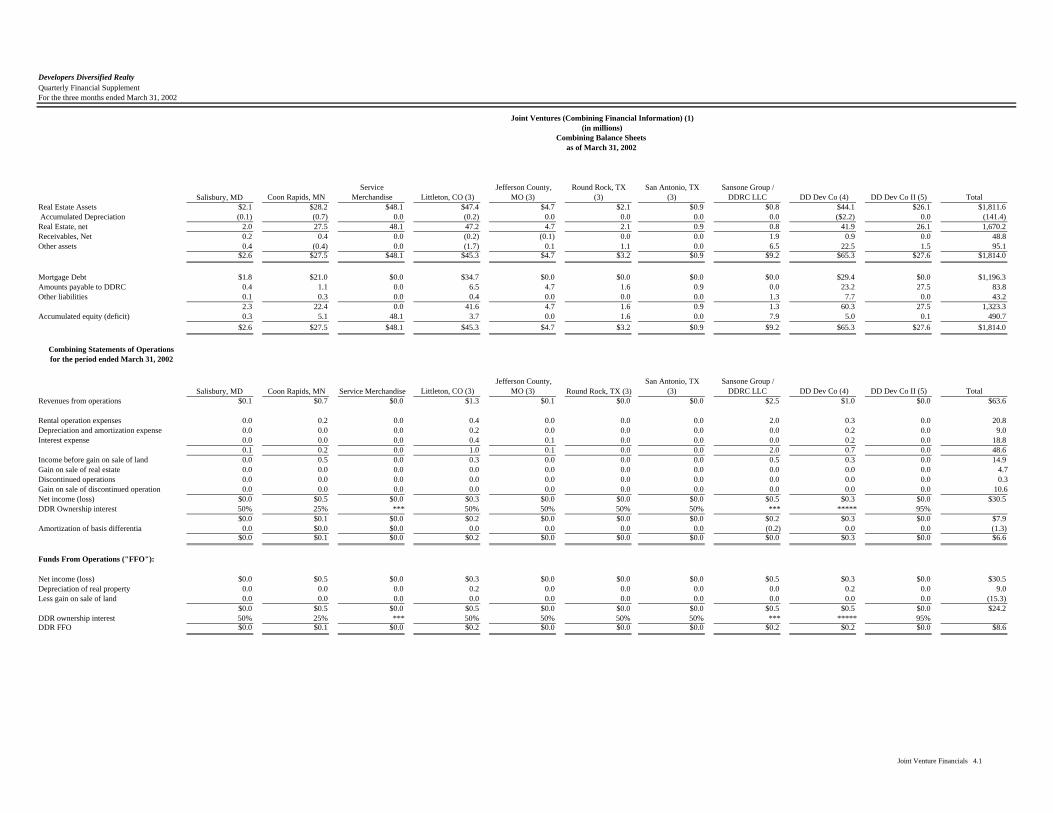
Joint Ventures (Combining Financial Information) (1(in millions)
Combining Balance Sheets as of March 31, 2002
RVIP I A Plainville,CT
RVIP III A Round Rock, TX
RVIP III B Deer Park, IL
RVIP III C San Antonio, TX
RVIP IV A Hagerstown, MD RVIP VII Community Centers
Community CentersFour
Community CentersFive
Community CentersSix
Real Estate Assets $52.5 $64.0 $64.8 $35.5 $36.9 $266.6 $430.0 $40.7 $247.2 $17.0 Accumulated Depreciation (1.9) (1.4) (2.1) (0.5) (1.7) (6.7) (50.9) (4.2) (17.5) (0.8)Real Estate, net 50.6 62.6 62.7 35.0 35.2 259.9 379.1 36.5 229.7 16.2Receivables, Net 0.5 1.0 1.6 0.6 0.2 6.2 17.3 1.2 7.2 0.2Other assets 1.5 2.1 1.3 1.0 1.4 10.7 28.5 1.3 3.6 1.2
$52.6 $65.7 $65.6 $36.6 $36.8 $276.8 $424.9 $39.0 $240.5 $17.6
Mortgage Debt $32.3 $55.2 $46.7 $32.4 $34.0 $140.9 $339.5 $27.4 $156.0 $12.9Amounts payable to DDRC 0.0 0.0 0.0 0.0 0.0 0.0 10.0 0.0 0.2 0.0Other liabilities 0.7 1.5 2.4 (0.1) 0.4 8.1 4.3 0.5 3.4 0.2
33.0 56.7 49.1 32.3 34.4 149.0 353.8 27.9 159.6 13.1Accumulated equity (deficit) 19.6 9.0 16.5 4.3 2.4 127.8 71.1 11.1 80.9 4.5
$52.6 $65.7 $65.6 $36.6 $36.8 $276.8 $424.9 $39.0 $240.5 $17.6
Combining Statements of Operations for the period ended March 31, 2002
RVIP I A Plainville,CT
RVIP III A Round Rock, TX
RVIP III B Deer Park, IL
RVIP III C San Antonio, TX
RVIP IV A Hagerstown, MD RVIP VII Community Centers
Community CentersFour
Community CentersFive
Community CentersSix
Revenues from operations $2.0 $2.2 $2.6 $1.3 $1.3 $9.4 $16.5 $1.2 $8.7 $0.7
Rental operation expenses 0.7 0.7 0.9 0.3 0.3 3.3 4.6 0.5 2.5 0.2Depreciation and amortization expense 0.3 0.2 0.4 0.1 0.3 1.5 2.3 0.2 1.3 0.1Interest expense 0.3 0.5 0.8 0.3 0.3 2.4 5.9 0.5 2.6 0.3
1.3 1.4 2.1 0.7 0.9 7.2 12.8 1.2 6.4 0.6Income before gain on sale of land 0.7 0.8 0.5 0.6 0.4 2.2 3.7 0.0 2.3 0.1Gain on sale of real estate 0.0 0.0 0.0 0.0 0.0 0.0 4.7 0.0 0.0 0.0Discontinued operations 0.0 0.0 0.0 0.0 0.0 0.0 0.3 0.0 0.0 0.0Gain on sale of discontinued operation 0.0 0.0 0.0 0.0 0.0 0.0 10.6 0.0 0.0 0.0Net income (loss) $0.7 $0.8 $0.5 $0.6 $0.4 $2.2 $19.3 $0.0 $2.3 $0.1DDR Ownership interest *** *** 24.75% *** *** 20% 20% 35% 50% 50%
$0.2 $0.2 $0.1 $0.1 $0.1 $0.4 $3.9 $0.0 $1.1 $0.0Amortization of basis differentia 0.0 0.0 0.0 0.0 0.0 0.0 (1.0) 0.0 0.1 0.0
$0.2 $0.2 $0.1 $0.1 $0.1 $0.4 $2.9 $0.0 $1.1 $0.0
Funds From Operations ("FFO"):
Net income (loss) $0.7 $0.8 $0.5 $0.6 $0.4 $2.2 $19.3 $0.0 $2.3 $0.1Depreciation of real property 0.3 0.2 0.4 0.1 0.3 1.5 2.3 0.2 1.3 0.1Less gain on sale of land 0.0 0.0 0.0 0.0 0.0 0.0 (15.3) 0.0 0.0 0.0
$1.0 $1.0 $0.9 $0.7 $0.7 $3.7 $6.3 $0.2 $3.6 $0.2DDR ownership interest *** *** *** *** *** *** 20% 35% 50% 50%DDR FFO $0.4 $0.4 $0.3 $0.3 $0.3 $0.9 $1.3 $0.1 $1.8 $0.1
Joint Venture Financials 4.1
Developers Diversified RealtyQuarterly Financial SupplementFor the three months ended March 31, 2002
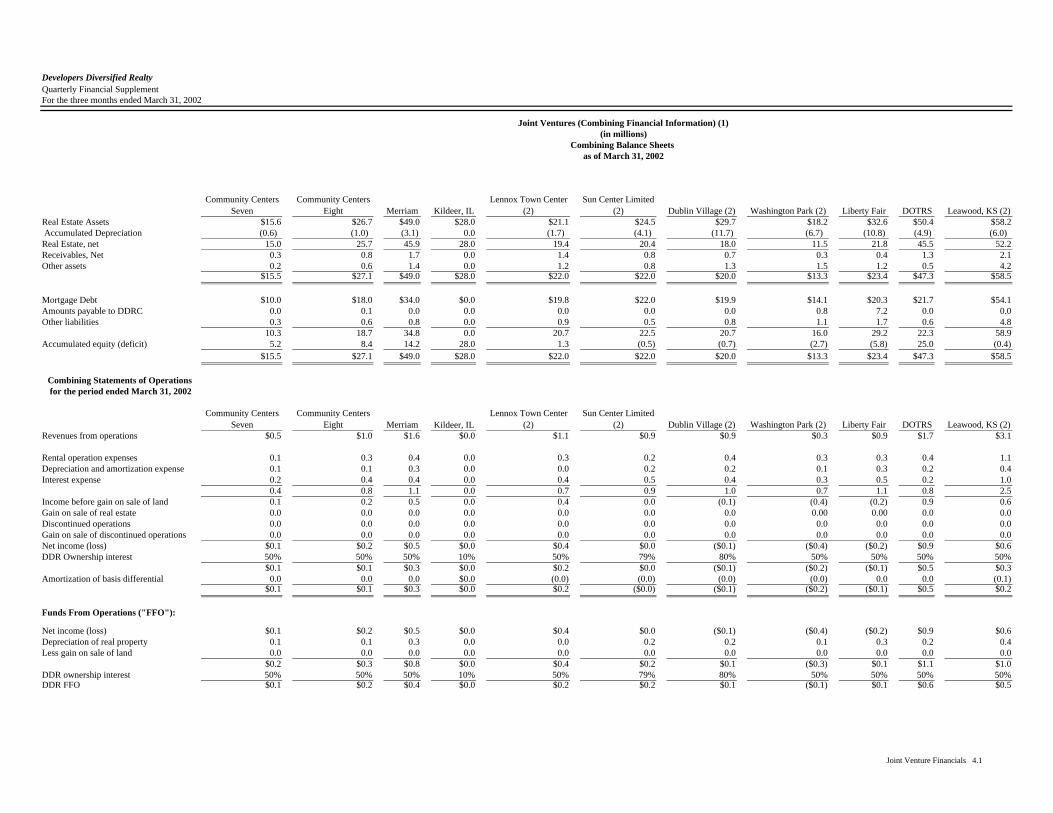
Joint Ventures (Combining Financial Information) (1)(in millions)
Combining Balance Sheets as of March 31, 2002
Community Centers Seven
Community Centers Eight Merriam Kildeer, IL
Lennox Town Center (2)
Sun Center Limited (2) Dublin Village (2) Washington Park (2) Liberty Fair DOTRS Leawood, KS (2)
Real Estate Assets $15.6 $26.7 $49.0 $28.0 $21.1 $24.5 $29.7 $18.2 $32.6 $50.4 $58.2 Accumulated Depreciation (0.6) (1.0) (3.1) 0.0 (1.7) (4.1) (11.7) (6.7) (10.8) (4.9) (6.0)Real Estate, net 15.0 25.7 45.9 28.0 19.4 20.4 18.0 11.5 21.8 45.5 52.2Receivables, Net 0.3 0.8 1.7 0.0 1.4 0.8 0.7 0.3 0.4 1.3 2.1Other assets 0.2 0.6 1.4 0.0 1.2 0.8 1.3 1.5 1.2 0.5 4.2
$15.5 $27.1 $49.0 $28.0 $22.0 $22.0 $20.0 $13.3 $23.4 $47.3 $58.5
Mortgage Debt $10.0 $18.0 $34.0 $0.0 $19.8 $22.0 $19.9 $14.1 $20.3 $21.7 $54.1Amounts payable to DDRC 0.0 0.1 0.0 0.0 0.0 0.0 0.0 0.8 7.2 0.0 0.0Other liabilities 0.3 0.6 0.8 0.0 0.9 0.5 0.8 1.1 1.7 0.6 4.8
10.3 18.7 34.8 0.0 20.7 22.5 20.7 16.0 29.2 22.3 58.9Accumulated equity (deficit) 5.2 8.4 14.2 28.0 1.3 (0.5) (0.7) (2.7) (5.8) 25.0 (0.4)
$15.5 $27.1 $49.0 $28.0 $22.0 $22.0 $20.0 $13.3 $23.4 $47.3 $58.5
Combining Statements of Operations for the period ended March 31, 2002
Community Centers Seven
Community Centers Eight Merriam Kildeer, IL
Lennox Town Center (2)
Sun Center Limited (2) Dublin Village (2) Washington Park (2) Liberty Fair DOTRS Leawood, KS (2)
Revenues from operations $0.5 $1.0 $1.6 $0.0 $1.1 $0.9 $0.9 $0.3 $0.9 $1.7 $3.1
Rental operation expenses 0.1 0.3 0.4 0.0 0.3 0.2 0.4 0.3 0.3 0.4 1.1Depreciation and amortization expense 0.1 0.1 0.3 0.0 0.0 0.2 0.2 0.1 0.3 0.2 0.4Interest expense 0.2 0.4 0.4 0.0 0.4 0.5 0.4 0.3 0.5 0.2 1.0
0.4 0.8 1.1 0.0 0.7 0.9 1.0 0.7 1.1 0.8 2.5Income before gain on sale of land 0.1 0.2 0.5 0.0 0.4 0.0 (0.1) (0.4) (0.2) 0.9 0.6Gain on sale of real estate 0.0 0.0 0.0 0.0 0.0 0.0 0.0 0.00 0.00 0.0 0.0Discontinued operations 0.0 0.0 0.0 0.0 0.0 0.0 0.0 0.0 0.0 0.0 0.0Gain on sale of discontinued operations 0.0 0.0 0.0 0.0 0.0 0.0 0.0 0.0 0.0 0.0 0.0Net income (loss) $0.1 $0.2 $0.5 $0.0 $0.4 $0.0 ($0.1) ($0.4) ($0.2) $0.9 $0.6DDR Ownership interest 50% 50% 50% 10% 50% 79% 80% 50% 50% 50% 50%
$0.1 $0.1 $0.3 $0.0 $0.2 $0.0 ($0.1) ($0.2) ($0.1) $0.5 $0.3 Amortization of basis differential 0.0 0.0 0.0 $0.0 (0.0) (0.0) (0.0) (0.0) 0.0 0.0 (0.1)
$0.1 $0.1 $0.3 $0.0 $0.2 ($0.0) ($0.1) ($0.2) ($0.1) $0.5 $0.2
Funds From Operations ("FFO"):
Net income (loss) $0.1 $0.2 $0.5 $0.0 $0.4 $0.0 ($0.1) ($0.4) ($0.2) $0.9 $0.6Depreciation of real property 0.1 0.1 0.3 0.0 0.0 0.2 0.2 0.1 0.3 0.2 0.4Less gain on sale of land 0.0 0.0 0.0 0.0 0.0 0.0 0.0 0.0 0.0 0.0 0.0
$0.2 $0.3 $0.8 $0.0 $0.4 $0.2 $0.1 ($0.3) $0.1 $1.1 $1.0DDR ownership interest 50% 50% 50% 10% 50% 79% 80% 50% 50% 50% 50%DDR FFO $0.1 $0.2 $0.4 $0.0 $0.2 $0.2 $0.1 ($0.1) $0.1 $0.6 $0.5
Joint Venture Financials 4.1
Developers Diversified Realty Quarterly Financial SupplementFor the three months ended March 31, 2002
Joint Ventures (Combining Financial Information) (1)(in millions)
Combining Balance Sheets as of March 31, 2002
Salisbury, MD Coon Rapids, MNService
Merchandise Littleton, CO (3)Jefferson County,
MO (3)Round Rock, TX
(3)San Antonio, TX
(3)Sansone Group /
DDRC LLC DD Dev Co (4) DD Dev Co II (5) TotalReal Estate Assets $2.1 $28.2 $48.1 $47.4 $4.7 $2.1 $0.9 $0.8 $44.1 $26.1 $1,811.6 Accumulated Depreciation (0.1) (0.7) 0.0 (0.2) 0.0 0.0 0.0 0.0 ($2.2) 0.0 (141.4)Real Estate, net 2.0 27.5 48.1 47.2 4.7 2.1 0.9 0.8 41.9 26.1 1,670.2 Receivables, Net 0.2 0.4 0.0 (0.2) (0.1) 0.0 0.0 1.9 0.9 0.0 48.8 Other assets 0.4 (0.4) 0.0 (1.7) 0.1 1.1 0.0 6.5 22.5 1.5 95.1
$2.6 $27.5 $48.1 $45.3 $4.7 $3.2 $0.9 $9.2 $65.3 $27.6 $1,814.0
Mortgage Debt $1.8 $21.0 $0.0 $34.7 $0.0 $0.0 $0.0 $0.0 $29.4 $0.0 $1,196.3Amounts payable to DDRC 0.4 1.1 0.0 6.5 4.7 1.6 0.9 0.0 23.2 27.5 83.8 Other liabilities 0.1 0.3 0.0 0.4 0.0 0.0 0.0 1.3 7.7 0.0 43.2
2.3 22.4 0.0 41.6 4.7 1.6 0.9 1.3 60.3 27.5 1,323.3 Accumulated equity (deficit) 0.3 5.1 48.1 3.7 0.0 1.6 0.0 7.9 5.0 0.1 490.7
$2.6 $27.5 $48.1 $45.3 $4.7 $3.2 $0.9 $9.2 $65.3 $27.6 $1,814.0
Combining Statements of Operations for the period ended March 31, 2002
Salisbury, MD Coon Rapids, MN Service Merchandise Littleton, CO (3)Jefferson County,
MO (3) Round Rock, TX (3)San Antonio, TX
(3)Sansone Group /
DDRC LLC DD Dev Co (4) DD Dev Co II (5) TotalRevenues from operations $0.1 $0.7 $0.0 $1.3 $0.1 $0.0 $0.0 $2.5 $1.0 $0.0 $63.6
Rental operation expenses 0.0 0.2 0.0 0.4 0.0 0.0 0.0 2.0 0.3 0.0 20.8 Depreciation and amortization expense 0.0 0.0 0.0 0.2 0.0 0.0 0.0 0.0 0.2 0.0 9.0 Interest expense 0.0 0.0 0.0 0.4 0.1 0.0 0.0 0.0 0.2 0.0 18.8
0.1 0.2 0.0 1.0 0.1 0.0 0.0 2.0 0.7 0.0 48.6Income before gain on sale of land 0.0 0.5 0.0 0.3 0.0 0.0 0.0 0.5 0.3 0.0 14.9Gain on sale of real estate 0.0 0.0 0.0 0.0 0.0 0.0 0.0 0.0 0.0 0.0 4.7 Discontinued operations 0.0 # 0.0 0.0 0.0 0.0 0.0 0.0 0.0 0.0 0.0 0.3 #Gain on sale of discontinued operation 0.0 # 0.0 0.0 0.0 0.0 0.0 0.0 0.0 0.0 0.0 10.6 #Net income (loss) $0.0 $0.5 $0.0 $0.3 $0.0 $0.0 $0.0 $0.5 $0.3 $0.0 $30.5DDR Ownership interest 50% 25% *** 50% 50% 50% 50% *** ***** 95%
$0.0 $0.1 $0.0 $0.2 $0.0 $0.0 $0.0 $0.2 $0.3 $0.0 $7.9Amortization of basis differentia 0.0 $0.0 $0.0 0.0 0.0 0.0 0.0 (0.2) 0.0 0.0 (1.3)
$0.0 $0.1 $0.0 $0.2 $0.0 $0.0 $0.0 $0.0 $0.3 $0.0 $6.6
Funds From Operations ("FFO"):
Net income (loss) $0.0 $0.5 $0.0 $0.3 $0.0 $0.0 $0.0 $0.5 $0.3 $0.0 $30.5Depreciation of real property 0.0 0.0 0.0 0.2 0.0 0.0 0.0 0.0 0.2 0.0 9.0Less gain on sale of land 0.0 0.0 0.0 0.0 0.0 0.0 0.0 0.0 0.0 0.0 (15.3)
$0.0 $0.5 $0.0 $0.5 $0.0 $0.0 $0.0 $0.5 $0.5 $0.0 $24.2DDR ownership interest 50% 25% *** 50% 50% 50% 50% *** ***** 95%DDR FFO $0.0 $0.1 $0.0 $0.2 $0.0 $0.0 $0.0 $0.2 $0.2 $0.0 $8.6
Joint Venture Financials 4.1
Developers Diversified RealtyQuarterly Financial SupplementFor the three months ended March 31, 2002
(1) Amounts may differ slightly from actual results, due to rounding
(2) Asset values reflect historical cost basis due to acquisition of partnership interest (i.e. does not reflect step up in bas
(3) Asset under development
(4) The Company owns a 95% economic interest in DD Development Co. (a C-Corp.). This entity holds various LLC interests in the following projects owned through the Prudential Retail Value Fund: several retail sformerly occupied by Best Products acquired from Metropolitan Life, a 170,278 square foot shopping center development in Salem, NH, a portfolio of six retail properties in Kansas City, KS a 440,000 square foot redevelopment project in Long Beach, CA (5) The Company owns a 95% economic interest in DD Development Co. II (a C-Corp.). This entity has an interest in a retail site under development in Long Beach, CA annote receivable secured by certain real estate, which were received in settlement of advances made to DDR OliverMcMill
***See Section 4.2, Joint Venture Summaries, discussing respective ownership percentage, as ownership percentage may have changed during the year, or the promoted interest is in e
*****See footnote (4) discussing respective ownership percentag
Joint Venture Financials 4.1
Developers Diversified RealtyQuarterly Financial SupplementalFor the three months ended March 31, 2002
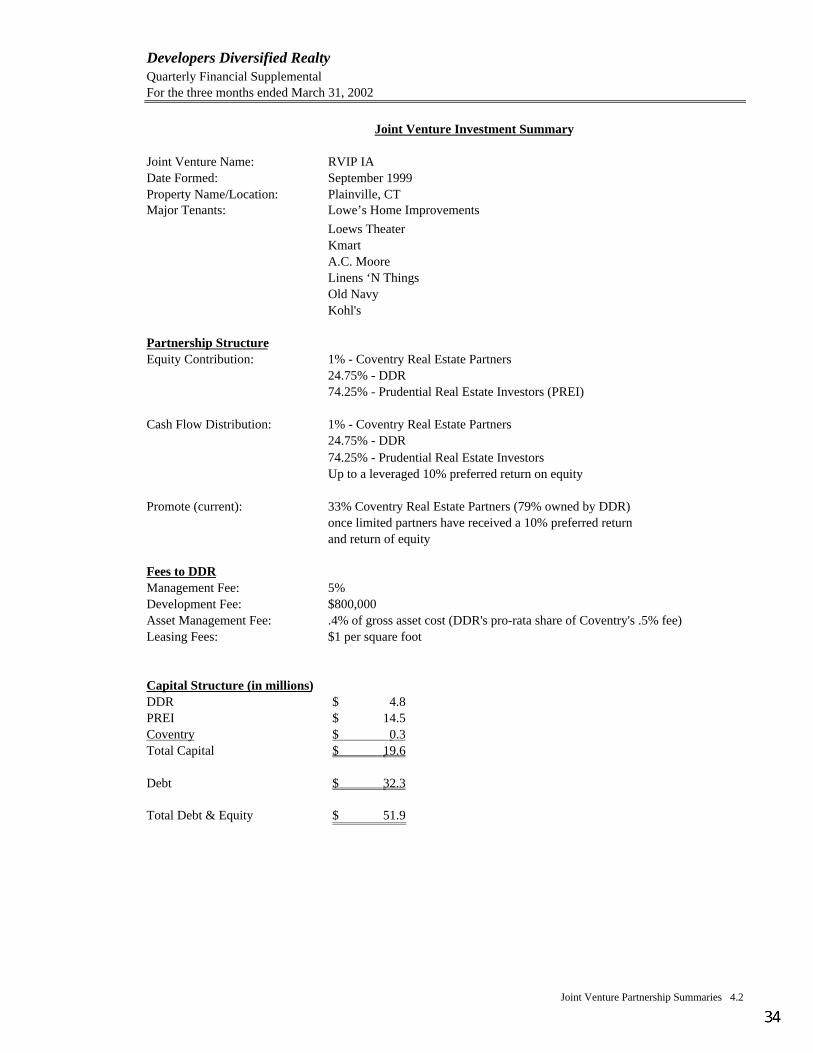
Joint Venture Investment Summary
Joint Venture Name: RVIP IADate Formed: September 1999Property Name/Location: Plainville, CTMajor Tenants: Lowe’s Home Improvements
Loews TheaterKmartA.C. MooreLinens ‘N ThingsOld NavyKohl's
Partnership StructureEquity Contribution: 1% - Coventry Real Estate Partners
24.75% - DDR 74.25% - Prudential Real Estate Investors (PREI)
Cash Flow Distribution: 1% - Coventry Real Estate Partners24.75% - DDR 74.25% - Prudential Real Estate InvestorsUp to a leveraged 10% preferred return on equity
Promote (current): 33% Coventry Real Estate Partners (79% owned by DDR)once limited partners have received a 10% preferred return and return of equity
Fees to DDRManagement Fee: 5%Development Fee: $800,000Asset Management Fee: .4% of gross asset cost (DDR's pro-rata share of Coventry's .5% fee)Leasing Fees: $1 per square foot
Capital Structure (in millions)DDR 4.8$ PREI 14.5$ Coventry 0.3$ Total Capital 19.6$
Debt 32.3$
Total Debt & Equity 51.9$
Joint Venture Partnership Summaries 4.2
Developers Diversified RealtyQuarterly Financial SupplementalFor the three months ended March 31, 2002
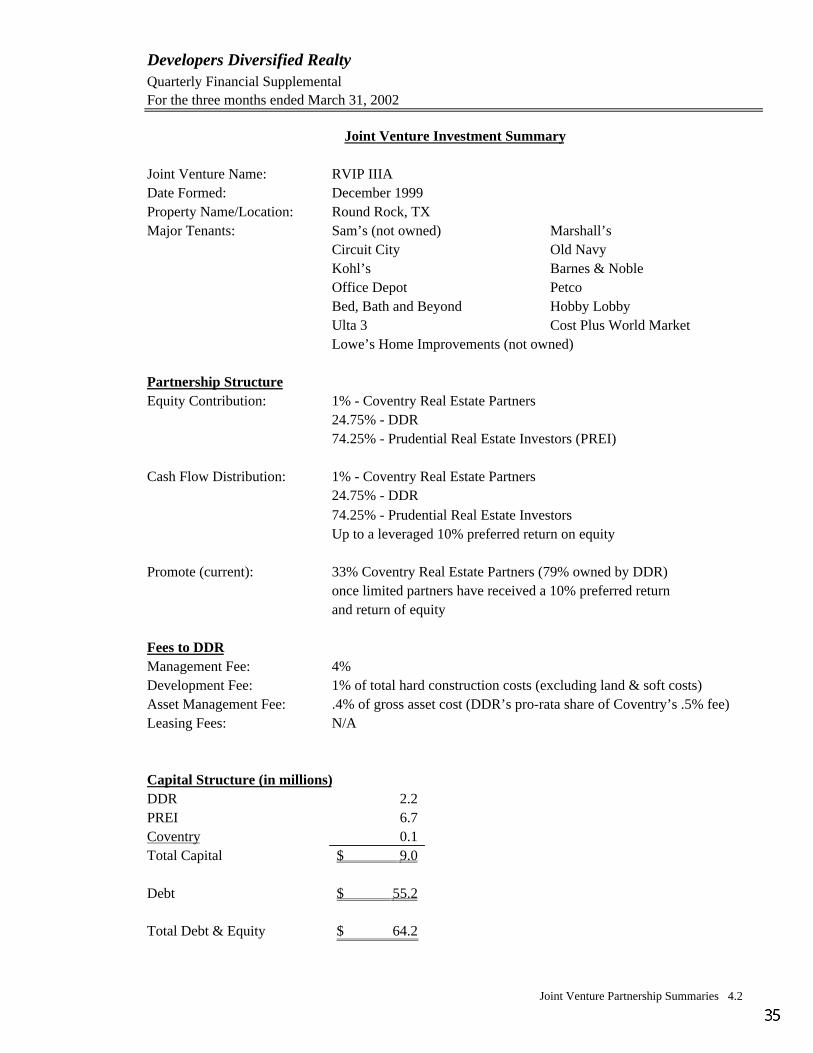
Joint Venture Investment Summary
Joint Venture Name: RVIP IIIADate Formed: December 1999Property Name/Location: Round Rock, TXMajor Tenants: Sam’s (not owned) Marshall’s
Circuit City Old NavyKohl’s Barnes & NobleOffice Depot PetcoBed, Bath and Beyond Hobby LobbyUlta 3 Cost Plus World MarketLowe’s Home Improvements (not owned)
Partnership StructureEquity Contribution: 1% - Coventry Real Estate Partners
24.75% - DDR 74.25% - Prudential Real Estate Investors (PREI)
Cash Flow Distribution: 1% - Coventry Real Estate Partners24.75% - DDR74.25% - Prudential Real Estate InvestorsUp to a leveraged 10% preferred return on equity
Promote (current): 33% Coventry Real Estate Partners (79% owned by DDR)once limited partners have received a 10% preferred return and return of equity
Fees to DDRManagement Fee: 4%Development Fee: 1% of total hard construction costs (excluding land & soft costs)Asset Management Fee: .4% of gross asset cost (DDR’s pro-rata share of Coventry’s .5% fee)Leasing Fees: N/A
Capital Structure (in millions)DDR 2.2 PREI 6.7 Coventry 0.1 Total Capital 9.0$
Debt 55.2$
Total Debt & Equity 64.2$
Joint Venture Partnership Summaries 4.2
Developers Diversified RealtyQuarterly Financial SupplementalFor the three months ended March 31, 2002
Joint Venture Investment Summary
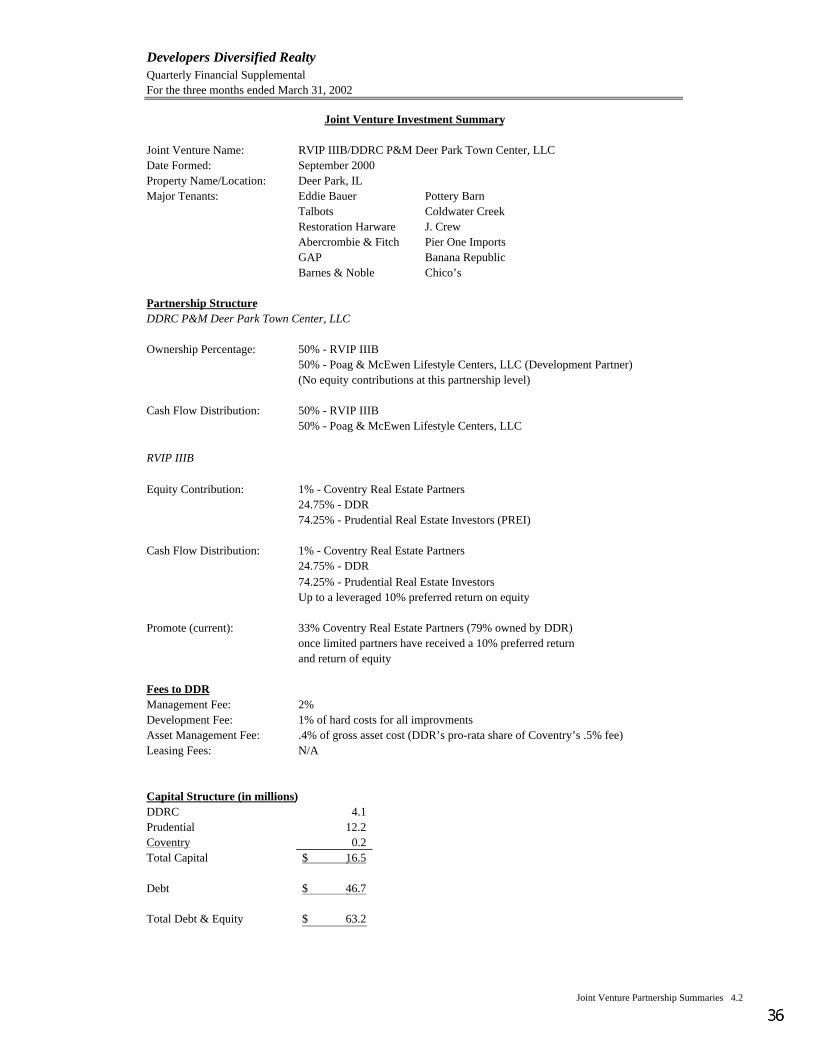
Joint Venture Name: RVIP IIIB/DDRC P&M Deer Park Town Center, LLCDate Formed: September 2000Property Name/Location: Deer Park, ILMajor Tenants: Eddie Bauer Pottery Barn
Talbots Coldwater CreekRestoration Harware J. CrewAbercrombie & Fitch Pier One ImportsGAP Banana RepublicBarnes & Noble Chico’s
Partnership StructureDDRC P&M Deer Park Town Center, LLC
Ownership Percentage: 50% - RVIP IIIB50% - Poag & McEwen Lifestyle Centers, LLC (Development Partner)(No equity contributions at this partnership level)
Cash Flow Distribution: 50% - RVIP IIIB50% - Poag & McEwen Lifestyle Centers, LLC
RVIP IIIB
Equity Contribution: 1% - Coventry Real Estate Partners24.75% - DDR74.25% - Prudential Real Estate Investors (PREI)
Cash Flow Distribution: 1% - Coventry Real Estate Partners24.75% - DDR74.25% - Prudential Real Estate InvestorsUp to a leveraged 10% preferred return on equity
Promote (current): 33% Coventry Real Estate Partners (79% owned by DDR)once limited partners have received a 10% preferred return and return of equity
Fees to DDRManagement Fee: 2%Development Fee: 1% of hard costs for all improvments Asset Management Fee: .4% of gross asset cost (DDR’s pro-rata share of Coventry’s .5% fee)Leasing Fees: N/A
Capital Structure (in millions)DDRC 4.1 Prudential 12.2 Coventry 0.2 Total Capital 16.5$
Debt 46.7$
Total Debt & Equity 63.2$
Joint Venture Partnership Summaries 4.2
Developers Diversified RealtyQuarterly Financial SupplementalFor the three months ended March 31, 2002
Joint Venture Investment Summary
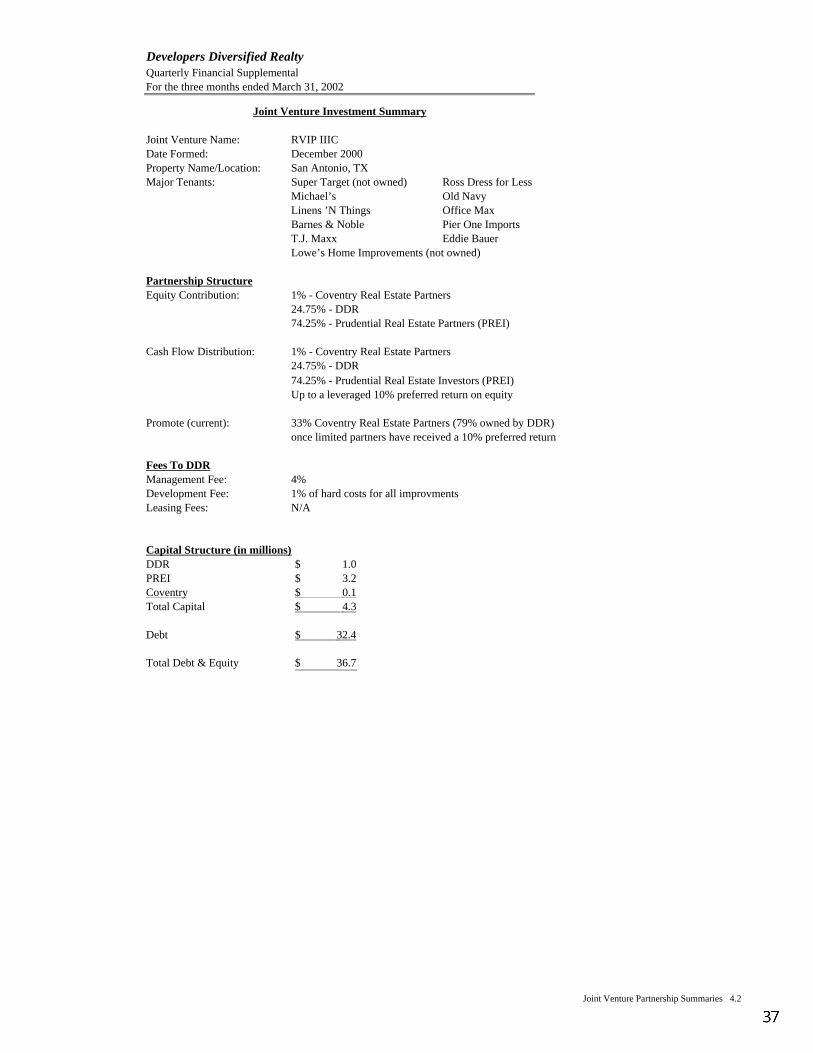
Joint Venture Name: RVIP IIICDate Formed: December 2000Property Name/Location: San Antonio, TXMajor Tenants: Super Target (not owned) Ross Dress for Less
Michael’s Old NavyLinens ’N Things Office MaxBarnes & Noble Pier One ImportsT.J. Maxx Eddie BauerLowe’s Home Improvements (not owned)
Partnership StructureEquity Contribution: 1% - Coventry Real Estate Partners
24.75% - DDR74.25% - Prudential Real Estate Partners (PREI)
Cash Flow Distribution: 1% - Coventry Real Estate Partners24.75% - DDR 74.25% - Prudential Real Estate Investors (PREI)Up to a leveraged 10% preferred return on equity
Promote (current): 33% Coventry Real Estate Partners (79% owned by DDR)once limited partners have received a 10% preferred return
Fees To DDRManagement Fee: 4%Development Fee: 1% of hard costs for all improvmentsLeasing Fees: N/A
Capital Structure (in millions)DDR 1.0$ PREI 3.2$ Coventry 0.1$ Total Capital 4.3$
Debt 32.4$
Total Debt & Equity 36.7$
Joint Venture Partnership Summaries 4.2
Developers Diversified RealtyQuarterly Financial SupplementalFor the three months ended March 31, 2002
Joint Venture Investment Summary
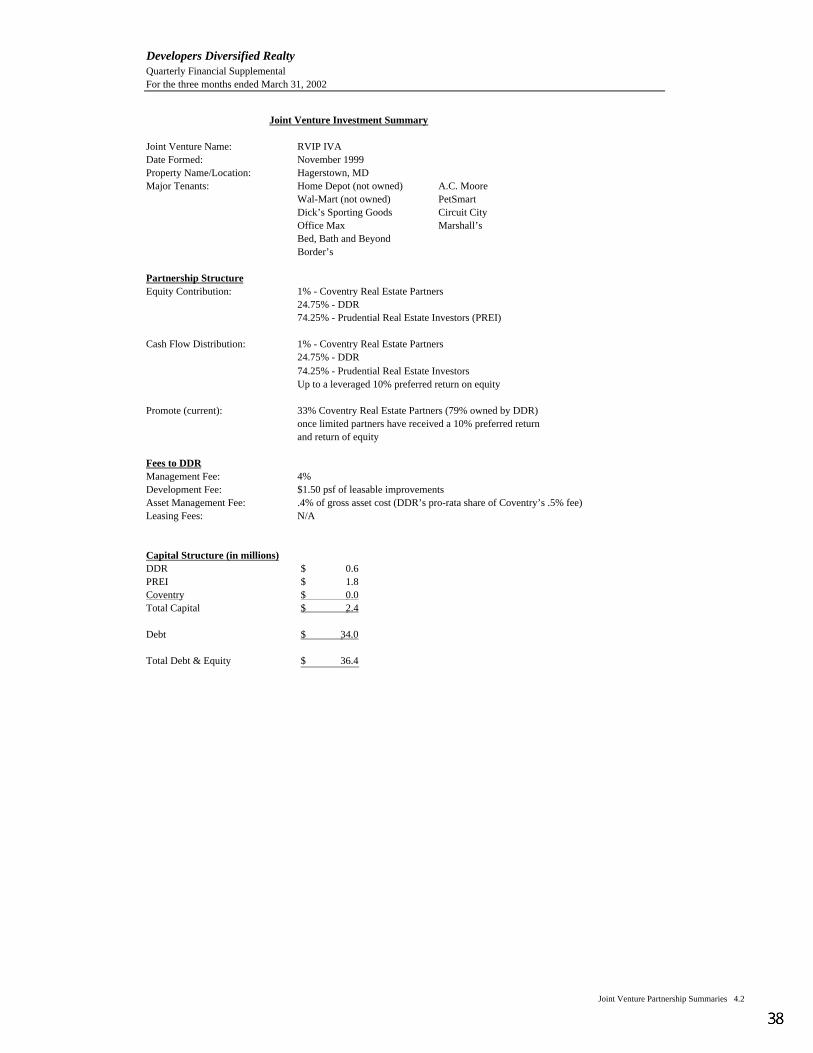
Joint Venture Name: RVIP IVADate Formed: November 1999Property Name/Location: Hagerstown, MDMajor Tenants: Home Depot (not owned) A.C. Moore
Wal-Mart (not owned) PetSmartDick’s Sporting Goods Circuit CityOffice Max Marshall’sBed, Bath and BeyondBorder’s
Partnership StructureEquity Contribution: 1% - Coventry Real Estate Partners
24.75% - DDR 74.25% - Prudential Real Estate Investors (PREI)
Cash Flow Distribution: 1% - Coventry Real Estate Partners24.75% - DDR74.25% - Prudential Real Estate Investors Up to a leveraged 10% preferred return on equity
Promote (current): 33% Coventry Real Estate Partners (79% owned by DDR)once limited partners have received a 10% preferred return and return of equity
Fees to DDRManagement Fee: 4%Development Fee: $1.50 psf of leasable improvementsAsset Management Fee: .4% of gross asset cost (DDR’s pro-rata share of Coventry’s .5% fee)Leasing Fees: N/A
Capital Structure (in millions)DDR 0.6$ PREI 1.8$ Coventry 0.0$ Total Capital 2.4$
Debt 34.0$
Total Debt & Equity 36.4$
Joint Venture Partnership Summaries 4.2
Developers Diversified RealtyQuarterly Financial SupplementalFor the three months ended March 31, 2002
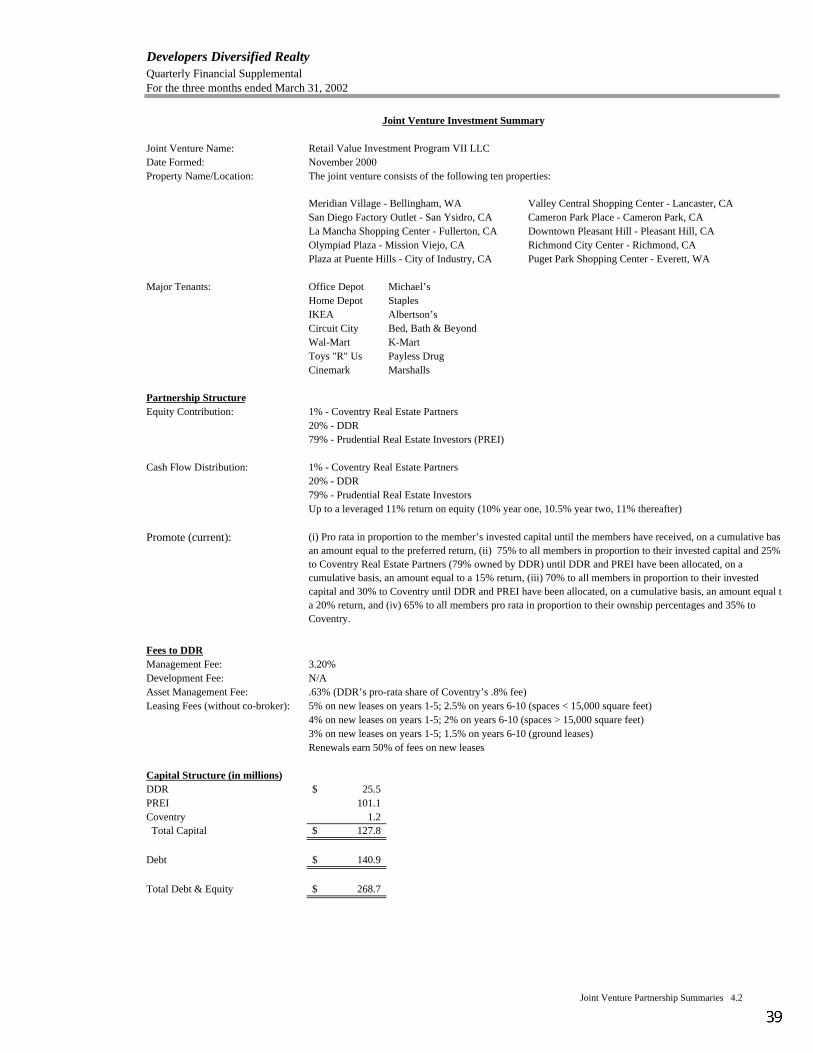
Joint Venture Name: Retail Value Investment Program VII LLCDate Formed: November 2000Property Name/Location: The joint venture consists of the following ten properties:
Meridian Village - Bellingham, WA Valley Central Shopping Center - Lancaster, CASan Diego Factory Outlet - San Ysidro, CA Cameron Park Place - Cameron Park, CALa Mancha Shopping Center - Fullerton, CA Downtown Pleasant Hill - Pleasant Hill, CAOlympiad Plaza - Mission Viejo, CA Richmond City Center - Richmond, CAPlaza at Puente Hills - City of Industry, CA Puget Park Shopping Center - Everett, WA
Major Tenants: Office Depot Michael’sHome Depot StaplesIKEA Albertson’sCircuit City Bed, Bath & BeyondWal-Mart K-MartToys "R" Us Payless DrugCinemark Marshalls
Partnership StructureEquity Contribution: 1% - Coventry Real Estate Partners
20% - DDR79% - Prudential Real Estate Investors (PREI)
Cash Flow Distribution: 1% - Coventry Real Estate Partners20% - DDR79% - Prudential Real Estate InvestorsUp to a leveraged 11% return on equity (10% year one, 10.5% year two, 11% thereafter)
Promote (current):
Fees to DDRManagement Fee: 3.20%Development Fee: N/AAsset Management Fee: .63% (DDR’s pro-rata share of Coventry’s .8% fee)Leasing Fees (without co-broker): 5% on new leases on years 1-5; 2.5% on years 6-10 (spaces < 15,000 square feet)
4% on new leases on years 1-5; 2% on years 6-10 (spaces > 15,000 square feet)3% on new leases on years 1-5; 1.5% on years 6-10 (ground leases)Renewals earn 50% of fees on new leases
Capital Structure (in millions)DDR 25.5$ PREI 101.1 Coventry 1.2 Total Capital 127.8$
Debt 140.9$
Total Debt & Equity 268.7$
Joint Venture Investment Summary
(i) Pro rata in proportion to the member’s invested capital until the members have received, on a cumulative basan amount equal to the preferred return, (ii) 75% to all members in proportion to their invested capital and 25% to Coventry Real Estate Partners (79% owned by DDR) until DDR and PREI have been allocated, on a cumulative basis, an amount equal to a 15% return, (iii) 70% to all members in proportion to their invested capital and 30% to Coventry until DDR and PREI have been allocated, on a cumulative basis, an amount equal ta 20% return, and (iv) 65% to all members pro rata in proportion to their ownship percentages and 35% to Coventry.
Joint Venture Partnership Summaries 4.2
Developers Diversified Realty Quarterly Financial SupplementFor the three months ended March 31, 2002
Joint Venture Investment Summary
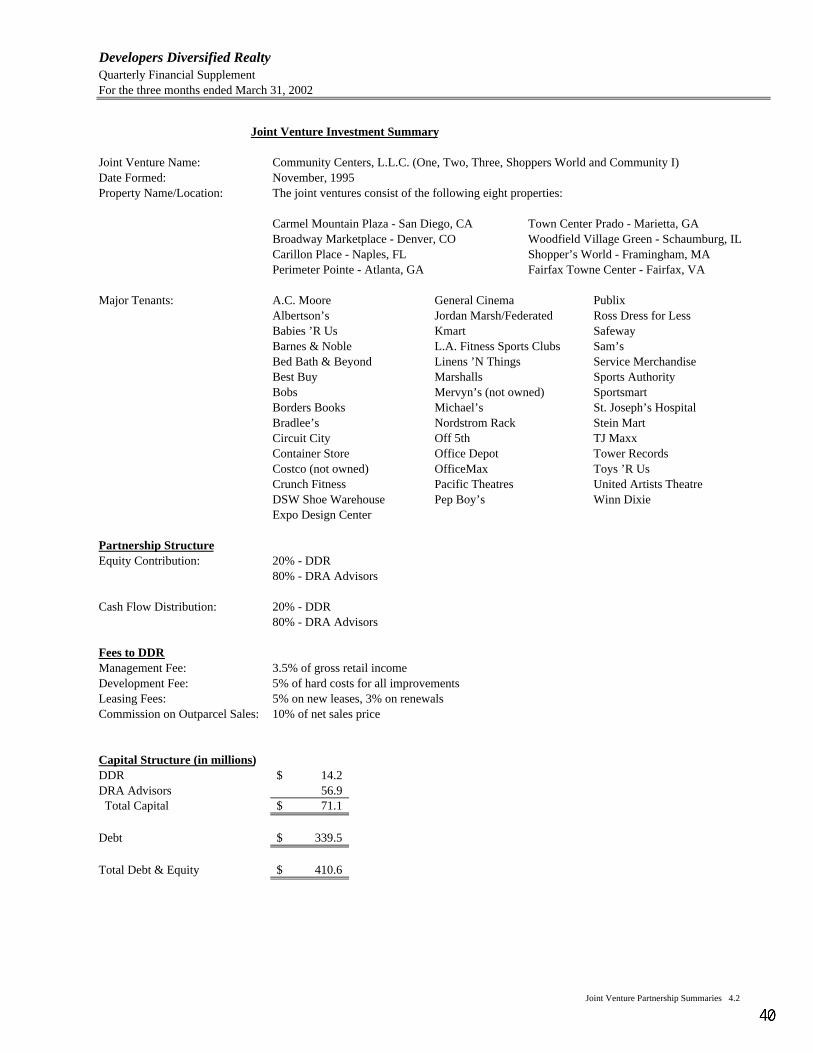
Joint Venture Name: Community Centers, L.L.C. (One, Two, Three, Shoppers World and Community I)Date Formed: November, 1995Property Name/Location: The joint ventures consist of the following eight properties:
Carmel Mountain Plaza - San Diego, CA Town Center Prado - Marietta, GABroadway Marketplace - Denver, CO Woodfield Village Green - Schaumburg, ILCarillon Place - Naples, FL Shopper’s World - Framingham, MAPerimeter Pointe - Atlanta, GA Fairfax Towne Center - Fairfax, VA
Major Tenants: A.C. Moore General Cinema PublixAlbertson’s Jordan Marsh/Federated Ross Dress for LessBabies ’R Us Kmart SafewayBarnes & Noble L.A. Fitness Sports Clubs Sam’sBed Bath & Beyond Linens ’N Things Service MerchandiseBest Buy Marshalls Sports AuthorityBobs Mervyn’s (not owned) SportsmartBorders Books Michael’s St. Joseph’s HospitalBradlee’s Nordstrom Rack Stein MartCircuit City Off 5th TJ MaxxContainer Store Office Depot Tower RecordsCostco (not owned) OfficeMax Toys ’R UsCrunch Fitness Pacific Theatres United Artists TheatreDSW Shoe Warehouse Pep Boy’s Winn DixieExpo Design Center
Partnership StructureEquity Contribution: 20% - DDR
80% - DRA Advisors
Cash Flow Distribution: 20% - DDR80% - DRA Advisors
Fees to DDRManagement Fee: 3.5% of gross retail incomeDevelopment Fee: 5% of hard costs for all improvementsLeasing Fees: 5% on new leases, 3% on renewalsCommission on Outparcel Sales: 10% of net sales price
Capital Structure (in millions)DDR 14.2$ DRA Advisors 56.9 Total Capital 71.1$
Debt 339.5$
Total Debt & Equity 410.6$
Joint Venture Partnership Summaries 4.2
Developers Diversified Realty Quarterly Financial SupplementFor the three months ended March 31, 2002
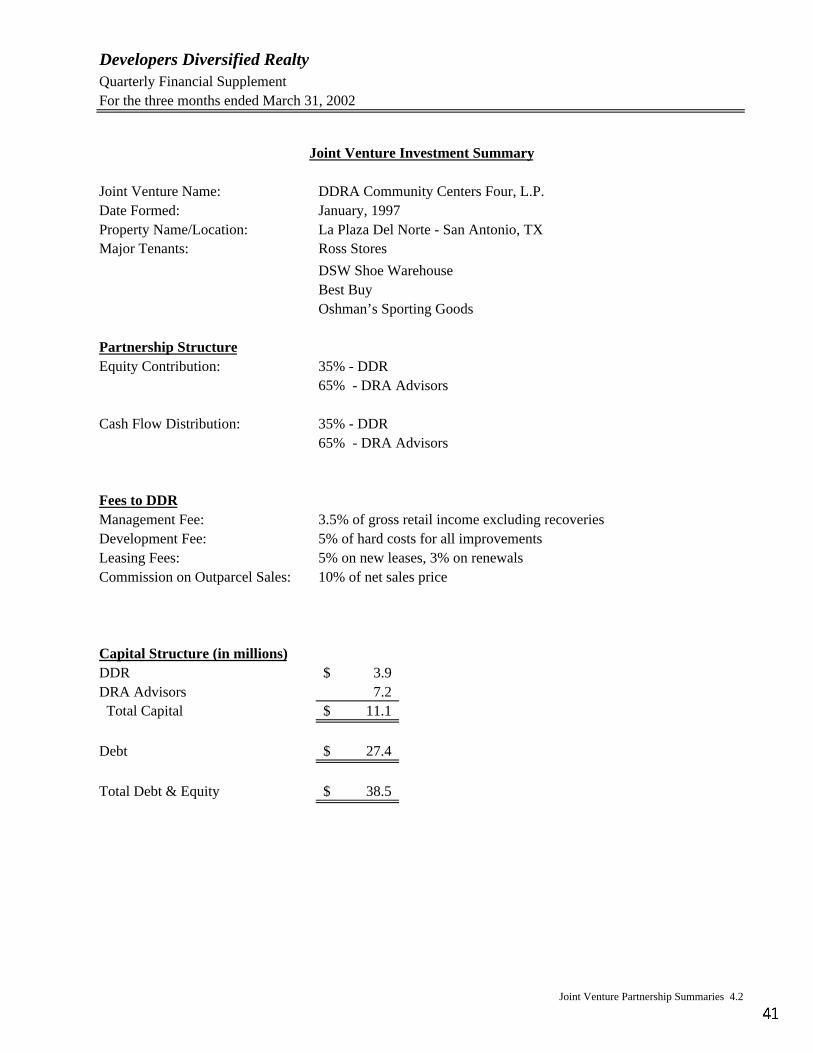
Joint Venture Investment Summary
Joint Venture Name: DDRA Community Centers Four, L.P.Date Formed: January, 1997Property Name/Location: La Plaza Del Norte - San Antonio, TXMajor Tenants: Ross Stores
DSW Shoe WarehouseBest BuyOshman’s Sporting Goods
Partnership StructureEquity Contribution: 35% - DDR
65% - DRA Advisors
Cash Flow Distribution: 35% - DDR65% - DRA Advisors
Fees to DDRManagement Fee: 3.5% of gross retail income excluding recoveriesDevelopment Fee: 5% of hard costs for all improvementsLeasing Fees: 5% on new leases, 3% on renewalsCommission on Outparcel Sales: 10% of net sales price
Capital Structure (in millions)DDR 3.9$ DRA Advisors 7.2 Total Capital 11.1$
Debt 27.4$
Total Debt & Equity 38.5$
Joint Venture Partnership Summaries 4.2
Developers Diversified Realty Quarterly Financial SupplementFor the three months ended March 31, 2002
Joint Venture Investment Summary
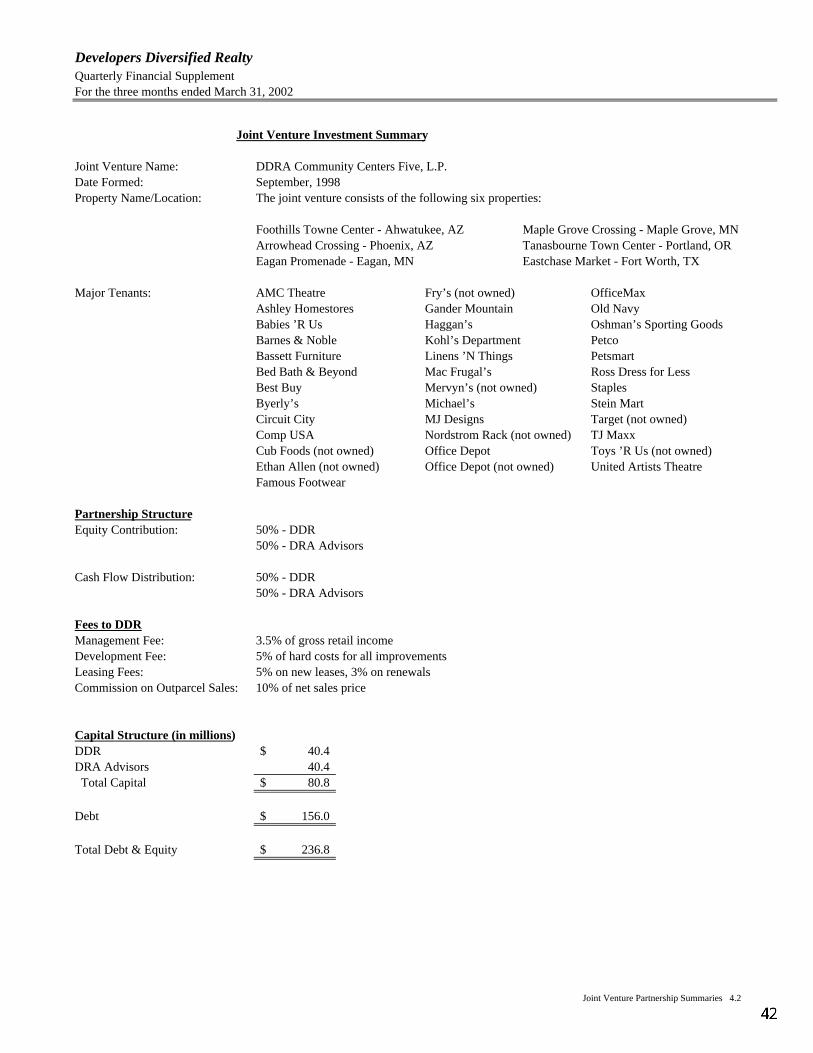
Joint Venture Name: DDRA Community Centers Five, L.P.Date Formed: September, 1998Property Name/Location: The joint venture consists of the following six properties:
Foothills Towne Center - Ahwatukee, AZ Maple Grove Crossing - Maple Grove, MNArrowhead Crossing - Phoenix, AZ Tanasbourne Town Center - Portland, OREagan Promenade - Eagan, MN Eastchase Market - Fort Worth, TX
Major Tenants: AMC Theatre Fry’s (not owned) OfficeMaxAshley Homestores Gander Mountain Old NavyBabies ’R Us Haggan’s Oshman’s Sporting GoodsBarnes & Noble Kohl’s Department PetcoBassett Furniture Linens ’N Things PetsmartBed Bath & Beyond Mac Frugal’s Ross Dress for LessBest Buy Mervyn’s (not owned) StaplesByerly’s Michael’s Stein MartCircuit City MJ Designs Target (not owned)Comp USA Nordstrom Rack (not owned) TJ MaxxCub Foods (not owned) Office Depot Toys ’R Us (not owned)Ethan Allen (not owned) Office Depot (not owned) United Artists TheatreFamous Footwear
Partnership StructureEquity Contribution: 50% - DDR
50% - DRA Advisors
Cash Flow Distribution: 50% - DDR50% - DRA Advisors
Fees to DDRManagement Fee: 3.5% of gross retail incomeDevelopment Fee: 5% of hard costs for all improvementsLeasing Fees: 5% on new leases, 3% on renewalsCommission on Outparcel Sales: 10% of net sales price
Capital Structure (in millions)DDR 40.4$ DRA Advisors 40.4 Total Capital 80.8$
Debt 156.0$
Total Debt & Equity 236.8$
Joint Venture Partnership Summaries 4.2
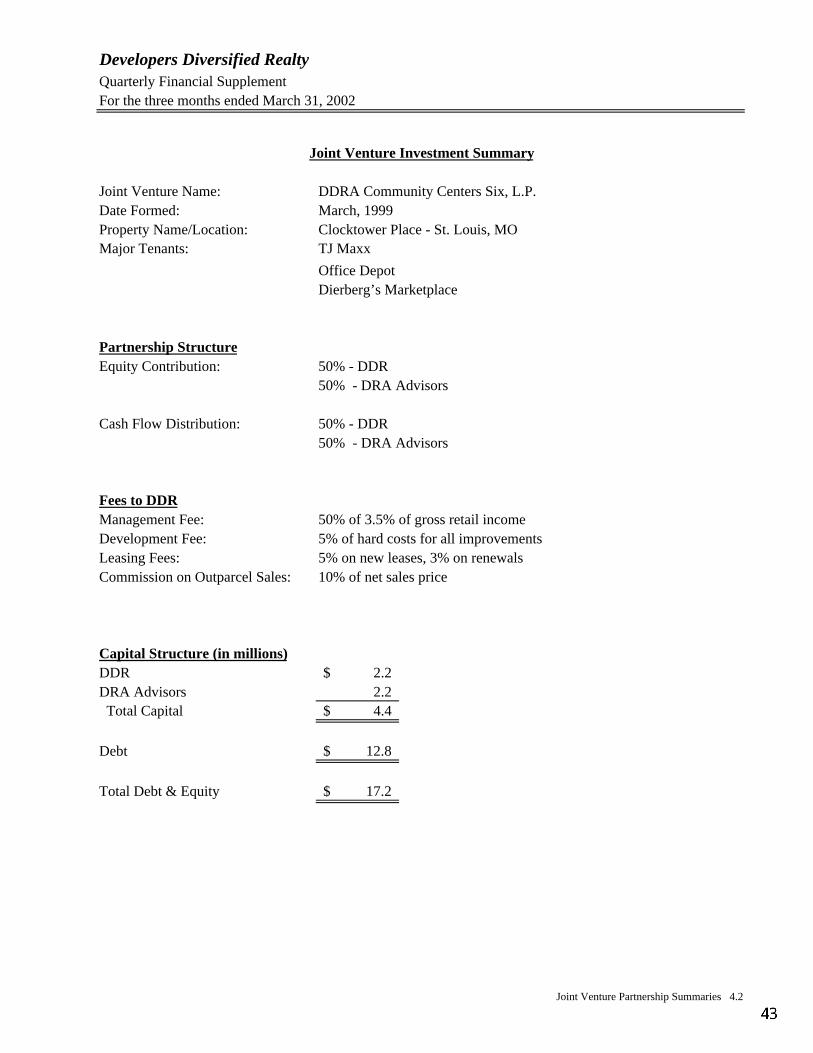
Developers Diversified Realty Quarterly Financial SupplementFor the three months ended March 31, 2002
Joint Venture Investment Summary
Joint Venture Name: DDRA Community Centers Six, L.P.Date Formed: March, 1999Property Name/Location: Clocktower Place - St. Louis, MOMajor Tenants: TJ Maxx
Office DepotDierberg’s Marketplace
Partnership StructureEquity Contribution: 50% - DDR
50% - DRA Advisors
Cash Flow Distribution: 50% - DDR50% - DRA Advisors
Fees to DDRManagement Fee: 50% of 3.5% of gross retail incomeDevelopment Fee: 5% of hard costs for all improvementsLeasing Fees: 5% on new leases, 3% on renewalsCommission on Outparcel Sales: 10% of net sales price
Capital Structure (in millions)DDR 2.2$ DRA Advisors 2.2 Total Capital 4.4$
Debt 12.8$
Total Debt & Equity 17.2$
Joint Venture Partnership Summaries 4.2
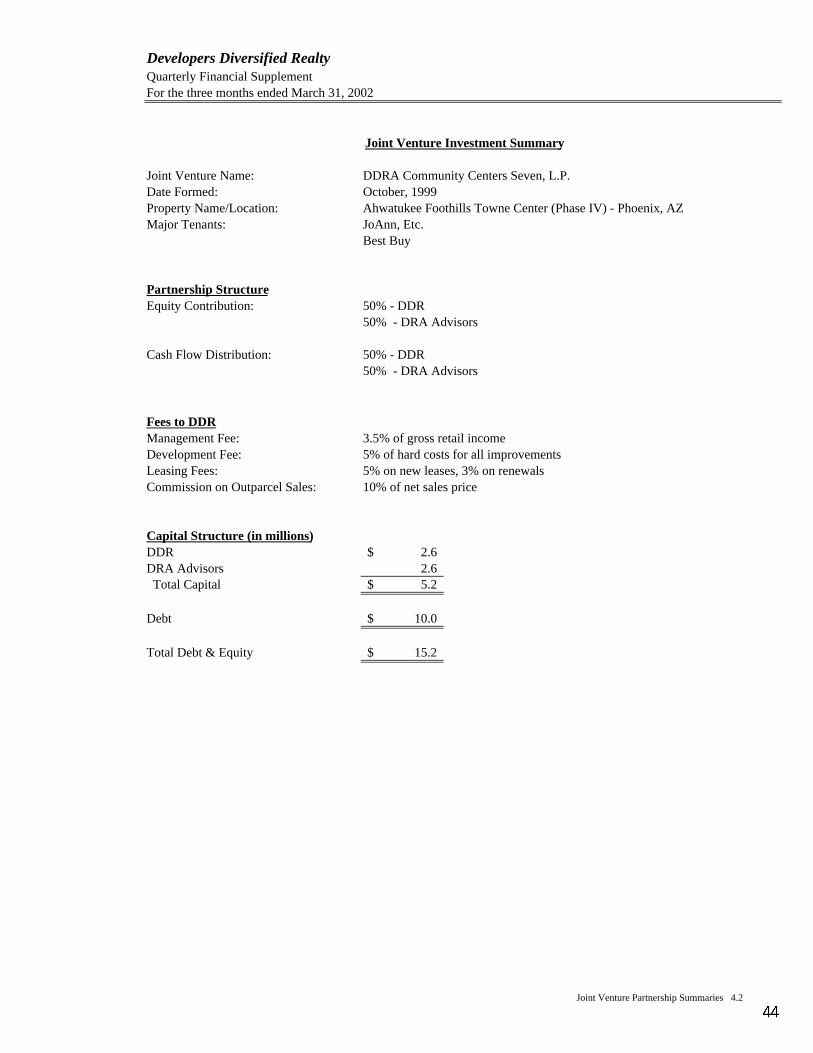
Developers Diversified Realty Quarterly Financial SupplementFor the three months ended March 31, 2002
Joint Venture Investment Summary
Joint Venture Name: DDRA Community Centers Seven, L.P.Date Formed: October, 1999Property Name/Location: Ahwatukee Foothills Towne Center (Phase IV) - Phoenix, AZMajor Tenants: JoAnn, Etc.
Best Buy
Partnership StructureEquity Contribution: 50% - DDR
50% - DRA Advisors
Cash Flow Distribution: 50% - DDR50% - DRA Advisors
Fees to DDRManagement Fee: 3.5% of gross retail incomeDevelopment Fee: 5% of hard costs for all improvementsLeasing Fees: 5% on new leases, 3% on renewalsCommission on Outparcel Sales: 10% of net sales price
Capital Structure (in millions)DDR 2.6$ DRA Advisors 2.6 Total Capital 5.2$
Debt 10.0$
Total Debt & Equity 15.2$
Joint Venture Partnership Summaries 4.2
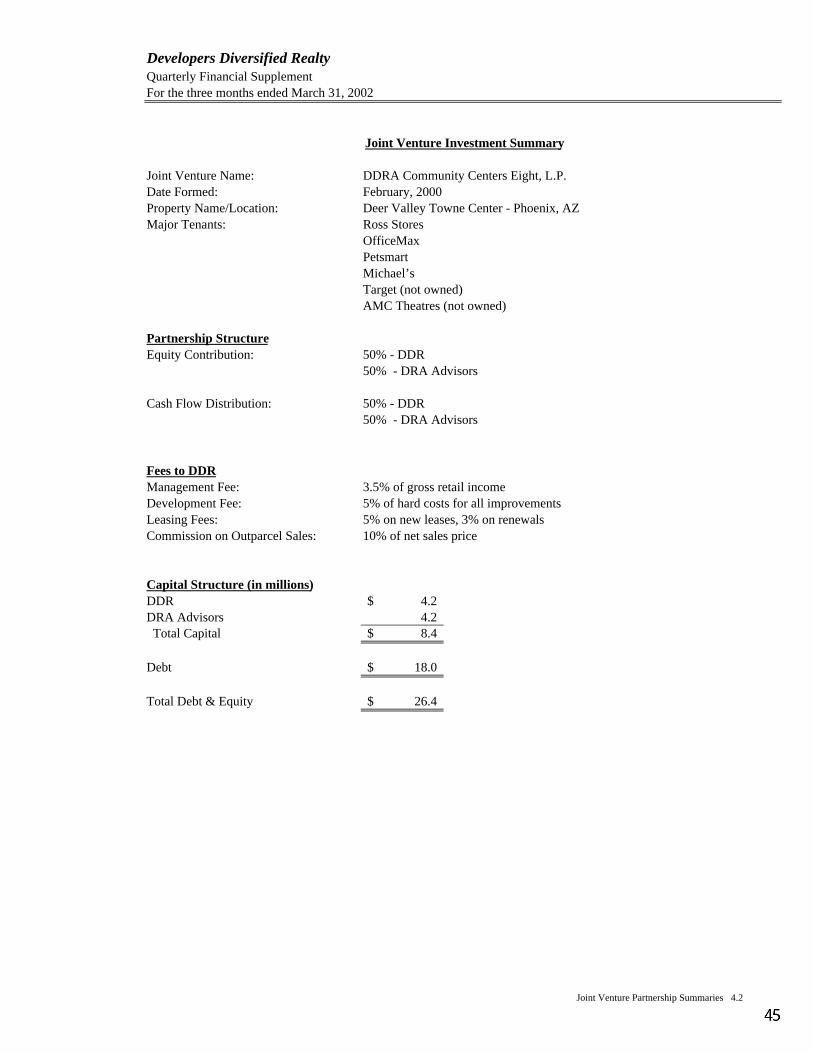
Developers Diversified Realty Quarterly Financial SupplementFor the three months ended March 31, 2002
Joint Venture Investment Summary
Joint Venture Name: DDRA Community Centers Eight, L.P.Date Formed: February, 2000Property Name/Location: Deer Valley Towne Center - Phoenix, AZMajor Tenants: Ross Stores
OfficeMaxPetsmartMichael’sTarget (not owned)AMC Theatres (not owned)
Partnership StructureEquity Contribution: 50% - DDR
50% - DRA Advisors
Cash Flow Distribution: 50% - DDR50% - DRA Advisors
Fees to DDRManagement Fee: 3.5% of gross retail incomeDevelopment Fee: 5% of hard costs for all improvementsLeasing Fees: 5% on new leases, 3% on renewalsCommission on Outparcel Sales: 10% of net sales price
Capital Structure (in millions)DDR 4.2$ DRA Advisors 4.2 Total Capital 8.4$
Debt 18.0$
Total Debt & Equity 26.4$
Joint Venture Partnership Summaries 4.2
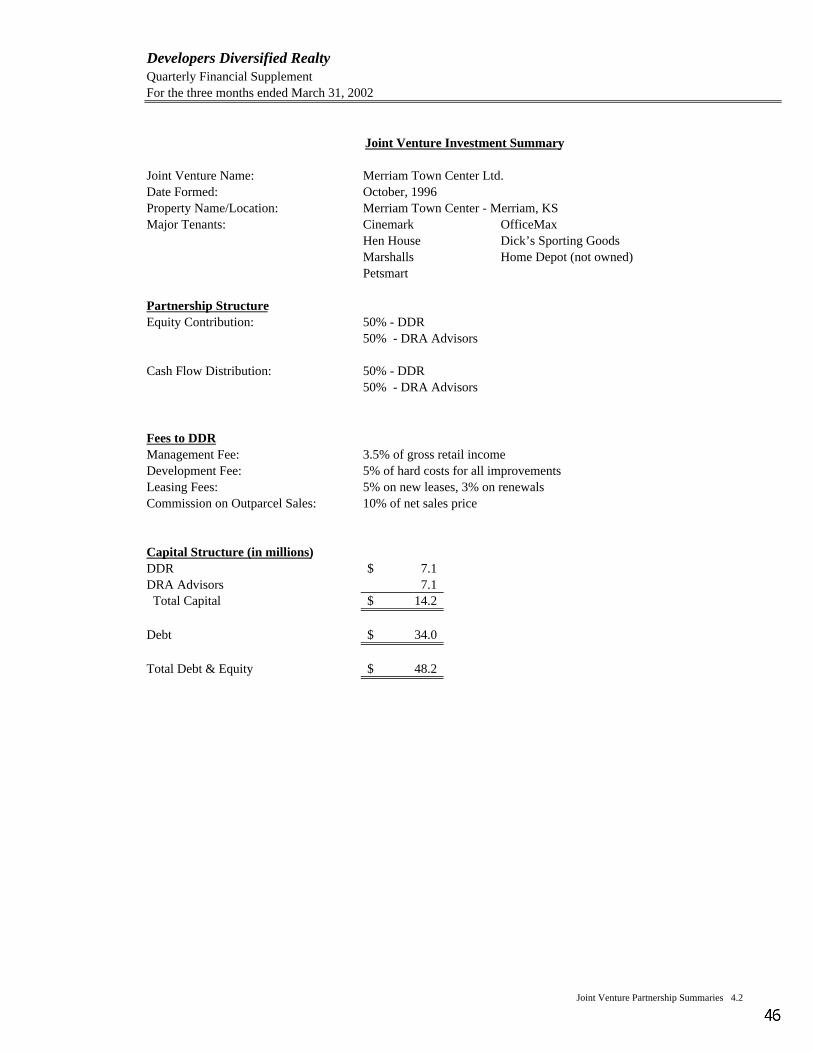
Developers Diversified Realty Quarterly Financial SupplementFor the three months ended March 31, 2002
Joint Venture Investment Summary
Joint Venture Name: Merriam Town Center Ltd.Date Formed: October, 1996Property Name/Location: Merriam Town Center - Merriam, KSMajor Tenants: Cinemark OfficeMax
Hen House Dick’s Sporting GoodsMarshalls Home Depot (not owned)Petsmart
Partnership StructureEquity Contribution: 50% - DDR
50% - DRA Advisors
Cash Flow Distribution: 50% - DDR50% - DRA Advisors
Fees to DDRManagement Fee: 3.5% of gross retail incomeDevelopment Fee: 5% of hard costs for all improvementsLeasing Fees: 5% on new leases, 3% on renewalsCommission on Outparcel Sales: 10% of net sales price
Capital Structure (in millions)DDR 7.1$ DRA Advisors 7.1 Total Capital 14.2$
Debt 34.0$
Total Debt & Equity 48.2$
Joint Venture Partnership Summaries 4.2
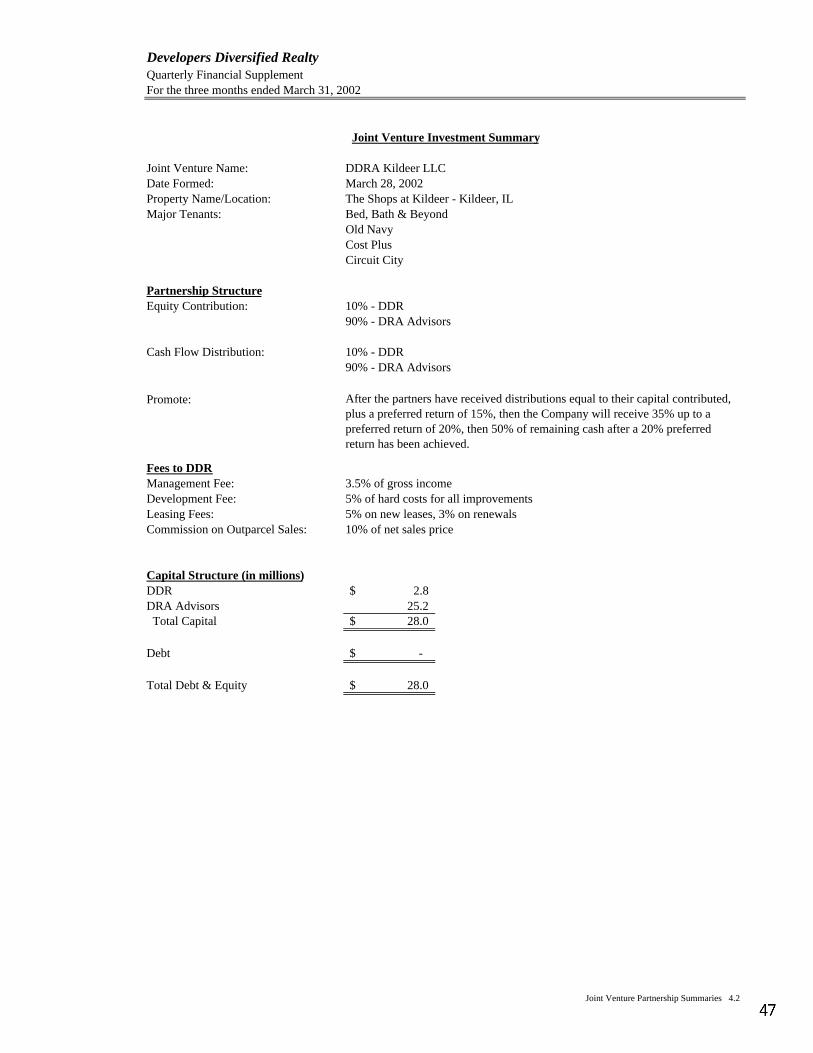
Developers Diversified Realty Quarterly Financial SupplementFor the three months ended March 31, 2002
Joint Venture Investment Summary
Joint Venture Name: DDRA Kildeer LLCDate Formed: March 28, 2002Property Name/Location: The Shops at Kildeer - Kildeer, ILMajor Tenants: Bed, Bath & Beyond
Old NavyCost PlusCircuit City
Partnership StructureEquity Contribution: 10% - DDR
90% - DRA Advisors
Cash Flow Distribution: 10% - DDR90% - DRA Advisors
Promote:
Fees to DDRManagement Fee: 3.5% of gross income Development Fee: 5% of hard costs for all improvementsLeasing Fees: 5% on new leases, 3% on renewalsCommission on Outparcel Sales: 10% of net sales price
Capital Structure (in millions)DDR 2.8$ DRA Advisors 25.2 Total Capital 28.0$
Debt -$
Total Debt & Equity 28.0$
After the partners have received distributions equal to their capital contributed, plus a preferred return of 15%, then the Company will receive 35% up to a preferred return of 20%, then 50% of remaining cash after a 20% preferred return has been achieved.
Joint Venture Partnership Summaries 4.2
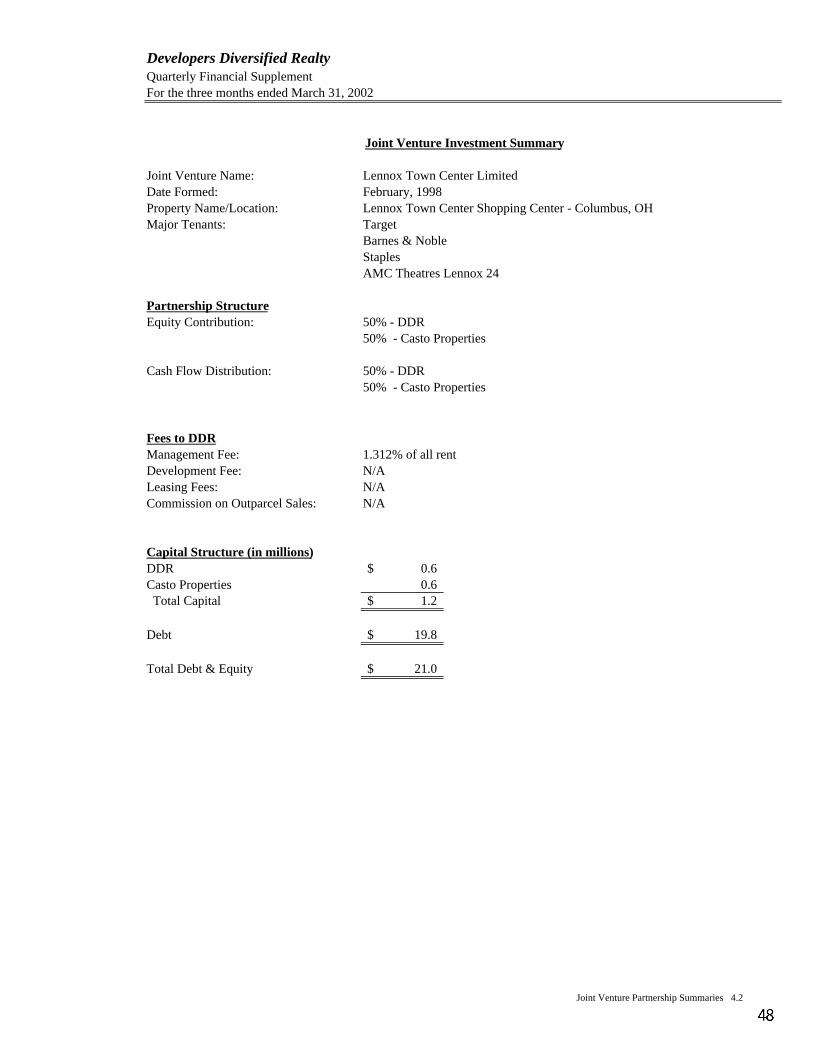
Developers Diversified Realty Quarterly Financial SupplementFor the three months ended March 31, 2002
Joint Venture Investment Summary
Joint Venture Name: Lennox Town Center LimitedDate Formed: February, 1998Property Name/Location: Lennox Town Center Shopping Center - Columbus, OHMajor Tenants: Target
Barnes & NobleStaplesAMC Theatres Lennox 24
Partnership StructureEquity Contribution: 50% - DDR
50% - Casto Properties
Cash Flow Distribution: 50% - DDR50% - Casto Properties
Fees to DDRManagement Fee: 1.312% of all rentDevelopment Fee: N/ALeasing Fees: N/ACommission on Outparcel Sales: N/A
Capital Structure (in millions)DDR 0.6$ Casto Properties 0.6 Total Capital 1.2$
Debt 19.8$
Total Debt & Equity 21.0$
Joint Venture Partnership Summaries 4.2
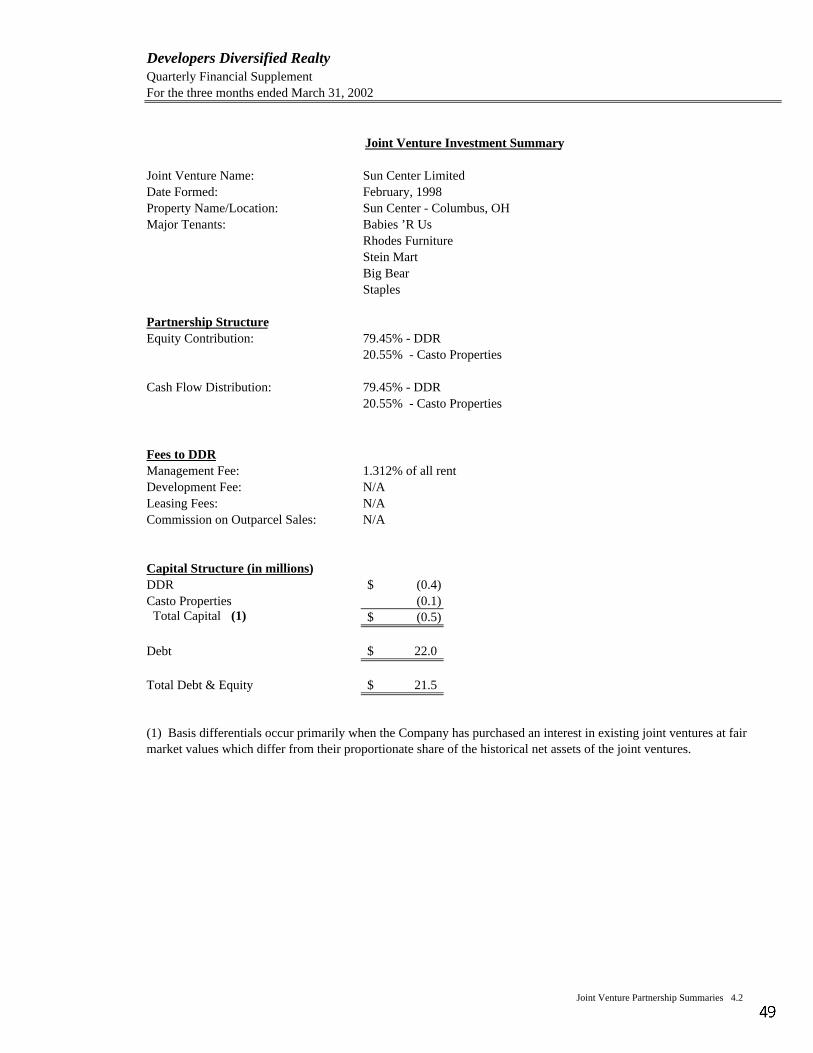
Developers Diversified Realty Quarterly Financial SupplementFor the three months ended March 31, 2002
Joint Venture Investment Summary
Joint Venture Name: Sun Center LimitedDate Formed: February, 1998Property Name/Location: Sun Center - Columbus, OHMajor Tenants: Babies ’R Us
Rhodes FurnitureStein MartBig BearStaples
Partnership StructureEquity Contribution: 79.45% - DDR
20.55% - Casto Properties
Cash Flow Distribution: 79.45% - DDR20.55% - Casto Properties
Fees to DDRManagement Fee: 1.312% of all rentDevelopment Fee: N/ALeasing Fees: N/ACommission on Outparcel Sales: N/A
Capital Structure (in millions)DDR (0.4)$ Casto Properties (0.1) Total Capital (1) (0.5)$
Debt 22.0$
Total Debt & Equity 21.5$
(1) Basis differentials occur primarily when the Company has purchased an interest in existing joint ventures at fair market values which differ from their proportionate share of the historical net assets of the joint ventures.
Joint Venture Partnership Summaries 4.2
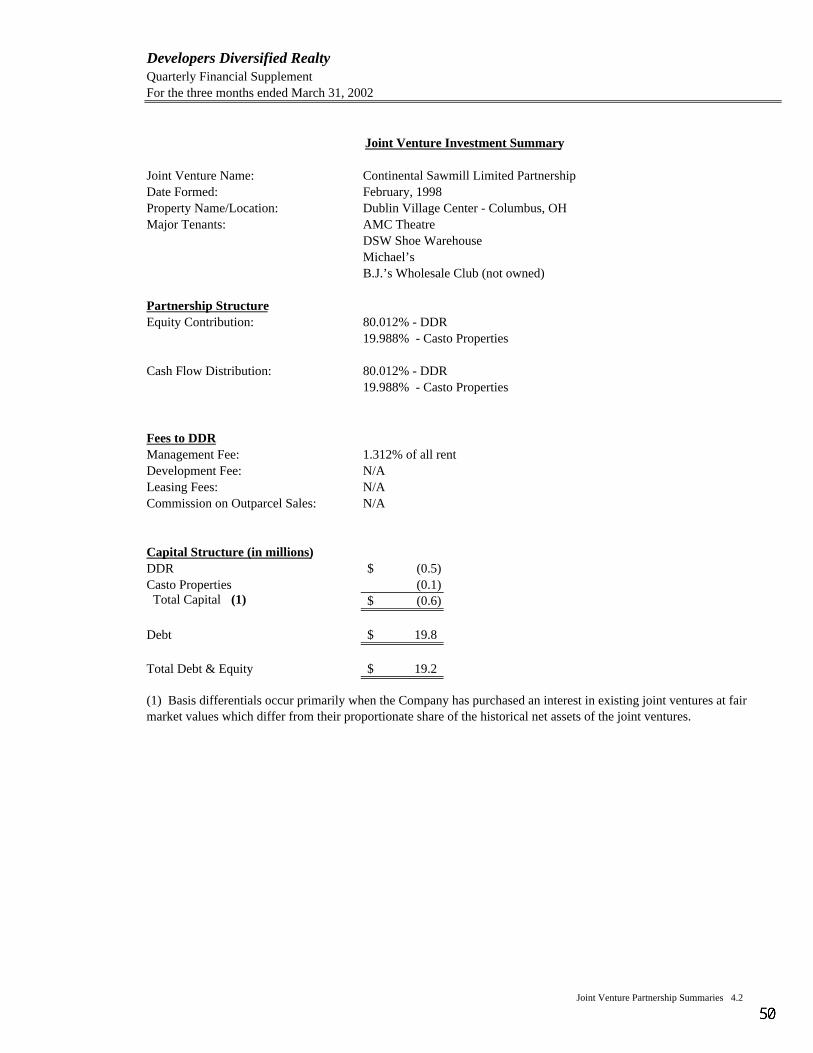
Developers Diversified Realty Quarterly Financial SupplementFor the three months ended March 31, 2002
Joint Venture Investment Summary
Joint Venture Name: Continental Sawmill Limited PartnershipDate Formed: February, 1998Property Name/Location: Dublin Village Center - Columbus, OHMajor Tenants: AMC Theatre
DSW Shoe WarehouseMichael’sB.J.’s Wholesale Club (not owned)
Partnership StructureEquity Contribution: 80.012% - DDR
19.988% - Casto Properties
Cash Flow Distribution: 80.012% - DDR19.988% - Casto Properties
Fees to DDRManagement Fee: 1.312% of all rentDevelopment Fee: N/ALeasing Fees: N/ACommission on Outparcel Sales: N/A
Capital Structure (in millions)DDR (0.5)$ Casto Properties (0.1) Total Capital (1) (0.6)$
Debt 19.8$
Total Debt & Equity 19.2$
(1) Basis differentials occur primarily when the Company has purchased an interest in existing joint ventures at fair market values which differ from their proportionate share of the historical net assets of the joint ventures.
Joint Venture Partnership Summaries 4.2
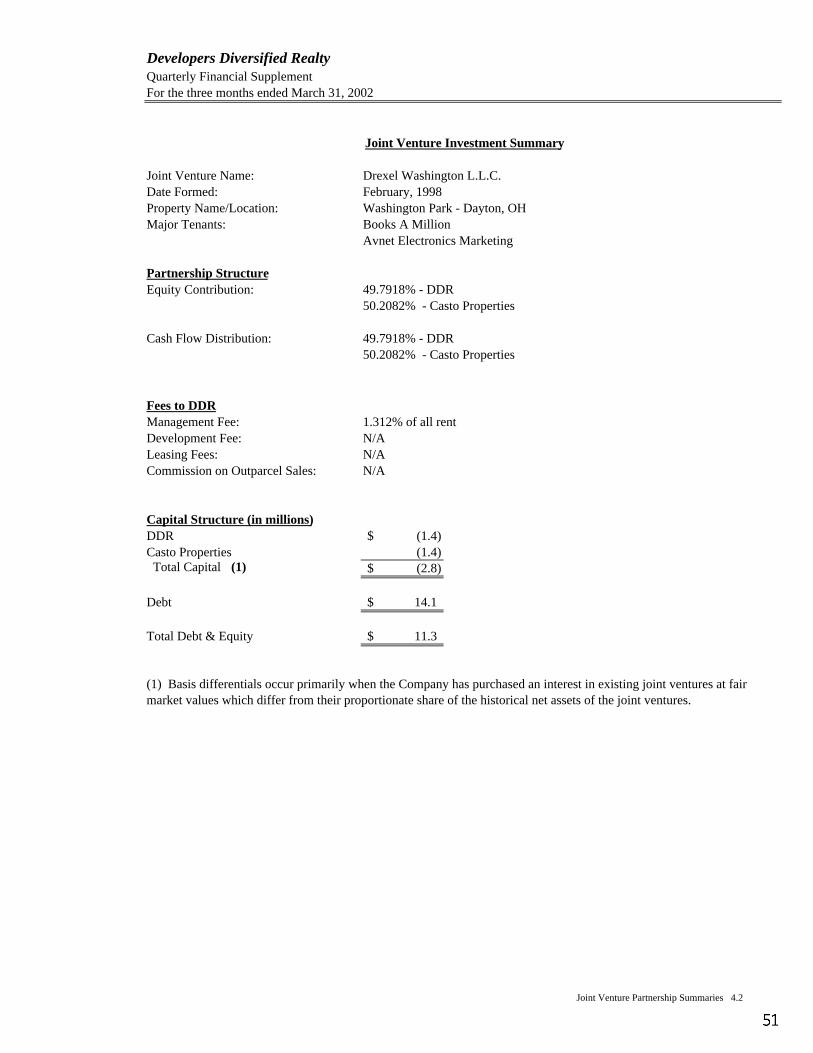
Developers Diversified Realty Quarterly Financial SupplementFor the three months ended March 31, 2002
Joint Venture Investment Summary
Joint Venture Name: Drexel Washington L.L.C.Date Formed: February, 1998Property Name/Location: Washington Park - Dayton, OHMajor Tenants: Books A Million
Avnet Electronics Marketing
Partnership StructureEquity Contribution: 49.7918% - DDR
50.2082% - Casto Properties
Cash Flow Distribution: 49.7918% - DDR50.2082% - Casto Properties
Fees to DDRManagement Fee: 1.312% of all rentDevelopment Fee: N/ALeasing Fees: N/ACommission on Outparcel Sales: N/A
Capital Structure (in millions)DDR (1.4)$ Casto Properties (1.4) Total Capital (1) (2.8)$
Debt 14.1$
Total Debt & Equity 11.3$
(1) Basis differentials occur primarily when the Company has purchased an interest in existing joint ventures at fair market values which differ from their proportionate share of the historical net assets of the joint ventures.
Joint Venture Partnership Summaries 4.2
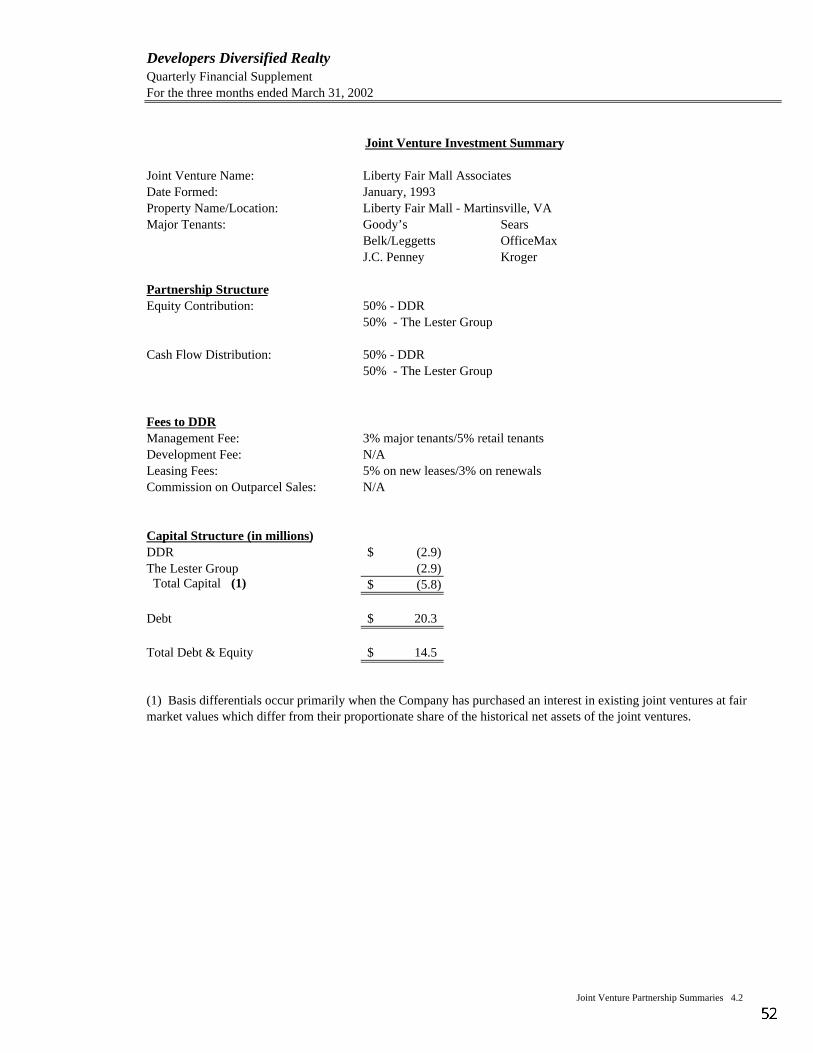
Developers Diversified Realty Quarterly Financial SupplementFor the three months ended March 31, 2002
Joint Venture Investment Summary
Joint Venture Name: Liberty Fair Mall AssociatesDate Formed: January, 1993Property Name/Location: Liberty Fair Mall - Martinsville, VAMajor Tenants: Goody’s Sears
Belk/Leggetts OfficeMaxJ.C. Penney Kroger
Partnership StructureEquity Contribution: 50% - DDR
50% - The Lester Group
Cash Flow Distribution: 50% - DDR50% - The Lester Group
Fees to DDRManagement Fee: 3% major tenants/5% retail tenantsDevelopment Fee: N/ALeasing Fees: 5% on new leases/3% on renewalsCommission on Outparcel Sales: N/A
Capital Structure (in millions)DDR (2.9)$ The Lester Group (2.9) Total Capital (1) (5.8)$
Debt 20.3$
Total Debt & Equity 14.5$
(1) Basis differentials occur primarily when the Company has purchased an interest in existing joint ventures at fair market values which differ from their proportionate share of the historical net assets of the joint ventures.
Joint Venture Partnership Summaries 4.2
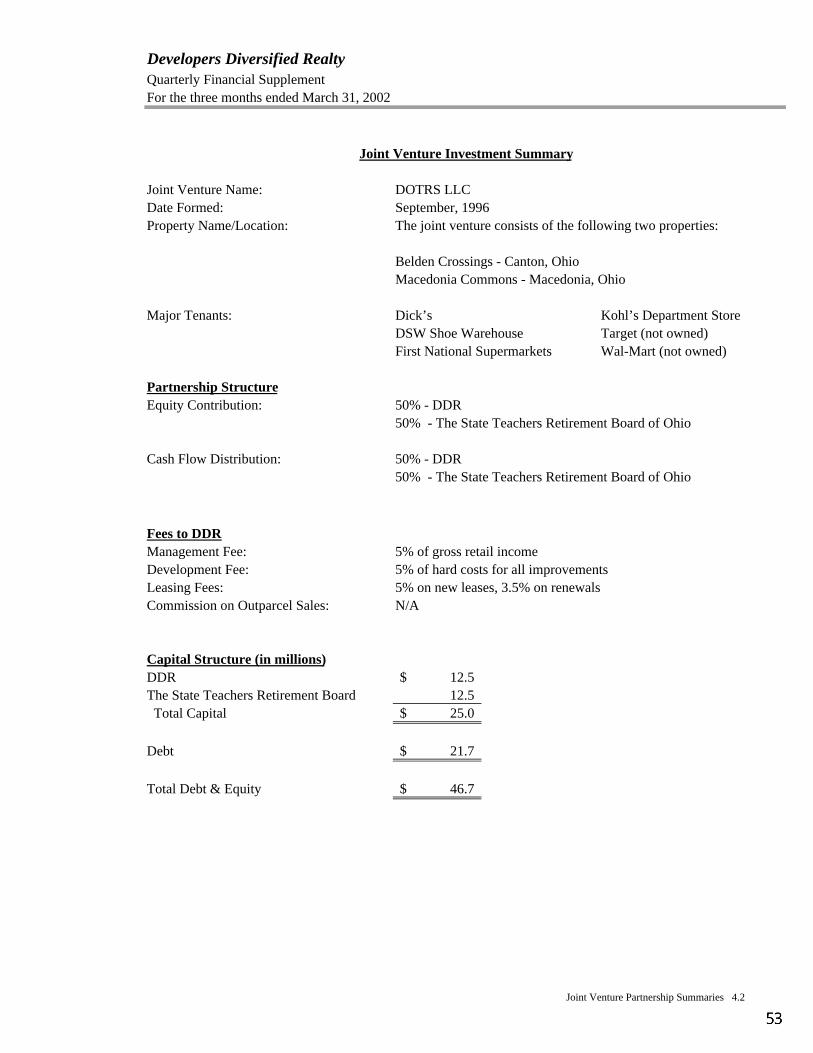
Developers Diversified Realty Quarterly Financial SupplementFor the three months ended March 31, 2002
Joint Venture Investment Summary
Joint Venture Name: DOTRS LLC Date Formed: September, 1996Property Name/Location: The joint venture consists of the following two properties:
Belden Crossings - Canton, OhioMacedonia Commons - Macedonia, Ohio
Major Tenants: Dick’s Kohl’s Department StoreDSW Shoe Warehouse Target (not owned)First National Supermarkets Wal-Mart (not owned)
Partnership StructureEquity Contribution: 50% - DDR
50% - The State Teachers Retirement Board of Ohio
Cash Flow Distribution: 50% - DDR50% - The State Teachers Retirement Board of Ohio
Fees to DDRManagement Fee: 5% of gross retail incomeDevelopment Fee: 5% of hard costs for all improvementsLeasing Fees: 5% on new leases, 3.5% on renewalsCommission on Outparcel Sales: N/A
Capital Structure (in millions)DDR 12.5$ The State Teachers Retirement Board 12.5 Total Capital 25.0$
Debt 21.7$
Total Debt & Equity 46.7$
Joint Venture Partnership Summaries 4.2
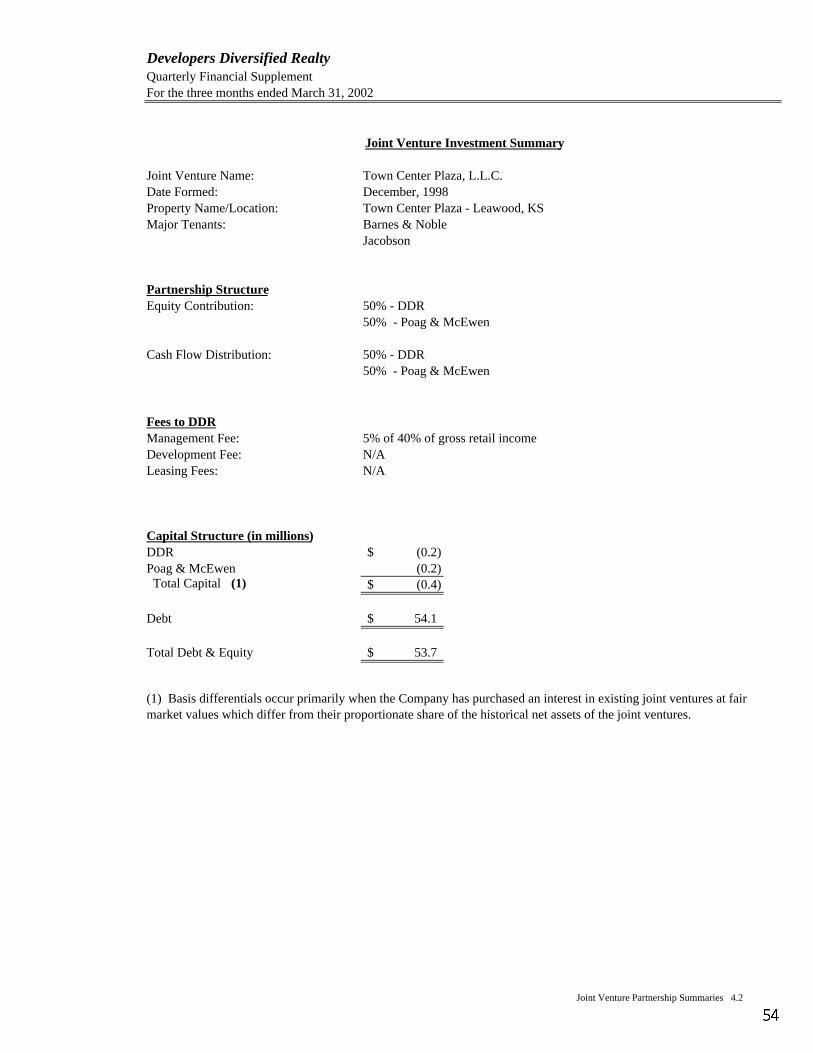
Developers Diversified Realty Quarterly Financial SupplementFor the three months ended March 31, 2002
Joint Venture Investment Summary
Joint Venture Name: Town Center Plaza, L.L.C.Date Formed: December, 1998Property Name/Location: Town Center Plaza - Leawood, KSMajor Tenants: Barnes & Noble
Jacobson
Partnership StructureEquity Contribution: 50% - DDR
50% - Poag & McEwen
Cash Flow Distribution: 50% - DDR50% - Poag & McEwen
Fees to DDRManagement Fee: 5% of 40% of gross retail incomeDevelopment Fee: N/ALeasing Fees: N/A
Capital Structure (in millions)DDR (0.2)$ Poag & McEwen (0.2) Total Capital (1) (0.4)$
Debt 54.1$
Total Debt & Equity 53.7$
(1) Basis differentials occur primarily when the Company has purchased an interest in existing joint ventures at fair market values which differ from their proportionate share of the historical net assets of the joint ventures.
Joint Venture Partnership Summaries 4.2
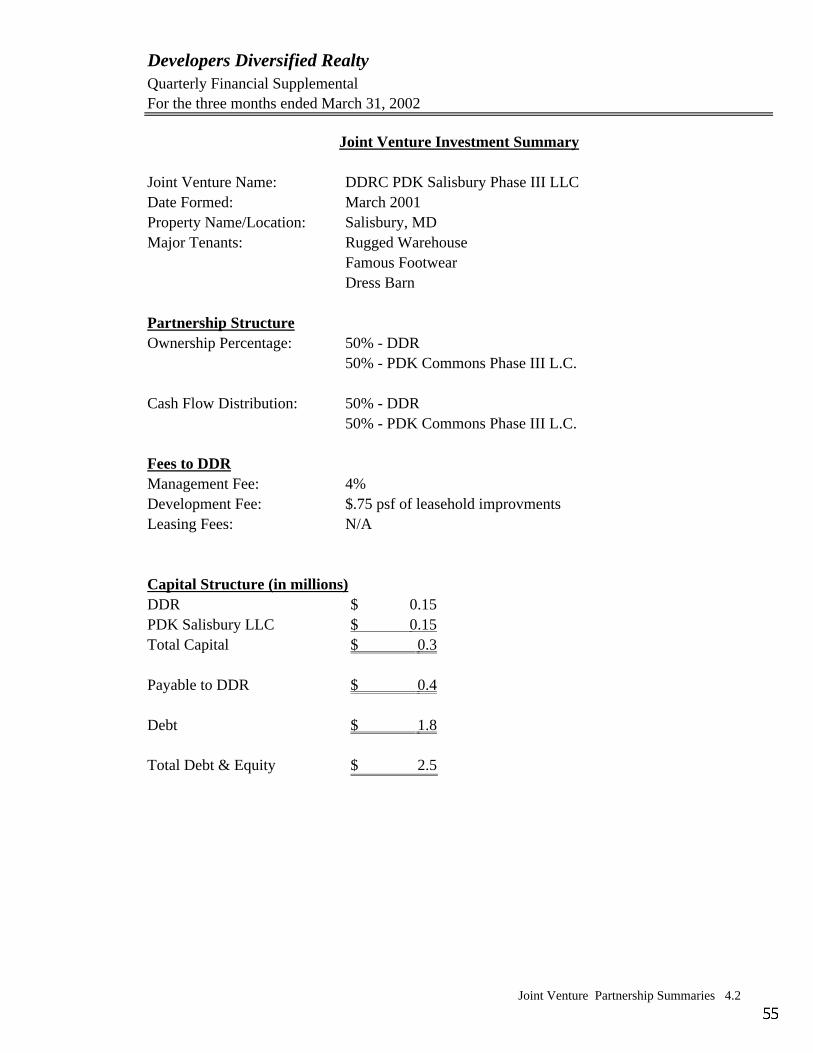
Developers Diversified RealtyQuarterly Financial SupplementalFor the three months ended March 31, 2002
Joint Venture Investment Summary
Joint Venture Name: DDRC PDK Salisbury Phase III LLCDate Formed: March 2001Property Name/Location: Salisbury, MDMajor Tenants: Rugged Warehouse
Famous FootwearDress Barn
Partnership StructureOwnership Percentage: 50% - DDR
50% - PDK Commons Phase III L.C.
Cash Flow Distribution: 50% - DDR50% - PDK Commons Phase III L.C.
Fees to DDRManagement Fee: 4%Development Fee: $.75 psf of leasehold improvmentsLeasing Fees: N/A
Capital Structure (in millions)DDR 0.15$ PDK Salisbury LLC 0.15$ Total Capital 0.3$
Payable to DDR 0.4$
Debt 1.8$
Total Debt & Equity 2.5$
Joint Venture Partnership Summaries 4.2
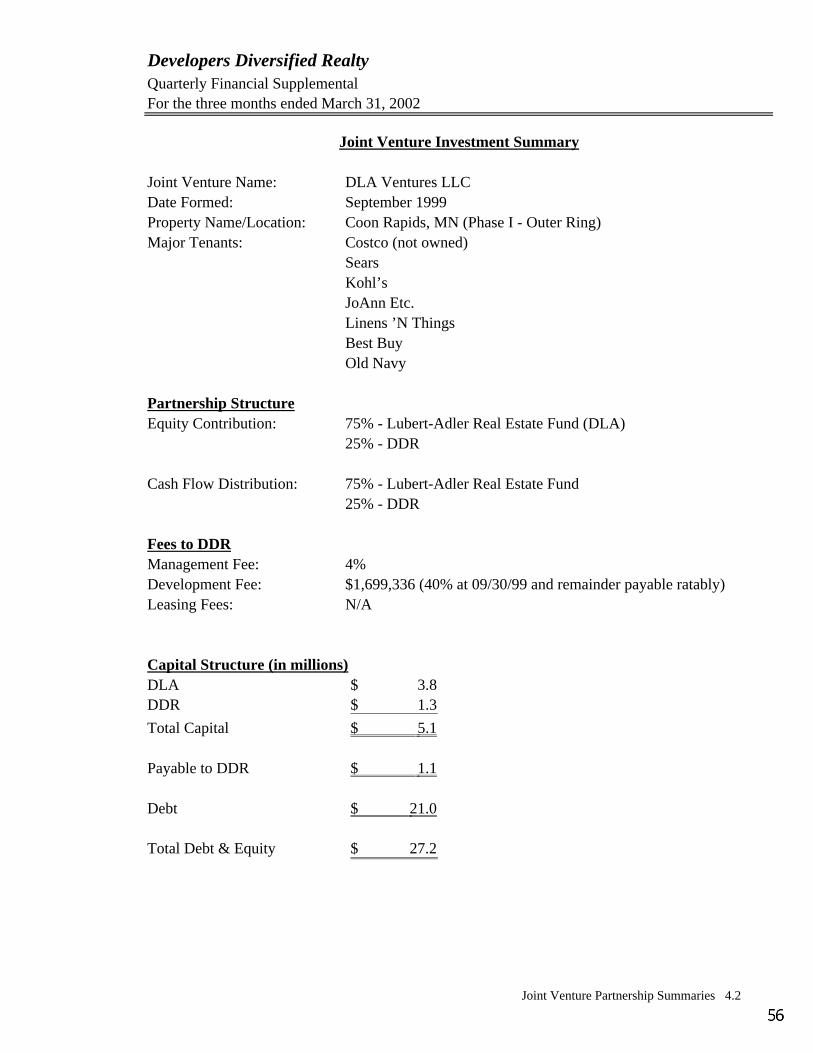
Developers Diversified RealtyQuarterly Financial SupplementalFor the three months ended March 31, 2002
Joint Venture Investment Summary
Joint Venture Name: DLA Ventures LLCDate Formed: September 1999Property Name/Location: Coon Rapids, MN (Phase I - Outer Ring)Major Tenants: Costco (not owned)
SearsKohl’s JoAnn Etc.Linens ’N ThingsBest BuyOld Navy
Partnership StructureEquity Contribution: 75% - Lubert-Adler Real Estate Fund (DLA)
25% - DDR
Cash Flow Distribution: 75% - Lubert-Adler Real Estate Fund25% - DDR
Fees to DDRManagement Fee: 4%Development Fee: $1,699,336 (40% at 09/30/99 and remainder payable ratably)Leasing Fees: N/A
Capital Structure (in millions)DLA 3.8$ DDR 1.3$
Total Capital 5.1$
Payable to DDR 1.1$
Debt 21.0$
Total Debt & Equity 27.2$
Joint Venture Partnership Summaries 4.2
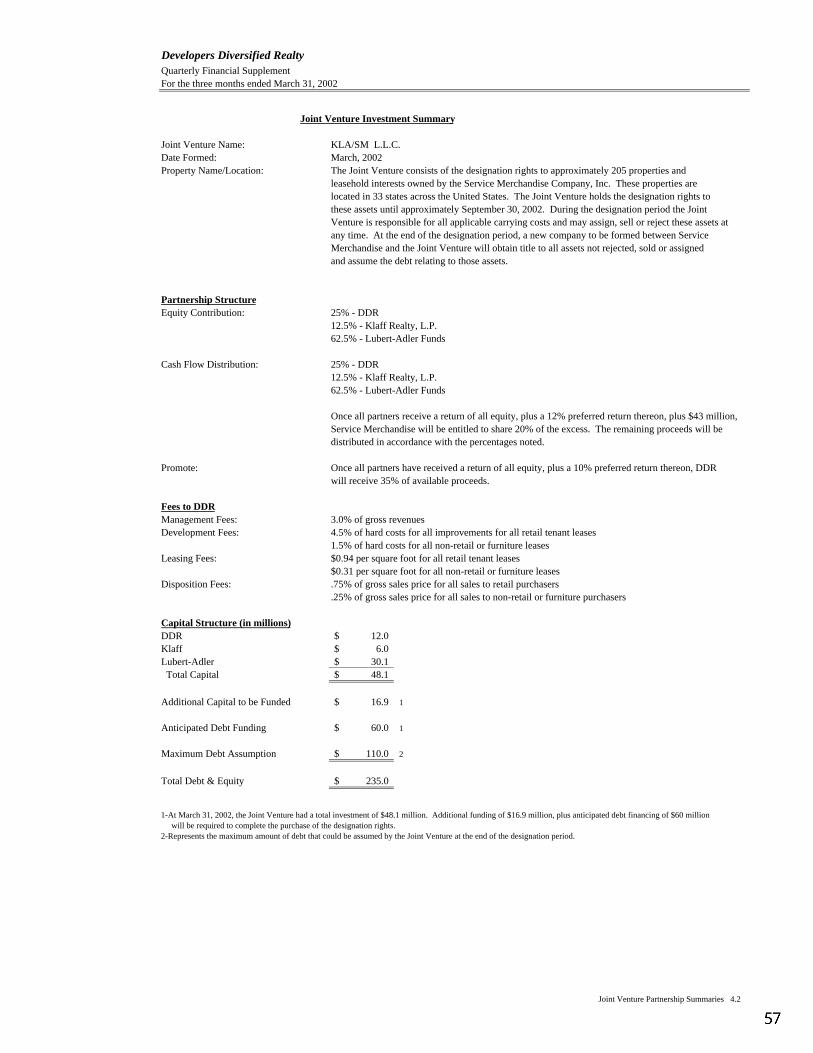
Developers Diversified Realty Quarterly Financial SupplementFor the three months ended March 31, 2002
Joint Venture Investment Summary
Joint Venture Name: KLA/SM L.L.C.Date Formed: March, 2002Property Name/Location: The Joint Venture consists of the designation rights to approximately 205 properties and
leasehold interests owned by the Service Merchandise Company, Inc. These properties arelocated in 33 states across the United States. The Joint Venture holds the designation rights to these assets until approximately September 30, 2002. During the designation period the JointVenture is responsible for all applicable carrying costs and may assign, sell or reject these assets atany time. At the end of the designation period, a new company to be formed between ServiceMerchandise and the Joint Venture will obtain title to all assets not rejected, sold or assignedand assume the debt relating to those assets.
Partnership StructureEquity Contribution: 25% - DDR
12.5% - Klaff Realty, L.P.62.5% - Lubert-Adler Funds
Cash Flow Distribution: 25% - DDR12.5% - Klaff Realty, L.P.62.5% - Lubert-Adler Funds
Once all partners receive a return of all equity, plus a 12% preferred return thereon, plus $43 million,Service Merchandise will be entitled to share 20% of the excess. The remaining proceeds will bedistributed in accordance with the percentages noted.
Promote: Once all partners have received a return of all equity, plus a 10% preferred return thereon, DDRwill receive 35% of available proceeds.
Fees to DDRManagement Fees: 3.0% of gross revenuesDevelopment Fees: 4.5% of hard costs for all improvements for all retail tenant leases
1.5% of hard costs for all non-retail or furniture leasesLeasing Fees: $0.94 per square foot for all retail tenant leases
$0.31 per square foot for all non-retail or furniture leasesDisposition Fees: .75% of gross sales price for all sales to retail purchasers .25% of gross sales price for all sales to non-retail or furniture purchasers
Capital Structure (in millions)DDR 12.0$ Klaff 6.0$ Lubert-Adler 30.1$ Total Capital 48.1$
Additional Capital to be Funded 16.9$ 1
Anticipated Debt Funding 60.0$ 1
Maximum Debt Assumption 110.0$ 2
Total Debt & Equity 235.0$
1-At March 31, 2002, the Joint Venture had a total investment of $48.1 million. Additional funding of $16.9 million, plus anticipated debt financing of $60 million will be required to complete the purchase of the designation rights. 2-Represents the maximum amount of debt that could be assumed by the Joint Venture at the end of the designation period.
Joint Venture Partnership Summaries 4.2
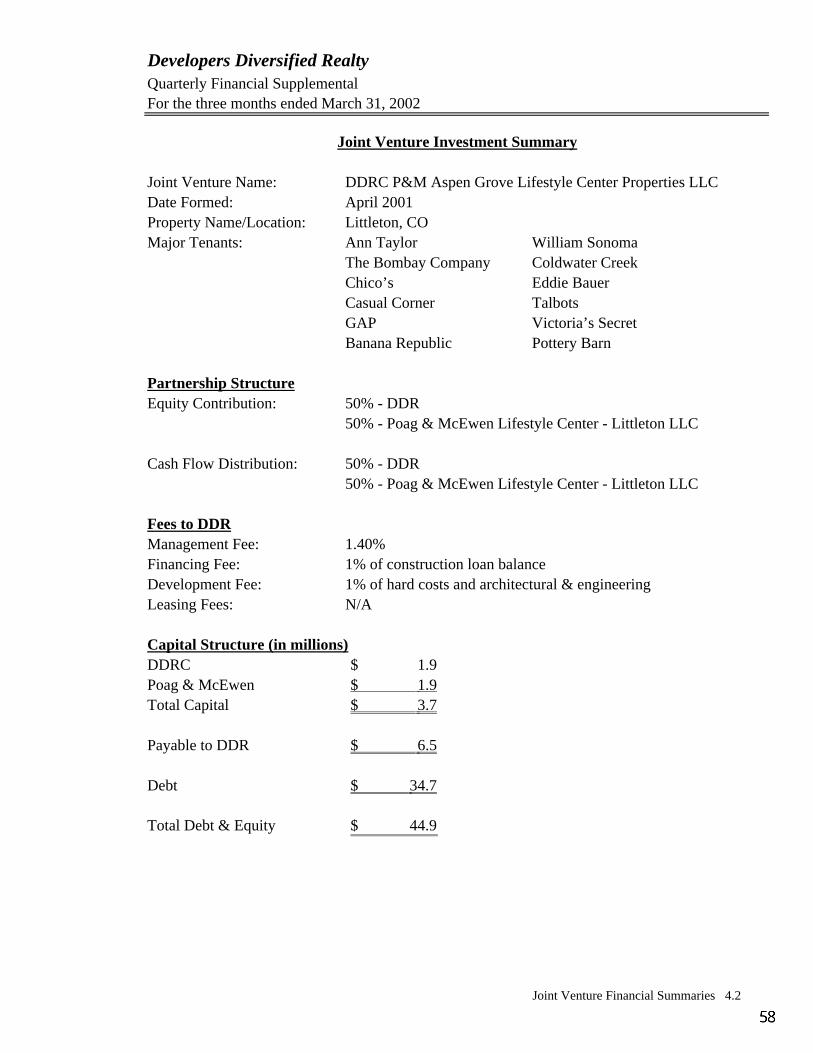
Developers Diversified RealtyQuarterly Financial SupplementalFor the three months ended March 31, 2002
Joint Venture Investment Summary
Joint Venture Name: DDRC P&M Aspen Grove Lifestyle Center Properties LLCDate Formed: April 2001Property Name/Location: Littleton, COMajor Tenants: Ann Taylor William Sonoma
The Bombay Company Coldwater CreekChico’s Eddie BauerCasual Corner TalbotsGAP Victoria’s SecretBanana Republic Pottery Barn
Partnership StructureEquity Contribution: 50% - DDR
50% - Poag & McEwen Lifestyle Center - Littleton LLC
Cash Flow Distribution: 50% - DDR50% - Poag & McEwen Lifestyle Center - Littleton LLC
Fees to DDRManagement Fee: 1.40%Financing Fee: 1% of construction loan balance Development Fee: 1% of hard costs and architectural & engineering Leasing Fees: N/A Capital Structure (in millions)DDRC 1.9$ Poag & McEwen 1.9$ Total Capital 3.7$
Payable to DDR 6.5$
Debt 34.7$
Total Debt & Equity 44.9$
Joint Venture Financial Summaries 4.2
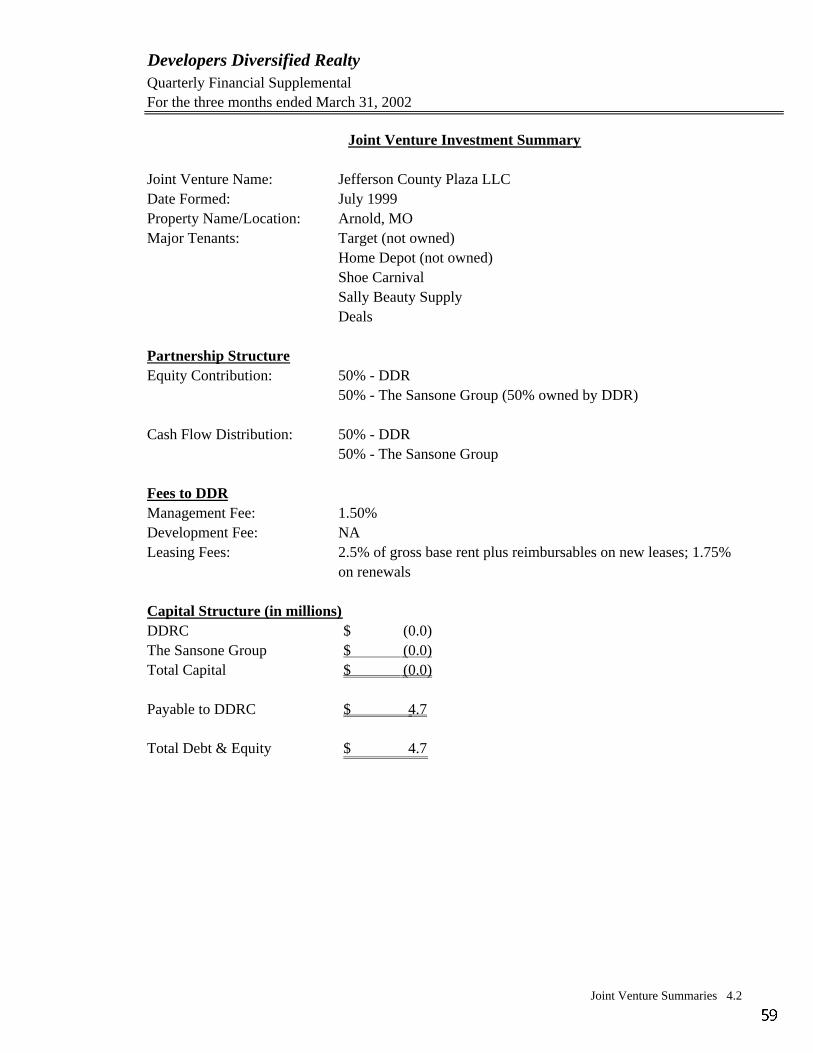
Developers Diversified RealtyQuarterly Financial SupplementalFor the three months ended March 31, 2002
Joint Venture Investment Summary
Joint Venture Name: Jefferson County Plaza LLCDate Formed: July 1999Property Name/Location: Arnold, MOMajor Tenants: Target (not owned)
Home Depot (not owned)Shoe CarnivalSally Beauty SupplyDeals
Partnership StructureEquity Contribution: 50% - DDR
50% - The Sansone Group (50% owned by DDR)
Cash Flow Distribution: 50% - DDR50% - The Sansone Group
Fees to DDRManagement Fee: 1.50%Development Fee: NALeasing Fees: 2.5% of gross base rent plus reimbursables on new leases; 1.75% on renewals
Capital Structure (in millions)DDRC (0.0)$ The Sansone Group (0.0)$ Total Capital (0.0)$
Payable to DDRC 4.7$
Total Debt & Equity 4.7$
Joint Venture Summaries 4.2
Joint Venture Financial Operations
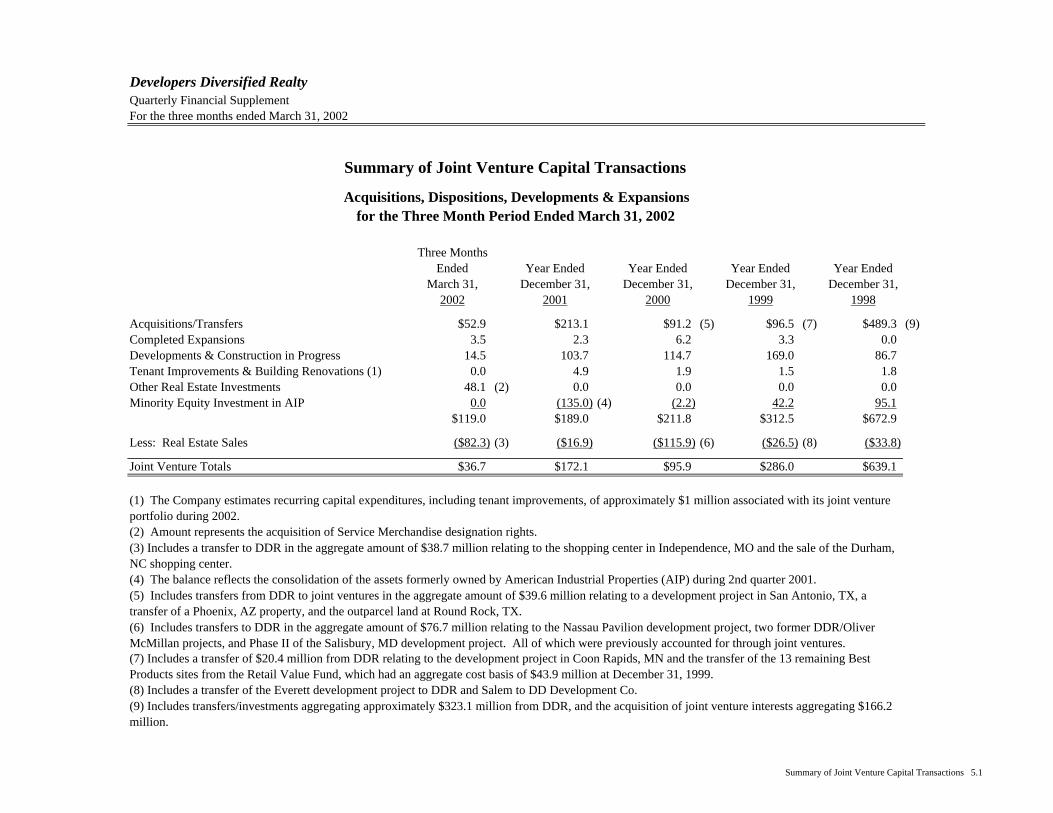
Developers Diversified RealtyQuarterly Financial SupplementFor the three months ended March 31, 2002
Three MonthsEnded Year Ended Year Ended Year Ended Year Ended
March 31, December 31, December 31, December 31, December 31,2002 2001 2000 1999 1998
Acquisitions/Transfers $52.9 $213.1 $91.2 (5) $96.5 (7) $489.3 (9)Completed Expansions 3.5 2.3 6.2 3.3 0.0Developments & Construction in Progress 14.5 103.7 114.7 169.0 86.7Tenant Improvements & Building Renovations (1) 0.0 4.9 1.9 1.5 1.8Other Real Estate Investments 48.1 (2) 0.0 0.0 0.0 0.0Minority Equity Investment in AIP 0.0 (135.0) (4) (2.2) 42.2 95.1
$119.0 $189.0 $211.8 $312.5 $672.9
Less: Real Estate Sales ($82.3) (3) ($16.9) ($115.9) (6) ($26.5) (8) ($33.8)
Joint Venture Totals $36.7 $172.1 $95.9 $286.0 $639.1
(8) Includes a transfer of the Everett development project to DDR and Salem to DD Development Co.
(1) The Company estimates recurring capital expenditures, including tenant improvements, of approximately $1 million associated with its joint venture portfolio during 2002.
(3) Includes a transfer to DDR in the aggregate amount of $38.7 million relating to the shopping center in Independence, MO and the sale of the Durham, NC shopping center.
for the Three Month Period Ended March 31, 2002
Summary of Joint Venture Capital Transactions
Acquisitions, Dispositions, Developments & Expansions
(6) Includes transfers to DDR in the aggregate amount of $76.7 million relating to the Nassau Pavilion development project, two former DDR/Oliver McMillan projects, and Phase II of the Salisbury, MD development project. All of which were previously accounted for through joint ventures.
(9) Includes transfers/investments aggregating approximately $323.1 million from DDR, and the acquisition of joint venture interests aggregating $166.2 million.
(4) The balance reflects the consolidation of the assets formerly owned by American Industrial Properties (AIP) during 2nd quarter 2001.(5) Includes transfers from DDR to joint ventures in the aggregate amount of $39.6 million relating to a development project in San Antonio, TX, a transfer of a Phoenix, AZ property, and the outparcel land at Round Rock, TX.
(7) Includes a transfer of $20.4 million from DDR relating to the development project in Coon Rapids, MN and the transfer of the 13 remaining Best Products sites from the Retail Value Fund, which had an aggregate cost basis of $43.9 million at December 31, 1999.
(2) Amount represents the acquisition of Service Merchandise designation rights.
Summary of Joint Venture Capital Transactions 5.1
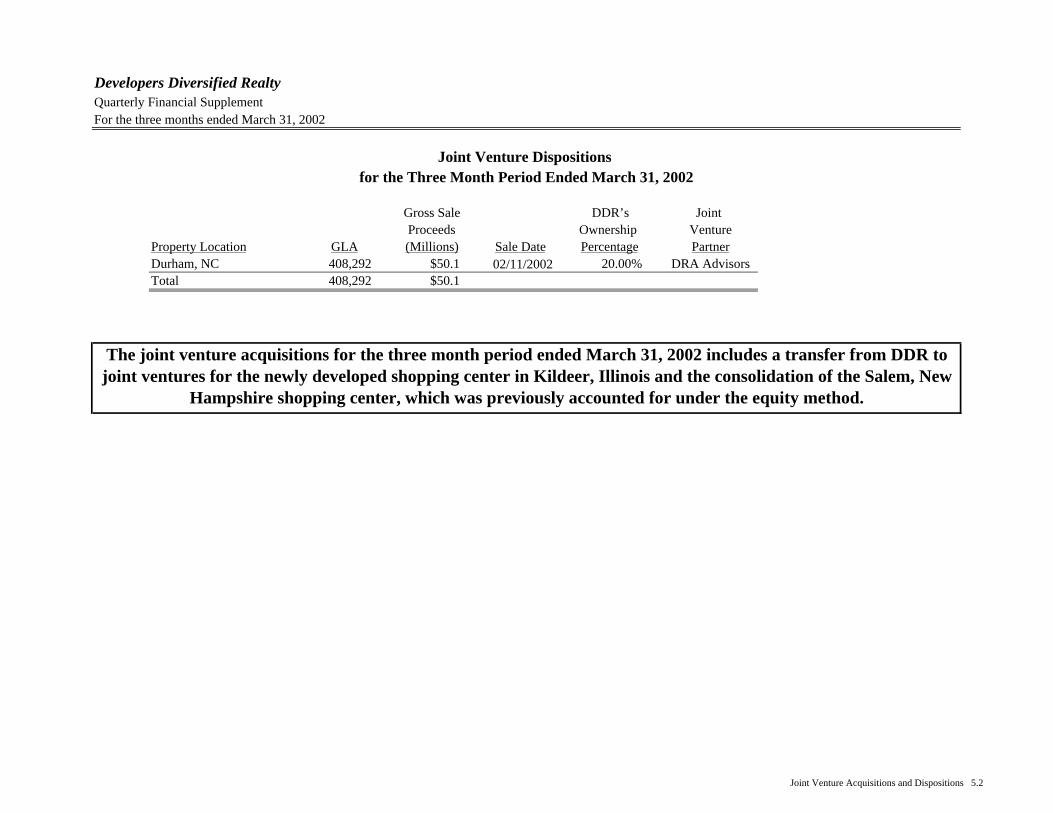
Developers Diversified Realty Quarterly Financial SupplementFor the three months ended March 31, 2002
Gross Sale DDR’s Joint Proceeds Ownership Venture
Property Location GLA (Millions) Sale Date Percentage PartnerDurham, NC 408,292 $50.1 02/11/2002 20.00% DRA AdvisorsTotal 408,292 $50.1
Joint Venture Dispositions for the Three Month Period Ended March 31, 2002
The joint venture acquisitions for the three month period ended March 31, 2002 includes a transfer from DDR to joint ventures for the newly developed shopping center in Kildeer, Illinois and the consolidation of the Salem, New
Hampshire shopping center, which was previously accounted for under the equity method.
Joint Venture Acquisitions and Dispositions 5.2
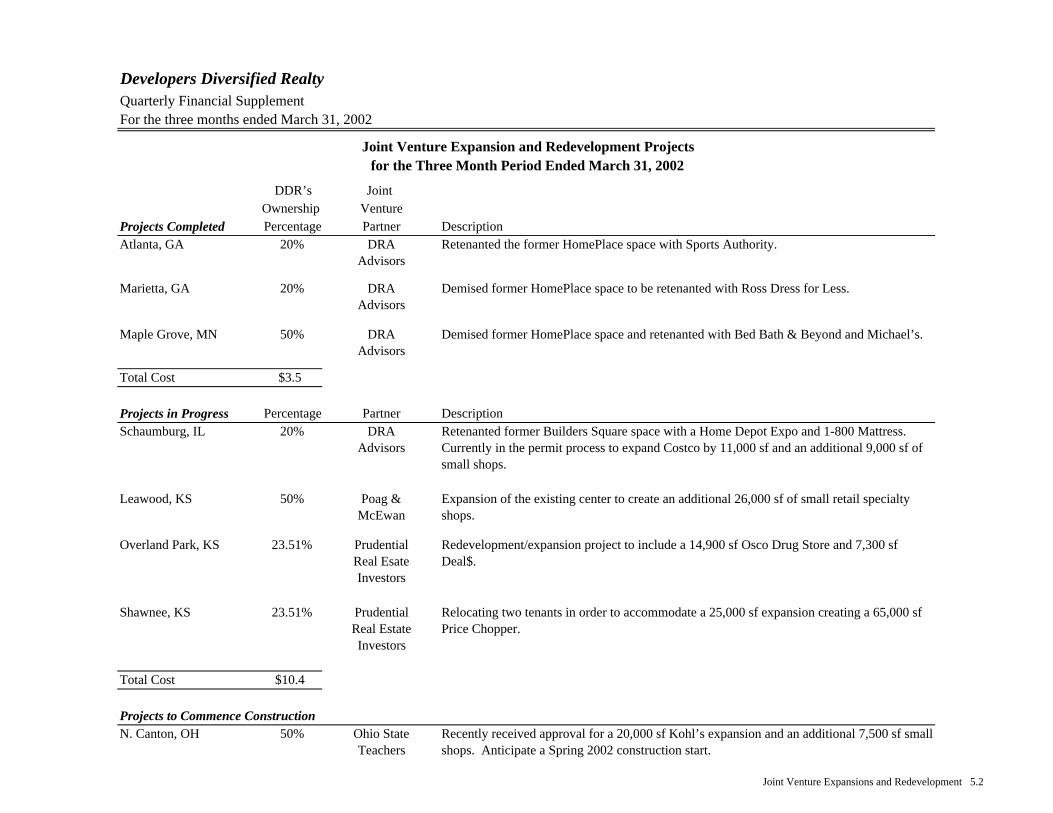
Developers Diversified RealtyQuarterly Financial SupplementFor the three months ended March 31, 2002
DDR’s Joint Ownership Venture
Projects Completed Percentage Partner DescriptionAtlanta, GA 20% DRA
AdvisorsRetenanted the former HomePlace space with Sports Authority.
Marietta, GA 20% DRA Advisors
Maple Grove, MN 50% DRA Advisors
Total Cost $3.5
Projects in Progress Percentage Partner DescriptionSchaumburg, IL 20% DRA
Advisors
50% Poag & McEwan
Overland Park, KS 23.51% Prudential Real Esate Investors
Shawnee, KS 23.51% Prudential Real Estate Investors
Total Cost $10.4
Projects to Commence ConstructionN. Canton, OH 50% Ohio State
Teachers
Relocating two tenants in order to accommodate a 25,000 sf expansion creating a 65,000 sf Price Chopper.
Recently received approval for a 20,000 sf Kohl’s expansion and an additional 7,500 sf small shops. Anticipate a Spring 2002 construction start.
Redevelopment/expansion project to include a 14,900 sf Osco Drug Store and 7,300 sf Deal$.
Retenanted former Builders Square space with a Home Depot Expo and 1-800 Mattress. Currently in the permit process to expand Costco by 11,000 sf and an additional 9,000 sf of small shops.
Leawood, KS
Joint Venture Expansion and Redevelopment Projectsfor the Three Month Period Ended March 31, 2002
Demised former HomePlace space to be retenanted with Ross Dress for Less.
Demised former HomePlace space and retenanted with Bed Bath & Beyond and Michael’s.
Expansion of the existing center to create an additional 26,000 sf of small retail specialty shops.
Joint Venture Expansions and Redevelopment 5.2
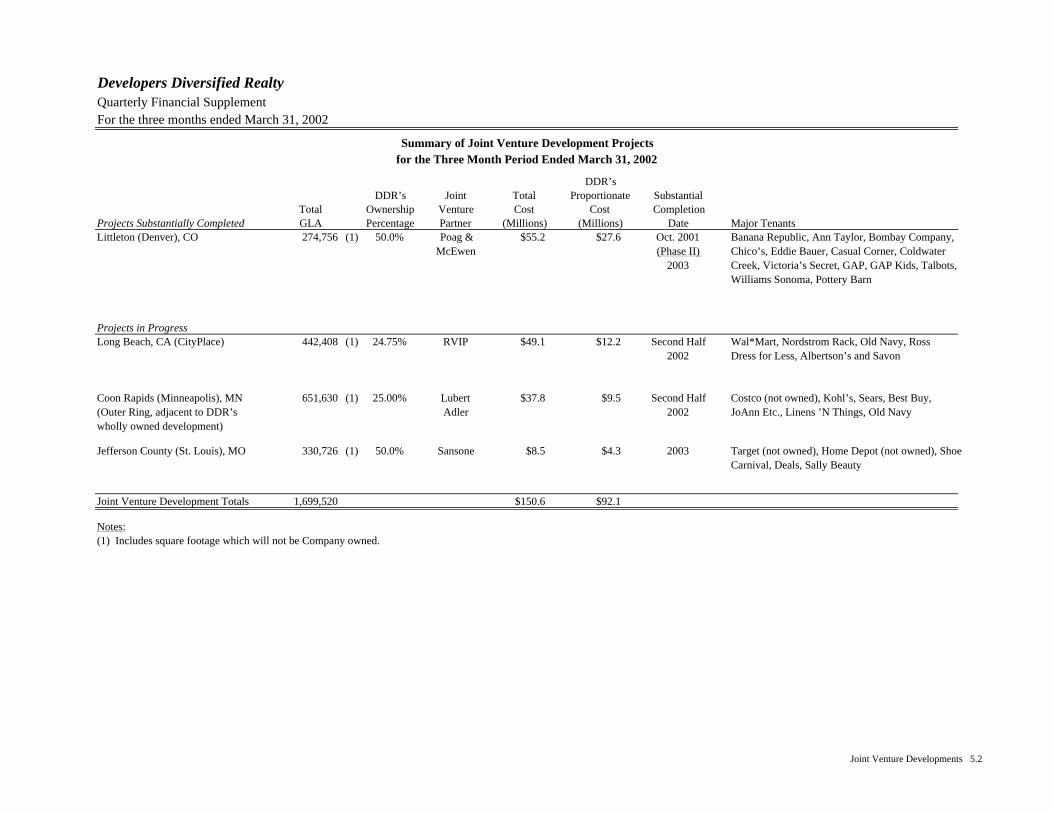
Developers Diversified RealtyQuarterly Financial SupplementFor the three months ended March 31, 2002
DDR’sDDR’s Joint Total Proportionate Substantial
Total Ownership Venture Cost Cost CompletionProjects Substantially Completed GLA Percentage Partner (Millions) (Millions) Date Major Tenants
274,756 (1) 50.0% Poag & McEwen
$55.2 $27.6 Oct. 2001 (Phase II)
2003
Projects in Progress442,408 (1) 24.75% RVIP $49.1 $12.2 Second Half
2002
651,630 (1) 25.00% Lubert Adler
$37.8 $9.5 Second Half 2002
330,726 (1) 50.0% Sansone $8.5 $4.3 2003
Joint Venture Development Totals 1,699,520 $150.6 $92.1
Notes:(1) Includes square footage which will not be Company owned.
Summary of Joint Venture Development Projects
Littleton (Denver), CO Banana Republic, Ann Taylor, Bombay Company, Chico’s, Eddie Bauer, Casual Corner, Coldwater Creek, Victoria’s Secret, GAP, GAP Kids, Talbots, Williams Sonoma, Pottery Barn
for the Three Month Period Ended March 31, 2002
Jefferson County (St. Louis), MO Target (not owned), Home Depot (not owned), ShoeCarnival, Deals, Sally Beauty
Long Beach, CA (CityPlace) Wal*Mart, Nordstrom Rack, Old Navy, Ross Dress for Less, Albertson’s and Savon
Costco (not owned), Kohl’s, Sears, Best Buy, JoAnn Etc., Linens ’N Things, Old Navy
Coon Rapids (Minneapolis), MN (Outer Ring, adjacent to DDR’s wholly owned development)
Joint Venture Developments 5.2
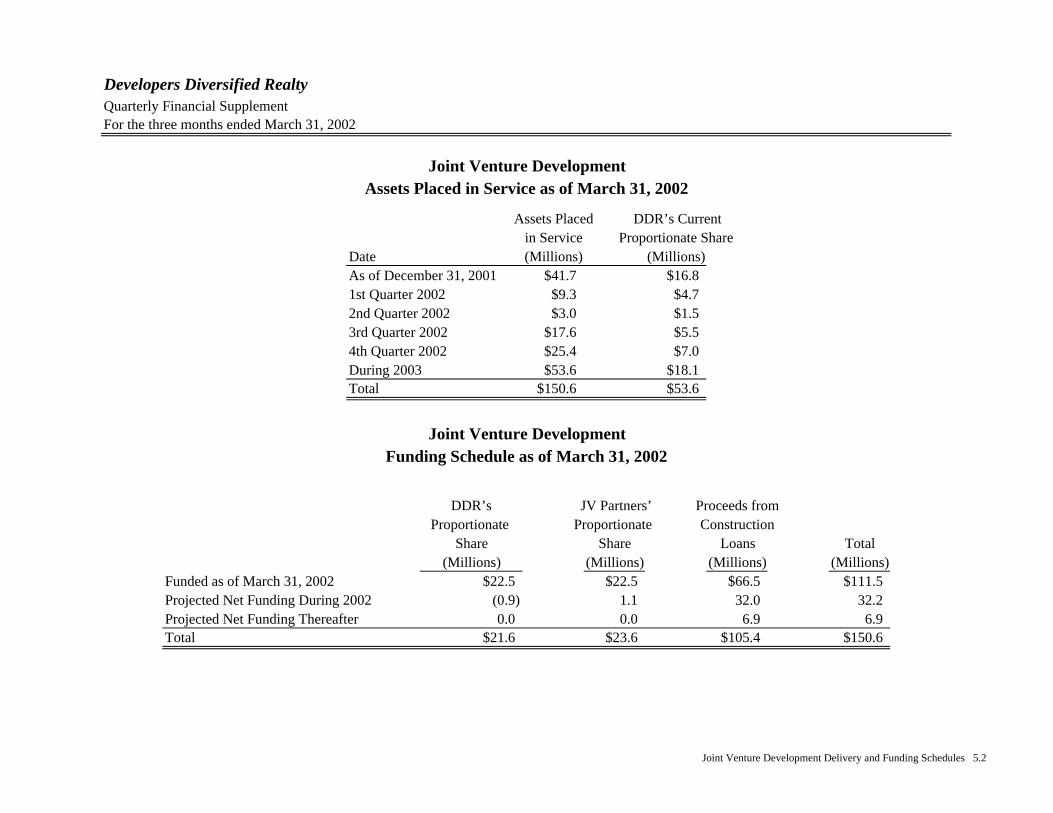
Developers Diversified Realty Quarterly Financial SupplementFor the three months ended March 31, 2002
Assets Placed DDR’s Currentin Service Proportionate Share
Date (Millions) (Millions)As of December 31, 2001 $41.7 $16.81st Quarter 2002 $9.3 $4.72nd Quarter 2002 $3.0 $1.53rd Quarter 2002 $17.6 $5.54th Quarter 2002 $25.4 $7.0During 2003 $53.6 $18.1Total $150.6 $53.6
DDR’s JV Partners’ Proceeds fromProportionate Proportionate Construction
Share Share Loans Total(Millions) (Millions) (Millions) (Millions)
Funded as of March 31, 2002 $22.5 $22.5 $66.5 $111.5Projected Net Funding During 2002 (0.9) 1.1 32.0 32.2Projected Net Funding Thereafter 0.0 0.0 6.9 6.9Total $21.6 $23.6 $105.4 $150.6
Assets Placed in Service as of March 31, 2002
Funding Schedule as of March 31, 2002
Joint Venture Development
Joint Venture Development
Joint Venture Development Delivery and Funding Schedules 5.2
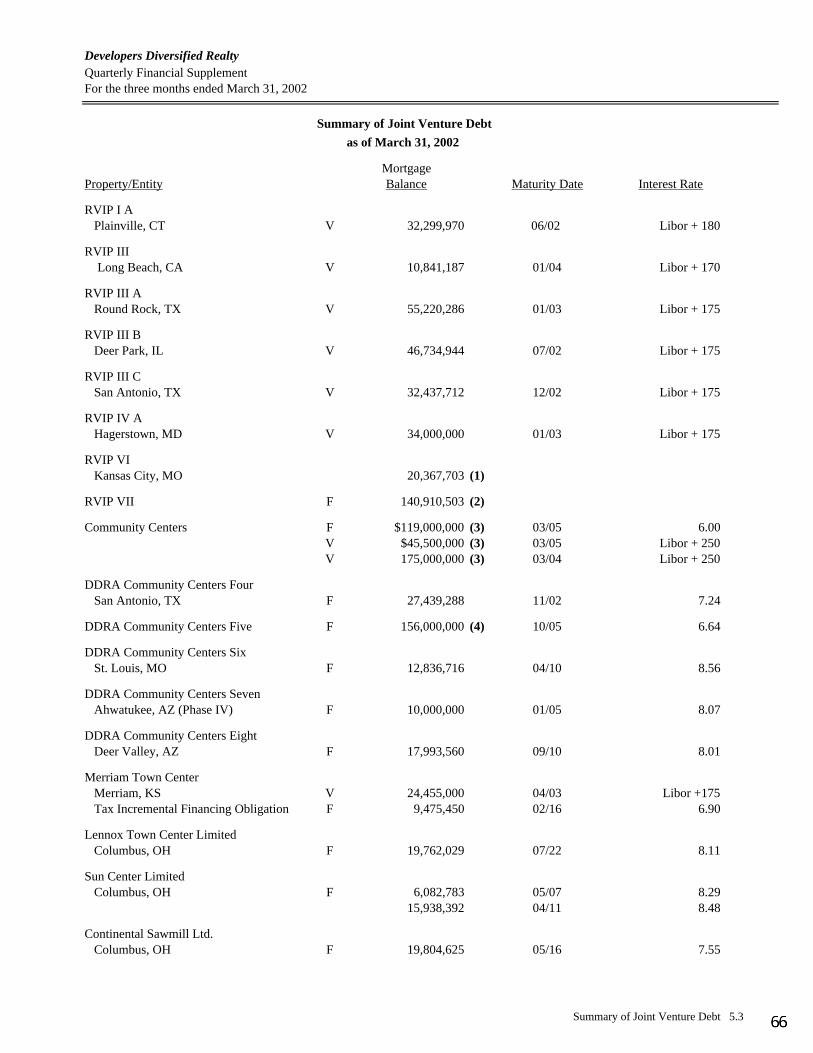
Developers Diversified Realty Quarterly Financial SupplementFor the three months ended March 31, 2002
MortgageProperty/Entity Balance Maturity Date Interest Rate
RVIP I A Plainville, CT V 32,299,970 06/02 Libor + 180
RVIP IIILong Beach, CA V 10,841,187 01/04 Libor + 170
RVIP III A Round Rock, TX V 55,220,286 01/03 Libor + 175
RVIP III B Deer Park, IL V 46,734,944 07/02 Libor + 175
RVIP III C San Antonio, TX V 32,437,712 12/02 Libor + 175
RVIP IV A Hagerstown, MD V 34,000,000 01/03 Libor + 175
RVIP VI Kansas City, MO 20,367,703 (1)
RVIP VII F 140,910,503 (2)
Community Centers F $119,000,000 (3) 03/05 6.00V $45,500,000 (3) 03/05 Libor + 250V 175,000,000 (3) 03/04 Libor + 250
DDRA Community Centers Four San Antonio, TX F 27,439,288 11/02 7.24
DDRA Community Centers Five F 156,000,000 (4) 10/05 6.64
DDRA Community Centers Six St. Louis, MO F 12,836,716 04/10 8.56
DDRA Community Centers Seven Ahwatukee, AZ (Phase IV) F 10,000,000 01/05 8.07
DDRA Community Centers Eight Deer Valley, AZ F 17,993,560 09/10 8.01
Merriam Town Center Merriam, KS V 24,455,000 04/03 Libor +175 Tax Incremental Financing Obligation F 9,475,450 02/16 6.90
Lennox Town Center Limited Columbus, OH F 19,762,029 07/22 8.11
Sun Center Limited Columbus, OH F 6,082,783 05/07 8.29
15,938,392 04/11 8.48
Continental Sawmill Ltd. Columbus, OH F 19,804,625 05/16 7.55
Summary of Joint Venture Debt
as of March 31, 2002
Summary of Joint Venture Debt 5.3
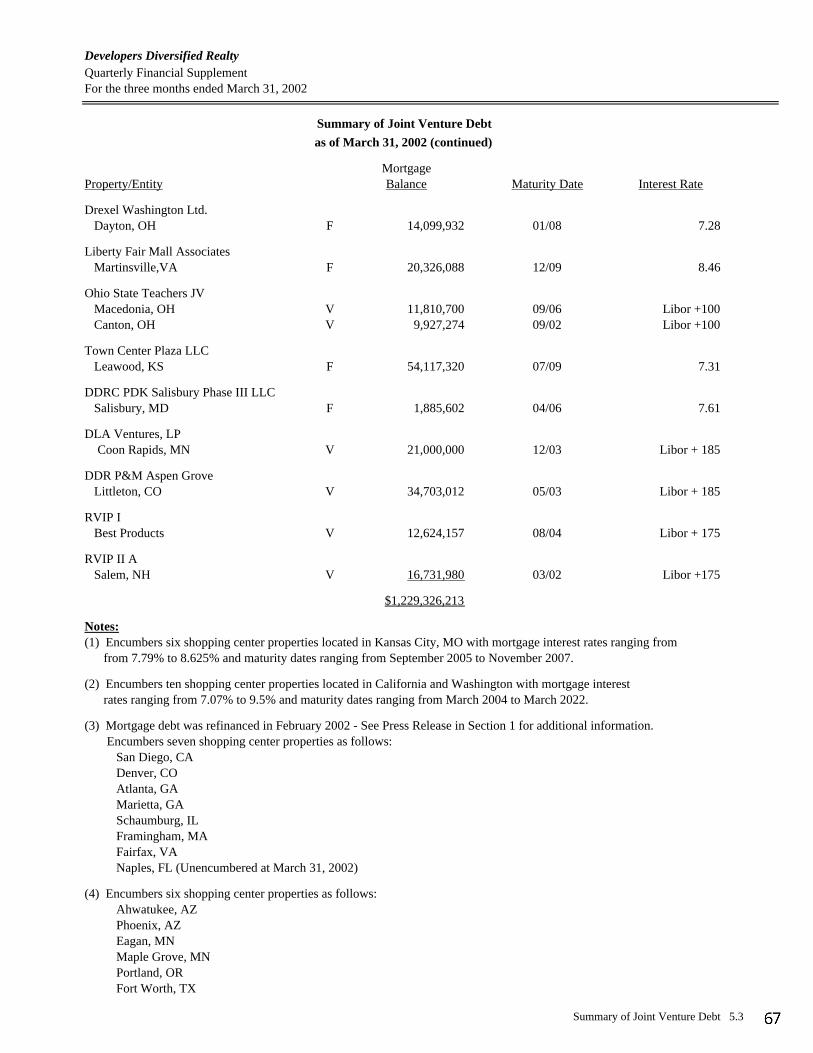
Developers Diversified Realty Quarterly Financial SupplementFor the three months ended March 31, 2002
MortgageProperty/Entity Balance Maturity Date Interest Rate
Drexel Washington Ltd. Dayton, OH F 14,099,932 01/08 7.28
Liberty Fair Mall Associates Martinsville,VA F 20,326,088 12/09 8.46
Ohio State Teachers JV Macedonia, OH V 11,810,700 09/06 Libor +100 Canton, OH V 9,927,274 09/02 Libor +100
Town Center Plaza LLC Leawood, KS F 54,117,320 07/09 7.31
DDRC PDK Salisbury Phase III LLC Salisbury, MD F 1,885,602 04/06 7.61
DLA Ventures, LPCoon Rapids, MN V 21,000,000 12/03 Libor + 185
DDR P&M Aspen Grove Littleton, CO V 34,703,012 05/03 Libor + 185
RVIP I Best Products V 12,624,157 08/04 Libor + 175
RVIP II A Salem, NH V 16,731,980 03/02 Libor +175
$1,229,326,213
Notes:(1) Encumbers six shopping center properties located in Kansas City, MO with mortgage interest rates ranging from from 7.79% to 8.625% and maturity dates ranging from September 2005 to November 2007.
(2) Encumbers ten shopping center properties located in California and Washington with mortgage interest rates ranging from 7.07% to 9.5% and maturity dates ranging from March 2004 to March 2022.
(3) Mortgage debt was refinanced in February 2002 - See Press Release in Section 1 for additional information. Encumbers seven shopping center properties as follows: San Diego, CA Denver, CO Atlanta, GA Marietta, GA Schaumburg, IL Framingham, MA Fairfax, VA Naples, FL (Unencumbered at March 31, 2002)
(4) Encumbers six shopping center properties as follows: Ahwatukee, AZ Phoenix, AZ Eagan, MN Maple Grove, MN Portland, OR Fort Worth, TX
Summary of Joint Venture Debt
as of March 31, 2002 (continued)
Summary of Joint Venture Debt 5.3
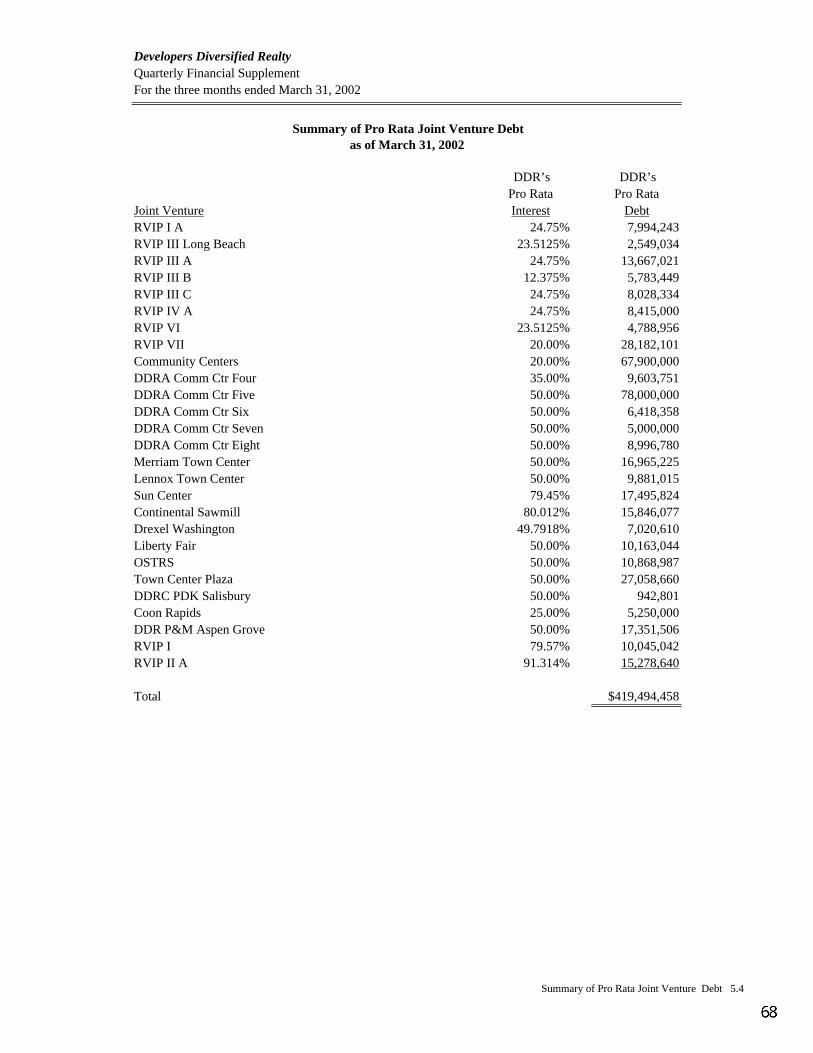
Developers Diversified Realty Quarterly Financial SupplementFor the three months ended March 31, 2002
DDR’s DDR’sPro Rata Pro Rata
Joint Venture Interest DebtRVIP I A 24.75% 7,994,243RVIP III Long Beach 23.5125% 2,549,034RVIP III A 24.75% 13,667,021RVIP III B 12.375% 5,783,449RVIP III C 24.75% 8,028,334RVIP IV A 24.75% 8,415,000RVIP VI 23.5125% 4,788,956RVIP VII 20.00% 28,182,101Community Centers 20.00% 67,900,000DDRA Comm Ctr Four 35.00% 9,603,751DDRA Comm Ctr Five 50.00% 78,000,000DDRA Comm Ctr Six 50.00% 6,418,358DDRA Comm Ctr Seven 50.00% 5,000,000DDRA Comm Ctr Eight 50.00% 8,996,780Merriam Town Center 50.00% 16,965,225Lennox Town Center 50.00% 9,881,015Sun Center 79.45% 17,495,824Continental Sawmill 80.012% 15,846,077Drexel Washington 49.7918% 7,020,610Liberty Fair 50.00% 10,163,044OSTRS 50.00% 10,868,987Town Center Plaza 50.00% 27,058,660DDRC PDK Salisbury 50.00% 942,801Coon Rapids 25.00% 5,250,000DDR P&M Aspen Grove 50.00% 17,351,506RVIP I 79.57% 10,045,042RVIP II A 91.314% 15,278,640
Total $419,494,458
Summary of Pro Rata Joint Venture Debtas of March 31, 2002
Summary of Pro Rata Joint Venture Debt 5.4
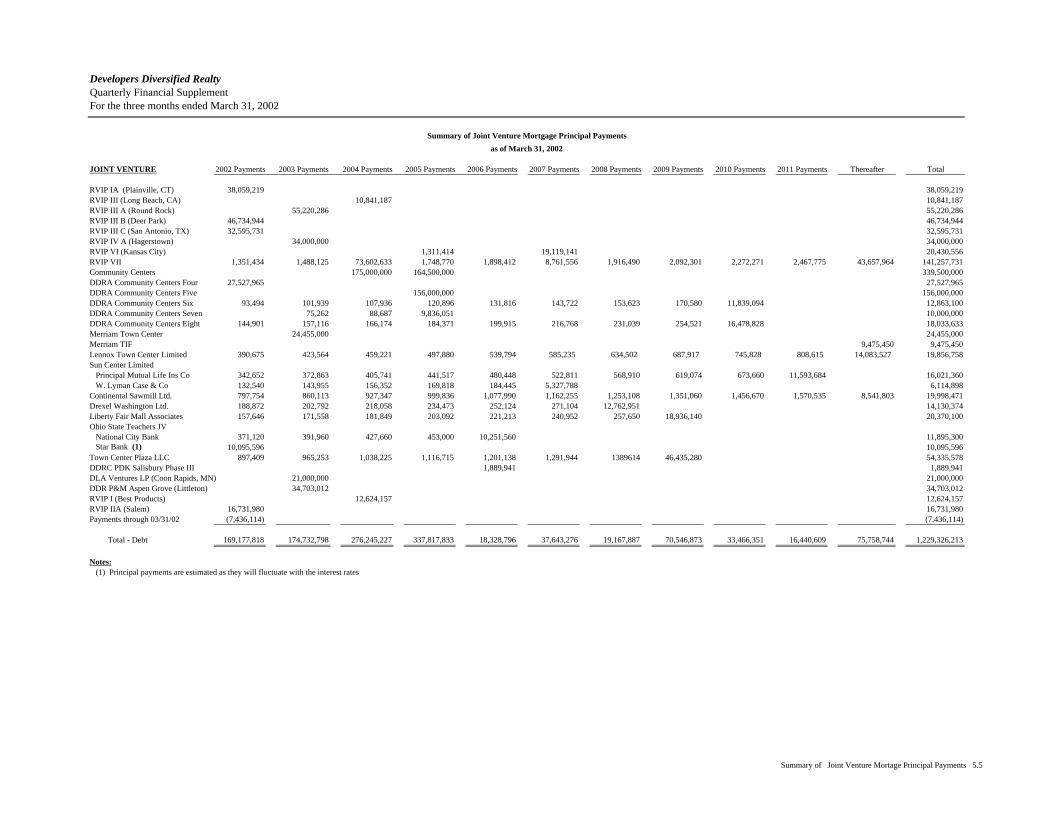
Developers Diversified Realty Quarterly Financial SupplementFor the three months ended March 31, 2002
Summary of Joint Venture Mortgage Principal Payments
as of March 31, 2002
JOINT VENTURE 2002 Payments 2003 Payments 2004 Payments 2005 Payments 2006 Payments 2007 Payments 2008 Payments 2009 Payments 2010 Payments 2011 Payments Thereafter Total
RVIP IA (Plainville, CT) 38,059,219 38,059,219RVIP III (Long Beach, CA) 10,841,187 10,841,187RVIP III A (Round Rock) 55,220,286 55,220,286RVIP III B (Deer Park) 46,734,944 46,734,944RVIP III C (San Antonio, TX) 32,595,731 32,595,731RVIP IV A (Hagerstown) 34,000,000 34,000,000RVIP VI (Kansas City) 1,311,414 19,119,141 20,430,556RVIP VII 1,351,434 1,488,125 73,602,633 1,748,770 1,898,412 8,761,556 1,916,490 2,092,301 2,272,271 2,467,775 43,657,964 141,257,731Community Centers 175,000,000 164,500,000 339,500,000DDRA Community Centers Four 27,527,965 27,527,965DDRA Community Centers Five 156,000,000 156,000,000DDRA Community Centers Six 93,494 101,939 107,936 120,896 131,816 143,722 153,623 170,580 11,839,094 12,863,100DDRA Community Centers Seven 75,262 88,687 9,836,051 10,000,000DDRA Community Centers Eight 144,901 157,116 166,174 184,371 199,915 216,768 231,039 254,521 16,478,828 18,033,633Merriam Town Center 24,455,000 24,455,000Merriam TIF 9,475,450 9,475,450Lennox Town Center Limited 390,675 423,564 459,221 497,880 539,794 585,235 634,502 687,917 745,828 808,615 14,083,527 19,856,758Sun Center Limited Principal Mutual Life Ins Co 342,652 372,863 405,741 441,517 480,448 522,811 568,910 619,074 673,660 11,593,684 16,021,360 W. Lyman Case & Co 132,540 143,955 156,352 169,818 184,445 5,327,788 6,114,898Continental Sawmill Ltd. 797,754 860,113 927,347 999,836 1,077,990 1,162,255 1,253,108 1,351,060 1,456,670 1,570,535 8,541,803 19,998,471Drexel Washington Ltd. 188,872 202,792 218,058 234,473 252,124 271,104 12,762,951 14,130,374Liberty Fair Mall Associates 157,646 171,558 181,849 203,092 221,213 240,952 257,650 18,936,140 20,370,100Ohio State Teachers JV National City Bank 371,120 391,960 427,660 453,000 10,251,560 11,895,300 Star Bank (1) 10,095,596 10,095,596Town Center Plaza LLC 897,409 965,253 1,038,225 1,116,715 1,201,138 1,291,944 1389614 46,435,280 54,335,578DDRC PDK Salisbury Phase III 1,889,941 1,889,941DLA Ventures LP (Coon Rapids, MN) 21,000,000 21,000,000DDR P&M Aspen Grove (Littleton) 34,703,012 34,703,012RVIP I (Best Products) 12,624,157 12,624,157RVIP IIA (Salem) 16,731,980 16,731,980Payments through 03/31/02 (7,436,114) (7,436,114)
Total - Debt 169,177,818 174,732,798 276,245,227 337,817,833 18,328,796 37,643,276 19,167,887 70,546,873 33,466,351 16,440,609 75,758,744 1,229,326,213
Notes: (1) Principal payments are estimated as they will fluctuate with the interest rates
Summary of Joint Venture Mortage Principal Payments 5.5

Portfolio Statistics
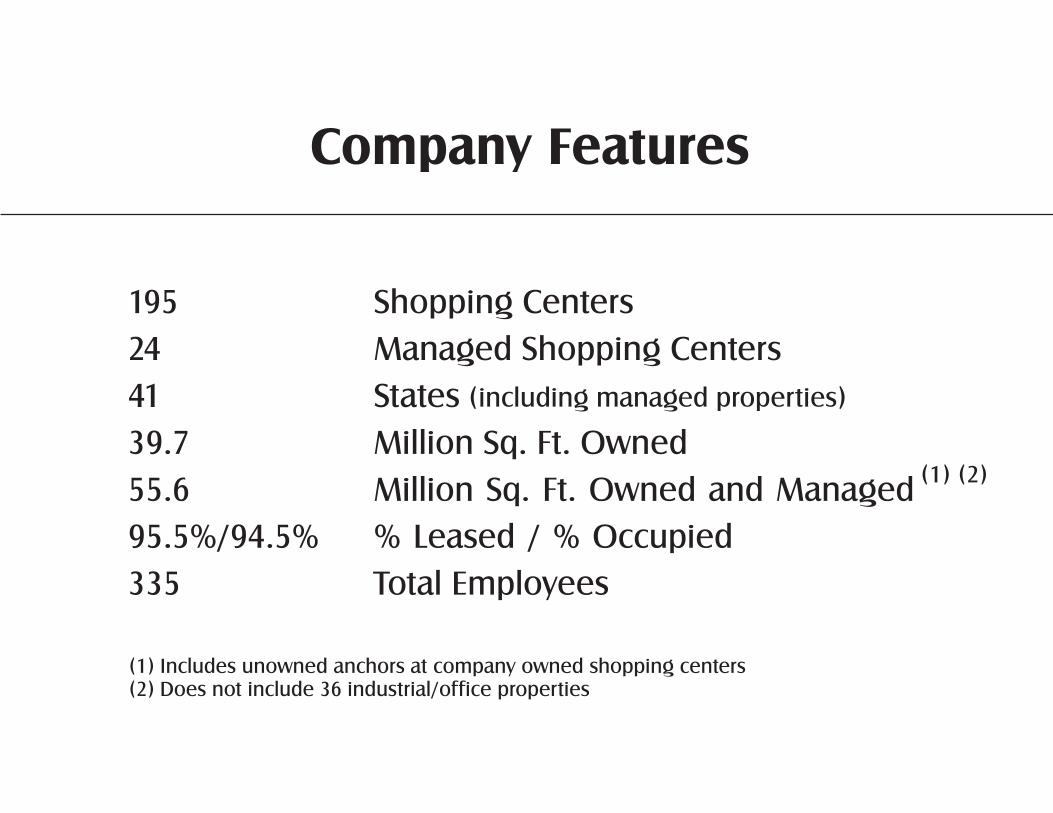
Company Features
195 Shopping Centers
24 Managed Shopping Centers
41 States
39.7 Million Sq. Ft. Owned
55.6 Million Sq. Ft. Owned and Managed
95.5%/94.5% % Leased / % Occupied
335 Total Employees
(1) Includes unowned anchors at company owned shopping centers(2) Does not include 36 industrial/office properties
(including managed properties)
(1) (2)
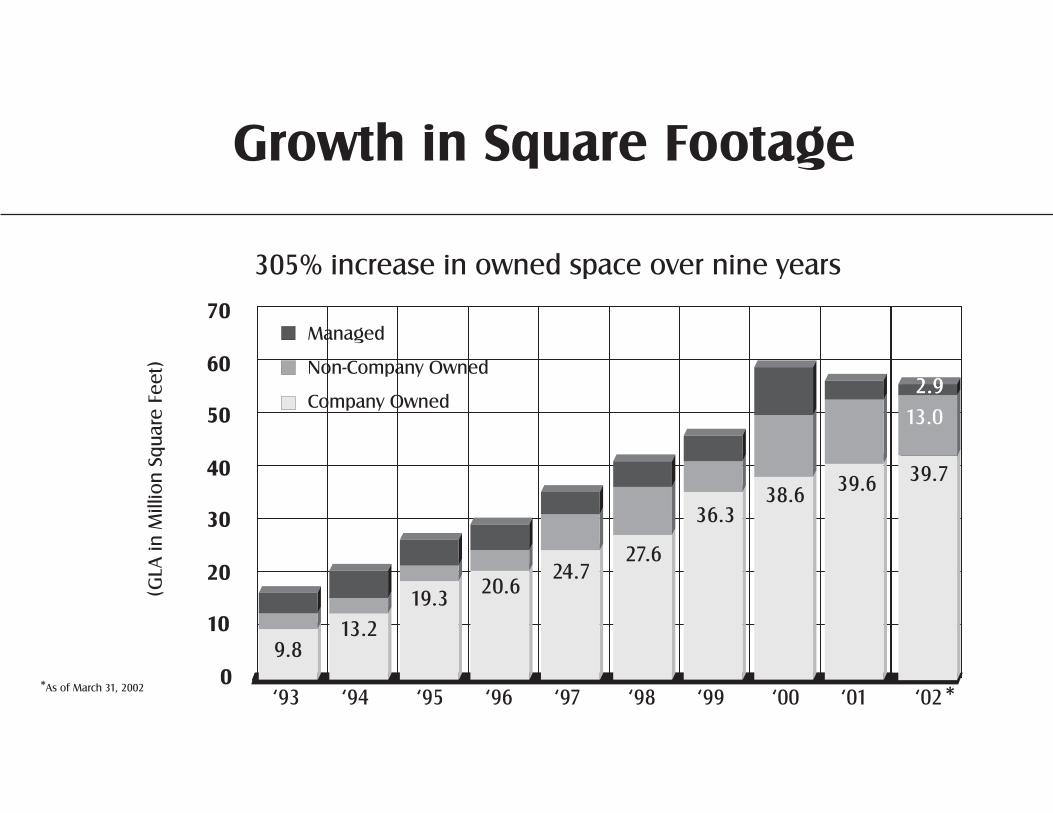
Growth in Square Footage(G
LAin
Millio
nSqu
are
Feet)
305% increase in owned space over nine years
As of March 31, 2002*
Managed
Non-Company Owned
Company Owned
‘93 ‘94 ‘95 ‘96 ‘97 ‘98 ‘99 ‘00 ‘01 ‘020
10
20
30
40
50
60
70
9.813.2
19.320.6
24.727.6
36.338.6
*
39.7
13.0
39.6
2.92.9
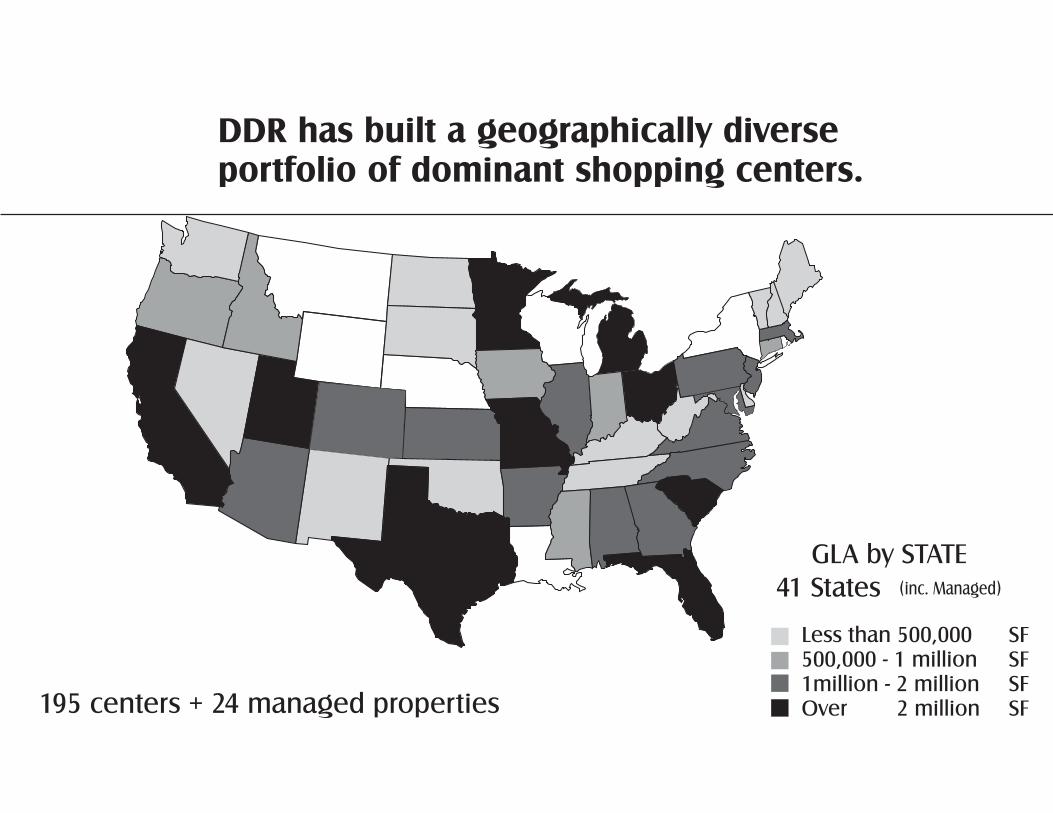
DDR has built a geographically diverseportfolio of dominant shopping centers.
GLA by STATE(inc. Managed)41 States
Less than 500,000 SF500,000 - 1 million SF1million - 2 million SFOver 2 million SF195 centers + 24 managed properties
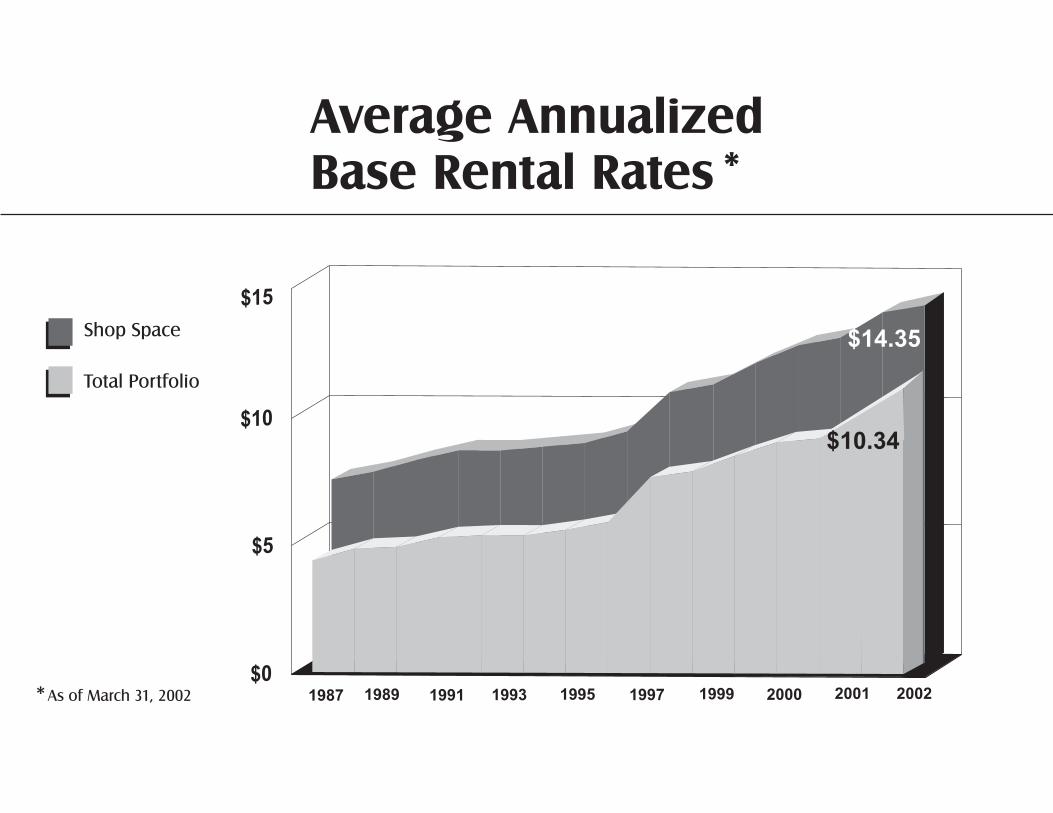
*Average AnnualizedBase Rental Rates
Shop Space
Total Portfolio
As of March 31, 2002* 1987 1989 1991 1993 1995 1997 1999 2000 2001$0
$5
$10
$15
2002
$14.35
$10.34
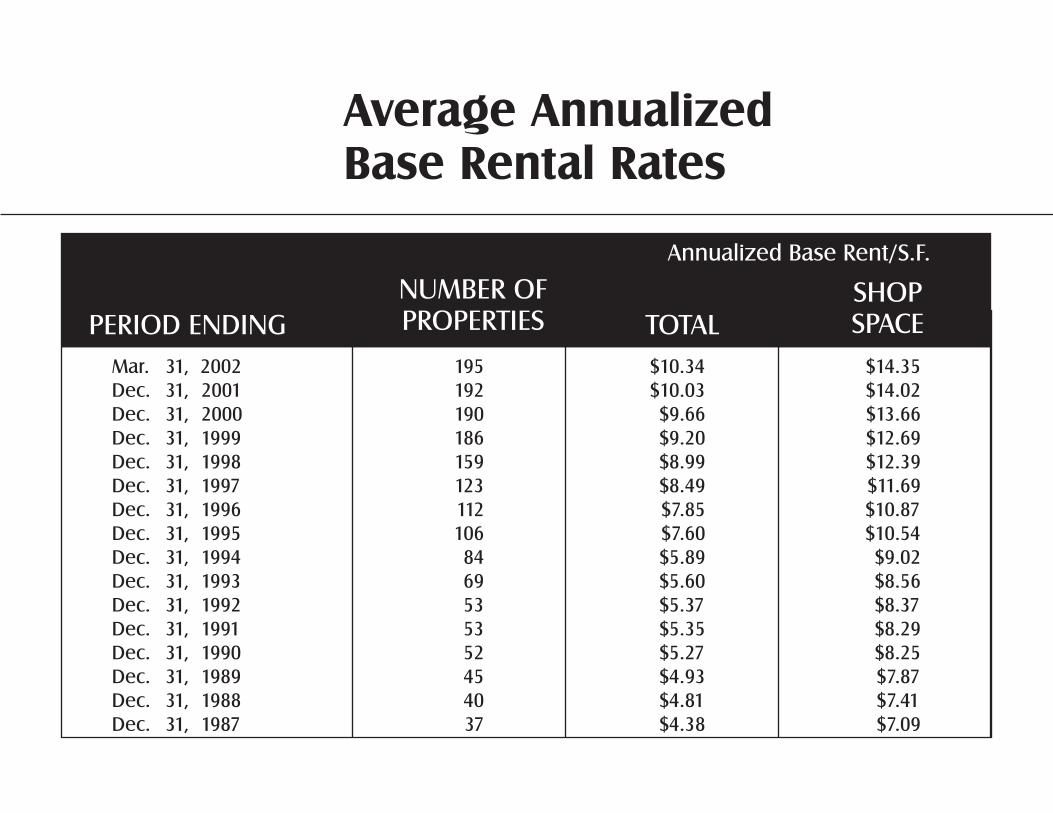
Average AnnualizedBase Rental Rates
PERIOD ENDING
NUMBER OFPROPERTIES TOTAL
SHOPSPACE
Annualized Base Rent/S.F.
Mar. 31, 2002 195 $10.34 $14.35
Dec. 31, 2001 192 $10.03 $14.02
Dec. 31, 2000 190 $9.66 $13.66
Dec. 31, 1999 186 $9.20 $12.69
Dec. 31, 1998 159 $8.99 $12.39
Dec. 31, 1997 123 $8.49 $11.69
Dec. 31, 1996 112 $7.85 $10.87
Dec. 31, 1995 106 $7.60 $10.54
Dec. 31, 1994 84 $5.89 $9.02
Dec. 31, 1993 69 $5.60 $8.56
Dec. 31, 1992 53 $5.37 $8.37
Dec. 31, 1991 53 $5.35 $8.29
Dec. 31, 1990 52 $5.27 $8.25
Dec. 31, 1989 45 $4.93 $7.87
Dec. 31, 1988 40 $4.81 $7.41
Dec. 31, 1987 37 $4.38 $7.09
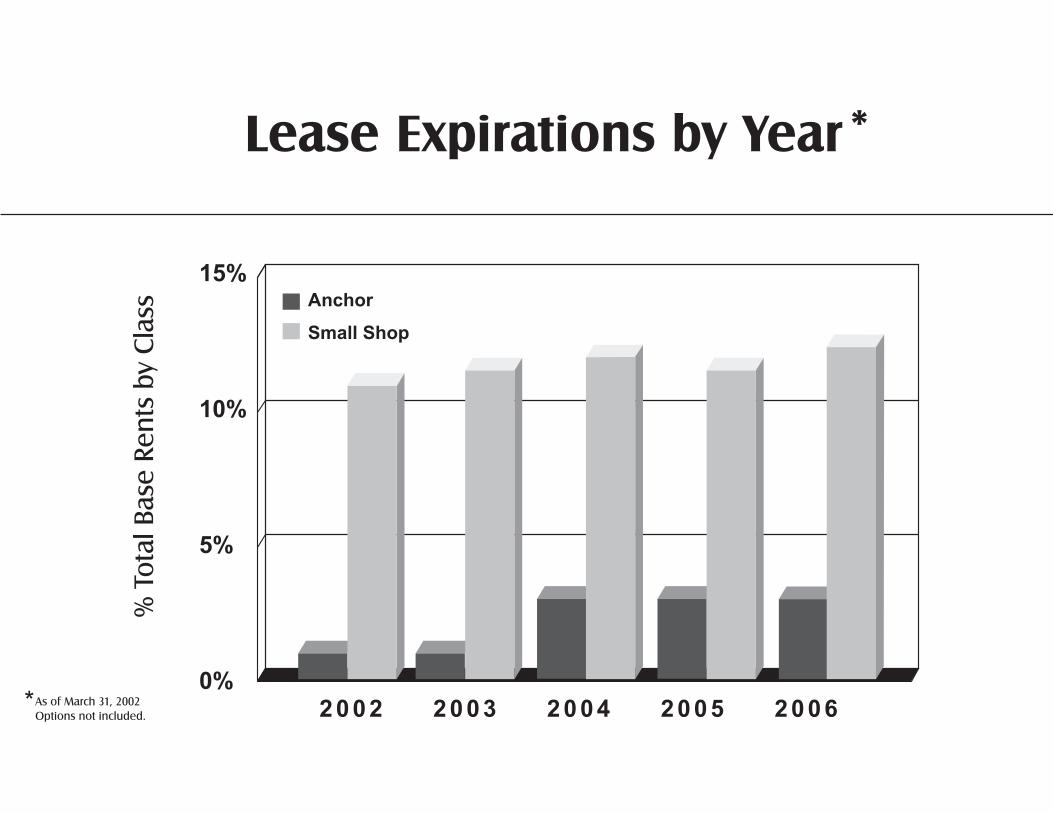
Lease Expirations by Year
As of March 31, 2002
Options not included.*
*
2 0 0 2 2 0 0 3 2 0 0 4 2 0 0 5 2 0 0 6
Anchor
Small Shop
%To
talBase
Ren
tsb
yC
lass
15%
10%
5%
0%
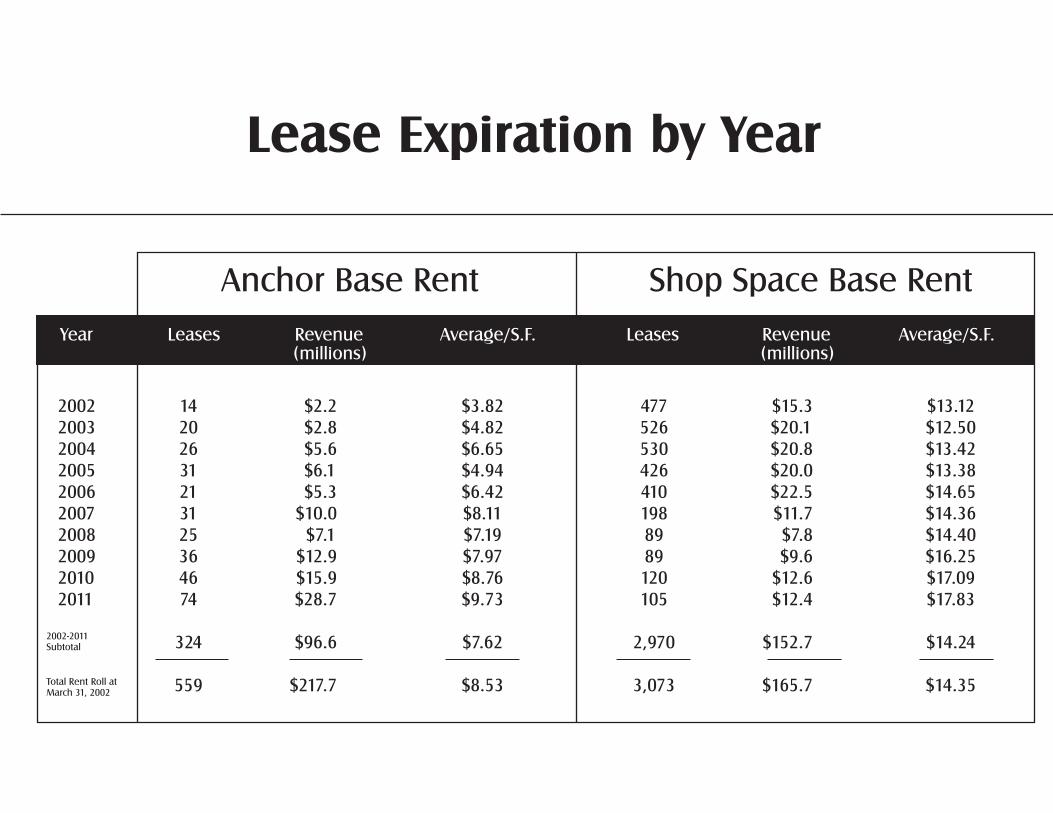
Lease Expiration by Year
Anchor Base Rent Shop Space Base Rent
(millions)LeasesYear Revenue Average/S.F.
(millions)Leases Revenue Average/S.F.
2002-2011Subtotal
Total Rent Roll atMarch 31, 2002
2002 14 $2.2 $3.82 477 $15.3 $13.122003 20 $2.8 $4.82 526 $20.1 $12.502004 26 $5.6 $6.65 530 $20.8 $13.422005 31 $6.1 $4.94 426 $20.0 $13.382006 21 $5.3 $6.42 410 $22.5 $14.652007 31 $10.0 $8.11 198 $11.7 $14.362008 25 $7.1 $7.19 89 $7.8 $14.402009 36 $12.9 $7.97 89 $9.6 $16.252010 46 $15.9 $8.76 120 $12.6 $17.092011 74 $28.7 $9.73 105 $12.4 $17.83
324 $96.6 $7.62 2,970 $152.7 $14.24
559 $217.7 $8.53 3,073 $165.7 $14.35
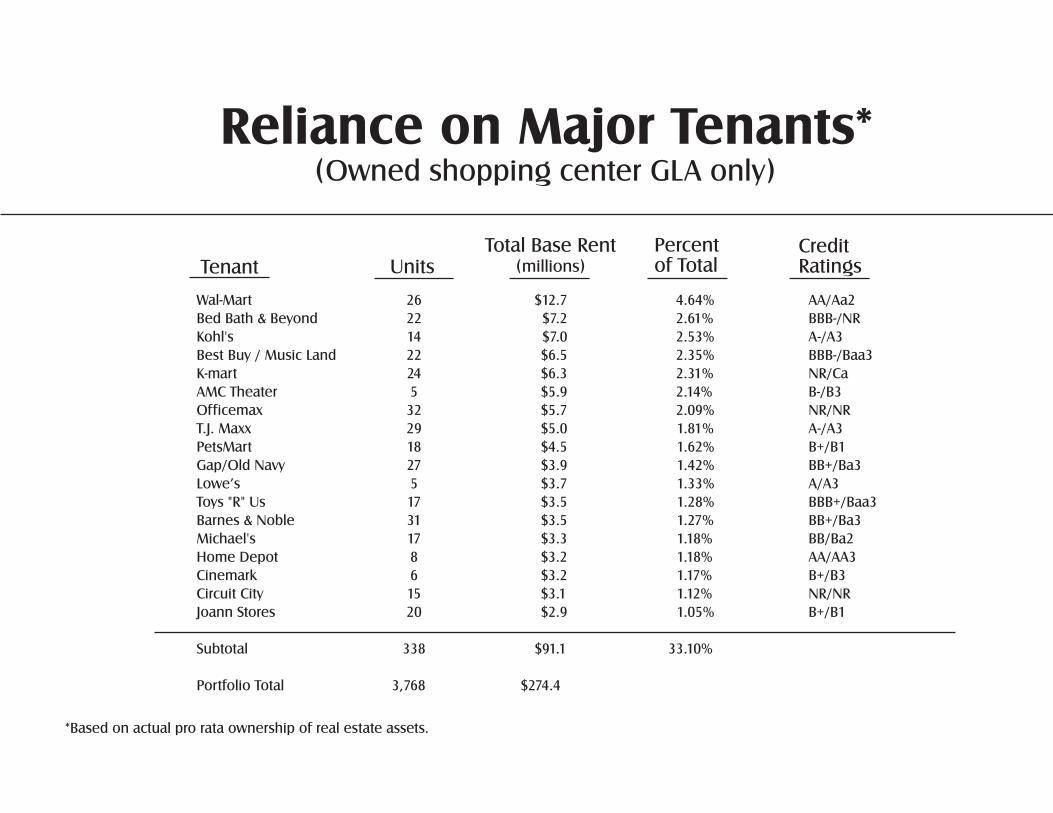
Reliance on Major Tenants*
Tenant UnitsPercentof Total
CreditRatings
Total Base Rent(millions)
(Owned shopping center GLA only)
*Based on actual pro rata ownership of real estate assets.
Wal-Mart 26 $12.7 4.64% AA/Aa2
Bed Bath & Beyond 22 $7.2 2.61% BBB-/NR
Kohl's 14 $7.0 2.53% A-/A3
Best Buy / Music Land 22 $6.5 2.35% BBB-/Baa3
K-mart 24 $6.3 2.31% NR/Ca
AMC Theater 5 $5.9 2.14% B-/B3
Officemax 32 $5.7 2.09% NR/NR
T.J. Maxx 29 $5.0 1.81% A-/A3
PetsMart 18 $4.5 1.62% B+/B1
Gap/Old Navy 27 $3.9 1.42% BB+/Ba3
Lowe’s 5 $3.7 1.33% A/A3
Toys "R" Us 17 $3.5 1.28% BBB+/Baa3
Barnes & Noble 31 $3.5 1.27% BB+/Ba3
Michael's 17 $3.3 1.18% BB/Ba2
Home Depot 8 $3.2 1.18% AA/AA3
Cinemark 6 $3.2 1.17% B+/B3
Circuit City 15 $3.1 1.12% NR/NR
Joann Stores 20 $2.9 1.05% B+/B1
Subtotal 338 $91.1 33.10%
Portfolio Total 3,768 $274.4
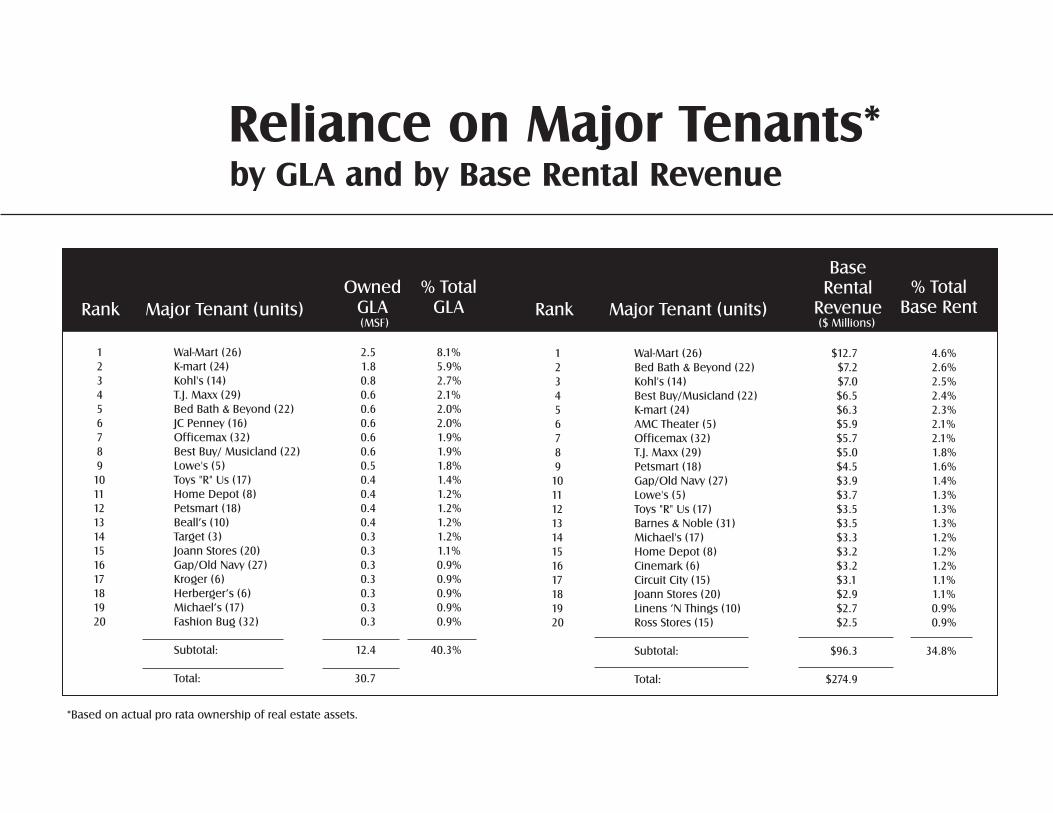
1 Wal-Mart (26) $12.7 4.6%
2 Bed Bath & Beyond (22) $7.2 2.6%
3 Kohl's (14) $7.0 2.5%
4 Best Buy/Musicland (22) $6.5 2.4%
5 K-mart (24) $6.3 2.3%
6 AMC Theater (5) $5.9 2.1%
7 Officemax (32) $5.7 2.1%
8 T.J. Maxx (29) $5.0 1.8%
9 Petsmart (18) $4.5 1.6%
10 Gap/Old Navy (27) $3.9 1.4%
11 Lowe's (5) $3.7 1.3%
12 Toys "R" Us (17) $3.5 1.3%
13 Barnes & Noble (31) $3.5 1.3%
14 Michael's (17) $3.3 1.2%
15 Home Depot (8) $3.2 1.2%
16 Cinemark (6) $3.2 1.2%
17 Circuit City (15) $3.1 1.1%
18 Joann Stores (20) $2.9 1.1%
19 Linens ‘N Things (10) $2.7 0.9%
20 Ross Stores (15) $2.5 0.9%
Subtotal: $96.3 34.8%
Total: $274.9
1 Wal-Mart (26) 2.5 8.1%
2 K-mart (24) 1.8 5.9%
3 Kohl's (14) 0.8 2.7%
4 T.J. Maxx (29) 0.6 2.1%
5 Bed Bath & Beyond (22) 0.6 2.0%
6 JC Penney (16) 0.6 2.0%
7 Officemax (32) 0.6 1.9%
8 Best Buy/ Musicland (22) 0.6 1.9%
9 Lowe's (5) 0.5 1.8%
10 Toys "R" Us (17) 0.4 1.4%
11 Home Depot (8) 0.4 1.2%
12 Petsmart (18) 0.4 1.2%
13 Beall’s (10) 0.4 1.2%
14 Target (3) 0.3 1.2%
15 Joann Stores (20) 0.3 1.1%
16 Gap/Old Navy (27) 0.3 0.9%
17 Kroger (6) 0.3 0.9%
18 Herberger’s (6) 0.3 0.9%
19 Michael’s (17) 0.3 0.9%
20 Fashion Bug (32) 0.3 0.9%
Subtotal: 12.4 40.3%
Total: 30.7
Reliance on Major Tenants*
Rank RankMajor Tenant (units) Major Tenant (units)
OwnedGLA
BaseRental
Revenue% Total
GLA% Total
Base Rent
*Based on actual pro rata ownership of real estate assets.
(MSF) ($ Millions)
by GLA and by Base Rental Revenue

Appendix
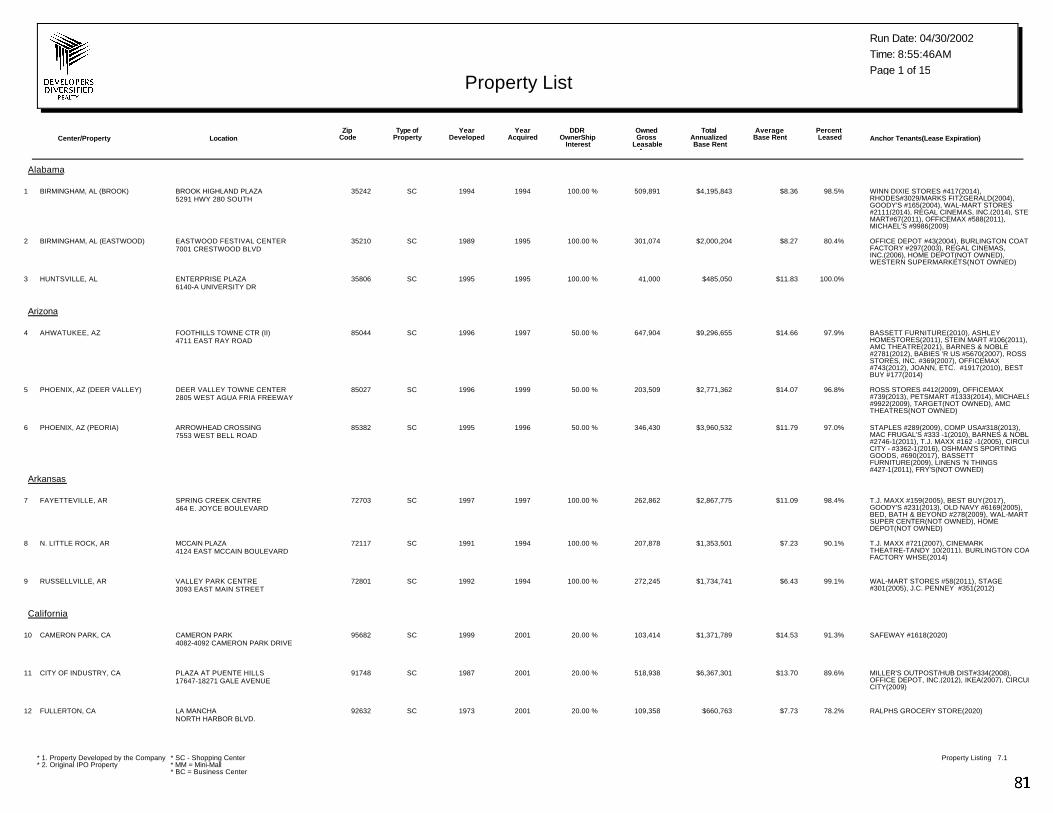
Center/Property LocationYear
AcquiredYear
DevelopedDDR
OwnerShip Interest
Type ofProperty Anchor Tenants(Lease Expiration)
Percent Leased
Average Base Rent
Total Annualized Base Rent
OwnedGross
Leasable Area
Zip Code
Run Date: 04/30/2002
Page 1 of 15Property List
Time: 8:55:46AM
Alabama
BIRMINGHAM, AL (BROOK) 35242 %100.00BROOK HIGHLAND PLAZA5291 HWY 280 SOUTH
$8.36 %98.5$4,195,8431994SC1 509,891 WINN DIXIE STORES #417(2014), RHODES#3029/MARKS FITZGERALD(2004), GOODY'S #165(2004), WAL-MART STORES #2111(2014), REGAL CINEMAS, INC.(2014), STEIN MART#67(2011), OFFICEMAX #588(2011), MICHAEL'S #9986(2009)
1994
BIRMINGHAM, AL (EASTWOOD) 35210 %100.00EASTWOOD FESTIVAL CENTER7001 CRESTWOOD BLVD
$8.27 %80.4$2,000,2041995SC2 301,074 OFFICE DEPOT #43(2004), BURLINGTON COAT FACTORY #297(2003), REGAL CINEMAS, INC.(2006), HOME DEPOT(NOT OWNED), WESTERN SUPERMARKETS(NOT OWNED)
1989
HUNTSVILLE, AL 35806 %100.00ENTERPRISE PLAZA6140-A UNIVERSITY DR
$11.83 %100.0$485,0501995SC3 41,0001995
Arizona
AHWATUKEE, AZ 85044 %50.00FOOTHILLS TOWNE CTR (II)4711 EAST RAY ROAD
$14.66 %97.9$9,296,6551997SC4 647,904 BASSETT FURNITURE(2010), ASHLEY HOMESTORES(2011), STEIN MART #106(2011), AMC THEATRE(2021), BARNES & NOBLE #2781(2012), BABIES 'R US #5670(2007), ROSS STORES, INC. #369(2007), OFFICEMAX #743(2012), JOANN, ETC. #1917(2010), BEST BUY #177(2014)
1996
PHOENIX, AZ (DEER VALLEY) 85027 %50.00DEER VALLEY TOWNE CENTER2805 WEST AGUA FRIA FREEWAY
$14.07 %96.8$2,771,3621999SC5 203,509 ROSS STORES #412(2009), OFFICEMAX #739(2013), PETSMART #1333(2014), MICHAELS #9922(2009), TARGET(NOT OWNED), AMC THEATRES(NOT OWNED)
1996
PHOENIX, AZ (PEORIA) 85382 %50.00ARROWHEAD CROSSING7553 WEST BELL ROAD
$11.79 %97.0$3,960,5321996SC6 346,430 STAPLES #289(2009), COMP USA#318(2013), MAC FRUGAL'S #333 -1(2010), BARNES & NOBLE #2746-1(2011), T.J. MAXX #162 -1(2005), CIRCUIT CITY - #3362-1(2016), OSHMAN'S SPORTING GOODS, #690(2017), BASSETT FURNITURE(2009), LINENS 'N THINGS #427-1(2011), FRY'S(NOT OWNED)
1995
Arkansas
FAYETTEVILLE, AR 72703 %100.00SPRING CREEK CENTRE464 E. JOYCE BOULEVARD
$11.09 %98.4$2,867,7751997SC7 262,862 T.J. MAXX #159(2005), BEST BUY(2017), GOODY'S #231(2013), OLD NAVY #6169(2005), BED, BATH & BEYOND #278(2009), WAL-MART SUPER CENTER(NOT OWNED), HOME DEPOT(NOT OWNED)
1997
N. LITTLE ROCK, AR 72117 %100.00MCCAIN PLAZA4124 EAST MCCAIN BOULEVARD
$7.23 %90.1$1,353,5011994SC8 207,878 T.J. MAXX #721(2007), CINEMARK THEATRE-TANDY 10(2011), BURLINGTON COAT FACTORY WHSE(2014)
1991
RUSSELLVILLE, AR 72801 %100.00VALLEY PARK CENTRE3093 EAST MAIN STREET
$6.43 %99.1$1,734,7411994SC9 272,245 WAL-MART STORES #58(2011), STAGE #301(2005), J.C. PENNEY #351(2012)
1992
California
CAMERON PARK, CA 95682 %20.00CAMERON PARK4082-4092 CAMERON PARK DRIVE
$14.53 %91.3$1,371,7892001SC10 103,414 SAFEWAY #1618(2020)1999
CITY OF INDUSTRY, CA 91748 %20.00PLAZA AT PUENTE HILLS17647-18271 GALE AVENUE
$13.70 %89.6$6,367,3012001SC11 518,938 MILLER'S OUTPOST/HUB DIST#334(2008), OFFICE DEPOT, INC.(2012), IKEA(2007), CIRCUIT CITY(2009)
1987
FULLERTON, CA 92632 %20.00LA MANCHANORTH HARBOR BLVD.
$7.73 %78.2$660,7632001SC12 109,358 RALPHS GROCERY STORE(2020)1973
* 1. Property Developed by the Company* 2. Original IPO Property
* SC - Shopping Center* MM = Mini-Mall* BC = Business Center
Property Listing 7.1
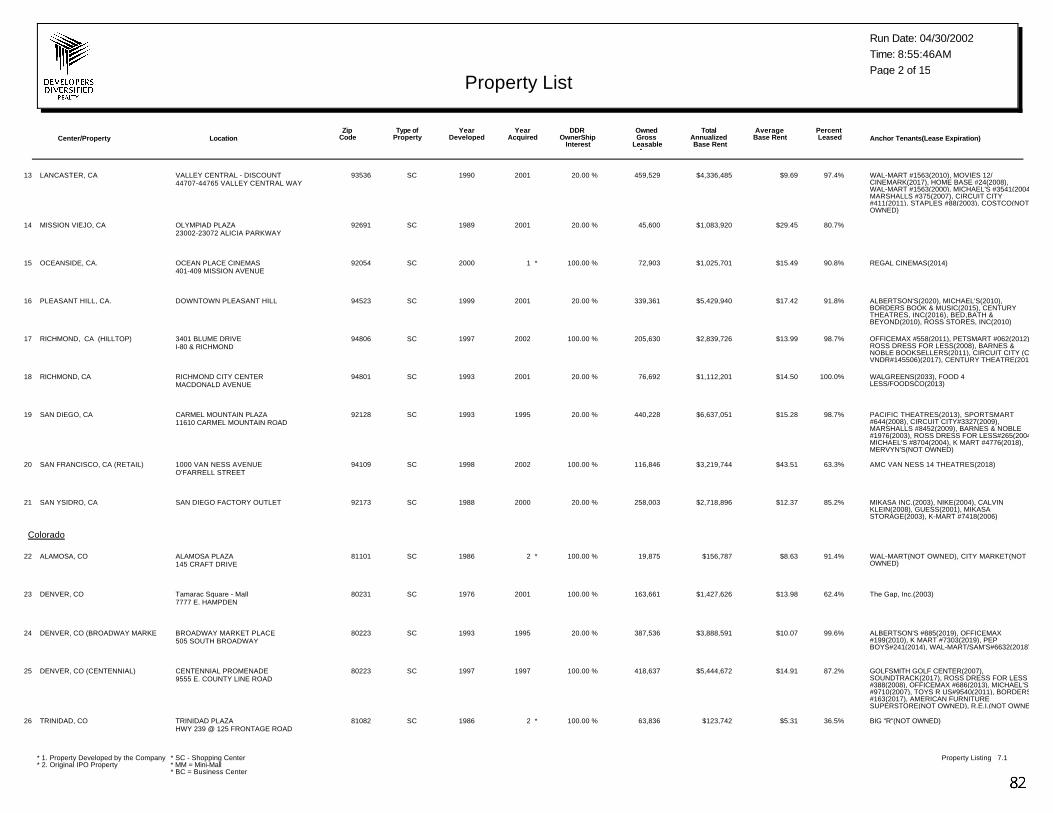
Center/Property LocationYear
AcquiredYear
DevelopedDDR
OwnerShip Interest
Type ofProperty Anchor Tenants(Lease Expiration)
Percent Leased
Average Base Rent
Total Annualized Base Rent
OwnedGross
Leasable Area
Zip Code
Run Date: 04/30/2002
Page 2 of 15Property List
Time: 8:55:46AM
LANCASTER, CA 93536 %20.00VALLEY CENTRAL - DISCOUNT44707-44765 VALLEY CENTRAL WAY
$9.69 %97.4$4,336,4852001SC13 459,529 WAL-MART #1563(2010), MOVIES 12/ CINEMARK(2017), HOME BASE #24(2008), WAL-MART #1563(2000), MICHAEL'S #3541(2004), MARSHALLS #375(2007), CIRCUIT CITY #411(2011), STAPLES #88(2003), COSTCO(NOT OWNED)
1990
MISSION VIEJO, CA 92691 %20.00OLYMPIAD PLAZA23002-23072 ALICIA PARKWAY
$29.45 %80.7$1,083,9202001SC14 45,600 1989
OCEANSIDE, CA. 92054 %100.00OCEAN PLACE CINEMAS401-409 MISSION AVENUE
$15.49 %90.8$1,025,7011SC *15 72,903 REGAL CINEMAS(2014)2000
PLEASANT HILL, CA. 94523 %20.00DOWNTOWN PLEASANT HILL $17.42 %91.8$5,429,9402001SC16 339,361 ALBERTSON'S(2020), MICHAEL'S(2010), BORDERS BOOK & MUSIC(2015), CENTURY THEATRES, INC(2016), BED,BATH & BEYOND(2010), ROSS STORES, INC(2010)
1999
RICHMOND, CA (HILLTOP) 94806 %100.003401 BLUME DRIVEI-80 & RICHMOND
$13.99 %98.7$2,839,7262002SC17 205,630 OFFICEMAX #558(2011), PETSMART #062(2012), ROSS DRESS FOR LESS(2008), BARNES & NOBLE BOOKSELLERS(2011), CIRCUIT CITY (CC VNDR#145506)(2017), CENTURY THEATRE(2016)
1997
RICHMOND, CA 94801 %20.00RICHMOND CITY CENTERMACDONALD AVENUE
$14.50 %100.0$1,112,2012001SC18 76,692 WALGREENS(2033), FOOD 4 LESS/FOODSCO(2013)
1993
SAN DIEGO, CA 92128 %20.00CARMEL MOUNTAIN PLAZA11610 CARMEL MOUNTAIN ROAD
$15.28 %98.7$6,637,0511995SC19 440,228 PACIFIC THEATRES(2013), SPORTSMART #644(2008), CIRCUIT CITY#3327(2009), MARSHALLS #8452(2009), BARNES & NOBLE #1976(2003), ROSS DRESS FOR LESS#265(2004), MICHAEL'S #8704(2004), K MART #4776(2018), MERVYN'S(NOT OWNED)
1993
SAN FRANCISCO, CA (RETAIL) 94109 %100.001000 VAN NESS AVENUEO'FARRELL STREET
$43.51 %63.3$3,219,7442002SC20 116,846 AMC VAN NESS 14 THEATRES(2018)1998
SAN YSIDRO, CA 92173 %20.00SAN DIEGO FACTORY OUTLET $12.37 %85.2$2,718,8962000SC21 258,003 MIKASA INC.(2003), NIKE(2004), CALVIN KLEIN(2008), GUESS(2001), MIKASA STORAGE(2003), K-MART #7418(2006)
1988
Colorado
ALAMOSA, CO 81101 %100.00ALAMOSA PLAZA145 CRAFT DRIVE
$8.63 %91.4$156,7872SC *22 19,875 WAL-MART(NOT OWNED), CITY MARKET(NOT OWNED)
1986
DENVER, CO 80231 %100.00Tamarac Square - Mall7777 E. HAMPDEN
$13.98 %62.4$1,427,6262001SC23 163,661 The Gap, Inc.(2003)1976
DENVER, CO (BROADWAY MARKE 80223 %20.00BROADWAY MARKET PLACE505 SOUTH BROADWAY
$10.07 %99.6$3,888,5911995SC24 387,536 ALBERTSON'S #885(2019), OFFICEMAX #199(2010), K MART #7303(2019), PEP BOYS#241(2014), WAL-MART/SAM'S#6632(2018)
1993
DENVER, CO (CENTENNIAL) 80223 %100.00CENTENNIAL PROMENADE9555 E. COUNTY LINE ROAD
$14.91 %87.2$5,444,6721997SC25 418,637 GOLFSMITH GOLF CENTER(2007), SOUNDTRACK(2017), ROSS DRESS FOR LESS #388(2008), OFFICEMAX #686(2013), MICHAEL'S #9710(2007), TOYS R US#9540(2011), BORDERS #163(2017), AMERICAN FURNITURE SUPERSTORE(NOT OWNED), R.E.I.(NOT OWNED)
1997
TRINIDAD, CO 81082 %100.00TRINIDAD PLAZAHWY 239 @ 125 FRONTAGE ROAD
$5.31 %36.5$123,7422SC *26 63,836 BIG "R"(NOT OWNED)1986
* 1. Property Developed by the Company* 2. Original IPO Property
* SC - Shopping Center* MM = Mini-Mall* BC = Business Center
Property Listing 7.1
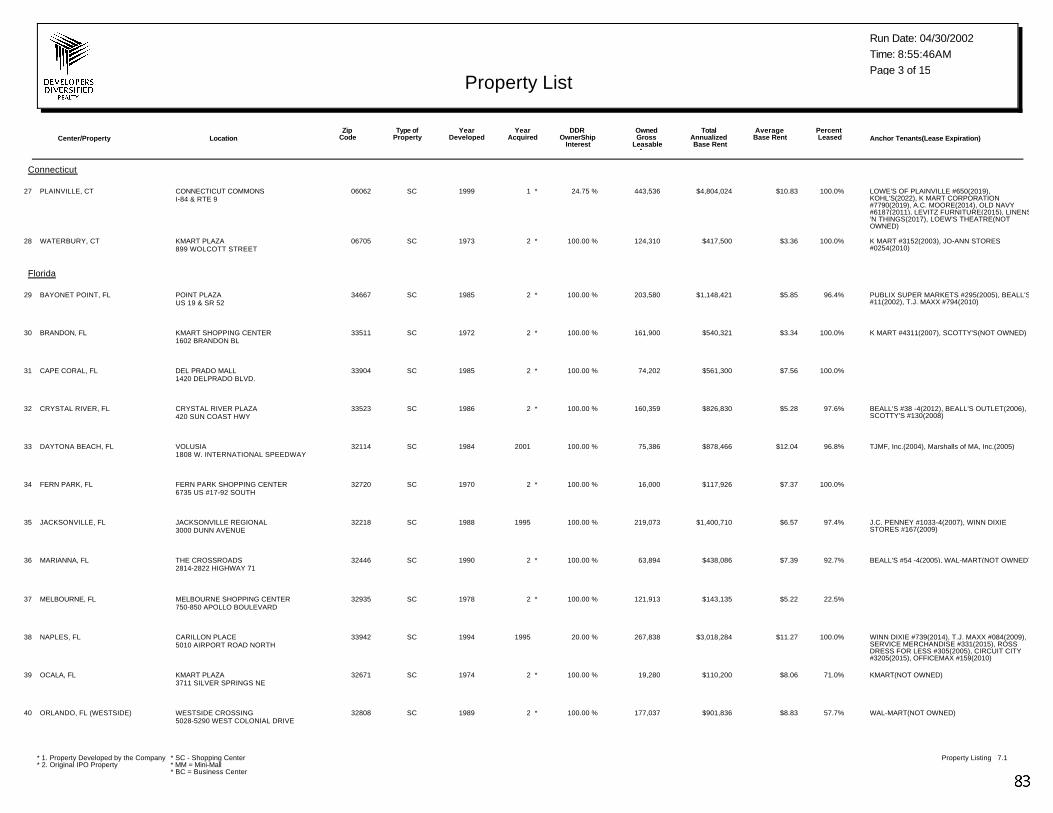
Center/Property LocationYear
AcquiredYear
DevelopedDDR
OwnerShip Interest
Type ofProperty Anchor Tenants(Lease Expiration)
Percent Leased
Average Base Rent
Total Annualized Base Rent
OwnedGross
Leasable Area
Zip Code
Run Date: 04/30/2002
Page 3 of 15Property List
Time: 8:55:46AM
Connecticut
PLAINVILLE, CT 06062 %24.75CONNECTICUT COMMONSI-84 & RTE 9
$10.83 %100.0$4,804,0241SC *27 443,536 LOWE'S OF PLAINVILLE #650(2019), KOHL'S(2022), K MART CORPORATION #7790(2019), A.C. MOORE(2014), OLD NAVY #6187(2011), LEVITZ FURNITURE(2015), LINENS 'N THINGS(2017), LOEW'S THEATRE(NOT OWNED)
1999
WATERBURY, CT 06705 %100.00KMART PLAZA899 WOLCOTT STREET
$3.36 %100.0$417,5002SC *28 124,310 K MART #3152(2003), JO-ANN STORES #0254(2010)
1973
Florida
BAYONET POINT, FL 34667 %100.00POINT PLAZAUS 19 & SR 52
$5.85 %96.4$1,148,4212SC *29 203,580 PUBLIX SUPER MARKETS #295(2005), BEALL'S #11(2002), T.J. MAXX #794(2010)
1985
BRANDON, FL 33511 %100.00KMART SHOPPING CENTER1602 BRANDON BL
$3.34 %100.0$540,3212SC *30 161,900 K MART #4311(2007), SCOTTY'S(NOT OWNED)1972
CAPE CORAL, FL 33904 %100.00DEL PRADO MALL1420 DELPRADO BLVD.
$7.56 %100.0$561,3002SC *31 74,2021985
CRYSTAL RIVER, FL 33523 %100.00CRYSTAL RIVER PLAZA420 SUN COAST HWY
$5.28 %97.6$826,8302SC *32 160,359 BEALL'S #38 -4(2012), BEALL'S OUTLET(2006), SCOTTY'S #130(2008)
1986
DAYTONA BEACH, FL 32114 %100.00VOLUSIA1808 W. INTERNATIONAL SPEEDWAY
$12.04 %96.8$878,4662001SC33 75,386 TJMF, Inc.(2004), Marshalls of MA, Inc.(2005)1984
FERN PARK, FL 32720 %100.00FERN PARK SHOPPING CENTER6735 US #17-92 SOUTH
$7.37 %100.0$117,9262SC *34 16,000 1970
JACKSONVILLE, FL 32218 %100.00JACKSONVILLE REGIONAL3000 DUNN AVENUE
$6.57 %97.4$1,400,7101995SC35 219,073 J.C. PENNEY #1033-4(2007), WINN DIXIE STORES #167(2009)
1988
MARIANNA, FL 32446 %100.00THE CROSSROADS2814-2822 HIGHWAY 71
$7.39 %92.7$438,0862SC *36 63,894 BEALL'S #54 -4(2005), WAL-MART(NOT OWNED)1990
MELBOURNE, FL 32935 %100.00MELBOURNE SHOPPING CENTER750-850 APOLLO BOULEVARD
$5.22 %22.5$143,1352SC *37 121,913 1978
NAPLES, FL 33942 %20.00CARILLON PLACE5010 AIRPORT ROAD NORTH
$11.27 %100.0$3,018,2841995SC38 267,838 WINN DIXIE #739(2014), T.J. MAXX #084(2009), SERVICE MERCHANDISE #331(2015), ROSS DRESS FOR LESS #305(2005), CIRCUIT CITY #3205(2015), OFFICEMAX #159(2010)
1994
OCALA, FL 32671 %100.00KMART PLAZA3711 SILVER SPRINGS NE
$8.06 %71.0$110,2002SC *39 19,280 KMART(NOT OWNED)1974
ORLANDO, FL (WESTSIDE) 32808 %100.00WESTSIDE CROSSING5028-5290 WEST COLONIAL DRIVE
$8.83 %57.7$901,8362SC *40 177,037 WAL-MART(NOT OWNED)1989
* 1. Property Developed by the Company* 2. Original IPO Property
* SC - Shopping Center* MM = Mini-Mall* BC = Business Center
Property Listing 7.1
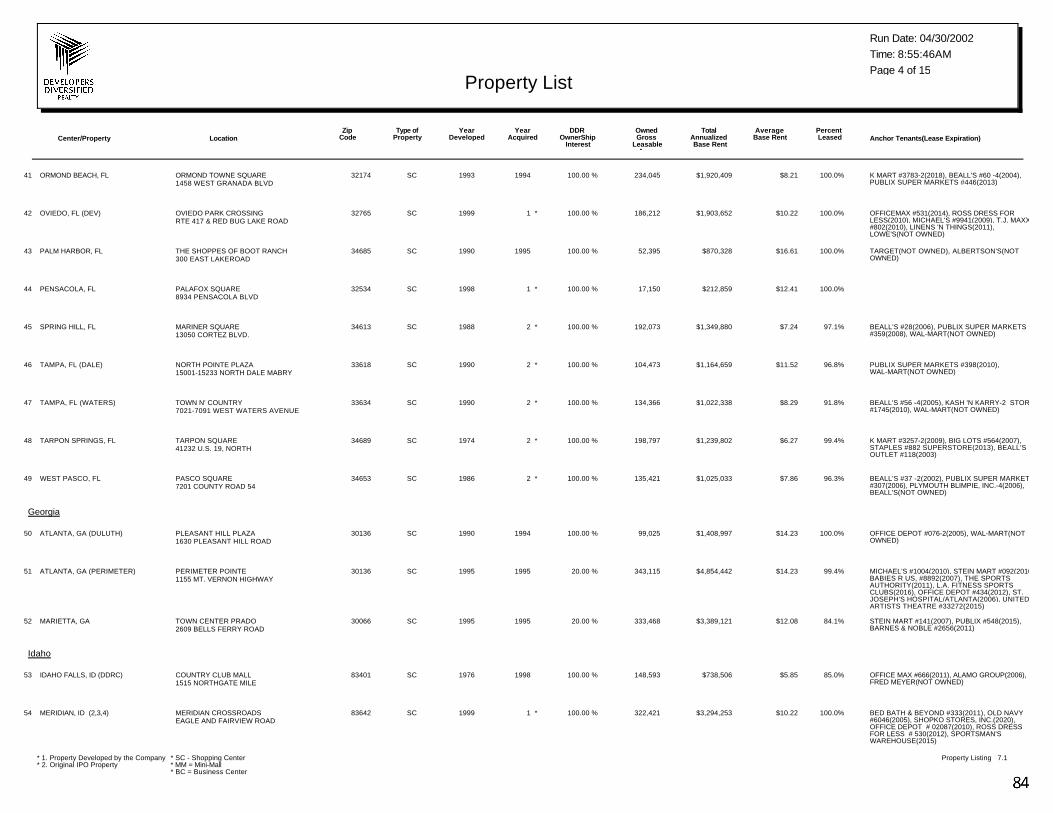
Center/Property LocationYear
AcquiredYear
DevelopedDDR
OwnerShip Interest
Type ofProperty Anchor Tenants(Lease Expiration)
Percent Leased
Average Base Rent
Total Annualized Base Rent
OwnedGross
Leasable Area
Zip Code
Run Date: 04/30/2002
Page 4 of 15Property List
Time: 8:55:46AM
ORMOND BEACH, FL 32174 %100.00ORMOND TOWNE SQUARE1458 WEST GRANADA BLVD
$8.21 %100.0$1,920,4091994SC41 234,045 K MART #3783-2(2018), BEALL'S #60 -4(2004), PUBLIX SUPER MARKETS #446(2013)
1993
OVIEDO, FL (DEV) 32765 %100.00OVIEDO PARK CROSSINGRTE 417 & RED BUG LAKE ROAD
$10.22 %100.0$1,903,6521SC *42 186,212 OFFICEMAX #531(2014), ROSS DRESS FOR LESS(2010), MICHAEL'S #9941(2009), T.J. MAXX #802(2010), LINENS 'N THINGS(2011), LOWE'S(NOT OWNED)
1999
PALM HARBOR, FL 34685 %100.00THE SHOPPES OF BOOT RANCH300 EAST LAKEROAD
$16.61 %100.0$870,3281995SC43 52,395 TARGET(NOT OWNED), ALBERTSON'S(NOT OWNED)
1990
PENSACOLA, FL 32534 %100.00PALAFOX SQUARE8934 PENSACOLA BLVD
$12.41 %100.0$212,8591SC *44 17,150 1998
SPRING HILL, FL 34613 %100.00MARINER SQUARE13050 CORTEZ BLVD.
$7.24 %97.1$1,349,8802SC *45 192,073 BEALL'S #28(2006), PUBLIX SUPER MARKETS #359(2008), WAL-MART(NOT OWNED)
1988
TAMPA, FL (DALE) 33618 %100.00NORTH POINTE PLAZA15001-15233 NORTH DALE MABRY
$11.52 %96.8$1,164,6592SC *46 104,473 PUBLIX SUPER MARKETS #398(2010), WAL-MART(NOT OWNED)
1990
TAMPA, FL (WATERS) 33634 %100.00TOWN N' COUNTRY7021-7091 WEST WATERS AVENUE
$8.29 %91.8$1,022,3382SC *47 134,366 BEALL'S #56 -4(2005), KASH 'N KARRY-2 STORE #1745(2010), WAL-MART(NOT OWNED)
1990
TARPON SPRINGS, FL 34689 %100.00TARPON SQUARE41232 U.S. 19, NORTH
$6.27 %99.4$1,239,8022SC *48 198,797 K MART #3257-2(2009), BIG LOTS #564(2007), STAPLES #882 SUPERSTORE(2013), BEALL'S OUTLET #118(2003)
1974
WEST PASCO, FL 34653 %100.00PASCO SQUARE7201 COUNTY ROAD 54
$7.86 %96.3$1,025,0332SC *49 135,421 BEALL'S #37 -2(2002), PUBLIX SUPER MARKETS #307(2006), PLYMOUTH BLIMPIE, INC.-4(2006), BEALL'S(NOT OWNED)
1986
Georgia
ATLANTA, GA (DULUTH) 30136 %100.00PLEASANT HILL PLAZA1630 PLEASANT HILL ROAD
$14.23 %100.0$1,408,9971994SC50 99,025 OFFICE DEPOT #076-2(2005), WAL-MART(NOT OWNED)
1990
ATLANTA, GA (PERIMETER) 30136 %20.00PERIMETER POINTE1155 MT. VERNON HIGHWAY
$14.23 %99.4$4,854,4421995SC51 343,115 MICHAEL'S #1004(2010), STEIN MART #092(2010), BABIES R US, #8892(2007), THE SPORTS AUTHORITY(2011), L.A. FITNESS SPORTS CLUBS(2016), OFFICE DEPOT #434(2012), ST. JOSEPH'S HOSPITAL/ATLANTA(2006), UNITED ARTISTS THEATRE #33272(2015)
1995
MARIETTA, GA 30066 %20.00TOWN CENTER PRADO2609 BELLS FERRY ROAD
$12.08 %84.1$3,389,1211995SC52 333,468 STEIN MART #141(2007), PUBLIX #548(2015), BARNES & NOBLE #2656(2011)
1995
Idaho
IDAHO FALLS, ID (DDRC) 83401 %100.00COUNTRY CLUB MALL1515 NORTHGATE MILE
$5.85 %85.0$738,5061998SC53 148,593 OFFICE MAX #666(2011), ALAMO GROUP(2006), FRED MEYER(NOT OWNED)
1976
MERIDIAN, ID (2,3,4) 83642 %100.00MERIDIAN CROSSROADSEAGLE AND FAIRVIEW ROAD
$10.22 %100.0$3,294,2531SC *54 322,421 BED BATH & BEYOND #333(2011), OLD NAVY #6046(2005), SHOPKO STORES, INC.(2020), OFFICE DEPOT # 02087(2010), ROSS DRESS FOR LESS # 530(2012), SPORTSMAN'S WAREHOUSE(2015)
1999
* 1. Property Developed by the Company* 2. Original IPO Property
* SC - Shopping Center* MM = Mini-Mall* BC = Business Center
Property Listing 7.1
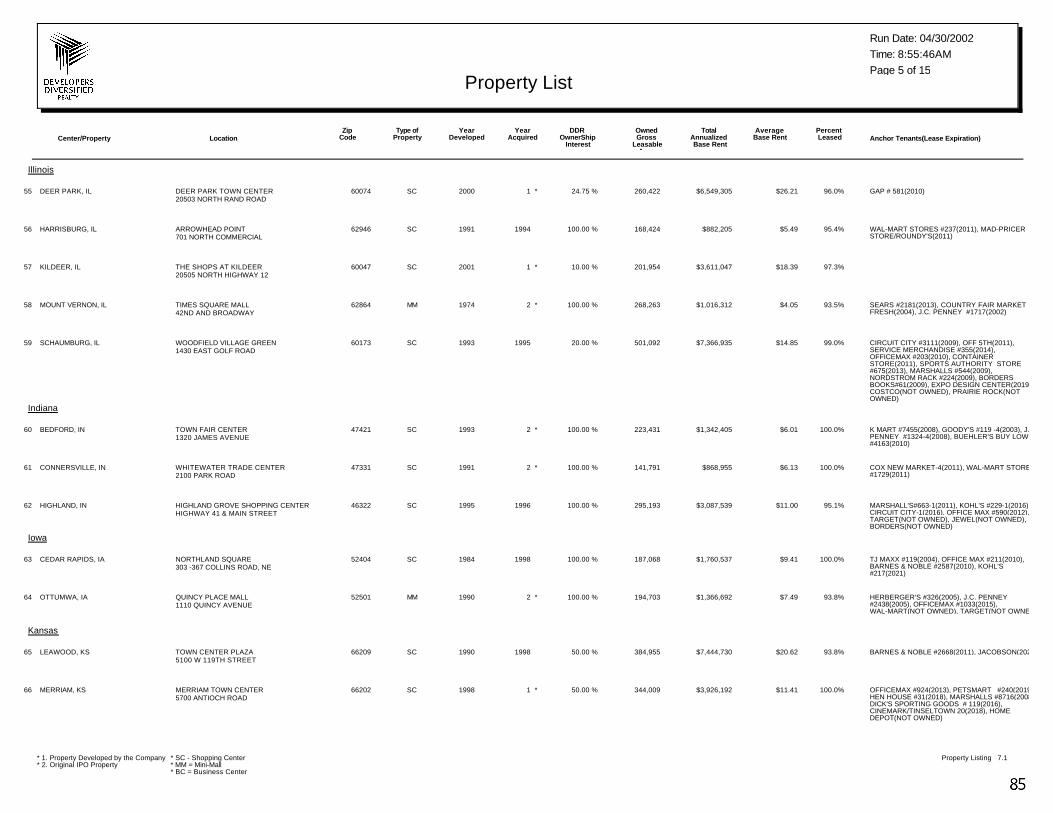
Center/Property LocationYear
AcquiredYear
DevelopedDDR
OwnerShip Interest
Type ofProperty Anchor Tenants(Lease Expiration)
Percent Leased
Average Base Rent
Total Annualized Base Rent
OwnedGross
Leasable Area
Zip Code
Run Date: 04/30/2002
Page 5 of 15Property List
Time: 8:55:46AM
Illinois
DEER PARK, IL 60074 %24.75DEER PARK TOWN CENTER20503 NORTH RAND ROAD
$26.21 %96.0$6,549,3051SC *55 260,422 GAP # 581(2010)2000
HARRISBURG, IL 62946 %100.00ARROWHEAD POINT701 NORTH COMMERCIAL
$5.49 %95.4$882,2051994SC56 168,424 WAL-MART STORES #237(2011), MAD-PRICER STORE/ROUNDY'S(2011)
1991
KILDEER, IL 60047 %10.00THE SHOPS AT KILDEER20505 NORTH HIGHWAY 12
$18.39 %97.3$3,611,0471SC *57 201,954 2001
MOUNT VERNON, IL 62864 %100.00TIMES SQUARE MALL42ND AND BROADWAY
$4.05 %93.5$1,016,3122MM *58 268,263 SEARS #2181(2013), COUNTRY FAIR MARKET FRESH(2004), J.C. PENNEY #1717(2002)
1974
SCHAUMBURG, IL 60173 %20.00WOODFIELD VILLAGE GREEN1430 EAST GOLF ROAD
$14.85 %99.0$7,366,9351995SC59 501,092 CIRCUIT CITY #3111(2009), OFF 5TH(2011), SERVICE MERCHANDISE #355(2014), OFFICEMAX #203(2010), CONTAINER STORE(2011), SPORTS AUTHORITY STORE #675(2013), MARSHALLS #544(2009), NORDSTROM RACK #224(2009), BORDERS BOOKS#61(2009), EXPO DESIGN CENTER(2019), COSTCO(NOT OWNED), PRAIRIE ROCK(NOT OWNED)
1993
Indiana
BEDFORD, IN 47421 %100.00TOWN FAIR CENTER1320 JAMES AVENUE
$6.01 %100.0$1,342,4052SC *60 223,431 K MART #7455(2008), GOODY'S #119 -4(2003), J.C. PENNEY #1324-4(2008), BUEHLER'S BUY LOW #4163(2010)
1993
CONNERSVILLE, IN 47331 %100.00WHITEWATER TRADE CENTER2100 PARK ROAD
$6.13 %100.0$868,9552SC *61 141,791 COX NEW MARKET-4(2011), WAL-MART STORES #1729(2011)
1991
HIGHLAND, IN 46322 %100.00HIGHLAND GROVE SHOPPING CENTERHIGHWAY 41 & MAIN STREET
$11.00 %95.1$3,087,5391996SC62 295,193 MARSHALL'S#663-1(2011), KOHL'S #229-1(2016), CIRCUIT CITY-1(2016), OFFICE MAX #590(2012), TARGET(NOT OWNED), JEWEL(NOT OWNED), BORDERS(NOT OWNED)
1995
Iowa
CEDAR RAPIDS, IA 52404 %100.00NORTHLAND SQUARE303 -367 COLLINS ROAD, NE
$9.41 %100.0$1,760,5371998SC63 187,068 TJ MAXX #119(2004), OFFICE MAX #211(2010), BARNES & NOBLE #2587(2010), KOHL'S #217(2021)
1984
OTTUMWA, IA 52501 %100.00QUINCY PLACE MALL1110 QUINCY AVENUE
$7.49 %93.8$1,366,6922MM *64 194,703 HERBERGER'S #326(2005), J.C. PENNEY #2438(2005), OFFICEMAX #1033(2015), WAL-MART(NOT OWNED), TARGET(NOT OWNED)
1990
Kansas
LEAWOOD, KS 66209 %50.00TOWN CENTER PLAZA5100 W 119TH STREET
$20.62 %93.8$7,444,7301998SC65 384,955 BARNES & NOBLE #2668(2011), JACOBSON(2021)1990
MERRIAM, KS 66202 %50.00MERRIAM TOWN CENTER5700 ANTIOCH ROAD
$11.41 %100.0$3,926,1921SC *66 344,009 OFFICEMAX #924(2013), PETSMART #240(2019), HEN HOUSE #31(2018), MARSHALLS #8716(2008), DICK'S SPORTING GOODS # 119(2016), CINEMARK/TINSELTOWN 20(2018), HOME DEPOT(NOT OWNED)
1998
* 1. Property Developed by the Company* 2. Original IPO Property
* SC - Shopping Center* MM = Mini-Mall* BC = Business Center
Property Listing 7.1
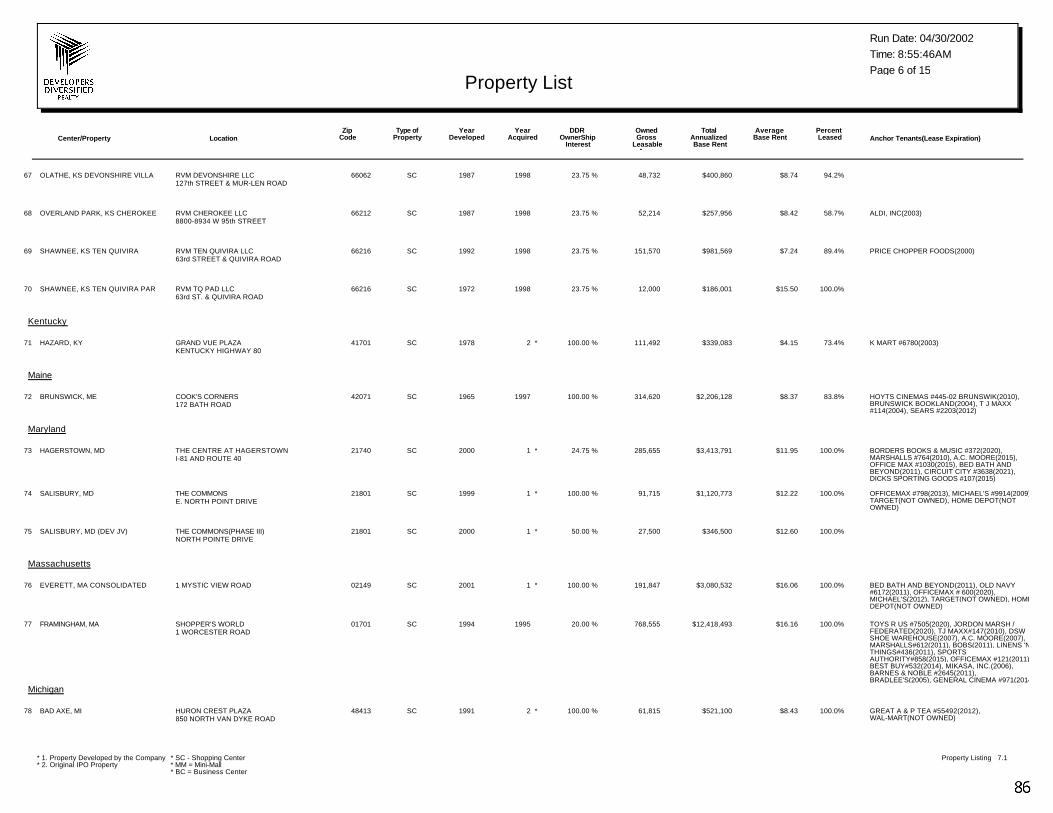
Center/Property LocationYear
AcquiredYear
DevelopedDDR
OwnerShip Interest
Type ofProperty Anchor Tenants(Lease Expiration)
Percent Leased
Average Base Rent
Total Annualized Base Rent
OwnedGross
Leasable Area
Zip Code
Run Date: 04/30/2002
Page 6 of 15Property List
Time: 8:55:46AM
OLATHE, KS DEVONSHIRE VILLA 66062 %23.75RVM DEVONSHIRE LLC127th STREET & MUR-LEN ROAD
$8.74 %94.2$400,8601998SC67 48,732 1987
OVERLAND PARK, KS CHEROKEE 66212 %23.75RVM CHEROKEE LLC8800-8934 W 95th STREET
$8.42 %58.7$257,9561998SC68 52,214 ALDI, INC(2003)1987
SHAWNEE, KS TEN QUIVIRA 66216 %23.75RVM TEN QUIVIRA LLC63rd STREET & QUIVIRA ROAD
$7.24 %89.4$981,5691998SC69 151,570 PRICE CHOPPER FOODS(2000)1992
SHAWNEE, KS TEN QUIVIRA PAR 66216 %23.75RVM TQ PAD LLC63rd ST. & QUIVIRA ROAD
$15.50 %100.0$186,0011998SC70 12,000 1972
Kentucky
HAZARD, KY 41701 %100.00GRAND VUE PLAZAKENTUCKY HIGHWAY 80
$4.15 %73.4$339,0832SC *71 111,492 K MART #6780(2003)1978
Maine
BRUNSWICK, ME 42071 %100.00COOK'S CORNERS172 BATH ROAD
$8.37 %83.8$2,206,1281997SC72 314,620 HOYTS CINEMAS #445-02 BRUNSWIK(2010), BRUNSWICK BOOKLAND(2004), T J MAXX #114(2004), SEARS #2203(2012)
1965
Maryland
HAGERSTOWN, MD 21740 %24.75THE CENTRE AT HAGERSTOWNI-81 AND ROUTE 40
$11.95 %100.0$3,413,7911SC *73 285,655 BORDERS BOOKS & MUSIC #372(2020), MARSHALLS #764(2010), A.C. MOORE(2015), OFFICE MAX #1030(2015), BED BATH AND BEYOND(2011), CIRCUIT CITY #3638(2021), DICKS SPORTING GOODS #107(2015)
2000
SALISBURY, MD 21801 %100.00THE COMMONSE. NORTH POINT DRIVE
$12.22 %100.0$1,120,7731SC *74 91,715 OFFICEMAX #798(2013), MICHAEL'S #9914(2009), TARGET(NOT OWNED), HOME DEPOT(NOT OWNED)
1999
SALISBURY, MD (DEV JV) 21801 %50.00THE COMMONS(PHASE III)NORTH POINTE DRIVE
$12.60 %100.0$346,5001SC *75 27,500 2000
Massachusetts
EVERETT, MA CONSOLIDATED 02149 %100.001 MYSTIC VIEW ROAD $16.06 %100.0$3,080,5321SC *76 191,847 BED BATH AND BEYOND(2011), OLD NAVY #6172(2011), OFFICEMAX # 600(2020), MICHAEL'S(2012), TARGET(NOT OWNED), HOME DEPOT(NOT OWNED)
2001
FRAMINGHAM, MA 01701 %20.00SHOPPER'S WORLD1 WORCESTER ROAD
$16.16 %100.0$12,418,4931995SC77 768,555 TOYS R US #7505(2020), JORDON MARSH / FEDERATED(2020), TJ MAXX#147(2010), DSW SHOE WAREHOUSE(2007), A.C. MOORE(2007), MARSHALLS#612(2011), BOBS(2011), LINENS 'N THINGS#436(2011), SPORTS AUTHORITY#858(2015), OFFICEMAX #121(2011), BEST BUY#532(2014), MIKASA, INC.(2006), BARNES & NOBLE #2645(2011), BRADLEE'S(2005), GENERAL CINEMA #971(2014)
1994
Michigan
BAD AXE, MI 48413 %100.00HURON CREST PLAZA850 NORTH VAN DYKE ROAD
$8.43 %100.0$521,1002SC *78 61,815 GREAT A & P TEA #55492(2012), WAL-MART(NOT OWNED)
1991
* 1. Property Developed by the Company* 2. Original IPO Property
* SC - Shopping Center* MM = Mini-Mall* BC = Business Center
Property Listing 7.1
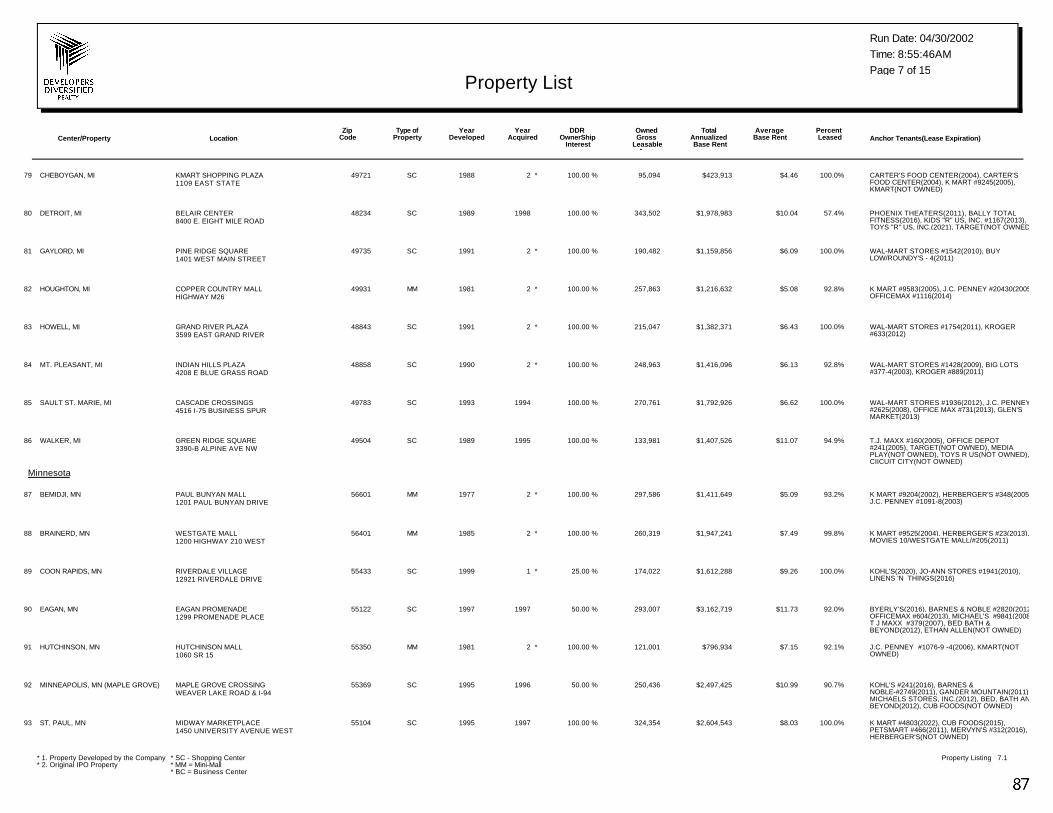
Center/Property LocationYear
AcquiredYear
DevelopedDDR
OwnerShip Interest
Type ofProperty Anchor Tenants(Lease Expiration)
Percent Leased
Average Base Rent
Total Annualized Base Rent
OwnedGross
Leasable Area
Zip Code
Run Date: 04/30/2002
Page 7 of 15Property List
Time: 8:55:46AM
CHEBOYGAN, MI 49721 %100.00KMART SHOPPING PLAZA1109 EAST STATE
$4.46 %100.0$423,9132SC *79 95,094 CARTER'S FOOD CENTER(2004), CARTER'S FOOD CENTER(2004), K MART #9245(2005), KMART(NOT OWNED)
1988
DETROIT, MI 48234 %100.00BELAIR CENTER8400 E. EIGHT MILE ROAD
$10.04 %57.4$1,978,9831998SC80 343,502 PHOENIX THEATERS(2011), BALLY TOTAL FITNESS(2016), KIDS "R" US, INC. #1167(2013), TOYS "R" US, INC.(2021), TARGET(NOT OWNED)
1989
GAYLORD, MI 49735 %100.00PINE RIDGE SQUARE1401 WEST MAIN STREET
$6.09 %100.0$1,159,8562SC *81 190,482 WAL-MART STORES #1542(2010), BUY LOW/ROUNDY'S - 4(2011)
1991
HOUGHTON, MI 49931 %100.00COPPER COUNTRY MALLHIGHWAY M26
$5.08 %92.8$1,216,6322MM *82 257,863 K MART #9583(2005), J.C. PENNEY #20430(2005), OFFICEMAX #1116(2014)
1981
HOWELL, MI 48843 %100.00GRAND RIVER PLAZA3599 EAST GRAND RIVER
$6.43 %100.0$1,382,3712SC *83 215,047 WAL-MART STORES #1754(2011), KROGER #633(2012)
1991
MT. PLEASANT, MI 48858 %100.00INDIAN HILLS PLAZA4208 E BLUE GRASS ROAD
$6.13 %92.8$1,416,0962SC *84 248,963 WAL-MART STORES #1428(2009), BIG LOTS #377-4(2003), KROGER #889(2011)
1990
SAULT ST. MARIE, MI 49783 %100.00CASCADE CROSSINGS4516 I-75 BUSINESS SPUR
$6.62 %100.0$1,792,9261994SC85 270,761 WAL-MART STORES #1936(2012), J.C. PENNEY #2625(2008), OFFICE MAX #731(2013), GLEN'S MARKET(2013)
1993
WALKER, MI 49504 %100.00GREEN RIDGE SQUARE3390-B ALPINE AVE NW
$11.07 %94.9$1,407,5261995SC86 133,981 T.J. MAXX #160(2005), OFFICE DEPOT #241(2005), TARGET(NOT OWNED), MEDIA PLAY(NOT OWNED), TOYS R US(NOT OWNED), CIICUIT CITY(NOT OWNED)
1989
Minnesota
BEMIDJI, MN 56601 %100.00PAUL BUNYAN MALL1201 PAUL BUNYAN DRIVE
$5.09 %93.2$1,411,6492MM *87 297,586 K MART #9204(2002), HERBERGER'S #348(2005), J.C. PENNEY #1091-8(2003)
1977
BRAINERD, MN 56401 %100.00WESTGATE MALL1200 HIGHWAY 210 WEST
$7.49 %99.8$1,947,2412MM *88 260,319 K MART #9525(2004), HERBERGER'S #23(2013), MOVIES 10/WESTGATE MALL/#205(2011)
1985
COON RAPIDS, MN 55433 %25.00RIVERDALE VILLAGE12921 RIVERDALE DRIVE
$9.26 %100.0$1,612,2881SC *89 174,022 KOHL'S(2020), JO-ANN STORES #1941(2010), LINENS 'N THINGS(2016)
1999
EAGAN, MN 55122 %50.00EAGAN PROMENADE1299 PROMENADE PLACE
$11.73 %92.0$3,162,7191997SC90 293,007 BYERLY'S(2016), BARNES & NOBLE #2820(2012), OFFICEMAX #604(2013), MICHAEL'S #9841(2008), T J MAXX #379(2007), BED BATH & BEYOND(2012), ETHAN ALLEN(NOT OWNED)
1997
HUTCHINSON, MN 55350 %100.00HUTCHINSON MALL1060 SR 15
$7.15 %92.1$796,9342MM *91 121,001 J.C. PENNEY #1076-9 -4(2006), KMART(NOT OWNED)
1981
MINNEAPOLIS, MN (MAPLE GROVE) 55369 %50.00MAPLE GROVE CROSSINGWEAVER LAKE ROAD & I-94
$10.99 %90.7$2,497,4251996SC92 250,436 KOHL'S #241(2016), BARNES & NOBLE-#2749(2011), GANDER MOUNTAIN(2011), MICHAELS STORES, INC.(2012), BED, BATH AND BEYOND(2012), CUB FOODS(NOT OWNED)
1995
ST. PAUL, MN 55104 %100.00MIDWAY MARKETPLACE1450 UNIVERSITY AVENUE WEST
$8.03 %100.0$2,604,5431997SC93 324,354 K MART #4803(2022), CUB FOODS(2015), PETSMART #466(2011), MERVYN'S #312(2016), HERBERGER'S(NOT OWNED)
1995
* 1. Property Developed by the Company* 2. Original IPO Property
* SC - Shopping Center* MM = Mini-Mall* BC = Business Center
Property Listing 7.1
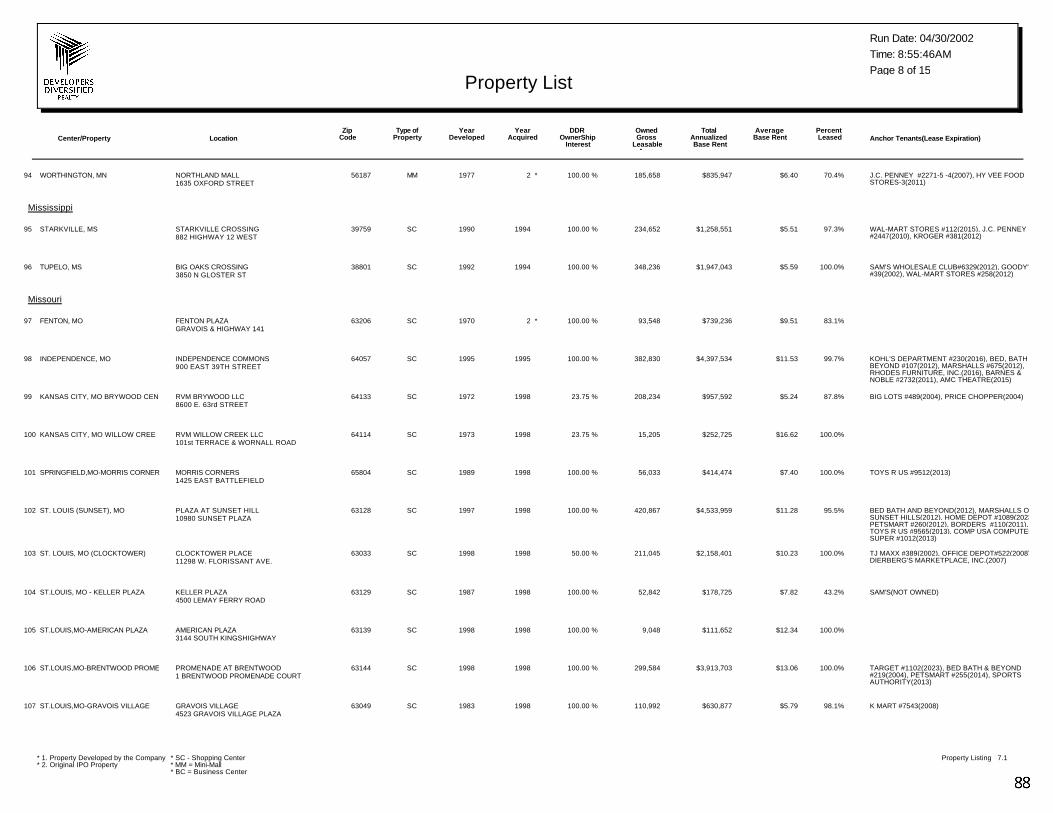
Center/Property LocationYear
AcquiredYear
DevelopedDDR
OwnerShip Interest
Type ofProperty Anchor Tenants(Lease Expiration)
Percent Leased
Average Base Rent
Total Annualized Base Rent
OwnedGross
Leasable Area
Zip Code
Run Date: 04/30/2002
Page 8 of 15Property List
Time: 8:55:46AM
WORTHINGTON, MN 56187 %100.00NORTHLAND MALL1635 OXFORD STREET
$6.40 %70.4$835,9472MM *94 185,658 J.C. PENNEY #2271-5 -4(2007), HY VEE FOOD STORES-3(2011)
1977
Mississippi
STARKVILLE, MS 39759 %100.00STARKVILLE CROSSING882 HIGHWAY 12 WEST
$5.51 %97.3$1,258,5511994SC95 234,652 WAL-MART STORES #112(2015), J.C. PENNEY #2447(2010), KROGER #381(2012)
1990
TUPELO, MS 38801 %100.00BIG OAKS CROSSING3850 N GLOSTER ST
$5.59 %100.0$1,947,0431994SC96 348,236 SAM'S WHOLESALE CLUB#6329(2012), GOODY'S #39(2002), WAL-MART STORES #258(2012)
1992
Missouri
FENTON, MO 63206 %100.00FENTON PLAZAGRAVOIS & HIGHWAY 141
$9.51 %83.1$739,2362SC *97 93,548 1970
INDEPENDENCE, MO 64057 %100.00INDEPENDENCE COMMONS900 EAST 39TH STREET
$11.53 %99.7$4,397,5341995SC98 382,830 KOHL'S DEPARTMENT #230(2016), BED, BATH & BEYOND #107(2012), MARSHALLS #675(2012), RHODES FURNITURE, INC.(2016), BARNES & NOBLE #2732(2011), AMC THEATRE(2015)
1995
KANSAS CITY, MO BRYWOOD CEN 64133 %23.75RVM BRYWOOD LLC8600 E. 63rd STREET
$5.24 %87.8$957,5921998SC99 208,234 BIG LOTS #489(2004), PRICE CHOPPER(2004)1972
KANSAS CITY, MO WILLOW CREE 64114 %23.75RVM WILLOW CREEK LLC101st TERRACE & WORNALL ROAD
$16.62 %100.0$252,7251998SC100 15,205 1973
SPRINGFIELD,MO-MORRIS CORNER 65804 %100.00MORRIS CORNERS1425 EAST BATTLEFIELD
$7.40 %100.0$414,4741998SC101 56,033 TOYS R US #9512(2013)1989
ST. LOUIS (SUNSET), MO 63128 %100.00PLAZA AT SUNSET HILL10980 SUNSET PLAZA
$11.28 %95.5$4,533,9591998SC102 420,867 BED BATH AND BEYOND(2012), MARSHALLS OF SUNSET HILLS(2012), HOME DEPOT #1089(2023), PETSMART #260(2012), BORDERS #110(2011), TOYS R US #9565(2013), COMP USA COMPUTER SUPER #1012(2013)
1997
ST. LOUIS, MO (CLOCKTOWER) 63033 %50.00CLOCKTOWER PLACE11298 W. FLORISSANT AVE.
$10.23 %100.0$2,158,4011998SC103 211,045 TJ MAXX #389(2002), OFFICE DEPOT#522(2008), DIERBERG'S MARKETPLACE, INC.(2007)
1998
ST.LOUIS, MO - KELLER PLAZA 63129 %100.00KELLER PLAZA4500 LEMAY FERRY ROAD
$7.82 %43.2$178,7251998SC104 52,842 SAM'S(NOT OWNED)1987
ST.LOUIS,MO-AMERICAN PLAZA 63139 %100.00AMERICAN PLAZA3144 SOUTH KINGSHIGHWAY
$12.34 %100.0$111,6521998SC105 9,048 1998
ST.LOUIS,MO-BRENTWOOD PROME 63144 %100.00PROMENADE AT BRENTWOOD1 BRENTWOOD PROMENADE COURT
$13.06 %100.0$3,913,7031998SC106 299,584 TARGET #1102(2023), BED BATH & BEYOND #219(2004), PETSMART #255(2014), SPORTS AUTHORITY(2013)
1998
ST.LOUIS,MO-GRAVOIS VILLAGE 63049 %100.00GRAVOIS VILLAGE4523 GRAVOIS VILLAGE PLAZA
$5.79 %98.1$630,8771998SC107 110,992 K MART #7543(2008)1983
* 1. Property Developed by the Company* 2. Original IPO Property
* SC - Shopping Center* MM = Mini-Mall* BC = Business Center
Property Listing 7.1
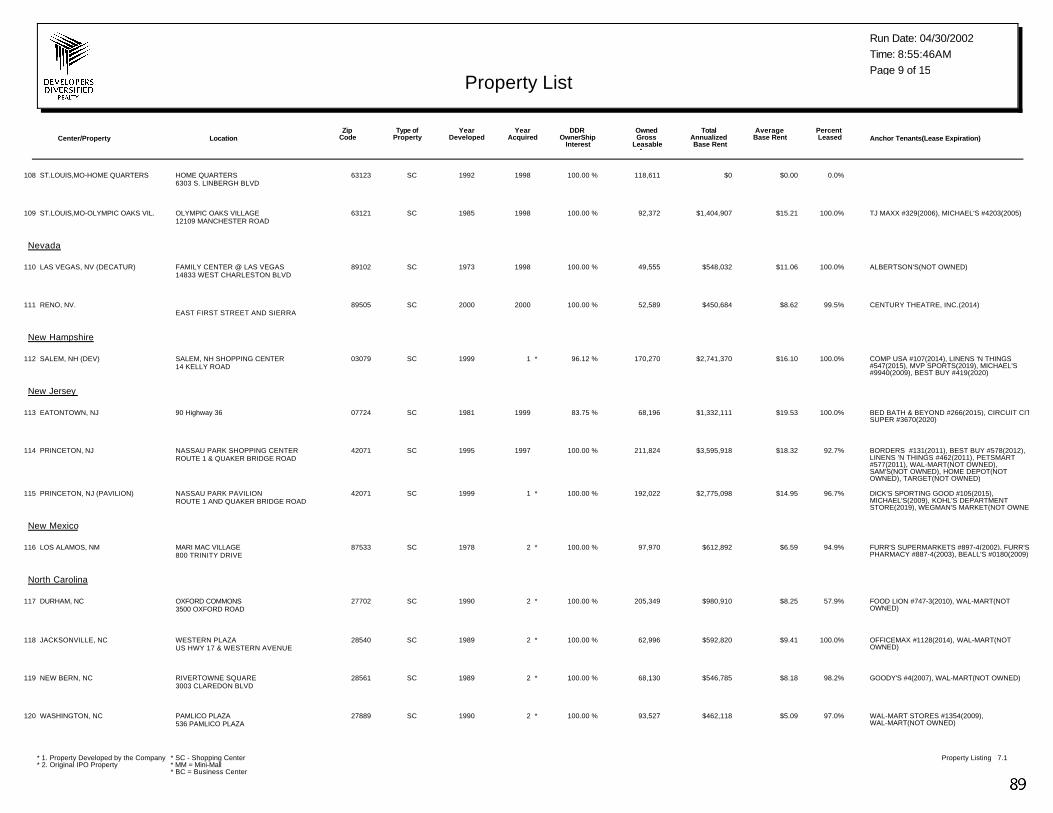
Center/Property LocationYear
AcquiredYear
DevelopedDDR
OwnerShip Interest
Type ofProperty Anchor Tenants(Lease Expiration)
Percent Leased
Average Base Rent
Total Annualized Base Rent
OwnedGross
Leasable Area
Zip Code
Run Date: 04/30/2002
Page 9 of 15Property List
Time: 8:55:46AM
ST.LOUIS,MO-HOME QUARTERS 63123 %100.00HOME QUARTERS6303 S. LINBERGH BLVD
$0.00 %0.0$01998SC108 118,611 1992
ST.LOUIS,MO-OLYMPIC OAKS VIL. 63121 %100.00OLYMPIC OAKS VILLAGE12109 MANCHESTER ROAD
$15.21 %100.0$1,404,9071998SC109 92,372 TJ MAXX #329(2006), MICHAEL'S #4203(2005)1985
Nevada
LAS VEGAS, NV (DECATUR) 89102 %100.00FAMILY CENTER @ LAS VEGAS14833 WEST CHARLESTON BLVD
$11.06 %100.0$548,0321998SC110 49,555 ALBERTSON'S(NOT OWNED)1973
RENO, NV. 89505 %100.00EAST FIRST STREET AND SIERRA
$8.62 %99.5$450,6842000SC111 52,589 CENTURY THEATRE, INC.(2014)2000
New Hampshire
SALEM, NH (DEV) 03079 %96.12SALEM, NH SHOPPING CENTER14 KELLY ROAD
$16.10 %100.0$2,741,3701SC *112 170,270 COMP USA #107(2014), LINENS 'N THINGS #547(2015), MVP SPORTS(2019), MICHAEL'S #9940(2009), BEST BUY #419(2020)
1999
New Jersey
EATONTOWN, NJ 07724 %83.7590 Highway 36 $19.53 %100.0$1,332,1111999SC113 68,196 BED BATH & BEYOND #266(2015), CIRCUIT CITY SUPER #3670(2020)
1981
PRINCETON, NJ 42071 %100.00NASSAU PARK SHOPPING CENTERROUTE 1 & QUAKER BRIDGE ROAD
$18.32 %92.7$3,595,9181997SC114 211,824 BORDERS #131(2011), BEST BUY #578(2012), LINENS 'N THINGS #462(2011), PETSMART #577(2011), WAL-MART(NOT OWNED), SAM'S(NOT OWNED), HOME DEPOT(NOT OWNED), TARGET(NOT OWNED)
1995
PRINCETON, NJ (PAVILION) 42071 %100.00NASSAU PARK PAVILIONROUTE 1 AND QUAKER BRIDGE ROAD
$14.95 %96.7$2,775,0981SC *115 192,022 DICK'S SPORTING GOOD #105(2015), MICHAEL'S(2009), KOHL'S DEPARTMENT STORE(2019), WEGMAN'S MARKET(NOT OWNED)
1999
New Mexico
LOS ALAMOS, NM 87533 %100.00MARI MAC VILLAGE800 TRINITY DRIVE
$6.59 %94.9$612,8922SC *116 97,970 FURR'S SUPERMARKETS #897-4(2002), FURR'S PHARMACY #887-4(2003), BEALL'S #0180(2009)
1978
North Carolina
DURHAM, NC 27702 %100.00OXFORD COMMONS3500 OXFORD ROAD
$8.25 %57.9$980,9102SC *117 205,349 FOOD LION #747-3(2010), WAL-MART(NOT OWNED)
1990
JACKSONVILLE, NC 28540 %100.00WESTERN PLAZAUS HWY 17 & WESTERN AVENUE
$9.41 %100.0$592,8202SC *118 62,996 OFFICEMAX #1128(2014), WAL-MART(NOT OWNED)
1989
NEW BERN, NC 28561 %100.00RIVERTOWNE SQUARE3003 CLAREDON BLVD
$8.18 %98.2$546,7852SC *119 68,130 GOODY'S #4(2007), WAL-MART(NOT OWNED)1989
WASHINGTON, NC 27889 %100.00PAMLICO PLAZA536 PAMLICO PLAZA
$5.09 %97.0$462,1182SC *120 93,527 WAL-MART STORES #1354(2009), WAL-MART(NOT OWNED)
1990
* 1. Property Developed by the Company* 2. Original IPO Property
* SC - Shopping Center* MM = Mini-Mall* BC = Business Center
Property Listing 7.1
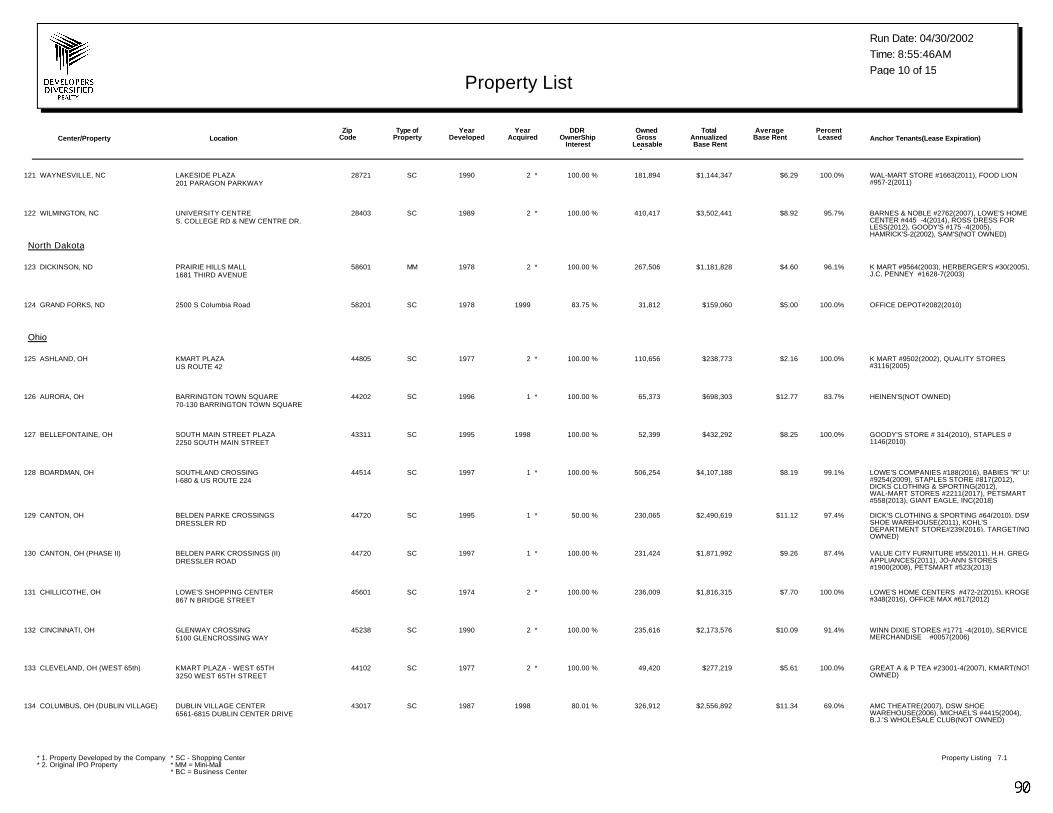
Center/Property LocationYear
AcquiredYear
DevelopedDDR
OwnerShip Interest
Type ofProperty Anchor Tenants(Lease Expiration)
Percent Leased
Average Base Rent
Total Annualized Base Rent
OwnedGross
Leasable Area
Zip Code
Run Date: 04/30/2002
Page 10 of 15Property List
Time: 8:55:46AM
WAYNESVILLE, NC 28721 %100.00LAKESIDE PLAZA201 PARAGON PARKWAY
$6.29 %100.0$1,144,3472SC *121 181,894 WAL-MART STORE #1663(2011), FOOD LION #957-2(2011)
1990
WILMINGTON, NC 28403 %100.00UNIVERSITY CENTRES. COLLEGE RD & NEW CENTRE DR.
$8.92 %95.7$3,502,4412SC *122 410,417 BARNES & NOBLE #2762(2007), LOWE'S HOME CENTER #445 -4(2014), ROSS DRESS FOR LESS(2012), GOODY'S #175 -4(2005), HAMRICK'S-2(2002), SAM'S(NOT OWNED)
1989
North Dakota
DICKINSON, ND 58601 %100.00PRAIRIE HILLS MALL1681 THIRD AVENUE
$4.60 %96.1$1,181,8282MM *123 267,506 K MART #9564(2003), HERBERGER'S #30(2005), J.C. PENNEY #1628-7(2003)
1978
GRAND FORKS, ND 58201 %83.752500 S Columbia Road $5.00 %100.0$159,0601999SC124 31,812 OFFICE DEPOT#2082(2010)1978
Ohio
ASHLAND, OH 44805 %100.00KMART PLAZAUS ROUTE 42
$2.16 %100.0$238,7732SC *125 110,656 K MART #9502(2002), QUALITY STORES #3116(2005)
1977
AURORA, OH 44202 %100.00BARRINGTON TOWN SQUARE70-130 BARRINGTON TOWN SQUARE
$12.77 %83.7$698,3031SC *126 65,373 HEINEN'S(NOT OWNED)1996
BELLEFONTAINE, OH 43311 %100.00SOUTH MAIN STREET PLAZA2250 SOUTH MAIN STREET
$8.25 %100.0$432,2921998SC127 52,399 GOODY'S STORE # 314(2010), STAPLES # 1146(2010)
1995
BOARDMAN, OH 44514 %100.00SOUTHLAND CROSSINGI-680 & US ROUTE 224
$8.19 %99.1$4,107,1881SC *128 506,254 LOWE'S COMPANIES #188(2016), BABIES "R" US #9254(2009), STAPLES STORE #817(2012), DICKS CLOTHING & SPORTING(2012), WAL-MART STORES #2211(2017), PETSMART #558(2013), GIANT EAGLE, INC(2018)
1997
CANTON, OH 44720 %50.00BELDEN PARKE CROSSINGSDRESSLER RD
$11.12 %97.4$2,490,6191SC *129 230,065 DICK'S CLOTHING & SPORTING #64(2010), DSW SHOE WAREHOUSE(2011), KOHL'S DEPARTMENT STORE#239(2016), TARGET(NOT OWNED)
1995
CANTON, OH (PHASE II) 44720 %100.00BELDEN PARK CROSSINGS (II)DRESSLER ROAD
$9.26 %87.4$1,871,9921SC *130 231,424 VALUE CITY FURNITURE #55(2011), H.H. GREGG APPLIANCES(2011), JO-ANN STORES #1900(2008), PETSMART #523(2013)
1997
CHILLICOTHE, OH 45601 %100.00LOWE'S SHOPPING CENTER867 N BRIDGE STREET
$7.70 %100.0$1,816,3152SC *131 236,009 LOWE'S HOME CENTERS #472-2(2015), KROGER #348(2016), OFFICE MAX #617(2012)
1974
CINCINNATI, OH 45238 %100.00GLENWAY CROSSING5100 GLENCROSSING WAY
$10.09 %91.4$2,173,5762SC *132 235,616 WINN DIXIE STORES #1771 -4(2010), SERVICE MERCHANDISE #0057(2006)
1990
CLEVELAND, OH (WEST 65th) 44102 %100.00KMART PLAZA - WEST 65TH3250 WEST 65TH STREET
$5.61 %100.0$277,2192SC *133 49,420 GREAT A & P TEA #23001-4(2007), KMART(NOT OWNED)
1977
COLUMBUS, OH (DUBLIN VILLAGE) 43017 %80.01DUBLIN VILLAGE CENTER6561-6815 DUBLIN CENTER DRIVE
$11.34 %69.0$2,556,8921998SC134 326,912 AMC THEATRE(2007), DSW SHOE WAREHOUSE(2006), MICHAEL'S #4415(2004), B.J.'S WHOLESALE CLUB(NOT OWNED)
1987
* 1. Property Developed by the Company* 2. Original IPO Property
* SC - Shopping Center* MM = Mini-Mall* BC = Business Center
Property Listing 7.1
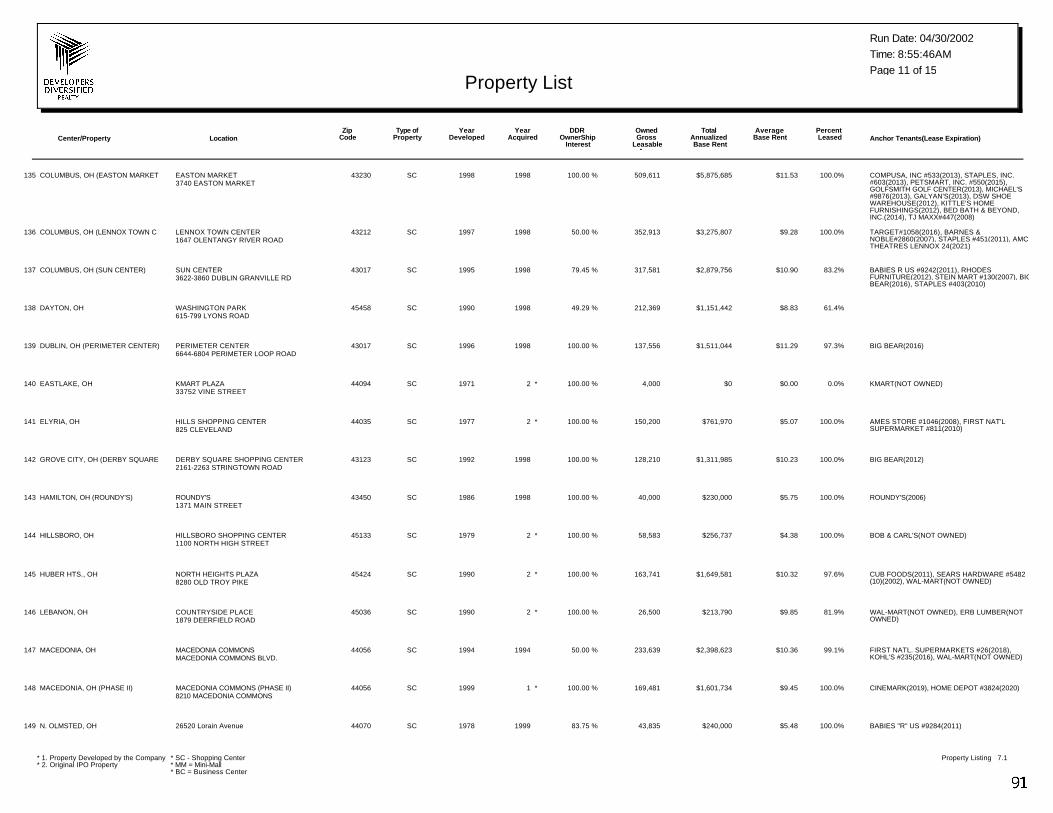
Center/Property LocationYear
AcquiredYear
DevelopedDDR
OwnerShip Interest
Type ofProperty Anchor Tenants(Lease Expiration)
Percent Leased
Average Base Rent
Total Annualized Base Rent
OwnedGross
Leasable Area
Zip Code
Run Date: 04/30/2002
Page 11 of 15Property List
Time: 8:55:46AM
COLUMBUS, OH (EASTON MARKET 43230 %100.00EASTON MARKET3740 EASTON MARKET
$11.53 %100.0$5,875,6851998SC135 509,611 COMPUSA, INC #533(2013), STAPLES, INC. #603(2013), PETSMART, INC. #550(2015), GOLFSMITH GOLF CENTER(2013), MICHAEL'S #9876(2013), GALYAN'S(2013), DSW SHOE WAREHOUSE(2012), KITTLE'S HOME FURNISHINGS(2012), BED BATH & BEYOND, INC.(2014), TJ MAXX#447(2008)
1998
COLUMBUS, OH (LENNOX TOWN C 43212 %50.00LENNOX TOWN CENTER1647 OLENTANGY RIVER ROAD
$9.28 %100.0$3,275,8071998SC136 352,913 TARGET#1058(2016), BARNES & NOBLE#2860(2007), STAPLES #451(2011), AMC THEATRES LENNOX 24(2021)
1997
COLUMBUS, OH (SUN CENTER) 43017 %79.45SUN CENTER3622-3860 DUBLIN GRANVILLE RD
$10.90 %83.2$2,879,7561998SC137 317,581 BABIES R US #9242(2011), RHODES FURNITURE(2012), STEIN MART #130(2007), BIG BEAR(2016), STAPLES #403(2010)
1995
DAYTON, OH 45458 %49.29WASHINGTON PARK615-799 LYONS ROAD
$8.83 %61.4$1,151,4421998SC138 212,369 1990
DUBLIN, OH (PERIMETER CENTER) 43017 %100.00PERIMETER CENTER6644-6804 PERIMETER LOOP ROAD
$11.29 %97.3$1,511,0441998SC139 137,556 BIG BEAR(2016)1996
EASTLAKE, OH 44094 %100.00KMART PLAZA33752 VINE STREET
$0.00 %0.0$02SC *140 4,000 KMART(NOT OWNED)1971
ELYRIA, OH 44035 %100.00HILLS SHOPPING CENTER825 CLEVELAND
$5.07 %100.0$761,9702SC *141 150,200 AMES STORE #1046(2008), FIRST NAT'L SUPERMARKET #811(2010)
1977
GROVE CITY, OH (DERBY SQUARE 43123 %100.00DERBY SQUARE SHOPPING CENTER2161-2263 STRINGTOWN ROAD
$10.23 %100.0$1,311,9851998SC142 128,210 BIG BEAR(2012)1992
HAMILTON, OH (ROUNDY'S) 43450 %100.00ROUNDY'S1371 MAIN STREET
$5.75 %100.0$230,0001998SC143 40,000 ROUNDY'S(2006)1986
HILLSBORO, OH 45133 %100.00HILLSBORO SHOPPING CENTER1100 NORTH HIGH STREET
$4.38 %100.0$256,7372SC *144 58,583 BOB & CARL'S(NOT OWNED)1979
HUBER HTS., OH 45424 %100.00NORTH HEIGHTS PLAZA8280 OLD TROY PIKE
$10.32 %97.6$1,649,5812SC *145 163,741 CUB FOODS(2011), SEARS HARDWARE #5482 (10)(2002), WAL-MART(NOT OWNED)
1990
LEBANON, OH 45036 %100.00COUNTRYSIDE PLACE1879 DEERFIELD ROAD
$9.85 %81.9$213,7902SC *146 26,500 WAL-MART(NOT OWNED), ERB LUMBER(NOT OWNED)
1990
MACEDONIA, OH 44056 %50.00MACEDONIA COMMONSMACEDONIA COMMONS BLVD.
$10.36 %99.1$2,398,6231994SC147 233,639 FIRST NATL. SUPERMARKETS #26(2018), KOHL'S #235(2016), WAL-MART(NOT OWNED)
1994
MACEDONIA, OH (PHASE II) 44056 %100.00MACEDONIA COMMONS (PHASE II)8210 MACEDONIA COMMONS
$9.45 %100.0$1,601,7341SC *148 169,481 CINEMARK(2019), HOME DEPOT #3824(2020)1999
N. OLMSTED, OH 44070 %83.7526520 Lorain Avenue $5.48 %100.0$240,0001999SC149 43,835 BABIES "R" US #9284(2011)1978
* 1. Property Developed by the Company* 2. Original IPO Property
* SC - Shopping Center* MM = Mini-Mall* BC = Business Center
Property Listing 7.1
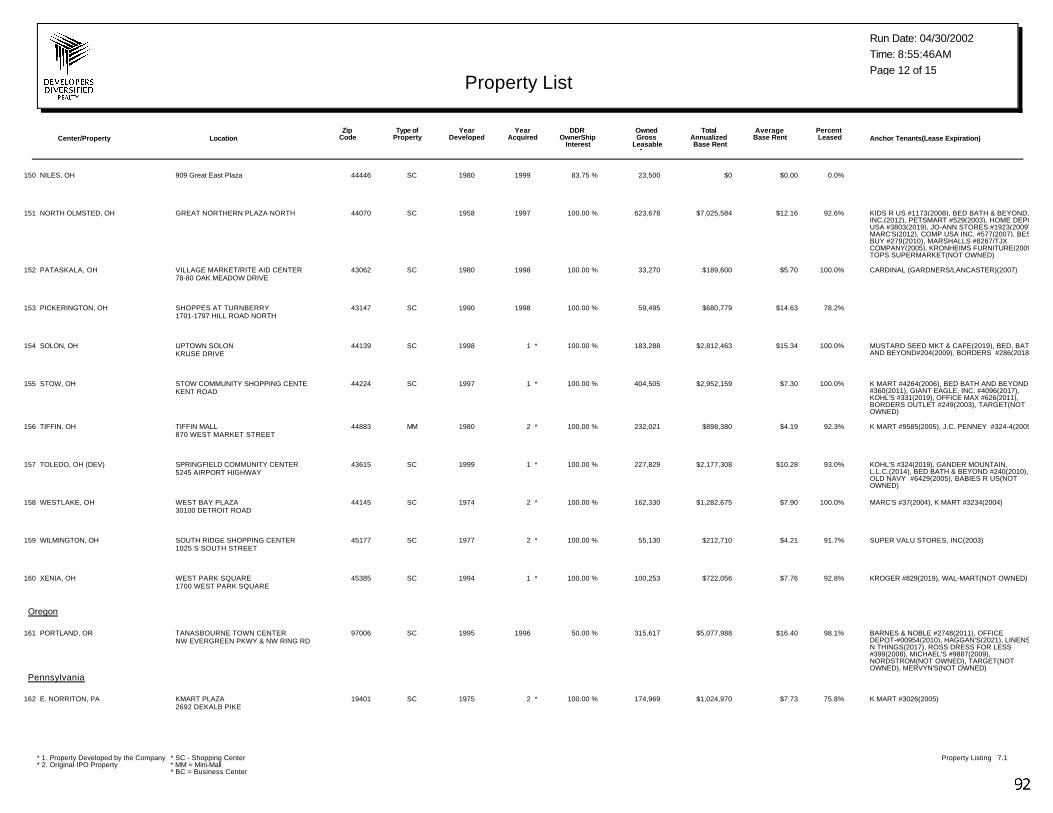
Center/Property LocationYear
AcquiredYear
DevelopedDDR
OwnerShip Interest
Type ofProperty Anchor Tenants(Lease Expiration)
Percent Leased
Average Base Rent
Total Annualized Base Rent
OwnedGross
Leasable Area
Zip Code
Run Date: 04/30/2002
Page 12 of 15Property List
Time: 8:55:46AM
NILES, OH 44446 %83.75909 Great East Plaza $0.00 %0.0$01999SC150 23,500 1980
NORTH OLMSTED, OH 44070 %100.00GREAT NORTHERN PLAZA NORTH $12.16 %92.6$7,025,5841997SC151 623,678 KIDS R US #1173(2008), BED BATH & BEYOND, INC.(2012), PETSMART #529(2003), HOME DEPOT USA #3803(2019), JO-ANN STORES #1923(2009), MARC'S(2012), COMP USA INC. #577(2007), BEST BUY #279(2010), MARSHALLS #8267/TJX COMPANY(2005), KRONHEIMS FURNITURE(2009), TOPS SUPERMARKET(NOT OWNED)
1958
PATASKALA, OH 43062 %100.00VILLAGE MARKET/RITE AID CENTER78-80 OAK MEADOW DRIVE
$5.70 %100.0$189,6001998SC152 33,270 CARDINAL (GARDNERS/LANCASTER)(2007)1980
PICKERINGTON, OH 43147 %100.00SHOPPES AT TURNBERRY1701-1797 HILL ROAD NORTH
$14.63 %78.2$680,7791998SC153 59,495 1990
SOLON, OH 44139 %100.00UPTOWN SOLONKRUSE DRIVE
$15.34 %100.0$2,812,4631SC *154 183,288 MUSTARD SEED MKT & CAFE(2019), BED, BATH AND BEYOND#204(2009), BORDERS #286(2018)
1998
STOW, OH 44224 %100.00STOW COMMUNITY SHOPPING CENTEKENT ROAD
$7.30 %100.0$2,952,1591SC *155 404,505 K MART #4264(2006), BED BATH AND BEYOND #360(2011), GIANT EAGLE, INC. #4096(2017), KOHL'S #331(2019), OFFICE MAX #626(2011), BORDERS OUTLET #249(2003), TARGET(NOT OWNED)
1997
TIFFIN, OH 44883 %100.00TIFFIN MALL870 WEST MARKET STREET
$4.19 %92.3$898,3802MM *156 232,021 K MART #9585(2005), J.C. PENNEY #324-4(2005)1980
TOLEDO, OH (DEV) 43615 %100.00SPRINGFIELD COMMUNITY CENTER5245 AIRPORT HIGHWAY
$10.28 %93.0$2,177,3081SC *157 227,829 KOHL'S #324(2019), GANDER MOUNTAIN, L.L.C.(2014), BED BATH & BEYOND #240(2010), OLD NAVY #6429(2005), BABIES R US(NOT OWNED)
1999
WESTLAKE, OH 44145 %100.00WEST BAY PLAZA30100 DETROIT ROAD
$7.90 %100.0$1,282,6752SC *158 162,330 MARC'S #37(2004), K MART #3234(2004)1974
WILMINGTON, OH 45177 %100.00SOUTH RIDGE SHOPPING CENTER1025 S SOUTH STREET
$4.21 %91.7$212,7102SC *159 55,130 SUPER VALU STORES, INC(2003)1977
XENIA, OH 45385 %100.00WEST PARK SQUARE1700 WEST PARK SQUARE
$7.76 %92.8$722,0561SC *160 100,253 KROGER #829(2019), WAL-MART(NOT OWNED)1994
Oregon
PORTLAND, OR 97006 %50.00TANASBOURNE TOWN CENTERNW EVERGREEN PKWY & NW RING RD
$16.40 %98.1$5,077,9881996SC161 315,617 BARNES & NOBLE #2748(2011), OFFICE DEPOT-#00954(2010), HAGGAN'S(2021), LINENS N THINGS(2017), ROSS DRESS FOR LESS #399(2008), MICHAEL'S #9887(2009), NORDSTROM(NOT OWNED), TARGET(NOT OWNED), MERVYN'S(NOT OWNED)
1995
Pennsylvania
E. NORRITON, PA 19401 %100.00KMART PLAZA2692 DEKALB PIKE
$7.73 %75.8$1,024,9702SC *162 174,969 K MART #3026(2005)1975
* 1. Property Developed by the Company* 2. Original IPO Property
* SC - Shopping Center* MM = Mini-Mall* BC = Business Center
Property Listing 7.1
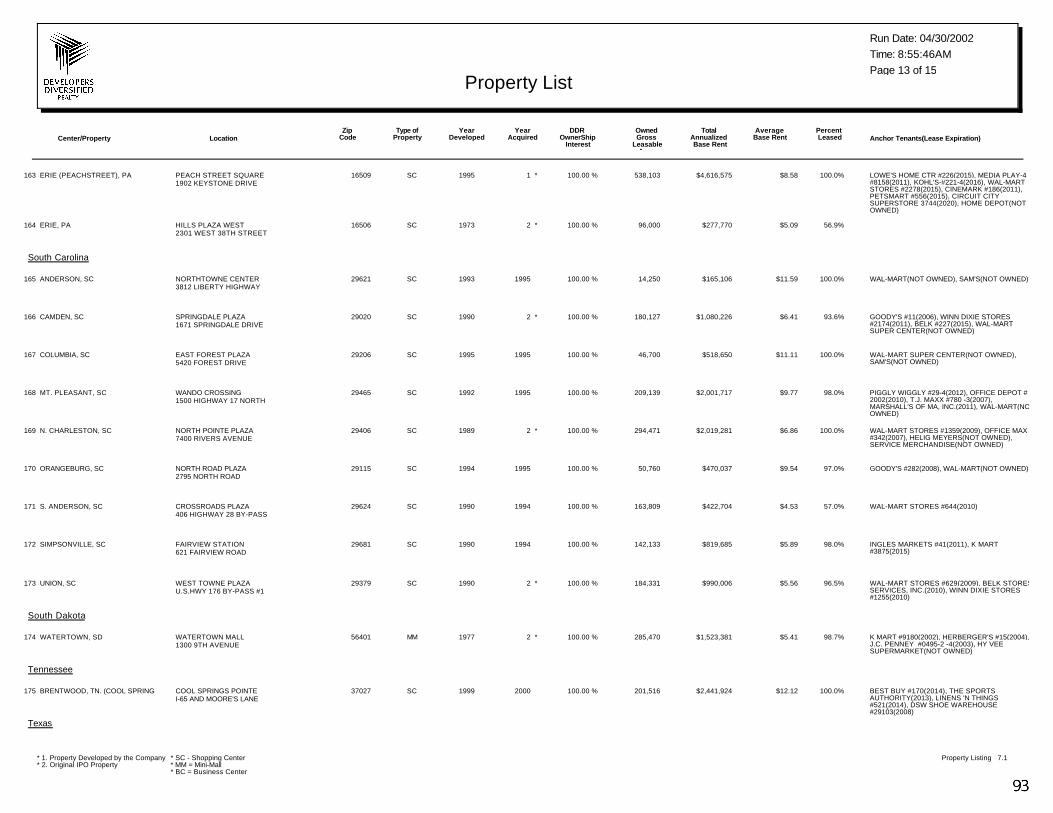
Center/Property LocationYear
AcquiredYear
DevelopedDDR
OwnerShip Interest
Type ofProperty Anchor Tenants(Lease Expiration)
Percent Leased
Average Base Rent
Total Annualized Base Rent
OwnedGross
Leasable Area
Zip Code
Run Date: 04/30/2002
Page 13 of 15Property List
Time: 8:55:46AM
ERIE (PEACHSTREET), PA 16509 %100.00PEACH STREET SQUARE1902 KEYSTONE DRIVE
$8.58 %100.0$4,616,5751SC *163 538,103 LOWE'S HOME CTR #226(2015), MEDIA PLAY-4 #8158(2011), KOHL'S-#221-4(2016), WAL-MART STORES #2278(2015), CINEMARK #186(2011), PETSMART #556(2015), CIRCUIT CITY SUPERSTORE 3744(2020), HOME DEPOT(NOT OWNED)
1995
ERIE, PA 16506 %100.00HILLS PLAZA WEST2301 WEST 38TH STREET
$5.09 %56.9$277,7702SC *164 96,000 1973
South Carolina
ANDERSON, SC 29621 %100.00NORTHTOWNE CENTER3812 LIBERTY HIGHWAY
$11.59 %100.0$165,1061995SC165 14,250 WAL-MART(NOT OWNED), SAM'S(NOT OWNED)1993
CAMDEN, SC 29020 %100.00SPRINGDALE PLAZA1671 SPRINGDALE DRIVE
$6.41 %93.6$1,080,2262SC *166 180,127 GOODY'S #11(2006), WINN DIXIE STORES #2174(2011), BELK #227(2015), WAL-MART SUPER CENTER(NOT OWNED)
1990
COLUMBIA, SC 29206 %100.00EAST FOREST PLAZA5420 FOREST DRIVE
$11.11 %100.0$518,6501995SC167 46,700 WAL-MART SUPER CENTER(NOT OWNED), SAM'S(NOT OWNED)
1995
MT. PLEASANT, SC 29465 %100.00WANDO CROSSING1500 HIGHWAY 17 NORTH
$9.77 %98.0$2,001,7171995SC168 209,139 PIGGLY WIGGLY #29-4(2012), OFFICE DEPOT # 2002(2010), T.J. MAXX #780 -3(2007), MARSHALL'S OF MA, INC.(2011), WAL-MART(NOT OWNED)
1992
N. CHARLESTON, SC 29406 %100.00NORTH POINTE PLAZA7400 RIVERS AVENUE
$6.86 %100.0$2,019,2812SC *169 294,471 WAL-MART STORES #1359(2009), OFFICE MAX #342(2007), HELIG MEYERS(NOT OWNED), SERVICE MERCHANDISE(NOT OWNED)
1989
ORANGEBURG, SC 29115 %100.00NORTH ROAD PLAZA2795 NORTH ROAD
$9.54 %97.0$470,0371995SC170 50,760 GOODY'S #282(2008), WAL-MART(NOT OWNED)1994
S. ANDERSON, SC 29624 %100.00CROSSROADS PLAZA406 HIGHWAY 28 BY-PASS
$4.53 %57.0$422,7041994SC171 163,809 WAL-MART STORES #644(2010)1990
SIMPSONVILLE, SC 29681 %100.00FAIRVIEW STATION621 FAIRVIEW ROAD
$5.89 %98.0$819,6851994SC172 142,133 INGLES MARKETS #41(2011), K MART #3875(2015)
1990
UNION, SC 29379 %100.00WEST TOWNE PLAZAU.S.HWY 176 BY-PASS #1
$5.56 %96.5$990,0062SC *173 184,331 WAL-MART STORES #629(2009), BELK STORES SERVICES, INC.(2010), WINN DIXIE STORES #1255(2010)
1990
South Dakota
WATERTOWN, SD 56401 %100.00WATERTOWN MALL1300 9TH AVENUE
$5.41 %98.7$1,523,3812MM *174 285,470 K MART #9180(2002), HERBERGER'S #15(2004), J.C. PENNEY #0495-2 -4(2003), HY VEE SUPERMARKET(NOT OWNED)
1977
Tennessee
BRENTWOOD, TN. (COOL SPRING 37027 %100.00COOL SPRINGS POINTEI-65 AND MOORE'S LANE
$12.12 %100.0$2,441,9242000SC175 201,516 BEST BUY #170(2014), THE SPORTS AUTHORITY(2013), LINENS 'N THINGS #521(2014), DSW SHOE WAREHOUSE #29103(2008)
1999
Texas
* 1. Property Developed by the Company* 2. Original IPO Property
* SC - Shopping Center* MM = Mini-Mall* BC = Business Center
Property Listing 7.1
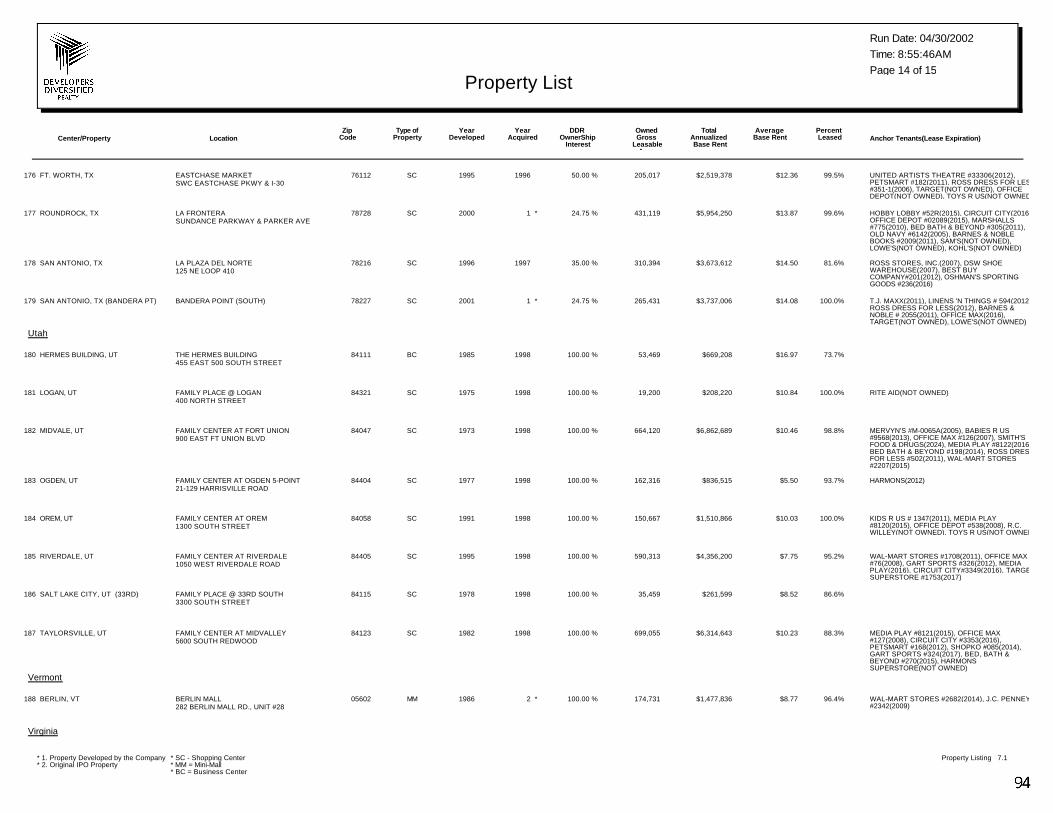
Center/Property LocationYear
AcquiredYear
DevelopedDDR
OwnerShip Interest
Type ofProperty Anchor Tenants(Lease Expiration)
Percent Leased
Average Base Rent
Total Annualized Base Rent
OwnedGross
Leasable Area
Zip Code
Run Date: 04/30/2002
Page 14 of 15Property List
Time: 8:55:46AM
FT. WORTH, TX 76112 %50.00EASTCHASE MARKETSWC EASTCHASE PKWY & I-30
$12.36 %99.5$2,519,3781996SC176 205,017 UNITED ARTISTS THEATRE #33306(2012), PETSMART #182(2011), ROSS DRESS FOR LESS #351-1(2006), TARGET(NOT OWNED), OFFICE DEPOT(NOT OWNED), TOYS R US(NOT OWNED)
1995
ROUNDROCK, TX 78728 %24.75LA FRONTERASUNDANCE PARKWAY & PARKER AVE
$13.87 %99.6$5,954,2501SC *177 431,119 HOBBY LOBBY #52R(2015), CIRCUIT CITY(2016), OFFICE DEPOT #02089(2015), MARSHALLS #775(2010), BED BATH & BEYOND #305(2011), OLD NAVY #6142(2005), BARNES & NOBLE BOOKS #2009(2011), SAM'S(NOT OWNED), LOWE'S(NOT OWNED), KOHL'S(NOT OWNED)
2000
SAN ANTONIO, TX 78216 %35.00LA PLAZA DEL NORTE125 NE LOOP 410
$14.50 %81.6$3,673,6121997SC178 310,394 ROSS STORES, INC.(2007), DSW SHOE WAREHOUSE(2007), BEST BUY COMPANY#201(2012), OSHMAN'S SPORTING GOODS #236(2016)
1996
SAN ANTONIO, TX (BANDERA PT) 78227 %24.75BANDERA POINT (SOUTH) $14.08 %100.0$3,737,0061SC *179 265,431 T.J. MAXX(2011), LINENS 'N THINGS # 594(2012), ROSS DRESS FOR LESS(2012), BARNES & NOBLE # 2055(2011), OFFICE MAX(2016), TARGET(NOT OWNED), LOWE'S(NOT OWNED)
2001
Utah
HERMES BUILDING, UT 84111 %100.00THE HERMES BUILDING455 EAST 500 SOUTH STREET
$16.97 %73.7$669,2081998BC180 53,469 1985
LOGAN, UT 84321 %100.00FAMILY PLACE @ LOGAN400 NORTH STREET
$10.84 %100.0$208,2201998SC181 19,200 RITE AID(NOT OWNED)1975
MIDVALE, UT 84047 %100.00FAMILY CENTER AT FORT UNION900 EAST FT UNION BLVD
$10.46 %98.8$6,862,6891998SC182 664,120 MERVYN'S #M-0065A(2005), BABIES R US #9568(2013), OFFICE MAX #126(2007), SMITH'S FOOD & DRUGS(2024), MEDIA PLAY #8122(2016), BED BATH & BEYOND #198(2014), ROSS DRESS FOR LESS #502(2011), WAL-MART STORES #2207(2015)
1973
OGDEN, UT 84404 %100.00FAMILY CENTER AT OGDEN 5-POINT21-129 HARRISVILLE ROAD
$5.50 %93.7$836,5151998SC183 162,316 HARMONS(2012)1977
OREM, UT 84058 %100.00FAMILY CENTER AT OREM1300 SOUTH STREET
$10.03 %100.0$1,510,8661998SC184 150,667 KIDS R US # 1347(2011), MEDIA PLAY #8120(2015), OFFICE DEPOT #538(2008), R.C. WILLEY(NOT OWNED), TOYS R US(NOT OWNED)
1991
RIVERDALE, UT 84405 %100.00FAMILY CENTER AT RIVERDALE1050 WEST RIVERDALE ROAD
$7.75 %95.2$4,356,2001998SC185 590,313 WAL-MART STORES #1708(2011), OFFICE MAX #76(2008), GART SPORTS #326(2012), MEDIA PLAY(2016), CIRCUIT CITY#3349(2016), TARGET SUPERSTORE #1753(2017)
1995
SALT LAKE CITY, UT (33RD) 84115 %100.00FAMILY PLACE @ 33RD SOUTH3300 SOUTH STREET
$8.52 %86.6$261,5991998SC186 35,459 1978
TAYLORSVILLE, UT 84123 %100.00FAMILY CENTER AT MIDVALLEY5600 SOUTH REDWOOD
$10.23 %88.3$6,314,6431998SC187 699,055 MEDIA PLAY #8121(2015), OFFICE MAX #127(2008), CIRCUIT CITY #3353(2016), PETSMART #168(2012), SHOPKO #085(2014), GART SPORTS #324(2017), BED, BATH & BEYOND #270(2015), HARMONS SUPERSTORE(NOT OWNED)
1982
Vermont
BERLIN, VT 05602 %100.00BERLIN MALL282 BERLIN MALL RD., UNIT #28
$8.77 %96.4$1,477,8362MM *188 174,731 WAL-MART STORES #2682(2014), J.C. PENNEY #2342(2009)
1986
Virginia
* 1. Property Developed by the Company* 2. Original IPO Property
* SC - Shopping Center* MM = Mini-Mall* BC = Business Center
Property Listing 7.1
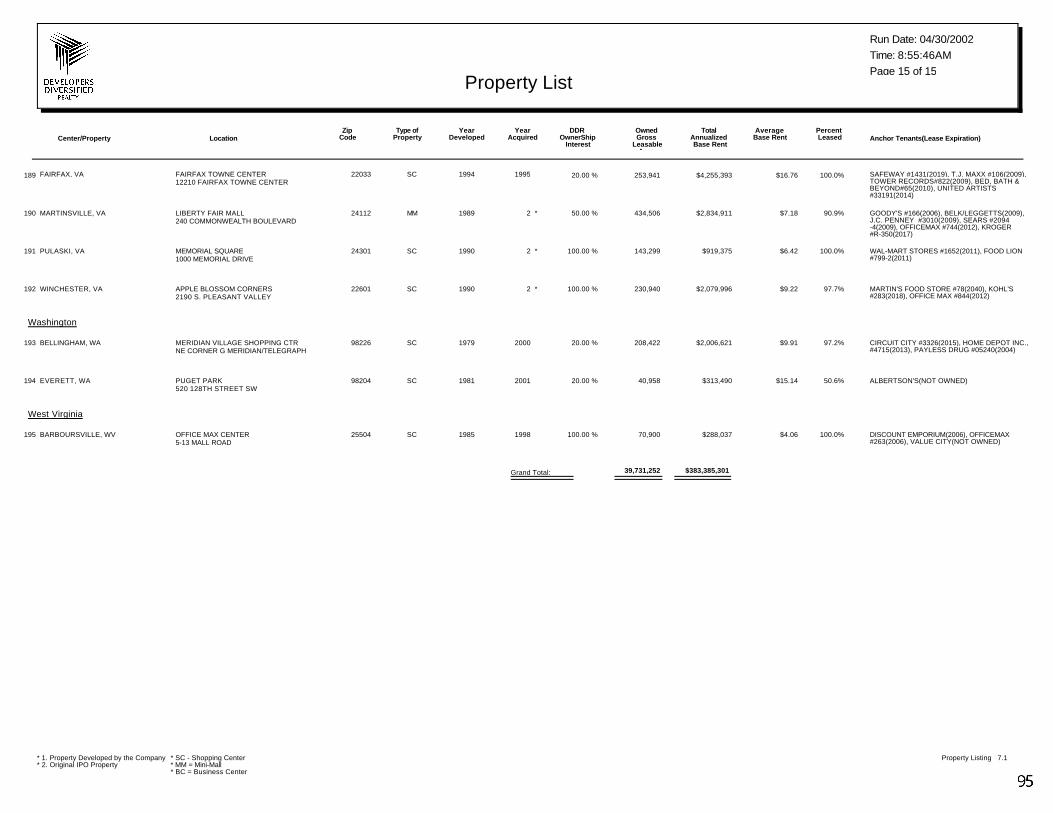
Center/Property LocationYear
AcquiredYear
DevelopedDDR
OwnerShip Interest
Type ofProperty Anchor Tenants(Lease Expiration)
Percent Leased
Average Base Rent
Total Annualized Base Rent
OwnedGross
Leasable Area
Zip Code
Run Date: 04/30/2002
Page 15 of 15Property List
Time: 8:55:46AM
FAIRFAX, VA 22033 %20.00FAIRFAX TOWNE CENTER12210 FAIRFAX TOWNE CENTER
$16.76 %100.0$4,255,3931995SC189 253,941 SAFEWAY #1431(2019), T.J. MAXX #106(2009), TOWER RECORDS#822(2009), BED, BATH & BEYOND#65(2010), UNITED ARTISTS #33191(2014)
1994
MARTINSVILLE, VA 24112 %50.00LIBERTY FAIR MALL240 COMMONWEALTH BOULEVARD
$7.18 %90.9$2,834,9112MM *190 434,506 GOODY'S #166(2006), BELK/LEGGETTS(2009), J.C. PENNEY #3010(2009), SEARS #2094 -4(2009), OFFICEMAX #744(2012), KROGER #R-350(2017)
1989
PULASKI, VA 24301 %100.00MEMORIAL SQUARE1000 MEMORIAL DRIVE
$6.42 %100.0$919,3752SC *191 143,299 WAL-MART STORES #1652(2011), FOOD LION #799-2(2011)
1990
WINCHESTER, VA 22601 %100.00APPLE BLOSSOM CORNERS2190 S. PLEASANT VALLEY
$9.22 %97.7$2,079,9962SC *192 230,940 MARTIN'S FOOD STORE #78(2040), KOHL'S #283(2018), OFFICE MAX #844(2012)
1990
Washington
BELLINGHAM, WA 98226 %20.00MERIDIAN VILLAGE SHOPPING CTRNE CORNER G MERIDIAN/TELEGRAPH
$9.91 %97.2$2,006,6212000SC193 208,422 CIRCUIT CITY #3326(2015), HOME DEPOT INC., #4715(2013), PAYLESS DRUG #05240(2004)
1979
EVERETT, WA 98204 %20.00PUGET PARK520 128TH STREET SW
$15.14 %50.6$313,4902001SC194 40,958 ALBERTSON'S(NOT OWNED)1981
West Virginia
BARBOURSVILLE, WV 25504 %100.00OFFICE MAX CENTER5-13 MALL ROAD
$4.06 %100.0$288,0371998SC195 70,900 DISCOUNT EMPORIUM(2006), OFFICEMAX #263(2006), VALUE CITY(NOT OWNED)
1985
$383,385,301Grand Total: 39,731,252
* 1. Property Developed by the Company* 2. Original IPO Property
* SC - Shopping Center* MM = Mini-Mall* BC = Business Center
Property Listing 7.1
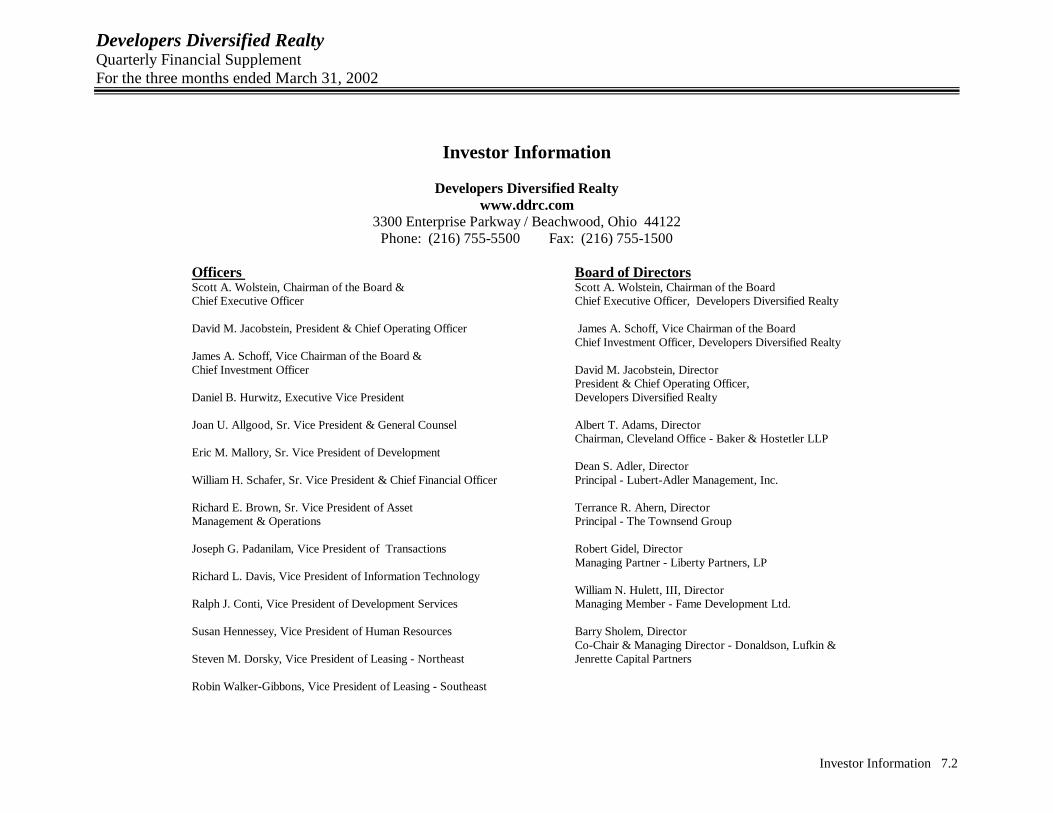
Developers Diversified Realty Quarterly Financial Supplement For the three months ended March 31, 2002
Investor Information 7.2
Investor Information
Developers Diversified Realty www.ddrc.com
3300 Enterprise Parkway / Beachwood, Ohio 44122 Phone: (216) 755-5500 Fax: (216) 755-1500
Officers Board of Directors Scott A. Wolstein, Chairman of the Board & Scott A. Wolstein, Chairman of the Board Chief Executive Officer Chief Executive Officer, Developers Diversified Realty David M. Jacobstein, President & Chief Operating Officer James A. Schoff, Vice Chairman of the Board
Chief Investment Officer, Developers Diversified Realty James A. Schoff, Vice Chairman of the Board & Chief Investment Officer David M. Jacobstein, Director President & Chief Operating Officer, Daniel B. Hurwitz, Executive Vice President Developers Diversified Realty Joan U. Allgood, Sr. Vice President & General Counsel Albert T. Adams, Director Chairman, Cleveland Office - Baker & Hostetler LLP Eric M. Mallory, Sr. Vice President of Development Dean S. Adler, Director William H. Schafer, Sr. Vice President & Chief Financial Officer Principal - Lubert-Adler Management, Inc. Richard E. Brown, Sr. Vice President of Asset Terrance R. Ahern, Director Management & Operations Principal - The Townsend Group Joseph G. Padanilam, Vice President of Transactions Robert Gidel, Director Managing Partner - Liberty Partners, LP Richard L. Davis, Vice President of Information Technology William N. Hulett, III, Director Ralph J. Conti, Vice President of Development Services Managing Member - Fame Development Ltd. Susan Hennessey, Vice President of Human Resources Barry Sholem, Director Co-Chair & Managing Director - Donaldson, Lufkin & Steven M. Dorsky, Vice President of Leasing - Northeast Jenrette Capital Partners Robin Walker-Gibbons, Vice President of Leasing - Southeast
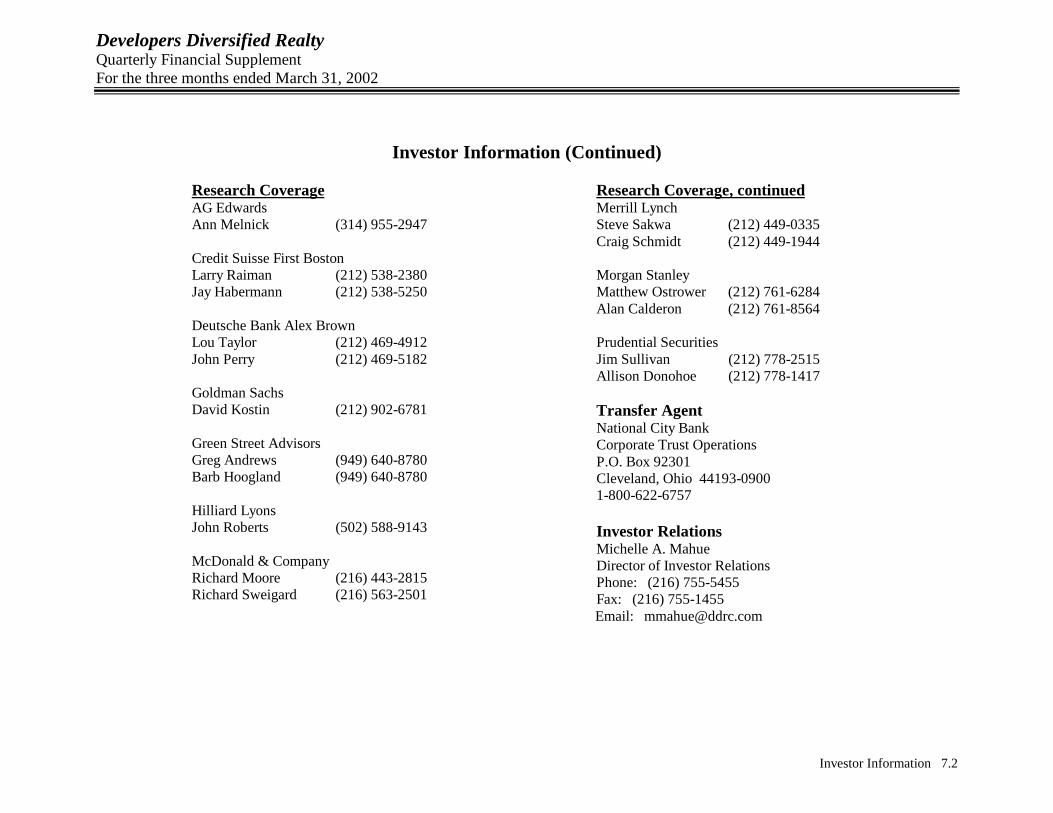
Developers Diversified Realty Quarterly Financial Supplement For the three months ended March 31, 2002
Investor Information 7.2
Investor Information (Continued) Research Coverage AG Edwards Ann Melnick (314) 955-2947 Credit Suisse First Boston Larry Raiman (212) 538-2380 Jay Habermann (212) 538-5250 Deutsche Bank Alex Brown Lou Taylor (212) 469-4912 John Perry (212) 469-5182 Goldman Sachs David Kostin (212) 902-6781 Green Street Advisors Greg Andrews (949) 640-8780 Barb Hoogland (949) 640-8780 Hilliard Lyons John Roberts (502) 588-9143 McDonald & Company Richard Moore (216) 443-2815 Richard Sweigard (216) 563-2501
Research Coverage, continued Merrill Lynch Steve Sakwa (212) 449-0335 Craig Schmidt (212) 449-1944 Morgan Stanley Matthew Ostrower (212) 761-6284 Alan Calderon (212) 761-8564 Prudential Securities Jim Sullivan (212) 778-2515 Allison Donohoe (212) 778-1417 Transfer Agent National City Bank Corporate Trust Operations P.O. Box 92301 Cleveland, Ohio 44193-0900 1-800-622-6757 Investor Relations Michelle A. Mahue Director of Investor Relations Phone: (216) 755-5455 Fax: (216) 755-1455
Email: [email protected]


