Embed Size (px)
Citation preview
Quantitative Neuromorphometry Using Magnetic ResonanceHistology
G. Allan Johnson, Alexandra Badea, and Yi JiangDuke Center for In Vivo Microscopy, Durham, NC 27710
AbstractMagnetic resonance imaging (MRI), now common in the clinical domain, has been adapted for useby the neuropathologist by increasing the spatial resolution over 100,000-times what is common inhuman clinical imaging. This increase in spatial resolution has been accomplished through avariety of technical advances—higher magnetic fields, more sensitive receivers, and cleverencoding methods. Magnetic resonance histology (MRH), i.e. the application of MRI to studytissue specimens, now makes three-dimensional imaging of the fixed brain in the cranium routine.Active staining (perfusion fixation with a paramagnetic contrast agent) has allowed us to reducethe scan time by more than 8-times over earlier methods. The result is a three-dimensionalisotropic image array that can be viewed along any direction without loss of spatial resolution.Homologous slices can be chosen interactively. Since the tissue is still fully hydrated in thecranium, tissue shrinkage and distortion are virtually eliminated. Volume measurements of neuralstructures can be made with a high degree of precision and accuracy. MRH will not replace moretraditional methods, but it promises enormous value in choosing particular areas and times formore traditional sectioning and assessment.
KeywordsContrast agents; magnetic resonance microscopy; magnetic resonance imaging; magneticresonance histology; neuromorphometry; neuroimaging
IntroductionMagnetic resonance imaging (MRI) has revolutionized modern clinical medicine. PaulLauterbur and Peter Mansfield, who shared the 2003 Nobel Prize in Physiology andMedicine for their invention of MRI, both recognized the potential for the application ofMRI beyond the clinical domain. The concluding sentence of Lauterbur’s paper notes that“Zeugmatographic (imaging) techniques should find many useful application in studies ofthe internal structures, states and compositions of microscopic objects” (Lauterbur, 1973).Peter Mansfield recognized in one of his early papers “Diffraction in microscopy in solidsand liquids by NMR” that MRI could be performed at spatial resolution far higher than thelimit imposed by conventional diffraction (Mansfield and Grannell, 1975). Magneticresonance microscopy (MRM) was introduced to practice in 1986 with the first laboratorydemonstration of MRM (Aguayo et al., 1986; Eccles and Callaghan, 1986; Johnson et al.,1986).
Conflict of interest:None of the authors have conflicts of interest associated with this manuscript.
NIH Public AccessAuthor ManuscriptToxicol Pathol. Author manuscript; available in PMC 2012 January 1.
Published in final edited form as:Toxicol Pathol. 2011 ; 39(1): 85–91. doi:10.1177/0192623310389622.
NIH
-PA Author Manuscript
NIH
-PA Author Manuscript
NIH
-PA Author Manuscript
Over the last 25 years, steady technical progress has been made in magnetic resonancemicroscopy with applications in a wide range of animal models, drug discovery, and safetyassessment. The demonstration of magnetic resonance histology (MRH) in 1993 (Johnson etal., 1993) introduced a particularly novel application for pathologists. While there have beena number of reports of MRH in neurotoxicology (Lester et al., 1999; Lester et al., 2000;Maronpot et al., 2004; Morgan et al. 2004; Sills et al., 2004), broad use of the technologyhas been limited by spatial resolution, complexity, availability, and cost. This paper willprovide an update on efforts to remove these barriers, thus making MRH more widelyavailable to the pathology community.
Materials and MethodsAll imaging studies were conducted at the Duke Center for In Vivo Microscopy, an NIH/National Center for Research Resources (NCRR) National Biomedical Technology ResearchCenter, under guidelines approved by the Duke Institutional Animal Care and UseCommittee. Tissues were prepared using the active staining protocol described more fullyelsewhere (Johnson et al., 2002). The same perfusion technique is used for both the mouseand rat. Animals are brought to a surgical plane of anesthesia. The thoracic cavity is openedand a small catheter is inserted into the left ventricle, and the right atrium is then cut fordrainage. The animal is perfused initially with a mixture of saline and ProHance (10:1saline:ProHance) (Gadoteridol, Bracco Diagnostics, Inc., Princeton, NJ), followed by amixture of ProHance in 10% neutral buffered formalin (10:1 formalin:ProHance byvolume). The head is removed from the body and further fixed for at least 24 hours byimmersion in neutral buffered formalin before imaging. On the day of imaging, excess skin,muscle, and lower jaw are trimmed from the head with the brain still in the cranium, so itfits tightly in an acrylic holder filled with fomblin (Ausimont USA, Inc., Thorofare, NJ) (aperfluorocarbon used to limit magnetic susceptibility artifacts); this holder has beendesigned explicitly for MR histology.
Data shown here were acquired on three systems operating at 9.4T, 7.0T, and 1.0T. The 9.4T system is an 89-mm vertical bore (50-mm clear bore) superconducting magnet withResonance Research gradients (Resonance Research, Inc., Billerica, MA) capable ofreaching 2000 mT/m. The 7.0T system is a 210-mm bore (90-mm clear bore) horizontalsuperconducting magnet with Resonance Research gradients achieving 740 mT/m. Both the9.4 and 7.0 T systems are interfaced to General Electric (GE Healthcare, Milwaukee, WI)imaging consoles that have been modified for MR microscopy. The 1.0 T magnet representsa more economical new approach using a permanent magnet. The self-shielded permanentmagnet requires very little site preparation, uses no cryogens, and is significantly lessexpensive. The computer console has been designed for simple imaging protocols andhigher throughput required in screening studies.
A range of imaging software has been used for this work. For the highest-resolution studiesfrom the 7.0T and 9.4T systems, data were reconstructed on specialized offlinereconstruction engines that accommodate very large image arrays (to 40963) (Johnson et al.,2007). Image-processing pipelines have been developed on two dedicated workstations forimage segmentation using tools implemented in Advanced Normalization Tools (ANTS)(http://www.picsl.upenn.edu/ANTS/) and the National Library of Medicine’s InsightSegmentation and Registration Toolkit (ITK) (www.itk.org); diffusion calculation usingDTIStudio (https://www.mristudio.org/); and visualization using a combination of ImageJ(http://rsbweb.nih.gov/ij/), Avizo (VSG, Visualization Sciences Group, Burlington MA)(http://www.vsg3d.com), and Vitrea (Vital Images, Inc., Minnetonka, MN)(http://www.vitalimages.com/home.aspx).
Johnson et al. Page 2
Toxicol Pathol. Author manuscript; available in PMC 2012 January 1.
NIH
-PA Author Manuscript
NIH
-PA Author Manuscript
NIH
-PA Author Manuscript
ResultsActive staining allows one to reduce the scan time by as much as 10 times by perfusing thespecimen with a mixture of formalin and an MR contrast agent that reduces the spin latticerelaxation time of the tissues. Figure 1 shows a series of 1-mm-thick MR images of fixedmouse brains acquired on the 9.4T system. The details of spatial encoding in MR can befound in these good textbooks (Haacke et al., 1999;Bernstein et al., 2004). To encode thedata (i.e. to image), a series of radiofrequency pulses is applied to the specimen at regularintervals (TR) ranging from 10 ms to 3 seconds. During the interval between pulses, theexcited protons recover. The active stain used for specimen studies contains gadolinium(Gd), a transition metal with unpaired electrons. These paramagnetic electrons enhance therecovery process, which results in enormous gain in signal strength. The top row of Figure 1shows images acquired with TR ranging from 20 ms to 2.56 seconds. In this formalin-fixedspecimen, there is very little signal until TR reaches 320 ms. The bottom row of Figure 1shows a specimen that was actively stained with the Gd contrast agent, and the same seriesof images was acquired. The faster recovery of the signal between pulses results in muchstronger signal at all TRs. A plot of signal in the caudate putamen is shown in Figure 2. Thetime required to generate an image is TR × number of phase-encoding steps (in thisexample, 256 along the vertical axis). Thus, the acquisition time for images in the stainedbrain (lower row) is 82 seconds. In the absence of the stain (top row), the signal requiresmore than 2.5 seconds to recover to yield an imaging time of 656 seconds, i.e. a scan that is8-times longer.
With a shorter TR, a specimen can be scanned with three-dimensional (3D) arrays. Again,the interested reader is directed to the literature for the technical details (Suddarth andJohnson, 1991; Johnson et al., 2007). 3D encoding strategies allow volumetric images to beacquired in which the spatial resolution is the same along any axis—the results are shown inFigure 3. The images are extracted from a 512×512×1024 3D array of an actively stained18.5-day mouse fetus. The data are from a study of the developing fetus from embryonic day9 through postnatal day 32 (Petiet et al., 2008). The spatial resolution is isotropic, i.e. thesame along every axis. Each element of the 3D array represents the signal from a volume oftissue (voxel) that is 20 µm on a side (voxel volume=8 pl). By comparison, a clinical humanbrain scan can use voxels that are 1 mm on a side (voxel volume=1µl). Thus, the resolutionin Figure 3 is 125,000-times greater than those typically encountered in the clinic. In theexample shown in Figure 3, we have used Vitrea software that allows interactively anglingthe slice through the volume to define the plane in Figure 3a at ~2° from the longitudinalaxis of the animal (see red line in Figure 3a). This allows viewing of the optic nerve exitingthe back of the eye (arrow 1 Figure 3a). The nerve can be followed into the visual cortex(arrow 2 in Figure 3b). A set of cursors (blue and red) in this plane can then be rotated todefine the oblique plane that follows the optic nerve. The result shown in Figure 3b showsthe nerve entering the cranial vault (arrow 2 in Figure 3b) in the sagittal plane.
Since the specimen is not physically sliced, i.e. the specimen is intact and the tissue has notbeen dehydrated, the anatomic relationships are maintained—for example, the optic nerverelative to the cochlea (arrow 3 in Figure 3a). Since the specimen is still in the cranial vaultand there is no visible separation of the tissues, any linear measurements taken will be farmore representative of the in vivo setting than those done with conventional optical sections.
A reasonable question to ask is why MR has been successful clinically, when computedtomography (CT) scanners provide such superb anatomical data, relatively fast, and atconsiderably lower capital cost than that of an MRI system. The answer lies in the superbsoft tissue contrast that can be obtained in MRI. The images in Figure 4 can be described interms a pathologist would use for tissue stains. In MRI, the signal from any tissue is
Johnson et al. Page 3
Toxicol Pathol. Author manuscript; available in PMC 2012 January 1.
NIH
-PA Author Manuscript
NIH
-PA Author Manuscript
NIH
-PA Author Manuscript
dependent on the water in the tissue and how it is bound. By choosing different acquisitionparameters, one can highlight different aspects of the physical interaction of the waterprotons with the tissue. We have coined the term “proton stain” to refer to the underlyingphysical mechanism that differentiates one tissue from another (Johnson et al., 1993). In thisexample, all attributes of the tissue water are altered to some degree by the presence of thecontrast agent used as the active stain. In the T1-weighted image seen in Figure 4a, thesignal is dependent primarily on differential recovery of signal between the individualradiofrequency pulses used to stimulate the tissue. In this example, TR=50 ms and TE=5.6ms. There is also some dependence on the number of water protons in each voxel. Thegranular layer (GrDG, arrow in Figure 4a) is most likely dark because of a longer spin latticerelaxation time (T1). Note the strong signal from the reticular part of the substantia nigra(SNR). The boundary between this structure and the lateral terminal nucleus of theaccessory optic tract (LT) in the T1-weighted image can also be resolved. The contrast inFigure 4b is dependent on the spin spin relaxation time (T2) (Sharief and Johnson, 2006).The distinction between the substantia nigra and the lateral nucleus is lost in the T2-weighted image, and the granular layer is not as evident. The substantia nigra is now darkrelative to the surrounding structures. But the anterior pretectal nucleus (APT), which is notvisible at all in the T1-weighted image, is now visible. In the T2*-weighted image (Figure4c), which reflects a combined effect of T2, field inhomogeneity and susceptibility, thepretectal nucleus is no longer visible, but the medial geniculate nucleus (MG, in Figure 4c)is now seen. Vessels, not seen in either the T1- or T2-weighted images are much moreprominent in the T2*-weighted image (Figure 4c).
Linear morphometric measures are clearly possible for a number of structures shown inFigure 4. Since the data is isotropic, the section can be rotated interactively to yieldhomologous slices. Finally, since the brain is in the cranium and with no physical sectioning,the accuracy of such linear measures relative to the same measure in vivo is far greater thanwhat can be obtained from glass slides. The data is isotropic, so volumetric measurementsare possible in structures like the substantia nigra, where the boundary is well defined. Thisprocess of structural segmentation has been studied extensively in clinical radiology.Unfortunately, the boundaries of some structures are clear in one acquisition and not inanother. The contrast in each image is dependent on the acquisition parameter that can becontrolled, along with the physical state of the tissue (Wehrli et al., 1988;Callaghan,1994;Haacke et al., 1999). It is worth noting that the images in Figure 4 are of the very sameslice of tissue. Since the tissue is not “sectioned” physically but through the spatialencoding, it is possible to image the same tissue in many different ways. This is equivalentto having three different stains of the same section of tissue. This fourth dimension ofinformation can help in the volumetric segmentation of the brain structure (Ali et al.,2005;Johnson et al., 2010). Figure 5 shows a 3D (volume-rendered) image in which theinternal structures have been segmented using this multispectral information. Recentextensions now make it possible to segment more than 35 different structures (Badea et al.,2007;Badea et al., 2009a). Figure 5a is a volume-rendered image of a C57BL/6J mousebrain in which 37 structures have been semi-automatically segmented using a dedicatedimaging pipeline. The pipeline consists of a series of sophisticated software operations thatare performed sequentially through the use of scripts. In Figure 5b, the majority of thestructures have been “turned off,” i.e. made invisible in the dataset to allow viewing of therelative volume and relationships between hippocampus, fimbria, fornix, amygdala, andanterior commissure. The volumes of these structures are readily computed and can be usedto assess differences among strains, such as the BXD family of recombinant inbred mice(Badea et al., 2009a;Badea et al., 2009b), or to identify morphometric changes in mousemodels of neurological or psychiatric conditions (Badea et al., 2010).
Johnson et al. Page 4
Toxicol Pathol. Author manuscript; available in PMC 2012 January 1.
NIH
-PA Author Manuscript
NIH
-PA Author Manuscript
NIH
-PA Author Manuscript
While the value of MR histology for neuromorphometry seems clear from the example inFigure 5, there is currently very little use of the technology in practice. This is probably dueto a number of very practical barriers—no standardized protocols; a limited base ofpathologists familiar with reading the material; no regulatory acceptance; the complexity ofthe technology; and cost. The cost for a high-field research system (7T to 9.4T) can rangefrom $1.5 million to $3 million. These systems employ superconducting magnets that mustremain cold, so there is an ongoing cost for liquid nitrogen and helium. The systems areextremely flexible, but with this flexibility comes complexity.
Figure 6 shows a possible solution recently introduced by Aspect (ASPECT MagnetTechnologies Ltd. Netanya, Israel). The Aspect system employs a novel 1.0T permanentmagnet that requires no cryogens and is quite easy to site. The system is 20–50% the cost ofhigher field systems with cryogenic magnets. The most immediate consequence of operatingat lower magnetic field is a loss of signal. The signal is roughly linear with magnetic field.There are, however, some very interesting secondary effects that offset this signal loss. TheT1 of tissues is considerably shorter at lower field and the T2 is longer (Johnson et al.,1985;Dockery et al., 1989;Malisch et al., 1991). These changes in the tissue parametershave significant impact on the contrast-to-noise, i.e. the distinction of one tissue from anadjacent tissue. Figure 6 shows several contiguous transverse slices from a 3D volumeimage of an actively stained Sprague-Dawley rat brain. While the spatial resolution (100µm) is considerably less than that attained at higher field (43 µm in Figure 4), there isadequate resolution, signal, and contrast in this roughly one-hour scan to delineate most ofthe major anatomical landmarks. The protocols have been carefully designed to routinelyproduce scans of this quality without requiring detailed understanding of the relaxationmechanisms. These representative images allow ready definition of ventricles, cortex,corpus callosum, and several other white matter tracts.
DiscussionThe increasing complexity of drug discovery, safety assessment, and regulatorydocumentation require us to consider new approaches in pathology. Current safetyassessment protocols review less than1% of the available tissue. The relatively low expenseof tissue preparation and the time required for an experienced pathologist to review thesections preclude any immediate change in this practice. MR histology will not replace themore traditional approaches. However, MR histology has the potential to supplement andenhance the traditional approaches. A 3D exam can be acquired on a whole, intact organ inless than one hour. The MR image provides much more accurate morphometry than can bemade with traditionally prepared tissue slices, since the tissue is not dehydrated and remainsintact in the cranium. Volume measurements that can be easily made from the MR imagesare tedious at best from physical tissue slices using a stereologic approach. Since the study isnon-destructive, the same tissue can be forwarded for traditional processing (Himes et al.,2004). The MR images can provide the pathologist a survey of the entire organ byhighlighting lesions that might otherwise be missed (Maronpot et al., 2004). Finally, sincethe 3D volumes are measured in situ with virtually no physical distortion, it becomespossible to mine much more information from tissues, such as surface areas, shapes, andstructural volumes (Badea et al., 2007). For example, Cyr et al. demonstrated that changes inlocal morphology derived from 3D MR images reflected very subtle changes in neuronaldensity in animals with elevated dopamine (Cyr et al., 2005). Automated volumemeasurements can be used to replace tedious stereologic measures.
Many of the barriers noted to wide acceptance of MR histology still exist—limitedprotocols, lack of regulatory acceptance, and a limited workforce to interpret the images.But, these same barriers existed when MR imaging was first introduced to the clinical
Johnson et al. Page 5
Toxicol Pathol. Author manuscript; available in PMC 2012 January 1.
NIH
-PA Author Manuscript
NIH
-PA Author Manuscript
NIH
-PA Author Manuscript
domain. Economic pressures and the need for more effective safety assessment will continueto be significant stimuli to the broad acceptance of MR histology, and it seems reasonable toexpect that the technology will soon have the same broad impact it has in clinical care.
Abbreviations
3D three-dimensional
ANTS Advanced Normalization Tools
APT anterior pretectal nucleus
CT computed tomography
GrDG granular layer
ITK Insight Segmentation and Registration Toolkit
LT Lateral terminal
MG medial geniculate
MRH magnetic resonance histology
MRI magnetic resonance imaging
MRM magnetic resonance microscopy
NMR nuclear magnetic resonance
SNR substantia nigra, reticular part
AcknowledgmentsAll studies were performed at the Duke Center for In Vivo Microscopy, an NIH/NCRR National BiomedicalTechnology Research Center (P41 RR005959) and NCI Small Animal Imaging Resource Program (U24CA092656). We are grateful to Sally Zimney MEd for editorial assistance.
ReferencesAguayo JB, Blackband SJ, Schoeniger J, Mattingly MA, Hintermann M. Nuclear magnetic resonance
imaging of a single cell. Nature. 1986; 322:190–191. [PubMed: 3724861]Ali AA, Dale AM, Badea A, Johnson GA. Automated segmentation of neuroanatomical structures in
multispectral MR microscopy of the mouse brain. Neuroimage. 2005; 27:425–435. [PubMed:15908233]
Badea A, Ali-Sharief A, Dale AM, Johnson GA. Morphometric analysis of the C57BL/6J mouse brain.Neuroimage. 2007; 37:683–693. [PubMed: 17627846]
Badea A, Johnson GA, Jankowsky JL. Remote sites of structural atrophy predict later amyloidformation in a mouse model of Alzheimer's disease. Neuroimage. 2010; 50:416–427. [PubMed:20035883]
Badea A, Johnson GA, Williams R. Genetic dissection of the mouse CNS using magnetic resonancemicroscopy. Current Opin Neurol. 2009a; 22:379–386.
Badea A, Williams RW, Johnson GA. Genetic dissection of the mouse brain using high-field magneticresonance microscopy. Neuroimage. 2009b; 45:1067–1079. supplement: www.civm.duhs.duke.edu/bxd/index.html. [PubMed: 19349225]
Bernstein, MA.; KIng, KF.; Zhou, XJ. Handbook of MRI Pulse Sequences. San Diego: ElsevierAcademic Press; 2004.
Callaghan, PT. Principles of Nuclear Magnetic Resonance Microscopy. Oxford University Press;1994.
Johnson et al. Page 6
Toxicol Pathol. Author manuscript; available in PMC 2012 January 1.
NIH
-PA Author Manuscript
NIH
-PA Author Manuscript
NIH
-PA Author Manuscript
Cyr M, Caron MG, Johnson GA, Laakso A. Magnetic resonance imaging at microscopic resolutionreveals subtle morphological changes in a mouse model of dopaminergic hyperfunction.Neuroimage. 2005; 26:83–90. [PubMed: 15862208]
Dockery SE, Suddarth SA, Johnson GA. Relaxation measurements at 300 MHz using MR microscopy.Magn Reson Med. 1989; 11:182–192. [PubMed: 2779411]
Eccles CD, Callaghan PT. High resolution imaging: the NMR microscope. J Magn Reson. 1986;68:393–398.
Haacke, EM.; Brown, RW.; Thompson, MR.; Venkatesan, R. Magnetic resonance imaging: physicalprinciples and sequence design. New York, NY: Wiley-Liss; 1999.
Himes N, Min JY, Lee R, Brown C, Shea J, Huang X, Xiao YF, Morgan JP, Burstein D, Oettgen P. Invivo MRI of embryonic stem cells in a mouse model of myocardial infarction. Magn Reson Med.2004; 52:1214–1219. [PubMed: 15508153]
Johnson GA, Herfkens RJ, Brown MA. Tissue relaxation time: in vivo field dependence. Radiology.1985; 156:805–810. [PubMed: 2991980]
Johnson GA, Thompson MB, Gewalt SL, Hayes CE. Nuclear magnetic resonance imaging atmicroscopic resolution. J Magn Reson. 1986; 68:129–137.
Johnson GA, Benveniste H, Black RD, Hedlund LW, Maronpot RR, Smith BR. Histology by magneticresonance microscopy. Magn Reson Quarterly. 1993; 9:1–30.
Johnson GA, Cofer GP, Fubara B, Gewalt SL, Hedlund LW, Maronpot RR. Magnetic resonancehistology for morphologic phenotyping. J Magn Reson Imaging. 2002; 16:423–429. [PubMed:12353257]
Johnson GA, Ali-Sharief A, Badea A, Brandenburg J, Cofer G, Fubara B, Gewalt S, Hedlund LW,Upchurch L. High-throughput morphologic phenotyping of the mouse brain with magneticresonance histology. Neuroimage. 2007; 37:82–89. [PubMed: 17574443]
Johnson GA, Badea A, Brandenburg J, Cofer G, Fubara B, Liu S, Nissanov J. Waxholm Space: Animage-based reference for coordinating mouse brain research. Neuroimage. 2010; 53:365–372.[PubMed: 20600960]
Lauterbur PC. Image formation by induced local interactions - examples employing nuclear magneticresonance. Nature. 1973; 242:190–191.
Lester DS, Johannessen JN, Pine PS, McGregor GN, Johnson GA. Virtual neuropathology: A newapproach to preclinical pathology using magnetic resonance imaging microscopy. Spectroscopy.1999; 14:17–22.
Lester DS, Pine PS, Delnomdedieu M, Johannessen JN, Johnson GA. Virtual neuropathology: three-dimensional visualization of lesion due to toxic insult. Toxicol Path. 2000; 28:100–104. [PubMed:10668995]
Malisch TW, Hedlund LW, Suddarth SA, Johnson GA. MR microscopy at 7 T: the effects of brainiron. J Magn Reson Imaging. 1991; 1:301–305. [PubMed: 1802143]
Mansfield P, Grannell PK. Diffraction in microscopy in solids and liquids by NMR. Phys Rev B. 1975;12:3618–3634.
Maronpot RR, Sills RC, Johnson GA. Applications of magnetic resonance microscopy. Toxicol Pathol.2004; 32:42–48. [PubMed: 15503663]
Morgan DL, Little PB, Herr DW, Moser VC, Collins B, Herbert R, Johnson GA, Maronpot RR, HarryGJ, Sills RC. Neurotoxicity of carbonyl sulfide in F344 rats following inhalation exposure for upto 12 weeks. Toxicol and Appl Pharmacol. 2004; 200:131–145. [PubMed: 15476866]
Petiet AE, Kaufman MH, Goddeeris MM, Brandenburg J, Elmore SA, Johnson GA. High-resolutionmagnetic resonance histology of the embryonic and neonatal mouse: a 4D atlas and morphologicdatabase. Proc Natl Acad Sci U S A. 2008; 105:12331–12336. [PubMed: 18713865]
Sharief AA, Johnson GA. Enhanced T2 contrast for MR histology of the mouse brain. Magn ResonMed. 2006; 56:717–725. [PubMed: 16964618]
Sills RC, Morgan DL, Herr DW, Little PB, George NM, Ton TV, Love NE, Maronpot RR, JohnsonGA. Contribution of magnetic resonance microscopy in the 12-week neurotoxicity evaluation ofcarbonyl sulfide in Fischer 344 rats. Toxicol Pathol. 2004; 32:501–510. [PubMed: 15603534]
Suddarth SA, Johnson GA. Three-dimensional MR microscopy with large arrays. Magn Reson Med.1991; 18:132–141. [PubMed: 2062225]
Johnson et al. Page 7
Toxicol Pathol. Author manuscript; available in PMC 2012 January 1.
NIH
-PA Author Manuscript
NIH
-PA Author Manuscript
NIH
-PA Author Manuscript
Wehrli, F.; Shaw, D.; Kneeland, J. Biomedical magnetic resonance imaging: principles, methodology,and applications. New York: VCH; 1988.
Johnson et al. Page 8
Toxicol Pathol. Author manuscript; available in PMC 2012 January 1.
NIH
-PA Author Manuscript
NIH
-PA Author Manuscript
NIH
-PA Author Manuscript
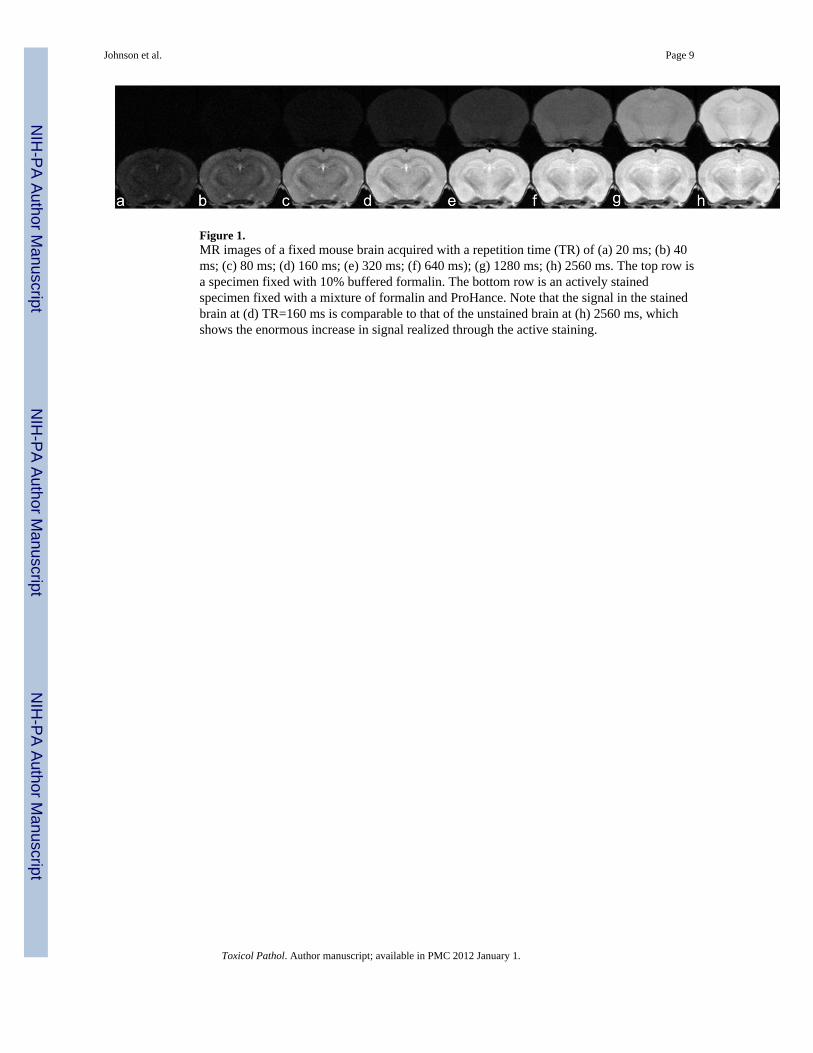
Figure 1.MR images of a fixed mouse brain acquired with a repetition time (TR) of (a) 20 ms; (b) 40ms; (c) 80 ms; (d) 160 ms; (e) 320 ms; (f) 640 ms); (g) 1280 ms; (h) 2560 ms. The top row isa specimen fixed with 10% buffered formalin. The bottom row is an actively stainedspecimen fixed with a mixture of formalin and ProHance. Note that the signal in the stainedbrain at (d) TR=160 ms is comparable to that of the unstained brain at (h) 2560 ms, whichshows the enormous increase in signal realized through the active staining.
Johnson et al. Page 9
Toxicol Pathol. Author manuscript; available in PMC 2012 January 1.
NIH
-PA Author Manuscript
NIH
-PA Author Manuscript
NIH
-PA Author Manuscript
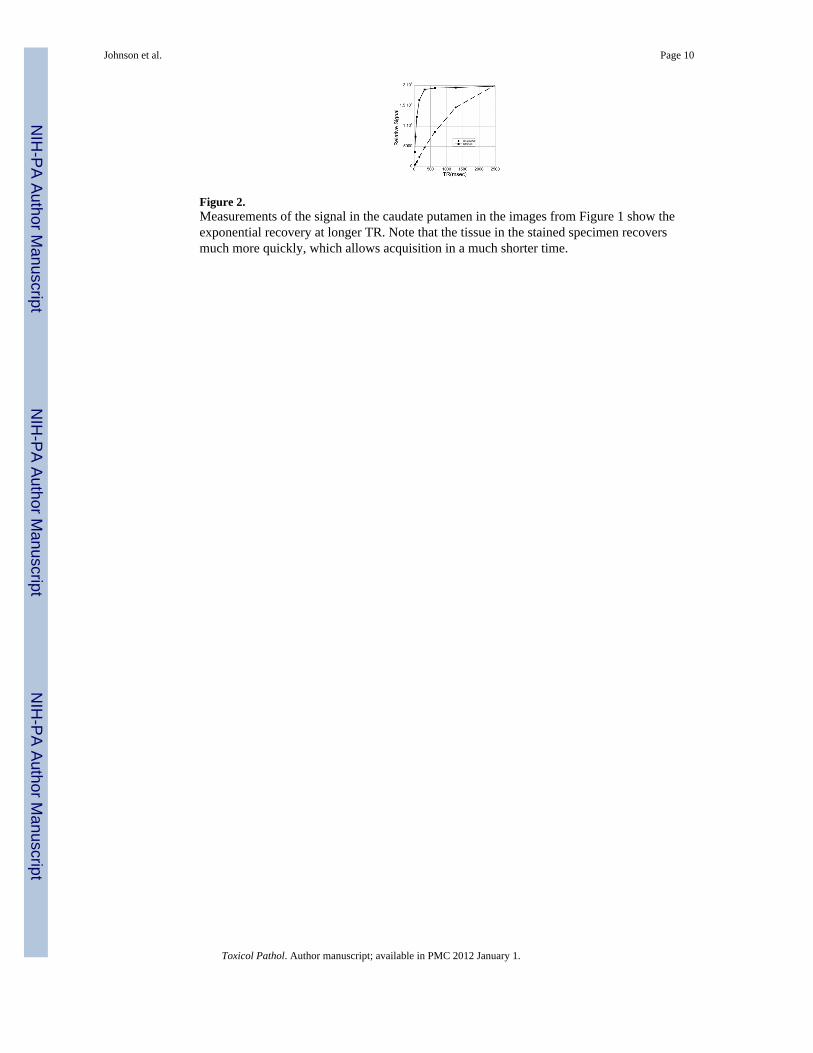
Figure 2.Measurements of the signal in the caudate putamen in the images from Figure 1 show theexponential recovery at longer TR. Note that the tissue in the stained specimen recoversmuch more quickly, which allows acquisition in a much shorter time.
Johnson et al. Page 10
Toxicol Pathol. Author manuscript; available in PMC 2012 January 1.
NIH
-PA Author Manuscript
NIH
-PA Author Manuscript
NIH
-PA Author Manuscript
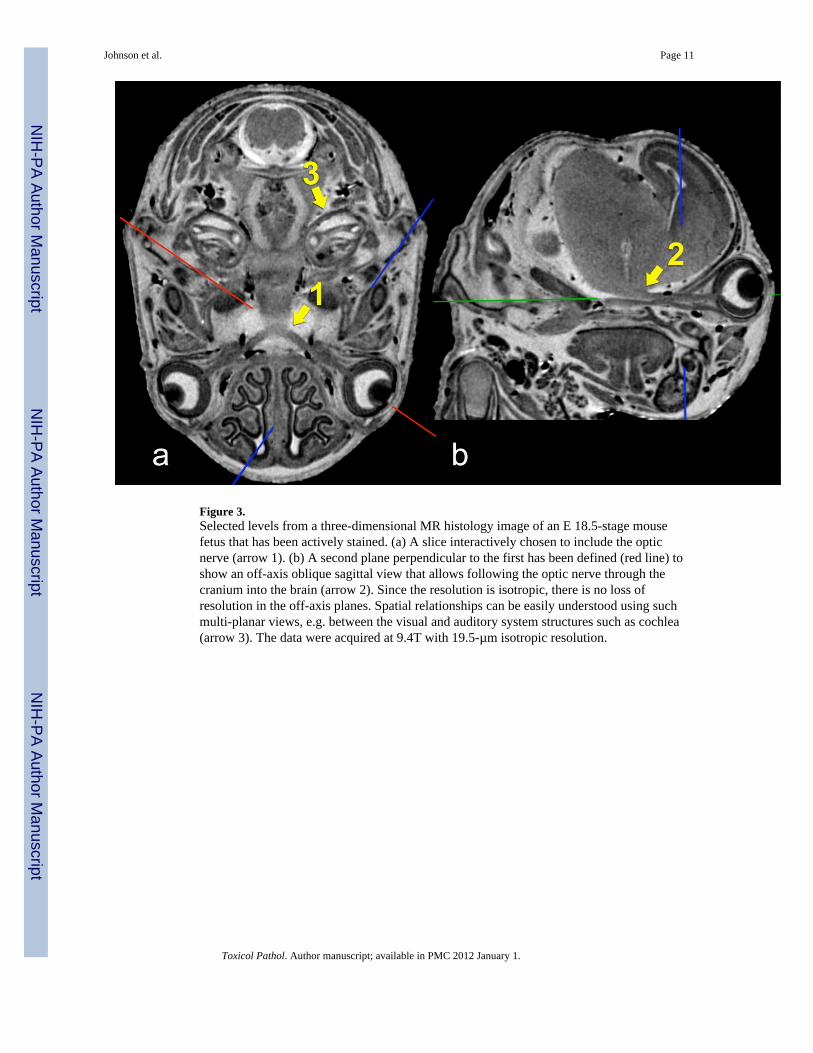
Figure 3.Selected levels from a three-dimensional MR histology image of an E 18.5-stage mousefetus that has been actively stained. (a) A slice interactively chosen to include the opticnerve (arrow 1). (b) A second plane perpendicular to the first has been defined (red line) toshow an off-axis oblique sagittal view that allows following the optic nerve through thecranium into the brain (arrow 2). Since the resolution is isotropic, there is no loss ofresolution in the off-axis planes. Spatial relationships can be easily understood using suchmulti-planar views, e.g. between the visual and auditory system structures such as cochlea(arrow 3). The data were acquired at 9.4T with 19.5-µm isotropic resolution.
Johnson et al. Page 11
Toxicol Pathol. Author manuscript; available in PMC 2012 January 1.
NIH
-PA Author Manuscript
NIH
-PA Author Manuscript
NIH
-PA Author Manuscript
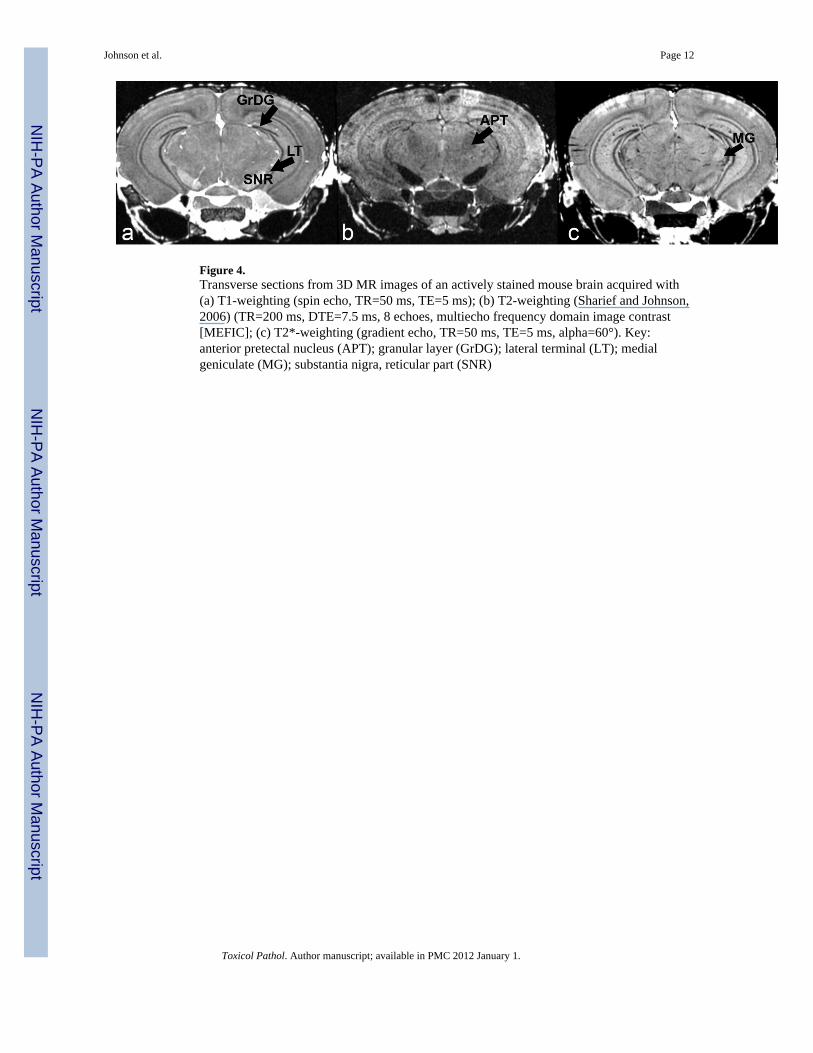
Figure 4.Transverse sections from 3D MR images of an actively stained mouse brain acquired with(a) T1-weighting (spin echo, TR=50 ms, TE=5 ms); (b) T2-weighting (Sharief and Johnson,2006) (TR=200 ms, DTE=7.5 ms, 8 echoes, multiecho frequency domain image contrast[MEFIC]; (c) T2*-weighting (gradient echo, TR=50 ms, TE=5 ms, alpha=60°). Key:anterior pretectal nucleus (APT); granular layer (GrDG); lateral terminal (LT); medialgeniculate (MG); substantia nigra, reticular part (SNR)
Johnson et al. Page 12
Toxicol Pathol. Author manuscript; available in PMC 2012 January 1.
NIH
-PA Author Manuscript
NIH
-PA Author Manuscript
NIH
-PA Author Manuscript
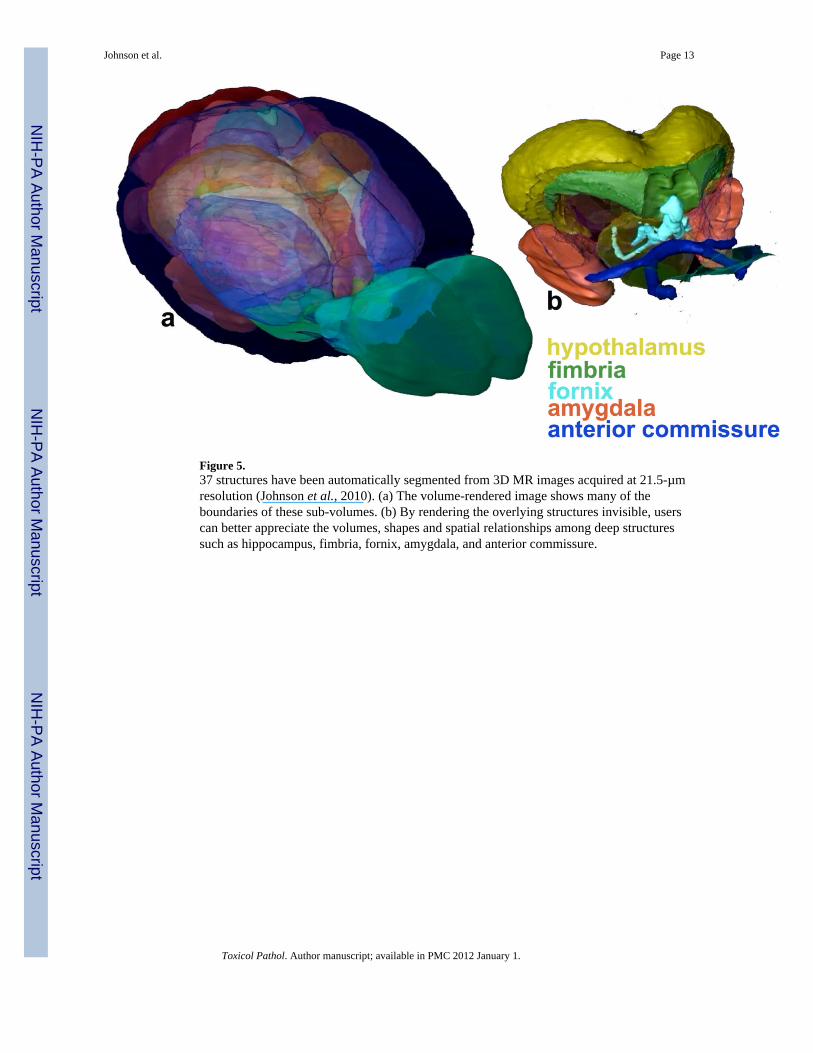
Figure 5.37 structures have been automatically segmented from 3D MR images acquired at 21.5-µmresolution (Johnson et al., 2010). (a) The volume-rendered image shows many of theboundaries of these sub-volumes. (b) By rendering the overlying structures invisible, userscan better appreciate the volumes, shapes and spatial relationships among deep structuressuch as hippocampus, fimbria, fornix, amygdala, and anterior commissure.
Johnson et al. Page 13
Toxicol Pathol. Author manuscript; available in PMC 2012 January 1.
NIH
-PA Author Manuscript
NIH
-PA Author Manuscript
NIH
-PA Author Manuscript
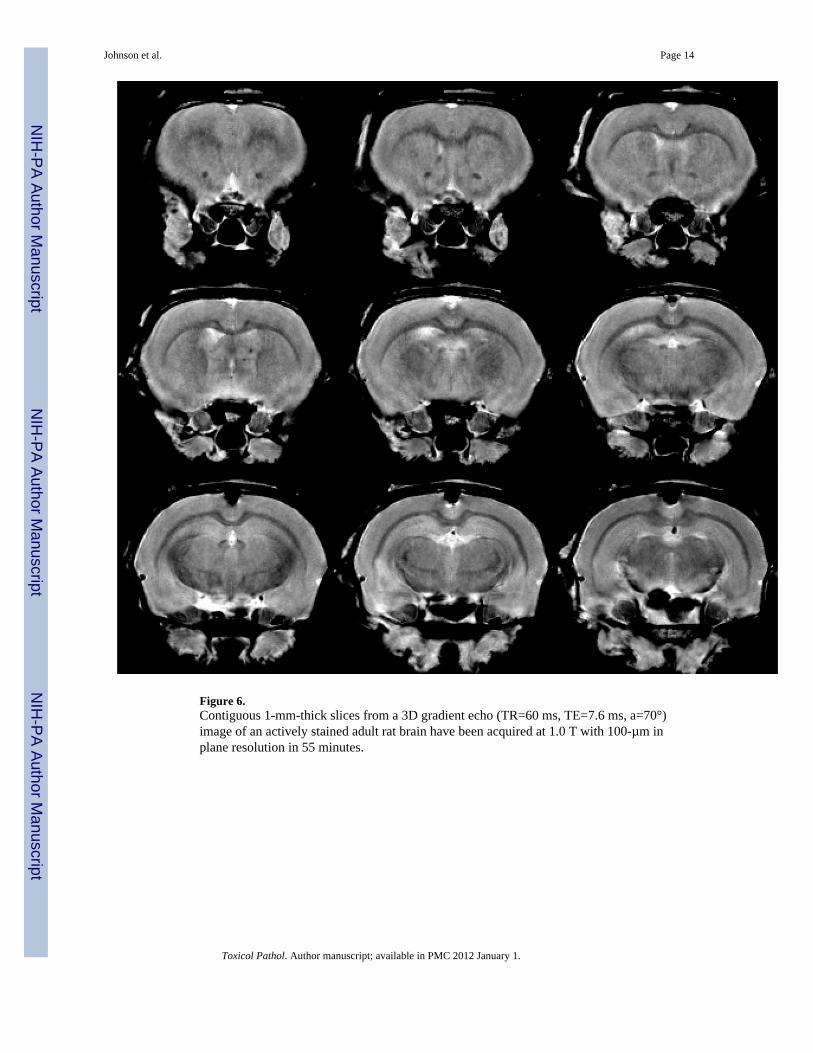
Figure 6.Contiguous 1-mm-thick slices from a 3D gradient echo (TR=60 ms, TE=7.6 ms, a=70°)image of an actively stained adult rat brain have been acquired at 1.0 T with 100-µm inplane resolution in 55 minutes.
Johnson et al. Page 14
Toxicol Pathol. Author manuscript; available in PMC 2012 January 1.
NIH
-PA Author Manuscript
NIH
-PA Author Manuscript
NIH
-PA Author Manuscript
NIH
-PA Author Manuscript
NIH
-PA Author Manuscript
NIH
-PA Author Manuscript
Johnson et al. Page 15
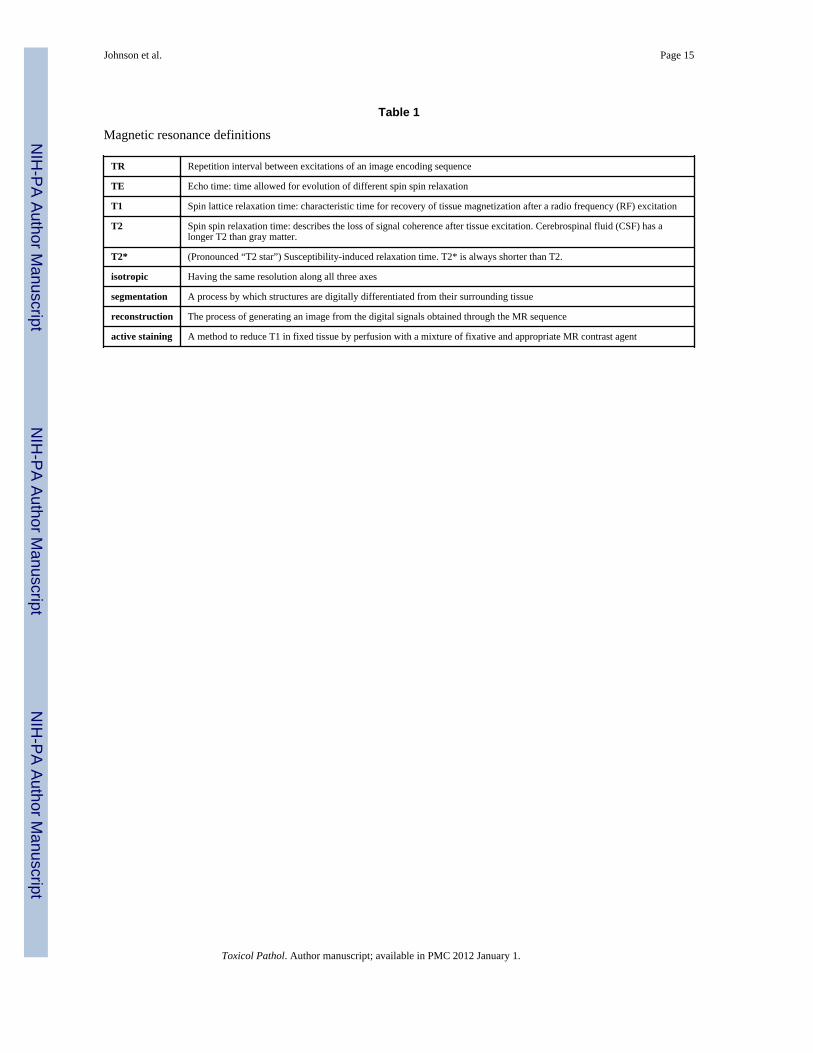
Table 1
Magnetic resonance definitions
TR Repetition interval between excitations of an image encoding sequence
TE Echo time: time allowed for evolution of different spin spin relaxation
T1 Spin lattice relaxation time: characteristic time for recovery of tissue magnetization after a radio frequency (RF) excitation
T2 Spin spin relaxation time: describes the loss of signal coherence after tissue excitation. Cerebrospinal fluid (CSF) has alonger T2 than gray matter.
T2* (Pronounced “T2 star”) Susceptibility-induced relaxation time. T2* is always shorter than T2.
isotropic Having the same resolution along all three axes
segmentation A process by which structures are digitally differentiated from their surrounding tissue
reconstruction The process of generating an image from the digital signals obtained through the MR sequence
active staining A method to reduce T1 in fixed tissue by perfusion with a mixture of fixative and appropriate MR contrast agent
Toxicol Pathol. Author manuscript; available in PMC 2012 January 1.


