Embed Size (px)
Citation preview
ExpresSed
Quantitative high resolution cathodoluminescence spectroscopyof diagenetic and hydrothermal dolomites
Axel Gillhausa, Detlev K. Richtera,*, Jan Meijerb,Rolf D. Neusera, Andreas Stephanb
aDepartment of Geology, Mineralogy and Geophysics, Ruhr-University Bochum, D-44780, GermanybDepartment of Experimental Physics III, Ruhr-University Bochum, D-44780, Germany
Received 7 November 2000; accepted 13 December 2000
Abstract
A combination of high resolution cathodoluminescence-spectroscopy (HRS-CL� high resolution spectroscopy of cathodo-
luminescence emission) with spatial resolving trace element analyses (PIXE� proton induced X-ray emission) is used to
establish a method for the quantitative determination of the Mn-content of diagenetic and hydrothermal dolomites using the
measurements of peak areas of Mn-activated CL emission bands. This method takes into account the overlap of the CL broad
bands of Mn21 in the Mg- and the Ca-lattice-position of dolomite. There is a linear correlation between the peak areas and Mn
concentration up to approx. 1000±1500 ppm. Thus, CL spectroscopy allows a determination of Mn concentrations below the
abilities of PIXE (10±15 ppm) to less than 1 ppm by extrapolation of this linear relation.
Up to an Fe-content of approx. 2000 ppm, no quenching effect of Fe on this linear relationship occurs. However, Fe-contents
above 2000 ppm result in a decrease of Mn-induced luminescence. Even at Fe-concentration .25,000 ppm spectroscopy
reveals that Mn-activated CL of dolomite is not entirely extinguished. q 2001 Elsevier Science B.V. All rights reserved.
Keywords: Dolomites; Cathodoluminescence; Spectral analysis; Manganese concentration; PIXE
1. Introduction
In carbonate minerals, Mn21 and trivalent REE are
substantial activators of extrinsic cathodolumines-
cence (CL), while Fe21 is regarded as the main
quencher element (Marshall, 1988; Pagel et al.,
2000). Similar to calcite (see Habermann et al.,
1998) the occurrence of a lower detection limit of
Mn-activation with regard to a visible yellow-orange
CL of dolomite has been controversially discussed.
Long and Agrell (1965); Martin and Zeeghers
(1969) indicate 0.1 wt% Mn as a lower luminescence
limit. Others claim a detectable Mn-activated CL of
dolomite even at lower concentrations: Pierson (1981)
80 ppm; Richter and Zinkernagel (1981) 20±40 ppm;
Fairchild (1983) 150 ppm; and Ten Have and Heijnen
(1985) 30±35 ppm. On the one hand, these discrepan-
cies may be due to the CL devices used (e.g. cold
versus hot cathode). On the other hand, investigations
based on visual observations can be considered as
subjective, which can be easily demonstrated when
assessing a dimly luminescing sample by two persons.
Habermann et al. (1998, 1999a,b) have established
an exact quanti®cation of the Mn-induced lumines-
cence of calcite using HRS-CL (high resolution
spectral analysis of CL emission) and PIXE (proton
Sedimentary Geology 140 (2001) 191±199
0037-0738/01/$ - see front matter q 2001 Elsevier Science B.V. All rights reserved.
PII: S0037-0738(01)00062-8
www.elsevier.nl/locate/sedgeo
* Corresponding author. Tel.: 149-234-32-23-253; fax: 149-
234-32-14-571.
E-mail address: [email protected] (D.K. Richter).
induced X-ray emission). Here, the peak heights of CL
emissions were used to evaluate the concentrations.
The method was calibrated by an Iceland spar and
covers concentrations between 10 and 3000 ppm Mn
in Fe-poor calcites. Mn-contents below 10 ppm Mn
(detection limit of PIXE) are obtained by extrapola-
tion, allowing the detection of Mn concentrations of
less than 1 ppm by evaluating the Mn-peak in the
CL-spectrum. Thus, it is shown that there is no low
Mn-activation limit for calcite, supporting the assump-
tion of Walker et al. (1989) based on theoretical
considerations.
However, an immediate application of Mn quanti-
®cation in calcite by HRS-CL to the mineral dolomite
is dif®cult, because Mn21 can occur in both the Ca-
and Mg-position of the lattice. This results in an over-
lap of the ¯anks of wide spectral bands in the
CL-spectra (Sommer, 1972; El±Ali et al., 1993;
Habermann et al., 1996). Gillhaus et al. (2000) have
studied dolomites luminescing red (Mn21 in Mg-
position: l � 656 nm) and yellow (Mn21 in Ca-
position: l � 575 nm) and predominantly used red
luminescing dolomites to examine the correlation
between Mn concentration (PIXE) and CL intensity
(HRS-CL). A linear correlation was found for samples
between 20 and 100 ppm Mn by peak height measure-
ments, which matches approximately the correspond-
ing correlation developed by Habermann (1997) for
Fe21-free to -poor calcite.
In this study, we present a quanti®cation of Mn-
induced CL of dolomites using a combination of
PIXE-analyses and peak area measurements in CL
spectra. This project promises a faster Mn-determina-
tion by CL spectra compared to combined height
measurements at ®ltered red- and/or yellow emission
bands.
2. Samples
The sample material is predominantly taken from
the more than 2500 m thick Permian/Jurassic succes-
sion of Hydra Island, Greece (see Richter, 1999;
Gillhaus, 1999). Here, fault-related coarse crystalline
dolostones with irregular shape in the range of some
tens of metres show white colour in the outcrop and
less CL zonation and intensity in thin section because
they are poor in trace elements. Fracture-related
single crystals of (saddle) dolomite show broad CL
zones of different luminescence intensities and occur
in all carbonate facies of the Permian/Jurassic succes-
sion. Early to late diagenetic dolomite phases in
Upper Permian and Upper Triassic sabkha sequences
often show narrow CL zonation due to changes in
growth conditions. Furthermore, there are pseudo-
morphic pores after gypsum and prism/sheet cracks
which often exhibit larger dolomite crystals ideal for
spectroscopic investigations.
Additionally, three extraordinarily Fe-rich dolo-
mites (dark brown CL, no zonation) from salt
domes in the Triassic salinar of the Maghreb
(Algeria) and an especially Mn-rich dolomite (bright
orange-yellow CL) in the anhydrite of the Leine
carbonate (Ca3, Lehrbach/Germany) as well as
three Upper Triassic(?)±Jurassic dolomite breccias
from the ¯ysch of Karpathos, Greece (as a compar-
ison to the fault-related dolomites from Hydra) were
investigated.
3. Methods
For our combined HRS-CL and PIXE analyses we
used thin sections polished on both sides (thickness
70±100 mm) of diagenetical and hydrothermal
(,2008C) dolomites, mounted on highly pure quartz
glass slides (Suprasil).
CL investigations were carried out on the hot cathode
CL-device at Bochum (HC1-LM, Neuser, 1995) in
combination with the high resolution spectral analysis
equipment (Neuser et al., 1996; Habermann et al., 1996,
1998). The spectrograph and detector technology with
digital data processing (EG&G spectrograph with N2-
cooled CCD camera) using special light guide optics
allows a spatial resolution of approx. 30 mm in
diameter. The maximum spectral resolution within the
visible region of the spectrum totals 0.06 nm at a repro-
duction precision of the peak intensity of $99.8%. All
CL spectra were recorded at 14 keV.
Trace element analyses were accomplished using
the proton microprobe (PIXE) at the dynamitron-
tandem laboratory in Bochum (method in Meijer et
al., 1994). Here, at a proton energy of 3 MeV a beam
diameter of nominally 10 mm is reached. The evalua-
tion of the point measurements was carried out with
the software-program gupix (Maxwell et al., 1995).
A. Gillhaus et al. / Sedimentary Geology 140 (2001) 191±199192
The detection limit for Mn totals 10±15 ppm with a
maximum indicated error of 10% from the current
measurement.
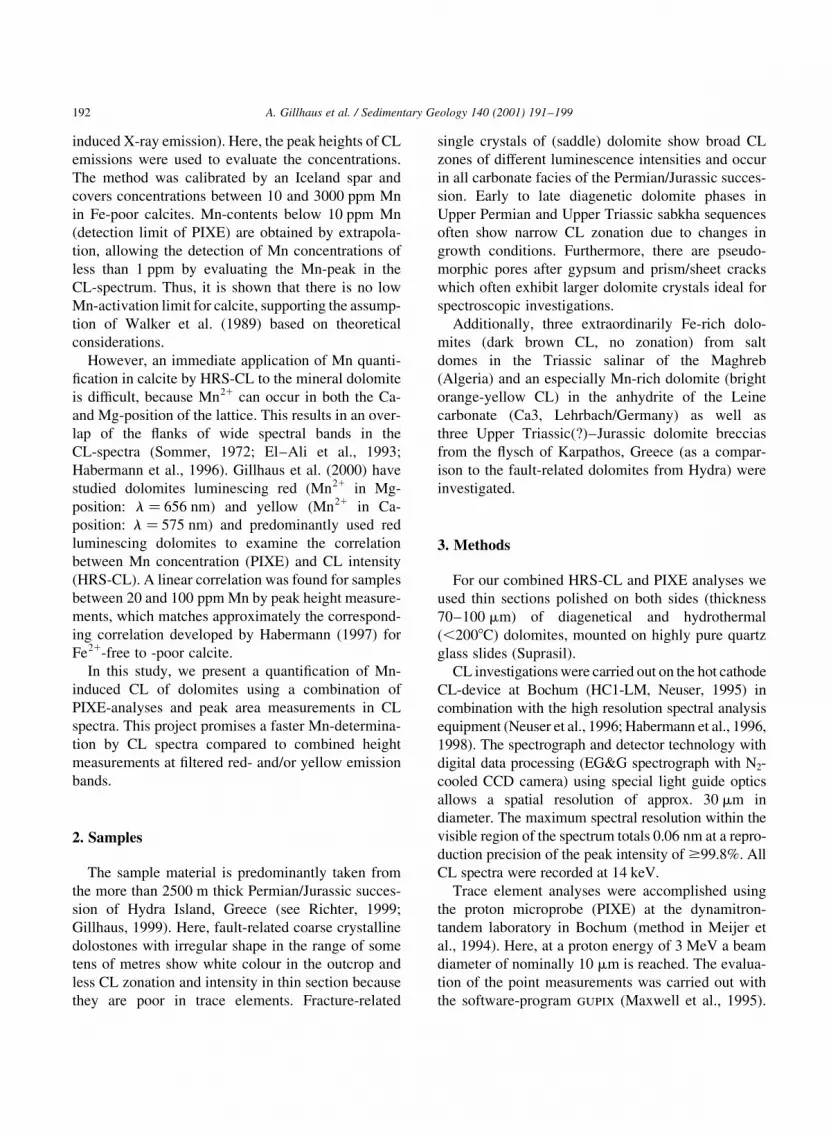
The standardization and calculation of the CL peak
areas can be done by any calculation program and is
shown in Fig. 1. Following the example of intrinsic
calcite spectra with broad bands between 400 and
660 nm of different intensity (see Habermann et al.,
1999b) the intrinsic part of the dolomite spectrum is
subtracted along with the background, before the
remaining Mn21 peak area is integrated. As intrinsic
CL spectra of pure, Mn-free dolomite were
previously unknown, the intrinsic portion of the CL
spectra of calcite is used for standardization of the
Mn-activated peak. This is following the example of
intrinsic calcite spectra (see Fig. 1 and Plate 1)
considering a linearly sloping function to higher
wavelengths.
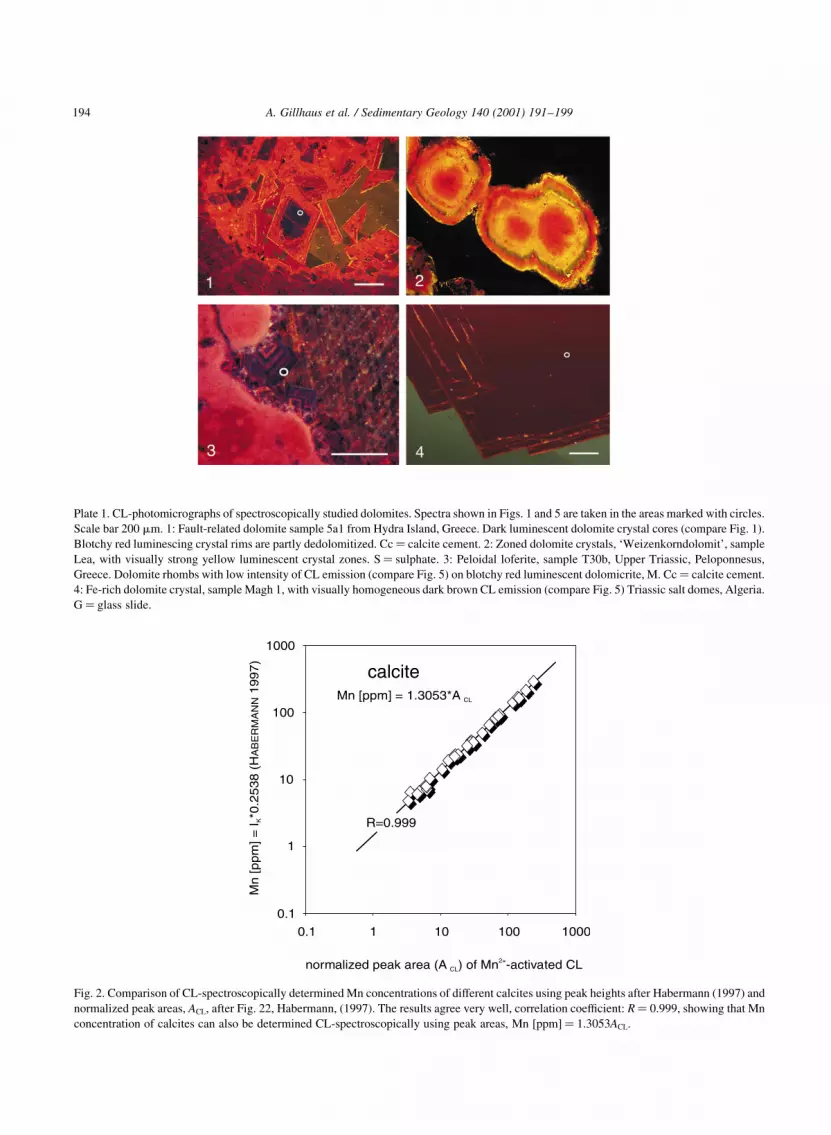
Fig. 2 documents the equivalence of CL spectra
evaluation of different calcites by linear peak height
measurements (after Habermann, 1997) and peak area
measurements (this work). A comparison of the linear
correlations shows the equivalent applicability of the
peak area method for calcite.
4. Results
4.1. Correlation of Mn21-activated CL (HRS-CL) and
Mn concentrations (PIXE)
As dolomites are usually inhomogeneous (see
Reeder, 1983; compare plate 1), it is not meaningful
to calibrate the method by measurement of a single
dolomite sample (as Iceland Spar for calcite, see
above). Instead, all measured points of the combined
analyses (PIXE versus HRS-CL) were used for the
investigation of a supposed correlation.
Using combined analyses of 94 homogeneously
luminescing dolomite crystals and dolomite crystal
zones with Mn concentrations between 10 and
2671 ppm, we determined a linear correlation
(R� 0.98) for Fe-poor dolomite (,2000 ppm Fe)
with the equation Mn [ppm]� 1.3129ACL [normalized
area units] with 82 samples having Mn concentrations
above the detection limit of PIXE (10±15 ppm) (see
Fig. 3 and Table 1). The intensity of luminescence of
dolomites containing .2000, and up to 27,000 ppm
Fe deviates increasingly from the correlation line
due to the quenching effect of Fe21, making a
A. Gillhaus et al. / Sedimentary Geology 140 (2001) 191±199 193re
l.in
tens
ity
wavelength [nm]
sample 5a1:dominant
red CL
residual spectrumafter subtraction
sample 1b25:yellow-reddish CL-
mixing colors
300 500400 600 700 800
rel.
inte
nsity
sample 5a1:normalized peak areaof Mn -activated CL
(14keV, 5s)
2+
sample Zoo2 (calcite):intrinsic spectrum
wavelength [nm]
300 500400 600 700 800
~~
A CL
Fig. 1. Left side: cathodoluminescence spectra of two dolomite samples from Hydra Island, Greece. Sample 5a1 with dominant red CL, Mn21
predominantly in the Mg-position of the crystal lattice, ratio 8.9:1, compare Gillhaus et al. (2000) and sample 1b25 with yellowish-red mixing
colours of CL, Mn21 in Mg- and Ca-positions of the crystal lattice, are revealed by an obvious asymmetry of the broad emission bands to lower
wavelengths, compare Plate 1/1 and 1/2. Subtracting both spectra from each other reveals the additional part of Mn21-activated CL in the Ca-
position of sample 1b25 as a residual broad brand. Right side: normalization of the peak areas of Mn21-activated CL of dolomite is shown using
the example of sample 5a1. The intrinsic part of the dolomite spectrum is subtracted from a linear function in accordance with the evaluation of
intrinsic calcite spectra. Additionally, for the clari®cation of the procedure, the intrinsic spectrum of a Mn-free calcite is shown, cave sinter,
sample Zoo2, kindly made available by G. Wurth, RUB, 14 keV, 120 s, intensity adjusted.
A. Gillhaus et al. / Sedimentary Geology 140 (2001) 191±199194
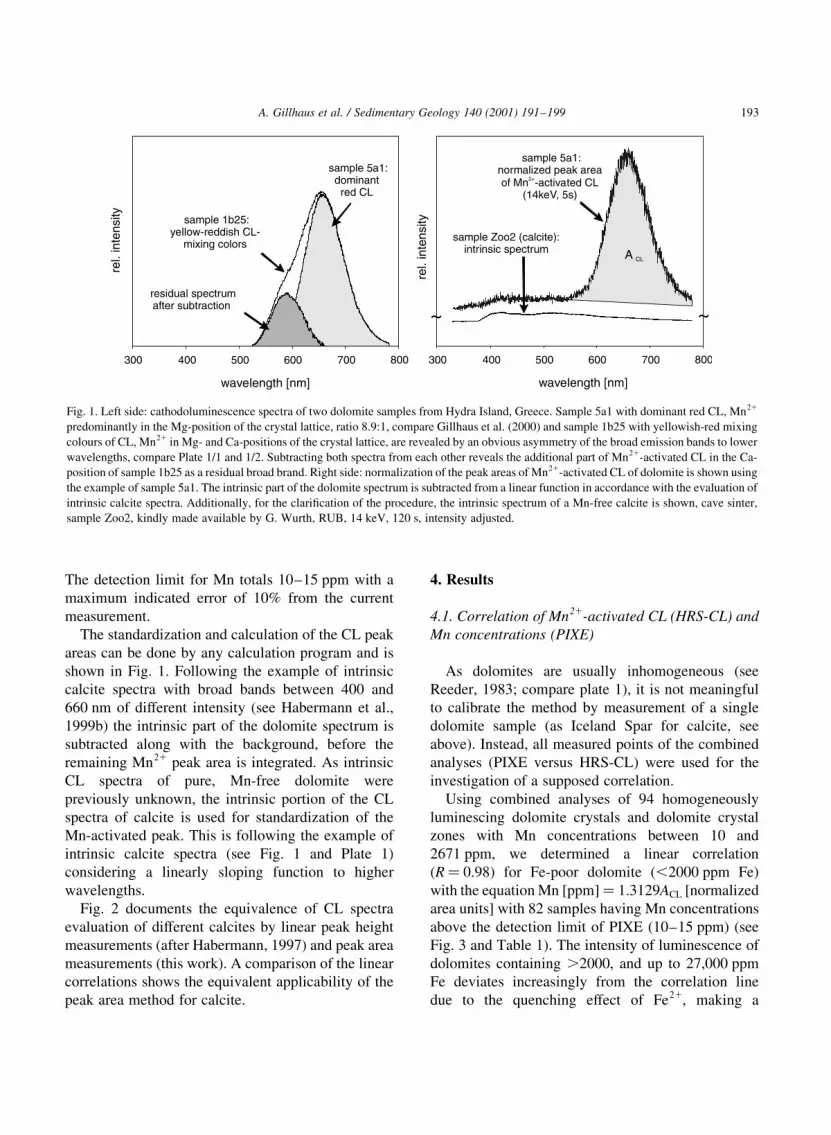
Plate 1. CL-photomicrographs of spectroscopically studied dolomites. Spectra shown in Figs. 1 and 5 are taken in the areas marked with circles.
Scale bar 200 mm. 1: Fault-related dolomite sample 5a1 from Hydra Island, Greece. Dark luminescent dolomite crystal cores (compare Fig. 1).
Blotchy red luminescing crystal rims are partly dedolomitized. Cc� calcite cement. 2: Zoned dolomite crystals, `Weizenkorndolomit', sample
Lea, with visually strong yellow luminescent crystal zones. S� sulphate. 3: Peloidal loferite, sample T30b, Upper Triassic, Peloponnesus,
Greece. Dolomite rhombs with low intensity of CL emission (compare Fig. 5) on blotchy red luminescent dolomicrite, M. Cc� calcite cement.
4: Fe-rich dolomite crystal, sample Magh 1, with visually homogeneous dark brown CL emission (compare Fig. 5) Triassic salt domes, Algeria.
G� glass slide.
0.1
0.1 1
Mn [ppm] = 1.3053*A CL
Mn
[pp
m]=
I*0
.25
38
(1
99
7)
KH
AB
ER
MA
NN
normalized peak area (A ) of Mn -activated CLCL2+
1
10
R=0.999
10
100
100
1000
1000
calcite
Fig. 2. Comparison of CL-spectroscopically determined Mn concentrations of different calcites using peak heights after Habermann (1997) and
normalized peak areas, ACL, after Fig. 22, Habermann, (1997). The results agree very well, correlation coef®cient: R� 0.999, showing that Mn
concentration of calcites can also be determined CL-spectroscopically using peak areas, Mn [ppm]� 1.3053ACL.
quanti®cation of the Mn concentration in the Fe-rich
dolomites impossible with this methodology. Fe-rich
dolomites need additional Fe-analyses.
4.2. Lower activation limit of Mn21-activated CL of
dolomite
All of the studied dolomite crystals and crystal
zones spectroscopically show Mn-activated CL and
12 of them have Mn concentrations below the
detection limit of PIXE. For the CL spectra of the
latter, an extrapolation of the correlation line Mn
[ppm]� 1.3129ACL was done. Theoretically and prac-
tically, Mn concentrations below 1 ppm (see Figs. 4
and 5) are detectable by CL spectroscopy using the
peak areas. This shows that for dolomite, as for calcite
(see Habermann et al., 1998), there is no lower activa-
tion limit for Mn, which was already assumed by
Walker et al. (1989) due to theoretical considerations.
4.3. Quenching (suppression) of Mn21-activated CL
by increasing Fe concentrations
The bivalent Fe ion is well known as the most
effective quencher of CL of carbonates (Machel et
al., 1991). Pierson (1981) visually observed Fe
quenching of Mn21-activated CL starting from
10,000 ppm Fe as well as entire deletion of CL
above 15,000 ppm. However, Richter and Zinkerna-
gel (1975) still observed dark reddish-brown CL of
dolomites at .10 wt% FeCO3 using a CL microscope
with a `hot' cathode. The samples investigated in this
work spectroscopically show the beginning of
suppression of CL intensity from approx. 2000 ppm
by Fe by a slight deviation from the linear correlation
(Mn [ppm]� 1.3129ACL), clearly increasing with
rising Fe concentrations (see Fig. 3). At Fe concentra-
tions above 20,000 ppm visual CL is hardly detected,
even if a high performance device such as the CL
microscope at Bochum is employed. However,
A. Gillhaus et al. / Sedimentary Geology 140 (2001) 191±199 195
0.1
0.1 1
Mn
-co
nce
ntr
ati o
n[p
pm
]fr
om
PIX
E
normalized peak area (A ) of Mn -activated CLCL2+
1
10
10
100
100
1000 10000
1000
10000
Mn [ppm] = 1.3129*A CL
R=0.98
dolomite
n = 82
detection limitof PIXE
< 2000ppm Fe
2000 bis < 5000ppm Fe
5000 bis < 15000ppm Fe
> 20000ppm Fe
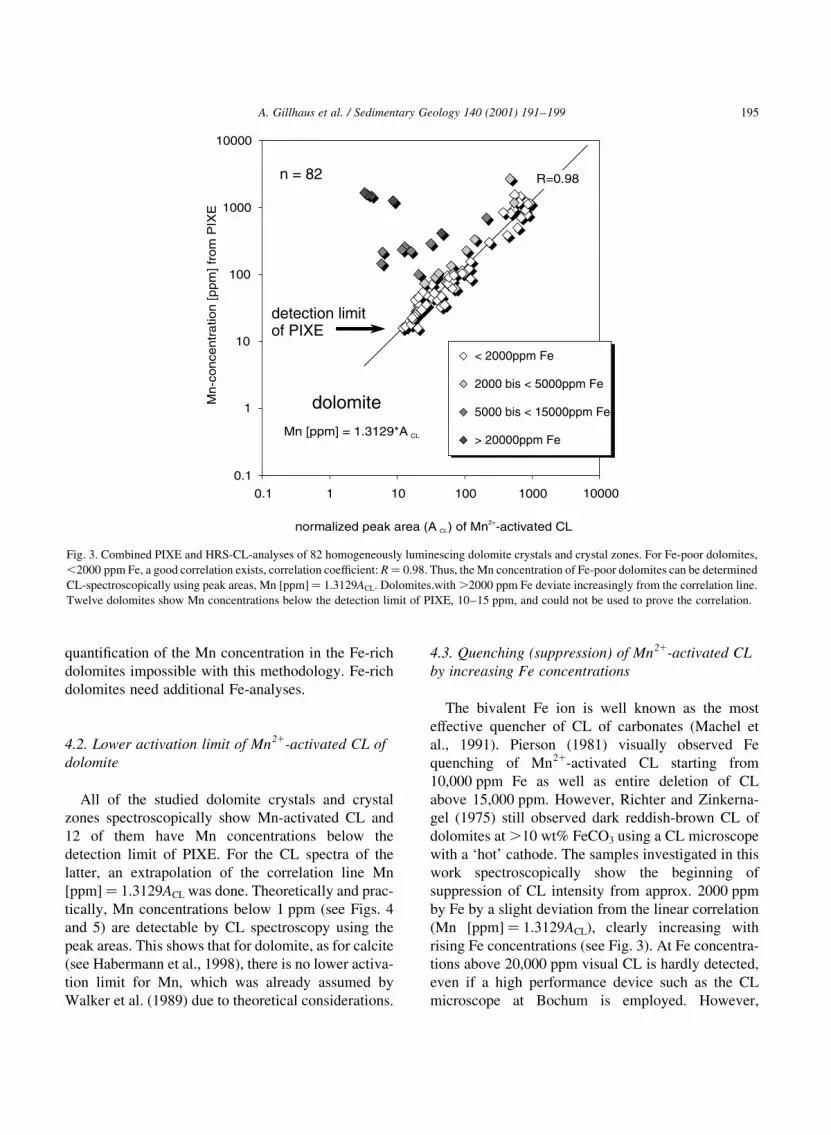
Fig. 3. Combined PIXE and HRS-CL-analyses of 82 homogeneously luminescing dolomite crystals and crystal zones. For Fe-poor dolomites,
,2000 ppm Fe, a good correlation exists, correlation coef®cient: R� 0.98. Thus, the Mn concentration of Fe-poor dolomites can be determined
CL-spectroscopically using peak areas, Mn [ppm]� 1.3129ACL. Dolomites.with .2000 ppm Fe deviate increasingly from the correlation line.
Twelve dolomites show Mn concentrations below the detection limit of PIXE, 10±15 ppm, and could not be used to prove the correlation.
A. Gillhaus et al. / Sedimentary Geology 140 (2001) 191±199196
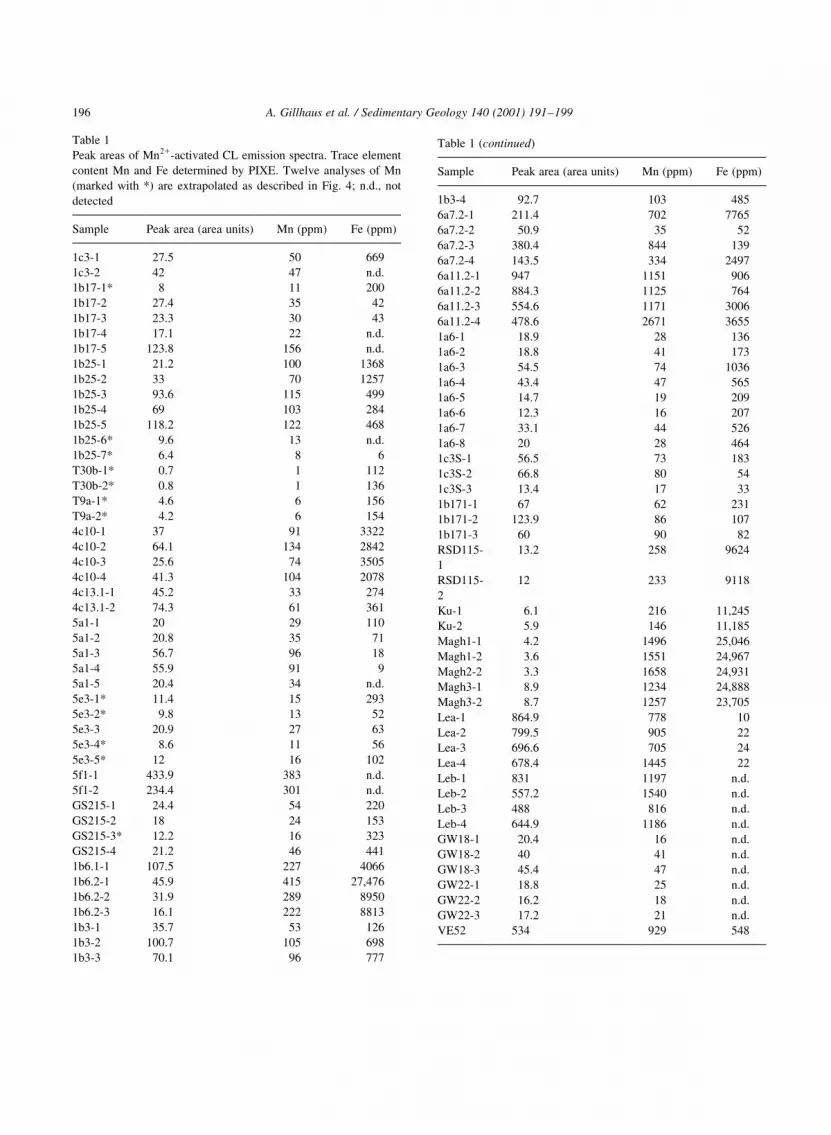
Table 1
Peak areas of Mn21-activated CL emission spectra. Trace element
content Mn and Fe determined by PIXE. Twelve analyses of Mn
(marked with *) are extrapolated as described in Fig. 4; n.d., not
detected
Sample Peak area (area units) Mn (ppm) Fe (ppm)
1c3-1 27.5 50 669
1c3-2 42 47 n.d.
1b17-1* 8 11 200
1b17-2 27.4 35 42
1b17-3 23.3 30 43
1b17-4 17.1 22 n.d.
1b17-5 123.8 156 n.d.
1b25-1 21.2 100 1368
1b25-2 33 70 1257
1b25-3 93.6 115 499
1b25-4 69 103 284
1b25-5 118.2 122 468
1b25-6* 9.6 13 n.d.
1b25-7* 6.4 8 6
T30b-1* 0.7 1 112
T30b-2* 0.8 1 136
T9a-1* 4.6 6 156
T9a-2* 4.2 6 154
4c10-1 37 91 3322
4c10-2 64.1 134 2842
4c10-3 25.6 74 3505
4c10-4 41.3 104 2078
4c13.1-1 45.2 33 274
4c13.1-2 74.3 61 361
5a1-1 20 29 110
5a1-2 20.8 35 71
5a1-3 56.7 96 18
5a1-4 55.9 91 9
5a1-5 20.4 34 n.d.
5e3-1* 11.4 15 293
5e3-2* 9.8 13 52
5e3-3 20.9 27 63
5e3-4* 8.6 11 56
5e3-5* 12 16 102
5f1-1 433.9 383 n.d.
5f1-2 234.4 301 n.d.
GS215-1 24.4 54 220
GS215-2 18 24 153
GS215-3* 12.2 16 323
GS215-4 21.2 46 441
1b6.1-1 107.5 227 4066
1b6.2-1 45.9 415 27,476
1b6.2-2 31.9 289 8950
1b6.2-3 16.1 222 8813
1b3-1 35.7 53 126
1b3-2 100.7 105 698
1b3-3 70.1 96 777
Table 1 (continued)
Sample Peak area (area units) Mn (ppm) Fe (ppm)
1b3-4 92.7 103 485
6a7.2-1 211.4 702 7765
6a7.2-2 50.9 35 52
6a7.2-3 380.4 844 139
6a7.2-4 143.5 334 2497
6a11.2-1 947 1151 906
6a11.2-2 884.3 1125 764
6a11.2-3 554.6 1171 3006
6a11.2-4 478.6 2671 3655
1a6-1 18.9 28 136
1a6-2 18.8 41 173
1a6-3 54.5 74 1036
1a6-4 43.4 47 565
1a6-5 14.7 19 209
1a6-6 12.3 16 207
1a6-7 33.1 44 526
1a6-8 20 28 464
1c3S-1 56.5 73 183
1c3S-2 66.8 80 54
1c3S-3 13.4 17 33
1b171-1 67 62 231
1b171-2 123.9 86 107
1b171-3 60 90 82
RSD115-
1
13.2 258 9624
RSD115-
2
12 233 9118
Ku-1 6.1 216 11,245
Ku-2 5.9 146 11,185
Magh1-1 4.2 1496 25,046
Magh1-2 3.6 1551 24,967
Magh2-2 3.3 1658 24,931
Magh3-1 8.9 1234 24,888
Magh3-2 8.7 1257 23,705
Lea-1 864.9 778 10
Lea-2 799.5 905 22
Lea-3 696.6 705 24
Lea-4 678.4 1445 22
Leb-1 831 1197 n.d.
Leb-2 557.2 1540 n.d.
Leb-3 488 816 n.d.
Leb-4 644.9 1186 n.d.
GW18-1 20.4 16 n.d.
GW18-2 40 41 n.d.
GW18-3 45.4 47 n.d.
GW22-1 18.8 25 n.d.
GW22-2 16.2 18 n.d.
GW22-3 17.2 21 n.d.
VE52 534 929 548
A. Gillhaus et al. / Sedimentary Geology 140 (2001) 191±199 197
0.1
0.1 1
1
10
10
100
100
1000 10000
1000
10000
Mn [ppm] = 1,3129*A CL
dolomite
detection limitof PIXE PIXE
QHRS-CL
Mn
-co
nce
ntr
atio
n[p
pm
]fr
om
PIX
E
normalized peak area (A ) of Mn -activated CLCL2+
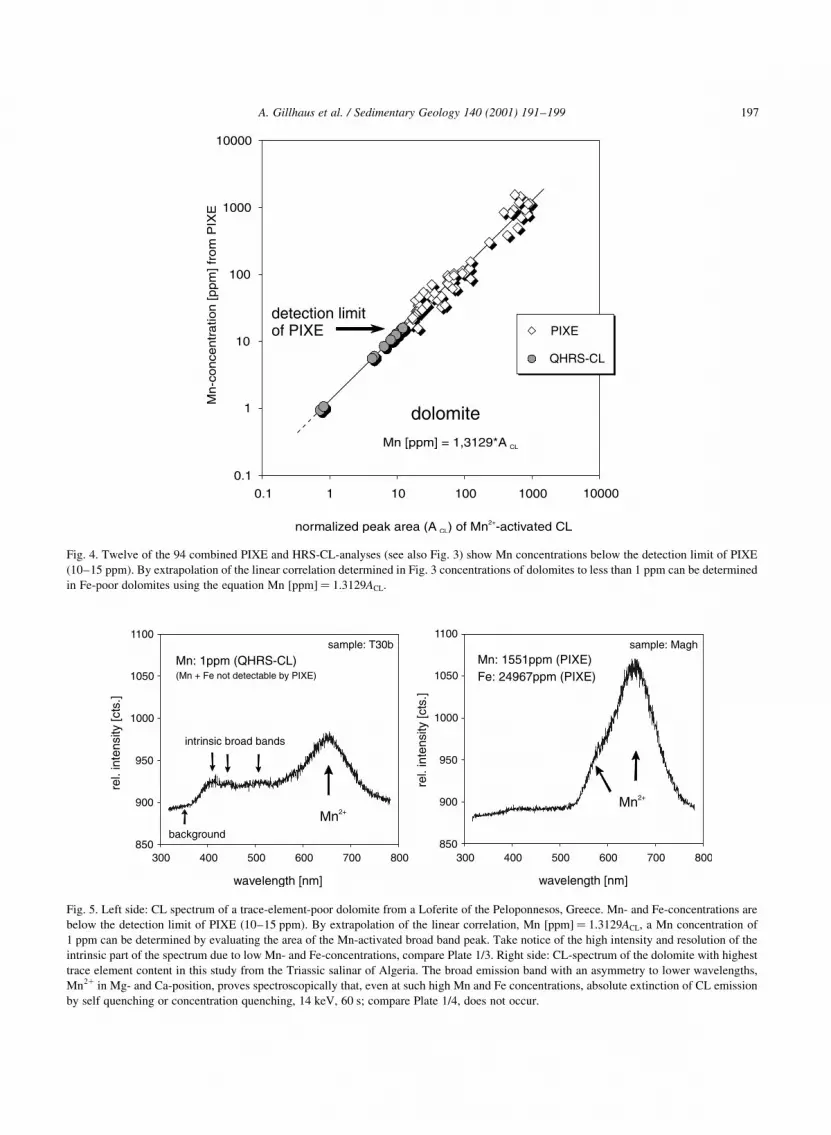
Fig. 4. Twelve of the 94 combined PIXE and HRS-CL-analyses (see also Fig. 3) show Mn concentrations below the detection limit of PIXE
(10±15 ppm). By extrapolation of the linear correlation determined in Fig. 3 concentrations of dolomites to less than 1 ppm can be determined
in Fe-poor dolomites using the equation Mn [ppm]� 1.3129ACL.
850
950
1050
900
1000
1100
300 500400 600 700 800
[cts
.]re
l.in
tens
ity
wavelength [nm]
Mn: 1ppm (QHRS-CL)(Mn + Fe not detectable by PIXE)
Mn2+
intrinsic broad bands
background
sample: T30b sample: Magh
Mn2+
850
950
1050
900
1000
1100
300 500400 600 700 800
[cts
.]re
l.in
tens
ity
wavelength [nm]
Mn: 1551ppm (PIXE)Fe: 24967ppm (PIXE)
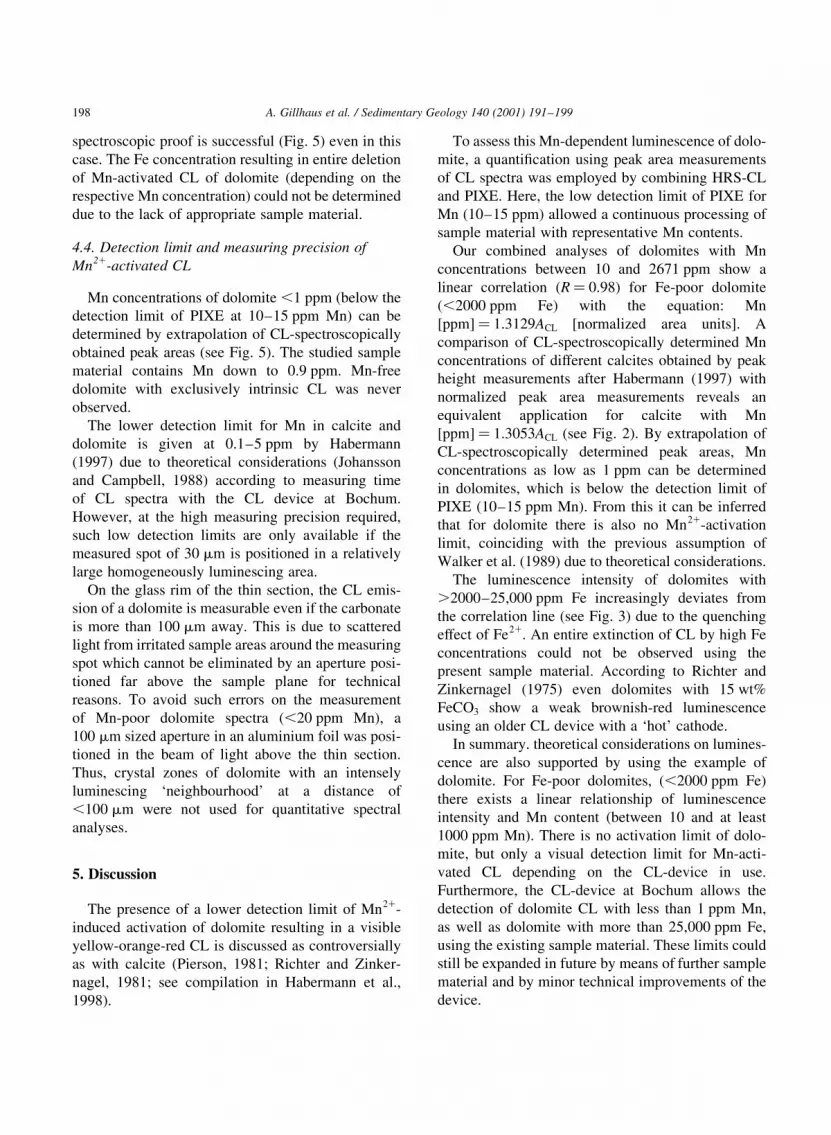
Fig. 5. Left side: CL spectrum of a trace-element-poor dolomite from a Loferite of the Peloponnesos, Greece. Mn- and Fe-concentrations are
below the detection limit of PIXE (10±15 ppm). By extrapolation of the linear correlation, Mn [ppm]� 1.3129ACL, a Mn concentration of
1 ppm can be determined by evaluating the area of the Mn-activated broad band peak. Take notice of the high intensity and resolution of the
intrinsic part of the spectrum due to low Mn- and Fe-concentrations, compare Plate 1/3. Right side: CL-spectrum of the dolomite with highest
trace element content in this study from the Triassic salinar of Algeria. The broad emission band with an asymmetry to lower wavelengths,
Mn21 in Mg- and Ca-position, proves spectroscopically that, even at such high Mn and Fe concentrations, absolute extinction of CL emission
by self quenching or concentration quenching, 14 keV, 60 s; compare Plate 1/4, does not occur.
spectroscopic proof is successful (Fig. 5) even in this
case. The Fe concentration resulting in entire deletion
of Mn-activated CL of dolomite (depending on the
respective Mn concentration) could not be determined
due to the lack of appropriate sample material.
4.4. Detection limit and measuring precision of
Mn21-activated CL
Mn concentrations of dolomite ,1 ppm (below the
detection limit of PIXE at 10±15 ppm Mn) can be
determined by extrapolation of CL-spectroscopically
obtained peak areas (see Fig. 5). The studied sample
material contains Mn down to 0.9 ppm. Mn-free
dolomite with exclusively intrinsic CL was never
observed.
The lower detection limit for Mn in calcite and
dolomite is given at 0.1±5 ppm by Habermann
(1997) due to theoretical considerations (Johansson
and Campbell, 1988) according to measuring time
of CL spectra with the CL device at Bochum.
However, at the high measuring precision required,
such low detection limits are only available if the
measured spot of 30 mm is positioned in a relatively
large homogeneously luminescing area.
On the glass rim of the thin section, the CL emis-
sion of a dolomite is measurable even if the carbonate
is more than 100 mm away. This is due to scattered
light from irritated sample areas around the measuring
spot which cannot be eliminated by an aperture posi-
tioned far above the sample plane for technical
reasons. To avoid such errors on the measurement
of Mn-poor dolomite spectra (,20 ppm Mn), a
100 mm sized aperture in an aluminium foil was posi-
tioned in the beam of light above the thin section.
Thus, crystal zones of dolomite with an intensely
luminescing `neighbourhood' at a distance of
,100 mm were not used for quantitative spectral
analyses.
5. Discussion
The presence of a lower detection limit of Mn21-
induced activation of dolomite resulting in a visible
yellow-orange-red CL is discussed as controversially
as with calcite (Pierson, 1981; Richter and Zinker-
nagel, 1981; see compilation in Habermann et al.,
1998).
To assess this Mn-dependent luminescence of dolo-
mite, a quanti®cation using peak area measurements
of CL spectra was employed by combining HRS-CL
and PIXE. Here, the low detection limit of PIXE for
Mn (10±15 ppm) allowed a continuous processing of
sample material with representative Mn contents.
Our combined analyses of dolomites with Mn
concentrations between 10 and 2671 ppm show a
linear correlation (R� 0.98) for Fe-poor dolomite
(,2000 ppm Fe) with the equation: Mn
[ppm]� 1.3129ACL [normalized area units]. A
comparison of CL-spectroscopically determined Mn
concentrations of different calcites obtained by peak
height measurements after Habermann (1997) with
normalized peak area measurements reveals an
equivalent application for calcite with Mn
[ppm]� 1.3053ACL (see Fig. 2). By extrapolation of
CL-spectroscopically determined peak areas, Mn
concentrations as low as 1 ppm can be determined
in dolomites, which is below the detection limit of
PIXE (10±15 ppm Mn). From this it can be inferred
that for dolomite there is also no Mn21-activation
limit, coinciding with the previous assumption of
Walker et al. (1989) due to theoretical considerations.
The luminescence intensity of dolomites with
.2000±25,000 ppm Fe increasingly deviates from
the correlation line (see Fig. 3) due to the quenching
effect of Fe21. An entire extinction of CL by high Fe
concentrations could not be observed using the
present sample material. According to Richter and
Zinkernagel (1975) even dolomites with 15 wt%
FeCO3 show a weak brownish-red luminescence
using an older CL device with a `hot' cathode.
In summary. theoretical considerations on lumines-
cence are also supported by using the example of
dolomite. For Fe-poor dolomites, (,2000 ppm Fe)
there exists a linear relationship of luminescence
intensity and Mn content (between 10 and at least
1000 ppm Mn). There is no activation limit of dolo-
mite, but only a visual detection limit for Mn-acti-
vated CL depending on the CL-device in use.
Furthermore, the CL-device at Bochum allows the
detection of dolomite CL with less than 1 ppm Mn,
as well as dolomite with more than 25,000 ppm Fe,
using the existing sample material. These limits could
still be expanded in future by means of further sample
material and by minor technical improvements of the
device.
A. Gillhaus et al. / Sedimentary Geology 140 (2001) 191±199198
Acknowledgements
We thank Thomas GoÈtte (Ruhr-University
Bochum, Germany) and Dirk Habermann (University
of Freyberg, Germany) for discussions concerning
methodical aspects.
References
El-Ali, A., Barbin, V., Calas, G., Cervelle, B., Ramseyer, K.,
Bouroulec, J., 1993. Mn21-activated luminescence in dolomite,
calcite and magnesite: quantitative determination of manganese
and site distribution by EPR and CL-spectroscopy. Chem. Geol.
104, 189±202.
Fairchild, I.J., 1983. Chemical controls of cathodoluminescence
of natural dolomites and calcites: new data and review.
Sedimentology 27, 631±650.
Gillhaus, A., GoÈtte, T., Pletz, A., Richter, D.K., Sedlmayr, N.,
Wentzler, S., 1999. Zur hoÈhergradigen Diagenese in der
permisch/ju rassischen Schichtenfolge von Hydra, Grieche-
naldn. In: Richter, D.K., Wurth, G. (Eds.), BeitraÈge zur
Sedimentologie von Griechenland I. Bochumer geol. geotech.
Arb. 53, 107±125.
Gillhaus, A., Habermann, D., Meijer, J., Richter, D.K., 2000.
Cathodoluminescence spectroscopy and micro-PIXE: combined
high-resolution Mn-analyses in dolomites: ®rst results. Nucl.
Instr. Meth. Phys. Res. B161±163, 842±845.
Habermann, D., 1997. Quantiative hochau¯oÈsende Kathodo-
lumineszenz-Spektroskopie von Calcit und Dolomit. Diss.
Ruhr-Univ. Bochum, 152S.
Habermann, D., Neuser, R.D., Richter, D.K., 1996. Hochau¯oÈsende
Spektralanalyse der Kathodolumineszenz (CL) von Dolomit
und Calcit: Beispiele der Mn- und SEE-aktivierten CL in
Karbonatsedimenten. Zbl. Geol. PalaÈont. I (1/2), 145±157.
Habermann, D., Neuser, R.D., Richter, D.K., 1998. Low limit of
Mn21-activated cathodoluminescence of calcite: state of the art.
Sedim. Geol. 116, 13±24.
Habermann, D., Meijer, J., Neuser, R.D., Richter, D.K., Rolfs, C.,
Stephan, A., 1999a. Micro-PIXE and quantitative cathodolumi-
nescence spectroscopy: combined high resolution trace element
analyses in minerals. Nucl. Instr. Meth. Phys. Res. B150,
470±477.
Habermann, D., GoÈtze, J., Neuser, R.D., Richter, D.K., 1999b.
The phenomenon of intrinsic cathodoluminescence: case studies
of quartz, calcite and apatite. Zbl. Geol. PalaÈont. I (10/12),
1275±1284.
Johansson, S.A.E., Campbell, J.L., 1988. PIXE: a Novel Technique
for Elemental Analysis. Wiley, New York.
Long, J.V.P., Agrell, S.O., 1965. The cathodoluminescence of
minerals in thin sections. Mineral. Mag. 34, 318±326.
Machel, H.G., Mason, R.A., Mariano, A.N., Mucci, A., 1991.
Causes and measurements of luminescence in calcite and
dolomite. In: Barker, C.E., Kopp, O.C. (Eds.), Luminescence
Microscopy and Spectroscopy: Qualitative and Quantitative
Applications. SEPM Short Course 25, pp. 9±25.
Marshall, D.J., 1988. Cathodoluminescence of Geological
Materials. Unwin Hyman, Boston.
Martin, H., Zeeghers, H., 1969. Cathodoluminescence et distribu-
tion du manganeÁse dans les calcaries et dolomies du Tournaisien
SupeÂrieur au Sud de Dinant. Belgique. Comptes Rendus de
l'AcadeÂmie des Sciences Paris 269 (1), 922±924.
Maxwell, J.A., Teesdale, W.J., Campbell, J.L., 1995. The Guelph
PIXE software package II. Nucl. Instr. Meth. B95, 407±421.
Meijer, J., Stephan, A., Adamczewski, J., Bukow, H.H., Rolfs, C.,
Pickart, T., Bruhn, F., Veizer, J., 1994. PIXE microprobe for
geoscience application. Nucl. Instr. Meth. Phys. Res. B89,
229±232.
Neuser, R.D., 1995. A new high-intensity cathodoluminescence
microscope and its application to weakly luminescing materials.
Bochumer geol. u. geotech. Arb. 44, 116±118.
Neuser, R.D., Bruhn, F., GoÈtze, J., Habermann, D., Richter, D.K.,
1996. Kathodolumineszenz: Methodik und Anwendung. Zbl.
Geol. PalaÈont. I (1/2), 287±306.
Pagel, M., Barbin, V., Blanc, P., Ohnenstetter, D., 2000. In
geosciences: an introduction. In: Pagel, M., Barbin, V.,
Blanc, P., Ohnenstetter, D. (Eds.). Cathodoluminescence in
Geosciences. Springer, Berlin, pp. 1±21.
Pierson, B.J., 1981. The control of cathodoluminescence in
dolomite by iron and manganese. Sedimentology 28, 601±610.
Reeder, R.J., 1983. Crystal chemistry of the rhombohedral
carbonates. In: Reeder, R.J., (Ed.), Carbonates: Mineralogy
and Chemistry: Reviews in Mineralogy, 11, pp. 1±48.
Richter, D.K., 1999. HydraÐEin geologischer UÈ berblick. In: Richter,
D.K., Wurth, G. (Eds.), BeitraÈge zur Sedimentologie von
Griechenland, I. Bochumer geol. u. geotechn. Arb. 53, 41±106.
Richter, D.K., Zinkernagel, U., 1975. Petrographie des
`Permoskyth' der Jaggl-Plawen-Einheit, SuÈdtirol und Diskus-
sion der Detritusherkunft mit Hilfe von Kathodolumineszenz-
Untersuchungen. Geol. Rdsch. 64, 783±807.
Richter, D.K., Zinkernagel, U., 1981. Zur Anwendung der
Kathodolumineszenz in der Karbonatpetrographie. Geol.
Rdsch. 70, 1276±1302.
Sommer, S.E., 1972. Cathodoluminescence of carbonates, 1.
Characterization of cathodoluminenscence from carbonate
solid solutions. Chem. Geol. 9, 257±273.
Ten Have, T., Heijnen, W.J., 1985. Cathodoluminescence activation
and zonation in carbonate rocks: an experimental approach.
Geologie en Mijnbouw 64, 297±310.
Walker, G., Abumere, O.E., Kamaluddin, B., 1989. Luminescence
spectroscopy of Mn21 centres in rock forming carbonates.
Mineral. Mag. 53, 201±211.
A. Gillhaus et al. / Sedimentary Geology 140 (2001) 191±199 199


