Embed Size (px)
Citation preview
Available online at www.sciencedirect.com
Magnetic Resonance Imagi
ng 29 (2011) 335–341Quantitative assessment of mobile protein levels in human kneesynovial fluid: feasibility of chemical exchange saturation
transfer (proteinCEST) MRI of osteoarthritis☆
Guang Jiaa,1, Yukihisa Takayamaa, David C. Flaniganb, Christopher C. Kaedingb,Jinyuan Zhouc, Ajit Chaudharib, Daniel Clarka, Steffen Sammet a, Jiachao Lianga,
Seongjin Choia, Michael V. Knoppa,⁎aDepartment of Radiology and Wright Center of Innovation in Biomedical Imaging, The Ohio State University, Columbus, OH 43210, USA
bDepartment of Orthopedics, The Ohio State University, Columbus OH 43210, USAcDepartment of Radiology, Johns Hopkins University, Baltimore, MD 21205, USA
Received 23 June 2010; revised 16 September 2010; accepted 23 October 2010
Abstract
Purpose: To establish the feasibility of chemical exchange saturation transfer (proteinCEST) MRI in the differentiation of osteoarthritis (OA)knee joints from non-OA joints by detecting mobile protein and peptide levels in synovial fluid by determining their relative distribution.Materials and Methods: A total of 25 knees in 11 men and 12 women with knee injuries were imaged using whole knee joint proteinCESTMRI sequence at 3 T. The joint synovial fluid was segmented and the asymmetric magnetization transfer ratio at 3.5 ppm MTRasym (3.5 ppm)was calculated to assess protein content in the synovial fluid. The 85th percentile of synovial fluid MTRasym (3.5 ppm) distribution profilewas compared using the independent Student's t test. The diagnostic performance of the 85th percentile of synovial fluid MTRasym (3.5 ppm)in differentiating OA and non-OA knee joints was evaluated.Results: The 85th percentile of synovial fluid MTRasym (3.5 ppm) in knee joints with OA was 8.6%±3.4% and significantly higher than thatin the knee joints without OA (6.3%±1.4%, Pb.05). A knee joint with an 85th percentile of synovial fluid MTRasym (3.5 ppm) greater than7.7% was considered to be an OA knee joint. With the threshold, the sensitivity, specificity and overall accuracy for differentiating kneejoints with OA from the joints without OA were 54% (7/13), 92% (11/12) and 72% (18/25), respectively.Conclusion: proteinCEST MRI appears feasible as a quantitative methodology to determine mobile protein levels in synovial fluid andidentify patterns characteristic for OA disease.© 2011 Elsevier Inc. All rights reserved.
Keywords: Human knee; Osteoarthritis; Synovial fluid; MRI; Chemical exchange saturation transfer; Amide proton transfer
1. Introduction
Osteoarthritis (OA) is a chronic condition characterizedby the breakdown and eventual loss of articular cartilage ofthe joint [1]. It is estimated that nearly 27 million people in
☆ Source of support: Wright Center of Innovation in BiomedicaImaging and OSUMC Imaging Signature Program at the Ohio StateUniversity, Columbus, OH, USA.
⁎ Corresponding author. Tel.: +1 614 293 9998; fax: +1 614 293 9275E-mail address: [email protected] (M.V. Knopp).1 The abstract of the study won the RSNA Research Trainee Award in
December 2008 in Chicago, IL, USA.
0730-725X/$ – see front matter © 2011 Elsevier Inc. All rights reserved.doi:10.1016/j.mri.2010.10.006
l
.
the United States are affected by OA and suffer stiffness,pain and disability of this degenerative disease [2–4]. Effortsto identify disease-modifying OA interventions are impor-tant and require reliable imaging markers. The total proteinconcentration of synovial fluid in patients with OA wasfound to be slightly elevated compared to normal [5], and theendogenous peptides in synovial fluid was found to beassociated with OA [6]. Nonimmunoglobulin proteins, suchas haptoglobin, α2-macroglobulin, orosomucoid, transferrinand ceruloplasmin, exhibit a higher concentration in OAjoints compared to normal joints, which was found tocorrelate with increased capillary permeability in thesynovial membrane due to capillary dilation and stasis [7].
336 G. Jia et al. / Magnetic Resonance Imaging 29 (2011) 335–341
The OA-induced accumulation of total protein was found tobe alleviated by treatments such as combined hyaluronan andultrasound treatment [8] and calycosin-7-O-β-D-glucopyr-anoside injection [9] in a rabbit model.
Protein level is generally measured by collecting synovialfluid via nonsurgical penetration and joint aspiration, whichis an invasive procedure with inherent risks and therefore theevaluation of normal synovial fluid is limited [10]. The fluidsample is likely mixed with blood due to traumaticaspiration, which causes difficulty in assessing proteincontent in the synovial fluid. The noninvasive capabilitiesof protein content measurement may be achieved bychemical exchange saturation transfer (CEST) MRI. CESTMRI has recently emerged as a new quantitative molecular-MRI technique, in which the magnetization transfer ratiobetween the chemical exchangeable solute protons and thebulk water protons is determined [11–13]. The CEST MRItechnique was first applied to biological tissues by Guivel-Scharen et al. [14]. They reported that the exchange betweenlabile protons in low-concentration solute and water protonsprovides a sensitivity enhancement scheme useful as a newMRI contrast mechanism [15]. CEST MRI has been shownto detect the overexpressed proteins and peptides in braintumors [16] as well as to detect cartilage glycosaminoglycanconcentration [17,18].
The approach using a CEST sensitivity enhancementscheme for amide protons, called amide proton transfer orproteinCEST imaging, can estimate the concentration of theamide protons in endogenous mobile proteins and peptidesvia water signal [19–22]. Amide protons in peptide bondshave a resonant frequency of 3.5 ppm offset from waterprotons, i.e., 448 Hz at 3 T MRI. Amide protons cannot bedirectly imaged due to low concentration and short T2relaxation time [23]. In proteinCEST MRI, a saturation pre-pulse with different frequency offsets is applied to obtain themagnetization transfer spectrum, which exhibits both amideproton-induced water signal decrease (at the offset of 3.5ppm; namely, the proteinCEST effect) and direct watersignal saturation (normally assigned as 0 ppm). Becausethere is no proteinCEST effect at −3.5 pm, the asymmetricsaturation at ±3.5 ppm can be used to measure the chemicalexchange of amide protons by suppressing other saturationeffects concurrent with proteinCEST measurements [22].
The purpose of this study was to establish the capabilityof proteinCEST MRI to quantitatively measure mobileprotein levels in synovial fluid for differentiating humanknees with OA from those without OA.
2. Methods
2.1. Patients
Institutional review board approval was granted for thisHIPPA-compliant study, and informed consent was waived.A total of 28 patients with knee injury were recruited fromthe sports medicine clinic of the Ohio State University
Medical Center. All patients complained of pain in the studyknee. Patients with hemarthrosis were excluded from thisstudy due to the possible effect on protein level of thesynovial fluid. Five patients were excluded for the followingreasons: a large knee that would not fit into the knee coil inone patient, inadequate image quality caused by motionartifacts or low image resolution in three, incomplete magnetfield shimming in one. proteinCEST MR imaging of theknee was performed successfully in 23 patients [11 (48%)men and 12 (52%) women; 31±8 years; range, 17–49 years],in which 12 had a history of previous knee trauma, kneesurgery or arthroscopy. Classification on disease state (OAor non-OA knee) was performed by a radiologist based onclinical imaging (MRI and radiographs) and whole knee jointevaluation of the knee independent of this study [24].
2.2. MR Imaging examinations
All patients were imaged on a 3-T MR system (Achieva,Philips Healthcare, Cleveland, OH, USA) using an eight-channel receiver knee coil. Whole knee joint proteinCESTMRI was acquired using a sagittal turbo spin-echo (TSE)sequence with the following parameters: TR/TE=5625/26ms; TSE factor=15; field of view=165×165 mm2; ma-trix=224×124; slice thickness=3 mm; slice gap=0 mm;number of slices=28–35; number of signal averages=1. Inthis study, TSE images were acquired without and withsaturation prepulses at two frequency offsets (3.5 and −3.5ppm), composed of a train of sixteen 1400° block pulses withpulse length of 30 ms and saturation amplitude of 130 Hz(∼3.0 μT). The scan time was 15 min without parallelimaging in the first seven subjects and 5 min with sensitivityencoding (SENSE) factor of 3 in the rest of the 16 subjectsfor shorter acquisition since no effect on protein levelevaluation was found by comparing the acquisitions withand without SENSE on phantom scans. A whole magneti-zation transfer (MT) spectrum was acquired on one subjectusing sagittal single-slice single-shot TSE with the followingparameters: TR/TE=5250/84 ms; TSE factor=56; field ofview=165×165 mm2; matrix=96×77; slice thickness=4 mm;number of signal average=1. MT spectrum was composed of33 different frequency offsets (−8 to 8 ppm; interval: 0.5ppm) with the acquisition of 3 min without parallel imaging.Both proteinCEST-MRI methods were implemented withinFDA-regulated specific absorption rate limit.
2.3. MR Imaging analysis
The proteinCEST MRI analysis was performed using in-house developed software based on the Interactive DataLanguage (IDL, ITT Visual Information Solutions, Boulder,CO, USA) environment. When the saturation prepulse isapplied to amide protons, it may saturate bulk water protonsdue to the small frequency difference between them (3.5ppm). Therefore, the magnetization transfer from amideprotons cannot be directly measured from the conventionalmagnetization transfer ratio (MTR) at 3.5 ppm. To reduce the
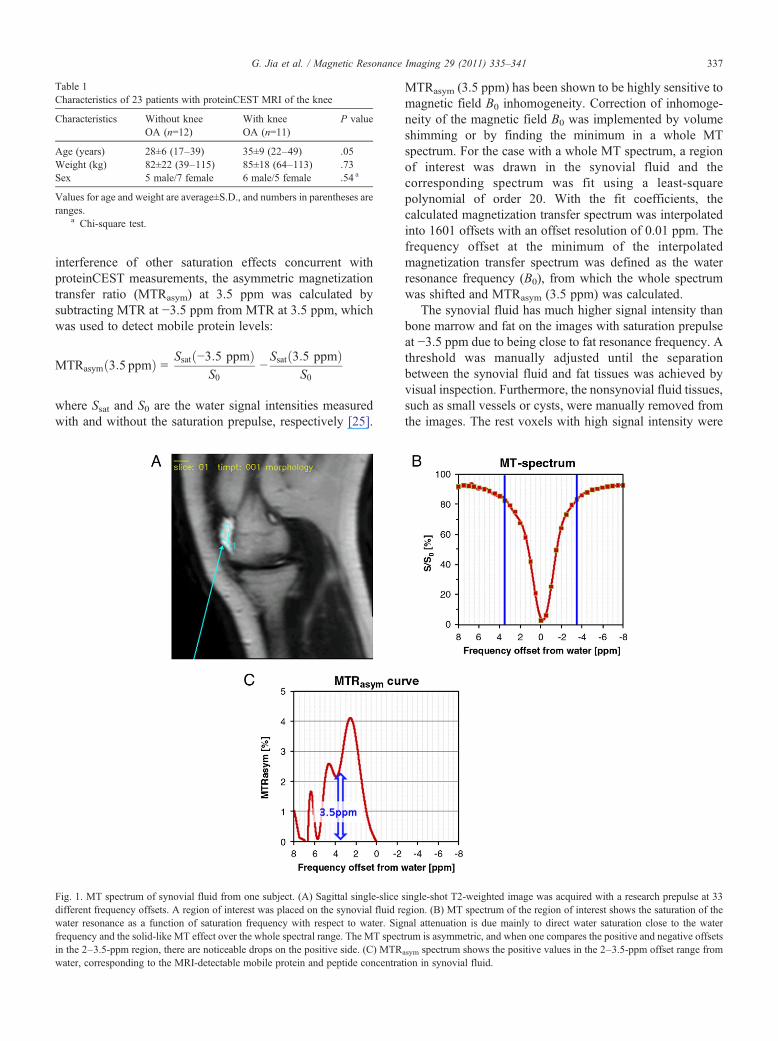
Table 1Characteristics of 23 patients with proteinCEST MRI of the knee
Characteristics Without kneeOA (n=12)
With kneeOA (n=11)
P value
Age (years) 28±6 (17–39) 35±9 (22–49) .05Weight (kg) 82±22 (39–115) 85±18 (64–113) .73Sex 5 male/7 female 6 male/5 female .54 a
Values for age and weight are average±S.D., and numbers in parentheses areranges.
a Chi-square test.
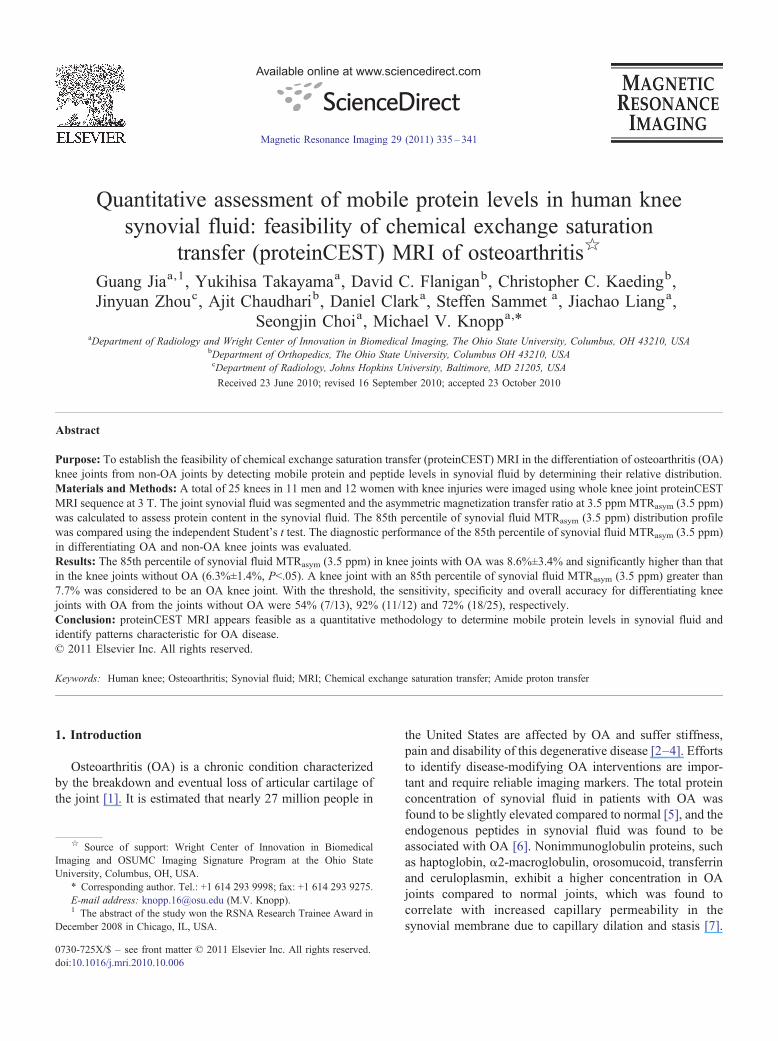
Fig. 1. MT spectrum of synovial fluid from one subject. (A) Sagittal singldifferent frequency offsets. A region of interest was placed on the synovialwater resonance as a function of saturation frequency with respect to wafrequency and the solid-like MT effect over the whole spectral range. The Min the 2–3.5-ppm region, there are noticeable drops on the positive side. (Cwater, corresponding to the MRI-detectable mobile protein and peptide co
337G. Jia et al. / Magnetic Resonance Imaging 29 (2011) 335–341
interference of other saturation effects concurrent withproteinCEST measurements, the asymmetric magnetizationtransfer ratio (MTRasym) at 3.5 ppm was calculated bysubtracting MTR at −3.5 ppm from MTR at 3.5 ppm, whichwas used to detect mobile protein levels:
MTRasym 3:5 ppmð Þ = Ssat −3:5 ppmð ÞS0
−Ssat 3:5 ppmð Þ
S0
where Ssat and S0 are the water signal intensities measuredwith and without the saturation prepulse, respectively [25].
e-slice sfluid reter. SigT spect) MTRncentrat
MTRasym (3.5 ppm) has been shown to be highly sensitive tomagnetic field B0 inhomogeneity. Correction of inhomoge-neity of the magnetic field B0 was implemented by volumeshimming or by finding the minimum in a whole MTspectrum. For the case with a whole MT spectrum, a regionof interest was drawn in the synovial fluid and thecorresponding spectrum was fit using a least-squarepolynomial of order 20. With the fit coefficients, thecalculated magnetization transfer spectrum was interpolatedinto 1601 offsets with an offset resolution of 0.01 ppm. Thefrequency offset at the minimum of the interpolatedmagnetization transfer spectrum was defined as the waterresonance frequency (B0), from which the whole spectrumwas shifted and MTRasym (3.5 ppm) was calculated.
The synovial fluid has much higher signal intensity thanbone marrow and fat on the images with saturation prepulseat −3.5 ppm due to being close to fat resonance frequency. Athreshold was manually adjusted until the separationbetween the synovial fluid and fat tissues was achieved byvisual inspection. Furthermore, the nonsynovial fluid tissues,such as small vessels or cysts, were manually removed fromthe images. The rest voxels with high signal intensity were
ingle-shot T2-weighted image was acquired with a research prepulse at 33gion. (B) MT spectrum of the region of interest shows the saturation of thenal attenuation is due mainly to direct water saturation close to the waterum is asymmetric, and when one compares the positive and negative offsets
asym spectrum shows the positive values in the 2–3.5-ppm offset range fromion in synovial fluid.
r
338 G. Jia et al. / Magnetic Resonance Imaging 29 (2011) 335–341
categorized as synovial fluid, and the sum of voxel volumesdefined to be the volume of the synovial fluid.
MTRasym (3.5 ppm) maps were visualized by three-dimensional reconstruction of the segmented synovial fluidvoxels. MTRasym (3.5 ppm) values were then tabulated in apixel histogram and the 85th percentile of synovial fluidMTRasym (3.5 ppm) was calculated. The reader was blindedto the patient diagnosis.
2.4. Statistical analysis
MTRasym (3.5 ppm) showed spatial inhomogeneity insynovial fluid and the 85th percentile level in synovial fluiddistribution was defined as the lower boundary of highsynovial fluid protein and peptide concentration. Theindependent Student's t test was used to compare the 85thpercentile of synovial fluid MTRasym (3.5 ppm) in patientknees with OA and those without OA. To evaluate thediagnostic performance of the 85th percentile of synovialfluid MTRasym (3.5 ppm) in differentiating knee joints withOA and knee joints without OA, receiver-operating-
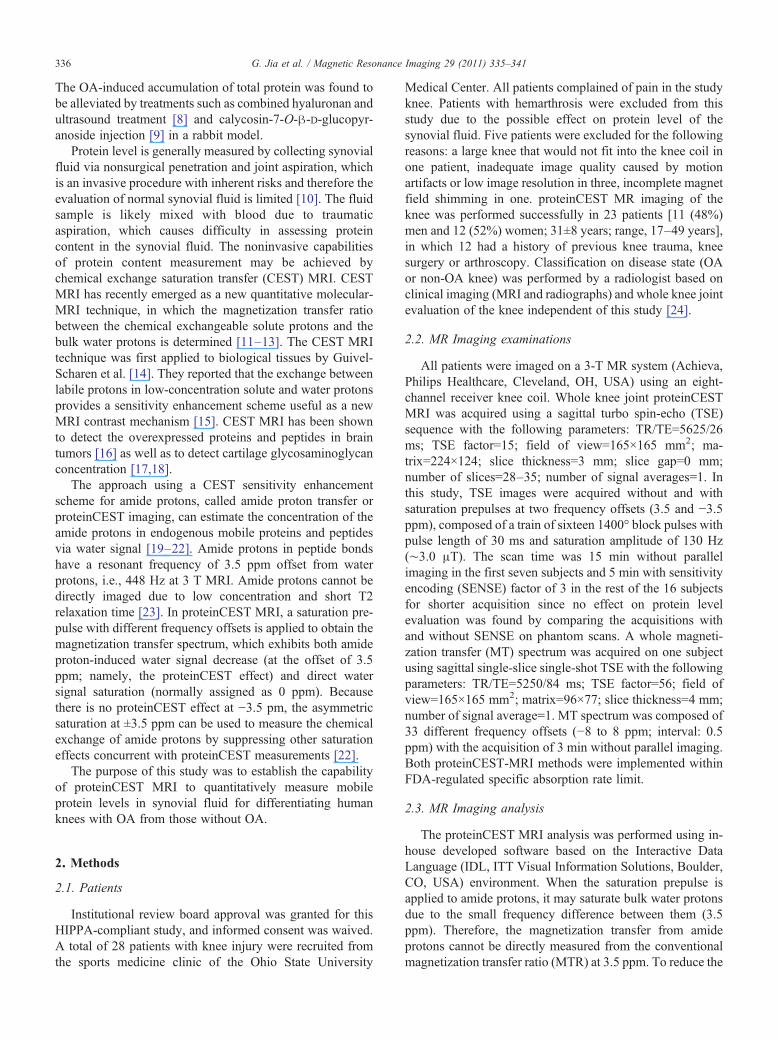
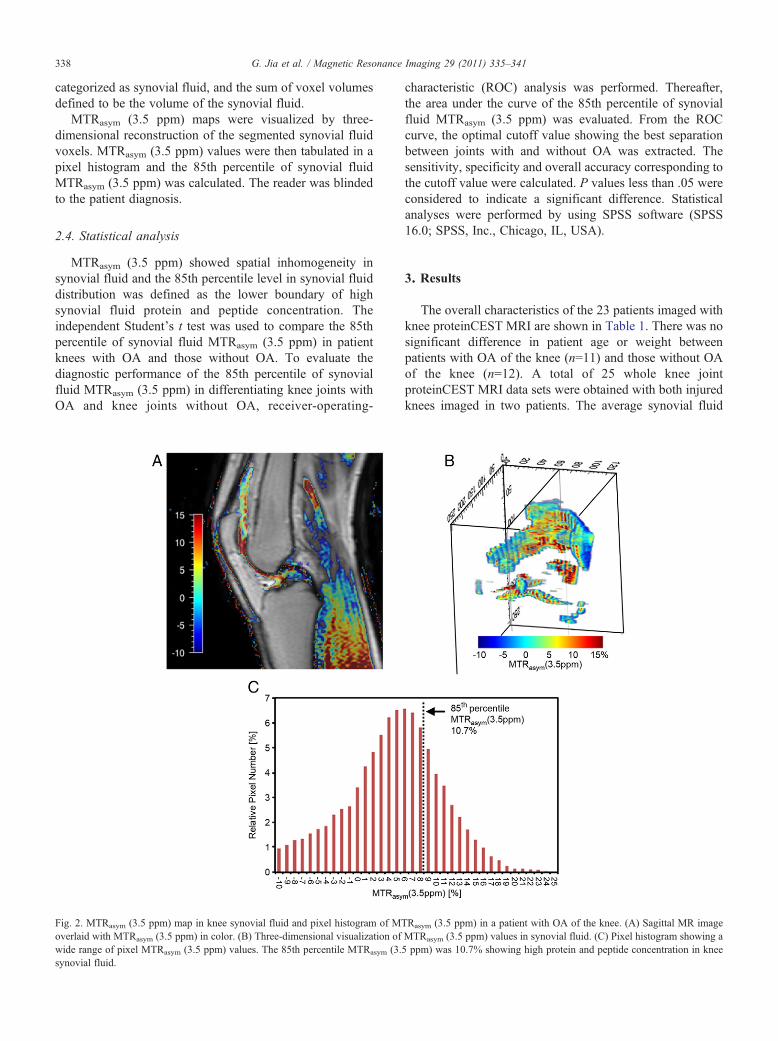
Fig. 2. MTRasym (3.5 ppm) map in knee synovial fluid and pixel histogram of MToverlaid with MTRasym (3.5 ppm) in color. (B) Three-dimensional visualization ofwide range of pixel MTRasym (3.5 ppm) values. The 85th percentile MTRasym (3.5synovial fluid.
characteristic (ROC) analysis was performed. Thereafter,the area under the curve of the 85th percentile of synovialfluid MTRasym (3.5 ppm) was evaluated. From the ROCcurve, the optimal cutoff value showing the best separationbetween joints with and without OA was extracted. Thesensitivity, specificity and overall accuracy corresponding tothe cutoff value were calculated. P values less than .05 wereconsidered to indicate a significant difference. Statisticalanalyses were performed by using SPSS software (SPSS16.0; SPSS, Inc., Chicago, IL, USA).
3. Results
The overall characteristics of the 23 patients imaged withknee proteinCEST MRI are shown in Table 1. There was nosignificant difference in patient age or weight betweenpatients with OA of the knee (n=11) and those without OAof the knee (n=12). A total of 25 whole knee jointproteinCEST MRI data sets were obtained with both injuredknees imaged in two patients. The average synovial fluid
Rasym (3.5 ppm) in a patient with OA of the knee. (A) Sagittal MR imageMTRasym (3.5 ppm) values in synovial fluid. (C) Pixel histogram showing appm) was 10.7% showing high protein and peptide concentration in knee
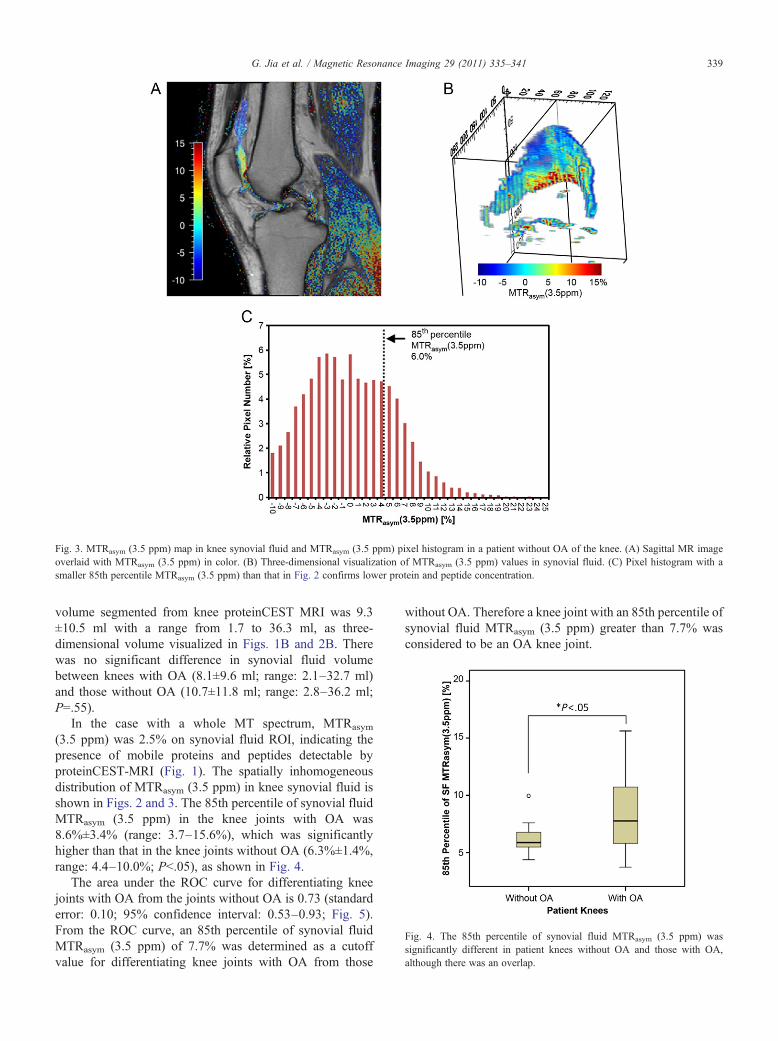
Fig. 3. MTRasym (3.5 ppm) map in knee synovial fluid and MTRasym (3.5 ppm) pixel histogram in a patient without OA of the knee. (A) Sagittal MR imageoverlaid with MTRasym (3.5 ppm) in color. (B) Three-dimensional visualization of MTRasym (3.5 ppm) values in synovial fluid. (C) Pixel histogram with asmaller 85th percentile MTRasym (3.5 ppm) than that in Fig. 2 confirms lower protein and peptide concentration.
Fig. 4. The 85th percentile of synovial fluid MTRasym (3.5 ppm) wassignificantly different in patient knees without OA and those with OA,although there was an overlap.
339G. Jia et al. / Magnetic Resonance Imaging 29 (2011) 335–341
volume segmented from knee proteinCEST MRI was 9.3±10.5 ml with a range from 1.7 to 36.3 ml, as three-dimensional volume visualized in Figs. 1B and 2B. Therewas no significant difference in synovial fluid volumebetween knees with OA (8.1±9.6 ml; range: 2.1–32.7 ml)and those without OA (10.7±11.8 ml; range: 2.8–36.2 ml;P=.55).
In the case with a whole MT spectrum, MTRasym
(3.5 ppm) was 2.5% on synovial fluid ROI, indicating thepresence of mobile proteins and peptides detectable byproteinCEST-MRI (Fig. 1). The spatially inhomogeneousdistribution of MTRasym (3.5 ppm) in knee synovial fluid isshown in Figs. 2 and 3. The 85th percentile of synovial fluidMTRasym (3.5 ppm) in the knee joints with OA was8.6%±3.4% (range: 3.7–15.6%), which was significantlyhigher than that in the knee joints without OA (6.3%±1.4%,range: 4.4–10.0%; Pb.05), as shown in Fig. 4.
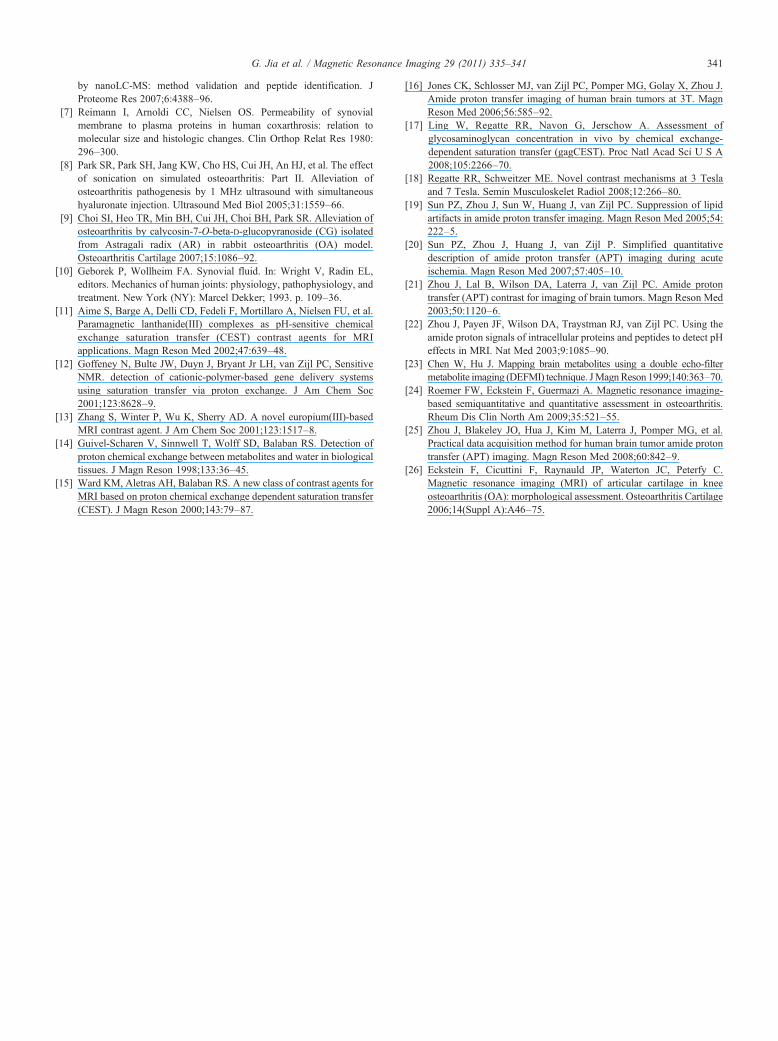
The area under the ROC curve for differentiating kneejoints with OA from the joints without OA is 0.73 (standarderror: 0.10; 95% confidence interval: 0.53–0.93; Fig. 5).From the ROC curve, an 85th percentile of synovial fluidMTRasym (3.5 ppm) of 7.7% was determined as a cutoffvalue for differentiating knee joints with OA from those
without OA. Therefore a knee joint with an 85th percentile ofsynovial fluid MTRasym (3.5 ppm) greater than 7.7% wasconsidered to be an OA knee joint.
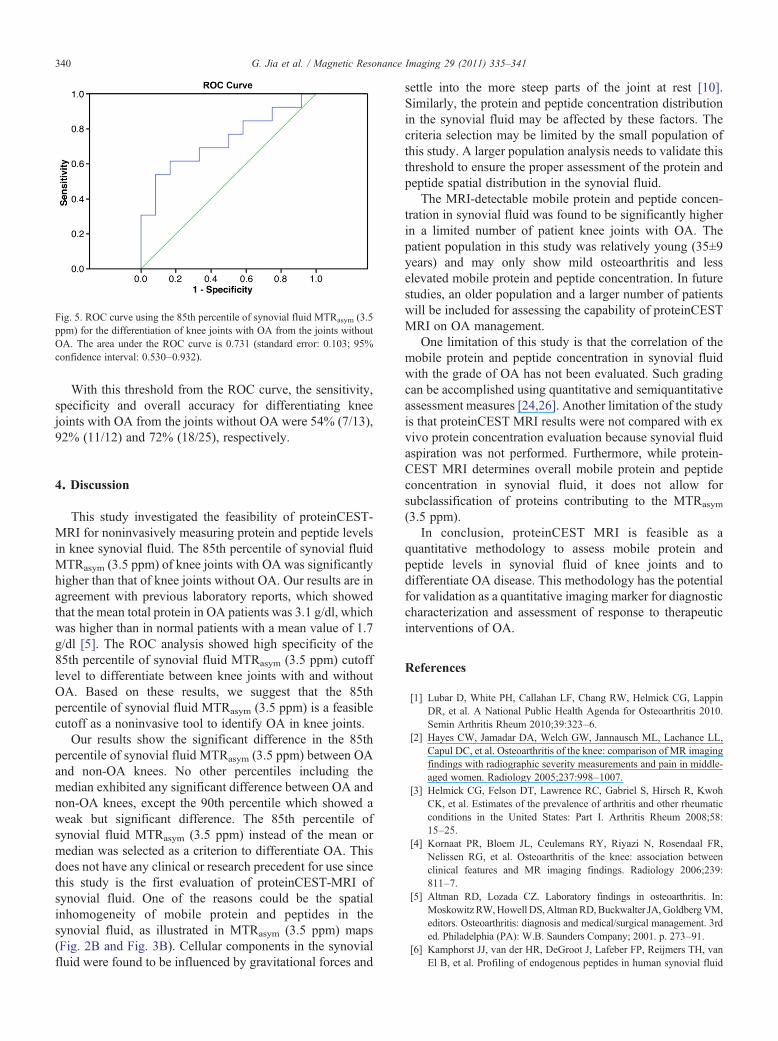
Fig. 5. ROC curve using the 85th percentile of synovial fluid MTRasym (3.5ppm) for the differentiation of knee joints with OA from the joints withoutOA. The area under the ROC curve is 0.731 (standard error: 0.103; 95%confidence interval: 0.530–0.932).
340 G. Jia et al. / Magnetic Resonance Imaging 29 (2011) 335–341
With this threshold from the ROC curve, the sensitivity,specificity and overall accuracy for differentiating kneejoints with OA from the joints without OA were 54% (7/13),92% (11/12) and 72% (18/25), respectively.
4. Discussion
This study investigated the feasibility of proteinCEST-MRI for noninvasively measuring protein and peptide levelsin knee synovial fluid. The 85th percentile of synovial fluidMTRasym (3.5 ppm) of knee joints with OA was significantlyhigher than that of knee joints without OA. Our results are inagreement with previous laboratory reports, which showedthat the mean total protein in OA patients was 3.1 g/dl, whichwas higher than in normal patients with a mean value of 1.7g/dl [5]. The ROC analysis showed high specificity of the85th percentile of synovial fluid MTRasym (3.5 ppm) cutofflevel to differentiate between knee joints with and withoutOA. Based on these results, we suggest that the 85thpercentile of synovial fluid MTRasym (3.5 ppm) is a feasiblecutoff as a noninvasive tool to identify OA in knee joints.
Our results show the significant difference in the 85thpercentile of synovial fluid MTRasym (3.5 ppm) between OAand non-OA knees. No other percentiles including themedian exhibited any significant difference between OA andnon-OA knees, except the 90th percentile which showed aweak but significant difference. The 85th percentile ofsynovial fluid MTRasym (3.5 ppm) instead of the mean ormedian was selected as a criterion to differentiate OA. Thisdoes not have any clinical or research precedent for use sincethis study is the first evaluation of proteinCEST-MRI ofsynovial fluid. One of the reasons could be the spatialinhomogeneity of mobile protein and peptides in thesynovial fluid, as illustrated in MTRasym (3.5 ppm) maps(Fig. 2B and Fig. 3B). Cellular components in the synovialfluid were found to be influenced by gravitational forces and
settle into the more steep parts of the joint at rest [10].Similarly, the protein and peptide concentration distributionin the synovial fluid may be affected by these factors. Thecriteria selection may be limited by the small population ofthis study. A larger population analysis needs to validate thisthreshold to ensure the proper assessment of the protein andpeptide spatial distribution in the synovial fluid.
The MRI-detectable mobile protein and peptide concen-tration in synovial fluid was found to be significantly higherin a limited number of patient knee joints with OA. Thepatient population in this study was relatively young (35±9years) and may only show mild osteoarthritis and lesselevated mobile protein and peptide concentration. In futurestudies, an older population and a larger number of patientswill be included for assessing the capability of proteinCESTMRI on OA management.
One limitation of this study is that the correlation of themobile protein and peptide concentration in synovial fluidwith the grade of OA has not been evaluated. Such gradingcan be accomplished using quantitative and semiquantitativeassessment measures [24,26]. Another limitation of the studyis that proteinCEST MRI results were not compared with exvivo protein concentration evaluation because synovial fluidaspiration was not performed. Furthermore, while protein-CEST MRI determines overall mobile protein and peptideconcentration in synovial fluid, it does not allow forsubclassification of proteins contributing to the MTRasym
(3.5 ppm).In conclusion, proteinCEST MRI is feasible as a
quantitative methodology to assess mobile protein andpeptide levels in synovial fluid of knee joints and todifferentiate OA disease. This methodology has the potentialfor validation as a quantitative imaging marker for diagnosticcharacterization and assessment of response to therapeuticinterventions of OA.
References
[1] Lubar D, White PH, Callahan LF, Chang RW, Helmick CG, LappinDR, et al. A National Public Health Agenda for Osteoarthritis 2010.Semin Arthritis Rheum 2010;39:323–6.
[2] Hayes CW, Jamadar DA, Welch GW, Jannausch ML, Lachance LL,Capul DC, et al. Osteoarthritis of the knee: comparison of MR imagingfindings with radiographic severity measurements and pain in middle-aged women. Radiology 2005;237:998–1007.
[3] Helmick CG, Felson DT, Lawrence RC, Gabriel S, Hirsch R, KwohCK, et al. Estimates of the prevalence of arthritis and other rheumaticconditions in the United States: Part I. Arthritis Rheum 2008;58:15–25.
[4] Kornaat PR, Bloem JL, Ceulemans RY, Riyazi N, Rosendaal FR,Nelissen RG, et al. Osteoarthritis of the knee: association betweenclinical features and MR imaging findings. Radiology 2006;239:811–7.
[5] Altman RD, Lozada CZ. Laboratory findings in osteoarthritis. In:Moskowitz RW,Howell DS,AltmanRD,Buckwalter JA, GoldbergVM,editors. Osteoarthritis: diagnosis and medical/surgical management. 3rded. Philadelphia (PA): W.B. Saunders Company; 2001. p. 273–91.
[6] Kamphorst JJ, van der HR, DeGroot J, Lafeber FP, Reijmers TH, vanEl B, et al. Profiling of endogenous peptides in human synovial fluid
341G. Jia et al. / Magnetic Resonance Imaging 29 (2011) 335–341
by nanoLC-MS: method validation and peptide identification. JProteome Res 2007;6:4388–96.
[7] Reimann I, Arnoldi CC, Nielsen OS. Permeability of synovialmembrane to plasma proteins in human coxarthrosis: relation tomolecular size and histologic changes. Clin Orthop Relat Res 1980:296–300.
[8] Park SR, Park SH, Jang KW, Cho HS, Cui JH, An HJ, et al. The effectof sonication on simulated osteoarthritis: Part II. Alleviation ofosteoarthritis pathogenesis by 1 MHz ultrasound with simultaneoushyaluronate injection. Ultrasound Med Biol 2005;31:1559–66.
[9] Choi SI, Heo TR, Min BH, Cui JH, Choi BH, Park SR. Alleviation ofosteoarthritis by calycosin-7-O-beta-D-glucopyranoside (CG) isolatedfrom Astragali radix (AR) in rabbit osteoarthritis (OA) model.Osteoarthritis Cartilage 2007;15:1086–92.
[10] Geborek P, Wollheim FA. Synovial fluid. In: Wright V, Radin EL,editors. Mechanics of human joints: physiology, pathophysiology, andtreatment. New York (NY): Marcel Dekker; 1993. p. 109–36.
[11] Aime S, Barge A, Delli CD, Fedeli F, Mortillaro A, Nielsen FU, et al.Paramagnetic lanthanide(III) complexes as pH-sensitive chemicalexchange saturation transfer (CEST) contrast agents for MRIapplications. Magn Reson Med 2002;47:639–48.
[12] Goffeney N, Bulte JW, Duyn J, Bryant Jr LH, van Zijl PC, SensitiveNMR. detection of cationic-polymer-based gene delivery systemsusing saturation transfer via proton exchange. J Am Chem Soc2001;123:8628–9.
[13] Zhang S, Winter P, Wu K, Sherry AD. A novel europium(III)-basedMRI contrast agent. J Am Chem Soc 2001;123:1517–8.
[14] Guivel-Scharen V, Sinnwell T, Wolff SD, Balaban RS. Detection ofproton chemical exchange between metabolites and water in biologicaltissues. J Magn Reson 1998;133:36–45.
[15] Ward KM, Aletras AH, Balaban RS. A new class of contrast agents forMRI based on proton chemical exchange dependent saturation transfer(CEST). J Magn Reson 2000;143:79–87.
[16] Jones CK, Schlosser MJ, van Zijl PC, Pomper MG, Golay X, Zhou J.Amide proton transfer imaging of human brain tumors at 3T. MagnReson Med 2006;56:585–92.
[17] Ling W, Regatte RR, Navon G, Jerschow A. Assessment ofglycosaminoglycan concentration in vivo by chemical exchange-dependent saturation transfer (gagCEST). Proc Natl Acad Sci U S A2008;105:2266–70.
[18] Regatte RR, Schweitzer ME. Novel contrast mechanisms at 3 Teslaand 7 Tesla. Semin Musculoskelet Radiol 2008;12:266–80.
[19] Sun PZ, Zhou J, Sun W, Huang J, van Zijl PC. Suppression of lipidartifacts in amide proton transfer imaging. Magn Reson Med 2005;54:222–5.
[20] Sun PZ, Zhou J, Huang J, van Zijl P. Simplified quantitativedescription of amide proton transfer (APT) imaging during acuteischemia. Magn Reson Med 2007;57:405–10.
[21] Zhou J, Lal B, Wilson DA, Laterra J, van Zijl PC. Amide protontransfer (APT) contrast for imaging of brain tumors. Magn Reson Med2003;50:1120–6.
[22] Zhou J, Payen JF, Wilson DA, Traystman RJ, van Zijl PC. Using theamide proton signals of intracellular proteins and peptides to detect pHeffects in MRI. Nat Med 2003;9:1085–90.
[23] Chen W, Hu J. Mapping brain metabolites using a double echo-filtermetabolite imaging (DEFMI) technique. JMagnReson 1999;140:363–70.
[24] Roemer FW, Eckstein F, Guermazi A. Magnetic resonance imaging-based semiquantitative and quantitative assessment in osteoarthritis.Rheum Dis Clin North Am 2009;35:521–55.
[25] Zhou J, Blakeley JO, Hua J, Kim M, Laterra J, Pomper MG, et al.Practical data acquisition method for human brain tumor amide protontransfer (APT) imaging. Magn Reson Med 2008;60:842–9.
[26] Eckstein F, Cicuttini F, Raynauld JP, Waterton JC, Peterfy C.Magnetic resonance imaging (MRI) of articular cartilage in kneeosteoarthritis (OA): morphological assessment. Osteoarthritis Cartilage2006;14(Suppl A):A46–75.


