Embed Size (px)
Citation preview
Cement and Concrete Research 40 (2010) 1620–1629
Contents lists available at ScienceDirect
Cement and Concrete Research
j ourna l homepage: ht tp: / /ees.e lsev ie r.com/CEMCON/defau l t .asp
Quantification of the degree of reaction of fly ash
M. Ben Haha a,⁎, K. De Weerdt b,⁎, B. Lothenbach a
a Empa, Swiss Federal Laboratory for Materials Testing and Research, Laboratory for Concrete and Construction Chemistry, 8600 Dübendorf, Switzerlandb SINTEF Building and Infrastructure, 7465 Trondheim, Norway
⁎ Corresponding authors. Haha is to be contacted at Te44 823 40 35. De Weerdt, Tel.: +47 73 59 48 66; fax: +
E-mail addresses: [email protected] ([email protected] (K. De Weerdt).
0008-8846/$ – see front matter © 2010 Elsevier Ltd. Aldoi:10.1016/j.cemconres.2010.07.004
a b s t r a c t
a r t i c l e i n f oArticle history:Received 23 April 2010Accepted 16 July 2010
Keywords:Blended cementsChemical dissolutionScanning electron microscopy (SEM)Image analysis (IA)Degree of reaction
The quantification of the fly ash (FA) in FA blended cements is an important parameter to understand theeffect of the fly ash on the hydration of OPC and on the microstructural development. The FA reaction in twodifferent blended OPC-FA systems was studied using a selective dissolution technique based on EDTA/NaOH,diluted NaOH solution, the portlandite content and by backscattered electron image analysis.The amount of FA determined by selective dissolution using EDTA/NaOH is found to be associated with asignificant possible error as different assumptions lead to large differences in the estimate of FA reacted. Inaddition, at longer hydration times, the reaction of the FA is underestimated by this method due to thepresence of non-dissolved hydrates and MgO rich particles. The dissolution of FA in diluted NaOH solutionagreed during the first days well with the dissolution as observed by image analysis. At 28 days and longer,the formation of hydrates in the diluted solutions leads to an underestimation. Image analysis appears to giveconsistent results and to be most reliable technique studied.
l.: +41 44 823 49 47; fax: +4147 73 59 71 36.Haha),
l rights reserved.
© 2010 Elsevier Ltd. All rights reserved.
1. Introduction
The development of new materials and technologies utilizingwaste and bi-products of industrial processes is an important task forthe cement industry in their quest to reduce CO2 emissions. Fly ash(FA) is a commonly used pozzolanic material in concrete, and manyresearchers have investigated its effect on the microstructure ofconcrete. Commercial fly ash blended cements in Europe can containup to 35% of fly ash (CEM II). Due to regulations on CO2 emissionscement producers are interested in replacing even larger parts of thePortland cement with fly ash. This gives new incentives to study highvolume fly ash cements.
When combined with ordinary Portland cement, SiO2 and Al2O3
originating from the glass phase of the FAwill partly dissolve due to thehigh pH of the pore solution and will react with Ca(OH)2 to formhydration products similar to the ones formed by ordinary Portlandcement [1]. The determination of the amount of reacted as a function oftime in fly ash blended cements enables to link the progress of thereaction of the different components (OPC, fly ash) and the subsequentchanges.
FA gives a very broad X-ray peak which makes a quantification ofunhydrated fly ash by XRD in the presence of other amorphous phasesrather imprecise. Methods reported in literature to determine theamount of fly ash reacted include (i) selective dissolution methods,
(ii) consumption of portlandite, and (iii) determination of fly ashreactivity in highly diluted solution.
Selective dissolution methods are commonly used techniques andaim at dissolving the hydrates and the unhydrated clinkers withoutdissolving the unreacted fly ash. This allows a direct determination ofthe amount of unreacted fly ash in a hardened cement paste as theunreacted fly ash remains as residue and can be quantified. A numberof different methods have been reported in literature, generally basedon the use of either acids or complexing agents.
Amongall the acids reported in literature, picric acid appears to be themost promising for selective dissolution of hydrates and clinkers [2,3].The method has been originally tested for a fly ash–gypsum–Ca(OH)2systems [2] and for hydrated cement pastes containing fly ash [3]. In themeantime the method has been employed in several studies [4–7]. Inother studies, salicylic acid has been used as a dissolving agent as it isknown todissolve the silicates phases inOPC [8]. The technique appearedto be suitable when applied to a C3S–fly ash systems [9,10]. However,when used in cementitious composite systems, it dissolved hydrates andinterstitial (aluminates and ferrites) unreacted OPC phases insufficiently[2,11]. NaOH and sugar are known to dissolve the interstitial phases inunreacted OPC [8]. NaOH and sugar have been therefore combined withsalicylic acid to study the fly ash reaction in blended cements [12]. Thefraction of glass in fly ash reacted did not increase and agreed with theresults found in previous studies [9,10]. Salicylic acid has also been testedin combination with hydrochloric acid (HCl) [11,13]. However, HCl wasfound to be too aggressive and to dissolve parts of the fly ash [2]. Acidconditions can also result in silica gel precipitation [11].
A frequently used complexing agent for selective dissolution ofblended cements is ethylene diamine tetra acetic acid (EDTA) combined
Table 1Chemical composition of the clinker, fly ash and limestone in wt.%.
Clinker Fly ash Limestone
SiO2 20.8 50.0 12.9Al2O3 5.6 23.9 2.7Fe2O3 3.2 6.0 2.0CaO 63.0 6.3 42.3MgO 3.0 2.1 1.8SO3 1.5 0.4 –
P2O5 0.1 1.1 –
K2O 1.3 1.4 0.6Na2O 0.5 0.6 0.5Na2O Eq. 1.4 1.6LOI 0.3 3.6 37.7Carbon – 3.1 –
Chloride 0.051 – –
Free CaO 1.85 – –
Blaine surface [m2/kg] 310 450 900Density [kg/m3] 3150 2740 2490
1621M.B. Haha et al. / Cement and Concrete Research 40 (2010) 1620–1629
with triethanolamine (TEA). It was first tried on slag blended cements[11] and later tested in a slightly adapted version on fly ash blendedcements [14]. The EDTA method was not able to dissolve hydrotalciteand siliceous hydrogarnet-like phases and might have led to precipi-tationof amorphous silica [14]. The application of theEDTA/TEAmethodon fly ash was not a success [14].
In this study, different selective dissolutionmethods are comparedon a hydrated fly ash cement pastes as previously reportedcomparative studies had been performed on “ideal systems” such asgypsum–Ca(OH)2 [2] or on slag blended cements [11].
The pozzolanic reaction of the fly ash consumes Ca(OH)2 toproduce C–S–H. Thus the consumption of Ca(OH)2 has been used as ameasure for the degree of reaction of the fly ash [14]. The Ca(OH)2content in the hydrated OPC cement paste without fly ash is comparedto the Ca(OH)2 content in a corresponding paste containing fly ash.These results are difficult to interpret as not only the pozzolanicreaction influences the Ca(OH)2 content but the fly ash also promotesclinker hydration due to the filler effect. Portland cement blendedwith fly ash shows initially a higher degree of reaction resulting in thepresence of more portlandite than cement without fly ash [12]. Thiscomplicates the evaluation as it is difficult to assess where the fillereffect ends and the pozzolanic reaction starts. Furthermore, there isthe possibility that the dissolved silicate from the fly ash reactsdirectly with already formed C–S–H gel [15–17] rather than toprecipitate in reaction with portlandite. This reaction mechanism willlead to lower Ca/Si ratio of the C–S–H instead of a decrease of theportlandite content.
A more theoretical approach to study the reactivity of fly ash is toinvestigate strongly diluted suspension of fly ash at high pH values[15]. The solution has been analyzed for Si, Al and K as a function oftime and the obtained values are compared with Si, Al and K contentof the glass phase in the FA. The fly ash was found to dissolvecongruently; the difference in pH appeared to bemore important thanthe difference in fly ash chemistry [15].
Backscattered electrons (BSE) images coupled with image analysisare a further possibility to quantify the reaction of fly ash in blendedcements. BSE coupled with images analysis has been successfully usedto quantify the reaction of Portland cement clinkers [18–20] and ofblast furnace slags [21] and to study the extent of alkali aggregatereaction in concrete samples [22]. In this study the SEM-BSE imageswere analyzed quantitatively to get volume fractions of hydrated andunhydrated phases in the blended cement pastes. The segmentationof the unreacted fly ash particles was obtained using a combination ofimage analysis techniques such as grey-level threshold, and specificmorphological filtering.
In this study different techniques of quantification of FA reaction inFA blended cements are evaluated and compared critically.
Table 2XRD-Rietveld analyses of the FA (wt.%).
[g/100 g]
Quartz 12.3Calcite 0.4Hematite 0.6Anhydrite 0.4Mullite 18.3Amorphous* 68.0
* glass and 3% amorphous carbon.
2. Materials and methods
2.1. Materials
The chemical composition of the Portland cement clinker, type Fsiliceous fly ash (FA) and limestone powder used in this study aregiven in Table 1. The CaCO3 content of limestone determined by TGA isabout 81%. The clinker has been interground with 3.7% of naturalgypsum to obtain a total SO3 content of 3% in the Portland cement. Theused gypsum contained 0.2% free water, and had a CaSO4·2H2Ocontent of 91.4%. The XRD-Rietveld of the FA indicates the presence of18 wt.% mullite, 12 wt.% quartz and an amorphous content of 68 wt.%(Table 2). The amorphous content includes besides the glass phase, 3%of amorphous carbon. The composition of the glass phase given inTable 3 was calculated by subtracting the oxides present in thecrystalline phases of FA (determined by XRD-Rietveld) from the totalamount of oxides present in the FA as determined by XRF.
2.2. Assessment of the degree of reaction
2.2.1. Selective dissolutionIn this study, six different selective dissolution methods based on
salicylic acid, hydrochloric acid (HCl), EDTA or picric acid have beentested and compared (see Table 4). The materials subjected to theselective dissolution experiments are:
• unhydrated OPC• unreacted FA• reacted OPC-FA=hydrated paste (80%OPC+20% FAwithw/b=0.5hydrated for 90 days at 20 °C)
• 80% reacted OPC-FA+20% unreacted FA
The selective dissolution methods aim to dissolve selectively thehydrates and the unhydrated clinkers without dissolving theunreacted fly ash. The residue after dissolution is compared withthe original sample mass to calculate the degree of reaction of the FA.The effectiveness of the different selective dissolution techniqueswere tested on the raw materials, unreacted FA and unhydrated OPCin order to identify techniques that dissolve all unhydrated clinkerand hydrates without affecting the unreacted FA.
To study the efficiency of different dissolution techniques, on the“reacted OPC-FA”, consisting of the hydrated 80% OPC+20% FA curedfor 90 days at 20 °C: the residues after dissolutionwere examined usingSEM techniques. To check for systematic errors, a fourth combinationwas tested, consisting of 80% reactedOPC-FA towhich20%unreacted FAwas added. Theweight difference of the residues between reacted OPC-FA and 80% reacted OPC-FA+20% unreacted FA should be the weightcorresponding to 20% FA considering the amount of residue notdissolved by the different dissolution techniques.
The unreacted FA and OPC were used as received for the selectivedissolution. The hydrated pastes were treated prior to the selectivedissolution with isopropanol and ether to stop hydration, ground topass a 63 μm sieve and stored in a dessicator over silica gel. Thepowder was added to the solvent and stirred for the required time(Table 4). After mixing, the suspension was filtrated through a dried
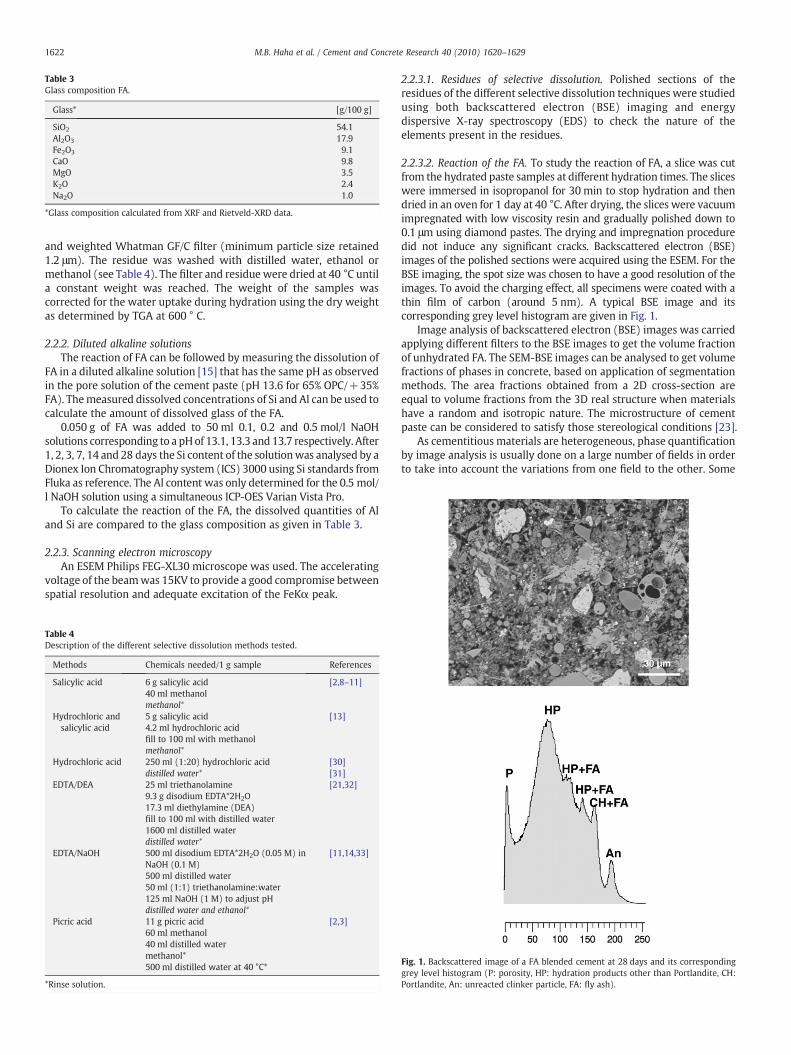
Table 3Glass composition FA.
Glass* [g/100 g]
SiO2 54.1Al2O3 17.9Fe2O3 9.1CaO 9.8MgO 3.5K2O 2.4Na2O 1.0
*Glass composition calculated from XRF and Rietveld-XRD data.
1622 M.B. Haha et al. / Cement and Concrete Research 40 (2010) 1620–1629
and weighted Whatman GF/C filter (minimum particle size retained1.2 μm). The residue was washed with distilled water, ethanol ormethanol (see Table 4). The filter and residue were dried at 40 °C untila constant weight was reached. The weight of the samples wascorrected for the water uptake during hydration using the dry weightas determined by TGA at 600 ° C.
2.2.2. Diluted alkaline solutionsThe reaction of FA can be followed by measuring the dissolution of
FA in a diluted alkaline solution [15] that has the same pH as observedin the pore solution of the cement paste (pH 13.6 for 65% OPC/+35%FA). Themeasured dissolved concentrations of Si and Al can be used tocalculate the amount of dissolved glass of the FA.
0.050 g of FA was added to 50 ml 0.1, 0.2 and 0.5 mol/l NaOHsolutions corresponding to a pHof 13.1, 13.3 and 13.7 respectively. After1, 2, 3, 7, 14 and 28 days the Si content of the solutionwas analysed by aDionex Ion Chromatography system (ICS) 3000 using Si standards fromFluka as reference. The Al content was only determined for the 0.5 mol/l NaOH solution using a simultaneous ICP-OES Varian Vista Pro.
To calculate the reaction of the FA, the dissolved quantities of Aland Si are compared to the glass composition as given in Table 3.
2.2.3. Scanning electron microscopyAn ESEM Philips FEG-XL30 microscope was used. The accelerating
voltage of the beamwas 15KV to provide a good compromise betweenspatial resolution and adequate excitation of the FeKα peak.
Table 4Description of the different selective dissolution methods tested.
Methods Chemicals needed/1 g sample References
Salicylic acid 6 g salicylic acid40 ml methanolmethanol*
[2,8–11]
Hydrochloric andsalicylic acid
5 g salicylic acid4.2 ml hydrochloric acidfill to 100 ml with methanolmethanol*
[13]
Hydrochloric acid 250 ml (1:20) hydrochloric aciddistilled water*
[30][31]
EDTA/DEA 25 ml triethanolamine9.3 g disodium EDTA*2H2O17.3 ml diethylamine (DEA)fill to 100 ml with distilled water1600 ml distilled waterdistilled water*
[21,32]
EDTA/NaOH 500 ml disodium EDTA*2H2O (0.05 M) inNaOH (0.1 M)500 ml distilled water50 ml (1:1) triethanolamine:water125 ml NaOH (1 M) to adjust pHdistilled water and ethanol*
[11,14,33]
Picric acid 11 g picric acid60 ml methanol40 ml distilled watermethanol*500 ml distilled water at 40 °C*
[2,3]
*Rinse solution.
2.2.3.1. Residues of selective dissolution. Polished sections of theresidues of the different selective dissolution techniques were studiedusing both backscattered electron (BSE) imaging and energydispersive X-ray spectroscopy (EDS) to check the nature of theelements present in the residues.
2.2.3.2. Reaction of the FA. To study the reaction of FA, a slice was cutfrom the hydrated paste samples at different hydration times. The sliceswere immersed in isopropanol for 30 min to stop hydration and thendried in an oven for 1 day at 40 °C. After drying, the slices were vacuumimpregnated with low viscosity resin and gradually polished down to0.1 μm using diamond pastes. The drying and impregnation proceduredid not induce any significant cracks. Backscattered electron (BSE)images of the polished sections were acquired using the ESEM. For theBSE imaging, the spot size was chosen to have a good resolution of theimages. To avoid the charging effect, all specimens were coated with athin film of carbon (around 5 nm). A typical BSE image and itscorresponding grey level histogram are given in Fig. 1.
Image analysis of backscattered electron (BSE) images was carriedapplying different filters to the BSE images to get the volume fractionof unhydrated FA. The SEM-BSE images can be analysed to get volumefractions of phases in concrete, based on application of segmentationmethods. The area fractions obtained from a 2D cross-section areequal to volume fractions from the 3D real structure when materialshave a random and isotropic nature. The microstructure of cementpaste can be considered to satisfy those stereological conditions [23].
As cementitious materials are heterogeneous, phase quantificationby image analysis is usually done on a large number of fields in orderto take into account the variations from one field to the other. Some
Fig. 1. Backscattered image of a FA blended cement at 28 days and its correspondinggrey level histogram (P: porosity, HP: hydration products other than Portlandite, CH:Portlandite, An: unreacted clinker particle, FA: fly ash).
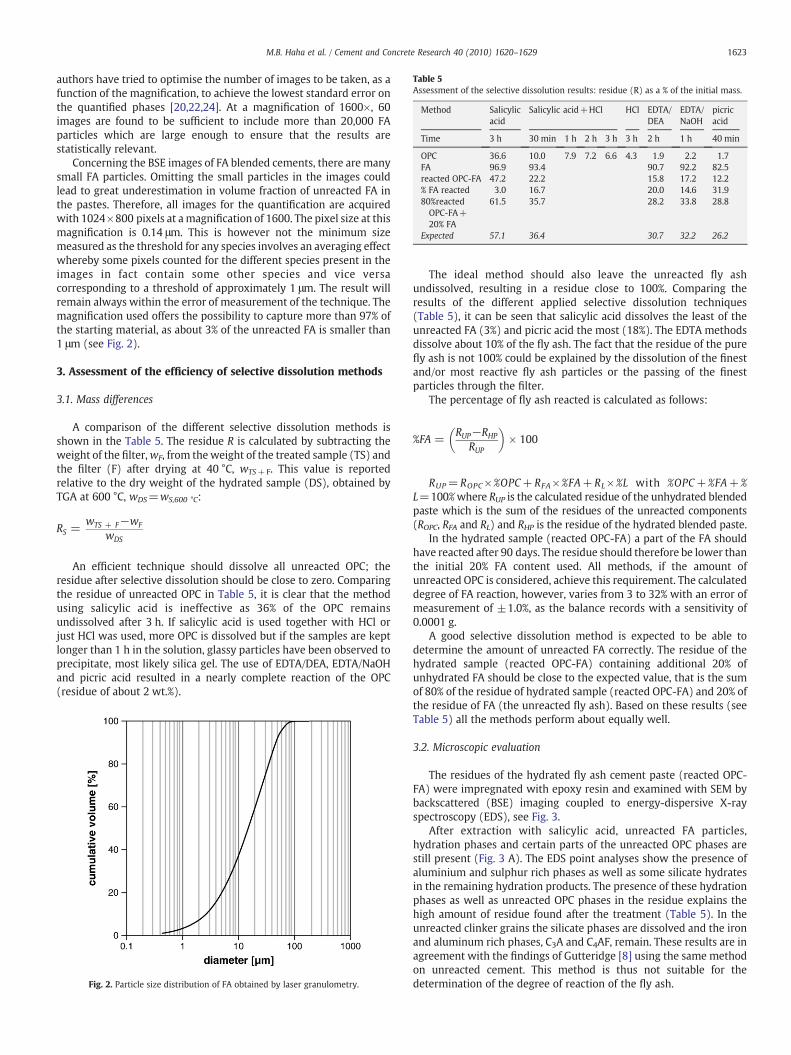
Table 5Assessment of the selective dissolution results: residue (R) as a % of the initial mass.
Method Salicylicacid
Salicylic acid+HCl HCl EDTA/DEA
EDTA/NaOH
picricacid
Time 3 h 30 min 1 h 2 h 3 h 3 h 2 h 1 h 40 min
OPC 36.6 10.0 7.9 7.2 6.6 4.3 1.9 2.2 1.7FA 96.9 93.4 90.7 92.2 82.5reacted OPC-FA 47.2 22.2 15.8 17.2 12.2% FA reacted 3.0 16.7 20.0 14.6 31.980%reactedOPC-FA+20% FA
61.5 35.7 28.2 33.8 28.8
Expected 57.1 36.4 30.7 32.2 26.2
1623M.B. Haha et al. / Cement and Concrete Research 40 (2010) 1620–1629
authors have tried to optimise the number of images to be taken, as afunction of the magnification, to achieve the lowest standard error onthe quantified phases [20,22,24]. At a magnification of 1600×, 60images are found to be sufficient to include more than 20,000 FAparticles which are large enough to ensure that the results arestatistically relevant.
Concerning the BSE images of FA blended cements, there are manysmall FA particles. Omitting the small particles in the images couldlead to great underestimation in volume fraction of unreacted FA inthe pastes. Therefore, all images for the quantification are acquiredwith 1024×800 pixels at amagnification of 1600. The pixel size at thismagnification is 0.14 μm. This is however not the minimum sizemeasured as the threshold for any species involves an averaging effectwhereby some pixels counted for the different species present in theimages in fact contain some other species and vice versacorresponding to a threshold of approximately 1 μm. The result willremain always within the error of measurement of the technique. Themagnification used offers the possibility to capture more than 97% ofthe starting material, as about 3% of the unreacted FA is smaller than1 μm (see Fig. 2).
3. Assessment of the efficiency of selective dissolution methods
3.1. Mass differences
A comparison of the different selective dissolution methods isshown in the Table 5. The residue R is calculated by subtracting theweight of the filter,wF, from theweight of the treated sample (TS) andthe filter (F) after drying at 40 °C, wTS+F. This value is reportedrelative to the dry weight of the hydrated sample (DS), obtained byTGA at 600 °C, wDS=wS,600 °C:
RS =wTS + F−wF
wDS
An efficient technique should dissolve all unreacted OPC; theresidue after selective dissolution should be close to zero. Comparingthe residue of unreacted OPC in Table 5, it is clear that the methodusing salicylic acid is ineffective as 36% of the OPC remainsundissolved after 3 h. If salicylic acid is used together with HCl orjust HCl was used, more OPC is dissolved but if the samples are keptlonger than 1 h in the solution, glassy particles have been observed toprecipitate, most likely silica gel. The use of EDTA/DEA, EDTA/NaOHand picric acid resulted in a nearly complete reaction of the OPC(residue of about 2 wt.%).
Fig. 2. Particle size distribution of FA obtained by laser granulometry.
The ideal method should also leave the unreacted fly ashundissolved, resulting in a residue close to 100%. Comparing theresults of the different applied selective dissolution techniques(Table 5), it can be seen that salicylic acid dissolves the least of theunreacted FA (3%) and picric acid the most (18%). The EDTA methodsdissolve about 10% of the fly ash. The fact that the residue of the purefly ash is not 100% could be explained by the dissolution of the finestand/or most reactive fly ash particles or the passing of the finestparticles through the filter.
The percentage of fly ash reacted is calculated as follows:
%FA =RUP−RHP
RUP
� �× 100
RUP=ROPC× %OPC+ RFA× %FA+RL× %L with %OPC+ %FA+ %L=100%where RUP is the calculated residue of the unhydrated blendedpaste which is the sum of the residues of the unreacted components(ROPC, RFA and RL) and RHP is the residue of the hydrated blended paste.
In the hydrated sample (reacted OPC-FA) a part of the FA shouldhave reacted after 90 days. The residue should therefore be lower thanthe initial 20% FA content used. All methods, if the amount ofunreacted OPC is considered, achieve this requirement. The calculateddegree of FA reaction, however, varies from 3 to 32% with an error ofmeasurement of ±1.0%, as the balance records with a sensitivity of0.0001 g.
A good selective dissolution method is expected to be able todetermine the amount of unreacted FA correctly. The residue of thehydrated sample (reacted OPC-FA) containing additional 20% ofunhydrated FA should be close to the expected value, that is the sumof 80% of the residue of hydrated sample (reacted OPC-FA) and 20% ofthe residue of FA (the unreacted fly ash). Based on these results (seeTable 5) all the methods perform about equally well.
3.2. Microscopic evaluation
The residues of the hydrated fly ash cement paste (reacted OPC-FA) were impregnated with epoxy resin and examined with SEM bybackscattered (BSE) imaging coupled to energy-dispersive X-rayspectroscopy (EDS), see Fig. 3.
After extraction with salicylic acid, unreacted FA particles,hydration phases and certain parts of the unreacted OPC phases arestill present (Fig. 3 A). The EDS point analyses show the presence ofaluminium and sulphur rich phases as well as some silicate hydratesin the remaining hydration products. The presence of these hydrationphases as well as unreacted OPC phases in the residue explains thehigh amount of residue found after the treatment (Table 5). In theunreacted clinker grains the silicate phases are dissolved and the ironand aluminum rich phases, C3A and C4AF, remain. These results are inagreement with the findings of Gutteridge [8] using the same methodon unreacted cement. This method is thus not suitable for thedetermination of the degree of reaction of the fly ash.
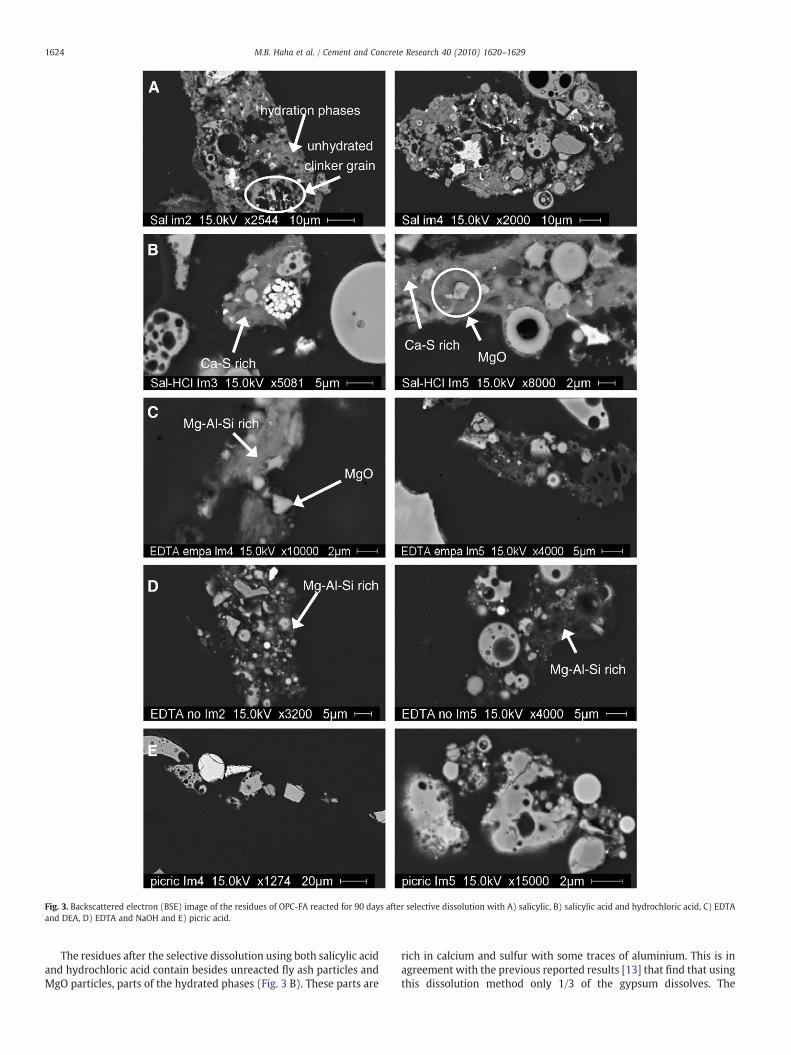
Fig. 3. Backscattered electron (BSE) image of the residues of OPC-FA reacted for 90 days after selective dissolution with A) salicylic, B) salicylic acid and hydrochloric acid, C) EDTAand DEA, D) EDTA and NaOH and E) picric acid.
1624 M.B. Haha et al. / Cement and Concrete Research 40 (2010) 1620–1629
The residues after the selective dissolution using both salicylic acidand hydrochloric acid contain besides unreacted fly ash particles andMgO particles, parts of the hydrated phases (Fig. 3 B). These parts are
rich in calcium and sulfur with some traces of aluminium. This is inagreement with the previous reported results [13] that find that usingthis dissolution method only 1/3 of the gypsum dissolves. The
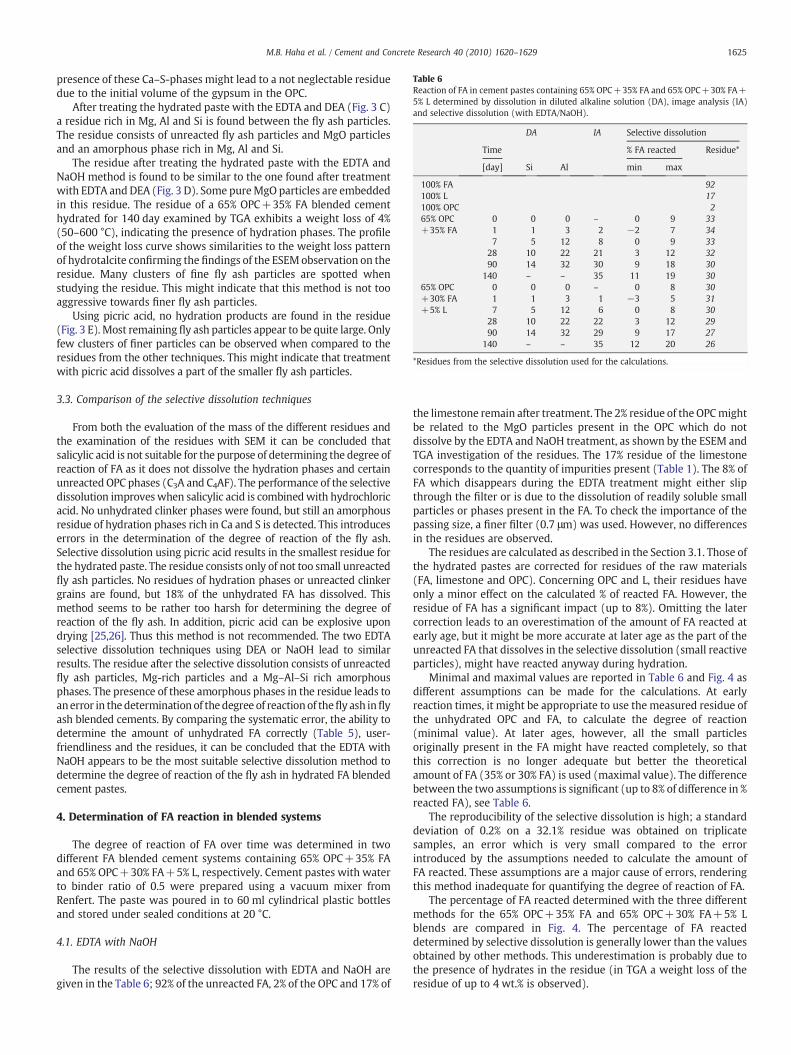
Table 6Reaction of FA in cement pastes containing 65% OPC+35% FA and 65% OPC+30% FA+5% L determined by dissolution in diluted alkaline solution (DA), image analysis (IA)and selective dissolution (with EDTA/NaOH).
DA IA Selective dissolution
Time % FA reacted Residue*
[day] Si Al min max
100% FA 92100% L 17100% OPC 265% OPC 0 0 0 – 0 9 33+35% FA 1 1 3 2 −2 7 34
7 5 12 8 0 9 3328 10 22 21 3 12 3290 14 32 30 9 18 30
140 – – 35 11 19 3065% OPC 0 0 0 – 0 8 30+30% FA 1 1 3 1 −3 5 31+5% L 7 5 12 6 0 8 30
28 10 22 22 3 12 2990 14 32 29 9 17 27
140 – – 35 12 20 26
*Residues from the selective dissolution used for the calculations.
1625M.B. Haha et al. / Cement and Concrete Research 40 (2010) 1620–1629
presence of these Ca–S-phases might lead to a not neglectable residuedue to the initial volume of the gypsum in the OPC.
After treating the hydrated paste with the EDTA and DEA (Fig. 3 C)a residue rich in Mg, Al and Si is found between the fly ash particles.The residue consists of unreacted fly ash particles and MgO particlesand an amorphous phase rich in Mg, Al and Si.
The residue after treating the hydrated paste with the EDTA andNaOH method is found to be similar to the one found after treatmentwith EDTA and DEA (Fig. 3 D). Some pureMgO particles are embeddedin this residue. The residue of a 65% OPC+35% FA blended cementhydrated for 140 day examined by TGA exhibits a weight loss of 4%(50–600 °C), indicating the presence of hydration phases. The profileof the weight loss curve shows similarities to the weight loss patternof hydrotalcite confirming the findings of the ESEM observation on theresidue. Many clusters of fine fly ash particles are spotted whenstudying the residue. This might indicate that this method is not tooaggressive towards finer fly ash particles.
Using picric acid, no hydration products are found in the residue(Fig. 3 E). Most remaining fly ash particles appear to be quite large. Onlyfew clusters of finer particles can be observed when compared to theresidues from the other techniques. This might indicate that treatmentwith picric acid dissolves a part of the smaller fly ash particles.
3.3. Comparison of the selective dissolution techniques
From both the evaluation of the mass of the different residues andthe examination of the residues with SEM it can be concluded thatsalicylic acid is not suitable for the purpose of determining the degree ofreaction of FA as it does not dissolve the hydration phases and certainunreacted OPC phases (C3A and C4AF). The performance of the selectivedissolution improves when salicylic acid is combinedwith hydrochloricacid. No unhydrated clinker phases were found, but still an amorphousresidue of hydration phases rich in Ca and S is detected. This introduceserrors in the determination of the degree of reaction of the fly ash.Selective dissolution using picric acid results in the smallest residue forthe hydrated paste. The residue consists only of not too small unreactedfly ash particles. No residues of hydration phases or unreacted clinkergrains are found, but 18% of the unhydrated FA has dissolved. Thismethod seems to be rather too harsh for determining the degree ofreaction of the fly ash. In addition, picric acid can be explosive upondrying [25,26]. Thus this method is not recommended. The two EDTAselective dissolution techniques using DEA or NaOH lead to similarresults. The residue after the selective dissolution consists of unreactedfly ash particles, Mg-rich particles and a Mg–Al–Si rich amorphousphases. The presence of these amorphous phases in the residue leads toanerror in thedeterminationof thedegree of reactionof thefly ash inflyash blended cements. By comparing the systematic error, the ability todetermine the amount of unhydrated FA correctly (Table 5), user-friendliness and the residues, it can be concluded that the EDTA withNaOH appears to be the most suitable selective dissolution method todetermine the degree of reaction of the fly ash in hydrated FA blendedcement pastes.
4. Determination of FA reaction in blended systems
The degree of reaction of FA over time was determined in twodifferent FA blended cement systems containing 65% OPC+35% FAand 65% OPC+30% FA+5% L, respectively. Cement pastes with waterto binder ratio of 0.5 were prepared using a vacuum mixer fromRenfert. The paste was poured in to 60 ml cylindrical plastic bottlesand stored under sealed conditions at 20 °C.
4.1. EDTA with NaOH
The results of the selective dissolution with EDTA and NaOH aregiven in the Table 6; 92% of the unreacted FA, 2% of the OPC and 17% of
the limestone remain after treatment. The 2% residue of the OPCmightbe related to the MgO particles present in the OPC which do notdissolve by the EDTA and NaOH treatment, as shown by the ESEM andTGA investigation of the residues. The 17% residue of the limestonecorresponds to the quantity of impurities present (Table 1). The 8% ofFA which disappears during the EDTA treatment might either slipthrough the filter or is due to the dissolution of readily soluble smallparticles or phases present in the FA. To check the importance of thepassing size, a finer filter (0.7 μm) was used. However, no differencesin the residues are observed.
The residues are calculated as described in the Section 3.1. Those ofthe hydrated pastes are corrected for residues of the raw materials(FA, limestone and OPC). Concerning OPC and L, their residues haveonly a minor effect on the calculated % of reacted FA. However, theresidue of FA has a significant impact (up to 8%). Omitting the latercorrection leads to an overestimation of the amount of FA reacted atearly age, but it might be more accurate at later age as the part of theunreacted FA that dissolves in the selective dissolution (small reactiveparticles), might have reacted anyway during hydration.
Minimal and maximal values are reported in Table 6 and Fig. 4 asdifferent assumptions can be made for the calculations. At earlyreaction times, it might be appropriate to use the measured residue ofthe unhydrated OPC and FA, to calculate the degree of reaction(minimal value). At later ages, however, all the small particlesoriginally present in the FA might have reacted completely, so thatthis correction is no longer adequate but better the theoreticalamount of FA (35% or 30% FA) is used (maximal value). The differencebetween the two assumptions is significant (up to 8% of difference in %reacted FA), see Table 6.
The reproducibility of the selective dissolution is high; a standarddeviation of 0.2% on a 32.1% residue was obtained on triplicatesamples, an error which is very small compared to the errorintroduced by the assumptions needed to calculate the amount ofFA reacted. These assumptions are a major cause of errors, renderingthis method inadequate for quantifying the degree of reaction of FA.
The percentage of FA reacted determined with the three differentmethods for the 65% OPC+35% FA and 65% OPC+30% FA+5% Lblends are compared in Fig. 4. The percentage of FA reacteddetermined by selective dissolution is generally lower than the valuesobtained by other methods. This underestimation is probably due tothe presence of hydrates in the residue (in TGA a weight loss of theresidue of up to 4 wt.% is observed).
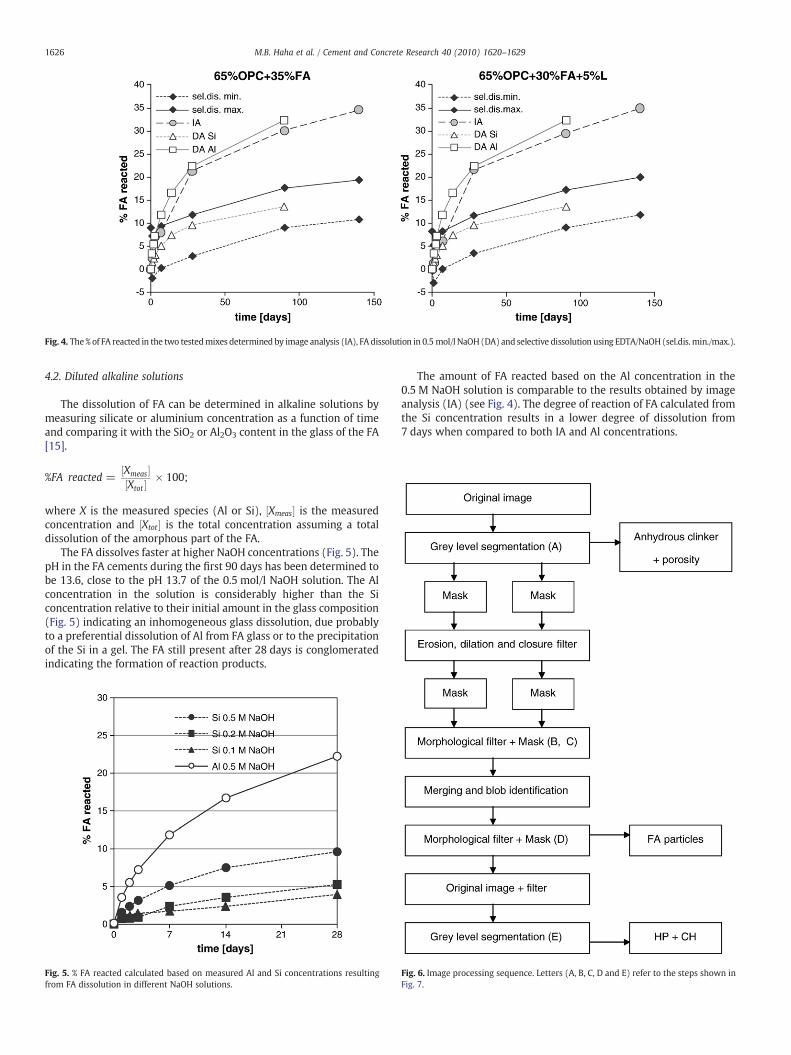
Fig. 4. The% of FA reacted in the two testedmixes determined by image analysis (IA), FA dissolution in 0.5 mol/l NaOH(DA) and selective dissolution using EDTA/NaOH (sel.dis.min./max.).
1626 M.B. Haha et al. / Cement and Concrete Research 40 (2010) 1620–1629
4.2. Diluted alkaline solutions
The dissolution of FA can be determined in alkaline solutions bymeasuring silicate or aluminium concentration as a function of timeand comparing it with the SiO2 or Al2O3 content in the glass of the FA[15].
%FA reacted =Xmeas½ �Xtot½ � × 100;
where X is the measured species (Al or Si), Xmeas½ � is the measuredconcentration and Xtot½ � is the total concentration assuming a totaldissolution of the amorphous part of the FA.
The FA dissolves faster at higher NaOH concentrations (Fig. 5). ThepH in the FA cements during the first 90 days has been determined tobe 13.6, close to the pH 13.7 of the 0.5 mol/l NaOH solution. The Alconcentration in the solution is considerably higher than the Siconcentration relative to their initial amount in the glass composition(Fig. 5) indicating an inhomogeneous glass dissolution, due probablyto a preferential dissolution of Al from FA glass or to the precipitationof the Si in a gel. The FA still present after 28 days is conglomeratedindicating the formation of reaction products.
Fig. 5. % FA reacted calculated based on measured Al and Si concentrations resultingfrom FA dissolution in different NaOH solutions.
The amount of FA reacted based on the Al concentration in the0.5 M NaOH solution is comparable to the results obtained by imageanalysis (IA) (see Fig. 4). The degree of reaction of FA calculated fromthe Si concentration results in a lower degree of dissolution from7 days when compared to both IA and Al concentrations.
Fig. 6. Image processing sequence. Letters (A, B, C, D and E) refer to the steps shown inFig. 7.
1627M.B. Haha et al. / Cement and Concrete Research 40 (2010) 1620–1629
4.3. Image analysis
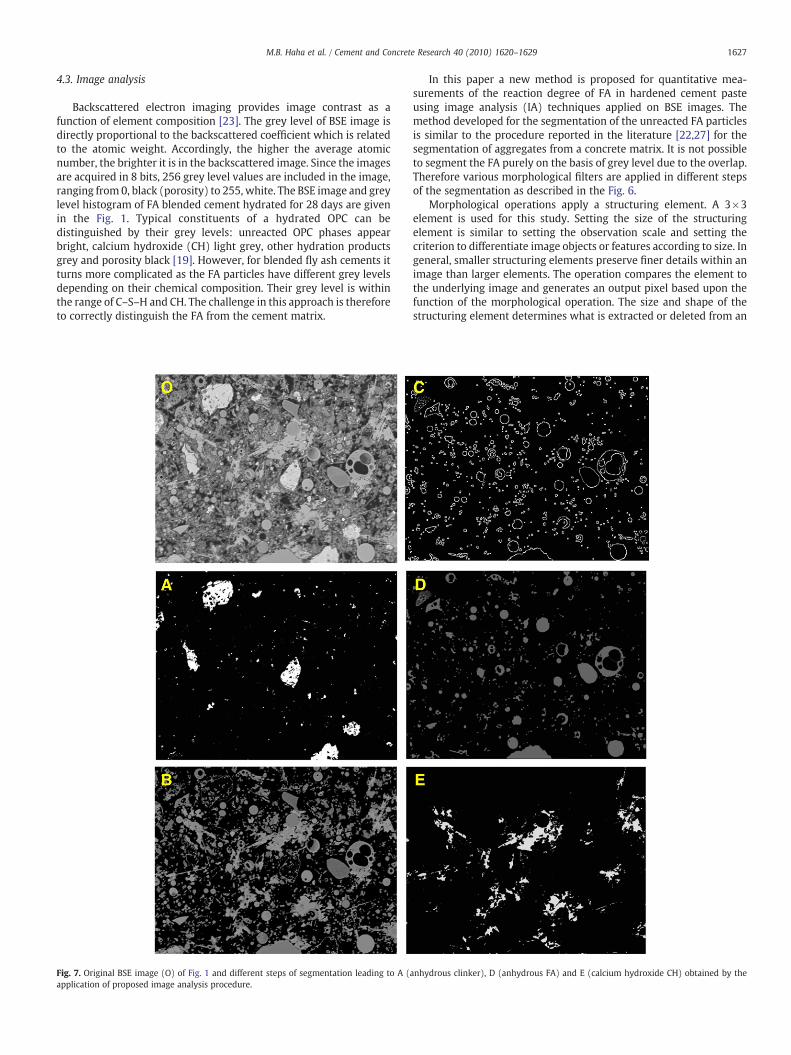
Backscattered electron imaging provides image contrast as afunction of element composition [23]. The grey level of BSE image isdirectly proportional to the backscattered coefficient which is relatedto the atomic weight. Accordingly, the higher the average atomicnumber, the brighter it is in the backscattered image. Since the imagesare acquired in 8 bits, 256 grey level values are included in the image,ranging from 0, black (porosity) to 255, white. The BSE image and greylevel histogram of FA blended cement hydrated for 28 days are givenin the Fig. 1. Typical constituents of a hydrated OPC can bedistinguished by their grey levels: unreacted OPC phases appearbright, calcium hydroxide (CH) light grey, other hydration productsgrey and porosity black [19]. However, for blended fly ash cements itturns more complicated as the FA particles have different grey levelsdepending on their chemical composition. Their grey level is withinthe range of C–S–H and CH. The challenge in this approach is thereforeto correctly distinguish the FA from the cement matrix.
Fig. 7. Original BSE image (O) of Fig. 1 and different steps of segmentation leading to A (application of proposed image analysis procedure.
In this paper a new method is proposed for quantitative mea-surements of the reaction degree of FA in hardened cement pasteusing image analysis (IA) techniques applied on BSE images. Themethod developed for the segmentation of the unreacted FA particlesis similar to the procedure reported in the literature [22,27] for thesegmentation of aggregates from a concrete matrix. It is not possibleto segment the FA purely on the basis of grey level due to the overlap.Therefore various morphological filters are applied in different stepsof the segmentation as described in the Fig. 6.
Morphological operations apply a structuring element. A 3×3element is used for this study. Setting the size of the structuringelement is similar to setting the observation scale and setting thecriterion to differentiate image objects or features according to size. Ingeneral, smaller structuring elements preserve finer details within animage than larger elements. The operation compares the element tothe underlying image and generates an output pixel based upon thefunction of the morphological operation. The size and shape of thestructuring element determines what is extracted or deleted from an
anhydrous clinker), D (anhydrous FA) and E (calcium hydroxide CH) obtained by the
1628 M.B. Haha et al. / Cement and Concrete Research 40 (2010) 1620–1629
image. When applying morphological operations to a greyscale level,each pixel value is compared to the neighbourhood minimum ormaximum value (as required by the morphological process).
The blob filter is used after segmentation to group pixels in somemeaningful way into blobs of a single color with black pixels being thebackground [28,29]. When the image is grouped into blobs, the maskfilters are used to remove the pixels remaining in the image that arenot wanted.
Inorder to follow the reaction over timeof FAparticles,well polishedthin sections of pastes at different ages of reaction are required. A goodpolishing is a key factor for a good image analysis. The application of themorphological filter to get out the FA particles could miss edges of theparticles in notwell polished surfaces presenting sharp edges. However,this error involves only the contours of FA particles these are estimatedto 2.5% of the total volume of FA. This value will contribute to thesystematic error of the method in not well polished samples.
The threshold of 1 μm could lead to an overestimation of the FAreaction. Nevertheless, this overestimation is controlled by comparingthe original and segmented images. The results obtained at 1 dayusing SEM-IA (around 2% of FA reacted for both systems) show thatthese error are fairly low for the FA investigated.
The BSE-IA technique enables the quantification of the content ofunreacted FA particles. Additionally, the total volumes of unreactedcement, CH, other hydrates or capillary porosity is obtained (seeFig. 7). However, in this paper we focus on quantifying the FA.
The degree of reaction of FA is obtained by subtracting the contentof unreacted FA determined by IA from the initial FA content anddividing it by the initial FA content.
%FA reacted = 1−Vmeas
Vini
� �× 100;
where Vmeas is the volume of FA obtained from the IA and Vini is theinitial volume of FA in the mix proportions.
The data as shown in Table 6 and Fig. 4 indicate little reactionduring the first day (≤2%) confirming that at least 98% of the FAparticles are visible by IA. The FA continues to react at a rather steadyrate during the first 28 days (Fig. 4), at longer hydration times thereaction rate of FA slows down, resulting in a total reaction of the FA of35% after 140 days.
The SEM image analysis is a direct method for the calculation of thedegree of reaction. Indeed, from the segmented images the differentphase assemblages could be controlled visually in order to verifywhether the segmentation process is accurate or not. A combination offilters and grey level thresholding was applied to distinguish betweenthe unreacted FA and the hydrated phases. The results at early age showno overestimation of the reaction degree of FA, indicating accuratequantification of these phases. The results of the IA during thefirst weekare comparable to the reaction determined in diluted alkaline solutions(Fig. 4). However, at later ages the results of the diluted solutiondiverges between Al and Si and some precipitates are observed. In thediluted solutionmethod, a nearly infinitemedium is available around FAparticles: 0.05 g of FA in 50 ml of the solvent, which does not representthe situation in concrete. Additionally, other ions thatmay interact withFA particles to enhance or retard its dissolution are missed. The use ofSEM-IA for quantifying the reactivity of the FA particles in the FAblended cements is a relatively simple and reliable method even if itrequires advanced equipment and it is time consuming.
5. Conclusions
Different methods to determine the degree of reaction of FA inblended cement were evaluated and compared: selective dissolution,dissolution of FA in a diluted alkaline solution and image analysis. Thetechniques use different approaches: selective dissolution uses theweight fraction of phases; the dissolution rate is based on the
concentration values in the solution, while the SEM image analysis iscalculated from the volume change of unreacted FA.
Selective dissolution, 0.5 NaOH diluted solution and IA indicatethat in both the OPC–FA and the OPC–FA–L mixture all the FA reactssignificantly during the first 28 days and the reaction slows downlater.
During the first 90 days, the degree of reaction of the FA measuredby SEM-IA agrees well with the degree of reaction determined by Al-dissolution in alkaline solution even if the conditions are different(cementitious environment and alkaline solution). The Si concentra-tion underestimate the FA reaction. After 28 days, conglomerateswere observed in the alkaline solution, which lead to an underesti-mation of the degree of reaction of FA using the dilution method.
The difference in the degree of reaction between the maximumvalues of selective dissolution and SEM-IA starts to be very significantafter 28 days, due to the presence of hydrates in the residues of theselective dissolution (Fig. 3D) leading to an underestimation of the FAreaction for the selective dissolution method. The different assump-tions and corrections as well as to the presence of hydration productsin the residues as observed by SEM and TGA introduce a large error inthe degree of reaction determined by selective dissolution.
The SEM image analysis technique gave the most reliable andconsistent results of the degree of reaction of FA in FA blendedcements.
Acknowledgements
The authors would like to acknowledge COIN, the COncreteINnovation centre (http://www.coinweb.no) for facilitating thecooperation and the financial support; Frank Winnefeld and FlorianDeschner for their helpful discussions of the experimental setup andthe results; Harald Justnes for his helpful comments; Zajac Maciej forhis contribution concerning the dissolution techniques; Gwenn LeSaout for the Rietveld analysis of FA; Boris Ingold for the excellentpreparation of the polished SEM samples and Luigi Brunetti for hishelp on the selective dissolution experiments.
References
[1] H.F.W. Taylor, Cement chemistry, Thomas Telford publishing, London, 1997.[2] S. Ohsawa, K. Asaga, S. Goto, M. Daimon, Quantitative determination of fly ash in
the hydrated fly ash — CaSO4·2H2O–Ca(OH)2 system, Cement and ConcreteResearch 15 (1985) 357–366.
[3] S. Li, D.M. Roy, A. Kumar, Quantitative determination of pozzolanas in hydratedsystems of cement or Ca(OH)2 with fly ash or silica fume, Cement and ConcreteResearch 15 (1985) 1079–1086.
[4] S.K. Antiohos, A. Papageorgiou, V.G. Papadakis, S. Tsimas, Influence of quicklimeaddition on the mechanical properties and hydration degree of blended cementscontaining different fly ashes, Construction and Building Materials 22 (2008)1191–1200.
[5] G. Baert, Physico-chemical interactions in Portland cement — (high volume) flyash binders, PhD, Faculty of Engineering, Ghent University, , 2009.
[6] L. Lam, Y.L. Wong, C.S. Poon, Degree of hydration and gel/space ratio of high-volume fly ash/cement systems, Cement and Concrete Research 30 (2000)747–756.
[7] Y.M. Zhang, W. Sun, H.D. Yan, Hydration of high-volume fly ash cement pastes,Cement and Concrete Composites 22 (2000) 445–452.
[8] W.A. Gutteridge, On the dissolution of the interstitial phases in Portland cement,Cement and Concrete Research 9 (1979) 319–324.
[9] K. Mohan, H.F.W. Taylor, Pastes of tricalcium silicate with fly ash — analytical,electron microscopy, trimethylsilylation and other studies, Material ResearchSociety, Annual Meeting (1981) 54–59.
[10] K. Ogawa, H. Uchikawa, K. Takemoto, I. Yasui, The mechanism of the hydration inthe system C3S-pozzolana, Cement and Concrete Research 10 (1980) 683–696.
[11] K. Luke, F.P. Glasser, Selective dissolution of hydrated blast furnace slag cements,Cement and Concrete Research 17 (1987) 273–282.
[12] J.A. Dalziel, W.A. Gutteridge, The influence of pulverized fuel ash upon thehydration characteristics and certain physical properties of a Portland cementpaste, Cement and Concrete Association, technical report 560, 1986, 28 pages.
[13] B.A. Suprenant, G. Papadopoulos, Selective dissolution of Portland Fly Ashcements, Journal of Materials and Civil Engineering 3 (1991).
[14] K. Luke, F.P. Glasser, Internal chemical evolution of the constitution of blendedcements, Cement and Concrete Research 18 (1988) 495–502.
[15] H.S. Pietersen, The reactivity of fly ash in cement, PhD thesis, TU Delft, (1993).
1629M.B. Haha et al. / Cement and Concrete Research 40 (2010) 1620–1629
[16] P.L. Rayment, The effect of pulverised-fuel ash on the c/s molar ratio and alkalicontent of calcium silicate hydrates in cement, Cement and Concrete Research 12(1982) 133–140.
[17] H.F.W. Taylor, K. Mohan, G.K. Moir, Analytical study of pure and extendedPortland cement pastes: II, fly ash- and slag-cement pastes, Journal of theAmerican Ceramic Society 68 (1985) 685–690.
[18] M. Mouret, A. Bascoul, G. Escadeillas, Study of the degree of hydration of concreteby means of image analysis and chemically bound water, Advanced Cement BasedMaterials 6 (1997) 109–115.
[19] K.L. Scrivener, Backscattered electron imaging of cementitious microstructures:understanding and quantification, Cement and Concrete Composites 26 (2004)935–945.
[20] K.L. Scrivener, H.H. Patel, P.L. Pratt, L.J. Parrott, Analysis of phases in cement pasteusing backscattered electron images, methanol adsorption and thermogravi-metric analysis, Proceeding Material Research Society Symposium, Microstruc-tural Development During the Hydration of Cement (1986) 67–76.
[21] A. Gruskovnjak, B. Lothenbach, F. Winnefeld, B. Münch, R. Rigi, S. Ko, M. Adler, U.Mäder, Quantification of hydration phases in supersulphated cements : reviewand new approaches, Advances in cement research, (Submitted).
[22] M. Ben Haha, E. Gallucci, A. Guidoum, K.L. Scrivener, Relation of expansion due toalkali silica reaction to the degree of reaction measured by SEM image analysis,Cement and Concrete Research 37 (2007) 1206–1214.
[23] K.L. Scrivener, T. Füllmann, E. Gallucci, G. Walenta, E. Bermejo, Quantitative studyof Portland cement hydration by X-ray diffraction/Rietveld analysis andindependent methods, Cement and Concrete Research 34 (2004) 1541–1547.
[24] M. Mouret, E. Ringot, A. Bascoul, Image analysis: a tool for the characterisation ofhydration of cement in concrete — metrological aspects of magnification onmeasurement, Cement and Concrete Composites 23 (2001) 201–206.
[25] P.C. Ashbrook, T.A. Houts, Picric acid, Chemical Health and Safety 10 (2003)27–???.
[26] G. Lunn, E.B. Sansone, Destruction of hazardous chemicals in the laboratory, JohnWiley & Sons, New York, 1990, pp. 219–221.
[27] R. Yang, N.R. Buenfeld, Binary segmentation of aggregate in SEM image analysis ofconcrete, Cement and Concrete Research 31 (2001) 437–441.
[28] T. Jiang, M.B. Merickel, Identification and boundary extraction of blobs in compleximagery, Computerized Medical Imaging and Graphics 13 (1989) 369–382.
[29] D. Marr, E. Hildreth, Theory of edge detection, Proceedings of the Royal Society ofLondon Series B, Biological Sciences 207 (1980) 187–217.
[30] A. Fernández-Jiménez, A.G. de la Torre, A. Palomo, G. López-Olmo, M.M. Alonso, M.A.G.Aranda, Quantitative determination of phases in the alkaline activation of fly ash. PartII: degree of reaction, Fuel 85 (2006) 1960–1969.
[31] K. Dombrowski, A. Buchwald, M. Weil, The influence of calcium content on thestructure and thermal performance of fly ash based geopolymers, Journal ofMaterials Science 42 (2007) 3033–3043.
[32] J.S. Lumley, R.S. Gollop, G.K. Moir, H.F.W. Taylor, Degrees of reaction of the slag insome blends with Portland cements, Cement and Concrete Research 26 (1996)139–151.
[33] H.M. Dyson, I.G. Richardson, A.R. Brough, A combined [29]Si MAS NMR andselective dissolution technique for the quantitative evaluation of hydrated blastfurnace slag cement blends, Blackwell, Malden, MA, ETATS-UNIS, 2007.


